Derivation of a shortwave infrared water stress index from MODIS near-and shortwave infrared data in...
11
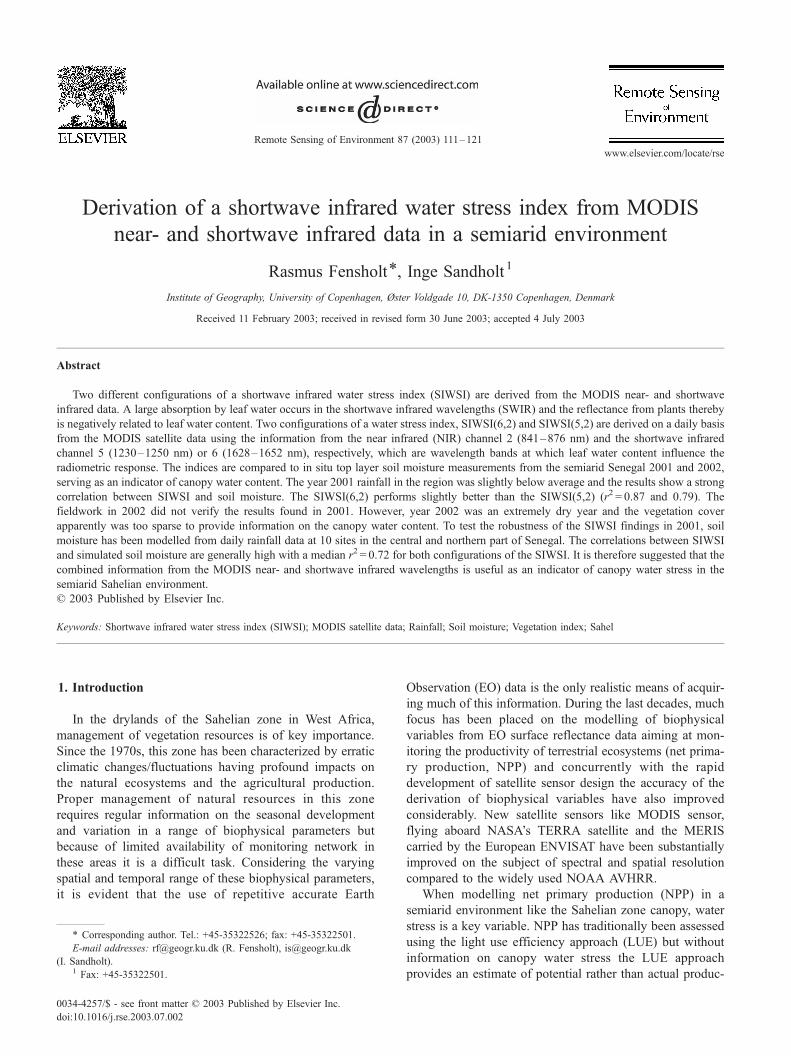
Derivation of a shortwave infrared water stress index from MODIS near- and shortwave infrared data in a semiarid environment Rasmus Fensholt * , Inge Sandholt 1 Institute of Geography, University of Copenhagen, Øster Voldgade 10, DK-1350 Copenhagen, Denmark Received 11 February 2003; received in revised form 30 June 2003; accepted 4 July 2003 Abstract Two different configurations of a shortwave infrared water stress index (SIWSI) are derived from the MODIS near- and shortwave infrared data. A large absorption by leaf water occurs in the shortwave infrared wavelengths (SWIR) and the reflectance from plants thereby is negatively related to leaf water content. Two configurations of a water stress index, SIWSI(6,2) and SIWSI(5,2) are derived on a daily basis from the MODIS satellite data using the information from the near infrared (NIR) channel 2 (841 – 876 nm) and the shortwave infrared channel 5 (1230– 1250 nm) or 6 (1628– 1652 nm), respectively, which are wavelength bands at which leaf water content influence the radiometric response. The indices are compared to in situ top layer soil moisture measurements from the semiarid Senegal 2001 and 2002, serving as an indicator of canopy water content. The year 2001 rainfall in the region was slightly below average and the results show a strong correlation between SIWSI and soil moisture. The SIWSI(6,2) performs slightly better than the SIWSI(5,2) (r 2 = 0.87 and 0.79). The fieldwork in 2002 did not verify the results found in 2001. However, year 2002 was an extremely dry year and the vegetation cover apparently was too sparse to provide information on the canopy water content. To test the robustness of the SIWSI findings in 2001, soil moisture has been modelled from daily rainfall data at 10 sites in the central and northern part of Senegal. The correlations between SIWSI and simulated soil moisture are generally high with a median r 2 = 0.72 for both configurations of the SIWSI. It is therefore suggested that the combined information from the MODIS near- and shortwave infrared wavelengths is useful as an indicator of canopy water stress in the semiarid Sahelian environment. D 2003 Published by Elsevier Inc. Keywords: Shortwave infrared water stress index (SIWSI); MODIS satellite data; Rainfall; Soil moisture; Vegetation index; Sahel 1. Introduction In the drylands of the Sahelian zone in West Africa, management of vegetation resources is of key importance. Since the 1970s, this zone has been characterized by erratic climatic changes/fluctuations having profound impacts on the natural ecosystems and the agricultural production. Proper management of natural resources in this zone requires regular information on the seasonal development and variation in a range of biophysical parameters but because of limited availability of monitoring network in these areas it is a difficult task. Considering the varying spatial and temporal range of these biophysical parameters, it is evident that the use of repetitive accurate Earth Observation (EO) data is the only realistic means of acquir- ing much of this information. During the last decades, much focus has been placed on the modelling of biophysical variables from EO surface reflectance data aiming at mon- itoring the productivity of terrestrial ecosystems (net prima- ry production, NPP) and concurrently with the rapid development of satellite sensor design the accuracy of the derivation of biophysical variables have also improved considerably. New satellite sensors like MODIS sensor, flying aboard NASA’s TERRA satellite and the MERIS carried by the European ENVISAT have been substantially improved on the subject of spectral and spatial resolution compared to the widely used NOAA AVHRR. When modelling net primary production (NPP) in a semiarid environment like the Sahelian zone canopy, water stress is a key variable. NPP has traditionally been assessed using the light use efficiency approach (LUE) but without information on canopy water stress the LUE approach provides an estimate of potential rather than actual produc- 0034-4257/$ - see front matter D 2003 Published by Elsevier Inc. doi:10.1016/j.rse.2003.07.002 * Corresponding author. Tel.: +45-35322526; fax: +45-35322501. E-mail addresses: [email protected] (R. Fensholt), [email protected] (I. Sandholt). 1 Fax: +45-35322501. www.elsevier.com/locate/rse Remote Sensing of Environment 87 (2003) 111– 121
-
Upload
independent -
Category
Documents
-
view
9 -
download
0
Transcript of Derivation of a shortwave infrared water stress index from MODIS near-and shortwave infrared data in...
www.elsevier.com/locate/rse
Remote Sensing of Environment 87 (2003) 111–121
Derivation of a shortwave infrared water stress index from MODIS
near- and shortwave infrared data in a semiarid environment
Rasmus Fensholt*, Inge Sandholt1
Institute of Geography, University of Copenhagen, Øster Voldgade 10, DK-1350 Copenhagen, Denmark
Received 11 February 2003; received in revised form 30 June 2003; accepted 4 July 2003
Abstract
Two different configurations of a shortwave infrared water stress index (SIWSI) are derived from the MODIS near- and shortwave
infrared data. A large absorption by leaf water occurs in the shortwave infrared wavelengths (SWIR) and the reflectance from plants thereby
is negatively related to leaf water content. Two configurations of a water stress index, SIWSI(6,2) and SIWSI(5,2) are derived on a daily basis
from the MODIS satellite data using the information from the near infrared (NIR) channel 2 (841–876 nm) and the shortwave infrared
channel 5 (1230–1250 nm) or 6 (1628–1652 nm), respectively, which are wavelength bands at which leaf water content influence the
radiometric response. The indices are compared to in situ top layer soil moisture measurements from the semiarid Senegal 2001 and 2002,
serving as an indicator of canopy water content. The year 2001 rainfall in the region was slightly below average and the results show a strong
correlation between SIWSI and soil moisture. The SIWSI(6,2) performs slightly better than the SIWSI(5,2) (r2 = 0.87 and 0.79). The
fieldwork in 2002 did not verify the results found in 2001. However, year 2002 was an extremely dry year and the vegetation cover
apparently was too sparse to provide information on the canopy water content. To test the robustness of the SIWSI findings in 2001, soil
moisture has been modelled from daily rainfall data at 10 sites in the central and northern part of Senegal. The correlations between SIWSI
and simulated soil moisture are generally high with a median r2 = 0.72 for both configurations of the SIWSI. It is therefore suggested that the
combined information from the MODIS near- and shortwave infrared wavelengths is useful as an indicator of canopy water stress in the
semiarid Sahelian environment.
D 2003 Published by Elsevier Inc.
Keywords: Shortwave infrared water stress index (SIWSI); MODIS satellite data; Rainfall; Soil moisture; Vegetation index; Sahel
1. Introduction
In the drylands of the Sahelian zone in West Africa,
management of vegetation resources is of key importance.
Since the 1970s, this zone has been characterized by erratic
climatic changes/fluctuations having profound impacts on
the natural ecosystems and the agricultural production.
Proper management of natural resources in this zone
requires regular information on the seasonal development
and variation in a range of biophysical parameters but
because of limited availability of monitoring network in
these areas it is a difficult task. Considering the varying
spatial and temporal range of these biophysical parameters,
it is evident that the use of repetitive accurate Earth
0034-4257/$ - see front matter D 2003 Published by Elsevier Inc.
doi:10.1016/j.rse.2003.07.002
* Corresponding author. Tel.: +45-35322526; fax: +45-35322501.
E-mail addresses: [email protected] (R. Fensholt), [email protected]
(I. Sandholt).1 Fax: +45-35322501.
Observation (EO) data is the only realistic means of acquir-
ing much of this information. During the last decades, much
focus has been placed on the modelling of biophysical
variables from EO surface reflectance data aiming at mon-
itoring the productivity of terrestrial ecosystems (net prima-
ry production, NPP) and concurrently with the rapid
development of satellite sensor design the accuracy of the
derivation of biophysical variables have also improved
considerably. New satellite sensors like MODIS sensor,
flying aboard NASA’s TERRA satellite and the MERIS
carried by the European ENVISAT have been substantially
improved on the subject of spectral and spatial resolution
compared to the widely used NOAA AVHRR.
When modelling net primary production (NPP) in a
semiarid environment like the Sahelian zone canopy, water
stress is a key variable. NPP has traditionally been assessed
using the light use efficiency approach (LUE) but without
information on canopy water stress the LUE approach
provides an estimate of potential rather than actual produc-
R. Fensholt, I. Sandholt / Remote Sensing of Environment 87 (2003) 111–121112
tion. Canopy water stress has proved to be difficult to derive
from conventional EO data. However, the spectral config-
uration on the MODIS sensor open up the possibilities of
the derivation of a shortwave infrared water stress index
(SIWSI) on a daily basis using the information from the
shortwave infrared channel 5 (1230–1250 nm) or 6 (1628–
1652 nm), which are wavelength areas at which leaf water
content influence the radiometric response. In this paper,
two different configurations of the SIWSI are derived from
the MODIS near- and shortwave infrared data. The indices
are compared to in situ top layer soil moisture measurements
from the semiarid Senegal 2001 and 2002, serving as an
indicator of canopy water content. Soil moisture is further-
more modelled from daily rainfall data to be able to test the
SIWSIs against soil moisture for a larger number of loca-
tions than the fieldwork sites.
2. Background
A summary of the approaches on the subject of plant
water stress monitoring is provided starting with a brief
review on the development of the NPP assessment to
underline the importance of a water stress estimate within
the scientific domain of modelling NPP in a semiarid
environment.
The net primary production provides a measure of the
production activity or growth of terrestrial vegetation.
Estimation of NPP is often based on the LUE concept
originally proposed by Monteith (1972) who considered
biomass accumulation as an ongoing process correlated with
the amount of photosynthetically action radiation (PAR)
absorbed or intercepted by green foliage (APAR). The LUE
approach however provides an estimate of potential produc-
tion rather than the actual production and the applicability of
modelling plant production using this approach depends on
the possibilities of taking into account variations in the
physical environment regarding plant stress arising from
temperature, light, lack of water and nutrients, and proper
modelling of respiration for maintenance and growth
(Goetz, Prince, Goward, Thawley, & Small, 1999; Prince
& Goward, 1995). In semiarid areas like the Sahelian zone,
rainfall is considered to be the limiting parameter for
vegetation growth (Diallo, Diouf, Hanan, Ndiaye, & Pre-
vost, 1991; Hendricksen & Durkin 1986; Hielkema, Prince,
& Astle, 1986; Malo & Nicholson, 1990). The need for
implementation of information on canopy water stress in the
NPP models is therefore evident. A number of studies have
focused on the derivation of information on plant water
stress and the majority of these can be divided into two
different theoretical approaches.
2.1. Near infrared and thermal infrared
The concept of using information from the thermal
infrared wavelengths (TIR) to monitor canopy water stress
was originally proposed by Jackson, Reginato, and Idso
(1977) who developed the crop water stress index (CWSI).
Numerous studies have suggested that the combined infor-
mation from surface temperature (Ts) and NDVI in combi-
nation indirectly can provide information on vegetation
stress and moisture conditions at the surface. As a given
area dries, it is expected that the relationship between
NDVI and Ts when plotted as scatterplot will be altered
due to an increased Ts for the low NDVI areas (Nemani &
Running, 1989). The relation is often expressed by the
slope of a line fit to the Ts/NDVI dry edge. Nemani and
Running (1989) related the slope of the Ts/NDVI relation-
ship to the stomata resistance and the evapotranspiration of
a deciduous forest. Boegh, Soegaard, Hanan, Kabat, and
Lesch (1998) and Jiang and Islam (1999) relates the Ts/
NDVI slope to the surface evapotranspiration. Analysis of
the NDVI/Ts space has also been used to derive information
on regional soil moisture conditions (Carlson & Gillies,
1993; Goetz, 1997; Goward, Xue, & Czajkowski, 2002;
Sandholt, Rasmussen, & Andersen, 2002). Moran, Clarke,
Inoue, and Vidal (1994) combined the NDVI/Ts space
approach with standard meteorological data to form a water
deficit index (WDI).
2.2. Near infrared and shortwave infrared
Physically based radiative transfer models and laboratory
studies have shown that changes in water content in plant
tissues have a large effect on the leaf reflectance in several
regions of the 0.4–2.5 Am spectrum. It is well known that a
large absorption by leaf water occurs in these wavelengths
and therefore shortwave infrared reflectance (SWIR) reflec-
tance is negatively related to leaf water content (Bowman,
1989; Ceccato, Flasse, Tarantola, Jacquemoud, & Gregoire,
2001; Hunt, Rock, & Nobel, 1987; Tucker, 1980) and
increased reflectance in these wavelengths is the most
consistent leaf reflectance response to plant stress in general
including water stress (Carter, 1994). It then might be
possible to obtain a direct measure of vegetation water
content. The largest of these regions is the 1.3–2.5 Aminterval (SWIR) where the amount of water available in the
internal leaf structure largely controls the spectral reflec-
tance (Tucker, 1980). Moving from the demonstration of
plant water stress towards EO-based observation of canopy
water stress introduces some new difficulties. The main
challenge is to investigate if the changes introduced by
changing the scale will affect the relationships found on leaf
level. Reflectance from other sources will inevitably mix
with the signal from the plant when using satellite images.
The effect of soil background reflectance, leaf biochemical
parameters (cellulose and lignin), leaf internal structure, leaf
dry matter, canopy biophysical parameters (LAI) and the
influence from the atmosphere will all have an effect on the
satellite measured reflectance (Ceccato et al., 2001; Hunt &
Rock, 1989; Penuelas, Filella, Biel, Serrano, & Save, 1993;
Rollin & Milton, 1998) and the question is whether the

R. Fensholt, I. Sandholt / Remote Sensing of Environment 87 (2003) 111–121 113
effect of water content on plant reflectance is still distin-
guishable from these influences.
Tucker, 1980 considered simulated leaf reflectance
combined with the transmission properties of the atmo-
sphere and found out that the spectral region best suited
for remotely sensed leaf water content was from 1550 to
1750 nm. This spectrum is identical to the Landsat TM
channel 5 and numerous studies have been conducted
using Landsat TM data for water stress monitoring through
broad channel ratio and combination techniques using
Landsat TM channels 4 and 5. Several of these studies
concluded that the changes of canopy water status were
less than the variations due to other factors like changes in
canopy geometry (Cohen, 1991) while other studies using
the hyper spectral advanced visible infrared imaging spec-
trometer (AVIRIS) with a sampling interval of 10 nm
appears more promising (Gao, 1996; Serrano, Ustin, Rob-
erts, Gamon, and Penuelas, 2000).
3. Method
The method used in this study is a continuation of the
approach using information from the near- and shortwave
infrared wavelengths. The new MODIS satellite instrument
has the advantage of two narrow discrete channels in the
SWIR with a signal to noise ratio above 100 (Guenther,
Xiong, Salomonson, Barnes, & Young, 2002) which both
could be useful for monitoring of leaf water content (Gao,
1996). In Fig. 1, the MODIS bands 1–6 spectral config-
urations combined with information of the atmospheric
water vapour transmission function can be seen. It should
be noticed that all the MODIS bands are placed in atmo-
spheric windows where the influence from water vapour
(and aerosols) is minimized. Superimposed are the spectral
reflectance from a vegetated surface with two different leaf
water contents (low water content = 0.001, high water con-
tent = 0.03). It can be seen that the MODIS channels 5 and 6
are located in wavelength areas where the leaf water content
plays a decisive role on the leaf reflectance. This makes the
Fig. 1. The MODIS bands 1–6 spectral configuration combined with information o
spectral reflectance from a vegetated surface with two different values of water
atmospheric water vapour transmission; modified after Vermote and Vermeulen (
(2001).
MODIS instrument channels 5 and 6 well suited for canopy
water monitoring because of the plant water sensitivity in
these wavelengths combined with the high atmospheric
water vapour transmittance.
Canopy water content is not the only parameter respon-
sible for reflectance variations in the MODIS channels 5 and
6 (SWIR). Variations in leaf internal structure and leaf dry
matter content also influences the SWIR reflectance and
consequently SWIR reflectance values alone are not suitable
for retrieving vegetation water content. A method to isolate
the reflectance contribution due variations in leaf internal
structure and leaf dry matter content is to exploit reflectance
information from near infrared wavelength (NIR) from 700
to 900 nm. The NIR reflectance is affected by leaf internal
structure and leaf dry matter content but not by water
content. By combining the NIR reflectance information with
the SWIR reflectance information, variations induced by
leaf internal structure and leaf dry matter content can be
removed and thus improve the accuracy in retrieving the
vegetation water content (Ceccato et al., 2001).
Two configurations of the shortwave infrared water stress
index will be tested:
SIWSIð6;2Þ ¼ q6 � q2
q6 þ q2
ð1Þ
SIWSIð5;2Þ ¼ q5 � q2
q5 þ q2
ð2Þ
where q is the reflectance and the spectral range of MODIS
channel 2 is from 841 to 876 nm, channel 5 is from 1230 to
1250 nm and channel 6 is from 1628 to 1652 nm. The
SIWSIs are normalized indices and the values thereby
theoretically vary between � 1 and 1. An index value above
zero means that the reflectance from channel 6 is higher than
the channel 2 reflectance and this indicates canopy water
stress. A low index value is a consequence of a higher
channel 2 reflectance than channel 6 which indicates suffi-
cient quantities of water in the canopy for photosynthetical
activity. Some considerations on the phenology of the
vegetation are needed to be able to derive information on
f the atmospheric water vapour transmission function. Superimposed are the
thickness (low water content = 0.001, high water content = 0.03). Sources:
1999). Water thickness reflectance; modified after Zarco-Tejada and Ustin
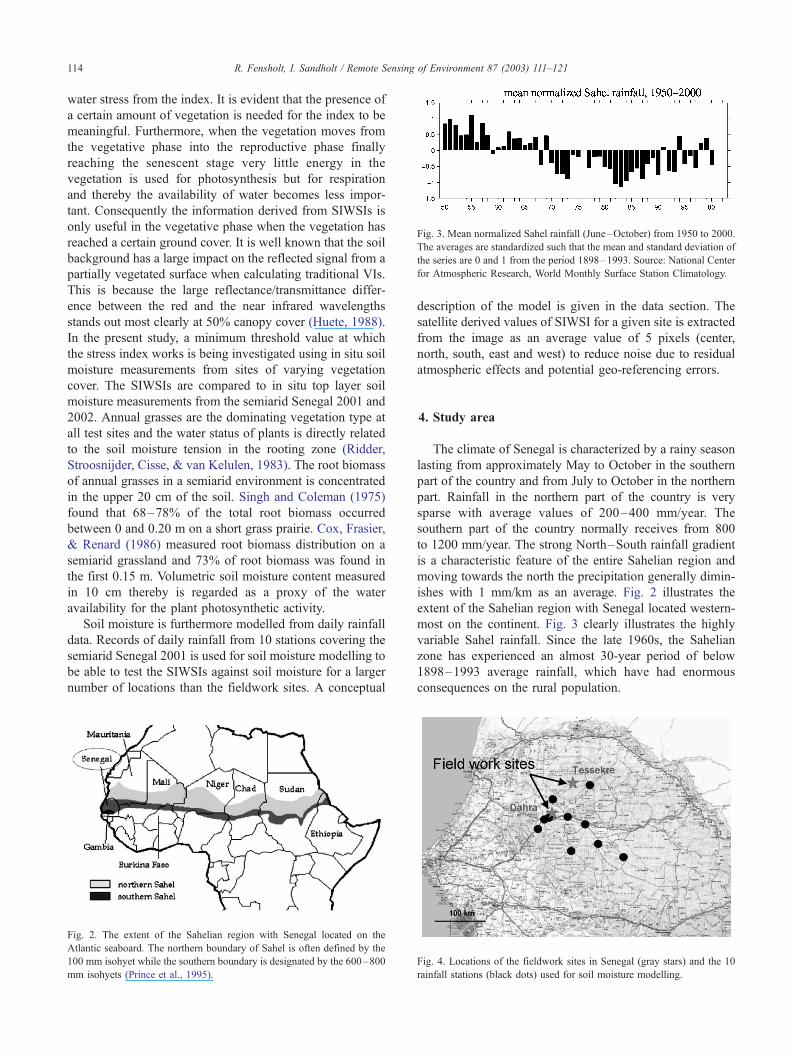
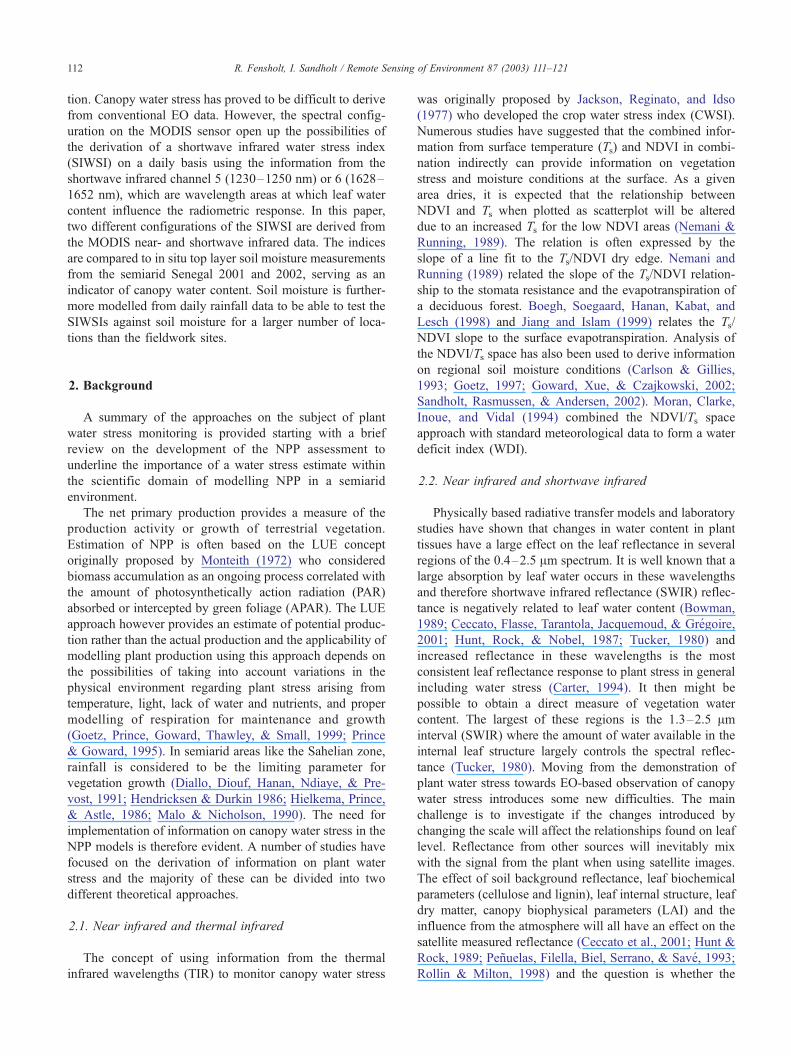
Fig. 3. Mean normalized Sahel rainfall (June–October) from 1950 to 2000.
The averages are standardized such that the mean and standard deviation of
the series are 0 and 1 from the period 1898–1993. Source: National Center
for Atmospheric Research, World Monthly Surface Station Climatology.
R. Fensholt, I. Sandholt / Remote Sensing of Environment 87 (2003) 111–121114
water stress from the index. It is evident that the presence of
a certain amount of vegetation is needed for the index to be
meaningful. Furthermore, when the vegetation moves from
the vegetative phase into the reproductive phase finally
reaching the senescent stage very little energy in the
vegetation is used for photosynthesis but for respiration
and thereby the availability of water becomes less impor-
tant. Consequently the information derived from SIWSIs is
only useful in the vegetative phase when the vegetation has
reached a certain ground cover. It is well known that the soil
background has a large impact on the reflected signal from a
partially vegetated surface when calculating traditional VIs.
This is because the large reflectance/transmittance differ-
ence between the red and the near infrared wavelengths
stands out most clearly at 50% canopy cover (Huete, 1988).
In the present study, a minimum threshold value at which
the stress index works is being investigated using in situ soil
moisture measurements from sites of varying vegetation
cover. The SIWSIs are compared to in situ top layer soil
moisture measurements from the semiarid Senegal 2001 and
2002. Annual grasses are the dominating vegetation type at
all test sites and the water status of plants is directly related
to the soil moisture tension in the rooting zone (Ridder,
Stroosnijder, Cisse, & van Kelulen, 1983). The root biomass
of annual grasses in a semiarid environment is concentrated
in the upper 20 cm of the soil. Singh and Coleman (1975)
found that 68–78% of the total root biomass occurred
between 0 and 0.20 m on a short grass prairie. Cox, Frasier,
& Renard (1986) measured root biomass distribution on a
semiarid grassland and 73% of root biomass was found in
the first 0.15 m. Volumetric soil moisture content measured
in 10 cm thereby is regarded as a proxy of the water
availability for the plant photosynthetic activity.
Soil moisture is furthermore modelled from daily rainfall
data. Records of daily rainfall from 10 stations covering the
semiarid Senegal 2001 is used for soil moisture modelling to
be able to test the SIWSIs against soil moisture for a larger
number of locations than the fieldwork sites. A conceptual
Fig. 2. The extent of the Sahelian region with Senegal located on the
Atlantic seaboard. The northern boundary of Sahel is often defined by the
100 mm isohyet while the southern boundary is designated by the 600–800
mm isohyets (Prince et al., 1995).
description of the model is given in the data section. The
satellite derived values of SIWSI for a given site is extracted
from the image as an average value of 5 pixels (center,
north, south, east and west) to reduce noise due to residual
atmospheric effects and potential geo-referencing errors.
4. Study area
The climate of Senegal is characterized by a rainy season
lasting from approximately May to October in the southern
part of the country and from July to October in the northern
part. Rainfall in the northern part of the country is very
sparse with average values of 200–400 mm/year. The
southern part of the country normally receives from 800
to 1200 mm/year. The strong North–South rainfall gradient
is a characteristic feature of the entire Sahelian region and
moving towards the north the precipitation generally dimin-
ishes with 1 mm/km as an average. Fig. 2 illustrates the
extent of the Sahelian region with Senegal located western-
most on the continent. Fig. 3 clearly illustrates the highly
variable Sahel rainfall. Since the late 1960s, the Sahelian
zone has experienced an almost 30-year period of below
1898–1993 average rainfall, which have had enormous
consequences on the rural population.
Fig. 4. Locations of the fieldwork sites in Senegal (gray stars) and the 10
rainfall stations (black dots) used for soil moisture modelling.
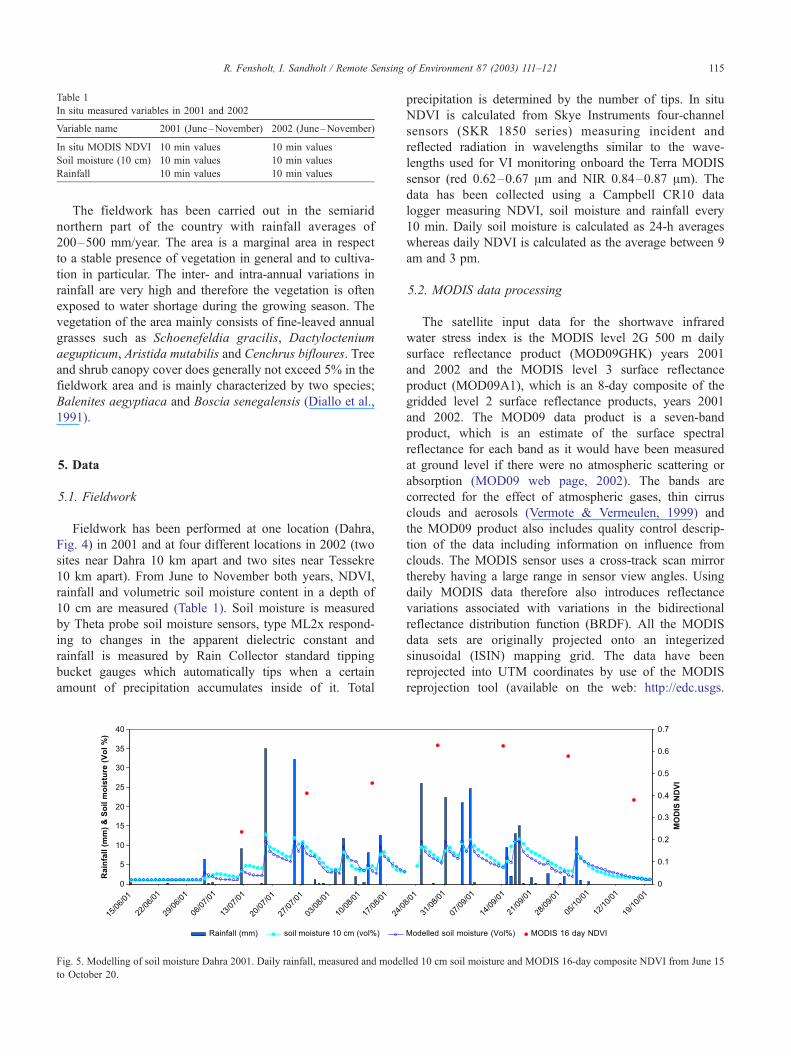
Table 1
In situ measured variables in 2001 and 2002
Variable name 2001 (June–November) 2002 (June–November)
In situ MODIS NDVI 10 min values 10 min values
Soil moisture (10 cm) 10 min values 10 min values
Rainfall 10 min values 10 min values
R. Fensholt, I. Sandholt / Remote Sensing of Environment 87 (2003) 111–121 115
The fieldwork has been carried out in the semiarid
northern part of the country with rainfall averages of
200–500 mm/year. The area is a marginal area in respect
to a stable presence of vegetation in general and to cultiva-
tion in particular. The inter- and intra-annual variations in
rainfall are very high and therefore the vegetation is often
exposed to water shortage during the growing season. The
vegetation of the area mainly consists of fine-leaved annual
grasses such as Schoenefeldia gracilis, Dactyloctenium
aegupticum, Aristida mutabilis and Cenchrus bifloures. Tree
and shrub canopy cover does generally not exceed 5% in the
fieldwork area and is mainly characterized by two species;
Balenites aegyptiaca and Boscia senegalensis (Diallo et al.,
1991).
5. Data
5.1. Fieldwork
Fieldwork has been performed at one location (Dahra,
Fig. 4) in 2001 and at four different locations in 2002 (two
sites near Dahra 10 km apart and two sites near Tessekre
10 km apart). From June to November both years, NDVI,
rainfall and volumetric soil moisture content in a depth of
10 cm are measured (Table 1). Soil moisture is measured
by Theta probe soil moisture sensors, type ML2x respond-
ing to changes in the apparent dielectric constant and
rainfall is measured by Rain Collector standard tipping
bucket gauges which automatically tips when a certain
amount of precipitation accumulates inside of it. Total
Fig. 5. Modelling of soil moisture Dahra 2001. Daily rainfall, measured and model
to October 20.
precipitation is determined by the number of tips. In situ
NDVI is calculated from Skye Instruments four-channel
sensors (SKR 1850 series) measuring incident and
reflected radiation in wavelengths similar to the wave-
lengths used for VI monitoring onboard the Terra MODIS
sensor (red 0.62–0.67 Am and NIR 0.84–0.87 Am). The
data has been collected using a Campbell CR10 data
logger measuring NDVI, soil moisture and rainfall every
10 min. Daily soil moisture is calculated as 24-h averages
whereas daily NDVI is calculated as the average between 9
am and 3 pm.
5.2. MODIS data processing
The satellite input data for the shortwave infrared
water stress index is the MODIS level 2G 500 m daily
surface reflectance product (MOD09GHK) years 2001
and 2002 and the MODIS level 3 surface reflectance
product (MOD09A1), which is an 8-day composite of the
gridded level 2 surface reflectance products, years 2001
and 2002. The MOD09 data product is a seven-band
product, which is an estimate of the surface spectral
reflectance for each band as it would have been measured
at ground level if there were no atmospheric scattering or
absorption (MOD09 web page, 2002). The bands are
corrected for the effect of atmospheric gases, thin cirrus
clouds and aerosols (Vermote & Vermeulen, 1999) and
the MOD09 product also includes quality control descrip-
tion of the data including information on influence from
clouds. The MODIS sensor uses a cross-track scan mirror
thereby having a large range in sensor view angles. Using
daily MODIS data therefore also introduces reflectance
variations associated with variations in the bidirectional
reflectance distribution function (BRDF). All the MODIS
data sets are originally projected onto an integerized
sinusoidal (ISIN) mapping grid. The data have been
reprojected into UTM coordinates by use of the MODIS
reprojection tool (available on the web: http://edc.usgs.
led 10 cm soil moisture and MODIS 16-day composite NDVI from June 15

Fig. 6. Modelled soil moisture versus measured soil moisture Dahra 2001
(June 15–October 20).
R. Fensholt, I. Sandholt / Remote Sensing of Environment 87 (2003) 111–121116
gov/programs/sddm/modisdist/). The resampling of data is
done by use of the bilinear interpolation resampling
algorithm.
5.3. Soil moisture modelling
Modelling volumetric soil moisture from daily rainfall
records makes it possible to test the SIWSIs from a number
of sites in the central and northern part of Senegal. Daily
rainfall data from 10 different stations in the central part of
Senegal covering the area of fieldwork was provided by the
local department of agriculture, Linguere. The locations of
the stations are given in Fig. 4. Modelling of soil moisture in
a depth of 10 cm from daily rainfall data is performed by a
simple two-layer ‘‘bucket’’ model with input parameters of
soil field capacity, wilting point (estimated from soil maps)
and vegetation density (from MODIS NDVI). The soil
moisture model distinguishes between upward water loss
from evaporation and transpiration and if the volumetric soil
water content exceeds the soil field capacity, the water will
percolate into a deeper layer. The modelling of the cumu-
lative evaporation is based on Monteith (1991) and is
Fig. 7. Modelling of soil moisture Dahra south 2002. Daily rainfall measured and
16-day composite NDVI from July 2 to October 30.
derived for partially vegetated surfaces in the Sudano–
Sahelian zone:
XEs ¼ a
ffiffit
pð3Þ
where SEs is the cumulative evaporation from the soil,
the constant a is dependent on soil hydraulic properties
and t is the time (number of days) from last rainfall
event. Soils having high clay content are, because of
efficient upward water movement due to capillarity, able
to evaporate corresponding to the potential evaporation
for 3 days before it starts decreasing with the square of
the time as given in Eq. (3). For the Sudano–Sahelian
zone in general and for the sites used in this study, soils
are however primarily sandy, falling into the luvic are-
nosol category according to FAO. Sandy soil types are
only able to correspond to the large atmospheric demand
for moisture for 1 day before evaporation starts decreas-
ing (Monteith, 1991) which means that Eq. (2) is suf-
ficient for modelling the evaporative water loss. The
transpiration loss from the soil moisture is found from
the amount of vegetation derived from the MODIS
NDVI. The MODIS NDVI 16-day composite values has
been linearly interpolated to daily values and the tran-
spiration loss was estimated empirically as a residual by
fitting the modelled soil moisture curves to the mea-
sured by adding weights to the transpiration term in the
calculation.
The model is calibrated from the fieldwork sites 2001
(one site) and 2002 (four sites) where both 10 cm soil
moisture and rainfall are known. Results from two sites are
presented here but all five sites are relatively similar in
respect to the model agreement with measured soil moisture.
Figs. 5 and 7 show the time series of rainfall, soil moisture
(measured and modelled) and NDVI (satellite and in situ
measurements). The model agreement with measured soil
moisture is given in Figs. 6 and 8.
modelled 10 cm soil moisture, in situ measured MODIS NDVI and MODIS
R. Fensholt, I. Sandholt / Remote Sensing of Environment 87 (2003) 111–121 117
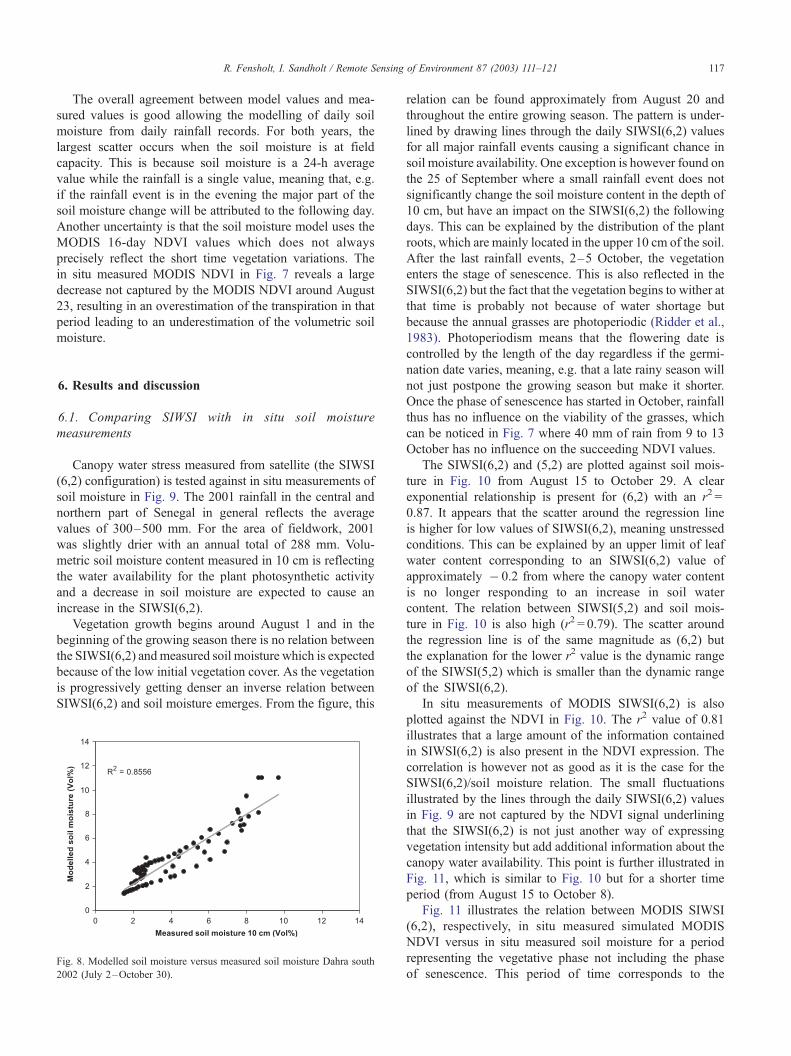
The overall agreement between model values and mea-
sured values is good allowing the modelling of daily soil
moisture from daily rainfall records. For both years, the
largest scatter occurs when the soil moisture is at field
capacity. This is because soil moisture is a 24-h average
value while the rainfall is a single value, meaning that, e.g.
if the rainfall event is in the evening the major part of the
soil moisture change will be attributed to the following day.
Another uncertainty is that the soil moisture model uses the
MODIS 16-day NDVI values which does not always
precisely reflect the short time vegetation variations. The
in situ measured MODIS NDVI in Fig. 7 reveals a large
decrease not captured by the MODIS NDVI around August
23, resulting in an overestimation of the transpiration in that
period leading to an underestimation of the volumetric soil
moisture.
6. Results and discussion
6.1. Comparing SIWSI with in situ soil moisture
measurements
Canopy water stress measured from satellite (the SIWSI
(6,2) configuration) is tested against in situ measurements of
soil moisture in Fig. 9. The 2001 rainfall in the central and
northern part of Senegal in general reflects the average
values of 300–500 mm. For the area of fieldwork, 2001
was slightly drier with an annual total of 288 mm. Volu-
metric soil moisture content measured in 10 cm is reflecting
the water availability for the plant photosynthetic activity
and a decrease in soil moisture are expected to cause an
increase in the SIWSI(6,2).
Vegetation growth begins around August 1 and in the
beginning of the growing season there is no relation between
the SIWSI(6,2) andmeasured soil moisture which is expected
because of the low initial vegetation cover. As the vegetation
is progressively getting denser an inverse relation between
SIWSI(6,2) and soil moisture emerges. From the figure, this
Fig. 8. Modelled soil moisture versus measured soil moisture Dahra south
2002 (July 2–October 30).
relation can be found approximately from August 20 and
throughout the entire growing season. The pattern is under-
lined by drawing lines through the daily SIWSI(6,2) values
for all major rainfall events causing a significant chance in
soil moisture availability. One exception is however found on
the 25 of September where a small rainfall event does not
significantly change the soil moisture content in the depth of
10 cm, but have an impact on the SIWSI(6,2) the following
days. This can be explained by the distribution of the plant
roots, which are mainly located in the upper 10 cm of the soil.
After the last rainfall events, 2–5 October, the vegetation
enters the stage of senescence. This is also reflected in the
SIWSI(6,2) but the fact that the vegetation begins to wither at
that time is probably not because of water shortage but
because the annual grasses are photoperiodic (Ridder et al.,
1983). Photoperiodism means that the flowering date is
controlled by the length of the day regardless if the germi-
nation date varies, meaning, e.g. that a late rainy season will
not just postpone the growing season but make it shorter.
Once the phase of senescence has started in October, rainfall
thus has no influence on the viability of the grasses, which
can be noticed in Fig. 7 where 40 mm of rain from 9 to 13
October has no influence on the succeeding NDVI values.
The SIWSI(6,2) and (5,2) are plotted against soil mois-
ture in Fig. 10 from August 15 to October 29. A clear
exponential relationship is present for (6,2) with an r2 =
0.87. It appears that the scatter around the regression line
is higher for low values of SIWSI(6,2), meaning unstressed
conditions. This can be explained by an upper limit of leaf
water content corresponding to an SIWSI(6,2) value of
approximately � 0.2 from where the canopy water content
is no longer responding to an increase in soil water
content. The relation between SIWSI(5,2) and soil mois-
ture in Fig. 10 is also high (r2 = 0.79). The scatter around
the regression line is of the same magnitude as (6,2) but
the explanation for the lower r2 value is the dynamic range
of the SIWSI(5,2) which is smaller than the dynamic range
of the SIWSI(6,2).
In situ measurements of MODIS SIWSI(6,2) is also
plotted against the NDVI in Fig. 10. The r2 value of 0.81
illustrates that a large amount of the information contained
in SIWSI(6,2) is also present in the NDVI expression. The
correlation is however not as good as it is the case for the
SIWSI(6,2)/soil moisture relation. The small fluctuations
illustrated by the lines through the daily SIWSI(6,2) values
in Fig. 9 are not captured by the NDVI signal underlining
that the SIWSI(6,2) is not just another way of expressing
vegetation intensity but add additional information about the
canopy water availability. This point is further illustrated in
Fig. 11, which is similar to Fig. 10 but for a shorter time
period (from August 15 to October 8).
Fig. 11 illustrates the relation between MODIS SIWSI
(6,2), respectively, in situ measured simulated MODIS
NDVI versus in situ measured soil moisture for a period
representing the vegetative phase not including the phase
of senescence. This period of time corresponds to the
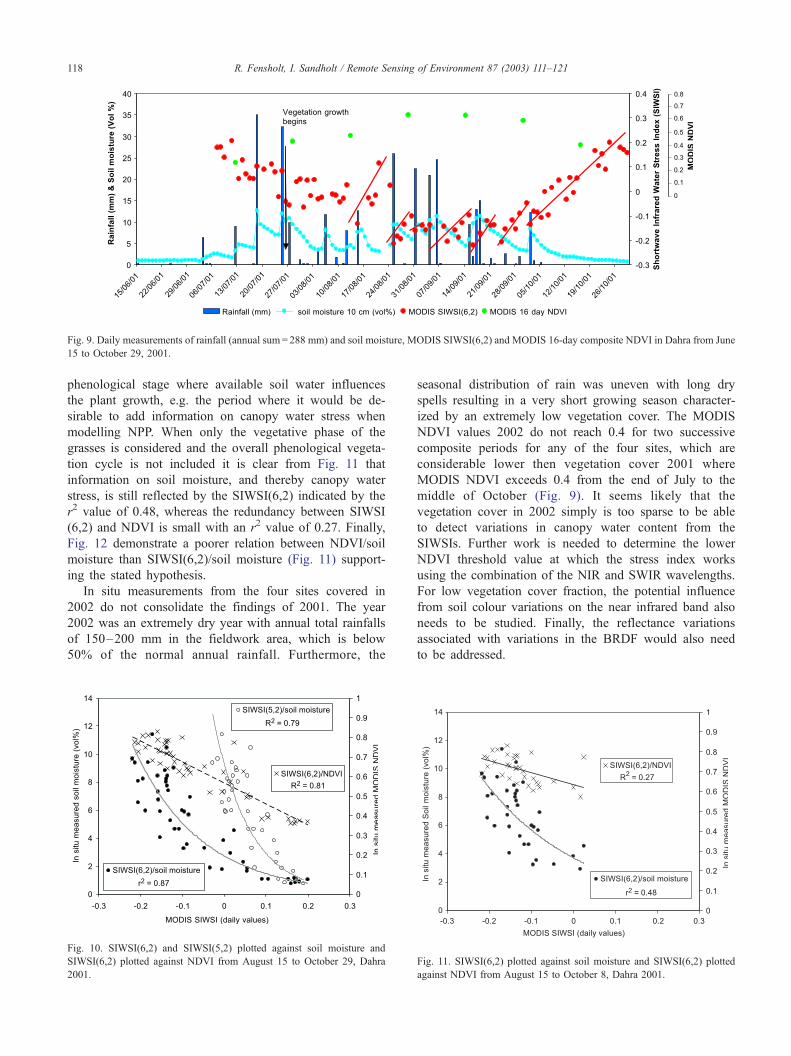
Fig. 9. Daily measurements of rainfall (annual sum= 288 mm) and soil moisture, MODIS SIWSI(6,2) and MODIS 16-day composite NDVI in Dahra from June
15 to October 29, 2001.
R. Fensholt, I. Sandholt / Remote Sensing of Environment 87 (2003) 111–121118
phenological stage where available soil water influences
the plant growth, e.g. the period where it would be de-
sirable to add information on canopy water stress when
modelling NPP. When only the vegetative phase of the
grasses is considered and the overall phenological vegeta-
tion cycle is not included it is clear from Fig. 11 that
information on soil moisture, and thereby canopy water
stress, is still reflected by the SIWSI(6,2) indicated by the
r2 value of 0.48, whereas the redundancy between SIWSI
(6,2) and NDVI is small with an r2 value of 0.27. Finally,
Fig. 12 demonstrate a poorer relation between NDVI/soil
moisture than SIWSI(6,2)/soil moisture (Fig. 11) support-
ing the stated hypothesis.
In situ measurements from the four sites covered in
2002 do not consolidate the findings of 2001. The year
2002 was an extremely dry year with annual total rainfalls
of 150–200 mm in the fieldwork area, which is below
50% of the normal annual rainfall. Furthermore, the
Fig. 10. SIWSI(6,2) and SIWSI(5,2) plotted against soil moisture and
SIWSI(6,2) plotted against NDVI from August 15 to October 29, Dahra
2001.
seasonal distribution of rain was uneven with long dry
spells resulting in a very short growing season character-
ized by an extremely low vegetation cover. The MODIS
NDVI values 2002 do not reach 0.4 for two successive
composite periods for any of the four sites, which are
considerable lower then vegetation cover 2001 where
MODIS NDVI exceeds 0.4 from the end of July to the
middle of October (Fig. 9). It seems likely that the
vegetation cover in 2002 simply is too sparse to be able
to detect variations in canopy water content from the
SIWSIs. Further work is needed to determine the lower
NDVI threshold value at which the stress index works
using the combination of the NIR and SWIR wavelengths.
For low vegetation cover fraction, the potential influence
from soil colour variations on the near infrared band also
needs to be studied. Finally, the reflectance variations
associated with variations in the BRDF would also need
to be addressed.
Fig. 11. SIWSI(6,2) plotted against soil moisture and SIWSI(6,2) plotted
against NDVI from August 15 to October 8, Dahra 2001.
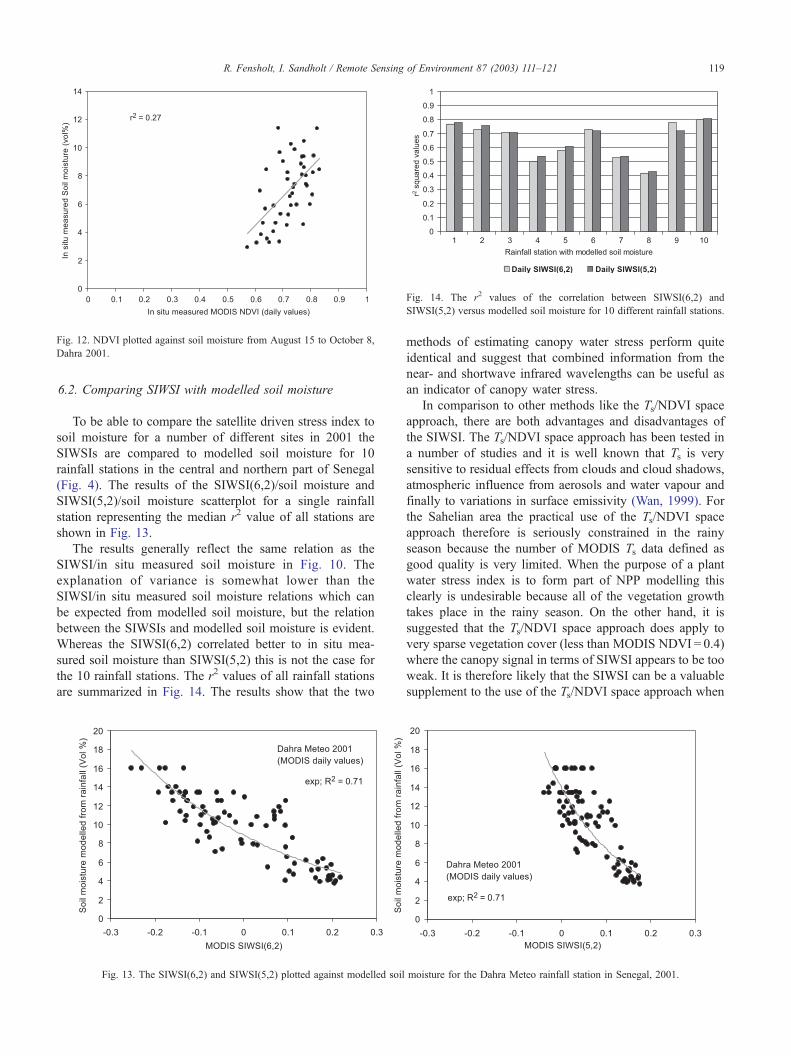
Fig. 12. NDVI plotted against soil moisture from August 15 to October 8,
Dahra 2001.
Fig. 14. The r2 values of the correlation between SIWSI(6,2) and
SIWSI(5,2) versus modelled soil moisture for 10 different rainfall stations.
R. Fensholt, I. Sandholt / Remote Sensing of Environment 87 (2003) 111–121 119
6.2. Comparing SIWSI with modelled soil moisture
To be able to compare the satellite driven stress index to
soil moisture for a number of different sites in 2001 the
SIWSIs are compared to modelled soil moisture for 10
rainfall stations in the central and northern part of Senegal
(Fig. 4). The results of the SIWSI(6,2)/soil moisture and
SIWSI(5,2)/soil moisture scatterplot for a single rainfall
station representing the median r2 value of all stations are
shown in Fig. 13.
The results generally reflect the same relation as the
SIWSI/in situ measured soil moisture in Fig. 10. The
explanation of variance is somewhat lower than the
SIWSI/in situ measured soil moisture relations which can
be expected from modelled soil moisture, but the relation
between the SIWSIs and modelled soil moisture is evident.
Whereas the SIWSI(6,2) correlated better to in situ mea-
sured soil moisture than SIWSI(5,2) this is not the case for
the 10 rainfall stations. The r2 values of all rainfall stations
are summarized in Fig. 14. The results show that the two
Fig. 13. The SIWSI(6,2) and SIWSI(5,2) plotted against modelled soil
methods of estimating canopy water stress perform quite
identical and suggest that combined information from the
near- and shortwave infrared wavelengths can be useful as
an indicator of canopy water stress.
In comparison to other methods like the Ts/NDVI space
approach, there are both advantages and disadvantages of
the SIWSI. The Ts/NDVI space approach has been tested in
a number of studies and it is well known that Ts is very
sensitive to residual effects from clouds and cloud shadows,
atmospheric influence from aerosols and water vapour and
finally to variations in surface emissivity (Wan, 1999). For
the Sahelian area the practical use of the Ts/NDVI space
approach therefore is seriously constrained in the rainy
season because the number of MODIS Ts data defined as
good quality is very limited. When the purpose of a plant
water stress index is to form part of NPP modelling this
clearly is undesirable because all of the vegetation growth
takes place in the rainy season. On the other hand, it is
suggested that the Ts/NDVI space approach does apply to
very sparse vegetation cover (less than MODIS NDVI = 0.4)
where the canopy signal in terms of SIWSI appears to be too
weak. It is therefore likely that the SIWSI can be a valuable
supplement to the use of the Ts/NDVI space approach when
moisture for the Dahra Meteo rainfall station in Senegal, 2001.
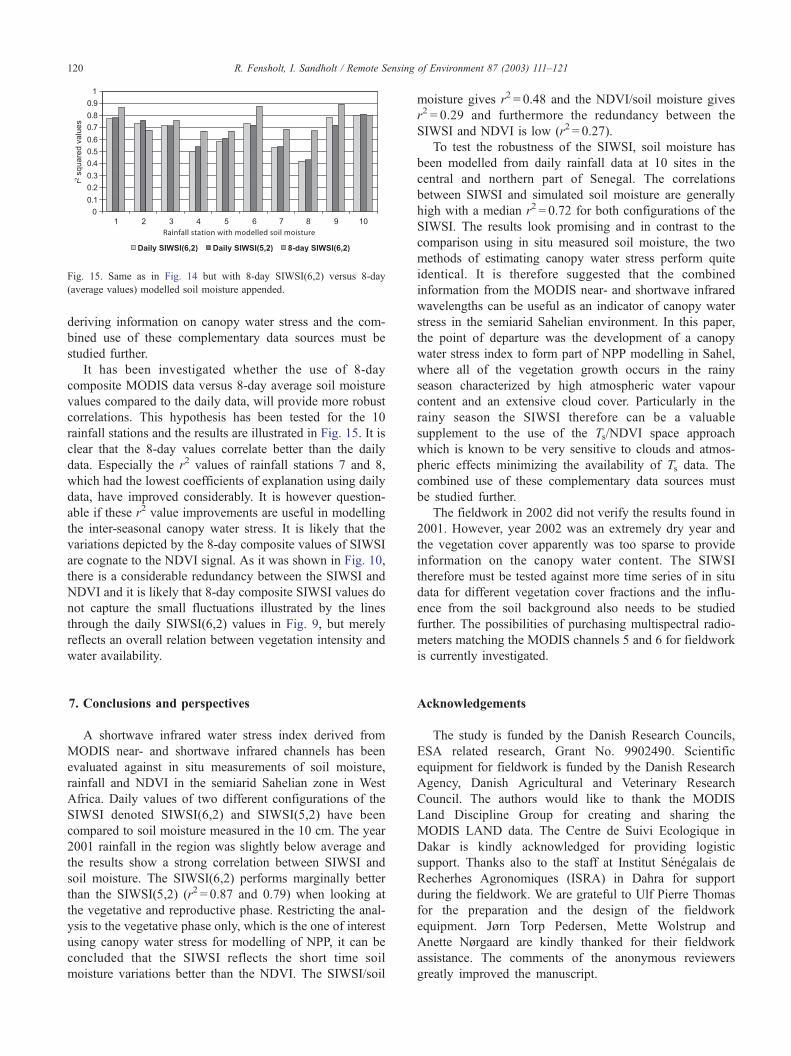
Fig. 15. Same as in Fig. 14 but with 8-day SIWSI(6,2) versus 8-day
(average values) modelled soil moisture appended.
R. Fensholt, I. Sandholt / Remote Sensing of Environment 87 (2003) 111–121120
deriving information on canopy water stress and the com-
bined use of these complementary data sources must be
studied further.
It has been investigated whether the use of 8-day
composite MODIS data versus 8-day average soil moisture
values compared to the daily data, will provide more robust
correlations. This hypothesis has been tested for the 10
rainfall stations and the results are illustrated in Fig. 15. It is
clear that the 8-day values correlate better than the daily
data. Especially the r2 values of rainfall stations 7 and 8,
which had the lowest coefficients of explanation using daily
data, have improved considerably. It is however question-
able if these r2 value improvements are useful in modelling
the inter-seasonal canopy water stress. It is likely that the
variations depicted by the 8-day composite values of SIWSI
are cognate to the NDVI signal. As it was shown in Fig. 10,
there is a considerable redundancy between the SIWSI and
NDVI and it is likely that 8-day composite SIWSI values do
not capture the small fluctuations illustrated by the lines
through the daily SIWSI(6,2) values in Fig. 9, but merely
reflects an overall relation between vegetation intensity and
water availability.
7. Conclusions and perspectives
A shortwave infrared water stress index derived from
MODIS near- and shortwave infrared channels has been
evaluated against in situ measurements of soil moisture,
rainfall and NDVI in the semiarid Sahelian zone in West
Africa. Daily values of two different configurations of the
SIWSI denoted SIWSI(6,2) and SIWSI(5,2) have been
compared to soil moisture measured in the 10 cm. The year
2001 rainfall in the region was slightly below average and
the results show a strong correlation between SIWSI and
soil moisture. The SIWSI(6,2) performs marginally better
than the SIWSI(5,2) (r2 = 0.87 and 0.79) when looking at
the vegetative and reproductive phase. Restricting the anal-
ysis to the vegetative phase only, which is the one of interest
using canopy water stress for modelling of NPP, it can be
concluded that the SIWSI reflects the short time soil
moisture variations better than the NDVI. The SIWSI/soil
moisture gives r2 = 0.48 and the NDVI/soil moisture gives
r2 = 0.29 and furthermore the redundancy between the
SIWSI and NDVI is low (r2 = 0.27).
To test the robustness of the SIWSI, soil moisture has
been modelled from daily rainfall data at 10 sites in the
central and northern part of Senegal. The correlations
between SIWSI and simulated soil moisture are generally
high with a median r2 = 0.72 for both configurations of the
SIWSI. The results look promising and in contrast to the
comparison using in situ measured soil moisture, the two
methods of estimating canopy water stress perform quite
identical. It is therefore suggested that the combined
information from the MODIS near- and shortwave infrared
wavelengths can be useful as an indicator of canopy water
stress in the semiarid Sahelian environment. In this paper,
the point of departure was the development of a canopy
water stress index to form part of NPP modelling in Sahel,
where all of the vegetation growth occurs in the rainy
season characterized by high atmospheric water vapour
content and an extensive cloud cover. Particularly in the
rainy season the SIWSI therefore can be a valuable
supplement to the use of the Ts/NDVI space approach
which is known to be very sensitive to clouds and atmos-
pheric effects minimizing the availability of Ts data. The
combined use of these complementary data sources must
be studied further.
The fieldwork in 2002 did not verify the results found in
2001. However, year 2002 was an extremely dry year and
the vegetation cover apparently was too sparse to provide
information on the canopy water content. The SIWSI
therefore must be tested against more time series of in situ
data for different vegetation cover fractions and the influ-
ence from the soil background also needs to be studied
further. The possibilities of purchasing multispectral radio-
meters matching the MODIS channels 5 and 6 for fieldwork
is currently investigated.
Acknowledgements
The study is funded by the Danish Research Councils,
ESA related research, Grant No. 9902490. Scientific
equipment for fieldwork is funded by the Danish Research
Agency, Danish Agricultural and Veterinary Research
Council. The authors would like to thank the MODIS
Land Discipline Group for creating and sharing the
MODIS LAND data. The Centre de Suivi Ecologique in
Dakar is kindly acknowledged for providing logistic
support. Thanks also to the staff at Institut Senegalais de
Recherhes Agronomiques (ISRA) in Dahra for support
during the fieldwork. We are grateful to Ulf Pierre Thomas
for the preparation and the design of the fieldwork
equipment. Jørn Torp Pedersen, Mette Wolstrup and
Anette Nørgaard are kindly thanked for their fieldwork
assistance. The comments of the anonymous reviewers
greatly improved the manuscript.
R. Fensholt, I. Sandholt / Remote Sensing of Environment 87 (2003) 111–121 121
References
Boegh, E., Soegaard, H., Hanan, N., Kabat, P., & Lesch, L. (1998). A
remote sensing study of the NDVI-Ts relationship and the transpiration
from sparse vegetation in the Sahel based on high resolution satellite
data. Remote Sensing of Environment, 69, 224–240.
Bowman, W. D. (1989). The relationship between leaf water status, gas
exchange, and spectral reflectance in cotton leaves. Remote Sensing of
Environment, 30, 249–255.
Carlson, T. N., & Gillies, R. R. (1993). A physical approach for in-
verting vegetation index with surface radiometric temperature to es-
timate surface soil water content. Proceedings for Remote Sensing
Conference.
Carter, G. A. (1994). Ratios of leaf reflectances in narrow wavebands as
indicators of plant stress. International Journal of Remote Sensing, 15,
697–703.
Ceccato, P., Flasse, S., Tarantola, S., Jacquemoud, S., & Gregoire, J. M.
(2001). Detecting vegetation leaf water content using reflectance in the
optical domain. Remote Sensing of Environment, 77, 22–33.
Cohen, W. B. (1991). Temporal versus spatial variation in leaf reflectance
under changing water stress conditions. International Journal of Re-
mote Sensing, 12, 1865–1876.
Cox, J. R., Frasier, G. W., & Renard, K. G. (1986). Biomass distribution at
grassland and shrubland sites. Rangelands, 8(2), 67–68.
Diallo, O., Diouf, A., Hanan, N. P., Ndiaye, A., & Prevost, Y. (1991).
AVHRR monitoring of savannah primary production in Senegal, West
Africa. International Journal of Remote Sensing, 12, 1259–1279.
Gao, B. C. (1996). NDWI—a normalized difference water index for remote
sensing of vegetation liquid water from space. Remote Sensing of En-
vironment, 58, 257–266.
Goetz, S. J. (1997). Multisensor analysis of NDVI, surface temperature and
biophysical variables at a mixed grassland site. International Journal of
Remote Sensing, 18, 71–94.
Goetz, S. J., Prince, S. D., Goward, S. N., Thawley, M. M., & Small, J.
(1999). Satellite remote sensing of primary production: An improved
production efficiency modeling approach. Ecological Modeling, 122(3),
239–255.
Goward, S. N., Xue, Y., & Czajkowski, K. P. (2002). Evaluating land
surface moisture conditions from the remotely sensed temperature/veg-
etation index measurements: An exploration with the simplified simple
biosphere model. Remote Sensing of Environment, 79, 225–242.
Guenther, B., Xiong, X., Salomonson, V. V., Barnes, W. L., & Young, J.
(2002). On-orbit performance of the Earth observing system moderate
resolution imaging spectroradiometer; first year of data. Remote Sensing
of Environment, 83, 16–30.
Hendricksen, B. L., & Durkin, J. W. (1986). Growing period and drought
early warning in Africa using satellite data. International Journal of
Remote Sensing, 7, 1583–1608.
Hielkema, J. U., Prince, S. D., & Astle, W. L. (1986). Rainfall and vege-
tation monitoring in the Savanna Zone of the Democratic Republic of
Sudan using the NOAA advanced very high resolution radiometer.
International Journal of Remote Sensing, 7, 1499–1513.
Huete, A. R. (1988). A soil-adjusted vegetation index (SAVI). Remote
Sensing of Environment, 25, 295–309.
Hunt, E. R., & Rock, B. N. (1989). Detection of changes in leaf water
content using near and middle-infrared reflectances. Remote Sensing of
Environment, 30, 43–54.
Hunt, E. R., Rock, B. N., & Nobel, P. S. (1987). Measurement of leaf
relative water content by infrared reflectance. Remote Sensing of Envi-
ronment, 22, 429–435.
Jackson, R. D., Reginato, R. J., & Idso, S. B. (1977). Wheat canopy
temperature: A practical tool for evaluating water requirements. Water
Resources Research, 13, 651–656.
Jiang, L., & Islam, S. (1999). A methodology for estimation of surface
evapotranspiration over large areas using remote sensing observations.
Geophysical Research Letters, 26, 2773–2776.
Malo, A. R., & Nicholson, S. E. (1990). A study of rainfall and vegetation
dynamics in the African Sahel using normalized difference vegetation
index. Journal of Arid Environments, 19, 1–24.
MOD09 web page, Nov. 2002. http://modis-land.gsfc.nasa.gov/mod09/
html/surfref.htm.
Monteith, J. L. (1972). Solar radiation and productivity in tropical ecosys-
tems. Journal of Applied Ecology, 9, 747–766.
Monteith, J. L. (1991). Weather and water in the Sudano–Sahelian
zone. In M. V. K. Sivakumar, J. S. Wallace, C. Renard, & C. Girous
(Eds.), Soil water balance in the Sudano–Sahelian Zone. IAHS
Publication, vol. 199 ( pp. 11–29). Wallingford, UK: IAHS Press, Ins-
titute of Hydrology.
Moran, M. S., Clarke, T. R., Inoue, Y., & Vidal, A. (1994). Estimating
crop water deficit using the relation between surface-air temperature
and spectral vegetation index. Remote Sensing of Environment, 49,
246–263.
Nemani, R. R., & Running, S. W. (1989). Estimation of regional surface
resistance to evapotranspiration from NDVI and thermal IR AVHRR
data. Journal of Applied Meteorology, 28, 276–284.
Penuelas, J., Filella, I., Biel, C., Serrano, L., & Save, R. (1993). The
reflectance at the 950–970 nm region as an indicator of plant water
status. International Journal of Remote Sensing, 14, 1887–1905.
Prince, S. D., Engman, E. T., Sellers, P., Kerr, Y. H., Goutorbe, J. P.,
Lebel, T., Tinga, A., Bessemoulin, P., Brouwer, J., Dolman, A. J.,
Gash, J. H. C., Hoepffner, M., et al. (1995). Geographical, biological
and remote sensing aspects of the hydrologic atmospheric pilot ex-
periment in the Sahel (HAPEX-Sahel). Remote Sensing of Environ-
ment, 51, 215–234.
Prince, S. D., & Goward, S. N. (1995). Global primary production: A
remote sensing approach. Journal of Biogeography, 22, 815–835.
Ridder, N., Stroosnijder, L., Cisse, A. M., & van Kelulen, H. (1983).
Productivity of Sahelian rangelands, a study of the soils, the vegetation
and the exploitation of the natural resources. PPS Coursebook, vol. 1.
Wageningen, Netherlands: Agricultural University.
Rollin, E. M., & Milton, E. J. (1998). Processing of high spectral resolution
reflectance data for the retrieval of canopy water content information.
Remote Sensing of Environment, 65, 86–92.
Sandholt, I., Rasmussen, K., & Andersen, J. (2002). A simple interpre-
tation of the surface temperature/vegetation index space for assess-
ment of surface moisture status. Remote Sensing of Environment, 79,
213–224.
Serrano, L., Ustin, S. L., Roberts, D. A., Gamon, J. A., & Penuelas, J.
(2000). Deriving water content of chaparral vegetation from AVIRIS
data. Remote Sensing of Environment, 74, 570–581.
Singh, J. S., & Coleman, D. C. (1975). Evaluation of functional root bio-
mass and translocation of photoassimilated carbon-14 in a shortgrass
prairie ecosystem. In J. K. Marshall (Ed.), The belowground ecosystem:
A synthesis of plant associated processes (pp. 123–131). Stroudsburg,
PA: Dowden, Hutchison and Ross.
Tucker, C. J. (1980). Remote sensing of leaf water content in the near
infrared. Remote Sensing of Environment, 10, 23–32.
Vermote, E. F., & Vermeulen, A. (1999). Atmospheric correction algorithm:
Special reflectances (MOD09), ATBD version 4.0.
Wan, Z. (1999). MODIS Land-Surface Temperature (MOD11). ATBD Ver-
sion 3.3.
Zarco-Tejada, P. J., & Ustin, S. L. (2001). Modelling canopy water content
for carbon estimates from MODIS data at Land EOS validation sites.
Proceedings of the IEEE 2001 International Geoscience and Remote
Sensing Symposium, Sydney.