Shortwave Infrared Imaging and Its Translation to Clinically ...
144
Shortwave Infrared Imaging and Its Translation to Clinically-Relevant Designs by Jessica Ann Carr B.S. Chemistry, Mathematics, 2013 West Virginia University Submitted to the Department of Chemistry in partial fulfillment of the requirements for the degree of DOCTOR OF PHILOSOPHY IN PHYSICAL CHEMISTRY at the Massachusetts Institute of Technology June 2018 © 2018 Massachusetts Institute of Technology. All rights reserved. Signature of Author: __________________________________________________________ Department of Chemistry April 9, 2018 Certified by: ________________________________________________________________ Moungi G. Bawendi Lester Wolfe Professor of Chemistry Thesis Supervisor Accepted by: ________________________________________________________________ Robert W. Field Haslam and Dewey Professor of Chemistry Chairman, Departmental Committee on Graduate Students
-
Upload
khangminh22 -
Category
Documents
-
view
0 -
download
0
Transcript of Shortwave Infrared Imaging and Its Translation to Clinically ...

Shortwave Infrared Imaging
and Its Translation to Clinically-Relevant Designs
by
Jessica Ann Carr
B.S. Chemistry, Mathematics, 2013
West Virginia University
Submitted to the Department of Chemistry
in partial fulfillment of the requirements for the degree of
DOCTOR OF PHILOSOPHY
IN PHYSICAL CHEMISTRY
at the
Massachusetts Institute of Technology
June 2018
© 2018 Massachusetts Institute of Technology.
All rights reserved.
Signature of Author: __________________________________________________________
Department of Chemistry
April 9, 2018
Certified by: ________________________________________________________________
Moungi G. Bawendi
Lester Wolfe Professor of Chemistry
Thesis Supervisor
Accepted by: ________________________________________________________________
Robert W. Field
Haslam and Dewey Professor of Chemistry
Chairman, Departmental Committee on Graduate Students

2

3
This doctoral thesis has been examined by a
Committee of the Department of Chemistry as follows:
______________________________________________________
Troy Van Voorhis
Haslam and Dewey Professor of Chemistry
Thesis Committee Chairperson
______________________________________________________
Moungi G. Bawendi
Lester Wolfe Professor of Chemistry
Thesis Supervisor
______________________________________________________
Gabriela S. Schlau-Cohen
Cabot CD Assistant Professor
Thesis Committee Member

4

5
Shortwave Infrared Imaging
and Its Translation to Clinically-Relevant Designs
by
Jessica Ann Carr
Submitted to the Department of Chemistry
on April 9, 2018 in partial fulfillment of the requirements
for the degree of Doctor of Philosophy in Physical Chemistry
Abstract
Visualizing structures deep within biological tissue is a central challenge in biomedical imaging, with both preclinical implications and clinical relevance. Using shortwave infrared (SWIR) light enables imaging with high resolution, high sensitivity, and sufficient penetration depth to noninvasively interrogate sub-surface tissue features. However, the clinical potential of this approach has been largely unexplored. Until recently, suitable detectors have been either unavailable or cost-prohibitive. Additionally, clinical adoption of SWIR imaging has been inhibited by a poor understanding of its advantages over conventional techniques. For fluorescence imaging in particular, there has further been a perceived need for clinically-approved contrast agents. Here, taking advantage of newly available detector technology, we investigate a variety of biomedical applications with SWIR-based imaging devices. We describe the development of a medical otoscope and our clinical observations using this device to evaluate middle ear pathologies in both adult and pediatric populations, showing that SWIR otoscopy could provide diagnostic information complementary to that provided by conventional visible otoscopy. We further describe fluorescence detection of an endogenous disease biomarker in animal models including nonalcoholic fatty liver disease and cirrhotic liver models and models of a neurodegenerative disease pathway. While this biomarker has been known for decades, we describe a method for its noninvasive detection in living animals using near infrared and SWIR light, as opposed to its conventional ex vivo detection. Furthermore, we show that SWIR image contrast and penetration depth are primarily mediated by the absorptivity of tissue, and can be tuned through deliberate selection of imaging wavelength. This understanding is crucial for rationally determining the optimal imaging window for a given application, and is a prerequisite for understanding which clinical applications could benefit from SWIR imaging. Finally, we show that commercially-available near infrared dyes, including the FDA-approved contrast agent indocyanine green, exhibit optical properties suitable for in vivo SWIR fluorescence imaging, including intravital microscopy, noninvasive, real-time imaging in blood and lymph vessels, and tumor-targeted imaging with IRDye 800CW, a dye being tested in clinical trials. Thus, we suggest that there is significant potential for SWIR imaging to be implemented alongside existing imaging modalities in the clinic.
Thesis Supervisor: Moungi G. Bawendi
Title: Lester Wolfe Professor of Chemistry

6

7
Acknowledgements
This work was possible only with the support of many insightful and talented individuals:
I would first like to thank Professor Moungi Bawendi, who has been an excellent thesis
advisor. Moungi has built an incredibly diverse lab that is enriching both scientifically and
culturally. Having the pleasure to work in this environment has greatly expanded my
perspective. Moungi has always provided the freedom to truly experiment and to explore my
personal creativity. Meanwhile, he has instilled through example values crucial to my PhD
experience, including scientific diligence, rigor, and exactness.
The Bawendi Lab as a whole deserves sincere acknowledgements. To members past
and present I have benefitted from the structure you’ve given the group and from your individual
scientific and interpersonal contributions. I’ve learned more than I ever could have expected,
particularly about German culture. Thank you to Li Miao for providing excellent support to our
group and for keeping me company with great conversation while I waited outside of Moungi’s
office on many occasions. Thank you to Oliver Bruns for being a mentor to me and to Marianne
Aellen, Jason Yoo, and Mari Saif for patiently providing me the opportunity to learn about
mentorship myself. Thank you to Michel Nasilowski, my safety officer and gastronomic
counterpart. Thank you to the Bio subgroup members for detailed discussions about
experiments, and to the “Muddy subgroup” members for detailed discussion about everything
else. Thank you to the “Stadiums subgroup” members, in particular Jenn Scherer and Lea
Nienhaus, for challenging me and encouraging me that I can always do “just one more.” Thank
you to the “’Yoga’ subgroup” members—Whitney Hess and Jenn Scherer braving this class with
me initially, Maciej Korzynski for providing excellent “support,” Sophie Bertram, Allena Goren,
and Jay Matthews for more recently helping to make this a successful program within the
Chemistry Department, and our talented recent recruits. A very special thank you to Marina
Kovalenko who has shaped me inside and out, inspired me with positivity, given me confidence,
and taught me skills that I applied not only throughout my PhD, but that I will use for the rest of
my life.
Many external scientific collaborators have also made this work possible. Associate
Professor Tulio Valdez, Associate Professor Klaus van Leyen, and Professor Rakesh Jain
contributed not only their resources, but also their unique perspectives and expertise in biology
and in the clinic. Thank you in particular to Tulio for mentorship both inside and outside of the
lab. I have enjoyed working with many of their students to this effect as well, including Yi Zhang,
Franziska Lieschke, Ivy Chen, and especially Wilco Kwanten. I also enjoyed working with
Bridgette Carter at Connecticut Children’s Medical Center who made many of our clinical
imaging studies possible there, and I would like to thank all volunteers who “lent us their ears.”
Thank you to several internal academic collaborators. Dr. Christopher Rowlands has at
many points provided excellent optics advice toward the goals of this thesis. Thank you to the
Women in Chemistry admin board for giving me the opportunity to lead with you and organize
many positive events for women inside and outside of the MIT community. Thank you to the
executive team of the MIT Biotech Group—Brett, Ashvin, Greg, Rachit, and Sam—for giving me
the opportunity to lead with you as well and for expanding my perspective to the broader biotech
community, which will undoubtedly impact my career moving forward.

8
I would like to further thank many friends who have provided support during my entire
PhD journey. Thank you to Tim Barnum, Daniel Franke, Maciej Korzynski, Wesley Transue, and
Salima Bahri who set the bar high in our first year academically, who I wouldn’t have gotten
through classes without, and who have been supporting and entertaining me ever since. Thank
you especially to Dani who has also been involved in many aspects of the research presented in
this thesis. Thank you to my roommates over the years, Ramya Ramakrishnan—whose
positivity continues to inspire me—Tim Barnum, Kathleen White, Hendrik Utzat, and Anna
Ponomarenko who have helped hash out scientific debates, German vocabulary, and complex
recipes in the kitchen (or tolerated these things).
Finally, I would like to thank past mentors and members of my family who helped me get
to MIT for graduate studies in the first place and have continued their support throughout this
work. Thank you to Professor Jeffrey Petersen and Professor James P. Lewis at WVU for
encouraging me to go to graduate school and providing significant academic and personal
support leading up to this time. Thank you to Mom and Dad who have given me more than what
I needed to be successful and for making the long drive from West Virginia to visit Boston each
year. Thank you also to the Olivetos for always being cheerleaders behind my endeavors, and
especially to Nick for reasons that could take an entire additional thesis to tease out.
Thank you!

9
Table of Contents
CHAPTER 1 Introduction to shortwave infrared biological imaging as a
potential clinical technology...................................................
17
1.1 Translating preclinical techniques into clinical technologies................ 17
1.2 A clinical translation case study in biological imaging.......................... 18
1.3 Biological imaging in the shortwave infrared........................................ 21
1.4 Thesis overview................................................................................... 22
CHAPTER 2 Endogenous SWIR reflectance imaging of middle ear
pathologies in the clinic………………………………………….
25
2.1 Introduction: challenges in diagnosing otitis media.............................. 25
2.2 Optical characterization of middle ear tissue....................................... 26
2.3 Proof of concept imaging in a 3D-printed model.................................. 29
2.4 Imaging middle ear anatomy in adults................................................. 31
2.5 Clinical observations in a pediatric population..................................... 34
2.6 Discussion and conclusions................................................................. 37
2.7 Additional experimental details............................................................ 39
2.8 Chapter-specific acknowledgements................................................... 41
CHAPTER 3 Endogenous SWIR autofluorescence imaging as a
biomarker for disease…………………………………………….
43
3.1 Introduction: autofluorescence as a biomarker for disease………....... 43
3.2 Fluorescence imaging apparatuses for whole animal down to sub-
cellular imaging....................................................................................
44
3.3 Identification and optical characterization of a NIR/SWIR-
autofluorescent pigment.......................................................................
48
3.4 NIR/SWIR autofluorescence imaging ex vivo and in vivo in cirrhotic
liver models..........................................................................................
54
3.5 Detection of liver disease progression in NAFLD models.................... 59
3.6 NIR/SWIR autofluorescence in mouse models with dysregulated
autophagy............................................................................................
65
3.7 Discussion and conclusions................................................................. 68
3.8 Additional experimental details............................................................ 70
3.9 Chapter-specific acknowledgements................................................... 71

10
CHAPTER 4 Tuning fluorescence imaging contrast in the SWIR………... 73
4.1 Introduction: the role of tissue optical properties in fluorescence
imaging................................................................................................
73
4.2 The effects of absorption and scattering on fluorescence contrast in
three-dimensional tissue phantoms.....................................................
75
4.3 The wavelength-dependence of contrast in vivo.................................. 79
4.4 The attenuation-dependence of contrast and penetration depth in a
theoretical contrast model....................................................................
82
4.5 Contrast and penetration depth enhancement in ex vivo tissue
microscopy...........................................................................................
86
4.6 Discussion and conclusions................................................................. 88
4.7 Additional experimental details............................................................ 90
4.8 Chapter-specific acknowledgements................................................... 93
CHAPTER 5 SWIR fluorescence imaging with the clinically-approved
near infrared dye indocyanine green………………................
95
5.1 Introduction: from preclinical animal imaging to image-guided
surgery in humans...............................................................................
95
5.2 Characterization of ICG emission through SWIR wavelengths............ 96
5.3 High contrast SWIR fluorescence imaging in vivo using ICG.............. 100
5.4 Real-time SWIR fluorescence imaging in vivo using ICG.................... 103
5.5 Targeted SWIR fluorescence imaging in vivo using IRDye 800CW.... 106
5.6 Discussion and conclusions................................................................. 106
5.7 Additional experimental details............................................................ 108
5.8 Chapter-specific acknowledgements................................................... 113
APPENDIX A Raw quantification data and detailed image acquisition
settings......................................................................................
115
A.1 Full image sets used for quantifications in Chapter 3.......................... 115
A.2 Tables of integration times and optics for each image......................... 121
REFERENCES……………………………………………………………………….. 127

11
List of Figures
Figure 2.1: Attenuation of human tympanic membrane tissue………………………………. 27
Figure 2.2: Optical properties of human middle ear fluid…………………………………….. 28
Figure 2.3: Schematic and characterization of the SWIR otoscope prototype........………. 29
Figure 2.4: Fluid visualization in a 3D-printed middle ear model……………...................... 30
Figure 2.5: Schematic of the middle ear and SWIR and visible otoscopic examinations in
healthy adults………………….............................................................................................
32
Figure 2.6: Quantification of contrast in SWIR and visible otoscopy of adult human
subjects...............................................................................................................................
33
Figure 2.7: Image of the SWIR otoscope prototype…………….......................................... 34
Figure 2.8: Evaluation of healthy middle ear anatomy in pediatric patients……................. 35
Figure 2.9: Tympanometry, visible otoscopy, and SWIR otoscopy of pediatric patients
with middle ear effusions………………………………………………………………………...
36
Figure 2.10: Additional middle ear pathologies in pediatric patients visualized by SWIR
and visible otoscopy............................................................................................................
37
Figure 3.1: Optical set-up for NIR/SWIR fluorescence imaging.......................................... 45
Figure 3.2: NIR/SWIR autofluorescence imaging from macroscopic in vivo imaging to ex
vivo tissue imaging and tissue microscopy.........................................................................
46
Figure 3.3: Tissue treatments for microscopy of mouse cirrhotic liver tissue...................... 49
Figure 3.4: Histological stains for lipofuscin/ceroid and their correlation with NIR/SWIR
autofluorescence.................................................................................................................
51
Figure 3.5: Autofluorescence microscopy using visible through SWIR wavelength
channels..............................................................................................................................
53
Figure 3.6: Emission characterization of liver tissue........................................................... 54
Figure 3.7: NIR/SWIR autofluorescence in mouse models of cirrhosis…………………… 57
Figure 3.8: Quantification of ex vivo liver tissue autofluorescence in cirrhotic mice
induced with CCl4 and ethanol............................................................................................
58
Figure 3.9: NIR/SWIR autofluorescence detection in vivo in a NAFLD mouse model........ 60
Figure 3.10: NIR/SWIR autofluorescence detection in ex vivo liver tissue shows
correlation between signal intensity and disease progression in NAFLD mouse models...
61

12
Figure 3.11: NIR/SWIR autofluorescence of the gastrointestinal tract in SC, CD, and
CDAHFD mice…………………………………………………………………………………….
63
Figure 3.12: Genitourinary anatomy NIR/SWIR autofluorescence and other potential
competing signals…………………………………………………………………………………
64
Figure 3.13: Autofluorescence in the brain and liver of 12/15-LOX KO mice versus wild
type mice.............................................................................................................................
66
Figure 3.14: Immunofluorescence staining of 12/15-LOX KO brain tissue......................... 67
Figure 3.15: Correlation between ex vivo and in vivo liver intensities for mouse models
of liver disease....................................................................................................................
70
Figure 4.1: Water absorption enhances contrast in a three-dimensional tissue phantom
through background signal suppression………………………………………………………..
76
Figure 4.2: Water absorption enhances contrast and resolution through scattering
suppression.........................................................................................................................
78
Figure 4.3: Mouse brain vasculature imaged across SWIR wavelengths………………….. 79
Figure 4.4: Correlation of in vivo fluorescence contrast with water absorptance………….. 80
Figure 4.5: The wavelength-dependence of contrast for different regions of interest and
contrast metrics…………………………………………………………………………………...
81
Figure 4.6: Contrast dependence on attenuation shown in a theoretical contrast model… 83
Figure 4.7: Dependence of contrast on imaging depth and inherent background
intensity...............................................................................................................................
84
Figure 4.8: Theoretical model of penetration depth versus inherent background signal
shows two regimes with opposing wavelength relationships………………………………...
85
Figure 4.9: Ex vivo liver microscopy…………………………………………………………… 86
Figure 4.10: Contrast and penetration depth enhancement in microscopy of ex vivo liver
tissue...................................................................................................................................
87
Figure 4.11: Resolution enhancement of cells in an ex vivo liver tissue sample………….. 88
Figure 4.12: Opposing wavelength dependencies of signal and contrast………………….. 89
Figure 4.13: Complete set of two-layer capillary phantom images in 1% Intralipid®……... 91
Figure 4.14: Contrast trend in a weakly-scattering silica bead-based liquid tissue
phantom..............................................................................................................................
92
Figure 5.1: Representative detector efficiencies and responsivities………………………... 97

13
Figure 5.2: Optical properties of ICG and IRDye 800CW……………………………………. 97
Figure 5.3: Optical properties of aqueous ICG, IRDye 800CW, and SWIR dye IR-
E1050..................................................................................................................................
98
Figure 5.4: Comparison of ICG and IR-E1050 in blood and in vivo………………………… 99
Figure 5.5: High contrast in vivo SWIR fluorescence imaging using ICG………………….. 100
Figure 5.6: Contrast and resolution quantification of brain and hind limb vasculature in a
mouse.................................................................................................................................
101
Figure 5.7: High contrast SWIR intravital microscopy of mouse brain vasculature……….. 102
Figure 5.8: Temporal resolution in intravital ICG angiography………………………………. 103
Figure 5.9: High temporal and spatial resolution demonstrated through ICG SWIR
fluorescence angiography………………………………………………………………………..
104
Figure 5.10. Noninvasive imaging beyond 1300 nm using ICG SWIR fluorescence……... 105
Figure 5.11: Targeted SWIR imaging in vivo with IRDye 800CW…………………………... 107
Figure 5.12: Corrections applied to photoluminescence spectra…………………………… 109
Figure 5.13: Validation of imaging set-ups and control images for NIR and SWIR image
contrast comparisons……………………………………………………………………………
112
Figure A.1: NIR/SWIR autofluorescence detected in vivo and ex vivo in liver tissue of
cirrhosis mouse models......................................................................................................
116
Figure A.2: NIR/SWIR autofluorescence detected in ex vivo tissue of NAFLD mouse
models on CDAHF diet versus mice on a control diet for 3, 6, 9, and 12 weeks................
117
Figure A.3: NIR/SWIR autofluorescence detected in vivo in NAFLD mouse models on
CDAHF diet versus mice on a control diet for 3, 6, 9, and 12 weeks..................................
118
Figure A.4: NIR/SWIR autofluorescence detected ex vivo in NAFLD mouse models on
CDAHF diet versus mice on a control diet for 12 weeks, 4 of which included treatment
with telmisartan...................................................................................................................
119
Figure A.5: NIR/SWIR autofluorescence detected in control mice receiving standard
chow for the equivalent to 0, 6, and approximately 30 weeks with no other treatment.......
120

14

15
List of Tables
Table 2.1: Number of ears in which each middle ear anatomical structure was
identifiable using visible versus SWIR otoscopy………………………………………………
32
Table 3.1: Filter cube descriptions for visible light microscopy........................................... 47
Table 3.2: Summary of in vivo and ex vivo mouse liver autofluorescence intensities for
cirrhosis models..................................................................................................................
56
Table 3.3: Summary of in vivo and ex vivo mouse liver autofluorescence intensities for
NAFLD models and SC mice..............................................................................................
62
Table 5.1: SWIR brightness comparison of ICG to IR-E1050……………………................ 99
Table A.1: Camera, emission filters, exposure times, and objective used for each of the
images presented in Chapter 3...........................................................................................
122
Table A.2: Emission filters and exposure times used for each of the images presented in
Chapter 4............................................................................................................................
123
Table A.3: Camera, emission filters, exposure times, and objective used for each of the
images presented in Chapter 5...........................................................................................
125

16

17
Chapter 1
Introduction to shortwave infrared biological
imaging as a potential clinical technology
1.1 Translating preclinical techniques into clinical technologies
Successfully implementing a new clinical technology is one of the most rewarding
accomplishments that a researcher in the biomedical field can attain. With potential rewards like
increasing the accuracy of diagnostics, enabling better disease management, and improving
patients’ health outcomes, there are many reasons to feel motivated along the journey. The
process, however, is long, requires the input of many, and can feel fraught with many setbacks
among the forward progress. A technology traverses from basic research to drug discovery to
preclinical tests, through clinical evaluation, then launch and monitoring; yet, rarely is this
process linear—often requiring iteration between steps before advancing—and demands both
foresight and hindsight to move efficiently forward.
As a result, most clinical technologies begin many years (often decades) before clinical
trials with humans can ever be performed.1–4 The first challenges that must be overcome begin
with the inevitable complications of new discoveries in basic research, where certainty or “de-
risking” is a desired end goal rather than a feature of the work. Next comes establishing cross-
disciplinary collaborations, with difficulties including balancing cultural differences between basic
scientists and clinicians, and the different goals and reward mechanisms for each stakeholder,
also including patients and payers. Finally, navigating complex regulatory affairs poses its own
set of challenges, from materials transfer agreements and intellectual property rights, to clinical
trial design and data monitoring. Each of these steps further requires a vast array of resources
from workforce, to funding, to infrastructure.
The setting of this thesis is largely in the very first step of the process—within basic
science and translational research. The motivation is to enable both preclinical and clinical
advances in imaging techniques. Chapter 2 will describe the development of a diagnostic
device from the rational assembly of individual optical components into a handheld tool, proof of
concept testing in the lab, all the way through initial observations in patients under Institutional
Review Board (IRB) approvals between an academic institution and a surgery center. Chapter
3 details a new technique for more efficient preclinical discovery related to studying liver and
neurodegenerative diseases, and the validation of a potential biomarker for clinically monitoring

18
their progression, although not translated so far here. Chapter 4 begins the story of very early
stage discovery, unveiling critical design principles for imaging in a new wavelength window,
and lays the groundwork for the results presented in the following chapter. Chapter 5 builds on
this work, showing that one of the only remaining barriers to translating this technique from
preclinical to clinical evaluation has been merely a perception and partially a misconception, and
demonstrates the immediate clinical readiness of this tool. Each of these chapters builds on
decades of prior basic science, preclinical work, and clinical examples, some of the relevant
fundamentals of which are introduced below, first as a case study (Section 1.2) and then as a
literature and field-specific review for our particular technology (Section 1.3). With this context,
a more technical thesis overview is presented in Section 1.4.
1.2 A clinical translation case study in biological imaging
Biological imaging is a method of interrogating human, animal, or plant tissue with light. In
general, a biological tissue sample is illuminated with a particular wavelength or wavelengths of
light, and the diffusely reflected, transmitted, or emitted light is analyzed to determine the two-
and sometimes three-dimensional composition and/or function of the sample. At present, most
optical imaging uses visible (400–700 nm) and/or near infrared (NIR, 700–1000 nm) light for
biological interrogations. In this wavelength region, many different biomolecules absorb,
transmit, reflect, and emit light uniquely, enabling the extraction of countless biological
parameters from a tissue sample. For example, tissue absorption is primarily due to
hemoglobin, melanin, lipids, and water, each with their own unique spectral profile. In the visible
and NIR, oxygenated and deoxygenated hemoglobin are the primary physiologically active
optical absorbers, and the functional status of tissue can be measured based on their relative
concentrations.5–8 Tissue autofluorescence (or emission) is also prevalent at visible
wavelengths, reporting the position of molecules such as NADPH, flavins, and collagen.
At this point, many optical imaging techniques are well-established, for both in vitro
investigation of cells and in vivo investigations of tissues, and have proven valuable for a variety
of diagnostic applications in humans.9–11 In particular, fluorescence imaging, in which the
emitted light is observed, has emerged as a powerful tool for preclinical in vivo imaging and as a
promising clinical technology, particularly for surgical guidance.12–17 Here described is an
example of a biological imaging technique—NIR fluorescence imaging—which building upon
decades of prior basic research, has successfully navigated the journey to clinical translation for
certain applications, and is still being vigorously evaluated for many more.
However, before NIR fluorescence imaging could be established, several technological
requirements had to be met. In order to carry out an optical imaging experiment, one needs a
light source of sufficient power and at the right wavelength or wavelengths (e.g. a broadband
lamp, an LED, or a laser), the correct optics to deliver the light (e.g. fibers or diffusers) and
19
subsequently collect the light (e.g. lenses and filters) onto a detector or camera. In fluorescence
imaging, often an exogenous light-emitting fluorophore is also introduced into the tissue to
target and highlight a specific biological phenomenon that may not naturally send out its own
signal. Thus, for these measurements, one also needs a light-emitting and possibly targeted
probe (e.g. an organic molecule dye or a nanoparticle, such as quantum dots, rare earth-doped
nanoparticles, or metal clusters). Finally, but perhaps foremost, one needs a key biological
question or interest motivating the study.
For NIR fluorescence imaging, the motivations behind its development were to expand
vision beyond what the eye itself can detect, and also to image deeper into tissue without
invasive interventions. In general, there are two main limitations to the effectiveness of optical
imaging. Sometimes, an application is “signal-limited,” in which case there is insufficient light
reaching the detector to form an image. This can be the result of insufficient light source power,
insufficient probe brightness, insufficient detector sensitivity, and/or too much attenuation of the
signal by the sample (via absorption or scattering of light). In other cases, an application is
“contrast-limited,” in which case the image is too “blurry” to resolve the structures of interest,
generally as a result of tissue scattering, high background signal, and/or insufficient signal to be
above the detector noise threshold. Both absorption and scattering of light by tissue are high at
visible wavelengths of light, thus the eye and other visible light-based technologies are generally
restricted to imaging superficial features, and require invasive procedures to expose deeper
tissue structures for observation.
The NIR, on the other hand, has been identified as an optimal imaging window for in vivo
studies requiring high penetration depths.18–25 The absorptive components of tissue share a
common absorption minimum between approximately 650 nm and 900 nm, and tissue
scattering continually declines from the visible into the NIR, maximizing light transmission. At
this point, NIR fluorophores are also widely available (i.e. commercially available) and can be
detected on high-performing, inexpensive silicon detectors. Overall, the equipment for these
optical measurements is now often simple and portable, interrogations can be carried out
without contacting or perturbing the tissue over a wide field of view, and the resulting data is
generally easy to interpret, all of which have made NIR fluorescence imaging a powerful
technique in clinical settings.9,26
Decades of iterating through research and development on these topics—from tissue
optical properties to optical devices to fluorescent probes—has enabled the NIR-based medical
devices that are emerging today. The majority of these iterations took place in vitro in cell
studies, using ex vivo tissue samples or tissue phantoms, or in vivo in preclinical animal models.
These preclinical studies have provided, and are still unveiling, valuable insight into
mechanisms of disease and their potential treatments, as in atherosclerosis, Alzheimer’s
disease, and many others.27–29 However, NIR fluorescence imaging is now being tested in
humans in well over 300 clinical trials for applications such as angiography and perfusion

20
assessment in reconstructive and bypass surgeries, metastatic lymph node mapping and
lymphatic transport measurements in lymphedema, and cancer localization and surgical margin
assessment.30–36 The FDA has granted approval for only one NIR dye—indocyanine green
(ICG). Approved since 1959, ICG has been used clinically for over 50 years for determining
cardiac output, hepatic function and liver blood flow, and retinal angiography on the basis of its
strong absorption properties (giving it a dark green color).37 It is administered at concentrations
as high as 2.5 mg/mL (up to 2 mg/kg total in adults), and although this approved form of ICG
has no functional group for molecular targeting, it does rapidly associate with plasma proteins
like albumin in the blood, forming an excellent, nonspecific vascular agent.37–39 Only one other
NIR dye, namely IRDye 800CW, has safety and toxicity profiles reported.34,38,40,41 Many
preclinical imaging studies and clinical trials employ this and other contrast agents with
functional groups (e.g. antibodies, antibody fragments, peptides, or sugars) for targeted imaging
of cancer, vascular disease, infection, and other targets.
NIR fluorescence imaging is now routinely used in a variety of ophthalmologic
indications. For example, fundus autofluorescence imaging is a technique for noninvasively
imaging the endogenous ocular fluorophore lipofuscin, present in the retinal pigment
epithelium.42,43 Over the past decade, fundus autofluorescence imaging has become an
essential tool for obtaining earlier diagnoses and better predictions of the progression of age
related macular degeneration, macular dystrophies, retinitis pigmentosa, white dot syndromes,
retinal drug toxicities, and various other retinal diseases.42 Clinicians now have their choice of
multiple commercially available imaging systems.44 NIR fluorescence imaging using exogenous
contrast agents has been slow to become standard of care for a specific indication, however, it
is now common to employ ICG in angiography of the eye alongside, or instead of, the
conventional visible dye fluorescein. Fluorescein angiography is one of the best ways to
examine retinal blood vessels, while ICG is now recognized as a better method of evaluating the
deeper choroidal blood vessels that are often difficult to visualize with fluorescein alone.
Building on the clinical utility demonstrated by fundus autofluorescence imaging and ICG
angiography of the eye, adoption of NIR fluorescence imaging more broadly among different
medical specialties is an anticipated next step, particularly in oncology. For many of these
indications, translation through clinical trials is currently as a combinational, investigational
product consisting of both a device (the imaging instrument) and a drug (the exogenous contrast
agent). While this approval process presents a greater challenge than for imaging endogenous
fluorophores inherent to the tissue, the clinically-accessible dye ICG is accelerating adoption in
both blood and lymphatic vasculature applications in off-label, investigational studies.38
Thus, NIR fluorescence imaging is an apt example of a technology which has built on
decades of fundamental and preclinical research before becoming a routine clinical tool in
ophthalmology. This initial clinical adoption has further opened the door for more advanced
imaging, now being evaluated in clinical trials within nearly every medical discipline.
21
1.3 Biological imaging in the shortwave infrared
Building on the same body of scientific results as NIR fluorescence imaging, it has recently been
shown that extending optical measurements into shortwave infrared (SWIR, 1000–2000 nm)
wavelengths offers several further advantages for in vivo imaging applications.45–47,11 For
example, the SWIR regime features absorption from tissue constituents such as water (near
1150, 1450, and 1900 nm), lipids (near 1040, 1200, 1400, and 1700 nm), and collagen (near
1200 and 1500 nm) that are more prominent than corresponding features in the visible and NIR
regions.48 The enhanced sensitivity to these chromophores enables better characterization of
changes in their concentration, with recent spectroscopy-based examples in detecting and
monitoring cancerous tissues,49–51 burns,11 and intestinal ischemia,52 distinguishing skin bruises
from surrounding tissue,53,54 and discriminating histologically vulnerable and stable plaques of
blood vessels in vivo.55–57 In addition, SWIR light offers greater transmission through biological
tissue than visible or NIR light, providing sufficient optical penetration depth to noninvasively
interrogate changes in subsurface tissue features.45,47,58,59 The increase in transmission is
mostly due to decreased scattering of photons, which is minimized by imaging at the longest
wavelengths possible.47 As scattering misdirects photons from the direct path to the detector,
avoiding scattering can also improve spatial resolution. Furthermore, tissue autofluorescence,
which creates interfering background signal to an exogenous fluorophore, is primarily emitted at
visible wavelengths in tissue in response to ultraviolet or visible radiation; autofluorescence can
be mostly avoided using NIR and SWIR excitation light.60
Despite these advantages, the SWIR regime has so far been underutilized in optical
imaging, and in particular, medical devices have been mostly limited to exploratory or proof-of-
principle in nature. One reason for this is the limited availability of technological requirements
that are distinct from NIR imaging. Whereas both visible and NIR light can be measured using
ubiquitous silicon-based cameras, these sensors cannot detect longer SWIR wavelengths,
which require a different sensor material (e.g. indium gallium arsenide, indium antimonide, or
mercury cadmium telluride). SWIR detection technology, once cost-prohibitive and restricted by
military regulations (e.g. ITAR, the International Traffic in Arms Regulations, in the U.S.), has
only recently become readily available for commercial use and research purposes.
Manufacturers have made a recent effort to develop cameras which can be classified as dual
use, with now over 30 models classified as such by the U.S. Department of State.61
Simultaneously, advances in detector fabrication are producing high performing sensors with
significantly smaller form factors and reduced weight. These technological advances and an
increasing supply of SWIR detectors has enabled a price drop of roughly an order of magnitude
over the time period from 2010 to 2014.48
Furthermore, an absence of high-quality, commercially-available SWIR fluorophores,
and the perceived need for a clinically-approved contrast agent has inhibited full realization of

22
this technique beyond preclinical demonstrations. Within the past decade, a wide variety of
biologically-compatible SWIR emitters have emerged, including organic dyes with peak
emission in the SWIR,62–65 carbon nanotubes,47,66 quantum dots,67–69 rare-earth-doped
nanocomposites,70 and gold nanoparticles.71 More recently, it was also shown that NIR dyes,
which are commercially available and approved for clinical use, can be used for many SWIR
imaging applications (expanded on later in this thesis).72 Thus, with SWIR detection technology
and SWIR fluorophores only recently becoming available, the advantages over conventional
methods have yet to be fully demonstrated or realized. With these recent technological
developments, SWIR fluorescence imaging is rapidly evolving at present, and we believe,
pushing toward clinical utilization. This thesis expands on a series of studies which aim to edge
this technology closer to the clinic, answering key fundamental questions on SWIR tissue optical
properties and lowering some of the existing barriers to translation.
1.4 Thesis overview
Thus, optical imaging provides advantageous features for both preclinical biological
investigations and clinical applications. Building on decades of NIR optical imaging
development, SWIR imaging is now emerging as a noninvasive technique for interrogating sub-
surface tissue features with unique biological contrast. Here, taking advantage of newly
available SWIR technology, we demonstrate a number of applications which illustrate the
significant preclinical and clinical potential waiting in the SWIR spectral region of the light
spectrum.
In Chapter 2 and Chapter 3, we explore the use of endogenous SWIR signals of the
tissue to provide disease-correlated contrast in an image. The use of endogenous signal in
these applications lowers the barrier to clinical translation, as only an imaging device must be
approved for human studies, as opposed to both the device and a contrast agent (i.e. drug).
Thus, in Chapter 2, we are able to describe the development of a medical otoscope from its
proof of principle in a 3D-printed model, all the way through our initial clinical observations using
our device to evaluate middle ear pathologies in adult and pediatric populations. We show that
SWIR otoscopy has the potential to provide valuable diagnostic information complementary to
that provided by conventional visible pneumotoscopy. In addition, use of a SWIR otoscope does
not require significant clinician training, as the ergonomics, visual output, and operation are
similar to that of a conventional otoscope. In Chapter 3, we begin proof of concept testing of a
disease biomarker in animal models, including nonalcoholic fatty liver disease (NAFLD) and
cirrhotic liver models, and models of a neurodegenerative disease pathway. While this
biomarker has been known for decades, we describe a method for its noninvasive detection in
living animals, as opposed to its conventional ex vivo detection. This advantage could

23
significantly reduce the number of animals required per preclinical study, and could potentially
enable more rapid and less invasive clinical determinations as well.
In Chapter 4 and Chapter 5, we introduce an exogenous agent into the system to
highlight a particular biological feature or process more specifically. While the use of this
external agent often delays clinical access due to the need to prove its safety to humans, the
advantages can in the long run be well worth it for increased accuracy, sensitivity, and/or
specificity. We first show in Chapter 4 a mechanistic understanding of how image contrast in
this type of imaging evolves across SWIR wavelengths. Using 3D tissue phantoms, an in vivo
animal model, a theoretical model, and ex vivo biological tissue, we obtain results which
suggest that water is the dominant optical property contributing to image contrast and
penetration depth in the SWIR. This understanding is crucial for rational determination of the
optimal imaging window for a given application, or in other words, is critical to understanding
which clinical applications could potentially benefit from using SWIR light over conventional
techniques, such as NIR imaging.
We further eliminate a major barrier to clinical adoption of SWIR imaging technology in
our results described in Chapter 5. Here we show that despite the perceived need for clinically-
approved exogenous contrast agents, commercially available NIR dyes, including the FDA-
approved contrast agent ICG, exhibit optical properties suitable for in vivo SWIR fluorescence
imaging, including intravital microscopy, noninvasive, real-time imaging in blood and lymph
vessels, imaging of hepatobiliary clearance, and tumor-targeted SWIR imaging. Our findings
suggest that SWIR imaging can be implemented alongside existing imaging modalities in the
clinic, simply by switching the detection of conventional NIR fluorescence systems from silicon-
based NIR cameras to emerging indium gallium arsenide SWIR cameras.

24

25
Chapter 2
Endogenous SWIR reflectance imaging of middle
ear pathologies in the clinic
2.1 Introduction: challenges in diagnosing otitis media
Otitis media is one of the most common reasons for pediatrician visits, antibiotic prescriptions,
and surgery in the pediatric population.73–76 Second in diagnosis frequency only to acute upper
respiratory infection, at least 80% of U.S. children will have experienced one or more episodes
of otitis media by the age of 3 years.77–80 The term otitis media encompasses a variety of
inflammatory conditions of the middle ear, such as acute otitis media (AOM), otitis media with
effusion (OME), and chronic suppurative otitis media (CSOM).81 These conditions are closely
related and can overlap, but most importantly they are linked by presence of middle ear fluid or
in the case of CSOM, fluid that drains out of the middle ear through a tympanic membrane
perforation or a tympanostomy tube.
While CSOM is easily identifiable due to this fluid discharge, diagnosis of OME and AOM
is not as straightforward.82,83 Successful diagnosis of otitis media is estimated at 51% for U.S.
pediatricians, with over-diagnosis of AOM occurring 26% of the time.82,84,85 The difficulty in
identifying middle ear effusion is largely responsible for both this over-diagnosis of cases of
AOM and the frequent under-diagnosis of cases of OME.82,86 Over-diagnosis of AOM has made
otitis media a primary factor in increased antibiotic resistance.87–89 On the other hand, OME is
the most common reason for conductive hearing loss in the pediatric population and has been
associated with behavioral and learning difficulties.90 Recent research on cases of reversible
conductive hearing loss has even identified changes that occur in the neurological pathways
that persist long after the conductive hearing loss has resolved.91 Failure to diagnose AOM or
OME can thus lead to long-term hearing impairment, intracranial complications, a delay in
language acquisition, or formation of destructive skin growths, known as cholesteatoma, which
must be treated by surgical excision.76,92–94
Otoscopy is the most widely used technology for assessing middle ear effusions, and
has been the diagnostic workhorse for external auditory canal and middle ear examinations for
over a century. Using this tool, physicians assess middle ear pathologies based on the
appearance of the tympanic membrane, or ear drum, and its mobility against hand-generated
pneumatic pressure. However, otoscopic examinations are known to suffer from subjective

26
interpretations, especially in the hands of inexperienced practitioners; studies have shown
limited accuracy in assessing otitis media, with correct interpretation by only 46% of general
practitioners, 51% of pediatricians, and 76% of otolaryngologists.85,95–97 The limitations of
otoscopy are due in part to difficulty seeing beyond the tympanic membrane, which despite
being semi-translucent, reflects, absorbs, and scatters incident light at the surface, limiting
signal penetration to deeper middle ear structures or fluid. A study by Rosenfeld of 135 acute
otitis media cases diagnosed by U.S. primary care practitioners found that 40 were false
positives, 35 of which had no middle ear effusion.86
Here we describe the development of an otoscope sensitive to SWIR light for more
objective diagnoses of trans-tympanic middle ear pathologies. The endogenous contrast
generated with SWIR light is unique from that observed with traditional visible otoscopy in two
key ways. First, deeper tissue penetration is achievable with SWIR light than with visible light,
allowing better visualization of middle ear structures through the tympanic membrane. In
addition, strong SWIR light absorption by water molecules provides more evident contrast
between the presence and absence of middle ear effusions. Meanwhile, a SWIR otoscope
maintains the ergonomics, visual output, and small footprint of a conventional otoscope, making
it familiar to clinicians and thus readily translated to the clinic. We suggest that a SWIR
otoscope could complement conventional otoscopic diagnoses by providing access to the
endogenous optical properties of the middle ear across an expanded wavelength range.
2.2 Optical characterization of middle ear tissue
We first aimed to characterize the interaction of SWIR light with the tissues of the middle ear.
We obtained both human tympanic membrane tissue and human middle ear fluid samples
ranging in consistency from serous to mucoid and measured their optical properties. Human
tympanic membrane tissue samples (approximately 1 mm sections) were collected
intraoperatively from pediatric patients (ages 0–18 years) during a typical tympanoplasty
procedure. Measuring the attenuation spectrum, we find that light attenuation decreases with
increasing wavelength (Fig. 2.1A), consistent with the inverse power law relationship between
wavelength and scattering of photons measured previously for skin.58,59 Absorption beyond
1300 nm is also evident in the tympanic membrane attenuation spectrum due to water in the
tissue, however, the overall transparency of the tympanic membrane is greater at SWIR
wavelengths than in the visible.
The enhanced transmission of SWIR light through the tympanic membrane should
benefit visualization of the middle ear structures, such as the highly reflective ossicles and the
promontory, underlying this tissue. In particular, reduction in scattering at SWIR wavelengths
should benefit image contrast and resolution, as reflected light travels more directly through the
tympanic membrane to the detector after reflecting off of the structures of interest (Fig. 2.1B,C).

27
We investigated this idea further using a sector star resolution target and a liquid Intralipid®
tissue phantom.98–100 The phantom was prepared by diluting 20% Intralipid® (Baxter Healthcare
Corporation, Deerfield, IL, USA) to 2% Intralipid® in water. This was added to a glass-bottom
microwell dish (MatTek Corporation, Ashland, MA, USA) between 0.5-2 mm deep. The dish was
placed on top of the sector star resolution target and images were acquired in reflection
geometry (illumination and detection from above the phantom). We observed that adding
Intralipid® to the top of the resolution target had no effect on the resolution of the target below,
up to 2 mm thickness of phantom (Fig. 2.1E). This was true for both broadband SWIR detection,
which had a resolution of 21 lp/mm with and without phantom, and 1300 nm long-pass
detection, which had a resolution of 20 lp/mm with no phantom and 19 lp/mm with 2 mm
phantom. For the visible imaging system, on the other hand, the resolution was strongly
dependent on the thickness of the phantom. Because the pixel size of the CMOS camera is
much smaller (3.6 μm) the imaging resolution is initially higher, even through the phantom, until
at some point the transmission of the phantom is too low to observe the resolution target below
(Fig. 2.1D). Resolution values were 85 lp/mm for no phantom, 53 lp/mm with approximately 0.5
mm of phantom, 38 lp/mm with approximately 1 mm of phantom, and at 2 mm of phantom the
target could not be resolved. Based on these results, we expect that using SWIR light for
otoscopy will improve visualization of anatomy behind the thin tympanic membrane.
Figure 2.1: Attenuation of human tympanic membrane tissue. As wavelength increases, light
scattering by the tissue decreases, causing attenuation to decline proportional to the inverse power
law λ–0.26
(A, dashed grey line). Absorption by water in the tissue causes attenuation around 1440 nm
and absorption by hemoglobin causes small features at 540 nm and 575 nm. Noise in the spectrum
around 800 nm is due to poor detector sensitivity and grating performance in this region under
conditions of low light transmission. The spectrum indicates that visible light reflected by the middle
ear ossicles and promontory would scatter more through the tympanic membrane (B) than SWIR light
(C), resulting in lower contrast and resolution. Analysis with a sector star resolution target shows that
indeed when covered by approximately 2 mm of liquid tissue phantom, the target can no longer be
resolved at visible wavelengths (D) while it is still resolvable using SWIR wavelengths (E).

28
We next characterized human middle ear fluid samples for their light attenuation
properties. Human middle ear fluid samples (30–200 microliter volumes) were collected
intraoperatively from pediatric patients during myringotomy and placement of pressure-
equalizing tubes for standard treatment of recurrent otitis media or persistent middle ear
effusion. See Sec. 2.7 for sample collection, storage, and preparation details. Spectroscopic
characterization confirms strong attenuation of specific spectral bands of SWIR light (Fig. 2.2A).
Water in the fluid gives rise to absorption observed in small features around 970 nm and 1180
nm, and strong features around 1440 nm and beyond 1800 nm which correspond to the
vibrational overtone of the O-H bond, and the first overtone of the O-H stretching respectively.
Thicker-consistency mucoid middle ear fluid samples contain less water relative to thin samples,
but water absorption is still the dominant cause of attenuation (Fig. 2.2B). Two peaks are also
distinguishable at 540 nm and 575 nm from the absorption of oxygenated hemoglobin, but
middle ear fluid generally appears translucent by eye due to minimal absorption of
chromophores at visible wavelengths. Light scattering processes that occur within the viscous
mucous also cause attenuation, particularly at visible wavelengths of light (400–700 nm). The
strength of this wavelength dependence is a complicated function of the geometry of the
Figure 2.2: Optical properties of human middle ear fluid. The attenuation of light through a sample
of middle ear fluid shows strong absorption between 1400 and 1550 nm due to water content (A). This
absorption of SWIR light causes the fluid to appear black in a SWIR image, whereas it is translucent
with visible imaging or by eye. Serous, or thin, middle ear fluid (B, thin solid line) shows strong
absorption between 1400 and 1550 nm and beyond 1800 nm from water present in the fluid.
Centrifuging such a sample isolates this absorptive component from the scattering particles (e.g.
cells), and attenuation of the supernatant solution (B, bold solid line) shows the strong water
absorption isolated from the majority of the attenuation due to scattering. Absorption between 1400
and 1550 nm is less for a thicker, or mucoid, fluid sample (B, dashed line) due to less water; however,
water absorption is still the dominant cause of attenuation.

29
scattering particles, which vary with the composition of individual fluid samples; however, in
general, the attenuation steadily rises with decreasing wavelength. In the thickest samples,
attenuation is as strong at visible wavelengths due to scattering, as it is in the SWIR due to
water absorption. We therefore expect SWIR wavelengths to provide better optical contrast than
visible and NIR imaging in the detection of middle ear fluid, due to the strong absorption
endogenous to water molecules in the fluid, regardless of fluid consistency.
2.3 Proof of concept imaging in a 3D-printed model
To take advantage of decreased SWIR light scattering, we designed a SWIR otoscope
prototype capable of imaging the middle ear with 900–1700 nm light (Fig. 2.3). Using a 5 mm
speculum, the device images an approximately 10.5 mm diameter circular field of view with 45
µm maximum resolution. The SWIR otoscope is comprised of a fiber-coupled broadband
halogen light source, a medical speculum that guides the device into the ear canal (Welch Allyn,
Skaneateles Falls, NY, USA), and a lens system to focus the diffusely reflected light onto an
Indium Gallium Arsenide (InGaAs) array detector. The lenses used in these experiments were
Edmund Optics (Barrington, NJ) near-infrared achromatic doublet lenses with 75 mm and 100
mm effective focal lengths. The detector is a Xenics (Leuven, Belgium) XS Trigger InGaAs
detector with a 320 x 256 array of 30 μm pixels and 14 bit analog to digital conversion. A filter
holder in front of the sensor allows easy adaptation with various shortpass, longpass, and band-
pass filters, enabling optimization of the device sensitivity for a variety of applications.
Initially, we tested the performance of the SWIR otoscope in a 3D-printed middle ear
model (Fig. 2.4A). The middle ear phantom was 3D-printed using computer-assisted design
software Solid Edge ST7 (Siemens, Plano). The shapes and angles were modeled to resemble
the normal middle ear anatomical configuration based on previously described anatomical
measurements.101 A Makerbot Replicator Desktop 3D Printer (Makerbot Industries, LLC) was
Figure 2.3: Schematic and characterization of
the SWIR otoscope prototype. The SWIR
otoscope prototype is composed of a compact
InGaAs SWIR detector, a filter holder, a pair of
achromatic doublet lenses, a fiber-coupled light
source, and a disposable medical speculum (A).
Analysis with a concentric square calibration
target (B) and a sector star resolution target with
36 bars over 360⁰ (C) indicates that the imaging
system can achieve a maximum resolution of 22
lp/mm or 45 μm and de-magnifies the object by a
factor of 0.76 onto the sensor with minimal
aberrations.

30
used with polylactic acid (PLA) as the printing filament. To model the semi-rigid and angled
nature of the external auditory canal, a 3D-printed PLA cast was made and high performance
platinum silicone (Dragon Skin FX-Pro, Smooth On, Inc. Macungie, PA) was used for the canal
castings. The silicone was also cast into a thin, translucent sheet approximately 0.5 mm thick for
the tympanic membrane and lining of the 3D-printed middle ear cavity, representing the
mucosa. A small hole in the back of the middle ear cavity was used to add fluid via a syringe
into the phantom behind the silicone tympanic membrane while recording video using the SWIR
or a visible otoscope inserted in the model canal.
We then evaluated the effectiveness of the SWIR otoscope at detecting fluid in the 3D-
printed middle ear model. In our model, orange juice was selected as a phantom for middle ear
Figure 2.4: Fluid visualization in a 3D-printed middle ear model. A model middle ear cavity and
ossicle were 3D-printed from polylactic acid, covered with a thin tympanic membrane phantom, a thick
silicone ear canal, and cased with a model outer ear and lobe (A). Orange juice was selected as a
phantom for middle ear fluid, as the attenuation (B, dashed line) includes both water absorption (B,
thin line) and scattering of visible light exhibited by middle ear fluid (B, thick line). As the model middle
ear is filled with fluid phantom, a subtle intensity change behind the membrane can be observed using
visible otoscopy (C, top). The SWIR otoscope provides a more striking contrast between presence
and absence of fluid, particularly with a 1300 nm longpass filter which selectively passes the
wavelengths of maximum fluid absorption (C, bottom). Monitoring the Weber contrast of the model
ossicle shows that the contrast of this feature is poorer for visible otoscopy (D) compared with SWIR
otoscopy (E). With SWIR otoscopy, the contrast increases four-fold to 1.2 compared with contrast in
the absence of fluid of 0.30; this is a significant improvement over the two-fold contrast increase from
0.36 to 0.72 observed using visible otoscopy (F).

31
fluid, as it has representative spectroscopic properties, particularly the dominant water
absorption features and scattering of visible wavelengths of light (Fig. 2.4B). Using visible
otoscopy, slow addition of fluid into the ear model is barely perceptible; reflected light intensity
from the middle ear space decreases by only 29% (Fig. 2.4C, top). The malleus, which is a
superficial anatomical structure, experiences relatively less change in intensity as fluid is added.
As a result, the Weber contrast of this feature, defined as the difference between the feature
intensity and the background intensity all divided by the background intensity, is doubled from
0.36 to 0.72 when the malleus is surrounded with fluid (Fig. 2.4D,F).
On the other hand, using a 1300 nm longpass filter and SWIR detection, the SWIR
otoscope can selectively image between 1300–1700 nm where absorption of middle ear fluid is
maximal. Addition of fluid to the model obstructs any features lying behind the superficial
structures at the tympanic membrane, and reduces the overall reflected light intensity by 73%
(Fig. 2.4C, bottom). This notable intensity reduction causes contrast of the malleus to increase
four-fold from 0.30 to 1.2 when surrounded by fluid (Fig. 2.4E, F), a significant improvement
over the visible case.
Based on these models and spectroscopic characterization of the middle ear tissues, we
therefore expect the imaging contrast of middle ear anatomy and fluid in vivo to be significantly
enhanced with SWIR light compared to what is currently achievable with visible otoscopy. The
relative level of SWIR absorption of middle ear fluid, which provides a striking contrast, could
facilitate a clinician’s determination of the absence or presence of fluid in the middle ear.
2.4 Imaging middle ear anatomy in adults
We tested in vivo performance of the SWIR otoscope on ten adults (18 ears) and show that the
increased penetration of SWIR light through the tympanic membrane enables the SWIR
otoscope to image middle ear anatomy with exceptional detail compared to visible otoscopy
(Fig. 2.5). The external auditory canal was used as the optical access for visible and SWIR
imaging of middle ear structures. The speculum was inserted into the canal within approximately
2 cm of the tympanic membrane and the middle ear was illuminated with the light source.
Reflected light was collected by the optical system either broadband or filtered through a
bandpass, longpass, or shortpass filter.
Using traditional visible otoscopy, the only clearly identifiable features besides the
tympanic membrane are typically those that are large or superficial, such as the cochlear
promontory (observed in 15/18 cases), which is formed by the outward projection of the first turn
of the cochlea against the posterior wall of the middle ear cavity, and the malleus (observed in
18/18 cases) which lies directly under the tympanic membrane. In a few cases, the tympanic
membrane is thinner, and light reflection off of smaller or deeper anatomy such as the incus
(9/18 cases), stapes (2/18 cases), and stapedial tendon (2/18) is identifiable.

32
We show that in a typical human middle ear, the SWIR otoscope images landmarks of
the entire ossicular chain (middle ear bones), including the incus and stapes (16/18 and 11/18
cases respectively), in addition to the malleus (18/18 cases). In 12 out of 18 cases it was also
possible to image the supporting stapedial tendon. Besides the ossicular chain, the SWIR
otoscope can also clearly image the cochlear promontory (18/18 cases), and visualization of the
round window niche—one of the two openings from the middle ear to the inner ear—was also
achieved (16/18 cases). Furthermore, the SWIR otoscope could identify the chorda tympani
(9/18 cases), a branch of the facial nerve that carries taste sensation from the anterior two-
thirds of the tongue. The location of the chorda tympani is generally obstructed by a thicker
region of the tympanic membrane with visible imaging (visible in 4/18 cases). See Table 2.1 for
a summary of anatomy visualization.
Table 2.1: Number of ears in which each middle ear anatomical structure was identifiable using
visible versus SWIR otoscopy. A two-proportion z-test was used to assess whether the difference
between the visible anatomy visualization and SWIR anatomy visualization is significant. At a significance
level of 0.05, the proportion of anatomy that could be visualized using SWIR otoscopy was significant for
the incus, stapes, stapedial tendon, cochlear promontory, round window, and chorda tympani. The
difference was insignificant for the malleus which was easily visualized by both techniques.
Otoscopy wavelength
Malleus Incus Stapes Stapedial tendon
Promontory Round window
Chorda tympani
Visible 18/18 9/18 2/18 2/18 15/18 8/18 4/18
SWIR 18/18 16/18 11/18 12/18 18/18 16/18 9/18
Z-score – –2.5 –3.1 –3.4 –1.8 –2.8 –1.7
p-value – 0.0062 0.00097 0.00034 0.036 0.0026 0.045
Figure 2.5: Schematic of the middle ear and SWIR and visible otoscopic examinations in
healthy adults. Representative images from examinations of 10 healthy adult humans are shown.
Under visible examination, all anatomy besides the malleus is obstructed by the tympanic membrane
(B, top). Using the SWIR otoscope, the chorda tympani, malleus, incus, stapes, stapedial tendon,
cochlear promontory, and round window niche (indicated by ct, m, i, s, st, p, and rw respectively and
shown schematically in A) are all identifiable (B, bottom).

33
Thus, SWIR otoscopy enables visualization of anatomical features that would normally
be undetectable due to poor transmission of visible light through the tympanic membrane. We
also find that for middle ear structures already detectable by visible otoscopy, SWIR otoscopy
further improves their contrast. We quantified contrast using Weber contrast, defined as
𝐼𝑓 − 𝐼𝑏
𝐼𝑏
where If is the average intensity of a middle ear feature region of interest and Ib is the average
intensity of a background region of interest. The absolute value was taken for round window
contrast calculations, since the round window is given by negative contrast relative to the
reflected light from the promontory.
This analysis was carried out for the incus and round window of all imaged ears in which
the anatomy was visible using both SWIR and visible otoscopy (Fig. 2.6). The average contrast
value for the incus was 0.21 using visible otoscopy and 0.61 using SWIR otoscopy—an
increase by a factor of 4. The average contrast value for the round window was 0.26 using
visible otoscopy and 0.52 using SWIR otoscopy—an increase by a factor of 2. The incus and
round window contrast value for each volunteer is plotted and shown in Fig. 2.6D,E.
Figure 2.6: Quantification of contrast in SWIR and visible otoscopy of adult human subjects.
The intensity profile was plotted across middle ear features as imaged using SWIR otoscopy (column
1, orange trace) and visible otoscopy (column 2, blue trace) in order to calculate the relative contrast
of each method. The round window of one subject is shown in (A) with Weber contrast values inset in
the intensity plot (0.57 for SWIR and 0.27 for visible). The incus of a separate subject is shown in (B)
with SWIR contrast 0.87 and visible contrast 0.63, and the incus of a third subject is shown in (C) with
SWIR contrast 0.43 and visible contrast 0.12. The contrast was likewise plotted for 8 volunteers in
whom the incus was identifiable by both methods (D) and 7 volunteers in whom the round window was
identifiable (E). In all cases, SWIR otoscopy provides the greatest contrast of the middle ear feature.

34
2.5 Clinical observations in a pediatric population
The utility of the SWIR otoscope for middle ear diagnostics was evaluated in a pediatric patient
population. First, the design of the SWIR otoscope was optimized based on the findings in
Section 2.3 and Section 2.4 to improve ergonomics and adaptability to a wide range of patient
ear geometries (Fig. 2.7). Achromatic lenses were replaced with three 250 focal length biconvex
lenses each (Thorlabs, LB1056-C) to greatly reduce
spherical aberration in the images. A right angle cage
system with a silver mirror (Thorlabs, PF10-03-P01)
was implemented between the lenses for a more
ergonomic arrangement, and the focusing lenses were
placed in a translating lens tube to enable adjustable
focus for ear canals of different sizes and geometries.
The sensor was also replaced with a higher resolution,
smaller form factor, and lower weight InGaAs sensor,
the OWL 640 Mini VIS-SWIR (Raptor Photonics,
Northern Ireland).
Patients 3 years of age and older seen in the
otolaryngology clinic with an audiogram and
tympanogram obtained within a week of the visit were
recruited broadly for the study. Ears with a tympanic
membrane perforation or history of cholesteatoma
surgery were excluded from the study. Otoscopic
evaluation was performed by two pediatric
otolaryngologists using video otoscopy during the
office visit. Consecutive videos were obtained for
visible otoscopy and SWIR otoscopy.
A total of 74 ear video recordings were obtained in the study. Images of eleven ears
were excluded from analysis due to poor image quality for reasons including patient movement,
inadequate camera integration time, or presence of cerumen limiting view of the tympanic
membrane. Of the excluded videos, 7 were from SWIR imaging and 4 were from visible light
otoscopy. Images were deemed adequate for interpretation in 63/74 (85.1%) of videos
examined. There was no statistical significance between ability to perform SWIR otoscopy
versus white light video otoscopy as indicated by a p-value of 0.376.
To determine differences between visible light otoscopy and SWIR otoscopy in the ability
to identify the promontory, the ossicular chain, and middle ear effusion, videos were obtained
with both modalities. All videos were de-identified and displayed on a computer for review. For
each video, the otolaryngologist was asked to rate the quality of the video, ability to identify the
Figure 2.7: Image of the SWIR
otoscope prototype. The system is
composed of a fiber-coupled
broadband halogen light source, an ear
speculum, and an adjustable lens
system to focus the reflected light onto
an InGaAs array detector. A filter
holder in front of the sensor allows use
of a variety of SWIR filters.

35
promontory, ability to identify the ossicular chain, and presence or absence of middle ear fluid.
Criteria to document absence of middle ear effusion were adequate movement of the ear drum
during the office examination with pneumatic otoscopy and identifiable promontory and ossicles
behind the tympanic membrane in visible and SWIR otoscopy. Criteria to document the
presence of middle ear fluid included visible fluid in visible otoscopy and decreased light
intensity from absorption of SWIR light by fluid in SWIR otoscopy. Results of the audiograms
and tympanograms and ear examination were made available to the pediatric otolaryngologists
at the time of the evaluation. Inter-rater agreement was performed using Cohen’s kappa, and
Chi square analysis was used for our nominal data using SPSS 22.0 (SPSS Inc. Chicago,
Illinois). Differences were considered significant for a p-value < 0.05.
In 8 cases, the ossicular chain was visible when using the SWIR otoscope compared to
1 case using the visible otoscope (Fig. 2.8). Thus, there was statistical significance between
SWIR otoscopy and visible otoscopy in the ability to image the promontory (p=0.012) and the
ossicular chain (p=0.010). There was high inter-rater agreement for identification of both the
Figure 2.8: Evaluation of healthy middle ear anatomy in pediatric patients. A normal type A
tympanogram from a clinically normal patient is shown (A). The incus (B) and promontory (C) of this
patient is shown with greater clarity in SWIR otoscopy images compared to the visible otoscopy
images. Likewise a second clinically normal patient tympanogram (D), incus images (E), and
promontory images (F) are shown.

36
promontory and the ossicular chain with kappa values of 0.81 and 0.92 respectively. In addition,
three patients were determined to have presence of middle ear effusion, confirmed by
pneumatic otoscopy during the otolaryngology visit. The patients were all identified using both
visible and SWIR otoscopy. In these patients, contrast was also quantified with ImageJ software
by calculating the standard deviation in signal intensity divided by the mean signal intensity for a
defined region of interest within the image. The region of interest encompassed areas both with
and without suspected fluid accumulation. This calculation was carried out for four video frames
and averaged. An improvement in contrast using SWIR otoscopy was observed in some areas
where effusion was present in the middle ear (Fig. 2.9). The average contrast for visible
otoscopy was 0.097 and for SWIR was 0.29.
Additional pathologies were also observed in individual patients and differences between
SWIR and visible otoscopy noted (Fig. 2.10). For example, in tympanic membranes with
myringosclerosis, neither technique was able to see through areas of myringosclerosis.
However, we observed that the SWIR otoscope was able to see through dried blood, dried
Figure 2.9: Tympanometry, visible otoscopy, and SWIR otoscopy of pediatric patients with
middle ear effusions. A tympanogram (A) of the right ear (B) and left ear (C) of a patient indicates
presence of bilateral middle ear fluid. Visible images show partial obstruction by cerumen. Bubbles in
the fluid are most noticeable by SWIR otoscopy (indicated here by arrows). Also shown is a Type A
tympanogram of a right tympanic membrane and middle ear (D) for a patient with an air-fluid level
detected using visible (E) and SWIR (F) otoscopy (indicated by a black arrow). The absorption of fluid
is quantified by plotting the detected intensities across a region of interest containing fluid (yellow
line). Contrast of the air-fluid level, defined as the standard deviation divided by the mean signal
intensity for the region of interest (G), is more than double for SWIR imaging (orange squares,
average of 4 images shown with a black line) than for visible imaging (blue diamonds, average of 4
images is shown with a black line).

37
secretions and thin dry areas of cerumen overlying the tympanic membrane. In one particular
case, this enabled visualization of an underlying tympanostomy tube that could otherwise not be
evaluated. The SWIR otoscope in general aided evaluation of tympanostomy tube flanges to
assess the tube’s placement across the tympanic membrane and fluid draining from the tube,
confirming no blockage.
Thus, we have demonstrated the feasibility of using SWIR otoscopy in a pediatric
population. Furthermore, we show that expanding otoscopy into the SWIR can offer advantages
over traditional visible otoscopy, such as better visualization of the middle ear structures, seeing
through opaque media, and increased contrast of middle ear effusion. SWIR otoscopy could
provide an adjuvant method for identification of middle ear pathologies in the clinic.
2.6 Discussion and conclusions
We have developed an otoscope sensitive to SWIR light for imaging the middle ear and its
pathologies. We show that deeper tissue penetration of SWIR light enhances contrast and
enables better visualization of middle ear anatomy through the thin tissue of the tympanic
membrane. While the middle ear anatomy is obfuscated by the tympanic membrane during
visible light examinations, SWIR otoscopy can be used to examine the ossicular chain, cochlear
Figure 2.10: Additional middle ear pathologies in pediatric patients visualized by SWIR and
visible otoscopy. Myringosclerosis on the tympanic membrane is opaque using both visible (A) and
SWIR (B) otoscopy techniques. However, we find that SWIR otoscopy can be useful in evaluating
tympanostomy tube placement. Images of a normal tympanostomy tube are shown in the left ear of a
patient whose right ear, also shown, contained dried blood obscuring view of the tube in the visible (C)
and SWIR (D). Notably, reflection of the tube can be seen with SWIR otoscopy (arrow), confirming that
the tube is present and in place. A tympanostomy tube with otorrhea is also imaged with visible (E)
and SWIR (F) otoscopy. SWIR images show the ability to see through dry secretions and cerumen
which enables visualization of the tympanostomy tube flange. Fluid draining from the tympanostomy
tube can also be seen with greater contrast using SWIR otoscopy compared to visible otoscopy.

38
promontory, round window niche, and chorda tympani. The ability to inspect the ossicular chain
in greater detail could provide valuable diagnostic information in cases of conductive hearing
loss such as in ossicular discontinuity or otosclerosis, a disorder characterized by abnormal
bone growth. Imaging deeper within the middle ear can also allow evaluation of cholesteatoma
extension within the middle ear, especially in cases where the ossicular chain is suspected to be
involved. The round window is used as an insertion site for cochlear implant electrodes, and has
also recently been used as an implantation site for hearing aid transducers.102–104 Clear
visualization of the round window using a SWIR otoscope could provide an alternative to
radiographic imaging for evaluation of such surgical implants. Thus, a SWIR otoscope has
diagnostic potential in evaluating the cause of a variety of middle ear complications and in
informing surgical procedures.
Furthermore, we predict that a SWIR otoscope can indicate middle ear effusions based
on the strong light absorption of middle ear fluid beyond 1300 nm. Integrating SWIR light into
otoscopy extends the available wavelengths to a regime in which endogenous contrast of
middle ear fluid is much greater than at visible wavelengths. It should therefore provide a more
objective determination of the presence or absence of middle ear effusion. Bringing objectivity to
this diagnosis which has long been plagued by diagnostic and therapeutic inconsistency has the
potential to reduce over-prescription of antibiotics and unnecessary tympanostomy tube
surgeries, which is the most common surgical procedure performed in US children.105
Potentially, a SWIR otoscope could also be used for differential detection of mucoid versus
serous middle ear effusion, which is also of clinical interest. Measuring the attenuation of the
middle ear at different wavelength regimes (e.g. 1100 nm versus 1450 nm) simultaneously
should provide a measure of the volumetric percentage of water in the fluid, enabling distinction
of thin versus thick ear fluid.
The conventional pneumatic otoscope has long served as an initial means of identifying
tympanic membrane perforations, causes of conductive hearing loss, and most commonly, otitis
media. However, to compensate for the limitations of pneumatic otoscopy, other diagnostic tools
such as tympanometry and acoustic reflectometry have emerged to assist clinicians with the
diagnosis of middle ear effusions. The Current American Academy of Otolaryngology-Head and
Neck Surgery (AAO-HNS) guidelines for management of OME recommend use of
tympanometry to assist with the diagnosis of middle ear effusion when pneumatic otoscopy
examination is not conclusive.106 Tympanometry is an audiometric method shown to raise
diagnostic success of otitis media to 83%; however, this method is not widely used in primary
care settings.89,95,107 Studies show that primary care providers find the use of tympanometry
easier than pneumatic otoscopy, yet utilization is low, due to the need for additional training,
increased time during the visit, and the cost of the device.108,109 Specificity of this method is also
low, between 50-75%.110 Emerging technologies such as optical coherence tomography,
spectral gradient acoustic reflectometry, and sonography have likewise shown potential for

39
improving the diagnosis of otitis media, but so far have not been widely adopted in general
practice due to the difficulty of data interpretation or unfamiliarity of physicians with their use.111–
116
We therefore underscore the importance of having a photonic method for direct
visualization of the functional status of biological tissue. Using SWIR technology does not add
time or complexity to a diagnosis, and requires little additional training of medical practitioners
who have already been trained in otoscopy. It is thus easily integrated into the clinic. The
general architecture of the SWIR otoscope, which provides immediate functional information,
could also be extended to the development of a variety of other medical devices to assist in a
wide range of surgical procedures throughout the airway and gastrointestinal tract. For example,
other disease conditions characterized by the build-up of fluid could be characterized by the
enhanced contrast due to endogenous SWIR absorption. The SWIR otoscope is therefore only
an initial example of how extending optical measurements into the SWIR can provide
complimentary visual data to conventional visible light-based technologies, addressing some of
their existing limitations.
2.7 Additional experimental details
All biospecimen sample collection and transfer procedures were approved by the Connecticut
Children’s Medical Center Institutional Review Board and were from volunteers who provided
informed consent. Samples were used and characterized following the procedures approved by
the Massachusetts Institute of Technology Committee on the Assessment of Biohazards and
Embryonic Stem Cell Research Oversight (CAB/ESCRO) and Biosafety Program. All
participants in the imaging experiments provided informed consent and consent to publish
images, and methods were carried out in accordance with the procedures approved by the
Massachusetts Institute of Technology Institutional Review Board and Committee on the Use of
Humans as Experimental Subjects, and Connecticut Children’s Medical Center Institutional
Review Board, and all procedures were in accordance with the Declaration of Helsinki
guidelines.
Tympanic membrane tissue samples (1 mm solid sample) were cut from the tympanic
membrane via tympanic membrane perforation during a typical tympanoplasty procedure of
pediatric patients (ages 0–18 years). The tissue was flash frozen with liquid nitrogen on Tefla
and stored in a specimen cup at -80ºC for up to one week before being transferred over
approximately 3 hours in a Styrofoam container of dry ice. Tissue was stored in the second
location at –80ºC for one week before being thawed to room temperature and mounted intact on
a glass slide. Human middle ear fluid samples were collected intraoperatively from pediatric
patients (ages 0–18 years) during myringotomy and placement of pressure-equalizing tubes for
standard treatment of recurrent otitis media or persistent middle ear effusion. Following incision

40
on the tympanic membrane with a Beaver blade, a Juhn Tym-Tap (Medtronic Xomed Inc.,
Jacksonville, FL) middle ear fluid aspirator was used to collect 30–200 microliter samples from
either the left or the right ear into Eppendorf tubes. The collected fluid ranged from serous to
mucoid in consistency, designated as such based on visual inspection and ability to suction the
fluid. One set of samples was centrifuged at 500 rpm for 5 minutes to separate cells from middle
ear fluid and subsequently stored at –80 ºC. The other set was not centrifuged and was frozen
directly at –80 ºC. After five days, the middle ear fluid samples were transported over
approximately 3 hours in a Styrofoam container of dry ice to a new location where they were
again stored at –80 ºC. Immediately prior to spectroscopic characterization, samples were
thawed to room temperature and transferred to 1 mm or 0.2 mm path-length, demountable
quartz cuvettes. Attenuation spectra of human tympanic membrane tissue and middle ear fluid
were measured using a Cary 5000 UV-VIS-NIR spectrophotometer (Varian/Agilent, Santa Clara,
CA, USA).
Otoscopic measurements were made on comparable SWIR and visible otoscope
devices. The SWIR otoscope was designed as described in Section 2.3. The visible otoscope
analogue was assembled using a Thorlabs, Inc. 1280 x 1024 pixel CMOS color sensor, and a
mounted achromatic lens pair (Edmund Optics) with 75 and 100 EFL achromats (MgF2-coated
for visible wavelengths). The visible camera and lens were adapted to the otoscope head and
broadband illumination from the otoscope was used to illuminate the object of interest.
Resolution measurements of both systems were determined using Thorlabs, Inc. (Newton, New
Jersey, USA) positive sector star test targets with 36 bars and 72 bars and a concentric square
calibration target. Depending on the resolution of the optical system, the sector star bars will
appear to merge at some radial distance from the center of the target; by measuring this
distance, r, the thickness of a line pair can be calculated using the formula for the chord length:
𝑐 = 2𝑟 ∗ sin𝜃
2
where the angle theta is the number of degrees covered by one pair of light and dark bars. The
resolution in lp/mm is thus given by 1/c. Using this method, the maximum resolution for the
optical system was determined to be 22 lp/mm, or 45 μm. Analysis with a concentric square
calibration target indicated that the lenses de-magnify the object onto the sensor by a factor of
0.76, resulting in an approximately 10.5 mm diameter circular field of view while using a 5.0 mm
speculum.
Light intensities output from the SWIR otoscope were also measured. At a distance of 2
cm away from the end of the otoscope speculum, the broadband illumination between 900-1700
nm is 10–30 mW/cm2 depending on the output power of the lamp. Illumination specifically
between 1300-1700 nm was measured to be roughly 1–3 mW/cm2.
Ten adults were imaged in total in both left and right ears. In eighteen out of twenty ears,
clear visualization of the middle ear was achieved; two out of twenty ears were excluded due to

41
cerumen in the external auditory canal blocking access to the middle ear. For the eighteen ears
with a clear view of the middle ear, the individual anatomical structures were identified by the
otolaryngologist performing the examination (Table 2.1). A two-proportion one-tailed z-test was
used to assess whether the difference between the visible anatomy visualization and SWIR
anatomy visualization is significant. We hypothesized that the proportion of volunteers in which
the middle ear anatomy could be visualized would be greater using SWIR otoscopy than using
visible otoscopy. Using a one-tailed test, and at a significance level of 0.05, the proportion of
anatomy that could be visualized using SWIR otoscopy was significantly greater for the incus,
stapes, stapedial tendon, cochlear promontory, round window, and chorda tympani. The
difference was insignificant for the malleus which was easily visualized by both techniques. At a
significance level of 0.01, the difference was significant for visualization of the incus, stapes,
stapedial tendon, and round window and insignificant for the malleus, promontory, and chorda
tympani.
2.8 Chapter-specific acknowledgements
The results described in this chapter are reported in Carr, et al.117 and an additional manuscript
in preparation.
Jessica Carr, Dr. Tulio Valdez, Dr. Oliver Bruns, and Professor Moungi Bawendi
contributed to the conception and design of these studies, and discussed their results and
implications. Jessica machined and assembled the otoscope prototypes and characterized their
performance. Dr. Valdez designed and fabricated the 3D-printed middle ear model and Jessica
carried out phantom imaging on the model. Dr. Valdez acquired biospecimens and Jessica
performed spectroscopic characterization. Jessica recruited adult human subject volunteers and
Bridgette Carter recruited pediatric volunteers. Jessica and Dr. Valdez carried out human
subject imaging, aided by Danielle Blake. Dr. Katherine Kavanagh and Marissa Schwartz aided
in evaluation of pediatric patient videos. This work received further support in part from the
National Institute of Health through the Laser Biomedical Research Center, grant number 9-
P41-EB015871-26A1 (M.G.B.), the Massachusetts Institute of Technology through the Institute
for Soldier Nanotechnologies, grant number W911NF-13-D-0001 (M.G.B.), and was conducted
with Government support under and awarded by DoD, Air Force Office of Scientific Research,
National Defense Science and Engineering Graduate (NDSEG) Fellowship, 32 CFR 168a. Dr.
Bruns was additionally supported by an EMBO long-term fellowship.

42

43
Chapter 3
Endogenous SWIR autofluorescence imaging as
a biomarker for disease
3.1 Introduction: autofluorescence as a biomarker for disease
When biological tissue is irradiated with light, some biological structures within the tissue can
absorb the light and re-emit light at a lower energy wavelength, a phenomenon known as
autofluorescence. Autofluorescent molecules in cells, e.g. aromatic amino acids, lipopigments,
NAD(P)H, and flavin coenzymes, can act as endogenous reporters of the morphological and
metabolic properties of cells and tissues, providing a means for living cell analysis in basic
research studies, and also as a disease biomarker.118–120 As the signal is inherent to tissue,
autofluorescence imaging is part of a wider range of analytical procedures known as optical
biopsy, which promise diagnostic information in a noninvasive or minimally-invasive manner,
without removal of tissue specimens or the injection of exogenous markers.120–122 Moreover,
unlike histochemical procedures on biopsies, which are the standard method in the diagnosis of
many disorders, optical biopsies can be performed in real-time and in a manner that is
nondestructive to the sample, requiring no pre-treatment steps (e.g. fixing or staining).
The diagnostic potential of autofluorescence was first recognized over a century ago, yet
difficulties detecting low-intensity signals or interpreting complex, overlapping signals redirected
most research focus to the use of exogenous fluorophores.119,123 The relatively recent availability
of high-sensitivity, low-noise cameras has improved detection of autofluorescence signals,
however, and the development of more compact, powerful light sources and fiber optics is
renewing interest in autofluorescence both in basic research and as a diagnostic
technique.124,125 Moreover, a variety of methods have now been developed to help uncouple
autofluorescence signal from various other signals within the tissue (e.g. autofluorescence
lifetime imaging).122,126,127 The autofluorescence of biomolecules and their combinations have
now been investigated as biomarkers for various cancers,125,128–131 liver functionality,132–136
gastrointestinal disorders,137–142 and other conditions.119,143 Over the past decade, fundus
autofluorescence imaging, which measures the ocular fluorophore lipofuscin in retinal pigment
epithelia, has become an essential clinical tool for obtaining earlier diagnoses and better
predictions of the progression of age related macular degeneration, macular dystrophies,
retinitis pigmentosa, white dot syndromes, retinal drug toxicities, and other retinal diseases.42,144

44
Nonetheless, most autofluorescence imaging to date uses ultraviolet radiation (UVA,
315-400 nm) or high energy visible wavelengths to excite endogenous fluorophores. However, it
is known that UVA exposure induces oxidative stress in cells and photo-oxidation processes,
resulting in acute and persistent cellular injury or even cell death.145 High energy visible light can
also create an uncomfortable patient experience, as has been documented in fundus
autofluorescence imaging.146 Furthermore, UVA and visible light are limited in their tissue
penetration depth, and can only image superficial (e.g. skin or retinal) or
surgically/endoscopically-accessible structures.45 Another major problem in conventional
autofluorescence microscopy techniques is photobleaching, resulting in diminished
autofluorescence signal. Thus, there remains a need for a noninvasive method to detect
autofluorescence that is repeatable and nondestructive for cells and tissue.
Here, we make use of NIR excitation and high-sensitivity, low-noise cameras (silicon-
based and InGaAs-based) to detect endogenous NIR and SWIR autofluorescence. The choice
of NIR excitation enables nondestructive, noninvasive, in vivo detection, as it has lower energy
and greater tissue penetration depths than UVA or visible light wavelengths.19,22 Detection of
longer NIR/SWIR autofluorescence emission further facilitates deep-tissue measurements, due
to greater tissue transmittivity, less scattering of light, and lower background autofluorescence
compared with visible imaging.19,45,47 Most healthy tissue has very little autofluorescence of NIR
and SWIR light, but NIR excitation can give rise to elevated NIR/SWIR autofluorescence signals
under certain disease conditions, providing disease-correlated contrast in an image, as has
already been shown clinically feasible in the eye.19,146,60,147,148
We show that lipopigments in particular can serve as NIR- and SWIR-autofluorescent
pigments, and demonstrate the potential for their use as disease biomarkers. For example, we
find strong NIR/SWIR autofluorescence in the liver of mouse models of cirrhosis and of
nonalcoholic fatty liver disease (NAFLD). In the latter, we show further that the increase of
NIR/SWIR signal parallels the progression of disease. We have also detected NIR/SWIR
autofluorescence in the brain and liver of 12/15-lipoxygenase knockout mice with consequential
up-regulated autophagy, a major intracellular degradation pathway that may be linked to an
increasing number of neurodegenerative and other diseases.149–151 We show here the
noninvasive detection of these disease-correlated autofluorescence signals in vivo in preclinical
animal models and discuss the potential relevance of this technique to human clinical samples.
3.2 Fluorescence imaging apparatuses for whole animal down to
sub-cellular imaging
We designed an optical system to detect NIR and SWIR fluorescence of tissues at both
macroscopic and microscopic scales (Fig. 3.1). These systems were used for the studies
presented in this chapter, and were also adapted for many of the following studies described in

45
Figure 3.1: Optical set-up for NIR/SWIR fluorescence imaging. The optical system uses a near
infrared excitation unit, a transmission unit configured to illuminate a region of interest with incident
excitation light, and a detection unit configured to sense the resulting fluorescence. For macro- and
mesoscopic imaging, the transmission unit is composed of an optical fiber which guides light from the
excitation unit, an excitation filter to block undesirable excitation wavelengths, and a diffuser to spread the
excitation light across the biological sample (A). The detection unit contains a set of filters to block
reflected excitation light and to select the desired fluorescence wavelengths, a lens system to image the
fluorescence onto the sensor, and a sensor sensitive to NIR/SWIR light. For microscopy, the transmission
unit contains a dichroic mirror which reflects the desired excitation wavelength from the excitation unit
through an objective which focuses the excitation light onto a biological sample; autofluorescence from
the sample is focused through the objective, passed by the dichroic mirror, and detected by a unit
composed of a set of filters to block reflected excitation light and a sensor sensitive to NIR/SWIR light (B).
In both set-ups, NIR excitation light is used (e.g. 808 nm laser light), and NIR and/or SWIR emission
wavelengths are measured (C).

46
Chapter 4 and Chapter 5. The systems include an excitation source for illuminating a sample
with incident light, a series of filters and optics to focus select excitation onto the sample and to
focus specific reflected or emitted light onto a detector.
For macro- and mesoscopic imaging, the output of a 10 W 808 nm laser (Opto Engine;
MLL-N-808) was coupled into a fiber (Thorlabs; MHP910L02) and passed through a ground-
glass plate (Thorlabs; DG10-220-MD) directed over the working area. The final laser intensity at
the working surface was approximately 50 mW/cm2, well below the maximum permissible
exposure limit (330 mW/cm2 for 808 nm continuous wave light).152 Sample fluorescence was
directed from the imaging stage to the camera using a four-inch square first-surface silver mirror
(Edmund Optics; Part No. 84448). The laser light was blocked with two colored glass 2” 850 nm
longpass filters (Thorlabs; FGL850S) and an 850 nm longpass dielectric filter (Thorlabs;
FELH0850) in front of the objective (Navitar; F/2.8, 50 mm EFL, MVL50M23) before collecting
the fluorescence on an InGaAs camera (Princeton Instruments; NIRvana, 640x512 pixel array)
or a back-illuminated, deep depletion silicon CCD camera (Princeton Instruments; PIXIS
1024BR, 1024x1024 pixel array). Fig. 3.2A,B shows an example of in vivo mouse imaging and
ex vivo tissue imaging using this set-up.
For microscopy imaging, the 808 nm laser output of the multimode fiber was directed
through the diffuser of a laser speckle reducer (Optotune; LSR-3005) and deflected at a silver
mirror (Newport; 10D20ER.2) after which it entered an inverted microscope (Nikon; Eclipse Ti)
through its backport unit. A longpass 850 nm dichroic mirror (Thorlabs; DMLP850R) was used
Figure 3.2: NIR/SWIR autofluorescence imaging from macroscopic in vivo imaging to ex vivo
tissue imaging and tissue microscopy. An example of macroscopic, whole-animal, in vivo
NIR/SWIR autofluorescence imaging is shown in which signal is detected in the liver (A, yellow arrow)
of a NAFLD mouse model (described in greater detail in Section 3.5) and in the genitourinary
anatomy (A, white arrows). NIR/SWIR autofluorescence detected in ex vivo tissue is shown in (B) of
the excised liver tissue of the animal shown in A. NIR/SWIR autofluorescence microscopy of cells is
also shown in (C) in 5 μm sections of formaldehyde-fixed, paraffin-embedded liver tissue from a
cirrhosis mouse model (described further in Section 3.4).

47
to guide the laser beam onto the back aperture of the objective (Nikon; CFI Plan Apochromat
4x or 10x) which focused the laser onto the sample placed on a motorized stage (Ludl
Electronic Products Ltd.; MAC 6000 Systems). Light emitted by the sample was collected by the
same objective and passed through the longpass 850 nm dichroic mirror and a hard-coated 850
nm longpass filter (Thorlabs; FELH0850). The light in some cases was magnified by an
additional 1.5x using a built-in microscope function and was directed to a microscope output
port onto the array of the InGaAs or silicon camera. Fig. 3.2C shows an example of microscopic
autofluorescent granules imaged using this set-up.
In some studies, visible light microscopy was carried out for comparison. The above-
described microscopy set-up was adapted for this purpose. Samples were illuminated with
either a halogen lamp (Nikon; Halogen 12 V 100 W, LHS-H100C-1) for reflectance imaging or a
Xenon lamp (Nikon; Intensilight C-HGFI) for fluorescence excitation. Excitation and emission
light was filtered through one of the filter cubes described in Table 3.1, and imaged onto either
the grey-scale CCD camera (PIXIS 1024BR) or a color CMOS camera (Thorlabs; DCC1645C).
For all imaging, the NIRvana 640 camera was cooled to –80 oC, the analog to digital (AD)
conversion rate set to 2 MHz or 10 MHz, and the gain set to high. All images were background-
and blemish-corrected within the LightField imaging software. The PIXIS 1024BR camera was
cooled to –70 oC, the AD conversion rate set to 2 MHz, and the gain set to high. Detailed
acquisition settings (e.g. integration time, filters) for each figure are detailed in Appendix A,
Table A.1. ImageJ (1.48v, NIH) was used for all image measurements (frame averaging, pixel
intensity average, standard deviation, etc.).153–155
Table 3.1: Filter cube descriptions for visible light microscopy. The following table details the
excitation and emission wavelengths selected by the filter cubes used in the following microscopy studies.
Filter cube label Excitation filter
wavelengths
Emission filter
wavelengths
DAPI/BFP 372–408 nm 425–520 nm
GFP 452–486 nm 505–545 nm
Cy3/TRITC/DSRed 532–552 nm 594–646 nm
Cy5 590–650 nm 662–738 nm
NIR/SWIR < 850 nm > 850 nm

48
3.3 Identification and optical characterization of a NIR/SWIR-
autofluorescent pigment
Most cell autofluorescence originates from molecules within the mitochondria and lysosomes,
such as aromatic amino acids, lipopigments, NAD(P)H, and flavin coenzymes.119 Collagen,
elastin, and melanin are also common fluorophores in the extracellular matrix, autofluorescent
porphyrins and eosinophil granulocytes can be found in blood, and the autofluorescent
biomolecules biliverdin and bilirubin are present in bile.156,157 Many of these molecules are
readily detected in the visible spectrum using UVA or short-wave visible excitation, but few
absorb significant amounts of NIR light and even fewer emit sufficient autofluorescence to be
detected by NIR or SWIR detection.19,118,60 We show here the identification of lipopigments,
namely lipofuscin/ceroid, as unique NIR-excitable and NIR/SWIR-detectable autofluorescent
pigments, demonstrated primarily in tissue from mouse models of liver cirrhosis.
Previous studies have shown that ceroid-laden macrophages are present at high
densities in cirrhotic liver tissue relative to healthy liver tissue, and are often accompanied by
granules of autofluorescent lipopigments.158–163 We therefore investigated the possibility that
NIR/SWIR autofluorescence in liver tissue could originate from these or similar granules. Male
C3Hf/Sed mice were administered 20% carbon tetrachloride (CCl4) in olive oil via oral gavage
(200 µL) three times per week, causing hepatotoxic cirrhosis. Ethanol was also added to the
drinking water at a concentration of 5% to intensify the fibrogenesis.164 Mice were sacrificed
after 8 weeks or after 12 weeks of their treatment, and excised liver samples were fixed in 4%
paraformaldehyde (PFA) in phosphate buffered saline (PBS) for 24h, washed in PBS and
further processed to paraffin embedding. Paraffin-embedded tissue was sectioned into 5 μm
thick slices onto glass microscope slides and were subsequently deparaffinized, stained, and/or
mounted in a mounting medium.
Under 808 nm excitation, in the microscope described in Section 3.2, we indeed detect
autofluorescent granules throughout the paraffin-embedded cirrhotic liver tissue. We detect
using 850 nm longpass filters on both a silicon NIR camera (i.e. 850–1050 nm detection) (Fig.
3.3A), and an InGaAs SWIR camera (i.e. 900–1620 nm detection) (Fig. 3.3B). We also find that
the signal survives deparaffinization (Fig. 3.3C) and mounting procedures using a variety of
mounting media types (Fig. 3.3D-F) without substantial quenching. Furthermore, we find that
the signal can be detected on deparaffinized, stained, and mounted slides (Fig. 3.3G,H). We
show here representative images of 5 μm slices of cirrhotic liver tissue that were deparaffinized,
immunohistochemically stained for P62 or F4/80 and α-smooth muscle Actin (α-SMA), and
mounted with Faramount medium (DAKO North America Inc.; S3025). The NIR/SWIR
autofluorescence signal did not overlay with P62 or LC3A/B stain (not shown), indicating that
the signal may not correlate with autophagy in this model. The NIR/SWIR signal also did not
correlate with α-SMA, which indicates activated stellate cells that are involved in fibrogenesis.

49
Figure 3.3: Tissue treatments for microscopy of mouse cirrhotic liver tissue. Paraffin-embedded
mouse cirrhotic liver tissue was sectioned into 5 μm thick slices onto glass microscope slides and were
subsequently deparaffinized, stained, and/or mounted in a mounting medium. Under 808 nm excitation, in
the microscopy set-up described in Section 3.2, autofluorescence could be detected using either 850 nm
longpass detection on a silicon camera (i.e. 850–1050 nm) (A) or using 850 nm longpass detection on an
InGaAs camera (i.e. 900–1620 nm) (B). The autofluorescence was also detectable on deparaffinized
tissue (C) and deparaffinized tissue mounted with Faramount (D), Permount® (E), and ProLong® Gold
(F), shown here using with 850 nm longpass detection on the silicon camera. Furthermore, we detected
NIR/SWIR autofluorescence in slides stained for P62 (G) and F4/80 with α-SMA (H). We show here
visible light color camera images on the left and 850 nm longpass images on the right for each stain. All
scale bars indicate 100 μm.

50
However, in these same slides, the NIR/SWIR signal did seem to correlate with cells having
F4/80-positive membranes. The NIR/SWIR signal did not directly overlay with F4/80, but rather
with the cytoplasm of the F4/80-positive cells, which indicate Kupffer cells or tissue
macrophages. The light brown appearance of the cytoplasm of these cells in this stain is
reminiscent of ceroid macrophages.160
We subsequently explored the correlation of the NIR/SWIR autofluorescent pigment with
three known stains for lipofuscin/ceroid lipopigments: Nile Blue A Sulphate (NBS), periodic acid
schiff reaction after diastase (PAS-D), and Sudan Black B (SBB).165–170 NBS is a fatty acid and
acidic phospholipid stain, often used for the differentiation of melanin and lipofuscin/ceroid.170
PAS-D is a polysaccharide stain that is also positive for lipofuscin/ceroid granules. SBB is a
highly lipophilic dye that binds to lipofuscin/ceroid granules, staining them a brown-black color,
and as a consequence, quenching their fluorescence at visible light wavelengths. SBB is
therefore frequently used to remove undesired lipofuscin/ceroid background autofluorescence
during immunofluorescent microscopy.171,172
For the NBS stain, deparaffinized sections (using xylenes and ethanol) were stained for
20 minutes in NBS at room temperature, prepared with 0.05% Nile Blue A (Acros Organics;
pure, certified, 415690100; Lot number A0377281) in 1% sulfuric acid. Sections were then
rinsed in running water for 15 minutes and no counterstain was performed. We find that the
NIR/SWIR autofluorescence correlates nearly perfectly with NBS-positive regions of the tissue
(Fig. 3.4A). A subset of sections were alternatively rinsed in 1% sulfuric acid followed by four
changes of absolute acetone to remove most of the NBS, and hence destain lipofuscin/ceroid in
the slide (Fig. 3.4B). We found that the NIR/SWIR autofluorescence intensity does not change
significantly after destaining (average pixel intensities were 11,020 counts per second for NBS-
stained slides and 10,955 counts per second for destained slides), confirming that the
fluorescence detected in these slides is primarily due to the endogenous pigment and not Nile
Blue A itself, which in 1% sulfuric acid has peak absorption at 572 nm and peak emission at 673
nm (Fig. 3.4C). This method further enables differentiation of lipofuscin/ceroid from melanin, as
melanin does not destain via acetone wash.
Other deparaffinized sections were stained with PAS-D or SBB. For PAS-D, slides were
incubated in 0.2% malt diastase (MP Biomedicals; ICN10153925) in a phosphate buffer for 1
hour at 37˚C. After washing, they were subsequently oxidized with 1% periodic acid for 5
minutes and incubated with Schiffs reagent (Electron Microscopy Sciences; 26052-05) for 20
minutes at room temperature. Counterstain was performed with Gills haematoxylin #2. For the
SBB stain, sections were incubated in 0.7% SBB (Sigma-Aldrich; certified by the Biological
Stain Commission, 199664; Lot number MKBX9860V) in 70% ethanol for 6 minutes, then rinsed
quickly in 50% ethanol solution and subsequently counterstained with nuclear fast red.167 We
find that the NIR/SWIR autofluorescence correlates well with both PAS-D-positive (Fig. 3.4D)
and SBB-positive tissue (Fig. 3.4E).
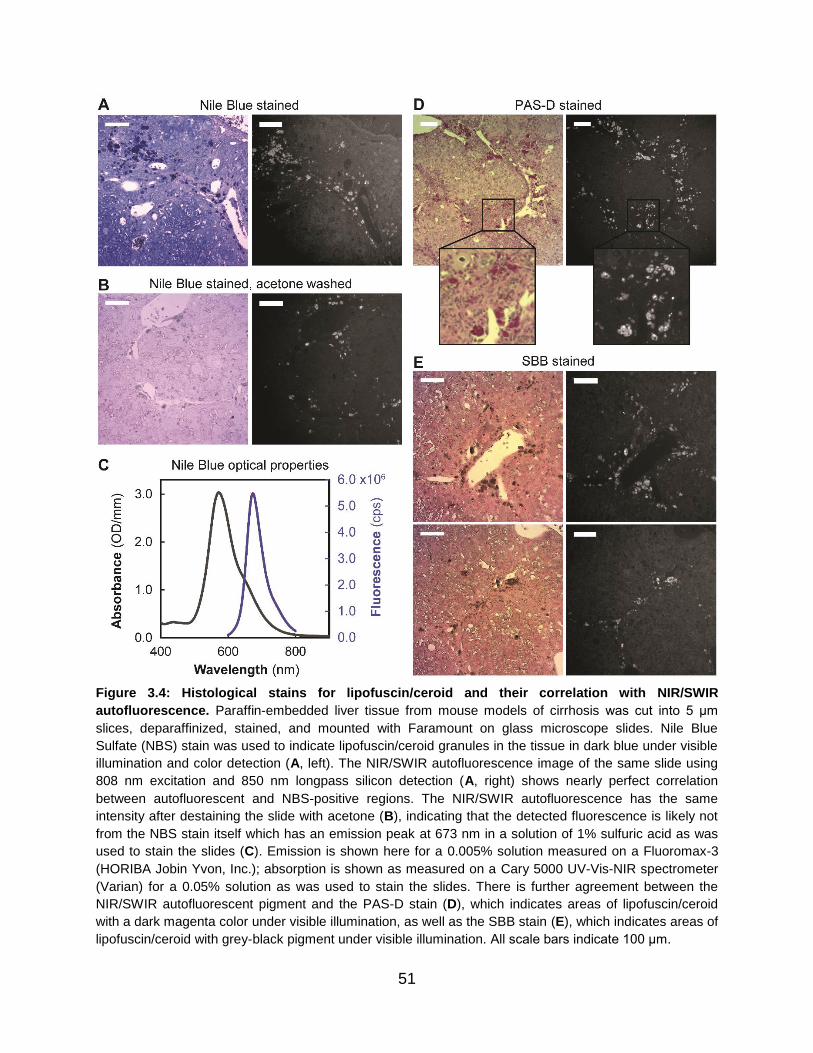
51
Figure 3.4: Histological stains for lipofuscin/ceroid and their correlation with NIR/SWIR
autofluorescence. Paraffin-embedded liver tissue from mouse models of cirrhosis was cut into 5 μm
slices, deparaffinized, stained, and mounted with Faramount on glass microscope slides. Nile Blue
Sulfate (NBS) stain was used to indicate lipofuscin/ceroid granules in the tissue in dark blue under visible
illumination and color detection (A, left). The NIR/SWIR autofluorescence image of the same slide using
808 nm excitation and 850 nm longpass silicon detection (A, right) shows nearly perfect correlation
between autofluorescent and NBS-positive regions. The NIR/SWIR autofluorescence has the same
intensity after destaining the slide with acetone (B), indicating that the detected fluorescence is likely not
from the NBS stain itself which has an emission peak at 673 nm in a solution of 1% sulfuric acid as was
used to stain the slides (C). Emission is shown here for a 0.005% solution measured on a Fluoromax-3
(HORIBA Jobin Yvon, Inc.); absorption is shown as measured on a Cary 5000 UV-Vis-NIR spectrometer
(Varian) for a 0.05% solution as was used to stain the slides. There is further agreement between the
NIR/SWIR autofluorescent pigment and the PAS-D stain (D), which indicates areas of lipofuscin/ceroid
with a dark magenta color under visible illumination, as well as the SBB stain (E), which indicates areas of
lipofuscin/ceroid with grey-black pigment under visible illumination. All scale bars indicate 100 μm.

52
Since lipofuscin/ceroid is known to have broad excitation and emission spectra, we also
investigated the visible autofluorescence of the lipopigment in this cirrhotic liver tissue (using the
excitation/emission parameters described in Section 3.2, Table 3.1, and depicted in Fig. 3.5C).
We find that fluorescence is detectable in many visible channels, consistent with the behavior of
lipofuscin/ceroid and lipofuscin-like pigments (Fig. 3.5A).171,173 Moreover, we find that the
autofluorescent pigments in the cirrhotic liver tissue are indeed quenched at visible wavelengths
after SBB staining (Fig. 3.5B), but are still detectable at NIR/SWIR wavelengths beyond the
strong absorption maximum of the SBB, measured here for a 0.37 mg/mL solution of SBB in
70% ethanol in 1 mm path-length quartz cuvettes (Spectrocell) on a Cary 5000 UV-Vis-NIR
infrared spectrometer (Varian) (Fig. 3.5D). It is theoretically possible that SBB could itself
fluoresce in the NIR/SWIR channel (due to residual absorption at 808 nm), making it difficult to
distinguish SBB fluorescence from the endogenous autofluorescent pigment. However, we note
the nearly perfect co-localization of the fluorescent signal with SBB-positive regions of the tissue
(there is no endogenous autofluorescence in SBB-negative tissue regions), and due to the
minimal absorption of SBB at the 808 nm excitation wavelength, believe that any SBB
fluorescence would be negligible relative to the endogenous autofluorescent pigment. Notably,
this method of staining tissues with SBB extends the wavelength span for immunofluorescence
imaging, as the lipopigments can be imaged in the NIR/SWIR wavelengths while traditional
immunofluorescent stains can still be used in visible channels in the absence of interfering
lipopigment autofluorescence.
Thus, as NBS, PAS-D, and SBB staining of cirrhotic liver slices all show a positive
correlation between stain and autofluorescence, and the behavior at visible wavelengths is
further consistent, we attribute the autofluorescence detected in these tissues to lipopigments,
and specifically to lipofuscin/ceroid. Lipofuscin has been characterized previously as having an
absorption maximum between 320–480 nm and an emission maximum in the range of 460–630
nm; however, the peak wavelengths can vary widely depending on the tissue (as even within a
given tissue the composition of lipofuscin/ceroid is quite heterogeneous), and in general, both
excitation and emission spectra are very broad.173 The larger than expected Stokes-shift
suggests that several intramolecular energy-transfers occur between different electron systems
before the absorbed energy is emitted as a “multi-Stokes-shifted” fluorescence photon, resulting
in broad spectra.44 We are thus able to excite the lipofuscin/ceroid in tissue at 808 nm even
though this is far from their absorption maxima and detect fluorescence from the tail of their
emission in the NIR/SWIR.
We characterized the autofluorescence emission spectrum on the cameras used
subsequently for ex vivo and in vivo imaging, and show that indeed the detected
autofluorescence is a decreasing tail in this region (Fig. 3.6). The emission intensity was
measured in 20 nm spectral bands across the NIR and SWIR by exciting an ex vivo liver sample
with approximately 70–90 mW/cm2 of diffuse 808 nm excitation light and filtering the resulting

53
Figure 3.5: Autofluorescence microscopy using visible through SWIR wavelength channels. We
show here autofluorescence microscopy of mouse cirrhotic liver tissue, deparaffinized and mounted with
Faramount, either with or without Sudan Black B (SBB) stain which quenches visible wavelength emission
of lipofuscin. Autofluorescence is detectable in Cy3-TRITC, Cy5, and NIR/SWIR channels for unstained
sections (A), but is only detectable in the NIR/SWIR channel for SBB stained sections (B), indicating that
the signal detected in unstained sections is likely lipofuscin. The excitation and emission wavelengths for
each filter cube setting are depicted in (C) and shows separation of the NIR/SWIR channel from the other
channels. The absorption spectrum of Sudan Black B shows that the dye absorbs visible light up to
approximately 800 nm, which is the mechanism of lipofuscin emission quenching at visible wavelengths,
but transmits NIR/SWIR light, allowing signal to be detected in this channel even for Sudan Black B
stained sections (D). All images have the same scale as the last panel of A, which indicates 100 μm.
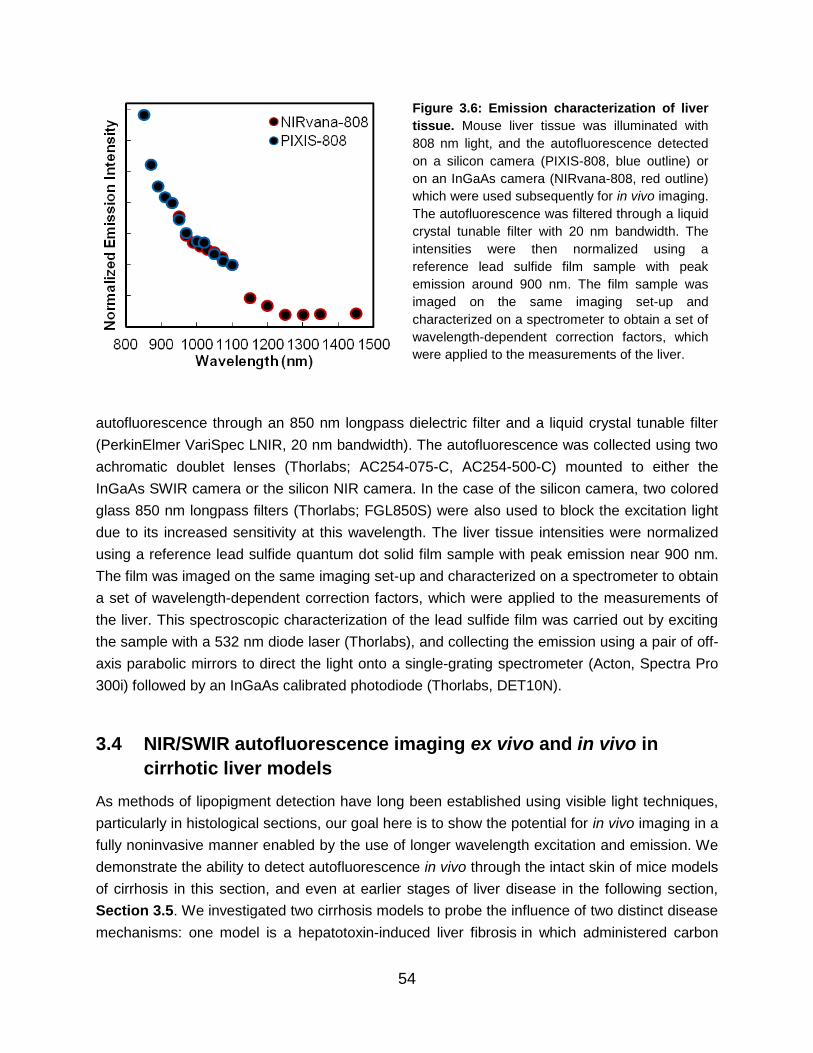
54
autofluorescence through an 850 nm longpass dielectric filter and a liquid crystal tunable filter
(PerkinElmer VariSpec LNIR, 20 nm bandwidth). The autofluorescence was collected using two
achromatic doublet lenses (Thorlabs; AC254-075-C, AC254-500-C) mounted to either the
InGaAs SWIR camera or the silicon NIR camera. In the case of the silicon camera, two colored
glass 850 nm longpass filters (Thorlabs; FGL850S) were also used to block the excitation light
due to its increased sensitivity at this wavelength. The liver tissue intensities were normalized
using a reference lead sulfide quantum dot solid film sample with peak emission near 900 nm.
The film was imaged on the same imaging set-up and characterized on a spectrometer to obtain
a set of wavelength-dependent correction factors, which were applied to the measurements of
the liver. This spectroscopic characterization of the lead sulfide film was carried out by exciting
the sample with a 532 nm diode laser (Thorlabs), and collecting the emission using a pair of off-
axis parabolic mirrors to direct the light onto a single-grating spectrometer (Acton, Spectra Pro
300i) followed by an InGaAs calibrated photodiode (Thorlabs, DET10N).
3.4 NIR/SWIR autofluorescence imaging ex vivo and in vivo in
cirrhotic liver models
As methods of lipopigment detection have long been established using visible light techniques,
particularly in histological sections, our goal here is to show the potential for in vivo imaging in a
fully noninvasive manner enabled by the use of longer wavelength excitation and emission. We
demonstrate the ability to detect autofluorescence in vivo through the intact skin of mice models
of cirrhosis in this section, and even at earlier stages of liver disease in the following section,
Section 3.5. We investigated two cirrhosis models to probe the influence of two distinct disease
mechanisms: one model is a hepatotoxin-induced liver fibrosis in which administered carbon
Figure 3.6: Emission characterization of liver
tissue. Mouse liver tissue was illuminated with
808 nm light, and the autofluorescence detected
on a silicon camera (PIXIS-808, blue outline) or
on an InGaAs camera (NIRvana-808, red outline)
which were used subsequently for in vivo imaging.
The autofluorescence was filtered through a liquid
crystal tunable filter with 20 nm bandwidth. The
intensities were then normalized using a
reference lead sulfide film sample with peak
emission around 900 nm. The film sample was
imaged on the same imaging set-up and
characterized on a spectrometer to obtain a set of
wavelength-dependent correction factors, which
were applied to the measurements of the liver.

55
tetrachloride (CCl4) is metabolized into free radicals and reactive oxygen species,174,175 while the
other is based on obstructive cholestasis inducing portal fibrosis.176,177
All animal procedures were carried out following the Public Health Service Policy on
Humane Care of Laboratory Animals and approved by the Institutional Animal Care and Use
Committee of Massachusetts General Hospital and the MIT Committee on Animal Care. Both
liver cirrhosis models were investigated using male C3Hf/Sed mice. For the first experimental
group, mice were administered 20% CCl4 in olive oil via oral gavage (200 µL) three times per
week, causing hepatotoxic cirrhosis, or were administered just olive oil in the case of the
respective controls. Ethanol was added to the drinking water of both groups at a concentration
of 5% to intensify the fibrogenesis.164 Mice were sacrificed after 24 hours (acute intoxication;
n=3/group), 3 weeks (n=4–5/group), or 6 weeks (n=5/group), of their respective treatments.
Prior to imaging, mice were anesthetized via intraperitoneal injection of ketamine/xylazine (100
mg/kg ketamine and 10 mg/kg xylazine in saline) and sufficient depth of anesthesia was
maintained, re-dosing with one third the original dose in ketamine only as necessary. Mice were
shaved with electric clippers and residual hair was removed using NairTM, applied for
approximately 3 minutes. Animals were then imaged in vivo. Whole blood samples were
subsequently obtained by intra-cardiac puncture using EDTA-flushed needles. Next, the liver
was extirpated, weighed, and after ex vivo NIR/SWIR imaging, further processed. The left liver
lobe was taken for histology, while the remaining liver and the spleen were snap-frozen in liquid
nitrogen and stored at –80˚C until further processing.
In the acute model (i.e. those sacrificed 24 hours after a single high dose of CCl4), we
noted that mice administered CCl4 treatment did manifest a detectable signal in vivo 6 hours
and 24 hours post-administration, but not fully anatomically attributable to the liver. Upon
dissection, it was apparent that the administration of CCl4 induces an acute gastritis, resulting in
gastroparesis wherein the food causes fluorescence of the stomach in these mice, but not in
mice receiving only vehicle. Intensities of the ex vivo livers, on the other hand, were not
significantly different between mice administered CCl4 and those administered only vehicle (22 ±
4 counts per millisecond, and 20 ± 5 counts per millisecond respectively). This result is
expected, as lipofuscin/ceroid cannot be formed within 24 hours.
When CCl4 is administered chronically, we find that the livers become highly
autofluorescent in this model. Autofluorescence in ex vivo tissue of the CCl4-administered group
was significantly higher than the control group—over two times greater after 6 weeks of
administration—and was also significantly higher in vivo even after only three weeks of
treatment (Fig. 3.7, Table 3.2, Appendix A.1). Both in vivo and ex vivo intensities increase with
increasing weeks of CCl4-administration. Furthermore, the difference in in vivo liver intensities
between CCl4 and control groups was detectable in awake and freely behaving mice at real-time
imaging speeds of 9.17 frames per second, a testament to the brightness of the signal.

56
Table 3.2: Summary of in vivo and ex vivo mouse liver autofluorescence intensities for cirrhosis
models. Shown here are the autofluorescence intensities of the liver both in vivo and ex vivo given in
counts per millisecond (cpms). Results are shown for 3 and 6 weeks of oral administration of CCl4 in olive
oil (OO) and 5% ethanol (EtOH) in the drinking water, for 3 and 6 weeks of control mice which received
only OO orally and 5% EtOH in the drinking water, for mice sacrificed 4 weeks after a CBDL procedure,
and for age-matched control mice having no procedure.
Weeks
of
treatment
Treatment n
in vivo
intensity
(cpms)
ex vivo
intensity
(cpms)
3 OO + EtOH 4 7 ± 1 17 ± 1 6 OO + EtOH 5 10 ± 1 20 ± 1 3 CCl4/OO + EtOH 5 14 ± 2 31 ± 3 6 CCl4/OO + EtOH 5 16.8 ± 0.4 44 ± 4
4 control 8 7 ± 1 17 ± 2 4 CBDL 5 10 ± 1 22 ± 2
The results of these experiments indicate that the liver signal manifests from chronic
administration of CCl4, but fluorescence from the stomach and gastrointestinal tract may impact
the in vivo results due to intrinsic autofluorescence of chow.178 In most cases, the position of the
liver is anterior to that of the stomach, which aids quantification of liver signal (see Appendix
A.1 for full image sets). Nevertheless, we excised the stomachs of the mice administered CCl4
for 3 weeks and find that the intensity of the stomach is on average 1.5 times brighter in treated
mice versus controls, whereas the ex vivo liver is 1.8 times brighter. Meanwhile, the in vivo
intensity differs between the two groups by a factor of 2. For mice administered CCl4 for 6
weeks, this difference in the stomach intensity went away (average intensities were not
significantly different), whereas the ex vivo liver became 2.2 times brighter than controls.
Potentially the CCl4-treated mice increased tolerance to the treatment over time, resulting in less
gastritis, while still progressing in severity of cirrhosis. Thus, the measured in vivo intensities
may have contributions from both stomach and liver, but we expect the measurement to be
dominated by the liver intensity, especially when disease pathology is further advanced.
A separate experimental group of this model was studied over longer time scales of
treatment. Mice were sacrificed after 2-4 weeks (n=12), 8 weeks (n=8), and 12 weeks (n=9) of
CCl4 and ethanol treatment, and their livers fixed in 4% PFA in PBS and embedded in paraffin.
We quantified the paraffin-embedded liver tissue autofluorescence in the mesoscopic imaging
set-up described in Section 3.2 with 850 nm longpass detection on the silicon camera (Fig.
3.8). The average autofluorescence intensity of the tissue nearly doubled between 2-4 weeks
and 8 weeks of treatment, but remained approximately the same between 8 weeks and 12
weeks of treatment. Standard deviations of the signal intensities increased significantly with
increasing weeks of treatment. It should be noted that different thicknesses of tissue embedded
in the paraffin blocks could give rise to variability in the detected intensities; however, this

57
Figure 3.7: NIR/SWIR autofluorescence in mouse models of cirrhosis. We observed NIR/SWIR
autofluorescence in mouse models of cirrhosis based on oral administration of CCl4 in olive oil (OO) and
5% ethanol (EtOH) drinking water versus control mice which received only OO orally and 5% EtOH
drinking water. Using 808 nm excitation and 850 nm longpass detection on a silicon camera, the intensity
of the liver was high enough to be detected in vivo after only 3 weeks of treatment (A), although difficult to
distinguish from stomach fluorescence here (bright field image on the left and fluorescence on the right).
Ex vivo livers were clearly distinguishable (visible image on the left, fluorescence on the right). By 6
weeks of treatment, the CCl4-treated liver is clearly distinguishable from the control both in vivo and ex
vivo (B). Quantification of the intensities (in counts per millisecond, or cpms) shows clear separation of
the two groups (C, D). The CBDL model of cirrhosis, on the other hand, shows a more subtle increase in
liver intensity over age-matched control mice. All intensity values and their standard deviations are
detailed in Table 3.2.
should contribute approximately the same amount of variability to each time point. The
increasing variability in fluorescence intensity with weeks of treatment could more likely be the
result of varying degrees of disease which progresses at different rates in each animal.179

58
The second model of liver cirrhosis investigated in this study was the common bile duct
ligation (CBDL) model. CBDL surgery was performed in mice to double ligate the common bile
duct, causing a secondary biliary cirrhosis.164 Mice (n=5) were sacrificed 4 weeks after the
procedure. We find that the liver autofluorescence of these mice is slightly elevated compared to
age-matched control mice which did not have a CBDL procedure (n=8), but not as significantly
as mice with CCl4-induced cirrhosis (Fig. 3.7C,D, Table 3.2). In contrast to CCl4, CBDL cirrhosis
relies less on oxidative stress mechanisms, which are known to play a role in the formation of
lipofuscin/ceroid.180 These results confirm that the oxidation damage pathway is, as expected,
an important factor in the enhancement of autofluorescence with disease progression
(originating from lipofuscin/ceroid). We further noted that in CBDL mice, the bile duct and gall
bladder, while significantly enlarged compared to controls, was not autofluorescent, ruling out a
component of the bile (e.g. biliverdin/bilirubin) itself as the origin of the autofluorescent signal.
Taken together, our results indicate that NIR/SWIR autofluorescence is capable of in
vivo and ex vivo detection of liver damage. Models of cirrhosis based on CCl4 administration are
clearly distinguishable from controls, even in awake, freely behaving animals without
administration of anesthesia and without excision of tissue. However, cirrhosis models based on
CBDL were only subtly more autofluorescent than controls, indicating that this method is not
necessarily a measure of cirrhosis, but perhaps rather a measure of the experienced oxidative
stress of the tissue.
Figure 3.8: Quantification of ex vivo liver
tissue autofluorescence in cirrhotic mice
induced with CCl4 and ethanol. Mice were
sacrificed after 2-4 weeks (n=12), 8 weeks
(n=8), and 12 weeks (n=9) of CCl4 and ethanol
treatment, and their livers embedded in paraffin.
The paraffin-embedded liver tissue
autofluorescence was imaged in the
mesoscopic imaging set-up described in
Section 3.2 with 850 nm longpass detection on
the silicon camera (representative images
shown in A). The autofluorescence intensity for
a region of interest within the tissue was
quantified and averaged for each tissue sample
and is plotted in B versus weeks of treatment.
The average intensity was 13 ± 1 cpms for mice
induced 2-4 weeks (green points), 21 ± 2 cpms
for mice induced 8 weeks (orange points), and
22 ± 5 cpms for mice induced 12 weeks (red
points).

59
3.5 Detection of liver disease progression in NAFLD models
As we have demonstrated the ability of our NIR/SWIR autofluorescence technique to detect the
evolution of severe liver disease in vivo in cirrhosis mouse models, we investigate here the
sensitivity of our technique to earlier stages of liver disease and their progression in a mouse
model of nonalcoholic fatty liver disease (NAFLD).
Male C3Hf/Sed mice were fed a control diet (CD) or a choline-deficient, L-amino acid-
defined, high-fat diet (CDAHFD) (A06071314i and A06071302i; Research Diets, New
Brunswick, NJ, USA) for indicated time points (3, 6, 9, 12 weeks of diet; n=6/group). After 9-12
weeks of diet, the CDAHFD diet induces NASH and fibrosis.181 Animals were imaged in vivo as
described above. The mice were also injected with 60 mg/kg body weight of pimonidazole (for
hypoxia studies) at a concentration of 6 mg/mL in PBS 1 hour before sacrifice. Whole blood
samples were subsequently obtained by intra-cardiac puncture using EDTA-flushed needles.
Next, the liver was extirpated, weighed, and after ex vivo SWIR imaging (taking approximately
five minutes), further processed. The left liver lobe was taken for histology, while the remaining
was snap-frozen in liquid nitrogen and stored at –80˚C until further processing. The heart,
kidneys and spleen were extirpated, weighed and snap-frozen as well. Finally, the inter-scapular
brown adipose tissue, the gonadal white adipose tissue (as an indicator for visceral fat mass)
and the inguinal white adipose tissue (as an indicator for subcutaneous fat mass) were
identified, dissected and snap-frozen.182
We find that NIR/SWIR autofluorescence is indeed detectable at higher levels both in
vivo and ex vivo in the CDAHFD mice compared with CD mice. After 9 weeks of diet, and
especially after 12 weeks of diet, CDAHFD mice livers were sufficiently autofluorescent even for
in vivo detection (Fig. 3.9). However, just under 30% of the mice had to be excluded from in
vivo quantification, due to interfering autofluorescence signal in the intestines near the liver. We
discuss the origin of this signal below in greater detail. Quantification of ex vivo liver signal
intensities confirms increasing average intensity with increasing weeks of CDAHFD, while CD
mice show no significant intensity change over the course of the experiment (Fig. 3.10). The
complete set of ex vivo and in vivo images for all mice is shown in Appendix A.1, and all
quantification data is summarized below in Table 3.3. Histology of liver sections (see Section
3.8 for histology methods) confirms that CD mice have normal livers, while CDAHFD mice have
severe steatosis from 3 weeks of diet and longer, and begin signs of inflammation and fibrosis
(based on H&E and Sirius Red stains) by 12 weeks of diet.
In another group of mice, the effect of the angiotensin receptor type 1 blocker
telmisartan was investigated. After 8 weeks of CDAHFD or CD, mice were fed their respective
diet for an additional 4 weeks while also being treated daily with 3 mg/kg body weight
telmisartan or with an equal volume of vehicle (4% DMSO in PBS) via intraperitoneal injection.
After 12 weeks of diet total, 4 of which included treatment, the mice (n=6/group) were sacrificed.

60
Figure 3.9: NIR/SWIR autofluorescence detection in vivo in a NAFLD mouse model. Mice fed 12
weeks of CDAHFD to induce NAFLD are clearly distinguishable from mice fed a control diet (CD) which
does not induce NAFLD, based on the intensity of signal in the liver (white arrows). The livers of mice on
the CD show on average of approximately 7 cpms of NIR/SWIR autofluorescence whereas mice on the
CDAHFD show on average approximately 10 cpms (averages and standard deviations are detailed in
Table 3.3). Note, there is also presence of autofluorescence of the male genitourinary tract in both CD
and CDAHFD mice. All images were taken using the same integration time and scaled to the same
maximum and minimum intensities.
We find no difference in the in vivo nor the ex vivo liver intensities between telmisartan- and
vehicle-treated mice (Table 3.3). This result suggests that the autofluorescence measurement
may not be sensitive to disease regression. This is not surprising, given that lipofuscin/ceroid is
known to be difficult to dissolve (hence its persistence through many tissue processing
conditions, as noted in Section 3.3) even after disease severity has regressed, which has been
noted by others for the behavior of lipofuscin/ceroid in liver disease.162,183,184 We therefore
conclude that the NIR/SWIR autofluorescence measurement may not be effective as a real-time
representation of the current disease state, but rather as an indicator of cumulative liver injury.
We noted during these experiments that the CDAHFD is itself autofluorescent at
NIR/SWIR wavelengths, while CD is not and this may have affected the above observations.
Thus, to investigate the effect of fluorescent chow on the liver, mice were fed standard chow
(SC; LabDiet, 5066), which is also autofluorescent (at an intermediate intensity compared to the
experimental diets), and were sacrificed at time points corresponding with 0, 6, and
approximately 30 weeks of diet to provide adequate controls (n=8, 7, and 4 respectively). We
found that there is no significant increase in the in vivo nor the ex vivo liver intensities between 0

61
Figure 3.10: NIR/SWIR autofluorescence detection in ex vivo liver tissue shows correlation
between signal intensity and disease progression in NAFLD mouse models. Mice were fed up to 12
weeks of choline-deficient, L-amino acid-defined, high-fat diet (CDAHFD) to induce NAFLD or were fed a
control diet (CD). Representative images of the ex vivo livers of mice are shown for mice on their
respective diet for 3 weeks, 6 weeks, 9 weeks, and 12 weeks, taken with 808 nm excitation and 850 nm
longpass detection on a silicon camera (A). The images are displayed using a color map to represent
their relative intensities, given by the color bar on the right. A region of interest in the livers of mice on the
CD (n=24, blue points) show on average 12.5 counts per millisecond (cpms) of NIR/SWIR
autofluorescence whereas mice on the CDAHFD show on average approximately 18, 20, 24, and 29
cpms for 3 weeks, 6 weeks, 9 weeks, and 12 weeks of CDAHFD respectively (n=6 for each time point,
orange points), as plotted in (B). The position of the average is indicated by the black bar and all
averages and their standard deviations are detailed in Table 3.3. We show also the same quantification of
ex vivo liver intensity represented by the percent increase in signal versus the average intensity of the
controls at the respective time point (C).

62
and approximately 30 weeks, indicating that diet-induced autofluorescence and aging-induced
lipofuscin/ceroid does not accumulate at a detectable level over the time-frame of our
experiments. When compared with the experimental diets, all SC mice had liver
autofluorescence at a similar level to the 3 and 6 week CDAHFD mice (Table 3.3, Appendix
A.1). These results suggest that autofluorescent chow (i.e. the dietary composition) may cause
a base level of autofluorescence, in this case at a level higher than mice with non-fluorescent
chow (i.e. the CD mice). However, since this signal does not increase over time, we conclude
that the increasing signal observed in CDAHFD mice is an effect of the investigated disease.
For all mice, we further investigated if the measured in vivo NIR/SWIR autofluorescence
intensities are representative of the actual ex vivo liver intensities, given that the signal could be
scattered, attenuated, or obscured to different extents by the skin or surrounding tissues. We
plotted the in vivo liver intensities versus the respective ex vivo liver intensities (for the same
mouse) for each of the CCl4-treated mice and their respective controls, CBDL, SC, CD,
CDAHFD, CD/CDAHFD with vehicle, and CD/CDAHFD with telmisartan mice, and indeed
observed a linear trend (see Section 3.8, Fig. 3.15).
Table 3.3: Summary of in vivo and ex vivo mouse liver autofluorescence intensities for NAFLD
models and SC mice. Shown here are the autofluorescence intensities of the liver in vivo and ex vivo
given in counts per millisecond (cpms). Results are shown for 3-12 weeks of CD and CDAHFD in NAFLD
mouse models, for 12 weeks of CD and CDAHFD in NAFLD mouse models which received 4 weeks of
vehicle (VEH) or telmisartan (TELMI) treatment, and for mice receiving only standard chow (SC). The
table also includes the number of animals excluded from in vivo quantification due to an interfering
autofluorescent gastrointestinal artifact. The ex vivo liver intensities of special diet and/or treated mice are
also shown as the percent of the average control liver intensity; in the case of treated mice, the CDAHFD
/ VEH mice are compared to CD / VEH and CDAHFD / TELMI mice are compared to CD / TELMI.
Weeks
of diet/
treatment
Diet/
treatment
in vivo
intensity
(cpms)
excluded
ex vivo
intensity
(cpms)
ex vivo
intensity
(% of controls)
3 CD 7 ± 1 2 / 6 12 ± 1 – 6 CD 7 ± 1 3 / 6 11 ± 1 – 9 CD 8 ± 1 3 / 6 13 ± 1 – 12 CD 6.6 ± 0.4 1 / 6 11.0 ± 0.4 – 3 CDAHFD 8 ± 1 1 / 6 16 ± 1 141 % 6 CDAHFD 7.6 ± 0.4 2 / 6 17 ± 2 156 % 9 CDAHFD 10 ± 1 1 / 6 21 ± 2 165 % 12 CDAHFD 10 ± 1 0 / 6 24 ± 3 219 %
12 / 4 CD / VEH 7 ± 1 0 / 6 10 ± 1 – 12 / 4 CD / TELMI 7.3 ± 0.4 0 / 6 11 ± 1 – 12 / 4 CDAHFD / VEH 9 ± 1 0 / 6 24 ± 1 236 % 12 / 4 CDAHFD / TELMI 9 ± 1 0 / 6 24 ± 3 208 %
0 SC 7 ± 1 2 / 8 17 ± 2 – 6 SC 8 ± 1 0 / 7 18 ± 2 –
~30 SC 8 ± 1 0 / 4 18 ± 2 –

63
We further investigated the gastrointestinal tract as a potential source of interfering
signal in addition to the above-discussed role of the stomach, as we noted autofluorescence in
the intestines of several mice regardless of diet (Fig. 3.11). We dissected the gastrointestinal
tract of these mice and found that areas of fluorescence correlate with regions of the intestines
that contained food or feces for CDAHFD and SC mice. For CD mice, the stomach and feces
were not as fluorescent as CDAHFD and SC mice. Given that the diet of CDAHFD and SC mice
is itself autofluorescent, it is not surprising that the diet remains fluorescent throughout the
digestion process. However, it is surprising that fluorescence in the intestines was also
observed for some CD mice whose diet is not significantly autofluorescent. Autofluorescence in
the intestines is a common problem reported in in vivo fluorescence studies using NIR light, and
Figure 3.11: NIR/SWIR autofluorescence of the gastrointestinal tract in SC, CD, and CDAHFD mice.
We show an example of a SC mouse with significant autofluorescence in the gastrointestinal (GI) tract
detectable during in vivo imaging and in the excised tissue in the stomach, intestines, and feces. We also
show two examples of CD mice—one without autofluorescence in the GI tract, despite feces present, and
one with autofluorescence present. We also show an example of a CDAHFD mouse with some
autofluorescence detectable in the stomach but none elsewhere; however, no feces were present in this
example, which in general were autofluorescent in CDAHFD mice. Note the autofluorescence present in
all mice in the inferior region of the abdomen during in vivo imaging is not from the gastrointestinal tract,
but rather from the genitourinary anatomy, discussed in greater detail below (Fig. 3.12).

64
strategies for its avoidance have been proposed (mostly via changing diet composition).178,185,186
These observations suggests that the digestion process itself creates an autofluorescent
pigment, perhaps through oxidation of fat and/or complex polysaccharides in the diet (creating
crosslinked proteins, lipids, and carbohydrates like the lipopigments which autofluoresce in the
liver), although the exact molecular origin of the signal was not further investigated here.
We further note that the genitourinary anatomy of the mice frequently exhibited
measurable autofluorescence, detectable with in vivo imaging. We dissected the genitourinary
anatomy of SC mice and find that the testis, epididymis, and preputial gland give rise to this
signal (Fig. 3.12A). It is known that the Sertoli and interstitial cells of Leydig in mice testis and
the Leydig cells of human testis contain high levels of lipofuscin (increasing with age) as a
consequence of moderate lipid droplet content in these cells.187–190 Therefore, we speculate that
the signal that we observe in the mice genitourinary anatomy may also originate from
lipofuscin/ceroid. We also note that the blood and gall bladders of the mice did not contain
measurable autofluorescence (Fig. 3.12B,C), regardless of diet, suggesting that porphyrins and
biliverdin/bilirubin do not have significant NIR/SWIR autofluorescence and do not contribute to
Figure 3.12: Genitourinary anatomy NIR/SWIR autofluorescence and other potential competing
signals. In nearly all mice (SC, CD, and CDAHFD) NIR/SWIR autofluorescence was detectable in the
inferior region of the abdomen during in vivo imaging (A, top). By excising the genitourinary anatomy, we
identify this signal to be from the testes (white arrows), the epididymis, and the preputial gland (yellow
arrow) (A, bottom). We further imaged the blood of CD and CDAHFD mice (B) and the gall bladders (C)
and find that they are negative for NIR/SWIR autofluorescence, suggesting that porphyrins and
biliverdin/bilirubin likely do not play a significant role in our NIR/SWIR autofluorescence quantification.

65
our measured disease-correlated signal. Potential signal of biliverdin/bilirubin was unlikely
based on our results of CBDL cirrhotic liver models, which did not exhibit increased NIR/SWIR
signal despite having high levels of accumulated bilirubin as a characteristic of the model.
3.6 NIR/SWIR autofluorescence in mouse models with dysregulated
autophagy
Having identified lipofuscin/ceroid as the origin of NIR/SWIR autofluorescence in liver disease
models, we can predict extensions of this work to other diseases characterized by changes in
intracellular lipopigments. For one, an increasing number of neurodegenerative diseases are
thought to feature accumulation of intracellular pigments like lipofuscin. These pigments often
accumulate as a result of dysregulated macro-autophagy, which is a major intracellular
degradation pathway.191 Intracellular autophago-lysosomes contain a mixture of cellular
contents in various stages of degradation, including mitochondria and protein aggregates, and
their steady state levels are determined by a balance of vesicle formation versus vesicle
clearance.151,192 Among the neurodegenerative diseases that in at least some animal models
feature enhanced levels of autophagic vacuoles are Alzheimer's,193 Huntington's,194 and
Parkinson's Disease,151 as well as neuronal ceroid lipofuscinosis (NCL).195
One major limitation in studying autophagy and its either beneficial or pathologic effects
has been the difficulty of analyzing autophagic vacuoles, which typically involves either
laborious ultrastructural techniques such as electron microscopy, or introducing a fluorescently
labeled transgene into cells and organisms to be probed. Probing the marker protein LC3-II can
be a good indicator, but needs to be properly interpreted. Moreover, all these methods give a
snapshot of a highly dynamic process, obscuring clear interpretation between increased
formation and/or decreased breakdown. Developing a quick and straightforward imaging
method for autophagic vacuoles would be a major advance, and may accelerate investigations
into autophagic mechanisms contributing to brain pathology in neurodegenerative diseases, but
also in other fields wherein autophagy is pathophysiologically involved. We investigate here the
potential of our NIR/SWIR autofluorescence imaging technique to provide such an advance.
We investigate the NIR/SWIR autofluorescence of 12/15-lipoxygenase knockout mice as
models of increased autophagy. The enzyme 12/15-lipoxygenase (12/15-LOX) has been
studied for many years for its causative role in stroke-related brain injury,196–201 and recent
studies have discovered that mice in which the enzyme is genetically deleted (12/15-LOX KO)
exhibit increased autophagy, also in brain and liver, even under non-ischemic conditions.202
These knockout mice are otherwise reported to be phenotypically normal, although they have
reduced breeding success and some of the mice may develop murine leukemia.203–205 The
increased autophagy could result in accumulation of pigments like lipofuscin/ceroid in these
mice, and thus we predict an increase in NIR/SWIR autofluorescence.180
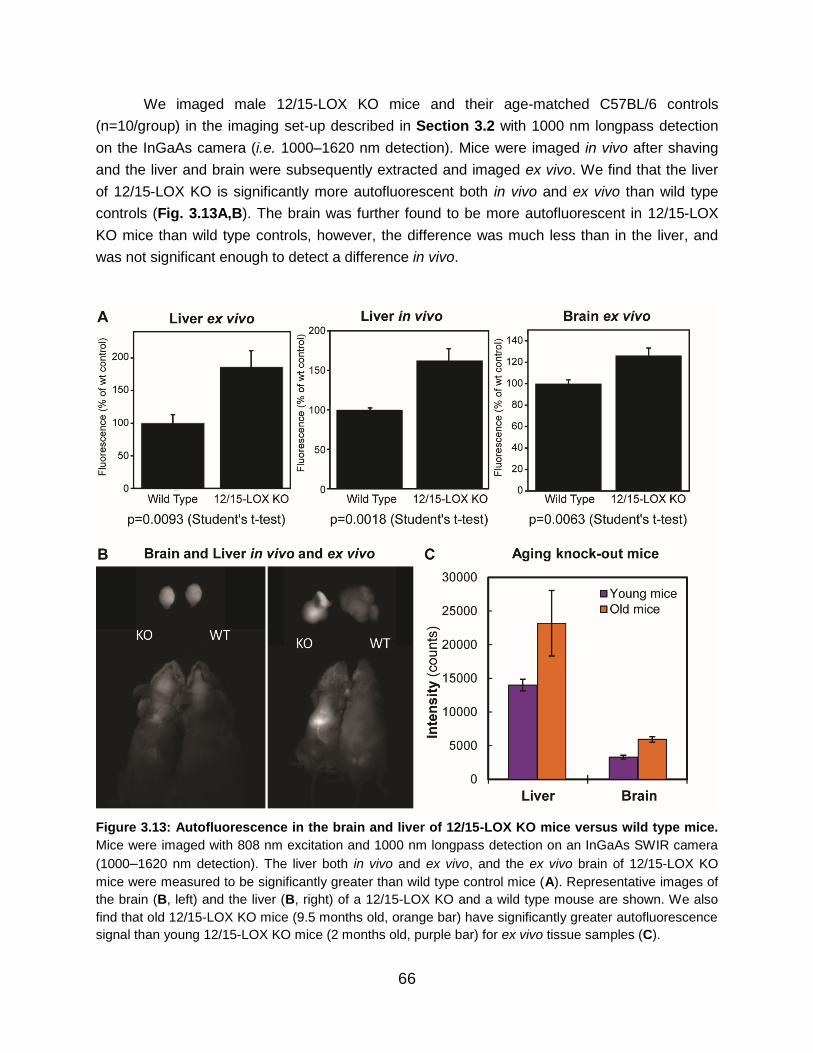
66
We imaged male 12/15-LOX KO mice and their age-matched C57BL/6 controls
(n=10/group) in the imaging set-up described in Section 3.2 with 1000 nm longpass detection
on the InGaAs camera (i.e. 1000–1620 nm detection). Mice were imaged in vivo after shaving
and the liver and brain were subsequently extracted and imaged ex vivo. We find that the liver
of 12/15-LOX KO is significantly more autofluorescent both in vivo and ex vivo than wild type
controls (Fig. 3.13A,B). The brain was further found to be more autofluorescent in 12/15-LOX
KO mice than wild type controls, however, the difference was much less than in the liver, and
was not significant enough to detect a difference in vivo.
Figure 3.13: Autofluorescence in the brain and liver of 12/15-LOX KO mice versus wild type mice.
Mice were imaged with 808 nm excitation and 1000 nm longpass detection on an InGaAs SWIR camera
(1000–1620 nm detection). The liver both in vivo and ex vivo, and the ex vivo brain of 12/15-LOX KO
mice were measured to be significantly greater than wild type control mice (A). Representative images of
the brain (B, left) and the liver (B, right) of a 12/15-LOX KO and a wild type mouse are shown. We also
find that old 12/15-LOX KO mice (9.5 months old, orange bar) have significantly greater autofluorescence
signal than young 12/15-LOX KO mice (2 months old, purple bar) for ex vivo tissue samples (C).

67
Given that these mice are characterized by an accumulation of autophagic vacuoles
over time, we further investigated the evolution of NIR/SWIR autofluorescence signal with mice
age. We compared 12/15-LOX KO with age-matched wild type controls at approximately 38
weeks of age and at approximately 8 weeks of age (n=6 and n=3 respectively for old mice;
n=2/group for young mice). We find that old mice have greater autofluorescence than young
mice both in the liver and brain ex vivo tissues (Fig. 3.13C), in line with the expected
accelerated age-related lipofuscin formation resulting from increased autophagy.
We further analyzed the 12/15-LOX KO mice tissue through immunohistochemistry to
identify which neural cells exhibit SWIR autofluorescence. PFA-fixed brain tissue slices (20 μm
thick) from 60 week old 12/15-LOX KO mice were stained with GFAP (for astrocytes), CD-31
(for endothelial cells), or Iba-1 (for microglia) antibodies conjugated to Alexa 647, or NeuN (for
neurons) antibody conjugated to Alexa 488. We imaged the slides in the microscope (described
in Section 3.2) using 900 nm longpass detection on the silicon camera (900–1050 nm
detection) to detect the NIR/SWIR autofluorescent pigment, or using the Cy5 channel (Table
3.1) to detect Alexa 647 or the GFP channel to detect Alexa 488 on the same camera. We
found no co-localization of the NIR/SWIR signal with the astrocyte and endothelial cell markers.
However, we did find partial
co-localization with NeuN
and Iba1 cell markers,
suggesting that the signal
clusters intracellularly within
neurons and microglia (Fig.
3.14A,B). This is consistent
with the idea of NIR/SWIR
autofluorescent intracellular
deposits, possibly those
containing lipofuscin/ceroid,
which is characteristic of
some neurodegenerative
diseases. While these
studies are ongoing, we
suggest that NIR/SWIR
autofluorescence in these
models or others could be
used to study the
mechanisms of increased
autophagy and its relevance
to disease.
Figure 3.14: Immunofluorescence staining of 12/15-LOX KO
brain tissue. Brain tissue from 12/15-LOX KO mice were sliced 20
μm thick and stained with Iba-1 (A, for microglia) or NeuN (B, for
neurons) conjugated to Alexa 647 and Alexa 488 respectively. The
slides were imaged in the microscope described in Section 3.2
using 900 nm longpass detection on the silicon camera (i.e. 900–
1050 nm detection) to detect the autofluorescent pigment (red
image) or using the Cy5 or GFP channels (Table 3.1) and the same
camera to detect Alexa 647 and Alexa 488 respectively (green
image). The overlay of the two images is shown in the third column,
with co-localized signal indicated by white arrows. Scale bars
represent 100 μm.

68
3.7 Discussion and conclusions
Liver cirrhosis is a severe health condition with high rates of morbidity and mortality. Over
600,000 adults in the U.S. are affected by cirrhosis, yet nearly 70% percent report being
unaware of having liver disease, suggesting that many cases are undiagnosed.206 Non-alcoholic
fatty liver disease (NAFLD) is the most common liver disorder in Western industrialized
countries, and prevalence worldwide is steadily increasing due to increasing incidence of
several common risk factors, such as metabolic syndrome, obesity, and type II diabetes.207,208
An estimated 30% of adults in the U.S. have NAFLD, with 2–3% of the general population
estimated to have advanced to non-alcoholic steatohepatitis (NASH), which can progress to
advanced fibrosis, liver cirrhosis, and hepatocarcinoma.209
We show here enhanced NIR/SWIR autofluorescence signal in a variety of animal
models for liver disease, sufficiently bright to detect noninvasively in vivo and with sufficient
contrast to delineate between abnormal and healthy biological structures. We find strong
NIR/SWIR autofluorescence in the livers of mice with CCl4-induced cirrhosis (based on free
radical induction), bright enough for in vivo detection in awake, and freely-behaving mice at
near-video rate speeds. We further show detection of very early-stage and less severe liver
pathologies in NAFLD mouse models. The signal intensity in these models correlated with
disease progression, promising a method of detecting cumulative liver disease-related injury in
these animals, and potentially having broader implications as a diagnostic technique for patients
in the clinic. We have further detected NIR/SWIR autofluorescence in the brains and livers of
12/15 lipoxygenase knockout mice with consequential up-regulated autophagy, a major
intracellular degradation pathway that may be linked to an increasing number of
neurodegenerative diseases including Huntington's, Parkinson’s, and Alzheimer's disease.
We attribute the NIR/SWIR autofluorescence signal in these models to the lipopigment
lipofuscin/ceroid. Lipopigments are granules consisting of an autofluorescent pigment and lipid
components enclosed by a common, continuous membrane.210 They appear to be the product
of lipid peroxidation, and may be symptomatic of membrane, mitochondrial, or lysosomal
damage, or alterations of the intracellular degradation pathway, macro-autophagy.119 Ceroid and
lipofuscin—terms that are closely related and often used interchangeably—are two types of
lipopigments. Although ceroid and lipofuscin have the same cellular substance with similar
physiochemical and histochemical properties, some distinguish the two based on the underlying
pathophysiological mechanism of accumulation.180,211 Lipofuscin is often referred to as the
“aging pigment” or “wear-and-tear pigment,” as it has long been associated with senescence,
and can be found in post-mitotic cells undergoing regressive changes, e.g. in the liver, neurons,
cardiac myocytes, and retinal pigment epithelial cells.43,212 The term ceroid is generally used for
the same lipopigment in all but aging, and is thus a broader term used to reflect pathological
lipopigment accumulation in a variety of cells/tissues, including, but not limited to the brain, liver,
pancreas, and testis; ceroid presence has been used as a diagnostic parameter in a variety of

69
pathological conditions such as tumors, atherosclerosis, malnutrition, toxic injury, and retinal
degeneration.43,119,165,213–217 The intracellular accumulation of lipofuscin-like pigments can also
be found as a consequence of oxidative stress, as a response to pathological conditions (e.g.
the neuronal ceroid lipofuscinosis or Batten disease), or to toxic compounds.118 As we show
here the use of NIR/SWIR autofluorescence to monitor lipofuscin/ceroid accumulation, we
suggest that this technique could aid investigations into mechanisms of disease, mechanisms of
senescence, or serve as a diagnostic/prognostic medical device.
Previous autofluorescence techniques have suffered from difficulties in detecting low-
intensity signals, interpreting overlapping signals due to their spectral complexity, and/or the use
of high-energy excitation sources. Our technique can detect low-quantum yield
autofluorescence signals through the use of high-sensitivity, low noise cameras (both silicon-
based and InGaAs-based for NIR/SWIR detection), and lower energy NIR excitation, which is
less destructive to and penetrates deeper through biological tissue than UVA or visible light
wavelengths. Furthermore, detecting longer NIR/SWIR wavelengths could enable greater
specificity to lipofuscin/ceroid autofluorescnce, as there is less autofluorescent background from
other biomolecules at these wavelengths.19,60 These factors combined—nondestructive and
deeper-penetrating excitation, and higher specificity due to suppressed background
autofluorescence—enable our method to monitor disease-correlated autofluorescence
noninvasively.
The possibility to monitor samples directly, in real-time is one of the most attractive
features of autofluorescence-based techniques. At present, histochemical methods are the
standard procedures in diagnosis of many disorders. However, these diagnostic procedures
require the surgical removal of tissue samples (biopsies) followed by laboratory processing and
staining, which can be expensive and time consuming. The invasiveness of repeated biopsies
can further be considered unethical and hinder accurate longitudinal follow-up of disease. On
the contrary, autofluorescence techniques do not require sample processing, as the detected
signal is an intrinsic property of the tissue, and is a nondestructive method of analyzing cells
and tissue in real-time with high spatial resolution. Potentially, in vivo analysis could be carried
out without the need for sample excision (or sacrifice of the animal, in the case of longitudinal
animal studies), especially as the development of fiber-optic instrumentation has made it
possible to perform analyses in any area accessible to an endoscope.
We show here that indeed we can detect the state of disease in animal models in real
time, and suggest that the NIR/SWIR wavelengths could open a new window for
autofluorescence imaging at all size scales, from in vivo imaging down to microscopy of cellular
and sub-cellular structures.

70
3.8 Additional experimental details
We validated the above-presented animal models of disease through histology on the liver
tissue of each model, and describe the methods here in detail. H&E and picrosirius red
(Electron Microscopic Sciences; 26357-02) sections of liver tissue of mice fed a CD and
CDAHFD-diet were blindly scored according to the SAF-score, that provides a semi-quantitative
evaluation of the severity of NAFLD.218 The amount of steatosis was scored using the
percentage of the hepatic parenchyma occupied by fat-laden hepatocytes: a score of 0
indicated no fat; 1 indicates <33%; 2 indicates 34–66%; 3 indicates >67%. The activity is the
compound score of hepatocellular ballooning and inflammation, whereas ballooning is graded:
0: none; 1: presence of clusters of ballooned cells; and 2: same as 1 but with some enlarged
hepatocytes (≥2 times). Inflammation was graded as: 0: none; 1: ≤2 foci per 20x; and 2: >2 foci
per 20x. Fibrosis was scored as F0: no fibrosis; F1: mild pericellular fibrosis; F2: pericellular and
(peri)portal fibrosis; F3: bridging fibrosis; F4: cirrhosis. NASH is defined as the presence of
steatosis accompanied by both inflammation and ballooning.
We also investigated the relationship between the in vivo and the ex vivo NIR/SWIR
autofluorescence intensities measured for all mice of Section 3.5 (CCl4-treated mice and their
respective controls, CBDL, SC, CD, CDAHFD, CD/CDAHFD with vehicle, and CD/CDAHFD
with telmisartan mice). We plotted the in vivo liver intensities versus the respective ex vivo liver
intensities (for the same mouse) and observed a linear trend (Fig. 3.15). Fitting a linear
regression to the data resulted in an R2 value of 0.702.
Figure 3.15: Correlation
between ex vivo and in vivo
liver intensities for mouse
models of liver disease. This
plot shows the NIR/SWIR
autofluorescence intensities
measured for all mice of
Section 3.5, in which each point
(black circles) represents the in
vivo and ex vivo intensity for a
given mouse. A linear
regression was fit to the data
(dotted line) which had an R2
value of 0.702.

71
3.9 Chapter-specific acknowledgements
The results presented here are based on a manuscript in preparation.
Many individuals contributed to the conception and design of these studies, and
discussed their results and implications. Dr. Oliver Bruns and Dr. Matthias Pinter are
acknowledged for their initial observation of SWIR autofluorescence in the liver of a CCl4
cirrhotic mouse model. Matthias, Ivy Chen, and Dr. Wilhelmus (Wilco) Kwanten provided all liver
disease mouse models for these studies. Wilco, in particular, provided CBDL mice, NAFLD
mice, and 3/6 week CCl4 mice, and all of their tissue processing (slices, staining procedures,
slides, histology). Jessica prepared all imaging set-ups with prior guidance from Oliver, and
Wilco, Ivy, and Juanye Zhang were also present for and aided in animal imaging. Jessica and
Wilco performed microscopy of tissue slides. Professor Rakesh Jain, Professor Moungi
Bawendi, Wilco, and Ivy participated with Jessica in essential discussions and helped plan
these experiments. We further thank Julia Kahn and Sam Chatterjee for excellent technical
support. Assistant Professor Klaus van Leyen and Dr. Yi Zheng provided all of the 12/15-
lipoxygenase knock-out mice, aided in their imaging and tissue harvesting, and processed the
tissues for all staining procedures. Professor Bawendi, Klaus, Yi, Franziska Lieschke and Oliver
all provided many helpful suggestions and discussions in these experiments. Jessica processed
and analyzed all imaging data.
This work received support in part from the NIH through the Laser Biomedical Research
Center, Grant 9-P41-EB015871-26A1, the MIT-MGH Grand Challenge Award, the
Massachusetts Institute of Technology through the Institute for Soldier Nanotechnologies, Grant
W911NF-13-D-0001, and was conducted with government support under and awarded by the
Department of Defense, Air Force Office of Scientific Research, National Defense Science and
Engineering Graduate Fellowship 32 CFR 168a. Dr. Bruns was additionally supported by a
European Molecular Biology Organization (EMBO) long-term fellowship.

72

73
Chapter 4
Tuning fluorescence imaging contrast in the
SWIR
4.1 Introduction: the role of tissue optical properties in fluorescence
imaging
Fluorescence imaging has emerged as a powerful tool for preclinical in vivo imaging and as a
promising clinical technology, particularly for surgical guidance.12–17 The strength of this
technique has largely derived from the development of exogenous contrast agents that are
capable of specifically highlighting particular anatomical features or biological processes, down
to the single-cell level in some applications.219–221 The agent is designed to target a biomolecule
of interest, is injected or ingested, and imaged either noninvasively through the skin or accessed
during surgery. Fluorescence imaging has become the standard of care in a variety of
ophthalmologic diagnostics, and is emerging as a diagnostic and/or surgical aid in nearly every
other medicinal practice, including tumor resection and metastatic lymph node mapping in
oncology, bypass surgeries in gastroenterology and cardiology, and perfusion assessments in
reconstructive and plastic surgeries.30–36
Most fluorescence imaging approaches use widely available visible (400–700 nm) and
near infrared (NIR, 700–1000 nm) light emitting fluorophores, which can be detected on high-
performing, inexpensive silicon detectors. However, recent advances in longer wavelength
detection and synthesis of infrared emitters have enabled fluorescence imaging to also expand
into the shortwave infrared (SWIR, 1000–2000 nm) region. Recent progress in indium gallium
arsenide (InGaAs) sensor fabrication has led to the steady decline in the cost of SWIR imaging
cameras, while camera sensitivity and resolution have increased. Moreover, a wide variety of
biologically-compatible SWIR emitters have emerged, including organic dyes with peak
emission in the SWIR,62–65 carbon nanotubes,47,66 quantum dots,67–69 rare-earth-doped
nanocomposites,70 and gold nanoparticles.71 It has also been shown that NIR dyes, which are
commercially available and approved for clinical use, can be used for many SWIR imaging
applications.72,222
Selecting an appropriate imaging wavelength is critical to enabling a given application in
biological fluorescence imaging. Imaging sensitivity, penetration depth, and spatial resolution
depend on the optical properties of biological tissue, and these tissue properties, including

74
autofluorescence, absorption, and scattering, are each wavelength-dependent. Tissue
autofluorescence creates interfering background signal, decreasing sensitivity to an exogenous
fluorophore. Autofluorescent molecules, such as NADPH, flavins, and collagen, emit the
majority of light at visible wavelengths and can be avoided by moving into the NIR and SWIR.60
Tissue absorption, which reduces overall signal intensity, is primarily due to hemoglobin,
melanin, lipids, and water. These tissue components each have unique spectral profiles, but
share a common absorption minimum between approximately 650–900 nm, thus, the NIR has
long been identified as an optimal imaging window for in vivo studies requiring high penetration
depths.18–21,23–25,223 Finally, scattering, caused by the refractive index inhomogeneities within
most tissues, misdirects photons from the direct path to the detector, degrading spatial
resolution. Tissue scattering is dominated by Mie scattering, which has a complicated
wavelength-dependency, but in general can be minimized by imaging at longer wavelengths.47,72
Considering the combined effects of tissue autofluorescence, absorption, and scattering,
the SWIR regime promises greater fluorophore sensitivity, higher tissue penetration depths, and
greater spatial resolution than visible and NIR imaging.47,48,58,59,67,224 For many applications,
these improvements are related to an overall increase in image contrast. Studies in two-
dimensional tissue-mimicking phantoms predict fluorescent contrast to be the highest between
700 nm and 1400 nm and between 1500 nm and 1600 nm,225 corresponding to the minima in
the transmission spectra of biological tissues.45,58 Furthermore, recent demonstrations in vivo,
with fluorescence originating from a three dimensional network of structures, show particularly
high contrast between 1300 nm and 1400 nm and an additional contrast increase between 1500
and 1700 nm.47,66,60 However, in vivo image contrast has only been probed using wide
wavelength windows in the SWIR and has not been investigated with high wavelength
resolution.
By probing image contrast with high wavelength resolution, we show that SWIR
fluorescence contrast is primarily governed by water absorption in tissue. We first show the
wavelength-dependence of contrast in three-dimensional tissue phantoms, disentangling the
individual contributions of tissue absorption and tissue scattering toward image contrast. We
then corroborate our phantom results with studies in vivo in mice. We further propose a
theoretical model to investigate how contrast and penetration depth vary with wavelength in the
SWIR, and confirm the results with experimental data from ex vivo biological tissue. We find in
each case that the highest contrast occurs at wavelengths with the highest water absorption.
While these wavelengths have conventionally been avoided to obtain greater signal throughput,
we show that in contrast-limited applications, such as tissue with high fluorescent label density,
the improvement in contrast from water absorption enables resolution of deeper structures,
resulting in a greater imaging penetration depth. The trade-off between contrast, penetration
depth, and fluorescence signal intensity can thus be balanced for a given application by
selectively imaging at wavelengths with a particular level of tissue absorption.

75
4.2 The effects of absorption and scattering on fluorescence
contrast in three-dimensional tissue phantoms
Here, we aim to probe the relationship between tissue scattering, tissue absorption, and
fluorescence contrast at SWIR wavelengths. The combined role of tissue scattering and water
absorption determines optimal contrast, however, their individual influence are important to
understand to be able to predict the expected behavior of contrast with wavelength. It is
expected that contrast should continuously increase with wavelength due to scattering alone, as
tissue scattering decreases largely in accordance with Mie theory.226,227 However, biological
tissue absorption, dominated by water in the SWIR, has a more dynamic wavelength-
dependency; water exhibits three local absorption peaks near 970 nm, 1200 nm, and 1450 nm
with increasing respective intensity. A significant difference in the behavior of scattering and
absorption occurs at wavelengths longer than 1450 nm: scattering decreases beyond these
wavelengths, suggesting an increase in contrast, while water absorption decreases past its
strong peak near 1450 nm. Thus, the dominant mechanism of contrast improvement can be
identified if the contrast is probed with sufficient wavelength resolution.
We probed the individual influence of absorption and scattering on fluorescence contrast
through three-dimensional tissue phantoms (Fig. 4.1). Liquid tissue phantoms were designed
based on previous literature which confirmed similarity to biological tissue optical properties.228–
233 Intralipid® 20% (Baxter Healthcare Corporation), as a scattering medium, was diluted to 1%
in water (H2O) to mimic the attenuation (both scattering and absorption) of tissue, or in
deuterium oxide (D2O, Aldrich; 99.9 atom % D) which exhibits approximately equal scattering
properties but has no absorption in the SWIR. Thus, the D2O phantom was used to measure the
influence of scattering alone on contrast, while the H2O phantom revealed the influence of
scattering in the presence of absorption. Attenuation spectra of the phantom materials were
recorded on a Cary 5000 UV-Vis-NIR infrared spectrometer from Varian (Fig. 4.1A).
Glass capillaries were filled with a mixture of fluorescent quantum dots (QDs) and
submerged in the phantom materials. We chose QDs as the fluorescent probe in our study in
order to obtain bright emission across all SWIR wavelengths. Lead sulfide (PbS) QDs were
prepared according to the procedure of Hines and Scholes, and solutions with emission maxima
near 1020 nm, 1200 nm, and 1430 nm were mixed to obtain a broadband SWIR emitter.234
Photoluminescence spectra of the QD mixture was measured by exciting the samples with a
532 nm diode laser, and collecting the emission using a pair of gold-coated off-axis parabolic
mirrors directing to a single-grating spectrometer (Acton; Spectra Pro 300i). The output of the
spectrometer was measured using a liquid nitrogen cooled InGaAs line camera (Princeton
Instruments; OMA V, 512 × 1 pixel array) (Fig. 4.1B). The QD mixture was then loaded into
glass capillaries (1 mm diameter, VWR) and submerged in the liquid phantoms individually or in
two, perpendicular layers (Fig. 4.1C). Submersion depths of 2 mm and 4 mm were chosen for
the two-layer capillaries to mimic overlapping vessels beneath a layer of tissue; the depth

76
roughly corresponds to that reported previously for brain vessels underlying the scalp tissue of a
mouse.47 The submerged QD capillaries were excited with diffuse 808 nm light and their
fluorescence was imaged in 50 nm wavelength bands across the SWIR (Fig. 4.1D, see Section
4.7, Fig. 4.13 for full image sets).
We then quantified the contrast of each image of the fluorescent QD capillaries. We
used the coefficient of variation as our contrast metric, which is defined as the ratio of the
standard deviation in signal intensities, , to the mean signal intensity, ,
Figure 4.1: Water absorption enhances contrast in a three-dimensional tissue phantom through
background signal suppression. The tissue phantom is composed of Intralipid® diluted to 1% in
either water or deuterium oxide. The attenuation spectra of the tissue phantom materials show
scattering of light for 1% Intralipid® in deuterium oxide (D2O, orange line) and both scattering and
absorption for 1% Intralipid® in water (H2O, blue line) (A). We filled two capillaries with a mixture of
SWIR-emitting lead sulfide (PbS) quantum dots (QDs), the photoluminescence (PL) spectrum of which
shows broad SWIR emission (B). We then submerged the capillaries 2 mm and 4 mm deep in the
liquid tissue phantoms, illuminated with diffuse 808 nm light, and imaged from the top with an InGaAs
SWIR camera (C). Images of the capillaries in both D2O-based (top) and H2O-based (bottom)
phantoms were taken, filtering the emission through 50 nm bandwidth bandpass (BP) filters centered
across SWIR wavelengths (D, complete image set shown in Fig. 4.13). All images are scaled to fill the
maximum displayable intensities and scale bars represent 1 mm. The contrast, 𝑐𝑉 (Eq. 4.1) of the
images varies strongly with wavelength in the H2O-based phantom and is overall greater than in the
D2O-based phantom (E).

77
𝑐𝑉 =𝜎
𝜇 . Equation 4.1
In a high contrast image, pixel intensities are high for regions of signal and are low for regions of
background, resulting in a high 𝜎 and thus in a high value of the contrast metric. Low contrast
images, on the other hand, have little variability in pixel intensity, and thus a low 𝜎 and contrast
metric. We divide 𝜎 by to account for the fact that a small is negligible if the average
intensity is high, while the same small matters if the average intensity is low. This metric is
applicable when comparing different images of the same object, and can be applied to an entire
image with multiple features, unlike the signal to background ratio contrast metric, which can
only be applied to a single image feature, and also requires known boundaries between the
signal-generating feature and the background.235
We find that only in the presence of absorption does contrast significantly change as a
function of wavelength between 900-1600 nm (Fig. 4.1E). In the D2O-based phantom, contrast
increased slightly across SWIR wavelengths. However, when D2O in the phantom is replaced
with H2O, contrast was overall greater, and increased up to 1450 nm before decreasing beyond
1450, to the edge of our detection range at 1600 nm. The decreasing contrast beyond 1450 nm
reveals the important role of absorption in the enhancement of contrast, as the decline in
scattering beyond these wavelengths should, in its absence, favor a contrast increase. This
result is reproducible and perhaps even more evident in a separate tissue phantom based on
silica beads as a scattering medium, which is more weakly-scattering, approximating the
scattering of tissue such as skull (see Section 4.7).236–238
The increase in contrast that we observe at wavelengths of strong water absorption can in
part be attributed to the suppression of background signal from the deeper submerged capillary.
According to the Beer-Lambert law, the signal attenuation depends exponentially on the depth
of the emitting structure and the absorption strength of the medium. By varying the absorption
strength, which is achieved by tuning the imaging wavelength, we can tune the depth at which
the signal falls below the noise level of the system. Thus, the relative intensities of structures at
different depths is controlled by the choice of wavelengths.
In addition, we find that water absorption also improves SWIR contrast by suppressing
scattered light from the emitting object itself. We immersed a single capillary into the tissue
phantoms at a depth of 2 mm and imaged with the same set of 50 nm bandpass filters (Fig.
4.2). Analyzing the intensity profile of the capillary cross-section reveals a narrowing of the
intensity profile for wavelengths with strong water absorption. Narrowing is also observed in the
D2O phantom, but continuously with wavelength and overall to a lesser extent. We quantified
this effect by calculating the inverse of the capillary intensity profile peak widths at ten percent
maximum height and find that the metric is indeed the greatest at 1450 nm, with broadening of
the width observed for wavelengths longer than 1450 nm. This indicates that water absorption is

78
responsible for suppressing the scattering around the capillary, thus improving capillary contrast
and resolution.
Therefore, our results suggest that water absorption is the primary optical property which
enhances fluorescence contrast across SWIR wavelengths. We expect that highly scattered
photons from deeper lying structures, as well as scattered photons from an object itself, are
more likely to be absorbed than ballistic photons of the same object, as scattered photons travel
a longer path length through the tissue. This difference in absorption probability becomes more
pronounced for wavelengths that exhibit stronger water absorption. As a result, fluorescence
contrast is greatest at those wavelengths with the highest absorption.
Figure 4.2: Water absorption enhances contrast and resolution through scattering
suppression. A SWIR-emissive capillary was submerged 2 mm deep in 1% Intralipid® tissue
phantom diluted in D2O (A, top) or H2O (A, bottom), was illuminated with 808 nm light, and the
emission filtered through 50 nm bandwidth bandpass filters centered at the indicated wavelengths.
Scale bars represent 1 mm and images are scaled to fill the maximum displayable intensities. The
intensity profiles (B, C) and the inverse of the full width at 10% maximum height (FW10%M) of the
intensity profiles (D) shows that the scattering pedestal of capillaries in the H2O-based phantom
narrows at wavelengths of stronger water absorption, and is overall narrower than that of capillaries
immersed in the D2O-based phantom, which narrows continuously.

79
4.3 The wavelength-dependence of contrast in vivo
To investigate the wavelength-dependence of contrast in vivo, we labeled the brain vasculature
of a mouse using a mixture of QDs, and imaged the fluorescence through the mouse’s skin and
skull in 50 nm wavelength bands centered across SWIR wavelengths. For this application, we
used indium arsenide (InAs) QDs, as their ability to be protected with multiple over-coated
“shell” layers (e.g. cadmium selenide (CdSe) and/or cadmium sulfide (CdS)) compared to PbS
QDs better protects the core and thus the fluorescence quantum yield when transferred into
aqueous solutions. InAsCdSeCdS and InAsCdSeZnS core-shell-shell QDs were synthesized67
and transferred into aqueous solution via phospholipid micelles239 as previously described. To
obtain broad SWIR emission, aqueous QD samples emitting at 970 nm, 1110 nm, and 1300 nm
were mixed. A C57BL/6J mouse (34 g, male, 22 weeks, Jackson Lab) was anaesthetized via
intraperitoneal injection of ketamine/xylazine, shaved, and placed in the imaging setup. It was
irradiated with 808 nm laser light at 50–70 mW/cm2 and 300 μg of aqueous QD-phospholipid
micelles were injected via the tail vein. The brain vasculature was imaged using 50 nm
bandwidth bandpass filters centered across SWIR wavelengths, refocusing the optics to
maximize the resolution of the central brain feature after each filter change (Fig. 4.3).
Figure 4.3: Mouse brain vasculature imaged across SWIR wavelengths. The brain vasculature of a
mouse was fluorescently labeled with a broadly-emitting InAs QD mixture and imaged through intact skin
and skull. The emission was filtered with 50 nm bandwidth bandpass filters centered in 50 nm spacing
between 950 nm and 1600 nm. Each image is scaled to fill the maximum displayable intensities.

80
The contrast 𝑐𝑉 (Eq. 4.1) was evaluated for each image, and plotted as a function of
bandpass center wavelength (Fig. 4.4). In accordance with our phantom studies, we find that
the wavelength-dependence of contrast for the in vivo vasculature follows the same trend as the
water absorptance spectrum, suggesting that water absorption plays a key role in improving in
vivo fluorescence image contrast at SWIR wavelengths. The contrast generally increases with
wavelength until reaching a peak at 1450 nm. In particular, the decrease of contrast in vivo
beyond 1450 nm supports the dominant influence of water absorption on contrast over
scattering, as the continuous decrease of scattering would cause an increase in contrast
beyond these wavelengths.
We reproduced our findings with multiple regions of interest, and further verified our
findings with a secondary contrast metric (Fig. 4.5). The contrast metric 𝑐𝑉 (Eq. 4.1) was
assessed for regions of interest across three distinct vessels in the brain, and for all pixels of the
image. Furthermore, we compared the trend reflected by our contrast metric 𝑐𝑉 (Eq. 4.1) to that
of the signal to background ratio. The signal to background ratio metric requires a region of
interest with a clearly defined object of interest (in our case, a particular brain vessel). The mean
signal intensity of the object of interest is then divided by the mean intensity of all other values in
the region of interest which are background signal. Using this contrast metric likewise shows
good agreement with the water absorptance spectrum and with the contrast metric, 𝑐𝑉.
Figure 4.4: Correlation of in vivo fluorescence contrast with water absorptance. Brain
vasculature of a mouse was fluorescently labeled with a broadly-emitting InAs quantum dot mixture
and imaged with 50 nm bandwidth bandpass filters centered in 50 nm spacing between 950 nm and
1600 nm (Fig. 4.3). We show here images taken with 1000 nm, 1200 nm, 1450 nm, and 1600 nm
filters and their respective intensity profiles across a line of interest (yellow line in image inset) used to
calculate the contrast (standard deviation/mean) of a vessel (A). Images are scaled to fill the
maximum number of displayable intensities. The contrast, 𝑐𝑉 (Eq. 4.1), of the vessel plotted against
bandpass center wavelength (black solid line) shows correlation with water absorptance (blue dotted
line) (B).

81
Figure 4.5: The wavelength-dependence of contrast for different regions of interest and
contrast metrics. The contrast 𝑐𝑉 (Eq. 4.1) was calculated for each of the images in Fig. 4.3 across
the entire image (A, B) and across three different brain vessels (C-H). Regions of interest are shown
in yellow on the images, which are taken with a 1600 nm bandpass filter. The contrast was plotted
against wavelength for each region of interest (black solid line) and overlaid with the water
absorptance spectrum (blue dashed line) and shows good agreement. In I-J, the same region of
interest depicted in E was used to calculate contrast using the signal to background ratio, defined as
the average signal intensity of the vessel divided by the average signal intensity of all other line of
interest values. The plot also shows good agreement with the water absorptance spectrum and with
𝑐𝑉 (Eq. 4.1).

82
4.4 The attenuation-dependence of contrast and penetration depth
in a theoretical contrast model
Conventionally, wavelengths of high tissue absorption have been avoided in fluorescence
imaging, due to the belief that penetration depth is limited by signal intensity. Indeed, if tissue
attenuation is too high, fluorescence emission from submerged structures will never reach the
detector. However, we show here the existence of two regimes—one in which penetration depth
is signal-limited and one in which penetration depth is contrast-limited. We demonstrate an
example of the latter case, and show that tissue absorption can enhance imaging penetration
depth in the SWIR for such applications.
We first quantify the relationship between contrast and attenuation through an illustrative
theoretical model. In the model, tissue is described by a semi-infinite slab with emitting cells
homogenously distributed throughout the slab. The signal of interest, S, arises from the focal
plane at depth D, and a background signal, BG, arises from all planes elsewhere (Fig. 4.6A).
The background signal BG can result from autofluorescence, non-specific labeling, or a high
label density, for example. The signal intensities are modeled according to Beer-Lambert’s law:
𝑆 = 𝑆0 𝑒−𝐷𝜇𝑒𝑥 𝑒−𝐷𝜇𝑒𝑚
= 𝑆0 𝑒−𝐷(𝜇𝑒𝑥+𝜇𝑒𝑚)
Here, 𝑆0 describes the in-focus signal intensity at zero depth, and 𝜇𝑒𝑥 and 𝜇𝑒𝑚 are the
attenuation coefficients of the excitation and emission wavelengths, respectively. We consider
the attenuation coefficient as a lumped parameter containing all sources of attenuation (e.g.
absorption and scattering). The first exponential term accounts for the attenuation of the
excitation light on the way to the focal plane and the second exponential term denotes the
decay of the emitted light traveling from the focal plane to the detector.
Similarly, we calculate the background intensity, assuming that the emission is uniform
through all planes of the slab:
𝐵𝐺 = 𝐵𝐺0′ ∫ 𝑒−𝑧(𝜇𝑒𝑥+𝜇𝑒𝑚)
∞
0
𝑑𝑧
= 𝐵𝐺0′
1
𝜇𝑒𝑥+𝜇𝑒𝑚
where 𝐵𝐺0′ is the out-of-focus background intensity per millimeter slab at zero depth. We then
approximate the contrast as the ratio of the signal intensity to the background intensity:
𝐶 =𝑆0
𝐵𝐺0′ 𝑒−𝐷(𝜇𝑒𝑥+𝜇𝑒𝑚) (𝜇𝑒𝑥 + 𝜇𝑒𝑚) Equation 4.2
We then use Eq. 4.2 to plot contrast as a function of the total attenuation at a fixed depth
of 1 mm. Our results show that initially, contrast increases with attenuation, until reaching a
maximum, after which stronger attenuation reduces the contrast (Fig. 4.6B). For a fixed

83
excitation wavelength, this trend can be explained by the roles of the emission originating from
behind the focal plane and the emission originating from in front of the focal plane. Initially, the
stronger the attenuation, the less emission originates from background signal behind the focal
plane, reducing background signal and increasing contrast (Fig. 4.6C). A maximum is reached
when the attenuation length (namely the inverse of the overall attenuation coefficient) equals the
imaging depth (Fig. 4.6D). If the attenuation is further increased, the signal from the focal plane
is attenuated and therefore the contrast decreases (Fig. 4.6E).
With this model, we further estimated the penetration depth trend across SWIR
wavelengths. The penetration depth can be thought of as the maximum imaging depth at which
one can still resolve the structures of interest; this depth is reached when the image contrast
drops below some threshold contrast value. In our model, we required 𝐶 to be at least 3, such
that 𝑆0 is significantly greater than 𝐵𝐺0′ at zero depth, and therefore distinguishable from
background. We first calculated the contrast as a function of imaging depth (D) and background
(BG0) using literature values238 for the tissue attenuation coefficient at 808 nm for the excitation
wavelength and at wavelengths of different SWIR bandpass filters for the emission (Fig. 4.7A).
Using the established threshold for the minimum resolvable contrast, 𝐶, we extracted the
penetration depth for each wavelength (Fig. 4.7B,C).
Figure 4.6: Contrast dependence on
attenuation shown in a theoretical contrast
model. Schematic of tissue modeled by our one-
dimensional contrast model shows a semi-infinite
slab of tissue containing homogeneously
fluorescing cells (A). The signal (S) arises from
the focal plane (red rectangle) at a given depth
(D), and the background (BG) comprises
emission from all other depths in the tissue. The
contrast was calculated for a fixed depth of 1
mm, varying the magnitude of the attenuation
coefficient which is a sum of the excitation
wavelength attenuation coefficient μex and the
emission wavelength attenuation coefficient μem
(B). Schemes 1, 2, and 3 illustrate the relation
between contrast and attenuation coefficient as it
relates to the emission from above and below the
focal plane (C, D, E).

84
Figure 4.7: Dependence of contrast on imaging depth and inherent background intensity. Contrast
is plotted as a function of imaging depth and inherent background intensity for a fixed level of signal (A).
Contrast is scaled according to the color bar shown, with contrast values greater than 5 displayed at the
maximum intensity color. The white dotted line indicates the threshold contrast value of three, considered
to be the minimal resolvable contrast; values to the right of this line are considered unresolvable. Thus,
this line indicates the maximum penetration depth for a given level of background signal in the system as
plotted in Fig. 4.8. The penetration depth shows opposing trends with SWIR wavelength for applications
with low levels of background (B), versus applications with high levels of background (C) (schematized in
Fig. 4.8).

85
The results show the existence of two regimes which have opposite relationships between
penetration depth and imaging wavelength (Fig. 4.8). In the first regime, wavelengths with low
tissue absorption favor contrast and therefore also penetration depth. This “signal-limited”
regime applies in the case when 𝑆0
𝐵𝐺0′ is inherently high, i.e. systems with inherently strong
contrast, such as tissue with a large, isolated emitting structure of strong signal or tissue with
sparse label density and low background signal. In the second regime, wavelengths with high
absorption enable the greatest contrast and simultaneously enable the greatest imaging
penetration depth. The system is thus “contrast-limited” which occurs in the case when 𝑆0
𝐵𝐺0′ is
small, as in a highly-labelled tissue with significant background emission, or for small, weakly-
emitting objects with inherently low signal to background. We note that while our discussion
above centered on a fixed excitation and a varying emission wavelength, Eq. 4.2 implies that
the same findings should apply when varying the excitation wavelength while keeping a fixed
emission window.
Figure 4.8: Theoretical model of
penetration depth versus inherent
background signal shows two
regimes with opposing wavelength
relationships. By selecting a threshold
contrast in our model to define
minimally resolvable structures (Fig.
4.7), we extracted the penetration
depth for each wavelength, plotted here
against background signal for select
wavelengths. We find that for a fixed
signal intensity at small BG0,
wavelengths of minimal absorption
have the greatest penetration depth,
defining a signal-limited regime,
schematized as a large, single-emitting
structure, whereas at large BG0 the
opposite trend prevails, defining a
contrast-limited regime, schematized
as many small, distributed, labeled
structures.
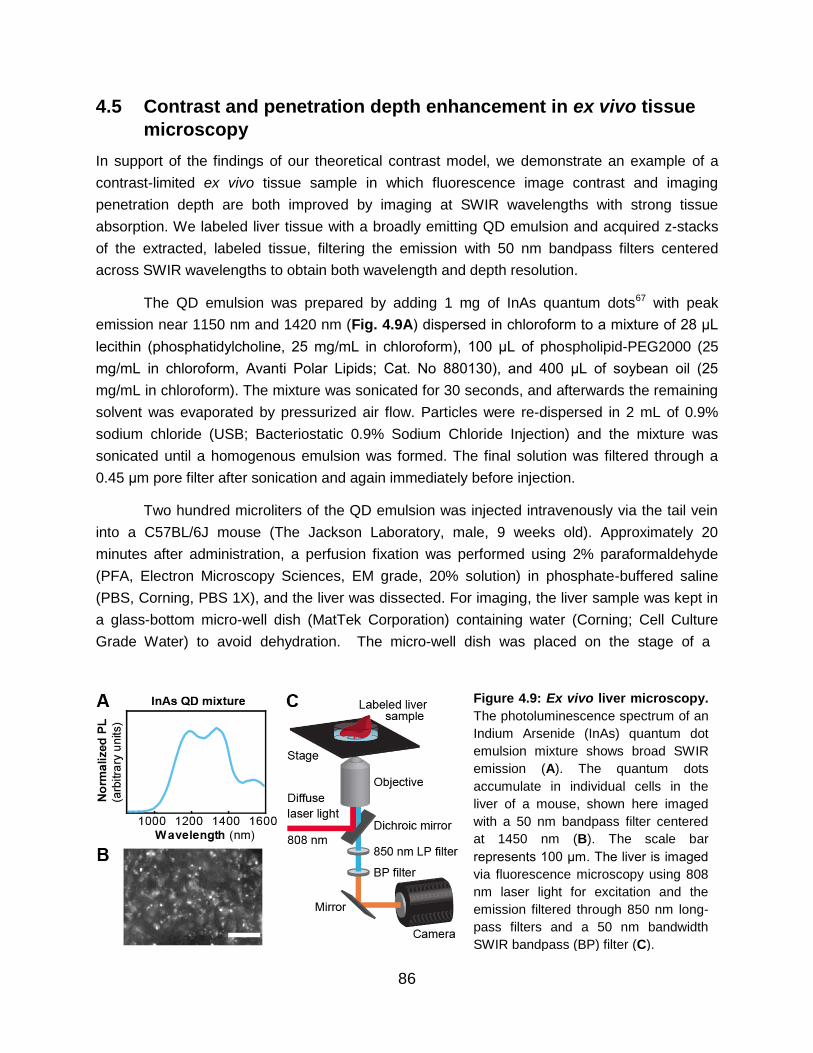
86
4.5 Contrast and penetration depth enhancement in ex vivo tissue
microscopy
In support of the findings of our theoretical contrast model, we demonstrate an example of a
contrast-limited ex vivo tissue sample in which fluorescence image contrast and imaging
penetration depth are both improved by imaging at SWIR wavelengths with strong tissue
absorption. We labeled liver tissue with a broadly emitting QD emulsion and acquired z-stacks
of the extracted, labeled tissue, filtering the emission with 50 nm bandpass filters centered
across SWIR wavelengths to obtain both wavelength and depth resolution.
The QD emulsion was prepared by adding 1 mg of InAs quantum dots67 with peak
emission near 1150 nm and 1420 nm (Fig. 4.9A) dispersed in chloroform to a mixture of 28 μL
lecithin (phosphatidylcholine, 25 mg/mL in chloroform), 100 μL of phospholipid-PEG2000 (25
mg/mL in chloroform, Avanti Polar Lipids; Cat. No 880130), and 400 μL of soybean oil (25
mg/mL in chloroform). The mixture was sonicated for 30 seconds, and afterwards the remaining
solvent was evaporated by pressurized air flow. Particles were re-dispersed in 2 mL of 0.9%
sodium chloride (USB; Bacteriostatic 0.9% Sodium Chloride Injection) and the mixture was
sonicated until a homogenous emulsion was formed. The final solution was filtered through a
0.45 μm pore filter after sonication and again immediately before injection.
Two hundred microliters of the QD emulsion was injected intravenously via the tail vein
into a C57BL/6J mouse (The Jackson Laboratory, male, 9 weeks old). Approximately 20
minutes after administration, a perfusion fixation was performed using 2% paraformaldehyde
(PFA, Electron Microscopy Sciences, EM grade, 20% solution) in phosphate-buffered saline
(PBS, Corning, PBS 1X), and the liver was dissected. For imaging, the liver sample was kept in
a glass-bottom micro-well dish (MatTek Corporation) containing water (Corning; Cell Culture
Grade Water) to avoid dehydration. The micro-well dish was placed on the stage of a
Figure 4.9: Ex vivo liver microscopy.
The photoluminescence spectrum of an
Indium Arsenide (InAs) quantum dot
emulsion mixture shows broad SWIR
emission (A). The quantum dots
accumulate in individual cells in the
liver of a mouse, shown here imaged
with a 50 nm bandpass filter centered
at 1450 nm (B). The scale bar
represents 100 μm. The liver is imaged
via fluorescence microscopy using 808
nm laser light for excitation and the
emission filtered through 850 nm long-
pass filters and a 50 nm bandwidth
SWIR bandpass (BP) filter (C).

87
microscope (described previously in detail in Section 3.2) to acquire z-stacks of images for
different wavelengths (Fig. 4.9B,C). Light emitted by the sample was collected by the objective
(Nikon; CFI Plan Apochromat 10x) and passed through a longpass 900nm dichroic mirror, a
hard-coated 850 nm longpass filter (Thorlabs; FELH0850), and a 50 nm bandpass filter
(Edmund Optics) for wavelength-selective imaging. The light was directed to an output port of
the microscope onto the array of the InGaAs camera. Acquisition settings (e.g. integration time,
filters) for each figure are detailed in Appendix A, Table A.2.
For each image, we determined the contrast, 𝑐𝑉 (Eq. 4.1), over the entire image for each
wavelength, and the penetration depth of the z-stacks (Fig. 4.10). The penetration depth was
determined using an algorithm adapted from Rowlands et al.240 This algorithm determines the
deepest tissue position at which an image with a given spatial resolution can be formed (see
Section 4.7 for algorithm details).
Figure 4.10: Contrast and penetration depth enhancement in microscopy of ex vivo liver
tissue. A mouse liver labeled with a QD emulsion was imaged via microscopy at 10x magnification
with 50 nm bandpass (BP) emission filters centered across SWIR wavelengths, a subset of which are
shown here at imaging depths of 40 μm, 70 μm, and 100 μm for 1000 nm, 1200 nm, 1450, and 1600
nm filters (A). All images are set to fill the maximum displayable intensities and the scale bar
represents 200 μm. The contrast, 𝑐𝑉 (Eq. 4.1) was calculated and plotted as a function of wavelength
(black line) for images taken at a depth of 80 μm (B). The contrast shows a similar trend to the water
absorptance spectrum (blue line). Furthermore, penetration depth was calculated using an algorithm
adapted from Rowlands et al. and plotted as a function of wavelength, which exhibits a similar trend
(C).240
The dashed lines mark the depths at which the images in (A) were taken, and the crosses
display the wavelength positions. Green boxes and crosses indicate images considered to be
resolvable within the contrast threshold.

88
Consistent with our macroscopic tissue phantom and in vivo data, we find that the liver
microscopy images have the greatest contrast at wavelengths of high water absorption.
Furthermore, as predicted by our theoretical model, we observe that the penetration depth
likewise increases with water absorption. At shallow depths, e.g. 40 μm, an image of the labeled
liver features is formed at all SWIR wavelengths, but imaging much deeper, e.g. 100 μm,
causes significant loss of image contrast for most SWIR wavelengths except for those
immediately around the water absorption peak at 1450 nm. While signal decreases when
imaging at 1450 nm versus 1000 nm due to an almost 20 times greater optical density (OD) of
the tissue, contrast and penetration depth more than double.
Our data also demonstrate that in this application, imaging at maximum absorption around
1450 nm enhances the penetration depth by almost 50% compared to imaging at 1600 nm
which was previously believed to be the optimum for SWIR imaging.224 This observation shows
that the contrast, and not the signal, limits penetration depth in this case. Although deep
structures have sufficient signal to be detected, they are unable to be resolved due to
overlapping signal from structures in the background, foreground, or scattered light from the
object itself (Fig. 4.11). Imaging at wavelengths of strong tissue absorption enhances image
contrast, and therefore enables resolution of deeper structures, resulting in a higher penetration
depth.
4.6 Discussion and conclusions
Our findings provide a rationale for tuning image contrast in biological SWIR fluorescence
imaging. We show in a three-dimensional tissue phantom, in in vivo brain vasculature imaging
of a mouse, and in ex vivo microscopy of liver cells that image contrast has a wavelength-
dependence governed by the absorption of the tissue, which is dominated by water absorption
Figure 4.11: Resolution
enhancement of cells in an ex
vivo liver tissue sample. Images
of the labeled liver tissue are
shown taken at a depth of 58 μm at
20x magnification with bandpass
filters centered at 1000 nm, 1200
nm, 1450 nm, and 1600 nm on an
InGaAs camera (A). We see at
1000 nm that two nearby cells
cannot be resolved by an intensity
profile across the cells, but become
resolvable as two distinct structures
imaging at longer SWIR
wavelengths (B).

89
in the SWIR. We observe in these experiments that the greatest image contrast is obtained
around 1450 nm where absorption from water is the greatest. We demonstrate the correlation
between absorption of water and the selective suppression of light having a longer path length
through tissue, such as multiply-scattered photons and fluorescence from deep background
structures. This interplay between absorption and scattering enables fine-tuning of fluorescence
imaging contrast along the water absorption spectrum. Suppression of this light, however,
comes at the cost of decreasing the overall signal intensity, which requires longer integration
times to achieve a sufficient signal to noise ratio. In our study, the bright indium arsenide and
lead sulfide quantum dots67 used for contrast had sufficient signal to be imaged in 50 nm
wavelength bands across the SWIR, eliminating signal limitations. However, for contrast agents
or applications that radiate less fluorescence signal, it may be necessary to choose an imaging
wavelength that balances signal requirements with optimal image contrast, such as wavelengths
near 1300–1350 nm or using a 1300 nm longpass filter on an InGaAs camera (Fig. 4.12).47,72
Furthermore, we predict with a theoretical model and demonstrate in ex vivo liver tissue
microscopy that penetration depth is likewise tunable by selection of the SWIR wavelength
(either the emission and/or the excitation wavelength). In our study, the greatest penetration
depth was achieved at wavelengths of greatest water absorption, around 1450 nm, which had
the greatest image contrast. We expect any contrast-limited tissues such as those with a high
label density, strong autofluorescence, or other strong background signal, to show a similar
Figure 4.12: Opposing wavelength dependencies of signal and contrast. We suggest that in the
event of limited signal (e.g. a weakly-emitting contrast agent, a small object of interest, or a deeply
submerged structure) a compromise must be established to select a wavelength that provides
sufficient signal intensity for detection above the detector noise, but with sufficient attenuation to
resolve the structure of interest and optimize its contrast. Absorption of water in tissue increases
contrast, but at the cost of signal, shown here for in vivo brain vasculature fluorescence images
described in Sec. 4.3 (A). Wavelengths between 1200-1300 nm or beyond 1300 nm (as with a
longpass filter) could be used to balance signal requirements and optimal contrast in applications with
lower intensity signal insufficient for imaging at 1450 nm where contrast is maximized (B).

90
effect. However, our theoretical model suggests that the penetration depth for other
applications, such as those with low fluorescent labeling density, low background signal, or
large, easily resolvable structures (e.g. whole organs), may be limited by signal rather than
contrast. For these applications, wavelengths with lower absorption lead to the highest
penetration depths. Furthermore, we expect imaging with higher numerical aperture, and
consequently a smaller depth of field, as in microscopy, will benefit more from this absorption
effect than imaging with lower numerical aperture. We conclude that it is therefore important to
understand whether a given imaging application is contrast-limited or signal-limited in order to
predict the behavior of the penetration depth with wavelength.
These results suggest an approach for improving both fluorescence image contrast and
penetration depth in tissue by deliberate selection of specific SWIR wavelengths. The variance
of the magnitude of water absorption within the SWIR spectral window distinguishes this
wavelength regime from the NIR, which was previously proposed as an ideal optical window for
fluorescence imaging. Given these results, which show that contrast and penetration depth
increase with increasing tissue attenuation, the SWIR wavelength regime may be preferable for
imaging over the NIR in contrast-limited applications (e.g. resolution of fine, highly labelled
structures, as in angiography). This work further motivates the continued development of bright
and biocompatible fluorescent probes for the longest SWIR wavelengths.
4.7 Additional experimental details
All animal experiments were conducted in accordance with approved institutional protocols of
the MIT Committee on Animal Care.
The fluorescence imaging set-up in these experiments was assembled as previously
described in detail (Section 3.2).67,68 The InGaAs camera (Princeton Instruments; NIRvana, 640
x 512 pixel array) was equipped with achromatic doublet lenses (Thorlabs; AC254-150-C and
AC254-75-C). The laser light was blocked with two colored glass 2” 850 nm longpass filters
(Thorlabs; FGL850S) in front of the lenses and an 850 nm longpass dielectric filter (Thorlabs;
FELH0850) in front of the sensor. Emission light was selected using various 50 nm bandpass
filters (Edmund Optics) between the lenses. All images were background-corrected using
LightField software and analyzed using ImageJ or MATLAB R2016a.153–155 Acquisition settings
(e.g. integration time, filters) for each figure are detailed in Appendix A, Table A.2.
We expand here on the three-dimensional tissue phantoms used to probe the individual
influence of absorption and scattering on fluorescence contrast described in Section 4.2. The
QD capillaries submerged in D2O- and H2O-Intralipid® liquid tissue phantoms were excited with
diffuse 808 nm light and their fluorescence was imaged in 50 nm wavelength bands across the
SWIR. The full set of images are shown here for both phantoms (Fig. 4.13) and were used to
derive the plot shown in Fig. 4.1.

91
Figure 4.13: Complete set of two-layer capillary phantom images in 1% Intralipid®. Two SWIR-
emitting quantum dot-filled capillaries were submerged in a perpendicular arrangement 2 mm and 4 mm
deep in a (A) water-based or (B) deuterium oxide-based Intralipid® tissue phantom. The quantum dots
were excited with 808 nm light and the emission imaged, filtering through 50 nm bandwidth bandpass
filters centered across SWIR wavelengths. All images are scaled to fill the maximum number of
displayable intensities, and scale bars represent 1 mm.

92
Figure 4.14: Contrast trend in a weakly-scattering silica bead-based liquid tissue phantom. The
attenuation spectra of the H2O-based silica phantom (blue) shows strong absorption and weak scattering
while the D2O-based phantom (orange) exhibits weak absorption and weak scattering (A). Images of two
SWIR-emitting capillaries submerged 1 mm and 3 mm deep in a D2O-based (top row) and H2O-based
(bottom row) tissue phantom were taken with 50 nm bandwidth bandpass (BP) filters centered across the
SWIR (B). Images are scaled to fill the maximum number of displayable intensities and the scale bar
represents 1 mm. Plotting the contrast versus wavelength for the capillary images shows that contrast
improves sharply with phantom attenuation in the H2O-based phantom (blue), while little change in the
contrast is observed in the D2O-based phantom (orange) (C).
We further reproduced the contrast trend observed in our Intralipid®-based phantoms in a
separate tissue phantom based on silica beads as a scattering medium (Fig. 4.14). The
polydisperse silica beads (U.S. Silica; MIN-U-SIL® 40) were dispersed at a concentration of 5
mg/mL in water to mimic the absorption of tissue, or dispersed in deuterium oxide which has no
absorption in the SWIR. MIN-U-SIL® 40 contains ground silica beads with a median diameter of
11 μm and a maximum diameter of 40 μm. This size regime mimics the size range of refractive
objects in tissue, such as sub-cellular organelles (<10 μm), microvasculature (5–10 μm), and
entire cells (10–50 μm).228 The resulting phantom was weakly-scattering, approximating the
scattering of tissue such as skull.236–238 The D2O phantom was used to measure the influence of
scattering alone (without any absorption), while the H2O phantom revealed the influence of
scattering in the presence of absorption. The medium was stirred with a magnetic stir bar to
prevent sedimentation of the silica beads while images were acquired across SWIR
wavelengths.
We evaluated the contrast 𝑐𝑉 (Eq. 4.1) between the top capillary, which represents the
object of interest, and the bottom capillary, which introduces a background signal. The contrast
was observed to be relatively constant across SWIR wavelengths in the D2O phantom.
However, when D2O in the phantom is replaced by water, contrast increases through 1450 nm
and then decreases again up to 1600 nm, indicating an important role of absorption in the
enhancement of contrast, as observed in our Intralipid® phantoms.
The penetration depth evaluation of ex vivo liver tissue (described in Section 4.5) was
evaluated with an adapted algorithm from Rowlands et al.240 in MATLAB R2016a. Each image

93
of the z-stack was transformed to Fourier space applying a two-dimensional fast Fourier
transform. The amplitude spectrum was calculated and divided by the total number of pixels for
image size normalization. The quadrants were shifted such that low frequencies were displayed
in the center and high frequencies at the edges of the Fourier space image. A radial averaging
was performed over a ring of one pixel thickness centered at the DC frequency. This averaging
process is repeated for all ring radii ranging from the DC frequency (center pixel) to the Nyquist
frequency (edge pixel). The radial averaging resulted in the intensity of all spatial frequencies.
A threshold that determines the highest visible frequency in a single image was found by
fitting the logarithm of the frequency intensity versus spatial frequency curve with an exponential
function of the form 𝑓(𝑥) = 𝑎 ∙ 𝑒−𝑏𝑥 + 𝑐. The median of the parameter c, which represents the
noise baseline of the camera, was determined over all images of one z-stack and averaged over
all z-stacks. The highest visible frequency was set at the highest frequency that had greater
intensity than twice the overall noise baseline, corresponding to a signal to noise ratio of 2. It
was found that a signal to noise ratio of 2 yields penetration depths that agree best with a
viewer’s perception when looking at a random choice of z-stacks. The frequency thresholding
procedure was repeated for all images of one z-stack, resulting in a threshold frequency versus
imaging depth curve. A five-point moving average was applied on this curve to reduce the
influence of outliers, and create a continuous threshold frequency curve.
To extract the penetration depth, the threshold frequency for a given imaging depth was
compared to the spatial frequency of the cells, which was approximated by 100 lp/mm as cells
have an average size of roughly 10 μm and are homogeneously distributed. The penetration
depth was defined at the imaging depth where the threshold frequency drops below the spatial
frequency of the cells. Performing this procedure for z-stacks acquired at wavelengths regime of
the SWIR, the penetration depth as a function of wavelength was determined.
4.8 Chapter-specific acknowledgements
Jessica Carr, Marianne Aellen, Dr. Daniel Franke, Professor Moungi Bawendi, and Dr. Oliver
Bruns contributed to the conception and design of these studies, and discussed their results and
implications. Jessica carried out Intralipid® tissue phantom imaging while Marianne carried out
silica bead tissue phantom imaging. Dr. Franke synthesized all InAs QD materials and with
Marianne made aqueous formulations. Jessica, Marianne, Dr. Franke, and Dr. Bruns carried out
in vivo imaging. Contrast modeling was carried out by Marianne, Jessica, and Dr. Franke. QD-
labelled ex vivo tissue was prepared by Marianne and Dr. Bruns, and the tissue microscopy was
carried out by Marianne. The penetration depth determination algorithm was generously
provided by and implemented with the help of Dr. Christopher Rowlands and Professor Peter
So.

94
This work received support in part from the NIH through the Laser Biomedical Research
Center, Grant 9-P41-EB015871-26A1, the NSF through EECS-1449291, and the
Massachusetts Institute of Technology through the Institute for Soldier Nanotechnologies, Grant
W911NF-13-D-0001 and was conducted with government support under and awarded by the
Department of Defense, Air Force Office of Scientific Research, National Defense Science and
Engineering Graduate Fellowship 32 CFR 168a to Jessica. Dr. Franke was supported by a
fellowship of the Boehringer Ingelheim Fonds and Dr. Bruns was additionally supported by a
European Molecular Biology Organization (EMBO) long-term fellowship.

95
Chapter 5
SWIR fluorescence imaging with the clinically-
approved near infrared dye indocyanine green
5.1 Introduction: from preclinical animal imaging to image-guided
surgery in humans
For diagnostic imaging techniques, the journey towards clinical translation starts with building a
proof of concept device around a preclinical model. Access to the necessary optics, detectors,
and light sources are key, as well as access to the model itself, be it animal or otherwise. Many
imaging technologies additionally require the administration of an exogenous contrast agent to
highlight a particular anatomical feature or biological process; this agent must then also be
designed as biocompatible or clinically approved, and effective (sensitive, selective, or both) at
its targeting. Most techniques require years of design iterations at this phase before achieving
sufficient validation to enter the next risky and costly phase of clinical testing.
Near infrared (NIR, 700-1000 nm) fluorescence imaging, while at first limited to
preclinical applications in small animals, is an example of a technology that has emerged as a
versatile tool, currently being evaluated in many clinical trials for a variety of image-guided
surgery applications in humans.34,36,241,242,19,243 Compared with conventional diagnostic imaging
such as computed tomography, positron emission tomography, or magnetic resonance imaging,
NIR fluorescence imaging provides a lower cost, high sensitivity method for real-time molecular
imaging.34,242,19 A variety of NIR contrast agents are now commercially available that exhibit high
brightness and the ability to target a range of biological substrates. Moreover, one of these
dyes—indocyanine green (ICG)—has been approved by the FDA for clinical use since 1959,
and has been the standard of care for several applications in ophthalmology for decades.34,40
ICG and other NIR dyes such as IRDye 800CW are the subject of over 300 clinical trials for
emerging applications such as fluorescence angiography and perfusion assessment in
reconstructive and bypass surgeries, metastatic lymph node mapping and lymphatic transport in
lymphedema, cancer localization and surgical margin assessment, and many others.30–36
Recent research has shown that extending fluorescence imaging into shortwave infrared
wavelengths (SWIR, 1000–2000 nm) can further enhance the advantages of NIR imaging, as
discussed in previous sections in detail (Section 1.3, Section 4.1). In particular, low levels of
background tissue autofluorescence in the SWIR increase imaging sensitivity to a target

96
fluorophore, and the different tissue absorption and scattering properties increase contrast of
structures at greater penetration depths compared to fluorescence imaging in the NIR.47,58–
60,244,245,68 However, the translation of SWIR fluorescence imaging from preclinical to clinical
settings has been largely unaccomplished. The limited availability of SWIR detection technology
has historically prevented the necessary research for this translation (see Section 1.3), but as
detector availability has increased in the past 5 years, clinical translation has not immediately
followed. Clinical translation has most recently been prevented by the perceived need for
clinically-approved fluorophores with peak emission in the SWIR. Several examples of inorganic
nanomaterials and hydrophobic organic molecules exist with peak emission in the SWIR;
however, increasing the quantum yield, functionality, and biocompatibility of SWIR fluorophores
is still an active focus of emerging research studies.63,67,69,71,246–259
Here we show that two commercially available dyes with peak emission in the NIR
spectral region, including the FDA-approved contrast agent ICG, can function sufficiently as
SWIR emitters. Our findings are based on the observation that even though the emission
spectra of NIR dyes such as ICG or IRDye 800CW peak outside of the SWIR spectral region,
these spectra exhibit broad shoulders with a spectral tail extending well into the SWIR, that can
be easily detected by modern SWIR cameras, and even outperforms commercial SWIR
fluorophores with peak emission in the SWIR. Demonstrating both functional and targeted in
vivo SWIR imaging, we suggest that NIR dyes could bridge the gap between current
shortcomings of fluorescent SWIR probes and applications in clinical setting, and highlight
advantages of imaging ICG using SWIR detection over conventional NIR detection. Our findings
further suggest that new SWIR-fluorescent contrast agents should be benchmarked against the
SWIR emission of ICG.
5.2 Characterization of ICG emission through SWIR wavelengths
The visible and NIR emission properties of fluorescent materials are conventionally
characterized using ubiquitous silicon-based detection technology and spectrometers. However,
the detection efficiency of these detectors sharply declines beyond 900 nm, making calibration
beyond this wavelength challenging, and often limiting detection of the full spectrum of materials
with NIR emission (Fig. 5.1). Many of approximately 3000 papers published on the NIR dye
ICG, for example, under-detect the extent of its NIR and SWIR emission. According to the
Franck-Condon principle (or mirror image rule), most fluorescent organic dye emission spectra
should approximate the mirror image of their absorption spectra.260 However, spectra of NIR
dyes reported in the literature and by dye manufacturers often appear to disobey this rule: while
the absorption spectra of the dyes exhibit a clear shoulder to the blue of the absorption
maximum, the reported emission spectra lack this shoulder.261–263 We reproduce this disparity
using an example commercial silicon-based spectrometer system (Fig. 5.2A).

97
Recording the emission spectrum on a more suitable system, such as an InGaAs-based
system with visible through SWIR light sensitivity, and applying appropriate spectral corrections,
shows that ICG emission indeed follows the Franck-Condon principle, and that the tail of its
emission spectrum extends well into the SWIR (Fig. 5.2A, see Section 5.7 for spectral
correction details).264 It is even possible to detect emission from an aqueous solution of ICG on
an InGaAs camera beyond 1500 nm, even though the emission of ICG peaks at 820 nm (Fig.
5.2B, see Section 5.7 for methods). The same principle applies not only to ICG, but also to
other NIR dyes, such as IRDye 800CW (Fig. 5.2C), which is currently in multiple phase II
clinical trials and promises improved stability over ICG.265 This finding is significant in the
context of recent studies showing the improvement in contrast, sensitivity, and penetration that
can be gained by performing fluorescence imaging at the longest SWIR wavelengths.47,60,266
Figure 5.2: Optical properties of ICG and IRDye 800CW. Measuring the emission of ICG on a
thinned InGaAs detector (A, red line) shows that the full emission spectrum mirrors the absorption
spectrum of ICG (A, black line), as predicted by the Franck-Condon principle, whereas measuring the
spectrum on the Ocean Optics QE650000 (A, blue line) artificially truncates the spectrum. The
emission intensity of a 0.027 mg/mL aqueous ICG solution as detected in 20 nm spectral bands on an
InGaAs camera shows that emission from an aqueous solution of ICG is detectable even up to 1575
nm (inset image of vial) (B). The lower intensity observed between 1400 nm and 1500 nm is due to
absorption of water in that region. We also show the absorption and emission spectra of aqueous
IRDye 800CW-PEG (C). The absorption spectrum (black) exhibits a peak at 776 nm and the emission
spectrum (red), measured using an InGaAs-based spectrometer, mirrors the absorption spectrum,
exhibiting an emission peak at 801 nm and a lower energy shoulder extending into the SWIR.
Figure 5.1: Representative detector
efficiencies and responsivities. Silicon-based
spectrometer systems have high quantum
efficiency at visible and some NIR wavelengths,
but decline sharply beyond 900 nm, shown
here for the Ocean Optics QE650000
spectrometer (blue line). InGaAs-based
detectors have high responsivity at SWIR
wavelengths (yellow line), and some thinned
InGaAs detectors can span visible, NIR, and
SWIR wavelengths (red line).

98
In fact, the SWIR emission from NIR dyes such as ICG and IRDye 800CW exceeds the
brightness of a commercially available organic fluorophore developed specifically for in vivo
SWIR imaging applications (IR-E1050). We compared the optical properties of aqueous ICG
and IRDye 800CW to IR-E1050, which has its emission peak in the SWIR (Fig. 5.3).267 We
define brightness of the fluorescent probes as the product of the fluorescence quantum yield
with the probe’s absorption cross-section at the excitation wavelength. ICG and IRDye 800CW
exhibit both higher quantum yields in aqueous solutions (0.9% and 3.3% respectively), and
higher peak absorption cross-sections (15x104 M-1 cm-1 and 24x104 M-1 cm-1) than IR-E1050
(quantum yield 0.2%, peak absorption cross section 0.80 x10⁴ M-1 cm-1).268–271 Consequently,
when normalized to equimolar concentrations, we measure the emission intensity of ICG
between 1000 nm and 1300 nm to be 8.7 times higher than IR-E1050. Indeed, multiplying the
absorption cross-section, quantum yield, and ratio of the fluorescence signal between 1000 nm
and 1300 nm to the total fluorescence signal predicts that ICG should be 9.1 times brighter than
IR-E1050, consistent with our measurements (Table 5.1). The superior brightness of ICG
Figure 5.3: Optical properties of aqueous ICG, IRDye 800CW, and SWIR dye IR-E1050.
Normalized to identical mass concentrations, ICG absorbs much stronger at 785 nm excitation
(dashed line) than IR-E1050, a commercially available SWIR dye marketed for in vivo imaging (A).
Thus, even though the peak of the emission spectrum of ICG is significantly blue-shifted compared to
IR-E1050 (B), the absolute measured emission intensity between 1000 nm and 1300 nm normalized
to equimolar concentration is 8.7 times higher for ICG than for IR-E1050 (C). We confirmed this by
calculating the SWIR brightness of ICG and IR-E1050 between 1000 nm and 1300 nm: multiplying the
fluorescence quantum yield, the maximum absorption cross-section, and the ratio of the fluorescence
between 1000 nm and 1300 nm to the total fluorescence signal shows that ICG is around 9 times
brighter than IR-E1050 (D). We further compared the fluorescence intensity of 0.01 mg/mL aqueous
solutions of IR-E1050 and ICG on an InGaAs camera with 808 nm excitation (E). The results show
superior emission of ICG compared to IR-E1050 beyond 1300 nm (1300 nm longpass filter) (F).

99
Absorption cross section
Quantum yield
SWIR photons
SWIR brightness
ICG 1.5 x 10⁵ M-1 cm-1 0.9 % 5 % 68 M-1 cm-1
IR-E1050 0.08 x 10⁵ M-1 cm-1 0.2 % 47 % 8 M-1 cm-1
compared to IR-E1050 in the SWIR is further apparent when comparing images of vials of the
two dyes on the InGaAs camera that we subsequently used for in vivo imaging (Fig. 5.3E,F).
We further compare the emission intensity of ICG, IRDye 800CW, and IR-E1050 in
bovine blood on an InGaAs camera to best estimate the in vivo brightness of the probes (Fig.
5.4). It is important that a full characterization includes a comparison in blood, as
characterization in water under-represents the in vivo brightness of ICG due to (1) formation of
H-dimer species at low concentrations in water that causes fluorescence quenching, and (2) the
association of ICG with albumin and other proteins in blood that stabilize the dye and increases
its quantum yield.35,264 To quantify the molar brightness of the probes on the camera, the
intensity of each vial containing equal masses of the respective dye was measured individually,
averaged, normalized to integration time, and multiplied with the molecular mass of the
respective dye. In blood, equimolar ICG and IRDye 800CW were 16 and 1.3 times brighter,
respectively, than IR-E1050 in the wavelength range between 1300–1620 nm when excited with
808 nm light. We further confirm these results with in vivo SWIR imaging which shows that ICG
is at least one order of magnitude brighter than IR-E1050 when imaged beyond 1000 nm, in
good agreement with the in vitro comparison.
Table 5.1: SWIR brightness comparison of ICG to IR-E1050. The following table shows our
independently measured quantum yields, the maximum absorption cross-sections, and the ratio of
fluorescence signal between 1000 nm and 1300 nm to the total fluorescence signal of ICG and IR-
E1050. The SWIR brightness is the multiplication of these three parameters.
Figure 5.4: Comparison of ICG and IR-E1050 in blood and in vivo. (A) We further compared the
fluorescence intensity of IR-E1050, (0.01 mg/mL), with IRDye 800CW PEG (0.01 mg/mL, not
accounting for PEG shell of 25–60 kDA), and ICG (0.01 mg/mL) in bovine blood on a SWIR camera.
(B) On a molar basis, the NIR dyes outperform IR-E1050 beyond 1300 nm. Similarly, we found that
the in vivo fluorescence intensity of the recommended bolus of (C) IR-E1050 (67 nmoles) and (D) ICG
(64 nmoles) injected via the tail vein of a mouse was approximately one order of magnitude greater for
ICG beyond 1000 nm. Shown here is the relative fluorescence intensity of ICG in the vasculature and
in the liver imaged noninvasively through intact skin approximately one minute after ICG injection.

100
5.3 High contrast SWIR fluorescence imaging in vivo using ICG
The SWIR emission of commercially available and FDA-approved ICG enables straightforward
application to in vivo fluorescence imaging in the SWIR. We present here a selection of
preclinical in vivo imaging applications in mice using the clinically approved dose of ICG, and
highlight advantages of imaging ICG using SWIR detection over conventional NIR detection.
We first show that imaging ICG in the SWIR enables high-contrast mesoscopic imaging
of brain and hind limb vasculature in mice through intact skin (Fig. 5.5), as has been previously
demonstrated with carbon nanotubes.47 For this, two C3H/HeJ mice (21.7 g and 20.5 g, female,
10 weeks old, The Jackson Laboratory) were anesthetized, and the hair on the head was
removed with electric clippers and hair removal cream. We injected an aqueous solution of ICG
into the tail veins at a dose of 0.2 mg/kg, which is within the recommended dose for humans
(0.2–0.5 mg/kg recommended, 5 mg/kg maximum).35 We illuminated the mice with 50–70
mW/cm2 of 808 nm excitation light, staying below the maximum permissible exposure limit (330
mW/cm2 for 808 nm continuous wave light).152 We noninvasively imaged the resulting
fluorescence on a silicon camera at NIR wavelengths, and on an InGaAs camera at SWIR
wavelengths between 1300 nm and 1620 nm, the detection cutoff of the cooled SWIR camera.
We chose the 1300–1620 nm wavelength range, since as we show here and others have
previously demonstrated, contrast and resolution are maximized above 1300 nm.45,47,244
Figure 5.5: High contrast in vivo SWIR fluorescence imaging using ICG. (A) We noninvasively
imaged the brain vasculature of a mouse using ICG contrast and find that the vessels are difficult to
resolve through skin and skull using 850 nm longpass NIR detection on a silicon camera. (B)
Switching to 1300 nm longpass SWIR detection on an InGaAs camera greatly improves vessel
contrast (see Fig. 5.6 for contrast quantification). (C) Similarly, only large hind limb vessels are
imaged with good contrast through the skin using NIR detection. The intensity across a line of interest
(red line) shows insufficient contrast to resolve smaller vessels from background signal. (D) Using
1300 nm longpass SWIR detection greatly improves image contrast and resolution of vessels. All
images were scaled to the maximum displayable intensities.

101
Our images show that ICG is successfully imaged noninvasively in vivo at SWIR
wavelengths, and that imaging ICG in the SWIR enables greater contrast than imaging ICG in
the NIR. We quantified the contrast within a region of interest containing the brain vasculature in
the NIR image and the SWIR image by calculating the coefficient of variation, defined as the
standard deviation of pixel intensity normalized to the mean pixel intensity (Fig. 5.6A). We find
that the SWIR image contrast for brain vasculature is nearly 50% greater at a value of 0.29,
compared to the NIR image with a contrast value of 0.20, and it is more than 58% greater for
hind limb vasculature at a value of 0.19 for SWIR imaging compared to 0.12 for NIR imaging.
Furthermore, we calculated the apparent vessel width for a brain vessel by measuring
the full width at half maximum of a two-Gaussian fit to the intensity profile across a brain vessel
of interest (Fig. 5.6B). We find that the apparent vessel width in this specific example is over
twice as wide in the NIR image as in the SWIR image with values of 430 μm and 210 μm,
respectively. These findings are in good agreement with previous studies employing other
fluorophores, e.g. the contrast and resolution of brain vessels originally demonstrated through
noninvasive imaging using SWIR-emissive carbon nanotubes.47 Thus, contrast and resolution of
fine vasculature structures can be greatly improved while using FDA-approved ICG contrast by
Figure 5.6: Contrast and resolution quantification of brain and hind limb vasculature in a
mouse. Two-hundred microliters of aqueous ICG (0.025 mg/mL) were injected into the tail vein of two
mice and the fluorescent vasculature was imaged noninvasively through intact skin. (A) The contrast,
defined as the standard deviation (σ) divided by the mean (μ) pixel intensity, was quantified for a
region of interest (yellow box) to compare NIR and SWIR imaging of the brain vasculature and hind
limb vasculature. The contrast was found to be 0.20 for NIR-imaged brain vasculature and 0.29 for
SWIR-imaged brain vasculature. The contrast was 0.12 and 0.19 for NIR- and SWIR-imaged hind
limb vasculature respectively. (B) Apparent vessel width was also calculated by calculating the full
width at half maximum of a two-term Gaussian fit to the intensity profile of a brain vessel. Gaussian-
fitting was performed in MATLAB using the Curve Fitting ToolboxTM
. The apparent vessel width was
430 μm and 210 μm for NIR- and SWIR-imaged brain vasculature, respectively.

102
simply switching the detection wavelength from traditional NIR imaging using a silicon camera to
detection beyond 1300 nm on an InGaAs SWIR camera.
We further show that the contrast improvement of SWIR detection over NIR detection
can be enabling for intravital microscopic imaging (Fig. 5.7). We incorporated ICG into
polyethylene glycol-phospholipids39 to increase its blood half-life, which is typically limited to 3–4
min (see Section 5.7 for experimental details.272,273 We injected an aqueous solution of these
micelles at a dose of 5 mg ICG/kg mouse into the tail vein of a NU/NU nude mouse (female, 15
weeks old, Massachusetts General Hospital colony) with implanted cranial window. The window
was implanted as previously described.274,275 The cranial window of the mouse was then fixed to
the stage of a Nikon Ti-E inverted microscope (described in Section 3.2) and the fluorescence
of the ICG-phospholipid micelles in the brain vasculature was imaged with both NIR and 1300
nm longpass SWIR detection. Images of the entire cranial window at 2x magnification show the
ability to resolve nearly all the same vessels using either NIR or SWIR imaging. The overall
contrast, however, was 1.4 times greater for the SWIR image (standard deviation/mean was
0.24 for NIR versus 0.33 for SWIR). Higher magnification (6x) reveals that this contrast
improvement using SWIR imaging enables the resolution of vessels which, due to the high label
density of surrounding vessels, are difficult to distinguish from background signal in the NIR
image.
Figure 5.7: High contrast SWIR intravital microscopy of mouse brain vasculature. An aqueous
ICG-phospholipid mixture was injected via the tail vein of a mouse, and the fluorescence in the brain
vasculature was imaged through a cranial window. (A) Microscopy of the brain vasculature through
the cranial window shows poor contrast with 850 nm longpass NIR detection. (B) The intensity across
a line of interest (red dotted line) shows insufficient contrast to resolve overlapping vessels from
background signal. (C) Using 1300 nm longpass SWIR detection greatly improves image contrast and
(D) resolution of the vessels. Scale bars represent 1 mm in 2x images and 100 µm in 6x images.
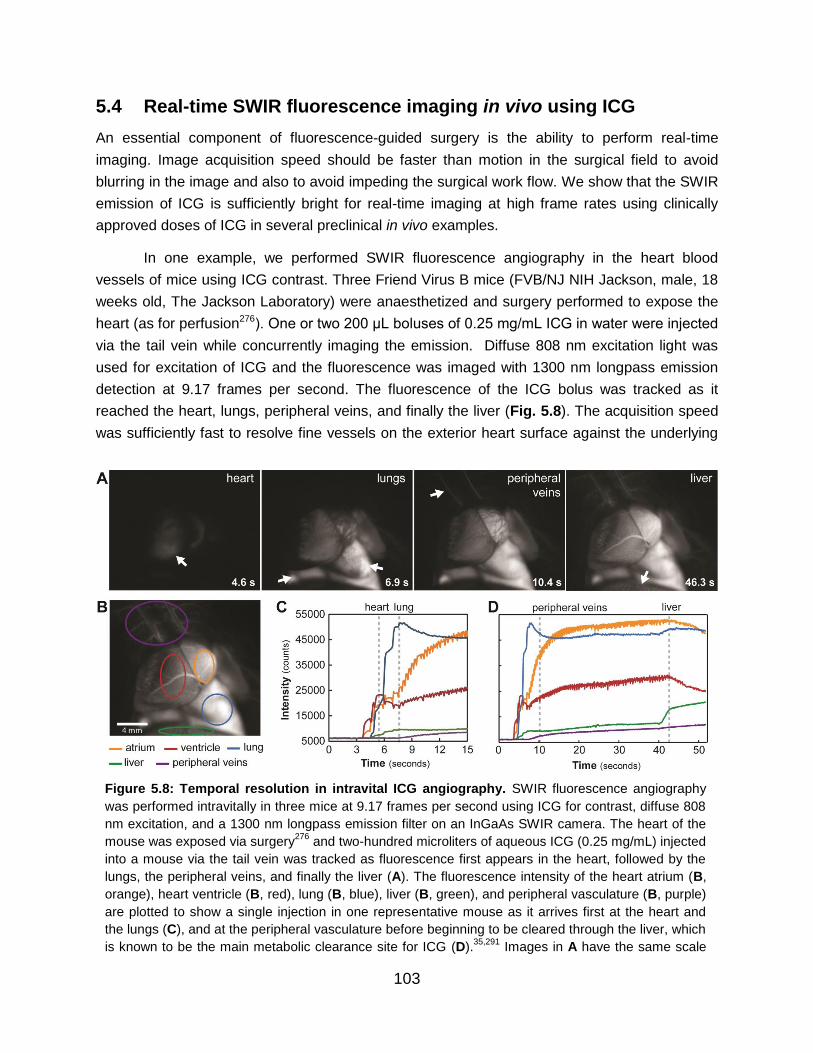
103
5.4 Real-time SWIR fluorescence imaging in vivo using ICG
An essential component of fluorescence-guided surgery is the ability to perform real-time
imaging. Image acquisition speed should be faster than motion in the surgical field to avoid
blurring in the image and also to avoid impeding the surgical work flow. We show that the SWIR
emission of ICG is sufficiently bright for real-time imaging at high frame rates using clinically
approved doses of ICG in several preclinical in vivo examples.
In one example, we performed SWIR fluorescence angiography in the heart blood
vessels of mice using ICG contrast. Three Friend Virus B mice (FVB/NJ NIH Jackson, male, 18
weeks old, The Jackson Laboratory) were anaesthetized and surgery performed to expose the
heart (as for perfusion276). One or two 200 μL boluses of 0.25 mg/mL ICG in water were injected
via the tail vein while concurrently imaging the emission. Diffuse 808 nm excitation light was
used for excitation of ICG and the fluorescence was imaged with 1300 nm longpass emission
detection at 9.17 frames per second. The fluorescence of the ICG bolus was tracked as it
reached the heart, lungs, peripheral veins, and finally the liver (Fig. 5.8). The acquisition speed
was sufficiently fast to resolve fine vessels on the exterior heart surface against the underlying
Figure 5.8: Temporal resolution in intravital ICG angiography. SWIR fluorescence angiography
was performed intravitally in three mice at 9.17 frames per second using ICG for contrast, diffuse 808
nm excitation, and a 1300 nm longpass emission filter on an InGaAs SWIR camera. The heart of the
mouse was exposed via surgery276
and two-hundred microliters of aqueous ICG (0.25 mg/mL) injected
into a mouse via the tail vein was tracked as fluorescence first appears in the heart, followed by the
lungs, the peripheral veins, and finally the liver (A). The fluorescence intensity of the heart atrium (B,
orange), heart ventricle (B, red), lung (B, blue), liver (B, green), and peripheral vasculature (B, purple)
are plotted to show a single injection in one representative mouse as it arrives first at the heart and
the lungs (C), and at the peripheral vasculature before beginning to be cleared through the liver, which
is known to be the main metabolic clearance site for ICG (D).35,291
Images in A have the same scale
as B.

104
contrast while in motion and to capture the anesthetized mouse heart rate of 207 beats per
minute, determined by tracking the intensity fluctuations of the heart (Fig. 5.9).
In a second example, we show real-time SWIR imaging of ICG in the liver and small
intestine of a mouse, and further demonstrate in vivo imaging of ICG fluorescence beyond 1500
nm (Fig. 5.10A). An NCr nude mouse (male, 14 weeks old, Taconic Biosciences) was
anaesthetized, placed in the imaging setup, and injected via a tail vein catheter with 200 μL of
ICG at a concentration of 0.25 mg/mL in water. Hepatobiliary clearance of ICG from the liver
into the intestines was then monitored and imaged noninvasively through intact skin over
approximately 2 hours using an 850 nm dielectric longpass filter and a silicon detector, or an
additional 1200 nm longpass or 1500 nm longpass filter with InGaAs detection.35 ICG emitted
sufficient SWIR signal for near video rate imaging (19.7 frames per second, 1200 nm longpass
filter), enabling capture of the peristaltic movements of the small intestine. Although at the cost
of speed (2.0 frames per second), it was even feasible to image the ICG clearance using a 1500
nm longpass filter, capturing wavelengths between roughly 1500 and 1620 nm. Images shown
were taken approximately 1.5–2 hours after the initial ICG injection.
In a third example, we demonstrate noninvasive imaging of lymphatic flow in mice. Four
C57BL/6 mice (male, 12–15 weeks old, The Jackson Laboratory) were anaesthetized and the
hair was removed. We injected 10–100 µL of 0.18 mg/mL aqueous solution of ICG
subcutaneously in the hind feet and subcutaneously in the tail. The fluorescence from the dorsal
Figure 5.9: High temporal and spatial resolution demonstrated through ICG SWIR fluorescence
angiography. Intravital SWIR fluorescence angiography was performed in a mouse heart at 9.17
frames per second using ICG, diffuse 808 nm excitation, and 1300 nm longpass emission detection on
an InGaAs SWIR camera. High spatial resolution was demonstrated by measuring fine vasculature on
the heart on the order of 100 μm in diameter (A). Temporal resolution was sufficiently high to resolve
the heartbeat of the mouse (B). By tracking a region of interest within the atrium of the heart (C, red
circle, lungs are also indicated with white arrows), and taking the Fourier transform (D) of the intensity
fluctuations (E), the heart rate was calculated to be 207 beats per minute for the anesthetized mouse.

105
lymph vessels and nodes was immediately imaged at 9.17 frames per second noninvasively
through the intact skin using 850 nm, 1000 nm, 1200 nm, 1300 nm, 1400 nm longpass dielectric
filters (Thorlabs). We find that lymph vessels and nodes are visible with ICG contrast up to
approximately 1400 nm, at which point only the vessels and superficial nodes are visible and
the signal of deeper lymph nodes becomes attenuated (Fig. 5.10B). Thus, for applications
which are not contrast-limited, such as those with low background signal and/or high label
specificity, it may be preferable to image ICG in the NIR or the shorter wavelengths of the SWIR
where signal attenuation is minimized.
Figure 5.10. Noninvasive imaging beyond 1300 nm using ICG SWIR fluorescence. Two-hundred
microliters of aqueous ICG (0.25 mg/mL) were injected into a mouse via the tail vein, and the liver and
small intestine, outlined in red and yellow respectively, were imaged noninvasively through the skin,
shown here approximately 1.5–2 hours after injection (A). The liver and small intestine were imaged
in the NIR on a silicon camera with an 850 nm longpass filter and in the SWIR on an InGaAs camera
with a 1200 nm longpass filter and a 1500 nm longpass filter. The image acquired with the 1500 nm
longpass filter shows a clear enhancement in image resolution. Separately, ICG (0.18 mg/mL) was
injected subcutaneously into the hind paws and subcutaneously in the tail of a mouse, excited with
808 nm excitation light, and imaged noninvasively through the skin as it localized in the dorsal
lymphatic vasculature and nodes (B, nodes indicated with white arrows). The lymphatic system was
imaged in the NIR with an 850 nm longpass filter on a silicon camera and in the SWIR with 1000 nm,
1200 nm, 1300 nm, and 1400 nm longpass filters on an InGaAs camera. While image contrast
improves at longer wavelengths, deep lymph node signal is attenuated.

106
5.5 Targeted SWIR fluorescence imaging in vivo using IRDye 800CW
The ease of molecular targeting is one of the major strengths of fluorescence imaging over
other imaging modalities. We show here that straightforward conjugation chemistry can be used
to perform targeted imaging in the SWIR using the NIR dye IRDye 800CW. We used a
commercially-available labeling kit (Li-Cor, P/N 928-38040) to conjugate IRDye 800CW to the
tumor-targeting antibody trastuzumab (Genentech277). Briefly, 1 mg of trastuzumab was
dissolved in 900 μL PBS buffer and 100 μL 1M potassium phosphate buffer (pH 9) to obtain an
8.5 pH solution. Twenty-five microliters of ultra-pure water were added to the NHS-IRDye
800CW and the solution was shaken for 2 minutes until the dye completely dissolved. Eight
microliters of the resulting solution were added to the trastuzumab solution and the mixture was
incubated for 2 hours at room temperature protected from light. Subsequently, the trastuzumab-
dye conjugate was separated from free residual dye using Pierce Zeba desalting spin columns.
We injected 330 µL of IRDye 800CW-trastuzumab (15 mg/kg dose) intraperitoneally into
two nude mice (female, 11 weeks old) implanted with human BT474 breast cancer cells in the
brain (see Section 5.7 for experimental details of tumor implantation). Two additional tumor-
bearing nude mice were not injected and served as controls. After three days, the mice were
anaesthetized and noninvasively imaged through intact skin and skull using diffuse 808 nm
excitation, and an 1150 nm longpass emission filter on an InGaAs camera. Subsequently, all
mice were injected via the tail vein with up to 300 µL (3 nmoles) of IRDye 800CW conjugated to
polyethylene glycol (IRDye 800CW-PEG, Li-Cor, P/N 926-50401) to highlight the brain
vasculature surrounding the tumor. The mice were then either illuminated with 808 nm excitation
and imaged on the SWIR camera, or illuminated with 780 nm excitation (Thorlabs, M780L3) and
imaged with an 800 nm longpass filter on a NIR camera. A multi-color functional image of the
brain was generated by temporally resolving the two labels, i.e. by assigning different colors
before and after the addition of IRDye 800CW-PEG (Fig. 5.11).278
5.6 Discussion and conclusions
We show that commercially available and clinically-approved NIR fluorophores have significant
SWIR emission, eliminating one of the key barriers to adoption of SWIR fluorescence imaging in
both basic research and clinical applications. These results also emphasize that the candidates
for SWIR fluorescence contrast agents are not limited to probes with peak emission in the
SWIR. As conventional SWIR fluorophores have low quantum yields and low absorption cross
sections, we find the brightest probe to be one with only tail emission in the SWIR. New SWIR
contrast agents should therefore be benchmarked against the SWIR emission of ICG in blood,
as the latter is sufficiently bright for in vivo imaging, and is already FDA-approved and clinically
used.

107
These findings could improve clinical use of ICG in fluorescence angiography. Clinical
imaging of ICG in the NIR has already shown value for angiography in ophthalmology,
intraoperative assessment of blood vessel patency in tissue grafts, bypass surgeries, and
intracranial aneurism surgeries.34,241,279–282 Noninvasive imaging of lymphatic vasculature using
ICG has also been described for surgical mapping and intraoperative identification of sentinel
nodes, following surgical excision of nodes, and evaluation and monitoring of
lymphedema.34,241,283,284 Increasingly, ICG fluorescence imaging is also being used in robot-
assisted surgery, in which the surgeon cannot rely on tactile feedback.33,36,284 However, full
clinical implementation has been partially limited by insufficient image quality in deep operating
fields. The higher contrast of ICG SWIR fluorescence imaging over NIR imaging could benefit
these applications and enable the resolution of finer vessels, especially in systems with high
label density or interfering background signal. Importantly, the implementation of this contrast
improvement would be straightforward, requiring only a switch from cameras with NIR detection
to those with SWIR detection while continuing the familiar surgical set-up and use of ICG.
Figure 5.11: Targeted SWIR imaging in vivo with IRDye 800CW. A nude mouse with a brain tumor
(~50–70 mm3) from implanted human BT474 breast cancer cells is imaged here under room light
illumination (bright field imaging) (A). Three days after injecting IRDye 800CW-trastuzumab conjugate
(15 mg/kg dose), fluorescence from the labeled tumor was imaged noninvasively through skin and
skull on a SWIR camera with 1150 nm longpass emission detection (B). Immediately subsequent
injection (up to 3 nmoles) of IRDye 800CW conjugated to polyethylene glycol (PEG) was used to
provide contrast to surrounding brain vasculature which was temporally separated from the labeled
tumor in post-processing (C). The tumor and vessel images were then assigned a color (blue and red
respectively) and overlaid to generate a false-color fluorescence image of the tumor and its
surrounding vasculature (D). The vessels overlaying the tumor are better defined using SWIR imaging
on an InGaAs camera with an 1150 nm longpass filter (E) compared with NIR imaging on a silicon
camera with an 800 nm longpass filter (F). We also show a control mouse which was implanted with a
tumor, and labeled with IRDye800-PEG, but not labeled with IRDye800-trastuzumab, imaged with
1150 nm longpass detection on the SWIR camera (G).

108
Our real-time in vivo imaging examples demonstrate the applicability of ICG SWIR
imaging to fluorescence guided surgery. ICG is bright enough to image in the SWIR at speeds
sufficiently high for intraoperative imaging of dynamic or moving features, shown here in the
heart, intestine, and lymphatic system of mice. We show that the required speed for a given
application can be balanced with the desired contrast by selecting the imaging wavelength;
using the full SWIR regime enables the highest frame rates due to maximized signal from ICG,
while imaging at the longest SWIR wavelengths can be used to improve contrast at the cost of
speed. Thus, using a SWIR camera for detecting ICG provides a tunable platform for optimizing
both contrast and speed in fluorescence guided surgery.
While targeted SWIR imaging has previously been hindered by either the challenging
preparation of targeted nanomaterials, size-dependent delivery effects, or the unavailability of
commercial solutions, the use of small NIR dye labelling kits overcomes these barriers. NIR
imaging of these readily available, targeted dyes has already shown promise for aiding cancer
localization and intraoperative surgical margin assessment.285 Our results suggest that SWIR
imaging of these NIR dyes could further benefit these applications by increasing the resolution
of both fine and large structures which may be overlapping, as this is a common occurrence in
highly vascular malignant lesions.
We show that established, commercially-available NIR dyes, including the FDA-
approved dye ICG, can be used to perform state-of-the art SWIR imaging including intravital
microscopy, noninvasive, real-time imaging in blood and lymph vessels, imaging of hepatobiliary
clearance, and molecularly-targeted in vivo imaging. The advantages of SWIR imaging over NIR
techniques, such as increased sensitivity, contrast, and resolution of fine anatomical structures
are therefore more readily available for increased adoption in pre-clinical and clinical imaging
systems, simply by switching the detection from conventional silicon-based NIR cameras to
emerging, high-performance InGaAs SWIR cameras. While no FDA-approved fluorophores with
peak emission in the SWIR yet exist, we show here that detecting the off-peak fluorescence of
clinically accessible NIR dyes on SWIR detectors bears the potential for rapid translation of
SWIR fluorescence imaging to humans in clinical applications.
5.7 Additional experimental details
Absorption and emission characterization measurements are presented here in detail. An
aqueous solution of ICG (Pfaltz & Bauer), IRDye 800CW PEG (LI-COR Biosciences), or IR-
E1050 (Nirmidas Biotech) was prepared in quartz cuvettes. Absorption spectra were recorded
on a Cary 5000 UV-Vis-NIR infrared spectrometer (Varian). To collect the emission spectra,
samples were excited with a 635 nm diode laser (Thorlabs), and emission was collected using a
pair of off-axis parabolic mirrors, and directed to a single-grating spectrometer (Acton, Spectra
Pro 300i). An InGaAs calibrated photodiode (Thorlabs, DET10N) was used to detect the

109
intensity of the emission. As the determination of the spectral responsivity is critical to
accurately measuring a fluorescence spectrum, we carefully calibrated the fluorescence setup
across visible and SWIR wavelengths. Using a 200W Quartz Tungsten Halogen Lamp
(Newport Instruments), we acquired an absolute spectrum which we compared to the known
spectral irradiance of the lamp to arrive at a spectral responsivity curve as depicted in Fig.
5.12A. We further corrected the fluorescence spectra for solvent reabsorption as described in
our previous work,63 and for plots in energy, we apply the Jacobian correction. The effects of
these corrections on a raw spectrum are shown in Fig. 5.12B. The emission spectrum of ICG
was also measured using excitation from a 532 nm diode laser, and the resulting emission
detected on a silicon-based spectrometer (OceanOptics, QE65000) as shown in Fig. 5.2A.
The emission intensity of ICG in water (0.027 mg/mL) was measured in 20 nm spectral
bands using an InGaAs camera (Princeton Instruments NIRvana 640) as shown in Fig. 5.2B. A
glass vial containing the ICG solution was placed in the imaging set up previously described in
detail (Section 3.2). The vial was illuminated with 50–70 mW/cm2 of 808 nm light, and the
fluorescence of the ICG was filtered through two colored glass 850 nm longpass filters
(Thorlabs FGL850S) and through a liquid crystal tunable filter (PerkinElmer VariSpec LNIR, 20
nm bandwidth), and focused onto the SWIR camera with a C-mount objective (Navitar SWIR-
35). The tunable filter was scanned from 900 to 1650 nm in 25 nm steps. A final image at 950
nm was acquired to ensure that the intensity matched the first measurement, verifying that the
ICG solution was not bleached throughout the measurement.
Quantum yield measurements were obtained using an integrating sphere (Labsphere
RTC-060-SF). The sample was illuminated using a 785 nm diode laser with an excitation power
of 25 mW that was modulated at 260 Hz. The output was collected using a calibrated
Figure 5.12: Corrections applied to photoluminescence spectra. The raw fluorescence spectra of
NIR dyes measured using the InGaAs detector-based spectrometer were corrected for the spectral
responsivity of the detector (A) as well as for solvent reabsorption. For plots depicted on an energy
scale, we also applied the Jacobian correction. The effects of all three corrections on the raw
spectrum (here exemplified with ICG) are visualized in panel (B).
110
germanium detector (Newport: 818-IR) through a Stanford Research Systems lock-in amplifying
system. Colored glass longpass filters (2x Schott Glass RG800 or 1x RG850) were used to
block the excitation beam. The sample was placed in a PTFE-capped quartz cuvette and a
solvent blank was used to ensure a consistent environment inside the integrating sphere. The
measured photocurrent was adjusted to account for the external quantum efficiency of the
detector when calculating the quantum yield. Finally, the measured quantum yield was
corrected to account for leakage of the excitation light and the transmittance of the filter.
While measuring the absolute quantum yield of IR-E1050 using an integrating sphere,
we found a lower value (0.2%) compared to the one reported by the manufacturer (2%), which
used the dye IR-26 as reference for relative quantum yield measurements. Their relative
quantum yield measurements rely on a quantum yield of 0.5% for IR-26 that was reported by
Drexhage and coworkers in 1982.286 More recently however, two independent publications by
Beard and coworkers287 (0.05%) and Resch-Genger and coworkers288 (0.07%) have found the
original value to be ~ten times too large. Measuring the absolute quantum yield of IR-26 in our
laboratory yielded a value of 0.05%, which is in line with the more recent publications. We
therefore believe that 0.05% is the correct value of the quantum yield of IR-26.
To compare the brightness of ICG and IR-E1050 in aqueous solutions (Fig. 5.3), ICG
(Pfaltz & Bauer) and IR-E1050 (Nirmidas Biotech) were diluted to a concentration of 0.01
mg/mL in cell culture grade water and in PBS, respectively. The solutions were imaged in the
imaging set-up (described in Section 3.2) with 808 nm excitation, and the emission filtered
through two colored glass 1000 nm longpass filters and an additional dielectric 1300 nm
longpass filter. In the resulting background-corrected images, the average emission intensity
was calculated from a region of interest within the vials and normalized to the integration time.
To compare brightness in blood (Fig. 5.4), ICG, IR-E1050, and IRDye 800CW PEG (LI-
COR Biosciences) were diluted in bovine blood (Rockland Immunochemicals, sodium citrate-
conjugated) to a concentration of 0.01 mg/mL. The solutions were imaged individually, and side-
by-side with 808 nm excitation, and the emission filtered through either two colored glass 1000
nm longpass filters or through an additional dielectric 1300 nm longpass filter. In the resulting
background-corrected images, the average emission intensity was calculated from a region of
interest within the vials and normalized to the integration time.
To compare the brightness of the SWIR emitters in vivo, ICG and IR-E1050 were
injected at the recommended concentrations (ICG: 0.25 mg/mL ≈ 322 nmoles/mL in cell culture
grade water, IR-E1050: 1 mg/mL ≈ 333 nmoles/mL in PBS), which yielded roughly equimolar
concentrations. 200 µL of the respective solution (64 nmoles of ICG, 66 nmoles of IR-E1050)
was injected into the tail vain of a NU/NU nude mouse (12 weeks old, male, Taconic
Biosciences) and excited with diffuse 808 nm excitation (50 mW/cm2). The fluorescence was
collected with a commercial SWIR lens (Navitar, 35 mm), filtered through two colored glass

111
1000 nm longpass filters, and detected on an InGaAs camera (Princeton Instruments, NIRvana
640, cooled to –80 °C) using an integration time of 1 ms. To estimate the in vivo brightness, the
intensity in the heart was measured one minute post-injection (100 frame average).
All animal procedures were carried out in accordance with approved institutional
protocols of the MIT Committee on Animal Care. Mice were anesthetized via intraperitoneal
injection of a ketamine/xylazine and shaved prior to imaging. The in vivo imaging set-up was as
described in Section 3.2 with diffuse 808 nm excitation (50–70 mW/cm2), and an exchangeable
filter holder for incorporating various bandpass and longpass emission filters. Different
objectives and filters were used depending on the requirements of each application as detailed
in Appendix A, Table A.3. The InGaAs camera (Princeton Instruments, NIRvana 640) was
cooled to –80 oC, the analog to digital (AD) conversion rate set to 2 MHz or 10 MHz, the gain set
to high, and different exposure times used to achieve sufficient signal and/or frame rates
(Appendix A, Table A.3). All images were background- and blemish-corrected within the
LightField imaging software. The silicon camera (Princeton Instruments PIXIS 1024BR) was
cooled to –70 oC, the AD conversion rate set to 2 MHz, the gain set to high, and the exposure
time adjusted to achieve sufficient signal and/or frame rates (Appendix A, Table A.3). ImageJ
was used to average 10 frames for NIRvana and PIXIS images. Frame averaging was not used
in videos unless otherwise noted. ImageJ was also used for all image measurements as well
(pixel intensity average, standard deviation, etc.).153–155
We validated our imaging set-up using tissue phantoms, and support our key finding that
SWIR imaging of ICG improves image contrast and resolution compared with NIR imaging of
ICG. Tissue phantom images were taken by submerging a 0.8–1.1 mm wide (inner diameter)
capillary filled with 0.0175 mg/mL aqueous ICG (Pfaltz & Baur) in 20% Intralipid® (Baxter
Healthcare Corporation, Deerfield, IL, USA) that was diluted to 2% Intralipid® in water. Images
were taken in the NIR and the SWIR of the capillary before and after being submerged 3 mm
below the surface of the 2% Intralipid® solution (Fig. 5.13A). Importantly, the resolution of the
capillary is high on the NIR imaging set-up without tissue phantom present, confirming that the
resolution and the optics of the NIR imaging set-up are not responsible for the poorer contrast
observed compared to SWIR imaging when the phantom is present or in our in vivo imaging.
We further verified that the poor contrast observed in NIR imaging relative to SWIR
imaging is not due to excitation leak through being detected with higher sensitivity on the NIR
camera (Fig. 5.13B,C). The two C3H/HeJ mice described previously for noninvasive, through-
skull brain vasculature imaging were used for this control experiment. The first mouse was
imaged before and after ICG injection with 850 nm longpass NIR detection. There was minimal
detectable signal prior to ICG injection, thus we conclude that the scattering of ICG signal
observed after injection is not attributed to leak-through of 808 nm excitation light being imaged
on the NIR camera, but must instead be caused by the tissue. Similarly, there is minimal leak-

112
through of excitation light imaged on the SWIR camera using a 1300 nm longpass filter, and the
majority of detectable signal comes from ICG after being injected.
Additional experimental details related to the in vivo imaging presented are expanded on
here. Preparation of ICG-phospholipid micelles were prepared by dissolving 4.8 mg ICG in a 2:1
mixture of chloroform and methanol, agitating with 23 mg polyethylene glycol-2000
phospholipids in chloroform (1,2-dioleoyl-sn-glycero-3-phosphoethanolamine-N-
[methoxy(polyethylene glycol)-2000] (ammonium salt), Avanti Polar Lipids, #880130C), drying
off the solvent under nitrogen flow, and re-suspending the dried phospholipids in 2 mL cell
grade water, resulting in a final concentration of 13.9 mg/mL ICG-phospholipid solution, or 2.4
Figure 5.13: Validation of imaging set-ups and control images for NIR and SWIR image
contrast comparisons. A 0.8–1.1 mm wide (inner diameter) capillary was filled with aqueous ICG,
and the fluorescence was imaged using 850 nm longpass NIR detection showing that resolution and
contrast of the capillary is high before the addition of tissue phantom (A). The capillary was then
submerged in approximately 3 mm of 2% Intralipid® liquid tissue phantom and imaged again with 850
nm longpass NIR detection, 1000 nm longpass SWIR detection, and 1300 nm longpass SWIR
detection, showing that the scatter of light caused by the tissue phantom is suppressed with
increasing imaging wavelength. In addition, two-hundred microliters of aqueous ICG (0.025 mg/mL)
were injected into the tail vein of two mice and the fluorescent vasculature was imaged noninvasively
through intact skin. The first mouse was imaged before and after ICG injection with 850 nm longpass
NIR detection (B). Comparing the two images we see that the scattering of ICG signal is caused by
the tissue, and the poor contrast is not attributed to leak-through of 808 nm excitation light being
imaged on the NIR camera. Similarly, there is minimal leak-through of excitation light imaged on the
SWIR camera using a 1300 nm longpass filter, and the majority of detectable signal comes from ICG
after being injected (C).

113
mg/mL concentration of ICG. The aqueous ICG-phospholipid mixture was passed through a
0.22 µm syringe filter before injecting approximately 50 μL via the tail vein into the
anaesthetized mouse, and the fluorescence was immediately imaged.
For in vivo targeted imaging with IRDye 800CW, female nude mice (8 to 9 weeks of age)
were implanted with a 0.36- or 0.72-mg 17b-estradiol pellet (Innovative Research of America)
the day before implantation of tumor cells. Injection of BT474-Gluc cells in the brain
parenchyma was performed as previously described.275,277,289 Briefly, the head of the mouse
was fixed with a stereotactic apparatus and the skull was exposed via skin incision. Using a
high-speed air-turbine drill (CH4201S; Champion Dental Products) with a burr tip size of 0.5 mm
in diameter, three sides of a square (∼2.5 mm in length, each side) were drilled through the
skull over the left hemisphere of the brain until a bone flap became loose. The bone flap was
pulled back, exposing the brain parenchyma. 100,000 BT474-Gluc cells diluted in 1 μL PBS
were stereotactically injected in the left frontal lobe of the mouse brain using an insulin syringe.
Subsequently, the bone flap was placed back into position in the skull and sealed using histo-
compatible cyanoacrylate glue, and the skin atop the skull was sutured closed. All animal
procedures were performed according to the guidelines of the Public Health Service Policy on
Human Care of Laboratory Animals and in accordance with a protocol approved by the
Institutional Animal Care and Use Committee of Massachusetts General Hospital.
Tumor growth was determined by measuring the Gluc activity in the blood as previously
described.277,289 Blood Gluc activity was measured with a Promega Glomax 96 microplate
luminometer (Fisher Scientific, Waltham, MA). The correlation between Gluc activity and tumor
size was previously determined and established using in vivo ultrasonography imaging
performed through a cranial window.277,289 At the time of imaging, we estimate the tumors to
have a size of 50–70 mm3.
5.8 Chapter-specific acknowledgements
The results described in this chapter are reported in Carr & Franke, et al.72,290
Jessica Carr, Dr. Daniel Franke, Dr. Oliver Bruns, and Professor Moungi Bawendi
contributed to the conception and design of these studies, and discussed their results and
implications. Dr. Justin Caram and Collin Perkinson were essential in optimizing, calibrating,
and correcting the photoluminescence spectrometer and measurements. Mari Saif aided in
some of the SWIR imaging experiments. Dr. Vasileios Askoxylakis carried out all tumor
implantation procedures in mice and aided in IRDye 800CW-trastuzumab conjugation and
imaging. Meenal Datta carried out cranial window implantation in mice. We would like to further
thank Dr. Rakesh Jain for animal model and clinical insight, Sylvie Roberge for excellent
technical support, Tulio Valdez for helpful discussions on imaging applications, Dr. Ou Chen for

114
help with spectroscopic characterization, and Dr. Ellen Sletten and Dr. Christopher Rowlands for
additional critical feedback.
This work received support in part from the National Institute of Health through the Laser
Biomedical Research Center, grant numbers 9-P41-EB015871-26A1, CA080124, CA126642,
CA197743, and CA096915; the Massachusetts Institute of Technology through the Institute for
Soldier Nanotechnologies, grant number W911NF-13-D-0001; the NSF through EECS-
1449291; the DOE Office of Science, Basic Energy Sciences, under Award No. DE-FG02-
07ER46454; and the DoD BCRP Innovator Award W81XWH-10-1-0016. This work was further
conducted with Government support under and awarded by DoD, Air Force Office of Scientific
Research, National Defense Science and Engineering Graduate (NDSEG) Fellowship, 32 CFR
168a to Jessica, Dr. Bruns was supported by an European Molecular Biology Organization
(EMBO) long-term fellowship, Dr. Franke was supported by a fellowship of the Boehringer
Ingelheim Fonds, Collin was supported by an NSF GRFP fellowship, and Meenal was supported
by the National Heart, Lung, and Blood Institute of the NIH (award number F31HL126449).

115
Appendix A
Raw quantification data and detailed image
acquisition settings
A.1 Full image sets used for quantifications in Chapter 3
In Chapter 3, much of the data presented was the result of analyzing image intensities and their
numerical quantifications in the form of averages. In an effort toward transparency, we show
here the individual images used for these analyses. The images themselves are also rich with
information in terms of the morphological distribution of signal intensities and their anatomical
relationships beyond numerically averaged results.

116
Figure A.1: NIR/SWIR autofluorescence detected in vivo and ex vivo in liver tissue of cirrhosis
mouse models. In vivo images were taken using 1000 ms of integration time and ex vivo images were
taken using 500 ms. Intensities are given in counts per second as indicated by the color bar.

117
Figure A.2: NIR/SWIR autofluorescence detected in ex vivo tissue of NAFLD mouse models on
CDAHF diet versus mice on a control diet for 3, 6, 9, and 12 weeks. Intensities are given in counts per
second as indicated by the color bar at the bottom. Most images were taken with 1000 ms integration, but
some taken with 500 ms were scaled to 1000 ms in post processing (intensities doubled) for comparison
here. One liver had to be excluded from the quantification due to contamination on the surface.

118
Figure A.3: NIR/SWIR autofluorescence detected in vivo in NAFLD mouse models on CDAHF diet
versus mice on a control diet for 3, 6, 9, and 12 weeks. Intensities are given in counts per second as
indicated by the color bar at the bottom. Most images were taken with 1000 ms integration, but some
taken with 500 ms were scaled to 1000 ms in post processing (intensities doubled) for comparison here.
Several mice were excluded from the quantification due to interfering signals in the GI tract (red boxes).

119
Figure A.4: NIR/SWIR autofluorescence detected ex vivo in NAFLD mouse models on CDAHF diet
versus mice on a control diet for 12 weeks, 4 of which included treatment with telmisartan. Images
were taken with 1000 ms integration. Intensities are given in counts per second as indicated by the color
bar at the bottom.

120
Figure A.5: NIR/SWIR autofluorescence detected in control mice receiving standard chow for the
equivalent to 0, 6, and approximately 30 weeks, with no other treatment. All images were taken with
1000 ms integration. Intensities are given in counts per second as indicated by the color bar.

121
A.2 Tables of integration times and optics for each image
The following tables detail the exact optical components and camera settings used for the
images presented in this thesis. In these tables:
The “Figure” column indicates the figure number and panel referred to within the thesis.
The “Camera” column refers to the Princeton Instruments PIXIS 1024BR camera, which
is a deep depletion silicon CCD for NIR imaging, the Princeton Instruments NIRvana
640, which is an InGaAs camera for SWIR imaging, or the Thorlabs color CMOS camera
(part number DCC1645C).
The "Filters" column lists Thorlabs part numbers of the filters used except for 50 nm
bandwidth bandpass (BP) filters which are from Edmund Optics (EO). In general, the
first letters of the part number indicate the filter type (FGL: Longpass Colored Glass
Filters, FEL: Longpass Edgepass Filters, FELH: Premium Hard-Coated Longpass
Edgepass Filters, DML: Longpass Dichroic Mirrors). The following numbers indicating
the wavelength, and an "S" at the end of the part number refers to a square filter,
whereas the absence of an "S" denotes circular filters. Part number FGL1000S for
example denotes a colored glass 1000 nm longpass filter with square dimensions.
The “Exposure time” column indicates the camera setting used for exposure time in each
image, given in milliseconds (ms) of integration.
The “Objective” column indicates whether a commercial lens was used (Navitar SWIR-
35 (F1.4/35mm EFL), Navitar MVL50M23 (F2.8/50 mm EFL), or Nikon CFI Plan
Apochromat 4x or 10x on the Nikon Eclipse Ti-E microscope) or lists the individual
optical components assembled using Thorlabs part numbers. A part number of the form
AC254-###-C indicates an achromatic doublet lens, 25.4 cm in diameter, with a ###
effective focal length, and a C-coating (C antireflection coating is for 1050–1700 nm). In
some images, biconvex lenses were used, with part number LB1945-C (200 mm focal-
length biconvex lenses, 25.4 mm, C-coated) or LB1909-C (500 mm focal-length
biconvex lenses, 50.8 mm, C-coated).

122
Table A.1: Camera, emission filters, exposure times, and objective used for each of the images
presented in Chapter 3.
Figure
Camera Filters Exposure
time (ms) Objective
Fig. 3.2 A, B PIXIS 2x FGL850S, FELH0850 1000 Navitar F2.8/50
C PIXIS DMLP850R, FELH0850 1000 Nikon 10x
Fig. 3.3
A, C-F, G-
2, H-2, I-2 PIXIS DMLP850R, FELH0850 1000 Nikon 10x
B NIRvana DMLP850R, FELH0850 500 Nikon 10x
G-1, H-1,
I-1 DCC NA auto Nikon 4x
Fig. 3.4
A-1, B-1,
D-1, E-1,
F-1
DCC NA auto Nikon 4x
A-2, B-2,
D-2, E-2,
F-2
PIXIS DMLP850R, FELH0850 2500 Nikon 10x
Fig. 3.5 A, B PIXIS as indicated in figure 1000/SWIR
5000/visible Nikon 10x
Fig. 3.7 A, B PIXIS 2x FGL850S, FELH0850 1000 Navitar F2.8/50
Fig. 3.8 A PIXIS 2x FGL850S, FELH0850 250 Navitar F2.8/50
Fig. 3.9
PIXIS 2x FGL850S, FELH0850 1000 Navitar F2.8/50
Fig. 3.10 A PIXIS 2x FGL850S, FELH0850 1000 Navitar F2.8/50
Fig. 3.11 top PIXIS 2x FGL850S, FELH0850 1000 Navitar F2.8/50
bottom PIXIS 2x FGL850S, FELH0850 250-1000 Navitar F2.8/50
Fig. 3.12
A, B, C
(right
column)
PIXIS 2x FGL850S, FELH0850 1000 Navitar F2.8/50
Fig. 3.13 B NIRvana 2x FGL850S,
2x FGL1000S 500 Navitar SWIR-35
Fig. 3.14 column 1
column 2
PIXIS
PIXIS
DMLP900R, FELH0900
Cy5 channel (Table 3.1)
1000
500 Nikon 10x

123
Table A.2: Emission filters and exposure times used for each of the images presented in Chapter
4. All images were taken with the NIRvana SWIR camera unless otherwise noted in the figure captions.
The objective used was as noted in the Chapter 4 text.
Figure
Filters Exposure time (ms)
Fig. 4.1
D (1000 nm) 2xFGL1000S, FELH0850, 1000 nm BP (EO) D2O: 50 H2O: 50
D (1200 nm) 2xFGL1000S, FELH0850, 1200 nm BP (EO) D2O: 50 H2O: 50
D (1450 nm) 2xFGL1000S, FELH0850, 1450 nm BP (EO) D2O: 50 H2O: 2500
D (1600 nm) 2xFGL1000S, FELH0850, 1600 nm BP (EO) D2O: 500 H2O: 1000
Fig. 4.2
A (1000 nm) 2xFGL1000S, FELH0850, 1000 nm BP (EO) D2O: 50 H2O: 50
A (1200 nm) 2xFGL1000S, FELH0850, 1200 nm BP (EO) D2O: 50 H2O: 50
A (1450 nm) 2xFGL1000S, FELH0850, 1450 nm BP (EO) D2O: 25 H2O: 2500
A (1600 nm) 2xFGL1000S, FELH0850, 1600 nm BP (EO) D2O: 250 H2O: 1000
Fig. 4.3
950 nm 2xFGL1000S, FES1100, 950 nm BP (EO) 150
1000 nm 2xFGL1000S, FES1100, 1000 nm BP (EO) 50
1050 nm
2xFGL1000S plus noted bandpass filter
50
1100 nm 50
1150 nm 100
1200 nm 150
1250 nm 100
1300 nm 100
1350 nm 200
1400 nm 750
1450 nm 2500
1500 nm 2500
1550 nm 2500
1600 nm
5000
Fig. 4.4
A (1000 nm) 2xFGL1000S, 1000 nm BP (EO) 50
A (1200 nm) 2xFGL1000S, 1200 nm BP (EO) 150
A (1450 nm) 2xFGL1000S, 1450 nm BP (EO) 2500
A (1600 nm) 2xFGL1000S, 1600 nm BP (EO) 5000
Fig. 4.5 A, C, E, G, I 2xFGL1000S, 1600 nm BP (EO) 5000
Fig. 4.10
A (1000 nm) DMLP900R, FELH0850, 1000 nm BP (EO) 200
A (1200 nm) DMLP900R, FELH0850, 1200 nm BP (EO) 180
A (1450 nm) DMLP900R, FELH0850, 1450 nm BP (EO) 2200
A (1600 nm) DMLP900R, FELH0850, 1600 nm BP (EO) 4000
Fig. 4.11
A (1000 nm) DMLP900R, FELH0850, 1000 nm BP (EO) 170
A (1200 nm) DMLP900R, FELH0850, 1200 nm BP (EO) 150
A (1450 nm) DMLP900R, FELH0850, 1450 nm BP (EO) 1200
A (1600 nm) DMLP900R, FELH0850, 1600 nm BP (EO) 2300
Fig. 4.12 B 2xFGL1000S, 1350 nm BP 200
Fig. 4.13
900 nm BP 2xFGL1000S, FES1000, 900 nm BP (EO) H2O: 1000 D2O: 2500
925 nm BP 2xFGL1000S, FES1000, 925 nm BP (EO) H2O: 250 D2O: 500
950 nm BP 2xFGL1000S, FES1000, 950 nm BP (EO) H2O: 100 D2O: 250
975 nm BP 2xFGL1000S, FES1000, 975 nm BP (EO) H2O: 50 D2O: 100

124
1000 nm BP 2xFGL1000S, FELH0850, 1000 nm BP (EO) H2O: 50 D2O: 50
1050 nm BP 2xFGL1000S, FELH0850, 1050 nm BP (EO) H2O: 25 D2O: 50
1100 nm BP
2xFGL1000S, FELH0850, plus noted
bandpass filter
H2O: 25 D2O: 50
1150 nm BP H2O: 25 D2O: 50
1200 nm BP H2O: 25 D2O: 50
1250 nm BP H2O: 50 D2O: 50
1275 nm BP H2O: 25 D2O: 25
1300 nm BP H2O: 25 D2O: 25
1350 nm BP H2O: 25 D2O: 25
1400 nm BP H2O: 100 D2O: 50
1450 nm BP H2O: 2500 D2O: 50
1500 nm BP H2O: 2500 D2O: 100
1550 nm BP H2O: 1000 D2O: 250
1600 nm BP H2O: 1000 D2O: 500
Fig. 4.14
A (1000 nm) 2xFGL1000S, 1000 nm BP (EO) H2O: 25 D2O: 25
A (1450 nm) 2xFGL1000, 1450 nm BP (EO) H2O: 2000 D2O: 10
A (1600 nm) 2xFGL1000S, 1600 nm BP (EO) H2O: 1500 D2O:200
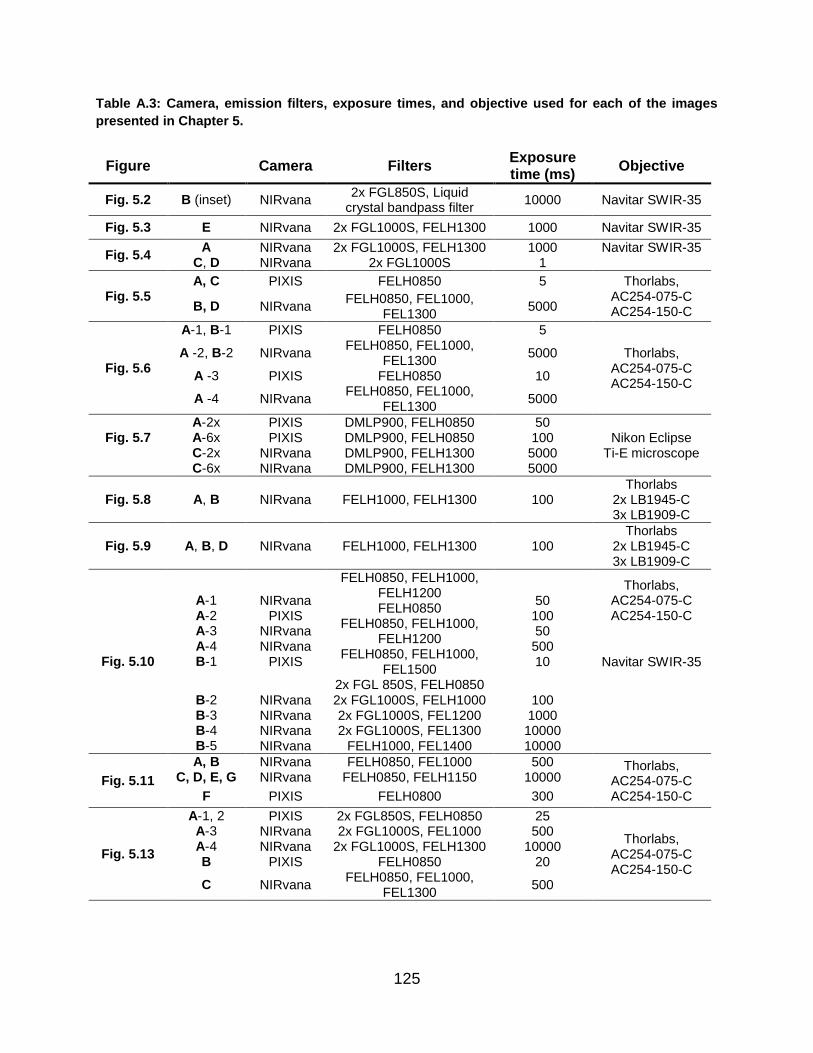
125
Table A.3: Camera, emission filters, exposure times, and objective used for each of the images
presented in Chapter 5.
Figure
Camera Filters Exposure time (ms)
Objective
Fig. 5.2 B (inset) NIRvana 2x FGL850S, Liquid
crystal bandpass filter 10000 Navitar SWIR-35
Fig. 5.3 E NIRvana 2x FGL1000S, FELH1300 1000 Navitar SWIR-35
Fig. 5.4 A NIRvana 2x FGL1000S, FELH1300 1000 Navitar SWIR-35
C, D NIRvana 2x FGL1000S 1
Fig. 5.5 A, C PIXIS FELH0850 5 Thorlabs,
AC254-075-C AC254-150-C B, D NIRvana
FELH0850, FEL1000, FEL1300
5000
Fig. 5.6
A-1, B-1 PIXIS FELH0850 5
Thorlabs, AC254-075-C AC254-150-C
A -2, B-2 NIRvana FELH0850, FEL1000,
FEL1300 5000
A -3 PIXIS FELH0850 10
A -4 NIRvana FELH0850, FEL1000,
FEL1300 5000
Fig. 5.7
A-2x PIXIS DMLP900, FELH0850 50 Nikon Eclipse
Ti-E microscope A-6x PIXIS DMLP900, FELH0850 100 C-2x NIRvana DMLP900, FELH1300 5000 C-6x NIRvana DMLP900, FELH1300 5000
Fig. 5.8 A, B NIRvana FELH1000, FELH1300 100 Thorlabs
2x LB1945-C 3x LB1909-C
Fig. 5.9 A, B, D NIRvana FELH1000, FELH1300 100 Thorlabs
2x LB1945-C 3x LB1909-C
Fig. 5.10
A-1 A-2 A-3 A-4 B-1
NIRvana PIXIS
NIRvana NIRvana
PIXIS
FELH0850, FELH1000, FELH1200 FELH0850
FELH0850, FELH1000, FELH1200
FELH0850, FELH1000, FEL1500
2x FGL 850S, FELH0850
50 100 50 500 10
Thorlabs, AC254-075-C AC254-150-C
Navitar SWIR-35
B-2 NIRvana 2x FGL1000S, FELH1000 100 B-3 NIRvana 2x FGL1000S, FEL1200 1000 B-4 NIRvana 2x FGL1000S, FEL1300 10000 B-5 NIRvana FELH1000, FEL1400 10000
Fig. 5.11
A, B C, D, E, G
NIRvana NIRvana
FELH0850, FEL1000 FELH0850, FELH1150
500 10000
Thorlabs, AC254-075-C AC254-150-C F PIXIS FELH0800 300
Fig. 5.13
A-1, 2 PIXIS 2x FGL850S, FELH0850 25
Thorlabs, AC254-075-C AC254-150-C
A-3 NIRvana 2x FGL1000S, FEL1000 500 A-4 NIRvana 2x FGL1000S, FELH1300 10000 B PIXIS FELH0850 20
C NIRvana FELH0850, FEL1000,
FEL1300 500

126
127
References
1. Hait, W. N. Translating research into clinical practice: deliberations from the American Association for Cancer Research. Clin. Cancer Res. 11, 4275–7 (2005).
2. Butler, D. Translational research: Crossing the valley of death. Nature 453, 840–842 (2008).
3. English, R. A., Lebovitz, Y. & Giffin, R. B. Forum on Drug Discovery, Development, and Translation: Transforming Clinical Research in the United States. (2010).
4. Homer-Vanniasinkam, S. & Tsui, J. The Continuing Challenges of Translational Research: Clinician-Scientists’ Perspective. Cardiol. Res. Pract. 2012, 1–5 (2012).
5. Jobsis, F. F. Noninvasive, infrared monitoring of cerebral and myocardial oxygen sufficiency and circulatory parameters. Science. 198, 1264–1267 (1977).
6. Ferrari, M., Giannini, I., Sideri, G. & Zanette, E. Continuous Non Invasive Monitoring of Human-Brain by Near-Infrared Spectroscopy. Adv. Exp. Med. Biol. 191, 873–882 (1985).
7. Murkin, J. M. & Arango, M. Near-infrared spectroscopy as an index of brain and tissue oxygenation. Br. J. Anaesth. 103, i3–i13 (2009).
8. Valdez, T. A. et al. Multi-color reflectance imaging of middle ear pathology in vivo. Anal. Bioanal. Chem. 407, 3277–3283 (2015).
9. Brown, J. Q., Vishwanath, K., Palmer, G. M. & Ramanujam, N. Advances in quantitative UV-visible spectroscopy for clinical and pre-clinical application in cancer. Curr. Opin. Biotechnol. 20, 119–131 (2009).
10. O’Sullivan, T. D., Cerussi, A. E., Cuccia, D. J. & Tromberg, B. J. Diffuse optical imaging using spatially and temporally modulated light. J. Biomed. Opt. 17, 71311-1-71311–14 (2012).
11. Wilson, R. H. et al. Quantitative short-wave infrared multispectral imaging of in vivo tissue optical properties. J. Biomed. Opt. 19, 86011-1-86011–4 (2014).
12. Orosco, R. K., Tsien, R. Y. & Nguyen, Q. T. Fluorescence Imaging in Surgery. IEEE Rev. Biomed. Eng. 6, 178–187 (2013).
13. Nguyen, Q. T. & Tsien, R. Y. Fluorescence-guided surgery with live molecular navigation — a new cutting edge. Nat. Rev. Cancer 13, 653–662 (2013).
14. Vasefi, F., MacKinnon, N., Farkas, D. L. & Kateb, B. Review of the potential of optical technologies for cancer diagnosis in neurosurgery: a step toward intraoperative neurophotonics. Neurophotonics 4, 11010 (2016).
15. Lavazza, M. et al. Indocyanine green-enhanced fluorescence for assessing parathyroid perfusion during thyroidectomy. Gland Surg. 5, 512–521 (2016).
16. Koch, M. & Ntziachristos, V. Advancing Surgical Vision with Fluorescence Imaging. Annu. Rev. Med. 67, 153–164 (2016).
17. van Dam, G. M. et al. Intraoperative tumor-specific fluorescence imaging in ovarian cancer by folate receptor-alpha targeting: first in-human results. Nat Med 17, 1315–1319 (2011).

128
18. Weissleder, R. A clearer vision for in vivo imaging. Nat. Biotechnol. 19, 316–317 (2001).
19. Frangioni, J. In Vivo Near-Infrared Fluorescence Imaging. Curr. Opin. Chem. Biol. 7, 626–634 (2003).
20. Hilderbrand, S. A. & Weissleder, R. Near-infrared fluorescence: application to in vivo molecular imaging. Curr. Opin. Chem. Biol. 14, 71–79 (2010).
21. Ntziachristos, V., Ripoll, J. & Weissleder, R. Would near-infrared fluorescence signals propagate through large human organs for clinical studies? Opt. Lett. 27, 333 (2002).
22. Ntziachristos, V., Bremer, C. & Weissleder, R. Fluorescence imaging with near-infrared light: new technological advances that enable in vivo molecular imaging. Eur. Radiol. 13, 195–208 (2003).
23. Kim, S. et al. Near-infrared fluorescent type II quantum dots for sentinel lymph node mapping. Nat. Biotechnol. 22, 93–97 (2004).
24. Allen, P. M. et al. InAs(ZnCdS) Quantum Dots Optimized for Biological Imaging in the Near-Infrared. J. Am. Chem. Soc. 132, 470–471 (2010).
25. Ke, S. et al. Near-infrared optical imaging of epidermal growth factor receptor in breast cancer xenografts. Cancer Res. 63, 7870–5 (2003).
26. Bydlon, T. M., Nachabé, R., Ramanujam, N., Sterenborg, H. J. C. M. & Hendriks, B. H. W. Chromophore based analyses of steady-state diffuse reflectance spectroscopy: current status and perspectives for clinical adoption. J. Biophotonics 8, 9–24 (2015).
27. Tong, H., Lou, K. & Wang, W. Near-infrared fluorescent probes for imaging of amyloid plaques in Alzheimer׳s disease. Acta Pharm. Sin. B 5, 25–33 (2015).
28. Celeng, C. et al. PET Molecular Targets and Near-Infrared Fluorescence Imaging of Atherosclerosis. Curr. Cardiol. Rep. 20, 11 (2018).
29. Htun, N. M. et al. Near-infrared autofluorescence induced by intraplaque hemorrhage and heme degradation as marker for high-risk atherosclerotic plaques. Nat. Commun. 8, 75 (2017).
30. Polom, K. et al. Current trends and emerging future of indocyanine green usage in surgery and oncology. Cancer 117, 4812–4822 (2011).
31. te Velde, E. A., Veerman, T., Subramaniam, V. & Ruers, T. The Use of Fluorescent Dyes and Probes in Surgical Oncology. Eur. J. Surg. Oncol. 36, 6–15 (2010).
32. Rasmussen, J. C., Tan, I.-C., Marshall, M. V, Fife, C. E. & Sevick-Muraca, E. M. Lymphatic imaging in humans with near-infrared fluorescence. Curr. Opin. Biotechnol. 20, 74–82 (2009).
33. Daskalaki, D. et al. Indocyanine Green (ICG) Fluorescent Cholangiography During Robotic Cholecystectomy: Results of 184 Consecutive Cases in a Single Institution. Surg. Innov. 21, 615–621 (2014).
34. Marshall, M. V et al. Near-Infrared Fluorescence Imaging in Humans with Indocyanine Green: A Review and Update. Open Surg. Oncol. J. 2, 12–25 (2010).
35. Alander, J. T. et al. A Review of indocyanine green fluorescent imaging in surgery. International Journal of Biomedical Imaging 2012, Article ID 940585 (2012).

129
36. Koch, M. & Ntziachristos, V. Advancing Surgical Vision with Fluorescence Imaging. Annu. Rev. Med. 67, 153–164 (2016).
37. Akorn Inc. IC-Green (indocyanine green for injection, USP). (2009).
38. Sevick-Muraca, E. M. Translation of Near-Infrared Fluorescence Imaging Technologies: Emerging Clinical Applications. Annu. Rev. Med. 63, 217–231 (2012).
39. Kraft, J. C. & Ho, R. J. Y. Interactions of Indocyanine Green and Lipid in Enhancing Near-Infrared Fluorescence Properties: The Basis for Near-Infrared Imaging in Vivo. Biochemistry 53, 1275–1283 (2014).
40. Alander, J. T. et al. A Review of Indocyanine Green Fluorescent Imaging in Surgery, A Review of Indocyanine Green Fluorescent Imaging in Surgery. Int. J. Biomed. Imaging, Int. J. Biomed. Imaging 2012, e940585 (2012).
41. Marshall, M. V., Draney, D., Sevick-Muraca, E. M. & Olive, D. M. Single-Dose Intravenous Toxicity Study of IRDye 800CW in Sprague-Dawley Rats. Mol. Imaging Biol. 12, 583–594 (2010).
42. Yung, M., Klufas, M. A. & Sarraf, D. Clinical applications of fundus autofluorescence in retinal disease. Int. J. Retin. Vitr. 2, 12 (2016).
43. Yin, D. & Brunk, U. in Free Radical and Antioxidant Protocols 217–228 (Humana Press, 1998). doi:10.1385/0-89603-472-0:217
44. Jung, T., Höhn, A. & Grune, T. in Methods in molecular biology (Clifton, N.J.) 594, 173–193 (2010).
45. Lim, Y. T. et al. Selection of quantum dot wavelengths for biomedical assays and imaging. Mol. Imaging 2, 50–64 (2003).
46. Nachabé, R., Hendriks, B. H. W., van der Voort, M., Desjardins, A. E. & Sterenborg, H. J. C. M. Estimation of biological chromophores using diffuse optical spectroscopy: benefit of extending the UV-VIS wavelength range to include 1000 to 1600 nm. Biomed. Opt. Express 1, 1432–1442 (2010).
47. Hong, G. et al. Through-skull fluorescence imaging of the brain in a new near-infrared window. Nat. Photonics 8, 723–730 (2014).
48. Wilson, R. H., Nadeau, K. P., Jaworski, F. B., Tromberg, B. J. & Durkin, A. J. Review of short-wave infrared spectroscopy and imaging methods for biological tissue characterization. J. Biomed. Opt. 20, 30901-1-30901–10 (2015).
49. Nachabé, R. et al. Diagnosis of breast cancer using diffuse optical spectroscopy from 500 to 1600 nm: comparison of classification methods. J. Biomed. Opt. 16, 87010-1-87010–12 (2011).
50. Taroni, P., Bargigia, I., Farina, A., Cubeddu, R. & Pifferi, A. First in vivo spectral characterization of breast up to 1300 nm. in SPIE BiOS, Optical Tomography and Spectroscopy of Tissue IX 7896, 78962L–1–78962L–4 (2011).
51. Akbari, H., Uto, K., Kosugi, Y., Kojima, K. & Tanaka, N. Cancer detection using infrared hyperspectral imaging. Cancer Sci. 102, 852–857 (2011).
52. Akbari, H., Kosugi, Y., Kojima, K. & Tanaka, N. Detection and Analysis of the Intestinal Ischemia Using Visible and Invisible Hyperspectral Imaging. IEEE Trans. Biomed. Eng.
130
57, 2011–2017 (2010).
53. Randeberg, L. L., Skallerud, B., Langlois, N. E. I., Haugen, O. A. & Svaasand, L. O. in (eds. Welch, A. J. & Gemert, M. J. C. van) 825–858 (Springer Netherlands, 2010).
54. Randeberg, L. L. & Hernandez-Palacios, J. Hyperspectral imaging of bruises in the SWIR spectral region. in SPIE BiOS, Photonic Therapeutics and Diagnostics VIII 8207, 82070N–1–82070N–10 (2012).
55. Altshuler, G. B., Anderson, R. R. & Manstein, D. Method and apparatus for the selective targeting of lipid-rich tissues. US7060061B2 (2006).
56. Waxman, S., Ishibashi, F. & Caplan, J. D. Rationale and use of near-infrared spectroscopy for detection of lipid-rich and vulnerable plaques. J. Nucl. Cardiol. 14, 719–728 (2007).
57. Goldstein, J. A. et al. Detection of lipid-core plaques by intracoronary near-infrared spectroscopy identifies high risk of periprocedural myocardial infarction. Circ. Cardiovasc. Interv. 4, 429–437 (2011).
58. Bashkatov, A. N., Genina, E. A., Kochubey, V. I. & Tuchin, V. V. Optical properties of human skin, subcutaneous and mucous tissues in the wavelength range from 400 to 2000 nm. J. Phys. D. Appl. Phys. 38, 2543–2555 (2005).
59. Bashkatov, A. N., Genina, E. A. & Tuchin, V. V. Optical properties of skin, subcutaneous, and muscle tissues: a review. J. Innov. Opt. Health Sci. 4, 9–38 (2011).
60. Diao, S. et al. Biological imaging without autofluorescence in the second near-infrared region. Nano Res. 8, 3027–3034 (2015).
61. U.S. Department of State - Directorate of Defense Trade Controls - Commodity Jurisdiction Final Determinations. (2016). Available at: https://www.pmddtc.state.gov/commodity_jurisdiction/determinationAll.html. (Accessed: 20th November 2016)
62. Antaris, A. L. et al. A small-molecule dye for NIR-II imaging. Nat. Mater. 15, 235–242 (2016).
63. Cosco, E. D. et al. Flavylium Polymethine Fluorophores for Near- and Shortwave Infrared Imaging. Angew. Chemie Int. Ed. 56, 13126–13129 (2017).
64. Zhu, S. et al. Molecular imaging of biological systems with a clickable dye in the broad 800- to 1,700-nm near-infrared window. Proc. Natl. Acad. Sci. U. S. A. 114, 962–967 (2017).
65. Yang, Q. et al. Rational Design of Molecular Fluorophores for Biological Imaging in the NIR-II Window. Adv. Mater. 29, 1605497 (2017).
66. Hong, G. et al. Multifunctional in vivo vascular imaging using near-infrared II fluorescence. Nat. Med. 18, 1841–6 (2012).
67. Franke, D. et al. Continuous injection synthesis of indium arsenide quantum dots emissive in the short-wavelength infrared. Nat. Commun. 7, 12749 (2016).
68. Bruns, O. T. et al. Next-generation in vivo optical imaging with short-wave infrared quantum dots. Nat. Biomed. Eng. 1, 56 (2017).

131
69. Tang, R. et al. Tunable Ultrasmall Visible-to-Extended Near-Infrared Emitting Silver Sulfide Quantum Dots for Integrin-Targeted Cancer Imaging. ACS Nano 9, 220–230 (2015).
70. Liu, Q. et al. Sub-10 nm Hexagonal Lanthanide-Doped NaLuF 4 Upconversion Nanocrystals for Sensitive Bioimaging in Vivo. J. Am. Chem. Soc. 133, 17122–17125 (2011).
71. Chen, Y. et al. Shortwave Infrared in Vivo Imaging with Gold Nanoclusters. Nano Lett. 17, 6330–6334 (2017).
72. Carr, J. A. et al. Shortwave infrared fluorescence imaging with the clinically approved near-infrared dye indocyanine green. Proc. Natl. Acad. Sci. 115, 4465–4470 (2018).
73. Rovers, M. et al. Grommets in otitis media with effusion: an individual patient data meta-analysis. Arch. Dis. Child. 90, 480 (2005).
74. Venekamp, R. P., Sanders, S. L., Glasziou, P. P., Del Mar, C. B. & Rovers, M. M. Antibiotics for acute otitis media in children. Cochrane Database Syst. Rev. CD000219 (2015). doi:10.1002/14651858.CD000219.pub4
75. Monasta, L. et al. Burden of Disease Caused by Otitis Media: Systematic Review and Global Estimates. PLoS One 7, e36226 (2012).
76. Rovers, M. M. The burden of otitis media. Vaccine 26, G2–G4 (2008).
77. Table 2: top 5 diagnoses at visits to office-based physicians and hospital outpatient departments by patient age and sex: United States 2008.
78. Leibovitz, E. Acute otitis media in pediatric medicine: Current issues in epidemiology, diagnosis, and management. Pediatr. Drugs 5, 1–12 (2003).
79. Soni, A. Statistical Brief #228: Ear Infections (Otitis Media) in Children (0–17): Use and Expenditures, 2006. (2008).
80. Teele, D. W., Klein, J. O., Rosner, B. & Group, G. B. O. M. S. Epidemiology of Otitis Media During the First Seven Years of Life in Children in Greater Boston: A Prospective, Cohort Study. J. Infect. Dis. 160, 83–94 (1989).
81. Lieberthal, A. S. et al. The Diagnosis and Management of Acute Otitis Media. Pediatrics 131, e964–e999 (2013).
82. Pichichero, M. & Poole, M. Assessing Diagnostic Accuracy and Tympanocentesis Skills in the Management of Otitis Media. Arch. Pediatr. Adolesc. Med. 155, 1137–1142 (2001).
83. Verhoeff, M., van der Veen, E. L., Rovers, M. M., Sanders, E. A. & Schilder, A. G. Chronic suppurative otitis media: a review. Int J Pediatr Otorhinolaryngol 70, 1–12 (2006).
84. Pichichero, M. E. Diagnostic Accuracy of Otitis Media and Tympanocentesis Skills Assessment Among Pediatricians. Eur. J. Clin. Microbiol. Infect. Dis. 22, 519–524 (2003).
85. Pichichero, M. E. & Poole, M. D. Comparison of performance by otolaryngologists, pediatricians, and general practioners on an otoendoscopic diagnostic video examination. Int. J. Pediatr. Otorhinolaryngol. 69, 361–366 (2005).
86. Rosenfeld, R. M. Diagnostic certainty for acute otitis media. Int. J. Pediatr. Otorhinolaryngol. 64, 89–95 (2002).

132
87. Powers, J. H. Diagnosis and Treatment of Acute Otitis Media: Evaluating the Evidence. Infect. Dis. Clin. North Am. 21, 409–426 (2007).
88. McGrath, L. J., Becker-Dreps, S., Pate, V. & Brookhart, M. A. Trends in Antibiotic Treatment of Acute Otitis Media and Treatment Failure in Children, 2000–2011. PLoS One 8, 1–6 (2013).
89. Garbutt, J., Jeffe, D. B. & Shackelford, P. Diagnosis and Treatment of Acute Otitis Media: An Assessment. Pediatrics 112, 143–149 (2003).
90. Bennett, K. E., Haggard, M. P., Silva, P. A. & Stewart, I. A. Behaviour and developmental effects of otitis media with effusion into the teens. Arch. Dis. Child. 85, 91–5 (2001).
91. Clarkson, C., Antunes, F. M. & Rubio, M. E. Conductive Hearing Loss Has Long-Lasting Structural and Molecular Effects on Presynaptic and Postsynaptic Structures of Auditory Nerve Synapses in the Cochlear Nucleus. J. Neurosci. 36, 10214–10227 (2016).
92. Pelton, S. I. & Leibovitz, E. Recent advances in otitis media. Pediatr. Infect. Dis. J. 28, S133-137 (2009).
93. Gupta, A. & Agarwal, S. R. A study of prevalence of cholesteatoma in complications of suppurative otitis media. Indian J. Otolaryngol. Head Neck Surg. 50, 140–146 (1998).
94. Masanta, W. O., Hinz, R. & Zautner, A. E. Infectious Causes of Cholesteatoma and Treatment of Infected Ossicles prior to Reimplantation by Hydrostatic High-Pressure Inactivation. Biomed Res. Int. 2015, e761259 (2015).
95. Abbott, P., Rosenkranz, S., Hu, W., Gunasekera, H. & Reath, J. The effect and acceptability of tympanometry and pneumatic otoscopy in general practitioner diagnosis and management of childhood ear disease. BMC Fam. Pract. 15, 181 (2014).
96. Jones, W. S. & Kaleida, P. H. How Helpful Is Pneumatic Otoscopy in Improving Diagnostic Accuracy? Pediatrics 112, 510–513 (2003).
97. Rosser, W. W. Approach to diagnosis by primary care clinicians and specialists: is there a difference? J. Fam. Pract. 42, 139–144 (1996).
98. van Staveren, H. J., Moes, C. J. M., van Marie, J., Prahl, S. A. & van Gemert, M. J. C. Light scattering in lntralipid-10% in the wavelength range of 400–1100 nm. Appl. Opt. 30, 4507 (1991).
99. Pogue, B. W. & Patterson, M. S. Review of tissue simulating phantoms for optical spectroscopy, imaging and dosimetry. J. Biomed. Opt. 11, 41102-41102–16 (2006).
100. Ninni, P. Di, Martelli, F. & Zaccanti, G. Intralipid: towards a diffusive reference standard for optical tissue phantoms. Phys. Med. Biol. 56, N21 (2011).
101. Hong, P. et al. An anatomically sound surgical simulation model for myringotomy and tympanostomy tube insertion. Int. J. Pediatr. Otorhinolaryngol. 78, 522–529 (2014).
102. Skarzynski, H., Lorens, A., Piotrowska, A. & Anderson, I. Preservation of low frequency hearing in partial deafness cochlear implantation (PDCI) using the round window surgical approach. Acta Otolaryngol. 127, 41–48 (2007).
103. Erixon, E., Köbler, S. & Rask-Andersen, H. Cochlear implantation and hearing preservation: Results in 21 consecutively operated patients using the round window approach. Acta Otolaryngol. 132, 923–931 (2012).

133
104. Colletti, V., Soli, S. D., Carner, M. & Colletti, L. Treatment of mixed hearing losses via implantation of a vibratory transducer on the round window. Int. J. Audiol. 45, 600–608 (2006).
105. Kogan, M. D., Overpeck, M. D., Hoffman, H. J. & Casselbrant, M. L. Factors associated with tympanostomy tube insertion among preschool-aged children in the United States. Am. J. Public Health 90, 245–250 (2000).
106. Rosenfeld, R. M. et al. Clinical Practice Guideline: Otitis Media with Effusion (Update). Otolaryngol. Neck Surg. 154, S1–S41 (2016).
107. Gates, G. A., Avery, C., Hearne, E. M., Cooper, J. C. & Holt, G. R. Predictive Value of Tympanometry in Middle Ear Effusion. Ann. Otol. Rhinol. Laryngol. 95, 46–50 (1986).
108. Abbott, P., Rosenkranz, S., Hu, W., Gunasekera, H. & Reath, J. The effect and acceptability of tympanometry and pneumatic otoscopy in general practitioner diagnosis and management of childhood ear disease. BMC Fam. Pract. 15, 181 (2014).
109. Lieberthal, A. S. et al. The Diagnosis and Management of Acute Otitis Media. Pediatrics 131, e964–e999 (2013).
110. Takata, G. S. et al. Evidence assessment of the accuracy of methods of diagnosing middle ear effusion in children with otitis media with effusion. Pediatrics 112, 1379–1387 (2003).
111. Monroy, G. L. et al. Noninvasive depth-resolved optical measurements of the tympanic membrane and middle ear for differentiating otitis media. Laryngoscope e276–e282 (2015). doi:10.1002/lary.25141
112. Nguyen, C. T. et al. Investigation of bacterial biofilm in the human middle ear using optical coherence tomography and acoustic measurements. Hear. Res. 301, 193–200 (2013).
113. Puhakka, T., Pulkkinen, J., Silvennoinen, H. & Heikkinen, T. Comparison of spectral gradient acoustic reflectometry and tympanometry for detection of middle-ear effusion in children. Pediatr. Infect. Dis. J. 33, e183-186 (2014).
114. Discolo CM et al. Ultrasonic detection of middle ear effusion: A preliminary study. Arch. Otolaryngol. Neck Surg. 130, 1407–1410 (2004).
115. Combs, J. T. & Combs, M. K. Acoustic reflectometry: spectral analysis and the conductive hearing loss of otitis media. Pediatr. Infect. Dis. J. 15, 683–686 (1996).
116. Muderris, T. et al. Consumer acoustic reflectometry: Accuracy in diagnosis of otitis media with effusion in children. Int. J. Pediatr. Otorhinolaryngol. 77, 1771–1774 (2013).
117. Carr, J. A., Valdez, T. A., Bruns, O. T. & Bawendi, M. G. Using the shortwave infrared to image middle ear pathologies. Proc. Natl. Acad. Sci. 113, 9989–9994 (2016).
118. Croce, A. C. & Bottiroli, G. Autofluorescence spectroscopy and imaging: a tool for biomedical research and diagnosis. Eur. J. Histochem. 58, 2461 (2014).
119. Monici, M. Cell and tissue autofluorescence research and diagnostic applications. Biotechnol. Annu. Rev. 11, 227–256 (2005).
120. Vishwanath, K., Ramanujam, N., Vishwanath, K. & Ramanujam, N. in Encyclopedia of Analytical Chemistry (John Wiley & Sons, Ltd, 2011).

134
doi:10.1002/9780470027318.a0102.pub2
121. Wang, T. D. & Van Dam, J. Optical biopsy: a new frontier in endoscopic detection and diagnosis. Clin. Gastroenterol. Hepatol. 2, 744–53 (2004).
122. Richards-Kortum, R. & Sevick-Muraca, E. Quantitative Optical Spectroscopy for Tissue Diagnosis. Annu. Rev. Phys. Chem. 47, 555–606 (1996).
123. Stübel, H. Die Fluoreszenz tierischer Gewebe in ultraviolettem Licht. Pflüger’s Arch. für die Gesammte Physiol. des Menschen und der Tiere 142, 1–14 (1911).
124. Carrington, W. A. et al. Superresolution three-dimensional images of fluorescence in cells with minimal light exposure. Science 268, 1483–7 (1995).
125. Koenig, F., McGovern, F. J., Althausen, A. F., Deutsch, T. F. & Schomacker, K. T. Laser induced autofluorescence diagnosis of bladder cancer. J. Urol. 156, 1597–601 (1996).
126. Shirshin, E. A. et al. Two-photon autofluorescence lifetime imaging of human skin papillary dermis in vivo: assessment of blood capillaries and structural proteins localization. Sci. Rep. 7, 1171 (2017).
127. Coda, S. et al. Fluorescence lifetime spectroscopy of tissue autofluorescence in normal and diseased colon measured ex vivo using a fiber-optic probe. Biomed. Opt. Express 5, 515–38 (2014).
128. Rigacci, L. et al. Multispectral imaging autofluorescence microscopy for the analysis of lymph-node tissues. Photochem. Photobiol. 71, 737–42 (2000).
129. De Veld, D. C. G., Witjes, M. J. H., Sterenborg, H. J. C. M. & Roodenburg, J. L. N. The status of in vivo autofluorescence spectroscopy and imaging for oral oncology. Oral Oncol. 41, 117–131 (2005).
130. Miranda-Lorenzo, I. et al. Intracellular autofluorescence: a biomarker for epithelial cancer stem cells. Nat. Methods 11, 1161–1169 (2014).
131. Xylas, J. et al. Noninvasive assessment of mitochondrial organization in three-dimensional tissues reveals changes associated with cancer development. Int. J. Cancer 136, 322–332 (2015).
132. Hübscher, S. G. & Harrison, R. F. Portal lymphadenopathy associated with lipofuscin in chronic cholestatic liver disease. J. Clin. Pathol. 42, 1160–5 (1989).
133. Croce, A. C. et al. Integrated autofluorescence characterization of a modified-diet liver model with accumulation of lipids and oxidative stress. Biomed Res. Int. 2014, 803491 (2014).
134. Croce, A. C., Ferrigno, A., Santin, G., Vairetti, M. & Bottiroli, G. Bilirubin: an autofluorescence bile biomarker for liver functionality monitoring. J. Biophotonics 7, 810–817 (2014).
135. Croce, A. C. & Bottiroli, G. Lipids: Evergreen autofluorescent biomarkers for the liver functional profiling. Eur. J. Histochem. 61, 2808 (2017).
136. Croce, A. C. et al. Fluorescing fatty acids in rat fatty liver models. J. Biophotonics 10, 905–910 (2017).
137. Tajiri, H. Autofluorescence endoscopy for the gastrointestinal tract. Proc. Jpn. Acad. Ser.

135
B. Phys. Biol. Sci. 83, 248–55 (2007).
138. Ducháč, V. et al. Peroperative optical autofluorescence biopsy—verification of its diagnostic potential. Lasers Med. Sci. 26, 325–333 (2011).
139. Roy, H. K. & Backman, V. Spectroscopic Applications in Gastrointestinal Endoscopy. Clin. Gastroenterol. Hepatol. 10, 1335–1341 (2012).
140. Angelova, L. et al. Fluorescence spectroscopy of gastrointestinal tumors: in vitro studies and in vivo clinical applications. in (eds. Spigulis, J. & Kuzmina, I.) 9032, 903209 (International Society for Optics and Photonics, 2013).
141. Liu, J., Dlugosz, A. & Neumann, H. Beyond white light endoscopy: the role of optical biopsy in inflammatory bowel disease. World J. Gastroenterol. 19, 7544–51 (2013).
142. Wan, Q.-S., Wang, T. & Zhang, K.-H. Biomedical optical spectroscopy for the early diagnosis of gastrointestinal neoplasms. Tumor Biol. 39, 101042831771798 (2017).
143. Amano, T., Kunimi, K. & Ohkawa, M. Fluorescence spectra from human semen and their relationship with sperm parameters. Arch. Androl. 36, 9–15 (1996).
144. Yin, D. & Brunk, U. in Free Radical and Antioxidant Protocols 217–228 (Humana Press, 1998). doi:10.1385/0-89603-472-0:217
145. Tyrrell, R. M. & Keyse, S. M. New trends in photobiology. The interaction of UVA radiation with cultured cells. J. Photochem. Photobiol. B. 4, 349–61 (1990).
146. Cideciyan, A. V, Swider, M. & Jacobson, S. G. Autofluorescence imaging with near-infrared excitation:normalization by reflectance to reduce signal from choroidal fluorophores. Invest. Ophthalmol. Vis. Sci. 56, 3393–406 (2015).
147. Piccolino, F. C., Borgia, L., Zinicola, E., Iester, M. & Torrielli, S. Pre-injection fluorescence in indocyanine green angiography. Ophthalmology 103, 1837–1845 (1996).
148. Gibbs, D., Cideciyan, A. V, Jacobson, S. G. & Williams, D. S. Retinal pigment epithelium defects in humans and mice with mutations in MYO7A: imaging melanosome-specific autofluorescence. Invest. Ophthalmol. Vis. Sci. 50, 4386–4393 (2009).
149. Pivtoraiko, V. N., Stone, S. L., Roth, K. A. & Shacka, J. J. Oxidative Stress and Autophagy in the Regulation of Lysosome-Dependent Neuron Death. Antioxid. Redox Signal. 11, 481–496 (2009).
150. Nixon, R. A. The role of autophagy in neurodegenerative disease. Nat. Med. 19, 983–997 (2013).
151. Hensley, K. & Harris-White, M. E. Redox regulation of autophagy in healthy brain and neurodegeneration. Neurobiol. Dis. 84, 50–59 (2015).
152. American National Standard for Safe Use of Lasers ANSI Z136.1. (2007).
153. Schneider, C. A., Rasband, W. S. & Eliceiri, K. W. NIH Image to ImageJ: 25 years of image analysis. Nat. Methods 9, 671–675 (2012).
154. Rasband, W. S. ImageJ. U. S. National Institutes of Health, Bethesda, Maryland, USA Available at: https://imagej.nih.gov/ij/.
155. Abramoff, M. D., Magalhaes, P. J. & Ram, S. J. Image Processing with ImageJ.

136
Biophotonics Int. 11, 36–42 (2004).
156. Grossi, C. E. & Zaccheo, D. On the autofluorescence of specific granulations of eosinophilic leukocytes. Boll. Soc. Ital. Biol. Sper. 39, 421–4 (1963).
157. Fuerst, D. E. & Jannach, J. R. Autofluorescence of Eosinophils: a Bone Marrow Study. Nature 205, 1333–1334 (1965).
158. Isobe, K., Nakayama, H. & Uetsuka, K. Relation between lipogranuloma formation and fibrosis, and the origin of brown pigments in lipogranuloma of the canine liver. Comp. Hepatol. 7, 5 (2008).
159. Beljaars, L. et al. Hepatic Localization of Macrophage Phenotypes during Fibrogenesis and Resolution of Fibrosis in Mice and Humans. Front. Immunol. 5, 430 (2014).
160. Rantakari, P. et al. Stabilin-1 expression defines a subset of macrophages that mediate tissue homeostasis and prevent fibrosis in chronic liver injury. Proc. Natl. Acad. Sci. 113, 9298–9303 (2016).
161. Lillie, R. D., Ashburn, L. L., Sebrell, W. H., Daft, F. S. & Lowry, J. V. Histogenesis and Repair of the Hepatic Cirrhosis in Rats Produced on Low Protein Diets and Preventable with Choline. Public Heal. Reports 57, 502 (1942).
162. Tsuchida, M., Miura, T. & Aibara, K. Lipofuscin and lipofuscin-like substances. Chem. Phys. Lipids 44, 297–325 (1987).
163. Nagano, K. et al. Inhalation Carcinogenicity and Chronic Toxicity of Carbon Tetrachloride in Rats and Mice. Inhal. Toxicol. 19, 1089–1103 (2007).
164. Geerts, A. M. et al. Comparison of three research models of portal hypertension in mice: macroscopic, histological and portal pressure evaluation. Int. J. Exp. Pathol. 89, 251–263 (2008).
165. Everson Pearse, A. G. Histochemistry Theoretical and Applied. (Churchill Livingstone, 1985).
166. Glees, P. & Hasan, M. Lipofuscin in neuronal aging and diseases. Norm. Pathol. Anat. (Stuttg). 32, 1–68 (1976).
167. Evangelou, K. & Gorgoulis, V. G. in 111–119 (Humana Press, New York, NY, 2017). doi:10.1007/978-1-4939-6670-7_10
168. Barden, H. The intragranular location of carboxyl groups in neuromelanin and lipofuscin in human brain and in meningeal melanosomes in mouse brain. J. Histochem. Cytochem. 34, 1271–1279 (1986).
169. Layton, C. & Bancroft, J. D. in Bancroft’s Theory and Practice of Histological Techniques (eds. Suvarna, S. K., Layton, C. & Bancroft, J. D.) 215–238 (Churchill Livingstone, 2013). doi:10.1016/B978-0-7020-4226-3.00012-3
170. Lillie, R. D. A nile blue staining technic for the differentiation of melanin and lipofuscins. Biotech. Histochem. 31, 151–153 (1956).
171. Schnell, S. A., Staines, W. A. & Wessendorf, M. W. Reduction of Lipofuscin-like Autofluorescence in Fluorescently Labeled Tissue. J. Histochem. Cytochem. 47, 719–730 (1999).

137
172. Sun, Y. et al. Sudan Black B Reduces Autofluorescence in Murine Renal Tissue. Arch. Pathol. Lab. Med. 135, 1335–1342 (2011).
173. Seehafer, S. S. & Pearce, D. A. You say lipofuscin, we say ceroid: Defining autofluorescent storage material. Neurobiol. Aging 27, 576–588 (2006).
174. Boll, M., Weber, L. W., Becker, E. & Stampfl, A. Mechanism of carbon tetrachloride-induced hepatotoxicity. Hepatocellular damage by reactive carbon tetrachloride metabolites. Z. Naturforsch. C. 56, 649–659 (2001).
175. Slater, T. F. Necrogenic Action of Carbon Tetrachloride in the Rat: A Speculative Mechanism Based on Activation. Nature 209, 36–40 (1966).
176. Chang, M.-L., Yeh, C.-T., Chang, P.-Y. & Chen, J.-C. Comparison of murine cirrhosis models induced by hepatotoxin administration and common bile duct ligation. World J. Gastroenterol. 11, 4167–72 (2005).
177. Delire, B., Stärkel, P. & Leclercq, I. Animal Models for Fibrotic Liver Diseases: What We Have, What We Need, and What Is under Development. J. Clin. Transl. Hepatol. 3, 53–66 (2015).
178. Inoue, Y., Izawa, K., Kiryu, S., Tojo, A. & Ohtomo, K. Diet and Abdominal Autofluorescence Detected by in Vivo Fluorescence Imaging of Living Mice. Mol. Imaging 7, 7290.2008.0003 (2008).
179. Scholten, D., Trebicka, J., Liedtke, C. & Weiskirchen, R. The carbon tetrachloride model in mice. Lab. Anim. 49, 4–11 (2015).
180. Terman, A. & Brunk, U. T. Lipofuscin. Int. J. Biochem. Cell Biol. 36, 1400–1404 (2004).
181. Matsumoto, M. et al. An improved mouse model that rapidly develops fibrosis in non-alcoholic steatohepatitis. Int. J. Exp. Pathol. 94, 93–103 (2013).
182. Casteilla, L., Pénicaud, L., Cousin, B. & Calise, D. Choosing an adipose tissue depot for sampling: factors in selection and depot specificity. Methods Mol. Biol. 456, 23–38 (2008).
183. Tohma, H., Hepworth, A. R., Shavlakadze, T., Grounds, M. D. & Arthur, P. G. Quantification of ceroid and lipofuscin in skeletal muscle. J. Histochem. Cytochem. 59, 769–79 (2011).
184. O’Neil, M., Damjanov, I. & Taylor, R. M. Liver Pathology for Clinicians. (Springer International Publishing, 2015). doi:10.1007/978-3-319-20080-4
185. Li-cor Biosciences. In Vivo Animal Imaging Diet Considerations. (2008).
186. Bhaumik, S., DePuy, J. & Klimash, J. Strategies to minimize background autofluorescence in live mice during noninvasive fluorescence optical imaging. Lab Anim. (NY). 36, 40–43 (2007).
187. Miquel, J., Lundgren, P. R. & Johnson, J. E. Spectrophotofluorometric and electron microscopic study of lipofuscin accumulation in the testis of aging mice. J. Gerontol. 33, 3–19 (1978).
188. Giannessi, F., Giambelluca, M. A., Scavuzzo, M. C. & Ruffoli, R. Ultrastructure of testicular macrophages in aging mice. J. Morphol. 263, 39–46 (2005).

138
189. Paniagua, R., Amat, P., Nistal, M. & Martin, A. Ultrastructure of Leydig cells in human ageing testes. J. Anat. 146, 173–83 (1986).
190. Nygaard, M. B., Almstrup, K., Lindbæk, L., Christensen, S. T. & Svingen, T. Cell context-specific expression of primary cilia in the human testis and ciliary coordination of Hedgehog signalling in mouse Leydig cells. Sci. Rep. 5, 10364 (2015).
191. Höhn, A. & Grune, T. Lipofuscin: formation, effects and role of macroautophagy. Redox Biol. 1, 140–4 (2013).
192. Terman, A., Gustafsson, B. & Brunk, U. Autophagy, organelles and ageing. J. Pathol. 211, 134–143 (2007).
193. Yang, D.-S. et al. Defective macroautophagic turnover of brain lipids in the TgCRND8 Alzheimer mouse model: prevention by correcting lysosomal proteolytic deficits. Brain 137, 3300–3318 (2014).
194. Zheng, S. et al. Deletion of the Huntingtin Polyglutamine Stretch Enhances Neuronal Autophagy and Longevity in Mice. PLoS Genet. 6, e1000838 (2010).
195. Cao, Y. et al. Autophagy Is Disrupted in a Knock-in Mouse Model of Juvenile Neuronal Ceroid Lipofuscinosis. J. Biol. Chem. 281, 20483–20493 (2006).
196. van Leyen, K., Holman, T. R. & Maloney, D. J. The potential of 12/15-lipoxygenase inhibitors in stroke therapy. Future Med. Chem. 6, 1853–5 (2014).
197. Kuhn, H., Banthiya, S. & van Leyen, K. Mammalian lipoxygenases and their biological relevance. Biochim. Biophys. Acta - Mol. Cell Biol. Lipids 1851, 308–330 (2015).
198. Yigitkanli, K. et al. Inhibition of 12/15-lipoxygenase as therapeutic strategy to treat stroke. Ann. Neurol. 73, 129–135 (2013).
199. Pallast, S. et al. Increased nuclear apoptosis-inducing factor after transient focal ischemia: a 12/15-lipoxygenase-dependent organelle damage pathway. J. Cereb. Blood Flow Metab. 30, 1157–67 (2010).
200. van Leyen, K. et al. Baicalein and 12/15-Lipoxygenase in the Ischemic Brain. Stroke 37, 3014–3018 (2006).
201. van Leyen, K., Duvoisin, R. M., Engelhardt, H. & Wiedmann, M. A function for lipoxygenase in programmed organelle degradation. Nature 395, 392–395 (1998).
202. Jang, I. et al. Genetic ablation and short-duration inhibition of lipoxygenase results in increased macroautophagy. Exp. Cell Res. 321, 276–287 (2014).
203. Sun, D. & Funk, C. D. Disruption of 12/15-lipoxygenase expression in peritoneal macrophages. Enhanced utilization of the 5-lipoxygenase pathway and diminished oxidation of low density lipoprotein. J. Biol. Chem. 271, 24055–62 (1996).
204. Kinder, M. et al. Hematopoietic stem cell function requires 12/15-lipoxygenase-dependent fatty acid metabolism. Blood 115, 5012–22 (2010).
205. Moore, K. et al. Altered epididymal sperm maturation and cytoplasmic droplet migration in subfertile male Alox15 mice. Cell Tissue Res. 340, 569–581 (2010).
206. Scaglione, S. et al. The Epidemiology of Cirrhosis in the United States. J. Clin. Gastroenterol. 49, 690–696 (2015).

139
207. Younossi, Z. M. et al. Changes in the prevalence of the most common causes of chronic liver diseases in the United States from 1988 to 2008. Clin. Gastroenterol. Hepatol. 9, 524–530.e1 (2011).
208. Younossi, Z. M. et al. Global epidemiology of nonalcoholic fatty liver disease-Meta-analytic assessment of prevalence, incidence, and outcomes. Hepatology 64, 73–84 (2016).
209. Bellentani, S., Scaglioni, F., Marino, M. & Bedogni, G. Epidemiology of Non-Alcoholic Fatty Liver Disease. Dig. Dis. 28, 155–161 (2010).
210. Wisniewski, H. M. & Wen, G. Y. Lipopigment in the aging brain. Am. J. Med. Genet. Suppl. 5, 183–91 (1988).
211. Pearse, A. G. E. Pigments and Pigment Precursors. Histochemistry. Theoretical and applied, Vol. 2: Analytical technology 2, (Churchill Livingstone, 1985).
212. Grizzi, F. et al. Mast cells and the liver aging process. Immun. Ageing 10, 9 (2013).
213. Mahmoodi, M., Zhang, S., Salim, S., Hou, J. S. & Garcia, F. U. Lipofuscin pigment can be used as a prognostic marker in prostatic adenocarcinoma. Ann. Diagn. Pathol. 10, 257–262 (2006).
214. Matsumoto, Y. Lipofuscin pigmentation in pleomorphic adenoma of the palate. Oral Surgery, Oral Med. Oral Pathol. Oral Radiol. Endodontology 92, 299–302 (2001).
215. Ball, R. Y., Carpenter, K. L. & Mitchinson, M. J. What is the significance of ceroid in human atherosclerosis? Arch. Pathol. Lab. Med. 111, 1134–40 (1987).
216. Porta, E. A. Pigments in aging: an overview. Ann. N. Y. Acad. Sci. 959, 57–65 (2002).
217. Riga, D. & Riga, S. Lipofuscin and ceroid pigments in aging and brain pathology. A review. I. Biochemical and morphological properties. Rom J Neurol Psychiatry 33, 121–136 (1995).
218. Bedossa, P. et al. Histopathological algorithm and scoring system for evaluation of liver lesions in morbidly obese patients. Hepatology 56, 1751–9 (2012).
219. Isherwood, B. et al. Live cell in vitro and in vivo imaging applications: accelerating drug discovery. Pharmaceutics 3, 141–70 (2011).
220. Choi, M., Kwok, S. J. J. & Yun, S. H. In vivo fluorescence microscopy: lessons from observing cell behavior in their native environment. Physiology (Bethesda). 30, 40–49 (2015).
221. Yang, K. S., Kohler, R. H., Landon, M., Giedt, R. & Weissleder, R. Single cell resolution in vivo imaging of DNA damage following PARP inhibition. Sci. Rep. 5, 10129 (2015).
222. Starosolski, Z. et al. Indocyanine green fluorescence in second near-infrared (NIR-II) window. PLoS One 12, e0187563 (2017).
223. Weissleder, R. & Ntziachristos, V. Shedding light onto live molecular targets. Nat. Med. 9, 123–128 (2003).
224. Diao, S. et al. Fluorescence Imaging In Vivo at Wavelengths beyond 1500 nm. Angew. Chemie 127, 14971–14975 (2015).

140
225. Salo, D., Kim, D. M. & Berezin, M. Y. Multispectral measurement of contrast in tissue-mimicking phantoms in near-infrared spectral range of 650 to 1600 nm spectral range of 650 to 1600 nm. J. Biomed. Opt. 19, 86008 (2014).
226. M., K. The Scattering of Light and Other Electromagnetic Radiation. (Academic Press, 1970).
227. Mie, G. Beiträge zur Optik trüber Medien, speziell kolloidaler Metallösungen. Ann. Phys. 330, 377–445 (1908).
228. Wang, D., Chen, Y. & Liu, J. T. C. A liquid optical phantom with tissue-like heterogeneities for confocal microscopy. 3, 3153–3160 (2012).
229. van Staveren, H. J., Moes, C. J. M., van Marle, J., Prahl, S. A. & van Gemert, M. J. C. Light scattering in Intralipid-10% in the wavelength range of 400-1100 nm. Appl. Opt. 30, 4507–4514 (1991).
230. Driver, I., Feather, J. W., King, P. R. & Dawson, J. B. The optical properties of aqueous suspensions of Intralipid, a fat emulsion. Phys. Med. Biol. 34, 1927–1930 (1989).
231. Flock, S. T., Jacques, S. L., Wilson, B. C., Star, W. M. & van Gemert, M. J. C. Optical properties of intralipid: A phantom medium for light propagation studies. Lasers Surg. Med. 12, 510–519 (1992).
232. Pogue, B. W. & Patterson, M. S. Review of tissue simulating phantoms for optical spectroscopy, imaging and dosimetry. J. Biomed. Opt. 11, 41102 (2006).
233. Lai, P., Xu, X. & Wang, L. V. Dependence of optical scattering from Intralipid in gelatin-gel based tissue-mimicking phantoms on mixing temperature and time. J. Biomed. Opt. 19, 35002 (2014).
234. Hines, M. A. & Scholes, G. D. Colloidal PbS Nanocrystals with Size-Tunable Near-Infrared Emission: Observation of Post-Synthesis Self-Narrowing of the Particle Size Distribution. Adv. Mater. 15, 1844–1849 (2003).
235. Mora, M., Tauber, C. & Batatia, H. Robust level set for heart cavities detection in ultrasound images. Comput. Cardiol. 32, 235–238 (2005).
236. Bevilacqua, F., Berger, A. J., Cerussi, A. E., Jakubowski, D. & Tromberg, B. J. Broadband absorption spectroscopy in turbid media by combined frequency-domain and steady-state methods. Appl. Opt. 39, 6498–6507 (2000).
237. Firbank, M., Hiraoka, M., Essenpreis, M. & Delpy, D. T. Measurement of the optical properties of the skull in the wavelength range 650-950 nm. Phys. Med. Biol. 38, 503–510 (1993).
238. Jacques, S. L. Optical Properties of Biological Tissues: A Review. Phys. Med. Biol. 58, R37-61 (2013).
239. Dubertret, B. et al. In vivo imaging of quantum dots encapsulated in phospholipid micelles. Science (80-. ). 298, 1759–1762 (2002).
240. Rowlands, C. J., Bruns, O. T., Bawendi, M. G. & So, P. T. C. Objective, comparative assessment of the penetration depth of temporal-focusing microscopy for imaging various organs. J. Biomed. Opt. 20, 61107 (2015).
241. Sevick-Muraca, E. M. Translation of Near-Infrared Fluorescence Imaging Technologies:

141
Emerging Clinical Applications. Annu. Rev. Med. 63, 217–231 (2012).
242. Zhu, B. & Sevick-Muraca, E. M. A review of performance of near-infrared fluorescence imaging devices used in clinical studies. Br. J. Radiol. 88, 20140547 (2015).
243. Vahrmeijer, A. L., Hutteman, M., van der Vorst, J. R., van de Velde, C. J. H. & Frangioni, J. V. Image-guided cancer surgery using near-infrared fluorescence. Nat. Rev. Clin. Oncol. 10, 507–518 (2013).
244. Sordillo, L. A., Pu, Y., Pratavieira, S., Budansky, Y. & Alfano, R. R. Deep optical imaging of tissue using the second and third near-infrared spectral windows. J. Biomed. Opt. 19, 56004 (2014).
245. Zhang, H. et al. Penetration depth of photons in biological tissues from hyperspectral imaging in shortwave infrared in transmission and reflection geometries. J. Biomed. Opt. 21, 126006 (2016).
246. Qian, G. et al. Band Gap Tunable, Donor−Acceptor−Donor Charge-Transfer Heteroquinoid-Based Chromophores: Near Infrared Photoluminescence and Electroluminescence. Chem. Mater. 20, 6208–6216 (2008).
247. Qian, G. et al. Simple and Efficient Near-Infrared Organic Chromophores for Light-Emitting Diodes with Single Electroluminescent Emission above 1000 nm. Adv. Mater. 21, 111–116 (2009).
248. Rogach, A. L., Eychmüller, A., Hickey, S. G. & Kershaw, S. V. Infrared-Emitting Colloidal Nanocrystals: Synthesis, Assembly, Spectroscopy, and Applications. Small 3, 536–557 (2007).
249. van Saders, B., Al-Baroudi, L., Tan, M. C. & Riman, R. E. Rare-earth doped particles with tunable infrared emissions for biomedical imaging. Opt. Mater. Express 3, 566 (2013).
250. Antaris, A. L. et al. A small-molecule dye for NIR-II imaging. Nat. Mater. 15, 235–242 (2016).
251. Hong, G. et al. Ultrafast fluorescence imaging in vivo with conjugated polymer fluorophores in the second near-infrared window. Nat. Commun. 5, (2014).
252. Naczynski, D. J. et al. Rare-earth-doped biological composites as in vivo shortwave infrared reporters. Nat. Commun. 4, 2199 (2013).
253. Hong, G. et al. In Vivo Fluorescence Imaging with Ag2S Quantum Dots in the Second Near-Infrared Region. Angew. Chemie Int. Ed. 51, 9818–9821 (2012).
254. Villa, I. et al. 1.3 μm emitting SrF2:Nd3+ nanoparticles for high contrast in vivo imaging in the second biological window. Nano Res. 8, 649–665 (2015).
255. Tao, Z. et al. Biological Imaging Using Nanoparticles of Small Organic Molecules with Fluorescence Emission at Wavelengths Longer than 1000 nm. Angew. Chemie Int. Ed. 52, 13002–13006 (2013).
256. Imamura, Y. et al. Near-Infrared Emitting PbS Quantum Dots for in Vivo Fluorescence Imaging of the Thrombotic State in Septic Mouse Brain. Molecules 21, 1080 (2016).
257. Resch-Genger, U., Grabolle, M., Cavaliere-Jaricot, S., Nitschke, R. & Nann, T. Quantum dots versus organic dyes as fluorescent labels. Nat. Methods 5, 763–775 (2008).

142
258. Gorka, A. P., Nani, R. R. & Schnermann, M. J. Cyanine polyene reactivity: scope and biomedical applications. Org. Biomol. Chem. 13, 7584–98 (2015).
259. Nani, R. R., Shaum, J. B., Gorka, A. P. & Schnermann, M. J. Electrophile-Integrating Smiles Rearrangement Provides Previously Inaccessible C4′- O -Alkyl Heptamethine Cyanine Fluorophores. Org. Lett. 17, 302–305 (2015).
260. Condon, E. A Theory of Intensity Distribution in Band Systems. Phys. Rev. 28, 1182–1201 (1926).
261. IRDye 800CW NHS Ester will Label Primary and Secondary Amines. Available at: https://www.licor.com/bio/products/reagents/irdye/800cw/nhs_ester. (Accessed: 11th January 2018)
262. Akorn - IC-Green® (indocyanine green for injection, USP). Available at: http://www.akorndirect.com/prod_detail.php?ndc=17478-701-02. (Accessed: 11th January 2018)
263. Drugs@FDA: FDA Approved Drug Products. Available at: https://www.accessdata.fda.gov/scripts/cder/daf/index.cfm?event=overview.process&applno=011525. (Accessed: 11th January 2018)
264. Philip, R., Penzkofer, A., Bäumler, W., Szeimies, R. M. & Abels, C. Absorption and fluorescence spectroscopic investigation of indocyanine green. J. Photochem. Photobiol. A Chem. 96, 137–148 (1996).
265. Yi, X., Wang, F., Qin, W., Yang, X. & Yuan, J. Near-infrared fluorescent probes in cancer imaging and therapy: an emerging field. Int. J. Nanomedicine 9, 1347–1365 (2014).
266. Hong, G. et al. Multifunctional in vivo vascular imaging using near-infrared II fluorescence. Nat. Med. 18, 1841–1846 (2012).
267. NIR-II Dye — Nirmidas Biotech. Available at: http://www.nirmidas.com/nirii-dye/. (Accessed: 8th April 2017)
268. Würth, C., Grabolle, M., Pauli, J., Spieles, M. & Resch-Genger, U. Relative and absolute determination of fluorescence quantum yields of transparent samples. Nat. Protoc. 8, 1535–1550 (2013).
269. Lim, S. J. et al. Brightness-equalized quantum dots. Nat. Commun. 6, 8210 (2015).
270. Landsman, M. L., Kwant, G., Mook, G. A. & Zijlstra, W. G. Light-absorbing properties, stability, and spectral stabilization of indocyanine green. J. Appl. Physiol. 40, 575–83 (1976).
271. Leung, K. IRDye 800CW-Human serum albumin. Molecular Imaging and Contrast Agent Database (MICAD) (2004).
272. Paumgartner, G., Probst, P., Kraines, R. & Leevy, C. M. Kinetics of Indocyanine Green Removal from the Blood. Ann. N. Y. Acad. Sci. 170, 134–147 (1970).
273. Meijer, D. K. F., Weert, B. & Vermeer, G. A. Pharmacokinetics of biliary excretion in man. VI. Indocyanine green. Eur. J. Clin. Pharmacol. 35, 295–303 (1988).
274. Brown, E., Munn, L. L., Fukumura, D. & Jain, R. K. In vivo imaging of tumors. Cold Spring Harb. Protoc. 2010, pdb.prot5452 (2010).

143
275. Kodack, D. P. et al. Combined targeting of HER2 and VEGFR2 for effective treatment of HER2-amplified breast cancer brain metastases. Proc. Natl. Acad. Sci. 109, E3119–E3127 (2012).
276. Gage, G. J., Kipke, D. R. & Shain, W. Whole animal perfusion fixation for rodents. J. Vis. Exp. (2012). doi:10.3791/3564
277. Askoxylakis, V. et al. Preclinical Efficacy of Ado-trastuzumab Emtansine in the Brain Microenvironment. J. Natl. Cancer Inst. 108, (2016).
278. Hillman, E. M. C. & Moore, A. All-optical anatomical co-registration for molecular imaging of small animals using dynamic contrast. Nat. Photonics 1, 526–530 (2007).
279. Dashti, R., Laakso, A., Niemelä, M., Porras, M. & Hernesniemi, J. in Acta neurochirurgica. Supplement 109, 247–250 (2011).
280. Washington, C. W. et al. Comparing indocyanine green videoangiography to the gold standard of intraoperative digital subtraction angiography used in aneurysm surgery. J. Neurosurg. 118, 420–427 (2013).
281. Dashti, R., Laakso, A., Niemelä, M., Porras, M. & Hernesniemi, J. Microscope-integrated near-infrared indocyanine green videoangiography during surgery of intracranial aneurysms: the Helsinki experience. Surg. Neurol. 71, 543–550 (2009).
282. Gruber, A., Dorfer, C., Standhardt, H., Bavinzski, G. & Knosp, E. Prospective Comparison of Intraoperative Vascular Monitoring Technologies During Cerebral Aneurysm Surgery. Neurosurgery 68, 657–673 (2011).
283. Sugie, T., Ikeda, T., Kawaguchi, A., Shimizu, A. & Toi, M. Sentinel lymph node biopsy using indocyanine green fluorescence in early-stage breast cancer: a meta-analysis. Int. J. Clin. Oncol. (2016). doi:10.1007/s10147-016-1064-z
284. Lee, Z., Moore, B., Giusto, L. & Eun, D. D. Use of Indocyanine Green During Robot-assisted Ureteral Reconstructions. Eur. Urol. 67, 291–298 (2015).
285. Rosenthal, E. L. et al. Successful Translation of Fluorescence Navigation During Oncologic Surgery: A Consensus Report. J. Nucl. Med. 57, 144–50 (2016).
286. Kopainsky, B., Qiu, P., Kaiser, W., Sens, B. & Drexhage, K. H. Lifetime, photostability, and chemical structure of IR heptamethine cyanine dyes absorbing beyond 1 um. Appl. Phys. B Photophysics Laser Chem. 29, 15–18 (1982).
287. Semonin, O. E. et al. Absolute photoluminescence quantum yields of IR-26 dye, PbS, and PbSe quantum dots. J. Phys. Chem. Lett. 1, 2445–2450 (2010).
288. Hatami, S. et al. Absolute photoluminescence quantum yields of IR26 and IR-emissive Cd1−x Hgx Te and PbS quantum dots – method- and material-inherent challenges. Nanoscale 7, 133–143 (2015).
289. Kodack, D. P. et al. The brain microenvironment mediates resistance in luminal breast cancer to PI3K inhibition through HER3 activation. Sci. Transl. Med. 9, eaal4682 (2017).
290. Carr, J. A. et al. Shortwave Infrared Fluorescence Imaging with the Clinically Approved Near-Infrared Dye Indocyanine Green. bioRxiv 100768 (2017). doi:10.1101/100768
291. Leevy, C. M., Smith, F., Longueville, J., Paumgartner, G. & Howard, M. M. Indocyanine Green Clearance as a Test for Hepatic Function. JAMA 200, 236 (1967).

144