Sediment loss in semiarid small watershed due to the land use
11
Revista Ciência Agronômica, v. 44, n. 3, p. 488-498, jul-set, 2013 Centro de Ciências Agrárias - Universidade Federal do Ceará, Fortaleza, CE www.ccarevista.ufc.br ISSN 1806-6690 Artigo Científico Sediment loss in semiarid small watershed due to the land use 1 Produção de sedimentos em microbacias hidrográficas semiáridas sobre manejos diferenciados Joseilson Oliveira Rodrigues 2 , Eunice Maia de Andrade 3 *, Helba Araújo Queiroz Palácio 4 , Luiz Alberto Ribeiro Mendonça 5 e Júlio César Neves dos Santos 6 ABSTRACT - The aim of this study was to evaluate and compare the sedimentological behavior in two small rural watersheds in the semiarid Northeast of Brazil, examining the influence of human activity on the sediment yields. The studied area is sited in the Alto Jaguaribe basin, more precisely in the Iguatu County, Ceará State. The experimental area was composed of two small watersheds denominated B1 and B2. In watershed B1 a treatment (thinning) was applied, eliminating the plant species with diameters lower than 10 cm. The results showed that the Caatinga clearing practice did have an influence in changing the sediment yield during the first events. It was also found that the magnitude of previous events contributed to an increase in the sediment yields by the subsequent events as a consequence of the sediment deposit in the drainage network. The accumulated sediment yields reached at the end of the 2009 rainfall season values of 1.45 and 1.39 tons ha -1 year -1 for B1 and B2, respectively, with no significant difference at 5%. It was concluded that, even when the effect of treatment on the sediment yields at the beginning of the rainy season is measured, the total sediment yields was not changed by the adoption of clearing. Therefore, it is a management system that can be employed in the land use at semiarid regions. Key words: Caatinga. Soil degradation. Soil erosion. Ephemeral creek. RESUMO - O objetivo central deste trabalho foi avaliar e comparar o comportamento sedimentológico em pequenas bacias rurais no semiárido nordestino, verificando a influência da ação antrópica sobre a produção de sedimentos. O estudo de caso foi conduzido em duas microbacias adjacentes e com uso da terra distintos. Estas estão localizadas no Bioma Caatinga, no semiárido do nordeste do Brasil. Em uma microbacia (B1) foi aplicado um tratamento (raleamento), eliminando-se as espécies vegetais com diâmetro inferior a 10 cm. A segunda microbacia experimental (2) foi mantida com sua cobertura vegetal original, que não é explorada há 30 anos. Os resultados revelaram que a prática de raleamento da Caatinga teve influência na alteração da produção de sedimentos durante os primeiros eventos. Verificou-se também que a magnitude dos eventos anteriores contribuiu para aumento na produção de sedimentos pelos eventos subseqüentes em conseqüência da deposição de sedimentos na rede de drenagem. A produção acumulada de sedimentos atingiu ao final do período chuvoso de 2009 valores de 1,45 e 1,39 ton ha -1 ano -1 para as microbacias B1 e B2, respectivamente, não apresentando diferença significativa ao nível de 5%. Conclui-se que, mesmo sendo constatado o efeito do tratamento sobre a produção de sedimentos no inicio da estação chuvosa, a produção total de sedimentos não foi alterada pela adoção do raleamento. Portanto, o mesmo é um manejo que pode ser empregado no uso da terra de regiões semiáridas. Palavras-chave: Caatinga. Solos-degradação. Solos-erosão. Cursos efêmeros. *Autor para correspondência 1 Recebido para publicação em 02/04/2012; aprovado 08/02/2013 Parte da Dissertação do primeiro autor apresentada ao Programa de Pós-Graduação em Engenharia Agrícola/UFC 2 Departamento de Engenharia Agrícola, Universidade Federal do Ceará, Foirtaleza-CE, Brasil, [email protected] 3 Universidade Federal do Ceará, Campus Cariri, Juazeiro do Norte-CE, Brasil, [email protected] 4 Instituto Federal do Ceara, Campus de Iguatu-CE, Brasil, [email protected] 5 Universidade Federal do Ceará, Campus Cariri, Juazeiro do Norte-CE, Brasil, [email protected] 6 Programa de Pós-Graduação em Engenharia Agrícola, CCA/UFC, Fortaleza-CE, Brasil, [email protected]
-
Upload
independent -
Category
Documents
-
view
4 -
download
0
Transcript of Sediment loss in semiarid small watershed due to the land use

Revista Ciência Agronômica, v. 44, n. 3, p. 488-498, jul-set, 2013Centro de Ciências Agrárias - Universidade Federal do Ceará, Fortaleza, CEwww.ccarevista.ufc.br ISSN 1806-6690
Artigo Científico
Sediment loss in semiarid small watershed due to the land use1
Produção de sedimentos em microbacias hidrográficas semiáridas sobre manejosdiferenciados
Joseilson Oliveira Rodrigues2, Eunice Maia de Andrade3*, Helba Araújo Queiroz Palácio4, Luiz Alberto RibeiroMendonça5 e Júlio César Neves dos Santos6
ABSTRACT - The aim of this study was to evaluate and compare the sedimentological behavior in two small rural watershedsin the semiarid Northeast of Brazil, examining the influence of human activity on the sediment yields. The studied area issited in the Alto Jaguaribe basin, more precisely in the Iguatu County, Ceará State. The experimental area was composed oftwo small watersheds denominated B1 and B2. In watershed B1 a treatment (thinning) was applied, eliminating the plantspecies with diameters lower than 10 cm. The results showed that the Caatinga clearing practice did have an influence inchanging the sediment yield during the first events. It was also found that the magnitude of previous events contributed to anincrease in the sediment yields by the subsequent events as a consequence of the sediment deposit in the drainage network.The accumulated sediment yields reached at the end of the 2009 rainfall season values of 1.45 and 1.39 tons ha-1 year-1 forB1 and B2, respectively, with no significant difference at 5%. It was concluded that, even when the effect of treatment on thesediment yields at the beginning of the rainy season is measured, the total sediment yields was not changed by the adoptionof clearing. Therefore, it is a management system that can be employed in the land use at semiarid regions.
Key words: Caatinga. Soil degradation. Soil erosion. Ephemeral creek.
RESUMO - O objetivo central deste trabalho foi avaliar e comparar o comportamento sedimentológico em pequenas baciasrurais no semiárido nordestino, verificando a influência da ação antrópica sobre a produção de sedimentos. O estudo decaso foi conduzido em duas microbacias adjacentes e com uso da terra distintos. Estas estão localizadas no Bioma Caatinga,no semiárido do nordeste do Brasil. Em uma microbacia (B1) foi aplicado um tratamento (raleamento), eliminando-se asespécies vegetais com diâmetro inferior a 10 cm. A segunda microbacia experimental (2) foi mantida com sua coberturavegetal original, que não é explorada há 30 anos. Os resultados revelaram que a prática de raleamento da Caatinga teveinfluência na alteração da produção de sedimentos durante os primeiros eventos. Verificou-se também que a magnitude doseventos anteriores contribuiu para aumento na produção de sedimentos pelos eventos subseqüentes em conseqüência dadeposição de sedimentos na rede de drenagem. A produção acumulada de sedimentos atingiu ao final do período chuvosode 2009 valores de 1,45 e 1,39 ton ha-1 ano-1 para as microbacias B1 e B2, respectivamente, não apresentando diferençasignificativa ao nível de 5%. Conclui-se que, mesmo sendo constatado o efeito do tratamento sobre a produção de sedimentosno inicio da estação chuvosa, a produção total de sedimentos não foi alterada pela adoção do raleamento. Portanto, o mesmoé um manejo que pode ser empregado no uso da terra de regiões semiáridas.
Palavras-chave: Caatinga. Solos-degradação. Solos-erosão. Cursos efêmeros.
*Autor para correspondência1Recebido para publicação em 02/04/2012; aprovado 08/02/2013 Parte da Dissertação do primeiro autor apresentada ao Programa de Pós-Graduação em Engenharia Agrícola/UFC2Departamento de Engenharia Agrícola, Universidade Federal do Ceará, Foirtaleza-CE, Brasil, [email protected] Federal do Ceará, Campus Cariri, Juazeiro do Norte-CE, Brasil, [email protected] Federal do Ceara, Campus de Iguatu-CE, Brasil, [email protected] Federal do Ceará, Campus Cariri, Juazeiro do Norte-CE, Brasil, [email protected] de Pós-Graduação em Engenharia Agrícola, CCA/UFC, Fortaleza-CE, Brasil, [email protected]

Rev. Ciênc. Agron., v. 44, n. 3, p. 488-498, jul-set , 2013 489
J. O. Rodrigues et al.
INTRODUCTION
Semiarid regions cover approximately one thirdof the earth’s surface and approximately 20% of theworld’s population lives in them (GAISER et al., 2003).These regions are very fragile and are characterized bya high spatial and temporal variability of rainfall depth(RODRIGUES et al., 2008). The variability of the pluvialregime in these regions associated with man’s interventionin land and water usage may change them, bringing abouta new support ability from these resources. As a resultof this problem, the improper management of the basinshas led to serious socioeconomic and environmentalconsequences, such as erosion in agricultural areas,resulting in an impoverishing of agricultural land, siltingand a reduction in the hydraulic capacity of downstreamreservoirs (ALBUQUERQUE et al., 2002; CANTÓNet al., 2001; MAMEDE, 2008; MEDEIROS et al., 2010;THOMAZ, 2009). The semiarid regions of the BrazilianNortheast, where Caatinga vegetation prevails, experiencea significant variation in precipitation indices and thesoils are normally very shallow, making them vulnerableto erosive processes. In several cases, depending on thedistribution and intensity of the rains, soil losses mayextend beyond the tolerable limits, which are around 2.5to 5 ton ha-1 year-1 for shallow soils according to the Foodand Agriculture Organization (FOOD AGRICULTUREORGANIZATION, 1965).
In addition to the problems mentioned,deforestation is a common practice in these regions asa consequence of demographic pressures induced by agrowing demand for agricultural and forestry products.Clearing the land is used as a way to achieve useable areasfor agricultural and livestock production. Indiscriminatedeforestation in order to create new farms, together withthe removal of wood for profit (construction, firewood,charcoal etc.) and the successive burns with inadequate
soil management, has combined with prolonged droughtsto compromise the fragile Caatinga equilibrium. Thecombination of these activities often results in permanentchanges in hydrosedimentological processes (AGUIARet al., 2006; BERTOL et al., 2006; SOUGNEZ; VANWEBEMAEL; VANACKER, 2010).
Significant effort has been made in an attempt tounderstand the behavior and/or changes in the sedimentyield process in the small basins. Despite there havingbeen some studies conducted in semiarid regions on thechanges in the pattern of sedimentological responses,the research needed to have been implemented in sucha way as to generate information at the ephemeral smallwatershed scale, primarily investigating the influenceof man on the alteration of natural processes (erosion,superficial runoff, maximum outflows, infiltration,etc.) (BARTLEY et al., 2006; GARFUR et al., 2003;GARCIA-RUIZ et al., 2008; SANTOS et al., 2011).
The challenges in studies of hydrosedimentologicalprocesses are related to the generation of consistentqualitative and quantitative information that can accuratelydescribe these processes. In this setting, the objectiveof this study was to evaluate and compare the sedimentyields on a mayfly small watershed scale, seeking toidentify the influence of man’s activities on the change inthe production of this resource.
MATERIALS AND METHODSDescription of the studied location
The studied area is located in the Alto Jaguaribebasin, more precisely in the Iguatu County, in theSouth Central region of Ceará State, Brazil, betweenthe geographic coordinates 6°23’42’’ to 6°23’47’’ Sand 39°15’24’’ to 39°15’29’’ W (Figure 1).
Figure 1 - Location of the small watersheds in the state of Ceará, Brazil

Rev. Ciênc. Agron., v. 44, n. 3, p. 488-498, jul-set, 2013490
Sediment loss in semiarid small watershed due to the land use
Figure 2 - Soils with cracks during the dry season (a) and sediment deposition in the main channel (b)
Figure 3 - The monthly rainfall data set at the Iguatu station, CE.The vertical bars represent the monthly standard deviation forthe 35 years data set (1973-2008)
The soil of the watershed is classified as atypical deep-black, Carbonate Vertisol, followingthe Brazilian Soil Classification System (EMPRESABRASILEIRA DE PESQUISA AGROPECUÁRIA, 2006).Its profile is flat and smoothly wavy from an intenseerosive process in clay soils, with type 2:1 clay, fromthe Montmorillonite group. Than, these soils have thepotential to shrink and swell, especially in climateregions that have distinct wet and dry seasons. During
dry season, these soils have large cracks on the surfaceand in the wet season the cracks disappear (Figure 2).
The climate is classified as hot semiarid climate(BSw’h’), with maximum rainfall in autumn, and theaverage monthly temperature is always above 18 ºC. Theannual average of rainfall is 970 ± 316 mm, characterizedby a high seasonal variability. The pluviometric precipitationexhibited an unimodal distribution with the maximum rainfallrecorded in the months of January to May (Figure 3).
Experimental small watersheds
The experimental area comprised two smallwatershed named B1 and B2, located near one another,with evaluation areas no larger than 3 hectares that weresurrounded and equipped and intended for sedimentologicalstudies under natural rain conditions. The average slope
of the studied watersheds was 8.7 for B1 and 10.6% forB2, and the water ways are of the first and second orderfor B1 and B2, respectively and belong to the ephemeralhydrologic regime. Based on flora samples from the smallwatersheds, the structure of the vegetal coverage foundin the area is formed primarily be herbaceous vegetalspecies, like Hyptis sauaviolens (L.) point (Bambural)and Hyptis sp. (minty); followed by a lesser proportionof characteristically shrubby and arboreal vegetal specieslike Aspidosperma pyrifolium Mart (Pereiro) (ALVES,2008). To identify the effect human activity on thehydrosedimentological process, small watershed B1 wascleared, a practice widely implemented by small farmersin the Brazilian semiarid region to increase the biomassof herbaceous extract and provide a greater availability offeed for herds of sheep, goats or cattle (ARAÚJO FILHOet al., 2002). This treatment was applied with the intentionof gauging the influence of the practice of clearing in theCaatinga, on the hydrosedimentological response in smallrural basins. The vegetal species with a diameter of equalor greater than 10 cm and herbaceous species were keptin the area. The cut material whose diameter was lessthan 5 cm (branch tips and twigs) was left on the top ofthe soil (Figure 4a) to reduce the erosive effect of the rain(impact of the rain drops and surface runoff).
Rev. Ciênc. Agron., v. 44, n. 3, p. 488-498, jul-set , 2013 491
J. O. Rodrigues et al.
Figure 4 - (a) watershed B1 after clearing treatment (November 2008); (b) details of the vegetal coverage in watershed B2 during dryseason (November, 2008)
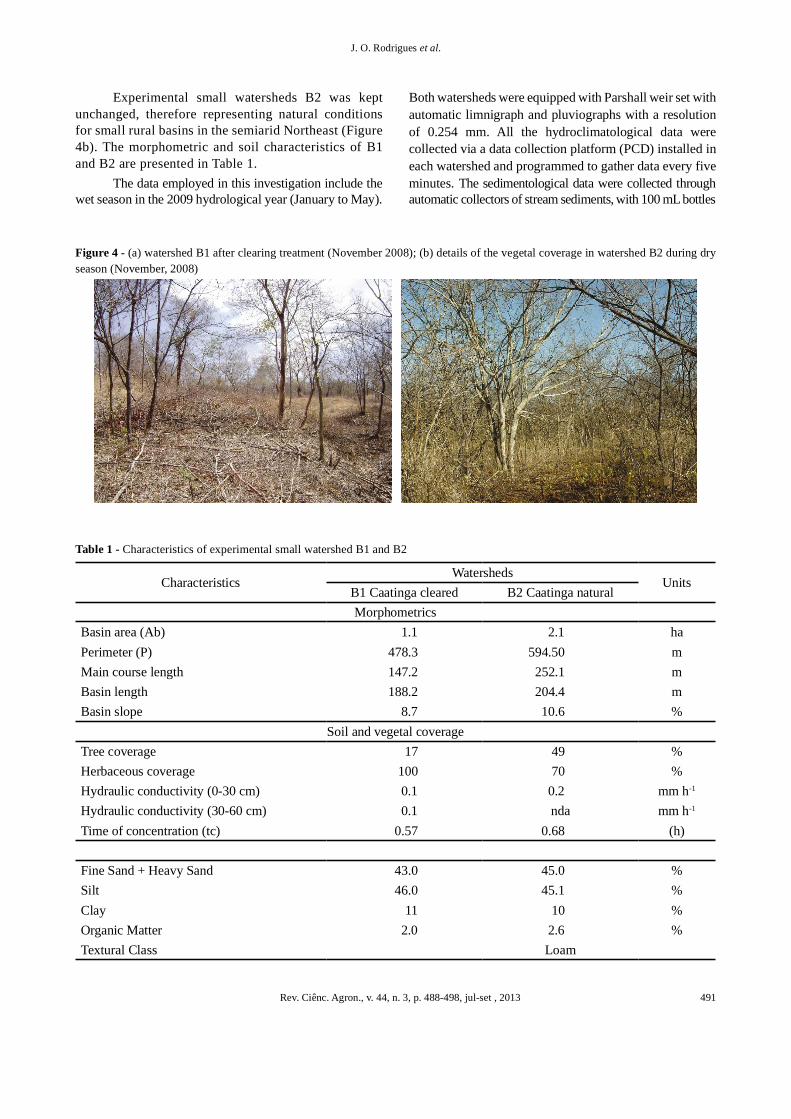
Table 1 - Characteristics of experimental small watershed B1 and B2
Experimental small watersheds B2 was keptunchanged, therefore representing natural conditionsfor small rural basins in the semiarid Northeast (Figure4b). The morphometric and soil characteristics of B1and B2 are presented in Table 1.
The data employed in this investigation include thewet season in the 2009 hydrological year (January to May).
Both watersheds were equipped with Parshall weir set withautomatic limnigraph and pluviographs with a resolutionof 0.254 mm. All the hydroclimatological data werecollected via a data collection platform (PCD) installed ineach watershed and programmed to gather data every fiveminutes. The sedimentological data were collected throughautomatic collectors of stream sediments, with 100 mL bottles
CharacteristicsWatersheds
UnitsB1 Caatinga cleared B2 Caatinga naturalMorphometrics
Basin area (Ab) 1.1 2.1 haPerimeter (P) 478.3 594.50 mMain course length 147.2 252.1 mBasin length 188.2 204.4 mBasin slope 8.7 10.6 %
Soil and vegetal coverageTree coverage 17 49 %Herbaceous coverage 100 70 %Hydraulic conductivity (0-30 cm) 0.1 0.2 mm h-1
Hydraulic conductivity (30-60 cm) 0.1 nda mm h-1
Time of concentration (tc) 0.57 0.68 (h)
Fine Sand + Heavy Sand 43.0 45.0 %Silt 46.0 45.1 %Clay 11 10 %Organic Matter 2.0 2.6 %Textural Class Loam

Rev. Ciênc. Agron., v. 44, n. 3, p. 488-498, jul-set, 2013492
Sediment loss in semiarid small watershed due to the land use
nda - absence of data, Monitoring and treatment of the hydrosedimentological data
0-5 cmSoil density 1.65 1.29 g cm-3
Microporosity 40.03 46.04 %Macroporosity 12.58 12.48 %Total Porosity 52.61 58.52 %
5-15 cmSoil density 1.38 1.50 g cm-3
Microporosity 36.72 50.88 %Macroporosity 11.55 7.14 %Total Porosity 48.27 58.01 %
continuação tabela 1
available every 15 cm, a total of 12 for each watershed. Thesamples were collected soon after generating flow events ofsurface clearing that reached a collection point in the sedimenttower. The concentration analyses of solids were performedlater on in the Laboratory of Water, Solids and Vegetal Tissueat the Federal Institute of Education, Science and Technologyat Iguatu, Ceará, according to the American Public HealthAssociation (1998) methodology.
The superficial flow monitored via the Parshall weirswere later converted to runoff volume by expression 1. Thetotal sediment yield was determined by multiplying thesediment concentration by the total volume of runoff.
(1)
where:V - volume of runoff water corresponding to eachrainfall event, L; to - start time of the overland flow, s; tn -end time of the overland flow; Q(t) - drainage as a functionof time, L s-1 and t - the runoff time interval, s.
In all watersheds rating curves were created, correlatingthe sediment yield values (ton ha-1) for each individual eventwith the corresponding peak flow (L s-1). For each one, avariance analysis was done, intended to test the modelfor the best adjustment of the ratio between runoff andsediment yield. With the models generated, the streamsediment yield was estimated, and the difference betweenthe values measured and those estimated is determinedaccording to the following ratio. (HOROWITZ, 2003).
(2)
where: %d - represents the percentage deviation betweenthe sediment yield measured and estimated (%); SY -
Measured sediment yield (ton ha-1); SYest - Estimatedsediment yield (ton ha-1).
As a way to evaluate the sediment yield, erosivityvalues are also calculated, which is considered to be agood indicator/estimator of soil loss (ALBUQUERQUEet al., 2005). The rainfall erosivity (EI30) was estimated byexpression 3 (WISCHMEIER; SMITH, 1978):
(3)
where: Ec = kinetic energy of rainfall per area unit (MJ ha-1);and I30 = maximum rainfall intensity in half an hour(mm h-1). Further information about the calculationprocesses involving the estimated kinetic energy canbe found in Wischmeier and Smith, 1978. The averagesediment yield values were compared by the t test at asignificance level of 5%, also it was investigated therelationship between sediment productivity and dischargepeak by a regression analysis using the SPSS v.16.0.
RESULTS AND DISCUSSION
During the period of investigation, it wasregistered an erosivity varying from 74 MJ mm ha-1 h-1,responding to the lower sediment yield in the period(24 kg ha-1), to 1.114 MJ mm ha-1 h-1 for the event onJanuary 30, 2009. Although, it was the largest erosivityevent, it accounted for a low sediment yield (Figure 5).
This fact is explained by the high value of initialabstraction of water registered in the early rainfallevents, resulting in a low runoff volume and promotinga reduction in sediment yield (SANTOS et al., 2011).Before the first rainfall events that generally occur atthe end of January, the region experiences long periodsof drought (June/December) and with a high potential

Rev. Ciênc. Agron., v. 44, n. 3, p. 488-498, jul-set , 2013 493
J. O. Rodrigues et al.
of evapotranspiration (>1900 mm year-1). This climaticcharacteristic results in an increased deficit in the soil,thereby requiring an increased intake of water by the soilto promote saturation and surface runoff, influencingsediment yield. Another important process that is relatedwith the low sediment yield in the early events is shrink
Figure 5 - Erosivity (EI30), Sediment yield (SY) and Accumulated sediment yield (SYacum) by events in watersheds B1 andB2 for the 2009 rainfall season
and swell of soils due to the occurrence of 2:1 clay. Theexpansion of these clay minerals depends so much ofsoil moisture. In fact if soil is dry, a large quantity ofwater is required until soil be saturated. Because of this,the soils of watershed present a high initial abstractionat the beginning of rainfall season (Figure 2a).

Rev. Ciênc. Agron., v. 44, n. 3, p. 488-498, jul-set, 2013494
Sediment loss in semiarid small watershed due to the land use
Although there is a difference in the watershedsmacroporosities, we can not attribute the changes occurredin the sediment yield during the end of wet season to them,since they do not change at this time. Also, geomorphologicwatershed characteristics cannot explain the sediment yieldbehavior since there is a high geomorphologic similaritybetween B1 and B2 (Table 1). Thus, the main cause forsediment yield alteration is the growth of herbaceousvegetation. The great growth of herbaceous vegetation inB1 due to the land use (Figure 6) during the wet seasonresulted in a physical barrier to sediment dynamics. Thisfact, largely justifies the lower sediment yield of the thinnedwatershed B1, as will be discussed.
As has already been presented in material andmethods, B1 was cleared, the vegetal coverage waschanged, while B2 characteristics were unaltered, servingas a standard for comparison of the two. Analyzing theavailable data, a high sediment yield tendency can beobserved in two periods, one of them during the eventsthat took place from 18 February to 4 March, and theother from 30 April to 8 May (Figure 5). For the event on 18February the sediment yield value is justified by the magnitudeof the vent, and this is considered the largest for the year 2009,with the peak flow reaching 105 and 80 L ha-1 s-1 in B1 andB2 respectively, with I30 at 61.2 mm h-1. For the followingevent (4 March), although smaller in magnitude than thefirst, with I30 equal to 29.5 mm h-1, a high sediment yieldwas also registered, greater than 100 kg ha-1 (Figure 5).
The greatest sediment yield was recorded in B2 forthe event of 30 April, 2009, reaching the value 635 kg ha-1,resulting in a total yield similar to the cleared watershed, B1
Figure 6 - Herbaceous vegetation cover in the watershed B1after thinning
(Figure 5). The event referred to was the shortest in duration(0.75 h), with I30 and I5 reaching a rate of 55.8 mm h-1 and97.5 mm h-1, respectively. It is significant that during theperiod of the event on 30 April, the content of the waterin the soil was 27%, and registered as saturated or nearlysaturated (RODRIGUES, 2009). It is believed that theelevated water content in the soil influenced in reducing therate of infiltration, this aspect combined with high intensityof the events favored a high drag rate and soil sedimentalong the beds of the waterway.
In addition to generate high suspended sedimentconcentrations (SSC), events of this magnitude result infinancial and environmental damages from the removalof this resource from the basin, causing fertility depletion(BARTLEY et al., 2006; THOMAZ, 2009). Also, it givesway for a residual effect associated with the disturbance ofthe soil and sediment deposit in susceptible areas, whichare easily carried away in subsequent events. Accordingto Garfur et al. (2003), values of I30 greater than 25 mm h-1
may be considered critical for erosive processes. Of all theobserved events (Figure 5), only four have a maximumintensity in thirty minutes (I30) less than this threshold, theevent on 13 April, 2009 (I30 of 18.7 mm h-1) is the lowestsediment yield value in B1 and B2, with values of 9.6and 10 kg ha-1, respectively.
According to the previous analysis, it was identifiedthe effect of the characteristics of the event on the sedimentyield in the next events. This way, the characteristics ofthe event of february 18 influenced in the sediment yieldof the subsequent event (March/04).
The same effect can be observed for B1 and B2in the events on the 30 April and 8 May. These resultssuggest the existence of connectivity between the eventsregarding the production and transportation of sediments;that is, the characteristics of the event from 18 February,may be influenced in the removal and transportation ofsediments, with their deposit on the main channel and thelowest parts of the basin (Figure 2b), becoming availableto be transported in the subsequent event (March 4).
This condition of production and transportationof sediments by successive events may suggest that thesediments, and nutrients along with them, may leavethe basin at small intervals of time, due to the speed ofthe flow, and by the fact that the transportation becomesfacilitated by the presence of sediments directly on thedrainage network (FRYIRS et al., 2007).
Also, upon examining Figure 5, it can be identifiedthat, until around April 25, 2009, the experimental unit B1presented a sediment yield greater than that of B2, inspiteof the fact that its area was practically twice that of area B1.The accumulated sediment yield in B1 until this date wasaround 82% of that produced by B2. These results confirm

Rev. Ciênc. Agron., v. 44, n. 3, p. 488-498, jul-set , 2013 495
J. O. Rodrigues et al.
Figure 7 - Peak discharge versus accumulated rainfall untilthe peaks (PPTant)
the hypothesis of the increment in the sediment yield as aconsequence of the differences in the land use. This factwas true only in the initial phase of the wet season. Inthe events subsequent to this date (April 17 to May 13,the phase of full herbaceous growth development), aninversion occurred and B2 began to present a greatersediment yield compared to B1. It is believed that therapid herbaceous vegetation development during thepost-treatment at small watershed B1 and the effect ofinternal roughness in the basin caused by microelevações,microdepressions and the residual litter, have contributedto the attenuation of the sediment yield. The bloom ofvegetation began after the first rainfall events and increasedprogressively until the end of the rainy season. After theherbaceous cover had been established the infiltration andretention of sediments increased in the area. These resultsconfirm the observations of Bertol et al. (2006), thatshow the effect of surface vegetation and waste left on theground on reducing runoff and sediment yield. Aguiar etal. (2006), who studied soil and water losses in intenselycultivated conditions in semiarid regions, also identifiedthe influence of herbaceous growth on the reduction oflosses from the soil. This observation point out to moresequential observations, where the contribution of eachperiod of herbaceous growth in watershed sediment yieldin semiarid regions can be quantified.
The total sediment yields accumulated ofexperimental units B1 and B2 in 2009 correspondedto 1.45 and 1.39 ton ha-1, respectively (Figure 5). Thesevalues are greater than those concluded by Sougnez,Van Webemael and Vanacker (2010), who determinedmaximum annual values of 250 kg ha-1 year-1 in sparselyvegetated catchments in southeast Spain; and greater thanthose calculated by Gargur et al. (2003) in watershedsin India, which reached average losses of 1.2 ton ha-1
year-1 in constant tilled and abandoned land agriculturalsystems. However, statistical analysis about the averagesediment yield values between B1 (96.73 kg ha-1) andB2 (139.78 kg ha-1) in the period revealed that there wasno significant difference between both at 5% statisticalsignificance. But, considering that the critical level ofloss for shallow soils is between 2.5 and 5 ton ha-1 year-1
(FOOD AGRICULTURE ORGANIZATION , 1965), andthat the year 2009 presented well distributed precipitationand with erosivity values that are much lower compared to2008 (ALVES, 2008), the values found for the year 2009raised the alarm with respect to sustainability, especially ifthese levels were kept up over several years.
The relationship between peak discharges andaccumulated rainfall until the peaks (PPTantec) shows upthe effect of them over the increases in runoff and sedimentyield (Figure 7). It is observed that the production ofrunoff in watersheds B1 and B2 occurs for accumulated
rainfall of respectively 8 and 6 mm with a flow rate ofincrease of 3.3 and 4.9 L s-1. For the individual relationshiprunoff up monitoring units in B1 and B2 is explained byrespectively 79 and 78% of the variation of precipitateaccumulation before the peak. This analisy suggeststhat the accumulated previous rainfall, are important inexplaining the effect of water accumulation in soil on thespecific elevation of peak discharges. Garcia-Ruiz et al.(2008) e Cantón et al. (2001), also point to the influenceof previous rainfall in higher peak discharges.
In the absence of data measuring the sedimentconcentration, generally rating curves are used toapproximately estimate the sediment yield, which requiresmeasuring of runoff and sediment yield. In Figure 8, ratingcurves are displayed for the individual events for the 2009wet season in B1 and B2, respectively. A total of 23 eventswere employed in sediment yield in the two watersheds,fourteen of which were in B1 and 9 in B2. The linearregression analysis revealed the adjusted potential as beingthe one most applicable to explain the sediment yieldvariation as a function of the maximum observed runoff.In these, the adjusted model of best performance was thepotential, with a statistical significance of 1% and R2 of 0.80and 0.68, respectively (Figure 8) Although sediment yieldis a multivariate process and a single parameter analysiscan explain only part of the phenomenon, these analysis areimportant to point out the tendency of the process.
The observed and estimated sediment yieldvalues, employing the models from Figure 8, as well asthe percentage deviation between the both, are found inTable 2. The negative sign in the deviations implies anunderestimate of the observed values, and the positivevalues are indicative of an overestimate.

Rev. Ciênc. Agron., v. 44, n. 3, p. 488-498, jul-set, 2013496
Sediment loss in semiarid small watershed due to the land use
Figure 8 - Rating curves: Sediment yield observed vs Peakflow for experimental small watershed B1 and B2 in the 2009rainy season
Table 2 - Sediment yield observed (SY) and sediment yield estimated (SYest) employing the models from figure 8 and Percentagedeviations in small watershed B1 and B2 in the 2009 rainy season
nda - absence of data; *- negative deviations indicate that the estimated values were underestimates of what was observed
EventB1 B2
SY SYest % SY SYest %Jan-30-09 17.66 56.14 217.92 6.94 19.59 182.31Feb-04-09 1.16 2.80 141.62 ndaFeb-12-09 6.21 4.88 -21.35 ndaFeb-18-09 295.75 254.26 -14.03 94.02 254.27 170.45Mar-04-09 104.74 100.23 -4.31 123.26 129.50 5.06Mar-17-09 41.98 74.12 76.55 ndaApr-13-09 nda 10.23 8.35 -18.33Apr-05-09 54.78 71.80 31.06 ndaApr-17-09 83.10 181.17 118.01 89.33 207.49 132.28Apr-09-09 nda 30.90 37.11 20.09Apr-23-09 24.63 8.42 -65.80 ndaApr-24-09 84.28 45.65 -45.84 ndaApr-25-09 60.27 35.21 -41.57 76.78 43.14 -43.81Apr-30-09 406.37 206.85 -49.10 635.50 207.90 -67.29May-08-09 209.78 108.92 -48.08 245.18 100.92 -58.84May-13-09 50.61 70.47 39.24 85.60 61.91 -27.67
The results reveal variations of up to 217.9%between observed and estimated values of sediment yieldto B1. This watershed still involved two other eventswhere the observed data was greatly overestimated(February 4 and March 17, 2009). It was also noted that
the smaller the event in relation to sediment yield, themore inaccurate the estimates are, especially for sedimentyield of less than 60 kg ha-1. It is believed that the effectof the treatment applied to B1 is the source of the greatervariation between the estimates, resulting in the changesin the sediment load response, making this type of precisequantification about the observed values more difficult.By the percent deviations of the B2 sediment yield,there is also a high degree of variation, the greatest ofwhich was on January 30, which can observed a 182.3%overestimate of the observed values.
It is important to emphasize that the resultsobtained with the rating curves only indicate trends inproduction and sediment estimates that leave these units.A monitoring sequence is necessary to obtain a series witha greater number of records. Yet, the results obtained dohave a significant relevance in explaining the principalspatial-temporal aspects of the sediment deliver, as wellas the sedimentological answers in ephemeral flow insemiarid regions. In fact it is serving as support forcomprehension of the processes and opening for studiesat a later date. However, due to the distinct differences inthe outcome between the watersheds, it is evident that theresults of a simple basin cannot be regionally extrapolatedto other neighboring areas without first performing a

Rev. Ciênc. Agron., v. 44, n. 3, p. 488-498, jul-set , 2013 497
J. O. Rodrigues et al.
detailed study on the connectivity between them and onthe primary variables that affect the processes. This maybe a problem in semiarid regions due to the climaticuncertainties associated with the significant temporal andspatial variability of the characteristics of precipitation(RODRIGUES et al., 2008) that act directly on the sedimentyield process. These results also raise the alarm towardsgeneralizations about sedimentological characteristics insemiarid regions, that even though they are specializedbasins in the same environment, the conditions of soilusage may result in sedimentological differentiations,making it more difficult to extrapolate the results.
CONCLUSION
1. The results of this investigation show that thesedimentological modifications from human actions onwatershed B1 had a greater effect on the first events.The growth of the herbaceous vegetal covering after thetreatment reduced the quantity of sediments load at theend of the period. This fact highlights the need for specificinvestigative studies about the power of erosive control onherbaceous and arboreal growth in semiarid regions;
2. The rate of soil losses in both land use did not exceedthe allowable limits;
3. It is also noticed that the magnitude of previousevents affected the sediment deposit in the drainagenetwork, contributing to an increase in the sedimentsyield in subsequent events.
REFERENCESAGUIAR, M. I. et al. Perdas de solo, água e nutrientes emsistemas agroflorestais no município de Sobral, CE. RevistaCiência Agronômica, v. 37, n. 3, p. 270-278, 2006.
ALBUQUERQUE, A. W. et al. Determinação de fatores daequação universal de perda de solo em Sumé, PB. RevistaBrasileira de Engenharia Agrícola e Ambiental, v. 9, n. 2,p. 153-160, 2005.
ALBUQUERQUE, A. W. et al. Manejo da cobertura do soloe de práticas conservacionistas nas perdas de solo e água emSumé, PB. Revista Brasileira de Engenharia Agrícola eAmbiental, v. 6, n. 1, p. 136-141, 2002.
ALVES, N. N. L. Caracterização de micro-baciahidrográfica experimental no semi-árido brasileiro comosuporte a estudos da degradação. 2008. 77 f. Dissertação(Mestrado em Irrigação e Drenagem) - Universidade Federaldo Ceará, Fortaleza, 2008.
AMERICAN PUBLIC HEALTH ASSOCIATION. Standardmethods for the examination of water and wastewater. 20.ed. Washington, DC: American Public Health Association,1998. 1220 p.
ARAÚJO FILHO, et al. Pastoreio misto em caatinga manipuladano Sertão Cearense. Revista Cientifica de Produção Animal,v.4, n.1-2, p.9-21, 2002.
BARTLEY, R. et al. Runoff and erosion from Australian’stropical semi-arid rangelands: influence of ground cover fordiffering space and time scale. Hydrological Processes, v. 20,n. 15, p. 3317-3333, 2006.
BERTOL, I. et al. Parâmetros relacionados com a erosãohídrica sob taxa constante da enxurrada, em diferentesmétodos de preparo do solo. Revista Brasileira de Ciênciasdo Solo, v. 30, n. 4, p. 715-722, 2006.
CANTÓN, Y. et al. Hydrological and erosion response of abadland system in semiarid SE Spain. Journal of Hydrology,v. 252, n. 1, p. 65-84, 2001.
EMPRESA BRASILEIRA DE PESQUISA AGROPECUÁRIA).Sistema brasileiro de classificação de solos. Brasilia:EMBRAPA-CNPS, 2006. 306 p.
FOOD AND AGRICULTURE ORGANISATION. Soil Erosionby Water: Some measures for its Control on Cultivated Lands.Rome: FAO, 1965. 299 p.
FRYIRS, K. A. et al. Buffers, barriers and blankets: The(dis)connectivity of catchment-scale sediment cascades.Catena, v. 70, n. 1, p. 49-67, 2007.
GAISER, T. et al. Global Change and Regional ImpactsBerlin: Springer Verlag, 2003. 428 p.
GARCIA-RUIZ, J. M. et al. Flood generation and sediment transportin experimental catchments affected by land use changes in thecentral Pyrenees. Journal of Hydrology, v. 274, p. 30-46, 2008.
GARFUR, A. et al. Runoff and losses of soil and nutrientsfrom small watersheds under shifting cultivation (Jhum)in the Chittagong Hill Tracts of Bangladesh. Journal ofHydrology, v. 274, n. 1/4, p. 30-46, 2003.
HOROWITZ, A. J. An evaluation of sediment rating curvesfor estimating suspended sediment concentrations forsubsequent flux calculations. Hydrological Processes, v. 17,n. 17, p. 3389-3409, 2003.
MAMEDE, J. L Reservoir Sedimentation in DrylandCatchments: Modelling and Management. Potsdam. 2008.120 f. Tese (Doutorado em Hidrologia) - Instituto de Geocologiada Universidade de Potsdam, Potsdam, 2008.
MEDEIROS, P. H. A. et al. Modelling spatio-temporalpatterns of sediment yield and connectivity in a semi-aridcatchment with the WASA-SED model. HydrologicalSciences Journal, v. 55, n. 4, p. 636-648, 2010.
MILTON, J. S. Statistical methods in the biological and healthsciences. 2. ed. New York: McGrow-Hill, 1992. 526 p.
RODRIGUES, J. O. O uso da terra e a respostahidrossedimentológica em pequenas bacias hidrográficassemiáridas. 2009. 128 f. Dissertação (Mestrado em EngenhariaAgrícola) - Universidade Federal do Ceará, Fortaleza, 2009.
RODRIGUES, J. O. et al. Equações de Intensidade-Duração-Frequência de chuvas para as localidades de Fortaleza e Pentecoste,Ceará. Scientia Agrária, v. 9, n. 4, p. 511-519, 2008.

Rev. Ciênc. Agron., v. 44, n. 3, p. 488-498, jul-set, 2013498
Sediment loss in semiarid small watershed due to the land use
SANTOS, J. C. N. et al. Runoff and soil and nutrient losses insemiarid uncultivated fields. Revista Ciência Agronômica,v. 42, n. 3, p. 813-820, 2011.
SOUGNEZ, N.; VAN WESEMAEL, B.; VANACKER, V. Lowerosion rates measured for steep, sparsely vegetated catchmentsin southeast Spain. Catena, v. 84, n. 1/2, p. 1-11, 2010.
THOMAZ, E. L. The influence of traditional steep landagricultural practices on runoff and soil loss. Agricultural,Ecosystem and environment, v. 130, p. 23-30, 2009.
WISCHMEIER, W. H.; SMITH, D. D. Predicting rainfallerosion losses: A guide to conservation planning. Washington:USDA, 1978. 58 p.