White River Watershed Preliminary Habitat Assessment
72
WHITE RIVER WATERSHED PRELIMINARY HABITAT ASSESSMENT MR-2003-18 Prepared for: The Community Foundation for Muskegon County Prepared by: Dr. Richard Rediske, Senior Research Scientist Matt Cooper, Research Assistant Dr. Don Uzarski, Research Scientist Rod Denning, Research Associate Annis Water Resources Institute 740 Shoreline Drive Muskegon, MI 49441 And Dr. Thomas M. Burton Department of Zoology Michigan State University East Lansing, MI 48823-5399 February 2003
Transcript of White River Watershed Preliminary Habitat Assessment
WHITE RIVER WATERSHED
PRELIMINARY HABITAT ASSESSMENT
MR-2003-18
Prepared for:
The Community Foundation for Muskegon County
Prepared by:
Dr. Richard Rediske, Senior Research Scientist
Matt Cooper, Research Assistant Dr. Don Uzarski, Research Scientist Rod Denning, Research Associate Annis Water Resources Institute
740 Shoreline Drive Muskegon, MI 49441
And
Dr. Thomas M. Burton Department of Zoology
Michigan State University East Lansing, MI 48823-5399
February 2003

i
2
Executive Summary
The White River watershed is the product of the interaction of its unique geologic, hydrologic, and ecologic systems. Glacial geology formed the moraine ridges in the headwaters and produced the outwash plains, soil associations, tributary systems, and pitted areas where kettle lakes and depressional wetlands are found. The coupling with Lake Michigan and the influence of its water level fluctuations carved the deep river valleys and formed the extensive drowned rivermouth complex of White Lake and its wetlands. The hydrologic system in the watershed focuses local groundwater into the stream channel, maintains cold temperature environments that support a significant trout fishery, sustains the regional lakes and wetlands, and provides the vehicle that transports and deposits carbon and nutrients throughout the watershed. Using these geologic and hydrologic resources, a diverse array of biological communities function and interact in the upland forests and prairies of the catchment, the transitional wetland areas, and the aquatic systems present in lakes and streams. In its current state, the White River watershed contains approximately 200,000 acres of forest, 43,000 acres of wetlands, 6,300 acres of open water (lakes and streams), and 38,000 acres of open field. Lands under agricultural production and urban land use cover only 30% of the watershed area. These anthropomorphic systems interact with the geologic, hydrologic, and ecologic framework of the watershed to define the structure and function of the entire basin. In this project, a preliminary assessment of habitats in the White River watershed was conducted. Land cover and land use were evaluated using available remote sensing data to provide an assessment of current conditions and an analysis of significant change over a 20 year period (1978 to 1992/1997/1998). Investigations of water and habitat quality were also conducted in White Lake, the drowned rivermouth wetland, and selected streams and wetlands in the tributaries and branches of the White River. Significant findings of these assessments include:
Land cover/use on a watershed basis appeared to be stable with
forested and wetland areas showing slight increases in total acreage. With respect to agriculture, row crop usage declined with a corresponding increase in orchards and open fields.
Areas of significant change were noted on a subwatershed basis. The areas of greatest urban growth were concentrated in the US 31 corridor, the villages, and around larger lakes.
Mid and lower stream sections and wetlands were located in forested areas with riparian vegetative cover and buffers. Wetlands and streams in several of the headwater areas have poor riparian zones.
The watershed contains a number of rare and endangered habitats including coastal marshes, bogs, dry sand prairies, barrens, wet
3
meadows, and mesic prairies. The acreage of Pine/Oak Barrens have decreased by almost 50% over the last 20 years.
White Lake has remained eutrophic and will require a detailed investigation of nutrient loading and hydrologic modeling to develop a plan to improve water quality.
The drowned rivermouth was found to be impacted by a combination of agricultural and urban sources.
Cushman Creek and Heald Creek were found to be impacted by anthropogenic pollution.
Several wetlands in the upper watershed were impacted by adjacent land use practices (agriculture and road/stream crossings).
Based on the above findings, the following recommendations were made:
Establish a watershed assembly to promote, prioritize, and coordinate water quality and habitat management/restoration activities throughout the basin.
Initiate programs involving public education, best management practices, and land acquisition to promote stewardship, improve environmental quality, and preserve rare habitats, respectively.
Conduct the necessary hydrologic modeling to evaluate nutrient loading to White Lake and identify critical areas to target source control programs in the upper watershed.
Develop and implement a plan to restore the drowned rivermouth wetland
This project was an important beginning for future planning and educational activities in the watershed. Preliminary data on the geological, hydrological, and ecological systems were assembled and several areas of concern were identified. In consideration of the size and complexity of the watershed, it is clear that more information will be required to develop effective management plans. Without this information, it is impossible to prioritize issues, formulate mitigation strategies, and initiate changes that are truly beneficial to the system. We must also communicate this information through a public educational process that fosters resource preservation and stewardship. Education will help foster lasting change. The data from this project also illustrate the importance of a holistic approach to watershed management. It will be impossible to maintain water and habitat quality on a watershed basis if problems in headwater streams and development pressure are not addressed. The future of the White River watershed depends on a detailed assessment of the resource, the development of a holistic preservation plan, and a strong public education component to promote active stewardship. The watershed is a unique and diverse resource with important ecologic and economic value that will require a coordinated and holistic approach for preservation and restoration.
4
4.0 White River Watershed Land Cover Analysis
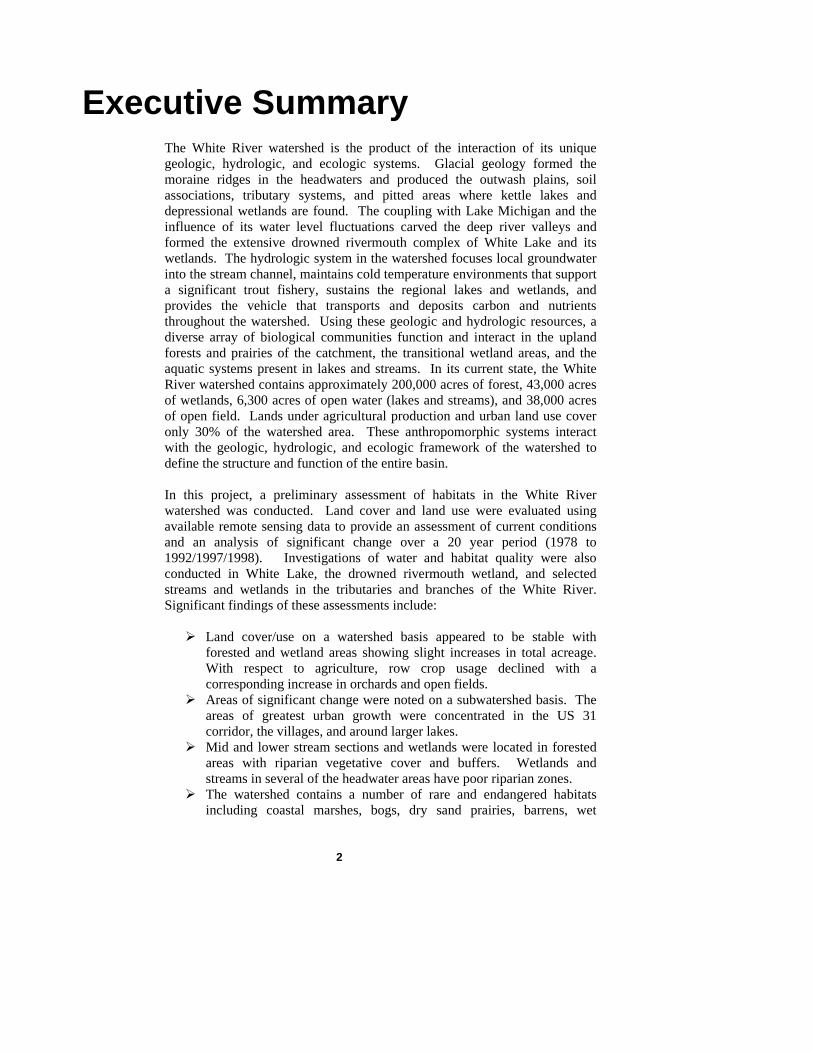
Land cover analyses were conducted in each of the subwatersheds using MIRIS data from 1978 and 1992/1997/1998. The most recent data sets were used for each county (Oceana 1992, Newaygo 1997, and Muskegon 1998) and were compared to the 1978 information to determine areas where significant change occurred. The results of the GIS land cover analyses and field surveys are presented in Sections 4.1-4.10 for the individual subwatersheds. Summaries of the current land cover and significant changes from 1978 to 1992/1997/1998 are also presented. 4.1 UPPER SOUTH BRANCH The Upper South Branch subwatershed covers 60,473 acres and includes sections of eight townships and the City of White Cloud. The land cover data for this area are summarized in Table 4.1.1 and displayed in map format on Figure 4.1.1. The Upper South Branch subwatershed consists primarily of mature forests (68.4%), cropland (13.6%), open fields (11.2%), wetlands (4.25%), open water (0.57%), and developed (0.99% residential, 0.04% commercial/institutional, 0.56% other development). Most of the cropland and open fields are concentrated in the southern and eastern portions of the subwatershed, and the wetlands are mainly found in the northwest portions in Monroe and Merrill Townships. This subwatershed contains nearly 26% of all the wetlands found in the White River watershed, totaling 2,571.2 acres (Table 4.1.1). The majority of these wetlands are located in close proximity to the smaller headwater tributaries and lakes of the Upper South Branch. A large wetland complex is also located in the upper northwest portion of the watershed (Oxford Swamp). The western headwaters of the South Branch and part of Mullen Creek near Van Buren Street, pass through a section of agricultural land where the stream channel lacks a significant riparian zone. This is reflected by a change in water temperature as the streams pass through this area. Diamond Lake is the largest water body in the subwatershed. Approximately 60% of the shoreline is residential and agricultural lands border the home sites in the eastern shore. Since 1978, very little change in land usage has occurred (Table 4.1.1). The most significant change was a shift from cropland and open fields to forested areas. The increase in other developed areas was related to the expansion of an oil and gas field near Four Mile Road and the addition of lands dedicated to utilities and infrastructure in
5
the White Cloud area. The continued stability of the wetlands and forests in this subwatershed is essential to the local trout fishery and protection of the headwater streams.
Table 4.1.1 Land Cover Analysis of the Upper South Branch Subwatershed.
1992/1997/1998
Land Use/Cover Classification
1978 Acreage
AcreagePercent of Total
Net Change Acreage
Percent Change
Residential 576 596 1.0 20 3.5 Commercial/Institutional 19 23 < 0.1 4 23 Industrial 54 75 0.1 20 37 Other Developed Area 125 341 0.6 216 173 Cropland 8,771 8,196 14 -575 -6.6 Confined Feeding and Permanent Pasture 232 8 < 0.1 -223 -96
Orchard or Other Specialty Crop 8 154 0.3 146 1,781
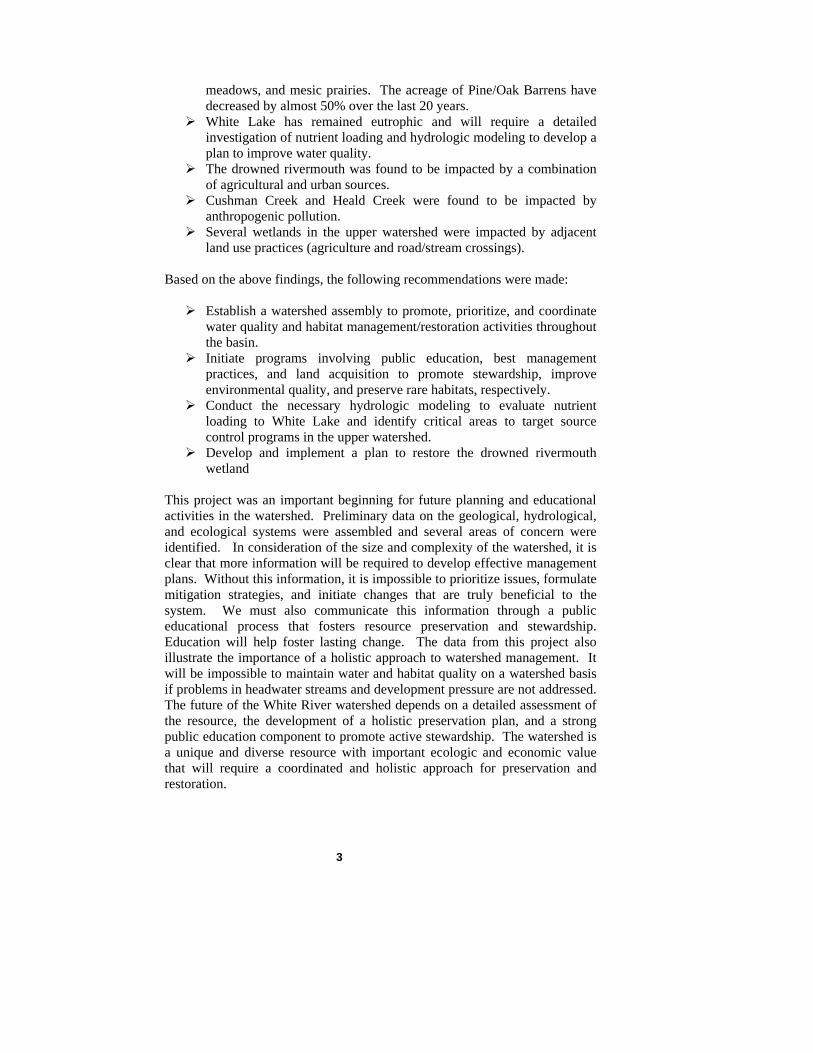
Other Agricultural Land 23 25 < 0.1 2 8.5 Open Field 7,191 6,753 11 -438 -6.1 Forest 40,661 41,372 68 711 1.7 Water 350 347 0.6 -4 -1.1 Wetland 2,464 2,571 4.3 108 4.4 Transitional Land 0 3 < 0.1 3 NA 60,464 4.2 SOUTH BRANCH WHITE RIVER/ROBINSON LAKE The South Branch White River/Robinson Lake subwatershed covers 39,372 acres and includes sections of six townships and the City of White Cloud. GIS land cover data are presented in Table 4.2.1 and displayed in map format on Figure 4.2.1. Approximately 60% of the subwatershed is undeveloped forest, 20% is cropland and 11% is open fields. The forested areas are found in the eastern half of the subwatershed, and the majority of the cropland and open fields are concentrated in the western portion. Riparian corridors have been removed from most of the wetlands and stream channels in the agricultural area. This subwatershed contains 12% of all the wetlands found in the White River watershed, which are concentrated mainly in Dayton and Sherman Townships south of Baseline Road. Developed areas include approximately

6
FIGURE 4.1.1 LAND COVER MAP OF UPPER SOUTH BRANCH SUBWATERSHED.
7
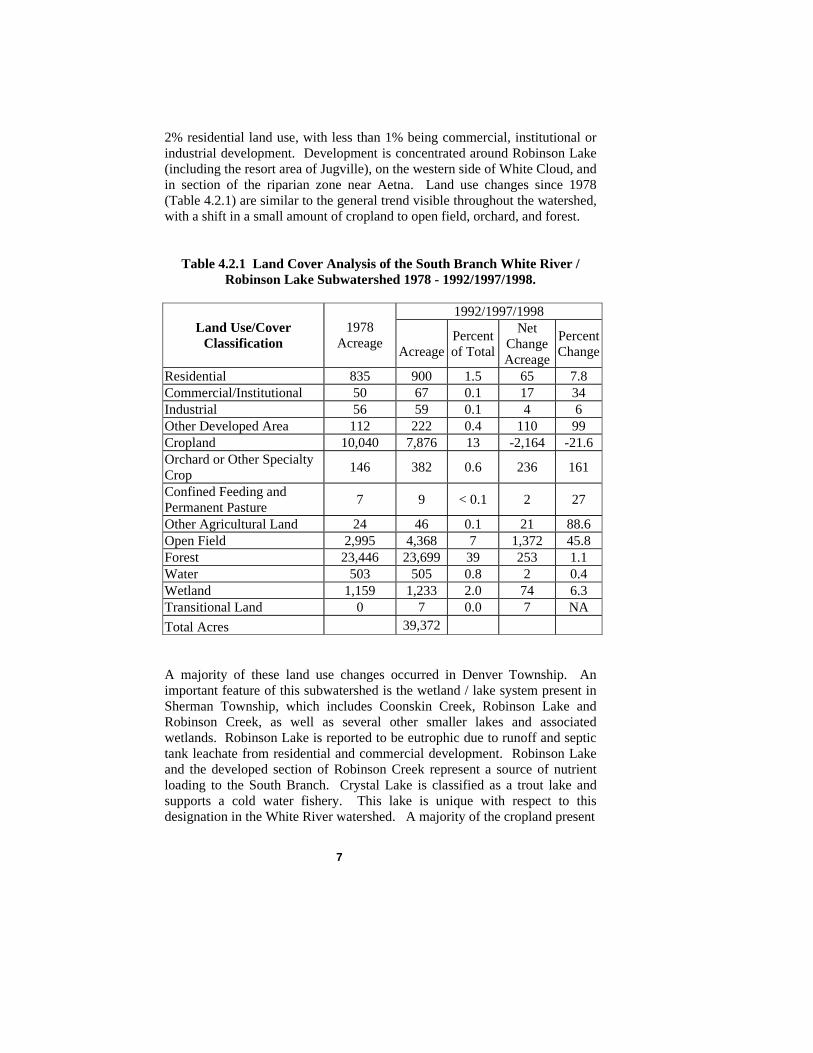
2% residential land use, with less than 1% being commercial, institutional or industrial development. Development is concentrated around Robinson Lake (including the resort area of Jugville), on the western side of White Cloud, and in section of the riparian zone near Aetna. Land use changes since 1978 (Table 4.2.1) are similar to the general trend visible throughout the watershed, with a shift in a small amount of cropland to open field, orchard, and forest.
Table 4.2.1 Land Cover Analysis of the South Branch White River / Robinson Lake Subwatershed 1978 - 1992/1997/1998.
1992/1997/1998
Land Use/Cover Classification
1978 Acreage
AcreagePercent of Total
Net Change Acreage
Percent Change
Residential 835 900 1.5 65 7.8 Commercial/Institutional 50 67 0.1 17 34 Industrial 56 59 0.1 4 6 Other Developed Area 112 222 0.4 110 99 Cropland 10,040 7,876 13 -2,164 -21.6 Orchard or Other Specialty Crop 146 382 0.6 236 161
Confined Feeding and Permanent Pasture 7 9 < 0.1 2 27
Other Agricultural Land 24 46 0.1 21 88.6 Open Field 2,995 4,368 7 1,372 45.8 Forest 23,446 23,699 39 253 1.1 Water 503 505 0.8 2 0.4 Wetland 1,159 1,233 2.0 74 6.3 Transitional Land 0 7 0.0 7 NA Total Acres 39,372 A majority of these land use changes occurred in Denver Township. An important feature of this subwatershed is the wetland / lake system present in Sherman Township, which includes Coonskin Creek, Robinson Lake and Robinson Creek, as well as several other smaller lakes and associated wetlands. Robinson Lake is reported to be eutrophic due to runoff and septic tank leachate from residential and commercial development. Robinson Lake and the developed section of Robinson Creek represent a source of nutrient loading to the South Branch. Crystal Lake is classified as a trout lake and supports a cold water fishery. This lake is unique with respect to this designation in the White River watershed. A majority of the cropland present
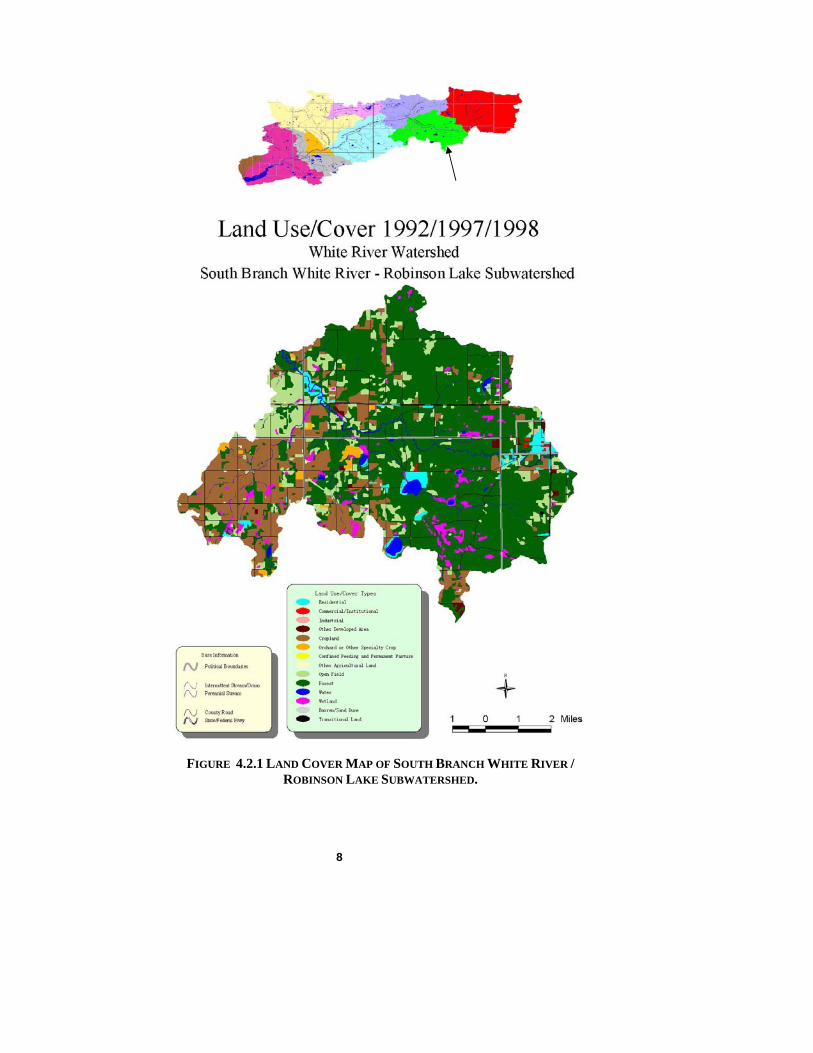
FIGURE 4.2.1 LAND COVER MAP OF SOUTH BRANCH WHITE RIVER / ROBINSON LAKE SUBWATERSHED.
8
9
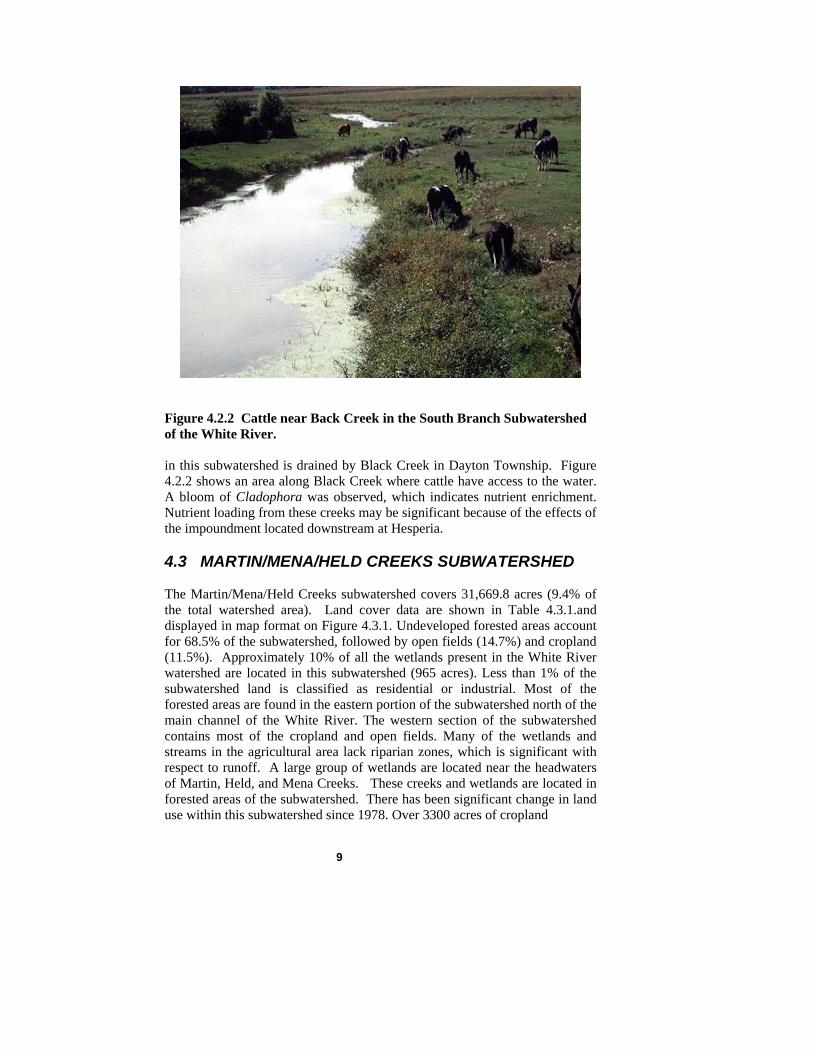
Figure 4.2.2 Cattle near Back Creek in the South Branch Subwatershed of the White River. in this subwatershed is drained by Black Creek in Dayton Township. Figure 4.2.2 shows an area along Black Creek where cattle have access to the water. A bloom of Cladophora was observed, which indicates nutrient enrichment. Nutrient loading from these creeks may be significant because of the effects of the impoundment located downstream at Hesperia. 4.3 MARTIN/MENA/HELD CREEKS SUBWATERSHED The Martin/Mena/Held Creeks subwatershed covers 31,669.8 acres (9.4% of the total watershed area). Land cover data are shown in Table 4.3.1.and displayed in map format on Figure 4.3.1. Undeveloped forested areas account for 68.5% of the subwatershed, followed by open fields (14.7%) and cropland (11.5%). Approximately 10% of all the wetlands present in the White River watershed are located in this subwatershed (965 acres). Less than 1% of the subwatershed land is classified as residential or industrial. Most of the forested areas are found in the eastern portion of the subwatershed north of the main channel of the White River. The western section of the subwatershed contains most of the cropland and open fields. Many of the wetlands and streams in the agricultural area lack riparian zones, which is significant with respect to runoff. A large group of wetlands are located near the headwaters of Martin, Held, and Mena Creeks. These creeks and wetlands are located in forested areas of the subwatershed. There has been significant change in land use within this subwatershed since 1978. Over 3300 acres of cropland

10
Table 4.3.1 Land Cover Analysis of the Martin/Mena/Held Creeks
Subwatershed 1978 - 1992/1997/1998
1992/1997/1998 Land Use/Cover
Classification 1978
Acreage Acreage
Percent of Total
Net Change Acreage
Percent Change
Residential 31 36 0.1 5 15.0 Industrial 0 5 0.0 5 NA Other Developed Area 0 49 0.2 49 NA Cropland 6,988 3,654 12 -3,334 -48 Orchard or Other Specialty Crop 161 395 1.2 234 146
Confined Feeding and Permanent Pasture 31 31 0.1 0 -0.6
Other Agricultural Land 10 27 0.1 17 163 Open Field 2,358 4,644 15 2,285 97 Forest 20,945 21,692 68 747 3.6 Water 172 173 0.5 0 0.2 Wetland 976 965 3.0 -11 -1.1 Total 31,670 changed to open fields, and a large portion of this change was concentrated south of the main channel of the White River’s south branch near M-20 and Green Avenue in Dayton Township. Martin, Mena, and Held Creeks are classified as quality trout streams with high gradients and considerable woody debris. It is imperative that the riparian zone and surrounding forests be maintained in their current condition to maintain habitat quality. 4.4 SKEEL/CUSHMAN/BRATON CREEKS
SUBWATERSHED The Skeel/Cushman/Braton Creek subwatershed covers 49,644 acres or 14.8% of the White River watershed. Land cover data are shown in Table 4.4.1.and displayed in map format on Figure 4.4.1. The subwatershed includes seven townships in addition to the City of Hesperia. With respect to land cover, cropland and forested area percentages are nearly equal (38.4% and 44.8%, respectively), followed by open fields (5.9%). Developed areas account for slightly more than 5% of the land area. The undeveloped forested areas are located primarily in the southwestern portions of the subwatershed in the areas surrounding the White River channel. A majority of the residential land use is located in the city of Hesperia and in the surrounding areas, extending
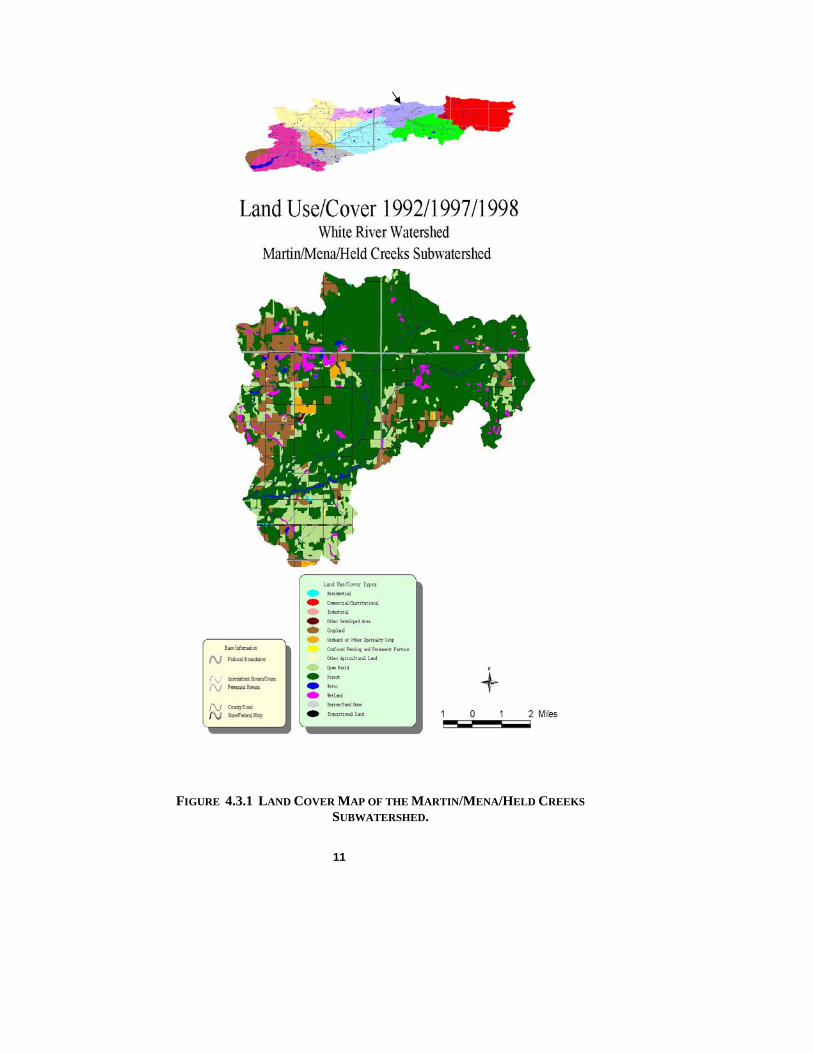
FIGURE 4.3.1 LAND COVER MAP OF THE MARTIN/MENA/HELD CREEKS SUBWATERSHED.
11

12
Table 4.4.1 Land Cover Analysis of the Skeel/Cushman/Braton Creeks
Subwatershed 1978 - 1992/1997/1998.
1992/1997/1998 Land Use/Cover
Classification 1978
Acreage Acreage
Percent of Total
Net Change Acreage
Percent Change
Residential 752 1,682 3.4 929 124 Commercial/Institutional 63 77 0.2 14 23 Industrial 9 9 < 0.1 0 0.1 Other Developed Area 552 920 1.9 368 67 Cropland 21,651 19,068 38 -2582 -12 Orchard or Other Specialty Crop 957 952 1.9 -5 -0.5
Confined Feeding and Permanent Pasture 318 251 0.5 -67 -21
Other Agricultural Land 9 99 0.2 91 1059 Open Field 2,493 2,938 5.9 445 18 Forest 21,457 22,228 45 771 3.6 Water 203 250 0.5 46 23 Wetland 1,167 1,154 2.3 -14 -1.2 Barren/Sand Dune 32 16 < 0.1 -16 -49 Total Acres 49,644 southward along the Oceana / Newaygo County line. Since 1978 there has been an marked increase in residential land use (124% increase, 929 new acres). Cropland decreased by 2,582 acres with a corresponding increase in developed areas (1,297 acres), forest (771 acres) and open field (368 acres). A majority of the land taken out of agricultural production is located north of Hesperia. A loss of 16 acres of Oak/Pine Barrens was noted in the transition zone of agricultural and forest lands near Braton Creek. Barrens are unique habitats (Section 3.6) and should be preserved to promote diversity. The increase in the other developed area category was related to the expansion of extractive sites. A number of gravel mining sites are located in the subwatershed and constructed in close proximity to streams. Hesperia Dam is also located in this subwatershed. The impoundment was very shallow and was subject to excessive siltation. This impoundment may be a source of nutrients and temperature related problems to the downstream section of the South Branch. As discussed in Section 3.7, Skeel, Cushman, and Braton Creeks were classified as trout streams that support natural reproduction. The headwaters of the three creeks are located in agricultural lands with limited riparian cover. Soil textures and slopes in the headwater areas have the potential for erosion and consequently, these creeks may be subject to
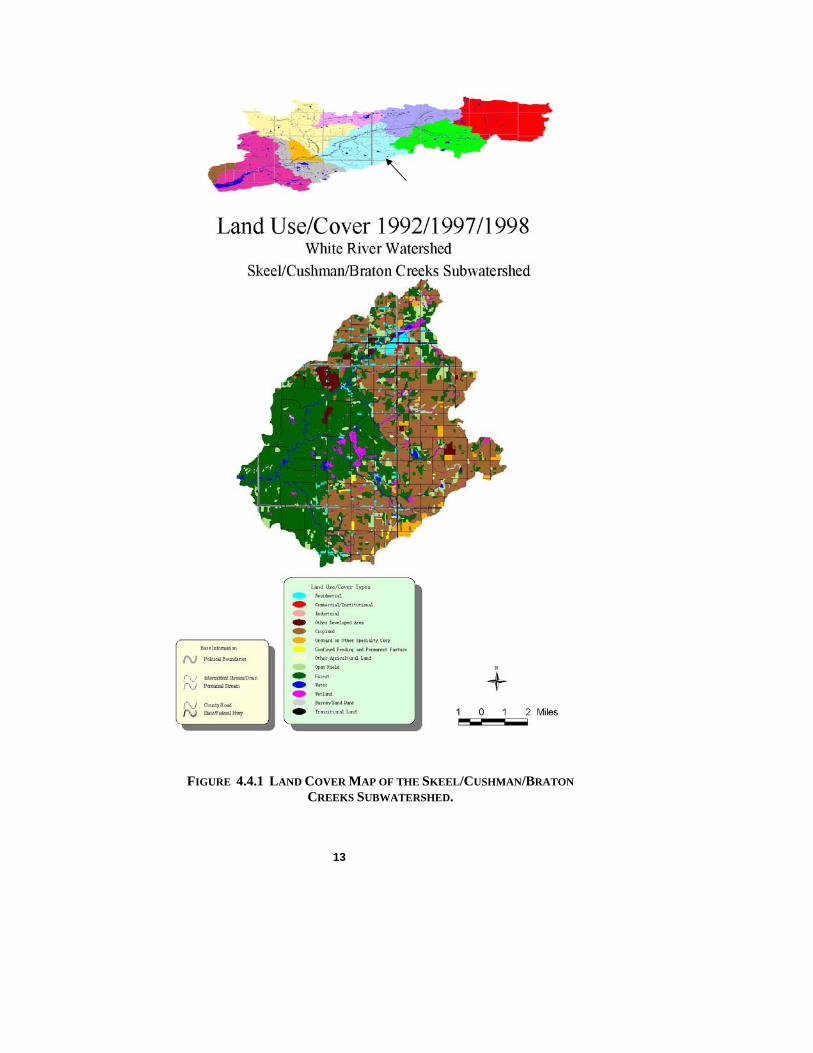
FIGURE 4.4.1 LAND COVER MAP OF THE SKEEL/CUSHMAN/BRATON
CREEKS SUBWATERSHED.
13
14
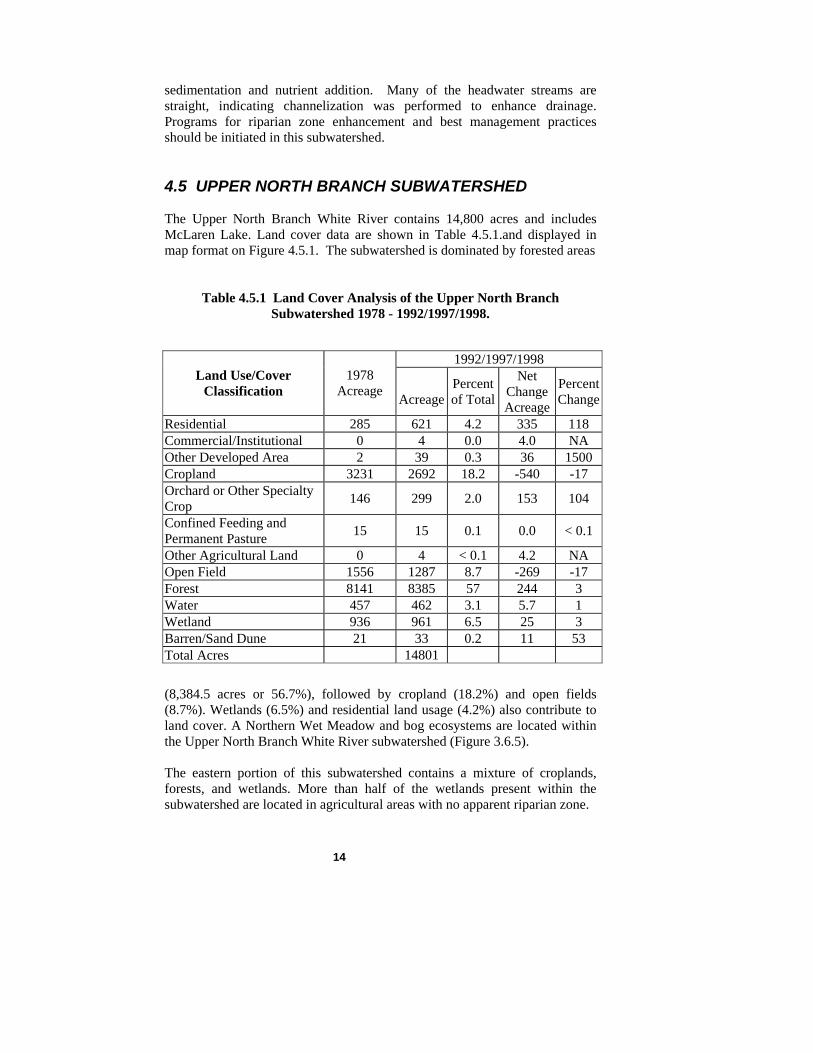
sedimentation and nutrient addition. Many of the headwater streams are straight, indicating channelization was performed to enhance drainage. Programs for riparian zone enhancement and best management practices should be initiated in this subwatershed. 4.5 UPPER NORTH BRANCH SUBWATERSHED The Upper North Branch White River contains 14,800 acres and includes McLaren Lake. Land cover data are shown in Table 4.5.1.and displayed in map format on Figure 4.5.1. The subwatershed is dominated by forested areas
Table 4.5.1 Land Cover Analysis of the Upper North Branch Subwatershed 1978 - 1992/1997/1998.
1992/1997/1998 Land Use/Cover
Classification 1978
Acreage Acreage
Percent of Total
Net Change Acreage
Percent Change
Residential 285 621 4.2 335 118 Commercial/Institutional 0 4 0.0 4.0 NA Other Developed Area 2 39 0.3 36 1500 Cropland 3231 2692 18.2 -540 -17 Orchard or Other Specialty Crop 146 299 2.0 153 104
Confined Feeding and Permanent Pasture 15 15 0.1 0.0 < 0.1
Other Agricultural Land 0 4 < 0.1 4.2 NA Open Field 1556 1287 8.7 -269 -17 Forest 8141 8385 57 244 3 Water 457 462 3.1 5.7 1 Wetland 936 961 6.5 25 3 Barren/Sand Dune 21 33 0.2 11 53 Total Acres 14801 (8,384.5 acres or 56.7%), followed by cropland (18.2%) and open fields (8.7%). Wetlands (6.5%) and residential land usage (4.2%) also contribute to land cover. A Northern Wet Meadow and bog ecosystems are located within the Upper North Branch White River subwatershed (Figure 3.6.5). The eastern portion of this subwatershed contains a mixture of croplands, forests, and wetlands. More than half of the wetlands present within the subwatershed are located in agricultural areas with no apparent riparian zone.

FIGURE 4.5.1 LAND COVER MAP OF THE UPPER NORTH BRANCH SUBWATERSHED.
15

16
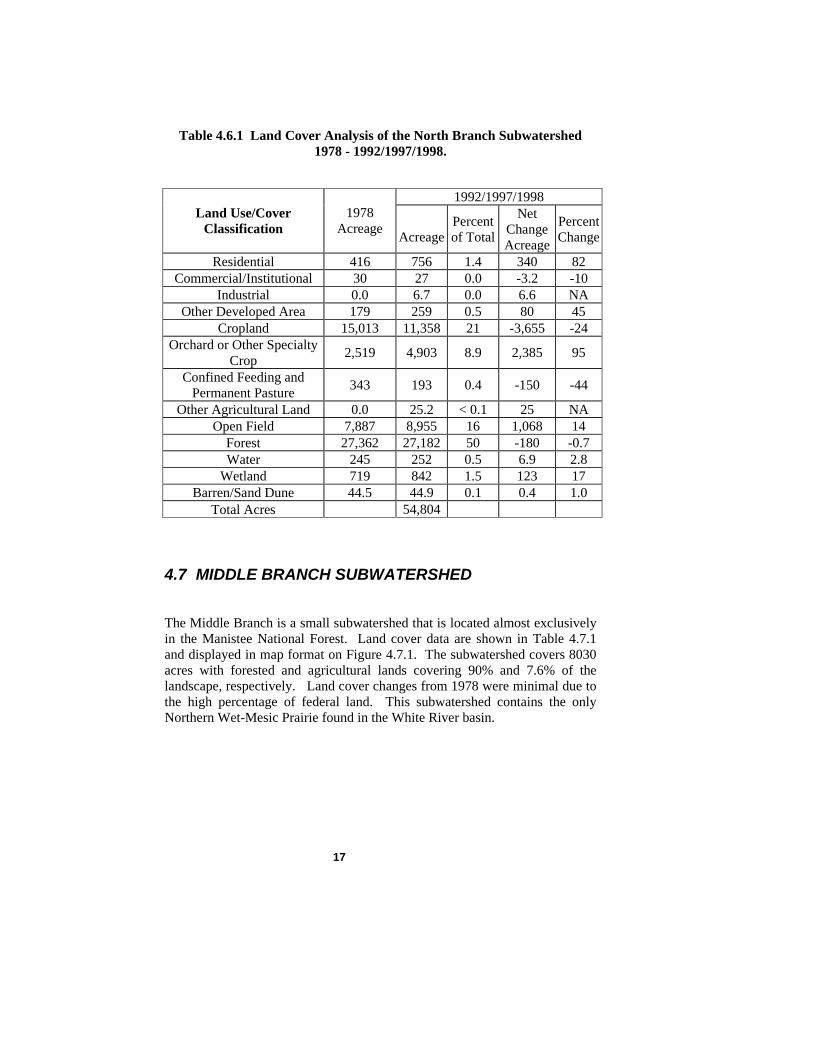
Much of the residential development present in this subwatershed is located around McLaren Lake, with some areas extending to the southwest. The western half is much less developed and contains large tracts of undeveloped forested areas. A few areas of cropland are present, although the majority of cropland is found to the east in the areas surrounding McLaren Lake. Land use changes since 1978 are slightly different than the pattern found throughout the White River watershed. There was a shift from both cropland and open fields to residential and orchard land use types. Forested areas expanded by 244 acres. As discussed in Section 3.7, this subwatershed is the only one that supports a warm water fishery. Drainage from McLaren Lake and several open wetlands form the headwaters of the Upper North Branch and influence the temperature. After passing through the riparian forests and reaches with additional groundwater flows, the temperature decreases to a cold water fishery. Continued residential development in the area surrounding McLaren Lake may be problematic in the future due to increased eutrophication and nutrient loading in the headwaters. 4.6 NORTH BRANCH SUBWATERSHED The North Branch subwatershed, includes portions of 7 townships and has a area of 53,804 acres (16% of the entire watershed). Land cover data are shown in Table 4.6.1 and displayed in map format on Figure 4.6.1. The subwatershed has a very diverse array of land usage with significant amounts of agricultural, residential, forested and wetland areas. Undeveloped forested areas represent the predominant land cover (27,182 acres or 50.0%) followed by croplands (11,358 or 20.7%). Other significant land covers include 16.3% open fields, 8.9% orchards, 1.5% wetland and 1.4% residential. Agricultural land use is primarily concentrated in Shelby Township, and in Elbridge Township in the northern portions of the subwatershed. On a percentage basis, the North Branch has low amount of wetlands compared to the remainder of the subwatersheds. This is due to the higher elevation and permeable soils found in the moraine ridge that makes up a majority of the area. A notable feature of this catchment area is the high percentage of land cover designated as orchards or specialty crop land. Orchards are found primarily in Shelby Township, however smaller plots are scattered throughout the subwatershed. Land use changes since 1978 involved more acreage in the North Branch than the other subwatersheds. The largest change was the conversion of 3,655 acres of cropland into orchard/specialty crops and open fields. This conversion should enhance water quality by lowering the potential for erosion and reducing the amount of land that is extensively fertilized. Residential growth for the watershed was also high as development increased by 82% (340 acres).
17
Table 4.6.1 Land Cover Analysis of the North Branch Subwatershed 1978 - 1992/1997/1998.
1992/1997/1998 Land Use/Cover
Classification 1978
Acreage Acreage
Percent of Total
Net Change Acreage
Percent Change
Residential 416 756 1.4 340 82 Commercial/Institutional 30 27 0.0 -3.2 -10
Industrial 0.0 6.7 0.0 6.6 NA Other Developed Area 179 259 0.5 80 45
Cropland 15,013 11,358 21 -3,655 -24 Orchard or Other Specialty
Crop 2,519 4,903 8.9 2,385 95
Confined Feeding and Permanent Pasture 343 193 0.4 -150 -44
Other Agricultural Land 0.0 25.2 < 0.1 25 NA Open Field 7,887 8,955 16 1,068 14
Forest 27,362 27,182 50 -180 -0.7 Water 245 252 0.5 6.9 2.8
Wetland 719 842 1.5 123 17 Barren/Sand Dune 44.5 44.9 0.1 0.4 1.0
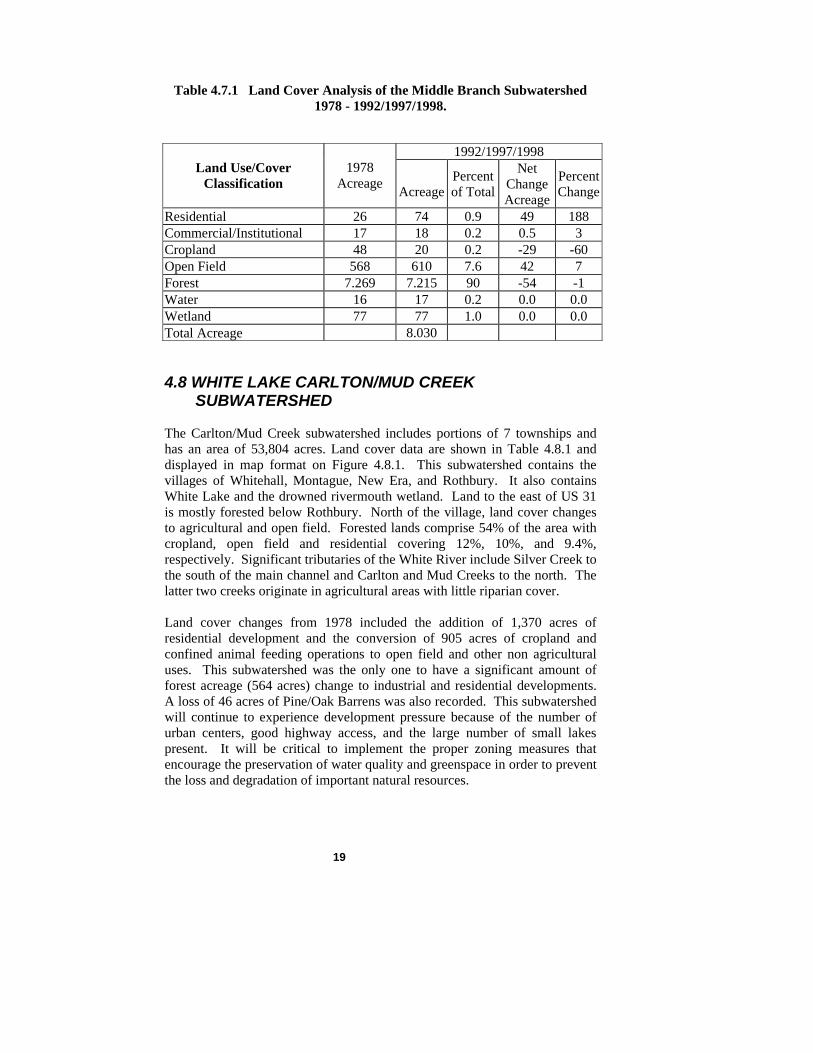
Total Acres 54,804 4.7 MIDDLE BRANCH SUBWATERSHED The Middle Branch is a small subwatershed that is located almost exclusively in the Manistee National Forest. Land cover data are shown in Table 4.7.1 and displayed in map format on Figure 4.7.1. The subwatershed covers 8030 acres with forested and agricultural lands covering 90% and 7.6% of the landscape, respectively. Land cover changes from 1978 were minimal due to the high percentage of federal land. This subwatershed contains the only Northern Wet-Mesic Prairie found in the White River basin.
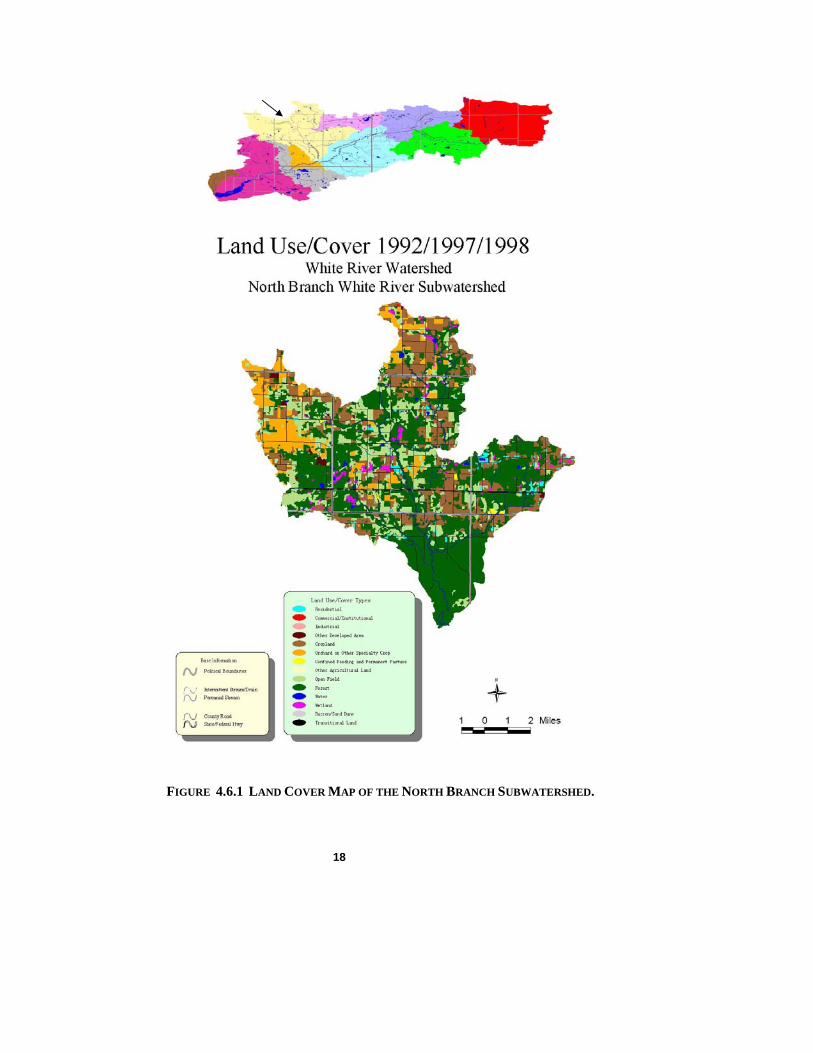
FIGURE 4.6.1 LAND COVER MAP OF THE NORTH BRANCH SUBWATERSHED.
18
19
Table 4.7.1 Land Cover Analysis of the Middle Branch Subwatershed
1978 - 1992/1997/1998.
1992/1997/1998 Land Use/Cover
Classification 1978
Acreage Acreage
Percent of Total
Net Change Acreage
Percent Change
Residential 26 74 0.9 49 188 Commercial/Institutional 17 18 0.2 0.5 3 Cropland 48 20 0.2 -29 -60 Open Field 568 610 7.6 42 7 Forest 7.269 7.215 90 -54 -1 Water 16 17 0.2 0.0 0.0 Wetland 77 77 1.0 0.0 0.0 Total Acreage 8.030
4.8 WHITE LAKE CARLTON/MUD CREEK SUBWATERSHED
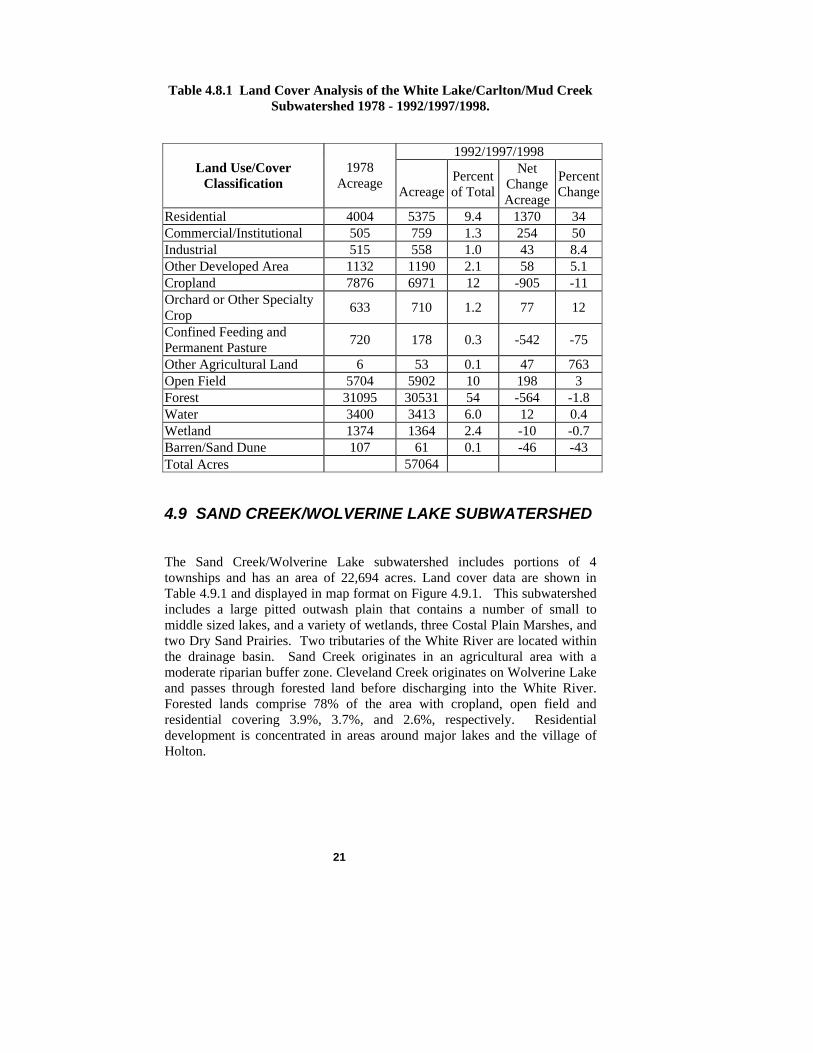
The Carlton/Mud Creek subwatershed includes portions of 7 townships and has an area of 53,804 acres. Land cover data are shown in Table 4.8.1 and displayed in map format on Figure 4.8.1. This subwatershed contains the villages of Whitehall, Montague, New Era, and Rothbury. It also contains White Lake and the drowned rivermouth wetland. Land to the east of US 31 is mostly forested below Rothbury. North of the village, land cover changes to agricultural and open field. Forested lands comprise 54% of the area with cropland, open field and residential covering 12%, 10%, and 9.4%, respectively. Significant tributaries of the White River include Silver Creek to the south of the main channel and Carlton and Mud Creeks to the north. The latter two creeks originate in agricultural areas with little riparian cover. Land cover changes from 1978 included the addition of 1,370 acres of residential development and the conversion of 905 acres of cropland and confined animal feeding operations to open field and other non agricultural uses. This subwatershed was the only one to have a significant amount of forest acreage (564 acres) change to industrial and residential developments. A loss of 46 acres of Pine/Oak Barrens was also recorded. This subwatershed will continue to experience development pressure because of the number of urban centers, good highway access, and the large number of small lakes present. It will be critical to implement the proper zoning measures that encourage the preservation of water quality and greenspace in order to prevent the loss and degradation of important natural resources.
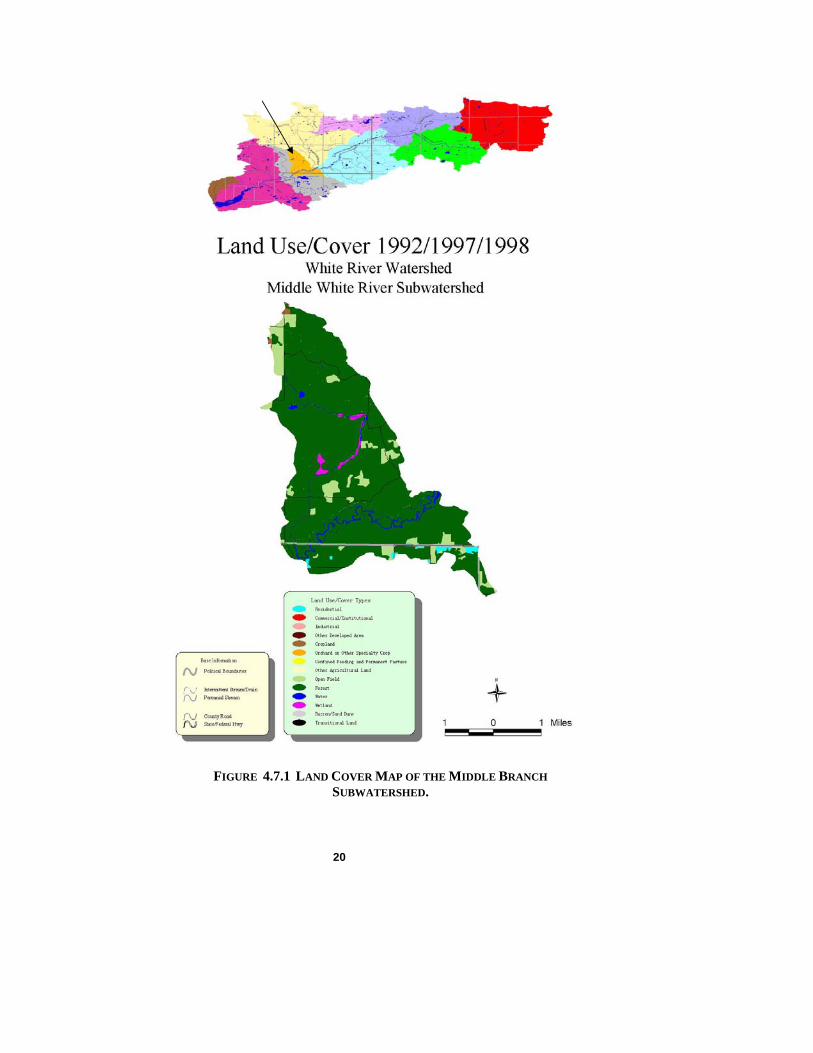
FIGURE 4.7.1 LAND COVER MAP OF THE MIDDLE BRANCH SUBWATERSHED.
20
21
Table 4.8.1 Land Cover Analysis of the White Lake/Carlton/Mud Creek
Subwatershed 1978 - 1992/1997/1998.
1992/1997/1998 Land Use/Cover
Classification 1978
Acreage Acreage
Percent of Total
Net Change Acreage
Percent Change
Residential 4004 5375 9.4 1370 34 Commercial/Institutional 505 759 1.3 254 50 Industrial 515 558 1.0 43 8.4 Other Developed Area 1132 1190 2.1 58 5.1 Cropland 7876 6971 12 -905 -11 Orchard or Other Specialty Crop 633 710 1.2 77 12
Confined Feeding and Permanent Pasture 720 178 0.3 -542 -75
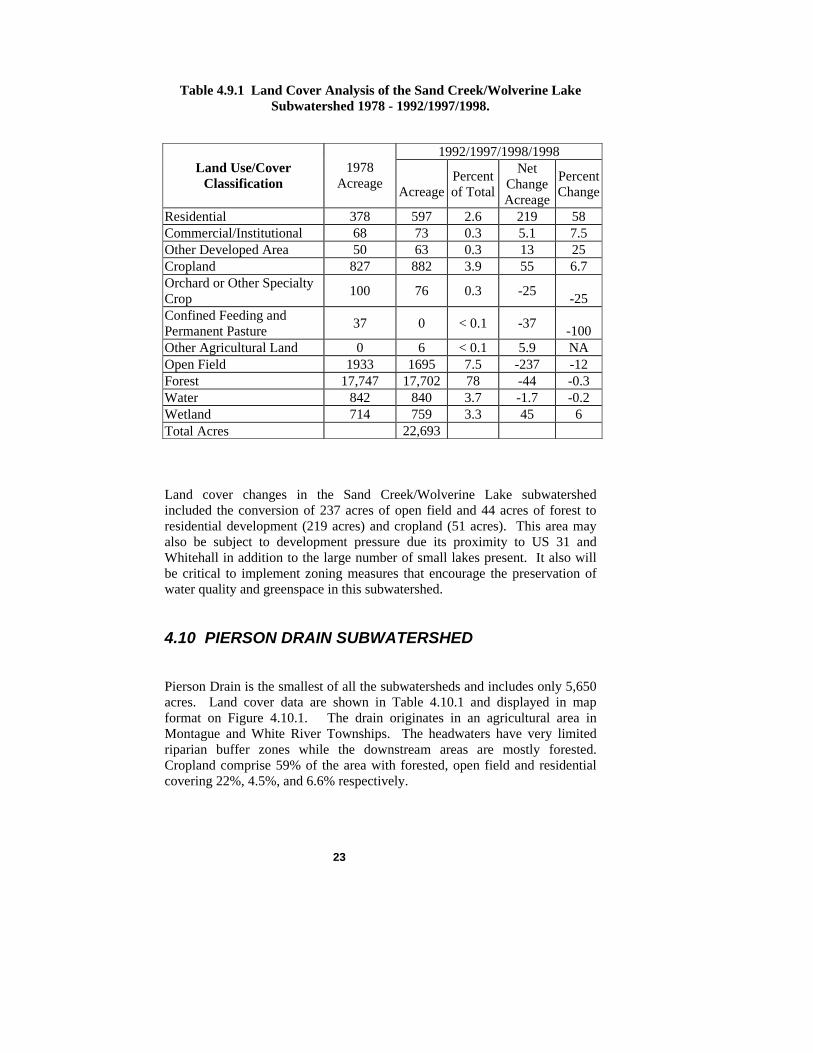
Other Agricultural Land 6 53 0.1 47 763 Open Field 5704 5902 10 198 3 Forest 31095 30531 54 -564 -1.8 Water 3400 3413 6.0 12 0.4 Wetland 1374 1364 2.4 -10 -0.7 Barren/Sand Dune 107 61 0.1 -46 -43 Total Acres 57064 4.9 SAND CREEK/WOLVERINE LAKE SUBWATERSHED The Sand Creek/Wolverine Lake subwatershed includes portions of 4 townships and has an area of 22,694 acres. Land cover data are shown in Table 4.9.1 and displayed in map format on Figure 4.9.1. This subwatershed includes a large pitted outwash plain that contains a number of small to middle sized lakes, and a variety of wetlands, three Costal Plain Marshes, and two Dry Sand Prairies. Two tributaries of the White River are located within the drainage basin. Sand Creek originates in an agricultural area with a moderate riparian buffer zone. Cleveland Creek originates on Wolverine Lake and passes through forested land before discharging into the White River. Forested lands comprise 78% of the area with cropland, open field and residential covering 3.9%, 3.7%, and 2.6%, respectively. Residential development is concentrated in areas around major lakes and the village of Holton.

FIGURE 4.8.1 LAND COVER MAP OF THE WHITE LAKE CARLTON/MUD
CREEK SUBWATERSHED.
22
23
Table 4.9.1 Land Cover Analysis of the Sand Creek/Wolverine Lake
Subwatershed 1978 - 1992/1997/1998.
1992/1997/1998/1998 Land Use/Cover
Classification 1978
Acreage Acreage
Percent of Total
Net Change Acreage
Percent Change
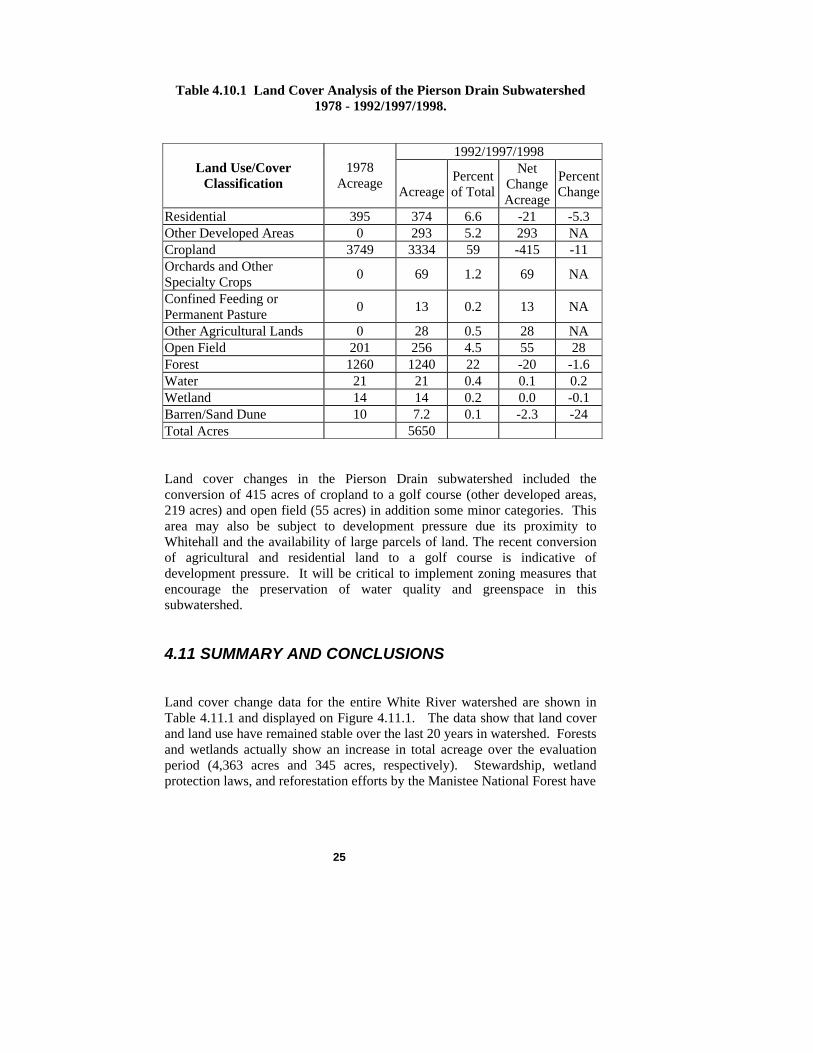
Residential 378 597 2.6 219 58 Commercial/Institutional 68 73 0.3 5.1 7.5 Other Developed Area 50 63 0.3 13 25 Cropland 827 882 3.9 55 6.7 Orchard or Other Specialty Crop 100 76 0.3 -25 -25 Confined Feeding and Permanent Pasture 37 0 < 0.1 -37 -100 Other Agricultural Land 0 6 < 0.1 5.9 NA Open Field 1933 1695 7.5 -237 -12 Forest 17,747 17,702 78 -44 -0.3 Water 842 840 3.7 -1.7 -0.2 Wetland 714 759 3.3 45 6 Total Acres 22,693 Land cover changes in the Sand Creek/Wolverine Lake subwatershed included the conversion of 237 acres of open field and 44 acres of forest to residential development (219 acres) and cropland (51 acres). This area may also be subject to development pressure due its proximity to US 31 and Whitehall in addition to the large number of small lakes present. It also will be critical to implement zoning measures that encourage the preservation of water quality and greenspace in this subwatershed. 4.10 PIERSON DRAIN SUBWATERSHED Pierson Drain is the smallest of all the subwatersheds and includes only 5,650 acres. Land cover data are shown in Table 4.10.1 and displayed in map format on Figure 4.10.1. The drain originates in an agricultural area in Montague and White River Townships. The headwaters have very limited riparian buffer zones while the downstream areas are mostly forested. Cropland comprise 59% of the area with forested, open field and residential covering 22%, 4.5%, and 6.6% respectively.

FIGURE 4.9.1 LAND COVER MAP OF THE WHITE LAKE SAND CREEK/WOLVERINE LAKE SUBWATERSHED.
24
25
Table 4.10.1 Land Cover Analysis of the Pierson Drain Subwatershed
1978 - 1992/1997/1998.
1992/1997/1998 Land Use/Cover
Classification 1978
Acreage Acreage
Percent of Total
Net Change Acreage
Percent Change
Residential 395 374 6.6 -21 -5.3 Other Developed Areas 0 293 5.2 293 NA Cropland 3749 3334 59 -415 -11 Orchards and Other Specialty Crops 0 69 1.2 69 NA
Confined Feeding or Permanent Pasture 0 13 0.2 13 NA
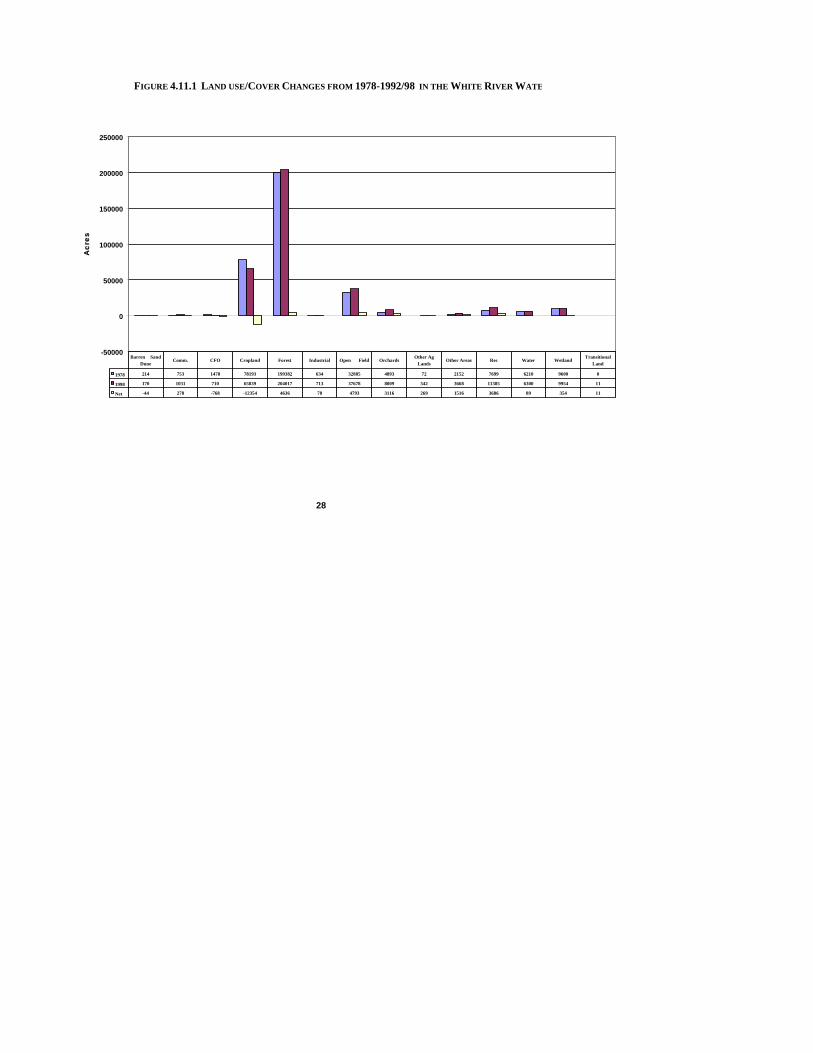
Other Agricultural Lands 0 28 0.5 28 NA Open Field 201 256 4.5 55 28 Forest 1260 1240 22 -20 -1.6 Water 21 21 0.4 0.1 0.2 Wetland 14 14 0.2 0.0 -0.1 Barren/Sand Dune 10 7.2 0.1 -2.3 -24 Total Acres 5650 Land cover changes in the Pierson Drain subwatershed included the conversion of 415 acres of cropland to a golf course (other developed areas, 219 acres) and open field (55 acres) in addition some minor categories. This area may also be subject to development pressure due its proximity to Whitehall and the availability of large parcels of land. The recent conversion of agricultural and residential land to a golf course is indicative of development pressure. It will be critical to implement zoning measures that encourage the preservation of water quality and greenspace in this subwatershed. 4.11 SUMMARY AND CONCLUSIONS Land cover change data for the entire White River watershed are shown in Table 4.11.1 and displayed on Figure 4.11.1. The data show that land cover and land use have remained stable over the last 20 years in watershed. Forests and wetlands actually show an increase in total acreage over the evaluation period (4,363 acres and 345 acres, respectively). Stewardship, wetland protection laws, and reforestation efforts by the Manistee National Forest have
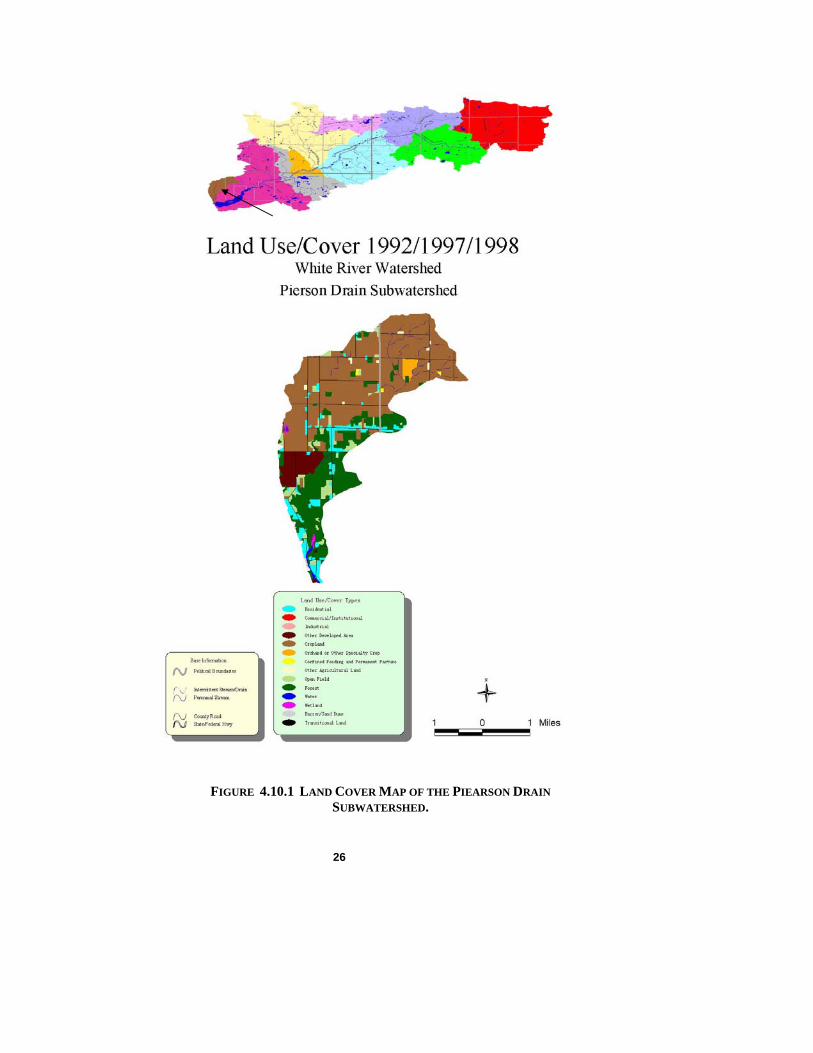
FIGURE 4.10.1 LAND COVER MAP OF THE PIEARSON DRAIN
SUBWATERSHED.
26

27
TABLE 4.10.1 LAND COVER ANALYSIS OF THE WHITE RIVER
SUBWATERSHED 1978 - 1992/1997/1998.
1992/1997/1998 Land Use/Cover
Classification 1978
Acreage Acreage
Percent of Total
Net Change Acreage
Percent Change
Barren/Sand Dune 214 170 < 1 -44 -21 Commercial/Institutional 753 1031 < 1 278 37
Confined Feeding or Permanent 1478 710 < 1 -768 -52
Cropland 78193 65839 19 -12354 -16 Forest 199382 204017 58 4636 2
Industrial 634 713 < 1 78 12 Open Field 32885 37678 11 4793 15
Orchards or Other Specialty Crops 4893 8009 2 3116 64
Other Agricultural Lands 72 342 < 1 269 373 Other Developed Areas 2152 3668 1 1516 70
Residential 7699 11385 3 3686 48 Water 6210 6300 2 89 1
Wetland 9600 9954 3 354 4 Transitional Land 0 11 < 1 11 NA
all contributed the preservation of these natural resources. The only significant change to the natural land cover was the loss of 44 acres of Pine/Oak Barrens. While this represents a small change in total acreage, the loss of this rare habitat is significant to the ecological diversity in the watershed. In consideration of the fragile nature of these systems, future preservation will depend on the acquisition and management of these rare habitats to prevent impacts from surrounding land use. Agricultural production and development declined in over the last 20 years, following regional trends in western Michigan. Sixteen percent of the cropland (12,354 acres) was allowed to go fallow for open fields (4,793 acres) or be converted to orchard (3,116 acres). The remainder was reforested or converted to residential/commercial use. Urban development was concentrated in the areas of Whitehall, White Cloud, Hesperia, and Rothbury. The land around the US 31 corridor experienced the most growth. Residential development was also noted around many of the areas lakes including McLaren Lake, Robinson Lake, Diamond Lake, and Blue Lake. These lakes are all in remote areas and are all serviced by private wells and septic systems.
-50000
0
50000
100000
150000
200000
250000
Acr
es
28
FIGURE 4.11.1 LAND USE/COVER CHANGES FROM 1978-1992/98 IN THE WHITE RIVER WATE
1978 214 753 1478 78193 199382 634 32885 4893 72 2152 7699 6210 9600 0
1998 170 1031 710 65839 204017 713 37678 8009 342 3668 11385 6300 9954 11
Net -44 278 -768 -12354 4636 78 4793 3116 269 1516 3686 89 354 11
Barren Sand Dune
Comm. CFO Cropland Forest Industrial Open Field Orchards Other Ag
LandsOther Areas Res Water Wetland
Transitional Land
29
In consideration of the sandy soils and high water tables in the land surrounding these lakes, increased residential development can have a negative affect on surface and groundwater quality. The same consideration applies to urban growth in the watershed’s villages. These villages have limited infrastructure and increased population density and commercial growth can result in local stormwater and wastewater problems. A trend that was evident in most of the subwatersheds was that riparian zones in many of the headwater streams contained limited vegetative cover. This was true also for wetlands with respect to the absence of buffer zones separating adjacent agricultural uses. In streams, high quality water that is buffered from excessive sedimentation and peak flows is critical to the integrity of the headwaters and the downstream reaches. These same considerations are true for wetlands as the unstable hydrology and sedimentation will adversely impact their structure and function. A number of state and federal programs are available through the Michigan Department of Agriculture and the U.S.D.A.’s Natural Resources Conservation Service that provide technical and financial assistance to install vegetative buffer strips and restore riparian zones along stream corridors. The implementation of these programs will benefit aquatic ecosystems by lowering nutrient and sediment influx, improving flow and temperature stability, and increasing particulate organic carbon inputs to the stream.

5.0 White Lake Survey 5.1 INTRODUCTION A survey of White Lake was conducted on July 27, 2002. The lake has a long history of environmental problems related to the discharge of hazardous materials and excessive nutrient loading. The purpose of the survey was to collect and analyze a series of representative samples from White Lake and prepare a preliminary assessment of current status. Five locations were sampled and the stations are shown on Figure 5.1.1. Station 1 was located in the eastern basin near the mouth of the White River and had a depth of 2.5 m. The remainder of the stations were located in the central and western sections of the lake with depths ranging from 16 m – 20 m. Samples for dissolved oxygen, temperature, and chlorophyll were collected at one meter intervals at Stations 2-5. Discrete samples for nutrients were collected at 1 m below the
3
1
2
5 4
FIGURE 5.1.1 WHITE LAKE SAMPLING LOCATIONS. JULY 27, 2002.
30
31
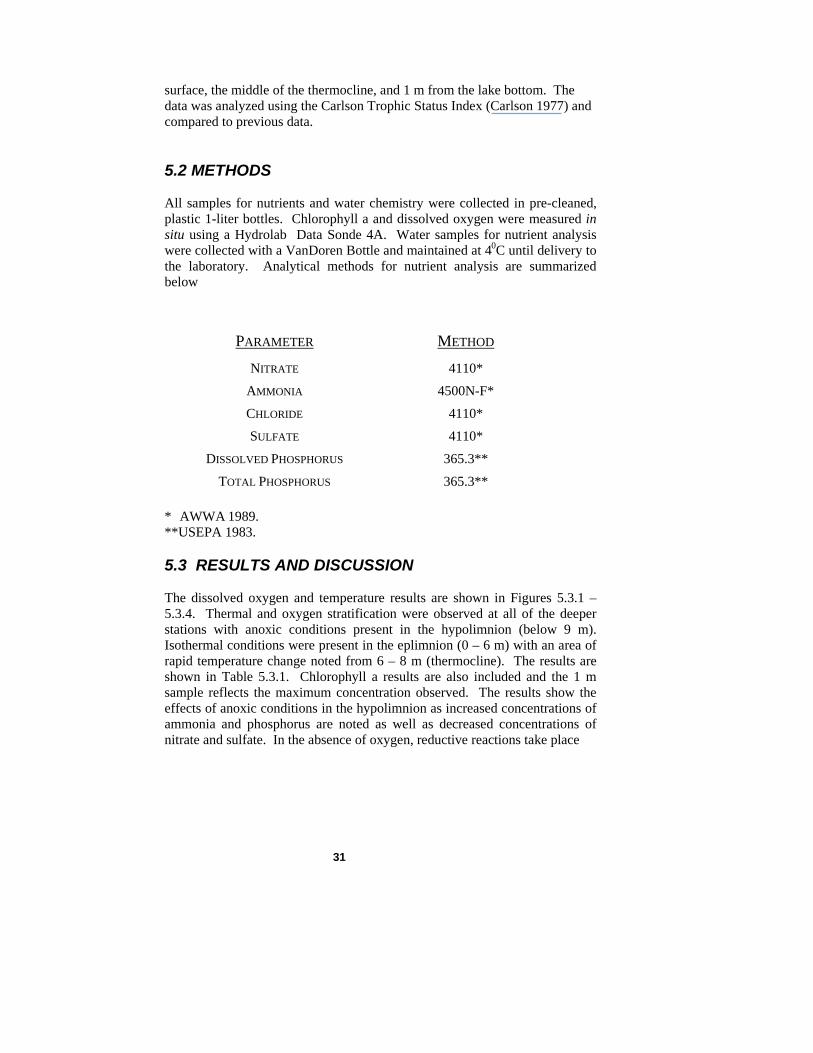
surface, the middle of the thermocline, and 1 m from the lake bottom. The data was analyzed using the Carlson Trophic Status Index (Carlson 1977) and compared to previous data. 5.2 METHODS All samples for nutrients and water chemistry were collected in pre-cleaned, plastic 1-liter bottles. Chlorophyll a and dissolved oxygen were measured in situ using a Hydrolab Data Sonde 4A. Water samples for nutrient analysis were collected with a VanDoren Bottle and maintained at 40C until delivery to the laboratory. Analytical methods for nutrient analysis are summarized below
PARAMETER METHOD
NITRATE 4110*
AMMONIA 4500N-F*
CHLORIDE 4110*
SULFATE 4110*
DISSOLVED PHOSPHORUS 365.3**
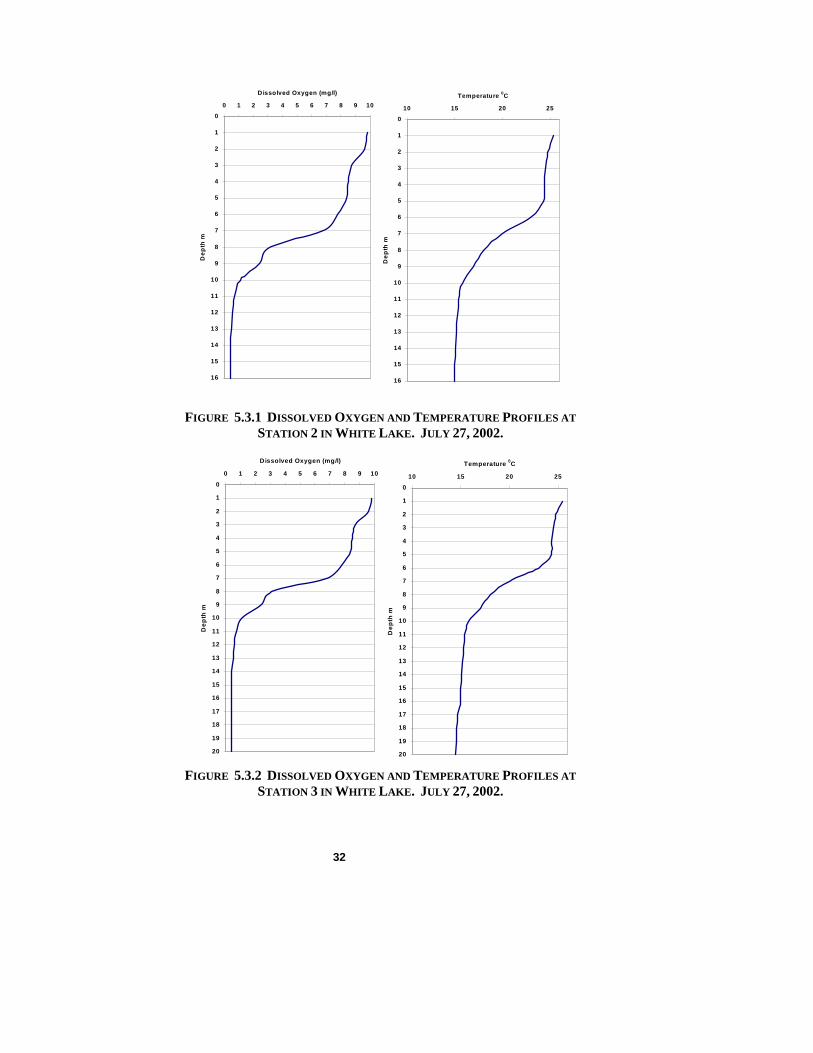
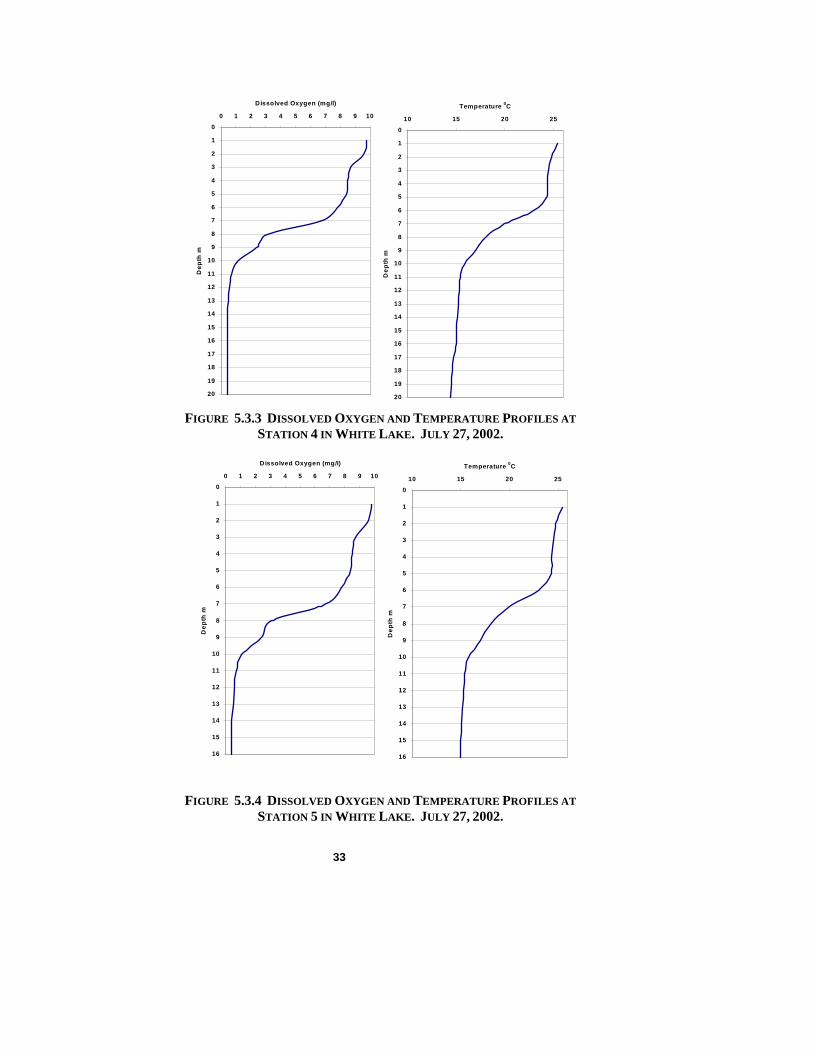
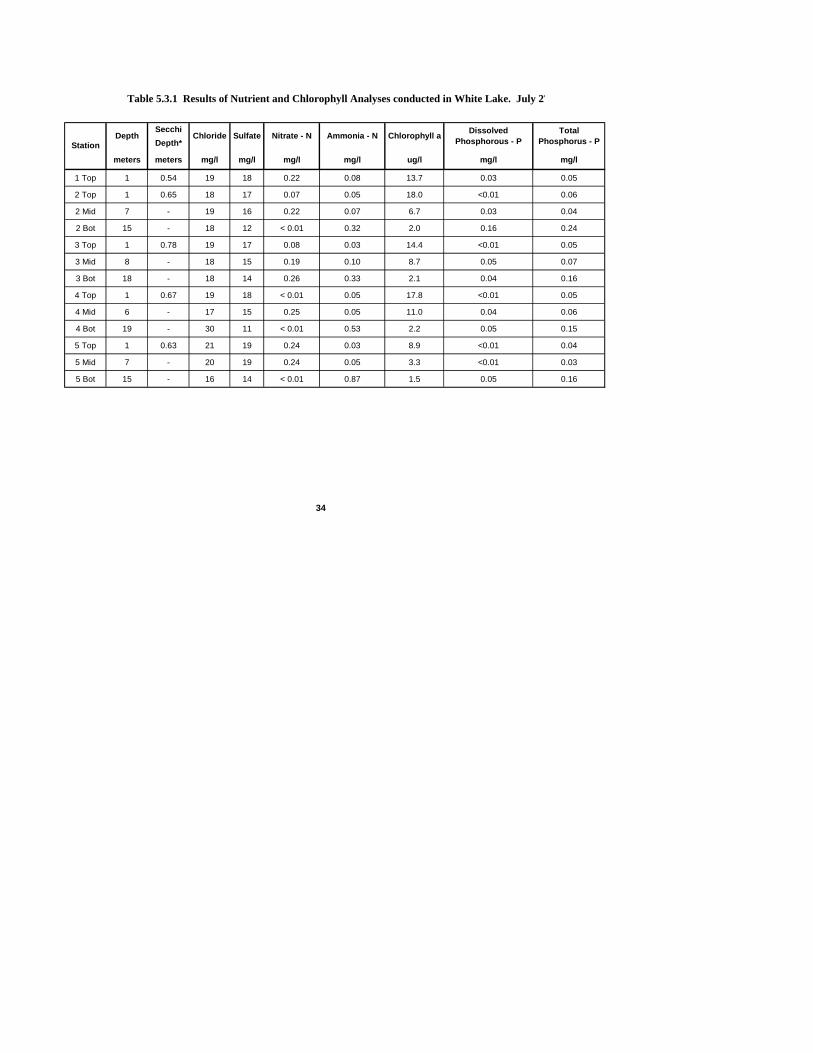
TOTAL PHOSPHORUS 365.3** * AWWA 1989. **USEPA 1983. 5.3 RESULTS AND DISCUSSION The dissolved oxygen and temperature results are shown in Figures 5.3.1 – 5.3.4. Thermal and oxygen stratification were observed at all of the deeper stations with anoxic conditions present in the hypolimnion (below 9 m). Isothermal conditions were present in the eplimnion (0 – 6 m) with an area of rapid temperature change noted from 6 – 8 m (thermocline). The results are shown in Table 5.3.1. Chlorophyll a results are also included and the 1 m sample reflects the maximum concentration observed. The results show the effects of anoxic conditions in the hypolimnion as increased concentrations of ammonia and phosphorus are noted as well as decreased concentrations of nitrate and sulfate. In the absence of oxygen, reductive reactions take place
32
FIGURE 5.3.1 DISSOLVED OXYGEN AND TEMPERATURE PROFILES AT
STATION 2 IN WHITE LAKE. JULY 27, 2002.
FIGURE 5.3.2 DISSOLVED OXYGEN AND TEMPERATURE PROFILES AT STATION 3 IN WHITE LAKE. JULY 27, 2002.
0
1
2
3
4
5
6
7
8
9
10
11
12
13
14
15
16
0 1 2 3 4 5 6 7 8 9 10
Dissolved Oxygen (mg/l)
Dep
th m
0
1
2
3
4
5
6
7
8
9
10
11
12
13
14
15
16
10 15 20 25
Temperature 0C
Dep
th m
0
1
2
3
4
5
6
7
8
9
10
11
12
13
14
15
16
17
18
19
20
0 1 2 3 4 5 6 7 8 9 10
Dissolved Oxygen (mg/l)
Dep
th m
0
1
2
3
4
5
6
7
8
9
10
11
12
13
14
15
16
17
18
19
20
10 15 20 25
Temperature 0C
Dep
th m
33
FIGURE 5.3.3 DISSOLVED OXYGEN AND TEMPERATURE PROFILES AT STATION 4 IN WHITE LAKE. JULY 27, 2002.
FIGURE 5.3.4 DISSOLVED OXYGEN AND TEMPERATURE PROFILES AT STATION 5 IN WHITE LAKE. JULY 27, 2002.
0
1
2
3
4
5
6
7
8
9
10
11
12
13
14
15
16
17
18
19
20
0 1 2 3 4 5 6 7 8 9 10
Dissolved Oxygen (mg/l)
Dep
th m
0
1
2
3
4
5
6
7
8
9
10
11
12
13
14
15
16
17
18
19
20
10 15 20 25
Temperature 0C
Dep
th m
0
1
2
3
4
5
6
7
8
9
10
11
12
13
14
15
16
0 1 2 3 4 5 6 7 8 9 10
Dissolved Oxygen (mg/l)
Dep
th m
0
1
2
3
4
5
6
7
8
9
10
11
12
13
14
15
16
10 15 20 25
Temperature 0C
Dep
th m
34
SecchiDepth*
meters meters mg/l mg/l mg/l mg/l ug/l mg/l mg/l
1 Top 1 0.54 19 18 0.22 0.08 13.7 0.03 0.05
2 Top 1 0.65 18 17 0.07 0.05 18.0 <0.01 0.06
2 Mid 7 - 19 16 0.22 0.07 6.7 0.03 0.04
2 Bot 15 - 18 12 < 0.01 0.32 2.0 0.16 0.24
3 Top 1 0.78 19 17 0.08 0.03 14.4 <0.01 0.05
3 Mid 8 - 18 15 0.19 0.10 8.7 0.05 0.07
3 Bot 18 - 18 14 0.26 0.33 2.1 0.04 0.16
4 Top 1 0.67 19 18 < 0.01 0.05 17.8 <0.01 0.05
4 Mid 6 - 17 15 0.25 0.05 11.0 0.04 0.06
4 Bot 19 - 30 11 < 0.01 0.53 2.2 0.05 0.15
5 Top 1 0.63 21 19 0.24 0.03 8.9 <0.01 0.04
5 Mid 7 - 20 19 0.24 0.05 3.3 <0.01 0.03
5 Bot 15 - 16 14 < 0.01 0.87 1.5 0.05 0.16
Nitrate - NDepth Chlorophyll aStation
Chloride Sulfate Ammonia - N Dissolved Phosphorous - P
Total Phosphorus - P
Table 5.3.1 Results of Nutrient and Chlorophyll Analyses conducted in White Lake. July 27
35
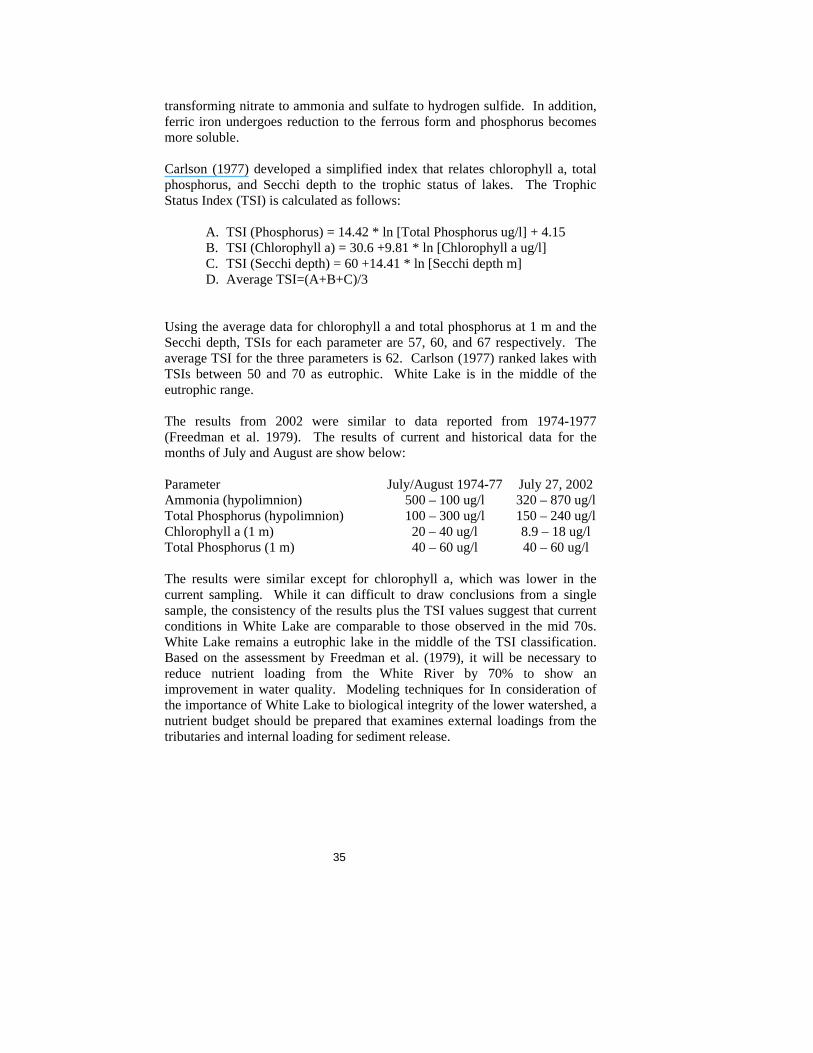
transforming nitrate to ammonia and sulfate to hydrogen sulfide. In addition, ferric iron undergoes reduction to the ferrous form and phosphorus becomes more soluble. Carlson (1977) developed a simplified index that relates chlorophyll a, total phosphorus, and Secchi depth to the trophic status of lakes. The Trophic Status Index (TSI) is calculated as follows:
A. TSI (Phosphorus) = 14.42 * ln [Total Phosphorus ug/l] + 4.15 B. TSI (Chlorophyll a) = 30.6 +9.81 * ln [Chlorophyll a ug/l] C. TSI (Secchi depth) = 60 +14.41 * ln [Secchi depth m] D. Average TSI=(A+B+C)/3
Using the average data for chlorophyll a and total phosphorus at 1 m and the Secchi depth, TSIs for each parameter are 57, 60, and 67 respectively. The average TSI for the three parameters is 62. Carlson (1977) ranked lakes with TSIs between 50 and 70 as eutrophic. White Lake is in the middle of the eutrophic range. The results from 2002 were similar to data reported from 1974-1977 (Freedman et al. 1979). The results of current and historical data for the months of July and August are show below: Parameter July/August 1974-77 July 27, 2002 Ammonia (hypolimnion) 500 – 100 ug/l 320 – 870 ug/l Total Phosphorus (hypolimnion) 100 – 300 ug/l 150 – 240 ug/l Chlorophyll a (1 m) 20 – 40 ug/l 8.9 – 18 ug/l Total Phosphorus (1 m) 40 – 60 ug/l 40 – 60 ug/l The results were similar except for chlorophyll a, which was lower in the current sampling. While it can difficult to draw conclusions from a single sample, the consistency of the results plus the TSI values suggest that current conditions in White Lake are comparable to those observed in the mid 70s. White Lake remains a eutrophic lake in the middle of the TSI classification. Based on the assessment by Freedman et al. (1979), it will be necessary to reduce nutrient loading from the White River by 70% to show an improvement in water quality. Modeling techniques for In consideration of the importance of White Lake to biological integrity of the lower watershed, a nutrient budget should be prepared that examines external loadings from the tributaries and internal loading for sediment release.
36
6.0 White River Watershed Wetlands Assessment
6.1 INTRODUCTION Great Lakes coastal wetlands serve as important interfaces between upland and pelagic habitats. They have been shown to be important habitat for waterfowl (Prince et al. 1992; Prince & Flegel 1995; Whitt 1996), passerine birds (Harris et al. 1983; Whitt 1996; Riffell 2000; Weeber & Vallianatos 2000), fish (Goodyear et al. 1982; Liston & Chubb 1985; Jude & Pappas 1992; Brazner 1992/1997/1998) and invertebrates (Krieger 1992; Cardinale et al. 1992/1997/1998, 1998; Gathman et al. 1999; Gathman 2000). Despite their importance, Great Lakes coastal marshes have suffered extensive degradation and continue to receive developmental pressures. Understanding invertebrate community composition within these systems is vital to our understanding of their structure and function and subsequent role as an interface or buffer to the Great Lakes. Invertebrates form important links between trophic levels and play key roles in nutrient cycling. They respond predictably to anthropogenic disturbance and are valuable indicators of ecosystem health (Kashian and Burton 2000, Burton et al. 1999, Flint 1979, Reynoldson and Zarull 1989, Uzarski et al. 2003). Benthic macroinvertebrates are continually exposed to conditions of natural and anthropogenic origin. Thus, macroinvertebrate community structure can be used to integrate time and space, and therefore, detect both episodic and cumulative impacts to water quality. Currently, invertebrate-based indices of biotic integrity (IBIs) have been developed and are being tested for use in monitoring Great Lakes coastal wetlands (Kashian and Burton 2000, Burton et al. 1999, Uzarski et al. 2003). Discerning between natural ecosystem stressors, such as water level fluctuation, and anthropogenic stressors has likely been the greatest hurdle encountered during IBI development and partitioning this variability is key. Within-wetland variability is then superimposed on this, posing an additional challenge to developing effective wetland IBIs. The focus of this study was to determine variability in macroinvertebrate assemblages within a single coastal wetland and to determine whether assemblages could be best predicted by water quality, surrounding land-use/cover, dominant plant type, or a combination of these. Understanding the extent to which anthropogenic disturbance affects community composition within the overlying variability in community composition due to natural conditions will be valuable in future attempts to utilize macroinvertebrates in determining Great Lakes wetland health.

37
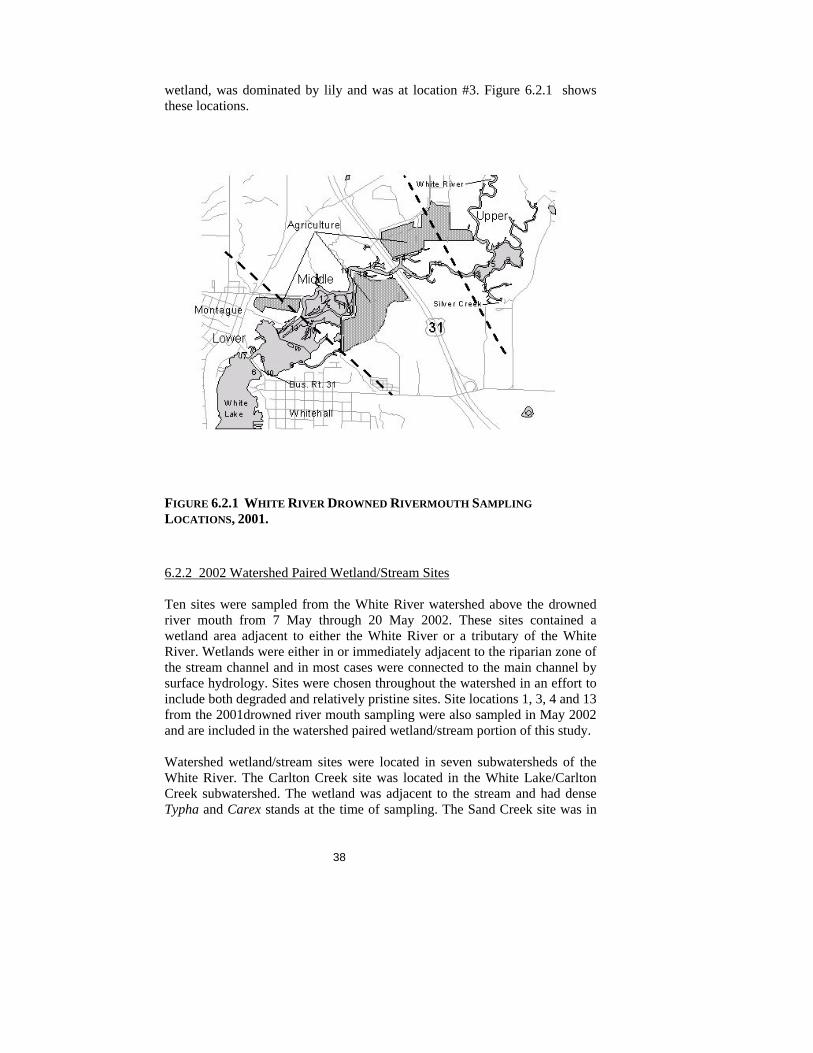
6.2 METHODS 6.2.1 2001 Drowned River Mouth Study Sites The White is a fourth order river that lies on the western shore of the lower peninsula of Michigan. It drains a 1,370 km2 watershed and forms a freshwater estuary where it empties into Lake Michigan via White Lake (Muskegon County, N43.41° W86.35°). The confluence of the White River and White Lake forms a drowned river mouth wetland of approximately 350 ha. The wetland has three diked and drained agricultural areas adjacent to it that are currently used for row crop production (Fig. 6.2.1). Runoff from these fields either drains or is pumped into the river at a number of locations. U.S. 31, a four-lane highway built on an earthen levee with a bridged opening over the main river channel, bisects the middle of the wetland. Business route U.S. 31, a two-lane road also built on an earthen levee with a bridged opening, crosses the lower wetland and links the cities of Whitehall (pop. 3,403) and Montague (pop. 2,422) (1998 U.S. Census) (Fig 6.2.1). The White River watershed is 59% forested and 24% agricultural. White Lake is a 1040 ha eutrophic drowned river mouth lake that has considerably degraded water quality from many residential, industrial, and municipal pollutants (EPA 1979) and is considered an area of concern (AOC) by the International Joint Commission (IJC 1989). Sampling of the drowned river mouth wetland sites was conducted from 13 August through 15 August 2001. Sample sites were selected across a gradient of anthropogenic disturbance, determined a priori from adjacent land-use and preliminary limnological parameters, from the relatively pristine upper wetland to the relatively impacted lower wetland. Specific sampling locations were chosen based on inundation of vegetation and access by boat. Specific sampling locations within a site were randomly selected within each inundated monodominant vegetation type. Five plant community types were identified in the drowned river mouth and sites were classified as either Typha- (mostly Typha latifolia L.: Cattail), Sparganium- (Bur-reed), Scirpus- (mostly Scirpus acutus Muhl.: Hardstem-Bulrush), Pontederia- (mostly Pontederia cordata L.: Pickerel-weed), or Nuphar and Nymphaea (water lily) dominated. All sites had relatively dense vegetation and little if any detectable current. Depths rarely exceeded one meter and were as shallow as 10 cm. To facilitate comparisons of the more pristine habitats of the upper wetland to the more impacted habitats of the lower wetland, we classified sites as either ‘upper,’ ‘middle’ or ‘lower’ wetland (Fig. 16.2.1). This classification was based on upstream/downstream location of sites within the drowned river mouth which could also be interpreted as relative distance from headwaters of the White River. Henceforth, sites will be referred to by name based on their classification (upper, middle or lower), dominant vegetation type, and site location number. For instance, site Upper-Lily-3 was located in the upper
38
wetland, was dominated by lily and was at location #3. Figure 6.2.1 shows these locations.
FIGURE 6.2.1 WHITE RIVER DROWNED RIVERMOUTH SAMPLING LOCATIONS, 2001. 6.2.2 2002 Watershed Paired Wetland/Stream Sites Ten sites were sampled from the White River watershed above the drowned river mouth from 7 May through 20 May 2002. These sites contained a wetland area adjacent to either the White River or a tributary of the White River. Wetlands were either in or immediately adjacent to the riparian zone of the stream channel and in most cases were connected to the main channel by surface hydrology. Sites were chosen throughout the watershed in an effort to include both degraded and relatively pristine sites. Site locations 1, 3, 4 and 13 from the 2001drowned river mouth sampling were also sampled in May 2002 and are included in the watershed paired wetland/stream portion of this study. Watershed wetland/stream sites were located in seven subwatersheds of the White River. The Carlton Creek site was located in the White Lake/Carlton Creek subwatershed. The wetland was adjacent to the stream and had dense Typha and Carex stands at the time of sampling. The Sand Creek site was in
39
the Sand Creek/Wolverine Lake subwatershed. The wetland/stream site at Sand Creek was immediately downstream of an artificial impoundment and Skeels Rd. This riparian wetland was dominated by Sparganium and Myosotis at the time of sampling. We assumed that both the artificial impoundment and Skeels Rd. would have impacted this site. The Skeels Creek site was located in the Skeel/Cushman/Braton Creeks subwatershed. The wetland at the Skeels Creek site was in the flood plain of Skeels Creek at the bottom of a large ravine near the end of Eweing Rd. This site appeared to be relatively pristine and was surrounded by forest and wetland. Dominant vegetation at the Skeels Creek site included Carex and deciduous trees. The Cushman Creek site was also within the Skeel/Cushman/Braton Creeks subwatershed. The stream at the Cushman Creek site contained a concrete riprap riffle near where the stream passed under 192nd Ave. The wetland at this site was a large lowland marsh dominated by grasses and Typha stands with few inundated areas. The Robinson Creek at Johnson Rd. site was in the North Branch subwatershed. The wetland at this site was in a small depression adjacent to Robinson Creek, but was not connected to the main channel by surface hydrology. The site appeared to be relatively pristine and was surrounded by forest. Wetland vegetation at the Robinson Creek at Johnson Rd. site was mainly sedges including Carex. The 148th and Garfield Rd. site was also in the North Branch subwatershed. This site appeared to be one of the most degraded sites that we sampled. The wetland at the 148th and Garfield Rd. site was adjacent to, but not connect to, the stream by surface hydrology. The Fitzgerald Rd. site was in the Martin/Mena/Heald Creeks Subwatershed. This site contained a wetland in the stream flood plain and the site appeared to be relatively pristine. Deciduous trees shaded the wetland. The Alger Rd. wetland and Heald Creek sites were also in the Martin/Mena/Heald Creeks Subwatershed. The Alger Rd. wetland contained very thick organic sediments and was immediately adjacent to Alger Rd. We assumed that the road would have an impact on the biota at this site. The Heald Creek site was the stream companion site to the Alger Rd. wetland and appeared to be relatively pristine. The South Branch at Monroe Rd. site was in the Upper South Branch subwatershed and contained a forested wetland approximately 200 meters from the stream channel. This wetland contained both woody vegetation and Typha. The stream at this site contained both a pool and a man-made riffle near where Monroe Rd. crosses the south branch of the White River. We assumed that the biota of the wetland were being impacted by Monroe Rd. The Robinson Creek at Baldwin Rd site was in the South Branch White River/Robinson Lake subwatershed. We assumed this site would be one of our most impacted sites due to its location immediately downstream of Robinson Lake and the village of Jugville. The wetland at the Robinson Creek at Baldwin Rd site was in the riparian of Robinson Creek and contained woody shrubs including Cornus (Dogwood). 6.2.3 Macroinvertebrate Sampling Macroinvertebrate samples were collected with standard 0.5 mm mesh, D-frame dip nets. Sampling consisted of sweeps at the surface, mid depth and
40
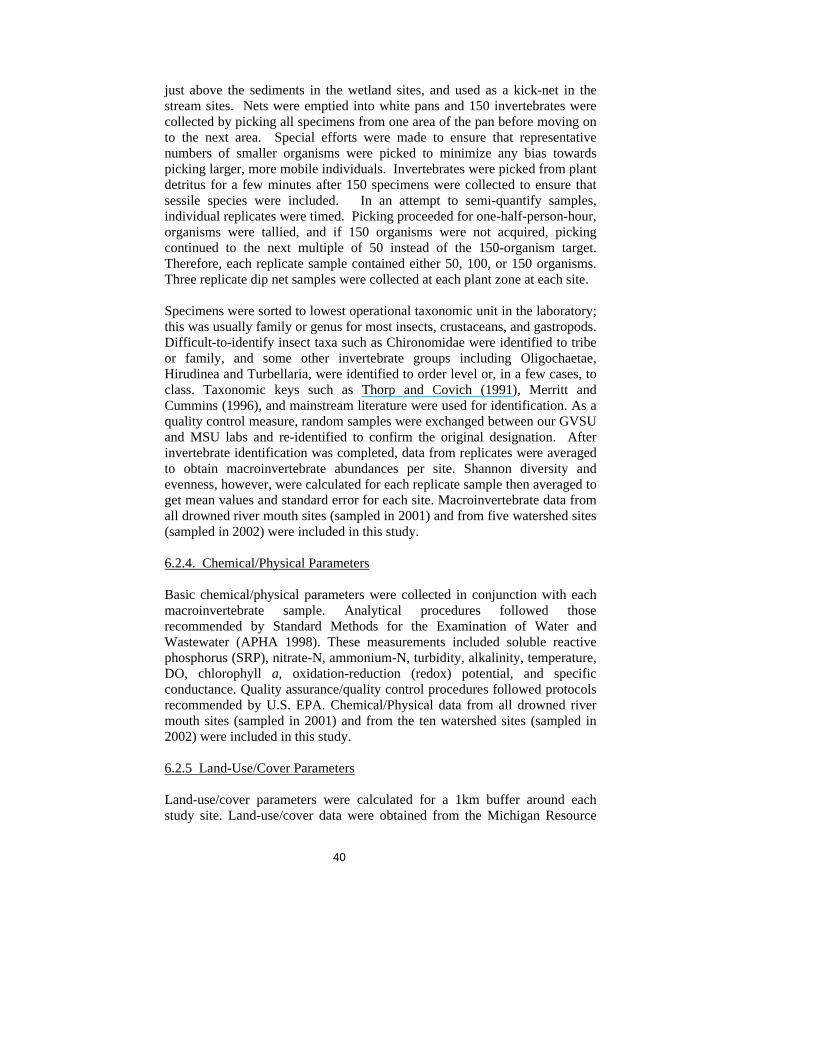
just above the sediments in the wetland sites, and used as a kick-net in the stream sites. Nets were emptied into white pans and 150 invertebrates were collected by picking all specimens from one area of the pan before moving on to the next area. Special efforts were made to ensure that representative numbers of smaller organisms were picked to minimize any bias towards picking larger, more mobile individuals. Invertebrates were picked from plant detritus for a few minutes after 150 specimens were collected to ensure that sessile species were included. In an attempt to semi-quantify samples, individual replicates were timed. Picking proceeded for one-half-person-hour, organisms were tallied, and if 150 organisms were not acquired, picking continued to the next multiple of 50 instead of the 150-organism target. Therefore, each replicate sample contained either 50, 100, or 150 organisms. Three replicate dip net samples were collected at each plant zone at each site. Specimens were sorted to lowest operational taxonomic unit in the laboratory; this was usually family or genus for most insects, crustaceans, and gastropods. Difficult-to-identify insect taxa such as Chironomidae were identified to tribe or family, and some other invertebrate groups including Oligochaetae, Hirudinea and Turbellaria, were identified to order level or, in a few cases, to class. Taxonomic keys such as Thorp and Covich (1991), Merritt and Cummins (1996), and mainstream literature were used for identification. As a quality control measure, random samples were exchanged between our GVSU and MSU labs and re-identified to confirm the original designation. After invertebrate identification was completed, data from replicates were averaged to obtain macroinvertebrate abundances per site. Shannon diversity and evenness, however, were calculated for each replicate sample then averaged to get mean values and standard error for each site. Macroinvertebrate data from all drowned river mouth sites (sampled in 2001) and from five watershed sites (sampled in 2002) were included in this study. 6.2.4. Chemical/Physical Parameters Basic chemical/physical parameters were collected in conjunction with each macroinvertebrate sample. Analytical procedures followed those recommended by Standard Methods for the Examination of Water and Wastewater (APHA 1998). These measurements included soluble reactive phosphorus (SRP), nitrate-N, ammonium-N, turbidity, alkalinity, temperature, DO, chlorophyll a, oxidation-reduction (redox) potential, and specific conductance. Quality assurance/quality control procedures followed protocols recommended by U.S. EPA. Chemical/Physical data from all drowned river mouth sites (sampled in 2001) and from the ten watershed sites (sampled in 2002) were included in this study. 6.2.5 Land-Use/Cover Parameters Land-use/cover parameters were calculated for a 1km buffer around each study site. Land-use/cover data were obtained from the Michigan Resource
41
Information System (MIRIS) with updates and ground-truthing conducted by the Information Services Center of the Annis Water Resources Institute. Seven land-use/cover parameters were calculated for each site including %agriculture, %barren field, %developed land, %forest, %wetland, %lake and total road density. Arcview version 3.3 was used to calculate all land-use/cover parameters. Land-use/cover data from all of the drowned river mouth sites were included in this study. 6.2.6 Statistical Analysis Principal Components Analysis (PCA) was conducted on thirteen chemical/physical parameters and seven land-use/cover parameters. Correspondence Analysis (CA) was conducted on the 47 most-abundant invertebrate taxa (taxa represented by 7 or more organisms or 0.05% total abundance). Multivariate analyses were conducted using SAS version 8.0 (Cary, North Carolina). Kruskal-Wallis and Mann-Whitney U-tests were used to determine significant differences in invertebrate data. Student’s t-tests were used to determine significant differences in chemical/physical, land-use/cover data as well as site scores from the multivariate analyses. Pearson correlation was used to determine significant relationships between multivariate site scores and individual physical/chemical and land-use/cover parameters. Differences and correlations were deemed significant at p < 0.05. Kruskal-Wallis, Mann-Whitney U-tests, t-tests and Pearson correlation analysis were all conducted using SYSTAT version 5.0 (Evanston, Illinois). 6.3 2001 DROWNED RIVER MOUTH WETLAND
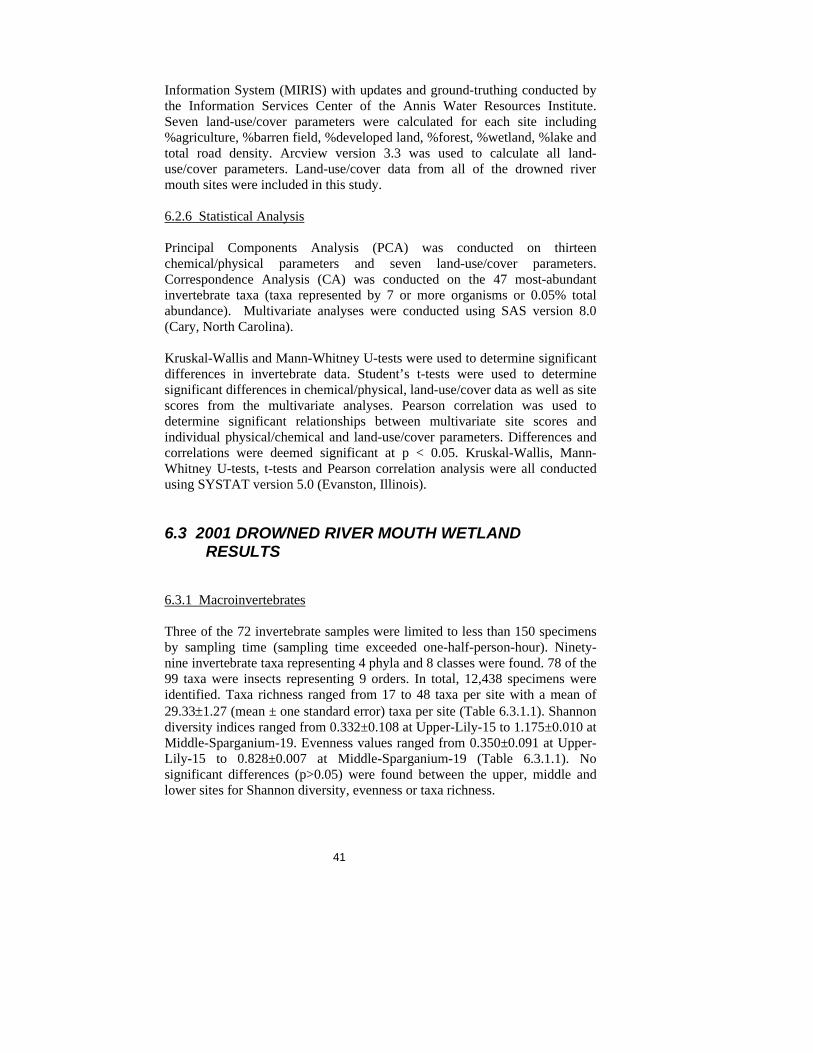
RESULTS 6.3.1 Macroinvertebrates Three of the 72 invertebrate samples were limited to less than 150 specimens by sampling time (sampling time exceeded one-half-person-hour). Ninety-nine invertebrate taxa representing 4 phyla and 8 classes were found. 78 of the 99 taxa were insects representing 9 orders. In total, 12,438 specimens were identified. Taxa richness ranged from 17 to 48 taxa per site with a mean of 29.33±1.27 (mean ± one standard error) taxa per site (Table 6.3.1.1). Shannon diversity indices ranged from 0.332±0.108 at Upper-Lily-15 to 1.175±0.010 at Middle-Sparganium-19. Evenness values ranged from 0.350±0.091 at Upper-Lily-15 to 0.828±0.007 at Middle-Sparganium-19 (Table 6.3.1.1). No significant differences (p>0.05) were found between the upper, middle and lower sites for Shannon diversity, evenness or taxa richness.
42
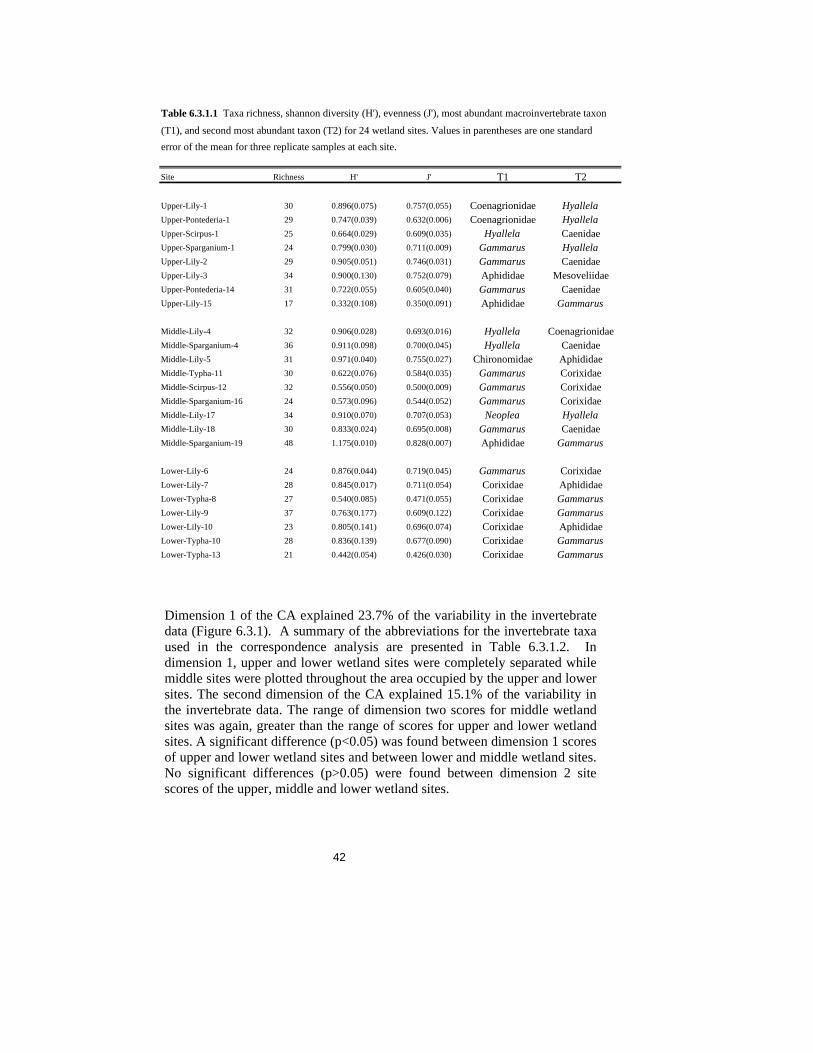
Table 6.3.1.1 Taxa richness, shannon diversity (H'), evenness (J'), most abundant macroinvertebrate taxon
(Terro
UppeUppeUppeUppeUppeUppeUppeUppe
MiddlMiddlMiddlMiddlMiddlMiddlMiddlMiddlMiddl
LoweLoweLoweLoweLoweLoweLowe
1), and second most abundant taxon (T2) for 24 wetland sites. Values in parentheses are one standard r of the mean for three replicate samples at each site.
Site Richness H' J' T1 T2
r-Lily-1 30 0.896(0.075) 0.757(0.055) Coenagrionidae Hyallelar-Pontederia-1 29 0.747(0.039) 0.632(0.006) Coenagrionidae Hyallelar-Scirpus-1 25 0.664(0.029) 0.609(0.035) Hyallela Caenidaer-Sparganium-1 24 0.799(0.030) 0.711(0.009) Gammarus Hyallelar-Lily-2 29 0.905(0.051) 0.746(0.031) Gammarus Caenidaer-Lily-3 34 0.900(0.130) 0.752(0.079) Aphididae Mesoveliidaer-Pontederia-14 31 0.722(0.055) 0.605(0.040) Gammarus Caenidaer-Lily-15 17 0.332(0.108) 0.350(0.091) Aphididae Gammarus
e-Lily-4 32 0.906(0.028) 0.693(0.016) Hyallela Coenagrionidaee-Sparganium-4 36 0.911(0.098) 0.700(0.045) Hyallela Caenidaee-Lily-5 31 0.971(0.040) 0.755(0.027) Chironomidae Aphididaee-Typha-11 30 0.622(0.076) 0.584(0.035) Gammarus Corixidaee-Scirpus-12 32 0.556(0.050) 0.500(0.009) Gammarus Corixidaee-Sparganium-16 24 0.573(0.096) 0.544(0.052) Gammarus Corixidaee-Lily-17 34 0.910(0.070) 0.707(0.053) Neoplea Hyallelae-Lily-18 30 0.833(0.024) 0.695(0.008) Gammarus Caenidaee-Sparganium-19 48 1.175(0.010) 0.828(0.007) Aphididae Gammarus
r-Lily-6 24 0.876(0.044) 0.719(0.045) Gammarus Corixidaer-Lily-7 28 0.845(0.017) 0.711(0.054) Corixidae Aphididaer-Typha-8 27 0.540(0.085) 0.471(0.055) Corixidae Gammarusr-Lily-9 37 0.763(0.177) 0.609(0.122) Corixidae Gammarusr-Lily-10 23 0.805(0.141) 0.696(0.074) Corixidae Aphididaer-Typha-10 28 0.836(0.139) 0.677(0.090) Corixidae Gammarusr-Typha-13 21 0.442(0.054) 0.426(0.030) Corixidae Gammarus
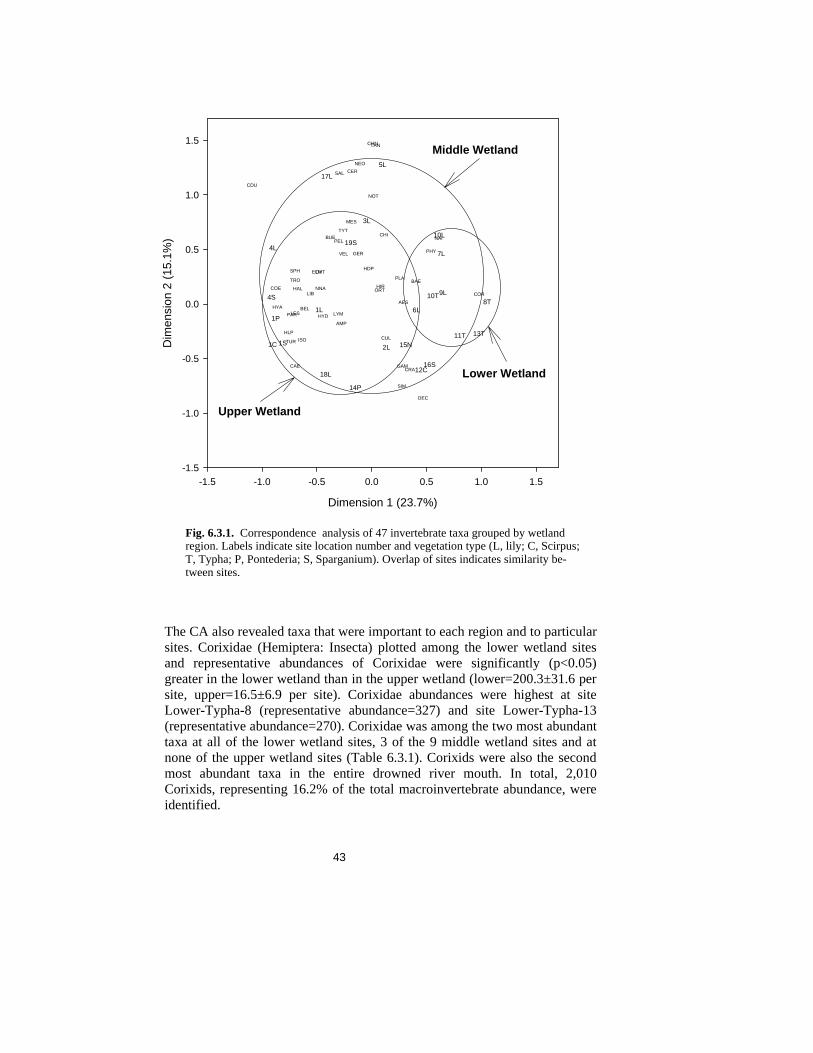
Dimension 1 of the CA explained 23.7% of the variability in the invertebrate data (Figure 6.3.1). A summary of the abbreviations for the invertebrate taxa used in the correspondence analysis are presented in Table 6.3.1.2. In dimension 1, upper and lower wetland sites were completely separated while middle sites were plotted throughout the area occupied by the upper and lower sites. The second dimension of the CA explained 15.1% of the variability in the invertebrate data. The range of dimension two scores for middle wetland sites was again, greater than the range of scores for upper and lower wetland sites. A significant difference (p<0.05) was found between dimension 1 scores of upper and lower wetland sites and between lower and middle wetland sites. No significant differences (p>0.05) were found between dimension 2 site scores of the upper, middle and lower wetland sites.
43
Dimension 1 (23.7%)
-1.5 -1.0 -0.5 0.0 0.5 1.0 1.5
Dim
ensi
on 2
(15.
1%)
-1.5
-1.0
-0.5
0.0
0.5
1.0
1.5
TUR
HIR
NAI
SPH
HYD LYM
PHY
PLA
CRAGAM
HYA
AMP
DEC
ISO
CAE
BAE
AES
COE
CDU
LES
LIB
BEL
COR
GER
MES
NOT
BUE
NNA
NEO
PAR
SAL
VEL
DYTELM
HAL
HLP
PEL
HDP
TRO
CER
CHI
CHN
TYT
ORT
TAN
CUL
SIM
6L
7L
8T9L
10L
10T
13T
4L
4S
5L
11T
12C16S
17L
18L
19S
2L
3L
14P
15N
1L1P
1C 1S
Fig. 6.3.1. Correspondence analysis of 47 invertebrate taxa grouped by wetlandregion. Labels indicate site location number and vegetation type (L, lily; C, Scirpus;T, Typha; P, Pontederia; S, Sparganium). Overlap of sites indicates similarity be-tween sites.
Middle Wetland
Lower Wetland
Upper Wetland
The CA also revealed taxa that were important to each region and to particular sites. Corixidae (Hemiptera: Insecta) plotted among the lower wetland sites and representative abundances of Corixidae were significantly (p<0.05) greater in the lower wetland than in the upper wetland (lower=200.3±31.6 per site, upper=16.5±6.9 per site). Corixidae abundances were highest at site Lower-Typha-8 (representative abundance=327) and site Lower-Typha-13 (representative abundance=270). Corixidae was among the two most abundant taxa at all of the lower wetland sites, 3 of the 9 middle wetland sites and at none of the upper wetland sites (Table 6.3.1). Corixids were also the second most abundant taxa in the entire drowned river mouth. In total, 2,010 Corixids, representing 16.2% of the total macroinvertebrate abundance, were identified.

Genus/Species/Class Order Family Tribe Abbreviation
Turbellaria TURHirudinea HIROligochaeta Naididae NAIBivalvia Sphaeriidae SPHGastropoda Hydrobiidae HYD
Lymnaeidae LYMPhysidae Physa gyrina PHYPlanorbidae PLA
Crustacea Amphipoda Crangonyctidae Crangonyx sp. CRAGammaridae Gammarus sp. GAMTalitridae Hyalella azteca HYAUnknown AMP
Decapoda DECIsopoda ISO
Asellidae Caecidotea sp. CAEInsecta Ephemeroptera Baetidae BAE
Odonata Aeshnidae AESCoenagrionidae COECorduliidae CDULestidae Lestes LESLibellulidae LIB
Hemiptera Belostomatidae Belostoma sp. BELCorixidae CORGerridae GERMesoveliidae Mesovelia MESNotonectidae NOT
Buenoa BUENotonecta NNA
Pleidae Neoplea NEOParaplea PAR
Saldidae SALVeliidae VEL
Coleoptera Dytiscidae DYTElmidae ELMHaliplidae HAL
Halipus HLPPeltodytes PEL
Hydrophilidae HDPTropisternus TRO
Diptera Ceratopogonidae CERChironomidae CHI
Chironomini CHNTanytarsini TYTOrthocladiinae ORTTanypodinae TAN
Culicidae CULSimuliidae SIM
Table 6.3.1.2 Abbreviations used in the Correspondence Analysis of 47 Invertebrate Taxa.
44
45
Physidae (Pulmonata: Gastropoda) was also shown to be important in the lower wetland by dimension 1 of the CA. A significant difference (p<0.05) in Physidae abundances was found between the upper and lower wetland sites. Physidae was not the dominant taxa at any site, and the mean relative abundance of Physids was 0.018±0.005 for all sites in the drowned river mouth. Upper wetland sites had significantly higher (p<0.05) Hyallela azteca (Talitridae: Amphipoda) abundances than lower wetland sites. The location of Hyallela azteca on the CA reflected the importance of this species in the upper wetland. Upper-Scirpus-1 had the most Hyallela azteca (representative abundance=266). Hyallela azteca was among the two most abundant taxa at 4 of the 8 upper wetland sites, 3 of the 9 middle wetland sites and none of the lower wetland sites (Table c). Site Middle-Lily-18 also had a notably high Hyallela azteca abundance (representative abundance=66). Hyallela azteca was not found in large numbers at any lower wetland sites (representative abundances<35). Gammarus (Gammaridae: Amphipoda) was among the two most abundant taxa at 5 of the 7 lower wetland sites, 5 of the 9 middle wetland sites and at 5 of the 8 upper wetland sites (Table 6.3.1). Gammarus was also the most abundant taxa in the drowned river mouth. In total 2,460 Gammarus were identified which represented 19.8% of the total invertebrate representative abundance for the wetland. No significant differences were found between Gammarus abundances of the upper, middle and lower wetland. In dimension 1 of the CA Gammarus plotted in the range where upper and lower wetland sites converge (Figure 6.2.1). Coenagrionidae (Odonata: Insecta) was also shown to be important in the upper wetland by its location in dimension 1. However, Coenagrionidae abundances were not significantly different (p>0.05) between the upper, middle and lower wetland sites. Mean relative abundance of Coenagrionidae for all sites in the drowned river mouth was 0.059±0.016. Coenagrionidae were among the two most abundant taxa at 2 of the 8 upper sites, 1 of the 9 middle wetland sites, and was not found in large numbers at any of the lower wetland sites (Table 6.3.1). Naididae (Oligochaeta) was relatively important at Lower-Lily-7 where it was the third most abundant taxa, representing 16.1% of the site’s macroinvertebrate abundance. The CA plotted Naididae near Lower-Lily-7 in the area occupied by the lower wetland sites for this reason. Naididae was not found in large numbers at any other sites in the drowned river mouth (relative abundances ≤0.035). Neoplea (Pleidae: Hemiptera) was especially important at Middle-Lily-17 where it represents 26.4% of the macroinvertebrate abundance and was the most abundant taxa. Relatively high abundances of Neoplea were also found at Lower-Lily-10 where it was the third most abundant taxa and represented 9.3% of the macroinvertebrate abundance. No significant differences (p>0.05) were found in Neoplea abundances between the upper, middle and lower wetland sites.
46
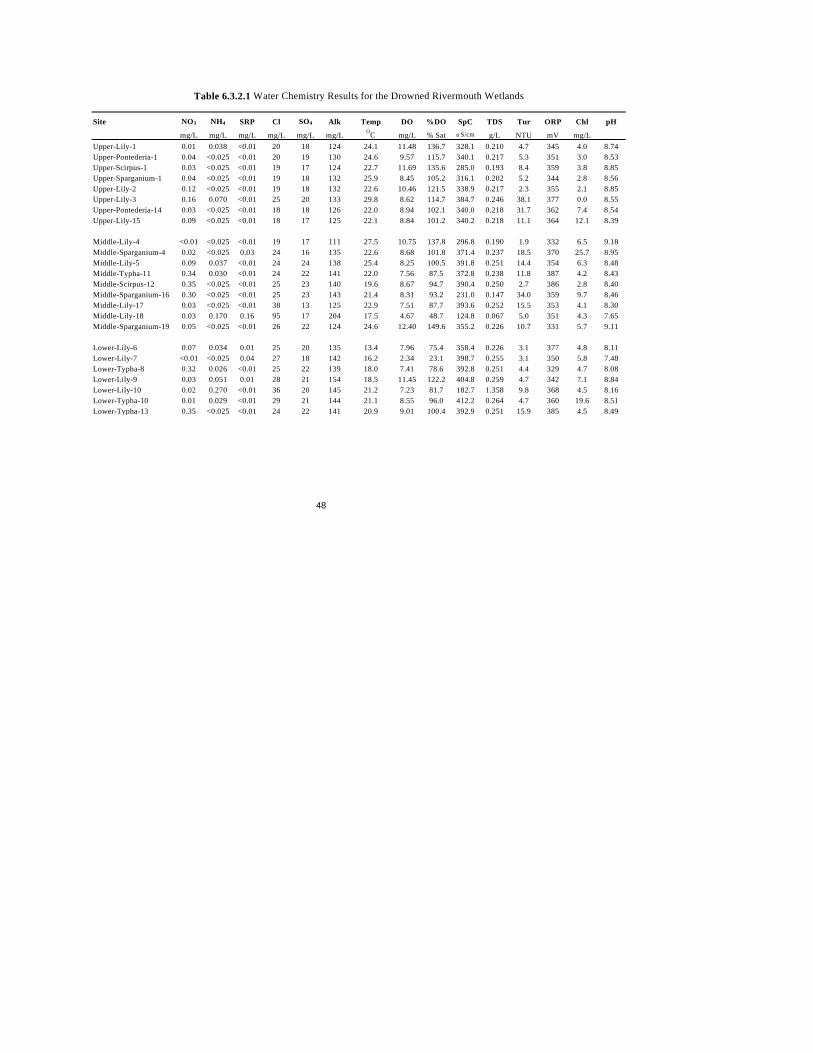
Since sampling was conducted within distinct vegetation zones, the CA was also used to search for patterns in macroinvertebrate assemblages based on plant community type. Typha-dominated zones were found only in the lower and middle wetland and three of our seven lower sites were Typha-dominated. The remaining lower wetland sites were lily-dominated (mostly Nuphar). In addition, Pontederia, Scirpus and Sparganium-dominated sites could only be found in the middle and upper wetland. Therefore, our interpretation of the CA based on vegetation type is tenuous. The four Typha-dominated sites did, however, group fairly close to one another. Lily-dominated zones formed the largest group and had the greatest range in dimension 2. Pontederia, Scirpus and Sparganium-dominated sites formed groups that overlapped nearly entirely. Further interpretation of the CA in terms of vegetation types suffers from a lack of comparable sites throughout the drowned river mouth. Percent non-insect taxa richness was greatest at Lower-Lily-7 (46.42%) and least at site Middle-Lily-4 (21.9%). Mean %non-insect taxa richness was 34.4±1.4% for all sites. A significant difference (p<0.05) in %non-insect taxa was found between lower wetland and middle wetland sites and between upper and lower wetland sites. Lower wetland sites %non-insect taxa richness was 40.4±2.3% while middle and upper wetland sites %non-insect taxa richness were 31.8±1.9% and 32.0±2.0% respectively. 6.3.2. Chemical/Physical PCA of 13 chemical/physical variables separated sites of the upper wetland from sites of the lower wetland (Figure 6.3.2). In the first two principal components (explaining 52% of the variation) seven of the eight upper wetland sites were pulled away from lower wetland sites. Sites of the middle wetland plotted throughout the area occupied by sites of the upper and lower wetland. The PCA pulled upper wetland sites out in the same direction as dissolved oxygen and pH and away from total dissolved solids, ammonium, chloride, soluble reactive phosphorus, turbidity, sulfate, and nitrate. Six of the seven lower wetland sites and five of the nine middle wetland sites were pulled away from upper sites in either principal component 1 (PC 1) or principal component 2 (PC 2). Lower-Lily-7 was pulled out in PC 1 because of its relatively high SRP concentration (0.04 mg/L) and its low dissolved oxygen (23.1% saturation) (Table 6.3.2.1). Lower-Lily-7 and Middle-Lily-18 were the only sites with dissolved oxygen below 5 mg/L. Lower-Lily-10 is also being pulled out in PC 1, presumably because of its high ammonium (0.27 mg/L) and low specific conductance (182.7 uS/cm). Middle-Lily-18 had the highest score in PC 1 due to a chloride concentration that was over twice that of any other site in the drowned river mouth (95 mg/L). SRP at site Middle-Lily-18 was four-times higher than any other site (0.16 mg/L). Middle-Typha-11, Middle-Scirpus-12 and Lower-Typha-13 scored highest in PC 2 because of their high nitrate concentrations, all being greater than 0.34 mg/L.

47
Principal Component 1 (34.4%)
-2 0 2 4 6 8
Prin
cipa
l Com
pone
nt 2
(17.
2%)
-2
0
2
4
6
8
L-6L
L-7L
L-8T
L-9L
L-10LL-10T
L-13T
M-4L
M-4S
M-5L
M-11TM-12C
M-16S
M-17LM-18LM-19S
U-2L
U-3L
U-14PU-15L
U-1L
U-1P
U-1CU-1S
Chl
pH
DO
SpC
SO4Tur NO3 ORP
Alk
TDS
NH4
Cl
SRP
Lower Wetland
Upper Wetland
Fig. 6.3.2. Principal components analysis of 13 chemical/physical parameters.Labels indicate wetland region (upper, U-; middle, M-; lower, L-), site locationnumber and vegetation type (L, lily; P, Pontederia; S, Sparganium; C, Scirpus; T, Typha). Overlap of sites indicates similarity between sites.
Middle-Sparganium-16 also scored relatively high in PC 2, because of the site’s high nitrate concentration (0.30 mg/L) and high turbidity (34.0 NTU). Most upper wetland sites scored low in both PC 1 and PC 2. Upper-Lily-3 is the exception and was pulled out of the group of upper sites in PC 1. Nitrate concentrations and turbidity at Upper-Lily-3 were well above those of any other upper wetland site (0.16 mg/L nitrate and 38.1 NTU turbidity). Based on their smaller range of PC 1 and PC 2 scores as well as their smaller coefficients of variation for individual physical/chemical parameters (Table 6.3.2.2), sites in the upper wetland had the least physical/chemical variability
48
NO3 NH4 SRP Cl SO4 Alk Temp DO %DO SpC TDS Tur ORP Chl pH
mg/L mg/L mg/L mg/L mg/L mg/L OC m
Site
g/L % Sat u S/cm g/L NTU mV mg/Ly-1 0.01 0.038 <0.01 20 18 124 24.1 11.48 136.7 328.1 0.210 4.7 345 4.0 8.74
ontederia-1 0.04 <0.025 <0.01 20 19 130 24.6 9.57 115.7 340.1 0.217 5.3 351 3.0 8.53irpus-1 0.03 <0.025 <0.01 19 17 124 22.7 11.69 135.6 285.0 0.193 8.4 359 3.8 8.85arganium-1 0.04 <0.025 <0.01 19 18 132 25.9 8.45 105.2 316.1 0.202 5.2 344 2.8 8.56y-2 0.12 <0.025 <0.01 19 18 132 22.6 10.46 121.5 338.9 0.217 2.3 355 2.1 8.85y-3 0.16 0.070 <0.01 25 20 133 29.8 8.62 114.7 384.7 0.246 38.1 377 0.0 8.55
ontederia-14 0.03 <0.025 <0.01 18 18 126 22.0 8.94 102.1 340.0 0.218 31.7 362 7.4 8.54y-15 0.09 <0.025 <0.01 18 17 125 22.1 8.84 101.2 340.2 0.218 11.1 364 12.1 8.39
ly-4 <0.01 <0.025 <0.01 19 17 111 27.5 10.75 137.8 296.8 0.190 1.9 332 6.5 9.18parganium-4 0.02 <0.025 0.03 24 16 135 22.6 8.68 101.8 371.4 0.237 18.5 370 25.7 8.95ly-5 0.09 0.037 <0.01 24 24 138 25.4 8.25 100.5 391.8 0.251 14.4 354 6.3 8.48
11 0.34 0.030 <0.01 24 22 141 22.0 7.56 87.5 372.8 0.238 11.8 387 4.2 8.43irpus-12 0.35 <0.025 <0.01 25 23 140 19.6 8.67 94.7 390.4 0.250 2.7 386 2.8 8.40
parganium-16 0.30 <0.025 <0.01 25 23 143 21.4 8.31 93.2 231.0 0.147 34.0 359 9.7 8.46ly-17 0.03 <0.025 <0.01 38 13 125 22.9 7.51 87.7 393.6 0.252 15.5 353 4.1 8.30ly-18 0.03 0.170 0.16 95 17 204 17.5 4.67 48.7 124.8 0.067 5.0 351 4.3 7.65
parganium-19 0.05 <0.025 <0.01 26 22 124 24.6 12.40 149.6 355.2 0.226 10.7 331 5.7 9.11
ily-6 0.07 0.034 0.01 25 20 135 13.4 7.96 75.4 358.4 0.226 3.1 377 4.8 8.11ily-7 <0.01 <0.025 0.04 27 18 142 16.2 2.34 23.1 398.7 0.255 3.1 350 5.8 7.48
pha-8 0.32 0.026 <0.01 25 22 139 18.0 7.41 78.6 392.8 0.251 4.4 329 4.7 8.08ily-9 0.03 0.051 0.01 28 21 154 18.5 11.45 122.2 404.8 0.259 4.7 342 7.1 8.84ily-10 0.02 0.270 <0.01 36 20 145 21.2 7.23 81.7 182.7 1.358 9.8 368 4.5 8.16
pha-10 0.01 0.029 <0.01 29 21 144 21.1 8.55 96.0 412.2 0.264 4.7 360 19.6 8.51
Upper-LilUpper-PUpper-ScUpper-SpUpper-LilUpper-LilUpper-PUpper-Lil
Middle-LiMiddle-SMiddle-LiMiddle-Typha-Middle-ScMiddle-SMiddle-LiMiddle-LiMiddle-S
Lower-LLower-LLower-TyLower-LLower-LLower-TyLower-Typha-13 0.35 <0.025 <0.01 24 22 141 20.9 9.01 100.4 392.9 0.251 15.9 385 4.5 8.49
Table 6.3.2.1 Water Chemistry Results for the Drowned Rivermouth Wetlands
49
wetland region NO3 NH4 SRP Cl SO4 Alk Temp pH
upper 0.825 0.919 0.000* 0.114 0.055 0.030 0.109 0.019middle 1.103 1.488 2.069 0.710 0.200 0.186 0.133 0.055lower 1.316 1.490 1.069 0.147 0.068 0.041 0.157 0.052
wetland region DO %DO SpC TDS Tur ORP Chl
upper 0.133 0.120 0.084 0.072 1.024 0.031 0.850middle 0.252 0.293 0.284 0.304 0.776 0.056 0.914lower 0.358 0.373 0.224 0.187 0.722 0.055 0.756
* No upper wetland sites had SRP above our dection limit of 0.01 mg/L.
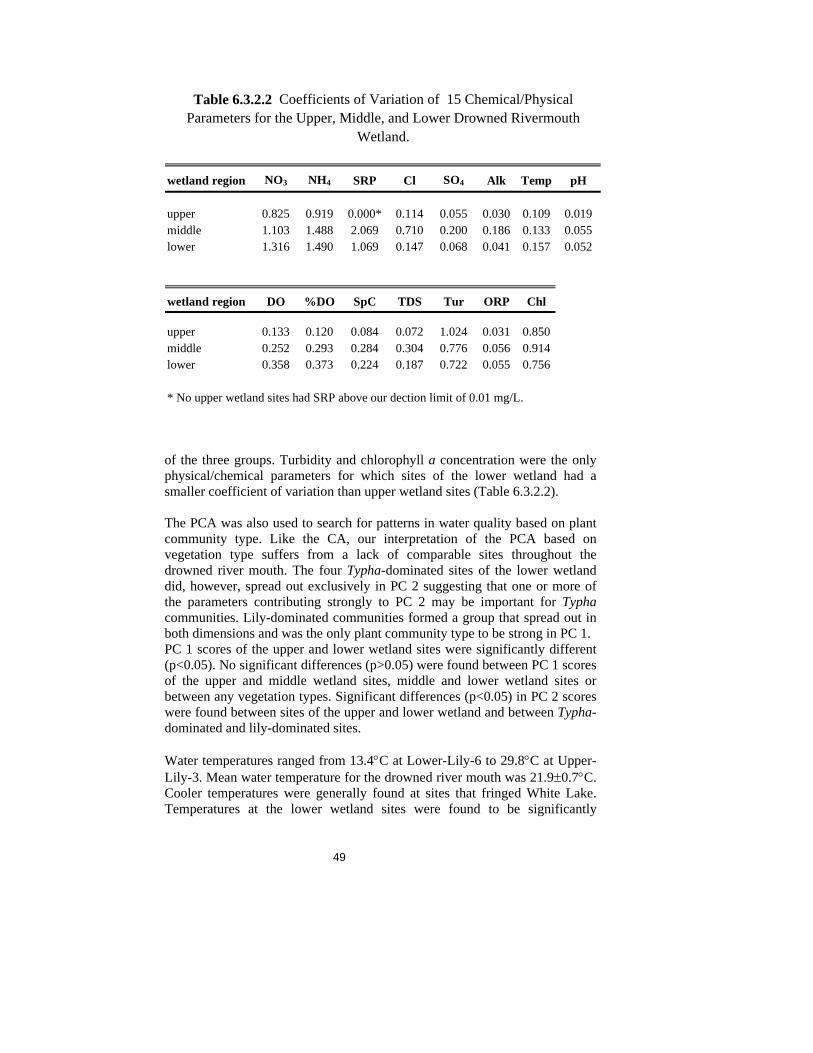
Table 6.3.2.2 Coefficients of Variation of 15 Chemical/Physical Parameters for the Upper, Middle, and Lower Drowned Rivermouth
Wetland.
of the three groups. Turbidity and chlorophyll a concentration were the only physical/chemical parameters for which sites of the lower wetland had a smaller coefficient of variation than upper wetland sites (Table 6.3.2.2). The PCA was also used to search for patterns in water quality based on plant community type. Like the CA, our interpretation of the PCA based on vegetation type suffers from a lack of comparable sites throughout the drowned river mouth. The four Typha-dominated sites of the lower wetland did, however, spread out exclusively in PC 2 suggesting that one or more of the parameters contributing strongly to PC 2 may be important for Typha communities. Lily-dominated communities formed a group that spread out in both dimensions and was the only plant community type to be strong in PC 1. PC 1 scores of the upper and lower wetland sites were significantly different (p<0.05). No significant differences (p>0.05) were found between PC 1 scores of the upper and middle wetland sites, middle and lower wetland sites or between any vegetation types. Significant differences (p<0.05) in PC 2 scores were found between sites of the upper and lower wetland and between Typha-dominated and lily-dominated sites. Water temperatures ranged from 13.4°C at Lower-Lily-6 to 29.8°C at Upper-Lily-3. Mean water temperature for the drowned river mouth was 21.9±0.7°C. Cooler temperatures were generally found at sites that fringed White Lake. Temperatures at the lower wetland sites were found to be significantly

50
different (p<0.05) from temperatures of the upper and middle wetland (Table 6.3.2.1). Turbidity was highly variable throughout the drowned river mouth with a mean of 11.1±2.1 NTU. High turbidity (>30 NTU) was found at Upper-Lily-3, Upper-Pontederia-14 and Middle-Sparganium-16. Chlorophyll a concentrations did not correlate with the high turbidity of these three sites, suggesting that phytoplankton did not contribute appreciably to the high turbidity. Lower-Lily-3 had the highest turbidity (38.1 NTU). Middle-Lily4 had the lowest turbidity (1.9 NTU). No significant differences (p<0.05) in turbidity were found between upper, middle and lower wetland sites. Specific conductance values were also highly variable throughout the drowned river mouth with a mean of 339.3±14.7 uS/cm. Highest specific conductance levels were found in the lower wetland at Lower-Typha-9 and Lower-Typha-10. Specific conductance and chloride concentrations appeared to be negatively correlated based on their eigenvectors in the PCA. However, an insignificant correlation was found between their respective values (p>0.05). The opposing orientation of the eigenvectors of chloride and specific conductance is probably the result of sites Middle-Lily-18 and Lower-Lily-10 having high chloride concentrations and low specific conductance. No significant differences (p<0.05) were found in specific conductance of the upper, middle and lower wetland sites (Table 6.3.2.2). 6.3.3 Land-Use/Cover: Principal components analysis of 7 land-use/land-cover parameters separated sites of the upper, middle and lower wetland (Figure 6.3.3). PC1 explained 70.9% of the variability in the land-use/land-cover data and PC2 explained 18.4%. Upper wetland sites were pulled out in the same direction as the forest and barren field eigenvectors. Middle wetland sites were pulled out in the same direction as the eigenvectors for agriculture and wetland. Sites of the lower wetland were pulled out in the same direction as the eigenvectors for lake/stream, road density and developed land. Lower-13 scored the lowest of any other lower wetland site in PC1. This site was also further upstream than any other lower wetland site. Lower and middle wetland sites were not significantly different (p>0.05) in PC 1. Thirteen significant correlations were found between individual land-use/land-cover parameters (Table 6.3.3). No individual land-use/land-cover parameter had an overwhelming power of separation in PC1 or PC2. Significant differences (p<0.05) were found between upper, middle and lower wetland sites for most land-use/land-cover parameters. Upper and lower wetland sites were not significantly different in the amount of wetland area and the middle and upper wetland sites were not significantly different in the amount of developed land within one kilometer of their respective sites.

Principal Component 1 (70.9%)
-2 0 2 4
Prin
cipa
l Com
pone
nt 2
(18.
4%)
-2
0
2
4
Low-6Low-7Low-8
Low-9
Low-10
Low-13Mid-4Mid-5
Mid-11Mid-12
Mid-16
Mid-17Mid-18
Mid-19
Up-1
Up-2Up-3Up-14Up-15
road density
wetland
culture
open water
developed
forest barren field
agri
Fig. 6.3.3. Principal components analysis of 7 land-use/cover parameters. Labelsindicate wetland region (upper, middle, lower) and site location numbers.
Developed Agriculture Barren Forest Open Water WetlandDeveloped n/a * * * * *Agricultur
51
e -0.72 n/a * * * *Barren -0.57 NS n/a * * *Forest -0.76 NS 0.69 n/a * *Water 0.96 -0.56 -0.69 -0.9 n/a *
Wetland -0.76 0.63 NS NS -0.6 n/a
Table 6.3.3. Significant correlations between land-use/cover parameters at p<0.05. Value in matrix = r, NS=not significant.
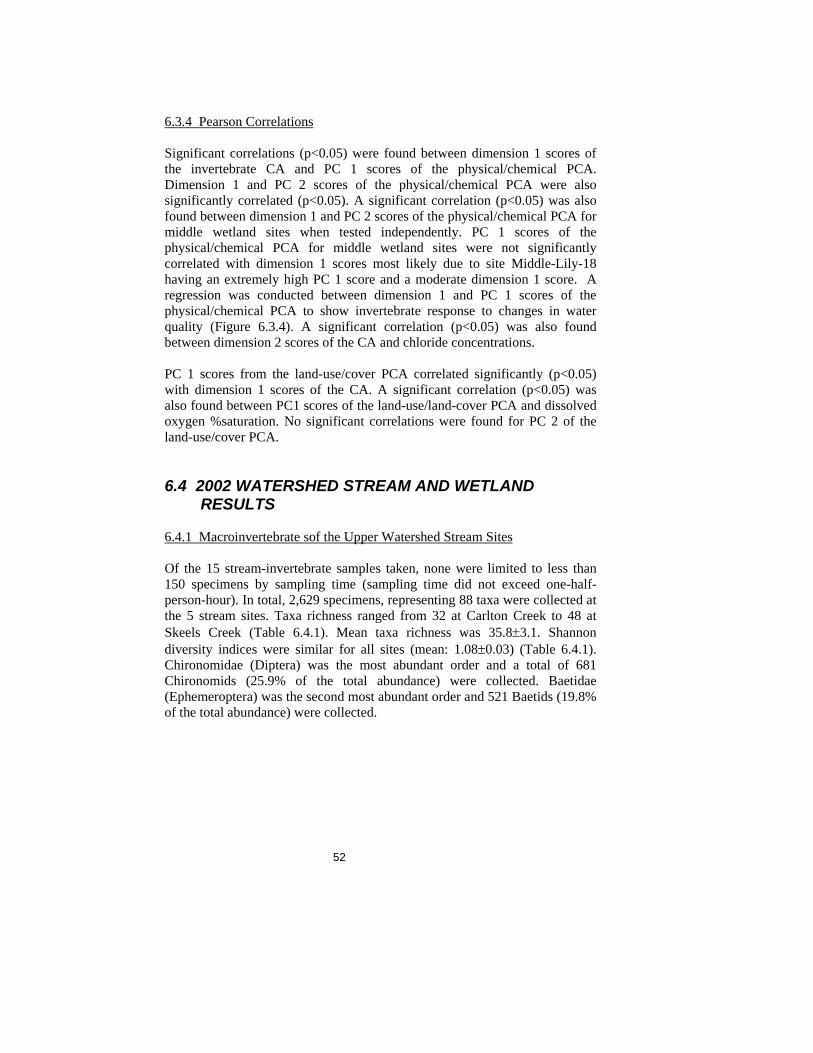
52
6.3.4 Pearson Correlations Significant correlations (p<0.05) were found between dimension 1 scores of the invertebrate CA and PC 1 scores of the physical/chemical PCA. Dimension 1 and PC 2 scores of the physical/chemical PCA were also significantly correlated (p<0.05). A significant correlation (p<0.05) was also found between dimension 1 and PC 2 scores of the physical/chemical PCA for middle wetland sites when tested independently. PC 1 scores of the physical/chemical PCA for middle wetland sites were not significantly correlated with dimension 1 scores most likely due to site Middle-Lily-18 having an extremely high PC 1 score and a moderate dimension 1 score. A regression was conducted between dimension 1 and PC 1 scores of the physical/chemical PCA to show invertebrate response to changes in water quality (Figure 6.3.4). A significant correlation (p<0.05) was also found between dimension 2 scores of the CA and chloride concentrations. PC 1 scores from the land-use/cover PCA correlated significantly (p<0.05) with dimension 1 scores of the CA. A significant correlation (p<0.05) was also found between PC1 scores of the land-use/land-cover PCA and dissolved oxygen %saturation. No significant correlations were found for PC 2 of the land-use/cover PCA. 6.4 2002 WATERSHED STREAM AND WETLAND
RESULTS 6.4.1 Macroinvertebrate sof the Upper Watershed Stream Sites Of the 15 stream-invertebrate samples taken, none were limited to less than 150 specimens by sampling time (sampling time did not exceed one-half-person-hour). In total, 2,629 specimens, representing 88 taxa were collected at the 5 stream sites. Taxa richness ranged from 32 at Carlton Creek to 48 at Skeels Creek (Table 6.4.1). Mean taxa richness was 35.8±3.1. Shannon diversity indices were similar for all sites (mean: 1.08±0.03) (Table 6.4.1). Chironomidae (Diptera) was the most abundant order and a total of 681 Chironomids (25.9% of the total abundance) were collected. Baetidae (Ephemeroptera) was the second most abundant order and 521 Baetids (19.8% of the total abundance) were collected.
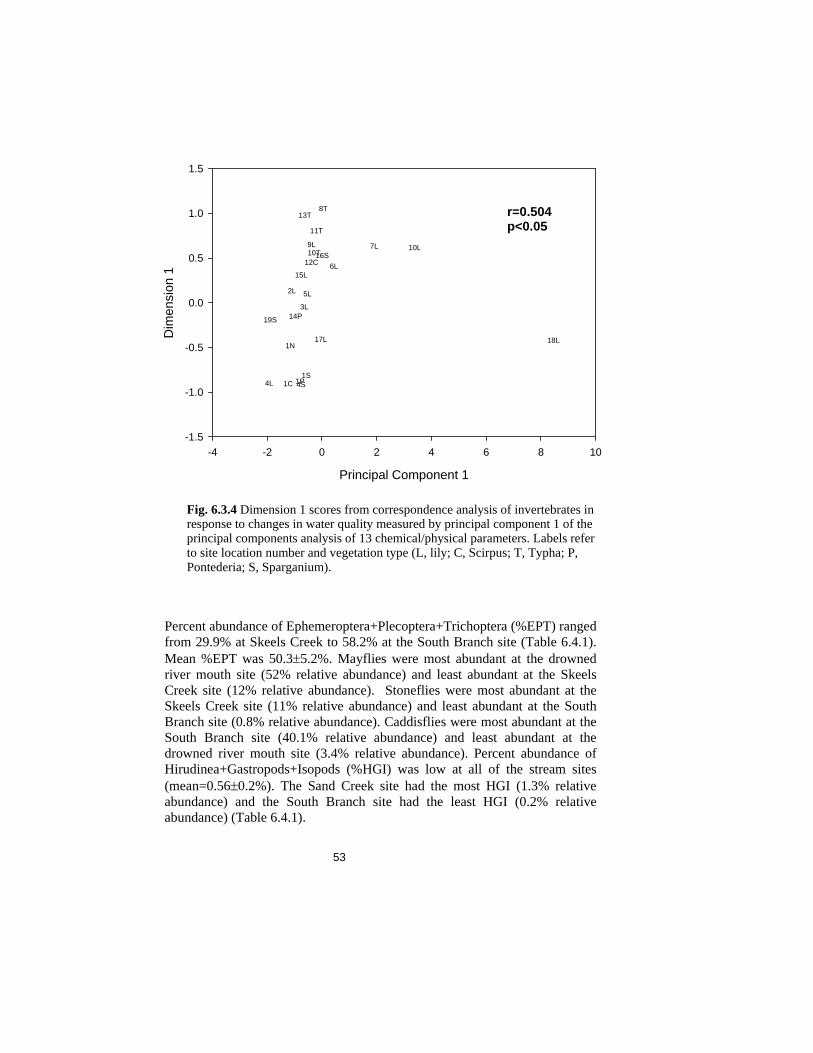
53
Principal Component 1
-4 -2 0 2 4 6 8 10
Dim
ensi
on 1
-1.5
-1.0
-0.5
0.0
0.5
1.0
1.5
6L
7L
8T
9L 10L10T
13T
4L 4S
5L
11T
12C16S
17L 18L
19S
2L
3L14P
15L
1N
1P1C1S
r=0.504p<0.05
Fig. 6.3.4 Dimension 1 scores from correspondence analysis of invertebrates in response to changes in water quality measured by principal component 1 of the principal components analysis of 13 chemical/physical parameters. Labels referto site location number and vegetation type (L, lily; C, Scirpus; T, Typha; P, Pontederia; S, Sparganium).
Percent abundance of Ephemeroptera+Plecoptera+Trichoptera (%EPT) ranged from 29.9% at Skeels Creek to 58.2% at the South Branch site (Table 6.4.1). Mean %EPT was 50.3±5.2%. Mayflies were most abundant at the drowned river mouth site (52% relative abundance) and least abundant at the Skeels Creek site (12% relative abundance). Stoneflies were most abundant at the Skeels Creek site (11% relative abundance) and least abundant at the South Branch site (0.8% relative abundance). Caddisflies were most abundant at the South Branch site (40.1% relative abundance) and least abundant at the drowned river mouth site (3.4% relative abundance). Percent abundance of Hirudinea+Gastropods+Isopods (%HGI) was low at all of the stream sites (mean=0.56±0.2%). The Sand Creek site had the most HGI (1.3% relative abundance) and the South Branch site had the least HGI (0.2% relative abundance) (Table 6.4.1).
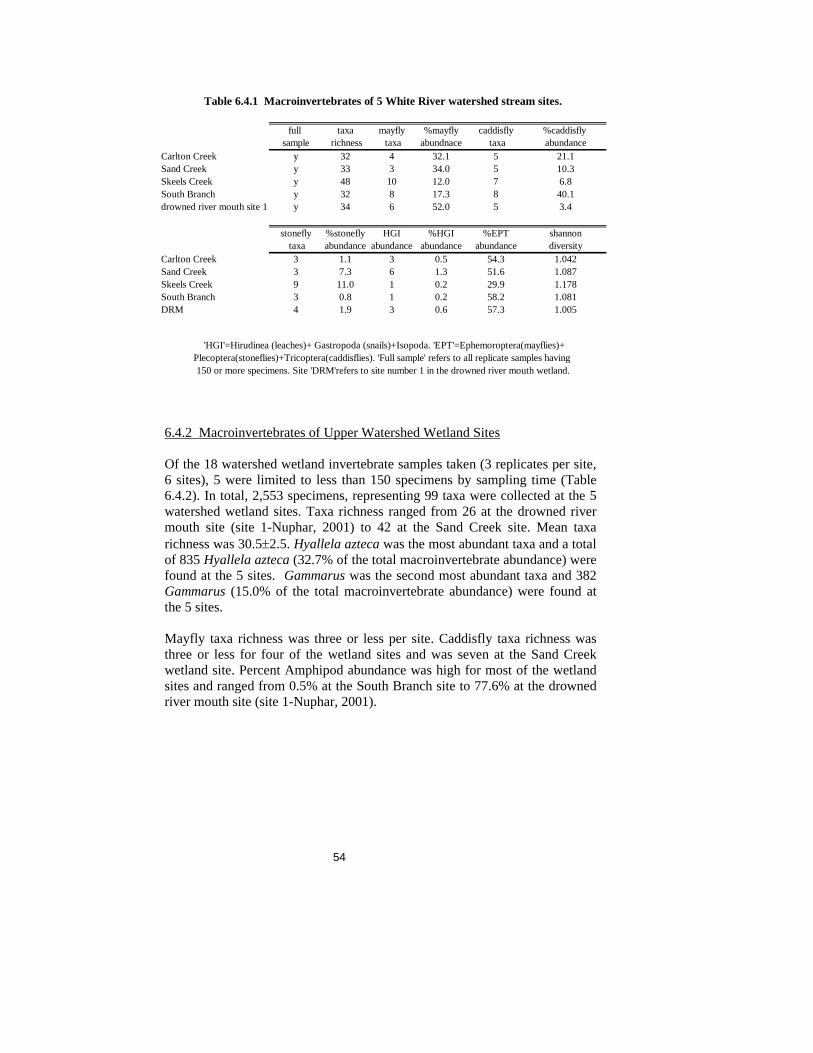
54
full taxa mayfly %mayfly caddisfly %caddisfly sample richness taxa abundnace taxa abundance
Carlton Creek y 32 4 32.1 5 21.1Sand Creek y 33 3 34.0 5 10.3Skeels Creek y 48 10 12.0 7 6.8South Branch y 32 8 17.3 8 40.1drowned river mouth site 1 y 34 6 52.0 5 3.4
stonefly %stonefly HGI %HGI %EPT shannon taxa abundance abundance abundance abundance diversity
Carlton Creek 3 1.1 3 0.5 54.3 1.042Sand Creek 3 7.3 6 1.3 51.6 1.087Skeels Creek 9 11.0 1 0.2 29.9 1.178South Branch 3 0.8 1 0.2 58.2 1.081DRM 4 1.9 3 0.6 57.3 1.005
Table 6.4.1 Macroinvertebrates of 5 White River watershed stream sites.
'HGI'=Hirudinea (leaches)+ Gastropoda (snails)+Isopoda. 'EPT'=Ephemoroptera(mayflies)+Plecoptera(stoneflies)+Tricoptera(caddisflies). 'Full sample' refers to all replicate samples having 150 or more specimens. Site 'DRM'refers to site number 1 in the drowned river mouth wetland.
6.4.2 Macroinvertebrates of Upper Watershed Wetland Sites Of the 18 watershed wetland invertebrate samples taken (3 replicates per site, 6 sites), 5 were limited to less than 150 specimens by sampling time (Table 6.4.2). In total, 2,553 specimens, representing 99 taxa were collected at the 5 watershed wetland sites. Taxa richness ranged from 26 at the drowned river mouth site (site 1-Nuphar, 2001) to 42 at the Sand Creek site. Mean taxa richness was 30.5±2.5. Hyallela azteca was the most abundant taxa and a total of 835 Hyallela azteca (32.7% of the total macroinvertebrate abundance) were found at the 5 sites. Gammarus was the second most abundant taxa and 382 Gammarus (15.0% of the total macroinvertebrate abundance) were found at the 5 sites. Mayfly taxa richness was three or less per site. Caddisfly taxa richness was three or less for four of the wetland sites and was seven at the Sand Creek wetland site. Percent Amphipod abundance was high for most of the wetland sites and ranged from 0.5% at the South Branch site to 77.6% at the drowned river mouth site (site 1-Nuphar, 2001).

55
full taxa mayfly %mayfly caddisfly %caddisfly sample richness taxa abundnace taxa abundance
Carlton Creek y 32 1 1.2 1 3.4Sand Creek y 42 3 9.8 7 6.4Skeels Creek n 27 3 2.9 3 1.6South Branch n 28 0 0.0 0 0.0DRM (Nuphar) y 26 3 4.1 0 0.0DRM (Sparganium) y 28 3 3.5 1 0.2
Odonata %Odonata HGI %HGI %Amphipoda shannontaxa abundance abundance abundance abundance diversity
Carlton Creek 2 1.0 159 31.8 33.8 1.068Sand Creek 1 0.4 99 19.8 30.5 1.103Skeels Creek 1 0.5 119 31.6 49.9 0.866South Branch 2 2.2 101 54.9 0.5 1.062DRM (Nuphar) 1 0.2 25 5.2 77.6 0.608DRM (Sparganium) 2 0.4 26 5.1 70.3 0.690
HGI'=Hirudinea (leaches)+ Gastropoda (snails)+Isopoda.'Full sample' refers to all replicate samples having 150 or more specimens. Site 'DRM' refers to site number 1 in the drowned river mouth wetland where
two plant zones were sampled.
Table 6.4.2 Macroinvertebrates of 5 White River Watershed Wetland Sites
6.4.3. Chemical/Physical Data for the Upper Watershed Wetland Sites Chemical/physical measurements were highly variable among the 10 watershed wetland sites (Table 6.4.3). Dissolved oxygen ranged from 5.21 mg/L (47.9% saturation) at the South Branch site to 10.99 mg/L (107.0% saturation) at the Alger Rd. site. Mean dissolved oxygen was 8.29±0.64 mg/L and 78.2±6.6% saturation. Specific conductance (SpC) ranged from 203.5 uS/cm at the South Branch site to 640.3 uS/cm at the Robinson Creek at Johnson Rd. site. Mean SpC was 328.6±39.0 uS/cm. The highest total dissolved solids (TDS) concentration was also at the Robinson Creek at Johnson Rd. site and the lowest concentration was at the South Branch site. Mean TDS was 0.214±0.028 g/L. The pH was fairly consistent among the wetland sites with a mean of 7.6±0.2. Chloride concentrations were highly variable among wetland sites with the highest concentration (110.0 mg/L) at the Robinson Creek at Johnson Rd. site and the lowest concentration (1 mg/L) at the Cushman Creek site. Nitrate was also variable among the ten wetlands. The highest nitrate concentration was 1.63 mg/L at the 148th Ave. and Garfield Rd. site while four of the ten wetlands had nitrate concentrations below our detection limit of 0.01 mg/L. Mean nitrate concentration was 0.29±0.17 mg/L. Ammonium concentrations tended to be lower than nitrate concentrations and the mean ammonium concentration was 0.01±0.006 mg/L.
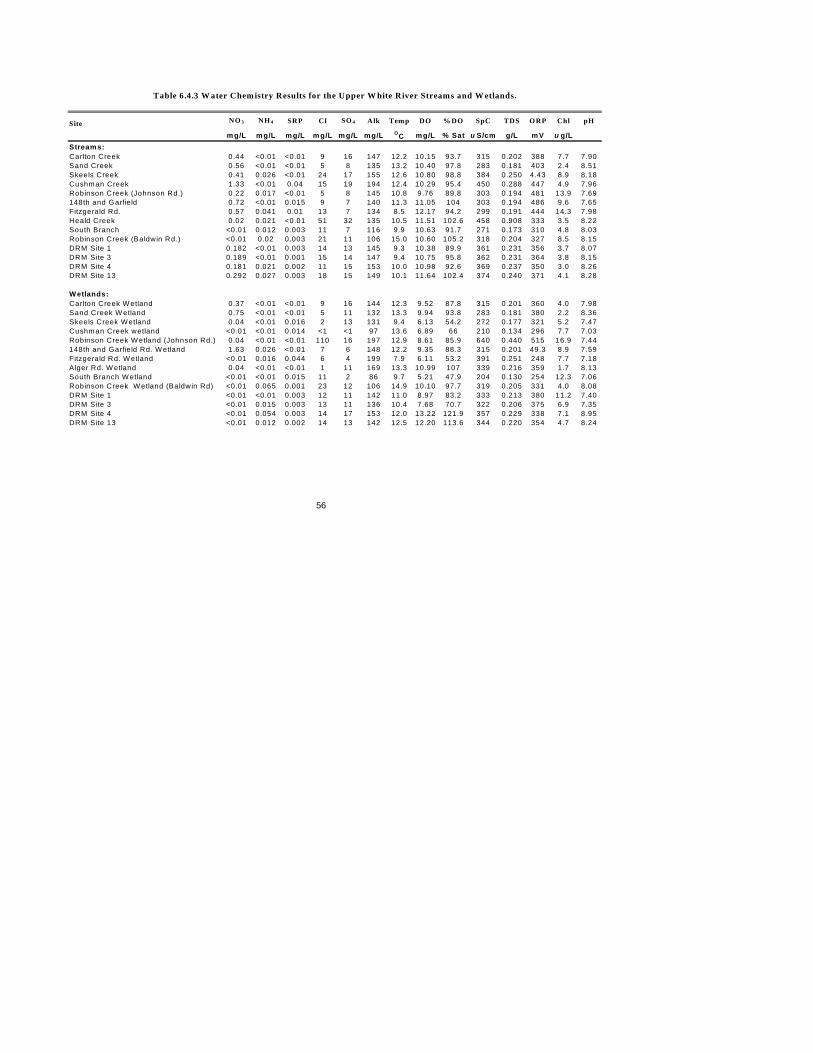
56
0.44 <0.01 <0.01 9 16 147 12.2 10.15 93.7 315 0.202 388 7.7 7.900.56 <0.01 <0.01 5 8 135 13.2 10.40 97.8 283 0.181 403 2.4 8.510.41 0.026 <0.01 24 17 155 12.6 10.80 98.8 384 0.250 4.43 8.9 8.181.33 <0.01 0.04 15 19 194 12.4 10.29 95.4 450 0.288 447 4.9 7.96
(Johnson Rd.) 0.22 0.017 <0.01 5 8 145 10.8 9.76 89.8 303 0.194 481 13.9 7.69ield 0.72 <0.01 0.015 9 7 140 11.3 11.05 104 303 0.194 486 9.6 7.65
0.57 0.041 0.01 13 7 134 8.5 12.17 94.2 299 0.191 444 14.3 7.980.02 0.021 <0.01 51 32 135 10.5 11.51 102.6 458 0.908 333 3.5 8.22
<0.01 0.012 0.003 11 7 116 9.9 10.63 91.7 271 0.173 310 4.8 8.03 (Baldwin Rd.) <0.01 0.02 0.003 21 11 106 15.0 10.60 105.2 318 0.204 327 8.5 8.15
0.182 <0.01 0.003 14 13 145 9.3 10.38 89.9 361 0.231 356 3.7 8.070.189 <0.01 0.001 15 14 147 9.4 10.75 95.8 362 0.231 364 3.8 8.150.181 0.021 0.002 11 15 153 10.0 10.98 92.6 369 0.237 350 3.0 8.260.292 0.027 0.003 18 15 149 10.1 11.64 102.4 374 0.240 371 4.1 8.28
etland 0.37 <0.01 <0.01 9 16 144 12.3 9.52 87.8 315 0.201 360 4.0 7.98tland 0.75 <0.01 <0.01 5 11 132 13.3 9.94 93.8 283 0.181 380 2.2 8.36etland 0.04 <0.01 0.016 2 13 131 9.4 6.13 54.2 272 0.177 321 5.2 7.47 wetland <0.01 <0.01 0.014 <1 <1 97 13.6 6.89 66 210 0.134 296 7.7 7.03 W etland (Johnson Rd.) 0.04 <0.01 <0.01 110 16 197 12.9 8.61 85.9 640 0.440 515 16.9 7.44
ield Rd. Wetland 1.63 0.026 <0.01 7 6 148 12.2 9.35 88.3 315 0.201 49.3 8.9 7.59 Wetland <0.01 0.016 0.044 6 4 199 7.9 6.11 53.2 391 0.251 248 7.7 7.18and 0.04 <0.01 <0.01 1 11 169 13.3 10.99 107 339 0.216 359 1.7 8.13
etland <0.01 <0.01 0.015 11 2 86 9.7 5.21 47.9 204 0.130 254 12.3 7.06 W etland (Baldwin Rd) <0.01 0.065 0.001 23 12 106 14.9 10.10 97.7 319 0.205 331 4.0 8.08
<0.01 <0.01 0.003 12 11 142 11.0 8.97 83.2 333 0.213 380 11.2 7.40<0.01 0.015 0.003 13 11 136 10.4 7.68 70.7 322 0.206 375 6.9 7.35<0.01 0.054 0.003 14 17 153 12.0 13.22 121.9 357 0.229 338 7.1 8.95<0.01 0.012 0.002 14 13 142 12.5 12.20 113.6 344 0.220 354 4.7 8.24
Site NO 3 NH 4 SRP Cl SO 4 Alk Tem p DO % DO SpC TDS ORP Chl pH
m g/L m g/L m g/L m g/L mg/L mg/L OC mg/L % Sat u S/cm g/L mV u g/LStreams:Carlton CreekSand CreekSkeels CreekCushman CreekRobinson Creek148th and GarfFitzgerald Rd.Heald CreekSouth BranchRobinson CreekDRM Site 1DRM Site 3DRM Site 4DRM Site 13
Wetlands:Carlton Creek WSand Creek W eSkeels Creek WCushman CreekRobinson Creek148th and GarfFitzgerald Rd.Alger Rd. W etlSouth Branch WRobinson CreekDRM Site 1DRM Site 3DRM Site 4DRM Site 13
Table 6.4.3 W ater Chem istry Results for the Upper W hite River Streams and W etlands.
Seven of the ten wetland sites had ammonium concentrations below detection limit. The highest SRP concentration (0.044 mg/L) was found at the Fitzgerald Rd. site. Six of the ten wetland sites had SRP concentrations that were below our detection limit of 0.01 mg/L. 6.4.3. Chemical/Physical Data for the Upper Watershed Stream Sites Less chemical/physical variability was found among the stream sites compared to wetland sites of the watershed. Temperatures ranged from 8.5 ºC at the Fitzgerald Rd. site to 15.0 ºC at the Robinson Creek at Baldwin Rd. site. Mean temperature was 11.6±0.5.9ºC. Dissolved oxygen was near saturation for most of the sites with a mean of 10.7±0.2 mg/l (97.3±1.7 %saturation). SpC was variable among stream sites and the highest SpC was found at the Heald Creek site and the Cushman Creek site where SpC levels were 457.6 and 450.2 uS/cm respectively. TDS was also highest at the Heald Creek site (0.908 g/L). The remaining stream sites had TDS concentrations between 0.173 and 0.288 g/L. pH ranged from 7.65 to 8.51 with a mean of 8.03±0.08. Chloride concentrations were variable among stream sites, though less variable than the wetland sites. The highest chloride concentration was at the Heald Creek site (50.5 mg/L) and the lowest was at the Robinson Creek at Johnson Rd. site (5.08 mg/L). Mean chloride concentration was 16.4±4.3 mg/L. The highest nitrate concentration was found at the Cushman Creek site (1.33 mg/L). Two sites had nitrate concentrations below our detection limit of 0.01 mg/L (Table 6.4.3). Mean nitrate concentration was 0.43±0.13 mg/L. Ammonium concentrations were lower than nitrate and four of the ten sites had ammonium concentrations below our detection limit of 0.01 mg/L. The highest ammonium concentration was 0.04 mg/L at the Fitzgerald Rd. site (Table 6.4.3). Seven of the ten stream sites had SRP concentrations that were below our detection limit of 0.01 mg/L. The highest SRP concentration was found at the Cushman Creek site (0.04 mg/L) (Table 6.3.2.1). 6.5 DISCUSSION 6.5.1. 2001 Drowned River Mouth Considerable variability was found among invertebrate communities of the White River drowned river mouth. Water quality was also variable and coincided with differences in surrounding land-use/cover. Correlation between multivariate analyses of water quality and invertebrate assemblages suggest a link between anthropogenic disturbance and biota. Invertebrate communities appeared to respond to the degraded water quality of the lower wetland and some middle wetland sites. Anthropogenic disturbance, based on measured
Comment: Okay, now go through and add a bit of a disclaimer
A-1
differences in water quality, was determined to be the most important factor in structuring invertebrate communities of the White River drowned river mouth. Sites in the lower wetland had relatively degraded water quality due to the surrounding urban areas of Whitehall and Montague as well as their proximity to White Lake. Lower wetland sites had relatively similar community composition regardless of dominant vegetation type and local variability in ambient conditions. Upper wetland sites were more pristine than lower sites in terms of water quality; this was most likely due to predominantly forested surrounding land. Sites of the upper wetland were also similar to one another in their community composition regardless of dominant vegetation type. Sites in the middle wetland had the most variability in community composition and water quality and the link between anthropogenic disturbance and biota was most evident among middle wetland sites. Corixidae comprised significantly more of the invertebrate community at sites that had greater anthropogenic disturbance. Corixids occurred in greater abundances at sites of the lower wetland and at middle wetland sites that had elevated nitrate. In the upper wetland Corixids were only found in large numbers at the Silver Creek site (Upper-Lily-3) where sewage effluent discharge made water quality more similar to the lower wetlands than the upper sites. Physidae abundances also appeared to be dictated by anthropogenic disturbance. Physids were found at all of the lower sites, but in the upper wetland, were found only at Upper-Lily-2, Upper-Lily-3 and Upper-Lily-14. These were the 3 sites closest to Silver Creek and consequently had relatively high nitrate and/or high turbidity compared to the other upper wetland sites. Upper-Lily-1, Upper-Pontederia-1, Upper-Scirpus-1, Upper-Sparganium-1 and Upper-Lily-15 had comparatively better water quality and had no Physids. Middle-Lily-4 had the best water quality of any middle wetland site and was also void of Physidae. Sites that had the highest Hyallela azteca abundances were those that had the least anthropogenic disturbance. All of the upper wetland sites as well as Middle-Lily-4, Middle-Sparganium-4 and Middle-Lily-17 had high abundances of Hyallela azteca and relatively low turbidity, sulfate, nitrate, ammonium, chloride and SRP. Hyallela azteca represented significantly less of the invertebrate community composition of the lower wetland and at sites of the middle wetland with degraded water quality. An interesting exception to this trend occurred at Middle-Lily-18 where water quality appeared to be severely degraded, but Hyallela azteca made up 13.8% of the macroinvertebrate community. This anomaly suggests that the water quality at Middle-Lily-18 appeared more degraded than it actually was or that the structure of the invertebrate community was dictated by factors that we could not account for in our analysis.
Comment: Again, say low in SRP, NH4....etc. Not PC1 and PC2. Say what it means, the reader already had a chance to look at the results, now they will look to you to tell them what you think it means.
A-2
A number of taxa did not respond to variability in water quality but were rather cosmopolitan among our sampling sites. Gammarus and Chironomidae, for instance, were found throughout the drowned river mouth. Yet, no specific correlations were found between their abundances and water quality. The influence of vegetation type on community composition was either masked by the influence of anthropogenic disturbance or was not detected because an insufficient number of plant zones existed across the three regions of the drowned river mouth. Lily was the only plant zone that was sampled in all three regions. Invertebrate community composition among the lily sites was variable and was better predicted by water quality. The effect of plant community on invertebrate assemblages may have been detectable with greater replication of vegetation zones within a given region of the drowned river mouth. Invertebrate community composition of the middle wetland sites was the most variable of the three regions yet corresponded predictably to water quality. Middle-Scirpus-12, Middle-Typha-11 and Middle-Sparganium-16, had extremely high nitrate concentrations probably due to their proximity to farm fields. Invertebrate communities at these three sites were similar to lower wetland sites and were characterized by their high abundance of Corixidae and low abundance of Hyallela azteca. Middle-Lily-4, Middle-Sparganium-19, Midddle-Sparganium-4 and Middle-Lily-17 were low in nutrients and had a high pH and dissolved oxygen, making them more similar to the upper wetland sites in terms of water quality. Invertebrate communities at these 4 middle sites were also similar to those of the upper wetland (low Corixidae abundance, high Hyallela azteca and Coenagrionidae abundances). The link between invertebrate community composition and anthropogenic disturbance among systems is well established. The current study demonstrates that considerable variability in invertebrate communities due to anthropogenic disturbance can occur within a system. 6.5.2 2002 Watershed Sites Upon preliminary analysis and site observations, four of the wetland sites sampled in the watershed appear to be relatively pristine. The Carlton Creek, Skeels Creek, Cushman Creek and Alger Rd. sites were relatively low in the chemical/physical parameters generally attributed to anthropogenic disturbance (chloride, nitrate, ammonium and phosphorus). Our observations, taken while sampling, support our suggestion that these four wetlands are among the most pristine of the ten wetlands sampled. All four were surrounded by forest and were either upstream of or not adjacent to major roads.
Comment: same as above.

A-3
Three of the ten sites appear to be moderately impacted by anthropogenic disturbance. The Sand Creek site was below an artificial impoundment and nitrate concentrations were the second highest of the ten wetlands. The Sand Creek site was also immediately downstream of Skeels Rd., which presumably impacted the wetland. The Fitzgerald Rd. site also appeared to be moderately impacted upon observation and preliminary analysis. SRP at the Fitzgerald Rd site was the highest of the ten-wetland sites. The wetland at the South Branch site did not have obvious anthropogenic impacts. However, moderately high chloride concentration at the site indicated runoff entering the wetland, probably from Monroe Rd. Three wetland sites appear to be the most impacted of the ten. The Robinson Creek at Johnson Rd. site looked fairly pristine, however, chloride was higher there than any other site. Elevated conductivity and total dissolved solids at the Robinson Creek at Johnson Rd. site reflects the high concentration of chloride in the wetland. The 148th and Garfield Rd site appeared to be impacted from surrounding agricultural fields and houses. This wetland had the highest nitrate concentration of the ten sites. The Robinson Creek at Baldwin Rd. was downstream of Robinson Lake and had relatively high chloride and ammonium. With respect to stream water chemistry, the elevated chloride level (51 mg/L) at Heald Creek and the nitrate concentration at Cushman Creek (1.33 mg/L) are indicative of anthropogenic enrichment. A series of abandoned oil wells are located west of the Heald Creek sampling location. Brine leakage from these wells may be entering the creek from groundwater influx. The elevated sulfate concentration (32 mg/L) would also indicate brine contamination as fluids from hydrocarbon bearing formations in west Michigan are known to contain high levels of calcium sulfate (Eberts and George 2000). The elevated nitrate concentration found in Cushman Creek is indicative of agricultural runoff. While the sample was collected in a heavily forested area, the stream character changes several kilometers upstream to a channelized agricultural drain. A previous investigation (Walker 2000) reported a nitrate concentration of 2.3 mg/L in the vicinity of 200th Ave. and noted clumps of Cladophora present in the stream channel.
A-4
7.0 Conclusions and Recommendations
The White River watershed is the product of the interaction of its unique geologic, hydrologic, ecologic systems. Glacial geology formed the moraine ridges in the headwaters and produced the outwash plains, soil associations, tributary systems, and pitted areas where kettle lakes and depressional wetlands are found. The coupling with Lake Michigan and the influence of its water level fluctuations carved the deep river valleys and formed the extensive drowned rivermouth complex of White Lake and its wetlands. The hydrologic system in the watershed focuses local groundwater into the stream channel, maintains cold temperature environments that support a significant trout fishery, sustains the regional lakes and wetlands, and provides the vehicle that transports and deposits carbon and nutrients throughout the watershed. Using these geologic and hydrologic resources, a diverse array of biological communities function and interact in the upland forests and prairies of the catchment, the transitional wetland areas, and the aquatic systems present in lakes and streams. In its current state, the White River watershed contains approximately 200,000 acres of forest, 43,000 acres of wetlands, 6,300 acres of open water (lakes and streams), and 38,000 acres of open field. Lands under agricultural production and urban land use cover only 28% of the watershed area. These anthropomorphic systems interact with the geologic, hydrologic, and ecologic framework of the watershed to define the structure and function of the entire basin. In this project, a preliminary assessment of habitats in the White River watershed was conducted. Land cover and land use were evaluated using available remote sensing data to provide an assessment of current conditions and an analysis of significant change over a 20 year period (1978 to 1992/1997/1998). Investigations of water and habitat quality were also conducted in White Lake, the drowned rivermouth wetland, and selected streams and wetlands in the tributaries and branches of the White River. Significant findings of these assessments include:
Land cover/use on a watershed basis appeared to be stable with
forested and wetland areas showing slight increases in total acreage. With respect to agriculture, row crop usage declined with a corresponding increase in orchards and open fields.
Areas of significant change were noted on a subwatershed basis. The areas of greatest urban growth were concentrated in the US 31 corridor, the villages, and around larger lakes.
A-5
Mid and lower stream sections and wetlands were located in forested
areas with riparian vegetative cover and buffers. Wetlands and streams in several of the headwater areas have poor riparian zones.
The watershed contains a number of rare and endangered habitats including coastal plain marshes, bogs, dry sand prairies, barrens, wet meadows, and mesic prairies. The acreage of Pine/Oak Barrens has decreased by almost 50% over the last 20 years.
Critical data gaps exist with respect to the hydrologic and ecological information needed to develop effective management plans
White Lake has remained eutrophic and will require a detailed investigation of nutrient loading to develop a plan to improve water quality.
The drowned rivermouth was found to be impacted by a combination of agricultural and urban sources.
Cushman Creek and Heald Creek were found to be impacted by anthropogenic pollution.
Several wetlands in the upper watershed were impacted by adjacent land use practices (agriculture and road/stream crossings).
While land cover/use patterns appear stable on a watershed level, many of the subwatersheds are experiencing pressures from urban growth. Increased residential development was noted around all of the larger inland lakes including Robinson Lake, Crystal Lake, Diamond Lake, Blue Lake, and McLaren Lake. These lakes are not serviced by public utilities and increased usage of private septic fields may impact groundwater and surface water quality. Urban growth was also noted in the villages of White Cloud, Hesperia, Whitehall, and Rothbury. The US 31 corridor will continue to focus development in the western part of the watershed. In order to prevent further degradation of White Lake and the drowned rivermouth wetlands, adequate planning/zoning regulations plus infrastructure related to wastewater and stormwater systems need to be in place. This corridor also contains prime orchard lands that also may require future planning/zoning activities to preserve their agricultural function. Additional urban growth is occurring in the areas of Hesperia and White Cloud. These villages also have limited utilities and continued growth may influence water quality. The importance of the Manistee National Forest (MNF) was very visible in the watershed. In addition to preserving terrestrial and aquatic habitats, the forested and undeveloped areas facilitate the accrual of groundwater into streams that have been impacted by riparian zone removal and nonpoint source pollution. This process lowers the stream temperature and dilutes nutrient concentrations. The surrounding forest provides shading of the stream channel and a source of carbon and woody debris. Headwater streams that are outside of the MNF have been converted to agricultural drains in many areas of the North Branch, the South Branch, and the Skeel/Cushman/Braton Creek subwatersheds. In these areas, high nutrient
A-6
concentrations were noted along with biological disturbances in some of the wetlands. It is critical that public education efforts are conducted in these subwatersheds related to importance of headwater streams and the use of riparian buffers to improve water quality. Many state and federal assistance programs are available to provide technical and financial support to land owners that are interested in implementing best management practices. The watershed contained a number of rare and endangered habitats including coastal plain marshes, bogs, dry sand prairies, barrens, wet meadows, and mesic prairies. The acreage of Pine/Oak Barrens has decreased by almost 50% over the last 20 years. The presence of these rare habitats and recent loss of acreage underscores the need for the protection and management of these lands. This can be accomplished by land acquisition, the establishment of conservation easements, and the implementation of effective land use planning. While some of these rare habitats are protected on federal lands, environments under private holdings need to be evaluated for long term preservation. The trophic status of White Lake is of concern based on current and past data. The lake remains eutrophic and subject to excessive nutrient loadings from the White River watershed. Anthropogenic impacts to the wetlands plus tributary loadings appear to be the major factors contributing to eutrophication. Given the complex hydrology of the system and size of the drainage basin, a comprehensive hydrologic model and nutrient budget needs to be prepared for the tributaries in the watershed and White Lake. Interactive models are available that can determine sources and evaluate control technologies in order to prioritize restoration plans in the most beneficial and cost effective manner. A modeling study of this magnitude is expensive, however it is essential to establishment of future courses of action. The intrinsic habitat value of the watershed and its linkage to the Great Lakes can be used as justification for obtaining the necessary grant funding for a modeling project. Along with the condition of the headwaters and White Lake, the hydrologic and ecologic functioning of the drowned rivermouth wetlands merits special attention. This investigation determined measurable impacts to water chemistry and invertebrate communities from the adjacent land use of this wetland. Based on current and historical data, the drowned rivermouth wetland functions as a nutrient source for White Lake. Modifications to the wetland that restore the natural water flow, reduce nonpoint nutrient loading, and stabilize hydrology will have a positive effect on the habitat quality and the wetland’s ability to store and process nutrients. In addition, an investigation phosphorus and nitrogen isotherms in the wetland soils and sediments will determine their ability to serve as a source or sink for nutrients. The presence of alterations to water and habitat quality in the small sampling of streams and wetlands suggests that a more comprehensive assessment needs to be conducted. The MDEQ collected a number of stream samples

A-7
during a survey of the White River watershed during the summer of 2002. When these results are available, the data from both projects need to evaluated to determine the nature and extent of water quality issues in the watershed. Information gleaned from more detailed assessments of the system will drive the decision making process for the White River watershed. Again, our ability to develop and effectively implement resource management plans for the White River watershed depends on access to detailed hydrologic and ecological information and the formulation of strategies that include these critical variables. We also need to broaden watershed management plans to holistically embellish the entire resource. The Manistee National Forest is currently managed for the preservation of terrestrial and aquatic habitats. Since this area only covers 23% of the watershed, resource management needs to be expanded through public and private partnerships. It is also important to continue the current programs of stream bank stabilization and substrate enhancement to improve fisheries and protect the watershed from flood events. Based on the above findings, the following recommendations can be made:
Establish a watershed assembly to promote, prioritize, and coordinate water quality and habitat management/restoration activities throughout the basin.
Initiate programs involving public education, best management practices, and land acquisition to promote stewardship, improve environmental quality, and preserve rare habitats.
Conduct the necessary hydrologic modeling and field validation to evaluate nutrient loading to White Lake and identify critical areas to target source control programs in the upper watershed.
Develop and implement a plan to restore the drowned rivermouth wetland
From the above discussion, it is clear that we need more information about the watershed to develop management plans. Without this information, it is impossible to prioritize issues, formulate mitigation strategies, and initiate changes that are beneficial to the system. Just as the need for data is critical for the development of watershed management plans, it is also important to disseminate this information to decision makers and the general public. An outreach education program must be developed that identifies the issues and answers, fosters long term stewardship of the resource, and builds effective partnerships that are capable of addressing current and future problems. Public commitment to watershed management depends on understanding the issues and appreciating the value of the resource. . It is critical that the educational program should cover age all groups to include children and adults. By focusing education at both age groups, we can address current problems and ensure that future generations have the commitment to preserve the resources of the White River watershed. We must also communicate this
A-8
information through a public educational process that fosters resource preservation and stewardship. Education will help foster lasting change. The data from this project also illustrate the importance of a holistic approach to watershed management. It will be impossible to maintain water and habitat quality on a watershed basis if problems in headwater streams and development pressure are not addressed. The future of the White River watershed depends on a detailed assessment of the resource, the development of a holistic preservation plan, and a strong public education component to promote active stewardship. Watershed management will also require considerable financial resources for analysis and mitigation and utilize resources at local, regional, state, and national levels The White River watershed is a unique and diverse resource with important ecologic and economic value that will require a coordinated and holistic approach for preservation and restoration.

A-9
8.0 References Albert, D. A., and M. A. Kost. 1998. Natural community abstract for lakeplain
wet prairie. Michigan Natural Features Inventory, Lansing, MI. Albert, D.A. 2001 Natural community abstract for Great Lakes Marsh.
Michigan Natural Features Inventory 11 pp. APHA. 1998. Standard Methods for the Evaluation of Water and Wastewater.
20th edition. American Public Health Association. Washington, DC. Brazner, J.C. 1992/1997/1998. Regional, habitat, and human development
influences on coastal wetland and beach fish assemblages in Green Bay, Lake Michigan. J. Great Lakes Res. 23: 36-51.
Breneman, D., Richards, C., and Lozano, S. 2000. Environmental influences
on benthic community structure in a great lakes embayment. J. Great Lakes Res.26: 287-304.
Bridgham, S.D., and C.J. Richardson. 1993. Hydrology and nutrient gradients
in North Carolina peatlands. Wetlands 13(3): 207–218. Burton, T.M., Stricker, C.A., and Uzarski, D.G. 2002. Effects of plant
community composition and exposure to wave action on invertebrate habitat use of Lake Huron coastal wetlands. Lakes & Reservoirs: Research and Management 7: 255-269.
Burton, T.M., Uzarski, D.F., Gathman, J.P., Genet, J.A., Keas, B.E., and
Stricker, C.A. 1999. Development of a preliminary invertebrate index of biotic integrity for Lake Huron Coastal wetlands. Wetlands 19: 869-82.
Cardinale, B.J., Burton, T.M., and Brady, V.J. 1992/1997/1998. The
community dynamics of epiphytic midge larvae across the pelagic-littoral interface: do animals respond to changes in the abiotic environment? Can J. Fish. Aquat. Sci. 54: 2314-22
Cardinale, B.J., Brady V.J. and Burton T.M. 1998. Changes in the abundance and diversity of coastal wetland fauna from the open water/macrophyte edge towards shore. Wetland Ecol. Manage. 6:59-68.
A-10
Carlson, R. E. 1977. Trophic state index for lakes., Limnol. and Oceanogr.,
22:361-369. Chapman, K.A. 1990. Natural community abstract for coastal plain marsh.
Midweat Regional Office of the Nature Conservancy. Minneapolis, MN. 6 pp.
Cohen, J.G.. 1999. Natural community abstract for oak-pine barrens.
Michigan Natural Features Inventory. 6 pp. Cowardin, L.; Carter, V.; Golet, F. and LaRoe, E.. 1979. Classification of
Wetlands and Deepwater Habitats of the United States. US Department of Interior, Fish and Wildlife Service, US Government Printing Office, Washington, DC.
Davis, W.M. 1899. The geographical cycle. Geographical Journal 14:481-504. Ebberts, S.M. and L.L George 2000. Regional Ground-Water Flow and
Geochemistry in the Midwestern Basins and Arches Aquifer System in Parts of Indiana, Ohio, Michigan, and Illinois. U.S. Geological Survey Profezzional Paper 1423–C.
Evans, E. 1976. Final report of the Michigan Bureau of Water Management's
investigation of the sediments and benthic communities of Mona, Muskegon, and White Lakes, White County, Michigan, 1972. 68 pp.
Evans, E.D. 1992. Mona, Muskegon, and White Lakes in White County,
Michigan The 1950s to the 1980s. Michigan Department of Natural Resources. MI/DNR/SWQ-92/261. 91pp.
Flint, R.W. 1979. Responses of freshwater benthos to open-lake dredge spoils
in Lake Erie. J. Great Lakes Res. 5(3-4): 264-275. Freedman, P.L., R.P. Canale, and M.T. Auer. 1979. Applciability of Land
Treatment in the Grat Lakes Basin Area Impact of Wastewater Diversion, Spray Irigation on Water Quality in the Muskegon County, Michigan Lakes. United States Environmental Protection Agency. Washington, DC. EPA-905/9-79-006.
Gatham, J.P. 2000. Abiotic and biotic influences on aquatic invertebrate
community structure in a Lake Huron wetland (PhD Dissertation). Department of Xoology, Michigan State University, East Lansing, Michignan.
Gathman, J.P., Burton T. M., and Armitage, B.H. 1999. Coastal wetlands of
the upper Great Lakes. Distribution of invertebrate communities in response to environmental variation. In: Invertebrates in Freshwater
A-11
Wetlands of North America (eds D.P. Batzer, R.B. Rader, and S.A. Wissinger) pp. 949-94. John Wiley and Sons, New York.
GLC. 2000. Assessment of the Lake Michigan monitoring inventory: A report
on the Lake Michigan tributary monitoring project. Great Lakes Commission, Ann Arbor, MI. 98 pp.
Goodyear, C.D., Edsall T.A., Ormsby Dempsey, D., Moss G.D., and Polanski,
P.E. 1982. Atlas of Spawning and Nursery Areas of Great Lakes Fishes, Vol. 1-A. US Fish and Wildlife Service, Washington, D. C.
Harris H.J., Milligan M. S., and Fewless G. AS. 1983. Diversity:
Quantification and ecological evaluation in freshwater marshes. Biol. Conserv. 27, 99-110.
Hauser, R.S. 1953. An ecological analysis of isolated prairies in Newaygo
Countym Michigan. Ph.D. Thesis. Michigan State University. Hough, J.L. 1958. Geology of the Great Lakes. University of Illinois Press. International Joint Commission. 1989. Revised water quality agreement of
1978. International Joint Commission. United States and Canada. Jude, D.J., and Pappas, J. 1992. Fish utilization of Great Lakes wetlands. J.
Great Lakes Res. 18: 651-72 Kashian, D.R., and Burton, T. M. 2000. A comparison of macroinvertebrates
of two Great Lakes coastal wetlands: Testing potential metrics for an index of ecological integrity. J. Great Lakes Res. 26: 460-81.
Keough, J.R., Thompson, T.A., Guntenspergen, G.R., and Wilcox, D.A.
1999. Hydrogeomorphic factors and ecosystem responses in coastal wetlands of the Great Lakes. Wetlands 19:821-834.
Kost, MA 2000. Natural community abstract for coastal plain marsh.
Michigan Natural Features Inventory, Lansing, MI. 11 pp. Kost, M.A. 2001. Natural community abstract for Northern Wet Meadow.
Michigan Natural Features Inventory. 6 pp. Krieger, K.A. 1992. The ecology of invertebrates in Great Lakes coastal
wetlands: Current knowledge and research needs. J. Great Lakes Res. 18. 634-50.
Larson, G.and S. Randall 2001. Origin and Evolution of the Great Lakes. J.
Great Lakes Res. 27(4):518-546.
A-12
Liston C.R., and Chubb, S. 1985. Relationships of water level fluctuations
and fish In: Coastal Wetlands. Proceedings of the First Great Lakes Coastal WetlandsColloquium (eds H.H. Prince, and F.M. D’Itri) pp. 121-40. Lewis Publishers, Chelsea, Michigan.
MDEQ 1998 Michigan Department of Environmental Quality. Land and
Water Management Division. Hydrologic Studies Unit. MDNR 1975. White River Natural River Plan. Michigan Department of
Natural Resources. Fisheries Division. MDNR 1989. Fisheries Division Collection Report, White River. Michigan
Department of Natural Resources. 54 pp. MDNR 1997. A Landscape-Based Ecological Classification System fir River
Valley Segments in Lower Michigan (VSEC). MDNR Fisheries Division.
MDNR 2001. Michigan Department of Natural Resources Land and Mineral
Services Division, Resource Mapping and Photography Section. Merrit, R.W., and Cummins, K.W., eds. 1996. An Introduction to the Aquatic
Insects of North America, 3rd ed, Dubuque: Kendall/Hunt Publishing Co.
Montgomery, D.R. and J.M. Buffington. 1993. Channel classification,
prediction of channel response, and assessment of channel condition: Washington State Department of Natural Resources, Report TFW-SH10-002, 84 p.
MFNI 1988. Landtype Associations of Northern Michigan. Michigan Natural
Features Inventory, Lansing, MI. Prince H. H., and Flegel C.S. 1995. Breeding avifauna of Lake Huron. In:
The Lake Huron Ecosystems: Ecology, Fisheries and Management (eds M. Munawar, T. Edsall & J. Leach) pp. 247-72. SPB Academic Publishing, Amsterdam.
Prince H.H., Padding P.I., & Knapton R.W. 1992. Waterfowl use of the
Laurentian Great Lakes. J. Great Lakes Res. 18: 673-99. Rediske R., G. Fahnensteil, T. Nalepa, P. Meier, and C. Schelske 1998.
Preliminary Investigation of the Extent and Effects of Sediment Contamination in White Lake, Michigan. EPA-905-R-98-004.
Reynoldson, T.B., and Zarull, M.A. 1989. The biological assessment of
contaminated sediments-the Detroit River example. In Environmental
A-13
Bioassay Techniques and Their Application, eds. M. Munawar, G. Dixon, C. I. Mayfield, T. Reynoldson, and M.H. Sadar, pp. 463-476. Belgium: Kluwer Academic Publishers.
Riffell S.K. 2000. The effects of landscape context and coastline complexity
on birds in Great Lakes coastal wet meadows (PhD Dissertation). Department of Zoology, Michigan State University, East Lansing, Michigan.
Robertson, D.M. 1997. Regionalized loads of sediment and phosphorus to
Lakes Michigan and Superior – high flow and long-term average. J. Great Lakes Res. 23:416-439.
Satterlund, D.R. and Adams, P.W. 1992. Wildland Watershed Management.
Second Edition, John Wiley & Sons Inc. 188-200 pp. Stricker, C.A., Burton, T.M., Brady, V.J., Cardinale, B.J., and Gathman, J.P.
2001.Invertebrate communities of Great Lakes’ coastal wetlands, Saginaw Bay, Lake Huron. Verh. Internat. Verein. Limnol. 27: 588-615.
Thorp, J.H., and Covich, A.P. (eds.). 1991. Ecology and classification of
North American freshwater invertebrates. San Diego, CA: Academic Press, Inc.
TNC 2002. Bioblitz Report. Owassippi Scout Camp. Muskegon County
Michigan. The Nature Conservancy. Grand Rapids, MI. USDA 1968. Soil Survey for Muskegon County Michigan US Department of
Agriculture. Natural Resource Conservation Service. Washington, D.C.
USDA 1995. Soil Survey for Newaygo County Michigan US Department of
Agriculture. Natural Resource Conservation Service. Washington, D.C.
USDA 1996. Soil Survey for Oceana County Michigan US Department of
Agriculture. Natural Resource Conservation Service. Washington, D.C.
U.S. Environmental Protection Agency. 1979. Applicability of land treatment
of wastewater in the Great Lakes area basin. EPA-905/9-79-006-A. United States Census. 1998. State of Michigan.
A-14
Uzarski, D.G., Burton, T.M., and Genet, J.A. Validation and performance of
an invertebrate index of biotic integrity for Lakes Huron and Michigan fringing wetlands during a period of lake level decline. Submitted.
Vannote, R.L., G.W. Minshall, K.W. Cummins, J.R. Sedell, and C.E.
Cushing. 1980. The river continuum concept. Canadian Journal of Fisheries and Aquatic Sciences 37:130-137.
Vollenweider, R.A. "Input-Output Models with Special Reference to the
Phosphorus Loading Concept in Limnology." Schweiz. Zeitschr., Hydrol., 37:53-84. 1975.
Walker, B. 2000. Biological Surveys of Martin Creek, Knutson Creek, and
Cushman Creek Newaygo and Oceana County. August 4-5, 1997. Michigan Department of Environmental Quality. MI/DEQ/SWG-99/090.
Weeber R.C., and Vallianatos M. (eds). 2000. The Marsh Monitoring
Program 1995-99: Monitoring Great Lakes Wetlands and their Amphibian and Bird Inhabitants. Bird Studies Canadian Port Rowan, Ontario.
Wiley, M.J., and P.W. Seelbach. 1997. An introduction to rivers. Michigan
Department of Natural Resources, Special Report 20, Ann Arbor. Whitt M.B. 1996. Avian breeding use of coastal wetlands on the Saginaw
Bay of Lake Huron (MSc Thesis). Department of Fisheries and Wildlife, Michigan State University, East Lansing, Michigan.
Wilcox, D.A., Meeker, J.E., Hudson, P.L., Armitage, B.J., Black, M.G., and
Uzarski, D.G. 2002. Hydrologic variability and the application of index of biotic integrity metrics to wetlands: a Great lakes evaluation. Wetlands 22: 588-615.