Long-term monitoring (1960-2008) of the river-sediment transport in the Red River Watershed...
11
Long-term monitoring (1960–2008) of the river-sediment transport in the Red River Watershed (Vietnam): Temporal variability and dam-reservoir impact Thi Ha Dang a,b , Alexandra Coynel a, ⁎, Didier Orange c , Gérard Blanc a , Henri Etcheber a , Lan Anh Le b a Université de Bordeaux, UMR CNRS 5805 EPOC, Avenue des Facultés, 33405 Talence, France b Vietnam Academy of Science and Technology, 18 Hoang QuocViet, Cau giay, Hanoï, Vietnam c IRD, BIOEMCO, IWMI Office, SFRI, 35 DienBienPhu, BaDinh, Hanoï, Vietnam abstract article info Article history: Received 12 February 2010 Received in revised form 18 June 2010 Accepted 1 July 2010 Available online 31 July 2010 Keywords: Red river Erosion Suspended particulate matter flux Temporal variability Dam reservoir The Red River (China/Vietnam, A = 155,000 km²) is a typical humid tropics river originating from the mountainous area of Yunnan Province in China. Based on information on daily discharge (Q) and suspended particulate matter (SPM) concentration between 1960–2008 for the SonTay gauging station (outlet of the River and entry to the Delta) provided by the National Institute IMHE-MONRE, the mean annual SPM flux was estimated at 90 Mt/yr, corresponding to a sediment yield of 600 t/km²/yr. The temporal variability of annual SPM fluxes (ranging from 24 to 200 Mt/yr) is strongly related to the interannual hydrological conditions. However, some years of high water flow were not associated with high sediment fluxes, especially after 1989 when the HoaBinh dam came into operation. Therefore, the median discharge pre- (3389 m 3 /s) and post 1989 (3495 m 3 /s) are similar indicating there was little or no change between both periods. Sediment rating curves (power law-type; SPM = aQ b ) were fitted for both periods (1960–1989; 1990–2008). The analysis of the pre- and post-1989 sediment rating parameters (a, b) suggests a downshift of b-parameter values after 1989, attributed to a decrease of the sediment supply due to the commissioning of the HoaBinh dam. A single sediment rating curve derived from 1960–1989 data was used to simulate the annual variability of former sediment delivery, generating excellent cumulative flux estimates (error ~ 1%). In contrast, applying the same rating curve to the 1990–2008 data resulted in systematic and substantial (up to 109%) overestimation. This suggests that the HoaBinh dam reduces annual SPM delivery to the delta by half, implying important metal/metalloid storage behind the HoaBinh dam. © 2010 Published by Elsevier B.V. 1. Introduction Mechanical erosion rates control the transport of suspended particulate matter (SPM) and associated elements (e.g. trace element, organic matter) from the continent to the ocean and are attributed to a combination of natural parameters related to geomorphic, tectonic, and climatic influences as well as land cover (Douglas, 1967; Ahnert, 1970; Milliman and Meade, 1983; Milliman and Syvitski, 1992; Harrison, 2000; Farnsworth and Milliman, 2003; Prathumratana et al., 2008). Additionally, human disturbance may affect mechanical erosion and SPM supply to estuaries, deltas or coastal zones. Therefore, in recent years, there has been increasing concern about the global river SPM balance, particularly with respect to its response to climate change and anthropogenic impacts (e.g. Vörösmarty et al., 2000; Farnsworth and Milliman, 2003; Vörösmarty et al., 2003; Nilsson et al., 2005; Syvitski et al., 2005; Milliman et al., 2008; Dai et al., 2009; Lu and Jiang, 2009). However, important uncertainties persist, mainly due to the non- stationary nature of the sediment fluxes and the use of dated and/or questionable data (short-term sampling, inappropriate sampling frequency and/or data collected before dam-reservoir construction, deforestation or climatic changes; Walling, 2006). The rivers draining the Himalaya Mountains into South-East Asia have been recognized as significantly contributing to SPM delivery to the global ocean (Milliman and Meade, 1983; Milliman and Syvitski, 1992; Ludwig and Probst, 1998; Syvitski and Milliman, 2007). In this key area, recent and rapid changes in population and economic growth have strongly affected the functioning of the river-systems leading to major human pressure on its sustainable development. Therefore, South-East Asian Rivers are good indicators of the strong influence of anthropogenic activities on suspended sediment transport. In Taiwan, for example, the specific yield in the Lanyang His River System has increased from 3,100 t/km 2 /yr to 8,300 t/km 2 /yr during the last three decades resulting from road construction (Kao and Liu, 1996). In contrast, in Chinese rivers, the sediment flux has declined with the construction of large reservoirs: e.g. on the Yellow River (Walling and Fang, 2003, Wang et al., 2008, Xu and Milliman, 2009, Dai et al., 2009) and the Changjiang/ Yangtze River (Dai et al., 2009; Xiong et al., 2009), as previously observed on others large rivers (e.g. for the Nile River, Milliman and Science of the Total Environment 408 (2010) 4654–4664 ⁎ Corresponding author. Tel.: + 33 540008838. E-mail address: [email protected] (A. Coynel). 0048-9697/$ – see front matter © 2010 Published by Elsevier B.V. doi:10.1016/j.scitotenv.2010.07.007 Contents lists available at ScienceDirect Science of the Total Environment journal homepage: www.elsevier.com/locate/scitotenv
-
Upload
independent -
Category
Documents
-
view
3 -
download
0
Transcript of Long-term monitoring (1960-2008) of the river-sediment transport in the Red River Watershed...

Science of the Total Environment 408 (2010) 4654–4664
Contents lists available at ScienceDirect
Science of the Total Environment
j ourna l homepage: www.e lsev ie r.com/ locate /sc i totenv
Long-term monitoring (1960–2008) of the river-sediment transport in the Red RiverWatershed (Vietnam): Temporal variability and dam-reservoir impact
Thi Ha Dang a,b, Alexandra Coynel a,⁎, Didier Orange c, Gérard Blanc a, Henri Etcheber a, Lan Anh Le b
a Université de Bordeaux, UMR CNRS 5805 EPOC, Avenue des Facultés, 33405 Talence, Franceb Vietnam Academy of Science and Technology, 18 Hoang QuocViet, Cau giay, Hanoï, Vietnamc IRD, BIOEMCO, IWMI Office, SFRI, 35 DienBienPhu, BaDinh, Hanoï, Vietnam
⁎ Corresponding author. Tel.: +33 540008838.E-mail address: [email protected] (A. Co
0048-9697/$ – see front matter © 2010 Published by Edoi:10.1016/j.scitotenv.2010.07.007
a b s t r a c t
a r t i c l e i n f oArticle history:Received 12 February 2010Received in revised form 18 June 2010Accepted 1 July 2010Available online 31 July 2010
Keywords:Red riverErosionSuspended particulate matter fluxTemporal variabilityDam reservoir
The Red River (China/Vietnam, A=155,000 km²) is a typical humid tropics river originating from themountainous area of Yunnan Province in China. Based on information on daily discharge (Q) and suspendedparticulate matter (SPM) concentration between 1960–2008 for the SonTay gauging station (outlet of theRiver and entry to the Delta) provided by the National Institute IMHE-MONRE, the mean annual SPM fluxwas estimated at 90 Mt/yr, corresponding to a sediment yield of 600 t/km²/yr. The temporal variability ofannual SPM fluxes (ranging from 24 to 200 Mt/yr) is strongly related to the interannual hydrologicalconditions. However, some years of high water flow were not associated with high sediment fluxes,especially after 1989 when the HoaBinh dam came into operation. Therefore, the median discharge pre-(3389 m3/s) and post 1989 (3495 m3/s) are similar indicating there was little or no change between bothperiods. Sediment rating curves (power law-type; SPM=aQb) were fitted for both periods (1960–1989;1990–2008). The analysis of the pre- and post-1989 sediment rating parameters (a, b) suggests a downshiftof b-parameter values after 1989, attributed to a decrease of the sediment supply due to the commissioningof the HoaBinh dam. A single sediment rating curve derived from 1960–1989 data was used to simulate theannual variability of former sediment delivery, generating excellent cumulative flux estimates (error ~1%). Incontrast, applying the same rating curve to the 1990–2008 data resulted in systematic and substantial (up to109%) overestimation. This suggests that the HoaBinh dam reduces annual SPM delivery to the delta by half,implying important metal/metalloid storage behind the HoaBinh dam.
ynel).
lsevier B.V.
© 2010 Published by Elsevier B.V.
1. Introduction
Mechanical erosion rates control the transport of suspendedparticulate matter (SPM) and associated elements (e.g. trace element,organic matter) from the continent to the ocean and are attributed to acombination of natural parameters related to geomorphic, tectonic, andclimatic influences as well as land cover (Douglas, 1967; Ahnert, 1970;Milliman and Meade, 1983; Milliman and Syvitski, 1992; Harrison,2000; Farnsworth and Milliman, 2003; Prathumratana et al., 2008).Additionally, human disturbance may affect mechanical erosion andSPM supply to estuaries, deltas or coastal zones. Therefore, in recentyears, there has been increasing concern about the global river SPMbalance, particularly with respect to its response to climate change andanthropogenic impacts (e.g. Vörösmarty et al., 2000; Farnsworth andMilliman, 2003; Vörösmarty et al., 2003; Nilsson et al., 2005; Syvitskiet al., 2005; Milliman et al., 2008; Dai et al., 2009; Lu and Jiang, 2009).However, important uncertainties persist, mainly due to the non-
stationary nature of the sediment fluxes and the use of dated and/orquestionable data (short-term sampling, inappropriate samplingfrequency and/or data collected before dam-reservoir construction,deforestation or climatic changes; Walling, 2006).
The rivers draining the Himalaya Mountains into South-East Asiahave been recognized as significantly contributing to SPM delivery tothe global ocean (Milliman and Meade, 1983; Milliman and Syvitski,1992; Ludwig andProbst, 1998; Syvitski andMilliman, 2007). In this keyarea, recent and rapid changes in population and economic growthhavestrongly affected the functioning of the river-systems leading to majorhuman pressure on its sustainable development. Therefore, South-EastAsianRivers are good indicatorsof the strong influenceof anthropogenicactivities on suspended sediment transport. In Taiwan, for example, thespecific yield in the Lanyang His River System has increased from3,100 t/km2/yr to 8,300 t/km2/yr during the last three decades resultingfrom road construction (Kao and Liu, 1996). In contrast, in Chineserivers, the sediment flux has declined with the construction of largereservoirs: e.g. on the YellowRiver (Walling and Fang, 2003,Wang et al.,2008, Xu and Milliman, 2009, Dai et al., 2009) and the Changjiang/Yangtze River (Dai et al., 2009; Xiong et al., 2009), as previouslyobserved on others large rivers (e.g. for the Nile River, Milliman and

4655T.H. Dang et al. / Science of the Total Environment 408 (2010) 4654–4664
Meade, 1983; and for the Mississippi, Walling and Fang, 2003).Predicting the modification of sediment fluxes in South-East Asiarepresents one today's major challenges for environmental sciences,because of the continually shifting anthropogenic and/or climaticimpact and the need for continually updated fluvial data (e.g. Lu andJiang, 2009).
After the Mekong River, the Red River is the second largest river inVietnam and plays an important role in the economic, cultural andpolitical life of the Vietnamese people. Its overall sediment load(160×106 t/yr) has been previously classed 9th in the world(Milliman and Meade, 1983). However, this estimate is “so recycledthat the true database is poor or unknown” (Milliman and Meade,1983). More recently, based on the available hydrological data fromthe period 1997–2004 and the 2003 year-long survey of daily SPMconcentrations in the Red River system, a modelling approachestimated a mean annual SPM flux of 40×106t/yr under presentconditions (Le et al., 2007). This value is only about one quarter of theprevious estimate, suggesting either significant errors in previousestimates or strong temporal variability.
This paper is based on an extensive dataset of daily waterdischarges and suspended particulate matter (SPM) concentrationscollected between 1960 and 2008 at a permanent observation station(SonTay gauging station; data from IMHE) near Hanoi, considered tobe the entry point to the Red River Delta and located at the upstreamlimit of the dynamic tide. The objectives of this study are to: (i) definethe influence of sampling frequency on the uncertainty in SPM fluxestimates in a tropical river in order to establish the uncertaintyassociated with SPM flux estimates; (ii) analyse the temporal (annualand inter-annual) variation of river sediment-discharge, in order toidentify the controlling factors; (iii) clearly specify the impact of theHoaBinh reservoir on the regime of SPM fluxes and (iv) evaluate thesediment and sediment-associated metal/metalloid storage withinthe reservoir based on the sediment rating-curve-derived fluxcalculations and the geochemical composition of stream sediments.
2. Materials and methods
2.1. Area description
The Red River system, located in South-East Asia, has a totalwatershed area of 169,000 km2 (Haruyama, 1995; Van den Berghet al., 2007a), 50.3% of which is situated in Vietnam, 48.8% is situatedin China and 0.9% is situated in Laos and includes a fertile and denselypopulated delta plain (14,000 km2; Van Maren, 2007). The Red Riveroriginates from the mountainous area of Yunnan Province in China,flows 1200 km south-eastward and then flows through sevenVietnamese provinces before flowing into the Gulf of Tonkin in theSouth China Sea (Fig. 1). The red laterite soils are abundant in thismountainous area and give the river its characteristic colour (Gourou,1936; Van Maren, 2007).
The main tributaries of the Red River are the Da River, on the rightbank, and the Lo River, on the left bank (Fig. 1). The Da River has itssource in Yunnan Province, near to that of the upstream Red River, atan elevation of more than 2000 m (Funabiki et al., 2007). The Lo Riveralso comes from China at an elevation of about 1100 m (Nguyen andNguyen, 2001).
The Red River basin is characterized by a tropical monsoonalclimate with a wet season fromMay to October and a dry season fromNovember to April (Fig. 1). The summer season is warm and veryhumid, with mean temperatures ranging from 27 °C to 29 °C, whereasthe winter season is cool and dry with mean monthly temperaturesranging from 16 °C to 21 °C (Li et al., 2006). The average annualrainfall in the Red River System is 1600 mm, with 85%–95% of thisfalling during the summer season (Le et al., 2007). Consequently, thehydrological regime of the Red River is characterized by a unimodaltropical regime with a mean monthly maximum/minimum discharge
ratio of 7.9 (1085 m3/s–8600 m3/s; Fig. 1) and the extreme dailydischarges differing by a factor of 210 (160 m3/s–33,600 m3/s;Table 1), based on the record from 1960 to 2008 at the SonTaygauging station. The mean annual water discharge of the Red River is3500 m3/s, corresponding to a specific discharge of 20.5 l/s/km2 (forthe period 1960–2008). For the same period, the mean annual waterdischarges of the Da and the Lo Rivers were 1700 m3/s and 1050 m3/s,respectively (Tran et al., 2007).
The HoaBinh reservoir, considered to be one of the largest(V=9.5 km3) and highest (120 m) dams in South-East Asia, is locatedon the Da River (Fig. 1). It was built in 1985 and started its operationin the middle of 1989, with the main purpose being flood control andhydropower generation (Ngo et al., 2007). It provides about 40% ofVietnam's electricity (Le et al., 2007, Ngo et al., 2007). This reservoirmay affect water and SPM transport as already observed in other riversystems (Maneux et al., 2001; Vörösmarty et al., 2003) andhypothesized for the Red River (Le et al., 2007).
2.2. Data and methodology
In this study, the available dataset constitutes high temporalresolution measurements of water discharge and SPM concentrationat the SonTay gauging station from 1960 to 2008, and daily waterdischarge measurements at the HoaBinh gauging station from 1998–2008, supplied by the Vietnam Institute of Meteorology, Hydrologyand Environment (IMHE). Daily SPM concentrations were manuallycollected one time per day at the reference site and filtered using pre-weighted filters, according to the Vietnamese national standardcriteria: during low water levels, daily water samples were collectedat 20–30 cm from the surface water and 4 m from the right riverbank;during high water discharges, daily samples were collected fromdepth-integrated vertical profiles. Water discharges are estimatedfrom daily measurements of river stage and the stage-discharge ratingcurve; (MONRE, 1997–2004). The daily SPM concentrations andwaterdischarges can be considered accurate with 10–15%. The scattererror is probably random rather than systematically biased; conse-quently the annual SPM flux estimates may be considered accuratewithin 5–10% as proposed by Meade and Moody (2010) for theMississippi System.
2.2.1. Annual reference SPM fluxBased on well known methods (Walling and Webb, 1985;
Horowitz et al., 2001) and daily water discharge and SPM concentra-tions, the SPM fluxes have been calculated for each year as follows:
FSPMa = ∑n
i=1FSPMd with FSPMd = c × SPM½ �d × Qd
where:
– FSPMa is the annual SPM flux (expressed in t/yr),– FSPMd are the daily SPM fluxes (t/day),– [SPM]d and Qd are the daily SPM concentrations (mg/l) and water
discharges (m3/s), with n=365 or 366.– c is the coefficient for converting units=0.0864
2.2.2. Simulation of various temporal sampling frequenciesThe annual SPM fluxes obtained represent the most accurate
estimates available from our dataset and can be considered to representreference fluxes. In order to investigate the effect of sampling frequencyon estimations of the SPM flux, we have tested 6 different simulationscorresponding to fixed period strategies of lower sampling frequenciesby extracting individual SPM concentrations and correspondingdischarge values from the database (reduced datasets) as detailed byCoynel et al. (2004): one sample per month, either with irregularmonthly sampling (M1; random selection of one SPM concentration for
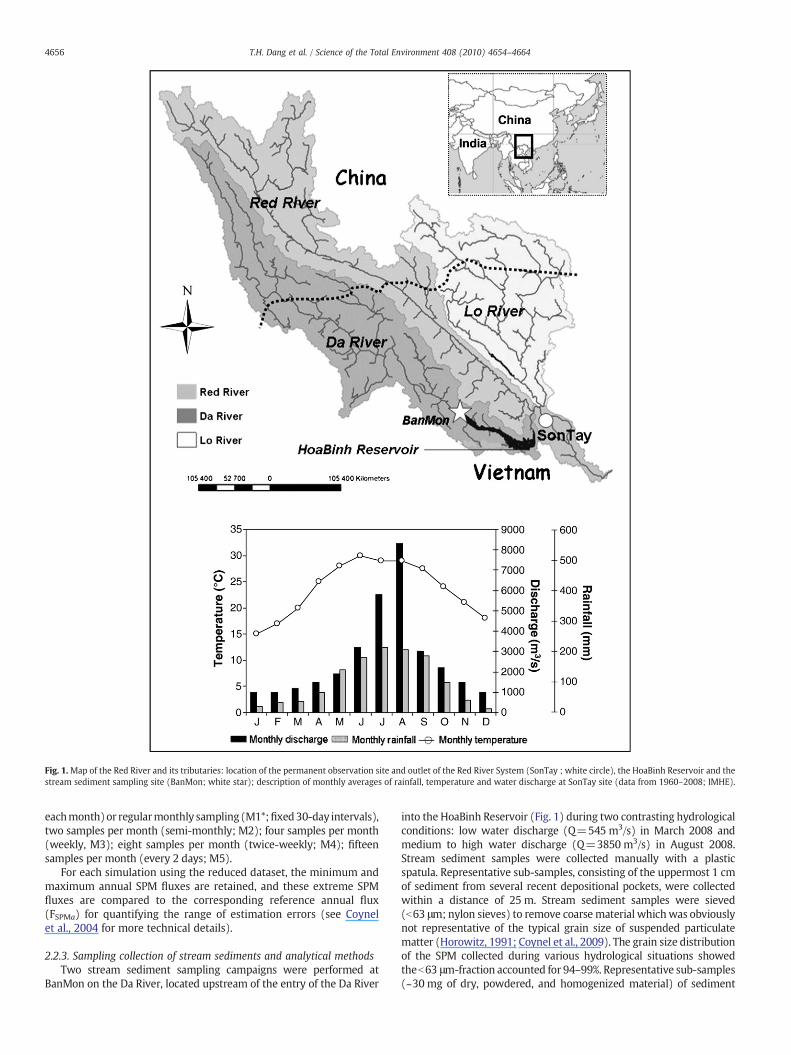
Fig. 1.Map of the Red River and its tributaries: location of the permanent observation site and outlet of the Red River System (SonTay ; white circle), the HoaBinh Reservoir and thestream sediment sampling site (BanMon; white star); description of monthly averages of rainfall, temperature and water discharge at SonTay site (data from 1960–2008; IMHE).
4656 T.H. Dang et al. / Science of the Total Environment 408 (2010) 4654–4664
eachmonth)or regularmonthly sampling(M1*;fixed30-day intervals),two samples per month (semi-monthly; M2); four samples per month(weekly, M3); eight samples per month (twice-weekly; M4); fifteensamples per month (every 2 days; M5).
For each simulation using the reduced dataset, the minimum andmaximum annual SPM fluxes are retained, and these extreme SPMfluxes are compared to the corresponding reference annual flux(FSPMa) for quantifying the range of estimation errors (see Coynelet al., 2004 for more technical details).
2.2.3. Sampling collection of stream sediments and analytical methodsTwo stream sediment sampling campaigns were performed at
BanMon on the Da River, located upstream of the entry of the Da River
into the HoaBinh Reservoir (Fig. 1) during two contrasting hydrologicalconditions: low water discharge (Q=545 m3/s) in March 2008 andmedium to high water discharge (Q=3850 m3/s) in August 2008.Stream sediment samples were collected manually with a plasticspatula. Representative sub-samples, consisting of the uppermost 1 cmof sediment from several recent depositional pockets, were collectedwithin a distance of 25 m. Stream sediment samples were sieved(b63 μm; nylon sieves) to remove coarse material whichwas obviouslynot representative of the typical grain size of suspended particulatematter (Horowitz, 1991; Coynel et al., 2009). The grain size distributionof the SPM collected during various hydrological situations showedtheb63 μm-fraction accounted for 94–99%. Representative sub-samples(~30 mg of dry, powdered, and homogenized material) of sediment

Table 1Flow and SPM transport regime characteristics for the Red River: annual discharges (Qa), annual SPM fluxes (FSPM), annual discharge-weighted SPM concentrations (SPM*),hydrological condition (Hyd.), minimum andmaximum values of daily discharges (Qi (min–max)), minimum andmaximum values of daily SPM concentrations (SPMi (min–max)),the annual rating coefficients a (a) and the annual rating exponent b (b), annual correlation coefficient (R); Annual SPM flux estimates based on annual rating curve and errorcorrespond (Est.FaSPM; Era); Annual SPM flux estimates based on cumulative rating curve 1960–1989 period and error correspond (Est.FcSPM; Erc) the Ms2, Ts50, Vw2 and Tw50
indicators of SPM flux and water discharge variability (see details in the text).
Year Qa m3/s FSPM(⁎106t)
SPM⁎
(mg/l)Hyd. Q i (min−max) SPMi
(min−max)a b R Est. FaSPM
(⁎106t)Era(%)
Est.FcSPM(⁎106t)
Erc(%)
Ms2 Ts50 Vw2 Tw50
1960 3287 83 796 Mean (−6%) 380−14300 15.9−3190 0.160 0.96 0.87 77 −7% 101 22% 19.8 7.9 7.4 18.61961 3763 124 1046 Mean (7%) 890−15100 74.0−3350 0.157 0.99 0.92 114 −8% 120 −3% 18.5 8.1 7.1 21.21962 3296 80 765 Mean (−6%) 850−12300 93.1−3250 0.186 0.95 0.92 72 −9% 92 16% 18.5 9.0 6.4 20.21963 2948 56 605 Dry (−19%) 575−12700 36.2−3260 0.122 0.98 0.90 50 −12% 75 33% 18.6 9.3 6.9 21.31964 3839 103 853 Mean (9%) 800−20 100 9.10−2710 0.033 1.15 0.91 104 1% 127 23% 19.6 9.3 8.8 21.71965 3301 75 717 Mean(−6%) 700−12700 2509−2700 0.092 1.04 0.90 72 −4% 82 9% 17.7 10.5 6.2 22.81966 4342 186 1360 Wet (20%) 545−19500 50.1−8890 0.124 1.03 0.91 188 1% 179 −4% 21.1 8.9 7.7 19.81967 3105 91 932 Mean (−13%) 610−17000 27.8−4950 0.050 1.13 0.89 84 −8% 79 −13% 29.2 7.0 8.7 23.11968 4366 172 1246 Wet (20%) 870−23400 38.3−4700 0.030 1.19 0.89 192 12% 162 −5% 17.8 9.7 8.5 21.31969 3396 111 1040 Mean (−3%) 570−27900 16.5−3080 0.043 1.13 0.88 148 33% 144 29% 26.5 5.9 13.6 15.21970 3925 146 1176 Mean (12%) 545−21700 36.4−3610 0.371 0.89 0.87 146 0% 154 6% 19.3 7.8 9.6 18.41971 5058 201 1258 Wet (31%) 770−33600 10.2−3920 3.621 0.62 0.78 177 −12% 294 47% 21.6 7.8 10.5 16.11972 3580 137 1211 Mean (2%) 635−13800 25.6−6780 0.189 0.99 0.84 116 −15% 101 −26% 21.9 8.4 6.1 23.81973 4557 155 1080 Wet (23%) 980−16000 28.9−4930 0.093 1.04 0.83 145 −7% 173 12% 16.9 10.8 5.6 23.11974 3456 111 1020 Mean (−1%) 755−12400 27.4−4710 0.021 1.23 0.89 101 −9% 98 −12% 19.1 9.4 5.7 23.21975 3286 84 810 Mean (−6%) 630−13000 22.6−2530 0.163 0.98 0.79 75 −10% 83 −1% 17.2 10.8 6.8 25.31976 3388 100 933 Mean (−3%) 666−15400 7.50−6460 0.020 1.24 0.81 95 −5% 94 −6% 22.1 8.6 6.7 23.61977 3053 122 1269 Mean (−14%) 845−16200 41.1−6720 0.091 1.08 0.82 116 −5% 87 −29% 25.1 5.6 7.6 18.71978 3913 122 987 Mean (11%) 720−17400 19.3−6080 1.066 0.74 0.67 97 −20% 128 5% 21.6 8.3 6.4 23.21979 3429 127 1172 Mean (−2%) 749−17000 12.6−3830 0.236 0.94 0.77 108 −15% 111 −12% 23.0 6.4 8.5 18.41980 2989 89 941 Dry (−17%) 537−19600 6.90−3390 0.260 0.91 0.76 69 −22% 88 0% 28.3 5.2 9.3 17.51981 4131 140 1075 Wet (16%) 714−15600 3.50−5360 0.011 1.28 0.80 112 −20% 135 −4% 18.7 9.4 4.8 25.21982 3389 85 797 Mean (−3%) 822−14000 3.30−5327 0.050 1.08 0.55 65 −24% 98 15% 15.0 10.2 5.2 23.91983 3269 123 1193 Mean (−7%) 858−17 400 4.80−7930 0.002 1.49 0.77 117 −5% 84 −31% 26.6 6.1 8.4 21.91984 3276 93 904 Mean (−7%) 650−11300 3.30−4280 0.004 1.42 0.78 77 −17% 83 −11% 15.8 10.2 4.6 25.01985 3385 107 1007 Mean (−3%) 630−15800 51.7−5440 0.148 1.00 0.86 94 −13% 96 −10% 20.3 9.7 7.3 22.71986 4210 200 1504 Wet (17%) 617−20600 23.4−14600 0.027 1.20 0.90 173 −13% 147 −26% 29.7 5.6 7.1 22.51987 2925 79 855 Dry (−19%) 606−13300 21.3−4640 0.019 1.25 0.88 79 0% 73 −8% 18.1 9.3 5.5 22.41988 2834 45 500 Dry (−23%) 577−11100 23.4−2260 0.566 0.77 0.75 39 −14% 74 65% 20.4 8.5 7.4 20.61989 3020 57 599 Dry (−16%) 460−12300 3.50−2770 0.047 1.09 0.77 53 −8% 79 38% 14.2 10.7 4.4 23.41990 4473 134 947 Wet (22%) 817−17100 15.7−7690 0.119 0.95 0.69 90 −32% 177 33% 28.1 5.4 7.2 20.61991 3404 68 637 Mean (−3%) 770−16700 10.9−3310 0.307 0.85 0.66 61 −10% 116 70% 20.3 8.1 7.8 20.31992 2665 39 469 Dry (−31%) 860−16400 64.8−3360 9.840 0.43 0.45 32 −20% 89 126% 25.7 8.9 7.6 23.61993 2921 42 451 Dry (−20%) 870−10700 51.3−3080 2.755 0.58 0.62 33 −20% 70 68% 20.4 8.4 5.4 22.51994 3667 54 468 Mean (5%) 926−14500 29.4−6640 0.908 0.68 0.67 41 −25% 112 106% 23.4 9.0 5.2 23.51995 3860 50 412 Mean (10%) 1880−17800 17.5−2010 0.173 0.89 0.68 50 −1% 124 147% 16.7 10.1 6.7 22.71996 4057 56 439 Wet (16%) 1070−19800 11.3−1850 0.142 0.90 0.62 52 −8% 134 138% 20.1 9.5 6.9 24.71997 3580 48 424 Mean (2%) 1020−16100 14.2−2240 0.576 0.74 0.67 40 –16% 108 125% 20.5 8.3 6.8 22.51998 3586 36 315 Mean (3%) 700−16900 9.00−1669 0.034 1.04 0.77 40 13% 131 268% 24.1 6.4 8.4 18.41999 3495 82 746 Mean (0%) 555−14900 13.6−2690 0.005 1.33 0.88 75 −8% 101 23% 19.4 7.2 7.1 21.62000 2926 38 411 Dry (−16%) 1030−11200 12.1−4100 0.061 1.01 0.63 33 −12% 67 77% 23.3 7.2 6.4 24.62001 3730 57 482 Mean (7%) 1080−16300 6.20−7563 0.008 1.25 0.71 59 4% 124 118% 24.1 9.3 5.2 22.12002 3708 58 496 Mean (6%) 1160−20900 9.50−2030 0.769 0.71 0.67 53 −9% 147 153% 24.4 7.1 9.6 17.92003 2725 26 300 Dry (−22%) 1030−10200 4.10−1673 0.015 1.17 0.77 24 −7% 58 126% 17.2 9.1 5.9 23.42004 2955 33 356 Dry (−16%) 870−14600 5.30−1270 0.014 1.19 0.80 34 1% 65 96% 16.6 10.2 6.0 24.32005 3097 26 262 Mean (−11%) 987−11100 2.10−1720 0.002 1.36 0.82 25 −3% 71 176% 20.4 8.1 6.1 25.22006 2850 24 263 Dry (−18%) 870−13300 6.20−2070 0.001 1.44 0.82 23 −3% 62 162% 21.9 7.7 5.3 23.42007 3303 35 334 Mean (−5%) 830−12100 6.60−1850 0.003 1.34 0.80 24 −32% 82 136% 16.9 8.8 3.8 24.52008 4095 30 234 Wet (25%) 730−14400 2.40−2350 0.030 0.99 0.76 24 −22% 113 274% 29.9 7.8 6.0 25.8Max 5058 201 1504 9.840 1.49 192 33% 294 274% 29.9 10.8 13.6 25.8Min 2665 24 234 0.001 0.43 23 −32% 58 −31% 14.2 5.2 3.8 15.2Average 3506 89 778 0.485 1.03 81 −9% 110 52% 21.1 8.4 7.0 22.0
4657T.H. Dang et al. / Science of the Total Environment 408 (2010) 4654–4664
were digested in closed reactors using 1.5 ml HCl s.p. (12 M), 2 ml HF s.p. (22 M) and 0.75 ml HNO3 s.p. (14 M) at 110 °C in a Digiprep®digestion system (SCP SCIENCE). After evaporating to dryness, theresidues were completely re-dissolved in 0.25 ml HNO3 s.p. (14 M) and5 mlMilli-Qwater (18.2 MΩ) and brought to 10 ml in volumetric flasksusingMilli-Q deionized water. Particulate trace element concentrationswere measured using ICP-MS (X7, Thermo) with external calibrationaccording to the standard conditions. The applied analytical methodswere continuously quality checked by analysis of international certifiedreference sediments (PACS-1, BCR320, SL-1). Accuracywaswithin±5%of the certified values and the analytical errors were generally betterthan ±5% (rsd).
3. Results
Water discharges, SPM concentrations and fluxes show strongtemporal variations from daily to interannual scales throughout the49 year-monitoring period of the Red River System (Table 1).
During the dry season (November to April), daily values of waterdischarge and SPM concentration can be very low (Qmin=160 m3/s;SPMmin=3 mg/l) and although average values generally reach1515 m3/s and 180 mg/l. These values can increase up to 33,600 m3/sand 14,600 mg/l in the wet season (May to October) and reflect theriver's response to seasonal rainy distribution and runoff with averagevalues around 5470 m3/s and 730 mg/l.
4658 T.H. Dang et al. / Science of the Total Environment 408 (2010) 4654–4664
We used the mean water discharge during the 1960–2008 period(3500 m3/s) to classify the individual years comprising the study periodinto dry, mean or wet years. For this, we used as deviation of ±15%compared to the long term average as the threshold. The years 1963,1987, 1988, 1992, 1993, 2003, 2004 and 2006have been classified as dryyears because their annual water discharge was at least 15% below themean annual discharge (Table 1). In contrast, nine years (1966, 1968,1971, 1973, 1981, 1986, 1990, 1996 and 2008) are representative ofwetyears, exceeding the average by between 15% and 45% for the wettestyear (1971; Table 1).
For each year, a discharge–weighted SPM concentration (SPM*)was calculated from daily discharges and concentrations as follows:
SPM⁎ =∑n
i=1ðCiQiÞ
∑n
i=1Qi
TheSPM*concentrations arehighlyvariable, ranging from235mg/l to1500 mg/l (in 2008 and 1986, respectively; Table 1). These interannualvariations do not appear to be closely linked to the hydrologicalclassification or the magnitude of the annual water discharge,because these extreme values occurred during two wet years (Table 1).Based on the world river classification of SPM* categories proposedby Meybeck et al. (2003), the SPM* values can be considered as eithermedium (100–500 mg/l), generally observed in mountainous head-waters and/or in lowrelief basinsdrainingerodible rocks, or ashigh (500–2,000 mg/l), generally found in active mountain ranges such as the Alps,CaucasusorAndes. Basedon thewholedataset, the annual SPMfluxof theRed River at the SonTay gauging station was calculated for the entire 49-year observation period (Table 1). Due to the temporal variation of waterdischarge and SPMconcentration, annual SPMfluxes are characterized byastrong interannual variability, from24×106 t/yr (in2006) to200×106 t/yr (in 1971). Themean annual SPMflux of the RedRiverwas estimated at90×106 t/yr for the period 1960–2008, corresponding to a specificsediment yield of 600 t/km2/yr (with annual values ranging from 160 t/km²/yr to 1340 t/km2/yr).
4. Discussion
4.1. Sampling frequency and the uncertainty of annual SPM fluxestimates
Based on theflux estimates from randomly extracted individual SPMconcentration and corresponding discharge values, annual SPM fluxesobtained from the different simulations (M1–M5) were compared toreference fluxes in order to estimate the error range for the givensampling frequency. Fig. 2 shows the dispersion of relative errors of sixsampling frequencies for each year of the period 1960–2008, using astatistical distribution (10- and90-percentiles,medianvalue,maximumand minimum errors).
The results show that (i) the range of possible estimated Er valuesof annual SPM flux, produced by 6 kinds of simulation, narrow withgrowing sampling frequency and (ii) low sampling frequencies leadmainly (median values of Er) to underestimation of the annual SPMfluxes; median values of Er tend to approach annual reference fluxes(0%) with increasing sampling frequency.
When irregular and regular monthly samplings (M1 and M1*) areapplied, Er values range from−80% to ~300% and from−60% to 200%,respectively (Fig. 2). Even if these results represent “worst case”scenarios, considered as extreme results that might theoretically beobtained in a relatively small number of cases, monthly sampling doesnot appear to be appropriate to obtain reliable annual SPM fluxestimates. Based on the decile distribution, the major part (80%) ofsimulated M1* results yields Er fall within the range −54% (underes-timation) to 46% (overestimation); this range exceeds the±20%
deviation from the reference flux, considered as reliable estimates.Theminimumsampling frequencyproducingannual SPMfluxestimateswithin reliability interval is twice-weekly or weekly if we consideredextreme values or values within the 10 and 90-percentiles, respectively(Fig. 2). This work leads us to the following conclusions/recommenda-tions: i) As thiswatershed is representativeofmany rivers in the tropicalarea, calendar-based sampling strategies require high sampling fre-quencies (at least ~3–7 days) for reliable SPM budgets and erosionassessment; however, as 93% of annual SPM flux is carried during highwater levels, this sampling frequency is required for the wet season andmay be reduced during the dry season to once a month; ii) Based on ahigher sampling frequency (every day), the annual fluxes of the RedRiver calculated in this study can be considered as the most accurateestimates and their annual variation can be interpreted in order todefine controlling factors.
4.2. Factors controlling annual SPM transport in the Red River
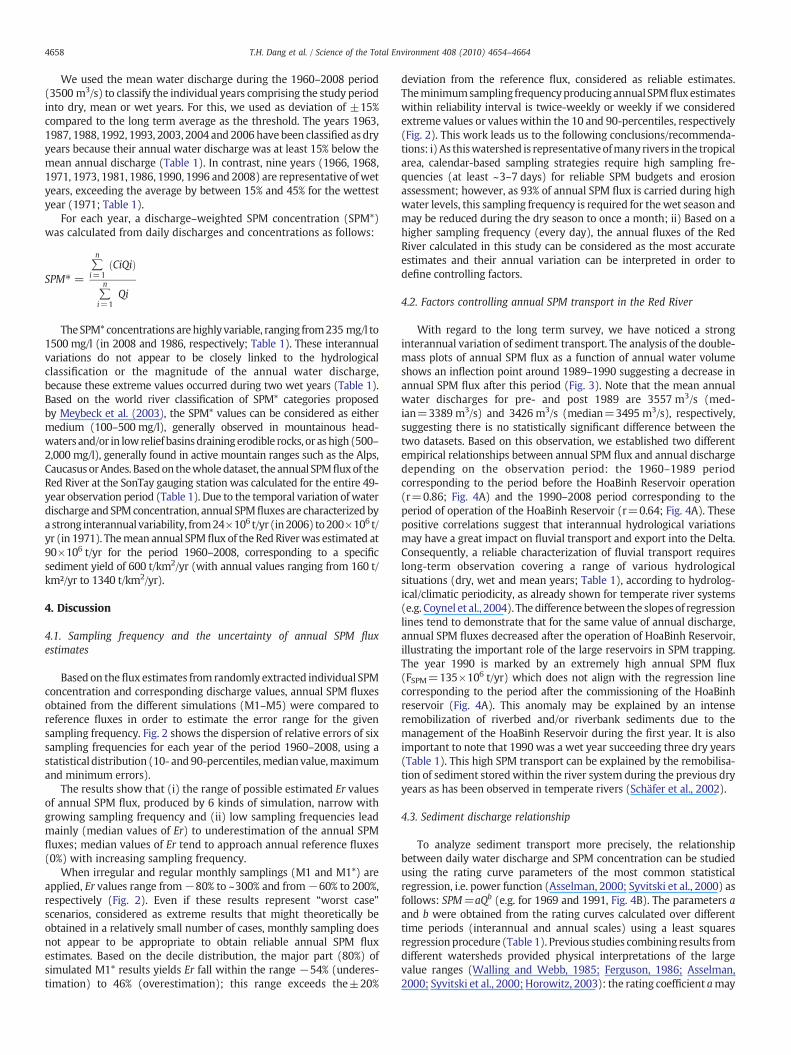
With regard to the long term survey, we have noticed a stronginterannual variation of sediment transport. The analysis of the double-mass plots of annual SPM flux as a function of annual water volumeshows an inflection point around 1989–1990 suggesting a decrease inannual SPM flux after this period (Fig. 3). Note that the mean annualwater discharges for pre- and post 1989 are 3557 m3/s (med-ian=3389 m3/s) and 3426 m3/s (median=3495 m3/s), respectively,suggesting there is no statistically significant difference between thetwo datasets. Based on this observation, we established two differentempirical relationships between annual SPM flux and annual dischargedepending on the observation period: the 1960–1989 periodcorresponding to the period before the HoaBinh Reservoir operation(r=0.86; Fig. 4A) and the 1990–2008 period corresponding to theperiod of operation of the HoaBinh Reservoir (r=0.64; Fig. 4A). Thesepositive correlations suggest that interannual hydrological variationsmay have a great impact on fluvial transport and export into the Delta.Consequently, a reliable characterization of fluvial transport requireslong-term observation covering a range of various hydrologicalsituations (dry, wet and mean years; Table 1), according to hydrolog-ical/climatic periodicity, as already shown for temperate river systems(e.g. Coynel et al., 2004). The difference between the slopesof regressionlines tend to demonstrate that for the same value of annual discharge,annual SPM fluxes decreased after the operation of HoaBinh Reservoir,illustrating the important role of the large reservoirs in SPM trapping.The year 1990 is marked by an extremely high annual SPM flux(FSPM=135×106 t/yr) which does not align with the regression linecorresponding to the period after the commissioning of the HoaBinhreservoir (Fig. 4A). This anomaly may be explained by an intenseremobilization of riverbed and/or riverbank sediments due to themanagement of the HoaBinh Reservoir during the first year. It is alsoimportant to note that 1990 was a wet year succeeding three dry years(Table 1). This high SPM transport can be explained by the remobilisa-tion of sediment storedwithin the river system during the previous dryyears as has been observed in temperate rivers (Schäfer et al., 2002).
4.3. Sediment discharge relationship
To analyze sediment transport more precisely, the relationshipbetween daily water discharge and SPM concentration can be studiedusing the rating curve parameters of the most common statisticalregression, i.e. power function (Asselman, 2000; Syvitski et al., 2000) asfollows: SPM=aQb (e.g. for 1969 and 1991, Fig. 4B). The parameters aand b were obtained from the rating curves calculated over differenttime periods (interannual and annual scales) using a least squaresregression procedure (Table 1). Previous studies combining results fromdifferent watersheds provided physical interpretations of the largevalue ranges (Walling and Webb, 1985; Ferguson, 1986; Asselman,2000; Syvitski et al., 2000; Horowitz, 2003): the rating coefficient amay

Fig. 2. Results of simulatedSPMfluxestimates for theRedRiver. The0% level represents referenceSPMfluxescalculated fromthedailymeasurements. Theblack circles representmedianvalues,error bars denote minimum and maximum values and grey bars represent precision (10-percentile and 90-percentile) of results obtained by different frequency simulations (M1: irregularmonthly sampling; M1*: regular monthly sampling; M2: two samples per month; M3: weekly sampling; M4: two samples per week; M5: one sample every 2 days).
4659T.H. Dang et al. / Science of the Total Environment 408 (2010) 4654–4664
give information on the soil erodibility with high values observed inareas with intensively weathered materials which can easily be erodedand transported; the rating exponent b (log–log slope of the power law)may represent the erosive power of the river and its sediment transportcapacity (see Asselman, 2000).
For each of the 49 years of the Red River data, we calculated theannual ratingparameters anddistinguished the resultingparameters forthe 1960–1989 and 1990–2008 periods (Fig. 5). It is important to notethat the Red River usually has a strong correlation (rN0.62, except for1982 and 1992 due to a cloud of points around the rating curves) in thepower law relationships between daily water discharges and SPMconcentrations (Table 1). Furthermore, the long term rating parameterswere calculatedwith thewhole database (black diamond),with data forthe 1960–1989 period (grey square) and for the 1990–2008 period(white square, Fig. 5).
The annual coefficient a and the exponent b in the Red River are veryvariable, with values ranging from 0.001 to 9.8 and from 0.43 to 1.50,
respectively (Fig. 5). The annual exponents b in the Red River cover awide range which is similar to that reported for natural and/or humanaffected rivers (typical values varying from0.5 to 1.5),whereas the largechanges in annual coefficients a are lower than the range observed indifferent rivers with seven orders of magnitude (Syvitski et al., 2000).
An inverse exponential relationship can be fitted to the plot of theannual rating coefficient a and the exponent b for the Red River System(Fig. 5), as previously observed in other systems (Asselman, 2000;Syvitski et al., 2000; Wang et al., 2008). Two parallel lines can beobserved: the upper line is attributed to the rating curve parametersobtained for the 1960–1989periodwhereas the upper line coincideswiththe 1990–2008 period. The long term rating parameters related to the1960–1989 and 1990–2008 periods are positioned on the correspondinglines. A significant change in the long term exponent b can be observedleading to a reduction from 1.05 (1960–1989) to 0.95 (1990–2008)attributed to human-induced disturbance of the river watershed and thesediment-discharge relationship. The b-shift suggests a decrease of the
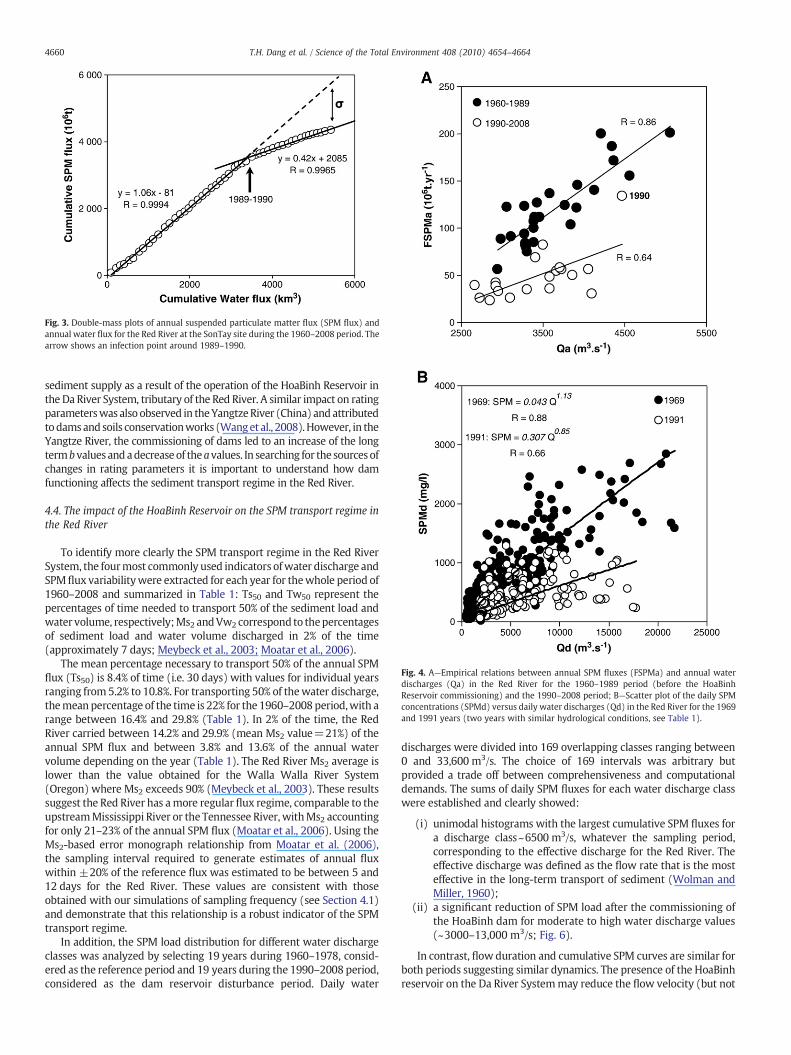
Fig. 3. Double-mass plots of annual suspended particulate matter flux (SPM flux) andannual water flux for the Red River at the SonTay site during the 1960–2008 period. Thearrow shows an infection point around 1989–1990.
Fig. 4. A—Empirical relations between annual SPM fluxes (FSPMa) and annual waterdischarges (Qa) in the Red River for the 1960–1989 period (before the HoaBinhReservoir commissioning) and the 1990–2008 period; B—Scatter plot of the daily SPMconcentrations (SPMd) versus daily water discharges (Qd) in the Red River for the 1969and 1991 years (two years with similar hydrological conditions, see Table 1).
4660 T.H. Dang et al. / Science of the Total Environment 408 (2010) 4654–4664
sediment supply as a result of the operation of the HoaBinh Reservoir inthe Da River System, tributary of the Red River. A similar impact on ratingparameterswas also observed in theYangtzeRiver (China) andattributedtodamsand soils conservationworks (Wanget al., 2008).However, in theYangtze River, the commissioning of dams led to an increase of the longtermbvalues andadecreaseof theavalues. In searching for the sourcesofchanges in rating parameters it is important to understand how damfunctioning affects the sediment transport regime in the Red River.
4.4. The impact of the HoaBinh Reservoir on the SPM transport regime inthe Red River
To identify more clearly the SPM transport regime in the Red RiverSystem, the fourmost commonly used indicators ofwater discharge andSPMflux variabilitywere extracted for each year for thewhole period of1960–2008 and summarized in Table 1: Ts50 and Tw50 represent thepercentages of time needed to transport 50% of the sediment load andwater volume, respectively;Ms2 andVw2 correspond to thepercentagesof sediment load and water volume discharged in 2% of the time(approximately 7 days; Meybeck et al., 2003; Moatar et al., 2006).
The mean percentage necessary to transport 50% of the annual SPMflux (Ts50) is 8.4% of time (i.e. 30 days) with values for individual yearsranging from 5.2% to 10.8%. For transporting 50% of thewater discharge,themean percentage of the time is 22% for the 1960–2008 period,with arange between 16.4% and 29.8% (Table 1). In 2% of the time, the RedRiver carried between 14.2% and 29.9% (mean Ms2 value=21%) of theannual SPM flux and between 3.8% and 13.6% of the annual watervolume depending on the year (Table 1). The Red River Ms2 average islower than the value obtained for the Walla Walla River System(Oregon) where Ms2 exceeds 90% (Meybeck et al., 2003). These resultssuggest the Red River has amore regular flux regime, comparable to theupstreamMississippi River or the Tennessee River, withMs2 accountingfor only 21–23% of the annual SPM flux (Moatar et al., 2006). Using theMs2-based error monograph relationship from Moatar et al. (2006),the sampling interval required to generate estimates of annual fluxwithin ±20% of the reference flux was estimated to be between 5 and12 days for the Red River. These values are consistent with thoseobtained with our simulations of sampling frequency (see Section 4.1)and demonstrate that this relationship is a robust indicator of the SPMtransport regime.
In addition, the SPM load distribution for different water dischargeclasses was analyzed by selecting 19 years during 1960–1978, consid-ered as the reference period and 19 years during the 1990–2008 period,considered as the dam reservoir disturbance period. Daily water
discharges were divided into 169 overlapping classes ranging between0 and 33,600 m3/s. The choice of 169 intervals was arbitrary butprovided a trade off between comprehensiveness and computationaldemands. The sums of daily SPM fluxes for each water discharge classwere established and clearly showed:
(i) unimodal histograms with the largest cumulative SPM fluxes fora discharge class~6500 m3/s, whatever the sampling period,corresponding to the effective discharge for the Red River. Theeffective discharge was defined as the flow rate that is the mosteffective in the long-term transport of sediment (Wolman andMiller, 1960);
(ii) a significant reduction of SPM load after the commissioning ofthe HoaBinh dam for moderate to high water discharge values(~3000–13,000 m3/s; Fig. 6).
In contrast, flow duration and cumulative SPM curves are similar forboth periods suggesting similar dynamics. The presence of the HoaBinhreservoir on the Da River Systemmay reduce the flow velocity (but not

Fig. 5. Annual rating parameters for the 1960–1989 period (white circles) and the1990–2008 (black circles) and the long term rating parameters (1960–2008: blackdiamond; 1960–1989: grey square and 1990–2008: white square).
Fig. 6. Analysis of thewater and SPM transport regime: Cumulative SPMflux curves—Flowduration curve and sediment transport rate as a function of discharge classes expressed bythe sums of SPM fluxes for the 1960–1978 (A) and 1990–2008 periods (B). The difference“σ” between the schematic curves corresponding to the cumulative SPM fluxes for the1960–1978 and the 1990–2008 periods illustrates the significant reduction of SPM loadafter the commissioning of the HoaBinh dam (C).
4661T.H. Dang et al. / Science of the Total Environment 408 (2010) 4654–4664
the water quantity) and, consequently, the sediment that would haveremained in suspension in thewater column and have been transporteddownstream accumulated in the reservoir instead.
4.5. Estimation of sediment and metal/metalloid stocks trapped in theHoaBinh Reservoir
The decline in the annual SPM fluxes in the Red River is the resultof sediment trapping by the HoaBinh dam which was commissionedin 1990 and which has caused a significant reduction of downstreamexport, and associated trapping and storage of sediment andsediment-bound elements in the reservoir. This last part focuses onproviding an estimate of the amount of sediment and associatedmetals/metalloids trapped behind the reservoir based on the ratingcurves and information on the chemical composition of streamsediments.
4.5.1. Estimation of sediment storage and the trap efficiency of theHoaBinh Reservoir
An evaluation of sediment rating curves over periods of 20 or moreyears in several small to large rivers in the USA and in Europe reportedby Horowitz (2003) demonstrated that errors of b1% in the estimate ofthe totalflux can be achieved using a single sediment rating curve basedon data spanning the entire period (Horowitz, 2003). Based on a similarapproach, a single Red River rating curve was fitted to the waterdischarge and sediment concentration data for the 1960–1989 period(i.e. in the absence of the HoaBinh Reservoir) in order to reconstructannual SPM fluxes from daily water discharge measured for the whole1960–2008 period (Fig. 7). It is important to note that we have useddaily measurements over a period of 30 years covering contrastinghydrological conditions (Table 1). For the 1960–1989 period, thesediment rating-curve-derived flux calculations provide a good 30-yearcumulative estimate with a difference of 1% between the measured(FSPM=3403×106 t) and the estimated (Est. FaSPM=3444×106 t) SPMfluxes. This cumulative SPM flux estimate produced a better result thanthe sum of annual SPM fluxes based on annual rating curves (Est.FcSPM=3154×106 t; i.e. error: −7%; Table 1) even if, in some cases,individual annual errors had been substantially reduced with separaterating curves (see for examples in1964and1977; Table 1). Additionally,separate rating curves were developed for mean, wet and dry years;however, the error on the cumulative SPMflux estimateswas evaluatedto −6% for the 1960–1989 period (with the following distributions:errors=−9% for mean years,−6% for dry years and 5% for wet years).This result tends to demonstrate that a single 1960–1989 rating curvemay produce a better result on the cumulative SPM flux than separaterating curves depending on hydrological conditions for our studysystem. In contrast, the cumulative annualflux calculation for the 1990–
2008period (1951×106 t) basedon the30-year rating curveproduced asignificant overestimation (~109%) in comparison to themeasured SPMflux (935×106 t). The difference between the estimated and themeasured fluxes can be used to estimate the magnitude of sediment

Fig. 7. Annual variation of SPM fluxes measured at the SonTay site (daily measure-ments) and SPM fluxes estimated using rating curves in the Red River during the 1960–2008 period.
4662 T.H. Dang et al. / Science of the Total Environment 408 (2010) 4654–4664
trapping, ~1020×106 t, accumulated in 19 years. Furthermore, usingthe doublemass curve, theflux sediment trapping inHoaBinh Reservoirduring 19 years was estimated at 1550×106 t. Based on both methods,these results show a 52%–80% reduction of the total SPM flux at theSonTay site (including the SPM supply of the Red River) since thefunctioning of the HoaBinh Reservoir. The mean annual sedimenttrapped by the HoaBinh reservoir is estimated at 53.7–81.6×10⁶ t/yr.This value is higher than that estimated in theManwan reservoir (26.9–28.5×10⁶ t/yr; Fu et al., 2008) on theUpperMekong. However, the totalcapacity of the Manwan reservoir (1060×106 m3) is 9 times smallerthan that of the HoaBinh Reservoir.
The sediment trapping efficiency of the HoaBinh Reservoir can beestimated by using the hydraulic residence time (Vörösmarty et al.,1997; Maneux et al., 2001; Vörösmarty et al., 2003). From the annualwater discharge of the Da River (data supplied by IMHE) during the1998–2008 period, the residence time of water discharge (ΔTR) of theDa River in the HoaBinh Reservoir was calculated, for each year, as theratio between the effective volume of the HoaBinh Reservoir(=9.5 km3) and the annual water discharge of the Da River. Thesediment trapping efficiency of the HoaBinh reservoir (TE), i.e. theproportion of the sediment flux of the Da River entering the reservoirwhich is trapped by the reservoir was estimated as follow:
TE = 1– 0:05 = ΔT0:05R
h i� �
With a residence time of the water discharge in the HoaBinhReservoir varying between 13.2% and 19.4% (i.e., from 48.6 to70.9 days depending on the year), we find that the annual sedimenttrapping efficiency of the HoaBinh Reservoir ranges from 86% to 89%,with a mean annual value around 88%. This estimate is in agreementwith the previous work of Vörösmarty et al. (2003) which estimatedthat more than 40% of the global river discharge is currentlyintercepted by large reservoirs; in many impounded watersheds(e.g. Rio Grande and Nile Rivers), this retention exceeds 90%.
Considering a dry sediment density of about 2650 kg/m3, thecumulative dry sediment flux trapped in the reservoir is equivalent to77×106–293×106m3 for the 1990–2008 period (i.e. 4.1×10⁶–15.4×10⁶
Table 2Inventory of Cu, Zn, As, Cd, Sb, Pb and U in the stream sediments (b63 μm) at the BanMon staAverage Chemical Composition of SPM in World Rivers; ACC flux (103 t/yr): global flux car
Cu Zn As
BanMon _high Water (mg/kg); n=3 45.9 104 15BanMon-Low Water (mg/kg); n=3 82.2 138 4ACC (mg/kg)a 75.9 208 3HoaBinh R. stock flux (103t) Min–Max 49.4–75.1 108–165 14ACC flux (103 t/yr)a 1140 3123 54
m3/yr).Based on the height of the HoaBinh Reservoir (h=123m; Ngoet al., 2007) and a sediment porosity of between 50 and 80%, the meansedimentation rate ranges between approximately 52 to 200 cm/yr (i.e.between9.9 mand37.6 m in19 years). In comparison, the sedimentationrate range obtained in this study is two orders of magnitude greater thanthose found in other world reservoirs, like the Cajarc Reservoir in France(2.4–2.8 cm/yr; Audry et al., 2004a), the Malter Reservoir in Germany(2.9 cm/yr; Müller et al., 2000) or the Patroon Reservoir in USA (4 cm/yr;Arnason and Fletcher; 2003). One of the most vital problems in thestorage and utilization of surface waters for flood control andhydropower generation is that of sedimentation in reservoirs andsubsequent decline of dam lifetime. The dead storage level is defined asthe lowest water level has to keep under the normal operatingconditions in a reservoir. Based on the HoaBinh dead storage (80 m;Ngo et al., 2007), and themean sedimentation rate (52–200 cm/yr), theuseful lifetime of the HoaBinh Reservoir would be estimated to bearound 40–154 years.
4.5.2. Estimation of the sediment-associated metal/metalloid stocksThe installation of many large dams on major rivers worldwide
over the past century has led to large and complex contaminantloadings becoming trapped in the sediment deposited behind thesedams (Rayne and Friesen, 2009). Little peer-reviewed scientific workhas been performed on the quality of the sediment transported by theRed River and potential sediment-associated contaminant storage inthe HoaBinh Reservoir, in contrast to the delta area (e.g. Borges andHuh, 2007; Le et al., 2007 for the River System; e.g. Berg et al., 2007, Doet al., 2007, Van den Bergh et al., 2007b, Mai et al., 2009; Nishina et al.,2009; Luu et al., 2010 for the Delta System). However, the HoaBinhreservoir probably is an efficient trap for metals/metalloids which areconsidered to be serious pollutants of aquatic ecosystems because oftheir environmental persistence, toxicity and ability to be incorpo-rated in food chains (Forrester et al. 2003; Geffard et al. 2005; Ruelas-Inzunza and Páez-Osuna, 2008). As a first approximation, theparticulate metal/metalloid concentrations in SPM collected duringtwo contrasting hydrological conditions at the inflow of the HoaBinhReservoir (at the BanMon site) are considered as representative of the19 year study period. The sediment-associated metal/metalloidconcentrations were significantly higher during the dry season forCu, Pb, Zn, Cd, Sb and U, in contrast to particulate As concentrations.The low concentrations observed during the wet season, for most ofthe elements studied, can be related to a higher percentage of coarseparticles carried by the Red River. This grain size-related effect onmetal concentrations, resulting in higher concentrations associatedwith smaller particles (and inversely), has been reported in varioussystems (Horowitz et al., 2008; Larrose et al., submitted forpublication). These results suggest that point-sources may contributemore than diffuse sources in the Red River except for As (Table 2).Note that As concentrations under high and low water discharges areelevated relative to the average chemical composition of SPM inWorld Rivers (Viers et al., 2009; Table 2). Using the sediment trappingefficiency, the proportion of SPM transported during the high water(93%) and low water (7%) and the mean particulate metal/metalloidconcentration in stream sediments measured during both periods, the
tion and corresponding metal/metalloid stocks in the HoaBinh Reservoir; ACC (mg/kg):ried by fluvial suspended sediments to the oceans (Viers et al., 2009)a.
Cd Sb Pb U
2 0.329 2.89 50.2 4.069.2 0.386 4.55 69.2 3.336.3 1.55 2.19 61.1 3.308–225 0.34–0.52 3.07–4.66 52.6–79.9 4.09–6.214 23.0 33.0 916 50.0

4663T.H. Dang et al. / Science of the Total Environment 408 (2010) 4654–4664
resulting contaminant trapping behind the HoaBinh reservoir can beestimated (Table 2) as follows:
MeST = STR × MeHW × 0:93 × FSPM1990−2008ð Þ + MeLW × 0:07 × FSPM1990−2008ð Þ½ �
where:
– MeST: the metal/metalloid stock behind the HoaBinh reservoir fora given element;
– STR: the reduction range of the total SPM flux, i.e. 52–80%;– MeHW and MeLWare the mean particulate metal/metalloid during
High Water (HW) and Low Water (LW) levels, respectively;– FSPM1990–2008is the cumulative annual SPM flux between 1990
and 2008.
In decreasing order ofmagnitude,metal/metalloid storage estimatesgenerated for the 19 year period are As (148,000–225,000 t)NZn(108,000–165,000 t)NPb (52,600–79,900 t)NCu (49,400–75,100 t)NU(4090–6210 t)NSb (3070–4660 t)NCd(340–520 t). Thesevalues canbecomparedwith the global flux carried by fluvial suspended sediment tothe oceans, as establishedbyViers et al. (2009) tohighlight the impact ofthe HoaBinh Reservoir acting as a significant temporary sink for river-bornemetals/metalloids (Table 2). This reservoirmay represent a futurepotential source in case of natural and/or anthropogenic remobilizationduring extreme flood events induced by climate change and/or futuredam management considering the short useful lifetime of the HoaBinhReservoir.
5. Conclusion
Denudation of the continental surface naturally is controlled bymultiple physical and chemical processes regulating fluvial SPMconcentrations and fluxes. However now, sediment export anddynamics aremore controlled by anthropogenic forcing than by naturaldrivers (e.g. Meybeck, 2003) characterizing the Anthropocene era(Crutzen and Stoermer, 2000). The existence of a long term (1960–2008) record of high temporal resolution water discharge and SPMconcentration data has allowedus to assess the sedimentflux in the RedRiver System (Vietnam) and to analyse its temporal variability mainlydue to hydrological conditions and human disturbance. The annual SPMfluxes established at the outlet of the Red River System havesignificantly changed since the operation of the HoaBinh Reservoir onthe Da River. Reservoir construction is one of the greatest changes thathas affected continental aquatic systems in the past 100 years, withmultiple environmental impacts like temporary sinks for sediment andriver-borne pollutants, as demonstrated in this study with theassessment of the trap efficiency of the HoaBinh dam(~88%) and theimportance of sediment-associated metal/metalloid storage. Reservoirsediments are also a great concern since they can turn from sink tosource of heavy metals for fluvial systems; this change may result from(i)physicalprocesses due tonatural and/or anthropogenic resuspension(e.g. flood, dredging, dam flush) and/or (ii) early diagenesis processes(e.g. dissolution of Fe oxides) due changing redox potential resultingfrom post-depositional remobilization within the sediment column(Audry et al., 2004b; Coynel et al., 2007; Audry et al., 2010).Resuspension of reservoir sediments may result in a massive changein the annual metal/metalloid budget and biogeochemical processes ofthe downstream system. Future research efforts need to consider boththe presence and the distribution of contaminants within the HoaBinhReservoir as well their speciation (carrier phases), in order to evaluatebioavailability and eco-toxicological potential. This information isneeded for future management because these sediments may becomethe target of an investigation when a spill, survey, toxic effect, orhistorical record flags them as posing a potential risk to human health,fisheries, or the environment (Förstner and Apitz, 2007), especially incountries where river systems play an important role in daily life.
Acknowledgements
This work was supported by the INSU-ST River-Sông program, theInstitute of Meteorology, Hydrology and Environment (IMHE, Hanoï,Vietnam) and the International Water Management Institute (IWMI-IRD). The PhD thesis of Thi Ha Dangwas supported by a scholarship fromthe French Embassy in Vietnam and the Vietnamese Academy of Scienceand Technology (VAST). We gratefully acknowledge the generousassistance of two anonymous reviewers for useful comments.
References
Ahnert F. Functional relationships between denudation, relief and uplift in large mid-latitude drainage basins. Am J Sci 1970;268:243–63.
Arnason JG, Fletcher BA. A 40+ year record of Cd, Hg, Pb, and U deposition in sedimentsof Patroon Reservoir, Albany County, NY, USA. Environ Pollut 2003;123:383–91.
Asselman NEM. Fitting and interpretation of sediment rating curves. J Hydrol 2000;234:228–48.
Audry S, Grosbois C, Bril H, Schäfer J, Kierczak J, Blanc G. Post-depositionalredistribution of trace metals in reservoir sediment of a mining/smelting-impactedwatershed (the Lot River, SW France). Appl Geochem 2010;25:778–94.
Audry S, Schäfer J, Blanc G, Bossy C, Lavaux G. Anthropogenic components of heavymetal(Cd, Zn, Cu, Pb) budgets in the Lot-Garonne fluvial system (France). Appl Geochem2004a;19:769–86.
Audry S, Schäfer J, Blanc G, Jouanneau JM. Fifty-year sedimentary record of heavy metalpollution (Cd, Zn, Cu, Pb) in the Lot River reservoirs (France). Environ Pollut 2004b;132:413–26.
Berg M, Stengel C, Trang PTK, Hung Viet P, Sampson ML, Leng M, et al. Magnitude ofarsenic pollution in the Mekong and Red River Deltas—Cambodia and Vietnam. SciTotal Environ 2007;372:413–25.
Borges J, Huh Y. Petrography and chemistry of the bed sediments of the Red River in Chinaand Vietnam: Provenance and chemical weathering. Sed Geol 2007;194:155–68.
Coynel A, Blanc G, Marache A, Schäfer J, Dabrin A, Maneux E, et al. Assessment of metalcontamination in a small mining- and smelting-affected watershed: High resolutionmonitoring coupled with spatial analysis by GIS. J Environ Monit 2009;11:962–76.
Coynel A, Schäfer J, Blanc G, Bossy C. Scenario of particulate trace metal and metalloidtransport during a major flood event inferred from transient geochemical signals.Appl Geochem 2007;22:821–36.
Coynel A, Schäfer J, Hurtrez JE, Dumas J, Etcheber H, Blanc G. Sampling frequency andaccuracy of SPM flux estimates in two contrasted drainage basins. Sci Total Environ2004;330:233–47.
Crutzen PJ, Stoermer EF. The “Anthropocene”. IGBP Newslett 2000;41:17–8.Dai SB, Yang SL, Li M. The sharp decrease in suspended sediment supply from China's
rivers to the sea: anthropogenic and natural causes. Hydrol Sci J 2009;54:135–46.Douglas I. Man, vegetation and the sediment yield of rivers. Nature 1967;215:925–8.Do MD, Nhuan MT, Ngoi CV, Nghi T, Tien DM, TjCE Van Weering, et al. Sediment
distribution and transport at the nearshore zone of the Red River delta, NorthernVietnam. J Asian Earth Sci 2007;29:558–65.
Farnsworth KL, Milliman JD. Effects of climatic and anthropogenic change on smallmountainous rivers: the Salinas River example. Glob Planet Change 2003;39:53–64.
Ferguson RI. River loads underestimated by rating curves. Water Resour Res 1986;22:74–6.
Forrester GE, Fredericks BI, Gerdeman D, Evans B, Steele MA, Zayed K, et al. Growth ofestuarine fish is associated with the combined concentration of sediment contami-nants and shows no adaptation or acclimation to past conditions. Mar Environ Res2003;56:423–42.
Förstner U, Apitz SE. Sediment remediation: U.S. Focus on Capping and MonitoredNatural Recovery. Fourth International Battelle Conference on Remediation ofContaminated Sediments. J Soils Sediments 2007;7:351–8.
Fu KD, He DM, Lu XX. Sedimentation in theManwan reservoir in the Upper Mekong andits downstream impacts. Quatern Int 2008;186:91–9.
Funabiki A, Haruyama S, Quy NV, Hai PV, Thai DH. Holocene delta plain development inthe Song Hong (Red River) delta, Vietnam. J Asian Earth Sci 2007;30:518–29.
GeffardO,GeffardA,BudzinskiH,CrouzetC,MenasriaR,Amiard J, et al.Mobility andpotentialtoxicity of sediment-bound metals in a tidal estuary. Environ Toxicol 2005;20:407–17.
Gourou P. Les Paysans du Delta Tonkinois. Paris: Mouton and Co; 1936.Harrison CGA. What factors control mechanical erosion rates? Int J Earth Sci 2000;88:
752–63.Haruyama S. Geomorphic environment of Tonkin delta, 21. Tsuda College: The study of
International relations; 1995. p. 1-13.Horowitz AJ, Elrick KA, Smith JJ. Monitoring urban impacts on suspended sediment,
trace element, and nutrient fluxes within the City of Atlanta, Georgia, USA: programdesign, methodological considerations, and initial results. Hydrol Process 2008;22:1473–96.
Horowitz AJ. An evaluation of sediment rating curves for estimating suspendedsediment concentrations for subsequent flux calculations. Hydrol Process 2003;17:3387–409.
Horowitz AJ, Elrick K, Smith JJ. Estimating suspended sediment and trace element fluxesin large river basins: methodological considerations as applied to the NASQANprogramme. Hydrol Process 2001;15:1107–32.
Horowitz AJ. A primer on sediment-trace element chemistry. 2nd edition. Chelsea,Lewis Publishing Co; 1991.

4664 T.H. Dang et al. / Science of the Total Environment 408 (2010) 4654–4664
Kao SJ, Liu KK. Particulate organic carbon export from a subtropical mountainous river(Lanyang His) in Taiwan. Limnol Oceanogr 1996;41:1749–57.
Larrose A, Coynel A, Schäfer J, Blanc G, Massé L, Maneux E. Assessing the current state ofthe Gironde Estuary by mapping priority contaminant distribution and riskpotential in surface sediment. Applied Geochemistry; submitted for publication.
Le TPQ, Garnier J, Billen G, Thery S, Chau VM. The changing flow regime and sedimentload of the Red River, Vietnam. J Hydrol 2007;334:199–214.
Li Z, Saito Y, Matsumoto E, Wang Y, Tanabe S, Vu QL. Climate change and human impacton the Song Hong (Red River) Delta, Vietnam, during the Holocene. Quatern Int2006;144:4-28.
Lu X, Jiang T. Larger Asian rivers: Climate change, river flow and sediment flux. QuaternInt 2009;208:1–3.
Ludwig W, Probst JL. River sediment discharge to the oceans: present-day controls andglobal budgets. Am J Sci 1998;298:265–95.
Luu TNM, Garnier J, Billen G, Orange D, Némery J, Le TPQ, et al. Hydrological regime andwater budget of the Red River Delta (Northern Vietnam). J Asian Earth Sci 2010;37:219–28.
Mai CV, Stive MJF, Van Gelder PHAJM. Coastal protection strategies for the Red RiverDelta. J Coast Res 2009;25:105–16.
Maneux E, Probst JL, Veyssy E, Etcheber H. Assessment of dam trapping efficiency fromwater residence time: Application to fluvial sediment transport in the Adour,Dordogne, and Garonne River basins (France). Water Resour Res 2001;37:801–11.
Meade RH, Moody J. Causes for the decline of suspended-sediment discharge in theMississippi River system, 1970–2007. Hydrol Process 2010;24:35–49.
Meybeck M. Global analysis of river systems: From Earth system controls toAnthropocene syndromes. Philosophical Transactions of the Royal Society B:Biological Sciences 2003;358:1935–55.
Meybeck M, Laroche L, Dürr HH, Syvitski JPM. Global variability of daily total suspendedsolids and their fluxes in river. Glob Planet Change 2003;39:65–93.
Milliman JD, Farnsworth KL, Jones PD, Xu KH, Smith LC. Climatic and anthropogenicfactors affecting river discharge to the global ocean, 1951–2000. Glob PlanetChange 2008;62:187–94.
Milliman JD, Syvitski JPM. Geomorphic/Tectonic control of sediment discharge to theOcean: The importance of small mountainous river. J Geol 1992;100:525–44.
Milliman JD, Meade RH. World-wide delivery of river sediment to the oceans. J Geol1983;91:1-21.
Moatar F, Person G, Meybeck M, Coynel A, Etcheber H, Crouzet P. The influence ofcontrasting suspended particulate matter transport regimes on the bias andprecision of flux estimates. Sci Total Environ 2006;370:515–31.
MONRE, 1997–2004. Vietnamese Ministry of Environment and Natural Resources.Annual Report on Hydrological observation in Vietnam.
Müller J, Ruppert H, Muramatsu Y, Schneider J. Reservoir sediments—A witness ofmining and industrial development (Malter Reservoir, eastern Erzgebirge,Germany). Environ Geol 2000;39:1341–51.
Ngo LL, Madsen H, Rosbjerg D. Simulation and optimisation modelling approach foroperation of the HoaBinh Reservoir, Vietnam. J Hydrol 2007;336:269–81.
Nguyen HK, Nguyen VT. Geography and hydrology in Vietnam. Hanoi, Vietnam:Vietnam National University Publisher; 2001.
Nilsson C, Reidy CA, Dynesius M, Revenga C. Fragmentation and flow regulation of theworld's large river systems. Science 2005;308:405–8.
Nishina T, Kien CN, Noi NV, Ngoc HM, Kim CS, et al. Pesticide residues in soils,sediments, and vegetables in the Red River Delta, northern Vietnam. Environ MonitAssess 2009. doi:10.1007/s10661-009-1170-8.
Prathumratana L, Sthiannopkao S, Kim KW. The relationship of climatic and hydrologicalparameters to surface water quality in the lower Mekong River. Environ Int 2008;34:860–6.
Rayne S, Friesen KJ. Contaminant trapping behind large Dams: A mini-Review. NatureProceedings; 2009. hdl.10101/npre.2009.29651.
Ruelas-Inzunza J, Páez-Osuna F. Trophic distribution of Cd, Pb, and Zn in a food webfrom Altata-Ensenada del Pabellón subtropical lagoon, SE Gulf of California. ArchEnviron Contam Toxicol 2008;54:584–96.
Schäfer J, Blanc G, Lapaquellerie Y, Maillet N, Maneux E, Etcheber H. Ten-yearobservation of the Gironde tributary fluvial system: fluxes of suspended matter,particulates organic carbon and cadmium. Mar Chem 2002;79:229–42.
Syvitski JP, Milliman JD. Geology, Geography, and human battle for dominance over thedelivery of fluvial sediment to the coastal ocean. J Geol 2007;115:1-19.
Syvitski JPM, Vörösmarty CJ, Kettner AJ, Green P. Impact of humans on the flux ofterrestrial sediment to the global coastal ocean. Science 2005;308:376–80.
Syvitski JP, Morehead MD, Bahr DB, Mulder T. Estimating fluvial sediment transport:the rating parameters. Water Resour Res 2000;36:2747–60.
Tran TX, Nguyen VP, Dang VT. Streams in Vietnam. Hanoi: Science Publishing House;2007.
Van den Bergh GD, Boer W, Schaapveld MAS, Duc DM, van Weering TjCE. Recentsedimentation and sediment accumulation rates of the Ba Lat prodelta (Red River,Vietnam). J Asian Earth Sci 2007a;29:545–57.
Van den Bergh GD, TjCE Van Weering, Boels JF, Duc DM, Nhuan MT. Acoustical faciesanalysis at the Ba Lat delta front (Red River Delta, North Vietnam). J Asian Earth Sci2007b;29:532–44.
Van Maren DSV. Water and sediment dynamics in the Red River mouth and adjacentcoastal zone. J Asian Earth Sci 2007;29:508–22.
Viers J, Dupré B, Gaillardet J. Chemical composition of suspended sediments in WorldRivers: New insights from a new database. Sci Total Environ 2009;407:853–68.
Vörösmarty CJ, Meybeck M, Fekete B, Sharma K, Green P, Syvitski JPM. Anthropogenicsediment retention: major global impact from registered river impoundments.Glob Planet Change 2003;39:169–90.
Vörösmarty CJ, Green P, Salisbury J, Lammers RB. Global water resources: vulnerabilityfrom climate change and population growth. Science 2000;289:284–8.
Vörösmarty CJ, Sharma KP, Fekete BM, Copeland AH, Holden J, Marble J, et al. Thestorage and aging of continental runoff in large reservoir systems of the world.Ambio 1997;26:210–9.
Walling DE. Human impact on land-ocean sediment transfer by the world's rivers.Geomorphology 2006;79:192–216.
Walling DE, Fang D. Recent trend in suspended sediment load of the world's river. GlobPlanet Change 2003;39:111–26.
Walling DE, Webb BW. Estimating the discharge of contaminants to coastal waters byrivers. Mar Pollut Bull 1985;16:488–92.
Wang H, Yang Z, Wang Y, Saito Y, Liu JP. Reconstruction of sediment flux from theChanjiang (Yangtze River) to the sea since the 1860. J Hydrol 2008;349:318–32.
Wolman MG, Miller JP. Magnitude and frequency of forces in geomorphic processes.J Geol 1960;68:54–74.
Xiong M, Xu Q, Yuan J. Analysis of multi-factors affecting sediment load in the threeGorges Reservoir. Quatern Int 2009;208:76–84.
Xu K, Milliman JD. Seasonal variations of sediment discharge from the YangtzeRiver before and after impoundment of the Three Gorges Dam. Geomorphology2009;104:276–83.