Tracking and quantitation of fluorescent HIV during cell-to-cell transmission
14
Tracking and quantitation of fluorescent HIV during cell-cell transmission Benjamin M. Dale a , Gregory P. McNerney b , Wolfgang Hübner a,c , Thomas R. Huser b , and Benjamin K. Chen a a Division of Infectious Diseases, Department of Medicine, Immunology Institute, One Gustave Levy Place, Box 1630, Mount Sinai School of Medicine, New York, NY 10029. b Center for Biophotonics, University of California at Davis, 2700 Stockton Blvd, Sacramento, CA 95817. Abstract The green fluorescent protein (GFP) is a powerful genetic marking tool that has enabled virologists to monitor and track viral proteins during HIV infection. Expression-optimized Gag- GFP constructs have been used to study virus-like particle (VLP) assembly and localization in cell types that are easily transfected. The development of HIV-1 variants carrying GFP within the context of the viral genome has facilitated the study of infection and has been particularly useful in monitoring the transfer of virus between cells following virological synapse formation. HIV Gag- iGFP, a viral clone that contains GFP inserted between the matrix (MA) and capsid (CA) domains of Gag, is the first replication competent molecular clone that generates fluorescent infectious particles. Here, we discuss some methods that exploit HIV Gag-iGFP to quantify cell-to-cell transmission of virus by flow cytometry and to track the proteins during assembly and transmission using live cell imaging. Introduction HIV assembly, release, and entry are viral processes that depend upon complex cellular machineries that determine where and when each process occurs. Early efforts by virologists to study Gag localization used immunofluorescent staining of Gag in fixed cells and helped to map sequences that were important for plasma membrane binding and localization within the cell in the steady state [1]. These image-based studies supported a model of HIV membrane binding regulated by the MA domain of Gag during viral assembly. They defined clearly that certain sequences in MA are critical for the recruitment of Gag to the plasma membrane. A possible limitation of immunofluorescence studies, however, is the possible masking of some viral epitopes that may be hidden by the oligomerization of Gag during the assembly process [2]. © 2010 Elsevier Inc. All rights reserved. Correspondence to: Benjamin K. Chen. c Present Address: Structural and Computational Biology Unit, European Molecular Biology Laboratory, Meyerhofstrasse 1, Heidelberg 69117, Germany Publisher's Disclaimer: This is a PDF file of an unedited manuscript that has been accepted for publication. As a service to our customers we are providing this early version of the manuscript. The manuscript will undergo copyediting, typesetting, and review of the resulting proof before it is published in its final citable form. Please note that during the production process errors may be discovered which could affect the content, and all legal disclaimers that apply to the journal pertain. NIH Public Access Author Manuscript Methods. Author manuscript; available in PMC 2012 January 1. Published in final edited form as: Methods. 2011 January ; 53(1): 20–26. doi:10.1016/j.ymeth.2010.06.018. NIH-PA Author Manuscript NIH-PA Author Manuscript NIH-PA Author Manuscript
-
Upload
independent -
Category
Documents
-
view
2 -
download
0
Transcript of Tracking and quantitation of fluorescent HIV during cell-to-cell transmission

Tracking and quantitation of fluorescent HIV during cell-celltransmission
Benjamin M. Dalea, Gregory P. McNerneyb, Wolfgang Hübnera,c, Thomas R. Huserb, andBenjamin K. ChenaaDivision of Infectious Diseases, Department of Medicine, Immunology Institute, One GustaveLevy Place, Box 1630, Mount Sinai School of Medicine, New York, NY 10029.bCenter for Biophotonics, University of California at Davis, 2700 Stockton Blvd, Sacramento, CA95817.
AbstractThe green fluorescent protein (GFP) is a powerful genetic marking tool that has enabledvirologists to monitor and track viral proteins during HIV infection. Expression-optimized Gag-GFP constructs have been used to study virus-like particle (VLP) assembly and localization in celltypes that are easily transfected. The development of HIV-1 variants carrying GFP within thecontext of the viral genome has facilitated the study of infection and has been particularly useful inmonitoring the transfer of virus between cells following virological synapse formation. HIV Gag-iGFP, a viral clone that contains GFP inserted between the matrix (MA) and capsid (CA) domainsof Gag, is the first replication competent molecular clone that generates fluorescent infectiousparticles. Here, we discuss some methods that exploit HIV Gag-iGFP to quantify cell-to-celltransmission of virus by flow cytometry and to track the proteins during assembly andtransmission using live cell imaging.
IntroductionHIV assembly, release, and entry are viral processes that depend upon complex cellularmachineries that determine where and when each process occurs. Early efforts by virologiststo study Gag localization used immunofluorescent staining of Gag in fixed cells and helpedto map sequences that were important for plasma membrane binding and localization withinthe cell in the steady state [1]. These image-based studies supported a model of HIVmembrane binding regulated by the MA domain of Gag during viral assembly. They definedclearly that certain sequences in MA are critical for the recruitment of Gag to the plasmamembrane. A possible limitation of immunofluorescence studies, however, is the possiblemasking of some viral epitopes that may be hidden by the oligomerization of Gag during theassembly process [2].
© 2010 Elsevier Inc. All rights reserved.Correspondence to: Benjamin K. Chen.cPresent Address: Structural and Computational Biology Unit, European Molecular Biology Laboratory, Meyerhofstrasse 1,Heidelberg 69117, GermanyPublisher's Disclaimer: This is a PDF file of an unedited manuscript that has been accepted for publication. As a service to ourcustomers we are providing this early version of the manuscript. The manuscript will undergo copyediting, typesetting, and review ofthe resulting proof before it is published in its final citable form. Please note that during the production process errors may bediscovered which could affect the content, and all legal disclaimers that apply to the journal pertain.
NIH Public AccessAuthor ManuscriptMethods. Author manuscript; available in PMC 2012 January 1.
Published in final edited form as:Methods. 2011 January ; 53(1): 20–26. doi:10.1016/j.ymeth.2010.06.018.
NIH
-PA Author Manuscript
NIH
-PA Author Manuscript
NIH
-PA Author Manuscript

GFP is a powerful tool for studying viral protein localization and has provided virologistswith a complementary method to monitor the localization of viral proteins within humancells. Because expression of one viral protein, Gag, is sufficient to form virus-like particles(VLP), isolated Gag-GFP expressed from expression-optimized Gag constructs were used tomap domains required for membrane association. These studies revealed a tight linkbetween Gag oligomerization and binding to the plasma membrane of the cell in a mannerthat complemented immunofluorescence approaches [3–5]. Imaging of Gag-GFP allowedinvestigators to demonstrate the requirement for n-terminal myristoylation and basicsequences for recruitment of Gag to the plasma membrane [4] and determine residues withinnucleocapsid (NC) critical to the assembly of Gag [6]. Color variants of Gag-GFP have beencombined to perform fluorescence resonance energy transfer (FRET) imaging todemonstrate that Gag homo-oligomerization occurs at the plasma membrane [7].
Live cell imaging studies with Gag-GFP have begun to provide a more dynamic picture ofhow Gag moves within the cell before viruses are produced. Live confocal imaging of Gag-GFP constructs revealed that Gag fusion proteins can localize to the plasma membrane andendocytic compartments in virus-producing cells. This gave rise to a hypothesis that Gagmay use endocytic compartments as an important assembly hub [8,9]. Using fluorescencerecovery after photobleaching (FRAP) approaches, Gomez et al showed that the mobility ofGag at the plasma membrane requires cholesterol [10]. Jouvenet et al used total internalreflection fluorescent microscopy (TIRFM) to follow the accumulation of Gag in individualvirus particles as they formed at the plasma membrane in HeLa cells [11]. The authorsdemonstrated that there are two pools of VLPs at the membrane- one actively engaged invirus assembly and another which can be endocytosed from the surface of the cell.
While GFP enables one to track protein movements in cells with relative ease, it is critical tokeep in mind that the activity of any protein may be altered in its biological activity byfusion with a large fluorescent moiety. Thus, functional validation of protein fusions iscritical to ensure that the protein localization reflects that of the native, non-tagged protein.While Gag-GFP can be used to form VLPs, these fusions require the coexpression of helpervirus with native Gag to generate infectious particles. This suggests that Gag-GFP is lackingin some biological feature that allows it to participate in infectious particle production. Partof this phenotype could be due to changes in the mRNA sequence itself, as the localizationof Gag within the cell can be influenced by codon optimization or by the addition of RNAexport signals [12–14]. Additionally, the large GFP moiety may also interfere more directlywith assembly, thus causing the formation of irregular Gag-GFP VLP as seen in electronmicroscopy [15,16]. For the above reasons, codon-optimized Gag-GFP fusions may notfully reflect the trafficking patterns of native HIV Gag.
To address these issues, fluorescent molecular clones of HIV that express the fullcomplement of viral genes have been developed. These clones allow one to examine thebehavior of the Gag proteins in a context that more closely resembles native infection. TheKrausslich group produced a clone that carries GFP in the C-terminus of MA. While thisvirus was not infectious by itself, its infectivity could be rescued with helper virus [17]. If,however, the GFP moiety is inserted into the interdomain linker sequence between MA andCA, then the insertion of GFP only minimally perturbs the structure of the Gag precursor aswell as the individual subunits of Gag. The result of this strategy, a viral clone called HIVGag-iGFP, is a replication competent variant of pNL4.3 which is highly infectious in singleround production from HEK 293 cells and able to replicate freely in the highly permissive Tcell line, MT4. Time-lapsed confocal imaging of this virus has documented the changes inthe subcellular distribution of Gag-iGFP within the context of a cell producing infectiousviral particles [18]. Because of the stoichiometric loading of GFP into infectious particles,this construct is also well-suited to monitoring the efficiency of cell-to-cell HIV
Dale et al. Page 2
Methods. Author manuscript; available in PMC 2012 January 1.
NIH
-PA Author Manuscript
NIH
-PA Author Manuscript
NIH
-PA Author Manuscript
transmission in comparison to cell-free viral adsorption. Using a quantitative flowcytometry-based assay, we found that cell contact could transfer orders of magnitude morevirus into a naïve cell population. The flow cytometry based-assay also revealed differentialsensitivities to inhibitors of the actin cytoskeleton and some neutralizing antibodies [19]. Wewere also able to use the virus to study the dynamics of cell-to-cell transfer of HIV with hightemporal resolution using spinning disk confocal microscopy. These studies revealed therapid recruitment of micrometer-sized “buttons” of viral protein at the interface of theinfected (donor) lymphocytes and the non-infected (target) lymphocytes, followed bytransfer across these synapses into intracellular compartments of the target cells [20]. Liveimaging of HIV Gag-iGFP revealed dynamic movements that occur when infectious HIV isproduced within CD4+ T cells.
Because HIV Gag-iGFP is replication-competent in permissive cell lines, without the needof helper HIV Gag, it is more likely that the GFP signals that are tracked by flow cytometryor by live microscopy are indicative of functional pools of the recombinant Gag protein.Indeed, immunofluorescence studies of Gag-iGFP revealed that its localization is similar tothat of the native Gag protein [18]. Here we provide detailed methods by which we use HIVGag-iGFP and spectral variants of this construct to measure viral transfer from cell to celland to image this process with live cell confocal microscopy.
2. Description of methods2.1. Overview
Cell to cell transmission of HIV was originally described using HIV-expressing Jurkat cellsas donor cells and primary CD4+ T lymphocytes as acceptor cells [21–23]. In these studies,virus was detected in fixed cells using antibody staining. To track the transfer of virus fromcell to cell with greater sensitivity, we exploited a recombinant, infectious reporter virus thatcarries the green fluorescent protein (GFP) inserted internally into the Gag protein betweenthe MA and CA domains. In this clone, the protease cleavage sites are flanking the GFPleading to native-sized MA and CA after Gag processing occurs (Fig. 1A). This molecularclone of HIV retains infectivity without the need for helper virus (Fig. 1B) and in T cells thefluorescent Gag protein is localized primarily to the plasma membrane during the late stagesof infection (Fig. 1C). Virus particles made from this clone are stoichiometrically loadedwith GFP, providing improved signal of viral transfer (Fig. 1D). To monitor cell-to-celltransfer of the virus, flow cytometry (2.3.1) or live cell imaging (2.4.1) can be used toprovide quantitative readouts of the amount and kinetics of viral transfer between cells.When used in conjunction with inert cell-tracking fluorescent dyes, recipient cells canreadily be discriminated from input donor cells, and one can accurately measure or visualizethe transfer of virus from cell to cell.
The protocols below describe the methods used to express HIV Gag-iGFP in the Jurkat Tcell line so that they may be used in cell-to-cell viral transfer studies with dye labeledprimary CD4+ T cells.
2.2. Detailed Protocols2.2.1 Preparation of HIV Gag-iGFP transfected Jurkat T cells
1. The human CD4+ T cell line Jurkat CE6.1 was obtained from American TypeCulture Collection (ATCC, Manassas, VA) and is grown in Jurkat culture media(RPMI 1640, 10% Fetal Bovine Serum, 100 units/ml penicillin, and 100 µg/mlstreptomycin). The cells are maintained in a humidified incubator at 37°C with 5%CO2 at a concentrations between 1 × 10⁵ and 8 × 10⁵ cells/ml. Maintaining cellswithin this density is often critical for achieving maximum transfection efficiency.
Dale et al. Page 3
Methods. Author manuscript; available in PMC 2012 January 1.
NIH
-PA Author Manuscript
NIH
-PA Author Manuscript
NIH
-PA Author Manuscript
Culture of the Jurkat cells at concentrations in excess of 8 × 10⁵ cells/ml will resultin a reduction in transfection efficiency.
1.1 Note: The transfection of HIV Gag-iGFP proviral DNA into T cells, asdescribed below, results in the production of a replication-competenthuman immunodeficiency virus. As such, all procedures are to beundertaken only by trained laboratory personnel in certified biosafetylevel 2+ (BL2+) tissue culture hoods.
2. The HIV Gag-iGFP plasmid is relatively large (>15 KB) and thus requires optimaltransfection conditions for efficient expression. Jurkats T cells are generallyresistant to transfection by lipid-based transfection protocols. While we have hadsome success transfecting using a standard laboratory electroporator (BioRad GenePulser II), we observe the highest transfection efficiencies using nucleofection(Lonza, Walkersville, MD). We transfect Jurkat T cells with HIV Gag-iGFP usinga modification of the method provided by the manufacturer. On the day oftransfection, 5 × 10⁶ cells are centrifuged for 10 min at 150 × g. The supernatant isaspirated and the cells are gently resuspended in sterile phosphate buffered saline(PBS). Cells are centrifuged again for 10 min at 150 × g before resuspending in 97µl of prewarmed, supplemented nucleofector solution V. Three µl of HIV Gag-iGFP plasmid (1 µg/µl) are added to the cell suspension and gently mixed. Foroptimum transfection efficiency, it is essential to use endotoxin-free preparations ofDNA (Qiagen, Valencia, CA). The cell suspension is transferred to a cuvette andnucleofected using program S-18. For the purposes of a control, one can transfectan aliquot of Jurkat cells with GFP alone. The cells are immediately transferred to 3ml of prewarmed Jurkat culture media without antibiotics. We have found that wecan “scale up” the above protocol by 40% without observing an adverse effect ontransfection efficiency or cell viability. That is, 7 × 10⁶ Jurkats can be resuspendedin 136 µl of supplemented solution V with 4.2 µl of HIV Gag-iGFP plasmid (1 µg/µl) and transfected as described above.
3. On the day the Jurkat cells are transfected, an aliquot of frozen primary CD4+ Tcells are thawed. We isolate these cells from peripheral blood mononuclear cells(PBMCs) using a CD4+ T cell isolation kit II (Miltenyi Biotec, Auburn, CA) andstored in liquid N2 in aliquots of 5×10⁶ cells/500 µl of freezing media (90% fetalbovine serum/10% DMSO). Primary CD4+ T cells are rapidly thawed and culturedin Jurkat culture media supplemented with 10 units/ml of IL-2.
4. After allowing the Jurkat cells to recover overnight, cellular debris is removed bygradient centrifugation. In a 15 ml conical tube, 1.5 ml of Ficoll-Paque (GEHealthcare, Uppsala, Sweden) is added to a 15 ml tube and allowed to warm toroom temperature. Transfected Jurkat cells are diluted to a 5 ml volume with RPMIand gently layered on top of the Ficoll. Cells are centrifuged at 400 × g for 20 minat room temperature (no brake). Cells are carefully removed from the media/Ficollinterface with a pipette and transferred to a new 15 ml conical tube. RMPI is addedto a total volume of 15 ml and the cells are centrifuged at 300 × g for 10 min. Cellsare resuspended in 3 ml of Jurkat culture media and returned to the tissue cultureincubator. Recovery of the cells depends on a variety of factors, including thehealth of the cells at the time of transfection, the use of endotoxin-free DNA, andthe use of proper technique during Ficoll purification. With optimum conditions,>90% will viable and able to be recovered. We rarely (< 0.1% of cells) see theformation of syncytia using Jurkat T cells.
5. To distinguish target cells from donor cells in cell-cell transfer experiments weprelabel the recipient cells with fluorescent dyes. Primary CD4+ T cells are labeled
Dale et al. Page 4
Methods. Author manuscript; available in PMC 2012 January 1.
NIH
-PA Author Manuscript
NIH
-PA Author Manuscript
NIH
-PA Author Manuscript

the evening before use. We have had excellent success labeling T cells with bothCellTracker and CellTrace dyes (Invitrogen, Carlsbad, CA). While the dyeconcentration and incubation times must be optimized depending on the particulardye and cell type used, a representative protocol follows. Centrifuge 4 × 10⁶
primary CD4+ T cells by spinning at 400 × g for 10 min. Wash the cells in 5 ml ofPBS and resuspend in 2 ml of PBS. Add CellTracker Orange (cmtmr, Invitrogen,Carlsbad, CA) to a final concentration of 1.5 µM and incubate at 37°C for 20 min.Add 8 ml of complete Jurkat media and centrifuge at 400 × g for 10 min.Resuspend the cells in 3 ml of complete media supplemented with 10 units/ml ofIL-2 and place in the tissue culture incubator overnight. We routinely use HIV Gag-iGFP transfected Jurkat cells 48 hours post-transfection. However, we havesuccessfully used cells as early as 24 hours, and as late as 72 hours post-transfection. Below are detailed protocols for tracking virus using HIV Gag-iGFPby flow cytometry (2.3.1) and live cell imaging (2.4.1).
2.3.1 Monitoring cell-to-cell transfer of virus using HIV Gag-iGFP and flow cytometry1. Approximately 48 hours post-transfection, HIV Gag-iGFP transfected Jurkat cells
are counted and centrifuged at 300 × g. Resuspend cells in Jurkat cell mediasupplemented with 10 units/ml of IL-2 at a concentration of 2 × 10⁶ cells/ml. Forthe purpose of a control reaction, a separate aliquot of non-transfected Jurkat cellsare also counted, centrifuged, and resuspended at 2 × 10⁶ cells/ml in Jurkat cellmedia. Supernatant from HIV Gag-iGFP-transfected Jurkats can be harvested andfiltered through 0.45 µM filters. Supernatants from Jurkat T cells are usually lowtiter, yielding perhaps 20–40 ng/ml of virus as assessed by p24 ELISA. Moreconcentrated preparations of HIV Gag-iGFP virus can be obtained by calciumphosphate-mediated transfection of 293T cells. Supernatants from 293T cellsroutinely have viral titers of 1 µg/ml.
2. Remove dye-labeled primary CD4+ T cells from the 37°C incubator, count themand centrifuge at 400 × g. Jurkat cell media supplemented with 10 units/ml of IL-2at a concentration of 2 × 10⁶ cells/ml.
3. Set up control and transfer reactions in sterile 5 ml round bottom FACS tubes(Becton Dickinson, Franklin Lakes, NJ). For a control reaction, combine 100 µl ofGFP transfected Jurkat cells with 100 µl of dye-labeled primary CD4+ T cells. Thiscondition allows the investigator to set flow cytometry gates during sampleanalysis. In a separate tube, combine 100 µl of HIV Gag-iGFP-transfected Jurkatcells with 100 µl of labeled primary CD4+ T cells.
4. Additional controls and experimental conditions are set up as needed. To setdetectors for flow cytometry, individual tubes of unlabeled Jurkats, unlabeledprimary CD4+ T cells, HIV Gag-iGFP Jurkat T cells, and labeled primary CD4+ Tcells should be prepared. These tubes serve as references to identify individual cellpopulations and to facilitate spectral compensation. Additional control reactions inthe presence of chemical inhibitors may be set up to show the specificity of thetransfer, e.g. HIV Gag-iGFP-transfected Jurkat cells mixed with labeled primaryCD4+ T cells in the presence of 2.5 µM cytochalasin D (Sigma Aldrich, St. Louis,MO) or 0.5 µg/ml of leu3a (CD4 blocking, BD Biosciences, San Jose, CA)antibody. These reagents have been shown to dramatically inhibit the cell-to-celltransfer of virus [19,23].
5. Move all tubes to a 37°C tissue culture incubator and incubate for 3–4 hours. At theend of the incubation, add 3.5 ml of cold PBS to each tube and centrifuge at 4°C for5 min at 400 × g. Aspirate the supernatant and resuspend the cells in 300 µl
Dale et al. Page 5
Methods. Author manuscript; available in PMC 2012 January 1.
NIH
-PA Author Manuscript
NIH
-PA Author Manuscript
NIH
-PA Author Manuscript

prewarmed 0.05% Trypsin-EDTA (Invitrogen, Carlsbad, CA) and incubate at 37°Cfor 10 min. After 10 min, rapidly add 300 µl of Jurkat culture media and 3.5 ml ofcold PBS and centrifuge at 400 × g for 10 min. Aspirate the supernatant andresuspend the cell pellets in PBS with 4% paraformaldehyde. Incubate the cells inat room temperature in the dark for a minimum of 10 minutes. After fixation, addan additional 3.5 ml of PBS and centrifuge at 400 × g. Resuspend the pellets in 400µl of PBS.
6. Each flow cytometry session should begin with the user running fluorescent andnon-fluorescent single populations of both donor and acceptor T cells. This willallow the user to optimally set acquisition parameters and compensation. Ideally,this will enable the user to acquire information for both the donor and acceptor cellssimultaneously (Fig. 2). Lasers should be set so that unstained cells land in the firstlog. This will allow for easy discrimination between the donor cells and theacceptor cells. Data is then acquired from the control and experimental samplesanalyzing 1 × 10⁴ target cells per sample.
7. Following saving and export of FACS data, the user should open the data with acommercially available FACS analysis program such as CellQuest or FlowJo. Afluorescence gate set on the dual fluorescent population of cells may be set so thatthe control transfer condition (GFP transfected Jurkat cells with labeled primaryCD4+ T cells) shows fewer than 0.5% dual positive cells. The same gate is appliedto transfer conditions (Fig. 2). In a typical experiment, we successfully transfect30% of Jurkat T cells with HIV Gag-iGFP. When these cells are mixed withprimary CD4+ T cells at a 1:1 ratio for 3 hours, we typically see transfer of virus toapproximately 15–20% of the primary CD4+ T cells.
2.4.1 Monitoring cell-to-cell transfer of HIV Gag-iGFP using live cell imaging1. The transfection of Jurkat T cells with HIV Gag-iGFP and labeling of primary
CD4+ T cells is described in 2.2.1.
2. Approximately 48 hours post-transfection, HIV Gag-iGFP expressing Jurkats arecounted, washed 1× with CO2-independent media (Invitrogen, Carlsbad, CA), andresuspended in live cell imaging media (CO2 independent media, 10% Fetal BovineSerum, 100 U/ml penicillin, and 100 µg/ml streptomycin, 10 units/ml IL-2) at aconcentration of 1–3 × 10⁷ cells/ml.
3. In a similar fashion, wash and resuspend labeled primary CD4+ T cells at aconcentration of 1–3 × 10⁷ cells/ml in live cell imaging media.
4. Mix HIV Gag-iGFP transfected Jurkats with primary CD4+ T cells at a 1:2 or 1:3ratio and load into a tissue culture treated, gas permeable, microchamber chamber(Ibidi, Verona, WI). For example, mix 20 µl of HIV Gag-iGFP transfected Jurkatswith 40 µl of labeled primary CD4 T cells. Load 50 µl of this mixture into an Ibidichamber and seal the chamber with tight plastic plugs. Secure the plugs bywrapping the plug/Ibidi chamber interface with parafilm. Wipe the entire surface ofthe Ibidi chamber with 70% ethanol. Move the Ibidi chamber to a sealable plasticcontainer (e.g. Tupperware) for transport to the microscope.
2.5 Considerations for microscopy platforms: spinning disk confocal imagingThe above preparation is suitable for live cell imaging on any inverted fluorescencemicroscope platform outfitted with an appropriate slide holding device and thermostatictemperature regulation. We describe a simple, low-cost, but high-speed, high-resolutionimaging platform, which employs a thermostatic heating device and a spinning disc confocal
Dale et al. Page 6
Methods. Author manuscript; available in PMC 2012 January 1.
NIH
-PA Author Manuscript
NIH
-PA Author Manuscript
NIH
-PA Author Manuscript

microscope. After loading an Ibidi imaging chamber with cells, we immediately mount thedevice onto an inverted optical microscope (iX71 Olympus, Center Valley, PA). The Ibidichamber should be transferred to the microscope only by BL2+-trained laboratory personnelwearing appropriate safety garments. As noted above, appropriate approval for use of sealedimaging chamber must be approved by local biosafety committees. Although live-cellimaging commonly uses expensive incubation chambers to maintain a stable 37°Cenvironment, this was achieved using a simple and economical thermostatic heater (ASI400, Nevtek, Williamsville, VA) along with a T-type thermocouple tip mounted next to thesample for proper temperature feedback. We have found using CO2-independent mediaallows us to maintain high cell viability while avoiding the use of a CO2 chamber. To bufferthe platform against temperature fluctuations in the room and to block out background roomlight, a large black shroud is draped over the whole microscope/heater setup creating aninsulated air pocket around the system. This greatly reduces temperature variation andassociated temperature-related sample drift, but requires pre-heating for 30 minutes prior tomounting the sample.
2.5.1 Data acquisition, transfer and image processing—Images are taken using a60× 1.42 NA oil immersion objective (UPlanApo N, Olympus) as the high numericalaperture (NA) greatly improves resolution. To create 3D confocal images, scanning isperformed by a spinning disk confocal unit (CSU-10, Yokagawa, Japan) that simultaneouslyuses >800 confocal spots to dramatically increase the scan rate. To compliment its speed, theCSU-10 is paired with a highly sensitive electron-multiplying charged-coupled device(EMCCD, iXon+ 897, Andor Technologies, Ireland) camera to allow fast, low light imagingwhich reduces both photobleaching and photoxicity. The fluorescence light source is amulti-wavelength ArKr ion gas laser (Innova 70C, Coherent, Santa Clara) where the desiredwavelength (488 nm) and laser power measured right before the microscope objective (<1mW) are selected by an acousto-optic tunable filter (AOTF), (Andor Technologies). Tofurther reduce photobleaching and extend total imaging time, the AOTF rapidly(microseconds) shuts off the laser beam every time the camera is inactive (10–20 ms) whilethe newly acquired image is delivered from the CCD (15–30 ms exposure) to the computer.The laser light is coupled into the spinning disk system using a 405/488/568/647 quad banddichroic mirror (Semrock, Rochester, NY). Fluorescence emission is filtered using a 525/50bandpass filter (Semrock) inside a filter wheel (Ludl Electronic Products, Hawthorne, NY)mounted between the EMCCD camera and the confocal spinning disk unit. All hardwareand acquisition, including a z-stage (Mad City Labs, Madison, WI), are controlled by theAndor iQ v1.8 software. To maximize the speed of acquisition at around 1.2–1.9 second 3Dimage stacks, we crop the recording region of the EMCCD’s camera down to the cell-pair’simmediate area. Furthermore, at the expense of some information in z, a large z-stepbetween 0.45–0.75 µm can be used to speed up acquisition. Imaging under these conditionscan last up to 6 hours - using continuous 20–60 minute segments - with minimalphotobleaching. Altogether, each data segment typically occupies 5–20 Gb of space as tensof thousands of images are taken. To facilitate the transport and analysis of the large datafiles, each acquisition set needs to be broken down and exported as 1 Gb TIFF image filesegments using the Andor iQ v1.8 software. From here, many excellent software packagesare available for image analysis, such as Metamorph, Volocity and ImageJ (we recommendits variation Fiji).
When two fluorescent markers are to be tracked, we simultaneously record both of themwithout slowing down acquisition by using a “split screen mode.” Both markers are excitedby two different ArKr laser lines at once (often 488 and 568 nm). Inserted directly before theEMCCD camera is an image splitter (OptoSplit II, Cairn, Kent, UK) that separates the twodifferent images. Each image is then independently filtered using fluorescence filters(Semrock) and projected side-by-side on the camera at once creating the "split-screen"
Dale et al. Page 7
Methods. Author manuscript; available in PMC 2012 January 1.
NIH
-PA Author Manuscript
NIH
-PA Author Manuscript
NIH
-PA Author Manuscript

effect. This would then require manual cropping and aligning of images later in imageprocessing.
2.5.2 Considerations for image processing and data analysis—We typicallyperform image analysis with Volocity (PerkinElmer, Waltham, MA) on Macintoshcomputers (Apple, Inc). Spinning disk laser confocal microscopy images are first adjusted intheir intensity to correct for photobleaching, then deconvolved with Volocity. Intensitymeasurements and tracking of Gag puncta is performed with the Volocity Quantificationmodule. For image sets where the movement relative to a pre-formed synapse needs to becalculated, an automated tracking algorithm is employed which tracks the synaptic buttonthroughout the entire sequence. Manual inspection of the regions of interest defined by theautotracking software must be performed to confirm that the software has correctly trackedthe desired object. For objects where the contrast with the surrounding objects is too weak,manual tracking may be performed on a frame-by-frame basis. The Volocity softwarepackage allows the export of XYZ location, volume and integrated signal within the desiredobjects. The distance from the synapse and velocity of the tracked object are calculated bynormalizing movements to the center of the synaptic button.
With this in vitro protocol, the user must use caution regarding the interpretation of results.For example, conditions used in this protocol are lacking in extracellular matrix (ECM)components that are likely to regulate cell-cell interactions in vivo. Receptors and signalingmolecules that regulate the cell-cell transfer of HIV-1 may be influenced by cytokines andother factors that are not present in the in vitro environment. In addition, particularly withregard to the lymph nodes, it is likely that the cells are interacting at a much higher densityin a 3D tissue environment. While we have demonstrated that cell-cell transfer of virus canoccur between primary cells [20], the protocol here uses Jurkat cells as donor cells. Thus,while this protocol provides an excellent in vitro method for studying the cell-cell transfer ofHIV-1, it is possible, that the results will differ from those found in vivo.
2.5.3 Creation of an Image Sequence in the Volocity software package1. Open Volocity, create a new library, and under actions create a new image
sequence.
2. Drag the TIFF stack into the image sequence window. We routinely acquire ourimages in a split screen mode and thus the number of channels at this point is one.Enter the number of z slices acquired and the number of time points taken. Arrangeparameters in the correct order, e.g. z step, timepoints, channels.
3. Open the untitled image sequence and click on “image” tab. Use the rectangle tooland crop to selection. Save cropped images in an easily recognizable format.
4. Highlight the file containing the green cropped image and go to tools > splitvolumes. Be sure to “put all images in a single folder” and place in the appropriateorder, e.g. z step, timepoints, channels. Repeat this process for the red croppedimage.
5. Go to actions > create new image sequence. Double-click image sequence, dragboth volumes in. Enter the parameters as above; e.g. z step, then timepoint, thenchannels for the newly created two channel image sequence.
6. Set relevant spatial (edit > properties) and temporal (sequence > set timepoints)properties
7. Use tools > change colors to put channels in green and red.
8. Use tools > contrast enhancement to adjust the leveling
Dale et al. Page 8
Methods. Author manuscript; available in PMC 2012 January 1.
NIH
-PA Author Manuscript
NIH
-PA Author Manuscript
NIH
-PA Author Manuscript

9. Go to actions > create new registration. Adjust the overlay in all three planes.
10. Close registration file and open the image sequence. Go to tools > correctregistration and apply the recently created registration.
11. Export the image sequence as a movie encoded in TIFF format if furthercorrections are needed. Otherwise, image sequences can be exported as Quicktimemovies. To export a movie in extended focus, select file > export > view asQuicktime movie. Use the options tab to adjust the video compression and framerate.
2.5.4 Manual tracking of virus particles—The diameter of a mature HIV-1 virusparticle has been estimated to be approximately 120 nM. We have used structuredillumination microscopy (SIM) to confirm that HIV Gag-iGFP particles are a similar size(McNerney et al, manuscript in preparation). However, the resolution limit of the spinningdisk confocal microscope is limited by the wavelength of the diffracted light. Using theoptics described here, this resolution limit is approximately 225 nM. Thus, we cannotdetermine whether some particles that appear as single particles, may in fact be aggregatesof several particles. New technical advances, including the adaptation of stimulated emissiondepletion microscopy (STED) to GFP, have pushed resolution limits well under 80 nM.These new technologies will be able to be applied to HIV Gag-iGFP and thus increase ourconfidence that we are imaging single virions.
Using Volocity software, we have successfully used the automated tracking function to trackobjects as small as 20 pixels for extended periods of time. However, we have found thatVolocity automated tracking programs have difficulty in tracking very small (2–8 pixels)viral particles when in proximity to intense GFP signals from infected cells. For this reason,when using Volocity software, we use manual tracking to monitor particle activity overtime. A brief discussion of manual tracking using Volocity software is provided below.
1. Open an image sequence using Volocity software and click on the measurementstab. In this panel, select tools > track objects manually.
2. Use the zoom and inspection tool to find a particle and center it in all three planes.
3. Use the magic wand (tolerance set to 0) to select the center of a virus particle. Useedit > ROI > grow to adjust the size of the selection box so that it encompasses theparticle. Use the inspection tool to verify that the particle has been selected in allthree planes.
4. Once the particle has been selected, save the information by selectingmeasurements > make measurement item (current timepoint). Name this file, forexample, particle track.
5. Click next to proceed to the next timepoint.
6. Select the particle in the next timepoint as described above and continue in thisfashion for the desired amount of time.
7. Upon opening the “particle track” file in Volocity, the user has a large amount ofdata pertaining to the particle over time, including, fluorescence, area, and volocity.
OverviewThe tagging of HIV proteins with GFP has allowed researchers to make novel observationsregarding the localization and kinetics of individual viral processes. However, these studiesmay be compromised by the fact that the GFP-tagged viral proteins are not being expressedin the context of a fully infectious virus. HIV Gag-iGFP is replication competent, providing
Dale et al. Page 9
Methods. Author manuscript; available in PMC 2012 January 1.
NIH
-PA Author Manuscript
NIH
-PA Author Manuscript
NIH
-PA Author Manuscript

validation that the Gag-iGFP molecules that are being followed can contribute to theinfectious cycle and are not revealing the movement of non-functional GFP fusions. BecauseHIV Gag-iGFP virus particles incorporate GFP at a stoichiometry equivalent to Gag, itssignal is easily detectable by flow cytometry or using live cell imaging. As a viral trackingmethod, it is likely to compare favorably to alternative labeling strategies. Used incombination with the basic methodology outlined above, HIV Gag-iGFP will continue toreveal novel insights into the basic biology of the virus. We have found HIV Gag-iGFP to beespecially useful for studies on the cell-cell transmission of the virus.
References1. Zhou W, Resh MD. Differential membrane binding of the human immunodeficiency virus type 1
matrix protein. J Virol 1996;70(12):8540–8548. [PubMed: 8970978]2. Ono A, et al. Association of human immunodeficiency virus type 1 gag with membrane does not
require highly basic sequences in the nucleocapsid: use of a novel Gag multimerization assay. JVirol 2005;79(22):14131–14140. [PubMed: 16254348]
3. Ono A, Freed EO. Cell-type-dependent targeting of human immunodeficiency virus type 1 assemblyto the plasma membrane and the multivesicular body. J Virol 2004;78(3):1552–1563. [PubMed:14722309]
4. Hermida-Matsumoto L, Resh MD. Localization of human immunodeficiency virus type 1 Gag andEnv at the plasma membrane by confocal imaging. J Virol 2000;74(18):8670–8679. [PubMed:10954568]
5. Ono A, Demirov D, Freed EO. Relationship between human immunodeficiency virus type 1 Gagmultimerization and membrane binding. J Virol 2000;74(11):5142–5150. [PubMed: 10799589]
6. Sandefur S, et al. Mapping and characterization of the N-terminal I domain of humanimmunodeficiency virus type 1 Pr55(Gag). J Virol 2000;74(16):7238–7249. [PubMed: 10906178]
7. Derdowski A, Ding L, Spearman P. A novel fluorescence resonance energy transfer assaydemonstrates that the human immunodeficiency virus type 1 Pr55Gag I domain mediates Gag-Gaginteractions. J Virol 2004;78(3):1230–1242. [PubMed: 14722278]
8. Dong X, et al. AP-3 directs the intracellular trafficking of HIV-1 Gag and plays a key role in particleassembly. Cell 2005;120(5):663–674. [PubMed: 15766529]
9. Sherer NM, et al. Visualization of retroviral replication in living cells reveals budding intomultivesicular bodies. Traffic 2003;4(11):785–801. [PubMed: 14617360]
10. Gomez CY, Hope TJ. Mobility of human immunodeficiency virus type 1 Pr55Gag in living cells. JVirol 2006;80(17):8796–8806. [PubMed: 16912326]
11. Jouvenet N, Bieniasz PD, Simon SM. Imaging the biogenesis of individual HIV-1 virions in livecells. Nature 2008;454(7201):236–240. [PubMed: 18500329]
12. Zhang YJ, et al. Envelope-dependent, cyclophilin-independent effects of glycosaminoglycans onhuman immunodeficiency virus type 1 attachment and infection. J Virol 2002;76(12):6332–6343.[PubMed: 12021366]
13. Swanson CM, et al. Retroviral mRNA nuclear export elements regulate protein function and virionassembly. EMBO J 2004;23(13):2632–2640. [PubMed: 15201866]
14. Jin J, et al. HIV-1 matrix dependent membrane targeting is regulated by Gag mRNA trafficking.PLoS One 2009;4(8):e6551. [PubMed: 19662089]
15. Larson DR, et al. Visualization of retrovirus budding with correlated light and electronmicroscopy. Proc Natl Acad Sci U S A 2005;102(43):15453–15458. [PubMed: 16230638]
16. Pornillos O, et al. HIV Gag mimics the Tsg101-recruiting activity of the human Hrs protein. J CellBiol 2003;162(3):425–434. [PubMed: 12900394]
17. Muller B, et al. Construction and characterization of a fluorescently labeled infectious humanimmunodeficiency virus type 1 derivative. J Virol 2004;78(19):10803–10813. [PubMed:15367647]
Dale et al. Page 10
Methods. Author manuscript; available in PMC 2012 January 1.
NIH
-PA Author Manuscript
NIH
-PA Author Manuscript
NIH
-PA Author Manuscript

18. Hubner W, et al. Sequence of human immunodeficiency virus type 1 (HIV-1) Gag localization andoligomerization monitored with live confocal imaging of a replication-competent, fluorescentlytagged HIV-1. J Virol 2007;81(22):12596–12607. [PubMed: 17728233]
19. Chen P, et al. Predominant mode of human immunodeficiency virus transfer between T cells ismediated by sustained Env-dependent neutralization-resistant virological synapses. J Virol2007;81(22):12582–12595. [PubMed: 17728240]
20. Hubner W, et al. Quantitative 3D video microscopy of HIV transfer across T cell virologicalsynapses. Science 2009;323(5922):1743–1747. [PubMed: 19325119]
21. Blanco J, et al. High level of coreceptor-independent HIV transfer induced by contacts betweenprimary CD4 T cells. J Biol Chem 2004;279(49):51305–51314. [PubMed: 15371410]
22. Sourisseau M, et al. Inefficient human immunodeficiency virus replication in mobile lymphocytes.J Virol 2007;81(2):1000–1012. [PubMed: 17079292]
23. Jolly C, et al. HIV-1 cell to cell transfer across an Env-induced, actin-dependent synapse. J ExpMed 2004;199(2):283–293. [PubMed: 14734528]
24. Kimpton J, Emerman M. Detection of replication-competent and pseudotyped humanimmunodeficiency virus with a sensitive cell line on the basis of activation of an integrated beta-galactosidase gene. J Virol 1992;66(4):2232–2239. [PubMed: 1548759]
Dale et al. Page 11
Methods. Author manuscript; available in PMC 2012 January 1.
NIH
-PA Author Manuscript
NIH
-PA Author Manuscript
NIH
-PA Author Manuscript

Fig. 1. HIV Gag-iGFP, an infectious, replication competent clone of HIV-1(A) Diagram of the Gag-internal, interdomain GFP insertion strategy into HIV Gag. GFP isplaced between the MA and CA regions of Gag and flanked by viral protease cleavage sites.Upon maturation, the GFP is cleaved from Gag, but remains associated with the viralparticle. (B) HelaT4 Magi cells [24] were infected with HIV Gag-iGFP, parent virus NL4-3,or a mix of the two viruses for 48 hr and then stained for β-galactosidase. (C) Jurkat T cellswere transfected with HIV Gag-iGFP as described in the text. After 48 hrs, cells were platedon poly-l-lysine coated coverslips and fixed with 4% paraformaldehyde. Note theaccumulation of Gag at the plasma membrane. (D) 293T cells expressing HIV Gag-iGFPfollowing transfection using a calcium phosphate based method. After 48 hrs, supernatantswere filtered and spotted onto glass coverslips. Viral particles were fixed and imaged on aconfocal microscope using a 63× oil objective and 6× frame averaging.
Dale et al. Page 12
Methods. Author manuscript; available in PMC 2012 January 1.
NIH
-PA Author Manuscript
NIH
-PA Author Manuscript
NIH
-PA Author Manuscript

Fig. 2. Quantitation of cell-cell transfer of HIV Gag-iGFP using flow cytometryHIV Gag-iGFP transfected Jurkat T cells and cmtmr-labeled primary CD4+ T cells were co-cultured for three hours and processed for flow cytometry as described in the text. (A) TheJurkat T cells and the primary CD4+ T cells can be distinguished on the basis of theirforward scatter (FSC) and side scatter (SSC); the Jurkat T cells are larger and thus are thepopulation with the larger FSC/SSC profile. (B) Gating HIV Gag-iGFP transfected cells andplotting cmtmr versus GFP shows the donor cells to be cmtmr- population withapproximately 30% GFP-positive cells. (C) Primary CD4+ target cells mixed with non-HIV-expressing, GFP-positive Jurkat T cells shows no GFP transfer to the target cells. Targetcells may be gated based on FSC/SSC and by cmtmr label. A GFP-positive gate is selectedbased on this control so that the cmtmr(+)/GFP+ cells are fewer than 0.5%. (D) HIV Gag-iGFP transfected Jurkat T cells and cmtmr-labeled primary CD4+ T cells were co-culturedfor three hours and processed for flow cytometry. Virus is typically transferred to 15–20%of the primary CD4+ T cells.
Dale et al. Page 13
Methods. Author manuscript; available in PMC 2012 January 1.
NIH
-PA Author Manuscript
NIH
-PA Author Manuscript
NIH
-PA Author Manuscript

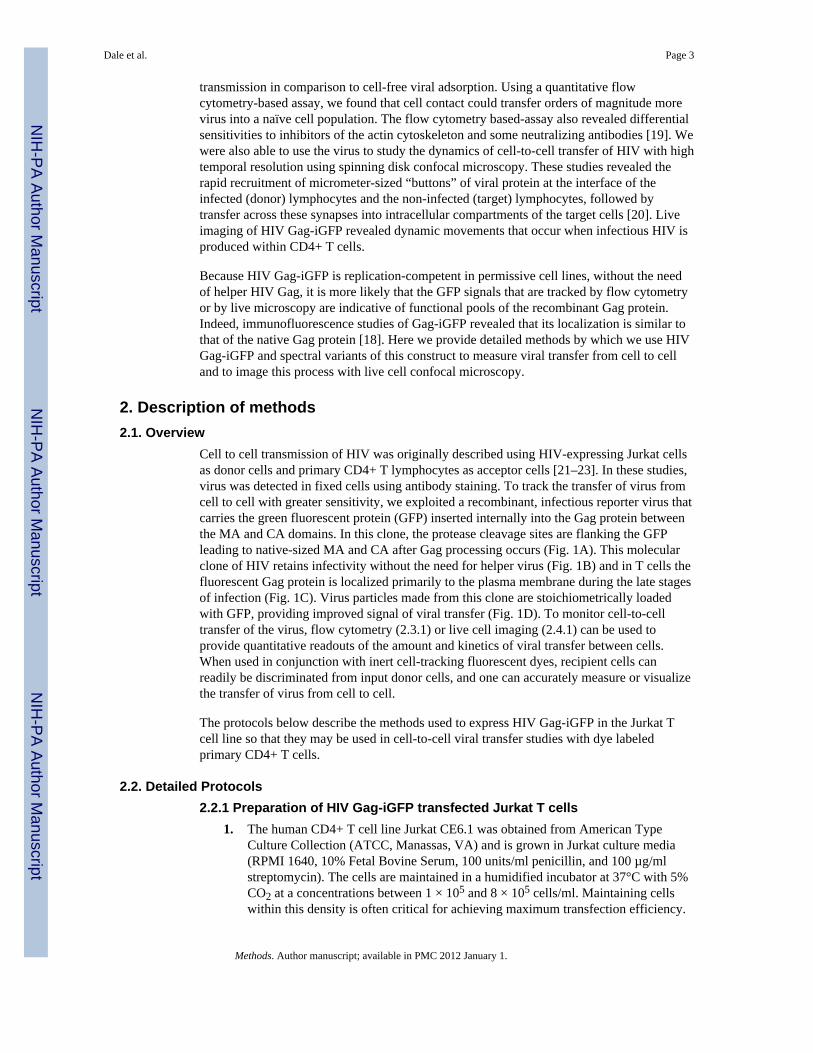
Fig. 3. Tracking puncta of HIV Gag-iGFP at the virological synapseHIV Gag-iGFP transfected Jurkat T cells and cmtmr-labeled primary CD4+ T cells weremixed and loaded into Ibidi chambers. Live cell imaging was performed with a spinningdisk confocal microscope using methodology described in the text. (A) Volocity softwarewas used to track the movement of Gag puncta moving towards a virological synapse. (B) Atracing of the movement of the Gag-iGFP puncta is shown over time. (C) Manual trackingwas used to generate a measurement file that enabled one to calculate the position (withrespect to the synapse) and velocity of the particle in microns/second. (D) Distribution ofvelocities of the object can be plotted to show the frequency with which the object moves ata given speed.
Dale et al. Page 14
Methods. Author manuscript; available in PMC 2012 January 1.
NIH
-PA Author Manuscript
NIH
-PA Author Manuscript
NIH
-PA Author Manuscript