
Fluorescent indicators for Ca2+based on green fluorescent proteins and calmodulin
6
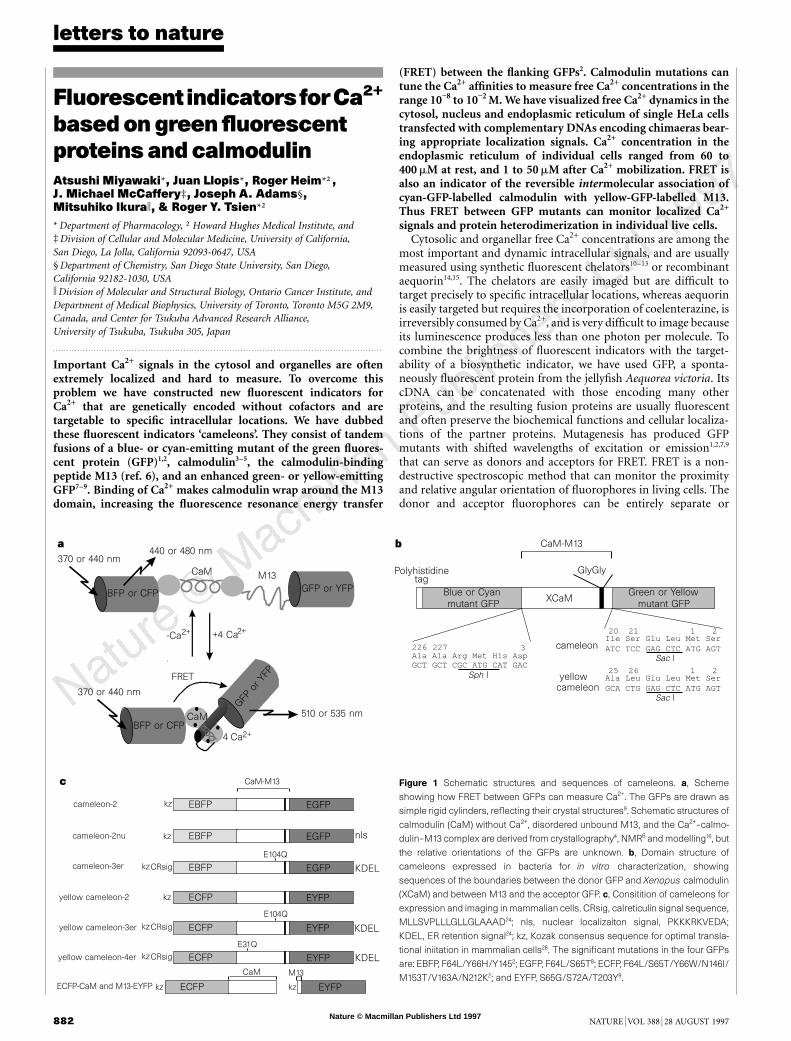
Nature © Macmillan Publishers Ltd 1997 Fluorescent indicators for Ca 2+ based on green fluorescent proteins and calmodulin Atsushi Miyawaki*, Juan Llopis*, Roger Heim*², J. Michael McCaffery‡, Joseph A. Adams§, Mitsuhiko Ikurak, & RogerY. Tsien*² * Department of Pharmacology, ² Howard Hughes Medical Institute, and ‡ Division of Cellular and Molecular Medicine, University of California, San Diego, La Jolla, California 92093-0647, USA § Department of Chemistry, San Diego State University, San Diego, California 92182-1030, USA k Division of Molecular and Structural Biology, Ontario Cancer Institute, and Department of Medical Biophysics, University of Toronto, Toronto M5G 2M9, Canada, and Center for Tsukuba Advanced Research Alliance, University of Tsukuba, Tsukuba 305, Japan ......................................................................................................................... Important Ca 2+ signals in the cytosol and organelles are often extremely localized and hard to measure. To overcome this problem we have constructed new fluorescent indicators for Ca 2+ that are genetically encoded without cofactors and are targetable to specific intracellular locations. We have dubbed these fluorescent indicators ‘cameleons’. They consist of tandem fusions of a blue- or cyan-emitting mutant of the green fluores- cent protein (GFP) 1,2 , calmodulin 3–5 , the calmodulin-binding peptide M13 (ref. 6), and an enhanced green- or yellow-emitting GFP 7–9 . Binding of Ca 2+ makes calmodulin wrap around the M13 domain, increasing the fluorescence resonance energy transfer (FRET) between the flanking GFPs 2 . Calmodulin mutations can tune the Ca 2+ affinities to measure free Ca 2+ concentrations in the range 10 -8 to 10 -2 M. We have visualized free Ca 2+ dynamics in the cytosol, nucleus and endoplasmic reticulum of single HeLa cells transfected with complementary DNAs encoding chimaeras bear- ing appropriate localization signals. Ca 2+ concentration in the endoplasmic reticulum of individual cells ranged from 60 to 400 mM at rest, and 1 to 50 mM after Ca 2+ mobilization. FRET is also an indicator of the reversible intermolecular association of cyan-GFP-labelled calmodulin with yellow-GFP-labelled M13. Thus FRET between GFP mutants can monitor localized Ca 2+ signals and protein heterodimerization in individual live cells. Cytosolic and organellar free Ca 2+ concentrations are among the most important and dynamic intracellular signals, and are usually measured using synthetic fluorescent chelators 10–13 or recombinant aequorin 14,15 . The chelators are easily imaged but are difficult to target precisely to specific intracellular locations, whereas aequorin is easily targeted but requires the incorporation of coelenterazine, is irreversibly consumed by Ca 2+ , and is very difficult to image because its luminescence produces less than one photon per molecule. To combine the brightness of fluorescent indicators with the target- ability of a biosynthetic indicator, we have used GFP, a sponta- neously fluorescent protein from the jellyfish Aequorea victoria. Its cDNA can be concatenated with those encoding many other proteins, and the resulting fusion proteins are usually fluorescent and often preserve the biochemical functions and cellular localiza- tions of the partner proteins. Mutagenesis has produced GFP mutants with shifted wavelengths of excitation or emission 1,2,7,9 that can serve as donors and acceptors for FRET. FRET is a non- destructive spectroscopic method that can monitor the proximity and relative angular orientation of fluorophores in living cells. The donor and acceptor fluorophores can be entirely separate or letters to nature 882 NATURE | VOL 388 | 28 AUGUST 1997 GFP or YFP CaM M13 440 or 480 nm CaM 510 or 535 nm FRET 4 Ca 2+ -Ca 2+ +4 Ca 2+ BFP or CFP BFP or CFP GFP or YFP 370 or 440 nm 370 or 440 nm a Figure 1 Schematic structures and sequences of cameleons. a, Scheme showing how FRET between GFPs can measure Ca 2+ . The GFPs are drawn as simple rigid cylinders, reflecting their crystal structures 9 . Schematic structures of calmodulin (CaM) without Ca 2+ , disordered unbound M13, and the Ca 2+ –calmo- dulin–M13 complex are derived from crystallography 4 , NMR 6 and modelling 16 , but the relative orientations of the GFPs are unknown. b, Domain structure of cameleons expressed in bacteria for in vitro characterization, showing sequences of the boundaries between the donor GFP and Xenopus calmodulin (XCaM) and between M13 and the acceptor GFP. c, Consitition of cameleons for expression and imaging in mammalian cells. CRsig, calreticulin signal sequence, MLLSVPLLLGLLGLAAAD 24 ; nls, nuclear localizaiton signal, PKKKRKVEDA; KDEL, ER retention signal 24 ; kz, Kozak consensus sequence for optimal transla- tional iniitation in mammalian cells 28 . The significant mutations in the four GFPs are: EBFP, F64L/Y66H/Y145 2 ; EGFP, F64L/S65T 8 ; ECFP, F64L/S65T/Y66W/N146I/ M153T/V163A/N212K 2 ; and EYFP, S65G/S72A/T203Y 9 . Blue or Cyan mutant GFP XCaM Green or Yellow mutant GFP GlyGly CaM-M13 Ala Ala Arg Met His Asp GCT GCT CGC ATG CAT GAC 226 227 3 Sph I Ile Ser Glu Leu Met Ser ATC TCC GAG CTC ATG AGT 20 21 1 2 Sac I Ala Leu Glu Leu Met Ser GCA CTG GAG CTC ATG AGT 25 26 1 2 Sac I Polyhistidine tag cameleon yellow cameleon b EBFP EGFP kz cameleon-2 EBFP EGFP kz nls cameleon-2nu ECFP EYFP CRsig kz KDEL yellow cameleon-4er E31Q ECFP EYFP kz yellow cameleon-2 ECFP EYFP kz kz M13 CaM ECFP-CaM and M13-EYFP CaM-M13 ECFP EYFP KDEL CRsig kz E104Q yellow cameleon-3er EBFP EGFP KDEL CRsig kz E104Q cameleon-3er c
-
Upload
independent -
Category
Documents
-
view
1 -
download
0
Transcript of Fluorescent indicators for Ca2+based on green fluorescent proteins and calmodulin
Nature © Macmillan Publishers Ltd 1997
Fluorescent indicatorsforCa2+
basedongreenfluorescentproteinsandcalmodulinAtsushi Miyawaki*, Juan Llopis*, Roger Heim*†,J. Michael McCaffery‡, Joseph A. Adams§,Mitsuhiko Ikurak, & Roger Y. Tsien*†
* Department of Pharmacology, † Howard Hughes Medical Institute, and‡ Division of Cellular and Molecular Medicine, University of California,San Diego, La Jolla, California 92093-0647, USA§ Department of Chemistry, San Diego State University, San Diego,California 92182-1030, USAkDivision of Molecular and Structural Biology, Ontario Cancer Institute, andDepartment of Medical Biophysics, University of Toronto, Toronto M5G 2M9,Canada, and Center for Tsukuba Advanced Research Alliance,University of Tsukuba, Tsukuba 305, Japan
. . . . . . . . . . . . . . . . . . . . . . . . . . . . . . . . . . . . . . . . . . . . . . . . . . . . . . . . . . . . . . . . . . . . . . . . . . . . . . . . . . . . . . . . . . . . . . . . . . . . . . . . . . . . . . . . . . . . . . . . .
Important Ca2+ signals in the cytosol and organelles are oftenextremely localized and hard to measure. To overcome thisproblem we have constructed new fluorescent indicators forCa2+ that are genetically encoded without cofactors and aretargetable to specific intracellular locations. We have dubbedthese fluorescent indicators ‘cameleons’. They consist of tandemfusions of a blue- or cyan-emitting mutant of the green fluores-cent protein (GFP)1,2, calmodulin3–5, the calmodulin-bindingpeptide M13 (ref. 6), and an enhanced green- or yellow-emittingGFP7–9. Binding of Ca2+ makes calmodulin wrap around the M13domain, increasing the fluorescence resonance energy transfer
(FRET) between the flanking GFPs2. Calmodulin mutations cantune the Ca2+ affinities to measure free Ca2+ concentrations in therange 10−8 to 10−2 M. We have visualized free Ca2+ dynamics in thecytosol, nucleus and endoplasmic reticulum of single HeLa cellstransfected with complementary DNAs encoding chimaeras bear-ing appropriate localization signals. Ca2+ concentration in theendoplasmic reticulum of individual cells ranged from 60 to400 mM at rest, and 1 to 50 mM after Ca2+ mobilization. FRET isalso an indicator of the reversible intermolecular association ofcyan-GFP-labelled calmodulin with yellow-GFP-labelled M13.Thus FRET between GFP mutants can monitor localized Ca2+
signals and protein heterodimerization in individual live cells.Cytosolic and organellar free Ca2+ concentrations are among the
most important and dynamic intracellular signals, and are usuallymeasured using synthetic fluorescent chelators10–13 or recombinantaequorin14,15. The chelators are easily imaged but are difficult totarget precisely to specific intracellular locations, whereas aequorinis easily targeted but requires the incorporation of coelenterazine, isirreversibly consumed by Ca2+, and is very difficult to image becauseits luminescence produces less than one photon per molecule. Tocombine the brightness of fluorescent indicators with the target-ability of a biosynthetic indicator, we have used GFP, a sponta-neously fluorescent protein from the jellyfish Aequorea victoria. ItscDNA can be concatenated with those encoding many otherproteins, and the resulting fusion proteins are usually fluorescentand often preserve the biochemical functions and cellular localiza-tions of the partner proteins. Mutagenesis has produced GFPmutants with shifted wavelengths of excitation or emission1,2,7,9
that can serve as donors and acceptors for FRET. FRET is a non-destructive spectroscopic method that can monitor the proximityand relative angular orientation of fluorophores in living cells. Thedonor and acceptor fluorophores can be entirely separate or
letters to nature
882 NATURE | VOL 388 | 28 AUGUST 1997
GFP or YFP
CaM M13
440 or 480 nm
CaM 510 or 535 nm
FRET
4 Ca2+
-Ca2+ +4 Ca2+
BFP or CFP
BFP or CFP
GFP
or Y
FP
370 or 440 nm
370 or 440 nm
a
Figure 1 Schematic structures and sequences of cameleons. a, Scheme
showing how FRET between GFPs can measure Ca2+. The GFPs are drawn as
simple rigid cylinders, reflecting their crystal structures9. Schematic structures of
calmodulin (CaM) without Ca2+, disordered unbound M13, and the Ca2+–calmo-
dulin–M13 complex are derived from crystallography4, NMR6 and modelling16, but
the relative orientations of the GFPs are unknown. b, Domain structure of
cameleons expressed in bacteria for in vitro characterization, showing
sequences of the boundaries between the donor GFP and Xenopus calmodulin
(XCaM) and between M13 and the acceptor GFP. c, Consitition of cameleons for
expression and imaging in mammalian cells. CRsig, calreticulin signal sequence,
MLLSVPLLLGLLGLAAAD24; nls, nuclear localizaiton signal, PKKKRKVEDA;
KDEL, ER retention signal24; kz, Kozak consensus sequence for optimal transla-
tional iniitation in mammalian cells28. The significant mutations in the four GFPs
are: EBFP, F64L/Y66H/Y1452; EGFP, F64L/S65T8; ECFP, F64L/S65T/Y66W/N146I/
M153T/V163A/N212K2; and EYFP, S65G/S72A/T203Y9.
Blue or Cyan mutant GFP
XCaMGreen or Yellow mutant GFP
GlyGly
CaM-M13
Ala Ala Arg Met His AspGCT GCT CGC ATG CAT GAC
226 227 3
Sph I
Ile Ser Glu Leu Met SerATC TCC GAG CTC ATG AGT
20 21 1 2
Sac I
Ala Leu Glu Leu Met SerGCA CTG GAG CTC ATG AGT
25 26 1 2
Sac I
Polyhistidinetag
cameleon
yellowcameleon
b
EBFP EGFPkzcameleon-2
EBFP EGFPkz nlscameleon-2nu
ECFP EYFPCRsigkz KDELyellow cameleon-4er
E31Q
ECFP EYFPkz yellow cameleon-2
ECFP EYFPkzkz
M13CaM
ECFP-CaM and M13-EYFP
CaM-M13
ECFP EYFP KDELCRsigkz
E104Q
yellow cameleon-3er
EBFP EGFP KDELCRsigkz
E104Qcameleon-3er
c

Nature © Macmillan Publishers Ltd 1997
attached to the same macromolecule. In the latter case, ligand-induced conformational changes might be monitored by FRET ifthe amino and carboxy termini of the binding protein are fused to adonor and acceptor GFP. This approach has several advantages overthe usual covalent labelling with fluorescent probes. First, theindicator is generated in situ by gene transfer into the cells ororganisms, obviating large-scale expression, purification, labellingand microinjection of recombinant proteins that must be soluble.Second, the sites of fusions are defined exactly, giving a molecularlyhomogenous product without the use of elaborate protein chem-istry. Third, the chromophore of GFP is fixed in the protein9. If theGFP donor and acceptor are rigidly fused to a host protein, minorchanges in the relative orientation of the ends of the latter wouldalter FRET. In contrast, most conventional fluorescent labels areattached by flexible linkers that at least partly decouple the fluor-ophore orientation from that of the protein to which it is attached.
Many effects of Ca2+ in cells are mediated by the binding of Ca2+
to calmodulin, which causes calmodulin to bind and activate targetproteins3. Based on the nuclear magnetic resonance solution struc-ture of calmodulin bound to M13, the 26-residue calmodulin-binding peptide of myosin light-chain kinase6, the C terminus ofcalmodulin has been fused to the M13 by means of a Gly-Glyspacer16. Ca2+ binding switched the resulting hybrid protein (cal-modulin–M13) from a dumb-bell-like extended form to a compactglobular form similar to the calmodulin–M13 intermolecularcomplex. We therefore sandwiched the calmodulin–M13 fusionbetween a blue (Y66H/Y145F)2 and a green (S65T)7 GFP mutant toconstruct a Ca2+ indicator (Fig. 1a). The amino-acid sequences of
the boundary regions between the calmodulin–M13 hybrid andGFPs proved critical to the optimization of protein folding and theCa2+ sensitivity of FRET. Numerous deletions, insertions andamino-acid substitutions were tested; the best splice sequencesfound are shown in Fig. 1b. The prototype fusion protein wasefficiently expressed and folded in bacteria and increased its ratio ofultraviolet-excited 510:445 nm emissions by 70% upon bindingCa2+ (Fig. 2a). The decrease in blue and increase in green emissionindicated that Ca2+ increased the efficiency of FRET from Y66H/Y145F to S65T, consistent with the expected decrease in distancebetween the two ends of the protein. The Ca2+ response was fullyreversible upon chelation of Ca2+. We have called this calmodulin-based indicator ‘cameleon-1’, because it readily changes colour andretracts and extends a long tongue (M13) into and out of the mouthof the calmodulin, often abbreviated CaM. Mg2+, pH and ionicstrength did not alter the emission spectra of either the Ca2+-saturated or Ca2+-unsaturated forms (data not shown), in accordwith the typical high specificity of calmodulin for Ca2+ (ref. 5).Cameleon-1 was not affected by hydrophobic proteins, such asbovine serum albumin. Isolated calmodulin saturated with Ca2+
becomes sticky with hydrophobic amino acids exposed to thesurface. The calmodulin in cameleon-1, however, seems to interactpreferentially with its intramolecularly adjacent M13 peptide. Sucha self-contained system should minimize the possibility that theprotein might interact with endogenous calmodulin-bindingsequences in eukaryotic cells.
The original calmodulin–M13 hybrid protein without GFPsdisplayed a biphasic Ca2+ binding with two dissociation constants,
letters to nature
NATURE | VOL 388 | 28 AUGUST 1997 883
Figure 2 Properties of cameleons in vitro. a, Emission spectra of cameleon-1
(excited at 380 nm) at the indicated free Ca2+ values at pH 7.47. b, Ca2+ titration
curves of cameleon-1 (open circles), cameleon-1/E104Q (filled circles), and
cameleon-1/E31Q (open triangles), combining 5 independent experiments using
Ca2+/EGTA and Ca2+/HEEDTA systems10 below 10−5 M free Ca2+ and unbuffered
Ca2+ above. The changes in emission ratio (510 to 445nm) were normalized to the
effects of full Ca2+ saturation, which were 60–80% increases in ratio over the
values at zero Ca2+. The fitted curves correspond to the apparent dissociation
constants and Hill coefficients given in the text. c, Relaxation rate constants, kobs
(¼ kon½Ca2þÿ þ koff ), for reaction of cameleon-1/E104Q with Ca2+; kon and koff are
the association and dissociation rate constants. d, Emission spectrum of yellow
cameleon-2 in vitro, excited at 432nm, at zero and saturating Ca2+.
Nature © Macmillan Publishers Ltd 1997
letters to nature
884 NATURE | VOL 388 | 28 AUGUST 1997

Nature © Macmillan Publishers Ltd 1997
2 mM and 80 nM, resulting from independent Ca2+ binding to theN- and C-terminal domains of calmodulin, respectively16. Theemission ratio of cameleon-1 has a similar biphasic Ca2+ depen-dency (Fig. 2b, open circles) with apparent dissociation constants(K9d) of 11 mM and 70 nM, and Hill coefficients (n) of 1.0 and 1.8,respectively. Therefore cameleon-1 can report a very wide range ofCa2+ concentration, from ,10−7 to .10−4 M. Many site-directedmutations have been studied for their effects on the Ca2+ bindingand Ca2+-induced conformational changes of calmodulin17,18.Mutation of the conserved bidentate glutamic acid (E104) atposition 12 of the third Ca2+-binding loop to glutamine (Q)eliminated the high-affinity component of the Ca2+ response (Fig.2b, filled circles). The resulting monophasic response (K9d, 4.4 mM;n, 0.76) corresponded fairly closely to the low-affinity component ofthe cameleon-1 response. An analogous mutation in the first Ca2+-binding loop (E31Q) resulted in a large rightward shift of the low-affinity component of cameleon-1, without affecting the high-affinity component (Fig. 2b, triangles). Cameleon-1/E31Q showeda biphasic response (K9d, 83 nM and 700 mM; n, 1.5 and 0.87. Muchmore tuning of Ca2+ affinities for particular applications should bepossible.
Because cameleon-1/E104Q had the simplest Ca2+-responsecurve, it was chosen for initial explorations of Ca2+-binding kineticsby stopped-flow measurements of the acceptor S65T emission afterrapid mixing with Ca2+. The approach to equilibrium was reason-ably exponential, and the inverse time constants were a linearfunction of free [Ca2+], as expected for simple 1 : 1 binding (Fig.2c). The association and dissociation rate constants correspondto the slope and intercept of the linear plot and wereð2:4 6 0:2Þ 3 106 M 2 1 s 2 1 and 13 6 9 s 2 1, in 100 mM KCl at25 8C. Their ratio is 5.4 mM, which is consistent with the apparentdissociation constant (4.4 mM) independently derived from equili-brium measurements (Fig. 2b). The dissociation rate is similar tothat (12 6 2 s2 1) for calmodulin and M13 without the GFPs19, sothe GFPs do not perturb the dissociation even though they are muchlarger than the interacting calmodulin and M13 domains.
Can cameleons work as Ca2+ indicators in mammalian cells?Initial transfections with the gene encoding cameleon-1 in thepcDNA3 vector (with a cytomegalovirus promoter) gave inade-quate fluorescence because the blue was not bright enough. Thesimplest remedy was to introduce mammalian codon bias andmutate Phe 64 to Leu, which improves expression and folding of
GFPs at 37 8C without greatly affecting the spectra of the final well-folded molecules8,20. The resulting enhanced blue and green fluor-escent proteins (‘EBFP’ and EGFP, respectively) fused to calmo-dulin–M13 constituted cameleon-2 (Fig. 1c), which indeed greatlyimproved mammalian cell expression. However, an even betterapproach for single-cell imaging proved to be replacement of theEBFP and EGFP by similarly enhanced cyan and yellow fluorescentmutants, ‘ECFP’ and ‘EYFP’, respectively (Fig. 1c). ECFP containsTrp at residue 66 in place of the His of EBFP and Tyr of EGFP,whereas EYFP contains the normal Tyr 66 in the fluorophore but isshifted to a yellowish emission by mutation of Thr 203 to Tyr (ref.9). Both genes have mammalian codon usage and encode appro-priate mutations to improve folding20. The substitution of ECFP forEBFP shifted the excitation peak from 381 to 433 nm and improvedthe brightness, signal-to-noise ratio and duration of recording, yetdecreased potential concerns regarding autofluorescence, photo-damage and incompatibility with caged compounds. The ‘yellowcameleons’ incorporating ECFP and EYFP have three minor dis-advantages. The maximal ratio changes (Fig. 2d) are slightly smaller(,1.5-fold) than for the original EBFP/EGFP cameleons (1.8-fold),perhaps because the emission spectrum of ECFP encroaches moreon the EYFP emission. Yellow cameleons are perturbed by acidifica-tion below pH 7.0, which mimics a fall in Ca2+. Also, EYFP canundergo reversible photochromism if illuminated too strongly(A. Miyawaki and J. Llopis, unpublished observations). Otherproperties, such as Ca2+ affinities, as well as the qualitative beha-viour inside cells, seem to be the same for the two families ofcameleons.
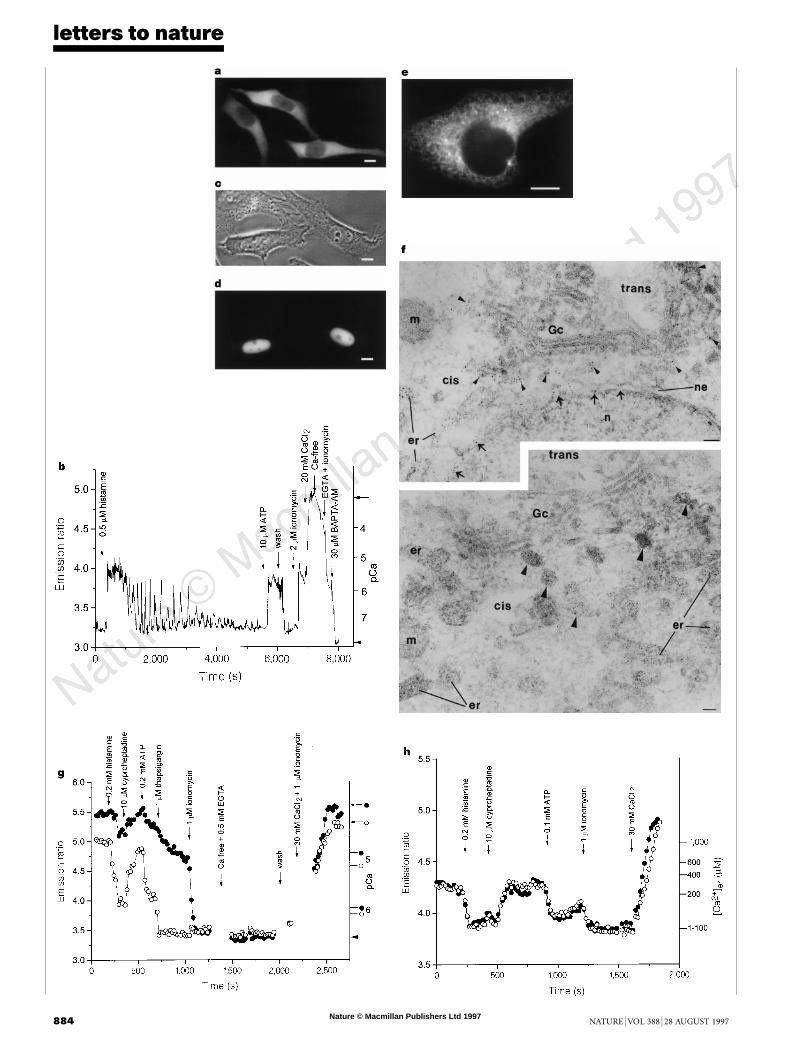
When yellow cameleon-2 was transfected into HeLa cells, thefluorescence was uniformly distributed in the cytosolic compart-ment but excluded from the nucleus (Fig. 3a), as expected for a74 kDa protein without targeting signals. The time course of thespatially averaged yellow : cyan emission ratios from a single HeLacell expressing yellow cameleon-2 is shown in Fig. 3b. A submaximaldose of histamine (0.5 mM) produced a significant increase in theemission ratio indicating an initial peak of about 3 mM cytosolic freeCa2+, [Ca2+]c. This response was gradually converted into oscilla-tions and eventually desensitized altogether. However, ATP added asa purinergic agonist could still stimulate another increase in [Ca2+]c
of similar amplitude to the initial histamine response. Theseresponses agree well with the known behaviour of HeLa cells tohistamine and ATP21,22. Application of the Ca2+ ionophore iono-mycin followed by a high concentration (20 mM) of extracellularCa2+ gave a large increase in the ratio, which should correspond tothe maximal ratio Rmax. To establish the minimal ratio Rmin, asrequired for a simple in situ calibration, the cell was loaded with thepermeant chelator ester BAPTA/AM, and external Ca2+ wasclamped to zero with EGTA in the presence of ionomycin. Theratio Rmax/Rmin inside cells was about 1.6, equal or slightly greaterthan that observed in vitro. This correspondence argues that theindicator in cells behaved in reasonable accord with its in vitrocalibration, and that the calibration protocol effectively achievedsaturating and zero [Ca2+]c.
Cameleons should be readily directable to interesting sites byfusion to appropriate organellar targeting signals or localized hostproteins. For example, addition of a nuclear localization signal tocameleon-2 yielded a Ca2+ indicator, ‘cameleon-2nu’ (Fig. 1c),fluorescence of which was tightly localized to nuclei (Fig. 3c, d)but excluded from nucleoli. The time course of nuclear [Ca2+]proved generally similar to those of [Ca2+]c, confirming previouscomparisons of nuclear and cytosolic aequorin23. We also succeededin monitoring agonist-induced changes in the free Ca2+ inside theendoplasmic reticulum ([Ca2+]er) in individual, intact, non-per-fused cells. Two low-affinity indicators, yellow cameleon-3er and4er (for endoplasmic reticulum) (Fig. 1c), whose Ca2+ responsesshould correspond to the filled circles and open triangles respec-tively of Fig. 2b, were engineered to reside in the lumen of
letters to nature
NATURE | VOL 388 | 28 AUGUST 1997 885
Figure 3 Imaging of cameleons in HeLa cells. a, Fluorescence image
(440 6 10 nm excitation, 535 6 12:5nm emission) of yellow cameleon-2 shows
cytosolic localizaiton in HeLa cells. Scale bar,10 mm in all fluorescence images.b,
Ratios of 535 6 12:5 nm to 480 6 15nm emissions from yellow cameleon-2 in the
cytoplasm of the leftmost cell of a, monitored every 7 s by digital imaging
microscopy. The ratios were calibrated in terms of absolute pCa on the right-
hand ordinate axis, using Rmin (arrowhead) and Rmax (arrow) determined in situ.
‘Ca2+ free’ indicates medium containing 0.5mM MgCl2. c, d, Matched phase-
contrast and fluorescence (480 6 15nm excitation, 535 6 22:5nm emission)
images of two HeLa cells showing cameleon-2nu localized to the nuclei. e,
Fluorescence image of yellow cameleon-3er, taken as in a. The same reticular
pattern of fluorescence was observed for yellow cameleon-4er. f, Immunogold
localizaiton of cameleon-3er in ultrathin cryosections using a polyclonal antibody
against GFP. The cameleon-3erwas abundant in the ER (er), nuclear envelope (ne
and arrows) and intermediate compartment (arrowheads), but absent from the
cis-most Golgi cisternae (Gc), mitochondria (m) and nucleus (n). ‘Cis’ and ‘trans’
show the orientation of the Golgi stack but do not mark specific structures. Scale
bars, 0.1 mm. g, The 535 to 480nm emission ratios from yellow cameleon-3er in
two cells. The right-hand ordinate gives Rmin (arrowhead), Rmax (arrows) and pCa
calibrations for each cell. h, Analogous emission ratios from yellowcameleon-4er
in two cells. The right-hand ordinate calibrates [Ca2+]er.
R

Nature © Macmillan Publishers Ltd 1997
endoplasmic reticulum (ER) by addition of a signal sequence at theN terminus and a KDEL signal for ER retention at the C terminus24.Reticular patterns of fluorescence were seen in HeLa cells expressingthe protein (Fig. 3e). Targeting to the ER was verified by electron-microscopic immunogold localization (Fig. 3f), which showed thatalmost all of the GFP immunoreactivity was within the ER andnuclear envelope. A few percent of gold particles were in theintermediate compartment between ER and Golgi, but the Golgiapparatus itself was essentially devoid of immunoreactivity. [Ca2+]er
reported by yellow cameleon-3er in two neighbouring cells is shownin Fig. 3g. In one cell (filled circles), the indicator was initiallysaturated (½Ca2þÿer . 100 mM), as shown by an emission ratiomatching Rmax and a time delay in response to the Ca2+-mobilizingeffect of histamine. The agonist eventually depleted [Ca2+]er toabout 30 mM, within the dynamic range of the indicator. In theother cell (open circles), [Ca2+]er started at about 60 mM andresponded to histamine with much less time delay, soon levellingoff at 1.5 mM. The depletion of [Ca2+]er was promptly reversed by ahistamine antagonist, cyproheptadine, and recapitulated by ATP.Responses to thapsigargin blockage of the ER Ca2+-ATPase were alsoheterogeneous, whereas ionomycin immediately clamped [Ca2+]er
almost to zero. To measure resting [Ca2+]er values above 100 mM, weturned to the lowest-affinity indicator, yellow cameleon-4er (Figs 2band 3h). This variant was clearly not saturated, because the ratiostarted well below Rmax, fell immediately upon histamine stimula-tion, but was delayed in recovering after antagonist application.Combined results from the two indicators separately applied to 75cells showed [Ca2+]er ranging from 60 to 400 mM before and 1 to50 mM after application of a maximal dose of agonists. Ourestimates for basal [Ca2+]er fall roughly in the middle of previousestimates, which range from 1 to 2,000 mM (refs 11, 14, 15, 25).Previous measurements using small-molecule indicators are subjectto severe uncertainties in dye localization and Mg2+ interference.Aequorin experiments can only be done on cell populations and arecomplicated by the opposing abilities of Ca2+ both to stimulate lightoutput and to irreversibly destroy the indicator. ER-targeted came-leons avoid both sets of problems. Ca2+ stores in the ER haverecently been suggested to contain spatially and functionally distinct
compartments13,26. Cameleons fused to different ER sequencesshould be able to examine such heterogeneity with the uniquecombination of precise molecular targeting, single-cell physiologi-cal imaging, and ultrastructural localization.
Is FRET between GFPs limited to detecting intramolecularproximity, or can it also detect intermolecular associations?Yellow cameleon-2 was expressed as two separate pieces: ECFP–calmodulin and M13–EYFP (Fig. 1c). When these two proteinswere mixed in vitro, the spectral difference between zero andsaturating Ca2+ was similar to but somewhat larger than that forthe corresponding intramolecular association in the fully fusedconstruct (data not shown), presumably because the unfusedpartners could get much further apart from each other in theabsence of Ca2+. When expressed in HeLa cells, ECFP–calmodulinand M13–EYFP were distributed throughout both the cytoplasmand the nucleus, as would be expected from their molecular weights(Mr 44K and 30K, respectively). This pattern is quite different fromthe exclusion of intact yellow cameleon-2 from the nucleus. Hista-mine mobilization of Ca2+ elevated the emission ratio of EYFP toECFP in both cytoplasm and nucleus, an effect reversed by ahistamine antagonist (Fig. 4, circles). ATP caused a similarlyreversible increase in the ratio. Such physiological [Ca2+]c transientscaused reciprocal changes in the EYFP and ECFP intensities (Fig. 4,lines without symbols), as expected for association/dissociationeffects on FRET, whereas artefacts such as a change of focuscaused parallel changes that were cancelled by calculating theratios. Thus GFP-based FRET can monitor the dynamics of rever-sible heterodimerizaiton in live cells. In a recent alternativeapproach27, blue- and green-emitting GFPs were linked throughthe calmodulin-binding domain of smooth-muscle myosin light-chain kinase. FRET between the GFPs was disrupted in vitro uponbinding of unlabelled (Ca2+)4-calmodulin to the linker. The fusionprotein was introduced into cells only by microinjection, andshowed small fluorescence response to [Ca2+]c that were amplifiableby co-injection of exogenous calmodulin.
Many further improvements in cameleons should be possible bymutagenesis, whereas small-molecule indicators can only be opti-mised by more laborious chemical resynthesis. The targetability of
letters to nature
886 NATURE | VOL 388 | 28 AUGUST 1997
Figure 4 GFP-based detection of protein asso-
ciation/dissociation. Top, 535 to 480nm emis-
sion ratios (filled and open circles) in two
adjacent cells co-transfected with M13–EYFP
and ECFP–calmodulin. Bottom, 535 (broken line,
left-hand scale) and 480nm (solid line, right-hand
scale) emissions, background-corrected, from
the cell corresponding to the filled circles.

Nature © Macmillan Publishers Ltd 1997
cameleons may eventually allow Ca2+ measurements at previouslyinaccessible sites, such as the immediate vicinity of synaptic vesiclesor Ca2+ channels. Cameleons should be well suited to geneticallytractable organisms such as bacteria, yeast, nematodes, flies, plantsand transgenic mice. Fluorescent indicators for analytes other thanCa2+ might be engineered by sandwiching other conformationallyresponsive receptors between GFP donors and acceptors. Fluores-cence readout of intermolecular associations by FRET (as in Fig. 4)is non-destructive, quantifiable with high spatiotemporal resolu-tion, and probably applicable to any compartment of the cell and tomany proteins other than calmodulin and M13. However, the ratioof intensities in the acceptor and donor channels starts from a non-zero baseline even in the absence of FRET. Therefore, rare associa-tions will be hard to detect, and positive and negative controls arecrucial, such as the ability to switch the putative association on andoff, ideally in situ. The dynamic range of such measurements both ofCa2+ and of protein association will benefit from further improve-ments in the GFP mutants to reduce leakage of the donor emissioninto the acceptor emission band. M. . . . . . . . . . . . . . . . . . . . . . . . . . . . . . . . . . . . . . . . . . . . . . . . . . . . . . . . . . . . . . . . . . . . . . . . . . . . . . . . . . . . . . . . . . . . . . . . . . . . . . . . . . . . . . . . . . . . . . . . .
Methods
Gene construction. The cDNA of the GFP blue mutant Y66H/Y145F (ref. 1)was amplified by the polymerase chain reaction (PCR) with a sense primercontaining a BamHI site and a reverse primer containing an SphI site andeliminating the GFP stop codon. Similarly the cDNA of S65T was amplifiedwith a SacI site and an EcoRI site introduced to the 59 and 39 ends of the gene,respectively. Two restriction sites (SphI and SacI) were introduced by PCR intothe 59 and 39 ends of the calmodulin–M13 gene, respectively, using pHY1(ref. 16) as a template. The restricted products were ligated and cloned in-frameinto the BamHI/EcoRI sites of pRSETB (Invitrogen). The modifications of theboundary regions between Y66H/Y145F and calmodulin and between M13 andS65T were performed by PCR or by a combined use of restriction enzymes,Klenow fragment of DNA polymerase I, T4 DNA polymerase, mung-beanexonuclease, and T4 DNA ligase. Enhanced GFP mutants EBFP, ECFP andEYFP were created by introducing appropriate substitutions2,9 into the com-mercially available phEGFP plasmid from Clontech, which has mammaliancodon usage20 and mutations F64L and S65T. Oligonucleotide-directed muta-geneses were performed using the Muta-Gene Phagemid in vitro kit (Bio-Rad).The 59 end of the EBFP or ECFP gene was modified by PCR to have a HindIIIrestriction site followed by a Kozak consensus sequence28 (ACCGCC-ATG).The HindIII/EcoRI fragment encoding the entire chimaeric protein was sub-cloned in the mammalian expression vector pcDNA3 (Invitrogen). Forcameleon-2nu, the cameleon-2 cDNA was extended by PCR at the 39 endwith the sequence encoding the nuclear localization signal (PKKKRKVEDA).Yellow cameleon-3er and -4er cDNA were obtained by extending yellowcameleon-3 cDNA at the 59 end with the sequence encoding the signal peptidefrom calreticulin (MLLSVPLLLGLLGLAAAD), and at the 39 end with thesequence encoding the ER retention signal (KDEL)24. The cDNAs coding forECFP–calmodulin and M13–EYFP were obtained from yellow cameleon-2 byPCR and cloned into pRSETB behind a polyhistidine tag for bacterial expres-sion and into pcDNA3 behind a Kozak sequence for mammalian expression.Protein expression, in vitro spectroscopy, Ca2+ titrations, and reaction
kinetics. Chimaeric proteins were expressed in Escherichia coli, purified andspectroscopically characterized as previously described2. Ca2+ titrations wereperformed by reciprocal dilution of Ca2+-free and Ca2+-saturated buffers10. Insitu calibration for [Ca2+] used the equation29 ½Ca2þÿ ¼ K9d½ðR 2 RminÞ=
ðRmax 2 RÞÿð1=nÞ, where K9d is the apparent dissociation constant correspondingto the Ca2+ concentration at which R is midway between Rmax and Rmin, and n isthe Hill coefficient. Fast kinetic experiments were performed in a stopped-flowspectrofluorometer (Applied Photophysics). After rapid mixing of purifiedcameleon-1/E104Q (0.8 mM final concentration) and Ca2+ of various concen-trations in 20 mM MOPS, 100 mM KCl, pH 7.2, at 25 8C, the fluorescence wasmonitored using an excitation wavelength of 380 nm with an emission cut-onfilter of 500 nm. The observed first-order constant (kobs) was calculated fromeach averaged set of data by nonlinear regression analysis.Electron microscopy and immunolabelling. Immunogold labelling of
ultrathin sections was performed as described previously30. The polyclonalantibody against GFP was a gift from C. Zuker (University of California,San Diego).Imaging. Between 2 and 5 days after cDNA transfection with lipofectin (GibcoBRL), HeLa cells at 22 8C were imaged on a Zeiss Axiovert microscope with acooled CCD camera (Photometrics, Tucson, AZ), controlled by MetaFluor 2.75software (Universal Imaging, West Chester, PA). Dual-emission ratio imagingof yellow cameleons used a 440DF20 excitation filter, a 455DRLP dichroicmirror, and two emission filters (480DF30 for ECFP, 535DF25 for EYFP)alternated by a filter changer (Lambda 10-2, Sutter Instruments, San Rafael,CA). Interference filters were obtained from Omega Optical and ChromaTechnologies (Brattleboro, VT).
Received 8 May; accepted 24 June 1997.
1. Heim, R., Prasher, D. C. & Tsien, R. Y. Wavelength mutations and post-translational autooxidation ofgreen fluorescent protein. Proc. Natl Acad. Sci. USA 91, 12501–12504 (1994).
2. Heim, R. & Tsien, R. Y. Engineering green fluorescent protein for improved brightness, longerwavelengths and fluorescence energy transfer. Curr. Biol. 6, 178–182 (1996).
3. Crivici, A. & Ikura, M. Molecular and structural basis of target recognition by calmodulin. Annu. Rev.Biophys. Biomol. Struct. 24, 85–116 (1995).
4. Babu, Y. S., Bugg, C. E. & Cook, W. J. Structure of calmodulin refined at 2.2 A resolution. J. Mol. Biol.204, 191–204 (1988).
5. Falke, J. J., Drake, S. K., Hazard, A. L. & Peersen, O. B. Molecular tuning of ion binding to calciumsignaling proteins. Q. Rev. Biophys. 27, 219–290 (1994).
6. Ikura, M. et al. Solution structure of a calmodulin-target peptide complex by multidimensional NMR.Science 256, 632–638 (1992).
7. Heim, R., Cubitt, A. B. & Tsien, R. Y. Improved green fluorescence. Nature 373, 663–664 (1995).8. Cormack, B. P., Valdivia, R. H. & Falkow, S. FACS-optimized mutants of the green fluorescent protein
(GFP). Gene 173, 33–38 (1996).9. Ormo, M. et al. Crystal structure of the Aequorea victoria green fluorescent protein. Science 273, 1392–
1395 (1996).10. Grynkiewicz, G., Poenie, M. & Tsien, R. Y. A new generation of Ca2+ indicators with greatly improved
fluorescence properties. J. Biol. Chem. 260, 3440–3450 (1985).11. Tse, F. W., Tse, A. & Hille, B. Cyclic Ca2+ changes in intracellular stores of gonadotropes during
gonadotropin-releasing hormone-stimulated Ca2+ oscillations. Proc. Natl Acad. Sci. USA 91, 9750–9754 (1994).
12. Hofer, A. M. & Schulz, I. Quantification of intraluminal free [Ca] in the agonist-sensitive internalcalcium store using compartmentalized fluorescent indicators: some considerations. Cell Calcium 20,235–242 (1996).
13. Golovina, V. A. & Blaustein, M. P. Spatially and functionally distinct Ca2+ stores in sarcoplasmic andendoplasmic reticulum. Science 275, 1643–1648 (1997).
14. Montero, M. et al. Monitoring dynamic changes in free Ca2+ concentration in the endoplasmicreticulum of intact cells. EMBO J. 14, 5467–5475 (1995).
15. Kendall, J. M., Badminton, M. N., Sala-Newby, G. B., Campbell, A. K. & Rembold, C. M. Recombinantapoaequorin acting as a pseudo-luciferase reports micromolar changes in the endoplasmic reticulumfree Ca2+ of intact cells. Biochem. J. 318, 383–387 (1996).
16. Porumb, T., Yau, P., Harvey, T. S. & Ikura, M. A calmodulin-target peptide hybrid molecule withunique calcium-binding properties. Protein Eng. 7, 109–115 (1994).
17. Maune, J. F., Klee, C. B. & Beckingham, K. Ca2+ binding and conformational change in two series ofpoint mutations to the individual Ca2+-binding sites of calmodulin. J. Biol. Chem. 267, 5286–5296(1992).
18. Gao, Z. H. et al. Activation of four enzymes by two series of calmodulin mutants with point mutationsin individual Ca2+ binding sites. J. Biol. Chem. 268, 20096–20104 (1993).
19. Martin, S. R. et al. Spectroscopic characterization of a high-affinity calmodulin-target peptide hybridmolecule. Biochemistry 35, 3508–3517 (1996).
20. Zolotukhin, S., Potter, M., Hauswirth, W., Guy, J. & Muzyczka, N. A ‘‘humanized’’ green fluorescentprotein cDNA adapted for high levels of expression in mammalian cells. J. Virol. 70, 4646–4654(1996).
21. Smit, M. J. et al. Extracellular ATP elevates cytoplasmatic free Ca2+ in HeLa cells by the interaction witha 59-nucleotide receptor. Eur. J. Pharmacol. 247, 223–226 (1993).
22. Bootman, M. D., Cheek, T. R., Moreton, R. B., Bennett, D. L. & Berridge, M. J. Smoothly graded Ca2+
release from inositol 1,4,5-trisphosphate-sensitive Ca2+ stores. J. Biol. Chem. 269, 24783–24791(1994).
23. Brini, M., Marsault, R., Bastianutto, C., Pozzan, T. & Rizzuto, R. Nuclear targeting of aequorin. A newapproach for measuring nuclear Ca2+ concentration in intact cells. Cell Calcium 16, 259–268 (1994).
24. Kendall, J. M., Dormer, R. L. & Campbell, A. K. Targeting aequorin to the endoplasmic reticulum ofliving cells. Biochem. Biophys. Res. Commun. 189, 1008–1016 (1992).
25. Bygrave, F. L. & Benedetti, A. What is the concentration of calcium ions in the endoplasmic reticulum?Cell Calcium 19, 547–551 (1996).
26. Button, D. & Eidsath, A. Aequorin targeted to the endoplasmic reticulum reveals heterogeneity inluminal Ca++ concentration and reports agonist- or InsP3-induced release of Ca++. Mol. Biol. Cell 7,419–434 (1996).
27. Romoser, V. A., Hinkle, P. M. & Persechini, A. Detection in living cells of Ca2+-dependent changes inthe fluorescence emission of an indicator composed of two green fluorescent protein variants linkedby a calmodulin-binding sequence. J. Biol. Chem. 272, 13270–13274 (1997).
28. Kozak, M. The scanning model for translation: an update. J. Cell Biol. 108, 229–241 (1989).29. Adams, S. R., Bacskai, B. J., Taylor, S. S. & Tsien, R. Y. Fluorescent Probes for Biological Activity of Living
Cells–A Practical Guide (ed. Mason, W. T.) 133–149 (Academic, New York, 1993).30. Balch, W. E., McCaffery, J. M., Plutner, H. & Farquhar, M. G. Vesicular stomatitis virus glycoprotein is
sorted and concentrated during export from the endoplasmic reticulum. Cell 75, 841–852 (1994).
Acknowledgements. We thank S. R. Adams and A. B. Cubitt for advice, C. Zuker for the GFP antibody,and C. Klee for the original Xenopus calmodulin gene. This work was supported by HHMI (R.Y.T.), NIH(R.Y.T.), HFSP (R.Y.T. and A.M.), MRCC (M.I.) and the Spanish Ministry of Science (J.L.). M.I. is anHHMI international research scholar and MRCC scholar.
Correspondence and requests for materials should be addressed to R.Y.T.
letters to nature
NATURE | VOL 388 | 28 AUGUST 1997 887


![Near-Membrane [Ca2+] Transients Resolved Using the Ca2+ Indicator FFP18](https://static.fdokumen.com/doc/165x107/631286873ed465f0570a4533/near-membrane-ca2-transients-resolved-using-the-ca2-indicator-ffp18.jpg)