
UNIVERSITY OF CALIFORNIA, IRVINE IP3-Mediated Ca2+ ...
163
UNIVERSITY OF CALIFORNIA, IRVINE IP 3 -Mediated Ca 2+ Signaling Deficit in Monogenic and Sporadic Forms of Autism Spectrum Disorders DISSERTATION submitted in partial satisfaction of the requirements for the degree of DOCTOR OF PHILOSOPHY in Biomedical Sciences by Galina Schmunk Dissertation Committee: Professor J. Jay Gargus, MD, PhD, Chair Department of Physiology & Biophysics, Department of Pediatrics Professor Ian Parker, PhD, FRS Department of Neurobiology and Behavior, Department of Physiology & Biophysics Professor Michael D. Cahalan, PhD Department of Physiology & Biophysics 2017
-
Upload
khangminh22 -
Category
Documents
-
view
0 -
download
0
Transcript of UNIVERSITY OF CALIFORNIA, IRVINE IP3-Mediated Ca2+ ...

UNIVERSITY OF CALIFORNIA,
IRVINE
IP3-Mediated Ca2+ Signaling Deficit in Monogenic and Sporadic Forms of
Autism Spectrum Disorders
DISSERTATION
submitted in partial satisfaction of the requirements
for the degree of
DOCTOR OF PHILOSOPHY
in Biomedical Sciences
by
Galina Schmunk
Dissertation Committee:
Professor J. Jay Gargus, MD, PhD, Chair Department of Physiology & Biophysics, Department of Pediatrics
Professor Ian Parker, PhD, FRS
Department of Neurobiology and Behavior, Department of Physiology & Biophysics
Professor Michael D. Cahalan, PhD Department of Physiology & Biophysics
2017

Chapter 2 and 4 © Nature Publishing Group
The rest of the work © 2017 Galina Schmunk

ii
ii
DEDICATION
I dedicate this work to people with autism, their families, and caregivers.

iii
iii
TABLE OF CONTENTS
LIST OF FIGURES V
LIST OF TABLES VII
LIST OF ABBREVIATIONS VIII
ACKNOWLEDGMENTS IX
CURRICULUM VITAE X
ABSTRACT OF THE DISSERTATION 1
CHAPTER 1. INTRODUCTION 3 1.1 AUTISM SPECTRUM DISORDER. 3 1.2 GENETIC ARCHITECTURE OF ASD. 5 1.3 CA2+ SIGNALING. 9 1.4 IP3 CA2+ SIGNALING. 11 1.5 NEUROLOGICAL AND PHYSIOLOGICAL CONSEQUENCES OF GENETIC DELETION OF IP3RS IN
MICE 16 1.5.1 IP3R type 1. 16 1.5.2 IP3R type 2. 17 1.5.3 IP3R type 3. 19
1.6 IP3 CA2+ SIGNALING AND ITS DISRUPTION IN NEUROLOGICAL DISEASES 19 1.6.1 Spinocerebellar ataxia. 19 1.6.2 Huntington’s disease. 21 1.6.3 Alzheimer’s disease. 21
1.7 CONCLUSIONS 25 1.8 TABLES 26 1.9 FIGURES 27
CHAPTER 2. CA2+ SIGNALING ABNORMALITIES IN HUMAN SUBJECTS WITH VARIOUS MONOGENIC AND SPORADIC FORMS OF ASD 28
2.1 INTRODUCTION 28 2.2 MATERIALS AND METHODS 29
2.2.1 Materials. 29 2.2.2 Subject fibroblast cell lines. 30 2.2.3 High-throughput Ca2+ imaging. 31 2.2.4 Whole-cell Ca2+ imaging. 32 2.2.5 Imaging local Ca2+ events. 33 2.2.6 Western blot analysis. 33 2.2.7 Data processing and analysis. 34
2.3 RESULTS 35 2.3.1 Agonist-induced Ca2+ signaling is depressed in FXS and TS fibroblasts. 35

iv
iv
2.3.2 Optimizing and expanding the FLIPR assay to include CART subjects. 37 2.3.3 ATP-evoked Ca2+ signals are depressed in fibroblasts from other monogenic and sporadic ASD subjects. 39 2.3.4 ROC curves discriminate between ASD subjects and controls. 41 2.3.5 IP3-induced Ca2+ release is reduced in FXS and TS cells. 42 2.3.6 IP3 signaling is affected at the level of local events. 44
2.4 DISCUSSION 46 2.5 TABLES 49 2.6 FIGURES 50
CHAPTER 3. IP3-MEDIATED CA2+ SIGNALING IN CENTRAL NERVOUS SYSTEM AND PERIPHERAL TISSUE CELLS FROM A MOUSE MODEL OF FXS 70
3.1 INTRODUCTION 70 3.2 MATERIALS AND METHODS 71
3.2.1 Materials. 71 3.2.2 Postnatal neuronal cultures. 71 3.2.3 Mouse fibroblast cultures. 73 3.2.4 Single-cell Ca2+ imaging. 73 3.2.5 High-throughput Ca2+ imaging. 74
3.3 RESULTS 75 3.3.1 Optimizing neuronal culture conditions. 75 3.3.2 Ca2+ measurements in neuronal cultures. 77 3.3.3 mGluR-mediated Ca2+ signaling events in cortical neurons from FXS and wild-type mice. 81 3.3.4 High-throughput FLIPR assay on mouse cell cultures. 83
3.4 DISCUSSION 85 3.5 FIGURES 89
CHAPTER 4. DISCUSSION AND IMPLICATIONS OF THIS WORK 102 4.1 DOWNSTREAM CONSEQUENCES OF DIMINISHED IP3 CA2+ SIGNALING. 102 4.2 CA2+ SIGNALING SCREEN AS A BIOMARKER FOR ASD. 105 4.3 LIMITATIONS AND FUTURE DIRECTIONS. 107 4.5 CONCLUDING REMARKS. 109
REFERENCES 111

v
v
LIST OF FIGURES
FIGURE 1.9. 1 LOCAL AND GLOBAL CA2+ SIGNALING EVENTS 27
FIGURE 2.6. 1 CA2+ RESPONSES TO EXTRACELLULAR APPLICATION OF ATP IN CA2+-
FREE SOLUTION ARE DEPRESSED IN HUMAN SKIN FIBROBLASTS FROM
FXS PATIENTS AS COMPARED WITH MATCHED CONTROLS. 50
FIGURE 2.6. 2 CA2+ RESPONSES TO EXTRACELLULAR APPLICATION OF ATP IN CA2+-
FREE SOLUTION ARE STRONGLY DEPRESSED IN HUMAN SKIN
FIBROBLASTS FROM TS1 AND TS2 PATIENTS COMPARED WITH
MATCHED CONTROLS. 52
FIGURE 2.6. 3 IP3R PROTEIN LEVEL EXPRESSION IN FXS, TSC AND CONTROL CELLS. 55
FIGURE 2.6. 4 CA2+ RESPONSE IN TWO DIFFERENT FIBROBLAST CELL LINES DERIVED
FROM THE SAME PATIENT. 56
FIGURE 2.6. 5 REPRESENTATIVE CA2+ RESPONSES TO EXTRACELLULAR APPLICATION
OF PURINERGIC AGONISTS AND IONOMYCIN IN ABSENCE OF
EXTRACELLULAR CA2+ IN FIBROBLASTS FROM ASD SUBJECTS AND
CONTROLS. 57
FIGURE 2.6. 6 REPRESENTATIVE CA2+ RESPONSES TO EXTRACELLULAR APPLICATION
OF DIFFERENT PURINERGIC RECEPTOR AGONISTS IN ABSENCE OF
EXTRACELLULAR CA2+ IN FIBROBLASTS FROM CONTROL AND ASD
PATIENTS. 59
FIGURE 2.6. 7 CA2+ RESPONSE IN FIBROBLASTS FROM SUBJECTS WITH SPORADIC ASD
AS WELL AS FROM CONTROLS AND THOSE WITH SYNDROMIC ASD. 61
FIGURE 2.6. 8 RECEIVER OPERATING CHARACTERISTIC (ROC) CURVES FOR ATP-
EVOKED CA2+ SIGNALING IN ASD. 63
FIGURE 2.6. 9 CA2+ RELEASE EVOKED BY PHOTORELEASED IP3 IS DEPRESSED IN FXS
AND TS CELLS. 64
FIGURE 2.6. 10 LOCAL IP3-EVOKED CA2+ EVENTS. 66

vi
vi
FIGURE 2.6. 11 IP3-MEDIATED CA2+ SIGNALING IN FXS AND TS FIBROBLASTS IS
IMPAIRED AT THE LEVEL OF LOCAL EVENTS. 68
FIGURE 3.5. 1 COMPARISON OF CA2+ TRANSIENTS RECORDED WITH CAL-630 AND
GCAMP6F IN MOUSE CORTICAL NEURONS IN VITRO. 89
FIGURE 3.5. 2 COMPARISON OF CAL-630 AND GCAMP6F PERFORMANCE IN RESPONSE
TO FIELD STIMULATION AND METABOTROPIC ACTIVATION OF MGLUR
RECEPTORS. 91
FIGURE 3.5. 3 UV UNCAGING OF T-ACPD INDUCES CA2+ RELEASE IN PROXIMAL
DENDRITES OF CORTICAL NEURONS. 93
FIGURE 3.5. 4 METABOTROPIC CA2+ RESPONSE IN ASTROCYTES FROM WT OR FXS
MICE. 95
FIGURE 3.5. 5 CA2+ RELEASE IN MOUSE ASTROCYTES EVOKED BY PHOTORELEASED
IP3. 96
FIGURE 3.5. 6 REPRESENTATIVE CA2+ RESPONSES TO EXTRACELLULAR APPLICATION
OF PURINERGIC AGONISTS IN ABSENCE OF EXTRACELLULAR CA2+ IN
CULTURES ENRICHED IN NEURONS FROM WT OR FXS P0 MICE. 97
FIGURE 3.5. 7 REPRESENTATIVE CA2+ RESPONSES TO EXTRACELLULAR APPLICATION
OF PURINERGIC AGONISTS IN ABSENCE OF EXTRACELLULAR CA2+ IN
CULTURES ENRICHED IN ASTROCYTES FROM WT OR FXS P0 MICE. 99
FIGURE 3.5. 8 REPRESENTATIVE CA2+ RESPONSES TO EXTRACELLULAR APPLICATION
OF ATP IN ABSENCE OF EXTRACELLULAR CA2+ IN SKIN FIBROBLASTS
FROM WT AND FXS P0 MICE. 101

vii
vii
LIST OF TABLES
TABLE 1.8.1 CA2+ CHANNELS AND CA2+ CHANNEL SUBUNITS IMPLICATED IN ASD. 26
TABLE 2.5.1 SKIN FIBROBLAST INFORMATION FOR ASD SUBJECTS AND CONTROLS. 49

viii
viii
LIST OF ABBREVIATIONS
AD Alzheimer’s disease
ADHD attention deficit hyperactivity disorder
ADOS Autism Diagnostic Observation Schedule
ADP adenosine diphosphate
ASD autism spectrum disorders
ATP adenosine triphosphate
Ca2+ calcium
CART Center for Autism Research and Translation
CICR Ca2+-induced Ca2+ release
EEG electroencephalogram
EGTA ethylene glycol-bis(β-aminoethyl ether)-N,N,N',N'-tetraacetic acid
EPSC excitatory postsynaptic current
ER endoplasmic reticulum
FLIPR fluorometric imaging plate reader
FXS fragile X syndrome
GPCR G protein-coupled receptor
IP3 inositol 1,4,5-trisphosphate
IP3R inositol 1,4,5-trisphosphate receptor
LTD long-term depression
LTP long-term potentiation
PLC phospholipase C
PWS Prader-Willi syndrome
RyR ryanodine receptor
SCA spinocerebellar ataxia
TSC tuberous sclerosis syndrome
UDP uridine diphosphate
UTP uridine triphosphate

ix
ix
ACKNOWLEDGMENTS
I would like to express my deepest gratitude to my advisor and committee chair, Dr. J. Jay
Gargus for his continuous support of my scientific curiosity and extracurricular endeavors. His
scientific insights about molecular mechanisms of autism spectrum disorders and guidance in the
field of genetic syndromes have been an integral part of my development as a scientist.
I would like to express my deep appreciation to my co-mentor and committee member, Dr.
Ian Parker, for gracefully providing me with a “foster lab family” to develop into a careful and
thorough scientist, and generously sharing his time, energy, and scientific insights about
biophysics, IP3 receptors, and Ca2+ imaging.
Special thanks go to Dr. Michael Cahalan, my committee member and the Chair of the
Physiology and Biophysics department, for his help and advice throughout my graduate school.
I would like to thank Kyle Ellefsen, who as a good friend was always willing to help and
give his best suggestions. It would have been a lot of lonely evenings in the lab without him.
Many thanks to other lab members, Divya Swaminathan, Jeffrey Lock, Ian Smith, Lu Forrest,
Angelo Demuro, and George Dickinson, and the members of my other group, David Ferguson,
Rachel Nguyen, and Kenny Kumar.
I thank my husband, David Schmunk, for his continuous support and encouragement. If not
for him, I would not have courage to start this amazing trip called “grad school”. I thank my
immediate family in Russia and the acquired one across the United States. Deep appreciation
goes to my friends, Marina Shmunk, Irene Vorontsova, Carley Karsten and Irina Ushach for their
words of wisdom, support, and heartfelt laughter.
I thank Nature Publishing Group for first accepting my papers and then their permission to
reprint them in chapter 2 and 4 of this dissertation. I also thank all co-authors who contributed to
the work.
This work was supported by The Thompson Family Foundation through a generous gift to
The UCI Center for Autism Research and Translation (to J.J. Gargus) through The Center for
Autism and Neurodevelopmental Disorders, an entrepreneurial public-private partnership, and
National Institutes of Health grant GM048071 (to Ian Parker).

x
x
CURRICULUM VITAE
EDUCATION
2011 –2017 PhD in Biomedical Sciences, University of California, Irvine • Program in Cellular and Molecular Biology, Department of Physiology and
Biophysics 2009 (2007) M.S. (B.S.), Mendeleev University of Chemical Technology, Moscow
• Chemical Engineering (major: Small Organic Synthesis and Chemistry of Dyes). Thesis title: “Development of oligomer synthesis methods based on (R)-2 ((1R, 2S)-2-aminocyclohexyl) butanoic acid”
WORK EXPERIENCE 2013 – 2017 PhD student; project on IP3-mediated calcium signaling in autism spectrum
disorders • Profs. J. Jay Gargus and Ian Parker – University of California, Irvine
2012 – 2013 PhD student; project on the Kv1.3 potassium channel function and its role in
colorectal cancer and obesity • Prof. K. George Chandy – University of California, Irvine
2009 – 2010 Pharm-Sintez, Chemist, Moscow, Russia
• Synthesis, isolation and purification of a synthetic growth hormone inhibitor Octreotide
2008 – 2009 Undergraduate researcher; synthesis and analysis of gamma aminoacids
• Prof. S. H. Gellman – University of Wisconsin, Madison. PATENTS
1. Defective calcium signaling as a tool in autism spectrum disorders, Appl. No. 62/035,412;
UC Ref. 2014-805-1. Inventors: J.J. Gargus, G. Schmunk, I. Parker, I. Smith

xi
PUBLICATIONS
1. Schmunk, G., Nguyen, R. L., Ferguson, D. L., Kumar, K., Parker, I. & Gargus, J. J. High-
throughput screen detects calcium signaling dysfunction in typical sporadic autism
spectrum disorder. Scientific Reports, 7, 40740 (2017).
2. Schmunk, G., Boubion, B. J., Smith, I. F., Parker, I. & Gargus, J. J. Shared functional
defect in IP3R-mediated calcium signaling in diverse monogenic autism syndromes. Transl.
Psychiatry 5, e643 (2015).
3. Gargus, J. J. & Schmunk, G. in Compr. Guid. to Autism (Vinood B. Patel, Victor R.
Preedy, C. R. M.) 1285–1312 (Springer Science+Business Media New York, 2014).
4. Schmunk, G. & Gargus, J. J. Channelopathy pathogenesis in autism spectrum disorders.
Front. Genet. 4, 222 (2013).
5. Upadhyay, S. K., Eckel-Mahan, K. L., Mirbolooki, M. R., Tjong, I., Griffey, S. M.,
Schmunk, G., Koehne, A., Halbout, B., Iadonato, S., Pedersen, B., Borrelli, E., Wang, P.,
Mukherjee, J., Sassone-Corsi, P. & Chandy, K. G.. Selective Kv1.3 channel blocker as
therapeutic for obesity and insulin resistance. Proc. Natl. Acad. Sci. U. S. A. 110, E2239–
2248 (2013).
6. Nguyen, H. M., Galea, C. A., Schmunk, G., Smith, B. J., Edwards, R. A., Norton, R. S. &
Chandy, K. G.. Intracellular trafficking of the KV1.3 potassium channel is regulated by the
prodomain of a matrix metalloprotease. J. Biol. Chem. 288, 6451–6464 (2013).
INVITED TALKS
1. “Calcium signaling defects in monogenic models of ASD and in sporadic autism”. UCI
Center for Autism Research and Translation Symposium, Irvine, CA, Dec. 2015
2. “Reduced IP3-mediated calcium signaling in autism spectrum disorder”, selected abstract for a data blitz presentation, Society for General Physiologists, Woods Hole, MA, Sep. 2015
3. “Reduced IP3-mediated calcium signaling in autism spectrum disorders in the context of fragile X and tuberous sclerosis syndromes”. Gordon Research Conference/Seminar, selected speaker, Newry, ME, June 2015
4. “Calcium signaling defects in monogenic models of ASD in the context of fragile X and tuberous sclerosis syndromes”. UCI Center for Autism Research and Translation Symposium, Irvine, CA, Nov. 2014

xii
CONFERENCE POSTER ABSTRACTS
1. Galina Schmunk, Rachel L. Nguyen, Kenny Kumar, David L. Ferguson, Ian Parker, J. Jay
Gargus. “IP3-mediated Ca2+ signaling biomarker for typical non-syndromic forms of autism spectrum disorders” – Advances and Breakthroughs in Calcium Signaling, Honolulu, April 2016
2. Galina Schmunk, Rachel L. Nguyen, Kenny Kumar, David Ferguson, Ian Parker, J. Jay Gargus. “Typical non-syndromic forms of autism spectrum disorders share the same reduced IP3-mediated Ca2+ signaling originally identified in rare syndromic forms” – Biophysical Society 59th Annual Meeting, March 2016
3. Galina Schmunk, Rachel L. Nguyen, Kenny Kumar, Dave Ferguson, Ian Parker, J.Jay
Gargus. “Reduced IP3-mediated Ca2+ signaling in syndromic and non-syndromic forms of autism spectrum disorders” – Society of General Physiologists meeting, 69th annual meeting, September 2015
4. Galina Schmunk, Bryan J. Boubion, Ian F. Smith, Ian Parker, J. Jay Gargus. “Reduced IP3-
mediated Ca2+ signaling in autism spectrum disorders in the context of fragile X and tuberous sclerosis syndromes” – Gordon Research Conference, June 2015
5. Galina Schmunk, Bryan J. Boubion, Ian F. Smith, Ian Parker, J. Jay Gargus. “IP3-mediated
Ca2+ signaling defects in autism spectrum disorders” – ICTS Clinical Translational Research Day, UCI, May 2015.
6. Galina Schmunk, Bryan J. Boubion, Ian F. Smith, Ian Parker, J. Jay Gargus. “Reduced IP3-
mediated Ca2+ signaling in autism spectrum disorders in the context of fragile X and tuberous sclerosis syndromes” – Biophysical Society 59th Annual Meeting, Feb. 2015

1
ABSTRACT OF THE DISSERTATION
IP3-Mediated Ca2+ Signaling Deficit in Monogenic and Sporadic Forms of Autism Spectrum
Disorders
By
Galina Schmunk
Doctor of Philosophy in Biomedical Sciences
University of California, Irvine, 2017
Professor John Jay Gargus, Chair
Autism spectrum disorder (ASD) affects 2% of children and is characterized by impaired
social and communication skills together with repetitive, stereotypic behavior. The
pathophysiology of ASD is complex due to genetic and environmental heterogeneity,
complicating the development of therapies and making diagnosis challenging. Growing evidence
supports a role of disrupted Ca2+ signaling in ASD. I developed and applied a high-throughput
fluorometric imaging plate reader (FLIPR) assay to monitor agonist-evoked Ca2+ signals in
human primary skin fibroblasts. My results indicate that IP3 -mediated Ca2+ release from the
endoplasmic reticulum in response to activation of purinergic receptors is significantly depressed
in subjects with sporadic, as well as rare syndromic forms of ASD. This was apparent in Ca2+
signals evoked by G protein-coupled receptors and by photoreleased IP3 at the levels of both

2
global and local elementary Ca2+ events, suggesting fundamental defects in IP3R channel activity
in ASD.
Given the ubiquitous involvement of IP3R-mediated Ca2+ signaling in neuronal excitability,
synaptic plasticity, gene expression and neurodevelopment, I further expanded my findings to a
murine model of FXS. Activation of the IP3 cascade via plasma membrane metabotropic
receptors did not reveal any Ca2+ signaling deficits in neurons from mice with the FMR1 gene
deletion. Glial cells from FXS mice did not demonstrate any sizable difference in response to
GPCR activation, or IP3 UV flash uncaging as compared with wild type. Finally, mouse
fibroblasts from FXS mice assayed with the high-throughput screen FLIPR, analogous to what
was used on the human skin fibroblasts, did not reveal any difference in the IP3-mediated Ca2+
release compared with wild type mice. These findings highlight divergence between animal
models and human conditions, and show inadequacy of the murine model in studying the effect
of the FMR1 gene mutation on IP3 signaling cascade.
In conclusion, my findings suggest that deficits in IP3-mediated Ca2+ signaling represent a
convergent function shared across the spectrum of autistic disorders – whether caused by rare
highly penetrant mutations or sporadic forms – and hold promise as a biomarker for diagnosis
and novel drug discovery. This work also highlights potential pharmaceutical targets, and
identifies Ca2+ screening in human skin fibroblasts as a promising technique for early detection
of individuals susceptible to ASD.

3
Chapter 1. Introduction
1.1 Autism spectrum disorder.
Autism spectrum disorder (ASD) is a complex neurodevelopmental disorder with three core
behavioral features: 1) qualitative impairment in social skills, 2) delayed or disordered language
and communication skills, and 3) restricted and repetitive behaviors. With the May 2013
publication of the American Psychiatric Association Diagnostic and Statistical Manual (DSM-
5), all autism subtypes, including Asperger’s Disorder and Pervasive Developmental Disorder
Not Otherwise Specified (PDD-NOS) were merged into one umbrella diagnosis of ASD
(Association 2016). The symptoms are highly variable and often co-exist with other
neuropsychiatric disorders, such as developmental delay, epilepsy, hyperactivity, and attention
deficit hyperactivity disorder (ADHD). The most recent report from the Centers for Disease
Control and Prevention estimates ASD prevalence to be 1 in 68 of children (Blumberg and
Bramlett 2013), a sharp 29% increase from the preceding estimate of 1 in 88 in 2008 and a 64%
increase from 1 in 110 in 2006. ASD prevalence estimates vary by gender and racial/ethnic
group, with boys being more than 4 times more affected than girls, and non-Hispanic white
children being 30% more likely to be diagnosed with ASD than non-Hispanic black children
and 50% more likely than Hispanic children (Autism and Developmental Disabilities
Monitoring Network Surveillance Year 2010 Principal Investigators 2014).
Symptoms of autism typically start between the second and third year of life and cause
problems of a wide range in various areas of development. The symptoms and severity vary
widely across autistic individuals, complicating diagnosis of this complex spectrum

4
encompassing many phenotypes and co-morbidities, and giving rise to a tragic “diagnostic
odyssey” that delays diagnosis, and hence treatment, until the typical mean age of 5yrs (Pringle
et al. 2012). Early diagnosis is critical for optimal intervention (Anderson, Liang, and Lord
2014; MacDonald et al. 2014), and accurate diagnosis is crucial in order to exclude other
potential conditions which may require different therapies. However, objective quantifiable
biochemical markers of this disease have been very hard to come by, delaying the age of
diagnosis.
Diagnosis of ASD is made based on questionnaires and behavioral tests, relying on parent
observations and comprehensive evaluation by psychologists, pediatricians, psychiatrists, and
speech therapists (for a recent review, see (Constantino and Charman 2015)). ASD diagnosis for
research studies is stricter, more complex, time consuming and quantitative, but even at this
most refined level ASD remains a group of developmental disorders that are only behaviorally,
not yet pathophysiologically, defined (Filipek 2013).
There is a great need for new therapeutics targeted against the core deficits in ASD (Ghosh et
al. 2013). Currently there are no approved pharmaceutical drugs to target communication and
social deficits and repetitive behavior. Currently available treatments focus on non-core
symptoms of ASD and other co-morbidities, such as seizures, ADHD, depression, and sleep
disorders. Drug development has proven to be problematic because of our limited understanding
of the pathophysiology of ASD, the heterogeneity of symptoms, current lack of physiologically
defined biomarkers and difficulties in modeling the disease in vitro and in vivo.

5
1.2 Genetic architecture of ASD.
The high heritability of ASD, calculated from concordance for monozygotic and dizygotic
twins and siblings, ranges from 50% to 90% (Bailey et al. 1995; Folstein and Rutter 1977; De
Rubeis and Buxbaum 2015), suggesting that information about the molecular basis of the
disease may be hidden in DNA sequence variations. That, and an unusually high incidence of
the disorder in several monogenic syndromes, led many scientists in the field to believe that a
handful of “autism genes” may be found, contributing to the development of so-called
monogenic models of ASD. Monogenic risk models assume that one highly penetrant de novo
gene mutation, or a limited number of moderately penetrant mutations, are sufficient to cause
ASD. The causal role of single genes is most obvious in rare, highly penetrant Mendelian
(monogenic) syndromes. Among monogenic syndromes that are highly co-morbid with ASD,
significant early discoveries included the identification of the FMR1 gene as a cause of fragile
X syndrome (FXS) (Fu et al. 1991), the MECP2 gene as a cause of Rett syndrome (Amir et al.
1999), and demonstration that mutations in either TSC1 (hamartin) (Slegtenhorst et al. 1997) or
TSC2 (tuberin) (Consortium 1993) genes cause tuberous sclerosis syndromes 1 and 2 (TSC1
and TSC2). Our understanding of the etiology of ASD has been greatly advanced by studies of
syndromic forms of ASD caused by rare single gene mutations (Wang, Berry-Kravis, and
Hagerman 2010; Yu and Berry-Kravis 2014; Ghosh et al. 2013). These individual syndromes
are rare, each accounting for less than 1% of all ASD cases. However, high co-morbidity with
ASD, ranging from 40% to 80% (de la Torre-Ubieta et al. 2016), makes them attractive models
for studying ASD. Indeed, recent advances in our understanding of FXS, Rett syndrome, and
TSC provided insight into the pathophysiology of these conditions, offered a tractable system

6
for better understanding of the underlying molecular mechanisms and genetic architecture of
ASD, and the development of animal models that can be extrapolated into other forms of ASD.
Here I will concentrate on two particular syndromic forms of ASD, fragile X and tuberous
sclerosis syndromes, because a large proportion of the work in this thesis was conducted using
these monogenic forms of ASD.
FXS is the most common monogenic cause of ASD (Coffee et al. 2009), and is a widely used
and well characterized model of ASD. It results from large (>200) expansion of a CGG repeat
on the fragile X mental retardation (FMR1) gene, resulting in methylation and translational
silencing of its corresponding protein, the fragile X mental retardation protein (FMRP). FMRP,
being a polyribosome-associated RNA binding protein, has been shown to affect the translation
of several hundreds of mRNA transcripts (Darnell et al. 2011), each with their own
“downstream” biology. The loss of FMRP leads to substantial cognitive functional impairment
and intracellular signaling defects both in humans and in mice. Several FMR1 knockout mouse
lines are available, providing a platform for behavioral testing and as a source of tissues and
cells.
Another important syndromic form of ASD is TSC, caused by dominant mutations in one of
two genes, hamartin (TSC1) or tuberin (TSC2) and leading to ASD-like behaviors, seizures,
intellectual disability, brain tumors and characteristic skin lesions. The protein products of these
two genes heteromultimerize to regulate mammalian target of rapamycin (mTOR), an
integrative regulator of Ca2+ signaling and mitochondrial function created by a large
multidomain protein kinase that regulates cell growth and metabolism in response to
environmental signals (Ramanathan and Schreiber 2009).

7
Rapid development of sequencing technologies made it possible to dramatically decrease
costs of DNA sequencing – dropping from ~$500 million for the first sequenced human genome
to $1,000 per full genome sequence (https://www.genome.gov/27565109/the-cost-of-
sequencing-a-human-genome/). The era of gene hunting in different diseases thus began. The
possibility to sequence and analyze billions of base pairs both cheaply and accurately allowed
the performance of large-scale, unbiased genome-wide searches necessary for complex
heterogeneous disorders such as ASD and permitted the identification of hundreds, if not
thousands of genes implicated in ASD. A handful of other monogenic syndromes have been
identified, together with over 800 individual genes contributing to susceptibility for autism
(Anney et al. 2010; Uddin et al. 2014; O’Roak, Vives, Girirajan, et al. 2012; O’Roak, Vives, Fu,
et al. 2012). These findings indicate that although one highly penetrant mutation is enough to
cause ASD (Geschwind and State 2015; O’Roak et al. 2011), this is very rare, and the number
of potentially contributory genes is too large to be of diagnostic utility. Although highly
heritable, the polygenic pattern of ASD inheritance (De Rubeis and Buxbaum 2015) implies that
heterogeneous, weakly penetrant genetic variants – either arising de novo or inherited from
parents – act in combination with environmental risk factors to cause ASD (Gaugler et al. 2014;
Klei et al. 2012). The field has thus begun to migrate from the study of single genes and
monogenic disorders, such as FXS and TSC, to envisaging how numerous susceptibility factors
may converge on a common functional signaling pathway, such as excitation/inhibition (Bateup
et al. 2013; Gibson et al. 2008; Nelson and Valakh 2015; Rubenstein and Merzenich 2003),
synaptic transmission (Deng, Sojka, and Klyachko 2011; Gilman et al. 2011; Südhof 2008) or
Ca2+ homeostasis (Group and Consortium 2013; Laumonnier et al. 2006; Palmieri et al. 2010;

8
Schmunk and Gargus 2013) to exert their deleterious effects. This has led to a convergence
hypothesis (Zeida´n-Chulia et al. 2013; Lu et al. 2012; Sakai et al. 2011), proposing that key
hubs within signaling pathways may be a point of convergence for many of the mutated genes.
The largest GWAS to date of single nucleotide polymorphisms (SNPs) in a European cohort of
over 30,000 psychiatric cases and a similar number of control subjects revealed that alterations
in several common Ca2+ channel genes are associated with five neurological disorders,
including schizophrenia, bipolar disorder, major depression, ADHD and ASD (Group and
Consortium 2013). Only 4 of the ~25,000 human loci were associated with neuropsychiatric
disease at “genome-wide significance” — with a probability of chance false positive association
being less than 5 in 100 million (p<5×10⁻⁸). Among them were genes encoding Ca2+ channel
subunits – CACNA1C, and the accessory Ca2+ channel subunit CACNB2. Mutations in the
CACNA1C gene are associated with Timothy syndrome – an autosomal dominant syndromic
disease involving heart, brain, immune and skin cells. Remarkably, over 80% also have ASD
(Splawski et al. 2004; Splawski et al. 2006). The voltage-gated Ca2+ channel family where
CACNA1C belongs is well-recognized to cause channelopathy diseases. Two close paralogs of
this gene, CACNA1S and CACNA1A, also have highly penetrant, simple dominant mutant
alleles that cause, respectively, the skeletal muscle diseases hypokalemic periodic paralysis and
malignant hyperthermia (Maclennan and Zvaritch 2011), and the neurological diseases
hemiplegic migraine, episodic ataxia and spinocerebellar ataxia (Gargus 2009; Pietrobon 2010)
Furthermore, numerous genetic studies have implicated “weak” genetic mutations in Ca2+
channels and Ca2+-associated proteins with increased susceptibility to ASD (Gargus 2009;
Palmieri et al. 2010; Lawrence et al. 2010; Lu et al. 2012; Ripke et al. 2013; Zeida´n-Chulia et

9
al. 2013). Those “weak” loci do not neatly segregate with ASD in a family, but instead appear
to contribute susceptibility to ASD pathogenesis. The first example of such a paralog is the gene
CACNA1H. In families with familial ASD, several affected subjects are observed to carry the
mutant allele, however, not all with the allele manifest diagnosable ASD. The “risk allele”
simply is shown to cluster in such cases of familial ASD (Splawski et al. 2006). CACNA1G,
another Ca2+ channel alpha subunit paralog, was found to be associated with ASD in male
multiplex families in the Autism Genetic Resource Exchange cohort (Strom et al. 2010). The
same family of voltage-gated Ca2+ channels was again found to contain SNPs in CACNA1I and
CACNA1C in a subsequent larger study (Lu et al. 2012). Several sequencing studies have
identified exon-disrupting copy-number variations in a Ca2+ channel accessory subunit
CACNA2D3 among recurrent CNV hotspots in ASD (Girirajan et al. 2013), and identified de
novo rare alleles in alpha subunit loci CACNA1D and CACNA1E as “top de novo risk
mutations" for ASD (O’Roak, Vives, Girirajan, et al. 2012). Table 1.8.1 summarizes Ca2+
channels and their subunits in which mutations have been implicated in ASD.
Taken together, these findings strongly implicate Ca2+ signaling as an emerging molecular
target implicated in pathogenesis of ASD.
1.3 Ca2+ signaling.
Ca2+ signaling is one of the most universal and ancient of cellular signals (Berridge 1997a). It
is a versatile and well-preserved biological messenger system, known to regulate an array of
cellular functions ranging from membrane potential, ion transporters, kinases, transcription
factors and even cell morphology. Deregulation of intracellular Ca2+ signaling outside of its

10
normal spatial and temporal boundaries can lead to detrimental downstream changes in Ca2+-
dependent signaling processes and ultimately cellular death. Intracellular Ca2+ signaling events
govern and orchestrate cellular functions ranging from conception (Berridge 1993) to necrosis
and apoptosis (Berridge, Lipp, and Bootman 2000).
Ca2+ homeostasis and signaling events are tightly regulated by an exquisite array of Ca2+-
permeable ion channels, transporters, and exchangers located in the plasmalemmal and
intracellular membranes, as well as a plethora of regulatory/accessory proteins and molecules
(Berridge 2016; Berridge 2009; Berridge, Lipp, and Bootman 2000). A combination of these
proteins and factors unique for each cell type provides highly customizable “Ca2+ toolkit” for
downstream signal transduction, catering to the specific needs of each cell. This variety ensures
that the speed, amplitude, duration, and spatial-temporal pattern of intracellular Ca2+ events
tailor to each cell’s unique and dynamic physiological needs.
Ca2+ passively enters the cytoplasm across the plasma membrane and is cleared from the
cytoplasm to a level far below extracellular levels by a host of ion pumps and carriers driven by
metabolic energy. Intracellular Ca2+ concentration is kept between 50 and 100 nM by a host of
Ca2+ pumps located on the plasmalemmal and ER/SR membranes and by Ca2+-binding proteins.
The cytosolic Ca2+ concentration is ~10,000 fold lower than concentrations of 2 mM found
extracellularly, or 0.5-1.0 mM within the lumen of ER/sarcoplasmic reticulum (SR). The
resulting concentration gradients create a strong driving force for Ca2+ flux into the cytosol.
Cytosolic Ca2+ signals thus originate by the release of Ca2+ from organellar stores through
intracellular ion channels and by extracellular Ca2+ entering through ion channels across the
plasma membrane.
11
The intracellular Ca2+ stores can be rapidly released via intrinsic ER channels, the inositol
1,4,5-trisphosphate receptors (IP3Rs) and the ryanodine receptors (RyRs). Once released, this
Ca2+ activates a host of kinases, ion channels and transcription factors, and then is resequestered
via the ER’s Ca2+ ATPase pump (SERCA) and cleared out of the cell via plasma membrane
Ca2+ ATPase (PMCA) (Di Leva et al. 2008).
Given that proper functioning of the Ca2+ signaling pathway is critical for many cellular
functions, it is not surprising that perturbations in this system cause profound downstream
defects. Disrupted functioning of ER Ca2+ release channels is observed in several cognitive
disorders including Alzheimer’s (Stutzmann et al. 2004; Ito et al. 1994; Stutzmann et al. 2006),
Huntington’s disease (Bezprozvanny 2011), and amyotrophic lateral sclerosis (Van Den Bosch
et al. 2006).
1.4 IP3 Ca2+ signaling.
IP3Rs are a family of Ca2+-permeable ion channels ubiquitously and predominantly expressed
in the ER membrane of nearly all known cells (for an exhaustive review see (Foskett et al.
2007)). Functional IP3Rs are tetramers, with each subunit consisting of a large cytosolic N-
terminus, six transmembrane domains containing the ion channel pore, and a short cytosolic C-
terminus (Foskett et al. 2007). In mammals, the IP3R family is comprised of three separate gene
products (IP3Rs types 1-3) and a number of splice variants (Foskett et al. 2007). At the protein
level, IP3R isoforms are 60-80% homologous, and their functional domains are similar.
However, different isotypes have different affinity for IP3 and Ca2+, and are differentially
modulated by ATP, cAMP and protein kinases. Different forms of IP3Rs exhibit distinct and

12
overlapping expression patterns with most cell types expressing more than one isoform.
IP3-mediated Ca2+ signal transduction is typically initiated by stimulation of cell surface
receptors linked to the activation of phospholipase C isoforms β or γ (PLC- β/γ) (Berridge
1993). PLC-β is activated following stimulation of G-protein coupled receptors linked to the
heterotrimeric Gq family proteins (GPCRs) (Berridge 1997a), whereas PLC-γ is turned on by
phosphorylation in response to tyrosine kinase-linked (Clandinin, DeModena, and Sternberg
1998) cell surface receptor stimulation. Activation of PLC leads to the generation of inositol
1,4,5-trisphosphate (IP3) and diacylglycerol (DAG) following hydrolysis of phosphatidylinositol
4,5-bisphosphate (PIP2). IP3 liberated from the inner leaflet of the plasmalemma diffuses into
the cytoplasm and binds to IP3Rs located in the ER membrane. The IP3R forms a Ca2+ -
permeable channel in the membrane of the ER, and its opening allows the release into the
cytosol of Ca2+ sequestered within the ER (Berridge 1997b; Bootman, Berridge, and Lipp 1997;
Parker and Yao 1996). Opening of the IP3R channel requires binding of IP3 together with Ca2+
to receptor sites on the cytosolic face. Gating by Ca2+ is biphasic, such that small elevations of
cytosolic Ca2+ induce channel opening, whereas larger elevations cause inactivation
(Bezprozvanny, Watras, and Ehrlich 1991; Foskett et al. 2007). The positive feedback by Ca2+
underlies the process known as Ca2+-induced Ca2+ release (CICR), whereby Ca2+ is released in a
regenerative manner that may remain restricted to a cluster of IP3Rs, producing local Ca2+
signals known as Ca2+ puffs (Fig. 1..1) (Yao, Choi, and Parker 1995), or may propagate
throughout the cell as a saltatory wave involving the recruitment of multiple puff sites by
successive cycles of Ca2+ diffusion and CICR. Thus, IP3-mediated Ca2+ signaling represents a
hierarchy of Ca2+ events of differing magnitudes (Lipp and Niggli 1996; Parker, Choi, and Yao

13
1996), and the spatial patterning and distribution of IP3Rs is critical to proper cellular function
(Fig. 1.9.1). The spatial and temporal localization of Ca2+ signaling ensures high specificity of
cellular responses.
In the mammalian brain, different isoforms of IP3Rs have distinct expression patterns
depending on the brain region and developmental state. IP3R type 1 is predominantly expressed
in neurons, especially in Purkinje cells in the cerebellum. IP3R type 3 demonstrates
predominantly a neuronal pattern of expression that does not overlap with the IP3R1. For
instance, Purkinje cells in the cerebellum are highly enriched in IP3R1, but have low or
undetectable levels of IP3R3, but granule cells of the cerebellum and many regions of the
medulla display moderately high levels of IP3R3, whereas IP3R1 is virtually undetectable in
these regions. IP3R1 expression levels are the highest in cerebellar Purkinje neurons, where IP3-
mediated Ca2+ signaling is necessary for induction of long-term depression (LTP), a candidate
mechanism for the cellular basis of motor learning (Inoue et al. 1998). Interestingly, cerebellar
dysfunction has been repeatedly implicated in the pathogenesis of ASD (Wang, Kloth, and
Badura 2014).
In neurons, IP3R-mediated Ca2+ release is involved in crucial functions – including synaptic
plasticity and memory (Inoue et al. 1998; Rose & Konnerth 2001), neuronal excitability
(Hernandez-Lopez et al. 2000; Stutzmann, LaFerla, and Parker 2003), neurotransmitter release
(Li et al. 1998; Diamant, Schwartz, and Atlas 1990), axon growth (Gomez and Spitzer 1999)
and long-term changes in gene expression (Li et al. 1998) - highlighting the central integrating
position played by IP3Rs (Patterson, Boehning, and Snyder 2004). IP3-induced Ca2+ response in
neurons propagates along the dendrite as a wave and is different from action potential-induced

14
Ca2+ fluctuations in both temporal and spatial aspects. Unlike brief spike-evoked Ca2+ signals
that occur throughout the cell, IP3-mediated events start at a local proximal dendrite and then
spread to the soma as a Ca2+ wave. This was first observed in hippocampal neurons (Shirasaki,
Harata, and Akaike 1994; Jaffe and Brown 1994). Subsequently, IP3-mediated Ca2+ waves were
observed and characterized in other brain regions – cortical pyramidal neurons and midbrain
dopamine neurons, suggesting a ubiquitous role of IP3 signaling throughout the brain
(Morikawa et al. 2000; Larkum et al. 2003).
In the cerebellum, IP3-mediated Ca2+ release is critical for induction of long-term depression
(Khodakhah and Armstrong 1997), a form of synaptic plasticity, which is thought to be an
important cellular mechanism for motor learning and coordination. In cerebellar Purkinje cells
that are especially enriched in IP3Rs, repetitive parallel fiber stimulation triggers metabotropic
glutamate receptor (mGluR) activation and subsequent IP3-mediated Ca2+ release from the ER
(Takechi, Eilers, and Konnerth 1998; Yuzaki and Mikoshiba 1992). Because both IP3 and Ca2+
are required for the initial IP3R activation, some cytoplasmic Ca2+ is necessary. If the
concentration of IP3 is high, even low basal Ca2+ concentration is enough, however, at lower IP3
concentrations an additional source of Ca2+ is required. This dual requirement for the two
messengers is met by two inputs to the Purkinje neurons: the climbing fiber input strongly
depolarizes Purkinje cells to generate a Ca2+ signal via plasmalemmal channels, whereas
parallel fiber inputs activate the mGluRs to produce IP3. Thus maximal activation of Ca2+
release via IP3Rs depends on the timing of co-activation and serves as a coincidence detector for
these two types of inputs (Sarkisov and Wang 2008). Consistent with the role of IP3R1 in
cerebellar long-term depression (LTD), LTD is completely abolished in mice with a genetic

15
deletion of IP3Rs (Inoue et al. 1998).
In cortical pyramidal neurons IP3R activation is a key signaling hub downstream of mGluRs
(Inoue et al. 1998; Berridge 1993), where it leads to a brief hyperpolarization followed by a
more prolonged depolarization (El-Hassar et al. 2011; Stutzmann, LaFerla, and Parker 2003).
The initial outward current results from the opening of small conductance Ca2+-activated K+
channels (Chandy et al. 1998; Köhler et al. 1996). This current is proportional to the Ca2+ signal
amplitude (Stutzmann, LaFerla, and Parker 2003); and can be triggered directly by intracellular
uncaging of IP3 (El-Hassar et al. 2011; Stutzmann, LaFerla, and Parker 2003). As a result, IP3-
evoked Ca2+ release transiently hyperpolarizes the cell and briefly depresses neuronal
excitability, leading to a reduction in firing frequency (Stutzmann, LaFerla, and Parker 2003).
Suppressed IP3-mediated Ca2+ release from the internal stores diminishes the inhibitory K+
conductance, and produces neuronal hyperexcitability (Repicky and Broadie 2009; Bateup et al.
2011), consistent with observations following mGluR stimulation of ASD-model neurons
(Repicky and Broadie 2009; Bateup et al. 2011).
In hippocampal CA1 slices, brief pre-treatment with group 1 mGluR agonists has been shown
to facilitate the induction of long-term potentiation (LTP), that manifests in an enhanced
magnitude and stability of LTP (Cohen and Abraham 1996). However, stronger activation of
the group 1 mGluRs induces LTD (Palmer et al. 1997; Oliet, Malenka, and Nicoll 1997).
Application of a group 1 mGluR agonist acutely reversibly depressed excitatory postsynaptic
currents (EPSCs) in rat slices. Intriguingly, this effect was age-dependent and strongest in
neonatal rats, as the EPSCs were significantly decreased in adolescent animals (day 12-30) and
almost completely abrogated in adults (age >80 days) (Baskys and Malenka 1991), highlighting

16
an important neurodevelopmental role played early in life by the IP3 Ca2+ signaling.
1.5 Neurological and physiological consequences of genetic deletion of IP3Rs in mice
1.5.1 IP3R type 1.
Genetic manipulation of a gene of interest in laboratory rodents has long been an invaluable
tool in determining that gene’s function. Knockout mouse models of all three IP3R isoforms
have been generated, with the most studied being the ITPR1 knockout. Mice with homozygous
deletion of ITPR1 suffer from severe ataxia and epilepsy and most of them die in utero or
before the weaning age (Matsumoto and Nagata 1999; Matsumoto et al. 1996). Interestingly, the
in utero lethality rate was reduced when the genetic background was shifted from widely used
C57Bl/6 to CD-1 strain. After birth, the IP3R1 knockout mice exhibit truncal ataxia on postnatal
day 7 and tonic-clonic epileptic seizures starting on postnatal day 13 or 14. Anti-convulsants
such as pentobarbital eliminate the seizures, while leaving ataxia intact, suggesting distinct
features responsible for each phenotype. Neuroanatomical analysis of the IP3R1 knockout brains
has shown no detectable malformations in the cerebellum with Purkinje cell numbers, with
morphological properties and arborization all being unaffected (Matsumoto and Nagata 1999).
Electrophysiological studies further failed to reveal any abnormalities in the membrane
excitability of Purkinje cells, the number or strength of parallel fiber or climbing fiber inputs.
However, subsequent studies demonstrated that LTD was completely abolished in Purkinje cells
(Inoue et al. 1998). Cerebellar LTD is commonly accepted as a molecular basis of cerebellar
motor learning and the development of motor coordination, suggesting that the lack of IP3R1 is
responsible for the ataxic phenotype of the knockout mice.

17
IP3R1-deficient mice also show impairments in hippocampal synaptic plasticity. In the CA1
hippocampal neurons of IP3R1 knockout mice, the mean magnitude of the LTP or LTD induced
by a standard tetanus of low-frequency stimulation (standard protocol for LTP and LTD
induction, respectively) were unaffected in the knockout animals. However, when a short
tetanus (10 pulses at 100 Hz) was used to induce LTP, the mean magnitude of the resulting LTP
was significantly greater in mutant mice than in wild-type mice (Fujii et al. 2000).
Depotentiation (DP) and LTP suppression are also attenuated in the CA1 hippocampal neurons
of IP3R1 knockout mice (Fujii et al. 2000). These results suggest that, unlike in Purkinje cells,
in hippocampal CA1 neurons the IP3R1 is involved in LTP, DP, and LTP suppression but is not
essential for LTD. In addition, deletion of IP3R1 results in a lack of heterosynaptic LTD in the
CA1 region of the hippocampus, indicating the contribution of IP3R1 to input specificity.
Whereas homozygous IP3R1 mice demonstrate these profound phenotypes, heterozygous
mice demonstrate only subtle motor coordination deficits, observed when tested with a rotarod
(Ogura, Matsumoto, and Mikoshiba 2001).
1.5.2 IP3R type 2.
IP3R type 2 receptor in the brain is predominantly expressed in astrocytes (Zhang et al. 2014).
ITPR2 loss in astrocytes was reported to lead to the apparent loss of all astrocytic Ca2+ signaling
(but also see (Srinivasan et al. 2015)), however, it was not accompanied by any gross deficits in
behavioral (Petravicz, Boyt, and McCarthy 2014) or neurological functions (Petravicz, Fiacco,
and McCarthy 2008; Agulhon, Fiacco, and McCarthy 2010). Interestingly, contrary to Petravicz
et al. findings that used astrocyte-specific ITPR2 knockout, a global knockout of the receptor
18
was associated with depressive-like behavior in mice, presumably mediated by a lack of ATP
signaling from astrocytes (Cao et al. 2013). Another study implicated a role of the IP3R2
signaling in synapse elimination, again mediated by astrocytic ATP release (Yang et al. 2016).
Moreover, other groups have demonstrated an apparent effect of ITPR2 knockout on cortical
plasticity in response to whisker stimulation, possibly through perturbed release of d-serine
from astrocytes (Takata et al. 2011), potentiation of visual responses in excitatory neurons of
the primary visual cortex (Chen et al. 2012), and modulation of neural network activity (Wang
et al. 2012). Astrocytic Ca2+ signaling mediated via IP3R2 was implicated in K+ uptake by
astrocytes, leading to decreased extracellular K+ concentrations and as a result hyperpolarization
of neurons and reduced excitatory synaptic activity. In conclusion, the vast majority of ITPR2
knockout studies concentrated on astrocytes as a predominant cell type expressing this receptor
in the brain. However, the apparent discrepancy between findings from studies utilizing cell-
type specific and global knockouts suggest that the role of IP3R type is not limited to astrocytes,
and may play a role in more subtle neurological functions fine-tuning brain activity.
In 2014 the presence of homozygous missense ITPR2 mutations was identified in five human
subjects from a consanguineous family. Interestingly, anhidrosis (inability to sweat) and severe
heat intolerance as a result were the only reported phenotype in these patients. Upon clinical
investigation, no other abnormalities were observed, with body growth, as well as teeth, hair,
nails and skin all normal. No neurological abnormalities were reported, suggesting that at least
in humans the complete loss of IP3R2 does not lead to any detrimental consequences beyond
inability to produce sweat (Klar et al. 2014).

19
1.5.3 IP3R type 3.
From the standpoint of neurophysiology, mice with a genetic deletion of ITPR3, dubbed a
“mouse with bad hair and poor taste”, are largely unexciting (Tordoff and Ellis 2013). IP3R3
regulates hair shedding in mice (Sato-Miyaoka et al. 2012) and is responsible for the tufted
locus – a locus responsible for irregular hair growth pattern – of the BTBR mouse model of
polygenic autism with several sporadic mutations (Tordoff and Ellis 2013; Ellis, Tordoff, and
Parker 2013). It would be tempting to suggest a causative link between the ITPR3 mutation and
the autism phenotype in the BTBR mice, however the currently available scientific evidence
indicates that the role of IP3R3, at least in mice, is limited to the taste perception and hair loss
only.
1.6 IP3 Ca2+ signaling and its disruption in neurological diseases
1.6.1 Spinocerebellar ataxia.
A straightforward example of dysregulation of IP3-mediated Ca2+ signaling is seen in
spinocerebellar ataxias (SCA), a group of neurodegenerative disorders characterized by
problems in coordination of movement affecting legs, hands, and eyes. While there are many
types of SCA, several of them have strong connection to Ca2+ signaling abnormalities that
eventually funnel onto an IP3 pathway. One unifying feature of this group of neurodegenerative
disorders is widespread Purkinje cell death mediated by dysregulated IP3-mediated Ca2+
signaling. Heterozygous deletions in ITPR1, a gene encoding IP3R1, were identified in several
unrelated families affected with SCA types 15 (SCA15) (Van De Leemput et al. 2007), an
autosomal dominant disease. The same study showed that the affected patients with confirmed

20
ITPR1 deletion had decreased amounts of IP3R1 at a protein level, unlike a family member who
does not carry the deletion, suggesting haploinsufficiency and decreased function of IP3R in the
pathogenesis of the disease. A large deletion and a point mutation in ITPR1 were subsequently
identified in two additional families (Hara et al. 2008), solidifying the causative pathogenic role
of ITPR1 haploinsufficiency in SCA. Gene mutations causative for SCA16 were mapped to a
locus overlapping with that of SCA15, that also contains ITPR1 heterozygous deletion (Iwaki et
al. 2008). It is worth noting that SCA16 was initially mapped to chromosome 8q (Miyoshi et al.
2001), but later additional studies established the linkage to 3p, where ITPR1 resides, making
SCA16 and SCA15 virtually the same disorder (Bezprozvanny 2011). Additional heterozygous
missense mutations in ITPR1 have been identified in SCA29 (Sasaki et al. 2015; Huang et al.
2012), which is clinically distinguished from SCA15 by early onset of symptoms.
SCA type 2 and 3 (SCA2 and SCA3) are autosomal dominant disorders that are caused by an
expansion of unstable CAG repeats that encode polyglutamine tract expansions (polyQ) in
genes encoding ataxin 2 and 3, respectively. Multiple lines of evidence suggest perturbed Ca2+
release from the ER in both of these disorders. Pull-down and co-immunoprecipitation have
revealed that the mutated ataxin-2 specifically associates with the COOH-terminal domain of
IP3R1, while the wild type form of it did not form such associations (Liu et al. 2009). In lipid
bilayer experiments, the mutated attaxin-2 increased the sensitivity of IP3Rs to IP3, dramatically
increasing its activation. In cultured Purkinje cells, expression of mutant ataxin-2 also facilitated
Ca2+ release in response to mGluR activation. Finally, prolonged treatment of mutant mice with
dantrolene, an antagonist of the ryanodine receptor, another channel on the ER that magnifies
IP3-initiated Ca2+ release, ameliorated Purkinje cell loss in cerebellum and improved
21
performance in aged mice on the rotarod test (Liu et al. 2009). Similar results were obtained
with a mutant ataxin-3 protein, suggesting that the polyglutamine repeat on ataxin proteins may
be a unifying theme in several types of ataxia and it contributes to its pathogenesis by
facilitation of binding to IP3R and increase in its sensitivity to IP3 (Chen et al. 2008).
1.6.2 Huntington’s disease.
In Huntington’s disease, a pathophysiological polyglutamine (polyQ) expansion in a protein,
huntingtin, enhances its binding to the COOH-terminus of IP3R1 and sensitizes it to IP3
(Bezprozvanny 2011). This gives rise to larger Ca2+ signals that disrupt neuronal function and
induce cell death. In a mouse model of Huntington’s disease, the increase in IP3-mediated Ca2+
release decreases ER store Ca2+ levels, leading to overactivation of store-activated Ca2+ entry
and subsequent striatal synaptic loss (Wu et al. 2016). Genetic ablation of IP3R1 and chemical
treatment with Li+, which leads to decrease in IP3 signaling, reduce accumulation of mutant
huntingtin proteins and ameliorates spine loss (Wu et al. 2016; Sarkar et al. 2008; Bauer et al.
2011).
1.6.3 Alzheimer’s disease.
Alzheimer’s disease (AD) is a devastating neurodegenerative disorder that progressively
destroys neurons leading to a sharp decline in cognitive abilities. AD is driven by a release of
soluble β-amyloid (Aβ) that forms Aβ oligomers toxic to neurons. Sustained upregulation of
intracellular Ca2+ levels was shown to initiate the disease early on and exacerbate the core
features from amyloid plaque formation to synapse loss (for reviews, see (Mattson and Chan
2001; Stutzmann 2007)). Disrupted IP3-mediated Ca2+ signaling is a well-documented
22
contributing factor in this process, both in familial and sporadic forms. Sporadic forms of AD
are more common among AD patients, have poorly defined etiology and strike later in life (>65
years). The familial form of AD (FAD) is an early-onset, less common form of the disease,
contributing to less than 10% of reported cases. FAD is caused by an autosomal-dominant
mutations in presenilin 1 (PS1), presenilin 2 (PS2), or amyloid precursor protein (APP) genes
(Campion et al. 1999), with the mutations in presenilins being responsible for the majority of
FAD cases. Despite relatively rare occurrence, the genetically defined architecture of FAD
makes it a tractable model for studying this highly heterogeneous condition. Moreover,
regardless of the type, AD progression follows the same steps in both familial and sporadic
forms, with accelerated development in the FAD form. Mutant PS1 is the most common cause
of FAD. The presenilin protein is a catalytic subunit of the gamma secretase complex located on
the ER membrane that generates Aβ by cleaving APP. The first proposed mechanism of PS1
pathogenicity is that its mutant form cleaves APP preferentially into a longer and more
amyloidogenic Aβ42 form. Another role of the PS mutant protein in the pathophysiology of
FAD is to increase Ca2+ release from the intracellular stores, contributing to cytotoxicity and
neuronal death (Mak et al. 2015; Stutzmann et al. 2004; Leissring et al. 1999). This effect has
been shown in cultured neuronal-like PC12 cells expressing mutant PS1 (Guo et al. 1996), in
cultured primary neurons from PS1 knockin mice (Chan et al. 2000; Guo et al. 1999) and in
brain slices from young, adult, and aged mutant PS1 knockin mice (Stutzmann et al. 2006). The
exact mechanism of such increases is still debated, but proposed causes include abnormal
elevation of the ER Ca2+ stores (Leissring et al. 2001), gain-of-function enhancement of IP3R
gating by presenilin proteins (Mak et al. 2015), and enhanced ryanodine receptor recruitment

23
consequent to initial IP3R activation (Stutzmann et al. 2006). Cheung et al. have shown that
several FAD PS mutations have a gain-of-function effect on IP3Rs, leading to a high open
probability burst mode of these channels, thus enhancing Ca2+ signaling (Cheung et al. 2010).
There are two important implications of such increased sensitivity. Under normal physiological
conditions (when PS is not mutated), the mean channel open time is too short (~10 ms) to
recruit neighboring IP3Rs and RyR and induce Ca2+-induced Ca2+ release. However, given that
in the presence of the mutant PS the IP3R channel has a propensity to dwell in a longer open
time with burst activity (>200ms), the resulting Ca2+ release will recruit spatially segregated
RyR, inducing CICR. As a result, the initial increase in Ca2+ store release will be further
amplified by downstream players and will lead to cytotoxicity. Secondly, taking into
consideration IP3R’s sensitivity to both IP3 and Ca2+, the channel’s increased sensitivity to IP3
potentiates the channel’s opening in response to increase in intracellular Ca2+ due to RyR
activation, leading to a self-propagating loop. Consistent with this, in mutant PS mice increasing
basal intracellular Ca2+ via RyR is enough to induce IP3R-mediated Ca2+ release (Goussakov,
Miller, and Stutzmann 2010).
To further support the calciumopathy phenotype in AD, exaggerated IP3-mediated Ca2+
signaling was observed in non-neuronal cells from symptomatic (Hirashima et al. 1996; Ito et
al. 1994) and pre-symptomatic AD patients (Etcheberrigaray et al. 1998), as well as in neurons
from mouse models of AD (Stutzmann et al. 2004).
Both familial and sporadic forms of AD are believed to be caused by pathologic actions of Aβ
protein oligomers. Among other cytotoxic effects of Aβ that are beyond the scope of the present
introduction section, the role of Aβ is to stimulate the IP3 production to release Ca2+ from the

24
ER (Mattson and Chan 2001). The neurotoxic effect of Aβ oligomers via Ca2+ release from the
intracellular stores was demonstrated with a bath application of Aβ to neuronal cultures
(Ferreiro, Oliveira, and Pereira 2004). Pre-incubation of cells with dantrolene or xestospongin
C, inhibitors of RyRs and IP3Rs, respectively, prevented Ca2+ release and protected cells from
the apoptotic cell death. A different set of experiments on human neuroblastoma SH-SY5Y cell
culture produced similar results, demonstrating Ca2+ release from intracellular stores upon bath
application of Aβ that was partially blocked by caffeine, an IP3R antagonist (Jensen et al. 2013).
Interestingly, when these experiments were done on permeabilized chicken DT40 TKO cells
that are void of any IP3Rs, the Ca2+ release in response to Aβ remained and was not different
from the WT DT40 cells (Jensen et al. 2013), implicating other molecular players besides
IP3Rs. Another line of evidence supporting the cytotoxic effect of Aβ was obtained from
injecting oligomers directly into frog oocytes. Such injections of Aβ led to Ca2+ increase due to
both Ca2+ entry across the plasma membrane and Ca2+ release from intracellular stores (Demuro
and Parker 2013). In these experiments, Ca2+ release could be inhibited by application of
caffeine, heparin, or pretreatment with pertussis toxin that blocks G-protein-mediated activation
of phospholipase C. Furthermore, incubation of oocytes with lithium to block the inositol
monophosphatase enzyme involved in de novo synthesis of inositol and hence depleting the
inositol phospholipid pools rescued oocytes from Aβ-mediated cytotoxicity and death, as did
co-injection with EGTA to buffer intracellular Ca2+ levels (Demuro and Parker 2013). These
findings establish that one of the roles of the Aβ in the pathogenesis of AD is in its ability to
evoke intracellular Ca2+ release. Sustained and prolonged increase in intracellular Ca2+ levels is
neurotoxic and leads to neuronal cell death and, as a result, memory loss. An important

25
confirmation of the Ca2+ signaling disruption in the AD came from in vivo findings that genetic
reduction of IP3R1 in several mouse models of familial AD reduces pathogeniety of the
condition (Shilling et al. 2014).
1.7 Conclusions
In light of the crucial roles of IP3-mediated Ca2+ signaling in regulating normal neuronal
development and function, as well as in pathogenesis of several neurological diseases, I
hypothesize that the IP3 receptor acts as a signaling ‘hub’ where many genes that are altered in
ASD converge to exert their deleterious effect. My overall goal was to investigate if IP3-
mediated Ca2+ signaling is altered in ASD and to elucidate downstream consequences of such
abnormalities relevant to ASD phenotypes.

26
1.8 Tables
Table 1.8.1 Ca2+ channels and Ca2+ channel subunits implicated in ASD.
Protein Description Normal function Disease association
CACNA1C Voltage-regulated L-type calcium channel, alpha 1C
subunit
Regulates entry of Ca2+ into excitable cells: muscle
contraction, hormone/neurotransmitter release,
gene expression, cell cycle
Timothy Syndrome, ASD, psychiatric
diseases
CACNA1D Voltage-regulated calcium channel, alpha 1D subunit
High-voltage activated, long-lasting calcium activity
Sinoatrial node dysfunction and deafness, ASD,
psychiatric diseases
CACNA1E Voltage-regulated R-type calcium channel, alpha 1E
subunit
High-voltage activated, rapidly inactivating
ASD, psychiatric diseases
CACNA1F Voltage-regulated L-type calcium channel, alpha 1F
subunit
Regulates entry of Ca2+ into excitable cells: muscle
contraction, hormone/neurotransmitter release,
gene expression, cell cycle
ASD and X-linked congenital stationary
night blindness
CACNA1G Voltage-regulated T-type
calcium channel, alpha 1G subunit
Regulates entry of Ca2+ into excitable cells: muscle
contraction, hormone/neurotransmitter release,
gene expression, cell cycle
ASD; intellectual disability; juvenile myoclonic epilepsy
CACNA1H Voltage-regulated T-type
calcium channel, alpha 1H subunit
Regulates neuronal and cardiac pacemaker activity
Familial autism; childhood absence
epilepsy
CACNA1I Voltage-regulated T-type calcium channel, alpha 1I
subunit
Characterized by a slower activation and inactivation
compared to other T-channels
Possibly implicated ASD
CACNA2D3 Voltage-regulated calcium
channel, alpha 2/delta 3 subunit
Accessory calcium channel subunit; regulates entry of Ca2+
into excitable cells ASD
CACNA2D4 Voltage-regulated calcium
channel, alpha 2/delta 4 subunit
Accessory calcium channel subunit; regulates entry of Ca2+
into excitable cells
Gene deletion along with CACNA1C leads
to ASD
CACNB2 Accessory calcium channel beta-2 subunit
Contributes to the function of calcium channels. Modulates
voltage dependence of activation and inactivation and controls
trafficking of the calcium channel family.
ASD, psychiatric diseases

27
1.9 Figures
Figure 1.9. 1 Local and global Ca2+ signaling events
Hierarchical organization of Ca2+ signals; from fundamental single-channel events ('blips'; A),
to elementary events ('puffs'; B) and global waves (C). Cartoons on the left illustrate the
proposed spatial organization of IP3R channels in the ER membrane that gives rise to these
events, and traces at right are representative experimental fluorescence traces of blips, puff and
wave. Note differences in amplitude and time scales.

28
Chapter 2. Ca2+ signaling abnormalities in human subjects with various monogenic and
sporadic forms of ASD
2.1 Introduction
Autism Spectrum Disorder (ASD) is a common complex polygenic disorder characterized by
difficulties in social interaction, communication and restricted, repetitive behaviors. The
symptoms and severity vary widely across autistic individuals, complicating diagnosis of this
complex spectrum and giving rise to a tragic “diagnostic odyssey” that delays diagnosis, and
hence treatment, until the typical mean age of 5yrs (Pringle et al. 2012). Diagnosis of ASD is
made based on questionnaires and behavioral tests, relying on parent observations and
comprehensive evaluation by psychologists, pediatricians, psychiatrists, and speech therapists
(Constantino and Charman 2015). The current lack of biomarkers and molecular targets makes
diagnosis, study and treatment of ASD a challenging task. Moreover, early diagnosis is critical
for optimal intervention (Anderson, Liang, and Lord 2014; MacDonald et al. 2014), and accurate
diagnosis is crucial in order to exclude other potential conditions which may require different
therapies.
A wealth of genetic data now implicate a host of genes encoding ion channels and associated
intracellular Ca2+ signaling proteins in the molecular architecture of ASD (Group and
Consortium 2013; Lu et al. 2012; Palmieri et al. 2010; Schmunk and Gargus 2013), placing Ca2+
homeostasis at a central node. Cytosolic Ca2+ homeostasis involves ion flux from intracellular
organellar stores, as well as transport across the plasma membrane. Diseases of the intracellular
organelles are an emerging area of medicine. Several prototypes are already well developed for

29
neurogenetic diseases of mitochondria and the lysosomes (Lim, Li, and Raben 2014; Valenti et
al. 2014; Wallace, Fan, and Procaccio 2010; Weinreb 2013), and increasing evidence implicates
the ER (Roussel et al. 2013). Ca2+ release from IP3Rs has been shown to be altered in cognitive
disorders including Alzheimer’s (Smith et al. 2005; Stutzmann et al. 2004) and Huntington’s
diseases (Bezprozvanny 2011), and IP3Rs have recently been identified among the genes affected
by rare de novo copy number variations in ASD patients (Gilman et al. 2011). I focus on Ca2+
signaling as a compelling potential root defect in the disorder, in light of the growing genetic
evidence supporting its role in susceptibility to ASD (Group and Consortium 2013; Lu et al.
2012; Palmieri et al. 2010; Schmunk and Gargus 2013) , and its ubiquitous participation in
cellular functions as diverse as neuronal excitability (Hernandez-Lopez et al. 2000; Stutzmann,
LaFerla, and Parker 2003), neurotransmitter release (Li et al. 1998; Diamant, Schwartz, and
Atlas 1990), cell secretion (Berridge and Patel 1968; Fain and Berridge 1979), gene expression,
and apoptosis (Pinton et al. 2008; La Rovere et al. 2016).
2.2 Materials and Methods
2.2.1 Materials.
Fluo-8 AM was purchased from AAT Bioquest, diluted in DMSO (Sigma D2650) to a stock
concentration of 2 mM and frozen as 25 µl aliquots until needed. On the day of the experiment
the Fluo-8 AM solution was thawed and diluted with an equal volume of 20% Pluronic F-127
(Molecular Probes, P6867) prepared in DMSO. Adenosine triphosphate (ATP), adenosine
diphosphate (ADP), uridine triphosphate (UTP) and uridine diphosphate (UDP) were purchased
from Sigma Aldrich, diluted in water to a stock concentration of 100 mM and frozen as 50 µl

30
aliquots until needed. MRS 2365 (supplied pre-dissolved at a concentration of 10mM) was
purchased from Tocris. Ionomycin was purchased from Life Technologies, diluted in DMSO to 1
mM and frozen as 10 µl aliquots until needed.
2.2.2 Subject fibroblast cell lines.
All methods were carried out in accordance with relevant guidelines and regulations, and all
experimental protocols were approved by UCI Institutional Review Board (IRB) review. Skin
fibroblast cultures were obtained from sporadic ASD subjects enrolled into the UCI Center for
Autism Research and Translation (CART). All CART-derived cell lines reported here were from
subjects who were referred with a clinical diagnosis of ASD. Three such subjects had Prader-
Willi syndrome and are classified as such. CART subjects underwent a full day of testing to
develop their deep phenotype, including skin biopsy, all obtained with informed consent and
assent. Age-appropriate research-grade ADOS and IQ tests were administered, followed by a set
of high-density EEG studies, a sleep study and preparation for a follow-up at home 5-day sleep
study with accelerometers and app-assisted parent sleep and behavior logging. Metabolomic
studies of blood, urine, saliva and volatile metabolites in breath were obtained, as well as blood
from the subject and family members for whole genome sequencing. Only those subjects with
validated ADOS scores in the “Autism” or the “Autism Spectrum Disorder” ranges were selected
for study (Table 2.5.1). Fibroblast cell lines were established from punch skin biopsy (2-3 mm)
explants and frozen at passage 5 in liquid nitrogen for long-term storage.
Primary, untransformed skin biopsy fibroblast cultures from neurotypical controls and
monogenic forms of ASD (fragile X syndrome, tuberous sclerosis, Rett, and one with Prader-

31
Willi syndrome) were obtained from Coriell cell biorepository.
Fibroblast were cultured in Dulbecco’s Modified Eagle’s Media (Gibco, 11965-092)
supplemented with 20% (v/v) fetal bovine serum without antibiotics at 37 °C in a humidified
incubator gassed with 95% air and 5% CO2, and used for up to 15 passages. Cells were studied at
passages 10-15. For Ca2+ signaling studies, cells were detached with Ca2+- and Mg2+-free 0.25%
trypsin-EDTA (Life Technologies), harvested in normal growth media and sub-cultured on
FLIPR 96 well plates for 2 days to provide standardized conditions prior to imaging studies.
2.2.3 High-throughput Ca2+ imaging.
Skin fibroblasts were seeded in clear-bottom black 96-well plates (Greiner Bio One T-3026-
16) at 1 x 10⁴ cells per well and grown to confluency. On the day of the experiment, cells were
loaded by incubation with 2 µM of the membrane-permeant Ca2+ indicator Fluo-8 AM (Takada,
Furuya, and Sokabe 2014) in standard buffer solution (130 mM NaCl, 2 mM CaCl2, 5 mM KCl,
10 mM glucose, 0.45 mM KH2PO4, 0.4 mM Na2HPO4, 8 mM MgSO4, 4.2 mM NaHCO3, 20 mM
HEPES and 10 µM probenecid, pH 7.4 at the room temperature) with 0.1% fetal bovine serum
for 1 h at 37 °C, then washed with a Ca2+ -free HBSS solution (120 mM NaCl, 4 mM KCl, 2 mM
MgCl2, 10 mM glucose, 10 mM HEPES, 1 mM EGTA, pH 7.4 at the room temperature) once.
The solution was replaced with 100 µl of fresh Ca2+ -free HBSS solution in each well and cells
were allowed to equilibrate for 5 minutes prior to assay with a fluorometric imaging plate reader
(FLIPR; Molecular Devices, Sunnyvale, CA). A basal read of fluorescence in each well (470–
495 nm excitation and 515–575 nm emission, expressed in arbitrary units; AU) was read for 2
seconds at 0.4 s exposure time. Next, 100 µl of 2x ATP (to 100 µM final concentration) or 100 µl

32
of 2x ionomycin (to 1 µM final concentration) in Ca2+ -free HBSS was added to a given well.
Only a single recording was obtained from each well. Ionomycin-induced fluorescence changes
from wells without prior addition of ATP were used to normalize ATP-evoked responses.
Recordings were performed in triplicate. Each experiment was repeated on at least two
independent days.
2.2.4 Whole-cell Ca2+ imaging.
Cells seeded in glass-bottomed dishes were loaded for imaging using membrane-permeant
esters of Fluo-8 and caged i-IP3 (ci-IP3 (Smith, Wiltgen, and Parker 2009; Ellefsen et al. 2014)).
Briefly, cells were incubated at room temperature in HEPES-buffered saline (2.5 mM CaCl2,
120 mM NaCl, 4 mM KCl, 2 mM MgCl2, 10 mM glucose, 10 mM HEPES) containing 1 µM ci-
IP3/PM for 45 mins, after which 4 µM Fluo-8 AM was added to the loading solution for further
45 minutes before washing three times with the saline solution. [Ca2+]i changes were imaged
using a Nikon Eclipse microscope system with a 40x (NA=1.30) oil objective. Fluo-8
fluorescence was excited by 488 nm laser light, and emitted fluorescence (l > 510 nm) was
imaged at 30 frames sec-1 using an electron-multiplied CCD Camera iXon DU897 (Andor). A
single flash of UV light (350-400 nm) from an arc lamp focused to uniformly illuminate a region
slightly larger than the imaging field was used to uncage i-IP3, a metabolically stable
isopropylidene analogue of IP3, which evoked activity persisting for a few minutes. Image data
were acquired as stack .nd2 files using Nikon Elements for offline analysis. Fluorescence signals
are expressed as a ratio (ΔF/F0) of changes in fluorescence (ΔF) relative to the mean resting
fluorescence at the same region before stimulation (F0). Recordings were performed in triplicate,
33
and the measurement outcomes were compared using Mann-Whitney test.
2.2.5 Imaging local Ca2+ events.
For experiments studying local Ca2+ signals, cells were incubated at room temperature in
HEPES buffer containing 1 µM ci-IP3/PM and 4 µM Cal-520 for one hour (Ellefsen et al. 2014),
washed and further incubated with 10 µM EGTA AM for an hour. Cells were then washed three
times and remained in buffer for 30 min to allow for de-esterification of loaded reagents.
[Ca2+]i signals were imaged using the Nikon Eclipse microscope system described above, but
now utilizing an Apo TIRF 100x (NA=1.49) oil objective. The imaging region on the camera
sensor was cropped to 128 x 512 pixels (20.48 x 81.92 µm) to enable rapid (129 frames per
second) imaging. Cal-520 fluorescence (l> 510 nm) was excited by 488 nm laser light within an
evanescent field extending a few hundred nanometers into the cells. Image acquisition and
processing was as described above for whole-cell imaging, except that local events were
identified and analyzed using a custom-written algorithm based on MatLab (Ellefsen et al. 2014).
2.2.6 Western blot analysis.
Cell lines were grown in triplicates and lysed in mammalian protein extraction reagent
(Thermo Scientific) with complete mini protease inhibitor cocktail tablets (Roche) and
phosphatase 2 inhibitor cocktail (Sigma-Aldrich). Lysates were subsequently centrifuged at
14,000 rpm for 15 minutes at +40C. Protein levels in the cell lysate were measured using the
Bradford method (Bradford 1976). 20 µg of protein was loaded per well with 5% β-
mercaptoethanol on 3%–8% gradient tris-acetate gels with tris-acetate SDS running buffer
(Invitrogen) and separated by electrophoresis at 130V. Proteins were transferred at 50 mA for 6

34
hours to 0.2 µm nitrocellulose membranes, which were blocked in 5% nonfat milk in tris-
buffered saline supplemented with 0.1% tween-20 for 1 hr. Membranes were probed overnight at
+40C with the following primary antibodies: rabbit polyclonal anti-IP3R1 (Millipore, AB5882),
rabbit polyclonal anti-IP3R2 (LifeSpan Biosciences, LS-C24911), mouse monoclonal anti-IP3R3
(BD Transduction Laboratories, 610312), rabbit polyclonal anti-IP3R1/2/3 (Santa-Cruz
Biotechnology, sc-28613), rabbit polyclonal anti-beta actin (Abcam, ab8227). Membranes were
then incubated, as appropriate, with goat anti-rabbit (1:5,000, Sigma-Aldrich) or goat anti-mouse
(1:5,000, Sigma-Aldrich) HRP-conjugated secondary antibodies for 1 hr. Bands were visualized
by an ImageQuant LAS 4000 imager (GE Healthcare) using peroxidase substrate for enhanced
chemiluminescence (ECL Prime; Amersham). Levels of protein expression were quantified via
densitometry analysis using ImageJ, and are expressed normalized to actin levels.
2.2.7 Data processing and analysis.
The peak change in fluorescence amplitude (ΔF) in each well was normalized to the basal
fluorescence of that well before stimulation (F0) after subtraction of the camera black offset
level. Mean ATP responses from triplicate wells were further normalized to the triplicate-
average ΔF/F0 of the ionomycin response from each corresponding cell line from the same plate
to express the ATP-releasable Ca2+ pool as a proportion of the total cellular Ca2+ store content.
To mitigate plate-to-plate and day-to-day variability, mean ATP/ionomycin responses for each
cell line from individual wells were divided by the ATP/ionomycin ratio of a reference cell line
(GM03440) (mean of triplicates) included on each plate. All data are presented as mean + 1
s.e.m.. Mann-Whitney test was used to determine statistical significance of the findings.

35
OriginPro 2015 (Origin Lab Corp., Northampton, Massachusetts) was used for data analysis
and graph plotting.
2.3 Results
2.3.1 Agonist-induced Ca2+ signaling is depressed in FXS and TS fibroblasts.
To screen for defects in IP3-mediated signaling associated with ASD, I used a fluorometric
imaging plate reader (FLIPR) to monitor cytosolic Ca2+ changes in fibroblasts (Table 2.5.1)
loaded with the Ca2+-sensitive fluorescent indicator Fluo-8. Primary skin fibroblasts derived
from five FXS males and five ethnicity- and age-matched unaffected male donors were grown to
confluency on 96 well plates. Cells were stimulated by application of ATP to activate purinergic
P2Y receptors (Fine, Cole, and Davidson 1989; Solini et al. 1999) and thereby evoke GPCR-
mediated intracellular Ca2+ release through IP3Rs. Recordings were made in Ca2+ -free
extracellular solution to exclude complication from Ca2+ influx through plasmalemmal channels.
Different concentrations of ATP were applied to individual wells containing FXS and matched
control cells. Fig. 2.6.1a (top panel) illustrates representative results, showing smaller ATP-
evoked Ca2+ signals in FXS cells. To determine whether differences in ATP-evoked signals may
result from differences in filling of ER Ca2+ stores, I recorded signals evoked in separate wells
by application of 1 µM ionomycin in Ca2+ -free medium to completely liberate all intracellular
Ca2+ stores (Fig. 2.6.1a, lower panel). No significant difference was observed between mean
ionomycin-evoked Ca2+ signals in FXS and control cells (Fig. 2.6.1b), suggesting that there is no
systematic defect in ER Ca2+ store filling in FXS cells. To normalize for differences in store
content among different cell lines and experimental days, I expressed ATP-evoked signals as a
36
percentage of the ionomycin response obtained in parallel measurements in the same 96 well
plate for each given cell line. Mean normalized Ca2+ signals evoked by 100 µM ATP were
significantly depressed in all five FXS fibroblast lines in comparison with their matched controls
(Fig. 2.6.1c). A similar depression was observed at lower concentrations of ATP, pooling data
across all 5 FXS and control cell lines (Fig. 2.6.1d). These results were consistently reproducible
across different experimental days and matched cell pairs (total of 12 paired trials).
I further extended these findings to another genetic disorder with high co-morbidity with
ASD, tuberous sclerosis (TS), caused by mutations in either of two distinct and independent
genes – hamartin (TSC1) or tuberin (TSC2). Fig. 2.6.2 shows data obtained by FLIPR screening
in the same way as performed for Fig. 2.6.1. Three cell lines derived from TS patients
demonstrated a consistent and highly significant deficit in ATP-evoked Ca2+ signals as compared
with matched controls (Figs. 2.6.2 a,b,c), but without any appreciable difference in intracellular
Ca2+ store content as assessed by ionomycin application (Fig. 2.6.2a, lower panel). These
findings were consistently replicated on different experimental days (total of 6 paired trials).
The diminished Ca2+ signals in FXS and TS cells could result from lower expression levels
of IP3R proteins. To investigate this, I performed western blot analysis on four cell lines selected
as showing pronounced defects in Ca2+ signaling (FXS-2, FXS-4, TS1-B, and TS2), together
with three matched control lines (Ctr-2, Ctr-3, Ctr-4), using antibodies specific to type 1, 2 and 3
IP3Rs as well as a non type-specific antibody (Fig. 2.6.3a). My results showed an overall slight
decrease in IP3R expression across all isotypes in FXS and TS cells relative to their matched
controls (Fig. 2.6.3b). However, in all cases the depression of IP3R expression was much smaller
than the corresponding depression of Ca2+ signaling as measured in the FLIPR experiments, and
37
there was little or no correlation between IP3R expression and Ca2+ signaling in the TS and FXS
cells after normalizing relative to their matched controls (Fig. 2.6.3b).
2.3.2 Optimizing and expanding the FLIPR assay to include CART subjects.
For this part of the project, I decided to capitalize on a rich database of patients with sporadic
ASD, as well as several forms of monogenic syndromes that were recruited through University
of California Center for Autism Research and Translation (CART). All enrolled patients undergo
a whole day of testing, including confirmation of the ASD diagnosis using a gold standard,
Autism Diagnostic Observation Schedule (ADOS) test, deep phenotyping and genome-
sequencing. Before running the Ca2+ screening assay on the newly obtained fibroblast cultures, I
sought to evaluate the extent to which factors including the source, culture initiation, and storage
conditions of fibroblast cell lines might affect the FLIPR Ca2+ signaling results. The same patient
who had previously provided cell line GM24529 to Coriell cell biorepository was enrolled and
re-biopsied at CART. The resulting cell line (AU0239-0201) was derived from the same
individual with a two-year interval between sampling. Cell cultures were initiated, maintained
and stored independently either at CART, exactly as for all of the other sporadic ASD samples;
or at the Coriell cell biorepository, as were a majority of syndromic ASD cell lines and all of the
controls. When run simultaneously on the same plate, both cell lines demonstrated closely
similar responses to ATP that were not statistically different when normalized to the ionomycin
response (Fig. 2.6.4).
Next I wanted to determine if CART sporadic ASD patients demonstrate a similar deficit in
Ca2+ signaling as FXS and TS patients. Representative fluorescence traces illustrating ATP

38
responses in fibroblasts from two neurotypical controls and one with FXS, as well as one from
an enrolled subject with typical, sporadic ASD are shown in Fig. 2.6.5a. The grey dashed line
shows the fluorescence signal change upon addition of vehicle only. I quantified fluorescence
signals as a ratio (ΔF/F0) of the fluorescence change (ΔF) at each well, after subtracting the
change resulting from addition of vehicle alone, relative to the basal fluorescence (F0) before
stimulation. Fig. 2.6.5b shows ΔF/F0 values (mean of measurements from three plotted replicate
wells) from these cell lines in response to 100 µM ATP.
Peak ionomycin response amplitudes, normalized to the basal fluorescence (ΔF/F0) from the
same ASD and control cells as shown in Fig. 2.6.5d were closely similar in ASD and control cell
lines. To account for any differences between individual cell lines in the Ca2+ store filling across
different 96-well plates and different days and to keep the data consistent with the previous
findings, I present all ATP-induced Ca2+ signals as a percentage of the ionomycin response
evoked in parallel wells on the same plate (Fig. 2.6.5e). Ca2+ signals with amplitudes comparable
to that evoked by ATP were obtained with 100 µM uridine triphosphate (UTP), an agonist that,
like ATP, primarily activates P2Y receptors (Fig. 2.6.5f).
In order to parse types of P2Y receptors responsible for the ATP-mediated Ca2+ release, I
used several purinergic agonists. While UTP evoked a robust and consistent Ca2+ response (Fig.
2.6.6a), diphosphates – adenosine diphosphate (ADP) and uridine diphosphate (UDP), and MRS
2365, a selective P2Y1 agonist, all failed to evoke appreciable Ca2+ signals at concentrations of
100 µM (Fig. 2.6.6). These data suggest that the receptors being activated by the FLIPR
screening procedure are of the P2Y2, or a combination of P2Y4 and P2Y11, receptor class
(Burnstock et al. 2016; Erb and Weisman 2012), concordant with reported expression of P2Y2

39
and P2Y4 in human dermal fibroblasts (Solini et al. 2003).
In addition to normalizing ATP-evoked Ca2+ signals relative to ionomycin responses, I
further sought to mitigate the day-to-day variability typical of high-throughput functional screens
such as FLIPR (Elkins et al. 2013) by expressing ionomycin-normalized responses from each
cell line as a percentage of the mean response in triplicate measurements from a “reference” cell
line (the control line GM03440) included on the same plate. I chose this cell line as a reference
because it demonstrated a robust Ca2+ response and had a low passage number (P4) at the time of
deposition at Coriell cell biorepository, similar to the passage number (P5) at which CART-
derived cells were frozen down. Moreover, this line has been widely used in >20 published
studies (Coriell 2016). Normalizing to the reference cell line reduced day-to-day variability in
ATP-evoked Ca2+ responses among individual cell lines by an average of 38%, measured using
three different cell lines each run on four independent days. For each run a mean value was taken
from triplicates and the variability between runs was calculated as the coefficient of variation
(CV: standard deviation divided by the mean across the four runs). Respective values of CV for
the three lines before and after normalization were: 0.81/0.33 (59% reduction in variability);
1.21/1.08 (11% reduction); 0.44/0.24 (45% reduction).
2.3.3 ATP-evoked Ca2+ signals are depressed in fibroblasts from other monogenic and
sporadic ASD subjects.
Monogenic syndromes represent just a small fraction of all ASD cases, with the majority
being sporadic, or polygenic (for a review, see (de la Torre-Ubieta et al. 2016)). To determine
whether the IP3-signaling defect I observe is a common feature of ASD, or is unique to single-

40
gene mutations, I decided to expand my observations to fibroblasts from subjects with sporadic
forms of ASD as well as two further monogenic syndromes (Prader-Willi syndrome, PWS; and
Rett syndrome, Rett). Fig. 2.6.7 presents ATP-evoked Ca2+ responses in fibroblasts from
multiple sporadic ASD subjects as well as those from control, PWS, FXS, TSC and Rett
syndromes, after normalizing each as a percentage of the Ca2+ response to the mean reference
cell line included in each plate. Data points (dots) show measurements from individual subjects
as means of triplicates; grey bars indicate means of N subjects with error bars showing ± 1 s.e.m.
Consistent with my previous findings, ATP-evoked Ca2+ responses in cells from individuals with
PWS and Rett were, on average, substantially reduced (to about 33% and 62%) as compared
with the mean response in cells from control neurotypical individuals.
Most importantly, the mean response from cell lines from sporadic ASD subjects was also
considerably depressed relative to controls (Fig. 2.6.7). A majority of the ASD cells gave very
small or no detectable responses, and all control cells gave responses above the mean of the ASD
cells. One ASD cell line consistently gave remarkably discrepant ATP responses, with a mean
amplitude close to that evoked by ionomycin (75%) and almost seven times greater than the
control average (Fig. 2.6.7, circled data point). That subject was shown to carry a chromosomal
deletion and for the present I exclude that cell line from the statistical analysis. The mean
response of the remaining 22 cell lines from subjects with sporadic ASD was 28% ± 7% s.e.m. of
the reference cell line as compared to 87% ± 14% for the controls; a reduction to about 31%.
However, despite the smaller average response, Ca2+ signal amplitudes among the cell lines from
subjects with sporadic ASD displayed a much wider spread than the controls, and six of the ASD
subjects had cell responses that overlapped those of the controls. This high variability and
41
skewed, non-normal Gaussian distribution points to considerable heterogeneity of Ca2+ signaling
among the cohort of sporadic ASD subjects.
2.3.4 ROC curves discriminate between ASD subjects and controls.
To assess the robustness of the difference between cell lines from subjects with sporadic
ASD and controls, I generated receiver operating characteristic (ROC) curves (Fig. 2.6.8); a
metric that is widely used to evaluate parameters to separate affected from unaffected individuals
for diagnostic purposes (Metz 1978; Hanley and McNeil 1982). The ROC curve expresses the
accuracy of a test in terms of two measures – sensitivity and specificity – in this case comparing
the Ca2+ signaling assay against the ADOS assessment as a ‘gold standard’ for diagnosis of ASD.
Thus, sensitivity refers to the proportion of subjects who are correctly identified by the assay as
having ASD (true positive): a highly sensitive test best assures that affected people will be
identified. Specificity refers to the true-negative rate: here, the proportion of subjects without
ASD who are correctly identified as not having the condition. At any given Ca2+ signaling value,
the sensitivity and the specificity are calculated from a ratio of people who are disease positive
(true positive) or disease negative (false positive) at that threshold. For example, it is apparent
from Fig. 2.6.7 that a low Ca2+ signal cutoff value would exclusively capture subjects with ASD,
but would not capture all of the affected subjects. As the signaling cutoff is increased, more ASD
subjects are captured, so the sensitivity increases, but the number of unaffected controls captured
increases, thereby decreasing the specificity. The ROC curve therefore essentially describes the
compromise between sensitivity and specificity of a test at varying threshold cutoff values.

42
After sorting all subjects by their Ca2+ signaling normalized to the reference cell line (as was
done for Fig. 2.6.7), I generated an ROC curve by plotting sensitivity (true positive rate) against
1-specificity (false positive rate) at each test value for individuals with syndromic ASD (FXS,
TSC1 and TSC2, Rett and Prader-Willi syndromes) as shown in Fig. 2.6.8a. The area under the
ROC curve (AUC) is a useful tool to compare the utility of a biomarker. It represents the overall
probability that the correct diagnostic status (ASD vs unaffected in my case) will be accurately
identified in a randomly chosen individual, with an AUC of 1 having a perfect predictive value
and 0.5 being no better than random. The ROC generated for syndromic ASD resulted in a robust
AUC of 0.86, a value considered an excellent discriminant in predicting disease status (Hosmer
and Lemeshow 2000).
Notably, my current cohort of subjects with sporadic ASD yielded an ROC curve (Fig.
2.6.8b) closely resembling that of syndromic ASD, with a similar AUC of 0.83. An ROC curve
pooling individuals with both syndromic and sporadic ASD (Fig. 2.6.8c) yielded an AUC of
0.84. The similarity of my findings between sporadic ASD subjects and those with diverse
monogenic syndromes suggests a common underlying signaling deficit across different forms of
ASD. Using a cutoff value at 40% of the “reference” cell-normalized ATP-evoked Ca2+ signal
achieved 73% sensitivity and 100% specificity for discriminating between pooled ASD subjects
and controls, irrespective of their genetic background (Fig. 2.6.8c). These findings indicate that
Ca2+ signaling may be a new promising biomarker target in ASD.
2.3.5 IP3-induced Ca2+ release is reduced in FXS and TS cells.
The FLIPR screen is a high-throughput, low-resolution Ca2+ signaling assay that allows

43
investigation of many different cell lines at the same time, however, it provides little information
on how those signals may be arising and what is the difference between individual cells’
responses. To discriminate whether the observed deficits in ATP-induced Ca2+ signals in ASD
cell lines arose through defects in any of the intermediate steps from binding to purinergic GPCR
receptors to generation of IP3, or at the level of IP3-mediated Ca2+ liberation itself, I
circumvented upstream GPCR signaling by loading cells with a caged analogue of IP3 (ci-IP3)
(Smith, Wiltgen, and Parker 2009). UV flash photolysis of ci-IP3 to photorelease physiologically
active i-IP3 then allowed us to directly evoke Ca2+ liberation through IP3Rs in a graded manner
by regulating flash duration and intensity to control the amount of i-IP3 that was photoreleased.
I chose one cell line from a FXS patient and one cell line from a patient with TS. Fig. 2.6.9a
illustrates images obtained by epifluorescence microscopy of FXS and control fibroblasts loaded
with Fluo-8 and caged i-IP3 by incubation with membrane-permeant esters of these compounds.
Fig. 2.6.9b shows superimposed fluorescence ratio (ΔF/Fo) traces measured from several
representative FXS-2 (GM09497) and matched control Ctr-2 (GM02912) cells in response to
uniform photolysis flashes. Concordant with my observations of defects in ATP-induced global
Ca2+ signals, global cytosolic Ca2+ responses evoked by equivalent photorelease of i-IP3 in these
FXS cells were smaller than in control cells (Fig. 2.6.9c); and displayed a longer time to peak
(Fig. 2.6.9d) and slower rate of rise (Fig. 2.6.9e). Similar results were obtained from two other
FXS-Ctr cell pairs (FXS-1/Ctr-1: 20.7±3.9/44.6±12.2 %ΔF/F0, FXS-3/Ctr-3:
20.1±4.8/156.8±17.3). Moreover, I observed a consistent proportional depression of Ca2+ signals
for different relative UV flash strengths corresponding to photorelease of different i-IP3
concentrations (25% flash strength, pooled FXS response 61% of control; 50% flash, 65% of

44
control; 100% flash, 74% of control: n = 13-17 cells for each flash duration).
TS cells also showed depressed and slowed Ca2+ responses to photoreleased i-IP3.
Measurements from the matched TS1-B (GM06149) and Ctr-3 Ctr-3 (GM03440) cell lines (Fig.
2.6.9f) revealed a pronounced deficit in average Ca2+ signal amplitudes (Fig. 2.6.9g); and again
the time to peak was lengthened (Fig. 2.6.9h) and the rate of rise slowed (Fig. 2.6.9i). These
differences were apparent employing two different relative UV flash strengths (15% flash
strength, TS response 18% of control; 25% flash, 20% of control: n = 13-15 cells for each flash
duration).
2.3.6 IP3 signaling is affected at the level of local events.
IP3-mediated cellular Ca2+ signaling is organized as a hierarchy, wherein global, cell-wide
signals, such as those discussed above, arise by recruitment of local, ‘elementary’ events
involving individual IP3R channels or clusters of small numbers of IP3Rs (Yao and Parker 1993;
Yao, Choi, and Parker 1995). I therefore imaged these elementary events to elucidate how
deficits in the global Ca2+ signals in FXS and TS cells may arise at the level of local IP3R
clusters. I selected one FXS (FXS-3) fibroblast line, one TS1 (TS1-B) line, and a common
control (Ctr-3) cell line matched to both. Ca2+ release from individual sites was resolved utilizing
total internal reflection fluorescence (TIRF) microscopy of Cal-520 (a Ca2+ indicator that was
shown to be superior to Fluo-8 in detecting local Ca2+ signals (Lock, Parker, and Smith 2015)),
in conjunction with cytosolic loading of the slow Ca2+ buffer EGTA to inhibit Ca2+ wave
propagation (Dargan and Parker 2003). This technique captures in real time the duration and
magnitude of the underlying Ca2+ flux, providing a close approximation of the channel gating

45
kinetics as would be recorded by electrophysiological patch-clamp recordings (Parker and Smith
2010). Ca2+ release evoked by spatially uniform photolysis of ci-IP3 across the imaging field was
apparent as localized fluorescent transients of varying amplitudes, arising at numerous discrete
sites widely distributed across the cell body (Fig. 2.6.10a). Representative fluorescence traces
illustrating responses at several sites (marked by large circles in Fig. 2.6.10a) are shown in Fig.
2.6.10b; and Figs. 2.6.10c,d respectively illustrate the time course and spatial distribution of
selected individual events.
To quantify differences in elementary Ca2+ events between the cell lines I utilized a custom-
written, automated algorithm (Ellefsen et al. 2014) to detect events and measure their amplitudes
and durations (Fig. 2.6.10e) A striking difference between control and ASD lines was apparent in
the numbers of detected sites, with control cells showing on average 97 sites per imaging field,
whereas FXS and TS cells showed only 12 and 29 sites, respectively (Fig. 2.6.11a). However,
this could be a secondary effect of under-counting the number of release sites with very small
Ca2+ release. The mean frequency of events per site appeared higher in control cells than in both
FXS and TS cells (Fig. 2.6.11b), but quantification was imprecise because many sites,
particularly in the FXS and TS cells, showed only a single event. Using the latency between the
UV flash and first event at each site as an alternative measure of the probability of event
initiation (Dickinson, Swaminathan, and Parker 2012; Shuai et al. 2007) showed no significant
difference among FXS, TS and control cell lines (Fig. 2.6.11c). Mean event amplitudes were also
similar among the three cell lines (Fig. 2.6.11d). A second key difference between the control
and FXS and TS cells was apparent in the durations of the local events. In all cell lines event
durations were statistically distributed as single-exponentials, as expected for stochastic events.

46
However, the time constants fitted to these distributions were appreciably shorter in FXS and TS
cells as compared with control cells (Fig. 2.6.11e).
2.4 Discussion
I report abnormalities of IP3-mediated Ca2+ signaling in several distinct genetic models that
display high co-morbidity with ASD – FXS, two genetically-distinct forms of TS (TS1 and TS2),
Rett, and PWS. I also extend those findings to reveal a corresponding deficit in IP3-mediated
Ca2+ release in cells from subjects with sporadic ASD, where each subject likely carries a unique
sampling of genetic risk alleles. Ca2+ responses evoked by agonist stimulation of GPCR-
mediated IP3 signaling were significantly smaller in fibroblasts derived from subjects with ASD,
as compared with matched control cell lines. By using a high throughput assay to measure Ca2+
signals evoked by ATP in fibroblasts from subjects with ASD and controls, I was able to derive
an ROC curve that can discriminate subjects with ASD from unaffected controls with high
sensitivity and specificity. Notably, this approach identifies subjects with highly heterogeneous
sporadic forms of ASD as well as a spectrum of homogeneous monogenic syndromes caused by
“major effect” mutations, and does so similarly well with both, pointing to a common signaling
defect in the ubiquitous IP3-mediated Ca2+ signaling pathway. Even though the number of
subjects used in this study was modest and the results need to be replicated with larger cohorts of
ASD subjects and neurotypical controls, it serves as a proof of principle for the prospective
utility of such testing.
In contrast, I found no significant differences in Ca2+ liberation evoked by application of the
Ca2+ ionophore ionomycin, indicating that the diminished responses to IP3 do not result from

47
diminished ER Ca2+ store content. Moreover, Ca2+ signals evoked by intracellular uncaging of i-
IP3 were depressed in FXS and TS cell lines, pointing to a deficit at the level of Ca2+ liberation
through IP3Rs and not solely because of diminished GPCR-mediated production of IP3. Finally, I
conclude that the depression of Ca2+ signals cannot be attributed entirely or substantially to
reduced expression of IP3R proteins, because mean agonist-evoked Ca2+ responses across four
FXS and TS lines were about 22% of matched controls, whereas western blots showed mean
IP3R levels to be about 80% of controls and uncorrelated with the extent of Ca2+ signaling
depression in these different cell lines.
By resolving Ca2+ liberation during ‘elementary’, local signals evoked by photoreleased IP3
(Yao, Choi, and Parker 1995), I further demonstrate that defects in global Ca2+ signaling in these
distinct ASD-associated models are reflected at the level of Ca2+ release through individual and
small clusters of IP3Rs. In both FXS and TS cell lines I observed fewer sites of local Ca2+ release
as compared to a control cell line, and the durations of these events were shorter. Because
functional sites are comprised of clusters of small numbers of individual IP3Rs, the amplitude of
the fluorescence signal at a site depends on the channel permeability, together with the number
of active channels in the cluster (Yao, Choi, and Parker 1995). I observed similar amplitudes of
local Ca2+ signals across the cell lines, suggesting that the Ca2+-permeation properties and cluster
organization of IP3Rs are not appreciably affected in FXS and TS. However, the shorter average
duration of local events points to a modulation of IP3R gating kinetics, and would lead to an
overall decrease in amount of Ca2+ released over time. Compounding this, I found the numbers of
local Ca2+ release sites within a cell to be dramatically lower in FXS and TS cells as compared
with control cells (respectively, 87% and 70%), although it is possible that the short duration

48
events observed in the mutants may have contributed to undercounting their release sites. Taken
together, these findings on local IP3-mediated Ca2+ signals indicate that the deleterious effects of
single gene mutations are manifest at the level of the functional channel gating of IP3Rs.
Fibroblasts are primary, untransformed cells that are readily obtained by skin biopsy. A
patient-derived, cell-based assay such as I describe here has potential as a biomarker for early
detection of children susceptible to ASD, before behavioral symptoms appear and when an
earlier intervention has a better chance of improving outcome (Anderson, Liang, and Lord 2014;
MacDonald et al. 2014). Although several blood-based biomarkers with high specificity and
sensitivity have been proposed for ASD (Zaman et al. 2016; Pramparo et al. 2015; West et al.
2014), they are not currently suitable for high-throughput screening, and may be subject to
alteration due to medication regimen, diet, lifestyle changes or other variables that would
potentially complicate the read-out.
The current practice of testing new ASD treatments in biologically and behaviorally
heterogeneous populations of ASD subjects is widely acknowledged to impede the identification
of new drugs that would be effective in only a specific subgroup of “responders” (Berry-Kravis
et al. 2012; Lozano, Martinez-Cerdeno, and Hagerman 2015). Therefore, there is hope that a set
of biomarkers could independently stratify patient populations into distinct, biologically
meaningful endophenotypes (Loth et al. 2016) to enable more robust clinical trials. Although
limited to a modest cohort of subjects, my results already hint at such a stratification of Ca2+
signal amplitudes among sporadic ASD subjects, which exhibit a much greater spread of
signaling responses than controls, with a majority giving almost no response whereas others
exhibit signals overlapping the control range.

49
2.5 Tables
Table 2.5.1 Skin fibroblast information for ASD subjects and controls.
Controls are defined as apparently healthy individuals without any known
neurodevelopmental disorders (Coriell cell biorepository). Cell lines starting with “GM#” were
purchased from the Coriell cell biorepository; cell lines starting with “AU#” were established by
UCI CART. The ASD diagnosis was established based on the results of administered appropriate
version of ADOS. PDD-NOS = Pervasive Developmental Disorder-Not Otherwise Specified.
Ca2+ signals are presented as percentage of the reference cell line (GM03440).
ID Sex Age Ethnicity Status Ca2+ signal ID Sex Age Ethnicity Status Ca2+ signal ID Sex Age Ethnicity Status Ca2+ signal
Monogenic ASD Sporadic ASD Control
GM09497 M 28 Caucasian FXS 33.4 AU0001-0201 M 29 Caucasian Autism 82.5 GM00498 M 3 N/A Healthy 104.8GM05848 M 4 Caucasian FXS 10.8 AU0027-0201 F 24 Caucasian Autism 115.5 GM01863 M 46 Caucasian Healthy 58.5GM05185 M 26 Caucasian FXS 11.7 AU0027-0202 M 21 Caucasian Autism 22.9 GM02185 M 36 Caucasian Healthy 107.8GM05131 M 3 Caucasian FXS 25.3 AU0078-0202 F 36 Caucasian Autism 96.3 GM02912 M 26 Caucasian Healthy 64.3GM04026 M 35 Caucasian FXS 31.4 AU0120-0202 M 15 Asian Autism 24.2 GM03440 M 20 Causasian Healthy 100.0GM04024 M 29 Black FXS 113.0 AU0197-0201 M 17 Hispanic PDD-NOS 38.9 GM04505 F 20 N/A Healthy 110.6GM21890 M 19 N/A PWS 82.7 AU0197-0202 F 14 Hispanic PDD-NOS 22.6 GM05659 M 1 Caucasian Healthy 40.8GM16548 F 5 Caucasian RETT 34.2 AU0236-0203 F 12 Caucasian Autism Spectrum 7.2 GM07492 M 17 Caucasian Healthy 44.7GM07982 F 25 Caucasian RETT 75.6 AU0237-0201 F 13 Caucasian Autism 686.6 GM07753 M 17 N/A Healthy 214.6GM06149 M 17 Caucasian TSC1 49.2 AU0239-0201 F 16 Caucasian Autism 21.3 GM08399 F 19 N/A Healthy 62.9GM06148 M 43 Caucasian TSC1 34.3 AU0239-0203 F 6 Caucasian Autism Spectrum 0.5 GM23973 M 19 Caucasian Healthy 42.7GM06121 M 22 Caucasian TSC2 22.8 AU0243-0201 M 2 Caucasian Autism 0.5 GM23976 M 22 Caucasian Healthy 93.0
AU0240-0203 M 12 Caucasian PWS 2.4 AU0245-0201 F 20 Caucasian Autism 68.4AU0244-0201 M 19 Caucasian PWS 24.8 AU0245-0202 F 18 Caucasian Autism Spectrum 28.0AU0250-0202 M 11 Caucasian PWS 16.4 AU0249-0202 F 10 Caucasian Autism 16.7
AU0251-0202 M 8 Hispanic Autism 40.6AU0251-0203 M 5 Hispanic Autism 22.8AU0252-0201 M 4 Asian Autism 20.6AU0254-0201 M 5 Hispanic Autism Spectrum 0.3AU0254-0202 F 3 Hispanic Autism 0.3AU0256-0201 M 5 Caucasian Autism 0.2AU0256-0202 M 3 Caucasian Autism 0.1AU0257-0202 M 3 Asian Autism 1.2

50
2.6 Figures
Figure 2.6. 1 Ca2+ responses to extracellular application of ATP in Ca2+-free solution
are depressed in human skin fibroblasts from FXS patients as compared with
matched controls.
(a) Representative FLIPR traces showing response to various concentrations of extracellular
ATP (top panel) and to the Ca2+ ionophore ionomycin (lower panel) in control (Ctr) and FXS

51
cells loaded with the Ca2+ indicator Fluo-8. Traces show fluorescence in arbitrary units, and
each recording was obtained from a separate well. (b) Peak Ca2+ responses to 1 µM ionomycin
in five control and five FXS cell lines. Bars show mean and s.e.m. of triplicate measurements.
(c) Cells from five FXS cell lines (grey bars) and matched controls (black bars) were stimulated
with 100 µM ATP in Ca2+-free solution to stimulate Ca2+ release from intracellular Ca2+ stores.
Recordings were performed in triplicate, averaged, and normalized with respect to
corresponding ionomycin responses in Ca2+-free solution. n=3 in each group. (d) Normalized
Ca2+ responses to various concentrations of ATP derived by combining results from 5 FXS and
5 matched controls. All data in this and following figures are presented as mean ± s.e.m.; * = p-
value <0.05; ** = p <0.01 calculated from a two-sample Student’s t-test.
Cell line numeration corresponds to Coriell IDs as follows: FXS-1 (GM05848), Ctr-1
(GM00498), FXS-2 (GM09497), Ctr-2 (GM02912), FXS-3 (GM05185), Ctr-3 (GM03440),
FXS-4 (GM04026), Ctr-4 (GM02185), FXS-5 (GM05131), Ctr-5 (GM05659).

52
Figure 2.6. 2 Ca2+ responses to extracellular application of ATP in Ca2+-free solution
are strongly depressed in human skin fibroblasts from TS1 and TS2 patients
compared with matched controls.
(a) Representative FLIPR traces showing response to various concentrations of extracellular
ATP (top panel) and to the Ca2+ ionophore ionomycin (lower panel) in control (Ctr) and TS cells
loaded with the Ca2+ indicator Fluo-8. (b) Peak Ca2+ responses to 1 µM ionomycin in three
control and three TS cell lines. Bars show mean and s.e.m. of triplicate measurements. (c) Three
cell lines from TS patients (grey bars) and matched controls (black bars) were stimulated with
0
5
10
15
20
25
30
TS1-B
% o
f ion
omyc
in
Ctr-3Ctr-2
Ctr-6TS2
TS1-A
**
**
**
0
2
4
6
8
10
12
14
16
18
20
10
% o
f ion
omyc
in
TSCtr1
Ctr TSATP ! µM):
Ctr TS100
*
n/s
*
Ctr TS0
50
100
150
200
250
300
350
400
450
500
550
% Δ
F/F 0
n/s
Ionomycinb a
d c
ATP (µM): 1 10 100
Ionomycin
0
200 s
6,00
0 A
U
200 s
27,0
00 A
U
Ctr
C
tr
TS
TS
+ + + +
(

53
100 µM ATP in Ca2+-free solution to stimulate Ca2+ release from intracellular Ca2+ stores.
Recordings were performed in triplicate, averaged, and normalized with respect to corresponding
ionomycin responses in Ca2+-free solution. (d) Normalized Ca2+ responses to various
concentrations of ATP derived by combining results from three TS and three matched controls.
n=3 replicates in each group. All data in this and following figures are presented as mean ±
s.e.m.; * = p-value <0.05; ** = p <0.01 calculated from a two-sample Student’s t-test.
Cell line numeration corresponds to Coriell IDs as follows: FXS-1 TS1-A (GM06148), Ctr-6
(GM01863), TS1-B (GM06149), Ctr-3 (GM03440), TS2 (GM06121), Ctr-2 (GM02912).
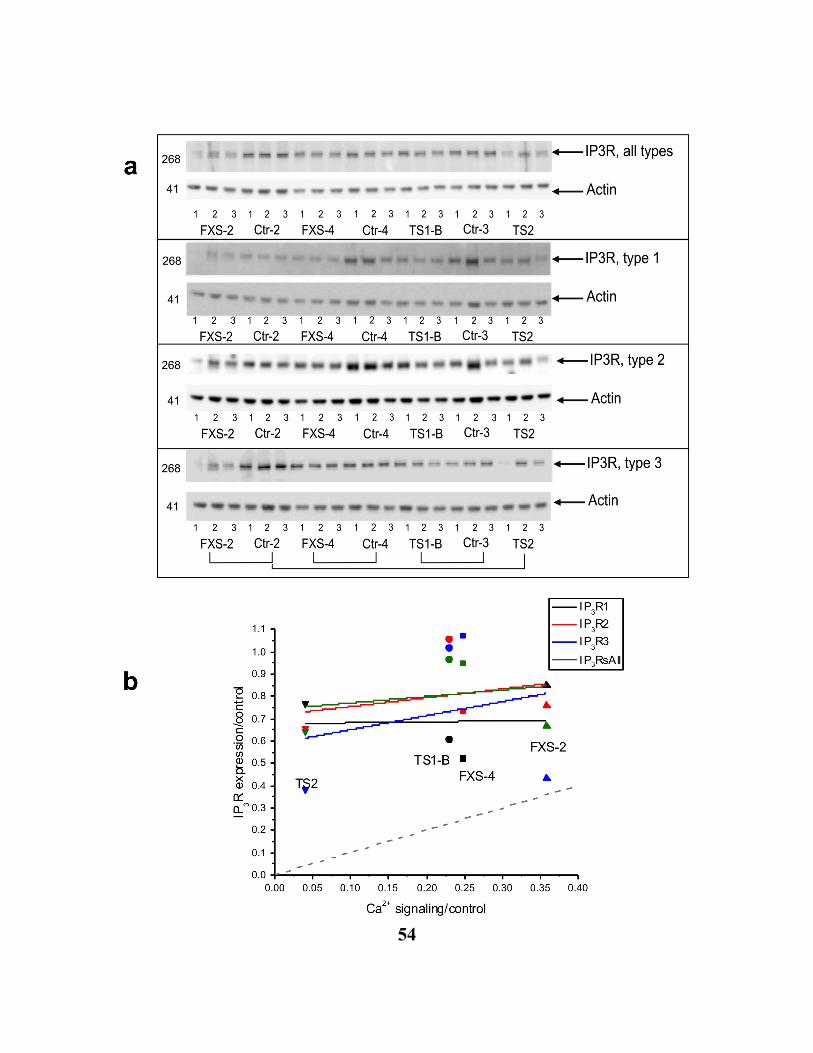
54

55
Figure 2.6. 3 IP3R protein level expression in FXS, TS and control cells.
(a) Representative immunoblots of IP3R proteins in skin fibroblast cell lines FXS-2, Ctr-2,
FXS-4, Ctr-4, TS1-B, Ctr-3 and TS2. Aliquots of protein lysates from cell lines grown in
triplicates were subjected to SDS-tris-acetate electrophoresis and then immunoblotted with the
indicated antibodies. All IP3R bands ran at a molecular mass of about 270 kD. Actin was used a
loading control. The leftmost lane typically showed weak transfer onto the blot, and was
excluded from quantitative analysis. (b) Scatter plot showing IP3R expression levels in TS and
FXS cell lines determined by western blotting versus the mean ATP-evoked Ca2+ signals in
these cells relative to matched control cells. Different symbols represent different cell lines
(TS2, downward arrow; TS1-B, circle; FXS-2, upward arrow; and FXS-4, square), and different
colors represent IP3R expression levels as determined using antibodies for type 1 (black), type 2
(red), type 3 (blue) IP3Rs, and a non type-specific antibody (green). All data are normalized
relative to matched control cells. Solid lines are regression fits to data for IP3R1 (black), IP3R2
(red), IP3R3 (blue), and total IP3Rs (green). The grey dashed line represents a one-to-one
relationship between normalized Ca2+ signal and normalized IP3R expression.
Cell line IDs correspond to Coriell numeration as follows: FXS-2 (GM09497), Ctr-2
(GM02912), Ctr-3 (GM03440), FXS-4 (GM04026), Ctr-4 (GM02185), TS1-B (GM06149), TS2
(GM06121).

56
Figure 2.6. 4 Ca2+ response in two different fibroblast cell lines derived from the
same patient.
(a) Peak amplitude (ΔF) Ca2+ response to 100 µM ATP normalized to the basal fluorescence
(F0) before stimulation. The data were calculated by subtracting vehicle addition peak response
from peak trace value of each corresponding cell line. Bar graphs show mean of triplicate
measurements. The cell line GM24529 was established by Coriell cell biorepository (Camden,
New Jersey). The same patient was re-biopsied at CART, UC Irvine, and a cell culture
(AU0239-0201) was established from an explant. Both cell lines were thawed from a liquid
nitrogen long-term storage, passaged and plated for high-throughput Ca2+ signaling in parallel.
(b) Peak amplitude Ca2+ response to 1 µM ionomycin normalized to the basal fluorescence
before stimulation. (c) Peak ATP response for each cell line from (a) normalized to that of
ionomycin response from (b). Bar graphs show mean of triplicate measurements from
individual wells. Data points represent individual triplicate responses.

57
Figure 2.6. 5 Representative Ca2+ responses to extracellular application of
purinergic agonists and ionomycin in absence of extracellular Ca2+ in fibroblasts
from ASD subjects and controls.
(a) Representative FLIPR traces showing changes in Fluo-8 fluorescence over the basal
fluorescence (ΔF/F0) in response to extracellular application of 100 µM ATP to fibroblast cell
lines from two controls (black; GM03440 and grey; GM02912), one FXS (red; GM09497) and
one sporadic ASD subject (green; AU0027-0202). Fluorescence changes ΔF are presented as a
% change from the basal fluorescence F0. The grey dashed line represents the artifactual
fluorescence change resulting from addition of vehicle alone to the ASD cell line. (b) Peak

58
amplitudes (ΔF) of Ca2+ responses to 100 µM ATP normalized to the basal fluorescence (F0)
before stimulation in control cell lines (black and grey), FXS (red) and a sporadic ASD line
(green). Bar graphs show mean of triplicate measurements after subtracting the artifactual signal
resulting from addition of vehicle alone to each corresponding cell line. Data points represent
individual triplicate responses. (c) Representative FLIPR traces showing changes in
fluorescence over the basal (ΔF/F0) in response to extracellular application of 1 µM ionomycin
to control (black and grey traces), FXS (red) and ASD (green) cell lines. (d) Mean peak Ca2+
responses (ΔF) to 1 µM ionomycin normalized to the basal fluorescence (F0) before stimulation
in control cell lines (black and grey), FXS line (red) and an ASD line (green). Bar graphs show
mean of triplicate measurements. Data points represent individual triplicate responses. (e) Mean
peak ATP responses for each cell line from (b) expressed as a percentage of the mean
ionomycin response from (d) in that cell line. (f) Mean peak responses evoked by addition of
100 µM UTP to each cell line as a percentage of the of ionomycin response for that cell line.

59
Figure 2.6. 6 Representative Ca2+ responses to extracellular application of different
purinergic receptor agonists in absence of extracellular Ca2+ in fibroblasts from
control and ASD patients.
(a) Representative FLIPR traces showing change in fluorescence over the basal (ΔF/F0) in
response to extracellular application of 100 µM UTP in control (black and grey traces), FXS
(red) and sporadic ASD (green) cells loaded with the Ca2+ indicator Fluo-8. Grey dashed line
represents fluorescence response of the ASD line to a vehicle addition alone. Ca2+-free buffer

60
contains 1 mM EGTA. (b) Representative FLIPR traces showing insignificant response to
extracellular application of 100 µM ADP. Color legend is the same as in (a). (c) Representative
FLIPR traces showing minimal response to extracellular application of 100 µM UDP. (d)
Representative FLIPR traces showing response to extracellular application of 100 µM MRS
2365.

61
Figure 2.6. 7 Ca2+ response in fibroblasts from subjects with sporadic ASD as well as
from controls and those with syndromic ASD.
Average Ca2+ response in skin fibroblasts from unaffected neurotypical controls (Ctr), Prader-
Willi syndrome (PWS), fragile X syndrome (FXS), tuberous sclerosis syndrome 1 and 2 (TSC),

62
Rett syndrome (Rett) and from subjects with sporadic ASD (ASD). N below each cell line
represents number of individuals tested. The star symbol represents the reference control cell
line (GM03440). Peak Ca2+ response (ΔF/F0) divided by the peak ionomycin response (ΔF/F0)
was normalized to the mean value of the reference cell line (GM03440) run on the same FLIPR
plate. Bar graphs show mean +/- s.e.m. for each group. Data points represent responses from an
individual. Circled data point (AU0237-0201) was excluded from the average and statistics. * =
p-value < 0.05, *** = p < 0.001, Mann-Whitney test.

63
Figure 2.6. 8 Receiver operating characteristic (ROC) curves for ATP-evoked Ca2+
signaling in ASD.
(a) ROC curve results for syndromic ASD cell lines (N=15) and unaffected neurotypical
controls (N=12). Sensitivity (the true-positive rate) was plotted against (1-specificity) (the false-
positive rate) for each value of Ca2+ signaling response normalized to a reference control cell
line (the data are the same as in Fig. 2.6.7). Only subjects with known identified genetic
syndromes co-morbid with ASD (FXS (N=6), Rett (N=2), PWS (N=4), TSC (N=3)) were used
to generate the curve. Area under the curve (AUC) is shown in each graph. (b) ROC curve
results for sporadic ASD subjects (N=23) and unaffected neurotypical controls (N=12). (c) ROC
results for Ca2+ signaling in sporadic and syndromic ASD cohorts combined from (a) and (b).
Numbers in % reflect Ca2+ signaling cutoff values (presented as % of the reference cell line) to
illustrate how different threshold values influence specificity and sensitivity of the ROC curve.

64
Figure 2.6. 9 Ca2+ release evoked by photoreleased IP3 is depressed in FXS and TS
cells.
(a) Representative frames taken from image sequences of control (top) and FXS fibroblasts
(bottom) loaded with Fluo-8 and stimulated by photorelease of i-IP3. Increasing cytosolic
[Ca2+] (increasing fluorescence ratio %F/F0) is depicted on a pseudocolor scale, as indicated

65
by the color bar. Time-stamps indicate time from beginning of the record; the photolysis flash
was delivered at 3 s. The monochrome panels on the left show resting fluorescence before
stimulation to indicate cell outlines. (b) Superimposed traces of representative global single-
cell Ca2+ responses to uncaging of i-IP3 in FXS (red) and control fibroblasts (black). Traces
represent average fluorescence ratio signals (%F/Fo) throughout regions of interest
encompassing the whole cell. Arrow indicates time of the UV flash. Data are from the cell
pair labeled as FXS-2/Ctr-2 in Fig. 2.6.1c. (c) Mean peak amplitude of Ca2+ responses is
significantly depressed in FXS cells relative to matched controls. (d) Mean latency from time
of photolysis flash to peak IP3-evoked Ca2+ response is prolonged in FXS fibroblasts. (e)
Mean rate of rise of Ca2+ fluorescence signal (peak amplitude / time to peak) is reduced in
FXS cells as compared with control cells. Data in (c-e) are from 13 control cells and 14 FXS
cells. (f-i) Corresponding traces (f), and mean values of amplitude (g), latency (h) and rate of
rise (i) derived from cells labeled as Ctr-3 and TS1-B in Fig. 2.6.2c. Data are from 11 TS cells
and 12 matched controls.

66
Figure 2.6. 10 Local IP3-evoked Ca2+ events.
(a) Resting Cal-520 fluorescence of a control fibroblast (b) (outlined) imaged by TIRF
microscopy. Circles mark all sites where Ca2+ release events were identified within a 40 sec
imaging record following photorelease of i-IP3 in a 128 x 512 pixel (20.48 x 81.92 µm) imaging
field. Larger circles mark sites from which traces in (b) were obtained. Representative traces

67
from sites numbered in (a). Dots underneath the traces mark events arising at that particular site;
unmarked signals represent fluorescence bleed-through from events localized to adjacent but
discrete sites. Arrow indicates the timing of the UV flash. (c) Examples of individual events
shown on an expanded timescale to better illustrate their kinetics. (d) Surface intensity plot of
three individual puffs near their peak times. (e) A single Ca2+ event shown on an expanded scale
to illustrate measurements of peak amplitude and event duration (tauo) at half-maximal
amplitude.

68
Figure 2.6. 11 IP3-mediated Ca2+ signaling in FXS and TS fibroblasts is impaired at
the level of local events.
Data are from 17 FXS-3 cells, 17 TS1-B cells, and 16 control cells (Ctr-3) matched to both
experimental groups. Open black squares in a-d represent mean measurements from individual

69
cells; histograms and error bars are overall means + 1 s.e.m. across all cells in each group. (a)
Total numbers of Ca2+ release sites detected within cells during 40 s imaging records following
uniform photorelease of i-IP3. (b) Mean event frequency per site, calculated from the number of
events observed per site throughout the recording period. (c) Mean latencies following the
photolysis flash to the first event at each site within a cell. (d) Mean amplitudes of all events
within each cell. (e) Distributions of event durations (at half maximal amplitude) derived from
all events identified in FXS (open diamonds), TS (stars) and control cells (black squares). The
data are fit by single-exponential distributions with time constants to of 15 ms (both FXS and
TS) and 32 ms (control). Outcomes were compared using two-sample Mann-Whitney test. * =
p-value <0.05; ** = p <0.01, n/s – non-significant.

70
Chapter 3. IP3-mediated Ca2+ signaling in central nervous system and peripheral tissue
cells from a mouse model of FXS
3.1 Introduction
My previous findings described in Chapter 2 provide strong evidence that Ca2+ release
through IP3Rs is decreased in skin fibroblasts from human patients with monogenic models and
sporadic forms of ASD. Given crucial roles played by IP3-mediated Ca2+ release in the brain, I
wanted to investigate if the same signaling abnormality is present in neurons.
The IP3R is a key signaling hub in the canonical metabotropic glutamate receptor (mGluR)
pathway in neurons (Inoue et al. 1998; Berridge 1993). Although a complex array of downstream
signals (Lüscher and Huber 2010) arising from mGluR activation has been previously reported in
FXS (Bear, Huber, and Warren 2004; Repicky and Broadie 2009; Nakamoto et al. 2007), the role
of downstream Ca2+ release at the level of IP3Rs in ASD has not been determined at a molecular
level.
The role of mGluR signaling gained a lot of attention when Mark Bear at Massachusetts
Institute of Technology postulated a “mGluR theory of Fragile X” (Bear, Huber, and Warren
2004). This theory postulates that disrupted mGluR signaling underlies the pathogenesis of the
disorder, and that hyperactivation of the group 1 mGluR receptors phenocopies a wide array of
biological landmarks of FXS. As a continuation of my previous work, I wanted to expand my
findings on molecular deficits in IP3-mediated Ca2+ signaling in humans with FXS to investigate
if metabotropic signaling in the mouse model of FXS also manifests in decreased Ca2+ release
from the ER.

71
3.2 Materials and Methods
3.2.1 Materials.
DMEM (cat. # 11995-065) was purchased from Life Technologies, Neurobasal-A (cat. #
12349-015), B-27 supplement (cat. # 17504-044) and GlutaMax (cat. # 35050-061) were from
Gibco/Thermo Fisher Scientific. 2.5% Trypsin (cat. # 25-054CI) was from Cellgro. DNase (cat.
# D4527-10KU) was from Sigma-Aldrich. NPEC-caged-(1S,3R)-1-Amino-1,3-
dicarboxycyclopentane (ACPD; cat. # 3331), (RS)-α-Methyl-4-carboxyphenylglycine (MCPG;
cat. # 0336) were from Tocris. Fluo-8AM, Cal-520AM and Cal-630AM were purchased from
AAT Bioquest, diluted in DMSO/Pluronic to a stock concentration of 2 mM and frozen until
needed. Adenosine triphosphate (ATP) was purchased from Sigma Aldrich, diluted in water to a
stock concentration of 100 mM and frozen as 50 µl aliquots until needed. Ionomycin was
purchased from Life Technologies, diluted in DMSO to 1 mM and frozen as 10 µl aliquots until
needed. GCaMP6f was obtained from the University of Pennsylvania Vector Core (Chen et al.
2013).
3.2.2 Postnatal neuronal cultures.
All experiments were performed in accordance with and approved by the Institutional
Animal Care and Use Committee (IACUC) at the University of California, Irvine. FVB.129P2-
Pde6b+ Tyrc-ch Fmr1tm1Cgr/J mice were used. Females heterozygous for the FMR1 gene were bred
with wild type males to generate male littermates that were either hemizygous or wild-type for
the FMR1 gene. Postnatal day 0-2 male mouse pups were used to initiate cortical

72
neuron/astrocyte co-cultures. On the day of the dissection, mouse pup tails were cut for
genotyping, and male pups that were either wild-type or knockout for FMR1 gene were used.
Primers were ordered from Integrated DNA Technologies: FXS primer: 5’-CAC GAG ACT
AGT GAG ACG TG-3’ (forward), WT primer: 5’-TGT GAT AGA ATA TGC AGC ATG TGA-
3’ (forward).
Brains were dissected in ice-cold dissection media (4.2 mM NaHCO3, 1 mM pyruvate, 20
mM HEPES, 5.33 mM KCl, 0.44 mM KH2PO4, 137 mM NaCl, 0.33 mM Na2HPO4*7H2O, 5.55
mM d-glucose, adjusted pH to 7.3.), and meninges were carefully removed. Cortices were
dissected, minced and placed into 450 µl of ice-cold dissection media. 50 µl of pre-warmed 2.5%
trypsin was added, and the mixture was incubated at 370C for 15 minutes. 20 µl of DNase was
added to the mixture and incubated for additional 5 minutes. 1 ml of the plating media was added
to inactivate the trypsin, and after the brain tissues settled to the bottom, the media was carefully
aspirated. Brain tissue was re-suspended in 1 ml of plating media and triturated with three fire-
polished glass Pasteur pipettes with decreasing size 8-10 times to dissociate the cells. After cells
were transferred to 50 ml conical tubes using a strainer, they were plated at 60,000/well in 0.5 ml
plating media in the center part of a 35 mm glass bottom dish that was pre-treated with 0.1
mg/ml poly-d-lysine for 1 hour.
In 2-4 hours, the plating media was carefully aspirated and replaced with 2 ml of the
maintenance media. 1 ml of media was changed twice a week. Neuronal cultures were used
between day 14 and day 21 in vitro.

73
3.2.3 Mouse fibroblast cultures.
Postnatal day 0-2 male mouse pups were euthanized through decapitation. A section of skin
from a flank was placed in ice-cold dissection media and cut into 1 mm pieces. 4-6 pieces of skin
were placed into each well of a gelatin-coated 6-well plate. 200 µl DMEM + 10% FBS were
carefully added to each well and explants were allowed to attach to the bottom of the well before
adding additional 2 ml of media. Proliferating fibroblasts grow out of the explants and on
average reach confluency after 7-10 days in culture before being harvested in Ca2+- and Mg2+-
free 0.25% trypsin-EDTA (Life Technologies) and sub-cultured at 1:4 ratio. Fibroblasts were
cultured in Dulbecco’s Modified Eagle’s Media (Gibco, 11965-092) supplemented with 10%
(v/v) fetal bovine serum with penicillin/streptomycin at 37 °C in a humidified incubator gassed
with 95% air and 5% CO2, and used for up to 10 passages. For Ca2+ signaling studies, cells were
detached with Ca2+- and Mg2+-free 0.25% trypsin-EDTA, harvested in normal growth media and
sub-cultured on FLIPR 96 well plates for 2 days to provide standardized conditions prior to
imaging studies.
3.2.4 Single-cell Ca2+ imaging.
Neuronal/astrocytic co-cultures grown in glass-bottomed 35 mm imaging dishes were loaded
for imaging using membrane-permeant esters of Cal-520. Briefly, cells were incubated at room
temperature in ACSF (1.8 mM CaCl2, 140 mM NaCl, 5 mM KCl, 0.5 mM MgCl2, 0.4 mM
MgSO4, 0.4 mM KH2PO4, 0.6 mM Na2HPO4, 3 NaHCO3, 10 mM glucose, 10 mM HEPES,
adjusted to pH 7.35 with NaOH) containing 4 µM Cal-520 AM for 45 minutes before washing
three times with the ACSF solution. [Ca2+]i changes were imaged using a Nikon Eclipse

74
microscope system with a 40x (NA=1.30) oil objective controlled by Nikon NIS Elements
software. Cal-520 ot GCaMP6f fluorescence was excited by 488 nm laser light, and emitted
fluorescence (l > 510 nm) was imaged at 30 frames sec-1 using an electron-multiplied CCD
Camera iXon DU897 (Andor). An arc lamp was used to emit a single flash of UV light (350-
400 nm) focused to uniformly illuminate a region slightly larger than the imaging field to uncage
the extracellular caged agonist ACPD, which evoked activity persisting for tens of seconds.
Image data were acquired as stack .nd2 files using Nikon Elements for offline analysis.
Fluorescence signals were expressed as a ratio (ΔF/F0) of change in fluorescence (ΔF) relative to
the mean resting fluorescence at the same region before stimulation (F0). Measurement outcomes
were tested for statistical significance using the Mann-Whitney non-parametric test.
A Hamamatsu W-View Gemini beam splitter was used for simultaneous Cal-630 and
GCaMP6f recordings. Cal-630 fluorescence was excited by 561 nm laser light, and GCaMP6f
fluorescence was excited at 488 nm. Emitted fluorescence was imaged with a Nikon quad filter
cube at 30 frames sec-1 using a CMOS camera (Hamamatsu Orca Flash 4.0LT). Cal-630
fluorescence was recorded at l > 635 nm, and GCaMP6f fluorescence was collected at l < 550
nm filters using the beam splitter. Recordings were binned by 2x2 pixels (512 x 1024 pixels,
166.4 x 332.8 µm resolution).
3.2.5 High-throughput Ca2+ imaging.
Dissociated cortical cultures from newborn mouse pups were seeded in clear-bottom black 96
well plates (Greiner Bio One T-3026-16) at 1 x 10⁵ cells per well and grown for five days at
37°C in a humidified incubator gassed with 95% air and 5% CO2. To promote neuronal cell

75
survival, cells were cultured in Neurobasal-A medium supplemented with serum-free B-27. To
promote astrocytic cell survival and proliferation, cells were plated and maintained in DMEM
supplemented with 10% FBS. On the day of the experiment, cells were loaded by incubation
with 2 µM of the membrane-permeant Ca2+ indicator Fluo-8 AM (Takada, Furuya, and Sokabe
2014) in ACSF for 1 h at 37 °C, then once washed with a Ca2+ -free HBSS solution (120 mM
NaCl, 4 mM KCl, 2 mM MgCl2, 10 mM glucose, 10 mM HEPES, 1 mM EGTA, pH 7.4 at room
temperature). The solution was replaced with 100 µl of fresh Ca2+-free HBSS solution in each
well and cells were allowed to equilibrate for 5 minutes prior to assay with a fluorometric
imaging plate reader (FLIPR; Molecular Devices, Sunnyvale, CA). A basal read of fluorescence
in each well (470–495 nm excitation and 515–575 nm emission, expressed in arbitrary units;
AU) was read for 2 seconds at 0.4 s exposure time. Next, 100 µl of 2x ATP (to 100 µM final
concentration), 100 µl of 2x DHPG (to 100 µM final concentration), or 100 µl of 2x ionomycin
(to 1 µM final concentration) in Ca2+-free HBSS was added to a given well. A single recording
was obtained from each well. Ionomycin-induced fluorescence changes from wells without prior
addition of agonists were used to normalize agonist-evoked responses. Recordings were
performed in triplicate.
3.3 Results
3.3.1 Optimizing neuronal culture conditions.
Choosing a model system is a crucial first step for studying ASD-specific molecular deficits,
as many signaling pathways will critically depend on when, where, and what cell type is studied.
Stages of neurodevelopment are modulated dynamically by many factors, including gene

76
expression patterns throughout the fetal and early postnatal life, the predominant types of
neurons present at different stages, the ratio of glial/neuronal cells, as well as neuromodulators
and hormones. Several studies have attempted to answer the questions of when ASD
susceptibility genes converge during development and which brain regions are most vulnerable
to these changes. As a guide, I used two recent studies that remarkably advanced this field. One
study mapped ASD risk genes onto co-expression networks that represent developmental courses
and transcriptional profiles in fetal and adult cortices (Parikshak et al. 2013). In this study,
multiple ASD risk-enriched modules strongly correlated with glutamatergic neurons in upper
cortical layers, predicting that specific disruption of cortical-cortical connectivity is more likely
to affect core ASD phenotypes such as social behavior. Genes that were combined into
independent clusters revealed predominant expression peaks evident throughout fetal
development and early postnatal stages. Interestingly, several modules that included ion channels
and plasma membrane receptors were highly correlated with ITPR1 gene expression and were
enriched in late fetal/early postnatal life. Another independent study demonstrated a similar
pattern of convergence of ASD vulnerability genes and precisely mapped it onto cortical layer
5/6 neurons, the innermost layer of neurons (Willsey et al. 2013). They identified the mid-fetal
stage (post conception week 10-24 in humans) as a point of convergence in expression for high-
risk ASD genes. Moreover, layer 5/6 projection neurons of the midfetal stage are among the first
cortical neurons to form synaptic connections, and it is these early neural circuits that may be
particularly vulnerable to a variety of genetic perturbations and related functional disturbances
that may all ultimately increase the risk for ASD.
77
Several studies have been published that attempted to translate mammalian
neurodevelopment across species (Workman et al. 2013; Clancy et al. 2007; Semple et al. 2013).
Based on different models used to extrapolate ages, human mid-fetal stage translates into mouse
post-conception day 17 (Clancy et al. 2007; Workman et al. 2013) to postnatal day 0 (Semple et
al. 2013). Late fetal development in humans can be roughly translated into early postnatal life in
mice. I therefore decided to use cortical neurons from postnatal days 0-2 mice to capture
dynamic expression changes taking place in this vulnerable developmental stage. In mice, this is
the period when intense gliogenesis occurs, thus providing sources for both neurons and
astrocytes in the same dish that support robust and healthy neuronal cultures. This fact allows
culturing without a feeder layer, thus minimizing any variation that may arise from combining
cells from different animals and genotypes. To minimize any inter-litter variations, I bred female
mice heterozygous for the FMR1 gene with wild-type males that produced male mouse pups that
were either hemizygous or had a wild-type copy of the FMR1 gene in the same litter. Cultured
neurons obtained with this protocol (Beaudoin et al. 2012) demonstrate great survival and
develop extensive axonal and dendritic connections. By day 12-17 in vitro, these neurons had
characteristic morphologies and expressed appropriate axonal markers (tau, tuj1; not shown).
They develop robust and mature network connections, suggesting functional excitatory inputs.
Moreover, these cultures are amenable to gene manipulations such as transfection.
3.3.2 Ca2+ measurements in neuronal cultures.
Postnatal cortical cells yield robust cultures in vitro in part because they provide an astrocytic
feeder layer along with neurons that supports survival and maturation of neuronal cells. By day

78
12 in vitro, astrocytes proliferate robustly and create a nearly confluent monolayer of cells on top
of which neurons reside. These glial cells support the culture by secreting growth and signaling
factors, as well as by regulating neuronal activity via neurotransmitter reuptake mechanisms.
This results in culture conditions that mimic in vivo conditions in terms of the cell type
composition. However, during the imaging process it creates certain challenges as many
neuronal cells reside on top of astrocytes, thus masking the fluorescence signal and complicating
analysis. The problem can be easily circumvented by delivering a Ca2+ indicator specifically in
neurons, thus making all other cell types practically “invisible” for the purposes of Ca2+ imaging.
Luckily, a large library of genetically-encoded Ca2+ indicators that can be expressed under
different promoters has been developed (Chen et al. 2013). In 2013, a new generation of highly
sensitive protein Ca2+ sensors called GCaMP6 was shown to outperform previous versions of
other sensors in mice in vivo as well as in cultured neurons (Chen et al. 2013). They were shown
to reliably detect single action potentials and record Ca2+ transients in neuronal processes and
single dendritic spines. More importantly for the purposes of this project, they can be specifically
and selectively expressed using a commonly used viral delivery method, adeno-associated virus,
under a neuron-specific promoter synapsin. In such configuration, the viral particles will infect
and integrate into the host’s DNA in all cells in the culture, but only cell types with an active
synapsin promoter will produce the target protein.
Thus, I set out to test this new Ca2+ sensing protein and compare it with the commonly used
synthetic dyes that I have previously used to image global and local events in human skin
fibroblasts. I chose the fast version of GCaMP6, as it was shown to have a dissociation constant
(Kd=375 nM (Chen et al. 2013, supplementary information)) similar to that of dyes commonly

79
used in our lab, such as Cal-520 AM (Kd=320 nM, https://www.aatbio.com/products/21130) and
Fluo-8 AM (Kd=389 nM, https://www.aatbio.com/products/21081). I used
AAV1.Syn.GCaMP6f.WPRE.SV40 viral delivery vector to infect neuronal cultures and to
specifically target gene expression to neuronal cells only (Kügler, Kilic, and Bähr 2003). After
the initial viral particle titration step with 1:2,000, 1:20,000 and 1:200,000 dilutions, I established
that the 1:20,000 dilution gave the most consistent results in terms of GCaMP6f expression (data
not shown). The infection was performed at day 7-14 in vitro, and the protein expression was
studied between days 14 and 21 in vitro. Neuronal cultures were routinely inspected using light
microscopy before the infection and prior to any imaging experiments. Under these conditions, I
was able to achieve healthy cultures with the majority of neurons showing low-level basal
fluorescence with the characteristic expression pattern of a cytosolic indicator having no
evidence of nuclear expression (Fig. 3.5.1(a) and 3.5.2 (a)).
To compare the performance of synthetic dyes and the genetically-encoded Ca2+ sensor
GCaMP6f, I incubated cells expressing GCaMP6f with 4 µMof Cal-630AM, a red-shifted Ca2+
sensor, and subjected the cells to trains of field electric stimulation at 70 mV at different
frequencies. The resulting action potential-induced Ca2+ transients in the same cell detected by
GCaMP6f or Cal-630 were recorded simultaneously using a dichroic beam splitter. As expected,
GCaMP6f localized to neurons only and could be distinguished from Cal-630 fluorescence by an
exclusively cytoplasmic expression pattern. In contrast to GCaMP6f, Cal-630 loaded
indiscriminately into both neuronal and glial cells. At resting conditions, astrocytes had very low
basal fluorescence with bouts of spontaneous Ca2+ waves spreading across the imaging field.
These events were observed as slow, large increases in fluorescence intensity evident in the Cal-

80
630 traces, but absent from the GCaMP6f traces (Fig. 3.5.1 (b), cell #4). GCaMP6f was excellent
at registering slow, large events in neurons, such as the ones caused by high-frequency field
stimulation (Fig. 3.5.1 (c)). These data demonstrate the wide dynamic range and large
signal/basal ratio properties of the GCaMP6f sensor. However, even the fast version of this
indicator appeared to be too slow to reveal fast events, such as those caused by low-frequency
electric stimulation (Fig. 3.5.1 (d) demonstrates a zoomed-in portion of the full-length trace from
Fig. 3.5.1 (b)). Therefore, my data show that the synthetic dye Cal-630 excels at reporting fast,
transient spikes caused by single action potentials, compared to the traces of GCaMP6f that are
barely distinguishable from the baseline noise, and where individual Ca2+ spikes cannot be
resolved (Fig. 3.5.1 (d), the GCaMP6f trace is offset for clarity). These results are consistent with
the previous findings from our group in that GCaMP6f is inferior to small molecule dyes in
detecting small events, either by the virtue of losing fast events, or by perturbing the Ca2+
signaling itself (Lock, Parker, and Smith 2015). However, while GCaMP6f is inferior in
detecting fast, transient local events, it is excellent at detecting large, slow events happening in
neurons, especially in neuronal/astrocytic co-cultures without “contaminating” the signal from
underlying glial cells.
Next I wanted to compare the performance of the two indicators with slower Ca2+ wave
responses that arise from activation of metabotropic receptors. I used an NPEC-caged analogue
of trans-1-amino-1,3-dicarboxycyclopentane (ACPD) that can be transformed into a biologically
active form upon UV light stimulation to selectively activate metabotropic glutamate receptors
without complications from activating ionotropic glutamate receptors. Consistent with my
previous findings on action potential-induced Ca2+ spikes, GCaMP6f could discriminate between
81
neurons and astrocytes, and again the amplitude of individual spikes appeared dampened
compared with the Cal-630 recordings (Fig. 3.5.2 (b)). One brief UV flash was sub-optimal in
eliciting a Ca2+ response, however, in GCaMP6f-expressing neurons it lead to an abrupt drop in
fluorescence signal, presumably due to photobleaching (Fig. 3.5.2 (c)). After a short train of four
UV flashes, neurons responded with a characteristic Ca2+ wave originating in proximal dendrites
and spreading into the soma, as previously reported (Nakamura, Nakamura, and Ross 1999).
Comparison of the waveforms from the GCaMP6f and Cal-630 recordings (Fig. 3.5.2 (d); the
GCaMP6f trace was offset to overlay the Cal-630 trace) suggested that the two indicators are
similarly effective in reporting a slow Ca2+ rise. Since the signal-to-noise ratio measured with the
two indicators is similar, it appears that GCaMP6f is as effective in detecting global
metabotropic signals as synthetic dyes, but has the advantage of allowing the selective targeting
to neurons, without a complicating signal from the glial cells.
Based on these results, I decided to use genetically encoded GCaMP6f indicator for imaging
slow Ca2+ waves in neurons, and employ synthetic dyes for any recordings of non-neuronal cells
or for fast events.
3.3.3 mGluR-mediated Ca2+ signaling events in cortical neurons from FXS and wild-
type mice.
The goal of the experiments presented in this chapter was to determine if Ca2+ signaling
abnormalities reported in human skin fibroblasts from patients with FXS are recapitulated in
mammalian neurons with a similar lack of functional FMR1 protein. Neurons are architecturally
complex cells, where spatial origin of the signal greatly influences downstream events. After

82
optimizing the culturing conditions and choice of indicator, I then went on to investigate whether
the Ca2+ signaling abnormality observed in human skin fibroblasts from patients with FXS was
also present in mouse neurons with the FMR1 gene deletion. IP3 signaling in neurons can be
stimulated by activation of plasma membrane metabotropic receptors. To stimulate IP3-mediated
Ca2+ release in neurons, I used UV flash uncaging of the broad-spectrum mGluR agonist trans-
ACPD, or bath application of the selective group 1 mGluR agonist, DHPG. Photoreleased ACPD
elicited Ca2+ waves originating in proximal dendrites that propagated bidirectionally and
frequently invaded the soma (Fig. 3.5.3 (a)), consistent with previous reports (El-Hassar et al.
2011; Hagenston, Fitzpatrick, and Yeckel 2008). Ca2+ waves were blocked by (RS)-α-Methyl-4-
carboxyphenylglycine (MCPG), a non-selective group I/group II metabotropic glutamate
receptor antagonist, suggesting that the effect of ACPD is on metabotropic, not ionotropic,
glutamate receptors (data not shown).
UV uncaging of ACPD under identical conditions elicited responses in neurons from FMR1-
/y and FMR1+/y mice that did not differ in their amplitude (Fig. 3.5.3 (c)), nor time after the UV
flash to reach the peak amplitude (Fig. 3.5.3 (d)).
One possible explanation for these discrepancies between my findings in human skin
fibroblasts and mouse neurons may lie in differential expression of of IP3 receptor types.
Fibroblasts express predominantly type 2 and 3 IP3Rs, whereas neurons primarily express type 1.
Thus, astrocytes that express mainly type 2 IP3Rs may be better translatable to my previous
findings in human skin fibroblast. To test this hypothesis, I measured IP3-mediated Ca2+ release
using the same co-cultures that were rich in glial cells. Cells were loaded with Cal-520 and
stimulated with extracellular agonists of mGluR receptors – cACPD and DHPG. Astrocytes

83
responded robustly to both of these agonists, however, again the amplitude of the response was
not different between genotypes (Fig. 3.5.4). Finally, I used caged IP3 to bypass the mGluR
signaling pathway and activate IP3Rs directly. This method also gives greater flexibility in the
size of the elicited response. I used three different UV flash durations to stimulate sub-maximal
and maximal responses to determine if there is a difference in the peak amplitude response or
sensitivity to IP3 in mouse astrocytes. Similar to my results with extracellular agonists, Ca2+
responses to photoreleased IP3 in wild-type astrocytes were undistinguishable from the FMR1-/y
cells (Fig. 3.5.5).
3.3.4 High-throughput FLIPR assay on mouse cell cultures.
Methodological differences in how Ca2+ signaling is being imaged may account for the
apparent discrepancies between the human and mouse cells. To probe this idea, I decided to use
the high-throughput Ca2+ screening assay, FLIPR, to closely replicate imaging conditions used
on human fibroblasts from the previous chapter. Cortical cells from newborn mice were plated
on a 96-well plate and were allowed to grow for five days in neuronal maintenance media to
promote neuronal cell survival. ATP (100 µM final concentration) was applied to activate cell-
surface purinergic receptors and induce subsequent IP3 production and Ca2+ release. Ca2+-free
extracellular medium supplemented with 1 mM EGTA was used to exclude Ca2+ entry across the
cell membrane. Averaged fluorescence traces from three independent wells illustrating ATP
responses in neurons from FMR1-/y or FMR1+/y mice are shown in Fig. 3.5.6. I quantified
fluorescence signals as a ratio (ΔF/F0) of the fluorescence change (ΔF) at each well relative to
the basal fluorescence (F0) before stimulation and further normalized it to the ionomycin

84
response to account for any possible differences in the ER store filling. Fig. 3.5.6 (b) shows
mean ΔF/F0 values from these cells in response to 100 µM ATP normalized to ΔF/F0 of the
ionomycin response (1 µM). FXS neuron-enriched cultures demonstrated slightly greater
response to ATP compared with that of wild-type neurons. Extracellular stimulation with 100
µM DHPG demonstrated even greater increase in Ca2+ signaling in FXS neurons (Fig. 3.5.6
(c,d))
Similarly to initiation of the neuron-enriched culture, I generated a cortical culture that was
enriched with astrocytes by culturing the cells in DMEM + 10% FBS media that is
accommodating for astrocyte growth and proliferation. Analogous to the results of neuron-
enriched cultures, Ca2+ responses in glial cells from knockout animals were more robust
compared with those from wild-type mice (Fig. 3.5.7).
Another possibility was that the Ca2+ signaling deficits observed in human cells are specific
to peripheral tissues such as skin fibroblasts, and do not mimic signaling machinery in the central
nervous system. Therefore, I decided to test mouse skin fibroblasts with the high-throughput
Ca2+ assay, thus fully replicating my early experiments on human skin fibroblasts from patients
with FXS. 100 µM ATP applied to each individual well with mouse skin fibroblasts in the
absence of extracellular Ca2+ elicited a robust response. Fig.3.5.8 (a) shows fluorescence traces
averaged from six independent wells in response to the agonist addition, and Fig. 3.5.8 (b)
demonstrates that response normalized to the corresponding ionomycin response. As can be seen
from the data, fibroblasts from the FMR1-/y did not differ in their response to ATP from the cells
obtained from wild-type mice. Clearly, murine fibroblasts, not only their glia and neurons, differ
from human cells.

85
3.4 Discussion
Here I report Ca2+ signaling results on dissociated cortical neurons, astrocytes and fibroblasts
obtained from a mouse model of FXS. This work was done because it was previously discovered
that non-neuronal (fibroblast) cells from human patients with FXS display a pronounced and
consistent Ca2+ signaling deficit arising at the level of IP3 receptors. However, no murine cell
type recapitulated the human findings.
IP3-mediated Ca2+ release is an important neuronal signaling mechanism implicated in
regulation of many neuronal functions, such as neuronal firing rates and short- and long-term
plasticity. It is mobilized in response to activation of various metabotropic neurotransmitter
receptors, including group 1 mGluRs. Normally, stimulation of mGluRs in dendrites triggers
increased local protein synthesis, ultimately resulting in AMPA receptor internalization and
slowing of net synaptic maturation through mGluR-mediated LTD. The mGluR theory of FXS
postulates that absence of FMRP overactivates the mGluR-mediated signaling pathway, and thus
leads to features associated with FXS. Moreover, multiple studies from different groups in Fmr1
knockout mice with pharmacological or genetic reduction of mGluR function showed correction
of many of these abnormalities, further demonstrating that mGluRs play a significant role in the
pathophysiology of FXS, at least in mice (Dölen et al. 2007; Darnell and Klann 2013; Yan et al.
2005). Despite the fact that overactivation of these receptors has long been implicated in
pathophysiology of FXS, surprisingly little is known about the resulting Ca2+ release upon
activation of these receptors. My findings described in Chapter 2 on human skin fibroblasts show
that IP3-mediated Ca2+ release is depressed in response to P2YR activation. Extrapolating these
findings to mouse neurons from the same disorder suggests that Ca2+ release from the ER

86
downstream of the mGluR signaling would be decreased, contrary to the widely reported
increased activity at the level of the plasma membrane receptor. However, data in this chapter
suggest that the mGluR-mediated Ca2+ signaling is not diminished in neurons and astrocytes
from Fmr1 KO mice, consistent with previous reports on overactivated mGluR signaling in the
mouse model of FXS (Yan et al. 2005; Osterweil et al. 2010).
Extracellular activation of the mGluRs with broad mGluR agonist t-ACPD and specific
group 1 agonist DHPG did not reveal deficits in the Ca2+ release in mouse neuronal or glial cells.
A high-throughput Ca2+ assay demonstrated increases in the Ca2+ signaling pathway in response
to activation of the IP3 signaling pathway with two metabotropic agonists, ATP and DHPG in
mouse cortical cultures, whereas no changes were observed in mouse skin fibroblasts.
Several factors could contribute to this seeming discrepancy. First, the human condition
primarily arises from a pathogenic expansion of a CGG repeat on the X chromosome. The
number of repeats predicts the pathology: in unaffected individuals with less than 40 repeats the
5’UTR portion of the FMR1 gene is unmethylated, and the protein product is expressed
normally. If the number of repeats exceeds 200, the FMR1 becomes fully methylated and
produces no protein. The mouse model represents a full genetic deletion, ultimately leading to
the same phenotype at the protein level, yet it fails to capture any other possible mechanisms
associated with the CGG expansion and gene methylation. The process of gene silencing in the
human full mutation patients is assumed to be a static and uniform process in all cells of the
body, across all developmental ages. However, one study has recently found that it may not
faithfully represent the reality. Induced pluripotent stem cells (iPSCs) derived from fibroblasts
from FXS patients did not necessarily replicate the CGG repeat length, the FMR1 methylation

87
status or the protein expression level in the original fibroblasts. In some cases, the resulting
iPSCs had reduced number of repeats, affecting epigenetic status of the FMR1 gene promoter
and ultimately altering neuronal differentiation of the resulting cell lines (Sheridan et al. 2011).
Thus the FMR1 knockout mouse model may not be appropriate for studying the condition at the
epigenetic level, and may also influence many signaling pathways, such as IP3 signaling.
Another possible explanation is the difference between the mouse and human proteomes. The
laboratory mouse, the premier model organism for studying mammalian organism functions in
biomedical research, shares a large proportion of its protein-coding genes with humans. Yet, the
two mammals differ in significant ways. A massive recent mouse genome mapping study
demonstrated that the expression pattern of many mouse genes show considerable divergences
from their human orthologues (Yue et al. 2014). Since the FMR1 protein has been shown to
interact with at least hundreds of mRNA target transcripts in the brain (Brown et al. 2001;
Darnell et al. 2011), it is likely that at least some of these targets will vary significantly from
mouse to human, thus creating divergent expression profiles of these gene targets downstream of
the FMR1 regulation. Specificity and versatility of the IP3 signaling pathway is ensured by a rich
network of interacting proteins (Prole and Taylor 2016) that (1) may or may not be shared among
humans and mice, and (2) may or may not be equally regulated by FMR1 expression. A well-
designed computational study could be capable of capturing those divergent protein interaction
pathways in two different organisms and would serve as a good roadmap for guiding future
studies on FXS and the translation between the two organisms. However, such a project is out of
scope of the current work.
88
Relevant to this work, several recent FXS clinical trials have failed, including those targeted
at reducing the mGluR signaling activity (Berry-Kravis et al. 2016; Jeste and Geschwind 2016).
A list of possible explanations for this failure is long and includes the limitations of the outcome
measures, the age of participants, and improvement of subtle changes that can only be seen in
small subtypes of the heterogeneous population (Mullard 2015). However, the validity of using
mouse models for modeling complex neurodevelopmental disorders such as ASD may also be
questioned. For example, while the commonly used FXS mouse model replicates many
behavioral and cellular phenotypes of FXS in humans, such as repetitive behavior,
hypersensitivity to stimuli and dendritic spine morphology, it fails to convincingly replicate other
symptoms, such as cognitive impairments and sociability seen in human patients (Kazdoba et al.
2014).
In this work, I demonstrate that at least one signaling deficit that exists in human cells is not
present in the mouse model of FXS. Intriguingly, this signaling pathway is immediately
downstream of the major signaling cascade commonly implicated in the mouse model pathology
– mGluR. Given that the latest treatments were targeted at reducing the overactive mGluR
signaling seen in mice, in human patients they may have further reduced already diminished IP3-
mediated Ca2+ release downstream of mGluRs, thus making those interventions counter
constructive.
Clearly, more work is needed to further understand the FXS Ca2+ signaling phenotype in
human models of the disease, but my current findings suggest that the field of the FXS may be
better served if such research is done on human, not mouse cells.

89
3.5 Figures
Figure 3.5. 1 Comparison of Ca2+ transients recorded with Cal-630 and GCaMP6f in
mouse cortical neurons in vitro.
(a) Images of neurons loaded with the Ca2+ dye Cal-630 (red) and expressing GCaMP6f (green)
composited from averaged frames of a video reveal the expression of GCaMP6f and loading of
Cal-630. (b) Representative traces of fluorescence response (F/F0) from four cells from (a) of
Cal-630 and GCaMP6f in response to 10 spikes at 1, 2, 4, 6, and 10 Hz given at 10, 30, 45, 60,
and 80 sec. Note different y-axis scale for cell #1. (c) Cell #1 from (a) and (b) is shown to

90
demonstrate a much larger ΔF/F0 change in GCaMP6f compared with Cal-630 in response to a
train of 10 spikes of 70 mV at 1, 2, 4, 6, and 10 Hz (each train is represented by arrows with the
frequency noted in brackets) (d) GCaMP6f has smaller amplitude response to a train of action
potentials at 1 and 2 Hz stimulation. The GCaMP6f trace (green) is offset -5 Y units for clarity of
representation.
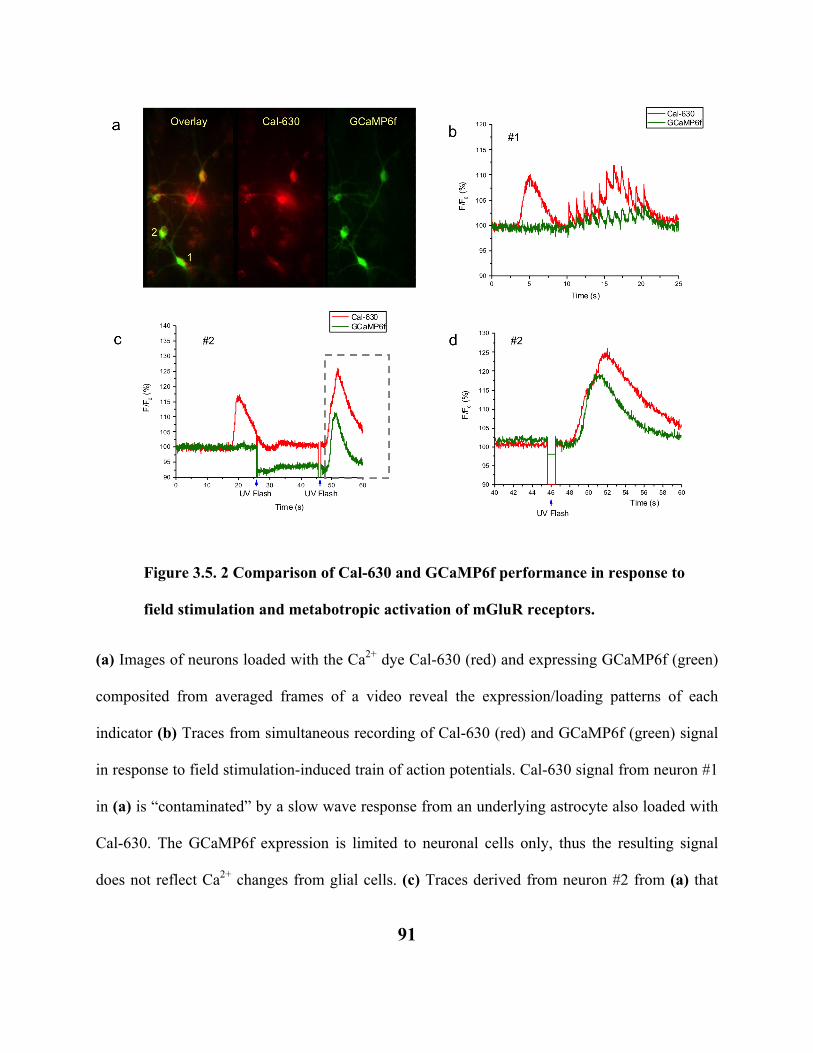
91
Figure 3.5. 2 Comparison of Cal-630 and GCaMP6f performance in response to
field stimulation and metabotropic activation of mGluR receptors.
(a) Images of neurons loaded with the Ca2+ dye Cal-630 (red) and expressing GCaMP6f (green)
composited from averaged frames of a video reveal the expression/loading patterns of each
indicator (b) Traces from simultaneous recording of Cal-630 (red) and GCaMP6f (green) signal
in response to field stimulation-induced train of action potentials. Cal-630 signal from neuron #1
in (a) is “contaminated” by a slow wave response from an underlying astrocyte also loaded with
Cal-630. The GCaMP6f expression is limited to neuronal cells only, thus the resulting signal
does not reflect Ca2+ changes from glial cells. (c) Traces derived from neuron #2 from (a) that

92
responded to uncaging of 100 µM of cACPD. UV flashes of different durations are depicted by
arrows. Photobleaching of GCaMP6f signal in response to the strong UV flash is seen as an
abrupt decrease in the signal level after the first flash. (d) An enlarged part of the trace from (c;
grey dashed outline) showing kinetics of the metabotropic response. Note that the GCaMP6f
signal was offset to overlap the Cal-630 signal.
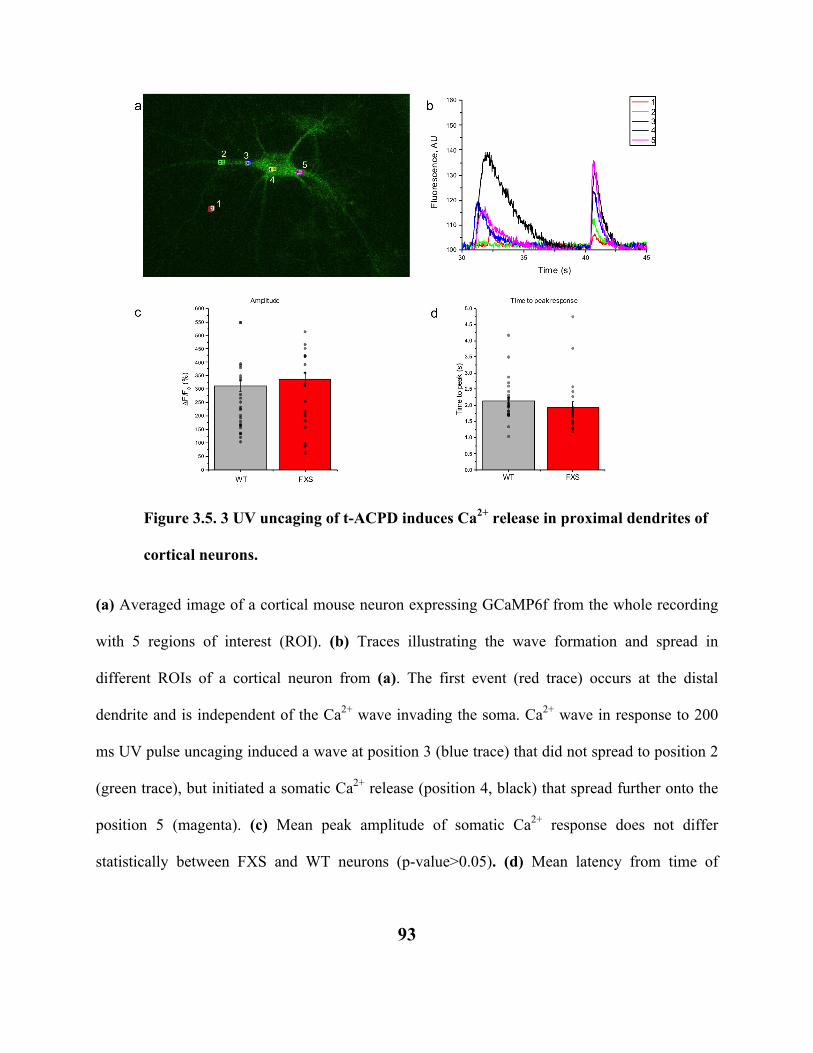
93
Figure 3.5. 3 UV uncaging of t-ACPD induces Ca2+ release in proximal dendrites of
cortical neurons.
(a) Averaged image of a cortical mouse neuron expressing GCaMP6f from the whole recording
with 5 regions of interest (ROI). (b) Traces illustrating the wave formation and spread in
different ROIs of a cortical neuron from (a). The first event (red trace) occurs at the distal
dendrite and is independent of the Ca2+ wave invading the soma. Ca2+ wave in response to 200
ms UV pulse uncaging induced a wave at position 3 (blue trace) that did not spread to position 2
(green trace), but initiated a somatic Ca2+ release (position 4, black) that spread further onto the
position 5 (magenta). (c) Mean peak amplitude of somatic Ca2+ response does not differ
statistically between FXS and WT neurons (p-value>0.05). (d) Mean latency from time of

94
photolysis flash to peak Ca2+ response is not different between FXS and WT neurons. All data
are presented as mean ± s.e.m. Individual data points represent responses from single neurons.

95
Figure 3.5. 4 Metabotropic Ca2+ response in astrocytes from WT or FXS mice.
(a) Mean peak amplitude of Ca2+ release in response to UV flash photolysis of 100 µM ACPD is
not depressed in FXS cells relative to WT controls (p-value > 0.05). (b) Mean peak response to
bath application of 100 µM of DHPG does not differ in astrocytes from WT or FXS mice (p-
value > 0.05). All data are presented as mean ± s.e.m..

96
Figure 3.5. 5 Ca2+ release in mouse astrocytes evoked by photoreleased IP3.
IP3-mediated Ca2+ release evoked by different flash durations of the UV flash induced peak
responses of similar amplitude in cultures of confluent astrocytes from WT or FXS mice. Ca2+
responses were recorded and averaged across a confluent monolayer of the cells. All data are
presented as mean ± s.e.m. Data points represent responses from individual recordings.
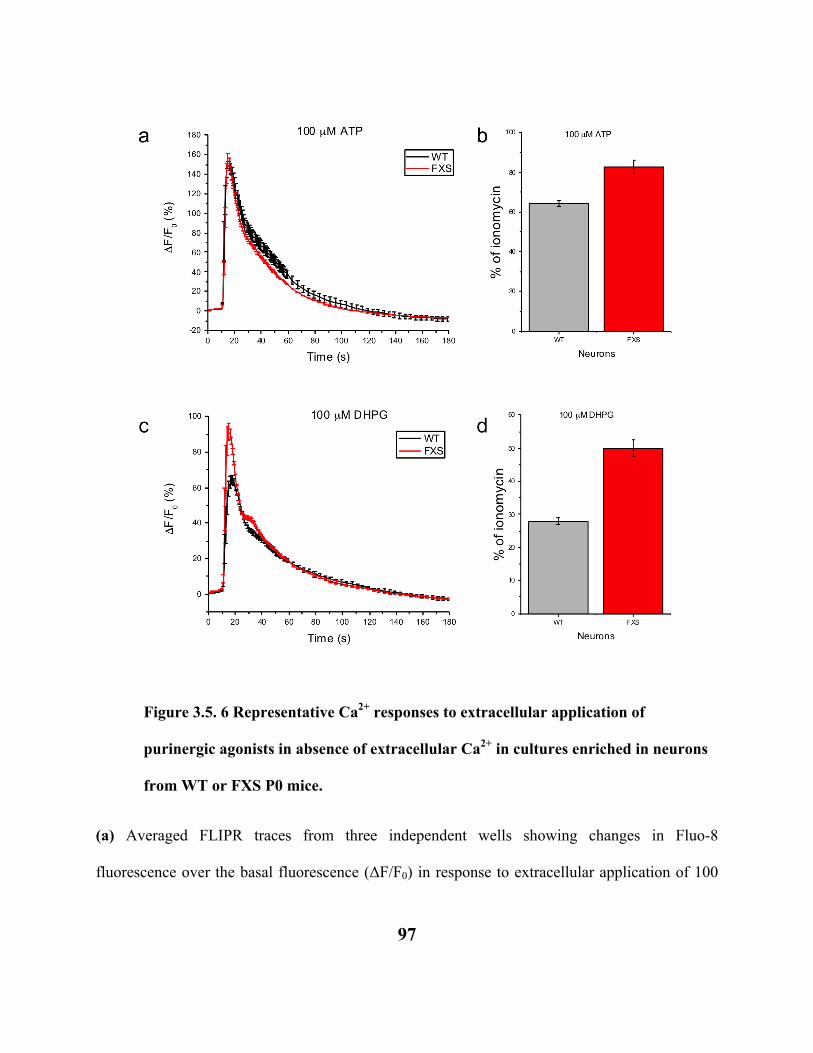
97
Figure 3.5. 6 Representative Ca2+ responses to extracellular application of
purinergic agonists in absence of extracellular Ca2+ in cultures enriched in neurons
from WT or FXS P0 mice.
(a) Averaged FLIPR traces from three independent wells showing changes in Fluo-8
fluorescence over the basal fluorescence (ΔF/F0) in response to extracellular application of 100
98
µM ATP to neuron-enriched cultures. Lines represent mean values ± s.e.m.. (b) Peak amplitudes
(ΔF) of Ca2+ responses to 100 µM ATP normalized to basal fluorescence (F0) before stimulation
are expressed as a percentage of the mean ionomycin response in neurons from WT mice (grey)
or FXS (red). Bar graphs show mean of triplicate measurements after subtracting the artifactual
signal resulting from addition of vehicle alone. Data are presented as mean ± s.e.m.. (c)
Averaged FLIPR traces showing changes in Fluo-8 fluorescence over the basal fluorescence
(ΔF/F0) in response to extracellular application of 100 µM DHPG to neuron-enriched cultures.
(d) Peak amplitudes (ΔF) of Ca2+ responses to 100 µM DHPG normalized to the basal
fluorescence (F0) before stimulation are expressed as a percentage of the mean ionomycin
response in neurons from WT mice (grey) or FXS (red). Bar graphs show mean of triplicate
measurements after subtracting the artifactual signal resulting from addition of vehicle alone.
Data are presented as mean ± s.e.m..

99
Figure 3.5. 7 Representative Ca2+ responses to extracellular application of
purinergic agonists in absence of extracellular Ca2+ in cultures enriched in
astrocytes from WT or FXS P0 mice.
(a) Averaged FLIPR traces from three independent wells showing changes in Fluo-8
fluorescence over the basal fluorescence (ΔF/F0) in response to extracellular application of 100

100
µM ATP to glia-enriched cultures. Lines represent mean values ± s.e.m.. (b) Peak amplitudes
(ΔF) of Ca2+ responses to 100 µM ATP normalized to the basal fluorescence (F0) before
stimulation are expressed as a percentage of the mean ionomycin response in astrocytes from
WT mice (grey) or FXS (red). Bar graphs show mean of triplicate measurements after
subtracting the artifactual signal resulting from addition of vehicle alone. Data are presented as
mean ± s.e.m.. (c) Averaged FLIPR traces showing changes in Fluo-8 fluorescence over the
basal fluorescence (ΔF/F0) in response to extracellular application of 100 µM DHPG to
astrocyte-enriched cultures. (d) Peak amplitudes (ΔF) of Ca2+ responses to 100 µM DHPG
normalized to the basal fluorescence (F0) before stimulation expressed as a percentage of the
mean ionomycin response in astrocytes from WT mice (grey) or FXS (red). Bar graphs show
mean of triplicate measurements after subtracting the artifactual signal resulting from addition of
vehicle alone. Data are presented as mean ± s.e.m..

101
Figure 3.5. 8 Representative Ca2+ responses to extracellular application of ATP in
absence of extracellular Ca2+ in skin fibroblasts from WT and FXS P0 mice.
(a) Averaged FLIPR traces from six independent wells showing changes in Fluo-8 fluorescence
over the basal fluorescence (ΔF/F0) in response to extracellular application of 100 µM ATP in
WT fibroblasts (black) and FXS cells (red). Lines represent mean values ± s.e.m.. (b) Peak
amplitudes (ΔF) of Ca2+ responses to 100 µM ATP normalized to the basal fluorescence (F0)
before stimulation from WT mice (grey) or FXS (red). Bar graphs show mean of triplicate
measurements after subtracting the artifactual signal resulting from addition of vehicle alone.
Data are presented as mean ± s.e.m..
WT FXS0
20
40
60
80
100
120
ΔF/F
0 (%
)
100 µM ATPa b
0 20 40 60 80 100 120 140 160 180
0
20
40
60
80
100
120
ΔF/
F 0 (%
)
Time (s)
WT FXS

102
Chapter 4. Discussion and implications of this work
ASD is a broad, umbrella diagnosis for a heterogeneous group of conditions encompassing
several neurodevelopmental problems, along with many phenotypes and co-morbidities. Here I
demonstrate that patient-derived fibroblasts from subjects with monogenic syndromes with high
prevalence of ASD (FXS, TSC1, TSC2, Rett, and Prader-Willi syndromes) display depressed
Ca2+ release evoked by purinergic receptor activation of IP3 signaling. I further extend these
findings to fibroblast cell lines from patients with sporadic ASD without any known genetic
mutations. This Ca2+ signaling defect was identified in 85% of the subjects with sporadic ASD,
suggesting that dysregulation of IP3 signaling constitutes a nexus where genes altered in ASD
converge to exert their deleterious effect. This decrease is not due to the defective activation
and/or signaling from the membrane-bound receptors, but results from decreased IP3R activity,
since the intracellular uncaging of i-IP3 leads to similarly dampened response. Using the optical
patch-clamp technique, I discovered that these changes may be attributed to decreased
functioning of elementary single or clustered IP3Rs at the molecular level. The mean open time
in human FXS fibroblasts was about one half that in wild type cells, and the numbers of
definable release sites were reduced. These results suggest that the IP3Rs, although carrying no
mutations themselves, are functionally altered at the level of single (or small clusters of)
channels in these three distinct ASD models.
4.1 Downstream consequences of diminished IP3 Ca2+ signaling.
In neurons, IP3-mediated Ca2+ signaling is activated through agonist stimulation of Gq-
coupled receptors such as 5HT2A or mGluR1/5 receptor subtypes found on the plasma

103
membrane. IP3R-mediated Ca2+ release in neurons is involved in crucial functions, including
synaptic plasticity and memory (Inoue et al. 1998; Rose and Konnerth 2001), neuronal
excitability (Hernandez-Lopez et al. 2000; Stutzmann, LaFerla, and Parker 2003),
neurotransmitter release (Li et al. 1998; Diamant, Schwartz, and Atlas 1990), axon growth
(Gomez and Spitzer 1999) and long-term changes in gene expression (Li et al. 1998),
highlighting the central integrating position played by IP3Rs (Patterson, Boehning, and Snyder
2004). Both spatial and temporal features of Ca2+ signals are crucial for the reliable signal
initiation and propagation. Large signals that propagate to the soma can carry information from
dendritic synapses, activating certain genes and transcription factors in the nucleus; while
smaller events confined to a single synapse regulate neuronal properties at the dendritic level.
Ca2+ release from the ER dynamically regulates activity-dependent membrane excitability
through the opening of small conductance Ca2+-activated K+ channels (Chandy et al. 1998;
Köhler et al. 1996). This current is proportional to the Ca2+ signal amplitude (Stutzmann,
LaFerla, and Parker 2003) and underlies spike-frequency adaptation, a phenomenon where
accumulating intracellular Ca2+ reaches sufficient levels to activate hyperpolarizing K+ currents
and transiently suppress membrane excitability. As a result, IP3-evoked Ca2+ release transiently
hyperpolarizes the cell and briefly depresses neuronal excitability, leading to a reduction in firing
frequency (Stutzmann, LaFerla, and Parker 2003). Suppressed IP3-mediated Ca2+ release from
the internal stores, as I report in diverse models of ASD, is thus expected to diminish the
inhibitory K+ conductance, and as such would tend to produce neuronal hyperexcitability,
consistent with observations in several models of ASD (Repicky and Broadie 2009; Bateup et al.
2011).

104
Depression of IP3-mediated Ca2+ signaling may further disrupt neurodevelopment through
separate mechanisms. IP3Rs have been shown to be central participants in autophagy (Cárdenas
et al. 2010; Criollo et al. 2007; Hamada et al. 2014; Vicencio et al. 2009). Decreased levels of
autophagy result in defective synaptic pruning, which have been repeatedly associated with ASD
in humans and mouse models (Tang et al. 2014). Promotion of autophagy also rescues behavioral
defects in mouse models of ASD (Tang et al. 2014). The role of mitochondria energy-deficient
endophenotype has long been an active line of investigation in a subset of patients with ASD
(Gargus and Imtiaz 2008; Filipek et al. 2003), and several studies have shown a link between
IP3-mediated Ca2+ release and mitochondrial function (Pinton et al. 2008; Cárdenas et al. 2010;
La Rovere et al. 2016; Decuypere et al. 2011). Under normal basal conditions, low-level
constitutive IP3R-mediated transfer of Ca2+ from the ER to mitochondria maintains optimal
cellular bioenergetics (Cárdenas et al. 2010). This ongoing transfer supports normal cellular
bioenergetics by maintaining oxidative phosphorylation and ATP production. In its absence,
cells undergo an energy crisis; oxidative phosphorylation is compromised, ATP levels fall and
AMPK-dependent, mTOR-independent autophagy is induced as a mechanism to enable the cell
to survive. Reduced mitochondrial activity likely has adverse consequences for normal
neurodevelopment and neuronal function, resulting from ATP deficiency and its effects on
membrane potential and neurotransmitter release, as well as production of excess reactive
oxygen species (ROS).

105
4.2 Ca2+ signaling screen as a biomarker for ASD.
The recent development of mouse models for ASD has greatly improved our understanding
of the condition. Laboratory mice can provide valuable information about neuronal networks and
synaptic function in primary neurons, as human neurons are largely unavailable for laboratory
research. A great deal of ASD animal work has been concentrated on the mouse model of FXS, a
syndromic form of ASD in humans. Since Mark Bear coined his mGluR theory of FXS in 2004
(Bear, Huber, and Warren 2004), it has taken a central role in the FXS research field. The theory
explains several cellular and molecular deficits occurring in a FXS brain by a hyperactive
signaling arising from the enhanced group 1 mGluR activation. The mouse model turned out to
be highly amenable to correction of many deficits with pharmacological and genetic mGluR
reduction. Three pharmacological companies – Novartis, Roche and Seaside Therapeutics (that
had partnered with Roche) launched independent clinical trials on mGluR antagonists in humans.
All of them failed to meet their primary endpoints.
The IP3R is a key signaling hub in the canonical metabotropic glutamate receptor pathway in
neurons (Inoue et al. 1998; Berridge 1993), and according to the mGluR theory of FXS (Bear,
Huber, and Warren 2004), the overactive mGluR signaling cascade underlies the pathogenesis of
the disorder. Surprisingly, not much is known about Ca2+ signaling release in response to
activation of the mGluR in FXS. In Chapter 2, I demonstrate that human skin fibroblasts from
patients with FXS have pronounced signaling deficits at the level of IP3Rs, which led me to
hypothesize that Ca2+ release resulting from activation of metabotropic receptors would be
decreased in neurons from a mouse model of FXS. However, my findings in Chapter 3
demonstrate that mouse neurons did not replicate this signaling deficit. Furthermore, neither

106
mouse astrocytes nor skin fibroblasts from FXS mice demonstrated this signaling abnormality. In
conclusion, the mouse completely fails as a model for the IP3R defect I observe in human FXS
cells, providing a possible explanation for recent failures of several clinical trials for this disease.
My findings tap into an important but often overlooked topic of divergence in signaling
pathways between species ((Yue et al. 2014; Seok et al. 2013), but also see (Takao and
Miyakawa 2015)). The mouse brain is not simply a mini-version of a human brain, and this fact
may explain poor success rates in translation between preclinical studies on rodents to clinical
studies in humans, especially in the neurological field. This is well exemplified by the recent
failures of two clinical FXS drug trials (Mullard 2015), and >100 failed clinical trials of
Alzheimer’s disease therapies (Schneider et al. 2014), all of which showed promise in mouse
models.
At present, a strong emphasis is put on mapping behavioral defects seen in humans onto
rodents and then correcting them in the mouse models. A different (and perhaps better) approach
would be to refine biochemical or biophysical functional biomarkers as molecular readouts for
validating drug targets in human cells. Biomarkers of ASD have long been sought in the hopes
that they might improve outcomes for these patients and their families. A high-throughput Ca2+
signaling assay such as the one I describe here may potentially serve as a molecular target for
future drug discoveries. Indeed, the promise of cell-based approaches to ASD is underscored by
the now well-established utility of going directly to human disease cells for drug discovery in
instances where animal models are lacking; as was the case for cystic fibrosis where novel
therapeutics were identified based on high throughput screening of patient cells for correction of

107
a patient’s cellular biomarker phenotype (Van Goor et al. 2009; Van Goor et al. 2011; Davis,
Yasothan, and Kirkpatrick 2012).
My study opens the prospect that a skin biopsy sample could become a functional cellular
diagnostic and surrogate clinical trial outcome end-point measure, much as long has been the
case for neurogenetic encephalopathies caused by defects in mitochondria, lysosomes and
peroxisomes (Kudoh, Velkoff, and Wenger 1983; Waterham and Ebberink 2012; Ye and Hoppel
2013; Saada 2011). Using this cell-based assay, novel or repurposed candidate drugs could be
rapidly screened to evaluate their efficacy on a subject’s cells prior to their enrollment in a
clinical trial, hopefully improving the prospects for children with autism and their families.
4.3 Limitations and future directions.
Although human skin fibroblasts have advantages as a model cell system to study ASD, the
central pathology of ASD lies in neuronal dysfunction. To truly understand the disease
pathogenesis these studies need to be extended to examine IP3/Ca2+ signaling in neurons. Results
in skin fibroblasts cannot be directly extrapolated to IP3-mediated signaling in neurons, given
that fibroblasts predominantly express type 3 IP3Rs whereas neurons predominantly express type
1 IP3Rs (Zhang et al. 2014). Nevertheless, because expression levels of all three isotypes of
IP3Rs are only slightly diminished in FXS and TSC fibroblasts, I conclude that the pronounced
depression of Ca2+ signaling does not result from diminished expression of a specific isotype.
Instead, the depressed Ca2+ signals likely result from modulatory effects on IP3R function, which
might extend across different isotypes.

108
Recent advances in stem cell biology and the advent of somatic cell reprogramming now
enable the generation of patient-derived induced pluripotent stem cells (iPSCs) that can be
differentiated in vitro into neurons, glia and other cell types (Takahashi and Yamanaka 2015). A
promising approach will be to utilize neuronal and glial cells derived from fibroblasts from a
selected small set of monogenic and sporadic ASD subjects as well as matched, non-affected
controls. This would allow a determination of how Ca2+ signaling may be altered in central
nervous system cells from ASD subjects, how these alterations relate to the corresponding
deficits in the fibroblasts from which the iPSC cells are derived, and provide a means to explore
consequences for neuronal excitability.
In recent years, several iPSC cell lines from patients with FXS have been developed by
different groups (Urbach et al. 2010; Sheridan et al. 2011). In light of the considerable attention
that has been devoted to the mGluR theory of FXS, including several human trials, it is
intriguing that there have yet to be any convincing reports of mGluR-mediated signaling
abnormalities in human cells. A first goal of future studies would be to compare IP3-mediated
Ca2+ signals in iPSC-derived neurons from FXS, TSC1 and TSC2 human subjects, as well as
unaffected controls. Given the ubiquity of the ER IP3/Ca2+ signaling pathway across all cells of
the body, and decades of experience with other organellar diseases, it is reasonable to expect that
the deficits I observed in fibroblasts from ASD subjects would be reflected in neuronal function;
however, that remains to be experimentally determined, and will be a critical achievement. The
correlation between Ca2+ signaling deficits in neurons vs. fibroblasts among different subjects
would reveal the extent to which neuronal deficits can be inferred from measurements in
fibroblasts, and whether similar correlations hold true across different monogenic and sporadic

109
cases of ASD. If such correlation exists, it would greatly support the view that Ca2+ signaling
deficiencies may play a causative role in ASD pathogenesis and provide an enormously powerful
tool to dissect the underlying mechanisms.
4.5 Concluding remarks.
In conclusion, my findings indicate that ER IP3R signaling is affected in three distinct
monogenic genetic models of ASD as well as a majority of cases of sporadic ASD, pointing to
the ER as a functional “hub” where different cellular signaling pathways merge to contribute to
the pathogenesis of ASD. In addition to its role in Ca2+ homeostasis, the ER serves as a key
integrator of environmental stressors with metabolism and gene expression, as it mediates a host
of broad ranging cell stress responses such as the heat shock and unfolded protein responses
(Brostrom and Brostrom 2003). Because of the ubiquitous nature of IP3R signaling and its
diverse roles in almost all cells of the body, deficits in IP3-mediated Ca2+ signaling may not be
limited to neurological correlates of ASD, but may also explain other characteristic ASD-
associated heterogeneous symptoms, such as those of the gastrointestinal tract (McElhanon et al.
2014; van De Sande, van Buul, and Brouns 2014) and immune system (Ziats and Rennert 2011;
Wei et al. 2011). Furthermore, since the ER serves as a sensor of a host of environmental
stressors, this same mechanism may contribute to the known environmental component to the
ASD phenotype, and holds the potential to reveal relevant stressors. In this light it can be seen to
integrate a matrix of ASD associated risk factors. Ca2+ screening in skin fibroblasts, which are
routinely acquired as clinical specimens, may thus offer a promising technique in conjunction

110
with behavioral testing for early detection of ASD, as well as their potential use for high-
throughput screening of novel therapeutic agents.

111
References
Agulhon, Cendra, Todd A. Fiacco, and Ken D. McCarthy. 2010. “Hippocampal Short- and Long-
Term Plasticity Are Not Modulated by Astrocyte Ca2+ Signaling.” Science 327 (5970):
1250–54. doi:10.1126/science.1184821.
Amir, Ruthie E, Ignatia B Van Den Veyver, Mimi Wan, Charles Q Tran, Uta Francke, and Huda
Y Zoghbi. 1999. “Rett Syndrome Is Caused by Mutations in X-Linked MECP2, Encoding
Methyl-CpG-Binding Protein 2.” Nature Genetics 23: 185–88.
Anderson, Deborah K, Jessie W Liang, and Catherine Lord. 2014. “Predicting Young Adult
Outcome among More and Less Cognitively Able Individuals with Autism Spectrum
Disorders.” Journal of Child Psychology and Psychiatry, and Allied Disciplines 55 (5): 485–
94. doi:10.1111/jcpp.12178.
Anney, Richard, Lambertus Klei, Dalila Pinto, Regina Regan, Judith Conroy, Tiago R
Magalhaes, Catarina Correia, et al. 2010. “A Genome-Wide Scan for Common Alleles
Affecting Risk for Autism.” Human Molecular Genetics 19 (20): 4072–82.
doi:10.1093/hmg/ddq307.
Association, American Psychiatric. 2016. “Diagnostic and Statistical Manual of Mental
Disorders | DSM Library.” Association, American Psychiatric. Accessed June 1.
http://psychiatryonline.org/doi/book/10.1176/appi.books.9780890425596.
Autism and Developmental Disabilities Monitoring Network Surveillance Year 2010 Principal

112
Investigators. 2014. “Prevalence of Autism Spectrum Disorder among Children Aged 8
Years - Autism and Developmental Disabilities Monitoring Network, 2010.” MMWR 63 (2):
1–21. doi:24670961.
Bailey, A., A. Le Couteur, I. Gottesman, P. Bolton, E. Simonoff, E. Yuzda, M. Rutter, et al.
1995. “Autism as a Strongly Genetic Disorder: Evidence from a British Twin Study.”
Psychological Medicine 25 (1): 63-77. doi:10.1017/S0033291700028099.
Baskys, A, and R C Malenka. 1991. “Agonists at Metabotropic Glutamate Receptors
Presynaptically Inhibit EPSCs in Neonatal Rat Hippocampus.” The Journal of Physiology
444: 687–701. doi:10.1113/jphysiol.1991.sp018901.
Bateup, Helen S, Caroline A Johnson, Cassandra L Denefrio, Jessica L Saulnier, Karl Kornacker,
and Bernardo L Sabatini. 2013. “Excitatory/inhibitory Synaptic Imbalance Leads to
Hippocampal Hyperexcitability in Mouse Models of Tuberous Sclerosis.” Neuron 78 (3).
Elsevier: 510–22. doi:10.1016/j.neuron.2013.03.017.
Bateup, Helen S, Kevin T Takasaki, Jessica L Saulnier, Cassandra L Denefrio, and Bernardo L
Sabatini. 2011. “Loss of Tsc1 in Vivo Impairs Hippocampal mGluR-LTD and Increases
Excitatory Synaptic Function.” The Journal of Neuroscience, 31 (24): 8862–69.
doi:10.1523/JNEUROSCI.1617-11.2011.
Bauer, Peter O., Roman Hudec, Shoichiro Ozaki, Misako Okuno, Etsuko Ebisui, Katsuhiko
Mikoshiba, and Nobuyuki Nukina. 2011. “Genetic Ablation and Chemical Inhibition of
IP3R1 Reduce Mutant Huntingtin Aggregation.” Biochemical and Biophysical Research

113
Communications 416 (1–2). doi:10.1016/j.bbrc.2011.10.096.
Bear, Mark F, Kimberly M Huber, and Stephen T Warren. 2004. “The mGluR Theory of Fragile
X Mental Retardation.” Trends in Neurosciences 27 (7): 370–77.
doi:10.1016/j.tins.2004.04.009.
Beaudoin, Gerard M J, Seung-Hye Lee, Dipika Singh, Yang Yuan, Yu-Gie Ng, Louis F
Reichardt, and Jyothi Arikkath. 2012. “Culturing Pyramidal Neurons from the Early
Postnatal Mouse Hippocampus and Cortex.” Nature Protocols 7 (9): 1741–54.
doi:10.1038/nprot.2012.099.
Berridge, M.J. 1997a. “Annual Review Prize Lecture Elementary and Global Aspects of Calcium
Signalling.” J. Physiol. 499 (2): 291–306.
Berridge, M.J. 1993. “Inositol Trisphosphate and Calcium Signaling.” Nature 361: 315–25.
Berridge, M.J. 2009. “Inositol Trisphosphate and Calcium Signalling Mechanisms.” Biochimica
et Biophysica Acta - Molecular Cell Research 1793 (6): 933–40.
doi:10.1016/j.bbamcr.2008.10.005.
Berridge, M.J. 2016. “The Inositol Trisphosphate/Calcium Signaling Pathway in Health and
Disease.” Physiological Reviews 96 (4): 1261–96. doi:10.1152/physrev.00006.2016.
Berridge, M J. 1997b. “Elementary and Global Aspects of Calcium Signalling.” The Journal of
Physiology 499 (2): 291–306.

114
Berridge, M J, P Lipp, and M D Bootman. 2000. “The Versatility and Universality of Calcium
Signalling.” Nature Reviews. Molecular Cell Biology 1 (1): 11–21. doi:10.1038/35036035.
Berridge, M J, and N G Patel. 1968. “Insect Salivary Glands: Stimulation of Fluid Secretion by
5-Hydroxytryptamine and Adenosine-3’,5’-monophosphate.” Science 162 (3852): 462–63.
http://www.ncbi.nlm.nih.gov/pubmed/4300804.
Berry-Kravis, Elizabeth M, David Hessl, Barbara Rathmell, Peter Zarevics, Maryann Cherubini,
Karen Walton-bowen, Yi Mu, et al. 2012. “Effects of STX209 ( Arbaclofen ) on
Neurobehavioral Function in Children and Adults with Fragile X Syndrome : A Randomized
, Controlled , Phase 2 Trial.” Science Translational Medicine 4 (152).
Berry-Kravis, Elizabeth, Vincent Des Portes, Randi Hagerman, Sébastien Jacquemont, Perrine
Charles, Jeannie Visootsak, Marc Brinkman, et al. 2016. “Mavoglurant in Fragile X
Syndrome : Results of Two Randomized , Double-Blind , Placebo-Controlled Trials.” Sci.
Transl. Med. 8 (321).
Bezprozvanny, I. 2011. “Role of Inositol 1,4,5-Trisphosphate Receptors in Pathogenesis of
Huntington’s Disease and Spinocerebellar Ataxias.” Neurochemical Research 36 (7): 1186–
97. doi:10.1007/s11064-010-0393-y.
Bezprozvanny, I, J Watras, and B E Ehrlich. 1991. “Bell-Shaped Calcium-Response Curves of
Ins(1,4,5)P3- and Calcium-Gated Channels from Endoplasmic Reticulum of Cerebellum.”
Nature 351 (6329): 751–54. doi:10.1038/351751a0.

115
Blumberg, Stephen J, and Matthew D Bramlett. 2013. “Changes in Prevalence of Parent-
Reported Autism Spectrum Disorder in School-Aged U.S. Children : 2007 to 2011 – 2012.”
National Health Statistics Reports, no. 65.
Bootman, M D, M J Berridge, and P Lipp. 1997. “Cooking with Calcium: The Recipes for
Composing Global Signals from Elementary Events.” Cell 91 (3): 367–73.
Bradford, M M. 1976. “A Rapid and Sensitive Method for the Quantitation of Microgram
Quantities of Protein Utilizing the Principle of Protein-Dye Binding.” Analytical
Biochemistry 72 (May): 248–54.
Brostrom, Margaret A, and Charles O Brostrom. 2003. “Calcium Dynamics and Endoplasmic
Reticular Function in the Regulation of Protein Synthesis: Implications for Cell Growth and
Adaptability.” Cell Calcium 34 (4–5): 345–63. doi:10.1016/S0143-4160(03)00127-1.
Brown, V, P Jin, S Ceman, J C Darnell, W T O’Donnell, S a Tenenbaum, X Jin, et al. 2001.
“Microarray Identification of FMRP-Associated Brain mRNAs and Altered mRNA
Translational Profiles in Fragile X Syndrome.” Cell 107 (4): 477–87.
Burnstock, Geoffrey, Maria-Pia Abbracchio, Jean-Marie Boeynaems, José L. Boyer, Stefania
Ceruti, Marta Fumagalli, Christian Gachet, et al. 2016. “P2Y Receptors.” IUPHAR/BPS
Guide to PHARMACOLOGY.
http://www.guidetopharmacology.org/GRAC/FamilyDisplayForward?familyId=52.
Campion, D, C Dumanchin, D Hannequin, B Dubois, S Belliard, M Puel, C Thomas-Anterion, et

116
al. 1999. “Early-Onset Autosomal Dominant Alzheimer Disease: Prevalence, Genetic
Heterogeneity, and Mutation Spectrum.” American Journal of Human Genetics 65 (3): 664–
70. doi:10.1086/302553.
Cao, X, L P Li, Q Wang, Q Wu, H H Hu, M Zhang, Y Y Fang, et al. 2013. “Astrocyte-Derived
ATP Modulates Depressive-like Behaviors.” Nat Med 19 (6). 773–77. doi:10.1038/nm.3162.
Cárdenas, César, Russell A. Miller, Ian Smith, Thi Bui, Jordi Molgó, Marioly Müller, Horia
Vais, et al. 2010. “Essential Regulation of Cell Bioenergetics by Constitutive InsP3 Receptor
Ca2+ Transfer to Mitochondria.” Cell 142 (2): 270–83. doi:10.1016/j.cell.2010.06.007.
Chan, Sic L., Michael Mayne, Clark P. Holden, Jonathan D. Geiger, and Mark P. Mattson. 2000.
“Presenilin-1 Mutations Increase Levels of Ryanodine Receptors and Calcium Release in
PC12 Cells and Cortical Neurons.” Journal of Biological Chemistry 275 (24): 18195–200.
doi:10.1074/jbc.M000040200.
Chandy, K G, E Fantino, O Wittekindt, K Kalman, L L Tong, T H Ho, G A Gutman, et al. 1998.
“Isolation of a Novel Potassium Channel Gene hSKCa3 Containing a Polymorphic CAG
Repeat: A Candidate for Schizophrenia and Bipolar Disorder?” Molecular Psychiatry 3 (1):
32–37.
Chen, Naiyan, Hiroki Sugihara, Jitendra Sharma, Gertrudis Perea, Jeremy Petravicz, and Chuong
Le. 2012. “Nucleus Basalis-Enabled Stimulus-Specific Plasticity in the Visual Cortex Is
Mediated by Astrocytes.” Proceedings of the National Academy of Sciences 109 (41):
E2832–E2841. doi:10.1073/pnas.1206557109/-

117
/DCSupplemental.www.pnas.org/cgi/doi/10.1073/pnas.1206557109.
Chen, Tsai-Wen, Trevor J Wardill, Yi Sun, Stefan R Pulver, Sabine L Renninger, Amy Baohan,
Eric R Schreiter, et al. 2013. “Ultrasensitive Fluorescent Proteins for Imaging Neuronal
Activity.” Nature 499 (7458): 295–300. doi:10.1038/nature12354.
Chen, Xi, Tie-Shan Tang, Huiping Tu, Omar Nelson, Mark Pook, Robert Hammer, Nobuyuki
Nukina, and Ilya Bezprozvanny. 2008. “Deranged Calcium Signaling and Neurodegeneration
in Spinocerebellar Ataxia Type 3.” The Journal of Neuroscience 28 (48): 12713–24.
doi:10.1523/JNEUROSCI.3909-08.2008.
Cheung, King-Ho, Lijuan Mei, Don-On Daniel Mak, Ikuo Hayashi, Takeshi Iwatsubo, David E
Kang, and J Kevin Foskett. 2010. “Gain-of-Function Enhancement of IP3 Receptor Modal
Gating by Familial Alzheimer’s Disease-Linked Presenilin Mutants in Human Cells and
Mouse Neurons.” Science Signaling 3 (114). doi:10.1126/scisignal.2000818.
Clancy, Barbara, Barbara L. Finlay, Richard B. Darlington, and K. J S Anand. 2007.
“Extrapolating Brain Development from Experimental Species to Humans.”
NeuroToxicology 28 (5): 931–37. doi:10.1016/j.neuro.2007.01.014.
Clandinin, Thomas R., John a. DeModena, and Paul W. Sternberg. 1998. “Inositol Trisphosphate
Mediates a RAS-Independent Response to LET-23 Receptor Tyrosine Kinase Activation in
C. Elegans.” Cell 92: 523–33. doi:10.1016/S0092-8674(00)80945-9.
Coffee, Bradford, Krayton Keith, Igor Albizua, Tamika Malone, Julie Mowrey, Stephanie L

118
Sherman, and Stephen T Warren. 2009. “Incidence of Fragile X Syndrome by Newborn
Screening for Methylated FMR1 DNA.” American Journal of Human Genetics 85 (4): 503–
14. doi:10.1016/j.ajhg.2009.09.007.
Cohen, A S, and W C Abraham. 1996. “Facilitation of Long-Term Potentiation by Prior
Activation of Metabotropic Glutamate Receptors.” J Neurophysiol 76 (2): 953–62.
Consortium, The European Chromosome 16 Tuberous Sclerosis. 1993. “Identification and
Characterization of the Tuberous Sclerosis Gene on Chromosome 16.” Cell 75 (7): 1305–15.
doi:10.1016/0092-8674(93)90618-Z.
Constantino, John N., and Tony Charman. 2015. “Diagnosis of Autism Spectrum Disorder:
Reconciling the Syndrome, Its Diverse Origins, and Variation in Expression.” The Lancet
Neurology 15 (3): 279–91. doi:10.1016/S1474-4422(15)00151-9.
Coriell. 2016. “Coriell Cell Biorepository.”
https://catalog.coriell.org/0/Sections/Search/Sample_Detail.aspx?Ref=GM03440&Product=C
C.
Criollo, A, M C Maiuri, E Tasdemir, I Vitale, A A Fiebig, D Andrews, J Molgó, et al. 2007.
“Regulation of Autophagy by the Inositol Trisphosphate Receptor.” Cell Death and
Differentiation 14 (5): 1029–39. doi:10.1038/sj.cdd.4402099.
Dargan, Sheila L, and Ian Parker. 2003. “Buffer Kinetics Shape the Spatiotemporal Patterns of
IP3-Evoked Ca2+ Signals.” The Journal of Physiology 553 (3): 775–88.

119
doi:10.1113/jphysiol.2003.054247.
Darnell, Jennifer C., Sarah J. Van Driesche, Chaolin Zhang, Ka Ying Sharon Hung, Aldo Mele,
Claire E. Fraser, Elizabeth F. Stone, et al. 2011. “FMRP Stalls Ribosomal Translocation on
mRNAs Linked to Synaptic Function and Autism.” Cell 146 (2): 247–61.
doi:10.1016/j.cell.2011.06.013.
Darnell, Jennifer C, and Eric Klann. 2013. “The Translation of Translational Control by FMRP:
Therapeutic Targets for FXS.” Nature Neuroscience 16 (11). 1530–36. doi:10.1038/nn.3379.
Davis, Pamela B., Uma Yasothan, and Peter Kirkpatrick. 2012. “Ivacaftor.” Nature Reviews
Drug Discovery 11 (5): 349–50. doi:10.1038/nrd3723.
de la Torre-Ubieta, Luis, Hyejung Won, Jason L Stein, and Daniel H Geschwind. 2016.
“Advancing the Understanding of Autism Disease Mechanisms through Genetics.” Nature
Medicine 22 (4). 345–61. doi:10.1038/nm.4071.
De Rubeis, Silvia, and Joseph D. Buxbaum. 2015. “Genetics and Genomics of Autism Spectrum
Disorder: Embracing Complexity.” Human Molecular Genetics 1 (8): 1–8.
doi:10.1093/hmg/ddv273.
Decuypere, Jean-Paul, Kirsten Welkenhuyzen, Tomas Luyten, Raf Ponsaerts, Michael Dewaele,
Jordi Molgó, Patrizia Agostinis, et al. 2011. “Ins(1,4,5)P3 Receptor-Mediated Ca2+
Signaling and Autophagy Induction Are Interrelated.” Autophagy 7 (12): 1472–89.
Demuro, A, and I Parker. 2013. “Cytotoxicity of Intracellular abeta42 Amyloid Oligomers

120
Involves Ca2+ Release from the Endoplasmic Reticulum by Stimulated Production of
Inositol Trisphosphate.” J Neurosci 33 (9): 3824–33. doi:10.1523/JNEUROSCI.4367-
12.2013.
Deng, Pan-Yue, David Sojka, and Vitaly a Klyachko. 2011. “Abnormal Presynaptic Short-Term
Plasticity and Information Processing in a Mouse Model of Fragile X Syndrome.” The
Journal of Neuroscience 31 (30): 10971–82. doi:10.1523/JNEUROSCI.2021-11.2011.
Di Leva, Francesca, Teuta Domi, Laura Fedrizzi, Dmitry Lim, and Ernesto Carafoli. 2008. “The
Plasma Membrane Ca2+ ATPase of Animal Cells: Structure, Function and Regulation.”
Archives of Biochemistry and Biophysics 476 (1): 65–74. doi:10.1016/j.abb.2008.02.026.
Diamant, S., L. Schwartz, and D. Atlas. 1990. “Potentiation of Neurotransmitter Release
Coincides with Potentiation of Phosphatidyl Inositol Turnover. A Possible in Vitro Model for
Long Term Potentiation.” Neuroscience Letters 109 (1–2): 140–45. doi:10.1016/0304-
3940(90)90552-K.
Dickinson, George D, Divya Swaminathan, and Ian Parker. 2012. “The Probability of Triggering
Calcium Puffs Is Linearly Related to the Number of Inositol Trisphosphate Receptors in a
Cluster.” Biophysical Journal 102 (8): 1826–36. doi:10.1016/j.bpj.2012.03.029.
Dölen, Gül, Emily Osterweil, B S Shankaranarayana Rao, Gordon B Smith, Benjamin D
Auerbach, Sumantra Chattarji, and Mark F Bear. 2007. “Correction of Fragile X Syndrome
in Mice.” Neuron 56 (6): 955–62. doi:10.1016/j.neuron.2007.12.001.

121
El-Hassar, Lynda, Anna M Hagenston, Lisa Bertetto D’Angelo, and Mark F Yeckel. 2011.
“Metabotropic Glutamate Receptors Regulate Hippocampal CA1 Pyramidal Neuron
Excitability via Ca2+ Wave-Dependent Activation of SK and TRPC Channels.” The Journal
of Physiology 589 (13): 3211–29. doi:10.1113/jphysiol.2011.209783.
Elkins, Ryan C., Mark R. Davies, Stephen J. Brough, David J. Gavaghan, Yi Cui, Najah Abi-
Gerges, and Gary R. Mirams. 2013. “Variability in High-Throughput Ion-Channel Screening
Data and Consequences for Cardiac Safety Assessment.” Journal of Pharmacological and
Toxicological Methods 68 (1): 112–22. doi:10.1016/j.vascn.2013.04.007.
Ellefsen, Kyle L, Brett Settle, Ian Parker, and Ian F Smith. 2014. “An Algorithm for Automated
Detection, Localization and Measurement of Local Calcium Signals from Camera-Based
Imaging.” Cell Calcium 56 (3): 147–56. doi:10.1016/j.ceca.2014.06.003.
Ellis, Hillary T., Michael G. Tordoff, and M. Rockwell Parker. 2013. “Itpr3 Is Responsible for
the Mouse Tufted (Tf) Locus.” Journal of Heredity 104 (2): 295–97.
doi:10.1093/jhered/ess089.
Erb, Laurie, and Gary A. Weisman. 2012. “Coupling of P2Y Receptors to G Proteins and Other
Signaling Pathways.” Wiley Interdisciplinary Reviews: Membrane Transport and Signaling 1
(6): 789–803. doi:10.1002/wmts.62.
Etcheberrigaray, R, N Hirashima, L Nee, J Prince, S Govoni, M Racchi, R E Tanzi, and D L
Alkon. 1998. “Calcium Responses in Fibroblasts from Asymptomatic Members of
Alzheimer’s Disease Families.” Neurobiology of Disease 5: 37–45.

122
doi:10.1006/nbdi.1998.0176.
Fain, J N, and M J Berridge. 1979. “Relationship between Hormonal Activation of
Phosphatidylinositol Hydrolysis, Fluid Secretion and Calcium Flux in the Blowfly Salivary
Gland.” The Biochemical Journal 178 (1): 45–58.
Ferreiro, Elisabete, Catarina R. Oliveira, and Cláudia M F Pereira. 2004. “Involvement of
Endoplasmic Reticulum Ca2+ Release through Ryanodine and Inositol 1,4,5-Triphosphate
Receptors in the Neurotoxic Effects Induced by the Amyloid-beta Peptide.” Journal of
Neuroscience Research 76 (6): 872–80. doi:10.1002/jnr.20135.
Filipek, Pauline A. 2013. “Medical Aspects of Autism.” In Handbook of Autism and Pervasive
Developmental Disorders, 534–78. Hoboken, NJ, USA: John Wiley & Sons, Inc.
doi:10.1002/9780470939345.ch20.
Filipek, Pauline A., Jenifer Juranek, Moyra Smith, Lee Z. Mays, Erica R. Ramos, Maureen
Bocian, Diane Masser-Frye, et al. 2003. “Mitochondrial Dysfunction in Autistic Patients with
15q Inverted Duplication.” Annals of Neurology 53 (6): 801–4. doi:10.1002/ana.10596.
Fine, Jenny, Peter Cole, and James S Davidson. 1989. “Extracellular Nucleotides Stimulate
Receptor-Mediated Calcium Mobilization and Inositol Phosphate Production in Human
Fibroblasts.” Biochem J. 263: 371–76.
Folstein, Susan, and Michael Rutter. 1977. “Genetic Influences and Infantile Autism.” Nature
265 (5596): 726–28. doi:10.1038/265726a0.

123
Foskett, J Kevin, Carl White, King-ho Cheung, and Don-on Daniel Mak. 2007. “Inositol
Trisphosphate Receptor Ca2+ Release Channels.” Physiology Reviews 87: 593–658.
doi:10.1152/physrev.00035.2006.
Fu, Ying-Hui, Derek P.A. Kuhl, Antonio Pizzuti, Maura Pieretti, James S. Sutcliffe, Stephen
Richards, Annemieke J.M.H. Verkert, et al. 1991. “Variation of the CGG Repeat at the
Fragile X Site Results in Genetic Instability: Resolution of the Sherman Paradox.” Cell 67
(6): 1047–58. doi:10.1016/0092-8674(91)90283-5.
Fujii, Satoshi, Mineo Matsumoto, Kotaro Igarashi, Hiroshi Kato, and Katsuhiko Mikoshiba.
2000. “Synaptic Plasticity in Hippocampal CA1 Neurons of Mice Lacking Type 1 Inositol-
1,4,5-Trisphosphate Receptors.” Learning & Memory (Cold Spring Harbor, N.Y.) 7 (5): 312–
20. doi:10.1101/lm.34100.Previous.
Gargus, J.J., and F. Imtiaz. 2008. “Mitochondrial Energy-Deficient Endophenotype in Autism.”
Am J Biochem and Biotech 4 (2): 198–207.
Gargus, J Jay. 2009. “Genetic Calcium Signaling Abnormalities in the Central Nervous System:
Seizures, Migraine, and Autism.” Annals of the New York Academy of Sciences 1151: 133–
56. doi:10.1111/j.1749-6632.2008.03572.x.
Gaugler, Trent, Lambertus Klei, Stephan J Sanders, Corneliu A Bodea, Arthur P Goldberg, Ann
B Lee, Milind Mahajan, et al. 2014. “Most Genetic Risk for Autism Resides with Common
Variation.” Nature Genetics 46 (8). doi:10.1038/ng.3039.

124
Geschwind, Daniel H, and Matthew W State. 2015. “Gene Hunting in Autism Spectrum
Disorder: On the Path to Precision Medicine.” The Lancet Neurology 4422 (15).
doi:10.1016/S1474-4422(15)00044-7.
Ghosh, Anirvan, Aubin Michalon, Lothar Lindemann, Paulo Fontoura, and Luca Santarelli.
2013. “Drug Discovery for Autism Spectrum Disorder: Challenges and Opportunities.”
Nature Reviews. Drug Discovery 12 (10): 777–90. doi:10.1038/nrd4102.
Gibson, Jay R, Aundrea F Bartley, Seth a Hays, and Kimberly M Huber. 2008. “Imbalance of
Neocortical Excitation and Inhibition and Altered UP States Reflect Network
Hyperexcitability in the Mouse Model of Fragile X Syndrome.” Journal of Neurophysiology
100 (5): 2615–26. doi:10.1152/jn.90752.2008.
Gilman, Sarah R, Ivan Iossifov, Dan Levy, Michael Ronemus, Michael Wigler, and Dennis
Vitkup. 2011. “Rare de Novo Variants Associated with Autism Implicate a Large Functional
Network of Genes Involved in Formation and Function of Synapses.” Neuron 70 (5): 898–
907. doi:10.1016/j.neuron.2011.05.021.
Girirajan, Santhosh, Megan Y Dennis, Carl Baker, Maika Malig, Bradley P Coe, Catarina D
Campbell, Kenneth Mark, et al. 2013. “Refinement and Discovery of New Hotspots of Copy-
Number Variation Associated with Autism Spectrum Disorder.” American Journal of Human
Genetics 92 (2): 221–37. doi:10.1016/j.ajhg.2012.12.016.
Gomez, Timothy M, and Nicholas C Spitzer. 1999. “In Vivo Regulation of Axon Extension and
Path Finding by Growth-Cone Calcium Transients.” Nature 397: 350–55.

125
Goussakov, Ivan, Megan B Miller, and Grace E Stutzmann. 2010. “NMDA-Mediated Ca 2 ϩ
Influx Drives Aberrant Ryanodine Receptor Activation in Dendrites of Young Alzheimer ’ S
Disease Mice.” J Neurosci 30 (36): 12128–37. doi:10.1523/JNEUROSCI.2474-10.2010.
Group, Cross-disorder, and Psychiatric Genomics Consortium. 2013. “Identification of Risk Loci
with Shared Effects on Five Major Psychiatric Disorders: A Genome-Wide Analysis.” The
Lancet 6736 (12): 1–9. doi:10.1016/S0140-6736(12)62129-1.
Guo, Q, K Furukawa, B L Sopher, D G Pham, J Xie, N Robinson, G M Martin, and M P
Mattson. 1996. “Alzheimer’s PS-1 Mutation Perturbs Calcium Homeostasis and Sensitizes
PC12 Cells to Death Induced by Amyloid Beta-Peptide.” Neuroreport 8 (1): 379–83.
Guo, Qing, Weiming Fu, Bryce L. Sopher, Miles W. Miller, Carol B. Ware, George M. Martin,
and Mark P. Mattson. 1999. “Increased Vulnerability of Hippocampal Neurons to
Excitotoxic Necrosis in Presenilin-1 Mutant Knock-in Mice.” Nature Medicine 5 (1): 101–6.
doi:10.1038/4789.
Hagenston, Anna M, John S Fitzpatrick, and Mark F Yeckel. 2008. “mGluR-Mediated Calcium
Waves That Invade the Soma Regulate Firing in Layer V Medial Prefrontal Cortical
Pyramidal Neurons.” Cereb. Cortex 18 (2): 407–23. doi:10.1093/cercor/bhm075.MGluR-
Mediated.
Hamada, Kozo, Akiko Terauchi, Kyoko Nakamura, Takayasu Higo, Nobuyuki Nukina, Nagisa
Matsumoto, Chihiro Hisatsune, Takeshi Nakamura, and Katsuhiko Mikoshiba. 2014.
“Aberrant Calcium Signaling by Transglutaminase-Mediated Posttranslational Modification

126
of Inositol 1,4,5-Trisphosphate Receptors.” Proceedings of the National Academy of Sciences
of the United States of America, 111(38): E3966-75. doi:10.1073/pnas.1409730111.
Hanley, A.J., and J.B. McNeil. 1982. “The Meaning and Use of the Area under a Receiver
Operating Characteristic (ROC) Curve.” Radiology 143: 29–36.
doi:10.1148/radiology.143.1.7063747.
Hara, K, A Shiga, H Nozaki, J Mitsui, Y Takahashi, H Ishiguro, H Yomono, et al. 2008. “Total
Deletion and a Missense Mutation of ITPR1 in Japanese SCA15 Families.” Neurology 71
(8): 547–51. doi:10.1212/01.wnl.0000311277.71046.a0.
Hernandez-Lopez, Salvador, Tatiana Tkatch, Enrique Perez-Garci, Elvira Galarraga, Heidi
Hamm, and D James Surmeier. 2000. “D2 Dopamine Receptors in Striatal Medium Spiny
Neurons Reduce L-Type Ca2+ Currents and Excitability via a Novel PLCbeta1 – IP3 –
Calcineurin-Signaling Cascade.” The Journal of Neuroscience 20 (24): 8987–95.
Hirashima, Naohide, René Etcheberrigaray, Stefania Bergamaschi, Marco Racchi, Fiorenzo
Battaini, Giuliano Binetti, Stefano Govoni, and Daniel L. Alkon. 1996. “Calcium Responses
in Human Fibroblasts: A Diagnostic Molecular Profile for Alzheimer’s Disease.”
Neurobiology of Aging 17 (4): 549–55. doi:10.1016/0197-4580(96)00074-7.
Hosmer, David W., and Stanley Lemeshow. 2000. Applied Logistic Regression. Edited by David
W. Hosmer and Stanley Lemeshow. Second. New York, NY: John Wiley and Sons.
doi:10.1198/tech.2002.s650.

127
Huang, Lijia, Jodi Warman Chardon, Melissa T Carter, Kathie L Friend, Tracy E Dudding,
Jeremy Schwartzentruber, Ruobing Zou, et al. 2012. “Missense Mutations in ITPR1 Cause
Autosomal Dominant Congenital Nonprogressive Spinocerebellar Ataxia.” Orphanet Journal
of Rare Diseases 7 (1): 67. doi:10.1186/1750-1172-7-67.
Inoue, T, K Kato, K Kohda, and K Mikoshiba. 1998. “Type 1 Inositol 1,4,5-Trisphosphate
Receptor Is Required for Induction of Long-Term Depression in Cerebellar Purkinje
Neurons.” The Journal of Neuroscience 18 (14): 5366–73.
Ito, E., K. Oka, R. Etcheberrigaray, T. J. Nelson, D. L. McPhie, B. Tofel-Grehl, G. E. Gibson,
and D. L. Alkon. 1994. “Internal Ca2+ Mobilization Is Altered in Fibroblasts from Patients
with Alzheimer Disease.” Proceedings of the National Academy of Sciences 91 (2): 534–38.
doi:10.1073/pnas.91.2.534.
Iwaki, A, Y Kawano, S Miura, H Shibata, D Matsuse, W Li, H Furuya, et al. 2008.
“Heterozygous Deletion of ITPR1, but Not SUMF1, in Spinocerebellar Ataxia Type 16.”
Journal of Medical Genetics 45 (1): 32–35. doi:10.1136/jmg.2007.053942.
Jaffe, D. B., and T. H. Brown. 1994. “Metabotropic Glutamate Receptor Activation Induces
Calcium Waves within Hippocampal Dendrites.” Journal of Neurophysiology 72 (1).
Jensen, Laura E., Geert Bultynck, Tomas Luyten, Hozeefa Amijee, Martin D. Bootman, and H.
Llewelyn Roderick. 2013. “Alzheimer’s Disease-Associated Peptide Aβ42 Mobilizes ER
Ca2+ via InsP3R-Dependent and -Independent Mechanisms.” Frontiers in Molecular
Neuroscience 6: 1–12. doi:10.3389/fnmol.2013.00036.
128
Jeste, Shafali S, and Daniel H Geschwind. 2016. “Clinical Trials for Neurodevelopmental
Disorders : At a Therapeutic Frontier.” Science Translational Medicine 8 (321): 1–4.
Kazdoba, Tatiana M, Prescott T Leach, Jill L Silverman, and Jacqueline N Crawley. 2014.
“Modeling Fragile X Syndrome in the Fmr1 Knockout Mouse.” Intractable & Rare Diseases
Research 3 (4): 118–33. doi:10.5582/irdr.2014.01024.
Khodakhah, K, and C M Armstrong. 1997. “Induction of Long-Term Depression and Rebound
Potentiation by Inositol Trisphosphate in Cerebellar Purkinje Neurons.” Proceedings of the
National Academy of Sciences of the United States of America 94 (25): 14009–14.
Klar, Joakim, Chihiro Hisatsune, Shahid M. Baig, Muhammad Tariq, Anna C V Johansson,
Mahmood Rasool, Naveed Altaf Malik, et al. 2014. “Abolished InsP3R2 Function Inhibits
Sweat Secretion in Both Humans and Mice.” Journal of Clinical Investigation 124 (11):
4773–80. doi:10.1172/JCI70720.
Klei, Lambertus, Stephan J Sanders, Michael T Murtha, Vanessa Hus, Jennifer K Lowe, a
Jeremy Willsey, Daniel Moreno-De-Luca, et al. 2012. “Common Genetic Variants, Acting
Additively, Are a Major Source of Risk for Autism.” Molecular Autism 3 (1): 3-9.
doi:10.1186/2040-2392-3-9.
Köhler, M, B Hirschberg, C T Bond, J M Kinzie, N V Marrion, J Maylie, and J P Adelman.
1996. “Small-Conductance, Calcium-Activated Potassium Channels from Mammalian
Brain.” Science 273 (5282): 1709–14.

129
Kudoh, T, M A Velkoff, and D A Wenger. 1983. “Uptake and Metabolism of Radioactively
Labeled Sphingomyelin in Cultured Skin Fibroblasts from Controls and Patients with
Niemann-Pick Disease and Other Lysosomal Storage Diseases.” Biochim Biophys Acta 754
(1): 82–92.
Kügler, S, E Kilic, and M Bähr. 2003. “Human Synapsin 1 Gene Promoter Confers Highly
Neuron-Specific Long-Term Transgene Expression from an Adenoviral Vector in the Adult
Rat Brain Depending on the Transduced Area.” Gene Therapy 10 (4): 337–47.
doi:10.1038/sj.gt.3301905.
La Rovere, Rita M L, Gemma Roest, Geert Bultynck, and Jan B Parys. 2016. “Intracellular
Ca(2+) Signaling and Ca(2+) Microdomains in the Control of Cell Survival, Apoptosis and
Autophagy.” Cell Calcium. 1–14. doi:10.1016/j.ceca.2016.04.005.
Larkum, Matthew E., Shigeo Watanabe, Takeshi Nakamura, Nechama Lasser-Ross, and William
N. Ross. 2003. “Synaptically Activated Ca2+ Waves in Layer 2/3 and Layer 5 Rat
Neocortical Pyramidal Neurons.” The Journal of Physiology 549 (2).
doi:10.1113/jphysiol.2002.037614.
Laumonnier, Frédéric, Sébastien Roger, Pascaline Guérin, Florence Molinari, Ridha M’rad,
Dominique Cahard, Ahlem Belhadj, et al. 2006. “Association of a Functional Deficit of the
BKCa Channel, a Synaptic Regulator of Neuronal Excitability, with Autism and Mental
Retardation.” The American Journal of Psychiatry 163 (9): 1622–29.
doi:10.1176/appi.ajp.163.9.1622.

130
Lawrence, Y a, T L Kemper, M L Bauman, and G J Blatt. 2010. “Parvalbumin-, Calbindin-, and
Calretinin-Immunoreactive Hippocampal Interneuron Density in Autism.” Acta Neurologica
Scandinavica 121 (2): 99–108. doi:10.1111/j.1600-0404.2009.01234.x.
Leissring, M A, F M LaFerla, N Callamaras, and I Parker. 2001. “Subcellular Mechanisms of
Presenilin-Mediated Enhancement of Calcium Signaling.” Neurobiology of Disease 8 (3):
469–78. doi:10.1006/nbdi.2001.0382.
Leissring, Malcolm A., Brooke A. Paul, Ian Parker, Carl W. Cotman, and Frank M. Laferla.
1999. “Alzheimer’s Presenilin-1 Mutation Potentiates Inositol 1,4,5- Trisphosphate-Mediated
Calcium Signaling in Xenopus Oocytes.” Journal of Neurochemistry 72 (3): 1061–68.
doi:10.1046/j.1471-4159.1999.0721061.x.
Li, W, J Llopis, M Whitney, G Zlokarnik, and RY Tsien. 1998. “Cell-Permeant Caged InsP3
Ester Shows That Ca2 Spike Frequency Can Optimize Gene Expression.” Nature 392: 936–
41.
Li, Yong-xin, Yinong Zhang, Henry A Lester, Erin M Schuman, and Norman Davidson. 1998.
“Enhancement of Neurotransmitter Release Induced by Brain- Derived Neurotrophic Factor
in Cultured Hippocampal Neurons.” The Journal of Neuroscience 18 (24): 10231–40.
Lim, Jeong-A, Lishu Li, and Nina Raben. 2014. “Pompe Disease: From Pathophysiology to
Therapy and Back Again.” Frontiers in Aging Neuroscience 6 (177): 1-14.
doi:10.3389/fnagi.2014.00177.

131
Lipp, P, and E Niggli. 1996. “A Hierarchical Concept of Cellular and Subcellular Ca(2+)-
Signalling.” Progress in Biophysics and Molecular Biology 65 (3): 265–96.
Liu, Jing, Tie-Shan Tang, Huiping Tu, Omar Nelson, Emily Herndon, Duong P Huynh, Stefan M
Pulst, and Ilya Bezprozvanny. 2009. “Deranged Calcium Signaling and Neurodegeneration in
Spinocerebellar Ataxia Type 2.” The Journal of Neuroscience 29 (29): 9148–62.
doi:10.1523/JNEUROSCI.0660-09.2009.
Lock, Jeffrey T., Ian Parker, and Ian F. Smith. 2015. “A Comparison of Fluorescent Ca2+
Indicators for Imaging Local Ca2+ Signals in Cultured Cells.” Cell Calcium 58 (6).
doi:10.1016/j.ceca.2015.10.003.
Loth, Eva, Will Spooren, Lindsay M. Ham, Maria B. Isaac, Caroline Auriche-Benichou, Tobias
Banaschewski, Simon Baron-Cohen, et al. 2016. “Identification and Validation of
Biomarkers for Autism Spectrum Disorders.” Nature Reviews Drug Discovery 15 (70).
doi:10.1093/nrd.2015.7.
Lozano, Reymundo, Veronica Martinez-Cerdeno, and Randi J Hagerman. 2015. “Advances in
the Understanding of the Gabaergic Neurobiology of FMR1 Expanded Alleles Leading to
Targeted Treatments for Fragile X Spectrum Disorder.” Current Pharmaceutical Design 21
(34): 4972–79. doi:10.1007/978-1-4614-5915-6.
Lu, Ake Tzu-Hui, Xiaoxian Dai, Julian A Martinez-Agosto, and Rita M Cantor. 2012. “Support
for Calcium Channel Gene Defects in Autism Spectrum Disorders.” Molecular Autism 3 (1):
18. doi:10.1186/2040-2392-3-18.

132
Lüscher, Christian, and Kimberly M Huber. 2010. “Group 1 mGluR-Dependent Synaptic Long-
Term Depression: Mechanisms and Implications for Circuitry and Disease.” Neuron 65 (4).
doi:10.1016/j.neuron.2010.01.016.
MacDonald, Rebecca, Diana Parry-Cruwys, Sally Dupere, and William Ahearn. 2014.
“Assessing Progress and Outcome of Early Intensive Behavioral Intervention for Toddlers
with Autism.” Research in Developmental Disabilities 35 (12), 3632–44.
doi:10.1016/j.ridd.2014.08.036.
Maclennan, David H, and Elena Zvaritch. 2011. “Mechanistic Models for Muscle Diseases and
Disorders Originating in the Sarcoplasmic Reticulum.” Biochimica et Biophysica Acta 1813
(5): 948–64. doi:10.1016/j.bbamcr.2010.11.009.
Mak, Don-On Daniel, King Ho Cheung, Patrick Toglia, J. Kevin Foskett, and Ghanim Ullah.
2015. “Analyzing and Quantifying the Gain-of-Function Enhancement of IP3 Receptor
Gating by Familial Alzheimer's Disease-Causing Mutants in Presenilins.” PLoS
Computational Biology 11 (10): 1–22. doi:10.1371/journal.pcbi.1004529.
Matsumoto, M., T. Nakagawa, T. Inoue, E. Nagata, K. Tanaka, H. Takano, J. Kuno, et al. 1996.
“Ataxia and Epileptic Seizures in Mice Lacking Type 1 Inositol 1,4,5-Trisphosphate
Receptor.” Nature 379 (6561), 168–71. doi:10.1038/379168a0.
Matsumoto, Review Mineo, and Eiichiro Nagata. 1999. “Type 1 Inositol 1,4,5-Trisphosphate
Receptor Knock-out Mice: Their Phenotypes and Their Meaning in Neuroscience and
Clinical Practice.” J. Mol. Med. 77: 406–11.

133
Mattson, M P, and S L Chan. 2001. “Dysregulation of Cellular Calcium Homeostasis in
Alzheimer’s Disease: Bad Genes and Bad Habits.” Journal of Molecular Neuroscience. 17
(2): 205–24. doi:10.1385/JMN:17:2:205.
McElhanon, Barbara O, Courtney McCracken, Saul Karpen, and William G Sharp. 2014.
“Gastrointestinal Symptoms in Autism Spectrum Disorder: A Meta-Analysis.” Pediatrics,
April. doi:10.1542/peds.2013-3995.
Metz, Charles E. 1978. “Basic Principles of ROC Analysis.” Seminars in Nuclear Medicine 8
(4): 283–298.
Miyoshi, Y, T Yamada, M Tanimura, T Taniwaki, K Arakawa, Y Ohyagi, H Furuya, et al. 2001.
“A Novel Autosomal Dominant Spinocerebellar Ataxia (SCA16) Linked to Chromosome
8q22.1-24.1.” Neurology 57 (1): 96–100.
Morikawa, Hitoshi, Farzin Imani, Kamran Khodakhah, and John T. Williams. 2000. “Inositol
1,4,5-Triphosphate-Evoked Responses in Midbrain Dopamine Neurons.” Journal of
Neuroscience 20 (20).
Mullard, Asher. 2015. “Fragile X Disappointments Upset Autism Ambitions.” Nature Reviews
Drug Discovery 14 (3), 151–53. doi:10.1038/nrd4555.
Nakamoto, Mika, Vijayalaxmi Nalavadi, Michael P Epstein, Usha Narayanan, Gary J Bassell,
and Stephen T Warren. 2007. “Fragile X Mental Retardation Protein Deficiency Leads to
Excessive mGluR5-Dependent Internalization of AMPA Receptors.” Proceedings of the

134
National Academy of Sciences of the United States of America 104 (39): 15537–42.
doi:10.1073/pnas.0707484104.
Nakamura, Takeshi, Kyoko Nakamura, and William N Ross. 1999. “Synergistic Release of Ca2+
from IP3 -Sensitive Stores Evoked by Synaptic Activation of mGluRs Paired with
Backpropagating Action Potentials.” Neuron 24: 727–37.
Nelson, Sacha B., and Vera Valakh. 2015. “Excitatory/Inhibitory Balance and Circuit
Homeostasis in Autism Spectrum Disorders.” Neuron 87 (4): 684–98.
doi:10.1016/j.neuron.2015.07.033.
O’Roak, Brian J, Pelagia Deriziotis, Choli Lee, Laura Vives, Jerrod J Schwartz, Santhosh
Girirajan, Emre Karakoc, et al. 2011. “Exome Sequencing in Sporadic Autism Spectrum
Disorders Identifies Severe de Novo Mutations.” Nature Genetics 43 (6): 585–89.
doi:10.1038/ng.835.
O’Roak, Brian J, Laura Vives, Wenqing Fu, Jarrett D Egertson, Ian B Stanaway, Ian G Phelps,
Gemma Carvill, et al. 2012. “Multiplex Targeted Sequencing Identifies Recurrently Mutated
Genes in Autism Spectrum Disorders.” Science 338 (6114): 1619–22.
doi:10.1126/science.1227764.
O’Roak, Brian J, Laura Vives, Santhosh Girirajan, Emre Karakoc, Niklas Krumm, Bradley P
Coe, Roie Levy, et al. 2012. “Sporadic Autism Exomes Reveal a Highly Interconnected
Protein Network of de Novo Mutations.” Nature 485 (7397): 246–50.
doi:10.1038/nature10989.

135
Ogura, Hiroo, Mineo Matsumoto, and Katsuhiko Mikoshiba. 2001. “Motor Discoordination in
Mutant Mice Heterozygous for the Type 1 Inositol 1,4,5-Trisphosphate Receptor.”
Behavioural Brain Research 122 (2): 215–19. doi:10.1016/S0166-4328(01)00187-5.
Oliet, S H, R C Malenka, and R A Nicoll. 1997. “Two Distinct Forms of Long-Term Depression
Coexist in CA1 Hippocampal Pyramidal Cells.” Neuron 18 (6): 969–82. doi:10.1016/S0896-
6273(00)80336-0.
Osterweil, Emily K, Dilja D Krueger, Kimberly Reinhold, and Mark F Bear. 2010.
“Hypersensitivity to mGluR5 and ERK1/2 Leads to Excessive Protein Synthesis in the
Hippocampus of a Mouse Model of Fragile X Syndrome.” The Journal of Neuroscience 30
(46): 15616–27. doi:10.1523/JNEUROSCI.3888-10.2010.
Palmer, M. J., A. J. Irving, G. R. Seabrook, D. E. Jane, and G. L. Collingridge. 1997. “The
Group I mGlu Receptor Agonist DHPG Induces a Novel Form of LTD in the CA1 Region of
the Hippocampus.” Neuropharmacology 36 (11–12): 1517–32. doi:10.1016/S0028-
3908(97)00181-0.
Palmieri, L, V Papaleo, V Porcelli, P Scarcia, L Gaita, R Sacco, J Hager, et al. 2010. “Altered
Calcium Homeostasis in Autism-Spectrum Disorders: Evidence from Biochemical and
Genetic Studies of the Mitochondrial Aspartate/glutamate Carrier AGC1.” Molecular
Psychiatry 15 (1): 38–52. doi:10.1038/mp.2008.63.
Parikshak, Neelroop N., Rui Luo, Alice Zhang, Hyejung Won, Jennifer K. Lowe, Vijayendran
Chandran, Steve Horvath, and Daniel H. Geschwind. 2013. “Integrative Functional Genomic

136
Analyses Implicate Specific Molecular Pathways and Circuits in Autism.” Cell 155 (5):
1008–21. doi:10.1016/j.cell.2013.10.031.
Parker, I, J Choi, and Y Yao. 1996. “Elementary Events of InsP3-Induced Ca2+ Liberation in
Xenopus Oocytes: Hot Spots, Puffs and Blips.” Cell Calcium 20 (2): 105–21.
Parker, Ian, and Ian F Smith. 2010. “Recording Single-Channel Activity of Inositol
Trisphosphate Receptors in Intact Cells with a Microscope, Not a Patch Clamp.” The Journal
of General Physiology 136 (2): 119–27. doi:10.1085/jgp.200910390.
Parker, I, and Y Yao. 1996. “Ca2+ Transients Associated with Openings of Inositol
Trisphosphate-Gated Channels in Xenopus Oocytes.” The Journal of Physiology 491 (3):
663–68.
Patterson, Randen L, Darren Boehning, and Solomon H Snyder. 2004. “Inositol 1,4,5-
Trisphosphate Receptors as Signal Integrators.” Annual Review of Biochemistry 73 (January):
437–65. doi:10.1146/annurev.biochem.73.071403.161303.
Petravicz, Jeremy, Kristen M. Boyt, and Ken D. McCarthy. 2014. “Astrocyte IP3R2-Dependent
Ca2+ Signaling Is Not a Major Modulator of Neuronal Pathways Governing Behavior.”
Frontiers in Behavioral Neuroscience 8 (November): 384. doi:10.3389/fnbeh.2014.00384.
Petravicz, Jeremy, Todd A Fiacco, and Ken D McCarthy. 2008. “Loss of IP3 Receptor-
Dependent Ca2+ Increases in Hippocampal Astrocytes Does Not Affect Baseline CA1
Pyramidal Neuron Synaptic Activity.” The Journal of Neuroscience 28 (19): 4967–73.

137
doi:10.1523/JNEUROSCI.5572-07.2008.
Pietrobon, Daniela. 2010. “CaV2.1 Channelopathies.” Pflügers Archiv : European Journal of
Physiology 460 (2): 375–93. doi:10.1007/s00424-010-0802-8.
Pinton, P, C Giorgi, R Siviero, E Zecchini, and R Rizzuto. 2008. “Calcium and Apoptosis: ER-
Mitochondria Ca2+ Transfer in the Control of Apoptosis.” Oncogene 27 (50): 6407–18.
doi:10.1038/onc.2008.308.
Pramparo, Tiziano, Karen Pierce, Michael V. Lombardo, Cynthia Carter Barnes, Steven
Marinero, Clelia Ahrens-Barbeau, Sarah S. Murray, Linda Lopez, Ronghui Xu, and Eric
Courchesne. 2015. “Prediction of Autism by Translation and Immune/Inflammation
Coexpressed Genes in Toddlers From Pediatric Community Practices.” JAMA Psychiatry
92093 (4): 386–94. doi:10.1001/jamapsychiatry.2014.3008.
Pringle, B, L J Colpe, S J Blumberg, R M Avila, and M D Kogan. 2012. “Diagnostic History and
Treatment of School-Aged Children with Autism Spectrum Disorder and Special Health Care
Needs.” NCHS Data Brief, no. 97: 1–8.
Prole, David L., and Colin W. Taylor. 2016. “Inositol 1,4,5-Trisphosphate Receptors and Their
Protein Partners as Signalling Hubs.” The Journal of Physiology 594(11): 2849-66.
doi:10.1113/JP271139.
Ramanathan, Arvind, and Stuart L Schreiber. 2009. “Direct Control of Mitochondrial Function
by mTOR.” Proceedings of the National Academy of Sciences of the United States of

138
America 106 (52): 22229–32. doi:10.1073/pnas.0912074106.
Repicky, Sarah, and Kendal Broadie. 2009. “Metabotropic Glutamate Receptor-Mediated Use-
Dependent down-Regulation of Synaptic Excitability Involves the Fragile X Mental
Retardation Protein.” Journal of Neurophysiology 101 (2): 672–87.
doi:10.1152/jn.90953.2008.
Ripke, Stephan, Colm O’Dushlaine, Kimberly Chambert, Jennifer L Moran, Anna K Kähler,
Susanne Akterin, and Sarah E Bergen. 2013. “Genome-Wide Association Analysis Identifies
13 New Risk Loci for Schizophrenia.” Nature Genetics 45(10): 1150-9.
doi:10.1038/ng.2742.
Rose, C R, and a Konnerth. 2001. “Stores Not Just for Storage. Intracellular Calcium Release
and Synaptic Plasticity.” Neuron 31 (4): 519–22.
Roussel, Benoit D, Antonina J Kruppa, Elena Miranda, Damian C Crowther, David a Lomas, and
Stefan J Marciniak. 2013. “Endoplasmic Reticulum Dysfunction in Neurological Disease.”
The Lancet. Neurology 12 (1): 105–18. doi:10.1016/S1474-4422(12)70238-7.
Rubenstein, J. L. R., and M. M. Merzenich. 2003. “Model of Autism: Increased Ratio of
Excitation/inhibition in Key Neural Systems.” Genes, Brain and Behavior 2 (5): 255–67.
doi:10.1034/j.1601-183X.2003.00037.x.
Saada, Ann. 2011. “The Use of Individual Patient’s Fibroblasts in the Search for Personalized
Treatment of Nuclear Encoded OXPHOS Diseases.” Molecular Genetics and Metabolism

139
104 (1–2): 39–47. doi:10.1016/j.ymgme.2011.07.016.
Sakai, Yasunari, Chad A Shaw, Brian C Dawson, Diana V Dugas, Zaina Al-Mohtaseb, David E
Hill, and Huda Y Zoghbi. 2011. “Protein Interactome Reveals Converging Molecular
Pathways among Autism Disorders.” Science Translational Medicine 3 (86): 86ra49.
doi:10.1126/scitranslmed.3002166.
Sarkar, Sovan, Gauri Krishna, Sara Imarisio, Shinji Saiki, Cahir J. O’Kane, and David C.
Rubinsztein. 2008. “A Rational Mechanism for Combination Treatment of Huntington’s
Disease Using Lithium and Rapamycin.” Human Molecular Genetics 17 (2): 170–78.
doi:10.1093/hmg/ddm294.
Sarkisov, Dmitry V, and Samuel S-H Wang. 2008. “Order-Dependent Coincidence Detection in
Cerebellar Purkinje Neurons at the Inositol Trisphosphate Receptor.” The Journal of
Neuroscience 28 (1): 133–42. doi:10.1523/JNEUROSCI.1729-07.2008.
Sasaki, Masayuki, Chihiro Ohba, Mizue Iai, Shinichi Hirabayashi, Hitoshi Osaka, Takuya
Hiraide, Hirotomo Saitsu, and Naomichi Matsumoto. 2015. “Sporadic Infantile-Onset
Spinocerebellar Ataxia Caused by Missense Mutations of the Inositol 1,4,5-Triphosphate
Receptor Type 1 Gene.” Journal of Neurology 262 (5): 1278–84. doi:10.1007/s00415-015-
7705-8.
Sato-Miyaoka, Mai, Chihiro Hisatsune, Etsuko Ebisui, Naoko Ogawa, Hiromi Takahashi-
Iwanaga, and Katsuhiko Mikoshiba. 2012. “Regulation of Hair Shedding by the Type 3 IP3
Receptor.” The Journal of Investigative Dermatology 132 (9): 2137–47.

140
doi:10.1038/jid.2012.141.
Schmunk, G, and J.J. Gargus. 2013. “Channelopathy Pathogenesis in Autism Spectrum
Disorders.” Frontiers in Genetics 4 (222): 1-20. doi:10.3389/fgene.2013.00222.
Schneider, L. S., F. Mangialasche, N. Andreasen, H. Feldman, E. Giacobini, R. Jones, V.
Mantua, et al. 2014. “Clinical Trials and Late-Stage Drug Development for Alzheimer’s
Disease: An Appraisal from 1984 to 2014.” Journal of Internal Medicine 275 (3): 251–83.
doi:10.1111/joim.12191.
Semple, Bridgette D., Klas Blomgren, Kayleen Gimlin, Donna M. Ferriero, and Linda J. Noble-
Haeusslein. 2013. “Brain Development in Rodents and Humans: Identifying Benchmarks of
Maturation and Vulnerability to Injury across Species.” Progress in Neurobiology 106–107.
doi:10.1016/j.pneurobio.2013.04.001.
Seok, Junhee, H Shaw Warren, Alex G Cuenca, Michael N Mindrinos, Henry V Baker, Weihong
Xu, Daniel R Richards, et al. 2013. “Genomic Responses in Mouse Models Poorly Mimic
Human Inflammatory Diseases.” Proceedings of the National Academy of Sciences of the
United States of America 110 (9): 3507–12. doi:10.1073/pnas.1222878110.
Sheridan, Steven D., Kraig M. Theriault, Surya A. Reis, Fen Zhou, Jon M. Madison, Laurence
Daheron, Jeanne F. Loring, and Stephen J. Haggarty. 2011. “Epigenetic Characterization of
the FMR1 Gene and Aberrant Neurodevelopment in Human Induced Pluripotent Stem Cell
Models of Fragile X Syndrome.” PLoS ONE 6 (10). doi:10.1371/journal.pone.0026203.

141
Shilling, Dustin, Marioly Müller, Hajime Takano, Don-On Daniel Mak, Ted Abel, Douglas a
Coulter, and J Kevin Foskett. 2014. “Suppression of InsP3 Receptor-Mediated Ca2+
Signaling Alleviates Mutant Presenilin-Linked Familial Alzheimer’s Disease Pathogenesis.”
The Journal of Neuroscience 34 (20): 6910–23. doi:10.1523/JNEUROSCI.5441-13.2014.
Shirasaki, T, N Harata, and N Akaike. 1994. “Metabotropic Glutamate Response in Acutely
Dissociated Hippocampal CA1 Pyramidal Neurones of the Rat.” The Journal of Physiology
475 (3): 439–53. doi:10.1113/jphysiol.1994.sp020084.
Shuai, Jianwei, John E Pearson, J Kevin Foskett, Don-On Daniel Mak, and Ian Parker. 2007. “A
Kinetic Model of Single and Clustered IP3 Receptors in the Absence of Ca2+ Feedback.”
Biophysical Journal 93 (4): 1151–62. doi:10.1529/biophysj.107.108795.
Slegtenhorst, Marjon van, Ronald de Hoogt, Caroline Hermans, Mark Nellist, Bart Janssen,
Senno Verhoef, Dick Lindhout, et al. 1997. “Identification of the Tuberous Sclerosis Gene
TSC1 on Chromosome 9q34.” Science 277 (5327): 805–8.
Smith, Ian F, Brian Hitt, Kim N Green, Salvatore Oddo, and Frank M LaFerla. 2005. “Enhanced
Caffeine-Induced Ca2+ Release in the 3xTg-AD Mouse Model of Alzheimer’s Disease.”
Journal of Neurochemistry 94 (6): 1711–18. doi:10.1111/j.1471-4159.2005.03332.x.
Smith, Ian F, Steven M Wiltgen, and Ian Parker. 2009. “Localization of Puff Sites Adjacent to
the Plasma Membrane: Functional and Spatial Characterization of Ca2+ Signaling in SH-
SY5Y Cells Utilizing Membrane-Permeant Caged IP3.” Cell Calcium 45 (1): 65–76.
doi:10.1016/j.ceca.2008.06.001.

142
Solini, A, P Chiozzi, A Morelli, R Fellin, and F Di Virgilio. 1999. “Human Primary Fibroblasts
in Vitro Express a Purinergic P2X7 Receptor Coupled to Ion Fluxes, Microvesicle Formation
and IL-6 Release.” Journal of Cell Science 112 (3): 297–305.
Solini, Anna, Paola Chiozzi, Anna Morelli, Angela Passaro, Renato Fellin, and Francesco Di
Virgilio. 2003. “Defective P2Y Purinergic Receptor Function: A Possible Novel Mechanism
for Impaired Glucose Transport.” Journal of Cellular Physiology 197 (3): 435–44.
doi:10.1002/jcp.10379.
Splawski, Igor, Katherine W. Timothy, Leah M. Sharpe, Niels Decher, Pradeep Kumar, Raffaella
Bloise, Carlo Napolitano, et al. 2004. “CaV1.2 Calcium Channel Dysfunction Causes a
Multisystem Disorder Including Arrhythmia and Autism.” Cell 119 (1): 19–31.
doi:10.1016/j.cell.2004.09.011.
Splawski, Igor, Dana S Yoo, Stephanie C Stotz, Allison Cherry, David E Clapham, and Mark T
Keating. 2006. “CACNA1H Mutations in Autism Spectrum Disorders.” The Journal of
Biological Chemistry 281 (31): 22085–91. doi:10.1074/jbc.M603316200.
Srinivasan,Rahul,BenSHuang,SharmilaVenugopal,AprilDJohnston,HuaChai,Hongkui
Zeng,PeymanGolshani,andBaljitSKhakh.2015.“Ca2+SignalinginAstrocytesfrom
Ip3r2−/−MiceinBrainSlicesandduringStartleResponsesinVivo.”Nature
Neuroscience,18(5):708-17.doi:10.1038/nn.4001.
Strom, S P, J L Stone, J R Ten Bosch, B Merriman, R M Cantor, D H Geschwind, and S F

143
Nelson. 2010. “High-Density SNP Association Study of the 17q21 Chromosomal Region
Linked to Autism Identifies CACNA1G as a Novel Candidate Gene.” Molecular Psychiatry
15 (10). 996–1005. doi:10.1038/mp.2009.41.
Stutzmann, Grace E.2007. "The Pathogenesis of Alzheimer's Disease - Is It a Lifelong
'Calciumopathy'? The Neuroscientist 13 (5):546-59. doi:10.1177/1073858407299730.
Stutzmann, Grace E, Antonella Caccamo, Frank M LaFerla, and Ian Parker. 2004. “Dysregulated
IP3 Signaling in Cortical Neurons of Knock-in Mice Expressing an Alzheimer’s-Linked
Mutation in presenilin1 Results in Exaggerated Ca2+ Signals and Altered Membrane
Excitability.” The Journal of Neuroscience 24 (2): 508–13. doi:10.1523/JNEUROSCI.4386-
03.2004.
Stutzmann, Grace E, Frank M LaFerla, and Ian Parker. 2003. “Ca2+ Signaling in Mouse Cortical
Neurons Studied by Two-Photon Imaging and Photoreleased Inositol Triphosphate.” The
Journal of Neuroscience 23 (3): 758–65.
Stutzmann, Grace E, Ian Smith, Antonella Caccamo, Salvatore Oddo, Frank M Laferla, and Ian
Parker. 2006. “Enhanced Ryanodine Receptor Recruitment Contributes to Ca2+ Disruptions
in Young, Adult, and Aged Alzheimer’s Disease Mice.” The Journal of Neuroscience 26
(19): 5180–89. doi:10.1523/JNEUROSCI.0739-06.2006.
Südhof, Thomas C. 2008. “Neuroligins and Neurexins Link Synaptic Function to Cognitive
Disease.” Nature 455 (7215): 903–11. doi:10.1038/nature07456.

144
Takada, H., K. Furuya, and M. Sokabe. 2014. “Mechanosensitive ATP Release from
Hemichannels and Ca2+ Influx through TRPC6 Accelerate Wound Closure in
Keratinocytes.” Journal of Cell Science 127: 4159–71. doi:10.1242/jcs.147314.
Takahashi, Kazutoshi, and Shinya Yamanaka. 2015. “A Developmental Framework for Induced
Pluripotency.” Development (Cambridge, England) 142 (19): 3274–85.
doi:10.1242/dev.114249.
Takao, Keizo, and Tsuyoshi Miyakawa. 2015. “Genomic Responses in Mouse Models Greatly
Mimic Human Inflammatory Diseases.” Proceedings of the National Academy of Sciences
112 (4): 1167–72.
Takata, Norio, Tsuneko Mishima, Chihiro Hisatsune, Terumi Nagai, Etsuko Ebisui, Katsuhiko
Mikoshiba, and Hajime Hirase. 2011. “Astrocyte Calcium Signaling Transforms Cholinergic
Modulation to Cortical Plasticity In Vivo.” Journal of Neuroscience 31 (49): 18155–65.
doi:10.1523/JNEUROSCI.5289-11.2011.
Takechi, Hajime, Jens Eilers, and Arthur Konnerth. 1998. “A New Class of Synaptic Response
Involving Calcium Release in Dendritic Spines.” Nature 396 (6713), 757–60.
doi:10.1038/25547.
Tang, Guomei, Kathryn Gudsnuk, Sheng-Han Kuo, Marisa L. Cotrina, Gorazd Rosoklija,
Alexander Sosunov, Mark S. Sonders, et al. 2014. “Loss of mTOR-Dependent
Macroautophagy Causes Autistic-like Synaptic Pruning Deficits.” Neuron 83 (5), 1131–43.
doi:10.1016/j.neuron.2014.07.040.

145
Tordoff, M G, and H T Ellis. 2013. “A Mouse with Bad Hair and Poor Taste.” Appetite 71
(2013). doi:10.1016/j.appet.2013.06.070.
Tordoff, Michael G, and Hillary T Ellis. 2013. “Taste Dysfunction in BTBR Mice due to a
Mutation of Itpr3, the Inositol Triphosphate Receptor 3 Gene.” Physiological Genomics 45
(18): 834–55. doi:10.1152/physiolgenomics.00092.2013.
Uddin, Mohammed, Kristiina Tammimies, Giovanna Pellecchia, Babak Alipanahi, Pingzhao Hu,
Zhuozhi Wang, Dalila Pinto, et al. 2014. “Brain-Expressed Exons under Purifying Selection
Are Enriched for de Novo Mutations in Autism Spectrum Disorder.” Nature Genetics 46 (7):
742–47. doi:10.1038/ng.2980.
Urbach, Achia, Ori Bar-Nur, George Q. Daley, and Nissim Benvenisty. 2010. “Differential
Modeling of Fragile X Syndrome by Human Embryonic Stem Cells and Induced Pluripotent
Stem Cells.” Cell Stem Cell 6 (5): 407–11. doi:10.1016/j.stem.2010.04.005.
Valenti, Daniela, Lidia de Bari, Bianca De Filippis, Alexandra Henrion-Caude, and Rosa Anna
Vacca. 2014. “Mitochondrial Dysfunction as a Central Actor in Intellectual Disability-
Related Diseases: An Overview of Down Syndrome, Autism, Fragile X and Rett Syndrome.”
Neuroscience and Biobehavioral Reviews 46(2): 202–17.
doi:10.1016/j.neubiorev.2014.01.012.
Van De Leemput, Joyce, Jayanth Chandran, Melanie A. Knight, Lynne A. Holtzclaw, Sonja
Scholz, Mark R. Cookson, Henry Houlden, et al. 2007. “Deletion at ITPR1 Underlies Ataxia
in Mice and Spinocerebellar Ataxia 15 in Humans.” PLoS Genetics 3 (6): 1076–82.

146
doi:10.1371/journal.pgen.0030108.
van De Sande, Marijke M H, Vincent J van Buul, and Fred J P H Brouns. 2014. “Autism and
Nutrition: The Role of the Gut-Brain Axis.” Nutrition Research Reviews, (17): 1–16.
doi:10.1017/S0954422414000110.
Van Den Bosch, L., P. Van Damme, E. Bogaert, and W. Robberecht. 2006. “The Role of
Excitotoxicity in the Pathogenesis of Amyotrophic Lateral Sclerosis.” Biochimica et
Biophysica Acta - Molecular Basis of Disease 1762 (11–12): 1068–82.
doi:10.1016/j.bbadis.2006.05.002.
Van Goor, Fredrick, Sabine Hadida, Peter D J Grootenhuis, Bill Burton, Dong Cao, Tim
Neuberger, Amanda Turnbull, et al. 2009. “Rescue of CF Airway Epithelial Cell Function in
Vitro by a CFTR Potentiator, VX-770.” Proceedings of the National Academy of Sciences of
the United States of America 106 (44): 18825–30. doi:10.1073/pnas.0904709106.
Van Goor, Fredrick, Sabine Hadida, Peter D J Grootenhuis, Bill Burton, Jeffrey H Stack,
Kimberly S Straley, Caroline J Decker, et al. 2011. “Correction of the F508del-CFTR Protein
Processing Defect in Vitro by the Investigational Drug VX-809.” Proceedings of the
National Academy of Sciences of the United States of America 108 (46): 18843–48.
doi:10.1073/pnas.1105787108.
Vicencio, J M, C Ortiz, A Criollo, A W E Jones, O Kepp, L Galluzzi, N Joza, et al. 2009. “The
Inositol 1,4,5-Trisphosphate Receptor Regulates Autophagy through Its Interaction with
Beclin 1.” Cell Death and Differentiation 16 (7): 1006–17. doi:10.1038/cdd.2009.34.

147
Wallace, Douglas C, Weiwei Fan, and Vincent Procaccio. 2010. “Mitochondrial Energetics and
Therapeutics.” Annual Review of Pathology 5 (January): 297–348.
doi:10.1146/annurev.pathol.4.110807.092314.
Wang, Fushun, Nathan A Smith, Qiwu Xu, Takumi Fujita, Akemichi Baba, Toshio Matsuda,
Takahiro Takano, Lane Bekar, and Maiken Nedergaard. 2012. “Astrocytes Modulate Neural
Network Activity by Ca2+-Dependent Uptake of Extracellular K+.” Science Signaling 5
(218): ra26. doi:10.1126/scisignal.2002334.
Wang, Lulu W, Elizabeth Berry-Kravis, and Randi J Hagerman. 2010. “Fragile X: Leading the
Way for Targeted Treatments in Autism.” Neurotherapeutics : The Journal of the American
Society for Experimental NeuroTherapeutics 7 (3): 264–74. doi:10.1016/j.nurt.2010.05.005.
Wang, Samuel S.-H, Alexander D Kloth, and Aleksandra Badura. 2014. “Neuron Perspective
The Cerebellum, Sensitive Periods, and Autism.” Neuron 83: 518–32.
doi:10.1016/j.neuron.2014.07.016.
Waterham, Hans R, and Merel S Ebberink. 2012. “Genetics and Molecular Basis of Human
Peroxisome Biogenesis Disorders.” Biochimica et Biophysica Acta 1822 (9): 1430–41.
doi:10.1016/j.bbadis.2012.04.006.
Wei, Hongen, Mazhar Malik, Ashfaq M Sheikh, George Merz, W Ted Brown, and Xiaohong Li.
2011. “Abnormal Cell Properties and down-Regulated FAK-Src Complex Signaling in B
Lymphoblasts of Autistic Subjects.” The American Journal of Pathology 179 (1): 66–74.
doi:10.1016/j.ajpath.2011.03.034.

148
Weinreb, Neal J. 2013. “Oral Small Molecule Therapy for Lysosomal Storage Diseases.”
Pediatric Endocrinology Reviews 11 (1): 77–90.
West, Paul R., David G. Amaral, Preeti Bais, Alan M. Smith, Laura A. Egnash, Mark E. Ross,
Jessica A. Palmer, et al. 2014. “Metabolomics as a Tool for Discovery of Biomarkers of
Autism Spectrum Disorder in the Blood Plasma of Children.” PLoS ONE 9 (11).
doi:10.1371/journal.pone.0112445.
Willsey, A. Jeremy, Stephan J. Sanders, Mingfeng Li, Shan Dong, Andrew T. Tebbenkamp,
Rebecca a. Muhle, Steven K. Reilly, et al. 2013. “Coexpression Networks Implicate Human
Midfetal Deep Cortical Projection Neurons in the Pathogenesis of Autism.” Cell 155 (5):
997–1007. doi:10.1016/j.cell.2013.10.020.
Workman, Alan D, Christine J Charvet, Barbara Clancy, Richard B Darlington, and Barbara L
Finlay. 2013. “Modeling Transformations of Neurodevelopmental Sequences across
Mammalian Species.” The Journal of Neuroscience 33 (17): 7368–83.
doi:10.1523/JNEUROSCI.5746-12.2013.
Wu, J., D. A. Ryskamp, X. Liang, P. Egorova, O. Zakharova, G. Hung, and I. Bezprozvanny.
2016. “Enhanced Store-Operated Calcium Entry Leads to Striatal Synaptic Loss in a
Huntington’s Disease Mouse Model.” Journal of Neuroscience 36 (1): 125–41.
doi:10.1523/JNEUROSCI.1038-15.2016.
Yan, Q J, M Rammal, M Tranfaglia, and R P Bauchwitz. 2005. “Suppression of Two Major
Fragile X Syndrome Mouse Model Phenotypes by the mGluR5 Antagonist MPEP.”

149
Neuropharmacology 49 (7): 1053–66. doi:10.1016/j.neuropharm.2005.06.004.
Yang, Junhua, Hongbin Yang, Yali Liu, Xia Li, Liming Qin, Huifang Lou, Shumin Duan, and
Hao Wang. 2016. “Astrocytes Contribute to Synapse Elimination via Type 2 Inositol 1,4,5-
Trisphosphate Receptor-Dependent Release of ATP.” eLife 5 (APRIL2016): 1–17.
doi:10.7554/eLife.15043.
Yao, Y, J Choi, and I Parker. 1995. “Quantal Puffs of Intracellular Ca2+ Evoked by Inositol
Trisphosphate in Xenopus Oocytes.” The Journal of Physiology 482 (3): 533–53.
Yao, Yong, and Ian Parker. 1993. “Inositol Trisphosphate-Mediated Ca2+ Influx into Xenopus
Oocytes Triggers Ca2+ Liberation from Intracellular Stores.” J. Physiol. 468: 275–95.
Ye, Fang, and Charles L Hoppel. 2013. “Measuring Oxidative Phosphorylation in Human Skin
Fibroblasts.” Analytical Biochemistry 437 (1): 52–58. doi:10.1016/j.ab.2013.02.010.
Yu, Timothy W, and Elizabeth Berry-Kravis. 2014. “Autism and Fragile X Syndrome.”
Seminars in Neurology 34 (3): 258–65. doi:10.1055/s-0034-1386764.
Yue, Feng, Yong Cheng, Alessandra Breschi, Jeff Vierstra, Weisheng Wu, Tyrone Ryba,
Richard Sandstrom, et al. 2014. “A Comparative Encyclopedia of DNA Elements in the
Mouse Genome.” Nature 515 (7527): 355–64. doi:10.1038/nature13992.
Yuzaki, M, and K Mikoshiba. 1992. “Pharmacological and Immunocytochemical
Characterization of Metabotropic Glutamate Receptors in Cultured Purkinje Cells.” The
Journal of Neuroscience 12 (11): 4253–63.

150
Zaman, Sayed, Umar Yazdani, Yan Deng, Wenhao Li, Bharathi S Gadad, Linda Hynan, David
Karp, et al. 2016. “A Search for Blood Biomarkers for Autism: Peptoids.” Scientific Reports
6, 19164. doi:10.1038/srep19164.
Zeida´n-Chulia, Fares, Jose´ Luiz Rybarczyk-Filho, Alla B. Salmina, Ben-Hur Neves de
Oliveira, Mami Noda, and Jose´ Cla´udio F. Moreira. 2013. “Exploring the Multifactorial
Nature of Autism Through Computational Systems Biology: Calcium and the Rho GTPase
RAC1 Under the Spotlight.” Neuromolecular Medicine 15(2): 364-83. doi:10.1007/s12017-
013-8224-3.
Zhang, Ye, Kenian Chen, Steven a Sloan, Mariko L Bennett, Anja R Scholze, Sean O Keeffe,
Hemali P Phatnani, et al. 2014. “An RNA-Sequencing Transcriptome and Splicing Database
of Glia, Neurons, and Vascular Cells of the Cerebral Cortex.” The Journal of Neuroscience
34 (36): 11929–47. doi:10.1523/JNEUROSCI.1860-14.2014.
Ziats, Mark N, and Owen M Rennert. 2011. “Expression Profiling of Autism Candidate Genes
during Human Brain Development Implicates Central Immune Signaling Pathways.” PloS
One 6 (9): e24691. doi:10.1371/journal.pone.0024691.