Immunohistochemistry and in situ hybridization in the study of human skin melanocytes
Upload
khangminh22Category
view
3download
0
Utah State University Utah State University
DigitalCommons@USU DigitalCommons@USU
All Graduate Theses and Dissertations Graduate Studies
5-1995
Development of Fluorescent In Situ Hybridization Techniques for Development of Fluorescent In Situ Hybridization Techniques for
Physical Mapping in Ovis aries Physical Mapping in Ovis aries
Eleanor P. Jenson Utah State University
Follow this and additional works at: https://digitalcommons.usu.edu/etd
Part of the Animal Sciences Commons
Recommended Citation Recommended Citation Jenson, Eleanor P., "Development of Fluorescent In Situ Hybridization Techniques for Physical Mapping in Ovis aries" (1995). All Graduate Theses and Dissertations. 3924. https://digitalcommons.usu.edu/etd/3924
This Thesis is brought to you for free and open access by the Graduate Studies at DigitalCommons@USU. It has been accepted for inclusion in All Graduate Theses and Dissertations by an authorized administrator of DigitalCommons@USU. For more information, please contact [email protected].

DEVELOPMENT OF FLUORESCENT IN SITU HYBRIDIZATION TECHNIQUES
FOR PHYSICAL MAPPING IN OVIS ARIES
Approved:
Noelle E. Cockett Major Professor
Thomas D. Bunch Committee Member
by
Eleanor P. Jenson
A thesis submitted in partial fulfillment of the requirements for the degree
of
MASTER OF SCIENCE
in
Bioveterinary Science
G. Reed Holyoak Committee Member
Robert C. Lamb Department Head
.fames 'P . Sliaver Dean of Graduate Studies
UTAH STATE UNIVERSITY Logan, Utah
1995

ii
ABSTRACT
Development of Fluorescent In Situ Hybridization Techniques
for Physical Mapping in Ovis aries
by
Eleanor P. Jenson, Master of Science
Utah State University, 1995
Major Professor : Dr . Noelle E. Cockett Department : An imal, Da iry, and Veterinary Sciences
Genome maps provide information used to identify economic trait loci
and loci proximal to genes affecting economically important traits. This
research contributes to the development of the ovine genome map by
establishing ovine tissue culture techniques and fluorescent in situ hybridization
techniques in this laboratory. In addition, a karyotype for sheep affected with
spider lamb syndrome was developed . Ovine tissue culture techniques were
established using fibroblasts grown from primary explants of sheep and
modified cytogenetic procedures . Metaphase chromosomes were obtained
from the fibroblast cultures and used for fluorescent in situ hybridization and
for banding procedures to develop the spider lamb karyotype . Fluorescent in
situ hybridization procedures were established by hybridizing a fluorescent-
labeled probe to fixed ovine chromosome spreads . The probe was a bacterial

iii
artificial chromosome clone conta ining the bovine 3-B-hydroxy-5-ene steroid
dehydrogenase gene . In this study, the probe hybridized to ovine chromosome
1. This chromosomal location was supported by the previous hybridization of
the probe to bovine chromosome 3, which has a high level of homology with
ovine chromosome 1. The final objective of this study was to determine
whether a chromosomal abnormality is the cause of spider lamb syndrome, a
fatal autosomal recess ive genetic disease in North American black-faced breeds
of sheep . A fibroblast cell line was produced from a four-week-old male
homozygous spider lamb. Chromosomes were banded with trypsin using
standard structural banding techniques . The lamb had a normal diploid
chromosome number of 54 and a karyotype of 3 pairs of large biarmed
chromosomes, 23 pairs of autosomal acrocentrics , and a large acrocentric X
and a minute biarmed Y chromosome. G-band analysis of all chromosomes
w ithin the karyotype did not reveal any abnormality that was attributable to
spider lamb syndrome.
(113 pages)

iv
ACKNOWLEDGMENTS
I express my sincere appreciation to Dr . Noelle Cockett for her help and
encouragement with this project. Her research abilities are very admirable . I
also appreciate her ability to teach genetic principles and her patience in helping
me to understand them . She has been a wonderful mentor during the last two
years .
I also appreciate the help I have received from Dr . Tom Bunch and Dr .
Reed Holyoak, Dr. Bunch for his cytogenetic expertise and Dr. Holyoak for
serving on my supervisory committee.
Melanie R. Heaton, a fellow graduate student, has also contributed to
this project. I thank her for her assistance throughout the project, her
mathematical ability to calculate chemical concentrations, her encouragement,
and her friendship.
Other scientists have also contributed valuable information for this
project . I would like to thank the following for their contributions: Dr . Dan
Gallagher, Clontech Laboratories, Palo Alto, California ; Dr. Arvind Babu, Beth
Israel Med ical Center, New York, New York; Dr . Abel Ponce de Leon, University
of Massachusetts , Amherst , Massachusetts ; Dr. Sheila Schmutz, University of
Saskatchewan, Saskatoon, Saskatchewan, Canada; and Dr . Helal Ansari, New
Zealand Agricultural Research , Palmerston North, New Zealand .

v
Without the support and encouragement I have received from family and
friends, th is accomplishment would not have been possible . Thank you .
Eleanor P. Jenson

vi
CONTENTS
Page
ABSTRACT ... .. ... .. .....• .... •.. . ... . . .. . .. .... .. ... ii
ACKNOWLEDGMENTS . .... ... . .... ... .. . .... .. .. .... . ... iv
LIST OF TABLES .... . .. .. . . ... .•... .. . . ......... . .. . .. viii
LIST OF FIGURES .. ..... .. .. ....... . . ... ... .. .. . .. ...... ix
INTRODUCTION . .. . .. ... .... . .... .. ...... ..... •. . ......
LITERATURE REVIEW . .. . .. ... . . •......•... .... . ..... .. . . 5
O~neKa~o~pe ....•.... . ...... . .................. 5 Gene Mapping . .. .. .. . . . . ... .... . . .... .....•.. . . ... 9 Linkage Mapping .. . .... . .... .. . . . .... ..... .... ... . . 9 Comparative Mapping . . . . . . . . . . . . . . . . . • . . . . . . . . . . . . 11 Physical Mapping . . . . . . . . . . . . . . . . . . . . . . . . . . . . . . . . . . 12
Somatic Cell Hybrid ization . . . . . . . . . . . • . . . . . . . . . . . 12 In Situ Hybridization . . . . . . . . . . . . . . . . . . . . • . . . . . . 13
MATERIALS AND METHODS .. . . ...... .. . •. . •......... . .. . 23
Tissue Culture . . . . . . . . . . . . . . . . . . . . . . . . . . . . . . . . . . . . 23 Fluorescent In Situ Hybridization . . . . . . . . . . . . . . . • . . . . . . . 24 Karyotyping . . ..... ..... ... . ........... . .... . . . .. 26
RESULTS AND DISCUSSION ... .. .. . .. . .. . .. . . . . . . .. ... .. . 28
Tissue Culture ... .. .. .. .. ... .. ... .... ... .. ..... . .. 28 Fluorescent In Situ Hybridization . . . . . . . . . . . . . . . . . . . • . . . 35 Karyotyping . . . . . . . . . . . . . . . . . • . . . . . . . . . . . . . . • . . . . 46
IMPLICATIONS .. ... . ..• ..... .. .............. .... .•.... 49
LITERATURE CITED ... . ......•..•. . . . ..... . ........ . • . . 50
APPENDICES .........• . .. ... . ... .•....... . . .. . • . . .. .. 64

vii
Append ix A : Karyotype Development . . . . . . . . . . . . . . . . . . . 65 Appendix B: Fluorescent In Situ Hybridization . . . . . . . . . . . . . . 88

viii
LIST OF TABLES
Table Page
Loci mapped to the sheep genome by in situ hybridization . . . . . . 19

ix
LIST OF FIGURES
Figure Page
A photomicrograph of dynamic A-banded ovine chromosomes . . . 33
2 A photomicrograph of ovine chromosomes hybridized to bovine HSD: with competitor DNA . . . .. . . .. . ..... . . . ... 39
3 A photomicrograph of ovine chromosomes hybrid ized to bovine HSD: w ithout compet itor DNA . . . . . . . . . . . . . . . . . . . 40
4 A photomicrograph of ovine chromosomes hybrid ized to bovine HSD: w ith amplification . . ......... . ........... . 43
5 A photomicrograph of ovine chromosomes hybridized to
6
bovine HSD: without amplification .. .. . .. . . ............ 44
A photomicrograph of ovine chromosomes hybridized to bovine HSD: visualized with a propidium iodide (PI) filter 45
7 Spider lamb syndrome (SLS) karyotype . . . . . . . . • . . . . . . • . . . 48

INTRODUCTION
The development of a genome map involves the differentiation and
character ization of chromosomes within an organism and the localization of
genes or specific DNA fragments on chromosomes. Concerted efforts to
develop species-specific genome maps began in 1988 with the Human
Genome Project (HUGO). A primary goal of HUGO is to provide genetic
markers 2 centimorgans (eM) apart across the entire human genome (Collins
and Galas , 1993) . Mammalian geneticists have also embarked on
developing genome maps for agricultural animal species . A common goal
among mammalian geneticists is to provide genetic markers located 10 eM
apart on domestic animal genomes . Despite recent efforts to develop
genome maps for livestock species, animal genome map development lags
behind the human genome project . For example, the human genome is
currently characterized by 16,000 mapped genes and genetic markers
(Coll ins and Galas, 1993). In contrast, the current bovine, porcine. and
ovine genome maps have 650, 800, and 430 genes and genetic markers
mapped to them, respectively (cattle: Barendse et al., 1994; Bishop et al .,
1994; Georges et al., 1995; swine: Rohrer et al. , 1994; sheep: Pearce and
Broad, 1994). Therefore, much work remains in completing animal genome
maps.
Physical mapping involves somatic cell hybridization or in situ
hybridization techniques . Somatic cell hybridization develops cell lines

2
conta ining specific chromosomes or parts of chromosomes . Although
somatic cell hybridization has been used extensively in physical mapping
efforts , problems arise in identifying ind ividual chromosomes w ithin the cell
lines (Stranzinger and Vercoe, 1988) . In addition, cell lines carrying species
specific chromosomes, such as sheep, are not readily available . In contrast,
in situ hybridization is an effective physical mapping technique . This
technique involves identifying chromosomes based on a standardized
karyotype , hybridizing a labeled DNA probe to its complementary sequence
on a fixed metaphase spread , and visualiz ing the hybridization signal.
Radioisotopes were originally used as labels for in situ hybrid ization , but
more recent techniques use nonradioactive substances such as fluorescent
labeled nucleotides. Fluorescent probes eliminate the problems associated
w ith radioactive probes such as safety precautions, limited shel f life , t ime
required for autorad iography, and limited spatial reso lution . Fluorescence in
situ hybridization (FISH) reduces processing t ime by greater than half,
improves sensitivity, and provides favorable spatial resolution (Ransom et
al., 1992).
The advantages of FISH make it an attractive resource for the
development of an ovine genome map. Therefore, one of the objectives of
th is study was to establ ish the procedures required for FISH, includ ing
preliminary requirements such as ovine t issue culture and chromosome
preparation . The second objective of the study was to identify a positive

control for the hybridization of fluorescent-labeled probes to the ovine
genome . A bacterial art ificial chromosome (BACI clone , conta ining the
bovine 3-B-hydroxy-5-ene steroid dehydrogenase (HSD) gene, which had
previously been hybridized to bovine chromosome 3 , was selected as a
potential positive control (Gallagher et al ., 1995).
3
The f inal objective of this study was to develop a karyotype for sheep
affected with spider lamb syndrome (SLS). Spider lamb syndrome is a semi
lethal genetic disorder in North American breeds of black-faced sheep. It has
surfaced in the Suffolk and Hampshire sheep breeds with in the last 2
decades (Berg et al., 1987) and is bel ieved to be caused by an autosomal
recessive gene (Thomas and Cobb, 1986) . The presence of the SLS gene
results in severe skeletal deformities apparent at birth or that develop by 3
mo of age. These deformities include bent, abnormally long limbs, spinal
curvature, and fac ial deformities (Rook et al., 1988) . The concern of
introducing the SLS gene into a producer 's f lock is turning sheep breeders
away from the Suffolk and Hampshire breeds . Therefore , it is imperative to
reduce the frequency of this gene. At present the only way to decrease the
frequency of SLS is by progeny test ing potential breeding animals or
dramatic culling of all suspected carriers, both of which are expensive and
very t ime consuming . Unfortunately, the identity of the SLS gene and its
location within the genome is not known at this time. It is possible that the
SLS defect is caused by a major mutation such as a deletion, insertion, or

4
translocation of a large chromosomal segment . If so, these chromosomal
aberrations could be detected by karyotype analysis , providing an accurate
method of detecting carrier animals . By comparing a karyotype developed
from a sheep known to have the SLS mutation with the Reading standard
ovine karyotype (Ford et al. , 1980), gross chromosomal abnormalities would
be detected . Thus, the third objective of this study was to determine
whether chromosomal aberrations were associated w ith SLS by developing
the respective karyotype .

LITERATURE REVIEW
Ovine Karyotype
Ovine cytogenetics began over 6 decades ago in <> n effort to
determine the number of domestic sheep chromosomes . The first study to
establish the ovine diploid chromosome number of 54 was by Shiwago
(1931 ). In addition to establishing the chromosome number, Shiwago also
identified three pairs of large submetacentr ic chromosomes w ithin the ovine
karyotype . These six chromosomes were also recognized in later studies
performed by Berry (1938 , 1941) and Ahmed (1940). In 1973, Evans et al.
identified the ovine X and Y chromosomes as the longest acrocentric and
smallest meta centric chromosomes, respectively.
5
As cytogenetic technology progressed, chromosome staining
techniques preceded the development of banded karyotypes . During the
1970's, banded karyotypes became increasing ly important for d ifferentiating
the normal from the abnormal karyotype (Hsu, 1979) . To avoid
discrepancies when describing individual chromosomes, it was deemed
necessary to create an internationally standardized ovine karyotype. The
result was an international conference held in Reading, England to
standardize banded karyotypes of domestic animals . The proceedings of this
conference were published by Ford et al. (1980) and accessed by
researchers internationally . The principal objective of the Reading
Conference was to characterize G-banded karyotypes by providing

descriptions of the main G-bands of each chromosome pair . The
proceedings of the Paris Conference ( 1971 ) describing human-banded
chromosomes served as a model for domestic livestock cytogenetics .
Certain descriptive terms have been used to describe chromosomes .
6
Submetacentric chromosomes use the letters p and q to signify the short
(petite) from the long (q) chromatid arms. Centromeres are reference points
from which chromosomal classifications are derived. The terms proximal,
central , and distal are used subjectively to describe characteristic band ing
patterns located near the centromere , at the center of the chromatid arm,
and at the chromatid arm terminus , respectively. Chromosome bands are
described as either light or dark, combined with at least one of the qualifying
adjectives : narrow, faint , broad , dist inct, prominent, and adjacent to.
The Reading Conference standard arranged ovine chromosomes in
order of decreasing size , numbering the autosomes sequentially from 1 to
26. The chromosomes were conventionally stained following G-banding
procedures . G-bands were obtained by pretreating chromosomes on sl ides
with proteolytic enzymes . The first three autosomal pairs were large
submetacentric chromosomes and the remaining 23 pairs were smaller
acrocentric chromosomes . The sex chromosomes were readily differentiated
from the autosomes . Chromosome X was the largest acrocentric
chromosome with in the ovine karyotype, and Y was a minute metacentric
chromosome.

7
Even with the development of this standardized ovine karyotype ,
efforts have continued to describe and clari fy differences between
acrocentric chromosomes of similar size . Long ( 1985) presented additional
nomenclature for the ovine G-band karyotype. In her study, she retained the
chromosome numbering system implemented at the Reading Conference ,
and incorporated the system derived from human cytogenetic nomenclature
for numbering chromosome regions and bands with in reg ions . With this
add ition, each band was identified by its corresponding chromosome
number, arm symbol, chromosome region number, and band number with in
that region . An example is 2p21, interpreted as a band on the short arm of
chromosome two, the first band within region two . Long also suggested
that banding patterns may vary in accordance with the degree of
chromosome contraction or elongation . Her findings suggested an error in
the previous standardized ovine karyotype . According to her study, the
Reading Conference proceedings reversed the descriptions corresponding to
the p and q arms of ovine chromosome 3 . Long's descriptions of
chromosomes 6 and 21 also differed from those presented at the Reading
Conference .
The International System for Cytogenetic Nomenclature of Domestic
Animals (ISCNDA) meeting in 1989 (DiBerardino et al. , 1990) further
supplemented the characterization of the ovine karyotype . The purpose of
this second standardization conference was to update previous domestic

8
animal standard karyotypes by correlating G-bands and ·R-bands (reverse
banding). subsequently establish ing standard R-band karyotypes (DiBerard ino
et al., 1990) . Because G-bands and R-bands differ in nucleotide content,
both can potentially contribute to cytogenetic analyses. Positive G-bands
contain high levels of adenine and thymine (Hsu, 1979). Conversely,
positive R-bands are guanine and cytosine-rich (Ponce de Leon et al. , 1992).
By providing standard R-band karyotypes for cattle, goats, and sheep,
ISCNDA hoped to universalize cytogenetic nomenclature for classifying
chromosomal abnormalities and gene mapping (DiBerardino et al., 1990).
ISCNDA also corrected some errors in the ovine karyotype established from
the Reading Conference . Specifically, the descriptions that corresponded
with chromosomes 8 and 9, and 19 and 20, had been interchanged
(DiBerardino et al., 1990; Ansari et al., 1994a) . To avoid further confusion ,
ISCNDA used only the karyotype presented by Long (1985) to establish an
updated standard ovine karyotype .
ISCNDA's f indings of banding pattern similarities suggested a high
level of genetic interspecies homology between cattle and sheep
(DiBerardino et al., 1990) . The strong correlations between the two species '
G-band patterns and R-band patterns created a basis on which the standard
R-band ovine karyotype was inferentially derived from the cattle R-band
karyotype (Ansari et al. , 1994a) . The R-band karyotype created by ISCNDA
serves as the most recently published standard ovine karyotype , despite a

9
few modifications proposed by Ansari et al. ( 1993b, 1994a) . These
modifications included interchanging chromosomes 4 and 6 from the
proposed A-band karyotype in ISCNDA, and resu ming the Reading standard
order for chromosomes 8 and 9, chromosomes 19, 20, and 21, and
chromosomes 23, 24, 25, and 26. To compare banding patterns, Ansari et
al. ( 1993b) used Robertson ian fus ions and nucleolus organizer regions
(NORs) as references. They also used chromosomes twice the length of the
Reading standard, thus producing high resolution karyotypes with many
more bands. The progress made in standardizing the ovine karyotype has
been imperative for expanding the efficiency of in situ hybridization as a
means to develop an ovine genomic map .
Gene Mapping
In addition to chromosome differentiation and characterization, a
genome map comprises information on the location of genes and genetic
markers w ith respect to each other (Hetzel, 1989). Thus, determination of
gene order and the genetic/physical distance between genes and genetic
markers is the objective of gene mapping . Genomic maps can be developed
using linkage mapping, comparative mapping, and/or physical mapping
methods.
Linkage Mapping
Linkage mapping estimates the genetic distance between loci in terms

10
of meiotic recombination units (Hetzel, 1989) . At meiosis, crossing over or
recombinat ion takes place between homologous chromosomes, thereby
altering allelic con binations. The recombination rate between two genes is
closely related to the physical distance between them (Hetzel, 1989). As
the distance between genes and genetic markers increases, the likelihood of
the loci separated by recombination also increases (Watkins, 1988). The
distance between genetic markers is measured in centimorgans (eM) and is
equivalent to the physical distance of approximately one million base pairs .
Two markers that are 1 eM apart segregate by recombination approximately
1% of the time .
Recombination frequency and therefore gene order can be computed
from observations of the genotypes of parents and offspring. The most
efficient linkage analyses are performed using large sibship families in which
one parent is heterozygous for the gene of interest and the other parent is
homozygous (Stranzinger and Vercoe, 1988). This type of pedigree provides
reliable information on allele inheritance patterns (White et al., 1985) .
The statistical significance of the recombination rate is determined
using the logarithm of odds (LOD) score (Morton, 1955) . A LOD score of
three or greater suggests significant evidence of linkage between two loci
(White et al., 1985). A LOD score of three is used as a rule-of-thumb to
separate linkage from non linkage because the probability of linkage between
two loci with a LOD score of three or greater is 1 ,000 times the probability

11
that the result is due to chance . Conversely , a LOD score of less than three
rejects the probabil ity of linkage (Ruddle and Fries , 1985) . In addition , gene
order can be predicted using LOD scores o evaluate the probabi lities of
different gene orders when at least three loci are studied (White et al.,
1985) .
Of more than 477 loci currently assigned to the ovine genome,
approximately 68% have been mapped using family linkage studies (Pearce
and Broad, 1994). The genetic markers used to map these loci are
polymorphic in DNA sequences surrounding the region. One method of
detecting the polymorphic sequences is the restriction fragment length
polymorphism (RFLP) assay; RFLPs are highly heritable, providing reliable
markers for linkage stud ies (Botstein et al. , 1980) .
Comparative Mapping
Comparative gene mapping utilizes the evolutionary conservation of
syntenic groups between species (Frezal, 1987; Hetzel, 1989; Ruddle and
Fries , 1985). This mapping method is contingent upon the production of
high resolution chromosome bands to identify conserved interspecies
chromosomal segments . The location of genes and genetic markers in one
species can then be extrapolated to another species . A lthough comparative
mapping is not conclus ive, it may be used to expedite gene mapping among
highly conserved species such as cattle , sheep, and goats (DiBerardino et
al., 1990).

12
Physical Mapping
Physical mapping facilitates the identification of genes and genetic
markers in relation to specific chromosome locations. By identifying genes
to chromosomes and to regions on chromosomes, a physical map can
provide landmarks to estimate genetic distances and define syntenic group
locations. The methods used to develop physical maps are somatic cell
hybridization and in situ hybridization.
Somatic Cell Hybridization . Somatic cell hybridization is a physical
mapping method in which cell lines containing specific chromsomes or parts
of chromosomes are developed (Watkins, 1988). Cell lines for ovine studies
are created by hybridizing nuclei from sheep somatic cells w ith rodent tumor
cells (Saidi -Mehtar et al., 1981; Burkin et al., 1993) . To stimulate cell
membrane fus ion between the two cell types , cells are treated with
inactivated Sendai virus or polyethylene glycol (Darnell et al. , 1990) . The
cells are then cultured in a specific enzyme deficient medium that is
selective for hybrid cell growth . As the hybrid cells grow and divide,
chromosomes from the ovine genome are progressively lost until only single
chromosomes or parts of chromosomes remain. This preferential
chromosome retention is determined by the location of the gene, which
complements the enzyme-deficient medium (Burkin et al., 1993). The
rodent chromosomes within the hybrid cells remain stable . Sheep and
rodent chromosomes are differentiated by species-specific staining

character istics and sheep chromosomes are banded and characterized
according to the Reading standard ovine karyotype (Burkin et al. , 1993) .
Cell lines containing specific ovine chromosomes are then maintained.
Viable sheep somatic cell hybrids were first produced in 1981 by Saidi
Mehtar et al . (1981) .
13
By hybridizing DNA probes to panels of ovine somatic cell hybrids ,
chromosome localization of the probe is determined . Although somatic cell
hybridization is used extensively in certa in species, problems arise in using
th is technique for ovine genome development because sheep cell hybrids are
not readily available . In addition , individual ovine chromosomes are difficult
to identify when segregated from other ovine chromosomes of similar size
(Stranzinger and Vercoe, 1988). Somatic cell hybrids have been used to
assign 13% of the genes and genetic markers to the sheep genome map
(Pearce and Broad, 1994).
In Situ Hybridization. In situ hybridization is the localization of labeled
nucleotide sequences (called probes) to complementary regions on fixed
metaphase chromosomes . This technique was introduced by Pardue and
Gall in 1969. Using Xenopus (toad) oocytes , they successfully hybridized
tritium-labeled DNA to fixed cytological preparations. DNA binding sites
were detected autoradiographically using photographic emulsifying and
developing procedures . Also at this time, John et al. (1969) hybridized 3H
Iabeled RNA to fixed Hela cell nuclei. Autoradiography was used to

14
visualize silver grains in specific locations within the nuclei . The grains
represented RNA-DNA hybrid formation and suggested base
complementar ity between labeled probe nucleotide sequences and DNA
(John et al., 1969). In 1974, Evans et al. verified specific binding by
observing specific chromosome reg ions with heavily distributed silver grains .
Chromosome reg ions with low grain yields were proposed as regions of
nonspecific probe binding . Later molecular hybridization studies revealed
that by increasing the autoradiographic exposure time, specific and
nonspecific binding increased (Harper et al., 1981 ). However, because there
were a limited number of specific hybridization sites, the clarity of the
labeled probe site decreased with longer exposure times (Harper et al.,
1981 ). This occurrence is described as a decrease in the signal-to-noise
ratio . In developing this concept, Gerhard et al. (1 981 ) labeled DNA
sequences with the radioisotope 1251 using nick translation and hybridized
different concentrations of the labeled probe to fixed chromosome spreads .
Their work concluded that the optimum probe concentration varied with the
size of the probe. In addition, the number of silver grains visualized at the
specific hybridization site was directly proport ional to probe size (Gerhard et
al. , 1981 ). To explain the occurrence of background signals, Gerhard and
associates postulated that the probes contained repetitive nucleotide
sequences yielding nonspecific binding sites .
High signal-to-noise ratios limit the potential of using in situ

15
hybridization for gene mapping (Lawrence et al., 1988). Another
disadvantage of using radiolabeled probes includes the time needed to
autoradiographically expose the hybridized chromosome spreads. These
times vary from several days to several weeks (Gerhard et al., 1981 ). In
addition to these limitations, probes labeled with radioisotopes provide low
resolution when referenced to specific chromosome locations. This limited
resolution is a consequence of the radioactive disintegrations which scatter
from the specific hybridization site (Lawrence et al. , 1988). Statistical
analysis of 50-100 chromosome spreads (Lawrence et al., 1988, 1990) is
also required when using radioisotopes in chromosomal localization studies.
These limitations prompted efforts to develop alternative probe labeling
methods and visualization techniques.
One of the first methods to replace radioisotope labeling of nucleotide
probes used antibodies tagged with a fluorescent molecule (Rudkin and
Stollar, 1977). This technique was developed by preparing antisera in
rabbits against sequences rich in A and T nucleotides. Cytological
preparations were exposed to the rabbit antiserum and then to a specific
anti-rabbit antibody that had been prepared in goats. The antibody was
tagged with rhodamine and visualized using fluorescent microscopy. Rudkin
and Stollar ( 1977) demonstrated the specificity of the immunological
reagents by identifying the chromosomal localization of the fluorescent
signal.

16
Due to the limited availability of specific anti-RNA-DNA antibodies,
researchers developed additional labeling methods. Chemically modified
DNA probes were introduced in 1975 when biotin was covalently coupled
with an RNA probe via polyamine bridges (Manning et al., 1975). Avidin, a
large glycoprotein with a high binding specificity for biot in, was labeled w ith
ferritin or polymethacrylate spheres and sequentially incubated with
chromosomes hybridized with the biotin-labeled probe. The large biotin
avidin complex was visualized with scanning electron microscopy. In 1981 ,
Langer et al. simplified the biot in labeling procedure by using nick translation
to incorporate biotinylated dUTP directly into a DNA probe . The biotin
labeled polynucleotides were chemically stable and hybridized specifically to
complementary nucleotide sequences (Langer et al., 1981 ). Another indirect
labeling method replaced avidin with an antibiotin antibody conjugated to
FITC (fluorescein isothiocyanate) or horseradish peroxidase (Lan ger-Safer et
al., 1982) . The signals were visualized with fluorescent and light
microscopy, respectively . This study reported significantly less nonspecific
background than was evident when using autoradiographic detection .
Simultaneous to indirect immunofluorescent studies, endeavors were
made to directly label RNA and DNA sequences with fluorescence . Bauman
et al ., 1980, 1981) initiated this work by covalently bind ing the fluorescent
molecule TRITC (tetramethyl rhodamine isothiocyanate) to the probe
sequence. The fluorochrome-labeled probes were then hybridized to

17
denatured DNA and the red f luorescent signal was v isualized microscopically
using excitat ion and emission filters specific for rhodamine. Significant
advantages in spatial resolution of the signal and time-conservative
procedures made fluorescent in situ hybridization attractive for cytogenetic
studies.
With the advances in labeling techniques, fluorochrome-labeled
probes contain ing repetitive sequences could be hybridized to
complementary DNA sequences and visualized microscopically . However, to
visualize most single-copy genes following in situ hybridization,
autoradiographic detection was required . The rare exception to this
limitation were very large unique sequences (25-50 kb) (Lawrence , 1990) .
Landegent et al. (1985) reported detection of a large single gene after
hybridizing a labeled probe containing the unique genomic sequence to
human chromosomes . The probe was labeled with AAF (2-
acetylaminofluorene) and detected using anti-AAF antibodies in conjunction
with reflection-contrast microscopy. Although this method accurately
validated the chromosomal location of the gene, a significant limitation was
observed because several loci sites showed no hybridization signal
(landegent et al., 1985) . Consequently, this single-copy gene mapping
procedure was not pursued .
The challenge posed by single-copy gene detection on the efficiency
of fluorescence in situ hybridization is gradually being overcome . By using

18
high concentrations of labeled probe DNA, the intensity of the fluorescent
signal is increased (lawrence et a!., 1988) . Increasing probe concentrations
allows the probe to effectively compete with the reannealing chromosomal
DNA . In addition, a number of detector molecules have been tested for
optimal fluorescent intensity. Among these are rhodamine-conjugated
avidin , fluorescein-conjugated avidin, Texas red-conjugated streptavidin, and
immunofluorescent detection of antibod ies conjugated to biotin . Based on a
study performed by Lawrence et al. (1 988), fluorescein -conjugated avidin
consistently produced the most intense signal with the least background .
Since 1988, the fluorescein -conjugated avidin detection system has
continued to be refined . Currently , this technique provides a single step
detection system that can be used for biotin-labeled probes and digoxigenin
labeled probes (Lawrence et a!., 1990) . Also, recent advances in detection
techniques have enabled visualization of smaller probes and weak signals
(lawrence, 1990). Improved detection techniques include computer
generated image visualization and enhancement.
In developing species-specific gene maps, increasing numbers of
probes are being hybridized and detected by fluorescent techniques.
Fluorescence in situ hybridization, in comparison w ith autorad iographic
techniques , provides some distinct advantages. These advantages include
significantly decreased detection time, disposal of radioactive products ,
lower background noise, increased hybridization effic iency , and increased

19
probe resolution on specific chromosomes . To date, in situ hybridization has
facilitated the assignment of 19% of the genes and genetic markers on the
sheep genome map (Pearce and Broad, 1994) . Table 1 provides specific loci
that have been mapped to the ovine genome using in situ hybridization. In
total, 69 loci have been mapped to specific ovine chromosomes using in situ
hybridization. Thus, the in situ hybridization technique is a powerful method
for enhancing the ovine genome map.
Table 1. Loci mapped to the sheep genome by in situ hybridization
Gene or marker name Chromosome First author of reference
Acetylcholine receptor, 11 q14-q22 Pearce et al. ( 1993) muscle, beta 1 subunit
Acetylcholine receptor, 2q42-qter Ansari et al. ( 1994b) muscle, delta subunit
Alpha 2 macroglobulin 3q26-q35 Graphodatsky et al. (1993)
Amelogenin, X-linked X Shaw et al. (1993)
Amelogenin, Y-linked y Shaw et al. ( 19931
Casein, alpha 52 6q32 Hayes et al. ( 1993a)
Casein, beta 6q22-q31 Hayes et al. ( 1992)
CD3 antigen, zeta 1 p14-p11 Broad et al. ( 1994a) polypeptide
cGMP rod 5q31 -q33 Pearce et al. ( 1994) phosphodiesterase, alpha
cGMP rod 6q33-qter Broad et al. ( 1994b) phosphodiesterase, beta
(table cont inues)

20
Coagulation factor VIII Xq24-q33 Backfisch et al. (1994)
Coagulat ion factor 1 0 1 Oq33-qter Pearce et al. ( 1994)
Collagen alpha 1, type Ill 2q12-q14 Ansari et al. ( 1994b)
Cort icotropin releas ing 9q23-q28 Broad et al. (1995) hormone
Cytochrome P450, 22q2 1-q23 Broad et al. ( 1992) Subfamily XVII
Cytokeratin, type I, acidic 11 q25-q29 Hediger et al. (1991a) (KRTA)
Cytokeratin, type II , basic 3q14-q22 Hediger et al. (1991a) (KRTB)
DNA segment BRY.1 y Matthews and Reed (1991)
DNA segment cos1 11 qter Monteagudo et al. (1992)
DNA segment CSRD1613 1 q36-qter Drinkwater et al. (1993)
DNA segment GMBT6 9q13-q17 Gunawardana (1991 l
DNA segment GMBT11 17q23-qter Gunawardana ( 1991 )
DNA segment GMBT11 22q11 -q21 Gunawardana (1991 )
DNA segment GMBT16 18q24 Georges et al. ( 1991 l
DNA segment GMBT19 7q15-q23 Georges et al. ( 1991 l
DNA segment GMBT22 11q17-qter Georges et al. ( 1991 l
DNA segment JMP8 6q34-q35 Pearce et al. ( 1994)
DNA segment OY1 .1 y Jorgensen et al. ( 1992)
DNA segment OY1 .11 y Jorgensen et al. ( 1992)
DNA segment RP11 1 Oq24-q32 Crawford et al. ( 1994)
Elastin 24q16-qter Broad et al. ( 1992)
(tab le continues)

21
Esterase D 3p34-p22 Graphodatsky et al. (1993)
Estrogen receptor 8q25-q27 Pearce et al . (1994)
Fibr inogen, gamma 17q12-q13 Johnson et al. ( 1993)
Fibroblast growth factor 2 17q23-q25 Pearce et al. ( 1994)
Fibronectin 1 2q41 -q44 Ansari et al. (1994b)
Follicle-stimulating hormone, 15q24-qter Hediger et al. (1991 b) beta
Gelsolin 2pter-p24 Ansari et al. (1993a)
Glucose phosphate 14q22-q24 Chowdhary et al. (1991) isomerase
Growth hormone I 11 q25-qter Hediger et al. ( 1990)
Hexosaminidase A , alpha 7q13-q22 Pearce et al. ( 1994) polypeptide
Immunoglobulin M-like 3p23 Hayes and Petit ( 1993)
lnhibin , beta A 4q26-q31 Ansari et al. (1993a)
Insulin-like growth factor 2 21q21 -qter Ansari et al. ( 1993a)
Interferon, omega 2p15 Iannuzzi et al. {1993)
Interferon, trophoblast 2p15 Iannuzzi et al. (1993)
lnterleukin receptor A 13q12-q15 Ansari et al. ( 1993a)
Lactalbumin , alpha 3q21 Hayes et al. ( 1993b)
Lactoglobulin, beta 3p28 Hayes and Petit ( 1993)
Lactoperoxidase 11q13 Hayes et al. ( 1993b)
Laminin, gamma I 12q22-q24 Pearce et al. (1994)
Myelin basic protein 23q11-q12.3 Broad et al. ( 1994a I
Nerve growth factor, beta 1 p24-p21 Broad et al. ( 1994a)
Neurotensin 3q12-q14 Wood et al. (1993)
Nucleoside phosphorylase 7 Burkin et al. ( 1993)
(table continues)

22
Ovine lymphocyte antigen 20q15-q23 Hediger et al. (1991a)
Protein kinase C, beta 1 24q 13-q 18 Ansari et al. (1993al polypeptide
Retinoblastoma 1 10q13 Hayes et al. (1993b)
Rhodopsin 19q23-qter Crawford et al. ( 1994)
Ribosomal DNA (RNR1) 1 pter Mareno-Millan and Rodero-Franganillo (1990)
Ribosomal DNA (RNR3) 3qter Broad et al. ( 1993)
Ribosomal DNA (RNR5 ) 25qter Ansari et al. ( 1992)
Ribosomal protein 4 , X- X Shaw et al. (1993) linked
Steroid sulphatase X Shaw et al. ( 1993)
Tachykinin 2 receptor 25q14-q22 Broad et al. ( 1994al
Transferrin 1q42-q45 Burkin et al. ( 1993)
Ubiquitin activating enzyme X Shaw et al. ( 1993)

23
MATERIALS AND METHODS
Tissue Culture
Initially, a one half thickness of epidermal tissue was excised from the
axillary region of a sheep . The tissue biopsy was performed using a sterile
technique with a scalpel blade and forceps . Immediately following excision ,
the t issue was placed in RPMI 1640 med ium (Gibco BRL) supplemented w ith
16% fetal bovine serum (Hyclone Laboratories) and 25 pL (one drop) of
ant ibiotic-antimycotic solution (Gibco BRL) was added. The tissue was left
in the culture medium at room temperature for 2 h to check for
contamination. The t issue was then incubated for an additional 3 h in fresh
tissue culture medium and homogenized with a tissue homogenizer . The
resulting cell suspension was poured into a 25-cm 2 tissue culture flask and
additional medium was added to completely cover the bottom of the flask .
RPM I medium 1640 supplemented w ith 16% fetal bovine serum, 1%
penicillin streptomycin (Gibco BRL). and 1% L-glutamine (Gibco BRL) was
used to culture the cells . The flask was gassed with 9 .98% C0 2 for
approximately 20 sand then incubated at 38°C. The flask was left
undisturbed for 3 d and then viewed microscopically with a 4X objective to
detect cell growth . Medium was changed every 5 to 7 d to stimulate cell
proliferation . A monolayer of fibroblasts developed w ithin 2 or 3 wk . At
cell confluency, medium was removed from the flask and replaced with
0 .25% trypsin (Hyclone Laboratories) . The cells were incubated at 38°C for

24
an additional 5 to 10 min until most cells had "rounded up" on the bottom of
the flask . The cells were det ached by tapping on a corner of the flask. The
trypsin was then inactivated by adding approximately 7 ml of fresh med ium
to the flask . Equal amounts of the flask contents were divided between the
original flask and a new 25-cm 2 flask. The flasks were gassed and left at
38°C. Culture medium was changed regularly until the cells grew to
confluency, at which time one of the flasks was passed into four additional
flasks . Following a 24-h incubation period , cell attachment was confirmed
and culture medium was replaced with 5 ml of fresh medium and
fluorouracil (Sigma; 260 ng/ml) . Incubation continued for another 17 to 18
h. The synchronization block was then released by rinsing the cells
thoroughly with Hank ' s Balanced Salt Solution (HBSS) (Hyclone
Laboratories). Fresh medium supplemented with 5-bromo-2' -deoxyuridine
(BrdU) (Sigma; 92.5 JJg /mL) , a nucleotide analogue to the nucleotide
thymine , was added to the culture and incubated for 5 to 6 h. Following the
BrdU incubation period, colcemid (Gibco BRL; 40 ng/ml) and ethidium
bromide (Sigma; 20 JJg/mL) were added to the culture medium for an
additional 30 min. Cells were then harvested and chromosome spreads
prepared using standard cytogenetic techniques as described by Verma and
Babu (1995) .
Fluorescent In Situ Hybridization
Nick translation was used to introduce a fluorescently-labeled

25
nucleotide (biotin-21-dUTP) into the DNA probe according to manufacturer ' s
directions (Biotin-21 -dUTP Nick Translation Kit , elontech Laboratories, Palo
Alto, eA) . Immediately prior to hybridization, chromosomes on prewarmed
microscope slides were denatured by immersing in 70% formamide/2X SSe
at 74°e for 2 min, dehydrated in a 70%-, 80%-, and 100%-ice cold ethanol
series and allowed to air dry at room temperature . The labeled probe was
also denatured in a 74°e water bath for 5 min and spotted onto the
denatured chromosomes. Hybrid ization was performed overnight in a 37°C
humidified chamber. Slides were washed in three changes of 50%
formamide/2X SSe at 45°e for 5 min each , followed by three washes in 2X
sse at 45 oe for 5 min each . To detect the probe, slides were first
incubated at 37°C with blocking buffer for 30 min and then incubated at
37°C with fluorescein-labeled avidin (Oncor) for 20 min. Slides were
washed three times in 4X SSC/0 .1% Tween 20 at 45°e for 5 min each.
The detection steps were repeated three times as described , with the
fo llowing two alterations . Slides were incubated with blocking buffer for 5
min at room temperature during the second and third detection rounds and
fluorescein-labeled avidin was replaced with biotinylated antiavidin in the
second detection round . Chromosomes were countersta ined with propidium
iod ide (Sigma; 200 ng/mL) and overlaid w ith p -phenylenediamine antifade
(pH 111 (Sigma) (Lemieux et al., 1992; Ponce de Leon, personal
communication ). By using a fluorescent microscope with a propidium iodide
26
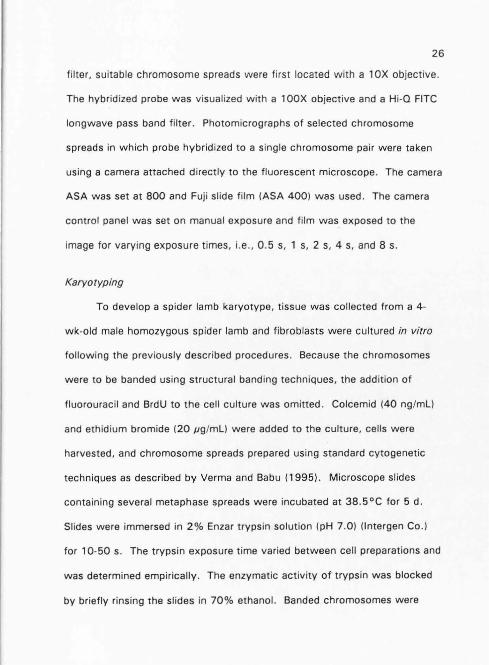
filter , suitable chromosome spreads were first located with a 1 OX objective .
The hybridized probe was visualized with a 1 OOX objective and a Hi-Q FITC
longwave pass band filter. Photomicrographs of selected chromosome
spreads in which probe hybridized to a single chromosome pair were taken
using a camera attached directly to the fluorescent microscope. The camera
ASA was set at BOO and Fuji slide film (ASA 400) was used . The camera
control panel was set on manual exposure and film was exposed to the
image for varying exposure times, i. e., 0 .5 s, 1 s, 2 s, 4 s, and 8 s.
Karyotyping
To develop a spider lamb karyotype, tissue was collected from a 4-
wk-old male homozygous spider lamb and fibroblasts were cultured in vitro
following the previously described procedures . Because the chromosomes
were to be banded using structural banding techniques , the addition of
fluorouracil and BrdU to the cell culture was omitted . Colcemid (40 ng/ml)
and ethidium bromide (20 pg/ml) were added to the culture, cells were
harvested, and chromosome spreads prepared using standard cytogenetic
techniques as described by Verma and Babu (1995). Microscope slides
containing several metaphase spreads were incubated at 38.5°C for 5 d.
Slides were immersed in 2% Enzar trypsin solution (pH 7.0) (lntergen Co .)
for 10-50 s. The trypsin exposure time varied between cell preparations and
was determined empirically. The enzymatic activity of trypsin was blocked
by briefly rinsing the slides in 70% ethanol. Banded chromosomes were

27
stained w ith 2% Giemsa (Sigma) and visualized through a light microscope
at 1 OOOX. Selected chromosome spreads were photographed with black
and white Kodak 100 speed film . The camera speed was set at 400 ASA
and the film was exposed using the automatic exposure settings '-1' and
'0 ' . To make the karyotype, photographs were enlarged using standard
procedures . The karyotype was compared to the Reading standard G-band
ovine karyotype (Ford et al., 1 980) .

28
RESULTS AND DISCUSSION
Tissue Culture
Blood cultures are frequently used in cytogenetic stud ies because they
are easy to obtain and require little attention following collection (Verma and
Babu, 1995). However, blood cultures do not provide a continuous cell
source without multiple collect ions . Conversely, fibroblast cultures require
some additional effort to collect and establish in vitro but provide a continual
source of cells for cytogenetic stud ies . In th is study, fibroblasts were
successfully cultured and provided adequate chromosome spreads for
fluorescent in situ hybridization (FISH) procedures and karyotype
development.
The steps and techniques provided in the materials and methods
section have been adapted from standard cytogenetic techniques (Verma
and Babu , 1989, 1995). Several adaptations were made to original
cytogenetic procedures for improvement of cell culture efficiency and to
provide quality chromosome spreads for FISH and banding studies . One of
these modifications was implemented by using a tissue homogenizer to
separate individual cells from the epidermal tissue sample . In the original
procedure , the sample was collected from the axillary region on a sheep and
incubated for 2 to 3 h in t issue culture med ium supplemented with 16%
fetal bovine serum and an antibiotic antimycotic solution to rinse possible
contaminants from the tissue. The culture medium was then replaced with

29
medium supplemented only with fetal bovine serum and incubation
continued for 4 to 5 d. The tissue sample was minced into a paste by
simultaneously cutting across the sample in opposite directions with two
sterile scalpel blades. The paste was then spread across the bottom of a
tissue culture flask and medium was carefully layered on top . The culture
was continued by gassing the contents of the culture flask with 9 .98% C0 2
and incubating at 38 .5°C. The more recent method used in this study
followed or iginal procedures to collect the tissue sample. However, tissue
incubation time in medium supplemented with serum and an antibiotic
antimycotic solution was shortened from 2 to 3 h to 1 h. The 4 to 5 d
incubation in antibiotic antimycotic-free medium was shortened to 2 to 3 h,
followed by pouring the tissue sample and culture medium into a tissue
homogenizer bag. The tissue was homogenized for 60 to 90 s. After
homogenization, the medium appeared cloudy, which was attributed to the
fibroblasts separating from the tissue sample and being dispersed in the
medium . The tissue was also smaller and looked white instead of pink
because of connective tissue which did not homogenize . The cloudy
medium was then poured into a 25-cm2 tissue culture flask and standard
cytogenetic procedures were resumed by gassing and incubating the flask
contents . Compared with the original method, the tissue homogenizing
method is faster and less tedious . Cell cultures that had been prepared
using a tissue homogenizer also became established more quickly than the

30
othe r cell cultures .
As cells attached to the plast ic surface of the culture flask and
began to proliferate , tissue culture medium was replaced every 7 to 10 d .
When the flasks reached cell confluency, cells were detached from the flask
surface with 0 .25% trypsin , diluted with 20 to 25 ml of fresh medium, and
passed into several new culture flasks. Typically, confluent cell cultures
were passed into five 25-cm2 culture flasks or a ratio of 1:5. However, cell
lines that grew exceptionally fast were passed 1 :6 and cell lines w ith a slow
cell proliferation rate were passed 1 :4 . Thus, the proportion of cells passed
into new flasks was dependent on the rate of cell proliferation and was
determined empirically for individual cell cultures.
Besides inherent differences in proliferation rates of individual cell
lines, other factors were found to influence cell proliferation rates . One
critical factor was the concentration of serum used to supplement the RPM!
medium . Tissue culture medium was prepared using two different serum
concentrations, 11.26% and 16%. Each concentration of serum
supplemented medium was added to different culture flasks containing cells
from the same cell line. Cells incubated in medium supplemented with 16%
fetal bovine serum consistently proliferated faster than cells incubated in
11 .26% serum supplemented med ium. Another factor that affected cell
proliferation rate was the type of serum used to supplement the tissue
culture med ium. In this study, two types of serum were used, fetal bovine

31
serum and Fetal Clone Ill (Hyclone Laboratories, Logan, UT) . Fetal Clone Ill
is a serum that was recently developed to replace the cost prohibitive fetal
bovine serum. Separate preparations of medium supplemented with 16%
fetal bovine serum and medium supplemented with 16% Fetal Clone Ill were
added to different flasks containing cells from the same ovine cell line. Cells
were grown to confluency and passed into new flasks with the respective
serum-supplemented medium . Cell proliferation rates between the two
cultures were compared through four generations of cell growth . Cells
incubated in fetal bovine serum-supplemented medium proliferated faster
than cells in the Fetal Clone Ill -supplemented medium. This study concluded
that medium supplemented w ith 16% fetal bovine serum provided faster cell
proliferation rates than did medium supplemented with 11 .26% fetal bovine
serum and med ium supplemented with 16% Fetal Clone Ill.
Cell proliferation rates were maintained by replacing the tissue culture
medium 24 h after passing the cells . Immediately prior to passing, cells
were exposed to 0 .25% trypsin. Trypsin is a proteolytic enzyme that
causes fibroblasts to detach from the plastic surface of the flask . Exposing
cells to trypsin can be deleterious and cause irreversible cell damage to some
cells . By replacing the culture medium 24 h after trypsin treatment,
damaged cells were removed and the growth rate of healthy cells increased .
When culture medium was not replaced until 5 to 7 d after passing , cells
exhibited a slower prol iferation rate . Cell proliferation rates were also

32
optimized by adjusting the pH of the medium to approximately 7 .0. This
was done by gassing the contents of the flask with 9 .98% C0 2 gas for 15
to 20 sec . Within 10 to 15 min following gassing, the culture medium
turned from dark pink to a pale orange-pink color, indicating a pH change. If
the cells were not gassed when the medium was dark pink, cell growth was
drastically inhibited. The cell prol iferation rate seemed best when an orange
pink medium color was maintained .
In addition to cell-culturing modifications, some modifications were
incorporated in cell-harvesting procedures. To synchronize mitotically active
cells at the DNA synthesis phase, traditional cytogenetic methods add
methotrexate to the tissue culture medium for 17 to 18 h. Initially in this
study, concentrations of methotrexate between 0.45 ng/ml and 500 ng/ml
were used to synchronize ovine cells for chromosome banding . However, an
inadequate number of chromosome spreads were obtained when
methotrexate was added to the cell culture . In later studies, methotrexate
was replaced with 260-ng/ml fluorouracil as described by Verma and Babu
(1995) . Cells were effectively synchronized and adequate numbers of
chromosome spreads were observed . Some dynamic A-banded
chromosomes that were obtained from cells synchronized with fluorouracil
and banded by BrdU incorporation and exposure to UV light are shown in
Figure 1. Thus, incubation of cells in fluorouracil replaced methotrexate for
obtaining dynamic banded chromosomes.

Figure 1 . A photomicrograph of dynamic A-banded ovine chromosomes. ( 1 OOOX)
When chromosomes are identified using banding patterns, it is
essential that chromosome length is sufficient to contain an informative
33
number of bands. To obtain chromosome elongation, ethidium bromide was
added to the cell cuHure 30 min prior to harvesting. The optimum
concentration of ethidium bromide was 0 .02 mg/ml, determined empirically
(0.01 mg/ml to 0.03 mg/ml). Lower concentrations of ethidium bromide
(0.01 mg/ml) resulted in short chromosomes with few bands, and higher
ethidium bromide concentrations (0.03 mg/ml) created extremely long,
overlapping chromosomes. Colcemid was added (at a standard

concentration of 40 ng/ml) to ce ll cultures simultaneous with ethidium
bromide to increase the mitotic index .
34
For cytogenetic stud ies, it is important that when cells are splashed
onto microscope slides , the chromosomes from a single cell do not overlap .
Chromosomes that are inadequately spread create difficulty in identifying
and characteriz ing individual chromosomes and chromosome bands . To
decrease chromosome overlap , the length of time and temperature at which
cells are exposed to hypoton ic solut ion can be mod ified . Hypotonic solution
causes the cells to swel l. Consequent ly , the chromosomes with in the cells
spread so when the cells are dropped onto a microscope slide and the cell
membranes rupture, the chromosomes will adequately spread . Typically,
cytogenetic procedures recommend using hypotonic solution at room
temperature for 20 min (Verma and Babu, 1995). If cells are exposed to
hypotonic solution too long and(or) at warm temperatures , the cells will
prematurely burst in suspension and few chromosome spreads will be
observed on the microscope slide . In this study, some ovine ce ll
suspensions were treated with hypotonic solution at room temperature for
times of 20 to 50 min. Others were treated with hypotonic solution at
37°C for times of 20 to 50 min . After the cell suspensions had been
washed in f ixative and splashed onto cold microscope slides , each slide was
examined for the ratio of chromosome spreads to the number of cells . The
slides with the highest ratio of chromosome spreads were from cell

35
suspensions that had been treated w ith hypotonic solution at 37°C for 40
min. Also, compared with other hypotonic treatments, fewer chromosomes
surrounded by cytoplasm were observed from cell suspensions treated with
hypotonic solution at 37°C for 40 min . Cytoplasm that surrounds the
chromosomes (cytoplasmic residues) can interfere with trypsin activity in
obtaining highly resolved chromosome bands and with hybridization
efficiency of a labeled probe to the chromosomes (Verma and Babu, 1989).
Following hypotonic treatment. cell suspensions were washed twice in
fresh fixative and a test slide was prepared from the cell suspension . The
necessity of additional washes was determined by the amount of cellular
debris on the test slide. If debris interfered with the visualization of several
chromosome spreads, one to two additional washes were performed . Slides
were prepared following standard cytogenetic techniques (Verma and Babu,
1989, 1995) or stored at -20°C to preserve chromosomes for FISH studies .
When tissue culture and cell harvesting methods were followed as
described, an average of three or four chromosome spreads was visible in a
low power microscope field.
Fluorescent In Situ Hybridization
Fluorescent in situ hybridization (FISH) utilizes cell culture techniques
to produce quality chromosomes on which unique DNA sequences, or
probes, are hybridized. FISH techniques were established using procedures
received from Clontech and Oncor Laboratories and personal communication

36
with Dr . Dan Gallagher and Dr . Abel Ponce de Leon.
Prior to hybridization, chromosome spreads were prepared on
microscope slides and aged to maintain chromosome morphology throughout
the FISH procedure . Ag ing techniques included storing the slides at room
temperature for 2 wk. storing them at 38.5°C for 2 to 3d, incubating the
sl ides in 2X SSC at 37°C for 1 h, incubating the slides at 65°C for 1 h, or
combinations of these techniques . The optimum aging technique was
determined empirically by vary ing the aging techniques among several slides
containing chromosome spreads . Following FISH, all slides were observed
microscopically for the quality of chromosome morphology. Chromosomes
that were not adequately aged appeared fuzzy and were paler than
chromosomes that had been adequately aged. Based on the sharpness and
high resolution of chromosomes that had been aged at room temperature for
2 wk and further aged by incubation in 2X SSC at 37°C for 1 h, this aging
technique was selected to prepare ovine chromosomes for FISH.
After chromosome spreads were aged, they were v iewed under a
phase contrast microscope. Mic roscope slides were selected that contained
several chromosome spreads in which the chromosomes appeared grey
black. This characteristic increased the likelihood that chromosome
morphology would be maintained throughout the FISH procedure .
Chromosomes that appeared glassy or pale grey were not used for FISH due
to a potential loss of morphology during the FISH procedure . This loss of

37
chromosome morphology would also adversely affect the hybridization
efficiency of the labeled probe. Chromosomes were then dehydrated by
immersing the selected slides in increasing concentrations of ice cold ethanol
(70%, 80%, and 1 00%) . Dehydration with ethanol hardens the
chromosomes, making them more resistant against loss of morphology
during the denaturing technique . Chromosomal DNA is denatured, or
separated into single strands, to allow the denatured probe to hybridize with
its complementary sequence on the chromosomes . The chromosomes were
denatured by immersing the microscope slides in a preheated solution of
70% formamide . The temperature was maintained at 74°C and the
chromosomes were left in the denaturation solution for 2 min. To ensure
that chromosome morphology was preserved during denaturation,
chromosome spreads were again v iewed under a phase contrast microscope .
Maintaining chromosome morphology is essential to obtain adequate results
from FISH.
The probe used to develop FISH techniques in this laboratory was 3-1?.
hydroxy-5-ene steroid dehydrogenase (HSD). a bovine BAC clone that had
been previously hybridized to bovine chromosome 3 (BTA 3) . The probe
was donated by Dan Gallagher at Clontech Laboratories, where it had been
labeled using Clontech ' s Biotin-21-dUTP Nick Translation Kit . Salmon sperm
DNA was added to the labeled probe solution . Salmon sperm DNA is used
as carrier DNA to protect the labeled probe DNA from being lost during the

38
probe preparation procedures . Prior to add ing the salmon sperm DNA to the
labeled probe solution , the salmon sperm DNA was denatured by dissolving
it in NaOH and boiling it for 45 min. The salmon sperm DNA was then
mechanically sheared into DNA fragments between 1 00 and 500 bp long by
forcing it through decreasing sizes of hypodermic needles.
The efficacy of using bovine competitor DNA (COT-1 DNA) to
suppress hybridization of HSD w ith repetit ive sequences on ovine
chromosomes was tested by adding bovine COT-1 DNA to specif ic orobe
solutions . Figure 2 depicts an ovine chromosome spread that was
hybridized w ith HSD in the presence of bovine COT-1 DNA. The competitor
DNA effectively prevented nonspecific hybridization of the fluorescently
labeled HSD probe. Specific hybrid ization of the HSD probe is evident by
the two pairs of fluorescent yellow signals being emitted from both
chromatids of a single large submetacentric chromosome pair . When
compared w ith Figure 3, in which the labeled probe solution was not
supplemented with competitor DNA, it is apparent that bovine COT-1 DNA is
essential to suppress nonspecific hybridization of the labeled probe.
Therefore, to provide quality FISH results , the probe solution contained
biotin-labeled HSD probe DNA (75 ng), sheared salmon sperm DNA (50 JJg) ,
and competitor (COT-1) DNA (2 Jig ).
The DNA probe solution was denatured for 5 min at 74°C and
spotted onto prepared microscope slides containing denatured

Figure 2 . A photomicrogragh of ovine chromosomes hybridized to bovine HSD: with competitor DNA. ( 1 OOOX)
39
chromosomes. During incubation at 37°C for 16 h, the labeled HSD probe
hybridized to its complementary sequence on the chromosomal DNA and the
COT-1 DNA hybridized to repetitive chromosomal DNA sequences.
Following hybridization, the microscope slides were washed in 2X SSC at
45 °C to remove excess probe solution and prepare the hybridized
chromosomes for the detection procedure. To detect the chromosomal
location of the hybridized HSD probe, slides were spotted with blocking
buffer and incubated at 37°C for 30 min. Blocking buffer minimizes
nonspecific binding of the detection reagents. Nonspecific binding inhibits

Figure 3. A photomicrograph of ovine chromosomes hybridized to bovine HSD: without competitor DNA. (1 OOOX)
the visualization of the fluorescent signal emitted from the labeled probe.
40
The detection reagent used in this procedure was fluorescein-labeled avidin.
Avidin has a strong affinity for biotin . Therefore, by spotting the slide with
fluorescein-labeled avidin and incubating at 37°C for 20 min, the avidin
binds to the hybridized biotin-labeled probe. After chromosome spreads are
stained , fluorescein-labeled avidin emits a fluorescent signal, ind icating the
chromosomal location of the hybridized probe.

41
If the fluorescent signal emitted from the fluorescein-labeled avidin
molecule is pale or too weak to visualize. the signal must be amplified.
When amplification of the fluorescent signal is necessary , it is performed
following the detection procedure. The signal amplification procedure used
in this study included spotting the microscope slide with blocking buffer to
minimize nonspecific binding of the amplification reagents, followed by
spotting an anti -avidin antibody solution onto the slide and incubating the
slide at 37°C for 20 min . Anti -avidin antibody has a strong affinity for
avidin and will bind to the localized fluorescein-labeled avidin molecule on
the microscope slide . Chromosomes were exposed to the blocking buffer a
second time after excess anti-avidin antibody had been washed from the
slide with three washes in 4X SSG at 45 °C . Next, fluorescein -labeled avidin
was spotted onto the slide and incubated at 37°C for 20 min . Having an
affinity for the anti-avidin antibody, this application of fluorescein -labeled
avidin will bind to the antibody . Thus, a chain of molecules is established to
identify the chromosomal location of an unique DNA sequence: biotin
labeled probe DNA (HSD) hybridized with a complementary sequence on the
chromosomal DNA, fluorescein -labeled avidin bound to the biotin-labeled
probe, anti -avidin antibody bound to the fluorescent avidin molecule, and a
second round of fluorescein-labeled avidin bound to the anti -avidin antibody.
In this way, the intensity of the DNA probe signal was increased. The
efficacy of amplification for the HSD probe was determined empirically by

42
microscopically viewing nonamplified and amplified ovine chromosome
spreads hybridized with the HSD probe. Figure 4 displays a chromosome
spread hybridized with the HSD probe in which amplification was not
performed . Although the fluorescent probe signal is light compared with the
probe signal emitted from chromosomes in Figure 5, it is visible on a specific
ovine chromosome pair . The chromosome spread in Figure 5 was hybridized
with the HSD probe and amplification was performed. The fluorescent
signal in Figure 5 is more intense than the signal observed on chromosomes
in Figure 4, but fluorescent background signals are also more intense.
Background signals result from nonspecific binding of detection and
amplification reagents and can potentially mask chromosomal locations of
specific hybridization. Therefore, this study determined that signal
amplification procedures are not essential to visualize the location of the
HSD probe to the ovine genome.
Chromosome spreads in Figures 2, 3, 4, and 5 were photographed
using a Hi-Q FITC longwave pass band filter following hybridization,
detection, and staining procedures. Chromosomes were stained with a
fluorescent red stain, propidium iodide (PI), at 200 ng/ml. Fluorescein , the
molecule used to visualize the HSD probe. fades rapidly when exposed to
light. Therefore, p -phenylenediamine antifade (pH 11 J is overlaid on the
stained microscope slide. Hybridized chromosomes were observed using
fluorescent microscopy and appropriate microscope filters .

43
The Hi-Q FITC filter was essential to detect the fluorescent yellow probe
signal. The chromosome spread in Figure 6 is the same chromosome spread
as seen in Figure 2. However, Figure 6 was photographed using a propidium
iodide (PI) filter that highlights the fluorescent red-stained chromosomes .
Figure 4 . A photomicrograph of ovine chromosomes hybridized to bovine HSD: with amplification. ( 1 OOOX)

Figure 5. A photomicrograph of ovine chromosomes hybridized to bovine HSD: without amplification. (1 OOOX)
44
The probe signal is not visible with the PI filter, indicating the importance of
the specific excitation and emission wavelengths of the Hi-Q FITC filter in
visualizing the hybridized probe.
In this study, HSD (3-B-hydroxy-5-ene steroid dehydrogenase), a
bovine BAC clone, consistently hybridized near the centromere of a single
large submetacentric ovine chromosome, either OAR 1, 2, or 3. The
successful hybridization of HSD to the ovine genome indicates that FISH
techniques were performed correctly. The HSD probe will serve as a

45
Figure 6 . A photomicrograph of ovine chromosomes hybrid ized to bovine HSD: visualized with a propidium iodide (PI) filter. ( 1 OOOX)
positive control for FISH techniques performed in this laboratory in the
future. The hybridization of HSD to a single ovine chromosome further
demonstrates the high level of genetic homology between livestock species.
Genetic homology is the evolutionary conservation of genes, chromosome
segments, and chromosomes between species and has been supported by
The International System for Cytogenetic Nomenclature of Domestic Animals
(ISCNDA) (DiBerardino et al., 1989). ISCNDA correlates cattle, sheep, and
goat karyotypes by identifying homologous chromosomes among the three
species . ISCNDA' s results suggest that bovine chromosome 3 (BTA 3) is

46
highly homologous with ovine chromosome 1 (OAR 1). Based on ISCNDA's
karyotypes and this FISH study , in which HSD was hybridized w ith a single
large submetacentric ovine chromosome pair (OAR 1, 2. or 3 ). the probable
location of the HSD probe is on ovine chromosome 1 (OAR 1 ). To verify
this location, additional studies utilizing banding for chromosome
differentiation are necessary .
Karyotyping
To develop a karyotype representing the chromosome morphology of
a sheep affected w ith SLS, epidermal tissue from a 4-wk-old male
homozygous spider lamb was collected and cultured. Structu ral banding
was performed on aged chromosome spreads using Enzar trypsin (Hopwood
and Pathak, 1994). As with FISH, the age of the chromosomes was a
crucial factor. If chromosomes were not adequately aged, they exhibited
complete loss of morphology following trypsin treatment. Aging was
empirically tested using a variety of techniques. These techniques included
placing microscope slides containing chromosome spreads at room
temperature for 1 to 2 wk, incubating the slides at 38 .5°C for 2 to 5 d,
incubating the slides at 65 °C for 24 to 48 h, and immersing freshly prepared
microscope slides in 15% H20 2 for 5 min prior to trypsin treatment. The
aging optimum for this cell line was determined by comparing the resolution
of chromosome bands following different aging techniques and exposure to
trypsin . Chromosomes that had been aged at 38.5°C for 5 d produced

47
chromosome bands with the sharpest resolution . Trypsin treatment was
also determined empirically. Slides containing adequately aged chromosome
spreads were immersed in a 2% buffered Enzar trypsin solution for times
ranging from 10 to 90 s. Enzar trypsin treatment alters chromosome
morphology by digesting protein at chromosomal sites rich in the nucleotides
guanine and cytosine (Hsu, 1979). When chromosomes were stained
following trypsin treatment, the highest quality positive G-bands were
observed on chromosomes that had been treated with trypsin for 40 to 45
s. To block the enzymatic activity of the trypsin, slides were immediately
rinsed in 70% ethanol. G-banded chromosomes were prepared for
visualization by staining the microscope slides in a 4% Geimsa solution . G
banded chromosome spreads were selected based on a complete number of
chromosomes (2n = 54) and on banding quality . Selected chromosome
spreads were microscopically photographed and photomicrographs were
enlarged using standard photography techniques . To assemble the
karyotype, chromosomes were cut from the enlarged photograph and
chromosome pairs were identified according to size and banding pattern.
The paired chromosomes w ere arranged in order of decreasing size (Figure
7) . The SLS karyotype was compared to the Reading standard ovine
karyotype (Ford et al., 1980) . No differences between the Reading standard
karyotype and the SLS karyotype were detected. The spider lamb had a
diploid chromosome number of 54 and a karyotype of 3 pairs of large

48
submetacentric chromosomes , 23 pairs of autosomal acrocentrics, and a
large acrocentric X and a minute biarmed Y chromosome. G-band analysis
of all chromosomes within the karyotype did not reveal any abnormality that
was attributable to SLS. The results suggest that the SLS defect is not
associated with gross chromosomal abnormalities. Therefore, animals that
are carriers for the SLS gene (heterozygous) cannot be detected using
karyotype analysis .
10 11 12 13
14 15 16 17 18
19 20 21 22 23
• 24 25 26
X y
Figure 7 . Spider lamb syndrome (SLS) karyotype .

49
IMPLICATIONS
In situ hybridization is the physical mapping technique of choice for
many researchers because it provides high resolution location of genes and
important loci on chromosomes . Genetic markers mapped by in situ
hybridization will provide anchors for markers and genes mapped by linkage
analysis, thereby aiding in the identification of economic trait loci. Also ,
because some species maintain evolutionarily conserved chromosomes and
chromosome segments, mapping probes developed in other species to ovine
chromosomes will enhance comparative mapping efforts between the ovine
genome and other species . The techniques developed in this project will
allow researchers at Utah State University to map additional loci to specific
ovine chromosomes, thereby contributing to the development of genome
maps for domestic animal species .

LITERATURE CITED
Ahmed, I.A. 1940. The structure and behavior of the chromosomes of the
sheep during mitos is and meiosis . Proc. , Royal Society of Edinburgh
60B pp 260-270.
50
Ansari , H.A., A.A . Bosma, T.D. Bunch , S.E. Long , and C.P. Popescu .
1994a. Clarification of chromosome nomenclature in the sheep (Ovis
aries) . Cytogenet. Cell Genet. 67:114.
Ansar i, H.A ., T .E. Broad , D.J . Burkin, L. Cambridge, M .A . Carpenter, B.P.
Davidson, C.A . Jones, P.E. Lewis, D.W. Maher, A .A . Malcolm, L.R.
McNabb, P.D. Pearce, S.H. Phua, and N.J . Wood . 1992. Regional
assignment of five genes onto sheep chromosomes. Abstracts 1Oth
European Colloquium on the Cytogenetics of Domestic An imals,
August, 1992, Utrecht .
Ansari, H.A ., P.D. Pearce, and D.W . Maher . 1993a. Regional assignment of
anchored reference loci to sheep chromosomes . 4th Australas ian Gene
Mapping Workshop, July, 1993, Adelaide .
Ansari, H.A., P.D. Pearce, D.W. Maher, A .A. Malcolm, and T .E. Broad .
1993b. Resolving ambiguities in the karyotype of domestic sheep
(Ovis aries) . Chromosoma 102:340.
Ansari, H.A ., P.D. Pearce, D.W. Maher, N.J. Wood , S.H. Phua, and T.E.
Broad . 1994b. Regional mapping of loci from human chromosome 2q
to sheep chromosome 2q . Genomics 20:122.

51
Backfisch, W ., S. Neuenschwander, U. Giger, G. Stranzinger, and V . Pliska.
1994. Carrier detection of ovine hemophilia A using and RFLP marker,
and mapping of the factor VIII gene on the ovine X-chromosome . J .
Hered . 85 :474.
Barendse, W ., S.M. Armitage , L.M . Kossarek, A . Shalom, B.W. Kirkpatr.ck,
A .M . Ryan, D. Clayton, L. Li, H.L. Neibergs, N. Zhang , W .M . Grosse,
J. Weiss, P. Creighton, F. McCarthy, M . Ron , A .J . Teale, R. Fries ,
A.A . McGraw, S.S. Moore, M. Georges, M . Soller, J .E. Womack, and
D.J .S. Hetzel. 1994. A genetic linkage map of the bovine genome .
Nature Genetics 6:227 .
Bauman, J .G.J ., J. Wiegant, P. Borst, and P. van Duijn . 1980. A new
method for fluorescence microscopical localization of specific DNA
sequences by in situ hybridization of fluorochrome-labeled RNA. Exp .
Cell Res . 128:485.
Bauman, J .G.J ., J . W iegant, P. Van Du ijn, N.H. Lubsen , P.J.A.
Sondermeijer, W. Hennig, and E. Kubli . 1981 . Rapid and high
resolution detection of in situ hybridisation to polytene chromosomes
using fluorochrome- labeled RNA. Chromosoma 84:1.
Berg, P.T., A .D. Alstad , B.L. Moore, J .A . Vanek, I.E . Berg , and A .C. Misek.
1987. The mode of inheritance of the Spider Lamb Syndrome in
Suffolk sheep . SID Res . Digest 4 :1.
Berry, R.O. 1938. Comparative stud ies on the chromosome numbers in

52
sheep, goat , and sheep X goat hybrids . J . Hered . 29 :343.
Berry, R.O. 1941. The chromosome complex of domestic sheep (Ovis aries ).
J . Hered . 32 :261.
Bishop, M.D ., S.M. Kappes , J .W . Keele, R.T . Stone, S.L .F. Sunden, G.A .
Hawkins, S.S. Toldo , R. Fries , M .D. Grosz, J. Yoo, and C.W . Beattie .
1994. A genetic linkage map for cattle . Genetics 136:619 .
Botstein , D., R.L. White , M . Skolnick, and R.W . Davis. 1980. Construction
of a genetic linkage map in man using restrict ion fragment length
polymorphisms. Am. J. Hum. Genet . 32 :314.
Broad, T .E., H.A . Ansari , D.J. Burkin , L.M . Cambridge, M .A . Carpenter, A .J .
Gleeson, C. Jones, P.E. Lewis, D.W . Maher, and P.O. Pearce . 1994a.
Physical mapping of the sheep genome : Six new chromosomal
assignments by in situ hybridization, and sixteen more loci mapped
using an expanded panel of sheep X hamster cell hybrids . 24th
International Conference on Animal Genetics, July, 1994, Prague.
Broad , T .E., H.A. Ansari, D.J . Burkin , L. Cambridge, B.P. Davidson , C.
Jones, P.E. Lewis, L.R. McNabb, O.W . Maher, A.A. Malcolm, P.O.
Pearce , S.H. Phua, and N.J . Wood. 1992. Twenty new loci mapped
to the ovine genome . Anim . Genet . 22(Suppl. 1 ):94.
Broad, T.E ., D.J . Burkin, L.M. Cambridge, D.W. Maher, P.E. Lewis, H.A .
Ansari, P.O. Pearce, and C. Jones. 1995. Assignment of five loci from
human chromosome 8q onto sheep chromosome 9 . Cytogenet. Cell
53
Genet. 68:102.
Broad, T .E., D.J . Burkin, L.M. Cambridge, D.W. Maher, P.E. Lewis, H.A .
Ansari , P.D. Pearce, and C. Jones . 1994b. Seven loci from human
chromosome 4 map onto sheep chromosome 6: A proposal to restore
the original nomenclature of this chromosome. Mamm. Genome
5 :429.
Broad , T.E., D.J . Burkin, C. Jones, P.E. Lewis, H.A . Ansar i, and P.O. Pearce .
1993. Mapping of MYF5, CIR, MYHL, TPI1, lAPP, A2MR and RNR
onto sheep chromosome 3q . Anim. Genet . 24:415.
Burkin, D.J ., H.G. Morse, T .E. Broad, P.D. Pearce, H.A. Ansari, P.E. Lewis,
and C. Jones. 1993. Mapping the sheep genome: Production of
characterized sheep X hamster cell hybrids . Genomics 16:466.
Chowdhary, B.P., I. Harbitz, W . Davies, and I. Gustavsson. 1991 .
Chromosomal localization of the glucose phosphate isomerase (GPI)
gene in canle, sheep and goat by in situ hybridization--chromosomal
banding homology versus molecular conservation in Bovidae.
Hereditas 114:161.
Collins, F., and D. Galas. 1993. A new five-year plan for the U.S. human
genome project . Science 262:43.
Crawford , A .M. , G.W. Montgomery, C.A. Pierson, T . Brown, K.G. Dodds,
S.l.F. Sunden, H.M . Henry, A .J . Ede, P.A. Swarbrick, T.Berryman,
J .M . Penty, and D.F. Hill. 1994. Sheep linkage mapping : Nineteen
54
linkage groups derived from the analysis of paterna l half-sib families .
Genetics 137:339.
Darnell J ., H. Lodish , and D. Baltimore . 1990. Molecular Cell Biology (2nd
Ed .). Scientific American Books, New York.
DiBerardino, 0., H. Hayes, R. Fries , and S. Long . 1990. International system
for cytogenetic nomenclature of domestic animals ( 1989). Cytogenet .
Cell Genet . 53 :65 .
Drinkwater, R.O., S.E. Johnson, W. Barendse, B. Harrison, J .E. Womack,
and O.J . Hetzel. 1993. Isolation and mapping of a single-locus
minisatellite sequence marker to 1 q36-qter and synteny group U 10 in
cattle and to 1 q36-qter in sheep. Genomics 19:149.
Evans, H.J., R.A . Buckland, and M.l. Pardue. 1974. Location of the genes
coding for 185 and 285 ribosomal RNA in the human genome .
Chromosoma 48:405 .
Evans, H.J ., R.A . Buckland, and A .T. Sumner . 1973 . Chromosome
homology and heterochromatin in the goat, sheep, and ox studied by
banding techniques. Chromosoma 42 :383 .
Ford, C.E., D.L. Pollock, and I. Gustavsson . 1980. Proceedings of the first
international conference for the standardization of banded karyotypes
of domestic animals . Hered itas 92:145.
Frezal , J . 1987. Genes, gene map, gene mapping . Cytogenet . Cell Genet .
46:1'

55
Gallagher, D., L. Cai, B. Huang, T. Yang , P. Nelson, T. Pham, S. Davis , and
J . Taylor. 1995. Use of biotin-21 -dUTP nick translated probes and
chromosomal FISH to localize seven new bovine BAG clones .
Clontechniques X: 1 6.
Georges, M ., A . Gunawardana, D.W. Threadgill, M. Lathrop, I. Olsaker, A .
Mishra, L.L. Sargeant, A. Schoeberlein , M .R. Steele, C. Terry, D.S.
Threadgill, X. Zhao, T . Holm, R. Fries, and J .E. Womack. 1991 .
Characterization of a set of variable number tandem repeat markers
conserved in Bovidae. Genomics 11 :24.
Georges, M ., D. Nielsen, M . Mackinnon, A . Mishra, R. Okimoto, A .T .
Pasquino , L.S. Sargeant, A . Sorenson, M .R. Steele, X. Zhao, J .E.
Womack, and I. Hoeschele. 1995. Mapping quantitative trait loci
controll ing milk production in dairy cattle by exploit ing progeny
testing. Genetics 139:907.
Gerhard, D.S., E.S. Kawasaki, F.C. Bancroft, and P. Szabo. 1981.
Localization of a unique gene by direct hybridization in situ.
Proc. , National Academy Science, USA 78:3755.
Graphodatsky, A .S., L.S. Biltueva, V .A . Filippov, T.P. Lushnikova, T.V .
Shumny, and V .I. Ermolaev. 1993. Localization of ESD and
A2M genes to sheep chromosome 3 by in situ hybridization.
Cytogenet. Cell Genet. 62:156.
Gunawardana, A . 1991 . Physical mapping polymorphic DNA markers in the

Bovidae family. (A comparative study in cattle, sheep and goat) .
Ph .D. Dissertation ETH No. 9556, Swiss Federal Institute of
Technology, Zurich .
56
Harper, M .E., A. Ullrich, and G.F. Saunders . 1981. Localization of the
human insulin gene to the distal end of the short arm of chromosome
11. Proc. , National Academy Science, USA 78:4458.
Hayes, H., and E. Petit. 1993. Mapping of the !?.-lactoglobulin gene and of an
immunoglobulin M heavy chain-li ke sequence to homoeologous
cattle, sheep and goat chromosomes. Mamm. Genome 4:207.
Hayes, H., E. Petit, C. Bouniol, and P. Popescu. 1993a. Localization of the
alpha 52-casein gene (CASAS2) to the homologous cattle ,
sheep and goat chromosomes 4 by in situ hybridization .
Cytogenet . Cell Genet . 64:281 .
Hayes, H., E. Petit, N. Lemieux , and B. Dutrillaux. 1992. Chromosomal
localization of ovine beta-casein gene by non isotopic in situ
hybridization and A-banding. Cytogenet. Cell Genet. 61 :286.
Hayes, H.C., P. Popescu, and B. Dutrillaux. 1993b. Comparative gene
mapping of lactoperoxidase, retinoblastoma, and a-lactalbumin
genes in cattle, sheep and goats . Mamm . Genome 4 :593.
Hediger, R., H.A. Ansari , and G.F. Stranzinger . 1991a. Chromosome banding
and gene localizations support extensive conservation of
chromosome structure between sheep and cattle. Cytogenet .

Cell Genet. 57 :127.
Hediger, R., S. Johnson, W . Barendse, R. Drinkwater, S. Moore, and J .
Hetzel . 1990. Assignment of the growth hormone gene locus to
19q26-qter in cattle and 11 q25-qter in sheep by in situ
hybridization. Genomics 8:171 .
57
Hediger, R. , S. Johnson, and D.J .S. Hetzel. 1991 b. Localization of the beta-
subunit of follicle stimulat hormone in cattle and sheep by in
situ hybridization. Anim. Genet . 22:237.
Hetzel, D.J .S. 1989. Construction of a bovine gene map. Proc ., New
Zealand Society of Animal Production 49 :53-56.
Hopwood, V.L. , and S. Pathak . 1994. Improved quality of Giemsa banding
by the use of trypsin concentrate . American Biotechnology
Laboratory, Oct. , p 52 .
Hsu, T.C. 1979. Human and Mammalian Cytogenetics : An Historical
Perspective . Springer-Verlag , New York .
lanuzzi, L., D.S. Gallagher, G.P. DiMeo, A .M . Ryan, L. Ferrara, and J .E.
Womack. 1993. Chromosomal localization of omega and
trophoblast interferon genes in goat and sheep by fluorescent in
situ hybridization . J. Hered . 84:301 .
John, H.A ., M .L. Birnstie l , and K.W . Jones. 1969. RNA-DNA hybrids at the
cytological level. Nature 223 :582.

58
Johnson, S.E., W. Barendse, and D.J .S. Hetzel. 1993. The r-fibrinogen gene
maps to chromosome 17 in both cattle and sheep. Cytogenet.
Cell Genet . 62 :176.
Jorgensen, C.B., D.S. Gallagher, M . Schwerin, and P.O. Thomsen. 1992.
Chromosomal distribution and use of some bovine male-specific
repeats . Anim. Genet . 23(Suppl. 1 ):79 .
Landegent, J.E., N. Jansen in de Wal , G.J .B. van Ommen, F. Baas, J .J .M .
de Vijlder, P. van Duijn, and M . van der Ploeg . 1985.
Chromosomal localization of a unique gene by non
autoradiographic in situ hybridization . Nature 317:175.
Langer, P.R. , A .A . Waldrop , and D.C . Ward . 1981. Enzymatic synthesis of
biotin-labeled polynucleotides : Novel nucleic acid affinity
probes. Proc. , National Academy Science, USA 78:6633 .
Langer-Sater P.R., M . Levine, and D.C. Ward . 1982. Immunological method
for mapping genes on Drosophila polytene chromosomes . Proc. ,
National Academy Science, USA 79:4381 .
Lawrence, J .B. 1990. A fluorescence in situ hybridization approach for gene
mapping and the study of nuclear organization . In: Genome
Analysis Volume 1: Genetic and Physical Mapping . pp 1. Cold
Spring Harbor Laboratory Press, Cold Spring Harbor, NY.
Lawrence, J .B., L.M. Marshelle, K.S. Byron, C. V. Johnson, J .L. Sullivan, and
R. H. Singer. 1990. Subcellular localization of low-abundance

human immunodeficiency virus nucleic acid sequences
visualized by fluorescence in situ hybrid ization. Proc ., National
Academy Science , USA 87 :5420.
lawrence, J .B., C.A . Villnave, and R.H. Singer . 1988. Sensitive, high
resolution chromatin and chromosome mapping in situ:
Presence and orientation of two closely integrated copies of
EBV in a lymphoma line. Cell 52 :51 .
59
Lemieux, N., B. Dutrillaux, and E. Viegas-Pequignot. 1992. A simple method
for simultaneous R· or G-band ing and fluorescence in situ hybridization
of small single-copy genes . Cytogenet . Cell Genet. 59 :311 .
long, S.E. 1985. Standard nomenclature for the G-band karyotype of the
domestic sheep (Ovis aries) . Hereditas 103:165.
Manning, J.E., N.D. Hershey, T .R. Broker, M . Pellegrini, H.K. Mitchell , and
N. Davidson. 1975 . A new method of in situ hybridization .
Chromosoma 53 :107.
Matthews. M .E .• and K.C . Reed . 1991 . A DNA sequence that is present in
both sexes of Artiodactyla is repeated on the Y chromosome of sheep,
cattle and goats. Cytogenet. Cell Genet. 56:40.
Monteagudo, l.V., F. Pitel , J . Gell in, M . Yerle, M.T. Tejedor, and M .V.
Arruga . 1992. In situ localization of cosmids carry ing
microsatellites. Anim. Genet. 23(Suppl. 1 ):95 .
Moreno-Millan, F., and A. Rodero-Franganillo . 1990. Nucleolar organizer

regions , types of assoc iation and identification of carrier
chromosome in domestic sheep. Genet . Sel. Evol. 22 :273.
Morton, N.E. 1955. Sequential tes ts for the detection of linkage . Am. J .
Human Genetics 7:277 .
Pardue, M .L. , and J .G. Gall . 1969. Molecular hybridization of radioactive
DNA to the DNA of cytological preparations . Genetics 64:600.
60
Paris Conference 1971 : Standardization in Human Cytogenetics. 1972. Birth
Defects: Orig inal Article Series , VIII (7) . The National
Foundation , New York .
Pearce , P.O. , H.A. Ansari , D.W. Maher, T.E. Broad , L.M . Cambridge , P.E.
Lewis , D.J. Burkin, and C. Jones . 1994. The assignment of
fourteen new loci to ovine chromosomes . 5th Australasian
Gene Mapping Workshop, July , 1994, Armidale.
Pearce, P.O., H.A . Ansari, D.W . Maher, A .A . Malcolm, N.J . Wood , S.H.
Phua, and T .E. Broad . 1993. Assignment of the B subunit of
the muscle nicotinic acetylchol ine receptor to sheep
chromosome 11 . Cytogenet . Cell Genet . 64:59 .
Pearce, P.O., and T.E . Broad . 1994. The sheep genome map. AgResearch ,
Grasslands Research Centre, Palmerston North, New Zealand .
Ponce de Leon, F.A ., Y. Li , and Z. Weng . 1992. Early and late replicative
chromosomal banding patterns of Gallus domesticus. J . Hered . 83:36.
Ransom, S., J . Anderson, H. Huang, J . Braman, and J . Moores. 1992.

Fluorescence in situ hybridization using directly fluoresce inated
probes . Strategies in Molec. Bioi. 5:35 .
Rohrer, G.A ., L.J . Alexander, J .W . Keele, T.P. Smith , and C.W . Beattie .
1994. A microsatellite linkage map of the porcine genome. Genetics
136:231 .
Rook, J .S., M . Kopcha , K. Spauld ing, P. Coe, M . Benson, J. Krehb iel, and
A .L. Trapp . 1988. Diagnosis of hered ita ry chondrodysplasia (Spider
Lamb Syndrome) in sheep. JAVMA 188:713.
Ruddle, F.H., and R. Fries . 1985. Mapping genes in domesticated animals .
Basic Life Sciences 37:39 .
61
Rudkin, G.T., and B.D. Stollar . 1977. High resolution detection of DNA-RNA
hybrids in situ by indirect immunofluorescence . Nature 265 :472.
Saidi-Mehtar, N., M .C. Hors-Cayla , and N. Van Cong. 1981 . Sheep gene
mapping by somatic cell hybridization: Four syntenic groups :
EN01 -PGD, ME1-PGM3, LDHB-PEPB-TPI, and G6PD-PGK
GALA . Cytogenet . Cell Genet. 30:193.
Shaw, J ., J .M . Watson, S. Wilcox , and J .A .M. Graves. 1993. Location of
genes of sheep and cattle on the sex chromosomes . 4th
Australasian Gene Mapping Workshop , July, 1993, Adelaide .
Shiwago, P.l. 1931 . Karyotype stud ies on ungulates. The chromosome
complex of sheep and goats . Z. Zellforsch. Mikroskop . Anat.
13:511 .

Stranzinger, G.F., and J .E. Vercoe . 1988. Molecular genetics and farm
animal improvement . Bank Vontobel AG, Zurich , Switzerland .
Thomas, D.L. , and A .R. Cobb. 1986. Spider Syndrome and other genetic
defects . Sheep Mag. 7:44.
Verma, R.S., and A. Babu . 1989. Human Chromosomes : Manual of Basic
Techniques. Pergamon Press , Elmsford, NY.
Verma , R.S., and A. Babu . 1995. Human Chromosomes: Principles and
Techniques (2nd Ed .) . McGraw-Hill, New York.
62
Watkins , P.C. 1988. RFLP: Applications in human chromosome mapping and
genetic disease research . Biotechniques 6 :310.
White R., M. Leppert, D.T. Bishop, D. Barker, J. Berkowitz, C. Brown, P.
Callahan, T. Holm, and L. Jerominski . 1985. Construction of
linkage maps with DNA markers for human chromosomes .
Nature 313:101 .
Wood , N.J ., H.A . Ansari, T.E. Broad , D.J . Burkin , C.A. Jones, P.E. Lewis ,
D.W. Maher, P.O. Pearce, and S.H. Phua . 1993. Regional
assignment of the neurotensin locus in sheep. Mamm. Genome
4 :541 .

63
APPENDICES

APPENDIX A
Karyotype Development
References :
Hopwood, V .L. and S. Pathak. 1995. Improved quality of Giemsa banding by the use of trypsin concentrate. American Biotechnology Laboratory . Oct, p. 52 .
Verma , R.S. and A . Babu . 1989. Human Chromosomes : Manual of Basic Techniques . Pergamon Press , Elmsford , NY .
64
Verma, R.S. and A. Babu . 1995. Human Chromosomes : Principles and Techniques . McGraw-Hi ll, New York.
Equipment:
Laminar flow hood such as SteriiGARD Hood, model SG-600, The Baker Co., Sanford, ME 04073 .
Tissue homogenizer such as Stomacher Lab-Blender 80, model #STOM 80, from Tekmar Co ., Cincinnati, OH 45222 .
Gas regulator such as Veriflo, Richmond , CA 94801 .
Incubator such as C0 2 Incubator, model 2500, VWR Scientific , Philadelphia, PA 19101 -9711 .
Low power microscope such as Olympus Tokyo, L.A . Scientific Instrument Co.
Timer such as 3-Channel Alarm Timer, cat . C651 0-1, Baxter Scientific Products, McGaw Park, IL 60085-6787 .
Centrifuge with fixed angle rotar such as IEC Clinical Centrifuge, International Equipment Co .
Water bath such as Circulating Water Bath, model 260, Precision Scientific, Chicago, IL 6064 7 .

pH meter such as Corning pH meter, model 240, Baxter, McGaw Park, IL 60085-6787 .
Hair dryer with cool air setting such as Revlon , model RV406.
High power microscope such as Zeiss Axioskop, Carl Zeiss Inc ., San Leandro, CA 94577 .
Microscope camera such as MC 80 microscope camera , Carl Zeiss Inc., San Leandro , CA 94577 .
Pipet such as V3-Series , cat. V200TE, Ulster Scientific, New Paltz, NY 12561 -0819.
Pipet filler such as pipet filler, cat . P53 10, Baxter Healthcare Corp ., McGaw Park, IL 60085-6787 .
65
Ultraviolet (UV) light such as Spectroline UV Light, model ENF-260C, Spectronics Corporation , Westbury , NY 11568.
Negative enlarger such as Beseler 23 CII -XL-Enlarger, Charles Beseler Company, Linden NJ 07036.
Safelight such as Kodak Adjustable Safelight Lamp, Model B, Eastman Kodak Company, Rochester, NY 14650.
Focus finder such as Micro Focus Finder, product PTP643, Paterson Products, Borehamwood Herts , England .
Supplies:
Permanent marking pen
Surgical blade (sterile)
Forceps (sterile)
Cotton swabs
Iodine
Alcohol swabs

RPMI medium 1640 -from Gibco BRL, Grand Island, NY 14072 -cat. #11875-069
Defined fetal bovine serum -from Hyclone Laboratories, Logan, UT 84321 -cat . #A-1111 -L Aliquot in 20 ml. Store at -80°C.
Penicillin streptomycin -from Gibco BRL, Grand Island, NY 14072 -cat . #15075-013
Rehydra te in 20 ml RPMI med ium 1640. A liquot in 1.5 mL. Store at -20°C.
L-glutamine-200 mM -from Gibco BRL, Grand Is land , NY 14072 -cat. #15039-019
Rehydrate in 20 mL RPMI medium 1640. Protect from light . Aliquot in 1.5 ml. Store at -80°C .
Antibiotic -Antimycotic ( 1 OOX) -from Gibco BRL, Grand Island, NY 14072 -cat. #15245-01 2
66
Rehydrate in 20 ml ster ile, ddH20 . A liquot in 50 pl. Store at -80°C.
Trypsin (0 .25%) -from Hyclone Laboratories , Logan, UT 84321 -cat . #B-3004
Colcemid (10 JJg/mL) -from Gibco BRL, Grand Island , NY 14072. -cat. #15212-012
Ethidium bromide -from Sigma, St. Louis, MO 63178 -cat. #E-8751

Hank's balanced salt solution (HBSSI -from Hyclone Laboratories, Logan , UT 84321 -cat . #B-4006-AA
Potassium chloride (KCI) -from Mallinckrodt, Paris , KY 40361 -cat. #6858
Methyl alcohol (anhydrous) -from Mallinckrodt, Paris, KY 40361 -cat . #3016
Acetic acid (glacial) -from Mall inckrodt, Paris, KY 40361 -cat . #8817
Sodium phosphate (monobasic) (NaH 2P04 H20) -from Mallinckrodt, Paris, KY 40361 -cat . #7892
Sodium phosphate (dibasic heptahydrate) (Na2 HP04 7H2 0) -from Mallinckrodt, Paris , KY 40361 -cat. #7914-(05)
Hydrochloric acid (HCI) ( 12N) -from Mallinckrodt. Paris , KY 40361 -cat . #2612
Giemsa stain, modified -from Sigma, St . Louis , MO 63178 -cat . #GS-500
Tissue homogenizer bags -such as Seward Medical Stomacher '80' Bags
Tissue culture flasks (25 cm2)
-from Corning , Corning, NY 14831 -cat. #251 00-25
Conical polypropylene centrifuge tubes (15 mL) -from Corning, Corning, NY 14831 -cat. #25319-1 5
67

Gas -9 .98% C02 -1 9 .98% 0 2 -70.04% N
9 inch pasteur pipets -from Kimble, Toledo, OH 43666 -cat . #72050
Microscope slides -from Corning , Corning NY 14830 -cat. #2948
Coplin staining jars -from Fisher Scientific, Pittsburgh, PA 15219-4785 -cat . #08-81 7
Ice
Pipets I 1 ml) -from Corning, Corning , NY 14831 -cat . #7075-1
Pipets I 10 ml) -from Corning , Corning , NY 14831 -cat. #27003-1 0
Pipets (25 ml) -from Corning, Corning, NY 14831 -cat. #7075-25
Pipet tips (1-200 pl) -from VWR Scientific, West Chester, PA 19380 -cat . #53508-81 0
Photography film -from Kodak -#TMX 135-24
Enzar-T (40X trypsin solution) -from lntergen Co., Purchase, NY 10577 -cat . #7000-65
68

Hank' s balanced salt solution (calcium and magnesium free) -from Gibco BRL, Grand Island , NY 14072 -cat. #14170-039
Sodium bicarbonate (7 .5%) -from Hyclone Laborator ies, Logan , UT 84321 -cat . #B-3002-D
Ethyl alcohol -from Mallinckrodt, Paris, KY 40361 -cat . #7018
5-Fiuorouracil -from Sigma, St. Louis, MO 63178 -cat #F-6627
5-bromo-2 ' -deoxyuridine (BrdU) -from Sigma, St. Louis, MO 63178 -cat #B-2398
Hoechst (stain) No . 33258 -from Sigma, St. Lou is, MO 63178 -cat #B-1782
Film developing canister
Photography developing trays
Wooden tongs
Clothes pins or photo clips
Negative squee-gee
Photography easel
Paper cutter
Scraper with rubber blade
Multigrade Contrast Filters -from ILFORD Limited , Moberly Cheshire, England, 13996141 J89
-cat #624 232
69

Polycontrast Ill RC glossy print paper -from Eastman Kodak Company, Rochester, NY 14650 -cat. #128 4645
Kodak D76 Developer -from Eastman Kodak Company, Rochester, NY 14650 -cat. #146 4817
Kodak Indicator Stop Bath -from Eastman Kodak Company , Rochester, NY 14650 -cat. #146 4247
Kodak Rapid Fixer -from Eastman Kodak Company, Rochester, NY 14650 -cat. #146 4106
Kodak Dektol Developer -from Eastman Kodak Company, Rochester, NY 14650 -cat . #146 4726
Kodak Hypo Clearing Agent -from Eastman Kodak Company , Rochester, NY 14650 -cat . #146 4254
Kodak Photo -Flo 200 Solution -from Eastman Kodak Company , Rochester, NY 14650 -cat. #146 4502
TISSUE COLLECTION AND CULTURE
Solutions/Reagents:
Tissue culture medium
RPMI medium 1640 Defined fetal bovine serum Pen icillin streptomycin L-glutamine
Protect from light. Store at 4 °C.
100 mL 20 mL
1.3 mL 1.3 mL
70

Procedures :
1. Thoroughly scrub the axillary reg ion on a sheep with iod ine . Rinse and wipe with alcohol swabs . Using sterile forceps, gently raise the skin and perform a one half th ickness skin biopsy. It is not necessary to cut deep into the t issue.
71
2. Transfer the excised tissue directly from the sterile forceps into a sterile 15 mL centrifuge tube containing 7 to 10 mL tissue culture medium.
3 . Add 1 drop of fungizone (antifungal agent) to med ium using a 9 in pasteur pipet .
4 . Leave t issue in fung izone-supplemented medium at room temperature for 1 to 2 h.
5. Under laminar flow hood, transfer tissue sample to a new, sterile 15 mL centr ifuge tube containing 7 to 1 0 mL fresh medium (fungizone-free) .
6. Leave tissue in medium at room temperature for 2 to 3 h.
To avoid contamination , all additional steps in whic tissue is manipulated or exposed to air need to be performeu under the laminar flow hood (unless otherwise stated) .
7 . Pour medium and t issue into homogenizer bag.
8 . Place bag in tissue homogenizer for 1 to 1 Y. min . After homogenizing, the medium should appear cloudy and the size of the tissue sample should decrease significantly. Tissue will look white instead of pink and contain connective tissue which does not homogenize. If these conditions are not observed, tissue may require additional homogenizing for 10 to 30 s.
9. Label a 25-cm 2 tissue culture flask with date and animal identification number.
1 0 . Pour medium from bag into tissue culture flask. Intact tissue (connective t issue) should be discarded w ith stomacher bag.
11 . Gas contents of flask by attaching a sterile pasteur pipet to gas regulator and holding pipet for 15 to 20 s with tip inside culture

flask , just beyond neck of flask . Immediately replace cap .
12. With cap tight, place cul ture flask in horizontal position at 38 .5°C and leave undisturbed for 3 to 4 d.
13. Check fibroblast growth after 3 to 4 d by microscopically viewing cells with 4X objective.
72
14. Following 4 to 5 d incubation, pour medium off flask and replace with fresh medium. If fresh medium is dark pink, gas flask for 10 to 20 s. This will lower the pH to provide an optimum growing environment for the fibroblasts . Within 10 to 15 min following gassing, culture medium should be orangepink. Medium may be changed every 24 to 48 h to enhance the rate of cell prol ife ration, although fresh medium is requ ired only every 7 to 10 d to maintain the cell culture .
15 . When the cell culture is confluent, remove medium and add approximately 1 ml of trypsin (enough trypsin to cover bottom of flask). Tilt the flask from side to side to rinse cells.
16. Pour off trypsin from flask and replace with approximately 1 y, ml fresh trypsin . Incubate at 38 .5 °C for 3 to 5 min . Cells should be checked every 2 min for "rounding up" and detaching from the flask surface. Once cells have begun to round up, a corner of the flask may be tapped against the palm of the hand to expedite the process . This limits the length of time cells are exposed to trypsin. Overexposing cells to trypsin can cause irreversible cell damage.
17. When most of the cells have detached , immediately add 6 to 7 ml fresh medium to the flask. Serum-supplemented medium inhibits trypsin activity and prevents further damage to the cells. Swirl the medium to evenly distribute cells .
18. Pour half of medium into new culture flask .
19. Gas both flasks for 15 to 20 s, immediately replacing caps.
20. Incubate at 38 .5°C for 12 to 24 h.
21 . Replace medium in both flasks . There may be several dead cells floating in medium. By removing these cells and adding fresh medium, the growth rate of healthy cells should increase.

22 . Continue to grow cells in vitro by repeat ing steps 14 to 21 .
CELL HARVESTING
Solutions\Reagents :
Tissue culture medium RPMI medium 1640 Defined fetal bovine serum Penicill in streptomycin L-glutamine
Protect from light . Store at 4°C.
Ethidium bromide working solution ( 1 mg/ml) Ethid ium bromide ddH20
Protect from light . Store at 4°C .
Hypotonic working solution (0 .56% or 0 .075 M)
Potass ium chloride (KCI ) ddH20
Store at room temperature for 1 to 2 wk.
Fixative (3 : 1 Methanoi :Acetic Acid) Methyl alcohol (anhydrous) Acetic acid (glacial)
Make fresh .
Procedures:
100 ml 20 ml
1.3 ml 1.3 ml
10 mg 10 ml
0 .56 g 100 ml
30 ml 10 ml
Cell cultures should be established using t issue collection and culture procedures . After cultures have been passed 2 to 3 t imes, their growth rate is generally adequate to obtain a suffic ient number of chromosome spreads for cytogenetic studies.
73

1. Select a culture flask in which the cells have reached confluency and remove cells from flask surface using the protocol described in Tissue Collection and Cultu re , steps 15 and 16.
2. Add 20 to 25 ml of med ium to flask and swirl medium to evenly distribute cells.
74
3 . Transfer equal amounts of med ium from this flask to four new flasks, leaving an equal portion of medium in orig inal flask. (This ratio is given as a starting point. It may be mod ified depend ing on the rate of cell prol iferation, i.e. cells that grow slower may be passed 1 :4 and cells that grow extremely fast passed 1 :6.) Cell prol iferation rate can vary greatly between cell lines . Therefore, the optimum passing ratio must be determined empirically.
4. Gas all flasks for 15 to 20 sand incubate at 38.5°C for 24 h.
5. Replace medium in all flasks with 5 ml fresh medium and incubate an additional 24 h.
6. View with light microscope (magnification 40X) . Cell confluency should be 60 to 70%, with several cells appearing rounded up (10 to 20 per microscope field ) among the majority of cells which are flattened against the plastic surface with numerous cytoplasmic processes . To obta in a sufficient number of chromosome spreads , it is critical that cell confluency be around 60 to 70%. The time following passing may be altered if cell prol iferation rate is particularly fast . This must be determined empirically for specific cell lines.
7. Select 3 to 4 flasks and add 20 JJL colcemid (final concentration 40 ng/ml) an d 100 JJL ethidium bromide (fi nal concentration 20 JJg /mL) solution to each. Remaining flasks w il l be kept to maintain the culture .
8. Incubate at 38 .5°C for 30 min.
9 . During the 30 min incubation, prewarm hypotonic solution in 37°C water bath.
10. Pour medium from flasks into separate, sterile, labeled 1 5 ml centrifuge tubes .

11. Remove cells from flasks following steps 15 to 16 in t issue collection and culture procedures .
12. Pour contents from each flask into respective centrifuge tube .
13. Before discarding flasks, rinse with 2 to 3 ml of Hank 's balanced salt solution (HBSS) and add contents to centrifuge tubes.
14. Replace caps on tubes and gently invert.
15. Centrifuge tubes at 800 to 1000 RPM for 8 min using a fixed angle rotor .
It is not necessary to work with cells in laminar flow hood in the remaining steps .
16. Pour off supernatant w ithout disturbing cell pellet. Approximately Y. ml of supernatant w ill remain .
75
17. Resuspend cell pellet by tapping on side of tube or by gently bubbling air through remaining supernatant with pasteur pipet until pellet is dislodged and broken up, forming a slightly cloudy suspension .
18. Slowly add 6 to 8 ml prewarmed hypotonic solut ion to each tube, replacing caps and inverting gently. Hypotonic solut ion causes the cells to swell and cell membranes to weaken. Therefore, in all future steps cells must be resuspended and handled gently .
19. Incubate tubes in a 37°C water bath for 40 min.
20. Centrifuge tubes at 800 to 1,000 RPM for 8 min .
21. While centrifuging, prepare fixative solution . (Fixative may be used at room temperature .)
22 . Carefully pour off supernatant and resuspend pellet using one of the methods described in step 17.
23. By holding a 9 inch pasteur pipet against inside of centrifuge tube near the opening, slowly layer 5 to 7 ml of fresh fixative onto cell suspension .

76
24. Replace cap and gently invert tube.
25. Place at room temperature for 5 to 10 min .
26. Centr ifuge tubes at 800 to 1 ,000 RPM for 8 min .
27 . Repeat steps 22 to 26 at least two t imes . The number of f ixative washes requ ired varies between cell preparations . A recommended approach to determine the number of washes is to follow the procedure through step 2 7, then prepare a test sl ide and view microscopically to identify whether excess cellular debris is present . If the cell preparation appears clean , additional washes are unnecessary . If the cell preparation contains debris that interfere with visualization of chromosome spreads, additional fi xative washes are needed .
28 . Cell preparations may be splashed onto microscope slides immed iately, stored at 4°C overnight, or stored at t o 20°C for several weeks .
SLIDE PREPARATION AND CHROMOSOME STAINING
Solutions\Reagents:
Fixative Methyl alcohol (anhydrous) Acetic acid (glacial)
Make fresh.
Hydrochloric acid (HCL) (6N) Hydrochloric acid (HCI) ( 12N) ddH 20
Phosphate buffer solution [0 .01 Ml (pH 6 .8) ddH20 Sodium phosphate (monobasic) (NaH 2P04 H20) Sodium phosphate (dibasic heptahydrate) (Na2HP0 4 7H 20)
Adjust pH to 6.8 with 6N HCI.
30 ml 10 ml
10 ml 10 ml
1 L 0.469 g
1 .77 g

4% Giemsa staining solution
Procedures :
Phosphate buffer [0 .01 Ml (pH 6 .8) Giemsa stain, mod ified
Make fresh every 1 to 2 h.
48 mL 2 mL
77
1. Immediately pr ior to splashing cell preparations, wash with 5 to 7 mL fresh f ixative . (Steps 23 to 26 of cell harvesting procedure .)
2 . Carefully pour off supernatant and resuspend the cell pellet by tapping on side of tube.
3. Add fresh fixative , one drop at a t ime, to the cell suspension unti l it appears only fain tl y cloudy . It is likely that cell suspensions w ill requ ire no additional fixative to dilute the cell concentration . This will vary between tubes and is determined by experience in recogniz ing the degree of cloudiness in the cell suspension . When initially working with cell cultures, test slides from different cell suspensions may be made to determine cell concentrations .
4 . Label microscope slides to correspond with ind ividual cell suspensions .
5. Place new microscope slides in ice for several seconds .
6. Transfer microscope sl ides to paper towel and place on sol id surface .
7 . Immediately draw up a small portion of cell suspension into pasteur pipet and release two or three drops 3 to 4 ft directly above cold slide . Aim drops so they fall along length of slide with little overlap .
8 . Place sl ides at 38 .5°C for 10 min or until cell suspension is dry .
9 . While sl ides are drying, prepare 4 % Giemsa sta ining solut ion in Coplin jar.
10. Stain slides in Giemsa solution for 3 to 5 min .

11. Remove slides from staining jar and quickly dip in Coplin jar contain ing ddH 20 .
78
12. Immediately dry the slide by holding a hair dryer 4 to 8 in . from slide surface and blowing cool air onto it. This quick-drying technique minimizes visual ization problems associated w ith Giemsa stain residues binding to the glass slide .
13. Visualize chromosome spreads with a light microscope and 1 OOX objective .
14. Adust light sources from high power microscope to provide high contrast level between chromosomes and background. Set automatic exposure panel at ' 0 ' or '- 1' and photograph using 35mm black and white film .
STRUCTURAL BANDING WITH TRYPSIN
Solutions\Reagents :
Enzar trypsin working solution (pH 7 .0) Enzar-T (40X trypsin solution ) Hank's balanced salt solution
1 ml 49 ml
When these 2 reagents are combined , solut ion should turn bright yellow. Adjust to pH 7.0 with sodium bicarbonate (7 .5%) . At pH 7.0, solution color should be pink-orange . Solution may be used for 3 to 4 d. Store at 4°C.
70% Ethanol solution Ethyl alcohol ddH20
Hydrochloric acid (HCL) (6N) Hydrochloric acid (12N) ddH 20
35 ml 15 ml
10 ml 10 ml

Phosphate buffer [0 .01 MJ (pH 6 .8) ddH20 Sod ium phosphate (monobasic) (NaH 2PO, H20) Sodium phosphate (dibasic heptahydrate) (Na 2HP0 4 7H 20)
Adjust pH to 6.8 with HCI (6N) .
4% Giemsa staining solution
Procedures :
Phosphate buffer [0 .01 MJ (pH 6.8) Giemsa stain , modified
Make fresh every 1 to 2 h.
1 L 0 .469 g
1.77 g
48 ml 2 ml
1. Splash several slides following slide preparation procedures, steps 1 to 8.
2. Leave slides at 38.5°C for 5 d.
3 . Prepare 2% buffered Enzar trypsin solut ion in Copl in jar.
4 . Treat incubated slides for 10 to 50 s in trypsin solution .
79
Optimum time for exposure to trypsin must be empirically tested by exposing several slides to trypsin for varying t imes and comparing banding quality . There is a tremendous variation in the time required to band chromosome spreads from different cell preparations and from different cell lines. Chromosome spreads on a single slide also vary in panding quality . Therefore, it is essential to locate several chromosome spreads before conclusively determining trypsin exposure time.
5. Immediately after removing slides from trypsin solution, briefly rinse in 70% ethanol.
6 . Transfer slides directly from ethanol rinse into a Coplin jar containing 4% Giemsa stain .
7. Stain and view banded chromosome spreads using steps 10 to 13 in slide preparation and chromosome staining procedures .

80
8 . Adust light sources from high power microscope to provide high contrast level between light and dark bands. Set automatic exposure panel at ' 0 ' or '-1' and photograph using 35mm black and white film .
DYNAMIC BANDING
Solutions\Reagents:
Tissue culture medium RPMI medium 1640 Defined fetal bovine serum Penicillin streptomycin L-glutamine
Protect from light . Store at 4°C.
Fluorouracil working solution Stock solution 1: Fluorouracil Sterile ddH 20
100 ml 20 ml
1.3 ml 1.3 ml
130 mg 10 ml
Protect from light. Shake on shaker until dissolves (approximately 6 h) .
Stock solution II : Stock solution I Sterile ddH20
Protect from light .
Working solution: Stock solution II Sterile ddH20
100 Jil 9 .9 ml
1 ml 9 ml
Protect from light . Store in 100 JJL aliquots at -80°C .
BrdU working solution (2.5 mg/ml) BrdU Sterile ddH 20
3 mg 1.2 ml
Protect from light . Store in 200 Jil aliquots at -80°C.

Ethidium bromide working solution (1 mg/mll Ethidium bromide ddH 20
Protect from light . Store at 4°C .
Hoechst stain working solution ( 150 ~g/ml) Hoechst (stain) No. 33258 ddH 20
10 mg 10 ml
1.5 mg 10 ml
Protect from light. Store in 1 ml aliquots at -80°C.
20X SSe stock solution
NaCI Na Citrate
il 350.7 g 176.4 g
M2.!.a.r.ll 3M
.3M
Bring to 2 L volume with ddH 20 . Use 6M HCI to adjust pH to 7.0 .
2x sse
4% Giemsa staining solution Giemsa stain , mod if ied .01 M P0 4 buffer
Make fresh every 1 to 2 h.
Procedures:
BrdU incorporation for R-band production
10 ml 90 ml
2 ml 48 ml
81
1. When fibroblasts in 25-cm2 flask are 60 to 75% confluent and numerous mitoses are observed, add 100 pl fluorourac il in 5 ml fresh media (260 ng/ml). Incubate for 17 to 20 h at 38 .5°C.
2. Pour off medium. Rinse flask 3X with HBSS. Add 185 pl BrdU in 5 ml fresh med ia (92 .5 pg/ml) . Incubate 4 Y, to 5 Y:z h at 38.5°C.
3. Add 100 pl ethidium bromide (20 pg/ml) and 20 pl colcemid

82
(40 ng/mL) to flask. Incubate 30 min at 38.5 °C.
4. Harvest and splash slides using standard cell harvest procedure , steps 9 to 28 and slide preparation procedures, steps 1 to 8.
5 . Perform FPG on slides after 1 d at room temperature or age slides for in situ hybridization procedure .
Fluorescence Photolysis Giemsa (FPG)
1. Mount slide incubate in 150 ,uL [150 ,ug/mL] Hoechst stain for 15 to 20 min in the dark.
2. Rinse slide with ddH20 and allow to air dry .
3. Cover slide with 2X SSC and place under UV light (long wavelength) for 30 to 60 min.
4. Rinse slide with ddH20. Place in prewarmed 2X SSC at 65°C for 1 h.
5. Rinse slide with ddH20 and stain in 4% Giemsa staining solution for 3 to 5 min .
6 . Rinse slide with ddH20 . Blow dry . View and photograph under light microscope.
BLACK AND WHITE PHOTOGRAPHY
Solutions\Reagents:
076 developer working solution Bring 2 L H20 to 52 °C. Slowly pour contents of packet into 3 .32 L H20 stirring until dissolved. Bring volume to 2 L with 52°C H 20. Store in dark bottle at RT. For working solution, dilute 1:1 with H20 .
Indicator stop bath working solution Kodak Indicator Stop Bath H20
16 mL 1984 mL

Store in dark bottle at RT. (Solution may be reused until t he color changes .)
Rapid fixer working solution Bring 3.8 L H20 to 16 to 27°C .
H20 Solution A Solution B
Films 1.9 L
946 ml 104 ml
~ 1.9 L
473 ml 52 ml
Ag itate rapidly w hile add ing Solut ion B. Bring to 3.8 L volume w ith H20 . Store in dark bottle at RT.
Dektol developer working solution Bring 3 .8 L H20 to 32 to 38°C. Slowly add contents of package to 3.32 L H20 stirring until dissolved . Bring to 3.8 L volume with H20. Store in dark bottle at RT.
For working solution , dilute 1:1 with H20 . (Working solution may be reused for several days .)
Hypo clearing agent working solution Bring 3 .8 L H20 to 26.5°C.
83
Slowly add contents of package to 3 .8 L H20 stirring unt il dissolved . Store in dark bottle at RT. For working solution , dilute stock solution 1 :4 w ith H20 .
Photo-Flo working solution Add 1 capful Photo-Flo to 1 L H20 .

84
Procedures :
Negative Development
1. Take photographs using Kodak 100 speed f ilm in Zeiss MC 80 camera . Rewind when roll is f inished.
2 . In complete darkness, load film onto reel and place in light-free developing canister .
3 . Add 300 mL D76 developer working solution. Develop for 13 y, min at 22°C , turn ing for t he fi rst 30 sand then once every 30 s.
4 . Pour out developer and add 300 ml ind icator stop bath working solution . Turn for 30 s.
5. Pour out stop bath and save. Indicator stop bath may be reused as long as color is yellow. Add 300 ml rap id f ixer working solution for f ilms to canister . Fix for 4 min, turning the first 30 s and then once every 30 s.
6. Pour out fixer solution and save for recycl ing . Add 300 mL H20 . Turn for 30 s.
7. Pour out H20 and add 300 ml hypo clearing agent working solution. Leave in hypoclearing agent for 2 Y. min, turning for first 30 s and then once every 30 s.
8 . Pour out hypo clearing agent solution . Remove reel from canister and unwind negatives from ree l. Rinse negatives in running H20 for 20 min.
9. Bathe negatives for 30 sin Photo-Flo working solution.
10. Strip negative roll with water-soaked squee-gee and hang overnight at RT with photo clips or clothes pins on each end .
11 . Cut negative roll into lengths short enough to f it into plastic photo sleeves .
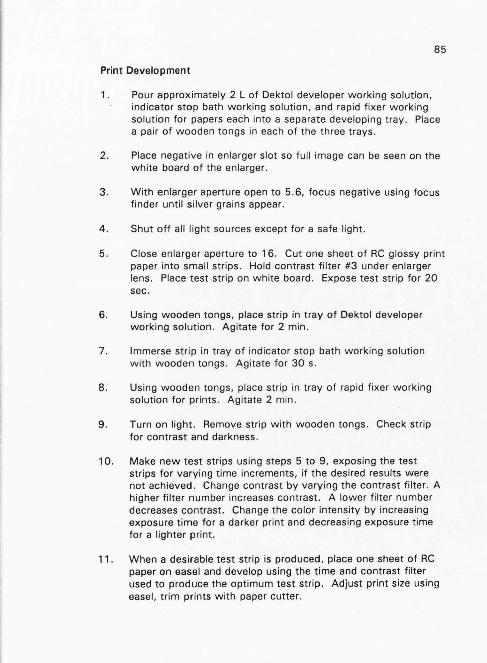
85
Print Development
1. Pour approximately 2 L of Dektol developer working solution, indicator stop bath working solution , and rapid fixer working solution for papers each into a separate developing tray . Place a pair of wooden tongs in each of the three trays .
2 . Place negative in enlarger slot so full image can be seen on the white board of the enlarger .
3 . With enlarger aperture open to 5.6, focus negative using focus finder until silver grains appear.
4 . Shut off all light sources except for a safe light .
5 . Close enlarger aperture to 16. Cut one sheet of RC glossy print paper into small strips . Hold contrast filter #3 under enlarger lens. Place test strip on white board. Expose test strip for 20 sec .
6. Using wooden tongs, place strip in tray of Dektol developer working solution . Agitate for 2 min .
7. Immerse strip in tray of indicator stop bath working solution with wooden tongs. Agitate for 30 s.
8 . Using wooden tongs, place strip in tray of rapid fixer working solution for prints . Agitate 2 min.
9 . Turn on light. Remove strip with wooden tongs . Check strip for contrast and darkness .
10. Make new test strips using steps 5 to 9, exposing the test strips for varying time increments, if the desired results were not achieved . Change contrast by varying the contrast filter. A higher filter number increases contrast. A lower filter number decreases contrast. Change the color intensity by increasing exposure time for a darker print and decreasing exposure time for a lighter print.
11 . When a desirable test strip is produced, place one sheet of RC paper on easel and develop using the time and contrast filter used to produce the optimum test strip. Adjust print size using easel, trim prints with paper cutter.

86
12. Develop using steps 6 to 9 . Turn on lights and immerse print in 500 ml hypo clear ing agent working solution for 2 min .
13. Wash print in runn ing H20 for 20 min .
14. Scrape H20 from prin t w ith rubber blade . Hang print for several hours or until dry.
15 . When print developing is finished for the day, save rapid fixer from tray for recycling . Save indicator stop bath (if color is yellow) from tray and Dektol developer (if fresher than 3 d) from tray .

APPENDIX B
Fluorescent In Situ Hybridization (FISH)
Equipment:
Vortexer such as Vortex-Genie 2, Scientific Industries, Bohemia , NY 11716.
Microcentrifuge such as Microcentrifuge, model 235C, Fisher Scientific, Pittsburgh, PA 15219.
Microwave
87
Timer such as 3-Channel Alarm Timer, cat . C651 0-1, Baxter Scientific Products, McGaw Park, IL 60085-6787.
Water baths such as Circulating Water Bath 260, model 260, Precision Scientific, Chicago, IL 6064 7 .
Miniature gel bed such as Mini Gel Bed Unit, model HE33, Hoeffer Scientific Instruments, San Francisco, CA 941 02-12.
Voltage meter such as model FB 154 voltage meter, Fisher Scientific, Pittsburgh, PA 15219.
UV light box with camera such as Foto Prep I. model 3-3500, Fotodyne, Inc., New Berlin , WI 53151 .
Cold water bath such as lsotemp Refrigerated Circulator, model 900, Fisher Scientific, Pittsburgh, PA 15219.
Microcentrifuge with variable temperature and RCF such as Avanti 30 Centrifuge with F2402 Rotor, Beckman Instruments, Palo Alto, CA 94303.
Shaker such as model 55 shaker, Reliable Scientific.
Incubator such as C0 2 Incubator, model 2500, VWR Scientific, Philadelphia, PA 19101-9711 .

88
Oven such as drying oven model 1305, VWR Scientific , Philadelphia , PA 19101-9711 .
-80°C freezer such as Cryo Fridge, Baxter Scientific Products , McGaw Park, IL 60085-6787.
Phase contrast microscope such as Nikon Diaphot Inverted M icroscope, Nikon, Japan .
High power microscope equipped with fluorescence such as Zeiss Axioskop , Carl Zeiss Inc. , San Leandro, CA 94577 .
Fluorescent filters to detect propidium iodide or FITC such as Propidium Iodide filter , model 31005, and Hi-Q FITC Long Pass filter , model 41012, Chromatechnology, Brattleboro , VT 05301 .
Microscope camera such as MC 80 microscope camera, Carl Zeiss Inc., San Leandro, CA 94577 .
Supplies:
Microcentrifuge tubes (1 .5 mL) -from Fisher Scientific , Pittsburgh, PA 15219 -cat. #4202
Ice
Biotin-21-dUTP Nick Translation Kit -from Clontech Laboratories, Inc., Palo Alto , CA 94303 -cat. #K 1022-1
Phi X RF DNA/ HAE Ill Fragments -from Gibco BRL, Grand Island, NY 14072 -cat . #15611 -015
Ethidium bromide -from Sigma, St. Louis, MO 63178 -cat . #E-8751
CHROMA SPIN+ TE-30 spin columns -from Clontech Laboratories , Inc., Palo Alto, CA 94303 -cat. #K1321-1

Hybond-N Hybridization transfer membranes -from Amersham, Arli ngton Heights , IL 60005 -cat . #RPN.303N
Metal forceps
Plastic containers -small (12 x 13 x 3 em) -medium (16 x 27 x 6 em)
Sure Blot Blue Detection Reagents DR Kit -from Oncor, Gaithersburg, MD 20884 -cat . #S4200-BOX
Membrane Blocking Solution (M.B.S.) 2.5X -from Oncor , Gait hersburg , MD 20884 -cat. #S4200-1 2
1 OX Staining Buffer -from Oncor, Gaithersburg , MD 20884 -cat . #S4200-13
100% Ethanol (ETOH) -from McCormick Distilling Co Inc., Weslo, MO 64098 -cat. #6505-00-1 05-0000
Whatman Chromatography Paper (3M Paper) -from Fisher Scientific, Pittsburgh , PA 15219 -cat . #05-714-4
Bovine COT-1 DNA -from Clontech Laboratories Inc ., Palo Alto, CA 94303 -Dan Gallagher, personal communication
Bovine BAC DNA (HSDB) -from Clontech Laboratories Inc ., Palo Alto, CA 94303 -Dan Gallagher, personal communication
DNA-sodium salt type II, salmon testes (salmon sperm DNA) -from Sigma, St. Lou is, MO 63178 -cat . #D-1626
89

90
Ultrapure formamide -from Gibco BRL, Grand Island, NY 14072 -cat. #5515UB
Amberlite MB-1 ion exchange resin -from Baxter Scientific Products, McGaw Park, IL 60085-6787 -cat. #IR-120
Humidified chamber -16 x 10 x 3 em plastic container with airtight lid -water-soaked paper towels overlaid with plastic mesh
Glass coverslides (22 x 22 mml -from Fisher Scientif ic, Pittsburgh , PA 15219 -cat. #12-5248
Rubber cement
Permanent marking pen
Microscope slides -from Corning, Corning , NY 14830 -cat . #2948
Fluorescein Detection of Biotin Labeled Probe kit -from Oncor, Gaithersburg, MD 20884 -cat. #S1333-8F
Coplin staining jars -from Fisher Scientific, Pittsburgh, PA 15219-4785 -cat. #08-817
Chromosome In Situ System Plastic Coverslips -from Oncor, Gaithersburg, MD 20884 -cat . #S 1331 -6
Tween 20 -from Sigma, St. Louis, MO 63178 -cat. #P-7949
Propidium Iodide (PI) -from Sigma, St. Louis, MO 63178 -cat. #P-4170

Dulbecco ' s Phosphate Buffered Saline (PBS) -from Gibco BRL, Grand Island , NY 14072 -cat. #14040-026
Glycerol
91
-from Baxter Scientific Products , McGaw Park, IL 60085-6787 -cat . #509 1-500
p -Phenylenediamine (PPD) -from Sigma , St. Louis, MO 63178 -cat. #P-6001
Glass coverslides (50 x 22 mm) -from Fisher Scientific, Pittsburgh, PA 15219 -cat . #12-531 E
Clear fingernail polish
BIOTIN LABELING OF PROBE DNA
Solutions\Reagents:
Biotin-21 -dUTP Nick Translation Kit. Solutions include: 1 OX Reaction buffer
10X TAE
Biotin-21 -dUTP Control lambda DNA Enzyme mix Sterile dH20 Stop solution
Tris Na Acetate EDTA
2L 97 g
13.5 g 7.5 g
M2!.2Lll .4M
.05 M
.01 M
Bring to 2 L volume with ddH 20 . Use acetic acid to adjust pH to 7.8.

Ethidium bromide ( 10 mg/ml) Eth idium bromide ddH 20
Protect from light . Store at 4°C.
1% Agarose gel SeaKem LE agarose 10X TAE ddH20
100 mg 10 ml
.5 g 5 ml
45 ml
92
Combine in 125 ml flask . Cover with plastic wrap . Microwave on medium power until mixture boils. Boil until d issolved . Cool to 60°C in water bath .Add 2.5 .uL ethid ium bromide. Swirl gently . Pour into mini-gel bed . Cool 10 to 20 min.
1 X T AE Buffer
STOP Buffer
10% SDS
5% SDS
10X TAE ddH 20 Ethidium bromide (10 mg/ml)
Pour into mini-gel bed chamber.
Glycerol EDTA [.25M) ddH20 Bromophenol blue
SDS
Bring to 1 L volume with ddH20.
25 ml 225 ml 12.5.ul
2.5ml .2 ml
2.3 ml 150 .uL
100 g
5 ml 5 ml

TE ~
Tris (1M, pH 7.6) 5 ml EDTA [.25 M] 2 ml
MQlQr.ll 10 mM
1 mM
Bring t o 500 ml volume w ith ddH 20 . Filter w ith sterile unit .
TE + . 1% SDS
2ox sse
2x sse
.1x sse
TE 10 ml 10% SDS 100 ,ul
il .M.Q1Q[Jl Na Cl 350.7 g 3M Na Citrate 176.4 g .3M
Bring to 2 L volume w ith ddH 20 . Use 6 M HCI to bring pH to 7 .0 .
2ox sse 5 ml ddH 20 45 ml
2ox sse 250,ul ddH20 44.75 ml
Sure Blot Blue Detection Reagents DR Kit . Solutions include: Detection Solution I (St reptavid in) Detection Solut ion II (Alkaline Phosphatase) NBT BCIP
1X Membrane Blocking Solution (M .B.S.)\Detection Solution I 2.5X M .B.S. 4 ml ddH20 6 ml Detection Solution I 10 .uL
Make f resh .
93

1x sse 2ox sse ddH 20
1X M .B.S.\Detection Solution II 2.5X M .B.S. ddH20 Detection Solution II
Make fresh.
1 OX Wash Buffer
NaCI Kcl Na 2HP0 4
KH 2P0 4
li 81.82 g 2.24 g
21.45 g 2.04 g
2 .5 ml 47 .5 ml
4 ml 6 ml
10 J.tl
MQ!.Qr.l1 1.4 M
30 mM 80 mM 15 mM
94
Bring to 1 L volume w ith ddH20. Stir 20 min to dissolve.
1X Wash Buffer 1 OX Wash Buffer ddH20
1 X Staining Buffer 1 OX Staining Buffer ddH 20
1X Staining Buffer + NBT + BCIP 1 X Staining Buffer NBT BCIP
Procedures :
Labeling
90 ml 810 ml
12.5 ml 112.5 ml
50 ml 100 J.tl 100 J.tl
1. Add the following in the order listed to a microcentrifuge tube on ice:
5 J.tl 1 OX reaction buffer 2 J.tl Biotin-21-dUTP 17 J.il YAC DNA (1 J.tg)
Add 21 J.tl sterile, dH20 for a final volume of 45 J.tl .
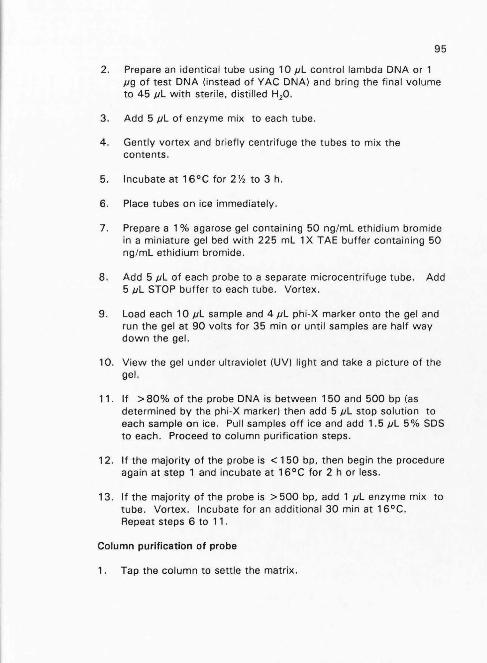
95
2 . Prepare an identical tube using 10 .uL control lambda DNA or 1 .ug of test DNA (instead of Y AC DNA) and bring the final volume to 45 .uL with sterile, distilled H20 .
3. Add 5 .uL of enzyme mix to each t ube.
4. Gently vortex and briefly centrifuge the tubes to mix the contents .
5. Incubate at 16°C for 2 % to 3 h .
6 . Place tubes on ice immediately .
7. Prepare a 1% agarose gel conta in ing 50 ng/ml ethidium bromide in a miniature gel bed with 225 ml 1 X TAE buffer containing 50 ng/ml ethidium bromide .
8 . Add 5 .uL of each probe to a separate microcentrifuge tube . Add 5 .uL STOP buffer to each tube . Vortex .
9. Load each 10 .uL sample and 4 .uL phi-X marker onto the gel and run the gel at 90 volts for 35 min or until samples are half way down the gel.
10. View the gel under ultraviolet (UV) light and take a picture of the gel.
11 . If > 80% of the probe DNA is between 150 and 500 bp (as determined by the phi -X marker) then add 5 .uL stop solution to each sample on ice. Pull samples off ice and add 1.5 .uL 5% SDS to each . Proceed to column purification steps.
12. If the majority of the probe is < 150 bp, then begin the procedure again at step 1 and incubate at 16°C for 2 h or less .
13. If the majority of the probe is > 500 bp , add 1 .uL enzyme mix to tube . Vortex. Incubate for an additional 30 min at 16°C. Repeat steps 6 to 11 .
Column purification of probe
1. Tap the column to settle the matrix .

2. Hold the CHROMA SPIN+ TE-30 upright, snap off the breakaway end . Place the end of the column into a sterile microcentrifuge tube . Remove and save the cap .
3 . Centrifuge for 3 min at 700 X g.
4 . Discard the collection microcentrifuge tube . Place column end into a new tube.
5 . Load 50 JJL TE + .1% SDS carefully into the center of the column .
6. Centrifuge at 700 X g for 5 min.
96
7. Measure the volume in the microcentrifuge tube . If the volume is approximately 50 JJL, then proceed to step 8 . If the volume is >50 JJL, then repeat steps 5 to 7 .
8 . Discard the microcentrifuge tube. Place column end into a new tube .
9 . Load probe sample carefully into the center of the column .
10. Centrifuge at 700 X g for 5 min.
11 . Sample is in the bottom of the microcentrifuge tube . Do not change tubes . Load 20 JJL TE + .1% SDS carefully into center of column.
12. Centrifuge at 700 X g for 5 min .
13. Sample volume should be approximately 70 Jil. Proceed to dot blot detection or place sample at -20°C.
Dot blot detection
1. Pipette 9 JJL ddH 20 into 6 1. 5 mL centrifuge tubes for each sample to be detected.
2. Add 1 JJL biotin-labeled sample [10 ng/mL] to first tube.
3. Vortex. Add 1 JJL from first tube to second tube.

97
4 . Repeat procedure in step 3 for second and third tubes, third and fourth tubes , and fourth and fifth tubes. The sixth tube will remain ddH 20 . The final concentration of probe DNA in each tube will be : first tube = 1 ng/ml, second tube = 100 pg/ml, third tube = 10 pg/ml, fourth tube = 1 pg/ml, fifth tube = . 1 pg/ml, sixth tube = 0 pg/ml.
5. Cut nylon membrane to 15 x 10 em . With pencil, label each sample and draw six circles for each . With forceps, lay nylon membrane on 50 ml H20 in small plastic container. Submerge membrane until soaked with H20 .
6 . Pour off H20 . Add 50 ml 2X SSC . Shake at moderate speed for 5 min.
7. Pour off 2X SSC . Add 50 ml .1 X SSC. Shake at moderate speed for 5 min .
8 . Remove membrane with forceps and lay on stack of 3M paper. For each sample, load 1 pl from first tube on first dot, 1 pl from second tube on second dot, and so forth for all tubes. Allow membrane to air dry .
9 . Pour 10 ml 1 X M .B.S. /Detection Solution I into small plastic container . Immerse membrane with DNA side up . Shake gently at RT for 10 min.
10. Place membrane in 150 ml 2X SSC in medium plastic container. Shake gently at RT for 5 min . Pour off 2X SSC and wash 2X more in 150 ml 2X SSC for 5 min each wash, shaking gently at RT.
11 . Pour 10 ml 1 X M.B.S. /Detection Solution II into small plastic container. Immerse membrane with DNA side up. Shake gently at RT 10 min .
12. Place membrane in 225 ml 1 X washing buffer in medium plastic container. Shake gently at RT for 5 min. Pour off washing buffer and wash 3X more in 225 ml washing buffer for 5 min each wash, shaking gently at RT.
13. Place membrane DNA side down in 75 ml 1 X staining buffer in small plastic container. Shake gently at RT for 2 min. Pour off

1 X staining buffer and add 50 ml 1 X staining buffer + NBT + BCIP. DNA side should remain down.
14. Incubate at 37°C 8 to 12 h. Check hourly for staining. When the membrane turns a light purple, staining is complete .
98
15. Immerse filter in 150 ml 75% EtOH in medium plastic container . Shake gently at RT 5 min .
16. Place membrane on stack of 3M paper and bake in oven at 80°C for 30 min .
17. Sample should be detected to at least the 10 pg/ml level or to tne same level as a control with known biotin incorporation. Store membrane in the dark at RT.
IN SITU HYBRIDIZATION
Solutions\Reagents :
Sheared salmon sperm DNA ssDNA NaOH (1M) ddH 20
1 g 40 ml 60 ml
Gently agitate overnight at RT. Place in boiling H20 for 45 min . Place on ice for 15 min . Neutralize to pH 4 to 7 using approximately 3 ml glacial acetic acid. Pour supernatant into 2 new tubes . Add 100 ml 100% ETOH to each tube. Place at -20°C overnight . Centrifuge for 10 min at 10,000 RPM . Add 10 ml 80% ETOH to each tube . Centrifuge for 10 min at 10,000 RPM. Dry 10 min. Dissolve in 80 ml ddH 20. Adjust to [10 Jlg/ml]. Force 10 ml through a series of 16, 18, 20, 21, 22 gauge needles. Pass through each size 20X.
3 M Na Acetate Na Acetate 81 .6 g
Bring to 200 ml volume with ddH 20. Use acetic acid to adjust pH to 5.2 .

Deionized Formamide Ultrapure formamide Amberlite
500 g 25 g
99
Stir overn ight at 4°e . Protect from light. Filter. Store at 4°e.
10% Dextran Sulfate Dextran Sulfate ddH 20
Hybridization Solution Deionized formamide 1 0 % Dextran Sul fate 2ox sse
10 g 100 mL
5 mL 2 mL 1 mL
Vortex well . Store in 1 mL al iquots at 4°e.
Denaturing Solution Deionized formamide 20x sse ddH20
70 mL 10 mL 18 mL
Using 6 M Hel , adjust pH to 7 .0 . Bring to 100 mL volume w ith ddH 20 . Make fresh .
Formamide Wash Solution Deionized formamide 20x sse ddH20
75 mL 15 mL 58 mL
Using 6 M Hel , adjust pH to 7 .0. Bring to 150 mL volume with ddH20 . Make fresh .
2x sse 15 mL
135 mL
Fluorescein Detection of Biotin Labeled Probes Kit . Solutions include: Fluorescein-Labeled Avidin Anti-Avidin Antibody (Ab)

4X SSC\. 1% Tween 20 2ox sse Tween 20 ddH 20
20% Sodium Azide Sodium Azide ddH 20
Blocking Buffer 2ox sse Sterile ddH20 Tween 20 20% Sod ium Azide BSA, fraction V
100 mL .5 mL
400 mL
2 g 10 mL
20 mL 60 mL
100 JJL 400 JJL
3g
100
Combine liquid reagents in ster ile 250 mL beaker . Gently swirl BSA on top until all dissolved (30 min) . Adjust to 100 mL volume with sterile ddH 20. Store in 1 mL aliquots at -20°e.
Propidium Iodide Staining Solution Stock solution ( 1 mg/mL) : Propidium iodide ddH 20
Protect from light . Store at 4°C .
Staining solution (200 ng/mL) : Stock solution 2x sse
2X SSC\ .05% Tween 20 2x sse Tween 20
PPD 11 Antifade PPD PBS Glycerol
10 mg 10 mL
10 JJL 50 mL
50 mL 25 JJL
10 mg 1 mL 9 mL
Dissolve PPD in PBS . Add glycerol. Using 4 M NaOH, adjust pH to 11 . Protect from light. Store at -20°C up to 1 wk .

101
Procedures :
EtOH precipitation , dissolution and denaturation of probe
1. Add the following to a 1.5 ml microcentrifuge tube : .±....C..QI :.J;_Q.I
For Y AC probes : Biotin-labeled probe DNA 15 .0pl 15.0 pl COT DNA 2 .0 pl Sheared salmon sperm DNA 5.0 pl 5 .0 pl ddH 20 78 .0 pl 80.0 pl
For BAC test probe: Biotin-labeled probe DNA 7. 5 pl 7 .5 pl COT DNA 2 .0 pl Sheared salmon sperm DNA 5 .0 pl 5 .0 pl ddH 20 85 .5 pl 87 .5 pl
2. Vortex . Add 10 pl 3M Na Acetate (pH 5.2) to each tube.
3 . Vortex well. Add 220 pl ice cold 100% ethanol.
4 . Vortex well. Place in -80°C freezer for one hour .
5. Thaw for 10 min . Cent rifuge for 20 min at 15,000 RPM at 0°C. White pellet should appear.
6 . Pour ethanol off gently. Add 300 pl ice cold 80% ethanol. Cent ri fuge for 20 min at 15,000 RPM at 0°C.
7 . Pour ethanol off gently . Aspirate rema ining ethanol, being careful to not aspirate pellet . Mark pellet size and location on outside of tube . Air dry overnight .
8 . Add 10 pl 1 X hybridization solution directly onto pellet . Vortex . Spin briefly.
9 . Place tube in 37°C waterbath for 6 to 8 h. Vortex period ically .
10. Place t ube at 4°C overnight .
11 . Prewarm tube in 37°C waterbath for 2 to 3 min . Vortex . Spin briefly .
12. Denature probe in 74°C waterbath for 5 min . Vortex. Spin briefly .

13. If probe contains COT DNA, place in 37°C waterbath for 19 min to preanneal.
102
14. If probe contains no COT DNA, place on ice immediately for 5 min or longer .
15. Bring probe to RT immediately prior to hybridizing to denatured, dehydrated chromosome preparations .
Prehybridization treatment of slides
1. Examine air dried chromosome preparations under a phase contrast microscope at 200X magnification . Select those that have adequate numbers of chromosome spreads. The chromosomes should be moderate to high contrast (gray-black) .
2 . Place preparations at room temperature for 2 wk. (If preparations are newer than 2 wk, place at 37 to 38 .5°C for 2 d.)
3 . Incubate sl ides for 1 hr in 2X SSC at 37°C.
4. Dehydrate slides in a 70%-, 85%-, and 100%-ice cold ethanol series for 2 min each . Allow slides to air dry.
5. Prewarm slides to 37 to 42°C.
6 . Prewarm denaturation solution in 50 ml coplin jars to 74°C. Check temperature of denaturation solution directly . Plunge slides ( 1 per jar) into denaturation solution and incubate for 2 min .
7. Rapidly transfer slides to ice cold 70% ethanol. Dehydrate slides in the ice cold 70%, 85%,and 100% ethanol series for 2 min each . Allow slides to air dry.
8 . Prewarm slides to 37 °C .
Probe hybridization and posthybridization washes
1. Spot 10 pl probe in hybridization solution onto denatured, prewarmed slide . Mount with 22 x 22 mm coverslip and seal with rubber cement . Mark the location of the probe on a blank slide with a permanent marker .

2 . Place sl ides in humidified chamber prewarmed to 37°C. Allow hybridization to occur for 16 h at 37°C.
103
3 . Remove rubber cement . Wash slides 3X in formamide wash solution at 45 °C for 5 min each wash . Do not shake . Coverslip should float off in first wash.
4 . Wash slides 3X in 2X SSG at 45 °C for 5 min each wash. Do not shake.
5. Place slides in room temperature 4X SSC/ .1% Tween 20 if detection is to be done immediately . Slides may be stored for 1 to 7 d in 4X SSC before detection .
Detection and amplification of probe
Do not allow slides to dry out at any point during the detection and amplification procedures!
1. Remove slides from wash bath one at a time and spot 100 ,ul blocking buffer on each slide . Mount with a 22 x 60 mm plastic coverslip or parafilm. Incubate for 30 min in humidified chamber at 37°C.
2. Remove coverslip . Drain slide . Add 60 ,ul fluorescein-labeled avidin. Mount w ith same coverslip and incubate for 20 min in humidified chamber at 37°C.
3 . Remove coverslip and wash slides 3X in 4X SSC/.1% Tween 20 at 45°C for 5 min each wash with shaking .
4 . Perform amplification on all YAC probes . BAC probe may be stained at this point.
5. For amplification, remove slides from wash solution one at a time. Spot 100 ,ul blocking buffer on each slide. Mount with new plastic coverslip or parafilm and incubate at room temperature for 5 min.
6. Remove coverslip . Drain slide . Add 60 ,ul anti-avidin antibody . Mount with same coverslip and incubate for 20 min in humidified chamber at 37°C.
7. Remove coverslips and wash slides 3X in 4X SSC/ .1% Tween 20 at 45°C for 5 min each wash with shaking.

104
8 . Remove sl ides from wash bath one at a time and spot 100 pl blocking buffer on each sl ide . Mount w ith new plastic coversl ip or parafilm . Incubate 5 min at room temperature in humidified chamber .
9. Remove coverslip . Drain slide. Add 60 pl fluorescein-labeled avidin . Mount w ith same coverslip and incubate 20 min in humidified chamber at 37°C .
10. Remove coverslips and wash slides 3X in 4X SSC/.1% Tween 20 at 45 °C for 5 min each wash with shaking.
11 . Place slides in 4X SSC at room temperature . Perform chromosome staining and microscopy.
Chromosome staining and microscopy
1. Stain slides in propid ium iodide staining solution (200 ng/ml) for 10 min .
2 . Rinse slides in 2X SSC/ .05% Tween 20 for 2 min at RT.
3. Spot one drop of PPD 11 antifade onto each slide and mount with 22 x 50 mm glass coverslip . Seal with clear fingernail polish . Allow polish to air dry.
4 . Locate chromosome spreads using fluorescent microscope with PI filter . View probe and bands with FITC filter.
5 . Photograph using Fujichrome 400 slide film. On MC 80 camera, bracket manual exposure times from .5 s to 4 s for pictures with PI filter . For pictures with FITC filter, bracket manual exposure times from 1 s to 8 s.
Copyright © 2022 FDOKUMEN