Protein sample preparation and quantitation for mass ...
168
Protein sample preparation and quantitation for mass spectrometry Reagents, consumables, instrumentation, and software for proteomics research
-
Upload
khangminh22 -
Category
Documents
-
view
1 -
download
0
Transcript of Protein sample preparation and quantitation for mass ...

Protein sample preparation and quantitation for mass spectrometryReagents, consumables, instrumentation, and software for proteomics research

Introduction 4
Workflows 8
Protein sample preparation Introduction 9
Sample lysis and protein extraction 10Pierce Mass Spec Sample Prep Kit for Cultured Cells 11Mem-PER Plus Membrane Protein Extraction Kit 13Subcellular Protein Fractionation Kit for Cultured Cells 16Protease and phosphatase inhibitors 18
Protein assays 20Pierce BCA and Micro BCA Protein Assays 21
Abundant protein depletion 22Pierce Albumin Depletion Kit 23Pierce Top 2 and Top 12 Abundant Protein Depletion Spin Columns 24
Protein enrichment using IP-MS 26Pierce Antibody Biotinylation Kit for IP 27Pierce MS-Compatible Magnetic IP Kits (Streptavidin/Protein A/G) 28Dynabeads Antibody Coupling and Co-Immunoprecipitation Kits 30Magnetic stands 31KingFisher Flex Purification System 31
Active site labeling and enrichment 32Pierce Kinase Enrichment Kits and Probes 33Pierce GTPase Enrichment Kit and Probe 34ActivX Serine Hydrolase Probes 35
Protein interactions and crosslinking 36Pierce DSS, No-Weigh Format 37Pierce BS3 (Sulfo-DSS), No-Weigh Format, and BS3-d4 37Pierce DSG 38Pierce BS2G-d0 and BS2G-d4 38Pierce DSSO 39
Protein clean-up 40Slide-A-Lyzer dialysis products 41Zeba desalting products 43Pierce Protein Concentrators 45
Gel electrophoresis and staining 47Handcast and precast gel systems 48NuPAGE protein gels 49Bolt Bis-Tris Plus gels 50Protein ladders and standards 51Protein stains 52Pierce Silver Stain for Mass Spectrometry 53Imperial Protein Stain 55
Protein digestion 56Pierce Trypsin Protease, MS Grade 57Lys-C Protease, MS Grade 59Pierce LysN Protease, MS Grade 60Asp-N Protease, MS Grade 61Glu-C Protease, MS Grade 61Chymotrypsin Protease, MS Grade 62In-Gel Tryptic Digestion Kit 63In-Solution Tryptic Digestion and Guanidination Kit 64Bond-Breaker TCEP Solution, Neutral pH 65Pierce DTT (Dithiothreitol), No-Weigh Format 65Pierce Iodoacetic Acid (IAA) 66Pierce Iodoacetamide (IAM) 66Pierce Methyl Methanethiosulfonate (MMTS) 67Pierce N-Ethylmaleimide (NEM) 67
Peptide enrichment and fractionation 68Phosphopeptide Enrichment Kits 69High-Select Fe-NTA Phosphopeptide Enrichment Kit 70High-Select TiO2 Phosphopeptide Enrichment Kit 71Pierce Magnetic TiO2 Phosphopeptide Enrichment Kit 72Pierce High pH Reversed-Phase Peptide Fractionation Kit 73
Peptide clean-up 75Pierce C18 Spin Tips 76Pierce C18 Tips 77Pierce C18 Spin Columns 78Pierce Graphite Spin Columns 79Detergent removal products 80
Peptide quantitation assays 84
Ordering information 87
Contents
Protein quantitation Introduction 90
Discovery quantitation 92SILAC protein quantitation kits and reagents 93Isobaric mass tagging overview 97Amine-reactive tandem mass tag reagents (TMT Reagents) and workflow 98Cysteine-reactive tandem mass tag reagents (iodoTMT Reagents) and workflow 102Carbonyl-reactive tandem mass tag reagents (aminoxyTMT Reagents) and workflow 105
Targeted quantitation 108Custom peptide synthesis service for targeted proteomics 109HeavyPeptide AQUA standards 110PEPotec SRM Peptide Libraries 112
Ordering information 115
Instrument calibration and ancillary reagents
Introduction 116
Calibration solutions 117Pierce LTQ ESI Positive Ion Calibration Solution 119Pierce LTQ Velos ESI Positive Ion Calibration Solution 119Pierce LTQ ESI Negative Ion Calibration Solution 120Pierce Triple Quadrupole Calibration Solution 120Pierce Triple Quadrupole Calibration Solution, Extended Mass Range 121
Standards 123Pierce Reserpine Standard for LC-MS 124Pierce Peptide Retention Time Calibration Mixture 125Pierce Digestion Indicator 126Pierce BSA Protein Digest Standard, LC-MS Grade 127Pierce 6 Protein Digest Standard, Equimolar, LC-MS Grade 128Pierce HeLa Protein Digest Standard 129
Ancillary reagents and accessories 130Pierce Trifluoroacetic Acid (TFA) 131Pierce 0.1% Trifluoroacetic Acid (v/v) in Acetonitrile, LC-MS Grade 132
Pierce 0.1% Trifluoroacetic Acid (v/v) in Water, LC-MS Grade 133Pierce Formic Acid, LC-MS Grade 134Pierce 0.1% Formic Acid (v/v) in Acetonitrile, LC-MS Grade 135Pierce 0.1% Formic Acid (v/v) in Water, LC-MS Grade 136Pierce Acetonitrile, LC-MS Grade 137Pierce Water, LC-MS Grade 138Pierce Heptafluorobutyric Acid (HFBA), Sequencing Grade 139Single-Use MALDI Matrices 140
Ordering information 141
HPLC instrumentation and columns Introduction 142
HPLC instrumentation 143EASY-nLC 1200 System 144UltiMate 3000 RSLCnano System 145
HPLC columns 146Acclaim PepMap 100 C18 LC Columns 147PepSwift Monolithic Capillary LC Columns 147EASY-Spray C18 LC Columns 148
Mass spectrometry instrumentation Introduction 149
HRAM Orbitrap mass spectrometry 152Q Exactive HF mass spectrometer 154Orbitrap Fusion and Orbitrap Fusion Lumos Tribrid systems 156TSQ Quantiva Triple Quadrupole mass spectrometer 158
Software Introduction 160
Proteome Discoverer software 161ProteinCenter software 163Pinpoint software 165TraceFinder software 166
3
Protein sample preparation and quantitation

Mass spectrometry (MS) has
become a method of choice for
protein analysis. The accuracy,
sensitivity, and flexibility of MS
instruments have enabled new
applications in biological research,
biopharmaceutical characterization,
and diagnostic detection. MS
can identify and quantify known
and unknown compounds by
revealing their structural and
chemical properties. With all of its
many forms of ionization and measurement, MS enables the analysis of
samples ranging in mass from 50 to 300,000 Da, in attomole through
nanomole quantities. Proper sample preparation and chromatography, as
well as the right instrumentation and software, are critical components for
successful MS-based proteomics analysis.
Sample preparationSample preparation is one of the most variable and time consuming steps in the analysis of proteins by MS, and the quality and reproducibility of sample extraction and preparation significantly impact the results.
Thermo Fisher Scientific offers complete workflows for sample preparation designed to improve MS analysis
of proteins. These workflows can vary based upon the sample type and biological context of protein—requiring subcellular fractionation, immunoprecipitation of a low-abundance target, or sample clean-up prior to digestion to remove compounds which interfere with MS analysis. Following denaturation, reduction, and alkylation, endoproteinases such as trypsin are used to cleave the
Overview of key elements for successful proteomics results
The mostsuccessfulproteomics
labs andcompanies
Qua
ntita
tion
Calibration and verification
Chromatography
Mass
spec
inst
rum
enta
tion
Software
Sam
ple prep
4
Introduction

proteins into smaller peptide fragments. These peptides may need further enrichment, fractionation, and/or clean-up for robust downstream liquid chromatography (LC) MS analysis.
Protein quantitationIn addition to the integration of the right sample preparation, chromatography, instrumentation, and software, a proteomics scientist also needs the right strategy to achieve the intended goals to achieve successful results. Project managers are familiar with the conflicts of time, cost, and scope; it is difficult to improve one of these factors without affecting the others. For example, if the scope of a project is increased, it is understood that the project will take more time to complete or cost more money. Similarly, proteomics researchers must also recognize the challenge in achieving scalability of the process, sensitivity of the technique, and comprehensive analysis of samples, simultaneously. Strategies to improve sensitivity and comprehensiveness of analysis generally require large sample quantities and multidimensional fractionation, which sacrifice throughput. Alternatively, efforts to improve the sensitivity
and throughput of protein quantification necessarily limit the number of features that can be monitored. For this reason, quantitative proteomics is typically divided into two categories: discovery and targeted analysis.
Discovery proteomics maximizes protein identification by spending more time and effort per sample, and reducing the number of samples analyzed. In contrast, targeted proteomics strategies limit the number of features that will be monitored, and then optimize the chromatography, instrument tuning, and acquisition methods to achieve the highest sensitivity and throughput for hundreds or thousands of samples.
Quantitative proteomics is a powerful approach used for both discovery and targeted proteomic analyses to understand global proteomic dynamics in a cell, tissue, or organism. Most quantitative proteomic analyses entail the isotopic labeling of proteins or peptides in the experimental groups, which can then be differentiated by mass spectrometry. Relative quantitation methods are used to compare protein or peptide abundance between samples. Alternatively, while spiking unlabeled samples
THEPROTEOMICSCHALLENGE
COMPREHENSIVE SCALABLE
SENSITIVE
Discovery proteomicsstrategies optimize sensitivity
and comprehensiveness
with few samples
Targeted proteomicsstrategies optimize sensitivity and
scalability by limiting the number
of monitored features
5
Tools for proteomics research

with known concentrations of isotopically labeled synthetic peptides can yield absolute quantitation of target peptides by selected reaction monitoring (SRM).
Instrument calibration and verificationRoutine calibration of mass spectrometers is required for optimal performance. Calibration mixtures contain specific compounds at different concentrations, which are used to adjust the calibration scale, as well as the relative intensities of the ions, to match that of known molecules. Instrument calibration is required to maintain high mass accuracy and proper performance that can be impacted over time by changes in lab conditions, electronics, or surface contamination.
Prior to sample analysis, it is recommended to run the standards to verify instrument methods and performance for different applications. Standards provide control over variability in sample preparation, chromatographic retention time, and ionization response in a mass spectrometer. Standards can also be used to specifically monitor instrument sensitivity, chromatography performance, digestion efficiency, or as a control sample to verify optimal methods for simple to complex sample analysis.
Liquid chromatography instruments and columnsLC-MS has become an indispensable tool for studying proteins because of its power in separation of complex protein and peptide mixtures. As sample complexity is usually several orders of magnitude higher than what the MS instruments can handle, chromatographic separation, when used in tandem with MS, can significantly increase the sensitivity and reproducibility of proteomic analysis. New innovations in LC columns, particles, and instruments have enabled high-resolution separation of minute sample amounts with diverse peptides or protein properties. When combined with electrospray ionization (ESI) and high- resolution accurate-mass (HRAM) spectrometry, LC-MS instrument platforms can enable analysis of complex protein samples with greater depth, improved sensitivity, and higher sequence coverage.
Mass spectrometry instrumentation Although mass spectrometers with various forms of ionization (e.g., ESI, MALDI) and mass measurement (e.g., ion trap, time-of-flight, triple quadrupole, Fourier transform) have been developed, recent advances in modern mass spectrometers have ushered in a new era of proteomics driven by improved throughput, sensitivity, and quantitative accuracy. Improvements in ionization and ion transmission have enabled detection of low-abundance ions in the most complex biological samples. New methods to select the specific ions of interest for mass measurement and MS/MS fragmentation have also increased instrument sensitivity. A variety of peptide fragmentation modes including collision-induced dissociation (CID), electron-transfer dissociation (ETD), and higher-energy collisional dissociation (HCD) can be used separately or in combination to identify unique peptides, improve protein sequence coverage, or localize sites of post-translational modifications (PTMs). However, the biggest advances in modern proteomic mass spectrometry instruments are related to HRAM measurements enabled by the Thermo Scientific™ Orbitrap™ mass analyzer. Improved mass resolution with high mass accuracy can separate near isobaric peptide species for detection and subsequent identification. Combined with the latest advances in liquid chromatography, these mass spectrometers continue to push the limits of protein detection, characterization, and quantitation.
Two platforms are widely utilized for proteomics workflows, and each is ideally suited for either discovery or targeted applications:
• Orbitrap platform LC-MS In order to identify as many peptides as possible from a complex mixture, a combination of high mass resolution, accurate mass, speed, and multiple fragmentation techniques are required. Because of its capabilities to support different MS/MS fragmentation modes with the highest resolution of all benchtop MS instruments, the Thermo Scientific™ Orbitrap™ family of instruments offers the optimal platform for the analysis of complex proteomics samples.
6
Introduction

• Triple quadrupole LC-MS For high-throughput quantitation of well-characterized proteins and peptides, SRM on triple quadrupole mass spectrometer platform is still the gold standard for targeted protein quantification. This platform provides extreme sensitivity and speed, ideally suited to samples in complex biological matrices.
Proteomics LC-MS softwareProteomics experiments generate large amounts of data that, even after preliminary identification and validation, leave scientists with the time-consuming, yet critical task of analysis and interpretation. There are a variety of algorithms for the interpretation of peptide fragmentation data. The most commonly employed algorithms, such as those used by SEQUEST™ [1], Mascot™, and Byonic™ software, attempt to determine the identity of a peptide by comparing the observed fragmentation pattern to the theoretical fragmentation patterns derived from protein sequence databases and heuristic fragmentation rules. The observed mass of the intact precursor ion is used to constrain the set of theoretical peptides that are considered within a tolerance range based on the accuracy of the measurement. Instruments that provide high mass accuracy precursor measurements also enable greatly improved search times and improved confidence in peptide identifications2, especially for modified peptides. [3]
After protein identification, verification, and quantitation, interpreting proteomics data to extract meaningful biological information from multiple, complex data sets can be challenging. Thermo Scientific™ ProteinCenter™ software is a web-based data interpretation tool that helps researchers to explore biological context over a variety of applications. Additional software packages are available for data analysis including Thermo Scientific™ Proteome Discoverer™ software for qualitative and quantitative analysis of proteomics data, Thermo Scientific™ ProSightPC™ Software for top-down and middle- down analysis, and Thermo Scientific™ Pinpoint™ or Thermo Scientific™ TraceFinder™ software for the creation of targeted quantitative assays. All are designed to take full advantage of the high-quality, high-resolution, accurate-mass data produced by Orbitrap mass spectrometers.
References1. Yates JR 3rd, Eng JK et al. (1995). Method to correlate tandem mass spectra
of modified peptides to amino acid sequences in the protein database. Anal Chem 67(8):1426–1436.
2. Mann M, Kelleher NL. (2008). Precision proteomics: The case for high resolution and high mass accuracy. Proc Natl Acad Sci USA 105(47):18132–18138.
3. Haas W, Faherty BK et al. (2006). Optimization and use of peptide mass measurement accuracy in shotgun proteomics. Mol Cell Proteomics 5(7):1326–1337.
7
Tools for proteomics research

8
Workflows
Cells
Abundant proteindepletion
Lysis andprotein extraction
Metabolic labeling
Protein clean-up
Immunoprecipitation or active site labeling and/or enrichment
Protein quantitationassays
Gel separation
In-gel digestionPeptide or
glycan labeling
Peptide enrichmentand/or fractionation
HeavyPeptideAQUA standards
Peptide clean-up
Peptide quantitationassays
Reagents for MS instrumentcalibration, QC, and analysis
HPLC instrumentation and columns
MS instrumentation Software
In-solution digestion
TissuesSerum, plasma, and bio�uids
Introduction
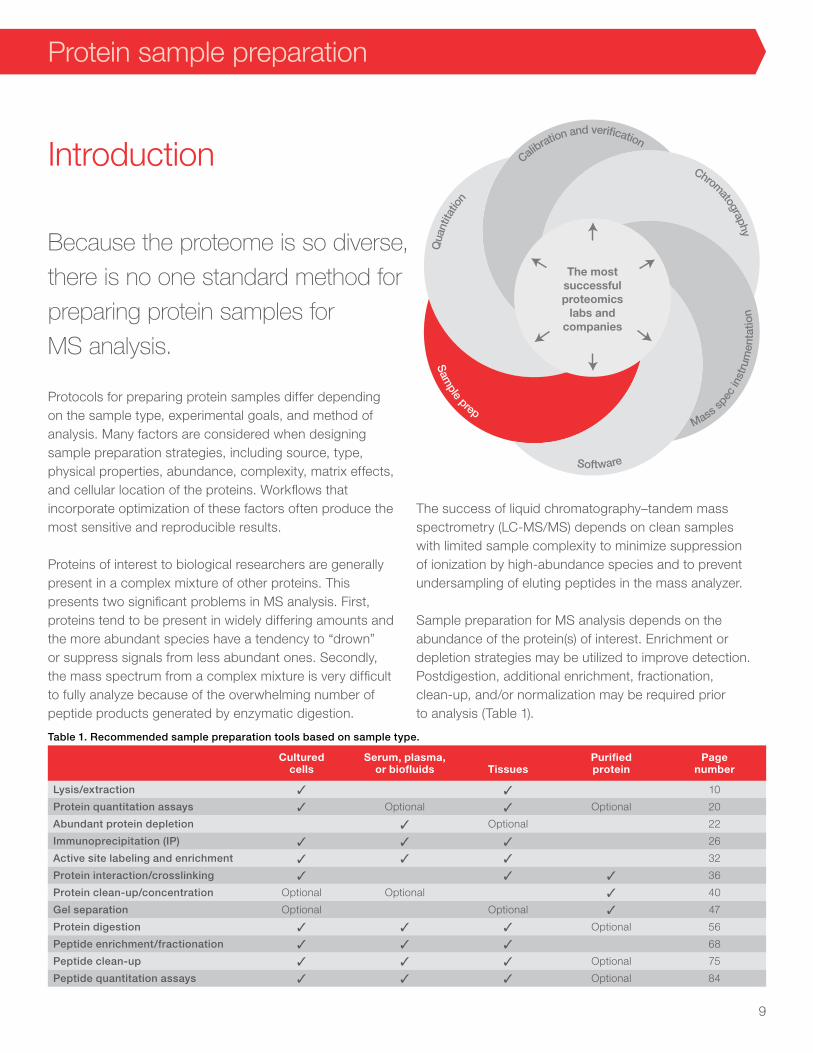
Because the proteome is so diverse,
there is no one standard method for
preparing protein samples for
MS analysis.
Protocols for preparing protein samples differ depending on the sample type, experimental goals, and method of analysis. Many factors are considered when designing sample preparation strategies, including source, type, physical properties, abundance, complexity, matrix effects, and cellular location of the proteins. Workflows that incorporate optimization of these factors often produce the most sensitive and reproducible results.
Proteins of interest to biological researchers are generally present in a complex mixture of other proteins. This presents two significant problems in MS analysis. First, proteins tend to be present in widely differing amounts and the more abundant species have a tendency to “drown” or suppress signals from less abundant ones. Secondly, the mass spectrum from a complex mixture is very difficult to fully analyze because of the overwhelming number of peptide products generated by enzymatic digestion.
The success of liquid chromatography–tandem mass spectrometry (LC-MS/MS) depends on clean samples with limited sample complexity to minimize suppression of ionization by high-abundance species and to prevent undersampling of eluting peptides in the mass analyzer.
Sample preparation for MS analysis depends on the abundance of the protein(s) of interest. Enrichment or depletion strategies may be utilized to improve detection. Postdigestion, additional enrichment, fractionation, clean-up, and/or normalization may be required prior to analysis (Table 1).
The mostsuccessfulproteomics
labs andcompanies
Qua
ntita
tion
Calibration and verification
Chromatography
Mass s
pec
inst
rum
enta
tion
Software
Sam
ple prep
Table 1. Recommended sample preparation tools based on sample type.
Cultured cells
Serum, plasma, or biofluids Tissues
Purifiedprotein
Page number
Lysis/extraction ✓ ✓ 10
Protein quantitation assays ✓ Optional ✓ Optional 20
Abundant protein depletion ✓ Optional 22
Immunoprecipitation (IP) ✓ ✓ ✓ 26
Active site labeling and enrichment ✓ ✓ ✓ 32
Protein interaction/crosslinking ✓ ✓ ✓ 36
Protein clean-up/concentration Optional Optional ✓ 40
Gel separation Optional Optional ✓ 47
Protein digestion ✓ ✓ ✓ Optional 56
Peptide enrichment/fractionation ✓ ✓ ✓ 68
Peptide clean-up ✓ ✓ ✓ Optional 75
Peptide quantitation assays ✓ ✓ ✓ Optional 84
9
Protein sample preparation

Tissue or cell lysis is the first step in
protein extraction, fractionation, and
enrichment. Numerous techniques
have been developed to obtain the
best possible yield and purity for
different species of organisms, sample
types (cells, biofluids, or tissues),
subcellular fractions, or specific
proteins. Both physical and reagent-
based methods may be required to
extract cellular proteins because of the
diversity of tissue and cell types.
Historically, mechanical disruption has been used to lyse cells and tissues; our gentle, detergent-based solutions have been developed to efficiently lyse cells and enable the separation of subcellular structures without requiring physical disruption, providing high yields of active proteins.
Cell lysis disrupts cell membranes and organelles, resulting in unregulated proteolytic activity that can reduce protein yield and function. To prevent these negative effects, protease and phosphatase inhibitors can be added to the lysis reagents. Numerous compounds have been identified and used to inactivate or block the activities of proteases and phosphatases by reversibly or irreversibly binding to them. Thermo Scientific™ Halt™ Protease and Phosphatase Inhibitor Cocktails and Thermo Scientific™ Pierce™ Protease and Phosphatase Inhibitor Tablets are broad-spectrum blends in both liquid (100X) and tablet formats for complete protein protection during extraction.
Sample lysis and protein extraction
Table 2. Protein extraction selection guide.
Mass Spec Sample Prep Kit for Cultured Cells
Mem-PER Plus Membrane Protein Extraction Kit
Subcellular Protein Fractionation Kit for
Cultured Cells
Fractions isolated Primarily cytosolic Integral and membrane associated proteins
Nucleus, cytoplasm, membrane, cytoskeletal, chromatin-bound
Amount of sample processed 20 samples of 1 million cells 50 samples of 5 million cells 50 samples of 2 million cells (20 µL packed)
Sample processing time (predigestion)
2.5 hr 1 hr 2–3 hr
Digestion proteases included? Yes No No
10
Protein sample preparation

Pierce Mass Spec Sample Prep Kit for Cultured CellsOptimized isolation and digestion of protein samples for MS analysis
The Thermo Scientific™ Pierce™ Mass Spec Sample Prep Kit for Cultured Cells is an easy-to-use, comprehensive kit for preparation of clean peptide mixtures from cultured cells for MS analysis.
This kit contains all the necessary reagents and enzymes to prepare up to 20 samples (1 million cells each) for MS analysis. The simple and robust workflow (Figure 1) uses a lysis protocol that generates approximately 100 μg of protein per sample. The kit includes the Thermo Scientific™ Pierce™ Digestion Indicator for Mass Spectrometry as an internal protein/peptide control to monitor the efficiency of the two-step enzymatic digestion protocol. The procedure consistently and reproducibly produces clean peptide mixtures for protein identification.
Highlights:• Complete—includes all reagents, a digestion indicator
control, proteases, and an optimized protocol needed to process up to 20 samples
• Simple—user-friendly kit can provide reproducible results even for non-expert MS analysts
• Flexible—can be adapted to handle sample sizes between 10 μg and 200 μg
• High yield—total protein yield from 1 million cells is greater than 100 μg
• Optimized—cysteine reduction and alkylation are 100%, with less than 1% over-alkylation of non-cysteine residues
• Efficient—percentage of missed cleavages is less than 10%
• Compatible—final preparation is ready for direct MS analysis and other downstream applications, including mass-tag labeling
Sample prep for MS remains one of the largest bottlenecks associated with MS analysis, and consistent and reproducible sample preparation can make the difference between a successful analysis and a failed outcome. Current sample prep protocols are primarily homebrew and can be highly variable, making data analysis and interpretation difficult. The Mass Spec Sample Prep Kit for Cultured Cells provides researchers with all the necessary tools to generate consistent and reproducible protein digests that are directly compatible with LC-MS workflows. The digests do not require further processing, such as C18 clean-up or detergent removal.
The Pierce Digestion Indicator, which can be purchased separately, is a nonmammalian recombinant protein (26 kDa) with 5 signature peptides for use in determining the digestion efficiency and reproducibility across multiple samples. The protein sequence and recommended peptides to monitor across samples are supplied with the product instructions.
45 min at 50°C;20 min at RT
2Reduce/alkylate
5 min at 95°C;then sonicate
1
Lyse cells
6PerformLC-MS
Overnight at 37°C
5Trypsindigest
1 hr at -20°C
3Acetone
precipitate
1 x 10⁶ cells
2 hr at 37°C
4Lys-Cdigest
Add DigestionIndicator
Assess quality by comparison to Digestion Indicator peptides
Figure 1. Protocol summary for the Pierce Mass Spec Sample Prep Kit for Cultured Cells. All reagent and enzymes are supplied in the kit, except trifluoroacetic acid (TFA), phosphate-buffered saline (PBS), and acetone. Thermo Scientific™ Pierce™ Universal Nuclease for Cell Lysis (Cat. No. 88700) can be used as an alternative to sonication for reducing viscosity during cell lysis.
11
Sample preparation
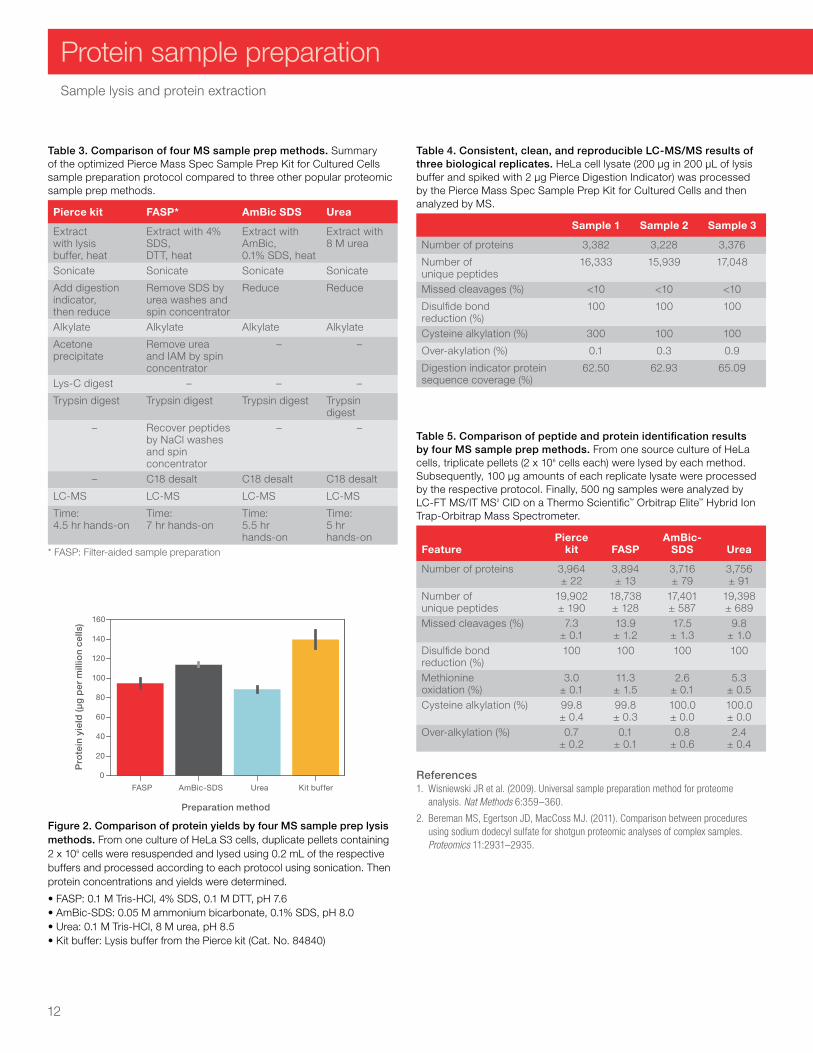
Table 3. Comparison of four MS sample prep methods. Summary of the optimized Pierce Mass Spec Sample Prep Kit for Cultured Cells sample preparation protocol compared to three other popular proteomic sample prep methods.
Pierce kit FASP* AmBic SDS Urea
Extract with lysis buffer, heat
Extract with 4% SDS, DTT, heat
Extract with AmBic, 0.1% SDS, heat
Extract with 8 M urea
Sonicate Sonicate Sonicate Sonicate
Add digestion indicator, then reduce
Remove SDS by urea washes and spin concentrator
Reduce Reduce
Alkylate Alkylate Alkylate Alkylate
Acetone precipitate
Remove urea and IAM by spin concentrator
– –
Lys-C digest – – –
Trypsin digest Trypsin digest Trypsin digest Trypsin digest
– Recover peptides by NaCl washes and spin concentrator
– –
– C18 desalt C18 desalt C18 desalt
LC-MS LC-MS LC-MS LC-MS
Time: 4.5 hr hands-on
Time: 7 hr hands-on
Time: 5.5 hr hands-on
Time: 5 hr hands-on
* FASP: Filter-aided sample preparation
Table 5. Comparison of peptide and protein identification results by four MS sample prep methods. From one source culture of HeLa cells, triplicate pellets (2 x 10⁶ cells each) were lysed by each method. Subsequently, 100 µg amounts of each replicate lysate were processed by the respective protocol. Finally, 500 ng samples were analyzed by LC-FT MS/IT MS2 CID on a Thermo Scientific™ Orbitrap Elite™ Hybrid Ion Trap-Orbitrap Mass Spectrometer.
FeaturePierce
kit FASPAmBic-
SDS Urea
Number of proteins 3,964 ± 22
3,894 ± 13
3,716 ± 79
3,756 ± 91
Number of unique peptides
19,902 ± 190
18,738 ± 128
17,401 ± 587
19,398 ± 689
Missed cleavages (%) 7.3 ± 0.1
13.9 ± 1.2
17.5 ± 1.3
9.8 ± 1.0
Disulfide bond reduction (%)
100 100 100 100
Methionine oxidation (%)
3.0 ± 0.1
11.3 ± 1.5
2.6 ± 0.1
5.3 ± 0.5
Cysteine alkylation (%) 99.8 ± 0.4
99.8 ± 0.3
100.0 ± 0.0
100.0 ± 0.0
Over-alkylation (%) 0.7 ± 0.2
0.1 ± 0.1
0.8 ± 0.6
2.4 ± 0.4
References1. Wisniewski JR et al. (2009). Universal sample preparation method for proteome
analysis. Nat Methods 6:359–360.
2. Bereman MS, Egertson JD, MacCoss MJ. (2011). Comparison between procedures using sodium dodecyl sulfate for shotgun proteomic analyses of complex samples. Proteomics 11:2931–2935.
Table 4. Consistent, clean, and reproducible LC-MS/MS results of three biological replicates. HeLa cell lysate (200 μg in 200 μL of lysis buffer and spiked with 2 μg Pierce Digestion Indicator) was processed by the Pierce Mass Spec Sample Prep Kit for Cultured Cells and then analyzed by MS.
Sample 1 Sample 2 Sample 3
Number of proteins 3,382 3,228 3,376
Number of unique peptides
16,333 15,939 17,048
Missed cleavages (%) <10 <10 <10
Disulfide bond reduction (%)
100 100 100
Cysteine alkylation (%) 300 100 100
Over-akylation (%) 0.1 0.3 0.9
Digestion indicator protein sequence coverage (%)
62.50 62.93 65.09
0
20
40
60
80
100
120
140
160
Preparation method
Pro
tein
yie
ld (
µg
per
mill
ion
cells
)
FASP AmBic-SDS Urea Kit buffer
Figure 2. Comparison of protein yields by four MS sample prep lysis methods. From one culture of HeLa S3 cells, duplicate pellets containing 2 x 10⁶ cells were resuspended and lysed using 0.2 mL of the respective buffers and processed according to each protocol using sonication. Then protein concentrations and yields were determined.
• FASP: 0.1 M Tris-HCl, 4% SDS, 0.1 M DTT, pH 7.6• AmBic-SDS: 0.05 M ammonium bicarbonate, 0.1% SDS, pH 8.0• Urea: 0.1 M Tris-HCl, 8 M urea, pH 8.5• Kit buffer: Lysis buffer from the Pierce kit (Cat. No. 84840)
12
Sample lysis and protein extraction
Protein sample preparation

Mem-PER Plus Membrane Protein Extraction KitFast and simple enrichment of integral membrane proteins and membrane-associated proteins
The Thermo Scientific™ Mem-PER™ Plus Membrane Protein Extraction Kit enables fast and efficient small-scale solubilization and enrichment of integral membrane proteins and membrane-associated proteins using a simple, selective detergent procedure.
Traditional methods for isolating membrane proteins are tedious and time-consuming—requiring gradient separation and expensive ultracentrifugation equipment. The Mem-PER Plus kit effectively isolates membrane proteins from cultured mammalian cells using a mild detergent-based, selective extraction protocol and a simple benchtop microcentrifuge procedure in less than 1 hr (Figure 3). The cells are first permeabilized with a mild detergent, allowing the release of soluble cytosolic proteins, after which a second detergent solubilizes membrane proteins. Membrane proteins with one or two transmembrane domains are typically extracted with an efficiency of up to 90%. Extraction efficiencies and yields will vary depending on cell type as well as the number of times the integral membrane protein spans the lipid bilayer. Cross-contamination of cytosolic proteins into the membrane fraction is usually less than 10%. Membrane fractions are compatible with many downstream applications, such as SDS-PAGE, western blotting, BCA, immunoprecipitation, and amine-reactive protein labeling techniques.
Highlights:• Fast and simple—complete in approximately 1 hr using
only a benchtop microcentrifuge
• Clean preparation—produces minimal cross-contamination of cytosolic protein (typically <10%)
• Compatible—can analyze membrane protein extracts by SDS-PAGE, western blotting, immunoprecipitation, and protein assays
Sequential detergent extraction increased the enrichment for both integral and peripheral membrane proteins compared to the nondetergent methods, as seen in Table 6. In addition, the sequential detergent method yielded higher sequence coverage of several integral membrane proteins containing 1–12 transmembrane domains compared to other commercial reagents (Figure 4).
To further increase the extraction efficiency of multispanning integral membrane proteins using the Mem-PER Plus Membrane Protein Extraction Kit, an isotonic solubilization buffer was utilized. HEK293 cells were lysed using the cell permeabilization buffer included in the Mem-PER Plus kit and subsequently solubilized with either the hypotonic solubilization buffer included in the kit
Figure 3. Mem-PER Plus Membrane Protein Extraction Kit protocol summary.
109
87
65
43
2
1112
1314
Harvest cells(5 min 300 x g)
3 mL cell wash solution:Resuspend, centrifuge,discard supernatant 1.5 mL cell wash solution:
Resuspend, transfer to small tube, centrifuge
0.75 mL permeabilizationbuffer: Vortex, incubate for 10 min at 4°C with mixing
Centrifuge 15 min 16,000 x g at 4°C
0.5 mL solubilization buffer:Resuspend, then incubate for 30 min at 4°C with mixing
Centrifuge 15 min 16,000 x g at 4°C
Collect supernatant
5 x 10⁶ cells
Collect supernatant
Membraneproteins
Cytosolicproteins
13
Sample preparation
Na+/K+ ATPase
ADP/ATP translocase 3
Hypotonic Isotonic
C
74% 83%
43% 71%
M P C M P
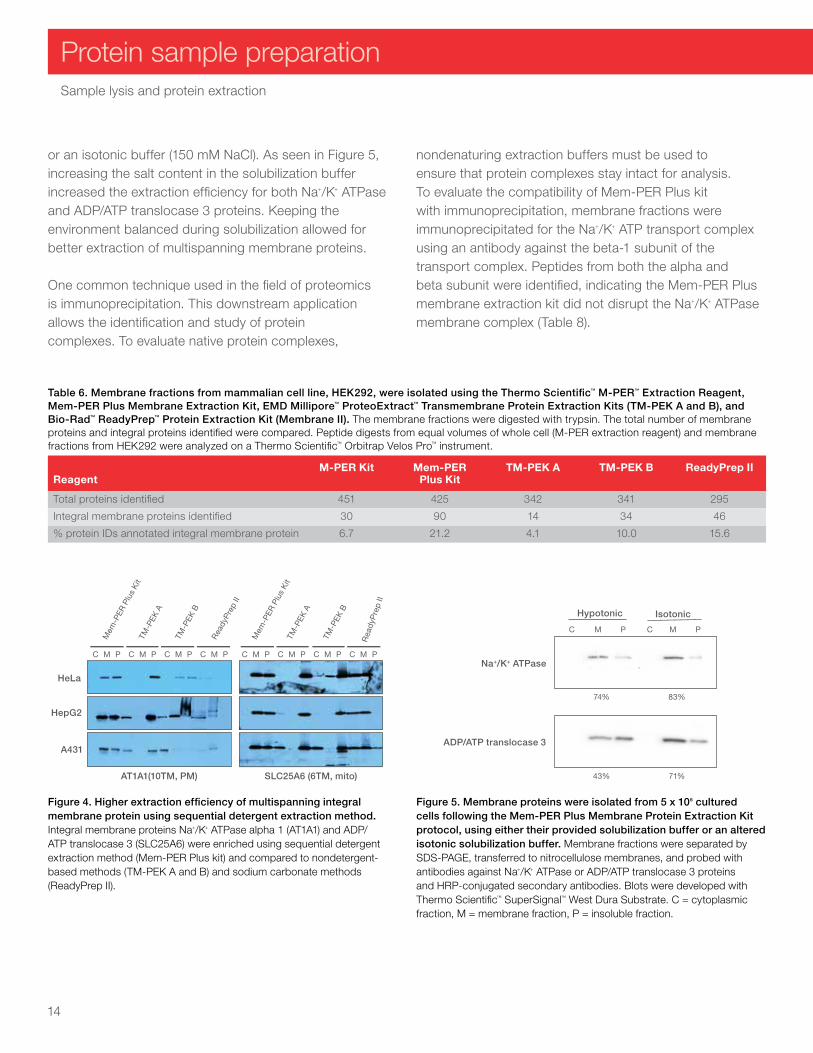
Figure 4. Higher extraction efficiency of multispanning integral membrane protein using sequential detergent extraction method. Integral membrane proteins Na+/K+ ATPase alpha 1 (AT1A1) and ADP/ATP translocase 3 (SLC25A6) were enriched using sequential detergent extraction method (Mem-PER Plus kit) and compared to nondetergent-based methods (TM-PEK A and B) and sodium carbonate methods (ReadyPrep II).
Table 6. Membrane fractions from mammalian cell line, HEK292, were isolated using the Thermo Scientific™ M-PER™ Extraction Reagent, Mem-PER Plus Membrane Extraction Kit, EMD Millipore™ ProteoExtract™ Transmembrane Protein Extraction Kits (TM-PEK A and B), and Bio-Rad™ ReadyPrep™ Protein Extraction Kit (Membrane II). The membrane fractions were digested with trypsin. The total number of membrane proteins and integral proteins identified were compared. Peptide digests from equal volumes of whole cell (M-PER extraction reagent) and membrane fractions from HEK292 were analyzed on a Thermo Scientific™ Orbitrap Velos Pro™ instrument.
ReagentM-PER Kit Mem-PER
Plus KitTM-PEK A TM-PEK B ReadyPrep II
Total proteins identified 451 425 342 341 295
Integral membrane proteins identified 30 90 14 34 46
% protein IDs annotated integral membrane protein 6.7 21.2 4.1 10.0 15.6
or an isotonic buffer (150 mM NaCl). As seen in Figure 5, increasing the salt content in the solubilization buffer increased the extraction efficiency for both Na+/K+ ATPase and ADP/ATP translocase 3 proteins. Keeping the environment balanced during solubilization allowed for better extraction of multispanning membrane proteins.
One common technique used in the field of proteomics is immunoprecipitation. This downstream application allows the identification and study of protein complexes. To evaluate native protein complexes,
nondenaturing extraction buffers must be used to ensure that protein complexes stay intact for analysis. To evaluate the compatibility of Mem-PER Plus kit with immunoprecipitation, membrane fractions were immunoprecipitated for the Na+/K+ ATP transport complex using an antibody against the beta-1 subunit of the transport complex. Peptides from both the alpha and beta subunit were identified, indicating the Mem-PER Plus membrane extraction kit did not disrupt the Na+/K+ ATPase membrane complex (Table 8).
Figure 5. Membrane proteins were isolated from 5 x 10⁶ cultured cells following the Mem-PER Plus Membrane Protein Extraction Kit protocol, using either their provided solubilization buffer or an altered isotonic solubilization buffer. Membrane fractions were separated by SDS-PAGE, transferred to nitrocellulose membranes, and probed with antibodies against Na+/K+ ATPase or ADP/ATP translocase 3 proteins and HRP-conjugated secondary antibodies. Blots were developed with Thermo Scientific™ SuperSignal™ West Dura Substrate. C = cytoplasmic fraction, M = membrane fraction, P = insoluble fraction.
HeLa
HepG2
A431
AT1A1(10TM, PM)
Mem
-PER
Plu
s K
itTM
-PEK
A
TM-P
EK B
Rea
dyPr
ep II
Mem
-PER
Plu
s K
itTM
-PEK
A
TM-P
EK B
Rea
dyP
rep
II
C M P C M P C M P C M P C M P C M P C M P C M P
SLC25A6 (6TM, mito)
14
Sample lysis and protein extraction
Protein sample preparation
Mg ATP3 Na+
2 K+
Mg ADP + Pi
β γα
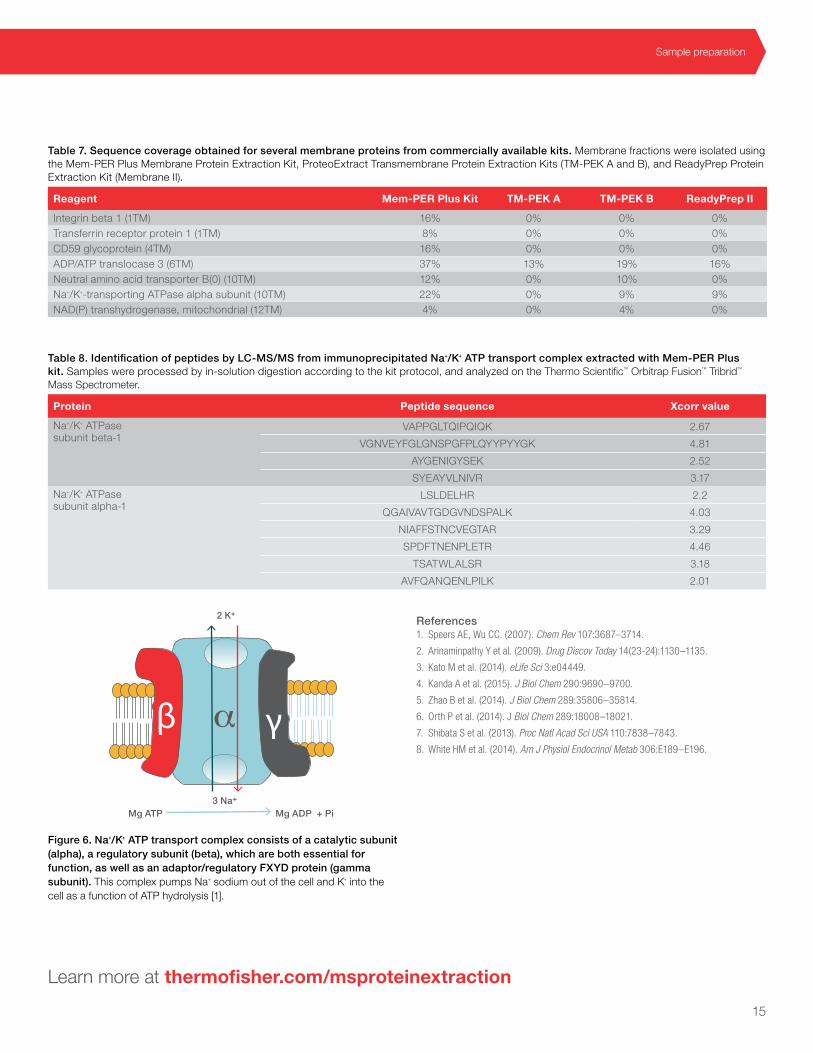
Figure 6. Na+/K+ ATP transport complex consists of a catalytic subunit (alpha), a regulatory subunit (beta), which are both essential for function, as well as an adaptor/regulatory FXYD protein (gamma subunit). This complex pumps Na+ sodium out of the cell and K+ into the cell as a function of ATP hydrolysis [1].
Table 8. Identification of peptides by LC-MS/MS from immunoprecipitated Na+/K+ ATP transport complex extracted with Mem-PER Plus kit. Samples were processed by in-solution digestion according to the kit protocol, and analyzed on the Thermo Scientific™ Orbitrap Fusion™ Tribrid™ Mass Spectrometer.
Protein Peptide sequence Xcorr value
Na+/K+ ATPase subunit beta-1
VAPPGLTQIPQIQK 2.67
VGNVEYFGLGNSPGFPLQYYPYYGK 4.81
AYGENIGYSEK 2.52
SYEAYVLNIVR 3.17
Na+/K+ ATPase subunit alpha-1
LSLDELHR 2.2
QGAIVAVTGDGVNDSPALK 4.03
NIAFFSTNCVEGTAR 3.29
SPDFTNENPLETR 4.46
TSATWLALSR 3.18
AVFQANQENLPILK 2.01
References1. Speers AE, Wu CC. (2007). Chem Rev 107:3687–3714.
2. Arinaminpathy Y et al. (2009). Drug Discov Today 14(23-24):1130–1135.
3. Kato M et al. (2014). eLife Sci 3:e04449.
4. Kanda A et al. (2015). J Biol Chem 290:9690–9700.
5. Zhao B et al. (2014). J Biol Chem 289:35806–35814.
6. Orth P et al. (2014). J Biol Chem 289:18008–18021.
7. Shibata S et al. (2013). Proc Natl Acad Sci USA 110:7838–7843.
8. White HM et al. (2014). Am J Physiol Endocrinol Metab 306:E189–E196.
Table 7. Sequence coverage obtained for several membrane proteins from commercially available kits. Membrane fractions were isolated using the Mem-PER Plus Membrane Protein Extraction Kit, ProteoExtract Transmembrane Protein Extraction Kits (TM-PEK A and B), and ReadyPrep Protein Extraction Kit (Membrane II).
Reagent Mem-PER Plus Kit TM-PEK A TM-PEK B ReadyPrep II
Integrin beta 1 (1TM) 16% 0% 0% 0%Transferrin receptor protein 1 (1TM) 8% 0% 0% 0%CD59 glycoprotein (4TM) 16% 0% 0% 0%ADP/ATP translocase 3 (6TM) 37% 13% 19% 16%Neutral amino acid transporter B(0) (10TM) 12% 0% 10% 0%Na+/K+-transporting ATPase alpha subunit (10TM) 22% 0% 9% 9%NAD(P) transhydrogenase, mitochondrial (12TM) 4% 0% 4% 0%
Learn more at thermofisher.com/msproteinextraction
15
Sample preparation

Subcellular Protein Fractionation Kit for Cultured CellsSegregate and enrich proteins from five cellular compartments
The Thermo Scientific™ Subcellular Protein Fractionation Kit for Cultured Cells enables the separation of proteins from different cellular compartments. The kit contains a combination of reagents for stepwise separation and extraction of cytoplasmic, membrane, nuclear soluble, chromatin-bound, and cytoskeletal proteins from mammalian cells obtained from culture or isolated from tissue.
Extracts obtained generally have less than 15% contamination between fractions, which is sufficient purity for most protein localization and redistribution experiments. The extracts are compatible with a variety of downstream applications, including mass spectrometry, western blotting, and protein assays.
Highlights:• Efficient and complete—extract functional cytoplasmic,
membrane, nuclear soluble, chromatin-bound, and cytoskeletal protein fractions with less than 15% cross- contamination in <3 hr from a single sample
• Convenient—perform a simple procedure without using gradient ultracentrifugation
• Compatible—use extracts for downstream applications such as mass spectrometry, protein assays, western blotting, gel-shift assays, and enzyme activity assays
• Robust—validated in HeLa, NIH 3T3, HEK293, and A549 cultured mammalian cells
Applications:• Determine a protein’s cellular location
• Extract and enrich proteins from different cellular compartments
• Study protein translocation
The Subcellular Protein Fractionation Kit for Cultured Cells contains four extraction buffers, a stabilized nuclease, and Halt Protease Inhibitor Cocktail, and is sufficient to fractionate 50 cell pellets, each containing 2 million cells (20 µL packed). The first reagent causes selective permeabilization of the cell membrane, releasing soluble cytoplasmic contents. The second reagent dissolves plasma, mitochondrial, endoplasmic reticulum, and Golgi complex membranes but does not solubilize the nuclear membranes. After recovering intact nuclei by centrifugation, a third reagent yields the soluble nuclear extract. An additional nuclear extraction with micrococcal nuclease is performed to release chromatin-bound nuclear proteins. The recovered insoluble pellet is then extracted with the final reagent to isolate cytoskeletal proteins (Figure 7).
Figure 7. Schematic of the subcellular fractionation procedure. Cellular compartments are sequentially extracted by incubating cells with cytoplasmic extraction buffer (CEB) followed by membrane extraction buffer (MEB) and nuclear extraction buffer (NEB). Adding micrococcal nuclease (MNase) to NEB extracts chromatin-bound proteins from the cell pellet before adding the pellet extraction buffer (PEB) to solubilize cytoskeletal proteins.
CEB MEB NEB PEBNEB+MNase
16
Sample lysis and protein extraction
Protein sample preparation

In order to identify additional proteins that fractionate with known marker proteins, subcellular protein fractions were analyzed separately using label-free mass spectrometry (MS) and also labeled with Thermo Scientific™ Tandem Mass Tag™ 6-plex (TMTsixplex™) reagents for MS/MS quantitation. The results from label-free quantitation (Figure 8) and TMTsixplex reagents (Figure 9) correlated well with western blot analysis. Overall, more than 40,000 unique peptides corresponding to 5,337 protein groups were identified from the combined subcellular protein fractions which were approximately 2.5-fold greater than unfractionated whole cell lysate (Figure 10).
Annotation of proteins by cellular compartment revealed significant enrichment for canonical gene ontology (GO) terms (Table 9). However, as most proteins are annotated for multiple subcellular locations, some terms did not show as much enrichment as others. In particular, proteins found in the chromatin-bound and cytoskeletal pellet fractions correlated less with the subcelluar GO terms. Further analysis of proteins by function revealed significant increases in additional protein groups for different fractions. Notably, the membrane-associated fraction showed enrichment for mitochondrial proteins and the pellet fraction showed enrichment of lipid raft–associated proteins.
The Subcellular Protein Fractionation Kit is compatible with gel-shift assays to further characterize transcription factor activation states (Figure 9).
Figure 8. Analysis of protein fractions using label-free quantitation of compartment-specific marker proteins. Normalized integrated average peak area for each fraction is shown. The red bars show normalized intensity of peptide peak area for each marker protein in different subcellular compartments. The gray bars indicate the relative intensity of marker proteins found in other fractions.
Figure 9. Representative quantitation of protein enrichment of marker proteins (Hsp90 and histone H3) using TMTsixplex reagents in different subcellular fractions relative to whole cell lysate. The red bars show the relative intensity of TMT reagent reporter ions for unique marker proteins.
Figure 10. Number of identified proteins (gray bars) and peptides (red bars) from in-gel digests of subcellular protein fractions and whole cell lysate.
0.0
0.2
0.4
0.6
0.8
1.0
1.2
Hsp90 EGFR Calreticulin SP1 HDAC2 Histone H3 Vimentin Cytokeratin 18
Cytoplasmic Membrane-associated Nuclear soluble Chromatin- bound
Cytoskeletal pellet
Whole cell lysate
Cytoplasmic Membrane- associated
Nuclear soluble
Chromatin- bound
Cytoskeletal pellet
0
50
100
150
200
250
0
50
100
150
200
250
300
350
Hsp90
Histone H3
Whole cell lysate
Cytoplasmic Membrane- associated
Nuclear soluble
Chromatin- bound
Cytoskeletal pellet
Inte
nsi
ty (1
03 )
Inte
nsi
ty (1
03 )
0
5,000
10,000
15,000
20,000
25,000
30,000
35,000
40,000
45,000
Cytoplasmic Membrane- associated
Nuclear soluble
Chromatin- bound
Cytoskeletal pellet
Combined fractions
Whole cell lysate
Proteins identified Unique peptides identified
Nu
mb
er (
pro
tein
s/p
epti
des
)
Table 9. Gene ontology (GO) annotation enrichment of subcellular protein fractions. Average integrated peak area and standard deviation for each identified protein was calculated for individual fractions and compared to whole cell lysate. Standard scores [(fraction area – average total area)/standard deviation] and fold change [In(area for fraction/average total area)] were calculated for each fraction. Proteins with a standard score of >0.6 and fold change of >0.5 were considered enriched. The enriched proteins for each fraction were annotated for cellular compartments using a UniProt database and canonical GO terms.
Fraction# protein enriched GO term
Proteins annotated
% GO term matched
Cytoplasmic 1,291 GO:0005737 (cytoplasm) 1,089 84.4
Membrane- associated 2,088 GO:0016020
(membrane) 1,374 65.8
Nuclear soluble 882 GO:0005634
(nucleus) 718 81.4
Chromatin- bound 329
GO:0003682 (chromatin-
binding)38 11.6
Cytoskeletal pellet 257 GO:0005856
(cytoskeleton) 62 24.1
Whole cell lysate
Cytoplasmic Membrane- associated
Nuclear soluble
Chromatin- bound
Cytoskeletal pellet
0
50
100
150
200
250
0
50
100
150
200
250
300
350
Hsp90
Histone H3
Whole cell lysate
Cytoplasmic Membrane- associated
Nuclear soluble
Chromatin- bound
Cytoskeletal pellet
Inte
nsi
ty (1
03 )
Inte
nsi
ty (1
03 )
17
Sample preparation

Protease and phosphatase inhibitors Broad-spectrum liquid cocktails and tablets for complete protein protection
Protease and phosphatase inhibitor cocktails and tablets are ideal for the protection of proteins during extraction or lysate preparation from primary cells, cultured mammalian cells, animal tissues, plant tissues, yeast cells, or bacterial cells. Formulations are packaged in multiple sizes, and EDTA-free versions are available for divalent cation–sensitive assays.
Highlights:• Convenient—ready-to-use, fully disclosed, broad-
spectrum formulations available as either liquid cocktails or tablets in multiple pack sizes and with a minimum one-year shelf life
• Complete protection—combined cocktail available with all-in-one formulations containing both protease and phosphatase inhibitors
• Compatible—use directly with Thermo Scientific™ Pierce™ Cell Lysis Buffers or other commercial or homemade detergent-based lysis reagents
Most researchers use a mixture or “cocktail” of several different inhibitors to ensure that protein extracts do not degrade before analysis of targets of interest. Protease inhibitors are nearly always needed, while phosphatase inhibitors are required only when investigating phosphorylation states (activation states). Particular research experiments may require the use of single inhibitors or customized mixtures, but most protein work is best served by using a broad-spectrum protease inhibitor cocktail.
Table 10. Components present in Halt Inhibitor Cocktails and Pierce Protease and Phosphatase Inhibitor Tablets.
Inhibitor component Target (mechanism)
Protease liquid cocktails and
tablets
Phosphatase liquid cocktails
and tablets
Combined protease and phosphatase liquid
cocktails and tablets
AEBSF·HCl Serine protease (irreversible) ●
Aprotinin Serine protease (reversible) ● ●
Bestatin Aminopeptidase (reversible) ● ●
E-64 Cysteine protease (irreversible) ● ●
Leupeptin Serine and cysteine proteases (reversible)
● ●
Pepstatin Aspartic acid protease (reversible) ●
EDTA* Metalloprotease (reversible) ● ●
Sodium fluoride Serine/threonine and acid phosphatases
● ●
Sodium orthovanadate Tyrosine and alkaline phosphatases ● ●
β-glycero-phosphate Serine/threonine phosphatase ● ●
Sodium pyrophosphate Serine/threonine phosphatase ● ●
* EDTA not in EDTA-free formulations.
18
Sample lysis and protein extraction
Protein sample preparation

For more information or to view additional products, go to thermofisher.com/inhibitorcocktails
Percentinhibition of
phosphataseactivity
Without inhibitor Pierce tablet PhosSTOP™ tablet
0
100
200
300
400
71 74
Acid phosphatase
Alkaline phosphatase
Protein phosphatase
96
88
9591
Pho
spha
tase
act
ivity
(Sub
stra
te �
uore
scen
ce a
t 52
8 nm
)
(Thermo Scienti�c) (Roche)
Liver Spleen
ERK1/2
pERK1/2
Inhibitor– + – +
NIH/3T3
– +
NIH/3T3
Inhibitor Inhibitor
AKT
pAKT
PDGFR
pPDGFR
– +
AA
Percentinhibition of
phosphataseactivity
Without inhibitor Pierce tablet PhosSTOP™ tablet
0
100
200
300
400
71 74
Acid phosphatase
Alkaline phosphatase
Protein phosphatase
96
88
9591
Pho
spha
tase
act
ivity
(Sub
stra
te �
uore
scen
ce a
t 52
8 nm
)
(Thermo Scienti�c) (Roche)
Liver Spleen
ERK1/2
pERK1/2
Inhibitor– + – +
NIH/3T3
– +
NIH/3T3
Inhibitor Inhibitor
AKT
pAKT
PDGFR
pPDGFR
– +
0
20
40
60
80
100
120
140
160
180
Cys
tein
e p
rote
ase
activ
ity
(Sub
stra
te �
uore
scen
ce a
t 46
0 nm
)
92 92 94
79
94 93
80
17
70
949491
7779
Haltliquid
Minitablet Tablet
Minitablet
UltratabletTablet Tablet
EDTA formula
EDTA-free
Withoutinhibitor
Protease inhibitors
Thermo Scienti�c Roche Sigma
0
20
40
60
80
100
120
140
160
180
200
220
Ser
ine
pro
teas
e ac
tivit
y(S
ubst
rate
�uo
resc
ence
at
520
nm)
77 77
85
59
82
75
61
9796
8781 81
6968
Haltliquid
Minitablet Tablet
Minitablet
UltratabletTablet Tablet
EDTA formula
EDTA-free
Withoutinhibitor
Protease inhibitors
Thermo Scienti�c Roche Sigma
B
CB
Figure 11. Comparison of commercially available protease inhibitor cocktails and tablets. Pancreatic extract (50 µL; 1 µg/µL protein) or trypsin (25 µL, 0.1 U/µL) was incubated with a quenched fluorescent, protease-cleavable substrate for cysteine (A) or serine proteases (B) in the presence or absence of commercially available protease inhibitors with EDTA-containing (orange) or EDTA-free (red) formulations. Reactions were incubated for 2 hr at 37°C and the fluorescence determined at the indicated detecting emissions. The percent protease inhibition is shown for each protease inhibitor formulation.
Figure 12. Protein phosphorylation is preserved in cell and tissue extracts. Relative levels of total and phosphorylated protein from extracts prepared in the absence or presence of phosphatase inhibitors were determined by western blot analysis. (A) AKT and PDGFR in serum-starved, PDGF-stimulated (100 ng/mL) NIH/3T3 cell extracts. (B) ERK1/2 in liver and spleen tissue extracts. (C) The degree of inhibition for protein, acid, and alkaline phosphatase activity was determined in mouse brain extract after treatment with Pierce Phosphatase Inhibitor Tablets or another commercially available phosphatase inhibitor tablet. Percent inhibition is indicated.
19
Sample preparation

Protein assays
For workflows utilizing in-solution
digestion protocols, it is critical to
measure protein concentration
following sample lysis using a standard
protein assay in order to optimize
the ratio of sample to protease (w/w)
for digestion.
Depending on the accuracy required and the amount and purity of the protein available, different methods are appropriate for determining protein concentration. Colorimetric reagent–based protein assay techniques have been developed that are used by nearly every laboratory involved in protein research. Protein is added to the reagent, producing a color change in proportion to the amount added. Protein concentration is determined by referencing to a standard curve consisting of known concentrations of a purified reference protein.
Unfortunately, no protein assay method exists that is either perfectly specific to proteins or uniformly sensitive to all protein types. Therefore, a successful protein assay involves selecting the method that is most compatible with the samples to be analyzed, choosing an appropriate assay standard, and understanding and controlling particular assumptions and limitations that remain.
Important criteria for choosing an assay include:• Compatibility with the sample type and components
• Assay range and required sample volume
• Protein-to-protein uniformity (see below)
• Speed and convenience for the number of samples to be tested
• Availability of spectrophotometer or plate reader necessary to measure the color produced (absorbance) by the assay
Table 11. Thermo Scientific™ Pierce™ Protein Assays recommended for MS workflows.
BCA Protein Assay Micro BCA Assay
Estimated working range Standard tube protocol 20–2,000 μg/mL 0.5–20 μg/mL
Enhanced tube protocol 5–250 μg/mL NA
Standard microplate protocol 20–2,000 μg/mL 2–40 μg/mL
20
Protein sample preparation

Pierce BCA and Micro BCA Protein AssaysUsed in more labs than any other detergent-compatible protein assay
The Thermo Scientific™ Pierce™ BCA Protein Assay Kit is a two-component, high-precision, detergent-compatible assay reagent set to measure total protein concentration (A562) compared to a protein standard. The Thermo Scientific™ Pierce™ Micro BCA™ Protein Assay Kit is a special three-component version of the BCA reagents, optimized to measure total protein concentration (A562) of dilute protein solutions (0.5–20 µg/mL). Mixing together the three Pierce™ Micro BCA reagents results in a working solution that is sufficiently concentrated to measure protein when mixed with an equal volume of sample. The result is an assay that can accurately measure 0.5–20 µg/mL protein solutions. The assay is exceptionally linear and exhibits very low protein-to-protein variability.
More widely used than any other detergent-compatible protein assay, Pierce BCA reagents provide accurate determination of protein concentration with most sample types encountered in protein research. The Pierce BCA assay can be used to assess yields in whole cell lysates and affinity column fractions, as well as to monitor protein contamination in industrial applications. Compared to most dye-binding methods, the BCA assay is affected much less by compositional differences in proteins, providing greater protein-to-protein uniformity.
Highlights:• Colorimetric—estimate visually or measure with a
standard spectrophotometer or plate reader (562 nm)
• Excellent uniformity—exhibits less protein-to-protein variation than dye-binding methods
• Compatible—unaffected by typical concentrations of most ionic and nonionic detergents
• Moderately fast—much easier and four times faster than the classical Lowry method
• High linearity—linear working range for bovine serum albumin (BSA) is 20–2,000 µg/mL
• Sensitive—detect down to 5 µg/mL with the enhanced protocol; Pierce Micro BCA assay accurately detects down to 0.5 µg/mL (2 µg/mL in microplate format)
• Stability—all reagents stable at room temperature for 2 years; once prepared, the working reagent is stable for 24 hr
• Convenient—microplate and cuvette protocols provided with the instructions
Figure 13. Pierce BCA Protein Assay protocol.
50 µL sample + 1 mL working reagent
50 parts A+1 part B
SpectrophotometerMix well
Incubate:30 min at 37°C
Then coolMix working reagent
Read at 562 nm
Learn more at thermofisher.com/proteinassays
21
Sample preparation

Sample complexity negatively affects
the ability to detect, identify, and
quantify low-abundance proteins
by MS because peptides from
high-abundance proteins can
mask detection of those from low-
abundance proteins. Therefore, the
more that a sample can be simplified
and the dynamic range of protein
concentrations reduced, the greater
the ability to detect proteins at very
low concentrations.
Depletion is used to reduce the complexity of biological samples such as serum, plasma, or biofluids, which contain high concentrations of albumin and immunoglobulins. Depletion strategies utilize immunoaffinity techniques using immobilized antibodies to remove the most abundant proteins, thus enhancing the detection of less abundant proteins in both discovery and targeted proteomic analyses. As some high-abundance proteins interact with proteins of lower abundance, low-abundance proteins may also be depleted if they are in a complex with high-abundance proteins.
Abundant protein depletion
Table 12. Overview of Thermo Scientific™ Pierce™ Abundant Protein Depletion Kits.
Albumin depletion kit Top 2 depletion kit Top 12 depletion kit
Proteins depleted Albumin Albumin, IgG Albumin, IgG, α1-acid glycoprotein, α1-antitrypsin, α2-macroglobulin, apolipoprotein A-I, apolipoprotein A-II, fibrinogen, haptoglobin, IgA, IgM, transferrin
Sample volume capacity 10–50 µL 10 µL (600 µg) 10 µL (600 µg)
Processing time 20–30 min 40–60 min 40–60 min
Formats Loose resin, buffers, empty spin columns
Prefilled spin columns Prefilled spin columns
22
Protein sample preparation

Pierce Albumin Depletion KitAlbumin-free serum samples in less than 15 min
The Thermo Scientific™ Pierce™ Albumin Depletion Kit uses an agarose resin of the affinity ligand Cibacron™ Blue dye for high-capacity, selective extraction of human serum albumin from 10–50 µL serum samples.
Pierce Albumin Depletion Resin is supplied as a 50% slurry. Dispense 200 µL of slurry into the supplied microcentrifuge spin columns to obtain 100 µL of settled beads for the standard protocol. Each aliquot of resin can be used to process 10–50 µL of serum sample in a single reaction. Processed samples are ready for immediate downstream analysis by electrophoresis or MS applications. The ease and versatility offered by the slurry format make this kit ideal for single- or multi-sample processing with the microcentrifuge spin columns supplied in the kit.
Highlights:• Complete—includes optimized buffer and
microcentrifuge spin columns to remove albumin quickly and conveniently from 10–50 µL samples
• Convenient—easy-to-dispense slurry enables processing of multiple samples, and can be adapted to larger or smaller columns or 96-well filter plates
• Compatible—removing excess albumin facilitates MS or electrophoresis gel analysis of low-abundance serum proteins
Human serum albumin (HSA) often accounts for greater than 60% of the total protein present in serum samples and can have a concentration of approximately 40 mg/mL. The high concentration of albumin obscures the detection of many proteins of biological interest, hindering research. Traditionally, researchers have produced albumin-free samples using chromatography methods involving multiple purification steps. In addition to involving lengthy and tedious procedures, these purification steps also tend to give low protein yields. The Pierce Albumin Depletion Kit was developed to take advantage of the Cibacron Blue dye albumin binding properties.
The kit is optimized to bind human, porcine, and sheep albumin from serum samples. With a modification to the protocol, albumin from bovine, calf, goat, and rat can also be removed by this method. The kit is not effective for removal of mouse albumin.
Figure 14. Effective albumin removal improves 2D gel analysis of serum. (A) Human serum was diluted 5-fold in TBS (i.e., 10 µL of serum added to 40 µL of TBS), and 5 µL of the diluted serum was separated by 2D SDS-PAGE. (B) Human serum was diluted 2-fold in binding and/or wash buffer (i.e., 50 µL of serum added to 50 µL of buffer) and processed using the Pierce Albumin Depletion Kit according to the instructions. Albumin-depleted samples and washes were combined (i.e., 100 µL sample with 150 µL wash buffer), and 5 µL was separated by 2D SDS-PAGE. For 2D SDS-PAGE analysis, samples were diluted with 2D SDS-PAGE loading buffer, focused using pH 4–7 isoelectric focusing (IEF) strips, and separated using 8–16% Tris-glycine gels. Gels were stained using Thermo Scientific™ GelCode™ Blue Stain (Cat. No. 24590). The black arrow points to the gel region where albumin is located on the duplicate gels (A) before and (B) after processing.
A
B
23
Sample preparation

Pierce Top 2 and Top 12 Abundant Protein Depletion Spin ColumnsDeplete abundant plasma proteins quickly and economically
Thermo Scientific™ Pierce™ Abundant Protein Depletion Spin Columns are optimized to decrease the abundant albumin and antibody components of human plasma samples in preparation for MS. Thermo Scientific™ Pierce™ Top 2 Abundant Protein Depletion Spin Columns use highly specific, immobilized anti-HSA and anti-IgG antibodies to remove HSA and all major subclasses of gamma globulin (IgG) from serum, plasma, or spinal fluids. Similarly, the Thermo Scientific™ Pierce™ Top 12 Abundant Protein Depletion Spin Columns are designed to remove HSA, IgG, and 10 other high-abundance proteins from human serum or plasma. The resins are provided in an economical and convenient spin column specifically designed for one-step processing and for single use.
Highlights:• Optimized—resin in spin columns is scaled and
optimized for treating 10 µL (600 µg) of human plasma samples for MS and/or 1D and 2D electrophoresis
• Efficient—kits are designed to remove >90% of IgG and >95% of albumin, plus other abundant proteins (Top 12)
• Fast—spin columns process samples in 40–60 min (depending on resin)
• Economical—cost-effective spin columns are priced for single use
• Consistent—one-time use prevents abundant protein carryover and experimental variability
• Flexible—choose the system appropriate for your need: 2- or 12-protein depletion columns
Analysis of human serum is hindered by the presence of high concentrations of albumin and IgG that can account for more than 70% of the total protein present in the sample. Removal of these proteins is often essential for the study of low-abundance proteins of biological interest by MS or 1D and 2D gel electrophoresis. Traditionally, researchers have produced albumin-free samples using chromatography methods involving multiple purification steps. In addition to involving lengthy and tedious procedures, these purification steps also tend to give low protein yields and poor reproducibility.
The Pierce Top 2 Abundant Protein Depletion Columns and Pierce Top 12 Abundant Protein Depletion Columns facilitate the removal of high-abundance proteins from serum samples. The Pierce Top 2 Abundant Protein Depletion Columns can deplete both albumin (>95%) and IgGs (>90%) from human serum, while the Pierce Top 12 Abundant Protein Depletion Columns remove the 12 most abundant proteins (>95%). Each prefilled depletion column can process 10 µL of human serum in 40–60 min using a convenient spin format compatible with low-speed centrifugation.
24
Protein sample preparationAbundant protein depletion

Figure 15. Ratio of protein abundance. Human serum albumin and IgG comprise almost 75% of all serum proteins. Other proteins of lower (but still significant) abundance include α1-acid glycoprotein, α1-antitrypsin, α2-macroglobulin, apolipoprotein A-I, apolipoprotein A-II, fibrinogen, haptoglobin, IgA, IgM, and transferrin, which altogether comprise up to 95% of serum proteins.
Table 14. Protein removal achieved using Pierce Top 12 Abundant Protein Depletion Spin Columns. Values were determined by targeted MS. The albumin depletion percentage was cross-validated by ELISA and was in agreement with >99% removal.
Protein Fold reduction Percent depletion
Albumin 3,369 99.97
Transferrin 266 99.62
α1-antitrypsin 37 97.30
Haptoglobin 127 99.21
α1-acid glycoprotein 402 99.75
α2-macroglobulin 116 99.14
Table 13. Proteins removed by Pierce Abundant Protein Depletion Spin Columns. Binding and removal of proteins is achieved via specific antibodies, which are immobilized on the affinity support.
Top 2 columns Top 12 columns
• Albumin • Albumin • Apolipoprotein A-II
• IgG • IgG • Fibrinogen
• α1-acid glycoprotein • Haptoglobin
• α1-antitrypsin • IgA
• α2-macroglobulin • IgM
• Apolipoprotein A-I • Transferrin
250
150
10075
50
37
252015
10
Antibodyfragments
Pierce Abundant Protein Depletion Spin Columns
PierceTop 12
FTMkDa Ser
um
E FT E FT E
SigmaSepproIgY14
AgilentHu-14
Heavy
chain
Light
chain
Figure 16. Performance of Pierce Top 12 Abundant Protein Depletion Spin Columns compared to equivalent products from other suppliers. Human serum (10–20 µL, Cat. No. 31876) was loaded onto each resin and processed according to the supplier’s protocol (Agilent: Human 14 Multiple Affinity Removal Spin Cartridge, Cat. No. 5188-6560; Sigma: SEPPRO™ IgY14 Spin Column, Cat. No. SEP010). Total protein in the depleted fractions was estimated using the Pierce BCA Protein Assay Kit (Thermo Fisher Scientific, Cat. No. 23225). Total amount of albumin in the depleted fractions was determined using AssayMax™ Human Albumin ELISA Kit (Assaypro, Cat. No. EA2201-1). FT = flow-through (i.e., depleted sample); E = eluate (i.e., proteins that were bound by the resin, plus stripped affinity antibodies of the column). Performance of all four products is comparable in this analysis. With the top 12 proteins removed, low-abundance proteins are now visible in each depleted sample lane (FT).
Top 12 Top 2
No depletion
Figure 17. Greater numbers of peptides identified following abundant protein removal. This proportional Venn diagram displays the relative number of unique peptides identified by MS when human serum is depleted by the Pierce Top 2 or Top 12 columns compared to that obtained from nondepleted human serum. A simple, fast depletion using the Top 12 columns doubled the number of unique peptides identified when compared to nondepleted human serum.
IgMIgG
TransferrinApolipoprotein A-II
Human serumalbumin
α1-acid glycoproteinHaptoglobinApolipoprotein A-IFibrinogen
Fraction containing proteins of interest
IgA
α1-antitrypsin
α2-macroglobulin
Learn more at thermofisher.com/msdepletion
25
Sample preparation

Protein enrichment encompasses
numerous techniques to isolate
subclasses of cellular proteins based
on their unique biochemical activity,
posttranslational modification (PTM),
or spatial localization in a cell.
Protein enrichment is essential for studying low-abundance proteins and for reducing the complexity of samples for proteomic analysis. Enrichment of specific proteins or protein complexes can most easily be accomplished using immunoaffinity techniques such as immunoprecipitation (IP). IP is the affinity purification of antigens using a specific antibody that is immobilized to a solid support such as
magnetic beads or agarose resin. IP is one of the most widely used methods for isolation of proteins from cell or tissue lysates for the purpose of subsequent detection by western blot, ELISA, and mass spectrometry. Co-immunoprecipitation (co-IP), is similar to IP, except that the target antigen bound by the antibody is used to study protein interactions or associated protein complexes from the lysate.
Our magnetic bead–based kits provide fast and reproducible sample processing with high protein yields and low nonspecific binding using antibody, biotin, or activated surface beads for custom immobilization. Captured proteins and protein complexes are easily separated, washed, and eluted using an Invitrogen™ DynaMag™ magnet or Thermo Scientific™ KingFisher™ Flex automated magnetic particle processors.
Protein enrichment using IP-MS
Table 15. IP-MS product selection guide.
Protein A/G IP-MS kit Streptavidin IP-MS kit Antibody coupling kit*Co-immunoprecipitation
kit*
Surface coating on bead
Protein A/G Streptavidin Epoxy-activated beads Epoxy-activated beads
Type of ligand required
Primary antibodies from most species
Any biotinylated antibody or ligand
Any antibody ligand Any antibody ligand
IP protocol time 2–3 hr 2–3 hr <40 min <40 min
Main benefits • Easiest protocol• Binds most antibodies• High yield, low
nonspecific binding, and reproducibility
• Binds any biotinylated Ab• For samples high in
soluble IgGs• Recombinant Ab lacking
the Fc region
• Covalent coupling of antibody gives ultralow nonspecific binding
• No need for crosslinking
• Covalent coupling of antibody gives ultralow nonspecific binding
• No need for crosslinking• Gentle, efficient co-IP
* Note that the SB buffer supplied in the kit contains Thermo Scientific™ Tween™ detergent, so the SB buffer will need to be replaced with standard TBS or PBS buffer.
26
Protein sample preparation

Pierce Antibody Biotinylation Kit for IPOptimized antibody biotinylation kits for IP and co-IP applications
The Thermo Scientific™ Pierce™ Antibody Biotinylation Kit for IP provides biotinylation reagents designed specifically for the labeling of primary antibodies used in IP applications.
The Pierce Antibody Biotinylation Kit reagents have been optimized and validated to biotinylate antibodies for IP and co-IP reactions. Determining the optimal number of biotins to attach to the target molecule is one of the major challenges of biotinylation. For IP and co-IP applications, too many biotins result in reduced affinity for the target antigen, while too few biotins result in antibody leaching upon elution of the target antigen. The biotin labeling procedure in the Pierce™ Antibody Biotinylation Kit for IP has been developed to address this challenge.
Highlights:• Optimized—reagents and protocols developed for
efficient antibody biotinylation for IP applications
• Easy to use—kit contains all reagents and accessories to label and clean up 50–200 µg of antibody
• Enhanced solubility—pegylated linker improves the solubility of the biotinylated antibody and reduces aggregation
• Improved binding—longer spacer arm (29 angstroms) on biotinylation reagent minimizes steric hindrance when binding to avidin molecules
The kit contains sufficient reagents to label 50-200 µg of antibody in 100 µL reaction volumes for eight samples. The NHS-PEG4-Biotin labeling reagent contains an amine-reactive N-hydroxysuccinimide ester (NHS) group and a water-soluble PEG4 spacer for optimal labeling and
is provided in easy-to-use, single-use microtubes. Both the labeling efficiency of the biotinylation reagent and binding affinity of the labeled antibody have been validated using mouse monoclonal (IgG1, IgG2), rabbit polyclonal, and rabbit monoclonal antibodies. Thermo Scientific™ Zeba™ Desalting Spin Columns are provided for easy and efficient removal of salts and excess biotin.
Figure 18. The Pierce Antibody Biotinylation Kit for IP enables effective labeling of multiple antibody types. The kit was used to label 17 different specific antibodies including mouse IgG1, mouse IgG2, rabbit monoclonal, and rabbit polyclonal. Biotinylation with this kit resulted in 3–7 biotins per IgG molecule as determined by the Thermo Scientific™ Pierce™ Fluorescent Biotin Quantitation Kit.
MouseIgG1
Bio
tin
s/Ig
G
0
1
2
3
4
5
6
7
MouseIgG2
Rabbitmono
Rabbitpoly
Figure 19. The Pierce Antibody Biotinylation Kit for IP allows effective target capture and elution. Antibodies were labeled with the kit and used in the Thermo Scientific™ Pierce™ MS-Compatible Magnetic IP Kit (Streptavidin) to IP target proteins from cell lysates. The elutions were analyzed by western blot.
LoadMS
elutionBeadboil Load
MSelution
Beadboil
PP2A
PTEN
EGFR
Stat1
β-catenin
HDAC1
P13K
pan Akt
27
Sample preparation

Pierce MS-Compatible Magnetic IP KitsValidated kits for the efficient and reproducible enrichment of target antigens for LC-MS analysis
The Thermo Scientific™ Pierce™ MS-Compatible Magnetic IP Kits provide MS-friendly reagents and optimized protocols to enable highly effective and efficient IP and co-IP of target antigens upstream of LC-MS analysis. In addition, low protein–binding microcentrifuge tubes are supplied separately to minimize loss during the sample processing.
Highlights:• MS–compatible—directly compatible with in-solution
peptide digestion
• Flexible—different IP strategies are available to utilize either native or biotinylated antibodies
• Sensitive—kits have been demonstrated to successfully enrich for low-abundance proteins
• Low background—buffers optimized to minimize enrichment of background proteins
• Robust—procedure and reagents have been robustly tested with numerous targets to enable consistent enrichment of low-abundance proteins
The Pierce MS-Compatible Magnetic IP Kits contain either high-quality Thermo Scientific™ Pierce™ Streptavidin or Protein A/G Magnetic Beads. The Pierce Protein A/G Magnetic Beads provide wider flexibility of antibody capture than using either Protein A or G alone.
The optimized components of each kit have been formulated to be compatible with downstream LC-MS analysis. After the immunoprecipitation procedure, the target-enriched elution fraction is ready for in-solution tryptic digestion, without the need for gel purification, detergent removal, or desalting. These kits have been rigorously validated using numerous target antigens with varying expression levels, including targets previously undetected without enrichment or by western blotting.
Additionally, the reagents and procedures have been validated using both manual and automated magnetic separation.
A
Load
MSelution
1
MSelution
2
MSelution
1
MSelution
2Beadboil Load
Beadboil
HDAC1(154%)
β-catenin(112%)
Stat1(108%)
EGFR(122%)
pan Akt(129%)
PP2A(87%)
PTEN(719%)
B
LoadMS
elutionBeadboil Load
MSelution
Beadboil
PP2A(72%)
PTEN(90%)
EGFR(80%)
Stat1(88%)
β-catenin(140%)
HDAC1(140%)
P13K(247%)
pan Akt(97%)
Figure 20. The Pierce MS-Compatible Magnetic Kits allow for effective target capture and elution. (A) Streptavidin kit. (B) Protein A/G kit. Percentages beneath target indicate elution efficiency compared to bead boil. The elutions were analyzed by western blot. Antibodies were labeled with the Pierce Antibody Biotinylation Kit for IP and used with the Pierce MS-Compatible Magnetic IP Kit (Streptavidin) to immunoprecipitate target proteins from cell lysates.
28
Protein sample preparationProtein enrichment using IP-MS

Table 16. Endogenous cellular targets identified with and without enrichment. The Pierce MS-Compatible Magnetic IP Kit (Streptavidin) was used to enrich 17 targets. Antibodies were labeled using the Pierce Antibody Biotinylation Kit for IP. Targets are generally grouped by their relative cellular abundance (high, medium, and low) and may be cell line dependent. Western blots were performed with the IP elutions. Western blot signal intensity is shown as low (+) to high (+++). MS analysis on unenriched lysates is indicated by “Yes” when at least two unique peptides were identified for the particular target. MS analysis (enriched) is denoted by “++” or indicating a medium or higher fold enrichment compared to the MS analysis on native lysate.
Target Cellular abundance Western blot (IP) MS analysis (unenriched) MS analysis (enriched)
PP2AHigh
+++ Yes ++
HDAC1 +++ Yes ++
STAT1Medium
+++ Yes ++
CBP + No +++
PTEN
Low
+++ Yes ++
EGFR ++ Yes +++
AKT2 ++ Yes +++
AKT1 + No +++
CTNNB1 ++ No +++
PI3K + No +++
SMAD4 + Yes ++
ERBB2 + No +++
TP53 + No +++
CDH2 – No +++
LKB1 ND No +++
NOTCH1 ND No +++
NOTCH2 ND Yes +++
Table 17. Endogenous cellular targets identified with and without enrichment. The Pierce MS-Compatible Magnetic IP Kit (Protein A/G) was used to enrich 20 targets. Targets are generally grouped by their relative cellular abundance (high, medium, and low) and may be cell line dependent. Western blots were performed with the IP elutions. Western blot signal intensity is shown as low (+) to high (+++). MS analysis on unenriched lysates is indicated by “Yes” when at least two unique peptides were identified for the particular target. MS analysis (enriched) is denoted by a “++” or indicating a "medium" or higher fold enrichment compared to the MS analysis on native lysate.
Target Cellular abundance Western blot (IP) MS analysis (unenriched) MS analysis (enriched)
PP2AHigh
+++ Yes ++
HDAC1 +++ Yes ++
STAT1Medium
+++ Yes ++
CBP + No +++
PTEN
Low
+++ Yes ++
EGFR ++ Yes +++
AKT2 ++ Yes +++
AKT1 + No +++
CTNNB1 ++ No +++
PI3K + No +++
SMAD4 + Yes ++
ERBB2 + No +++
KRAS + No +++
TP53 ND No +++
CDH2 ND No +++
ARAF ND Yes +++
BRAF ND No +++
LOK ND No +++
NOTCH1 ND No +++
NOTCH2 ND Yes +++
29
Sample preparation

Dynabeads Antibody Coupling and Co-Immunoprecipitation Kits Magnetic bead-based kits for the immobilization of antibodies for direct IP or co-IP applications
Invitrogen™ Dynabeads™ Antibody Coupling and Co-Immunoprecipitation Kits allow easy coupling of an antibody of your choice to the surface of uniform, 2.8 µm superparamagnetic Dynabeads™ M-270 Epoxy beads. Following immobilization of your antibody, the beads can then be used for IP or co-IP of protein complexes. The Dynabeads Epoxy beads in these kits do not contain Tween detergent, and so are compatible for use in MS analysis. In addition to Dynabeads magnetic beads, the kits supply all buffers needed for the coupling and washing steps. Note that the SB buffer supplied in the kit contains Tween detergent, so the SB buffer needs to be replaced
with standard TBS or PBS buffer if the kit is to be used for IP-MS workflows. Additional buffers are included in the co-IP kit for pure and reproducible co-IP.
Highlights:• Covenient—complete kits offer easy-to-use protocols
with minimal hands-on time
• Specific—covalent antibody coupling to the Dynabeads magnetic beads avoids co-elution of the antibody with the target protein
Antibodies are covalently coupled to Dynabeads M-270 Epoxy beads, minimizing the risk of bound antibody contaminating your final eluate. Dynabeads M-270 Epoxy beads exhibit ultralow background binding and do not require blocking before use.
Table 18. List of co-immunoprecipitated proteins. The Pierce MS-Compatible Magnetic IP Kits showed effective co-IP of interacting proteins for CTNNB1, EGFR, PI3KCA, CBP, NOTCH1, AKT, AKT1, SMAD4, and/or ARAF targets. These are known protein interactions reported in previous studies. Panel A: Streptavidin Kit. Panel B: Protein A/G Kit.
Learn more at thermofisher.com/ipms
Panel B
IP target Co-IP proteins
CTNNB1 CTNNA1, CDH11, CDH2, CTNND1
EGFR TUBB, TUBA1A, HSPA1A
PI3KCA PIK3R2, PIK3R1
NOTCH1 PTBP1, C14orf166
AKT1 AKT2, ACTB
ARAF YWHAG, STK25
Panel A
IP target Co-IP proteins
CTNNB1 CTNNA1, CDH2, CDH11, APC, ARVCF, PKP4
EGFR PRKDC, PFKP, SL C3A2, RPN1
PI3KCA PIK3R2, PIK3R1
CBP PSMC5, ACTA2, DDX5
AKT VIM, HSPA8, TUBA1A
SMAD4 EEF1A1, SQSTM1
Figure 21. Protein enrichment using the Dynabeads Co-Immunoprecipitation Kit (Cat. No. 14321D). The co-IP is performed in several steps. First, the antibody is covalently coupled to the beads. Then the antibody-coupled beads are added to the sample to bind to the target protein complex, and then washed and purified using a DynaMag magnet.
H
H
H HH
C C N
HOH
H H
HCC
O
N
Antibody coupling Co-IP
30
Protein sample preparationProtein enrichment using IP-MS

Magnetic stands Multiple formats for low- to high-throughput sample processing
Highlights:• Optimized—developed and certified for use with
Dynabeads and Pierce magnetic beads
• Easy to handle—designed with ergonomics in mind
• More choices—different formats to accommodate different volume and throughput needs
DynaMag magnets isolate any target in combination with Dynabeads magnetic beads. To help reduce waiting time, these powerful magnets quickly pull the bead-bound target to the tube wall. DynaMag magnets help to ensure optimal working positions and are functionally adapted to suit various workflows.
The Invitrogen™ DynaMag™-2 Magnet holds up to 16 standard 1.5–2 mL tubes and is optimal for working volumes of 10–2,000 µL. The top rack can be quickly removed from the magnet in the base, ready for vortexing, rotation, or manual sample shaking.
Plate-based magnetic stands, such as the Invitrogen™ DynaMag™-96 series magnets, are ideal for manual and automated work, with a footprint size that is the same as that of a 96-well plate. The recommended working volume is 5–200 µL.
Learn more at thermofisher.com/magnets
Learn more at thermofisher.com/kingfisher
KingFisher Flex Purification SystemOptimized platform for automated, high-throughput IP-MS applications
The Thermo Scientific™ KingFisher™ Flex Purification System is designed for automated transfer and processing of magnetic particles in microplate format. The patented technology of this system is based on the use of magnetic rods covered with a disposable, specially designed tip comb and plates. The instrument functions without any dispensing or aspiration parts or devices. Additionally, it can be integrated with liquid handling, robotics, and plate-stacking instruments to fully automate a workflow for higher throughput.
Highlights:• Fully automated system yields high-speed purification
of proteins
• High-throughput system processes up to 96 samples (with volumes between 20–5,000 µL), in less than 20 min
• Open and flexible system lets the customer use any magnetic particle–based kit to meet the application demands
• Easy-to-use Thermo Scientific™ BindIt™ Software provides instrument control, protocol creation, and modification
• Ready-made protocols for different type of applications are available
Samples and reagents, including magnetic particles, are dispensed into the plates according to the corresponding instructions. Ready-made protocols are available in the web for review and loading. BindIt Software can be used to create and run protocols.
DynaMag-96 Side MagnetDynaMag-96 Bottom MagnetDynaMag-96 Side Skirted Magnet
31
Sample preparation

Table 19. Active site probe and kit selection guide.
Kinase Enrichment Kit
with ATP or ADP Probe
GTPase Enrichment Kit with GTP Probe
TAMRA-FP Serine Hydrolase
Probe
Desthiobiotin-FP Serine Hydrolase
Probe
Azido-FP Serine Hydrolase
Probe
Target ATP- or ADP- binding sites
GTP binding sites Active serine hydrolase enzymes
Active serine hydrolase enzymes
Active serine hydrolase enzymes
Binding/labeling mechanism
Biotinylated ATP analog to active site lysine
Biotinylated GTP analog to active site lysine
TAMRA-labeled fluorophosphonate binds to active site serine
Biotinylated fluorophosphonate binds to active site serine
Fluorophosphonate (conjugated to phosphine- or alkyne-derivatized tags) binds to active site serine
Enrichment strategy
Immobilized streptavidin
Immobilized streptavidin
Immobilized anti-TAMRA mAb
Immobilized streptavidin
Immobilized affinity ligand to custom tag
Formats available
Kits or individual probes
Kit or individual probe Individual probe Individual probe Individual probe
Primary applications
MS, western blotting MS, western blotting Fluorescent gel imaging, capillary electrophoresis, MS
MS, western blotting MS, western blotting
Active site labeling and enrichment
– Inhibitor
Probe
Lysate mixture
Capture
CaptureDigest
+ Inhibitor –Inhibitor
+Inhibitor
Western blotanalysis
SDS-PAGE
Fluorescence gel imaging
Inte
nsi
ty
Time
- Inhibitor1,000
800
600
400
200
0
Inte
nsi
ty
Time
+ Inhibitor1,000
800
600
400
200
0
Targetedenzyme
Inhibitor
Probe
MS analysis
Thermo Scientific™ Pierce™ Enrichment
Kits with ActivX™ Probes enable
the specific targeting of several
enzyme classes, including kinases,
GTP-binding proteins, and serine
hydrolases from tissues, cells, and
subcellular proteomes.
The novel ActivX probes covalently bind the active sites of the appropriate enzyme and offer a number of labeling and detection options (Table 19). These reagents are ideal for selective subproteome enrichment, profiling inhibitor targets, and determining inhibitor binding affinity.
32
Protein sample preparation
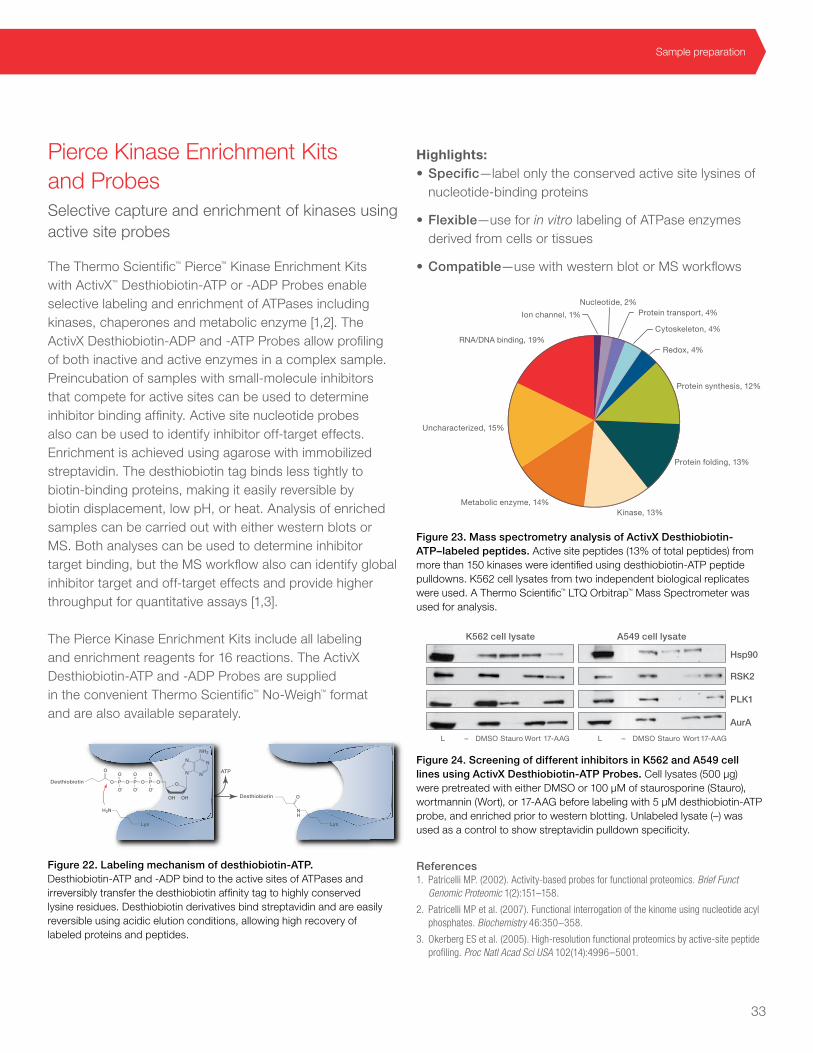
ATP
H2N
Lys
N
NN
N
NH2
O
OHOH
OPO
O-
O
P
O
O
O-
P
O
O-
O
O
Desthiobiotin
Desthiobiotin
O
N
Lys
H
Figure 22. Labeling mechanism of desthiobiotin-ATP. Desthiobiotin-ATP and -ADP bind to the active sites of ATPases and irreversibly transfer the desthiobiotin affinity tag to highly conserved lysine residues. Desthiobiotin derivatives bind streptavidin and are easily reversible using acidic elution conditions, allowing high recovery of labeled proteins and peptides.
Pierce Kinase Enrichment Kits and ProbesSelective capture and enrichment of kinases using active site probes
The Thermo Scientific™ Pierce™ Kinase Enrichment Kits with ActivX™ Desthiobiotin-ATP or -ADP Probes enable selective labeling and enrichment of ATPases including kinases, chaperones and metabolic enzyme [1,2]. The ActivX Desthiobiotin-ADP and -ATP Probes allow profiling of both inactive and active enzymes in a complex sample. Preincubation of samples with small-molecule inhibitors that compete for active sites can be used to determine inhibitor binding affinity. Active site nucleotide probes also can be used to identify inhibitor off-target effects. Enrichment is achieved using agarose with immobilized streptavidin. The desthiobiotin tag binds less tightly to biotin-binding proteins, making it easily reversible by biotin displacement, low pH, or heat. Analysis of enriched samples can be carried out with either western blots or MS. Both analyses can be used to determine inhibitor target binding, but the MS workflow also can identify global inhibitor target and off-target effects and provide higher throughput for quantitative assays [1,3].
The Pierce Kinase Enrichment Kits include all labeling and enrichment reagents for 16 reactions. The ActivX Desthiobiotin-ATP and -ADP Probes are supplied in the convenient Thermo Scientific™ No-Weigh™ format and are also available separately.
Highlights:• Specific—label only the conserved active site lysines of
nucleotide-binding proteins
• Flexible—use for in vitro labeling of ATPase enzymes derived from cells or tissues
• Compatible—use with western blot or MS workflows
Figure 24. Screening of different inhibitors in K562 and A549 cell lines using ActivX Desthiobiotin-ATP Probes. Cell lysates (500 µg) were pretreated with either DMSO or 100 µM of staurosporine (Stauro), wortmannin (Wort), or 17-AAG before labeling with 5 µM desthiobiotin-ATP probe, and enriched prior to western blotting. Unlabeled lysate (–) was used as a control to show streptavidin pulldown specificity.
RNA/DNA binding, 19%
Ion channel, 1%
Uncharacterized, 15%
Metabolic enzyme, 14%Kinase, 13%
Protein folding, 13%
Protein synthesis, 12%
Redox, 4%
Cytoskeleton, 4%
Protein transport, 4%Nucleotide, 2%
Figure 23. Mass spectrometry analysis of ActivX Desthiobiotin-ATP–labeled peptides. Active site peptides (13% of total peptides) from more than 150 kinases were identified using desthiobiotin-ATP peptide pulldowns. K562 cell lysates from two independent biological replicates were used. A Thermo Scientific™ LTQ Orbitrap™ Mass Spectrometer was used for analysis.
References1. Patricelli MP. (2002). Activity-based probes for functional proteomics. Brief Funct
Genomic Proteomic 1(2):151–158.
2. Patricelli MP et al. (2007). Functional interrogation of the kinome using nucleotide acyl phosphates. Biochemistry 46:350–358.
3. Okerberg ES et al. (2005). High-resolution functional proteomics by active-site peptide profiling. Proc Natl Acad Sci USA 102(14):4996–5001.
K562 cell lysate
L – DMSO Stauro Wort 17-AAG L – DMSO Stauro Wort 17-AAG
A549 cell lysate
Hsp90
RSK2
PLK1
AurA
33
Sample preparation
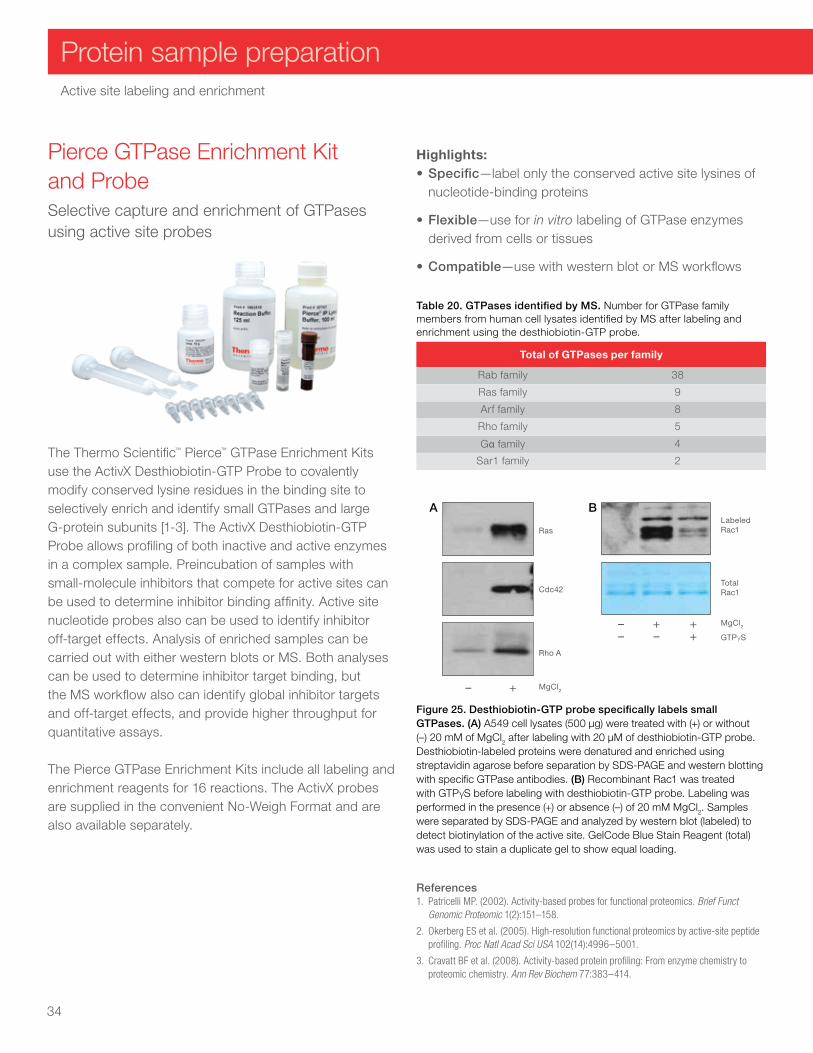
Pierce GTPase Enrichment Kit and ProbeSelective capture and enrichment of GTPases using active site probes
The Thermo Scientific™ Pierce™ GTPase Enrichment Kits use the ActivX Desthiobiotin-GTP Probe to covalently modify conserved lysine residues in the binding site to selectively enrich and identify small GTPases and large G-protein subunits [1-3]. The ActivX Desthiobiotin-GTP Probe allows profiling of both inactive and active enzymes in a complex sample. Preincubation of samples with small-molecule inhibitors that compete for active sites can be used to determine inhibitor binding affinity. Active site nucleotide probes also can be used to identify inhibitor off-target effects. Analysis of enriched samples can be carried out with either western blots or MS. Both analyses can be used to determine inhibitor target binding, but the MS workflow also can identify global inhibitor targets and off-target effects, and provide higher throughput for quantitative assays.
The Pierce GTPase Enrichment Kits include all labeling and enrichment reagents for 16 reactions. The ActivX probes are supplied in the convenient No-Weigh Format and are also available separately.
Highlights:• Specific—label only the conserved active site lysines of
nucleotide-binding proteins
• Flexible—use for in vitro labeling of GTPase enzymes derived from cells or tissues
• Compatible—use with western blot or MS workflows
Table 20. GTPases identified by MS. Number for GTPase family members from human cell lysates identified by MS after labeling and enrichment using the desthiobiotin-GTP probe.
Total of GTPases per family
Rab family 38
Ras family 9
Arf family 8
Rho family 5
Gα family 4
Sar1 family 2
References1. Patricelli MP. (2002). Activity-based probes for functional proteomics. Brief Funct
Genomic Proteomic 1(2):151–158.
2. Okerberg ES et al. (2005). High-resolution functional proteomics by active-site peptide profiling. Proc Natl Acad Sci USA 102(14):4996–5001.
3. Cravatt BF et al. (2008). Activity-based protein profiling: From enzyme chemistry to proteomic chemistry. Ann Rev Biochem 77:383–414.
Figure 25. Desthiobiotin-GTP probe specifically labels small GTPases. (A) A549 cell lysates (500 µg) were treated with (+) or without (–) 20 mM of MgCl2 after labeling with 20 µM of desthiobiotin-GTP probe. Desthiobiotin-labeled proteins were denatured and enriched using streptavidin agarose before separation by SDS-PAGE and western blotting with specific GTPase antibodies. (B) Recombinant Rac1 was treated with GTPγS before labeling with desthiobiotin-GTP probe. Labeling was performed in the presence (+) or absence (–) of 20 mM MgCl2. Samples were separated by SDS-PAGE and analyzed by western blot (labeled) to detect biotinylation of the active site. GelCode Blue Stain Reagent (total) was used to stain a duplicate gel to show equal loading.
Ras
TotalRac1
LabeledRac1
MgCl2
GTPγS
+
++–+––
–
A B
Cdc42
Rho A
MgCl2
34
Protein sample preparationActive site labeling and enrichment

Figure 26. Labeling mechanism of ActivX Serine Hydrolase Probes. Fluorophosphonate probes covalently label the active site serine of enzymatically active serine hydrolases.
ActivX Serine Hydrolase ProbesProbes for specific detection and enrichment of active serine hydrolases
The Thermo Scientific™ Serine Hydrolase Probes enable selective labeling and enrichment of active serine hydrolases. The serine hydrolase probe consists of a tag linked to a fluorophosphonate (FP) group that specifically and covalently labels serines of enzymatically active serine hydrolases [1-4].
The Thermo Scientific™ ActivX™ FP-labeled serine hydrolase probes also can be used to screen small molecule inhibitors against enzymes derived from cell lysates, subcellular fractions, tissues, and recombinant proteins.
Depending on the active site probe tag group, FP probe-labeled enzymes can be detected and quantified by western blot, fluorescent gel imaging, or MS. TAMRA-FP probes can be used to label and detect serine hydrolase activity in samples using fluorescent gel imaging, capillary electrophoresis or MS [1]. Azido-FP probes are used in combination with phosphine- or alkyne-derivatized tags for either detection or enrichment. Desthiobiotin-FP probes can be used for both enrichment and detection of active site–labeled proteins by western blot and MS.
Highlights:• Specific—labels the reactive site of active
serine hydrolases
• Compatible—tags available for capture, detection, and Staudinger conjugation
• Flexible—use for in vitro or intracellular enzyme labeling
Table 21. Serine hydrolases identified by MS with ActivX FP Probes. Number of serine hydrolase family members from mouse brain and liver tissue extracts identified by MS after labeling and enrichment using the desthiobiotin-FP probe.
Serine hydrolase family Number identified
Hydrolases 10
Esterase 6
Lipases 5
Peptidases 4
Other 4
References1. Okerberg ES et al. (2005). High-resolution functional proteomics by active-site peptide
profiling. Proc Natl Acad Sci USA 102(14):4996–5001.
2. Liu Y et al. (1999). Activity-based protein profiling: The serine hydrolases. Proc Natl Acad Sci USA 96(26):14694–14699.
3. Patricelli MP et al. (2001). Direct visualization of serine hydrolase activities in complex proteomes using fluorescent active site-directed probes. Proteomics 1:1067–1071.
4. Simon GM, Cravatt BF. (2010). Activity-based proteomics of enzyme superfamilies: Serine hydrolases as a case study. J Biol Chem 285(15):11051–11055.
Learn more at thermofisher.com/activesiteprobes
OHSer
NH
N
His
P
O
O
FTAMRA
P
O
O TAMRAO
Ser
NH
N
His
O
OAsp
O
OAsp
HF
Mouse liver
– 0 A U C ∆
Legend – : No probe 0 : No treatment A : 100 µM AEBSF U : 100 µM URB597 C : 100 µM CAY10401 ∆ : Heat denatured
Figure 27. Screening of different inhibitors in mouse liver lysates using serine hydrolase probes. Mouse liver tissue lysates (50 µg) were pretreated with either DMSO (0) or one of the serine hydrolase inhibitors 100 µM AEBSF (A), URB597 (U), or CAY10401 (C) for 1 hr before labeling with 2 µM TAMRA-FP probe. Labeled proteins were separated by SDS-PAGE and analyzed by fluorescent gel scanning using a GE Healthcare Typhoon™ Imager. Unlabeled lysate (–) and heat-denatured (Δ) lysate were used as a controls to show probe labeling specificity.
35
Sample preparation

Table 22. Overview of Thermo Scientific crosslinkers used for studying protein–protein interactions using MS.
Crosslinker DSS BS3 BS3-d4 DSG
Structure
Full name Disuccinimidyl suberate
Bis(sulfo-succinimidyl) suberate
Bis(sulfo-succinimidyl) 2,2,7,7-suberate-d4
Disuccinimidyl glutarate
Spacer arm 11.4 11.4 11.4 7.7
Water-soluble No Yes Yes No
Isotopically labeled No No Yes No
MS-cleavable No No No No
Crosslinker BS2G-d0 BS2G-d4 DSSO
Structure
Full name Bis(sulfo-succinimidyl) glutarate
Bis(sulfo-succinimidyl) 2,2,4,4-suberate-d4
Disuccinimidyl sulfoxide
Spacer arm 7.7 7.7 10.1
Water-soluble Yes Yes No
Isotopically labeled No Yes No
MS-cleavable No No Yes
NSO O
O O
O
N
OOO
O
DSSODisuccinimidyl sulfoxide
MW 388.35Spacer Arm 10.3 Å
Protein interactions and crosslinking
Chemical crosslinking in combination
with mass spectrometry is a powerful
method to determine protein–protein
interactions. This method has been
applied to recombinant and native
protein complexes, and more recently,
to whole cell lysates or intact unicellular
organisms in efforts to identify protein–
protein interactions on a global scale.
Thermo Scientific™ MS-grade crosslinkers are available with different linker lengths and as isotopically labeled sets to help elucidate protein–protein interactions. Both traditional noncleavable and MS-cleavable crosslinkers can provide insight into the identification of protein–protein interaction sites. These high-quality reagents have been validated in protein–protein interaction studies using Thermo Scientific™ mass spectrometers utilizing different types of fragmentation (CID, HCD, ETD, and EtHCD) and levels of tandem mass spectrometry (MS2 and MS3), in order to improve identification of protein–protein interaction sites.
BS2G-d0Bis(sulfosuccinimidyl) glutarate-d0
MW 530.35; Crosslink Mass 96.02Spacer Arm 7.7 Å
NO
O
OO
SO
O
O
NO
O
OS
O
ONa+O- O-Na+
BS2G-d0Bis(sulfosuccinimidyl) 2,2,4,4 glutarate-d4
MW 534.37; Crosslink Mass 100.04Spacer Arm 7.7 Å
NO
O
OO
SO
O
O
NO
O
OS
OO
DD DD
Na+O- O-Na+
N OO
OO
O
N
O
O O
DSSDisuccinimidyl suberate
MW 368.34Spacer Arm 11.4 Å
BS3Bis(sulfosuccinimidyl) suberate
MW 572.43Spacer Arm 11.4 Å
N OO
OO
O
N
O
O O
S O
O
S
O
O
Na+O-
O-Na+
BS3-d4Bis(sulfosuccinimidyl) 2,2,7,7 suberate-d4
MW 576.45; Crosslink Mass 142.09Spacer Arm 11.4 Å
N OO
O
O
ON
O
O O
S O
O
SO
OD D
D DNa+O-
O-Na+
N
OO
OO
O
O
N
O
O
DSGDisuccinimidyl glutarate
MW 326.26Spacer Arm 7.7 Å
36
Protein sample preparation

Our MS-grade crosslinkers are high-quality reagents that are available in multiple packaging options and sizes. We offer extensive technical expertise and support for various applications, as well as validation of these products in workflows using our mass spectrometers.
Highlights:• High quality—products manufactured in ISO 9001–
certified facilities
• Convenience—products available in No-Weigh™ packaging or in multiple pack sizes
• More choices—available with different linker lengths, MS-cleavability and deuterium isotope labels
• Technical support—extensive web resources and support to help ensure successful results
Pierce DSS, No-Weigh Format
Thermo Scientific™ Pierce™ DSS, also called disuccinimidyl suberate, is a noncleavable and membrane-permeant crosslinker that contains an amine-reactive N-hydroxysuccinimide (NHS) ester at each end of an 8-carbon spacer arm. NHS esters react with primary amines at pH 7–9 to form stable amide bonds, along with release of the N-hydroxysuccinimide. Proteins, including antibodies, generally have several primary amines in the side chain of lysine (K) residues and the N terminus of each polypeptide that are available as targets for NHS-ester crosslinking reagents. DSS is first dissolved in an organic solvent such as DMF or DMSO, then added to the aqueous crosslinking reaction. BS3, the water-soluble analog of DSS, is also available for applications that require a hydrophilic crosslinker (e.g., to effect cell-surface crosslinking). DSS and BS3 have essentially identical crosslinking activity toward primary amines.
Features of DSS:• Reactive groups: NHS ester (both ends)
• Reactive toward: amino groups (primary amines)
• Amine reactive NHS ester reacts rapidly with any primary amine–containing molecule
• Membrane-permeant, allowing for intracellular crosslinking
• High-purity, crystalline reagent can be used to create high-purity conjugates
• Noncleavable
• Water-insoluble (dissolve first in DMF or DMSO); compare to BS3 (Sulfo-DSS)
Lot specifications:• Identity: IR scan shows only peaks characteristic of the
structure and functional groups of DSS
• Purity: >90% by quantitative NMR
• Solubility: >9.2 mg/mL in DMF and DMSO, clear and colorless solution
Pierce BS3 (sulfo-DSS), No-Weigh Format, and BS3-d4
Thermo Scientific™ Pierce™ BS3 (sulfo-DSS, or bis(sulfosuccinimidyl) suberate) is an amine-to-amine crosslinker that is homobifunctional, water-soluble, noncleavable, and membrane-impermeant. BS3 contains an amine-reactive sulfo-N-hydroxysulfosuccinimide (sulfo-NHS) ester at each end of an 8-carbon spacer arm. Because it contains the hydrophilic sulfonyl moiety, BS3 is soluble up to ~100 mM in water and many commonly used buffers, thus avoiding the use of organic solvents, which may perturb protein structure. Although DSS and BS3 have essentially identical crosslinking activity toward primary amines, the negatively charged sulfo-NHS groups of BS3 reduces its ability to cross cell membranes, making BS3 an ideal cell surface crosslinker. BS3-d4 is a deuterated version of the crosslinker that can be used in combination with BS3 to identify crosslinked peptide pairs during MS acquisition.
Features of BS3:• Reactive groups: sulfo-NHS ester (both ends)
• Reactive toward: amino groups (primary amines)
• Amine-reactive sulfo-NHS ester reacts rapidly with any primary amine–containing molecule
37
Sample preparation

• Water-soluble; compare with DSS
• Membrane-impermeant, allowing for cell surface labeling
• High-purity, crystalline reagent can be used to create high-purity crosslinked conjugates
• Isotopically labeled versions for mass tagging
Lot specifications:• Purity: >93% by quantitative NMR
• Solubility: >5.8 mg/mL in DI water, clear solution with no insoluble material
Pierce DSG
Thermo Scientific™ Pierce™ DSG (disuccinimidyl glutarate), is an amine-to-amine crosslinker that is homobifunctional, noncleavable, and membrane-permeant. DSG contains an amine-reactive N-hydroxysulfosuccinimide (NHS) ester at each end of a 5-carbon spacer arm. Similar to DSS, DSG is water soluble but can result in different crosslinks as the linker length is shorter than DSS.
Features of DSG:• Reactive groups: NHS ester (both ends)
• Reactive toward: amino groups (primary amines)
• Amine-reactive NHS ester reacts rapidly with any primary amine–containing molecule
• Membrane-permeant, allowing for intracellular crosslinking
• High-purity, crystalline reagent can be used to create high-purity conjugates
• Noncleavable
• Water-insoluble (dissolve first in DMF or DMSO); compare to BS2G
Lot specifications:• Purity: >93% by quantitative NMR
• Solubility: >9.2 mg/mL in DMF and DMSO, clear and colorless solution
Pierce BS2G-d0 and BS2G-d4
Thermo Scientific™ Pierce™ BS2G (bis(sulfosuccinimidyl) glutarate) is an amine-to-amine crosslinker that is homobifunctional, water-soluble, noncleavable and membrane-impermeant. BS2G contains an amine-reactive sulfo-N-hydroxysulfosuccinimide (sulfo-NHS) ester at each end of a 5-carbon spacer arm. BS2G-d4 is a deuterated version of the crosslinker that can be used in combination with BS2G-d0 to identify crosslinked peptide pairs during MS acquisition.
Features of BS2G:• Reactive groups: sulfo-NHS ester (both ends)
• Reactive toward: amino groups (primary amines)
• Amine-reactive sulfo-NHS ester reacts rapidly with any primary amine–containing molecule
• Water-soluble; comparable with DSG
• Membrane-impermeant, allowing for cell surface labeling
• High-purity, crystalline reagent can be used to create high-purity crosslinked conjugates
• Isotopically labeled versions for mass tagging
Lot specifications:• Purity: >93% by quantitative NMR
• Solubility: >5.8 mg/mL in DI water, clear solution with no insoluble material
38
Protein sample preparationProtein interactions and crosslinking

Molar excess:
BSA
20-fold
– DSSOBS3
DSSDSSO
BS3DSS
DSSOBS3
DSS
100-fold 500-fold
Pierce DSSO
Thermo Scientific™ Pierce™ DSSO, also called disuccinimidyl sulfoxide, is an MS-cleavable and membrane-permeant crosslinker that contains an amine-reactive N-hydroxysuccinimide (NHS) ester at each end of a 7-carbon spacer arm. DSSO has reactivity similar to that of DSS and BS3, but contains a linker which can be cleaved in the gas phase during tandem MS (MS/MS) using collision-induced dissociation (CID). The ability to cleave crosslinked peptides during MS/MS enables MS3 acquisition methods which facilitate peptide sequencing using traditional database search engines. The MS cleavage of DSSO also generates diagnostic ion doublets during MS2 which enables searching using novel database search engines such as XlinkX.
Features of DSSO:• Reactive groups: NHS ester (both ends)
• Reactive toward: amino groups (primary amines)
• Amine-reactive NHS ester reacts rapidly with any primary amine–containing molecule
• Membrane-permeant, allowing for intracellular crosslinking
• High-purity, crystalline reagent can be used to create high-purity conjugates
• MS-cleavable
• Water-insoluble (dissolve first in DMF or DMSO)
Lot specifications:• Purity: >90% by quantitative NMR
• Solubility: >9.2 mg/mL in DMF and DMSO, clear and colorless solution
Learn more at thermofisher.com/mscrosslinkers
Figure 28. Comparison of BSA crosslinking efficiency by SDS-PAGE. Different crosslinkers were incubated with BSA at molar excess of crosslinker to protein (e.g., 20-, 100-, or 500-fold). Crosslinking efficiency is shown by decreased mobility by SDS-PAGE and varied by crosslinker type, solubility, and concentration.
Figure 30. Graph showing number of BSA crosslinked peptides identified using different noncleavable (BS3, DSS) and cleavable crosslinkers (DSSO) for various MSn methods. Both BS3 and DSS had similar numbers of crosslinked peptides identified for CID and HCD methods, with fewer crosslinked peptides identified with DSSO. Since DSSO is MS-cleavable, the MS2-MS3 method can be used to identify more crosslinks when a linear-peptide database search is used. All crosslinkers showed similar numbers of identified crosslinked peptides by electron-transfer and higher-energy collision dissociation (EThcD).
Figure 29. BSA crosslinked peptide spectra identified by MS2-MS3 method and XLinkX using DSSO crosslinker. XlinkX uses unique fragment ion patterns of MS-cleavable crosslinkers (purple annotation) to detect and filter crosslinked peptides for a crosslinked database search.
0
10
20
30
40
50
60
CID HCD EThcD
MS2-MS3
QE HF SID-HCD
BS3
DSS
DSSO
Nu
mb
er o
f p
epti
des
500 1,000 1,500 2,000 2,500
0e+
00
1e+
06
2e+
06
3e+
06
4e+
06
5e+
06
6e+
06
7e+
06
mass
Inte
nsi
ty
b3b4 y7
y5
y4
y3y2b4 b5 b6 b7 b8 b9
b10b11
b12 b13b14
y13y12y11
y10
y9
y8y7
y6
y5
y4
y3
A+XL_S
A+XL_L B+XL_S
B+XL_L
A_HCDA_ETD
B_HCDB_ETD
cross−linker cleavage
ALKAWSVARLAKEYEATLEECCAK
200 400 600 800 1,000
050
,000
15,0
000
m/z
inte
nsity
b2+
b3+
b4+ b5+ b6+ b8+ y1+
y2+
y3+
y4+
y5+y6+y7+y8+ y1++
y2++
y3++
A_b_ion A_y_ion
ALKAWSVAR+XL_S
200 400 600 800 1,000
05,
000
15,0
00
m/z
inte
nsity
b2+ b3+b7+ y1+
y2+
y3+
y4+
y5+
y6+y7+y8+
y1++
y2++
y3++
A_b_ion A_y_ion
ALKAWSVAR+XL_L
500 1,000 1,500
04,
000
8,00
0
m/z
inte
nsity
b2+
b3+
b4+
b5+ b7+b8+ b9+ b10+b12++
y2+
y3+
y4+y5+y6+y7+
y8+y9+
y10+y11+
y12+y2++
B_b_ion B_y_ion
LAKEYEATLEECCAK+XL_S
500 1,000 1,500
01,
0000
3,00
00
m/z
inte
nsity
b2+
b3+
b4+
b5+ b6+b7+b8+b9+ b10+ y1+y2+
y3+
y4+
y5+y6+
y7+
y8+y9+
y10+y11+
y12+y13+y14+ y2++
y9++
B_b_ion B_y_ion
LAKEYEATLEECCAK+XL_L
39
Sample preparation

Protein clean-up
Whether samples are simple or
complex, they often need to be
processed to ensure compatibility
with downstream mass spec analysis.
Thermo Fisher Scientific offers a range of general protein clean-up products for MS sample preparation. Dialysis, desalting, and concentrating devices can be used for buffer exchange or to remove common small molecule contaminants such as salts or detergents. Concentration devices can also be used to concentrate dilute protein samples after depletion of abundant proteins. Detergent removal resins quickly remove a wide range of detergents that can interfere with chromatographic separation of peptides or MS analysis. Although most of these techniques are used for clean-up of intact proteins, some can also be used for peptide clean-up.
Table 23. Protein clean-up selection guide.
Dialysis devices, cassettes, 96-well plates, and tubing
Desalting spin columns, 96-well spin plates,
and cartridges
Detergent removal spin columns and 96-well
spin plates Concentrators
Sample volume processing range
10 μL–250 mL 2 μL–4 mL 25 μL–1 mL 100 μL–100 mL
Sample processing time (volume dependent)
2–24 hr 5–10 min 15–20 min 5–30 min*
Key applications Buffer exchange, desalting, virus purification
Desalting, buffer exchange, removal of unincorporated label
Removal of anionic, nonionic, and zwitterionic detergents
Sample concentration, desalting, buffer exchange
Recommended sample type
Purified protein Lysate or purified protein Purified protein or peptide mixture
Lysate or purified protein
Compatible with viscous samples?
Yes No No No
Sample diluted during processing?
Possible No No No
Gamma-irradiated options available?
Yes No No No
* For 10K MWCO (device dependent—times may vary for other MWCOs).
40
Protein sample preparation

Pierce 96-Well Microdialysis Plate, 10–100 µL
0.5–3 mL
0.5–3 mL15 mL30 mL
70 mL12–30 mL
3–12 mL
250 mL
0.1–0.5 mL0.1–0.5 mL
Slide-A-Lyzer G2 Cassettes, 0.1–70 mL
SnakeSkin Dialysis Tubing, 15–100 mL
Slide-A-Lyzer MINI Dialysis Devices, 10–2,000 µL
Slide-A-Lyzer Dialysis Flask, 150–250 mL
Slide-A-Lyzer Cassettes, 0.1–30 mL
Slide-A-Lyzer dialysis productsEasy-to-handle devices, cassettes, and flasks for secure sample processing
Thermo Scientific™ dialysis units help facilitate rapid and trouble-free dialysis of sample volumes from 10 µL to 250 mL. Unlike standard flat tubing, these innovative devices do not require knots or clips that can lead to leaking and sample loss. Thermo Scientific™ Pierce™ 96-Well Microdialysis Plates and Thermo Scientific™ Slide-A-Lyzer™ MINI Dialysis Devices are ideal for small volumes, Slide-A-Lyzer™ Dialysis Cassettes (original and G2) are recommended for small to medium volumes, and Slide-A-Lyzer™ Dialysis Flasks are recommended for larger volumes.
Highlights:• Excellent sample recoveries—low-binding plastic and
membranes help minimize sample loss compared to filtration and resin systems
• Convenient—easy-to-grip format helps simplify sample addition and removal with syringe and/or pipette
• Secure—sealed membranes help prevent leakage that can occur with dialysis tubing and homemade devices
• Validated—each device is leak-tested during production
Table 24. High-performance Thermo Scientific™ dialysis product selection guide.
MWCO membrane
10–100 µL Pierce 96-Well Microdialysis
Plate
10–2,000 µL Slide-A-Lyzer MINI Dialysis
Device
0.1–70 mL Slide-A-Lyzer
G2 Dialysis Cassette
0.1–30 mL Slide-A-Lyzer
Dialysis Cassette
150–250 mL Slide-A-Lyzer Dialysis Flask
15–100 mL SnakeSkin
Dialysis Tubing
2K NA ✓ ✓ ✓ ✓ NA
3.5K ✓ ✓ ✓ ✓ ✓ ✓
7K NA ✓ ✓ ✓ NA ✓
10K ✓ ✓ ✓ ✓ ✓ ✓
20K NA ✓ ✓ ✓ ✓ NA
41
Sample preparation

For more information or to view additional products, go to thermofisher.com/dialysis
Figure 31. Protein recovery by the 2K, 3.5K, 7K, 10K, and 20K MWCO Thermo Scientific™ Slide-A-Lyzer™ Cassette membrane. Individual proteins or vitamin B12 (1 mg/mL) in either saline or 0.2 M carbonate bicarbonate buffer, pH 9.4, were dialyzed overnight (17 hr) at 4°C. The amount of retentate was estimated using either the Pierce BCA Protein Assay Kit or absorption at 360 nm (for vitamin B12).
Figure 32. The rate of removal of NaCl using various dialysis products. NaCl removal from samples was determined by measuring the conductivity of the retentate at the indicated times. (A) Slide-A-Lyzer MINI Dialysis Device (10K MWCO, 2 mL) versus conventional dialysis. BSA samples (2 mL, 0.25 mg/mL in 1 M NaCl) were dialyzed against 45 mL of water in 50 mL disposable conical tubes on an orbital shaker (300 rpm) at room temperature (RT). The water was changed once after 2 hr. Results are the average of two samples. For conventional dialysis, the samples were dialyzed against 2 L of water in a beaker with stirring. More than 95% of the NaCl was removed within 4 hr. (B) Samples of 0.1 mL (0.4 mg/mL cytochrome c containing 1 M NaCl) were dialyzed in the Pierce 96-Well Microdialysis Plate against 1.8 mL of water at RT with gentle shaking. The buffer was changed at various time points over a 4 hr period. Removal of NaCl was >83% after 2 hr and >99% after 4 hr. (C) Proteins in 200 mL samples containing 1 M NaCl were dialyzed at room temperature using Slide-A-Lyzer Dialysis Flasks with 2K, 3.5K, 10K, and 20K MWCO. The dialysis buffer (4 L) was changed after 2 and 5 hr (triangles; also at 41 hr for the 2K condition). Greater than 95% of NaCl was removed within 8–18 hr (41 hr for the 2K condition).
0
40
60
80
100
20
Ret
entio
n (%
)
0
40
60
80
100
20
Ret
entio
n (%
)
0
40
60
80
100
20R
eten
tion
(%)
0
40
60
80
100
20
Ret
entio
n (%
)
50
70
80
90
100
60
Ret
entio
n (%
)
2K MWCO 3.5K MWCO 7K MWCO 10K MWCO 20K MWCO
Vitamin B12 (1.4K MW)Bacitracin (1.4K MW)T kinase peptide (1.7K MW)Biotin-TPK (1.9K MW)Ce peptide (2K MW)Insulin A chain (2.5K MW)Insulin B chain (3.5K MW)Insulin (5K MW)Cytochrome c (12.4K MW)Lysozyme (14K MW)Myoglobin (17K MW)
Time (hr)
A B C
Dialysis device in conical tube
Conventional dialysis
Res
idua
l NaC
l (%
)
00
25
50
75
100
1 2 3 4 5
Time (hr)
Res
idua
l NaC
l (M
)
00
0.25
0.50
0.75
1.00
1.25
1 2 3 4 5 0 5 10 15 20 250
102030
40
50607080
90
100
Time (hr)
Res
idua
l 1 M
NaC
l (%
)
2K3.5K10K20K
42
Protein sample preparationProtein clean-up

Zeba desalting productsConvenient spin column and plate formats help ensure rapid desalting with high protein recovery
Thermo Scientific™ Zeba™ desalting products contain proprietary high-performance resins with exceptional desalting and protein-recovery characteristics. They can help process even very dilute protein samples, with high levels of protein recovery and greater than 95% retention (removal) of salts and other small molecules. The resin is provided in convenient spin columns, plates, and cartridges, for processing sample volumes between 2 µL and 4 mL.
Highlights:• High performance—proprietary resin enables excellent
protein recovery and efficient contaminant removal
• Flexible—available in spin columns, filter spin plates, and cartridges for a range of needs
• Fast—no fraction screening or waiting for protein to emerge by gravity flow
• Economical—cost-effective products that offer great performance
Table 25. Zeba desalting product selection guide by format and recommended sample volume.
Format
Micro spin
column
0.5 mL spin
column
2 mL spin
column
5 mL spin
column
10 mL spin
column
96-well spin plate
1 mL chromatography
column
5 mL chromatography
column
Resin bed 75 µL 0.5 mL 2 mL 5 mL 10 mL 550 µL 1 mL 5 mLSample volume (7K MWCO)
2–12 µL 30–130 µL 200–700 µL 500–2,000 µL 700–4,000 µL 20–100 µL 50–250 µL 100–1,500 µL
Sample volume (40K MWCO)
5–14 µL 70–200 µL 200–900 µL 300–2,000 µL 1,000–4,000 µL 20–100 µL NA NA
43
Sample preparation

0.04 mg/mL BSA
1.5 mL 2.5 mL 3.5 mL
0.2 mg/mL BSA
1.0 mg/mL BSA
Ther
mo
Sci
enti�
c
Ther
mo
Sci
enti�
c
Ther
mo
Sci
enti�
c
Load
GE
sp
in
GE
gra
vity
GE
sp
in
GE
gra
vity
GE
sp
in
GE
gra
vity
Figure 33. Zeba Spin Desalting Columns provide a high protein recovery while providing minimal sample dilution over a wider range of sample concentrations and volumes compared to alternative products. Zeba Spin Desalting Columns, 10 mL (7K MWCO) (Cat. No. 89893) and GE PD-10 Columns were used to desalt 1.5, 2.5, and 3.5 mL BSA samples at concentrations of 0.04, 0.2, and 1.0 mg/mL. Desalting was performed according to the suppliers’ recommended protocols; both the spin and gravity protocols were used for the GE PD-10. Protein recovery was analyzed by SDS-PAGE. For each electrophoresis gel, an aliquot of starting sample equal to 1 µg of BSA was loaded in lane 1 as the loading control; all other desalted samples were loaded in the gel at the same volume as the loading control. Differences in intensity between lanes are a combination of protein recovery and sample dilution caused by desalting. The largest differences in recovery and concentration were noticed in the outlined area.
For more information or to view additional products, go to thermofisher.com/desalting
Table 26. Zeba resin selection guide by protein recovery and small molecule removal.
7K MWCO 40K MWCO
Size Recovery Removal Recovery Removal
Peptide/protein <7 kDa NR NRProtein 7–13 kDa ++ ++Protein 14–20 kDa +++ +++Protein 20–150 kDa +++ +++Molecule <500 Da +++ +++Molecule 600–1,200 Da ++ +++Molecule 1,200–1,500 Da + ++Molecule >1,500–2,000 Da NR +
Table 27. Comparison of recommended sample volume capacity of common spin desalting products.
Zeba spin desalting products
GE Healthcare™ products
Bio-Rad™ products
0 mL 1 mL 2 mL 3 mL 4 mL0.1 mL 0.5 mL0.01 mL
Zeba Micro Spin Column
0.5 mL Zeba Spin Column 2 mL Zeba Spin Column
5 mL Zeba Spin Column
10 mL Zeba Spin Column
PD SpinTrap G-25 Column
PD MiniTrap G-25 Column
PD MiniTrap
G-25 ColumnPD-10
Desalting Columns
Micro Bio-Spin 6 Column
Bio-Spin 6 Column
44
Protein sample preparationProtein clean-up

Pierce Protein Concentrators Easy-to-use devices for rapid and efficient concentration
Thermo Scientific™ Pierce™ Protein Concentrators are easy-to-use centrifugal devices that provide fast processing and excellent recovery of protein samples. These disposable ultrafiltration devices contain a polyethersulfone (PES) membrane in five distinct MWCOs for the concentration, desalting, and buffer exchange of biological samples such
as tissue culture media, antisera, monoclonal antibody preparations, and chromatography fractions. They can also be used to remove unincorporated label following protein modification or crosslinking reactions.
Highlights:• Rapid processing—unique design minimizes membrane
fouling, and 10- to 30-fold sample concentration can be achieved in 5–30 min for 10K MWCO (device-dependent—times may vary for other MWCOs), even with particle-laden solutions
• High recovery—retain >90% of protein samples while removing contaminants or exchanging buffers
• Convenient—clear markings, wide sample chamber, and removable filtrate chamber make handling simple and easy
• Instrument compatible—can be used with standard centrifuges utilizing either fixed-angle or swinging- bucket rotors
Table 28. Pierce Protein Concentrator selection guide.
Volume range 0.1–0.5 mL 2–6 mL 5–20 mL 20–100 mL
MWCOs available 3K, 10K, 30K, 100K 3K, 10K, 30K, 100K 3K, 10K, 30K, 100K 5K, 10K, 30K, 100K
Processing time* 3–15 min 15–90 min 15–60 min 15–90 min
Retentate volume range* 9–67 µL 51–174 µL 121–777 µL 1.9–3.5 mL
Protein recovery range* 95–100% 94–100% 94–100% 92–98%
* Four different protein solutions were used for each molecular weight cutoff (MWCO).
45
Sample preparation

For more information or to view additional products, go to thermofisher.com/concentrators
Figure 34. Comparison of protein recovery between Pierce Protein Concentrators (using 3K, 5K, 10K, 30K, or 100K MWCO) and other suppliers' 0.5 mL, 6 mL, 20 mL, and 100 mL concentrators. Samples of different protein solutions were centrifuged in Pierce Protein Concentrators and other suppliers’ concentrators according to their instructions: 0.5 mL (15,000 x g), 6 mL (4,000 x g), 20 mL (4,700 x g), and 100 mL (1,200 x g). Samples were centrifuged until a 15- to 30-fold decrease in sample volume was achieved; protein concentration was measured by either the Pierce BCA Protein Assay Kit (0.5 mL concentrators only) or absorbance at A280.
0
20
40
30
10
60
80
100
90
70
50
Pro
tein
rec
over
y (%
)
Thermo Scienti�c 0.5 mL Millipore 0.5 mL Pall 0.5 mL
3K MWCOAprotinin (6.5 kDa)
10K MWCOProtein A (46 kDa)
30K MWCOProtein A (46 kDa)
27
98 98
85
9490
59
10095
0
20
40
30
10
60
80
100
90
70
50
Pro
tein
rec
over
y (%
)
97
86
Thermo Scienti�c 6 mL Millipore 4 mL
3K MWCOAprotinin (6.5 kDa)
10K MWCOCarbonic anhydrase (30 kDa)
30K MWCOOvalbumin (45 kDa)
100K MWCOFibrinogen (340 kDa)
909191 92 90 93
0
20
40
30
10
60
80
100
90
70
50
Pro
tein
rec
over
y (%
)
97 9796 9892
86 8990
Thermo Scienti�c 20 mL Millipore 15 mL
3K MWCOAprotinin (6.5 kDa)
10K MWCOCarbonic anhydrase (30 kDa)
30K MWCOOvalbumin (45 kDa)
100K MWCOFibrinogen (340 kDa)
0
20
40
30
10
60
80
100
90
70
50
Pro
tein
rec
over
y (%
)
92
Thermo Scienti�c 100 mL Millipore 70 mL
3K MWCOAprotinin (6.5 kDa)
10K MWCOCarbonic anhydrase (30 kDa)
30K MWCOOvalbumin (45 kDa)
100K MWCOFibrinogen (340 kDa)
93919895
76
8581
0.5 mL concentrators
20 mL concentrators
6 mL concentrators
100 mL concentrators
Learn how to effectively remove contaminants, buffer exchange, or concentrate protein samples from 2 µL to 250 mL using various Thermo Scientific™ protein biology tools in this 48-page handbook. Dialyze protein samples securely using Slide-A-Lyzer cassettes and devices. Rapidly desalt samples with high protein recovery using Zeba desalting spin columns and plates. Efficiently extract specific contaminants using resins optimized for detergent or endotoxin removal. Concentrate dilute protein samples quickly using Pierce Protein Concentrators.
thermofisher.com/proteincleanuphandbook
46
Protein sample preparationProtein clean-up

For workflows utilizing in-gel
digestion, proteins are separated
by 1- or 2-dimensional (1D and
2D) SDS- polyacrylamide gel
electrophoresis (SDS-PAGE). The 2D
PAGE separates proteins by isoelectric
point in the first dimension and by mass
in the second dimension.
Although different types of gels can be used for specific applications (e.g., isoelectric focusing, 2D PAGE, native PAGE), SDS-PAGE is the most widely used format for proteomics. In SDS-PAGE, the gel is cast in buffer contain sodium dodecyl sulfate (SDS) and protein samples are heated with SDS before electrophoresis so that the charge-density of all proteins is made roughly equal. When
heated, in SDS, an anionic detergent, denatures proteins in the sample and binds tightly to the uncoiled molecule. Usually, a reducing agent such as dithiothreitol (DTT) is also added to cleave the disulfide bonds in protein and ensure that no quaternary or tertiary protein structure remains. Consequently, when these samples are electrophoresed, proteins separate according to mass alone, with very little effect from compositional differences.
To assess the relative molecular weight (MW) of a protein on a gel, protein MW markers are run on the gel for comparison. A standard curve can be constructed from the distances migrated by each marker protein.
After electrophoresis, the protein bands are visualized using Coomassie, fluorescence, or silver stains, excised from the gel, and destained. The proteins in the excised gel band are reduced, alkylated, and digested in-gel, and the resulting peptides are then extracted from the gel matrix for further processing.
Gel electrophoresis and staining
Table 29. Gel selection guide. Find the right gel for your research needs based on downstream applications.
Application
Coomassie dye or silver staining
High-sensitivity western blotting
Downstream applications requiring high protein integrity (e.g., mass spectrometry)
Large sample volume for high detection sensitivity
NuPAGE Bis-Tris gels NuPAGE Bis-Tris gels NuPAGE Bis-Tris gels Bolt Bis-Tris Plus gels
Bolt Bis-Tris Plus gels Bolt Bis-Tris Plus gels Bolt Bis-Tris Plus gels
Novex WedgeWell Tris-glycine gels
SureCast Gel Handcast System
47
Sample preparation

Table 30. Electrophoresis chamber systems.
Which electrophoresis chamber system is right for you?
Mini Gel Tank XCell SureLock Mini-Cell XCell4 SureLock Midi-Cell
Gel capacity Up to 2 mini gels (8 x 8 cm) Up to 2 mini gels (8 x 8 cm) Up to 4 midi gels (8 x 13 cm)
Cell dimensions (L x W x H)
32 x 11.5 x 16 cm (height with lid on)
14 x 13 x 16 cm (height with lid on)
21 x 19 x 16 cm (height with lid on)
Advantages • Mini Gel Tank is versatile and com-patible with NuPAGE, Bolt, and Novex mini gels. Unique tank design enables convenient side-by-side gel loading and enhanced viewing during use.
• Mini Blot Module is available for wet protein transfers.
• XCell II Blot Module is available for semi-wet protein transfers.
• Instrument incorporates a gel tension wedge in place of the rear wedge used on earlier models.
• Advanced apparatus for easier, more reliable electrophoresis with midi gels.
Learn more at thermofisher.com/proteingels
Handcast and precast gel systemsHigh-performance and convenient formats to meet every need
The Invitrogen™ gel portfolio offers a new system designed to hand cast protein gels and the broadest range of precast protein gel options to help you achieve your research goals. Whether it is larger sample load capacities, unique protein size ranges, or the need to minimize protein degradation, our portfolio has you covered.
Highlights:• Flexible—gel chemistries optimized for separating high,
medium, and low molecular weight proteins of interest
• Optimized—gels available that are ideal for specific downstream applications, such as gel staining, sensitive western blotting, or mass spectrometry
• Consistent—coefficient of variation (CV) of only 2% for Rf values (migration)
• High performance—excellent protein band resolution and sharpness
• Extended shelf life—most precast formulations can be stored for up to 12 months at 4°C
48
Protein sample preparationGel electrophoresis and staining

1 2 3 4 5 6 7 8 9 10 1 2 3 4 5 6 7 8 9 10
1 2 3 4 5 6 7 8 9 10 1 2 3 4 5 6 7 8 9 10
Figure 35. NuPAGE Bis-Tris and Tris-acetate gel electrophoresis. Protein standards and samples were loaded at 10 µL sample volumes in (A) Invitrogen™ NuPAGE™ 4–12% Bis-Tris and (B) Invitrogen™ NuPAGE™ 3–8% Tris-acetate gels. Electrophoresis was performed using the Mini Gel Tank at 200 V (constant). Sharp, straight bands were observed after staining with Invitrogen™ SimplyBlue™ SafeStain. Images were acquired using a flatbed scanner. (A and B) Lane 1: Invitrogen™ SeeBlue™ Plus2 Prestained Protein Standard; lane 2: 10 µg E. coli lysate; lane 3: Mark12 Unstained Standard (blend of 12 purified proteins); lane 4: 40 µg HeLa cell lysate; lane 5: 20 µg HeLa cell lysate; lane 6: (A) not used (B) 5 µg BSA; lane 7: 40 µg Jurkat cell lysate; lane 8: 5 µg GST-fusion protein; lane 9: Invitrogen™ Novex™ Sharp Unstained Protein Standard; lane 10: 5 µg β-galactosidase.
NuPAGE protein gelsTrusted gels referenced in over 10,000 publications
The Invitrogen™ NuPAGE™ system is a high-performance PAGE system that simulates the denaturing conditions of the traditional Laemmli system. NuPAGE™ gels use a unique buffer formulation to maintain a neutral operating pH during electrophoresis, which minimizes protein modifications that can result in poor band resolution. Gels are available in two formulations—Invitrogen™ NuPAGE™ Bis-Tris gels are ideal for separating small to mid-sized proteins, while Invitrogen™ NuPAGE™ Tris-acetate gels are ideal for separating large proteins (Figure 35).
Highlights:• Superior resolution and stability—neutral-pH
environment during electrophoresis minimizes protein modifications
• More efficient—neutral pH prevents reoxidation of reduced samples during protein transfer
• Fast—sample run times are typically 35–50 min
• Long shelf life—gels are stable for 8–16 months
Results acquired with
the Mini Gel Tank
Learn more at thermofisher.com/nupage
49
Sample preparation

Bolt Bis-Tris Plus gelsNew wedge well format for up to 2x sample volume capacity
Invitrogen™ Bolt™ Bis-Tris Plus gels are precast polyacrylamide gels designed for optimal separation of a broad molecular weight range of proteins under denaturing conditions during gel electrophoresis (Figure 36). These gels help deliver consistent performance with a neutral-pH environment to minimize protein degradation. The unique wedge well design allows loading of up to 2x more sample volume than other precast gels. Bolt gels are ideal for western blot transfer and analysis along with any other technique where protein integrity is crucial.
Highlights:• High sample volume capacity—wedge well design
allows detection of proteins in very dilute samples or measurement of low-abundance proteins
• Preserved protein integrity—neutral-pH formulation minimizes protein modifications
• Superior band quality and band volume—Invitrogen™ Bis-Tris Plus gel chemistry is designed to deliver sharp, straight bands with higher band volume
• Better protein resolution—gels are 10% longer, allowing detection of more protein bands than standard mini gels
• High lot-to-lot consistency—CV of only 2% for Rf values (migration)
EPHB3
GSTHCK
FLT1
IKKβ
MAPK14
DDR2M
agicM
ark
stan
dard
Mag
icMar
k
stan
dard
EPHB3
GSTHCK
FLT1
MAPK14
DDR2
Figure 36. A western blot of a Bolt gel shows clean, sharp protein signals corresponding to only full-length proteins, whereas a western blot of a Bio-Rad™ TGX™ gel shows multiple low–molecular weight degradation products. Protein kinases implicated in cancer (IKKβ, EPHB3, HCK, MAPK14, FLT1, and DDR2) were analyzed on a Bolt Bis-Tris Plus gel and a Bio-Rad TGX Tris-glycine gel.
IKKβ
Bolt Bis-Tris Plus gel Bio-Rad TGX Tris-glycine gel
Learn more at thermofisher.com/bolt
50
Protein sample preparationGel electrophoresis and staining

Table 31. Unstained and prestained protein ladders.
Unstained protein ladders
Low range PageRuler Unstained Low Range Protein Ladder
Broad range PageRuler Unstained Protein LadderHigh range NativeMark Unstained Protein StandardRecommended for: • Precise determination of target protein
molecular weight
Other
Western MagicMark XP Western Protein StandardSpecialty PageRuler Prestained NIR Protein Ladder
BenchMark Fluorescent Protein Standard
BenchMark His-tagged Protein Standard
IEF Marker 3–10
Protein ladders and standardsPrestained and unstained formats with exceptional lot-to-lot consistency
We offer a broad range of prestained and unstained protein ladders supplied in a ready-to-use format to facilitate easy protein analysis during gel electrophoresis and western blotting (Table 31).
Highlights:• Performance—sharp protein bands and consistent
migration patterns provide easy molecular weight determination
• Convenience—protein ladders are ready to load, with no heating required
• Reliability—exceptional lot-to-lot consistency and reproducibility
Learn more at thermofisher.com/proteinstandards
kDa
260
140
10070
50
40
35
25
10
15
20
30
40
50
60
80
100
220
120
kDa
Prestained protein ladders
Low range PageRuler Prestained Protein LadderBroad range PageRuler Plus Prestained Protein Ladder
Spectra Multicolor Broad Range Protein Ladder
High range HiMark Prestained Protein Standard
Spectra Multicolor High Range Protein Ladder
Recommended for: • Approximate determination of molecular weight
• Monitoring the progress of electrophoresis runs
• Estimating the efficiency of protein transfer to the membrane during western blotting 70
50
40
kDa
300250180130
100
kDa
250
130
9572
55
36
28
17
10
PageRuler Plus Prestained
Protein Ladder
Spectra Multicolor High Range
Protein Ladder
Spectra Multicolor Broad Range
Protein Ladder
MagicMark XP Western
Protein Standard
51
Sample preparation

Download our “Protein gel electrophoresis technical handbook” to learn more about protein gels, sample preparation, buffers and reagents, standards, electrophoresis chambers, power supplies, and staining.
thermofisher.com/pagehandbook
Table 32. Gel stain selection guide.
Protein stains
Coomassie staining Silver staining Fluorescent protein staining
Sensitivity 25 ng 0.5 ng 0.5 ng
Ease of use +++ + +
Mode of action In acidic buffer conditions, Coomassie stain binds to basic and hydrophobic residues of proteins, changing from dull reddish-brown to intense blue.
Silver ions interact and bind with carboxylic acid groups (Asp and Glu), imidazoles (His), sulfhydryls (Cys), and amines (Lys). Silver ions are reduced to metallic silver, resulting in brown-black color.
Most fluorescent stains involve simple dye-binding mechanisms rather than chemical reactions that alter protein functional groups.
Detection Visual Visual Compatible imaging system
Compatibility with downstream applications
MS- and sequencing-compatible Certain formulations are MS-compatible Most stains are MS-compatible
Products Value: PageBlue Protein Staining Solution
Performance: SimplyBlue SafeStain
Premium: Imperial Protein Stain
Value: Pierce Silver Stain Kit
Performance: SilverXpress Silver Staining Kit
Mass spectrometry: Pierce Silver Stain for Mass Spectrometry
Value: SYPRO Red Protein Gel Stain
Performance: SYPRO Orange Protein Gel Stain
Premium: SYPRO Ruby Protein Gel Stain
Protein stainsOptimized formulations for specific applications
Once protein bands have been separated by electrophoresis, they can be directly visualized using different methods of in-gel detection. Over the past several decades, demands for improved sensitivity for
small sample volumes, compatibility with downstream applications and detection instrumentation have driven the development of several basic staining methods. Our portfolio includes Coomassie, silver, fluorescent, and specialty gel stains. Each method has particular advantages and disadvantages, with specific formulations that provide optimal performance for different detection systems.
Highlights:• Convenient—most formulations are ready to use
• Optimized—reagents and kits developed for specific applications and workflows
• Flexible offering—multiple options to meet sensitivity or budget needs
Learn more at thermofisher.com/proteinstains
52
Protein sample preparationGel electrophoresis and staining

Pierce Silver Stain for Mass SpectrometryFast and sensitive staining and destaining of protein gels for MS analysis
Thermo Scientific™ Pierce™ Silver Stain for Mass Spectrometry is a complete kit for rapid and sensitive silver staining of proteins in polyacrylamide gels, and efficient destaining of excised gel pieces for MS analysis. The kit bundles components of the high-performance Thermo Scientific™ Pierce™ Silver Stain Kit with optimized reagents to destain spots for subsequent in-gel tryptic digestion and to recover peptide fragments for proteomics analysis. The resulting MS-compatible product and protocol deliver outstanding sensitivity and maintain favorable conditions for high-yield recovery and identification (sequence coverage) of proteins by MS. Silver staining of 2D gels is now an important intermediate step in a set of procedures that leads ultimately to identification of specific proteins in the proteome by mass fingerprinting methods.
Highlights:• Sensitive and fast staining—the low-background,
easy-to-use silver stain provides subnanogram sensitivity, detecting proteins at less than 0.25 ng per spot in 30 min after fixing
• Flexible staining protocol—fix gel for 15–30 min or overnight without any affect on staining performance; stain for 1–30 min (typically 2–3 min)
• Robust—effective silver stain for even difficult-to-stain basic proteins, such as lysozyme (pI 10) and chymotrypsinogen A (pI 9.2), which are detectable at 0.2 ng and 0.5 ng, respectively
• Simple, trouble-free spot preparation—stained spots in excised gel pieces are easily destained and made ready for tryptic digestion in 1 hr
• MS compatible—reagents and protocol are optimized to provide excellent performance in MS following extraction of peptides from stained 1D or 2D gels (SDS-PAGE)
• Complete kit—contains all reagents necessary for staining and destaining before in-gel proteolysis and peptide recovery for analysis by MS
• Convenient—kit components are stable at room temperature; helps to save valuable refrigerator space and eliminates the need to equilibrate reagents before use
The Pierce Silver Stain protocol provides peak staining performance, flexibility, reliability, and robustness for applications such as matrix-assisted laser desorption ionization (MALDI)-MS. It enables both first-time and experienced users to achieve consistent and reliable staining using high- and low-percentage and gradient polyacrylamide gels in 1D and 2D formats. The optimized staining method enables extremely sensitive staining while minimizing covalent crosslinking of protein to the gel matrix, which can inhibit protein-peptide recovery following in-gel proteolysis. The destaining reagents facilitate complete removal of silver from stained protein bands and maximum protein recovery for subsequent MS analysis.
Silver staining methods generally use either glutaraldehyde or formaldehyde, which cause some covalent crosslinking of protein to each other and the gel matrix. To the extent that this crosslinking occurs, extraction or elution of protein from the gel will be inhibited. Pierce Silver Stain uses formaldehyde in the stain and developer working solutions. However, the procedure accompanying the Pierce Silver Stain for Mass Spectrometry is optimized to maximize polypeptide recovery without greatly sacrificing sensitivity.
53
Sample preparation

Table 33. Sequence coverage comparison for different gel stains. BSA, ovalbumin, chymotrypsinogen A, and myoglobin (50 ng each) were loaded onto mini gels and separated by SDS-PAGE. After electrophoresis, the respective gels were stained with Pierce Silver Stain for Mass Spectrometry, an MS-compatible stain silver stain from Supplier X and GelCode Blue Stain Reagent (Cat. No. 24590). Bands were excised and destained, subjected to in-gel tryptic digestion (using Cat. No. 89871), and prepared for analysis by MALDI/MS. Proteins were not reduced or alkylated before in-gel tryptic digestion. For all proteins, the Pierce Silver Stain for Mass Spectrometry performed better than or equal to the alternative silver staining method and GelCode Blue Stain.
Pierce Silver Stain for MS
Supplier X Silver Stain for MS
GelCode Blue Stain
Protein#
Peptides#
Proteins%
Coverage#
Peptides#
Proteins%
Coverage#
Peptides#
Proteins%
Coverage
BSA 63 13 21 53 6 11 40 7 18
Ovalbumin 40 5 13 44 1 2 42 1 2
Chymotrypsinogen A 47 4 9 41 2 5 41 1 2
Myoglobin 32 6 19 31 3 10 38 1 3
Figure 39. 2D gel stained with the Pierce Silver Stain for Mass Spectrometry. Proteins of a rat mitochondrial extract were separated by IEF (pH 5–8 gradient) and SDS-PAGE, then stained. Ten spots were identified that stained well in three identical gels that were stained with three different stains (Table 33). These spots were picked for in-gel digestion and MS analysis.
Figure 38. Spot excision and band destaining protocol summary. Place each gel piece in a 0.5 mL microcentrifuge tube. Mix destain working solution (DWS) at recommended volumes for reagent A, reagent B, and water. Add 200 µL of DWS to each gel piece, mix gently and incubate for 15 min. Repeat once. To prepare for in-gel digestion, wash three times with 25 mM ammonium bicarbonate in 50% acetonitrile for 10 min each. Proceed with in-gel tryptic digestion (e.g., Thermo Scientific™ In-Gel Tryptic Digestion Kit, Cat. No. 89871).
1. Wash 2 x 5 min with ultrapure water.
H2O
2. Fix 2 x 15 min in EtOH/ acetic acid.
EtOHAceticacid
F
F
4. Mix Sensitizer. Sensitize for 1 min. Wash 2 x 1 min.
SZ
SZ
3. Incubate 2 x 5 min with 10% EtOH. Wash.
10% EtOH
5. Mix Silver Stain. Stain for 5 min. Wash 2 x 20 sec.
S
S
6. Mix Developer. Develop for 2–3 min.
D
D
7. Remove developer. Stop with 5% acetic acid for 10 min.
5% Acetic acid
Figure 37. Staining protocol for the Pierce Silver Stain for Mass Spectrometry.
2D gel
DWS
Reagent A
Reagent B Water
Excised protein bandsAdd 200 µL
destain workingsolution
54
Protein sample preparationGel electrophoresis and staining

Imperial Protein StainA fast and sensitive protein gel stain based on Coomassie R-250 dye
Thermo Scientific™ Imperial™ Protein Stain is a ready-to-use colorimetric stain formulated with Coomassie dye R-250 that delivers consistent nanogram-level detection of proteins in polyacrylamide electrophoresis gels.
Imperial Protein Stain is a Coomassie dye reagent for detection of protein bands in SDS-PAGE and 2D gels. The stain is a unique formulation of Coomassie brilliant blue R-250 that delivers substantial improvements in protein-staining performance compared to homemade or other commercial stains. Staining results in intensely colored protein bands that are easy to photograph and document with gel imagers. This reagent is one of the most sensitive colorimetric stains available, easily detecting 3–6 nanograms of protein per band. The Imperial Protein Stain protocol uses simple water-wash steps rather than methanol/acetic acid fixation and destaining, which helps save valuable preparation time and minimizes reagent costs.
Highlights:• Sensitive—detects less than 3 ng protein per band with
the enhanced protocol (3 hr)
• Fast—ready-to-use reagent detects less than 6 ng protein per band in just 20 min
• Robust—highly consistent, reproducible protein staining technique
• High contrast—intense purple bands are easier to photograph or scan than typical Coomassie blue stains
• Versatile—compatible with downstream MS analysis and protein sequencing
• Convenient—water washes only; no acid fixative or methanol destaining solutions required
• Stable—room temperature stability for 1 year enables consistent performance and saves refrigerator space
• Flexible—adjust staining and washing times to meet time and sensitivity requirements
DI H2O DI H2O
1. Wash the gel 3x with deionized water (15 min).
2. Add Imperial Protein Stain (5 min–1 hr).
S
3. Water destain (15 min–overnight).
Figure 40. Protocol summary for Imperial Protein Stain.
Figure 41. Enhanced sensitivity and crystal-clear background using Imperial Protein Stain. For even greater sensitivity and reduced background, gels can be stained with Imperial Protein Stain for 1 hr and washed with water from 1 hr to overnight. Lane 1: BSA only (6 µg); lanes 2–9: protein mixture, left to right, 1,000 ng, 200 ng, 100 ng, 50 ng, 25 ng, 12 ng, 6 ng, and 3 ng, respectively.
5 min stain;15 min water destain
1 hr stain;2 hr water destain
1 hr stain;overnight water destain
Rabbit IgG
BSAProtein AProtein G
Lysozyme
21 4 5 6 7 8 93 21 4 5 6 7 8 93 21 4 5 6 7 8 93
Figure 42. Imperial Protein Stain is fast and sensitive. Proteins were separated on 4–20% Tris-glycine gels, stained for 5 min, and destained 3 x 5 min in water. Lane 1: BSA only (6 µg); lanes 2–9: protein mixture, left to right at 1,000 ng, 200 ng, 100 ng, 50 ng, 25 ng, 12 ng, 6 ng, and 3 ng, respectively.
Rabbit IgG
Imperial Protein Stain
EZBlue Gel Staining Reagent
Bio-Safe Coomassie Stain
BSAProtein AProtein G
Lysozyme
21 4 5 6 7 8 93 21 4 5 6 7 8 93 21 4 5 6 7 8 93
55
Sample preparation

The decision to perform in-solution
or in-gel digestion is generally
determined by the sample amount
and/or its complexity. In-solution
digestion is recommended for small
sample volumes because of the
limited capacity within a typical gel
well. Peptide extraction from the gel
band after digestion can also result
in significant peptide loss. In-solution
digestion is recommended for samples
with low to moderate complexity.
For highly complex samples, in-gel digestion has an inherent advantage because the SDS-PAGE workflow combines protein denaturation with separation, and provides a visual indication of the relative protein abundance in the sample. In addition, the peptide extraction protocol removes much of the salts and detergents that can be present in in-solutions workflows, although peptide recovery is reduced. In-solution digestion can be performed more rapidly than in-gel digestion because the extensive SDS-PAGE steps are eliminated.
The in-solution protocol is also more amendable to high-throughput sample processing because the various steps can be automated, although there are automated processes for in-gel digestion and extraction as well.
Trypsin is the protease of choice for protein digestion. However, digestion with alternative proteases, such as Glu-C, Lys-N, Lys-C, Asp-N, or chymotrypsin, can improve individual protein sequence coverage or generate unique peptide sequences for different MS applications. Thermo Scientific™ Pierce™ proteases are highly purified and modified for optimal protein digestion and validated for use in MS.
Protein digestion
Table 34. MS-grade protease selection guide.
Trypsin Protease, MS Grade
Lys-N Protease, MS Grade
Lys-C Protease, MS Grade
Asp-N Protease, MS Grade
Glu-C Protease, MS Grade
Chymotrypsin, MS Grade
Source Porcine pancreatic extracts
Grifola frondosa Lysobacter enzymogenes
Pseudomonas fragi
Staphylococcus aureus
Bovine pancreatic extracts
Cleavage specificity
Carboxyl side of arginine and lysine residues
Amino side of lysine residues
Carboxyl side of lysine residues
Amino side of aspartate residues
Carboxyl side of glutamate
Carboxyl side of tyrosine, phenylalanine, tryptophan and leucine
Modified? Yes, TPCK-treated and methylated
No No No No Yes, TLCK-treated
Formats Lyophilized or frozen
Lyophilized Lyophilized Lyophilized Lyophilized Lyophilized
Standard packaging
20 or 100 µg/vial 20 µg/vial 20 or 100 µg/vial 2 µg/vial 10 µg/vial 4 x 25 µg
56
Protein sample preparation

Figure 43. Excellent digestion performance with Pierce Trypsin Protease, MS Grade. Base peak chromatograms of a five-protein mixture sample digested with Pierce Trypsin Protease (top two) and Promega Trypsin Gold (bottom two). Samples (10 µg each) were mixed with trypsin at a 1:50 ratio in a 50 mM TEAB buffer (pH ~8) and incubated at 37°C for 30 min or 3 hr. Digested sample peptides (0.5 µg each) were separated using nanoflow high-pressure liquid chromatography for analysis by a Thermo Scientific™ Velos Pro™ Mass Spectrometer.
Pierce Trypsin Protease, MS GradeAn economical alternative to Promega™ Trypsin Gold
Thermo Scientific™ Pierce™ Trypsin Protease, MS Grade is a highly purified trypsin derived from porcine pancreatic extracts that has been chemically modified for maximum activity and stability in proteomics applications. The enzyme is TPCK-treated to eliminate chymotryptic activity and methylated to improve stability during protein digestion. This MS-grade, modified trypsin is then repurified and packaged in frozen liquid format (100 µg at 1 mg/mL), or lyophilized into glass vials and packaged in convenient 5 x 20 µg, 5 x 100 µg, or 1 mg fill sizes.
Highlights:• Exceptional selectivity—cleaves at the carboxyl
side of lysine and arginine residues with greater than 95% specificity
• High purity—no detectable chymotrypsin activity
• Enhanced stability—chemically modified for reduced autolytic activity
• Economical—available in multiple packaging formats including larger, more cost-effective sizes
Applications:• In-gel digestion of proteins from 1D or 2D gels
• In-solution tryptic digestion of proteins
Trypsin is a serine protease that specifically cleaves at the carboxyl side of lysine and arginine residues. The selectivity of this enzyme is critical for reproducible protein digestion and MS-based protein identification. Because chymotrypsin co-purifies with trypsin derived from natural sources, Pierce Trypsin Protease, MS Grade has been treated with TPCK to eliminate chymotrypsin activity, improving digestion specificity. Native trypsin is also subject to autolysis, which can reduce enzyme stability and efficiency. To reduce autolytic degradation, Pierce Trypsin Protease, MS Grade is chemically modified by methylation, yielding a highly active and more stable form of the enzyme.
Pierce Trypsin Protease, MS Grade0.5 hr digestion
RT: 10.56 – 95.40
Rel
ativ
e ab
und
ance
Pierce Trypsin Protease, MS Grade3 hr digestion
PromegaTrypsin Gold, MS Grade0.5 hr digestion
PromegaTrypsin Gold, MS Grade3 hr digestion
Time (min)
15.45
15.31
15.73 16.25 19.25 24.7827.89
37.80
57.77
57.89
94.1888.6682.7580.8977.0271.6170.6661.8261.4859.5357.63
48.83
49.4952.97
44.2240.96
35.5235.06
17.9315.66
20.0421.88 23.91
25.11
28.79 30.74
34.50 34.82 38.96
41.32
45.14
47.0849.64
50.1550.59
53.50
58.6861.77
65.24
68.0768.71
70.31
71.87 75.6181.35
84.18 88.8394.26
80.9977.43
18.84 26.52 27.95 34.33
35.4535.6335.91
38.3940.96 45.16 47.48
49.8453.56
58.38
58.54
61.86 62.25 70.2272.18 77.42 81.13 82.33 88.97 94.63
100
80
60
40
20
0
2015 25 30 35 40 45 50 55 60 65 70 75 80 85 90 95
18.9620.24 22.02 30.43
33.49
35.0335.21
35.94 40.5143.07
46.92
53.83
53.2654.50 61.26
63.99
67.36
68.1371.08
77.6180.52
83.47 88.31 91.5559.27
100
80
60
40
20
0100
80
60
40
20
0100
80
60
40
20
0
57
Sample preparation

Figure 44. Comparison of the cleavage selectivity of MS-grade trypsin products. Five-protein mixture samples (10 µg) were digested with Pierce Trypsin Protease or Promega Trypsin Gold for 3 hr and analyzed by LC-MS using a Velos Pro Mass Spectrometer. Data analysis was performed using a Mascot search engine with “no enzyme” digestion settings. Greater than 95% cleavage selectivity for lysine and arginine (K/R) was observed for Pierce Trypsin Protease.
0
1
2
3
4
Pierce Trypsin Protease, MS Grade
Promega Trypsin Gold,MS Grade80
85
90
95
100
Amino acid residue at C terminus
Tota
l id
enti
fied
pep
tid
es (%
)
A C E F G H I K/R L M N P Q S T V W Y
Table 36. Percent sequence coverage of selected proteins in a protein sample digest.
Pierce Trypsin Protease, MS Grade
Promega Trypsin Gold, MS Grade
Protein 30 min 3 hr 30 min 3 hr
Glutamate dehydrogenase
49 51 54 55
Myoglobin 68 82 68 78
Lactoperoxidase 41 45 46 45
Transferrin 63 64 67 64
Table 37. Percent sequence coverage for Erk1. Results were obtained by digestion with individual proteases, MS/MS analysis with CID or ETD fragmentation methods, and pairwise combination of search results in Thermo Scientific™ Proteome Discoverer™ MultiConsensus Reports for Erk1.
Sequence coverage (%)
CID ETD
Trypsin 87 51
Lys-C 45 52
Glu-C 47 43
Trypsin alone + Lys-C alone 93 74
Trypsin alone + Glu-C alone 93 71
Table 35. Comparison of Pierce Trypsin Protease, MS Grade to MS-grade trypsin from other suppliers. Enzyme purity, specific activity, chymotrypsin activity, activity retained after incubation, and cost per microgram of Pierce, Sigma, and Promega MS-grade trypsin proteases.
SpecificationsPierce
Trypsin ProteaseSigma Proteomics
Grade Trypsin Promega Trypsin Gold
Purity >95% Not specified Not specified
Specific activity (BAEE units) >15,000 >10,000 >15,000
Chymotrypsin activity (BTEE units) <0.1 Not specified Not specified
Activity retained after 3 hr incubation at 37°C, pH 7.8
>85% Not specified >85%
Cost/µg (based on 2014 US list price) $0.56–$0.45 $1.85–$0.50 $1.08
In addition to possessing high specific activity and being resistant to autolytic digestion, Pierce Trypsin Protease, MS Grade can tolerate commonly used partially denaturing conditions such as 0.1% SDS, 1M urea or 10% acetonitrile. Pierce Trypsin Protease is most active in pH ranges of pH 7 to 9 and can be reversibly inactivated at pH <4. The lyophilized enzyme is also stable for >1 year when stored at −20°C.
Pairwise combinations of search results from two protease or fragmentation methods reveal complementary results. For example, trypsin digestion of Erk1 produces 87% coverage with CID but, when combined with Lys-C results, the total coverage increased to 93%. Peptide and protein sequence identifications are also improved for in-gel digestions of complex cell lysates. The combination of results from multiple individual protease digestions improves the number and confidence of protein identifications.
58
Protein sample preparationProtein digestion

Figure 45. Performance of Pierce Lys-C Protease, MS Grade compared to equivalent products from other suppliers. A549 cells were prepared and digested with Lys-C Protease from Thermo Scientific (Cat. No. 90051), Roche, and Promega at an enzyme:protein ratio of 1:50. The digested sample peptides were separated using a C18 column for analysis using an Orbitrap Fusion Tribrid Mass Spectrometer for a 3 hr gradient (in duplicate). (A) LC-MS spectra of the Pierce Lys-C digest of A549 cell lysate. (B) Total proteins identified using the different suppliers. (C) Total peptides identified, including number of missed cleavages using different suppliers. Pierce Lys-C outperformed the other suppliers by providing the lowest missed cleavages and the highest number of peptides and proteins identified.
Lys-C Protease, MS GradeHighly active alternative enzyme to trypsin that increases digestion efficiency
Thermo Scientific™ Lys-C Protease, MS Grade is purified native Lys-C protease that has been validated for maximum activity and stability in proteomic applications.
Lys-C Protease, MS Grade is a 30 kDa serine protease isolated from Lysobacter enzymogenes that hydrolyzes proteins specifically at the carboxyl side of lysine. It can be used for in-solution or in-gel digestion workflows to produce peptides for LC-MS/MS protein identification. Lys-C has high activity and specificity for lysine residues, resulting in larger peptides and less sample complexity than trypsin (i.e., fewer peptides). Lys-C can also cleave lysines followed by prolines and remains active under highly denaturing conditions (i.e., 8 M urea). For this reason, Lys-C is often used for sequential digestion of proteins followed by trypsin to decrease tryptic missed cleavages. These unique properties of Lys-C help to ensure high digestion efficiency alone or followed by tryptic digestion.
Lys-C prototypic enzymes typically have higher charge states, making it a widely used enzyme for use with ETD fragmentation. Lys-C is also used commonly in phosphopeptide enrichment workflows and with isobaric-tagged peptide quantitation. Because Lys-C generates peptides with primary amines at both the N and C termini of a peptide, each peptide can be double-labeled with
amine-reactive isobaric tags. This results in enhanced peptide ionization and improved limits of quantitation since more fragment ions can be reisolated during MS3 acquisition.
Highlights:• Enhanced digestion—when used in tandem with
trypsin, decreases tryptic missed cleavages
• Increased sequence coverage—better protein characterization results from overlapping peptides with complementary chromatographic, ionization, and fragmentation properties
• Carboxyl lysine cleavage specificity—at least 90% for a complex protein sample
• Efficient—protein digestion can be completed in 2 hr at 37°C
• Versatile—effective even under highly denaturing conditions (e.g., 8 M urea, 2 M guanidine HCl, 1% SDS, 2% CHAPS, and 40% acetonitrile)
• Stable—store lyophilized protease for up to 1 year at –20°C
Applications:• Improved sequence coverage of protein digests
• De novo sequencing
• Epigenetic studies
• In-gel digestion of proteins
3,500 12,000
11,000
10,000
9,000
8,000
7,000
6,000
5,000
4,000
3,0002,000
1,000
0
3,000
2,500
2,000
1,500
1,000
500
0Thermo
Scienti�cPromega Roche Thermo
Scienti�cPromega Roche
Fully cleaved1 or 2 missed
A. Total ion chromatogram (TIC) of A549 cells digestested with Lys-C Protease, MS Grade.
B. Proteins identified after Lys-C digestion.
C. Peptides identified after Lys-C digestion.
20 30 40 50 60 70 80 90 100 110 120 130 140 150 160 170 180 190 200 210 220
Time (min)
05
101520253035404550
55
6065707580859095
100
Rel
ativ
e ab
un
dan
ce
3,500 12,000
11,000
10,000
9,000
8,000
7,000
6,000
5,000
4,000
3,0002,000
1,000
0
3,000
2,500
2,000
1,500
1,000
500
0Thermo
Scienti�cPromega Roche Thermo
Scienti�cPromega Roche
Fully cleaved1 or 2 missed
59
Sample preparation

Pierce LysN Protease, MS GradeFast-digesting alternative to trypsin that yields complementary peptides
Thermo Scientific™ Pierce™ LysN Protease, MS Grade is highly purified native Lys-N protease that has been validated for maximum activity and stability in proteomic applications. This zinc metalloprotease is derived from Grifola frondosa and has been highly purified to improve stability, specific activity and cleavage selectivity. Unlike trypsin, Lys-N protease cleaves at the amino terminus of lysine residues. As a result, the peptides generated by Lys-N are longer than those generated by trypsin and have more prevalent charged amino-terminal peptide fragments. In addition, Pierce LysN Protease is more promising for epigenetic MS applications than Lys-C or trypsin because it is capable of cleaving methylated lysines [1]. The thermostability and chemical compatibility with denaturants make Pierce LysN Protease ideal for digestion of complex protein samples for “shotgun” proteomics [2].
Pierce LysN Protease is active over a wide range of temperatures and denaturing conditions. Efficient protein
digestion can be completed in 2 hr at 50°C or 4 hr at 37°C; however, digestion is possible at both lower and higher temperatures. Lys-N also remains active under moderate denaturing conditions including 0.1% SDS, 6 M urea or heating to 70°C. Maximal Lys-N activity occurs at pH 7–9. The lyophilized enzyme is stable for 2 years when stored at –20°C, and reconstituted stock solutions of Lys-N are stable at –80°C for 2 years or –20°C for 1 year.
Highlights:• Thermostable—allows better digestion at higher
temperatures (e.g., 50°C) in less time
• Complementary to tryptic digests—different cleavage site from that of trypsin
• High purity—no additional protease activity detected
• N-terminal lysine cleavage specificity—≥90% for a complex protein sample
• Versatile—enzyme is effective over a wide temperature range and denaturing conditions
Applications:• Improved sequence coverage of protein digests
• De novo sequencing with CID
• Epigenetic studies
• In-solution digestion of proteins
Figure 46. Exceptional digestion performance with Pierce LysN Protease, MS Grade. Base peak LC-MS chromatogram of an A549 cell lysate sample digested with Pierce LysN Protease. The sample (50 µg) was prepared with the Pierce Mass Spec Sample Prep Kit for Cultured Cells and digested with Lys-N at a 1:75 protein:enzyme ratio and incubated at 37°C for 4 hr. Digested sample peptides (0.5 µg) were separated using nanoflow high-pressure liquid chromatography and analyzed on a Thermo Scientific™ Orbitrap™ XL Mass Spectrometer.
RT: 0.00 - 139.99
0 10 20 30 40 50 60 70 80 90 100 110 120 130
Time (min)
05
101520253035404550556065707580859095
100
Rel
ativ
e ab
un
dan
ce
128.00897.28
127.57415.21
54.46581.30
22.49482.75
57.87599.83
22.77599.76 70.14
668.81 126.93947.84
44.60611.79 128.21
451.1662.88401.23
119.76966.5743.91
435.2524.47454.72
38.93576.27
78.64510.27
35.06745.41 133.51
639.6220.54453.22
11.15409.89 81.62
873.42106.41655.85
98.19709.8671.97
637.33 108.24551.306.10
455.24 96.79659.96
89.89565.32
NL:8.93E7Base Peak
MS again
References1. Taouatas N et al. (2010). Evaluation of metalloendopeptidase Lys-N protease
performance under different sample handling conditions. J Proteome Res 9(8):4282–4288.
2. Taouatas N et al. (2008). Straightforward ladder sequencing of peptides using a Lys-N metalloendopeptidase. Nat Methods 5(5):405–407.
Table 38. Percent sequence coverage of selected proteins in an A549 cell lysate upon in-solution digestion with Pierce LysN Protease or trypsin. The total (merged) sequence coverage represents the combined coverage of separate Lys-N and trypsin digestions followed by LC-MS/MS analysis with CID.
Protein Lys-N Trypsin Merged
Moesin 21% 24% 37%
Src substrate cortactin 25% 10% 30%
Glutamate dehydrogenase 1 16% 12% 28%
Epoxide hydrolase 1 13% 14% 23%
60
Protein sample preparationProtein digestion

Asp-N Protease, MS GradeEnzyme complementary to trypsin that cleaves at the amino side of aspartate residues
Thermo Scientific™ Asp-N Protease is a 27 kDa metallo- proteinase, isolated from a mutant of Pseudomonas fragi, that hydrolyzes proteins specifically at the amino side of aspartate and cysteic acid residues with high specificity. Asp-N Protease can be used alone or in parallel with trypsin or other proteases to produce protein digests for peptide mapping and protein sequencing due to its highly specific cleavage of peptides, generating a limited number of peptide fragments. Asp-N Protease is suitable for either in-solution or in-gel digestion workflows. This MS-grade Asp-N Protease is packaged in a convenient lyophilized, stable format (2 µg) and is stable for up to 1 year when stored at –20°C.
Cysteic acids result from the oxidization of cysteine residues. Cleavage can also occur at glutamic residues; however, the rate of cleavage at the glutamyl residues is significantly lower than that at the aspartic acid residues.
Asp-N Protease can efficiently digest proteins in 2–20 hr at 37°C, and remains active under denaturing conditions such as 1 M urea, 2 M guanidine HCl, 0.1% SDS, 2% CHAPS, or 10% acetonitrile. Asp-N activity is optimal in the pH range of 6–8.
Highlights:• Increased sequence coverage—better protein
characterization results from overlapping peptides with complementary chromatographic, ionization, and fragmentation properties
• High specific activity—>20,000 U/mg protein
• N-terminal arginine cleavage specificity—≥90% for a complex protein sample
Applications:• Improved sequence coverage of protein digests
• In-gel or in-solution digestion of proteins
Glu-C Protease, MS GradeEnzyme complementary to trypsin that cleaves at the carboxyl side of glutamate
Thermo Scientific™ Glu-C Protease, also referred to as V-8 protease, is a 27 kDa serine protease, isolated from Staphylococcus aureus, that hydrolyzes proteins specifically at the carboxyl side of glutamic acids with high specificity. Glu-C Protease can be used alone or in combination with trypsin or other proteases to produce protein digests for peptide mapping and protein sequencing due to its highly specific cleavage of peptides, generating a limited number of peptide fragments. Only the glutamic residues are cleaved in ammonium bicarbonate and ammonium acetate buffers, while glutamic and aspartic residues are cleaved in phosphate buffers. Glu-C Protease is suitable for either in-solution or in-gel digestion workflows. This MS-grade Glu-C is packaged in a convenient, lyophilized format (5 x 10 µg) and is stable for up to 1 year when stored at –20°C.
Glu-C Protease can efficiently digest proteins in 5–18 hr at 37°C, and remains active under denaturing conditions such as 2 M urea, 1 M guanidine HCl, 0.1% SDS, 2% CHAPS, or 20% acetonitrile. Glu-C Protease activity is optimal at pH 8.
Highlights:• Increased sequence coverage—better protein
characterization results from overlapping peptides with complementary chromatographic, ionization, and fragmentation properties
• High specific activity—>500 U/mg protein
• C-terminal glutamine cleavage specificity—at least 90% for a complex protein sample
Applications:• Improved sequence coverage of protein digests
• In-gel or in-solution digestion of proteins
61
Sample preparation

Chymotrypsin Protease, MS GradeEnzyme complementary to trypsin that cleaves at the carboxyl side of tyrosine, phenylalanine, tryptophan, and leucine
Thermo Scientific™ Chymotrypsin Protease, MS Grade is a 25 kDa serine protease derived from bovine pancreatic extracts. This enzyme generates a larger number of shorter peptides than trypsin. This MS-grade chymotrypsin is packaged in a convenient, lyophilized format (4 x 25 µg).
Two predominant forms of chymotrypsin, A and B, are found in equal amounts in bovine pancreas. They are similar proteins (80% homology) but have different proteolytic characteristics. Both forms of chymotrypsin are present in Chymotrypsin Protease, MS Grade.
The selectivity of this enzyme is important for reproducible protein digestion and MS-based protein identification. Because chymotrypsin copurifies with trypsin derived from natural sources, it has been treated with TLCK to eliminate potential tryptic activity, improving digestion specificity.
In addition to possessing high specific activity, Chymotrypsin Protease, MS Grade can tolerate commonly used partially denaturing conditions, such as 0.1% SDS, 2 M urea, 2 M guanidine HCl, 1% CHAPS, and 30% acetonitrile. The enzyme is most active in the pH 7.5-8.5 range. The lyophilized protease is stable for >1 year when stored at –20°C.
Highlights:• Increased sequence coverage—better protein
characterization results from overlapping peptides with complementary chromatographic, ionization, and fragmentation properties
• High purity—treated with TLCK to eliminate trypsin activity
• High activity—greater than 45 U/mg protein
Applications:• In-gel digestion of proteins from 1D or 2D gels
• In-solution tryptic digestion of proteins
62
Protein sample preparationProtein digestion

In-Gel Tryptic Digestion KitConvenient kit for efficient in-gel protein digestion
The Thermo Scientific™ In-Gel Tryptic Digestion Kit provides a complete set of reagents for performing approximately 150 digestions on colloidal Coomassie- or fluorescent dye–stained protein bands. The kit includes modified porcine trypsin, destaining buffers, reduction reagents, alkylation reagents and digestion buffers along with detailed, easy-to-follow instructions. Each component and step has been optimized to produce clean digests for reproducible MS analysis with high sequence coverage.
Highlights: • Convenient—includes all necessary reagents for
destaining Coomassie- or fluorescent dye–stained proteins, reduction and alkylation of cystines, and tryptic digestion
• Robust—the procedure and reagents produce reliable digestions and data generation using a wide range of conditions without optimization
• Accurate—contains highly purified and modified MS-grade trypsin that shows no chymotryptic activity and minimal autolytic activity
Figure 48. Schematic protocol for the In-Gel Tryptic Digestion Kit.
Figure 47. MALDI-TOF MS analysis of BSA digest. Ten nanograms (150 fmol) of BSA was separated by SDS-PAGE and stained with GelCode Blue Stain Reagent and then processed with the In-Gel Tryptic Digestion Kit. The resulting digest was treated with Thermo Scientific™ Pierce™ C18 Spin Columns (Cat. No. 89870) and then subjected to analysis on an Applied Biosystems™ Voyager-DE™ Pro MALDI-MS in positive ion, linear, delayed-extraction mode. Database searches identified BSA with 47.0% sequence coverage.
100
90
80
70
60
50
40
30
20
10
0700 1,4201,060 1,780 2,140 2,500
Mass (m/z)
Inte
nsi
ty %
2.0E+4
927.49
1138.52
1163.63 1305.711399.67
1439.80
1639.94
1907.92
1927.80
1880.92
1747.711724.83
2033.962045.03
1567.74
1249.61
842.51
200 µL destaining solution
1. Destain gel slices (2 x 30 min at 37°C)
2. Reduce (10 min at 60°C)
3. Alkylate Perform in the dark (1 hr at room temperature)
30 µLalkylation buffer
30 µLreducing buffer
4. Wash (2 x 15 min at 37°C)
Steps 2–4 are optional, but recommended.
5. Shrink and dry gel slice (25 min)
6. Digest (4 hr at 37°C or overnight at 30°C)
35 µL digestion buffer
and activated trypsinAdd 50 µL 100% ACNExcised protein
bands.Add 200 µL
destaining solution
63
Sample preparation

In-Solution Tryptic Digestion and Guanidination KitConvenient kit for in-solution protein digestion
Accurate identification of proteins and analysis of PTMs by MS require accurate and complete protein digestion and peptide modification. The Thermo Scientific™ In-Solution Tryptic Digestion and Guanidination Kit provides an optimized procedure and reagents for approximately 90 protein digests.
Trypsin specifically cleaves peptide bonds at the carboxyl side of arginine and lysine residues, generating a peptide map unique to each protein. Analysis of tryptic peptides by MS provides a powerful tool for identifying proteins or analyzing PTMs. Reliable mass spectral analysis requires accurate and complete digestion of the target proteins as well as modification of peptides to optimize ionization and detection. The In-Solution Tryptic Digestion and Guanidination Kit contains optimized procedures and reagents for reduction, alkylation, digestion, and guanidination to provide reliable MS analysis of approximately 90 protein samples containing 0.025−10 µg of protein.
The In-Solution Tryptic Digestion and Guanidination Kit contains a proteomics-grade modified trypsin that produces clean, complete digests with minimal autolysis products present. A reduction and alkylation protocol
eliminates disulfide bonds, improving peptide identification and simplifying data analysis.
Proteins processed with the In-Solution Tryptic Digestion and Guanidination Kit produce clean and reliable mass spectra with high sequence coverage (Table 39).
Using the guanidination procedure to convert lysines to homoarginines enhances the overall signal intensity of lysine-containing peptides by an average of 1.5 to 4.0 times, eliminating the ionization bias for peptides with a terminal arginine and improving sequence coverage and the reliability of data analysis.
Highlights: • Optimized—complete digestion is achieved for
0.025−10 µg protein samples with minimal to no side reactions
• Quick—protein can be reduced, alkylated, digested, and guanidinated all in one day
• Convenient—kit includes reagents for reduction, alkylation, digestion, and guanidination
Figure 49. Protocol for the In-Solution Tryptic Digestion and Guanidination Kit.
Table 39. Sequence coverage data for tryptic digestions with and without guanidination for three proteins.
Sequence coverage
Protein No guanidination With guanidination*
Lysozyme (14 kDa)
6/8 peptides 66/86 aa** 77%
8/8 peptides86/86 aa**100%
Myoglobin (17 kDa)
6/12 peptides78/134 aa**58%
8/12 peptides90/134 aa**67%
BSA(66 kDa)
25/44 peptides318/489 aa**65%
28/44 peptides344/489 aa**70%
* High levels of sequence coverage were obtained for all test proteins processed with the In-Solution Tryptic Digestion and Guanidination Kit, especially when the guanidination procedure was used. Sequence coverage was based only on those peptides expected to be identified based on scanning from 600–2,000 m/z.
** aa = amino acids
20 min atroom temperature
Alkylate
3 hr at 37°C
Digest
5 min at 95°C
1 2 3Denature/
reduce
2 hr at 37°Cor overnight at 30°C
Digest Process forMS analysis
12 min at 65°C
Guanidinate
Split fornon-guanidinated control (optional)
4 6
5
5
64
Protein sample preparationProtein digestion

SHHS
OH
OH
DTTMW 154.25
Bond-Breaker TCEP Solution, Neutral pHEfficient, odor-free alternative for sample reduction prior to SDS-PAGE analysis
Thermo Scientific™ Bond-Breaker™ TCEP Solution, Neutral pH is a stable, 0.5 M solution of the thiol-free, phosphine-based compound, TCEP (tris(2-carboxyethyl)phosphine)— a potent, odorless, thiol-free reducing agent with broad application to protein and other research involving reduction of disulfide bonds.
This product is an effective and convenient replacement for 2-mercaptoethanol (2-ME) or DTT in SDS-PAGE sample buffers. The neutral pH of this reagent provides sharp bands and avoids exposing proteins to the strong acid of TCEP·HCl, which can result in hydrolysis and carbohydrate modification.
Highlights: • Odorless—unlike DTT and 2-ME, TCEP is odor-free,
contributing to a healthier lab environment
• Specific—selective and complete reduction of even the most stable water-soluble alkyl disulfides
• Fast and efficient—reduces most peptide or protein disulfides over a broad range of pH, salt, detergent, and temperature conditions within minutes
• Stable—resistant to air oxidation; nonvolatile and nonreactive toward other functional groups found in proteins
• Compatible—removal of the reducing agent is not necessary before most applications, (e.g., histidine-tagged protein purification, maleimide conjugations), because TCEP does not contain sulfhydryl groups
Pierce DTT (Dithiothreitol), No-Weigh FormatPopular disulfide reducing agent in highly convenient packaging
Dithiothreitol (DTT) is a popular reducing agent for many protein research applications, including reducing polyacrylamide electrophoresis (SDS-PAGE) [1]. The Thermo Scientific™ Pierce™ DTT No-Weigh™ Format consists of a 48-microtube tray containing dry, stable, single-use aliquots of the DTT. Just puncture the seal of one microtube and add 100 µL of water or buffer. In just a few seconds you will have a solution of 500 mM DTT, ready to use or further dilute for a variety of laboratory methods.
The unique packaging ensures that the reducing agent is at full strength and able to protect proteins from oxidative damage or reduce any disulfides prior to electrophoresis.
Highlights:• Convenient—just add 100 µL water to make a 500 mM
DTT solution in seconds
• Fresh—full reducing strength for every use; no need to waste store stock solutions
Reference1. Zahler WL, Cleland WW. (1964). Biochemistry 3:480–482.
65
Sample preparation
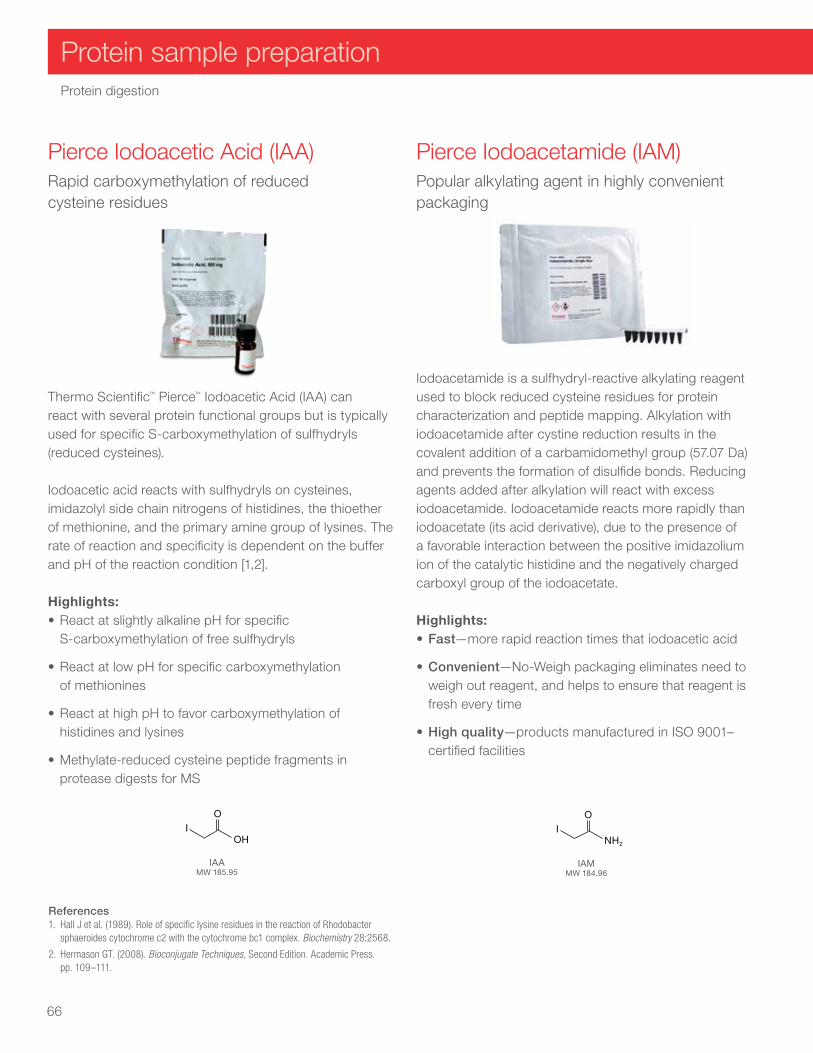
Pierce Iodoacetic Acid (IAA) Rapid carboxymethylation of reduced cysteine residues
Thermo Scientific™ Pierce™ Iodoacetic Acid (IAA) can react with several protein functional groups but is typically used for specific S-carboxymethylation of sulfhydryls (reduced cysteines).
Iodoacetic acid reacts with sulfhydryls on cysteines, imidazolyl side chain nitrogens of histidines, the thioether of methionine, and the primary amine group of lysines. The rate of reaction and specificity is dependent on the buffer and pH of the reaction condition [1,2].
Highlights:• React at slightly alkaline pH for specific
S-carboxymethylation of free sulfhydryls
• React at low pH for specific carboxymethylation of methionines
• React at high pH to favor carboxymethylation of histidines and lysines
• Methylate-reduced cysteine peptide fragments in protease digests for MS
Pierce Iodoacetamide (IAM)Popular alkylating agent in highly convenient packaging
Iodoacetamide is a sulfhydryl-reactive alkylating reagent used to block reduced cysteine residues for protein characterization and peptide mapping. Alkylation with iodoacetamide after cystine reduction results in the covalent addition of a carbamidomethyl group (57.07 Da) and prevents the formation of disulfide bonds. Reducing agents added after alkylation will react with excess iodoacetamide. Iodoacetamide reacts more rapidly than iodoacetate (its acid derivative), due to the presence of a favorable interaction between the positive imidazolium ion of the catalytic histidine and the negatively charged carboxyl group of the iodoacetate.
Highlights:• Fast—more rapid reaction times that iodoacetic acid
• Convenient—No-Weigh packaging eliminates need to weigh out reagent, and helps to ensure that reagent is fresh every time
• High quality—products manufactured in ISO 9001–certified facilities
References1. Hall J et al. (1989). Role of specific lysine residues in the reaction of Rhodobacter
sphaeroides cytochrome c2 with the cytochrome bc1 complex. Biochemistry 28:2568.
2. Hermason GT. (2008). Bioconjugate Techniques, Second Edition. Academic Press. pp. 109–111.
OI
OH
IAAMW 185.95
OI
NH2
IAMMW 184.96
66
Protein sample preparationProtein digestion

Pierce Methyl Methanethiosulfonate (MMTS)Reversibly blocks cysteines and other sulfhydryl groups
Thermo Scientific™ Pierce™ Methyl Methanethiosulfonate (MMTS) is a small compound that reversibly blocks cysteines and other sulfhydryl groups, enabling the study of enzyme activation and other protein functions.
MMTS is a sulfhydryl-reactive compound that can reversibly sulfenylate thiol-containing molecules. Reacting MMTS with reduced sulfhydryls (-SH) results in their modification to dithiomethane (-S-S-CH3). Treatment with reducing agents such as dithiothreitol (DTT), 2-ME, or TCEP will cleave the disulfide groups to restore the original sulfhydryl. MMTS is commonly used to study biochemical pathways involving thiol-dependent enzymes.
Highlights:• Converts sulfhydryl groups on cysteine side chains into
-S-S-CH3
• Reaction is reversible with DTT or TCEP, restoring the free sulfhydryl
• Used to modify thiol groups in creatine kinase
Learn more at thermofisher.com/msdigestion
Pierce N-Ethylmaleimide (NEM)Permanently blocks sulfhydryl groups
Thermo Scientific™ Pierce™ N-Ethylmaleimide (NEM) is a small compound that forms stable, covalent thioether bonds with sulfhydryls (e.g., reduced cysteines), enabling them to be permanently blocked to prevent disulfide bond formation.
NEM is an alkylating reagent that reacts with sulfhydryls. At pH 6.5−7.5, the maleimide reaction is specific for sulfhdryls; however, at pH >7.5, reactivity with amino groups occurs. Maleimide groups react with sulfhydryls by nucleophilic attack of the thiolate anion on one of the carbons of the double bond. When sufficient sulfhydryls have been blocked, the reaction can be monitored by measuring the decrease in absorbance at 300 nm as the double bond becomes a single bond. The resulting thioether group is nonreversible and terminates in an ethyl group, blocking or capping the sulfhydryl.
Highlights:• Permanently block sulfhydryls to prevent disulfide
bond formation
• Monitor the reaction by measuring the decrease in absorbance at 300 nm
• Block sulfhydryl-containing reagents that interfere in enzyme assays
CH3
O
O
N
NEMMW 125.13
O
O
S
S
CH3
H3C
MMTSMW 126.20
67
Sample preparation

Successful analysis of low-abundance
proteins and/or the identification
of posttranslationally modified
peptides often require several steps:
enrichment, fractionation, and/or
clean-up. Phosphorylation is arguably
the most intensively studied PTM.
Phosphoproteins are integral to global
cellular signaling in disease and key to
understanding biological regulation.
Unfortunately, many phosphopeptides are present at very low levels in a typical cell lysate. Initial approaches focused on enrichment with immobilized metal ion affinity chromatography (IMAC). However, enrichment and recovery of phosphopeptides using an IMAC system
strongly depends on the type of metal ion and column material, and is often hampered by the nonselective enrichment of acidic residues. An alternative strategy is to carry out metal-oxide affinity chromatography using aluminum, titanium, zirconium, and other metal oxides; this was successfully applied for selective enrichment of phosphopeptides.
Many biologically relevant changes in the proteome occur at the mid-to-low range of the protein abundance scale. The fractionation of complex peptide mixtures from sample digests enables deeper proteome sequencing through increased protein identifications and sequence coverage. Numerous strategies are available, including strong cation exchange (SCX), peptide isoelectric focusing (pIEF), and SDS-PAGE. Similar to SCX peptide fractionation methods, high-pH reversed-phase fractionation enables peptide fractionation orthogonal to low-pH reversed-phased separation. In contrast to SCX fractionation, samples fractionated by high-pH reversed-phase fractionation do not require desalting before LC-MS analysis.
Peptide enrichment and fractionation
Table 40. Peptide enrichment and fractionation kit selection guide.
Fe-NTA Phosphopeptide Enrichment Kit
TiO2 Phosphopeptide Enrichment Kit
Magnetic TiO2 Phosphopeptide Enrichment Kit
High pH Reversed- Phase Peptide
Fractionation Kit
Target Phosphopeptides Phosphopeptides Phosphopeptides All peptidesBinding/labeling mechanism
Metal-chelate affinity to phosphate groups
Metal-oxide affinity to phosphate groups
Metal-oxide affinity to phosphate groups
Hydrophobic interaction
Loading capacity/rxn* 0.5–5 mg 0.5–3 mg 100 µg 10–100 µgBase support IMAC-Agarose resin Spherical porous
TiO2 beadTiO2 coated magnetic particles
Hydrophobic polymer based resin
Format Spin column Tip Magnetic bead Spin columnProcessing time 45–60 min 45–60 min 15 min 30–60 min
* Based on a standard HeLa protein digest sample
68
Protein sample preparation

Phosphopeptide Enrichment Kits
Phosphopeptides have high hydrophilicity and are low in abundance, resulting in poor chromatography, ionization, detection, and fragmentation. Phosphopeptide enrichment is therefore essential to successful MS analysis. We offer a variety of ligand and formats for the enrichment of phosphopeptides, including titanium dioxide (TiO2) and Fe-NTA immobilized metal affinity chromatography (IMAC) resins. Because of unique binding characteristics of each ligand, Fe-NTA IMAC and TiO2 phosphopeptide enrichment kits bind a complementary set of phosphopeptides from complex samples.
Choosing between the two ligands depends on the researchers’ goals. Although these two ligands similar numbers of phosphopeptides per sample, there is only a 50% overlap between the identified phosphopeptides (Figure 50). Although there is a slight bias using TiO2
enrichment toward multiply phosphorylated (i.e., two or more) peptides (Figure 51), each ligand type clearly has affinity for different phosphopeptide sequences. In contrast to our TiO2 tip or magnetic supports, Fe-NTA spin columns have a much higher binding capacity and are recommended if additional fractionation steps will be utilized postenrichment for deeper proteome coverage and the detection of low-abundance phosphopeptides (Figure 52).
Figure 50. Fe-NTA and TiO2 resins enrich a complementary set of phosphopeptides. The Venn diagram shows the number of phosphopeptides identified from 1.0 mg of peptides prepared from nocodazole-treated HeLa cells. Phosphopeptides were enriched with the Thermo Scientific™ High-Select™ Fe-NTA Phosphopeptide Enrichment Kit and the High-Select™ TiO2 Phosphopeptide Enrichment Kit. Eluted peptides were analyzed with Trap column and Thermo Scientific™ Acclaim™ PepMap™ RSLC C18 (2 μm, 100Å, 75 μm x 50 cm) on a Orbitrap Fusion Tribrid Mass Spectrometer.
Fe-NTA 3,983 4,3644,929 TiO2
Figure 51. The multiple phosphopeptides profile. Both the Fe-NTA kit and TiO2 kit effectively capture peptides with multiple phosphates. TiO2 enrichment had a slight bias toward multiple phosphopeptides.
Phosphate per peptide
Fe-NTA kit
TiO2 kit
Single0
20
84
72
1120
1 3
40
60
80
100
Pho
spho
pep
tide
(%)
Double Triple
Figure 52. Enrichment and yield obtained from increasing sample sizes. Each Fe-NTA column or TiO2 spin tip can enrich phosphopeptides from 0.5–5 mg or from 0.5-3 mg of a total protein digest in the starting samples, respectively. Phosphopeptide yield, determined by the Thermo Scientific™ Pierce™ Quantitative Colorimetric Peptide Assay
(Cat. No. 23275), was proportional to sample size with consistent ≥90% selectivity. The Fe-NTA kit can enrich five times more phosphopeptides than TiO2 kits; it is recommended for users who have >2 mg of complex biological sample and need to get >50 μg phosphopeptide yield for further process such as fractionation.
Phosphopeptide yield with increasing sample size per Fe-NTA microspin column Phosphopeptide yield with increasing sample size per TiO2 spin tip
0.5mg
0
5
10
15
20
25
30
35
0
20
40
60
80
100
0
2,000
4,000
6,000
8,000
10,000
12,000
16,000
14,00094 94
92 90
3.0
6.3
15.5
23.7
1mg
3mg
Starting sample size (mg)
Yie
ld (µ
g)
Sel
ectiv
ity
Starting sample size (mg)
0.5mg
1mg
3mg
5mg
5mg
0.5mg
90 92
0
20
40
60
80
100
120
140
160
180
200
0 0
20
40
60
80
100
0
2,000
4,000
6,000
8,000
10,000
12,000
14,000
10
20
30
40
50
60
70
80
90
10092 90 90
90
92 92
1428
80
136
1mg
3mg
Starting sample size (mg)
Yie
ld (µ
g)
Sel
ectiv
ity
Sel
ectiv
ity
Starting sample size (mg)
0.5mg
1mg
3mg
5mg
5mg
Selectivity (%)Total peptidesYield Phosphopeptides
69
Sample preparation

High-Select Fe-NTA Phosphopeptide Enrichment KitFe-NTA format optimized for high-binding capacity of phosphopeptides
The Thermo Scientific™ High-Select™ Fe-NTA Phosphopeptide Enrichment Kit enables fast and efficient enrichment of phosphorylated peptides with greater than 90% specificity. This new and improved kit contains preformulated buffers and ready-to-use spin columns that provide a simplified and more rapid (45–60 min) procedure to enrich phosphopeptides from protein digests or peptide fractions for mass spec analysis. Each prefilled spin column contains a phosphopeptide-specific resin that offers excellent binding and recovery properties for enriching up to 150 μg of phosphopeptides. Each column has a loading capacity of 0.5–5 mg of a total protein digest and phosphopeptide yields are typically 2–4% of the starting sample. This kit fully complements our lysis, reduction, alkylation, and digestion reagents, along with C18, graphite spin, and high pH reversed-phase fractionation columns to provide a complete workflow for phosphopeptide enrichment.
Highlights:• Complete—kit includes all columns and buffers for
optimized phosphopeptide enrichment
• Convenient—prefilled spin-columns and ready-to-use buffers enable easy sample processing
• High binding capacity—each column enriches up to 150 μg of phosphopeptides from 5 mg of protein digest
• High specificity—recover phosphopeptides with >90% selectivity
• Excellent recovery—enriches more total and unique phosphopeptides than other commercially available resins
• Complementary—enriches a unique set of phosphopeptides that complements our TiO2 kit
Figure 53. New High-Select Fe-NTA kit with significantly improved selectivity and yield. The average selectivity is 95% ± 2% per 1 mg of HeLa protein digest used for the enrichment. Phosphopeptide yield is improved 4-fold with the new Fe-NTA kit.
Previous kit
Fe-NTA
(8 µg)Newly optimized
(33 µg)
Total unique peptidesPhosphopeptidesSelectivity (%)
3,000
70
3,932
6,045
99
0 0
20
60
80
100
40
6,000
9,000
# of
pep
tides
Sel
ectiv
ity (%
)
70
Protein sample preparationPeptide enrichment and fractionation

High-Select TiO2 Phosphopeptide Enrichment KitTiO2 spin tips selective for phosphopeptides
The Thermo Scientific™ High-Select™ TiO2 Phosphopeptide Enrichment Kit enables efficient isolation of phosphorylated peptides from complex and fractionated protein digests for analysis by MS. This new and improved kit has eliminated a toxic component and provides a simplified and more rapid (45–60 min) procedure to enrich phosphopeptides from protein digests or peptide fractions for mass spec analysis. The spherical, porous TiO2 resin spin tips and optimized buffers provide enhanced identification and enrichment of phosphopeptides with greater than 90% specificity. Each tip has a loading capacity of 0.5–3 mg of total protein digest and phosphopeptide yields are typically 1–3% of starting sample tip load. The easy-to-use protocol produces a high yield of clean phosphopeptide samples ready for MS analysis. This kit fully complements our lysis, reduction, alkylation, digestion, and high-pH reversed-phase fractionation columns to provide a complete workflow for phosphopeptide enrichment.
Highlights:• Complete—kit includes all columns and buffers for
optimized phosphopeptide enrichment
• Convenient—spin-tip format enables parallel processing of multiple samples
• Highly specific—recovers phosphopeptides with >85% selectivity
• Complementary—TiO2 enriches a unique set of phosphopeptides that complements our Fe-NTA IMAC kit
Figure 54. Effective enrichment of phosphopeptides by the High-Select TiO2 Kit. The High-Select TiO2 Phosphopeptide Enrichment Kit was used to enrich phosphopeptides from 1 mg of protein digest from HeLa cell extract. The selectivity and yield of the kit was benchmarked against the EMD Millipore ProteoExtract™ Phosphopeptide Enrichment TiO2 Kit. The same amount (1 μg) of eluted phosphopeptide determined by the Pierce™ Quantitative Colorimetric Peptide Assay (Cat. No. 23275) was analyzed on an Orbitrap Fusion Tribrid Mass Spectrometer.
Thermo Scienti�cTiO2
Millipore ProteoExtract
Total peptidesPhosphopeptidesSelectivity (%)
91
47
6,908
1,188
0
2,000
4,000
6,000
8,000
10,000
12,000
0
20
40
60
80
100
# of
pep
tides
Sel
ectiv
ity (%
)
Thermo Scientific EMD Millipore
Selectivity 91% 47%
Phosphopeptides 6,908 1,188
Yield 9.4 µg 70 µg*
Binding capacity 3 µg/mg dry resin 15 µg/mg dry resin
* Interference in Pierce peptide
71
Sample preparation

Pierce Magnetic TiO2 Phosphopeptide Enrichment KitTiO2 magnetic particles for high-throughput phosphopeptide isolation
The Thermo Scientific™ Pierce™ Magnetic TiO2 Phosphopeptide Enrichment Kit is used for isolating phosphopeptides from complex biological samples using titanium dioxide (TiO2)-coated magnetic beads. The TiO2 ligand selectively binds peptides containing phosphorylated serine (Ser), tyrosine (Tyr), or threonine (Thr), enabling phosphopeptide enrichment from protease-digested samples. The isolated phosphopeptides are compatible for analysis downstream by MS (Table 41).
The high-performance superparamagnetic TiO2 particles are validated and optimized for use with high-throughput magnetic platforms such as the KingFisher Flex instruments. The beads also enable premium performance for simple benchtop applications using an appropriate magnetic stand.
Highlights:• Complete MS-compatible kits—include ready-to-use
binding, wash, and elution buffers that are optimized for phosphopeptide enrichment and downstream analysis by MALDI and ESI MS
• Optimized for high-throughput screening—procedure validated for processing 1–96 samples at a time; complete entire assay in about 15 min using a KingFisher Flex Instrument
• Stable affinity ligand—TiO2 is specially coated as a film on the magnetic particles
• Selective—affinity system is selective for phosphorylated Ser, Tyr, and Thr; exhibits minimal nonspecific binding to acidic residues
• Sensitive—affinity format provides more than 1,000x greater sensitivity than traditional IMAC technologies; enables enrichment and MS measurement of less than 100 fmol of phosphoprotein
Table 41. Phosphopeptide enrichment improves MS identification of phosphoproteins. Two milligrams of a tryptic digest prepared from peripheral blood mononuclear cells (lymphocytes) with and without phosphopeptide enrichment were analyzed by MS. Enrichment was performed with the Pierce TiO2 Phosphopeptide Enrichment Kit using the KingFisher 96 Instrument. Samples were analyzed on a LTQ Orbitrap Mass Spectrometer.
Enriched Unenriched
Total number of proteins identified 185 247
Total number of phosphoproteins identified 160 1
Total number of peptides identified 2,347 2,457
Total number of phosphopeptides identified 2,009 7
Total number of unique phosphopeptides identified 177 1
Relative enrichment for phosphopeptides (%) 86 0.3
Figure 55. Major protein functions identified in a phosphoprotein- and phosphopeptide-enriched MS data set using the Pierce Magnetic TiO2 Phosphopeptide Enrichment Kit.
Learn more at thermofisher.com/peptidekits
Transcriptionfactor, 11%
Structural, 2%
RNA, 8%
Receptor, 8%
Phosphatase, 2%
Other function, 5%
Other enzyme, 5%
Kinase, 3%
DNA, 9%
Binding, 44%
ATPase orGTPase, 3%
72
Protein sample preparationPeptide enrichment and fractionation

Column conditioning Sample loading
WashFractionation and elution
(1) Acetonitrile (x2)(2) 0.1% TFA (x2)
Conditionedspin column
Digestsample
Centrifuge at 5,000 x g(2 min)
Centrifuge at 3,000 x g(2 min)
Centrifuge at 3,000 x g(2 min)
Centrifuge at 3,000 x g(2 min)
Peptide elution with step gradient
Waste
Elution solution 1
Flowthroughfraction
Washfraction
Sample fractions1 2 3 4 5 6 7 8
Water
Pierce High pH Reversed-Phase Peptide Fractionation KitEasy-to-use peptide fractionation kit that reduces sample complexity and increases protein identification
The Thermo Scientific™ Pierce™ High pH Reversed-Phase Peptide Fractionation Kit increases protein identification from LC-MS analysis through orthogonal peptide fractionation of complex peptide samples.
Highlights:• Easy to use—resin provided in single-use spin
column format
• Improved protein identifications—protein identifications increased by ≥50% when compared to unfractionated samples
• Reproducible—elution profiles and fractional resolution vary by less than 20%
• Optimized—robust procedure for maximal protein identification and peptide recovery while minimizing fractional overlap
• Compatible—reagents have been validated with a variety of complex samples, including peptides labeled with Thermo Scientific™ Tandem Mass Tag™ (TMT™) reagents
To enable deep proteome sequencing, it is often necessary to reduce the sample complexity by fractionation in an orthogonal dimension prior to LC-MS analysis. The Pierce High pH Reversed-Phase Peptide Fractionation Kit uses high-pH reversed-phase chromatography to separate peptides by hydrophobicity and provides excellent orthogonality to low-pH reversed-phase LC-MS gradients. The kit is designed to improve protein identification through the use of a proprietary reversed-phase resin in an easy-to-use spin column format with a high-pH fractionation protocol. In contrast to strong cation exchange (SCX) fractionation, the high-pH reversed-phase fractions do not require an additional desalting step before LC-MS analysis.
The Pierce High pH Reversed-Phase Peptide Fractionation Kit includes a high-pH solution (0.1% triethylamine) and 12 spin columns containing pH-resistant reversed-phase resin. Each reversed-phase fractionation spin column enables fractionation of 10–100 µg of peptide sample using a microcentrifuge. Native phosphorylated samples labeled with TMT reagents and other complex peptide mixture samples can be fractionated using the kit. Combining the search results generated by the individual fractions improves protein sequence coverage and increases number of identified proteins relative to unfractionated samples
Figure 56. Procedure summary. Peptides are bound to the hydrophobic resin under aqueous conditions and desalted by washing the column with water by low-speed centrifugation. A step gradient of increasing acetonitrile concentrations in a volatile high-pH elution buffer is then applied to the columns to elute bound peptides into 8 different fractions collected by centrifugation. Each fraction is then dried in a vacuum centrifuge and stored until analysis by MS. During LC-MS analysis, peptides in each high-pH fraction are further separated using a low-pH gradient, thus reducing the overall sample complexity and improving the ability to identify low-abundance peptides.
73
Sample preparation

Figure 57. High-pH reversed-phase fractionation profile of 100 µg HeLa cell lysate tryptic digest. (A) Unique peptides and (B) protein groups identified in each elution fraction compared to the total number of identifications from a combined search of all elution fractions and a single injection of unfractionated sample. Over 100% more unique peptides and over 50% more protein groups are identified in the sample upon high-pH reversed-phase fractionation compared to analysis of a no-fractionation sample. (C) Excellent fractional resolution is attained, with only ~30% fractional overlap. The analysis, performed using triplicate sample sets, shows exceptional reproducibility, as indicated by the very narrow error bars.
Figure 58. High-pH reversed-phase fractionation profile of 100 µg HeLa cell lysate tryptic digest labeled with TMT reagent. (A) Unique peptides and (B) protein groups identified in each elution fraction compared to the total number of identifications from a combined search of all elution fractions and a single injection of unfractionated sample. Over 100% more unique peptides and over 50% more protein groups are identified in the sample upon high-pH reversed-phase fractionation compared to analysis of a no-fractionation sample. (C) Excellent fractional resolution is attained, with only ~30% fractionation overlap. The analysis, performed using triplicate sample sets, shows exceptional reproducibility, as indicated by the very narrow error bars.
Un
iqu
e p
epti
de
IDs
Pro
tein
gro
up
IDs
Pep
tid
es (%
)in
ove
rlap
pin
g f
ract
ion
s
0
5,000
10,000
15,000
20,000
30,000
35,000
40,000
25,000
0
500
1,000
1,500
2,000
2,500
3,000
3,500
4,000
4,500
5,000
5,500
0
20
40
60
80
100
10 12.5 15 17
.5 2022.5 25 50
Combined
No fractio
nation
Acetonitrile (%)
5.012
.5 15 17.5 20
22.5 25 50
Combined
No fractio
nation
Acetonitrile (%)
Number of fractions
1 2 3 4 5 6 7 8
A
B
C
Un
iqu
e p
epti
de
IDs
Pro
tein
gro
up
IDs
Pep
tid
es (%
)in
ove
rlap
pin
g f
ract
ion
s
0
0
0
20
40
60
80
100
2,500
5,000
7,500
Flowthro
ughW
ash 5.0 7.5 10.0
12.5
15.0
17.5
20.050.0
Tota
l
No fractio
nation
5,000
Acetonitrile (%)
Flowthro
ughW
ash 5.0 7.5 10.0
12.5
15.0
17.5
20.050.0
Tota
l
No fractio
nation
Acetonitrile (%)
Number of fractions
1 2 3 4 5 6 7 8
10,000
15,000
20,000
25,000
30,000
35,000
40,000
45,000
50,000
55,000A
B
C
74
Protein sample preparationPeptide enrichment and fractionation

After isolation of peptides, salts
and buffers can be removed using
either C18 reversed-phase (RP) or
graphite resin.
The peptides bind to reversed-phase columns in high-aqueous mobile phase; the salts and buffers are then washed off, and the peptides are eluted using a high-organic mobile phase. In RP, HPLC compounds are separated based on their hydrophobic character. As very hydophilic peptides, including phosphopeptides, may bind to C18 resins poorly, graphite spin columns may provide better peptide recovery.
However, C18 and graphite resins do not efficiently remove contaminants such as detergents. Detergent removal from peptide samples is a challenge, especially for MS analysis in which even low detergent concentrations contaminate instruments and interfere with column binding, elution, and ionization.
Detergent removal can be attempted in a number of ways. Acetone or acid precipitation can be used for proteins (not peptides) and generally has poor recovery. Ion exchange chromatography can be used to bind and remove selective detergents, but only if they are anionic or cationic detergents, such as SDS. These methods can be somewhat labor- and/or time-intensive or detergent-specific.
The Thermo Scientific™ Pierce™ detergent removal products contain a proprietary resin that specifically bind a wide variety of detergents. The spin-column format provides a convenient and rapid method for removing detergents before downstream analysis.
Peptide clean-up
Table 42. Peptide clean-up selection guide.
C18 Spin Tips C18 Tips
C18 Spin Columns
Graphite Spin Columns
Detergent Removal Products
Primary application Concentrate, desalt peptides
Concentrate, desalt peptides
Concentrate, desalt peptides
Concentrate, desalt phosphopeptides
Remove detergents
Format(s) Spin tip Tip Spin column Spin column Spin columns, spin plates, loose resin
Resin bed volume 20 µL 100 µL 8 mg 10 mg (in 0.5 mL of slurry)
125 µL–4 mL slurry
Binding capacity or loading volume
10 µg 80 µg 30 µg 100 µg 0.1–1,000 mL
Processing time 5–10 min 5 min 25 min 10 min 15 min
75
Sample preparation

Pierce C18 Spin TipsEasy-to-use C18 spin tips for fast and efficient clean-up of peptides for MS analysis
Thermo Scientific™ Pierce™ C18 Spin Tips enable fast and efficient capture, concentration, desalting, and elution of up to 10 µg peptides per 20 µL sample for MS analysis.
Pierce C18 Spin Tips are 20 µL-capacity pipette tips with accompanying adaptors for microcentrifuge sample processing. The tips contain a C18 reversed-phase sorbent that minimizes flow resistance and provides excellent binding and recovery characteristics at a wide range of peptide concentrations, upstream of MALDI or nanoelectrospray ionization techniques. Sample clean-up with C18 resin significantly improves protein analysis results by removing urea, salts, and other contaminants before MS. Each Pierce C18 Spin Tip has a 20 µL volume capacity with a 10 µg peptide-binding capacity.
Highlights:• Rapid—C18 fast-flow tips have low resistance and
improved flow characteristics compared to other commercially available tips
• High capacity—up to 10 µg peptide per 20 µL solution
• Convenient—spin tips come with tip adaptors for easy centrifugation
• Cleaner sample—device design filters out particulates that can cause autosampler and column clogging
Pierce C18 Spin Tips offer excellent flow properties with a high-efficiency C18 sorbent for fast wetting, loading, washing, and eluting. Sample is simply loaded in prepared tip and washed and eluted using multiple centrifugation steps. The procedure is simple and typically requires less than 5 min to process protein digests, strong cation-exchange fractions, and other protein and peptide samples for mass spectrometric analyses. The unique tip design also removes any particulates in the sample, eliminating clogging of the auto sampler or column upstream of the MS.
Figure 59. Pierce C18 Spin Tips outperform other popular C18 tips. BSA tryptic digests were analyzed on a Thermo Scientific™ LTQ Orbitrap™ XL ETD Mass Spectrometer after processing 10 µg aliquots of the same digest with Pierce C18 Spin Tips or ZipTip™ Pipette Tips (10 µL tips with 0.6 µL C18 resin; EMD Millipore). Base peak chromatograms of the peptide elution were extracted from the data sets to evaluate sample complexity and chromatographic resolution. MS results were analyzed using the SEQUEST™ search engine and the SwissProt™ database to determine protein sequence coverage.
0 20 40 60 80 100 120
Time (min)
0
10
20
30
40
50
60
70
80
90
100
0
10
20
30
40
50
60
70
80
90
100
Rel
ativ
e ab
un
dan
ce
58.76473.90
71.87740.40
36.51461.74
51.951002.57
60.85582.31 93.30
862.9130.81722.32 129.95
639.6286.15700.3463.08
830.0393.71862.91
129.12639.62
102.58831.75
74.29682.6817.05
488.53 105.911028.2215.92
443.04 119.70409.16
61.29582.31
29.21569.75 37.51
461.74 48.98653.36 73.61
740.39
16.74488.53
63.76830.03
94.33862.91
86.89700.34 128.17
425.21103.06831.7576.61
879.1719.22534.72 129.15
639.6215.17443.04
126.75409.17108.33
734.04
Pierce C18 Spin Tips
ZipTip Pipette Tips
Sequence coverage = 71%
Sequence coverage = 71%
76
Protein sample preparationPeptide clean-up

Pierce C18 TipsMonolithic C18 sorbent in a pipette tip for fast sample desalting and concentrating
Thermo Scientific™ Pierce™ C18 Tips enable efficient purification of peptides and small proteins before MS. They provide a reproducible method for capturing, concentrating, desalting, and eluting femtomole to nanomole quantities of peptides for improved data generation and analysis. The Pierce C18 Tips have unique monolithic C18 sorbent technology and offer superior flow and exceptional binding capacity, delivering uniform flow and strong analyte-to-surface interactions. They are designed to consistently achieve better sequence coverage, higher peak intensities, and improved peptide capture for accurate protein identification. With the quick and easy-to-use protocol, peptides and small proteins bind to the C18 resin while contaminants are washed away. The target peptides are then recovered in their concentrated and purified form with an aqueous, organic solvent blend.
Highlights:• Better sequence coverage—obtain high sequence
coverage for more reliable protein identification
• Higher peak intensities—assure correct protein identification with significant signal improvements
• Increased recoveries—isolate more peptides using superior binding capacity of Pierce C18 Tips
• Flexible tip formats—available in 10 and 100 µL bed volumes for processing up to 8 or 80 µg of samples, respectively
• Expandable—our design conveniently adapts to a variety of automated liquid-handling systems with pipetting stations for maximum performance, speed, and hands-off convenience
Improve protein analysis results with Pierce C18 Tips by removing urea, salts, and other contaminants before MS analysis (Figures 60 and 61). The tips are ideal for matrix-assisted laser desorption ionization (MALDI) or nanoelectrospray ionization techniques.
Figure 60. Removing urea and NaCl eliminates interference in MS chromatograms. A bovine serum albumin (BSA) tryptic digest was analyzed on a Thermo Scientific™ MALDI-Orbitrap™ XL Hybrid Mass Spectrometer. Digests and samples containing 150 mM NaCl and 4 M urea were analyzed with or without processing with Pierce C18 Tips (10 µL).
Figure 61. Pierce C18 Tips outperform other suppliers’ tips. BSA tryptic digests were analyzed either directly on a Thermo Scientific™ LTQ XL™ Ion Trap Mass Spectrometer or after processing with Pierce C18 Tips (100 µL) or supplier X tips. Base peak chromatograms of the peptide elution were extracted from the data sets to evaluate sample complexity and chromatographic resolution. MS results were analyzed with Matrix Science Mascot software and the SwissProt Release 52 database to determine protein sequence coverage.
Rel
ativ
e A
bun
dan
ce
800 900 1,000 1,100 1,200 1,300 1,400 1,500m/z
1,600 1,700 1,800 1,900 2,000 2,100
830.73
881.73 930.73 1073.91 1184.55 1321.91 1414.00 1501.00 1565.82 1650.91 1783.73 1850.36 2016.00 2105.64
990.91
927.00
1722.09 1784.27
1872.64
2076.55
1636.55
2038.91
1911.82
1436.73
1179.001107.73
1419.271282.09
0
10
20
30
40
50
60
70
80
90
1000
10
20
30
40
50
60
70
80
90
100
Rel
ativ
e ab
un
dan
ce
BSA tryptic digestwith 4 M urea + 150 mM NaCl
Unprocessed
with Pierce C18 Tips
Processed
100
80
60
40
20
034.49
34.34
34.0534.63 35.7636.22
36.29 36.37
36.45 36.9136.99 37.53
38.30
38.41
38.45
38.4939.33 39.79
40.55
40.58
41.2842.74
42.66
42.93 43.85
43.01
43.78
43.74
44.43
45.24
45.28
45.35
45.39
47.3746.7346.2845.86
44.47
45.16
41.3941.43
41.66
38.56
34.67 35.95 36.14
36.53
38.92 39.72
40.10 40.83
40.8641.52
41.48 42.59
42.63 42.82
43.5942.85
43.4744.19
44.97
45.00
45.04
45.08
45.12
45.16
45.20
47.1146.72
45.7445.2344.2342.55
40.7540.79
38.88
38.76
38.6537.99
36.7237.22
35.14 35.2135.29 36.27 37.16
38.30
38.38
39.2540.48
40.44
39.95
40.56
40.59
41.2541.29
41.44
42.59
42.63
42.75
43.56
44.13
45.02 45.13
45.10
45.17
45.7145.79
46.72 47.34
44.1744.94
44.40
42.82
42.86
38.26
38.15
38.11
100
80
60
40
20
0
100
80
60
40
20
34 35 36 37 38 39 40 41 42 43 44 45 46 470
Tryptic digest of BSASequence coverage: 32%
Pierce C18 TipSequence coverage: 37%
Supplier XSequence coverage: 29%
Time (min)
Rel
ativ
e ab
un
dan
ce
77
Sample preparation

Pierce C18 Spin ColumnsPurify and/or concentrate multiple peptide samples in less than 30 min
Peptide samples can be purified and concentrated for a variety of applications using Pierce C18 Spin Columns. Each spin column contains a porous C18 reversed-phase resin with excellent binding and recovery characteristics for a wide range of peptide concentrations. The spin column format allows simultaneous processing of multiple samples (10–150 µL) in approximately 30 min without laborious repeat pipetting or specialized equipment. Pierce C18 Spin Columns can be used effectively for processing peptides derived from 10 ng to 30 µg of protein. Sensitivity and detection limits are dependent on the downstream application.
Highlights:• Removes MS-interfering contaminants—helps to
reduce signal suppression and improves signal-to-noise ratios and sequence coverage; works on a variety of reversed-phase–compatible contaminants
• Robust—works with a wide variety of load volumes (10–150 µL) and concentrations; no need to reduce sample volume before application
• Convenient—easy to handle and requires no special equipment for processing multiple samples simultaneously (unlike tip-driven systems that require samples to be processed one at a time)
• Sensitive—special C18 resin allows for excellent recovery percentages, even at low (sub-picomole) sample loads
Figure 62. Thermo Scientific Pierce C18 Spin Column protocol summary.
Figure 63. Effective clean-up of MS sample with Pierce C18 Spin Columns. (A) MALDI-TOF MS analysis of an unknown protein isolated from a mitochondrial extract separated by 2D electrophoresis and subjected to in-gel tryptic digestion followed by processing with Pierce C18 Spin Columns. (B) MALDI-TOF MS analysis of an identical digest that has not been C18 processed.
6. Dry and resuspend for
MS analysis
1. Activate resin
Wet resin with 200 µL 50% methanol or 50% ACN.
Centrifuge and repeat.3–5 min
2. Equilibrate resin
Equilibrate resin with 200 µL 5% ACN, 0.5% TFA.
Centrifuge and repeat. 3–5 min
3. Bind sample
Load 10-150 µL ofsample to wetted resin. Centrifuge and repeat.
3–5 min
4. Wash
Wash resin with 200 µL0.5% TFA in 5% ACN. Centrifuge and repeat.1–2 additional times.
5 min
5. Elute
Elute sample using 20 µL 70% ACN.
Centrifuge and repeat.3 min
100
90
80
70
60
50
40
30
20
10
0700 1,4201,060 1,780 2,140 2,500
Mass (m/z)
Inte
nsi
ty %
2.1E+4
1425.6243
A
1723.8519
2242.1354
1711.73081059.5423
963.5254
842.5100
1196.6809
1219.6092
100
90
80
70
60
50
40
30
20
10
0500 1,100800 1,400 1,700 2,000
Mass (m/z)
Inte
nsi
ty %
B
2315.4
867.2458796.2132523.389
779.2962777.2472
656.2006
566.1264
78
Protein sample preparationPeptide clean-up

Pierce Graphite Spin ColumnsGraphite spin columns efficiently purify and concentrate hydrophilic phosphopeptides
The Thermo Scientific™ Pierce™ Graphite Spin Columns enable fast and efficient capture, concentration, desalting, and elution of hydrophilic peptides. The five-step procedure is simple and requires less than 10 min to process. These columns are ideal for improving mass spectrometric analyses of samples from protein digests (Figure 64), strong-cation exchange fractions, and enriched phosphopeptides eluted from TiO2 and immobilized metal affinity chromatography (IMAC) columns and tips.
Highlights:• Convenient—spin format enables parallel processing of
multiple samples
• High-binding capacity—excellent recovery of up to 100 µg of hydrophilic peptides per column
• Efficient—porous graphite resin enables efficient clean-up of phosphopeptide samples before MS analysis
C18 resins and tips, commonly used to desalt peptides, do not efficiently capture hydrophilic peptides, like phosphopeptides. The Pierce Graphite Spin Columns improve phosphopeptide analysis by efficiently binding hydrophilic peptides and efficiently removing urea, salts, and other contaminants before MS analysis (Figure 65). The spin columns are ideal for MALDI or nanoelectrospray ionization techniques.
Figure 65. Improved recovery of representative hydrophilic phosphopeptides using graphite spin columns. Stable isotope–labeled A3 and B9 peptides (10 pmol) were acidified with 1% trifluoroacetic acid, processed according to instructions for C18 tips or the Pierce Graphite Spin Columns, and eluted with 50% acetonitrile/0.1% formic acid. The corresponding heavy isotope–labeled peptides (5 pmol) were spiked in the eluate, dried, and resuspended in 0.1% formic acid. Samples were analyzed by targeted LC-MS/MS with the Orbitrap XL Mass Spectrometer to quantitate percent recovery. Peptides: A3= RPRAApTFPFR*, B9 = RTPKDpSPGIPPFR*.
*Position of heavy isotope–labeled amino acid used for absolute MS quantitation.
Figure 64. Graphite clean-up enables phosphopeptide identification. U2OS human osteosarcoma cells synchronized at the G2/M boundary with nocodazole (200 ng/mL, 36 hr) were lysed with 6 M guanidine·HCl. After enzymatic protein digestion (100 µg), phosphopeptides were enriched with IMAC and desalted with Pierce Graphite Spin Columns or C18 tips before LC-MS/MS analysis on an LTQ Orbitrap XL Mass Spectrometer. Representative spectra is shown for a phosphopeptide not observed after C18 clean-up. A novel doubly phosphorylated peptide was identified within the putative ATP-binding site of cyclin dependent kinase cdc2 (CDK1). This phosphopeptide is not present in Phospho.ELM version 8.2 database.
Learn more at thermofisher.com/peptidecleanup
Rec
ove
ry %
A3 peptide B9 peptide A3 peptide B9 peptide
C18 Graphite
0.00
20
40
60
80
100
120
140
Rel
ativ
e in
ten
sity
m/z0
0%
25%
50%
75%
100%
A.
B.
250 500 750 1000
CDC2_HUMAN Cell division control portion2 homolog(K)IGEGpTpYGVVYK(G)
1250
Rel
ativ
e in
ten
sity
m/z0
0%
25%
50%
75%
100%
200 400 600 800
MP2K2_HUMAN Dual speci�city mitogen-activatedprotein kinase kinase 2(R)LNQPGpTPTR(T)
1000
79
Sample preparation

Detergent removal products
The Thermo Scientific™ Pierce™ Detergent Removal Resins are provided in convenient spin-column or plate formats that quickly and efficiently remove ionic, nonionic, and/or zwitterionic detergents from protein or peptide samples to improve compatibility with downstream applications. Two formulations are available that are optimized to remove detergents from peptide samples with different concentration ranges. The Thermo Scientific™ HiPPR™ (high protein and peptide recovery) products are recommended for peptide samples </= 100 µg/mL. The standard Pierce Detergent Removal Resin products are ideal for peptide samples >100 µg/mL.
Highlights:• High performance—removes detergent with >90%
recovery and no sample dilution
• Versatile—effectively removes a wide variety of detergents from peptide or protein samples
• Optimized—separate formulations for samples with peptide concentrations ≤ or >100 µg/mL
• Flexible—available in various formats, including spin columns, 96-well spin plates, and loose resin
• Convenient—simple method that helps to improve MS peptide coverage
Table 43. Detergent removal product selection guide.
HiPPR Detergent
Removal Spin Columns
HiPPR Detergent
Removal Spin Kit
HiPPR Detergent
Removal Spin Plates
PierceDetergent
Removal Spin Columns
PierceDetergent
Removal Resin
PierceDetergent
Removal Spin Plates
Sample volume range(s)
100 µL 25–200 µL 100 µL 10–25 µL25–100 µL
150–500 µL500–1,000 µL
10–2,500 µL 20–100 µL
Recommended peptide sample concentration range
1–100 µg/mL 1–100 µg/mL 1–100 µg/mL >100 µg >100 µg >100 µg
Format Pre-filled spin columns
5 mL resin + 0.8 mL empty spin columns
96-well pre-filled spin plate
Pre-filled spin columns
10 mL resin 96-well pre-filled spin plate
Resin bed volume(s)
0.1 mL 0.025–0.2 mL 0.1 mL 0.125 mL0.5 mL2 mL4 mL
0.125 mL–10 mL 0.55 mL
80
Protein sample preparationPeptide clean-up

Spin columns, loose resin, and kits
The Thermo Scientific™ HiPPR™ Detergent Removal Resin is available in a predispensed 0.1 mL format or as a kit with bulk resin and empty spin columns for customizing filling and processing. The Pierce Detergent Removal Resin is available in four convenient prepacked column sizes for
quick and easy sample processing; simply remove storage buffer, wash resin with equilibration buffer, add sample, incubate, and obtain detergent free sample upon final centrifugation. The resin is also available in a loose resin (10 mL pack size) for customized applications or columns.
96-well spin plates
The prepacked Thermo Scientific™ HiPPR™ and Pierce™ 96-Well Detergent Removal Spin Plates do not require resin hydration or dispensing, and offer the same high protein
and peptide recovery as the spin-column format. Each plate can process up to 96 samples simultaneously, using 25–100 µL of sample per well.
Figure 66. Protocol summary for Pierce Detergent Removal Spin Columns (0.5 mL).
1. Centrifuge for 1 min at 1,500 x g to remove the storage buffer.
2. Add 0.4 mL equilibration buffer, centrifuge at 1,500 x g for 1 min and discard the �ow-through. Repeat two additional times.
4. Centrifuge at 1,500 x g for 2 min to collect the detergent-free sample for downstream applications.
3. Add detergent-containing sample (25–100 µL) and incubate for 2 min at room temperature.
Discard Discard
Figure 67. Protocol summary for Pierce Detergent Removal Spin Plates.
Learn more at thermofisher.com/detergentremoval
1. Remove the bottom seal and stack the detergent removal plate on top of a wash plate. Remove the top seal and centrifuge.*
* Centrifugations are performed for 2 min at 1,000 x g.
2. Add 300 µL of buffer to each well and centrifuge. Discard the �ow-through. Repeat this step two times.
3. Stack the detergent removal plate on top of a sample collection plate. Apply sample and incubate at room temperature for 2 min. Centrifuge to remove detergent.
4. Recover the detergent-free sample for downstream analysis.
81
Sample preparation

Table 45. Results using the standard Thermo Scientific™ Pierce™ Detergent Removal Spin Column, 0.5 mL. Detergent removal efficiency and protein recovery. BSA sample (25–200 µL) + detergent in 0.15 M NaCl, 0.05% sodium azide was mixed with an equal volume of detergent removal resin (2x volume for CHAPS removal) and processed as shown in the protocol (page 81).
Detergent
Sample volume
(µL)
Protein quantity
(µg)
Detergent removal
(%)
Protein recovery
(%)
SDS (1%) 25 0.375 >99 98
50 0.75 >99 97
100 1.5 >99 100
200 3.0 >99 100
Triton X-100 (1%)
25 0.375 >95 82
50 0.75 >95 86
100 1.5 >95 86
200 3.0 >95 93
NP-40 (0.75%)
25 0.375 95 90
50 0.75 96 94
100 1.5 97 91
200 3.0 97 97
CHAPS (1%)
25 0.375 95 64
50 0.75 97 70
100 1.5 98 78
200 3.0 98 75
Table 44. Results using HiPPR Detergent Removal Resin. Each column and well plate contained ~550 µL of detergent-removal resin slurry and 0.1 mL of sample. Similar results were obtained with both process formats.
Process format† Detergent
Detergent concentration
(%)
Detergent removal
(%)
BSA recovery
(%)
0.5 mL spin column
Sodium deoxycholate 5 99 100
Octyl glucoside 5 99 90
Octyl thioglucoside 5 99 95
Lauryl maltoside 1 98 99
Triton X-114 2 95 100
Brij-35 1 99 97
Tween 20 0.25 99 87
96-well spin plate
SDS 5 99 89Triton X-100 4 99 100NP-40 1 95 100CHAPS 5 99 100
Figure 68. Results using HiPPR Detergent Removal Resin. BSA (100 µg/mL) tryptic digests were prepared without detergent, in the presence of 0.5% Triton™ X-100 or spiked with 0.5% SDS following enzymatic digestion. Samples (0.1 mL) containing detergent were
processed with the HiPPR Detergent Removal Resin and compared to unprocessed or detergent-free samples by LC-MS/MS. Results demonstrate that detergent removal is effective and produces results similar to those observed for samples containing no detergent.
100
80
60
40
20
0
Rel
ativ
e ab
un
dan
ce
2.52
1.62
0.262.60 3.03
4.39
5.89
5.36
6.37
6.798.02
9.73
9.749.68
9.15
7.766.76
6.495.63
5.06
4.194.092.911.45
1.47 1.88 2.583.35 4.74 5.21 7.10
8.55
8.66 9.36
9.22
9.98 11.78 14.0916.60
16.7917.09 19.82 19.9616.8016.63
16.3013.9312.6711.84
11.33
11.57
11.97 12.99
13.15 16.60 18.7416.1713.55
7.89
2.95 4.07 5.09 6.10 6.517.71
9.41 9.51 10.2913.16
15.25
15.72 16.00
16.18
16.71
16.33
17.7017.2210.44
2.61 4.094.16
5.20
5.75
6.656.90
7.90
9.089.14
10.18 12.63 14.63 16.8416.55
19.76
100
80
60
40
20
0100
80
60
40
20
0
100
80
60
40
20
0100
80
60
40
20
0
No detergent unprocessed
+0.5% Triton X-100 unprocessed+0.5% SDS unprocessed
+0.5% SDS processed+0.5% Triton X-100 processed
82
Protein sample preparationPeptide clean-up

Figure 69. Results using the standard Pierce Detergent Removal Spin Column, 0.5 mL. Tryptic digests (0.1 mL, 100 µg) containing detergent were each processed through 0.5 mL of Pierce Detergent Removal Resin and subjected to LC-MS/MS analysis. Top row: Base peak LC-MS chromatograms. Bottom row: Integrated mass spectra. Similar results were produced for Thermo Scientific™ Brij™-35 detergent, octyl glucoside, octyl thioglucoside, and SDS (data not shown).
31 32 33 34 35 36 37 38 39 40 41 42 43 44 45 46 47 48 49 50 51 52 53 54Time (min)
No detergent, unprocessed
0
5
10
15
20
25
30
35
40
45
50
55
60
65
70
75
80
85
90
95
100 44.18
43.50
46.1639.59 40.8747.56
41.4737.92
38.0047.15
44.7740.02
39.37 42.43 44.82 50.0236.81 45.54
38.1852.8449.23 52.32 54.8954.0151.4834.52 48.7235.1034.39 53.92
35.6433.8831.5932.0930.47
400 500 600 700 800 900 1000 1100 1200 1300 1400 1500 1600m/z
0
5
10
15
20
25
30
35
40
45
50
55
60
65
70
75
80
85
90
95
100 518.98
445.07
536.08
1176.98
592.87410.28
462.01610.12
785.41
820.67
481.06666.82 740.83
875.20584.15 708.61653.83 863.181192.68941.03997.55
1585.091242.511111.50 1324.641030.58 1527.621481.781399.36
No detergent, unprocessed
30 31 32 33 34 35 36 37 38 39 40 41 42 43 44 45 46 47 48 49 50 51 52 53 54 55Time (min)
0
5
10
15
20
25
30
35
40
45
50
55
60
65
70
75
80
85
90
95
100 40.37
39.7032.13 44.27
41.4233.01 39.03 42.4841.08 43.56
31.84 42.5738.7030.03 50.0636.42 45.4033.62 48.9546.5852.1050.5347.3938.3833.9234.25 54.4730.60 36.65 46.5236.0931.81 51.7548.8334.55 37.38 54.3148.08 51.37 53.63
49.7746.23
+ 1% lauryl maltoside, unprocessed
400 500 600 700 800 900 1000 1100 1200 1300 1400 1500 1600m/z
0
5
10
15
20
25
30
35
40
45
50
55
60
65
70
75
80
85
90
95
100 546.43
502.41590.47
634.47458.39
678.50
419.45
722.52
763.04
782.97
815.69854.60
1037.79902.801055.17922.95 1020.93 1123.93 1456.741195.56 1325.281275.72 1500.791410.22 1575.75
+ 1% lauryl maltoside, unprocessed
30 31 32 33 34 35 36 37 38 39 40 41 42 43 44 45 46 47 48 49 50 51 52 53 54 55Time (min)
0
5
10
15
20
25
30
35
40
45
50
55
60
65
70
75
80
85
90
95
100 47.20
45.67
43.83
42.89
40.26
49.46
46.74
37.08
38.92 40.83
37.54
35.88
39.5138.6736.18 41.7845.4242.25 48.2334.33 44.66
50.7833.77 34.8532.3132.20 49.84 54.5754.2352.4430.45 51.18
Lauryl maltoside, processed
400 500 600 700 800 900 1000 1100 1200 1300 1400 1500 1600m/z
0
5
10
15
20
25
30
35
40
45
50
55
60
65
70
75
80
85
90
95
100 536.07
519.00
445.08
610.13 863.39
419.23462.01
700.88 784.78 875.02708.65666.77 820.81582.77 637.38
740.81 997.59887.45917.54508.04 1171.82954.76
1182.151250.061048.571112.571286.761356.781389.82 1513.351584.88
Lauryl maltoside, processed
30 31 32 33 34 35 36 37 38 39 40 41 42 43 44 45 46 47 48 49 50 51 52 53 54 55Time (min)
0
5
10
15
20
25
30
35
40
45
50
55
60
65
70
75
80
85
90
95
100 35.6137.6934.0135.5036.14
36.21 44.0633.86 37.9036.4943.8838.8237.15 39.67 43.3740.55 44.26 47.3242.9741.7330.4730.71 45.7834.30 42.27 47.7444.30 46.22
44.4331.4731.63 44.63 46.5733.6932.73
48.54
53.2849.3249.8550.9451.4350.27
51.9452.5354.59
+ 1% NP-40, unprocessed
400 500 600 700 800 900 1000 1100 1200 1300 1400 1500 1600m/z
0
5
10
15
20
25
30
35
40
45
50
55
60
65
70
75
80
85
90
95
100 590.54546.53
507.58634.51
463.59
639.60678.51
419.56
683.61
722.54727.61
766.53
810.55
859.70903.74 1499.92947.77 1573.86991.74 1425.951080.381118.591179.17 1351.971236.271277.93
+ 1% NP-40, unprocessed
30 31 32 33 34 35 36 37 38 39 40 41 42 43 44 45 46 47 48 49 50 51 52 53 54 55Time (min)
0
5
10
15
20
25
30
35
40
45
50
55
60
65
70
75
80
85
90
95
100 43.39
45.46
46.93
42.6939.6836.79
43.83
38.3540.22
46.5539.57 49.5538.15
40.3437.24
35.62
41.3545.2538.99
48.1544.2534.7233.0632.61 52.6851.0331.93 49.30 53.0654.86
NP-40, processed
400 500 600 700 800 900 1000 1100 1200 1300 1400 1500 1600m/z
0
5
10
15
20
25
30
35
40
45
50
55
60
65
70
75
80
85
90
95
100 518.99536.08
820.75
863.40
445.08874.63
637.30610.14701.11
474.44 708.69419.23 582.81
740.73
899.45785.19 956.43997.61941.34
1172.191030.95 1229.891112.66 1271.58 1399.591325.65 1466.781513.791590.89
NP-40, processed
Base peak LC-MS chromatograms
Integrated mass spectra
Figure 70. Results using HiPPR Detergent Removal Resin. BSA (25 and 100 µg/mL) was digested in the presence and absence of detergents, and the samples were processed for LC-MS/MS analysis. Effective detergent removal resulted in greater peptide identification and high Mascot scores.
Figure 71. Results using Pierce Detergent Removal Spin Columns, 0.5 mL. A tryptic digest of HeLa cell lysate (0.1 mL, 100 µg) containing 1% SDS was processed through 0.5 mL of Pierce Detergent Removal Resin and subjected to LC-MS/MS analysis. The processed sample allowed similar numbers of identified peptides as digests containing no SDS. Peptide identification is greatly reduced in sample containing SDS. Effective detergent removal enables greater peptide identification.
80
70
60
50
40
30
20
10
0
No det
ergen
t-
unpro
cess
ed (2
.5 µ
g)
Number of unique peptidesSequence coverage (%)
No det
ergen
t-pro
cess
ed (2
.5 µ
g)
SDS-unp
roce
ssed
(2.5
µg)
SDS-pro
cess
ed (2
.5 µ
g)
No det
ergen
t-
unpro
cess
ed (1
0 µg
)
No det
ergen
t-pro
cess
ed (1
0 µg
)
SDS-unp
roce
ssed
(10
µg)
SDS-pro
cess
ed (1
0 µg
)
Nu
mb
er
of
pe
pti
de
s
900
Spectral count
Peptide count800
700
600
500
400
300
200
100
SDS-unprocessedSDS-processed No SDS-unprocessed
83
Sample preparation

For workflows utilizing isobaric labeling
or label-free protein quantitation
protocols, it is important to measure
peptide concentration following protein
digestion, enrichment, and/or C18
clean-up steps in order to normalize
sample-to-sample variation.
In particular, for experiments utilizing isobaric labeling, it is critical to ensure that equal amounts of sample are labeled before mixing in order to have accurate results.
Similar to protein assay methods, different methods are available for determining peptide concentration. Historically, UV-Vis (A280) or colorimetric, reagent-based protein assay techniques have been employed to measure peptide concentrations. BCA and micro-BCA have often been used, and although these work well for protein samples, these reagents are not designed for accurately detecting peptides.
Recently, two powerful assays have been developed: the Thermo Scientific™ Pierce™ Quantitative Peptide Assays (colorimetric or fluorometric microplate assay), both of which are easy-to-use kits designed specifically for the quantitation of peptide mixtures.
When choosing between the two assay kits, there are several important criteria to consider:
• Compatibility with the sample type, components, and workflows
• Assay range and required sample volume
• Speed and convenience for the number of samples to be tested
• Availability of the spectrophotometer or fluorometer needed to measure the output of the assay
Peptide quantitation assays
Table 46. Peptide quantitation assay selection guide.
Colorimetric Peptide Assay Fluorometric Peptide Assay
Measurement Colorimetric (480 nm) Fluorescent (Ex/Em 390/475 nm)Linear range 15–1,000 µg/mL 5–1,000 µg/mLSensitivity 15 µg/mL 5 µg/mLMinimum sample volume required 20 µL 10 µLAmount detected at minimum sample volume 300 ng peptide 50 ng peptideAssay time 30 min 5 minKey feature Recommended for peptides labeled
with TMT reagentsRecommended for single peptides
84
Protein sample preparation

Pierce Quantitative Peptide AssaysNovel colorimetric or fluorometric assays for simple, sensitive peptide quantitation
The Pierce Quantitative Peptide Assays are easy-to-use, colorimetric, or fluorometric microplate assay designed specifically for the quantitation of peptide mixtures.
Highlights:• Sensitive—accurately detect as low as 5 µg/mL
(fluorometric assay) or 25 μg/mL (colorimetric assay) of peptide mixtures
• Robust—assay performance rigorously tested using peptide digest mixtures
• Validated standard—each kit includes a validated peptide digest standard for improved reproducibility of quantitation
• Compatible—can be used directly with most MS sample preparation reagents (Table 47); colorimetric assay is ideal for normalizing peptides labeled with TMT reagents
• Convenient—easy mix-and-read-format; signal is stable and may be read within 5 min (fluorometric assay) or 15 min (colorimetric assay)
The Pierce Quantitative Colorimetric Peptide Assay provides modified BCA reagents for the reduction of Cu2+ to Cu+ and a proprietary chelator optimized for the quantitation of peptide mixtures. In this reaction, the copper is first reduced by the amide backbone of peptides under alkaline conditions (Biuret reaction), followed by the proprietary chelator coupling with the reduced copper to form a bright red complex with absorbance at 480 nm. The signal produced from this reaction is 3- to 4-fold more sensitive than the Thermo Scientific™ Pierce™ Micro BCA Protein Assay for peptide analysis. This colorimetric peptide assay requires a small amount of sample (20 μL) and has a working peptide concentration range of 25–1,000 μg/mL. The assay’s sensitivity, low sample assay volume, and included reference standard enable accurate and robust measurement of peptide digest samples, especially for MS applications.
The Pierce Quantitative Fluorometric Peptide Assay reagents include peptide assay buffer, fluorescent peptide labeling reagent, and a peptide digest assay standard for the quantitative measurement of peptide concentrations. In this assay, peptides are specifically labeled at the amino terminus using an amine-reactive fluorescent reagent, and the fluorescently labeled peptides are detected at Ex/Em 390/475 nm. Because of the labeling mechanism of the fluorescent assay reagent, this assay is suitable for the quantitative measurement of synthetic peptides as well as peptide digest mixtures. This sensitive assay requires only 10 μL of sample, produces a linear response with increasing peptide concentrations (5–1,000 μg/mL), and results in a stable final fluorescence that can be detected in as quickly as 5 min.
Both kits contain a high-quality peptide digest reference standard to generate linear standard curves and calibration controls.
Table 47. Compatibility of Pierce Quantitative Peptide Assays with commonly used reagents in MS.
Compatible concentrationSubstance Colorimetric assay Fluorometric assay
Acetone 50% 25%
Acetonitrile 50% 50%
Ammonium acetate Not compatible 100 mM
Ammonium bicarbonate 50 mM 50 mM
DMSO 50% 50%
DTT (dithiothreitol) Not compatible 10 mM
EDTA 5 mM 25 mM
Formic acid 0.50% 0.10%
Guanidine 0.25 mM 1 mM
Iodoacetamide 1 M 100 mM
Methanol 25% 25%
SDS 1% 1%
Sodium azide 1% 1%
TCEP Not compatible 10 mM
TEA acetate 5 mM 100 mM
TEA bicarbonate 5 mM 100 mM
Trifluoroacetic acid 0.50% 0.20%
Tris 100 mM Not compatible
Urea 1 M 1 M
85
Sample preparation

Figure 72. Sensitivity of the Pierce Quantitative Colorimetric Peptide Assay. (A) Sensitivity of Pierce Quantitative Colorimetric Peptide Assay compared to the Pierce Micro BCA Assay using BSA Digest. (B) Quantitation comparison between Pierce Quantitative Peptide Assays using 12 different cultured mammalian cell lysates.
Ab
sorb
ance
(480
/562
nm
)C
on
cen
trat
ion
(μg
/mL
)
Concentration (μg/mL)
LOQ (Peptide Assay) = 30 μg/mLLOQ (Micro BCA) = 107 μg/mL
2.0
1.5
1.0
0.5
0
350
Colorimetric
Fluorometric
Cell lysate
300
250
200
150
100
50
0
A549
HepG2
HeLa
DV145
IMR 9
0
LNCap
A431
3T3
HCT116
HEK293
HeLa
A549
0 100 200 300 400 500 600
Peptide AssayR2 = 0.996
Micro BCA AssayR2=0.998
175
150
125
100
75
50
25
0
175
150
125
100
75
50
25
0
0 200 400 600 800 1000
0 200 400 600 800 1000
Concentration (μM)
Concentration (μg/mL)
Flu
ore
scen
ce (A
U)
Flu
ore
scen
ce (A
U)
Figure 73. Standard curves for Pierce Fluorometric Peptide Assay. (A) Pierce Peptide Digest Assay Standard curves using the Pierce Quantitative Fluorometric Peptide Assay. (B) Quantitation of individual peptides using the Pierce Quantitative Fluorometric Peptide Assay.
Mea
sure
d c
on
cen
trat
ion
(μM
)
Weighed concentration (μM)
1000
750
500
250
0
0 100 200 300 400 500 600
control
1
2
3
4
5
6
7
8
9
10
11
12
Peptide Sequence1 SYSMEHFRWG2 RPKPQQFFGLM-NH2
3 DRVYIHPFHL4 RPPGFSPFR5 CYIQNCPLG6 FGGFTGARKSARK7 GSNKGAIIGLM8 KRPPGFSPFR9 CYFQNCPRG -NH2
10 INLKALAALAKKIL -NH2
11 DRVYIHPF12 QKRPSQRSKYL
Ab
sorb
ance
(480
/562
nm
)C
on
cen
trat
ion
(μg
/mL
)
Concentration (μg/mL)
LOQ (Peptide Assay) = 30 μg/mLLOQ (Micro BCA) = 107 μg/mL
2.0
1.5
1.0
0.5
0
350
Colorimetric
Fluorometric
Cell lysate
300
250
200
150
100
50
0
A549
HepG2
HeLa
DV145
IMR 9
0
LNCap
A431
3T3
HCT116
HEK293
HeLa
A549
0 100 200 300 400 500 600
Peptide AssayR2 = 0.996
Micro BCA AssayR2=0.998
B
B
A
A
86
Protein sample preparationPeptide quantitation assays

Product Quantity Cat. No.
Protein enrichment using IP (IP-MS)
Pierce Antibody Biotinylation Kit for IP 1 unit 90407Pierce MS-Compatible Magnetic IP Kit (Streptavidin)
40 reactions 90408
Pierce MS-Compatible Magnetic IP Kit (Protein A/G)
40 reactions 90409
Dynabeads Antibody Coupling Kit Kit 14311DDynabeads Co-Immunoprecipitation Kit 40 reactions 14321DLow Protein Binding Microcentrifuge Tubes, 1.5 mL
250 tubes 90410
Low Protein Binding Microcentrifuge Tubes, 1.5 mL
10 x 250 tubes
90411
To view additional pack sizes and products, go to thermofisher.com/ipms
Active site probes labeling and enrichment
Pierce Kinase Enrichment Kit with ATP Probe
16-rxn kit 88310
ActivX Desthiobiotin-ATP Probe 16 x 12.6 µg 88311Pierce Kinase Enrichment Kit with ADP Probe
16-rxn kit 88312
ActivX Desthiobiotin-ADP Probe 16 x 9.9 µg 88313Pierce GTPase Enrichment Kit with GTP Probe
16-rxn kit 88314
ActivX Desthiobiotin-GTP Probe 16 x 12.9 µg 88315ActivX Azido-FP Serine Hydrolase Probe 3.5 µg 88316ActivX Desthiobiotin-FP Serine Hydrolase Probe
4.6 µg 88317
ActivX TAMRA-FP Serine Hydrolase Probe 6.8 µg 88318† ActivX Desthiobiotin-ATP, -ADP, and -GTP Probes are exclusively licensed from ActivX Biosciences Inc. to Thermo Fisher Scientific for research use only.
To view additional pack sizes and products, go to thermofisher.com/activesiteprobes
Crosslinkers
DSS (disuccinimidyl suberate), No-Weigh Format
8 x 2 mg 21658
BS3 (bis(sulfosuccinimidyl) suberate), No-Weigh Format
8 x 2 mg 21585
BS3-d4 BS3-d4 (bis(sulfosuccinimidyl) 2,2,7,7-suberate-d4)
10 mg 21595
DSG (disuccinimidyl glutarate) 50 mg 20593BS2G-d0 (bis(sulfosuccinimidyl) glutarate) 10 mg 21610BS2G-d4 (BS2G-d4 (bis(sulfosuccinimidyl) 2,2,4,4-glutarate-d4)
10 mg 21615
DSSO (disuccinimidyl sulfoxide) 10 x 1 mg A33545To view additional pack sizes and MWCOs, go to thermofisher.com/mscrosslinkers
Product Quantity Cat. No.
Sample lysis and protein extraction
Pierce Mass Spec Sample Prep Kit for Cultured Cells
20-rxn kit 84840
Mem-PER Plus Membrane Protein Extraction Kit
Kit 89842
Subcellular Protein Fractionation Kit for Cultured Cells
Kit 78840
To view additional pack sizes and products, go to thermofisher.com/msproteinextraction
Inhibitor cocktails and tablets
Halt Protease Inhibitor Cocktail (100X) 1 mL 87786Halt Protease Inhibitor Cocktail (100X), EDTA-free
1 mL 87785
Pierce Protease Inhibitor Mini Tablets 30 tablets A32953Pierce Protease Inhibitor Tablets 20 tablets A32963Pierce Protease Inhibitor Mini Tablets, EDTA-free
30 tablets A32955
Pierce Protease Inhibitor Tablets, EDTA-free 20 tablets A32965Halt Phosphatase Inhibitor Cocktail (100X) 1 mL 78420Pierce Phosphatase Inhibitor Mini Tablets 20 tablets A32957Halt Protease and Phosphatase Inhibitor Cocktail (100X)
1 mL 78440
Halt Protease and Phosphatase Inhibitor Cocktail (100X), EDTA-free
1 mL 78441
Pierce Protease and Phosphatase Inhibitor Mini Tablets
30 tablets A32959
Pierce Protease and Phosphatase Inhibitor Mini Tablets, EDTA-free
30 tablets A32961
To view additional pack sizes and products, go to thermofisher.com/inhibitorcocktails
Protein assay kits
Pierce BCA Protein Assay Kit 500 mL kit 23227
Pierce Micro BCA Protein Assay Kit Kit 23235
To view additional pack sizes and products, go to thermofisher.com/bca
Abundant protein depletion
Pierce Albumin Depletion Kit 24-rxn kit 85160Pierce Top 2 Abundant Protein Depletion Spin Columns
6 columns 85161
Pierce Top 2 Abundant Protein Depletion Spin Columns
24 columns 85162
Pierce Top 12 Abundant Protein Depletion Spin Columns
6 columns 85164
Pierce Top 12 Abundant Protein Depletion Spin Columns
24 columns 85165
To view additional pack sizes and products, go to thermofisher.com/msdepletion
87
Sample preparation
Ordering information

Product Quantity Cat. No.
Dialysis devices, cassettes, and flasks
Slide-A-Lyzer MINI Dialysis Devices, 10K MWCO, 0.1 mL
50 devices 69570
Slide-A-Lyzer MINI Dialysis Devices, 10K MWCO, 0.5 mL
25 devices 88401
Slide-A-Lyzer MINI Dialysis Devices, 10K MWCO, 2 mL
25 devices 88404
Slide-A-Lyzer G2 Dialysis Cassettes, 7K MWCO, 0.5 mL
10 cassettes 87727
Slide-A-Lyzer G2 Dialysis Cassettes, 7K MWCO, 3 mL
10 cassettes 87728
Slide-A-Lyzer G2 Dialysis Cassettes, 0.5K MWCO, 0.5 mL
8 cassettes 87729
Slide-A-Lyzer G2 Dialysis Cassettes, 3K MWCO, 3 mL
6 cassettes 87730
Slide-A-Lyzer G2 Dialysis Cassettes, 15K MWCO, 15 mL
6 cassettes 87731
Slide-A-Lyzer G2 Dialysis Flask, 10K MWCO, 250 mL
4 flasks 87762
To view additional pack sizes and MWCOs, go to thermofisher.com/dialysis
Desalting products
Zeba Spin Desalting Columns, 7K MWCO, 75 μL
25 columns 89877
Zeba Spin Desalting Columns, 7K MWCO, 0.5 mL
25 columns 89882
Zeba Spin Desalting Columns, 7K MWCO, 2 mL
25 columns 89890
Zeba Spin Desalting Columns, 7K MWCO, 5 mL
25 columns 89892
Zeba Spin Desalting Columns, 7K MWCO, 10 mL
25 columns 89894
Zeba 96-well Spin Desalting Plates, 7K MWCO
2 plates 89807
Zeba Chromatography Cartridges, 7K MWCO, 1 mL
5 cartridges 89934
Zeba Chromatography Cartridges, 7K MWCO, 5 mL
5 cartridges 89935
Zeba Spin Desalting Columns, 40K MWCO, 75 μL
25 columns 87764
To view additional pack sizes and MWCOs, go to thermofisher.com/desalting
Protein concentrators
Pierce Protein Concentrators PES, 10K MWCO, 0.5 mL
25/pkg 88513
Pierce Protein Concentrator PES, 10K MWCO, 2–6 mL
24/pkg 88517
Pierce Protein Concentrator PES, 10K MWCO, 5–20 mL
24/pkg 88528
Pierce Protein Concentrator PES, 10K MWCO, 20–100 mL
4/pkg 88535
To view additional pack sizes and MWCOs, go to thermofisher.com/concentrators
Product Quantity Cat. No.
Protein gels
NuPAGE Bis-Tris Mini Gels Multiple MultipleNuPAGE Bis-Tris Midi Gels Multiple MultipleNuPAGE Tris-Acetate Mini Gels Multiple MultipleNuPAGE Tris-Acetate Midi Gels Multiple MultipleBolt Bis-Tris Plus Gels Multiple MultipleTo view additional products, go to thermofisher.com/proteingels
Protein standards
PageRuler Unstained Low Range Protein Ladder
2 x 250 μL 26632
PageRuler Unstained Protein Ladder 2 x 250 μL 26614NativeMark Unstained Protein Standard 5 x 50 μL LC0725PageRuler Prestained Protein Ladder 2 x 250 μL 26616PageRuler Plus Prestained Protein Ladder 2 x 250 μL 26619HiMark Prestained Protein Standard 250 μL LC5699Spectra Multicolor Broad Range Protein Ladder
2 x 250 μL 26634
Spectra Multicolor High Range Protein Ladder
2 x 250 μL 26625
MagicMark XP Western Protein Standard 250 μL LC5602To view additional products, go to thermofisher.com/proteinstandards
88
Protein sample preparationOrdering information

Product Quantity Cat. No.
Stains
Pierce Silver Stain for Mass Spectrometry 1 L kit 24600Imperial Protein Stain 1 L 24615To view additional pack sizes and products, go to thermofisher.com/proteinstains
Protein digestion
Pierce Trypsin Protease, MS Grade, Frozen 100 µg 90305Pierce Trypsin Protease, MS Grade 5 x 20 µg 90057Pierce Trypsin Protease, MS Grade 5 x 100 µg 90058Pierce Trypsin Protease, MS Grade 1 mg 90059Lys-C Protease, MS Grade 20 µg 90051Pierce LysN Protease, MS Grade 20 µg 90300Pierce LysN Protease, MS Grade 5 x 20 µg 90301Asp-N Protease, MS Grade 2 µg 90053Glu-C Protease, MS Grade 5 x 10 µg 90054Chymotrypsin Protease, MS Grade 4 x 25 µg 90056In-Gel Tryptic Digestion Kit Kit 89871In-Solution Tryptic Digestion and Guanidination Kit
Kit 89895
Bond-Breaker TCEP Solution, Neutral pH 5 mL 77720Pierce DTT (Dithiothreitol), No-Weigh Format 48 x 7.7 mg 20291Pierce Iodoacetic Acid 500 mg 35603Pierce Iodoacetamide, Single-Use 24 x 9.3 mg 90034Pierce MMTS 200 mg 23011Pierce N-Ethylmalemide (NEM) 25 g 23030To view additional pack sizes and products, go to thermofisher.com/msdigestion
Peptide enrichment and fractionation
High-Select Fe-NTA Phosphopeptide Enrichment Kit
Kit A32992
High-Select TiO2 Phosphopeptide Enrichment Kit
Kit A32993
Pierce TiO2 Phosphopeptide Enrichment Spin Tips
96 tips 88303
Pierce Magnetic TiO2 Phosphopeptide Enrichment Kit
96-rxn kit 88811
Pierce Magnetic TiO2 Phosphopeptide Enrichment Kit, Trial Size
24-rxn kit 88812
Pierce High pH Reversed-Phase Peptide Fractionation Kit
12 columns 84868
Low Protein Binding Microcentrifuge Tubes, 2.0 mL
250 tubes 88379
Low Protein Binding Microcentrifuge Tubes, 2.0 mL
10 x 250 tubes 88380
To view additional pack sizes and products, go to thermofisher.com/peptidekits
Product Quantity Cat. No.
Peptide clean-up
Pierce C18 Spin Tips 96 tips 84850Pierce C18 Tips, 10 µL bed 8 tips 87781Pierce C18 Tips, 10 µL bed 96 tips 87782Pierce C18 Tips, 100 µL bed 8 tips 87783Pierce C18 Tips, 100 µL bed 96 tips 87784Pierce C18 Spin Columns 25 columns 89870Pierce C18 Spin Columns 50 columns 89873Pierce Graphite Spin Columns 30 columns 88302Pierce 96-Well Detergent Removal Spin Plates
2 plates 88304
Pierce Detergent Removal Spin Column, 125 µL
25 columns 87776
Pierce Detergent Removal Spin Column, 0.5 mL
25 columns 87777
Pierce Detergent Removal Spin Column, 2 mL
5 columns 87778
Pierce Detergent Removal Spin Column, 4 mL
5 columns 87779
Pierce Detergent Removal Resin 10 mL 87780HiPPR Detergent Removal Spin Column
54 columns 88305
HiPPR Detergent Removal Spin Columns, 0.1 mL
24 columns 88306
HiPPR Detergent Removal 96-Well Spin Plates, 0.1 mL
2 plates 88307
To view additional pack sizes and products, go to thermofisher.com/peptidecleanup
Peptide quantitation assays
Pierce Quantitative Colorimetric Peptide Assay
Kit 23275
Peptide Digest Assay Standard 1.5 mL 23295Pierce Quantitative Fluorometric Peptide Assay
500 assays 23290
96-Well Black Plate 25 pack 88378To view additional pack sizes and products, go to thermofisher.com/peptideassays
89
Sample preparation

Introduction
Quantitative proteomics
is a powerful tool used to
analyze differences in protein
expression between control
and experimental samples.
Differences in protein expression can be studied both globally (discovery proteomics) or within a specific subset of proteins (targeted proteomics). Most quantitative proteomic analyses utilize the isotopic labeling of proteins or peptides in the experimental groups, which can then be differentiated by mass spectrometry. Relative quantitation methods are used to compare protein or peptide abundance between samples, while spiking unlabeled samples with known concentrations of isotopically labeled synthetic peptides can help to enable absolute quantitation of target peptides via selected reaction monitoring (SRM).
Relative quantitation strategies include stable isotope labeling using amino acids in cell culture (SILAC) and labeling using tandem mass tag (TMT) reagents.
• SILAC-based quantitation is a powerful and widely used technique for identifying and quantifying relative changes in complex protein samples. The SILAC technique can be applied to complex biomarker discovery and systems biology studies, as well as to isolated proteins and protein complexes, and involves labeling protein samples in cultured mammalian cells with a heavy isotope–labeled form of an amino acid. Inclusion of the labeled amino acid in cell or tissue culture media results in replacement
The mostsuccessfulproteomics
labs andcompanies
Qua
ntita
tion
Calibration and verification
ChromatographyMass s
pec
inst
rum
enta
tion
Software
Sam
ple prep
Table 1. Overview of Thermo Scientific™ protein quantitation reagents.
SILAC Isobaric tags Peptides for SRM
Method of labeling Metabolic Amine-, sulfhydryl-, or carbonyl- reactive mass tags
Spike-in standard
Sample type Cultured mammalian cells Cultured mammalian cells, tissue, biofluids
Cultured mammalian cells, tissue, biofluids
Primary workflow Discovery Discovery TargetedQuantitation mode MS1 MS2 or SPS* MS3 MS2
Multiplex options 2-plex, 3-plex 2-plex, 6-plex, 10-plex Samples not combined* SPS = synchronous precursor selection
90
Protein quantitation
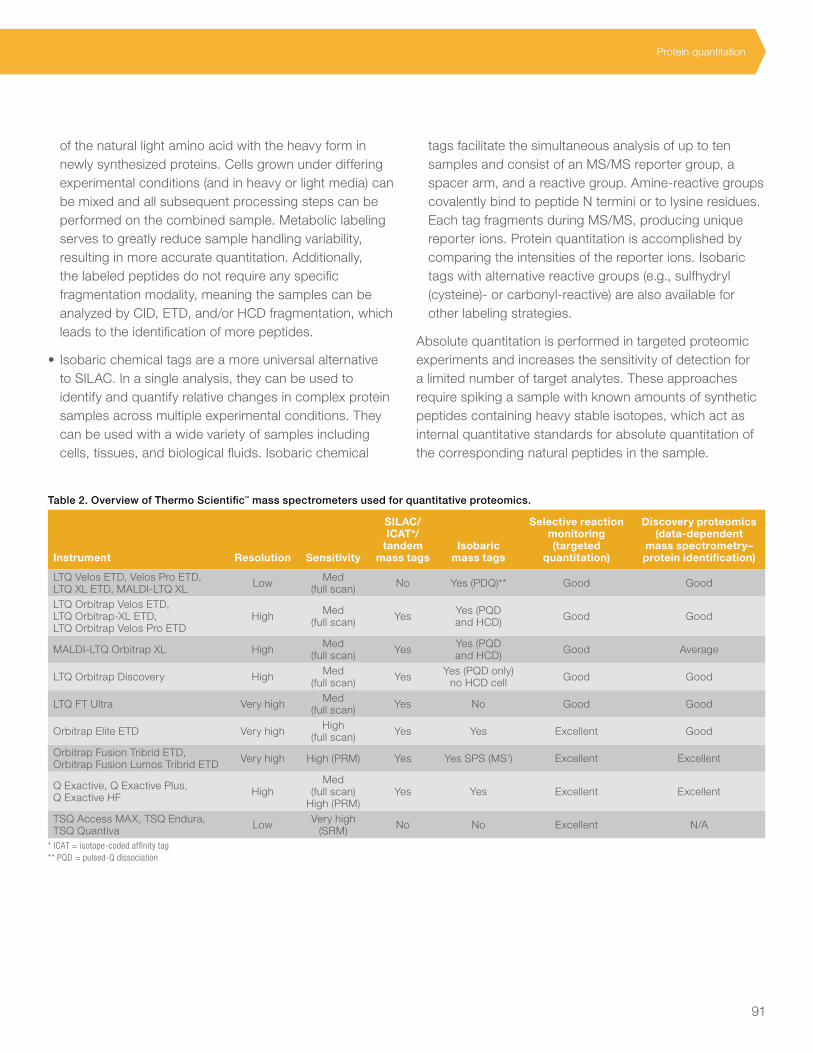
of the natural light amino acid with the heavy form in newly synthesized proteins. Cells grown under differing experimental conditions (and in heavy or light media) can be mixed and all subsequent processing steps can be performed on the combined sample. Metabolic labeling serves to greatly reduce sample handling variability, resulting in more accurate quantitation. Additionally, the labeled peptides do not require any specific fragmentation modality, meaning the samples can be analyzed by CID, ETD, and/or HCD fragmentation, which leads to the identification of more peptides.
• Isobaric chemical tags are a more universal alternative to SILAC. In a single analysis, they can be used to identify and quantify relative changes in complex protein samples across multiple experimental conditions. They can be used with a wide variety of samples including cells, tissues, and biological fluids. Isobaric chemical
tags facilitate the simultaneous analysis of up to ten samples and consist of an MS/MS reporter group, a spacer arm, and a reactive group. Amine-reactive groups covalently bind to peptide N termini or to lysine residues. Each tag fragments during MS/MS, producing unique reporter ions. Protein quantitation is accomplished by comparing the intensities of the reporter ions. Isobaric tags with alternative reactive groups (e.g., sulfhydryl (cysteine)- or carbonyl-reactive) are also available for other labeling strategies.
Absolute quantitation is performed in targeted proteomic experiments and increases the sensitivity of detection for a limited number of target analytes. These approaches require spiking a sample with known amounts of synthetic peptides containing heavy stable isotopes, which act as internal quantitative standards for absolute quantitation of the corresponding natural peptides in the sample.
Table 2. Overview of Thermo Scientific™ mass spectrometers used for quantitative proteomics.
Instrument Resolution Sensitivity
SILAC/ICAT*/
tandem mass tags
Isobaric mass tags
Selective reaction monitoring (targeted
quantitation)
Discovery proteomics (data-dependent
mass spectrometry–protein identification)
LTQ Velos ETD, Velos Pro ETD, LTQ XL ETD, MALDI-LTQ XL Low Med
(full scan) No Yes (PDQ)** Good Good
LTQ Orbitrap Velos ETD, LTQ Orbitrap- XL ETD, LTQ Orbitrap Velos Pro ETD
High Med (full scan) Yes Yes (PQD
and HCD) Good Good
MALDI- LTQ Orbitrap XL High Med (full scan) Yes Yes (PQD
and HCD) Good Average
LTQ Orbitrap Discovery High Med (full scan) Yes Yes (PQD only)
no HCD cell Good Good
LTQ FT Ultra Very high Med (full scan) Yes No Good Good
Orbitrap Elite ETD Very high High (full scan) Yes Yes Excellent Good
Orbitrap Fusion Tribrid ETD, Orbitrap Fusion Lumos Tribrid ETD Very high High (PRM) Yes Yes SPS (MS3) Excellent Excellent
Q Exactive, Q Exactive Plus, Q Exactive HF High
Med (full scan)
High (PRM)Yes Yes Excellent Excellent
TSQ Access MAX, TSQ Endura, TSQ Quantiva Low Very high
(SRM) No No Excellent N/A
* ICAT = isotope-coded affinity tag ** PQD = pulsed-Q dissociation
91
Protein quantitation

Discovery proteomics experiments are
intended to identify as many proteins
as possible across a broad dynamic
range. This often requires depletion of
high-abundance proteins, enrichment
of relevant proteins (e.g., protein
immunoprecipitation), and fractionation
(e.g., SDS-PAGE or chromatography)
to decrease sample complexity.
These strategies reduce the dynamic range between components in an individual sample and reduce the competition between proteins or peptides for ionization and mass spectrometry (MS) duty cycle time. Quantitative discovery proteomics experiments add a further challenge because they seek to identify and quantify protein levels across multiple samples. Quantitative discovery proteomics experiments utilize label-free or stable isotope labeling methods to quantify proteins.
Label-free strategies require highly reproducible peptide separation, increased instrumentation time and alignment of peptides across LC-MS/MS experiments to compare spectral counts or ion intensities. Stable isotope protein labeling strategies (e.g., SILAC and labeling with Thermo Scientific™ Tandem Mass Tag (TMT)™ reagents) incorporate 2H, 13C, 15N, or 18O isotopes into proteins and peptides, resulting in distinct mass shifts but otherwise identical chemical properties. This allows 2 to 10 samples to be labeled and combined prior to processing and LC-MS/MS analysis. Multiplexing reduces sample processing variability, improves specificity by quantifying the proteins from each condition simultaneously, and reduces turnaround time for multiple samples.
Quantitative proteomic studies are typically performed on high-resolution hybrid mass spectrometers, such as the Thermo Scientific™ Orbitrap Fusion™ Lumos™, Orbitrap Elite™, and Q Exactive™ Mass Spectrometers.
The Thermo Scientific™ Proteome Discoverer™ 2.1 and ProteinCenter™ software enable the extraction and analysis of high-quality data from the experimental results.
Discovery quantitation
Table 3. Overview of Thermo Scientific™ quantitation reagents for discovery proteomics.
SILACmetabolic labeling
reagents TMT labeling reagentsiodoTMT™
labeling reagentsaminoxyTMT™
labeling reagents
Method of labeling Metabolic Amine-reactive mass tags Sulfhydryl-reactive mass tags Carbonyl-reactive mass tags
Sample type Cultured mammalian cells Cultured mammalian cells, tissue, biofluids
Cultured mammalian cells, tissue, biofluids
Cultured mammalian cells, tissue, biofluids
Digestion protocol In-gel or in-solution In-solution In-solution In-solution
Quantitation mode MS1 MS2 or SPS MS3 MS2 or SPS MS3 MS2 or SPS MS3
Multiplex options 2-plex, 3-plex 2-plex, 6-plex, 10-plex 6-plex 6-plex
92
Protein quantitation
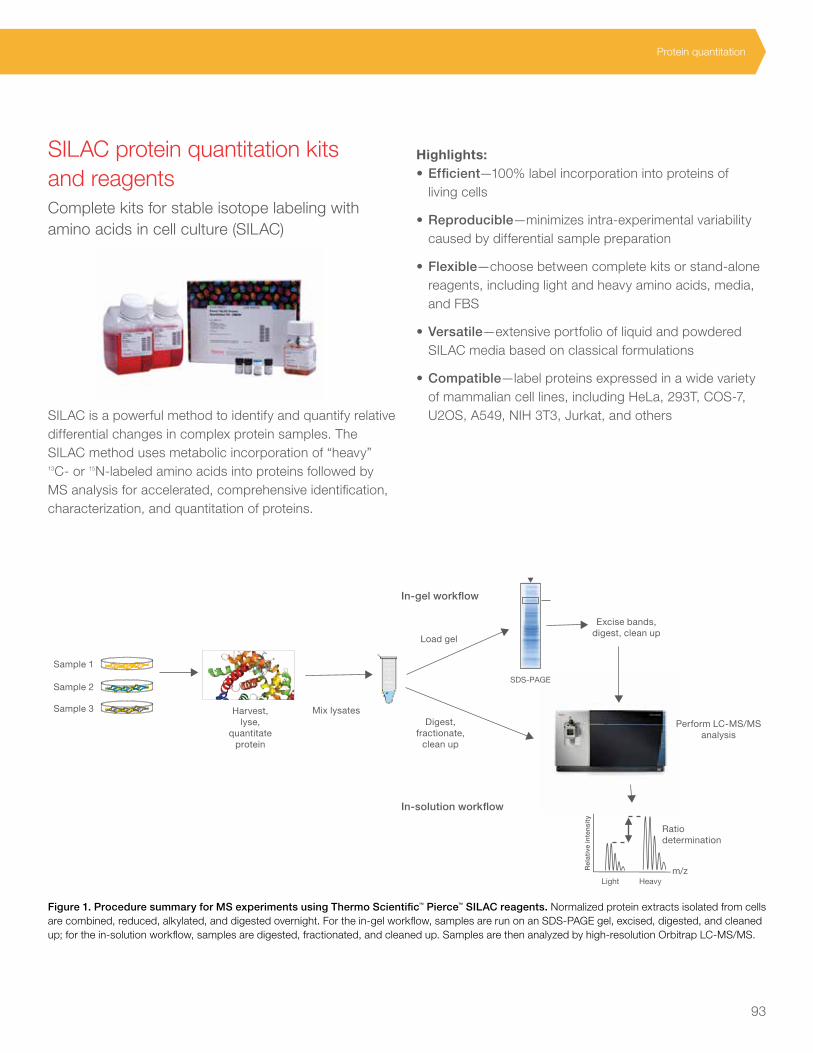
SILAC protein quantitation kits and reagentsComplete kits for stable isotope labeling with amino acids in cell culture (SILAC)
SILAC is a powerful method to identify and quantify relative differential changes in complex protein samples. The SILAC method uses metabolic incorporation of “heavy” 13C- or 15N-labeled amino acids into proteins followed by MS analysis for accelerated, comprehensive identification, characterization, and quantitation of proteins.
Highlights:• Efficient—100% label incorporation into proteins of
living cells
• Reproducible—minimizes intra-experimental variability caused by differential sample preparation
• Flexible—choose between complete kits or stand-alone reagents, including light and heavy amino acids, media, and FBS
• Versatile—extensive portfolio of liquid and powdered SILAC media based on classical formulations
• Compatible—label proteins expressed in a wide variety of mammalian cell lines, including HeLa, 293T, COS-7, U2OS, A549, NIH 3T3, Jurkat, and others
Figure 1. Procedure summary for MS experiments using Thermo Scientific™ Pierce™ SILAC reagents. Normalized protein extracts isolated from cells are combined, reduced, alkylated, and digested overnight. For the in-gel workflow, samples are run on an SDS-PAGE gel, excised, digested, and cleaned up; for the in-solution workflow, samples are digested, fractionated, and cleaned up. Samples are then analyzed by high-resolution Orbitrap LC-MS/MS.
Sample 1
Sample 2
Sample 3 Harvest,lyse,
quantitateprotein
Digest,fractionate,
clean up
Excise bands,digest, clean up
Perform LC-MS/MSanalysis
Mix lysates
Load gel
In-gel workflow
In-solution workflow
SDS-PAGE
Ratio determination
m/zLight Heavy
Rel
ativ
e in
ten
sity
93
Protein quantitation

Light (L) Heavy (H)
1,036 1,037 1,038 1,039 1,040 1,041 1,042 1,043 1,044 1,045
m/z
0
10
20
30
40
50
60
70
80
90
100
Rel
ativ
e ab
un
dan
ce
1,041.017
1,038.508
1,042.020
1,039.010
1,042.5211,039.512
1,043.023
1,038.007
1,041.518
SILAC ratioH:L = 2.1
Figure 2. Representative MS spectra generated using SILAC. Light and heavy (13C6) L-lysine–containing peptides (AEDNADTLALVFEAPNQEK) from proliferating cell nuclear antigen (PCNA) were analyzed by MS. Mass spectra of heavy peptides containing 13C6 L-lysine have an increased mass of 6 Da and are shifted to the right of light peptide spectra by a mass-to-charge ratio (m/z) of 3, caused by a +2 ionization of peptides.
General applications:• Quantitative analysis of relative changes in protein
abundance from different cell treatments
• Quantitative analysis of proteins for which there are no antibodies available
• Protein expression profiling of normal cells vs. abnormal cells
• Identification and quantification of hundreds to thousands of proteins in a single experiment
• Simultaneous immunoprecipitation of labeled, native proteins and protein complexes from multiple conditions
SILAC requires growing mammalian cells in specialized media supplemented with light or heavy forms of essential amino acids, e.g., 12C6 and 13C6 L-lysine, respectively. A typical experiment involves growing one cell population in a medium containing light amino acids (control), while the other population is grown in the presence of heavy amino acids (experimental). The heavy and light amino acids are incorporated into proteins through natural cellular protein synthesis. After alteration of the proteome in one sample
through chemical treatment or genetic manipulation, equal amounts of protein from both cell populations are then combined, separated by SDS-PAGE, and digested with trypsin before MS analysis. Because peptides labeled with heavy and light amino acids are chemically identical, they coelute during reversed-phase column prefractionation and, therefore, are detected simultaneously during MS analysis. The relative peak intensities of multiple, isotopically distinct peptides from each protein are then used to determine the average change in protein abundance in the treated sample (Figure 2).
Multiple SILAC kits are available, providing media that are compatible with different mammalian cell lines. Each kit includes all necessary reagents to isotopically label cells, including media, heavy and light amino acid pairs, and dialyzed serum. A wide range of isotopes of lysine and arginine are available separately, enabling multiplexed experiments and analysis. In addition, dialyzed fetal bovine serum (FBS) and other stand-alone media are available for additional mammalian cell lines. When combined with Thermo Scientific™ protein or peptide enrichment kits, the Thermo Scientific™ Pierce™ SILAC Protein Quantitation Kits enable MS analysis of low-abundance proteins such as cell surface proteins, organelle-specific proteins, and proteins with post-translational modifications such as phosphorylation or glycosylation.
Application using SILAC for global protein quantitationUsing a Pierce SILAC Protein Quantitation Kit, A549 cells adapted to grow in Thermo Scientific™ Dulbecco’s Modified Eagle Medium (DMEM) for SILAC were labeled with 13C6 L-lysine to >98% isotope incorporation. Heavy isotope–labeled cells treated with camptothecin were lysed, mixed with control lysates, separated by SDS-PAGE, and digested with trypsin before MS analysis. More than 350 proteins were successfully identified and quantified using a Thermo Scientific™ LTQ Orbitrap™ mass spectrometer.
94
Protein quantitationDiscovery quantitation

Learn more at thermofisher.com/silac
Most of the proteins identified had no change in abundance level after camptothecin treatment; however, 20% of proteins quantified in heavy isotope–labeled cells had protein levels (SILAC ratios) 1.5-fold higher than the control cells. One protein that was identified as being upregulated 2.1-fold in response to camptothecin treatment was proliferating cell nuclear antigen (PCNA), a protein with involvement in DNA repair (Figure 2). To verify SILAC data, protein levels were separately quantitated by western blot
(Figure 3). The abundance ratios determined by western blot were comparable to those determined by SILAC.
Application using SILAC for verification of co-IP protein complexesA major bottleneck in the proteomic characterization of signaling pathway targets is the lack of methods and/or reagents to quantify medium to low levels of proteins of interest in human samples. Immunoprecipitation followed by mass spectrometry (IP-MS) enables the simultaneous analysis of protein expression, protein–protein interactions, and post-translational modifications (PTMs). Immunoprecipitation provides both enrichment and increased sensitivity while the MS provides specific identification, high selectivity, and multiplex possibility.
However, when comparing proteins enriched from different immunoprecipitation experiments, it is sometimes difficult to determine if proteins identified by MS in the samples are co-immunoprecipitating with the antigen or are nonspecifically binding to the beads or antibodies.
Figure 3. Comparison of A549 protein levels detected by western blotting after camptothecin treatment. Ten micrograms of each light (L) and heavy (H) sample were analyzed by 4–20% SDS-PAGE and western blotting using specific antibodies.
p53
– +5 µM camptothecin
GAPDH
PCNA
5.9
1.9
1.1
1.2
Light (L) Heavy (H)
H:L
β-actin
Table 4. IP enrichment of SILAC-labeled samples facilitates the identification of key pathway targets and demonstrates the upregulation of phospho-AKT and phospho-GSK3α/β in response to insulin-like growth factor (IGF) stimulation. The heavy-to-light ratios with greater than a 2-fold difference indicate the upregulation (H:L >2) upon IGF stimulation. Slight increases in phospho-mTOR levels were also observed. Relevant phosphopeptides were identified for AKT, mTOR, and GSK3α/β. AKT is activated by phosphorylation while GSK3α/β is inactivated by phosphorylation, both leading to glycogen synthesis, cytoskeletal rearrangement, translation initiation, and cell growth. The total number of proteins identified was less than 250 for each IP sample.
IP antibody Target IDAverage
heavy:light ratioAverage no. of
unique peptidesRelevant
phosphopeptide ID
IR IR 0.85 38 NA
IGF-1R IGF-1R 0.75 32 NA
IRS1 IRS1 0.78 42 NA
PI3K 110 PI3K 110 1.03 9 NA
PTEN PTEN 1.02 11 NA
Pan AKT AKT1AKT2
0.860.84
199
NANA
Phospho-AKT AKT1AKT2
92.5596.23
1914
Yes (S473)Yes (S474)
mTOR mTOR 0.88 96 NA
Phospho-mTOR mTOR 1.79 94 Yes (S2448)
Phospho-GSK3α/β GSK3αGSK3β
3.502.57
910
Yes (S21)Yes (S9)
Phospho-p70S6K p70S6K 1.85 12 No
95
Protein quantitation

Control +IGF
IP:α-AKT Lysate
Contro
l+I
GF
Contro
l+I
GF
Contro
l+I
GF
Contro
l+I
GF
WB:α-AKT
WB:α-mTOR
WB:α-phospho-
mTOR
WB:α-phospho-
AKT
Control +IGF
IP: α-phospho-AKT Lysate
Control +IGF
IP:α-mTOR Lysate
Control +IGF
IP: α-phospho-mTOR Lysate
Figure 4. AKT and mTOR western blot results correlate with SILAC/LC-MS results. Immunoprecipitations were performed on control and stimulated (+IGF) lysates. Upon IGF stimulation, more phospho-AKT and phospho-mTOR are observed in the lysates as well as in the IP eluates, while the total protein levels remain the same.
One method to distinguish these distinct protein groups is to use SILAC to isotopically label cells for antigen-specific immunoprecipitations, and use unlabeled cells for control immunoprecipitations with non-antigen–specific antibodies (e.g., rabbit IgG or a different antibody). In this method, both specific and control samples are enriched separately and combined before LC-MS analysis. This allows for direct comparison of specific protein enrichment and facilitates identification of true interacting proteins as they will be isotopically labeled (i.e., increased SILAC ratio) vs. nonspecific background proteins (i.e., SILAC ratio ~1).
Dysregulation of IGF1R-PI3K-AKT-mTOR signaling is a pivotal driver for many cancers, making this pathway an attractive potential therapeutic target for cancer therapy development. To investigate the IGF1R-PI3K-AKT-mTOR signaling pathway, the SILAC method was used to differentially label proteins for quantification in insulin growth factor (IGF)–stimulated vs. unstimulated A549 and HCT116 cells. Targets were immunoprecipitated from the cell lysates, captured on streptavidin or protein A/G magnetic beads, and eluted from the beads for direct in-solution tryptic digestion. Quantitative changes in total and phosphorylated forms of AKT-mTOR pathway targets
were evaluated by LC-MS on a Thermo Scientific™ Orbitrap Fusion™ platform.
SILAC, combined with the improved IP-MS method permits relative quantification of specific and functional protein–protein interactions and PTMs in the IGF1R-PI3K-AKT-mTOR pathway, which can ultimately lead to future characterization studies and monitoring of cancer.
Table 5. Relevant protein interactions are preserved during co-immunoprecipitation of pathway targets. The optimized IP kit and protocol enable isolation of interacting proteins, and SILAC labeling helps to distinguish relevant protein IDs from potential background. PI3K interaction with IRS1 increased significantly upon IGF stimulation. The number of unique peptides for each target is listed as an average of triplicates.
IP antibodyCo-IP
target IDAverage
heavy:light ratioAverage no.
of unique peptides
IR IGF-1R 0.77 20
IGF-1R IR 0.85 24
IRS1 PI3K 85a 2.80 5
PI3K 85b 2.49 17
PI3K 110 11.35 3
PI3K 110 PI3K 85a 0.63 3
PI3K 85b 0.82 11
mTOR GBL (MLST8) 0.78 9
Rictor 0.96 7
SIN1 1.16 3
Phospho-mTOR GBL (MLST8) 1.63 9
Rictor 1.22 8
SIN1 1.47 2
PRR5 1.36 3
96
Protein quantitationDiscovery quantitation
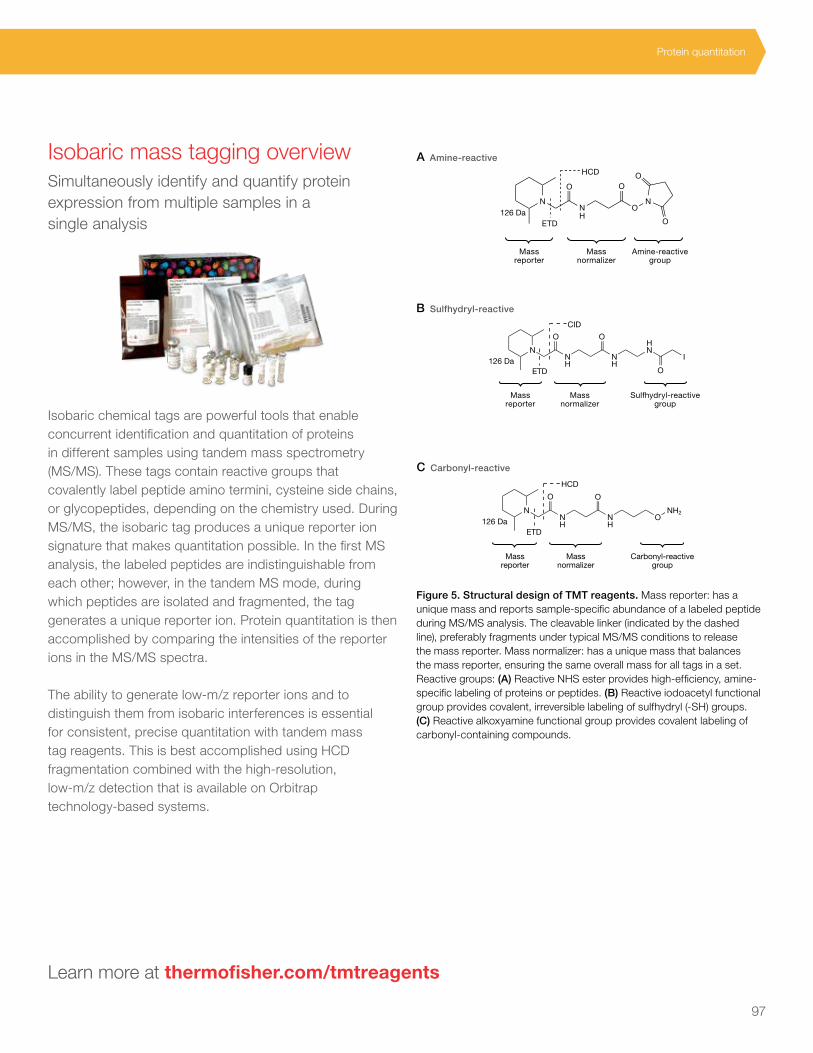
Isobaric mass tagging overviewSimultaneously identify and quantify protein expression from multiple samples in a single analysis
Isobaric chemical tags are powerful tools that enable concurrent identification and quantitation of proteins in different samples using tandem mass spectrometry (MS/MS). These tags contain reactive groups that covalently label peptide amino termini, cysteine side chains, or glycopeptides, depending on the chemistry used. During MS/MS, the isobaric tag produces a unique reporter ion signature that makes quantitation possible. In the first MS analysis, the labeled peptides are indistinguishable from each other; however, in the tandem MS mode, during which peptides are isolated and fragmented, the tag generates a unique reporter ion. Protein quantitation is then accomplished by comparing the intensities of the reporter ions in the MS/MS spectra.
The ability to generate low-m/z reporter ions and to distinguish them from isobaric interferences is essential for consistent, precise quantitation with tandem mass tag reagents. This is best accomplished using HCD fragmentation combined with the high-resolution, low-m/z detection that is available on Orbitrap technology-based systems.
126 Da
HCD
ETD
Massreporter
Massnormalizer
Carbonyl-reactivegroup
NNH
OO
NH
ONH2
126 Da
CID
NNH
NH
O OHN
I
OETD
Massreporter
Massnormalizer
Sulfhydryl-reactivegroup
NNH
ON
O O
O
O
Massreporter
Massnormalizer
Amine-reactivegroup
HCD
ETD126 Da
Figure 5. Structural design of TMT reagents. Mass reporter: has a unique mass and reports sample-specific abundance of a labeled peptide during MS/MS analysis. The cleavable linker (indicated by the dashed line), preferably fragments under typical MS/MS conditions to release the mass reporter. Mass normalizer: has a unique mass that balances the mass reporter, ensuring the same overall mass for all tags in a set. Reactive groups: (A) Reactive NHS ester provides high-efficiency, amine-specific labeling of proteins or peptides. (B) Reactive iodoacetyl functional group provides covalent, irreversible labeling of sulfhydryl (-SH) groups. (C) Reactive alkoxyamine functional group provides covalent labeling of carbonyl-containing compounds.
A Amine-reactive
B Sulfhydryl-reactive
C Carbonyl-reactive
Learn more at thermofisher.com/tmtreagents
97
Protein quantitation

Amine-reactive tandem mass tag reagentsAmine-reactive 6-plex and 10-plex isobaric tag reagents
The TMT reagents are designed to enable identification and quantitation of proteins in different samples using MS/MS. Thermo Scientific™ TMT10plex™ label reagents share an identical structure with TMTzero™, TMTduplex™, and TMTsixplex™ reagents but contain different numbers and combinations of 13C and 15N isotopes in the mass reporter. The different isotopes result in a 10-plex set of tags that have mass differences in the reporter that can be detected using high-resolution Orbitrap mass spectrometers.
Highlights:• Powerful—concurrent MS analysis of multiple samples
increases sample throughput and enables relative quantitation of up to 10 different samples derived from cells, tissues, or biological fluids
• Consistent—identical reagent structure and performance among TMTzero, TMTduplex, TMTsixplex, and TMT10plex reagents allow efficient transition from method development to multiplex quantitation
• Robust—increased multiplex capability results in fewer missing quantitative values
• Efficient—amine-reactive, NHS ester–activated reagents enable efficient labeling of all peptides regardless of protein sequence or proteolytic enzyme specificity
• Compatible—optimized for use with high-resolution MS/MS platforms, such as Thermo Scientific™ Orbitrap Fusion Lumos, Velos Pro, Orbitrap Elite, and Q Exactive instruments with data analysis fully supported by Proteome Discoverer 2.1 software
The TMT10plex reagent set contains 10 different isobaric compounds with the same mass and chemical structure (i.e., isotopomeric) composed of an amine-reactive NHS ester group, a spacer arm and a mass reporter. The reagent set enables up to 10 different peptide samples prepared from cells or tissues to be labeled in parallel and then combined for analysis. For each sample, a unique reporter mass (i.e., TMT10plex reagent that is 126–131 Da) in the low-mass region of the high-resolution MS/MS spectrum is used to measure relative protein expression levels during peptide fragmentation and MS/MS.
Applications:• Protein identification and quantitation from multiple
samples of cells, tissues, or biological fluids
• Protein expression profiling of normal vs. abnormal states, or control vs. treated cells
• Quantitative analysis of proteins for which no antibodies are available
• Identification and quantitation of membrane and post-translationally modified proteins
• Identification and quantification of hundreds to thousands of proteins in a single experiment
NNH
ON
O O
O
O
Massreporter
Massnormalizer
Amine-reactivegroup
HCD
ETD126 Da
Figure 6. Functional regions of the TMT reagent chemical structure, including MS/MS fragmentation sites by HCD and ETD.
98
Protein quantitationDiscovery quantitation

Figure 7. Chemical structures of TMT reagents. (A) Structures of TMT10plex reagents with 13C and 15N heavy-isotope positions (red asterisks). (B) TMTsixplex reagent structures with 13C and 15N heavy-isotope positions (red asterisks).
NNH
ON
O O
O
O
* ** * *126
NNH
ON
O O
O
O
** * **127N
NNH
ON
O O
O
O
***
*
*
129N
NNH
ON
O O
O
O*
*
*
* * 130C
NNH
ON
O O
O
O*
*
* * * 128C
NNH
ON
O O
O
O*
*
*
*
*131
A. TMT10plex Reagents (TMT10)
NNH
ON
O O
O
O
* ** ** 127C
NNH
ON
O O
O
O
*****128N
NNH
ON
O O
O
O
***
*
*
129C
NNH
ON
O O
O
O*
*
* * *130N
A. TMT Reagent Generic Chemical Structure
NNH
ON
O O
O
O
MassReporter
MassNormalizer
Amine-ReactiveGroup
HCD
ETD
NNH
ON
O O
O
O
* ** * *126
NNH
ON
O O
O
O
** * **127
NNH
ON
O O
O
O
***
*
*129
NNH
ON
O O
O
O*
*
*
* *130
NNH
ON
O O
O
O*
*
* * *128N
NH
ON
O O
O
O*
*
*
*
*131
B. TMTsixplex Reagents (TMT6)
TMT10-126
TMT10-127N
TMT10-128N
TMT10-129N
TMT10-130N
TMT10-131
Label
TMT10-127C
TMT10-128C
TMT10-129C
TMT10-130C
Sample 1
Sample 2
Sample 3
Sample 4
Sample 5
Sample 6
Sample 7
Sample 8
Sample 9
Sample 10
Treatsamplesand isolateproteins Fractionate,
clean up,perform
LC-MS/MSanalysis
Normalize usingpeptide quantitationassay and combine
400 500 600 700 800 900 1000 1100 1200 1300 1400 1500 1600
m/z
0
5
10
15
20
25
30
35
40
45
50
55
60
65
70
75
80
85
90
95
100631.89 761.41
473.82
525.64 595.38
466.83
637.86
546.84
445.27 875.46
933.49866.69
645.39
701.86 817.95432.28
771.40
1010.81
735.93
1058.50 1168.501212.97 1446.861396.78 1542.31
126 127 128 129 130 1310
10
20
30
40
50
60
70
80
90
100
m/z
N C
N C N C
N C
MS selection MS/MS quantitationFigure 8. Procedure summary for MS experiments with TMT10plex Isobaric Mass Tagging Reagents. Protein extracts isolated from cells or tissues are reduced, alkylated, and digested overnight. Samples are labeled with the TMT reagents, and then mixed before sample fractionation and clean-up. Labeled samples are analyzed by high-resolution Orbitrap LC-MS/MS mass spectrometer before data analysis to identify peptides and quantify reporter ion relative abundance.
A B
99
Protein quantitation

Figure 9. Example of relative quantitation using TMT10plex reagents. BSA tryptic digests labeled with TMT10plex reagents (TMT10 reagent that is 126–131 Da) were mixed 16:8:4:2:1:1:2:4:8:16 and analyzed by high-resolution Orbitrap LC-MS. The relative abundance of the target protein or peptide fragment in 10 different samples is easily measured by comparing the reporter ions generated by MS/MS fragmentation of the different mass tags.
Figure 10. Benchmarking Orbitrap MS instruments using TMT reagents with higher multiplexing. Numbers of (A) total peptide identifications and (B) protein groups are shown at 1% FDR for 500 ng of Thermo Scientific™ Pierce™ HeLa Protein Digest Standard. The numbers of quantifiable peptides and protein groups are also shown. Results represent averages of two replicate runs for each sample.
40,000
Pep
tid
es
Total
Unlabeled
TMT6
TMT8
TMT10
Q Exactive MS
Quanti�ed Total
No decrease in #PSMs
Orbitrap Elite MS
Quanti�ed Total
Orbitrap Fusion MS
Q Exactive MS Orbitrap Elite MS Orbitrap Fusion MS
Quanti�ed
35,000
30,000
25,000
20,000
15,000
10,000
5,000
0
4,000
4,500
Pro
tein
gro
up
s
Total
Unlabeled
TMT6
TMT8
TMT10
Quanti�ed Total Quanti�ed Total Quanti�ed
3,500
3,000
2,500
2,000
1,500
1,000
500
0
A
B
Load (L)Phospho-
enriched (P)High-pH
fractions (L)High-pH
fractions (P)Total
(unique)
Protein groups (ID) 3,770 1,399 7,865 4,493 8,689
Protein groups (Quan) 3,553 1,220 7,528 3,592 8,328
Total peptides (ID) 24,897 2,734 83,626 17,017 92,099
Total peptides (Quan) 22,796 2,252 80,091 13,987 84,287
010,00020,00030,00040,00050,00060,00070,00080,00090,000
100,000
Figure 11. Number of quantifiable proteins and peptides using MS2 HCD fragmentation on the Orbitrap Fusion mass spectrometer after high-pH fractionation and phosphopeptide enrichment. Results are the MUDPIT search of two replicate files.
125.5 126.0 126.5 127.0 127.5 128.0 128.5 129.0 129.5 130.0 130.5 131.0 131.5
m/z
05
101520253035404550556065707580859095
100
Rel
ativ
e ab
un
dan
ce
131.1381126.1277
127.1246
127.1309
128.1281
128.1341
129.1376
129.1317
130.1409
130.1348
Application showing relative quantitation of protein abundance using TMT10plex reagentsTMT10plex reagents enabled the simultaneous comparison of relative protein abundance in response to epidermal growth factor (EGF) stimulation, exposure to erlotinib, or both. Using the Orbitrap Fusion mass spectrometer, approximately 7,800 protein groups and 90,000 unique peptides were identified from samples, with a quantitation rate exceeding 90% at the peptide level employing HCD MS2 quantitation and fragmentation (Figure 11). High-pH reversed-phase fractionation of unenriched and phosphopeptide enriched sample increased the number of quantified proteins almost 3-fold compared to unfractionated samples. Hierarchical cluster analysis revealed numerous changes in relative protein abundance between parental and resistant cell lines (Figure 12).
Protein expression profiling studies of H358 erlotinib-resistance (ER) and SU11274-resistance (SR) cells using SILAC have shown that β-catenin was downregulated in H358 ER cells but upregulated in H2170 cells. Quantitation of TMT10plex reagents in this study also showed ~2-fold lower expression of β-catenin (Figure 13). Epidermal growth factor receptor (EGFR, Erb2) and SHC-transforming protein 1 (SHC1) were both phosphorylated after EGF and hepatocyte growth factor (HGF) treatment, but showed partial inhibition to erlotinib treatment in ER cells. Both staphylococcal nuclease domain–containing protein 1 (SND1) and glucosamine 6-phosphate N-acetyltransferase (GNA1) were phosphorylated in ER cells compared to parental and SR cells (Figure 14).
100
Protein quantitationDiscovery quantitation
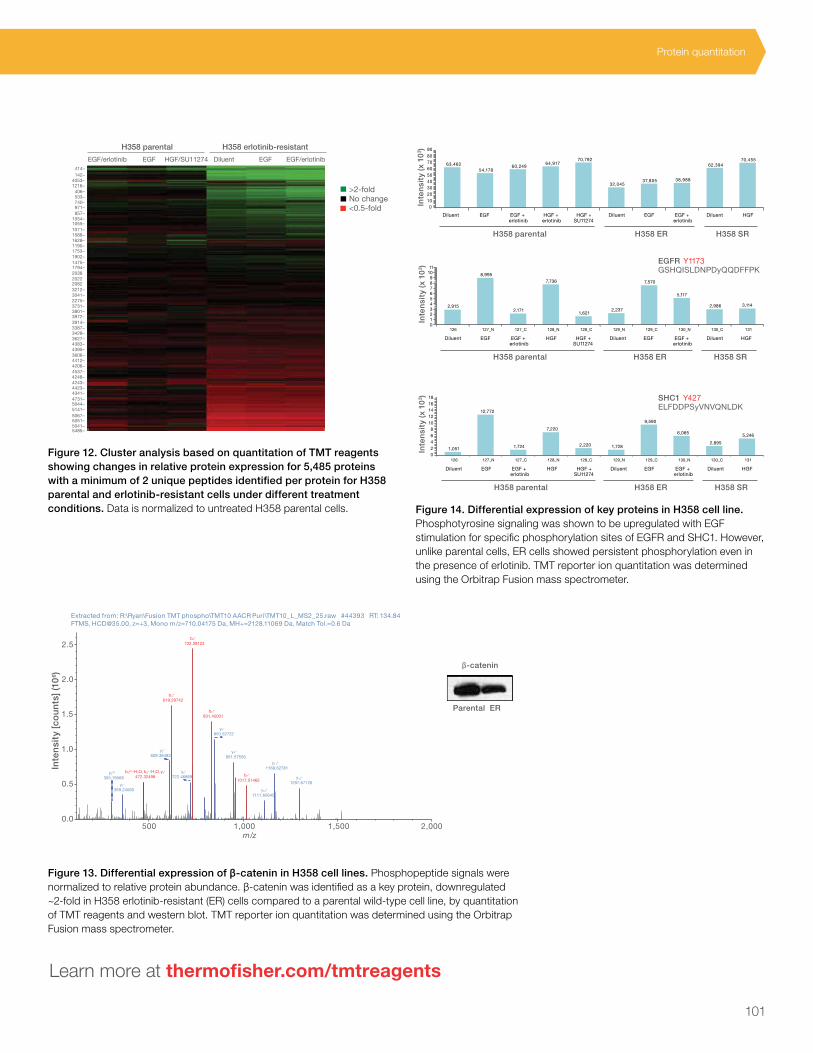
Learn more at thermofisher.com/tmtreagents
Figure 12. Cluster analysis based on quantitation of TMT reagents showing changes in relative protein expression for 5,485 proteins with a minimum of 2 unique peptides identified per protein for H358 parental and erlotinib-resistant cells under different treatment conditions. Data is normalized to untreated H358 parental cells.
H358 parental
>2-foldNo change<0.5-fold
EGF/erlotinib EGF HGF/SU11274 Diluent EGF EGF/erlotinib
H358 erlotinib-resistant
414–142–
406–533–740–971–857–
4053–1216–
1054–1055–1071–1588–1628–1190–1753–1902–1475–1794–2038202220823212–3041–2275–3731–3801–3972–3914–3387–3428–3627–4383–4395–3606–4412–4206–4537–4248–4243–4423–4341–4731–5044–5141–5067–5051–5041–5485–
Figure 13. Differential expression of β-catenin in H358 cell lines. Phosphopeptide signals were normalized to relative protein abundance. β-catenin was identified as a key protein, downregulated ~2-fold in H358 erlotinib-resistant (ER) cells compared to a parental wild-type cell line, by quantitation of TMT reagents and western blot. TMT reporter ion quantitation was determined using the Orbitrap Fusion mass spectrometer.
Figure 14. Differential expression of key proteins in H358 cell line. Phosphotyrosine signaling was shown to be upregulated with EGF stimulation for specific phosphorylation sites of EGFR and SHC1. However, unlike parental cells, ER cells showed persistent phosphorylation even in the presence of erlotinib. TMT reporter ion quantitation was determined using the Orbitrap Fusion mass spectrometer.
y₅2⁺305.19568
y₁₀⁺1111.60645
y₃⁺359.24060
y₁₂⁺1297.67126
b₇⁺1017.51465
b₆2⁺-H₂O, b₂⁺-H₂O, y₄⁺472.32498
y₆⁺722.46869
y₁₁⁺1168.62781
y₉⁺951.57556
y₅⁺609.38483
y₈⁺850.52722
b₅⁺831.45001
b₃⁺619.29742
b₄⁺732.38123
500 1,000 1,500 2,000m/z
0.0
0.5
1.0
1.5
2.0
2.5
Extracted from: R:\Ryan\Fusion TMT phospho\TMT10 AACR Puri\TMT10_L_MS2_25.raw #44393 RT: 134.84 FTMS, [email protected], z=+3, Mono m/z=710.04175 Da, MH+=2128.11069 Da, Match Tol.=0.6 Da
Inte
nsi
ty [c
ou
nts
] (10
6 )
Parental ER
β-catenin
126
0102030405060708090
70,45562,394
38,98837,80532,045
70,79264,917
60,24954,178
63,462
Diluent
H358 parental H358 ER
EGF EGF + erlotinib
HGF + erlotinib
HGF + SU11274
Diluent EGF EGF + erlotinib
Diluent HGF
H358 SR
Inte
nsi
ty (x
10
3 )In
ten
sity
(x 1
03 )
Inte
nsi
ty (x
10
3 )
EGFR Y1173 GSHQISLDNPDyQQDFFPK
Diluent
H358 parental H358 ER
EGF EGF + erlotinib
HGF HGF + SU11274
Diluent EGF EGF + erlotinib
Diluent HGF
H358 SR
126 127_N 127_C 128_N 128_C 129_N 129_C 130_N 130_C 131 0
1
2
3
4 5
6
7
8
9
10
11
3,114 2,986
5,117
7,570
2,237 1,621
7,736
2,171
8,995
2,915
126 127_N 127_C 128_N 128_C 129_N 129_C 130_N 130_C 131 0
2
4
6
8
10
12
14
16
18
5,246 2,895
6,065
9,590
1,728 2,220
7,220
1,724
12,772
1,051
SHC1 Y427 ELFDDPSyVNVQNLDK
Diluent
H358 parental H358 ER
EGF EGF + erlotinib
HGF HGF + SU11274
Diluent EGF EGF + erlotinib
Diluent HGF
H358 SR
101
Protein quantitation

Cysteine-reactive tandem mass tag reagentsFor protein expression analysis of sulfhydryl groups by mass spectrometry
The Thermo Scientific™ iodoTMT™ reagents enable concurrent identification and multiplexed quantitation of proteins in different samples using tandem mass spectrometry. These labeling reagents are sets of isobaric isomers (i.e., same mass and structure) that contain iodoacetyl functional groups for covalent, irreversible labeling of sulfhydryl (-SH) groups. Similar to iodoacetamide, iodoTMT reagents react specifically with reduced cysteines in peptides and proteins. The iodoTMT reagents can be differentiated by tandem mass spectrometry (MS/MS), enabling identification and relative quantitation of cysteine modifications, such as S-nitrosylation, oxidation, and disulfide bond formation, across different samples or experimental conditions.
Highlights:• Specific—only reacts with reduced sulfhydryl groups
• Irreversible—labeled proteins and peptides are not susceptible to reducing agents
• Flexible—options for duplex isotopic (MS) or sixplex isobaric (MS/MS) quantitation
• Complete—workflow combines efficient labeling, enrichment, and elution for identification and quantitation of cysteine-containing peptides
Applications:• Identify and quantify low-abundance, cysteine-containing
peptide subproteome
• Combine up to six different samples or experimental conditions in a single LC-MS analysis
• Determine sites of cysteine post-translational modifications (e.g., S-nitrosylation, oxidation, and disulfide bonds)
• Measure cysteine post-translational modification occupancy across different samples or experimental conditions
Figure 15. Mechanism of Thermo Scientific™ iodoTMTzero™ reaction with cysteine-containing proteins or peptides.
NHHS
O
R’
R
NNH
NH
O OHN
O
NH
O
S
R’
R
+
Cysteine
iodoTMTzero reagent Conjugation reaction
iodoTMTsixplex reagents
* ** * *126N
NH
NH
O OHN
I
O
** * **
127N
NH
NH
O OHN
I
O
*
*
* * *128N
NH
NH
O OHN
I
O
***
*
*129
NNH
NH
O OHN
I
O
*
*
*
* *130
NNH
NH
O OHN
I
O
*
*
*
*
*131
NNH
NH
O OHN
I
O
126 Da
CID
NNH
NH
O OHN
I
OETD
Massreporter
Massnormalizer
Cysteine-reactivegroup
102
Protein quantitationDiscovery quantitation

NHHS
O
R’
R
NNH
NH
O OHN
O
NH
O
S
R’
R
+
Cysteine
iodoTMTzero reagent Conjugation reaction
iodoTMTsixplex reagents
* ** * *126N
NH
NH
O OHN
I
O
** * **
127N
NH
NH
O OHN
I
O
*
*
* * *128N
NH
NH
O OHN
I
O
***
*
*129
NNH
NH
O OHN
I
O
*
*
*
* *130
NNH
NH
O OHN
I
O
*
*
*
*
*131
NNH
NH
O OHN
I
O
126 Da
CID
NNH
NH
O OHN
I
OETD
Massreporter
Massnormalizer
Cysteine-reactivegroup
Figure 17. Schematic of the iodoTMTsixplex reagent workflow. Six different sample conditions can be prepared for iodoTMT reagent labeling. Labeled proteins are combined before iodoTMT-labeled peptide enrichment using immobilized anti-TMT antibody resin and subsequent LC-MS/MS analysis of isobaric reporter ions.
1
2
3
4
5
6
Treat samples,
isolate proteins
Denature;reduce
Samples
IodoTMT6-126
IodoTMT6-127
IodoTMT6-128
IodoTMT6-129
IodoTMT6-130
IodoTMT6-131
Enrich for TMT-labeled
peptide using anti-TMTantibody
resin
= TMT peptide(or protein)
Combine,removeexcess
reagent,digest
Label
Fractionate,clean up,
analyze by LC-MS/MS
Figure 16. Structure of Thermo Scientific™ iodoTMTsixplex™ reagents for cysteine labeling, enrichment, and isobaric MS quantitation.
103
Protein quantitation

Figure 18. Enrichment of iodoTMT-labeled peptides. (A) Percent of iodoTMT-labeled peptide modifications from A549 cell lysate proteins identified before and after enrichment using acidic and TMT elution buffers. (B) Comparison of total number of unique peptides and proteins identified before and after anti-TMT antibody resin enrichment. (C) Venn diagram of unique proteins identified before and after anti-TMT antibody resin enrichment.
Figure 19. Measured induction of S-nitrosylation in phosphoglycerate kinase 1 peptide. BV-2 glioma cells were either untreated or treated with lipopolysaccharide (LPS) or S-nitrosocysteine (SNOC) for 20 hr to induce S-nitrosylation, and were selectively labeled with iodoTMTsixplex reagents using the S-nitrosylation switch assay. MS spectrum includes phosphoglycerate kinase 1 peptide (GCITIIGGGDTATCCAK, inset) showing localization of the iodoTMT-modified cysteine (red). Inserted graph shows an increase in S-nitrosylation of phosphoglycerate kinase 1 peptide in response to S-nitrosylation–inducing agents lipopolysaccharide (LPS, 127 and 130) and S-nitrosocysteine (SNOC, 128 and 131) determined by relative quantitation of TMT reporter ions in duplicate samples.
A Specificity of enrichment B Distribution of enrichment C Composition of unique proteins
Notenriched
Acidelutionbuffer
0
20
30
40
50
10
60
70
80
90
100
Lab
eled
pep
tid
es %
TMTelutionbuffer
Enriched
Uniquepeptides
Uniqueproteins
0
1,000
2,500
2,000
2,500
500
3,000
3,500
4,000
4,500
5,000
Nu
mb
er o
f p
epti
des
or
pro
tein
s EnrichedUnenriched
EnrichedUnenriched
EnrichedUnenriched
EnrichedUnenriched
438 552 282
Learn more at thermofisher.com/iodotmt
b₁₁⁺1045.61
b₁₂⁺1116.70
b₂⁺, y₂⁺218.20
y₁₆2⁺985.85
y₈2⁺599.70
b₃⁺331.09
y₇2⁺542.51
y₃⁺378.28
y₉2⁺628.26
b₅⁺545.22
b₁₄2⁺825.63
y₅2⁺456.27
b₁₆2⁺940.99
y₁₃2⁺798.48
y₁₁2⁺685.51
b₁₅2⁺, y₁₅2⁺905.48
y₁₄2⁺848.94
y₁₀2⁺656.84
y₁₂2⁺741.86
200 400 600 800 1,000 1,200m/z
0
500
1,000
1,500
2,000
2,500
Inte
nsi
ty (c
ou
nts
)
G C I I IT T TGGG D A A KC C
126 127 128 129 130
iodoTMTsixplex channel
0
2,000
3,000
4,000
5,000
1,000
6,000
7,000
8,000
Inte
nsi
ty (c
ou
nts
)
131
LPS
SNOC
(–)
LPS
SNOC
(–)
104
Protein quantitationDiscovery quantitation

Carbonyl-reactive tandem mass tag reagentsEnable characterization and multiplex quantitation of carbonyl-containing biomolecules
The Thermo Scientific™ aminoxyTMT™ Mass Tag Labeling Reagents enable multiplexed relative quantitation of carbonyl-containing compounds by mass spectrometry (MS). The six compounds of the Thermo Scientific™ aminoxyTMTsixplex™ Reagent Set have the same nominal mass (i.e., isobaric) and chemical structure (carbonyl-reactive aminoxy group, spacer arm, and mass reporter). However, the specific distribution of 13C and 15N isotopes on either side of the HCD or ETD MS/MS fragmentation site in each reagent results in a unique reporter mass (126–131 Da) in the low–mass region. This distribution of reporter masses is used to measure the relative abundance of labeled molecules in a combined (multiplexed) MS sample representing six different experimental conditions. The aminoxyTMT reagents may be used to quantify a broad range of biologically important molecules, including carbohydrates, steroids, or oxidized proteins.
For glycobiology MS applications, native glycans are difficult to study by mass spectrometry because of their poor ionization efficiency. Quantitation of glycans is particularly challenging due to the lack of standards for all naturally occurring glycans and difficulties with reproducibly quantifying multiple samples. The aminoxy group has better reactivity with carbonyls and better stability of the labeled product compared to hydrazide groups. Labeling with the aminoxyTMT reagents improves ionization of glycans, thus improving sensitivity, and enables relative quantitation of glycans for up to six samples concurrently.
Highlights:• Quantitative—enables relative quantitation of glycans or
other carbonyl-reactive proteins from multiple samples of cells, tissues, or biological fluids
• Stable—stable product formed after labeling reaction
• Efficient—achieve labeling efficiency greater than 90% in 1 hr
• Sensitive—improved signal-to-noise ratio of labeled glycan by greater than 20-fold when compared to native glycan
• Multiplex—identify and characterize up to six samples concurrently
• Optimized—procedure and reagents optimized for excellent labeling efficiency and recovery of glycans
Applications:• Relative quantitation of glycans
• Study of structural diversity of protein glycosylation
• Study of glycosylation in cell signaling and regulation
• Study of cancer progression, biomarker discovery, and analysis of biotherapeutics development
• Study of protein oxidation
105
Protein quantitation
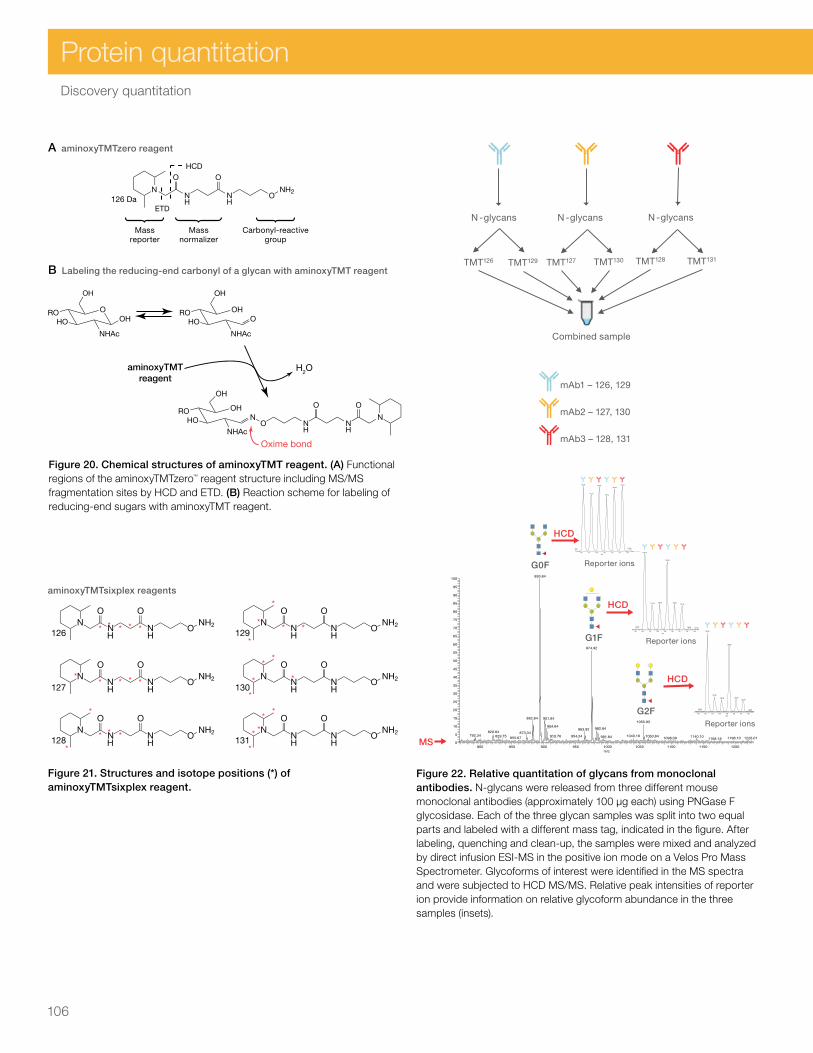
Figure 20. Chemical structures of aminoxyTMT reagent. (A) Functional regions of the aminoxyTMTzero™ reagent structure including MS/MS fragmentation sites by HCD and ETD. (B) Reaction scheme for labeling of reducing-end sugars with aminoxyTMT reagent.
Figure 22. Relative quantitation of glycans from monoclonal antibodies. N-glycans were released from three different mouse monoclonal antibodies (approximately 100 μg each) using PNGase F glycosidase. Each of the three glycan samples was split into two equal parts and labeled with a different mass tag, indicated in the figure. After labeling, quenching and clean-up, the samples were mixed and analyzed by direct infusion ESI-MS in the positive ion mode on a Velos Pro Mass Spectrometer. Glycoforms of interest were identified in the MS spectra and were subjected to HCD MS/MS. Relative peak intensities of reporter ion provide information on relative glycoform abundance in the three samples (insets).
Figure 21. Structures and isotope positions (*) of aminoxyTMTsixplex reagent.
mAb1 – 126, 129
mAb2 – 127, 130
mAb3 – 128, 131
MS 800 850 900 950 1000 1050 1100 1150 1200
m/z
0
5
10
15
20
25
30
35
40
45
50
55
60
65
70
75
80
85
90
95
100893.84
974.92
882.84 901.841055.93
904.84982.84963.92
820.84 873.34792.34 1040.18910.76 954.34 1063.84829.75 1140.10991.84855.67 1198.101098.09 1226.011168.18
G0F
G1F
G2F
HCD
HCD
HCD
N -glycansN -glycans N -glycans
TMT129 TMT126 TMT127 TMT130 TMT128 TMT131
Combined sample
Reporter ions
3_mAbs_123123_894 #10 RT: 0.10 AV: 1 NL: 5.69E3T: ITMS + p ESI Full ms2 [email protected] [50.00-1500.00]
122 123 124 125 126 127 128 129 130 131 132 133 134 135m/z
0
5
10
15
20
25
30
35
40
45
50
55
60
65
70
75
80
85
90
95
100
Rel
ativ
e A
bun
dan
ce
126.25 131.34128.34130.34
127.34129.34
124.25
132.25125.25 133.25123.25122.25 134.25 135.17
Reporter ions
3_mabs_123123_975 #21 RT: 0.24 AV: 1 NL: 5.48E3T: ITMS + p ESI Full ms2 [email protected] [50.00-1500.00]
122 123 124 125 126 127 128 129 130 131 132 133 134 135 136m/z
0
5
10
15
20
25
30
35
40
45
50
55
60
65
70
75
80
85
90
95
100
Rela
tive
Ab
un
dan
ce
126.25
129.34
128.34 130.34127.34131.34
124.17125.25 132.25123.25 133.25122.25 134.25 135.17
Reporter ions
3_mabs_123123_1056 #8 RT: 0.10 AV: 1 NL: 1.22E3T: ITMS + p ESI Full ms2 [email protected] [50.00-1500.00]
122 123 124 125 126 127 128 129 130 131 132 133m/z
0
5
10
15
20
25
30
35
40
45
50
55
60
65
70
75
80
85
90
95
100
Rela
tive A
bu
nd
an
ce
126.25
129.34
127.25
130.34128.34131.34
124.17 125.25 132.25123.25 133.25122.25
126 Da
HCD
ETD
Massreporter
Massnormalizer
Carbonyl-reactivegroup
NNH
OO
NH
ONH2
NNH
OO
NH
ONH2* ** * *126
NNH
OO
NH
ONH2
127*
* * **
NNH
OO
NH
ONH2
128
*
*
* * *
NNH
OO
NH
ONH2
129 ***
*
*
NNH
OO
NH
ONH2
130
*
*
*
* *
NNH
OO
NH
ONH2
131
*
*
**
*
A aminoxyTMTzero reagent
aminoxyTMTsixplex reagents
B Labeling the reducing-end carbonyl of a glycan with aminoxyTMT reagent
OH
HORO
NO N
HNH
N
NHAc
OH
O O
O
HORO
NHAc
OH
OHOH
HORO
NHAc
OH
O
H2OaminoxyTMTreagent
Oxime bond
106
Protein quantitationDiscovery quantitation

Figure 23. Positive ion mode electrospray ionization (ESI) of native unlabeled and aminoxyTMT-labeled maltoheptaose (Glc7) standard. (A) MS spectrum of native unlabeled Glc7. (B) MS spectrum of aminoxyTMT-labeled Glc7 standard. A 50-fold lower concentration of the aminoxyTMT-labeled sample solution produced a similar base peak intensity as the unlabeled sample. Residual aminoxyTMT reagent or unlabeled Glc7 were not detected after labeling and sample clean-up (B).
300 400 500 600 700 800 900 1000 1100 1200 1300 1400 1500 1600 1700 1800 1900 200005
101520253035404550556065707580859095
100
Glc7_100 µgmL_unlabeledT: ITMS + p ESI Full ms [50.00–25000.00]
# 35 RT: 0.11 AV: 1 NL: 1.91E7
Glc7_2 µgmL_oxyTMTT: ITMS + p ESI Full ms [50.00–20000.00]
# 35 RT: 0.11 AV: 1 NL: 2.21E7
Rel
ativ
e a
bu
nd
ance
Rel
ativ
e a
bu
nd
ance
599.43
1175.69
736.60437.43 1013.61791.43494.84 851.52 1225.111095.11 1560.37648.43413.51 926.27 1449.951331.03 1642.12 1752.87 1868.29 1945.21
Native unlabeled Glc7 100 µg/mL
aminoxyTMT-labeled Glc7 2 µg/mL
300 400 500 600 700 800 900 1000 1100 1200 1300 1400 1500 1600 1700 1800 1900 2000m/z
05
101520253035404550556065707580859095
100 736.60
747.52
360.59 655.51502.09 1449.87830.68574.51 974.60 1068.19 1129.36 1787.541270.28 1353.03 1513.53 1699.37 1896.04 1955.79
Glc7 (unlabeled) [M+Na]+
[M+2Na]2+Glc7 (unlabeled)
Glc7 (labeled) [M+H+Na]2+
[M+H]+
20- to 50-fold increase in S/N
Glc7 (labeled)
ESI solution: 50% ACN, 50 µM NaOH Velos Pro Mass Spectrometer
No residual reagent
A
B m/z
Learn more at thermofisher.com/aminoxytmt
107
Protein quantitation

Discovery proteomics globally profiles
and identifies thousands of proteins,
whereas targeted proteomics focuses
on the quantitation of selected proteins
and peptides. The end goal of targeted
assay development is to quantify
selected proteins with high precision,
sensitivity, selectivity, and throughput.
Synthetic peptides are an integral part
of targeted assay development.
Crude peptide libraries are used as a screening tool, while heavy peptides are utilized for absolute quantitation with selective reaction monitoring (SRM), multiple reaction monitoring (MRM), or parallel reaction monitoring (PRM).
Pharmaceutical and diagnostic research applications increasingly rely on quantitative proteomic experiments to quantify proteins in complex samples. Experimental design begins with software-assisted selection of proteotypic peptide candidates. After synthesis, crude peptides or peptide libraries are screened to identify the best peptide candidates and to optimize the quantitative LC-MS
assay. After optimal peptide sequence selection, highly pure heavy peptides from the best candidates are then synthesized for target quantitation. The heavy peptides serve as internal quantitative standards for absolute quantification of the corresponding natural peptides in a biological sample. We offer products that enable assay development from verification to quantitation, including Thermo Scientific™ SRM Peptide Libraries and Thermo Scientific™ HeavyPeptide™ AQUA peptides for quantitation.
Targeted protein quantitation is commonly analyzed with triple quadrupole mass spectrometers, such as the Thermo Scientific™ TSQ Quantiva™ triple-stage quadrupole mass spectrometer. A triple quadrupole mass spectrometer measures peptides by serially monitoring specific mass windows for peptides of interest, isolating the peptides, fragmenting, and then quantifying several fragment ions specific for each peptide of interest. This selective reaction monitoring (SRM) strategy for targeted quantitation, along with chromatographic retention time information, provides high sensitivity and specificity. Alternatively, high-resolution and accurate-mass instruments, such as the Q Exactive mass spectrometer, are being used to quantify proteins with even greater selectivity for PRM.
Specialized software such as Pinpoint 1.4 software ensures the maximum acquisition of high-quality data and extraction of valuable information. TraceFinder 4.1 software may also be used for targeted quantitation, specifically the quantitation of peptides.
Targeted quantitation
Thousands of peptides Hundreds of peptides Tens of peptides
Discovery Confirmation Verification
Solutions PEPotec SRM peptides (3 grades)HeavyPeptide AQUA standards (Basic, QuantPro, and Ultimate grades)
Figure 24. Overview of Thermo Scientific™ products for targeted quantitation.
108
Protein quantitation

Custom peptide synthesis service for targeted proteomicsHigh-quality peptides tailored to meet your needs
The Thermo Scientific™ Custom Peptide Synthesis Service offers multiple options to meet your targeted proteomics needs during every step of the process, from discovery through confirmation and verification. We offer both standard and heavy peptides in various grades and formats to meet budget, throughput, and timeline goals.
Targeted assay design
Proteotypic peptide library heavy or light
PEPotec SRM custom peptide library
SRM/MRM assay verification
HeavyPeptide AQUA standards
SRM/MRM assay quantitation
Samples spiked with HeavyPeptide standards
LC-MS/MS SRM setup
LC-MS/MS quantitation
TSQ Quantiva triple-stage quadrupole mass
spectrometer
Pinpoint software or TraceFinder software
Peptide sequence selectionHundreds to thousands of peptides
Peptide veri�cationUp to tens of peptides
Target quantitation
Targeted quantitation workflow
109
Protein quantitation

HeavyPeptide AQUA standardsHigh-quality isotopically labeled peptides for absolute quantitation
The HeavyPeptide AQUA Custom Synthesis Service provides isotopically labeled, AQUA (“Absolute QUAntitation”)-grade peptides for the relative and absolute quantitation of proteins at very low concentrations in complex protein mixtures.
HeavyPeptide standards up to 30 amino acids in length are synthesized using the latest Fmoc solid-phase peptide synthesis technology, purified by HPLC, and analyzed by mass spectrometry. Purity of AQUA, Ultimate, and QuantPro grade peptides is confirmed using stringent analytical HPLC to assure high-quality peptides for absolute quantitation. We offer advanced heavy peptide synthesis capabilities with a wide range of labels, modifications, scales, and purities to help meet your research needs.
HeavyPeptide standards are packaged using our ArgonGuard service, in which peptides are packaged in argon gas to minimize amino acid oxidation during shipping and storage. This standard service helps maintain biological activity of custom peptides and reduce experimental variation.
Highlights:• Accurate—peptide concentration precision for
quantitative application needs
• Multiplexed—up to hundreds of peptides possible
• Sensitive—enables the absolute quantification of low-abundance proteins (fmol)
• Specific—100% peptide sequence specificity
• Flexible—variety of modification and formatting options
Applications:• Biomarker discovery, verification, and
analytical confirmation• Functional quantitative proteomics• Quantitation of posttranslational modifications• Confirmation of RNA interference (RNAi)• Pharmacokinetics• ADME toxicology studies• Anti-doping testing
Targeted quantitation
Target LOD (fmol) LLOQ (fmol) ULOQ (fmol) Linearity (R2)
EGFR0.7 18.5 1,500 0.99990.2 0.7 1,500 0.9999
AKT20.7 6.2 1,500 0.99990.7 6.2 1,500 0.9969
Table 6. HeavyPeptide AQUA grades.
Grade Description
AQUA Ultimate Fully solubilized; concentration precision 5–10%;* ideal for absolute quantitation
AQUA QuantPro
Fully solubilized; concentration precision 10–25%;* ideal for biomarker verification
AQUA Basic Lyophilized; relative quantitation* Depending on sequence composition.
Figure 25. HeavyPeptide analysis. Heavy peptides were selected from discovery MS data. HeavyPeptide AQUA peptides were analyzed in a BSA matrix using a Thermo Scientific™ EASY-nLC™ 1200 System (300 nL/min, C18 reversed-phase column) and Thermo Scientific™ TSQ Vantage™ mass spectrometer. Three transitions were monitored per peptide using the scheduled SRM method and the results are summarized in the table. Data was analyzed using Pinpoint and Skyline software.
y = 0.0559x−0.0099 R2 = 0.999
0.0
10.0
20.0
30.0
40.0
50.0
60.0
70.0
80.0
90.0
0.0 200.0 400.0 600.0 800.0 1,000.0 1,200.0 1,400.0 1,600.0
Avg
H/L
rat
io
Quantity (fmol)
EGFR peptide
AKT2 peptide
y = 0.005x−0.0036 R2 = 0.999
0.0
1.0
2.0
3.0
4.0
5.0
6.0
7.0
8.0
0.0 200.0 400.0 600.0 800.0 1,000.0 1,200.0 1,400.0 1,600.0
Avg
H/L
rat
io
Quantity (fmol)
110
Protein quantitation

Learn more at thermofisher.com/heavypeptide
Table 7. Specifications of HeavyPeptide AQUA-grade standards.
Parameters AQUA Ultimate grade AQUA QuantPro grade AQUA Basic-grade
Formulation 5 pmol/μL in 5% (v/v) acetonitrile/H2O 5 pmol/μL in 5% (v/v) acetonitrile/H2O Lyophilized
Actual concentration Measured by qAAA* Measured by qAAA* Measured by qAAA*
Final concentration ±5–10%** ±10–25%** NA
Peptide purity >97% >97% >95%
Isotopic enrichment >99% >99% >99%
Peptide length Up to 30 amino acids Up to 30 amino acids Up to 30 amino acids
Amount/no. of aliquots
10 nmol/10 aliquots
40 nmol/40 aliquots
96 nmol/96 aliquots
10 nmol/10 aliquots
40 nmol/40 aliquots
96 nmol/96 aliquots
15 to 30 nmol† (0.05–0.1 mg)/1 aliquot
Quality control MS and analytical HPLC, AAA (±5–10%) MS and analytical HPLC, AAA (±10–25%) MS and analytical HPLC
Delivery time†† 3–6 weeks 3–6 weeks 3–6 weeks
Shipment In solution on wet ice In solution on wet ice Lyophilized at room temperature
Product options • Additional light amino acids to extend the peptide length
• Additional heavy amino acid on each peptide
• Multiple solvents, concentrations, and aliquot sizes available
Peptide modifications
• Single or double phosphorylation (pY, pT, or pS)
• Cysteine carbamidomethylation (CAM)‡
• Chloro-L-tyrosine
• Pyroglutamic acid
• Methionine oxidation [Met(O)]
• Other modifications available on request * Quantitative amino acid analysis. ** Depending on sequence composition. † 30 nmol is valid for peptides 6–15 amino acids in length. For shorter or longer peptides, the amount might decrease to as little as 15 nmol. †† These production times are estimates that vary based on the number of peptides ordered. ‡ CAM tends to cause cyclization at the N terminus. Fully cyclized form can be provided upon request.
Table 8. Heavy amino acids offered with HeavyPeptide Custom Synthesis.*
Amino acid Code Mass difference Isotope Isotopic enrichment
Alanine A +4 Da U13C3, 15N >99%
Arginine R +10 Da U13C6, 15N >99%
Isoleucine I +7 Da U13C6, 15N >99%
Leucine L +7 Da U13C6, 15N >99%
Lysine K +8 Da U13C6, 15N >99%
Phenylalanine F +10 Da U13C9, 15N >99%
Proline P +6 Da U13C5, 15N >99%
Valine V +6 Da U13C5, 15N >99%
* Other amino acids on request.
111
Protein quantitation

PEPotec SRM Peptide LibrariesFully synthetic, crude peptides customized for the development of mid- to high-throughput SRM and MRM assays
The study of proteomes, subproteomes, and protein pathways often requires quantitative MS analysis that depends on the development and verification of SRM and MRM assays. The Thermo Scientific™ PEPotec™ SRM Peptide Libraries offer great convenience and flexibility for the development of quantitative MS with many customizable options.
The standard service supplies a suspension of at least 0.1 mg of each crude peptide housed in individual tubes in a 96-well plate format with either arginine (R) or lysine (K) as the C-terminal amino acid (other C-terminal amino acids are available as well; contact us for more information). Three quality-control grades are available, and optional services and peptide modifications are offered to give you the peptide libraries that fit your experimental needs.
Highlights:• Traceable—peptides are provided in individual,
2D-barcoded tubes in 96-tube plates
• Customized—libraries available in various grades with optional services available
• Convenient—standard libraries are delivered solubilized in 0.1% TFA in 50% (v/v) acetonitrile/water
• Flexible—extensive list of available modifications
Applications:• Mid- to high-throughput development of SRM and
MRM assays
• MS workflows with relative and absolute quantitation strategies
Includes:• Fully synthetic, crude (as synthesized) peptides
• Multiple grades of QC analysis and optional services and modifications
• Provided in individual Thermo Scientific™ Matrix™ 96-tube plates
Table 9. PEPotec SRM Peptide Libraries—three grades to fit your experimental needs.
ParametersGrade 1
Fast and easyGrade 2
Greater analysisGrade 3
Maximum assurance
Quantity >0.1 mg
Length* 6 to 25 amino acids. Up to 35 amino acids are available for an additional fee
Purity Crude (as synthesized)
Formulation* Suspended in 0.1% TFA in 50% (v/v) acetonitrile/water
Delivery format Matrix 96-tube plates (Cat. No. 3712)
C-terminal residue* R or K
Counterion TFA
Quality control (QC) MS check of 5% of peptides MS check of 100% of peptides MS analysis of 100% of peptides
Peptide resynthesis** Not provided Not provided One resynthesis provided
Failed synthesis policy You pay for entire set of peptides ordered
You pay only for peptides successfully synthesized
You pay only for peptides successfully synthesized
Included documentation Peptide amount Peptide amount Peptide amount and MS spectra
Minimum order† 24 peptides 4 peptides 4 peptides
* Changes to the standard length restrictions, formulation, and C-terminal residues are available as optional services.** Peptides not detected during MS analysis will be resynthesized (depending on the grade selected). † Orders for fewer than 48 peptides incur a plate fee.
Targeted quantitation
112
Protein quantitation

Learn more or download a quote form at thermofisher.com/pepotec
General guidelines for solubilizing peptides: Because of the unique solubility of each peptide, we recommend first testing the solubilization of each peptide with a small amount of product.1. Always use sterile water or buffer [phosphate-
buffered saline (PBS), Tris or phosphate, pH 7] to solubilize peptides.
2. Oxygen-free solvents should be used to solubilize peptides containing cysteine, methionine, or tryptophan, which are susceptible to rapid oxidation.
3. Allow the peptide to warm to room temperature (preferably in a desiccator) prior to adding the solvent of choice.
4. Solubilization can be improved by warming (<40°C) or sonicating the solution.
5. If the pH of the solution needs to be increased, use only very weak bases to prevent immediate inactivation or racemization.
Guidelines for solubilizing hydrophobic peptides:1. If the product proves to be insoluble in aqueous buffers
due to high hydrophobicity, dissolve a small amount of product in the smallest possible volume of a 50% (v/v) dimethylsulfoxide (DMSO)/water mixture. Then add the desired aqueous solution until the target concentration is achieved.
2. If the product precipitates during this process and cannot be redissolved by adding DMSO, then lyophilize the peptide and try again, adding a little more 50% DMSO than in the previous attempt.
3. If DMSO interferes with your experimental system, dimethylformamide (DMF) or acetonitrile can serve as alternate solvents.
Table 11. PEPotec SRM Peptide optional modifications—available with all grades on a per-peptide basis.
C-terminal heavy labeling at R or K
Internal heavy labeling at A, R, I, L, K, F, P, or V
Alternative heavy amino acid at C terminus
Alternative light amino acid at C terminus
Phosphorylation at 1–3 sites
All cysteines protected by carbamidomethylation (CAM)
Diglycine ubiquitination motif on lysine [Lys(GG)]
Methionine sulfoxide [Met(O)]
Acetylation at side chain of lysine [Lys(Ac)]
Methylation at side chain of lysine [Lys(Me)] and arginine [Arg(Me)]
Dimethylation at side chain of lysine [Lys(Me)2]
3-chloro-tyrosine
Hydroxyproline (Hyp)
Isoaspartic acid
Formylation at C terminus
Carboxymethylcysteine (CMC) at cysteine
Others available on request.
Table 10. PEPotec SRM Peptide Library optional services.
QC: Analytical HPLC and MALDI-MS of 100% of samples*
QC: LC-MS of 100% of samples*
Lyophilized
Individually labeled tubes
Peptides that are 3–5 or 26–35 amino acids in length
* Only for grade 3.
Contact us using these email addresses, or to send the quote form.
• Europe, Middle East, and Africa: [email protected]
• Rest of world (incl. North America): [email protected]
113
Protein quantitation

References
SILAC references1. Amanchy R et al. (2005) Science STKE 267:1–20.
2. Blagoev B et al. (2004) Nat Biotechnol 22(9):1139–1145.
3. Everley P et al. as presented at The American Society for Biochemistry and Molecular Biology. MCP Papers in Press. Published on July 11, 2007 as Manuscript M700057–MCP200.
4. Kratchmarova I et al. (2005) Science 308(5727):1472–1477.
5. Mann M. (2006) Nat Rev Mol Cell Biol 7(12):952–958.
6. Ong SE et al. (2002) Mol Cell Proteomics 1(5):376–386.
7. Selbach M, Mann M. (2006) Nat Methods 3(12):981–983.
8. Everley PA et al. (2004) Mol Cell Proteomics 3.7:729–735.
9. Levine AJ. (1997) Cell 88:323–331.
HeavyPeptide reagent references1. Anderson NL et al. (2009) Mol Cell Proteomics 8(5):883–886.
2. Streit F et al. (2002) Clin Chem 48:955–958.
3. Anderson NL et al. (2002) Mol Cell Proteomics 1:845–867.
4. Kamiie J et al. (2008) Pharm Res 25(6):1469–1483.
5. Tuthill CW et al. (2000) AAPS PharmSciTech 1:E11.
6. Desiderio DM et al. (1981) J Chromatogr 217:437–452.
7. Arsene CG et al. (2008) Anal Chem 80(11):4154–4160.
8. Barr JR, Maggio VL. (1996) Clin Chem 42:1676–1682.
9. Gerber SA et al. (2003) Proc Natl Acad Sci USA 100(12):6940–6945.
10. Kuster B et al. (2005) Nat Rev Mol Cell Biol 6:577–583.
11. Prakash A et al. (2009) J Proteome Res 6:2733–2739.
12. Yu Y et al. (2009) Proc Natl Acad Sci USA 106:11606–11610.
13. Malmstrom J et al. (2009) Nature 460:762–765.
14. Lange V et al. (2008) Mol Syst Biol 4:222.
15. Arsene CG et al. (2008) Anal Chem 80:4154–4160.
16. Kirsch S et al. (2007) J Chromatogr A 1153:300–306.
17. Guan F et al. (2007) Anal Chem 79:4627–4635.
18. Desiderio DM. (1999) J Chromatogr B 731:3–22.
19. Burkit WI et al. (2008) Anal Chem 376:242–251.
20. Holzmann J et al. (2009) Anal Chem 81:10254–10261.
21. Kubota K et al. (2009) Nat Biotechnol 10:933–940.
22. Wepf A et al. (2009) Nat Methods 6:203–205.
TMT reagent references1. Dephoure N et al. (2013) Mol Biol Cell 24:535–542.
2. Matsui K et al. (2013) Appl Envir Microbiol 79:6576–6584.
3. Xiao D et al. (2013) Cardiovasc Res 10:1093/cvr/cvt264.
4. Li N et al. (2013) Nucleic Acids Res 41:7073–7083.
5. Islam K et al. (2013) Proc Natl Acad Sci USA 110:16778–16783.
6. Zhuang G et al. (2013) Sci Signal 6(271):ra25.
7. Nawrocki S et al. (2013) Clin Cancer Res 19:3577–3590.
8. Yang F et al. (2013) Mol Cell Proteomics 12:2497–2508.
9. León I et al. (2013) Mol Cell Proteomics 12:2992–3005.
10. Tang X et al. (2013) Occup Environ Med 70:561–567.
11. King J et al. (2013) Mol Biol Cell 24:2714–2726.
12. Tilghman S et al. (2013) Mol Cell Proteomics 12:2440–2455.
13. Sherwood V et al. (2014) Carcinogenesis 35(4);784–794.
14. Bloem E et al. (2013) J Biol Chem 288:29670–29679.
15. Guo Q et al. (2013) Nucleic Acids Res 41:2609–2620.
16. Zhang X et al. (2013) Mol Cell Biol 33:1657–1670.
17. Castro-Núñez L et al. (2013) J Biol Chem 288:393–400.
18. Fratini F et al. (2012) Neurology 79:1012–1018.
19. Bloem E et al. (2012) J Biol Chem 287:5775–5783.
20. Mirza S. (2012) Circ Cardiovasc Genet 5:477.
21. Weston A et al. (2012) Mol Cell Proteomics 11:M111.015487.
22. Bennett E et al. (2012) Mol Cell Proteomics 11:1523–1528.
23. Bailey D et al. (2012) Proc Natl Acad Sci USA 109:8411–8416.
24. Cargnello M et al. (2012) Mol Cell Biol 32:4572–4584.
25. Sánchez-Quiles V et al. (2011) Mol Cell Proteomics 10:M111.009126.
26. Van Eyk J. (2011) Circ Res 108:490–498.
27. McAlister G et al. (2011) Mol Cell Proteomics 10:O111.009456.
28. Jedrychowski M et al. (2011) Mol Cell Proteomics 10:M111.009910.
29. Diaz Vivancos P et al. (2011) Plant Physiol 157:256–268.
114
Protein quantitation

Product Quantity Cat. No.
Protein quantitation reagents—SILAC
Pierce SILAC Protein Quantitation Kit (LysC) – RPMI 1640
Kit A33971
Pierce SILAC Protein Quantitation Kit (LysC) – DMEM
Kit A33969
Pierce SILAC Protein Quantitation Kit (LysC) – DMEM:F-12
Kit A33970
L-Arginine∙HCl 50 mg 89989L-Arginine∙HCl 500 mg 8842713C6 L-Arginine∙HCl 50 mg 8821013C6 L-Arginine∙HCl 500 mg 8843313C6
15N4 L-Arginine∙HCl 50 mg 8999013C6
15N4 L-Arginine∙HCl 500 mg 88434L-Lysine∙2HCl 50 mg 89987L-Lysine∙2HCl 500 mg 8842913C6 L-Lysine∙2HCl 50 mg 8998813C6 L-Lysine∙2HCl 500 mg 8843113C6
15N2 L-Lysine∙2HCl 50 mg 8820913C6
15N2 L-Lysine∙2HCl 500 mg 884324,4,5,5-D4 L-Lysine∙2HCl 50 mg 884374,4,5,5-D4 L-Lysine∙2HCl 500 mg 88438NeuCode™ Lysine-080 (3,3,4,4,5,5,6,6-D8 L-Lysine-2HCl)
50 mg A33613
NeuCode™ Lysine-080 (3,3,4,4,5,5,6,6-D8 L-Lysine-2HCl)
500mg A33614
L-Leucine 500 mg 8842813C6 L-Leucine 50 mg 8843513C6 L-Leucine 500 mg 88436L-Proline 115 mg 88211L-Proline 500 mg 88430RPMI Media for SILAC 500 mL 88365RPMI Media for SILAC 6 x 500 mL A33823Powdered RPMI Media for SILAC 104 g 88426DMEM for SILAC 500 mL 88364DMEM for SILAC 6 x 500 mL A33822Powdered DMEM Media for SILAC 135 g 88425MEM for SILAC 500 mL 88368DMEM:F12 (1:1) Media for SILAC 500 mL 88370IMDM for SILAC 500 mL 88367Fetal Bovine Serum, dialyzed 100 mL 26400036Fetal Bovine Serum, dialyzed 500 mL 26400044To view additional pack sizes and products, go to thermofisher.com/silac
Product Quantity Cat. No.
Protein quantitation reagents—amine-reactive tandem mass tag reagentsTMT10plex Isobaric Label Reagent Set, 1 x 0.8 mg
10-rxn set 90110
TMT10plex Isobaric Labeling Reagent Set, 3 x 0.8 mg
30-rxn set 90111
TMT10plex Isobaric Mass Tag Kit 30-rxn kit 90113TMT10plex Isobaric Label Reagent Set 60-rxn set 90406TMT10plex Isobaric Label Reagent Set, 8 x 0.2 mg
80-rxn set 90309
TMTsixplex Isobaric Label Reagent Set, 1 x 0.8 mg
6-rxn set 90061
TMTsixplex Isobaric Label Reagent Set, 2 x 0.8 mg
12-rxn set 90062
TMTsixplex Isobaric Mass Tagging Kit 35-rxn set 90064TMTsixplex Isobaric Label Reagent Set, 5 x 0.8 mg
30-rxn set 90066
TMTsixplex Isobaric Label Reagent Set, 2 x 5 mg
72-rxn set 90068
TMTsixplex Isobaric Label Reagent Set, 16 x 0.2 mg
96-rxn set 90308
TMTduplex Isobaric Mass Tagging Kit 15-rxn kit 90063TMTduplex Isobaric Label Reagent Set, 5 x 0.8 mg
10-rxn set 90065
TMTduplex Isotopic Label Reagent Set, 5 x 0.8 mg
10-rxn set 90060
TMTzero Isobaric Label Reagent Set, 5 x 0.8 mg
5-rxn set 90067
To view additional pack sizes and products, go to thermofisher.com/tmtreagents
Protein quantitation reagents—sulfhydryl (cysteine)-reactive tandem mass tag reagentsiodoTMTzero Isobaric Label Reagent Set, 5 x 0.2 mg
5-rxn set 90100
iodoTMTsixplex Isobaric Label Reagent Set, 1 x 0.2 mg
6-rxn set 90101
iodoTMTsixplex Isobaric Label Reagent Set, 5 x 0.2 mg
30-rxn set 90102
iodoTMTsixplex Isobaric Mass Tag Labeling Kit
30-rxn kit 90103
To view additional pack sizes and products, go to thermofisher.com/iodotmt
Protein quantitation reagents—carbonyl-reactive tandem mass tag reagentsaminoxyTMTzero Isobaric Label Reagent Set, 6 x 0.2 mg
6-rxn set 90400
aminoxyTMTsixplex Isobaric Label Reagent Set, 1 x 0.2 mg
6-rxn set 90401
aminoxyTMTsixplex Isobaric Label Reagent Set, 5 x 0.2 mg
30-rxn set 90402
To view additional pack sizes and products, go to thermofisher.com/aminoxytmt
TMT accessories and reagentsHENS Buffer 100 mL 90106Anti-TMT Antibody 0.1 mL 90075Immobilized Anti-TMT Antibody Resin 6 mL 90076TMT Elution Buffer 20 mL 901041M Triethylammonium Bicarbonate (TEAB) 50 mL 9011450% Hydroxylamine 5 mL 90115
Ordering information
115
Protein quantitation

Routine calibration of mass
spectrometers is required for
optimal performance because
minor changes in lab conditions,
electronics, or surface contamination
can affect reproducibility.
Introduction
The mostsuccessfulproteomics
labs andcompanies
Qua
ntita
tion
Calibration and verification
ChromatographyMass s
pec
inst
rum
enta
tion
Software
Sam
ple prep
Calibration compounds or mixtures are used to adjust the mass spectrometer calibration scale, as well as the relative intensities of the ions, to match that of known molecules.
Standards are also recommended prior to sample analysis to provide control for variability in sample preparation, chromatographic retention time, and ionization response in a mass spectrometer. Spiking with internal standards is critical for accurate protein quantitation in targeted proteomics applications, as described in Section 2 (pp. 108–114).
The proper choice of mobile phases and acidic ion-pairing agents is essential for achieving effective and reproducible liquid chromatography (LC) separation of peptides for electrospray ionization (ESI) MS. The most commonly used solvents or solvent blends include LC-MS grade water and acetonitrile, with ion-pairing agents. For matrix-assisted laser desorption ionization (MALDI), peptides are combined with specific crystalline matrices of energy-absorbing dyes.
Table 1. Overview of Thermo Scientific™ reagents for instrument calibration and LC.
Calibration solutions Standards Solvents/pairing reagents
Recommended for: Thermo Scientific™ LC-MS systems Any LC-MS system Any LC-MS system
Primary purpose Instrument calibration Control for sample variability Maximize peptide separation
# of different formulations available 5 6 11
Format Ready-to-use liquid formulations Lyophilized solid or frozen solution Solvent or solvent blends
Storage Room temp or 2–8°C –20°C–80°C Room temp
116
Instrument calibration and ancillary reagents

Thermo Scientific™ Pierce™ calibration
solutions for mass spectrometry are
ready-to-use liquid formulations for
convenient calibration of Thermo
Scientific™ LC-MS instrumentation.
These mixtures are designed to evaluate various mass spectrometry features including low resolution, high resolution, electron impact, chemical ionization, and positive- or negative-ion mass spectrometry. The high-quality Pierce calibration solutions are ideal for busy laboratories that opt to avoid time-consuming reagent preparation. Reagents are provided in high-purity Teflon-coated containers tested rigorously to provide the highest batch-to-batch reproducibility. All standards are fully verified using our LC-MS systems.
Calibration solutions
Table 2. Overview of Pierce calibration solutions for mass spectrometry.
LTQ ESI Positive Ion
Calibration Solution
LTQ Velos ESI Positive Ion
Calibration Solution
ESI Negative Ion Calibration
Solution
Triple Quadrupole
Calibration Solution
Triple Quadrupole
Calibration Solution, Extended Mass Range
Recommended for these Thermo Scientific™ mass spec instrument series
LTQ, LTQ Orbitrap, LXQ, LCQ Fleet,
Exactive
LTQ Velos/Velos Pro, LTQ Orbitrap Velos/Orbitrap Velos Pro,
Orbitrap Elite, Q Exactive, Orbitrap
Fusion Tribrid/ Fusion Lumos
LTQ, LTQ Velos, LTQ Orbitrap,
Exactive
TSQ Quantum, TSQ Discovery,
TSQ Quantum Access Max, TSQ Vantage,
TSQ Endura, TSQ Quantiva
TSQ Quantum, TSQ Discovery,
TSQ Quantum Access Max, TSQ Vantage,
TSQ Endura, TSQ Quantiva
Q ExactiveComponents Caffeine, MRFA,
Ultramark 1621Caffeine, MRFA, Ultramark 1621, n-butyl-amine
SDS, sodium taurocholate,
Ultramark 1621
Tyrosine1, Tyrosine3, Tyrosine6
17 components*
Mass range (Da) 195–1,522 74–1,522 265–1,680 182–997 69–2,722 (Pos) 69–2,934 (Neg)
Calibration mode Positive Positive Negative Positive Positive and negative
Storage Room temp 2–8°C 2–8°C 2–8°C 2–8°C
Key features of Thermo Scientific Pierce calibration solutions:• Strong peaks—premixed highly ionizable components in
an MS-compatible solvent
• Ready to use—load the mass reference standard into a syringe and inject into the instrument
• High purity—mass spectrometry–grade reagents in a non-leachable container
• Stable—minimum 1 year shelf life as liquid solution when stored at the recommended temperature
117
Instrument calibration

Table 3. Recommended calibration solutions and standards for Thermo Scientific™ mass spectrometers.
Calibration solution or standard Cat. No.
LXQ, LCQ Fleet,
LTQ XL ETD, LTQ Orbitrap
Discovery, LTQ Orbitrap
XL, Orbitrap XL ETD, LTQ FT
Ultra
LTQ Velos, Orbitrap
Fusion Tribrid, Orbitrap
Fusion Lumos
LTQ Velos Pro, Orbitrap
Elite
MALDI LTQ XL,
MALDI LTQ Orbitrap XL Exactive
Exactive Plus, Q Exactive, Q Exactive
Plus, Q Exactive HF
TSQ Access Max, TSQ
Quantum Max Ultra, TSQ
Vantage, TSQ Endura, TSQ
Quantiva
LTQ ESI Positive Ion Calibration Solution
88322 ✓ ✓ ✓ NR NR NR ✓ ✓ ✓ NR NR
LTQ Velos ESI Positive Ion Calibration Solution
88323 NR ✓ ✓ ✓ ✓ ✓ ✓ NR NR ✓ ✓ ✓ NR
ESI Negative Ion Calibration Solution
88324 ✓ ✓ ✓ ✓ ✓ ✓ ✓ ✓ ✓ NR ✓ ✓ ✓ ✓ ✓ ✓ NR
Triple Quadrupole Calibration Solution
88325 NR NR NR NR NR NR ✓ ✓ ✓
Triple Quadrupole Calibration Solution, Extended Mass Range
88340 NR NR NR NR NR NR ✓ ✓ ✓
Reserpine Standard for LC-MS
88326 ✓ ✓ ✓ ✓ ✓ ✓ ✓ NR ✓ ✓ ✓ ✓ ✓
Peptide Retention Time Calibration Mixture
88320, 88321 ✓ ✓ ✓ ✓ ✓ ✓ ✓ ✓ ✓ ✓ ✓ ✓ ✓ ✓ ✓ ✓ ✓ ✓ ✓ ✓ ✓
Digestion Indicator for Mass Spectrometry
84841 ✓ ✓ ✓ ✓ ✓ ✓ ✓ ✓ ✓ ✓ ✓ ✓ ✓ ✓ ✓ ✓ ✓ ✓ ✓ ✓ ✓
BSA Digest Standard 88341 ✓ ✓ ✓ ✓ ✓ ✓ ✓ ✓ ✓ ✓ ✓ ✓ ✓ ✓ ✓ ✓ ✓ ✓ ✓ ✓ ✓
6-Protein Mixture Standard
88342 ✓ ✓ ✓ ✓ ✓ ✓ ✓ ✓ ✓ ✓ ✓ ✓ ✓ ✓ ✓ ✓ ✓ ✓ ✓ ✓ ✓
HeLa Protein Digest Standard
88328, 88329 ✓ ✓ ✓ ✓ ✓ ✓ ✓ ✓ ✓ ✓ ✓ ✓ ✓ ✓ ✓ ✓ ✓ ✓ ✓ ✓ ✓
NR = Not recommended.
118
Instrument calibration and ancillary reagentsCalibration solutions

100
90
80
70
60
50
40
30
20
10
0200 400 600 800 1000
m/z1200 1400 1600 1800 2000
195.06
262.67
393.33
288.33 435.33
524.25
537.83552.42 736.58 875.50
922.00
1022.00
1122.00
1222.00
1322.00
1422.00
1522.00
1622.00
1722.00
1822.00
1921.92
PIERCEVELOSCALMX #2 RT: 0.01 AV: 1 NL: 1.9586T: ITMS + pESIFu ms [150.00-2000.00]
Rel
ativ
e ab
un
dan
ce
Pierce LTQ ESI Positive Ion Calibration Solution Convenient, verified solution for the calibration of Thermo Scientific™ Ion Trap and Orbitrap instruments in the positive mode
The Thermo Scientific™ Pierce™ LTQ ESI Positive Ion Calibration Solution is a mixture of highly purified, ionizable molecules (caffeine, MRFA, and Ultramark 1621) in an acetonitrile/methanol/acetic acid solution, and is specifically designed for positive-mode calibration of LTQ Series, LTQ Orbitrap Series, LXQ, LCQ Fleet, and Exactive™ (classic) mass spectrometer instruments.
The Pierce LTQ ESI Positive Ion Calibration Solution is a ready-to-use liquid formulation, ideal for quickly performing the routine calibration required to maintain robust performance of our mass spectrometers. The LTQ ESI Positive Ion Calibration Solution is manufactured at an ISO 9001–certified facility, and each lot is quality-controlled with strict specifications. The solution is provided in a leakproof, high-purity polytetrafluoroethylene (PTFE) bottle and is stable for up to 1 year when stored at room temperature.
Figure 1. Pierce LTQ ESI Positive Ion Calibration Solution spectra. Formulation: Caffeine (20 µg/mL), MRFA (1 µg/mL) and Ultramark 1621 (0.001%) in an aqueous solution of acetonitrile (50%), methanol (25%), and acetic acid (1%).
Pierce LTQ Velos ESI Positive Ion Calibration SolutionConvenient, verified solution for the calibration of Thermo Scientific™ LTQ Velos™ series mass spectrometer instruments in the positive mode
The Thermo Scientific™ Pierce™ LTQ Velos ESI Positive Ion Calibration Solution is a mixture of highly purified, ionizable molecules (caffeine, MRFA, Ultramark 1621, and n-butylamine) in an acetonitrile/methanol/acetic acid solution, and is specifically designed for positive-mode calibration of LTQ Velos series, LTQ Orbitrap Velos, Q Exactive series, and Exactive Plus mass spectrometer instruments.
The Pierce LTQ Velos ESI Positive Ion Calibration Solution is a ready-to-use liquid formulation ideal for quickly performing the routine calibration required to maintain the robust performance of our mass spectrometers. The LTQ Velos ESI Positive Ion Calibration Solution is manufactured at an ISO 9001–certified facility, and each lot is quality-controlled with strict specifications. The solution is provided in a leakproof, high-purity PTFE bottle and is stable for up to 1 year when stored at 2–8°C.
Figure 2. Pierce LTQ Velos ESI Positive Ion Calibration Solution spectra. Formulation: Caffeine (2 µg/mL), MRFA (1 µg/mL). Ultramark 1621 and n-butylamine (0.0005%) (0.001%) in an aqueous solution of acetonitrile (50%), methanol (25%) and acetic acid (1%).
200 400 600 800 1000m/z
1200 1400 1600 1800 2000
262.67
196
393352.26
531.8611.01 732.01 918.10
922.02
1022.02
1122.021221.94
1322.031422.96
1521.96
1621.87
1721.961821.96
1921.88435279.25
10095908580757065605550454035302520151050
Rel
ativ
e in
ten
sity
#136778 IT: 0.137 ST: 0.37 US: 3 CS: 1 AUUU: 19.08 ML: 2.1886F: ms + p H ESI Fu ms [150.00-2000.00]
119
Instrument calibration

100 200 300 400 500 600 700 800 900 1000 1100 1200 1300 1400 1500 1600 1700 1800 1900 2000
m/z
138.00262.67
331.25409.25
453.25580.83
524.42
195.08
637.33 731.50 831.00 922.17
1022.08
1122.08
1222.08
1322.08
1422.001522.00
1622.00
1822.00
1722.00
1922.00
1408.00 1500.92 1601.08 1700.92 1800.75 1880.92 1981.83
Rel
ativ
e ab
un
dan
ce
10095908580757065605550454035302520151050
Methodtest_10130142718#1-429 RT: 0.00-1-9.99 AV: 143 NL: 5.74E5T: ITMS + pESIFull ms [75.00-2000.00]
MMR Gold Standard Spectrum #1-100 RT: 0.01-1.74 AV: 100 NL: 6.57E7T: + p ESIQ1MS [150.070-1050.000]
Rel
ativ
e ab
un
dan
ce
10095908580757065605550454035302520151050
200 250 300 350 400 450 500 550 600
m/z650 700 750 800 850 900 950 1000 1050
182.13
217.06 249.05 299.09 345.15 371.12 425.23 493.48
499.43
508.18
518.40564.18
625.28653.14679.18 743.23 772.00816.24
856.41834.30 894.42 979.33985.49
1016.57546.12
997.32
Pierce ESI Negative Ion Calibration SolutionConvenient, verified solution for the calibration of Thermo Scientific™ LTQ Series mass spectrometers in the negative mode
The Thermo Scientific™ Pierce™ ESI Negative Ion Calibration Solution is a mixture of highly purified, ionizable molecules (SDS, sodium taurocholate, and Ultramark 1621) in an acetonitrile/methanol/acetic acid solution, and is specifically designed for the negative mode calibration of LTQ, LTQ Velos, and the LTQ Orbitrap series, and Exactive mass spectrometer instruments.
The Pierce ESI Negative Ion Calibration Solution is a ready-to-use liquid formulation ideal for quickly performing the routine calibration required to maintain the robust performance of our mass spectrometers. The Pierce ESI Negative Ion Calibration Solution is manufactured at an ISO 9001–certified facility, and each lot is quality-controlled with strict specifications. The solution is provided in a leak-proof, high-purity PTFE bottle and is stable for up to 1 year when stored at 2–8°C.
Figure 3. Pierce ESI Negative Calibration Solution spectra. Formulation: sodium dodecyl sulfate (2.9 µg/mL), sodium taurocholate (5.4 µg/mL), and Ultramark 1621 (0.001%) in an aqueous solution of acetonitrile (50%), methanol (25%), and acetic acid (1%).
Pierce Triple Quadrupole Calibration SolutionConvenient, verified solution for the calibration of Thermo Scientific™ triple-stage quadrupole mass spectrometers in the positive mode
The Thermo Scientific™ Pierce™ Triple Quadrupole Calibration Solution is a mixture of high purity, ionizable components (three tyrosine polymers) in methanol/formic acid solution, and is specifically designed for the positive mode calibration of Thermo Scientific™ TSQ Quantum™, TSQ Discovery™, TSQ Quantum Ultra™, TSQ Quantum™ Access Max, TSQ Endura™, and TSQ Quantiva™ series.
The Pierce Triple Quadrupole Calibration Solution is a ready-to-use liquid formulation ideal for quickly performing the required routine calibration to maintain the robust performance of our mass spectrometers. The Pierce Triple Quadrupole Calibration Solution is manufactured at an ISO 9001–certified facility, and each lot is quality-controlled with strict specifications. The solution is provided in a leak-proof, high-purity PTFE bottle and is stable for up to 1 year when stored at 2–8°C.
Figure 4. Pierce Triple Quadrupole Calibration Solution. Formulation: 25 µM Tyr1, 25 µM Tyr3, and 25 µM Tyr6, in an aqueous solution of methanol (50%) and formic acid (0.1%).
120
Instrument calibration and ancillary reagentsCalibration solutions

Pierce Triple Quadrupole Calibration Solution, Extended Mass RangeVerified, extended mass range calibration solution that can be used in both positive and negative ionization modes for triple quadrupole instruments
The Thermo Scientific™ Pierce™ Triple Quadrupole Calibration Solution, Extended Mass Range is a mixture of 14 highly pure, ionizable components (mass ranges 69 m/z to 2,800 m/z) designed for both positive and negative ionization calibration of Thermo Scientific™ triple-stage quadrupole instruments.
The Pierce Triple Quadrupole Calibration Solution is a ready-to-use formulation that has been optimized for both positive and negative ionization instrument calibration. The extended mass range (69 to 2,800 m/z) calibration has been specifically optimized to improve sensitivity and mass accuracy of the TSQ Quantiva and TSQ Endura series triple quadrupole mass spectrometers and is also compatible with the TSQ Quantum, Thermo Scientific TSQ Discovery, Thermo Scientific TSQ Quantum Ultra, TSQ Quantum Access, and TSQ Vantage series instruments using the list of recommended masses. This calibration solution is manufactured at an ISO 9001–certified facility and each lot is quality-controlled with strict specifications. The stable solution is provided in a leakproof, high-purity PTFE bottle.
Highlights:• Improved mass accuracy—extended mass range
improves mass accuracy of instrumentation
• Positive and negative mode calibration—single formulation with extended mass ranges for both calibration modes
• Highly verified—high-quality, rigorously tested formulation with lot-specific Certificates of Analysis
• Ready to use—reference standard may be directly loaded into a syringe and injected into the instrument
• Stable—store at 2–8°C for up to 1 year
• Positive mode (m/z): 69.0447, 142.1590, 322.0481, 622.0289, 922.0098
• Negative mode (m/z): 59.0128, 112.9845, 301.9970, 601.9779, 1,033.9870
For the calibration procedure, use: TSQ Series Getting Started Guide (70111-97152)
121
Instrument calibration
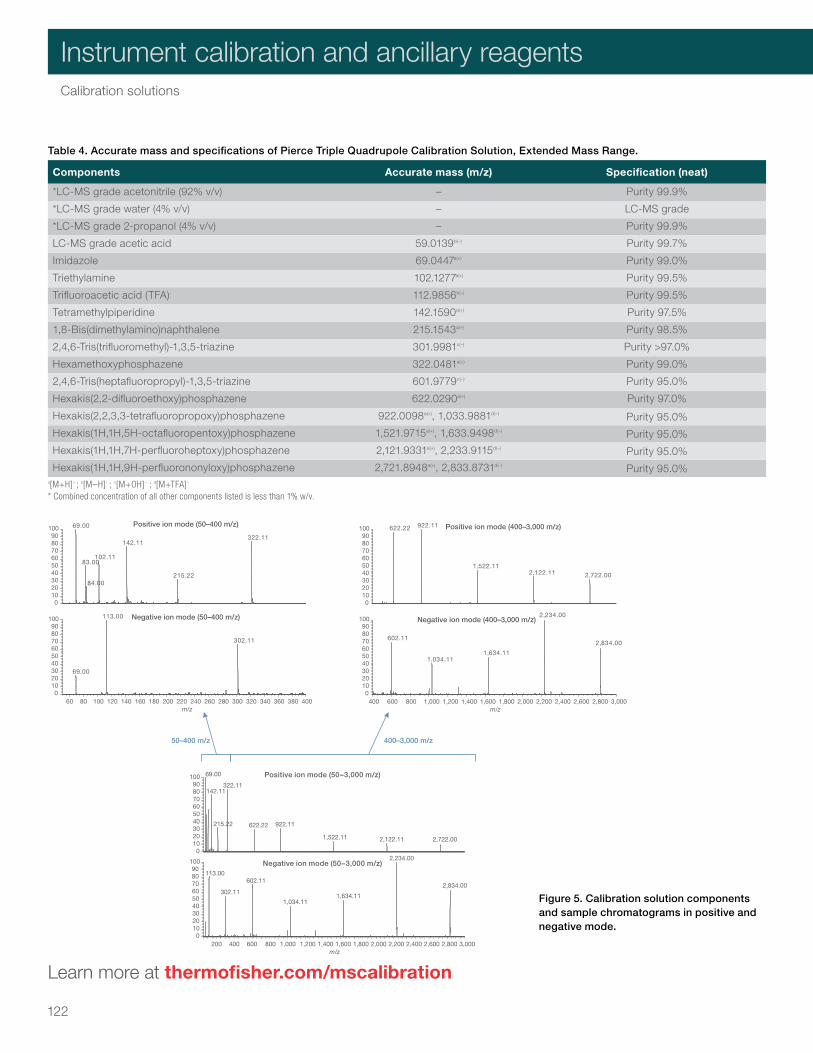
Learn more at thermofisher.com/mscalibration
Table 4. Accurate mass and specifications of Pierce Triple Quadrupole Calibration Solution, Extended Mass Range.
Components Accurate mass (m/z) Specification (neat)
*LC-MS grade acetonitrile (92% v/v) – Purity 99.9%
*LC-MS grade water (4% v/v) – LC-MS grade
*LC-MS grade 2-propanol (4% v/v) – Purity 99.9%
LC-MS grade acetic acid 59.0139b(–) Purity 99.7%
Imidazole 69.0447a(+) Purity 99.0%
Triethylamine 102.1277a(+) Purity 99.5%
Trifluoroacetic acid (TFA) 112.9856b(–) Purity 99.5%
Tetramethylpiperidine 142.1590a(+) Purity 97.5%
1,8-Bis(dimethylamino)naphthalene 215.1543a(+) Purity 98.5%
2,4,6-Tris(trifluoromethyl)-1,3,5-triazine 301.9981c(–) Purity >97.0%
Hexamethoxyphosphazene 322.0481a(+) Purity 99.0%
2,4,6-Tris(heptafluoropropyl)-1,3,5-triazine 601.9779c(–) Purity 95.0%
Hexakis(2,2-difluoroethoxy)phosphazene 622.0290a(+) Purity 97.0%
Hexakis(2,2,3,3-tetrafluoropropoxy)phosphazene 922.0098a(+), 1,033.9881d(–) Purity 95.0%
Hexakis(1H,1H,5H-octafluoropentoxy)phosphazene 1,521.9715a(+), 1,633.9498d(–) Purity 95.0%
Hexakis(1H,1H,7H-perfluoroheptoxy)phosphazene 2,121.9331a(+), 2,233.9115d(–) Purity 95.0%
Hexakis(1H,1H,9H-perfluorononyloxy)phosphazene 2,721.8948a(+), 2,833.8731d(–) Purity 95.0%a[M+H]+ ; b[M–H]- ; c[M+OH]– ; d[M+TFA]–
* Combined concentration of all other components listed is less than 1% w/v.
60 80 100 120 140 160 180 200 220 240 260 280 300 320 340 360 380 400m/z
0102030405060708090
100 113.00
302.11
69.00
Negative ion mode (50–400 m/z)
0102030405060708090
100 69.00
322.11142.11
102.1183.00
215.2284.00
Positive ion mode (50–400 m/z)
400 600 800 1,000 1,200 1,400 1,600 1,800 2,000 2,200 2,400 2,600 2,800 3,000m/z
0102030405060708090
1002,234.00
602.112,834.00
1,634.111,034.11
0102030405060708090
100 922.11622.22
1,522.112,122.11 2,722.00
Negative ion mode (400–3,000 m/z)
Positive ion mode (400–3,000 m/z)
400–3,000 m/z50–400 m/z
200 400 600 800 1,000 1,200 1,400 1,600 1,800 2,000 2,200 2,400 2,600 2,800 3,000m/z
0102030405060708090
100 2,234.00
113.00602.11
2,834.00302.11
1,634.111,034.11
Negative ion mode (50–3,000 m/z)
0102030405060708090
100 Positive ion mode (50–3,000 m/z)69.00
322.11142.11
215.22 922.11622.22
1,522.11 2,122.11 2,722.00
Figure 5. Calibration solution components and sample chromatograms in positive and negative mode.
122
Instrument calibration and ancillary reagentsCalibration solutions
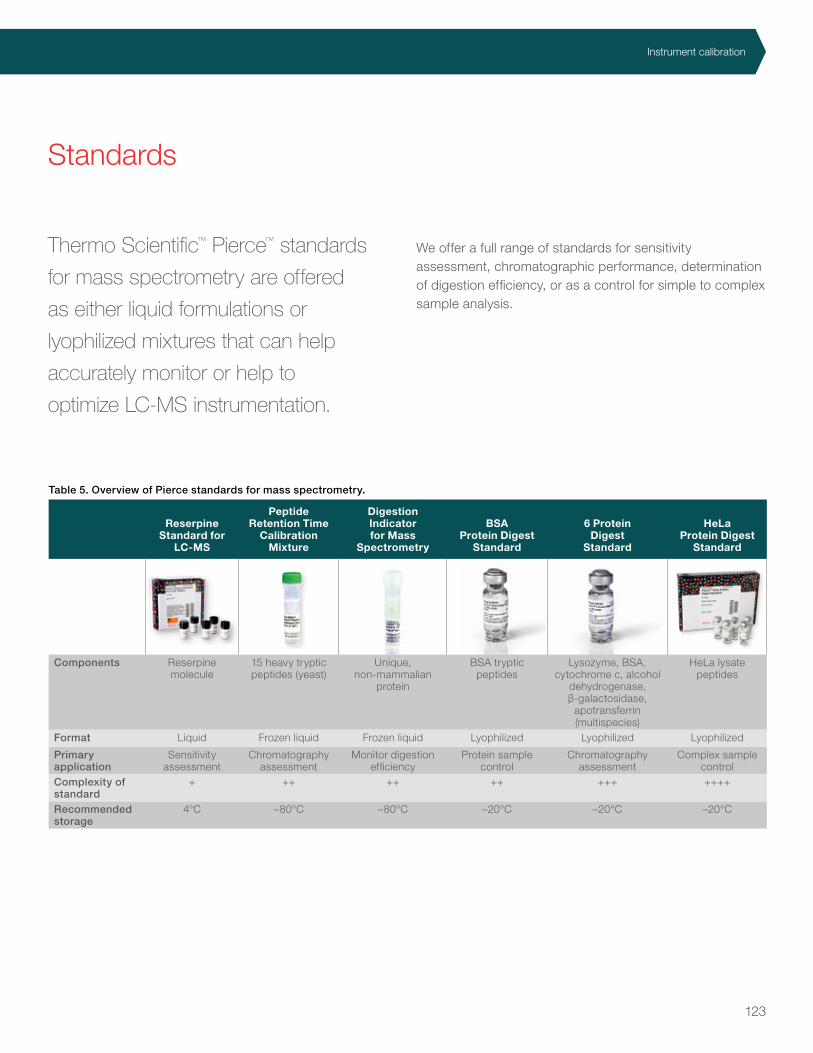
Table 5. Overview of Pierce standards for mass spectrometry.
Reserpine Standard for
LC-MS
Peptide Retention Time
Calibration Mixture
Digestion Indicator for Mass
Spectrometry
BSA Protein Digest
Standard
6 Protein Digest
Standard
HeLa Protein Digest
Standard
Components Reserpine molecule
15 heavy tryptic peptides (yeast)
Unique, non-mammalian
protein
BSA tryptic peptides
Lysozyme, BSA, cytochrome c, alcohol
dehydrogenase, β-galactosidase,
apotransferrin (multispecies)
HeLa lysate peptides
Format Liquid Frozen liquid Frozen liquid Lyophilized Lyophilized Lyophilized
Primary application
Sensitivity assessment
Chromatography assessment
Monitor digestion efficiency
Protein sample control
Chromatography assessment
Complex sample control
Complexity of standard
+ ++ ++ ++ +++ ++++
Recommended storage
4°C –80°C –80°C –20°C –20°C –20°C
Thermo Scientific™ Pierce™ standards
for mass spectrometry are offered
as either liquid formulations or
lyophilized mixtures that can help
accurately monitor or help to
optimize LC-MS instrumentation.
We offer a full range of standards for sensitivity assessment, chromatographic performance, determination of digestion efficiency, or as a control for simple to complex sample analysis.
Standards
123
Instrument calibration

Pierce Reserpine Standard for LC-MSHigh purity solution for sensitivity performance evaluation for MS instruments
The Thermo Scientific™ Pierce™ Reserpine Standard for LC-MS is a precise concentration of reserpine, specifically designed for sensitivity performance evaluation of mass spectrometers, including the Ion Trap and TSQ Series of instruments.
The Pierce Reserpine Standard for LC-MS is a prediluted liquid formulation that is ideal for performing installation tests of Thermo Fisher Scientific and other suppliers’ mass spectrometers. The standard is provided at a concentration of 100 pg/μL in 50% isopropyl alcohol and requires minimal additional dilutions. The product is provided as a pack of 5 x 1 mL glass amber vials with PTFE-lined screw caps. The Pierce Reserpine Standard for LC-MS is manufactured at an ISO 9001–certified facility and each lot is quality-controlled with strict specifications.
Highlights:• Convenient—provided at a concentration of 100 pg/μL
in 50% isopropyl alcohol, requiring minimal additional dilutions to reach target concentration for injection
• Safe handling—unlike glass ampules, cap can be easily removed and replaced when withdrawing solution
• High purity—mass spectrometry–grade reagent in non-leachable screw-cap vials
• Stable—store at 4°C for up to 1 year
Figure 6. Chemical structure of reserpine. The Pierce Reserpine Standard for LC-MS consists of high-purity reserpine at 100 pg/μL in 50% isopropyl alcohol.
Figure 7. Example of SRM of 500 fg reserpine on a TSQ Vantage triple quadrupole mass spectrometer. Chromatogram of three 5 μL loop injections of 100 fg/μL Pierce Reserpine on a Thermo Scientific™ Hypersil GOLD™ aQ 2.1 x 20 mm Javelin column with isocratic 300 μL/min flow of 70% methanol: 30% water: 0.05% formic acid (upper panel). The SRM transitions monitored were 609.3-195.1 and 609.3-448.2 m/z with a 0.2 full width at half maximum (FWHM) Q1 peak width (lower panel).
Reserpine
Exact mass: 608.27MW: 608.68
NH
H
OO
OH
O O
OO
O
O
N H
0
20
40
60
80
100R
elat
ive
abu
nd
ance
0.0 0.5 1.0 1.5 2.0 2.5 3.0 3.5 4.0 4.5
Time (min)
RT: 2.05AH: 2085RT: 1.04
AH: 2015RT: 3.09AH: 1997
V3374_SENSITIVITY_MeOH_100_100 5 µL of 100 fg/µL reserpine70%MeOH/30%Water (0.05% formic acid)
RT: 0.00 - 4.65
V3374_SENSITIVITY_MeOH_100_100 #114 RT: 0.61 AV: 1 NL: 1.13T: + c ESI SRM ms2 609.320 [195.099-195.101, 448.199-448.201]
195.10
448.20
195.099
0
10
20
30
40
50
60
70
80
90
100
Rel
ativ
e ab
un
dan
ce
195.100 195.101m/z
448.200 448.201m/z
448.199
124
Instrument calibration and ancillary reagentsStandards

Pierce Peptide Retention Time Calibration MixtureConvenient solution for chromatographic performance assessment
The Thermo Scientific™ Pierce™ Peptide Retention Time Calibration Mixture can be used for optimization and regular assessment of chromatographic performance and for rapid development of multiplexed, scheduled, targeted MS assays for the quantification of dozens to hundreds of peptide targets per run on Thermo Scientific™ Triple Quadrupole, Exactive™ Orbitrap™, Exactive and ion trap mass spectrometers.
Highlights: • Convenient—assess chromatography and MS
instrument performance and predict peptide retention across multiple instrument platforms
• Powerful—predict peptide retention time from sequence using calculated hydrophobicity factor and optimize the scheduled MS acquisition windows for improved quantification and increased multiplexing
• Improved performance—serves as an internal standard to normalize for variation in retention times and peak intensities between runs
The Pierce Peptide Retention Time Calibration Mixture contains 15 synthetic heavy peptides mixed at an equimolar ratio that elute across the chromatographic gradient. The peptide sequences and chromatographic results are used to assess LC performance. In addition, the observed retention times and hydrophobicity factors (HFs) for these calibrants are fit to a linear equation to determine the slope of the retention time/HF relationship. This equation and the HF of uncharacterized peptides are then used to predict retention time.
Table 6. Pierce Peptide Retention Time Calibration Mixture components and properties. The peptide sequences, peptide masses, and chromatographic behavior of each component of the Pierce Peptide Retention Time Calibration Mixture are given below. The position and identity of the heavy isotope–labeled amino acid in each sequence is indicated in bold.
Peptide sequenceMass (Da)
Hydrophobicity factor (HF)
1 SSAAPPPPPR 985.5220 7.56
2 GISNEGQNASIK 1,224.6189 15.50
3 HVLTSIGEK 990.5589 15.52
4 DIPVPKPK 900.5524 17.65
5 IGDYAGIK 843.4582 19.15
6 TASEFDSAIAQDK 1,389.6503 25.88
7 SAAGAFGPELSR 1,171.5861 25.24
8 ELGQSGVDTYLQTK 1,545.7766 28.37
9 GLILVGGYGTR 1,114.6374 32.18
10 GILFVGSGVSGGEEGAR 1,600.8084 34.50
11 SFANQPLEVVYSK 1,488.7704 34.96
12 LTILEELR 995.5890 37.30
13 NGFILDGFPR 1,144.5905 40.42
14 ELASGLSFPVGFK 1,358.7326 41.18
15 LSSEAPALFQFDLK 1,572.8279 46.66
Figure 8. Chromatographic analysis of the Pierce Peptide Retention Time Calibration Mixture. The Pierce Retention Time Calibration Mixture was also analyzed on a TSQ Vantage Mass Spectrometer using a Thermo Scientific™ Hypersil GOLD™ C18 column (1.0 x 150 mm, Cat. No. 25005-150165) with a 1.0% per min gradient at 120 µL per min. Numbered peaks correspond to the calibrant peptides described above.
Rel
ativ
e ab
und
ance
Rel
ativ
e ab
und
ance
125
Instrument calibration

Pierce Digestion Indicator Convenient solution to assess protein digestion for LC-MS
The Thermo Scientific™ Pierce™ Digestion Indicator is a unique non-mammalian protein (26 kDa) that can be spiked into cell lysates and carried through the sample preparation procedure, resulting in five distinct peptides that can be quantified. The Pierce Digestion Indicator is provided as a frozen liquid (10 µg) and an aliquot of 0.5 µg is recommended per 100 µg sample of lysate. The Pierce Digestion Indicator is also provided as a component of the Thermo Scientific™ Pierce™ Mass Spec Sample Prep Kit for Cultured Cells (Cat. No. 84840).
Highlights:• Non-mammalian—Pierce Digestion Indicator
peptides can be easily distinguished from endogenous mammalian peptides
• Ready to use—just thaw and spike into lysate
• Verified—contains 5 distinct peptides that can be quantitated to assess digestion efficiency
The Pierce Digestion Indicator serves as an internal digestion control standard protein to assure protocol performance and to quantify sample preparation processing and digestion efficiency across samples. The properties of the signature peptides following digestion are shown in Table 7.
To test the reproducibility of the Pierce Mass Spec Sample Prep Kit for Cultured Cells, triplicate samples of a HeLa cell culture were processed and analyzed using the Pierce Digestion Indicator protocol by spiking the Pierce Digestion Indicator into each lysate after the initial lysis step. The samples were analyzed by LC-MS/MS on a Velos Pro ion trap mass spectrometer. Digestion indicator peptides were quantified with Pinpoint 1.2 software, which is preprogrammed to quantify the Pierce Digestion Indicator peptides and MS2 transitions. The coefficients of variation (CV) for replicates of the five peptides were 6% to 16% (Table 8).
Table 7. Properties of the five Pierce Digestion Indicator peptide sequences.
Digestion indicator peptide sequence
Observed mass/charge
Observed charge
Hydrophobicity factor (HF)
ITGTLNGVEFELVGGGEGTPEQGR 1,209.1007 +2 40.59
VMGTGFPEDSVIFTDK 871.9189 +2 40.24
DGGYYSSVVDSHMHFK 610.2701 +3 27.24
SAIHPSILQNGGPMFAFR 648.3367 +3 42.42
VEEDHSNTELGIVEYQHAFK 587.0315 +4 35.13
Table 8. Pierce Digestion Indicator peptides and example assessment of reproducibility. Sequences of the five peptides that result from the Pierce Digestion Indicator, and CV for triplicate samples processed using the product protocol.
Digestion indicator peptide sequence
Observed mass/charge
Coefficients of variation (CV)
ITGTLNGVEFELVGGGEGTPEQGR 1,209.1010 16
VMGTGFPEDSVIFTDK 871.9189 13
DGGYYSSVVDSHMHFK 610.2701 6
SAIHPSILQNGGPMFAFR 648.3367 13
VEEDHSNTELGIVEYQHAFK 587.0315 13
126
Instrument calibration and ancillary reagentsStandards

Pierce BSA Protein Digest Standard, LC-MS GradeHigh-quality, verified BSA protein digest standard for LC-MS applications
The Thermo Scientific™ Pierce™ BSA Protein Digest Standard is produced using high-quality bovine serum albumin (BSA) and MS-grade trypsin. The BSA is fully reduced, alkylated (iodoacetamide), and desalted (C18) after trypsin digestion to provide a quality LC-MS grade standard that is free of intact protein. The peptide digest provides excellent sequence coverage with minimal overalkylation and missed cleavages. This digest has been robustly tested for peptide quality, digestion efficiency and lot-to-lot uniformity, and is suitable for LC and LC-MS applications.
Highlights:• Positive control sample—BSA protein
digest optimized and verified as a quality control standard for MS applications
• Excellent sequence coverage—greater than 70% sequence coverage
• Verified peptide quality—digestion procedure optimized for minimal missed cleavages and overalkylation
• Rigorously tested—high-quality, consistent BSA protein digest documented via lot-specific Certificates of Analysis
• Stable—provided in a stable lyophilized format
The Pierce BSA Protein Digest Standard is a lyophilized tryptic peptide mixture that can be used as a quality control standard for LC separation, MS method development, and MS performance benchmarking. The digest is specifically formulated for LC-MS experiments and does not contain salts or detergents. Using the digest standard routinely before analysis of samples with similar complexity makes it possible to monitor and normalize LC-MS performance between samples and over time. Moreover, unlike other commercially available protein digests for MS, the Pierce BSA Protein Digest Standard must meet stringent quality testing specifications including peptide quality, digestion efficiency, and lot-to-lot digest uniformity.
Figure 9. Pierce BSA Protein Digest Standard base peak chromatogram. Base peak chromatogram of 1 pmol Pierce BSA Protein Digest Standard separated using a Thermo Scientific™ Acclaim™ PepMap™ 100 Column, 3 µm x 75 µm x 15 cm (Cat. No. 160321) with a 2–35% gradient (A: 0.1% FA in water, B: 0.1% FA in 100% acetonitrile) at 300 nL/min for 60 min and detected on a LTQ Orbitrap XL mass spectrometer.
RT: 0.00-60.00
100
90
80
70
60
50
40
30
20
10
00 5 10
7.30545.34
8.13409.72
13.21488.53
19.17722.32
28.22582.32
30.06682.68
51.52469.18
49.78430.89
39.28784.38
38.64997.59
30.74879.17
35.71700.35
24.19464.25
22.94653.36
18.78417.21
12.21407.21
15 20 25
Time (min)
Rel
ativ
e ab
un
dan
ce
30 35 40 45 50 55 60
127
Instrument calibration

Pierce 6 Protein Digest Standard, Equimolar, LC-MS GradeHigh-quality, verified six-protein digest mixture for the standardization of LC-MS applications
The Thermo Scientific™ Pierce™ 6 Protein Digest Standard, Equimolar, LC-MS Grade is a verified protein digest optimized for use as a quality control sample for LC and MS analysis of proteomic samples.
The Pierce 6 Protein Digest Standard contains an equimolar mixture of highly pure bovine cytochrome c, lysozyme, alcohol dehydrogenase, bovine serum albumin, apo-transferrin, and β-galactosidase. The proteins are reduced, alkylated (iodoacetic acid), digested (MS-grade trypsin), and desalted (C18) after trypsin digestion to provide a high-quality, LC-MS grade standard, free of intact protein. The peptide digest provides excellent sequence coverage with minimal overalkylation and missed cleavages. This digest has been robustly tested for peptide quality, digestion efficiency, and lot-to-lot uniformity, and is suitable for LC and LC-MS applications.
Highlights:• Positive control sample—6-protein standard
optimized and verified as a quality control standard for MS applications
• Excellent sequence coverage—greater than 85% sequence coverage
• Verified peptide quality—digestion procedure optimized for minimal missed cleavages and overalkylation
• Rigorously tested—high-quality, consistent BSA protein digest documented via lot-specific Certificates of Analysis
• Stable—provided in a stable lyophilized format
The Pierce 6 Protein Digest Standard has been optimized as a medium-complexity, quality control standard for LC-MS applications. It has been optimized to have maximal sequence coverage with minimal missed cleavages and overalkylation. The digest is specifically formulated for LC-MS experiments and does not contain salts or detergents. Using the digest standard routinely before analysis of samples with similar complexity makes it possible to monitor and normalize LC-MS performance between samples and over time. Moreover, unlike other commercially available protein digests for MS, the Pierce 6 Protein Digest Standard must meet stringent quality testing specifications including peptide quality, digestion efficiency, and lot-to-lot digest uniformity.
Figure 10. Pierce 6 Protein Digest Standard base peak chromatogram. Base peak chromatogram of 500 fmol Pierce 6 Protein Digest Standard separated using an Acclaim PepMap 100 Column, 3 µm x 75 µm x 15 cm (Cat. No. 160321) with a 2–35% gradient (A: 0.1% FA in water, B: 0.1% FA in 100% acetonitrile) at 300 nL/min for 120 min and detected on an LTQ Orbitrap XL mass spectrometer.
RT: 0.00-120.00
Rel
ativ
e ab
un
dan
ce
Time (min)
100
90
80
70
60
50
40
30
20
10
00 20
108.89445.12
93.80863.41
91.90697.87
91.10784.37
79.38593.36
69.361043.82
63.28736.88
54.06567.30
50.49401.25
49.34418.22
44.41653.36
32.39417.21
23.41489.19
22.07407.23
16.26437.71
8.28550.79
40 60 80 100 120
128
Instrument calibration and ancillary reagentsStandards

Learn more at thermofisher.com/ms-standards
Pierce HeLa Protein Digest Standard High-quality, verified, complex mammalian protein digest for the standardization of LC-MS applications
The Thermo Scientific™ Pierce™ HeLa Protein Digest Standard is a highly verified mammalian protein digest that may be used as a quality control sample for MS analysis of complex proteomic samples.
Highlights:• Positive control sample—complex mammalian
proteome sample protein digest (>15,000 proteins)
• High digestion efficiency—less than 10% missed cleavages using trypsin and Lys-C
• Superior peptide quality—less than 10% methionine oxidation and less than 10% lysine carbamylation
• Rigorously tested—high-quality, efficient protein digest with lot-to-lot digest uniformity
• Stable—provided in a stable, lyophilized format
The Pierce HeLa Protein Digest Standard is a lyophilized tryptic peptide mixture that can be used as a quality control standard for LC separation, MS method development, and MS performance benchmarking. The digest is specifically formulated for LC-MS experiments and does not contain salts or detergents. Using the digest standard routinely before analysis of complex samples makes it possible to monitor and normalize LC-MS performance between samples and over time.
The protein digest is derived from a well-established adenocarcinoma (HeLa) reference cell line, which expresses over 15,000 proteins with relevant post-translational modifications, making it an ideal standard for complex proteome MS applications. The protein lysate has been digested with both Lys-C and trypsin to reduce tryptic missed cleavages and improve protein sequence coverage. Moreover, unlike other commercially available protein digests for MS, the Pierce HeLa Protein Digest Standard must meet stringent quality testing specifications including peptide quality, digestion efficiency, and lot-to-lot digest uniformity.
Table 9. Pierce HeLa Protein Digest Standard quality testing specifications.
Analysis Specification
UV absorbance A280 = 1.0 ± 0.1
LC-MS chromatogram LC-MS chromatogram conforms to reference
Reference peptide area
Ratio of peptide area to reference = 0.75–1.25
Peptide missed cleavage* Tryptic peptide missed cleavage ≤10%
Peptide alkylation* Cysteine carbamidomethyl modification ≥98%
Peptide oxidation* Methionine oxidation ≤10%Other peptide modification* Carbamylation <10%
* Peptide missed cleavage, alkylation, oxidation and modification determined by Preview™ Software (Protein Metrics)™ using a human protein Swiss-Prot database.
Figure 11. Pierce HeLa Protein Digest Standard base peak chromatogram. Chromatogram of 200 ng Pierce HeLa Protein Digest Standard separated using an Acclaim PepMap 100 Column, 3 µm x 75 µm x 15 cm (Cat. No. 160321) with a 2–35% gradient (A: 0.1% FA in water, B: 0.1% FA in 100% acetonitrile) at 300 nL/min for 120 min and detected on a LTQ Orbitrap XL Mass Spectrometer.
RT: 0.00–120.00
0 10 20 30 40 50 60 70 80 90 100 110 120
Time (min)
0
10
20
30
40
50
60
70
80
90
100
Rel
ativ
e ab
un
dan
ce
58.60
55.11
29.95
49.60 74.5030.6747.6124.39
37.3761.96
18.9343.84
87.856.02 18.17 64.56
6.5717.59 78.80 94.68
82.74 97.8698.73
104.23
129
Instrument calibration

The most commonly used solvents
or solvent blends include LC-MS
grade water and acetonitrile, with ion-
pairing agents such as trifluoroacetic
acid (TFA), formic acid (FA), or
heptafluorobutyric acid (HFBA). Thermo
Scientific™ Pierce™ solvents and blends
are available as single-component
formulations or convenient blends.
Solvents are manufactured in an ISO 9001–certified facility and are provided with a Certificate of Analysis. Solvents and blends have been verified using our mass spectrometers. All Thermo Scientific™ MALDI matrices, including alpha-cyano-4-hydroxy-cinnamic acid (CHCA), sinapinic acid (SA), and 2,5-dihydroxybenzoic acid (DHB), are available in a convenient single-use format.
The proper choice of mobile phases and acidic ion-pairing agents is essential for achieving effective and reproducible LC separation of peptides for ESI-MS. The most commonly used solvents or solvent blends include LC-MS grade water and acetonitrile, with ion-pairing agents such as TFA, FA, or HFBA. For MALDI, peptides are combined with specific crystalline matrices of energy-absorbing dyes. All of our MALDI matrices are available in a convenient single-use format.
Ancillary reagents and accessories
Table 10. Overview of Pierce solvents and blends (LC-MS grade).
Trifluoroacetic acid (TFA)
0.1% TFA in
acetonitrile0.1% TFA in water
Formic acid (FA)
0.1% FA in acetonitrile
0.1% FA in water Acetonitrile Water
Formulation Solvent Solvent blend Solvent blend Solvent Solvent blend Solvent blend Solvent Solvent
Formats Liquid (in ampules or bottles)
Liquid (bottles)
Liquid (bottles)
Liquid (in ampules or bottles)
Liquid (bottles)
Liquid (bottles)
Liquid (bottles)
Liquid (bottles)
Specifications measured
>10 >20 >20 7–20 >20 >20 >20 >20
130
Instrument calibration and ancillary reagents

Pierce Trifluoroacetic Acid (TFA)High-quality ion-pairing reagent for LC-MS applications
Thermo Scientific™ Pierce™ Trifluoroacetic Acid (TFA) is manufactured and tested to meet strict specifications that help ensure superior performance for use as an ion-pairing agent in reversed-phase peptide separations. TFA is the most commonly used ion-pairing agent for use in reversed-phase HPLC peptide separations because it sharpens peaks and improves resolution, is volatile and easily removed, has low absorption within detection wavelengths, and has a proven history of use.
Highlights:• High purity and exceptional clarity—allows sensitive,
nondestructive peptide detection at low UV wavelengths in reversed-phase HPLC protein and peptide separation systems
• High-performance packaging—TFA packaged under nitrogen in amber glass ampules or bottles with protective PTFE-lined fluorocarbon caps to enable TFA integrity
• Economical convenience—choose the TFA format that works best for your application; in just a few seconds, 1 mL ampules can be used to prepare 1 L of fresh 0.1% v/v trifluoroacetic acid solution for the mobile phase in reversed-phase chromatography
Applications:• Ion-pairing reagent for reversed-phase HPLC
• Protein and peptide sequencing
• Protein and peptide solubilizing agent
• Solid-phase peptide synthesis
• Amino acid analysis
• Making 0.1% solutions of trifluoroacetic acid (w/v vs. v/v)
O
F
FF
OH
TFAMW 114.02
References1. Che FY et al. (2011). Mol Cell Proteomics 10:M110.000745.
2. Agnes JT et al. (2011). Infect Immun 79:1311–1318.
3. Warner AH et al. (2010). J Biochem 148:581–592.
4. Blouin CM et al. (2010). J Lipid Res 51:945–956.
Table 11. General properties of TFA.
Alternative names Perfluoroacetic acid, trifluoroethanoic acid, trifluoracetic acid
Molecular formula CF3COOHMolecular weight 114.02Density 1.53 g/mL, 20°CMelting/boiling point –15°C/72°CCAS number 76-05-01
Table 12. Specifications of Pierce TFA.
TFA purity ≥99.5%Water content ≤0.1%Chain length ≤99.5% C2Ninhydrin positives A570 ≤0.02 above blankTollen’s test (aldehydes) NegativeUV absorbance (0.1% aqueous) A280 nm ≤0.001
A254 nm ≤0.003 A230 nm ≤0.064
UV absorbance (neat) A300 nm ≤0.02 A275 nm ≤Passes test Cut-off ≤259 nm
131
Instrument calibration

Pierce 0.1% Trifluoroacetic Acid (v/v) in Acetonitrile, LC-MS GradeConvenient, pre-diluted solvent blend for LC-MS applications
Thermo Scientific™ Pierce™ 0.1% Trifluoroacetic Acid (v/v) in Acetonitrile is an LC-MS grade preparation with high purity and low UV absorptivity that is ideal for HPLC and MS applications.
Pierce 0.1% TFA in Acetonitrile is specially purified by a proprietary method and tested to help ensure lot-to-lot consistency with a low UV absorbance, providing the most sensitive detection across wavelengths and prolonging equipment life. The chromatography- and spectrometry-grade 0.1% TFA in acetonitrile is 0.2 µm–filtered, packaged in solvent-rinsed amber glass bottles, and sealed under nitrogen with PTFE-lined fluorocarbon caps for ultimate protection.
Highlights:• Verified—tested more than 20 ways to enable maximal
LC-MS sensitivity
• Purified—processed, filtered, and sealed to extend LC-MS column life
• Convenient—packaged to eliminate variability and reduce handling
For complex peptide separations, the key to success can be to vary selectivity. Varying mobile phase composition on the same column can change selectivity enough to resolve peptides that would otherwise overlap. TFA is the most frequently used modifier for peptide separations in reversed-phase HPLC. The TFA concentration usually specified is 0.1%. For reproducible separations from run to run or from lab to lab, it is essential to make TFA concentrations the same.
O
F
FF
OH
TFAMW 114.02
Table 14. Specifications of Pierce 0.1% Trifluoroacetic Acid (v/v) in Acetonitrile.
Trifluoroacetic acid content 0.095 to 0.105%Water content ≤0.01%Residue after evaporation ≤1 ppmColor ≤10 ALPHALC-MS gradient suitability PassesIdentification PassesUV absorbance (au) 210 nm ≤0.6
220 nm ≤0.55 230 nm ≤0.4 254 nm ≤0.03
Trace ionic impurities Aluminum (Al) ≤25 ppb Calcium (Ca) ≤50 ppb Copper (Cu) ≤10 ppb Iron (Fe) ≤10 ppb Lead (Pb) ≤10 ppb Magnesium (Mg) ≤10 ppb Manganese (Mn) ≤10 ppb Nickel (Ni) ≤10 ppb Potassium (K) ≤20 ppb Silver (Ag) ≤10 ppb Sodium (Na) ≤50 ppb Zinc (Zn) ≤20 ppb
Table 13. General properties of TFA.
Alternative names Perfluoroacetic acid, trifluoroethanoic acid, trifluoracetic acid
Molecular formula CF3COOHMolecular weight 114.02Density 1.53 g/mL, 20°CMelting/boiling point –15°C/72°CCAS number 76-05-01
132
Instrument calibration and ancillary reagentsAncillary reagents and accessories

Pierce 0.1% Trifluoroacetic Acid (v/v) in Water, LC-MS GradeConvenient, prediluted solvent blend for LC-MS applications
Thermo Scientific™ Pierce™ 0.1% Trifluoroacetic Acid (v/v) in Water is an LC-MS grade preparation with high purity and low UV absorptivity that is ideal for HPLC and MS applications.
Pierce 0.1% TFA in Water is specially purified by a proprietary method and tested to help ensure lot-to-lot consistency with a low UV absorbance, providing the most sensitive detection across wavelengths and prolonging equipment life. The chromatography- and spectrometry-grade 0.1% TFA in water is 0.2 µm–filtered, packaged in solvent-rinsed amber glass bottles, and sealed under nitrogen with PTFE-lined fluorocarbon caps for ultimate protection.
Highlights:• Verified—tested more than 20 ways to enable maximal
LC-MS sensitivity
• Purified—processed, filtered, and sealed to extend LC-MS column life
• Convenient—packaged to eliminate variability and reduce handling
For complex peptide separations, the key to success can be to vary selectivity. Varying the composition of the mobile phase on the same column can change selectivity enough to resolve peptides that would otherwise overlap. TFA is the most frequently used modifier for peptide separations in reversed-phase HPLC. The TFA concentration usually specified is 0.1%. For reproducible separations from run to run or from lab to lab, it is essential to make TFA concentrations the same.
Table 15. General properties of TFA.
Alternative names Perfluoroacetic acid, trifluoroethanoic acid, trifluoracetic acid
Molecular formula CF3COOHMolecular weight 114.02Density 1.53 g/mL, 20°CMelting/boiling point –15°C/72°CCAS number 76-05-01
Table 16. Specifications of Pierce 0.1% Trifluoroacetic Acid (v/v) in Water.
Protease Not detected
Trifluoroacetic acid content 0.095–0.105%
Residue after evaporation ≤1 ppmColor ≤10 ALPHALC-MS gradient suitability PassesIdentification PassesTrace ionic impurities Aluminum (Al) ≤20 ppb
Calcium (Ca) ≤50 ppb Copper (Cu) ≤10 ppb Iron (Fe) ≤10 ppb Lead (Pb) ≤10 ppb Magnesium (Mg) ≤10 ppb Manganese (Mn) ≤10 ppb Nickel (Ni) ≤10 ppb Potassium (K) ≤20 ppb Silver (Ag) ≤10 ppb Sodium (Na) ≤50 ppb Zinc (Zn) ≤20 ppb
O
F
FF
OH
TFAMW 114.02
133
Instrument calibration

Pierce Formic Acid, LC-MS GradeHigh-quality reagent for LC-MS applications
Thermo Scientific™ Pierce™ Formic Acid is a high-purity solvent supplied in bottles or ampules as a convenient, contamination-free alternative for preparing elution solvents for HPLC separations of protein and peptides.
Pierce Formic Acid is sealed in amber glass ampules under a dry nitrogen atmosphere. A premeasured aliquot of acid greatly simplifies preparation of liter quantities of mobile phases at the standard 0.1% formic acid concentration. The quality of this formic acid coupled with either glass-ampule or bottle packaging provides reliability and convenience that adds value to both the chromatographic and MS results.
Highlights:• >99% pure formic acid—consistent LC baselines, with
less signal suppression of peptide in LC-MS applications
• High-performance packaging—choose bottles or amber glass, prescored, nitrogen-flushed ampules to protect formic acid from light, moisture, and contamination
• Convenient format—ampule packaging simplifies the preparation of gradient and isocratic mobile phases containing 0.1% (v/v) formic acid in water or acetonitrile; the contents of a single vial in a final volume of 1 L of solvent yields a mobile phase of the most common formic acid concentration
Formic acid is a common component of reversed-phase mobile phases that provide protons for LC-MS analysis. The presence of a low concentration of formic acid in the mobile phase is also known to improve the peak shapes of the resulting separation. Unlike TFA, formic acid is not an ion-pairing reagent, and it does not suppress MS ionization of polypeptides when used as a mobile phase component.
Table 17. General properties of formic acid.
Molecular formula HCOOH (CH2O2)Molecular weight 46.025Density 1.22 g/mLCAS number 64-18-6Refractive index 1.3701–1.3721 (20ºC)Flash point 69ºCFreezing point 8ºC
Table 18. Specifications of Pierce Formic Acid.Visual Clear liquid, free of particulate matterIdentity (IR) Must show only peaks characteristic for
the compoundPurity >99%Refractive index 1.3701–1.3721 (20°C, 589 nm)
O
OHH
Formic acidMW 46.025
134
Instrument calibration and ancillary reagentsAncillary reagents and accessories

Pierce 0.1% Formic Acid (v/v) in Acetonitrile, LC-MS GradeConvenient, optimized solvent blend for LC-MS applications
Thermo Scientific™ Pierce™ 0.1% Formic Acid (v/v) in Acetonitrile is an LC-MS grade preparation with high purity and low UV absorptivity that is ideal for HPLC and MS applications.
Pierce 0.1% Formic Acid in Acetonitrile is specially purified by a proprietary method and tested to help ensure lot-to-lot consistency with a low UV absorbance, providing the most sensitive detection across wavelengths and prolonging equipment life. The chromatography- and spectrometry-grade 0.1% formic acid in acetonitrile is 0.2 µm–filtered, packaged in solvent-rinsed amber glass bottles, and sealed under nitrogen with PTFE-lined fluorocarbon caps for ultimate protection.
Highlights:• Verified—tested more than 20 ways to enable maximal
LC-MS sensitivity
• Purified—processed, filtered, and sealed to extend LC-MS column life
• Convenient—packaged to eliminate variability and reduce handling
Formic acid is a common component of reversed-phase mobile phases that provide protons for LC-MS analysis. The presence of a low concentration of formic acid in the mobile phase is also known to improve the peak shapes of the resulting separation. Unlike TFA, formic acid is not an ion-pairing agent and it does not suppress MS ionization of polypeptides when used as a mobile-phase component.
Table 20. Specifications of Pierce 0.1% Formic Acid (v/v) in Acetonitrile.
Formic acid content 0.095–0.105%Water content ≤0.01%Residue after evaporation ≤1 ppmColor ≤10 ALPHALC-MS gradient suitability PassesIdentification PassesUV absorbance (au) 210 nm ≤1.30
220 nm ≤1.25 230 nm ≤0.75 254 nm ≤0.03
Trace ionic impurities Aluminum (Al) ≤25 ppb Calcium (Ca) ≤50 ppb Copper (Cu) ≤10 ppb Iron (Fe) ≤10 ppb Lead (Pb) ≤10 ppb Magnesium (Mg) ≤10 ppb Manganese (Mn) ≤10 ppb Nickel (Ni) ≤10 ppb Potassium (K) ≤20 ppb Silver (Ag) ≤10 ppb Sodium (Na) ≤50 ppb Zinc (Zn) ≤20 ppb
O
OHH
Formic acidMW 46.025
Table 19. General properties of formic acid.
Molecular formula HCOOH (CH2O2)Molecular weight 46.025Density 1.22 g/mLCAS number 64-18-6Refractive index 1.3701–1.3721 (20ºC)Flash point 69ºCFreezing point 8ºC
135
Instrument calibration

Pierce 0.1% Formic Acid (v/v) in Water, LC-MS GradeConvenient, optimized solvent blend for LC-MS applications
Thermo Scientific™ Pierce™ 0.1% Formic Acid (v/v) in Water is an LC-MS grade preparation with high purity and low UV absorptivity that is ideal for HPLC and MS applications.
Pierce 0.1% Formic Acid in Water is specially purified by a proprietary method and tested to help ensure lot-to-lot consistency with a low UV absorbance, providing the most sensitive detection across wavelengths and prolonging equipment life. The chromatography- and spectrometry-grade 0.1% formic acid in water is 0.2 µm–filtered, packaged in solvent-rinsed amber glass bottles, and sealed under nitrogen with PTFE-lined fluorocarbon caps for ultimate protection.
Highlights:• Verified—tested more than 20 ways to enable maximal
LC-MS sensitivity
• Purified—processed, filtered, and sealed to extend LC-MS column life
• Convenient—packaged to eliminate variability and reduce handling
Formic acid is a common component of reversed-phase mobile phases that provide protons for LC-MS analysis. The presence of a low concentration of formic acid in the mobile phase is also known to improve the peak shapes of the resulting separation. Unlike TFA, formic acid is not an ion-pairing agent and it does not suppress MS ionization of polypeptides when used as a mobile-phase component.
Table 21. General properties of formic acid.
Molecular formula HCOOH (CH2O2)Molecular weight 46.025Density 1.22 g/mLCAS number 64-18-6Refractive index 1.3701–1.3721 (20ºC)Flash point 69ºCFreezing point 8ºC
Table 22. Specifications of Pierce 0.1% Formic Acid (v/v) in Water.
Protease Not detectedFormic acid content 0.095–0.105%Residue after evaporation ≤1 ppmColor ≤10 ALPHALC-MS gradient suitability PassesIdentification PassesUV absorbance (au) 210 nm ≤1.25
220 nm ≤0.85 230 nm ≤0.55 254 nm ≤0.01
Trace ionic impurities Aluminum (Al) ≤20 ppb Calcium (Ca) ≤50 ppb Copper (Cu) ≤10 ppb Iron (Fe) ≤10 ppb Lead (Pb) ≤10 ppb Magnesium (Mg) ≤10 ppb Manganese (Mn) ≤10 ppb Nickel (Ni) ≤10 ppb Potassium (K) ≤20 ppb Silver (Ag) ≤10 ppb Sodium (Na) ≤50 ppb Zinc (Zn) ≤20 ppb
O
OHH
Formic acidMW 46.025
136
Instrument calibration and ancillary reagentsAncillary reagents and accessories

Pierce Acetonitrile, LC-MS GradeHigh-quality formulation for LC-MS applications
Thermo Scientific™ Pierce™ Acetonitrile (ACN) is an LC-MS grade preparation with high purity and low UV absorptivity that makes it suitable for HPLC and MS applications.
Pierce LC-MS Grade Acetonitrile is specially purified using a proprietary method and tested to help ensure lot-to-lot consistency with a low UV absorbance to provide the most sensitive detection across all wavelengths. Pierce Acetonitrile is 0.2 µm–filtered, packaged in solvent-rinsed amber glass bottles, and sealed under a nitrogen atmosphere with PTFE-lined fluorocarbon caps for ultimate protection.
Highlights:• Verified—37 quality tests enable low, stable baselines
and lot-to-lot consistency
• Sensitive—low UV absorbance yields low baselines and high detection sensitivity
• Purified—low impurity protects columns and simplifies analysis by eliminating extraneous peaks
Pierce LC-MS Grade Acetonitrile is specially purified and tested to the highest specifications to help ensure the integrity of your data, to maximize sensitivity in your assay, and to prolong the life of your equipment. These specifications also meet ACS standards.
Table 23. General properties of acetonitrile.
Alternative names Methyl cyanide, cyanomethane, ethanenitrileMolecular formula CH3CNMolecular weight 41.05Density 0.780 g/mLCAS number 75-05-8
Table 24. Specifications of Pierce Acetonitrile.
Purity (by GC) ≥99.9%Water content ≤0.01%Residue after evaporation ≤0.8 ppmTitratable acid, mEQ/g ≤0.008Titratable base, mEQ/g ≤0.0006LC-MS gradient suitability PassesLC-MS at positive mode as reserpine
≤50 ppb
LCMS at negative mode as aldicarb
≤50 ppb
LC gradient suitability at 254 and 210 nm
Passes
Optical absorbance (au) 190 nm ≤1.00195 nm ≤0.15200 nm ≤0.05205 nm ≤0.04210 nm ≤0.03215 nm ≤0.025220 nm ≤0.015225 nm ≤0.015230 nm ≤0.01254 nm ≤0.005280 nm ≤0.005
Trace ionic impurities Aluminum (Al) ≤25 ppbBarium (Ba) ≤5 ppbCadmium (Cd) ≤5 ppbCalcium (Ca) ≤25 ppbChromium (Cr) ≤5 ppbCobalt (Co) ≤5 ppbCopper (Cu) ≤5 ppbIron (Fe) ≤5 ppbLead (Pb) ≤5 ppbMagnesium (Mg) ≤10 ppbManganese (Mn) ≤5 ppbNickel (Ni) ≤5 ppbPotassium (K) ≤10 ppbSilver (Ag) ≤5 ppbSodium (Na) ≤50 ppbTin (Sn) ≤5 ppbZinc (Zn) ≤10 ppb
N C CH3
AcetonitrileMW 41.05
137
Instrument calibration

Pierce Water, LC-MS GradeUltrapure water for formulation of solvents for LC-MS
Thermo Scientific™ Pierce™ Water is an ultrapure, LC-MS grade preparation with low UV absorptivity that makes it suitable and trustworthy for use in HPLC and MS applications.
Pierce LC-MS Grade Water is specially purified by a proprietary method and tested to help ensure lot-to-lot consistency with a low UV absorbance to provide you with the most sensitive detection across all wavelengths. Pierce Water is 0.2 µm–filtered, packaged in solvent-rinsed amber glass bottles, and sealed under a nitrogen atmosphere with TFE-lined fluorocarbon caps for ultimate protection.
Highlights:• Verified—30 tests to enable purity and quality for use in
LC-MS applications
• High-performance packaging—0.2 µm–filtered, packed in solvent-rinsed amber glass bottles, and sealed under nitrogen atmosphere to eliminate absorption of unknown atmospheric gases
• High purity—helps ensure high lot-to-lot consistency and reliability
Table 25. General properties of water.
Molecular formula H2OMolecular weight 18.015CAS number 7732-18-5
Table 26. Specifications of Pierce Water.
Protease Not detectedTotal halogens (as chloride) Not detectedResidue after evaporation ≤1 ppmLC-MS gradient suitability PassesLC-MS at positive mode as reserpine
≤50 ppb
LC-MS at negative mode as aldicarb
≤50 ppb
LC gradient suitability at 254 and 205 nm
Passes
Optical absorbance (au) 210 nm ≤0.01220 nm ≤0.01230 nm ≤0.01240 nm ≤0.01254 nm ≤0.005260 nm ≤0.005280 nm ≤0.005
Trace ionic impurities Aluminum (Al) ≤10 ppbBarium (Ba) ≤10 ppbCadmium (Cd) ≤10 ppbCalcium (Ca) ≤20 ppbChromium (Cr) ≤10 ppbCobalt (Co) ≤10 ppbCopper (Cu) ≤10 ppbIron (Fe) ≤10 ppbLead (Pb) ≤10 ppbMagnesium (Mg) ≤10 ppbManganese (Mn) ≤10 ppbNickel (Ni) ≤10 ppbPotassium (K) ≤10 ppbSilver (Ag) ≤10 ppbSodium (Na) ≤20 ppbTin (Sn) ≤10 ppbZinc (Zn) ≤10 ppb
O
HH
WaterMW 18.015
138
Instrument calibration and ancillary reagentsAncillary reagents and accessories

Pierce Heptafluorobutyric Acid (HFBA), Sequencing GradeIon-pairing reagent for the reversed-phase HPLC separation of proteins and peptides
Thermo Scientific™ Pierce™ Heptafluorobutyric Acid (HFBA) is manufactured and tested to meet strict specifications that help ensure superior performance for use as an ion-pairing agent in reversed-phase peptide separations.
Pierce HFBA is highly purified and stably packaged HFBA that is tested and prepared for use as an ion-pairing reagent in HPLC methods and similar applications. The solution is tested for overall purity, chain length purity, water content, sulfate content, and absorptivity at three different UV wavelengths. The liquid reagent is offered in convenient 1 mL ampules and 100 mL bottles.
Highlights:• Greater than 99.5% purity—allows sensitive,
nondestructive peptide detection at low UV wavelengths in reversed-phase HPLC protein and peptide separation systems
• High-performance packaging—HFBA packaged under nitrogen in amber glass ampules or bottles
• Economical convenience—in just a few seconds, a 1 mL ampule can be used to prepare 1 L of fresh 0.1% HFBA solution for the mobile phase in reversed-phase chromatography
Applications:• Ion-pairing reagent for reversed-phase HPLC
• Protein and peptide sequencing
• Protein and peptide solubilizing agent
• Solid-phase peptide synthesis
• Amino acid analysis
Table 27. Properties of heptafluorobutyric acid.
Molecular formula C4HF7O2
Molecular weight 214.04Density 1.64 g/mLCAS number 375-22-4
References1. Hermann PM et al. (2000). J Neurosci 20:6355–6364.
2. Hearn MTW, Hancock WS. (1979). Trends in Biochem Sci 4:N58–N62.
3. Bennett HPJ et al. (1980). J Liquid Chromatogr 3:1353–1365.
4. Bennett HPJ et al. (1981). Biochem 20:4530–4538.
Table 28. Specifications of Pierce HFBA.
Purity >99.5%Water content <0.1%Chain length >99.5% C4UV (neat) A280 nm <0.004
A254 nm <0.006 A230 nm <0.150
Sulfate Negative
O
FF F
F
F
F
F
OH
HFBAHepta�uorobutyric acid
(2,2,3,3,4,4,4-hepta�uorobutanoic acid)MW 214.04
Learn more at thermofisher.com/ms-solvents
139
Instrument calibration

Single-Use MALDI MatricesReady-to-use, high-quality MS reagents
Thermo Scientific™ Single-Use MALDI Matrices are highly purified, recrystallized reagents supplied in a convenient single-use microtube format for use in MS. Three different popular matrices—alpha-cyano-4-hydroxy-cinnamic acid (CHCA), sinapinic acid (SA), and 2,5-dihydroxybenzoic acid (DHB) are offered individually as packages of 24 single-use microtubes and as a sample pack containing 8 single-use microtubes of each matrix.
MALDI matrices provide the cleanest MS spectra when recrystallized and prepared in 60% acetonitrile/0.1% TFA. Traditional recrystallization and preparation of milligram amounts of matrix produces significant waste and is inconvenient. Our exclusive packaging technology provides purified, recrystallized CHCA, SA, and DHB MALDI matrices in just the right amounts for individual experiments, making it easy to prepare high-quality MALDI reagents in minutes with decreased waste.
Highlights:• Cost-effective—single-use packaging saves time and
reduces waste
• Accurate—preweighed aliquot minimizes handling errors
• Convenient—just add solvent and use
Figure 12. Single-Use MALDI Matrices produce better spectra. MALDI-MS spectra from a MALDI-LTQ Orbitrap XL Mass Spectrometer of a tryptic digest of BSA co-crystallized with typical reagent quality and single-use CHCA or DHB-recrystallized MALDI matrices.
100
95
90
85
80
75
70
65
Pierce_080808_2 # 1-10 RT: 0.06-0.40 AV: 10 NL: 7.09 ES T: FTMS+p MALDI Full ms [300.00-2004.23]
579.38
597.39
637.39
60
55
50
45
40
35
30
25
20
15
10
5
0600 700 800 900 1000 1100 1200
m/z14001300 1500 1600 1700 1800 1900 2000
Rel
ativ
e ab
sorb
ance
651.31
689.37
715.45 773.38830.41
871.43
927.49
942.46984.52
991.59
1121.47
1149.47
1203.591234.61
1295.711340.731419.69
1585.82
1639.94
1676.83
567.74
1511.84
1724.84
1749.67
1761.66 1880.92
1937.94
1956.97
1806.69
1853.93
1351.69
1362.741163.63
1107.511051.41
997.59
LKPDPNTLCDEFK2 ppm error
DAFLGSFLYEYSR11 ppm error
1439.811283.71
1479.80
1496.83
140
Instrument calibration and ancillary reagentsAncillary reagents and accessories
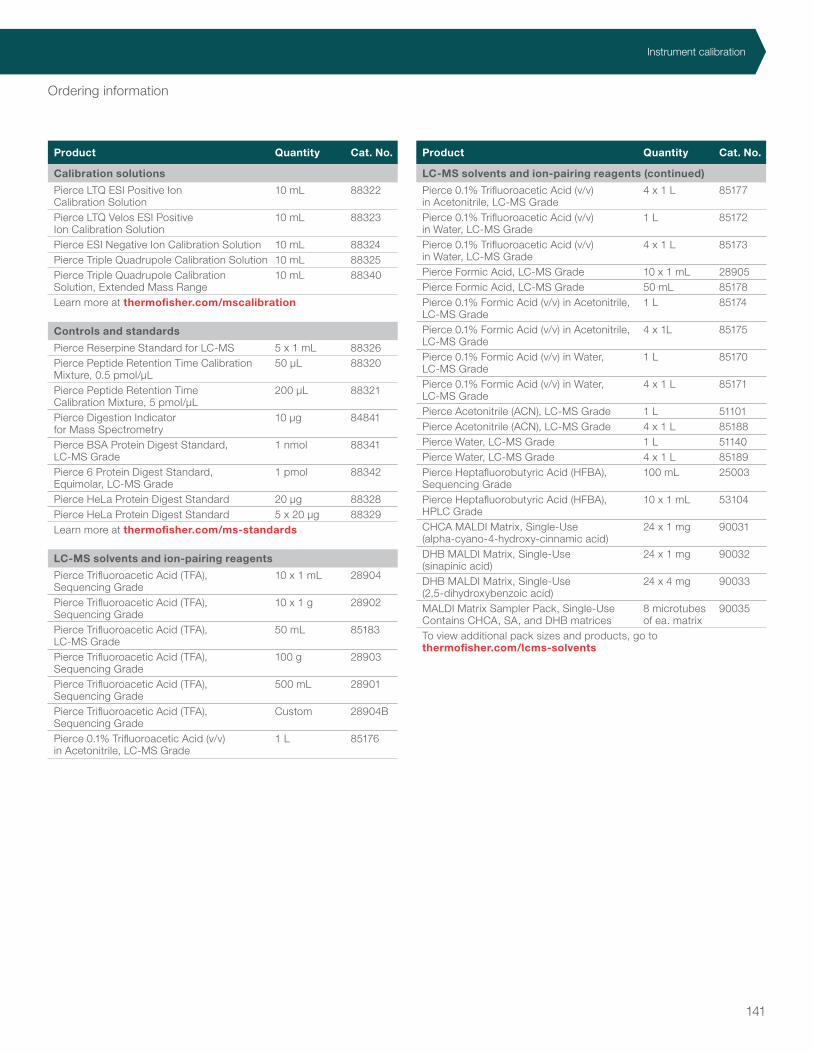
Ordering information
Product Quantity Cat. No.
Calibration solutions
Pierce LTQ ESI Positive Ion Calibration Solution
10 mL 88322
Pierce LTQ Velos ESI Positive Ion Calibration Solution
10 mL 88323
Pierce ESI Negative Ion Calibration Solution 10 mL 88324Pierce Triple Quadrupole Calibration Solution 10 mL 88325Pierce Triple Quadrupole Calibration Solution, Extended Mass Range
10 mL 88340
Learn more at thermofisher.com/mscalibration
Controls and standards
Pierce Reserpine Standard for LC-MS 5 x 1 mL 88326Pierce Peptide Retention Time Calibration Mixture, 0.5 pmol/µL
50 µL 88320
Pierce Peptide Retention Time Calibration Mixture, 5 pmol/µL
200 µL 88321
Pierce Digestion Indicator for Mass Spectrometry
10 µg 84841
Pierce BSA Protein Digest Standard, LC-MS Grade
1 nmol 88341
Pierce 6 Protein Digest Standard, Equimolar, LC-MS Grade
1 pmol 88342
Pierce HeLa Protein Digest Standard 20 μg 88328Pierce HeLa Protein Digest Standard 5 x 20 μg 88329Learn more at thermofisher.com/ms-standards
LC-MS solvents and ion-pairing reagents
Pierce Trifluoroacetic Acid (TFA), Sequencing Grade
10 x 1 mL 28904
Pierce Trifluoroacetic Acid (TFA), Sequencing Grade
10 x 1 g 28902
Pierce Trifluoroacetic Acid (TFA), LC-MS Grade
50 mL 85183
Pierce Trifluoroacetic Acid (TFA), Sequencing Grade
100 g 28903
Pierce Trifluoroacetic Acid (TFA), Sequencing Grade
500 mL 28901
Pierce Trifluoroacetic Acid (TFA), Sequencing Grade
Custom 28904B
Pierce 0.1% Trifluoroacetic Acid (v/v) in Acetonitrile, LC-MS Grade
1 L 85176
Product Quantity Cat. No.
LC-MS solvents and ion-pairing reagents (continued)
Pierce 0.1% Trifluoroacetic Acid (v/v) in Acetonitrile, LC-MS Grade
4 x 1 L 85177
Pierce 0.1% Trifluoroacetic Acid (v/v) in Water, LC-MS Grade
1 L 85172
Pierce 0.1% Trifluoroacetic Acid (v/v) in Water, LC-MS Grade
4 x 1 L 85173
Pierce Formic Acid, LC-MS Grade 10 x 1 mL 28905Pierce Formic Acid, LC-MS Grade 50 mL 85178Pierce 0.1% Formic Acid (v/v) in Acetonitrile, LC-MS Grade
1 L 85174
Pierce 0.1% Formic Acid (v/v) in Acetonitrile, LC-MS Grade
4 x 1L 85175
Pierce 0.1% Formic Acid (v/v) in Water, LC-MS Grade
1 L 85170
Pierce 0.1% Formic Acid (v/v) in Water, LC-MS Grade
4 x 1 L 85171
Pierce Acetonitrile (ACN), LC-MS Grade 1 L 51101Pierce Acetonitrile (ACN), LC-MS Grade 4 x 1 L 85188Pierce Water, LC-MS Grade 1 L 51140Pierce Water, LC-MS Grade 4 x 1 L 85189Pierce Heptafluorobutyric Acid (HFBA), Sequencing Grade
100 mL 25003
Pierce Heptafluorobutyric Acid (HFBA), HPLC Grade
10 x 1 mL 53104
CHCA MALDI Matrix, Single-Use (alpha-cyano-4-hydroxy-cinnamic acid)
24 x 1 mg 90031
DHB MALDI Matrix, Single-Use (sinapinic acid)
24 x 1 mg 90032
DHB MALDI Matrix, Single-Use (2,5-dihydroxybenzoic acid)
24 x 4 mg 90033
MALDI Matrix Sampler Pack, Single-Use Contains CHCA, SA, and DHB matrices
8 microtubes of ea. matrix
90035
To view additional pack sizes and products, go to thermofisher.com/lcms-solvents
141
Instrument calibration

Introduction
High-performance liquid
chromatography (HPLC)
evolved from traditional liquid
chromatography (LC) when it
was shown that the separation
of molecules within a mixture
could be improved using higher
pressures and smaller-diameter
matrix particles.
HPLC hardware and instrumentation was introduced in the 1970s as scientists began using pumps, injectors, and specialized columns to make the first prototypes of these systems. Equally important was the evolution of the particles and stationary phases for the efficient separation of molecules. Most frequently, reversed-phase HPLC (RP-HPLC) is used, which utilizes a nonpolar stationary phase (e.g., surface-modified silica) and a mobile phase comprising water and organic solvent (e.g., acetonitrile or methonol). In gradient separation mode, the proportion of organic solvent is adjusted in a step or linear process starting with low organic concentration. This results in separation of molecules (such as peptides) by their polarity. HPLC has enabled the separation (or fractionation) of complex peptide mixtures, ultimately allowing identification and quantification of several thousands of peptides by mass spectrometry (MS) in a single experiment.
HPLC has become an integral tool in proteomics research, providing rapid, sensitive, and high-resolution separation of peptides. Modern HPLC systems have been improved to work at much higher pressures, and therefore are able to use much smaller particle sizes in the columns. These are called “Ultra-High–Performance Liquid Chromatography” or UHPLC systems.
The mostsuccessfulproteomics
labs andcompanies
Qua
ntita
tion
Calibration and verification
ChromatographyMass s
pec
inst
rum
enta
tion
Software
Sam
ple prep
142
HPLC instrumentation and columns
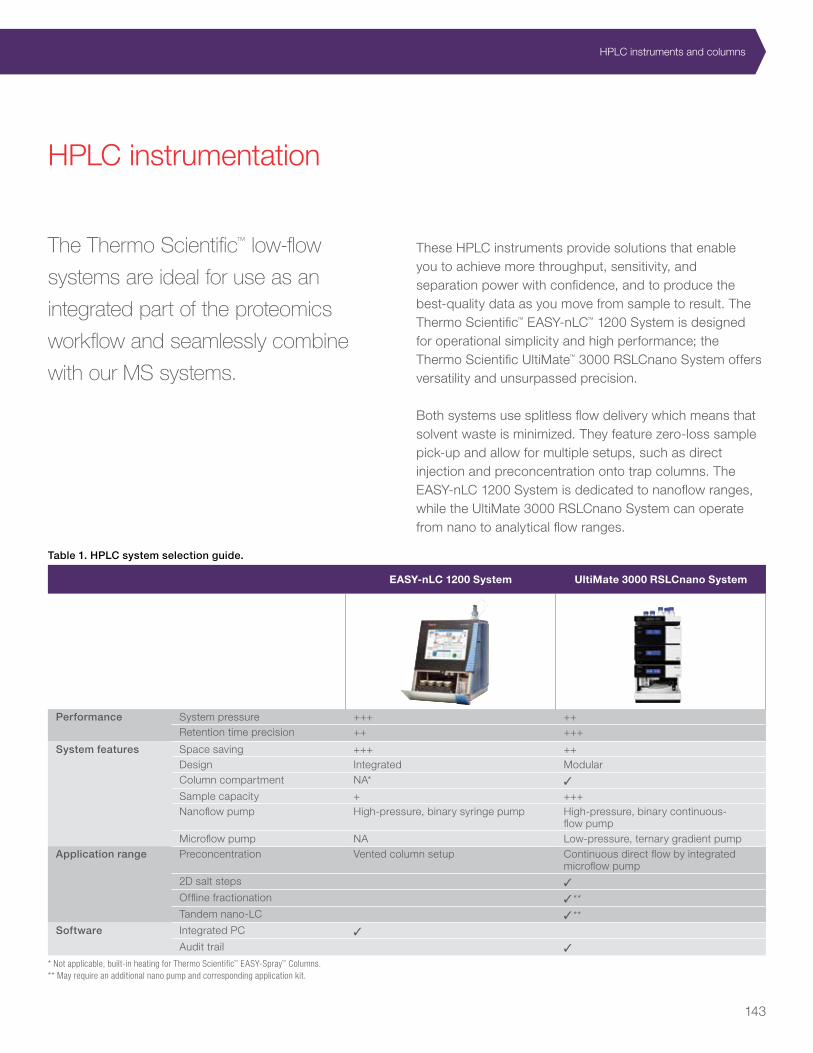
The Thermo Scientific™ low-flow
systems are ideal for use as an
integrated part of the proteomics
workflow and seamlessly combine
with our MS systems.
These HPLC instruments provide solutions that enable you to achieve more throughput, sensitivity, and separation power with confidence, and to produce the best-quality data as you move from sample to result. The Thermo Scientific™ EASY-nLC™ 1200 System is designed for operational simplicity and high performance; the Thermo Scientific UltiMate™ 3000 RSLCnano System offers versatility and unsurpassed precision.
Both systems use splitless flow delivery which means that solvent waste is minimized. They feature zero-loss sample pick-up and allow for multiple setups, such as direct injection and preconcentration onto trap columns. The EASY-nLC 1200 System is dedicated to nanoflow ranges, while the UltiMate 3000 RSLCnano System can operate from nano to analytical flow ranges.
HPLC instrumentation
Table 1. HPLC system selection guide.
EASY-nLC 1200 System UltiMate 3000 RSLCnano System
Performance System pressure +++ ++Retention time precision ++ +++
System features Space saving +++ ++Design Integrated ModularColumn compartment NA* ✓
Sample capacity + +++Nanoflow pump High-pressure, binary syringe pump High-pressure, binary continuous-
flow pumpMicroflow pump NA Low-pressure, ternary gradient pump
Application range Preconcentration Vented column setup Continuous direct flow by integrated microflow pump
2D salt steps ✓
Offline fractionation ✓ **Tandem nano-LC ✓ **
Software Integrated PC ✓
Audit trail ✓
* Not applicable, built-in heating for Thermo Scientific™ EASY-Spray™ Columns. ** May require an additional nano pump and corresponding application kit.
143
HPLC instruments and columns

EASY-nLC 1200 SystemOptimized, easy-to-operate integrated HPLC system
The EASY-nLC 1200 System is optimized, fully integrated, and designed for users at any level of expertise. A pressure rating of 1,200 bar provides reduced cycle times and increased throughput. New maintenance-free ceramic valves and tool-free connections (Thermo Scientific™ nanoViper™ Fingertight Fittings) result in less system downtime, lower cost of ownership, and reliable, fast system setup. New software features give you intelligent system maintenance. Its new features lead to a robust, easily serviceable system ultimately delivering better MS data.
Highlights:• All-in-one design—optimized and integrated for
proteomics, fully compatible with Thermo Scientific mass spectrometers
• Easy to use—intuitive system operations for every level of expertise
• Highest pressure rating available—ideal for ultralong column applications
• Small footprint—saves on valuable lab space
• Easy maintenance—automated built-in check routines and fast troubleshooting
Figure 1. High performance of the EASY-nLC 1200 System translates into high protein identification rates. Using the EASY-nLC 1200 System, 50 cm and even 75 cm EASY-Spray Columns can be operated at standard flow rates (300 nL/min). This results in outstanding peak capacities for 120 min and 240 min gradients. As a consequence, more than 4,000 proteins can be identified in each run. Combining triplicate runs on a 75 cm column results in nearly 6,500 protein identifications.
Table 2. Specifications.
Maximum system pressure
Up to 1,200 bar
Solvent delivery Binary syringe pump Flow range Recommended: 100 nL/min–1 µL/minFlow type Direct flow Gradient delay volume
<1 µL
Retention time precision
0.1–0.4% RSD
Injection linearity R≥0.9985 for 0.5–10 µL R≥0.9995 for 0.3–1.6 µL
Injection volume range
100 nL–18 µL (20 µL loop) 18 µL–48 µL (50 µL loop)
Injection precision <0.2% RSD at 5 µL pickupCarryover <0.05% (caffeine)Possible configurations
Direct injection; trap and elute (vented setup)
Retention time (min)
Gradient time Gradient time
50 cm 70 cm
120 min 240 min
120 min 240 min
Ob
serv
ed p
eak
cap
acit
y
480
4696
5008
5338
5721 5283
5710
5859
6453
667 631
827
Proteins/run Proteins/run3 runscombined
3 runscombined
144
HPLC instrumentation and columnsHPLC instrumentation

UltiMate 3000 RSLCnano SystemHigh-performing and versatile HPLC system
The UltiMate 3000 RSLCnano System offers outstanding performance and workflow versatility. In nanoflow configuration, this liquid chromatography system features Thermo Scientific™ ProFlow™ technology, which further improves nanoflow-rate control and results in high retention-time precision and higher-quality data. The system can also be adapted to capillary- and micro-flow rates when higher throughput is required. The integrated micro-flow ternary pump increases system versatility. Whether you preconcentrate your sample on a trapping column, set up two-dimensional workflows, or tailor the system to your needs with our application kits, the UltiMate 3000 RSLCnano System is capable of handling all low-flow workflows.
Highlights:• Versatile—one system for all low-flow workflows
• Easy to use—fast and simple startup and operation
• High performance—improved retention time precision enables more confident identification
• Accurate—improved run-to-run reproducibility enables better quantification
• Convenient—straightforward integration with mass spectrometers
Table 3. Specifications.
Maximum system pressure
860 bar (nano) 800 bar (cap) 800 bar (micro)
Solvent delivery Binary gradient pump Ternary microflow pump
Flow range Recommended: Nano: 50 nL/min–1.5 µL/min Cap: 0.5−15 µL/min Micro: 5−50 µL/min Ternary microflow pump: 5−2,500 µL/min
Flow type Direct flowGradient delay volume
<25 nL (for pump) <300 nL/min in preconcentration configuration
Retention time precision
≤0.2% or <0.1 SD, whichever is greater in 30 min gradient
Injection linearity R ≥ 0.9995 for 0.1–0.5 µLInjection volume range
20 nL–20 µL (20 µL loop) Up to 125 µL with upgrade kit
Injection precision
<0.4% RSD at 1 µL full loop
Carryover <0.02% (caffeine)Possible configurations
Direct injectionPreconcentration (continuous flow)2D applications
Figure 2. Retention time precision using ProFlow technology. Seven consecutive replicates of Thermo Scientific™ Pierce™ HeLa Protein Digest Standard (Cat. No. 88329) were run using a 50 cm EASY-Spray Column with a gradient duration of 90 min. Due to outstanding retention-time precision, ProFlow technology enables more confident identification and more accurate quantitation.
Learn more or get a quote at thermofisher.com/nanolcms
Retention time, min
145
HPLC instruments and columns

Thermo Scientific™ LC columns are
available in an array of chemistries
to optimize separations and provide
enhanced retention or changes in
elution order. Reversed-phase columns
are one of the most popular matrices
for bottom-up proteomics.
This extensive family of products offers a variety of particle sizes and column designs to meet all separation needs, including improved resolution, enhanced sensitivity, faster analysis, and consistent performance. Thermo Scientific™ HPLC and UHPLC columns are backed by over 40 years of experience and are supported by extensive resources and expertise.
HPLC columns
Table 4. Overview of Thermo Scientific™ LC columns recommended for bottom-up proteomics applications.
Acclaim PepMap 100 C18 LC column PepSwift LC column EASY-Spray LC column
Key advantage High loading capacity Speed Ease of use
Packing material Spherical, fully porous ultrapure silica Monolithic polymer Spherical, fully porous ultrapure silica or monolithic polymer
Particle size 2, 3, or 5 µm Monolithic polymer 2, 3, or 5 µm or monolithic
Formats Analytical column, trap cartridge, trap column
Analytical column, trap cartridge, trap column
Analytical column
Column diameters 0.05, 0.075, 0.1, 0.2, 0.3, 0.75, 1 mm 0.1, 0.2, 0.5 mm 0.05, 0.075, 0.2 mm
Column lengths 5, 10, 50, 250, 500, 750 mm 5, 50, 250 mm 150, 250, 500, 750 mm
146
HPLC instrumentation and columns
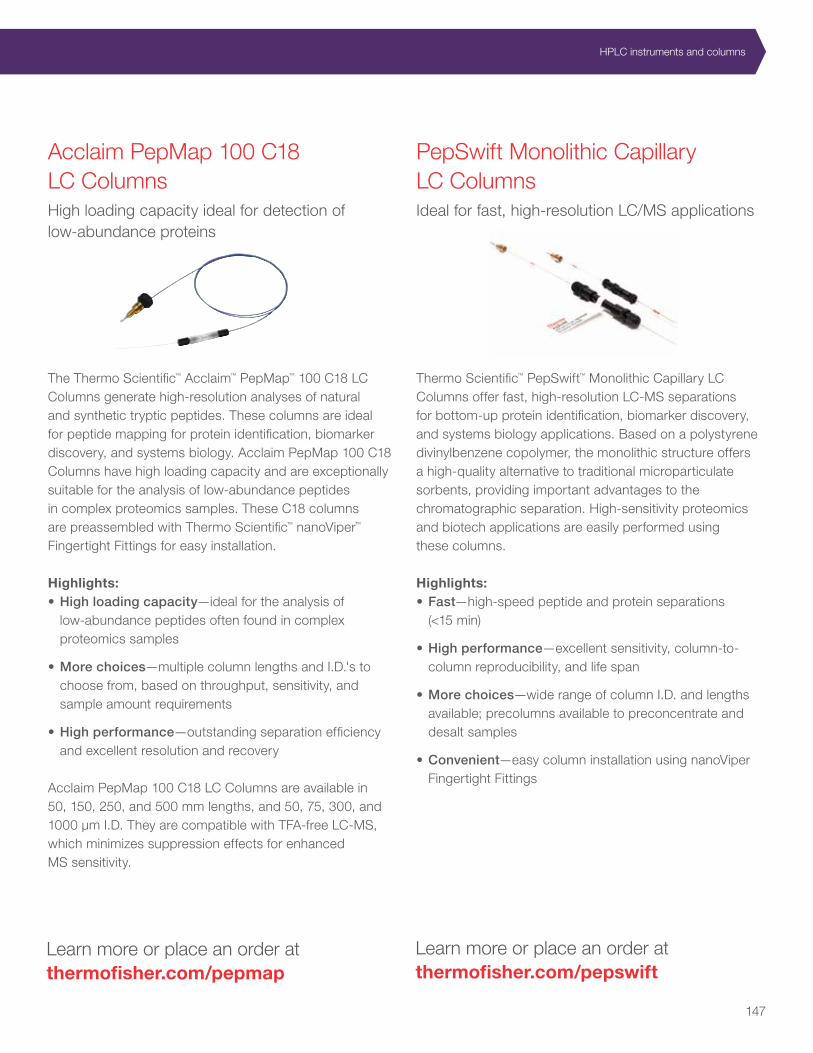
Acclaim PepMap 100 C18 LC ColumnsHigh loading capacity ideal for detection of low-abundance proteins
The Thermo Scientific™ Acclaim™ PepMap™ 100 C18 LC Columns generate high-resolution analyses of natural and synthetic tryptic peptides. These columns are ideal for peptide mapping for protein identification, biomarker discovery, and systems biology. Acclaim PepMap 100 C18 Columns have high loading capacity and are exceptionally suitable for the analysis of low-abundance peptides in complex proteomics samples. These C18 columns are preassembled with Thermo Scientific™ nanoViper™ Fingertight Fittings for easy installation.
Highlights:• High loading capacity—ideal for the analysis of
low-abundance peptides often found in complex proteomics samples
• More choices—multiple column lengths and I.D.'s to choose from, based on throughput, sensitivity, and sample amount requirements
• High performance—outstanding separation efficiency and excellent resolution and recovery
Acclaim PepMap 100 C18 LC Columns are available in 50, 150, 250, and 500 mm lengths, and 50, 75, 300, and 1000 µm I.D. They are compatible with TFA-free LC-MS, which minimizes suppression effects for enhanced MS sensitivity.
PepSwift Monolithic Capillary LC ColumnsIdeal for fast, high-resolution LC/MS applications
Thermo Scientific™ PepSwift™ Monolithic Capillary LC Columns offer fast, high-resolution LC-MS separations for bottom-up protein identification, biomarker discovery, and systems biology applications. Based on a polystyrene divinylbenzene copolymer, the monolithic structure offers a high-quality alternative to traditional microparticulate sorbents, providing important advantages to the chromatographic separation. High-sensitivity proteomics and biotech applications are easily performed using these columns.
Highlights:• Fast—high-speed peptide and protein separations
(<15 min)
• High performance—excellent sensitivity, column-to-column reproducibility, and life span
• More choices—wide range of column I.D. and lengths available; precolumns available to preconcentrate and desalt samples
• Convenient—easy column installation using nanoViper Fingertight Fittings
Learn more or place an order at thermofisher.com/pepmap
Learn more or place an order at thermofisher.com/pepswift
147
HPLC instruments and columns

1
2
3
4
EASY-Spray C18 LC ColumnsUnique design offers improved ease of use and robust performance
Thermo Scientific™ EASY-Spray™ C18 LC Columns provide robust and reproducible nanoflow LC-MS. The unique design provides uncompromised performance and ease of use. The integrated column-emitter design eliminates dead volumes and is temperature-controlled for maximum reliability and performance. The highest-quality chromatographic media and device components enable high precision and robustness for routine operation. The columns are rigorously tested to help ensure excellent reproducibility, and are compatible for use up to 1,200 bar.
Highlights:• Higher peak capacity—enables enhanced
separation of complex mixtures for comprehensive proteome characterization
• Longer gradients—maximizes sequence coverage
• Excellent resolution—improves protein identification
• Compatible—designed for TFA-free LC-MS analysis, minimizing ion suppression effects
• High pressure capability—allows for fast loading and equilibration
EASY-Spray C18 LC Column design features:
• Precision positioned glass emitter—quality-controlled and polished, fused silica emitter with a uniform inner diameter of 7 μm delivers an exceptionally stable spray.
• Integrated design—column-to-emitter connection with zero dead volume delivers narrower peaks and maximized peak capacity, leading to improved sequence coverage.
• nanoViper fitting—easy-to-use, fingertight fitting, rated to 1,200 bar, eliminates column damage due to overtightening, and failure of experiments due to bad connections.
• Column with integrated temperature control—temperature control increases run-to-run reproducibility and allows the use of even longer columns and/or smaller particle sizes since elevated temperatures lower eluent viscosity and reduce the overall backpressure.
Learn more or place an order at thermofisher.com/easyspray
Figure 3. The peak width at half height (PWHH) values for the three peptides on two column types. Three peptides from the Pierce Peptide Retention Calibration Mixture (Cat. No. 88321) were directly compared between the 50 cm and 75 cm EASY-Spray C18 LC Column using a EASY-nLC 1200 System. Comparing results from a 75 cm column with the 50 cm column showed that for the three peptides, the PWHH values on the 75 cm column were significantly less than the same peptides on the 50 cm column.
m/z 422.7363
Pea
k w
idth
at
hal
f h
eig
ht
(In
ten
sity
)
m/z 558.3259 m/z 745.3924
45
40
35
30
25
20
15
10
5
0
75 cm column 50 cm column
148
HPLC instrumentation and columnsHPLC columns
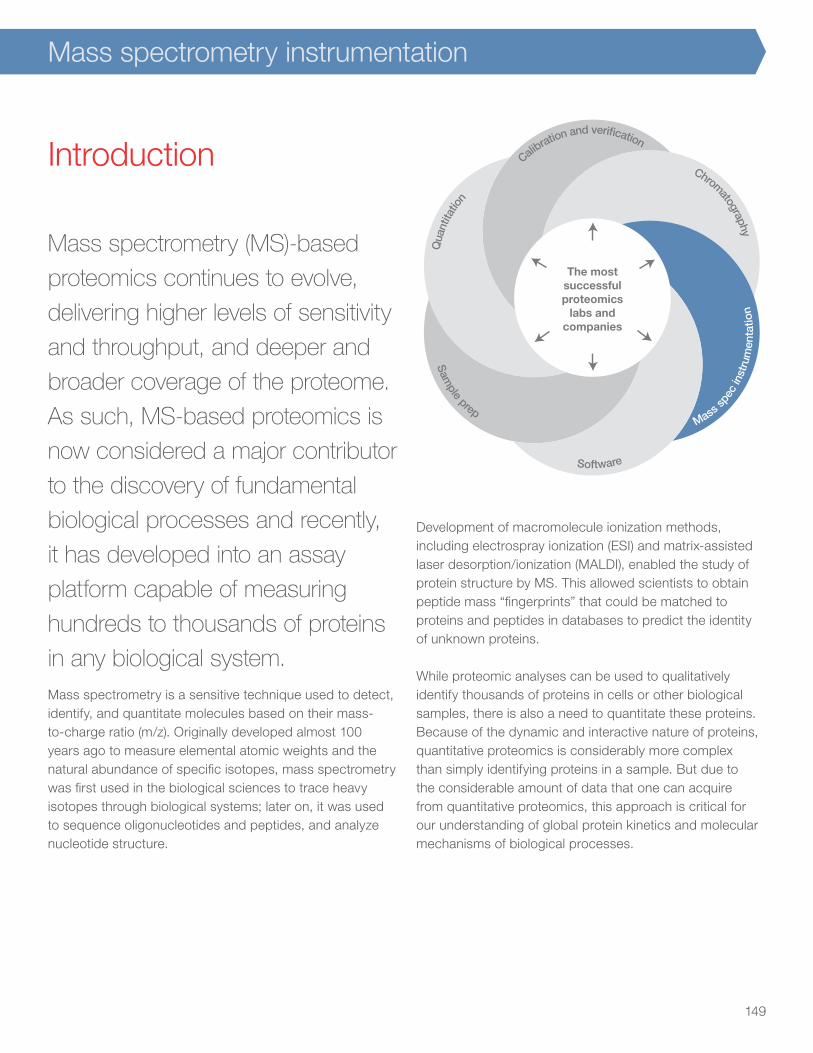
Introduction
The mostsuccessfulproteomics
labs andcompanies
Qua
ntita
tion
Calibration and verification
Chromatography
Mass sp
ec in
stru
men
tatio
n
Software
Sam
ple prep
Mass spectrometry (MS)-based
proteomics continues to evolve,
delivering higher levels of sensitivity
and throughput, and deeper and
broader coverage of the proteome.
As such, MS-based proteomics is
now considered a major contributor
to the discovery of fundamental
biological processes and recently,
it has developed into an assay
platform capable of measuring
hundreds to thousands of proteins
in any biological system. Mass spectrometry is a sensitive technique used to detect, identify, and quantitate molecules based on their mass-to-charge ratio (m/z). Originally developed almost 100 years ago to measure elemental atomic weights and the natural abundance of specific isotopes, mass spectrometry was first used in the biological sciences to trace heavy isotopes through biological systems; later on, it was used to sequence oligonucleotides and peptides, and analyze nucleotide structure.
Development of macromolecule ionization methods, including electrospray ionization (ESI) and matrix-assisted laser desorption/ionization (MALDI), enabled the study of protein structure by MS. This allowed scientists to obtain peptide mass “fingerprints” that could be matched to proteins and peptides in databases to predict the identity of unknown proteins.
While proteomic analyses can be used to qualitatively identify thousands of proteins in cells or other biological samples, there is also a need to quantitate these proteins. Because of the dynamic and interactive nature of proteins, quantitative proteomics is considerably more complex than simply identifying proteins in a sample. But due to the considerable amount of data that one can acquire from quantitative proteomics, this approach is critical for our understanding of global protein kinetics and molecular mechanisms of biological processes.
149
Mass spectrometry instrumentation

Figure 1. Protein quantitation strategies and recommended platforms.
Thousands of proteins One to hundreds of proteins
Fusion Lumos Tribrid MS
Discovery proteomics Targeted proteomics
Orbitrap platform TSQ triple quadrupole platform
Q Exactive MS TSQ Quantiva MS
Accurate, sensitive, robust quantitation of proteins and peptides in complex biological systems is one of the most challenging areas of proteomics. Liquid chromatography coupled to mass spectrometry (LC-MS) has become the dominant technique in this area due to its unparalleled ability to acquire relevant, quantitative biological information from highly complex and diverse sample types. It can be used for both discovery-based (untargeted) and targeted determination of changes in protein abundance.
Discovery-based analysesWith discovery-based quantitative analyses, the goal is to both identify proteins and measure their abundance changes across multiple sample sets. Several discovery-based techniques have been developed, including stable isotope labeling by amino acids in cell culture (SILAC), chemical labeling with isobaric mass tags, and label-free analysis.
Targeted analysesTargeted analyses can be performed once candidate proteins are identified by either discovery-based MS experiments or based on prior information. Targeted analyses provide improved selectivity, quantitation sensitivity (LOQ), increased speed of analyses, and
analysis of expanded sample sets to assess the validity of the candidate proteins. Spiking biological samples with proteotypic, isotopically labeled peptide standards makes possible the absolute quantitation of each protein or posttranslational modification of interest.
Quantitative proteomic studies are typically performed on high-resolution hybrid mass spectrometers. The Orbitrap™ mass analyzer is found in an array of high-resolution accurate-mass instruments, starting with the Q Exactive benchtop mass spectrometers, to the Orbitrap Elite Hybrid Ion Trap-Orbitrap MS, to the most transformative mass spectrometers to date: the Thermo Scientific™ Orbitrap Fusion™ Tribrid™ and Orbitrap Fusion™ Lumos™ Tribrid™ Mass Spectrometers. The sensitivity of high-resolution, accurate-mass spectrometers allows scientists to detect analytes at concentrations in the attomolar range (10–18 M). In addition, targeted quantitation of proteins that require robust, reproducible assays with ultimate sensitivity for detection of certain representative peptides, such as proteotypic peptides, can be accomplished by selected reaction monitoring (SRM) using a TSQ Quantiva triple quadrupole mass spectrometer (Table 1).
150
Mass spectrometry instrumentation

Table 1. Overview of discovery-based and targeted quantitation techniques and recommended mass spectrometer platforms.
Technique Type# samples/run
Precision (% CV) Benefits Drawbacks Instruments
Discovery-based (untargeted quantitative analysis coupling protein identification with quantitation)
Label-free Relative 1 <20 • Applicable to any sample type
• Cost-efficient sample preparation
• Minimal sample handling
• Each sample runs individually (low throughput)
• Requires extremely reproducible LC separations
• Requires multiple technical replicates
Orbitrap
TMT Relative 2 to 10 <20 • Applicable to any sample type
• Multiplexing increases MS throughput
• Requires extensive fractionation or long chromatographic gradients
Orbitrap with HCD
SILAC Relative 2 or 3 <20 • Least susceptible to inter-sample variations in sample handling and preparation
• Multiplexing increases MS throughput
• Only readily applicable to cell cultures
• Increases MS spectral complexity
Orbitrap
Targeted (analysis of predetermined peptides from discovery-based experiments or literature)
HRAM-SIM Relative or absolute
1 <20 • Uses the same MS system as discovery quantitation
• Easy method development using Pinpoint software
• Requires reproducible LC separations
Orbitrap
Internal standard selected reaction monitoring (iSRM)
Relative or absolute
1 <20 • Up to 15,000 SRM transitions per run
• Simultaneous protein quantitation and confirmation of identity
• Suitable for determining the absolute quantity of a protein in a complex biological matrix
• Easy method development using Pinpoint software
• Requires reproducible LC separations
TSQ triple quadrupole
Parallel reactionmonitoring (PRM)
Relative or absolute
1 <20 • Eliminates most interferences, providing attomole-level limits of detection and quantification
• Confident peptide identity confirmation with spectral library matching
• Reduced assay development time • UHPLC-compatible data acquisition
speeds with spectrum multiplexing and advanced signal processing
• Limited number of targets Orbitrap
Data independentacquisition (DIA)
Relative or absolute
1 <20 • Large-scale targeted proteomics studies with qualitative confirmation
• Simple and universal acquisition and method development
• Increases coverage and reproducibility with a complete record of quantitative data
• Facilitates retrospective mining of additional analytes
• Requires spectral library, so DDA experiments need to be done
• Dynamic range (2–3 orders of magnitude)
• Limited sample complexity
Orbitrap
151
Mass spectrometers
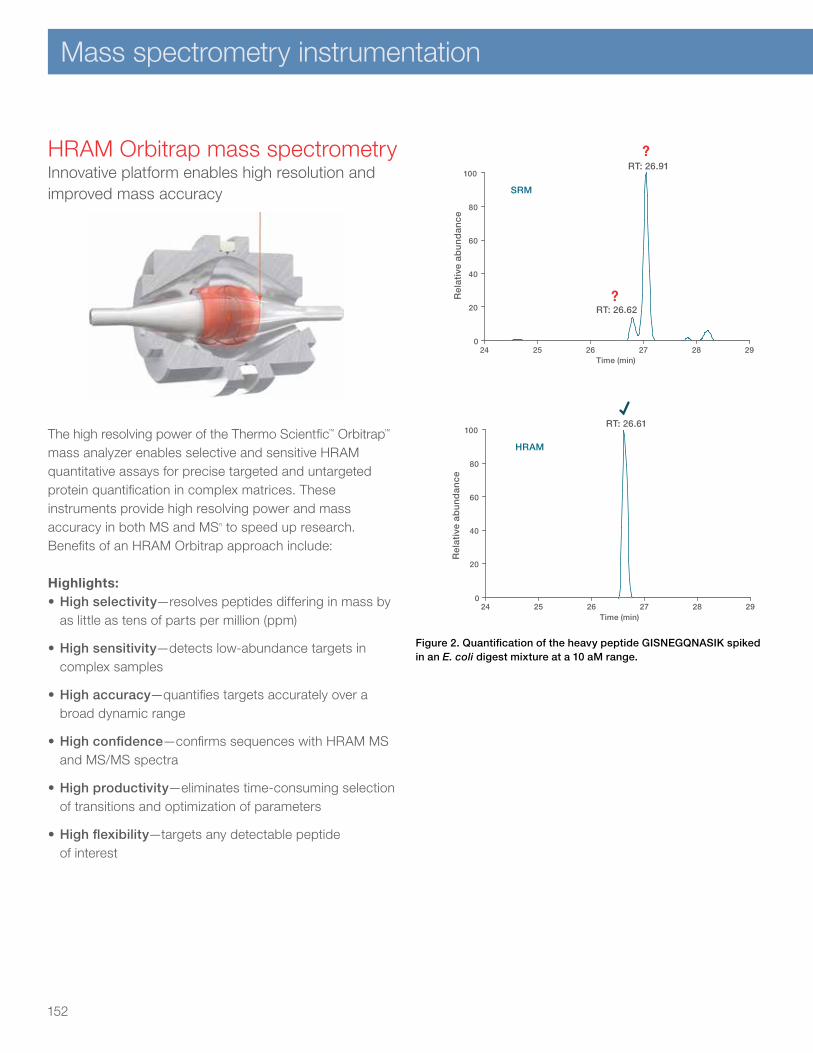
HRAM Orbitrap mass spectrometry Innovative platform enables high resolution and improved mass accuracy
The high resolving power of the Thermo Scientfic™ Orbitrap™ mass analyzer enables selective and sensitive HRAM quantitative assays for precise targeted and untargeted protein quantification in complex matrices. These instruments provide high resolving power and mass accuracy in both MS and MSn to speed up research. Benefits of an HRAM Orbitrap approach include:
Highlights: • High selectivity—resolves peptides differing in mass by
as little as tens of parts per million (ppm)
• High sensitivity—detects low-abundance targets in complex samples
• High accuracy—quantifies targets accurately over a broad dynamic range
• High confidence—confirms sequences with HRAM MS and MS/MS spectra
• High productivity—eliminates time-consuming selection of transitions and optimization of parameters
• High flexibility—targets any detectable peptide of interest
24 25 26 27 28 29Time (min)Time (min)
0
20
40
60
80
100
Rel
ativ
e ab
un
dan
ce
24 25 26 27 28 290
20
40
60
80
100
Rel
ativ
e ab
un
dan
ce
RT: 26.61RT: 26.91
RT: 26.62
SRM HRAM
?
?
24 25 26 27 28 29Time (min)Time (min)
0
20
40
60
80
100
Rel
ativ
e ab
un
dan
ce
24 25 26 27 28 290
20
40
60
80
100
Rel
ativ
e ab
un
dan
ce
RT: 26.61RT: 26.91
RT: 26.62
SRM HRAM
?
?
Figure 2. Quantification of the heavy peptide GISNEGQNASIK spiked in an E. coli digest mixture at a 10 aM range.
152
Mass spectrometry instrumentation

Table 2. Overview of Orbitrap LC-MS instrumentation platforms.
Attributes Q Exactive Q Exactive Plus Q Exactive HF Orbitrap Elite Orbitrap FusionOrbitrap Fusion
Lumos
Max resolution (FWHM) at m/z 200
140K 140K(280K with enhanced resolution option)
120K(240K with enhanced resolution option)
240K 500K 500K
Mass accuracy, ppm (internal call)
<1 <1 <1 <1 <1 <1
Mass range 50–6,000 m/z 50–6,000 m/z 50–6,000 m/z 50–2,000 m/z 50–6,000 m/z 50–6,000 m/z
Scan rate (Hz) 12 12 20 4 20 20
Polarity switch(s) Yes Yes Yes Yes Yes Yes
Parallel reaction monitoring (PRM)
Yes Yes Yes Yes Yes Yes
Selected ion monitoring (SIM)
Yes Yes Yes Yes Yes Yes
Data independent acquisition (DIA)
Yes Yes Yes No Yes Yes
Multiplex (precursor/scan)
Yes Yes Yes – Yes Yes
MSn (n=10) – – – Yes Yes Yes
ETD option (EThcD)* – – – – Yes Yes
Decision-tree (CID/HCD/EDT/EThcD)
– – – Yes Yes Yes
Synchronous MS3 (20 precursors per MS2 scan)
– – – – Yes Yes
ETD HD – (provides high dynamic range ETD)
– – – – – Yes
* Electron-transfer and higher-energy collision dissociation
Learn more or request a quote at thermofisher.com/orbitrap
153
Mass spectrometers

Q Exactive HF mass spectrometerFlexible MS systems that offer accuracy, resolution, and speed
The Q Exactive instruments have several key features, including high-resolution precursor measurements, high-resolution fragment measurements, efficient precursor window isolation, and multiplexing capabilities. Multiple approaches to quantitation are supported by this platform, including selected ion monitoring (SIM), parallel reaction monitoring (PRM), and data-independent acquisition (DIA).
The state-of-the-art Thermo Scientific™ Q Exactive™ HF hybrid quadrupole-Orbitrap mass spectrometer features an ultra-high-field Orbitrap analyzer which doubles its speed and resolution relative to previous generation Q Exactive instruments, enabling shorter analysis time for the same number of peptides identified. Based on the Q Exactive Plus platform, the Q Exactive HF mass spectrometer utilizes the same active beam guide technology and advanced quadrupole design for very stable system operation and exceptional analytical performance. The system delivers mass accuracy and resolution and provides far greater speed than ever before, enabling protein identification that is faster than ever, while maintaining the resolution and accuracy required for high confidence results (Figure 3).
Highlights:• Ultra-high-field orbitrap (HF) mass analyzer—faster
scan speed and higher resolution
• Advanced quadrupole technology (AQT)—improves precursor selection and transmission for more accurate quantitation of low-abundance analytes in complex matrices
• Data-independent acquisition (DIA) and parallel reaction monitoring (PRM)—deliver reproducible quantitation with complete qualitative confidence
• Advanced active beam guide (AABG)—reduces noise and improves instrument robustness
• Optional intact protein mode—provides superior trapping of large molecules for improved analysis of intact proteins
Figure 3. Q Exactive HF ion options.
Figure 4. Comparable number of protein IDs in half the time. Base peak chromatogram (BPC) of a 120 min gradient on the Q Exactive Plus MS (red) and a 60 min gradient on the Q Exactive HF MS (blue) showing one half the analysis time.
HCD cell
RF lens
Ultra-high-field Orbitrap (HF) mass analyzer
Quadrupole mass filter with advanced quadrupole
technology (AQT)
Advanced active beam guide (AABG)
Q Exactive Plus MS, 120 min gradient
Q Exactive HF MS, 60 min gradient
Q Exactive Plus MS, 120 min gradient
354.29895.95
966.59
822.77655.86
499.75589.82
894.47
654.64
495.29
492.79
477.31
652.36
706.40
472.77
599.84
590.82581.31
383.22
420.79
416.25
398.21
566.77
350.73
425.77
358.21
444.74
488.73599.77
100
80
60
40
20
10 20 30 40 50 60 70
Time (min)80 90 100 110 120 130
0Rel
ativ
e ab
un
dan
ce
738.71567.78
966.58
886.11903.78
655.86
714.35
495.29
477.30
652.36420.79
416.25
566.77
425.77444.74
516.80
599.76
630.54
Q Exactive HF MS, 60 min gradient
154
Mass spectrometry instrumentationHRAM Orbitrap mass spectrometry

0
200,000,000
400,000,000
0 40,000 80,000 120,000
Pea
k ar
ea
Heavy peptide YF*QGYARspiked in 250 ng CSF digest 10 amol–100 fmol
200 400 600 800 1,000m/z
0
20
40
60
80
100
Rel
ativ
e ab
un
dan
ce
y10
y9
y8
y7
y6
y5
y4y3
b2
b3
26 27 28RT
0
20
40
60
80
100
Rel
ativ
e ab
un
dan
ce
26.61
Qual QuanXICs of three y ions with ± 5 ppm mass range
Sample amount (amol)
Isolationwith the quadrupole
Fragmentationwith the HCD cell
Detectionwith the Orbitrap Analyzer
Identificationusing MS/MS spectrum
Quantificationof XIC
RT
m/z
PRM with the Q Exactive mass spectrometer
Increased sensitivity of HRAM PRM eliminates PRM provides precise quantification
557.0 558.0 559.0 560.0
558.3 558.5 558.7 558.9
558.3261 (S/N=48)
558.8287 (S/N=22)
Scan #: 5810
SIM Scan
Rel
ativ
e ab
un
dan
ce
100
80
60
40
20
0
m/z
32.6 32.8 33.0
Time (min)
Full Scan m/z = 558.3233–558.3289
SIM Scanm/z = 558.3233–558.3289
Rel
ativ
e ab
un
dan
ce
Scan #: 5809
Full Scan: (m/z 300-1000)
300 400 500 600 700 800 900 1000m/z
0
20
40
60
80
100
Rel
ativ
e ab
un
dan
ce
558.4 558.6 558.8 559.0
558.3256(S/N≈1)
Learn more or request a quote at thermofisher.com/orbitrap
Figure 5. Lower detection limit with targeted SIM (tSIM) scan. Detection of a heavy peptide standard (GLILVGGYGTR*, m/z = 558.326) at 100 amol load in the presence of a 1 μg yeast tryptic digest with both (A) full scan 300-100 amu, AGC target: 1E6 and (B) tSIM scan, m/z 571.3-575.3, AGC target: 2E5 that were acquired sequentially. (C) Extracted ion chromatogram of the target with 5 ppm tolerance is shown for both full scan and SIM scan.
Figure 6. PRM for high selectivity. PRM methodology uses the quadrupole of the Q Exactive MS to isolate a target precursor ion, fragments the targeted precursor ion in the collision cell, and then detects the resulting product ions in the Orbitrap mass analyzer. Quantification is carried out after data acquisition by extracting one or more fragment ions with 5–10 ppm mass windows.
A
C
B
155
Mass spectrometers
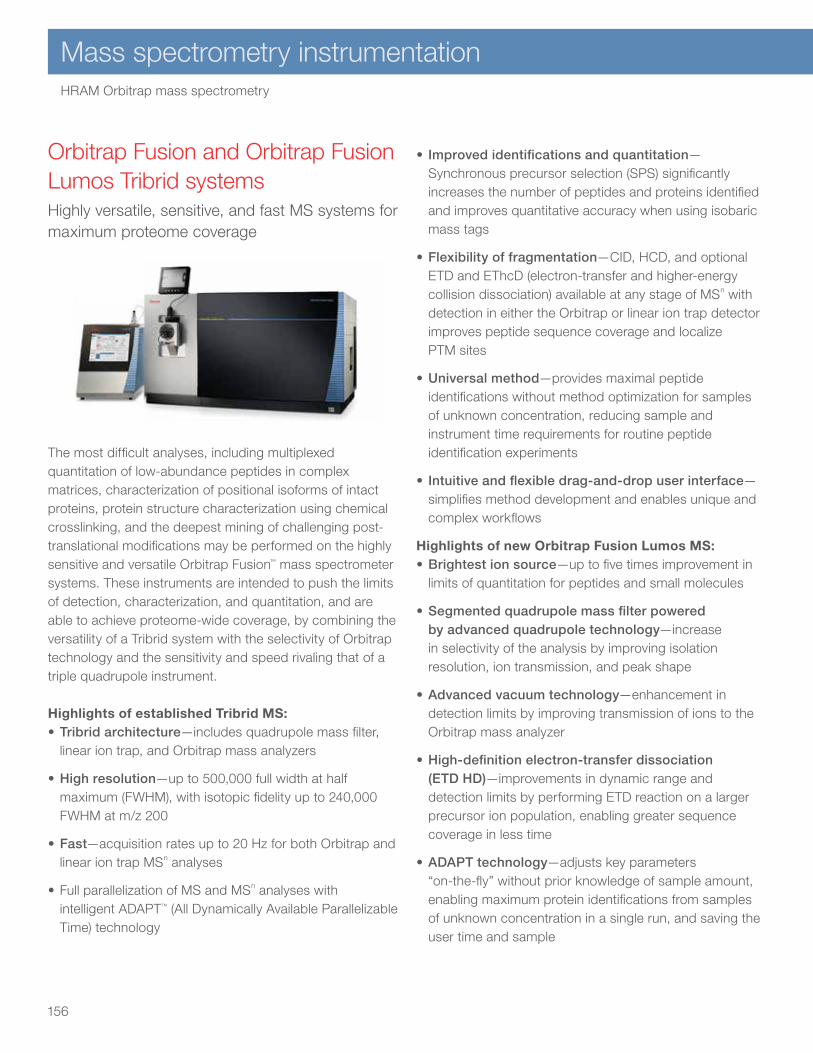
Orbitrap Fusion and Orbitrap Fusion Lumos Tribrid systemsHighly versatile, sensitive, and fast MS systems for maximum proteome coverage
The most difficult analyses, including multiplexed quantitation of low-abundance peptides in complex matrices, characterization of positional isoforms of intact proteins, protein structure characterization using chemical crosslinking, and the deepest mining of challenging post-translational modifications may be performed on the highly sensitive and versatile Orbitrap Fusion™ mass spectrometer systems. These instruments are intended to push the limits of detection, characterization, and quantitation, and are able to achieve proteome-wide coverage, by combining the versatility of a Tribrid system with the selectivity of Orbitrap technology and the sensitivity and speed rivaling that of a triple quadrupole instrument.
Highlights of established Tribrid MS:• Tribrid architecture—includes quadrupole mass filter,
linear ion trap, and Orbitrap mass analyzers
• High resolution—up to 500,000 full width at half maximum (FWHM), with isotopic fidelity up to 240,000 FWHM at m/z 200
• Fast—acquisition rates up to 20 Hz for both Orbitrap and linear ion trap MSn analyses
• Full parallelization of MS and MSn analyses with intelligent ADAPT™ (All Dynamically Available Parallelizable Time) technology
• Improved identifications and quantitation—Synchronous precursor selection (SPS) significantly increases the number of peptides and proteins identified and improves quantitative accuracy when using isobaric mass tags
• Flexibility of fragmentation—CID, HCD, and optional ETD and EThcD (electron-transfer and higher-energy collision dissociation) available at any stage of MSn with detection in either the Orbitrap or linear ion trap detector improves peptide sequence coverage and localize PTM sites
• Universal method—provides maximal peptide identifications without method optimization for samples of unknown concentration, reducing sample and instrument time requirements for routine peptide identification experiments
• Intuitive and flexible drag-and-drop user interface— simplifies method development and enables unique and complex workflows
Highlights of new Orbitrap Fusion Lumos MS:• Brightest ion source—up to five times improvement in
limits of quantitation for peptides and small molecules
• Segmented quadrupole mass filter powered by advanced quadrupole technology—increase in selectivity of the analysis by improving isolation resolution, ion transmission, and peak shape
• Advanced vacuum technology—enhancement in detection limits by improving transmission of ions to the Orbitrap mass analyzer
• High-definition electron-transfer dissociation (ETD HD)—improvements in dynamic range and detection limits by performing ETD reaction on a larger precursor ion population, enabling greater sequence coverage in less time
• ADAPT technology—adjusts key parameters “on-the-fly” without prior knowledge of sample amount, enabling maximum protein identifications from samples of unknown concentration in a single run, and saving the user time and sample
156
Mass spectrometry instrumentationHRAM Orbitrap mass spectrometry
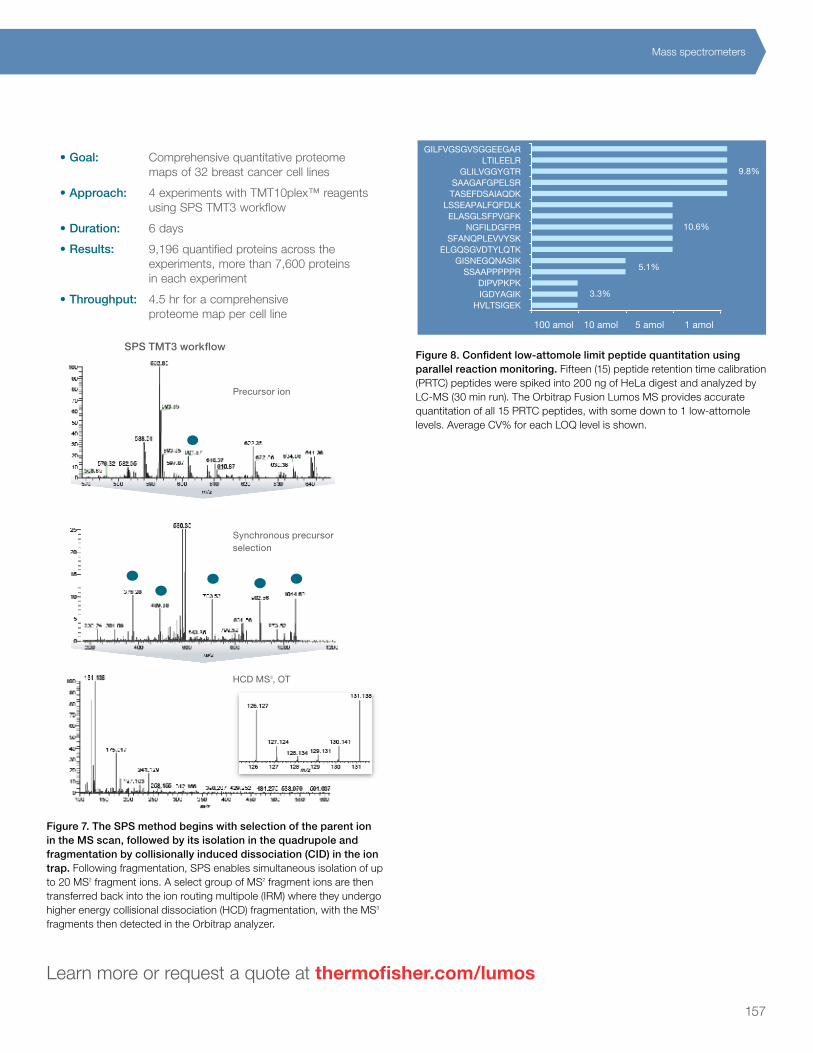
9.8%
3.3%
5.1%
10.6%
100 amol
GILFVGSGVSGGEEGARLTILEELR
GLILVGGYGTRSAAGAFGPELSRTASEFDSAIAQDK
LSSEAPALFQFDLKELASGLSFPVGFK
NGFILDGFPRSFANQPLEVVYSK
ELGQSGVDTYLQTKGISNEGQNASIK
SSAAPPPPPRDIPVPKPKIGDYAGIK
HVLTSIGEK
10 amol 5 amol 1 amol
Figure 7. The SPS method begins with selection of the parent ion in the MS scan, followed by its isolation in the quadrupole and fragmentation by collisionally induced dissociation (CID) in the ion trap. Following fragmentation, SPS enables simultaneous isolation of up to 20 MS2 fragment ions. A select group of MS2 fragment ions are then transferred back into the ion routing multipole (IRM) where they undergo higher energy collisional dissociation (HCD) fragmentation, with the MS3 fragments then detected in the Orbitrap analyzer.
Learn more or request a quote at thermofisher.com/lumos
Figure 8. Confident low-attomole limit peptide quantitation using parallel reaction monitoring. Fifteen (15) peptide retention time calibration (PRTC) peptides were spiked into 200 ng of HeLa digest and analyzed by LC-MS (30 min run). The Orbitrap Fusion Lumos MS provides accurate quantitation of all 15 PRTC peptides, with some down to 1 low-attomole levels. Average CV% for each LOQ level is shown.
Precursor ion
HCD MS3, OT
Synchronous precursor selection
SPS TMT3 workflow
Comprehensive quantitative proteome maps of 32 breast cancer cell lines
4 experiments with TMT10plex™ reagents using SPS TMT3 workflow
6 days
9,196 quantified proteins across the experiments, more than 7,600 proteins in each experiment
4.5 hr for a comprehensive proteome map per cell line
• Goal:
• Throughput:
• Results:
• Duration:
• Approach:
157
Mass spectrometers

TSQ Quantiva Triple Quadrupole Mass SpectrometerUser-friendly MS system with ultimate sensitivity, speed, and dynamic range
The continuously evolving challenges in research requirements drive the need for higher sensitivity in the detection and quantitation of proteins. A modern triple quadrupole LC-MS system must be capable of achieving the lowest LODs and LOQs for every assay—and every day, and regardless of sample type or matrix. The Thermo Scientific™ TSQ Quantiva™
triple-stage quadrupole mass spectrometer uses active ion management to exceed even the most stringent analytical requirements with superb sensitivity, speed, and dynamic range. It does so with an ease of operation—from method development through routine maintenance—that allows users of all levels of expertise to address their analytical challenges with ease, and to spend more time thinking about their research and less time worrying about instrument setup and operation.
Highlights:• Attomole sensitivity—increased signal and selectivity,
decreased noise, boosted dynamic range and scan speed enables fast, sensitive, reproducible quantitation of your precious samples
• Selectivity—high-resolution selected reaction monitoring (H-SRM) allows the narrowing of Q1 resolution to 0.2 FWHM, which can minimize co-isolation of interferences and improve signal-to-noise ratio in complex sample matrices
• Speed—500 SRMs/sec allows for monitoring of hundreds of peptides with multiple product ions for greater confidence in peptide identification
• Linear range—6 orders of magnitude of linear range allow for simultaneous quantitation of both abundant and trace levels of proteins and peptides
• Robustness—even when using nano-LC, where complex matrices are sprayed directly into the high-capacity ion transfer tube (for ultimate sensitivity), the ion beam guide with neutral blocker allows for continuous use without loss of performance (Figure 9)
• Improved usability—software and hardware innovations make operation simple and intuitive; an easy-to-use method editor, integrated with application-specific software that enables maximum productivity, and a plug-and-play ion source make operation straightforward for experts and non-experts alike
• Sensitive, robust peptide quantitation—in combination with the Thermo Scientific™ EASY-Spray NG™ source and Thermo Scientific™ TraceFinder™ software, the TSQ Quantiva MS enables detection and sensitive quantitation of low-abundance proteins and targeted SRM methods (Figures 10 and 11)
Figure 9. TSQ Quantiva ion optics. Thermo Scientific™ active ion management (AIM™) technology — electrodynamic ion funnel, ion beam guide with neutral blocker, Thermo Scientific™ HyperQuad™ quadrupole mass filter, and active collision cell — enables attogram-level sensitivity.
158
Mass spectrometry instrumentation

Learn more or request a quote at thermofisher.com/quantiva
Research samples are precious and are frequently limited in volume. The TSQ Quantiva™ mass spectrometer makes the most of every sample, with innovations that enable quantification of even the most complex and challenging samples with extreme sensitivity and reproducibility. The TSQ Quantiva MS offers improved analytical performance while addressing the complexity of samples. In addition, a combination of user-friendly software and hardware innovations make operation simple and intuitive, helping research laboratories to achieve their quantitation challenges with greater ease. An entirely new drag-and-drop method editor simplifies method development, while integration with application-specific software enables maximum productivity. A plug-and-play ion source eliminates manual gas and electrical connections and is automatically detected on installation.
Putative biomarkers and other proteins of scientific interest are frequently obscured by common high-abundance proteins. The TSQ Quantiva MS and EASY-Spray NG ion source offer the sensitivity, precision, and dynamic range needed to screen for, verify, and quantitate such elusive research targets. The TraceFinder software enables rapid data processing and statistical analyses of SRM data.
Figure 10. (A) Response curve for PRTC peptide GISNEGQNASIK in digested plasma (1 µg/µL), as plotted in TraceFinder software. (A) The concentration range spanned from 25 amol/µL to 100 fmol/µL on column, using nanoflow LC. The zoomed plot shows the linearity of the low-end response. (B) Extracted ion chromatograms (XICs) for the low end of the PRTC curve in digested plasma matrix.
Figure 11. Peak area CV for a heavy PRTC peptide response curve in digested plasma. The data represent the peak area coefficient of variation (CV) for replicate injections (n = 3) of light PRTC peptides (2.5 fmol/µL) and varying concentration of heavy PRTC peptides (25 amol/µL–100 fmol/µL) spiked into digested plasma (1 µg/µL). A total of 130 transitions were monitored (13 light and heavy peptides, with 5 SRMs each) continuously throughout the nanoflow method.
A B
Peak area CV (%)
Heavy PRTC concentration (fmol/µL)
Light peak area CV (%)
Heavy peak area CV (%)
60
50
40
CV
(%)
30
20
10
00 0.025 0.1 0.25 0.5 1 10 25 100
159
Mass spectrometers

Introduction
Thermo Scientific™ software
platforms offer unique solutions for
analyzing proteins and peptides,
enabling a seamless transition
from discovery to targeted protein
quantitation using in-depth high-
resolution, accurate-mass (HRAM)
and MS/MS analysis.
Proteome Discoverer™ software simplifies a wide range of proteomics workflows, from peptide and protein identification to post-translational modification (PTM) analysis to quantitation. It supports multiple database search algorithms (SEQUEST™, Mascot™, Byonic™ software, etc.) and multiple dissociation techniques (CID, HCD, ETD and EThcD) for more comprehensive analyses.
ProteinCenter™ software is a web-based tool that enables scientists to compare and interpret proteomics data sets in minutes and overcomes the hurdle of proteins existing under different names and accession keys in different databases. This software is regularly updated from all major protein databases and provides a consolidated, biologically annotated protein sequence database to enable filtering, clustering, and statistical bioinformatic analysis from single, combined, or comparison data sets.
ProteinCenter software can reveal the biological context of each data set, in quantitative studies and for a single protein. ProteinCenter software serves as a bioinformatics tool, which supports the critical, final step involving data interpretation, while Proteome Discoverer and Pinpoint™ software packages serve as tools for the discovery and targeted steps along the proteomic workflow.
Pinpoint and TraceFinder™ software enable the transition from initial proteomic discovery to verification of proteins and biomarkers of interest.
The mostsuccessfulproteomics
labs andcompanies
Qua
ntita
tion
Calibration and verification
ChromatographyMass
spec
inst
rum
enta
tion
Software
Sam
ple prep
Figure 1. Software tools for discovery to targeted proteomics workflows.
Create targeted protein quantification assays
Pinpoint Software and TraceFinder Software
Identify, quantify, and characterizeProteome Discoverer
Biologicalexperiment
Convert data sets to meaningful biologyProteinCenter Software
160
Software

Proteome Discoverer software Powerful tool to enable analysis of bottom-up proteomics results
Proteome Discoverer software supports a wide range of proteomics workflows, from protein and peptide identification to PTM analysis to quantitation, such as label-free, SILAC, and isobaric mass tagging approaches.
Proteome Discoverer software supports multiple database search algorithms (SEQUEST, Mascot, Byonic) and multiple dissociation techniques (CID, HCD, ETD, EThcD) for more comprehensive analyses. Additionally, it supports third-party nodes for data processing.
Proteome Discoverer software is a comprehensive and expandable software platform for the analysis of qualitative and quantitative proteomics data.
Highlights:• Compatible—identifies proteins from the mass spectra
generated from all Thermo Scientific mass spectrometers and others for bottom-up proteomics
• Powerful—enables deep data mining using multiple search engines, spectral libraries, and verification tools for the number of true positive peptide spectrum matches for peptides and proteins
• Convenient—ready-to-use, optimized workflows as well as the flexibility to create custom workflows for processing complex data sets with optimum search parameters
• Multiplex analysis—easily determine relative protein expression changes from large-scale, hyperplexed proteome studies using the “Study Management” feature
• Fast and robust—optimized algorithms for peak-picking and peptide quantification to extract the maximum information from quantitative proteomics studies
Proteome Discoverer software helps to obtain reliable statistics and verify quantification results visually. In addition, ptmRS (post-translational modification resources) helps to enable confident PTM identification and site localization.
Proteome Discoverer software enables users to:• Retrieve gene ontology (GO) and protein family
annotations to illuminate the biological context of the proteins identified
• Obtain comprehensive and interactive visualization of results
• Process raw files automatically after data acquisition with user-defined workflows using the “Discoverer Daemon” application and view the results on any computer
• Create persistent and filtered results
161
Software

Learn more or request a quote at thermofisher.com/proteome-discoverer
Figure 2. “Study Management” enables file and fraction grouping for easy replicate data analysis and visualization for multiplex quantitation experiments. Proteome Discoverer software provides flexible file annotation and protein grouping options of different LC-MS data files and search results to enable label-free, SILAC, and TMT reagent quantitation.
Figure 3. Proteome Discoverer software enables accurate and sensitive quantification of glycopeptides. This report shows the combined results with peptide sequence, glycosylation site, glycan composition, and annotated spectra from Byonic software combined with the quantitative results coming from Proteome Discoverer software.
162
Software

ProteinCenter software Powerful tool to extract meaningful biology from proteomics data
ProteinCenter software reduces complexity and adds biological meaning to proteomics experiments. It helps to enable visualization of protein identification data by providing statistics on detected proteins (e.g., domains, annotation, gene ontology, pathways). The heat map interface allows users to quickly view their quantitative proteomic data either as individual peptides or proteins, or by group of proteins or functional category. The user can quickly go from thousands to tens or hundreds of proteins that demonstrate quantitative profiles with significant correlation. Proteins that are correlated may have common biological functions or interact. Analysis by ProteinCenter software will enable researchers to find proteins that respond similarly to experimental conditions, as well as calculate statistics and view data in the context of annotations and ontologies that are overrepresented, indicating pathways and protein functions that are of biological significance in the sample analyzed. ProteinCenter software is deployed in the cloud so results can be accessed and viewed by collaborators instantly using their favorite web browser.
Highlights:• Fast—extract meaningful biology from complex data sets
in minutes
• Comprehensive—access a single database consolidated from >20 public databases and including all historical data
• Powerful—produces meaningful results by removing redundancy, seamlessly comparing data sets identified at different times and in different databases, and clustering proteins by protein sequence, shared peptides, or peptide-indistinguishable protein groups
Key features of ProteinCenter software: • Visualization of protein quantitation data
– Profiling of time course events
– Colored heat maps for pathways
– Projection of quantitative data onto pathways
• Visualization of information on protein level
– Post-translational processing
– Structural domains
• Visualization of information on biological pathway level
– Pathway coverage
– Time course profiling
– Up-/downregulation mapping
163
Software

Figure 4. Automated GO annotation provides specific biological context about complex protein mixtures. Proteome Discoverer and ProteinCenter software provide critical annotation information for protein cellular locations and family and function, in addition to data analysis tools such as Venn diagrams, clustering analysis, and comparison charts.
Figure 5. Representative heat map using Proteome Discoverer and ProteinCenter software. The heat map interface allows users to quickly view their quantitative proteomic data either as individual peptides or proteins, or by group of proteins or functional category, such as gene ontology, enzyme codes, KEGG pathways, reactome pathways, UniProt pathways, Wiki pathways, PFAM domains, InterPro domains, and keywords.
Learn more or request a quote at thermofisher.com/proteincenter
164
Software

Learn more or request a quote at thermofisher.com/pinpoint
Pinpoint software Flexible tool to enable a seamless transition from discovery to targeted proteomics
Pinpoint software facilitates the transition from proteomic discovery experiments to verification of putative biomarkers and general quantitative proteomics. Pinpoint software simplifies development and refinement of targeted quantitative methods. It uses data from previous discovery experiments to predict proteotypic peptides and determine the best transitions for selected reaction monitoring (SRM) experiments. Pinpoint software can also process targeted quantitation experiments performed on HRAM Orbitrap instruments.
Highlights:• Compatible—imports and processes panels
of targeted proteins and peptides selected from discovery experiments
• Powerful—automates searching of user-created and public (e.g., Peptide Atlas) MS/MS spectral libraries, or in silico prediction of target peptides for hypothesis-driven experiments
• Robust—automates selection of the most abundant precursor and product ions, with highly accurate, automated determination of optimal collision energies for SRM transitions
• Convenient—provides flexible method design that can integrate high-resolution precursor selection, timed acquisition, and full MS/MS scans (QED) into SRM assays
• Accurate—matches experimental and library spectra, providing correlation analysis with probability scoring for high-confidence targeted peptide verification
• Customizable—integrates discovery results with relative and absolute quantitation, resulting in customizable reports; easily exports results for use in refining the method
• “
Figure 6. Pinpoint software refines targeted proteomics methods. The software provides many strategies for extracting ideal peptide candidates from one experiment and applying them to the next experiment. Information such as retention time windows, precursor charge states, and product ions can be used to create libraries. Additional verification tools such as peptide-based hydrophobicity factors can relate measured retention times to predicted retention times. Refined methods can be stored as libraries or transferred back into the “Main Workbook” for a more accurate data acquisition and/or processing method.
165
Software

TraceFinder™ Optimized for Quantitation
TraceFinder softwareFlexible software for targeted peptide screening and quantitation
TraceFinder software offers increased flexibility and an array of capabilities in performing targeted screening and routine quantitation with either high-resolution, accurate-mass (HRAM) and/or triple-stage quadrupole (TSQ) mass spectrometers. TraceFinder software provides method development tools for all molecule types, including peptides. When used with Thermo Scientific™ Q Exactive™ HRAM or TSQ mass spectrometry systems, TraceFinder software offers the most comprehensive and quantitative workflows that help you address critical challenges in your routine or advanced quantitation assays.
Highlights:• Convenient—streamlined quantitation of peptides, with
easy access to all necessary information in seconds
• Powerful—simple workflow-driven method setup for data acquisition, data processing, and reporting
• Robust—automates data acquisition with intelligent sequencing, allowing users to specify protocols for a variety of fault conditions for confidence during unattended operation
• Efficient—facilitates data review with multipeak review capabilities, automatic retention time and ion ratio adjustment, configurable layouts, extensive flagging options, and custom reporting
• Flexible—provides quantitative, semiquantitative, and screening workflows
Figure 7. TraceFinder 4.1 software enables LC-MS quantitation and screening. The software streamlines your workflows, and provides customizable reports and an “Intelligent Sequencing” standard. Other new features include a Peptide Predictor Tool, amino acid support, enhanced data displays, and a Thermo Scientific™ mzVault™ library search. Peptide and mass lists can be imported from Pinpoint software or any .csv file.
Learn more or request a quote at thermofisher.com/tracefinder
166
Software

New mass spectrometry digital resources
Mass spec rewards program
Mass spec rewards program 2017Save money | Find out about new products | Improve sample preparation and quantitationSave up to 40% on a single order up to $2,500 through the Thermo Scientific™ Mass Spec Rewards Program.* Save even more if you purchase one or more Thermo Scientific™ mass spectrometers in 2017.
Save up to 40% on a single order through the Thermo Scientific™ Mass Spec Rewards Program. Save even more if you purchase one or more Thermo Scientific™ mass spectrometers in 2017. Learn more on how to make a purchase through this program, obtain a list of eligible products, or register to be contacted by your local sales representative.
Learn more at thermofisher.com/msrewards
Improve your mass spectrometry results by accessing helpful white papers and late-breaking posters for specific applications like subcellular fractionation, peptide fractionation, isobaric labeling, and more. Increase your knowledge of sample preparation and protein quantitation through our free, on-demand webinars.
Register now at thermofisher.com/msresources
167
Protein sample preparation and quantitationResources and rewards program

Find out more at thermofisher.com/msreagents
For Research Use Only. Not for use in diagnostic procedures. © 2017 Thermo Fisher Scientific Inc. All rights reserved. All trademarks are the property of Thermo Fisher Scientific and its subsidiaries unless otherwise specified. ActivX is a trademark of ActivX Biosciences, Inc. Bio-Spin, Micro Bio-Spin, ReadyPrep, and TGX are trademarks of Bio-Rad Laboratories. Brij is a trademark of Uniqema Americas. Byonic is a trademark of Protein Metrics. Cibacron is a trademark of Ciba Geigy. iodoTMT, iodoTMTsixplex, iodoTMTzero, Tandem Mass Tag, TMT, TMTduplex, TMTsixplex, TMTzero, TMT10plex, aminoxyTMT, aminoxyTMTsixplex, and aminoxyTMTzero are trademarks of Proteome Sciences. Mascot is a trademark of Matrix Science. PhosSTOP is a trademark of Roche Diagnostics. ProteoExtract is a trademark of Merck KGAA. SEQUEST is a trademark of University of Washington. SwissProt is a trademark of the Swiss Institute of Bioinformatics. Teflon is a trademark of The Chemours Company. Triton is a trademark of Union Carbide Corp. Tween is a trademark of Croda Americas. Typhoon is a trademark of GE Healthcare. Ultramark is a trademark of PCR, Inc. ActivX Desthiobiotin-ATP and -ADP Probes are licensed exclusively from ActivX Biosciences to Thermo Fisher Scientific for research use only. COL02228 0117