1996 ASMS fall workshop: Limits to confirmation, quantitation, and detection
11
REPORT 1996 ASMS FALL WORKSHOP: Limits to Confirmation, Quantitation, and Detection Richard Baldwin U.S. Food and Drug Administration Division of Field Science Rockville, Maryland Robert A. Bethem ALTA Analytical Laboratory E1 Dorado Hills, California Robert K. Boyd National Research Council Halifax, Nova Scotia, Canada William L. Budde U.S. Environmental Protection Agency EMSL Cincinnati, Ohio Thomas Cairns Psychemedics Corporation Culver City, California Robert D. Gibbons Department of Biometrics University of Illinois at Chicago Chicago, Illinois Jack D. Henion Advanced BioAnalytical Services Inc. Ithaca, New York Mary A. Kaiser DuPont Central Research and Development Corporate Center for Analytical Sciences Wilmington, Delaware David L. Lewis Radian International Austin, Texas Jean E. Matusik and James A. Sphon U.S. Food and Drug Administration Center for Food Safety and Applied Nutrition Damico Mass Spectrometry Laboratory Washington, DC Rainer W. Stephany RIVM, National Institute of Public Health and the Environment Bilthoven, The Netherlands Richard K. Trubey DuPont Agricultural Products Wilmington, Delaware Objectives of the Workshop and of this Report The Fall Workshop on Limits to Confirmation, Quantita- tion, and Detection, organized by the American Society for Mass Spectrometry (ASMS), was held on November 1-2, 1996, at the Radisson Plaza Hotel, Alexandria, VA. The objectives of the Workshop were to examine the closely related and often directly opposed practical problems of decreasing the limits to detection and quantitation while ensuring that the analytical signals being measured really do correspond to the target compound for that analysis. In the context of trace analysis by chromatography with mass spectrometric detection, it is conventional practice, when using scan- ning spectrometers, to decrease limits of detection and of quantitation by monitoring only a few ions rather than the entire mass spectrum. Such improvements in detection sensitivity are achieved at the cost of a lesser degree of confidence that the observed signals do correspond to the target analyte, or to only that analyte. The issue is further complicated by the increasing use of tandem mass spectrometry to increase the selectivity of detection. It was hoped that an open discussion of these closely related issues would assist the analytical com- munity in reaching a usable set of guidelines for labo- ratories working in real-life situations. In this regard, it must be recognized that the American Society for Mass Spectrometry is a purely scientific body, with no authority to decide what should be the accepted practice in any context with legal or quasilegal implications. Accordingly, the Workshop and this Report must be regarded only as an airing of the issues, and do not necessarily represent the position of the ASMS. The present Report is intended to be only-a summary of material presented at the Workshop. Subsequent to the Workshop itself, several colleagues expressed a desire for a more proactive document that would make specific proposals as to how these issues might be resolved in the future. Publication of such a document would present problems for those Workshop contribu- tors who are employed by government regulatory agen- cies, as any proposals of this kind contained in a document coauthored by them would de facto be con- strued as representing official policy. Accordingly, some proposals of this kind will be published sepa- rately without these government colleagues as coau- thors. The Workshop program, which was organized by Robert Bethem, included nine invited oral presenta- tions. A poster session was held on the evening of 1 November. In addition, a major portion of the program was devoted to questions and discussion from the floor. The approximately 120 participants engaged in a lively exchange of views and experiences. In somewhat more detail, the original objectives of the Workshop organizers were: 1. To summarize the progress made by professional statisticians in developing usable statistical models that permit theoretically defensible definitions of limits of detection and of quantitation and related limits. Professor Robert Gibbons of the University of Illinois at Chicago opened the Workshop with a ©1997American Societyfor Mass Spectrometry.Publ~hed by ElsevierScienceInc. 1044-0305/97/$17.00 PII $1044-0305(97)00149-9
Transcript of 1996 ASMS fall workshop: Limits to confirmation, quantitation, and detection
REPORT
1996 ASMS FALL WORKSHOP: Limits to Confirmation, Quantitation, and Detection Richard Baldwin U.S. Food and Drug Administration Division of Field Science Rockville, Maryland Robert A. Bethem ALTA Analytical Laboratory E1 Dorado Hills, California Robert K. Boyd National Research Council Halifax, Nova Scotia, Canada William L. Budde U.S. Environmental Protection Agency EMSL Cincinnati, Ohio Thomas Cairns Psychemedics Corporation Culver City, California Robert D. Gibbons Department of Biometrics University of Illinois at Chicago Chicago, Illinois Jack D. Henion Advanced BioAnalytical Services Inc. Ithaca, New York Mary A. Kaiser DuPont Central Research and Development Corporate Center for Analytical Sciences Wilmington, Delaware David L. Lewis Radian International Austin, Texas Jean E. Matusik and James A. Sphon U.S. Food and Drug Administration Center for Food Safety and Applied Nutrition Damico Mass Spectrometry Laboratory Washington, DC Rainer W. Stephany RIVM, National Institute of Public Health and the Environment Bilthoven, The Netherlands Richard K. Trubey DuPont Agricultural Products Wilmington, Delaware
Objectives of the Workshop and of this Report The Fall Workshop on Limits to Confirmation, Quantita- tion, and Detection, organized by the American Society for Mass Spectrometry (ASMS), was held on November 1-2, 1996, at the Radisson Plaza Hotel, Alexandria, VA. The objectives of the Workshop were to examine the closely related and often directly opposed practical
problems of decreasing the limits to detection and quantitation while ensuring that the analytical signals being measured really do correspond to the target compound for that analysis. In the context of trace analysis by chromatography with mass spectrometric detection, it is conventional practice, when using scan- ning spectrometers, to decrease limits of detection and of quantitation by monitoring only a few ions rather than the entire mass spectrum. Such improvements in detection sensitivity are achieved at the cost of a lesser degree of confidence that the observed signals do correspond to the target analyte, or to only that analyte. The issue is further complicated by the increasing use of tandem mass spectrometry to increase the selectivity of detection. It was hoped that an open discussion of these closely related issues would assist the analytical com- munity in reaching a usable set of guidelines for labo- ratories working in real-life situations.
In this regard, it must be recognized that the American Society for Mass Spectrometry is a purely scientific body, with no authority to decide what should be the accepted practice in any context with legal or quasilegal implications. Accordingly, the Workshop and this Report must be regarded only as an airing of the issues, and do not necessarily represent the position of the ASMS.
The present Report is intended to be only- a summary of material presented at the Workshop. Subsequent to the Workshop itself, several colleagues expressed a desire for a more proactive document that would make specific proposals as to how these issues might be resolved in the future. Publication of such a document would present problems for those Workshop contribu- tors who are employed by government regulatory agen- cies, as any proposals of this kind contained in a document coauthored by them would de facto be con- strued as representing official policy. Accordingly, some proposals of this kind will be published sepa- rately without these government colleagues as coau- thors.
The Workshop program, which was organized by Robert Bethem, included nine invited oral presenta- tions. A poster session was held on the evening of 1 November. In addition, a major portion of the program was devoted to questions and discussion from the floor. The approximately 120 participants engaged in a lively exchange of views and experiences.
In somewhat more detail, the original objectives of the Workshop organizers were:
1. To summarize the progress made by professional statisticians in developing usable statistical models that permit theoretically defensible definitions of limits of detection and of quantitation and related limits. Professor Robert Gibbons of the University of Illinois at Chicago opened the Workshop with a
©1997American Society for Mass Spectrometry. Publ~hed by Elsevier Science Inc. 1044-0305/97/$17.00 PII $1044-0305(97)00149-9

J Am Soc Mass Spectrom 1997, 8, 1180-1190 REPORT 1181
presentation titled Some Statistical and Conceptual Issues in the Detection of Low-Level Environmental Pol- lutants.
2. To make a link between this highly mathematical approach and the everyday world of the busy ana- lytical laboratory. The key speaker here was Dr. David Lewis of Radian Corporation in Austin, Texas, whose presentation was entitled Beyond Signal-to- Noise: Addressing Qualitative Considerations in the De- tectability Function.
3. To summarize and explain the current approaches of the government regulatory agencies to these prob- lems. Dr. Bill Budde of the Environmental Protection Agency (EPA) in Cincinnati discussed The EPA Method Detection Limit: Does It have Any Merit? Dr. Jean Matusik of the U.S. Food and Drug Administra- tion (FDA) Center for Food Safety and Applied Nutrition in Washington, DC spoke on FDA Regula- tory Confirmation Criteria (coauthored by J. A. Sphon). Dr. Richard Baldwin of the FDA Division of Field Science in Rockville, MD discussed Regulatory Cred- ibility in the Arena of Consumer Protection, and Dr. Rainer Stephany of the National Institute of Public Health and the Environment in The Netherlands described European Union Regulatory Reshtue Analysis for Veterinary Drugs and Banned Anabolic Agents: A Strategic System, Its Tools and Reliability Targets.
4. To benefit from the expertise of colleagues with wide practical experience in these matters, who have sug- gestions as to how the present definitions and pro- tocols could be updated. In this context, Dr. Thomas Cairns of Psychemedics Corporation in Culver City, CA described his proposed Development of Guidelines for Detection, Confirmation, and Quantification by GC/ MS, LC/MS, and MS~MS, and Dr. Jack Henion of Advanced BioAnalytical Services, Inc. in Ithaca, NY illustrated the more general discussion with a de- scription of problems faced in a real-world example, in Acceptance Criteria for Trace LC/MS/MS Qualitative and Quantitative Determination of Sulfonyl Urea Com- pounds in Soil (coauthored by L. Y. T. Li, D. A. Campbell, and P. K. Bennett).
5. To remind mass spectrometrists, and analytical chemists in general, that their analytical data, and their conclusions drawn from these data, are subject not only to peer review but to scrutiny by nonscien- tists, possibly including lawyers in a courtroom setting. Dr. Mary Kaiser, of DuPont Central Research and Development in Wilmington, DE, gave an infor- mative and entertaining account of her experiences with the court system, in a presentation titled Defend- ing Analytical Data In and Out of the Courtroom (coau- thored by D. G. Gibian).
In addition to the oral presentations, seven posters were presented during an informal reception on the evening of Friday, 1 November. These posters made an invaluable contribution to the discussions, but details of these contributions are more appropriately included in
the second (proactive) document based on the Work- shop. In no particular order, the poster titles and presenters were:
Factors Affecting Confirmation of Fluoroquinolones in Milk by Electrospray LC/MS; Sherri Turnipseed (with coauthors J. E. Roybal, A. P. Pfenning, and C. C. Walker), FDA Animal Drugs Research Center, Denver, CO.
Detection, Quantitation, and Reporting of Pesticide Re- sults from GC/MS Methods by the U.S. Geological Survey National Water Quality Laboratory; Jeffrey ]Pitt, U.S. Geo- logical Survey National Water Quality Laboratory, Ar- vada, CO.
Detection and Confirmation of Residual Agent and Toxic Products From Decontamination of the Chemical Weapons Agent VX; William Creasy (with coauthors J. Mays, R. Duevel, T. Connell, and B. Williams), EAI Corporation, Abingdon, MD.
Exclusion of Alternatives as an Approach to Confirming the Identity of Violative Compounds by Mass Spectrometry; David Heller, FDA Center for Veterinary Medicine, Beltsville, MD.
Surface Coverage Determination of Tributyl Phosphate on Soils by Static SIMS; Jani C. Ingrain (with coauthors G. S. Groenewold, A. D. Appelhans, J. E. Delmore, and D. A. Dahl), Idaho National Engineering Laboratory, Idaho Falls, ID.
Confirmation and Quantitation of Pestichtes and Fungi- cides by Large-Volume Injection Mass Spectroscopy; Marc Engel, Florida Department of Agriculture and Con- sumer Services, Tallahassee, FL.
Measurement Error and Detection Limits in Analytical Chemistry; David Rocke, Center for Statistics in Science and Technology, University of California,. Davis, CA.
Not unexpectedly, the outcome of the Workshop did not correspond exactly to the objectives set out in advance, thanks to the lively exchange of views among all participants. However, for reasons described above, the present Report is only an attempt to summarize the nine formal Workshop presentations. Rather than sim- ply present these summaries in turn, the material has been grouped under several headings in order to con- trast the differing views expressed. These differences are not further commented on in this Report, which attempts to provide a straightforward outline of the views of each speaker. Inevitably, this summary will be colored by the perceptions of the writers of this Report (Bethem, Boyd, Trubey), who accept full responsibility for any inadvertent errors and omissions which may have crept in during the process of condensing a large quantity of material. The sometimes strong differences of opinion will be addressed in a subsequent paper.
Criteria for Qualitative Confirmation
A mass spectrometer design meeting the idealized criterion of parallel detection of the entire spectrum, either mass spectrometry or tandem mass spectrometry, is not yet proven for routine use in a busy analytical

1182 BALDWIN ET AL. J Am Soc Mass Spectrorn 1997, 8, 1180-1190
Table 1. Matching selected values of mass-to-charge ratio (nominal mass) and relative abundance (RA), in an EI spectrum of diethylstilbesterol, to a mass spectral library
Mass-to-charge ratio values selected (range of % RA) No. of matching compounds
268 (1-100) 268 (1-100), 239 (1-100) 268 (90-100), 239 (10-90) 266 (90-100), 239 (50-70) 266 (90-100), 239 (50-90), 145 (5-90) 268 (90-100), 239 (50-70), 145 (45-65)
9995 5536
46 9
15 1
laboratory. Sector instruments fitted with array detec- tors, ion traps, and time-of-flight technologies could conceivably be developed to the point where their performance approaches this ideal in a rugged, cost- effective format. However, at present the vast majority of instruments, in use in those laboratories for whom the topic of this Workshop is pertinent, are scanning instruments employing serial detection of the mass spectrum. It is, of course, common practice in target analyte quantitation to increase the effective sensitivity of mass spectrometric detection by foregoing full spec- tral recording, and monitoring only a few mass-to- charge ratio values characteristic of that analyte. Thus, the analyst can increase sensitivity (decrease limits of detection and of quantitation, however defined) at the expense of selectivity, provided that the limitation on sensitivity is due to limited ion statistics rather than to, e.g., background interferences (so-called "chemical noise"). The crucial question here, one of the two principal questions addressed at the Workshop, con- cerns how much selectivity can be sacrificed without seriously compromising the confidence level for analyte identification.
The only scientific approach to this question in the refereed literature appears to be that of Sphon [1], published in 1978. This approach was the focal point of much of the discussion of confirmation at the Work- shop, and was presented and amplified by Dr. Matusik and Dr. Sphon. This work [1] was a response to one of the requirements (that of specificity in the confirmatory procedure) for regulatory assays for carcinogenic resi- dues, published by the FDA in 1977 [2]. At that time most mass spectrometry was conducted using electron ionization (EI) although chemical ionization (CI) was also in use in a few analytical (as distinct from research) laboratories. Accordingly, the emphasis was placed [1] on EI spectra that are sufficiently reproducible amongst different laboratories, and over time, that spectral li- braries are realistic and of practical use. Using diethyl- stilbesterol (DES) as an example, Sphon [1] was able to show that monitoring of three mass-to-charge ratio values at essentially "unit mass" resolving power, with adequate restrictions on relative intensities, was suffi- cient to uniquely select DES from the approximately 30,000 compounds represented in the 1978 EI database. Table 1 [3] shows a modern version of this same approach, using an updated mass spectral library con- taining some 270,000 mass spectra. Again, three char-
acteristic mass-to-charge ratio values with reasonably tight specifications for relative intensities are required in order to uniquely select DES from the larger data- base. Although the derivation of the three-ion criterion was based upon EI libraries [1], it was also proposed as a recommendation for other ionization techniques.
As emphasized by Sphon [1], when working at sensitivities near a detection limit, the raw mass spec- trum can contain a significant response at almost every mass-to-charge ratio value in an appropriate range. As a result, by monitoring for some other compound at only one mass-to-charge ratio value, a false positive would be produced if DES were present in the sample and had a retention time close to that of the other compound targetted by the selected mass-to-charge ratio value [1]. Although such single-ion monitoring procedures are considered to be inadequate for analyte confirmation under many circumstances, they may be acceptable if the matrix to be analyzed has been well characterized in the past, and also are suitable for rapid prescreening of a large number of samples, or for quantitation following proper confirmation of peak identity.
Sphon's work [1] was initiated 20 years ago, and there have been far-reaching developments in mass spectrometry and ancillary chromatographic techniques since then. Even for volatile compounds amenable to EI mass spectrometry [and therefore also to introduction by gas chromatography (GC)], the general availability of fused-silica GC columns in about 1980 meant that retention time became a much more specific identifier for analytes than before, when only packed columns were generally available [1]. Similarly, the increasing availability of tandem mass spectrometry (MS/MS) in analytical laboratories has introduced a new dimension to the question, even for EI. The introduction of new ionization techniques, particularly atmospheric pres- sure ionization (API) methods, has greatly extended the range of compounds amenable to analysis by mass spectrometry to include involatile polar and thermally labile compounds formerly analyzed by high-perfor- mance liquid chromatography (HPLC, or LC) using much less specific detectors. These API techniques are generally "soft," producing only ions containing the intact molecule with no characteristic fragment ions, and in these cases tandem mass spectrometry tech- niques are essential for confirmation. Table 2 was used by Dr. Matusik to illustrate the shift over the last 20

J Am Soc Mass Spectrom 1997, 8, 1180-1190 REPORT 1183
Table 2. Examples of mass spectrometric techniques used by the Damico Mass Spectrometry Laboratory of the U.S. FDA Center for Food Safety and Applied Nutrition over a 20-year period
Compound Year Separation technique Mass spectrometric technique
MGA 1976 Derivtn., GC El, FS Carbadox 1979 Derivtn., GC El, SlM Morantel 1980 Derivtn., GC El, SlM Lasalocid 1981 Derivtn., GC CI (NI), SlM Levamisole 1984 GC El, SlM Albendazole 1985 Derivtn., GC CI (NI), FS Halofuginone 1985 DEP MS/MS CI (NI), SlM Diethylstilbesterol/zeranol 1986 Derivtn., GC El, SlM Chlorsulon 1987 Derivtn., GC El, SlM Omethoate 1987 DEP MS/MS MS/MS, FS Sulfonamides 1988 Derivtn., GC MS/MS, FS Chloramphenicol 1988 GC CI (NI), FS Cygro 1988 LC TSP, MS/MS, SIM Ethyl carbamate 1988 GC El, MS/MS, SIM Nicarbazin 1989 LC TSP (NI), SlM Tilmicosin 1991 LC TSP (NI), SlM Pirlimycin 1992 LC TSP (PI), MS/MS, SlM Glycols 1993 GC CI (PI), MS/MS, FS Halofuginone 1994 LC ESl (PI), MS/MS, SIM Tilmicosin 1995 LC APCI (PI), MS/MS, SlM/FS Doramectin 1996 LC ESl (PI), MS/MS, SlM Ractopamine 1996 LC ESI (PI), SIM Enrofloxacin 1996 LC ESl (PI), MS/MS, SlM Des-ciprofloxacin 1996 LC ESI (PI), MS/MS, SlM
Key: CI, chemical ionization; DEP, direct exposure probe; El, electron ionization; ESI, etectrospray ionization; FS, full scan; GC, gas chromatography; NI, negative ion; PI, positive ion; SIM, selected ion monitoring; TSP, thermospray ionization.
years away from GC-based methods with EI to methods using LC with API techniques and tandem mass spec- trometry. Unfortunately, the particular scientific ap- proach exploiting EI libraries, adopted by Sphon [1] to deduce defensible confirmation criteria, is not directly applicable to techniques employing API with tandem mass spectrometry. This reflects the irreproducibility of relative intensities in MS/MS spectra, evidenced by the lack of tandem mass spectral libraries analogous to the EI libraries. The three-ion criterion is applicable to such methods only by extension in the same way as was necessary for CI and other early ionization techniques in the original work [1].
However, it is important to distinguish between two kinds of spectral irreproducibility. It is true that relative intensities in MS/MS spectra are generally not portable to any useful extent between different laboratories nor even within the same laboratory on different occasions. On the other hand, provided that instrumental param- eters are well controlled, relative intensities obtained using a given instrument in a laboratory on a single occasion (i.e., without other methods being imple- mented on the same instrument in an intervening period) are usually found [3] to be reproducible to an extent useful for confirmation criteria. Such standard MS/MS spectra will be referred to here as contemporary reference spectra. While not suitable for construction of universally applicable libraries, they do provide usable confirmation criteria for that particular period in which the analytical method was set up. The length of that
period, during which the contemporary reference spec- t rum is valid, will vary with circumstances and will thus determine the frequency with which the reference spectra must be reacquired [3].
The presentation of Dr. Cairns at the Workshop took a rather different approach to the question of confirma- tion criteria, based on his many years of experience with the FDA and currently with a commercial laboratory. Owing to space limitations, it is not possible to repro- duce Dr. Cairns' document in its entirety. What appears below (in italics) are his proposed guidelines for mat- ters pertaining to confirmation, with occasional addi- tions of some of his associated discussion where this seemed appropriate. (Dr. Cairns' proposed guidelines on quantitation and QC matters are summarized in Method Performance and Quality Control.)
Tuning and calibration: Considering the diversity of instruments used for trace analysis and the mass range of the ions being monitored, it is recommended practice to optimize the mass range being used on a contemporary basis (i.e., mass discriminate to the advantage of the assay) rather than the absolute conformity of interlaboratory comparisons em- ploying specified reference compounds for instrument tuning.
Retention time criteria: Retention time correlation of the incurred analyte should fall within a +2% error factor (as currently generally accepted for both LC and GC) as com- pared to a contemporary reference standard.
Mass spectral criteria: For EI spectra, intralaboratory criteria should be developed to permit direct comparison of a sample spectrum with a contemporary reference spectrum

1184 BALDWIN ET AL. J Am Soc Mass Spectrom 1997, 8, 1180-1190
to provide confirmation via contemporary ion abundance ratios that fall within +20%. (The emphasis on contemporary reference spectra is a natural consequence of the recommen- dation on tuning. Clearly, this guideline refers to analyses for target analytes, not to identifications of unknowns.)
For chemical ionization spectra, the same guideline should be followed but with acceptable bounds on ion abun- dance ratios of +25%. When selected ion monitoring is employed, confirmation of presence via single mass spec- trometry methods (generally E1 or CI) should require the presence of at least three structurally related ions with ion abundance ratios falling within limits specified above for full spectra. When softer ionization methods [e.g., some CI, liquid secondary ion mass spectrometry (LSIMS), continu- ous-flow fast-atom bombardment (FAB)] are employed with single mass spectrometry methods and selected ion monitoring, two ions are acceptable for confirmation pro- vided that they represent the intact molecule or a closely related fragment ion (e.g., arising from loss of a small neutral such as water) plus one structurally related fragment ion. When detection is by tandem mass spectrometry meth- ods, confirmation of presence should require observation of a precursor ion representing the intact molecule (or a closely related fragment, see above) plus one structurally significant product ion observed at the same retention time.
It is extremely useful to have available such a clearly stated set of confirmation guidelines, based on Dr. Cairns' considerable practical experience, as a basis for discussion. A complementary approach to exploitation of extensive practical experience in reaching consensus criteria for confirmation was described during the Workshop by Dr. Stephany. This approach describes a process for determining a suitable compromise solution to the confirmation problem in any particular case, rather than a prescription intended for application to any situation.
Dr. Stephany's ideas, presented at the Workshop, are contained in a document [4] that is not readily accessi- ble other than directly from him. Accordingly, a sum- mary is presented here. The general philosophy under- lying this proposed process concerns the selectivity of the entire analytical procedure, not only of the mass spectrometric detection technique. Thus, it is proposed [4] that "selectivity indices" be assigned to the various techniques for extraction, cleanup, separation, and de- tection. The effective selectivity of any particular inte- grated analytical procedure is then calculated by com- bining the individual "selectivity indices." In principle, selectivity indices could be assigned systematically by applying concepts of information theory to analytical procedures [5-7]. The information content (and thus selectivity) of chromatographic separations has been evaluated for thin layer chromatography [8-10] and for GC [11], and also for chromatography in general [12]. A similar information theory approach has been applied to mass spectrometry, GC/MS, and tandem mass spec- trometry by Fetterolf and Yost [13], and to several chromatographic and detection techniques by de Ruig et al. [14].
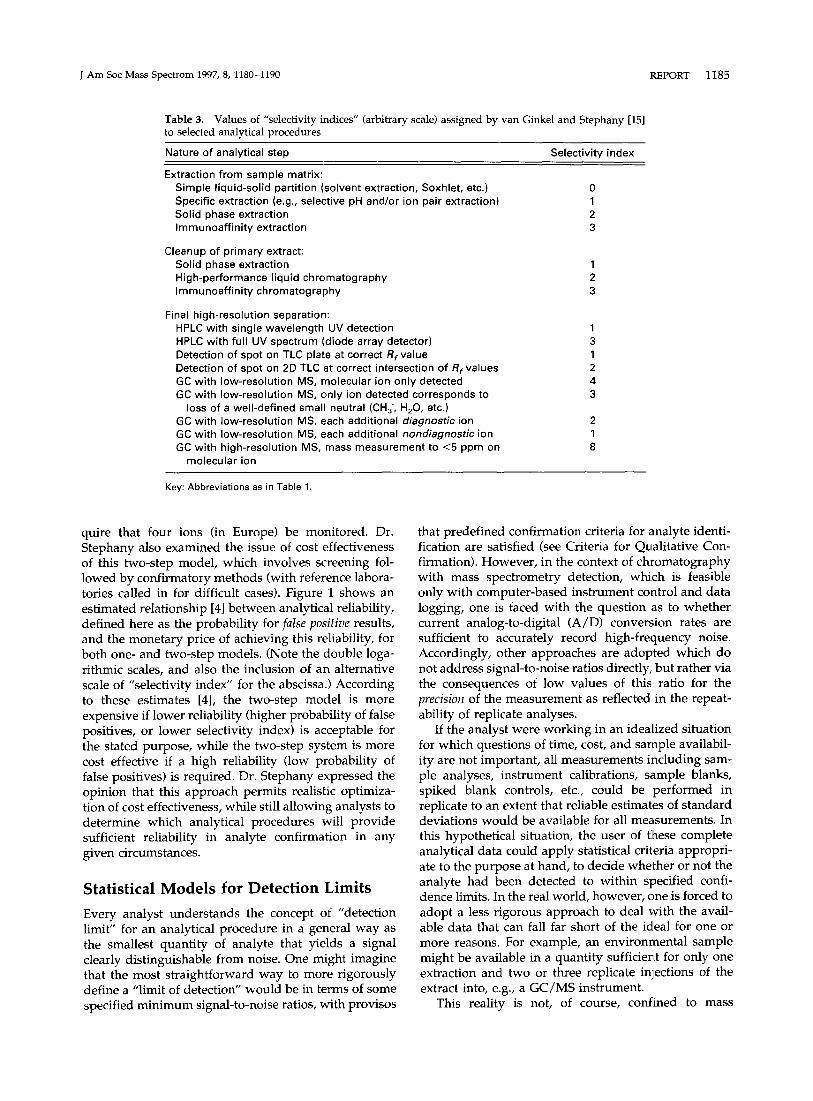
However, a more empirical approach was adopted by van Ginkel and Stephany [15] in work referred to later by Stephany [4]. Values of "selectivity indices" were assigned to selected analytical steps in a some- what arbitrary manner, though informed by previous work [14]. These values (the scale is arbitrary) are reproduced in Table 3. Table 3 is clearly incomplete, and one can always argue with the particular (relative) values assigned to the various analytical steps. How- ever, van Ginkel and Stephany [15] tested the general validity of their approach as follows. Twelve complete analytical procedures, each comprised of combinations of the analytical steps listed in Table 3, were evaluated for overall selectivity by combining the individual se- lectivity indices in an additive manner. These calculated scores were normalized relative to the most selective of the 12, which was assigned a value of unity. Indepen- dently, a group of 25 experienced analytical chemists was shown the list of 12 complete analytical procedures (but not Table 3), and asked to rank them in what, in their personal judgement, was the order of overall selectivity (highest ranking of 12 for the most selective). After averaging and normalization, these "experimen- tal" selectivity scores (range from 0.18 to 1.00) were plotted against those calculated from Table 3, and a good linear correlation was found (slope 1.0 + 0.1, intercept -0.07 -+ 0.07, correlation coefficient 0.96). This test simply checks that the practical experience that led to assignment of the selectivity index values (Table 3) is consistent with the combined experience of the other 25 experts. However, it does suggest that the general approach [15] has some validity, and may be worthy of development as a process for estimating selectivities (and thus, implicitly, degrees of confidence in confir- mation) of integrated analytical procedures.
It is of interest in the present context to note that, under regulations of the European Community, confir- mation by GC with selected ion monitoring requires that at least four ions be monitored [16], compared with the three recommended by Sphon [1].
Dr. Stephany also described the hierarchy of labora- tories involved in residue analysis in Europe [4]. The European Community (EC) has a hierarchy of 200 routine/field laboratories, 39 national reference labora- tories, and four community referee laboratories, linked by common reference materials, minimum quality cri- teria for analytical techniques, reference manuals, and ongoing series of laboratory workshops. These labora- tories perform different roles, categorized as screening, confirmatory analyses, and reference arbitration, distin- guished by different probabilities of false results, viz., screening (<1:5 false positive, <1:104 false negative), confirmatory (<1:104 false positive, <1:104 false nega- tive), and reference (<1:106 false positive, -<1:104 false negative). Clearly these different roles imply different degrees of selectivity of the overall analytical proce- dures, as discussed above. For example, GC/MS with single-ion monitoring would in many cases be perfectly acceptable for screening, but confirmation would re-
J Am Soc Mass Spectrom 1997, 8, 1180-1190 REPORT 1185
Table 3. Values of "selectivity indices" (arbitrary scale) assigned by van Ginkel and Stephany [15] to selected analytical procedures
Nature of analytical step Selectivity index
Extraction from sample matrix: Simple liquid-solid partition (solvent extraction, Soxhlet, etc.) Specific extraction (e.g., selective pH and/or ion pair extraction) Solid phase extraction Immunoaffinity extraction
Cleanup of primary extract: Solid phase extraction High-performance liquid chromatography Immunoaffinity chromatography
Final high-resolution separation: HPLC with single wavelength UV detection HPLC with full UV spectrum (diode array detector) Detection of spot on TLC plate at correct Rr value Detection of spot on 2D TLC at correct intersection of Rr values GC with low-resolution MS, molecular ion only detected GC with low-resolution MS, only ion detected corresponds to
loss of a well-defined small neutral (CH3", H20, etc.) GC with low-resolution MS, each additional diagnostic ion GC with low-resolution MS, each additional nondiagnostic ion GC with high-resolution MS, mass measurement to <5 ppm on
molecular ion
Key: Abbreviations as in Table 1,
quire that four ions (in Europe) be monitored. Dr. Stephany also examined the issue of cost effectiveness of this two-step model, which involves screening fol- lowed by confirmatory methods (with reference labora- tories called in for difficult cases). Figure 1 shows an estimated relationship [4] between analytical reliability, defined here as the probability for false positive results, and the monetary price of achieving this reliability, for both one- and two-step models. (Note the double loga- rithmic scales, and also the inclusion of an alternative scale of "selectivity index" for the abscissa.) According to these estimates [4], the two-step model is more expensive if lower reliability (higher probability of false positives, or lower selectivity index) is acceptable for the stated purpose, while the two-step system is more cost effective if a high reliability (low probability of false positives) is required. Dr. Stephany expressed the opinion that this approach permits realistic optimiza- tion of cost effectiveness, while still allowing analysts to determine which analytical procedures will provide sufficient reliability in analyte confirmation in any given circumstances.
Statistical Models for Detection Limits
Every analyst understands the concept of "detection limit" for an analytical procedure in a general way as the smallest quantity of analyte that yields a signal clearly distinguishable from noise. One might imagine that the most straightforward way to more rigorously define a "limit of detection" would be in terms of some specified minimum signal-to-noise ratios, with provisos
that predefined confirmation criteria for analyte identi- fication are satisfied (see Criteria for Qualitative Con- firmation). However, in the context of chromatography with mass spectrometry detection, which is feasible only with computer-based instrument control and data logging, one is faced with the question as to whether current analog-to-digital (A/D) conversion rates are sufficient to accurately record high-frequency noise. Accordingly, other approaches are adopted which do not address signal-to-noise ratios directly, but rather via the consequences of low values of this ratio for the precision of the measurement as reflected in the repeat- ability of replicate analyses.
If the analyst were working in an idealized situation for which questions of time, cost, and sample availabil- ity are not important, all measurements including sam- ple analyses, instrument calibrations, sample blanks, spiked blank controls, etc., could be performed in replicate to an extent that reliable estimates of standard deviations would be available for all measurements. In this hypothetical situation, the user of tlhese complete analytical data could apply statistical criteria appropri- ate to the purpose at hand, to decide whether or not the analyte had been detected to within specified confi- dence limits. In the real world, however, one is forced to adopt a less rigorous approach to deal with the avail- able data that can fall far short of the ideal for one or more reasons. For example, an environmental sample might be available in a quantity sufficient for only one extraction and two or three replicate injections of the extract into, e.g., a GC/MS instrument.
This reality is not, of course, confined to mass

1186 B A L D W I N ET AL. J A m Soc M a s s S p e c t r o m 1997, 8, 1180 -1190
I I, / [
/ / t
/ / / / /
/ / + 5 [Iog scale] O,Ol
selectivity 3
index ~..
7 8 iO
Pnc~ for final result Clog scalel
I ECU
1500
700
1(30
50
0 error %
103 reliability %
Figure 1. Proposed relationship [4] between reliability (probabil- ity of false positive errors) for an integrated analytical procedure and the monetary cost [in European Community units (ECU)] of analyses required to achieve this degree of reliability. The full curve is for a single-step model (each sample analyzed using a procedure with sufficiently high selectivity index that the required reliability can be achieved), and the dashed curve is for a two-step model in which a prescreening analysis with a suitably low rate of false negatives is used to identify samples with an apparent positive response, which are then submitted to the high-reliability procedure for confirmation.
spectrometry, and there exists a considerable literature dealing with this general problem. Early work by Kaiser [17-19] was further developed by Currie [20]. The statistical definition of detection limit which is best known to environmental mass spectrometrists is prob- ably the EPA definition of method detection limit (MDL) described by Glaser et al. [21], and in view of its practical importance it seems appropriate to describe it briefly here. At the Workshop the history behind the development of this definition, and an outline of its rationale, were described by Dr. Bill Budde, who was involved in the original project. This model [21] recom- mends determination of the actual variability at a single fortified concentration of analyte in the specified matrix (or as close a match as can be found) in the vicinity (three to five times) of an approximate MDL estimated from preliminary experiments. The EPA MDL [21] is calculated by multiplying this measured standard de- viation of the N replicate analyses by Student 's t-value for a one-tailed test at the 99% confidence level with (N - 1) degrees of freedom. Dr. Budde stressed both the positive and negative aspects of the EPA model of the MDL. It appeals to the experimental analyst because it refers to the total analytical method, not only to the final measurement step, it recognizes matrix differences if determined in a representative control matrix and is thus a measured value which is variable, and presumes that analyte identification is satisfactory. In addition, it
has an operational definition which is simple to use, and does appear to have some scientific rationale, even to chemists who are not expert statisticians. Although the standard deviation of replicate analyses will gener- ally increase with decreasing concentration, in the re- gion of three to five times the MDL the general experi- ence is that the standard deviation remains more or less independent of concentration and, therefore, so will the measured MDL, which is thus a characteristic of the analytical method applied to that analyte in that matrix on that day in that laboratory. This intrinsic variability of the EPA MDL reflects the reality of analytical chemistry, and indeed the MDL is best regarded as a quality control (QC) tool for tracking analytical performance with time in a single laboratory or for interlaboratory comparisons. For this reason Dr. Budde regularly coun- sels EPA Program Offices to not set regulatory levels based on MDL values, but rather on appropriate risk assessments.
If the fortified concentration of the substance is too low the identification criteria may not be met, thus invalidating the MDL measurement [21] (which is usu- ally made by integrating over the GC or LC peak the abundance of just one characteristic mass-to-change ratio value). If the criteria are met, a relatively large standard deviation will produce a MDL higher than the fortified concentration. If the fortified concentration is too high, the value of the standard deviation will be high in absolute terms and the MDL will be meaning- less. If the measured MDL is more than about a factor of 3 from the fortified concentration, Dr. Budde suggested a second determination using the first measured MDL as the fortification level for the second iteration. Until adequate experience with the method is available, this iterative procedure may be needed to find a good estimate of the MDL. The relative standard deviation should be -30%-33% at the MDL. The MDL is an average detection limit and will vary with repeated determinations because all the conditions of all the measurements cannot be duplicated exactly, but the variability should not be very large unless something in the method has changed significantly (which is the point of its use as a QC tool). About 50% of measure- ments of fortified concentrations at the MDL may not detect the analyte because a 50% false negative rate at the MDL is an implicit consequence of its definition [21].
Most of the assumptions involved in the definition of the EPA MDL [21] are quite transparent, particularly its reliance on an assumed constancy of standard deviation over a critical range just above the limit (see above). However, the price paid for the simplicity of the EPA definition of MDL [21] is a lack of complete statistical theory rigor. The Workshop presentations of Dr. Gib- bons and Dr. Lewis were mainly concerned with ex- plaining the strengths and deficiencies of the Currie model [20] and of the EPA [21] and later models for defining detection limits, in a mathematically rigorous fashion. Hubaux and Vos [22] were the first to apply the

J Am Soc Mass Spectrom 1997, 8, 1180-1190 REPORT 1187
theory of statistical prediction to the problem of deter- mination of detection limits based on estimates of measurement variability determined for the calibration curve over an appropriate concentration range in the vicinity of the detection limit. (However, there seems to be no reason why the general concept [22] could not be applied also to spiked blank determinations as for the EPA model.) The Hubaux-Vos work [22] emphasized the distinction amongst confidence limit, tolerance limit, and prediction limit. This distinction has been expressed by Hahn [23] in terms of the safety concerns of an astronaut about to board a rocket:
"An astronaut who has been assigned a limited number of space flights is not very interested in what will happen on the average in the population of all space flights, of which his happens to be a random sample (a confidence limit), or even in what will happen in 99% of the population of such space flights (a tolerance limit). His main interest is in the worst that might happen in the one, or three, or five flights in which he will be personally involved (a prediction limit)."
Proper understanding of these theoretical discus- sions involves a significant learning curve for most mass spectrometrists and other analytical chemists, and the writers of this Report are certainly not competent to attempt any meaningful summary of the technical pre- sentations of Dr. Gibbons and Dr. Lewis. Some relevant references [24-29] are provided here, and expository texts which provide a more accessible entry to these discussions include those by Liteanu and Rica [30], Caulcutt and Boddy [31], and most recently by Gibbons [32]. A volume [33] edited by Currie from a Symposium organized by the American Chemical Society contains several chapters that provide an entry to this approach that should be accessible to most analytical chemists. At the risk of oversimplifying the presentations of the two expert speakers, it can be said that the EPA approach [21] involves repetitive analyses of fortified sample matrices and sets the detection limit so that 99% of true negatives test negative, while the Currie model [20] sets the detection limit so that 99% of true positives test positive. The Hubaux-Vos approach [22] evaluates the standard curve and sets the detection limit where the curve describing the lower uncertainty bound inter- cepts the concentration axis, and addresses both false positive and false negative errors. This latter approach [22] has formed the basis for further work correspond- ing to improved methods of evaluating the uncertain- ties in standard curves near the detection limit.
It would clearly be desirable to have an operational definition of MDL that combines the simplicity and other desirable features of the EPA model [21] with more satisfactory underpinnings from statistical theory (see [32] for a comprehensive critique of the EPA model). In addition, the relationship between a MDL and the corresponding limit of quantitation would benefit from some clarification. The distinctions amongst confidence limits, tolerance limits, and predic- tion limits certainly deserve to be more widely appre- ciated by analytical chemists. In this regard it was noted
that the International Union of Pure and Applied Chemistry (IUPAC) hcs published an article, again coordinated by Currie [34], on nomenclature and deft- nitions in evaluation of analytical methods including detection and quantification capabilities.
Experimental Approach to Statistical Detection Limits
In his presentation to the Workshop, Dr. Lewis intro- duced his "probability of detection" model, which provides an experimental estimate of detectability in a transparent and intuitively appealing manner. Essen- tially a series of fortified blank matrix samples is prepared, covering the concentration range from zero to well above the detection limit. Each fortified blank is analyzed several times, and a binary "hit-or-miss" detection result is recorded based on specified criteria, e.g., minimum signal-to-noise ratios, together with mul- tiple qualitative identification criteria (e.g., three char- acteristic mass-to-change ratio values with specified limits on relative intensities, within an appropriate retention time window). The results of these detectabil- ity trials (zero or unity) are plotted against fortification level and are force fitted to an assumed mathematical form. The limit of detection is set at tlhe fortification level corresponding to 90% probability of detection, i.e., the detection limit in this method is the concentration at which 90% of true positives test positiw. ~.
As emphasized by Dr. Lewis, this approach is highly time consuming and, to be successful, the "hit-or-miss" behavior in the region in the vicinity of the detection limit needs to be very well characterized. For this reason, despite its intuitive appeal, the approach is unlikely to provide a realistic alternative for a busy laboratory that requires frequent checks on the time variation of the detection limit for any given analytical method. However, it does appear to have potential as an excellent tool for method validation and for longer- term studies of detection limit variability. In addition, the same spiked matrix samples can be used as detect- ability check samples for routine methods.
Method Performance and Quality Control
All of the discussion thus far has assumed that the analytical laboratory follows appropriate quality assur- ance/quali ty control (QA/QC) procedures. In his Workshop presentation, Dr. Cairns described some general principles relevant to this concern, and these are reported here in an abbreviated form.
Instrument performance: Instrument performance tests should be conducted prior to analysis in order to demonstrate practical ability to analyze samples containing the analyte in the matrix of interest (or a close approximation) within the concentration range of interest. The absence of carryover of analyte into the next sample should be demonstrated by

1188 BALDWIN ET AL. J A m Soc Mass Spectrom 1997, 8, 1180-1190
analyzing a known negative sample immediately after one of the higher concentration samples tested.
Quality control: Demonstration of the ability of the analytical method to measure both above and below the concentration of greatest interest can be achieved by includ- ing two control samples whose concentrations are approxi- mately within +25% of the desired regulatory level. The addition of a negative control demonstrates the ability of the method to avoid false positives.
Quality assurance: At least one blind QA sample, with an analyte level no greater than one order of magnitude above the regulatory level of interest, should be incorporated into a batch sample stream. A negative blind QA sample should be added if no negative control sample has been included. The QA/QC sample contribution need not exceed 10% of the samples being analyzed.
Quantification: Isotope dilution mass spectrometry offers the most reliable quantification of trace levels provided that the addition of the isotope-labeled (most often deuterated) internal standard is within a factor of 10 of the concentration level(s) of greatest interest. Usually the labelled and native analytes are assumed to have identical response factors for both mass spectrometry and tandem mass spectrometry methods. In the case of external standards, a calibration curve covering above and below the concentration level(s) of great- est interest should be demonstrated before analysis.
Dr. Cairns' carefully considered recommendations, based on extensive practical experience, are of great value. However, it seems worthwhile to depart briefly from straightforward reporting of the Workshop pre- sentations to comment that not all participants accepted his recommendations as universally applicable. Recon- ciliation of such disagreements will be a major objective of the second paper arising from the Workshop.
A Real-World Example
The Workshop satisfied the desirable criterion of relat- ing the more or less theoretical discussions to the real world of ultratrace analytical chemistry, by inviting Dr. Jack Henion to describe recent work on determination of sulfonylurea herbicides in soil. This work has now been published [35], so this Report will be restricted to emphasizing features of the work that refer to and illustrate some of the principles discussed above.
The sulfonylurea work [35] emphasized from the outset that qualitative identification of analytes is a necessary prerequisite for any meaningful quantitation. For this particular application, it was concluded that identification criteria for forensically valid HPLC tan- dem mass spectrometry data should include HPLC retention time reproducibility (---2%), detection of at least two and preferably three precursor-product ion transition characteristics of each analyte, and relative abundance criteria for the selected ions of +20% (com- pare Criteria for Qualitative Confirmation). A notable feature of this work [35] was the meticulous attention paid to optimization of the mass spectrometric condi- tions in order to satisfy these desired criteria.
Quantitation was achieved [35] using in-matrix for- tification with a deuterated internal standard for one of the eight target analytes. Limits of detection and of quantitation were determined using a conservative sig- nal-to-noise criterion, rather than an MDL based on statistical considerations (Statistical Models for Detec- tion Limits). It was possible [35] to obtain detection limits of 0.05 ppb for all eight analytes while maintain- ing the stated qualitative identification criteria for at least two tandem mass spectrometry transitions in all cases, with signal-to-noise ratios for the weakest transi- tions of at least 3:1.
This is an excellent example (others could be cited) of the scientific approach to analyses at the ultratrace level. It is also notable that the limitations of the work were clearly stated by the authors [35], e.g., although recovery studies were undertaken at both the 1- and 10-ppb levels of spiked soils, the effects of soil pH, percent organic matter, extended storage time, etc., were not explored. Such information can be crucial for colleagues who wish to apply these methods [35] for their own purposes.
Defending Analytical Data In and Out of the Courtroom
The questions addressed at the Workshop were largely scientific and technical. However, increasingly, analyt- ical chemists find themselves working in a context in which their data may end up as evidence in legal proceedings, and this was the topic addressed by Dr. Kaiser in her presentation at the Workshop. The differ- ences between "scientific peer review" and review by a "jury of one's peers" are enormous. The role of legal proceedings is emphatically not to establish the degree of scientific validity to be ascribed to a set of measure- ments and their interpretation (the scientific consensus achieved by a peer review process), but to determine winners and losers in the dispute. The courtroom environment is confrontational, hierarchical (judges and lawyers rule), and the proceedings are conducted using dense legal jargon.
The analytical chemist called as an expert witness can expect no respect in court merely as a result of the years of training, study, and experience that were necessary for appointment to his or her present posi- tion. The objective of a lawyer is to win the case for the client by any means available under the rules. These rules are administered and interpreted by the judge, who can in fact disallow an expert's testimony for a variety of reasons. Dr. Kaiser provided examples of reasons that have been used by judges to disallow expert testimony. Some of these are reproduced here to serve as cautionary warnings to colleagues who have not yet been subjected to courtroom procedures: (1) the testimony is not derived by scientific methods or sup- ported by appropriate validation or testing (i.e., it has not been shown to be capable of being tested to deter-

J Am Soc Mass Spectrom 1997, 8, 1180-1190 REPORT 1189
mine that it is false) in that it is not based upon controlled experiments, comparable controlled observa- tion, and chemical or other analysis; (2) the testimony is not based on scientifically valid reasoning and method- ology in that, inter alia, it is based upon rejection of accepted scientific techniques and objective evidence (such as analytical tests and experiments) as well as failure to consider reasonable alternative explanations; (3) the testimony is not based on theories and tech- niques that have been subjected to peer review and publication; (4) the testimony is not based on theories and techniques that the relevant scientific community has generally accepted; (5) the testimony is not based on a procedure reasonably relied upon by experts in the field; (6) the testimony is not shown to have a known rate of accuracy or error; (7) the testimony is based on opinions that the expert is unqualified to offer based on the expert's knowledge, training, and experience; (8) the opinion was formed from research conducted solely for the purpose of litigation; and (9) the testimony requires the rejection of the scientifically valid testing done by others.
Although many of these reasons for rejection would meet with the approval of the scientific community if valid in a particular case, it is also true that data that would not be at serious issue in a scientific venue are frequently challenged in court for a variety of alleged reasons, and can be ultimately ignored or rejected by a judge or jury. Most scientists are unprepared for the cultural differences between the scientific community, with its search for the most reasonable consensus inter- pretation of the available observations, and the court- room's "win-or-lose" attitude.
Given this reality, is there any value from a purely legal standpoint in pursuing the scientific and technical questions discussed at the Workshop? Dr. Kaiser em- phasized that indeed there is appreciable value, as implied in some of the reasons given for rejection of expert testimony. In the case of analysis by chromatog- raphy with detection using mass spectrometry (includ- ing tandem mass spectrometry), establishment of scien- tifically grounded criteria for interpreting such data, particularly under the aegis of a respected scientific society like ASMS, will provide the foundation of "proper scientific opinion." In turn, judge and jury will hear opinions that are based on the best current scien- tific consensus, and that will aid them in performing one of their roles, that of understanding evidence. If and when such consensus criteria are available, however, they will not provide a universal crutch for the analyst who will still have to apply his or her professional judgement as to how strictly the criteria need to be applied in any given case. Dr. Kaiser emphasized this point in her discussion of the concept of fitness for purpose, defined by Thompson and Ramsey [36] as follows: "Fitness for purpose is the property of data produced by a measurement process that enables the user of the data to make technically correct decisions for a stated purpose."
The authors [36] provide a detailed discussion of an illustrative example concerning the precision require- ments for identification of an "anomalous site," which in the context of environmental surveys :might indicate an area of pollution or, in mineral exploration, a mineral vein. The simple illustrative example described by Dr. Kaiser at the Workshop involved determination of gold concentration in various materials for different pur- poses. When measuring gold content in scrap metal returned for credit, very high accuracy and precision in the assay are appropriate and time is generally not a critical factor. In contrast, in survey assays conducted to aid geochemical prospecting (search for "anomalous sites" [36l), high accuracy and precision are not needed and indeed would be too expensive and time consum- ing for the purposes of the geologists in the field. Dr. Kaiser proposed an alternative definition of "fitness for purpose" more closely related to the immediate goals of the Workshop: "Fitness for purpose refers to the mag- nitude of the uncertainty associated with a measure- ment in relation to the needs of the application area."
This concept of "fitness for purpose" [36] corre- sponds closely to the idea of "credibility"' emphasized by Dr. Baldwin in his Workshop presentation. Dr. Baldwin emphasized that we analytical mass spectrom- etrists should not become too engrossed in our technol- ogy, but must take a larger view to ensure the credibility of everything we do. Our work must be credible not only to our immediate peer group, but to a wider scientific community as well as to the general public, politicians, etc. Thus, the choices we make in our laboratories as to how to proceed witih a particular analytical problem should always take the larger per- spective into account. These concepts of "credibility" and "fitness for purpose" will be prominent in the second (proactive) document to be derived from this Workshop.
Conclusions
This Report has attempted to summarize the nine formal presentations made at this Workshop, for the benefit of those ASMS members unable to attend. The authors of this report (Bethem, Boyd, and Trubey) are willing to provide copies of the Workshop materials. It is hoped that the Report has highlighted the issues and, by simply reporting what was presented, has demon- strated the significant differences of opinion on these matters.
However, in view of the excellent discussion from the floor at the Workshop and the several communica- tions received by the organizers following the event, it was felt that the subject material should be taken a step further. In particular, several Workshop participants have commented that it would be desirable for ASMS, as a respected scientific body, to publish suggestions for analytical mass spectrometrists faced wit]~ problems not covered by regulations (e.g., from the EPA) nor by existing standard operating procedures (SOPs) within

1190 BALDWIN ET AL. J Am Soc Mass Spectrom 1997, 8, 1180-1190
their o w n organiza t ion . Cer ta in ly the W o r k s h o p orga- n izers have no m a n d a t e to speak for ASMS, bu t have felt suff icient ly m o t i v a t e d b y all of these commen t s to p r e p a r e a second "proac t ive" document . This second p a p e r wi l l a t t empt to reconci le the d i spa ra t e v iews s u m m a r i z e d in the p resen t Report , and also to m a k e some p roposa l s and r e c o m m e n d a t i o n s as to h o w to fill this pe rce ived gap. It is h o p e d that the ASMS Board wil l cons ider ass ign ing this p r o b l e m to a commi t t ee wi th a m a n d a t e to p r o d u c e sugges t ed p rocedu re s for such c i rcumstances , and that the d o c u m e n t s emerg ing f rom this W o r k s h o p wil l p r o v i d e a usefu l bas is for these discussions .
Acknowledgment The Workshop organizers wish to thank Cindi Lilly of the ASMS office for the excellent arrangements and infrastructure provided.
References 1. Sphon, J. A. J. Assoc. Off. Anal. Chem. 1978, 61, 1247. 2. U.S. Federal Register, 22 Feb. 1977, 42, No. 35. 3. Matusik, J. E., private communication. 4. Stephany, R. W. Reliability of Residue Analysis, For What Purpose
and What Price?, CRL document 389002-033 (Amended Ver- sion); European Union Communities Reference Laboratory for Residues; April 1996.
5. Kaiser, H. Anal. Chem. 1970, 42, 24A. 6. Griepink, B.; Dijkstra, G. Fresenius" Z. Anal. Chem. 1971, 257,
269. 7. Fitzgerald, J. J.; Winefordner, J. D. Res. Anal. Chem. 1975, 2,299. 8. Cleij, P.; Dijkstra, G. Fresenius' Z. Anal. Chem. 1979, 294, 361. 9. Cleij, P.; Dijkstra, G. Fresenius" Z. Anal. Chem. 1979, 298, 97.
10. Massart, D. J. Chromatogr. 1973, 79, 157. 11. Eskens, A.; Dupuis, F.; Dijkstra, G.; De Clercq, H.; Massart,
D. L. Anal. Chem. 1975, 47, 2168. 12. Massart, D. L.; Smits, R. Anal. Chem. 1974, 46, 283. 13. Fetterolf, D. D.; Yost, R. A. Int. J. Mass Spectrom. Ion Proc. 1984,
62, 33.
14. de Ruig, W. G.; Dijkstra, G.; Stephany, R. W. Anal. Chim. Acta 1989, 223, 277.
15. van Ginkel, L.; Stephany, R. W. Proc. EuroResidue II, Conference on Residues of Veterinary Drugs in Food; Veldhoven, The Neth- erlands, May 1993; p 303.
16. de Ruig, W. G.; Stephany, R. W.; Dijkstra, G. ]. Assoc. Off. Anal. Chem. 1989, 72, 487.
17. Kaiser, H.; Specker, H. Fresenius" Z. Anal. Chem. 1956, 149, 46. 18. Kaiser, H. Fresenius" Z. Anal. Chem. 1965, 209, 1. 19. Kaiser, H. Fresenius' Z. Anal. Chem. 1966, 216, 80. 20. Currie, L. A. Anal. Chem. 1968, 40, 586. 21. Glaser, J. A.; Foerst, D. L.; McKee, G. D.; Quave, S. A.; Budde,
W. L. Environ. Sci. Technol. 1981, 15, 1426. 22. Hubaux, A.; Vos, G. Anal. Chem. 1970, 42, 849. 23. Hahn, G. J. J. Am. Statist. Assoc. 1970, 65, 1668. 24. Oppenheimer, L.; Capizi, T. P.; Weppelman, R. M.; Mehta, H.
Anal. Chem. 1983, 55, 638. 25. Clayton, C. A.; Hines, J. w.; Elkins, P. D. Anal. Chem. 1987, 59,
2506. 26. Gibbons, R. D.; Jarke, F. H.; Stoub, K. P. In Waste Testing and
Quality Assurance, ASTM STP 1075; Friedman, D., Ed.; Amer- ican Society for Testing and Materials: Philadelphia, 1991; p 377.
27. Gibbons, R. D.; Grams, N. E.; Jarke, F. H.; Stoub, K. P. Chemometr. Intelligent Lab. Syst. 1992, 12, 225.
28. Rocke, D. M.; Lorenzato, S. Technometrics 1995, 37, 176. 29. Gibbons, R. D. Env. Ecol. Stat. 1995, 2, 125. 30. Liteanu, C.; Rica, I. Statistical Theory and Methodology of Trace
Analysis; Halsted: Chicago, 1983; Chap 7. 31. Caulcutt, R.; Boddy, R. Statistics for Analytical Chemists; Chap-
man and Hall: London, 1983; pp 201-205. 32. Gibbons, R. D. Statistical Methods for Groundwater Monitoring;
Wiley-Interscience: New York, 1994; Chap 5. 33. Currie, L. A., Ed.; Detection in Analytical Chemistry: Importance,
Theory and Practice; ACS Symposium Series 361; American Chemical Society: Washington, DC, 1988.
34. Currie, L. A. Pure Appl. Chem. 1995, 67, 1699. 35. Li, L. Y. T.; Campbell, D. A.; Bennett, P. K.; Henion, J. Anal.
Chem. 1996, 68, 3397. 36. Thompson, M.; Ramsey, M. H. Analyst 1995, I20, 261.


![Identification and quantitation of benzo[a]pyrene-DNA adducts formed in mouse skin](https://static.fdokumen.com/doc/165x107/6333eb3bb94d623842027004/identification-and-quantitation-of-benzoapyrene-dna-adducts-formed-in-mouse-skin.jpg)