Effect of Sample Preparation on the Detection and ... - MDPI
21
molecules Article Effect of Sample Preparation on the Detection and Quantification of Selected Nuts Allergenic Proteins by LC-MS/MS Sorel Tchewonpi Sagu 1 , Gerd Huschek 2 , Thomas Homann 1 and Harshadrai M. Rawel 1, * Citation: Sagu, S.T.; Huschek, G.; Homann, T.; Rawel, H.M. Effect of Sample Preparation on the Detection and Quantification of Selected Nuts Allergenic Proteins by LC-MS/MS. Molecules 2021, 26, 4698. https:// doi.org/10.3390/molecules26154698 Academic Editor: Giorgio Marrubini Received: 9 July 2021 Accepted: 29 July 2021 Published: 3 August 2021 Publisher’s Note: MDPI stays neutral with regard to jurisdictional claims in published maps and institutional affil- iations. Copyright: © 2021 by the authors. Licensee MDPI, Basel, Switzerland. This article is an open access article distributed under the terms and conditions of the Creative Commons Attribution (CC BY) license (https:// creativecommons.org/licenses/by/ 4.0/). 1 Institute of Nutritional Science, University of Potsdam, Arthur-Scheunert-Allee 114-116, 14558 Nuthetal, Germany; [email protected] (S.T.S.); [email protected] (T.H.) 2 GV-Institut für Getreideverarbeitung GmbH, Arthur-Scheunert-Allee 40/41, 14558 Nuthetal, Germany; [email protected] * Correspondence: [email protected]; Tel.: +49-33200-88-5525 or +49-33200-88-5578 Abstract: The detection and quantification of nut allergens remains a major challenge. The liquid chroma-tography tandem mass spectrometry (LC-MS/MS) is emerging as one of the most widely used methods, but sample preparation prior to the analysis is still a key issue. The objective of this work was to establish optimized protocols for extraction, tryptic digestion and LC-MS analysis of almond, cashew, hazelnut, peanut, pistachio and walnut samples. Ammonium bicar-bonate/urea extraction (Ambi/urea), SDS buffer extraction (SDS), polyvinylpolypyrroli-done (PVPP) extraction, trichloroacetic acid/acetone extraction (TCA/acetone) and chloro-form/methanol/sodium chlo- ride precipitation (CM/NaCl) as well as the performances of con-ventional tryptic digestion and microwave-assisted breakdown were investigated. Overall, the protein extraction yields ranged from 14.9 ± 0.5 (almond extract from CM/NaCl) to 76.5 ± 1.3% (hazelnut extract from Ambi/urea). Electrophoretic profiling showed that the SDS extraction method clearly presented a high amount of extracted proteins in the range of 0–15 kDa, 15–35 kDa, 35–70 kDa and 70–250 kDa compared to the other methods. The linearity of the LC-MS methods in the range of 0 to 0.4 μg equivalent defatted nut flour was assessed and recovery of internal standards GWGG and DPLNV(d8)LKPR ranged from 80 to 120%. The identified bi-omarkers peptides were used to relatively quantifier selected allergenic protein form the inves-tigated nut samples. Considering the overall results, it can be concluded that SDS buffer allows a better protein extraction from almond, peanut and walnut samples while PVPP buffer is more appropriate for cashew, pistachio and hazelnut samples. It was also found that conventional overnight digestion is indicated for cashew, pistachio and hazelnut samples, while microwave assisted tryptic digestion is recommended for almond, hazelnut and peanut extracts. Keywords: nut allergenic proteins; sample preparation; protein extraction; tryptic digestion; microwave assisted digestion; SDS PAGE; LC-MS/MS 1. Introduction Sensitive and selective analytical multi-parameter methods are necessary to evaluate whether food labelling complies with the legal regulations to protect consumers [1,2]. A particular analytical challenge concerns the labelling of allergens, as minimal amounts of allergenic foods are sufficient to cause severe or even fatal allergic reactions. Since the amount of allergen for an allergic reaction depends on specific allergens and the immune system of an individual, there is no legal threshold for allergens in foods except for gluten [3]. For the analytical detection, only recommendations for specific allergenic foods are made ranging between 10 to 100 mg allergenic food/kilogram [4]. Among allergenic food, nuts represent a special group causing often severe aller- genic reactions and affecting especially children. However, nuts are particularly used in the food industry and are popular both raw and processed because of their nutritional Molecules 2021, 26, 4698. https://doi.org/10.3390/molecules26154698 https://www.mdpi.com/journal/molecules
-
Upload
khangminh22 -
Category
Documents
-
view
4 -
download
0
Transcript of Effect of Sample Preparation on the Detection and ... - MDPI
molecules
Article
Effect of Sample Preparation on the Detection andQuantification of Selected Nuts Allergenic Proteinsby LC-MS/MS
Sorel Tchewonpi Sagu 1 , Gerd Huschek 2, Thomas Homann 1 and Harshadrai M. Rawel 1,*
�����������������
Citation: Sagu, S.T.; Huschek, G.;
Homann, T.; Rawel, H.M. Effect of
Sample Preparation on the Detection
and Quantification of Selected Nuts
Allergenic Proteins by LC-MS/MS.
Molecules 2021, 26, 4698. https://
doi.org/10.3390/molecules26154698
Academic Editor: Giorgio Marrubini
Received: 9 July 2021
Accepted: 29 July 2021
Published: 3 August 2021
Publisher’s Note: MDPI stays neutral
with regard to jurisdictional claims in
published maps and institutional affil-
iations.
Copyright: © 2021 by the authors.
Licensee MDPI, Basel, Switzerland.
This article is an open access article
distributed under the terms and
conditions of the Creative Commons
Attribution (CC BY) license (https://
creativecommons.org/licenses/by/
4.0/).
1 Institute of Nutritional Science, University of Potsdam, Arthur-Scheunert-Allee 114-116,14558 Nuthetal, Germany; [email protected] (S.T.S.); [email protected] (T.H.)
2 GV-Institut für Getreideverarbeitung GmbH, Arthur-Scheunert-Allee 40/41, 14558 Nuthetal, Germany;[email protected]
* Correspondence: [email protected]; Tel.: +49-33200-88-5525 or +49-33200-88-5578
Abstract: The detection and quantification of nut allergens remains a major challenge. The liquidchroma-tography tandem mass spectrometry (LC-MS/MS) is emerging as one of the most widelyused methods, but sample preparation prior to the analysis is still a key issue. The objective of thiswork was to establish optimized protocols for extraction, tryptic digestion and LC-MS analysis ofalmond, cashew, hazelnut, peanut, pistachio and walnut samples. Ammonium bicar-bonate/ureaextraction (Ambi/urea), SDS buffer extraction (SDS), polyvinylpolypyrroli-done (PVPP) extraction,trichloroacetic acid/acetone extraction (TCA/acetone) and chloro-form/methanol/sodium chlo-ride precipitation (CM/NaCl) as well as the performances of con-ventional tryptic digestion andmicrowave-assisted breakdown were investigated. Overall, the protein extraction yields rangedfrom 14.9 ± 0.5 (almond extract from CM/NaCl) to 76.5 ± 1.3% (hazelnut extract from Ambi/urea).Electrophoretic profiling showed that the SDS extraction method clearly presented a high amount ofextracted proteins in the range of 0–15 kDa, 15–35 kDa, 35–70 kDa and 70–250 kDa compared to theother methods. The linearity of the LC-MS methods in the range of 0 to 0.4 µg equivalent defattednut flour was assessed and recovery of internal standards GWGG and DPLNV(d8)LKPR ranged from80 to 120%. The identified bi-omarkers peptides were used to relatively quantifier selected allergenicprotein form the inves-tigated nut samples. Considering the overall results, it can be concludedthat SDS buffer allows a better protein extraction from almond, peanut and walnut samples whilePVPP buffer is more appropriate for cashew, pistachio and hazelnut samples. It was also found thatconventional overnight digestion is indicated for cashew, pistachio and hazelnut samples, whilemicrowave assisted tryptic digestion is recommended for almond, hazelnut and peanut extracts.
Keywords: nut allergenic proteins; sample preparation; protein extraction; tryptic digestion;microwave assisted digestion; SDS PAGE; LC-MS/MS
1. Introduction
Sensitive and selective analytical multi-parameter methods are necessary to evaluatewhether food labelling complies with the legal regulations to protect consumers [1,2]. Aparticular analytical challenge concerns the labelling of allergens, as minimal amountsof allergenic foods are sufficient to cause severe or even fatal allergic reactions. Sincethe amount of allergen for an allergic reaction depends on specific allergens and theimmune system of an individual, there is no legal threshold for allergens in foods exceptfor gluten [3]. For the analytical detection, only recommendations for specific allergenicfoods are made ranging between 10 to 100 mg allergenic food/kilogram [4].
Among allergenic food, nuts represent a special group causing often severe aller-genic reactions and affecting especially children. However, nuts are particularly used inthe food industry and are popular both raw and processed because of their nutritional
Molecules 2021, 26, 4698. https://doi.org/10.3390/molecules26154698 https://www.mdpi.com/journal/molecules
Molecules 2021, 26, 4698 2 of 21
content, taste and texture [5–7]. The most commonly used nuts include almond, wal-nut and peanut. Other important nuts such as pistachio, hazelnut, macadamia, pecanor even cashew are also among the most popular varieties [6,7]. It is estimated thatpeanut allergy prevalence rates are in the range of 1 and 6%, with up to 20–30% ofpeanut and tree nut allergies co-existing in the population [8,9]. The majority of nutallergens have been found to be proteins, belonging to the families of 2S albumins, vicilins,legumes and more generally seed storage proteins [7,10]. Previous studies documentedsolid proof that the 2S albumins are the most relevant nut allergens and highlightedhow the structural similarities between the 2S albumins might explain the observed clin-ical cross-reactivity [7,11]. Table S1 (Supplementary Materials) presents the complete listof the allergenic proteins of almond, cashew, hazelnut, peanut, pistachio and walnut.The data from this Table were compiled from the online database of the World HealthOrganization/International Union of Immunological Societies “Allergen Nomenclature”(WHO/IUIS; http://www.allergen.org; accessed on 13 June 2021) and the online UniProtknowledge database (UniProtKB, https://www.uniprot.org; accessed on 13 June 2021).During food processing, the proteins including their epitopes i.e. the specific segments of aprotein where an antibody binds to a protein can change. There are two types of epitopesas typically reported for nut allergens: continuous epitopes which are linear sequences ofamino acids and discontinuous epitopes which are composed of amino acids which arebrought into close physical proximity by the folding of the protein [12]. This distinction isimportant as especially thermal processing of food destroys or may create new structuralepitopes, whereas sequence epitopes are usually retained and analytically detectable byvarious methods [12–16].
Common detection methods for allergens are molecular biological methods such asELISA (Enzyme-linked Immunosorbent Assay) and real-time PCR. However, as thermaltreatment leads to protein denaturation, structural modifications and changes of propertiesof the targeted analytes and since complex food matrices can interact with the DNA, thesemethods can lead to an underestimation of allergen traces [12,14,17]. Proteomic toolshave become an important alternative analytical option to detect allergens from foods.Especially, liquid chromatography with tandem mass spectrometry has become populardue to its high sensitivity and specificity, thus the possibility to avoid cross-reactivityto other species and the possibility of multiple-allergen analysis even in processed andcomplex food matrices [18,19]. MS-identified protein biomarkers have successfully beenused to quantify allergenic traces in processed food as well as to authenticate ingredientswith species-specific markers [2,18,20,21].
The main challenge in establishing LC-MS/MS proteomics analytical methods liesin the sample preparation procedures that allows efficient detection and quantificationof analytes in the subsequent mass spectrometric analysis. This is particularly the casewhen dealing with food/vegetable samples consisting of complex matrices. They usuallycontain high levels of proteases and secondary metabolites that significantly interfere withthe protein extraction, separation and identification [22,23]. Obtaining the best proteinquality and yield being the main target of the extraction, selecting an appropriate extractionmethod according to the type of sample has therefore to be the first step leading to thefurther analysis [24]. Conventional sample preparation strategies often involve aggressivemethods of extraction of recalcitrant proteins and protein solubilization is usually achievedby a combination of physical and chemical methods using detergents [25]. The efficiencyof detergents in the extraction and the dissolution of proteins are often refined by additivessuch as chaotropes (urea and thiourea) [26]. All such chemical compounds are known tointerfere during the protein digestion processes (partly inhibiting the enzymatic activity)or during the LC-MS analysis. It is therefore usually essential to remove such compoundsprior to the analysis, making the procedure more challenging. The standard and primaryprotocols generally used for protein extraction from plant tissues are the conventionalbuffer extraction such as ammonium bicarbonate, Tris-HCl, and sodium phosphate [27,28],TCA precipitation [29–32], phenol extraction methods [33–35], polyvinylpolypyrrolidone
Molecules 2021, 26, 4698 3 of 21
(PVPP) extraction [27,28,36], or using the sodium dodecyl sulfate (SDS) buffer [33,37,38].Doellinger et al. [39] presented a sample preparation method by easy extraction and diges-tion (SPEED) using neither detergents nor chaotropic agents but pure trifluoroacetic acidfor protein extraction. However, these extraction methods using chemicals such as urea,SDS or acids generally denatures proteins and are therefore not used when molecules areto remain in their folded state, especially for the measurement of biochemical activity [32].The optimal protocol being a method allowing the total extraction of all protein compo-nents from the proteome of the samples to be analyzed, keeping contamination by othermolecules to a minimum and enabling a high level of reproducibility.
Besides the extraction, the digestion step is also essential in the sample process-ing for protein analysis by LC-MS. With conventional digestion methods, the enzyme(trypsin)/substrate (protein) ratios are generally kept very low (between 1:30 and 1:50)with reaction times extending over several hours [28,40]. An increase in enzyme concentra-tions can speed up the digestion process, thus reducing reaction times. However, this maylead to an increase in enzymatic auto-proteolysis, resulting eventually in an alteration ofthe signal interpretation [41].
The aim of this work was to establish optimized protocols for extraction and trypticdigestion of nut samples, including almond, cashew, hazelnut, peanut, pistachio andwalnut, and to develop and validate methods for quantification of their allergenic proteinby LC-MS/MS. The potential efficiency of the ammonium bicarbonate/urea extraction(Ambi/urea), SDS buffer extraction (SDS), polyvinylpolypyrrolidone (PVPP) extraction,trichloroacetic acid/acetone extraction (TCA/acetone) and chloroform/methanol/sodiumchloride precipitation (CM/NaCl) to extract/precipitate proteins from the selected nutsamples was investigated. Conventional and microwave-assisted tryptic were also assessed.The evaluation of the different extraction methods was focused on the comparison ofthe extracted protein content, the extraction yields and the composition of the extractedproteins by SDS PAGE. Furthermore, an LC-MS/MS method was developed to analyze theallergenic proteins of each of the 6 nut samples. Finally, an individual protein extractionand digestion protocol was established for the analysis of allergenic proteins from almond,cashew, hazelnut, peanut, pistachio and walnut by LC-MS/MS.
2. Results and Discussion2.1. Composition of the Extracted Proteins
Initially, our intention was to establish sample preparation for unsalted and unroastednut samples as reported in the following, before turning to the more complex processedfood matrices.
2.1.1. Protein Content According to the Bradford Method
Five extraction methods as indicated in the objectives above were used to extractproteins from nut samples. Prio to the tryptic digestion and the tandem mass spec-trometry analysis of the allergenic proteins, the protein contents of the extracts wereevaluated according to the Bradford method and the results are consigned in Table 1.The trends were completely different from one sample to another. For example, the al-mond extracts obtained from the PVPP, SDS and TCA/acetone methods contained similarprotein concentrations of about 15 mg/mL while the CM/NaCl extract showed a concen-tration of only 03.82 ± 0.13 mg/mL. Conversely, peanut extracts obtained by Ambi/urea,CM/NaCl, PVPP and SDS methods showed protein levels between 10.49 ± 0.41 and12.64 ± 0.38 mg/mL while the use of TCA/acetone precipitation produced an extract witha protein content of only 06.06 ± 0.10 mg/mL. TCA and acetone have been reported toallow the inactivation of proteases as well as phenoloxidases and oxidases, preventingthe oxidation of phenol to quinones that would result in the binding of proteins intoinsoluble complexes [42]. This should theoretically allow a more effective extraction ofproteins, which was not the case here with the peanut samples. It was showed that walnutscontained more free and total polyphenols in both the combined raw and roasted sam-
Molecules 2021, 26, 4698 4 of 21
ples as well the highest lipoprotein-bound antioxidant activity among the other nuts [43].The US Department of Agriculture (USDA) reported a total phenols content of 418, 269,835, 1420 and 1556 mg GAE/100 mg for almond, cashew, hazelnut, pistachio and walnut,respectively [44].
Table 1. Composition of nut samples in term of crude protein, defatted dry matter (DDM) total fat, extracted proteincontents according to the Bradford method and yields according to the different extraction methods.
Almond Cashew Hazelnut Peanut Pistachio Walnut
* CrudeProtein(g/100g)
- 23.7 20.7 15.3 22.3 29.6 18.0
Defatted DryMatter (%) - 48.2 48.2 33.8 47.9 49.1 41.3
Total Fat(g/100g) - 54.7 46.9 65.3 51.5 51.2 65.6
** ExtractedProteins(mg/mL)
Ambi/urea 12.93 ± 0.01 a 10.24 ± 0.10 a 11.94 ± 0.20 a 12.24 ± 0.14 a 19.51 ± 0.31 a 06.77 ± 0.48 a
CM/NaCl 03.82 ± 0.13 b 08.72 ± 0.18 b 10.81 ± 0.10 b 10.49 ± 0.41 b 11.32 ± 0.05 b 5.02 ± 0.02 b
PVPP 15.40 ± 0.31 c 16.13 ± 0.59 c 12.06 ± 0.17 a 11.86 ± 0.52 a 24.38 ± 0.03 c 10.20 ± 0.03 c
SDS buffer 14.89 ± 0.09 c 19.13 ± 0.69 d 11.51 ± 0.14 ab 12.64 ± 0.38 a 15.25 ± 0.17 d 15.18 ± 0.38 d
TCA/Acetone 15.06 ± 0.06 c 14.96 ± 1.48e 12.99 ±0.10 c 06.06 ± 0.10 c 15.97 ± 0.10 d 06.85 ± 0.21 a
ExtractionYield(%)
Ambi/urea 57.3.5 ± 0.1 a 63.3 ± 0.6 a 76.5 ± 1.3 a 61.5 ± 0.7 a 69.2 ± 1.1 a 37.6 ± 2.7 a
CM/NaCl 14.9 ± 0.5 b 38.9 ± 0.8 b 65.3 ± 0.6 b 43.5 ± 1.7 b 35.4 ± 0.1 b 25.8 ± 0.1 b
PVPP 48.7 ± 1.0 c 62.3 ± 2.3 a 48.1 ± 0.7 c 45.2 ± 2.0 b 53.5 ± 0.1 c 48.2 ± 0.2 c
SDS buffer 46.5 ± 0.3 c d 70.2 ± 2.5 c 57.2 ± 0.7 d 42.5 ± 1.3 b 40.2 ± 0.5 d 65.8 ± 1.6 d
TCA/Acetone 43.2 ± 0.2 d 49.1 ± 4.9 d 57.7 ± 0.5 d 18.5 ± 0.3 c 36.7 ± 0.2 b 25.9 ± 0.8 b
* Total protein content according to Kjeldahl. ** Extracted protein according to Bradford and expressed as mg protein/mg defatted nutflours. Means with different lowercase letters in the same column indicate significant differences at p = 0.05 (Tukey test); n = 3.
With cashew samples, the protein concentration values of the five extracts were all sig-nificantly different (p < 0.001); the lowest value being obtained with the CM/NaCl method(08.72 ± 0.18 mg/mL), followed by Ambi/urea extract (10.24 ± 0.10 mg/mL), TCA/acetoneprecipitation extract (14.96 ± 1.48 mg/mL) and PVPP extract (16.13 ± 0.59 mg/mL). Thehighest value was produced by the SDS method (19.13 ± 0.69 mg/mL). The SDS extractalso yielded the highest protein value with walnut samples, followed by the PVPP methodwhile the other three methods produced extracts with protein levels between 5.02 ± 0.02and 06.85 ± 0.21 mg/mL. Finally, the PVPP method proved to be more efficient for theextraction of proteins from hazelnut and pistachio samples. However, although withhazelnut samples the difference between PVPP and other extracts was not in all casessignificant, with pistachio samples, the differences with other extracts were found to bealways significant; ranging from 20 (Ambi/ure extract) to 55% (CM/NaCl extract).
As the use of the five extraction methods resulted in different amounts of extract interms of volume, it was relevant to evaluate the extracts obtained not only in terms of theirprotein content, but also in terms of their extraction yield. For this purpose, the crudeprotein content of each nut sample was initially analyzed by the Kjeldahl method, usingas conversion factor N × 6.25. The results expressed as g of protein per 100 g of defatteddry matter are presented in Table 1. Values of 23.7; 20.7; 15.3; 22.3; 29.6 and 18.0 g/100 gdefatted dry matter were obtained for almond, cashew, hazelnut, peanut, pistachio andwalnut. Based on the starting sample masses as well as the different amounts of extractsobtained (in volume) and their corresponding protein concentration, an estimation of theprotein content in mg protein per 100 mg flour was performed, allowing to determinethe different extraction yields. The results of these calculations are also shown in Table 1.Overall, the protein extraction yields ranged from 14.9 ± 0.5 (almond extract obtainedby CM/NaCl precipitation) to 76.5 ± 1.3% (hazelnut extract obtained by the Ambi/ureamethod). From these data (see also Figure S1, Supplementary Materials), it clearly ap-peared that the Ambi/urea extraction method produced higher protein extraction yieldsfor almond (57.3.5 ± 0.1%), hazelnut (76.5 ± 1.3%), peanut (61.5 ± 0.7%) and pistachio(69.2 ± 1.1%) samples. The SDS buffer extraction yielded the best results with cashew

Molecules 2021, 26, 4698 5 of 21
(70.2 ± 2.5%) and walnut (65.8 ± 1.6%) samples. Urea has been reported to attach carbamy-lations artificial modifications to proteins, preventing samples from being lysed and thusbeneficial for protein extraction [39].
2.1.2. Sodium Dodecyl Sulphate–Polyacrylamide Gel Electrophoresis (SDS PAGE)
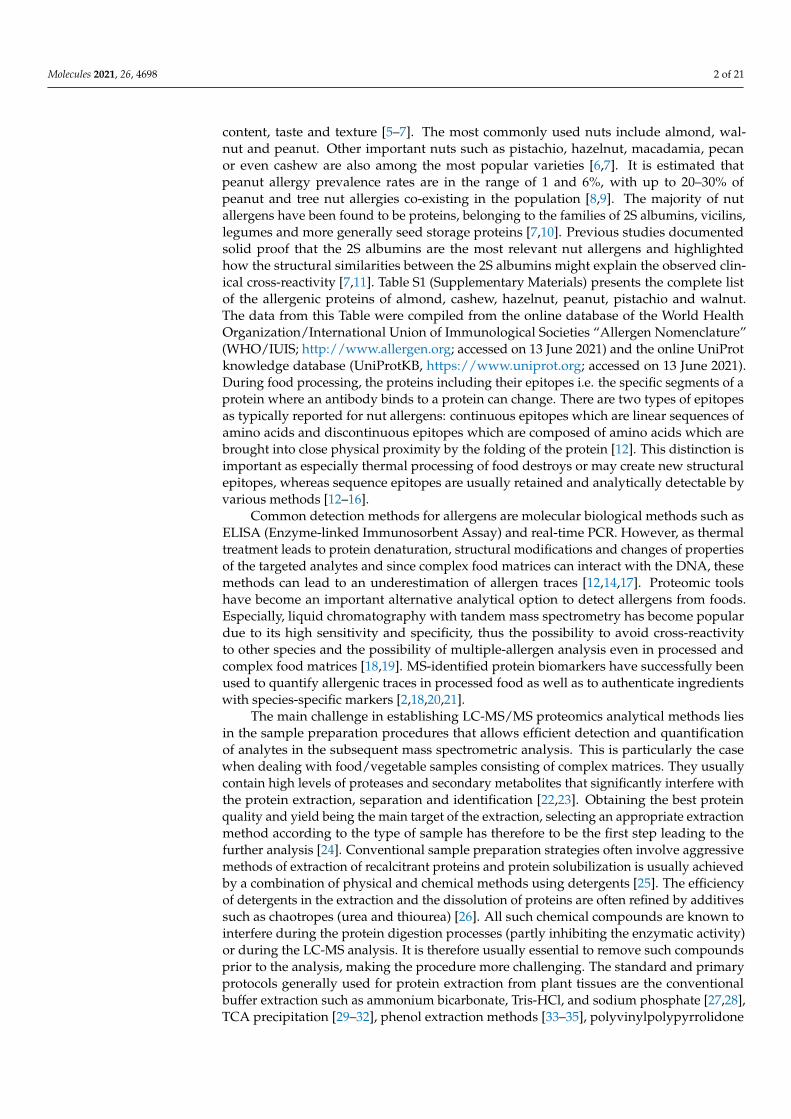
The SDS PAGE electrophoresis was performed in order to separate and elucidate theprotein composition of the different nut samples according to the applied extraction methodand the results are consigned in Figures 1 and 2. To this aim, samples were prepared underdenaturing conditions mixing the extracts with the sample buffer in the ratio 1:1 and samevolume of the mixture was loaded into the wells of 10% precast polyacrylamide gels forseparation. The analysis of the protein composition was performed comparing the proteinprofiles in different ranges (0–15 kDa, 15–35 kDa, 35–70 kDa and 70–250 kDa) It should benoted that the main allergenic proteins of the different nut samples selected for this studyshow molecular weights ranging from 5 to 70 kDa (See Table S1, Supplementary Materials).
Figure 1. SDS PAGE band profiles of the extracted proteins of almond, cashew and hazelnut. Lines 1,2, 3, 4 and 5 of the SDS PAGE pictures represent samples from ambi/urea, CM/NaCl, PVPP, SDS andTCA extraction methods, respectively.
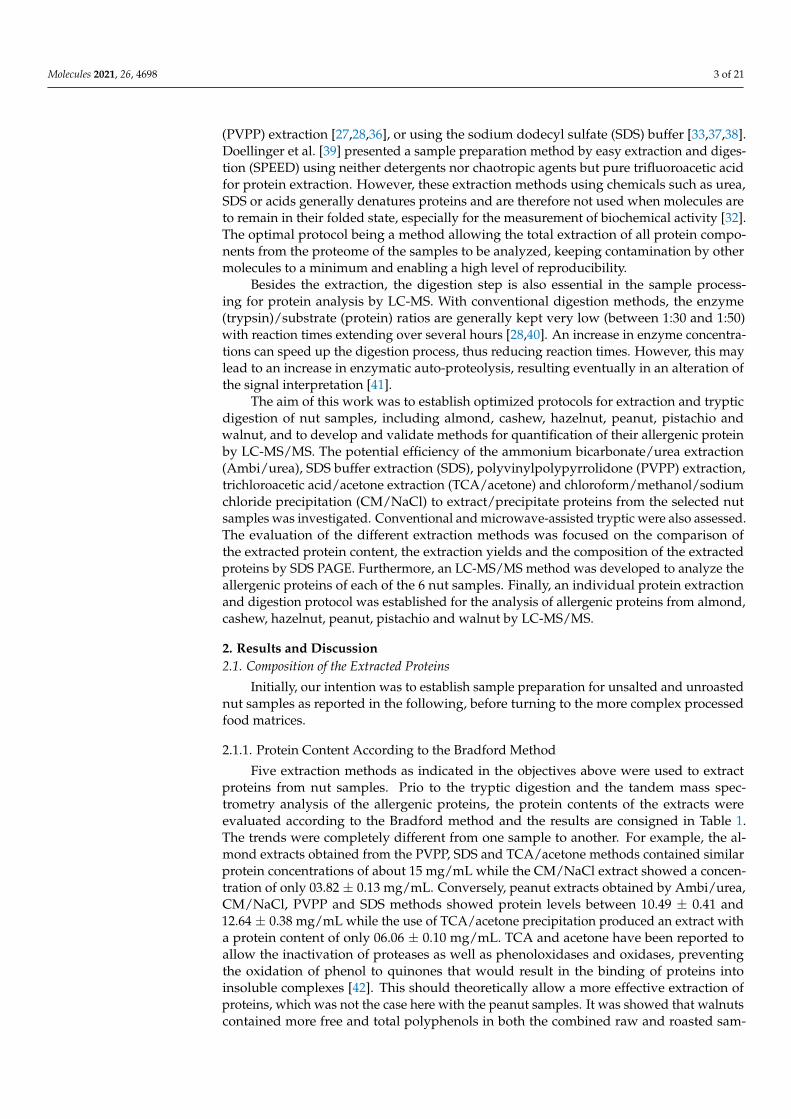
Figure 2. SDS PAGE band profiles of the extracted proteins of peanut, pistachio and walnut. Lines 1,2, 3, 4 and 5 of the SDS PAGE pictures represent samples from ambi/urea, CM/NaCl, PVPP, SDS andTCA extraction methods, respectively.
For almond, if the application of PVPP and SDS extraction methods showed similarprofiles with two main protein bands of 20 and 45 kDa, the use of TCA presented a main
Molecules 2021, 26, 4698 6 of 21
protein band of 55 kDa. Ambi/urea extract exhibited the presence of these three differentbands, but at much lower proportions while CM/NaCl extract presented protein bandsof very low intensity (Figure 1). The CM/NaCl method extracted very low amount ofprotein compared to the other methods while PVPP and SDS extracts showed similar totalintensity with similar composition of proteins.
With cashew, PVPP and SDS extract presented similar profiles of proteins as withalmond and moreover, it can be seen that their composition in the ranges of 0–15 and15–35 kDa was almost the same. CM/NaCl, on the other hand, revealed lower proteinfractions, especially in the range of 0 to 15 kDa. An approximately analogous pattern wasalso observed with hazelnut extracts. Here, CM/NaCl precipitation also showed the lowestprotein intensity while PVPP and SDS extracts exhibited higher intensities. In view ofFigure 1, it is however important to note that the protein profiles of Ambi/urea, SDS andTCA extracts displayed similarities in both areas of 35–70 and 70–250 kDa.
Looking at the peanut extracts, the sample of the ammonium bicarbonate/urea extrac-tion generated the highest number of protein bands, with an intense band at 62 kDa. Theextract obtained from TCA/acetone precipitation showed little or almost no protein bandwith a molecular weight below 25 kDa and it was the same for CM/NaCl extract. PVPPand SDS buffer methods debited similar protein profiles; even though the proteins fromthe PVPP method seemed to be more abundant (Figure 2). In contrast, it could be shownin the study of Prodic et al [45] that TCA/acetone precipitation of milled peanut grainscould results in many proteins in the low molecular weight range depending on the priortreatment executed (e.g. gastric treatments).
Interestingly, when considering the SDS PAGE gel of the pistachio extracts, almost allextraction methods showed a similar profile of extracted proteins, with the exception of thePVPP extract which showed two protein bands of 52 and 56 kDa with significantly higherintensities than the other extracts (Figure 2). However, the PVPP, SDS and TCA/acetoneextracts showed a comparable protein configuration in the ranges of 15–35, 35–70 and70–250 kDa; the PVPP extract, meanwhile, exhibited a significantly higher intensity in thearea of the low molecular weight proteins (Figure S2, Supplementary Materials).
Looking at the walnut samples, it appears that the Ambi/urea and TCA/acetoneextracts showed similar profiles while the use of CM/NaCl precipitation resulted in alower proportion of extracted protein (Figure 2). The SDS extraction method clearly pre-sented a high profile of extracted proteins compared to the other methods, both for low,intermediate and high molecular weight proteins. SDS is an anionic detergent known tobind to proteins through ionic and hydrophobic interactions, solubilising proteins witha wide range of physical properties by changing their secondary and tertiary structures.This leads to optimal extraction of proteins from tissues [46]. However, the presence ofSDS in samples raises questions about LC-MS-based proteomics analysis as it can interferewith reversed-phase chromatography separations and electrospray ionization [38], andthus needs to be entirely washed out after extraction. As with peanut, the TCA/acetoneextract of walnut samples showed a low protein density in terms of composition comparedto SDS, PVPP or Ambi/urea extracts. Similar results were obtained by Yadav et al. [27]who found that after precipitation in 20% TCA-acetone, the amount of soluble proteinwas lower than in 50 mM Tris-HCl (pH 7.5) and 1.5 M Tris-HCl (pH 8.8) solutions. Incontrast, when testing different extraction methods for tomato pollen proteome analysis,Sheoran et al. [47] found the TCA-acetone protein extraction method to be more appropri-ate. In fact, while TCA/acetone precipitation minimizes protein degradation and proteaseactivity and reduces contaminants such as salts or polyphenols, prolonged incubation ofsamples in TCA/acetone can lead to protein modification, protein degradation and more-over, precipitated proteins tend to be more difficult to solubilize and require additionalNaOH to increase their re-solubilization [30,31,48]. It seems that this extraction protocolmay lead to intact sub-units of selected major storage proteins (~50–60 kDa) as shown foralmond samples (Figure 1).
Molecules 2021, 26, 4698 7 of 21
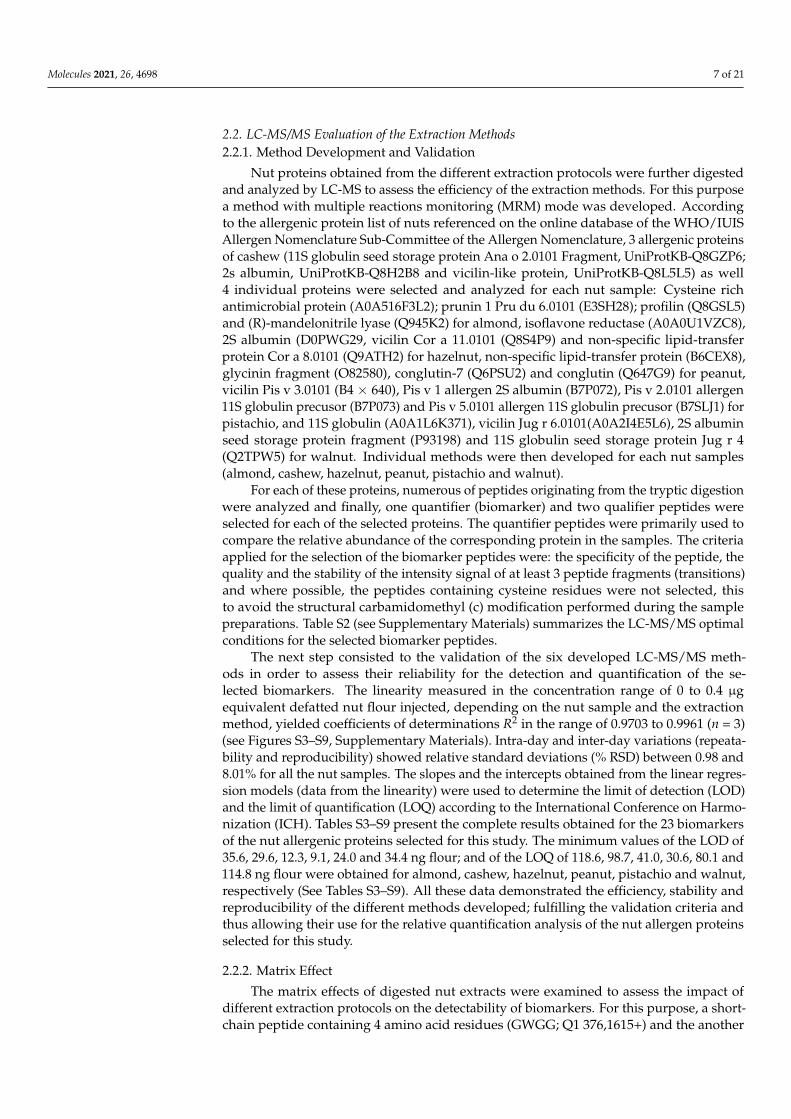
2.2. LC-MS/MS Evaluation of the Extraction Methods2.2.1. Method Development and Validation
Nut proteins obtained from the different extraction protocols were further digestedand analyzed by LC-MS to assess the efficiency of the extraction methods. For this purposea method with multiple reactions monitoring (MRM) mode was developed. Accordingto the allergenic protein list of nuts referenced on the online database of the WHO/IUISAllergen Nomenclature Sub-Committee of the Allergen Nomenclature, 3 allergenic proteinsof cashew (11S globulin seed storage protein Ana o 2.0101 Fragment, UniProtKB-Q8GZP6;2s albumin, UniProtKB-Q8H2B8 and vicilin-like protein, UniProtKB-Q8L5L5) as well4 individual proteins were selected and analyzed for each nut sample: Cysteine richantimicrobial protein (A0A516F3L2); prunin 1 Pru du 6.0101 (E3SH28); profilin (Q8GSL5)and (R)-mandelonitrile lyase (Q945K2) for almond, isoflavone reductase (A0A0U1VZC8),2S albumin (D0PWG29, vicilin Cor a 11.0101 (Q8S4P9) and non-specific lipid-transferprotein Cor a 8.0101 (Q9ATH2) for hazelnut, non-specific lipid-transfer protein (B6CEX8),glycinin fragment (O82580), conglutin-7 (Q6PSU2) and conglutin (Q647G9) for peanut,vicilin Pis v 3.0101 (B4 × 640), Pis v 1 allergen 2S albumin (B7P072), Pis v 2.0101 allergen11S globulin precusor (B7P073) and Pis v 5.0101 allergen 11S globulin precusor (B7SLJ1) forpistachio, and 11S globulin (A0A1L6K371), vicilin Jug r 6.0101(A0A2I4E5L6), 2S albuminseed storage protein fragment (P93198) and 11S globulin seed storage protein Jug r 4(Q2TPW5) for walnut. Individual methods were then developed for each nut samples(almond, cashew, hazelnut, peanut, pistachio and walnut).
For each of these proteins, numerous of peptides originating from the tryptic digestionwere analyzed and finally, one quantifier (biomarker) and two qualifier peptides wereselected for each of the selected proteins. The quantifier peptides were primarily used tocompare the relative abundance of the corresponding protein in the samples. The criteriaapplied for the selection of the biomarker peptides were: the specificity of the peptide, thequality and the stability of the intensity signal of at least 3 peptide fragments (transitions)and where possible, the peptides containing cysteine residues were not selected, thisto avoid the structural carbamidomethyl (c) modification performed during the samplepreparations. Table S2 (see Supplementary Materials) summarizes the LC-MS/MS optimalconditions for the selected biomarker peptides.
The next step consisted to the validation of the six developed LC-MS/MS meth-ods in order to assess their reliability for the detection and quantification of the se-lected biomarkers. The linearity measured in the concentration range of 0 to 0.4 µgequivalent defatted nut flour injected, depending on the nut sample and the extractionmethod, yielded coefficients of determinations R2 in the range of 0.9703 to 0.9961 (n = 3)(see Figures S3–S9, Supplementary Materials). Intra-day and inter-day variations (repeata-bility and reproducibility) showed relative standard deviations (% RSD) between 0.98 and8.01% for all the nut samples. The slopes and the intercepts obtained from the linear regres-sion models (data from the linearity) were used to determine the limit of detection (LOD)and the limit of quantification (LOQ) according to the International Conference on Harmo-nization (ICH). Tables S3–S9 present the complete results obtained for the 23 biomarkersof the nut allergenic proteins selected for this study. The minimum values of the LOD of35.6, 29.6, 12.3, 9.1, 24.0 and 34.4 ng flour; and of the LOQ of 118.6, 98.7, 41.0, 30.6, 80.1 and114.8 ng flour were obtained for almond, cashew, hazelnut, peanut, pistachio and walnut,respectively (See Tables S3–S9). All these data demonstrated the efficiency, stability andreproducibility of the different methods developed; fulfilling the validation criteria andthus allowing their use for the relative quantification analysis of the nut allergen proteinsselected for this study.
2.2.2. Matrix Effect
The matrix effects of digested nut extracts were examined to assess the impact ofdifferent extraction protocols on the detectability of biomarkers. For this purpose, a short-chain peptide containing 4 amino acid residues (GWGG; Q1 376,1615+) and the another

Molecules 2021, 26, 4698 8 of 21
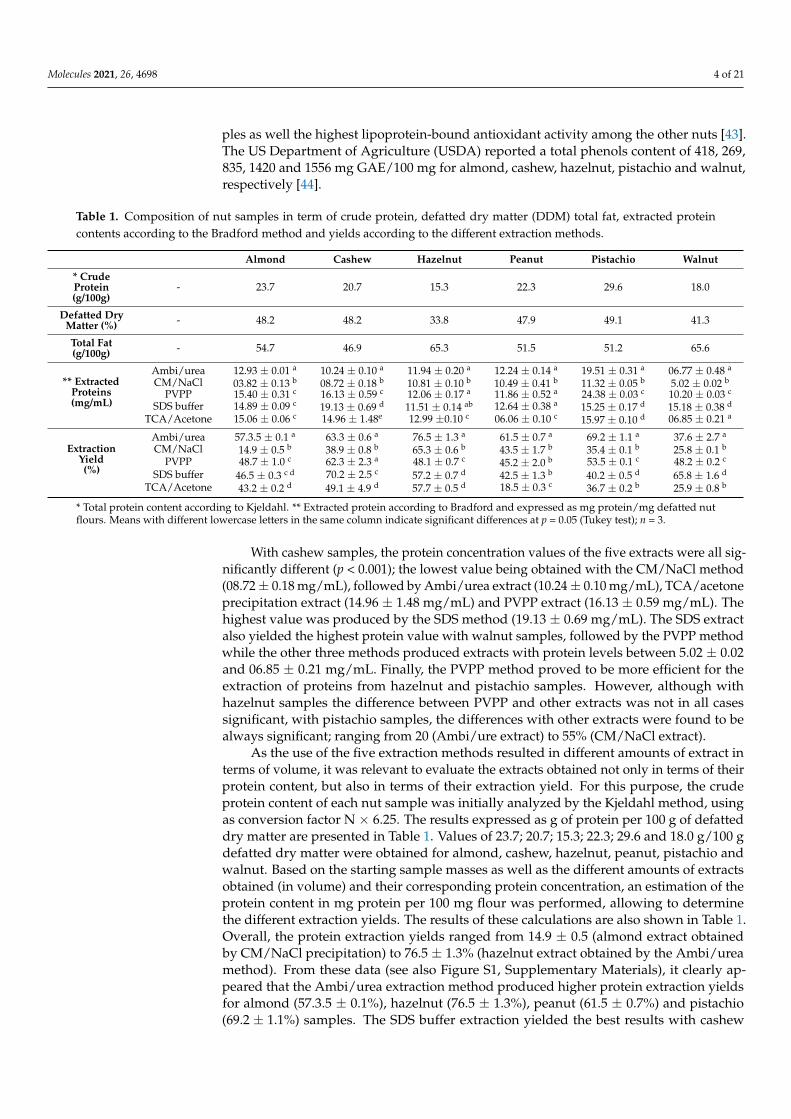
one, DPLNV(d8)LKPR (Q1 = 530,3479++, heavy), containing 9 amino acid residues (bothobtained from Bachem AG, Bubendorf, Switzerland and from peptide&elephants GmbH,Hennigsdorf, Germany, respectively) were used as internal standard (IS). The recoveryrate was determined in the different samples for both IS initial concentrations of 0.01 and0.1 µg/mL, corresponding to the initial injected masses of 0.1 and 1 ng for IS GWGG andDPLNV(d8)LKPR, respectively. The signal intensity of the peaks of the two IS in distilledwater and in the different matrices were evaluated and expressed as ng internal standarddetected (Figure S10, Supplementary Materials) and as percentage recoveries (Figure 3).As it can be seen, contrasting results were obtained for each of the matrices. The idealrecovery value being 100%, all data were statistically compared to this reference valuefor both internal standards. The recovery values of GWGG in the five almond matricesshowed no significant difference compared to the IS in water while the recovery values ofDPLNVLKPR in the digested samples from Ambi/urea and SDS extracts were significantlyhigher than the reference (p < 0.001).
Figure 3. Recovery of the injected internal standards (a) GWGG and (b) DPLNV(d8)LKPR in the dif-ferent nut matrixes according to the extraction protocols: ammonium bicarbonate/urea (Ambi/urea),chloroform/methanol/sodium chloride (CM/NaCl), polyvinylpolypyrrolidone (PVPP), sodiumdodecyl sulfate (SDS) and trichloroacetic acid (TCA). The results are expressed in percent internalstandard detected (n = 3). Comparisons were performed per family with internal standards IS1 andIS2 as reference, and different lowercase letters to the standards indicate significant differences atp = 0.05 (Tukey test).
Molecules 2021, 26, 4698 9 of 21
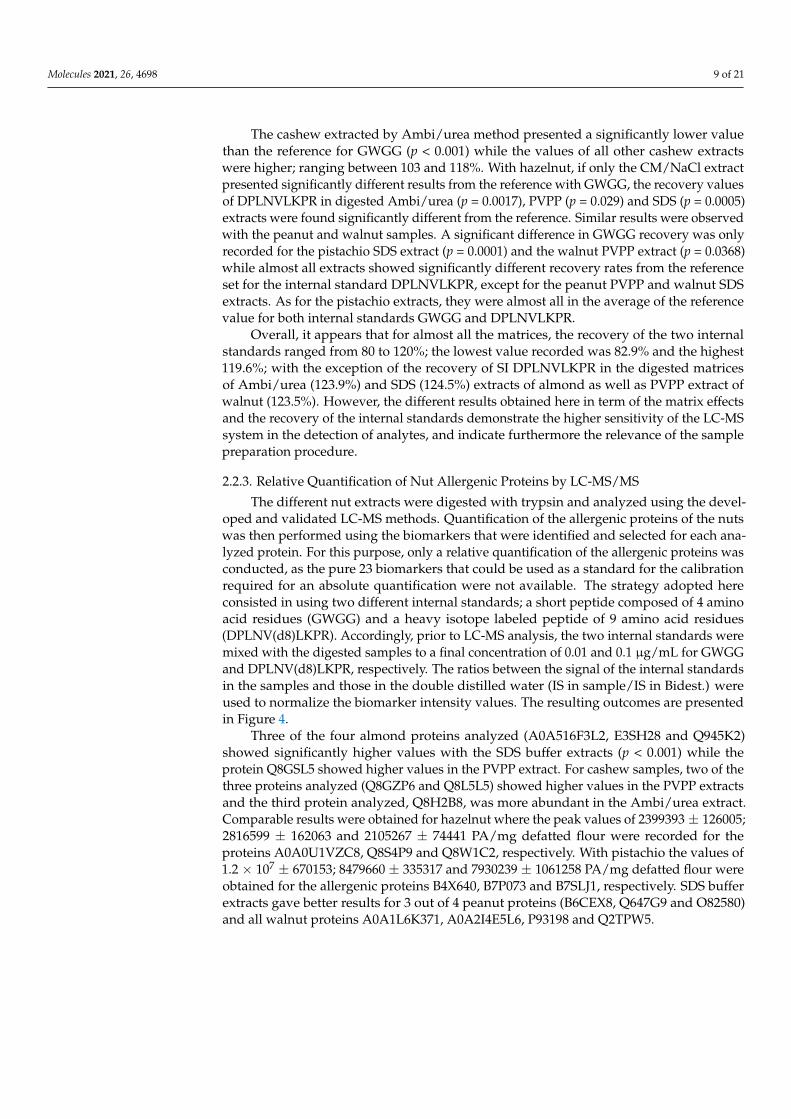
The cashew extracted by Ambi/urea method presented a significantly lower valuethan the reference for GWGG (p < 0.001) while the values of all other cashew extractswere higher; ranging between 103 and 118%. With hazelnut, if only the CM/NaCl extractpresented significantly different results from the reference with GWGG, the recovery valuesof DPLNVLKPR in digested Ambi/urea (p = 0.0017), PVPP (p = 0.029) and SDS (p = 0.0005)extracts were found significantly different from the reference. Similar results were observedwith the peanut and walnut samples. A significant difference in GWGG recovery was onlyrecorded for the pistachio SDS extract (p = 0.0001) and the walnut PVPP extract (p = 0.0368)while almost all extracts showed significantly different recovery rates from the referenceset for the internal standard DPLNVLKPR, except for the peanut PVPP and walnut SDSextracts. As for the pistachio extracts, they were almost all in the average of the referencevalue for both internal standards GWGG and DPLNVLKPR.
Overall, it appears that for almost all the matrices, the recovery of the two internalstandards ranged from 80 to 120%; the lowest value recorded was 82.9% and the highest119.6%; with the exception of the recovery of SI DPLNVLKPR in the digested matricesof Ambi/urea (123.9%) and SDS (124.5%) extracts of almond as well as PVPP extract ofwalnut (123.5%). However, the different results obtained here in term of the matrix effectsand the recovery of the internal standards demonstrate the higher sensitivity of the LC-MSsystem in the detection of analytes, and indicate furthermore the relevance of the samplepreparation procedure.
2.2.3. Relative Quantification of Nut Allergenic Proteins by LC-MS/MS
The different nut extracts were digested with trypsin and analyzed using the devel-oped and validated LC-MS methods. Quantification of the allergenic proteins of the nutswas then performed using the biomarkers that were identified and selected for each ana-lyzed protein. For this purpose, only a relative quantification of the allergenic proteins wasconducted, as the pure 23 biomarkers that could be used as a standard for the calibrationrequired for an absolute quantification were not available. The strategy adopted hereconsisted in using two different internal standards; a short peptide composed of 4 aminoacid residues (GWGG) and a heavy isotope labeled peptide of 9 amino acid residues(DPLNV(d8)LKPR). Accordingly, prior to LC-MS analysis, the two internal standards weremixed with the digested samples to a final concentration of 0.01 and 0.1 µg/mL for GWGGand DPLNV(d8)LKPR, respectively. The ratios between the signal of the internal standardsin the samples and those in the double distilled water (IS in sample/IS in Bidest.) wereused to normalize the biomarker intensity values. The resulting outcomes are presentedin Figure 4.
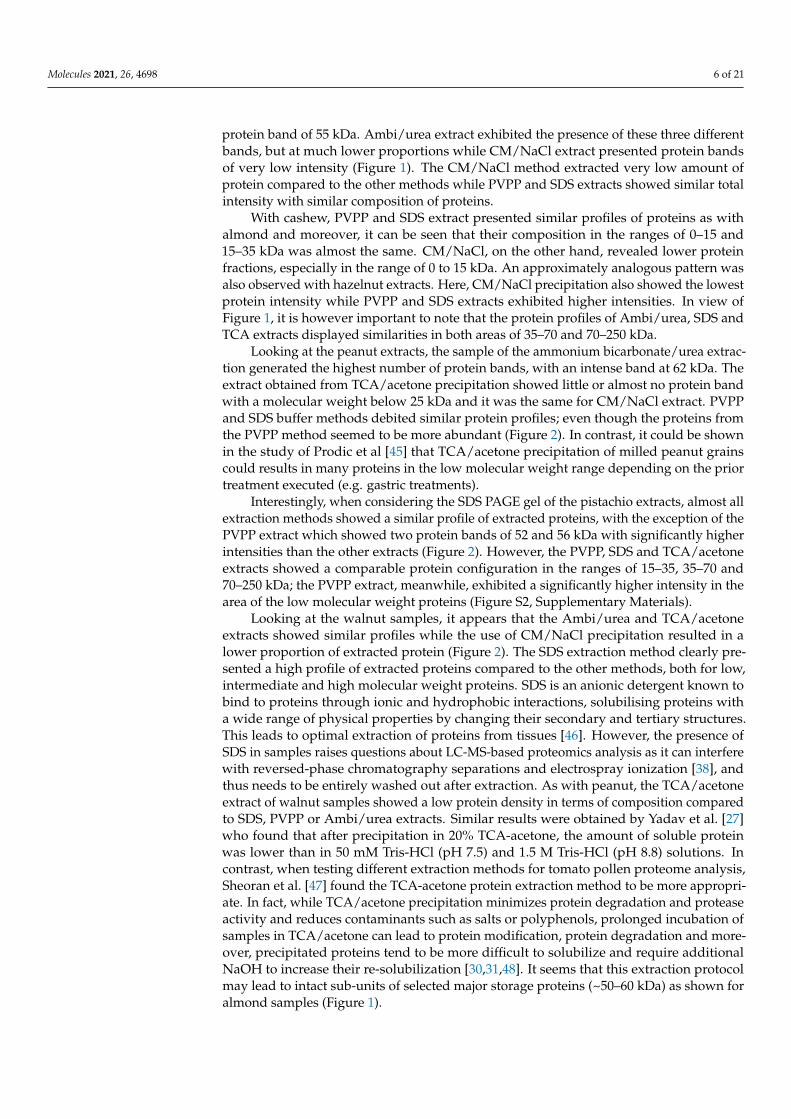
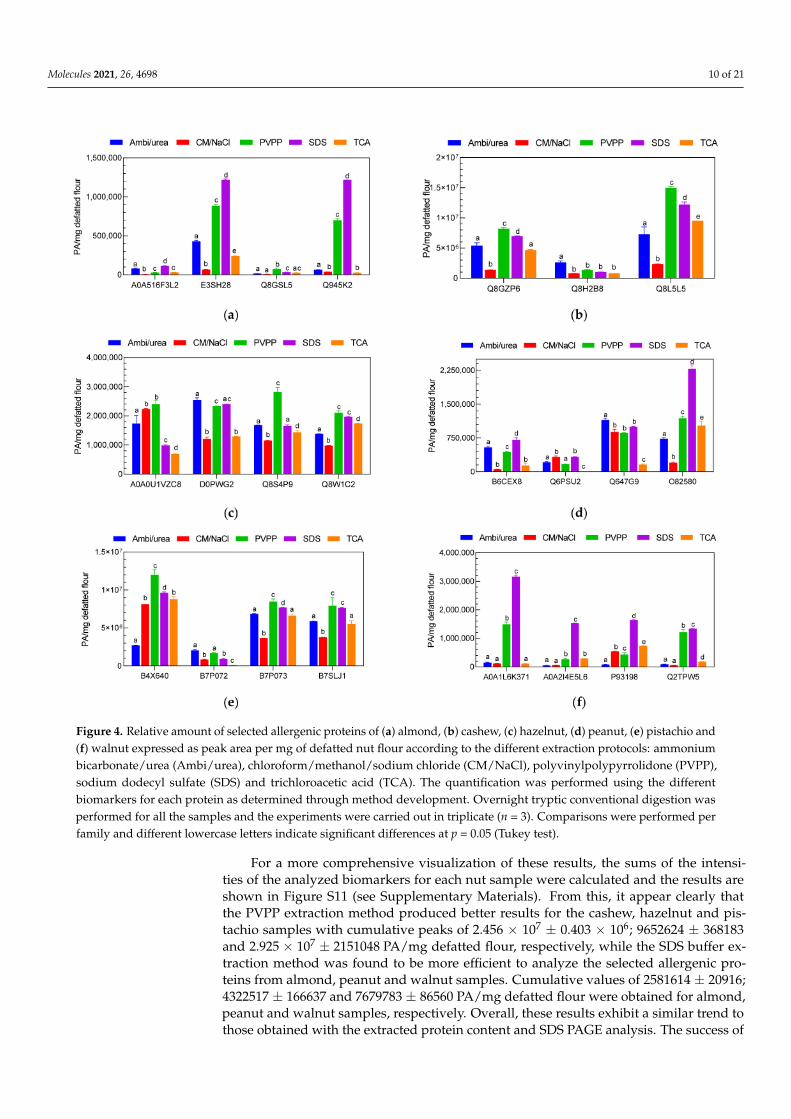
Three of the four almond proteins analyzed (A0A516F3L2, E3SH28 and Q945K2)showed significantly higher values with the SDS buffer extracts (p < 0.001) while theprotein Q8GSL5 showed higher values in the PVPP extract. For cashew samples, two of thethree proteins analyzed (Q8GZP6 and Q8L5L5) showed higher values in the PVPP extractsand the third protein analyzed, Q8H2B8, was more abundant in the Ambi/urea extract.Comparable results were obtained for hazelnut where the peak values of 2399393 ± 126005;2816599 ± 162063 and 2105267 ± 74441 PA/mg defatted flour were recorded for theproteins A0A0U1VZC8, Q8S4P9 and Q8W1C2, respectively. With pistachio the values of1.2 × 107 ± 670153; 8479660 ± 335317 and 7930239 ± 1061258 PA/mg defatted flour wereobtained for the allergenic proteins B4X640, B7P073 and B7SLJ1, respectively. SDS bufferextracts gave better results for 3 out of 4 peanut proteins (B6CEX8, Q647G9 and O82580)and all walnut proteins A0A1L6K371, A0A2I4E5L6, P93198 and Q2TPW5.
Molecules 2021, 26, 4698 10 of 21
Figure 4. Relative amount of selected allergenic proteins of (a) almond, (b) cashew, (c) hazelnut, (d) peanut, (e) pistachio and(f) walnut expressed as peak area per mg of defatted nut flour according to the different extraction protocols: ammoniumbicarbonate/urea (Ambi/urea), chloroform/methanol/sodium chloride (CM/NaCl), polyvinylpolypyrrolidone (PVPP),sodium dodecyl sulfate (SDS) and trichloroacetic acid (TCA). The quantification was performed using the differentbiomarkers for each protein as determined through method development. Overnight tryptic conventional digestion wasperformed for all the samples and the experiments were carried out in triplicate (n = 3). Comparisons were performed perfamily and different lowercase letters indicate significant differences at p = 0.05 (Tukey test).
For a more comprehensive visualization of these results, the sums of the intensi-ties of the analyzed biomarkers for each nut sample were calculated and the results areshown in Figure S11 (see Supplementary Materials). From this, it appear clearly thatthe PVPP extraction method produced better results for the cashew, hazelnut and pis-tachio samples with cumulative peaks of 2.456 × 10⁷ ± 0.403 × 10⁶; 9652624 ± 368183and 2.925 × 10⁷ ± 2151048 PA/mg defatted flour, respectively, while the SDS buffer ex-traction method was found to be more efficient to analyze the selected allergenic pro-teins from almond, peanut and walnut samples. Cumulative values of 2581614 ± 20916;4322517 ± 166637 and 7679783 ± 86560 PA/mg defatted flour were obtained for almond,peanut and walnut samples, respectively. Overall, these results exhibit a similar trend tothose obtained with the extracted protein content and SDS PAGE analysis. The success of
Molecules 2021, 26, 4698 11 of 21
the SDS extracts is probably related to its ability to denature the three-dimensional struc-tures of the proteins, allowing the trypsin to reach more efficiently the different cleavagesites on the proteins. The PVPP on the other hand allows the binding of polyphenolsduring the extraction process, thus releasing the proteins from the complexes structures,making them more accessible.
2.2.4. Effect of the Digestion Method
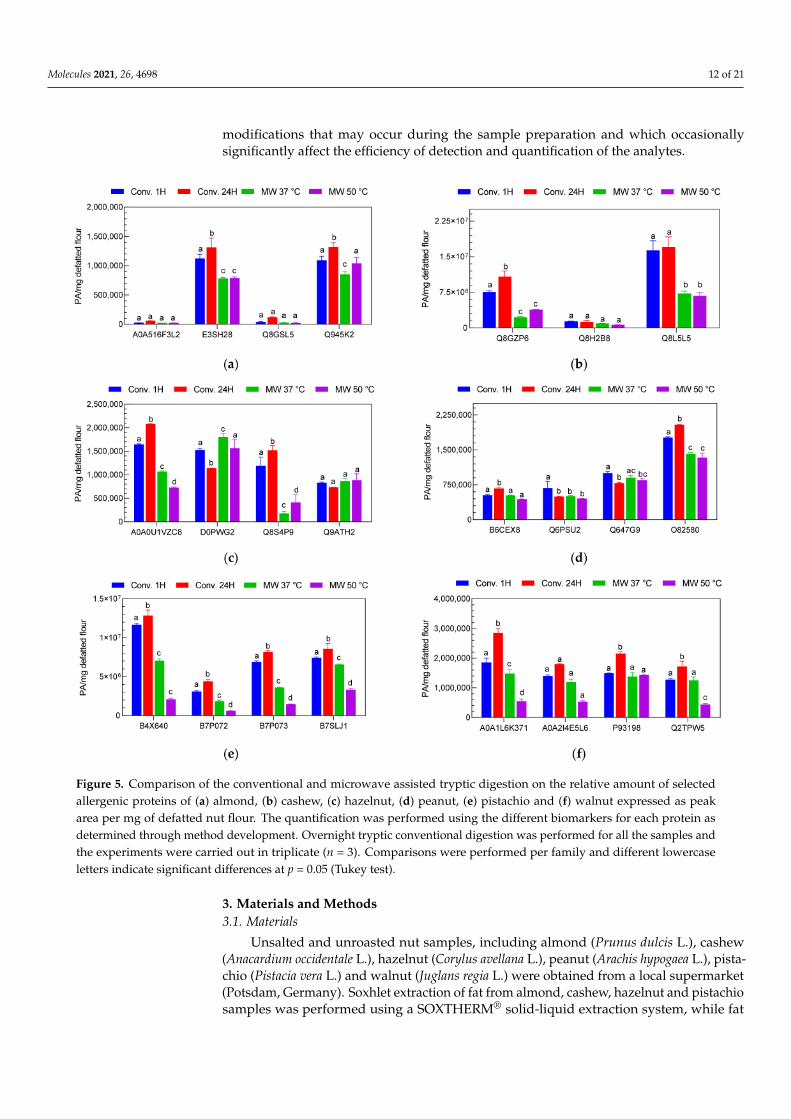
Besides the extraction process, protein digestion is one of the key steps involved inthe sample preparation process in proteomics. This is especially true since the ultimateanalytes used for the LC-MS/MS analysis are the peptides resulting from the degradationof proteins. In this respect, there are several enzymes often used, including trypsin,chymotrypsin, pepsin, pronase and many others. Trypsin, however, is the most commonlyused enzyme in proteomics, due to its high specificity and its ability to digest efficientlyproteins from different sources and matrixes. In this study, trypsin was used to evaluatetwo different digestion methods: the conventional digestion method performed at 37 ◦C ina thermoshaker, and the microwave-assisted digestion method. The conventional methodwas conducted at two different reaction times: 1 and 18 hour (overnight), while themicrowave assisted digestion was conducted for a total reaction time of 11 min at twodifferent temperatures: 37 ◦C and 50 ◦C. Only the extracts from the methods that yieldedthe best results previously were used here (SDS buffer extracts for the almond, peanut andwalnut samples, and PVPP extracts for the cashew, hazelnut and pistachio samples. Theresulting outputs are presented in Figure 5.
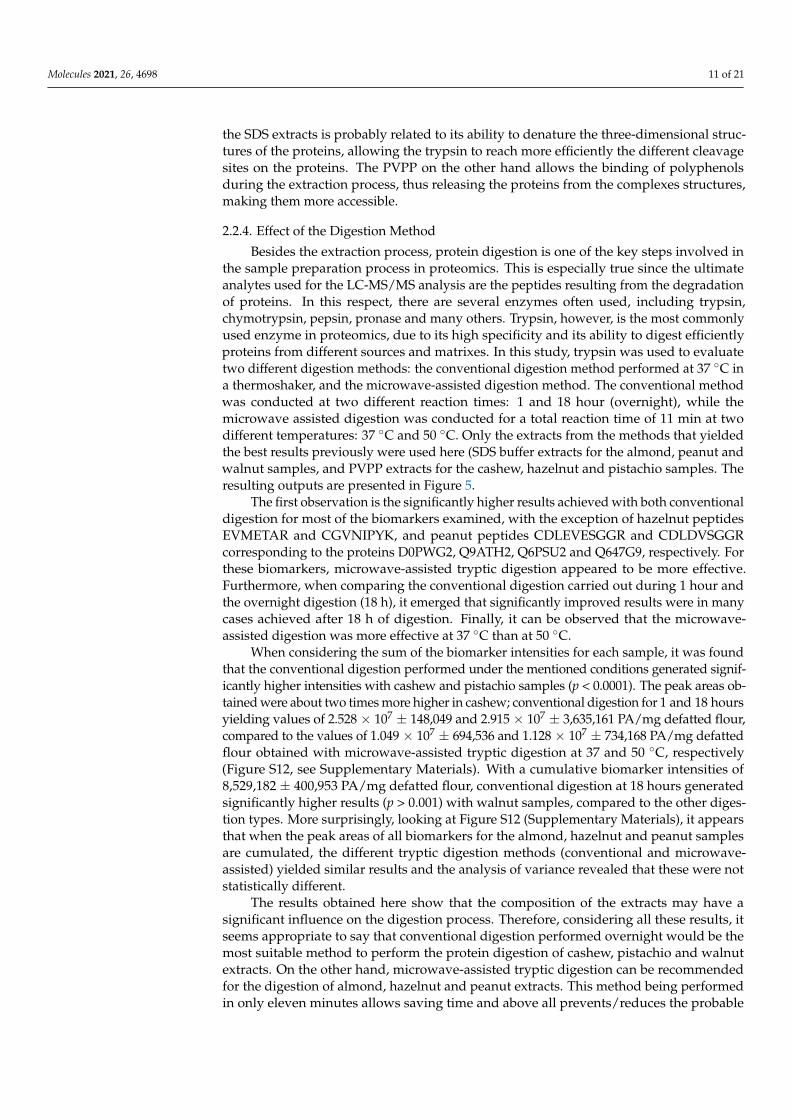
The first observation is the significantly higher results achieved with both conventionaldigestion for most of the biomarkers examined, with the exception of hazelnut peptidesEVMETAR and CGVNIPYK, and peanut peptides CDLEVESGGR and CDLDVSGGRcorresponding to the proteins D0PWG2, Q9ATH2, Q6PSU2 and Q647G9, respectively. Forthese biomarkers, microwave-assisted tryptic digestion appeared to be more effective.Furthermore, when comparing the conventional digestion carried out during 1 hour andthe overnight digestion (18 h), it emerged that significantly improved results were in manycases achieved after 18 h of digestion. Finally, it can be observed that the microwave-assisted digestion was more effective at 37 ◦C than at 50 ◦C.
When considering the sum of the biomarker intensities for each sample, it was foundthat the conventional digestion performed under the mentioned conditions generated signif-icantly higher intensities with cashew and pistachio samples (p < 0.0001). The peak areas ob-tained were about two times more higher in cashew; conventional digestion for 1 and 18 hoursyielding values of 2.528 × 10⁷ ± 148,049 and 2.915 × 10⁷ ± 3,635,161 PA/mg defatted flour,compared to the values of 1.049 × 10⁷ ± 694,536 and 1.128 × 10⁷ ± 734,168 PA/mg defattedflour obtained with microwave-assisted tryptic digestion at 37 and 50 ◦C, respectively(Figure S12, see Supplementary Materials). With a cumulative biomarker intensities of8,529,182 ± 400,953 PA/mg defatted flour, conventional digestion at 18 hours generatedsignificantly higher results (p > 0.001) with walnut samples, compared to the other diges-tion types. More surprisingly, looking at Figure S12 (Supplementary Materials), it appearsthat when the peak areas of all biomarkers for the almond, hazelnut and peanut samplesare cumulated, the different tryptic digestion methods (conventional and microwave-assisted) yielded similar results and the analysis of variance revealed that these were notstatistically different.
The results obtained here show that the composition of the extracts may have asignificant influence on the digestion process. Therefore, considering all these results, itseems appropriate to say that conventional digestion performed overnight would be themost suitable method to perform the protein digestion of cashew, pistachio and walnutextracts. On the other hand, microwave-assisted tryptic digestion can be recommendedfor the digestion of almond, hazelnut and peanut extracts. This method being performedin only eleven minutes allows saving time and above all prevents/reduces the probable
Molecules 2021, 26, 4698 12 of 21
modifications that may occur during the sample preparation and which occasionallysignificantly affect the efficiency of detection and quantification of the analytes.
Figure 5. Comparison of the conventional and microwave assisted tryptic digestion on the relative amount of selectedallergenic proteins of (a) almond, (b) cashew, (c) hazelnut, (d) peanut, (e) pistachio and (f) walnut expressed as peakarea per mg of defatted nut flour. The quantification was performed using the different biomarkers for each protein asdetermined through method development. Overnight tryptic conventional digestion was performed for all the samples andthe experiments were carried out in triplicate (n = 3). Comparisons were performed per family and different lowercaseletters indicate significant differences at p = 0.05 (Tukey test).
3. Materials and Methods3.1. Materials
Unsalted and unroasted nut samples, including almond (Prunus dulcis L.), cashew(Anacardium occidentale L.), hazelnut (Corylus avellana L.), peanut (Arachis hypogaea L.), pista-chio (Pistacia vera L.) and walnut (Juglans regia L.) were obtained from a local supermarket(Potsdam, Germany). Soxhlet extraction of fat from almond, cashew, hazelnut and pistachiosamples was performed using a SOXTHERM® solid-liquid extraction system, while fat

Molecules 2021, 26, 4698 13 of 21
extraction from peanut and walnut samples was performed by the beaker method withpetroleum ether as solvent.
Ammonium bicarbonate, tris, tris hydrochloride, sodium dodecyl sulfate (SDS), ethylene-diaminetetraacetic acid (EDTA), trichloroacetic acid, sodium chloride, 1,4-Dithiothreitol (DTT),tris(2-carboxyethyl)phosphine (TCEP), glycerol, acetonitrile LC-MS grade, chloroform,methanol, and formic acid were purchased from Carl Roth GmbH (Karlsruhe, Germany).Acetone and n-hexane were obtained from VWR International GmbH, Darmstadt, Germany.Polyvinylpolypyrrolidone was provided by Fluka Chemie GmbH, Buchs, Switzerland andurea was obtained from Merck KGaA, Darmstadt, Germany. Triton™ X-100, iodacetamide(IAA) and 3-(N-morpholino) propane sulfonic acid (MOPS) were from Sigma AldrichGmbH, Steinheim, Germany. The digestion of protein was carried out with a crystallinetrypsin, proteomics Grade (Sigma-Aldrich Chemie, Steinhagen, Germany). Short-chainpeptide containing 4 amino acid residues - GWGG (Bachem AG, Bubendorf, Switzerland)as well as a stable isotope peptide labeling with 9 amino acid residues DPLNV(d8)LKPR(peptide&elephants GmbH, Hennigsdorf, Germany) were used as internal standards dur-ing the LC-MS analysis for the relative quantification purposes. All the other chemicalsused in this work were of analytical grade.
3.2. Sample Preparation3.2.1. Extraction Procedures
Six different extraction methods among those most commonly used, the ammonium bi-carbonate/urea extraction, SDS buffer extraction, polyvinylpolypyrrolidone (PVPP) extrac-tion, trichloroacetic acid/acetone extraction and chloroform/methanol/sodium chlorideprecipitation were applied for the extraction of proteins. Figure 6 presents the schematicflowchart of the extraction protocols. The first step common to all the extraction methodswas a second defatting step to remove the residual lipid components. For this purpose,n-Hexane solvent was added to the nut powders (ratio 1:10; w/v) and the whole wasmixed for 20 min at room temperature, then centrifuged at 10,000× g, 4 ◦C for 5 min.The supernatant was removed and discarded, while the precipitate was dried at roomtemperature in a fume hood for about 1 hour.
Ammonium Bicarbonate/Urea Extraction
The extraction protocol using ammonium bicarbonate buffer containing urea is theone optimized and applied in our previous work [28,49,50]. Briefly, 100 mg of each defattednut sample were mixed with 1.5 mL of extraction buffer (100 mM ammonium bicarbonatecontaining 4 M urea) and the whole was shaken at 95 rpm at room temperature for 60 min,followed by the centrifugation (10,000× g, 4 ◦C for 5 min). The supernatants were collectedinto the new eppendorf 1.5 ml eppis, kept at −20 ◦C for 20 min, after thawing at 4 ◦C for20 min, centrifuged (10,000× g, 4 ◦C for 5 min) and the clear supernatants constituting thenut protein extracts were collected and stored at −20 ◦C for further analysis.
Chloroform/Methanol/Sodium Chloride Extraction
Chloroform/Methanol/sodium chloride (CM/NaCl) extraction is a three phase par-titioning concentration and purification method, allowing the precipitation of proteinsfrom aqueous solution. Here, 100 mg of defatted nut samples were first extracted withextraction buffer according to the ammonium bicarbonate/urea method as described pre-viously (using 1.5 mL of 100 mM ammonium bicarbonate containing 4 M urea). Volumesof 0.5 mL of the obtained clear supernatants were collected into the 2 ml eppis, 0.8 mL ofchloroform/methanol mixture (1:2, v/v) was added in each, and the whole was vortexedfor ca. 1 min. Another 0.5 mL of 100% chloroform solvent was added and the mixturevortexed again for 1 min. Finally, 0.2 mL of NaCl solution (1:10, w/v) was introduced andthe mixture vortexed again. The samples were then incubated for 10 min at 4 ◦C, whichresulted in the formation of the 3 phases: the upper phase consisting of the organic solvent,the lower aqueous phase and the intermediate phase consisting of the protein precipitate.
Molecules 2021, 26, 4698 14 of 21
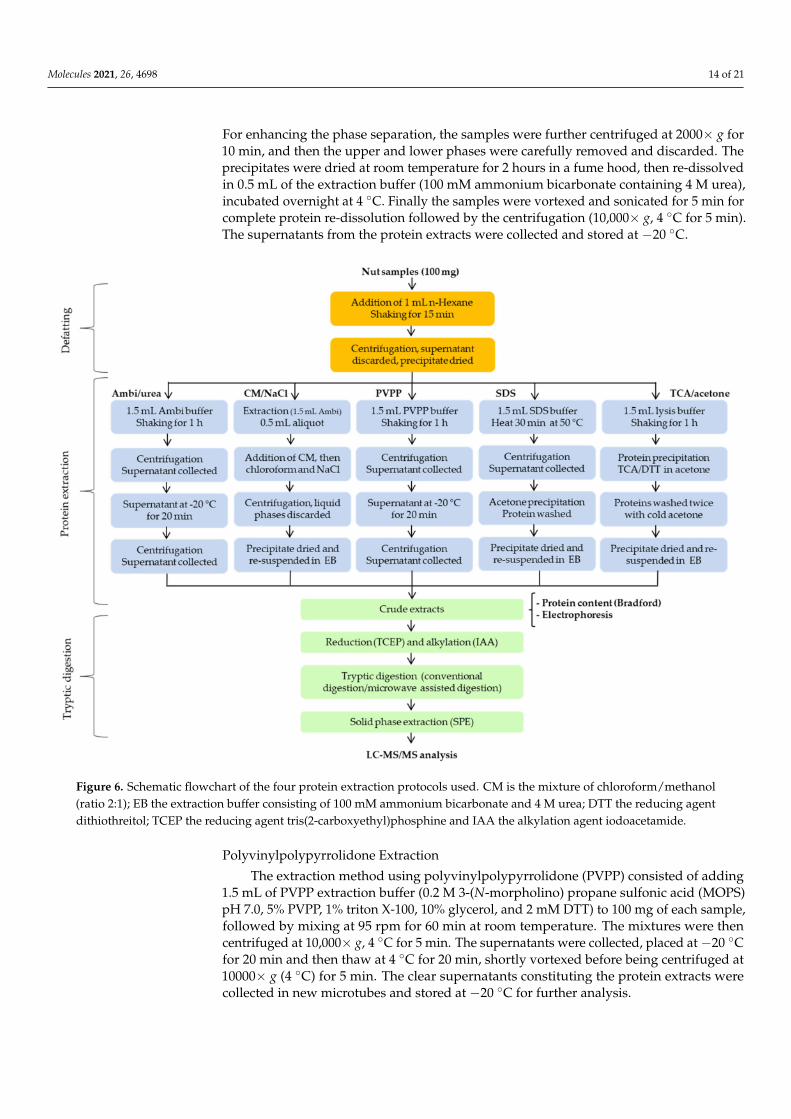
For enhancing the phase separation, the samples were further centrifuged at 2000× g for10 min, and then the upper and lower phases were carefully removed and discarded. Theprecipitates were dried at room temperature for 2 hours in a fume hood, then re-dissolvedin 0.5 mL of the extraction buffer (100 mM ammonium bicarbonate containing 4 M urea),incubated overnight at 4 ◦C. Finally the samples were vortexed and sonicated for 5 min forcomplete protein re-dissolution followed by the centrifugation (10,000× g, 4 ◦C for 5 min).The supernatants from the protein extracts were collected and stored at −20 ◦C.
Figure 6. Schematic flowchart of the four protein extraction protocols used. CM is the mixture of chloroform/methanol(ratio 2:1); EB the extraction buffer consisting of 100 mM ammonium bicarbonate and 4 M urea; DTT the reducing agentdithiothreitol; TCEP the reducing agent tris(2-carboxyethyl)phosphine and IAA the alkylation agent iodoacetamide.
Polyvinylpolypyrrolidone Extraction
The extraction method using polyvinylpolypyrrolidone (PVPP) consisted of adding1.5 mL of PVPP extraction buffer (0.2 M 3-(N-morpholino) propane sulfonic acid (MOPS)pH 7.0, 5% PVPP, 1% triton X-100, 10% glycerol, and 2 mM DTT) to 100 mg of each sample,followed by mixing at 95 rpm for 60 min at room temperature. The mixtures were thencentrifuged at 10,000× g, 4 ◦C for 5 min. The supernatants were collected, placed at −20 ◦Cfor 20 min and then thaw at 4 ◦C for 20 min, shortly vortexed before being centrifuged at10000× g (4 ◦C) for 5 min. The clear supernatants constituting the protein extracts werecollected in new microtubes and stored at −20 ◦C for further analysis.

Molecules 2021, 26, 4698 15 of 21
Sodium Dodecyl Sulfate Buffer Extraction
Sodium dodecyl sulfate (SDS) is an anionic detergent that allows a high solubility ofchallenging proteins through both ionic and hydrophobic binding, modifying the three-dimensional structures of proteins. For this purpose, proteins were extracted from 100 mgof each defatted sample by adding 1.5 mL of SDS buffer (4.0 g SDS, 0.61 g Tris, 130 mMDithiothreitol in 100 mL H2O; the pH adjusted to 6.8 with 0.1 N HCL). The mixturewas heated at 50 ◦C for 20 min on a thermo-shaker (Thermomixer Comfort, Eppendorf-Netheler-Hinz GmbH, Hamburg) with a stirring function (1000 rpm), and then centrifugedat 10,000× g for 5 min. The supernatants were transferred to fresh microtubes and 1 mL ofcold acetone was added, vortexed and incubated at −20 ◦C for 20 min. After centrifugation(at 7000× g, 4 ◦C, 5 min), the supernatants were removed, the precipitate rinsed withanother 1 ml cold acetone. The whole was further centrifuged under the same conditionsand the supernatant discarded. The precipitates were dried under a fume hood for about30 min. The extracted proteins (precipitate) were taken up in 0.8 ml of extraction buffer(100 mM ammonium bicarbonate containing 4 M urea). The whole was vortexed for 1 minfollowed by sonication for 5 min to completely dissolve the proteins. After centrifugationat 10,000× g for 5 min at 4 ◦C, the supernatants were collected and kept at −20 ◦C for thefurther experiments.
Trichloroacetic Acid/Acetone Precipitation
TCA/acetone extraction experiments were carried out as described by Mechin et al. [42]with some modifications. One hundred milliliters defatted nut samples were homogenizedin 1.5 mL of extraction buffer (50 mM Tris-HCl, 25 mM sucrose, 0.1 M EDTA pH 8.1% TritonX 100, 10% Glycerol and 10mM DTT). The extraction was performed at room temperaturefor 1 h and after centrifugation (10,000× g, 4 ◦C for 5 min), the supernatants were collectedinto the fresh microtubes. For the TCA/acetone precipitation, 1 mL of 10% TCA in acetonecontaining 10 mM DTT was added to the obtained extracts (for a final concentration ofTCA of ~5% in the mixture), the whole was vortexed and then incubated at –20 ◦C for 1 h.samples were then centrifuged (10,000× g, 4 ◦C for 10 min) and the supernatants werediscarded. The precipitates were then washed by adding 1 mL of ice cold acetone, incubatedat −20 ◦C for 20 min, then centrifuged at 10,000× g, 4 ◦C for 10 min. The supernatants werediscarded; the precipitates dried for 30 min at room temperature under the fume hood andre-dissolved in 0.7 mL of extraction buffer (100 mM ammonium bicarbonate containing4 M urea). After vortex and sonication for 10 min, the samples were centrifuged and theclear supernatants consisting of extracted proteins were collected and save at −20 ◦C forthe further experiments.
3.2.2. Tryptic Digestion
Both conventional and microwave digestion were applied and compared. Prior tothe tryptic digestion, 400 µL of each extracted nut proteins were first reduced by applying10 µL of 0.25 M of tris(2-carboxyethyl)phosphin (TCEP) for 20 min at 50 ◦C, followed bythe alkylation (using 10 µL of 0.25 M of iodoacetamide solution for 20 min at 50 ◦C in thedark), and finally 135 µL of digestion buffer (ammonium bicarbonate) were added. Then,20 µL of 4 mg/mL trypsin solution were added. The conventional digestion consistedto keep sample for 1 h and overnight (18 h) at 37 ◦C under the shaking conditions ona thermomixer. The microwave digestion was performed using a CEM Discover SP-DDigestion Microwave (CEM GmbH, Kamp-Lintfort, Germany). Here, the digestion wasperformed at a pressure of 40 psi with a maximum power of the microwave set at 300 Watt.Two different temperatures (27 and 50 ◦C) were evaluated with a ramp and hold timesof 1 and 10 min, respectively (total digestion time of 11 min). Both conventional andmicrowave digestions were stopped by adding 15 µL of 40% formic acid.
Molecules 2021, 26, 4698 16 of 21
3.2.3. Solid Phase Extraction
To purify the peptides from the matrix compounds, a solid phase extraction usingcolumns containing 300 mg of C18 material (Chromabond C18 ec, Macherey Nagel Düren,Germany) was performed. The columns were first activated using 6 mL of buffer containing50% acetonitrile, 50% double-distilled water (bidest water) and 0.1% formic acid; and thenconditioned with 6 mL of bidest water. The samples from the tryptic digestion were thenloaded onto the columns, washed with 6 mL of bidest water and the peptides were collectedusing 6 mL of 100% acetonitrile containing 0.1% formic acid. The eluate were finally dilutedin a ratio 1:5 (v/v) using bidest water and the samples were filled into the vials for theLC-MS/MS analysis.
3.3. Analysis3.3.1. Protein Content
The Bradford method [51] was used to determine the protein concentration of the dif-ferent extracts. Briefly, 40 µL of adequately diluted protein samples were mixed with 1.6 mL ofCoomassie dye binding protein assay (Bradford reagent, Sigma-Aldrich, Steinheim, Germany)and incubated at room temperature for 5 min. The absorbance was then measured at awavelength of 595 nm using a UV-VIS spectrophotometer (Hanna instruments, Vöhringen,Germany). Bovine serum albumin (BSA) solutions with concentrations of 0 to 1.4 mg/mLwere prepared and used as standard for the calibration curve.
The results were expressed as mg protein per mL extract. Furthermore, in orderto evaluate the efficiency of the different extraction methods, the extraction yields weredetermined and reported as µg extracted protein per mg of starting nut powder.
3.3.2. Sodium Dodecyl Sulfate Polyacrylamide Gel Electrophoresis (SDS PAGE)
The sample preparation for SDS PAGE was performed as previously described [52].Briefly, samples from different extraction methods were mixed in a ratio of 1:1 (v/v) withthe sample buffer (consisting of 125 mM Tris buffer, pH = 6.8, 20% (v/v) glycerol, 2% (v/v)2-mercaptoethanol, 2% (w/v) SDS, 0.1% (w/v) bromphenol blue) and the mixtures wereheated at 95 ◦C for 5 min. After cooling to room temperature, the same volume of themixture (10 µL of each sample)was loaded into gels (Invitrogen NuPAGE 10% Bis-Trisprotein gel, 12 wells, Thermo Fisher Scientific, Carlsbad, CA, USA). Spectra™ MulticolorBroad Range Protein Ladder with molecular weight proteins of 10, 15, 25, 35, 40, 50, 70,100, 140 and 260 kDa (Thermo Fisher Scientific) was used for calibration purposes. Thegels were then run initially at 20 mA for 30 min, and then the current was increased to50 mA till the end of the separation. The gels were stained overnight with a coomassie bluesolution (constituted of one PhastGel® blue R250 tablet in 2 liters of 10% acetic acid), thendistained with a 10% acetic acid solution. The distaining solution was changed regularly tillfor about 3 h. The gels were finally scanned (Bio-5000 Professional VIS Gel Scanner, SERVAElectrophoresis GmbH, Heidelberg, Germany) and analyzed using Image Lab software(Bio-Rad Laboratories Ltd., Hemel Hempstead, UK).
3.3.3. LC-MS/MS—Method Development and Analysis
The allergenic proteins of almond, cashew, and hazelnut, peanut, pistachio andwalnut were identified from the online database “allergen nomenclature” of the WorldHealth Organization and International Union of Immunological Societies (WHO/IUIS;http://www.allergen.org; accessed on 13 June 2021). Table S1 (Supplementary Materials)presents the list of all nut allergenic proteins identified and their characteristics. The proteinsequences (primary structure) of the different allergens were extracted from the UniProtonline knowledge base (UniProtKB) (https://www.uniprot.org; accessed on 13 June 2021)as FASTA files and imported into the Skyline software MacCoss Lab Software, version 20.2,University of Washington, Seattle, WA, USA; https://skyline.gs.washington.edu; ac-cessed on 13 June 2021) [53]. Protein sequences were then theoretically digested underthe following conditions: Digestion enzyme-trypsin; Partial-0; Chemical modification-

Molecules 2021, 26, 4698 17 of 21
carbamidomethyl of cysteine residues, precursor charges-2 and 3; ionic charge-1; peptidelength filter-4 and 30 amino acid residues. All the generated peptides were screened fortheir specificity using the “unique peptide” function. The peptides were then analyzed andfinally 2 to 3 peptides were selected to characterize each allergenic protein.
The allergenic proteins identified in the previous step were tested for their species-selectivity with the BLAST algorithm (Basic Local Alignment Search Tool from the databaseUniProt Universal Protein Resource, http://www.uniprot.org/; accessed on 13 June 2021).Candidates with less than 95% protein sequence similarity to other species were in-silicodigested with the Skyline software using trypsin as enzyme. The additional settings aredescribed in our previous works [28,49,50]. The species selectivity of the identified indi-vidual nut peptides was analyzed once more by the BLAST algorithm (UniProt UniversalProtein Resource, http://www.uniprot.org/; accessed on 13 June 2021).
The trypsin-digested nut proteins were analyzed with a High-performance liquid chro-matography (a 1260 Infinity Binary Pump, a 1260 Infinity II Multisampler, a 1260 Infinity IIMulticolumn Thermostat, a 1260 Infinity II Diode Array Detector and an Agilent instru-ment control framework) coupled with an electrospray ionization tandem mass spectrom-etry system equipped with an Agilent 6470 Triple Quadrupole LC/MS (1260 Infinity IILC System; Agilent Technologies, Waldbronn, Germany). The HPLC was fitted witha Kinetex® reverse phase C8 column, 2.6 µm, 100 Å, 150 × 4.6 mm (Phenomenex Ltd.,Aschaffenburg, Germany). The separation was performed with a column temperature of30 ◦C for 28 min with a column equilibration time between each run (post run) of 4 min(total time of 32 min per run); and in gradient mode using 0.1% formic acid in water aseluent A and acetonitrile as eluent B. The elution program was designed as indicatedbelow: 0.01–2.0 min, 5% solvent B; 2–18 min, 50% sol-vent B; 18–19 min, 95% solvent B;19–22 min, 95% solvent B; 22–23 min, 5% solvent B; and 23–28 min, 5% solvent B. Thetemperature of the desolvation gas in the ionization source was set at 250 ◦C with a gasflow rate of 11 L/min and a nebulizer pressure of 35 psi; using nitrogen as the collisiongas. The fragmentor voltage and collision energy were individually optimized for everypeptide of each nut sample, using a dwell time of 20 ms. Finally, a multiple reaction moni-toring (MRM) method to optimally detect specific transitions of the analyzed peptides withpreviously identified retention times was established. Three to four transitions with thehighest intensity response in the product ion spectrum of the respective marker peptideswere selected and the relative quantification was achieved by summing the total peak areasof the individual transitions using the software Skyline.
3.4. Statistical Analysis
The LC-MS/MS method was validated while applying the linearity, the selectivity,the sensitivity, the recovery, the repeatability and the reproducibility. In addition, the limitsof detection (LOD) and the limit of quantification (LOQ) were calculated. All validationtools were performed according to the International Conference on Harmonization (ICH).All the experiments were performed in triplicate and data were expressed as means withtheir standard deviations. A two-way analysis of variance (ANOVA) was applied followedby Tukey’s test using GraphPad Prism 6 (GraphPad Software, San Diego, CA, USA). Thedifferences between the values were considered significantly different for p-values < 0.05(95% confidence level).
4. Conclusions
In this work, five protein extraction methods including the ammonium bicar-bonate/ureaextraction (Ambi/urea), SDS buffer extraction (SDS), polyvinylpolypyrrolidone (PVPP) extrac-tion, trichloroacetic acid/acetone extraction (TCA/acetone) and chloroform/methanol/sodiumchloride precipitation (CM/NaCl) were tested to extract proteins from almond, cashew, hazel-nut, peanut, pistachio and walnut samples. In addition, the performances of conventionaltryptic digestion and microwave-assisted tryptic digestion of protein extracts were compared.The objective was to establish optimized protocols for extraction and tryptic digestion of

Molecules 2021, 26, 4698 18 of 21
nut proteins, and to develop and validate methods for quantification of allergenic pro-tein contents of each nut sample by liquid chromatography tandem mass spectrometry(LC-MS/MS). The results of the extracted protein content as well as the protein yields andelectrophoresis showed that the SDS buffer extraction method was the most suitable toperform the protein extraction from almond, peanut and walnut samples while the PVPPextraction method produced better results for cashew, pistachio and hazelnut samples.These results were confirmed by the relative quantification of allergenic proteins fromthe digestion of the different extracts by the LC/MS method. It was also found that theconventional overnight digestion was the most effective method to digest cashew, pistachioand hazelnut proteins, while microwave-assisted tryptic digestion was recommended forthe digestion of almond, hazelnut and peanut extracts. Further experiments will considerthe absolute quantification aspects to allow comparison with other similar studies andto consider selected food processing matrix effects (e.g. backing/roasting, boiling, highpressure treatment etc).
Supplementary Materials: Figure S1: Extracted protein (a) and protein extraction yield of nutsamples almond, cashew, hazelnut, peanut, pistachio and walnut using Ambi/urea, CM/NaCl,PVPP, SDS and TCA methods; Figure S2: Relative composition of extracted proteins of (a) almond,cashew, hazelnut, and (b) peanut, pistachio and walnut using Ambi/urea, CM/NaCl, PVPP, SDSand TCA methods; Figure S3: Linearity of the HPLC-MS/MS measurements of internal standards (a)GWGG and (b) DPLNVLKPR; Figure S4: Linearity of the HPLC-MS/MS measurements of analyzedalmond allergenic proteins (a) Cysteine rich antimicrobial protein (A0A516F3L2), (b) Prunin 1 Prudu 6.0101 (E3SH28), (c) Profilin (Q8GSL5) and (d) (R)-mandelonitrile lyase 2 (Q945K2); Figure S5:Linearity of the HPLC-MS/MS measurements of analyzed cashew allergenic proteins (a) 11S globulinseed storage protein Ana o 2.0101 Fragment (Q8GZP6), (b) 2s albumin (Q8H2B8) and (c) Vicilin-likeprotein (Q8L5L5); Figure S6: Linearity of the HPLC-MS/MS measurements of analyzed hazelnutallergenic proteins (a) Isoflavone reductase (A0A0U1VZC8), (b) 2S albumin (D0PWG2), (c) VicilinCor a 11.0101 (Q8S4P9) and (d) Non-specific lipid-transfer protein Cor a 8.0101 (Q9ATH2); Figure S7:Linearity of the HPLC-MS/MS measurements of analyzed peanut allergenic proteins (a) Non-specificlipid-transfer protein (B6CEX8), (b) Conglutin-7 (Q6PSU2), (c) Conglutin (Q647G9) and (d) GlycininFragment (O82580); Figure S8: Linearity of the HPLC-MS/MS measurements of analyzed pistachioallergenic proteins (a) Superoxide dismutase (B2BDZ8), (b) Pis v 1 allergen 2S albumin (B7P072), (c)Pis v 2.0101 allergen11S globulin precusor (B7P073) and (d) Pis v 5.0101 allergen 11S globulin precusor(B7SLJ1); Figure S9: Linearity of the HPLC-MS/MS measurements of analyzed walnut allergenicproteins (a) 11S globulin (A0A1L6K371), (b) Vicilin Jug r 6.0101 (A0A2I4E5L6), (c) 2S albumin seedstorage protein Fragment (P93198) and (d) 11S globulin seed storage protein Jug r 4 (Q2TPW5);Figure S10: Recovery of the injected internal standards (a) GWGG and (b) DPLNV(d8)LKPR in thedifferent nut matrixes according to the extraction protocols Ambi/urea, CM/NaCl, PVPP, SDS andTCA; Figure S11: Sum of the relative amount of selected allergenic proteins of (a) almond, (b) cashew,(c) hazelnut, (d) peanut, (e) pistachio and (f) walnut expressed as peak area per mg of defatted nutflour according to the different extractions protocols; Figure S12: Sum of the relative amount ofselected allergenic proteins of (a) almond, (b) cashew, (c) hazelnut, (d) peanut, (e) pistachio and(f) walnut expressed as peak area per mg of defatted nut flour according to the different digestionprotocols; Table S1: List of nut allergenic proteins available from the online database allergennomenclature, the WHO/IUIS Allergen Nomenclature Sub-Committee (http://www.allergen.org;accessed on 13 June 2021); Table S2: The optimized conditions of the HPLC-MS/MS method forthe analysis and relative quantification of almond, cashew, hazelnut, peanut, pistachio and walnutallergenic proteins; Table S3: LC-MS/MS method validation results of almond allergenic proteins;Table S4: LC-MS/MS method validation results of cashew allergenic proteins; Table S5: LC-MS/MSmethod validation results of hazelnut allergenic proteins; Table S6: LC-MS/MS method validationresults of peanut allergenic proteins; Table S7: LC-MS/MS method validation results of pistachioallergenic proteins; Table S8: LC-MS/MS method validation results of walnut allergenic proteins;Table S9: LC-MS/MS method validation results of two peptides used as internal standards.
Molecules 2021, 26, 4698 19 of 21
Author Contributions: Conceptualization, S.T.S., G.H. and H.M.R.; methodology, S.T.S., H.M.R.and G.H.; formal analysis, S.T.S.; investigation, S.T.S. and T.H.; data curation, S.T.S. and H.M.R.;writing—original draft preparation, S.T.S.; writing—review and editing, H.M.R., S.T.S., G.H. andT.H.; supervision. H.M.R. and G.H.; funding acquisition, S.T.S. and H.M.R. All authors have readand agreed to the published version of the manuscript.
Funding: The author Sorel Tchewonpi Sagu was funded by the Alexander von Humboldt Foundationunder the Georg Forster Research Fellowship (Ref 3.4-CMR-1164093-GF-P).
Data Availability Statement: Not applicable.
Acknowledgments: We acknowledge the support of the Deutsche Forschungsgemeinschaft andOpen Access Publishing Fund of University of Potsdam.
Conflicts of Interest: The authors declare no conflict of interest.
References1. Black, C.; Chevallier, O.P.; Elliott, C.T. The current and potential applications of ambient mass spectrometry in detecting food
fraud. TrAC Trends Anal. Chem. 2016, 82, 268–278. [CrossRef]2. Primrose, S.; Woolfe, M.; Rollinson, S. Food forensics: Methods for determining the authenticity of foodstuffs. Trends Food Sci.
Technol. 2010, 21, 582–590. [CrossRef]3. Larsen, J.N.; Broge, L.; Jacobi, H. Allergy immunotherapy: The future of allergy treatment. Drug Discov. Today 2016, 21, 26–37.
[CrossRef] [PubMed]4. EFSA NDA Panel (EFSA Panel on Dietetic Products, Nutrition and Allergies). Scientific Opinion on the evaluation of allergenic
foods and food ingredients for labelling purposes. EFSA J. 2014, 12, 3894–4180. [CrossRef]5. Kumari, S.; Gray, A.R.; Webster, K.; Bailey, K.; Reid, M.; Kelvin, K.A.H.; Tey, S.L.; Chisholm, A.; Brown, R.C. Does ’activating’ nuts
affect nutrient bioavailability? Food Chem. 2020, 319, 126529. [CrossRef]6. Alasalvar, C.; Salvado, J.S.; Ros, E. Bioactives and health benefits of nuts and dried fruits. Food Chem. 2020, 314, 126192. [CrossRef]7. Geiselhart, S.; Hoffmann-Sommergruber, K.; Bublin, M. Tree nut allergens. Mol. Immunol. 2018, 100, 71–81. [CrossRef] [PubMed]8. McWilliam, V.; Koplin, J.; Lodge, C.; Tang, M.; Dharmage, S.; Allen, K. The prevalence of tree nut allergy: A systematic review.
Curr. Allergy Asthma Rep. 2015, 15, 54. [CrossRef]9. Maloney, J.M.; Rudengren, M.; Ahlstedt, S.; Bock, S.A.; Sampson, H.A. The use of serum-specific ige measurements for the
diagnosis of peanut, tree nut, and seed allergy. J. Allergy Clin. Immunol. 2008, 122, 145–151. [CrossRef]10. Roux, K.H.; Teuber, S.S.; Sathe, S.K. Tree nut allergens. Int. Arch. Allergy Immunol. 2003, 131, 234–244. [CrossRef]11. Dreskin, S.C.; Koppelman, S.J.; Andorf, S.; Nadeau, K.C.; Kalra, A.; Braun, W.; Negi, S.S.; Chen, X.; Schein, C.H. The importance
of the 2s albumins for allergenicity and cross-reactivity of peanuts, tree nuts, and sesame seeds. J. Allergy Clin. Immunol. 2021,147, 1154–1163. [CrossRef]
12. Masthoff, L.J.; Hoff, R.; Verhoeckx, K.C.; van Os-Medendorp, H.; Michelsen-Huisman, A.; Baumert, J.L.; Pasmans, S.G.;Meijer, Y.; Knulst, A.C. A systematic review of the effect of thermal processing on the allergenicity of tree nuts. Allergy 2013, 68,983–993. [CrossRef]
13. Bu, G.; Luo, Y.; Chen, F.; Liu, K.; Zhu, T. Milk processing as a tool to reduce cow’s milk allergenicity: A mini-review. Dairy Sci.Technol. 2013, 93, 211–223. [CrossRef]
14. Cuadrado, C.; Cabanillas, B.; Pedrosa, M.M.; Varela, A.; Guillamon, E.; Muzquiz, M.; Crespo, J.F.; Rodriguez, J.; Burbano, C. Influ-ence of thermal processing on ige reactivity to lentil and chickpea proteins. Mol. Nutr. Food Res. 2009, 53, 1462–1468. [CrossRef]
15. Kamath, S.D.; Rahman, A.M.; Voskamp, A.; Komoda, T.; Rolland, J.M.; O’Hehir, R.E.; Lopata, A.L. Effect of heat processing onantibody reactivity to allergen variants and fragments of black tiger prawn: A comprehensive allergenomic approach. Mol. Nutr.Food Res. 2014, 58, 1144–1155. [CrossRef]
16. Korte, R.; Lepski, S.; Brockmeyer, J. Comprehensive peptide marker identification for the detection of multiple nut allergensusing a non-targeted lc-hrms multi-method. Anal. Bioanal. Chem. 2016, 408, 3059–3069. [CrossRef] [PubMed]
17. Eischeid, A.C.; Kasko, S.M. Quantitative multiplex real-time pcr assay for shrimp allergen: Comparison of commercial mastermixes and pcr platforms in rapid cycling. J. Food Prot. 2015, 78, 230–234. [CrossRef]
18. Huschek, G.; Bönick, J.; Löwenstein, Y.; Sievers, S.; Rawel, H. Quantification of allergenic plant traces in baked products bytargeted proteomics using isotope marked peptides. Lwt 2016, 74, 286–293. [CrossRef]
19. Planque, M.; Arnould, T.; Gillard, N. Food Allergen Analysis: Detection, Quantification and Validation by Mass Spectrometry.Available online: https://www.intechopen.com/chapters/55777 (accessed on 2 July 2021).
20. Ruiz Orduna, A.; Husby, E.; Yang, C.T.; Ghosh, D.; Beaudry, F. Assessment of meat authenticity using bioinformatics, targetedpeptide biomarkers and high-resolution mass spectrometry. Food Addit Contam Part. A Chem Anal. Control. Expo. Risk Assess. 2015,32, 1709–1717. [CrossRef] [PubMed]
21. Korte, R.; Brockmeyer, J. Mrm(3)-based lc-ms multi-method for the detection and quantification of nut allergens. Anal. Bioanal.Chem. 2016, 408, 7845–7855. [CrossRef] [PubMed]

Molecules 2021, 26, 4698 20 of 21
22. Wang, W.; Tai, F.; Chen, S. Optimizing protein extraction from plant tissues for enhanced proteomics analysis. J. Sep. Sci. 2008, 31,2032–2039. [CrossRef] [PubMed]
23. Sagu, S.T.; Nso, E.J.; Homann, T.; Kapseu, C.; Rawel, H.M. Extraction and purification of beta-amylase from stems of abrusprecatorius by three phase partitioning. Food Chem. 2015, 183, 144–153. [CrossRef]
24. Somayajula, D.; Desai, N. Optimization of protein extraction and proteomic studies in cenchrus polystachion (l.) schult. Heliyon2019, 5, e02968. [CrossRef] [PubMed]
25. Rabilloud, T.; Luche, S.; Santoni, V.; Chevallet, M. Detergents and chaotropes for protein solubilization before two-dimensionalelectrophoresis. Methods Mol. Biol. 2006, 355, 111–120.
26. Awad, D.; Brueck, T. Optimization of protein isolation by proteomic qualification from cutaneotrichosporon oleaginosus. Anal.Bioanal. Chem. 2019, 412, 449–462. [CrossRef] [PubMed]
27. Yadav, S.; Srivastava, A.; Biswas, S.; Chaurasia, N.; Singh, S.K.; Kumar, S.; Srivastava, V.; Mishra, Y. Comparison and optimizationof protein extraction and two-dimensional gel electrophoresis protocols for liverworts. BMC Res. Notes 2020, 13, 60. [CrossRef]
28. Sagu, S.T.; Zimmermann, L.; Landgraber, E.; Homann, T.; Huschek, G.; Ozpinar, H.; Schweigert, F.J.; Rawel, H.M. Comprehensivecharacterization and relative quantification of alpha-amylase/trypsin inhibitors from wheat cultivars by targeted hplc-ms/ms.Foods 2020, 9, 1448. [CrossRef] [PubMed]
29. Nandakumar, M.P.; Shen, J.; Raman, B.; Marten, M.R. Solubilization of trichloroacetic acid (tca) precipitated microbial proteinsvia naoh for two-dimensional electrophoresis. J. Proteome Res. 2003, 2, 89–93. [CrossRef]
30. Wang, W.; Vignani, R.; Scali, M.; Cresti, M. A universal and rapid protocol for protein extraction from recalcitrant plant tissues forproteomic analysis. Electrophoresis 2006, 27, 2782–2786. [CrossRef]
31. Niu, L.; Zhang, H.; Wu, Z.; Wang, Y.; Liu, H.; Wu, X.; Wang, W. Modified tca/acetone precipitation of plant proteins for proteomicanalysis. PLoS ONE 2018, 13, e0202238. [CrossRef]
32. Koontz, L. Tca precipitation. Methods Enzymol. 2014, 541, 3–10.33. Chatterjee, M.; Gupta, S.; Bhar, A.; Das, S. Optimization of an efficient protein extraction protocol compatible with two-
dimensional electrophoresis and mass spectrometry from recalcitrant phenolic rich roots of chickpea (cicer arietinum L.). Int. J.Proteom. 2012, 2012, 1–10. [CrossRef]
34. Hashiguchi, A.; Yamaguchi, H.; Hitachi, K.; Watanabe, K. An optimized protein extraction method for gel-free proteomic analysisof opuntia ficus-indica. Plants 2021, 10, 115. [CrossRef] [PubMed]
35. Isaacson, T.; Damasceno, C.M.B.; Saravanan, R.S.; He, Y.; Catalá, C.; Saladié, M.; Rose, J.K.C. Sample extraction techniques forenhanced proteomic analysis of plant tissues. Nat. Protoc. 2006, 1, 769–774. [CrossRef]
36. Huang, X.; Zhou, H.-W. Evaluation of Six Different Protocols for Protein Extraction from Rice Young Panicles by Two-DimensionalElectrophoresis. Available online: https://www.researchsquare.com/article/rs-16995/v1 (accessed on 27 July 2021).
37. Saravanan, R.S.; Rose, J.K.C. A critical evaluation of sample extraction techniques for enhanced proteomic analysis of recalcitrantplant tissues. Proteomics 2004, 4, 2522–2532. [CrossRef]
38. Zhou, J.Y.; Dann, G.P.; Shi, T.; Wang, L.; Gao, X.; Su, D.; Nicora, C.D.; Shukla, A.K.; Moore, R.J.; Liu, T.; et al. Simple sodiumdodecyl sulfate-assisted sample preparation method for lc-ms-based proteomics applications. Anal. Chem. 2012, 84, 2862–2867.[CrossRef] [PubMed]
39. Doellinger, J.; Schneider, A.; Hoeller, M.; Lasch, P. Sample preparation by easy extraction and digestion (speed)—A uni-versal, rapid, and detergent-free protocol for proteomics based on acid extraction. Mol. Cell. Proteom. 2020, 19, 209–222.[CrossRef] [PubMed]
40. Gundry, R.L.; White, M.Y.; Murray, C.I.; Kane, L.A.; Fu, Q.; Stanley, B.A.; Van Eyk, J.E. Preparation of proteins and peptides formass spectrometry analysis in a bottom-up proteomics workflow. Available online: https://currentprotocols.onlinelibrary.wiley.com/doi/full/10.1002/0471142727.mb1025s88 (accessed on 2 July 2021).
41. Lin, S.; Lin, Z.; Yao, G.; Deng, C.; Yang, P.; Zhang, X. Development of microwave-assisted protein digestion based on trypsin-immobilized magnetic microspheres for highly efficient proteolysis followed by matrix-assisted laser desorption/ionizationtime-of-flight mass spectrometry analysis. Rapid Commun. Mass Spectrom. 2007, 21, 3910–3918. [CrossRef]
42. Mechin, V.; Damerval, C.; Zivy, M. Total protein extraction with tca-acetone. Methods Mol. Biol. 2007, 355, 1–8.43. Vinson, J.A.; Cai, Y. Nuts, especially walnuts, have both antioxidant quantity and efficacy and exhibit significant potential health
benefits. Food Funct. 2012, 3, 134–140. [CrossRef]44. Bolling, B.W.; Chen, C.Y.; McKay, D.L.; Blumberg, J.B. Tree nut phytochemicals: Composition, antioxidant capacity, bioactivity,
impact factors. A systematic review of almonds, brazils, cashews, hazelnuts, macadamias, pecans, pine nuts, pistachios andwalnuts. Nutr. Res. Rev. 2011, 24, 244–275. [CrossRef] [PubMed]
45. Prodic, I.; Smiljanic, K.; Simovic, A.; Radosavljevic, J.; Cirkovic Velickovic, T. Thermal processing of peanut grains impairstheir mimicked gastrointestinal digestion while downstream defatting treatments affect digestomic profiles. Foods 2019, 8,463. [CrossRef]
46. Andersen, K.K.; Oliveira, C.L.; Larsen, K.L.; Poulsen, F.M.; Callisen, T.H.; Westh, P.; Pedersen, J.S.; Otzen, D. The role of decoratedsds micelles in sub-cmc protein denaturation and association. J. Mol. Biol. 2009, 391, 207–226. [CrossRef] [PubMed]
47. Sheoran, I.S.; Ross, A.R.S.; Olson, D.J.H.; Sawhney, V.K. Compatibility of plant protein extraction methods with mass spectrometryfor proteome analysis. Plant. Sci. 2009, 176, 99–104. [CrossRef]
Molecules 2021, 26, 4698 21 of 21
48. Simpson, D.M.; Beynon, R.J. Acetone precipitation of proteins and the modification of peptides. J. Proteome Res. 2010, 9, 444–450.[CrossRef] [PubMed]
49. Sagu, S.T.; Landgraber, E.; Henkel, I.M.; Huschek, G.; Homann, T.; Bussler, S.; Schluter, O.K.; Rawel, H. Effect of cereal alpha-amylase/trypsin inhibitors on developmental characteristics and abundance of digestive enzymes of mealworm larvae (tenebriomolitor L.). Insects 2021, 12, 454. [CrossRef]
50. Sagu, S.T.; Landgraber, E.; Rackiewicz, M.; Huschek, G.; Rawel, H. Relative abundance of alpha-amylase/trypsin inhibitors inselected sorghum cultivars. Molecules 2020, 25, 5982. [CrossRef]
51. Bradford, M.M. A rapid and sensitive method for the quantitation of microgram quantities of protein utilizing the principle ofprotein-dye binding. Anal. Biochem. 1976, 72, 248–254. [CrossRef]
52. Tchewonpi Sagu, S.; Huschek, G.; Bonick, J.; Homann, T.; Rawel, H.M. A new approach of extraction of alpha-amylase/trypsininhibitors from wheat (triticum aestivum L.), based on optimization using plackett-burman and box-behnken designs. Molecules2019, 24, 3589. [CrossRef] [PubMed]
53. MacLean, B.; Tomazela, D.M.; Shulman, N.; Chambers, M.; Finney, G.L.; Frewen, B.; Kern, R.; Tabb, D.L.; Liebler, D.C.;MacCoss, M.J. Skyline: An open source document editor for creating and analyzing targeted proteomics experiments. Bioinfor-matics 2010, 26, 966–968. [CrossRef] [PubMed]