Fluorescence-Activated Cell Sorting in Microfluidic Devices ...
Upload
independentCategory
view
1download
0
Lab on a Chip
PAPER
4284 | Lab Chip, 2014, 14, 4284–4294 This journal is © The R
a INESC Microsistemas e Nanotecnologias and IN-Institute of Nanoscience and
Nanotechnology, Lisbon, Portugal. E-mail: [email protected];
Fax: +351 21 314 58 43; Tel: +351 21 310 02 37bDepartment of Bioengineering, Instituto Superior Técnico, Universidade de
Lisboa, Lisbon, Portugalc IBB – Institute for Biotechnology and Bioengineering, Centre for Biological and
Chemical Engineering, Instituto Superior Técnico, Universidade de Lisboa,
Lisbon, Portugal
† Electronic supplementary information (ESI) available. See DOI: 10.1039/c4lc00695j‡ Current address: Leibniz-Institut für Analytische Wissenschaften - ISAS - e.V.,Otto-Hahn-Str. 6b, 44227 Dortmund, Germany.
Cite this: Lab Chip, 2014, 14, 4284
Received 13th June 2014,Accepted 29th August 2014
DOI: 10.1039/c4lc00695j
www.rsc.org/loc
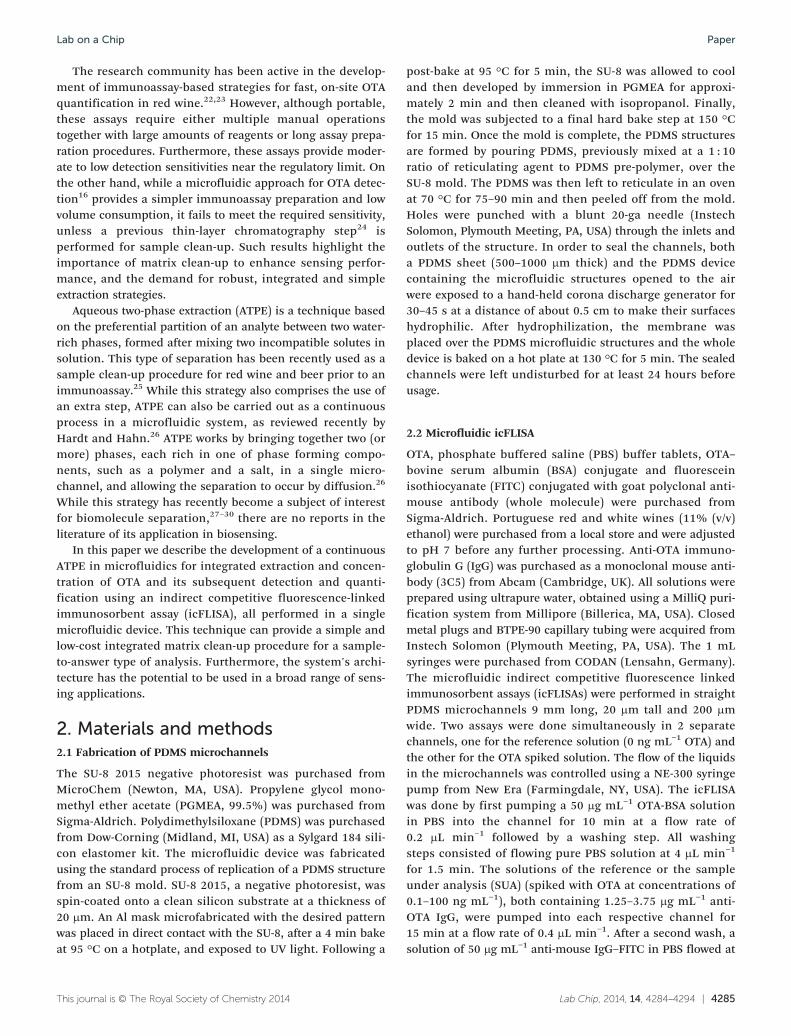
On-chip sample preparation and analytequantification using a microfluidic aqueoustwo-phase extraction coupled with animmunoassay†
R. R. G. Soares,ac P. Novo,‡a A. M. Azevedo,bc P. Fernandes,bc M. R. Aires-Barros,bc
V. Chua and J. P. Conde*ab
Immunoassays are fast and sensitive techniques for analyte quantification, and their use in point-of-care
devices for medical, environmental, and food safety applications has potential benefits of cost, portability,
and multiplexing. However, immunoassays are often affected by matrix interference effects, requiring the
use of complex laboratory extraction and concentration procedures in order to achieve the required sensi-
tivity. In this paper we propose an integrated microfluidic device for the simultaneous matrix clean-up,
concentration and detection. This device consists of two modules in series, the first performing an aqueous
two-phase extraction (ATPE) for matrix extraction and analyte pre-concentration, and the second an
immunoassay for quantification. The model analyte was the mycotoxin ochratoxin A (OTA) in a wine matrix.
Using this strategy, a limit of detection (LoD) of 0.26 ng mL−1 was obtained for red wine spiked with OTA,
well below the regulatory limit for OTA in wines of 2 ng mL−1 set by the European Union. Furthermore,
the linear response on the logarithmic concentration scale was observed to span 3 orders of magnitude
(0.1–100 ng mL−1). These results are comparable to those obtained for the quantification of OTA in plain
buffer without an integrated ATPE (LoD = 0.15 ng mL−1). The proposed method was also found to provide
similar results for markedly different matrices, such as red and white wines. This novel approach based on
aqueous two-phase systems can help the development of point-of-care devices that can directly deal with
real samples in complex matrices without the need for extra extraction processes and equipment.
1. Introduction
Immunoassays are powerful bioanalytical techniques thathave been used extensively in clinical diagnosis for decades,either performed in a laboratory1–3 or, more recently, inte-grated into portable devices.4,5 Immunoassay applicationshave been successfully broadened to environmental analy-sis,6,7 with a significant and increasing share targeted tomycotoxin quantification in feed and foodstuff.8–10 However,immunoassays suffer from significant matrix interference
in samples such as blood,11 urine,12 water,6 and foodextracts.13–17 This interference is responsible for a pro-nounced decrease in sensitivity and inter-assay reproducibil-ity, usually requiring sample treatment steps prior to analysis,which are often complex and time-consuming. While thesetreatments are feasible in a laboratory, they are a significantdrawback in the development of novel immunoassays forpoint-of-need analysis. Therefore, to overcome this limitation,it is desirable to have an integrated sample clean-up step.
In this work, the mycotoxin ochratoxin A (OTA) wasselected as a model analyte and red wine as the modelmatrix. OTA has been found to contaminate a variety of foodand feed on a worldwide scale,18,19 raising important publichealth concerns since its consumption has been found toinduce hepatotoxic, nephrotoxic, neurotoxic, teratogenic,immunotoxic and carcinogenic effects in multiple animalmodels.20 Given these potentially harmful effects, the regula-tory limit for OTA in wines in the European Union has beenset at a maximum of 2 ng mL−1.21 Therefore, to effectivelyenforce this regulation, there is a high demand for simplemethods to quickly quantify OTA “on site” and, if necessary,send the sample to a certified laboratory.
oyal Society of Chemistry 2014
Lab on a Chip Paper
The research community has been active in the develop-ment of immunoassay-based strategies for fast, on-site OTAquantification in red wine.22,23 However, although portable,these assays require either multiple manual operationstogether with large amounts of reagents or long assay prepa-ration procedures. Furthermore, these assays provide moder-ate to low detection sensitivities near the regulatory limit. Onthe other hand, while a microfluidic approach for OTA detec-tion16 provides a simpler immunoassay preparation and lowvolume consumption, it fails to meet the required sensitivity,unless a previous thin-layer chromatography step24 isperformed for sample clean-up. Such results highlight theimportance of matrix clean-up to enhance sensing perfor-mance, and the demand for robust, integrated and simpleextraction strategies.
Aqueous two-phase extraction (ATPE) is a technique basedon the preferential partition of an analyte between two water-rich phases, formed after mixing two incompatible solutes insolution. This type of separation has been recently used as asample clean-up procedure for red wine and beer prior to animmunoassay.25 While this strategy also comprises the use ofan extra step, ATPE can also be carried out as a continuousprocess in a microfluidic system, as reviewed recently byHardt and Hahn.26 ATPE works by bringing together two (ormore) phases, each rich in one of phase forming compo-nents, such as a polymer and a salt, in a single micro-channel, and allowing the separation to occur by diffusion.26
While this strategy has recently become a subject of interestfor biomolecule separation,27–30 there are no reports in theliterature of its application in biosensing.
In this paper we describe the development of a continuousATPE in microfluidics for integrated extraction and concen-tration of OTA and its subsequent detection and quanti-fication using an indirect competitive fluorescence-linkedimmunosorbent assay (icFLISA), all performed in a singlemicrofluidic device. This technique can provide a simple andlow-cost integrated matrix clean-up procedure for a sample-to-answer type of analysis. Furthermore, the system's archi-tecture has the potential to be used in a broad range of sens-ing applications.
2. Materials and methods2.1 Fabrication of PDMS microchannels
The SU-8 2015 negative photoresist was purchased fromMicroChem (Newton, MA, USA). Propylene glycol mono-methyl ether acetate (PGMEA, 99.5%) was purchased fromSigma-Aldrich. Polydimethylsiloxane (PDMS) was purchasedfrom Dow-Corning (Midland, MI, USA) as a Sylgard 184 sili-con elastomer kit. The microfluidic device was fabricatedusing the standard process of replication of a PDMS structurefrom an SU-8 mold. SU-8 2015, a negative photoresist, wasspin-coated onto a clean silicon substrate at a thickness of20 μm. An Al mask microfabricated with the desired patternwas placed in direct contact with the SU-8, after a 4 min bakeat 95 °C on a hotplate, and exposed to UV light. Following a
This journal is © The Royal Society of Chemistry 2014
post-bake at 95 °C for 5 min, the SU-8 was allowed to cooland then developed by immersion in PGMEA for approxi-mately 2 min and then cleaned with isopropanol. Finally,the mold was subjected to a final hard bake step at 150 °Cfor 15 min. Once the mold is complete, the PDMS structuresare formed by pouring PDMS, previously mixed at a 1 : 10ratio of reticulating agent to PDMS pre-polymer, over theSU-8 mold. The PDMS was then left to reticulate in an ovenat 70 °C for 75–90 min and then peeled off from the mold.Holes were punched with a blunt 20-ga needle (InstechSolomon, Plymouth Meeting, PA, USA) through the inlets andoutlets of the structure. In order to seal the channels, botha PDMS sheet (500–1000 μm thick) and the PDMS devicecontaining the microfluidic structures opened to the airwere exposed to a hand-held corona discharge generator for30–45 s at a distance of about 0.5 cm to make their surfaceshydrophilic. After hydrophilization, the membrane wasplaced over the PDMS microfluidic structures and the wholedevice is baked on a hot plate at 130 °C for 5 min. The sealedchannels were left undisturbed for at least 24 hours beforeusage.
2.2 Microfluidic icFLISA
OTA, phosphate buffered saline (PBS) buffer tablets, OTA–bovine serum albumin (BSA) conjugate and fluoresceinisothiocyanate (FITC) conjugated with goat polyclonal anti-mouse antibody (whole molecule) were purchased fromSigma-Aldrich. Portuguese red and white wines (11% (v/v)ethanol) were purchased from a local store and were adjustedto pH 7 before any further processing. Anti-OTA immuno-globulin G (IgG) was purchased as a monoclonal mouse anti-body (3C5) from Abcam (Cambridge, UK). All solutions wereprepared using ultrapure water, obtained using a MilliQ puri-fication system from Millipore (Billerica, MA, USA). Closedmetal plugs and BTPE-90 capillary tubing were acquired fromInstech Solomon (Plymouth Meeting, PA, USA). The 1 mLsyringes were purchased from CODAN (Lensahn, Germany).The microfluidic indirect competitive fluorescence linkedimmunosorbent assays (icFLISAs) were performed in straightPDMS microchannels 9 mm long, 20 μm tall and 200 μmwide. Two assays were done simultaneously in 2 separatechannels, one for the reference solution (0 ng mL−1 OTA) andthe other for the OTA spiked solution. The flow of the liquidsin the microchannels was controlled using a NE-300 syringepump from New Era (Farmingdale, NY, USA). The icFLISAwas done by first pumping a 50 μg mL−1 OTA-BSA solutionin PBS into the channel for 10 min at a flow rate of0.2 μL min−1 followed by a washing step. All washingsteps consisted of flowing pure PBS solution at 4 μL min−1
for 1.5 min. The solutions of the reference or the sampleunder analysis (SUA) (spiked with OTA at concentrations of0.1–100 ng mL−1), both containing 1.25–3.75 μg mL−1 anti-OTA IgG, were pumped into each respective channel for15 min at a flow rate of 0.4 μL min−1. After a second wash, asolution of 50 μg mL−1 anti-mouse IgG–FITC in PBS flowed at
Lab Chip, 2014, 14, 4284–4294 | 4285
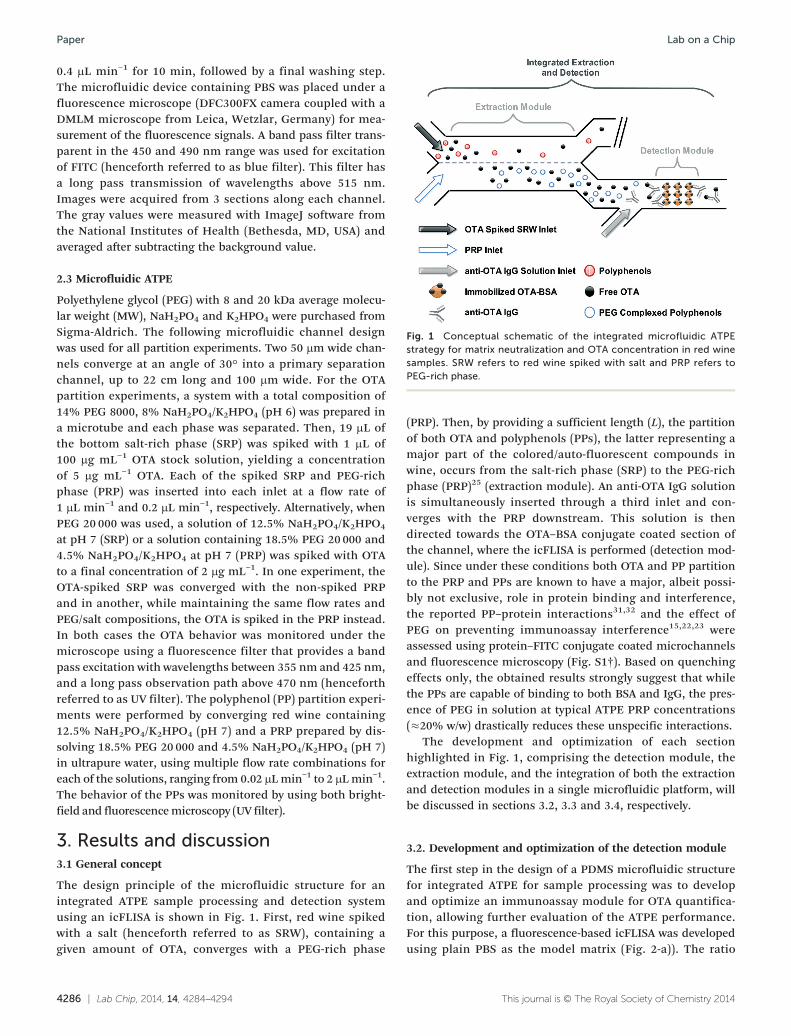
Fig. 1 Conceptual schematic of the integrated microfluidic ATPEstrategy for matrix neutralization and OTA concentration in red winesamples. SRW refers to red wine spiked with salt and PRP refers toPEG-rich phase.
Lab on a ChipPaper
0.4 μL min−1 for 10 min, followed by a final washing step.The microfluidic device containing PBS was placed under afluorescence microscope (DFC300FX camera coupled with aDMLM microscope from Leica, Wetzlar, Germany) for mea-surement of the fluorescence signals. A band pass filter trans-parent in the 450 and 490 nm range was used for excitationof FITC (henceforth referred to as blue filter). This filter hasa long pass transmission of wavelengths above 515 nm.Images were acquired from 3 sections along each channel.The gray values were measured with ImageJ software fromthe National Institutes of Health (Bethesda, MD, USA) andaveraged after subtracting the background value.
2.3 Microfluidic ATPE
Polyethylene glycol (PEG) with 8 and 20 kDa average molecu-lar weight (MW), NaH2PO4 and K2HPO4 were purchased fromSigma-Aldrich. The following microfluidic channel designwas used for all partition experiments. Two 50 μm wide chan-nels converge at an angle of 30° into a primary separationchannel, up to 22 cm long and 100 μm wide. For the OTApartition experiments, a system with a total composition of14% PEG 8000, 8% NaH2PO4/K2HPO4 (pH 6) was prepared ina microtube and each phase was separated. Then, 19 μL ofthe bottom salt-rich phase (SRP) was spiked with 1 μL of100 μg mL−1 OTA stock solution, yielding a concentrationof 5 μg mL−1 OTA. Each of the spiked SRP and PEG-richphase (PRP) was inserted into each inlet at a flow rate of1 μL min−1 and 0.2 μL min−1, respectively. Alternatively, whenPEG 20 000 was used, a solution of 12.5% NaH2PO4/K2HPO4
at pH 7 (SRP) or a solution containing 18.5% PEG 20 000 and4.5% NaH2PO4/K2HPO4 at pH 7 (PRP) was spiked with OTAto a final concentration of 2 μg mL−1. In one experiment, theOTA-spiked SRP was converged with the non-spiked PRPand in another, while maintaining the same flow rates andPEG/salt compositions, the OTA is spiked in the PRP instead.In both cases the OTA behavior was monitored under themicroscope using a fluorescence filter that provides a bandpass excitation with wavelengths between 355 nm and 425 nm,and a long pass observation path above 470 nm (henceforthreferred to as UV filter). The polyphenol (PP) partition experi-ments were performed by converging red wine containing12.5% NaH2PO4/K2HPO4 (pH 7) and a PRP prepared by dis-solving 18.5% PEG 20 000 and 4.5% NaH2PO4/K2HPO4 (pH 7)in ultrapure water, using multiple flow rate combinations foreach of the solutions, ranging from 0.02 μLmin−1 to 2 μLmin−1.The behavior of the PPs was monitored by using both bright-field and fluorescencemicroscopy (UV filter).
3. Results and discussion3.1 General concept
The design principle of the microfluidic structure for anintegrated ATPE sample processing and detection systemusing an icFLISA is shown in Fig. 1. First, red wine spikedwith a salt (henceforth referred to as SRW), containing agiven amount of OTA, converges with a PEG-rich phase
4286 | Lab Chip, 2014, 14, 4284–4294
(PRP). Then, by providing a sufficient length (L), the partitionof both OTA and polyphenols (PPs), the latter representing amajor part of the colored/auto-fluorescent compounds inwine, occurs from the salt-rich phase (SRP) to the PEG-richphase (PRP)25 (extraction module). An anti-OTA IgG solutionis simultaneously inserted through a third inlet and con-verges with the PRP downstream. This solution is thendirected towards the OTA–BSA conjugate coated section ofthe channel, where the icFLISA is performed (detection mod-ule). Since under these conditions both OTA and PP partitionto the PRP and PPs are known to have a major, albeit possi-bly not exclusive, role in protein binding and interference,the reported PP–protein interactions31,32 and the effect ofPEG on preventing immunoassay interference15,22,23 wereassessed using protein–FITC conjugate coated microchannelsand fluorescence microscopy (Fig. S1†). Based on quenchingeffects only, the obtained results strongly suggest that whilethe PPs are capable of binding to both BSA and IgG, the pres-ence of PEG in solution at typical ATPE PRP concentrations(≈20% w/w) drastically reduces these unspecific interactions.
The development and optimization of each sectionhighlighted in Fig. 1, comprising the detection module, theextraction module, and the integration of both the extractionand detection modules in a single microfluidic platform, willbe discussed in sections 3.2, 3.3 and 3.4, respectively.
3.2. Development and optimization of the detection module
The first step in the design of a PDMS microfluidic structurefor integrated ATPE for sample processing was to developand optimize an immunoassay module for OTA quantifica-tion, allowing further evaluation of the ATPE performance.For this purpose, a fluorescence-based icFLISA was developedusing plain PBS as the model matrix (Fig. 2-a)). The ratio
This journal is © The Royal Society of Chemistry 2014

Fig. 2 Schematics of the microchannel icFLISA protocol (a) and the method (b) used for OTA quantification. (I) Adsorption of OTA–BSA conjugatemolecules on the inner channel surfaces. (II) Flow of a reference or OTA spiked solution. (III) Flow of a solution containing FITC labeled secondaryantibodies. (IV) Fluorescence quantification under the microscope. All of the previous steps are performed under continuous liquid flow, from theinlets to the outlets as schematized in (b).
Lab on a Chip Paper
between the average fluorescence of each of the independentsamples under analysis (SUA) and the reference channel(Fig. 2-b)) is used to estimate the OTA concentration presentin the target SUA. Since this is a competitive assay, the gener-ated signal is inversely proportional to the OTA concentrationin solution.
To optimize the icFLISA, both the OTA-BSA concentrationused to coat the channel surface and the primary antibody(anti-OTA IgG) concentration added to the SUA were studied.
For the study of the OTA–BSA concentration, conditionswere optimized to allow saturation of the inner channelsurfaces, ensuring that the surface coverage is reproduciblebetween experiments, assuming that a multilayer is notformed. To select the appropriate concentration, an experi-ment was performed in which the OTA–BSA is insertedinto the microchannels at increasing concentrations. Thechannels were then washed with PBS prior to flowing thesecondary antibody solution (anti-mouse FITC-labeled IgG).As no primary antibody is present, the appearance of fluores-cence is related to a non-specific binding of the secondaryantibody due to insufficient coating of the surface of thechannel with OTA–BSA. The results are shown in Fig. 3-a).In order to minimize the background signal and reagentconsumption, a concentration of 50 μg mL−1 OTA–BSA wasselected.
For the study of the anti-OTA IgG concentration in theSUA and reference solutions, the effect of increasing theconcentrations on fluorescence was tested. The obtainedfluorescence ratios were then compared for the detectionof 10 ng mL−1 OTA spiked in PBS. The results are shown inFig. 3-b). It can be observed that as the concentration of anti-
This journal is © The Royal Society of Chemistry 2014
OTA IgG decreases, the fluorescence in the reference andSUA channels becomes increasingly similar. This observationmay be due to the increasing proximity of both reference andSUA channels to the lower fluorescence detection limit of theexperimental settings used. On the other hand, if the concen-tration of anti-OTA increases above a threshold of 5 μg mL−1,a plateau is reached for the fluorescence intensity in thereference channel, while the same was not observed for theSUA channel. Therefore, in order to avoid conditions inwhich a fluorescence intensity plateau is reached in the refer-ence channel, while still obtaining a relatively good signalratio, an anti-OTA IgG concentration of 3.75 μg mL−1 wasselected for further experiments.
The microfluidic icFLISA results obtained from increasingOTA concentrations in PBS using the previously optimizedconditions are shown in Fig. 3-c). After performing a loga-rithmic fit, a LoD of 0.15 ng mL−1 was obtained, which wascalculated from the OTA concentration that provides a signalreduction that is 3 times the standard deviation of the aver-age ratio between reference channels (3σ). It is important tohighlight that the obtained LoD is more than one order ofmagnitude below the target regulatory limit for OTA inwines, which stands as the first validation of this immuno-assay for OTA monitoring in food samples.
3.3. Development and optimization of the extraction andconcentration modules
The partition of OTA and the PP molecules was studied priorto the integration of ATPE with the microfluidic icFLISA.Both OTA and PPs are naturally fluorescent under UV light,
Lab Chip, 2014, 14, 4284–4294 | 4287

Fig. 3 Optimization of the OTA–BSA concentration used to coat themicrochannels (a), optimization of anti-OTA IgG concentration addedto the SUA (b), and quantification of OTA spiked in PBS using the opti-mized conditions (c). For the last point in plot (a), labeled with anasterisk (*), a solution of 1 mg mL−1 BSA in PBS buffer was flowedbefore the secondary antibody, after performing the adsorption stepusing 100 μg mL−1 OTA–BSA solution, in order to achieve a maximumin blocking efficiency. In (b), the fluorescence values for the referenceand 10 ng mL−1 OTA correspond to the highest measured fluorescenceintensity (reference channel when using 5 μg mL−1 anti-OTA IgG). Thesignal ratio was calculated by dividing the absolute fluorescence inthe SUA channel by the fluorescence in the reference channel. In (c),the icFLISA assays were performed using concentrations of OTA–BSAand anti-OTA IgG of 50 μg mL−1 and 3.75 μg mL−1, respectively. Thesignal ratios were calculated as in (b). All points are an average of threeindependent experiments, except for 0.1 ng mL−1 and 100 ng mL−1
OTA, which are an average of two independent experiments. The errorbars are the standard deviation (±SD) for each set of measurements.The shaded area refers to the non-specific background fluorescencevalue when the anti-OTA antibody is not present in solution.
Lab on a ChipPaper
therefore using a UV filter coupled with a fluorescence micro-scope allows the imaging of how they are concentrated acrossthe channel in real time. The design shown in Fig. 4-a) wasused in all subsequent experiments.
3.3.1. Optimization of polyphenol extraction. Thedesign used for the microfluidic ATPE requires the salt-richphase (SRP) and PEG-rich phase (PRP) to each flow intochannels already at near-equilibrium concentrations for bothphase forming components. Therefore, for a concentrationof 12.5% NaH2PO4/K2HPO4 (pH 7) in the SRP, the equilib-rium PRP composition is approximately 18.5% PEG 20 000and 4.5% NaH2PO4/K2HPO4 (pH 7), according to publishedbinodal curves measured under similar conditions.33 PEG20 000 was used for all further experiments unless statedotherwise.
4288 | Lab Chip, 2014, 14, 4284–4294
Under these conditions, it was observed that as theSRP, initially containing the interfering PPs, and the PRPconverged, two PRPs are formed at each side of the SRP.As expected, one flows on the side at which the PRP wasinserted in the channel (henceforth referred to as primaryPRP) and the other on the opposite side of the channel(henceforth referred to as secondary PRP). The formation ofthis secondary PRP, although unexpected, is highly advanta-geous as the PP molecules are concentrated in the secondaryPRP and can be easily disposed of, thus removing them fromthe solutions of interest (Fig. 4-b) at L = 12 cm) as will bediscussed next. Nevertheless, even if this secondary phasedid not form, the matrix clean-up effect still occurred aspreviously demonstrated by batch studies on the lab scale.25
Another phenomenon, observed in Fig. 4-b) at L = 0 cmand L = 1 cm, was the precipitation of PPs at the SRW-PRPinterface possibly due to PRP saturation. This precipitationphenomenon can be more clearly seen in Fig. S2,† whichwas acquired after several minutes of pumping both thesesolutions into the channels. These precipitates were not re-dissolved by the SRP, accumulating on the SRP insertion sideof the channel, but were easily dissolved by the PRP, flowingas a highly rich PP solution in the secondary PRP that simul-taneously formed at L = 0. It should be noted that thissecondary PRP also formed without adding wine to the SRP,thus its formation is not related to the precipitation of PPs.Curiously, this secondary PRP was not observed whenPEG 8000 was used under the same flow rate conditions(Fig. S3†). The formation of this secondary phase is possiblydue to the PRP-PDMS interface having a more favorablemolecular interaction than the SRP-PDMS, considering theobserved contact angles of approximately 105.7° and 113.5°,respectively (Fig. S4†). Therefore, the hypothesis is that thePRP crosses the SRP as a thin liquid film, in contact with thebottom and top surfaces of the channel. This is stronglysupported by (1) the gradual increase in width of this second-ary PRP with increasing L (Fig. S5†); (2) a very fast PPand OTA mass transfer from the SRW to the secondary PRP(Fig. S6† and Fig. 4), justified by the increased contact areabetween the phases; and (3) the gradual re-distribution ofboth PP and OTA molecules between the primary and second-ary PRPs along the separation channel (Fig. S6† and Fig. 4).Furthermore, in accordance with the contact angle hypothe-sis described above, it was also observed that when BSA wasadsorbed on the channel surface, rendering it more hydro-philic than the native PDMS surface, the opposite effect wasobserved as the SRP crosses the PRP to the top and bottomsides of the channel, forming a secondary SRP (Fig. S7†).Interestingly, with an L up to 12 cm, the PP concentration inthe primary and secondary PRPs did not achieve an equalvalue, as shown in Fig. 4-b), possibly due to the relativelyhigh molecular weight and low diffusion coefficient of somePPs. This property presents an advantage when collectingthe primary PRP for further detection, since it is stronglydepleted of PPs in comparison to the secondary PRP, particu-larly at a shorter L. Furthermore, by varying the flow rates of
This journal is © The Royal Society of Chemistry 2014
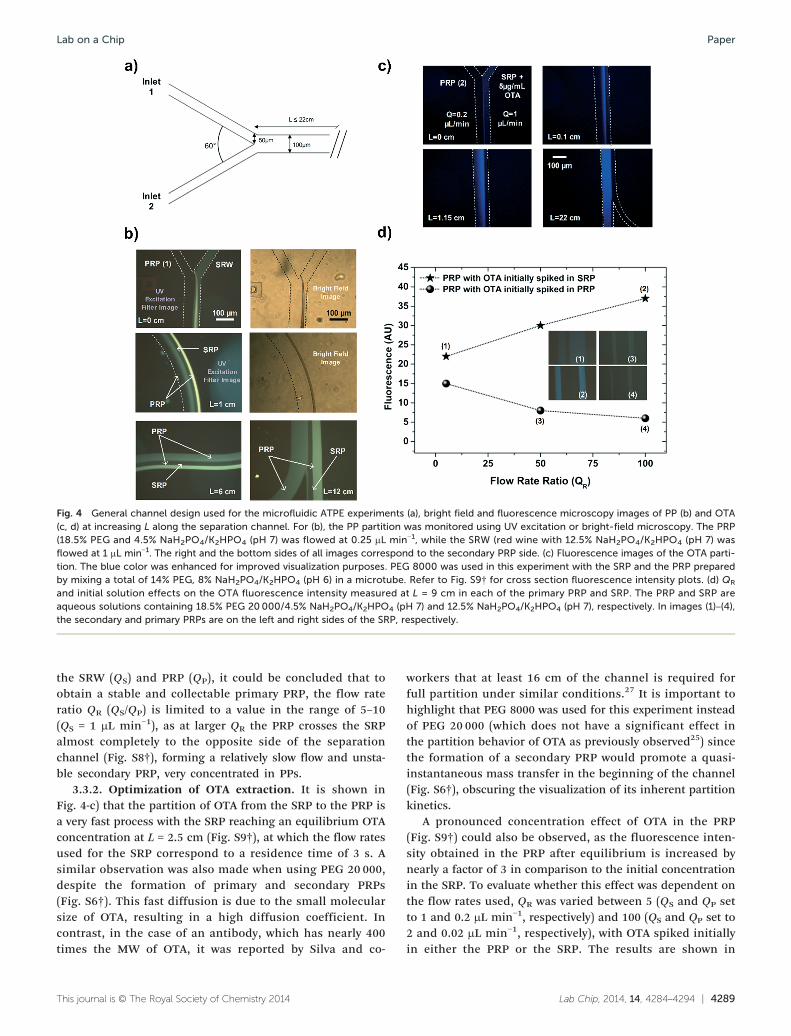
Fig. 4 General channel design used for the microfluidic ATPE experiments (a), bright field and fluorescence microscopy images of PP (b) and OTA(c, d) at increasing L along the separation channel. For (b), the PP partition was monitored using UV excitation or bright-field microscopy. The PRP(18.5% PEG and 4.5% NaH2PO4/K2HPO4 (pH 7) was flowed at 0.25 μL min−1, while the SRW (red wine with 12.5% NaH2PO4/K2HPO4 (pH 7) wasflowed at 1 μL min−1. The right and the bottom sides of all images correspond to the secondary PRP side. (c) Fluorescence images of the OTA parti-tion. The blue color was enhanced for improved visualization purposes. PEG 8000 was used in this experiment with the SRP and the PRP preparedby mixing a total of 14% PEG, 8% NaH2PO4/K2HPO4 (pH 6) in a microtube. Refer to Fig. S9† for cross section fluorescence intensity plots. (d) QR
and initial solution effects on the OTA fluorescence intensity measured at L = 9 cm in each of the primary PRP and SRP. The PRP and SRP areaqueous solutions containing 18.5% PEG 20000/4.5% NaH2PO4/K2HPO4 (pH 7) and 12.5% NaH2PO4/K2HPO4 (pH 7), respectively. In images IJ1)–IJ4),the secondary and primary PRPs are on the left and right sides of the SRP, respectively.
Lab on a Chip Paper
the SRW (QS) and PRP (QP), it could be concluded that toobtain a stable and collectable primary PRP, the flow rateratio QR IJQS/QP) is limited to a value in the range of 5–10(QS = 1 μL min−1), as at larger QR the PRP crosses the SRPalmost completely to the opposite side of the separationchannel (Fig. S8†), forming a relatively slow flow and unsta-ble secondary PRP, very concentrated in PPs.
3.3.2. Optimization of OTA extraction. It is shown inFig. 4-c) that the partition of OTA from the SRP to the PRP isa very fast process with the SRP reaching an equilibrium OTAconcentration at L = 2.5 cm (Fig. S9†), at which the flow ratesused for the SRP correspond to a residence time of 3 s. Asimilar observation was also made when using PEG 20 000,despite the formation of primary and secondary PRPs(Fig. S6†). This fast diffusion is due to the small molecularsize of OTA, resulting in a high diffusion coefficient. Incontrast, in the case of an antibody, which has nearly 400times the MW of OTA, it was reported by Silva and co-
This journal is © The Royal Society of Chemistry 2014
workers that at least 16 cm of the channel is required forfull partition under similar conditions.27 It is important tohighlight that PEG 8000 was used for this experiment insteadof PEG 20 000 (which does not have a significant effect inthe partition behavior of OTA as previously observed25) sincethe formation of a secondary PRP would promote a quasi-instantaneous mass transfer in the beginning of the channel(Fig. S6†), obscuring the visualization of its inherent partitionkinetics.
A pronounced concentration effect of OTA in the PRP(Fig. S9†) could also be observed, as the fluorescence inten-sity obtained in the PRP after equilibrium is increased bynearly a factor of 3 in comparison to the initial concentrationin the SRP. To evaluate whether this effect was dependent onthe flow rates used, QR was varied between 5 (QS and QP setto 1 and 0.2 μL min−1, respectively) and 100 (QS and QP set to2 and 0.02 μL min−1, respectively), with OTA spiked initiallyin either the PRP or the SRP. The results are shown in
Lab Chip, 2014, 14, 4284–4294 | 4289
Lab on a ChipPaper
Fig. 4-d). It can be seen that when OTA was initially spiked inthe SRP, the OTA concentration in the PRP at L = 9 cmincreased linearly with QR (R2 = 0.995). On the other hand,when OTA was initially spiked in the PRP, the OTA concentra-tion in the PRP at L = 9 cm decreased with an increase in QR.Due to the strong partition of OTA to the PRP25 no OTA couldbe measured in the SRP at L = 9 cm under any of the previousconditions.
This previous observations can possibly be explained byintroducing an extra factor defined as
vvP
S
(1)
in which vP and vS correspond to the velocities (independentof the channel cross-sectional area) of the PRP and SRPphases, respectively. Considering an extreme condition ofγ ≪ 1 and OTA spiked initially in the SRP phase with a con-centration of β, this value will approach the value of β in theSRP at a given L. On the other hand, the concentration ofOTA in the PRP will approach βK, with K being the partitioncoefficient for OTA defined as
K OTAOTA
t
b
(2)
with [OTA]t and [OTA]b being the equilibrium concentrationsof OTA in the top and bottom phases, respectively, when thesystem is prepared in batch conditions.34 In a differentsituation in which the OTA is initially spiked in the PRP, thehigh speed of the SRP will tend to continuously dilute thePRP to maintain the equilibrium driven by K. Therefore both
4290 | Lab Chip, 2014, 14, 4284–4294
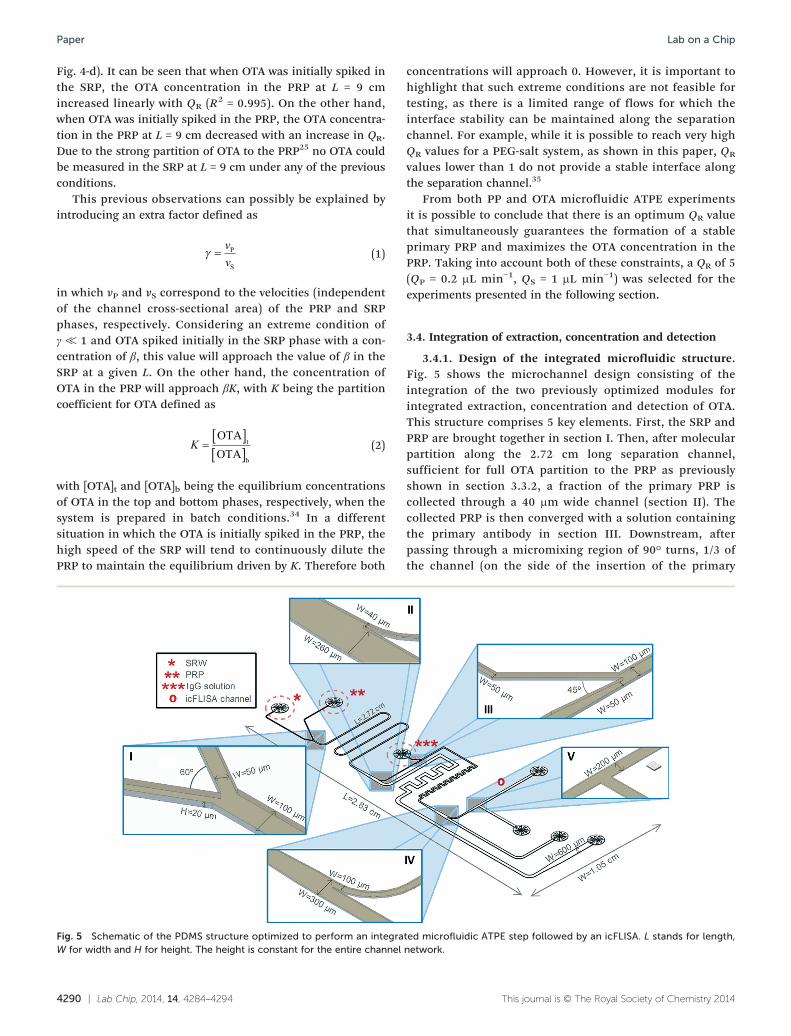
Fig. 5 Schematic of the PDMS structure optimized to perform an integraW for width and H for height. The height is constant for the entire channel
concentrations will approach 0. However, it is important tohighlight that such extreme conditions are not feasible fortesting, as there is a limited range of flows for which theinterface stability can be maintained along the separationchannel. For example, while it is possible to reach very highQR values for a PEG-salt system, as shown in this paper, QR
values lower than 1 do not provide a stable interface alongthe separation channel.35
From both PP and OTA microfluidic ATPE experimentsit is possible to conclude that there is an optimum QR valuethat simultaneously guarantees the formation of a stableprimary PRP and maximizes the OTA concentration in thePRP. Taking into account both of these constraints, a QR of 5(QP = 0.2 μL min−1, QS = 1 μL min−1) was selected for theexperiments presented in the following section.
3.4. Integration of extraction, concentration and detection
3.4.1. Design of the integrated microfluidic structure.Fig. 5 shows the microchannel design consisting of theintegration of the two previously optimized modules forintegrated extraction, concentration and detection of OTA.This structure comprises 5 key elements. First, the SRP andPRP are brought together in section I. Then, after molecularpartition along the 2.72 cm long separation channel,sufficient for full OTA partition to the PRP as previouslyshown in section 3.3.2, a fraction of the primary PRP iscollected through a 40 μm wide channel (section II). Thecollected PRP is then converged with a solution containingthe primary antibody in section III. Downstream, afterpassing through a micromixing region of 90° turns, 1/3 ofthe channel (on the side of the insertion of the primary
This journal is © The Royal Society of Chemistry 2014
ted microfluidic ATPE step followed by an icFLISA. L stands for length,network.
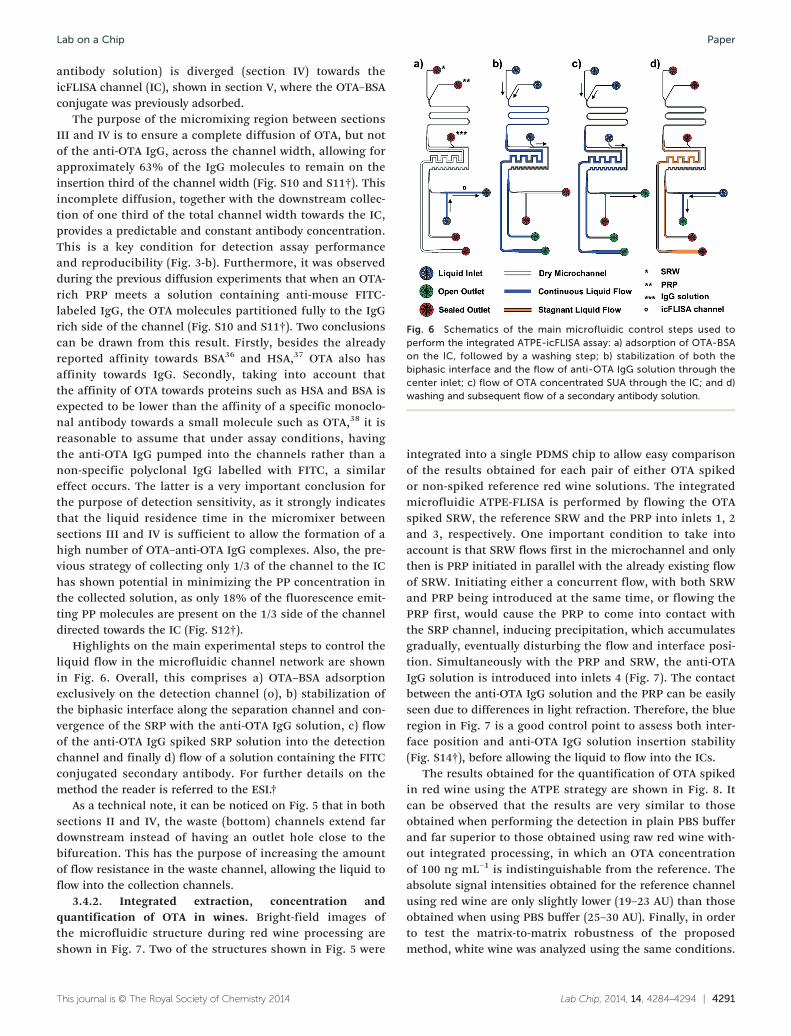
Fig. 6 Schematics of the main microfluidic control steps used toperform the integrated ATPE-icFLISA assay: a) adsorption of OTA-BSAon the IC, followed by a washing step; b) stabilization of both thebiphasic interface and the flow of anti-OTA IgG solution through thecenter inlet; c) flow of OTA concentrated SUA through the IC; and d)washing and subsequent flow of a secondary antibody solution.
Lab on a Chip Paper
antibody solution) is diverged (section IV) towards theicFLISA channel (IC), shown in section V, where the OTA–BSAconjugate was previously adsorbed.
The purpose of the micromixing region between sectionsIII and IV is to ensure a complete diffusion of OTA, but notof the anti-OTA IgG, across the channel width, allowing forapproximately 63% of the IgG molecules to remain on theinsertion third of the channel width (Fig. S10 and S11†). Thisincomplete diffusion, together with the downstream collec-tion of one third of the total channel width towards the IC,provides a predictable and constant antibody concentration.This is a key condition for detection assay performanceand reproducibility (Fig. 3-b). Furthermore, it was observedduring the previous diffusion experiments that when an OTA-rich PRP meets a solution containing anti-mouse FITC-labeled IgG, the OTA molecules partitioned fully to the IgGrich side of the channel (Fig. S10 and S11†). Two conclusionscan be drawn from this result. Firstly, besides the alreadyreported affinity towards BSA36 and HSA,37 OTA also hasaffinity towards IgG. Secondly, taking into account thatthe affinity of OTA towards proteins such as HSA and BSA isexpected to be lower than the affinity of a specific monoclo-nal antibody towards a small molecule such as OTA,38 it isreasonable to assume that under assay conditions, havingthe anti-OTA IgG pumped into the channels rather than anon-specific polyclonal IgG labelled with FITC, a similareffect occurs. The latter is a very important conclusion forthe purpose of detection sensitivity, as it strongly indicatesthat the liquid residence time in the micromixer betweensections III and IV is sufficient to allow the formation of ahigh number of OTA–anti-OTA IgG complexes. Also, the pre-vious strategy of collecting only 1/3 of the channel to the IChas shown potential in minimizing the PP concentration inthe collected solution, as only 18% of the fluorescence emit-ting PP molecules are present on the 1/3 side of the channeldirected towards the IC (Fig. S12†).
Highlights on the main experimental steps to control theliquid flow in the microfluidic channel network are shownin Fig. 6. Overall, this comprises a) OTA–BSA adsorptionexclusively on the detection channel (o), b) stabilization ofthe biphasic interface along the separation channel and con-vergence of the SRP with the anti-OTA IgG solution, c) flowof the anti-OTA IgG spiked SRP solution into the detectionchannel and finally d) flow of a solution containing the FITCconjugated secondary antibody. For further details on themethod the reader is referred to the ESI.†
As a technical note, it can be noticed on Fig. 5 that in bothsections II and IV, the waste (bottom) channels extend fardownstream instead of having an outlet hole close to thebifurcation. This has the purpose of increasing the amountof flow resistance in the waste channel, allowing the liquid toflow into the collection channels.
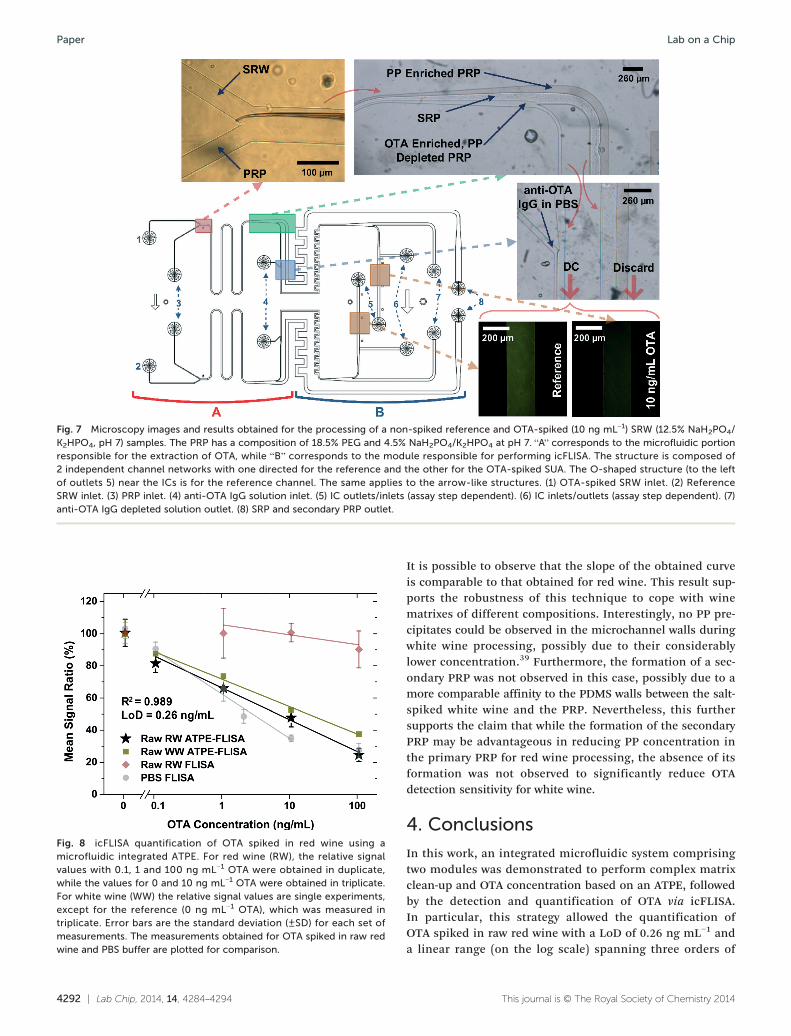
3.4.2. Integrated extraction, concentration andquantification of OTA in wines. Bright-field images ofthe microfluidic structure during red wine processing areshown in Fig. 7. Two of the structures shown in Fig. 5 were
This journal is © The Royal Society of Chemistry 2014
integrated into a single PDMS chip to allow easy comparisonof the results obtained for each pair of either OTA spikedor non-spiked reference red wine solutions. The integratedmicrofluidic ATPE-FLISA is performed by flowing the OTAspiked SRW, the reference SRW and the PRP into inlets 1, 2and 3, respectively. One important condition to take intoaccount is that SRW flows first in the microchannel and onlythen is PRP initiated in parallel with the already existing flowof SRW. Initiating either a concurrent flow, with both SRWand PRP being introduced at the same time, or flowing thePRP first, would cause the PRP to come into contact withthe SRP channel, inducing precipitation, which accumulatesgradually, eventually disturbing the flow and interface posi-tion. Simultaneously with the PRP and SRW, the anti-OTAIgG solution is introduced into inlets 4 (Fig. 7). The contactbetween the anti-OTA IgG solution and the PRP can be easilyseen due to differences in light refraction. Therefore, the blueregion in Fig. 7 is a good control point to assess both inter-face position and anti-OTA IgG solution insertion stability(Fig. S14†), before allowing the liquid to flow into the ICs.
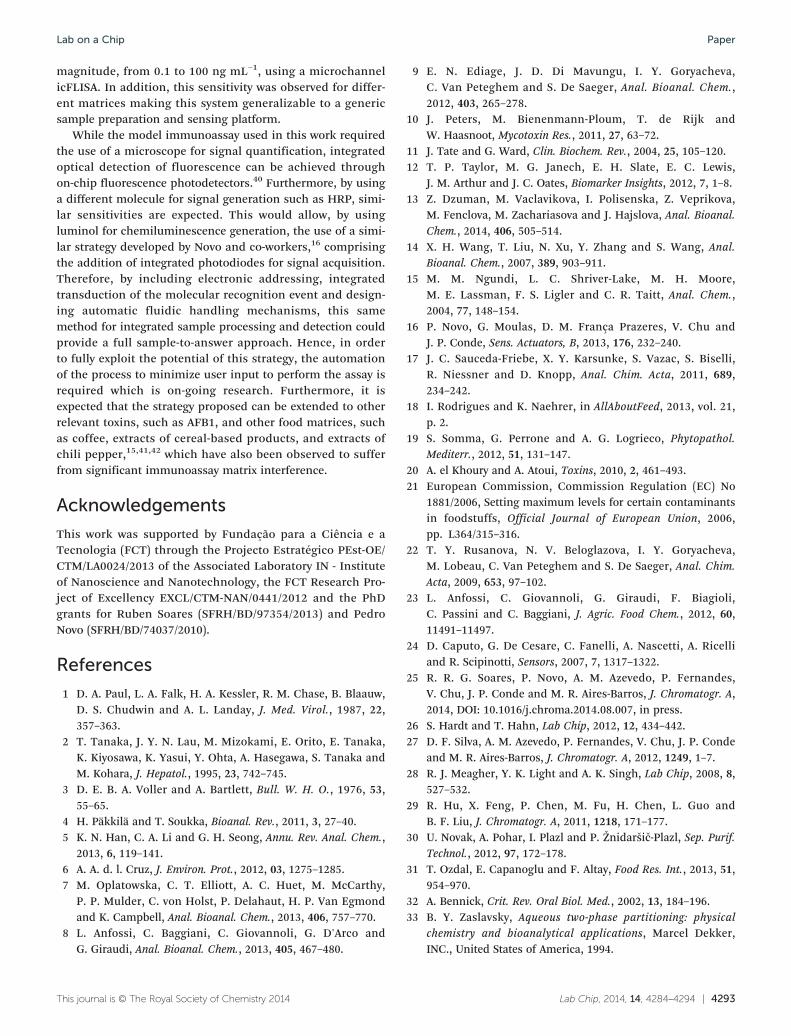
The results obtained for the quantification of OTA spikedin red wine using the ATPE strategy are shown in Fig. 8. Itcan be observed that the results are very similar to thoseobtained when performing the detection in plain PBS bufferand far superior to those obtained using raw red wine with-out integrated processing, in which an OTA concentrationof 100 ng mL−1 is indistinguishable from the reference. Theabsolute signal intensities obtained for the reference channelusing red wine are only slightly lower (19–23 AU) than thoseobtained when using PBS buffer (25–30 AU). Finally, in orderto test the matrix-to-matrix robustness of the proposedmethod, white wine was analyzed using the same conditions.
Lab Chip, 2014, 14, 4284–4294 | 4291
4292 | Lab Chip, 2014, 14, 4284–4294
Fig. 7 Microscopy images and results obtained for the processing of a non-spiked reference and OTA-spiked (10 ng mL−1) SRW (12.5% NaH2PO4/K2HPO4, pH 7) samples. The PRP has a composition of 18.5% PEG and 4.5% NaH2PO4/K2HPO4 at pH 7. “A” corresponds to the microfluidic portionresponsible for the extraction of OTA, while “B” corresponds to the module responsible for performing icFLISA. The structure is composed of2 independent channel networks with one directed for the reference and the other for the OTA-spiked SUA. The O-shaped structure (to the leftof outlets 5) near the ICs is for the reference channel. The same applies to the arrow-like structures. (1) OTA-spiked SRW inlet. (2) ReferenceSRW inlet. (3) PRP inlet. (4) anti-OTA IgG solution inlet. (5) IC outlets/inlets (assay step dependent). (6) IC inlets/outlets (assay step dependent). (7)anti-OTA IgG depleted solution outlet. (8) SRP and secondary PRP outlet.
Fig. 8 icFLISA quantification of OTA spiked in red wine using amicrofluidic integrated ATPE. For red wine (RW), the relative signalvalues with 0.1, 1 and 100 ng mL−1 OTA were obtained in duplicate,while the values for 0 and 10 ng mL−1 OTA were obtained in triplicate.For white wine (WW) the relative signal values are single experiments,except for the reference (0 ng mL−1 OTA), which was measured intriplicate. Error bars are the standard deviation (±SD) for each set ofmeasurements. The measurements obtained for OTA spiked in raw redwine and PBS buffer are plotted for comparison.
Lab on a ChipPaper
It is possible to observe that the slope of the obtained curveis comparable to that obtained for red wine. This result sup-ports the robustness of this technique to cope with winematrixes of different compositions. Interestingly, no PP pre-cipitates could be observed in the microchannel walls duringwhite wine processing, possibly due to their considerablylower concentration.39 Furthermore, the formation of a sec-ondary PRP was not observed in this case, possibly due to amore comparable affinity to the PDMS walls between the salt-spiked white wine and the PRP. Nevertheless, this furthersupports the claim that while the formation of the secondaryPRP may be advantageous in reducing PP concentration inthe primary PRP for red wine processing, the absence of itsformation was not observed to significantly reduce OTAdetection sensitivity for white wine.
4. Conclusions
In this work, an integrated microfluidic system comprisingtwo modules was demonstrated to perform complex matrixclean-up and OTA concentration based on an ATPE, followedby the detection and quantification of OTA via icFLISA.In particular, this strategy allowed the quantification ofOTA spiked in raw red wine with a LoD of 0.26 ng mL−1 anda linear range (on the log scale) spanning three orders of
This journal is © The Royal Society of Chemistry 2014
Lab on a Chip Paper
magnitude, from 0.1 to 100 ng mL−1, using a microchannelicFLISA. In addition, this sensitivity was observed for differ-ent matrices making this system generalizable to a genericsample preparation and sensing platform.
While the model immunoassay used in this work requiredthe use of a microscope for signal quantification, integratedoptical detection of fluorescence can be achieved throughon-chip fluorescence photodetectors.40 Furthermore, by usinga different molecule for signal generation such as HRP, simi-lar sensitivities are expected. This would allow, by usingluminol for chemiluminescence generation, the use of a simi-lar strategy developed by Novo and co-workers,16 comprisingthe addition of integrated photodiodes for signal acquisition.Therefore, by including electronic addressing, integratedtransduction of the molecular recognition event and design-ing automatic fluidic handling mechanisms, this samemethod for integrated sample processing and detection couldprovide a full sample-to-answer approach. Hence, in orderto fully exploit the potential of this strategy, the automationof the process to minimize user input to perform the assay isrequired which is on-going research. Furthermore, it isexpected that the strategy proposed can be extended to otherrelevant toxins, such as AFB1, and other food matrices, suchas coffee, extracts of cereal-based products, and extracts ofchili pepper,15,41,42 which have also been observed to sufferfrom significant immunoassay matrix interference.
Acknowledgements
This work was supported by Fundação para a Ciência e aTecnologia (FCT) through the Projecto Estratégico PEst-OE/CTM/LA0024/2013 of the Associated Laboratory IN - Instituteof Nanoscience and Nanotechnology, the FCT Research Pro-ject of Excellency EXCL/CTM-NAN/0441/2012 and the PhDgrants for Ruben Soares (SFRH/BD/97354/2013) and PedroNovo (SFRH/BD/74037/2010).
References
1 D. A. Paul, L. A. Falk, H. A. Kessler, R. M. Chase, B. Blaauw,
D. S. Chudwin and A. L. Landay, J. Med. Virol., 1987, 22,357–363.2 T. Tanaka, J. Y. N. Lau, M. Mizokami, E. Orito, E. Tanaka,
K. Kiyosawa, K. Yasui, Y. Ohta, A. Hasegawa, S. Tanaka andM. Kohara, J. Hepatol., 1995, 23, 742–745.3 D. E. B. A. Voller and A. Bartlett, Bull. W. H. O., 1976, 53,
55–65.4 H. Päkkilä and T. Soukka, Bioanal. Rev., 2011, 3, 27–40.
5 K. N. Han, C. A. Li and G. H. Seong, Annu. Rev. Anal. Chem.,2013, 6, 119–141.6 A. A. d. l. Cruz, J. Environ. Prot., 2012, 03, 1275–1285.
7 M. Oplatowska, C. T. Elliott, A. C. Huet, M. McCarthy,P. P. Mulder, C. von Holst, P. Delahaut, H. P. Van Egmondand K. Campbell, Anal. Bioanal. Chem., 2013, 406, 757–770.
8 L. Anfossi, C. Baggiani, C. Giovannoli, G. D'Arco and
G. Giraudi, Anal. Bioanal. Chem., 2013, 405, 467–480.This journal is © The Royal Society of Chemistry 2014
9 E. N. Ediage, J. D. Di Mavungu, I. Y. Goryacheva,
C. Van Peteghem and S. De Saeger, Anal. Bioanal. Chem.,2012, 403, 265–278.10 J. Peters, M. Bienenmann-Ploum, T. de Rijk and
W. Haasnoot, Mycotoxin Res., 2011, 27, 63–72.11 J. Tate and G. Ward, Clin. Biochem. Rev., 2004, 25, 105–120.
12 T. P. Taylor, M. G. Janech, E. H. Slate, E. C. Lewis,J. M. Arthur and J. C. Oates, Biomarker Insights, 2012, 7, 1–8.13 Z. Dzuman, M. Vaclavikova, I. Polisenska, Z. Veprikova,
M. Fenclova, M. Zachariasova and J. Hajslova, Anal. Bioanal.Chem., 2014, 406, 505–514.
14 X. H. Wang, T. Liu, N. Xu, Y. Zhang and S. Wang, Anal.
Bioanal. Chem., 2007, 389, 903–911.15 M. M. Ngundi, L. C. Shriver-Lake, M. H. Moore,
M. E. Lassman, F. S. Ligler and C. R. Taitt, Anal. Chem.,2004, 77, 148–154.16 P. Novo, G. Moulas, D. M. França Prazeres, V. Chu and
J. P. Conde, Sens. Actuators, B, 2013, 176, 232–240.17 J. C. Sauceda-Friebe, X. Y. Karsunke, S. Vazac, S. Biselli,
R. Niessner and D. Knopp, Anal. Chim. Acta, 2011, 689,234–242.18 I. Rodrigues and K. Naehrer, in AllAboutFeed, 2013, vol. 21,
p. 2.19 S. Somma, G. Perrone and A. G. Logrieco, Phytopathol.
Mediterr., 2012, 51, 131–147.20 A. el Khoury and A. Atoui, Toxins, 2010, 2, 461–493.
21 European Commission, Commission Regulation (EC) No1881/2006, Setting maximum levels for certain contaminantsin foodstuffs, Official Journal of European Union, 2006,pp. L364/315–316.
22 T. Y. Rusanova, N. V. Beloglazova, I. Y. Goryacheva,
M. Lobeau, C. Van Peteghem and S. De Saeger, Anal. Chim.Acta, 2009, 653, 97–102.23 L. Anfossi, C. Giovannoli, G. Giraudi, F. Biagioli,
C. Passini and C. Baggiani, J. Agric. Food Chem., 2012, 60,11491–11497.24 D. Caputo, G. De Cesare, C. Fanelli, A. Nascetti, A. Ricelli
and R. Scipinotti, Sensors, 2007, 7, 1317–1322.25 R. R. G. Soares, P. Novo, A. M. Azevedo, P. Fernandes,
V. Chu, J. P. Conde and M. R. Aires-Barros, J. Chromatogr. A,2014, DOI: 10.1016/j.chroma.2014.08.007, in press.26 S. Hardt and T. Hahn, Lab Chip, 2012, 12, 434–442.
27 D. F. Silva, A. M. Azevedo, P. Fernandes, V. Chu, J. P. Condeand M. R. Aires-Barros, J. Chromatogr. A, 2012, 1249, 1–7.28 R. J. Meagher, Y. K. Light and A. K. Singh, Lab Chip, 2008, 8,
527–532.29 R. Hu, X. Feng, P. Chen, M. Fu, H. Chen, L. Guo and
B. F. Liu, J. Chromatogr. A, 2011, 1218, 171–177.30 U. Novak, A. Pohar, I. Plazl and P. Žnidaršič-Plazl, Sep. Purif.
Technol., 2012, 97, 172–178.31 T. Ozdal, E. Capanoglu and F. Altay, Food Res. Int., 2013, 51,
954–970.32 A. Bennick, Crit. Rev. Oral Biol. Med., 2002, 13, 184–196.
33 B. Y. Zaslavsky, Aqueous two-phase partitioning: physicalchemistry and bioanalytical applications, Marcel Dekker,INC., United States of America, 1994.
Lab Chip, 2014, 14, 4284–4294 | 4293
Lab on a ChipPaper
34 S. Raja, V. R. Murty, V. Thivaharan, V. Rajasekar and
V. Ramesh, Sci. Technol., 2012, 1, 7–16.35 Y. Lu, Y. Xia and G. Luo, Microfluid. Nanofluid., 2010, 10,
1079–1086.36 F. S. Chu, Arch. Biochem. Biophys., 1971, 147, 359–366.
37 Y. V. Il'ichev, J. L. Perry and J. D. Simon, J. Phys. Chem. B,2001, 106, 452–459.38 T. J. Kindt, R. A. Goldsby, B. A. Osborne and J. Kuby, Kuby
Immunology, W. H. Freeman, 2007.
4294 | Lab Chip, 2014, 14, 4284–4294
39 J. A. Vinson and B. A. Hontz, J. Agric. Food Chem., 1995, 43,
401–403.40 J. P. Conde, A. C. Pimentel, A. T. Pereira, A. Gouvêa,
D. M. F. Prazeres and V. Chu, J. Non-Cryst. Solids, 2008, 354,2594–2597.41 M. Solfrizzo, G. Avantaggiato and A. Visconti, J. Chromatogr.
A, 1998, 815, 67–73.42 A. Prelle, D. Spadaro, A. Denca, A. Garibaldi and
M. L. Gullino, Toxins, 2013, 5, 1827–1844.This journal is © The Royal Society of Chemistry 2014
Copyright © 2022 FDOKUMEN