Microfluidic Devices: Useful Tools for Bioprocess Intensification
Upload
khangminh22Category
view
0download
0
Fluorescence-Activated Cell Sorting in Microfluidic Devices Lauren Nicolaisen
University of Colorado, Boulder Research Experience for Undergraduates
Advisor: Ralph Jimenez

The development of cell-sorting techniques has been influential in the advance of biomedical research in recent decades. Cell sorters have aided in the diagnosis and treatment of diseases including HIV, leukemia, and cancer. However, traditional cell sorters require large samples of often expensive and difficult to produce populations. By utilizing microfluidic devices as cell sorters, we can minimize the initial population requirements and increase the recovery rate. In addition, we can dramatically reduce the size and complexity of the sorter, such that it can be easily transported for mobile use. My project in the Research Experience for Undergraduates program was to design and build the optical and electronic components of a microfluidic-based cell sorter. I. Traditional Fluorescence-Activated Cell Sorters A method of sorting cells based upon the proteins they carry is an essential need in biomedical research. It is especially useful in immunology, where cell sorting is used to measure blood cell counts in patients with HIV and leukemia, both for diagnosis of these diseases and for monitoring the response of patients to treatment. Cell sorting can be used to research the effects of drugs and develop an understanding of drug resistance. Moreover, it can be used to analyze the effectiveness of chemotherapy or other treatment options in patients. Cell sorting is also vital to the detection and identification of viral antigens, as well as to the development of new drug and treatment options for various diseases. The traditional method for sorting cells is a fluorescence-activated cell sorting (FACS) machine. A suspension of cells containing varying amount of the protein of interest are placed into a flask. Antibodies that bond with the specific protein are coated with a fluorescent dye. Therefore, cells that contain the protein will also hold the fluorescent dye. A nozzle at the end of the flask is set to vibrate, which forms drops that contain only one cell at a time. The cells pass through the focus of a laser, operating at the wavelength of absorption for the fluorescent dye that is being used. Therefore, cells that hold the protein of interest will fluoresce. Traditionally, the fluorescence will be measured by a photomultiplier tube whose signal is being monitored by a computer. The computer controls an electric wire which generates an electric charge in the cell. If the cell fluoresces (it holds the protein), it will be positively charged. Otherwise, it will be negatively charged. All of the cells then pass through two charged plates. The positively charged cells will be forced toward the negative plate and the negatively charged cells will be forced toward the positive plate. Two collection tubes placed at either side of the plates will collect the cells. Therefore, the population has been sorted based upon the presence of the specific protein. The traditional cell sorting method is very effective. It can potentially sort as many as 50,000 cells per second. Moreover, it is not limited to one single sorting criterion. Multiple lasers and detectors can be used to simultaneously sort by more than one factor. Moreover, populations sorted in a traditional FACS sorter have very high purity, typically 95-100%. However, there are drawbacks to this method. The primary shortcoming is that the sorter is intended for use with a large population. The recovery rate is fairly low, and there is a tradeoff between the sorting speed, the purity rate, and the recovery rate. Often, the population that needs to be analyzed is very expensive or difficult to produce. Especially in modern cancer and immunology research, it is imperative to recover all of the cells from the cell sorter with the maximum possible purity rate. Another major drawback of the traditional FACS machine is that they are very large and cumbersome. Ideally, it would be possible to transport the cell sorter between locations quickly so that it could be a part of mobile

clinics, aiding in the diagnosis and research of disease. A diagram of the traditional cell sorting method is shown below.
Figure I. Traditional Cell-Sorting Machine
II. Microfluidic Cell Sorting One of the major advances in biomedical technology in the past few decades is the miniaturization of biological assays through the use of microfluidics. Microfluidics are small devices with micrometer-scale channels through which various fluids can be sent. In our case, the microfluidic is made by placing a layer of PDMS above a template with raised areas to represent the channels, thus leaving the channels as indentations on the PDMS. The PDMS is then affixed to a sheet of glass and tubes are attached through which various fluids can be sent. Microfluidics can be used for many different measurements, such as DNA analysis, enzyme analysis, viscosity and pH levels, disease diagnosis, and detection of chemicals and toxins. Its primary advantage is in the integration of multiple measurements into a small, compact, and easy to transport device. For example, the diagnosis of various diseases or the detection of various biological toxins can be accomplished with a
Cell Suspension Green Cells Have Protein Red Cells Do Not
Nozzle Sends Through One Cell at a Time
Laser Photomultiplier Tube Collects Fluorescence + ‐ + ‐
Computer Registers Fluorescence Sends Signal to Wire to Charge Cell

minimal amount of equipment, such that it could be used in mobile clinics. Another major advantage is that the microfluidics are relatively inexpensive and are capable of being mass-produced once the initial design has been created. Ideally, the long term plan is to have inexpensive microfluidics readily available for home and clinic use. The compact nature and flexibility of microfluidics makes them ideal for building an easily transportable cell sorter. The basic idea is to inject a suspension of cells into a microfludic channel. As in the traditional FACS sorter, we will focus a laser onto the cells such that those cells that hold a certain protein will fluoresce. In order for this to be possible, however, the cells must pass through the detection area one at a time. In the case of the traditional sorter, this was accomplished via the vibrating tip, which only enabled one cell to pass through the laser focus. In our case, however, we will rely on the microfluidic channels to create a steady stream of cells. This is done by having two other channels intersect the main channel. Buffer is sent through these channels at high pressure, so that when the three channels meet, the cells are pushed to the center and driven by the pressure. This process is known as hydrodynamic focusing. As the cells pass through the laser focus, those cells that possess the protein in question will fluoresce. The fluorescence will then be focused into a photodiode. The photodiode will send a current signal to a laser diode driver. This driver will convert the signal to a voltage and amplify it. Moreover, it will take the signal and convert it into a trigger on a second laser. This trigger will have a delay in it and a certain width, such that the laser will only be on when the cell passes through its focus. The second laser is a near-infrared (808 nm) diode bar. The laser will be focused onto the microfluidic approximately 0.5 mm down the channel from the fluorescence laser. The laser will be triggered such that it will turn on when a cell that contains the protein in question passes through its focus. If the trapping laser is turned off, the cell will progress normally through the channel. However, the trapping laser uses optical forces to drag the fluorescent cells into a different side channel. Optical forces are extremely weak, typically only a few pN in magnitude. However, they are sufficient to divert the cells (approximately 15 µm in diameter) by a few µm, such that they enter a different channel. Optical forces arise because the laser profile is not constant. Light at the center of the focus will typically be brighter than light at the outside, such that there is a gradient in the intensity profile. The refraction of the light rays will generate a gradient force that will trap the cell along the laser focus. Thus, the trapping laser can divert the cell from its original path. As a result, fluorescent cells will be separated from the non-fluorescent cells. A diagram of the microfluidic, as well as an image of an actual microfluidic, are shown below.

Figure 2: Diagram of Microfluidic Figure 3: Image of Microfluidic
III. Experimental Setup – Detection The first step in designing the cell sorter is deciding how to set up the fluorescence and detection. The primary goal of the project is to make the cell sorter compact and easy to transport. In addition, due to the small size of the microfluidic, there is insufficient room for multiple focusing optics. In light of these constraints, we decided to use the same objective for focusing the laser light and collecting the fluorescence. The objective that we chose was an infinity corrected, 10x magnification objective. The fluorescence laser would be collimated prior to the objective, so that it would be focused onto the microfluidic at the working distance of the objective. When a cell containing the protein in question passed through the focus, its fluorescence would pass through the objective. The fluorescence would then be collimated at the opposite end of the objective. In order to detect the fluorescence, it was necessary to separate the laser beam and the fluorescence. To accomplish this, we used a dichroic mirror. A dichroic mirror is a type of filtering mirror that selectively passes through specific wavelengths. In our case, the dichroic transmits light with wavelength between 450 nm and 600 nm. All other wavelengths are reflected. We placed this mirror at a 45o angle with respect to the
Green Cells Have Protein Red Cells Do Not Buffer Solution Focuses Cells Into a Line Laser Causes Cells to Fluoresce – Triggering The Trapping Laser Trapping Laser Diverts The Fluorescent Cells Into Separate Channel

microfluidic. The fluorescence from the microfluidic would pass straight through the dichroic. In contrast, the laser is initially placed at a right angle to the microfluidic. It is aligned to reflect off of the dichroic and into the objective. Thus, the dichroic serves to reflect the laser light into the microfluidic, but transmit the fluorescence coming out of the microfluidic. The fluorescence from the cells would then pass through a 20 cm focal length lens, as well as a 450 - 480 nm bandpass filter that blocks out any background light. It is thereby focused onto a photodetector. In addition, we placed a pop-up mirror between the lens and the photodetector that deflects the fluorescence into a standard CCD camera. This camera is used for the alignment of the microfluidic and the lasers. Each of the components used for the detection of fluorescence is rigidly mounted onto the table. The height is fixed by the height of the laser, and all other optics are mounted at the same height. The laser and the camera are at 90o angles with the respect to the detection axis. The microfluidic itself is mounted on an x-y-z translation stage. This is necessary in order to ensure that the laser is focused within the channel exactly where it is needed, and to ensure that the microfluidic is located at the working distance of the objective. A diagram of the setup, as well as an actual image of the setup, is shown below.
Figure 4: Diagram of Fluorescence and Detection Optics
Microfluidic Objective Dichroic Mirror Lens f = 20 cm Pop‐up Mirror Photodetector Violet Laser CCD Camera
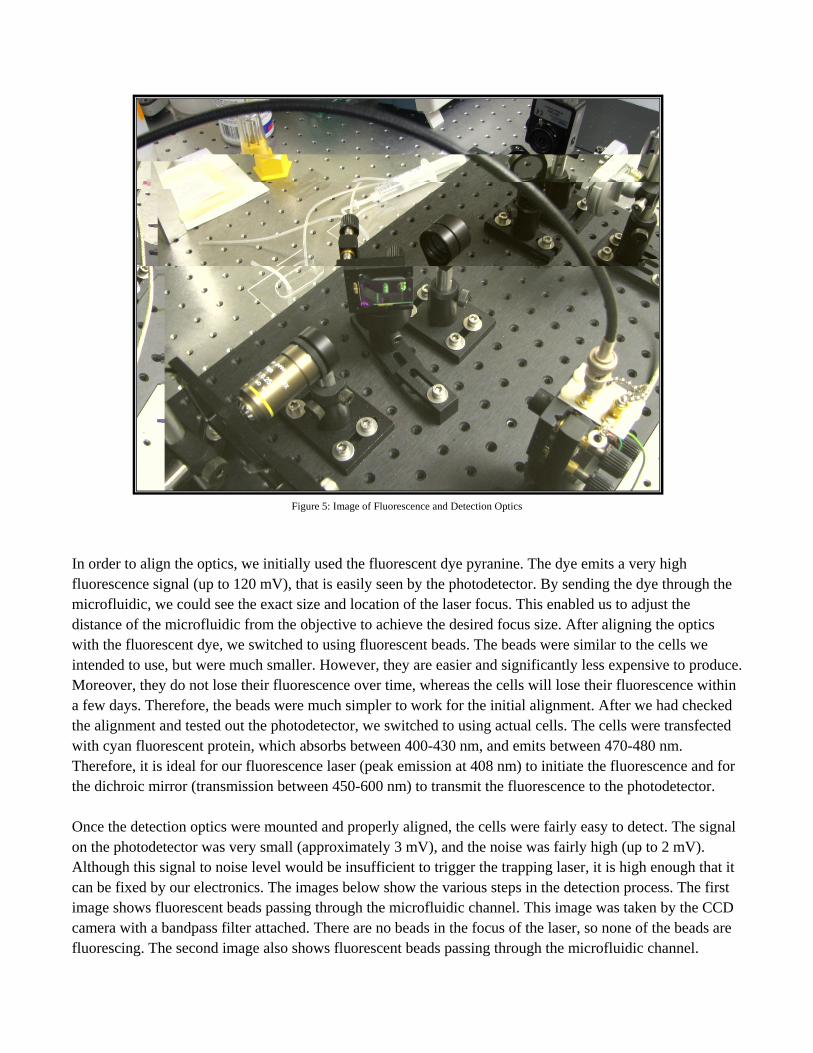
Figure 5: Image of Fluorescence and Detection Optics
In order to align the optics, we initially used the fluorescent dye pyranine. The dye emits a very high fluorescence signal (up to 120 mV), that is easily seen by the photodetector. By sending the dye through the microfluidic, we could see the exact size and location of the laser focus. This enabled us to adjust the distance of the microfluidic from the objective to achieve the desired focus size. After aligning the optics with the fluorescent dye, we switched to using fluorescent beads. The beads were similar to the cells we intended to use, but were much smaller. However, they are easier and significantly less expensive to produce. Moreover, they do not lose their fluorescence over time, whereas the cells will lose their fluorescence within a few days. Therefore, the beads were much simpler to work for the initial alignment. After we had checked the alignment and tested out the photodetector, we switched to using actual cells. The cells were transfected with cyan fluorescent protein, which absorbs between 400-430 nm, and emits between 470-480 nm. Therefore, it is ideal for our fluorescence laser (peak emission at 408 nm) to initiate the fluorescence and for the dichroic mirror (transmission between 450-600 nm) to transmit the fluorescence to the photodetector. Once the detection optics were mounted and properly aligned, the cells were fairly easy to detect. The signal on the photodetector was very small (approximately 3 mV), and the noise was fairly high (up to 2 mV). Although this signal to noise level would be insufficient to trigger the trapping laser, it is high enough that it can be fixed by our electronics. The images below show the various steps in the detection process. The first image shows fluorescent beads passing through the microfluidic channel. This image was taken by the CCD camera with a bandpass filter attached. There are no beads in the focus of the laser, so none of the beads are fluorescing. The second image also shows fluorescent beads passing through the microfluidic channel.

However, in this image, there is a bead passing through the laser focus and it is fluorescing. The third image shows the laser focus on the microfluidic channel. The image was taken by the CCD camera with a neutral density filter attached. Finally, the fourth image shows a cell fluorescing at the intersection of multiple channels. In this case, the stream of cells has been hydrodynamically focused, so that all cells will pass through this central area.
Figure 6: Microchannel with Beads Not in Laser Focus; Figure 7: Microchannel with Bead in Laser Focus Figure 8: Focus of Laser on Microchannel; Figure 9: Hydrodynamically Focused Fluorescing Bead in Channel
Fluorescent Bead
IV. Experimental Setup - Electronics The signal from the photodetector has a large amount of noise and a very low signal. In order to convert this signal into a trigger for the trapping laser, it was necessary to adjust the signal with electronics. In addition, the trigger needed to occur after the detection with a set delay and occur for a fixed amount of time. The velocity of the cells is determined by the pressure of the focusing. The goal of the project is to maximize the throughput of the cell sorter, so it would be ideal to send cells through quickly. However, there are limitations on how much pressure can occur in the microfluidic, as well as how quickly the detection and electronics can generate the trigger in the trapping laser. The velocity of the cells and the distance between the detection area and the trapping laser focus would determine the delay and the duration of the trigger. It was necessary to create a circuit that could alter the signal to generate the appropriate pulse to control the trapping laser. The circuit itself consisted of a current-to-voltage converter connected to an amplifier with adjustable gain. This allowed us to adjust the signal level to maximize the efficiency of the trapping. We were able to generate a signal of up to 400 mV with the gain maximized. The noise level was only approximately 20 mV. This signal was much better than the initial signal of the photodetector and was sufficient to control the trapping laser. After the amplifier, the signal is sent to a comparator. The comparator blocks out any signal that is below a certain threshold and passes through any signal above this threshold. The threshold was adjustable. Next, the signal would pass through a dual re-triggerable one shot. The one shot generates a pulse whose width and delay can be adjusted. It is re-triggerable so that if another cell fluoresces during the delay, it will still trigger the laser for the second cell. The delay can be adjusted between 8 ms and 400 ms. The width can be adjusted between 0.5 ms and 10 ms. These settings are ideal for a cell velocity of approximately 25 mm/s and a distance between the fluorescent laser focus and the trapping laser focus of approximately 0.5 mm. The pulse from the one shot then passes to a laser diode driver. The driver is connected to the laser diode itself and controls the amount of current passing to the laser. The base current of the driver can be adjusted so that the laser is normally off, or so that the laser has an initial current. In either case, the pulse from the circuit will generate a current in the laser that will add to any initial current. By modulating the current instead of simply turning the laser on and off, the laser is able to switch much quicker. This enables a more rapid sorting process, as well as increasing the lifetime of the laser. The circuit and the diode driver were mounted into an electronics box, along with a +12V power supply. Moreover, two fans and a Pentium heatsink were mounted into the box to prevent the driver and power supply from overheating. Lastly, a counter was built into the box to display the number of times the laser was triggered and a current meter was built into the box to display the current delivered to the trapping laser. A switch was also built in to toggle the laser between gated mode and CW mode for alignment purposes. The images below show the various steps of the electronics process. The first image shows the actual electronics box. The second image shows a signal from a function generator (yellow), along with the threshold level (blue) and the unaltered trigger (purple). The third image shows the same signal from the function generator (yellow), along with the threshold level (blue) and the pulse with a new delay and width (purple).

Figure 10: Image of Electronics Setup
Figures 11-14: These images are from the monitors on the electronics box. Yellow represents a sine wave from a function generator and is the input to the electronics box. Blue represents the threshold level. When the signal is above the threshold, a pulse (purple on bottom left) is generated. The circuit then triggers the laser with a different pulse (purple on bottom right) that has a fixed delay and width.

V. Experimental Setup - Trapping Laser The trapping laser is a diode laser bar with a 100 µm emission width. In order to trap the cells, it is necessary to image this laser one-to-one onto the microfluidic. However, the diode bar has a 40o divergence along its fast axis and a 10o divergence along its slow axis. There are two major difficulties associated with the divergence along each axis. First, the high divergence requires extremely short focal length lenses, or else the majority of the light will not be caught by the lenses. Second, since there is a divergence along both axes, it will require multiple lenses to collimate and focus the light along both axes. The original plan was to use three cylindrical lenses. The first lens, with a very small focal length, would correct the fast axis. Further along, a moderate focal length lens would correct the slow axis. Lastly, a third lens would focus the collimated beam. However, the focal length that would be required was much smaller than is available. As an alternative, we used a matched aspheric pair. This consists of two spherical lenses mounted together. The first lens collimates the beam and corrects the fast axis and the second lens focuses the beam. This lens pair will not correct the slow axis divergence. However, the lens is very low focal length (6.24 mm), so the amount of light that is lost due to the slow axis divergence is minimal. The main difficulty of using lenses with a very low focal length is that the alignment must be much more precise. The laser diode must be centered on the lens. Therefore, we needed to mount the lens onto an x-y translator. Additionally, the angle of the diode bar with respect to the microfluidic is extremely important. The cells will be trapped along the bar and pushed into the side channel. When the cell hits the diode bar its trajectory is changed and its velocity with respect to the channel is altered. In order to facilitate high throughput and avoid trap failure, it is important to minimize the change in trajectory of the cell upon hitting the diode bar. Therefore, the bar should be as close to parallel as possible so that the amount of deflection is minimized. However, in order to control the angle of the bar with respect to the channel, we will need to be able to rotate the laser diode. Therefore, the laser diode must be mounted in a rotation mount. The final difficulty in mounting the laser diode is that it must be cooled. The power delivered to the diode is 13 W, whereas only 5 W is used in operation. Therefore, 8 W are dissipated as heat. Our initial plan was to use a thermoelectric cooler operating at a constant current to cool the laser diode. However, at a constant current of 5A, our TEC allowed a maximum temperature difference of 20o C between the hot and cold side. In order to heatsink the TEC, it would be necessary for the heatsink to have a thermal conductivity of under 2.5 oC / W. However, a heatsink of this size would not fit well within the laser diode mount. Therefore, we reverted to water cooling. The laser diode is mounted onto a piece of aluminum that is held within a rotation mount. On the opposite side of the rotation mount, water is passed through a hole in the aluminum. An image of the diode bar setup is shown below.

Figure 15: Image of the Diode Bar Mount Setup
VI. Future Plans
The cell sorter we have built has several advantages over the traditional FACS machine. The microfluidic itself is extremely small and holds very little fluid. As a result, the initial population that is required for cell sorting is extremely small. A traditional FACS sorter requires a large population and has a low recovery rate. However, there are several cases in which a large initial population is not available. Often, the cells of interest are expensive or very difficult to produce. Also, in many research applications the goal is to isolate rare cells and enrich the population. The microfluidic-based system will allow a small initial sample and will be able to maintain both a high recovery rate and a high purity rate. Another advantage of our cell sorter is that it is fairly small. The setup fits onto a small plate and has the potential to become significantly smaller. Moreover, the expense of the cell sorter is primarily in the optical components. The microfluidics themselves are inexpensive and have the potential to be mass-produced in the future. As a result, it is likely that a microfluidic-based cell sorter will be simple enough and inexpensive enough to become available for mobile clinic and household use in the diagnosis and treatment of diseases in the future.
Another major advantage of using the microfluidics to build a cell sorter is that they are very flexible. The traditional cell sorter is limited to its specific purpose; however, since the movement and flow of the cells is controlled solely by the microfluidic, it is possible to vary and elaborate upon the sorting of cells by redesigning the microfluidic. The next step that is planned in this project is to develop a method for isolating cells that are receptive to Zn2+. In order to do this, we can use a beamsplitter to analyze the fluorescence at two locations. The first location will measure the fluorescence as before. However, in between the first and second location, Zn2+ will be inserted into the channels. The fluorescence will be measured at the second location and the ratio of the signal at the two locations will be calculated. The trapping laser will then sort the cells based upon this ratio. The purpose of this is to isolate the cells that have the binding sites for Zn2+. By generating an enriched population of these cells, we can study them in more detail and understand the protein that binds with Zn2+. This will potentially enable us to develop Zn2+ sensors. This idea can eventually be extended to other metals as well.

In conclusion, my project was fairly successful. The optical and electronic components of the cell sorter were successfully built and tested. In the following weeks, we will begin to sort cells based on the presence of cyan fluorescent protein. When this has been successfully completed and the cell sorter has been shown to work effectively, the additional components to sort cells based upon their reception of Zn2+ will be added.
I would like to thank my advisor, Ralph Jimenez, for the opportunity to help in the designing and building of the cell sorter. I would also like to thank Emily Gibson for her help throughout the project. Also, thanks to Terry Brown of the JILA Electronics Shop for the design of the circuit and for his help and guidance in building the electronics box. I have learned an enormous amount about biology, optics, machining, and electronics throughout this project, far more than I would have thought possible. I greatly appreciate the help of everyone at JILA and the CU Physics Department throughout the program.
References:
1. Applegate, et al. “Microfluidic Sorting System Based on Optical Waveguide Integration and Diode Laser Bar Trapping” Lab on a Chip, 2006, 6, 422-426.
2. Applegate, et al. “Optical Trapping, Manipulation, and Sorting of Cells and Colloids in Microfluidic Systems with Diode Laser Bars” Optics Express, 2004, 12, 1-9.
3. Wang, et al. “Microfluidic Sorting of Mammalian Cells by Optical Force Switching” Nature Biotechnology, 2005, 23, 83-87.
Copyright © 2022 FDOKUMEN