New Microfluidic Technologies for Studying Histone ...
170
New Microfluidic Technologies for Studying Histone Modifications and Long Non-Coding RNA Bindings Yuan-Pang Hsieh Dissertation submitted to the faculty of the Virginia Polytechnic Institute and State University in partial fulfillment of the requirements for the degree of Doctor of Philosophy In Chemical Engineering Chang Lu, Chair Liwu Li Aaron S. Goldstein Rong Tong May 1, 2020 Blacksburg, VA Keywords: Microfluidics, Epigenomics, Precision Medicine, Chromatin Immunoprecipitation, Histone Modification, Long Non-coding RNA Interaction, Next Generation Sequencing, NGS
-
Upload
khangminh22 -
Category
Documents
-
view
1 -
download
0
Transcript of New Microfluidic Technologies for Studying Histone ...

New Microfluidic Technologies for Studying
Histone Modifications and Long Non-Coding RNA Bindings
Yuan-Pang Hsieh
Dissertation submitted to the faculty of the Virginia Polytechnic Institute and
State University in partial fulfillment of the requirements for the degree of
Doctor of Philosophy
In
Chemical Engineering
Chang Lu, Chair
Liwu Li
Aaron S. Goldstein
Rong Tong
May 1, 2020
Blacksburg, VA
Keywords: Microfluidics, Epigenomics, Precision Medicine, Chromatin
Immunoprecipitation, Histone Modification, Long Non-coding RNA Interaction,
Next Generation Sequencing, NGS

ii
New Microfluidic Technologies for Studying Histone Modifications and Long Non-Coding RNA Bindings
Yuan-Pang Hsieh
Abstract
Previous studies have shown that genes can be switched on or off by age,
environmental factors, diseases, and lifestyles. The open or compact structures of
chromatin is a crucial factor that affects gene expression. Epigenetics refers to
hereditary mechanisms that change gene expression and regulations without
changing DNA sequences. Epigenetic modifications, such as DNA methylation,
histone modification, and non-coding RNA interaction, play critical roles in cell
differentiation and disease processes. The conventional approach requires the use
of a few million or more cells as starting material. However, such quantity is not
available when samples from patients and small lab animals are examined.
Microfluidic technology offers advantages to utilize low-input starting material and for
high-throughput.
In this thesis, I developed novel microfluidic technologies to study epigenomic
regulations, including 1) profiling epigenomic changes associated with LPS-induced
murine monocytes for immunotherapy, 2) examining cell-type-specific epigenomic
changes associated with BRCA1 mutation in breast tissues for breast cancer
treatment, and 3) developing a novel microfluidic oscillatory hybridized ChIRP-seq
assay to profile genome-wide lncRNA binding for numerous human diseases.
We used 20,000 and 50,000 primary cells to study histone modifications in
inflammation and breast cancer of BRCA1 mutation, respectively. In the project of
whole-genome lncRNA bindings, our microfluidic ChIRP-seq assay, for the first time,
謝元榜

iii
allowed us to probe native lncRNA bindings in mouse tissue samples successfully.
The technology is a promising approach for scientists to study lncRNA bindings in
primary patients. Our works pave the way for low-input and high-throughput
epigenomic profiling for precision medicine development.
謝元榜

iv
New Microfluidic Technologies for Studying Histone Modifications and Long Non-Coding RNA Bindings
Yuan-Pang Hsieh
General Audience Abstract
Traditionally, physicians treat patients with a one-size-fits-all approach, in
which disease prevention and treatment are designed for the average person. The
one-size-fits-all approach fits many patients, but does not work on some. Precision
medicine is launched to improve the low efficiency and diminish side effects, and all
of these drawbacks are happening in the traditional approaches. The genomic,
transcriptomic, and epigenomic data from patients is a valuable resource for
developing precision medicine.
Conventional approaches in profiling functional epigenomic regulation use
tens to hundreds of millions cells per assay, that is why applications in clinical
samples are restricted for several decades. Due to the small volume manipulated in
microfluidic devices, microfluidic technology exhibits high efficiency in easy
operation, reducing the required number of cells, and improving the sensitivity of
assays. In order to examine functional epigenomic regulations, we developed novel
microfluidic technologies for applications with the small number of cells.
We used 20,000 cells from mice to study the epigenomic changes in
monocytes. We also used 50,000 cells from patients and mice to study epigenomic
changes associated with BRCA1 mutation in different cell types. We developed a
novel microfluidic technology for studying lncRNA bindings. We used 100,000-
500,000 cells from cell lines and primary tissues to test several lncRNAs.
謝元榜

v
Traditional approaches require 20-100 million cells per assay, and these cells
are infected by virus for over-producing specific lncRNA. However, our technology
just needs 100,000 cells (non-over-producing state) to study lncRNA bindings. To
the best of our knowledge, this is the first allowed us to study native lncRNA bindings
in mouse samples successfully. Our efforts in developing microfluidic technologies
and studying epigenomic regulations pave the way for precision medicine
development.
謝元榜

vi
Acknowledgements
I would not have been able to accomplish my research and this dissertation
without the support from my family, friends, and professors. They play pivotal roles in
my life in making me the person who I am today. They provide love, help, support,
assistance, and advice to me not only in my research, but in my life. I would like to
express my sincere gratitude to all of them.
Most of all, I would like to thank my advisor, Dr. Chang Lu, for his kind help
and support. He educates knowledge and shares his personal life experience as not
only a teacher, but a friend and mentor to me. His enthusiastic, motivated, and
vigorous personality inspires me to explore the scientific field. He provided brilliant
advices when I faced difficulty in my research. He always generously offered his
praises and encouragements to me. He provided me the room to grow and gave me
the chance to examine three mechanisms of epigenomics. The experimental
experience gave me the comprehensive understanding in epigenomic regulations.
He paid tremendous attention and help to me for getting a job. It is my pleasure to
work with him during my doctoral research.
I would like to thank my committee members, Dr. Liwu Li, Dr. Aaron
Goldstein, and Dr. Rong Tong for their insightful advice. I had some collaborations
with Dr. Liwu Li in inflammatory research. His knowledge in inflammation and
immunoscience led me to accomplish my project of profiling epigenomic changes
associated with LPS-induced murine monocytes. Dr. Aaron Goldstein gave me
brilliant advice in my preliminary examination based on his professional background
in biomedical and tissue engineering. Dr. Rong Tong proffered precious guidance in
culturing cells, virus infection, and mouse tissue dissection.

vii
I am really grateful to gain assistance from my collaborators, Prof. Liwu Li, Dr.
Ruoxi Yuan, Dr. Shuo Geng, Dr. Yao Zhang (from Virginia Tech), Prof. Rong Li, Dr,
Xiaowen Zhang (from George Washington University), and Prof. Zhen Chen (from
City of Hope). Your valuable help is very important in my works.
I cannot express my appreciation to the Department of Chemical Engineering
at Virginia Tech. The Department Head, Prof. David Cox, and all office staffs provide
beneficial help during my Ph.D. program.
I really enjoy my Ph.D. journey due to the fun and support from members of
Lu lab: Dr. Zhenning Cao, Dr. Chen Sun, Dr. Sai Ma, Dr. Yan Zhu, Dr. Travis W.
Murphy, Dr. Mimosa Sarma, Chengyu Deng, Qiang Zhang, Bohan Zhu, Lynette B.
Naler, Zhengzhi Liu, Zirui Zhou, Yining Hao, and Zeren Sheng. I would like to
especially thank Dr. Yan Zhu, Dr. Travis W. Murphy, and Lynette B. Naler for their
kind help. Dr. Yan Zhu guided me the knowledge in epigenomics and instructed me
in conducting MOWChIP-seq process. Dr. Travis W. Murphy and Lynette B. Naler
gave me numerous help in data analysis and English writing.
Last but not least, I am deeply grateful to my parents and best friends, Tzu-
Yin Hsieh, Hsiu-Chun Chen, Yu-Min Chang, and Machi, for all their continuous love
and support throughout my life. They have always been there for me and provided
their endless love and support for me in my whole life. Thank you, my parents, for
giving me strength to reach for the stars and chase my dream.

viii
Table of Contents
Abstract ...................................................................................................................... ii
General Audience Abstract ..................................................................................... iv
Acknowledgements .................................................................................................. vi
Table of Contents ................................................................................................... viii
List of Figures ........................................................................................................... xi
List of Tables .......................................................................................................... xiii
List of Abbreviations .............................................................................................. xiv
Chapter 1 Overview ................................................................................................... 1
Chapter 2 Introduction .............................................................................................. 4
2.1 Epigenetics ................................................................................................................... 4 2.1.1 Histone modification ............................................................................................................. 4 2.1.2 Long non-coding RNA (lncRNA) .......................................................................................... 7
2.2 Chromatin immunoprecipitation (ChIP) ..................................................................... 8 2.2.1 Conventional approaches ..................................................................................................... 9 2.2.2 Microfluidic oscillatory washing-based ChIP (MOWChIP) .................................................. 10 2.2.3 SurfaceChIP ....................................................................................................................... 11 2.2.4 Low-Input Fluidized-Bed Enabled ChIP (LIFEChIP) .......................................................... 12
2.3 Chromatin isolation by RNA purification (ChIRP) .................................................. 13 2.3.1 Capture hybridization analysis of RNA targets (CHART) ................................................... 16 2.3.2 RNA antisense purification (RAP) ...................................................................................... 16
2.4 Next Generation Sequencing (NGS) ......................................................................... 18
2.5 ChIP-seq ..................................................................................................................... 18
2.6 Microfluidic device .................................................................................................... 20
2.7 Precision medicine .................................................................................................... 21
Chapter 3 Study of epigenomic changes associated with LPS-induced murine monocytes ............................................................................................................... 24

ix
3.1 Project Summary ....................................................................................................... 24
3.2 Introduction ................................................................................................................ 24
3.3 Results and discussion ............................................................................................. 26
3.4 Materials and methods .............................................................................................. 38
3.5 Conclusions ............................................................................................................... 45
Chapter 4 Profiled cell-type-specific epigenomic changes associated with BRCA1 mutation in breast tissues using MOWChIP-seq .................................... 47
4.1 Project Summary ....................................................................................................... 47
4.2 Introduction ................................................................................................................ 48
4.3 Results and discussion ............................................................................................. 50 4.3.1 BRCA1 mutation in human samples .................................................................................. 50
4.3.1-1 Pearson’s correlation of human sequencing data ....................................................... 51 4.3.1-2 Differential H3K27ac peak regions ............................................................................. 53 4.3.1-3 Examination of enhancers of patient samples ........................................................... 59 4.3.1-4 Motif analysis at enhancers of patient samples ......................................................... 60 4.3.1-5 Cell-type-specific transcription factors ........................................................................ 61
4.3.2 Profiling mouse samples ................................................................................................... 64
4.4 Materials and methods .............................................................................................. 66
4.5 Conclusions ............................................................................................................... 76
Chapter 5 Microfluidic oscillatory hybridized ChIRP-seq assay to profile genome-wide lncRNA binding ............................................................................... 77
5.1 Project Summary ....................................................................................................... 77
5.2 Introduction ................................................................................................................ 78
5.3 Results and discussion ............................................................................................. 80 5.3.1 Development of microfluidic oscillatory hybridized ChIRP technology ............................... 80 5.3.2 Adenovirus transfection and infection ................................................................................ 82 5.3.3 Profiling LEENE using pooling and splitting probes with microfluidic ChIRP technology ... 86 5.3.4 Profiling BY707159.1 with microfluidic ChIRP technology ................................................. 92 5.3.5 Profiling native HOTAIR with microfluidic ChIRP technology ............................................. 96
5.4 Materials and methods .............................................................................................. 99
5.5 Conclusions and Future work ................................................................................ 104
Chapter 6 Summary and Outlook ........................................................................ 105

x
References ............................................................................................................. 108
Publications ........................................................................................................... 127
Journal Articles .............................................................................................................. 127
Conference Presentation .............................................................................................. 128
Appendix A ............................................................................................................ 129
Microfluidic oscillatory hybridized ChIRP-seq protocol ............................................ 129
Summary of sequencing data information .................................................................. 144

xi
List of Figures
Fig. 2.1-1 Epigenetic mechanisms: DNA methylation, histone modification and non-
coding RNA (ncRNA) bindings .................................................................................... 5
Fig. 2.1-2 Chromosomes composed of condensed histones wrapped in DNA ........... 6
Fig. 2.1-3 Cell differentiation and self-renewal are regulated by lncRNAs .................. 8
Fig. 2.2-1 Chromatin immunoprecipitation .................................................................. 9
Fig. 2.2-2 Overview of the MOWChIP process ......................................................... 11
Fig. 2.2-3 Overview of SurfaceChIP .......................................................................... 12
Fig. 2.2-4 Overview of LIFEChIP .............................................................................. 13
Fig. 2.3-1 Overview of the ChIRP process ................................................................ 14
Fig. 2.3-2 Even and odd probe groups are used in ChIRP-seq ................................ 15
Fig. 2.3-3 Schematic of three approaches for profiling the genomic localization of
lncRNAs .................................................................................................................... 17
Fig. 2.5-1 Overview of ChIP-seq ............................................................................... 20
Fig. 2.7-1 The strategy of precision medicine compares with conventional one-size-
fits-all approach ......................................................................................................... 22
Fig. 3.2-1 The inflammatory responses with high-dose and low-dose LPS .............. 25
Fig. 3.3-1 Fragment size for ChIP-seq ...................................................................... 27
Fig. 3.3-2 Fragment size among three conditions ..................................................... 27
Fig. 3.3-3 Optimization of MOWChIP with different concentrations of antibody
(H3K27ac) ................................................................................................................. 28
Fig. 3.3-4 Optimization of MOWChIP with different oscillatory washing pressure .... 29
Fig. 3.3-5 Optimization of MOWChIP with different oscillatory washing time ........... 29
Fig. 3.3-6 MOWChIP sequencing data of mouse samples visualized in IGV ........... 30
Fig. 3.3-7 Pearson correlation matrix of MOWChIP sequencing data ...................... 31
Fig. 3.3-8 Epigenetic regulation of Apoe (left) and Bcl3 (right) ................................. 34
Fig. 3.3-9 Epigenetic regulations of C1qa, C1qb, C1qc ............................................ 34
Fig. 3.3-10 Epigenetic regulation of Fpr1 and Fpr2 ................................................... 34
Fig. 3.3-11 Gene ontology (GO) ................................................................................ 35
Fig. 3.3-12 Venn diagrams of enhancers and super enhancers ............................... 36
Fig. 3.3-13 Motif analysis at enhancers .................................................................... 38
Fig. 4.2-1 Four different cell types in breast tissues .................................................. 49
Fig. 4.3-1 ChIP-seq data from H3K27ac of human breast samples .......................... 52

xii
Fig. 4.3-2 ChIP-seq data from H3K4me3 of human breast samples ........................ 53
Fig. 4.3-3 Differential H3K27ac peak regions ........................................................... 54
Fig. 4.3-4 MOWChIP sequencing data of human samples, visualized in IGV .......... 55
Fig. 4.3-5 Different histone modification pattern in human basal cells ...................... 57
Fig. 4.3-6 Different histone modification pattern in human luminal progenitor cells .. 57
Fig. 4.3-7 Different histone modification pattern in human mature luminal and stromal
cells ........................................................................................................................... 58
Fig. 4.3-8 Different histone modification pattern in human stromal cells ................... 58
Fig. 4.3-9 Enhancers ................................................................................................. 59
Fig. 4.3-10 Motif analysis at enhancers .................................................................... 61
Fig. 4.3-11 Cell-type-specific transcription factors in NC and their enrichment in MUT
.................................................................................................................................. 63
Fig. 4.3-12 ChIP-seq data from mouse samples ....................................................... 65
Fig. 4.3-13 Mouse H3K27ac data in basal cells (8-month old mice), luminal
progenitors (8-month old mice) and young luminal progenitor (8-week old mice) .... 66
Fig. 5.3-1 The schematic of microfluidic oscillatory hybridized ChIRP ...................... 81
Fig. 5.3-2 Overview of adenovirus transfection system ............................................ 83
Fig. 5.3-3 Adenovirus transfection in HEK293 cells .................................................. 85
Fig. 5.3-4 Adenovirus infection in HUVECs .............................................................. 86
Fig. 5.3-5 Visualization of normalized sequencing data with pooling probes in IGV
(LEENE) .................................................................................................................... 89
Fig. 5.3-6 Visualization of normalized sequencing data with splitting probes in IGV
(LEENE) .................................................................................................................... 90
Fig. 5.3-7 The comparison of LEENE binding among Ad-GFP-LEENE, Ad-GFP, and
Control ....................................................................................................................... 92
Fig. 5.3-8 Visualization of normalized sequencing data with splitting probes in IGV
(BY707159.1) ............................................................................................................ 94
Fig. 5.3-9 The comparison of BY707159.1 binding between wild type and
BY707159.1 knockout mouse ................................................................................... 95
Fig. 5.3-10 Visualization of normalized sequencing data with splitting probes in IGV
(HOTAIR) .................................................................................................................. 97
Fig. 5.3-11 The comparison of HOTAIR binding between Chu’s and our data ......... 99

xiii
List of Tables
Table 3.3-2 Epigenomic regulations among different conditions .............................. 33
Table 3.3-1 Summary of MOWChIP sequencing data information ......................... 144
Table 4.3-1 Summary of MOWChIP sequencing data (H3K27ac, non-carrier)
information in human samples ................................................................................ 144
Table 4.3-2 Summary of MOWChIP sequencing data (H3K27ac, carrier) information
in human samples ................................................................................................... 146
Table 4.3-3 Summary of MOWChIP sequencing data (H3K4me3, non-carrier)
information in human samples ................................................................................ 147
Table 4.3-4 Summary of MOWChIP sequencing data (H3K4me3, carrier) information
in human samples ................................................................................................... 147
Table 4.3-5 Summary of MOWChIP sequencing data (H3K27ac, wild type)
information in mouse samples ................................................................................ 148
Table 4.3-6 Summary of MOWChIP sequencing data (H3K27ac, knockout)
information in mouse samples ................................................................................ 149
Table 4.3-7 Summary of MOWChIP sequencing data (H3K4me3, wild type)
information in mouse samples ................................................................................ 151
Table 4.3-8 Summary of MOWChIP sequencing data (H3K4me3, knockout)
information in mouse samples ................................................................................ 152
Table 5.3-1 Summary of ChIRP-seq in HUVECs with pooling all probes ............... 152
Table 5.3-2 Summary of ChIRP-seq in HUVECs with splitting probes ................... 153
Table 5.3-3 Summary of ChIRP-seq from wild type and BY707159.1 knockout mice
................................................................................................................................ 154
Table 5.3-4 Summary of HOTAIR ChIRP-seq from Chu and our data ................... 154

xiv
List of Abbreviations
3’ UTR 3’ untranslated region
5’ UTR 5’ untranslated region
ATAC-seq Assay for Transposase-Accessible Chromatin-seq
bp base pair
CHART Capture Hybridization Analysis of RNA Targets
ChIP Chromatin ImmunoPrecipitation
ChIP-seq Chromatin ImmunoPrecipitation followed by sequencing
ChIRP Chromatin Isolation by RNA Purification
DI water Deionized water
DMSO Dimethyl sulfoxide
DNA Deoxyribonucleic acid
dNTP Nucleoside triphosphate
DRIP-seq R-loop-specific DNA-RNA ImmunoPrecipitation-seq
EDTA Ethylenediaminetetraacetic acid
ENCODE Encyclopedia of DNA Elements
FACS Fluorescence-activated cell sorting
FBS Fetal bovine serum
GFP Green fluorescent protein
GO Gene Ontology
H3K4me3 tri-methylation at the 4th lysine residue of the histone H3 protein
H3K27ac acetylation at the 27th lysine residue of the histone H3 protein
H3K27me3 tri-methylation at the 27th lysine residue of the histone H3 protein
LIFEChIP Low-Input Fluidized-bed Enabled ChIP
lncRNA long non-coding RNA

xv
LPS Lipopolysaccharide
MNase Micrococcal Nuclease
MOWChIP Microfluidic Oscillatory Washing-based ChIP
NChIP Native ChIP
ncRNA non-coding RNA
NGS Next Generation Sequencing
nt nucleotide
PBS Phosphate-buffered saline
PCR Polymerase Chain Reaction
PDMS Polydimethylsiloxane
PIC Protease inhibitor cocktail
PMSF Phenylmethylsulfonyl fluoride
PS Penicillin streptomycin
PTM Post-Translational Modification
qPCR quantitative PCR
qRT-PCR quantitative Reverse Transcription-PCR
RAP RNA Antisense Purification
RFU Relative fluorescence units
RNA Ribonucleic acid
mRNA messenger RNA
rRNA ribosomal RNA
tRNA transfer RNA
SDS Sodium dodecyl sulfate
ssDNA Single stranded DNA
Tris Tris(hydroxymethyl)aminomethane

xvi
TSS Transcription Start Site
XChIP Crosslinked ChIP

1
Chapter 1 Overview
Previous studies have shown that genes can be switched on or off by age,
environmental factors, diseases, and lifestyle. The open or compact structure of
chromatin is a crucial factor that impacts on gene regulation. Epigenetics refers to
hereditary mechanisms that change gene expression and regulation without altering
DNA sequences. Epigenetics plays critical roles in cell differentiation1 and disease
processes2. Common epigenetics mechanisms include histone modification, DNA
methylation and non-coding RNA interactions.
The gold-standard method for studying histone modification and transcription
factor binding is chromatin immunoprecipitation coupled with next generation
sequencing (ChIP-seq)3. The limitations of conventional ChIP include the
requirement of a large number of cells as starting materials (e.g. 106 cells for ChIP-
qPCR and 107 cells for ChIP-seq)4,5. The application of ChIP-seq assays in clinical
studies is significantly restricted because primary patient samples rarely provide
such a large number of cells. Employing microfluidic devices allows this requirement
to be lowered to a few hundred cells, thus more primary patient samples can be
tested. Recent advances in DNA sequencing tools in combination with microfluidic
devices, provide a more comprehensive view of epigenetic regulations.
Non-coding RNAs (ncRNAs) are functional and informational RNAs
transcribed from DNA, but do not further encode proteins6. Recent studies have
suggested that histone modification and DNA methylation are regulated by ncRNAs7-
11. Long non-coding RNAs (lncRNAs) are ncRNAs more than 200 nucleotides in
length. They play crucial roles in cancers and human diseases, such as HORTAIR
participating in breast cancer formation12. They also have important functions in
regulating chromatin, such as dosage compensation and gene expression13-17.

2
Chromatin isolation by RNA purification (ChIRP) was developed by Chu et al. in
201118 and this technology provides scientists an approach to profile genome-wide
mapping of long non-coding RNA interaction. The requirement of 20-100 million cells
leaves this technology incapable of examining primary patient samples.
In this thesis, I focus on profiling epigenomic regulation of histone
modifications in inflammation and breast cancer and developing a new, low input
microfluidic technology to examine whole-genome lncRNA bindings. The work is
divided into three projects.
For Project 1, I collected primary monocytes from mice as target cells.
Lipopolysaccharide (LPS) was used to activate cellular responses and the resulting
histone modification profile was examined with our previously developed microfluidic
device - microfluidic oscillatory washing-based ChIP (MOWChIP)19. Twenty
thousand cells were used per assay and histone mark H3K27ac was used to map
the genome-wide histone modification. We compared H3K27ac binding level among
three conditions (no treatment, low-dose LPS, and high-dose LPS treatment), and
different epigenetic regulations (e.g. upregulation and downregulation) were
detected. Our results showed the relationship between histone modification of
H3K27ac and different treating conditions in monocytes.
For Project 2, we investigated epigenetic regulations in mutant and normal
breast tissues. Three different cell types were isolated from two murine strains (wild
type (Brca1f/f, BFF) and BRCA1 knockout (BKO)), respectively; four cell types were
isolated from each human sample (BRCA1 mutation carrier and non-carrier, all
human samples were cancer-free). Fifty thousand cells were used per assay for
ChIP-seq with two histone marks (H3K4me3 and H3K27ac). Different epigenetic
regulations between mutant and normal human samples were identified. Similar

3
result was observed from a published paper20 that used western blot and quantitative
reverse transcription-PCR (qRT–PCR) analysis. To the best of our knowledge, this is
the first time ChIP-seq was performed on four different breast cell types from the
same patient to confirm the existence and importance of epigenomic regulations in
histone modifications. Sequencing data from mouse model showed 40% overlap with
transcription factors enriched in human samples. The homozygous exon 11 knockout
mouse is not a good epigenomic model for BRCA1 mutation in human research.
For Project 3, we designed a novel microfluidic technology to map genome-
wide profile of long non-coding RNA interactions. We used adenovirus to
overexpress specific lncRNA (LEENE) in cells due to the low concentration of
lncRNAs in cells. Overexpressing specific lncRNAs is prevalent in examining lncRNA
interactions. We found distinct genome-wide profile of lncRNA interactions when
native and overexpressing states were compared. We suspected overexpression
may change lncRNA interactions. We used the new microfluidic system with
oscillatory hybridization to examine native primary cells from mouse lung tissue with
500,000 cells and this sequencing data provided original in vivo lncRNA binding
profile. This technology permitted profiling genome-wide lncRNA bindings using as
few as 100,000 cells, compared to 20-100 million cells required by conventional
assays. This, for the first time, allowed us to probe native lncRNA bindings in mouse
tissue samples successfully. This technology coupled with sequencing provides us
valuable knowledge about the role of lncRNAs in epigenetic regulations.

4
Chapter 2 Introduction
2.1 Epigenetics
Epigenetics is a phenomenon of hereditary changes in gene expression and
regulations without changing in DNA sequences. It is also defined as change in
phenotype with no change in genotype. There are three main systems of epigenetic
mechanisms, including DNA methylation, histone modifications, and non-coding
RNAs interactions, as shown in Fig. 2.1-1. Genes can be switched on or off by
epigenetic regulations. Age, environmental factors, diseases, and lifestyle can
contribute to epigenetic changes. The most common example of epigenetic change
is cell differentiation21,22. Even though the DNA sequences of cells in an individual’s
whole body are the same, cells differentiate into different types with varied
characteristics. Epigenetic changes also cause the development of cancer and other
diseases such as Prader-Willi syndrome, Angelman syndrome, and Beckwith-
Wiedemann syndrome23. We conducted experiments on histone modifications using
primary mouse and human samples and investigated whole-genome lncRNA
bindings to explore epigenetic regulations.
2.1.1 Histone modification
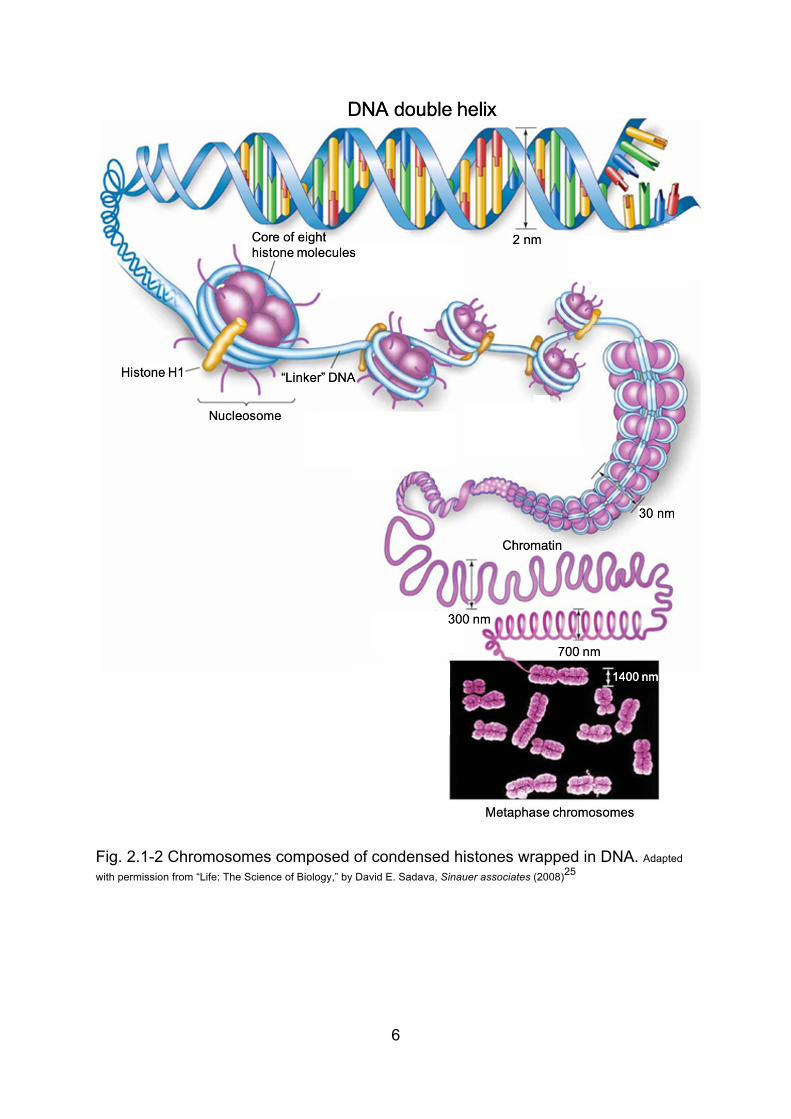
Chromosome is made up of condensed chromatin, which consists of proteins,
RNA, and DNA, the hereditary information materials. The subunit of chromatin is
nucleosome, 8 histones wrapped by a ~146bp long DNA chain, as shown in Fig.2.1-
2. There are five types of histone subunits: H1, H2A, H2B, H3 and H4. The
chromatin structure is stabilized by H1 linker binding. DNA wraps around the core
histones (two copies of H2A, H2B, H3 and H4 each) to form nucleosome.

5
Fig. 2.1-1 Epigenetic mechanisms: DNA methylation, histone modification and non-coding RNA (ncRNA) bindings. Adapted with permission from “Prenatal influences on temperament
development: The role of environmental epigenetics,” by Maria A. Gartstein, Development and Psychopathology (2018)24
6
Fig. 2.1-2 Chromosomes composed of condensed histones wrapped in DNA. Adapted
with permission from “Life: The Science of Biology,” by David E. Sadava, Sinauer associates (2008)25

7
Histone is modified by covalent post-translational modification (PTM) to its
tails. The main modifications include, but not limited to, methylation, acetylation,
phosphorylation, ubiquitylation and SUMOylating. These modifications alter the
structure of chromatin (open/compact), which in turn modulating gene expression
without changes to DNA sequences. More than one hundred unique histone
modification variants have been found in humans26, such as H3K4me3, H3K27ac,
H3K27me3, etc.
H3K27ac is the acetylation of the 27th lysine on histone H3, and is used as an
active promoter and enhancer mark in analyzing ChIP-seq data. H3K4me3 is the tri-
methylation of the 4th lysine on histone H3, and is used as an active promoter mark.
When ChIP-seq data of H3K4me3 and H3K27ac from the same sample are
compared to each other, the promoters are recognized as containing both H3K4me3
and H3K27ac peaks, and the enhancers are clarified as containing H3K27ac but no
H3K4me3 peaks27. A promoter is usually located ahead of the transcription start
sites (TSS) of that gene, and is key for RNA polymerase binding. Enhancer is
positioned randomly (a few to several thousand of bp away in the upstream or
downstream direction of TSS), and is only promotional for transcription. Knowing the
positions of promoter and enhancer can help to comprehensively understand the
whole genome regulation mechanism and explore the functions of super-enhancer,
which is an important factor in cell specification, gene regulations, and diseases28.
2.1.2 Long non-coding RNA (lncRNA)
A non-coding RNA is a functional and informational RNA transcribed from
DNA, but does not further encode proteins6. If non-coding RNA is longer than 200 nt,
it is called long non-coding RNA (lncRNA). Recent studies have shown that lncRNAs
play crucial roles in transcriptional and post-transcriptional regulations, epigenetic

8
regulations, organ and tissue development, and metabolic processes29-35. Cell
differentiation and self-renewal are regulated by lncRNAs36-39, as shown in Fig. 2.1-
3. By means of mutations and dysregulations35,40, lncRNAs contribute to certain
human diseases, such as breast cancer41, prostate cancer42, hepatocellular
cancer43,44, lung cancer44, and diabetes45. With increasing knowledge in regulation
mechanisms of lncRNAs, novel treatment can be devised to combat these diseases.
Fig. 2.1-3 Cell differentiation and self-renewal are regulated by lncRNAs. Adapted with permission from “Long noncoding RNAs in cell fat programming and reprogramming,” by Ryan A. Flynn, Cell Stem Cell (2014)39 2.2 Chromatin immunoprecipitation (ChIP)
Chromatin immunoprecipitation is a powerful tool to study the interaction
between proteins and DNA. It has been used to explore the relationship between
specific proteins (e.g. transcription factors and modified histones) and certain
genomic regions (e.g. promoters and enhancers) to verify putative epigenetic

9
mechanisms. Sample chromatin is sheared via physical methods (e.g. sonication) or
enzyme digestion (e.g. MNase) to gain optimal fragment size for ChIP process.
The specific histone modifications are recognized by antibodies coated on the
surface of magnetic beads, and DNA with wrapped histones are pulled down,
simultaneously. DNA is then isolated and purified by chemical extraction and ethanol
precipitation (Fig. 2.2-1).
Fig. 2.2-1 Chromatin immunoprecipitation. Adapted under CC BY from “Choosing a suitable method for
the identification of replication origins in microbial genomes,” by Chengcheng Song, Front Microbiol (2015)46
ChIP is the gold-standard method for studying histone modifications and
transcription factors3. Recent advances in DNA sequencing tools in combination with
microfluidic devices contribute to a more comprehensive view in epigenetics.
2.2.1 Conventional approaches
There are two types of conventional ChIP: native ChIP and crosslinked ChIP.
Native ChIP (NChIP) relies on the strong binding between proteins and DNA, and
does not involve crosslinking. Crosslinked ChIP (XChIP) uses a reversible

10
crosslinker (e.g. formaldehyde) to promote the binding interaction between proteins
and DNA, and is used for investigating histone modifications and transcription factor
bindings. One drawback of conventional ChIP is the need for a large number of cells
as starting materials (e.g. 106 cells for ChIP-qPCR and 107 cells for ChIP-seq). The
application of ChIP-seq in clinical studies have been limited since typical primary
patient samples are rare to provide the necessary cells. Using microfluidic devices,
this requirement can be lowered to a few hundred cells, thus accommodating
primary patient samples with wider specifications.
2.2.2 Microfluidic oscillatory washing-based ChIP (MOWChIP)
Cao et al. developed a microfluidic device for ChIP research (MOWChIP), as
shown in Fig. 2.2-2. Packed beads are used for highly efficient adsorption and
oscillatory washing is applied to remove non-specific bindings and physical trapping
for high efficiency. Magnetic beads coated with specific antibody are loaded into the
microfluidic chamber and packed in front of the sieve valve, which is partially closed
to trap beads but allow solution flow. Sample is loaded into the chamber by
electronic syringe pump. All chromatin molecules will contact the packed beads
before they leave the chamber. This drastically increases the likelihood of chromatin-
bead contact, and lowers the requirement on cell number. However, using packed
beads also increases the possibility of non-specific binding and physical trapping.
Oscillatory washing is designed to remove these non-target materials. After loading
sample, low/high salt washing buffer is loaded through inlet and outlet, and
oscillatory washing is performed by alternate pressure pulse. Beads with target
chromatin adsorbed are collected, reversed crosslinked and digested by proteinase
K. DNA is extracted by phenol-chloroform-isoamyl alcohol, purified by ethanol
precipitation, amplified with library preparation and sequenced through NGS. The

11
required starting material for MOWChIP is as few as 100 cells, hence it is a huge
improvement compared to conventional ChIP.
Fig. 2.2-2 Overview of the MOWChIP process. Adapted with permission from “A microfluidic device for
epigenomic profiling using 100 cells,” by Zhenning Cao, Nature Methods (2015)19 2.2.3 SurfaceChIP
Ma et al. developed a simpler microfluidic device for ChIP research known as
SurfaceChIP. Specific antibody is coated onto the surface of glass. Fragmented
chromatin is loaded and flowed through the channel containing immobilized
antibody. Target chromatin is captured by the antibody, and oscillatory washing is
used to remove non-specific bound fragments. Purified DNA is obtained after
proteinase K digestion, and ethanol precipitation, and used in library preparation for
sequencing (Fig. 2.2-3). SurfaceChIP is an improvement since as few as 30 cells
can be used per assay and the ChIP process is simplified without using beads.

12
Fig. 2.2-3 Overview of SurfaceChIP. Adapted with permission from “Low-input and multiplexed microfluidic
assay reveals epigenomic variation across cerebellum and prefrontal cortex,” by Sai Ma, Science Advances (2018)47 2.2.4 Low-Input Fluidized-Bed Enabled ChIP (LIFEChIP)
Murphy et al. developed a convenient, multiplexed microfluidic device for
ChIP research. Beads are loaded into four chambers simultaneously in parallel by
software-controlled syringe pumps and held in place using a magnet. Chromatin
fragments are then loaded into the chambers, followed by washing buffer. Purified
chromatin-beads are collected and DNA is isolated through reverse-crosslinking,
proteinase K digestion, phenol-chloroform-isoamyl alcohol extraction, and ethanol
precipitation. The isolated DNA is ready for the sequencing process, as shown in
Fig. 2.2-4. As few as 50 cells can be used per assay and four parallel reactions can
be performed simultaneously for high throughput.

13
Fig. 2.2-4 Overview of LIFEChIP. Adapted with permission from “Microfluidic Low-Input Fluidized-Bed Enabled
ChIP-seq Device for Automated and Parallel Analysis of Histone Modifications,” by Travis W. Murphy, Anal. Chem (2018)48
2.3 Chromatin isolation by RNA purification (ChIRP)
ChIRP, developed by Chu et al. in 2011, is a technology of choice for
examining lncRNA bindings18. As shown in Fig. 2.3-1, ChIRP includes 3 main steps:
fixation of chromatin with lncRNAs, hybridization of specific biotinylated tiling probes
to target lncRNAs, and isolation of chromatin complexes by streptavidin magnetic
beads.

14
Fig. 2.3-1 Overview of the ChIRP process. Adapted with permission from “Genomic Maps of Long Noncoding RNA Occupancy Reveal Principles of RNA-Chromatin Interactions,” by Ci Chu, Molecular Cell (2011)18
One limitation in profiling lncRNA bindings by ChIRP is knowing its sequence.
The biotinylated probes are 20 nt long oligonucleotides, whose sequences are
complementary to target lncRNA, and one biotin is designed to attach at the end of
each probe. The probes are separated into two sets according to the number, even
or odd, shown in Fig. 2.3-2.

15
Fig. 2.3-2 Even and odd probe groups are used in ChIRP-seq.
Two independent ChIRP-seq are performed by using even or odd probes.
Cells are fixed with glutaraldehyde and sheared with a sonicator to optimal fragment
size (100-500 bp). Crosslinked and sheared chromatin is mixed with biotinylated
tiling probes and hybridization buffer in a microtube and incubated on a rotator at
37˚C for 4 hr to hybridize. Washed streptavidin magnetic beads are added to the
microtube and incubated on a rotator at 37˚C for 30 min to capture lncRNA. DNA,
RNA, and proteins are isolated with TRIzol from the surface of streptavidin beads for
further biological analyses. Sequencing reads reacting with only one probe may be
false reads from non-target materials, and they may lower the sequencing quality of
lncRNA bindings. As such, peaks are kept if they appear in both even and odd
sequences simultaneously, and discarded if they exist in either even or odd probe
group. The probes of the third set are designed according to the sequence of lacZ
mRNA to act as negative control, due to lacZ is absent from human cells.
Conventional ChIRP requires 20-100 million target-lncRNA-over-expressed cells to
obtain enough lncRNAs, which makes it unsuitable for clinical application since
primary samples cannot provide such a large amount of cells. In order to overcome

16
this limitation, we developed a novel microfluidic technology for profiling whole-
genome lncRNA bindings.
2.3.1 Capture hybridization analysis of RNA targets (CHART)
CHART, developed by Simon et al.49 in 2011, is another method for profiling
genomic binding sites of non-coding RNAs. The whole process is similar to ChIRP
(including fixation of chromatin with lncRNAs, hybridization of specific biotinylated
tiling probes to target lncRNAs, and isolation of chromatin complexes by streptavidin
magnetic beads), except the design of tiling probes. Twenty-five nt desthiobiotin-
conjugated probes are designed to hybridize target lncRNA, and all probes are
pooled together.
2.3.2 RNA antisense purification (RAP)
RAP, designed by Engreitz et al.50, is another approach for genomic
localization of lncRNAs profiling. One hundred and twenty nt probes, which are tiled
every 15 nt across the target lncRNA, are designed to cover entire lncRNA. The
steps of purification and elution are similar to ChIRP.
The schematic of these three approaches for profiling the genomic localization
of lncRNAs is shown in Fig. 2.3-3.

17
Fig. 2.3-3 Schematic of three approaches for profiling the genomic localization of lncRNAs. Adapted under CC BY from “Unveiling the hidden function of long non-coding RNA by identifying its major partner-protein,” by Yang et al. Cell Biosci, (2015)51

18
2.4 Next Generation Sequencing (NGS)
Nucleic acid sequencing examines the exact order of nucleotides in DNA or
RNA. Since the completion of Human Genome Project in 2003, the sequencing
research has expanded exponentially52. The sequencing tool used for Human
Genome Project was Sanger sequencing, also known as first generation
sequencing. Due to its complicated process and high cost, a new sequencing
technology (second generation sequencing or next generation sequencing) was
developed.
Massively parallel sequencing enables NGS to sequence 200 billion
nucleotides in 3 days, while lowering the cost to below $2000 per lane. The most
common NGS platform is Illumina Hi-seq, based on cluster generation and
sequencing by synthesis. In order to be sequenced by Illumina system, all target
DNA should be end-repaired and have adaptors ligated on both ends. These single
strands of DNA are attached to flow cell surface with oligoenucleotides having
complementary sequences to the adaptors. Bridge amplification is then performed by
polymerase to create complementary strands and amplify the amount of DNA. Four
fluorescently tagged nucleotides (dNTPs) are used to sequence DNA fragments and
light of different wavelengths are emitted when different dNTPs are attached to DNA
clusters. DNA sequences are determined by recording the emitted wavelength.
2.5 ChIP-seq
Chromatin immunoprecipitation followed by sequencing (ChIP-seq) has
become the technology of choice for studying the binding of proteins to specific
genome regions. Recent progress in NGS enables ChIP-seq to offer higher
resolution, less bias, more comprehensive coverage of whole-genome, and lower

19
cost. It has become the most commonly employed tool for researching gene
regulations and epigenetic manipulation53.
As shown in Fig. 2.5-1, ChIP-seq follows the following steps: chromatin
immunoprecipitation by histone mark (e.g. H3K4me3, H3K27ac and H3K27me3) or
non-histone mark (transcription factors), DNA fragments isolation, library preparation
(attaching adaptors and amplification), NGS sequencing, and data analysis (mapping
reads to reference genome).

20
Fig. 2.5-1 Overview of ChIP-seq. Adapted with permission from “ChIP–seq: advantages and challenges of a
maturing technology,” by Peter J. Park, Nature Reviews Genetics (2009)53
2.6 Microfluidic device
Microfluidic devices are effective tools to circumvent the restriction of large
amount of cells for conventional ChIP-seq. They possess several advantages, such

21
as easy operation, low cost, short reaction time, accurate temperature control,
reduced contamination, small operating volume, and improved sensitivity of assay.
Microfluidic devices come in different designs and features for their specific
application in research. Most of these devices are made of polydimethylsiloxane
(PDMS), silicon, or glass. PMDS is usually adhered to glass by plasma bonding to
increase the bonding strength. In the patterns of microfluidic devices, channel shape
is the most common one. The possibility of contact between sample and target
antibody is increased when sample flows through a small volume. A device
integrating sonication and ChIP for reduced contamination and sample loss was
developed in 201654. More elaborate devices have been developed to explore the
epigenomic profiles within very low-input samples. It is beneficial to investigate rare
samples, such as circulating tumor cells (CTCs) and embryonic stem cells.
Holistic epigenomic regulations can be examined by assembling all
epigenomic information from different cell types with distinct target antibodies. Novel
therapies for human diseases can be developed from an expanded knowledge base
of epigenomics.
2.7 Precision medicine
Precision medicine, or personalized medicine, refers to a treatment targeting
individuals based on their genes, environment and lifestyle55. Different individuals
may need different treatments even though they present similar symptoms.
Traditionally, physicians treat patients with an one-size-fits-all approach, in which
disease prevention and treatment are designed for the average person56, as shown
in Fig. 2.7-1 (a). In 2015, the total prescription spending in the U.S. was $419.4
billion57, most of which based on one-size-fits-all strategy. This approach fits many
patients, but does not work on some. Precision medicine was launched to improve

22
the low efficiency and diminish side effects of the traditional approach58. President
Obama announced the Precision Medicine Initiative in his 2015 State of the Union
address, ‘Delivering the right treatments, at the right time, every time to the right
person.’
Fig. 2.7-1 The strategy of precision medicine compares with conventional one-size-fits-all approach.
Due to the accomplishment of Human Genome Project, genetic and
epigenetic examinations are thriving. Epigenomic data play crucial roles in diagnosis
and detection of cancer and other human diseases at early development stage59.
The advance in whole genome sequencing technology and evolution of healthcare
promote the development of precision medicine. Several published papers report
a) one-size-fits-all approach
All patients are treated with the same approach
(effective to 25% patients)
b) precision medicine
Different patient groups are treated with different approachs
(effective to 100% patients)

23
that precision medicine provides promising treatment for cancers60-62, cardiovascular
disease63, and Alzheimer’s disease64,65. Obtaining more genetic and epigenetic
profiles is more eager in developing precision medicine. Hundreds of transcription
factors and histone modifications have been identified26,66, but few have been used
to probe clinical samples as a result of limitations in technology and restrictions in
sample size67,68. To solve these problems, we have developed a semi-automated
high-throughput MOWChIP system to run 8 assays in parallel with low-input
samples69. This technology profiles clinical samples faster and more easily. In
addition, our microfluidic oscillatory hybridized ChIRP technology is the first one to
permit whole-genome profiling of lncRNA binding in primary murine cells. With these
important data, we can devise better precision medicine solutions for individual
patients.

24
Chapter 3 Study of epigenomic changes associated with LPS-induced murine monocytes 3.1 Project Summary
Lipopolysaccharide (LPS) is used to induce cells for LPS-stimulated
inflammation. Different concentrations of LPS play distinct roles in inflammatory
processes. High-dose LPS leads to acute inflammation followed by tolerance
resolution, while low-dose LPS causes persistent and non-resolving inflammation.
H3K27ac histone mark is used to detect active promoter and enhancer regions.
Several groups used transcriptome to calculate the gene expression to confirm the
relationship between gene expression and LPS, and most of them focused on high-
dose LPS stimulation. However, few laboratories explored the roles of LPS under
epigenomic regulations.
Here, we used different concentrations of LPS to induce murine monocytes
for 5 days and conducted ChIP with H3K27ac to profile active promoter and
enhancer regions. Different regulations by histone modifications among 3 conditions
(control, super low-dose LPS, and high-dose LPS) were located by DiffBind70. We
profiled condition-specific transcription factors. The gene list of epigenomic
regulations may provide valuable information to summarize the mechanism of
inflammation and design precision medicine.
3.2 Introduction
Monocytes and macrophages play crucial roles in immune responses,
inflammatory processes and homeostasis71. A holistic understanding of the
modulation of monocytes and macrophages can help develop more effective
immunotherapy. Lipopolysaccharide (LPS), also known as endotoxin, is composed

25
of a lipid and a polysaccharide. It is the main material on the surface of Gram-
negative bacteria and can induce intense inflammatory responses by stimulating
different cell types to release inflammatory cytokines72.
LPS challenge is defined as stimulating animals or cells by LPS to modulate
the respective pro-inflammatory cytokines, such as TNFα, IL-1β, and IL-673, and anti-
inflammatory cytokines, such as TRIF, IL4, and IL-1074, which are produced by
activated macrophages and monocytes, to induce innate inflammatory immune
responses. Endotoxin tolerance refers to the condition of low sensitivity to endotoxin
(LPS) after the first stimulation exhibited in animal tissues or cells 75-77. Cells and
animals treat with different amounts of LPS displayed dissimilar results. Recent
studies suggest that high-dose LPS leads to acute inflammation followed by
tolerance resolution, while low-dose LPS causes persistent and non-resolving
inflammation71,78-80, as shown in Fig. 3.2-1.
Fig. 3.2-1 The inflammatory responses with high-dose and low-dose LPS. Adapted under CC BY from “Innate immune programing by endotoxin and its pathological consequences,” by Morris, M.C. et al. , Front Immunol. (2015)71.
Research shows that low-grade inflammation causes cellular stress, inhibits
wound healing, and can lead to chronic diseases, such as diabetes, obesity-
associated complications, and heart diseases81-86. Li’s group confirm the correlation
between super-low-dose endotoxin and impaired wound healing, which exacerbated

26
steatohepatitis in high-fat diet fed mice87-89. However, the context of epigenomic
regulations of low-grade inflammation in monocytes remains to be defined. Knowing
the correct place of transcription start sites (TSS) is important for examining gene
regulations. The histone modification of H3K27ac is an indicator of active enhancer
regions. Whole-genome histone modification is profiled by chromatin
immunoprecipitation coupled with next generation sequencing (ChIP-seq).
Due to the relative low number of monocytes, conventional ChIP-seq cannot
be used. Instead, we employed MOWChIP technology, which is designed for low-
input samples. We induced cultured murine monocytes with 3 conditions (control:
PBS, super low-dose LPS: low LPS, high-dose LPS: high LPS) and conducted
MOWChIP with histone mark H3K27ac to profile epigenomic regulations of
inflammation.
3.3 Results and discussion
The fragment size of sheared DNA is important to ChIP, and the optimal size
range is 200-600 bp90. Based on our previous experiments, we decided on the
optimal range of 200-250 bp. One million cells were resuspended in 130 μl
sonication buffer and sonicated for 16 min by Covaris M220 (Covaris). The fragment
size we obtained was shown in Fig. 3.3-1 and Fig. 3.3-2.

27
Fig. 3.3-1 Fragment size for ChIP-seq. The green line region was our sheared DNA fragments, and the average size was 225bp. The blue lines were lower (25 bp) and upper (1500 bp) marker.
Fig. 3.3-2 Fragment size among three conditions. Green: control set; red: low-dose LPS set; blue: high-dose LPS set.
Chromatin equivalent to 20,000 cells were used to conduct MOWChIP. First
we optimized all performing conditions. Based on the published paper from our lab19,
we tested 3 different antibody concentrations (5 μg/ml, 6.7 μg/ml, and 8.3 μg/ml).
The original concentration of antibody (H3K27ac) was 1 μg/μl. When 1μl H3K27ac
was mixed with 149 μl IP buffer and beads, the concentration was 6.7 μg/ml. Two
positive primers (LAPTM5 and CHMP4B) and two negative primers (MYOD1 and

28
CCZ1) were used to check the quality of our ChIP samples. As shown in Fig. 3.3-3,
6.7 μg/ml of H3K27ac was better than 5 μg/ml and 8.3 μg/ml. The reason for this
phenomenon was that beads coated with more antibody had more binding sites for
the specific. However, excess amounts of antibody increased the chance of non-
specific binding and physical trapping.
Fig. 3.3-3 Optimization of MOWChIP with different concentrations of antibody (H3K27ac). The concentration of H3K27ac in 6.7 ug/ml showed higher relative fold enrichment.
Ideally, ChIP samples should have high positive percent input and low
negative percent input. Packed beads used in our microfluidic device increased the
efficiency of target chromatin capture, but also increased non-specific binding and
physical trapping. Oscillatory washing was used to diminish these problems.
Washing pressure was optimized to remove non-target DNA fragments but retain
target materials, so as to get the best enrichment possible. Three washing pressure
conditions (2.5 psi, 3 psi, and 3.5 psi) were tested. The enrichment of all three LPS-
induced conditions was improved when 3 psi of washing pressure was exerted (Fig.
3.3-4).
0
1
2
3
4
5
6
7
8
9
LAPTM5 CHMP4B MYOD1 CCZ1
Rela
tive
Fold
Enr
ichm
ent
Differnt concentrations of antibody (H3K27ac)
PBS - 5 μg/ml H3K27ac PBS - 6.7 μg/mll H3K27ac PBS - 8.3 μg/ml H3K27acLow LPS - 5 μg/ml H3K27ac Low LPS - 6.7 μg/mlH3K27ac Low LPS - 8.3 μg/ml H3K27acHigh LPS - 5 μg/ml H3K27ac High LPS - 6.7 μg/ml H3K27ac High LPS - 8.3 μg/ml H3K27ac

29
Fig. 3.3-4 Optimization of MOWChIP with different oscillatory washing pressure. The washing pressure of 5 psi exhibited the better relative fold enrichment.
In addition to washing pressure, washing time was another possible factor for
improving enrichment. We experimented with 5, 7.5 and 10 min of washing and
results showed that 7.5 min of washing time gave the best enrichment (Fig. 3.3-5).
Fig. 3.3-5 Optimization of MOWChIP with different oscillatory washing time. 7.5 min washing time displayed the best relative fold enrichment.
0
2
4
6
8
10
12
14
16
18
20
LAPTM5 CHMP4B MYOD1 CCZ1
Rel
ativ
e F
old
En
rich
men
t
Washing pressure
PBS - 2.5 psi PBS - 3 psi PBS - 3.5 psi
Low LPS - 2.5 psi Low LPS - 3 psi Low LPS - 3.5 psi
High LPS - 2.5 psi High LPS - 3 psi High LPS - 3.5 psi
0
5
10
15
20
25
30
35
LAPTM5 CHMP4B MYOD1 CCZ1
Rela
tive F
old
En
rich
men
t
Washing time
PBS - 5 min PBS - 7.5 min PBS - 10 min
Low LPS - 5 min Low LPS - 7.5 min Low LPS - 10 min
High LPS - 5 min High LPS - 7.5 min High LPS - 10 min

30
The optimized conditions (6.7 μg/ml of H3K27ac, 3 psi of washing pressure,
and 7.5 min of washing time) provided the best enrichment in PBS, low LPS, or high
LPS.
Accel-NGS 2S plus DNA library kit was used to prepare library. Different
barcodes were attached to different samples, which were pooled together for
sequencing. Sequencing data from different samples were separated and saved to
different files according to barcode sequences. Data were processed by Bowtie and
MACS and results were shown in Fig. 3.3-6, visualized in Integrative Genomics
Viewer (IGV). Peaks of all six different files appeared clear. The sequencing data
information was summarized in Table 3.3-1. Pearson correlation matrix of six
MOWChIP-seq samples was shown in Fig. 3.3-7. The values of correlation between
replications of different conditions were above 0.88 (PBS: 0.90, low LPS: 0.94, and
high LPS: 0.88), meaning that replications of each samples were highly reproducible
and consistent.
Fig. 3.3-6 MOWChIP sequencing data of mouse samples visualized in IGV. Red: control set; green: low-dose LPS; purple: high-dose LPS. Peak patterns were similar among three conditions.
[0-8.00]
[0-8.00]
[0-8.00]
[0-8.00]
[0-8.00]
[0-8.00]
Refseq genes
PBS_Rep1
PBS_Rep2
Low LPS_Rep1
Low LPS_Rep2
High LPS_Rep1
High LPS_Rep2
Mouse(mm10)Chr10
Supv3l1 Vps26a Srgn Kif1bp Ddx21

31
Fig. 3.3-7 Pearson correlation matrix of MOWChIP sequencing data. Software DiffBind was used to analyze ChIP-seq data to locate differentially
modified peak regions among different conditions. Fifty-two gene regions analyzed
by DiffBind were listed in Table 3.3-2.
As shown in Fig. 3.3-8, the epigenetic regulation of Apoe was downregulated
in high LPS. However, there was no obvious difference at the region of gene Bcl3.
Apoe plays a crucial role in atherosclerosis and inflammation91. The gene expression
of Apoe is repressed in the condition of high-dose LPS has been reported by several
labs in examining mRNA expression92,93. This effect is consistent with our work
based on the property of H3K27ac, defining as an active enhancer mark. The same
tendency was observed in Fig. 3.3-9, and there was no clear peak at the region of
gene C1q in high LPS. C1q is a pivotal component in immune response to induce
0.65
0.68
0.72
0.76
0.79
0.82
0.86
0.9
0.93
0.96
1
PBS_
Rep
1
PBS_
Rep
2
Low
LPS
_Rep
1
Low
LPS
_Rep
2
Hig
h LP
S_R
ep1
Hig
h LP
S_R
ep2
PBS_Rep1
PBS_Rep2
Low LPS_Rep1
Low LPS_Rep2
High LPS_Rep1
High LPS_Rep2

32
inflammation. Literature shows that gene expression of C1q is decreased when cells
are treated with high-dose LPS94,95.
At the other end of the spectrum, epigenetic regulation of genes Fpr1 and
Fpr2 was upregulated in high LPS (Fig. 3.3-10). Fpr1 and Fpr2 are crucial regulators
in inflammation96 and wound healing97. Since low LPS causes impaired wound
healing, it is reasonable that Fpr1 and Fpr2 are upregulated in the condition of high
LPS. The gene expression of Fpr1 and Fpr2 is promoted with high dose LPS has
been reported by different research laboratories98,99. All of above results were
consistent with the gene list from DiffBind in Table 3.3-2.

33
Table 3.3-2 Epigenomic regulations among different conditions. Blue: upregulation; red: downregulation.
Chr Gene High1 High2 Low1 Low2 PBS1 PBS2chr4 C1qbchr5 Pf4chr2 Ier5lchr12 4921507G05Rikchr7 Apoechr7 Cracr2bchr6 Apobec1chr11 Clec10achr19 Arhgap19chr19 Ms4a7chr6 Emp1chr2 Mafbchr15 Syngr1chr15 Gpd1chr15 Sepp1chr2 Abhd12chr14 Mir5131chr5 LOC108169116chr11 Slfn1chr7 Ifitm3chr8 Mir7238chr16 Socs1chr7 Ifitm1chr9 Ccr2chr5 Oasl2chr11 Socs3chr12 Irf2bplchr16 Rtp4chr15 Ly6echr7 Fam181bchr3 4931440P22Rikchr2 Zbp1chr13 Uqcrfs1chr7 Lipt2chr5 Upk3bchr6 LOC108168694chr11 Cd300echr7 Saa3chr10 1700124M09Rikchr7 3110009M11Rikchr19 Mir3084-1chr5 Mir7024chr2 6530402F18Rikchr11 Upp1chr17 Fpr1chr10 Gja1chr10 Adora2achr1 Ccdc185chr13 1700019C18RikchrX Mir680-2chr3 Il12achr1 Marco

34
Fig. 3.3-8 Epigenetic regulation of Apoe (left) and Bcl3 (right).
Fig. 3.3-9 Epigenetic regulations of C1qa, C1qb, C1qc.
Fig. 3.3-10 Epigenetic regulation of Fpr1 and Fpr2. The differentially modified regions were then mapped to the nearest genes
and examined significant enrichment of gene ontologies (Fig. 3.3-11). Gene
Ontology (GO) was a valuable tool to profile biological processes and molecular
functions for developing gene regulation mechanism. The immune response and
Clptm1 Apoc4-apoc2 Apoc1 Tomm40 Nectin2 Bcam Cblc Bcl3
[0-4.00]
[0-4.00]
[0-4.00]
[0-4.00]
[0-4.00]
[0-4.00]
Refseq genes
PBS_Rep1
PBS_Rep2
Low LPS_Rep1
Low LPS_Rep2
High LPS_Rep1
High LPS_Rep2
Mouse(mm10)Chr10
Apoe
Epha8C1qaC1qcC1qb
[0-8.00]
[0-8.00]
[0-8.00]
[0-8.00]
[0-8.00]
[0-8.00]
Refseq genes
PBS_Rep1
PBS_Rep2
Low LPS_Rep1
Low LPS_Rep2
High LPS_Rep1
High LPS_Rep2
Mouse(mm10)Chr10
Mir99b Has1 Fpr1 Fpr2
[0-4.00]
[0-4.00]
[0-4.00]
[0-4.00]
[0-4.00]
[0-4.00]
Refseq genes
PBS_Rep1
PBS_Rep2
Low LPS_Rep1
Low LPS_Rep2
High LPS_Rep1
High LPS_Rep2
Mouse(mm10)Chr10

35
metabolic process were enriched in both low-LPS and high-LPS, and both of them
were associated with inflammaion.
Fig. 3.3-11 Gene ontology (GO) analysis using GREAT of significant differentially modified peak regions between two of LPS, low-LPS, and high-LPS. Created by Lynette Naler.

36
We then examined enhancer regions among three stimulated conditions (Fig.
3.3-12 (a)). Enhancer regions were defined by signals in H3K27achigh that did not
correspond to areas nearby transcription start sites (+/- 2kb from TSS). Using PBS
condition as the reference, low-LPS covered 43.57% and high-LPS covered 49.30%.
Low-LPS and high-LPS exhibited 0.72% and 4.08% additional enhancers,
respectively. The super enhancers, clusters of active enhancers in close proximity,
were profiled in Fig. 3.3-12 (b). Low-LPS and high-LPS occupied 39.37% and
44.44% of super enhancers of PBS state, respectively. Low-LPS and high-LPS
showed 2.91% and 15.43% additional super enhancers. Significant numbers of
enhancers and super enhancers were diminished when monocytes were stimulated
with either low-LPS or high-LPS. Especially, more numbers of enhancers and super
enhancers were deteriorated and less additional aberrant enhancers and super
enhancers were profiled in low-LPS stimulated monocytes than in high-LPS
stimulated monocytes.
Fig. 3.3-12 Venn diagrams of enhancers and super enhancers. (a) Overlap among three stimulated conditions of enhancers and (b) super enhancers. Created by Lynette Naler.

37
Significant enriched transcription factor binding motifs were then profiled with
enhancer regions. Heatmap of enriched motifs were shown in Fig. 3.3-13. Nkx2.2
and Hif-1b were significant enriched only in high-LPS stimulated condition. Nkx2.2
regulates β cells100 and plays a critical role in inflammation101. Hif-1, a heterodimeric
transcription factor, is composed by Hif-1a and Hif-1b, and regulates tumor
progression and inflammatory process102. Six-2 and Bcl6 were considerably enriched
only in low-LPS stimulated condition. Six-2 dampens the promoter activity of
inflammatory genes to prevent damage associated with cytokine storm and plays a
pivotal role in chronic inflammation103. Bcl6 inhibits NF-κB signaling and attenuates
chronic and low-grade inflammation104. In the control group, Zfp3 and Olig2 exhibited
unique enrichment. Based on literature, they have few association with inflammation.
Zfp3 is a zinc finger protein, and its function is still unknown105. Olig2 regulates motor
neurons and oligodendrocytes106.

38
Fig. 3.3-13 Motif analysis at enhancers. Created by Lynette Naler.
3.4 Materials and methods
Fabrication of microfluidic chip
The microfluidic device was fabricated using polydimethylsiloxane (PDMS) and was
a two layers (fluidic and control layer)107 structure as described in previous

39
publication19. Briefly, two photomasks (for fabricating fluidic and control layers) with
microscale patterns were manufactured by software FreeHand MX (Macromedia,
San Francisco, CA, USA) and printed at high-resolution (5080 dpi). We poured
negative photoresist SU-8 2025 (Microchem, Newton, MA, USA) on 3-inch silicon
wafers (University Wafer, South Boston, MA, USA) and spun 500 rpm for 10 s and
2500 rpm for 30 s for fluidic master to make ~30 μm in photoresist thickness and 500
rpm for 10 s and 1500 rpm for 30 s for control layer to make ~50 μm in photoresist
thickness to make masters of the fluidic and control layer. The negative photoresist
SU-8 2025 produced partial close valves that allow solution to leave but keep beads
within the chamber. We baked both fluidic and control masters at 95 ˚C for 8 min
(soft bake), exposed UV (580 mW) for 17 s, then baked at 95 ˚C for another 8 min
(post bake). The masters were washed with SU-8 developer, shook for 2-3 min, and
rinsed with IPA, acetone, and DI water. PDMS (RTV615) with mass ratio of A:B = 5:1
was poured onto the fluidic layer master placed in the Petri dish to create ~5 mm in
thickness of fluidic layer PDMS, and degased for 1 h. PDMS with mass ratio of A:B =
20:1 was degased for 1 hour and poured onto the control layer master which was set
in the spinner and spun at 500 rpm for 10 s and 1100 rpm for 30 s to fabricate ~108
um in thickness of control layer PDMS. Both fluidic and control layer PDMS were
cured at 80 ˚C for 12 min. The fluidic layer was peeled off from the master by a
scalpel. The fluidic and control layer were aligned and combined by the pattern (the
neck of chamber of fluidic pattern was crossed with the bar shape of control pattern)
to form tow-layer PDMS. The two-layer PDMS was baked at 80 ˚C for 2 h and
peeled off from control layer master. The two-layer PDMS was punched by Harris
Uni-Cores 2.0 mm puncher (Electron Microscopy Sciences) at specific sites (inlet
part of control layer, inlet and outlet parts of fluidic layer). The two-layer PDMS and a

40
pre-cleaned glass slide (25mm x 75mm, VWR) were treated by plasma (Harrick
Plasma) and then bonded together. The chip device was cured at 80 ˚C for 1 h to
increase bonding strength and remove bubbles.
Mice
C57BL/6 mice were purchased from Jackson Laboratory. 8-12 week-old male mice
were used. All processes performed on mice were approved by the Institutional
Animal Care and Use Committee (IACUC) of Virginia Tech.
Primary cells from mice
We followed cell culture condition as previously described108. The RPMI 1640
medium supplemented with 10% fetal bovine serum (FBS), 2mM L-glutamine, 1%
penicillin-streptomycin and M-CSF (10ng/ml) in the presence of super low-dose LPS
(100pg/ml), high-dose LPS (1µg/ml) or vehicle control PBS was used to culture the
crude bone marrow cells isolated from wild type C57BL/6 mice at 37 ˚C in a humid
incubator with 5% CO2. We added fresh high/low-dose LPS or PBS to the cell
cultures every 2 days. The cells were harvested after 5 days.
Chromatin Shearing
Each sample containing 106 cells was centrifuged at 1600 g for 5 min at 4˚C and
washed twice with chilled 1 ml PBS. Cells were resuspened in 9.375 ml PBS in a
15ml tube. 0.625 ml 16% formaldehyde was added and incubated at room
temperature on a shaker for 5 min. 0.667ml 2M glycine was added to quench
crosslinking for 5 min on a rotator at room temperature. The crosslinked cells were
centrifuged at 1600 g for 5 min and washed twice with 1 ml PBS (4˚C). The pellet
was resuspended with 130ul of the Covaris buffer (10 mM Tris-HCl, pH 8.0, 1 mM
EDTA, 0.1% SDS and 1x protease inhibitor cocktail (PIC)) and sonicated at 4 ˚C with
75 W peak incident power, 5% duty factor, and 200 cycles per burst for 16 min by

41
Covaris M220 (Covaris). We centrifuged the sonicated sample at 16100 g for 10 min
at 4˚C. The supernatant (sheared chromatin) was transferred to a pre-autoclaved 1.5
ml microtube (VWR). 2.4 µl sheared chromatin was mixed with 46.6 µl IP buffer (20
Mm Tris-HCl, pH 8.0, 140 mM NaCl, 1 mM EDTA, 0.5 mM EGTA, 0.1 % (w/v)
sodium deoxycholate, 0.1 % SDS, 1 % (v/v) Triton X-100, with 1% freshly added
PMSF and PIC) so the amount of chromatin in each sample was equal to 20 k cells.
The amount of sheared chromation of 2.5 k cells was used to check fragment size by
HS D1000 tapes on Tapestation 2200 (Agilent).
Bead preparation
5 μl of protein A Dyanbeads for immunoprecipitation (Invitrogen) were washed twice
with 150 μl IP buffer. The beads were mixed with 149 μl IP buffer and 1ul of
H3K27ac antibody (abcam) and incubated at 4 ˚C on the rotator overnight.
Afterwards, the beads were washed twice with 150 μl IP buffer and resuspended in 5
μl IP buffer for following on-chip use.
Device operation
The overview of MOWChIP shown in Fig. 2.2-2 was composed of the fluidic layer
(oval chamber, inlet (point 1), and outlet (point 2)) and control layer (bar-shape and
inlet (point 3)). The chip device was placed on the microscope (Olympus microscope
IX71) and a tube was filled with DI water and connected with the inlet of control layer
and 30 psi gas pressure which was controlled by LabVIEW. After 10 min, the bar-
shaped control valve was filled with DI water. A 1 ml syringe filled with IP buffer was
connected with a 30 cm tube and placed on a syringe pump (Chenyx). The other end
of the aforementioned 30 cm tube was connected to the inlet of fluidic layer and filled
with IP buffer at the speed of 200 μl/min. To eliminate bubbles within the chamber,
the valve of the control layer was closed for a few seconds to allow pressure buildup

42
within the chamber. Then it was opened to release the pressure inside the chamber
and to eject the unwanted bubbles simultaneously. 5 μl beads coated with H3K27ac
antibody were loaded into the chamber and a magnet was used to confine the beads
within the chamber. 0.5 μl PMSF and 0.5 μl PIC were added to 49 μl sample solution
containing sheared chromatin of 20 k cells. The syringe connected with a 30 cm tube
was used to withdraw 50 μl sample solution (leaving a small space in the tube before
withdrawing sample solution to prevent contact between sample and the pre-loaded
IP buffer). The syringe pump was used to load sample solution into chamber at 1.5
μl/min. The coated beads were packed in front of the valve (the valve was partially
closed, so the solution could leave but beads were retained) when the sample
solution was loaded to the chamber. All sample solution was injected into the
chamber filled with beads in 50 min, the 30 cm tube was removed from the inlet of
the fluidic layer, and the valve was opened. Two 10 cm tubes were loaded with low
salt washing buffer (20 mM Tris-HCl, pH 8.0, 150 mM NaCl, 2 mM EDTA, 0.1% SDS,
1% (v/v) Triton X-100) and connected to inlet and outlet of fluidic layer respectively.
Oscillatory washing (pressure pulse at 3 psi for 0.5 second at inlet and outlet
alternatively) was performed for 7.5 minutes to remove nonspecifically adsorbed and
physically trapped materials from coated beads surface. The low salt washing buffer
was replaced by high salt washing buffer (20 mM Tris-HCl, pH 8.0, 500 mM NaCl, 2
mM EDTA, 0.1% SDS, 1% (v/v) Triton X-100) and the same process was repeated.
After that, the beads were held in place by a magnet within the chamber and IP
buffer was flushed through at 3 μl/min to remove all debris/ waste materials. The
beads were then flushed out of the chamber at 200 μl/min, and collected to a new
1.5 ml microtube.
DNA purification

43
The beads and input chromatin samples were incubated at 65 ˚C overnight with 198
μl reverse crosslinking buffer (200 mM NaCl, 50mM Tris-HCl, 10 mM EDTA, 1%
SDS, 0.1M NaHCO3) and 2 μl of 20 μg/μl proteinase K (Sigma). DNA was isolated
by adding 200 μl of Phenol:Chloroform:Isoamyl Alcohol 25:24:1 to the above solution
after incubation and vortexing. The solution was centrifuged at 16100 g for 5 min at
room temperature, and the supernatant was transferred to a new 1.5 ml microtube to
mix with 750 μl 100% ethanol, 50 μl 10M ammonium acetate and 5 μl of 5 μg/μl
glycogen. The mixture was vortexed and incubated at -80˚C for at least 2 h. After
that, the sample was centrifuged at 16100 g for 10 min at 4˚C and the supernatant
was discarded. 500 ml 70% ethanol was added to the microtube without disturbing
the pellet. The microtube was centrifuged at 16100 g for 5 min at 4 ˚C and
supernatant was discarded. The pellet was air dried for 5 min in BSC and then was
resuspended with 12 μl TE buffer.
Quantitative PCR (qPCR) Assay
qPCR assays were performed by a Real-Time PCR Detection System (CFX
Connect, BIO-RAD, Hercules, CA). 12.5 μl SYBR Green supermix (BIO-RAD), 1 μl
forward primer, 1 μl reverse primer, and 10.5 μl diluted DNA sample were mixed
together to perform PCR processes, including 95 ˚C for 15 s for denaturing, 58 ˚C for
40 s for annealing, and 72 ˚C for 30 s for extending. The following primers were used
to detect the ChIP-sample enrichment.
(positive primer) LAPTM5-forward 5’- TAC TCT GGG CCT TAG TAG TTC C -3’
(positive primer) LAPTM5-reverse 5’- AAC AAT CCC AAC CTG CAC TC -3’
(positive primer) CHMP4B-forward 5’- GCA TCA TCA GAC TCC CTT CAA -3’
(positive primer) CHMP4B-reverse 5’- GAA CAG AGT GGA ACA GAC TGA G -3’
(negative primer)MYOD1-forward 5’- CTC CAA ACC TCC TGC AAT CT -3’

44
(negative primer)MYOD1-reverse 5’- AAG CCT CTC CAG TGT CTA CT -3’
(negative primer)CCZ1-forward 5’- GGG ACA CGG AGT GTT TAC AA -3’
(negative primer)CCZ1-reverse 5’- CCA CCA CCT CCC AGT TTA AG -3’
Library preparation
We used Accel-NGS 2S Plus DNA Library Kit (Swift-Bio) to prepare library for
sequencing. The process was based on the protocol from Swift-Bio with minor
modification. Briefly, the purified DNA underwent 5 steps, including: repair I for
dephosphorylation, repair II for end repair and polishing, ligation I for 3’ ligation of
P7, ligation II for 5’ ligation of P5, and PCR for amplification of DNA. At the last step
of PCR, 2.5 μl of 20x EvaGreen was added to the reaction mixture to check the
amount of DNA during amplification. Amplification was terminated when the
fluorescent signal increased by 3000 RFU (CFX Connect, BIO-RAD, Hercules, CA).
SPRI beads were used to purify the amplified DNA and remove dimers which
resulted during amplifying due to low amount of input DNA. 10 μl TE buffer was used
to elute pure DNA after amplification. Different samples attached with different
barcodes were pooled together for sequencing. We used Illumina HiSeq 4000 with
single-end 50 nt read in sequencing.
Read Mapping and Normalization
Sequencing reads were trimmed by Trim Galore and then mapped to the mouse
genome (mm10) using bowtie v2.4109 with default parameter settings. Uniquely
mapped reads were computed to normalize signal for 25 bp bin across the genome
according to the following equation:
Normalized signals =
IP( !"#$%'("#)*+'(,-.#/0('10"/23#44"$5"#$%
× 1,000,000) – Input( 6789:;<78=>?;<@AB8CD<;ED7CFG8HH79I789:
× 1,000,000)
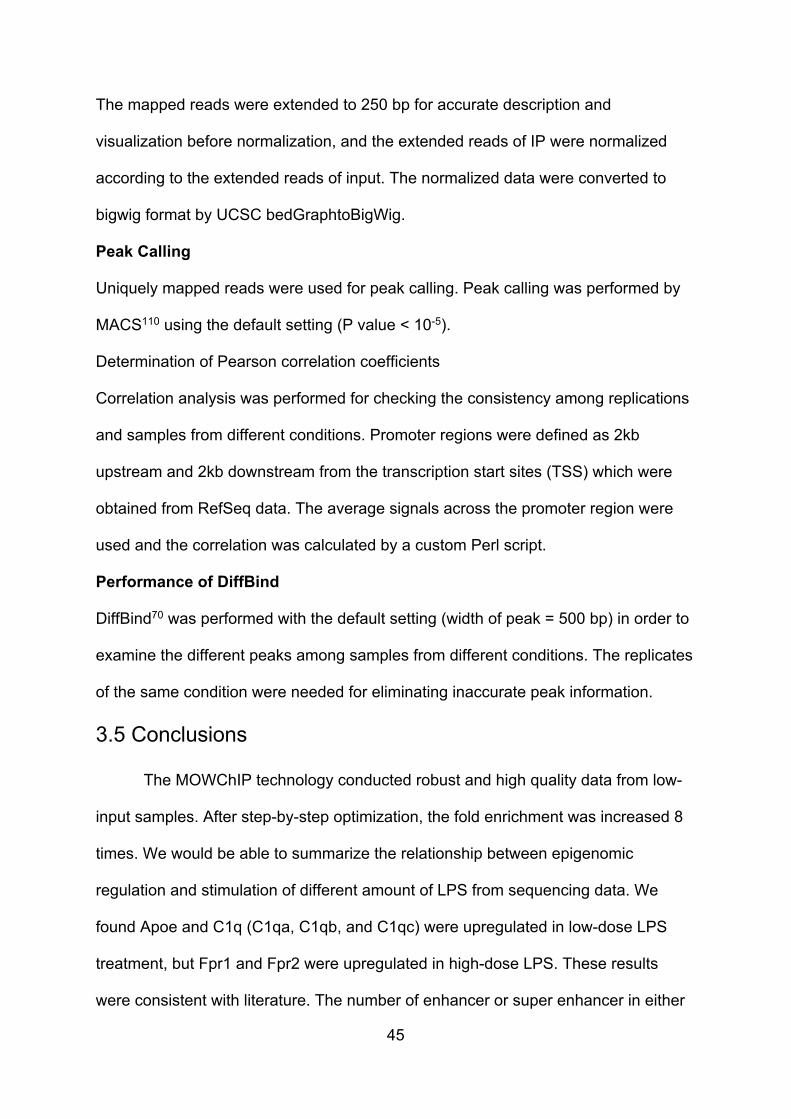
45
The mapped reads were extended to 250 bp for accurate description and
visualization before normalization, and the extended reads of IP were normalized
according to the extended reads of input. The normalized data were converted to
bigwig format by UCSC bedGraphtoBigWig.
Peak Calling
Uniquely mapped reads were used for peak calling. Peak calling was performed by
MACS110 using the default setting (P value < 10-5).
Determination of Pearson correlation coefficients
Correlation analysis was performed for checking the consistency among replications
and samples from different conditions. Promoter regions were defined as 2kb
upstream and 2kb downstream from the transcription start sites (TSS) which were
obtained from RefSeq data. The average signals across the promoter region were
used and the correlation was calculated by a custom Perl script.
Performance of DiffBind
DiffBind70 was performed with the default setting (width of peak = 500 bp) in order to
examine the different peaks among samples from different conditions. The replicates
of the same condition were needed for eliminating inaccurate peak information.
3.5 Conclusions
The MOWChIP technology conducted robust and high quality data from low-
input samples. After step-by-step optimization, the fold enrichment was increased 8
times. We would be able to summarize the relationship between epigenomic
regulation and stimulation of different amount of LPS from sequencing data. We
found Apoe and C1q (C1qa, C1qb, and C1qc) were upregulated in low-dose LPS
treatment, but Fpr1 and Fpr2 were upregulated in high-dose LPS. These results
were consistent with literature. The number of enhancer or super enhancer in either

46
low-LPS or high-LPS was lower than control (non-LPS-stimulated) group. Especially,
low-LPS lost more enhancers and super enhancers than high-LPS. In gene ontology,
a number of biological processes, such as immune response and metabolic
process, were enriched in both low-LPS and high-LPS. The condition-specific
transcription factors existed in high-LPS were associated with inflammation and
existed in low-LPS were associated with chronic immune responses. The
sequencing data of histone modification provides potential candidates to profile the
mechanism of inflammation and would healing. Taken together, our technology and
data are able to makes contributions to developing precision medicine.

47
Chapter 4 Profiled cell-type-specific epigenomic changes associated with BRCA1 mutation in breast tissues using MOWChIP-seq 4.1 Project Summary
Breast cancer is one of the most common cancers to women not only in
American, but in whole world, no matter developed, developing, or undeveloped
countries. Currently, the risk of American women being diagnosed with breast cancer
over the course of her lifetime is about 13%111. It means that one in eight American
women will develop breast cancer. Women having germline mutations in a gene of
BRCA1 or BRCA2 have 71.4% or 87.6% average possibility, respectively, to develop
breast cancer by age 70112.
Here, we implemented MOWChIP-seq technology with cells from human
breast and mouse mammary tissues to examine existence and importance of
epigenomic regulations. We used BRCA1 mutation carrier and non-carrier patient
samples and BRCA1 knockout and wild type mouse samples. We found significant
epigenomic differences in human basal and stromal cells between BRCA1 mutation
carriers and non-carriers. As H3K27ac is used as an active enhancer mark, the
enriched regions in H3K27ac associate with incresed ontologies. Some biological
processes, such as immune response and unforded protein response (UPR), were
enriched in both basal and stromal cells. Then, enhancer regions were studied to
examine the significantly enriched transcription factor binding motifs. Some
transcription factors including, but not limited to C-MYC, CTCF, VDR, and
P53,enriched in our analyses were also reported in literature associating with
BRCA1. However, the sequencing data from mouse model showed only 40%

48
overlap with transcription factors enriched in human samples, indicating that the
homozygous exon 11 knockout mouse was not a good epigenomic model for BRCA1
mutation in human research. This, for the first time, allowed us to profile epigenomic
regulations of histone modification by BRCA1 mutation in individual patients of
BRCA1 mutation carrier or non-carrier.
4.2 Introduction
Breast cancer is the second mortal cancer among American women, following
lung cancer. It is predicted that 42 thousand women will die due to breast cancer in
2020. BRCA1 and BRCA2 are extremely influential in repairing DNA double-strand
break through homologous recombination to suppress breast cancer113-116. Gene
mutations in BRCA1 and BRCA2 increase the risk of developing breast cancer117,118.
Human female mammary epithelium is a two-layer tissue, including inner
(luminal) layer and outer (basal) layer. The luminal progenitors (LP) and mature
luminal cells (ML) are from the inner layer and basal cells (B) are from the outer
layer. The fourth cell type is stromal cells (S) from mesodermal tissue. The four cell
types can be distinguished by expression of surface markers CD49f and EpCAM
following staining with anti-CD49f and anti-EpCAM antibody: CD49f-EpCAM- stromal
cells, CD49fhighEpCAMlow basal cells, CD49f+EpCAMhigh luminal progenitor cells, and
CD49f-EpCAMhigh mature luminal epithelial cells, as shown in Fig. 4.2-1.

49
Fig. 4.2-1 Four different cell types in breast tissues. Adapted under CC BY from “Attenuation of RNA polymerase II pausing mitigates BRCA1 associated R-loop accumulation and tumorigenesis,” by Xiaowen Zhang, Nat Commun (2017)119.
Recent advances in epigenetic research have enabled us to use sequencing
data to analyze the gene mutation sites among different cell types to explore gene
regulation mechanisms. Opinions vary as to which type of cells is the main cause for
breast cancer120-123. Pellacani et al.124 first proposed the enhancer and transcription
factor mechanisms of human mammary epigenomes by analyzing four cell types.
However, they only used normal human mammary cells (non-carriers) and combined
the same cell type from six different patient samples. Pooling of samples are likely to
cause individual sequencing profiles from different patients to be less defined. Zhang
et al.119 used four different cell types from individual normal (non-carrier) or mutant
(BRCA1 mutation carrier) patients for research. However, they only focused on R-
loop-specific DNA-RNA immunoprecipitation-seq (DRIP-seq), but did not reach to
profile promoters and enhancers across the entire genome. The mechanisms of

50
gene regulations will not be clearly understood unless histone modifications are also
investigated.
Conventional ChIP-seq necessitate the use of up to 1 to 10 million cells per
assay. Fortunately, the number of cells can be reduced to a few hundred when
microfluidic tools are employed. Patient samples contain various numbers of cells,
ranging from a few thousands to hundreds of thousands. It is difficult for conventional
methods to produce reliable ChIP-seq data from primary patient samples.
Microfluidic tools have the potential to overcome this limitation.
Based on the success in chapter 3, MOWChIP devices were used to explore
the cell-type specific epigenomic changes associated with BRCA1 mutation in breast
tissues.
4.3 Results and discussion
Based on our success in using MOWChIP with pooled primary murine
monocytes (chapter 3), we used the same conditions with minor modifications to
profile epigenomic changes associated with BRCA1 mutation using primary human
and mouse samples. Due to the different number of cells from individual
patient/mouse samples, sonication time was changed to produce the optimal
fragnment size (200-250 bp). Fifty thousand cells were used for H3K27ac and ten
thousdand cells for H3K4me3 in both human and mouse samples.
4.3.1 BRCA1 mutation in human samples
Breast tissue samples, from women undergoing cosmetic reduction
mammoplasty or diagnostic biopsy, were obtained from our collaborator, Dr. Rong Li.
We focused on cancer-free patients, including normal (non-carrier, NC) and BRCA1
mutant (carrier, MUT) samples. For privacy purposes, patients were assigned with
specific numbers (e.g. BSCXXX). In this set, four different cell types (stromal (SC),

51
basal (BC), luminal progenitor (LP), and mature luminal (ML) cells) from eight
patients (five normal (BSC 157, BSC162, BSC167, BSC173, and BSC186) and three
mutant (BSC164, BSC189, and BSC191)) were examined.
4.3.1-1 Pearson’s correlation of human sequencing data
The replicates of each condition from H3K27ac were pooled together and
then profiled for Pearson’s correlation, as shown in Fig. 4.3-1 (a). It showed high
correlation between technical replicates in the same group (0.950). The average
correlation among biological replicates in a group was 0.918. BCs and SCs exhibited
considerable difference between NC and MUT (0.739 in BCs and 0.877 in SCs). In
contrast, LPs and MLs exhibited higher correlation between NC and MUT (0.914 in
LPs and 0.888 in MLs). LPs and MLs were concordant with each other well (0.832 in
MUT and 0.872 in NC) than other cell types (0.668-0.794). The visual representation
of H3K27ac consisted with above results (Fig. 4.3-1 (b)).
No cell-type-specific cancer-free BRCA1 mutation data exist in literature, but
unsorted cancer-free BRCA1 mutation data were published125. We compared our
data with published data (Mix, breast tissue homogenate), as shown in Fig.4.3-1 (a).
There was no obvious difference between NC and MUT. This also underscored the
importance for cell-type-specific profiling to pinpoint specific roles for each cell type.

52
Fig. 4.3-1 ChIP-seq data from H3K27ac of human breast samples. (a) Pearson’s correlation in four cell types of BRCA1 carrier (MUT) and non-carrier (NC) and breast tissue homogenate from literature (Mix) along protomer regions (TSS +/- 2kb). (b) Visualization of normalized sequencing data in IGV. Created by Lynette Naler. (NC: BSC157, BSC162, BSC167, and BSC173; MUT: BSC164, BSC189, and BSC191)
We also profiled H3K4me3 with MOWChIP-seq, as shown in Fig. 4.3-2. It
exhibited higher correlation between technical replicates in the same group (average
r = 0.962). Besides, the average correlation among biological replicates in a group
was 0.960. Taken together, H3K4me3 was not a differentiating mark to profiling
BRCA1 mutation carriers and non-carriers.

53
Fig. 4.3-2 ChIP-seq data from H3K4me3 of human breast samples. (a) Pearson’s correlation in four cell types of BRCA1 carrier (MUT) and non-carrier (WT) along protomer regions (TSS +/- 2kb). (b) Visualization of normalized sequencing data in IGV. Created by Lynette Naler. (WT: BSC186; MUT: BSC189 and BSC191)
4.3.1-2 Differential H3K27ac peak regions
The H3K27ac sequencing data was then be analyzed by DiffBind (fold-
change ≥ 2, FDR < 0.05) to locate differentially modified peak regions, shown in Fig.
4.3-3. There were very little differences in MLs and LPs (2 in MLs and 518 in LPs).
However, the differential regions were moderate in BCs (3,545), and substantial in
SCs (19,946), shown in Fig. 4.3-3 (a). BCs had higher H3K27ac signal regions (dark
blue blocks) in either NC or MUT samples and the numbers of higher signal regions
in NC and MUT were 2,048 and 1,497. All higher signal regions in stromal cells were

54
in NC. Then, we analyzed the normalized H3K27ac signal based on the result from
DiffBind analysis (Fig 4.3-3 (b)). BCs and LPs showed similar overall values between
normal and mutant patients, but MLs and SCs exhibited slightly lower overall values
in MUT.
Fig. 4.3-3 Differential H3K27ac peak regions. (a) Heatmaps of differentially modified H3K27ac peak regions found to be significant (fold-change ≥ 2, FDR < 0.05) between normal and mutant patients. (b) Boxplots of normalized H3K27ac signal at all peak regions, and at those found to be significantly. (c) Gene Ontology (GO) analysis using GREAT of significant differentially modified peak regions between NC and MUT. Created by Lynette Naler.
BCs and SCs had significant differences (enriched H3K27ac signal) between
NC and MUT than other cell types, so we next examined gene ontology (GO) in

55
these two cell types (Fig. 4.3-3). Some biological processes, such as immune
response126-128 and unfolded protein repsonse (UPR)129, were enriched in both BCs
and SCs. Reduction in BRCA1 expression promotes the expression of GRP78,
which plays a critical role to regulate UPR expression129. In addition, some
processes were solely enriched in BCs or SCs. For instance, apoptosis130, RNA
polymerase II transcription131, and DNA damage response132 were enriched in SCs
and cell motility133 and adhesion were significant in BCs.
Human data were visualized in IGV, as shown in Fig. 4.3-4. Here, each cell
type displayed its specific pattern, regardless of being normal or mutant.
Fig. 4.3-4 MOWChIP sequencing data of human samples, visualized in IGV. BSC173: NC, BSC189L: MUT.
However, each cell type also exhibited the different peak patterns between
normal and mutant states implicating the existence of epigenomic regulations when
Human (hg19)Chr12
BSC173-B1BSC173-B2BSC189L-B1
BSC189L-LP1BSC189L-LP2BSC173-ML1BSC173-ML1BSC189L-ML1BSC189L-ML2BSC173-S1BSC173-S2BSC189L-S1BSC189L-S2
BSC173-LP2BSC173-LP1
BSC189L-B2
Refseq genes
[0-3.00]
[0-3.00]
[0-3.00]
[0-3.00]
[0-3.00]
[0-3.00]
[0-3.00]
[0-3.00]
[0-3.00]
[0-3.00]
[0-3.00]
[0-3.00]
[0-3.00]
[0-3.00]
[0-3.00]
[0-3.00]
VWF CD9 PLEKHG6 SCNN1A CD27-AS1 MRPL51 GAPDH CHD4 LPAR5 ZNF384 COPS7A

56
we focused on specific regions of gene identified by DiffBind analysis (Fig. 4.3-5 –
4.3-8). The detailed sequencing data were summarized in Table 4.3-1 to Table 4.3-4.
Gong et al. used western blot and quantitative reverse transcription-PCR
(qRT–PCR) to identify that repression of FOCA1 was correlated to the loss of
BRCA1 in luminal subtype20 and this result was accordant with our data in Fig. 4.3-6.
As H3K27ac is used as an active enhancer mark, its function is highly associated
with activation of transcription. Downregulation in FOCA1 due to BRCA1 mutation
correlated with repressing gene expression of FOCA1. This finding was the first time
confirmed by sequencing data.
qPCR can only quantify the genes with available primers and data are limited
because individual gene needs specific primers to detect. However, ChIP-seq can
profile the whole genome and all interesting genes can be localized by software and
listed. Owing to the advance in computer programs, interactions among all genes
can be identified. ChIP-seq generates far more information while saving cost and
labor.

57
Fig. 4.3-5 Different histone modification pattern in human basal cells. Light color (upper): non-carrier, dark color (lower): carrier.
Fig. 4.3-6 Different histone modification pattern in human luminal progenitor cells. Light color (upper): non-carrier, dark color (lower): carrier.
Human (hg19)Chr14
BSC173-B1BSC173-B2BSC189L-B1
BSC189L-LP1BSC189L-LP2BSC173-ML1BSC173-ML1BSC189L-ML1BSC189L-ML2BSC173-S1BSC173-S2BSC189L-S1BSC189L-S2
BSC173-LP2BSC173-LP1
BSC189L-B2
Refseq genesVSX2 VRTN SYNDIG1L NPC2 LTBP2 AREL1 YLPM1 PROX2 PGF EIF2B2 ACYP1 TMED10 FOS
[0-3.00]
[0-3.00]
[0-3.00]
[0-3.00]
[0-3.00]
[0-3.00]
[0-3.00]
[0-3.00]
[0-3.00]
[0-3.00]
[0-3.00]
[0-3.00]
[0-3.00]
[0-3.00]
[0-3.00]
[0-3.00]
Human (hg19)Chr14
BSC173-B1BSC173-B2BSC189L-B1
BSC189L-LP1BSC189L-LP2BSC173-ML1BSC173-ML1BSC189L-ML1BSC189L-ML2BSC173-S1BSC173-S2BSC189L-S1BSC189L-S2
BSC173-LP2BSC173-LP1
BSC189L-B2
Refseq genes
[0-3.00]
[0-3.00]
[0-3.00]
[0-3.00]
[0-3.00]
[0-3.00]
[0-3.00]
[0-3.00]
[0-3.00]
[0-3.00]
[0-3.00]
[0-3.00]
[0-3.00]
[0-3.00]
[0-3.00]
[0-3.00]
MIPOL1 FOXA1 TTC6

58
Fig. 4.3-7 Different histone modification pattern in human mature luminal and stromal cells. Light color (upper): non-carrier, dark color (lower): carrier.
Fig. 4.3-8 Different histone modification pattern in human stromal cells. Light color (upper): non-carrier, dark color (lower): carrier.
PRDM16 ARHGEF16 MEGF6 TPRG1L TP73
Human (hg19)Chr1
BSC173-B1BSC173-B2BSC189L-B1
BSC189L-LP1BSC189L-LP2BSC173-ML1BSC173-ML1BSC189L-ML1BSC189L-ML2BSC173-S1BSC173-S2BSC189L-S1BSC189L-S2
BSC173-LP2BSC173-LP1
BSC189L-B2
Refseq genes
[0-3.00]
[0-3.00]
[0-3.00]
[0-3.00]
[0-3.00]
[0-3.00]
[0-3.00]
[0-3.00]
[0-3.00]
[0-3.00]
[0-3.00]
[0-3.00]
[0-3.00]
[0-3.00]
[0-3.00]
[0-3.00]
Human (hg19)Chr15
BSC173-B1BSC173-B2BSC189L-B1
BSC189L-LP1BSC189L-LP2BSC173-ML1BSC173-ML1BSC189L-ML1BSC189L-ML2BSC173-S1BSC173-S2BSC189L-S1BSC189L-S2
BSC173-LP2BSC173-LP1
BSC189L-B2
Refseq genes
[0-3.00]
[0-3.00]
[0-3.00]
[0-3.00]
[0-3.00]
[0-3.00]
[0-3.00]
[0-3.00]
[0-3.00]
[0-3.00]
[0-3.00]
[0-3.00]
[0-3.00]
[0-3.00]
[0-3.00]
[0-3.00]
SPTBN5 NR_135681 EHD4 PLA2G4E-AS1

59
4.3.1-3 Examination of enhancers of patient samples
We examined enhancer regions of each cell type in NC and MUT (Fig. 4.3-9
(a)). Enhancers were defined by H3K27achigh signal regions, exclusive of regions
nearby transcription start sites (TSS). NC was used as the reference, mutant BCs,
LPs, MLs, and SCs covered 67%, 90%, 79%, and 29%, respectively. Mutant cells
had higher number of additional enhancers in BCs, LPs, and MLs. NC was used as
the reference again, mutant BCs, LPs, MLs, and SCs had 384.48%, 57.57%,
66.42%, and 7.94% of additional enhancers, respectively.
Fig. 4.3-9 Enhancers (a) Venn diagrams of overlap between NC and MUT in different cell types. (b) Distribution of genomic location in enhancers. Created by Lynette Naler.
The enhancers were then mapped to genomic regions, as showen in Fig 4.3-9
(b). There were some slight differences in each cell type between NC and MUT,
except for LPs. BCs exhibited exaggerated differences between NC and MUT due to
BRCA1 mutation. It suggested that BRCA1 mutation played different roles in
enhancers in different cell types.

60
4.3.1-4 Motif analysis at enhancers of patient samples
Enhancer regions were studied to profile the significantly enriched
transcription factor binding motifs in Fig. 4.3-10. BCs had substantially more
differentially enriched transcription factor binding motifs than other cell types, likely
as the result of smaller overlap between NC and MUT in BCs. BCs had numerous
additional transcription factors in MUT, however, all transcription factors that SCs
had were in NC. Even though over 50% of transcription factors had few connection
with BRCA1 when exploring in Pubmed (search term = “(Transcription Factor) AND
(BRCA1)”), some transcription factors were reported in literature to associate with
BRCA1 including, but not limited to, C-MYC134,135, CTCF136,137, VDR138, and
P53139,140.
We next examined the pathways of differential transcription factors by
PANTHER, and found that Gonadotropin-releasing hormone (GnRH) receptor
pathway and Wnt signaling pathway were present in all four cell types. BRCA1 has
been shown to be crucial in the Wnt signaling pathway144 and GnRH agonists have
effective treatment in breast cancer145.

61
Fig. 4.3-10 Motif analysis at enhancers. (a) Heatmap of motifs significantly enriched in either NC or MUT. (b) Venn diagrams of overlap enriched motifs between NC and MUT. Created by Lynette Naler.
4.3.1-5 Cell-type-specific transcription factors
We found that BCs and SCs had significant epigenomic regulations in cancer-
free human samples due to BRCA1 mutation, while LPs had few differences. This

62
result is unanticipated because LPs have been thought to possess functions in
driving BRCA1-mutation breast cancer122. Here, we examined the likelihood of BCs
differentiating into LPs, as hypothesized by Holliday et al146.
The cell-type-specific gene were identified from previous literature124. After
comparison, 6% (44/712) of BC-specific genes had changes due to BRCA1
mutation. LPs and MLs had fewer changes (1% (4/305) in LPs and 2% (23/444) in
MLs). We found 95% of BC-specific genes in MUT had lower H3K27ac signal,
implying that there was a loss of basal gene expression in MUT.
We also examined the cell-type-specific transcription factors, as shown in Fig
4.3-11. We extracted 8, 55, and 6 cell-type-specific TFs (in BC, LP, and ML,
respectively) in NC based on motif analysis. Mutant BCs enriched 27 of the LP-
specific TFs and 6 of the ML-specific TFs. In contrast, mutant LPs enriched 2 of the
BC-specific TFs and 6 of the ML-specific TFs; and mutant MLs enriched 1 of the BC-
specific TFs and 8 of the LP-specific TFs. The results suggested that BCs
experienced more substantial changes due to BRCA1 mutation. Taken together,
BCs might differentiate into LPs due to BRCA1 mutation.

63
Fig. 4.3-11 Cell-type-specific transcription factors in NC and their enrichment in MUT. Created by Lynette Naler.

64
4.3.2 Profiling mouse samples
Next, we examined mouse samples and checked whether the results from
Brca1 mutant mouse samples were accordant with human samples. We wanted to
check whether the homozygous exon 11 knockout mice147 model was good for
human research or not. We also studied the effect of age in Brca1 mutation. This
Brca1 mutation model was used to compare with wild type mice in this study. We
used BCs (from 8-month old mice) and LPs (from 8-week old and 8-month old mice)
(Fig. 4.3-12). The data showed good average correlation of H3K27ac signals at
promoter regions between biological replicates in the same group (0.948) and
between wild type and mutant cells (0.946), as shown in Fig. 4.3-12 (a). Young (8-
week old) and old (8-month old) luminal progenitors showed better correlation with
each other (0.916) than with basal cells (0.813). Visualization indicated slightly
different patterns for young and old luminal progenitor cells (Fig. 4-3-12 (b)). Similar
results were also exhibited in correlation of H3K4me3 signal at promoter regions
from 8-month old mice (Fig. 4.3-12 (c) & (d)).
Even though there were no significant differences in modified H3K27ac peak
regions, the differences in enhancers were still evaluated (Fig. 4.3-13 (a)). Mutant
BCs possessed fewer enhancers, and this result contrasted with our human data.
The LPs from young mice had more enhancers than old mice. Mutant LPs exhibited
almost all WT enhancers, and they also showed more aberrant enhancers. The
enhancers were then mapped to genomic regions, as showen in Fig 4.3-13 (b).
There were slight differences in each cell types between wild type and knockout
mice. BCs exhibited extremely different between WT and MUT than young and old
LPs. BCs had many additional TFs in WT, in sharp contrast to human BCs (Fig. 4.3-
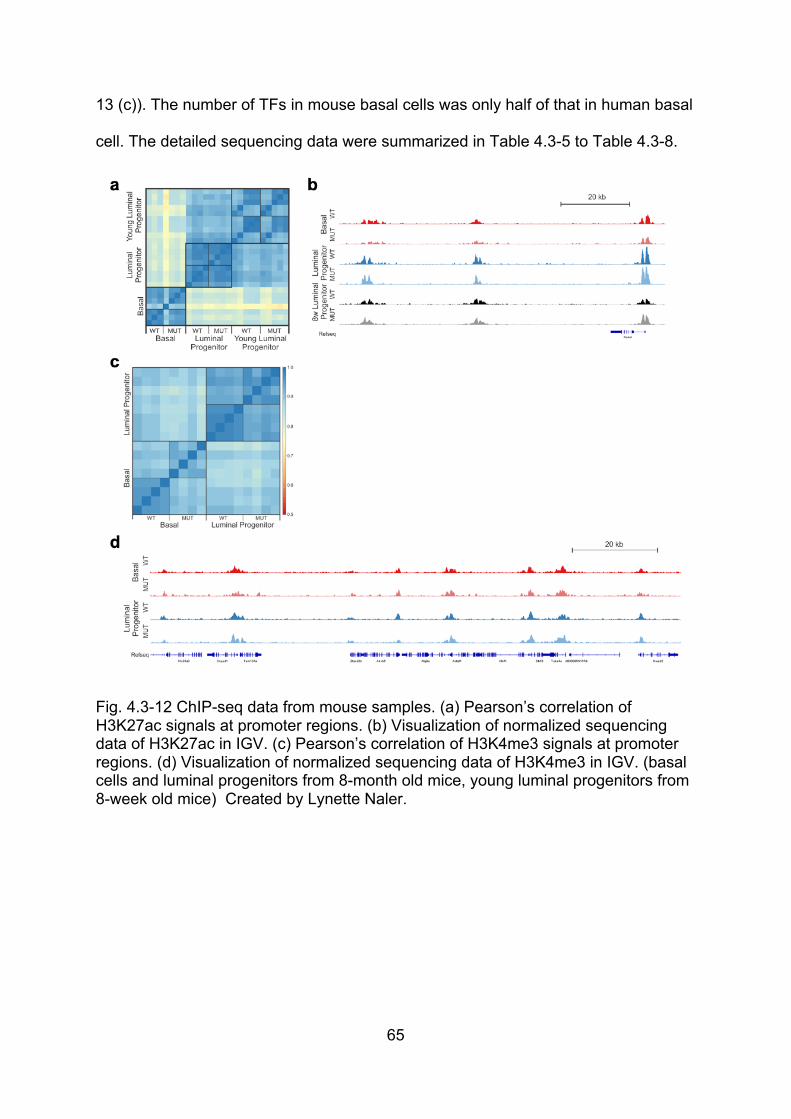
65
13 (c)). The number of TFs in mouse basal cells was only half of that in human basal
cell. The detailed sequencing data were summarized in Table 4.3-5 to Table 4.3-8.
Fig. 4.3-12 ChIP-seq data from mouse samples. (a) Pearson’s correlation of H3K27ac signals at promoter regions. (b) Visualization of normalized sequencing data of H3K27ac in IGV. (c) Pearson’s correlation of H3K4me3 signals at promoter regions. (d) Visualization of normalized sequencing data of H3K4me3 in IGV. (basal cells and luminal progenitors from 8-month old mice, young luminal progenitors from 8-week old mice) Created by Lynette Naler.

66
Fig. 4.3-13 Mouse H3K27ac data in basal cells (8-month old mice), luminal progenitors (8-month old mice) and young luminal progenitor (8-week old mice). (a) Venn diagrams of enhancers (left) and super enhancers (right) between normal and mutant mice. (b) Genomic locations of enhancers (left) and super enhancers (right). (c) Motif analysis at enhancers. Heatmap of motifs significantly enriched in either normal or mutant mice. Created by Lynette Naler.
4.4 Materials and methods
Fabrication of microfluidic chip
The microfluidic device was fabricated using polydimethylsiloxane (PDMS) and
consisted of two layers (fluidic and control layer)107 as described in previous
publication19. Briefly, two photomasks (for fabricating fluidic and control layers) with
microscale patterns were manufactured by computer-aided design software

67
FreeHand MX (Macromedia, San Francisco, CA, USA) and printed at high-resolution
(5080 dpi). The masters of the fluidic and control layer were created by pouring
negative photoresist SU-8 2025 (Microchem, Newton, MA, USA) on 3-inch silicon
wafers (University Wafer, South Boston, MA, USA) and spun 500 rpm for 10 s and
2500 rpm for 30 s for fluidic master to make ~30 μm in photoresist thickness and 500
rpm for 10 s and 1500 rpm for 30 s for control layer to make ~50 μm in photoresist
thickness. The negative photoresist SU-8 2025 produced partial close valves that
allow solution to leave but keep beads within the chamber. Both fluidic and control
masters were baked at 95 ˚C for 8 min (soft bake), exposed UV (580 mW) for 17 s,
then baked at 95 ˚C for another 8 min (post bake). The masters were washed with
SU-8 developer, shook for 2-3 min, and rinsed with IPA, acetone, and DI water.
PDMS (RTV615) with mass ratio of A:B = 5:1 was poured onto the fluidic layer
master placed in the Petri dish to create ~5 mm in thickness of fluidic layer PDMS,
and degased for 1 h. PDMS with mass ratio of A:B = 20:1 was degased for 1 h and
poured onto the control layer master which was set in the spinner and spun at 500
rpm for 10 s and 1100 rpm for 30 s to fabricate ~108 um in thickness of control layer
PDMS. Both fluidic and control layer PDMS were cured at 80 ˚C for 12 min. The
fluidic layer was peeled off from the master by a scalpel. The fluidic and control layer
were aligned and combined by the pattern (the neck of chamber of fluidic pattern
was crossed with the bar shape of control pattern) to form tow-layer PDMS. The two-
layer PDMS was baked at 80 ˚C for 2 h and peeled off from control layer master. The
two-layer PDMS was punched by Harris Uni-Cores 2.0 mm puncher (Electron
Microscopy Sciences) at specific sites (inlet part of control layer, inlet and outlet
parts of fluidic layer). The two-layer PDMS and a pre-cleaned glass slide (25mm x
75mm, VWR) were treated by plasma (Harrick Plasma) and then bonded together.

68
The chip device was cured at 80 ˚C for 1 h to increase bonding strength and remove
bubbles.
Mice
C57BL6 BRCA1f/f mice were obtained from Mouse Model of Human Cancer
Consortium, National Cancer Institute. Wild type BRCA1 mice were purchased from
Jackson Laboratory. All processes performed on animals were approved by the
Institutional Animal Care and Use Committee (IACUC) at the University of Texas
Health Science Center at San Antonio.
Breast tissue
Cancer-free BRCA1 mutant (carrier) or normal (non-carrier) breast tissue was
obtained from adult female patients who underwent cosmetic reduction of
mammoplasty, diagnostic biopsies, or mastectomy and all procedures were
approved by the University of Texas Health Science Center at San Antonio. The
consent forms were signed by donors to approve the use of the tissue for breast
cancer research.
Single-cell isolation of human and mouse breast tissue
Unfixed human or mouse breast tissue was processed following previous published
protocols with minor modification148. Briefly, breast tissue was fragmented by
scalpels and then digested in DMEM/F-12 complemented (StemCell) with 5% FBS
(StemCell), 300 U/ml collagenase (StemCell), 100 U/ml hyaluronidase (StemCell),
0.1% BSA (Fisher Scientific), 10 ng/ml epidermal growth factor (Invitrogen), 10 ng/ml
cholera toxin (Sigma), 5 μg/ml insulin (Sigma) and 0.5mg/ml hydrocortisone (Sigma)
with agitation at 37 ˚C for 15-18 h. The epithelial-rich tissue was obtained by
centrifuging at 100 g for 3 min. Red blood cells in epithelial-rich tissue were lysed by
0.8 % NH4Cl and then epithelial-rich tissue was digested with 0.05 % trypsin-EDTA

69
(Life Technologies), washed with Hank’s balanced salt solution complemented with
2 % FBS and resuspended in 5 mg/ml Dispase with 0.1mg/ml DNase I (Roche).
Single cells were obtained by filtration with a 40 μm filter (Fisher) and aggregates
were removed.
Flow cytometry and cell sorting
Single cells were incubated with 10 % rat serum on ice for 10 min for preblocking,
and then stained with anti-CD45 (eBiosciences), anti-CD235a (eBiosciences), and
anti-CD31 (eBiosciences) biotin-conjugated antibodies followed by Pacific Blue-
conjugated Streptavidin (Thermo Fisher Scientific) to remove haematopoietic and
endothelial cells and stained with anti-CD49f allophycocyanin-conjugated antibody
(R&D Systems) and anti-EpCAM FITC-conjugated antibody (StemCell) to separate
different cell types following the previously published protocols148. Cells were
incubated with 7-aminoactinomycin D (BD Biosciences) to separate live and dead
cells. Cells were sorted by a BD FACSAria Flow Cytometer (BD Biosciences). Cells
from human breast tissue were separated into 4 different cell types: EpCAM-CD49f-:
stromal cells (S), EpCAMlowCD49fhigh: basal cells (B), EpCAMhighCD49f+: luminal
progenitor cells (LP), and EpCAMhighCD49f-: mature luminal epithelial cells (ML).
Cells from mouse breast tissue were separated into 3 different cell types: EpCAM-
CD49f-: stromal cells (S), EpCAMhighCD49fmed: luminal epithelial cells (L), and
EpCAMmedCD49fhigh: myoepithelial cells. The purification of each cell type was
verified by performing real-time PCR to analyze VIM (stromal), KRT14 (basal),
KRT18 (luminal) and ESR1 (mature luminal) mRNA using ACTB to normalize.
Chromatin Shearing
Each sample containing 106 cells was centrifuged at 1600 g for 5 min at room
temperature and washed twice with 1 ml PBS (4˚C). Cells were resuspened in 9.375

70
ml PBS. 0.625 ml 16% formaldehyde was added and incubated at room temperature
on a shaker for 5 min. Crosslinking was quenched by adding 0.667ml 2M glycine and
shaking for 5 min at room temperature. The crosslinked cells were centrifuged at
1600 g for 5 min and washed twice with 1 ml PBS (4˚C). The pelleted cells were
resuspended in 130ul of the Covaris buffer (10 mM Tris-HCl, pH 8.0, 1 mM EDTA,
0.1% SDS and 1x protease inhibitor cocktail (PIC)) and sonicated at 4 ˚C with 105 W
peak incident power, 5% duty factor, and 200 cycles per burst for 16 min by Covaris
S220 (Covaris). The sonicated sample was centrifuged at 16100 g for 10 min at 4 ˚C.
The sheared chromatin in the supernatant was transferred to a pre-autoclaved 1.5 ml
microcentrifuge tube (VWR). 2.4 µl sheared chromatin was mixed with 46.6 µl IP
buffer (20 Mm Tris-HCl, pH 8.0, 140 mM NaCl, 1 mM EDTA, 0.5 mM EGTA, 0.1 %
(w/v) sodium deoxycholate, 0.1 % SDS, 1 % (v/v) Triton X-100, with 1% freshly
added PMSF and PIC) so the amount of chromatin in each sample was equal to 20 k
cells. The amount of sheared chromation of 2.5 k cells was used to check fragment
size by HS D1000 tapes on Tapestation 2200 (Agilent).
Bead preparation
5 μl of protein A Dyanbeads for immunoprecipitation (Invitrogen) were washed twice
with 150 μl IP buffer. The beads were mixed with 149 μl IP buffer and 1ul of
H3K27ac/H3K4me3 antibody (abcam) and incubated at 4 ˚C on the rotator overnight.
Afterwards, the beads were washed twice with 150 μl IP buffer and resuspended in 5
μl IP buffer for on-chip use.
Device operation
The overview of MOWChIP shown in Fig. 2.2-2 was composed of the fluidic layer
(oval chamber, inlet (point 1), and outlet (point 2)) and control layer (bar-shape and
inlet (point 3)). The chip device was placed on the microscope (Olympus microscope

71
IX71) and a tube was filled with DI water and connected with the inlet of control layer
and 30 psi gas pressure which was controlled by LabVIEW. After 10 min, the bar-
shaped control valve was filled with DI water. A 1 ml syringe filled with IP buffer was
connected with a 30 cm tube and placed on a syringe pump (Chenyx). The other end
of the aforementioned 30 cm tube was connected to the inlet of fluidic layer and filled
with IP buffer at the speed of 200 μl/min. To eliminate bubbles within the chamber,
the valve of the control layer was closed for a few seconds to allow pressure buildup
within the chamber. Then it was opened to release the pressure inside the chamber
and to eject the unwanted bubbles simultaneously. 5 μl beads coated with H3K27ac
antibody were loaded into the chamber and a magnet was used to confine the beads
within the chamber. 0.5 μl PMSF and 0.5 μl PIC were added to 49 μl sample solution
containing sheared chromatin of 20 k cells. The syringe connected with a 30 cm tube
was used to withdraw 50 μl sample solution (leaving a small space in the tube before
withdrawing sample solution to prevent contact between sample and the pre-loaded
IP buffer). The syringe pump was used to load sample solution into chamber at 1.5
μl/min. The coated beads were packed in front of the valve (the valve was partially
closed, so the solution could leave but beads were retained) when the sample
solution was loaded to the chamber. All sample solution was injected into the
chamber filled with beads in 50 min, the 30 cm tube was removed from the inlet of
the fluidic layer, and the valve was opened. Two 10 cm tubes were loaded with low
salt washing buffer (20 mM Tris-HCl, pH 8.0, 150 mM NaCl, 2 mM EDTA, 0.1% SDS,
1% (v/v) Triton X-100) and connected to inlet and outlet of fluidic layer respectively.
Oscillatory washing (pressure pulse at 3 psi for 0.5 second at inlet and outlet
alternatively) was performed for 5 minutes to remove nonspecifically adsorbed and
physically trapped materials from coated beads surface. The low salt washing buffer

72
was replaced by high salt washing buffer (20 mM Tris-HCl, pH 8.0, 500 mM NaCl, 2
mM EDTA, 0.1% SDS, 1% (v/v) Triton X-100) and the same process was repeated.
After that, the beads were held in place by a magnet within the chamber and IP
buffer was flushed through at 3 μl/min to remove all debris/ waste materials. The
beads were then flushed out of the chamber at 200 μl/min, and collected to a new
1.5 ml microtube.
DNA purification
The beads and input chromatin samples were incubated at 65 ˚C overnight with 198
μl reverse crosslinking buffer (200 mM NaCl, 50mM Tris-HCl, 10 mM EDTA, 1%
SDS, 0.1M NaHCO3) and 2 μl of 20 μg/μl proteinase K (Sigma). DNA was separated
from protein and beads by adding 200 μl of Phenol:Chloroform:Isoamyl Alcohol
25:24:1 to the above solution after incubation and vortexing. The solution was
centrifuged at 16100 g for 5 min, and the supernatant was transferred to a new 1.5
ml microtube to mix with 750 μl 100% ethanol, 50 μl 10M ammonium acetate and 5
μl of 5 μg/μl glycogen. The mixture was vortexed and incubated at -80 ˚C for 2 h.
After that, the sample was centrifuged at 16100 g for 10 min at 4 ˚C and the
supernatant was discarded. 500 ml 70% ethanol was added to the microtube without
disturbing the pellet. The microtube was centrifuged at 16100 g for 5 min at 4 ˚C and
supernatant was discarded. The pellet was air dried for 5 min and then was
resuspended with 12 μl TE buffer.
Quantitative PCR (qPCR) Assay
qPCR assays were performed by a Real-Time PCR Detection System (CFX
Connect, BIO-RAD, Hercules, CA). 12.5 μl SYBR Green supermix (BIO-RAD), 1 μl
forward primer, 1 μl reverse primer, and 10.5 μl diluted DNA sample were mixed
together to perform PCR processes, including 95 ˚C for 15 s for denaturing, 58 ˚C for

73
40 s for annealing, and 72 ˚C for 30 s for extending. The following primers were used
to detect the ChIP-sample enrichment.
H3K27ac human mammary cells:
(positive primer) KLF6-forward 5’- GCG TTT ACC TGT TGC CAG TA -3’
(positive primer) KLF6-reverse 5’- CCA TGT GCA GCA TCT TCC A -3’
(positive primer) BAZ1A-forward 5’- TCT CAA CTC CGC TCC TCT CT -3’
(positive primer) BAZ1A-reverse 5’- TGG GCT GGG CTT CGT TT -3’
(negative primer) N-SLC-forward 5’- TTC CCA ACG TCA CAG AGT TAG -3’
(negative primer) N-SLC-reverse 5’- GAC AGT ACA GCA CAG AGG TTA G -3’
(negative primer) N-PER-forward 5’- GGT GCT CCC TGA TTG TTA GT -3’
(negative primer) N-PER-reverse 5’- CTT GTG CTT TGG GTC CAT TAA G -3’
H3K4me3 human mammary cells:
(positive primer) UNKL-forward 5’- CAG CCA CCC ACC TAG GAA -3’
(positive primer) UNKL-reverse 5’- TCC TAT GGC TCC CCA GGT -3’
(positive primer) C9ORF3-forward 5’- CCT CCT CAG TTC TCC CAG ACT -3’
(positive primer) C9ORF3-reverse 5’- AGC TGA GGT GGT AAG ATG TGA C -3’
(negative primer) N1-forward 5’- TCA TCT GCA AAT GGG GAC AA -3’
(negative primer) N1-reverse 5’- AGG ACA CCC CCT CTC AAC AC -3’
(negative primer) N2-forward 5’- ATG GTT GCC ACT GGG GAT CT -3’
(negative primer) N2-reverse 5’- TGC CAA AGC CTA GGG GAA GA -3’
H3K27ac mouse mammary cells:
(positive primer) CDIPT-forward 5’- CTC GGG ACG GAG TAA TCT CTA -3’
(positive primer) CDIPT-reverse 5’- GCA AAG GAA GAA ACT GGA AAG G -3’
(positive primer) BRD2-forward 5’- CCC TCG CGC GAA AGT AAA -3’
(positive primer) BRD2-reverse 5’- GAC GTG CAC ACC TGT CTT -3’

74
(negative primer) H2-OB-forward 5’- ACA CAG GTG CAC TGT ATT CC -3’
(negative primer) H2-OB-reverse 5’- TCA CTC CCT ACA TTA ATG CTT CC -3’
(negative primer) ZG16-forward 5’- GAG ACA GGG TTT CTC TGT GTA G -3’
(negative primer) ZG16-reverse 5’- GAC AGA GGC AGG TGG ATT T -3’
H3K4me3 mouse mammary cells:
(positive primer) FOXC1-forward 5’- CCC TTC TAT CGG GAC AAT AAG C -3’
(positive primer) FOXC1-reverse 5’- CTT GAC GAA GCA CTC GTT GA -3’
(positive primer) BAHCC1-forward 5’- GGC AGG ACA GAA CAC AAA GA -3’
(positive primer) BAHCC1-reverse 5’- CTC TCA AGC CTG CTA GAC TTT C -3’
(negative primer) N-ZG16-forward 5’- GAT TTC TGA CCT GGA GAG ATG G -3’
(negative primer) N-ZG16-reverse 5’- CAT GTG GTT GCT GGG ATT TG -3’
(negative primer) N-GRIK5-forward 5’- GAC TGA CAT ACG CAA GGA CTA C -3’
(negative primer) N-GRIK5-reverse 5’- GAC TGC TAC TTG GAT GGT GAT AC -3’
Library preparation
The Accel-NGS 2S Plus DNA Library Kit (Swift-Bio) was used to perform library
preparation. The process was based on the protocol from Swift-Bio with minor
modification. Briefly, the purified DNA underwent 5 steps, including: repair I for
dephosphorylation, repair II for end repair and polishing, ligation I for 3’ ligation of
P7, ligation II for 5’ ligation of P5, and PCR for amplification of DNA. At the last step
of PCR, 2.5 μl of 20x EvaGreen was added to the reaction mixture to check the
amount of DNA during amplification. Amplification was terminated when the
fluorescent signal increased by 3000 RFU (CFX Connect, BIO-RAD, Hercules, CA).
SPRI beads were used to purify the amplified DNA and remove dimers which
resulted during amplifying due to low amount of input DNA. 10 μl TE buffer was used
to elute pure DNA after amplification and different samples attached with different

75
barcodes were pooled together for sequencing by Illumina HiSeq 4000 with single-
end 50 nt read.
Read Mapping and Normalization
Sequencing reads were trimmed by Trim Galore and then mapped to the mouse
genome (mm10) using bowtie v2.4109 with default parameter settings. Uniquely
mapped reads were computed to normalize signal for 25 bp bin across the genome
according to the following equation:
Normalized signals =
IP( !"#$%'("#)*+'(,-.#/0('10"/23#44"$5"#$%
× 1,000,000) – Input( 6789:;<78=>?;<@AB8CD<;ED7CFG8HH79I789:
× 1,000,000)
The mapped reads were extended to 250 bp for accurate description and
visualization before normalization, and the extended reads of IP were normalized
according to the extended reads of input. The normalized data were converted to
bigwig format by UCSC bedGraphtoBigWig.
Peak Calling
Uniquely mapped reads were used for peak calling. Peak calling was performed by
MACS110 using the default setting (P value < 10-5).
Determination of Pearson correlation coefficients
Correlation analysis was performed for checking the consistency among replications
and samples from different conditions. Promoter regions were defined as 2kb
upstream and 2kb downstream from the transcription start sites (TSS) which were
obtained from RefSeq data. The average signals across the promoter region were
used and the correlation was calculated by a custom Perl script.
Performance of DiffBind

76
DiffBind70 was performed with the default setting (width of peak = 500 bp) in order to
examine the different peaks among samples from different conditions. The replicates
of the same condition were needed for eliminating inaccurate peak information.
4.5 Conclusions
We found significant epigenomic changes in human BCs and SCs when
comparing NC and MUT states. The top 5 cell-type-specific TFs in BCs, LPs, and
MLs from literature were also enriched in our NC cell populations. Our NC data
matched well with previously published results. Based on the data of transcription
factor binding motifs, we analyzed cell-type-specific TFs in BCs, LPs, and MLs, and
the results suggested that BCs might differentiate into LPs due to BRCA1mutation.
Human basal cells had far more TF motifs than other cell types, but the
number of motifs in mouse basal cells was only half of that in human basal cells.
Sequencing data from mouse model showed only 40% overlap with transcription
factors enriched in human samples. The Brca1 knockout mouse model of deleting
homozygous exon 11 was not a good epigenomic model for BRCA1 mutation in
human research. This, for the first time, allowed us to profile epigenomic regulations
of histone modification by BRCA1 mutation in different cell types (BCs, LPs, MLs,
and SCs) from individual patient.

77
Chapter 5 Microfluidic oscillatory hybridized ChIRP-seq assay to profile genome-wide lncRNA binding 5.1 Project Summary
Only 2% of human genome is translated to functional proteins (25,000).
However, most of the human genome (>70%) is transcribed to RNAs with no further
encoding reactions149,150. Since non-coding RNAs (ncRNAs) are the overwhelming
majority, they may possess some specific functions instead of being effete
products151. Recent studies have shown that lncRNAs play crucial roles in
transcriptional and post-transcriptional regulations, epigenetic regulations, organ and
tissue development, and metabolic processes29-35. Chromatin isolation by RNA
purification coupled with next generation sequencing (ChIRP-seq) is a gold-standard
approach to profile genome-wide lncRNA binding. However, ChIRP-seq requires 20-
100 million cells per assay, and these cells are infected by
retrovirus/lentivirus/adenovirus to overexpress specific lncRNAs. This requirement
impedes the application of examining whole-genome lncRNA bindings of clinical
samples.
We developed a novel microfluidic technology, microfluidic oscillatory
hybridized ChIRP, to profile whole-genome lncRNA bindings. This technology
permits profiling genome-wide lncRNA bindings using as few as 100,000 cells
(conventional ChIRP-seq assays requiring 20-100 million infected cells per assay).
We used this technology to examine different lncRNAs (LEENE (lncRNA that
enhances eNOS expression), HOTAIR and BY707159) in a cell line (MDA-MB-231),
a primary cell line (HUVECs) and primary endothelial cells from murine lung tissues.
We conducted microfluidic ChIRP-seq with not only adenovirus-infected cells but

78
native state cells. This, for the first time, allowed us to probe native lncRNA bindings
in mouse tissue samples successfully. This technology is promising for developing
precision medicine in examining epigenomic regulations in binding activities of
lncRNAs.
5.2 Introduction
Recent advances in next generation sequencing technologies allow whole-
genome profile with higher resolution to be acquired, thus the information in gene
regulation would be more comprehensive. The new knowledge – epigenetics,
defined as the modification in gene regulation and expression without changes to
DNA sequence, has become increasingly important in many different fields, such as
gene therapy152, cancer treatment153-158, and immunotherapy158-161.
Only 2% of human genome is translated to functional proteins (25,000). Most
of the human genome (>70%) is transcribed to RNAs with no further encoding
reactions149,150. Since non-coding RNAs are the overwhelming majority, they may
possess some specific functions instead of being effete products151.
The field of epigenetics consists of three different mechanisms for regulation
of gene expression: histone modification, DNA methylation, and non-coding RNA
(ncRNA) interactions. Non-coding RNA is a functional and informational RNA
transcribed from DNA that does not further encode proteins6. Recent studies suggest
that histone modification and DNA methylation are regulated by ncRNAs7-10,162, and
they are crucial in developing cancers, such as breast cancer163-167, lung cancer168-
176, liver cancer177-185, gastric cancer186-188,and endometrial cancer189-191 , and non-
tumoural diseases, such as cardiovascular disease166,192-199, oesophageal
adenocarcinoma200,201, melanoma185,202-204, Crohn’s disease201, Silver-Russell

79
syndrome205, McCune-Albright syndrome205, Alzheimer’s disease206,
Pseudohypoparathyroidism207 and Beckwith-Wiedeman syndrome205.
ncRNAs include transfer RNAs (tRNAs), ribosomal RNAs (rRNAs), small
RNAs, long non-coding RNAs (lncRNAs)208,209 etc. lncRNAs have more than 200
nucleotides but do not translate to proteins. They play pivotal roles in the above
human diseases and have important functions in regulating chromatin assembly and
disassembly (e.g. dosage compensation) and gene expression14-17,210. Above
evidence suggests that lncRNAs have key roles in epigenetics, and scientists are
concentrating on them in order to better understand the holistic networks among
gene expression, epigenetics, human diseases and lncRNAs.
Exploring the roles of lncRNAs in such scenarios is important to uncover
underlying epigenetic regulations, but research of lncRNAs has been limited for
several years due to their extremely low concentration in cells. Chu et al. developed
the Chromatin Isolation by RNA Purification (ChIRP) assay with sequencing (ChIRP-
seq)18,211 method to explore the new field of lncRNA bindings, which offer an
expanded field of view on the roles of lncRNAs in epigenetics. The main three steps
in ChIRP-seq include fixation of chromatin with lncRNAs, hybridization of specific
biotinylated tiling probes to target lncRNAs, and isolation of chromatin complexes by
streptavidin magnetic beads. However, the original ChIRP-seq assay requires 20-
100 million cells, infected by retrovirus to overexpress target lncRNA, per assay, and
this requirement constrains its applications212.
We developed a novel microfluidic technology for reducing the required
number of cells and this technology was used to profile lncRNA bindings with not
only cell line and primary cell line, but primary murine cells from lung tissues. It can

80
be used to investigate the epigenomic regulation of lncRNA bindings in clinical
patient samples for developing precision medicine.
5.3 Results and discussion
5.3.1 Development of microfluidic oscillatory hybridized ChIRP
technology
We developed a novel microfluidic oscillatory hybridized ChIRP-seq
technology to profile genome-wide lncRNA binding sites. The two steps
(hybridization of specific biotinylated tiling probes to target lncRNAs, and isolation of
chromatin complexes by streptavidin magnetic beads) in conventional ChIRP were
combined into one step in a microfluidic device. The schematic of microfluidic
oscillatory hybridized ChIRP is shown in Fig. 5.3-1.

81
Fig. 5.3-1 The schematic of microfluidic oscillatory hybridized ChIRP. Left side: experimental processes; right side: molecular vision referring to the step at left side.
The streptavidin magnetic beads were coated with biotinylated tiling 20-nt
probes (the sequence of these probes was complementary to the target lncRNA).

82
Then the hybridized pulldown of target lncRNA was conducted on the surface of
streptavidin magnetic beads in a microfluidic device. The RNA binding proteins
(RBPs) and chromatin fragments were isolated simultaneously in this process,
including the following two steps. First, the oscillatory motion of sample solution
(fragmented fixed cells and hybridization buffer) was conducted with long pressure
pulses alternatingly on two ends of the chamber. Beads were retained in the
chamber area with a magnet to increase the possibility of hybridization. Second, the
sample solution was collected after oscillatory motion. Then, the sample was
reloaded to the chamber and ran through a packed bed of magnetic beads formed
by closing the sieving valve and a magnet. The closing sieving valve allowed the
solution to flow but retained beads in the chamber. This step made high absorbing
efficiency for lncRNA binding to the surface of beads. The oscillatory washing step
was conducted with washing buffer to remove nonspecific bound and physically
trapped RNA. Finally, the beads were collected for subsequent biochemical analyses
including, but not limited to, efficiency of RNA retrieval, enrichment of target loci, and
next generation sequencing.
5.3.2 Adenovirus transfection and infection
Overexpressed lncRNAs were used to test the efficiency of this technology in
catching target lncRNA. Methods to amplify the amount of lncRNAs in vivo by virus
infection had recently been developed. Multiple virus systems, such as
retrovirus18,211,213, lentivirus214,215, adenovirus216-218, and adeno-associated
virus(AAV)219,220, have been used to overexpress lncRNAs. We followed protocol216
to amplify LEENE (lncRNA) by adenovirus infection. The gene of interest (LEENE)
was cloned into a shuttle vector (pAdTrack-CMV), as shown in Fig. 5.3-2.

83
Fig. 5.3-2 Overview of adenovirus transfection system. Adapted with permission from “A simplified system for generating recombinant adenoviruses,” by Tong-Chuan He, PNAS (1998), Copyright (1998) National Academy of Science, U.S.A.221
Then the cloned shuttle vector and adenoviral vector (pAdEasy-1), deleted E1
for eliminating self-replication capacity, were co-transformed into E. Coli (BJ5183)
and kanamycin was used to select recombinants. The recombinants were digested
with PacI to liberate adenoviral genomes, and then transfected into a packaging cell
line (HEK 293 cells) when the culture confluence reached to 50-70%. Due to the lack
of E1 proteins, the adenovirus cannot replicate in most cell types. HEK293 could

84
create E1 to produce adenovirus when HEK293 was transfected with adenovirus.
Two types of adenovirus, Ad-GFP-LEENE for LEENE overexpression and Ad-GFP
as a control set-up, were used. They transfected HEK293 for adenovirus replication.
The HEK 293 cells transfected by adenovirus were harvested when cell dissociation
was around 50% or by checking GFP signals. Shown in Fig. 5.3-3, cells were
harvested after 2 days transfection.
We used snap-freezing physical lysis method to break HEK293 cells and kept
the pellet after centrifugation for isolating pure adenovirus. HUVECs were infected
with adenovirus (Ad-GFP-LEENE) to overexpress LEENE (lncRNA) and earlier
passages (less than 10) of HUVECs were used. When the dissociation of infected
HUVEC cells reached to 50%, cells were harvested, as shown in Fig. 5.3-4.

85
Fig. 5.3-3 Adenovirus transfection in HEK293 cells. Ad-GFP-LEENE for LEENE (lncRNA) overexpression, Ad-GFP as control set-up.

86
Fig. 5.3-4 Adenovirus infection in HUVECs. 5.3.3 Profiling LEENE using pooling and splitting probes with microfluidic
ChIRP technology
Endothelial nitric oxide synthase (eNOS) plays important roles in endothelial
homeostasis and vascular functions. eNOS expression is regulated by transcription
factors (KLF2 and KLF4), histone modifications, and shear stress (pulsatile and
oscillatory)216. However, the role of lncRNAs in epigenomic modulation of eNOS
expression is still not well characterized. Our collaborator, Dr. Chen, found the
amount of LEENE expression was overwhelming majority when endothelial cells
(ECs) were stimulated with pulsatile shear stress (PS) and LEENE was highly co-
regulated with eNOS by analyzing RNA-seq. She proposed LEENE played crucial

87
roles in regulating eNOS and endothelial function. Due to the large number of cells
required, the sequencing data was difficult to create with conventional approaches.
Based on our experience in profiling histone modification by using microfluidic
system, we developed and applied a novel microfluidic technology to examine
whole-genome lncRNA bindings with low-input samples.
We designed Ad-GFP-LEENE to infect HUVECs for LEENE overexpression,
and Ad-GFP as a control set. We also used native HUVECs as the real control set.
We designed ten tiling probes for profiling LEENE binding. For the first test, we
pooled all probes together to test three conditions (LEENE: Ad-GFP-LEENE; GFP:
Ad-GFP; control: no Adenovirus infection). Five hundred thousand and one hundred
thousand cells were used in three conditions to conduct microfluidic oscillatory
hybridized ChIRP, shown in Fig. 5.3-5. Ad-GFP-LEENE as shown in red patterns,
Ad-GFP in green, and native (control) in purple. Fig. 5.3-5 (a) shows the locus of
LINC00520 (LEENE), and it was reasonable that the magnitude of peak in the
condition of LEENE was higher than the other two due to overexpression of LEENE.
There was no LEENE overexpression in conditions of GFP and control, so the
patterns in these two conditions were similar with each other and magnitude of peak
in these two conditions was lower than Ad-GFP-LEENE. Fig. 5.3-5 (b) and (c) show
peak patterns in other loci. We could see clear LEENE binding sites in control set of
100,000 cells. The detail sequencing data information was also listed in Table 5.3-1.
Next, we used splitting-probe groups (even and odd) to examine LEENE
bindings (Fig. 5.3-6). As LEENE overexpressed in Ad-GFP-LEENE, we saw more
significant magnitude of peak in both even and odd probes, than others (Fig. 5.3-6
(a)). Some peak patterns were different between even and odd tiling probes in
infected cells (Ad-GFP-LEENE and Ad-GFP), however, this phenomenon was not

88
recognized in native cells (Fig. 5.3-6 (b) & (c)). It seemed that virus infection might
impact on lncRNA bindings in whole genome. The genome-wide magnitude of peaks
was similar among three conditions, except the locus of LINC00520. Since there was
no significant improvement in lncRNA genome-wide bindings when using virus
infection and flase sequencing peaks might be created, we next used primary cells
(no virus infection) to conduct microfluidic ChIRP-seq. The sequencing data
information is listed in Table 5.3-2.

89
Fig. 5.3-5 Visualization of normalized sequencing data with pooling probes in IGV (LEENE). Red patterns: Ad-GFP-LEENE; green patterns: Ad-GFP; purple patterns: no adenovirus infection. (a) focusing on LEENE (LINC00520), (b) and (c) focusing on other loci.

90
Fig. 5.3-6 Visualization of normalized sequencing data with splitting probes in IGV (LEENE). Red patterns: Ad-GFP-LEENE; green patterns: Ad-GFP; purple patterns: no adenovirus infection. (a) focusing on LEENE (LINC00520), (b) and (c) focusing on other loci.

91
The binding sites of LEENE were examined and three conditions (Ad-GFP-
LEENE, Ad-GFP, and Control) were compared, as shown in Fig. 5.3-7. The binding
sites were mapped to genomic regions (Fig. 5.3-7 (a)). We studied data of pooling
probes and splitting probe, and we also examined data of overlapping even and odd
peaks. All Ad-GFP-LEENE data were consistent with each other. No significant
differences were observed. Some slight differences were showed in Ad-GFP and
control samples. Peaks of overlapping even and odd probes from three conditions
were investigated and compared with pooling probes (Fig. 5.3-7 (b)). Using Venn
diagram of splitting probes as a reference, the Ad-GFP-LEENE of pooling probes
showed substantially additional number of peaks. The overexpression might be the
reason for causing these aberrant additional peaks in Ad-GFP-LEENE. Either Ad-
GFP-LEENE or Ad-GFP exhibited lower overlap with control, and it also confirmed
that epigenomic regulation might be changed in the process of overexpression.
Then, we profiled transcription factor binding motifs based on the ChIRP-seq data,
shown in Fig. 5.3-7 (c). LEENE regulates eNOS (endothelial nitric oxide synthase) to
modulate endothelial and vascular function216. Functions of some TFs, enriched in
Fig. 5.3-7 (c), were associated with cardiovascular diseases and atherosclerosis.
FOXH1 is crucial in lymphatic vessel development, angiogenesis, and cardiac
outflow tract formation222. The protein-protein interaction of FOXH1 and NKX2.5 is
essential in anterior heart field (AHF) development223. NKX2.5, a cardiac homeobox
protein, is pivotal in cardiac development224. Mutation in the gene of NKX2.5 causing
cardiac malformations implicates NKX2.5 playing an important role in regulation of
cardiac morphogenesis225. Some of these valuable TFs were not enriched in Ad-
GFP and Ad-GFP-LEENE, but all of them were significantly enriched in native
HUVECs.

92
Fig. 5.3-7 The comparison of LEENE binding among Ad-GFP-LEENE, Ad-GFP, and Control. (a) Genomic locations of peaks. Pooling: pooling probes; Splitting: splitting probes; Overlap: overlapping even and odd data. (b) Venn diagram of peak overlap. Pooling probes (upper) and splitting probes (lower). (c) Enriched transcription factors. Black: not significant. 5.3.4 Profiling BY707159.1 with microfluidic ChIRP technology
Chen’s group examined the genomic structure and chromosomal region
between KTN1 and PELI2 to locate BY707159.1 (lncRNA) in mouse chromosome 14
working as LEENE in human216. Her group create wild type and BY707159.1
knockout mice, and shipped murine lung tissues to us. We followed the protocol, as

93
shown in method section of this chapter, to isolate single endothelial cells and
sonicated cells following fixation for ChIRP. In here, we used unsorted cells from
murine lung tissues. As shown in Fig. 5.3-8, we could see significant differences
between even and odd tiling probes, however, just few differences between wild type
and BY707159.1 knockout mouse samples. Nevertheless, we still could find
remarkable differences between wild type and knockout mouse samples in the
number of peaks after we filtered the peaks, keeping shared peaks and comparing
even and odd data (Table 5.3-3). The number of peaks in wild type mouse was twice
than in the knockout mouse. It was reasonable that some lncRNA bindings might be
diminished in knockout condition. The fragments of lncRNA binding cannot be pulled
down when target lncRNA is knocked out.

94
Fig. 5.3-8 Visualization of normalized sequencing data with splitting probes in IGV (BY707159.1). Red patterns: wild type mouse; green patterns: BY707159.1 knockout mouse. The binding sites of BY7077159.1 were examined and compared between the
wild type and knockout mouse (Fig. 5.3-9). As shown in Fig. 5.3-9 (a), we used even,
odd, and overlapping data from the wild type and knockout mouse to profile genomic
locations of their bindings. Some insignificant changes were shown. The peaks from
knockout data covered 38% of the peaks from wild type sample (Fig. 5.3-9 (b)).
Some epigenomic regulations might persist through process of knockout. Next, we
profiled transcription factor binding motifs based on the ChIRP-seq data, shown in
Fig. 5.3-9 (c). BY7077159.1 is a lncRNA in mice and its function is similar to LEENE
in human in modulating endothelial homeostasis and vascular functions, directly or
95
indirectly. Numerous ETS (endothelial specific) factors, such as ETV1 and ETV4,
play important roles in vascular system development226,227. ZNF263, a zinc finger
transcription factor, showed a significant enrichment in our wild type sample. ROR-
alpha mutant mice are vulnerable in atherosclerosis228. ZNF263 may bind to ROR-
alpha to suppress the risk in cardiovascular diseases and atherosclerosis229. All of
them are crucial in modulating endothelial homeostasis and vascular functions, and
these properties are consistent with BY7077159.1.
Fig. 5.3-9 The comparison of BY707159.1 binding between wild type and BY707159.1 knockout mouse. (a) Genomic locations of peaks. (b) Venn diagram of peak overlap. (c) Enriched transcription factors. Black: insignificance.

96
5.3.5 Profiling native HOTAIR with microfluidic ChIRP technology
Chu et al. developed ChIRP technology and conducted ChIRP to profile
HOTAIR with MDA-MB-231 cells18. We planned to evaluate the accuracy of our
technology by comparing Chu’s data with ours. We conducted microfluidic ChIRP
with native MDA-MB-231 cells to examine the HOTAIR bindings, and data are shown
in Fig. 5.3-10. The upper two tracks are from Chu’s data, and the rest are from ours.
All four racks show high intensive peaks at the region of HOTAIR (Fig. 5.3-10 (a)).
Chu’s data exhibited taller peaks than ours due to HOTAIR overexpression (y-scale:
180:20). Some peak patterns are similar (Fig. 5.3-10 (b)), but some are different (Fig.
5.3-10 (c) & (d)). We found lncRNA bindings are changed by virus infection at 5.3.3.
Chu used retrovirus to overexpress HOTAIR in MDA-MB-231 cells, and this might be
the reason that there are abundant differences between Chu’s and our data.

97
Fig. 5.3-10 Visualization of normalized sequencing data with splitting probes in IGV (HOTAIR). Red patterns: HOTAIR overexpression from Chang’s group; green patterns: native HOTAIR from our group. (a) Focusing on HOTAIR, (b) similar patterns between two groups, (c) and (d) distinct patterns.
We then compared the HOTAIR bindings between Chu’s and our data. We
examined even, odd, and overlapping sequencing data to investigate genomic
locations (Fig. 5.3-11 (a)). There was no significant difference among all data, but
some slight differences existed after overlapping. The peaks of overlapping were

98
compared, shown in Fig. 5.3-11 (b). Most of Chu’s and our peaks did not overlap
with each other well. We suspect that the difference in epigenomic regulation is a
result of the overexpression process. Next, we profiled transcription factor binding
motifs (Fig. 5.3-11 (c)). Even though Chu’s data exhibited more additional TFs than
ours, some TFs were enriched in both data. ETS (epithelium specific) genes, such
as EHF, ELF3, ELF4, ERG, ETS1, and ETV2, associate with Ewing’s sarcoma230,
play critical roles in cell proliferation and apoptosis. In particular, the expression of
EHF and ELF3 is significantly upregulated in breast cancer cells231. EHF promotes
the migration and invasion of gastric cancer cells by modulating HRP family of
receptor tyrosine kinases232. More expression of ELF3 has been observed in breast
carcinomas than normal tissues233. Both GABPA and PU.1 are members of the ETS-
domain transcription factor family234,235. Taken together, our results suggests that
HOTAIR plays a crucial role in breast cancer cells or other carcinoma by modulating
the mechanisms of ETS family.

99
Fig. 5.3-11 The comparison of HOTAIR binding between Chu’s and our data. (a) Genomic locations of peaks. (b) Venn diagram of peak overlap. (c) Enriched transcription factors.
5.4 Materials and methods
Detailed experimental processes and information of ChIRP-seq are shown in
Appendix
Fabrication of microfluidic chip
As shown in the Chapter 3
Mice

100
C57BL/6 mice were purchased from Jackson Laboratory. 6-8 month-old male and
female mice were used. All processes performed on mice were approved by the
Institutional Animal Care and Use Committee (IACUC) of City of Hope National
Medical Center.
Cell culture The stored cells were centrifuged at 300 rcf for 5 min at 4˚C and supernatant was
discarded for diminishing DMSO. The cell pellet was resuspend with pre-warmed
medium and added to a 25T flask with 5ml pre-warmed medium. Then, the flask was
incubated at 37˚C in a humid incubator with 5% CO2. When the confluence was
around 80%, we used PBS to wash cells and used trypsin to harvest cells.
Adenovirus transfection
The adenovirus was added to 150T flask when the confluence of HEK293 reached to
50-70%, then the flask was incubated at 37˚C in a humid incubator with 5% CO2 for
2-4 days. The transfected HEK293 cells were harvested by trypsin and isolated at
1000 rpm for 5 min at 4˚C. The pellet was resuspended with PBS. We used snap-
freeze approach to purify amplified adenovirus.
Adenovirus infection and cells harvest (LEENE)
Adenovirus was used to infect HUVECs for overexpressing LEENE when the
confluence reached to 80%. The medium was changed after 6 hr. The HUVECs
were harvested after 2-4 days by checking the signal of fluorescence. We collected
and isolated HUVECs at 1000 rpm for 5 min at 4˚C.
Lentivirus infection and cell harvest (HOTAIR)
We added lentivirus to infect MDA-MB-231 for overexpressing HOTAIR when the
confluence reached to 80%. The medium was changed after overnight culture. The

101
MDA-MB-231 were harvested after 2-4 days by checking fluorescence. We collected
and isolated MDA-MB-231 at 1000 rpm for 5 min at 4˚C.
Isolation of mouse lung endothelial cells from lung tissue (BY707159.1)
The murine lung tissue was soaked in Collagenase solution and cut into pipettable
pieces. The tissue digestion was performed on the rotator at 37˚C for 45 min. 70 um
sterile syringe filter was used to discard undigested tissue. The cell pellet, after
centrifuging at 300 rcf 4˚C for 10 min, was resuspended with binding buffer, and
incubated on a rotator at 4˚C for 15 min with CD31 microbeads. Endothelial cells
were isolated with a magnet rack.
Cell fixations
The cell pellet was resuspended with 1% glutaraldehyde on a rotator at room
temperature for 10 min. The fixation was quenched by adding 125 mM glycine for 5
min. Fixed cells were isolated by centrifuging at 2000 rcf 4˚C for 5 min.
Chromatin shearing
The fixed cells were resuspended with lysis buffer and 1/100th volume of PIC, PMSF,
and Superase were added. We used 30 s ON and 45 s OFF pulse intervals to
sonicate fixed cells. The target fragment size was in the range of 100-500 bp.
Probes designing
We used the software offered by Biosearch Technologies to design probes. More
detail information was shown in Appendix.
Beads and sample preparation
MyOne streptavidin C1 Dynabeads were washed with lysis buffer thrice and
incubated with lysis buffer, probes, PIC, PMSF, and Superase on a rotator at 37˚C
for 2 hr. After that, Dynabeads were washed with lysis buffer, isolated with a magnet
rack, and resuspended with lysis buffer. The sample solution (after sonication) was

102
mixed with at least 2X volume of hybridization buffer, and PIC, PMSF, and Superase
were added.
Device operation for ChIRP
The chamber was filled with lysis buffer and sieve valve was filled with DI water. A
magnet was placed under the glass of the chamber and a heat control plate (37˚C)
was located under the magnet. A long PFA tube was connected with outlet part of a
device and one solenoid valve in a two-set solenoid manifold. The sieve valve was
closed after sample was loaded through syringe pump to a long PFA tube (prior
step). The beads were loaded into the inlet part by a pipette. The sieve valve was
opened after another long PFA tube was connected with inlet part and another
solenoid valve in the two-set solenoid manifold. We used LabVIEW to manipulate the
oscillatory hybridization for 4 hr. The sample solution was withdraw to a long tube
connected with a syringe. The sieve valve was closed again and beaded was leaded
to stay before the sieve valve by a magnet. The sample solution was loaded to
chamber and flowed through packed beads for increasing the efficiency of
hybridization (around 40-60 min). Washing buffer was loaded to two small tubes
connected with inlet and outlet parts respectively, and oscillatory washing was
performed twice. The beads were collected after washing and separated 2 parts
(10% and 90%).
RNA isolation and assay
The 10% beads were resuspended with 95 ul RNA PK buffer and 5 ul PK and
incubated at 50˚C for 45 min with shaking. The activity of PK was quenched by
incubated at 95˚C for 10 min. TRIzol and chloroform were used to isolate RNA
sample. The aqueous phase was kept after centrifugation at 12000 rcf at 4˚C for 15
min. 2ul RNase-free glycogen and 250 ul IPA were mixed well with aqueous phase.

103
The pellet after centrifugation was resuspended with nuclease-free H2O. Following
the protocol of High-capacity cDNA reverse transcription kit (ThermoFisher), we got
the cDNA for examining the efficiency of RNA retrieval by qPCR.
DNA isolation and assay
The 90% beads were mixed well with RNA digestion solution, and incubated at 37˚C
for 45 min with shaking. The supernatant was kept and beads were incubated with
RNA digestion solution again. The total supernatant was mixed with PK and
incubated at 50˚C for 2 hr with shaking. Phenol-chloroform-isoamyl alcohol was
added and aqueous phase was kept after centrifugation. Glycogen, NaOAc, and
ethanol were added for ethanol precipitation. The pellet, after centrifugation, was
used for analysis by qPCR and library preparation.
Library preparation
The Accel-NGS 2S Plus DNA Library Kit (Swift-Bio) was used to perform library
preparation. The process was based on the protocol from Swift-Bio with minor
modification. Briefly, the purified DNA underwent 5 steps, including: repair I for
dephosphorylation, repair II for end repair and polishing, ligation I for 3’ ligation of
P7, ligation II for 5’ ligation of P5, and PCR for amplification of DNA. At the last step
of PCR, 2.5 μl of 20x EvaGreen was added to the reaction mixture to check the
amount of DNA during amplification. Amplification was terminated when the
fluorescent signal increased by 3000 RFU (CFX Connect, BIO-RAD, Hercules, CA).
SPRI beads were used to purify the amplified DNA and remove dimers which
resulted during amplifying due to low amount of input DNA. 10 μl TE buffer was used
to elute pure DNA after amplification and different samples attached with different
barcodes were pooled together for sequencing by Illumina HiSeq 4000 with single-
end 50 nt read.

104
5.5 Conclusions and Future work
We took advantages of the ease of operation, reduced number of cells, and
improved sensitivity of microfluidic technology to develop a novel microfluidic
oscillatory hybridized ChIRP assay. Using this device, we found significant
differences between overexpressed and native cells in profiling genome-wide
lncRNA bindings. We used this technology to examine different lncRNAs (LEENE
(lncRNA that enhances eNOS expression), HOTAIR and BY707159) in a cell line
(MDA-MB-231), a primary cell line (HUVECs) and primary murine cells from lung
tissues. We conducted microfluidic ChIRP-seq with not only adenovirus-infected
cells but native state cells. We found some different peak patterns between even and
odd tiling probe conditions in profiling LEENE binding sites with infected cells. The
binding sites were mapped to genomic regions, and there was no significant
difference among even-, odd-probe data and overlapping data. However, substantial
peaks from virus-overexpression did not overlap well with native state. Next, we
profiled transcription factor binding motifs and found some TFs were downregulated
in examining LEENE of overexpressed state but some additional TFs were
upregulated in studying HOTAIR of overexpressed state comparing to native state.
Overexpression might change the epigenomic regulations and epigenomic results of
specific lncRNA in overexpression could not represent the native/true state. This, for
the first time, allowed us to probe native lncRNA bindings in mouse tissue samples
successfully. This technology is a promising approach for scientists to study lncRNA
binding in primary patients and it may make contributions to developing precision
medicine.

105
Chapter 6 Summary and Outlook
Owing to the rapid advances in sequencing technology, immunotherapy, and
genome editing, the success of developing more effective precision medicine is a
stone’s throw away. FDA approved 25 precision medicine treatments in 2018.
However, the number is not enough for human disease treatments. More and more
laboratories focus on the epigenomics for outlining the feasible mechanism of gene
regulation. This is a very important step to provide valuable information for designing
novel treatments and medicines.
Microfluidic technology provides an alternative approach to explore the field of
genomic and epigenomic regulations using less cells. In this thesis, I described my
projects in 1) profiling epigenomic changes associated with LPS-induced murine
monocytes for immunotherapy, 2) examining cell-type-specific epigenomic changes
associated with BRCA1 mutation in breast tissues for breast cancer treatment, and
3) developing novel microfluidic oscillatory hybridized ChIRP-seq assay to profile
genome-wide lncRNA binding for numerous human diseases.
Scientists have used bulk cells to construct and develop the knowledge of
epigenomic regulations. Since intercellular differences exist at the single-cell level
and signal of an individual single cell may be diminished or even erased in bulk cell
assays, studying epigenomics in single-cell may transform our understanding of
gene regulation mechanism. Based on the advance in technologies, profiling
epigenomics in single cell is not an unreachable dream any more. Guo et al.
developed single-cell DNA methylation technology in 2013236, and random priming
technology was used to improve the quality of sequencing data in 2014237. Now,
single-cell DNA methylation is prevalent in profiling cell identity238-240. Single-cell
ChIP-seq was developed in 2015241 and single cell ATAC-seq (Assay for

106
Transposase-Accessible Chromatin) was also launched in 2015242. Both methods
are conducted with microfluidic technologies. We developed microfluidic oscillatory
hybridized ChIRP-seq assay to profile whole-genome lncRNA bindings, and our
approach reduced the required number of cells to few thousands. However,
technologies for exploring single-cell lncRNA binding remain to be developed.
Brouzes et al. developed a droplet microfluidic technology for single-cell high-
throughput screening243. Droplet is an ideal microreactor or nanoreactor that
contains single cell in it for reaction. Single cell droplet technology has been applied
in RNA-seq244,245 and ChIP-seq241. Drop-seq is an accessible method to profile
single-cell lncRNA bindings. However, due to the extremely few amount of lncRNAs
possessing in one cell (copy number of MLLT4-AS1 and PRINS in Bladder Urothelial
Carcinoma (BLCA) is 3 and 1, respectively246), numerous substantial challenges
need to be considered and overcome for studying lncRNA bindings in single cell.
Based on success in profiling lncRNA bindings with primary native cells, we
next turn to examine proteins associated with lncRNA in modulating epigenomic
mechanism and gene expression. RNA-binding Protein Immunoprecipitation (RIP)
with quantitative real-time PCR (RIP-PCR) was used to study the mechanism of
lncRNA and associated proteins binding247. The possible associated protein was
pulled down with specific antibody and then the expression of lncRNA was evaluated
by RT-PCR following lncRNA isolation. The mechanism of HOTAIR mediating gene
silencing is reported using RIP-PCR data. HOTAIR interacts with PRC2 (containing
EZH2, SUZ12, and EED) to bind to target gene loci and silence their expression
through EZH2 introducing H3K27-trimethylation248. Knowing possible associated
proteins and using one specific antibody to capture associated protein are significant
obstacles in conducting RIP-PCR for building mechanism of lncRNA regulation.

107
Liquid chromatography (LC) is a technique to separate molecules by different
retention time (RT) and mass spectrometry (MS) is a high-throughput technique for
protein identification by analyzing peptides. Liquid chromatography-tandem mass
spectrometry (LC-MS/MS) is a prevalent technology for protein identification249,250.
Chu et al. profiled Xist (lncRNA) binding proteins through LC-MS/MS with cell
lines251. Native cells and cells from cell lines show different genetic and epigenetic
regulations, and these changes also affect the associated protein binding.
The growing evidence implies that HOTAIR plays a critical role in promoting
tumor growth and cancer metastasis41,252. However, the regulatory mechanism of
HOTAIR in genome-wide association study remains to be defined. Our microfluidic
ChIRP can be used to examine HOTAIR binding sites and isolate HOTAIR
associated proteins with primary animal and patient samples. These associated
proteins can be recognized by LC-MS/MS and western blot can be used for further
identification. In addition, the histone modification by HOTAIR regulation is pivotal in
epigenomic alternation. CRISPR-Cas13d is a robust technology in modulating
splicing of endogenous transcripts and specific RNA knockdown without interrupting
other gene expression and regulation253,254. We use this technique to knockdown
HOTAIR in primary cells and conduct MOWChIP-seq with anti-H3K27ac and anti-
H3K27me3 to profile epigenomic regulation between native and HOTAIR knockdown
primary cells. H3K27ac is defined as an active enhancer mark and H3K27me3 as a
repressive mark. Combination of whole-genome HOTAIR binding sites, HOTAIR
associated proteins, RNA-seq, and histone modification by HOTAIR regulation
provide a more comprehensive insight into epigenetic regulations of HOTAIR. This,
will be the first time to profile HOTAIR mechanism with primary mammalian cells.

108
References
1 Verzi, M. P., Shin, H. et al. Differentiation-Specific Histone Modifications Reveal Dynamic Chromatin Interactions and Partners for the Intestinal Transcription Factor CDX2. Dev. Cell 19, 713-726 (2010).
2 Sadri-Vakili, G. & Cha, J. H. Mechanisms of Disease: histone modifications in
Huntington's disease. Nat. Clin. Pract. Neurol. 2, 330-338 (2006). 3 Teytelman, L., Thurtle, D. M. et al. Highly expressed loci are vulnerable to misleading
ChIP localization of multiple unrelated proteins. PNAS 110, No. 46 (2013). 4 Acevedo, L. G., Iniguez, A. L. et al. Genome-scale ChIP-chip analysis using 10,000
human cells. Biotechniques 43, 791-797 (2007). 5 Gilfillan, G. D., Hughes, T. et al. Limitations and possibilities of low cell number ChIP-
seq. BMC Genomics 13, No. 645 (2012). 6 Mattick, J. S. & Makunin, I. V. Non-coding RNA. Hum. Mol. Genet. 15, R17-R29
(2006). 7 Joh, R. I., Palmieri, C. M. et al. Regulation of histone methylation by noncoding RNAs.
Biochim. Biophys. Acta 1839, 1385-1394 (2014). 8 O’Leary, V. B., Hain, S. et al. Long non-coding RNA PARTICLE bridges histone and DNA
methylation. Sci. Rep. 7, 1790 (2017). 9 Böhmdorfer, G. & Wierzbicki, A. T. Control of Chromatin Structure by Long
Noncoding RNA. Trends Cell Biol. 25, 623-632 (2015). 10 Chen, J. & Xue, Y. Emerging roles of non-coding RNAs in epigenetic regulation. Sci.
China Life Sci. 59, 227-235 (2016). 11 Majo, F. D. & Calore, M. Chromatin remodelling and epigenetic state regulation by
non-coding RNAs in the diseased heart. Noncoding RNA Res. 3, 20-28 (2018). 12 Hu, X., Ding, D. et al. Knockdown of lncRNA HOTAIR sensitizes breast cancer cells to
ionizing radiation through activating miR-218. Biosci. Rep. 39, BSR20181038 (2019). 13 Kelley, R. L., Meller, V. H. et al. Epigenetic Spreading of the Drosophila Dosage
Compensation Complex from roX RNA Genes into Flanking Chromatin. Cell 98, 513-522 (1999).
14 Koziol, M. J. & Rinn, J. L. RNA traffic control of chromatin complexes. Curr. Opin.
Genet. Dev. 20, 142-148 (2010).

109
15 Mercer, T. R., Dinger, M. E. et al. Long non-coding RNAs: insights into functions. Nat. Rev. Genet. 10, 155-159 (2009).
16 Zhao, J., Sun, B. K. et al. Polycomb Proteins Targeted by a Short Repeat RNA to the
Mouse X Chromosome. Science 322, 750-756 (2008). 17 Wang, K. C., Yang, Y. W. et al. A long noncoding RNA maintains active chromatin to
coordinate homeotic gene expression. Nature 472, 120-124 (2011). 18 Chu, C., Qu, K. et al. Genomic Maps of Long Noncoding RNA Occupancy Reveal
Principles of RNA-Chromatin Interactions. Mol. Cell 44, 667-678 (2011). 19 Cao, Z., Chen, C. et al. A microfluidic device for epigenomic profiling using 100 cells.
Nat. Methods 12, 959-962 (2015). 20 Gong, C., Fujino, K. et al. FOXA1 repression is associated with loss of BRCA1 and
increased promoter methylation and chromatin silencing in breast cancer. Oncogene 34, 5012-5024 (2015).
21 Atlasi, Y. & Stunnenberg, H. G. The interplay of epigenetic marks during stem cell
differentiation and development. Nat. Rev. Genet. 59, 643–658 (2017). 22 Wilson, C. B., Rowell, E. et al. Epigenetic control of T-helper-cell differentiation. Nat.
Rev. Immunol. 9, 91-105 (2009). 23 Zoghbi, H. Y. & Beaudet, A. L. Epigenetics and Human Disease. Cold Spring Harb.
Perspect. Biol. 8, a019497 (2016). 24 Gartstein, M. A. & Skinner, M.K. Prenatal influences on temperament development:
The role of environmental epigenetics. Dev. Psychopathol 30, 1269-1303 (2018). 25 Sadava, D., Hillis, D. M. et al. Life: The Science of Biology. sinauer associates (2008). 26 Zhao, Y. & Garcia, B.A. Comprehensive Catalog of Currently Documented Histone
Modifications. Cold Spring Harb. Perspect. Biol. 7, a025064 (2015). 27 Wang, X, Lee, R. S. et al. SMARCB1-mediated SWI/SNF complex function is essential
for enhancer regulation. Nat. Genet. 49, 289–295 (2017). 28 Pott, S. & Lieb, J. D. What are super-enhancers? Nat. Genet. 47, 8-12 (2015). 29 Wilusz, J. E., Sunwood, H. et al. Long noncoding RNAs: functional surprises from the
RNA world. Genes Dev. 23, 1494-1504 (2009). 30 Managadze, D., Rogozin, I. B. et al. Negative correlation between expression level
and evolutionary rate of long intergenic noncoding RNAs. Genome Biol. Evol. 3, 1390-1404 (2011).

110
31 Moran, V. A., Perera, R. J. et al. Emerging functional and mechanistic paradigms of
mammalian long non-coding RNAs. Nucleic Acids Res. 40, 6391-6400 (2012). 32 Liao, Q., Liu, C. et al. Large-scale prediction of long non-coding RNA functions in a
coding–non-coding gene co-expression network. Nucleic Acids Res. 39, 3864-3878 (2011).
33 Qureshi, I. A., Mattick, J. S. et al. Long non-coding RNAs in nervous system function
and disease. Brain Res. 1338, 20-35 (2010). 34 Lander, E. S., Linton, L. M. et al. Initial sequencing and analysis of the human
genome. Nature 409, 860–921 (2001). 35 Mercer, T. R., Dinger, M. E. et al. Long non-coding RNAs: insights into functions. Nat.
Rev. Genet. 10, 155-159 (2009). 36 Cao, J. The functional role of long non-coding RNAs and epigenetics. Biol. Proced.
Online 16, No. 11 (2014). 37 Kretz, M., Siprashvili, Z. et al. Control of somatic tissue differentiation by the long
non-coding RNA TINCR. Nature 493, 231-235 (2013). 38 Kretz, M., Webster, D. E. et al. Suppression of progenitor differentiation requires the
long noncoding RNA ANCR. Genes Dev. 26, 338-343 (2012). 39 Flynn, R. A. & Chang, H. Y. Long noncoding RNAs in cell fat programming and
reprogramming. Cell Stem Cell 14, 752-761 (2014). 40 Wapinski, O. & Chang, H. Y. Long noncoding RNAs and human disease. Trends Cell
Biol. 21, 354-361 (2011). 41 Gupta, R. A., Shah, N. et al. Long non-coding RNA HOTAIR reprograms chromatin
state to promote cancer metastasis. Nature 464, 1071-1076 (2010). 42 Chung, S., Nakagawa, H. et al. Association of a novel long non-coding RNA in 8q24
with prostate cancer susceptibility. Cancer Sci. 102, 245-252 (2011). 43 Wang, J., Liu, X. et al. CREB up-regulates long non-coding RNA, HULC expression
through interaction with microRNA-372 in liver cancer. Nucleic Acids Res. 38, 5366-5383 (2010).
44 Zhang, X., Zhou, Y. et al. A pituitary-derived MEG3 isoform functions as a growth
suppressor in tumor cells. J. Clin. Endocrinol. Metab. 88, 5119-5126 (2003).

111
45 Alvarez, M. L. & DiStefano, J. K. Functional characterization of the plasmacytoma variant translocation 1 gene (PVT1) in diabetic nephropathy. PLoS One 6, e18671 (2011).
46 Song, C., Zhang, S. et al. Choosing a suitable method for the identification of
replication origins in microbial genomes. Front Microbiol. 6, 1049 (2015). 47 Ma, S., Hsieh, Y. -P. et al. Low-input and multiplexed microfluidic assay reveals
epigenomic variation across cerebellum and prefrontal cortex. Sci. Adv. 4, No. 4 (2018).
48 Murphy, T. W., Hsieh, Y. -P. et al. Microfluidic Low-Input Fluidized-Bed Enabled ChIP-
seq Device for Automated and Parallel Analysis of Histone Modifications. Anal. Chem. 90, 7666-7674 (2018).
49 Simon, M. D., Wang, C. I. et al. The genomic binding sites of a noncoding RNA. PNAS
108, 20497-20502 (2011). 50 Engreitz, J. M., Pandya-Jones, A. et al. The Xist lncRNA Exploits ThreeDimensional
Genome Architecture to Spread Across the X Chromosome. Science 341, No 1237973 (2013).
51 Yang, Y., Wen, L. et al. Unveiling the hidden function of long non-coding RNA by
identifying its major partner-protein. Cell Biosci. 5, No. 59 (2015). 52 Grada, A. & Weinbrecht, K. Next-Generation Sequencing: Methodology and
Application. J. Invest. Dermatol. 133, e11 (2013). 53 Park, P. J. ChIP–seq: advantages and challenges of a maturing technology. Nat. Rev.
Genet. 10, 669-680 (2009). 54 Cao, Z. & Lu, C. A Microfluidic Device with Integrated Sonication and
Immunoprecipitation for Sensitive Epigenetic Assays. Anal. Chem. 88, 1965-1972 (2016).
55 Maier, M. Personalized medicine—a tradition in general practice! Eur. J. Gen. Pract
25, 63-64 (2019). 56 Kohler, S. Precision medicine – moving away from one-size-fits-all. Acad. Sci. South
Africa 14, 12-15 (2018). 57 Schumock, G. T., Li, E. C. et al. National trends in prescription drug expenditures and
projections for 2016. Am. J. Health Syst. Pharm. 73, 1058-1107 (2016). 58 Jameson, J. L. & Longo, D. L. Precision medicine--personalized, problematic, and
promising. N. Engl. J. Med. 372, 2229-2234 (2015).

112
59 Coppede, F., Lopomo, A. et al. Genetic and epigenetic biomarkers for diagnosis, prognosis and treatment of colorectal cancer. World J Gastroenterol: WJG 20, 943-956 (2014).
60 Pasculli, B., Barbano, R. et al. Epigenetics of breast cancer: biology and clinical
implication in the era of precision medicine. Semin. Cancer Biol. 51, 22-35 (2018). 61 Coyle, K. M., Boudreau, J. E. et al. Genetic Mutations and Epigenetic Modifications:
Driving Cancer and Informing Precision Medicine. BioMed Res. Int., 9620870-9620870 (2017 ).
62 Dienstmann, R., Vermeulen, L. et al. Consensus molecular subtypes and the
evolution of precision medicine in colorectal cancer. Nat. Rev. Cancer 17, 79-92 (2017).
63 Costantino, S., Libby, P. et al. PaneniEpigenetics and precision medicine in
cardiovascular patients: From basic concepts to the clinical arena. Eur. Heart J. 39, 4150-4158 (2018).
64 Hampel, H., O'Bryant, S. E. et al. A precision medicine initiative for Alzheimer’s
disease: the road ahead to biomarker-guided integrative disease modeling. Climacteric 20, 107-118 (2017).
65 Ferretti, M. T., Iulita, M. F. et al. Sex differences in Alzheimer disease—the gateway
to precision medicine. Nat. Rev. Neurol. 14, 457-469 (2018). 66 Babu, M. M., Luscombe, N. M. et al. Structure and evolution of transcriptional
regulatory networks. Curr. Opin. Struct. Biol. 14, 283-291 (2004). 67 Wittenberger, T., Sleigh, S. et al. DNA methylation markers for early detection of
women's cancer: promise and challenges. Epigenomics 6, 311-327 (2014). 68 Jones, A., Lechner, M. et al. Emerging promise of epigenetics and DNA methylation
for the diagnosis and management of women's cancers. Epigenomics 2, 9-38 (2010). 69 Zhu, B., Hsieh, Y. -P. et al. MOWChIP-seq for low-input and multiplexed profiling of
genome-wide histone modifications. Nat. Protoc. 14, 3366-3394 (2019). 70 Ross-Innes, C. S., Stark, R. et al. Differential oestrogen receptor binding is associated
with clinical outcome in breast cancer. Nature 481, 389–393 (2012). 71 Morris, M. C., Gilliam, E. A. et al. Innate immune programing by endotoxin and its
pathological consequences. Front. Immunol. 5, No. 680 (2015). 72 Ngkelo, A., Meja, K. et al. LPS induced inflammatory responses in human peripheral
blood mononuclear cells is mediated through NOX4 and Giα dependent PI-3 kinase signalling. J. Inflamm. (Lond) 9 (2012).

113
73 Dinarello, C. A. Proinflammatory cytokines. Chest 118, 503-508 (2000). 74 Cavailon, J. M. Pro- versus anti-inflammatory cytokines: myth or reality. Cell Mol.
Biol. (Noisy-le-grand) 47, 695-702 (2001). 75 West, M. A. & Heagy, W. Endotoxin tolerance: a review. Crit. Care Med. 30, 64-73
(2002). 76 Pena, O. M., Pistolic, J. et al. Endotoxin tolerance represents a distinctive state of
alternative polarization (M2) in human mononuclear cells. J. Immunol. 186, 7243-7254 (2011).
77 López-Collazo, E. & del Fresno, C. Pathophysiology of endotoxin tolerance:
mechanisms and clinical consequences. Crit. Care 17, 242 (2013). 78 Stoll, L. L., Denning, G. M. et al. Endotoxin, TLR4 signaling and vascular inflammation:
potential therapeutic targets in cardiovascular disease. Curr. Pharm. Des. 12, 4229-4245 (2006).
79 Stoll, L. L., Denning, G. M. et al. Potential role of endotoxin as a proinflammatory
mediator of atherosclerosis. Arterioscler. Thromb. Vasc. Biol. 24, 2227-2236 (2004). 80 Yadav, R., Zammit, D. J. et al. Effects of LPS-mediated bystander activation in the
innate immune system. J. Leukoc. Biol. 80, 1251-1261 (2006). 81 Mirza, R. & Koh, T. J. Dysregulation of monocyte/macrophage phenotype in wounds
of diabetic mice. Cytokine 56, 256-264 (2011). 82 Manco, M., Putignani, L. et al. Gut microbiota, lipopolysaccharides, and innate
immunity in the pathogenesis of obesity and cardiovascular risk. Endocr. Rev. 31, 817-844 (2010).
83 Wiesner, P., Choi, S. H. et al. Low doses of lipopolysaccharide and minimally oxidized
low-density lipoprotein cooperatively activate macrophages via nuclear factor kappa B and activator protein-1: possible mechanism for acceleration of atherosclerosis by subclinical endotoxemia. Circ. Res. 107, 56-65 (2010).
84 Qin, L., Wu, X. et al. Systemic LPS causes chronic neuroinflammation and progressive
neurodegeneration. Glia 55, 453-462 (2007). 85 Ridker, P. M. C-reactive protein and the prediction of cardiovascular events among
those at intermediate risk: moving an inflammatory hypothesis toward consensus. J. Am. Coll. Cardiol. 49, 2129-2138 (2007).
86 Singh, T. & Newman, A. B. Inflammatory markers in population studies of aging.
Ageing Res. Rev. 10, 319-329 (2011).

114
87 Yuan, R., Geng, S. et al. Low-grade inflammatory polarization of monocytes impairs
wound healing. J. Pathol. 238, 571-583 (2016). 88 Geng, S., Chen, K. et al. The persistence of low-grade inflammatory monocytes
contributes to aggravated atherosclerosis. Nat. Commun. 7, 13436 (2016). 89 Guo, H., Diao, N. et al. Subclinical dose endotoxin sustains low-grade inflammation
and exacerbates steatohepatitis in high-fat diet fed mice. J. Immunol. 196, 2300-2308 (2016).
90 Park, P. J. ChIP–seq: advantages and challenges of a maturing technology. Nat. Rev.
Genet. 10, 669–680 (2009). 91 Mahley, R. W. Apolipoprotein E: cholesterol transport protein with expanding role in
cell biology. Science 29, 622-630 (1988). 92 Gafencu, A. V., Robciuc, M. R. et al. Inflammatory Signaling Pathways Regulating
ApoE Gene Expression in Macrophages. J. Biol. Chem. 282, 21776 –21785 (2007). 93 Dowling, O., Chatterjee, P. K. et al. Magnesium sulfate reduces bacterial LPS-induced
inflammation at the maternal–fetal interface. Placenta 33 (2012). 94 Fraser, D., Melzer, E. et al. Macrophage production of innate immune protein C1q is
associated with M2 polarization. J. Immunol. 194, INM1P.434 (2015). 95 Armbrust, T., Nordmann, B. et al. C1Q synthesis by tissue mononuclear phagocytes
from normal and from damaged rat liver: up-regulation by dexamethasone, down-regulation by interferon gamma, and lipopolysaccharide. Hepatology 26, 98-106 (1997).
96 Dorward, D. A., Lucas, C. D. et al. The Role of Formylated Peptides and Formyl
Peptide Receptor 1 in Governing Neutrophil Function during Acute Inflammation. Am. J. Pathol. 185, 1172-1184 (2015).
97 Chen, K., Bao, Z. et al. Regulation of inflammation by members of the formyl-peptide
receptor family. J. Autoimmun. 85, 64-77 (2017). 98 Mandal, P., Novotny, M. et al. Lipopolysaccharide induces formyl peptide receptor 1
gene expression in macrophages and neutrophils via transcriptional and posttranscriptional mechanisms. J. Immunol. 175, 6085-6091 (2005).
99 Cui , Y. H., Le, Y. et al. Bacterial lipopolysaccharide selectively up-regulates the
function of the chemotactic peptide receptor formyl peptide receptor 2 in murine microglial cells. J. Immunol. 168, 434-442 (2002).

115
100 Doyle, M. J. & Sussel, L. Nkx2.2 Regulates β-Cell Function in the Mature Islet. Diabetes 56, 1999-2007 (2007).
101 Cassiani-Ingoni, R., Coksaygan, T. et al. Cytoplasmic translocation of Olig2 in adult
glial progenitors marks thegeneration of reactive astrocytes following autoimmune inflammation. Exp. Neurol. 201, 349-358 (2006).
102 Jung, Y. J., Isaaca, J. S. et al. IL-1β-mediated up-regulation of HIF-1α via an
NFκB/COX-2 pathway identifies HIF-1 as a critical link between inflammation and oncogenesis. FASEB J. 17, 2115-2117 (2003).
103 Liu, Z., Mar, K. B. et al. A NIK–SIX signalling axis controls inflammation by targeted
silencing of non-canonical NF-κB. Nature 568, 249-253 (2019). 104 Chen, D., Xiong, X. Q. et al. BCL6 attenuates renal inflammation via negative
regulation of NLRP3 transcription. Cell Death Dis. 8, e3156 (2017). 105 Wang, W., Lim, W. K. et al. An eleven gene molecular signature for extra-capsular
spread in oral squamous cell carcinoma serves as a prognosticator of outcome in patients without nodal metastases. Oral Oncol. 51, 355-362 (2015).
106 Zhou, Q. & Anderson, D. J. The bHLH Transcription Factors OLIG2 and OLIG1 Couple
Neuronal and Glial Subtype Specification. Cell 109, 61-73 (2002). 107 Unger, M. A., Chou, H. P. et al. Monolithic Microfabricated Valves and Pumps by
Multilayer Soft Lithography. Science 288, 113-116 (2000). 108 Yuan, R., Geng, S. et al. Low-grade inflammatory polarization of monocytes impairs
wound healing. J. Pathol. 238, 571-583 (2016). 109 Langmead, B., Trapnell, C. et al. Ultrafast and memory-efficient alignment of short
DNA sequences to the human genome. Genome Biol. 10 (2009). 110 Zhang, Y., Liu, T. et al. Model-based Analysis of ChIP-Seq (MACS). Genome Biol. 9
(2008). 111 Howlader, N., Noone, A. M. et al. SEER Cancer Statistics Review, 1975-2016. National
Cancer Institute. Bethesda, MD, based on November 2018 SEER data submission, posted to the SEER web site, April 2019 (2019).
112 van der Kolk, D. M., de Bock, G. H. et al. Penetrance of breast cancer, ovarian cancer
and contralateral breast cancer in BRCA1 and BRCA2 families: high cancer incidence at older age. Breast Cancer Res. Treat. 124, 643–651 (2010).
113 Hill, S. J., Clark, A. P. et al. BRCA1 Pathway Function in Basal-Like Breast Cancer Cells.
Mol. Cell Biol. 34, 3828-3842 (2014).

116
114 Roy, R., Chun, J. et al. BRCA1 and BRCA2: different roles in a common pathway of genome protection. Nat. Rev. Cancer 12, 68-78 (2012).
115 Tutt, A. & Ashworth, A. The relationship between the roles of BRCA genes in DNA
repair and cancer predisposition. Trends Mol. Med. 8, 571-576 (2002). 116 Farmer, H., McCabe, N. et al. Targeting the DNA repair defect in BRCA mutant cells
as a therapeutic strategy. Nature 434, 917-921 (2005). 117 Ford, D., Easton, D. F. et al. Genetic Heterogeneity and Penetrance Analysis of the
BRCA1 and BRCA2 Genes in Breast Cancer Families. Am. J. Hum. Genet. 62, 676-689 (1998).
118 Shattuck-Eidens, D., McClure, M. et al. A Collaborative Survey of 80 Mutations in the
BRCA1 Breast and Ovarian Cancer Susceptibility Gene Implications for Presymptomatic Testing and Screening. JAMA 273, 535-541 (1995).
119 Zhang, X., Chiang, H. C. et al. Attenuation of RNA polymerase II pausing mitigates
BRCA1 associated R-loop accumulation and tumorigenesis. Nat. Commun. 8, 15908 (2017).
120 Bertucci, F. Finetti, P. et al. Birnbaum. Basal Breast Cancer: A Complex and Deadly
Molecular Subtype. Curr. Mol. Med. 12, 96-110 (2012). 121 Boelens, M. C., Wu, T. J. et al. Exosome Transfer from Stromal to Breast Cancer Cells
Regulates Therapy Resistance Pathways. Cell 159, 499-513 (2014). 122 Lim, E., Vaillant, F. et al. Aberrant luminal progenitors as the candidate target
population for basal tumor development in BRCA1 mutation carriers. Nat. Med. 15, 907-913 (2009).
123 Molyneux, G., Geyer, F. C. et al. BRCA1 Basal-like Breast Cancers Originate from
Luminal Epithelial Progenitors and Not from Basal Stem Cells. Cell Stem cell 7, 403-417 (2010).
124 Pellacani, D., Bilenky, M. et al. Analysis of Normal Human Mammary Epigenomes
Reveals Cell-Specific Active Enhancer States and Associated Transcription Factor Networks. Cell Rep. 17, 2060-2074 (2016).
125 Zhang, X., Wang, Y. et al. BRCA1 mutations attenuate super-enhancer function and
chromatin looping in haploinsufficient human breast epithelial cells. Breast Cancer Res. 21, No. 51 (2019).
126 Strickland, K. C., Howitt, B. E. et al. Association and prognostic significance of
BRCA1/2-mutationstatus with neoantigen load, number of tumor-infiltrating lymphocytes and expression of PD-1/PD-L1 in high grade serous ovarian cancer. Oncotarget 7, 13587-13598 (2015).

117
127 Green, A. R., Aleskandarany, M. A., et al. Clinical Impact of Tumor DNA Repair
Expression and T-cell Infiltration in Breast Cancers. Cancer Immunol. Res. 5, 292-299 (2017).
128 Lu, L., Huang, H. et al. BRCA1 mRNA expression modifies the effect of T cell
activation score on patient survival in breast cancer. BMC Cancer 19, No. 387 (2019). 129 Yeung, B. H. Y., Kwan, B. W. Y. et al. Glucose-regulated protein 78 as a novel effector
of BRCA1 for inhibiting stress-induced apoptosis. Oncogene 27, 6782-6789 (2008). 130 Andrews, H. N., Mullan, P. B. et al. BRCA1 Regulates the Interferon gamma-mediated
Apoptotic Response. J. Biol. Chem. 277, 26225-26232 (2002). 131 Nair, S. J., Zhang, X. et al. Genetic suppression reveals DNA repair-independent
antagonism between BRCA1 and COBRA1 in mammary gland development. Nat. Commun. 7, No. 10913 (2016).
132 Yoshida, K. & Miki, Y. Role of BRCA1 and BRCA2 as regulators of DNA repair,
transcription, and cell cycle in response to DNA damage. Cancer Sci. 95, 866-871 (2004).
133 Yasmeen, A., Liu, W. et al. BRCA1 mutations contribute to cell motility and invasion
by affecting its main regulators. Cell Cycle 7, 3781-3783 (2008). 134 Wang, Q., Zhang, H. et al. BRCA1 binds c-Myc and inhibits its transcriptional and
transforming activity in cells. Oncogene 17, 1939-1948 (1998). 135 Li, H., Lee, T. H. et al. A novel tricomplex of BRCA1, Nmi, and c-Myc inhibits c-Myc-
induced human telomerase reverse transcriptase gene (hTERT) promoter activity in breast cancer. J. Biol. Chem. 277, 20965-20973 (2002).
136 Butcher, D. T. & Rodenhiser, D. I. Epigenetic inactivation of BRCA1 is associated with
aberrant expression of CTCF and DNA methyltransferase (DNMT3B) in some sporadic breast tumours. Eur. J. Cancer 43, 210-219 (2007).
137 Hilmi, K., Jangal, M. et al. CTCF facilitates DNA double-strand break repair by
enhancing homologous recombination repair. Sci. Adv. 3, e1601898 (2017). 138 Pickholtz, I., Saadyan, S. et al. Cooperation between BRCA1 and vitamin D is critical
for histone acetylation of the p21waf1 promoter and for growth inhibition of breast cancer cells and cancer stem-like cells. Oncotarget 5, 11827-11846 (2014).
139 Dong, C., Zhang, F. et al. p53 suppresses hyper-recombination by modulating BRCA1
function. DNA Repair (Amst) 33, 60-69 (2015).

118
140 Zhang, W., Luo, J. et al. BRCA1 regulates PIG3-mediated apoptosis in a p53-dependent manner. Oncotarget 6, 7608-7618 (2015).
141 He, W. A., Berardi, E. et al. NF-kappaB-mediated Pax7 dysregulation in the muscle
microenvironment promotes cancer cachexia. J. Clin. Invest. 123, 4821-4835 (2013). 142 von Maltzahn, J., Jones, A. E. et al. Pax7 is critical for the normal function of satellite
cells in adult skeletal muscle. PNAS 110, 16474-16479 (2013). 143 Blesch, K. S., Paice, J. A. et al. Correlates of fatigue in people with breast or lung
cancer. Oncol. Nurs. Forum. 18, 81-87 (1991). 144 Wu, Z. Q., Li, X. Y. et al. Canonical Wnt signaling regulates Slug activity and links
epithelial-mesenchymal transition with epigenetic Breast Cancer 1, Early Onset (BRCA1) repression. PNAS 109, 16654-16659 (2012).
145 Huerta-Reyes, M., Maya-Núñez, G. et al. Treatment of Breast Cancer With
Gonadotropin-Releasing Hormone Analogs. Front. Oncol. 9, No. 943 (2019). 146 Holliday, H., Baker, L. A. et al. Epigenomics of mammary gland development. Breast
Cancer Res. 20, No. 100 (2018). 147 Huber, L. J., Yang, T. W. et al. Impaired DNA damage response in cells expressing an
exon 11-deleted murine Brca1 variant that localizes to nuclear foci. Mol. Cell Biol. 21, 4005-4015 (2001).
148 Eirew, P., Stingl, J. et al. A method for quantifying normal human mammary
epithelial stem cells with in vivo regenerative ability. Nat. Med. 14, 1284-1289 (2008).
149 Birney, E., Stamatoyannopoulos, J. A. et al. Identification and analysis of functional
elements in 1% of the human genome by the ENCODE pilot project. Nature 447, 799-816 (2007).
150 Stein, L. D. Human genome: end of the beginning. Nature 431, 915-916 (2004). 151 Costa, F. F.. Non-coding RNAs: meet thy masters. Bioessays 32, 599-608 (2010). 152 El-Osta, A. Review on epigenetics in cancer gene therapy: series I. Cancer Gene Ther.
12, 663-664 (2005). 153 Sharma, S., Kelly, T. K. et al. Epigenetics in cancer. Carcinogenesis 31, 27-36 (2010). 154 Dawson, M. A. & Kouzarides, T. Cancer Epigenetics: From Mechanism to Therapy.
Cell 150, 12-27 (2012).

119
155 Flavahan, W. A., Gaskell, E. et al. Bernstein. Epigenetic plasticity and the hallmarks of cancer. Science 357, 1-10 (2017).
156 Biswas, S. & Rao, C. M. Epigenetics in cancer: Fundamentals and Beyond. Pharmacol.
Ther. 173, 118-134 (2017). 157 Baxter, E., Windloch, K. et al. Epigenetic regulation in cancer progression. Cell Biosci.
4, article 45 (2014). 158 Chiappinelli, K. B., Zahnow, C. A. et al. Combining Epigenetic and Immunotherapy to
Combat Cancer. Cancer Res. 76, 1683–1689 (2016). 159 Dunn, J. & Rao, S. Epigenetics and immunotherapy: The current state of play. Mol.
Immunol. 87, 227-239 (2017 ). 160 Dear, A. E. Epigenetic modulators and the new immunotherapies. N. Engl. J. Med.
374, 684-686 (2016). 161 Weintraub, K. Take two: Combining immunotherapy with epigenetic drugs to tackle
cancer. Nat. Med. 22, 8-10 (2016). 162 De Majo, F. & Calore, M. Chromatin remodelling and epigenetic state regulation by
non-coding RNAs in the diseased heart. Noncoding RNA Res. 3, 20-28 (2018). 163 Xu, S., Kong, D. et al. Oncogenic long noncoding RNA landscape in breast cancer.
Mol. Cancer 16, 129 (2017). 164 Soudyab, M., Iranpour, M. et al. The Role of Long Non-Coding RNAs in Breast Cancer.
Arch. Iran. Med. 19, 508-517 (2016). 165 Wang, J., Ye, C. et al. Dysregulation of long non-coding RNA in breast cancer: an
overview of mechanism and clinical implication. Oncotarget 8, 5508-5522 (2017). 166 Huan, J., Xing, L. et al. Long noncoding RNA CRNDE activates Wnt/β-catenin signaling
pathway through acting as a molecular sponge of microRNA-136 in human breast cancer. Am. J. Transl. Res. 9, 1977-1989 (2017).
167 Liu, Y., Du, Y. et al. Up-regulation of ceRNA TINCR by SP1 contributes to
tumorigenesis in breast cancer. BMC Cancer 18, 367 (2018). 168 Tao, H., Yang, J. J. et al. Emerging role of long noncoding RNAs in lung cancer:
Current status and future prospects. Respir. Med. 110, 12-19 (2016). 169 Wei, M. M. & Zhou, G. B. Long Non-coding RNAs and Their Roles in Non-small-cell
Lung Cancer. Genomics Proteomics Bioinformatics 14, 280-288 (2016).

120
170 Zhan, Y., Zang, H. et al. Long non-coding RNAs associated with non-small cell lung cancer. Oncotarget 8, 69174-69184 (2017).
171 Roth, A. & Diederichs, S. Long Noncoding RNAs in Lung Cancer. Curr. Top. Microbiol.
Immunol. 394, 57-110 (2016). 172 Chen, Z., Chen, X. et al. Long non-coding RNA SNHG20 promotes non-small cell lung
cancer cell proliferation and migration by epigenetically silencing of P21 expression. Cell Death Dis. 8, e3092 (2017).
173 Sun, Y., Hu, B. et al. Long non-coding RNA HOTTIP promotes BCL-2 expression and
induces chemoresistance in small cell lung cancer by sponging miR-216a. Cell Death Dis. 9, 85 (2018).
174 Sun, C. C., Li, S. J. et al. Long Intergenic Noncoding RNA 00511 Acts as an Oncogene
in Non–small-cell Lung Cancer by Binding to EZH2 and Suppressing p57. Mol. Ther. Nucleic Acids 5, e385 (2016).
175 Wu, J. & Wang, D. Long noncoding RNA TCF7 promotes invasiveness and self-
renewal of human non-small cell lung cancer cells. Hum. Cell 30, 23-29 (2017). 176 Xie, W., Yuan, S. et al. Long noncoding and circular RNAs in lung cancer: advances
and perspectives. Epigenomics 8, No. 9 (2016). 177 Cai, Z., Xu, K. et al. Long noncoding RNA in liver cancer stem cells. Discov. Med. 24,
87-93 (2017). 178 Mehra, M. & Chauhan, R. Long Noncoding RNAs as a Key Player in Hepatocellular
Carcinoma. Biomark Cancer 9, 1–15 (2017). 179 Quagliata, L. & Terracciano, L. M. Liver diseases and long non-coding RNAs: New
insight and perspective. Front. Med. (Lausanne) 1, 35 (2014). 180 Zhao, Y., Wu, J. et al. Long non-coding RNA in liver metabolism and disease: Current
status. Liver Res. 1, 163-167 (2017). 181 Huo, X., Han, S. et al. Dysregulated long noncoding RNAs (lncRNAs) in hepatocellular
carcinoma: implications for tumorigenesis, disease progression, and liver cancer stem cells. Mol. Cancer 16, 165 (2017).
182 Huang, J. L., Zheng, L. et al. Characteristics of long non-coding RNA and its relation to
hepatocellular carcinoma. Carcinogenesis 35, 507-514 (2014). 183 Bao, H. & Su, H. Long Noncoding RNAs Act as Novel Biomarkers for Hepatocellular
Carcinoma: Progress and Prospects. Biomed. Res. Int. 2017, 6049480 (2017).

121
184 Wang, Y., Chen, F. et al. The long noncoding RNA HULC promotes liver cancer by increasing the expression of the HMGA2 oncogene via sequestration of the microRNA-186. J. Biol. Chem. 292, 15395-15407 (2017).
185 Hulstaert, E., Brochez, L. et al. Long non-coding RNAs in cutaneous melanoma:
clinical perspectives. Oncotarget 8, 43470-43480 (2017). 186 Zeng, S., Xie, X. et al. Long noncoding RNA LINC00675 enhances phosphorylation
ofvimentin on Ser83 to suppress gastric cancer progression. Cancer Lett. 412, 179-187 (2018).
187 Nasrollahzadeh-Khakiani, M., Emadi-Baygi, M. et al. Long noncoding RNAs in gastric
cancer carcinogenesis and metastasis. Brief. Funct. Genomics 16, 129-145 (2017). 188 Arita, T., Ichikawa, D. et al. Circulating Long Non-coding RNAs in Plasma of Patients
with Gastric Cancer. Anticancer Res. 33, 3185-3193 (2013). 189 Takenaka, K., Chen, B. J. et al. The emerging role of long non-coding RNAs in
endometrial cancer. Cancer Genet. 209, 445-455 (2016). 190 Liu, L., Chen, X. et al. Long non-coding RNA TUG1 promotes endometrial cancer
development via inhibiting miR-299 and miR-34a-5p. Oncotarget 8, 31386-31394 (2017).
191 Li, W., Li, H. et al. Long non-coding RNA LINC00672 contributes to p53 protein-
mediated gene suppression and promotes endometrial cancer chemosensitivity. J. Biol. Chem. 292, 5801-5813 (2017).
192 Sallam, T., Sandhu, J. et al. Long Noncoding RNA Discovery in Cardiovascular Disease:
Decoding Form to Function. Circ. Res. 122, 155-166 (2018). 193 Greco, S., Salgado Somoza, A. et al. Long Noncoding RNAs and Cardiac Disease.
Antioxid. Redox Signal. 29, No. 9 (2017). 194 Haemmig, S., Simion, V. et al. Long noncoding RNAs in cardiovascular disease,
diagnosis, and therapy. Curr. Opin. Cardiol. 32, 776-783 (2017). 195 Sallam, T., Sandhu, J. et al. Long Noncoding RNA Discovery in Cardiovascular Disease.
Circ. Res. 122 (2018). 196 Uchida, S. & Dimmeler, S. Long Noncoding RNAs in Cardiovascular Diseases. Circ. Res.
116 (2015). 197 Greco, S., Gorospe, M. et al. Noncoding RNA in age-related cardiovascular diseases.
J. Mol. Cell. Cardiol. 83, 142-155 (2015).

122
198 Hennessy, E. J. Cardiovascular Disease and Long Noncoding RNAs. Circ. Genom. Precis. Med. 10, No. 4 (2017).
199 Gomes, C. P.C., Spencer, H. et al. The Function and Therapeutic Potential of Long
Non-coding RNAs in Cardiovascular Development and Disease. Mol. Ther. Nucleic Acids 8, 494-507 (2017).
200 Yang, X., Song, J. H. et al. Long non-coding RNA HNF1A-AS1 regulates proliferation
and migration in oesophageal adenocarcinoma cells. Gut 63, 881–890 (2014). 201 Abraham, J. M. & Meltzer, S. J. Long Noncoding RNAs in the Pathogenesis of Barrett’s
Esophagus and Esophageal Carcinoma. Gastroenterology 153, 27–34 (2017). 202 Zhao, H., Xing, G. et al. Long noncoding RNA HEIH promotes melanoma cell
proliferation, migration and invasion via inhibition of miR-200b/a/429. Biosci. Rep. 37, BSR20170682 (2017).
203 Leucci, E., Vendramin, R. et al. Melanoma addiction to the long non-coding RNA
SAMMSON. Nature 531, 518-522 (2016). 204 Tian, Y., Zhang, X. et al. Potential roles of abnormally expressed long noncoding RNA
UCA1 and Malat-1 in metastasis of melanoma. Melanoma Res. 24, 335–341 (2014). 205 Eggermann, T. Silver-Russell and Beckwith-Wiedemann syndromes: opposite
(epi)mutations in 11p15 result in opposite clinical pictures. Horm. Res. 71, 30-35 (2009).
206 Faghihi, M. A., Modarresi, F. et al. Expression of a noncoding RNA is elevated in
Alzheimer's disease and drives rapid feed-forward regulation of β-secretase. Nat. Med. 14, 723-730 (2008).
207 Williamson, C. M., Ball, S. T. et al. Uncoupling Antisense-Mediated Silencing and DNA
Methylation in the Imprinted Gnas Cluster. PLoS Genet. 7, e1001347 (2011). 208 Eddy, S. R. Non–coding RNA genes and the modern RNA world. Nat. Rev. Genet. 2,
919-929 (2001). 209 Gutschner, T. & Diederichs, S. The hallmarks of cancer. RNA Biol. 9, 703-719 (2012). 210 Kelley, R. L., Meller, V. H. et al. Epigenetic Spreading of the Drosophila Dosage
Compensation Complex from roX RNA Genes into Flanking Chromatin. Cell 98, 513-522 (1999).
211 Quinn, J. J., Ilik, I. A. et al. Revealing long noncoding RNA architecture and functions
using domain-specific chromatin isolation by RNA purification. Nat. Biotechnol. 32, 933-941 (2014).

123
212 Chu, C., Quinn, J. et al. Chromatin Isolation by RNA Purification (ChIRP). J. Vis. Exp. 61, e3912 (2012).
213 Gupta, R. A., Shah, N. et al. Long non-coding RNA HOTAIR reprograms chromatin
state to promote cancer metastasis. Nature 464, 1071-1076 (2010). 214 Deng, J., Yang, M. et al. Long Non-Coding RNA HOTAIR Regulates the Proliferation,
Self-Renewal Capacity, Tumor Formation and Migration of the Cancer Stem-Like Cell (CSC) Subpopulation Enriched from Breast Cancer Cells. PLoS ONE 12, e0170860 (2017).
215 Li, Z., Chao, T. C. et al. The long noncoding RNA THRIL regulates TNFα expression
through its interaction with hnRNPL. PNAS 111, 1002-1007 (2014). 216 Miao, Y., Ajami, N. E. et al. Enhancer-associated long non-coding RNA LEENE
regulates endothelial nitric oxide synthase and endothelial function. Nat. Commun. 9, No. 292 (2018).
217 Ruan, X., Li, P. et al. A Long Non-coding RNA, lncLGR, Regulates Hepatic Glucokinase
Expression and Glycogen Storage during Fasting. Cell Rep. 14, 1867-1875 (2016). 218 Liu, L., An, X. et al. The H19 long noncoding RNA is a novel negative regulator of
cardiomyocyte hypertrophy. Cardiovasc. Res. 111, 56-65 (2016). 219 Gao, Q., Gu, Y. et al. Long non-coding RNA Gm2199 rescues liver injury and promotes
hepatocyte proliferation through the upregulation of ERK1/2. Cell Death Dis. 9, No. 602 (2018).
220 Meola, N., Pizzo, M. et al. The long noncoding RNA Vax2os1 controls the cell cycle
progression of photoreceptor progenitors in the mouse retina. RNA 18, 111-123 (2012).
221 He, T. C., Zhou, S. et al. A simplified system for generating recombinant
adenoviruses. PNAS 95, 2509-2514 (1998). 222 Kume, T. The cooperative roles of Foxc1 and Foxc2 in cardiovascular development.
Adv. Exp. Med. Biol. 665, 63-77 (2009). 223 von Both, I., Silvestri, C. et al. Foxh1 Is Essential for Development of the Anterior
Heart Field. Dev. Cell 7, 331-345 (2004). 224 Benson, D. W., Silberbach, G. M. et al. Mutations in the cardiac transcription factor
NKX2.5 affect diverse cardiac developmental pathways. J. Clin. Invest. 104, 1567–1573 (1999).
225 Schott, J. J., Benson, D. W. et al. Congenital Heart Disease Caused by Mutations in
the Transcription Factor NKX2-5. Science 281, 108-111 (1998).

124
226 Oh, S. Y., Kim, J. Y. et al. The ETS Factor, ETV2: a Master Regulator for Vascular
Endothelial Cell Development. Mol. Cells 38, 1029-1036 (2015). 227 Vivekanand, P. & Rebay, I. The SAM Domain of Human TEL2 Can Abrogate
Transcriptional Output from TEL1 (ETV-6) and ETS1/ETS2. PLoS ONE 7, e37151 (2012).
228 Steinmayr, M., André, E. et al. staggerer phenotype in retinoid-related orphan
receptor α-deficient mice. PNAS 95, 3960-3965 (1998). 229 Gulec, C., Coban, N. et al. Identification of potential target genes of ROR-alpha in
THP1 and HUVEC cell lines. Exp. Cell Res. 353, 6-15 (2017). 230 Takahashi, A., Higashino, F. et al. EWS/ETS Fusions Activate Telomerase in Ewing’s
Tumors. Cancer Res. 63, 8338–8834 (2003). 231 He, J., Pan, Y. et al. Profile of Ets gene expression in human breast carcinoma. Cancer
Biol. Ther. 6, 76-82 (2007). 232 Shi, J., Qu, Y. et al. Increased expression of EHF via gene amplification contributes to
the activation of HER family signaling and associates with poor survival in gastric cancer. Cell Death Dis. 7, e2442 (2016).
233 Mesquita, B., Lopes, P. et al. Frequent copy number gains at 1q21 and 1q32 are
associated with overexpression of the ETS transcription factors ETV3 and ELF3 in breast cancer irrespective of molecular subtypes. Breast Cancer Res. Treat. 138, 37-45 (2013).
234 Chen, H., Ray-Gallet, D. et al. PU.1 (Spi-1) autoregulates its expression in myeloid
cells. Oncogene 11, 1549–1560 (1995). 235 Seuter, S., Neme, A. et al. ETS transcription factor family member GABPA contributes
to vitamin Dreceptor target gene regulation. J. Steroid Biochem. Biol. 177, 46-52 (2018).
236 Guo, H., Zhu, P. et al. Single-cell methylome landscapes of mouse embryonic stem
cells and early embryos analyzed using reduced representation bisulfite sequencing. Genome Res. 23, 2126-2135 (2013).
237 Smallwood, S. A., Lee, H. J. et al. Single-cell genome-wide bisulfite sequencing for
assessing epigenetic heterogeneity. Nat. Methods 11, 817-820 (2014). 238 Luo, C., Keown, C. L. et al. Single-cell methylomes identify neuronal subtypes and
regulatory elements in mammalian cortex. Science 357, 600-604 (2017).

125
239 Hui, T., Cao, Q. et al. High-Resolution Single-Cell DNA Methylation Measurements RevealEpigenetically Distinct Hematopoietic Stem Cell Subpopulations. Stem Cell Rep. 11, 578-592 (2018).
240 Zhu, P., Guo, H. et al. Single-cell DNA methylome sequencing of human
preimplantation embryos. Nat. Genet. 50, 12-19 (2018). 241 Rotem, A., Ram, O. et al. Single-cell ChIP-seq reveals cell subpopulations defined by
chromatin state. Nat. Biotechnol. 33, 1165-1172 (2015). 242 Buenrostro, J. D., Wu, B. et al. Single-cell chromatin accessibility reveals principles of
regulatory variation. Nature 523, 486-490 (2015). 243 Brouzes, E., Medkova, M. et al. Droplet microfluidic technology for single-cell high-
throughput screening. PNAS 106, 14195-14200 (2009). 244 Macosko, E. Z., Basu, A. et al. Highly Parallel Genome-wide Expression Profilingof
Individual Cells Using Nanoliter Droplets. Cell 161, 1202-1214 (2015). 245 Klein, A. M., Mazutis, L. et al. Droplet Barcoding for Single-Cell
TranscriptomicsApplied to Embryonic Stem Cells. Cell 161, 1187-1201 (2015). 246 Wang, Z. L., Li, B. et al. Integrative analysis reveals clinical phenotypes and oncogenic
potentials of long non-coding RNAs across 15 cancer types. Oncotarget 7, 35044-35055 (2016)
247 Khalil, A. M., Guttman, M. et al. Many human large intergenic noncoding RNAs
associate with chromatin-modifying complexes and gene expression. PNAS 106, 11667-11672 (2009)
248 Bhan, A. & Mandal, S. S. LncRNA HOTAIR: A master regulator of chromatin dynamics
and cancer. Biochim. Biophys. Acta. 1856, 151-164 (2015) 249 McCormack, A. L., Schieltz, D. M. et al. Direct analysis and identification of proteins
in mixtures by LC/MS/MS and database searching at the low-femtomole level. Anal. Chem. 69, 767-776 (1997)
250 Leitner, A., Walzthoeni, T. et al. Lysine-specific chemical cross-linking of protein
compleses and identification of cross-linking sites using LC-MS/MS and the xQuest/xProphet software pipeline. Nat. Protoc. 9, 120-137 (2014)
251 Chu, C., Zhang, Q. C. et al. Systematic discovery of Xist RNA binding proteins. Cell
161, 404-416 (2015) 252 Cooney, C. A., Jousheghany, F. et al. Chondroitin sulfates play a major role in breast
cancer metastasis: a role for CSPG4 and CHST11 gene expression in forming surface

126
P-selectin ligands in aggressive breast cancer cells. Breast Cancer Research 13, R58 (2011)
253 Yan, W. X., Chong, S. et al. Cas13d is a compact RNA-targeting type VI CRISPR
effector positively modulated by a WYL-domain-containing accessory protein. Mol. Cell 19, 327-339 (2018)
254 Konermann, S., Lotfy, P. et al. Transcriptome engineering with RNA-targeting type VI-
D CRISPR effectors. Cell 19, 665-676 (2018)

127
Publications
Journal Articles
1. Hsieh, Y.-P., Naler, L. B., Lu, C., “Microfluidic oscillatory hybridized ChIRP-
seq assay to profile genome-wide lncRNA bindings,” In Preparation.
2. Hsieh, Y.-P., Naler, L. B., Zhang, X., Murphy, T. W., Li, R., Lu, C., “Profiling
cell-type-specific epigenomic changes associated with BRCA1 mutation in
breast tissues using a low-input microfluidic technology,” In Preparation.
3. Hsieh, Y.-P., Sarma, M., Geng, S., Lu, C., Li, L., “Profiling epigenomic
changes and regulation associated with LPS-infected macrophages,” In
Preparation.
4. Murphy, T. W., Hsieh, Y.-P., Zhu, B., Naler, L. B., Lu, C., “Microfluidic
platform for next-generation sequencing library preparation with low-input
samples,” Analytical Chemistry 92 (2020) 2519-2526. (impact factor =6.350)
5. Zhu, B.#, Hsieh, Y.-P.#, Murphy, T. W., Zhang, Q., Naler, L. B., Lu, C.,
“MOWChIP-seq for low-input and multiplexe profiling of genome-wide histone
modifications,” Nature Protocols 14 (2019) 3366-3394. (co-first authors)
(impact factor =11.334)
6. Zhang, X., Wang, Y., Chiang, H.-C., Hsieh, Y.-P., Lu, C., Park, B. H., Jatoi, I.,
Jin, V. X., Hu, Y., Li, R., “BRCA1 mutations attenuated super-enhancer
function and chromatin looping in haploinsufficient human breast epithelial
cells,” Breast Cancer Research 21 (2019) 51. (impact factor =5.676)
7. Zhang, R., Qi, C.-F., Hu, Y., Shan, Y., Hsieh, Y.-P., Xu, F., Lu, G., Dai, J.,
Gupta, M., Gui, M., Peng, L., Yang, J., Xue, Q., Chen-Liang, R., Chen, K.,
Zhang, Y., Fung-Leung, W.-P., Mora, J. R., Li, L., Morse, H. C., Ozato, K.,
Heeger, P. S., Xiong, H., “T follicular helper cells restricted by IRF8 contribute

128
to T cell-mediated inflammation,” Journal of autoimmunity 96 (2019) 113-121.
(impact factor =7.543)
8. Murphy, T. W., Hsieh, Y.-P., Ma, S., Zhu, Y., Lu, C., “Microfluidic low-Input
fluidized-bed enabled ChIP-seq device for automated and parallel analysis of
histone modifications,” Analytical Chemistry 90 (2018) 7666–7674. (impact
factor =6.350)
9. Ma, S., Hsieh, Y.-P., Ma, J., Lu, C., “Low-input and multiplexed microfluidic
assay reveals epigenomic variation across cerebellum and prefrontal cortex,”
Science Advances 4 (2018) eaar8187. (impact factor =12.804)
10. Sun, C., Hsieh, Y.-P., Ma, S., Geng, S., Cao, Z., Li, L., Lu, C.,
“Immunomagnetic separation of tumor initiating cells by screening two surface
markers,” Scientific Reports 7 (2017) 40632. (impact factor =4.122)
11. Hsieh, Y.-P., Lin, S.-C., “Effect of PEGylation on the activity and stability of
horseradish peroxidase and L-Ncarbamoylase in aqueous phases,” Process
Biochemistry 50 (2015) 1372-1378. (impact factor =2.529)
Conference Presentation
Hsieh, Y.-P., Naler, L. B., Zhang, X., Murphy, T. W., Li, R., Lu, C., Profiling cell-type-
specific epigenomic changes associated with BRCA1 mutation in breast tissues
using a low-input microfluidic technology. AIChE 2019, Orlando, FL (Oral
presentation)

129
Appendix A
Microfluidic oscillatory hybridized ChIRP-seq protocol
Fabrication of microfluidic chip
As shown in the Chapter 3
Mice
C57BL/6 mice were purchased from Jackson Laboratory. 6-8 month-old male and
female mice were used. All processes performed on mice were approved by the
Institutional Animal Care and Use Committee (IACUC) of City of Hope National
Medical Center.
Cell culture
1. Thaw stored vial (liquid nitrogen) at 37˚C water bath for 1-2 min
2. Move cells to a microtube and centrifuge suspension at 300 rcf for 5 min at
4˚C
3. Discard the supernatant, and resuspend cell pellet with 1ml pre-warmed
medium
4. Add 4ml prewarmed medium to a 25T flack, then add step 3 cells
5. Mix well the 25 flask, and incubate at 37˚C in a humid incubator with 5% CO2
6. Change medium 2 days later, and subculture cells when the confluence is
around 80%
7. Remove medium, add 5ml prewarmed PBS for washing, and then discard
PBS
8. Add 1ml 0.25% trypsin to a 25T flask (2ml for 75T, 4ml for 150T) and mix well
9. Incubate for 5-15 min at 37˚C in a humid incubator with 5% CO2 (check cell
dissociation every 5 min)

130
10. Add medium (over 2x volume of trypsin for quenching), and collect cells by a
scraper to a tube
11. Centrifuge a tube at 300 rcf for 5 min at 4˚C
12. Discard supernatant, add medium, and repeat step 11
13. Discard supernatant, resuspend cell pellet with prewarmed medium, and add
to a bigger task
Adenovirus transfection
Due to the lack of E1 protein, adenovirus cannot be produced with most cell types.
HEK293 can create E1 to produce adenovirus when HEK293 is transfected with
adenovirus
1. Culture HEK293 in a 150T flask until confluence reaches to 50-70%
2. Change medium and add 100ul adenovirus (-80˚C, thaw at ice)
3. Incubate at 37˚C in a humid incubator with 5% CO2 for 2 days (check the
efficiency of transfection by detecting fluorescence)
4. Discard used medium, add 4ml 0.25% trypsin and incubate at 37˚C in a humid
incubator with 5% CO2 for 5 min
5. Add medium (over 2x volume of trypsin for quenching), and collect cells by a
scraper to a tube
6. Centrifuge a tube at 1000 rpm for 5 min at 4˚C
7. Discard supernatant, wash the pellet with 5ml DPBS, and discard supernatant
after centrifuge (1000 rpm for 5 min at 4˚C)
8. Repeat step 7
9. Add 450ul PBS, resuspend, and transfer to 1.5ml cryogenic tube.
10. Snap-freeze the 1.5ml cryogenic tune into liquid nitrogen for 10s and stay in
37˚C water bath for 1 min and do more 5 cycles for lysis

131
11. Transfer to 1.5ml microtube, centrifuge at 1000 rpm for 5 mins at 4˚C and
keep the supernatant with released virus particles (~400ul purified
adenovirus)
12. Store at -80˚C
Adenovirus infection and cells harvest (LEENE)
1. Culture HUVECs in a 150T flask until confluence reaches to 80%
2. Change medium and add 200ul adenovirus to incubate for more 4-6 hr
3. Change medium and incubate for more 2-3 days (check the efficiency of
transfection by detecting fluorescence)
4. Discard used medium, add 4ml 0.25% trypsin and incubate at 37˚C in a humid
incubator with 5% CO2 for 5 min
5. Add medium (over 2x volume of trypsin for quenching), and collect cells by a
scraper to a tube
6. Centrifuge a tube at 1000 rpm for 5 min at 4˚C
7. Discard supernatant, wash the pellet with 5ml DPBS 2, and discard
supernatant after centrifuge (1000 rpm for 5 min at 4˚C)
8. Repeat step 7
9. Store cell pellet at -80˚C
Lentivirus infection and cell harvest (HOTAIR)
1. Culture MDA-MB-231 in a 150T flask until confluence reaches to 80%
2. Change medium and add 100ul lentivirus to incubate overnight
3. Change medium and incubate for more 2-3 days (check the efficiency of
transfection by detecting fluorescence)
4. Discard used medium, add 4ml 0.25% trypsin and incubate at 37˚C in a humid
incubator with 5% CO2 for 5 min

132
5. Add medium (over 2x volume of trypsin for quenching), and collect cells by a
scraper to a tube
6. Centrifuge a tube at 1000 rpm for 5 min at 4˚C
7. Discard supernatant, wash the pellet with 5ml DPBS 2, and discard
supernatant after centrifuge (1000 rpm for 5 min at 4˚C)
8. Repeat step 7
9. Store cell pellet at -80˚C
Isolation of mouse lung endothelial cells from lung tissue (BY707159.1)
1. Take frozen murine lung tissue from -80˚C and thaw on ice
2. Resuspend 50 mg type I Collagenase with 25 ml DPBS+Ca2+/Mg2+ (2
mg/ml) and warm at 37˚C water bath for 10 min
3. Filter step 2 with 0.22 um sterile syringe filter to a new 50ml tube
4. Prepare binding/washing buffer- 0.5% BSA, 2mM EDTA in PBS, keep on ice
5. Wash lung tissue with cold PBS and then move lung tissue to a new petri dish
6. Add 5ml Collagenase (step 3) to step 5, cut lung tissue into pipettable pieces
and transfer to the tube of step 3
7. Incubate on a rotator at 37˚C for 45 min
8. Pour to a petri dish, use a 30 ml syringe to gently perform push-pull action 15
times for getting single cells (avoid bubble)
9. Filter step 8 with 70 um sterile syringe filter to a new 50 ml tube
10. Centrifuge at 300 rcf 4˚C for 10 min
11. Discard suspension (I leave 0.5 ml solution in the bottom, cannot see the
pellet), resuspend with 3ml binding/washing buffer
12. Add 20 ul CD31 microbeads (mix well before use it)
13. Mix well and incubate on a rotator at 4˚C for 15 min

133
14. Add 2 ml binding/washing buffer, and centrifuge at 300 rcf 4˚C for 10 min for
washing
15. Discard supernatant and resuspend with 500 ul binding/washing buffer and
move to a 1.5 ml microtube
16. Place on a magnetic rack, discard supernatant, and add 500 ul
binding/washing buffer (do not disturb beads)
17. Repeat step 16 twice
18. Discard supernatant, and store cell pellet with magnetic beads at -80˚C
Cells fixation
1. Prepare 1% glutaraldehyde with PBS at room temperature (10 ml for 10
million cells)
2. Resuspend cell pellet with 10 ml 1% glutaraldehyde, and put on a rotator at
room temperature for 10 min
3. Add 1/10th volume of 1.25 M glycine to step 2 on a rotator at room
temperature for 5 min to quench the fixation
4. Centrifuge at 2000 rcf 4˚C for 5 min, and discard supernatant
5. Add 10 ml chilled PBS, centrifuge at 2000 rcf 4˚C for 5 min, and discard
supernatant
6. Add 3 ml chilled PBS, centrifuge at 2000 rcf 4˚C for 3 min, and discard
supernatant
7. Perform chromatin shearing immediately or store at -80˚C
Chromatin shearing
1. Prepare Lysis buffer (50mM Tris-Cl pH 7.0, 10mM EDTA, 1% SDS), and set
4˚C for Bioruptor (check the amount of D.I. water in the cooler)

134
2. Thaw the cell pellet on ice, add proper amount of Lysis buffer and transfer to
Bioruptor microtubes
3. Add 1/100th volume of PIC, PMSF and Superase, and mix well
4. Place on the tube holder for Bioruptor (each site of holder needs to load a
microtube, put microtube with water if number of samples is less than 6)
5. Sonicate at 4˚C with 30 s ON and 45 s OFF pulse intervals until most
chromatin is solubilized and the size of DNA fragments is in the range of 100-
500 bp
6. Move cells to a new microtube and centrifuge at 16100 rcf and 4˚C for 5 min
7. Keep supernatant (do sonicate more time if the pellet is big) and store at
-80˚C
Fragment size checking
1. Take the proper volume (~2500 cells) of sonicated chromatin to a 1.5 ml
microtube, add 198 ul PBS and 2 ul proteinase K, and mix well
2. Place on a thermal cycle plate at 65˚C for 8 hr
3. Add 200 ul phenol-chloroform-isoamyl alcohol and mix well by vortex
4. Centrifuge at 16100 rcf and room temperature for 5 min
5. Transfer supernatant to a new 1.5 ml microtube and add 750 ul 100% ethanol,
50 ul 10M ammonium acetate and 5 ul of 5 ug/ul glycogen. Place on -80˚C for
2 hr for precipitation.
6. Centrifuge at 16100 rcf and 4˚C for 10 min
7. Discard supernatant, add 500 ul 70% enthanol (do not disturb the pellet) and
centrifuge at 16100 rcf and 4˚C for 5 min
8. Discard supernatant and air dry in the biosafety cabinet for 5 min
9. Resuspend with 3 ul D.I. water

135
10. Take 2 ul from step 9 mix well with 2 ul High sensitivity D1000 sample buffer
and load to TapeStation machine to analyze DNA fragment size
Probes designing
Based on the sequence of target long noncoding RNA, we can design several 20 nt
biotinylated probes whose sequences are complementary to the sequence of target
lncRNA. All probes we used for profiling lncRNAs binding sites were designed and
produced by LGC Biosearch Technologies with ChIRP Probe Designer version 4.2.
The probes are stored in a deep 96-well plate.
1. Add proper amount of Low EDTA to each sample well and resuspend. The
final concentration of each probe is 100 uM.
2. Prepard even and odd pooling probe sets. The final concentration of even and
odd pooling probe sets 10 uM.
3. Store at -20˚C.
LEENE – https://www.ncbi.nlm.nih.gov/nuccore/NR_026796 2092 bp
Oligo length:20nt, min. spacing length:80nt, masking level:5
LEENE-1 atagaatcttgcttgggcag
LEENE-2 ctgagtggattgtaggtgtt
LEENE-3 tcctgtcttcttacttgtac
LEENE-4 ccccaaaatcctttaaggta
LEENE-5 tgtctctgggaagaggagag
LEENE-6 tggatgtaaagactggtgcc
LEENE-7 ctgagctgtagaatccacag
LEENE-8 ctgacatctcatcaagggag
LEENE-9 gctcatcaagaagcagctag
LEENE-10 agtcacaagaagtccaaggc

136
HOTAIR – https://www.ncbi.nlm.nih.gov/nuccore/NR_003716 2364 bp
Oligo length:20nt, min. spacing length:80nt, masking level:5
HOTAIR-1 gatcaagctccagagcacag
HOTAIR-2 caggacctttctgattgaga
HOTAIR-3 tggcatttctggtcttgtaa
HOTAIR-4 ttcgtggttgctttttctac
HOTAIR-5 cacgtttgttccgggaactg
HOTAIR-6 gattattctctctgtactcc
HOTAIR-7 gtcttgttaacaagcctcat
HOTAIR-8 acgcccaacagatatattgt
HOTAIR-9 gtttgggcctcctaaaattg
HOTAIR-10 caagtagcagggaaaggctt
HOTAIR-11 ctatgttcctctcaaattcc
HOTAIR-12 tcaagagcttccaaaggcta
HOTAIR-13 gatgcattcttctagaccta
HOTAIR-14 ggggtctatatttagagtgc
HOTAIR-15 aggaggaagttcaggcattg
HOTAIR-16 tacctacccaatgtatggaa
HOTAIR-17 cctgagtctatttagctaca
BY707159 – https://www.ncbi.nlm.nih.gov/nuccore/BY707159 680 bp
Oligo length:20nt, min. spacing length:60nt, masking level:2
BY707159-1 aaggggtgagacagcatctt
BY707159-2 cacaataacacacccctttg
BY707159-3 ctgagaggtagttcttctca
BY707159-4 acatcagttggcaactcgtc

137
BY707159-5 atgagcacagtgagtcatga
BY707159-6 gcaagggagcaaggttgaca
BY707159-7 gcaggcaggaaatctgtgaa
BY707159-8 ccaaagggatgcctaatgtg
Bead and sample preparation
10 ul Dynabeads MyOne streptavidin and 10 ul 10 uM probes for one assay.
1. Prepare hybridization buffer (750 mM NaCl, 50 mM Tris-Cl pH 7.0, 1 mM
EDTA and 15% Formamide). Cover with aluminum foil. Formamide is light
sensitive. Place on the 37˚C water bath for 5 min if it is stored at 4˚C.
2. Wash 20 ul Dynabeads MyOne streptavidin C1 with 100 ul lysis buffer thrice.
Place on the magnetic rack for 1-2 min, discard supernatant (do not disturb
beads), and add lysis buffer.
3. Add 130 ul lysis buffer, 20 ul (even or odd) probes, 1.5 ul PIC, 1.5 ul PMSF,
and 1.5 ul Superase into a 1.5 ml microtube.
4. Place on a rotator at 37˚C for 2 hr.
5. Place microtube on a magnetic rack until pellet is formed. (~2 min)
6. Wash pellet with 100 ul lysis buffer twice. (Do not disturb beads)
7. Add 20 ul lysis buffer (the original volume of beads), and resuspend
8. Add proper amount of sample and at least 2X volume of hybridization buffer
(compared to the volume of sample) to a new 1.5 microtube. The total volume
is 100ul.
9. Add 1 ul PIC, 1 ul PMSF, and 1 ul Superase.
Device operation for ChIRP
1. Prepare washing buffer (2x SSC, 0.5% SDS)
2. Place a microfluidic device on a microscopy

138
3. Set the pressure to 30 psi for the solenoid valve, and fill the sieve valve in the
microfluidic device when turn on the solenoid valve (~5 min)
4. Fill the a syringe with lysis buffer, and load lysis buffer to a microfluidic device
by injecting a PFA tube, connecting with a syringe, to the inlet part of the
device to remove air bubbles (load buffer at 50 ul/min for 5 s while turning on
the solenoid valve following by turning off the solenoid valve thrice)
5. Place a magnet, contacting with a heat control plate (37˚C), under a
microfluidic device
6. Connect the outlet part of a microfluidic device and one solenoid valve in a
two-set solenoid manifold with a long PFA tube whiling turning off the solenoid
valve
7. Load sample to the long PFA tube, connecting with a syringe, by withdrawing
the syringe (keep air space before withdrawing)
8. Load sample to a long PFA tube at step 5 through chamber at 200 ul/min by
connecting at inlet part of the device. Turn on the solenoid valve and turn off
the pump simultaneously when sample is almost loaded.
9. Load beads into the chamber by using a pipette from the inlet part of the
device
10. Connect the inlet part of a microfluidic device and another solenoid valve in a
two-set solenoid manifold with another long PFA tube whiling turning on the
solenoid valve
11. Turn off the solenoid valve, and adjust pulses to make amount of sample in
two long PFA tubes same

139
12. Use LabVIEW program to set interval to 60 s, adjust to proper pressure (~0.5
psi) for pulses to make as much as possible volume of sample in each tube
can move through the chamber but no bubble created in the chamber
13. Perform the oscillatory hybridization at step 11 at 37˚C, 60 s interval, 0.5 psi
for 4 hr. Make beads stay in the chamber by using magnet
14. Use LabVIEW to make pulse through the inlet part of the solenoid valve in a
two-set solenoid manifold, and turn off the solenoid valve. Make almost all
sample stay in the long PFA tube connecting with outlet part of the chamber
15. Connect the inlet part of the chamber with long PFA tube, connecting with the
syringe, turn off the solenoid valve, and withdraw the syringe to collect
sample. Keep space before withdrawing, and use magnet to make beads stay
in the chamber
16. Remove the long PFA tube connecting with outlet part, turn on the solenoid
valve, make packed-bed beads before sieve valve with magnet, load sample
to chamber by operating the syringe with pump at 2 ul/min for around 40-60
min
17. Load more washing buffer to the chamber to wash out non-target material at
10 ul/min for 2 min
18. Remove syringe tube, turn on the solenoid valve, and load washing buffer to
two washing tubes (each tube connecting with inlet/outlet part and one
solenoid valve in a two-set solenoid manifold)
19. Turn off the solenoid valve, perform oscillatory washing at 1 psi, 0.3 s interval
for 7.5 min
20. Do step 17-19 again

140
21. Collect beads to a new 1.5 ml microtube and place on the magnetic rack until
a pellet is formed (~1-2 min)
22. Discard supernatant and load 100 ul washing buffer to mix the pellet
23. Place on the magnetic rack until a pellet is formed
24. Discard supernatant and load 100ul lysis buffer to mix
25. Separate 2 parts (10ul for RNA extraction and 90ul for DNA extraction)
RNA isolation and assay
Follow the instructions of TRIzol (invitrogen) and High-capacity cDNA reverse
transcription kit (ThermoFisher) with minor modification
1. Prepare RNA PK buffer (100mM NaCl, 10 mM Tris-Cl pH 8.0, 1 mM EDTA,
0.5 % SDS)
2. Place 10ul sample (after ChIRP) to magnetic rack and discard supernatant
3. Add 95 ul RNA PK buffer and 5 ul PK, mix well with vortex, and spin down
briefly
4. Incubate at 50˚C for 45 min with shaking (1000 rpm)
5. Spin down briefly and incubate sample at 95˚C for 10 min
6. Chill sample on ice for 5 min immediately following step 5
7. Add 500 ul TRIzol and mix well by pipetting
8. Incubate for 5 min at room temperature
9. Add 100 ul chloroform and mix well by pipetting
10. Incubate for 5 min at room temperature
11. Centrifuge at 12000 rcf at 4˚C for 15 min
12. Transfer the aqueous phase to a new 1.5 ml microtube (containing RNA)
13. Add 2 ul RNase-free glycogen and 250 ul IPA, and incubate for 10 min at
room temperature

141
14. Centrifuge at 12000 rcf at 4˚C for 10 min
15. Discard the supernatant and resuspend the pellet with 500 ul 75 % ethanol
16. Vortex briefly, and centrifuge at 7500 rcf at 4˚C for 5 min
17. Discard the supernatant and air dry in BSC for 5-10 min
18. Resuspend the pellet with 15 ul nuclease-free H2O
19. Add 2 ul 10X RT buffer, 0.8 ul 25X dNTP Mix, 2 ul 10X RT Random Primers,
and 1 ul MultiScribe Reverse Transcriptase
20. Mix well by pipetting and load to 96-well plate
21. Centrifuge briefly and treat with the following program using a thermocycle:
25˚C for 10 min, 37˚C for 120 min, 85˚C for 5min, and 4˚C forever)
22. Check the efficiency of RNA retrieval by qPCR
DNA isolation and assay
1. Prepare DNA elution buffer (100 mM NaCl, 10 mM Tris-Cl pH 8.0, 1 mM
EDTA, 0.5 % SDS) and 3M NaOAc
2. Prepare fresh RNA digestion solution (2 ul RNase A (100 mg/m) and 3.2 ul
RNase H (60 U/ul) in 1 ml DNA elution buffer), and mix well with a pipette
3. Place 90ul sample (after ChIRP) to magnetic rack and discard supernatant
4. Add 150 ul RNA digestion solution and incubate at 37˚C for 45 min with
shaking (1000 rmp)
5. Place on a magnetic rack until a bead-pellet is form
6. Transfer supernatant to a new labeled microtube
7. Resuspend bead-pellet with 150 ul RNA digestion buffer and incubate at 37˚C
for 45 min with shaking (1000 rmp)
8. Place on a magnetic rack and transfer supernatant to the labeled microtube at
step 6

142
9. Add 15 ul PK to step 8 and incubate at 50˚C for 2 hr with shaking (1000 rpm)
10. Spin down briefly
11. Add 300 ul phenol-chloroform-isoamyl alcohol and mix well by vortex for 5 min
11. Centrifuge at 16100 rcf at 4˚C for 5 min
12. Transfer the aqueous phase (~300 ul) to a new microtube
13. Add 5 ul glycogen, 30 ul NaOAc and 900 ul 100 % ethanol. Mix well by vortex
and store at -20˚C overnight
14. Centrifuge at 16100 rcf at 4˚C for 10 min
15. Discard supernatant and add 500 ul 70 % ethanol
16. Centrifuge at 16100 rcf at 4˚C for 5 min
17. Discard supernatant and air dry in BSC for 5 min
18. DNA is ready for analysis by qPCR and library preparation
Library preparation
The Accel-NGS 2S Plus DNA Library Kit (Swift-Bio) was used to perform library
preparation. The process was based on the protocol from Swift-Bio with minor
modification. Briefly, the purified DNA underwent 5 steps, including: repair I for
dephosphorylation, repair II for end repair and polishing, ligation I for 3’ ligation of
P7, ligation II for 5’ ligation of P5, and PCR for amplification of DNA. At the last step
of PCR, 2.5 μl of 20x EvaGreen was added to the reaction mixture to check the
amount of DNA during amplification. Amplification was terminated when the
fluorescent signal increased by 3000 RFU (CFX Connect, BIO-RAD, Hercules, CA).
SPRI beads were used to purify the amplified DNA and remove dimers which
resulted during amplifying due to low amount of input DNA. 10 μl TE buffer was used
to elute pure DNA after amplification and different samples attached with different

143
barcodes were pooled together for sequencing by Illumina HiSeq 4000 with single-
end 50 nt read.

144
Summary of sequencing data information
Table 3.3-1 Summary of MOWChIP sequencing data information. Total
reads (M)
Reads of after
trimming (M)
Aligned
reads (M)
Number of
peaks (k)
Mapping
efficiency (%)
PBS_Rep1 15.91 15.88 15.36 31.84 96.73
PBS_Rep2 13.81 13.78 13.45 26.35 97.59
Low LPS_Rep1 21.37 21.33 20.40 26.03 95.65
Low LPS_Rep2 19.38 19.37 18.89 21.72 97.51
High LPS_Rep1 19.37 19.35 18.56 16.65 95.91
High LPS_Rep2 38.29 38.27 37.24 15.80 97.32
Table 4.3-1 Summary of MOWChIP sequencing data (H3K27ac, non-carrier) information in human samples.
Total
reads (M)
Reads of after
trimming (M)
Aligned
reads (M)
Number of
peaks (k)
Mapping
efficiency (%)
BSC157-L-B1 19.64 19.49 18.77 13.58 96.28
BSC162-L-B1 8.15 7.53 7.03 3.56 93.27
BSC162-L-B2 8.28 7.95 7.47 1.71 94.01
BSC162-R-B1 16.44 15.37 14.17 19.32 92.19
BSC173-M-B1 10.14 10.08 9.63 10.55 95.48
BSC173-M-B2 17.66 17.43 16.68 12.26 95.66
BSC157-L-LP1 14.14 14.09 13.28 17.06 94.23
BSC157-L-LP2 16.92 16.81 15.91 28.43 94.61
BSC162-L-LP1 8.93 8.74 8.14 27.64 93.04
BSC162-L-LP2 10.40 9.72 9.16 52.97 94.21
BSC162-R-LP1 22.79 22.30 21.21 53.27 95.15

145
BSC162-R-LP2 13.64 13.49 12.93 71.43 95.80
BSC167-L-LP1 20.51 20.28 19.33 41.14 95.28
BSC167-L-LP2 18.62 18.37 17.31 39.59 94.26
BSC167-R-LP1 13.85 13.82 13.22 83.49 95.63
BSC167-R-LP2 22.13 21.86 20.98 54.36 95.98
BSC173-M-LP1 5.20 5.15 4.97 43.90 96.38
BSC173-M-LP2 23.32 23.04 22.23 61.19 96.51
BSC173-M-LP3 31.17 30.25 28.72 44.12 94.93
BSC157-L-ML1 12.06 11.74 11.01 40.97 93.75
BSC157-L-ML2 13.95 13.79 13.04 19.38 94.60
BSC162-L-ML1 10.00 9.42 9.00 30.74 95.62
BSC162-L-ML2 9.95 9.38 8.84 13.20 94.22
BSC162-R-ML1 12.25 12.06 11.43 12.38 94.75
BSC162-R-ML2 16.21 15.98 15.20 22.72 95.11
BSC167-L-ML1 17.55 17.44 16.75 31.00 96.05
BSC167-L-ML2 17.99 17.84 17.12 33.36 95.94
BSC167-R-ML1 19.60 19.55 18.91 33.70 96.75
BSC167-R-ML2 16.70 16.67 16.10 31.92 96.61
BSC173-M-ML1 41.90 41.72 40.56 37.43 97.22
BSC173-M-ML2 44.35 43.71 42.40 32.53 97.02
BSC157-L-S1 13.89 13.84 13.06 42.52 94.35
BSC157-L-S2 13.56 13.49 12.90 54.93 95.62
BSC162-L-S1 9.49 9.30 9.00 48.14 96.79
BSC162-L-S2 11.10 10.89 10.46 54.27 96.06

146
BSC162-R-S1 17.28 17.20 16.63 46.81 96.70
BSC162-R-S2 11.70 11.66 11.25 49.75 96.44
BSC173-M-S1 38.52 38.49 37.03 53.99 96.22
BSC173-M-S2 28.43 28.39 27.47 57.58 86.77
Table 4.3-2 Summary of MOWChIP sequencing data (H3K27ac, carrier) information in human samples.
Total
reads (M)
Reads of after
trimming (M)
Aligned
reads (M)
Number of
peaks (k)
Mapping
efficiency (%)
BSC164-R-B1 19.78 19.72 18.93 20.88 96.00
BSC189-L-B1 18.58 18.57 18.03 58.28 97.10
BSC189-L-B2 16.15 16.15 15.68 54.57 97.09
BSC191-M-B1 18.58 18.57 18.15 38.11 97.72
BSC191-M-B2 13.62 13.61 13.23 15.42 97.22
BSC164-R-LP1 14.60 14.55 14.01 69.81 96.27
BSC164-R-LP2 15.17 15.09 14.44 69.79 95.65
BSC164-R-LP3 20.58 20.52 19.71 40.69 96.03
BSC189-L-LP1 13.03 13.03 12.67 64.18 97.24
BSC189-L-LP2 21.42 21.41 20.78 85.55 97.05
BSC191-M-LP1 14.76 14.74 14.30 43.96 97.02
BSC191-M-LP2 13.34 13.33 12.96 41.81 97.17
BSC164-R-ML1 15.56 15.46 14.77 14.83 95.50
BSC189-L-ML1 18.32 18.31 17.74 57.39 96.88
BSC189-L-ML2 17.92 17.91 17.39 50.36 97.10
BSC191-M-ML1 13.50 13.49 13.08 17.93 96.90
BSC191-M-ML2 13.99 13.98 13.57 21.14 97.09

147
BSC164-R-S1 13.97 13.96 13.46 27.40 96.37
BSC164-R-S2 13.05 12.98 12.44 18.29 95.82
BSC164-R-S3 12.98 12.97 12.15 17.19 93.73
BSC189-L-S1 22.48 22.47 21.92 60.14 97.55
BSC189-L-S2 16.70 16.70 16.26 69.00 97.38
BSC191-M-S1 12.37 12.36 12.04 19.43 97.36
BSC191-M-S2 13.35 13.34 13.00 17.94 97.49
Table 4.3-3 Summary of MOWChIP sequencing data (H3K4me3, non-carrier) information in human samples.
Total
reads (M)
Reads of after
trimming (M)
Aligned
reads (M)
Number of
peaks (k)
Mapping
efficiency (%)
BSC186-B1 17.32 16.98 16.09 27.21 94.79
BSC186-B2 13.82 13.68 13.04 27.26 95.32
BSC186-LP1 18.39 18.38 17.38 31.83 94.57
BSC186-LP2 2.15 2.00 1.02 4.96 51.12
BSC186-ML1 13.06 12.92 12.29 23.96 95.12
BSC186-ML2 13.58 13.49 12.82 21.04 94.98
BSC186-S1 11.32 11.30 10.71 29.86 94.80
BSC186-S2 15.07 14.92 14.15 26.18 94.88
Table 4.3-4 Summary of MOWChIP sequencing data (H3K4me3, carrier) information in human samples.
Total
reads (M)
Reads of after
trimming (M)
Aligned
reads (M)
Number of
peaks (k)
Mapping
efficiency (%)
BSC189-L-B1 16.29 16.27 15.35 35.76 94.37
BSC189-L-B2 15.80 15.76 14.89 28.29 94.50

148
BSC191-B1 13.62 13.59 13.03 29.25 95.84
BSC191-B2 14.70 14.67 14.02 31.53 95.53
BSC189-L-LP1 12.73 12.61 11.74 31.62 93.12
BSC189-L-LP2 13.27 13.27 12.40 21.75 93.43
BSC189-L-LP3 12.88 12.86 12.00 23.05 93.27
BSC191-LP1 13.92 13.73 12.82 23.87 93.41
BSC191-LP2 12.62 12.52 11.88 19.09 94.88
BSC189-L-ML1 13.36 12.97 11.87 30.89 91.48
BSC189-L-ML2 15.48 15.41 14.16 31.54 91.86
BSC189-L-ML3 13.79 13.78 12.78 30.37 92.76
BSC191-ML1 15.19 15.13 14.36 18.37 94.89
BSC191-ML2 12.63 12.59 11.96 20.29 95.04
BSC189-L-S1 16.02 15.99 15.07 30.31 94.25
BSC189-L-S2 13.83 13.82 13.01 26.41 94.15
BSC191-S1 14.41 14.36 13.65 24.87 95.02
BSC191-S2 12.34 12.33 11.74 23.81 95.26
Table 4.3-5 Summary of MOWChIP sequencing data (H3K27ac, wild type) information in mouse samples.
Total
reads (M)
Aligned reads
(M)
Number of
peaks (k)
Mapping
efficiency (%)
8W-BFF1971-LP1 13.99 13.93 8.34 99.6
8W-BFF1971-LP2 15.66 15.60 19.89 99.6
8W-BFF1971-LP3 17.58 17.50 24.37 99.6
8W-BFF2009-LP1 21.70 21.27 40.81 98.0
8W-BFF2009-LP2 24.36 22.82 25.84 93.7

149
8W-BFF2009-LP3 17.83 17.64 41.47 98.9
8W-BFF2015-LP1 17.40 17.14 56.34 98.5
8W-BFF2015-LP2 17.17 17.11 46.76 99.7
8W-BFF2018-LP1 16.04 15.95 60.41 99.4
8W-BFF2018-LP2 15.09 14.97 42.93 99.2
8W-BFF2019-LP1 22.23 22.22 37.27 100.0
8W-BFF2019-LP2 18.04 18.03 38.86 99.9
8M-BFF2006-B1 22.19 21.95 32.69 98.9
8M-BFF2006-B2 19.29 19.28 34.44 99.9
8M-BFF2023-B1 16.11 16.05 41.04 99.7
8M-BFF2023-B2 24.26 24.10 40.04 99.4
8M-BFF2028-B1 12.29 12.26 32.65 99.8
8M-BFF2028-B2 20.35 20.34 29.87 100.0
8M-BFF1988-LP1 17.64 17.59 16.09 99.7
8M-BFF1988-LP2 18.05 17.96 11.78 99.5
8M-BFF1993-LP1 24.10 24.07 30.87 99.9
8M-BFF1993-LP2 17.06 16.99 24.41 99.6
8M-BFF1994-LP1 13.87 13.83 31.42 99.7
8M-BFF1994-LP2 20.33 20.24 34.29 99.5
8M-BFF2003-LP1 17.19 17.08 36.36 99.4
8M-BFF2003-LP2 19.48 19.45 20.43 99.8
8M-BFF2006-S1 10.93 10.85 48.27 99.3
8M-BFF2006-S2 11.10 10.90 62.16 98.2
Table 4.3-6 Summary of MOWChIP sequencing data (H3K27ac, knockout) information in mouse samples.

150
Total
reads (M)
Aligned reads
(M)
Number of
peaks (k)
Mapping
efficiency (%)
8W-BFF1970-LP1 15.93 15.81 43.85 99.3
8W-BFF1970-LP2 12.10 11.94 39.76 98.7
8W-BFF1970-LP3 16.39 15.78 39.84 96.3
8W-BFF2013-LP1 31.08 30.56 42.90 98.3
8W-BFF2013-LP2 15.77 15.57 49.15 98.7
8W-BFF2014-LP1 25.33 24.85 59.37 98.1
8W-BFF2014-LP2 23.93 23.52 60.11 98.3
8W-BFF2016-LP1 20.40 20.34 65.05 99.7
8W-BFF2016-LP2 15.85 15.79 73.79 99.7
8W-BFF2017-LP1 19.94 19.90 58.20 99.8
8W-BFF2017-LP2 16.84 16.81 54.02 99.8
8M-BFF2005-B1 14.37 14.35 8.60 99.8
8M-BFF2022-B1 12.99 12.98 18.56 99.9
8M-BFF2022-B2 19.09 19.08 16.09 100.0
8M-BFF2026-B1 11.44 11.40 21.63 99.6
8M-BFF2026-B2 15.14 14.91 29.19 98.5
8M-BFF2027-B1 18.69 18.68 42.51 99.9
8M-BFF1987-LP1 15.79 15.78 29.85 99.9
8M-BFF1987-LP2 20.07 20.00 31.42 99.6
8M-BFF1991-LP1 16.53 16.49 27.37 99.8
8M-BFF1991-LP2 18.82 18.77 26.29 99.7
8M-BFF1992-LP1 15.52 15.44 34.38 99.5

151
8M-BFF1992-LP2 23.73 23.64 27.69 99.6
8M-BFF2001-LP1 15.64 15.62 30.66 99.9
8M-BFF2001-LP2 17.79 17.71 26.80 99.6
8M-BFF2027-S1 11.55 11.46 54.39 99.3
Table 4.3-7 Summary of MOWChIP sequencing data (H3K4me3, wild type) information in mouse samples.
Total
reads (M)
Aligned reads
(M)
Number of
peaks (k)
Mapping
efficiency (%)
8M-BFF2006-B1 13.70 13.69 11.26 99.9
8M-BFF2006-B2 13.97 13.96 9.24 99.9
8M-BFF2023-B1 13.71 13.66 8.00 99.7
8M-BFF2023-B2 10.74 10.73 10.51 99.9
8M-BFF2028-B1 20.48 20.47 3.57 99.9
8M-BFF2028-B2 20.26 20.26 2.33 100.0
8M-BFF2029-B1 18.03 17.93 4.77 99.5
8M-BFF2029-B2 13.08 13.06 3.04 99.9
8M-BFF2006-LP1 12.41 12.40 13.31 99.9
8M-BFF2006-LP2 22.75 22.74 12.22 99.9
8M-BFF2006-LP3 18.14 18.14 12.34 100.0
8M-BFF2023-LP1 16.96 16.95 14.06 100.0
8M-BFF2023-LP2 19.24 19.23 12.11 100.0
8M-BFF2028-LP1 20.41 20.40 11.31 100.0
8M-BFF2028-LP2 16.17 16.17 12.22 100.0
8M-BFF2029-LP1 20.56 20.56 3.30 100.0
8M-BFF2029-LP2 19.20 19.19 9.79 100.0

152
8M-BFF2006-S1 18.40 18.38 17.41 99.9
8M-BFF2006-S2 22.22 22.21 12.31 99.9
Table 4.3-8 Summary of MOWChIP sequencing data (H3K4me3, knockout) information in mouse samples.
Total
reads (M)
Aligned reads
(M)
Number of
peaks (k)
Mapping
efficiency (%)
8M-BFF2005-B1 14.19 14.13 7.71 99.6
8M-BFF2005-B2 15.16 15.07 4.71 99.4
8M-BFF2022-B1 13.46 13.46 6.31 100.0
8M-BFF2026-B1 14.40 14.38 3.21 99.9
8M-BFF2026-B2 14.87 14.87 3.49 100.0
8M-BFF2027-B1 12.95 12.79 9.06 98.8
8M-BFF2005-LP1 17.49 17.43 11.40 99.6
8M-BFF2005-LP2 13.38 13.34 6.54 99.7
8M-BFF2022-LP1 20.61 20.60 8.51 100.0
8M-BFF2026-LP1 16.40 16.39 14.07 100.0
8M-BFF2026-LP2 20.82 20.80 9.15 99.9
8M-BFF2027-LP1 23.69 23.66 13.62 99.9
8M-BFF2027-LP2 24.09 24.08 12.79 100.0
8M-BFF2027-S1 12.63 12.61 12.55 99.9
8M-BFF2027-S2 16.10 16.06 14.29 99.8
Table 5.3-1 Summary of ChIRP-seq in HUVECs with pooling all probes.
Total
reads (M)
Reads of after
trimming (M)
Aligned
reads (M)
Number of
peaks
Mapping
efficiency (%)
LEENE-500K-1 22.27 22.07 9.48 5770 42.9

153
LEENE-500K-2 26.37 26.18 20.77 12327 79.3
LEENE-100K 24.09 23.64 14.98 6950 63.4
GFP-500K-1 28.07 28.01 8.23 4745 29.4
GFP-500K-2 26.56 25.20 14.62 4618 58.0
GFP-100K 21.63 21.19 12.06 3055 56.9
Control-500K-1 26.69 26.54 18.75 3357 70.6
Control-500K-2 22.79 22.33 13.26 2893 59.4
Control-100K 20.51 20.17 10.54 3619 52.2
Table 5.3-2 Summary of ChIRP-seq in HUVECs with splitting probes.
Total
reads (M)
Reads of after
trimming (M)
Aligned
reads
(M)
Number
of peaks
Mapping
efficiency
(%)
Overlap
peaks
LEENE-
500K-even 34.55 34.30 27.23 25,305 79.4
899 LEENE-
500K-odd 36.26 31.88 17.72 17,527 55.6
GFP-500K-
even 28.24 27.62 22.74 49,168 82.3
2,468 GFP-500K-
odd 31.02 30.42 20.75 40,451 68.2
Control-
500K-even 25.56 24.63 20.57 52,743 83.5
6,474 Control-
500K-odd 1.58 1.52 1.27 6,972 83.4

154
Table 5.3-3 Summary of ChIRP-seq from wild type and BY707159.1 knockout mice. Total
reads
(M)
Reads of after
trimming (M)
Aligned
reads (M)
Number of
peaks
Mapping
efficiency
(%)
Overlap
peaks
Wild type-
even 24.92 24.87 24.00 111,067 96.5
13,991 Wild type-
odd 25.90 25.85 24.64 171,137 95.3
Knockout-
even 26.55 26.49 25.16 77,730 95.0
7,818 Knockout-
odd 19.05 18.91 17.62 167,224 93.2
Table 5.3-4 Summary of HOTAIR ChIRP-seq from Chu and our data. Total
reads
(M)
Reads of after
trimming (M)
Aligned
reads
(M)
Number of
peaks
Mapping
efficiency
(%)
Overlap
peaks
Chu-even 13.55 12.36 10.28 72,259 83.2 4,488
Chu-odd 12.01 10.73 10.03 92,469 93.4
Hsieh-even 28.09 27.30 25.88 61,361 94.8 3,308
Hsieh-odd 21.89 19.54 18.56 66,184 95.0