Multiplex Immunoassay Techniques for On-Site Detection of ...
Upload
khangminh22Category
view
0download
0
Edited by
Application of Antibody and Immunoassay for Food Safety
Hongtao Lei, Zhanhui Wang and Sergei A. Eremin
Printed Edition of the Special Issue Published in Foods
www.mdpi.com/journal/foods

Application of Antibody andImmunoassay for Food Safety


Application of Antibody andImmunoassay for Food Safety
Editors
Hongtao Lei
Zhanhui Wang
Sergei A. Eremin
MDPI ‚ Basel ‚ Beijing ‚ Wuhan ‚ Barcelona ‚ Belgrade ‚ Manchester ‚ Tokyo ‚ Cluj ‚ Tianjin

Editors
Hongtao Lei
College of Food Science
South China Agricultural
University
Guangzhou
China
Zhanhui Wang
Basic Veterinary Medicine
Department, College of
Veterinary Medicine
China Agriculture University
Beijing
China
Sergei A. Eremin
Department of Chemical
Enzymology, Faculty of
Chemistry
M.V.Lomonosov Moscow State
University
Moscow
Russia
Editorial Office
MDPI
St. Alban-Anlage 66
4052 Basel, Switzerland
This is a reprint of articles from the Special Issue published online in the open access journal
Foods (ISSN 2304-8158) (available at: www.mdpi.com/journal/foods/special issues/antibody
immunoassay food).
For citation purposes, cite each article independently as indicated on the article page online and as
indicated below:
LastName, A.A.; LastName, B.B.; LastName, C.C. Article Title. Journal Name Year, Volume Number,
Page Range.
ISBN 978-3-0365-3632-3 (Hbk)
ISBN 978-3-0365-3631-6 (PDF)
© 2022 by the authors. Articles in this book are Open Access and distributed under the Creative
Commons Attribution (CC BY) license, which allows users to download, copy and build upon
published articles, as long as the author and publisher are properly credited, which ensures maximum
dissemination and a wider impact of our publications.
The book as a whole is distributed by MDPI under the terms and conditions of the Creative Commons
license CC BY-NC-ND.

Contents
About the Editors . . . . . . . . . . . . . . . . . . . . . . . . . . . . . . . . . . . . . . . . . . . . . . vii
Preface to ”Application of Antibody and Immunoassay for Food Safety” . . . . . . . . . . . . . ix
Hongtao Lei, Zhanhui Wang, Sergei A. Eremin and Zhiwei Liu
Application of Antibody and Immunoassay for Food SafetyReprinted from: Foods 2022, 11, 826, doi:10.3390/foods11060826 . . . . . . . . . . . . . . . . . . . 1
Ai-Fen Ou, Zi-Jian Chen, Yi-Feng Zhang, Qi-Yi He, Zhen-Lin Xu and Su-Qing Zhao
Preparation of Anti-Aristolochic Acid I Monoclonal Antibody and Development ofChemiluminescent Immunoassay and Carbon Dot-Based Fluoroimmunoassay for SensitiveDetection of Aristolochic Acid IReprinted from: Foods 2021, 10, 2647, doi:10.3390/foods10112647 . . . . . . . . . . . . . . . . . . . 7
Maksim A. Burkin, Inna A. Galvidis and Sergei A. Eremin
Influence of Endogenous Factors of Food Matrices on Avidin—Biotin Immunoassays for theDetection of Bacitracin and Colistin in FoodReprinted from: Foods 2022, 11, 219, doi:10.3390/foods11020219 . . . . . . . . . . . . . . . . . . . 19
Qidi Zhang, Ming Zou, Wanyu Wang, Jinyan Li and Xiao Liang
Design, Synthesis, and Characterization of Tracers and Development of a FluorescencePolarization Immunoassay for Rapid Screening of 4,4-Dinitrocarbanilide in Chicken MuscleReprinted from: Foods 2021, 10, 1822, doi:10.3390/foods10081822 . . . . . . . . . . . . . . . . . . . 31
Yingying Li, Haihuan Xie, Jin Wang, Xiangmei Li, Zhili Xiao and Zhenlin Xu et al.
Lateral Flow Immunochromatography Assay for Detection of Furosemide in Slimming HealthFoodsReprinted from: Foods 2021, 10, 2041, doi:10.3390/foods10092041 . . . . . . . . . . . . . . . . . . . 45
Yuping Wu, Jia Wang, Yong Zhou, Yonghua Qi, Licai Ma and Xuannian Wang et al.
Quantitative Determination of Nitrofurazone Metabolites in Animal-Derived Foods Based on aBackground Fluorescence Quenching Immunochromatographic AssayReprinted from: Foods 2021, 10, 1668, doi:10.3390/foods10071668 . . . . . . . . . . . . . . . . . . . 57
Bo Chen, Xing Shen, Zhaodong Li, Jin Wang, Xiangmei Li and Zhenlin Xu et al.
Antibody Generation and Rapid Immunochromatography Using Time-Resolved FluorescenceMicrospheres for Propiconazole: Fungicide Abused as Growth Regulator in VegetableReprinted from: Foods 2022, 11, 324, doi:10.3390/foods11030324 . . . . . . . . . . . . . . . . . . . 69
Disha Lu, Xu Wang, Ruijue Su, Yongjian Cheng, Hong Wang and Lin Luo et al.
Preparation of an Immunoaffinity Column Based on Bispecific Monoclonal Antibody forAflatoxin B1 and Ochratoxin A Detection Combined with ic-ELISAReprinted from: Foods 2022, 11, 335, doi:10.3390/foods11030335 . . . . . . . . . . . . . . . . . . . 85
Shibei Shao, Xuping Zhou, Leina Dou, Yuchen Bai, Jiafei Mi and Wenbo Yu et al.
Hapten Synthesis and Monoclonal Antibody Preparation for Simultaneous Detection ofAlbendazole and Its Metabolites in Animal-Origin FoodReprinted from: Foods 2021, 10, 3106, doi:10.3390/foods10123106 . . . . . . . . . . . . . . . . . . . 101
Xiya Zhang, Mingyue Ding, Chensi Zhang, Yexuan Mao, Youyi Wang and Peipei Li et al.
Development of a New Monoclonal Antibody against Brevetoxins in Oyster Samples Based onthe Indirect Competitive Enzyme-Linked Immunosorbent AssayReprinted from: Foods 2021, 10, 2398, doi:10.3390/foods10102398 . . . . . . . . . . . . . . . . . . . 115
v

Fangyu Wang, Ning Li, Yunshang Zhang, Xuefeng Sun, Man Hu and Yali Zhao et al.
Preparation and Directed Evolution of Anti-Ciprofloxacin ScFv for Immunoassay inAnimal-Derived FoodReprinted from: Foods 2021, 10, 1933, doi:10.3390/foods10081933 . . . . . . . . . . . . . . . . . . . 127
vi
About the Editors
Hongtao Lei
Hongtao Lei is a full professor of South China Agricultural University (SCAU), Guangzhou,
China. He obtained his bachelor degree in food science and engineering from Northwest Agriculture
and Forestry University in 1997. Following this, he did a master research in food chemistry from
September 1997 to June 2000 in SCAU, and then joined the College of Food Science, SCAU, as an
assistant lecturer. From September 2003 to June 2006, he did PhD research in food safety in SCAU.
From February 2009 to February 2010, he carried out one year of postdoctoral research at the Institute
of Global Food Security, Queen’s University of Belfast, U.K.. He was appointed as a professor in food
science in December 2012, and as dean since June 2015. His research interest focuses on food quality
and safety, molecular recognition, food authenticity, etc. He has coordinated more than 25 scientific
research projects supported by national or local grant, and compiled 10 professional standards for
product quality or analytical methods. He has published more than 100 peer reviewed articles in
international journals in the food science area, such as Comprehensive Reviews in Food Science
and Food Safety, Food Chemistry, Analytic Chemistry, Journal of Hazardous Materials, Biosensors
and Bioelectronics, etc. His achievements were widely used in the field of rapid detection and
were authorized more than 66 national invention patents. He has won six national and provincial
awards due to his academic and teaching achievements. He is an associate editor of Chemical and
Biological Technologies in Agriculture, editorial member of 10 journals such as Food and Agricultural
Immunology, Chinese Food Science, etc. He is also the deputy director of National Teaching Steering
Committee for Higher Education of Food Science and Engineering, Ministry of Education, deputy
Chairman of the Agricultural Products Processing and Storage Engineering Committee, Chinese
Society of Agricultural Engineering, etc.
Zhanhui Wang
Zhanhui Wang is a full professor of Veterinary Medicine at the China Agricultural University
(Be, China). He completed his D.Phil. at the college of Veterinary Medicine. His interests focus on
the following areas: the preparation and in vitro evolution of antibodies for small molecule such as
veterinary drugs, mycotoxins and illegal additives; the development of antibody-based analytical
techniques; and the antigen-antibody recognition mechanism. He has hosted or participated many
multiple scientific research projects. He is the author of more than 120 publications in leading journals
such as Anal Chem, Biosens Bioelectron, ACS Appl Mater Inter. He also developed more than 20
kinds of widely used rapid detection products and was authorized more than 50 national invention
patents. He is a member of the editorial board of J Agric Food Chem, Food Agric Immunol, Sensors
and Biomolecules. In addition, he served in several organizations including the director of BeKey
Laboratory of Animal Derived Food Safety Detection Technology, deputy general secretary of Food
Quality and Safety Testing Instruments and Technology Application branch of China Instrumentation
Society, executive director of Veterinary Pharmacology and Toxicology branch of China Animal
Husbandry and Veterinary Society.
Sergei A. Eremin
Prof. Sergei A. Eremin is head of Immunoassay group and leading researcher of the Department
of Chemical Enzymology, Faculty of Chemistry, M.V.Lomonosov Moscow State University. He was
educated in 1976 and obtained PhD in Organic Chemistry in 1982 and DSc degree in Biotechnology
vii

in 2005 from M.V.Lomonosov Moscow State University, Russia. His scientific interests lie in the
field of immunoanalytical techniques for food safety and environmental control. He prepared
immunoreagents and developed a fluorescence polarization immunoassay (FPIA) for detection of
pesticides, mycotoxins, veterinary drugs, endocrine disruptors and other small molecule organic
compounds. He is author of 279 papers in peer-reviewed journals and participated in several
international projects covering different aspects of food safety and food-related risks. h-index = 34.
viii

Preface to ”Application of Antibody and
Immunoassay for Food Safety”
Immunoassays are a class of analytical techniques wherein the reaction is based on highly
specific molecular recognition between antibodies and antigens. Immunoassay has played a
prominent role in the rapid detection of various analytes in food, including pesticides, veterinary
drugs, heavy metals, hormones, allergens, food adulterants, natural components, biomarkers in food
materials, etc.
A wide range of immunoassays have emerged endlessly, ranging from conventional
enzyme-linked immunosorbent assays (ELISA) and point-of-care tests typically represented by
lateral flow immunochromatography assay (LFIA) to biosensors with various principles, full
integration of lab-on-a-chip platforms, microfluidics, sensibilization employing novel nanomaterials,
miniaturization and interfacing of portable devices, especially emerging smart system technologies
equipped with intelligent smart phones, etc. New technologies are promoting the development of
immunoassays and their application in food safety.
Immunoreagents for food analysis are continuously developing during the last three decades,
with hapten design leading to the possibility of using antibodies against non-common low molecular
weight antigens and quantitative structure–activity relationship investigations, and structure biology
approaches assisting toward a better understanding of the molecular recognition of epitope and
antibody. In addition, novel antibodies such as various recombinant or fragment antibodies have
contributed to the identification of various novel characteristics of antibodies in food safety.
We organized 11 articles to demonstrate the recent progress and broadening the novel
knowledge about antibodies and immunoassays for the detection of chemical and biological analytes
in food, and all of the 11 articles have already been published online in the Special Issue of {Foods},
“Application of Antibody and Immunoassay for Food Safety”. Herein, we reprint this Special Issue
as a book, to help readers to comprehensively and easily understand the current state concerning
antibodies and immunoassays for food safty.
The book addressed several critical issues in application of antibodies and immunoassays for
food safety. (1) Methodologies for the enhancement of sensitivity, rapidity, and reliability; (2)
eliminating food matrix effect; (3) exploiting high-quality antibodies and new specific recognition
elements, such as bispecific monoclonal antibody, broad-specific antibodies, and single chain
antibody fragment (scFv) mutants; (4) preparing stable and strong signal labels to improve the
accuracy and sensitivity of immunoassays; (5) multiple detection abilities as inevitable trends in the
immunoassay development, etc.
Finally, we thank all the contributors for this book publishing, including all authors, academic
and managing editors from the publisher MPDI.
Hongtao Lei, Zhanhui Wang, and Sergei A. Eremin
Editors
ix


Citation: Lei, H.; Wang, Z.; Eremin,
S.A.; Liu, Z. Application of Antibody
and Immunoassay for Food Safety.
Foods 2022, 11, 826. https://doi.org/
10.3390/foods11060826
Received: 28 February 2022
Accepted: 7 March 2022
Published: 14 March 2022
Publisher’s Note: MDPI stays neutral
with regard to jurisdictional claims in
published maps and institutional affil-
iations.
Copyright: © 2022 by the authors.
Licensee MDPI, Basel, Switzerland.
This article is an open access article
distributed under the terms and
conditions of the Creative Commons
Attribution (CC BY) license (https://
creativecommons.org/licenses/by/
4.0/).
foods
Editorial
Application of Antibody and Immunoassay for Food Safety
Hongtao Lei 1,* , Zhanhui Wang 2,3 , Sergei A. Eremin 4 and Zhiwei Liu 1
1 Guangdong Province Key Laboratory of Food Quality and Safety/National-Local Joint Engineering ResearchCenter for Machining and Safety of Livestock and Poultry Products, College of Food Science,South China Agricultural University, Guangzhou 510642, China; [email protected]
2 Beijing Advanced Innovation Center for Food Nutrition and Human Health, College of Veterinary Medicine,China Agricultural University, Beijing 100193, China; [email protected]
3 Beijing Key Laboratory of Detection Technology for Animal-Derived Food Safety,Beijing Laboratory for Food Quality and Safety, Beijing 100193, China
4 Department of Chemical Enzymology, Faculty of Chemistry, M.V. Lomonosov Moscow State University,119991 Moscow, Russia; [email protected]
* Correspondence: [email protected]
This Special Issue of Foods, Application of Antibody and Immunoassay for FoodSafety, contains ten papers that were refereed and selected in accordance with the usualeditorial standards of the journal.
The aim of this Special Issue is to advance the current state of knowledge concerningantibodies and immunoassays for the detection of chemical and biological analytes such asfood contaminants, food fraud, and so on, in the field of food safety.
Food safety is of critical societal importance for producers, food agencies, regula-tory bodies and consumers. Therefore, there is a need to develop fast, sensitive, reliable,cost-effective, and easy-to-use analytical techniques for the protection of food safety andquality. Currently, instrumental analysis methods are commonly used for food safetypurposes, such as high-performance liquid chromatography (HPLC), high-performanceliquid chromatography–tandem mass spectrometry (HPLC-MS/MS), etc. Although theaforementioned assays are validated, sensitive, and reliable, they are unsuitable for ap-plication in rapid screening and field detection owing to the requirements of expensiveapparatus, time-consuming operation, and highly skilled personnel. Immunoassays, a classof analytical techniques based on the specific recognition between antibody and antigen, arepreferable to overcome these obstacles because of their high sensitivity, specificity, rapidityand cost-effectiveness, which allow them to play a prominent role in the rapid detection ofvarious analytes in food safety [1].
To pursue higher sensitivity, advances have been made to improve the analyticalsensitivity of immunoassays. In particular, chemiluminescent immunoassay (CLEIA) andfluoroimmunoassay (FIA) are two commonly proposed methods to meet the needs of strictscreening. Ou et al. [2] prepared a monoclonal antibody against aristolochic acid I (AA-I)and applied it in CLEIA and FIA for the highly sensitive determination of aristolochic acidI (AA-I) in foods (slimming capsule, slimming tea, and pleurotus ostreatus). The proposedCLEIA showed higher sensitivity compared with conventional ELISA. On the other hand,a novel fluorescent probe, carbon dots, was synthesized and employed in FIA, whichexhibited a five-fold greater enhancement in sensitivity than CLEIA. Moreover, the accuracyand practicability of CLEIA and FIA were verified by the standard instrument method,indicating that both were sensitive, rapid, and easy to use, making them effective tools forscreening AA-I in related products. Additionally, there are also various emergent strategiesthat address the poor sensitivity of immunoassays, including novel signal labels (i.e.,nanozymes and magnetic-loaded nanoparticles), unique antibody with unique nature, andheterologous strategies adjusting the binding capability of the competitive antigen, as wellas in combination with innovative detection platform (i.e., microfluidic detection platform,smart detection systems, and a detection platform combined with molecular biology).
1

Foods 2022, 11, 826
Despite enormous sensitivity-enhanced strategies for immunoassays, the unwantedinterference from food matrix is still a major factor affecting assay sensitivity due to thecomplexity and variability of matrix compounds in food samples, which might greatlyaffect the immunological reaction. Assessing the matrix interference on the assay sensitivityis thus an important issue in the development of methods. Burkin et al. [3] firstly evaluatedthe influence of avidin (AVI) and biotin (B7) contained in food matrices on two kinds of(Strept)avidin–biotin-based enzyme-linked immunosorbent assays (ELISAs) for bacitracin(BT) and colistin (COL) determination, with simultaneous assessment of extraneous AVI/B7and AVI/B7 from different matrices (egg, infant milk formulas enriched with B7, andchicken and beef liver). Summarizing the experience of the present study, it is recommendedto avoid immunoassays based on avidin–biotin interactions when analyzing samplescontaining these endogenous factors or enriched with B7.
Immunoassays, especially for ELISA, are generally heterogeneous, and involve re-peated washing and a certain degree of reaction time. In contrast, fluorescence polarizationimmunoassay (FPIA) is a homogeneous assay format without separation or washing, giv-ing the advantages of rapidity, reliability, and ease of use. It is based on the competitionbetween an analyte and a fluorescein-labeled tracer for binding antibody. Zhang et al. [4]established an FPIA for 4,4′-dinitrocarbanilide (DNC) in chicken samples, with favorablesensitivity, specificity, cost, time, and reliability. The sensitivity of the developed FPIAwas significantly improved by optimizing the selection of 25 tracers, tracer–antibody pairs,and physical and chemical reaction conditions. Furthermore, the reliability and robustnessof the assay were successfully demonstrated for the analysis of DNC in chicken musclematrices. The total analysis time, including sample pretreatment, was less than 40 min,which has not yet been achieved in other immunoassays for DNC. Up to now, many FPIAfor other analytes such as mycotoxins, pesticides, antibiotics, and so on, have been testedand compared favorably with instrumental reference methods.
Compared with the ELISA-based and FPIA assays mentioned above, another im-munoassay, namely lateral flow immunochromatography assay (LFIA), has gained increas-ing popularity because of its simple operation, rapidity, sensitivity, and cost-effectiveness.Li et al. [5] focus on the development of a rapid, convenient and sensitive LFIA based on tra-ditional Au nanoparticles (AuNPs) for furosemide in slimming health foods, and the resultscould be read by the naked eye within 12 min (including sample pretreatment). The qualita-tive limit of detection (LOD) of the AuNPs-LFIA was 1.0–1.2 µg/g in slimming health foods.The developed method showed high consistency with liquid chromatography–tandemmass spectrometry (LC-MS/MS), and no false positive or false negative results were foundin spiked slimming health foods. However, AuNPs-LFIA is known to have limited sensitiv-ity because of AuNPs’ narrow particle size range and poor colloid stability. Wu et al. [6]described a background fluorescence-quenching immunochromatographic assay (bFQICA)in which AuNPs were used to quench the fluorescence of a background fluorescence base-board instead of using the colorimetric method. Such a method was optimized, validated,and applied in the rapid on-site detection of nitrofurazone metabolite of semicarbazide(SEM) residues in animal-derived foods (egg, chicken, fish, and shrimp). Indeed, comparedwith the traditional AuNP-LFIA method, the detectability of the bFQICA method washigher, and the detection time was shortened compared with heterogeneous reactions suchas ELISA. In addition, the quantitative results of SEM can be directly displayed by using aportable fluorescence immunoquantitative analyzer and a QR code with a built-in standardcurve, which is efficient and convenient. Additionally, the signal label is a vital factor in theperformance of LFIA. Novel nanoparticle labels have been introduced to obtain satisfactorysensitivity. Chen et al. [7] designed a chiral carbon containing a structure similar to that ofpropiconazole, and a polyclonal antibody that specifically recognizes propiconazole was ob-tained for the first time. Based on this antibody, a time-resolved fluorescence microsphereslateral flow immunochromatographic assay (TRFMs-LFIA) was developed, optimized,and evaluated for its sensitivity, specificity, and recovery. The analysis of blind real-lifesamples (brassica campestris, lettuce, and romaine lettuce) showed a good agreement with
2

Foods 2022, 11, 826
results obtained using HPLC-MS/MS. Of course, there are many other nanoparticle labelshave been synthesized for the enhancement of LFIA performance. Despite these advances,some still need to be improved in order to enhance their high-throughput capacity in asingle assay, and to move toward miniaturization involves the use of mobile devices suchas smartphones.
Some scholars have also focused on preparing specific recognition molecules withunique performance, such as broad specificity, low molecule weight or small size (single-chain variable fragment (ScFv)), disulfide-stabilized antibodies, antigen-binding fragment(Fab), nanobodies, bispecific monoclonal antibodies (BsMAbs), aptamers, molecularlyimprinted polymers, etc. In recent years, BsAbs, broad-spectrum antibodies, and ScFv havebeen increasingly favored by researchers in the field of immunoassays.
Compared with a single-specific antibody which can only recognize one antigenin a complex food matrix, a bispecific monoclonal antibody (BsMAb) with two distinctantigen-binding sites could recognize two different target analyses, which is more efficient,convenient, and economical. Lu et al. [8] successfully prepared BsMAb against aflatoxinB1 (AFB1) and ochratoxin A (OTA), and developed a novel and efficient immunoaffinitycolumn (IAC) based on BsMAb for the rapid and effective extraction of AFB1 and OTA witha one-time extraction from corn and wheat samples. Then, the ELISA for AFB1 and OTAwere applied, combined with IAC, with a satisfactory matrix effect elimination effect andrecovery rate. The development of BsMAb has opened a whole new field in multi-analytedetection. Future advances will include, but not be limited to, exploiting new methodsbased on BsMAb, and novel techniques of antibody development that will allow for two ormore targets, as well as cheaper and faster analysis methods.
An immunoassay based on a broadly specific antibody is an emerging trend in the sen-sitive and simple detection of a group of similar compounds in a single assay. Shao et al. [9]designed and synthesized an unreported hapten, 5-(propylthio)-1H-benzo[d]imidazol-2-amine, which maximally exposed the characteristic sulfanyl group of albendazole (ABZ)to the animal immune system to induce the expected antibody. One mAb that can simul-taneously detect the sum of ABZs (ABZ and its metabolites, i.e., ABZSO2, ABZSO, andABZNH2SO2) was obtained. The results of computational chemistry methods revealed thatthe hydrophobicity and conformation of a characteristic group of molecules might be thekey factors that together influence the antibody recognition of these analytes. Furthermore,the practicability of the developed ELISA was verified by detecting ABZs in spiked milk,beef, and liver samples with recoveries. Zhang et al. [10] explored and developed novelhaptens using molecular modeling to prepare broad-spectrum mAbs against brevetoxin2 (PbTx-2), 1 (PbTx-1), and 3 (PbTx-3), followed by an ELISA method to detect brevetoxinsin oyster samples was developed. In particular, the differences between the haptens ofPbTx-2-CMO and PbTx-2-HS were evaluated using molecule alignment and electrostatic po-tential analysis. The results highlight that the spacer HS arm of PbTx-2-HS formed a specificspatial conformation with the parent nucleus structure, non-conducive to the productionof high-affinity antibodies against the target, while PbTx-2-CMO was the ideal hapten tobe used for antibody production due to its similar structure to the target, which was alsofurther verified by antibody production and characterization. Besides ideal specificity andrecovery rate, the sensitivity of the proposed ELISA based on such a mAb was higher thanthat of the high-resolution LC-MS, providing a useful method for monitoring PbTxs inoyster samples. The two studies above revealed that hapten design is an important featurewhen preparing antibodies against multiple target compounds. Importantly, molecularmodeling and theoretical tools may assist immunochemists to find the most appropriatehapten chemical structure for broad-spectrum antibody production.
Single-chain variable fragments (scFv), as one of the most common formats of re-combinant antibody, possess only one chain of the complete antibody while maintainingantigen-specific binding abilities, and can be expressed in a prokaryotic system. More-over, it can be easily engineered with enhanced affinity and selectivity. Wang et al. [11]constructed an immunized mouse phage display single-chain variable fragment (scFv)
3

Foods 2022, 11, 826
library for the screening of recombinant anti-ciprofloxacin single-chain antibody for thedetection of ciprofloxacin (CIP) in animal-derived food. The highest positive scFv-22 wasexpressed in E. coli BL21. Specifically, its recognition mechanisms were studied using themolecular docking method, and directional mutagenesis was performed for sensitivityimprovement. The results of the established icELISA demonstrate that the ScFv mutantshowed 16.6-fold improved sensitivity compared with parental scFv. Although scFvs havealready found widespread use in clinical therapy and imaging procedures in the pastdecades, the use of such antibody fragments can provide clear benefits in terms of assayperformance and relatively easy preparation in comparison to monoclonal and polyclonalantibodies, which will most probably lead to the increased use of recombinant antibodiesin analytical applications in the near future.
To conclude, the present Special Issue addresses several critical issues, ranging frommethodologies for performance enhancement (sensitivity, rapidity, and reliability), theassessment of food matrixes, and the development of specific recognition elements (BsMAb,broad-spectrum antibodies, and ScFv mutants). To satisfy higher detection requirements,the development of ultrasensitive and accurate immunoassays with multiple detectionabilities is a growing trend. Exploiting high-quality antibodies and new specific recog-nition elements is particularly important to assay performance. Additionally, preparingstable and strong signal labels is necessary for improving the accuracy and sensitivity ofimmunoassays. Moreover, multiplex testing technologies are also inevitable trends in thedevelopment of immunoassays.
Finally, we thank the authors for their valuable contributions to this Special Issue.
Author Contributions: Conceptualization, H.L., Z.W., S.A.E.; Investigation, analysis and revision,Z.W., S.A.E.; Writing—original draft, Z.L., H.L. Resource, H.L. All authors have read and agreed tothe published version of the manuscript.
Funding: This work was financially supported by the National Key Research and DevelopmentProgram of Thirteenth Five-Year Plan (No. 2017YFC1601700), the National Scientific Foundation ofChina (31871883, U1301214), HeYuan Planned Program in Science and Technology (210115091474673),Generic Technique Innovation Team Construction of Modern Agriculture of Guangdong Province(2021KJ130), Lingnan Modern Agricultural Science and Technology experiment project of GuangdongProvinc (LNSYSZX001).
Conflicts of Interest: The authors declare no conflict of interest.
References
1. Zhang, H.; Li, B.; Liu, Y.; Chuan, H.; Liu, Y.; Xie, P. Immunoassay technology: Research progress in microcystin-LR detection inwater samples. J. Hazard. Mater. 2022, 424, 127406. [CrossRef] [PubMed]
2. Ou, A.-F.; Chen, Z.-J.; Zhang, Y.-F.; He, Q.-Y.; Xu, Z.-L.; Zhao, S.-Q. Preparation of Anti-Aristolochic Acid I Monoclonal Antibodyand Development of Chemiluminescent Immunoassay and Carbon Dot-Based Fluoroimmunoassay for Sensitive Detection ofAristolochic Acid I. Foods 2021, 10, 2647. [CrossRef] [PubMed]
3. Burkin, M.A.; Galvidis, I.A.; Eremin, S.A. Influence of Endogenous Factors of Food Matrices on Avidin–Biotin Immunoassays forthe Detection of Bacitracin and Colistin in Food. Foods 2022, 11, 219. [CrossRef] [PubMed]
4. Zhang, Q.; Zou, M.; Wang, W.; Li, J.; Liang, X. Design, Synthesis, and Characterization of Tracers and Development of aFluorescence Polarization Immunoassay for Rapid Screening of 4, 4′-Dinitrocarbanilide in Chicken Muscle. Foods 2021, 10, 1822.[CrossRef] [PubMed]
5. Li, Y.Y.; Xie, H.H.; Wang, J.; Li, X.M.; Xiao, Z.L.; Xu, Z.L.; Lei, H.T.; Shen, X. Lateral Flow Immunochromatography Assay forDetection of Furosemide in Slimming Health Foods. Foods 2021, 10, 2041. [CrossRef] [PubMed]
6. Wu, Y.P.; Wang, J.; Zhou, Y.; Qi, Y.H.; Ma, L.C.; Wang, X.N.A.; Tao, X.Q. Quantitative Determination of Nitrofurazone Metabolitesin Animal-Derived Foods Based on a Background Fluorescence Quenching Immunochromatographic Assay. Foods 2021, 10, 1668.[CrossRef] [PubMed]
7. Chen, B.; Shen, X.; Li, Z.; Wang, J.; Li, X.; Xu, Z.; Shen, Y.; Lei, Y.; Huang, X.; Wang, X. Antibody Generation and RapidImmunochromatography Using Time-Resolved Fluorescence Microspheres for Propiconazole: Fungicide Abused as GrowthRegulator in Vegetable. Foods 2022, 11, 324. [CrossRef] [PubMed]
8. Lu, D.; Wang, X.; Su, R.; Cheng, Y.; Wang, H.; Luo, L.; Xiao, Z. Preparation of an Immunoaffinity Column Based on BispecificMonoclonal Antibody for Aflatoxin B1 and Ochratoxin A Detection Combined with ic-ELISA. Foods 2022, 11, 335. [CrossRef][PubMed]
4

Foods 2022, 11, 826
9. Shao, S.; Zhou, X.; Dou, L.; Bai, Y.; Mi, J.; Yu, W.; Zhang, S.; Wang, Z.; Wen, K. Hapten Synthesis and Monoclonal AntibodyPreparation for Simultaneous Detection of Albendazole and Its Metabolites in Animal-Origin Food. Foods 2021, 10, 3106.[CrossRef] [PubMed]
10. Zhang, X.; Ding, M.; Zhang, C.; Mao, Y.; Wang, Y.; Li, P.; Jiang, H.; Wang, Z.; Yu, X. Development of a New Monoclonal Antibodyagainst Brevetoxins in Oyster Samples Based on the Indirect Competitive Enzyme-Linked Immunosorbent Assay. Foods 2021, 10, 2398.[CrossRef] [PubMed]
11. Wang, F.; Li, N.; Zhang, Y.; Sun, X.; Hu, M.; Zhao, Y.; Fan, J. Preparation and Directed Evolution of Anti-Ciprofloxacin ScFv forImmunoassay in Animal-Derived Food. Foods 2021, 10, 1933. [CrossRef] [PubMed]
5

foods
Communication
Preparation of Anti-Aristolochic Acid I Monoclonal Antibodyand Development of Chemiluminescent Immunoassay andCarbon Dot-Based Fluoroimmunoassay for Sensitive Detectionof Aristolochic Acid I
Ai-Fen Ou 1,2, Zi-Jian Chen 3 , Yi-Feng Zhang 3, Qi-Yi He 1, Zhen-Lin Xu 3 and Su-Qing Zhao 1,*
Citation: Ou, A.-F.; Chen, Z.-J.;
Zhang, Y.-F.; He, Q.-Y.; Xu, Z.-L.;
Zhao, S.-Q. Preparation of
Anti-Aristolochic Acid I Monoclonal
Antibody and Development of
Chemiluminescent Immunoassay and
Carbon Dot-Based
Fluoroimmunoassay for Sensitive
Detection of Aristolochic Acid I. Foods
2021, 10, 2647. https://doi.org/
10.3390/foods10112647
Academic Editor: Thierry Noguer
Received: 27 September 2021
Accepted: 28 October 2021
Published: 1 November 2021
Publisher’s Note: MDPI stays neutral
with regard to jurisdictional claims in
published maps and institutional affil-
iations.
Copyright: © 2021 by the authors.
Licensee MDPI, Basel, Switzerland.
This article is an open access article
distributed under the terms and
conditions of the Creative Commons
Attribution (CC BY) license (https://
creativecommons.org/licenses/by/
4.0/).
1 Department of Pharmaceutical Engineering, School of Biomedical and Pharmaceutical Sciences,Guangdong University of Technology, Guangzhou 510006, China; [email protected] (A.-F.O.);[email protected] (Q.-Y.H.)
2 Department of Food, Guangzhou City Polytechnic, Guangzhou 510006, China3 Guangdong Provincial Key Laboratory of Food Quality and Safety/Guangdong Laboratory of Lingnan
Modern Agriculture, South China Agricultural University, Guangzhou 510642, China;[email protected] (Z.-J.C.); [email protected] (Y.-F.Z.); [email protected] (Z.-L.X.)
* Correspondence: [email protected]
Abstract: Aristolochic acid (AA) toxicity has been shown in humans regarding carcinogenesis,nephrotoxicity, and mutagenicity. Monitoring the AA content in drug homologous and healthyfoods is necessary for the health of humans. In this study, a monoclonal antibody (mAb) with highsensitivity for aristolochic acid I (AA-I) was prepared. Based on the obtained mAb, a chemilumi-nescent immunoassay (CLEIA) against AA-I was developed, which showed the 50% decrease inthe RLUmax (IC50) value of 1.8 ng/mL and the limit of detection (LOD) of 0.4 ng/mL. Carbon dotswith red emission at 620 nm, namely rCDs, were synthesized and employed in conventional indirectcompetitive enzyme-linked immunosorbent assay (icELISA) to improve the assay sensitivity of afluoroimmunoassay (FIA). Oxidized 3,3′ ′,5,5′ ′-tetramethylbenzidine dihydrochloride (oxTMB) canquench the emission of the rCDs through the inner-filter effect; therefore, the fluorescence intensityof rCDs can be regulated by the concentration of mAb. As a result, the assay sensitivity of FIA wasimproved by five-fold compared to CLEIA. A good relationship between the results of the proposedassays and the standard ultra-high performance liquid chromatography-triple quadrupole massspectrometer (UPLC-QQQ-MS/MS) of real samples indicated good accuracy and practicability ofCLEIA and FIA.
Keywords: aristolochic acid I; monoclonal antibody; computer-assisted simulation; chemilumines-cent immunoassay; fluoroimmunoassay
1. Introduction
Aristolochic acids (AAs) are a mixture of structurally related nitrophenanthrenecarboxylic acids, mainly consisting of aristolochic acid I (AA-I) and aristolochic acid II(AA-II), which exist in Aristolochia spp. [1,2], a kind of Chinese herb. Moreover, theseherbs can be used as raw materials of some drug homologous and healthy foods, andeven dietary supplements [3–5]. However, it has been reported that AA showed toxicity tohumans owing to carcinogenesis [2,6–8], nephrotoxicity [9–11], and mutagenicity [9,12].Some cases reported that the intake of slimming products containing AA resulted innephropathy [13,14]. Many countries have prohibited products containing AAs. Therefore,it is necessary to develop effective methods for detecting and monitoring AA in relatedfood products.
For the analysis of AA, the main detection method is the conventional instrumen-tal method, high performance liquid chromatography (HPLC) [15–17], due to the high
7
Foods 2021, 10, 2647
accuracy and high reproducibility. Nevertheless, it is a challenge that the instrumentalmethod is limited by high cost, the need for professional operators, and a long turnaroundtime. Therefore, immunoassay was proposed in this study because of the advantages ofrapidness, high-throughput, sensitivity, low-cost, simple pretreatment requirement. It iseasy-to-use and has been widely applied in fields of food analysis [18–24].
The most common and mature detection technology for the immunoassay of AAs isconventional indirect competitive enzyme-linked immunosorbent assay (icELISA); how-ever, the sensitivity of icELISA cannot meet the needs of strict screening. In this study, achemiluminescent immunoassay (CLEIA) was developed concerning its higher sensitivitycompared with conventional icELISAs [25,26]. On the other hand, a fluoroimmunoas-say (FIA) is a potential methodology through its advantages, including high sensitivity,real-time, fast response, and low cost to improve the method sensitivity [27]. As a novelfluorescent probe, the carbon dots (CDs) exhibit superiority of remarkable fluorescent prop-erties, simple preparation, good biocompatibility, and easy functionalization [28], whichcan be employed for FIA. For FIA development, most previous publications reported aphosphate-triggered method to recover the fluorescence of CDs [29–31]. Nevertheless,alkaline phosphatase (ALP) activity requires more than 30 min for the catalyst, which is notsatisfactory. For overcoming this time-consuming step, we employed horseradish peroxi-dase (HRP) and developed red CDs (rCDs)-based FIA. Compared with ALP, the activity ofHRP is higher and its catalysate-oxidized 3,3′ ′,5,5′ ′-tetramethylbenzidine dihydrochloride(oxTMB) can quench rCDs. Based on the above principle, we developed HRP and rCDsbased on FIA for AAs analysis.
2. Materials and Methods
2.1. Reagents and Animals
Standards of AA-I, AA-II, AA-III, AA-IV, and its analogs were purchased from YuanyeCo. Ltd. (Shanghai, China). Citric acid, urea, N,N-dimethylformamide (DMF), 1-(3-dimethylaminopropyl)-3-ethylcarbodiimide hydrochloride (EDC), N-hydroxysuccinimide(NHS) were supplied by Heowns Chemical Technology Co., Ltd. (Tianjin, China). The oval-bumin (OVA), keyhole limpet haemocyanin (KLH), and bovine serum albumin (BSA) weresupplied by Sigma (Shanghai, China). The incomplete and complete Freund’s adjuvantswere purchased from Merck Co. Ltd. (Shanghai, China). The TMB and chemiluminescentsubstrate solution were obtained from Yuanye Co. Ltd. (Shanghai, China). Protein G resinand a secondary antibody (goat anti-mouse IgG, HRP conjugated) were obtained fromTransGen Biotech Co. Ltd. (Beijing, China).
Bal b/c female mice were purchased from the Guangdong Medical ExperimentalAnimal Centre and raised at the Animal Experiment Centre of South China AgricultureUniversity (Animal Experiment Ethical Approval Number: 2019054, Figure S1).
2.2. Instruments
Multiskan FC microplate reader (Thermo Fisher, Shanghai, China) was used to mea-sure absorbance values. The fluorescence was measured at emission (Em) wavelengths of620 nm with excitation (Ex) wavelength of 540 nm using a SpectraMax i3 microplate reader(Molecular Devices, USA). A NanoDrop2000c spectrophotometer (Thermo Fisher, Shanghai,China) was used for concentration measurement and UV spectrum characterization.
2.3. Production of Monoclonal Antibody
Since AA-I is the main compound of AAs, it was directly conjugated to a carrier proteinto prepare immunogen and coating antigen. The conjugation procedure was referred to inour previous study [32], and the details are summarized in Supporting Information. Theartificial antigens were characterized by ultraviolet visible (UV-vis) spectral. The molarratio between hapten and carrier protein was obtained by MALDI-TOF-MS.
8

Foods 2021, 10, 2647
The produced artificial antigens were used for animal immunization described in ourprevious study [32]. The production of mAb was followed by our previous publication [33].The obtained mAb was purified by protein G and stored at −20 ◦C.
2.4. Development of Chemiluminescent Immunoassay
A serial concentration of AA-I (50 µL) and 50 µL of mAb solution was added to eachwell for 40 min incubation at 37 ◦C. Afterward, HRP-conjugated secondary antibody wasadded (100 µL/well) after five times washing with PBST (PBS with 0.5 ‰ Tween-20) for30 min incubation at 37 ◦C. Then the chemiluminescent substrate solution was added(100 µL/well), and the RLU value was measured after a 1 min reaction. The calibra-tion curve was fitted by sigmoidal fitting using the percent binding of mAb in the wells(RLU/RLU0) against the logarithm of the AA-I concentration. The 50% decrease in theRLUmax (IC50) value was calculated using Origin 8.5. The optimal conditions were con-firmed from the IC50 value, including the optimal pH, coating antigen/antibody, phosphate,and Tween-20 concentration.
2.5. Development of Fluoroimmunoassay
The synthesis of rCDs is summarized in Supporting Information for the developmentof FIA. It was the same as CLEIA except using TMB as substrate and polystyrene trans-parent microplate. After oxTMB generation, the solution of each well was mixed with50 µL of NaOH (1 mM, pH 11) to adjust the pH. Then, rCDs (50 µL) were added and mixedquickly. One hundred microliters of the mixture were transferred to black polystyreneopaque microplate, and the fluorescence signal was measured with Ex 540 nm and Em620 nm.
2.6. Recovery Test
Samples (drug homologous and foods) were obtained from a supermarket in Guangzhoucity. Samples (600, 300, and 150 ng/g) were ground into a powder using a stainless-steel grinder. The AA-I was added to samples (5.0 g) and mixed with methanol (5 mL)for 30 min ultrasonic water bath treatment. Afterward, the mixture was centrifuged at4000 rpm (2057× g) for 10 min. The extraction solution was dried by nitrogen flow andredissolved in an equivalent volume of 0.01 M pH 5.4 PBS (PB with 75 mM NaCl) andemployed for CLEIA and FIA. For UPLC-QQQ-MS/MS, the redissolved solutions werefiltered by 0.22 µm cellulose membrane before analysis. The details of UPLC-QQQ-MS/MSare summarized in Table S1.
3. Results
3.1. Characterization of Antisera
In this study, AA-I was conjugated to a carrier protein directly. The ultraviolet scanningshowed that the synthesized artificial antigens exhibited the characteristic absorption peakof AA-I and carrier proteins, suggesting the successful preparation of artificial antigens(Figure S2). The prepared immunogen and coating antigen were further utilized to prepareanti-AA-I mAb. The strategy is shown in Figure 1. The mouse antisera characterization issummarized in Table 1. The highest titer and sensitivity were observed for mouse 4 usingAA-I-KLH, which was chosen for the production of mAb. After subclone and hybridomascreening, the most sensitive cell lines 3A3 were obtained and used for ascites preparation(Table S2). Finally, the mAb was obtained after ascites purification and was stored at−20 ◦C after concentration measurement by Nanodrop.
9
Foods 2021, 10, 2647
‐ ‐ ‐ ‐ ‐ ‐
‐
‐
‐ ‐ ‐ ‐ ‐ ‐ ‐ ‐ ‐ ‐ ‐ ‐ ‐ ‐ ‐ ‐ ‐ ‐ ‐ ‐ ‐ ‐ ‐ ‐
μ
‐
μ
‐
‐
and ‐ ‐
‐ ‐
‐ ‐
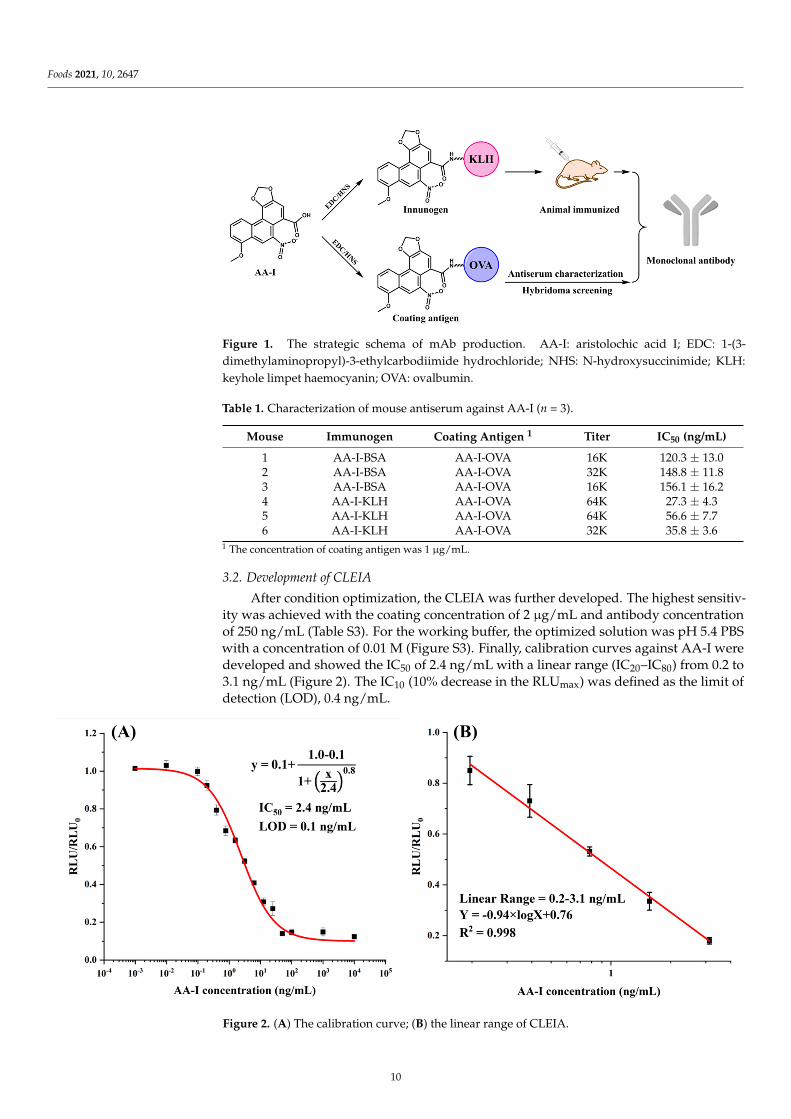
Figure 1. The strategic schema of mAb production. AA-I: aristolochic acid I; EDC: 1-(3-dimethylaminopropyl)-3-ethylcarbodiimide hydrochloride; NHS: N-hydroxysuccinimide; KLH:keyhole limpet haemocyanin; OVA: ovalbumin.
Table 1. Characterization of mouse antiserum against AA-I (n = 3).
Mouse Immunogen Coating Antigen 1 Titer IC50 (ng/mL)
1 AA-I-BSA AA-I-OVA 16K 120.3 ± 13.02 AA-I-BSA AA-I-OVA 32K 148.8 ± 11.83 AA-I-BSA AA-I-OVA 16K 156.1 ± 16.24 AA-I-KLH AA-I-OVA 64K 27.3 ± 4.35 AA-I-KLH AA-I-OVA 64K 56.6 ± 7.76 AA-I-KLH AA-I-OVA 32K 35.8 ± 3.6
1 The concentration of coating antigen was 1 µg/mL.
3.2. Development of CLEIA
After condition optimization, the CLEIA was further developed. The highest sensitiv-ity was achieved with the coating concentration of 2 µg/mL and antibody concentrationof 250 ng/mL (Table S3). For the working buffer, the optimized solution was pH 5.4 PBSwith a concentration of 0.01 M (Figure S3). Finally, calibration curves against AA-I weredeveloped and showed the IC50 of 2.4 ng/mL with a linear range (IC20–IC80) from 0.2 to3.1 ng/mL (Figure 2). The IC10 (10% decrease in the RLUmax) was defined as the limit ofdetection (LOD), 0.4 ng/mL.
‐ ‐
‐
‐
‐
‐
‐
N+
O
O-
O
O
OH
O
O
HO
Figure 2. (A) The calibration curve; (B) the linear range of CLEIA.
10

Foods 2021, 10, 2647
Based on the developed CLEIA, the specific test for mAb was performed, and theresults are summarized in Table 2. To be noticed, the AA-II showed the highest cross-reactivity (CR) amount of these analogs while only slight CR was observed for AA-III andAA-IV, suggesting the hydroxyl was the key site for recognition. For the other analogs, noobvious CR was observed, indicating the good specificity of mAb to AAs. Since both AA-Iand AA-II were the main components in the samples, the obtained mAb can be used forscreening these two AAs.
Table 2. The specific test of anti-AA-I mAb.
Compounds Structure IC50 (ng/mL) CR 1 (%)
AA-I
‐ ‐
‐
‐
‐
‐
‐
N+
O
O-
O
O
OH
O
O
HO
1.8 100
AA-II
‐ ‐
‐
‐
‐
‐
‐
N+
O
O-
O
O
OH
O
O
HO
2.1 86
AA-III
‐ ‐
‐
‐
‐
‐
‐
N+
O
O-
O
O
OH
O
O
HO
120.0 1.5
AA-IV
‐ ‐
‐
‐
‐
‐
‐
N+
O
O-
O
O
OH
O
O
HO450.0 0.4
Abietic acid
‐ ‐
‐
‐
‐
‐
‐
N+
O
O-
O
O
OH
O
O
HO
>1000 <0.1
Asarinin
‐ ‐
‐
‐
‐
‐
‐
N+
O
O-
O
O
OH
O
O
HO
>1000 <0.1
Colchicine
‐ ‐
‐
‐
‐
‐
‐
N+
O
O-
O
O
OH
O
O
HO
>1000 <0.1
Methyleugenol
‐ ‐
‐
‐
‐
‐
‐
N+
O
O-
O
O
OH
O
O
HO
>1000 <0.1
Ephedrine hydrochloride
‐ ‐
‐
‐
‐
‐
‐
N+
O
O-
O
O
OH
O
O
HO
>1000 <0.1
1 CR(%) = [IC50 (AA-I)/IC50 (analogues)] × 100%.
3.3. Characterization of rCDs
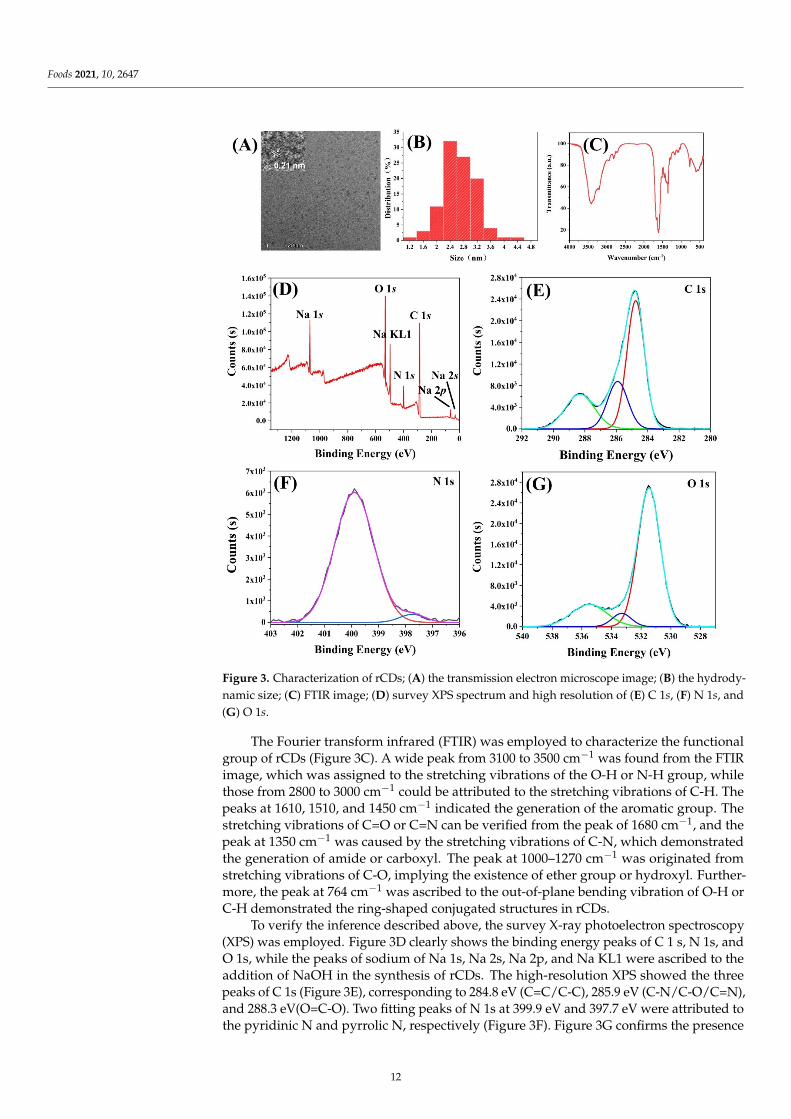
The rCDs were synthesized and characterized for the development of FIA. As shownin Figure 3A, rCDs exhibited a particle size of approximately 3 nm. Moreover, the high-resolution TEM image clearly showed the lattice fringe of rCDs with an interlayer spacingof 0.21 nm (Figure 3A). The dynamic light scattering (Figure 3B) showed the hydrodynamicsize of ~2.7 nm for rCDs, which agreed with TEM.
11
Foods 2021, 10, 2647
Figure 3. Characterization of rCDs; (A) the transmission electron microscope image; (B) the hydrody-namic size; (C) FTIR image; (D) survey XPS spectrum and high resolution of (E) C 1s, (F) N 1s, and(G) O 1s.
The Fourier transform infrared (FTIR) was employed to characterize the functionalgroup of rCDs (Figure 3C). A wide peak from 3100 to 3500 cm−1 was found from the FTIRimage, which was assigned to the stretching vibrations of the O-H or N-H group, whilethose from 2800 to 3000 cm−1 could be attributed to the stretching vibrations of C-H. Thepeaks at 1610, 1510, and 1450 cm−1 indicated the generation of the aromatic group. Thestretching vibrations of C=O or C=N can be verified from the peak of 1680 cm−1, and thepeak at 1350 cm−1 was caused by the stretching vibrations of C-N, which demonstratedthe generation of amide or carboxyl. The peak at 1000–1270 cm−1 was originated fromstretching vibrations of C-O, implying the existence of ether group or hydroxyl. Further-more, the peak at 764 cm−1 was ascribed to the out-of-plane bending vibration of O-H orC-H demonstrated the ring-shaped conjugated structures in rCDs.
To verify the inference described above, the survey X-ray photoelectron spectroscopy(XPS) was employed. Figure 3D clearly shows the binding energy peaks of C 1 s, N 1s, andO 1s, while the peaks of sodium of Na 1s, Na 2s, Na 2p, and Na KL1 were ascribed to theaddition of NaOH in the synthesis of rCDs. The high-resolution XPS showed the threepeaks of C 1s (Figure 3E), corresponding to 284.8 eV (C=C/C-C), 285.9 eV (C-N/C-O/C=N),and 288.3 eV(O=C-O). Two fitting peaks of N 1s at 399.9 eV and 397.7 eV were attributed tothe pyridinic N and pyrrolic N, respectively (Figure 3F). Figure 3G confirms the presence
12

Foods 2021, 10, 2647
of C=O (531.5 eV) bonds, O=C-O group (533.5 eV), and the C-O of the aromatic nucleus(535.5 eV). In general, the results of XPS showed good agreement with the generation ofthe aromatic group from FTIR analysis.
3.4. Development of FIA
The spectral characteristic of rCDs, TMB, and oxTMB was investigated to assessthe feasibility of FIA development. Figure 4A shows the Em wavelength of rCDs at620 nm with the Ex wavelength at 540 nm. Compared with TMB, the oxTMB exhibited anobvious absorbance peak at 650 nm, which overlaps the Em of rCDs, thereby quenching thefluorescent signal of rCDs. Therefore, the presence of HRP can catalyze TMB into oxTMBto quench rCDs; otherwise, the fluorescent signal was a turn-on. The fluorescence lifetimeof rCDs was investigated. In the presence of oxTMB, the fluorescence lifetime of rCDs(5.57 ns) showed no obvious difference to rCDs without oxTMB (5.59 ns), indicating theinner-filter effect caused the quenching (Figure 4B). The fluorescent intensity of rCDs withvarious pH values was also studied, and the highest intensity was observed for the pHvalue of 11 (Figure S4). Therefore, rCDs were diluted by NaOH (pH 11) to adjust the pHvalue before adding to microplates.
Based on the quenching mechanism, an rCDs-based FIA was developed, strategydiagram is shown in Figure 4C. In the absence of AA-I, the mAb was bound to coatingantigen, resulting in the generation of oxTMB, leading to the quenching of rCDs. In contrast,the presence of AA-I inhibited the binding of mAb to coating antigen, recovering thefluorescent signal of rCDs. Hence AA-I concentration regulated the fluorescence response.Based on the above optimized conditions, a fluorescent calibration curve against AA-Ishowed the IC50 of 0.41 ng/mL (Figure 4D), the LOD of 0.06 ng/mL, and a linear rangefrom 0.08 to 2.5 ng/mL. Compared with other publications for AA-I analysis, the developedFIA showed higher sensitivity (LOD) (Table 3), simplicity, and high efficiency withouta complicated procedure for sensitivity improvement, which makes the FIA suitable forsample screening. The downsides are that the FIA still requires at least approximately90 min to detect AA-I, and the microplate reader requirement limits the on-site detection ofFIA. To overcome these shortcomings, handheld reader-based lateral flow immunoassayswill be developed in future work for more rapid and on-site detection of AA-I.
Table 3. The comparison of immunoassay for AAs.
Method IC50 (ng/mL) Linear Range (ng/mL) LOD (ng/mL) Reference
icELISA 1.2 ND 1 0.1 1Injection analysis chemiluminescence ND 1 10–20000 3 4
CLEIA 2.4 0.2–3.1 0.1 This workFIA 0.41 0.08–2.50 0.06 This work
1 ND, no data.
3.5. Recovery Test
Three levels of AA-I were spiked to drug homologous and foods then analyzed byCLEIA and FIA. The results were verified by UPLC-QQQ-MS/MS, which is shown inTable 4. The recoveries of CLEIA and FIA were ranged between 83–119% and 86–118.4%with a coefficient of variance (CV) ranging from 3.8% to 13.3% and 5% to 14.4%, respectively.The UPLC-QQQ-MS/MS showed the average recoveries from 85.1% to 108.1%, with CVsfrom 1.2% to 7.5%. The developed CLEIA and FIA showed good agreement to standardinstrument methods, demonstrating good accuracy and practicability for AA-I detection.
13

Foods 2021, 10, 2647
′′ ′′‐
Figure 4. (A) The spectrum characterization of rCDs, TMB, and oxTMB. (B) The lifetime analysis of rCDs with and withoutoxTMB. (C) Strategic schema of development of FIA. (D) Calibration curve and (E) linear range of FIA. Acronym: TMB:3,3′ ′,5,5′ ′-tetramethylbenzidine dihydrochloride; oxTMB: oxidized TMB; Em: emission; Ex: excitation.
14

Foods 2021, 10, 2647
Table 4. Recovery test for CLEIA, FIA, and UPLC-QQQ-MS/MS (n = 3).
SampleNo.
Spiked(ng/g)
CLEIA FIA UPLC-QQQ-MS/MS
Measured(ng/mL)
(Mean ± SD 1)
Recovery(%)
CV 2
(%)
Measured(ng/mL)
(Mean ± SD)
Recovery(%)
CV(%)
Measured(ng/mL)
(Mean ± SD)
Recovery(%)
CV(%)
Pleurotusostreatus
600 511.4 ± 41.4 86.7 7.7 655.2 ± 92.4 109.2 14.1 648.3 ± 11.9 108.1 1.8300 165.3 ± 21.9 83.0 13.3 355.2 ± 55.2 118.4 15.5 303.7 ± 12.9 101.2 4.2150 135.1 ± 14 90.0 12.8 129 ± 18 86 14.0 127.7 ± 9.6 85.1 7.5
Slimmingcapsule
600 520.1 ± 11.3 86.7 10.4 642 ± 92.4 107 14.4 571.3 ± 12.9 95.2 2.3300 237.9 ± 30.4 119.0 12.6 306 ± 28.8 102 9.4 313.7 ± 16.5 104.6 5.3150 116 ± 41.1 116.0 36.2 147 ± 21 98 14.3 136 ± 5.6 90.7 4.1
Slimmingtea
600 517.4 ± 11.8 86.7 3.8 678 ± 62.4 113 9.2 644.3 ± 7.5 107.4 1.2300 204.9 ± 45.7 102.0 22.5 312 ± 15.6 104 5.0 305.3 ± 11.9 101.8 3.9150 114.3 ± 13.3 114.0 12.3 138 ± 9 92 6.5 155.3 ± 6.5 103.5 4.2
1 SD, standard deviation; 2 CV, coefficient of variance.
4. Conclusions
In this study, the AA-I was conjugated to a carrier protein to prepare artificial antigen,and a sensitive anti-AA-I mAb was generated after animal immunization and hybridomascreening. The obtained mAb was further used to develop CLEIA for the detection of AA-I.Since products containing AAs are prohibited in most countries, high sensitivity methodsare needed to screen out positive samples, but the sensitivity of CLEIA was still notsatisfying. Therefore, CDs with red emission were synthesized and employed to developFIA, which exhibited a five-fold improvement in sensitivity than CLEIA. The accuracy andpracticability of CLEIA and FIA were verified by the standard instrument method; theywere sensitive, rapid, and easy to use, making them effective tools for screening AA-I inrelated products.
Supplementary Materials: The following are available online at https://www.mdpi.com/article/10.3390/foods10112647/s1. Figure S1: Ethical review of animal experiments. Figure S2: Ultravioletscanning of synthesized antigens of AA-I (A) Ultraviolet spectrum of AA-I, KLH and AA-I-KLH; (B)AA-I, BSA and AA-I-BSA; (C) AA-I, OVA and AA-I-OVA. Figure S3: The optimizing of (A,B) ionicstrength; (C,D) pH value; (E,F) Tween-20 concentration; (G, H) methanol concentration. Figure S4:The optimizing of pH for rCDs. Table S1: Parameters of UPLC-QQQ-MS/MS. Table S2: Cell linesevaluation (n = 3). Table S3: Optimization of coating antigen concentration (n = 3).
Author Contributions: Conceptualization, methodology, software, and writing—original draftpreparation, A.-F.O.; methodology and software, Z.-J.C.; methodology, Y.-F.Z.; methodology, Q.-Y.H.;conceptualization, Z.-L.X.; conceptualization, writing—reviewing and editing, S.-Q.Z. All authorshave read and agreed to the published version of the manuscript.
Funding: Please add: This research was funded by Guangzhou Science and Technology Foundation,grant number 201903010034; Natural Resources Science Foundation of Guangdong Province, grantnumber 2018A030313926; Science and Technology Foundation Key R&D Program of GuangdongProvince, grant number 2019B020209009 & 2019B020218009; R&D Program of Guangdong ProvinceDrug Administration grant number 2021TDZ09 & 2021YDZ06.
Institutional Review Board Statement: The animal experiment was carried out in a laboratory witha license for experiment animal, which was conformed to the welfare principle (ethical approvalnumber: 2019054, Figure S1).
Informed Consent Statement: Not applicable.
Data Availability Statement: The datasets used and analyzed during the current study are availablefrom the corresponding author on request.
Conflicts of Interest: The authors declare no conflict of interest.
15

Foods 2021, 10, 2647
References
1. Yu, F.Y.; Lin, Y.H.; Su, C.C. A sensitive enzyme-linked immunosorbent assay for detecting carcinogenic aristolochic acid in herbalremedies. J. Agric. Food Chem. 2006, 54, 2496–2501. [CrossRef] [PubMed]
2. Yeh, Y.H.; Lee, Y.T.; Hsieh, H.S.; Hwang, D.F. Short-term toxicity of aristolochic acid, aristolochic acid-I and aristolochic acid-II inrats. Food Chem. Toxicol. 2008, 46, 1157–1163. [CrossRef] [PubMed]
3. Lee, T.Y.; Wu, M.L.; Deng, J.F.; Hwang, D.F. High-performance liquid chromatographic determination for aristolochic acid inmedicinal plants and slimming products. J. Chromatogr. B 2002, 766, 169–174. [CrossRef]
4. Oraby, H.F.; Alarfaj, N.A.; El-Tohamy, M.F. Gold nanoparticle-enhanced luminol/ferricyanide chemiluminescence system foraristolochic acid-I detection in medicinal plants and slimming products. Green Chem. Lett. Rev. 2017, 10, 138–147. [CrossRef]
5. Ioset, J.R.; Raoelison, G.E.; Hostettmann, K. Detection of aristolochic acid in Chinese phytomedicines and dietary supplementsused as slimming regimens. Food Chem. Toxicol. 2003, 41, 29–36. [CrossRef]
6. Nault, J.; Letouzé, E. Mutational processes in hepatocellular carcinoma: The story of aristolochic acid. Semin. Liver Dis. 2019,39, 334–340. [CrossRef]
7. Nortier, J.L.; Martinez, M.M.; Schmeiser, H.H.; Arlt, V.M.; Bieler, C.A.; Petein, M.; Depierreux, M.F.; De Pauw, L.; Abramowicz, D.;Vereerstraeten, P.; et al. Urothelial carcinoma associated with the use of a Chinese herb (Aristolochia fangchi). N. Engl. J. Med. 2000,342, 1686–1692. [CrossRef]
8. Cosyns, J.; Jadoul, M.; Squifflet, J.; van Cangh, P.; van Ypersele de Strihou, C. Urothelial malignancy in nephropathy due toChinese herbs. Lancet 1994, 344, 188. [CrossRef]
9. Zhang, H.M.; Zhao, X.H.; Sun, Z.H.; Li, G.C.; Liu, G.C.; Sun, L.R.; Hou, J.Q.; Zhou, W. Recognition of the toxicity of aristolochicacid. J. Clin. Pharm. Ther. 2019, 44, 157–162. [CrossRef]
10. Jadot, I.; Declèves, A.; Nortier, J.; Caron, N. An integrated view of aristolochic acid nephropathy: Update of the literature. Int. J.
Mol. Sci. 2017, 18, 297. [CrossRef]11. Kocic, G.; Gajic, M.; Tomovic, K.; Hadzi Djokic, J.; Anderluh, M.; Smelcerovic, A. Purine adducts as a presumable missing link for
aristolochic acid nephropathy-related cellular energy crisis, potential anti-fibrotic prevention and treatment. Brit. J. Pharmacol.
2021, 178, 4411–4427.12. Koyama, N.; Yonezawa, Y.; Nakamura, M.; Sanada, H. Evaluation for a mutagenicity of aristolochic acid by Pig-a and PIGRET
assays in rats. Mutat. Res. Genet. Toxicol. Environ. Mutagen. Environ. Mutagenesis 2016, 811, 80–85. [CrossRef]13. Vanherweghem, J.; Tielemans, C.; Abramowicz, D.; Depierreux, M.; Vanhaelen-Fastre, R.; Vanhaelen, M.; Dratwa, M.; Richard, C.;
Vandervelde, D.; Verbeelen, D.; et al. Rapidly progressive interstitial renal fibrosis in young women: Association with slimmingregimen including Chinese herbs. Lancet 1993, 341, 387–391. [CrossRef]
14. Depierreux, M.; Van Damme, B.; Vanden Houte, K.; Vanherweghem, J.L. Pathologic aspects of a newly described nephropathyrelated to the prolonged use of Chinese herbs. Am. J. Kidney Dis. 1994, 24, 172–180. [CrossRef]
15. Koh, H.L.; Wang, H.; Zhou, S.; Chan, E.; Woo, S.O. Detection of aristolochic acid I, tetrandrine and fangchinoline in medicinalplants by high performance liquid chromatography and liquid chromatography/mass spectrometry. J. Pharmaceut. Biomed. 2006,40, 653–661. [CrossRef]
16. Guo, L.; Yue, H.; Cai, Z.W. A novel pre-column fluorescent derivatization method for the sensitive determination of aristolochicacids in medicinal herbs by high-performance liquid chromatography with fluorescence detection. J. Pharmaceut. Biomed. 2010,53, 37–42. [CrossRef]
17. Wang, Y.A.; Chan, W. Determination of aristolochic acids by high-performance liquid chromatography with fluorescence detection.J. Agric. Food Chem. 2014, 62, 5859–5864. [CrossRef]
18. Wang, X.R.; Wang, Y.Y.; Wang, Y.D.; Chen, Q.; Liu, X. Nanobody-alkaline phosphatase fusion-mediated phosphate-triggeredfluorescence immunoassay for ochratoxin a detection. Spectrochim. Acta A 2020, 226, 117617. [CrossRef]
19. Inui, H.; Takeuchi, T.; Uesugi, A.; Doi, F.; Takai, M.; Nishi, K.; Miyake, S.; Ohkawa, H. Enzyme-linked immunosorbent assay withmonoclonal and single-chain variable fragment antibodies Selective to Coplanar Polychlorinated Biphenyls. J. Agric. Food Chem.
2012, 60, 1605–1612. [CrossRef]20. Zhou, J.J.; Ren, M.S.; Wang, W.J.; Huang, L.; Lu, Z.C.; Song, Z.Y.; Foda, M.F.; Zhao, L.; Han, H.Y. Pomegranate-inspired silica
nanotags enable sensitive dual-modal detection of rabies virus nucleoprotein. Anal. Chem. 2020, 92, 8802–8809. [CrossRef]21. Liu, Y.Z.; Zhao, G.X.; Wang, P.; Liu, J.; Zhang, H.C.; Wang, J.P. Production of the broad specific monoclonal antibody against
sarafloxacin for rapid immunoscreening of 12 fluoroquinolones in meat. J. Environ. Sci. Heal. B 2013, 48, 139–146. [CrossRef]22. Li, Y.; Liu, L.Q.; Kuang, H.; Xu, C.L. Preparing monoclonal antibodies and developing immunochromatographic strips for
paraquat determination in water. Food Chem. 2020, 311, 125897.1–125897.9. [CrossRef]23. Wu, Y.P.; Wang, J.; Zhou, Y.; Qi, Y.; Ma, L.C.; Wang, X.N.; Tao, X.Q. Quantitative determination of nitrofurazone metabolites
in animal-derived foods based on a background fluorescence quenching immunochromatographic Assay. Foods 2021, 10, 1668.[CrossRef]
24. Chen, X.R.; Miao, X.T.; Ma, T.T.; Leng, Y.K.; Hao, L.W.; Duan, H.; Yuan, J.; Li, Y.; Huang, X.L.; Xiong, Y.H. Gold nanobeads withenhanced absorbance for improved sensitivity in competitive lateral flow immunoassays. Foods 2021, 10, 1488. [CrossRef]
25. Tao, X.Q.; Zhou, S.; Yuan, X.M.; Li, H.J. Determination of chloramphenicol in milk by ten chemiluminescent immunoassays:Influence of assay format applied. Anal. Methods 2016, 8, 4445–4451. [CrossRef]
16
Foods 2021, 10, 2647
26. Xu, L.; Suo, X.Y.; Zhang, Q.; Li, X.P.; Chen, C.; Zhang, X.Y. ELISA and chemiluminescent enzyme immunoassay for sensitive andspecific determination of lead (II) in Water, Food and Feed Samples. Foods 2020, 9, 305. [CrossRef]
27. Yi, K.Y.; Zhang, X.T.; Zhang, L. Eu3+@metal–organic frameworks encapsulating carbon dots as ratiometric fluorescent probes forrapid recognition of anthrax spore biomarker. Sci. Total Environ. 2020, 743, 140692. [CrossRef]
28. Li, T.X.; Li, Z.; Huang, T.Z.; Tian, L. Carbon quantum dot-based sensors for food safety. Sens. Actuators A Phys. 2021, 331, 113003.[CrossRef]
29. Song, P.; Liu, Q.; Zhang, Y.; Liu, W.; Meng, M.; Yin, Y.M.; Xi, R.M. The chemical redox modulated switch-on fluorescence ofcarbon dots for probing alkaline phosphatase and its application in an immunoassay. RSC Adv. 2018, 8, 162–169. [CrossRef]
30. Ni, P.J.; Xie, J.F.; Chen, C.X.; Jiang, Y.Y.; Lu, Y.Z.; Hu, X. Fluorometric determination of the activity of alkaline phosphatase and itsinhibitors based on ascorbic acid-induced aggregation of carbon dots. Microchim. Acta 2019, 202, 186. [CrossRef]
31. Li, G.L.; Fu, H.L.; Chen, X.J.; Gong, P.W.; Chen, G.; Xia, L.; Wang, H.; You, J.M.; Wu, Y.N. Facile and sensitive fluorescence sensingof alkaline phosphatase activity with photoluminescent carbon dots based on inner filter effect. Anal. Chem. 2016, 88, 2720–2726.[CrossRef] [PubMed]
32. Chen, Z.J.; Liu, X.X.; Xiao, Z.L.; Fu, H.J.; Huang, Y.P.; Huang, S.Y.; Shen, Y.D.; He, F.; Yang, X.X.; Hammock, B.; et al. Production ofa specific monoclonal antibody for 1-naphthol based on novel hapten strategy and development of an easy-to-use ELISA in urinesamples. Ecotox. Environ. Saf. 2020, 196, 110533. [CrossRef] [PubMed]
33. Chen, Z.J.; Zhou, K.; Ha, W.Z.; Chen, P.H.; Fu, H.J.; Shen, Y.D.; Sun, Y.M.; Xu, Z.L. Development of a low-cost, simple, fast andquantitative lateral-flow immunochromatographic assay (ICA) strip for melatonin in health foods. Food Agric. Immunol. 2019,30, 497–509. [CrossRef]
17

Citation: Burkin, M.A.; Galvidis, I.A.;
Eremin, S.A. Influence of
Endogenous Factors of Food Matrices
on Avidin—Biotin Immunoassays for
the Detection of Bacitracin and
Colistin in Food. Foods 2022, 11, 219.
https://doi.org/10.3390/
foods11020219
Academic Editor: Simon Haughey
Received: 18 December 2021
Accepted: 12 January 2022
Published: 13 January 2022
Publisher’s Note: MDPI stays neutral
with regard to jurisdictional claims in
published maps and institutional affil-
iations.
Copyright: © 2022 by the authors.
Licensee MDPI, Basel, Switzerland.
This article is an open access article
distributed under the terms and
conditions of the Creative Commons
Attribution (CC BY) license (https://
creativecommons.org/licenses/by/
4.0/).
foods
Article
Influence of Endogenous Factors of Food Matrices onAvidin—Biotin Immunoassays for the Detection of Bacitracinand Colistin in Food
Maksim A. Burkin 1,* , Inna A. Galvidis 1 and Sergei A. Eremin 2,*
1 Immunology Department, I. Mechnikov Research Institute for Vaccines and Sera, 105064 Moscow, Russia;[email protected]
2 Faculty of Chemistry, M. V. Lomonosov Moscow State University, Leninsky Gory, 1, 119991 Moscow, Russia* Correspondence: [email protected] (M.A.B.); [email protected] (S.A.E.);
Tel.: +7-495-9172753 (M.A.B.)
Abstract: (Strept)avidin–biotin technology is frequently used in immunoassay systems to improvetheir analytical properties. It is known from clinical practice that many (strept)avidin–biotin-basedtests provide false results when analyzing patient samples with a high content of endogenousbiotin. No specific investigation has been carried out regarding possible interferences from avidin(AVI) and biotin (B7) contained in food matrices in (strept)avidin–biotin-based immunoanalyticalsystems for food safety. Two kinds of competitive ELISAs for bacitracin (BT) and colistin (COL)determination in food matrices were developed based on conventional hapten–protein coatingconjugates and biotinylated BT and COL bound to immobilized streptavidin (SAV). Coating SAV–B7–BT and SAV–B7–COL complexes-based ELISAs provided 2- and 15-times better sensitivity inBT and COL determination, corresponding to 0.6 and 0.3 ng/mL, respectively. Simultaneouslywith the determination of the main analytes, these kinds of tests were used as competitive assaysfor the assessment of AVI or B7 content up to 10 and 1 ng/mL, respectively, in food matrices(egg, infant milk formulas enriched with B7, chicken and beef liver). Matrix-free experiments withAVI/B7-enriched solutions showed distortion of the standard curves, indicating that these ingredientsinterfere with the adequate quantification of analytes. Summarizing the experience of the presentstudy, it is recommended to avoid immunoassays based on avidin–biotin interactions when analyzingbiosamples containing these endogenous factors or enriched with B7.
Keywords: bacitracin; colistin; biotinylated hapten coating; immunoassay; matrix biotin and avidininterference; food contaminants
1. Introduction
The interaction of (strept)avidin protein and biotin (vitamin B7) is widely used invarious bioanalytical systems, in particular, in immunoassays [1]. Due to the high affinity(KD ≈ 10−15 M) and binding valence between this protein (four binding sites) and thevitamin, they are successfully applied as immunoreagent labels to provide an additionalfunctionality [2], for oriented immobilization/presentation [3], as well as to accelerate theinteraction [4] or enhance the output signal in immunoassays of various designs [5,6]. Inthis regard, the involvement of the (strept)avidin–biotin system is one of the main strategiesfor increasing the sensitivity of immunoassay [7].
In a wide panel of commercial (strept)avidin–biotin-based immunoassay systemsused in clinical practice for diagnostic purposes, it has been found that the presence ofendogenous biotin in patients’ biofluids can interfere with the analysis, leading to falseresults and, consequently, to misdiagnosis and patient mismanagement [8,9]. However,with a dietary intake of about 35–70 µg B7/day, the blood B7 level in healthy subjects(0.12–0.36 nM) [10] has a negligible interfering effect on (strept)avidin–biotin assays. At
19
Foods 2022, 11, 219
the same time, excessive consumption as a result of therapy for a number of disorders(multiple sclerosis, phenylketonuria, biotinidase deficiency) or incorporation in “Hair, Skin,and Nails” cosmetic formulas may lead to µM B7 blood levels, which can significantlydistort the results of (strept)avidin–biotin-based tests [9].
The (strept)avidin–biotin technology is equally popular in immunoassays for foodsafety control [11–13]. However, researchers have not yet been concerned about the possi-bility that avidin and biotin in the matrix could interfere with the detection of a wide rangeof analytes in food. Avidin (AVI) is a known protein component in egg white, whereasbiotin is widely distributed in different natural foodstuffs. Foods relatively rich in biotininclude egg yolk, liver, some vegetables [14], and the majority of biotin in meats and cerealsappears to be protein-bound [10]. Thus, these endogenous components of the matrix,the content of which reaches ppb–ppm levels in many analyzed natural foods [15], canrepresent a serious obstacle in immunoassays based on (strept)avidin–biotin interaction.
In this regard, the objective of the present study was the assessment of the influenceof these factors on newly developed ELISA systems based on the coating of biotinylatedhaptens for the determination of the antibiotics bacitracin and colistin in food matrices richin AVI and B7 components.
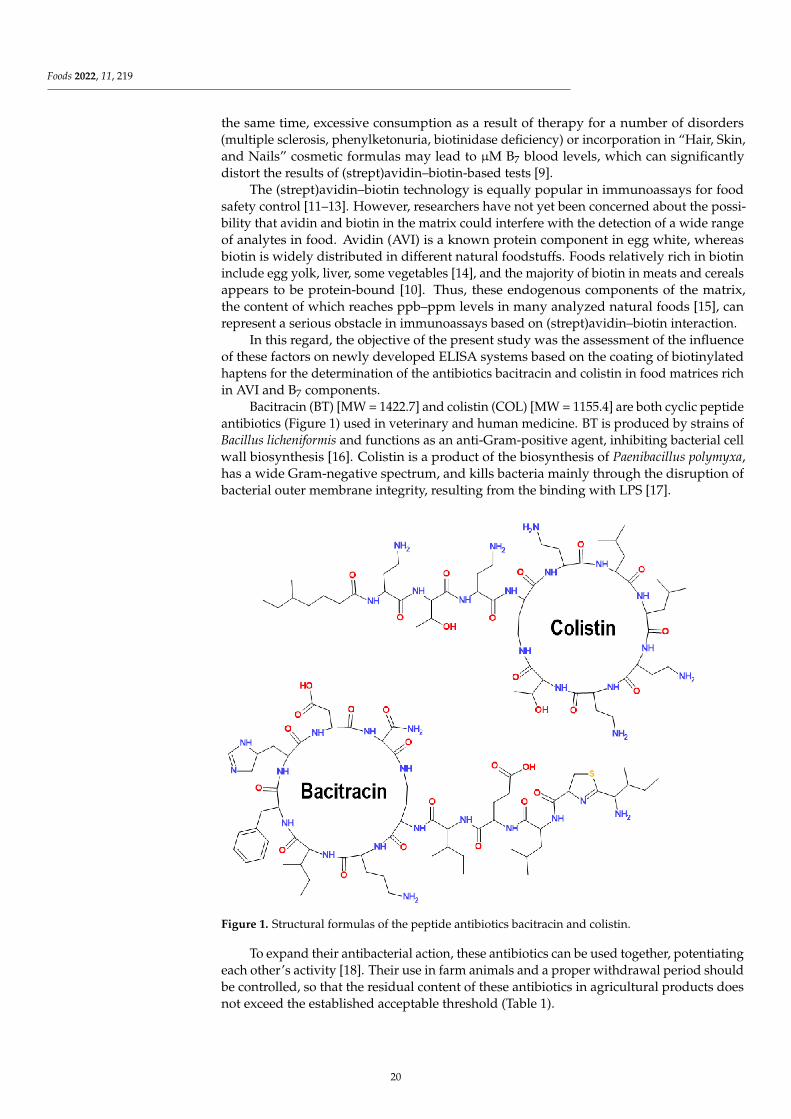
Bacitracin (BT) [MW = 1422.7] and colistin (COL) [MW = 1155.4] are both cyclic peptideantibiotics (Figure 1) used in veterinary and human medicine. BT is produced by strains ofBacillus licheniformis and functions as an anti-Gram-positive agent, inhibiting bacterial cellwall biosynthesis [16]. Colistin is a product of the biosynthesis of Paenibacillus polymyxa,has a wide Gram-negative spectrum, and kills bacteria mainly through the disruption ofbacterial outer membrane integrity, resulting from the binding with LPS [17].
Figure 1. Structural formulas of the peptide antibiotics bacitracin and colistin.
To expand their antibacterial action, these antibiotics can be used together, potentiatingeach other’s activity [18]. Their use in farm animals and a proper withdrawal period shouldbe controlled, so that the residual content of these antibiotics in agricultural products doesnot exceed the established acceptable threshold (Table 1).
20

Foods 2022, 11, 219
Table 1. Limitations of residual bacitracin (BT) and colistin (COL) content in foodstuff established bythe European Union (EU) and the Eurasian Economic Union (EAEU).
FoodstuffsMRLs (µg/kg) in EU [19] MRLs (µg/kg) in EAEU [20]
BT COL BT COL
Milk 100 50 NE ** 50Eggs NE 300 <20 300Meat, Fish, Poultry 150 * 150 <20 150Liver 150 * 150 <20 150Kidney 150 * 200 <20 200
* rabbit; ** not established.
Among the methods intended for the detection of food contamination with residuesof the antibiotics BT and COL, immunochemical methods, in addition to physicochemicaltechniques [21], are described [22–24]. However, no method involves the (strept)avidin–biotin technology.
2. Materials and Methods
2.1. Chemicals
Colistin (COL) and polymyxin B (PMB) sulphates were obtained from AppliChem(Darmstadt, Germany). Bacitracin (BT), colistin methanesulphonate (CMS), 1-ethyl-3-(3-dimethylaminopropyl)carbodiimide (EDC), N-hydroxysuccinimide (NHS), biotin N-hydroxysuccinimide ester (NHS-B7), caprylic acid, bovine serum albumin (BSA), gelatin(GEL) horseradish peroxidase (HRP), and dimethylformamide (DMF) were purchasedfrom Chimmed (Moscow, Russia). Avidins from Streptomyces avidini (streptavidin, SAV)and from egg white (AVI) were from Calbiochem (USA). Goat anti-rabbit IgG antibodiesconjugated to HRP (GAR–HRP) were purchased from Imtek Ltd. (Moscow, Russia). Rabbitantisera against BSA–PMB and BSA–BT were prepared and described earlier [25,26], andIgG fractions were isolated using the caprylate–sulphate ammonium method according toa described procedure [27].
2.2. Preparation of Biotinylated Analytes
NHS-B7 was dissolved in anhydrous DMF (10 mg/mL), added dropwise to solutionsof BT, COL, and PMB in 0.05 M carbonate–bicarbonate buffer (CBB, pH 9.6) at a molarratio (1:1), and stirred 1 h at RT using a magnet stirrer. The biotinylated peptides weresupplemented with equal volumes of glycerol and stored as 0.1 mM (B7) solutions at−20 ◦C until use.
2.3. Preparation of the Heterologous Coating Antigen GEL–BT(ae)
BT (1.42 mg, 1 µmol) in 0.284 mL DMF was added to EDC and NHS (2.5 eq of each)from 10 mg/mL solutions in DMF and stirred for 1.5 h. After activation of the carboxygroups, BT taken in 10- and 30-fold molar excesses over GEL (4 mg, 25 nmol) in CBB (pH9.6) was added dropwise and stirred for 2 h at RT. Unconjugated hapten was removed bydialysis against water.
2.4. Preparation of the Heterologous Coating Antigen GEL(pi)–PMB
The glycoprotein GEL was oxidized with sodium periodate and conjugated to aminesof PMB as a result of reductive amination, according to procedure described in [25]. GEL(4 mg, 25 nmol) and sodium periodate (1 mg, 5 µmol) in 0.5 mL of distilled water weremixed using a magnetic stirrer for 15 min. The oxidized GEL was dialyzed overnightagainst water at 4 ◦C and then added to the solution of PMB in CBB (pH 9.5) taken in 10-and 30-fold molar excess over the protein. After 2 h of stirring with a magnetic stirrer,0.1 mL of sodium borohydride solution (2 mg/mL) was added to the reaction mixture,which was stirred for another 2 h. The resulting conjugates were dialyzed against water for2 days at 4 ◦C.
21

Foods 2022, 11, 219
2.5. Competitive ELISAs Based on the Coating Complex SAV–Biotinylated Hapten and CoatedConjugates
SAV was adsorbed on 96-well high-binding Costar plates (Corning, USA) from 1.0–3.0 µg/mL solutions in CBB at 4 ◦C. After overnight coating, the plates were washed threetimes with 0.15 M PBS (pH 7.2) containing 0.05% Tween 20 (PBST) and filled with biotiny-lated antibiotics (B7, 100–0.1 nM). The interaction of SAV and B7–hapten was carried out for1 h at 37 ◦C. Alternatively, a one-step coating could be carried out using a mixture of SAVand B7–hapten previously prepared in PBS and coated overnight. The plates with the immo-bilized hapten were then washed and used for a conventional indirect competitive ELISAbased on coated hapten–protein conjugates using specific rabbit anti-hapten antibodies andGAR–HRP [28]. Antibodies added to the wells in the working concentration in 1% BSA-PBST (0.1 mL) were incubated for 1 h on an ST-3 L plate shaker (ELMI Ltd., Latvia) at 25 ◦C.Antibody binding at zero analyte concentration (B0) was maximal and dose-dependentlyinhibited in the presence of free analyte (B, 0.01–1000 ng/mL). Bound antibodies were de-tected using GAR–HRP (1 h, 37 ◦C) and a TMB-containing substrate mixture (0.5 h, 25 ◦C).The enzymatic reaction was terminated by the addition of 2 M H2SO4, and the absorbancewas read at 450 nm using a LisaScan spectrophotometer (Erba Mannheim, Czech Republic).The standard curves were plotted as ‘relative antibody binding B/B0, % vs. analyte concen-tration’ using GraphPad Prism 8 Software and served for the measurement of antibioticsin food matrices. The analyte concentrations (IC50) causing 50% inhibition of antibodybinding served as assay sensitivity values as well as to determine the cross-reactivity (CR)of analogs according to the equation: CR = IC50 MAIN ANALYTE/IC50 ANALOGUE × 100%.
2.6. Assessment of AVI and B7 in Food Matrices
AVI and B7 influence and their content in some food matrices were estimated by theELISAs based on biotinylated hapten-based coating antigens. Standards of AVI or B7 as wellas these components in food matrices could inhibit the binding of B7–haptens to coated SAVin a dose-dependent manner. Thus, the solutions of standards/samples were added to SAV-coated wells together with B7–hapten and incubated for 1 h at 25 ◦C. After this competitionstage, the assay was completed as described above. Standard-generated plots served toassess the content of AVI and B7 in food matrices and their effect on (strept)avidin-basedassays.
For testing eggs, homogenates were prepared from the contents of eggs by vigorousstirring with a magnetic stirrer. Several samples were tested for AVI/B7 content. Beforeanalysis in the developed ELISA, the homogenates were diluted 100 times with PBST.
Aliquots of milk were centrifuged for 5 min at 10,000 rpm (7500× g) to separate andremove milk fat. Then, the samples, diluted 100 times with PBST, were analyzed in ELISAs.
Liver samples from chicken and beef were homogenized using a blender. Portions ofthe homogenates (1 g) were vigorously stirred in 4 mL PBST. The obtained extracts werecentrifuged at 3000 rpm, and the supernatants were diluted 20-fold with the assay buffer.
3. Results and Discussion
3.1. Assessment of the SAV–Biotinylated Hapten Complexes as Coating Antigens
The optimization of immunoassay parameters is based on choosing the right ratiobetween antibody and antigen concentrations. A small-molecule analyte immunoassay,generally a competitive assay, involves the conjugated forms of the antigen. The haptenload in the conjugate can be influenced by the coupling ratio between the hapten and thecarrier/enzyme, the presence of available functional groups in the latter, and the conditionsof conjugation. Since the final hapten load is difficult to predict, the optimization requiresthe comparison of conjugates with different loads and the selection of the best one [29].Thus, a comparison of BT/COL coating conjugates prepared from 10- and 30-fold molarexcesses of hapten over GEL showed that a lower hapten loading increased the assaysensitivity, which was confirmed by our earlier observations [30,31].
22
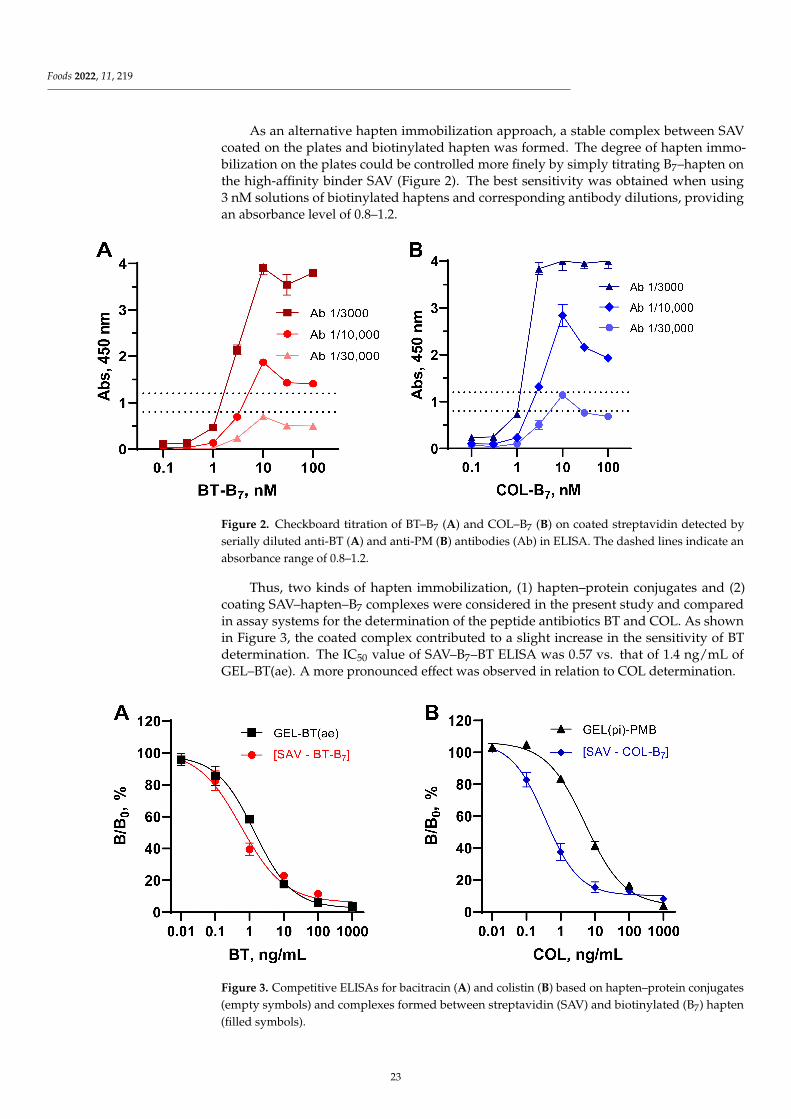
Foods 2022, 11, 219
As an alternative hapten immobilization approach, a stable complex between SAVcoated on the plates and biotinylated hapten was formed. The degree of hapten immo-bilization on the plates could be controlled more finely by simply titrating B7–hapten onthe high-affinity binder SAV (Figure 2). The best sensitivity was obtained when using3 nM solutions of biotinylated haptens and corresponding antibody dilutions, providingan absorbance level of 0.8–1.2.
Figure 2. Checkboard titration of BT–B7 (A) and COL–B7 (B) on coated streptavidin detected byserially diluted anti-BT (A) and anti-PM (B) antibodies (Ab) in ELISA. The dashed lines indicate anabsorbance range of 0.8–1.2.
Thus, two kinds of hapten immobilization, (1) hapten–protein conjugates and (2)coating SAV–hapten–B7 complexes were considered in the present study and comparedin assay systems for the determination of the peptide antibiotics BT and COL. As shownin Figure 3, the coated complex contributed to a slight increase in the sensitivity of BTdetermination. The IC50 value of SAV–B7–BT ELISA was 0.57 vs. that of 1.4 ng/mL ofGEL–BT(ae). A more pronounced effect was observed in relation to COL determination.
Figure 3. Competitive ELISAs for bacitracin (A) and colistin (B) based on hapten–protein conjugates(empty symbols) and complexes formed between streptavidin (SAV) and biotinylated (B7) hapten(filled symbols).
23
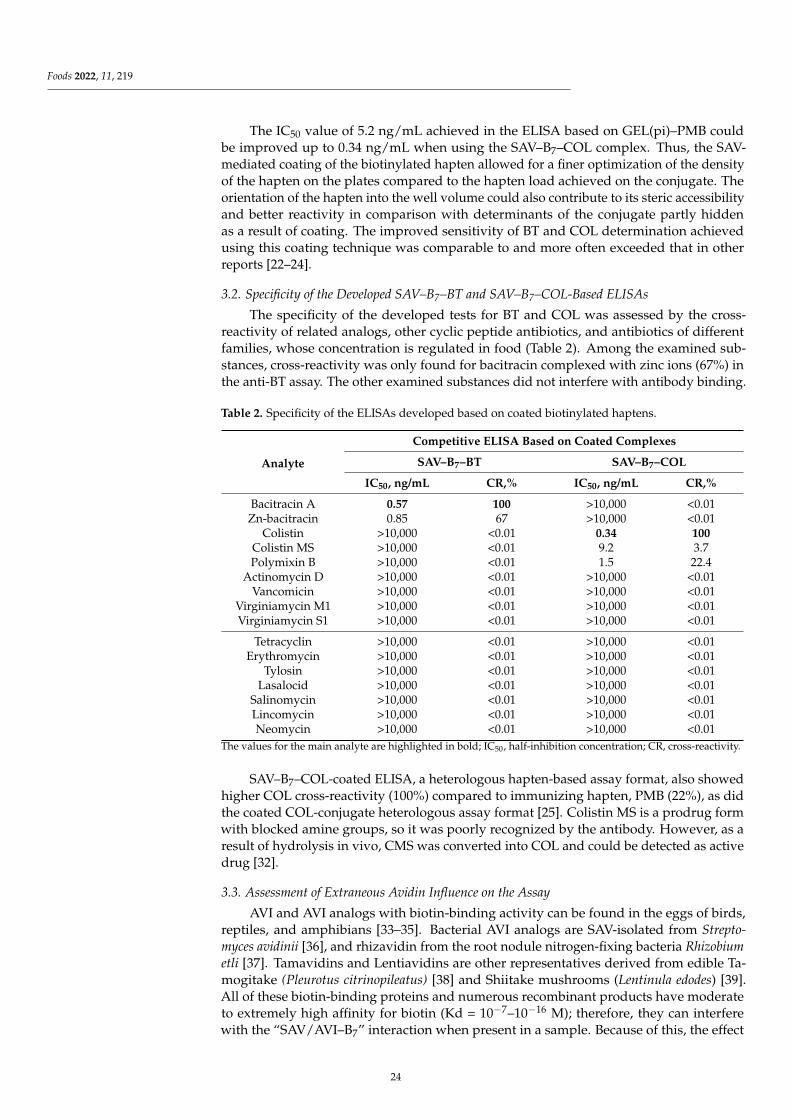
Foods 2022, 11, 219
The IC50 value of 5.2 ng/mL achieved in the ELISA based on GEL(pi)–PMB couldbe improved up to 0.34 ng/mL when using the SAV–B7–COL complex. Thus, the SAV-mediated coating of the biotinylated hapten allowed for a finer optimization of the densityof the hapten on the plates compared to the hapten load achieved on the conjugate. Theorientation of the hapten into the well volume could also contribute to its steric accessibilityand better reactivity in comparison with determinants of the conjugate partly hiddenas a result of coating. The improved sensitivity of BT and COL determination achievedusing this coating technique was comparable to and more often exceeded that in otherreports [22–24].
3.2. Specificity of the Developed SAV–B7–BT and SAV–B7–COL-Based ELISAs
The specificity of the developed tests for BT and COL was assessed by the cross-reactivity of related analogs, other cyclic peptide antibiotics, and antibiotics of differentfamilies, whose concentration is regulated in food (Table 2). Among the examined sub-stances, cross-reactivity was only found for bacitracin complexed with zinc ions (67%) inthe anti-BT assay. The other examined substances did not interfere with antibody binding.
Table 2. Specificity of the ELISAs developed based on coated biotinylated haptens.
Analyte
Competitive ELISA Based on Coated Complexes
SAV–B7–BT SAV–B7–COL
IC50, ng/mL CR,% IC50, ng/mL CR,%
Bacitracin A 0.57 100 >10,000 <0.01Zn-bacitracin 0.85 67 >10,000 <0.01
Colistin >10,000 <0.01 0.34 100Colistin MS >10,000 <0.01 9.2 3.7Polymixin B >10,000 <0.01 1.5 22.4
Actinomycin D >10,000 <0.01 >10,000 <0.01Vancomicin >10,000 <0.01 >10,000 <0.01
Virginiamycin M1 >10,000 <0.01 >10,000 <0.01Virginiamycin S1 >10,000 <0.01 >10,000 <0.01
Tetracyclin >10,000 <0.01 >10,000 <0.01Erythromycin >10,000 <0.01 >10,000 <0.01
Tylosin >10,000 <0.01 >10,000 <0.01Lasalocid >10,000 <0.01 >10,000 <0.01
Salinomycin >10,000 <0.01 >10,000 <0.01Lincomycin >10,000 <0.01 >10,000 <0.01Neomycin >10,000 <0.01 >10,000 <0.01
The values for the main analyte are highlighted in bold; IC50, half-inhibition concentration; CR, cross-reactivity.
SAV–B7–COL-coated ELISA, a heterologous hapten-based assay format, also showedhigher COL cross-reactivity (100%) compared to immunizing hapten, PMB (22%), as didthe coated COL-conjugate heterologous assay format [25]. Colistin MS is a prodrug formwith blocked amine groups, so it was poorly recognized by the antibody. However, as aresult of hydrolysis in vivo, CMS was converted into COL and could be detected as activedrug [32].
3.3. Assessment of Extraneous Avidin Influence on the Assay
AVI and AVI analogs with biotin-binding activity can be found in the eggs of birds,reptiles, and amphibians [33–35]. Bacterial AVI analogs are SAV-isolated from Strepto-myces avidinii [36], and rhizavidin from the root nodule nitrogen-fixing bacteria Rhizobiumetli [37]. Tamavidins and Lentiavidins are other representatives derived from edible Ta-mogitake (Pleurotus citrinopileatus) [38] and Shiitake mushrooms (Lentinula edodes) [39].All of these biotin-binding proteins and numerous recombinant products have moderateto extremely high affinity for biotin (Kd = 10−7–10−16 M); therefore, they can interferewith the “SAV/AVI–B7” interaction when present in a sample. Because of this, the effect
24

Foods 2022, 11, 219
of extraneous AVI on ELISAs in the detection of BT and COL using the coated SAV–B7–hapten complex was examined. This effect was investigated in different stages of theassay. Figure 4 (dashed lines) demonstrates that extraneous AVI (1–100,000 ng/mL) couldinhibit the formation of the complexes SAV–BT–B7 and SAV–COL–B7 in a dose-dependentmanner (stage 1). Therefore, the developed assay systems could simultaneously serveas competitive assays for AVI detection. No evident effect at stages 2 and 3 was foundwhen SAV–B7 complexes were already formed. Thus, interference from extraneous AVImay be a drawback for assay formats involving “coated antibody–hapten–B7” or “coatedhapten–antibody–B7”, where AVI can interact with unblocked biotin.
Figure 4. Influence of extraneous AVI on different stages of ELISAs for bacitracin (A) and colistin(B) based on coated complexes formed between SAV and biotinylated hapten. Complex formationbetween coated SAV and BT/COL–B7 (stage 1), antibody–analyte binding (stage 2), and boundantibody–GAR–HRP interaction (stage 3).
3.4. Assessment of Extraneous Biotin Influence on the Assay
Mammals cannot synthesize biotin but depend on dietary intake from microbial andplant sources [10]. Nevertheless, B7 uptake, accumulation in tissues, especially in theliver, and renal reabsorption of B7 determine its presence in animal-derived food. Thetissues richest in biotin are chicken and beef liver (0.4–1.9 µg/g), egg yolk (0.3 µg/g), fish(0.05–0.1 µg/g), while the majority of B7 in meat is protein-bound [15]. The mentionedB7 content is sufficient to cause an undesirable interference in (strept)avidin–biotin-basedimmunoassay.
The possible interference from extraneous B7 was examined in different stages ofthe developed assays as reported above for the assessment of AVI influence. As seen inFigure 5, the presence of B7 in the test samples up to 10,000 ng/mL (50 µM) could disruptthe formation of the complex between SAV and B7 at concentrations >1 ng/mL (Figure 5,stage 1). When the complexes between SAV and B7–hapten were already formed in stage 1,the influence of extraneous B7 could not strongly affect the binding in the assay rangingbetween 80 and 110% (Figure 5, stage 2,3).
Thus, these experiments showed that samples with moderate to high AVI or B7 contentcannot be analyzed using tests in which the analyte is detected during SAV–B7 complexationdue to the strong influence of endogenous matrix factors. In the assay design considered inthis work, the recognition of the analyte by antibodies (stage 2) was separated from theSAV–B7 interaction (stage 1) to minimize the possible influence of endogenous AVI/B7from the matrix.
25
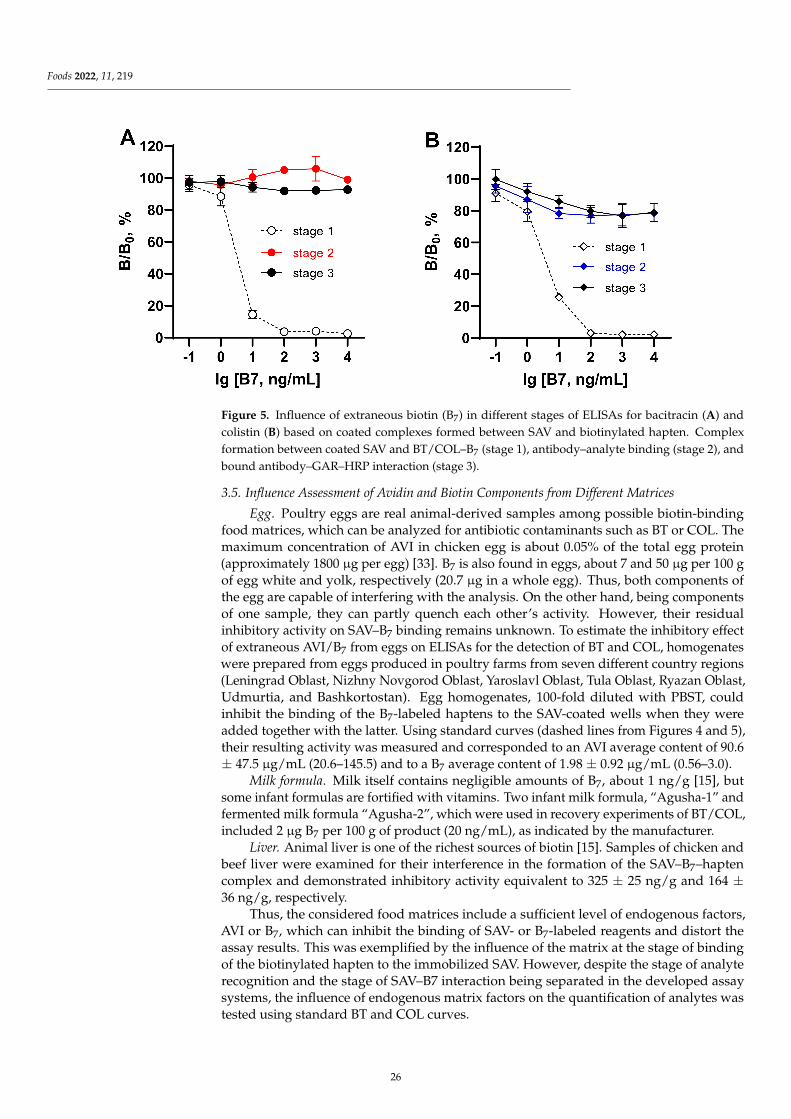
Foods 2022, 11, 219
Figure 5. Influence of extraneous biotin (B7) in different stages of ELISAs for bacitracin (A) andcolistin (B) based on coated complexes formed between SAV and biotinylated hapten. Complexformation between coated SAV and BT/COL–B7 (stage 1), antibody–analyte binding (stage 2), andbound antibody–GAR–HRP interaction (stage 3).
3.5. Influence Assessment of Avidin and Biotin Components from Different Matrices
Egg. Poultry eggs are real animal-derived samples among possible biotin-bindingfood matrices, which can be analyzed for antibiotic contaminants such as BT or COL. Themaximum concentration of AVI in chicken egg is about 0.05% of the total egg protein(approximately 1800 µg per egg) [33]. B7 is also found in eggs, about 7 and 50 µg per 100 gof egg white and yolk, respectively (20.7 µg in a whole egg). Thus, both components ofthe egg are capable of interfering with the analysis. On the other hand, being componentsof one sample, they can partly quench each other’s activity. However, their residualinhibitory activity on SAV–B7 binding remains unknown. To estimate the inhibitory effectof extraneous AVI/B7 from eggs on ELISAs for the detection of BT and COL, homogenateswere prepared from eggs produced in poultry farms from seven different country regions(Leningrad Oblast, Nizhny Novgorod Oblast, Yaroslavl Oblast, Tula Oblast, Ryazan Oblast,Udmurtia, and Bashkortostan). Egg homogenates, 100-fold diluted with PBST, couldinhibit the binding of the B7-labeled haptens to the SAV-coated wells when they wereadded together with the latter. Using standard curves (dashed lines from Figures 4 and 5),their resulting activity was measured and corresponded to an AVI average content of 90.6± 47.5 µg/mL (20.6–145.5) and to a B7 average content of 1.98 ± 0.92 µg/mL (0.56–3.0).
Milk formula. Milk itself contains negligible amounts of B7, about 1 ng/g [15], butsome infant formulas are fortified with vitamins. Two infant milk formula, “Agusha-1” andfermented milk formula “Agusha-2”, which were used in recovery experiments of BT/COL,included 2 µg B7 per 100 g of product (20 ng/mL), as indicated by the manufacturer.
Liver. Animal liver is one of the richest sources of biotin [15]. Samples of chicken andbeef liver were examined for their interference in the formation of the SAV–B7–haptencomplex and demonstrated inhibitory activity equivalent to 325 ± 25 ng/g and 164 ±36 ng/g, respectively.
Thus, the considered food matrices include a sufficient level of endogenous factors,AVI or B7, which can inhibit the binding of SAV- or B7-labeled reagents and distort theassay results. This was exemplified by the influence of the matrix at the stage of bindingof the biotinylated hapten to the immobilized SAV. However, despite the stage of analyterecognition and the stage of SAV–B7 interaction being separated in the developed assaysystems, the influence of endogenous matrix factors on the quantification of analytes wastested using standard BT and COL curves.
26
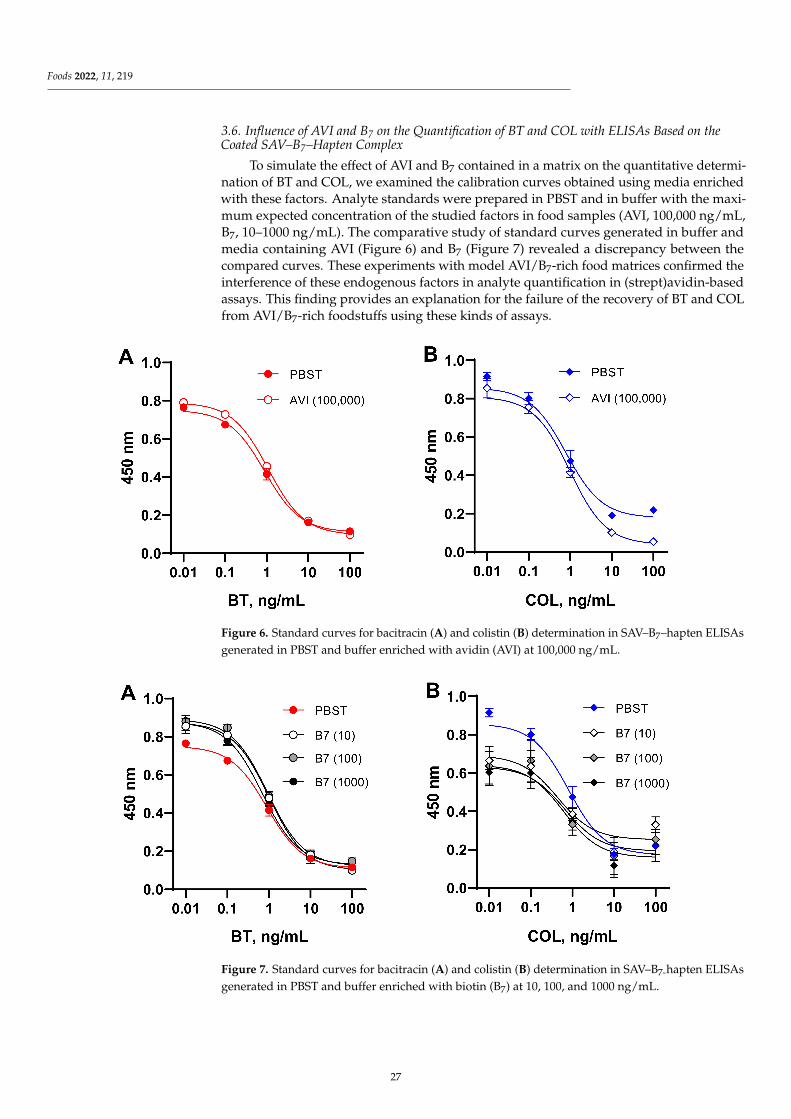
Foods 2022, 11, 219
3.6. Influence of AVI and B7 on the Quantification of BT and COL with ELISAs Based on theCoated SAV–B7–Hapten Complex
To simulate the effect of AVI and B7 contained in a matrix on the quantitative determi-nation of BT and COL, we examined the calibration curves obtained using media enrichedwith these factors. Analyte standards were prepared in PBST and in buffer with the maxi-mum expected concentration of the studied factors in food samples (AVI, 100,000 ng/mL,B7, 10–1000 ng/mL). The comparative study of standard curves generated in buffer andmedia containing AVI (Figure 6) and B7 (Figure 7) revealed a discrepancy between thecompared curves. These experiments with model AVI/B7-rich food matrices confirmed theinterference of these endogenous factors in analyte quantification in (strept)avidin-basedassays. This finding provides an explanation for the failure of the recovery of BT and COLfrom AVI/B7-rich foodstuffs using these kinds of assays.
Figure 6. Standard curves for bacitracin (A) and colistin (B) determination in SAV–B7–hapten ELISAsgenerated in PBST and buffer enriched with avidin (AVI) at 100,000 ng/mL.
Figure 7. Standard curves for bacitracin (A) and colistin (B) determination in SAV–B7-hapten ELISAsgenerated in PBST and buffer enriched with biotin (B7) at 10, 100, and 1000 ng/mL.
27

Foods 2022, 11, 219
4. Conclusions
An alternative approach for hapten coating on plates was realized using the orientedbinding of biotinylated BT and COL to immobilized SAV. Such formed complexes andBT/COL conjugated to protein carriers were compared as coating antigens in competitiveELISAs for the determination of these cyclic peptide antibiotics in food matrices. Thesimple titration of B7–haptens in SAV-coated plates provided a finer optimization of coatedhapten load compared with hapten load on the conjugates. Using the coating complexesSAV–B7–BT and SAV–B7–COL instead of the coating conjugates GEL–BT(ae) and GEL(pi)–PMB improved the sensitivity of the determination of BT and COL by 2 and 15 times,achieving 0.6 and 0.3 ng/mL, respectively. The applicability of an immunoassay basedon (strept)avidin–biotin interactions for the detection of analytes in food matrices rich inAVI or B7 was also challenged in this work. The possible interference of AVI or B7 from amatrix in different stages of the immunoassay was investigated. As a result, the developedcompetitive indirect ELISAs based on coated SAV–B7–BT and SAV–B–COL, in addition todetermining the main analytes, BT and COL, were applied for assessing AVI and B7 contentin food matrices such as eggs, infant milk formula enriched with B7, and chicken andbeef liver. Thus, due to the dose-dependent inhibition of the binding of B7–hapten to SAV,these ELISAs proved to be suitable for solving additional analytical tasks, detecting AVIand B7 up to 10 and 1 ng/mL, respectively. The interaction between SAV and B7–haptenwas the one most influenced by extraneous AVI and B7. The detection of the analyte byan antibody occurs at different stages of the immunoassay, which minimizes the possibleinterference from AVI and B7 contained in the matrix. However, an adequate quantitativeassessment of BT and COL in food matrices rich in AVI/B7 was not implemented in thedeveloped (strept)avidin–biotin-based immunoassays. Modification of the standard curvesin a matrix-free but AVI/B7-enriched environment provided evidence of the influence ofthese factors on the quantification of the analytes. This explains the failure of numerousrecovery experiments with fortified nutritional matrices. Thus, summarizing the experiencegained in the course of this study, it is recommended to avoid immunoassays based onavidin–biotin interactions when analyzing biosamples containing these factors.
Author Contributions: Conceptualization, Formal Analysis and Investigation, Writing—OriginalDraft Preparation, Review and Editing, M.A.B.; Formal Analysis and Investigation, Writing—OriginalDraft Preparation, I.A.G.; Funding Acquisition, Writing—Review and Editing, S.A.E. All authorshave read and agreed to the published version of the manuscript.
Funding: This research was supported by the Interdisciplinary Scientific and Educational School ofMoscow University «Future Planet and Global Environmental Change».
Institutional Review Board Statement: Not applicable.
Informed Consent Statement: Not applicable.
Data Availability Statement: The datasets used and/or analyzed during the current study areavailable from the corresponding author on request.
Conflicts of Interest: The authors declare no conflict of interest.
References
1. Wilchek, M.; Bayer, E.A. [54] Avidin-biotin mediated immunoassays: Overview. Methods Enzymol. 1990, 184, 467–469. [PubMed]2. El-Maghrabey, M.; Kishikawa, N.; Harada, S.; Ohyama, K.; Kuroda, N. Quinone-based antibody labeling reagent for enzyme-free
chemiluminescent immunoassays. Application to avidin and biotinylated anti-rabbit IgG labeling. Biosens. Bioelectron. 2020, 160,112215. [CrossRef]
3. Mustafaoglu, N.; Alves, N.J.; Bilgicer, B. Oriented immobilization of Fab fragments by site-specific biotinylation at the conservednucleotide binding site for enhanced antigen detection. Langmuir 2015, 31, 9728–9736. [CrossRef] [PubMed]
4. Ohashi, T.; Mawatari, K.; Kitamori, T. On-chip antibody immobilization for on-demand and rapid immunoassay on a microfluidicchip. Biomicrofluidics 2010, 4, 032207. [CrossRef] [PubMed]
5. Bratthauer, G.L. The avidin–biotin complex (ABC) method and other avidin–biotin binding methods. In Immunocytochemical
Methods and Protocols; Springer: Berlin/Heidelberg, Germany, 2010; pp. 257–270.
28
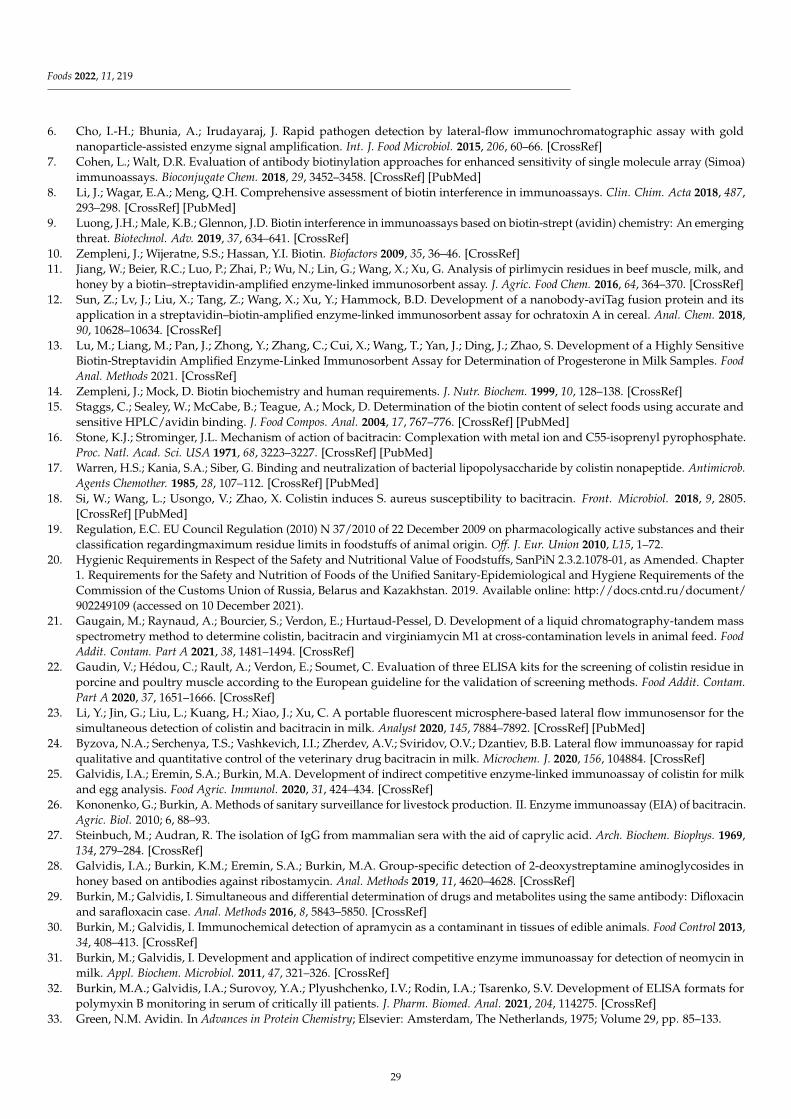
Foods 2022, 11, 219
6. Cho, I.-H.; Bhunia, A.; Irudayaraj, J. Rapid pathogen detection by lateral-flow immunochromatographic assay with goldnanoparticle-assisted enzyme signal amplification. Int. J. Food Microbiol. 2015, 206, 60–66. [CrossRef]
7. Cohen, L.; Walt, D.R. Evaluation of antibody biotinylation approaches for enhanced sensitivity of single molecule array (Simoa)immunoassays. Bioconjugate Chem. 2018, 29, 3452–3458. [CrossRef] [PubMed]
8. Li, J.; Wagar, E.A.; Meng, Q.H. Comprehensive assessment of biotin interference in immunoassays. Clin. Chim. Acta 2018, 487,293–298. [CrossRef] [PubMed]
9. Luong, J.H.; Male, K.B.; Glennon, J.D. Biotin interference in immunoassays based on biotin-strept (avidin) chemistry: An emergingthreat. Biotechnol. Adv. 2019, 37, 634–641. [CrossRef]
10. Zempleni, J.; Wijeratne, S.S.; Hassan, Y.I. Biotin. Biofactors 2009, 35, 36–46. [CrossRef]11. Jiang, W.; Beier, R.C.; Luo, P.; Zhai, P.; Wu, N.; Lin, G.; Wang, X.; Xu, G. Analysis of pirlimycin residues in beef muscle, milk, and
honey by a biotin–streptavidin-amplified enzyme-linked immunosorbent assay. J. Agric. Food Chem. 2016, 64, 364–370. [CrossRef]12. Sun, Z.; Lv, J.; Liu, X.; Tang, Z.; Wang, X.; Xu, Y.; Hammock, B.D. Development of a nanobody-aviTag fusion protein and its
application in a streptavidin–biotin-amplified enzyme-linked immunosorbent assay for ochratoxin A in cereal. Anal. Chem. 2018,90, 10628–10634. [CrossRef]
13. Lu, M.; Liang, M.; Pan, J.; Zhong, Y.; Zhang, C.; Cui, X.; Wang, T.; Yan, J.; Ding, J.; Zhao, S. Development of a Highly SensitiveBiotin-Streptavidin Amplified Enzyme-Linked Immunosorbent Assay for Determination of Progesterone in Milk Samples. Food
Anal. Methods 2021. [CrossRef]14. Zempleni, J.; Mock, D. Biotin biochemistry and human requirements. J. Nutr. Biochem. 1999, 10, 128–138. [CrossRef]15. Staggs, C.; Sealey, W.; McCabe, B.; Teague, A.; Mock, D. Determination of the biotin content of select foods using accurate and
sensitive HPLC/avidin binding. J. Food Compos. Anal. 2004, 17, 767–776. [CrossRef] [PubMed]16. Stone, K.J.; Strominger, J.L. Mechanism of action of bacitracin: Complexation with metal ion and C55-isoprenyl pyrophosphate.
Proc. Natl. Acad. Sci. USA 1971, 68, 3223–3227. [CrossRef] [PubMed]17. Warren, H.S.; Kania, S.A.; Siber, G. Binding and neutralization of bacterial lipopolysaccharide by colistin nonapeptide. Antimicrob.
Agents Chemother. 1985, 28, 107–112. [CrossRef] [PubMed]18. Si, W.; Wang, L.; Usongo, V.; Zhao, X. Colistin induces S. aureus susceptibility to bacitracin. Front. Microbiol. 2018, 9, 2805.
[CrossRef] [PubMed]19. Regulation, E.C. EU Council Regulation (2010) N 37/2010 of 22 December 2009 on pharmacologically active substances and their
classification regardingmaximum residue limits in foodstuffs of animal origin. Off. J. Eur. Union 2010, L15, 1–72.20. Hygienic Requirements in Respect of the Safety and Nutritional Value of Foodstuffs, SanPiN 2.3.2.1078-01, as Amended. Chapter
1. Requirements for the Safety and Nutrition of Foods of the Unified Sanitary-Epidemiological and Hygiene Requirements of theCommission of the Customs Union of Russia, Belarus and Kazakhstan. 2019. Available online: http://docs.cntd.ru/document/902249109 (accessed on 10 December 2021).
21. Gaugain, M.; Raynaud, A.; Bourcier, S.; Verdon, E.; Hurtaud-Pessel, D. Development of a liquid chromatography-tandem massspectrometry method to determine colistin, bacitracin and virginiamycin M1 at cross-contamination levels in animal feed. Food
Addit. Contam. Part A 2021, 38, 1481–1494. [CrossRef]22. Gaudin, V.; Hédou, C.; Rault, A.; Verdon, E.; Soumet, C. Evaluation of three ELISA kits for the screening of colistin residue in
porcine and poultry muscle according to the European guideline for the validation of screening methods. Food Addit. Contam.
Part A 2020, 37, 1651–1666. [CrossRef]23. Li, Y.; Jin, G.; Liu, L.; Kuang, H.; Xiao, J.; Xu, C. A portable fluorescent microsphere-based lateral flow immunosensor for the
simultaneous detection of colistin and bacitracin in milk. Analyst 2020, 145, 7884–7892. [CrossRef] [PubMed]24. Byzova, N.A.; Serchenya, T.S.; Vashkevich, I.I.; Zherdev, A.V.; Sviridov, O.V.; Dzantiev, B.B. Lateral flow immunoassay for rapid
qualitative and quantitative control of the veterinary drug bacitracin in milk. Microchem. J. 2020, 156, 104884. [CrossRef]25. Galvidis, I.A.; Eremin, S.A.; Burkin, M.A. Development of indirect competitive enzyme-linked immunoassay of colistin for milk
and egg analysis. Food Agric. Immunol. 2020, 31, 424–434. [CrossRef]26. Kononenko, G.; Burkin, A. Methods of sanitary surveillance for livestock production. II. Enzyme immunoassay (EIA) of bacitracin.
Agric. Biol. 2010; 6, 88–93.27. Steinbuch, M.; Audran, R. The isolation of IgG from mammalian sera with the aid of caprylic acid. Arch. Biochem. Biophys. 1969,
134, 279–284. [CrossRef]28. Galvidis, I.A.; Burkin, K.M.; Eremin, S.A.; Burkin, M.A. Group-specific detection of 2-deoxystreptamine aminoglycosides in
honey based on antibodies against ribostamycin. Anal. Methods 2019, 11, 4620–4628. [CrossRef]29. Burkin, M.; Galvidis, I. Simultaneous and differential determination of drugs and metabolites using the same antibody: Difloxacin
and sarafloxacin case. Anal. Methods 2016, 8, 5843–5850. [CrossRef]30. Burkin, M.; Galvidis, I. Immunochemical detection of apramycin as a contaminant in tissues of edible animals. Food Control 2013,
34, 408–413. [CrossRef]31. Burkin, M.; Galvidis, I. Development and application of indirect competitive enzyme immunoassay for detection of neomycin in
milk. Appl. Biochem. Microbiol. 2011, 47, 321–326. [CrossRef]32. Burkin, M.A.; Galvidis, I.A.; Surovoy, Y.A.; Plyushchenko, I.V.; Rodin, I.A.; Tsarenko, S.V. Development of ELISA formats for
polymyxin B monitoring in serum of critically ill patients. J. Pharm. Biomed. Anal. 2021, 204, 114275. [CrossRef]33. Green, N.M. Avidin. In Advances in Protein Chemistry; Elsevier: Amsterdam, The Netherlands, 1975; Volume 29, pp. 85–133.
29

Foods 2022, 11, 219
34. Taskinen, B.; Zmurko, J.; Ojanen, M.; Kukkurainen, S.; Parthiban, M.; Määttä, J.A.; Leppiniemi, J.; Jänis, J.; Parikka, M.; Turpeinen,H. Zebavidin-An avidin-like protein from zebrafish. PLoS ONE 2013, 8, e77207. [CrossRef]
35. Määttä, J.A.; Helppolainen, S.H.; Hytönen, V.P.; Johnson, M.S.; Kulomaa, M.S.; Airenne, T.T.; Nordlund, H.R. Structural andfunctional characteristics of xenavidin, the first frog avidin from Xenopus tropicalis. BMC Struct. Biol. 2009, 9, 1–13. [CrossRef][PubMed]
36. Chaiet, L.; Wolf, F.J. The properties of streptavidin, a biotin-binding protein produced by Streptomycetes. Arch. Biochem. Biophys.
1964, 106, 1–5. [CrossRef]37. Helppolainen, S.H.; Nurminen, K.P.; Määttä, J.A.; Halling, K.K.; Slotte, J.P.; Huhtala, T.; Liimatainen, T.; Ylä-Herttuala, S.; Airenne,
K.J.; Närvänen, A. Rhizavidin from Rhizobium etli: The first natural dimer in the avidin protein family. Biochem. J. 2007, 405,397–405. [CrossRef] [PubMed]
38. Takakura, Y.; Tsunashima, M.; Suzuki, J.; Usami, S.; Kakuta, Y.; Okino, N.; Ito, M.; Yamamoto, T. Tamavidins–novel avidin-likebiotin-binding proteins from the Tamogitake mushroom. FEBS J. 2009, 276, 1383–1397. [CrossRef] [PubMed]
39. Takakura, Y.; Sofuku, K.; Tsunashima, M.; Kuwata, S. Lentiavidins: Novel avidin-like proteins with low isoelectric points fromshiitake mushroom (Lentinula edodes). J. Biosci. Bioeng. 2016, 121, 420–423. [CrossRef]
30
foods
Article
Design, Synthesis, and Characterization of Tracers andDevelopment of a Fluorescence Polarization Immunoassay forRapid Screening of 4,4′-Dinitrocarbanilide in Chicken Muscle
Qidi Zhang 1,†, Ming Zou 1,†, Wanyu Wang 1, Jinyan Li 1 and Xiao Liang 1,2,*
Citation: Zhang, Q.; Zou, M.;
Wang, W.; Li, J.; Liang, X. Design,
Synthesis, and Characterization of
Tracers and Development of
a Fluorescence Polarization
Immunoassay for Rapid Screening of
4,4′-Dinitrocarbanilide in Chicken
Muscle. Foods 2021, 10, 1822. https://
doi.org/10.3390/foods10081822
Academic Editor: Cristina A. Fente
Received: 7 July 2021
Accepted: 2 August 2021
Published: 6 August 2021
Publisher’s Note: MDPI stays neutral
with regard to jurisdictional claims in
published maps and institutional affil-
iations.
Copyright: © 2021 by the authors.
Licensee MDPI, Basel, Switzerland.
This article is an open access article
distributed under the terms and
conditions of the Creative Commons
Attribution (CC BY) license (https://
creativecommons.org/licenses/by/
4.0/).
1 College of Veterinary Medicine, Qingdao Agricultural University, No. 700 Changcheng Road,Qingdao 266109, China; [email protected] (Q.Z.); [email protected] (M.Z.);[email protected] (W.W.); [email protected] (J.L.)
2 Basic Medical College, Qingdao University, No. 308 Ningxia Road, Qingdao 266071, China* Correspondence: [email protected]; Tel.: +86-139-64867-357† These authors contributed equally to this work.
Abstract: The compound, 4,4′-dinitrocarbanilide (DNC), is the marker residue of concern in edibletissues of broilers fed with diets containing anticoccidial nicarbazin (NIC). In this study, 25 fluorescein-labeled DNC derivatives (tracers) are synthesized and characterized to develop a rapid fluorescencepolarization immunoassay (FPIA) for the detection of DNC in chickens using DNC monoclonalantibodies (mAbs). The effect of the tracer structure on the sensitivity of the FPIA is investigated.Our results show that after optimization, the half maximal inhibitory concentrations (IC50) and limitof detection (LOD) of the FPIA in the buffer are 28.3 and 5.7 ng mL−1, respectively. No significantcross-reactivity (CR < 0.89%) with 15 DNC analogues is observed. The developed FPIA is validatedfor DNC detection in spiked chicken homogenates, and recoveries ranged from 74.2 to 85.8%, withcoefficients of variation <8.6%. Moreover, the total time needed for the detection procedure ofthe FPIA, including sample pretreatment, is <40 min, which has not been achieved in any otherimmunoassays for DNC from literature. Our results demonstrate that the FPIA developed here isa simple, sensitive, specific, and reproducible screening method for DNC residues in chickens.
Keywords: DNC residue; FPIA; tracers; chicken muscle
1. Introduction
Coccidiosis refers to the disease caused by protozoans of the genus Eimeria resulting ina wide range of injuries in the intestinal tracts of poultry [1,2]. Intestinal invasion by theseprotozoans disrupts feeding, digestive processes, and nutrient absorption and results indehydration, blood loss, and increased susceptibility to other etiological agents. Together,these effects can result in significant economic losses in the poultry industry, as well asconsiderable cause distress to the animals [3].
Numerous types of coccidiostats have been developed, and nicarbazin (NIC) wasthe first such agent found to give satisfactory control of coccidiosis in chicken productionfacilities and has been in general use for this purpose since the 1960s. The most commonform of NIC is an equimolar mixture of 4,4′-dinitrocarbanilide (DNC) and 2-hydroxy-4,6-dimethyl pyrimidine (HDP) (Figure S1). Despite emerging drug resistance in protozoanparasite populations, NIC has maintained its effectiveness against all species of Eimeria [4].However, NIC use as a coccidiostats is limited to the initial growth phases of chickens,since it causes adverse heat stress effects when administered to older birds and oftenresults in their mortality. Moreover, long term human exposure to low levels of NIC canresult in chronic toxicity [5]. In addition, NIC administered via feed in chickens results inthe persistence of the DNC residues in edible tissues [6]. Hence, DNC is the marker residueused for the detection of NIC in edible chicken tissues. The maximum residue limits (MRL)
31
Foods 2021, 10, 1822
of DNC in food matrices has been established by Food and Agriculture Organization (FAO),as well as by New Zealand for chicken muscle tissues at 200 µg kg−1 [7]. The MRL hasbeen set at 200 µg kg−1 in China [8]. Japan has established an MRL of DNC at 20 µg Kg−1
for aquatic products.The current analytic methods for the determination of DNC in food matrices utilize
high performance liquid chromatography (HPLC) and HPLC-tandem mass spectrometry(MS/MS) [9–13]. These methods are accurate and sensitive, but require well-equipped lab-oratories, high capital expenditures, highly trained personnel, and generally involve timeconsuming sample preparation steps. Therefore, a rapid and efficient alternative detectionmethod for screening large numbers of samples would streamline DNC screening efforts.
Immunoassay techniques are effective and economical alternatives to instrumentalmethods for DNC. The enzyme-linked immunosorbent assay (ELISA) is the most frequentchoice [1,14,15], but it is a heterogeneous solid phase method and the time required tocomplete the assay is often >2 h, because of the need to separate the unbound probe insolution before the bound probe can be quantified [1]. In contrast, fluorescence polarizationimmunoassay (FPIA) is a competitive homogeneous assay that is based on differences influorescence polarization (FP) of the fluorescently-labeled analyte in the antibody boundand non-bound fractions (Figure S2). These reactions can reach equilibrium in minutesor even seconds, and no separation or washing steps are required, which makes it idealfor high-throughput screening of large numbers of samples [16,17]. These advantages ofthe FPIA have resulted in their widespread use in high-throughput screening of chemicalcontaminants, such as veterinary drugs [16–19], mycotoxins, pesticides, and other envi-ronmental contaminants in foods, feed, and environmental samples [20–22]. However,the application of FPIA to the detection of DNC has not been reported.
The top priorities in developing high-throughput screening methods are to simplifythe assay and shorten analysis time, while maximizing the sensitivity of the methods [19].With this aim, we developed a novel FPIA method for the screening of DNC in the presentwork. We investigated the effects of different tracers and physicochemical factors onthe performance of the FPIA. The optimized immunoassay was compared with otherpublished detection methods, and the newly developed method provided a simple, rapid,reproducible, and highly sensitive detection of DNC. Analysis of DNC in chicken samplesrequired <40 min to complete using the FPIA.
2. Materials and Methods
2.1. Reagents and Equipments
NIC, 4-Nitroaniline, 2-Nitroaniline, 3-Nitroaniline, N-(4-Nitrophenyl) propionamide, H-Val-Pna HCl, L-Argininep-Nitroanilide Dihydrochloride, 4-Nitrophenethylamine hydrochlo-ride, N-Methyl-4-nitrophenethylamine hydrochloride, H-Ala-Pna HCl, N,N-Dimethyl-4-Nitroaniline, H-Glu-Pna, Halofuginone, Toltrazuril, 1, 3-Diphenylguanidine, Ronida-zole, and dinitolmide were obtained from Sigma-Aldrich (St. Louis, MO, USA). N, N-Dimethylformamide (DMF), 1-ethyl-3-(3-dimethylaminopropy) carbodiimide (EDC), N-hydroxysuccinimide (NHS), fluorescein isothiocyanate, ethylenediamine, butanediamine,hexamethylenediamine, 5-Aminofluorescein (5-AF), and 6-Aminofluorescein (6-AF) wereobtained from Aladdin (Shanghai, China). Nonbinding-surface black microplates were pur-chased from Corning Life Sciences (New York, NY, USA). Normal solvents and salts were ofanalytical reagent grade and were supplied by Beijing Reagent Corporation (Beijing, China).The haptens DNC-1, DNC-2, DNC-3, DNC-4, and DNC-5 and four mAbs (4E1, 4B8, 2A12,and 3B4) were acquired from China Agricultural University [23]. Borate buffer (0.05 M,pH 8.0) was used as the working buffer for all FPIA experiments. The standard solutionof DNC (2 mg mL−1) was prepared by dissolving 4 mg of the DNC standard in 2 mL ofdimethyl sulfoxide, and stored at −20 ◦C until use.
A SpectraMax M5 microplate reader from Molecular Devices (Downingtown, PA, USA)was used to measure FP. Black microplates (96-well) with a non-binding surface for FPIAwere purchased from Corning Life Sciences (New York, NY, USA). Water was purified
32
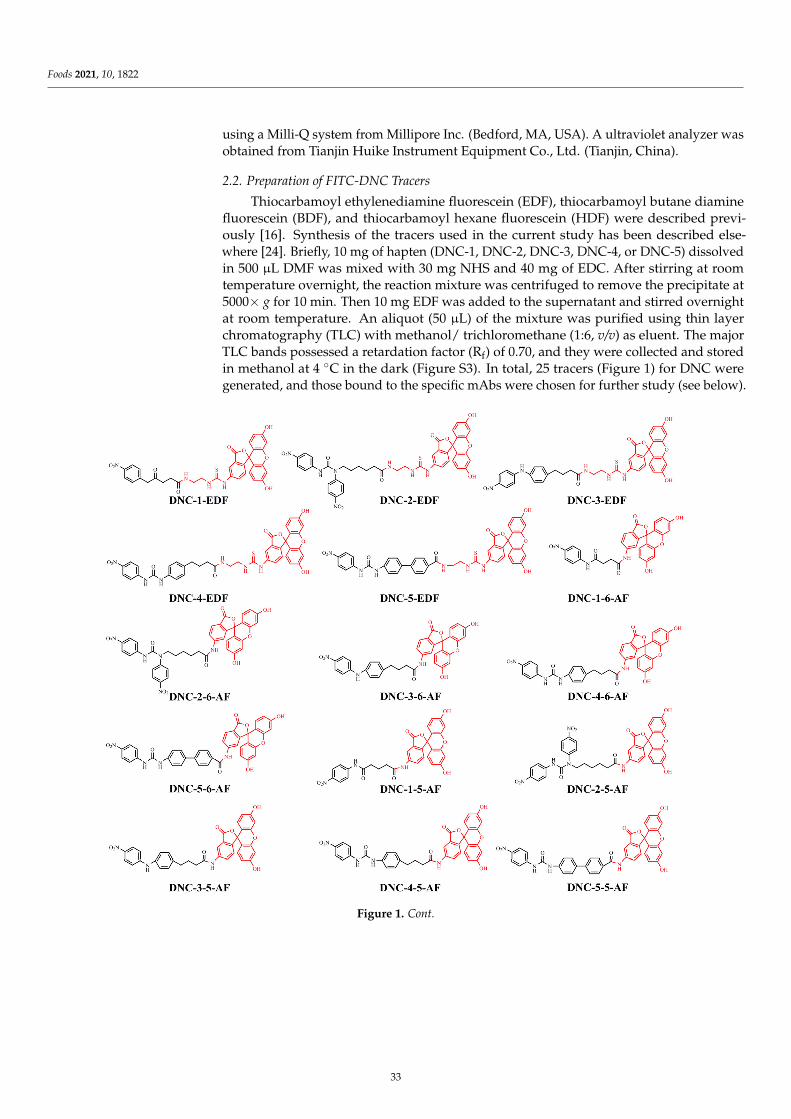
Foods 2021, 10, 1822
using a Milli-Q system from Millipore Inc. (Bedford, MA, USA). A ultraviolet analyzer wasobtained from Tianjin Huike Instrument Equipment Co., Ltd. (Tianjin, China).
2.2. Preparation of FITC-DNC Tracers
Thiocarbamoyl ethylenediamine fluorescein (EDF), thiocarbamoyl butane diaminefluorescein (BDF), and thiocarbamoyl hexane fluorescein (HDF) were described previ-ously [16]. Synthesis of the tracers used in the current study has been described else-where [24]. Briefly, 10 mg of hapten (DNC-1, DNC-2, DNC-3, DNC-4, or DNC-5) dissolvedin 500 µL DMF was mixed with 30 mg NHS and 40 mg of EDC. After stirring at roomtemperature overnight, the reaction mixture was centrifuged to remove the precipitate at5000× g for 10 min. Then 10 mg EDF was added to the supernatant and stirred overnightat room temperature. An aliquot (50 µL) of the mixture was purified using thin layerchromatography (TLC) with methanol/ trichloromethane (1:6, v/v) as eluent. The majorTLC bands possessed a retardation factor (Rf) of 0.70, and they were collected and storedin methanol at 4 ◦C in the dark (Figure S3). In total, 25 tracers (Figure 1) for DNC weregenerated, and those bound to the specific mAbs were chosen for further study (see below).
Figure 1. Cont.
33

Foods 2021, 10, 1822
Figure 1. Structures of 25 different tracers of DNC.
2.3. FPIA Procedure
The tracer solutions were diluted with borate buffer to working concentrations withFP values 10 times that of the borate buffer background. The FPIA approach was described,as follows—70 µL of each tracer solution and 70 µL DNC standard solution or borate bufferwere added to 70 µL antibody in a microplate well. After incubation for 20 min in the darkat room temperature, the FP value of the mixture was measured at λex 485 nm and λem530 nm (emission cutoff = 515 nm), respectively.
The antibody-tracer pair used in the final assay was the DNC-4-BDF and mAb 3B4combination. The concentration of DNC-4-BDF was 200 RFU, and the dilution of mAb 3B4was 1/300. The incubation time was 20 min at room temperature. The physicochemicalconditions of the reaction buffer were pH 8 and NaCl concentration at 0 mM, respectively.
2.4. Curve Fitting and Statistical Analysis
A sigmoidal curve was used to fit FPIA data via OriginPro 8.0 (Origin Lab,Northampton, MA, USA) for construction of the standard curves. A four-parameter logis-tic equation was used to fit the immunoassay data as follows:
Y = (A − D)/[1 + (X⁄C)B] + D (1)
where A and D represent the maximum and minimum values, respectively; B is the slopefactor; C is the concentration corresponding to 50% specific binding (IC50), and X isthe calibration concentration [25]. The limit of detection (LOD) was the concentrationof the standard causing 10% inhibition of tracer binding (IC10), and the working rangecorresponded to concentrations of the standard from IC20 to IC80 on the calibration curve.The IC50 and LOD values were used to evaluate the properties of the FPIA.
34
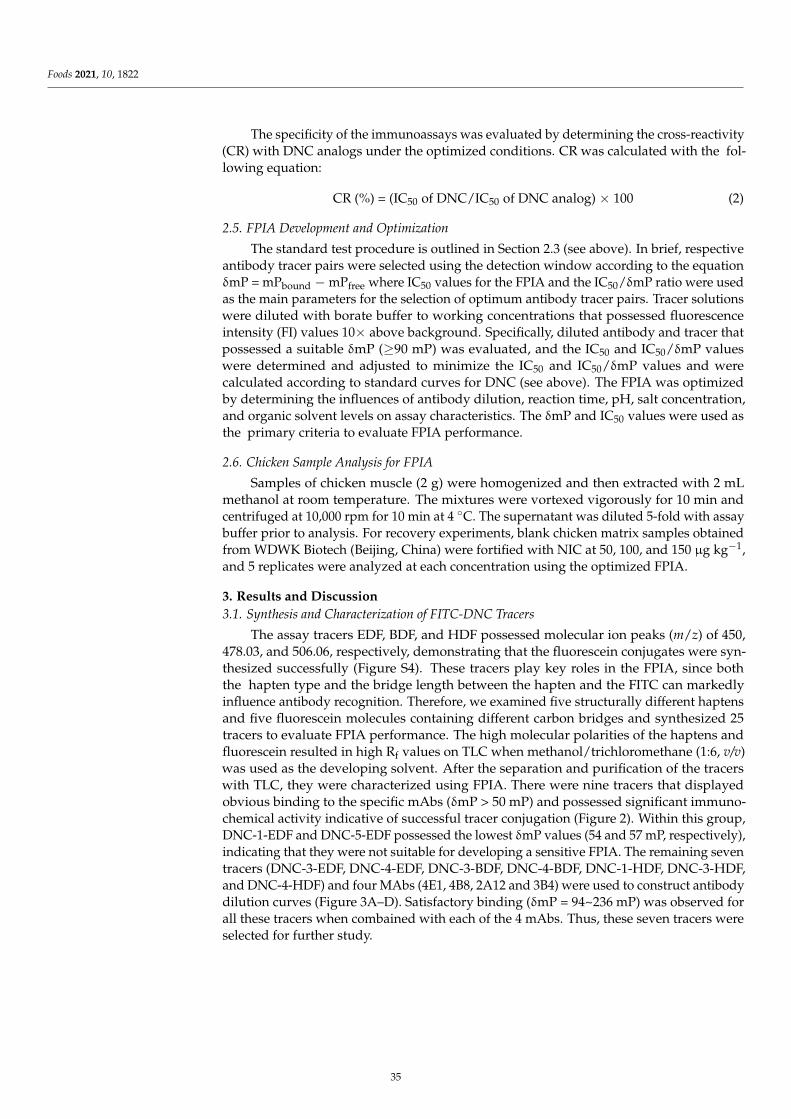
Foods 2021, 10, 1822
The specificity of the immunoassays was evaluated by determining the cross-reactivity(CR) with DNC analogs under the optimized conditions. CR was calculated with the fol-lowing equation:
CR (%) = (IC50 of DNC/IC50 of DNC analog) × 100 (2)
2.5. FPIA Development and Optimization
The standard test procedure is outlined in Section 2.3 (see above). In brief, respectiveantibody tracer pairs were selected using the detection window according to the equationδmP = mPbound − mPfree where IC50 values for the FPIA and the IC50/δmP ratio were usedas the main parameters for the selection of optimum antibody tracer pairs. Tracer solutionswere diluted with borate buffer to working concentrations that possessed fluorescenceintensity (FI) values 10× above background. Specifically, diluted antibody and tracer thatpossessed a suitable δmP (≥90 mP) was evaluated, and the IC50 and IC50/δmP valueswere determined and adjusted to minimize the IC50 and IC50/δmP values and werecalculated according to standard curves for DNC (see above). The FPIA was optimizedby determining the influences of antibody dilution, reaction time, pH, salt concentration,and organic solvent levels on assay characteristics. The δmP and IC50 values were used asthe primary criteria to evaluate FPIA performance.
2.6. Chicken Sample Analysis for FPIA
Samples of chicken muscle (2 g) were homogenized and then extracted with 2 mLmethanol at room temperature. The mixtures were vortexed vigorously for 10 min andcentrifuged at 10,000 rpm for 10 min at 4 ◦C. The supernatant was diluted 5-fold with assaybuffer prior to analysis. For recovery experiments, blank chicken matrix samples obtainedfrom WDWK Biotech (Beijing, China) were fortified with NIC at 50, 100, and 150 µg kg−1,and 5 replicates were analyzed at each concentration using the optimized FPIA.
3. Results and Discussion
3.1. Synthesis and Characterization of FITC-DNC Tracers
The assay tracers EDF, BDF, and HDF possessed molecular ion peaks (m/z) of 450,478.03, and 506.06, respectively, demonstrating that the fluorescein conjugates were syn-thesized successfully (Figure S4). These tracers play key roles in the FPIA, since boththe hapten type and the bridge length between the hapten and the FITC can markedlyinfluence antibody recognition. Therefore, we examined five structurally different haptensand five fluorescein molecules containing different carbon bridges and synthesized 25tracers to evaluate FPIA performance. The high molecular polarities of the haptens andfluorescein resulted in high Rf values on TLC when methanol/trichloromethane (1:6, v/v)was used as the developing solvent. After the separation and purification of the tracerswith TLC, they were characterized using FPIA. There were nine tracers that displayedobvious binding to the specific mAbs (δmP > 50 mP) and possessed significant immuno-chemical activity indicative of successful tracer conjugation (Figure 2). Within this group,DNC-1-EDF and DNC-5-EDF possessed the lowest δmP values (54 and 57 mP, respectively),indicating that they were not suitable for developing a sensitive FPIA. The remaining seventracers (DNC-3-EDF, DNC-4-EDF, DNC-3-BDF, DNC-4-BDF, DNC-1-HDF, DNC-3-HDF,and DNC-4-HDF) and four MAbs (4E1, 4B8, 2A12 and 3B4) were used to construct antibodydilution curves (Figure 3A–D). Satisfactory binding (δmP = 94~236 mP) was observed forall these tracers when combained with each of the 4 mAbs. Thus, these seven tracers wereselected for further study.
35

Foods 2021, 10, 1822
Figure 2. Characterization of the fluorescein-labeled DNC conjugates.
−
′
Figure 3. Antibody dilution curves of tracers. (A) 4E1 with DNC-4-EDF and DNC-1-HDF. (B) 4B8with DNC-3-EDF, DNC-4-EDF, DNC-3-BDF, DNC-4-BDF, DNC-1-HDF, DNC-3-HDF, and DNC-4-HDF. (C) 2A12 with DNC-3-EDF, DNC-4-EDF, DNC-3-BDF, DNC-4-BDF, DNC-3-HDF, and DNC-4-HDF. (D) 3B4 with DNC-4-EDF, DNC-4-BDF, and DNC-4-HDF.
3.2. FPIA Development and Optimization
3.2.1. Selection of Antibody—Tracer Pairs
The combination of tracer and antibody has significant impacts on the sensitivity andspecificity of an FPIA [26]. We evaluated the best tracer and antibody pair for use in the as-
36

Foods 2021, 10, 1822
say by constructing DNC standard curves. The optimum of mAb dilution was obtainedfrom antibody dilution curves, and a δmP of 100 mP was set as the target detection range.In particular, the DNC-4-BDF and mAb 3B4 combination provided the lowest IC50 (66 ngmL−1) and IC50/δmP ratio (0.61) along with a broad detection window (δmP = 107 mP)(Figure 4A). Moreover, the Z′ factor of 0.89 represented a good separation for the distribu-tions and indicated a robust FPIA. This combination was, therefore, selected to developan FPIA for the detection of DNC (Table 1).
Table 1. Analytical parameters of the standard curves were obtained using four anti-NIC mAbs withseven DNC tracers.
Tracers mAbs Dilution FoldIC50
(ng mL−1)δmP IC50/δmP Z′
DNC-3-EDF2A12 100 1890 94 20.11 0.934B8 400 26680 83.15 320.87 0.90
DNC-4-EDF
2A12 1800 5160 91.58 56.34 0.884B8 500 263 96 2.74 0.873B4 200 223 82.1 2.72 0.824E1 50 7240 99.92 72.46 0.98
DNC-3-BDF2A12 100 1520 98.72 15.39 0.924B8 200 11360 71.45 158.99 0.94
DNC-4-BDF2A12 400 1814 82.07 22.10 0.874B8 100 3370 99 34.04 0.943B4 200 66 107.76 0.61 0.89
DNC-1-HDF4B8 200 91 89.28 1.02 0.844E1 200 11600 75.65 153.33 0.81
DNC-3-HDF2A12 200 290 133.07 2.18 0.914B8 200 9960 68.85 144.66 0.87
DNC-4-HDF2A12 700 4130 104.6 39.48 0.974B8 200 4020 117.15 34.31 0.963B4 100 2623 132.55 19.78 0.93
The use of heterologous tracers for FPIA significantly enhances its sensitivity [16,27],and we found similar results in our study. For example, mAb 4B8 was prepared usingDNC-3-KLH as immunogen and was paired with the seven tracers [23]. The IC50 values(ng mL−1) for the FPIA with these structurally heterologous tracers were DNC-4-EDF (263),DNC-4-BDF (3370), DNC-1-HDF (91), DNC-4-HDF (4020). These values were generallylower than those for the FPIA generated with homologous tracers, such as DNC-3-EDF(26680), DNC-3-BDF (11360), and DNC-3-HDF (9960) (Figure S5 and Table 1). Whenthe remaining three mAbs (i.e., 2A12, 3B4, and 4E1) were examined in a similar way usingDNC-4-BSA, DNC-5-BSA, and DNC-1-BSA as immunogens and then paired with the seventracers, similar results were obtained because heterologous tracers could be more easilyreplaced by competitors (Table 1).
The effects of the length of the linker chain between a given hapten and fluoresceinon FPIA sensitivity were also investigated in this study. The primary differences werethe linker structure or length, as well as the orientation of the attached fluorophore.The IC50 values (ng mL−1) for the FPIA increased when mAb 4B8 was paired with DNC-4-EDF (263), DNC-4-BDF (3370), and DNC-4-HDF (4020). The lowest IC50 was obtained withDNC-4-BDF when mAb 3B4 or 2A12 were paired with DNC-4-based tracers. The DNC-3-HDF tracer possessed the longest bridge and displayed the lowest IC50 when combinedwith mAb 4B8 or 2A12 (Table 1). Previous studies have indicated that sensitivity wasoptimal with long linkers between a hapten and fluorescein [19,28,29]. In contrast, FPIAbased on short bridge tracers resulted in greater assay sensitivity [30,31]. Thus, boththe structural features of the tracer hapten itself and the structure and length of the bridge
37
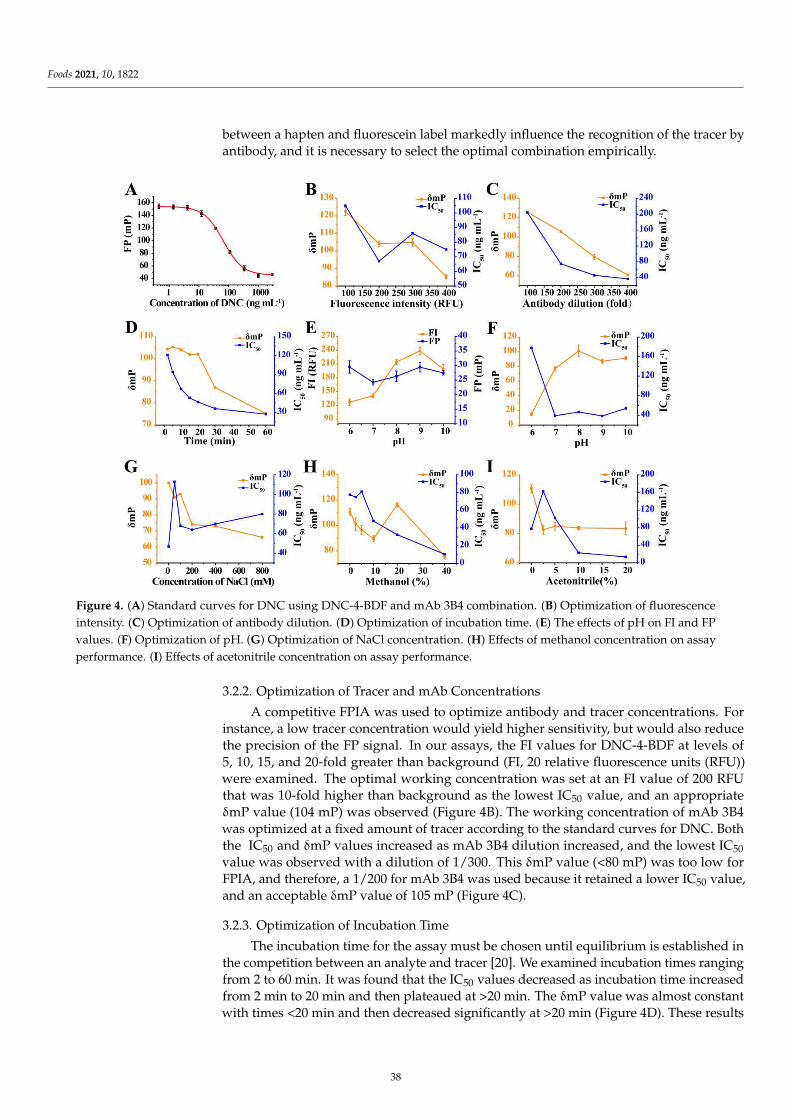
Foods 2021, 10, 1822
between a hapten and fluorescein label markedly influence the recognition of the tracer byantibody, and it is necessary to select the optimal combination empirically.
−
−
Figure 4. (A) Standard curves for DNC using DNC-4-BDF and mAb 3B4 combination. (B) Optimization of fluorescenceintensity. (C) Optimization of antibody dilution. (D) Optimization of incubation time. (E) The effects of pH on FI and FPvalues. (F) Optimization of pH. (G) Optimization of NaCl concentration. (H) Effects of methanol concentration on assayperformance. (I) Effects of acetonitrile concentration on assay performance.
3.2.2. Optimization of Tracer and mAb Concentrations
A competitive FPIA was used to optimize antibody and tracer concentrations. Forinstance, a low tracer concentration would yield higher sensitivity, but would also reducethe precision of the FP signal. In our assays, the FI values for DNC-4-BDF at levels of5, 10, 15, and 20-fold greater than background (FI, 20 relative fluorescence units (RFU))were examined. The optimal working concentration was set at an FI value of 200 RFUthat was 10-fold higher than background as the lowest IC50 value, and an appropriateδmP value (104 mP) was observed (Figure 4B). The working concentration of mAb 3B4was optimized at a fixed amount of tracer according to the standard curves for DNC. Boththe IC50 and δmP values increased as mAb 3B4 dilution increased, and the lowest IC50value was observed with a dilution of 1/300. This δmP value (<80 mP) was too low forFPIA, and therefore, a 1/200 for mAb 3B4 was used because it retained a lower IC50 value,and an acceptable δmP value of 105 mP (Figure 4C).
3.2.3. Optimization of Incubation Time
The incubation time for the assay must be chosen until equilibrium is established inthe competition between an analyte and tracer [20]. We examined incubation times rangingfrom 2 to 60 min. It was found that the IC50 values decreased as incubation time increasedfrom 2 min to 20 min and then plateaued at >20 min. The δmP value was almost constantwith times <20 min and then decreased significantly at >20 min (Figure 4D). These results
38

Foods 2021, 10, 1822
revealed that equilibrium was achieved at 20 min after the mixing of antibody and tracer;thus, 20 min was selected as the optimum incubation time.
3.2.4. Optimization of Physicochemical Conditions
The effects of pH, ionic strength, and organic solvent tolerance were also assessed forthe FPIA by comparing IC50 and δmP values under various reaction conditions. The dyesused in this assay were pH-sensitive materials, and their FI values increased in the pHrange of 6 to 8 and then decreased at pH >8, although the FP values were not affectedsignificantly by pH (Figure 4E,F). These results indicated that pH 6 was not suitable forthe assay system, due to insufficient binding (δmP = 14). This implied that the developedFPIA could not tolerate acidic conditions. The IC50 values changed little at pH valuesranging from 7 to 10, and the assay performed optimally at pH 8 with high sensitivity andmaximal δmP (>100 mP). NaCl concentrations between 0 to 800 mM and negative effectson the IC50 and δmP were observed for NaCl concentrations from 0 to 800 mM (Figure 4G).High ionic strength most likely resulted in the disruption of antibody-antigen interactions.Therefore, NaCl was not included in the assay buffer. Methanol and acetonitrile added tothe test system led to IC50 and δmP decreased in direct proportion to their concentrations.The presence of 20% methanol resulted in a significant increase of δmP (116 mP), andthis solvent was generally better tolerated than acetonitrile. Acetonitrile concentrationsexceeding 20% (final concentration) were not tolerated, although 20% acetonitrile was stilltolerated (Figure 4H,I). If needed, the assay could be used at methanol concentrations ofup to 20%.
3.3. Sensitivity and Cross-Reactivity of FPIA
Under the optimal conditions, the sensitivity and specificity of the FPIA were cal-culated using DNC and 15 DNC analogs. The IC50 value, the LOD defined as IC10 fromthe standard curve and linear range (IC20~IC80) were 28.39, 5.70, 10.31~78.17 ng mL−1,respectively (Figure 5A). The CR values for the developed FPIA were <0.89% for all 15 NICanalogs (Table 2). These results indicated that this FPIA was highly sensitive and specificfor DNC.
−
−
Figure 5. (A) Standard curves for NIC using the FPIA in assay buffer under optimized conditions. (B) Comparison of FPIAcurves obtained from standards prepared in assay buffer, and 5-fold diluted chicken extracts.
Table 2. IC50 values and Cross-reactivity of DNC and 15 structurally related analogs for the FPIA.
Analogues StructureIC50
(ng mL−1)CR(%)
DNC
−
−
28.39 100
39

Foods 2021, 10, 1822
Table 2. Cont.
Analogues StructureIC50
(ng mL−1)CR(%)
2-Nitroaniline
−
−
>30,000 <0.1
3-Nitroaniline
>30,000 <0.1
N-(4-Nitrophenyl)propionamide
>30,000 <0.1
H-Val-Pna HCl
>30,000 <0.1
L-Arginine P-NitroanilideDihydrochl Oride
>30,000 <0.1
4-Nitrophenethylaminehydrochloride
>30,000 <0.01
N-Methyl-4-nitrophenethylamine
hydrochloride
>30,000 <0.1
H-Ala-Pna HCl
>30,000 <0.1
N, N-Dimethyl-4-Nitroaniline
26,435 0.11
40
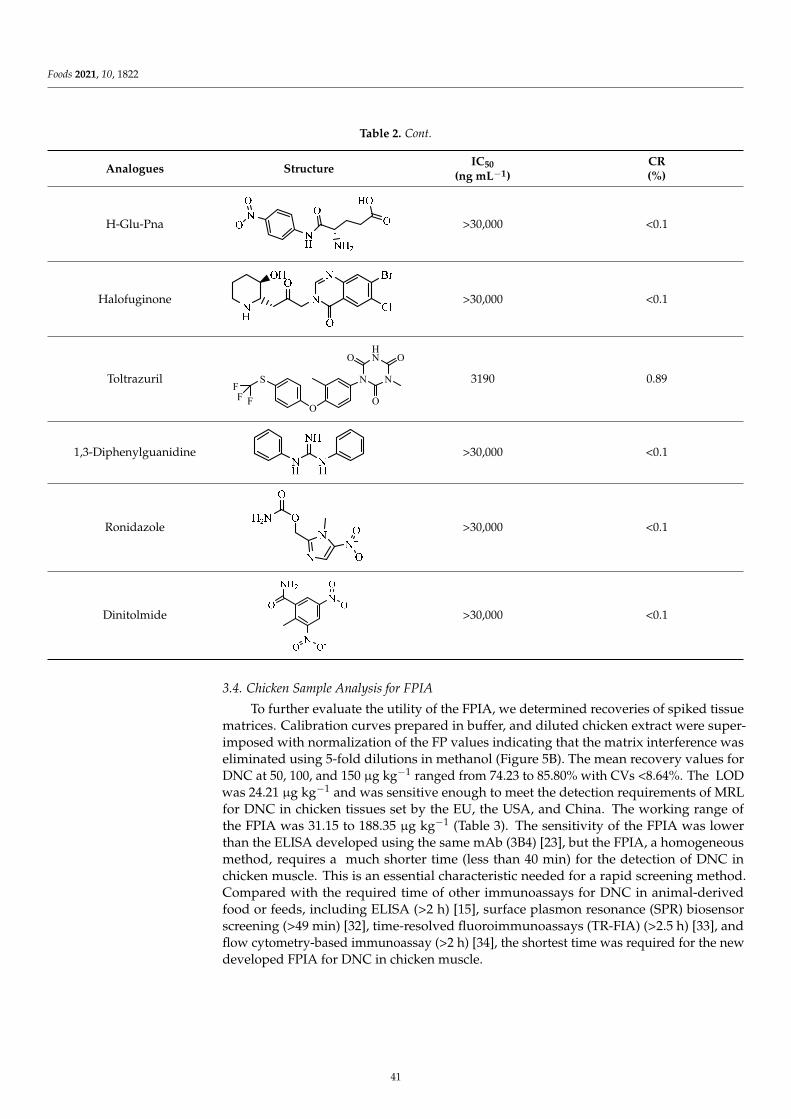
Foods 2021, 10, 1822
Table 2. Cont.
Analogues StructureIC50
(ng mL−1)CR(%)
H-Glu-Pna
>30,000 <0.1
Halofuginone
>30,000 <0.1
Toltrazuril
μ −
μ −
μ −
μ −
N N
HN OO
OO
SFF F
3190 0.89
1,3-Diphenylguanidine
μ −
μ −
μ −
μ −
N N
HN OO
OO
SFF F
>30,000 <0.1
Ronidazole
μ −
μ −
μ −
μ −
N N
HN OO
OO
SFF F
>30,000 <0.1
Dinitolmide
μ −
μ −
μ −
μ −
N N
HN OO
OO
SFF F
>30,000 <0.1
3.4. Chicken Sample Analysis for FPIA
To further evaluate the utility of the FPIA, we determined recoveries of spiked tissuematrices. Calibration curves prepared in buffer, and diluted chicken extract were super-imposed with normalization of the FP values indicating that the matrix interference waseliminated using 5-fold dilutions in methanol (Figure 5B). The mean recovery values forDNC at 50, 100, and 150 µg kg−1 ranged from 74.23 to 85.80% with CVs <8.64%. The LODwas 24.21 µg kg−1 and was sensitive enough to meet the detection requirements of MRLfor DNC in chicken tissues set by the EU, the USA, and China. The working range ofthe FPIA was 31.15 to 188.35 µg kg−1 (Table 3). The sensitivity of the FPIA was lowerthan the ELISA developed using the same mAb (3B4) [23], but the FPIA, a homogeneousmethod, requires a much shorter time (less than 40 min) for the detection of DNC inchicken muscle. This is an essential characteristic needed for a rapid screening method.Compared with the required time of other immunoassays for DNC in animal-derivedfood or feeds, including ELISA (>2 h) [15], surface plasmon resonance (SPR) biosensorscreening (>49 min) [32], time-resolved fluoroimmunoassays (TR-FIA) (>2.5 h) [33], andflow cytometry-based immunoassay (>2 h) [34], the shortest time was required for the newdeveloped FPIA for DNC in chicken muscle.
41

Foods 2021, 10, 1822
Table 3. Recovery studies from chicken muscle matrices using FPIA.
Sample Spiked(µg kg−1)
Intra-Assay (n = 5) Inter-Assay (n = 5)
Recovery(%)
CV(%)
Recovery(%)
CV(%)
Chicken50 84.41 4.39 80.45 4.81100 82.6 5.12 85.80 4.00150 74.23 8.64 76.95 6.41
4. Conclusions
In summary, an FPIA for DNC was established with favorable sensitivity, specificity,cost, time, and reliability for the first time. The sensitivity of the developed FPIA wassignificantly improved by optimizing the selection of tracers, tracer-antibody pairs, andphysical and chemical reaction conditions. Furthermore, the reliability and robustness ofthe assay were successfully demonstrated for analysis of DNC in chicken muscle matrices.In addition, the sample pretreatment was simple for the developed FPIA. The total analysistime, including sample pretreatment, was less than 40 min, which has not yet been achievedin other immunoassays for DNC residues.
Supplementary Materials: The following are available online at https://www.mdpi.com/article/10.3390/foods10081822/s1, Figure S1. The chemical structures of DNC and HDP, Figure S2. Schematicillustrations of the FPIA, Figure S3. The results of TLC for 25 tracers. (The red clip representsthe target band that binds to the antibody), Figure S4. (A) Mass spectrum of EDF with molecularion peak [M + 2H]2+ (m/z) of 450.00; (B) Mass spectrum of BDF with molecular ion peak [M + 2H]2+
(m/z) of 478.03; (C) Mass spectrum of HDF with molecular ion peak [M + 2H]2+ (m/z) of 506.06,Figure S5. Comparison of the effect of homologous and heterologous tracers on sensitivity.
Author Contributions: Conceptualization, X.L.; methodology, W.W.; software, Q.Z. and M.Z.; vali-dation, W.W.; formal analysis, W.W.; investigation, J.L.; resources, J.L.; data curation, Q.Z. and M.Z.;writing—original draft preparation, Q.Z. and M.Z.; writing—review and editing, X.L.; visualization,Q.Z. and M.Z.; supervision, X.L.; project administration, X.L.; funding acquisition, X.L. All authorshave read and agreed to the published version of the manuscript.
Funding: This research was funded by Natural Science Foundation of Shandong Province (ZR2020MC187),Postdoctoral Innovation Project of Shandong Province (202002027), Postdoctoral Fund of Qing-dao, HighLevel Talent Fund of Qingdao Agricultural University (663/1115026), the Scientific and TechnologicalProjects of Qingdao (19-6-1-94-nsh and 21-1-4-ny-10-nsh) and Natural Science Foundation of ShandongProvince (ZR2020MC188).
Institutional Review Board Statement: Not applicable.
Informed Consent Statement: Not applicable.
Data Availability Statement: Not applicable.
Conflicts of Interest: The authors declare no conflict of interest.
Ethical Approval: This article does not contain any studies with human and animal subjects.
References
1. Beier, R.C.; Ripley, L.H.; Young, C.R.; Kaiser, C.M. Production, Characterization, and Cross-Reactivity Studies of MonoclonalAntibodies against the Coccidiostat Nicarbazin. J. Agric. Food Chem. 2001, 49, 4542–4552. [CrossRef]
2. Clarke, L.; Fodey, T.L.; Crooks, S.R.; Moloney, M.; O’Mahony, J.; Delahaut, P.; O’Kennedy, R.; Danaher, M. A review of coccidiostatsand the analysis of their residues in meat and other food. Meat Sci. 2014, 97, 358–374. [CrossRef]
3. Protasiuk, E.; Olejnik, M.; Szprengier–Juszkiewicz, T.; Jedziniak, P.; Zmudzki, J. Determination of Nicarbazin in Animal Feed byHigh-Performance Liquid Chromatography with Interlaboratory Evaluation. Anal. Lett. 2015, 48, 2183–2194. [CrossRef]
4. Bacila, D.M.; Feddern, V.; Mafra, L.I.; Scheuermann, G.N.; Molognoni, L.; Daguer, H. Current research, regulation, risk, analyticalmethods and monitoring results for nicarbazin in chicken meat: A perspective review. Food Res. Int. 2017, 99, 31–40. [CrossRef]
42
Foods 2021, 10, 1822
5. Bacila, D.M.; Lazzarotto, M.; Hansel, F.A.; Scheuermann, G.N.; Feddern, V.; Cunha Junior, A.; Igarashi-Mafra, L. Thermal profileof 4,4′-dinitrocarbanilide determined by thermogravimetry–differential scanning calorimetry–mass spectrometry (TG–DSC–MS)and pyrolysis–gas chromatography–mass spectrometry (Py–GC–MS). J. Therm. Anal. Calorim. 2019, 138, 697–701. [CrossRef]
6. Tarbin, J.A.; Bygrave, J.; Bigwood, T.; Hardy, D.; Rose, M.; Sharman, M. The effect of cooking on veterinary drug residues in food:Nicarbazin (dinitrocarbanilide component). Food Addit. Contam. 2005, 22, 1126–1131. [CrossRef] [PubMed]
7. Capurro, E.; Danaher, M.; Anastasio, A.; Cortesi, M.L.; O’Keeffe, M. Efficient HPLC method for the determination of nicarbazin,as dinitrocarbanilide in broiler liver. J. Chromatogr. B 2005, 822, 154–159. [CrossRef]
8. Mortier, L.; Daeseleire, E.; Van Peteghem, C. Liquid chromatographic tandem mass spectrometric determination of five coccid-iostats in poultry eggs and feed. J. Chromatogr. B 2005, 820, 261–270. [CrossRef] [PubMed]
9. Teglia, C.M.; Gonzalo, L.; Culzoni, M.J.; Goicoechea, H.C. Determination of six veterinary pharmaceuticals in egg by liquidchromatography: Chemometric optimization of a novel air assisted-dispersive liquid-liquid microextraction by solid floatingorganic drop. Food Chem. 2019, 273, 194–202. [CrossRef] [PubMed]
10. Barreto, F.; Ribeiro, C.; Hoff, R.B.; Costa, T.D. A simple and high-throughput method for determination and confirmation of 14coccidiostats in poultry muscle and eggs using liquid chromatography–quadrupole linear ion trap-tandem mass spectrometry(HPLC–QqLIT-MS/MS): Validation according to European Union 2002/657/EC. Talanta 2017, 168, 43–51.
11. Bacila, D.; Cunha, A., Jr.; Gressler, V.; Scheuermann, G.; Coldebella, A.; Caron, L.; Mafra, L.; Feddern, V. Detection of p-NitroanilineReleased from Degradation of 4,4′-Dinitrocarbanilide in Chicken Breast during Thermal Processing. J. Agric. Food Chem. 2019, 67,9002–9008. [CrossRef]
12. de Lima, A.L.; Barreto, F.; Rau, R.B.; da Silva, G.R.; Lara, L.J.C.; de Figueiredo, T.C.; de Assis, D.C.S.; de Vasconcelos Cançado, S.Determination of the residue levels of nicarbazin and combination nicarbazin-narasin in broiler chickens after oral administration.PLoS ONE 2017, 12, e0181755.
13. Moretti, S.; Fioroni, L.; Giusepponi, D.; Pettinacci, L.; Saluti, G.; Galarini, R. Development and validation of a multiresidue liquidchromatography/tandem mass spectrometry method for 11 coccidiostats in feed. J. AOAC Int. 2013, 96, 1245–1257. [CrossRef]
14. Connolly, L.; Fodey, T.L.; Crooks, S.R.H.; Delahaut, P.; Elliott, C.T. The production and characterisation of dinitrocarbanilideantibodies raised using antigen mimics. J. Immunol. Methods 2002, 264, 45–51. [CrossRef]
15. Huet, A.C.; Mortier, L.; Daeseleire, E.; Fodey, T.; Elliott, C.; Delahaut, P. Screening for the coccidiostats halofuginone andnicarbazin in egg and chicken muscle: Development of an ELISA. Food Addit. Contam. 2005, 22, 128–134. [CrossRef] [PubMed]
16. Mi, T.; Wang, Z.; Eremin, S.A.; Shen, J.; Zhang, S. Simultaneous Determination of Multiple (Fluoro) quinolone Antibiotics in FoodSamples by a One-Step Fluorescence Polarization Immunoassay. J. Agric. Food Chem. 2013, 61, 9347–9355. [CrossRef] [PubMed]
17. Wang, Z.; Liang, X.; Wen, K.; Zhang, S.; Li, C.; Shen, J. A highly sensitive and class-specific fluorescence polarisation assay forsulphonamides based on dihydropteroate synthase. Biosens. Bioelectron. 2015, 70, 1–4. [CrossRef]
18. Gasilova, N.V.; Eremin, S.A. Determination of chloramphenicol in milk by a fluorescence polarization immunoassay. J. Anal.
Chem. 2010, 65, 255–259. [CrossRef]19. Dong, B.; Zhao, S.; Li, H.; Wen, K.; Ke, Y.; Shen, J.; Zhang, S.; Shi, W.; Wang, Z. Design, synthesis and characterization of tracers
and development of a fluorescence polarization immunoassay for the rapid detection of ractopamine in pork. Food Chem. 2019,271, 9–17. [CrossRef] [PubMed]
20. Ma, M.; Chen, M.; Feng, L.; You, H.; Yang, R.; Boroduleva, A.; Hua, X.; Eremin, S.A.; Wang, M. Fluorescence PolarizationImmunoassay for Highly Efficient Detection of Imidaclothiz in Agricultural Samples. Food Anal. Methods 2016, 9, 2471–2478.[CrossRef]
21. Li, C.; Wen, K.; Mi, T.; Zhang, X.; Zhang, H.; Zhang, S.; Shen, J.; Wang, Z. A universal multi-wavelength fluorescence polarizationimmunoassay for multiplexed detection of mycotoxins in maize. Biosens. Bioelectron. 2016, 79, 258–265. [CrossRef]
22. Raysyan, A.; Moerer, R.; Coesfeld, B.; Eremin, S.A.; Schneider, R.J. Fluorescence polarization immunoassay for the determinationof diclofenac in wastewater. Anal. Bioanal. Chem. 2021, 413, 999–1007. [CrossRef]
23. Qianqian Tang, Z.W. Production of Monoclonal Antibodies and Development of an Enzyme-Linked Immunosobent Assay for Nicarbazin;College of Veterinary Medicine, China Agricultural University: Beijing, China, 2018.
24. Mi, T.; Liang, X.; Ding, L.; Zhang, S.; Eremin, S.A.; Beier, R.C.; Shen, J.; Wang, Z. Development and optimization of a fluorescencepolarization immunoassay for orbifloxacin in milk. Anal. Methods 2014, 6, 3849–3857. [CrossRef]
25. Li, H.; Ma, S.; Zhang, X.; Li, C.; Dong, B.; Mujtaba, M.G.; Wei, Y.; Liang, X.; Yu, X.; Wen, K.; et al. Generic Hapten Synthesis,Broad-Specificity Monoclonal Antibodies Preparation, and Ultrasensitive ELISA for Five Antibacterial Synergists in Chicken andMilk. J. Agric. Food Chem. 2018, 66, 11170–11179. [CrossRef] [PubMed]
26. Zhang, X.; Eremin, S.A.; Wen, K.; Yu, X.; Li, C.; Ke, Y.; Jiang, H.; Shen, J.; Wang, Z. Fluorescence Polarization Immunoassay Basedon a New Monoclonal Antibody for the Detection of the Zearalenone Class of Mycotoxins in Maize. J. Agric. Food Chem. 2017, 65,2240–2247. [CrossRef]
27. Wang, Z.; Zhang, S.; Ding, S.; Eremin, S.A.; Shen, J. Simultaneous determination of sulphamerazine, sulphamethazine andsulphadiazine in honey and chicken muscle by a new monoclonal antibody-based fluorescence polarisation immunoassay. Food
Addit. Contam. Part A Chem. 2008, 25, 574–582. [CrossRef] [PubMed]28. Yakovleva, J.; Zeravik, J.; Michura, I.; Formanovsky, A.; Fránek, M.; Eremin, S. Hapten Design and Development of Polarization
Fluoroimmunoassay for Nonylphenol. Int. J. Environ. Anal. Chem. 2003, 83, 597–607. [CrossRef]
43

Foods 2021, 10, 1822
29. Krasnova, A.I.; Eremin, S.A.; Natangelo, M.; Tavazzi, S.; Benfenati, E. A polarization fluorescence immunoassay for the herbicidepropanil. Anal. Lett. 2001, 34, 2285–2301. [CrossRef]
30. Chun, H.S.; Choi, E.H.; Chang, H.-J.; Choi, S.-W.; Eremin, S.A. A fluorescence polarization immunoassay for the detection ofzearalenone in corn. Anal. Chim. Acta 2009, 639, 83–89. [CrossRef] [PubMed]
31. Wang, Q.; Haughey, S.A.; Sun, Y.-M.; Eremin, S.A.; Li, Z.-F.; Liu, H.; Xu, Z.-L.; Shen, Y.-D.; Lei, H.-T. Development of a fluorescencepolarization immunoassay for the detection of melamine in milk and milk powder. Anal. Bioanal. Chem. 2011, 399, 2275–2284.[CrossRef] [PubMed]
32. McCarney, B.; Traynor, I.M.; Fodey, T.L.; Crooks, S.R.H.; Elliott, C.T. Surface plasmon resonance biosensor screening of poultryliver and eggs for nicarbazin residues. Anal. Chim. Acta 2003, 483, 165–169. [CrossRef]
33. Hagren, V.; Crooks, S.R.; Elliott, C.T.; Lövgren, T.; Tuomola, M. An all-in-one dry chemistry immunoassay for the screening ofcoccidiostat nicarbazin in poultry eggs and liver. J. Agric. Food Chem. 2004, 52, 2429–2433.
34. Campbell, K.; Fodey, T.; Flint, J.; Danks, C.; Danaher, M.; O’Keeffe, M.; Kennedy, D.G.; Elliott, C. Development and validationof a lateral flow device for the detection of nicarbazin contamination in poultry feeds. J. Agric. Food Chem. 2007, 55, 2497–2503.[CrossRef] [PubMed]
44

foods
Article
Lateral Flow Immunochromatography Assay for Detection ofFurosemide in Slimming Health Foods
Yingying Li, Haihuan Xie, Jin Wang, Xiangmei Li, Zhili Xiao, Zhenlin Xu , Hongtao Lei and Xing Shen *
Citation: Li, Y.; Xie, H.; Wang, J.; Li,
X.; Xiao, Z.; Xu, Z.; Lei, H.; Shen, X.
Lateral Flow Immunochromatography
Assay for Detection of Furosemide in
Slimming Health Foods. Foods 2021,
10, 2041. https://doi.org/10.3390/
foods10092041
Academic Editor: Thierry Noguer
Received: 24 July 2021
Accepted: 23 August 2021
Published: 30 August 2021
Publisher’s Note: MDPI stays neutral
with regard to jurisdictional claims in
published maps and institutional affil-
iations.
Copyright: © 2021 by the authors.
Licensee MDPI, Basel, Switzerland.
This article is an open access article
distributed under the terms and
conditions of the Creative Commons
Attribution (CC BY) license (https://
creativecommons.org/licenses/by/
4.0/).
Guangdong Provincial Key Laboratory of Food Quality and Safety, South China Agricultural University,Guangzhou 510642, China; [email protected] (Y.L.); [email protected] (H.X.);[email protected] (J.W.); [email protected] (X.L.); [email protected] (Z.X.);[email protected] (Z.X.); [email protected] (H.L.)* Correspondence: [email protected]; Tel.: +86-135-6043-2677
Abstract: In recent years, furosemide has been found to be abused in slimming health foods. Thereis an urgent need for a simpler, faster method for detecting furosemide in slimming health foods.In this study, a rapid, convenient and sensitive lateral flow immunochromatography (LFIA) basedon Au nanoparticles (AuNPs) was established for the first time. Under optimal conditions, thequalitative limit of detection (LOD) of the AuNPs-based LFIA was 1.0~1.2 µg/g in slimming healthfoods with different substrates. AuNPs-LFIA could specifically detect furosemide within 12 min(including sample pretreatment) and be read by the naked eye. The developed AuNPs-LFIA showedhigh consistency with liquid chromatography with tandem mass spectrometry (LC-MS/MS), and nofalse positive or false negative results were found in spiked slimming health foods, proving that theAuNPs-LFIA should be accurate and reliable. The AuNPs-LFIA reported here provides a serviceableanalytical tool for the on-site detection and rapid initial screening of furosemide for the first time.
Keywords: furosemide; Au nanoparticles; lateral flow immunochromatography; slimming health food
1. Introduction
Overweight and obesity are the main risk factors for many chronic diseases. Accordingto a World Health Organization (WHO) report, 39% of the global population aged 18 andover were overweight in 2016, while 13% (male 11%, female 15%) were obese [1]. In order tolose weight quickly, people are increasingly turning to the consumption of slimming dietarysupplements. To pursue economic benefits, some slimming dietary supplements have beenillegally adulterated with synthetic drugs to obtain obvious short-term effects [2,3].
According to the current legislation of the European Union (EU), the USA and China,synthetic drugs are not allowed in dietary supplements due to their harmful side effects [4].However, some unscrupulous traders continue to illegally add drugs to slimming di-etary supplements to increase the weight loss effect for the purpose of promoting sales,especially diuretics, appetite suppressants, gastrointestinal lipase inhibitors, energy ex-penditure agents and laxatives. Diuretics are common adulterants in slimming healthfoods. They accelerate the excretion of water from the body, causing the illusion of weightloss. Consumers could purchase and take slimming health foods containing diureticswithout knowing it. Overdosing these products can produce side effects such as fluidand electrolyte abnormalities as well as acid–base disturbances, which may cause severearrhythmia and increase the risk of death from arrhythmia [5]. Furosemide is one of themost effective diuretic medications available. It acts directly on the kidneys to increaseurine output and the urinary excretion of sodium [6]. Oral formulations of furosemide arecommonly used to treat edema, congestive heart failure, renal failure and hypertension [7].In recent years, it has often been found to be illegally added to weight loss health foods.In 2020, the Institute for Drug Control of Suzhou, China, tested 84 batches of slimminghealth foods, and the illegal addition of furosemide was detected in 13 batches of samples
45
Foods 2021, 10, 2041
(positivity rate, 15.5%) [8]. Therefore, it is necessary to establish a detection method for theillegally added drug furosemide in health foods.
At present, various methods for detecting furosemide in slimming products havebeen reported, including capillary electrophoresis (CE) [9–11], ion migration spectrometry(IMS) [12], ion-pair chromatography (IPC) [13,14], liquid chromatography-tandem massspectrometry (LC-MS/MS) [15], high performance liquid chromatography (HPLC) [16]and ultra-high-pressure liquid chromatography (UHPLC) [17,18]. All these methods relyon expensive equipment, which is difficult to operate and requires trained operators.Although their instrumental methods are accurate, they can not meet the requirements ofrapid on-site inspection. The rapid detection of furosemide mainly includes electrochemicaland immunoassay methods. Electrochemical analysis methods are mainly used to detectfurosemide in urine and drugs, and have a good detection speed, detection sensitivityand detection throughput [6,19–21]; however, all of them lack simplicity and selectivityto the negatively charged furosemide. Immunoassay is a rapid analysis method that iscurrently widely used. By now, only two enzyme-linked immune sorbent assays (ELISAs)have been reported for detecting furosemide in horse plasma and milk [22–24]. However,ELISA also involves complex testing procedures and long incubation times, so it remainsa laboratory-based platform unsuited to on-site detection. A simpler and faster on-sitedetection method is needed for monitoring the growing number of slimming products.
Lateral flow immunochromatography assay (LFIA), which is simple, rapid and low-cost, has been widely used in food safety, environmental monitoring and medical diagnosisin recent years [25–29]. AuNPs have many advantages as a mature labeling material, suchas simple preparation, short labeling time, good stability and low cost [30,31]. Thus, theyare favored by manufacturers and occupy more than 90% of the label market in LFIA [32].In this paper, a convenient AuNPs-LFIA detecting furosemide with good sensitivity andspecificity was developed for the first time and proved to be efficient for application in thedetection of furosemide in slimming health foods.
2. Materials and Methods
2.1. Materials
Furosemide, goat anti-rabbit IgG (secondary antibody), bovine albumin (BSA), ovalbumin(OVA), N,N-dimethylformamide (DMF), 1-(3-fdimethylaminopropyl)-3-ethylcarbodiimidehydrochloride (EDC) and ProClin 300 were purchased from Sigma-Aldrich (St. Louis,MO, USA). Chloroauric acid, trisodium citrate and polyvinyl pyrrolidone (PVP) were pur-chased from Sinopharm Chemical Reagent Co., Ltd. (Shanghai, China). Anti-furosemideantibodies and coating antigens were prepared in our own laboratory. Other chemicalswere purchased from Guangzhou Chemical Reagent Co., Ltd. (Guangzhou, China). Allreagents were of analytical grade or higher purity. The nitrocellulose filter (NC) membrane(CN95) was obtained from Sartorius Stedim Biotech GmbH (Goettingen, Germany). Thesample pad (blood filtration membranes) and the polyvinyl chloride (PVC) backing plate(SMA31-40) were purchased from Shanghai Liangxin Co., Ltd. (Shanghai, China).
2.2. Instruments
An FEI/Talos L120C transmission electron microscope (TEM) (Thermo Scientific,Waltham, USA) was used to observe the morphologies of nanoparticles. The zeta potentialwas measured by a Zetasizer Nano ZS90 (Malvern Panalytical, UK). The XYZ 3060 DispensingPlatform (BioDot, Irvine, CA, USA) was used to spray antigen and secondary antibodiesonto the NC membrane. The strip cutter ZQ 2000 (Kinbio Tech, Shanghai, China) was usedto cut test strips into suitable sizes. LC-MS/MS was carried out on an AB QTRAP4500triple quadrupole mass spectrometer (SCIEX, Framingham, MA, USA).
2.3. Preparation of Coating Antigen
The coating antigen was obtained by furosemide coupled with cationized ovalbumin(cOVA). cOVA is obtained by modifying OVA with ethylenediamine. Furosemide contains
46

Foods 2021, 10, 2041
a carboxyl group, which could be directly coupled with cOVA by the active ester methodto produce a coating antigen. Furosemide (1 equiv.), N-Hydroxy succinimide (NHS)(1.5 equiv.) and 1-(3-fdimethylaminopropyl)-3-ethylcarbodiimide hydrochloride (EDC)(1.5 equiv.) were dissolved in 200 µL of N,N-dimethylformamide (DMF). The mixturewas stirred at 4 ◦C for 6 h, and then centrifuged at 2500× g for 10 min. The supernatantwas added dropwise to cOVA (20 mg) in 5 mL of PBS (phosphate-buffered saline, 0.01 M,pH 7.4). The conjugate mixture was stirred at 4 ◦C overnight and dialyzed against PBS(0.01 M, pH 7.4) for 3 days at 4 ◦C to remove the uncoupled free hapten and non-reactedreactants. The obtained conjugate was used as coating antigen.
2.4. Preparation of AuNPs
The AuNPs were produced by reducing HAuCl4 with sodium citrate according toa previous method, which was modified as described below [33]. An amount of 8 mL of1% chloroauric acid solution was quickly added into 200 mL of boiling ultrapure waterunder continuous stirring. When the solution boiled again, 9.25 mL of 1% trisodium citratewas added. The solution was then stirred and heated for another 10 min. After cooling,transmission electron microscopy and UV–visible absorption spectrometry were used tocharacterize the morphologies of AuNPs. The prepared AuNPs were stored at 4 ◦C for use.
2.5. Preparation of AuNPs–Abs Conjugated Probe
The AuNPs–Abs conjugated probe was prepared via electrostatic adsorption betweenAuNPs and antibodies (Figure 1a). The optimal labeling pH and the antibody amount wereadjusted by checkerboard titration. A suitable amount of 0.2 M K2CO3 was added into theAuNPs solution to adjust the pH value. Anti-furosemide antibody dissolved in 100 µL of0.01 M PB (phosphate buffer solution, pH 7.4) was quickly added into the pH-adjustedAuNPs solution. The mixture was reacted for 10 min at room temperature. Then, 20 µL of20% BSA was added and incubated for 20 min to block excess binding sites on the AuNPs.After centrifuging at 10,000× g and 4 ◦C for 10 min, the supernatant was discarded, thebottom red precipitate was resuspended with 200 µL of resuspension buffer (0.005 M boratebuffer solution, pH 8.0, containing 0.5% BSA, 5% trehalose for protecting antibody, 0.5%Tween-20 both for a better release AuNPs–Abs probe and to adjust the chromatographyspeed, 0.3% PVP as a steric stabilizer or capping agent to protect the AuNPs–Abs againstagglomeration, and 0.03% ProClin 300 to prevent metamorphism), and finally stored at4 ◦C for further use.
μ
μμ
μ μ
Figure 1. Schematic of the Au nanoparticles lateral flow immunochromatography (AuNPs-LFIA) for detecting furosemidein slimming coffee. (a) Preparation of the signal probe AuNPs–Abs and the sample treatment solution. (b) The structureand test procedure of the AuNPs-LFIA test strip. C line: control line (goat anti-rabbit immunoglobulin G, IgG) and T line:test line (furosemide coating antigen). (c) Schematic diagram of AuNPs-LFIA strip test results: 1, negative result; 2, weakpositive result; 3, positive result; 4–5, invalid result.
To better reflect the performance of the AuNPs–Abs conjugated probe, a series ofinfluencing parameters were optimized, including the pH value, the concentration and
47
Foods 2021, 10, 2041
dilution buffer of antibody and antigen, and the resuspension buffer of AuNPs–Abs. Theoptimal conditions were selected according to the T line color intensity and sensitivity(inhibition rate, (1-ODpositive/ODnegative) × 100%).
2.6. Strip Assembly
The test strip of the LFIA was composed of an NC membrane, a sample pad, anabsorbent pad and an adhesive backing pad (Figure 1b). The sample pad was saturatedwith 0.05 M PB (pH 7.4, containing 0.5% BSA, 0.5% Tween-20, 0.3% PVP and 0.03% ProClin300) and dried for 12 h at 37 ◦C. The coating antigen and goat anti-rabbit IgG, whichserved as the test line and the control line (T line and C line), were diluted with 0.05 M CB(carbonate buffer solution, pH 9.6) and 0.02 M PB (pH 7.4), respectively, to an appropriateconcentration, and then sprayed on the NC film with a volume of 0.8 µL/cm. The T linewas 8 mm from the bottom of the NC film, and the distance between the T line and theC line was 6 mm. Then the prepared NC membrane was dried at 37 ◦C for 12 h. Finally,all parts were pasted on a PVC baking card, cut into 3.5 mm-wide strips and placed in asealed bag with desiccant.
2.7. Sample Preparation
Four slimming health foods with different substrates (capsule, coffee, tea and tablet)were obtained from the local market, and were previously confirmed to be free of furosemideusing LC-MS/MS. The outer shell of the capsule was removed to obtain the powder. Thecoffee, tea and tablets were taken out of their packing bags and ground into powder. Anamount of 1.00 g of sample was added into a 10 mL centrifuge tube containing 4 mL ofmethanol and mixed on a vortex mixer for 2 min. Then the mixture was centrifuged at4000× g for 3 min. To obtain the sample solution, 200 µL of the supernatant was added to800 µL of 0.2 M PB (pH 7.4).
2.8. Test Procedure
In this study, the vertical operation mode was used in the strip testing process. Weadded 150 µL of sample solution and 5 µL of AuNPs-labeled conjugated probe to themicrowell, and the probe was gently pipetted back and forth to evenly disperse it in thesample solution. After incubating for 3 min at room temperature, the test strip was insertedimmediately and vertically into the microwell. After reacting for another 4 min, the teststrip was removed from the microwell. The qualitative result was simply read with thenaked eye. The signal intensity of the T line and C line was read and obtained by ImageJsoftware. In more detail, the optical density of the test zones (negatives and positives) ingrayscale mode was measured by the ImageJ software to obtain the color intensity.
2.9. Sensitivity
The cut-off value was utilized to determine the sensitivity of the developed LFIA teststrips by assessing the concentration of the furosemide in a series of spiked samples withtest strips. The cut-off value of the assay is defined as the furosemide level that causes theT line to disappear completely. The sensitivity in actual samples with different substrateswas evaluated separately. Sample preparation was carried out according to the previousdescription. Blank slimming health food samples were spiked with furosemide standardsolution (100 µg/mL, diluted in methanol) to the final concentrations of 0 (control), 0.1, 0.2,0.4, 0.6, 0.8, 1.0 and 1.2 µg/g. Each level was tested three times (n = 3).
2.10. Specificity
To evaluate the specificity of the proposed method, furosemide analogues which maybe illegally added to slimming health foods, including hydrochlorothiazide, metolazone,bumetanide, acetazolamide, torasemide and ethacrynic acid, were added to the samplesolution (1.2 µg/g) for detection.
48
Foods 2021, 10, 2041
2.11. Method Confirmation
Four different substrates of slimming health foods were selected to validate the accu-racy of the AuNPs-LFIA. The spiked concentrations were chosen according to the sensitivityof samples of different substrates. The spiked scalar was the furosemide concentrationcorresponding to 0.25, 0.5, 1 and 2 times the cut-off value. A total of 16 spiked sampleswere tested. Each sample was combined with 4 mL methanol, mixed on a vortex mixerfor 2 min, and then centrifuged at 4000× g for 3 min. Half of the supernatant was diluted5 times with PB and tested with test strips, and the other half was diluted 5 times withmethanol and passed through a 0.22 µm filter membrane, then tested with LC-MS/MS.Each sample was tested three times (n = 3).
Chromatographic separation of LC-MS/MS was performed on a Waters CORTECS T3column (2.1 × 100 mm, 2.7 µm). The column temperature was 30 ◦C. Mobile phase A wasan aqueous solution containing 0.1% formic acid, and phase B was an acetonitrile solutioncontaining 0.1% formic acid, which was used for gradient elution. The sample volume was 1 µL.
2.12. Analysis of Blind Samples
We purchased 16 blind samples of slimming health foods from a local Guangzhoumarket and analyzed them by the established AuNPs-LFIA and LC-MS/MS. The sampleswere pretreated following the method above. The established AuNPs-LFIA was used todetect furosemide in the blind samples, and the results were confirmed by LC-MS/MS.
3. Results and Discussion
3.1. Characterization of AuNPs and AuNPs–Abs
It can be seen from the obtained TEM images (Figure 2a) that the prepared AuNPswere monodisperse spherical particles. The diameter of the AuNPs was about 35 nm,which was consistent with the required size. In the stability test of AuNPs, the AuNPssolution stored at 4 ◦C for 6 months did not appear to aggregate or precipitate (Figure 2b),indicating that its dispersion stability could last for at least six months. According to theresults of UV–visible absorption spectrometry (Figure 2c), the AuNPs exhibited maximumabsorbance at a wavelength of 534 nm. After combination with antibodies, the maximumabsorbance shifted to 543 nm, indicating the formation of the AuNPs–Abs conjugate. Thecombination of AuNPs and antibodies is generally believed to be the result of electrostaticattraction [34]. Under certain conditions, AuNPs have a negative surface charge, and theantibodies have a positive charge on the surface [35]. From the performance of the zetapotential, when the negatively charged AuNPs were combined with the positively chargedantibodies, the result showed a decrease in the AuNPs zeta potential. Figure 2d showsthat the zeta potential decreased from 36.4 mV to 18.7 mV after conjugation, which furtherconfirms that the antibodies coupled with AuNPs successfully.
3.2. Optimization
3.2.1. pH Value
The pH values during the reaction were critical to the efficacy of AuNPs–Abs conju-gates. Theoretically, the pH of the reaction should be slightly higher than the isoelectricpoint of the protein. Below the isoelectric point, the antibodies may flocculate and causethe aggregation and precipitation of AuNPs–Abs, which would decrease the accuracy andcause false negatives. Above the isoelectric point, the adsorption effect is limited due tothe charge repulsion between the antibodies and the AuNPs, and the color of the test stripwould turn light. According to signal intensity and sensitivity, the optimal pH of AuNPssolutions was 7.8, corresponding to 12 µL of 0.2 M K2CO3 solution added (Figure 3a).
49

Foods 2021, 10, 2041
μ
μ
μ
Figure 2. Characterization of Au nanoparticles (AuNPs) and Au nanoparticles-antibodies (AuNPs–Abs). (a) Transmission electron microscopy images of AuNPs; (b) the results of naked-eye observationof AuNPs at different times; (c) the UV–visible absorption spectra of AuNPs and AuNPs–Abs; (d) thezeta potential of AuNPs and AuNPs–Abs.
3.2.2. Antibody Concentration
In general, the signal intensity is proportional to the concentration of antibodies, butexcess antibodies would affect the sensitivity of the LFIA. In order to screen the optimalconcentration of antibodies, antibodies of different concentrations (5, 10, 15 and 20 µg/mL)were added to AuNPs solution to synthesize AuNPs–Abs conjugates. The results showthat the highest sensitivity of strip assay was obtained at an antibody concentration of10 µg/mL (Figure 3b).
3.2.3. Dilution Buffer
The dilution buffer of antigen and goat anti-rabbit second antibody had a greatinfluence on color intensity as a result of the effects on the absorption of protein in theNC membrane caused by the ion type and pH value. In this study, 0.02 M PB (pH 7.4),0.02 M PBS (phosphate-buffered saline, pH 7.4) and 0.05 M CB (pH 9.6) were selected asthe dilution buffers. The results (Figure 3c) show that when the antigen was diluted in0.05 M CB and the second antibody was diluted in 0.02 M PB, a stronger signal couldbe obtained.
3.2.4. Resuspension Buffer
The resuspension buffer affected the stability of AuNPs–Abs. In this study, Tris-HCl(pH 7.4), 0.005 M borate buffer solution (pH 8.0), 0.005 M borate buffer solution (pH 8.5)and 0.02 M PB (pH 7.0) were chosen as the resuspension buffers. We found that theresuspension buffers of Tris-HCl and PB could lead to AuNPs–Abs coagulation on thesecond day, which may have been caused by inappropriate pH values for the dissolutionof the AuNPs–Abs probe. In the end, 0.005 M borate buffer solution (pH 8.0), which hadthe highest assay sensitivity, was chosen as the resuspension buffer (Figure 3d).
50
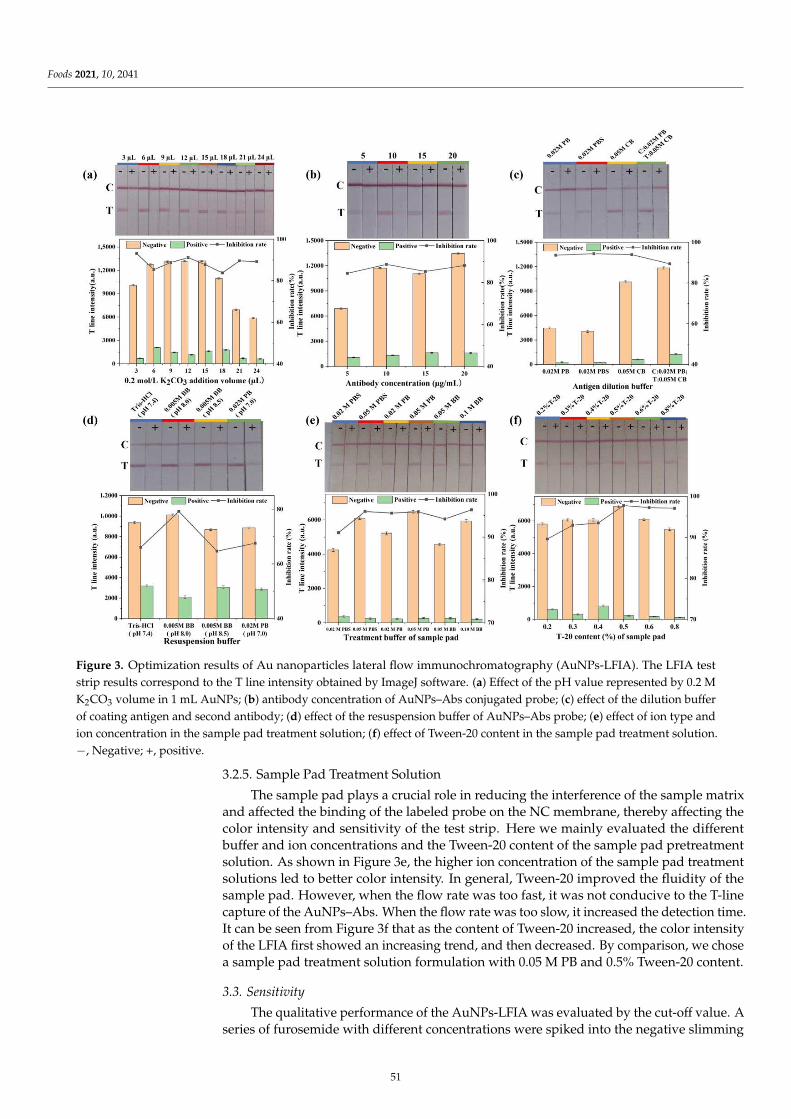
Foods 2021, 10, 2041
–
–
–
–
Figure 3. Optimization results of Au nanoparticles lateral flow immunochromatography (AuNPs-LFIA). The LFIA teststrip results correspond to the T line intensity obtained by ImageJ software. (a) Effect of the pH value represented by 0.2 MK2CO3 volume in 1 mL AuNPs; (b) antibody concentration of AuNPs–Abs conjugated probe; (c) effect of the dilution bufferof coating antigen and second antibody; (d) effect of the resuspension buffer of AuNPs–Abs probe; (e) effect of ion type andion concentration in the sample pad treatment solution; (f) effect of Tween-20 content in the sample pad treatment solution.−, Negative; +, positive.
3.2.5. Sample Pad Treatment Solution
The sample pad plays a crucial role in reducing the interference of the sample matrixand affected the binding of the labeled probe on the NC membrane, thereby affecting thecolor intensity and sensitivity of the test strip. Here we mainly evaluated the differentbuffer and ion concentrations and the Tween-20 content of the sample pad pretreatmentsolution. As shown in Figure 3e, the higher ion concentration of the sample pad treatmentsolutions led to better color intensity. In general, Tween-20 improved the fluidity of thesample pad. However, when the flow rate was too fast, it was not conducive to the T-linecapture of the AuNPs–Abs. When the flow rate was too slow, it increased the detection time.It can be seen from Figure 3f that as the content of Tween-20 increased, the color intensityof the LFIA first showed an increasing trend, and then decreased. By comparison, we chosea sample pad treatment solution formulation with 0.05 M PB and 0.5% Tween-20 content.
3.3. Sensitivity
The qualitative performance of the AuNPs-LFIA was evaluated by the cut-off value. Aseries of furosemide with different concentrations were spiked into the negative slimming
51

Foods 2021, 10, 2041
health food samples. Figure 4 shows that the color intensity of T line became weaker withincreasing furosemide concentration. When the concentration of furosemide was 0 ng/g,a vigorous color intensity could be seen with the naked eye on the T line, and the colorintensity became weaker when a higher concentration of furosemide was added. Accordingto the testing result, the cut-off value was 1.2 µg/g in capsule, coffee and tea samples,and it was 1.0 µg/g in tablet samples. However, the effective dosage of furosemide foran adult is 20–40 mg/day [36]. Therefore, slimming health foods would need to add atleast 20 mg of furosemide to the daily dosage to achieve significant weight loss, which isfar greater than the LOD of the AuNPs-LFIA. Additionally, compared to the LOD of theHPLC-MS/MS method (2.7 µg/g) established by the Chinese government (BJS 201710) forillegally added furosemide detection in health foods, the established AuNPs-LFIA showedhigher sensitivity and achieved on-site detection using a simple operation procedure.
μμ
μ
Figure 4. Sensitivity evaluation of the Au nanoparticles lateral flow immunochromatography(AuNPs-LFIA) for furosemide in slimming health foods of different substrates. Red rectangular boxesindicate the color intensity at the cut-off concentrations. Results for determination of furosemidein the slimming capsule samples (a), slimming coffee samples (b), slimming tea samples (c) andslimming tablet samples (d).
3.4. Specificity
The developed AuNPs-LFIA was used to detect six furosemide analogues, includinghydrochlorothiazide, metolazone, bumetanide, acetazolamide, torasemide and ethacrynicacid at a 1.2 µg/g level. The results showed that the test strip did not detect the other drugsat all, indicating that the LFIA had a high specificity for furosemide detection in slimminghealth foods (Figure 5).
52

Foods 2021, 10, 2041
Figure 5. Specificity evaluation results of the Au nanoparticles lateral flow immunochromatography(AuNPs-LFIA): 1, furosemide; 2, hydrochlorothiazide; 3, metolazone; 4, bumetanide; 5, acetazolamide;6, torasemide; 7, ethacrynic acid.
3.5. Confirmation by LC-MS/MS
LC-MS/MS was employed for the method confirmation. The detection results ofAuNPs-LFIA were consistent with LC-MS/MS in all 16 spiked samples. No false-positiveor false-negative results were found. The recoveries for furosemide in spiked samples werefrom 75.83% to 104.53%, with the CVs ranging from 0.09% to 4.92% (Table 1), indicating thatthe established LFIA is reliable and could be used for large-scale sample screening on-site.
Table 1. Comparison of the detection results of the Au nanoparticles lateral flow immunochromatography (AuNPs-LFIA)and the liquid chromatography with tandem mass spectrometry (LC-MS/MS) in slimming health foods spiked withfurosemide (n = 3).
Sample Spike Level (µg/g) LC-MS/MS (µg/mL) Recovery (%) CV (%) AuNPs-LFIA Result
coffee 0.30 0.346 ± 0.006 115.39 1.75 −−−0.60 0.707 ± 0.009 117.81 1.23 ±±±1.20 1.379 ± 0.026 114.95 1.89 +++2.40 2.781 ± 0.014 115.90 0.49 +++
capsule 0.30 0.302 ± 0.005 100.80 1.56 −−−0.60 0.649 ± 0.014 108.10 2.22 ±±±1.20 1.196 ± 0.059 99.64 4.92 +++2.40 2.295 ± 0.013 95.63 0.55 +++
tea 0.30 0.247 ± 0.004 82.25 1.70 −−−0.60 0.512 ± 0.016 85.35 3.05 ±±±1.20 1.048 ± 0.032 87.37 3.02 +++2.40 2.127 ± 0.026 88.61 1.22 +++
tablet 0.25 0.200 ± 0.004 80.18 2.09 −−−0.50 0.379 ± 0.011 75.83 2.86 ±±±1.00 0.879 ± 0.006 87.90 0.65 +++2.00 1.862 ± 0.002 93.11 0.09 +++
−, Negative; +, positive; ±, weakly positive.
3.6. Analysis of Blind Samples
The 16 slimming health foods purchased in a Guangzhou market were detected byAuNPs-LFIA, and the results showed that all were furosemide-negative samples (Table 2).The results were confirmed and consistent with LC-MS/MS. Although no positive samplewas found in this survey due to the sample size and strict supervision in Guangzhou,the results still indicate that the established AuNPs-LFIA is accurate and suitable for thedetection of different substrate samples.
53
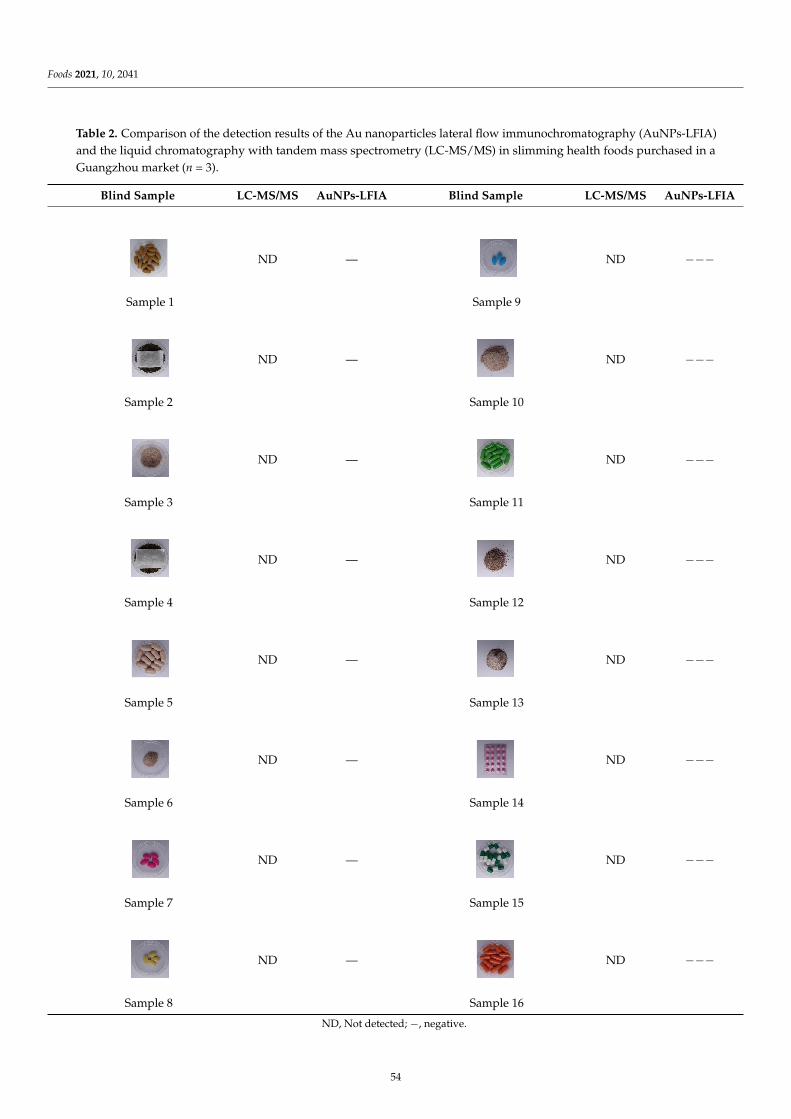
Foods 2021, 10, 2041
Table 2. Comparison of the detection results of the Au nanoparticles lateral flow immunochromatography (AuNPs-LFIA)and the liquid chromatography with tandem mass spectrometry (LC-MS/MS) in slimming health foods purchased in aGuangzhou market (n = 3).
Blind Sample LC-MS/MS AuNPs-LFIA Blind Sample LC-MS/MS AuNPs-LFIA
Sample 1
ND —
Sample 9
ND −−−
Sample 2
ND —
Sample 10
ND −−−
Sample 3
ND —
Sample 11
ND −−−
Sample 4
ND —
Sample 12
ND −−−
Sample 5
ND —
Sample 13
ND −−−
Sample 6
ND —
Sample 14
ND −−−
Sample 7
ND —
Sample 15
ND −−−
Sample 8
ND —
Sample 16
ND −−−
ND, Not detected; −, negative.
54

Foods 2021, 10, 2041
4. Conclusions
This study developed a sensitive AuNPs-LFIA for the rapid detection of the illegaladulterant drug furosemide that is sometimes found in slimming health foods for thefirst time. By optimizing a series of parameters that may affect the performance of theAuNPs-LFIA, the sensitivity for furosemide detection was higher than the detection limitof the HPLC-MS/MS method formulated by the Chinese government for the detection ofillegal furosemide addition to health food. The sample preparation and test operation ofthe developed AuNPs-LFIA is 12 min in total, and the procedure is simpler and faster thanother existing methods for furosemide detection. In conclusion, the developed AuNPs-LFIA could be applied as an on-site rapid detection method for the screening of furosemidein slimming health foods.
Author Contributions: Conceptualization, H.L. and X.S.; methodology, Y.L.; software, H.X.; vali-dation, H.X. and J.W.; resources, X.L., Z.X. (Zhili Xiao) and Z.X. (Zhenlin Xu); writing—originaldraft preparation, Y.L.; writing—review and editing, X.S.; project administration, H.L. and X.S.;funding acquisition, H.L. and X.S. All authors have read and agreed to the published version ofthe manuscript.
Funding: This research was funded by the National Key Research and Development Program ofThirteenth Five-Year Plan (2017YFC1601700), the National Scientific Foundation of China (31871883,32072316), Guangdong Basic and Applied Basic Research Foundation (2019A1515012107).
Conflicts of Interest: The authors declare no conflict of interest.
References
1. W.H.O. Obesity and Overweight. Available online: https://www.who.int/news-room/fact-sheets/detail/obesity-and-overweight (accessed on 11 August 2021).
2. Yun, J.; Choi, J.; Jo, C.; Kwon, K. Detection of synthetic anti-obesity drugs, designer analogues and weight-loss ingredients asadulterants in slimming Foods from 2015 to 2017. J. Chromatogr. Sep. Tech. 2018, 9, 2. [CrossRef]
3. Cohen, P.A. The FDA and adulterated supplements—dereliction of duty. JAMA Netw. Open 2018, 1, e183329. [CrossRef]4. Muschietti, L.; Redko, F.; Ulloa, J. Adulterants in selected dietary supplements and their detection methods. Drug Test. Anal. 2020,
12, 861–886. [CrossRef]5. Eid, P.S.; Ibrahim, D.A.; Zayan, A.H.; Abd Elrahman, M.M.; Shehata, M.A.A.; Kandil, H.; Abouibrahim, M.A.; Luc Minh, D.;
Shinkar, A.; Elfaituri, M.K.; et al. Comparative effects of furosemide and other diuretics in the treatment of heart failure: Asystematic review and combined meta-analysis of randomized controlled trials. Heart Fail. Rev. 2020, 26, 127–136. [CrossRef]
6. Silva, E.F.; Tanaka, A.A.; Fernandes, R.N.; Munoz, R.A.A.; Silva, I.S. Batch injection analysis with electrochemical detection for thesimultaneous determination of the diuretics furosemide and hydrochlorothiazide in synthetic urine and pharmaceutical samples.Microchem. J. 2020, 157, 105027. [CrossRef]
7. Banik, M.; Gopi, S.P.; Ganguly, S.; Desiraju, G.R. Cocrystal and Salt Forms of Furosemide: Solubility and Diffusion Variations.Cryst. Growth Des. 2016, 16, 5418–5428. [CrossRef]
8. Chu, R.; Chen, L.; Zhang, B.; Jia, C.; Qian, Y. Data Analysis of Illegally Adding Chemical Substances in 84 Batches of SlimmingHealth Foods. Chin. J. Mod. Appl. Pharm. 2020, 16, 1973–1976. [CrossRef]
9. Cianchino, V.; Acosta, G.; Ortega, C.; Martinez, L.D.; Gomez, M.R. Analysis of potential adulteration in herbal medicines anddietary supplements for the weight control by capillary electrophoresis. Food Chem. 2008, 108, 1075–1081. [CrossRef] [PubMed]
10. Muller, L.S.; Muratt, D.T.; Dal Molin, T.R.; Urquhart, C.G.; Viana, C.; de Carvalho, L.M. Analysis of Pharmacologic Adulterationin Dietary Supplements by Capillary Zone Electrophoresis Using Simultaneous Contactless Conductivity and UV Detection.Chromatographia 2018, 81, 689–698. [CrossRef]
11. Moreira, A.P.L.; Motta, M.J.; Dal Molin, T.R.; Viana, C.; de Carvalho, L.M. Determination of diuretics and laxatives as adulterantsin herbal formulations for weight loss. Food Addit. Contam. A 2013, 30, 1230–1237. [CrossRef] [PubMed]
12. Dunn, J.D.; Gryniewicz-Ruzicka, C.M.; Mans, D.J.; Mecker-Pogue, L.C.; Kauffman, J.F.; Westenberger, B.J.; Buhse, L.F. Qualitativescreening for adulterants in weight-loss supplements by ion mobility spectrometry. J. Pharm. Biomed. Anal. 2012, 71, 18–26.[CrossRef]
13. De Carvalho, L.M.; Viana, C.; Moreira, A.P.L.; do Nascimento, P.C.; Bohrer, D.; Motta, M.J.; da Silveira, G.D. Pulsed amperometricdetection (PAD) of diuretic drugs in herbal formulations using a gold electrode following ion-pair chromatographic separation.J. Solid State Electrochem. 2013, 17, 1601–1608. [CrossRef]
14. Muller, L.S.; Dal Molin, T.R.; Muratt, D.T.; Leal, G.C.; Urquhart, C.G.; Viana, C.; de Carvalho, L.M. Determination of Stimulants andDiuretics in Dietary Supplements for Weight Loss and Physical Fitness by Ion-pair Chromatography and Pulsed AmperometricDetection (PAD). Curr. Anal. Chem. 2018, 14, 562–570. [CrossRef]
55
Foods 2021, 10, 2041
15. Zeng, Y.; Xu, Y.M.; Kee, C.L.; Low, M.Y.; Ge, X.W. Analysis of 40 weight loss compounds adulterated in health supplements byliquid chromatography quadrupole linear ion trap mass spectrometry. Drug Test. Anal. 2016, 8, 351–356. [CrossRef] [PubMed]
16. Muratt, D.T.; Muller, L.S.; Dal Molin, T.; Viana, C.; de Carvalho, L.M. Pulsed amperometric detection of pharmacologic adulterantsin dietary supplements using a gold electrode coupled to HPLC separation. Anal. Methods 2018, 10, 2226–2233. [CrossRef]
17. Rebiere, H.; Guinot, P.; Civade, C.; Bonnet, P.A.; Nicolas, A. Detection of hazardous weight-loss substances in adulteratedslimming formulations using ultra-high-pressure liquid chromatography with diode-array detection. Food Addit. Contam. A 2012,29, 161–171. [CrossRef] [PubMed]
18. Lancanova Moreira, A.P.; Gobo, L.A.; Viana, C.; de Carvalho, L.M. Simultaneous analysis of antihypertensive drugs anddiuretics as adulterants in herbal-based products by ultra-high performance liquid chromatography-electrospray tandem massspectrometry. Anal. Methods 2016, 8, 1881–1888. [CrossRef]
19. Said, M.I.; Rageh, A.H.; Abdel-aal, F.A.M. Fabrication of novel electrochemical sensors based on modification with differentpolymorphs of MnO2 nanoparticles. Application to furosemide analysis in pharmaceutical and urine samples. RSC Adv. 2018,8, 18698–18713. [CrossRef]
20. Martins, T.S.; Bott-Neto, J.L.; Raymundo-Pereira, P.A.; Ticianelli, E.A.; Machado, S.A.S. An electrochemical furosemide sensorbased on pencil graphite surface modified with polymer film Ni-salen and Ni(OH)2/C nanoparticles. Sens. Actuator B Chem.
2018, 276, 378–387. [CrossRef]21. Heidarimoghadam, R.; Farmany, A. Rapid determination of furosemide in drug and blood plasma of wrestlers by a carboxyl-
MWCNT sensor. Mater. Sci. Eng. C Mater. Biol. Appl. 2016, 58, 1242–1245. [CrossRef]22. Nagata, S.I.; Kurosawa, M.; Kuwajima, M. A direct enzyme immunoassay for the measurement of furosemide in horse plasma.
J. Vet. Med. Sci. 2007, 69, 305–307. [CrossRef]23. Woods, W.E.; Wang, C.J.; Houtz, P.K.; Tai, H.H.; Wood, T.; Weckman, T.J.; Yang, J.M.; Chang, S.L.; Blake, J.W.; Tobin, T.
Immunoassay detection of drugs in racing horses. VI. Detection of furosemide (Lasix) in equine blood by a one step ELISA andPCFIA. Res. Commun. Chem. Pathol. Pharmacol. 1988, 61, 111–128. [PubMed]
24. Stanker, L.H.; Muldoon, M.T.; Buckley, S.A.; Braswell, C.; Kamps-Holtzapple, C.; Beier, R.C. Development of a monoclonalantibody-based immunoassay to detect furosemide in cow’s milk. J. Agric. Food Chem. 1996, 44, 2455–2459. [CrossRef]
25. Tang, R.H.; Yang, H.; Choi, J.R.; Gong, Y.; Feng, S.S.; Pingguan-Murphy, B.; Huang, Q.S.; Shi, J.L.; Mei, Q.B.; Xu, F. Advances inpaper-based sample pretreatment for point-of-care testing. Crit. Rev. Biotechnol. 2017, 37, 411–428. [CrossRef]
26. Di Nardo, F.; Chiarello, M.; Cavalera, S.; Baggiani, C.; Anfossi, L. Ten Years of Lateral Flow Immunoassay Technique Applications:Trends, Challenges and Future Perspectives. Sensors 2021, 21, 5185. [CrossRef]
27. Hnasko, R.M.; Jackson, E.S.; Lin, A.V.; Haff, R.P.; McGarvey, J.A. A rapid and sensitive lateral flow immunoassay (LFIA) for thedetection of gluten in foods. Food Chem. 2021, 355, 129514. [CrossRef] [PubMed]
28. Liu, Y.; Zhan, L.; Qin, Z.; Sackrison, J.; Bischof, J.C. Ultrasensitive and highly specific lateral flow assays for point-of-care diagnosis.ACS Nano 2021, 15, 3593–3611. [CrossRef] [PubMed]
29. Doyle, J.; Uthicke, S. Sensitive environmental DNA detection via lateral flow assay (dipstick)—A case study on corallivorouscrown-of-thorns sea star (Acanthaster cf. solaris) detection. Environ. DNA 2021, 3, 323–342. [CrossRef]
30. Chen, Z.; Wu, H.; Xiao, Z.; Fu, H.; Shen, Y.; Luo, L.; Wang, H.; Lei, H.; Hongsibsong, S.; Xu, Z. Rational hapten design to producehigh-quality antibodies against carbamate pesticides and development of immunochromatographic assays for simultaneouspesticide screening. J. Hazard. Mater. 2021, 412, 125241. [CrossRef]
31. Lan, J.; Sun, W.; Chen, L.; Zhou, H.; Fan, Y.; Diao, X.; Wang, B.; Zhao, H. Simultaneous and rapid detection of carbofuranand 3-hydroxy-carbofuran in water samples and pesticide preparations using lateral-flow immunochromatographic assay.Food Agric. Immunol. 2020, 31, 165–175. [CrossRef]
32. Li, J.; Duan, H.; Xu, P.; Huang, X.; Xiong, Y. Effect of different-sized spherical gold nanoparticles grown layer by layer on thesensitivity of an immunochromatographic assay. RSC Adv. 2016, 6, 26178–26185. [CrossRef]
33. Liu, Z.; Hua, Q.; Wang, J.; Liang, Z.; Li, J.; Wu, J.; Shen, X.; Lei, H.; Li, X. A smartphone-based dual detection mode deviceintegrated with two lateral flow immunoassays for multiplex mycotoxins in cereals. Biosens. Bioelectron. 2020, 158, 112178.[CrossRef] [PubMed]
34. Christopher, P.; Robinson, N.; Shaw, M.K. Antibody-Label Conjugates in Lateral-Flow Assays. In Drugs of Abuse: Body Fluid
Testing; Wong, R.C., Tse, H.Y., Eds.; Humana Press: Totowa, NJ, USA, 2005; pp. 87–98. [CrossRef]35. Kong, D.; Liu, L.; Song, S.; Suryoprabowo, S.; Li, A.; Kuang, H.; Wang, L.; Xu, C. A gold nanoparticle-based semi-quantitative
and quantitative ultrasensitive paper sensor for the detection of twenty mycotoxins. Nanoscale 2016, 8, 5245–5253. [CrossRef][PubMed]
36. Granero, G.; Longhi, M.; Mora, M.; Junginger, H.; Midha, K.; Shah, V.; Stavchansky, S.; Dressman, J.; Barends, D. Biowaivermonographs for immediate release solid oral dosage forms: Furosemide. J. Pharm. Sci. 2010, 99, 2544–2556. [CrossRef] [PubMed]
56

foods
Article
Quantitative Determination of Nitrofurazone Metabolites inAnimal-Derived Foods Based on a Background FluorescenceQuenching Immunochromatographic Assay
Yuping Wu 1, Jia Wang 2, Yong Zhou 3 , Yonghua Qi 1, Licai Ma 4, Xuannian Wang 1,* and Xiaoqi Tao 2,*
Citation: Wu, Y.; Wang, J.; Zhou, Y.;
Qi, Y.; Ma, L.; Wang, X.; Tao, X.
Quantitative Determination of
Nitrofurazone Metabolites in
Animal-Derived Foods Based on a
Background Fluorescence Quenching
Immunochromatographic Assay.
Foods 2021, 10, 1668. https://doi.org/
10.3390/foods10071668
Academic Editors: Hongtao Lei,
Zhanhui Wang and Sergei A. Eremin
Received: 7 June 2021
Accepted: 16 July 2021
Published: 20 July 2021
Publisher’s Note: MDPI stays neutral
with regard to jurisdictional claims in
published maps and institutional affil-
iations.
Copyright: © 2021 by the authors.
Licensee MDPI, Basel, Switzerland.
This article is an open access article
distributed under the terms and
conditions of the Creative Commons
Attribution (CC BY) license (https://
creativecommons.org/licenses/by/
4.0/).
1 College of Life Science and Basic Medicine, Xinxiang University, Xinxiang 453003, China;[email protected] (Y.W.); [email protected] (Y.Q.)
2 College of Food Science, Southwest University, Chongqing 400715, China; [email protected] College of Veterinary Medicine, China Agricultural University, Beijing 100193, China; [email protected] Beijing WDWK Biotech Co., Ltd., Beijing 100095, China; [email protected]* Correspondence: [email protected] (X.W.); [email protected] (X.T.);
Tel.: +86-150-9009-8008 (X.W.); +86-183-0600-8102 (X.T.)
Abstract: Due to their facile synthesis and friendly functionalization, gold nanoparticles (AuNPs)have been applied in all kinds of biosensors. More importantly, these biosensors, with the combinationof AuNPs and immunoassay, are expected to be used for the detection of different compounds withlow concentrations in complex samples. In this study, a AuNPs-labeled antibody immunoprobe wasprepared and combined with a fluorescence-quenching principle and a background fluorescence-quenching immunochromatographic assay (bFQICA), achieving rapid on-site detection. By using aportable fluorescence immunoquantitative analyzer and a QR code with a built-in standard curve,the rapid quantitative determination for nitrofurazone metabolite of semicarbazide (SEM) in animal-derived foods was realized. The limits of detection (LODs) for bFQICA in egg, chicken, fish, andshrimp were 0.09, 0.10, 0.12, and 0.15 µg kg−1 for SEM, respectively, with the linear range of0.08–0.41 µg L−1, the recoveries ranging from 73.5% to 109.2%, and the coefficient of variation <15%,only taking 13 min for the SEM detection. The analysis of animal-derived foods by bFQICA compliedwith that of liquid chromatography-tandem mass spectrometry (LC-MS/MS).
Keywords: semicarbazide (SEM); background fluorescence-quenching immunochromatographicassay (bFQICA); quantitative determination; animal-derived foods
1. Introduction
As a broad-spectrum antibiotic, nitrofurazone (NFZ) is a well-known member of thenitrofurans class and is widely applied in husbandry to prevent and control a variety ofanimal diseases caused by Salmonella and Escherichia coli infection [1,2]. Meanwhile, NFZwas also used as a medicinal feed additive to prevent the dysentery and bacterial enteritisin swine. NFZ as a kind of commonly used drug, can be metabolized to SEM in an animal’sbody [3]; therefore, the detection of SEM is usually used to reflect the residual state of NFZ.Studies have found that, after a period of accumulation in the human body, nitrofuranmetabolites can lead to various organ diseases and can cause serious harm to humanhealth, such as irreversible damage to the central nervous system, liver, kidney, heart,hypothalamus, reproductive system, and so on; toxic and side effects; allergic reactionor allergy; bacterial drug resistance; and dysbacteriosis, teratogenesis, carcinogenesis,and mutagenesis [4,5]. Since 1995, the European Union has prohibited nitrofuran usein livestock, aquaculture, and poultry [6]. Moreover, China and USA have also strictlyprohibited nitrofuran application in food-producing animals [7,8]. The European Unionand the USA have set the minimum required performance limit (MRPL) (1.0 µg kg−1) forSEM in animal-derived foods [9]. Hence, it is essential to establish effective methods forthe detection of SEM in animal-derived foods.
57

Foods 2021, 10, 1668
Indeed, various methods have been established for detecting NFZ and/or SEM(the metabolite of NFA) in animal-derived foods, such as high-performance liquidchromatography-ultraviolet (HPLC-UV) [10], HPLC with fluorescence (HPLC-FLD) [11],and HPLC-tandem mass spectrometry (HPLC-MS/MS) [12–16]. However, the above in-strumental methods require professional knowledge of operators and costly instruments,and they are unsuitable for on-site detection, which limits their use. The immunoassayis a rapid useful technique for SEM analysis with high throughput tests, such as enzyme-linked immunosorbent assay (ELISA) [17] and fluorescence-linked immunosorbent assay(FLISA) [18]. However, ELISA and FLISA are heterogeneous reactions and time-consuming,which requires tedious washing steps. The colloidal gold immunochromatographic assay(CGICA) [19] is simple, fast, and low cost; however, it always shows the disadvantages ofjust a qualified determination with a relatively high detection limit.
Due to their facile synthesis and friendly functionalization, gold nanoparticles (AuNPs)have been applied in all kinds of biosensors [20], whether chemical and biological, drugdelivery, or photothermal therapy [21–23]. More importantly, these biosensors with thecombination of AuNPs and immunoassay are expected to be used for the detection ofdifferent compounds with low concentrations in complex samples [24–26]. Wu et al. de-veloped a background fluorescence-quenching immunochromatographic assay (bFQICA)for the detection chloramphenicol (CAP) and aflatoxin M1 (AFM1) in milk with the limitof detection (LOD) for CAP of 0.0008 µg L−1 and for AFM1 of 0.0009 µg L−1 [25]. In2020, we successfully conducted the bFQICA to achieve co-determination of quinoxaline-2-carboxylic acid (QCA) and 3-methyl-quinoxaline-2-carboxylic acid (MQCA) in pork,with a sensitivity of 0.1–1.6 µg L−1 and only taking 30 min for the detection, exhibitingconvenience and efficiency [26]. The bFQICA has the advantages of having high specificityand high sensitivity, and it is quantitative, portable, and accommodates direct read-outmini devices; but so far, there has been no report on SEM detection by the bFQICA.
In this study, a bFQICA, achieving on-site quantitative determination of SEM residuesin animal-derived foods (egg, chicken, fish, and shrimp) was established (Figure 1), inwhich AuNPs were used to quench the fluorescence of a background fluorescence base-board, and a portable fluorescence immunoquantitative analyzer was used to measure thebackground fluorescence.
‐
‐ ‐ − ‐ − ‐ ‐
‐
‐
‐ ‐ ‐
‐ ‐ ‐ ‐ ‐
‐ ‐ ‐
μ )
μ ‐ ‐ μ
Figure 1. The scheme of bFQICA for detection of SEM in animal-derived foods.
58

Foods 2021, 10, 1668
2. Materials and Methods
2.1. Chemicals and Equipment
The parent nitrofurans and SEM were obtained from Dr. Ehrenstorfer (Augsburg,Germany), and other related materials can be seen in the Supplementary Materials. CPSEM-OVA (carboxybenzaldehyde semicarbazone-ovalbumin, 5.47 mg mL−1) and anti-NPSEMmonoclonal antibody (mAb) (4.05 mg mL−1) were obtained from Beijing WDWK BiotechCo., Ltd. (Beijing, China). Goat anti-mouse IgG was obtained from Jackson ImmunoRe-search Laboratories, Inc. (West Grove, PA, USA).
The sample pad and absorbent pad were from Shanghai Liangxin Co., Ltd. (Shanghai,China). The background fluorescence baseboard was obtained from Shanghai XinpuBiotechnology Co. Ltd. (Shanghai, China). A fluorescence immune-quantitative analyzerwas from Simp Bio-Science Co., Ltd. (Shanghai, China), and the UV-Vis spectrophotometerwas obtained from Hitachi Ltd. (Tokyo, Japan). The soft of NiceLabel Pro 2017 was obtainedfrom NiceLabel China (Shanghai, China)
2.2. Preparation and Characterization of AuNPs-Labeled Antibody Immunoprobe
The preparation of the AuNPs-labeled antibody (AuNPs-anti-NPSEM mAb) immuno-probe was according to previous literature with slight modifications [26–28].
First, AuNPs were synthetized by the reduction method of trisodium citrate [29].Second, for the preparation of AuNPs-anti-NPSEM mAb, the pH of AuNPs (1 mL) was
adjusted to 8.0 (K2CO3, 0.1 M), then the amount of anti-NPSEM mAb was added, quicklymixed, and incubated for 10 min at room temperature (RT). Afterward, 20 µL of BSA(20%, w/v) was added, mixed for blocking, and the mixture was centrifuged (8000 rpm,10 min, 4 ◦C). Finally, the supernatant was quickly moved, and the pellet was diluted instorage buffer (200 µL). In addition, AuNPs-anti-NPSEM mAb (4 µL) was transferred intoa microplate well and ultrasonically resuspended, then stored for use (4 ◦C).
2.3. Preparation of bFQICA Strip
The bFQICA strip contained a sample pad, background fluorescence baseboard, NCmembrane, absorbent pad, and background fluorescence baseboard. Initially, CPSEM-OVAwas dissolved in 0.02 M PBS with the final concentrations of 0.17 mg/mL and sprayedonto the NC membrane to form test line (T line). Goat anti-mouse IgG was dissolved in PB(0.02 M) with the final concentrations of 0.33 mg/mL and sprayed on the NC membrane asthe control line (C line). The spraying amount of CPSEM-OVA and goat anti-mouse IgGwas 0.7 µL/cm, with an interval between the T line and C line of 3.00 mm. Then, the as-prepared NC membrane was dried at 45 °C for 2 h. Next, the NC membrane was attachedto the fluorescent region of the background fluorescence baseboard; the sample pad andabsorbent pad were assembled on the two sides of the background fluorescence baseboard,respectively. Then, on the NC membrane and the assembled background fluorescencebaseboard with a 2 mm overlap, the strip was cut into 4.72 mm wide test strips. Finally, allwas put into a jam case and assembled into a bFQICA strip, and the assembled strips werestored and kept sealed in a dry environment until use.
2.4. The Procedure of bFQICA for SEM
First, a standard or samples extraction solution (200 µL) was added to the freeze-driedAuNPs-anti-NPSEM mAb immunoprobes, was gently blown by the pipette, and wasmixed until the purplish red particles at the bottom of the well were completely dissolved,after which the solution was incubated for 3 min at RT in microplate well. After that, theabove mixture (120 µL) was added into the sample pad. As a result, the mixture couldmove toward the absorbent pad through capillarity. Finally, the strip was measured bythe fluorescence immune-quantitative analyzer after 10 min incubation at RT, and thefluorescence signals for (F1/F2) T/C lines were measured.
59
Foods 2021, 10, 1668
2.5. Standard Curves and Generation of QR-Code
For the quantitative assay, four parameters were input into software (Nice Label Pro2017) to generate QR-code with the built-in standard curve, and the QR-code was printedby barcode printer (Label Shop). The accurate concentration of analytes could be obtainedby scanning the QR-code (Supplementary Materials).
2.6. Sample Pretreatment
The animal-derived foods (egg, chicken, fish, and shrimp) were from Xinxiang lo-cal supermarkets and were stored at −20 ◦C before use. The sample pretreatment wassimilar to our previous method [26] (Supplementary Materials). Before the detection bybFQICA, the collected solution had a dilution factor of 5, with a sample diluent (0.02 MPBS containing 0.05% Tween-20, pH 7.4) to remove the matrix interference.
2.7. Validation of bFQICA
Because of the low molecular weight of SEM, 2-NBA is often used to derivatize themetabolite to increase the molecular weight in the sample pretreatment process beforedetection. For validation of bFQICA, animal-derived food samples were confirmed to beSEM-free by LC-MS/MS (Supplementary Materials).
3. Results and Discussion
3.1. Principle of bFQICA for Quantification of SEM
The detection mode of this study was competitive reaction. The background flu-orescence of the membrane strip and the relative fluorescence intensity of the T linewere detected quantitatively. AuNPs-anti-NPSEM mAb immunoprobes were bound withNPSEM in the standard or samples extraction solution, and then the mixture was drippedonto the sample pad, moving toward the absorbent pad through capillarity. As shown inFigure 2(A1), when there was no (NP)SEM (negative), the immunoprobes (AuNPs-anti-NPSEM mAb) bound with the CPSEM-OVA coated on the T line in the NC membrane,which could obviously quench (cover) the fluorescence of the T line (F2) generated fromthe fluorescein of the background fluorescence baseboard. The remaining immunoprobes(AuNPs-anti-NPSEM mAb) continued to move toward the C line and were bound with thegoat anti-mouse IgG, generating less fluorescence at the C line (F1) due to the quenching(covering) of the fluorescein of the background fluorescence baseboard by AuNPs, in whichthe ratio of F1/F2 was maximum (max) (Figure 2(B1)).
Conversely, when (NP)SEM (positive) was present (Figure 2(A2)), the immunoprobes(AuNPs-anti-NPSEM mAb) were bound with the analytes, and then fewer immunoprobes(AuNPs-anti-NPSEM mAb) would bind with the CPSEM-OVA coated on the NC mem-brane, with less of a quenching (covering) effect, thus generating more fluorescence on theT line (F2). Moreover, these probes (the unbound immunoprobes (AuNPs-anti-NPSEMmAb) and AuNPs-anti-NPSEM mAb-analytes complex) could be captured by the goatanti-mouse IgG on the C line and an additional quenching (covering) effect occurred, withthe less fluorescence of the C line (F1), in which the ratio of F1/F2 was minimum (min)(Figure 2(B2)). As the concentration of (NP)SEM increased, the ratio of F1/F2 decreased.Furthermore, F1 waned and F2 waxed with the increased concentration of (NP)SEM. Inaddition, the concentration of (NP)SEM could be directly displayed by the built-in QR-code,which only took 13 min for the detection of (NP)SEM, including 10 min of incubation and3 min of signal collection and data calculation.
60
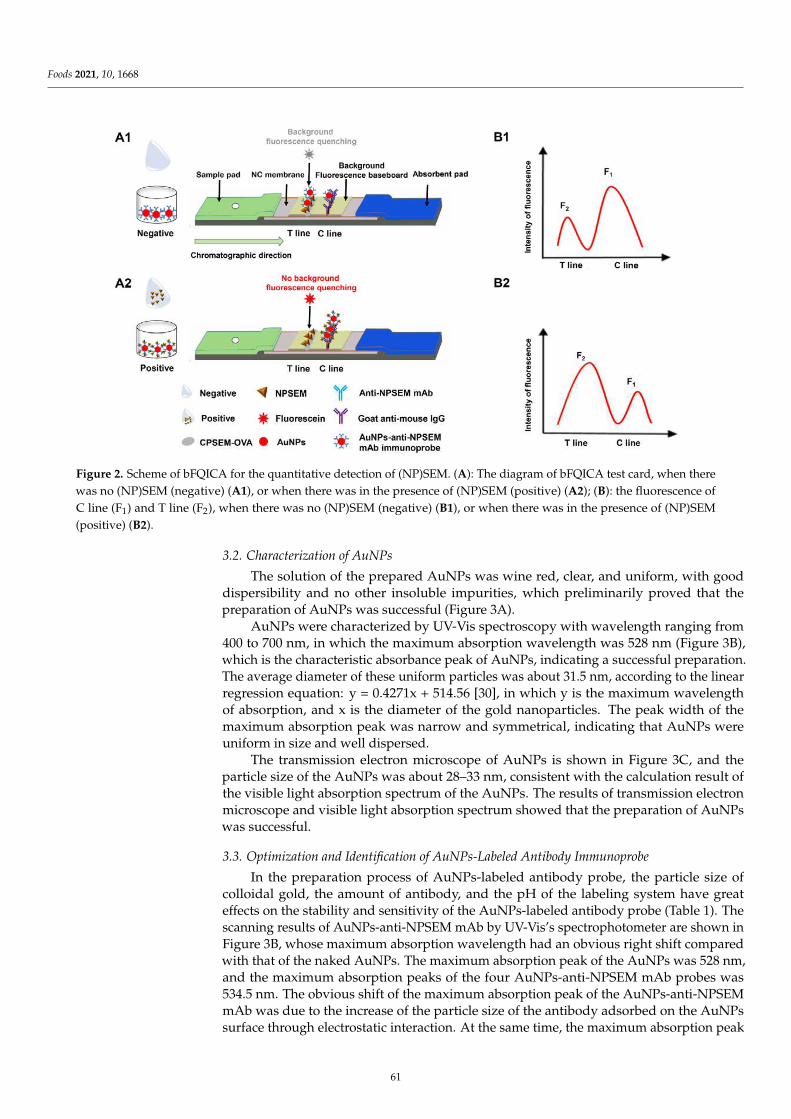
Foods 2021, 10, 1668
‐ ‐ ‐
‐ ‐ ‐ ‐
‐
‐ ‐ ‐ ‐ ‐
‐ ‐
‐ ‐ ‐ ‐ ‐
‐
‐ ‐
‐
Figure 2. Scheme of bFQICA for the quantitative detection of (NP)SEM. (A): The diagram of bFQICA test card, when therewas no (NP)SEM (negative) (A1), or when there was in the presence of (NP)SEM (positive) (A2); (B): the fluorescence ofC line (F1) and T line (F2), when there was no (NP)SEM (negative) (B1), or when there was in the presence of (NP)SEM(positive) (B2).
3.2. Characterization of AuNPs
The solution of the prepared AuNPs was wine red, clear, and uniform, with gooddispersibility and no other insoluble impurities, which preliminarily proved that thepreparation of AuNPs was successful (Figure 3A).
AuNPs were characterized by UV-Vis spectroscopy with wavelength ranging from400 to 700 nm, in which the maximum absorption wavelength was 528 nm (Figure 3B),which is the characteristic absorbance peak of AuNPs, indicating a successful preparation.The average diameter of these uniform particles was about 31.5 nm, according to the linearregression equation: y = 0.4271x + 514.56 [30], in which y is the maximum wavelengthof absorption, and x is the diameter of the gold nanoparticles. The peak width of themaximum absorption peak was narrow and symmetrical, indicating that AuNPs wereuniform in size and well dispersed.
The transmission electron microscope of AuNPs is shown in Figure 3C, and theparticle size of the AuNPs was about 28–33 nm, consistent with the calculation result ofthe visible light absorption spectrum of the AuNPs. The results of transmission electronmicroscope and visible light absorption spectrum showed that the preparation of AuNPswas successful.
3.3. Optimization and Identification of AuNPs-Labeled Antibody Immunoprobe
In the preparation process of AuNPs-labeled antibody probe, the particle size ofcolloidal gold, the amount of antibody, and the pH of the labeling system have greateffects on the stability and sensitivity of the AuNPs-labeled antibody probe (Table 1). Thescanning results of AuNPs-anti-NPSEM mAb by UV-Vis’s spectrophotometer are shown inFigure 3B, whose maximum absorption wavelength had an obvious right shift comparedwith that of the naked AuNPs. The maximum absorption peak of the AuNPs was 528 nm,and the maximum absorption peaks of the four AuNPs-anti-NPSEM mAb probes was534.5 nm. The obvious shift of the maximum absorption peak of the AuNPs-anti-NPSEMmAb was due to the increase of the particle size of the antibody adsorbed on the AuNPssurface through electrostatic interaction. At the same time, the maximum absorption peak
61
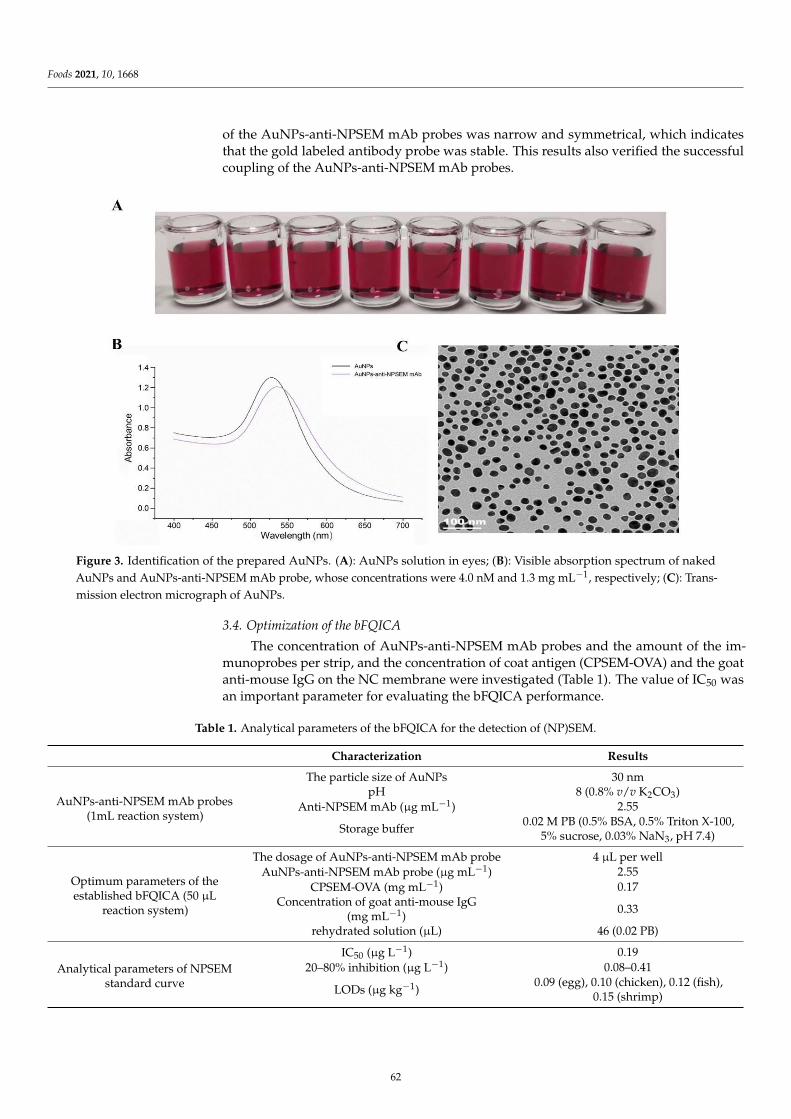
Foods 2021, 10, 1668
of the AuNPs-anti-NPSEM mAb probes was narrow and symmetrical, which indicatesthat the gold labeled antibody probe was stable. This results also verified the successfulcoupling of the AuNPs-anti-NPSEM mAb probes.
‐
‐
, ‐ ‐
‐ ‐ − ‐
‐ ‐ ‐
‐ ‐ ‐ ‐ ‐
‐ ‐ ‐ ‐
‐ ‐
Figure 3. Identification of the prepared AuNPs. (A): AuNPs solution in eyes; (B): Visible absorption spectrum of nakedAuNPs and AuNPs-anti-NPSEM mAb probe, whose concentrations were 4.0 nM and 1.3 mg mL−1, respectively; (C): Trans-mission electron micrograph of AuNPs.
3.4. Optimization of the bFQICA
The concentration of AuNPs-anti-NPSEM mAb probes and the amount of the im-munoprobes per strip, and the concentration of coat antigen (CPSEM-OVA) and the goatanti-mouse IgG on the NC membrane were investigated (Table 1). The value of IC50 wasan important parameter for evaluating the bFQICA performance.
Table 1. Analytical parameters of the bFQICA for the detection of (NP)SEM.
Characterization Results
AuNPs-anti-NPSEM mAb probes(1mL reaction system)
The particle size of AuNPs 30 nmpH 8 (0.8% v/v K2CO3)
Anti-NPSEM mAb (µg mL−1) 2.55
Storage buffer 0.02 M PB (0.5% BSA, 0.5% Triton X-100,5% sucrose, 0.03% NaN3, pH 7.4)
Optimum parameters of theestablished bFQICA (50 µL
reaction system)
The dosage of AuNPs-anti-NPSEM mAb probe 4 µL per wellAuNPs-anti-NPSEM mAb probe (µg mL−1) 2.55
CPSEM-OVA (mg mL−1) 0.17Concentration of goat anti-mouse IgG
(mg mL−1) 0.33
rehydrated solution (µL) 46 (0.02 PB)
Analytical parameters of NPSEMstandard curve
IC50 (µg L−1) 0.1920–80% inhibition (µg L−1) 0.08–0.41
LODs (µg kg−1)0.09 (egg), 0.10 (chicken), 0.12 (fish),
0.15 (shrimp)
62

Foods 2021, 10, 1668
3.5. Detectability
SEM was derivatized into NPSEM for detection by the bFQICA. The standard solutionsof NPSEM were diluted in PB (0.02 M) to generate the corresponding concentration from0 to 1.6 µg L−1 (0, 0.05, 0.1, 0.2, 0.4, 0.8, 1.6 µg L−1). The standard curves were generatedwith a series of NPSEM solutions. The detectability of the bFQICA was represented byIC50 values of 0.19 µg L−1 for NPSEM obtained from the standard curves (Figure 4 andFigure S1). The linear range was 0.08–0.41 µg L−1, represented by the concentrationscausing 20–80% inhibition (Table 1).
‐ ‐
‐
‐
‐ ‐
‐ ‐
‐
μ −
Figure 4. The standard curve of bFQICA method.
In this study, as NFZ was very unstable after entering an animal’s body, it could bequickly metabolized into SEM with smaller molecular weight in a short time and could con-sequently bind to tissue proteins in a relatively stable state. Because the molecular weightof SEM was too small, a derivatization reagent (2-NBA) was usually used to generateNPSEM, increasing its molecular weight [31]. For animal samples, the matrix componentwith the greatest interference in the extract was protein. Matrix interferences are a com-mon and challenging problem when applying bFQICA to real samples; therefore, samplepretreatment will directly affect the efficiency and accuracy of detection [32]. The purposeof sample pretreatment is to effectively extract, purify, and concentrate the target analyteand reduce the adverse effect of the matrix effect on immune response as much as possible.Generally, the influence of the matrix effect on immunoassay results can be eliminatedor weakened by the dilution method [33,34], which can effectively reduce the proportionof non-specific binding. Separation and extraction are also common methods that caneliminate or reduce the matrix effect by removing or reducing matrix components [35]. Inthis study, on the basis of common sample pretreatment technology (nitrogen blowingmethod), the amount of derivatization reagent (0.1 mL, 50 mM 2-NBA) was increased ap-propriately, the temperature of the derivatization process was increased (60 ◦C) to achieverapid derivatization [36], and the sample diluent (0.02 M PBS with 0.05% Tween-20, pH 7.4)was prepared to dilute the extract by 5 times, effectively reducing the matrix effect.
3.6. Specificity
There was negligible interference when detecting other chemical substances by thebFQICA (Table S1). The parent nitrofurans, nitrofuran metabolites, and other veterinarydrugs commonly used in poultry and aquaculture were individually tested to evaluate the
63

Foods 2021, 10, 1668
specificity of bFQICA. All the above results indicated the high specificity of the bFQICAfor (NP)SEM detection.
3.7. Validation of bFQICA
3.7.1. Limit of Detection
The LODs for bFQICA in egg, chicken, fish, and shrimp were 0.09, 0.10, 0.12, and0.15 µg kg−1 for SEM, respectively. The LOD of the developed bFQICA in egg, chicken,fish, and shrimp were below MRPL of 1.0 µg kg−1, which is compatible with the EUrequirements. The bFQICA method not only had the advantages of being a quantitativemethod for the detection of SEM compared with the published multi-CGICA method [19],but it also had a wider linear range than that of the published MBs-ICA method in fishsamples (0.1–50 µg L−1) [37]. Especially, although bFQICA nearly had the detectabilityof the instrument method using UPLC-MS/MS for SEM [12], it had the advantages ofeasy operation, low cost, and short implementation time. The developed bFQICA is animproved version of traditional colloidal gold immunochromatography, and it breaksthrough the bottleneck that AuNPs are usually only suitable for qualitative detection.
3.7.2. Accuracy and Precision
To evaluate the accuracy and precision of the developed bFQICA, blank animal-derived food samples were fortified with SEM at concentrations of LOD, 2LOD, 4LOD,and 1 µg kg−1 (MRPL). The recoveries of intra-assay ranged from 75.9% to 104.5%, and therecoveries of inter-assay ranged from 75.7% to 105.1% (Table 2). All the CV values were lessthan 15%. All the above results confirmed that the bFQICA was an accurate and effectivemethod and that it is fit for the rapid determination of SEM in animal-derived foods.
Table 2. Recovery and precision of SEM added in egg, chicken, fish, and shrimp.
SamplesSpiked
Concentration(µg kg−1)
Intra-Assay a Inter-Assay b
Measure ± SD c
(µg kg−1)Recovery ± CV d
(%)
Measure ± SD(µg kg−1)
Recovery ± CV(%)
Egg
0.09 0.074 ± 0.007 82.2 ± 8.9 0.077 ± 0.008 85.8 ± 9.90.18 0.181 ± 0.012 100.6 ± 6.4 0.168 ± 0.017 93.4 ± 10.30.36 0.302 ± 0.011 83.8 ± 3.8 0.323 ± 0.016 89.6 ± 5.11.00 0.981 ± 0.037 98.1 ± 3.8 0.932 ± 0.049 93.2 ± 5.3
Chicken
0.10 0.090 ± 0.006 90.1 ± 7.2 0.078 ± 0.007 78.1 ± 8.50.20 0.167 ± 0.015 83.5 ± 9.1 0.187 ± 0.012 93.6 ± 6.20.40 0.418 ± 0.015 104.5 ± 3.6 0.420 ± 0.016 105.1 ± 3.91.00 1.012 ± 0.050 101.2 ± 4.9 0.946 ± 0.069 94.6 ± 7.3
Fish
0.12 0.091 ± 0.006 75.9 ± 6.9 0.101 ± 0.006 83.9 ± 6.00.24 0.212 ± 0.012 88.4 ± 5.8 0.211 ± 0.018 88.1 ± 8.60.48 0.461 ± 0.034 96.0 ± 7.4 0.478 ± 0.045 99.6 ± 9.41.00 0.858 ± 0.040 85.8 ± 4.7 0.916 ± 0.057 91.6 ± 6.2
Shrimp
0.15 0.118 ± 0.012 78.4 ± 10.2 0.114 ± 0.013 75.7 ± 11.50.30 0.269 ± 0.017 89.8 ± 6.3 0.279 ± 0.025 92.9 ± 8.90.60 0.555 ± 0.049 92.5 ± 8.8 0.609 ± 0.033 101.5 ± 5.41.00 0.880 ± 0.032 88.0 ± 3.6 0.900 ± 0.060 90.0 ± 6.7
a Intra-assay variation was detection by 6 replicates on a single day. b Inter-assay variation was detection by 6 replicates on 3 different days.c SD, standard deviation. d CV, coefficient of variation.
3.8. Application in Field Samples
Eighty field samples of animal-derived food (egg, chicken, fish, and shrimp) weredetected by the bFQICA and LC-MS/MS, respectively [14,38]. All the detection results ofthe two methods were coincident (Table 3), suggesting that the developed bFQICA methodwas a reliable method for the detection of trace SEM residues in animal-derived foods.
64
Foods 2021, 10, 1668
Table 3. Determination of SEM in field animal-derived food samples collected by the bFQICA and LC-MS/MS (n = 3).
Sample No. bFQICA, Mean ± SD (µg kg−1) LC-MS/MS, Mean ± SD (µg kg−1)
Egg1–9 ND a ND10 ND ND
11–20 ND ND
Chicken1–6 ND ND7 ND ND
8–20 ND ND
Fish1 0.88 ± 0.04 0.92 ± 0.03
2–20 ND ND
Shrimp1–12 ND ND
13 ND ND14–20 ND ND
a ND not detected.
4. Conclusions
This is the first report on the bFQICA method for SEM detection. In this study,the bFQICA for the quantitative determination of SEM in animal-derived foods wassuccessfully developed. The LODs for bFQICA in egg, chicken, fish, and shrimp were 0.09,0.10, 0.12, and 0.15 µg kg−1 for SEM, respectively, with the recoveries ranging from 73.5% to109.2% (CVs < 15%), using a process that only takes 13 min. The analysis of animal-derivedfood samples by bFQICA was in accordance with that of LC-MS/MS. Compared withthe traditional CGICA method, the detectability of the bFQICA method was higher, andthe detection time was shortened compared with heterogeneous reactions such as ELISA.In addition, the concentration of SEM can be directly displayed by the built-in QR-code,which is efficient and convenient. As a promising approach, this method could also beextended for the nitrofurans metabolite in aquaculture and poultry products.
Supplementary Materials: The following are available online at https://www.mdpi.com/article/10.3390/foods10071668/s1, Figure S1: Detection of (NPSEM) of gradient concentration by the bFQICAtest card based on grey signal of AuNPs by eyes. Table S1: Cross reactivity (CR) of NPSEM and itsanalogs by bFQICA test cards.
Author Contributions: Y.W.: conducted the experiments and reviewed and edited the manuscript;J.W., Y.Z., Y.Q., and L.M.: analyzed experimental data and wrote the original draft of the manuscript;X.W. and X.T. contributed to project conceptualization and supervision. All authors have read andagreed to the published version of the manuscript.
Funding: This research was funded by the National Key Research and Development Program ofChina (2018YFC1602900), Key Scientific Research Projects of Higher Education in Henan Province(19B230015), Doctoral Research Initiation Fund of Xinxiang University (1366020122), Henan Scientificand Technological Project (212102310909).
Institutional Review Board Statement: Not applicable.
Informed Consent Statement: Not applicable.
Conflicts of Interest: The authors declare no conflict of interest. There are no conflicts of interestbetween the company and the research. The co-author Licai Ma prepared some test strips at BeijingWDWK Biotech Co. using the instruments.
References
1. Vass, M.; Hruska, K.; Franek, M. Nitrofuran antibiotics: A review on the application, prohibition and residual analysis. Vet. Med.
2008, 53, 469–500. [CrossRef]2. Liu, H.; Liang, D.P.; Hua, T.G.; She, Z.Y.; Deng, X.F.; Wu, S.Z.; Wu, B. Progress in analytical methods of nitrofuran antibiotics and
their metabolites in food: A review. J. Food Saf. Qual. 2013, 4, 383–388.3. Kwon, J. Semicarbazide: Natural occurrence and uncertain evidence of its formation from food processing. Food Control. 2017, 72,
268–275. [CrossRef]
65

Foods 2021, 10, 1668
4. Yang, W.Y.; Dong, J.X.; Shen, Y.D.; Yang, J.Y.; Wang, H.; Xu, Z.L.; Yang, X.X.; Sun, Y.M. Indirect competitive chemiluminescenceenzyme immunoassay for furaltadone metabolite in Metapenaeus Ensis. Chin. J. Anal. Chem. 2012, 40, 1816–1821. [CrossRef]
5. Zhao, H.X.; Guo, W.X.; Quan, W.N.; Jiang, J.Q.; Qu, B.C. Occurrence and levels of nitrofuran metabolites in sea cucumber fromDalian, China. Food Addit. Contam. A 2016, 33, 1672–1677. [CrossRef]
6. European Commission. Regulation (EC) No 470/2009 of the European Parliament and of the council of 6 may 2009. Off. J. Eur.
Union. 2009, L152, 11–22.7. Federal, R. Topical nitrofurans, extralabel animal drug use, order of prohibition. Fed. Reg. 2002, 67, 5470–5471.8. Announcement No.250, Ministry of Agriculture and Rural Affairs of the People’s Republic of China. 2019. Available online:
http://extwprlegs1.fao.org/docs/pdf/chn192931.pdf (accessed on 8 July 2021). (In Chinese)9. European Commission. 2003/181/EC Commission decision of 13 march amending decision 2002/657/EC. Off. J. Eur. Union.
2003, L71, 17–18.10. Tang, T.; Wei, F.D.; Wang, X.; Ma, Y.J.; Song, Y.Y.; Ma, Y.S.; Song, Q.; Xu, G.H.; Cen, Y.; Hu, Q. Determination of semicarbazide in
fish by molecularly imprinted stir bar sorptive extraction coupled with high performance liquid chromatography. J. Chromatog. B
2018, 1076, 8–14. [CrossRef] [PubMed]11. Sheng, L.Q.; Chen, M.M.; Chen, S.S.; Du, N.N.; Liu, Z.D.; Song, C.F.; Qiao, R. High-performance liquid chromatography with
fluorescence detection for the determination of nitrofuran metabolites in pork muscle. Food Addit. Contam. A 2013, 30, 2114–2122.[CrossRef] [PubMed]
12. Aldeek, F.; Hsieh, K.C.; Ugochukwu, O.N.; Gerard, G.; Hammack, W. Accurate quantitation and analysis of nitrofuran metabolites,chloramphenicol, and florfenicol in seafood by ultrahigh-performance liquid chromatography-tandem mass spectrometry:Method validation and regulatory samples. J. Agric. Food Chem. 2018, 66, 5018–5030. [CrossRef]
13. Zhang, Y.; Qiao, H.; Chen, C.; Wang, Z.; Xia, X. Determination of nitrofurans metabolites residues in aquatic products byultra-performance liquid chromatography-tandem mass spectrometry. Food Chem. 2016, 192, 612–617. [CrossRef]
14. Zhang, Z.W.; Wu, Y.P.; Li, X.W.; Wang, Y.Y.; Li, H.; Fu, Q.; Shan, Y.W.; Liu, T.H.; Xia, X. Multi-class method for the determination ofnitroimidazoles, nitrofurans, and chloramphenicol in chicken muscle and egg by dispersive-solid phase extraction and ultra-highperformance liquid chromatography-tandem mass spectrometry. Food Chem. 2017, 217, 182–190. [CrossRef] [PubMed]
15. Valera-Tarifa, N.M.; Plaza-Bolaños, P.; Romero-González, R.; Martínez-Vidal, J.L.; Garrido-Frenich, A. Determination of nitrofuranmetabolites in seafood by ultra-high performance liquid chromatography coupled to triple quadrupole tandem mass spectrometry.J. Food Compos. Anal. 2013, 30, 86–93. [CrossRef]
16. Kulikovskii, A.V.; Gorlov, I.F.; Slozhenkina, M.I.; Vostrikova, N.L.; Kuznetsova, O.A. Determination of nitrofuran metabolites inmuscular tissue by high-performance liquid chromatography with mass spectrometric detection. J. Anal. Chem. 2019, 74, 906–912.[CrossRef]
17. Jiang, W.X.; Luo, P.J.; Wang, X.; Chen, X.; Zhao, Y.F.; Shi, W.; Wu, X.P.; Wu, Y.N.; Shen, J.Z. Development of an enzyme-linkedimmunosorbent assay for the detection of nitrofurantoin metabolite, 1-amino-hydantoin, in animal tissues. Food Control. 2012, 23,20–25. [CrossRef]
18. Sun, Q.; Luo, J.H.; Zhang, L.; Zhang, Z.H.; Le, T. Development of monoclonal antibody-based ultrasensitive enzyme-linkedimmunosorbent assay and fluorescence-linked immunosorbent assay for 1-aminohydantoin detection in aquatic animals. J.
Pharmaceut. Biomed. 2018, 147, 417–424. [CrossRef] [PubMed]19. Wang, Q.; Liu, Y.; Wang, M.; Chen, Y.; Jiang, W. A multiplex immunochromatographic test using gold nanoparticles for the rapid
and simultaneous detection of four nitrofuran metabolites in fish samples. Anal. Bioanal. Chem. 2018, 410, 223–233. [CrossRef]20. Sharma, D.; Lee, J.; Seo, J.; Shin, H.J.S. Development of a sensitive electrochemical enzymatic reaction-based cholesterol biosensor
using nano-sized carbon interdigitated electrodes decorated with gold nanoparticles. Sensors 2017, 17, 2128. [CrossRef]21. Dykmana, L.; Khlebtsov, N. Gold Nanoparticles in Biomedical Applications: Recent Advances and Perspectives. Chem. Soc. Rev.
2012, 41, 2256–2282. [CrossRef]22. Dreaden, E.; Alkilany, A.; Huang, X.; Murphy, C.; El-Sayed, M. The Golden Age: Gold Nanoparticles for Biomedicine. Chem. Soc.
Rev. 2012, 41, 2740–2779. [CrossRef]23. Grzelczak, M.; Liz-Marzan, L.; Klajn, R. Stimuli-Responsive Self-Assembly of Nanoparticles. Chem. Soc. Rev. 2019, 48, 1342–1361.
[CrossRef] [PubMed]24. Chen, X.J.; Xu, Y.Y.; Yu, J.S.; Li, J.T.; Zhou, X.L.; Wu, C.Y.; Ji, Q.L.; Ren, Y.; Wang, L.Q.; Huang, Z.Y.; et al. Antigen detection based
on background fluorescence quenching immunochromatographic assay. Anal. Chim. Acta. 2014, 841, 44–50. [CrossRef] [PubMed]25. Wu, X.; Tian, X.; Xu, L.; Li, J.; Li, X.; Wang, Y. Determination of aflatoxin m1 and chloramphenicol in milk based on background
fluorescence quenching immunochromatographic assay. BioMed Res. Int. 2017, 2017, 8649314. [CrossRef] [PubMed]26. Wan, X.L.; Wan, X.; Tao, X.Q. Determination of 3-methyl-quinoxaline-2-carboxylic acid and quinoxaline-2-carboxylic acid in pork
based on a background fluorescence quenching immunochromatographic assay. Anal. Sci. 2020, 36, 783–785. [CrossRef]27. Zhou, Y.; Pan, F.; Li, Y.; Zhang, Y.; Zhang, J.; Lu, S.; Ren, H.; Liu, Z. Colloidal Gold Probe-Based Immunochromatographic Assay
for the Rapid Detection of Brevetoxins in Fishery Product Samples. Biosens. Bioelectron. 2009, 24, 2744–2747. [CrossRef]28. Wu, W.; Li, J.; Pan, D.; Li, J.; Song, S.; Rong, M.; Li, Z.; Gao, J.; Lu, J. Gold Nanoparticle-Based Enzyme-Linked Antibody-Aptamer
Sandwich Assay for Detection of Salmonella Typhimurium. ACS Appl. Mater. Inter. 2014, 6, 16974–16981. [CrossRef] [PubMed]29. Sun, X.; Zhao, X.; Jian, T.; Zhou, J.; Chu, F.S. Preparation of gold-labeled antibody probe and its use in immunochromatography
assay for detection of aflatoxin B1. Int. J. Food Microbiol. 2005, 99, 185–194.
66
Foods 2021, 10, 1668
30. Peng, J.C.; Liu, X.D.; Ding, X.P.; Fu, Z.J.; Wang, Q.L. Evaluation of the particle diameter of colloidal gold and its distributionthrough visible spectroscopy. Bull. Acad. Mil. Med. Sci. 2000, 24, 211–212.
31. Wang, K.; Kou, Y.; Wang, M.; Ma, X.; Wang, J. Determination of nitrofuran metabolites in fish by ultraperformance liq-uid chromatography-photodiode array detection with thermostatic ultrasound-assisted derivatization. ACS Omega 2020, 5,18887–18893. [CrossRef]
32. Points, J.; Burns, D.T.; Walker, M.J. Forensic issues in the analysis of trace nitrofuran veterinary residues in food of animal origin.Food Control. 2015, 50, 92–103. [CrossRef]
33. Berlina, A.N.; Taranova, N.A.; Zherdev, A.V. Quantum dot-based lateral flow immunoassay for detection of chloramphenicol inmilk. Anal. Bioanal. Chem. 2013, 405, 4997–5000. [CrossRef]
34. Wang, L.; Wang, S.; Zhang, J.Y.; Liu, J.W.; Zhang, Y. Enzyme-linked immunosorbent assay and colloidal gold immunoassay forsulphamethazine residues in edible animal foods: Investigation of the effects of the analytical conditions and the sample matrixon assay performance. Anal. Bioanal. Chem. 2008, 390, 1619–1627. [CrossRef] [PubMed]
35. Mitchell, J.S.; Lowe, T.E. Matrix effects on an antigen immobilized format for competitive enzyme immunoassay of salivarytestosterone. J. Immunol. Methods 2009, 349, 61–66. [CrossRef]
36. Cooper, K.M.; Caddell, A.; Elliott, C.T.; Kennedy, D.G. Production and characterisation of polyclonal antibodies to a derivative of3-amino-2-oxazolidinone, a metabolite of the nitrofuran furazolidone. Anal. Chim. Acta 2004, 520, 79–86. [CrossRef]
37. Lu, X.W.; Liang, X.L.; Dong, J.H.; Fang, Z.Y.; Zeng, L.W. Lateral flow biosensor for multiplex detection of nitrofuran metabolitesbased on functionalized magnetic beads. Anal. Bioanal. Chem. 2016, 408, 6703–6709. [CrossRef]
38. Tao, Y.F.; Chen, D.M.; Wei, H.M.; Pan, Y.H.; Liu, Z.L.; Huang, L.L.; Wang, Y.L.; Xie, S.Y.; Yuan, Z.H. Development of an acceleratedsolvent extraction, ultrasonic derivatisation LC-MS/MS method for the determination of the marker residues of nitrofurans infreshwater fish. Food Addit. Contam. Part A 2012, 29, 736–745. [CrossRef] [PubMed]
67


Citation: Chen, B.; Shen, X.; Li, Z.;
Wang, J.; Li, X.; Xu, Z.; Shen, Y.; Lei,
Y.; Huang, X.; Wang, X.; et al.
Antibody Generation and Rapid
Immunochromatography Using
Time-Resolved Fluorescence
Microspheres for Propiconazole:
Fungicide Abused as Growth
Regulator in Vegetable. Foods 2022,
11, 324. https://doi.org/10.3390/
foods11030324
Academic Editor: Evaristo
Ballesteros
Received: 14 November 2021
Accepted: 21 January 2022
Published: 24 January 2022
Publisher’s Note: MDPI stays neutral
with regard to jurisdictional claims in
published maps and institutional affil-
iations.
Copyright: © 2022 by the authors.
Licensee MDPI, Basel, Switzerland.
This article is an open access article
distributed under the terms and
conditions of the Creative Commons
Attribution (CC BY) license (https://
creativecommons.org/licenses/by/
4.0/).
foods
Article
Antibody Generation and Rapid ImmunochromatographyUsing Time-Resolved Fluorescence Microspheres forPropiconazole: Fungicide Abused as Growth Regulatorin Vegetable
Bo Chen 1, Xing Shen 1 , Zhaodong Li 2, Jin Wang 1, Xiangmei Li 1, Zhenlin Xu 1, Yudong Shen 1 , Yi Lei 3,
Xinan Huang 4, Xu Wang 5 and Hongtao Lei 1,*
1 Guangdong Province Key Laboratory of Food Quality and Safety, College of Food Science,South China Agricultural University, Guangzhou 510642, China; [email protected] (B.C.);[email protected] (X.S.); [email protected] (J.W.); [email protected] (X.L.);[email protected] (Z.X.); [email protected] (Y.S.)
2 College of Materials and Energy, South China Agricultural University, Guangzhou 510642, China;[email protected]
3 Guangdong Institute of Food Inspection, Zengcha Road, Guangzhou 510435, China; [email protected] Tropical Medicine Institute and South China Chinese Medicine Collaborative Innovation Center,
Guangzhou University of Chinese Medicine, Guangzhou 510405, China; [email protected] Institute of Quality Standard and Monitoring Technology for Agro-Products of Guangdong Academy of
Agricultural Sciences, Guangzhou 510405, China; [email protected]* Correspondence: [email protected]; Tel.: +86-20-8528-3925; Fax: +86-20-8528-0270
Abstract: Propiconazole (PCZ) is a fungicide popularly used to prevent and control wheat and ricebakanae disease, etc. However, it was recently found to be illegally employed as a plant regulator toinduce thick stems and dark green leaves of Brassica campestris, a famous vegetable in Guangdong,South China. Due to a lack of available recognition molecules to the target analyte, it is still a bigchallenge to establish a rapid surveillance screening method. In this study, a novel chiral hapten wasrationally designed, and an artificial immunogen was then prepared for the generation of a specificantibody against propiconazole for the first time. Using the obtained antibody, a highly sensitivetime-resolved fluorescence microspheres lateral flow immunochromatographic assay (TRFMs-LFIA)was established with a visual limit of detection of 100 ng/mL and a quantitative limit of detection of1.92 ng/mL for propiconazole. TRFMs-LFIA also exhibited good recoveries ranging from 78.6% to110.7% with coefficients of variation below 16%. The analysis of blind real-life samples showed agood agreement with results obtained using HPLC-MS/MS. Therefore, the proposed method couldbe used as an ideal screening surveillance tool for the detection of propiconazole in vegetables.
Keywords: propiconazole; hapten; antibody; time-resolved fluorescence; lateral flow immunochro-matographic assay
1. Introduction
Propiconazole (PCZ) is a systemic triazole fungicide that can prevent most fungaldiseases in banana, wheat and rice [1]. It is favored by farmers for its broad-spectrumsterilization and long duration. The crops registered for using of propiconazole in Chinaare banana, wheat and rice [2]. In 2018, the annual use of propiconazole in China reached2087.42 tons, which exceeded other countries [3]. In the hazard classification, propiconazoleis classified as reproductive toxicity 1B category and belongs to endocrine disruptingsubstances [4]. Related studies have confirmed that propiconazole can result in genetictoxicity, liver toxicity and growth toxicity [5–7]. The U.S. Environmental Protection Agencyhas included propiconazole in the list of possible human carcinogens [8].
69
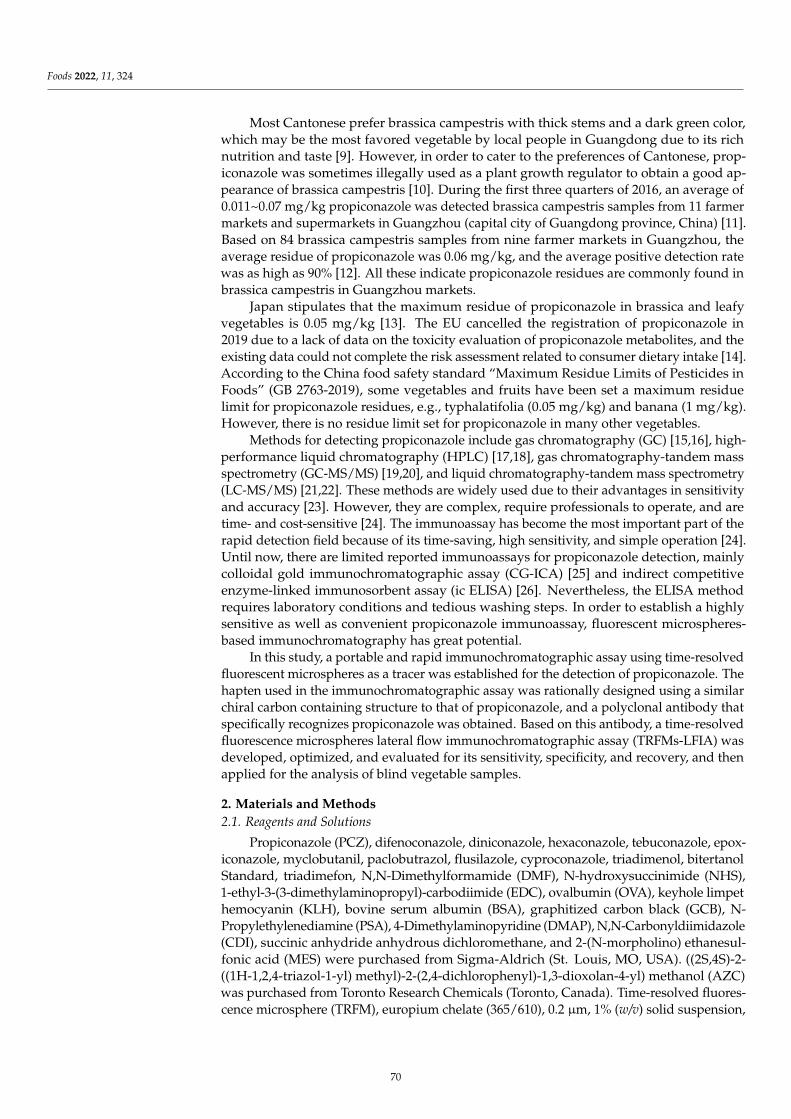
Foods 2022, 11, 324
Most Cantonese prefer brassica campestris with thick stems and a dark green color,which may be the most favored vegetable by local people in Guangdong due to its richnutrition and taste [9]. However, in order to cater to the preferences of Cantonese, prop-iconazole was sometimes illegally used as a plant growth regulator to obtain a good ap-pearance of brassica campestris [10]. During the first three quarters of 2016, an average of0.011~0.07 mg/kg propiconazole was detected brassica campestris samples from 11 farmermarkets and supermarkets in Guangzhou (capital city of Guangdong province, China) [11].Based on 84 brassica campestris samples from nine farmer markets in Guangzhou, theaverage residue of propiconazole was 0.06 mg/kg, and the average positive detection ratewas as high as 90% [12]. All these indicate propiconazole residues are commonly found inbrassica campestris in Guangzhou markets.
Japan stipulates that the maximum residue of propiconazole in brassica and leafyvegetables is 0.05 mg/kg [13]. The EU cancelled the registration of propiconazole in2019 due to a lack of data on the toxicity evaluation of propiconazole metabolites, and theexisting data could not complete the risk assessment related to consumer dietary intake [14].According to the China food safety standard “Maximum Residue Limits of Pesticides inFoods” (GB 2763-2019), some vegetables and fruits have been set a maximum residuelimit for propiconazole residues, e.g., typhalatifolia (0.05 mg/kg) and banana (1 mg/kg).However, there is no residue limit set for propiconazole in many other vegetables.
Methods for detecting propiconazole include gas chromatography (GC) [15,16], high-performance liquid chromatography (HPLC) [17,18], gas chromatography-tandem massspectrometry (GC-MS/MS) [19,20], and liquid chromatography-tandem mass spectrometry(LC-MS/MS) [21,22]. These methods are widely used due to their advantages in sensitivityand accuracy [23]. However, they are complex, require professionals to operate, and aretime- and cost-sensitive [24]. The immunoassay has become the most important part of therapid detection field because of its time-saving, high sensitivity, and simple operation [24].Until now, there are limited reported immunoassays for propiconazole detection, mainlycolloidal gold immunochromatographic assay (CG-ICA) [25] and indirect competitiveenzyme-linked immunosorbent assay (ic ELISA) [26]. Nevertheless, the ELISA methodrequires laboratory conditions and tedious washing steps. In order to establish a highlysensitive as well as convenient propiconazole immunoassay, fluorescent microspheres-based immunochromatography has great potential.
In this study, a portable and rapid immunochromatographic assay using time-resolvedfluorescent microspheres as a tracer was established for the detection of propiconazole. Thehapten used in the immunochromatographic assay was rationally designed using a similarchiral carbon containing structure to that of propiconazole, and a polyclonal antibody thatspecifically recognizes propiconazole was obtained. Based on this antibody, a time-resolvedfluorescence microspheres lateral flow immunochromatographic assay (TRFMs-LFIA) wasdeveloped, optimized, and evaluated for its sensitivity, specificity, and recovery, and thenapplied for the analysis of blind vegetable samples.
2. Materials and Methods
2.1. Reagents and Solutions
Propiconazole (PCZ), difenoconazole, diniconazole, hexaconazole, tebuconazole, epox-iconazole, myclobutanil, paclobutrazol, flusilazole, cyproconazole, triadimenol, bitertanolStandard, triadimefon, N,N-Dimethylformamide (DMF), N-hydroxysuccinimide (NHS),1-ethyl-3-(3-dimethylaminopropyl)-carbodiimide (EDC), ovalbumin (OVA), keyhole limpethemocyanin (KLH), bovine serum albumin (BSA), graphitized carbon black (GCB), N-Propylethylenediamine (PSA), 4-Dimethylaminopyridine (DMAP), N,N-Carbonyldiimidazole(CDI), succinic anhydride anhydrous dichloromethane, and 2-(N-morpholino) ethanesul-fonic acid (MES) were purchased from Sigma-Aldrich (St. Louis, MO, USA). ((2S,4S)-2-((1H-1,2,4-triazol-1-yl) methyl)-2-(2,4-dichlorophenyl)-1,3-dioxolan-4-yl) methanol (AZC)was purchased from Toronto Research Chemicals (Toronto, Canada). Time-resolved fluores-cence microsphere (TRFM), europium chelate (365/610), 0.2 µm, 1% (w/v) solid suspension,
70
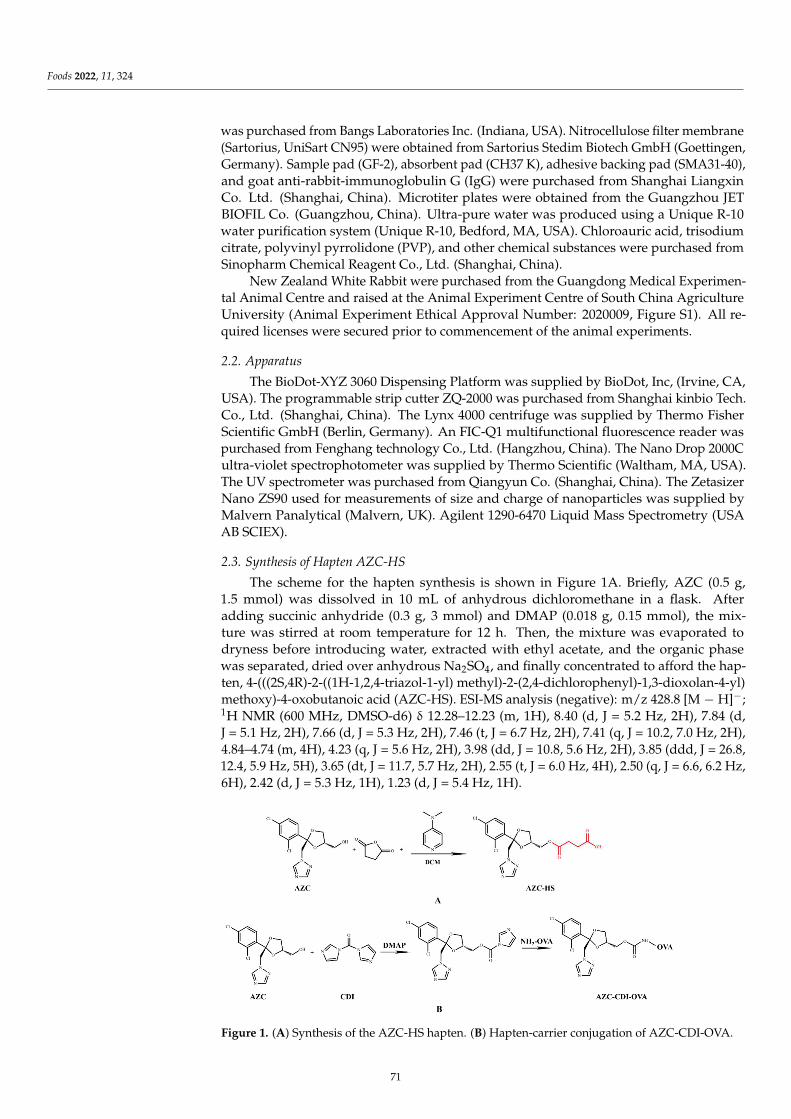
Foods 2022, 11, 324
was purchased from Bangs Laboratories Inc. (Indiana, USA). Nitrocellulose filter membrane(Sartorius, UniSart CN95) were obtained from Sartorius Stedim Biotech GmbH (Goettingen,Germany). Sample pad (GF-2), absorbent pad (CH37 K), adhesive backing pad (SMA31-40),and goat anti-rabbit-immunoglobulin G (IgG) were purchased from Shanghai LiangxinCo. Ltd. (Shanghai, China). Microtiter plates were obtained from the Guangzhou JETBIOFIL Co. (Guangzhou, China). Ultra-pure water was produced using a Unique R-10water purification system (Unique R-10, Bedford, MA, USA). Chloroauric acid, trisodiumcitrate, polyvinyl pyrrolidone (PVP), and other chemical substances were purchased fromSinopharm Chemical Reagent Co., Ltd. (Shanghai, China).
New Zealand White Rabbit were purchased from the Guangdong Medical Experimen-tal Animal Centre and raised at the Animal Experiment Centre of South China AgricultureUniversity (Animal Experiment Ethical Approval Number: 2020009, Figure S1). All re-quired licenses were secured prior to commencement of the animal experiments.
2.2. Apparatus
The BioDot-XYZ 3060 Dispensing Platform was supplied by BioDot, Inc, (Irvine, CA,USA). The programmable strip cutter ZQ-2000 was purchased from Shanghai kinbio Tech.Co., Ltd. (Shanghai, China). The Lynx 4000 centrifuge was supplied by Thermo FisherScientific GmbH (Berlin, Germany). An FIC-Q1 multifunctional fluorescence reader waspurchased from Fenghang technology Co., Ltd. (Hangzhou, China). The Nano Drop 2000Cultra-violet spectrophotometer was supplied by Thermo Scientific (Waltham, MA, USA).The UV spectrometer was purchased from Qiangyun Co. (Shanghai, China). The ZetasizerNano ZS90 used for measurements of size and charge of nanoparticles was supplied byMalvern Panalytical (Malvern, UK). Agilent 1290-6470 Liquid Mass Spectrometry (USAAB SCIEX).
2.3. Synthesis of Hapten AZC-HS
The scheme for the hapten synthesis is shown in Figure 1A. Briefly, AZC (0.5 g,1.5 mmol) was dissolved in 10 mL of anhydrous dichloromethane in a flask. Afteradding succinic anhydride (0.3 g, 3 mmol) and DMAP (0.018 g, 0.15 mmol), the mix-ture was stirred at room temperature for 12 h. Then, the mixture was evaporated todryness before introducing water, extracted with ethyl acetate, and the organic phasewas separated, dried over anhydrous Na2SO4, and finally concentrated to afford the hap-ten, 4-(((2S,4R)-2-((1H-1,2,4-triazol-1-yl) methyl)-2-(2,4-dichlorophenyl)-1,3-dioxolan-4-yl)methoxy)-4-oxobutanoic acid (AZC-HS). ESI-MS analysis (negative): m/z 428.8 [M − H]−;1H NMR (600 MHz, DMSO-d6) δ 12.28–12.23 (m, 1H), 8.40 (d, J = 5.2 Hz, 2H), 7.84 (d,J = 5.1 Hz, 2H), 7.66 (d, J = 5.3 Hz, 2H), 7.46 (t, J = 6.7 Hz, 2H), 7.41 (q, J = 10.2, 7.0 Hz, 2H),4.84–4.74 (m, 4H), 4.23 (q, J = 5.6 Hz, 2H), 3.98 (dd, J = 10.8, 5.6 Hz, 2H), 3.85 (ddd, J = 26.8,12.4, 5.9 Hz, 5H), 3.65 (dt, J = 11.7, 5.7 Hz, 2H), 2.55 (t, J = 6.0 Hz, 4H), 2.50 (q, J = 6.6, 6.2 Hz,6H), 2.42 (d, J = 5.3 Hz, 1H), 1.23 (d, J = 5.4 Hz, 1H).
−
−
Figure 1. (A) Synthesis of the AZC-HS hapten. (B) Hapten-carrier conjugation of AZC-CDI-OVA.
71
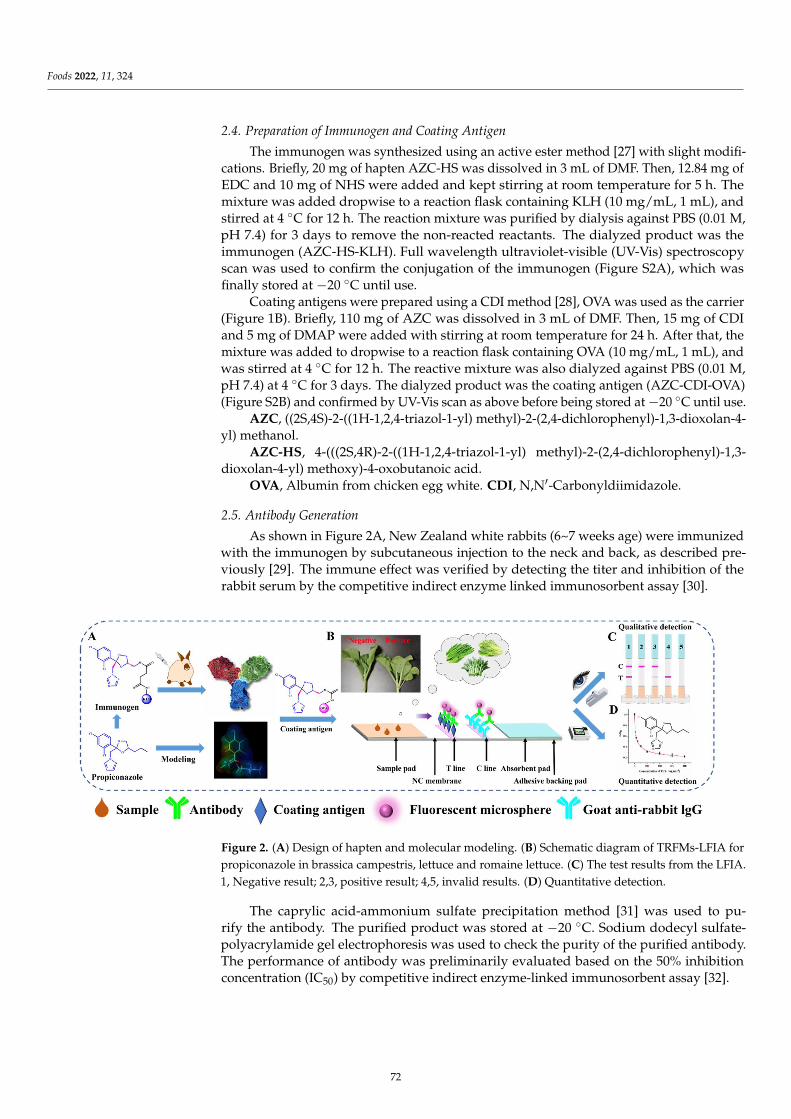
Foods 2022, 11, 324
2.4. Preparation of Immunogen and Coating Antigen
The immunogen was synthesized using an active ester method [27] with slight modifi-cations. Briefly, 20 mg of hapten AZC-HS was dissolved in 3 mL of DMF. Then, 12.84 mg ofEDC and 10 mg of NHS were added and kept stirring at room temperature for 5 h. Themixture was added dropwise to a reaction flask containing KLH (10 mg/mL, 1 mL), andstirred at 4 ◦C for 12 h. The reaction mixture was purified by dialysis against PBS (0.01 M,pH 7.4) for 3 days to remove the non-reacted reactants. The dialyzed product was theimmunogen (AZC-HS-KLH). Full wavelength ultraviolet-visible (UV-Vis) spectroscopyscan was used to confirm the conjugation of the immunogen (Figure S2A), which wasfinally stored at −20 ◦C until use.
Coating antigens were prepared using a CDI method [28], OVA was used as the carrier(Figure 1B). Briefly, 110 mg of AZC was dissolved in 3 mL of DMF. Then, 15 mg of CDIand 5 mg of DMAP were added with stirring at room temperature for 24 h. After that, themixture was added to dropwise to a reaction flask containing OVA (10 mg/mL, 1 mL), andwas stirred at 4 ◦C for 12 h. The reactive mixture was also dialyzed against PBS (0.01 M,pH 7.4) at 4 ◦C for 3 days. The dialyzed product was the coating antigen (AZC-CDI-OVA)(Figure S2B) and confirmed by UV-Vis scan as above before being stored at −20 ◦C until use.
AZC, ((2S,4S)-2-((1H-1,2,4-triazol-1-yl) methyl)-2-(2,4-dichlorophenyl)-1,3-dioxolan-4-yl) methanol.
AZC-HS, 4-(((2S,4R)-2-((1H-1,2,4-triazol-1-yl) methyl)-2-(2,4-dichlorophenyl)-1,3-dioxolan-4-yl) methoxy)-4-oxobutanoic acid.
OVA, Albumin from chicken egg white. CDI, N,N′-Carbonyldiimidazole.
2.5. Antibody Generation
As shown in Figure 2A, New Zealand white rabbits (6~7 weeks age) were immunizedwith the immunogen by subcutaneous injection to the neck and back, as described pre-viously [29]. The immune effect was verified by detecting the titer and inhibition of therabbit serum by the competitive indirect enzyme linked immunosorbent assay [30].
−
μμ
μ
μμ
μ
μ
μ
Figure 2. (A) Design of hapten and molecular modeling. (B) Schematic diagram of TRFMs-LFIA forpropiconazole in brassica campestris, lettuce and romaine lettuce. (C) The test results from the LFIA.1, Negative result; 2,3, positive result; 4,5, invalid results. (D) Quantitative detection.
The caprylic acid-ammonium sulfate precipitation method [31] was used to pu-rify the antibody. The purified product was stored at −20 ◦C. Sodium dodecyl sulfate-polyacrylamide gel electrophoresis was used to check the purity of the purified antibody.The performance of antibody was preliminarily evaluated based on the 50% inhibitionconcentration (IC50) by competitive indirect enzyme-linked immunosorbent assay [32].
72

Foods 2022, 11, 324
2.6. Molecular Surface Electrostatic Potential Simulation
Energy-minimized three-dimensional (3D) structure and surface electrostatic potentialiso-surfaces of hapten AZC-HS and 13 triazoles compounds were modelled using theSybyl-X 2.0 program package (Tripos Inc, St. Louis, MO, USA).
2.7. Preparation of TRFM Labeled Antibody
The carboxyl group on the surface of TRFM can be linked to the amino group in theantibody by the active ester method [33]. Hence, 10 µL of TRFM was mixed with 1 mL of theMES solution (50 mM, pH 5.5). Then, 15 µL of freshly prepared EDC solution (0.5 mg/mL)and 20 µL of freshly prepared NHS solution (0.5 mg/mL) were added to the above solution.The mixture was vortexed for 10 s in order to fully disperse in solution. After activationfor 15 min, the solution was centrifuged at 14,000 rpm at 4 ◦C for 15 min. After carefullydiscarding the supernatant, the white precipitate was resuspended with a boric acid buffer(BB, 20 mM, pH 8.0), and the anti-PCZ antibody (2 µL, 17.0 mg/mL) dissolved in 198 µLof BB (2 mM, pH 8.0) was added and mixed thoroughly. After incubation for another45 min, 20 µL of 20% (w/v) BSA was added dropwise for 60 min of blocking reaction. Themixture was then centrifuged at 14,000 rpm at 4 ◦C for 15 min, and the supernatant wasdiscarded to remove any unbound antibody and BSA. The white precipitate, which was thetarget TRFM-labeled antibody (TRFM-Ab) immunoconjugates, was redissolved in 200 µLphosphate buffer (PB, 20 mM, pH 7.4) containing 0.75% (v/v) Tween-20, 0.05% (w/v) NaCl,0.5% (w/v) BSA, 0.3% (w/v) PVP, and 0.03% (w/v) procline-300. The resuspension was storedat 4 ◦C for the further use.
2.8. Fabrication of the Lateral Flow Strip
As shown in Figure 2B, the test strip mainly consists of four parts, a sample pad,a nitrocellulose membrane, an absorbent pad, and an adhesive backing pad. First, thecoating antigen was diluted to 0.2 mg/mL with carbonic acid buffer and the goat anti-rabbitIgG antibody was diluted to 0.03 mg/mL with PB (20 mM, pH 7.4). Second, they weredispensed on the nitrocellulose membrane as the test (T) line and control (C) line, with0.8 µL/cm of spray volume, respectively. The distance between the T and C line was 8 mm,then the nitrocellulose membrane was dried at 37 ◦C for 12 h. Third, the nitrocellulosemembrane, sample pad, and absorbent pad were adhered to the adhesive backing pad asshown in Figure 2B. Finally, the assembled backing pad was cut into strips with widths of3.05 mm and placed in a ziplock bag with silica particles as a desiccant.
2.9. Sample Preparation
Blank lettuce and romaine lettuce purchased from a local supermarket were verifiedas PCZ-free by HPLC analysis.
The standard addition process is to add the standard analyte of the correspondingconcentration to 2 g of homogeneous vegetables, vortex, and mix for 1 min.
Samples were extracted by mixing 2 g of homogenized vegetables with 5 mL ofmethanol in 10 mL centrifuge tubes. After mixing and shaking for 1 min, the extractedsolutions were centrifuged at 5000 rpm for 5 min. The supernatants of 4 mL were collectedin a 10 mL centrifuge tube (containing 50 mg PSA, 30 mg GCB). After mixing and shakingfor 1 min, the extracted solutions were centrifuged at 5000 rpm for 5 min. The supernatantsof 2 mL were collected and dried with nitrogen. The substrate was reconstituted with 2 mLof PB (200 mM, pH 7.4) containing 10% (v/v) methanol, before being filtered through a0.22 µm membrane and then diluted four times with PB (200 mM, pH 7.4) containing 10%(v/v) methanol. The final volume of 8 mL used to for TRFMs-LFIA analysis.
2.10. Principle and Detection Protocol of TRFMs-LFIA
The main principle of TRFMs-LFIA is based on the indirect competitive reactionbetween antibody and antigen [34]. The TRFM-Ab acts as a sensitive fluorescent probe. Asshown in Figure 2B, with the help of absorption capacity of the absorbent pad, the solution
73

Foods 2022, 11, 324
can flow in the direction from the sample pad to the absorbent pad. When detecting apositive sample, the free propiconazole first reacts with the TRFM-Ab conjugates andoccupies the limited TRFM-Ab binding sites. Thus, fewer or no TRFM-Ab conjugates willbe captured by coating antigen on the T line. The more propiconazole exists in the sample,the weaker fluorescence response displays on the T line. In accordance with this principle,the fluorescence intensity at the test line is inversely proportional to the propiconazoleconcentration in the sample. If there is no fluorescence on the C line, the test strip is invalid(Figure 2C).
In this study, a vertical running mode was applied to the test strip for the detectionprocess. In our work, 120 µL of sample solution or standard analyte was added to themicrowells (microtiter plates, Guangzhou JET BIOFIL Co.), followed by mixing with 8 µLof the TRFM-Ab. After incubation for 3 min at room temperature, the test strips werevertically inserted into the microwells and incubated for another 5 min. Finally, the samplepad was discarded, and the test strips were visually inspected under ultraviolet (UV) light(Figure 2C) for qualitative results. Meanwhile, the fluorescence intensity of the T andC line were quantified by a FIC-Q1 multifunctional fluorescence reader (Figure 2D) forquantitative analysis. The ratio of T/C was used to quantify the result, where T representfluorescence intensity at the detection line [35].
2.11. Performance of TRFMs-LFIA
A series of concentration of propiconazole standard solutions (0, 5, 25, 50, 75, 100, 150,and 200 ng/mL) under the optimal conditions was analyzed using the established TRFMs-LFIA to achieve the visual limit of detection (vLOD), standard curves, and quantitativelimit of detection (qLOD). The vLOD, judged by the naked eyes under the UV light, isconsidered to be as the lowest analyte concentration that can form a significantly weakercolor band on the T line than that on the control strip [36]. The standard curves were obtainedby measuring a series of standard with various concentrations. Each level was tested intriplicate (n = 3) with the strip by FIC-Q1 fluorescence reader, which were plotted based onthe B/B0 against the propiconazole concentration, where B and B0 were the ratio of T/Cvalues with and without propiconazole in the sample solutions. The qLOD were defined asthe concentration that gave 80% B/B0 values according to the standard curves [37].
To evaluate the specificity of TRFMs-LFIA, 12 structural and functional analogs, in-cluding difenoconazole, diniconazole, hexaconazole, tebuconazole, epoxiconazole, my-clobutanil, paclobutrazol, flusilazole, cyproconazole, triadimenol, bitertanol standard, andtriadimefon, were tested along with propiconazole at the same concentration (100 ng/mL),and PB (0.1 M, 10% (v/v) methanol) was selected as the negative control. Each test wasrepeated in triplicates.
In order to confirm the reliability of the proposed TRFMs-LFIA, spiked and real-life samples were verified by HPLC-MS/MS analysis. The accuracy and precision ofthe developed test strip was evaluated by the recovery and coefficient of variation (CV),respectively [38]. At present, the residues of propiconazole in the brassica campestrisseem to be common, and in order to better evaluate the residues of propiconazole inmarkets, two extra leafy vegetables, lettuce and romaine lettuce, were also selected as thetest samples. Brassica campestris, lettuce, and romaine lettuce samples, including threelevels of propiconazole standard concentration (10, 40, 80 µg/kg), were detected via teststrip in triplicates. Blind samples (four samples of each vegetable) taken randomly fromlocal markets in Guangzhou were tested in triplicates by both TRFMs-LFIA and HPLC-MS/MS. The quantitative consistency of TRFMs-LFIA and HPLC-MS/MS was verified byregression analysis.
3. Results and Discussion
3.1. Hapten Design and Antibody Evaluation
As propiconazole is too small a molecule (molar mass 342.2 g mol−1) to be immuno-genic and to exert an immune response to an animal body, the hapten needs to be conjugated
74
Foods 2022, 11, 324
to a macromolecular protein carrier to become a complete antigen for animal immunity [39].However, propiconazole lacks an active group for conjugation with a carrier protein. There-fore, the structurally similar analogue molecule AZC was selected as a hapten, whichextended an arm similar to propiconazole feature on its side chain. There are two chiralcarbons in the molecular structure of propiconazole, and it is well known that the propi-conazole contains four optical isomers. The cis-isomer generally accounts for about 60% ofthe racemate, and the trans-isomer accounts for about 40% [40]. Herein, AZC-HS, the cisisomer (Figure 2) was chosen as the immunizing hapten for the conjugation with carrierprotein to prepare the immunogen, and then immunize rabbit to produce an antibody. Itwas expected to recognize the propiconazole isomer molecule, since the majority of theirfeatures are same except for a steric difference and the length of the side chain in theirstructures (Figure 1A).
In this conjugation, the overall structure of propiconazole was fully exposed by in-troducing the succinic anhydride arm, which was coupled with protein (KLH) to obtainimmunogen and the conjugate curves (Figure S2A) showed the conjugate has the weakcharacteristic peaks of both the hapten at 260 nm and the carrier protein at 280 nm, prelimi-narily judging that the coupling is successful. Meanwhile, the hapten AZC was directlycoupled to the OVA to obtain the coating antigen, and the conjugate curves (Figure S2B)showed that the conjugate has the characteristic peaks of both the hapten at 320 nm andthe carrier protein at 280 nm, indicating successful conjugation between the hapten andthe carrier (BSA or OVA) [41], thus supporting the formation of the immunogen. Thisimmunogen was then used for antibody production.
After the rabbit antiserum was obtained, preliminary purification and evaluation werecarried out per the previously reported protocol [31]. SDS-PAGE under reducing conditions(Figure S3A) shows the main protein band between 55 kDa and 180 kDa. The propiconazoleantibody showed two expected protein bands around 25 kDa and 55 kDa, respectively,indicating a normal antibody feature, and consequently high antibody purity.
A competitive indirect enzyme linked immunosorbent assay was developed to prelim-inarily assess the usability and suitability of the obtained antibody with IC50, which is theconcentration resulting the half decrease in optic absorbance [32] (Figure S3B). The perfor-mance of the competitive indirect enzyme linked immunosorbent assay calibration curveexhibited a good property with IC50 values of 0.51 ng/mL, a working range (IC20~IC80)of 0.11~2.42 ng/mL, and a limit of detection (LOD) 0.06 ng/mL. According to the Chinafood safety standard “Maximum Residue Limits of Pesticides in Foods” (GB 2763-2019),the maximum residue limits of propiconazole in other agricultural products is 0.05 mg/kg,the obtained performance of the antibody is much lower than the limit set by GB 2763-2019.This indicated that the antibody is sensitive enough to meet the limit regulation and suitablefor the further investigation and assay development.
3.2. Characterization of TRFM Labeled Antibody
When TRFM was coupled with antibody, the coupling can sometimes cause a changein the particle size and zeta potential, which indicates a successful conjugation [42]. Here,the particle size is shown in Figure S3C. When the 10 µL of TRFM and TRFM-Ab wasdispersed in 1 mL of ultrapure water, an average particle size of TRFM was approximately200 nm. After coupling, its average particle size of TRFM-Ab was about 240 nm. There is aremarkable change in particle size before and after coupling. With regard to zeta potential,the potential of TRFM-Ab increased significantly from −50 mV to −35 mV of TRFMs(Figure S3D). This indicated that the antibody was successfully labeled with the TRFMs.
3.3. Optimization of TRFMs-LFIA
To obtain the best performance, each step of the TRFM-LFIA assay procedure wasoptimized. In this study, several key factors were optimized, such as the conditions for thepreparation of TRFM-Ab (activation pH, antibody dilution buffer antibody amount, etc.)
75

Foods 2022, 11, 324
and the assay procedure (probe amount, ion concentration of standard diluent, methanolcontent in diluent, coupling pH, time of coupling reaction and blocking time, etc.).
3.3.1. Activation pH
The carboxyl group on the surface of the TRFMs requires activation to couple with theamino group of the antibody [43]. Therefore, the activated pH is the key factor affecting theefficiency of activation. The activation pH was adjusted to 5.0, 5.5, 6.0, and 6.5 with MES(0.05 M) solution and other pH was adjusted to 7.0 and 7.4 with PB (0.01 M), respectively.The result showed that with the increase of pH, the fluorescence intensity of C line firstincreases and then decreases (Figure 3A). When the pH was at 5.5 during preparation ofthe TRFM labeled antibody, the fluorescence intensity of C and T lines was desired underthe UV light. From the histogram analysis, the inhibition rate is the highest at the sametime. Therefore, pH 5.5 was selected as the optimal activation pH.
μ
Figure 3. Optimization of working conditions. All the optimize conditions were evaluated by thenegative (0 ng/mL) and positive (100 ng/mL). The values of T/C below were calculated from thepictures above by FIC-Q1 fluorescence reader and the screening criteria combined the T/C value,where B and B0 were the ratio of T/C values with and without propiconazole in the sample solutions.Inhibition rate is equal to 1-B0/B. (A) Activation pH, (B) Antibody dilution buffer, (C) Antibodyamount, (D) Immunoprobe amount.
3.3.2. Antibody Dilution Buffer
It is known that a suitable dilution type is an important factor that can affect thesensitivity and specificity of antibody [44]. In this investigation, five antibody dilutionbuffers, including ultrapure water, 0.01 M PB (pH 7.4), 0.5% BSA, 0.01 M PB (0.5% BSA), and0.002 M BB (pH 8.0), were used to dilute antibody. The results under UV light (Figure 3B)
76
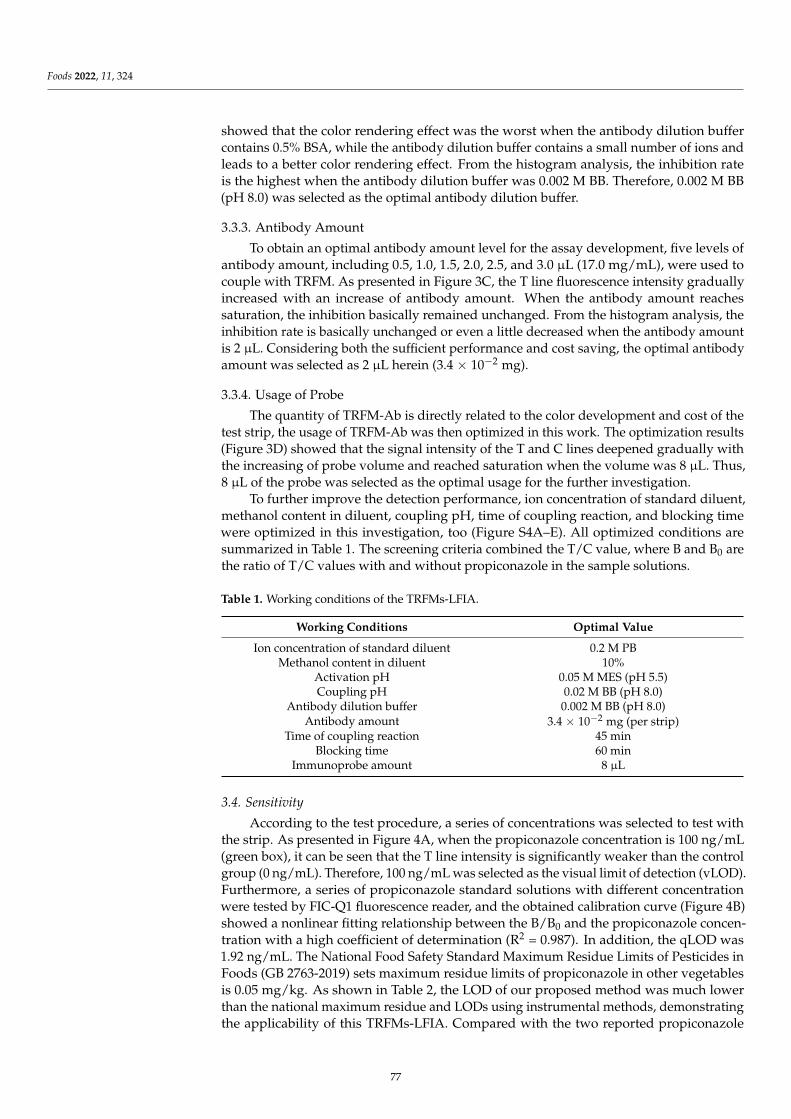
Foods 2022, 11, 324
showed that the color rendering effect was the worst when the antibody dilution buffercontains 0.5% BSA, while the antibody dilution buffer contains a small number of ions andleads to a better color rendering effect. From the histogram analysis, the inhibition rateis the highest when the antibody dilution buffer was 0.002 M BB. Therefore, 0.002 M BB(pH 8.0) was selected as the optimal antibody dilution buffer.
3.3.3. Antibody Amount
To obtain an optimal antibody amount level for the assay development, five levels ofantibody amount, including 0.5, 1.0, 1.5, 2.0, 2.5, and 3.0 µL (17.0 mg/mL), were used tocouple with TRFM. As presented in Figure 3C, the T line fluorescence intensity graduallyincreased with an increase of antibody amount. When the antibody amount reachessaturation, the inhibition basically remained unchanged. From the histogram analysis, theinhibition rate is basically unchanged or even a little decreased when the antibody amountis 2 µL. Considering both the sufficient performance and cost saving, the optimal antibodyamount was selected as 2 µL herein (3.4 × 10⁻² mg).
3.3.4. Usage of Probe
The quantity of TRFM-Ab is directly related to the color development and cost of thetest strip, the usage of TRFM-Ab was then optimized in this work. The optimization results(Figure 3D) showed that the signal intensity of the T and C lines deepened gradually withthe increasing of probe volume and reached saturation when the volume was 8 µL. Thus,8 µL of the probe was selected as the optimal usage for the further investigation.
To further improve the detection performance, ion concentration of standard diluent,methanol content in diluent, coupling pH, time of coupling reaction, and blocking timewere optimized in this investigation, too (Figure S4A–E). All optimized conditions aresummarized in Table 1. The screening criteria combined the T/C value, where B and B0 arethe ratio of T/C values with and without propiconazole in the sample solutions.
Table 1. Working conditions of the TRFMs-LFIA.
Working Conditions Optimal Value
Ion concentration of standard diluent 0.2 M PBMethanol content in diluent 10%
Activation pH 0.05 M MES (pH 5.5)Coupling pH 0.02 M BB (pH 8.0)
Antibody dilution buffer 0.002 M BB (pH 8.0)Antibody amount 3.4 × 10⁻² mg (per strip)
Time of coupling reaction 45 minBlocking time 60 min
Immunoprobe amount 8 µL
3.4. Sensitivity
According to the test procedure, a series of concentrations was selected to test withthe strip. As presented in Figure 4A, when the propiconazole concentration is 100 ng/mL(green box), it can be seen that the T line intensity is significantly weaker than the controlgroup (0 ng/mL). Therefore, 100 ng/mL was selected as the visual limit of detection (vLOD).Furthermore, a series of propiconazole standard solutions with different concentrationwere tested by FIC-Q1 fluorescence reader, and the obtained calibration curve (Figure 4B)showed a nonlinear fitting relationship between the B/B0 and the propiconazole concen-tration with a high coefficient of determination (R2 = 0.987). In addition, the qLOD was1.92 ng/mL. The National Food Safety Standard Maximum Residue Limits of Pesticides inFoods (GB 2763-2019) sets maximum residue limits of propiconazole in other vegetablesis 0.05 mg/kg. As shown in Table 2, the LOD of our proposed method was much lowerthan the national maximum residue and LODs using instrumental methods, demonstratingthe applicability of this TRFMs-LFIA. Compared with the two reported propiconazole
77

Foods 2022, 11, 324
immunoassay methods [25,26], our method showed slightly higher LOD. Maybe the lesssensitive polyclonal antibody we used was responsible for this phenomenon. However,the proposed TRFMs-LFIA not only fully meets the actual detection requirements, but alsooffers a sensitive as well as convenient immunoassay for propiconazole screening.
μ
Figure 4. Assay performance of TRFMs-LFIA for propiconazole detection. (A) Detection resultsfor propiconazole standard of different concentrations by the TRFMs-LFIA. Green rectangular boxrepresents the vLOD concentrations of propiconazole by the TRFMs-LFIA. (B) Calibration curve ofpropiconazole in standard buffer. (C) Specificity of the TRFMs-LFIA for propiconazole detection. Theconcentrations of propiconazole (PCZ), difenoconazole (DFCZ), diniconazole (DICZ), hexaconazole(HCZ), tebuconazole (TCZ), epoxiconazole (ECZ), myclobutanil (MOA), paclobutrazol (POA), flusi-lazole (FIZ), cyproconazole (CCZ), triadimenol (TDL), bitertanol standard (BRD), and triadimefon(TDN) are all 100 ng/mL.
Table 2. Comparison of performance of different methods.
Method Matrix The Detection Lim (itmg/kg) References
GC-MS Banana 0.02 [19]
LC-MS/MS Peppersoil
0.0050.0015 [22]
LC-MS/MS Soil 0.004 [21]SPE-GC-µECD Vegetable 0.01 [45]
GC-ECD Groundwater 2 [15]GC-MS Snow peas 0.003 [20]
HPLC-MS Soil 0.005 [46]GC Wolfberry 0.006 [16]
GC-ICA Vegetable 0.00013 [25]Ic ELISA Vegetable 0.00026 [26]
TRFMs-LFIA Brassica campestris 0.00192 This work
3.5. Specificity
According to the literature [47], the T/C value was chosen as the ordinate, and ahistogram was used to intuitively reflect the comparison between different drugs andthe blank. As shown in Figure 4C, compared with the negative control, the presence ofpropiconazole makes the T line disappear completely, while the other analogs did notcause obvious changes to the T line. When the buffer contains propiconazole, the T/C
78

Foods 2022, 11, 324
value of the green band is less than 0.2. The T/C value of the blue-green band with otheranalogs is more than twice the green band and adding other related molecules may affectthe fluorescence intensity of C line, thus cause T/C value to be larger than the negativecontrol group. This indicated that the proposed TRFMs-LFIA is highly specific for thedetection of propiconazole.
The results for the 3D models (Figure 5) also confirmed the feasibility of the aboveresults. At the lowest energy conformation, 13 triazoles and hapten AZC-HS have similarstructural areas that are all in accordance with the arrangement of the 1,3-dichlorobenzeneon the top, the trinitrogen ring at the bottom, and the side chain on the right. The chargedistribution of hapten what we used is similar to propiconazole and the transition frombenzene ring (A small amount of negative charge) to trinitrogen ring (positive charge),which implies that the obtained antibody demonstrated a good specificity. For the other12 triazole compounds, the benzene rings of difenoconazole, diniconazole, hexaconazole,tebuconazole, paclobutrazol, flusilazole, cyproconazole, triadimenol, bitertanol standard,and triadimefon show a strong negative charge. At the same time, the positive charge ofmyclobutanil is mainly concentrated in the central area. Therefore, the obtained antibodycannot recognize the 12 triazole compounds, and thus demonstrated high specificity. Thisis also reasonable and explainable in according with the molecule modeling.
Figure 5. Lowest energy conformations and molecular electrostatic potential isosurfaces of 13 triazolecompounds and hapten (Blue region represents negative charge, red region represents for positivecharge. The darker the color, the stronger the charge).
79

Foods 2022, 11, 324
3.6. Recovery
As shown in Table 3, the coefficient of variation is equal to the ratio of the standarddeviation to the mean and the average recovery rate of spiked samples ranged from 78.6%to 110.7% with corresponding CVs below 16%. This indicated that it could be acceptablefor a rapid screening method. The good recovery can also confirm that the chiral haptendesign strategy was efficient successful, since the resultant antibody can well recognizethe racemate.
Table 3. Recovery of propiconazole in brassica campestris, lettuce and romaine lettuce samplesdetected by TRFMs-LFIA (n = 3).
SamplesSpiked Level Found ± SD Recovery CV
(ng/g) (ng/g) (%) (%)
brassicacampestris
10.0 8.6 ± 0.8 86.3 9.140.0 44.3 ± 5.4 110.7 12.280.0 78.6 ± 12.3 98.3 15.6
lettuce10.0 8.7 ± 0.5 86.6 5.640.0 36.7 ± 5.1 91.6 13.980.0 83.2 ± 8.3 104.0 9.9
romaine lettuce10.0 8.1 ± 0.7 81.2 8.840.0 31.5 ± 3.7 78.6 11.880.0 71.1 ± 9.7 88.9 13.6
SD, Standard deviation. CV, Coefficient of Variation.
3.7. Analysis for Blind Samples
To verify the feasibility of this method in real-life samples, brassica campestris, lettuce,and romaine lettuce were chosen and tested using the TRFMs-LFIA. The vLOD of TRFMs-LFIA in samples for propiconazole was slightly higher than that in PB, which might beattributed to the effect of the complexed food matrix. As illustrated in Figure S5, withincreasing propiconazole concentration, the fluorescence intensity of T line becomes weakerunder UV light. When the propiconazole concentration of brassica campestris is 150 ng/mL(red box), it can be seen that the T line intensity is significantly weaker than the control group(0 ng/mL). Similarly, 200 ng/mL was selected as the visual limit of detection (vLOD) oflettuce and romaine lettuce. Therefore, the corresponding vLOD of the brassica campestris,lettuce and romaine lettuce were 150, 200, and 200 µg/kg, respectively.
Furthermore, blind samples (four samples of each type of vegetable) were detectedto evaluate the suitability of the TRFMs-LFIA for in practical applications. The data ofthe TRFMs-LFIA were consistent with that of the HPLC-MS/MS (Table 4). Meanwhile, asatisfactory correlation for the detection of propiconazole (Y = 1.15X − 0.74, R2 = 0.974)was obtained with the two methods (Figure S6), indicating that the established TRFMs-LFIA had excellent reliability and could provide the point-of-care quantitative detection ofpropiconazole in brassica campestris, lettuce, and romaine lettuce.
To our surprise, propiconazole residues were detectable in romaine lettuce, anothercommon vegetable on the dining table of Cantonese. It is also reported for the first timethat propiconazole residue was found in romaine lettuce so far. Therefore, a comprehensivemarket spot check for the residue of propiconazole in romaine lettuce have to be conductedto clarify the residual status, and it is recommended that the regulatory authorities need toinclude the lettuce as a regulatory object.
For brassica campestris, four blind samples from the two markets all led to the detec-tion of propiconazole residues. By calculating the dietary exposure risk entropy based onthe average positive detection value (0.026 mg/kg) [11], despite the dietary exposure riskbeing low at present, it is necessary to monitor the propiconazole residue in vegetables,because propiconazole is not registered for use on any leafy vegetables by any countryand organization.
80
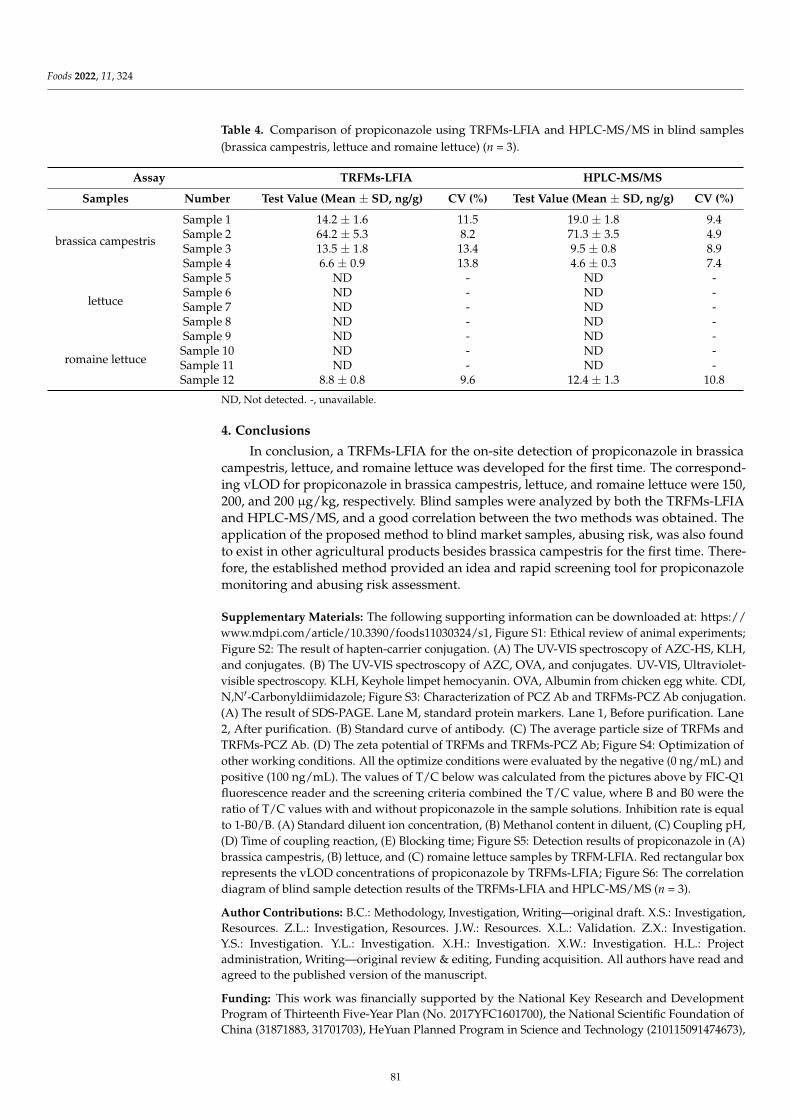
Foods 2022, 11, 324
Table 4. Comparison of propiconazole using TRFMs-LFIA and HPLC-MS/MS in blind samples(brassica campestris, lettuce and romaine lettuce) (n = 3).
Assay TRFMs-LFIA HPLC-MS/MS
Samples Number Test Value (Mean ± SD, ng/g) CV (%) Test Value (Mean ± SD, ng/g) CV (%)
brassica campestris
Sample 1 14.2 ± 1.6 11.5 19.0 ± 1.8 9.4Sample 2 64.2 ± 5.3 8.2 71.3 ± 3.5 4.9Sample 3 13.5 ± 1.8 13.4 9.5 ± 0.8 8.9Sample 4 6.6 ± 0.9 13.8 4.6 ± 0.3 7.4
lettuce
Sample 5 ND - ND -Sample 6 ND - ND -Sample 7 ND - ND -Sample 8 ND - ND -
romaine lettuce
Sample 9 ND - ND -Sample 10 ND - ND -Sample 11 ND - ND -Sample 12 8.8 ± 0.8 9.6 12.4 ± 1.3 10.8
ND, Not detected. -, unavailable.
4. Conclusions
In conclusion, a TRFMs-LFIA for the on-site detection of propiconazole in brassicacampestris, lettuce, and romaine lettuce was developed for the first time. The correspond-ing vLOD for propiconazole in brassica campestris, lettuce, and romaine lettuce were 150,200, and 200 µg/kg, respectively. Blind samples were analyzed by both the TRFMs-LFIAand HPLC-MS/MS, and a good correlation between the two methods was obtained. Theapplication of the proposed method to blind market samples, abusing risk, was also foundto exist in other agricultural products besides brassica campestris for the first time. There-fore, the established method provided an idea and rapid screening tool for propiconazolemonitoring and abusing risk assessment.
Supplementary Materials: The following supporting information can be downloaded at: https://www.mdpi.com/article/10.3390/foods11030324/s1, Figure S1: Ethical review of animal experiments;Figure S2: The result of hapten-carrier conjugation. (A) The UV-VIS spectroscopy of AZC-HS, KLH,and conjugates. (B) The UV-VIS spectroscopy of AZC, OVA, and conjugates. UV-VIS, Ultraviolet-visible spectroscopy. KLH, Keyhole limpet hemocyanin. OVA, Albumin from chicken egg white. CDI,N,N′-Carbonyldiimidazole; Figure S3: Characterization of PCZ Ab and TRFMs-PCZ Ab conjugation.(A) The result of SDS-PAGE. Lane M, standard protein markers. Lane 1, Before purification. Lane2, After purification. (B) Standard curve of antibody. (C) The average particle size of TRFMs andTRFMs-PCZ Ab. (D) The zeta potential of TRFMs and TRFMs-PCZ Ab; Figure S4: Optimization ofother working conditions. All the optimize conditions were evaluated by the negative (0 ng/mL) andpositive (100 ng/mL). The values of T/C below was calculated from the pictures above by FIC-Q1fluorescence reader and the screening criteria combined the T/C value, where B and B0 were theratio of T/C values with and without propiconazole in the sample solutions. Inhibition rate is equalto 1-B0/B. (A) Standard diluent ion concentration, (B) Methanol content in diluent, (C) Coupling pH,(D) Time of coupling reaction, (E) Blocking time; Figure S5: Detection results of propiconazole in (A)brassica campestris, (B) lettuce, and (C) romaine lettuce samples by TRFM-LFIA. Red rectangular boxrepresents the vLOD concentrations of propiconazole by TRFMs-LFIA; Figure S6: The correlationdiagram of blind sample detection results of the TRFMs-LFIA and HPLC-MS/MS (n = 3).
Author Contributions: B.C.: Methodology, Investigation, Writing—original draft. X.S.: Investigation,Resources. Z.L.: Investigation, Resources. J.W.: Resources. X.L.: Validation. Z.X.: Investigation.Y.S.: Investigation. Y.L.: Investigation. X.H.: Investigation. X.W.: Investigation. H.L.: Projectadministration, Writing—original review & editing, Funding acquisition. All authors have read andagreed to the published version of the manuscript.
Funding: This work was financially supported by the National Key Research and DevelopmentProgram of Thirteenth Five-Year Plan (No. 2017YFC1601700), the National Scientific Foundation ofChina (31871883, 31701703), HeYuan Planned Program in Science and Technology (210115091474673),
81

Foods 2022, 11, 324
Generic Technique Innovation Team Construction of Modern Agriculture of Guangdong Province(2021KJ130), Lingnan Modern Agricultural Science and Technology experiment project of GuangdongProvinc (LNSYSZX001).
Data Availability Statement: Data is contained within the article (or supplementary material).
Conflicts of Interest: The authors declare no conflict of interest.
References
1. Bai, A.; Chen, A.; Chen, W.; Luo, X.; Liu, S.; Zhang, M.; Liu, Y.; Zhang, D. Study on degradation behaviour, residue distribution,and dietary risk assessment of propiconazole in celery and onion under field application. J. Sci. Food Agric. 2021, 101, 1998–2005.[CrossRef]
2. Mao, L.G.; Dong-Mei, X.U.; Tian, M.Q.; Yuan, S.K.; Fu-Gen, L.I.; Zhang, L.; Zhang, Y.N.; Jiang, H.Y. Analysis on recommendeddosage of the strobilurin fungicides registered in China. Agrochemicals 2019, 58, 870–874. [CrossRef]
3. Yang, Y.J. Detailed analysis of China and global propiconazole market in 2019. Pestic. Mark. News 2019, 14, 49–51.4. European Food Safety Authority (EFSA); Arena, M.; Auteri, D.; Barmaz, S.; Bellisai, G.; Brancato, A.; Brocca, D.; Bura, L.; Byers,
H.; Chiusolo, A.; et al. Peer review of the pesticide risk assessment of the active substance propiconazole. EFSA J. 2017, 15, e04887.[CrossRef]
5. Nesnow, S.; Grindstaff, R.D.; Lambert, G.; Padgett, W.T.; Bruno, M.; Ge, Y.; Chen, P.J.; Wood, C.E.; Murphy, L. Propiconazoleincreases reactive oxygen species levels in mouse hepatic cells in culture and in mouse liver by a cytochrome P450 enzymemediated process. Chem.-Biol. Interact. 2011, 194, 79–89. [CrossRef]
6. Souders, C.L., II; Xavier, P.; Perez-Rodriguez, V.; Ector, N.; Zhang, J.L.; Martyniuk, C.J. Sub-lethal effects of the triazole fungicidepropiconazole on zebrafish (Danio rerio) development, oxidative respiration, and larval locomotor activity. Neurotoxicology Teratol.
2019, 74, 106809. [CrossRef]7. Teng, M.; Zhao, F.; Zhou, Y.; Yan, S.; Tian, S.; Yan, J.; Meng, Z.; Bi, S.; Wang, C. Effect of propiconazole on the lipid metabolism of
zebrafish embryos (Danio rerio). J. Agric. Food Chem. 2019, 67, 4623–4631. [CrossRef]8. Rossi, L. Propiconazole; Pesticide tolerances. Fed. Regist. 2012, 77, 38199–38204.9. Yang, X. The Nutritive composition and assessment of brassica parachinensis. Food Sci. Technol. 2002, 9, 74–76.10. Xiang, D.L. Vegetable farm “dwarf medicine” to cater to the concept of deformity Zecai. Ctry. Agric. Farmers B 2013, 2, 36–37.11. Huang, J.X.; Sun, L.; Qian, Y.E.; Gao, Y.W.; Wan, K.; Chen, H.C. Studies on effect of propiconazole on plant height and yield of
flowering Chinese cabbage and its residue behavior. China Veg. 2019, 3, 47–52.12. Qian, Y.E.; Huang, J.; Deng, Y.; Gao, Y.; Liang, Y.; Sun, L. Residue and dietary exposure risk assessment of propiconazole and
chlormequat in Chinese kale, flowering Chinese cabbage and Pak-Choi in Guangzhou. Chin. J. Trop. Crops 2017, 38, 752–757.13. Wang, C.; Wu, J.; Zhang, Y.; Wang, K.; Zhang, H. Field dissipation of trifloxystrobin and its metabolite trifloxystrobin acid in soil
and apples. Environ. Monit. Assess. 2015, 187, 4100. [CrossRef] [PubMed]14. Database, E.P. EUROPA-Plants-EU Pesticides Database. 2015. Available online: http://ec.europa.eu/sanco_pesticides/public/
?event=activesubstance.selection&language=EN (accessed on 6 January 2015).15. Song, S.L.; Zhu, R. Determination of chlorothalonil, propiconazole, hexaconazole, azoxystrobin and β-cypermethrin in ground-
water by gas chromatogramy with elektron captured etector. Rock Miner. Anal. 2011, 30, 174–177. [CrossRef]16. Yan, W.U. Gas chromatography for determination of propiconazole residues in wolfberries. Ningxia J. Agric. For. Sci. Technol. 2018,
59, 3. Available online: http://cnki.cgl.org.cn/kcms/detail/detail.aspx?&DbCode=CJFQ&filename=NXNL201801011 (accessedon 1 November 2021).
17. Mu, W.; Liu, F.; Sun, Z.; Wei, G.; Yang, L. Study on the quantitative analysis of tebuconazole, propiconazole and triadimefon byGC and HPLC. Pestic. Sci. Adm. 2005, 26, 1–3. Available online: https://xueshu.baidu.com/usercenter/paper/show?paperid=a7ecf7f87380713c5f775ca4f2b8752a&site=xueshu_se (accessed on 1 November 2021).
18. Zhang-Ming, C.; Shi-You, Y.; Rui, Z.; He, Z. Analysis of flusilazole·propiconazole by HPLC. Agrochemicals 2016, 55, 3. [CrossRef]19. Qiong, W.U.; Wang, M.; Daizhu, L.; Xiaochun, W.U.; Huilin, G.E.; Amp, A.; Center, T. Determination and analysis of propiconazole
residues in banana and soil. Chin. J. Trop. Agric. 2019, 39, 6.20. Wang, L.Z.; Wang, D.F.; Zheng, J.C.; Wang, R.L.; Liu, Y.N.; Liang, M.; Sheng-Yu, L.U. GC-ms determination of residual fluosilazole
propiconazole and difenoconazole in green pea. Phys. Test. Chem. Anal. Part B Chem. Anal. 2006, 42, 1025.21. Blondel, A.; Krings, B.; Ducat, N.; Pigeon, O. Validation of an analytical method for 1,2,4-triazole in soil using liquid chromatog-
raphy coupled to electrospray tandem mass spectrometry and monitoring of propiconazole degradation in a batch study. J.
Chromatogr. A 2018, 1562, 123–127. [CrossRef]22. Wu, S.; Zhang, H.; Zheng, K.; Meng, B.; Wang, F.; Cui, Y.; Zeng, S.; Zhang, K.; Hu, D. Simultaneous determination and method
validation of difenoconazole, propiconazole and pyraclostrobin in pepper and soil by LC-MS/MS in field trial samples from threeprovinces, China. Biomed. Chromatogr. Int. J. Devoted Res. Chromatogr. Methodol. Appl. Biosci. 2018, 32, e4052. [CrossRef] [PubMed]
23. Preechakasedkit, P.; Pinwattana, K.; Dungchai, W.; Siangproh, W.; Chaicumpa, W.; Tongtawe, P.; Chailapakul, O. Development ofa one-step immunochromatographic strip test using gold nanoparticles for the rapid detection of Salmonella typhi in humanserum. Biosens. Bioelectron. 2012, 31, 562–566. [CrossRef] [PubMed]
82
Foods 2022, 11, 324
24. Liu, L.Q.; Xu, L.G.; Suryoprabowo, S.; Song, S.S.; Kuang, H. Rapid detection of tulathromycin in pure milk and honey with animmunochromatographic test strip. Food Agric. Immunol. 2018, 29, 358–368. [CrossRef]
25. Xu, Z.K.; Meng, J.N.; Lei, Y.; Yang, X.X.; Yan, Y.Y.; Liu, H.H.; Lei, H.T.; Wang, T.C.; Shen, X.; Xu, Z.L. Highly selective monoclonalantibody-based lateral flow immunoassay for visual and sensitive determination of conazole fungicides propiconazole invegetables. Food Addit. Contam. Part A. 2022, 39, 92–104. [CrossRef]
26. Li, J.; Ding, Y.; Chen, H.; Sun, W.; Huang, Y.; Liu, F.; Wang, M.; Hua, X. Development of an indirect competitive enzyme-linkedimmunosorbent assay for propiconazole based on monoclonal antibody. Food Control 2022, 134, 108751. [CrossRef]
27. Chen, L.; Sun, Y.; Hu, X.; Xing, Y.; Zhang, G. Colloidal gold-based immunochromatographic strip assay for the rapid detection ofdiminazene in milk. Food Addit. Contam. Part A 2020, 37, 1667–1677. [CrossRef]
28. Zhao, D.; He, L.; Pu, C.; Deng, A. A highly sensitive and specific polyclonal antibody-based enzyme-linked immunosorbent assayfor detection of antibiotic olaquindox in animal feed samples. Anal. Bioanal. Chem. 2008, 391, 2653–2661. [CrossRef]
29. Liu, J.; Song, S.S.; Wu, A.H.; Kuang, H.; Liu, L.Q.; Xiao, J.; Xu, C.L. Development of immunochromatographic strips for thedetection of dicofol. Analyst 2021, 146, 2240–2247. [CrossRef]
30. Fa Ng, S.; Zhang, B.; Ren, K.W.; Cao, M.M.; Shi, H.Y.; Wang, M.H. Development of a sensitive indirect competitive enzyme-linkedimmunosorbent assay (ic-ELISA) based on the monoclonal antibody for the detection of the imidaclothiz residue. J. Agric. Food
Chem. 2011, 59, 1594–1597. [CrossRef]31. Liang, Y.-F.; Zhou, X.-W.; Wang, F.; Shen, Y.-D.; Xiao, Z.-L.; Zhang, S.-W.; Li, Y.-J.; Wang, H. Development of a monoclonal
antibody-based ELISA for the detection of Alternaria mycotoxin tenuazonic acid in food samples. Food Anal. Methods 2020, 13,1594–1602. [CrossRef]
32. Lei, H.; Rui, S.; Haughey, S.A.; Qiang, W.; Xu, Z.; Yang, J.; Shen, Y.; Hong, W.; Jiang, Y.; Sun, Y. Development of a specificallyenhanced enzyme-linked immunosorbent assay for the detection of melamine in milk. Molecules 2011, 16, 5591. [CrossRef]
33. Wang, D.; Zhang, Z.; Li, P.; Qi, Z.; Wen, Z. Time-resolved fluorescent immunochromatography of aflatoxin b1 in soybean sauce: Arapid and sensitive quantitative analysis. Sensors 2016, 16, 1094. [CrossRef] [PubMed]
34. Chang, X.; Zhang, Y.; Liu, H.; Tao, X. A quadruple-label time-resolved fluorescence immunochromatographic assay for simultane-ous quantitative determination of three mycotoxins in grains. Anal. Methods 2020, 12, 247–254. [CrossRef]
35. Li, X.; Chen, X.; Liu, Z.; Wang, J.; Hua, Q.; Liang, J.; Shen, X.; Xu, Z.; Lei, H.; Sun, Y. Latex microsphere immunochromatographyfor quantitative detection of dexamethasone in milk and pork. Food Chem. 2021, 345, 128607. [CrossRef]
36. Jiang, W.; Beloglazova, N.V.; Wang, Z.; Jiang, H.; Wen, K.; Saeger, S.D.; Luo, P.; Wu, Y.; Shen, J. Development of a multiplexflow-through immunoaffinity chromatography test for the on-site screening of 14 sulfonamide and 13 quinolone residues in milk.Biosens. Bioelectron. 2015, 66, 124–128. [CrossRef] [PubMed]
37. Liu, Z.; Hua, Q.; Wang, J.; Liang, Z.; Li, X. A smartphone-based dual detection mode device integrated with two lateral flowimmunoassays for multiplex mycotoxins in cereals. Biosens. Bioelectron. 2020, 158, 112178. [CrossRef]
38. Huang, D.; Ying, H.; Liu, F.; Xiaoyun, P.U. Evaluation of a time-resolved fluorescence immunochromatography for procalcitonin.J. Third Mil. Med. Univ. 2019, 41, 581–586. [CrossRef]
39. Xu, J.; Chen, Y.; Shen, P. Research progress on design and synthesis of hapten. Jiangsu J. Agric. Sci. 2009, 25, 1178–1182.40. Geng, J.M.; Long, Y.C.; Feng, J.; Ping, L.Y. Study on the relationship between structure and activity of the sterioisomers of golden
cyclotriazole fungicides. J. Nanjing Agric. Univ. 2003, 26, 102–105.41. Gan, J.H.; Deng, W.; Jin-Ping, L.I.; Xiao-Hui, A.I. Artificial antigen synthesis and antibody preparation of doxycycline. J. Food Sci.
Biotechnol. 2011, 30, 1673–1689. Available online: https://en.cnki.com.cn/Article_en/CJFDTotal-WXQG201102031.htm (accessedon 1 November 2021).
42. Miao, L.A.; Hw, B.; Js, A.; Jian, J.A.; Yy, A.; Xin, L.A.; Yz, A.; Xs, A. Rapid, on-site, and sensitive detection of aflatoxin M1 in milkproducts by using time-resolved fluorescence microsphere test strip. Food Control 2020, 121, 107616. [CrossRef]
43. Rodríguez-Cervantes, C.H.; Ramos, A.J.; Robledo-Marenco, M.L.; Sanchis, V.; Marín, S.; Girón-Pérez, M.I. Determination ofaflatoxin and fumonisin levels through ELISA and HPLC, on tilapia feed in Nayarit, Mexico. Food Agric. Immunol. 2013, 24,269–278. [CrossRef]
44. Li, X.; Chen, X.; Wu, X.; Wang, J.; Liu, Z.; Sun, Y.; Shen, X.; Lei, H. Rapid detection of adulteration of dehydroepiandrosterone inslimming products by competitive indirect enzyme-linked immunosorbent assay and lateral flow immunochromatography. Food
Agric. Immunol. 2019, 30, 123–139. [CrossRef]45. Ying-Jie, X.U. Determination of six triazole pesticides residues in vegetables by SPE-GC-µECD. J. Anhui Agric. Sci. 2014, 42,
5813–5815. [CrossRef]46. Shao, Y.H. Simultaneous determination of 8 bactericide residues in soil by high performance liquid chromatography–tandem
mass spectrometry. Chem. Anal. Meterage 2020, 29, 62–66. [CrossRef]47. Zhang, H.; Wang, L.; Yao, X.; Wang, Z.; Dou, L.; Su, L.; Zhao, M.; Sun, J.; Zhang, D.; Wang, J. Developing a simple immunochro-
matography assay for clenbuterol with sensitivity by one-step staining. J. Agric. Food Chem. 2020, 68, 15509–15515. [CrossRef][PubMed]
83

Citation: Lu, D.; Wang, X.; Su, R.;
Cheng, Y.; Wang, H.; Luo, L.; Xiao, Z.
Preparation of an Immunoaffinity
Column Based on Bispecific
Monoclonal Antibody for Aflatoxin
B1 and Ochratoxin A Detection
Combined with ic-ELISA. Foods 2022,
11, 335. https://doi.org/10.3390/
foods11030335
Academic Editor: Fernando
Benavente
Received: 15 December 2021
Accepted: 21 January 2022
Published: 25 January 2022
Publisher’s Note: MDPI stays neutral
with regard to jurisdictional claims in
published maps and institutional affil-
iations.
Copyright: © 2022 by the authors.
Licensee MDPI, Basel, Switzerland.
This article is an open access article
distributed under the terms and
conditions of the Creative Commons
Attribution (CC BY) license (https://
creativecommons.org/licenses/by/
4.0/).
foods
Article
Preparation of an Immunoaffinity Column Based on BispecificMonoclonal Antibody for Aflatoxin B1 and Ochratoxin ADetection Combined with ic-ELISA
Disha Lu, Xu Wang, Ruijue Su, Yongjian Cheng, Hong Wang, Lin Luo and Zhili Xiao *
Guangdong Provincial Key Laboratory of Food Quality and Safety, College of Food Science, South ChinaAgricultural University, Guangzhou 510642, China; [email protected] (D.L.); [email protected] (X.W.);[email protected] (R.S.); [email protected] (Y.C.); [email protected] (H.W.);[email protected] (L.L.)* Correspondence: [email protected]; Tel.: +86-2085280270
Abstract: A novel and efficient immunoaffinity column (IAC) based on bispecific monoclonal anti-body (BsMAb) recognizing aflatoxin B1 (AFB1) and ochratoxin A (OTA) was prepared and appliedin simultaneous extraction of AFB1 and OTA from food samples and detection of AFB1/OTA com-bined with ic-ELISA (indirect competitive ELISA). Two deficient cell lines, hypoxanthine guaninephosphoribosyl-transferase (HGPRT) deficient anti-AFB1 hybridoma cell line and thymidine kinase(TK) deficient anti-OTA hybridoma cell line, were fused to generate a hybrid-hybridoma producingBsMAb against AFB1 and OTA. The subtype of the BsMAb was IgG1 via mouse antibody isotypingkit test. The purity and molecular weight of BsMAb were confirmed by SDS-PAGE method. Thecross-reaction rate with AFB2 was 37%, with AFG1 15%, with AFM1 48%, with AFM2 10%, andwith OTB 36%. Negligible cross-reaction was observed with other tested compounds. The affinityconstant (Ka) was determined by ELISA. The Ka (AFB1) and Ka (OTA) was 2.43 × 10⁸ L/mol and1.57 × 108 L/mol, respectively. Then the anti-AFB1/OTA BsMAb was coupled with CNBr-Sepharose,and an AFB1/OTA IAC was prepared. The coupling time and elution conditions of IAC were opti-mized. The coupling time was 1 h with 90% coupling rate, the eluent was methanol–water (60:40, v:v,pH 2.3) containing 1 mol/L NaCl, and the eluent volume was 4 mL. The column capacities of AFB1
and OTA were 165.0 ng and 171.3 ng, respectively. After seven times of repeated use, the preservationrates of column capacity for AFB1 and OTA were 69.3% and 68.0%, respectively. The ic-ELISA forAFB1 and OTA were applied combined with IAC. The IC50 (50% inhibiting concentration) of AFB1
was 0.027 ng/mL, the limit of detection (LOD) was 0.004 ng/mL (0.032 µg/kg), and the linear rangewas 0.006 ng/mL~0.119 ng/mL. The IC50 of OTA was 0.878 ng/mL, the LOD was 0.126 ng/mL(1.008 µg/kg), and the linear range was 0.259 ng/mL~6.178 ng/mL. Under optimum conditions,corn and wheat samples were pretreated with AFB1-OTA IAC. The recovery rates of AFB1 and OTAwere 95.4%~105.0% with ic-ELISA, and the correlations between the detection results and LC-MSwere above 0.9. The developed IAC combined with ic-ELISA is reliable and could be applied to thedetection of AFB1 and OTA in grains.
Keywords: aflatoxin B1; ochratoxin A; bispecific monoclonal antibody; immunoaffinity column;ic-ELISA
1. Introduction
Mycotoxins are natural secondary metabolites produced by filamentous fungi undersuitable conditions, among which aflatoxin B1 (AFB1) and ochratoxin A (OTA) are themost toxic and exist widely in grains [1–4]. In 2012, aflatoxins were listed in the group 1classification (carcinogenic to humans) by the International Agency for Research on Cancer(IARC), and OTA was classified as group 2B (possibly carcinogenic to humans) by IARC in
85
Foods 2022, 11, 335
1993 [5]. Some research has indicated that AFB1 and OTA frequently and simultaneouslycontaminated the same grain and the toxic synergistic effect caused aggravated harm [6–8].
Considering the health impact of AFB1 and OTA, the European Union (EU) has set themaximum level of AFB1 at 5.0 µg/kg in maize or rice, and 2.0 µg/kg in other cereals. Asfor OTA, the maximum level is 3.0~5.0 µg/kg in cereals [9]. In China, the maximum levelfor AFB1 is mandated at 5.0~20 µg/kg in different cereals, and for OTA this is 5.0 µg/kgin all cereals [10]. Detection technology for mycotoxins in food is needed to detect andmonitor mycotoxins effectively. Due to the advantages of low cost, easy operation andspeed, immunoassay has become the ideal choice in large-scale screening of mycotoxins.
The preparation of antibodies in an immunoassay for mycotoxin is critical [11], andall are reported as single-specific, including polyclonal antibody [12,13], monoclonal anti-body (MAb) [14–18] and recombinant antibody [19–22]. Compared with a single-specificantibody which can only recognize a single analyte in a complex food matrix, a bispecificmonoclonal antibody (BsMAb) with two intrinsic specific binding sites could simultane-ously recognize and bind two distinct antigens [23–25]. It is predominant in immunoassaysfor food safety detection [25–27], which could reduce the cost of combined use of single-specific antibodies.
Several BsMAbs have been reported and applied to establish quantitative or qualitativeimmunoassays in the food safety field. Wang et al. [28] developed a BsMAb-based multi-analyte enzyme-linked immunosorbent assay (ELISA) for 5-morpholinomethyl-3-amino-2-oxazolidone (AMOZ), malachite green (MG), and leuco-malachite green (LMG) detectionin aquatic products. Jin et al. [29] reported a visual colloidal gold immunochromatographicstrip with BsMAb to detect carbofuran and triazophos.
In addition with regards to establishing an immunoassay method, BsMAb also hassignificant application value in other fields of immunoassay. Heterogeneous matrix ef-fects in food affect the detection result and lead to the reduction of sensitivity and accu-racy [30,31]. This is especially the case in trace quantity analysis of mycotoxins in grains.An immunoaffinity column (IAC) could separate and concentrate mycotoxins in grain andeffectively improve the matrix effect based on a specific and reversible interaction betweenantigen and antibody [32–34]. This may be one of the most applicable and adaptableprocedures for mycotoxin detection [35]. IACs have been reported as having extracted my-cotoxins in various matrices [36], such as cereals [21,34,37,38], spices [39], potables [40,41],and nuts [42]. The IACs available at present are all based on a single-specific antibody,which can only conjugate to one target compound. Simultaneous contamination of multiplemycotoxins often exists in many foods. In order to extract these mycotoxins, more IACsare needed for sample pretreatment, which would be complicated, time-consuming, andcostly. Two or more different antibodies were conjugated in the same IAC in some stud-ies [43,44], which could also recognize and extract two or more mycotoxins simultaneously.Nevertheless, more than one antibody was still necessary, and the preparation or the assayprocedures were complex. Moreover, the coupling ratio of different antibodies is uncertainand hard to measure, and mutual interference may be caused by competitive binding of dif-ferent antibodies. In comparison with single-specific antibody-based IAC, a BsMAb basedIAC would be more efficient, convenient, and economical when the sample is contaminatedwith two mycotoxins. Moreover, the coupling efficiency of BsMAb based IAC is easy tomeasure, and the interference caused by using two or more different antibodies couldbe effectively avoided because of the homogeneity of the antibody structure. At present,no BsMAb based IAC has been reported. In this study, in order to further investigatethe preparation and properties of BsMAb, and explore its application prospects in IAC, aBsMAb against AFB1 and OTA was generated and characterized. Based on this BsMAb,an IAC was prepared and applied in simultaneous extraction of AFB1 and OTA from foodsamples. The extraction conditions were optimized. Then the IAC was applied combinedwith ic-ELISA (indirect competitive ELISA) for AFB1 and OTA detection in food samples.
86
Foods 2022, 11, 335
2. Materials and Methods
2.1. Reagents and Material
Aflatoxin B1 (AFB1), ochratoxin A (OTA), aflatoxin B2 (AFB2), aflatoxin G1 (AFG1),aflatoxin G2 (AFG2), aflatoxin M1 (AFM1), aflatoxin M2 (AFM2), ochratoxin B (OTB), ochra-toxin C (OTC), zearalenone (ZEN), deoxynivalenol (DON), T-2 toxin (T-2) and fumonisin B1(FB1), N-methyl-N’-nitro-N-nitrosoguanidine (MNNG), Methyl Methane-sulfonate (MMS),8-Azaguanine (8-AG), 5-bromo-2′-deoxyuridine (5-BrdU), Paraffin liquid, 50% PEG 4000,goat anti-mouse Immunoglobulin G horseradish peroxidase conjugate (HRP-IgG) werepurchased from Sigma-Aldrich Chemical Co. (St. Louis, MO, USA). RPMI Medium 1640basic (1×), HAT Media Supplement (50×), HT Media Supplement (50×), Pierce RapidIsotyping Kits-Mouse were purchased from Thermo Fisher Scientific Co., Ltd. (Waltham,MA, USA). Fetal bovine serum was purchased from Guangzhou Saiguo Biotech Co., Ltd.(Guangzhou, China). All other chemicals and solvents were of analytical grade and werepurchased from Shanghai Aladdin Bio-Chem Technology Co., Ltd. (Shanghai, China).Water was prepared using a Milli-Q water purification system.
CNBr-activated Sepharose 4B and polyethylene columns (8.9 mm × 63 mm) werepurchased from Pharmacia Corporation (Wuhan, China). Female Balb/c mice (10 weeks old)were purchased from Guangdong Medical Laboratory Animal Centre (Foshan, China). Anti-AFB1 hybridoma cell line E4, anti-OTA hybridoma cell line B3, anti-AFB1 MAb (IgG1), anti-OTA MAb (IgG1), AFB1-OVA, OTA-OVA, blocking buffer, P solution and TMB chromogenicsolution were produced by our laboratory.
2.2. Apparatus
ELISA plates were washed using a Multiskan MK2 microplate washer (Thermo FisherScientific Inc., Waltham, MA, USA). Absorbances of ELISA were measured on a MultiskanMK3 microplate reader (Thermo Fisher Scientific Inc., Waltham, MA, USA). Absorbancesof antibody concentrations were measured on a NanoDrop 2000 c Ultraviolet spectrometer(Thermo Fisher Scientific Inc., Waltham, MA, USA).The LC-MS assay was conducted usingan Agilent 6400 series LC system and an ECLIPS PLUS C18 (2.1 × 100 mm, 1.8 µm) (AgilentTechnologies, Santa Clara, CA, USA) with a Triple Quadrupole Mass Spectrometer.
2.3. Mutagenesis of HGPRT and TK Deficient Hybridoma Cell Lines
The chemical mutagen scheme was performed as follows [28,45,46]: AFB1 hybridomacell line E4 was cultured in HAT medium for 2 d before mutagenic treatment in a humidified5% CO2 incubator at 37 ◦C. The cells were washed twice with PBS and cultured in HTmedium for 2 d to restore the cells to normal morphology and were cultured in HATmedium for 24 h. After washing the cells with PBS twice, the cells were mutagenized indifferent concentrations of MNNG (5.0 µg/mL, 10.0 µg/mL, 20.0 µg/mL, and 40.0 µg/mL).The mutagenic treatment time was 2 h, 4 h, 6 h and 10 h. At the same time, the controlgroup was cultured in 1‰ DMSO complete medium (RPMI-1640 culture media containing20% fetal bovine serum) without MNNG. The cells were washed twice with PBS to finishthe mutagenesis and cultured in complete medium. Finally, the cells were cultured for3 d and the survival rate of the cells was determined by trypan blue staining, and thecombination of MNNG concentration and mutagenic treatment time resulting in a survivalrate of about 70% were selected as the optimal mutation parameters. OTA hybridoma cellline B3 was mutated with MMS (1.0 µg/mL, 5.0 µg/mL, 10.0 µg/mL, and 20.0 µg/mL) andfor 2 h, 4 h, 6 h and 10 h by the same steps as above.
2.4. Screening of HGPRT and TK Deficient Hybridoma Cell Lines
After mutagenic treatment with MNNG, AFB1 hybridoma cells E4 were collectedand incubated in a 6-well culture plate in selective semi-solid media containing 6-TG(50 µg/mL). After 10 d, the visible white clonal cell clusters were placed into a 96-wellculture plate and cultured with 200 µL complete media containing 6-TG (50 µg/mL). Thecell supernatants were analyzed by ELISA to screen positive clones which could recognize
87
Foods 2022, 11, 335
and bound to AFB1. Then the cells were tested by HAT media to confirm their HATsensitivity. If the cell line could not grow in HAT media, it was HGPRT-deficient, and wasnamed E4-HGPRT−. Via the same steps, the TK-deficient OTA hybridoma cell line namedB3-TK− was screened with 5-BrdU (30 µg/mL).
2.5. Generation and Characterization of BsMAb
2.5.1. Generation of BsMAb
E4-HGPRT− and B3-TK− were fused under the effect of PEG 4000 [47]. The fused cellswere cultured in 96-well culture plates with HAT media for 10 d. The cell supernatantswere tested by ic-ELISA to confirm the presence of BsMAb which could recognize andbound to AFB1 and OTA simultaneously.
The selected tetra-doma cell lines were cloned by 4 rounds of limiting dilution assays,and then inoculated into female Balb/c mice that had been primed with 500 µL of sterileliquid paraffin. Ascites was collected from the Balb/c mice and purified with Protein Gto obtain BsMAb. The concentration of BsMAb was measured by a NanoDrop 2000 cultraviolet spectrometer. The subtype of BsMAb was determined by Pierce Rapid IsotypingKits-Mouse. The purity and molecular weight of BsMAb were estimated by the SDS-PAGE method.
2.5.2. Antibody Specificity Determination
The cross-reactivity (CR) could be used as an index to evaluate the specificity of the anti-AFB1/OTA BsMAb. Inhibition curves were fitted through ic-ELISA data to determine theIC50 (50% inhibiting concentration) of each common mycotoxin contaminant (aflatoxin B1,aflatoxin B2, aflatoxin G1, aflatoxin G2, aflatoxin M1, aflatoxin M2, ochratoxin A, ochratoxinB, ochratoxin C, zearalenone, deoxynivalenol, T-2 toxin and fumonisin B1). The CR wascalculated using the following equation:
CR =
IC50 of AFB1 or OTAIC50 of common mycotoxin contaminant
×100% (1)
2.5.3. Antibody Affinity Determination
The affinity of BsMAb was validated as follows [48]: the coating antigen AFB1-OVA and OTA-OVA diluted to four gradient concentrations (5.0 µg/mL, 2.5 µg/mL,1.25 µg/mL, 0.625 µg/mL) were coated in microplates at 4 ◦C for 14 h, respectively.The anti-AFB1/OTA BsMAb was diluted to eight gradient concentrations (9.6 × 10⁻³
mg/mL, 4.8 × 10⁻³ mg/mL, 2.4 × 10⁻³ mg/mL, 1.2 × 10⁻³ mg/mL, 6.0 × 10⁻⁴ mg/mL,3.0 × 10−4 mg/mL, 1.5 × 10⁻⁴ mg/mL, 7.5 × 10⁻⁵ mg/mL) with PBS buffer, and thenadded to the micropores for specific binding. After reacting with HRP-IgG as secondaryantibody, chromogenic solution, and termination solution successively, the A450nm wasdetermined. The reaction curve was fitted by Origin 8.5 software. The concentration ofBsMAb was used as abscissa and A450nm as ordinate. The average value of BsMAb concen-tration corresponding to the half-saturation index was taken as the affinity constant (Ka) ofBsMAb.
2.6. Preparation of BsMAb Based IAC
According to the instruction, the procedures of IAC preparation was as follow: 0.5 gof CNBr-Sepharose 4B powder was swelled with 3 mL of HCl (1 mM) and washed with20 mL of coupling buffer (0.1 M NaHCO3, pH 8.3) 5 times. Then, the Sepharose gel wasmixed with 2 mL anti-AFB1/OTA BsMAb solution (9.61 mg in coupling buffer) and gentlystirred at 25 ◦C. The concentration of unconjugated BsMAb in supernatant was determinedby NanoDrop 2000 c ultraviolet spectrometer every 0.5 h to calculate the coupling efficiency.The optimal coupling time was determined when the coupling efficiency was over 90%.
The coupling efficiency was calculated as follows:
88
Foods 2022, 11, 335
Coupling Efficiency =
Concentration of BsMAb before coupling − Concentration of unconjugated BsMAbConcentration of BsMAb Before Coupling
(2)
The agarose gel was redissolved in 50 mL blocking buffer (0.1 M Tris-HCl, pH 8.0)to block the free active sites at 25 ◦C for 2 h, and washed with 20 mL HAc-NaAc buffer(0.1 M, pH 4.0) and 20 mL Tris-HCl buffer (0.1 M Tris-HCl, pH 8.0) alternately for 4 cycles.Finally, 1 mL of immune gel prepared above was transferred to a polyethylene column andbalanced with 20 mL loading buffer (0.1 M PBS, pH 7.4). The IAC prepared was storedwith PBS containing 0.01% Merthiolate sodium (v/w) at 4 ◦C until use.
2.7. Optimization of Elution Conditions and Evaluation of the IAC Capacity
Mixed standard solution containing 50 ng AFB1 and 50 ng OTA was diluted in 15 mLloading buffer and drawn through the IAC. Then 20 mL of loading buffer was applied towash the IAC. Finally, elution buffer was used to elute the analyte bound to the column.The collected eluent diluted twice with PBS was detected by ic-ELISA and recovery rateswere evaluated.
Three elution conditions were optimized to determine the optimum conditions, in-cluding type of elution buffer, concentration of methanol in elution buffer, and volumesof elution buffer. Elution buffer A is 0.2 M glucine solution, pH 3.0. Elution buffer B ismethanol-water, 90:10, v:v. Elution buffer C is methanol-water, 60:40, v:v, pH 2.3. Elutionbuffer D is methanol-water, 60:40, v:v, pH 2.3, containing 1 M NaCl. The concentrationof methanol in elution buffer are 30%, 40%, 50%, and 60% (v/v). The volumes of elutionbuffer are 1 mL, 2 mL, 3 mL, 4 mL, 5 mL.
Under the optimal conditions, 15 mL of loading buffer containing excessive mixedstandard of AFB1 (300 ng) and OTA (300 ng) was passed through the IAC. The eluentdiluted with PBS was detected by ic-ELISA. The column was used repeatedly for severalcycles, and the column capacity and preservation rates were calculated and compared. Thecolumn capacity/preservation rate was expressed as follows:
Column Capacity =
Concentration of AFB1 or OTA × Loading AmountImmune Gel Volume
(3)
Preservation Rate =
Column Capacity for Several CyclesColumn Capacity for the First Treatment
(4)
2.8. ic-ELISA Combined with IAC
The collected eluent was detected by the ic-ELISA developed and optimized in ourlaboratory. The parameters of ic-ELISA are shown in Table 1 and the procedures are asfollows. Coating antigen solution was coated in a 96-well polystyrene microtiter plate with100 µL/well at 4 ◦C for 14 h, then washed with 300 µL/well wash solution (PBS containing0.05% Tween-20) twice. 120 µL/well blocking buffer was used to block uncoated sites at37 ◦C for 3 h, and then the plate was dried in a draught drying cabinet at 37 ◦C. Then,50 µL MAb solution and 50 µL AFB1/OTA standard solution of gradient concentrations orthe collected eluent diluted twice with PBS were added to each well and incubated, andthe plate was washed 4 times. 100 µL/well HPR-IgG was added for incubation, and thenwashed 4 times. After washing, 100 µL/well of TMB chromogenic solution was added intoeach well and incubated for 10 min at 37 ◦C, and 50 µL/well of 2 M H2SO4 was added toterminate the chromogenic reaction. The absorbance at 450 nm (A450nm) was measured.The A450nm of the well without standard solution was as B0 and with standard solutionwas as B. The inhibition curve was fitted by Origin 8.5 software adopting B/B0 versusthe concentration of AFB1 or OTA, and the IC50 was estimated (Figure 1). The limit ofdetection (LOD) was defined as the IC10 value. The linear range was taken as IC20 to IC80.The IC50 of AFB1 was 0.027 ng/mL, the LOD was 0.004 ng/mL (0.032 µg/kg), and thelinear range was 0.006 ng/mL~0.119 ng/mL. The IC50 of OTA was 0.878 ng/mL, the LODwas 0.126 ng/mL (1.008 µg/kg), and the linear range was 0.259 ng/mL~6.178 ng/mL. The
89

Foods 2022, 11, 335
LODs of the ic-ELISA to AFB1 and OTA were obviously lower than the maximum levels.Therefore, this method was suitable for quantitative detection of AFB1 and OTA.
Table 1. Parameters for ic-ELISA.
Target Analyte AFB1 OTA
Coating antigen AFB1-OVA OTA-OVACoating concentration (µg/mL) 0.31 0.26
Coating buffer 0.05 M carbonate buffer (pH 9.6)Coating condition 14 h, 4 ◦C
MAb Anti-AFB1 MAb Anti-OTA MAbStandard analyte AFB1 OTA
Competition condition 30 min, 37 ◦CHRP-IgG dilution 1:5000
HRP-IgG incubation condition 30 min, 37 ◦C
(a) (b)
Figure 1. The inhibition curve of ic-ELISA: (a) AFB1; (b) OTA.
2.9. Analysis of Corn and Wheat Samples
The pretreatment method for AFB1 and OTA analysis was carried out as follows [43].Corn and wheat samples were evenly crushed and passed through a 40-mesh sieve. 5.0 g ofsample was put into a 50 mL polypropylene centrifuge tube, and 25 mL of methanol-water(70:30, v:v, containing 2.4% NaCl) was added, and shaken periodically for 5 min. Aftercentrifuging at 4000 rpm for 10 min, the supernatant was collected through a 0.45 µmPTEE membrane filter to obtain the sample extract. Then 5 mL of the sample extract wasdiluted with 10 mL loading buffer and drawn through the AFB1/OTA-IAC. Nonspecificallyadsorbed impurities were washed off using 20 mL loading buffer. Then, elution bufferoptimized in 2.7 was used to elute, and diluted twice with PBS before detection by ic-ELISA.Concurrently, the samples were detected with LC-MS.
LC-MS conditions were modified from published methods [49] as follows: an AgilentLC system coupled with an Agilent 6400 series triple Quadrupole mass spectrometer wasused for the confirmatory analysis. An Agilent ECLIPS PLUS C18 (2.1 × 100 mm, 1.8 µm)with solvent consisted of 0.1% formic acid (mobile phase A) and acetonitrile (mobilephase B, 0–2 min, 30%; 2–5 min, 90%; 5–10 min, 5%) at a flow rate of 0.30 mL/min. Thetemperature was 40 ◦C and the injection volume was 5 µL. The analysis was performedusing positive-ion electrospray interface (ESI) with a multiple reaction monitoring (MRM)mode. The retention times of AFB1 and OTA were 3.339 min and 3.94 min, respectively.
90

Foods 2022, 11, 335
Blank corn and wheat samples without AFB1 and OTA, having been confirmed by LC-MS, were used to spike recovery experiments. AFB1 and OTA of different concentrations(4 µg/kg, 10 µg/kg, 20 µg/kg, 50 µg/kg, 100 µg/kg) were spiked into the blank samples.Eight grain samples were randomly selected from a local market, including four cornsamples and four wheat samples. After pretreatment, the sample eluents were detected byic-ELISA, and the results were compared with those of LC-MS.
3. Results
3.1. Mutagenesis and Screening of HGPRT and TK Deficient Hybridoma Cell Lines
The AFB1 hybridoma cell line E4 and OTA hybridoma cell line B3 were applied forconstruction of a HGPRT and TK deficient mutant, respectively. When the concentration ofMNNG was 10 µg/mL and the treatment time was 6 h, the cell survival percentage was69.9% (Figure 2a), which was determined as the optimal mutation condition of E4 cells.When the concentration of MMS was 5 µg/mL and the treatment time was 4 h, the cellsurvival percentage was 70.2% (Figure 2b), and the optimal mutation condition for B3 cellswas determined. As mutagens, MNNG and MMS have strong mutagenic effect on cells.Over-high concentration and overlong treating time will reduce the activity of cells, or evenresult in apoptosis.
(a) (b)
Figure 2. Effects of mutagen concentration and mutagenic treatment time on survival percentage (%)of the hybridoma cell line. (a) AFB1 hybridoma cell line E4; (b) OTA hybridoma cell line B3.
After MNNG mutation treatment, the E4 cells were inoculated in 6-TG mediumfor selective screening. The screened E4-HGPRT− cell line gradually formed colonieswith the ability to fission and grow. Finally, stable inherited deficient cells E4-HGPRT−
were obtained. Similarly, stable inherited deficient cells B3-TK− were screened in 5-BrdU.Figure 3 depict the growth curves of E4-HGPRT− and B3-TK− in screening reagent (6-TGand 5-BrdU), complete media and HAT media after mutagenic treatment. The unmutatedcells could not survive in screening reagent (Figure 3a,d). In complete medium culture,both normal cell line and mutant could grow normally (Figure 3b,e). The cell apoptosis inHAT medium was adopted as an indication of HGPRT or TK deficiency. The growth curve(Figure 3c,f) shows that E4-HGPRT− and B3-TK− were unable to divide in HAT media,which indicates that E4-HGPRT− and B3-TK− were sensitive to HAT media.
91

Foods 2022, 11, 335
(a) (b) (c)
(d) (e) (f)
Figure 3. The growth curve of AFB1 hybridoma cell lines E4 and OTA hybridoma cell lines B3: (a) cellline E4 and E4-HGPRT− in 6-TG; (b) cell line E4 and E4-HGPRT− in the complete media; (c) cell lineE4 and E4-HGPRT− in HAT media; (d) cell line B3 and B3-TK− in 5-BrdU; (e) cell line B3 and B3-TK−
in the complete media; (f) cell line B3 and B3-TK− in HAT media.
3.2. Generation and Characterization of BsMAb
3.2.1. Generation of BsMAb
E4-HGPRT− and B3-TK− were fused by hybrid-hybridoma technology. A total of83 tetradoma colonies were generated, and the cell supernatant was identified by ELISA.After 3–4 rounds of subcloning, a positive tetradoma T26 was chosen and was used forproduction of anti-AFB1/OTA BsMAb by induction in vivo. Clear bands of heavy chain(about 55 kDa) and light chain (about 25 kDa) from BsMAb were observed in the elec-tropherogram (Figure 4). The concentration of BsMAb was 9.61 mg/mL measured byNanoDrop ultraviolet spectrophotometer.
Figure 4. The electropherogram of BsMAb: (a) ascites; (b) purified BsMAb.
92
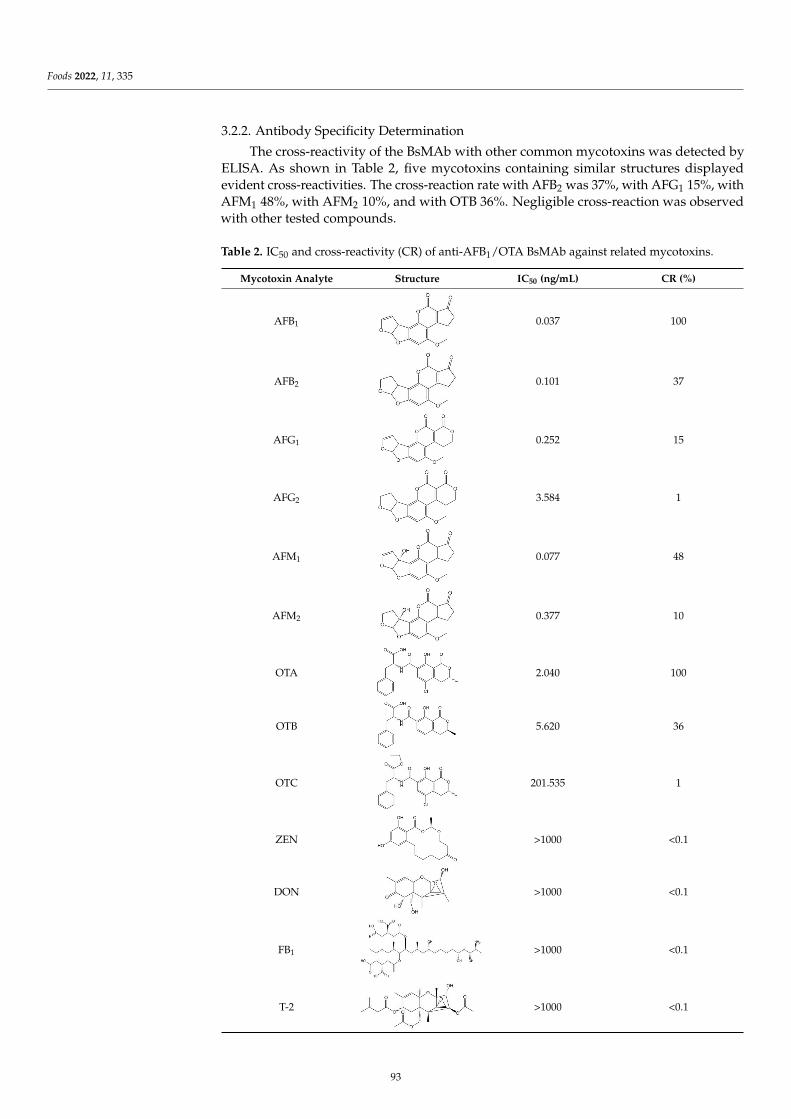
Foods 2022, 11, 335
3.2.2. Antibody Specificity Determination
The cross-reactivity of the BsMAb with other common mycotoxins was detected byELISA. As shown in Table 2, five mycotoxins containing similar structures displayedevident cross-reactivities. The cross-reaction rate with AFB2 was 37%, with AFG1 15%, withAFM1 48%, with AFM2 10%, and with OTB 36%. Negligible cross-reaction was observedwith other tested compounds.
Table 2. IC50 and cross-reactivity (CR) of anti-AFB1/OTA BsMAb against related mycotoxins.
Mycotoxin Analyte Structure IC50 (ng/mL) CR (%)
AFB1
0.037 100
AFB2
0.101 37
AFG1
0.252 15
AFG2
3.584 1
AFM1
0.077 48
AFM2
0.377 10
OTA
2.040 100
OTB
5.620 36
OTC
201.535 1
ZEN
>1000 <0.1
DON
>1000 <0.1
FB1
>1000 <0.1
T-2
>1000 <0.1
93
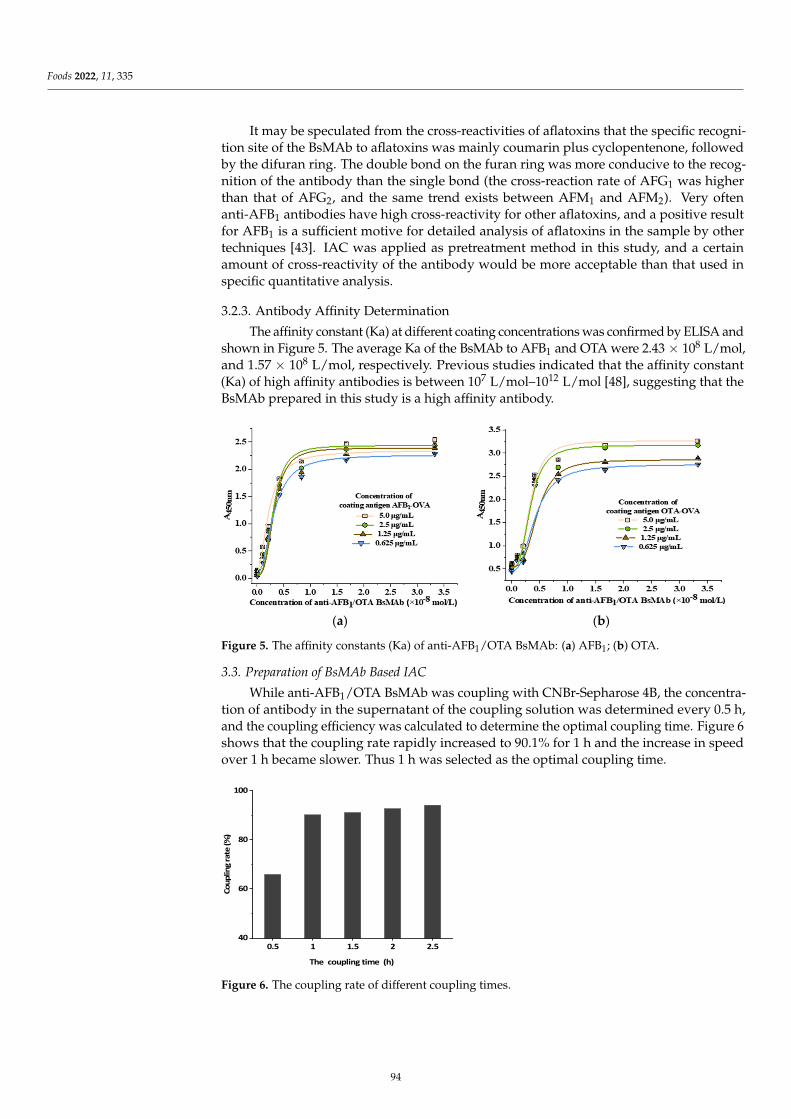
Foods 2022, 11, 335
It may be speculated from the cross-reactivities of aflatoxins that the specific recogni-tion site of the BsMAb to aflatoxins was mainly coumarin plus cyclopentenone, followedby the difuran ring. The double bond on the furan ring was more conducive to the recog-nition of the antibody than the single bond (the cross-reaction rate of AFG1 was higherthan that of AFG2, and the same trend exists between AFM1 and AFM2). Very oftenanti-AFB1 antibodies have high cross-reactivity for other aflatoxins, and a positive resultfor AFB1 is a sufficient motive for detailed analysis of aflatoxins in the sample by othertechniques [43]. IAC was applied as pretreatment method in this study, and a certainamount of cross-reactivity of the antibody would be more acceptable than that used inspecific quantitative analysis.
3.2.3. Antibody Affinity Determination
The affinity constant (Ka) at different coating concentrations was confirmed by ELISA andshown in Figure 5. The average Ka of the BsMAb to AFB1 and OTA were 2.43 × 10⁸ L/mol,and 1.57 × 10⁸ L/mol, respectively. Previous studies indicated that the affinity constant(Ka) of high affinity antibodies is between 107 L/mol–1012 L/mol [48], suggesting that theBsMAb prepared in this study is a high affinity antibody.
(a) (b)
Figure 5. The affinity constants (Ka) of anti-AFB1/OTA BsMAb: (a) AFB1; (b) OTA.
3.3. Preparation of BsMAb Based IAC
While anti-AFB1/OTA BsMAb was coupling with CNBr-Sepharose 4B, the concentra-tion of antibody in the supernatant of the coupling solution was determined every 0.5 h,and the coupling efficiency was calculated to determine the optimal coupling time. Figure 6shows that the coupling rate rapidly increased to 90.1% for 1 h and the increase in speedover 1 h became slower. Thus 1 h was selected as the optimal coupling time.
0.5 1 1.5 2 2.540
60
80
100
Coup
ling
rate
(%)
The coupling time (h)
Figure 6. The coupling rate of different coupling times.
94

Foods 2022, 11, 335
3.4. Optimization of Elution Conditions and Evaluating of the IAC Capacity
To achieve high extraction efficiency, three affecting conditions were optimized andwere evaluated by the recovery of AFB1 and OTA.
Firstly, four kinds of elution buffer (A, B, C, D) were tested. The recoveries are shownin Figure 7a. Solution A achieved the lowest recovery, containing no methanol and ioniccompound. When the column was eluted with solution D, the recovery of AFB1 and OTAwas up to 90%. The concentration of methanol, pH and ion concentration could all influencethe recovery. The methanol concentration has significant effect, and ion concentration andlow pH also improved the elution recovery. It can be seen from Figure 7a that the recoveriesof solution B and D are all around 80%. However, high methanol concentration may affectthe activity of the antibody [43], so solution D containing NaCl and medium concentrationof methanol is preferred.
(a) (b) (c)
OTA
Figure 7. Optimization results of the IAC elution conditions: (a) the recovery of AFB1 and OTA withdifferent kind of elution solution (n = 3); (b) the recovery of AFB1 and OTA with different ratios ofmethanol–water as elution solution (n = 3); (c) The recovery of AFB1 and OTA with different elutionvolume (n = 3).
Secondly, to further investigate the effect of methanol concentration, elution solutionscontaining different concentrations of methanol (30%, 40%, 50% and 60%, v/v, 1 M NaCl,pH 2.3) were evaluated. The recovery rose along with the increase of methanol concentra-tion, and the highest recovery was obtained when the concentration of methanol was 60%(Figure 7b).
Thirdly, under the conditions optimized above, using solution containing 60% methanol,1 M NaCl, pH 2.3 as elution solution, the effect of elution solution volumes (1, 2, 3, 4, 5 mL)on recoveries were also investigated. As shown in Figure 7c, recoveries increased from87.2% to 96.2% for AFB1 and 76.7% to 96.6% for OTA as the volume increased from 1 mL to4 mL. The highest recovery was acquired when the volume was above 4 mL, and furtherincrease of the volume did not visibly improve the recovery, thus 4 mL was selected as theoptimized volume.
Under the optimized elution conditions (4 mL of solution D with 60% methanol and1 M NaCl used as elution buffer), the IAC was used repeatedly for seven cycles and thecapacity was detected at every cycle. As shown in Table 3, the maximum binding capacitiesof the IAC for AFB1 and OTA were both over 165 ng. As the column is used repeatedly,the capacity decreases gradually. After seven cycles of use, the preservation rates ofcolumn capacity for AFB1 and OTA were 69.3% and 68.0%, respectively (Table 3), whichis equivalent to 114.4 µg/kg and 116.3 µg/kg of AFB1 and OTA in samples, respectively,by conversion. According to some investigation results of mycotoxin contamination inagro–products and food samples [50–53], the capacity of the IAC could meet the needs ofpractical applications.
95

Foods 2022, 11, 335
Table 3. Column capacity and preservation rate of AFB1 and OTA in 7 cycles (n = 3).
Cycle
AFB1 OTA
ColumnCapacity (ng)
PreservationRate (%)
ColumnCapacity (ng)
PreservationRate (%)
1 165.0 100.0 171.1 100.02 162.5 98.5 169.5 99.13 159.0 96.4 166.4 97.34 153.6 93.1 156.2 91.35 147.5 89.4 145.8 85.26 128.9 78.1 133.3 77.97 114.4 69.3 116.3 68.0
3.5. Analysis of Corn and Wheat Samples
AFB1 and OTA in spiked corn and wheat samples were detected by IAC combinedwith ELISA, and confirmed by LC-MS. The recoveries of IAC-ELISA ranged from 95.4%to 105.0%, and the coefficients of variation (CV) were less than 10% (Table 4). The resultsindicated that the assay performed well with appropriate recovery and accuracy. Thismay be ascribed to IAC pretreatment, which could relieve matrix interference effectivelyand ameliorate the recovery and accuracy of ELISA for AFB1 and OTA detection in foodmatrices. The results were confirmed by LC-MS to further prove the reliability of this assay.
Table 4. Results of spiked recovery experiments of corn and wheat samples with IAC-ELISA andLC-MS (n = 2).
Samples Analyte
SpikedConcentration
(µg/kg)
IAC-ELISA LC-MS
Measured(µg/kg)
Recovery(%)
CV (%)Measured
(µg/kg)Recovery
(%)CV (%)
Corn 0AFB1 0 ND a NC b NC ND NC NCOTA 0 ND NC NC ND NC NC
Corn 1AFB1 100 95.6 95.6 5.0 97.3 97.3 3.3OTA 100 98.6 98.6 4.5 97.9 97.9 3.5
Corn 2AFB1 50 49.2 98.4 4.7 49.8 99.6 3.3OTA 50 49.1 98.2 4.4 49.4 98.8 3.1
Corn 3AFB1 20 19.2 96.0 4.3 19.2 96.0 3.5OTA 20 19.6 98.0 4.4 19.2 96.0 3.2
Corn 4AFB1 10 9.9 99.0 3.4 9.8 98.0 3.8OTA 10 10.3 103.0 4.2 9.8 98.0 3.6
Corn 5AFB1 4 4.1 102.5 2.6 3.8 95.0 3.2OTA 4 4.2 105.0 2.4 3.9 97.5 3.5
Wheat 0AFB1 0 ND NC NC ND NC NCOTA 0 ND NC NC ND NC NC
Wheat 1AFB1 100 99.1 99.1 4.8 98.2 98.2 3.1OTA 100 98.9 98.9 4.6 97.5 97.5 3.1
Wheat 2AFB1 50 47.7 95.4 4.5 48.7 97.4 3.8OTA 50 47.7 95.4 3.3 49.2 98.4 3.5
Wheat 3AFB1 20 19.5 97.5 4.0 19.2 96.0 3.2OTA 20 19.4 97.0 3.3 19.7 98.5 3.1
Wheat 4AFB1 10 9.6 96.0 3.3 9.8 98.0 3.8OTA 10 9.9 99.0 3.2 9.9 99.0 3.5
Wheat 5AFB1 4 3.9 97.5 3.1 3.9 97.5 3.2OTA 4 3.9 97.5 2.8 4.0 100.0 3.8
a ND, not detectable. b NC, not calculated.
Eight real samples of corn and wheat were simultaneously analyzed by the establishedIAC-ELISA and LC-MS. The results are shown in Figure 8. AFB1 and OTA both testedpositive in the eight samples, but the levels were all below the maximum levels. The
96
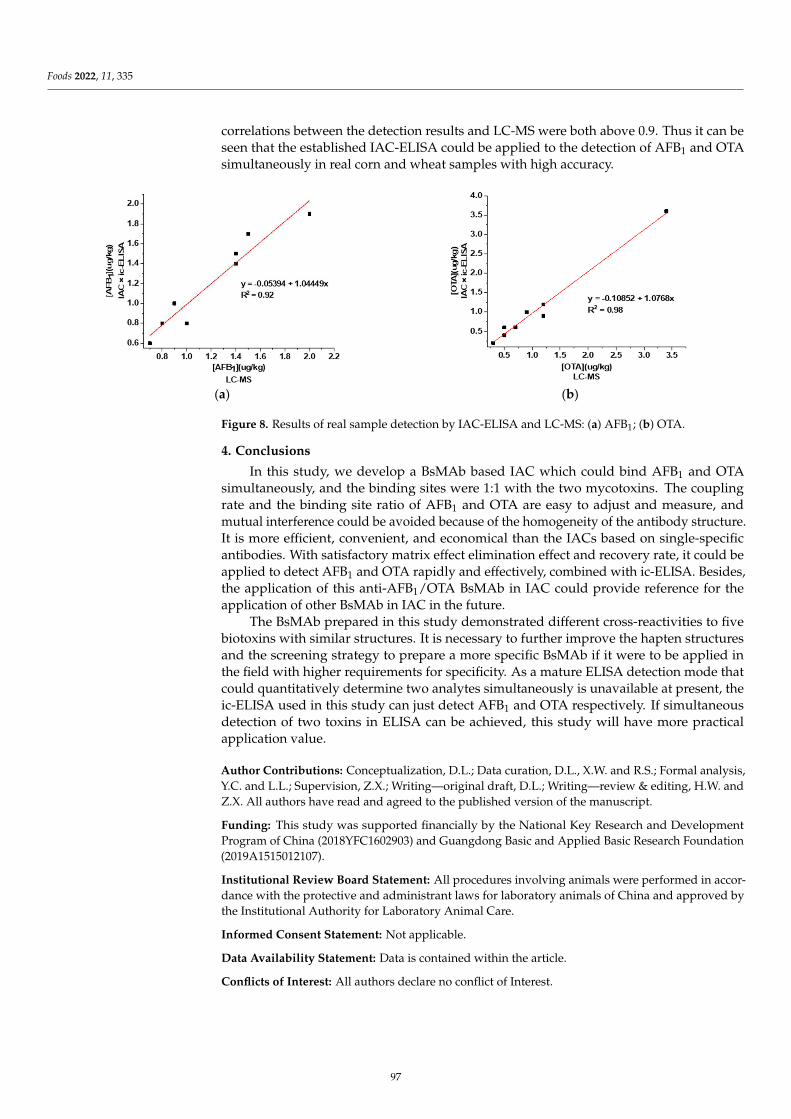
Foods 2022, 11, 335
correlations between the detection results and LC-MS were both above 0.9. Thus it can beseen that the established IAC-ELISA could be applied to the detection of AFB1 and OTAsimultaneously in real corn and wheat samples with high accuracy.
μ μμ
(a) (b)
Figure 8. Results of real sample detection by IAC-ELISA and LC-MS: (a) AFB1; (b) OTA.
4. Conclusions
In this study, we develop a BsMAb based IAC which could bind AFB1 and OTAsimultaneously, and the binding sites were 1:1 with the two mycotoxins. The couplingrate and the binding site ratio of AFB1 and OTA are easy to adjust and measure, andmutual interference could be avoided because of the homogeneity of the antibody structure.It is more efficient, convenient, and economical than the IACs based on single-specificantibodies. With satisfactory matrix effect elimination effect and recovery rate, it could beapplied to detect AFB1 and OTA rapidly and effectively, combined with ic-ELISA. Besides,the application of this anti-AFB1/OTA BsMAb in IAC could provide reference for theapplication of other BsMAb in IAC in the future.
The BsMAb prepared in this study demonstrated different cross-reactivities to fivebiotoxins with similar structures. It is necessary to further improve the hapten structuresand the screening strategy to prepare a more specific BsMAb if it were to be applied inthe field with higher requirements for specificity. As a mature ELISA detection mode thatcould quantitatively determine two analytes simultaneously is unavailable at present, theic-ELISA used in this study can just detect AFB1 and OTA respectively. If simultaneousdetection of two toxins in ELISA can be achieved, this study will have more practicalapplication value.
Author Contributions: Conceptualization, D.L.; Data curation, D.L., X.W. and R.S.; Formal analysis,Y.C. and L.L.; Supervision, Z.X.; Writing—original draft, D.L.; Writing—review & editing, H.W. andZ.X. All authors have read and agreed to the published version of the manuscript.
Funding: This study was supported financially by the National Key Research and DevelopmentProgram of China (2018YFC1602903) and Guangdong Basic and Applied Basic Research Foundation(2019A1515012107).
Institutional Review Board Statement: All procedures involving animals were performed in accor-dance with the protective and administrant laws for laboratory animals of China and approved bythe Institutional Authority for Laboratory Animal Care.
Informed Consent Statement: Not applicable.
Data Availability Statement: Data is contained within the article.
Conflicts of Interest: All authors declare no conflict of Interest.
97

Foods 2022, 11, 335
References
1. Duarte, S.C.; Lino, C.M.; Pena, A. Ochratoxin A in feed of food-producing animals: An undesirable mycotoxin with health andperformance effects. Vet. Microbiol. 2011, 154, 1–13. [CrossRef] [PubMed]
2. Egmond, H.; Dekker, W.H. Worldwide regulations for mycotoxins. Nat. Toxins 2010, 3, 332–336. [CrossRef] [PubMed]3. Fuchs, R.; Peraica, M. Ochratoxin A in human kidney diseases. Food Addit. Contam. 2005, 22, 53–57. [CrossRef] [PubMed]4. Santacroce, M.P.; Conversano, M.C.; Casalino, E.; Lai, O.; Zizzadoro, C.; Centoducati, G.; Crescenzo, G. Aflatoxins in aquatic
species: Metabolism, toxicity and perspectives. Rev. Fish Biol. Fish. 2008, 18, 99–130. [CrossRef]5. WHO International Agency for Research on Cancer. IARC Monographs on the Identification of Carcinogenic Hazards to Humans.
2021. Available online: https://monographs.iarc.who.int/list-of-classifications (accessed on 14 December 2021).6. Kumar, A.; Jindal, N.; Shukla, C.L.; Pal, Y.; Ledoux, D.R.; Rottinghaus, G.E. Effect of ochratoxin A on Escherichia coli-challenged
broiler chicks. Avian Dis. 2003, 47, 15–424. [CrossRef]7. Alassane-Kpembi, I.; Schatzmayr, G.; Taranu, I.; Marin, D.; Puel, O.; Oswald, I.P. Mycotoxins co-contamination: Methodological
aspects and biological relevance of combined toxicity studies. Crit. Rev. Food Sci. Nutr. 2016, 57, 3489–3507. [CrossRef]8. Madrigal-Santillan, E.; Morales-Gonzalez, J.A.; Vargas-Mendoza, N.; Reyes-Ramírez, P.; Cruz-Jaime, S.; Sumaya-Martínez, T.;
Pérez-Pastén, R.; Madrigal-Bujaidar, E. Antigenotoxic Studies of Different Substances to Reduce the DNA Damage Induced byAflatoxin B-1 and Ochratoxin A. Toxins 2010, 2, 738–757. [CrossRef]
9. European Commission. Commission Regulation (EC) No. 1881/2006 of 19 December 2006 setting maximum levels for certaincontaminants in foodstuffs. Off. J. Eur. Union 2006, L364, 20–23.
10. GB2761-2017; Chinese National Food Safety Standard, Maximum Residue Limits for Mycotoxins in Food. National MedicalProducts Administration: Beijing, China, 2017.
11. Amino, N.; Hidaka, Y. Various types of immunoassay. Nihon Rinsho Jpn. J. Clin. Med. 1995, 53, 2107–2111.12. Lee, N.; Wang, S.; Allan, R.D.; Kennedy, I.R. A Rapid Aflatoxin B1 ELISA: Development and Validation with Reduced Matrix
Effects for Peanuts, Corn, Pistachio, and Soybeans. J. Agric. Food. Chem. 2004, 52, 2746–2755. [CrossRef] [PubMed]13. Sun, X.; Zhao, X.; Tang, J.; Jun, Z.; Chu, F.S. Preparation of gold-labeled antibody probe and its use in immunochromatography
assay for detection of aflatoxin B1. Int. J. Food Microbiol. 2005, 99, 185–194.14. Huang, X.; Huang, T.; Li, X.; Huang, Z. Flower-like gold nanoparticles-based immunochromatographic test strip for rapid
simultaneous detection of fumonisin B1 and deoxynivalenol in Chinese traditional medicine. J. Pharm. Biomed. Anal. 2019, 177,112895. [CrossRef] [PubMed]
15. Machado, J.M.; Soares, R.R.; Chu, V.; Conde, J.P. Multiplexed capillary microfluidic immunoassay with smartphone dataacquisition for parallel mycotoxin detection. Biosens. Bioelectron. 2018, 99, 40–46. [CrossRef] [PubMed]
16. Gong, Y.; Zheng, Y.; Jin, B.; You, M.; Wang, J.; Li, X.; Lin, M.; Xu, F.; Li, F. A portable and universal upconversion nanoparticle-basedlateral flow assay platform for point-of-care testing. Talanta 2019, 201, 126–133. [CrossRef] [PubMed]
17. Qu, J.; Xie, H.; Zhang, S.; Luo, P.; Guo, P.; Chen, X.; Ke, Y.; Zhuang, J.; Zhou, F.; Jiang, W. Multiplex Flow Cytometric Immunoassaysfor High-Throughput Screening of Multiple Mycotoxin Residues in Milk. Food Anal. Methods 2019, 12, 877–886. [CrossRef]
18. Qileng, A.; Liang, H.; Huang, S.; Liu, W.; Xu, Z.; Liu, Y. Dual-function of ZnS/Ag 2 S nanocages in ratiometric immunosensors forthe discriminant analysis of ochratoxins: Photoelectrochemistry and electrochemistry. Sens. Actuators B Chem. 2020, 314, 128066.[CrossRef]
19. Han, Z.; Tang, Z.; Jiang, K.; Huang, Q.; Meng, J.; Nie, D.; Zhao, Z. Dual-target electrochemical aptasensor based on co-reducedmolybdenum disulfide and Au NPs (rMoS 2 -Au) for multiplex detection of mycotoxins. Biosens. Bioelectron. 2020, 150, 111894.[CrossRef]
20. Shen, Y.; Pan, D.; Li, G.; Hu, H.; Xue, H.; Zhang, M.; Zhu, M.; Gong, X.; Zhang, Y.; Wan, Y. Direct Immunoassay for Facile andSensitive Detection of Small Molecule Aflatoxin B1 based on Nanobody. Chemistry 2018, 24, 9869–9876.
21. Liu, H.; Zhang, J.; Ding, K.; Chen, X.; Han, T. The development and characterization of an immunoaffinity column used forthe simultaneous selective extraction of Fusarium toxins from grain products. Qual. Assur. Saf. Crops Foods 2019, 11, 325–331.[CrossRef]
22. Wang, F.; Li, Z.; Yang, Y.; Wan, D.; Vasylieva, N.; Zhang, Y.; Cai, J.; Wang, H.; Shen, Y.; Xu, Z. Chemiluminescent EnzymeImmunoassay and Bioluminescent Enzyme Immunoassay for Tenuazonic Acid Mycotoxin by Exploitation of Nanobody andNanobody-Nanoluciferase Fusion. Anal. Chem. 2020, 72, 11935–11942. [CrossRef]
23. Moldenhauer, G. Bispecific Antibodies from Hybrid Hybridoma. In Bispecific Antibodies; Kontermann, R., Ed.; Academic Press:Cambridge, MA, USA; Springer: Berlin/Heidelberg, Germany, 2011; pp. 29–46.
24. Sedykh, S.E.; Prinz, V.V.; Buneva, V.N.; Nevinsky, G.A. Bispecific antibodies: Design, therapy, perspectives. Drug Des. Dev. Ther.
2018, 12, 195. [CrossRef] [PubMed]25. Byrne, H.; Conroy, P.J.; Whisstock, J.C.; O’Kennedy, R.J. A tale of two specificities: Bispecific antibodies for therapeutic and
diagnostic applications. Trends Biotechnol. 2013, 31, 621–632. [CrossRef] [PubMed]26. Ouyang, H.; Wang, L.; Yang, S.; Wang, W.; Wang, L.; Liu, F.; Fu, Z. Chemiluminescence reaction kinetics-resolved multianalyte
immunoassay strategy using a bispecific monoclonal antibody as the unique recognition reagent. Anal. Chem. 2015, 87, 2952.[CrossRef] [PubMed]
27. Takahashi, M.; Fuller, S.A. Production of murine hybrid-hybridomas secreting bispecific monoclonal antibodies for use inurease-based immunoassays. Clin. Chem. 1988, 34, 1693–1696. [CrossRef] [PubMed]
98
Foods 2022, 11, 335
28. Wang, F.; Wang, H.; Shen, Y.; Li, Y.; Dong, J.; Xu, Z.; Yang, J.; Sun, Y.; Xiao, Z. Bispecific Monoclonal Antibody-Based MultianalyteELISA for Furaltadone Metabolite, Malachite Green, and Leucomalachite Green in Aquatic Products. J. Agric. Food. Chem. 2016,64, 8054–8061. [CrossRef] [PubMed]
29. Jin, R.; Guo, Y.; Wang, C.; Wu, J.; Zhu, G. Development of a Bispecific Monoclonal Antibody to Pesticide Carbofuran andTriazophos Using Hybrid Hybridomas. J. Food Sci. 2009, 74, T1–T6. [CrossRef]
30. Trucksess, M.W.; Weaver, C.M.; Oles, C.J.; Oles, C.J.; Fry, F.S.; Noonan, G.O.; Betz, J.M.; Rader, J.I. Determination of aflatoxins B1,B2, G1, and G2 and ochratoxin A in ginseng and ginger by multitoxin immunoaffinity column cleanup and liquid chromatographicquantitation: Collaborative study. J. AOAC Int. 2008, 91, 511–523. [CrossRef]
31. Suarez-Bonnet, E.; Carvajal, M.; Mendez-Ramirez, I.; Castillo-Urueta, P.; Cortés-Eslava, J.; Gómez-Arroyo, S.; Melero-Vara, J.M.Aflatoxin (B1, B2, G1, and G2) contamination in rice of Mexico and Spain, from local sources or imported. J. Food Sci. 2013, 78,T1822–T1829. [CrossRef]
32. Chan, D.; Macdonald, S.J.; Boughtflower, V.; Brereton, P. Simultaneous determination of aflatoxins and ochratoxin A in foodusing a fully automated immunoaffinity column clean-up and liquid chromatography–fluorescence detection. J. Chromatogr. A
2004, 1059, 13–16. [CrossRef]33. Gong, Y.; Yang, T.; Xiaosong, M.O.; Mo, X.; Zhang, H.; Huang, W.; Lu, T.; Zhang, D.; Wang, H. Preparation of Immunoaffinity
Column for AFB1 with Monoclonal Antibodies Immobilized on Protein A-Sepharose. Food Sci. 2015, 21, 193–198.34. Göbel, R.; Lusky, K. Simultaneous determination of aflatoxins ochratoxin A, and zearalenone in grains by new immunoaffinity
column/liquid chromatography. J. AOAC Int. 2004, 87, 411–416. [CrossRef] [PubMed]35. Krska, R. Performance of modern sample preparation techniques in the analysis of Fusarium mycotoxins in cereals. J. Chromatogr.
A 1998, 815, 49–57. [CrossRef]36. Li, P.; Zhang, Q.; He, T.; Zhang, Z.; Ding, X. Immunosorbent and Immunoaffinity Column for Aflatoxin M1 Nanobody and
Preparation Method Thereof. U.S. Patent 2015/0276729 A1, 6 September 2016.37. Xie, J.; Sun, Y.; Zheng, Y.; Wang, C.; Sun, S.; Li, J.; Ding, S.; Xia, X.; Jiang, H. Preparation and application of immunoaffinity
column coupled with dcELISA detection for aflatoxins in eight grain foods. Food Control 2017, 73, 445–451. [CrossRef]38. Ediage, E.N.; Van Poucke, C.; De Saeger, S. A multi-analyte LC–MS/MS method for the analysis of 23 mycotoxins in different
sorghum varieties: The forgotten sample matrix. Food Chem. 2015, 177, 397–404. [CrossRef]39. Ardic, M.; Karakaya, Y.; Atasever, M.; Durmaz, H. Determination of aflatoxin B1 levels in deep-red ground pepper (isot) using
immunoaffinity column combined with ELISA. Food Chem. Toxicol. 2008, 46, 1596–1599. [CrossRef]40. Arroyo-Manzanares, N.; Gámiz-Gracia, L.; García-Campaña, A.M. Determination of ochratoxin A in wines by capillary liquid
chromatography with laser induced fluorescence detection using dispersive liquid–liquid microextraction. Food Chem. 2012, 135,368–372. [CrossRef]
41. Goryacheva, I.Y.; Karagusheva, M.A.; Van Peteghem, C.; Sibanda, L.; Saeger, S.D. Immunoaffinity pre-concentration combinedwith on-column visual detection as a tool for rapid aflatoxin M1 screening in milk. Food Control 2009, 20, 802–806. [CrossRef]
42. Juan, C.; Zinedine, A.; Molto, J.C.; Idrissi, L.; Manes, J. Aflatoxins levels in dried fruits and nuts from Rabat-Salé area, Morocco.Food Control 2008, 19, 849–853. [CrossRef]
43. Goryacheva, I.Y.; Saeger, S.D.; Delmulle, B.; Lobeau, M.; Eremin, S.A.; Barna-VetrÓ, I.; Van Peteghem, C. Simultaneous non-instrumental detection of aflatoxin B1 and ochratoxin A using a clean-up tandem immunoassay column. Anal. Chim. Acta 2007,590, 118–124. [CrossRef]
44. Yang, T.; Lv, Y.; Zhang, D.; Tang, Y.; Yuan, Y.; Zhang, H.; Wang, H. Preparation and Application of Immunoaffinity Column forMulti-mycotoxins. Chin. J. Anal. Chem. 2016, 44, 1243–1249.
45. Hsie, A.W.; Brimer, P.A.; Mitchell, T.J.; Gosslee, D.G. The dose-response relationship for ethyl methanesulfonate-inducedmutations at the hypoxanthine-guanine phosphoribosyl transferase locus in Chinese hamster ovary cells. Somat. Cell Mol. Genet.
1975, 1, 247–261. [CrossRef] [PubMed]46. Tergel; Tai, D.; Liu, G.; Daorna; Wang, R.; Guo, H.; Li, Y.; Li, Y. Establishment of Hypoxanthine Guanine Phosphoribosyl
Transferase Mutant from Human Liver Cancer Cell Line HepG2. China Anim. Husb. Vet. Med. 2011, 38, 92–95.47. Kufer, P.; Lutterbüse, R.; Baeuerle, P.A. A Revival of Bispecific Antibodies. Trends Biotechnol. 2004, 22, 238–244. [CrossRef]
[PubMed]48. Beatty, J.D.; Beatty, B.G.; Vlahos, W.G. Measurement of monoclonal antibody affinity by non-competitive enzyme immunoassay. J.
Immunol. Methods 1987, 100, 173–179. [CrossRef]49. Delmulle, B.; Saeger, S.D.; Adams, A.; Kimpe, N.D.; Van Peteghem, C. Development of a liquid chromatography/tandem mass
spectrometry method for the simultaneous determination of 16 mycotoxins on cellulose filters and in fungal cultures. Rapid
Commun. Mass Spectrom. 2006, 20, 771–776. [CrossRef] [PubMed]50. Junsai, T.; Poapolathep, S.; Sutjarit, S.; Giorgi, M.; Zhang, Z.; Logrieco, A.F.; Li, P.; Poapolathep, A. Determination of Multiple
Mycotoxins and Their Natural Occurrence in Edible Vegetable Oils Using Liquid Chromatography-Tandem Mass Spectrometry.Foods 2021, 10, 2795. [CrossRef] [PubMed]
51. Akinyemi, M.O.; Braun, D.; Windisch, P.; Warth, B.; Ezekiel, C.N. Assessment of multiple mycotoxins in raw milk of threedifferent animal species in Nigeria. Food Control 2022, 131, 108258. [CrossRef]
52. Zhang, W.; Liu, Y.; Liang, B.; Zhang, Y.; Zhong, X.; Luo, X.; Huang, J.; Wang, Y.; Cheng, W.; Chen, K. Probabilistic risk assessmentof dietary exposure to aflatoxin B1 in Guangzhou, China. Sci. Rep. 2020, 10, 7973. [CrossRef]
99

Foods 2022, 11, 335
53. Fan, K.; Ji, F.; Xu, J.; Qian, M.; Duan, J.; Nie, D.; Tang, Z.; Zhao, Z.; Shi, J.; Han, Z. Natural Occurrence and Characteristic Analysisof 40 Mycotoxins in Agro-Products from Yangtze Delta Region. Sci. Agric. Sin. 2021, 54, 2870–2884.
100

foods
Article
Hapten Synthesis and Monoclonal Antibody Preparation forSimultaneous Detection of Albendazole and Its Metabolites inAnimal-Origin Food
Shibei Shao, Xuping Zhou, Leina Dou, Yuchen Bai, Jiafei Mi, Wenbo Yu, Suxia Zhang, Zhanhui Wang
and Kai Wen *
Citation: Shao, S.; Zhou, X.; Dou, L.;
Bai, Y.; Mi, J.; Yu, W.; Zhang, S.; Wang,
Z.; Wen, K. Hapten Synthesis and
Monoclonal Antibody Preparation for
Simultaneous Detection of
Albendazole and Its Metabolites in
Animal-Origin Food. Foods 2021, 10,
3106. https://doi.org/10.3390/
foods10123106
Academic Editor: Paolo Polidori
Received: 9 November 2021
Accepted: 1 December 2021
Published: 14 December 2021
Publisher’s Note: MDPI stays neutral
with regard to jurisdictional claims in
published maps and institutional affil-
iations.
Copyright: © 2021 by the authors.
Licensee MDPI, Basel, Switzerland.
This article is an open access article
distributed under the terms and
conditions of the Creative Commons
Attribution (CC BY) license (https://
creativecommons.org/licenses/by/
4.0/).
Beijing Laboratory for Food Quality and Safety, Beijing Key Laboratory of Detection Technology forAnimal-Derived Food Safety, College of Veterinary Medicine, China Agricultural University,Beijing 100193, China; [email protected] (S.S.); [email protected] (X.Z.);[email protected] (L.D.); [email protected] (Y.B.); [email protected] (J.M.);[email protected] (W.Y.); [email protected] (S.Z.); [email protected] (Z.W.)* Correspondence: [email protected]
Abstract: Albendazole (ABZ) is one of the benzimidazole anthelmintics, and the overuse of ABZin breeding industry can lead to drug resistance and a variety of toxic effects in humans. Sincethe residue markers of ABZ are the sum of ABZ and three metabolites (collectively referred to asABZs), albendazole-sulfone (ABZSO2), albendazole-sulfoxide (ABZSO), and albendazole-2-amino-sulfone (ABZNH2SO2), an antibody able to simultaneously recognize ABZs with high affinity is inurgent need to develop immunoassay for screening purpose. In this work, an unreported hapten,5-(propylthio)-1H-benzo[d]imidazol-2-amine, was designed and synthesized, which maximallyexposed the characteristic sulfanyl group of ABZ to the animal immune system to induce expectedantibody. One monoclonal antibody (Mab) that can simultaneously detect ABZs was obtainedwith IC50 values of 0.20, 0.26, 0.77, and 10.5 µg/L for ABZ, ABZSO2, ABZSO, and ABZNH2SO2
in ic-ELISA under optimized conditions respectively, which has been never achieved in previousreports. For insight into the recognition profiles of the Mab, we used computational chemistrymethod to parameterize cross-reactive molecules in aspects of conformation, electrostatic fields,and hydrophobicity, revealing that the hydrophobicity and conformation of characteristic groupof molecules might be the key factors that together influence antibody recognition with analytes.Furthermore, the practicability of the developed ic-ELISA was verified by detecting ABZs in spikedmilk, beef, and liver samples with recoveries of 60% to 108.8% and coefficient of variation (CV) of1.0% to 15.9%.
Keywords: albendazole; metabolites; hapten design; antibody; immunoassay; computational chemistry
1. Introduction
Albendazole (ABZ, shown in Figure 1a), one of benzimidazoles, is an effective an-thelmintic and often used to control soil-transmitted helminth infection in humans andanimals. ABZ is usually the first choice for treatment of parasitic diseases, such as cysticechinococcosis and alveolar echinococcosis [1–3], and for eliminating lymphatic filariasisin endemic areas [4–6]. After administration of ABZ, the kinds of residues that can bemonitored depend on the route of administration, target tissue or the detection time aftertreatment. At early periods, the most likely residues are albendazole sulfoxide (ABZSO)and albendazole sulfone (ABZSO2), while albendazole 2-amino sulfone (ABZNH2SO2)may be the most persistent residue in tissue at longer withdrawal periods [7,8]. Residuesof ABZ in animal food can lead to embryonic toxicity for consumer, as well as teratogenicand mutagenic effects [9,10]. The European Union (EU) has set the maximum residuelimits (MRLs) for ABZs (sum of ABZ, ABZSO, ABZSO2, and ABZNH2SO2, Figure 1a) at
101

Foods 2021, 10, 3106
100 µg/kg (L) in milk/muscle/fat, 500 µg/kg in kidney, and 1000 µg/kg in liver [11]. TheU.S. FDA has set different residue limits in different samples, for example, 200 µg/kg inliver, 50 µg/kg in muscle [12]. The Ministry of Agriculture and Rural Affairs of China hasset the MRLs (GB 31650-2019) for ABZs (sum of ABZ, ABZSO, ABZSO2, and ABZNH2SO2)at 100 µg/L in milk, and for ABZNH2SO2 at 100–5000 µg/kg in edible tissues of food-producing species [13]. To ensure food safety, various instrumental methods have beenestablished for determining ABZs in animal-derived food [14–19]. Although these methodsare highly sensitive, they rely heavily on expensive instruments and skilled personnel,which often cannot meet the current urgent need for fast screening. Thus, there is greatinterest in the development of accurate and fast methods.
μ μ μμ
μ
μ μ
)
Figure 1. Chemical structures and synthesis route used in the study: (a) Chemical structure offour ABZs. (b) Synthesis route of hapten and immunogen. (c) Mass spectrometry characterizationof hapten and (d) Matrix-assisted laser desorption/ionization time-of-flight mass spectrometrycharacterization of hapten- bovine serum albumin (BSA) conjugates.
Immunoassays, based on antibody-antigen recognition, offer a convenient and rapidalternative to instrumental methods and are currently the most widely used screening meth-ods in food safety. Though immunoassay has many advantages including high-throughput,rapidity, and on-line detection, few studies have been conducted on immunoassay devel-
102

Foods 2021, 10, 3106
opment due to the unavailability of antibody with high affinity and specificity to all ABZs,especially ABZNH2SO2. There have been only several reports of antibodies production forbenzimidazoles including some of ABZs (Table 1), but all of the antibodies were of limitedaffinity to ABZNH2SO2, and the non-specificity binding to various benzimidazoles greatlyconstrained its application in detection of ABZs. Hapten design is the key to producing an-tibody with desired affinity and specificity. In previous studies, the strategy of maintainingthe common moiety of benzimidazoles, carbamate group as the epitope [20–23] was usedto obtain a broad-spectrum antibody. To the best of our knowledge, no report describingthe production of antibody able to sensitively and specifically recognize all four ABZs hasbeen reported despite of the great demand. In the present study, we described the synthesisof one new hapten, production of a Mab with highly specificity, exploration of antibodyrecognition mechanism, and development of an indirect competitive ELISA (ic-ELISA)for the determination of ABZ and its metabolites in milk and tissue simultaneously withimproved sensitivity.
Table 1. Specificities of reported antibodies against ABZs in the literatures.
Compounds Haptens&IC50 (µg/L)
[22] [21] [20] This studyμ
′ ′
μ
′ ′
μ
′ ′
μ
′ ′
ABZ 1.4 >10,000 0.66 0.2ABZSO2 1.8 1253.2 5.34 0.26ABZSO 1.5 2241.4 2.91 0.77
ABZNH2SO2 >10,000 85.2 >1000 10.5Carbendazim - 1 - 14.84 >312.5Fenbendazole 3.8 >10,000 0.75 1.68Fenbendazole
sulfone 8.3 - 6.27 -
Flubendazole 0.63 >10,000 0.37 3.68Mebendazole 2.4 >10,000 0.3 4.14Oxfendazole 0.62 >10,000 19.99 >312.5
Oxibendazole 1.4 >10,000 0.64 2.29Parbendazole - - 1.13 -
Cambendazole >100 - >1000 -Thiabendazole >100 >10,000 - >312.5
1 Not mentiond or not detected.
2. Materials and Methods
2.1. Reagents and Materials
ABZ, ABZSO, ABZSO2, ABZNH2SO2, fenbendazole, flubendazole, mebendazole, ox-ibendazole, oxfendazole, triclabendazole, carbendazim, and thiabendazole were purchasedfrom J&K Chemical Technology (Beijing, China). Carbonyldiimidazole and other chemicalreagents were supplied by Sinopharm Chemical Reagent (Beijing, China). Ovalbumin(OVA), bovine serum albumin (BSA), hypoxanthine aminopterin thymidine (HAT), com-plete and incomplete Freund’s adjuvant, poly (ethylene glycol) (PEG) 1500, and fetal bovineserum were acquired from Sigma–Aldrich (St. Louis, MO, USA). Goat anti-mouse IgG(HRP labeled) was purchased from Jackson Immuno Research (West Grove, PA, USA).Cell culture medium (DMEM) was supplied by Thermo Fisher Scientific (Waltham, MA,USA). TMB (3,3′,5,5′-tetramethyl benzidine) substrate solution and hydrogen peroxide(H2O2) were purchased from Beyotime (Shanghai, China). Distilled water used in thisstudy was obtained from a Milli-Q purification system (Bedford, MA, USA). Microplatesfor ELISA were acquired from Costar (Cambridge, MA, USA). Flat-bottomed high-bindingpolystyrene cell culture plates were obtained from Corning Life Sciences (New York, NY,USA). Balb/c mice were supplied by Beijing Vital River Laboratory Animal Technology
103
Foods 2021, 10, 3106
(Beijing, China). All of the buffers used in the immunoassay have been listed inSupplementary Materials.
2.2. Preparation of hapten and conjugates
2.2.1. Synthesis and Identification of Hapten
The hapten synthesis route is shown in Figure 1b and briefly described as follows:500 mg of ABZ was firstly dissolved in 5.0 mL of ethanol in a round bottom flask with amagnetic stirrer, and then 10 mL of hydrochloric acid was added and heated to 80 ◦C for30 min with stirring and monitored by thin-layer chromatography. After reaction, the pHvalue of the mixture was adjusted to 9.0 by using 2 M of sodium hydroxide solution, andextracted twice with 30 mL of ethyl acetate. The organic phase was combined and driedby using 2.0 g water-free sodium sulfate and the precipitate were removed. Then, 1.5 gof 100–200 mesh silicon was added to the organic phase and then dried for subsequentcolumn chromatography (40 g 200–300 mesh chromatography silicone, eluted by petroleumether: ethyl acetate 4:1). Finally, the hapten was obtained and vacuum-dried for massspectrometry confirmation as shown in Figure 1c.
2.2.2. Synthesis and Identification of Immunogen and Coating Antigen
Amino groups of the acquired hapten were conjugated to carrier proteins by usingcarbonyldiimidazole as coupling reagent. Firstly, 9.2 mg of hapten was dissolved in 1.5 mLof DMF and stirred at 200 rpm for 10 min, then 7.6 mg carbonyldiimidazole was added, andthe solution was stirred at room temperature (500 rpm) for 3 h to obtain activated haptenfor subsequent coupling with carrier protein. Next, 50 mg of BSA was dissolved in 3.5 mLof 0.1 M of sodium bicarbonate solution, stirred at 200 rpm for 10 min, then cooled downvia ice-bath. The previous activated hapten was then dropped into the protein solutionat a rate of 1.0 mL/min under 1000 rpm stirring, then mixed at 500 rpm for 24 h. Thereaction products were dialyzed for 3 days against phosphate buffer solution (PBS, 0.01 M,pH 7.2) under 4 ◦C. Finally, the product was centrifuged at 5000 rpm for 6 min to harvestthe purified supernatant and stored at −20 ◦C until use. Immunogen was characterizedby matrix-assisted laser desorption/ionization time-of-flight mass specTrometry (MALDI-TOF-MS, see Figure 1c) and the conjugation ratio was calculated as follows:
Conjugation ratio = (M (conjugates) − M (BSA))/M (haptens) (1)
Coating antigen was synthesized using the above-mentioned procedure, except OVAwas substituted for BSA.
2.3. Production of Monoclonal Antibody
All animal experiments were conducted in strict accordance with Chinese laws andguidelines approved by the animal ethics committee of China agricultural university. EightBalb/c female mice aged 8 weeks were immunized with immunogen (diluted in PBSto 1.0 mg/mL) at a dose of 100 µg per mouse on an identical schedule. For primaryimmunization, mice were injected subcutaneously with a fully emulsified mixture of equalvolumes complete Freund’s adjuvant and prepared immunogen. For enhancement, micewere immunized with an emulsified mixture of immunogen and incomplete Freund’sadjuvant every 3 weeks. A total of 4 immunizations were administered with the last onegiven via intraperitoneal injection without the adjuvant. To better monitor the serumtiter and specificity by ic-ELISA, serum was collected 7–14 days after each immunization,according to results of a dynamics study of the antibody-mediated immune response [24].Four days after the last boost immunization, mice spleen cells were separated and fusedwith PEG 1500 pre-treated sp2/0 myeloma cells to prepare hybridomas according toprocedures described previously [25–27]. The fused cells were cultured in HAT mediumfor 7 days and were screened by testing the supernatant using ic-ELISA to determinethe binding ability. The positive and highly sensitive hybridomas were obtained aftersubcloning four times using the limiting dilution method. Finally, the hybridomas were
104

Foods 2021, 10, 3106
intraperitoneally injected into mice, and the ascites collected from mice were extracted andpurified with saturated ammonium sulfate to obtain purified Mabs.
2.4. Development and Optimization of ic-ELISA
An ic-ELISA was established under the following optimized assay conditions: mi-croplates were coated with 100 µL of coating antigen dissolved in 0.05 M carbonate bufferand incubated at 37 ◦C for 2 h. The plates were then washed three times for subsequentblocking. A volume of 150 µL/well of blocking buffer was added and incubated at 37 ◦Cfor 1.5 h, after which the buffer was removed. For the competitive step, both 50 µL ofcompetitor and 50 µL of antibody working solution were pipetted into each well andincubated at 37 ◦C for 30 min. The plates were then washed three times, 100 µL/well ofgoat-anti-mouse IgG-HRP diluted in PBS (1:5000) was added, and the plates were incubatedat 37 ◦C for 30 min. The plates were washed as above, 100 µL/well of newly preparedsubstrate solution was added, and the plates were incubated at 37 ◦C for 15 min. Finally,the chromogenic reaction was terminated with 50 µL/well H2SO4 (2 M). Optical density(OD) values at 450 nm were measured with a Multiskan FC machine by Thermo Scientific(Shanghai, China). The OD450 values were plotted against the analyte concentration ona logarithmic scale, and the generated sigmoidal curve was mathematically fitted to afour-parameter logistic equation using the OriginPro 8.5 software (OriginLab Corporation,Northampton, MA, USA).
Y = (A - D)/(1 + (X⁄C)B) + D (2)
where A = response at high asymptote, B = the slope factor, C = concentration correspondingto 50% specific binding (IC50), D = response at low asymptote, and X = the calibrationconcentration.
Several physicochemical factors were optimized to improve the performance of ic-ELISA, including pH and ionic strength of working solution.
2.4.1. Effect of pH
The effect of varying the pH on the ic-ELISA was tested by dissolving the analytesand Mabs in PBS buffer at a specified pH and adding them to the antigen coated plates inequal volumes (50 µL/well). The pH values of 5.5, 6.5, 7.0, 7.4, and 8.5 were tested in theic-ELISA incubation step with all other parameters of the assay fixed.
2.4.2. Effect of Ionic Strength
The effect of ionic strength of assay buffer on the ic-ELISA performance was studiedusing different NaCl concentrations of 0.05, 0.1, 0.15, 02, 0.4, and 0.8 M in 0.01 M ofphosphate buffer, respectively. The effects of these salt concentrations were evaluated onthe ic-ELISA by comparing the ABZ competition curves measured with each buffer atpH 7.4.
2.5. Cross-Reactivities and Computational Chemistry Analysis
The specificity of the developed ELISA was assessed using cross-reactivity (CR) deter-mined under optimal conditions. The CRs of ABZs and other widely used benzimidazoleanthelmintics, such as fenbendazole, oxibendazole, mebendazole, flubendazole, oxfenda-zole, triclabendazole, carbendazim, and thiabendazole, were calculated according to thefollowing equation:
CR = IC50 (ABZ, µg/L)/IC50 (analytes, µg/L) × 100% (3)
The computational chemistry method, which can provide electrostatic potential andconformational information of the molecule regarding antibody recognition, was em-ployed here to study the CRs of immunoassays and the binding interactions betweensmall molecules and antibody. All 3D structures were built in Gaussian 09 (Gaussian Inc.,Wallingford, CT, USA) and then optimized by the density functional theory calculations
105
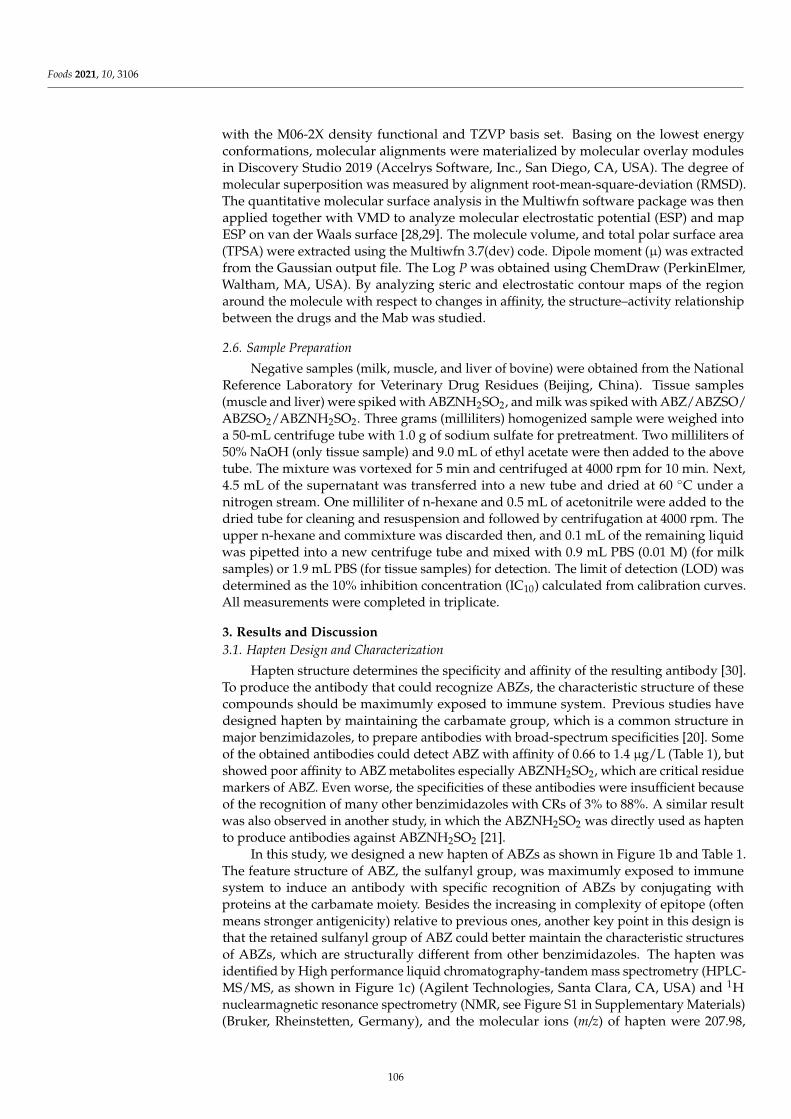
Foods 2021, 10, 3106
with the M06-2X density functional and TZVP basis set. Basing on the lowest energyconformations, molecular alignments were materialized by molecular overlay modulesin Discovery Studio 2019 (Accelrys Software, Inc., San Diego, CA, USA). The degree ofmolecular superposition was measured by alignment root-mean-square-deviation (RMSD).The quantitative molecular surface analysis in the Multiwfn software package was thenapplied together with VMD to analyze molecular electrostatic potential (ESP) and mapESP on van der Waals surface [28,29]. The molecule volume, and total polar surface area(TPSA) were extracted using the Multiwfn 3.7(dev) code. Dipole moment (µ) was extractedfrom the Gaussian output file. The Log P was obtained using ChemDraw (PerkinElmer,Waltham, MA, USA). By analyzing steric and electrostatic contour maps of the regionaround the molecule with respect to changes in affinity, the structure–activity relationshipbetween the drugs and the Mab was studied.
2.6. Sample Preparation
Negative samples (milk, muscle, and liver of bovine) were obtained from the NationalReference Laboratory for Veterinary Drug Residues (Beijing, China). Tissue samples(muscle and liver) were spiked with ABZNH2SO2, and milk was spiked with ABZ/ABZSO/ABZSO2/ABZNH2SO2. Three grams (milliliters) homogenized sample were weighed intoa 50-mL centrifuge tube with 1.0 g of sodium sulfate for pretreatment. Two milliliters of50% NaOH (only tissue sample) and 9.0 mL of ethyl acetate were then added to the abovetube. The mixture was vortexed for 5 min and centrifuged at 4000 rpm for 10 min. Next,4.5 mL of the supernatant was transferred into a new tube and dried at 60 ◦C under anitrogen stream. One milliliter of n-hexane and 0.5 mL of acetonitrile were added to thedried tube for cleaning and resuspension and followed by centrifugation at 4000 rpm. Theupper n-hexane and commixture was discarded then, and 0.1 mL of the remaining liquidwas pipetted into a new centrifuge tube and mixed with 0.9 mL PBS (0.01 M) (for milksamples) or 1.9 mL PBS (for tissue samples) for detection. The limit of detection (LOD) wasdetermined as the 10% inhibition concentration (IC10) calculated from calibration curves.All measurements were completed in triplicate.
3. Results and Discussion
3.1. Hapten Design and Characterization
Hapten structure determines the specificity and affinity of the resulting antibody [30].To produce the antibody that could recognize ABZs, the characteristic structure of thesecompounds should be maximumly exposed to immune system. Previous studies havedesigned hapten by maintaining the carbamate group, which is a common structure inmajor benzimidazoles, to prepare antibodies with broad-spectrum specificities [20]. Someof the obtained antibodies could detect ABZ with affinity of 0.66 to 1.4 µg/L (Table 1), butshowed poor affinity to ABZ metabolites especially ABZNH2SO2, which are critical residuemarkers of ABZ. Even worse, the specificities of these antibodies were insufficient becauseof the recognition of many other benzimidazoles with CRs of 3% to 88%. A similar resultwas also observed in another study, in which the ABZNH2SO2 was directly used as haptento produce antibodies against ABZNH2SO2 [21].
In this study, we designed a new hapten of ABZs as shown in Figure 1b and Table 1.The feature structure of ABZ, the sulfanyl group, was maximumly exposed to immunesystem to induce an antibody with specific recognition of ABZs by conjugating withproteins at the carbamate moiety. Besides the increasing in complexity of epitope (oftenmeans stronger antigenicity) relative to previous ones, another key point in this design isthat the retained sulfanyl group of ABZ could better maintain the characteristic structuresof ABZs, which are structurally different from other benzimidazoles. The hapten wasidentified by High performance liquid chromatography-tandem mass spectrometry (HPLC-MS/MS, as shown in Figure 1c) (Agilent Technologies, Santa Clara, CA, USA) and 1Hnuclearmagnetic resonance spectrometry (NMR, see Figure S1 in Supplementary Materials)(Bruker, Rheinstetten, Germany), and the molecular ions (m/z) of hapten were 207.98,
106

Foods 2021, 10, 3106
indicating that the hapten was successfully obtained. The hapten-BSA conjugate wasthen used as the immunogen, while hapten-OVA as the coating antigen. The immunogenwas characterized by MALDI-TOF-MS (Bruker, Rheinstetten, Germany). The correctmolecular weight of the hapten molecular ion and conjugate were observed (see Figure 1d),demonstrating that the hapten had been conjugated to the carrier protein, and the calculatedconjugation ratio of hapten to BSA was 8.8:1.
3.2. Development and Optimization of the ic-ELISA
Four ABZs, including ABZ, ABZSO2, ABZSO, and ABZNH2SO2, were used to de-termine the affinity (expressed by IC50) and specificity (expressed by CR) of antibodiesusing homologous coating antigen. The results indicated that the obtained antibodies12F12, 12H3, and 4E1 could recognize ABZs with varied affinities (IC50 values of antis-era were from 0.12 µg/L to beyond 100 µg/L). As shown in Figure 2a, the antibody 4E1exhibited relatively higher affinity to ABZ and ABZSO, but relatively worse recognitiontowards ABZNH2SO2; 12H3 had high affinity to three ABZs but unfavorable affinity toABZNH2SO2; while the antibody 12F12 showed high affinity to all four ABZs and wasselected for further optimization.
μ μ
(
Figure 2. Optimization of ic-ELISA. The IC50 was calculated when the Amax (Optical density (OD) value of negative control)ranged from 1.0 to 2.0. (a) Screening of Mab. Each Mab was estimated using four ABZs separately. The effect of (b) pHvalue and (c) ionic strength in the ic-ELISA were evaluated using Mab 12F12 and ABZ. (d) Standard curves of ic-ELISAfor ABZs. (e–j) the calibration curves of the ic-ELISA for (e) ABZ, (f) ABZSO2, (g) ABZSO, (h) ABZNH2SO2 in phosphatebuffer solution (PBS) and milk, and of ABZNH2SO2 in extracted (i) bovine liver and (j) beef. Each value represents theaverage of three independent replicates.
107

Foods 2021, 10, 3106
The development and optimization procedure were performed according to previousstudies [25,26]. Ionic strength and pH value of working buffer were further optimized.The Amax (means the OD value of negative control)/IC50 ratio was introduced here to bea criterion for optimization, and a higher ratio value meant a higher sensitivity. It can beseen that the ratio of Amax/IC50 was highest at an ionic strength of 0.15 mol/L (Figure 2b)and pH 7.4 (Figure 2c). Thus, the optimum conditions (pH 7.4 and 0.15 mol/L NaCl in PBbuffer, namely, 0.01 M PBS) were used in subsequent experiments.
The sensitivity of the ic-ELISA was characterized by IC50 values from standard curvesunder the optimized conditions, Standard curves of ABZ/ABZSO2/ABZSO were estab-lished at 27.0, 9.0, 3.0, 1.0, 0.33, 0.11, 0.037, 0.012, 0.004, 0.001, and 0 µg/L in PBS, standardcurves of ABZNH2SO2 were established at 270, 90, 30, 10, 3.33, 1.11, 0.37, 0.12, 0.04, 0.01,and 0 µg/L in PBS. As shown in Figure 2d, the developed ic-ELISA based on antibody12F12 could detect ABZ, ABZSO2, and ABZSO with IC50 values below 1.0 µg/L (0.20, 0.26,and 0.77 µg/L), and ABZNH2SO2 with IC50 values of 10.5 µg/L in PBS buffer, which is ofthe highest affinity so far. The results shown that the sensitivities of the developed ic-ELISAwere times better than those of other reported immunoassays for ABZs (Table 1).
3.3. Cross-Reactivities and Structure-Activity Relationship Study by Computational Chemistry
In the process of antibody-antigen recognition, cross-reactivity would arise if theconfiguration of the antigen matches the active pocket of the antibody [31,32]. As shown inTable 2, the ic-ELISA exhibited varied CRs with ABZ (100%), ABZSO2 (76.9%), ABZSO(26.0%), ABZNH2SO2 (1.9%), and other often-used benzimidazoles (fenbendazole, fluben-dazole, mebendazole, oxibendazole) less than 8%. The relative lower CR value ofABZNH2SO2 (CR = 1.9%) can easily draw our attention, which shares similar structurewith ABZSO2 (CR = 76.9%), except for the carbamate group on the right of molecule inthe case of ABZSO2. As the sulfanyl group of hapten was exposed to immune system asa characteristic epitope in primary hapten design, it would be the site for the antibodyrecognition. While the remote amide group, which formed after the hapten was coupledto carrier protein, should be masked by carrier protein and contribute much less for an-tibody recognition. However, the recognition ability of the obtained Mab seemed not inaccordance with expectation by analyzing only 2D dimension due to the relative poorerrecognition of ABZNH2SO2 without a methoxyamide or carbamate group. Nevertheless,the benzimidazoles having complex (from a 2D view) side chain groups or phenyl groups(fenbendazole, flubendazole, mebendazole, oxibendazole, Table 2) surprisingly showedhigher CRs than ABZNH2SO2. Though the ic-ELISA was with high sensitivity for detec-tion of all ABZs and far better than previous study, it was appealing to further study onthe CR data, and there was considerable interest in understanding at 3D level as well asquantitative analysis. Therefore, computational chemistry analysis was used to provide 3Dconformations and quantitative information, such as configuration, electrostatic potential,and hydrophobicity of molecules, to investigate the binding of antibody to compounds.Based on their optimized lowest energy conformations of ABZs and other benzimidazolesthat showed cross-reactivities, all molecules were aligned while ABZ was selected as thetemplate. All hydrogen atoms were hidden in the optimized geometric structures for aconcise view.
The hapten design of this work was based on the conjecture that the sulfanyl/sulfonylmoiety is the characteristic moiety of ABZs, thus should be retained to prepare ABZsantibodies. Figure 3a shows that when this moiety of the structure is changed, such as Satom (ABZ, in green) becomes O atom (oxibendazole, in yellow), chain alkyl group (ABZ,in green) becomes phenyl group (fenbendazole, in light blue), or both (flubendazole inbrick-red, or mebendazole in grey), etc., at least a 10-fold decrease in CRs was observed,indicating the criticality of the sulfanyl/sulfonyl group of the structure. It can be seen inFigure 3a that all molecules are well coincided with ABZ, and the RMSD values of thealignments are from 2.3 × 10⁻³ of ABZNH2SO2 to 1.3 × 10⁻² of ABZSO2 and fenbendazole(Table 3), demonstrating the extent of the difference of other molecules with ABZ, which
108

Foods 2021, 10, 3106
agreed with CR data on the whole. It can also be seen in Figure 3a, the substitution ofcarbon or oxygen atom for sulfur atom in flubendazole (in red), mebendazole (in gray),or oxibendazole (in gray) causes changes in torsion angle of the left group towards thebenzimidazole ring comparing with that of ABZ (in red), which might be partly responsiblefor the 10-fold decrease of Mab recognition. The ABZSO (in blue), ABZSO2 (in purple),and ABZNH2SO2 (in orange) show almost the same angle, but the difference between CRsis up to dozens of times. There shall be other factors which influence the recognition ofantibody besides the contribution of molecular conformation.
Table 2. Experimental IC50 values and cross-reactivities of ABZs in optimized ic-ELISA.
Analytes IC50 (µg/L) CR (%)
ABZ
μ
− −
0.20 100
ABZSO2
μ
− −
0.26 76.9
ABZSO
μ
− −
0.77 26.0
ABZNH2SO2
μ
− −
10.50 1.9
Fenbendazole
μ
− −
1.68 11.9
Flubendazole
μ
− −
3.68 5.4
Mebendazole
μ
− −
4.14 4.8
Oxibendazole
μ
− −
2.29 8.7
Oxfendazole
μ
− −
>312.5 <0.01
Triclabendazole
μ
− −
>312.5 <0.01
Carbendazim
μ
− −
>312.5 <0.01
Thiabendazole
μ
− −
>312.5 <0.01
109
Foods 2021, 10, 3106
μ
− − − − − − −
Figure 3. (a) The alignment of cross-reactive analytes with ABZ based on lowest energy conformations with all of thehydrogen atoms hidden. (b) Electrostatic potential energy of analytes. The negative potential areas are indicated in blue;red coloring indicates positive potential areas, and white indicates relatively neutral areas. The blue and golden globules onthe surface represent the minima and maxima of ESP (kcal/mol) on the van der Waals surface. (c) The calculated surfacearea distribution in different ESP ranges on the van der Waals surface.
Table 3. Comparison of cross-reactivities and molecular descriptors of benzimidazoles.
Items ABZ ABZSO2 ABZSO ABZNH2SO2 Fenbendazole Flubendazole Mebendazole Oxibendazole
CR (%) 100 76.9 26.0 1.9 11.9 5.4 4.8 8.7MW 265.1 297.3 281.3 239.3 299.3 313.3 295.3 249.3
volume(Å3) 320.9 336.4 328.5 201.8 255.3 261.1 256.2 225.0Log P 2.8 1.2 1.2 1.0 3.4 3.1 2.9 2.4µ 4.1 7.6 4.7 6.5 4.8 6.6 6.8 1.8
TPSA (Å2) 67.0 101.2 84.1 88.9 67.0 84.1 84.1 76.2alignment
RMSD 0 1.3 × 10⁻² 1.1 × 10⁻² 2.3 × 10⁻³ 1.3 × 10⁻² 8.5 × 10⁻³ 8.4 × 10⁻³ 5.4 × 10⁻³
ESP describes the potential energy of a proton placed at a point near the molecule.As different substituents may affect the electrostatic field, ESP analysis helps to visualizespatial regions of molecules and to analyze electrostatic interaction between antibody andantigen [30,33]. The ESP calculations displayed on van der Waals surfaces of global lowestenergy conformation are shown in Figure 3b, positive potential energy is represented byred areas around the molecules, of which the maxima were marked as golden globule,and these areas are repulsive to a proton, negative potential energy is represented by blueareas on the molecules with the minima marked as light blue globule, and these areas areattractive to a proton. It can be seen that the presence of the oxygen atom causes morenegative potential surface. With consideration of almost identical structure of ABZNH2SO2(CR = 1.9%) and ABZSO2 (CR = 76.9%), except for the methoxyamide group on the right ofmolecule in the case of ABZSO2 and amino group in the case of ABZSO2NH2, less positivepotential surface can be noticed in ABZNH2SO2, and the reduction of electronic effectassociated with the lack of group might influence the recognition by Mab. It is clearly seenfrom Figure 3c that the ESP surface area distribution of molecules in different ESP rangesare similar on the whole but obviously varied locally. Cross-reactive analytes seem to have
110

Foods 2021, 10, 3106
stronger electronic effect (positive or negative area) than ABZ, but do not generate betterCRs. The results imply that the electrostatic potential energy might play a limited role inthe antibody recognition or has been masked by other powerful factors.
Critical molecular descriptors were finally compared as shown in Table 3. Studies haveshown that molecular parameters such as lipid-water partition coefficient (Log P, a widelyused measure of hydrophobicity), dipole moments (µ, represents the polarity of molecule,the larger the polarity, the stronger the hydrophilicity), and topological polar surface area(TPSA) of analytes are important factors affecting recognition by antibodies [34–36], andhydrophobic force was believed to be the main driving force between small molecules andantibody [30,34]. In this study, Log P was found to be positively correlated with antibodyaffinity. The hydrophobicity decreases when the sulfur group in the molecule is replacedwith a sulfone or a sulfoxide groups, resulting in a decrease in CR. Compared with ABZ,the hydrophobicity of ABZNH2SO2 greatly decreases, which is the lowest among all theanalytes as well as the CR. Other compounds with strong hydrophobic groups do notshow high CRs, which may be due to the co-working conformational factors. Some otherphysicochemical parameters that may influence the immunogenicity of haptens, includingMW, SAs, and several hydrophobic parameters has also been calculated and summarizedin Table 3, which shows no significant relationship with the recognition.
In general, hydrophobicity still dominates in the process of recognition in this study,and conformational factors play a partial role. Changes in the part of what we maintained asepitope in hapten design, the sulfanyl group, cause decrease in antibody recognition. Thisconfirms the correctness of the hapten design strategy in this study, that is, the characteristicmoiety of the target molecule should be maximally exposed.
3.4. Matrix Effect and Recovery in Samples
Milk, muscle, and liver samples from bovine were chosen to determine matrix effectand recovery. Direct dilution following sample extraction was used as a simple wayto eliminate matrix effects for rapid screening purpose. The milk extracts were diluted5/10/20 times with PBS and the tissue samples extracts were diluted 10/20/40 times withPBS. The standard curves of ABZs prepared in diluted samples were then compared withthose in PBS to evaluate the matrix effects (Figure 2e–j).
Considering both Amax and IC50 performance, 10-fold dilution of milk samples and20-fold dilution of tissue samples (beef and liver) in PBS were chosen to establish thecalibration curves. The calculated LODs of ABZ, ABZSO2, ABZSO, and ABZNH2SO2were at 0.05, 0.05, 0.05, and 0.49 µg/L in milk samples, respectively, and the LODs ofABZNH2SO2 in beef and bovine liver samples were 1.12 and 0.56 µg/kg, which werebelow the MRL of ABZs. Negative foodstuffs were spiked with ABZs at concentrations of0.5/2.0/10.0 or 10/30/90 µg/kg (L), and the average absorbance values were interpolatedwith calibration curves to determine recoveries. The linearity ranges (from IC20 to IC80),recoveries, and CVs of ABZs in spiked milk samples are shown in Table 4, and that ofABZNH2SO2 in spiked tissue samples are shown in Table 5. As shown in Tables 4 and 5,the recoveries ranged from 60% to 108.8%, with CVs less than 15.9%, which confirmed thatthe ic-ELISA performed well in various matrices.
111

Foods 2021, 10, 3106
Table 4. Recoveries, CVs, LODs, and linearity range of ABZs in spiked milk samples using ic-ELISA.(n = 3).
ABZs in Milk Samples
SpikedLevel (µg/L)
Recovery(%)
CV (%) LOD (µg/L)Linearity
Range (µg/L)
ABZ 0.5 87.5% 1.0%0.05 0.08–0.42 82.1% 7.7%
10 78.7% 6.9%ABZSO2 0.5 94.2% 4.1%
0.05 0.08–0.52 71.4% 10.5%10 60.0% 6.8%
ABZSO 0.5 105.1% 11.9%0.05 0.1–2.52 98.7% 9.9%
10 74.5% 7.9%ABZNH2SO2 10 108.0% 10.3%
0.50 1.5–73.530 76.6% 12.3%90 75.2% 2.9%
Table 5. Recoveries, CVs, LODs, and linearity range of ABZNH2SO2 in spiked tissue samples usingic-ELISA. (n = 3).
ABZNH2SO2 in Tissue Samples
Spiked Level(µg/kg)
Recovery(%)
CV (%)LOD
(µg/kg)Linearity Range
(µg/kg)
Beef 10 84.1% 2.4%1.12 2.3–25.930 91.6% 4.9%
90 74.2% 6.6%Liver 10 87.8% 4.5%
0.56 1.3–23.730 106.1% 9.1%90 108.8% 15.9%
4. Conclusions
In this study, a new hapten was designed by exposing the characteristic sulfanylgroup of ABZ as an epitope. Furthermore, one Mab 12F12 for simultaneously detection ofABZs including ABZNH2SO2 was prepared for the first time and with the highest affinityto date. The established ic-ELISA based on the Mab 12F12 presented times lower IC50values than previously reported and was suitable for the screening of ABZs in foodstuffs.The molecular recognition mechanism was briefly explained via computational chemistryanalysis and indicated that the hydrophobicity of molecules and conformational factorsmight be the key factors that affect the binding between antibody and ABZs in this study,which might offer guides for antibody preparation to reduce the cost of trial-and-error insubsequent research.
Supplementary Materials: The following are available online at https://www.mdpi.com/article/10.3390/foods10123106/s1, Figure S1: 1 H NMR spectra of hapten.
Author Contributions: Conceptualization, S.S. and Z.W.; Methodology, S.S., L.D. and J.M.; software,S.S. and Y.B.; validation, W.Y.; formal analysis, W.Y.; investigation, X.Z.; resources, X.Z.; data curation,S.S.; writing—original draft preparation, S.S.; writing—review and editing, S.S., L.D., Y.B., J.M. andW.Y.; visualization, S.S. and X.Z.; supervision, Z.W., K.W. and S.Z.; project administration, Z.W.;funding acquisition, Z.W. and K.W. All authors have read and agreed to the published version of themanuscript.
Funding: This research was funded by the Ministry of Science and Technology (MOST) for theNational Key R&D Program of China, grant number 2018YFC1603500, Sanming Project of Medicinein Shenzhen (SZSM201611068), and supported by China Agriculture Research System of MOF andMARA.
112

Foods 2021, 10, 3106
Institutional Review Board Statement: Not applicable.
Informed Consent Statement: Not applicable.
Data Availability Statement: Not applicable.
Conflicts of Interest: The authors declare no conflict of interest.
References
1. Taylor, M.J.; Hoerauf, A.; Bockarie, M. Lymphatic filariasis and onchocerciasis. Lancet 2010, 376, 1175–1185. [CrossRef]2. Gobbi, F.; Buonfrate, D.; Tamarozzi, F.; Degani, M.; Angheben, A.; Bisoffi, Z. Efficacy of high-dose albendazole with ivermectin
for treating imported loiasis, Italy. Emerg. Infect. Dis. 2019, 25, 1574–1576. [CrossRef]3. Macfarlane, C.L.; Budhathoki, S.S.; Johnson, S.; Richardson, M.; Garner, P. Albendazole alone or in combination with microfilarici-
dal drugs for lymphatic filariasis. Cochrane. Db. Syst. Rev. 2019, 1, CD003753. [CrossRef]4. Budge, P.J.; Herbert, C.; Andersen, B.J.; Weil, G.J. Adverse events following single dose treatment of lymphatic filariasis:
Observations from a review of the literature. PLoS Negl. Trop. Dis. 2018, 12, e0006454. [CrossRef]5. Chami, G.F.; Bundy, D.A.P. More medicines alone cannot ensure the treatment of neglected tropical diseases. Lancet Infect. Dis.
2019, 19, 330–336. [CrossRef]6. Pullan, R.L.; Halliday, K.E.; Oswald, W.E.; Mcharo, C.; Beaumont, E.; Kepha, S.; Witek-McManus, S.; Gichuki, P.M.; Allen, E.;
Drake, T.; et al. Effects, equity, and cost of school-based and community-wide treatment strategies for soil-transmitted helminthsin Kenya: A cluster-randomised controlled trial. Lancet 2019, 393, 2039–2050. [CrossRef]
7. Danaher, M.; De Ruyck, H.; Crooks, S.R.; Dowling, G.; O’Keeffe, M. Review of methodology for the determination of ben-zimidazole residues in biological matrices. J. Chromatogr. B Analyt. Technol. Biomed. Life Sci. 2007, 845, 1–37. [CrossRef][PubMed]
8. Schulz, J.D.; Neodo, A.; Coulibaly, J.T.; Keiser, J. Pharmacokinetics of albendazole, Albendazole sulfoxide, and albendazolesulfone determined from plasma, Blood, Dried-blood spots, And mitra samples of hookworm-infected adolescents. Antimicrob.
Agents Chemother. 2019, 63, e02489-18. [CrossRef] [PubMed]9. Thomsen, E.K.; Sanuku, N.; Baea, M.; Satofan, S.; Maki, E.; Lombore, B.; Schmidt, M.S.; Siba, P.M.; Weil, G.J.; Kazura, J.W.;
et al. Efficacy, safety, and pharmacokinetics of coadministered diethylcarbamazine, albendazole, and ivermectin for treatment ofbancroftian filariasis. Clin. Infect. Dis. 2016, 62, 334–341. [CrossRef]
10. Ricken, F.J.; Nell, J.; Grüner, B.; Schmidberger, J.; Kaltenbach, T.; Kratzer, W.; Hillenbrand, A.; Henne-Bruns, D.; Deplazes, P.;Moller, P.; et al. Albendazole increases the inflammatory response and the amount of Em2-positive small particles of Echinococcusmultilocularis (spems) in human hepatic alveolar echinococcosis lesions. PLoS Negl. Trop. Dis. 2017, 11, e0005636. [CrossRef][PubMed]
11. The European Union. Commission Regulation (EU) No 37/2010 of 22 December 2009 on Pharmacologically Active Substances and Their
Classification Regarding Maximum Residue Limits in Foodstuffs of Animal Origin; Official Journal of the European Union: Brussels,Belgium, 2010.
12. The, U.S. Food and Drug Administration. 21CFR556.34. Specific Tolerances for Residues of Approved and ConditionallyApproved New Animal Drugs. Sec. 556.34 Albendazole. In The Code of Federal Regulations; U.S. Food and Drug Administration:Silver Spring, MD, USA, 2021.
13. The Ministry of Agriculture and Rural Affairs of the People’s Republic of China. National Food Safety Standard-Maximum Residue
Limits for Veterinary Drugs in Foods; GB 31650-2019; Standards Press of China: Beijing, China, 2019.14. Li, S.; Liang, Q.; Ahmed, S.A.H. Simultaneous determination of five benzimidazoles in agricultural foods by core-shell magnetic
covalent organic framework nanoparticle-based solid-phase extraction coupled with high-performance liquid chromatography.Food Anal. Methods 2020, 13, 1111–1118. [CrossRef]
15. Permana, A.D.; Tekko, I.A.; McCarthy, H.O.; Donnelly, R.F. New HPLC-MS method for rapid and simultaneous quantification ofdoxycycline, diethylcarbamazine and albendazole metabolites in rat plasma and organs after concomitant oral administration. J.
Pharm. Biomed. Anal. 2019, 170, 243–253. [CrossRef]16. Bach, T.; Bae, S.; D’Cunha, R.; Winokur, P.; An, G. Development and validation of a simple, fast, and sensitive LC/MS/MS
method for the quantification of oxfendazole in human plasma and its application to clinical pharmacokinetic study. J. Pharm.
Biomed. Anal. 2019, 171, 111–117. [CrossRef] [PubMed]17. Xu, N.; Dong, J.; Yang, Y.; Liu, Y.; Yang, Q.; Ai, X. Development of a liquid chromatography-tandem mass spectrometry method
with modified QuEChERS extraction for the quantification of mebendazole and its metabolites, albendazole and its metabolites,and levamisole in edible tissues of aquatic animals. Food Chem. 2018, 269, 442–449. [CrossRef] [PubMed]
18. Tejada-Casado, C.; Moreno-Gonzalez, D.; Lara, F.J.; Garcia-Campana, A.M.; Del Olmo-Iruela, M. Determination of benzimidazolesin meat samples by capillary zone electrophoresis tandem mass spectrometry following dispersive liquid-liquid microextraction.J. Chromatogr. A 2017, 1490, 212–219. [CrossRef]
19. Xia, X.; Wang, Y.; Wang, X.; Li, Y.; Zhong, F.; Li, X.; Huang, Y.; Ding, S.; Shen, J. Validation of a method for simultaneousdetermination of nitroimidazoles, benzimidazoles and chloramphenicols in swine tissues by ultra-high-performance liquidchromatography-tandem mass spectrometry. J. Chromatogr. A 2013, 1292, 96–103. [CrossRef]
113
Foods 2021, 10, 3106
20. Guo, L.; Wu, X.; Liu, L.; Kuang, H.; Xu, C. Gold nanoparticle-based paper sensor for simultaneous detection of 11 benzimidazolesby one monoclonal antibody. Small 2018, 14, 1701782. [CrossRef] [PubMed]
21. Peng, D.; Jiang, N.; Wang, Y.; Chen, D.; Liu, Z.; Yuan, Z. Development and validation of an indirect competitive enzyme-linkedimmunosorbent assay for the detection of albendazole 2-aminosulfone residues in animal tissues. Food Agric. Immunol. 2015, 27,273–287. [CrossRef]
22. Brandon, D.L.; Binder, R.G.; Bates, A.H.; Montague, W.C., Jr. Monoclonal antibody for multiresidue ELISA of benzimidazoleanthelmintics in liver. J. Agric. Food Chem. 1994, 42, 1588–1594. [CrossRef]
23. Brandon, D.L.; Holland, K.P.; Dreas, J.S.; Henry, A.C. Rapid screening for benzimidazole residues in bovine liver. J. Agric. Food
Chem. 1998, 46, 3653–3656. [CrossRef]24. Eyer, K.; Doineau, R.C.L.; Castrillon, C.E.; Briseño-Roa, L.; Menrath, V.; Mottet, G.; England, P.; Godina, A.; Brient-Litzler, E.;
Nizak, C.; et al. Single-cell deep phenotyping of IgG-secreting cells for high-resolution immune monitoring. Nat. Biotechnol. 2017,35, 977–982. [CrossRef] [PubMed]
25. Mi, J.; Dong, X.; Zhang, X.; Li, C.; Wang, J.; Mujtaba, M.G.; Zhang, S.; Wen, K.; Yu, X.; Wang, Z. Novel hapten design, antibodyrecognition mechanism study, and a highly sensitive immunoassay for diethylstilbestrol in shrimp. Anal. Bioanal. Chem. 2019,411, 5255–5265. [CrossRef]
26. Li, H.; Ma, S.; Zhang, X.; Li, C.; Dong, B.; Mujtaba, M.G.; Wei, Y.; Liang, X.; Yu, X.; Wen, K.; et al. Generic hapten synthesis,broad-specificity monoclonal antibodies preparation, and ultrasensitive ELISA for five antibacterial synergists in chicken andmilk. J. Agric. Food Chem. 2018, 66, 11170–11179. [CrossRef] [PubMed]
27. Köhler, G.; Milstein, C. Continuous cultures of fused cells secreting antibody of predefined specificity. Nature 1975, 256, 495–497.[CrossRef] [PubMed]
28. Lu, T.; Chen, F. Multiwfn, A multifunctional wavefunction analyzer. J Comput. Chem. 2012, 33, 580–592. [CrossRef]29. Lu, T.; Chen, F. Quantitative analysis of molecular surface based on improved marching tetrahedra algorithm. J. Mol. Graph.
Model. 2012, 38, 314–323. [CrossRef]30. Wen, K.; Bai, Y.; Wei, Y.; Li, C.; Shen, J.; Wang, Z. Influence of small molecular property on antibody response. J. Agric. Food Chem.
2020, 68, 10944–10950. [CrossRef]31. Xu, Z.L.; Shen, Y.D.; Beier, R.C.; Yang, J.Y.; Lei, H.; Wang, H.; Sun, Y.M. Application of computer-assisted molecular modeling for
immunoassay of low molecular weight food contaminants: A review. Anal. Chim. Acta. 2009, 647, 125–136. [CrossRef] [PubMed]32. Li, C.; Liang, X.; Wen, K.; Li, Y.; Zhang, X.; Ma, M.; Yu, X.; Yu, W.; Shen, J.; Wang, Z. Class-specific monoclonal antibodies and
dihydropteroate synthase in bioassays used for the detection of sulfonamides: Structural insights into recognition diversity. Anal.
Chem. 2019, 91, 2392–2400. [CrossRef]33. Wang, Z.; Zhu, Y.; Ding, S.; He, F.; Beier, R.C.; Li, J.; Jiang, H.; Feng, C.; Wan, Y.; Zhang, S.; et al. Development of a monoclonal
antibody-based broad-specificity ELISA for fluoroquinolone antibiotics in foods and molecular modeling studies of cross-reactivecompounds. Anal. Chem. 2007, 79, 4471–4483. [CrossRef]
34. Newman, D.J.; Price, C.P. Molecular aspects of design of immunoassays for drugs. Ther. Drug Monit. 1996, 18, 493–497. [CrossRef][PubMed]
35. Wang, Z.; Luo, P.; Cheng, L.; Zhang, S.; Shen, J. Hapten-antibody recognition studies in competitive immunoassay of α-zearalanolanalogs by computational chemistry and pearson correlation analysis. J. Mol. Recognit. 2011, 24, 815–823. [CrossRef] [PubMed]
36. Bai, Y.; Jiang, H.; Zhang, Y.; Dou, L.; Liu, M.; Yu, W.; Wen, K.; Shen, J.; Ke, Y.; Yu, X.; et al. Hydrophobic moiety of capsaicinoidshaptens enhancing antibody performance in immunoassay: Evidence from computational chemistry and molecular recognition.J. Agric. Food Chem. 2021, 69, 9957–9967. [CrossRef] [PubMed]
114

foods
Article
Development of a New Monoclonal Antibody againstBrevetoxins in Oyster Samples Based on the IndirectCompetitive Enzyme-Linked Immunosorbent Assay
Xiya Zhang 1, Mingyue Ding 1, Chensi Zhang 2, Yexuan Mao 1, Youyi Wang 1, Peipei Li 3, Haiyang Jiang 3,
Zhanhui Wang 3 and Xuezhi Yu 3,*
Citation: Zhang, X.; Ding, M.; Zhang,
C.; Mao, Y.; Wang, Y.; Li, P.; Jiang, H.;
Wang, Z.; Yu, X. Development of a
New Monoclonal Antibody against
Brevetoxins in Oyster Samples Based
on the Indirect Competitive
Enzyme-Linked Immunosorbent
Assay. Foods 2021, 10, 2398. https://
doi.org/10.3390/foods10102398
Academic Editor: Luís Abrunhosa
Received: 13 September 2021
Accepted: 2 October 2021
Published: 9 October 2021
Publisher’s Note: MDPI stays neutral
with regard to jurisdictional claims in
published maps and institutional affil-
iations.
Copyright: © 2021 by the authors.
Licensee MDPI, Basel, Switzerland.
This article is an open access article
distributed under the terms and
conditions of the Creative Commons
Attribution (CC BY) license (https://
creativecommons.org/licenses/by/
4.0/).
1 Henan Province Engineering Research Center for Food Safety Control of Processing and Circulation,College of Food Science and Technology, Henan Agricultural University, 63 Nongye Road,Zhengzhou 450002, China; [email protected] (X.Z.); [email protected] (M.D.);[email protected] (Y.M.); [email protected] (Y.W.)
2 College of Life Sciences, Henan Agricultural University, 63 Nongye Road, Zhengzhou 450002, China;[email protected]
3 Beijing Key Laboratory of Detection Technology for Animal–Derived Food Safety,Beijing Laboratory of Food Quality and Safety, College of Veterinary Medicine,China Agricultural University, Beijing 100193, China; [email protected] (P.L.);[email protected] (H.J.); [email protected] (Z.W.)
* Correspondence: [email protected]; Tel.: +86-10-6273-4975
Abstract: The consumption of shellfish contaminated with brevetoxins, a family of ladder-framepolyether toxins formed during blooms of the marine dinoflagellate Karenia brevis, can cause neu-rotoxic poisoning, leading to gastroenteritis and neurotoxic effects. To rapidly monitor brevetoxinlevels in oysters, we generated a broad-spectrum antibody against brevetoxin 2 (PbTx-2), 1 (PbTx-1),and 3 (PbTx-3) and developed a rapid indirect competitive enzyme-linked immunosorbent assay(icELISA). PbTx-2 was reacted with carboxymethoxylamine hemihydrochloride (CMO) to generate aPbTx-2-CMO hapten and reacted with succinic anhydride (HS) to generate the PbTx-2-HS hapten.These haptens were conjugated to keyhole limpet hemocyanin (KLH) and bovine serum albumin(BSA) to prepare immunogen and coating antigen reagents, respectively, using the active estermethod. After immunization and cell fusion, a broad-spectrum monoclonal antibody (mAb) termedmAb 1D3 was prepared. The 50% inhibitory concentration (IC50) values of the icELISA for PbTx-2,PbTx-1, and PbTx-3 were 60.71, 52.61, and 51.83 µg/kg, respectively. Based on the broad-spectrummAb 1D3, an icELISA was developed to determine brevetoxin levels. Using this approach, the limitof detection (LOD) for brevetoxin was 124.22 µg/kg and recoveries ranged between 89.08% and115.00%, with a coefficient of variation below 4.25% in oyster samples. These results suggest that ouricELISA is a useful tool for the rapid monitoring of brevetoxins in oyster samples.
Keywords: brevetoxins; monoclonal antibody; enzyme-linked immunosorbent assay
1. Introduction
Marine biotoxins have negative effects on the seafood industry. Typically, they aretransferred along food chains and affect other organisms, including humans. Different typesof poisoning are induced by marine biotoxins, e.g., puffer fish poisoning, paralytic shellfishpoisoning, scombroid fish poisoning, diarrhetic shellfish poisoning, neurotoxic shellfishpoisoning, ciguatera fish poisoning, and amnesic shellfish poisoning [1]. Brevetoxinsbelonging to the neurotoxic shellfish poisoning group are produced by the Florida red tideorganism Karenia brevis and are divided in two groups: (1) those derived from the brevetoxinA backbone (PbTx-1, PbTx-7, and PbTx-10) and (2) those from brevetoxin B (PbTx-2, PbTx-3,PbTx-5, PbTx-6, PbTx-9, PbTx-11, and PbTx-12) [2]. PbTx-1 is the most potent, while PbTx-2is the most highly produced brevetoxin (Figure 1) [3]. K. brevis blooms occur most years in
115

Foods 2021, 10, 2398
the Gulf of Mexico, killing high numbers of fish and marine mammals, including sea turtlesand aquatic birds, and generate economic losses of USD 2–24 million [4]. Physiologically,brevetoxins appear to activate voltage-sensitive sodium channels causing sodium influxand nerve membrane depolarization resulting in respiratory distress [5]. Thus, to protecthuman health and avoid food poisoning by brevetoxins, a rapid, sensitive, and specificassay for brevetoxins detection is required.
μμ
μ
μ
μ
Figure 1. PbTx-1, -2, and -3 structures.
Several analytical methods have been established to detect brevetoxins, includingliquid chromatography–tandem mass spectrometry (LC-MS/MS) and receptor/antibody-based immunoassays. For example, Shin et al. (2018) developed an LC-MS/MS protocolfor the PbTx-1, PbTx-2, and PbTx-3 brevetoxins with a limit of quantification (LOQ) of25 µg/kg for each toxin [6]. Similarly, Wunschel et al. (2018) developed an electrosprayLC-MS/MS system for the same brevetoxins with an LOQ of 2.5 µg/kg for each toxin [7].Dom et al. (2018) established a high-resolution LC-MS system to detect 14 brevetox-ins, with LOQs of 312 and 324 µg/kg for PbTx-2 in mussel and oyster, respectively [8].However, these analytical methods are often time-consuming, expensive, and involve com-plex sample preparation. Therefore, new rapid brevetoxin screening/detection methodsare required. McCall et al. (2012) developed a competitive binding assay based on rat brainsynaptosomes as receptors and BODIPY®-PbTx-2 as competitive fluorescent probes forbrevetoxin analogs [9]. In addition, Murata et al. (2019) developed a chemiluminescentreceptor binding assay based on rat brain synaptosomes and acridinium-PbTx-2, witha detection limit value of 1.4 amol [10]. However, the synaptosomes were unstable andrequired storage at -80◦C, and the assay was a time-consuming process.
Indirect competitive enzyme-linked immunosorbent assays (icELISAs) and lateral flowimmunoassays (LFAs) are antibody-based and are frequently used as screening methodsfor small molecules due to their rapid turnaround, low costs, and high sensitivity. Recently,Zhou et al. (2010) prepared the monoclonal antibody (mAb) 2C4 using the PbTx-2-HShapten; it exhibited IC50 values of 6.40, 6.57, and 5.31 µg/kg against PbTx-2, PbTx-1, andPbTx-3, respectively, with the accompanying icELISA having a limit of detection (LOD) of0.60 ng/well [11]. Zhou et al. (2009) developed an LFA based on a colloidal gold probe forthe rapid detection of brevetoxins in fish product samples, with a visual detection limit of20 µg/kg [12]. Lai et al. (2016) developed a novel colorimetric immunoassay for PbTx-2using an enzyme-controlled Fenton-based reaction and a 3,3’,5,5’-tetramethylbenzidine-based visual colored system, with an LOD of 0.08 ng/kg [13]. As is known, the preparationof broad-spectrum antibodies is a key step for developing an immunoassay. Hapten designis an important feature when preparing antibodies against target compounds. In the
116

Foods 2021, 10, 2398
literature, PbTx-2 always reacted with succinic anhydride (HS) which introduced activesites as hapten [11,14]. In principle, aldehyde groups from PbTx-2 may be conjugatedwith a spacer arm, such as carboxymethoxylamine hemihydrochloride (CMO) and/oraminobenzoic acid. In addition, molecular modeling has become a powerful tool in guidingand improving hapten design strategies [15–19]. Therefore, we explored and developednovel haptens using molecular modeling to prepare mAbs against brevetoxins. We thendeveloped an icELISA method to detect brevetoxins in oyster samples.
2. Materials and Methods
2.1. Materials and Reagents
PbTx-2, PbTx-1, PbTx-3, microcystins, nodularin (NOD), okadaic acid, keyhole limpethemocyanin (KLH), bovine serum albumin (BSA), Freund’s incomplete adjuvant (FIA),Freund’s complete adjuvant (FCA), PEG1450, hypoxanthine aminopterin thymidine (HAT),and hypoxanthine thymidine (HT) were purchased from Sigma-Aldrich (St. Louis. MO,USA). Peroxidase-conjugated goat anti-mouse IgG was obtained from Jackson ImmunoRe-search Laboratories, Inc. (West Grove, PA, USA). Succinic anhydride (HS), carboxymethoxy-lamine hemihydrochloride (CMO), N, N’-dicyclohexylcarbodiimide, N-hydroxysuccinimide,and tetramethylbenzidine were obtained from Aladdin Chemistry Co. Ltd. (Shanghai,China). Water was obtained from a Milli-Q purification system (Millipore Corp., Billerica,MA, USA). All other reagents were of analytical grade. Cell culture plates (24 and 96 wells)were from NEST (Wuxi, China). Polystyrene 96-well microtiter plates were from CostarCorp. (Cambridge, MA, USA). The absorbance at 450 nm was measured using a SpectraMaxMk3 microplate reader (Molecular Devices, Silicon Valley, CA, USA).
Coating buffer: Carbonate solution (0.05 mol/L, pH 9.60), 1.59 g Na2CO3, and2.93 g NaHCO3 were dissolved in 1 L water. Assay buffer: Phosphate-buffered saline(PBS, 0.01 mol/L, pH 7.4), 8.00 g NaCl, 0.20 g KCl, 2.93 g NaHPO4·12H2O, and 0.20 gK2PO4 were dissolved in 1 L water. Washing buffer: The washing buffer comprisedPBS containing 0.05% Tween 20 (PBST). Substrate solution: Solution A (pH 5) contained1.00 g urea hydrogen peroxide, 18.00 g Na2HPO4·2H2O, and 10.30 g citric acid·H2O perliter of water. Solution B (pH 2.40) contained 0.25 g tetramethylbenzidine, 40 mL N,N-dimethylformamide, 10.30 g citric acid·H2O, and 960 mL water. Before the assay, solutionsA and B were mixed in a 1:1 ratio [20].
Eight-week-old female BALB/c mice were provided by Vital River Laboratory AnimalTechnology Co. Ltd. (Beijing, China) and raised under strictly controlled conditions.The mice were manipulated according to the China Agricultural University regulationsconcerning the protection of animals used for scientific purposes (2010-SYXK-0037).
2.2. Preparation of PbTx-2-Protein Conjugates
PbTx-2 was reacted with CMO to insert a carboxyl group to facilitate coupling to acarrier protein, as previously described but with modifications (Figure 2A) [21,22]. Briefly,2 mg PbTx-2 in 5 mL pyridine was reacted with 2 mg CMO at 90◦C for 6 h, after whichthe reaction mixture was evaporated to dryness under nitrogen gas. Then, the residue wasdissolved in 5 mL 0.1 mol/L NaHCO3 and extracted by 5 mL ethyl acetate. The aqueousphase was adjusted to pH 3 with 0.05 mol/L HCl and extracted three times in 5 mL ethylacetate. The organic phase was dried under N2 at 40 ◦C to generate the PbTx-2-CMOhapten. The PbTx-2-HS hapten was similarly synthesized by reacting PbTx-2 with HS asdescribed (Figure 2B).
117

Foods 2021, 10, 2398
−
μ
Figure 2. PbTx-2 hapten and antigen synthesis routes. (A) PbTx-2-CMO-KLH/BSA. (B) PbTx-2HS-KLH/BSA.
Then, the PbTx-2-CMO and PbTx-2-HS haptens were conjugated to KLH (immunogen)and BSA (coating antigen), respectively, via the active ester method [23]. Briefly, the haptenswere respectively redissolved in 0.5 mL N,N-dimethylformamide containing 2 mg N,N’-dicyclohexylcarbodiimide and 1.5 mg N-hydroxysuccinimide and reacted for 12 h at roomtemperature. After centrifugation at 8000× g for 10 min, the supernatant of each activehapten solution was divided into two and added drop-wise to 4 mL PBS containing 5 mgKLH and 10 mL PBS containing 10 mg BSA, respectively. Reaction mixtures were stirred at4 ◦C for 12 h, and the conjugates of PbTx-2-CMO-KLH/BSA and PbTx-2-HS-KLH/BSAwere dialyzed in PBS for 48 h. Antigens were then stored at −20 ◦C.
2.3. Preparation of mAbs
Animal immunization procedures were as follows: twelve female BALB/c micewere immunized by subcutaneous injection. The immunogens PbTx-2-CMO-KLH andPbTx-2-HS-KLH (100 µg) were emulsified in Freund’s complete adjuvant for the firstimmunizations. After this, the mice were boosted with the same immunogen doses inFreund’s incomplete adjuvant every 3 weeks. Then, 7–10 days after the last immunization,serum was collected from the caudal vein. Antibody titers were analyzed by ELISA and
118
Foods 2021, 10, 2398
specificity was characterized by icELISA. Animals with the highest inhibition ratios weresacrificed for fusion studies [23]. The inhibition ratio was calculated as follows:
Inhibition ratio (%) = (1 − B/B0) × 100%, (1)
where B0 and B correspond to the absorbance value of wells without a standard and theabsorbance value of wells with x µg/kg PbTx-2 standard, respectively. Spleen cells fromanimals with the highest inhibition ratios were collected and fused with Sp2/0 myelomacells using PEG1450 at a 10:1 ratio. Fusion cells were cultured in hypoxanthine aminopterinthymidine medium for 7 days. Supernatants from fusion cultures were also assayed forthe titer and the inhibition ratios using ELISA and icELISA. Positive hybridomas weresubcloned three times using the limiting dilution method and injected into BALB/c miceto produce ascites [23].
2.4. ELISA and icELISA Protocols
ELISA was conducted as previously described [24]. Briefly, (1) 100 µL of coating anti-gen PbTx-2-CMO-BSA (or PbTx-2-HS-BSA) diluted in coating buffer at 1 µg/mL was addedto the wells of a 96-well plate and incubated at 4 ◦C for 10–12 h. (2) The coating antigenwas then discarded, and the plate was washed three times in wash buffer (250 µL/well).(3) Then, 200 µL of 2% skimmed milk powder in assay buffer was added per well andincubated at 37 ◦C for 1 h to reduce unspecific binding. (4) After this, 50 µL 10 mMPBS and 50 µL anti-PbTx-2 mAb diluted in assay buffer were added sequentially to wellsand incubated at 37 ◦C for 30 min. (5) After further washing, 100 µL/well peroxidase-conjugated goat anti-mouse IgG (diluted 1:5000) was added and incubated at 37 ◦C for30 min. (6) The plate was washed five times, 100 µL/well substrate solution was added tothe reaction, and the plate was incubated at 37 ◦C for 15 min. (7) The reaction was stoppedwith 50 µL 2 M H2SO4, and the absorbance was detected at 450 nm on a Multiskan MK3microplate reader.
For the icELISA procedure, the 50 µL 10 mM PBS was replaced by 50 µL seriesconcentration of PbTx-2 standard solution at step 4.
We characterized mAb properties using IC50 and cross-reactivity (CR) values.Sensitivity was assessed using IC50 values, with the concentration of the competitor result-ing in the inhibition ratio reaching 50%, and specificity was evaluated by CR based on thefollowing formula [24]:
CR (%) = (IC50 of PbTx-2/IC50 of competitors) × 100% (2)
We selected several marine toxin compounds as competitors, including PbTx-1 (100 µg/kg),PbTx-3 (100 µg/kg), domoic acid (1000 µg/kg), microcystins (1000 µg/kg), nodularin(1000 µg/kg), neosaxitoxin (1000 µg/kg), and tetrodotoxin (1000 µg/kg).
2.5. Sample Preparation
Blank oyster samples from a local supermarket were confirmed using the HPLC-MS/MS method [6]. The blank oyster samples were spiked with 200, 400, and 800 µg/kg.Then, brevetoxins were extracted from the oysters based on a previously described methodwith some modifications [6]. Briefly, 5 g homogenized sample was extracted in 5 mL80% methanol by vortexing for 5 min and then ultrasonication at 60 ◦C for 10 min.After centrifugation at 2400× g for 10 min, the supernatant was diluted 15-fold in assaybuffer to eliminate matrix interference. The LOD value in oyster samples was calculatedbased on 20 blank samples, accepting no false positive rates, with an average value plustriple standard deviation (SD), then multiplied by 15 (the diluted ratio) [23]. The recoverywas calculated as the following equation [23]:
Recovery (%) = (measured value (µg/kg)/spiked values (µg/kg)) × 100% (3)
119
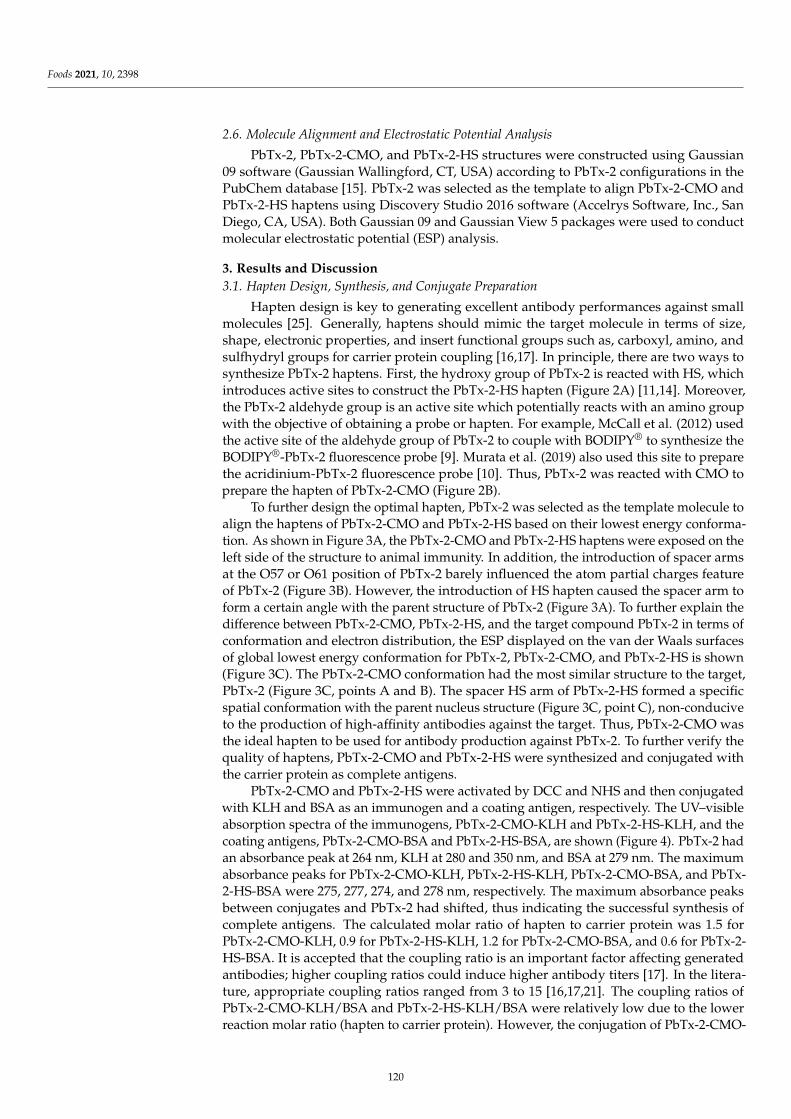
Foods 2021, 10, 2398
2.6. Molecule Alignment and Electrostatic Potential Analysis
PbTx-2, PbTx-2-CMO, and PbTx-2-HS structures were constructed using Gaussian09 software (Gaussian Wallingford, CT, USA) according to PbTx-2 configurations in thePubChem database [15]. PbTx-2 was selected as the template to align PbTx-2-CMO andPbTx-2-HS haptens using Discovery Studio 2016 software (Accelrys Software, Inc., SanDiego, CA, USA). Both Gaussian 09 and Gaussian View 5 packages were used to conductmolecular electrostatic potential (ESP) analysis.
3. Results and Discussion
3.1. Hapten Design, Synthesis, and Conjugate Preparation
Hapten design is key to generating excellent antibody performances against smallmolecules [25]. Generally, haptens should mimic the target molecule in terms of size,shape, electronic properties, and insert functional groups such as, carboxyl, amino, andsulfhydryl groups for carrier protein coupling [16,17]. In principle, there are two ways tosynthesize PbTx-2 haptens. First, the hydroxy group of PbTx-2 is reacted with HS, whichintroduces active sites to construct the PbTx-2-HS hapten (Figure 2A) [11,14]. Moreover,the PbTx-2 aldehyde group is an active site which potentially reacts with an amino groupwith the objective of obtaining a probe or hapten. For example, McCall et al. (2012) usedthe active site of the aldehyde group of PbTx-2 to couple with BODIPY® to synthesize theBODIPY®-PbTx-2 fluorescence probe [9]. Murata et al. (2019) also used this site to preparethe acridinium-PbTx-2 fluorescence probe [10]. Thus, PbTx-2 was reacted with CMO toprepare the hapten of PbTx-2-CMO (Figure 2B).
To further design the optimal hapten, PbTx-2 was selected as the template molecule toalign the haptens of PbTx-2-CMO and PbTx-2-HS based on their lowest energy conforma-tion. As shown in Figure 3A, the PbTx-2-CMO and PbTx-2-HS haptens were exposed on theleft side of the structure to animal immunity. In addition, the introduction of spacer armsat the O57 or O61 position of PbTx-2 barely influenced the atom partial charges featureof PbTx-2 (Figure 3B). However, the introduction of HS hapten caused the spacer arm toform a certain angle with the parent structure of PbTx-2 (Figure 3A). To further explain thedifference between PbTx-2-CMO, PbTx-2-HS, and the target compound PbTx-2 in terms ofconformation and electron distribution, the ESP displayed on the van der Waals surfacesof global lowest energy conformation for PbTx-2, PbTx-2-CMO, and PbTx-2-HS is shown(Figure 3C). The PbTx-2-CMO conformation had the most similar structure to the target,PbTx-2 (Figure 3C, points A and B). The spacer HS arm of PbTx-2-HS formed a specificspatial conformation with the parent nucleus structure (Figure 3C, point C), non-conduciveto the production of high-affinity antibodies against the target. Thus, PbTx-2-CMO wasthe ideal hapten to be used for antibody production against PbTx-2. To further verify thequality of haptens, PbTx-2-CMO and PbTx-2-HS were synthesized and conjugated withthe carrier protein as complete antigens.
PbTx-2-CMO and PbTx-2-HS were activated by DCC and NHS and then conjugatedwith KLH and BSA as an immunogen and a coating antigen, respectively. The UV–visibleabsorption spectra of the immunogens, PbTx-2-CMO-KLH and PbTx-2-HS-KLH, and thecoating antigens, PbTx-2-CMO-BSA and PbTx-2-HS-BSA, are shown (Figure 4). PbTx-2 hadan absorbance peak at 264 nm, KLH at 280 and 350 nm, and BSA at 279 nm. The maximumabsorbance peaks for PbTx-2-CMO-KLH, PbTx-2-HS-KLH, PbTx-2-CMO-BSA, and PbTx-2-HS-BSA were 275, 277, 274, and 278 nm, respectively. The maximum absorbance peaksbetween conjugates and PbTx-2 had shifted, thus indicating the successful synthesis ofcomplete antigens. The calculated molar ratio of hapten to carrier protein was 1.5 forPbTx-2-CMO-KLH, 0.9 for PbTx-2-HS-KLH, 1.2 for PbTx-2-CMO-BSA, and 0.6 for PbTx-2-HS-BSA. It is accepted that the coupling ratio is an important factor affecting generatedantibodies; higher coupling ratios could induce higher antibody titers [17]. In the litera-ture, appropriate coupling ratios ranged from 3 to 15 [16,17,21]. The coupling ratios ofPbTx-2-CMO-KLH/BSA and PbTx-2-HS-KLH/BSA were relatively low due to the lowerreaction molar ratio (hapten to carrier protein). However, the conjugation of PbTx-2-CMO-
120
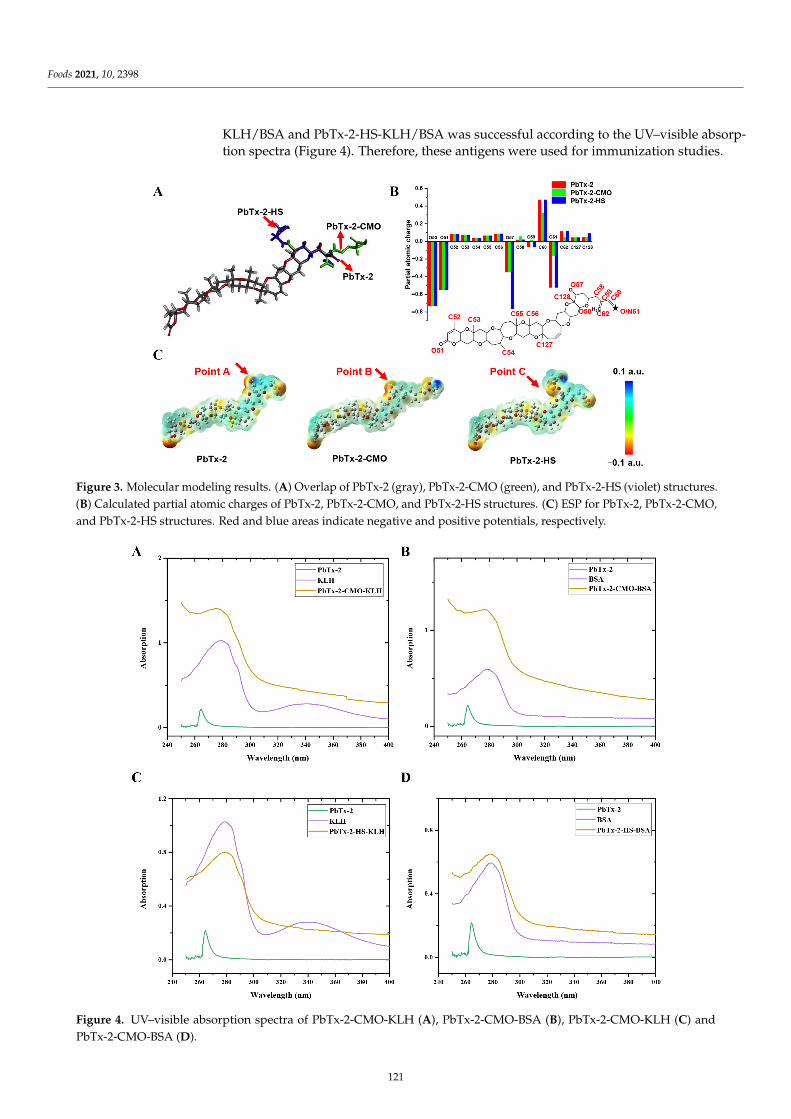
Foods 2021, 10, 2398
KLH/BSA and PbTx-2-HS-KLH/BSA was successful according to the UV–visible absorp-tion spectra (Figure 4). Therefore, these antigens were used for immunization studies.
Figure 3. Molecular modeling results. (A) Overlap of PbTx-2 (gray), PbTx-2-CMO (green), and PbTx-2-HS (violet) structures.(B) Calculated partial atomic charges of PbTx-2, PbTx-2-CMO, and PbTx-2-HS structures. (C) ESP for PbTx-2, PbTx-2-CMO,and PbTx-2-HS structures. Red and blue areas indicate negative and positive potentials, respectively.
Figure 4. UV–visible absorption spectra of PbTx-2-CMO-KLH (A), PbTx-2-CMO-BSA (B), PbTx-2-CMO-KLH (C) andPbTx-2-CMO-BSA (D).
121

Foods 2021, 10, 2398
3.2. Antibody Production and Characterization
The two immunogens PbTx-2-CMO-KLH and PbTx-2-HS-KLH were used to generateantibodies against PbTx-2. After a third immunization, serum was collected and character-ized using ELISA and icELISA (Table 1). Mice immunized with both complete antigensproduced antiserum against PbTX-2; the immune response to PbTx-2-CMO-KLH wassuperior to that to PbTx-2-HS-KLH from an inhibition rate perspective. However, the PbTx-2-HS-KLH antibody titer was higher than that for PbTx-2-CMO-KLH, possibly suggestingthe spacer HS arm of the PbTx-2-HS molecule that formed based on molecular modeling(Figure 3A,C), a specific spatial conformation with the parent nucleus structure conducedto the production of high-titer antibodies. Additionally, all the antiserum titers from micewere low due to the lower coupling ratios of the hapten to the carrier protein. Finally,mouse No. 1 (PbTx-2-CMO-KLH) and mouse No. 5 (PbTx-2-HS-KLH) were sacrificed forfusion studies as they exhibited a higher inhibition ratio and antiserum titer.
Table 1. Immunization with PbTx-2-CMO-KLH and PbTx-2-HS-KLH.
Immunogen: PbTx-2-CMO-KLH/Coating Antigen PbTx-2-CMO-BSA a
No. 1 2 3 4 5 6
Absorbance of PbTx at 0 mg/kg 1.64 ± 0.06 0.52 ± 0.07 0.74 ± 0.07 0.76 ± 0.08 0.98 ± 0.07 1.542 ± 0.06Absorbance of PbTx at 0.10 mg/kg c 0.51 ± 0.02 0.15 ± 0.01 0.17 ± 0.01 0.20 ± 0.03 0.29 ± 0.05 0.63 ± 0.06Absorbance of PbTx at 1.00 mg/kg c 0.11 ± 0.02 0.07 ± 0.01 0.08 ± 0.02 0.09 ± 0.01 0.11 ± 0.01 0.14 ± 0.01
Inhibition ratio by 0.10 mg/kg 68.90% 71.15% 77.03% 84.80% 70.41% 59.14%Inhibition ratio by 1.00 mg/kg 93.29% 86.54% 89.19% 88.16% 88.78% 90.92%
Immunogen: PbTx-2-HS-KLH/Coating Antigen PbTx-2-HS-BSA b
No. 1 2 3 4 5 6
Absorbance of PbTx at 0 mg/L 2.39 ± 0.05 0.71 ± 0.04 0.28 ± 0.01 1.07 ± 0.08 1.68 ± 0.14 0.79 ± 0.01Absorbance of PbTx at 0.50 mg/L c 2.13 ± 0.07 0.63 ± 0.05 0.17 ± 0.01 0.59 ± 0.01 1.14 ± 0.07 0.69 ± 0.04Absorbance of PbTx at 5.00 mg/L c 1.77 ± 0.03 0.58 ± 0.07 0.16 ± 0.05 0.34 ± 0.06 0.96 ± 0.06 0.49 ± 0.01
Inhibition ratio by 0.50 mg/kg 10.88% 14.86% 39.29% 44.86% 32.14% 12.66%Inhibition ratio by 5.00 mg/kg 25.94% 18.31% 42.86% 68.22% 42.86% 37.97%a The concentration of coating antigen was 1.00 µg/mL, and the antibody titer was 1:200. b The concentration of coating antigen was0.50 µg/mL, and the antibody titer was 1:1000. c The competition compound was PbTx-2.
After cell fusion, the 1D3 cell line from mouse No.1 (PbTx-2-CMO-KLH) and thecell lines 6D8 and 9E8 from mouse No. 5 (PbTx-2-HS-KLH) were identified as secretingantibodies against PbTx-2. Thus, all three cell lines were used for antibody production,and ELISAs and icELISAs were used to characterize mAbs (Table 2). All mAbs recognizedPbTx-2, PbTx-1, and PbTx-3. Additionally, the IC50 value for the 1D3 mAb was lower thanthat for the 6D8 and 9G8 mAbs, consistent with the molecular modeling data (Figure 3).Those results also indicated that PbTx-2-CMO was the best hapten for brevetoxin produc-tion, and the PbTx-2-HS-BSA coating antigen improved 1D3 mAb sensitivity.
Table 2. IC50 values (µg/kg) and cross-reaction (CR) of monoclonal antibodies.
Compound PbTx-2 CR (%) PbTx-1 CR (%) PbTx-3 CR (%)
mAb 6D8 a 786.72 100 806.52 97.92 726.51 108.29mAb 9G8 a 434.54 100 424.61 102.33 398.62 109.01mAb 1D3 b 78.53 100 80.62 97.41 69.84 112.44mAb 1D3 c 60.71 100 52.61 115.40 51.83 117.13
a The concentration of coating antigen PbTx-2-HS-BSA was 0.20 µg/mL, and the antibody titer was 1:1 × 105.b The concentration of coating antigen PbTx-2-CMO-BSA was 1.00 µg/mL, and the antibody titer was 1: 1 × 104.c The concentration of coating antigen PbTx-2-HS-BSA was 0.20 µg/mL, and the antibody titer was 1: 3 × 10⁴.
Next, PbTx-2-HS-BSA and 1D3 mAb were used to establish a standard curve in bufferassay. As shown (Figure 5), the curves that were based on the PbTx-2, PbTx-1 and PbTx-3gave IC50 values of 60.71 µg/kg, 52.61 µg/kg and 51.83 µg/kg, respectively. The mAb 1D3
122

Foods 2021, 10, 2398
exhibited a CR = 100% toward PbTx-2, CR = 115.40% toward PbTx-1, and CR = 117.13%toward PbTx-3. The LOD in assay buffer was 6.11 µg/kg, and the linearity range (IC10–IC90)was between 7.46 and 127.00 µg/kg. In addition, the mAb did not exhibit a measurable CRwith other marine biotoxins, including domoic acid, microcystins, nodularin, neosaxitoxin,and tetrodotoxin. These data indicated that mAb 1D3 was a broad spectrum homogeneousantibody for brevetoxins.. The sensitivity of the mAb 1D3 icELISA was lower than thatfor the mAb 2C4 (IC50 value of 5.3 µg/L towards PbTx-2) [11]. In this study, the lowercoupling ratios of PbTx-2-CMO to the carrier protein was because of the lower feed ratios(2 mg PbTx-2 reacted with 2 mg CMO), resulting in lower antibody titer immunized byPbTx-2-CMO-KLH. Ultimately, this affected the performance parameters of the mAb 1D3.More sensitive antibodies can be obtained if the ratios of haptens (PbTx-2-CMO) to carrierproteins are improved.
μ
μμ
μ
μμ
Figure 5. The brevetoxin icELISA standard curve using the mAb 1D3 with the PbTx-2-HS-BSAcoating antigen.
The recoveries for PbTx-2, PbTx-1, and PbTx-3 from spiked oyster samples at threedose levels (200, 400, and 800 µg/kg) are shown in Table 3 and were 91.21–108.33%,91.04–115.00%, and 89.08–113.17%, respectively. The LOD in the oyster sample was calcu-lated at 124.22 µg/kg. The sensitivity of this icELISA was higher than the high-resolutionLC-MS sensitivity (LOQ of 324 µg/kg for PbTx-2 in oyster samples) [8] and similar to thatof the LFA based on colloidal gold probe (visual detection limit of 20 µg/kg in fish productsamples) by Zhou et al. [12].
Table 3. Toxin recoveries from spiked oyster samples.
Toxin Concentration (µg/kg) Recovery of Toxins from Oyster
PbTx-2200 108.33 ± 3.82%400 91.25 ± 3.31%800 91.21 ± 1.25%
PbTx-1200 115.00 ± 5.00%400 92.92 ± 3.82%800 91.04 ± 3.21%
PbTx-3200 113.17 ± 4.25%400 94.42 ± 3.12%800 89.08 ± 1.12%
123

Foods 2021, 10, 2398
4. Conclusions
Using molecular modeling and experimental analyses, the PbTx-2-CMO hapten pro-duced acceptable antibody characteristics against brevetoxins. The IC50 values againstPbTx-2, PbTx-1, and PbTx-3 were 60.71, 52.61, and 51.83 µg/kg, respectively. The LODwas 124.22 µg/kg, and PbTx recoveries from oysters ranged from 89.08% to 115.00%.This icELISA will be a useful method for monitoring PbTxs in oyster samples.
Author Contributions: Conceptualization, X.Z.; methodology, X.Z. and M.D.; software, M.D.; vali-dation, C.Z.; formal analysis, Y.M.; data curation, Y.W. and P.L.; writing—original draft preparation,X.Z. and H.J.; writing—review and editing, Z.W. and X.Y.; visualization, X.Z. and M.D.; supervision,X.Y.; project administration, X.Y.; funding acquisition, X.Y. All authors have read and agreed to thepublished version of the manuscript.
Funding: This work was supported by the Chinese Ministry of Science and Technology (MOST)for the National Key R&D Program of China (2018YFC1602600), the Natural Science Foundationof China (No. 31802249), the Science and Technology Key Research Project of Henan ProvincialEducation Department of China (No. 20A550009), and the Key Scientific and Technological Project ofHenan Province Department of China (No. 202102310303).
Institutional Review Board Statement: Not applicable.
Informed Consent Statement: Not applicable.
Data Availability Statement: Not applicable.
Conflicts of Interest: The authors declare no conflict of interest.
References
1. Özogul, F.; Hamed, I. Marine-based toxins and their health risk. In Food Quality: Balancing Health and Disease; Academic Press:Cambridge, MA, USA, 2018; pp. 109–144.
2. Radwan, F.F.Y.; Wang, Z.H.; Ramsdell, J.S. Identification of a rapid detoxification mechanism for brevetoxin in rats. Toxicol. Sci.
2005, 85, 839–846. [CrossRef]3. Landsberg, J.H. The effects of harmful algal blooms on aquatic organisms. Rev. Fish. Sci. 2002, 10, 113–390.4. Hoagland, P.; Jin, D.; Beet, A.; Kirkpatrick, B.; Reich, A.; Ullmann, S.; Fleming, L.E.; Kirkpatrick, G. The human health effects of
Florida red tide (FRT) blooms: An expanded analysis. Environ. Int. 2014, 68, 144–153. [CrossRef] [PubMed]5. Baden, D.G.; Bourdelais, A.J.; Jacocks, H.; Michelliza, S.; Naar, J. Natural and derivative brevetoxins: Historical background,
multiplicity, and effects. Environ. Health Perspect. 2005, 113, 621–625. [CrossRef] [PubMed]6. Shin, C.; Hwang, J.Y.; Yoon, J.H.; Kim, S.H.; Kang, G.J. Simultaneous determination of neurotoxic shellfish toxins (brevetoxins) in
commercial shellfish by liquid chromatography tandem mass spectrometry. Food Control. 2018, 91, 365–371. [CrossRef]7. Wunschel, D.S.; Valenzuela, B.R.; Kaiser, B.L.D.; Victry, K.; Woodruff, D. Method development for comprehensive extraction
and analysis of marine toxins: Liquid-liquid extraction and tandem liquid chromatography separations coupled to electrospraytandem mass spectrometry. Talanta 2018, 187, 302–307. [CrossRef]
8. Dom, I.; Bire, R.; Hort, V.; Lavison-Bompard, G.; Nicolas, M.; Guerin, T. Extended targeted and non-targeted strategies for theanalysis of marine toxins in mussels and oysters by (LC-HRMS). Toxins 2018, 10, 375. [CrossRef]
9. McCall, J.R.; Jacocks, H.M.; Baden, D.G.; Bourdelais, A.J. Development of a competitive fluorescence-based synaptosome bindingassay for brevetoxins. Harmful Algae 2012, 19, 85–91. [CrossRef]
10. Murata, K.; Yasumoto, T. Chemiluminescent receptor binding assay for ciguatoxins and brevetoxins using acridinium brevetoxin-b2. Toxins 2019, 11, 580. [CrossRef]
11. Zhou, Y.; Li, Y.S.; Pan, F.G.; Zhang, Y.Y.; Lu, S.Y.; Ren, H.L.; Li, Z.H.; Liu, Z.S.; Zhang, J.H. Development of a new monoclonalantibody based direct competitive enzyme-linked immunosorbent assay for detection of brevetoxins in food samples. Food Chem.
2010, 118, 467–471. [CrossRef]12. Zhou, Y.; Pan, F.G.; Li, Y.S.; Zhang, Y.Y.; Zhang, J.H.; Lu, S.Y.; Ren, H.L.; Liu, Z.S. Colloidal gold probe-based immunochro-
matographic assay for the rapid detection of brevetoxins in fishery product samples. Biosens. Bioelectron. 2009, 24, 2744–2747.[CrossRef]
13. Lai, W.; Wei, Q.; Zhuang, J.; Lu, M.; Tang, D. Fenton reaction-based colorimetric immunoassay for sensitive detection of brevetoxinB. Biosens. Bioelectron. 2016, 80, 249–256. [CrossRef]
14. Naar, J.; Branaa, P.; Bottein-Dechraoui, M.Y.; Chinain, M.; Pauillac, S. Polyclonal and monoclonal antibodies to PbTx-2-typebrevetoxins using minute amount of hapten-protein conjugates obtained in a reversed micellar medium. Toxicon 2001, 39, 869–878.[CrossRef]
124

Foods 2021, 10, 2398
15. Li, H.; Ma, S.; Zhang, X.; Li, C.; Dong, B.; Mujtaba, M.G.; Wei, Y.; Liang, X.; Yu, X.; Wen, K.; et al. Generic hapten synthesis,broad-specificity monoclonal antibodies preparation, and ultrasensitive elisa for five antibacterial synergists in chicken and milk.J. Agric. Food Chem. 2018, 66, 11170–11179. [CrossRef] [PubMed]
16. Mari, G.M.; Li, H.; Dong, B.; Yang, H.; Talpur, A.; Mi, J.; Guo, L.; Yu, X.; Ke, Y.; Han, D.; et al. Hapten synthesis, monoclonalantibody production and immunoassay development for direct detection of 4-hydroxybenzehydrazide in chicken, the metaboliteof nifuroxazide. Food Chem. 2021, 355, 129598. [CrossRef]
17. Li, Z.; Wang, Y.; Li, D.; Chen, X.; Li, Z.; Gao, H.; Cao, L.; Li, S.; Hou, Y. Development of an indirect competitive enzyme-linkedimmunosorbent assay for screening ethopabate residue in chicken muscle and liver. RSC Adv. 2017, 7, 36072–36080. [CrossRef]
18. Han, X.; Sheng, F.; Kong, D.; Wang, Y.; Pan, Y.; Chen, M.; Tao, Y.; Liu, Z.; Ahmed, S.; Yuan, Z.; et al. Broad-spectrum monoclonalantibody and a sensitive multi-residue indirect competitive enzyme-linked immunosorbent assay for the antibacterial synergistsin samples of animal origin. Food Chem. 2019, 280, 20–26. [CrossRef]
19. Huang, J.X.; Yao, C.Y.; Yang, J.Y.; Li, Z.F.; He, F.; Tian, Y.X.; Wang, H.; Xu, Z.L.; Shen, Y.D. Design of novel haptens anddevelopment of monoclonal antibody-based immunoassays for the simultaneous detection of tylosin and tilmicosin in milk andwater samples. Biomolecules 2019, 9, 770. [CrossRef] [PubMed]
20. O’Keeffe, M.; Crabbe, P.; Salden, M.; Wichers, J.; Van Peteghem, C.; Kohen, F.; Pieraccini, G.; Moneti, G. Preliminary evaluation ofa lateral flow immunoassay device for screening urine samples for the presence of sulphamethazine. J. Immunol. Methods 2003,278, 117–126. [CrossRef]
21. Zhang, X.; Wen, K.; Wang, Z.; Jiang, H.; Beier, R.C.; Shen, J. An ultra-sensitive monoclonal antibody-based fluorescent microsphereimmunochromatographic test strip assay for detecting aflatoxin M1 in milk. Food Control 2016, 60, 588–595. [CrossRef]
22. Zhang, X.; Eremin, S.A.; Wen, K.; Yu, X.; Li, C.; Ke, Y.; Jiang, H.; Shen, J.; Wang, Z. Fluorescence polarization immunoassay basedon a new monoclonal antibody for the detection of the zearalenone class of mycotoxins in maize. J. Agric. Food Chem. 2017, 65,2240–2247. [CrossRef] [PubMed]
23. Zhang, X.; Song, M.; Yu, X.; Wang, Z.; Ke, Y.; Jiang, H.; Li, J.; Shen, J.; Wen, K. Development of a new broad-specific monoclonalantibody with uniform affinity for aflatoxins and magnetic beads-based enzymatic immunoassay. Food Control. 2017, 79, 309–316.[CrossRef]
24. Peng, D.; Chang, F.; Wang, Y.; Chen, D.; Liu, Z.; Zhou, X.; Feng, L.; Yuan, Z. Development of a sensitive monoclonal-basedenzyme-linked immunosorbent assay for monitoring T-2 toxin in food and feed. Food Addit. Contam. Part A Chem. Anal. Control.
Expo. Risk Assess. 2016, 33, 683–692. [CrossRef]25. Wang, Z.; Liu, M.; Shi, W.; Li, C.; Zhang, S.; Shen, J. New haptens and antibodies for ractopamine. Food Chem. 2015, 183, 111–114.
[CrossRef] [PubMed]
125


foods
Article
Preparation and Directed Evolution of Anti-Ciprofloxacin ScFvfor Immunoassay in Animal-Derived Food
Fangyu Wang 1,*,†, Ning Li 2,†, Yunshang Zhang 1, Xuefeng Sun 1, Man Hu 1, Yali Zhao 2 and Jianming Fan 3
Citation: Wang, F.; Li, N.; Zhang, Y.;
Sun, X.; Hu, M.; Zhao, Y.; Fan, J.
Preparation and Directed Evolution
of Anti-Ciprofloxacin ScFv for
Immunoassay in Animal-Derived
Food. Foods 2021, 10, 1933. https://
doi.org/10.3390/foods10081933
Academic Editor: Thierry Noguer
Received: 23 June 2021
Accepted: 17 August 2021
Published: 20 August 2021
Publisher’s Note: MDPI stays neutral
with regard to jurisdictional claims in
published maps and institutional affil-
iations.
Copyright: © 2021 by the authors.
Licensee MDPI, Basel, Switzerland.
This article is an open access article
distributed under the terms and
conditions of the Creative Commons
Attribution (CC BY) license (https://
creativecommons.org/licenses/by/
4.0/).
1 Key Laboratory for Animal Immunology, Henan Academy of Agricultural Sciences, 116#Huayuan Road,Zhengzhou 450002, China; [email protected] (Y.Z.); [email protected] (X.S.);[email protected] (M.H.)
2 Department of Food Nutrition and Health, College of Food Science and Technology, Henan AgriculturalUniversity, 63#Agricultural Road, Zhengzhou 450000, China; [email protected] (N.L.);[email protected] (Y.Z.)
3 China College of Public Health, Zhengzhou University, 100#Kexue Avenue, Zhengzhou 450001, China;[email protected]
* Correspondence: [email protected]† Both authors contributed equally to this work.
Abstract: An immunized mouse phage display scFv library with a capacity of 3.34 × 10⁹ CFU/mLwas constructed and used for screening of recombinant anti-ciprofloxacin single-chain antibodyfor the detection of ciprofloxacin (CIP) in animal-derived food. After four rounds of bio-panning,25 positives were isolated and identified successfully. The highest positive scFv-22 was expressed inE. coli BL21. Then, its recognition mechanisms were studied using the molecular docking method.The result showed the amino acid residue Val160 was the key residue for the binding of scFv to CIP.Based on the results of virtual mutation, the scFv antibody was evolved by directional mutagenesisof contact amino acid residue Val160 to Ser. After the expression and purification, an indirectcompetitive enzyme-linked immunosorbent assay (IC-ELISA) based on the parental and mutantscFv was established for CIP, respectively. The IC50 value of the assay established with the ScFvmutant was 1.58 ng/mL, while the parental scFv was 26.23 ng/mL; this result showed highlyincreased affinity, with up to 16.6-fold improved sensitivity. The mean recovery for CIP rangedfrom 73.80% to 123.35%, with 10.46% relative standard deviation between the intra-assay and theinter-assay. The RSD values ranged between 1.49% and 9.81%. The results indicate that we obtaineda highly sensitive anti-CIP scFv by the phage library construction and directional evolution, and thescFv-based IC-ELISA is suitable for the detection of CIP residue in animal-derived edible tissues.
Keywords: scFv; ciprofloxacin; recognition mechanism; directional mutagenesis; IC-ELISA
1. Introduction
Ciprofloxacin (CIP) is a synthetic third-generation fluoroquinolone (FQ) antibioticthat has been developed and is widely used to treat bacterial infections in humans andanimals. This antibiotic exerts effects by inhibiting DNA gyrase or topoisomerase II insusceptible bacteria and exhibits high activity against a broad spectrum of Gram-negativeand Gram-positive bacteria [1]. However, the unreasonable and extensive use of antibioticshas resulted in the potential for residual antibiotics in food of animal origin, which candamage multiple systems in the body [2,3] and cause bacterial resistance [4,5]. Therefore,the European Union, the Joint FAO/WHO Expert Committee on Food Additives (JECFA,Rome, Italy) and China established maximum residue limits of CIP in animal-derived foodto prevent the accumulation of antimicrobial residues, e.g., 100 µg/kg in milk and meat.
By now, many physicochemical methods have been reported for the detection ofresidues of FQs in foods of animal origin. These analytical methods are highly sensitiveand dependable; however, such methods require specialized instrumentation, trained
127

Foods 2021, 10, 1933
personals, and are time consuming. They are unsuitable for the rapid evaluation of largenumbers of samples. Immunoassays, especially the indirect competitive enzyme-linked im-munosorbent assay (IC-ELISA), which is based on the principle that antibodies specificallybind to antigens, are considered the most reliable method for detecting antibodies [6,7]. Inprevious studies, researchers have developed IC-ELISA based on monoclonal antibodies(MAbs) to determine fluoroquinolone in food of animal origin [8–10]. Although ELISA is amature and widely used method, it has many rigorous programs for preparing traditionalantibodies (PAbs and MAbs) from antigen-immunized animals [11]. Hence, a simple, rapid,and effective technology for preparing novel antibodies must be developed.
The development of gene engineering techniques facilitated the production of variousgene recombinant antibodies, and single-chain variable fragment (scFv) is the most popularformat of recombinant antibody that has been successfully constructed by assembling thevariable-heavy (VH) region and light chain (VL) domain of an antibody with a flexiblelinker [12]. The intrinsic properties of scFv antibodies can be improved by various mu-tagenesis techniques [13]. The recognition property of an scFv antibody can be evolvedin vitro [14]. For the evolution of the scFv antibody, its recognition mechanism should bestudied first, and binding sites, contact amino acids, and intermolecular forces should bedetermined [15]. In recent years, molecular docking has been used in analyzing the inter-actions between ligands and scFv antibodies, and random mutagenesis and site-directedmutagenesis have been used in obtaining scFv mutants [16,17].
Phage display technology (PDT) is the integration of foreign genes into specific coatprotein genes of phage and fusion, with coat protein to promote ligand recognition andbinding [18,19]. It is considered to be the most suitable technology for the production ofsingle-chain antibodies. The phage antibody library uses genetic engineering methods toamplify VH and VL genes. After random combination, it is inserted into the phage coatprotein gene and fused and expressed on the surface of the phage [20]. Specific single-chainantibodies are obtained through specific panning, which is extensively used for preparingantigen-specific artificial antibodies in biomedicine, environmental pollutants analysis, andfood safety detection fields. For example, Xu et al. [21] and Zhao et al. [22] obtained thebroad-specificity domain antibodies for Bt Cry toxins and pyrethroid pesticides by roundsof specific phage library biopanning, respectively, which are all based on phage antibodylibrary technology.
In this study, an immunized mouse phage display scFv library for screening of anti-CIP phage scFv particles was constructed. Then, we transfected the phage to E. coli BL21 forexpression, to obtain a highly sensitive anti-CIP scFv. The scFv recognition mechanism wasstudied through molecular docking, and the sensitivity and cross-reactivity were improvedthrough targeted mutagenesis. Then, IC-ELISA was developed based on the scFv mutantto detect the CIP in animal-derived edible tissues.
2. Material and Methods
2.1. Reagents and Chemicals
Ciprofloxacin (CIP), enrofloxacin (ENR), sarafloxacin (SAR), difloxacin (DIF), lome-floxacin (LOM), enrofloxacin (ENO), norfloxacin (NOR), amifloxacin (AMI), marbofloxacin(MAR), danofloxacin (DAN), fleroxacin (FLE), ofloxacin (OFL) and pefloxacin (PEF) wereobtained from the China Institute of Veterinary Drug Control (Beijing, China). All chemi-cals and reagents used in this study were at least analytical grade or better. The standardstock solutions of these FQs were prepared with methanol (10 µg/mL), and their work-ing solutions with series concentrations (0.1–200 ng/mL) were diluted from the stocksolutions with PBS. All the standard solutions were stored at 4 ◦C to remain stable for8 weeks. N-hydroxy succinimide (NHS), γ-aminobutyric acid (4AS), bovine serum albumin(BSA), ovalbumin (OVA), 1-ethyl-3- (3-dimethylaminopropyl)-carbodiimide (EDC), goatanti-mouse IgG horseradish peroxidase conjugate (HRP-IgG), Freund’s complete adjuvant(FCA) and Freund’s incomplete adjuvant (FIA) were from Sigma (St. Louis, MO, USA).PBS (pH 7.2) was prepared by dissolving 0.2 g of KH2PO4, 0.2 g of KCl, 1.15 g of Na2HPO4,
128
Foods 2021, 10, 1933
and 8.0 g of NaCl in 1000 mL of deionized water. Washing buffer (PBST) was PBS buffercontaining 0.05% Tween. Coating buffer was 5% MPBS (5% Skim milk powder in PBS).Substrate buffer was 0.1 mol/L citrate (pH 5.5). The substrate system was prepared byadding 200 µL of 1% (w/v) TMB in DMSO and 64 µL of 0.75% (w/v) H2O2 into 20 mL ofsubstrate buffer.
All the restriction enzymes and DNA modification enzymes were molecular biologygrade. The RNase prep pure Cell/Bacteria Kit was from Tiangen Biotech Co. Ltd. (Beijing,China). The Prime script RT-PCR Kit, IPTG (isopropyi-β-D-thirgalactopyranoside), X-Gal, pCANTAB5E Vector Cloning kit, horseradish peroxidase-labeled goat anti-GST-tagantibody, restriction enzymes (Sfi I and Not I) and T4 DNA Ligase were from TakaraCompany (Dalian, China). The EasyPure Quick Gel Extraction Kit, Easy Pure PlasmidMiniprep Kit, express vector PET-32a competent cell BL21(DE3), Fast MultiSite MutagenesisSystem and Luria–Bertani culture medium (liquid and solid) were from TransGen Biotech(Beijing, China). The DNA Purification Kit and SDS-PAGE gel preparation kit were fromBeijing ComWin Biotech Co. Ltd. (Beijing, China). The synthesis of primers and the analysisof gene sequence were performed at Sangon Biotechnology Co. Ltd. (Shanghai, China).
2.2. Synthesis of Antigen
The immunogens CIP-BSA and coating antigens CIP-OVA were synthesized in thisstudy. The details are described below. A mixture of CIP (30 mg), NHS (25 mg) and EDC(30 mg) in 1.5 mL of N, N-dimethylformamide (DMF) was stirred at room temperatureovernight. Then, the activated CIP was centrifuged for 15 min (5000 rpm), and the super-natant was added dropwise to 70 mg of BSA dissolved in a solution consisting of 10 mLof PBS and 1 mL of DMF under stirring. The conjugation mixture was stirred at 4 ◦C for5 h, and then centrifuged for 10 min (5000 rpm). The supernatant was dialyzed against0.01 mol/L PBS for 72 h. The dialysis solution was stored at −20 ◦C. The coating antigensCIP-OVA were prepared as described in the CIP-BSA synthesis section, except that BSAwas replaced by OVA.
2.3. Immunization
All animal experiments in this study adhered to the Zhengzhou University animal ex-periment center guidelines and were approved by the Animal Ethics Committee. Six Balb/cfemale mice (8 weeks old) were induced to express anti-CIP MAbs by immunizing the micewith five rounds of subcutaneous injection of CIP-BSA conjugates. In the first round ofimmunization, 250 µg of CIP-BSA with FCA was emulsified for subcutaneous multipointinjection, then four subsequent injections were given at 14-day intervals that were emulsi-fied in FCA. Antisera were collected 7 days after the third and fourth immunization, andthe antibody titer was determined through indirect ELISA. A week after the fourth roundof immunization, booster immunization with 150 µg of CIP-BSA was performed. After5 days, blood and spleen samples were collected for the construction of the phage displayscFv library.
2.4. Phage Display scFv Library Construction
Total RNA was extracted from mouse tissues with TRIzol reagent according to themanufacturer’s instructions. Then, total RNA was used as a template in the reversetranscription of cDNA. The sequences of the primers were used in the amplification of thecDNAs of VH and VL genes for scFv construction. The primers used for the amplificationof scFv coding sequences were designed according to Table 1 and then spliced to a wholescFv gene through splicing overlap extension PCR (SOE-PCR). The system conditionswere as follows: 94 ◦C for 5 min, 30 cycles at 94 ◦C for 45 s, 58 ◦C for 60 s, and 72 ◦C for45 s, and final extension at 72 ◦C for 10 min. Gene fragments encoding VH and VL wereamplified and spliced to a single gene by using a DNA linker encoding a pentadeca peptide(Gly4Ser) 3 through primary PCR. The system conditions were 94 ◦C for 5 min, 30 cycles ofat 94 ◦C for 45 s, 60 ◦C for 60 s, 72 ◦C for 45 s, and final extension at 72 ◦C for 10 min. PCR
129

Foods 2021, 10, 1933
products were verified through agarose gel electrophoresis, and the relevant fragmentswere sequenced. The gene fragments were then digested with Sfi I and Not I restrictionendonuclease and ligated into pCANTAB5E phagemid vectors. The recombinant vectorswere then transformed into E. coli TG1 cells. Serial dilutions of 10−1−10−8 were platedonto SOB plates (2% tryptone, 0.5% yeast extract, 0.05% NaCl, 2.5 mM KCl, 10 mM MgCl2,and 1.5% Agar powder) that contained 100 µg/mL Amp and 2% Glu. After inoculation,all the plates were incubated overnight in a previously set incubator at 30 ◦C, then cloneswere randomly selected and screened for inserts by performing another round of PCR.Finally, the colonies were scraped into 20 mL of 2YT (1.6% Tryptone, 1% yeast Extract, and0.5% NaCl), named the original antibody library, and stored at −80 ◦C in 20% glycerol.
Table 1. Nucleotide primer sequences.
Primer Names Nucleotide Sequences (5′→3′)
VH for GCGGCCCAGCCGGCCATGGCCGARGTGAAGCTGGTGGARTCTGGRVH back AGCGGCGGTGGCGGTTCTGGAGGCGGCGGTTCTGAYATGCAGATGACMCAG
VL for AGCGGCGGTGGCGGTTCTGGAGGCGGCGGTTCTRAMATTGTGMTGACCCAATCAGCGGCGGTGGCGGTTCTGGAGGCGGCGGTTCTGAYATGCAGATGACMCAGWC
VL back ACTAGTCGCGGCCGCGTCGACAGCMCGTTTBAKYTCTATCTTTGTACTAGTCGCGGCCGCGTCGACAGCMCGTTTCAGYTCCARYTT
scFv for CGCAATTCCTTTAGTTGTTCCTTTCTATGCGGCCCAGCCGGCCATGGCCscFv back GGTTCCAGCGGATCCGGATACGGCACCGGACTAGTCGCGGCCGCGTCGAC
2.5. Phage scFv Particle Enrichment and Screening
The phage library underwent four rounds of biopanning with coat antigen CIP-BSAfor phage scFv particle enrichment. A sterile cell flask was coated with 2 mL of CIP-OVA(the first round was 50 µg/mL, and the remaining three rounds were 25, 12, and 6 µg/mL)in PBS solution at 4 ◦C and left to stand overnight. The flask was washed five timeswith PBST solution and blocked with MPBS at 37 ◦C for 2 h. After being washed withPBST solution, 1 mL of library phage particles was added into a flask for shaking for 1 hat 150 rpm at room temperature, then left to stand for 1 h. The CIP-OVA-bound phagescFv particles were washed with PBST solution and eluted with 1 mL of trypsin solution(1 mg/mL in PBS). The eluent was the first round of enrichment library, and the phagescFv particles were amplified for the next round of enrichment. Four rounds of biopanningwere performed. The fourth round of enriched anti-CIP phage particles was infected withE. coli TG1 and spread on a TYE-AG medium (contains 100 µg/mL Amp and 1% Glu) forculturing overnight at 37 ◦C. Individual colonies were randomly picked and grown in2 × TY-AG medium glucose with 100 µg/mL ampicillin for 16 h at 37 ◦C and 200 rpm. Thenext day, 10 µL of culture per well was transferred into another 96-well plate for culturingfor 2 h at 37 ◦C and 200 rpm, and M13KO7 helper phages were added to rescue for 2 h at37 ◦C and 200 rpm. The plate was centrifuged at 3300 rpm for 20 min at 37 ◦C, and thepellets were resuspended with 250 µL/well of 2 × TY-AK medium and cultured overnightat 30 ◦C and 200 rpm. Finally, the plate was centrifuged at 4 ◦C and 3300 rpm for 30 min,then the supernatant was used in the monoclonal phage ELISA for CIP.
2.6. Colony PCR and Sequencing
The positive phage scFv colonies were cultured in a 2 × TY-AG medium until thelogarithmic phase for colony PCR, and the PCR products were examined by 1% agarosegel electrophoresis. The selected positive monoclonal phages were sequenced by SangonBiotechnology (Shanghai, China) Co., Ltd.
2.7. Expression and Purification of scFv
The target gene and prokaryotic expression vector pET-32a were digested with NcolIand NotI restriction enzymes and linked using T4 DNA ligase. Then, the positive recom-binant plasmid was used in producing E. coli strain BL21 (DE3). The mixture was heat
130

Foods 2021, 10, 1933
shocked for 90 s at 42 ◦C, and cultured in a Luria−Bertani (LB) medium (1% tryptone,0.5% yeast extract, and 1% NaCl) containing 100 µg/mL kanamycin at 37 ◦C overnight.After the OD600 of the bacterium solution reached 0.6–0.8, 1 mmol/L IPTG was added tothe culture to induce the expression of scFv. The culture was further grown at 37 ◦C for 16 h.The supernatant was collected and concentrated 100-fold by using MWCO: 8000–14,000 Daof dialysis bag in PEG/NaCl. The collected pellets were resuspended with PBS for theproduction of a periplasmic lysate and lysed through sonication for the production of thewhole-cell lysate. The supernatant and periplasmic and whole-cell lysates were used inanalyzing the solubility of the proteins through SDS-PAGE. Finally, BioMag-SA GST-tagProtein Purification magnetic beads were used to purify the anti-CIP scFv protein.
2.8. Denaturation and Renaturation of the scFv Protein
The inclusion bodies were washed five times with PBS containing 0.1% TritonX-100and 2 mol/mL urea at 2 h intervals; then, the inclusion bodies were solubilized in 20 mL of8 mol/mL urea solutions and slowly stirred at 4 ◦C for 16 h. The solubilized solution wascentrifuged for 20 min (12,000 rpm). Finally, the solution containing denatured scFv wasdialyzed in PBS at 4 ◦C for 48 h for the removal of urea from the protein solutions.
2.9. Characterization of scFv Antibody
Western blot. A volume of scFv solution was added to a nitrocellulose membraneimmersed in blocking buffer (4% BSA in PBS (w/v)) for 1 h. Then, a volume of horseradishperoxidase-labeled anti-GST-tag antibody (1:2000) was added to the block point, and themembrane was incubated for 2 h at room temperature. Finally, a volume of substratesolution (4-chloro-1-naphthol) was added for the visualization of the result.
Indirect competitive ELISA. The purified anti-CIP scFv was used in establishing IC-ELISA. Briefly, 100 µL/well of CIP-OVA solution was coated into 96-well plates overnightat 4 ◦C; then, the plates were washed with PBST solution and blocked with 300 µL perwell of 5% MPBS at 37 ◦C for 1 h. scFv (100 µL/well) previously diluted with PBS and aseries of CIP standard concentrations (200, 100, 80, 50, 20, 10, 5, 2, 1, and 0.1 ng/mL) werewashed with PBST and then mixed. The plates were incubated at 37 ◦C for 1 h, then washedwith PBST. Avidin conjugated with horseradish peroxidase (100 µL/well; 1/2000 dilutionin PBS) was added to the wells and incubated at 37 ◦C for 30 min. The wells were thenwashed five times with PBST, and 100 µL/well of TMB substrate was added and incubatedfor 10 min in the dark at room temperature. Color reaction was stopped with the additionof sulfuric acid (2 mol/L, 50 µL/well). Finally, absorbance was measured at 450 nm with anautomatic microplate reader (Thermo, Waltham, MA, USA). The IC50 value, assay dynamicrange, and limit of detection (LOD) served as the criteria for evaluating IC-ELISA. Theinhibition ratios of anti-CIP scFv, IC10, IC20, IC50, and IC80 were calculated using theformula [(P-S-N)]/(P-N)] × 100%, where P is the OD450 value of the positive sample (50 µLof anti-CIP scFv mixed with 50 µL of CBS), S is the OD450 value of the standard (50 µL ofscFv mixed with 50 µL of the serial concentration of CIP), and N is the OD450 value of thenegative control (100 µL of CBS).
2.10. Homology Modeling and Molecular Docking
In this experiment, the possible template sequences of the anti-CIP scFv model weresearched in the NCBI database (https://www.ncbi.nlm.nih.gov/ (accessed on 1 February 2021)),and sequence comparison was performed in the BLAST section for a selection template ofa high consistency with the anti-CIP scFv model. The anti-CIP scFv template sequence is asfollows: (sense): 5′-TCAAGTGTAAGTTACATGCCATGGTACCAGCAG-3′ and (antisense):5′-TCTTGGCTTCTGCTGGTACCATGGCATGTAACTTACACT-3′. The sequence with ahigh score and low e-value was used as a template sequence for anti-CIP scFv modelbuilding. Then, the SWISS MODEL online server was used in the homology modeling ofanti-CIP scFv. To verify the reliability of the homology modeling results and determine thebest model structure, we used Procheck, Verify3D, and ERRAT programs in the evaluation
131

Foods 2021, 10, 1933
of the consistency of the constructed an anti-CIP scFv homology model and selected thebest receptor model for further molecular docking study. To study the binding mode of CIPwith anti-CIP-scFv and find key residues, we used MOE 2015.10 in exploring the moleculardocking of CIP with scFv. In the Dock module, CIP was docked into the active site ofanti-CIP-scFv through the method of Induced Fit and under Amber10: EHT forcefield. Thedocking ligand, which had 30 docking conformations after default parameters were used,were used for further analysis.
2.11. Directional Mutagenesis of scFv Antibody
The binding affinity of CIP with scFv-CIP antibody was improved through the virtualmutation of the potential key residues of scFv-CIP. The process was based on the study ofthe binding mode of anti CIP scFv with CIP. MOE 2015.10 software was used in conductingthe virtual mutation of amino acid residues that affect the binding of CIP with scFv anddirectly replace them with other amino acids. In this study, Ser was used to replace Val160for the production of the mutant of scFv-CIP antibody. Then, the structure of the virtualmutation scFv model was optimized, and a stable scFv mutation model was obtained.Subsequently, the docking study of CIP with scFv mutation was performed through themethod of Induced Fit, and 30 conformations were obtained using the default parame-ters. During the experiments, the scFv gene in the express vector scFv-pCANTAB5E wasmutated directly for the production of a mutated express vector with a fast-multisite muta-genesis system according to the manufacturer’s recommended protocol. Then, the mutatedexpress vector was expressed for the production of scFv mutant using the proceduresdescribed above. The scFv mutant was identified and analyzed through SDS-Page andIC-ELISA [6].
2.12. Sample Preparation and Cross-Reactivity Analysis
Beef, pork, milk, and chicken samples were obtained from a local market. CIP(1000 µg/mL, prepared in PBS) was added to each sample for the production of spiked con-centrations of 0, 50, 100, and 200 µg/kg. Aliquots of the homogenized tissue samples (1 g ofwet mass) were transferred to a 50 mL centrifuge tube. Exactly 5 mL of 5% trichloroaceticacid and 10 mL of 0.2 M PBS were mixed with the tissue sample, and the mixture wasincubated for 1 h at 60 ◦C. Subsequently, the suspension was centrifuged at 5000× g for20 min. The supernatant was separated and diluted tenfold with deionized water. Thealiquots (100 mL each) were distributed into the microtiter plate. The CIP standards ofdifferent concentrations (0, 50, 100, and 200 µg/L) were added to milk samples, whichwere then defatted by centrifugation at 5000× g for 20 min at 4 ◦C. After 60 µL of sodiumnitroprusside (0.36 mol/L) and 60 µL of zinc sulfate (1.04 mol/L) were added to 2 mL ofeach defatted milk sample, the samples were vortexed for 1 min and then centrifuged at5000× g for 20 min at 4 ◦C. The supernatant was removed and diluted tenfold with PBSfor analysis. Recoveries were calculated on the basis of the standard curve constructedby IC-ELISA.
The specificity of the scFv under optimized conditions was evaluated by measuringcross-reactivity (CR) with a group of structurally related compounds, including 12 otheranalogs such as enrofloxacin, danofloxacin, and fleroxacin. The CRs of anti-CIP scFvfor CIP analogues were calculated using the formula: [CR (%) = IC50 (CIP)/IC50 (CIPanalogue)] × 100%.
2.13. Statistical Analysis
The statistical software SPSS 16.0 and data processing system 14.0 (DPS) were usedfor statistics. Values are expressed as mean ± standard deviation. All data are suitable foranalysis without any conversion.
132
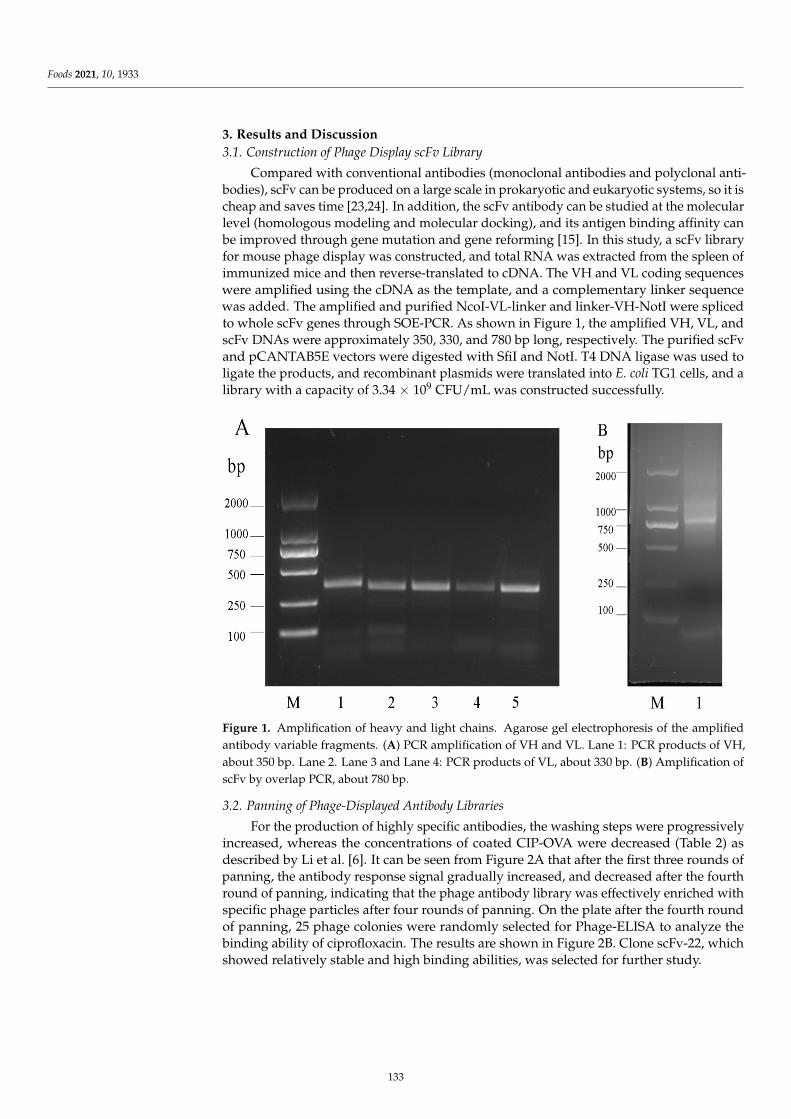
Foods 2021, 10, 1933
3. Results and Discussion
3.1. Construction of Phage Display scFv Library
Compared with conventional antibodies (monoclonal antibodies and polyclonal anti-bodies), scFv can be produced on a large scale in prokaryotic and eukaryotic systems, so it ischeap and saves time [23,24]. In addition, the scFv antibody can be studied at the molecularlevel (homologous modeling and molecular docking), and its antigen binding affinity canbe improved through gene mutation and gene reforming [15]. In this study, a scFv libraryfor mouse phage display was constructed, and total RNA was extracted from the spleen ofimmunized mice and then reverse-translated to cDNA. The VH and VL coding sequenceswere amplified using the cDNA as the template, and a complementary linker sequencewas added. The amplified and purified NcoI-VL-linker and linker-VH-NotI were splicedto whole scFv genes through SOE-PCR. As shown in Figure 1, the amplified VH, VL, andscFv DNAs were approximately 350, 330, and 780 bp long, respectively. The purified scFvand pCANTAB5E vectors were digested with SfiI and NotI. T4 DNA ligase was used toligate the products, and recombinant plasmids were translated into E. coli TG1 cells, and alibrary with a capacity of 3.34 × 10⁹ CFU/mL was constructed successfully.
Figure 1. Amplification of heavy and light chains. Agarose gel electrophoresis of the amplifiedantibody variable fragments. (A) PCR amplification of VH and VL. Lane 1: PCR products of VH,about 350 bp. Lane 2. Lane 3 and Lane 4: PCR products of VL, about 330 bp. (B) Amplification ofscFv by overlap PCR, about 780 bp.
3.2. Panning of Phage-Displayed Antibody Libraries
For the production of highly specific antibodies, the washing steps were progressivelyincreased, whereas the concentrations of coated CIP-OVA were decreased (Table 2) asdescribed by Li et al. [6]. It can be seen from Figure 2A that after the first three rounds ofpanning, the antibody response signal gradually increased, and decreased after the fourthround of panning, indicating that the phage antibody library was effectively enriched withspecific phage particles after four rounds of panning. On the plate after the fourth roundof panning, 25 phage colonies were randomly selected for Phage-ELISA to analyze thebinding ability of ciprofloxacin. The results are shown in Figure 2B. Clone scFv-22, whichshowed relatively stable and high binding abilities, was selected for further study.
133
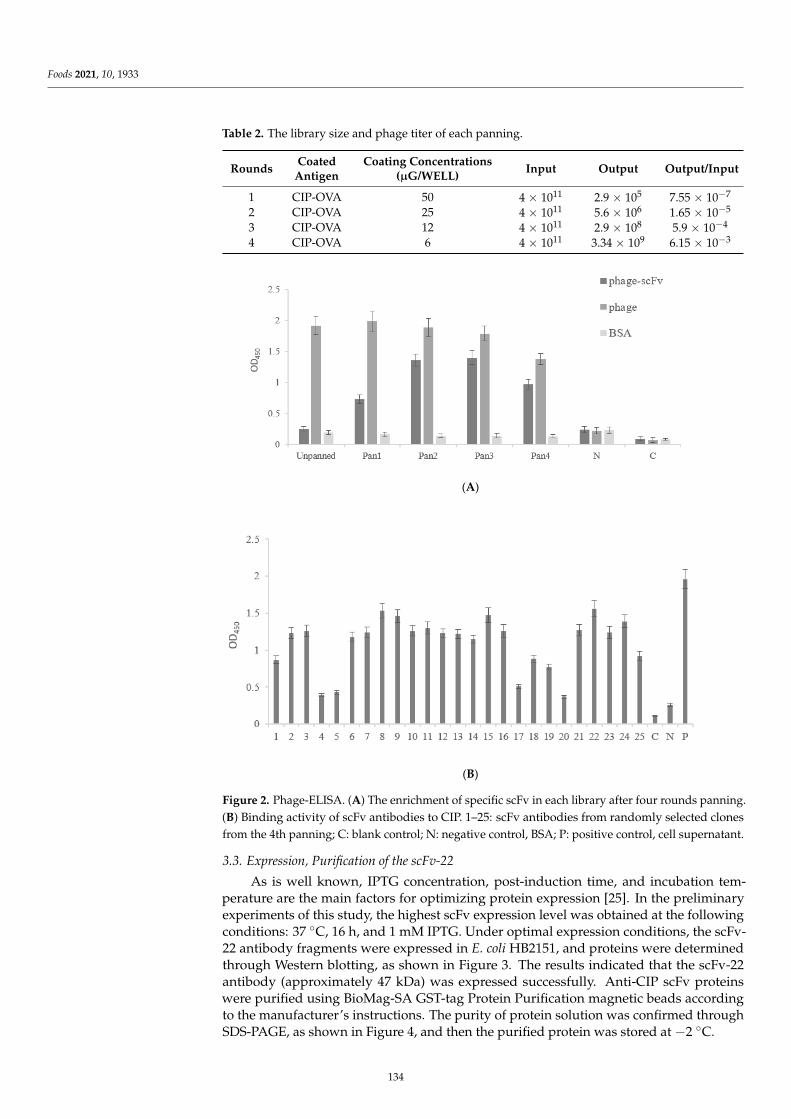
Foods 2021, 10, 1933
Table 2. The library size and phage titer of each panning.
RoundsCoated
AntigenCoating Concentrations
(µG/WELL)Input Output Output/Input
1 CIP-OVA 50 4 × 10¹¹ 2.9 × 10⁵ 7.55 × 10⁻⁷
2 CIP-OVA 25 4 × 10¹¹ 5.6 × 10⁶ 1.65 × 10⁻⁵
3 CIP-OVA 12 4 × 10¹¹ 2.9 × 10⁸ 5.9 × 10⁻⁴
4 CIP-OVA 6 4 × 10¹¹ 3.34 × 10⁹ 6.15 × 10⁻³
−
−
−
−
(A)
(B)
Figure 2. Phage-ELISA. (A) The enrichment of specific scFv in each library after four rounds panning.(B) Binding activity of scFv antibodies to CIP. 1–25: scFv antibodies from randomly selected clonesfrom the 4th panning; C: blank control; N: negative control, BSA; P: positive control, cell supernatant.
3.3. Expression, Purification of the scFv-22
As is well known, IPTG concentration, post-induction time, and incubation tem-perature are the main factors for optimizing protein expression [25]. In the preliminaryexperiments of this study, the highest scFv expression level was obtained at the followingconditions: 37 ◦C, 16 h, and 1 mM IPTG. Under optimal expression conditions, the scFv-22 antibody fragments were expressed in E. coli HB2151, and proteins were determinedthrough Western blotting, as shown in Figure 3. The results indicated that the scFv-22antibody (approximately 47 kDa) was expressed successfully. Anti-CIP scFv proteinswere purified using BioMag-SA GST-tag Protein Purification magnetic beads accordingto the manufacturer’s instructions. The purity of protein solution was confirmed throughSDS-PAGE, as shown in Figure 4, and then the purified protein was stored at −2 ◦C.
134
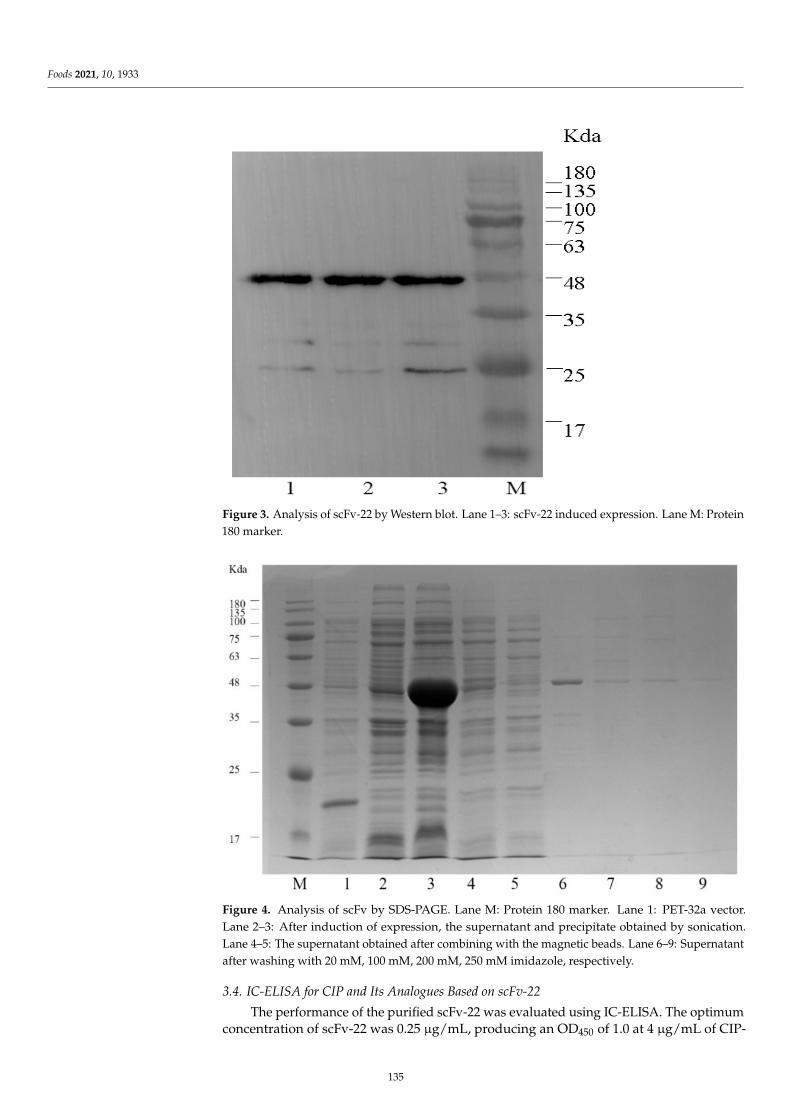
Foods 2021, 10, 1933 ′−
Figure 3. Analysis of scFv-22 by Western blot. Lane 1–3: scFv-22 induced expression. Lane M: Protein180 marker.
−
Figure 4. Analysis of scFv by SDS-PAGE. Lane M: Protein 180 marker. Lane 1: PET-32a vector.Lane 2–3: After induction of expression, the supernatant and precipitate obtained by sonication.Lane 4–5: The supernatant obtained after combining with the magnetic beads. Lane 6–9: Supernatantafter washing with 20 mM, 100 mM, 200 mM, 250 mM imidazole, respectively.
3.4. IC-ELISA for CIP and Its Analogues Based on scFv-22
The performance of the purified scFv-22 was evaluated using IC-ELISA. The optimumconcentration of scFv-22 was 0.25 µg/mL, producing an OD450 of 1.0 at 4 µg/mL of CIP-
135

Foods 2021, 10, 1933
OVA coating concentration through checkerboard titration. Under the optimal conditions,the regression curve equation of CIP-scFv was y = −0.4517x + 1.1409 (R2 = 0.9877), asshown in Figure 5. The IC50 value of the assay established with scFv-22 was 26.23 ng/mL,demonstrating that scFv can be used in detecting CIP. The linear range of the assay estab-lished with scFv ranged from 5.68 ng/mL to 201.55 ng/mL.
−
Figure 5. Standard curves of the competitive ELISA for CIP. X-axis shows the logarithm concentrationof CIP, Y-axis represents the inhibition rate (B/B0). B0 and B are the absorbance values obtained frombinding at zero and certain concentrations of CIP standard.
3.5. Homology Modeling and Molecular Docking
In this experiment, given the results of parameter evaluation, such as sequence identityand structural similarity, the protein PDB ID: 3UZQ was selected as the template sequence,which has the highest sequence identity (78.8%) with the target sequence anti-CIP-scFv.Subsequently, a stable model of single-chain antibody was established using the SWISSMODEL homology modeling software. The single-chain antibody of anti-CIP-scFv wasconnected by VH and VL through three connecting peptides (Gly4Ser) and had a typicalsingle-chain antibody structure with anti-parallel β-sheet and loop regions.
We evaluated the model to verify its reliability. The Procheck program was used inevaluating the three-dimensional structure of the anti-CIP-scFv model. The Ramachandranplot showed that 91.7% of the amino acids residues in the model were located in the coreregion, 7.8% in the allowable region, and only 0.5% in the forbidden zone of the twistangle. The results showed that the dihedral angles of 99% of protein residues in scFv modelwere within the reasonable range and conformed to the rule of stereochemical energy. Theresult of Verify-3D showed that the average 3D–1D score of 99.58% of amino acid residuesin the scFv model was greater than 0.2, and the model passed the Verify-3D test. TheErrat result showed that the overall quality factor was 87.82. Therefore, the experimentalmodel of anti-CIP-scFv has high reliability and can be used in the molecular docking of theCIP antigen.
The docking result of scFv-22 with CIP is shown in Figure 6. The active site of scFv-22 consists of residues Gln153, Pro155, Ala156, Leu158, Val160, Ile168, Val229, Asp233,Ala234, Ala235, Thr236, and Tyr237. The carboxyl group of CIP can form a 2.78 Å and3.15 Å hydrogen bond with the residue Gly251. The quinoline structure is located in thehydrophobic cavity formed by residues Gln153, Pro155, Ala156, Ile168, Gly251, and Thr236.The cyclopropyl group can interact with the residues Ala235 and forms hydrophobicinteraction with Tyr238. Thus, these forces may be the main reason for the increased abilityto bind to CIP. However, the hydrophilic carboxyl group in CIP and the carbonyl group onthe quinoline are close to the hydrophobic residue Val160. We preliminarily speculatedthat if the residue Val160 is transformed to a hydrophilic amino acid, it will promote
136
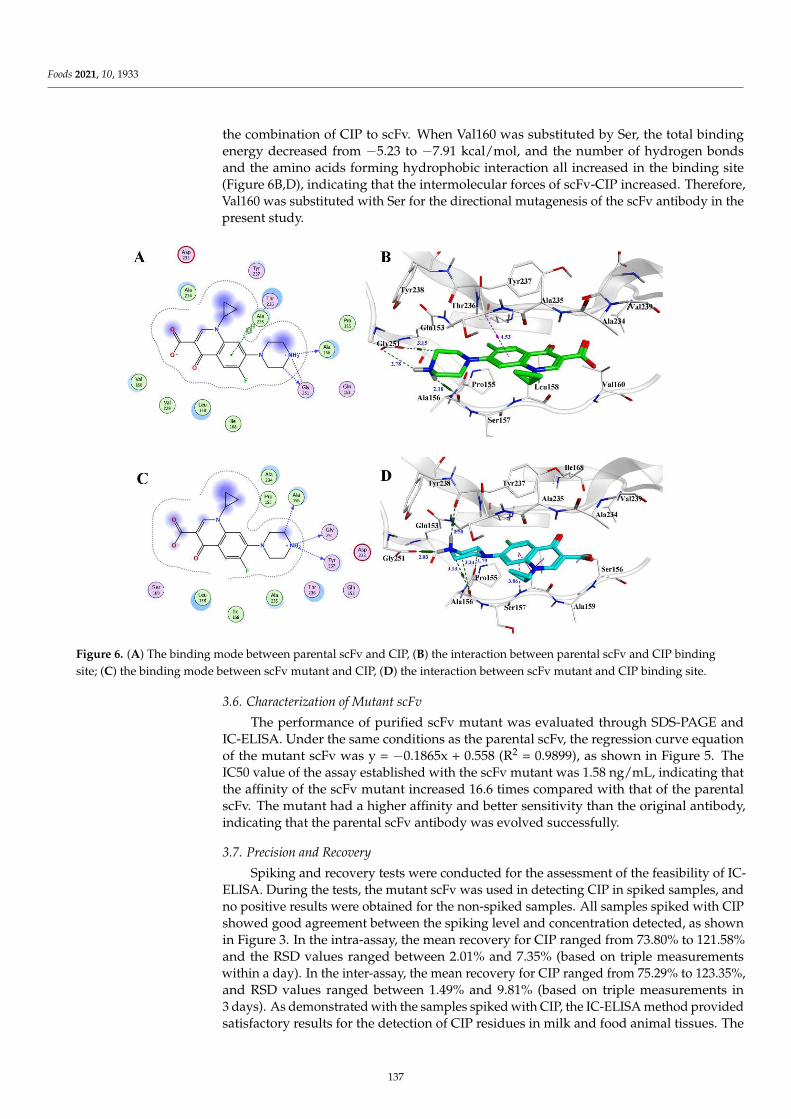
Foods 2021, 10, 1933
the combination of CIP to scFv. When Val160 was substituted by Ser, the total bindingenergy decreased from −5.23 to −7.91 kcal/mol, and the number of hydrogen bondsand the amino acids forming hydrophobic interaction all increased in the binding site(Figure 6B,D), indicating that the intermolecular forces of scFv-CIP increased. Therefore,Val160 was substituted with Ser for the directional mutagenesis of the scFv antibody in thepresent study.
−
Figure 6. (A) The binding mode between parental scFv and CIP, (B) the interaction between parental scFv and CIP bindingsite; (C) the binding mode between scFv mutant and CIP, (D) the interaction between scFv mutant and CIP binding site.
3.6. Characterization of Mutant scFv
The performance of purified scFv mutant was evaluated through SDS-PAGE andIC-ELISA. Under the same conditions as the parental scFv, the regression curve equationof the mutant scFv was y = −0.1865x + 0.558 (R2 = 0.9899), as shown in Figure 5. TheIC50 value of the assay established with the scFv mutant was 1.58 ng/mL, indicating thatthe affinity of the scFv mutant increased 16.6 times compared with that of the parentalscFv. The mutant had a higher affinity and better sensitivity than the original antibody,indicating that the parental scFv antibody was evolved successfully.
3.7. Precision and Recovery
Spiking and recovery tests were conducted for the assessment of the feasibility of IC-ELISA. During the tests, the mutant scFv was used in detecting CIP in spiked samples, andno positive results were obtained for the non-spiked samples. All samples spiked with CIPshowed good agreement between the spiking level and concentration detected, as shownin Figure 3. In the intra-assay, the mean recovery for CIP ranged from 73.80% to 121.58%and the RSD values ranged between 2.01% and 7.35% (based on triple measurementswithin a day). In the inter-assay, the mean recovery for CIP ranged from 75.29% to 123.35%,and RSD values ranged between 1.49% and 9.81% (based on triple measurements in3 days). As demonstrated with the samples spiked with CIP, the IC-ELISA method providedsatisfactory results for the detection of CIP residues in milk and food animal tissues. The
137

Foods 2021, 10, 1933
cross-reactivity of the CIP-scFv with danofloxacin, enrofloxacin, and fleroxacin and manymore were tested through IC-ELISA. As shown in Figure 4, the CIP-scFv showed lowcross-reactivity with other fluoroquinolones, indicating that scFv is highly specific for CIP.
4. Conclusions
A highly sensitive anti-CIP single-chain antibody was obtained through phage displayand directional evolution, and a rapid and highly sensitive IC-ELISA method for detectingCIP residues in products of animal origin was developed. The method showed goodstability, reproducibility, and accuracy for detecting CIP, indicating a wide applicationprospect for the rapid and sensitive detection of antibiotic residues in animal-derived food.
Author Contributions: Conceptualization, F.W. and N.L.; methodology, N.L.; software, F.W.; val-idation, Y.Z. (Yunshang Zhang) and M.H.; formal analysis, Y.Z. (Yunshang Zhang); investigation,X.S.; resources, X.S.; data curation, F.W.; writing—original draft preparation, Y.Z. (Yunshang Zhang);writing—review and editing, F.W.; visualization, Y.Z. (Yali Zhao); supervision, N.L. and J.F.; projectadministration, F.W.; funding acquisition, F.W. All authors have read and agreed to the publishedversion of the manuscript.
Funding: This research was funded by the National Key Research and Development Program ofChina (No. 2018YFC1602902, 2019YFC1605701).
Informed Consent Statement: Not applicable.
Acknowledgments: The authors are grateful for the financial supports from the National KeyResearch and Development Program of China (No. 2018YFC1602902, 2019YFC1605701).
Conflicts of Interest: The authors declare no conflict of interest.
References
1. Dalhoff, A. Antiviral, antifungal, and antiparasitic activities of fluoroquinolones optimized for treatment of bacterial infections:A puzzling paradox or a logical consequence of their mode of action? Eur. J. Clin. Microbiol. Infect. Dis. 2015, 34, 661–668.[CrossRef] [PubMed]
2. Bird, S.T.; Etminan, M. Risk of acute kidney injury associated with the use of fluoroquinolones. CMAJ 2013, 185, E475–E482.[CrossRef] [PubMed]
3. Patel, K.; Goldman, J.L. Safety Concerns Surrounding Quinolone Use in Children. J. Clin. Pharmacol. 2016, 56, 1060–1075. [CrossRef]4. Li, J.; Hao, H. The effects of different enrofloxacin dosages on clinical efficacy and resistance development in chickens experimen-
tally infected with Salmonella Typhimurium. Sci. Rep. 2017, 7, 11676. [CrossRef]5. Xu, L.; Wang, H. Integrated pharmacokinetics/pharmacodynamics parameters-based dosing guidelines of enrofloxacin in grass
carp Ctenopharyngodon idella to minimize selection of drug resistance. BMC Vet. Res. 2013, 9, 126. [CrossRef] [PubMed]6. Cui, L.; Jinxin, H. Preparation of a Chicken scFv to Analyze Gentamicin Residue in Animal Derived Food Products. Anal. Chem.
2016, 88, 4092–4098.7. Abdelwahab, M.; Loa, C.C. Recombinant nucleocapsid protein-based enzyme-linked immunosorbent assay for detection of
antibody to turkey coronavirus. J. Virol. Methods 2015, 217, 36–41. [CrossRef] [PubMed]8. Huang, B.; Yin, Y. Preparation of high-affinity rabbit monoclonal antibodies for ciprofloxacin and development of an indirect
competitive ELISA for residues in milk. J. Zhejiang Univ. Sci. B 2010, 11, 812–818. [CrossRef]9. Fan, G.-Y.; Yang, R.-S. Development of a class-specific polyclonal antibody-based indirect competitive ELISA for detecting
fluoroquinolone residues in milk. J. Zhejiang Univ. Sci. B 2012, 13, 545–554. [CrossRef]10. Zhang, H.-T.; Jiang, J.-Q. Development of an indirect competitive ELISA for simultaneous detection of enrofloxacin and
ciprofloxacin. J. Zhejiang Univ. Sci. B 2011, 12, 884–891. [CrossRef] [PubMed]11. Li, C.; Luo, X. A Class-Selective Immunoassay for Sulfonamides Residue Detection in Milk Using a Superior Polyclonal Antibody
with Broad Specificity and Highly Uniform Affinity. Molecules 2019, 24, 443. [CrossRef]12. Makvandi-Nejad, S.; Sheedy, C. Selection of single chain variable fragment (scFv) antibodies from a hyperimmunized phage
display library for the detection of the antibiotic monensin. J. Immunol. Methods 2010, 360, 103–118. [CrossRef] [PubMed]13. Norihiro, K. Anti-estradiol-17beta single-chain Fv fragments: Generation, characterization, gene randomization, and optimized
phage display. Steroids 2008, 73, 1485–1499.14. Kobayashi, N.; Oyama, H.; Kato, Y.; Goto, J.; Söderlind, E.; Borrebaeck, C.A. Two-step in vitro antibody affinity maturation
enables estradiol-17beta assays with more than 10-fold higher sensitivity. Anal. Chem. 2010, 82, 1027–1038. [CrossRef]15. Liu, J.; Zhang, H.C. Production of anti-amoxicillin ScFv antibody and simulation studying its molecular recognition mechanism
for penicillins. J. Environ. Sci. Health Part B Pestic. Food Contam. Agric. Wastes 2016, 51, 742–750. [CrossRef] [PubMed]
138

Foods 2021, 10, 1933
16. Wen, K.; Nolke, G. Improved fluoroquinolone detection in ELISA through engineering of a broad-specific single-chain variablefragment binding simultaneously to 20 fluoroquinolones. Anal. Bioanal. Chem. 2012, 403, 2771–2783. [CrossRef] [PubMed]
17. Tao, X.; Chen, M. Chemiluminescence competitive indirect enzyme immunoassay for 20 fluoroquinolone residues in fish andshrimp based on a single-chain variable fragment. Anal. Bioanal. Chem. 2013, 405, 7477–7484. [CrossRef]
18. Kumar, R.; Parray, H.A. Phage display antibody libraries: A robust approach for generation of recombinant human monoclonalantibodies. Int. J. Biol. Macromol. 2019, 135, 907–918. [CrossRef]
19. Zhao, A.; Tohidkia, M.R.; Siegel, D.L.; Coukos, G.; Omidi, Y. Phage antibody display libraries: A powerful antibody discoveryplatform for immunotherapy. Crit. Rev. Biotechnol. 2016, 36, 276–289. [CrossRef]
20. Arap, M.A. Phage display technology: Applications and innovations. Genet. Mol. Biol. 2005, 28, 1–9. [CrossRef]21. Xu, C.; Miao, W. Construction of an immunized rabbit phage display antibody library for screening microcystin-LR high sensitive
single-chain antibody. Int. J. Biol. Macromol. 2019, 123, 369–378. [CrossRef]22. Zhao, Y.; Liang, Y. Isolation of broad-specificity domain antibody from phage library for development of pyrethroid immunoassay.
Anal. Biochem. 2016, 502, 1–7. [CrossRef]23. Zhang, X.; Zhang, C. Construction of scFv phage display library with hapten-specific repertories and characterization of
anti-ivermectin fragment isolated from the library. Eur. Food Res. Technol. 2010, 231, 423–430. [CrossRef]24. Chaisri, U.; Chaicumpa, W. Evolution of Therapeutic Antibodies, Influenza Virus Biology, Influenza, and Influenza Immunother-
apy. BioMed Res. Int. 2018, 2018, 9747549. [CrossRef] [PubMed]25. Dong, S.; Bo, Z. Screening for single-chain variable fragment antibodies against multiple Cry1 toxins from an immunized mouse
phage display antibody library. Appl. Microbiol. Biotechnol. 2018, 102, 3363–3374. [CrossRef] [PubMed]
139


MDPISt. Alban-Anlage 66
4052 BaselSwitzerland
Tel. +41 61 683 77 34Fax +41 61 302 89 18
www.mdpi.com
Foods Editorial OfficeE-mail: [email protected]
www.mdpi.com/journal/foods


MDPI
St. Alban-Anlage 66
4052 Basel
Switzerland
Tel: +41 61 683 77 34
Fax: +41 61 302 89 18
www.mdpi.com ISBN 978-3-0365-3631-6
Copyright © 2022 FDOKUMEN