Comprehensive evaluation of solution nuclear magnetic resonance spectroscopy sample preparation for...
14
Abstract The preparation of high quality samples is a critical challenge for the structural characterization of helical integral membrane proteins. Solving the struc- tures of this diverse class of proteins by solution nu- clear magnetic resonance spectroscopy (NMR) requires that well-resolved 2D 1 H/ 15 N chemical shift correlation spectra be obtained. Acquiring these spectra demands the production of samples with high levels of purity and excellent homogeneity throughout the sample. In addition, high yields of isotopically en- riched protein and efficient purification protocols are required. We describe two robust sample preparation methods for preparing high quality, homogeneous samples of helical integral membrane proteins. These sample preparation protocols have been combined with screens for detergents and sample conditions leading to the efficient production of samples suitable for solution NMR spectroscopy. We have examined 18 helical integral membrane proteins, ranging in size from approximately 9 kDa to 29 kDa with 1–4 trans- membrane helices, originating from a number of bac- terial and viral genomes. 2D 1 H/ 15 N chemical shift correlation spectra acquired for each protein demon- strate well-resolved resonances, and >90% detection of the predicted resonances. These results indicate that with proper sample preparation, high quality solution NMR spectra of helical integral membrane proteins can be obtained greatly enhancing the probability for structural characterization of these important proteins. Keywords HSQC Integral Membrane Proteins NMR Sample Preparation Structural Genomics TROSY Introduction Membrane protein structural genomics faces numerous challenges, the most significant of which is, arguably, sample preparation, including preparing crystals for X- ray diffraction, 2D crystals for cryo-electron micros- copy, aligned samples for solid-state nuclear magnetic resonance spectroscopy (NMR) or isotropic solutions for solution NMR. Recently, several publications have demonstrated that numerous membrane proteins can be cloned and expressed in Escherichia coli [1–3]. Here R. C. Page J. D. Moore M. Sharma R. Chase F. P. Gao T. A. Cross Department of Chemistry and Biochemistry, Florida State University, Tallahassee, Florida 32306-4390, USA H. B. Nguyen R. C. Page J. D. Moore M. Sharma R. Chase F. P. Gao T. A. Cross National High Magnetic Field Laboratory, 1800 E. Paul Dirac Drive, Tallahassee, Florida 32310, USA H. B. Nguyen T. A. Cross (&) Institute of Molecular Biophysics, Florida State University, Tallahassee, Florida 32306-4380, USA e-mail: [email protected] C. K. Mobley C. R. Sanders Department of Biochemistry and Center for Structural Biology, Vanderbilt University, Nashville, Tennessee 37232- 8725, USA L. Ma F. D. So ¨ nnichsen Department of Physiology & Biophysics, and the Cleveland Center for Structural Biology, Case Western Reserve University, Cleveland, Ohio 44106, USA S. Lee S. C. Howell S. J. Opella Department of Chemistry and Biochemistry, University of California, San Diego, CA 92093-0307, USA J Struct Func Genom (2006) 7:51–64 DOI 10.1007/s10969-006-9009-9 123 ORIGINAL PAPER Comprehensive evaluation of solution nuclear magnetic resonance spectroscopy sample preparation for helical integral membrane proteins Richard C. Page Jacob D. Moore Hau B. Nguyen Mukesh Sharma Rose Chase Fei Philip Gao Charles K. Mobley Charles R. Sanders Liping Ma Frank D. So ¨ nnichsen Sangwon Lee Stanley C. Howell Stanley J. Opella Timothy A. Cross Received: 28 February 2006 / Accepted: 21 May 2006 / Published online: 19 July 2006 Ó Springer Science+Business Media B.V. 2006
-
Upload
independent -
Category
Documents
-
view
2 -
download
0
Transcript of Comprehensive evaluation of solution nuclear magnetic resonance spectroscopy sample preparation for...

Abstract The preparation of high quality samples is a
critical challenge for the structural characterization of
helical integral membrane proteins. Solving the struc-
tures of this diverse class of proteins by solution nu-
clear magnetic resonance spectroscopy (NMR)
requires that well-resolved 2D 1H/15N chemical shift
correlation spectra be obtained. Acquiring these
spectra demands the production of samples with high
levels of purity and excellent homogeneity throughout
the sample. In addition, high yields of isotopically en-
riched protein and efficient purification protocols are
required. We describe two robust sample preparation
methods for preparing high quality, homogeneous
samples of helical integral membrane proteins. These
sample preparation protocols have been combined
with screens for detergents and sample conditions
leading to the efficient production of samples suitable
for solution NMR spectroscopy. We have examined 18
helical integral membrane proteins, ranging in size
from approximately 9 kDa to 29 kDa with 1–4 trans-
membrane helices, originating from a number of bac-
terial and viral genomes. 2D 1H/15N chemical shift
correlation spectra acquired for each protein demon-
strate well-resolved resonances, and >90% detection of
the predicted resonances. These results indicate that
with proper sample preparation, high quality solution
NMR spectra of helical integral membrane proteins
can be obtained greatly enhancing the probability for
structural characterization of these important proteins.
Keywords HSQC Æ Integral Membrane Proteins ÆNMR Æ Sample Preparation Æ Structural Genomics ÆTROSY
Introduction
Membrane protein structural genomics faces numerous
challenges, the most significant of which is, arguably,
sample preparation, including preparing crystals for X-
ray diffraction, 2D crystals for cryo-electron micros-
copy, aligned samples for solid-state nuclear magnetic
resonance spectroscopy (NMR) or isotropic solutions
for solution NMR. Recently, several publications have
demonstrated that numerous membrane proteins can
be cloned and expressed in Escherichia coli [1–3]. Here
R. C. Page Æ J. D. Moore Æ M. Sharma Æ R. Chase ÆF. P. Gao Æ T. A. CrossDepartment of Chemistry and Biochemistry, Florida StateUniversity, Tallahassee, Florida 32306-4390, USA
H. B. Nguyen Æ R. C. Page Æ J. D. Moore Æ M. Sharma ÆR. Chase Æ F. P. Gao Æ T. A. CrossNational High Magnetic Field Laboratory, 1800 E. PaulDirac Drive, Tallahassee, Florida 32310, USA
H. B. Nguyen Æ T. A. Cross (&)Institute of Molecular Biophysics, Florida State University,Tallahassee, Florida 32306-4380, USAe-mail: [email protected]
C. K. Mobley Æ C. R. SandersDepartment of Biochemistry and Center for StructuralBiology, Vanderbilt University, Nashville, Tennessee 37232-8725, USA
L. Ma Æ F. D. SonnichsenDepartment of Physiology & Biophysics, and the ClevelandCenter for Structural Biology, Case Western ReserveUniversity, Cleveland, Ohio 44106, USA
S. Lee Æ S. C. Howell Æ S. J. OpellaDepartment of Chemistry and Biochemistry, Universityof California, San Diego, CA 92093-0307, USA
J Struct Func Genom (2006) 7:51–64
DOI 10.1007/s10969-006-9009-9
123
ORIGINAL PAPER
Comprehensive evaluation of solution nuclear magneticresonance spectroscopy sample preparation for helical integralmembrane proteins
Richard C. Page Æ Jacob D. Moore Æ Hau B. Nguyen Æ Mukesh Sharma ÆRose Chase Æ Fei Philip Gao Æ Charles K. Mobley Æ Charles R. Sanders ÆLiping Ma Æ Frank D. Sonnichsen Æ Sangwon Lee Æ Stanley C. Howell ÆStanley J. Opella Æ Timothy A. Cross
Received: 28 February 2006 / Accepted: 21 May 2006 / Published online: 19 July 2006� Springer Science+Business Media B.V. 2006

we demonstrate that many integral membrane proteins
can not only be expressed in rich media, but also in the
minimal media required for isotopic labeling. In addi-
tion, we show 1H/15N chemical shift correlation spectra
for 18 proteins with molecular weights ranging up to
29 kDa and 1–4 transmembrane (TM) helices that
represent excellent starting points for structure deter-
mination by solution NMR spectroscopy. These high
quality solution NMR spectra were obtained utilizing
two distinct, yet robust purification and sample prep-
aration protocols, ‘reconstitution’ and ‘detergent ex-
change’. We present a thorough analysis of the two
protocols and demonstrate the viability of each pro-
tocol for producing high quality samples of helical
integral membrane proteins for solution NMR struc-
ture determination efforts.
Membrane proteins are a functionally diverse class
of proteins representing 30% of protein encoding
genes [4]. Analyses of prokaryotic genomes have found
that proteins with molecular weights between 12 kDa
and 36 kDa occur most frequently [5] and that the
majority of integral membrane proteins (IMPs) are
helical [6]. This results in a large number of helical
IMPs that are well within the range of study by solution
NMR. Current estimates also suggest that membrane
proteins account for 60% of drug targets [7]. Despite
these facts, less than 100 of the 28,000 protein struc-
tures in the Protein Data Bank are unique IMPs [8, 9].
The striking disparity between the importance of these
proteins and the small amount of structural data
available reveals the inherent difficulty involved in
their structural characterization. It is clear that struc-
tural characterizations of helical IMPs require the
production of high quality samples composed of a
homogeneously folded and stable state solubilized in a
membrane mimetic that permits the recording of high
resolution spectra.
IMP expression and subcellular localization
To permit structural characterization, milligram quan-
tities of purified helical IMPs must be produced [10].
The scientific community has long regarded the
expression of IMPs as a significant bottleneck for
membrane protein structural genomics, yet recent ad-
vances are demonstrating that high expression levels
are becoming more routine [11]. Current approaches
have demonstrated that cloning and expressing mem-
brane proteins of relatively small molecular weight
with a small number of TM helices can be achieved
with great efficiency. The use of BL21(DE3) host cells
has been successful in many instances, however
C43(DE3) host cells have been proposed to be less
prone to the cytotoxic effects caused by the expression
of very large IMPs. For example, expression of CitS, a
47.5 kDa Na+-dependent citrate carrier with 11 TM
helices, was shown to increase by up to five fold in
comparison to expression in BL21(DE3) host cells [12].
However, in our experience BL21(DE3) cells have
performed comparably to cultures of C43(DE3) for the
proteins discussed herein.
While the purification of protein expressed in the
cell membrane is often favored by structural biologists
over expression in inclusion bodies as a source of
protein, the isolation of protein solely from cell mem-
branes is often hampered by extremely low yields. We
have observed that IMP overexpression into the cell
membrane is typically accompanied by expression of
the IMP into inclusion bodies. This is likely the result
of saturation of the secretory pathway due to protein
expression occurring at a faster rate than IMP insertion
into the membrane [11]. Until now reports on the
isolation and refolding of IMPs from inclusion bodies
have been limited to a small number of proteins [13–
15]. Our results for the proteins in this report show
remarkable success in isolating and refolding proteins
from inclusion bodies in quantities sufficient for
structural characterization by solution NMR.
Important factors in IMP purification
Robust protocols are necessary for the isolation and
purification of protein to produce homogeneous IMP
preparations. The detergent mediated isolation of
IMPs is routinely achievable and has been discussed in
detail elsewhere [16] as has purification via Ni2+ affinity
chromatography for efficiently producing protein at
purity levels acceptable for characterization by NMR
[17]. The level of purity needed for each protein is
dependent upon the identity of the contaminants. The
presence of contaminating lipids and low molecular
weight proteins can introduce unwanted heterogeneity
into the sample, broadening linewidths or even intro-
ducing spurious resonances. This was clearly illustrated
by the detection of the E. coli protein YodA in some
IMP samples purified by Ni2+affinity chromatography
from E. coli membrane fractions [17]. Low levels of
high molecular weight protein contaminants, while
undesirable, may be tolerated if they do not interact
with the protein of interest since the low concentration
and long rotational correlation times of these proteins
typically prevent them from being observed by
NMR. However, even very low concentrations of
low molecular weight contaminants can prove trou-
blesome. Non-proteinaceous contaminants can also
result in increased sample heterogeneity. Non-essential
52 J Struct Func Genom (2006) 7:51–64
123

lipid–protein interactions may allow host cell lipids to
remain bound to the protein throughout the Ni2+
affinity purification. In these cases further purification
via HPLC may be necessary to effectively remove the
contaminants and improve sample homogeneity.
Choosing the membrane mimetic: considerations
and limitations
An ideal membrane mimetic for solution NMR will
solubilize the IMP without loss of protein activity and
allow for the acquisition of well-resolved spectra. Fur-
thermore the protein should be stable enough to permit
a series of multidimensional NMR experiments to be
acquired on a single sample. Detergent micelles can
satisfy these requirements and provide good models of
membrane interfaces for small proteins [18]. Recent
literature suggests a number of choices for detergents
that allow high-resolution data to be acquired while
retaining protein function [19]. These choices are nec-
essary since different detergents have been essential for
solubilizing the few helical IMPs that have been studied
(e.g. SDS for MerF [20], DHPC for Vpu [21] and DPC
for phospholamban [22, 23]). For example, the lyso-
phosphatidylglycerol (lyso-PG) detergents are widely
applicable, yet these detergents have some stability
problems [24]. Additionally, different proteins with
varied amino acid compositions and topologies will
exhibit a wide range of interactions between the pro-
tein, detergent headgroups, and acyl chains. Unfortu-
nately the best detergent for a particular protein cannot
be determined a priori, rather it must be determined by
screening a number of detergents and sample condi-
tions. Similarly, screens have been established to
determine crystallization conditions. Here we demon-
strate that with proper sample preparation, highly re-
solved spectra can be obtained for a range of proteins in
a number of different detergents.
Solution NMR characterization of helical IMPs
While X-ray crystallography has provided the majority
of protein structures to date, significant challenges
have been encountered in the realm of membrane
proteins. Notably, only 20% of proteins purified by
structural genomics efforts have resulted in diffraction
quality crystals [25]. Solution NMR is an attractive
method to structurally characterize many helical IMPs,
yet few examples of the high quality spectra necessary
for a structural effort have been achieved. For helical
IMPs, spectral resolution is complicated by the limited
amide 1H chemical shift dispersion in a-helices and the
slow correlation time for many micelle bound proteins.
The feasibility of solution NMR based structural
characterization can be examined using the two-
dimensional 1H/15N-heteronuclear single-quantum
coherence (HSQC) experiment [26]. These spectra
correlate amide proton and nitrogen pairs within the
protein and serve as a building block for a multitude of
experiments that yield the three- and four-dimensional
triple resonance spectra essential for sequential back-
bone resonance assignment. Obtaining a sufficiently
resolved 1H/15N-HSQC spectrum is a prerequisite for
NMR based structural characterization. To enhance
resolution, TROSY based pulse sequences have been
applied to reduce resonance linewidths for some
membrane proteins [27]. The single most critical step,
however, in obtaining these high quality spectra is in
developing a sample preparation protocol that effi-
ciently and reliably produces homogeneous samples.
Idealized properties of an IMP solution NMR
sample
For this report we define high quality samples as those
capable of producing high-resolution solution NMR
spectra sufficient for structure determination. High
quality samples for solution NMR can be primarily
characterized by two parameters, sample purity and
homogeneity. Uniform labeling with stable isotopes
results not only in the labeling of the protein of inter-
est, but also every other molecule within the cell.
Proper purification is essential to limit the number of
resonances observed to only those originating from the
protein of interest. The second parameter, sample
homogeneity, is much more challenging to achieve.
The complexity of creating a homogeneous sample is a
direct consequence of the number of weak molecular
interactions the protein has with its heterogeneous
environment. Structurally inhomogeneous samples
give rise to spectra with either a higher number of
observed resonances than predicted, or a dramatic in-
crease in resonance linewidths and a reduction in the
ability to resolve individual resonances. The observa-
tion of more resonances than expected occurs when
there are multiple protein conformations and when
there are multiple populations of micelles within a
sample. Dramatic increases in resonance linewidths are
caused by a myriad of interactions and dynamics. A
high quality NMR sample therefore has high purity,
high structural homogeneity and an environment that
is the same for each protein. We herein report recent
progress in the sample preparation of helical IMPs for
solution NMR spectroscopy that represents significant
progress towards accelerating the rate at which mem-
brane protein structures can be solved.
J Struct Func Genom (2006) 7:51–64 53
123

Materials and methods
Expression of helical IMPs
Fourteen helical IMPs (Rv0008c, Rv0820, Rv0985c,
Rv1031, Rv1567c, Rv1616, Rv1761c, Rv1861, Rv2433c,
Rv2719c, Rv3004, Rv3069, Rv3368, Rv3773c) identi-
fied from the Mycobacterium tuberculosis genome [28]
were cloned into modified pET-16b or modified
pET-29b vectors producing fusion constructs with
either N- or C-terminal His6 tags respectively [1].
Proteins from M. tuberculosis were expressed in E. coli
BL21(DE3)CodonPlus-RP cells at levels ranging from
approximately 1–100 mg/l of minimal media (Table 1).
Proteins from the M. tuberculosis genome were chosen
based on molecular weight and number of transmem-
brane helices from an expression library of 143
M. tuberculosis integral membrane proteins. The M2
proton channel from Influenza A virus was cloned and
expressed at 100 mg/l miminal media as described
previously [29]. The proteins KcsA, MerFm and Vpu
were cloned and expressed as previously reported [20,
29, 30]. The number of TM helices reported for each
protein were either predicted by TMHMM v2.0 or
determined from experiments in previous literature
[31, 32].
Purification for reconstituted and detergent
exchanged samples
After cell lysis helical IMPs were purified by one of
two methods, either ‘reconstitution’ or ‘detergent
exchange’. A brief overview of the two sample
preparation protocols is given by the flow chart in
Fig. 1. Protein purified via the ‘reconstitution’
method was solubilized either from cell membranes
or under denaturing conditions from inclusion bodies.
Solubilized protein from both inclusion bodies and
membrane fractions were purified separately with
Ni2+ affinity chromatography. Chromatographic
refolding was utilized to simultaneously refold and
purify protein isolated from inclusion bodies [13].
Purified protein was extensively dialyzed to remove
detergent and subsequently lyophilized for later
sample preparation steps. Samples purified via the
‘detergent exchange’ method were isolated from cell
membrane fractions under mildly denaturing condi-
tions. Proteins were refolded and purified by Ni2+
affinity chromatography and on-column detergent
exchange [17, 33]. Purified protein was eluted in the
desired detergent for subsequent NMR spectroscopy.
In Fig. 2 the purity of 3 helical IMPs is shown by
SDS PAGE chromatography.
Frozen or freshly harvested cells to be lysed were
resuspended in 20 ml lysis buffer per gram of wet cells.
Lysis buffer for the ‘reconstitution’ protocol consisted
of 20 mM Tris–HCl, 500 mM NaCl, pH 7.9 and for the
‘detergent exchange’ protocol it consisted of 75 mM
Tris–HCl, 300 mM NaCl, 0.2 mM ethylenediamine-
tetraacetic acid (EDTA), pH 7.7. Phenylmethylsul-
fonyl fluoride, magnesium acetate, lysozyme (Sigma)
and either Benzonase (Novagen) or DNase and RNase
were added to both lysis buffers at final concentrations
of 1.1 mM, 5 mM, 0.2 mg/ml and 0.02 mg/ml, respec-
tively. Cells for both protocols were incubated at room
temperature for 30 min on a rotary shaker followed by
sonication in an ice bath for 5 min at 50% duty cycle
(repetitions of 5 s on, 5 s off).
For ‘reconstituted’ samples, inclusion bodies were
isolated from crude lysate via centrifugation at
15,000· g for 20 min. Inclusion bodies were solubilized
in 6 M urea and 0.5% Empigen (Calbiochem) in Buffer
A (20 mM Tris–HCl pH 7.9, 500 mM NaCl, 5 mM
imidazole). Solubilized inclusion bodies isolated from
1 l of culture were loaded onto 20 ml Ni-NTA resin
(Qiagen) equilibrated with the same buffer. Bound
protein was refolded by removal of urea in 1 M
increments using 2 column volumes per increment until
all urea was removed, followed by thorough washing
with Buffer A containing 0.5% DPC (dodecylphosph-
ocholine) and 40 mM imidazole. Protein eluted in
Buffer A with 400mM imidazole and 0.5% DPC was
thoroughly dialyzed against distilled deionized H2O
using 8,000 Da molecular weight cutoff regenerated
cellulose dialysis tubing (Fisher) for 48 h with six buf-
fer changes to remove detergent and to precipitate the
protein. Precipitated protein was repeatedly resus-
pended, washed, and centrifuged in 50:50 acetone:H2O
to remove contaminating detergents and lipids, and
subsequently lyophilized. The protein was stored at –
80�C until used for NMR sample preparation. Further
purification to remove additional contaminants was
conducted for M2, KcsA, MerFm and Vpu proteins via
HPLC as previously described [20, 29, 30].
Following removal of insoluble components from
crude lysates by centrifugation at 15,000· g for 20 min,
cell membranes were isolated from the remaining
supernatant via ultracentrifugation at 90,000· g for 3 h.
IMPs for ‘reconstituted’ samples were extracted from
cell membranes by resuspension in Buffer A with 0.5%
Empigen followed by incubation for 2 h at room tem-
perature on a rotary shaker. Insoluble components were
removed by ultracentrifugation at 90,000· g for 3 h. The
supernatant containing extracted IMPs was loaded onto
Ni-NTA resin equilibrated with Buffer A with 0.5%
Empigen. Bound protein was washed thoroughly with
54 J Struct Func Genom (2006) 7:51–64
123

Ta
ble
1P
rote
ine
xp
ress
ion
lev
els
,p
uri
fica
tio
na
nd
sam
ple
pre
pa
rati
on
con
dit
ion
s,N
MR
acq
uis
itio
np
ara
me
ters
,a
nd
pe
rce
nta
ge
of
pe
ak
so
bse
rve
din
1H
/15N
che
mic
al
shif
tco
rre
lati
on
spe
ctra
for
18
pro
tein
so
fd
iffe
rin
gto
po
log
ies
an
dm
ole
cula
rw
eig
hts
Pro
tein
ph
ysi
cal
pro
pe
rtie
sP
rote
ine
xp
ress
ion
Pro
tein
pu
rifi
cati
on
an
dsa
mp
lep
rep
ara
tio
nN
MR
acq
uis
itio
np
ara
me
ters
Ge
ne
aM
WT
Mh
eli
cesb
Ex
pre
ssio
nle
ve
l(m
g/l
)cE
xp
ress
ion
loca
tio
nd
Me
tho
de
De
terg
en
tP
rote
inso
urc
ef
pH
Ex
pe
rim
en
tty
pe
gM
Hz
Te
mp
t1 po
ints
t2 po
ints
Pe
ak
s(%
)hS
pe
ctro
sco
py
loca
tio
ni
Vp
u9
11
IR
CD
HP
CI
4.0
HS
QC
60
05
02
56
10
24
10
0U
CS
DM
21
1.9
15
/10
0M
/IR
CL
PP
GI
4.0
TR
OS
Y7
20
50
38
42
04
89
9N
HM
FL
Rv
30
04
13
.31
11
IR
CL
MP
GI
4.0
HS
QC
60
05
02
00
32
00
94
NH
MF
LR
v1
76
1c
16
.21
10
0I
RC
DP
CI
4.0
HS
QC
60
05
03
20
20
48
95
UC
SD
Rv
00
08
c1
8.4
15
/20
M/I
RC
SD
SI
4.2
TR
OS
Y7
20
50
22
03
20
09
0N
HM
FL
Rv
27
19
c1
8.4
11
0I
RC
DP
CI
4.0
HS
QC
90
05
05
12
20
48
92
NH
MF
LK
dp
C(R
v1
03
1)
21
.11
30
IR
CD
PC
I4
.1H
SQ
C9
00
50
51
22
04
89
4N
HM
FL
Rv
33
68
24
.81
4I
DE
Sa
rco
syl
I6
.5T
RO
SY
60
04
52
00
16
00
90
Ca
seP
ho
T(R
v0
82
0)
29
.21
3I
DE
DP
CI
6.5
TR
OS
Y8
00
45
12
81
02
49
9V
an
d.
Me
rFm
8.7
21
0I
RC
SD
SI
5.0
HS
QC
50
05
02
56
10
24
10
0U
CS
DK
csA
11
21
IR
CS
DS
I4
.0H
SQ
C6
00
40
30
02
04
89
0U
CS
DR
v2
43
3c
11
.32
20
/30
M/I
RC
LM
PG
M4
.0H
SQ
C7
20
50
38
42
04
89
8N
HM
FL
Rv
15
67
c1
1.6
22
2I
RC
LM
PG
I4
.0T
RO
SY
72
05
02
20
32
00
92
NH
MF
LM
scL
(Rv
09
85
c)1
7.2
23
5I
RC
SD
SI
3.7
HS
QC
90
05
05
10
20
48
96
UG
AR
v3
77
32
2.3
21
2I
DE
DP
CI
6.5
TR
OS
Y8
00
45
12
81
02
49
3V
an
d.
Rv
18
61
11
.33
13
IR
CS
DS
I4
.0H
SQ
C6
00
50
20
03
20
09
3N
HM
FL
Rv
16
16
15
.33
8/n
dM
/ID
ES
arc
osy
lM
6.5
TR
OS
Y6
00
40
12
01
60
09
6C
ase
.R
v3
06
91
5.4
41
5/n
dM
/ID
ED
PC
M6
.5T
RO
SY
80
04
51
28
10
24
98
Va
nd
.
aN
am
eo
ffu
nct
ion
all
yk
no
wn
ge
ne
an
d/o
rO
RF
(op
en
rea
din
gfr
am
e)
bN
um
be
ro
ftr
an
sme
mb
ran
eh
eli
ces
as
pre
dic
ted
by
TM
HM
Mv
2.0
or
as
de
term
ine
db
yp
rev
iou
se
xp
eri
me
nts
cA
mo
un
to
fp
rote
ine
xp
ress
ed
inm
illi
gra
ms
pe
rli
ter
of
min
ima
lm
ed
iasu
pp
lem
en
ted
wit
h15N
-am
mo
niu
mch
lori
de
.E
xp
ress
ion
lev
els
inb
oth
me
mb
ran
ea
nd
incl
usi
on
bo
die
sa
rese
pa
rate
dw
he
rea
pp
lica
ble
(me
mb
ran
e/i
ncl
usi
on
bo
die
s).
Ex
pre
ssio
nle
ve
lsin
toin
clu
sio
nb
od
ies
we
ren
ot
de
term
ine
d(n
d)
for
two
pro
tein
s(R
v1
616
an
dR
v3
06
9)
dS
ub
cell
ula
rlo
cali
zati
on
of
ex
pre
ssio
nin
eit
he
rm
em
bra
ne
(M),
incl
usi
on
bo
die
s(I
)o
rb
oth
(M/I
)e
Sa
mp
les
we
ree
ith
er
pu
rifi
ed
an
dp
rep
are
db
y‘r
eco
nst
itu
tio
n’
(RC
)o
r‘d
ete
rge
nt
ex
cha
ng
e’
(DE
)f
NM
Rsa
mp
les
use
dto
acq
uir
eth
esp
ect
rain
Fig
.3
we
rep
rep
are
dfr
om
pro
tein
iso
late
de
ith
er
fro
mth
em
em
bra
ne
(M)
or
incl
usi
on
bo
die
s(I
)g
1H
/15N
che
mic
al
shif
tco
rre
lati
on
spe
ctra
we
reo
bta
ine
du
tili
zin
ga
gra
die
nt
en
ha
nce
dH
SQ
Cp
uls
ese
qu
en
ce(H
SQ
C)
or
asp
in-s
tate
sele
ctiv
eg
rad
ien
te
nh
an
ced
TR
OS
Yp
uls
ese
qu
en
ce(T
RO
SY
)h
Nu
mb
er
of
ob
serv
ed
am
ide
ba
ckb
on
ere
son
an
ces
in1H
/15N
che
mic
al
shif
tco
rre
lati
on
spe
ctra
as
ap
erc
en
tag
eo
fe
xp
ect
ed
am
ide
ba
ckb
on
ere
son
an
ces
i Lo
cati
on
sw
he
reN
MR
spe
ctro
sco
py
for
ea
chp
rote
inw
as
con
du
cte
da
reth
eN
ati
on
al
Hig
hM
ag
ne
tic
Fie
ldL
ab
ora
tory
,T
all
ah
ass
ee
,F
L(N
HM
FL
),V
an
de
rbil
tU
niv
ers
ity
,N
ash
vil
le,
TN
(Va
nd
.),
Ca
seW
est
ern
Re
serv
eU
niv
ers
ity
,C
lev
ela
nd
,O
H(C
ase
)a
nd
the
Un
ive
rsit
yo
fC
ali
forn
ia,
Sa
nD
ieg
o,
CA
(UC
SD
)
J Struct Func Genom (2006) 7:51–64 55
123

Buffer A containing 0.5% DPC and 40 mM imidazole.
The protein was eluted, precipitated, washed and stored
as describe above for protein from inclusion bodies.
The purification of protein for ‘detergent exchanged’
samples was performed as described previously [17, 33].
Briefly, Empigen was added to crude lysates to a final
concentration of 3% and incubated at 4�C with tum-
bling for 30 min. Extracted lysate was centrifuged at
18,000· g for 20 min to remove insoluble components.
The supernatant was added to Ni-NTA resin (1.2 ml per
Fig. 1 Helical IMP solution NMR samples were prepared viaeither the ‘detergent exchange’ or ‘reconstitution’ methods. Theflow chart illustrates the key differences between the protocols in
terms of protein source, solubilization, purification, and finalsample preparation steps
56 J Struct Func Genom (2006) 7:51–64
123

gram wet cells) equilibrated with Buffer B (40 mM
HEPES, 300 mM NaCl, 10 mM butylated hydroxytol-
uene, pH 7.5) and incubated on a rotary shaker for
30 min at 4�C before being transferred to an empty
column. Resin with bound protein was washed with 3
column volumes of ice-cold Buffer B with 3% Empigen
followed with an additional 3 column volumes of Buffer
B with 3% Empigen, 40 mM imidazole and 0.5 mM
DTT. Rinsing the resin with 8 column volumes of cold
rinse buffer (25 mM sodium phosphate, 0.5% DPC,
pH 7.2) completed the detergent exchange process. The
protein was eluted in 250 mM imidazole, pH 7.2, 0.5%
DPC. Since the detergent used in the rinse and elution
steps will be the detergent present in the final NMR
sample, the 0.5% DPC may be substituted with 0.5%
LMPG (1-myristoyl-2-hydroxy-sn-glycero-3-[phospho-
RAC-(1-glycerol), 0.5% LPPG (1-palmitoyl-2-hydro-
xy-sn-glycero-3-[phospho-RAC-(1-glycerol), 0.2% SDS
(sodium dodecyl sulfate) or 0.2% Sarcosyl (sodium N-
laurylsarcosinate) during these steps. Purification via
nickel affinity chromatography for both ‘reconstitution’
and ‘detergent exchange’ methods typically resulted in
samples with greater than 95% purity.
Helical IMP sample preparation via reconstitution
or detergent exchange
‘Reconstituted’ samples were prepared by dissolving
lyophilized protein in approximately 400 ll 5% w/v
detergent with 90:10 H2O:D2O via repeated cycles of
heat (45�C) and bath sonication. These samples were
centrifuged to remove debris, and pH was adjusted
with acetic acid before being dispensed into a 5 mm i.d.
Shigemi NMR tube (Allison Park, PA). For ‘detergent
exchanged’ samples, D2O was added to the eluted
protein to a final concentration of 10%. To chelate free
nickel ions, EDTA was added to a final concentration
of 0.5 mM. Sample pH was adjusted with perdeuter-
ated acetic acid. Each sample was concentrated to a
final volume of approximately 600 ll using Millipore
Amicon Ultra 5 kDa cutoff centrifugal filters (Bille-
rica, MA) before being dispensed into a 5 mm i.d.
Wilmad (Buena, NJ) 528-PP or better thin walled
NMR tube.
NMR spectroscopy of helical IMP samples
1H/15N-HSQC spectra were acquired for 18 proteins
at proton frequencies ranging from 500 MHz to
900 MHz. For each protein a number of conditions
were tested including type of detergent, detergent
concentration, buffer pH, and sample temperature. For
the sake of brevity, only those spectra and corre-
sponding conditions giving rise to the highest quality1H/15N-HSQC spectra for each protein are shown.
Detailed descriptions of the conditions used for each
protein are located in Table 1. Spectra were typically
acquired on samples with protein concentrations
ranging from 1 mM to 1.5 mM. Datasets designated as
HSQC were acquired utilizing a gradient-enhanced
HSQC pulse sequence [34]. Datasets designated as
TROSY were acquired utilizing a spin-state selective
gradient-enhanced TROSY pulse sequence [17, 35].
Spectra were processed using NMRPipe [36] and
figures generated with Sparky [37].
Table 2 Average 1H and 15N linewidths and number of observedamide backbone resonances (as percent of predicted resonances)within ‘reconstituted’ and ‘detergent exchanged’ samples for
1H/15N-TROSY spectra of Rv0008c in 250 mM SDS, pH 4.15 at50�C and 1H/15N-HSQC spectra of KdpC (Rv1031) in 150 mMDPC, pH 4.1 at 50�C
Rv0008c KdpC (Rv1031)
RCa DEb RC DE
Average 1H dimension 23.3 25.0 25.3 19.8Linewidth (Hz) 15N dimension 18.5 18.8 18.9 15.6Percent observed peaks 90% 90% 94% 79%
a Sample prepared via reconstitution into detergent as discussed in Materials and Methodsb Sample prepared via detergent exchange as discussed in Materials and Methods
Fig. 2 Proteins presented in this report were typically purified togreater than 95% purity. Purified samples of the proteinsRv0008c, MscL (Rv0985c), and KdpC (Rv1031) were analyzedusing a 12% polyacrylamide gel with SDS. Protein bands werevisualized by Coomassie Brilliant Blue staining
J Struct Func Genom (2006) 7:51–64 57
123

Results and discussion
Protein expression for NMR spectroscopy
Utilizing E. coli BL21(DE3) cells we have achieved
robust expression levels up to 100 mg per liter of
minimal media for uniform 15N labeling as illustrated
in Table 1. Since a reduction in expression yield is
expected when culturing cells in minimal media, stable
expression platforms are paramount [38]. The com-
plete replacement of spent media and resuspension
into fresh isotope labeled media prior to induction has
been demonstrated to increase yields [39]. We have
further enhanced expression levels in minimal media
by increasing cell densities through a 4:1 concentrating
method [40]. High cell densities were therefore
achieved by growing 4 l of cell culture to O.D.600~0.7 in
LB media followed by centrifugation at 8,000· g for
8 min, resuspension into 1 l M9 minimal media, and
subsequent induction of expression after a short
equilibration time. Higher expression levels were
attained by effectively increasing the cell mass per unit
volume, reducing consumption of stable isotope
labeled compounds, and allowing expression to take
place during log phase growth.
The expression of large quantities of protein often
results in the formation of inclusion bodies and there-
fore, we frequently observe the expression of helical
IMPs in inclusion bodies, while high expression into
the cell membrane is relegated to a small number of
proteins [1]. Of the 18 proteins presented in this report,
only 5 resulted in quantifiable levels of expression in
the cell membrane. All five of these proteins exhibited
concomitant expression into inclusion bodies. Those
15N
Che
mic
al S
hift
(pp
m)
1H Chemical Shift (ppm)
c106
107
108
109
110
111
8.6 8.4 8.2 8.0
a105
110
115
120
125
7.8 7.68.6 8.4 8.2 8.08.8
d
** *
8.6 8.4 8.2 8.0
b
7.8 7.68.6 8.4 8.2 8.08.8
*
Fig. 3 1H/15N-TROSYspectra are nearly identicalfor Rv0008c in 150 mM DPC,pH 4.15 at 50�C prepared via(a) ‘reconstitution’ and (b)‘detergent exchange’ samplepreparation methods.1H/15N-HSQC glycineresonances of KdpC (Rv1031)in 150 mM DPC, pH 4.1 at50�C indicate differingnumbers of resonances forsamples produced by (c)reconstitution or (d)detergent exchange. Asterisksdenote locations of missingresonances present in 2c butabsent in 2d
58 J Struct Func Genom (2006) 7:51–64
123

cases exhibiting high expression levels in the cell
membrane are likely attributed to the production of
highly invaginated or other proliferated membrane
structures produced by the host cell in response to IMP
overexpression [41].
Sample preparation via ‘reconstitution’
or ‘detergent exchange’
Two primary methods for sample purification were used
in this study: ‘reconstitution’ and ‘detergent exchange’
as discussed in Materials and Methods. Here, solution
NMR samples of Rv0008c and KdpC (Rv1031) were
prepared via these two distinct methods. Both methods
produced nearly identical high quality samples. The
Rv0008c sample prepared by ‘reconstitution’ utilized
protein isolated from inclusion bodies, while the sample
prepared by ‘detergent exchange’ used protein isolated
from the cell membrane. Samples of KdpC (Rv1031)
prepared by ‘reconstitution’ and ‘detergent exchange’
each utilized protein isolated from inclusion bodies.
Spectra obtained via ‘reconstitution’ and ‘detergent
exchange’ for Rv0008c suggest similar well-folded
homogeneous samples from the two protocols (Fig. 3a,
b and Table 2). The number of observed peaks was
invariant between the two methods for this protein and
the difference in linewidths between the two methods is
less than 1 Hz in the 15N dimension, and 1.7 Hz in the 1H
dimension. ‘Detergent exchange’ and ‘reconstitution’
are both options for the production of helical IMP NMR
* e
g
b c
d f
h * i
125
120
115
110
105
125
120
115
110
105
125
120
115
110
105
9.0 8.5 8.0 7.5 7.0 9.0 8.5 8.0 7.5 7.0 9.0 8.5 8.0 7.5 7.0
* a
15N
Che
mic
al S
hift
(pp
m)
1H Chemical Shift (ppm)
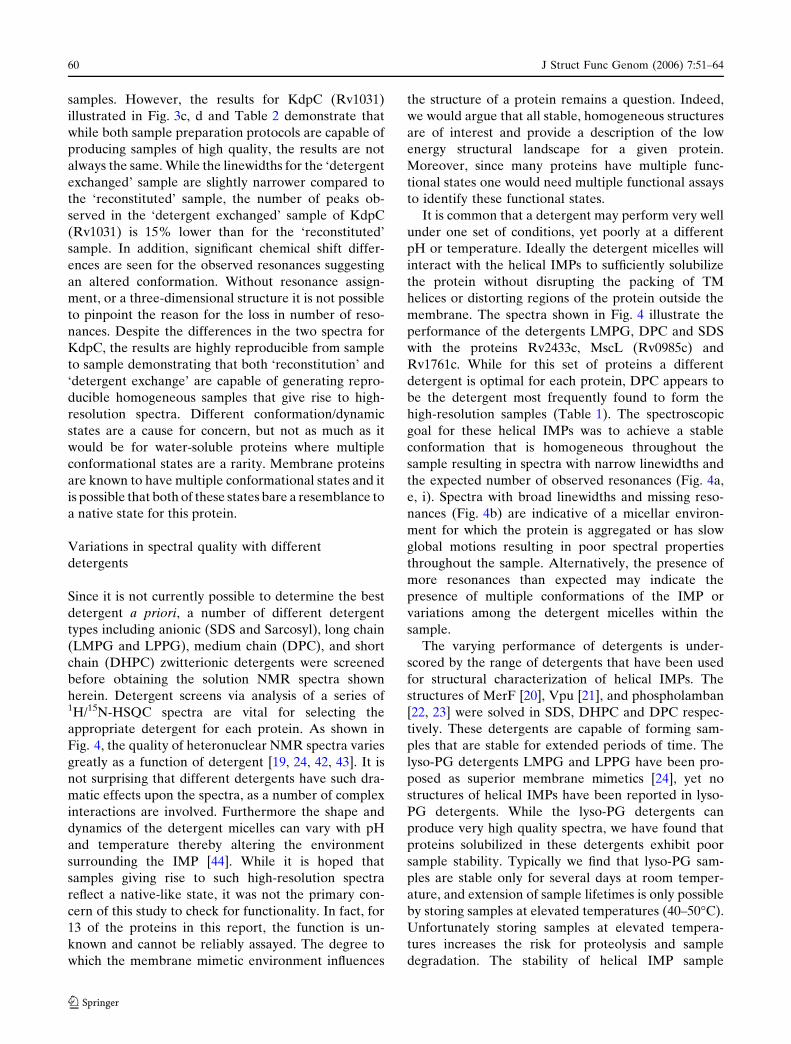
Fig. 4 The effect of differentmicellar environments uponthree different proteinsillustrated with 1H/15N-HSQCspectra. The detergentsLMPG (a, d, g), DPC (b, e, h)and SDS (c, f, i) were used toobtain spectra of Rv2433c (a–c), Rv1761c (d–f) and MscL(Rv0985c) (g–i). Asterisksdenote best spectra for eachprotein based on linewidthsand percent of predictedresonances observed. Spectrafor Rv1761c and Rv2433cwere acquired at pH 4 and50�C. Spectra for Rv0985cwere acquired at pH 3.7 and50�C
J Struct Func Genom (2006) 7:51–64 59
123
samples. However, the results for KdpC (Rv1031)
illustrated in Fig. 3c, d and Table 2 demonstrate that
while both sample preparation protocols are capable of
producing samples of high quality, the results are not
always the same. While the linewidths for the ‘detergent
exchanged’ sample are slightly narrower compared to
the ‘reconstituted’ sample, the number of peaks ob-
served in the ‘detergent exchanged’ sample of KdpC
(Rv1031) is 15% lower than for the ‘reconstituted’
sample. In addition, significant chemical shift differ-
ences are seen for the observed resonances suggesting
an altered conformation. Without resonance assign-
ment, or a three-dimensional structure it is not possible
to pinpoint the reason for the loss in number of reso-
nances. Despite the differences in the two spectra for
KdpC, the results are highly reproducible from sample
to sample demonstrating that both ‘reconstitution’ and
‘detergent exchange’ are capable of generating repro-
ducible homogeneous samples that give rise to high-
resolution spectra. Different conformation/dynamic
states are a cause for concern, but not as much as it
would be for water-soluble proteins where multiple
conformational states are a rarity. Membrane proteins
are known to have multiple conformational states and it
is possible that both of these states bare a resemblance to
a native state for this protein.
Variations in spectral quality with different
detergents
Since it is not currently possible to determine the best
detergent a priori, a number of different detergent
types including anionic (SDS and Sarcosyl), long chain
(LMPG and LPPG), medium chain (DPC), and short
chain (DHPC) zwitterionic detergents were screened
before obtaining the solution NMR spectra shown
herein. Detergent screens via analysis of a series of1H/15N-HSQC spectra are vital for selecting the
appropriate detergent for each protein. As shown in
Fig. 4, the quality of heteronuclear NMR spectra varies
greatly as a function of detergent [19, 24, 42, 43]. It is
not surprising that different detergents have such dra-
matic effects upon the spectra, as a number of complex
interactions are involved. Furthermore the shape and
dynamics of the detergent micelles can vary with pH
and temperature thereby altering the environment
surrounding the IMP [44]. While it is hoped that
samples giving rise to such high-resolution spectra
reflect a native-like state, it was not the primary con-
cern of this study to check for functionality. In fact, for
13 of the proteins in this report, the function is un-
known and cannot be reliably assayed. The degree to
which the membrane mimetic environment influences
the structure of a protein remains a question. Indeed,
we would argue that all stable, homogeneous structures
are of interest and provide a description of the low
energy structural landscape for a given protein.
Moreover, since many proteins have multiple func-
tional states one would need multiple functional assays
to identify these functional states.
It is common that a detergent may perform very well
under one set of conditions, yet poorly at a different
pH or temperature. Ideally the detergent micelles will
interact with the helical IMPs to sufficiently solubilize
the protein without disrupting the packing of TM
helices or distorting regions of the protein outside the
membrane. The spectra shown in Fig. 4 illustrate the
performance of the detergents LMPG, DPC and SDS
with the proteins Rv2433c, MscL (Rv0985c) and
Rv1761c. While for this set of proteins a different
detergent is optimal for each protein, DPC appears to
be the detergent most frequently found to form the
high-resolution samples (Table 1). The spectroscopic
goal for these helical IMPs was to achieve a stable
conformation that is homogeneous throughout the
sample resulting in spectra with narrow linewidths and
the expected number of observed resonances (Fig. 4a,
e, i). Spectra with broad linewidths and missing reso-
nances (Fig. 4b) are indicative of a micellar environ-
ment for which the protein is aggregated or has slow
global motions resulting in poor spectral properties
throughout the sample. Alternatively, the presence of
more resonances than expected may indicate the
presence of multiple conformations of the IMP or
variations among the detergent micelles within the
sample.
The varying performance of detergents is under-
scored by the range of detergents that have been used
for structural characterization of helical IMPs. The
structures of MerF [20], Vpu [21], and phospholamban
[22, 23] were solved in SDS, DHPC and DPC respec-
tively. These detergents are capable of forming sam-
ples that are stable for extended periods of time. The
lyso-PG detergents LMPG and LPPG have been pro-
posed as superior membrane mimetics [24], yet no
structures of helical IMPs have been reported in lyso-
PG detergents. While the lyso-PG detergents can
produce very high quality spectra, we have found that
proteins solubilized in these detergents exhibit poor
sample stability. Typically we find that lyso-PG sam-
ples are stable only for several days at room temper-
ature, and extension of sample lifetimes is only possible
by storing samples at elevated temperatures (40–50�C).
Unfortunately storing samples at elevated tempera-
tures increases the risk for proteolysis and sample
degradation. The stability of helical IMP sample
60 J Struct Func Genom (2006) 7:51–64
123
preparations is important since a number of multidi-
mensional spectra must be obtained for structural
characterization, making sample lifetimes longer than
one week highly desirable.
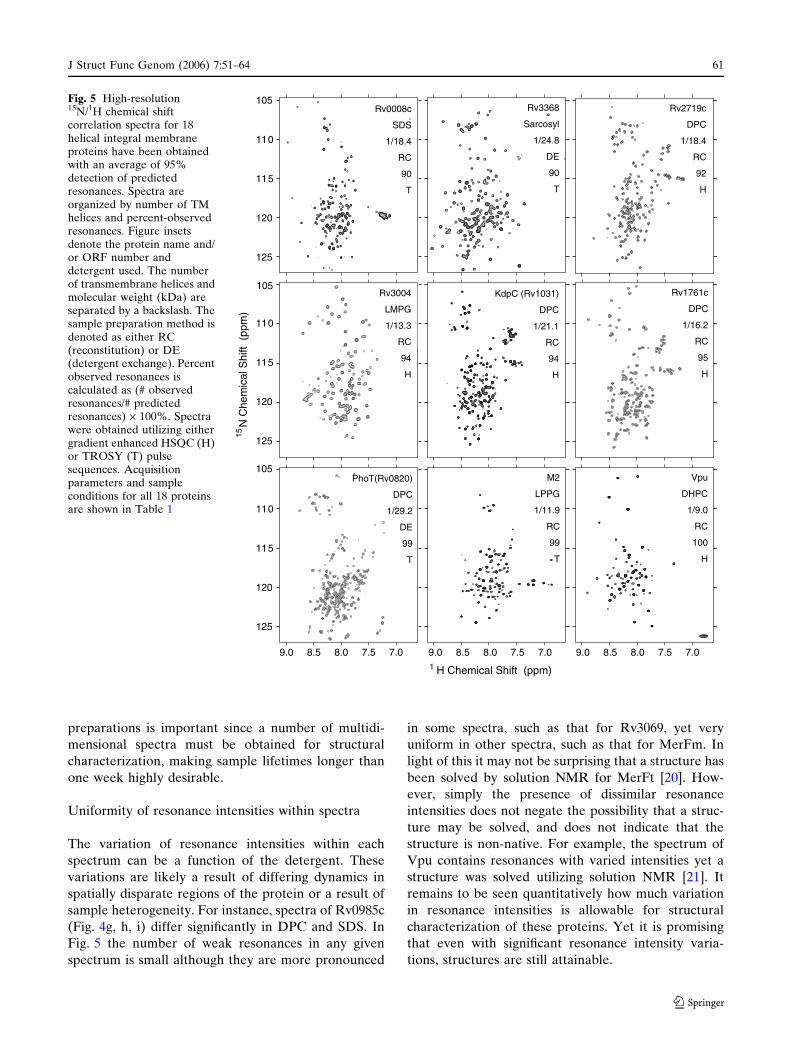
Uniformity of resonance intensities within spectra
The variation of resonance intensities within each
spectrum can be a function of the detergent. These
variations are likely a result of differing dynamics in
spatially disparate regions of the protein or a result of
sample heterogeneity. For instance, spectra of Rv0985c
(Fig. 4g, h, i) differ significantly in DPC and SDS. In
Fig. 5 the number of weak resonances in any given
spectrum is small although they are more pronounced
in some spectra, such as that for Rv3069, yet very
uniform in other spectra, such as that for MerFm. In
light of this it may not be surprising that a structure has
been solved by solution NMR for MerFt [20]. How-
ever, simply the presence of dissimilar resonance
intensities does not negate the possibility that a struc-
ture may be solved, and does not indicate that the
structure is non-native. For example, the spectrum of
Vpu contains resonances with varied intensities yet a
structure was solved utilizing solution NMR [21]. It
remains to be seen quantitatively how much variation
in resonance intensities is allowable for structural
characterization of these proteins. Yet it is promising
that even with significant resonance intensity varia-
tions, structures are still attainable.
125
120
115
110
105
1 H Chemical Shift (ppm)
9.0 8.5 8.0 7.5 7.0 9.0 8.5 8.0 7.5 7.0 9.0 8.5 8.0 7.5 7.0
125
120
115
110
105
125
120
115
110
105
15N
Che
mic
al S
hift
(pp
m)
Rv0008c
SDS
1/18.4
RC
90
T
PhoT(Rv0820)
DPC
1/29.2
DE
99
T
KdpC (Rv1031)
DPC
1/21.1
RC
94
H
Vpu
DHPC
1/9.0
RC
100
H
M2
LPPG
1/11.9
RC
99
T
Rv2719c
DPC
1/18.4
RC
92
H
Rv1761c
DPC
1/16.2
RC
95
H
Rv3004
LMPG
1/13.3
RC
94
H
Rv3368
Sarcosyl
1/24.8
DE
90
T
Fig. 5 High-resolution15N/1H chemical shiftcorrelation spectra for 18helical integral membraneproteins have been obtainedwith an average of 95%detection of predictedresonances. Spectra areorganized by number of TMhelices and percent-observedresonances. Figure insetsdenote the protein name and/or ORF number anddetergent used. The numberof transmembrane helices andmolecular weight (kDa) areseparated by a backslash. Thesample preparation method isdenoted as either RC(reconstitution) or DE(detergent exchange). Percentobserved resonances iscalculated as (# observedresonances/# predictedresonances) · 100%. Spectrawere obtained utilizing eithergradient enhanced HSQC (H)or TROSY (T) pulsesequences. Acquisitionparameters and sampleconditions for all 18 proteinsare shown in Table 1
J Struct Func Genom (2006) 7:51–64 61
123

Advances in helical IMP spectral quality
Obtaining high quality two-dimensional 1H/15N corre-
lation spectra is imperative for structural character-
ization by solution NMR. The quality of two-
dimensional spectra obtained by HSQC and TROSY
pulse sequences are generally similar for moderate-
sized helical IMPs in detergent micelles. We have ob-
tained high quality HSQC and TROSY spectra for 18
IMPs having molecular weights between 9 and 29 kDa
and 1 and 4 TM helices as shown in Fig. 5. A wide
variation in the performance of five commonly used
detergents was seen. It is clear that high quality spectra
can be obtained in DPC, SDS, Sarcosyl, DHPC, LMPG
and LPPG over a range of molecular weights and
topologies for helical IMPs as illustrated in Fig. 5 and
Table 1. DPC performs well in many cases, solubilizing
nearly all of the proteins examined and giving excellent
quality spectra in a number of cases. The lyso-PG
detergents produced very high quality spectra for 4
proteins that gave poor results in DPC. SDS was found
to produce highly resolved spectra for a number of
proteins.
The samples and corresponding solution NMR
spectra reported herein represent excellent prospects
for structure determination not unlike the prospects for
structural characterization once a well diffracting
crystal is obtained. The structural characterization of
proteins via solution NMR spectroscopy requires a
number of multidimensional experiments for backbone
resonance assignment and collection of distance and
orientational restraints [46, 47]. The 1H/15N-HSQC
125
120
115
110
105
1 H Chemical Shift (ppm)
9.0 8.5 8.0 7.5 7.0 9.0 8.5 8.0 7.5 7.0 9.0 8.5 8.0 7.5 7.0
125
120
115
110
105
125
120
115
110
105
15N
Che
mic
al S
hift
(pp
m)
Rv3773c
DPC
2/22.3
DE
93
T
MscL (Rv0985c)
SDS
2/17.2
RC
96
H
Rv2433c
LMPG
2/11.3
RC
98
H
Rv1567c
LMPG
2/11.6
RC
92
T
MerFm
SDS
2/8.7
RC
100
H
Rv1861
SDS
3/11.3
RC
93
H
KcsA
SDS
2/11.0
RC
90
H
Rv3069
DPC
4/15.4
DE
98
T
Rv1616
Sarcosyl
3/15.3
DE
96
T
Fig. 5 continued
62 J Struct Func Genom (2006) 7:51–64
123

experiment serves as a tool to predict the possible
success or failure of a sample for these more complex
experiments. To offer the best chance for success, one
must obtain a 1H/15N-HSQC spectrum that resolves as
many resonances as possible; typically 90% or more is
desired. Without this base level of spectral quality the
amount of information available in latter experiments
will be severely compromised, limiting the possibility
for successful structure determination. Each of the 18
spectra illustrated in Fig. 5 exhibit both the resolution
and percent detection of resonances needed to justify
further experiments for structural characterization. In
fact the 1H/15N-HSQC spectra in Fig. 5 for MerF and
Vpu have permitted the structural characterization of
these proteins [20, 21].
Conclusions
There have been numerous challenges in the struc-
tural characterization of helical IMPs by solution
NMR, but similar to other methodologies the most
critical challenge is sample preparation. To accom-
plish this goal a dependable expression system had to
be established that would provide adequate quantities
of isotope labeled protein. Robust purification
protocols, a streamlined detergent screen and
optimized sample conditions were developed leading
to an increased probability of success for obtaining
high-resolution spectra. The resulting samples are
stable for days to weeks and each represents a
homogeneous preparation in a folded conformation.
All of these hurdles have been overcome in demon-
strating numerous high quality spectra that provide
excellent prospects for structural characterization of
helical IMPs.
The expression systems employed here allow for
high expression levels into a combination of inclusion
bodies and cell membranes. Both the ‘reconstitution’
and ‘detergent exchange’ sample preparation methods
are fully capable of producing homogeneous prepara-
tions of protein extracted from inclusion bodies or cell
membranes. While these methods are capable of pro-
ducing high quality samples, a wide range in spectral
quality can be seen with different conditions, the most
dramatic of which is associated with the choice of
detergent. Although changes in sample conditions
yield variations in spectral quality, we have shown that
the appropriate conditions can often be found for each
protein that gives rise to high-resolution solution NMR
spectra. Furthermore, we have defined conditions that
represent a high probability starting point for structural
characterization.
The quality of spectra now attainable for helical
integral membrane proteins indicates that we have
achieved efficient and robust sample preparation pro-
tocols applicable to a range of proteins. These spectra,
obtained for proteins ranging in size from approxi-
mately 9–29 kDa with 1–4 TM helices, demonstrate
well-resolved resonances and an average of 95%
detection of the predicted resonances. While these
spectra do not represent a guarantee that a three-
dimensional structure can be determined, in much the
same way that a well diffracting crystal does not
guarantee a structure, these spectra do represent suc-
cess for crossing the most challenging hurdle in mem-
brane protein structural biology; that of sample
preparation. These advances in helical IMP sample
production for solution NMR spectroscopy will greatly
improve the speed with which structures of these pro-
teins may be solved, opening the doors to a realm of
proteins for which very little is known.
Acknowledgements The authors thank T.M. Logan of FloridaState University for his helpful discussion concerning initialsolution NMR spectroscopy of helical IMPs from M. tuberculo-sis. The authors also thank B. Xu, D.H. Jones, and S.H. Park ofUniversity of California, San Diego, and H. Qin and Y. Hua ofFlorida State University for their contributions to the work. Thiswork was supported by NIH grant PO1 GM064676 and NSFgrant MCB-0235774. A portion of this work was performed atthe National High Magnetic Field Laboratory funded by theNational Science Foundation (DMR 0084173) and the State ofFlorida. Parts of this research were performed in the Environ-mental Molecular Sciences Laboratory (a national scientific userfacility sponsored by the U.S. DOE Office of Biological andEnvironmental Research) located at Pacific Northwest NationalLaboratory, operated by Battelle for the DOE. This researchbenefited from activities at the Southeast Collaboratory forHigh-Field Biomolecular NMR, a research resource at theUniversity of Georgia, funded by the National Institute ofGeneral Medical Sciences (NIGMS grant number P41GM066340) and the Georgia Research Alliance. The researchutilized the Biomedical Technology Resource for NMR Molec-ular Imaging of Proteins supported by NIH grant P41 EB002031.C.K. Mobley was supported by NIH training grantT32GM008320. J.D. Moore was supported by NIH predoctoralfellowship F31NS054494. R.C. Page and H.B. Nguyen weresupported by American Heart Association predoctoral fellow-ships.
References
1. Korepanova A, Gao FP, Hua Y, Qin H, Nakamoto RK,Cross TA (2005) Protein Sci 14:148–158
2. Mohanty AK, Wiener MC (2004) Protein Expr Purif 33:311–325
3. Drew D, Froderberg L, Baars L, de Gier J-WL (2003) Bio-chim Biophys Acta, Biomembr 1610:3–10
4. Wallin E, von Heijne G (1998) Protein Sci 7:1029–10385. Liu J, Rost B (2001) Protein Sci 10:1970–19796. White SH, Wimley WC (1999) Annu Rev Biophys Biomol
Struct 28:319–365
J Struct Func Genom (2006) 7:51–64 63
123

7. Cole ST (2002) Eur Respir J 36:78s–86s8. Berman HM, Westbrook J, Feng Z, Gilliland G, Bhat TN,
Weissig H, Shindyalov IN, Bourne PE (2000) Nucleic AcidsRes 28:235–242
9. White SH (2004) Protein Sci 13:1948–194910. Wang D-N, Safferling M, Lemieux MJ, Griffith H, Chen Y,
Li X-D (2003) Biochim Biophys Acta, Biomembr 1610:23–3611. Loll PJ (2003) J Struct Biol 142:144–15312. Miroux B, Walker JE (1996) J Mol Biol 260:289–29813. Rogl H, Kosemund K, Kuhlbrandt W, Collinson I (1998)
FEBS Lett 432:21–2614. Gorzelle BM, Nagy JK, Oxenoid K, Lonzer WL, Cafiso, DS,
Sanders CR (1999) Biochemistry 38:16373–1638215. Baneres JL, Martin A, Hullot P, Girard JP, Rossi JC and
Parello J (2003) J Mol Biol 329:801–81416. Brusca JS, Radolf JD (1994) Methods Enzymol 228:182–19317. Tian C, Karra MD, Ellis CD, Jacob J, Oxenoid K,
Sonnichsen F, Sanders CR (2005) Methods Enzymol394:321–334
18. Beswick V, Guerois R, Cordier-Ochsenbein F, Coic Y,Huynh-Dinh T, Tostain J, Noel J, Sanson A, Neumann J(1998) Eur Biophys J 394:321–334
19. Vinogradova O, Sonnichsen F, Sanders CR 2nd (1998) JBiomol NMR 11:381–386
20. Howell SC, Mesleh MF, Opella SJ (2005) Biochemistry44:5196–5206
21. Park SH, Mrse AA, Nevzorov AA, Mesleh MF,Oblatt-Montal M, Montal M, Opella SJ (2003) J Mol Biol333:409–424
22. Zamoon J, Mascioni A, Thomas DD, Veglia G (2003)Biophys J 85:2589–2598
23. Oxenoid K, Chou JJ (2005) Proc Natl Acad Sci USA102:10870–10875
24. Krueger-Koplin RD, Sorgen PL, Krueger-Koplin ST,Rivera-Torres IO, Cahill SM, Hicks DB, Grinius L, KrulwichTA, Girvin ME (2004) J Biomol NMR 28:43–57
25. http://www.targetdb.pdb.org/statistics/TargetStatistics.html26. Kay L, Keif P, Saarinen T (1992) J Am Chem Soc 114:10663–
1066527. Fernandez C, Hilty C, Bonjour S, Adeishvili K, Pervushin K,
Wuthrich K (2001) FEBS Lett 504:173–17828. Cole ST, Brosch R, Parkhill J, Garnier T, Churcher C, Harris
D, Gordon SV, Eiglmeier K, Gas S, Barry CE 3rd, Tekaia F,Badcock K, Basham D, Brown D, Chillingworth T, Connor
R, Davies R, Devlin K, Feltwell T, Gentles S, Hamlin N,Holroyd S, Hornsby T, Jagels K, Krogh A, McLean J, MouleS, Murphy L, Oliver K, Osborne J, Quail MA, RajandreamMA, Rogers J, Rutter S, Seeger K, Skelton J, Squares R,Squares S, Sulston JE, Taylor K, Whitehead S and BarrellBG (1998) Nature 393:537–544
29. Tian C, Tobler K, Lamb RA, Pinto LH, Cross TA (2002)Biochemistry 41:11294–11300
30. Ma C, Marassi FM, Jones DH, Straus SK, Bour S, Strebel K,Schubert U, Oblatt-Montal M, Montal M, Opella SJ (2002)Protein Sci 11:546–557
31. Sonnhammer EL, von Heijne G, Krogh A (1998) Proc IntConf Intell Syst Mol Biol 6:175–182
32. Krogh A, Larsson B, von Heijne G, Sonnhammer EL (2001)J Mol Biol 305:567–580
33. Oxenoid K, Kim HJ, Jacob J, Sonnichsen FD, Sanders CR(2004) J Am Chem Soc 126:5048–5049
34. Kay LE, Nicholson LK, Delaglio F, Bax A, Torchia DA(1992) J Magn Reson 97:359–375
35. Weigelt J (1998) J Am Chem Soc 120:10778–1077936. Delaglio F, Grzesiek S, Vuister GW, Zhu G, Pfeifer J and
Bax A (1995) J Biomol NMR 6:277–29337. Goddard T, Kneller D, SPARKY 3. University of Califor-
nia, San Francisco38. Lian L-Y, Middleton DA (2001) Prog Nucl Magn Reson
Spectrosc 39:171–19039. Cai M, Huang Y, Sakaguchi K, Clore GM, Gronenborn AM
and Craigie R (1998) J Biomol NMR 11:97–10240. Marley J, Lu M, Bracken C (2001) J Biomol NMR 20:71–7541. Arechaga I, Miroux B, Karrasch S, Huijbregts R, de Kruijff
B, Runswick MJ, Walker JE (2000) FEBS Lett 482:215–219
42. Hwang PM, Kay LE (2005) Methods Enzymol 394:335–350
43. McDonnell PA, Shon K, Kim Y, Opella SJ (1993) J Mol Biol233:447–463
44. Otzen DE (2002) Biophys J 83:2219–223045. Fisher LE, Engelman DM, Sturgis JN (1999) J Mol Biol
293:639–65146. Kanelis V, Forman-Kay JD, Kay LE (2001) IUBMB Life
52:291–30247. Arora A, Tamm LK (2001) Curr Opin Struct Biol 11:540–547
64 J Struct Func Genom (2006) 7:51–64
123