Authenticity Assessment and Fraud Quantitation of Coffee ...
13
foods Article Authenticity Assessment and Fraud Quantitation of Coffee Adulterated with Chicory, Barley, and Flours by Untargeted HPLC-UV-FLD Fingerprinting and Chemometrics Nerea Núñez 1, *, Javier Saurina 1,2 and Oscar Núñez 2,3, * Citation: Núñez, N.; Saurina, J.; Núñez, O. Authenticity Assessment and Fraud Quantitation of Coffee Adulterated with Chicory, Barley, and Flours by Untargeted HPLC-UV-FLD Fingerprinting and Chemometrics. Foods 2021, 10, 840. https://doi.org/ 10.3390/foods10040840 Academic Editor: Raúl González-Domínguez Received: 25 March 2021 Accepted: 9 April 2021 Published: 12 April 2021 Publisher’s Note: MDPI stays neutral with regard to jurisdictional claims in published maps and institutional affil- iations. Copyright: © 2021 by the authors. Licensee MDPI, Basel, Switzerland. This article is an open access article distributed under the terms and conditions of the Creative Commons Attribution (CC BY) license (https:// creativecommons.org/licenses/by/ 4.0/). 1 Department of Chemical Engineering and Analytical Chemistry, University of Barcelona, Martí i Franquès 1-11, E08028 Barcelona, Spain; [email protected] 2 Research Institute in Food Nutrition and Food Safety, University of Barcelona, Recinte Torribera, Av. Prat de la Riba 171, Edifici de Recerca (Gaudí), Santa Coloma de Gramenet, E08921 Barcelona, Spain 3 Serra Húnter Fellow, Generalitat de Catalunya, E08007 Barcelona, Spain * Correspondence: [email protected] (N.N.); [email protected] (O.N.) Abstract: Coffee, one of the most popular drinks around the world, is also one of the beverages most susceptible of being adulterated. Untargeted high-performance liquid chromatography with ultraviolet and fluorescence detection (HPLC-UV-FLD) fingerprinting strategies in combination with chemometrics were employed for the authenticity assessment and fraud quantitation of adulter- ated coffees involving three different and common adulterants: chicory, barley, and flours. The methodologies were applied after a solid–liquid extraction procedure with a methanol:water 50:50 (v/v) solution as extracting solvent. Chromatographic fingerprints were obtained using a Kinetex ® C18 reversed-phase column under gradient elution conditions using 0.1% formic acid aqueous solution and methanol as mobile phase components. The obtained coffee and adulterants extract HPLC-UV-FLD fingerprints were evaluated by partial least squares regression-discriminants analysis (PLS-DA) resulting to be excellent chemical descriptors for sample discrimination. One hundred percent classification rates for both PLS-DA calibration and prediction models were obtained. In addition, Arabica and Robusta coffee samples were adulterated with chicory, barley, and flours, and the obtained HPLC-UV-FLD fingerprints subjected to partial least squares (PLS) regression, demonstrating the feasibility of the proposed methodologies to assess coffee authenticity and to quantify adulteration levels (down to 15%), showing both calibration and prediction errors below 1.3% and 2.4%, respectively. Keywords: coffee authenticity; HPLC-UV; HPLC-FLD; fingerprinting; chemometrics; food adulter- ation; chicory; barley; flours 1. Introduction Coffee, which consists of an infusion of ground roasted beans with a characteristic taste and aroma, is among the most popular drink consumed worldwide, and has become a vital product for the economic status of the countries involved in their production and exportation. The coffee plant belongs to Coffea genus from the Rubiaceae family, involving more than 120 species being Canephora coffea (Robusta) and Arabica coffea (Arabica), the ones with the highest economic and commercial importance [1–4]. Coffee contains a great number of bioactive substances (like phenolic acids, polyphenols, and alkaloids; with ellagic, caffeic, and chlorogenic acids among the most abundant ones) contributing to the great properties of coffee such as its antioxidant activity, well known for its beneficial health effects. In fact, some studies have related the coffee intakes with the decrease of prevalent diseases such as cirrhosis, diabetes, cancer, and cardiovascular diseases [1,5]. Considering coffee beneficial effects and their great popularity, the market niche becomes more competitive and, consequently, the economic cut of the coffee production Foods 2021, 10, 840. https://doi.org/10.3390/foods10040840 https://www.mdpi.com/journal/foods
-
Upload
khangminh22 -
Category
Documents
-
view
1 -
download
0
Transcript of Authenticity Assessment and Fraud Quantitation of Coffee ...

foods
Article
Authenticity Assessment and Fraud Quantitation of CoffeeAdulterated with Chicory, Barley, and Flours by UntargetedHPLC-UV-FLD Fingerprinting and Chemometrics
Nerea Núñez 1,*, Javier Saurina 1,2 and Oscar Núñez 2,3,*
�����������������
Citation: Núñez, N.; Saurina, J.;
Núñez, O. Authenticity Assessment
and Fraud Quantitation of Coffee
Adulterated with Chicory, Barley, and
Flours by Untargeted HPLC-UV-FLD
Fingerprinting and Chemometrics.
Foods 2021, 10, 840. https://doi.org/
10.3390/foods10040840
Academic Editor:
Raúl González-Domínguez
Received: 25 March 2021
Accepted: 9 April 2021
Published: 12 April 2021
Publisher’s Note: MDPI stays neutral
with regard to jurisdictional claims in
published maps and institutional affil-
iations.
Copyright: © 2021 by the authors.
Licensee MDPI, Basel, Switzerland.
This article is an open access article
distributed under the terms and
conditions of the Creative Commons
Attribution (CC BY) license (https://
creativecommons.org/licenses/by/
4.0/).
1 Department of Chemical Engineering and Analytical Chemistry, University of Barcelona,Martí i Franquès 1-11, E08028 Barcelona, Spain; [email protected]
2 Research Institute in Food Nutrition and Food Safety, University of Barcelona, Recinte Torribera,Av. Prat de la Riba 171, Edifici de Recerca (Gaudí), Santa Coloma de Gramenet, E08921 Barcelona, Spain
3 Serra Húnter Fellow, Generalitat de Catalunya, E08007 Barcelona, Spain* Correspondence: [email protected] (N.N.); [email protected] (O.N.)
Abstract: Coffee, one of the most popular drinks around the world, is also one of the beveragesmost susceptible of being adulterated. Untargeted high-performance liquid chromatography withultraviolet and fluorescence detection (HPLC-UV-FLD) fingerprinting strategies in combination withchemometrics were employed for the authenticity assessment and fraud quantitation of adulter-ated coffees involving three different and common adulterants: chicory, barley, and flours. Themethodologies were applied after a solid–liquid extraction procedure with a methanol:water 50:50(v/v) solution as extracting solvent. Chromatographic fingerprints were obtained using a Kinetex®
C18 reversed-phase column under gradient elution conditions using 0.1% formic acid aqueoussolution and methanol as mobile phase components. The obtained coffee and adulterants extractHPLC-UV-FLD fingerprints were evaluated by partial least squares regression-discriminants analysis(PLS-DA) resulting to be excellent chemical descriptors for sample discrimination. One hundredpercent classification rates for both PLS-DA calibration and prediction models were obtained. Inaddition, Arabica and Robusta coffee samples were adulterated with chicory, barley, and flours,and the obtained HPLC-UV-FLD fingerprints subjected to partial least squares (PLS) regression,demonstrating the feasibility of the proposed methodologies to assess coffee authenticity and toquantify adulteration levels (down to 15%), showing both calibration and prediction errors below1.3% and 2.4%, respectively.
Keywords: coffee authenticity; HPLC-UV; HPLC-FLD; fingerprinting; chemometrics; food adulter-ation; chicory; barley; flours
1. Introduction
Coffee, which consists of an infusion of ground roasted beans with a characteristictaste and aroma, is among the most popular drink consumed worldwide, and has becomea vital product for the economic status of the countries involved in their production andexportation. The coffee plant belongs to Coffea genus from the Rubiaceae family, involvingmore than 120 species being Canephora coffea (Robusta) and Arabica coffea (Arabica), theones with the highest economic and commercial importance [1–4]. Coffee contains a greatnumber of bioactive substances (like phenolic acids, polyphenols, and alkaloids; withellagic, caffeic, and chlorogenic acids among the most abundant ones) contributing to thegreat properties of coffee such as its antioxidant activity, well known for its beneficial healtheffects. In fact, some studies have related the coffee intakes with the decrease of prevalentdiseases such as cirrhosis, diabetes, cancer, and cardiovascular diseases [1,5].
Considering coffee beneficial effects and their great popularity, the market nichebecomes more competitive and, consequently, the economic cut of the coffee production
Foods 2021, 10, 840. https://doi.org/10.3390/foods10040840 https://www.mdpi.com/journal/foods

Foods 2021, 10, 840 2 of 13
ends, unfortunately in many cases, in committing adulteration frauds. Coffee adulterationis mostly performed by reducing the beans quality or by adding cheaper and lower qualitycoffee varieties. In addition, a growing tendency is the coffee adulteration with non-coffee materials such as corn, barley, rice, chicory, middling wheat, brown sugar, soybean,rye, stems or straw, among others, to reduce cost production and increase economicbenefits [3,4,6–9]. These practices are illegal and have not only economic consequences butcould also imply a danger to the consumer health. Is for these reasons that food qualitycontrol of commercial coffee products to ensure coffee authenticity and to protect theconsumers is very important [6,10–12].Both targeted and untargeted analytical strategieshave been described in the literature to address the discrimination, classification, andauthentication of coffee samples based on the coffee region of production, their variety ortheir roasting degree. Some examples rely on liquid chromatography (LC) with ultraviolet(UV) [13,14] and fluorescence detection (FLD) [15], or LC [16], gas chromatography [17,18]and direct analysis in real-time (DART) [19] with mass spectrometry. However, in the lastyears, several works have been focused on the study of coffee adulteration cases either withcoffees of inferior quality [14,15,20] or with different products such as chicory, corn, barleyor wheat, among others [7–9,21–25]. For example, a targeted LC-UV method was employedby Song et al. for the quantification of six monosaccharides, trigonelline, and nicotinicacid for the identification of coffee powders adulterated with barley, wheat, and rice [8].In another study, Cai et al. employed a targeted LC-mass spectrometry (MS) methodto detect the presence of soybeans and rice in ground coffee by means of determining17 oligosaccharides. Capillary electrophoresis coupled with mass spectrometry (CE-MS)has also been described as a targeted method for monosaccharide determination to detectcoffee adulteration with soybean and corn [9].
Nowadays, untargeted fingerprinting approaches are widely employed in the litera-ture to solve authentication problems, such as, for instance, in the case of essential oils andolive oils [26–28]. In the case of coffee, untargeted fingerprinting strategies based on nuclearmagnetic resonance (NMR) [29], and laser induced breakdown (LIB) [7] spectroscopies, theuse of electronic tongues [22], or digital images [23] have also been employed to detect andidentify different coffee adulterations.
Based on the good performances previously demonstrated by untargeted high-performance liquid chromatography (HPLC)-UV and HPLC-FLD fingerprinting methodologiesin the classification and authentication of coffees from different production regions andvarieties [14,15,20], the present contribution aims at assessing the authenticity and thefraud quantitation on coffees adulterated with common adulterants such as chicory, bar-ley, and different flours (wheat, rice, cornmeal, rye, and oatmeal). A simple liquid–solidextraction procedure based using methanol:water (50:50, v/v) was employed, and theC18 reversed-phase HPLC-UV-FLD fingerprints obtained from the analyzed methanolicaqueous extracts submitted to classificatory partial least squares regression-discriminantsanalysis (PLS-DA) chemometric methods to study their suitability as chemical descriptorsfor sample discrimination and authentication. Furthermore, PLS regression was employedas multivariate calibration method to detect and quantify adulterant levels on Arabica andRobusta coffees adulterated with chicory, barley, and flours.
2. Materials and Methods2.1. Reagents and Chemicals
Methanol, ethanol, acetonitrile, and acetone (all of them ChromosolvTM for HPLC,≥99.9%) were purchased from PanReac AppliChem (Barcelona, Spain). Formic acid (≥98%)was obtained from Sigma-Aldrich (St Louis, MO, USA). Water was purified with an Elix 3coupled to a Milli-Q system from Millipore Corporation (Millipore, Bedford, MA, USA),and was filtered through a 0.22 µm nylon membrane integrated into the Milli-Q system.

Foods 2021, 10, 840 3 of 13
2.2. Instrumentation
An Agilent 1100 Series HPLC instrument (Waldbronn, Germany) equipped with aG1312A binary pump, a WPALS G1367A automatic sample injector, a G1315B diode-arraydetector and a G1321A fluorescence detector connected in series, and a PC with the AgilentChemstation software was employed to obtain the untargeted HPLC-UV and HPLC-FLDchromatographic fingerprints. Chromatographic separation was performed in a Kinetex®
C18 reversed-phase (100 × 4.6 mm i.d., 2.6 µm partially porous particle size) columnobtained from Phenomenex (Torrance, CA, USA). Gradient elution conditions using 0.1%formic acid in water (solvent A) and methanol (solvent B) as mobile phase componentswere employed. The elution program started increasing the methanol percentage from 3to 75% in 30 min. Then, methanol increased from 75% to 95% in 2 min, and was kept at95% methanol for 2 min more. After that, the elution program came back to the mobilephase initial conditions in 0.2 min and, finally, there was an isocratic step at 3% of methanolof 5.8 min to guarantee column re-equilibration. The injection volume was 5 µL and themobile phase flow-rate was 0.4 mL/min. UV acquisition was performed at 280 nm andFLD acquisition at 310 nm (excitation) and at 410 nm (emission).
2.3. Samples and Sample Extraction Procedure
One hundred twenty-three samples belonging to different classes (Table 1), and pur-chased from supermarkets in Barcelona (Spain), Vietnam, and Cambodia, were analyzed.
Table 1. Summary of the analyzed samples.
Sample Class Sample Type Number of Samples
Coffee
Vietnamese Arabica coffee 13Vietnamese Robusta coffee 26
Vietnamese Arabica and Robusta mixture coffee 9Cambodian coffee (Unknown specie) 6
Chicory Chicory 21
Barley Barley 6
Flour
Wheat flour 7Rice flour 4
Cornmeal flour 11Rye flour 15
Oatmeal flour 5
Coffee samples obtained from Vietnam were of Arabica, Robusta, and Arabica+Robustamixture varieties. Regarding the coffee Cambodian samples, its variety was not declared inthe label. Flour samples of different cereals such as wheat, rice, cornmeal, rye, and oatmealwere employed. All the analyzed samples were provided grounded by the suppliers.
Optimal sample treatment started weighing 1.00 g of sample into a 15 mL PTFEcentrifuge tube (Serviquimia, Barcelona, Spain) and adding 10 mL of a methanol:water50:50 (v/v) solution. After that, the mixture was shaken for 2 min using a Vortex (Stuart,Stone, UK). Then, the extract was centrifuged at 3500 rpm for 5 min employing a Rotanta460 RS centrifuge (Hettich, Tuttlingen, Germany). Finally, the obtained aqueous methanolicextracts were filtered with 0.45 µm nylon filters (first mL was discarded) into an injectionvial, and were stored at −4 ◦C until HPLC analysis. It is important to highlight that toachieve a realistic situation on coffee adulteration studies, all the barley and flour sampleswere submitted to a roasting process. For that purpose, 80.00 g of each sample wereextended in an oven tray, and roasted for 7 min at 180 ◦C using a conventional oven (TekaHE 510 Me, Barcelona, Spain).
A quality control (QC) extract, prepared by mixing 50 µL of each one of the methanolicsample extracts, was used to ensure both the repeatability and robustness of the proposedmethodology and the obtained chemometric results.
Foods 2021, 10, 840 4 of 13
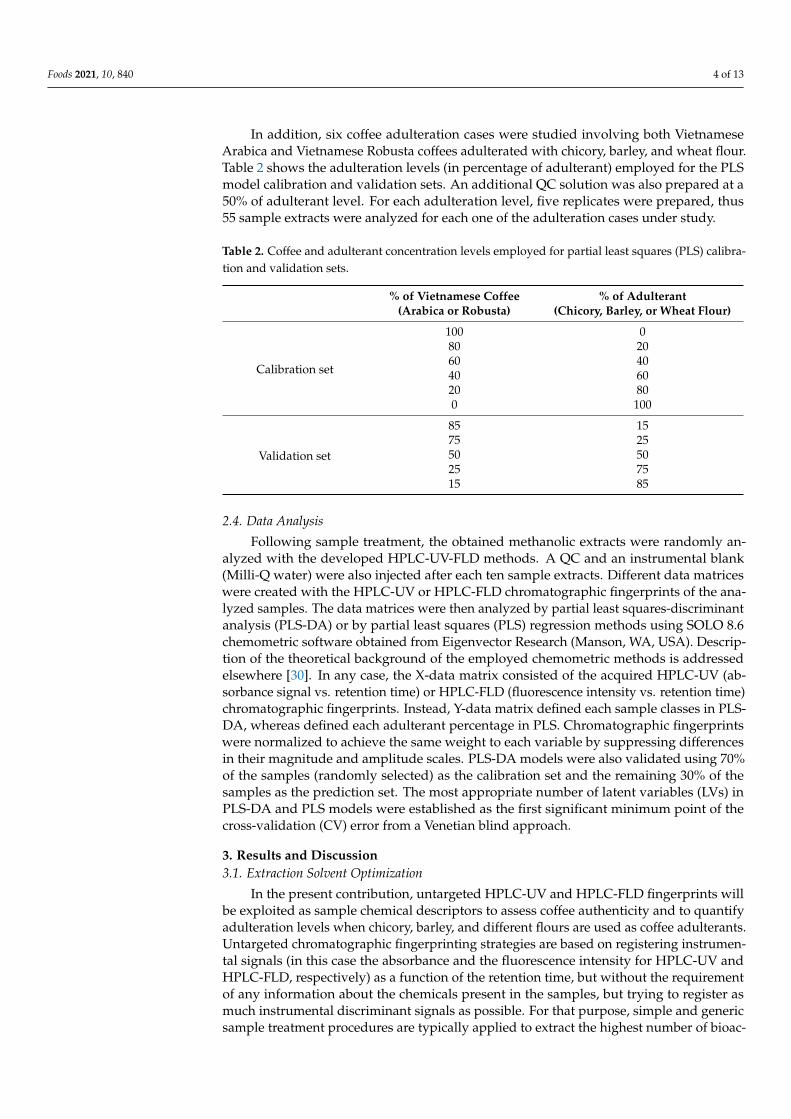
In addition, six coffee adulteration cases were studied involving both VietnameseArabica and Vietnamese Robusta coffees adulterated with chicory, barley, and wheat flour.Table 2 shows the adulteration levels (in percentage of adulterant) employed for the PLSmodel calibration and validation sets. An additional QC solution was also prepared at a50% of adulterant level. For each adulteration level, five replicates were prepared, thus55 sample extracts were analyzed for each one of the adulteration cases under study.
Table 2. Coffee and adulterant concentration levels employed for partial least squares (PLS) calibra-tion and validation sets.
% of Vietnamese Coffee(Arabica or Robusta)
% of Adulterant(Chicory, Barley, or Wheat Flour)
Calibration set
100 080 2060 4040 6020 800 100
Validation set
85 1575 2550 5025 7515 85
2.4. Data Analysis
Following sample treatment, the obtained methanolic extracts were randomly an-alyzed with the developed HPLC-UV-FLD methods. A QC and an instrumental blank(Milli-Q water) were also injected after each ten sample extracts. Different data matriceswere created with the HPLC-UV or HPLC-FLD chromatographic fingerprints of the ana-lyzed samples. The data matrices were then analyzed by partial least squares-discriminantanalysis (PLS-DA) or by partial least squares (PLS) regression methods using SOLO 8.6chemometric software obtained from Eigenvector Research (Manson, WA, USA). Descrip-tion of the theoretical background of the employed chemometric methods is addressedelsewhere [30]. In any case, the X-data matrix consisted of the acquired HPLC-UV (ab-sorbance signal vs. retention time) or HPLC-FLD (fluorescence intensity vs. retention time)chromatographic fingerprints. Instead, Y-data matrix defined each sample classes in PLS-DA, whereas defined each adulterant percentage in PLS. Chromatographic fingerprintswere normalized to achieve the same weight to each variable by suppressing differencesin their magnitude and amplitude scales. PLS-DA models were also validated using 70%of the samples (randomly selected) as the calibration set and the remaining 30% of thesamples as the prediction set. The most appropriate number of latent variables (LVs) inPLS-DA and PLS models were established as the first significant minimum point of thecross-validation (CV) error from a Venetian blind approach.
3. Results and Discussion3.1. Extraction Solvent Optimization
In the present contribution, untargeted HPLC-UV and HPLC-FLD fingerprints willbe exploited as sample chemical descriptors to assess coffee authenticity and to quantifyadulteration levels when chicory, barley, and different flours are used as coffee adulterants.Untargeted chromatographic fingerprinting strategies are based on registering instrumen-tal signals (in this case the absorbance and the fluorescence intensity for HPLC-UV andHPLC-FLD, respectively) as a function of the retention time, but without the requirementof any information about the chemicals present in the samples, but trying to register asmuch instrumental discriminant signals as possible. For that purpose, simple and genericsample treatment procedures are typically applied to extract the highest number of bioac-

Foods 2021, 10, 840 5 of 13
tive compounds possible and belonging to different families; although, their identificationor quantification is not required. With this aim, a simple liquid–solid extraction proce-dure was employed, and the extraction solvent composition was optimized. Differentsolvents such as pure water, methanol, acetonitrile, ethanol, and acetone, and the organicaqueous mixtures containing 20%, 50%, and 80% of each organic component under study(methanol, acetonitrile, ethanol, and acetone), were evaluated as extraction solvents. Foursamples, a Vietnamese Arabica coffee, a Vietnamese Robusta coffee, a cornmeal flour, anda wheat flour were employed as test samples. One gram of each sample was extractedwith 10 mL of each extraction solvent following the procedure described in Section 2.3,and the obtained extracts (17 different extracts for each sample under study) were ana-lyzed with the proposed HPLC-UV and HPLC-FLD methodology following the proceduredescribed in Section 2.2. Chromatograms with different signal profiling depending onthe sample composition were obtained. The total signal area of the chemicals extractedand detected within the chromatographic segment from minute 8 to 40 was considered aschemical data for the solvent selection (the first segment of the chromatograms was notconsidered to remove the signal contribution from the solvents). Figure 1 shows the totalsignal area (normalized to the solvent extract providing the highest signal) obtained by(a) HPLC-UV and (b) HPLC-FLD for the different samples and extraction solvents evalu-ated. Noticeable differences were observed depending on the sample under study as wellas the fingerprinting detection system; therefore, optimal conditions will be selected as acompromise of different factors. The first thing that can be observed is that pure organicsolvents (methanol, acetonitrile, acetone or ethanol) extraction capacity seems to be lowerin comparison to the use of organic aqueous extraction mixtures. In addition, and as ageneral trend, extraction capacity increases with the organic content up to a 50% and thenit decreases.
Figure 1. Total peak signal (normalized to the solvent providing the highest signal) of all the chemicals extracted withdifferent extraction solvents and detected by (a) high-performance liquid chromatography with ultraviolet (HPLC-UV) and(b) HPLC- fluorescence detection (FLD) (within the chromatogram segment from 8 to 40 min) for a Vietnamese Arabicacoffee, a Vietnamese Robusta coffee, a cornmeal flour, and a wheat flour.

Foods 2021, 10, 840 6 of 13
The highest extraction capacity for all the samples under study when fluorescencedetection is employed (Figure 1b) was achieved by using water:acetonitrile (50:50 v/v)as extraction solvent, obtaining almost the same normalized total peak area signal in-dependently on the sample typology. In contrast, when ultraviolet detection was used(Figure 1a), better results were observed with water:methanol (50:50 v/v). In addition, thissame solvent also provided a high extraction capacity with fluorescence detection, withnormalized peak area signals higher than 80% for all the samples under study. Therefore,as a compromise, water:methanol (50:50 v/v) was selected as the optimal extraction solventfor the proposed liquid–solid extraction procedure. In addition, this solvent compositionwas more compatible to the HPLC mobile phase components.
3.2. HPLC-UV and HPLC-FLD Fingerprints
In previous works [14,15,20], we have demonstrated that HPLC-UV and HPLC-FLDfingerprints obtained after simply brewing coffees resulted in good sample chemical de-scriptors to address coffee classification regarding their production region, variety, androasting degrees. This contribution aims to assess coffee authenticity when dealing withadulterations involving the use of common non-coffee-based adulterants relying on anuntargeted fingerprinting strategy. For that purpose, an important number of samplesbelonging to different typologies (coffee, chicory, barley, and several flours) were extractedfollowing the sample treatment previously commented, and the obtained methanolicaqueous extracts were analyzed with the proposed HPLC-UV-FLD method. For instance,Figure 2 shows the resulting HPLC-UV (a1–e1) and HPLC-FLD (a2–e2) fingerprints forrandomly selected Vietnamese Arabica coffee, Vietnamese Robusta coffee, chicory, wheatflour, and barley samples. As can be seen, important differences among the number ofpeak signals detected as well as their relative abundances were obtained. Regarding thenumber of peak signals (related to the variety of sample bioactive compounds extracted),HPLC-FLD fingerprints show less signals than the HPLC-UV ones, where very few signalsare detected, although comparison regarding the total abundance cannot be done. Whencomparing the sample typology, it is quite clear that coffee samples provide similar finger-prints independently of the detection system employed, which are completely different tothose observed for the other samples. Differences related to the coffee variety (Arabica vs.Robusta) are mainly based on relative intensities of different peak signals while followinga similar fingerprinting profile. This can be clearly observed, for example, on the intensityof the peak signal detected by HPLC-FLD at minute 17 for the Vietnamese Robusta coffee(Figure 2a2) which is clearly higher in comparison to the one observed in the VietnameseArabia coffee sample (Figure 2b2).
As commented before, the chromatographic fingerprints obtained for the samplestypically employed as coffee adulterants are completely different than those observed forcoffee samples, especially regarding the peak signal intensities which tend to be muchlower. However, the chicory fingerprint from UV-detection (Figure 2c1) clearly disrupt withthe general fingerprinting tendency obtained for the samples considered as adulterants,showing several peaks with an important signal intensity between minutes 9 and 11 incomparison to all the other samples, including the coffee ones. Regarding fluorescencefingerprints, those obtained for barley samples seem to be richer in signals detected, aswell as peak intensities, in comparison to those of chicory or wheat flour. Based on thesedifferences, and taking into consideration that fingerprints tend to be reproducible withinthe same sample typology, untargeted HPLC-UV and HPLC-FLD fingerprints will beevaluated as sample chemical descriptors for the characterization and classification of theanalyzed samples by chemometric analysis.

Foods 2021, 10, 840 7 of 13
Figure 2. Untargeted HPLC-UV (a1–e1) and HPLC-FLD (a2–e2) fingerprints obtained for a selected sample of (a) VietnameseArabica coffee, (b) Vietnamese Robusta coffee, (c) chicory, (d) wheat flour, and (e) barley. UV detection was registered at280 nm, and fluorescence detection at 310 nm (excitation) and 410 nm (emission).
3.3. Sample Characterization and Classification by Chemometrics
To evaluate if the obtained untargeted HPLC-UV and HPLC-FLD fingerprints workedproperly as sample chemical descriptors for classification purposes, the methanolic extractsof 123 samples belonging to different typologies (see Table 1) were randomly analyzed,together with a QC sample which was injected every ten samples to evaluate both the repro-ducibility and the robustness of the proposed methodology and the obtained chemometricresults. Then, the fingerprints were subjected to a classificatory PLS-DA chemometricmethod, and the resulting score plots defined by LV1 vs. LV2 are depicted in Figure 3.For that purpose, all the UV absorbance or the FL intensity signals, depending on thecase, registered as a function of the chromatographic retention time, independently of thebackground noise observed, were used as data to build the chemometric matrices.
In both score plots, QCs appeared grouped in a compact cluster in the center area of theplot, which ensures the reproducibility of the proposed HPLC fingerprinting methodologyas well as the robustness of the chemometric results. In addition, samples tend to be wellgrouped according to their typology, with the exception of chicory samples which form amore disperse group although perfectly discriminated from the other sample types, whichmay be related to the different brand and roasting process. Flour samples also appeared inquite a compacted group independently of the type or cereal (wheat, rice, cornmeal, rye,and oatmeal). Sample distribution within the score plots depends on the HPLC fingerprintsused as chemical descriptors. Thus, when HPLC-UV fingerprints are employed (Figure 3a)coffee samples tend to exhibit negative LV2 values, while adulterants show positive LV2values, and are separated from flours, barley to chicory sample with the increase in LV1

Foods 2021, 10, 840 8 of 13
values. As a result, the four groups of samples under study are perfectly discriminated. Incontrast, with HPLC-FLD fingerprints, full discrimination of all the sample groups wasnot accomplished. Coffee samples exhibited positive and negative LV2 and LV1 values,respectively, and are partially overlapped with barley samples; although, this last grouptend to be exhibiting mainly negative LV2 values. In any case, discrimination betweenthe three groups of adulterant samples was also accomplished, but both LV1 and LV2 areplaying an important role.
Figure 3. Partial least squares regression-discriminants analysis (PLS-DA) score plots of LV1 vs. LV2 for the classification ofthe analyzed samples when untargeted (a) HPLC-UV and (b) HPLC-FLD fingerprints were employed as sample chemicaldescriptors. PLS-DA models were built with 2 and 3 LVs for HPLC-UV and HPLC-FLD, respectively.
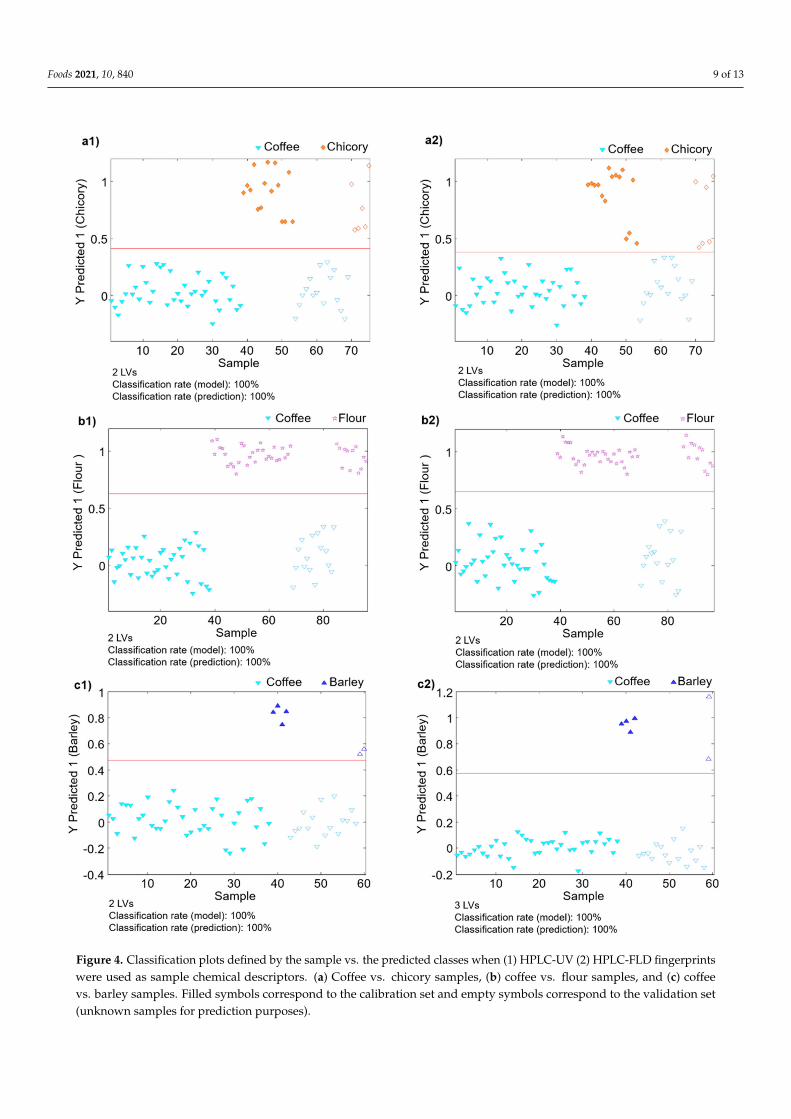
As previously commented, the present contribution aims to assess coffee authenticitywhen adulterations with chicory, barley, or flours are taking place. For that purpose, PLS-DA models of coffee against each one of the adulterants were validated to determine themodel classification rate. Thus, paired PLS-DA models were built using 70% of the samplesof each group, randomly selected, as the calibration set, and the remaining 30% of samplesas a validation set. They were considered as unknown samples for prediction purposesin order to evaluate the model classification performances. Figure 4 shows the obtainedresults for the paired PLS-DA model validations when (1) HPLC-UV and (2) HPLC-FLDfingerprints were employed as sample chemical descriptors for the classification studiesof coffee against chicory (Figure 4(a1,2)), flour (Figure 4(b1,2)), and barley (Figure 4(c1,2))adulterants. As can be seen, 100% classification rates for calibration and validation wereobtained using both HPLC-UV and HPLC-FLD fingerprinting methodologies, demon-strating the feasibility of the proposed untargeted fingerprinting strategy to assess coffeeclassification and authentication against common non-based coffee adulterants such aschicory, barley, and flours from different cereals.
Foods 2021, 10, 840 9 of 13
Figure 4. Classification plots defined by the sample vs. the predicted classes when (1) HPLC-UV (2) HPLC-FLD fingerprintswere used as sample chemical descriptors. (a) Coffee vs. chicory samples, (b) coffee vs. flour samples, and (c) coffeevs. barley samples. Filled symbols correspond to the calibration set and empty symbols correspond to the validation set(unknown samples for prediction purposes).
Foods 2021, 10, 840 10 of 13
3.4. Quantitation of Adulteration Levels by PLS
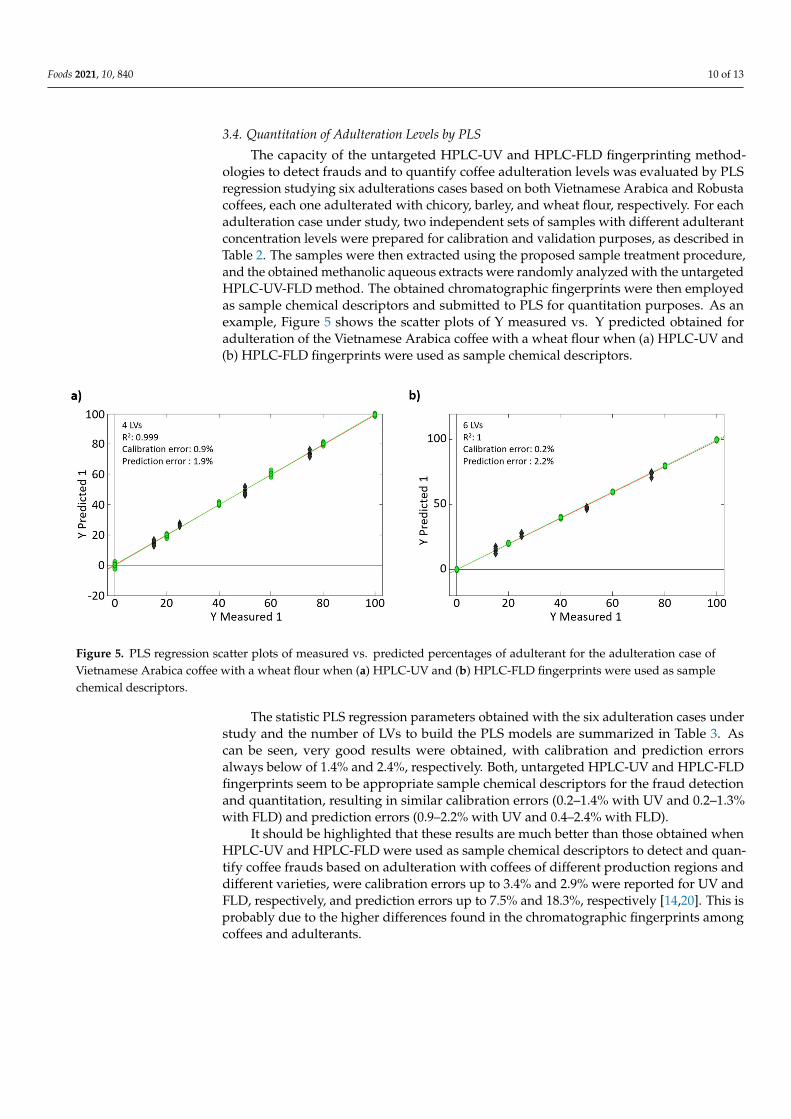
The capacity of the untargeted HPLC-UV and HPLC-FLD fingerprinting method-ologies to detect frauds and to quantify coffee adulteration levels was evaluated by PLSregression studying six adulterations cases based on both Vietnamese Arabica and Robustacoffees, each one adulterated with chicory, barley, and wheat flour, respectively. For eachadulteration case under study, two independent sets of samples with different adulterantconcentration levels were prepared for calibration and validation purposes, as described inTable 2. The samples were then extracted using the proposed sample treatment procedure,and the obtained methanolic aqueous extracts were randomly analyzed with the untargetedHPLC-UV-FLD method. The obtained chromatographic fingerprints were then employedas sample chemical descriptors and submitted to PLS for quantitation purposes. As anexample, Figure 5 shows the scatter plots of Y measured vs. Y predicted obtained foradulteration of the Vietnamese Arabica coffee with a wheat flour when (a) HPLC-UV and(b) HPLC-FLD fingerprints were used as sample chemical descriptors.
Figure 5. PLS regression scatter plots of measured vs. predicted percentages of adulterant for the adulteration case ofVietnamese Arabica coffee with a wheat flour when (a) HPLC-UV and (b) HPLC-FLD fingerprints were used as samplechemical descriptors.
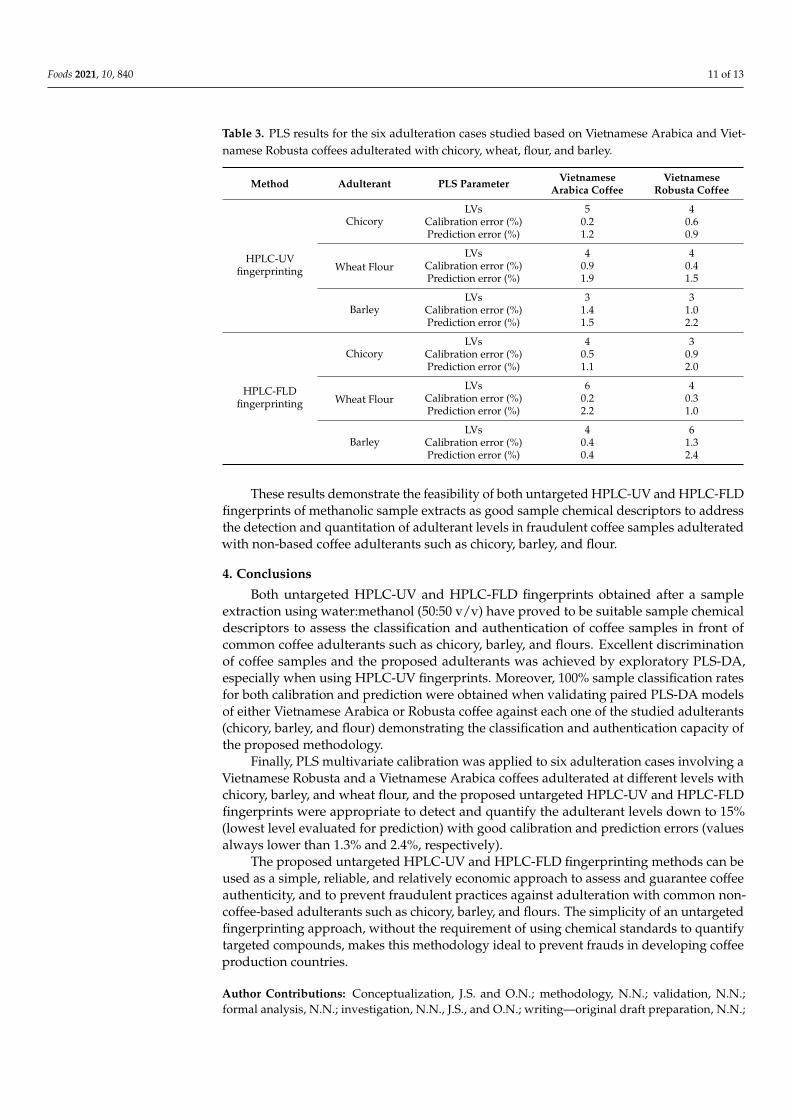
The statistic PLS regression parameters obtained with the six adulteration cases understudy and the number of LVs to build the PLS models are summarized in Table 3. Ascan be seen, very good results were obtained, with calibration and prediction errorsalways below of 1.4% and 2.4%, respectively. Both, untargeted HPLC-UV and HPLC-FLDfingerprints seem to be appropriate sample chemical descriptors for the fraud detectionand quantitation, resulting in similar calibration errors (0.2–1.4% with UV and 0.2–1.3%with FLD) and prediction errors (0.9–2.2% with UV and 0.4–2.4% with FLD).
It should be highlighted that these results are much better than those obtained whenHPLC-UV and HPLC-FLD were used as sample chemical descriptors to detect and quan-tify coffee frauds based on adulteration with coffees of different production regions anddifferent varieties, were calibration errors up to 3.4% and 2.9% were reported for UV andFLD, respectively, and prediction errors up to 7.5% and 18.3%, respectively [14,20]. This isprobably due to the higher differences found in the chromatographic fingerprints amongcoffees and adulterants.
Foods 2021, 10, 840 11 of 13
Table 3. PLS results for the six adulteration cases studied based on Vietnamese Arabica and Viet-namese Robusta coffees adulterated with chicory, wheat, flour, and barley.
Method Adulterant PLS Parameter VietnameseArabica Coffee
VietnameseRobusta Coffee
HPLC-UVfingerprinting
ChicoryLVs 5 4
Calibration error (%) 0.2 0.6Prediction error (%) 1.2 0.9
Wheat FlourLVs 4 4
Calibration error (%) 0.9 0.4Prediction error (%) 1.9 1.5
BarleyLVs 3 3
Calibration error (%) 1.4 1.0Prediction error (%) 1.5 2.2
HPLC-FLDfingerprinting
ChicoryLVs 4 3
Calibration error (%) 0.5 0.9Prediction error (%) 1.1 2.0
Wheat FlourLVs 6 4
Calibration error (%) 0.2 0.3Prediction error (%) 2.2 1.0
BarleyLVs 4 6
Calibration error (%) 0.4 1.3Prediction error (%) 0.4 2.4
These results demonstrate the feasibility of both untargeted HPLC-UV and HPLC-FLDfingerprints of methanolic sample extracts as good sample chemical descriptors to addressthe detection and quantitation of adulterant levels in fraudulent coffee samples adulteratedwith non-based coffee adulterants such as chicory, barley, and flour.
4. Conclusions
Both untargeted HPLC-UV and HPLC-FLD fingerprints obtained after a sampleextraction using water:methanol (50:50 v/v) have proved to be suitable sample chemicaldescriptors to assess the classification and authentication of coffee samples in front ofcommon coffee adulterants such as chicory, barley, and flours. Excellent discriminationof coffee samples and the proposed adulterants was achieved by exploratory PLS-DA,especially when using HPLC-UV fingerprints. Moreover, 100% sample classification ratesfor both calibration and prediction were obtained when validating paired PLS-DA modelsof either Vietnamese Arabica or Robusta coffee against each one of the studied adulterants(chicory, barley, and flour) demonstrating the classification and authentication capacity ofthe proposed methodology.
Finally, PLS multivariate calibration was applied to six adulteration cases involving aVietnamese Robusta and a Vietnamese Arabica coffees adulterated at different levels withchicory, barley, and wheat flour, and the proposed untargeted HPLC-UV and HPLC-FLDfingerprints were appropriate to detect and quantify the adulterant levels down to 15%(lowest level evaluated for prediction) with good calibration and prediction errors (valuesalways lower than 1.3% and 2.4%, respectively).
The proposed untargeted HPLC-UV and HPLC-FLD fingerprinting methods can beused as a simple, reliable, and relatively economic approach to assess and guarantee coffeeauthenticity, and to prevent fraudulent practices against adulteration with common non-coffee-based adulterants such as chicory, barley, and flours. The simplicity of an untargetedfingerprinting approach, without the requirement of using chemical standards to quantifytargeted compounds, makes this methodology ideal to prevent frauds in developing coffeeproduction countries.
Author Contributions: Conceptualization, J.S. and O.N.; methodology, N.N.; validation, N.N.;formal analysis, N.N.; investigation, N.N., J.S., and O.N.; writing—original draft preparation, N.N.;

Foods 2021, 10, 840 12 of 13
writing—review and editing, N.N., J.S., and O.N.; supervision, J.S. and O.N.; funding acquisition, J.S.and O.N. All authors have read and agreed to the published version of the manuscript.
Funding: This research was supported by the Agency for Administration of University and ResearchGrants (Generalitat de Catalunya, Spain) under the projects 2017SGR-171 and 2017SGR-310.
Data Availability Statement: Data is available upon request to the authors.
Conflicts of Interest: The authors declare no conflict of interest. The funders had no role in the designof the study; in the collection, analyses, or interpretation of data; in the writing of the manuscript, orin the decision to publish the results.
References1. Esquivel, P.; Jiménez, V.M. Functional properties of coffee and coffee by-products. Food Res. Int. 2012, 46, 488–495. [CrossRef]2. Naranjo, M.; Vélez, I.L.T.; Benjamín, I.I.; Iii, A.R. Actividad antioxidante de café colombiano de diferentes calidades Antioxidant
activity of different grades of Colombian coffee. Rev. Cub. Plant Med. 2011, 16, 164–173.3. Thornburn Burns, D.T.; Tweed, L.; Walker, M.J. Ground Roast Coffee: Review of Analytical Strategies to Estimate Geographic
Origin, Species Authenticity and Adulteration by Dilution. Food Anal. Methods 2017, 10, 2302–2310. [CrossRef]4. Toci, A.T.; Farah, A.; Pezza, H.R.; Pezza, L. Coffee Adulteration: More than Two Decades of Research. Crit. Rev. Anal. Chem. 2015,
46, 83–92. [CrossRef] [PubMed]5. Crozier, A.; Ahihara, H.; Tomás-Barbéran, F. (Eds.) Teas, Cocoa and Coffee. Plant Secondary Metabolites and Health; Wiley-Blackwell:
Oxford, UK, 2012; ISBN 9781444334418.6. Kamiloglu, S. Authenticity and traceability in beverages. Food Chem. 2019, 277, 12–24. [CrossRef]7. Sezer, B.; Apaydin, H.; Bilge, G.; Boyaci, I.H. Coffee arabica adulteration: Detection of wheat, corn and chickpea. Food Chem. 2018,
264, 142–148. [CrossRef]8. Song, H.Y.; Jang, H.W.; Debnath, T.; Lee, K.-G. Analytical method to detect adulteration of ground roasted coffee. Int. J. Food Sci.
Technol. 2018, 54, 256–262. [CrossRef]9. Daniel, D.; Lopes, F.S.; dos Santos, V.B.; do Lago, C.L. Detection of coffee adulteration with soybean and corn by capillary
electrophoresis-tandem mass spectrometry. Food Chem. 2018, 243, 305–310. [CrossRef] [PubMed]10. Campmajó, G.; Núñez, N.; Núñez, O. The Role of Liquid Chromatography-Mass Spectrometry in Food Integrity and Authenticity.
In Mass Spectrometry—Future Perceptions and Applications; Kamble, G.S., Ed.; IntechOpen: London, UK, 2019; pp. 3–20.11. Moore, J.C.; Spink, J.; Lipp, M. Development and Application of a Database of Food Ingredient Fraud and Economically Motivated
Adulteration from 1980 to 2010. J. Food Sci. 2012, 77, R118–R126. [CrossRef]12. Gonzalvez, A.; Armenta, S.; Guardia, M. De Trace-element composition and stable-isotope ratio for discrimination of foods with
Protected Designation of Origin. Trends Anal. Chem. 2009, 28, 1295–1311. [CrossRef]13. De Luca, S.; De Filippis, M.; Bucci, R.; Magrì, A.D.; Magrì, A.L.; Marini, F. Characterization of the effects of different roasting
conditions on coffee samples of different geographical origins by HPLC-DAD, NIR and chemometrics. Microchem. J. 2016, 129,348–361. [CrossRef]
14. Núñez, N.; Collado, X.; Martínez, C.; Saurina, J.; Núñez, O. Authentication of the Origin, Variety and Roasting Degree of CoffeeSamples by Non-Targeted HPLC-UV Fingerprinting and Chemometrics. Application to the Detection and Quantitation ofAdulterated Coffee Samples. Foods 2020, 9, 378. [CrossRef]
15. Núñez, N.; Martínez, C.; Saurina, J.; Núñez, O. High-performance liquid chromatography with fluorescence detection fingerprintsas chemical descriptors to authenticate the origin, variety and roasting degree of coffee by multivariate chemometric methods. J.Sci. Food Agric. 2021, 101, 65–73. [CrossRef] [PubMed]
16. Pérez-Míguez, R.; Sánchez-López, E.; Plaza, M.; Marina, M.L.; Castro-Puyana, M. Capillary electrophoresis-mass spectrometrymetabolic fingerprinting of green and roasted coffee. J. Chromatogr. A 2019, 1605, 360353. [CrossRef] [PubMed]
17. Mehari, B.; Redi-Abshiro, M.; Chandravanshi, B.S.; Combrinck, S.; McCrindle, R.; Atlabachew, M. GC-MS profiling of fatty acidsin green coffee ( Coffea arabica L.) beans and chemometric modeling for tracing geographical origins from Ethiopia. J. Sci. FoodAgric. 2019, 99, 3811–3823. [CrossRef] [PubMed]
18. Ongo, E.A.; Montevecchi, G.; Antonelli, A.; Sberveglieri, V.; Sevilla, F. Metabolomics fingerprint of Philippine coffee by SPME-GC-MS for geographical and varietal classification. Food Res. Int. 2020, 134, 109227. [CrossRef] [PubMed]
19. Danhelova, H.; Hradecky, J.; Prinosilova, S.; Cajka, T.; Riddellova, K.; Vaclavik, L.; Hajslova, J. Rapid analysis of caffeine invarious coffee samples employing direct analysis in real-time ionization–high-resolution mass spectrometry. Anal. Bioanal. Chem.2012, 403, 2883–2889. [CrossRef]
20. Núñez, N.; Saurina, J.; Núñez, O. Non-targeted HPLC-FLD fingerprinting for the detection and quantitation of adulterated coffeesamples by chemometrics. Food Control. 2021, 124, 107912. [CrossRef]
21. Cai, T.; Ting, H.; Jin-Lan, Z. Novel identification strategy for ground coffee adulteration based on UPLC–HRMS oligosaccharideprofiling. Food Chem. 2016, 190, 1046–1049. [CrossRef]
22. De Morais, T.C.B.; Rodrigues, D.R.; de Carvalho Polari Souto, U.T.; Lemos, S.G. A simple voltammetric electronic tongue for theanalysis of coffee adulterations. Food Chem. 2019, 273, 31–38. [CrossRef]

Foods 2021, 10, 840 13 of 13
23. Souto, U.T.D.C.P.; Barbosa, M.F.; Dantas, H.V.; De Pontes, A.S.; Lyra, W.D.S.; Diniz, P.H.G.D.; De Araújo, M.C.U.; Da Silva, E.C.Screening for Coffee Adulteration Using Digital Images and SPA-LDA. Food Anal. Methods 2014, 8, 1515–1521. [CrossRef]
24. Reis, N.; Botelho, B.G.; Franca, A.S.; Oliveira, L.S. Simultaneous Detection of Multiple Adulterants in Ground Roasted Coffee byATR-FTIR Spectroscopy and Data Fusion. Food Anal. Methods 2017, 10, 2700–2709. [CrossRef]
25. Winkler-Moser, J.K.; Singh, M.; Rennick, K.A.; Bakota, E.L.; Jham, G.N.; Liu, S.X.; Vaughn, S.F. Detection of Corn Adulteration inBrazilian Coffee (Coffea arabica) by Tocopherol Profiling and Near-Infrared (NIR) Spectroscopy. J. Agric. Food Chem. 2015, 63,10662–10668. [CrossRef] [PubMed]
26. Taghadomi-Saberi, S.; Garcia, S.M.; Masoumi, A.A.; Sadeghi, M.; Marco, S. Classification of Bitter Orange Essential Oils Accordingto Fruit Ripening Stage by Untargeted Chemical Profiling and Machine Learning. Sensors 2018, 18, 1922. [CrossRef] [PubMed]
27. Beale, D.J.; Morrison, P.D.; Karpe, A.V.; Dunn, M.S. Chemometric Analysis of Lavender Essential Oils Using Targeted andUntargeted GC-MS Acquired Data for the Rapid Identification and Characterization of Oil Quality. Molecules 2017, 22, 1339.[CrossRef] [PubMed]
28. Barbieri, S.; Cevoli, C.; Bendini, A.; Quintanilla-Casas, B.; García-González, D.L.; Toschi, T.G. Flash Gas Chromatography inTandem with Chemometrics: A Rapid Screening Tool for Quality Grades of Virgin Olive Oils. Foods 2020, 9, 862. [CrossRef]
29. Milani, M.I.; Rossini, E.L.; Catelani, T.A.; Pezza, L.; Toci, A.T.; Pezza, H.R. Authentication of roasted and ground coffee samplescontaining multiple adulterants using NMR and a chemometric approach. Food Control. 2020, 112, 107104. [CrossRef]
30. Massart, D.L.; Vandeginste, B.G.M.; Buydens, L.M.C.; de Jong, S.; Lewi, P.J.; Smeyers-Verbeke, J. Handbook of Chemometrics andQualimetrics; Elsevier: Amsterdam, The Netherlands, 1997.