Development and validation of HPLC method for analysis of dexamethasone acetate in microemulsions
8
Journal of Chromatography B, 911 (2012) 76–83 Contents lists available at SciVerse ScienceDirect Journal of Chromatography B j ourna l ho me pag e: www.elsevier.com/l o cate/chromb Development and validation of a HPLC method for the assay of dapivirine in cell-based and tissue permeability experiments José das Neves a,b,∗ , Bruno Sarmento a,b,c , Mansoor Amiji d , Maria Fernanda Bahia a a Laboratory of Pharmaceutical Technology, LTF/CICF, Faculty of Pharmacy, University of Porto, Rua de Jorge Viterbo Ferreira, 228, 4050-313, Porto, Portugal b CICS – Centro de Investigac ¸ ão em Ciências da Saúde, Department of Pharmaceutical Sciences, Instituto Superior de Ciências da Saúde-Norte, CESPU, Rua Central de Gandra 1317, 4585-116, Gandra, Portugal c INEB – Instituto de Engenharia Biomédica, NEWTherapies Group, Rua do Campo Alegre, 823, 4150-180, Porto, Portugal d Department of Pharmaceutical Sciences, School of Pharmacy, Northeastern University, 110 Mugar Life Sciences Building, 360 Huntington Avenue, Boston, MA 02115, USA a r t i c l e i n f o Article history: Received 19 August 2012 Accepted 1 October 2012 Available online xxx Keywords: Microbicides Liquid chromatography Box-Behnken design Method validation Polymeric nanoparticles Diphenylamine a b s t r a c t Dapivirine, a non-nucleoside reverse transcriptase inhibitor, is being currently used for the development of potential anti-HIV microbicide formulations and delivery systems. A new high-performance liquid chromatography (HPLC) method with UV detection was developed for the assay of this drug in different biological matrices, namely cell lysates, receptor media from permeability experiments and homogenates of mucosal tissues. The method used a reversed-phase C18 column with a mobile phase composed of trifluoroacetic acid solution (0.1%, v/v) and acetonitrile in a gradient mode. Injection volume was 50 L and the flow rate 1 mL/min. The total run time was 12 min and UV detection was performed at 290 nm for dapivirine and the internal standard (IS) diphenylamine. A Box-Behnken experimental design was used to study different experimental variables of the method, namely the ratio of the mobile phase components and the gradient time, and their influence in responses such as the retention factor, tailing factor, and theoretical plates for dapivirine and the IS, as well as the peak resolution between both compounds. The optimized method was further validated and its usefulness assessed for in vitro and ex vivo experiments using dapivirine or dapivirine-loaded nanoparticles. The method showed to be selective, linear, accurate and precise in the range of 0.02–1.5 g/mL. Other chromatographic parameters, namely carry-over, lower limit of quantification (0.02 g/mL), limit of detection (0.006 g/mL), recovery (equal or higher than 90.7%), and sample stability at different storage conditions, were also determined and found adequate for the intended purposes. The method was successfully used for cell uptake assays and permeability studies across cell monolayers and pig genital mucosal tissues. Overall, the proposed method provides a simple, versatile and reliable way for studying the behavior of dapivirine in different biological matrices and assessing its potential as an anti-HIV microbicide drug. © 2012 Elsevier B.V. All rights reserved. 1. Introduction HIV/AIDS is one of the most important health, social and economic global burdens of our days. Prevention, particular to sexual transmission, is a keystone in the fight against infection and disease, but highly effective strategies are limited to condom use and sexual abstinence. Microbicides are products intended for vaginal or rectal administration around the time of sexual intercourse in order to avoid the transmission of HIV and poten- tially other pathogens [1]. Despite several initial disappointing results, recent success of a vaginal gel product containing 1% of ∗ Corresponding author at: Laboratory of Pharmaceutical Technology, LTF/CICF, Faculty of Pharmacy, University of Porto, Rua de Jorge Viterbo Ferreira, 228, 4050- 313, Porto, Portugal. Tel.: +351 222 078 949; fax: +351 222 003 977. E-mail address: [email protected] (J. das Neves). the antiretroviral drug tenofovir boosted interest in the field [2]. Alongside tenofovir and other promising compounds, dapivirine (TMC120; 4-[[4-[2,4,6-trimethylphenyl)amino]-2-pyrimidinyl]- amino]-benzonitrile) (Fig. 1) is one of the leading antiretroviral agents currently being tested for the development of anti-HIV vaginal microbicides [1]. Preclinical testing of this potent non- nucleoside reverse transcriptase inhibitor provided encouraging results in terms of activity and toxicity for both vaginal and rectal applications [3–5]. Moreover, recent clinical studies indicate that dapivirine is safe and provides favorable pharmacokinetics when delivered either as a vaginal gel or ring [6–8]. Two phase III clinical trials testing dapivirine vaginal rings are currently underway [9,10]. Different dosage forms/delivery systems have been proposed for the vaginal administration of dapivirine. Alongside vaginal gels and rings, others such as films [11] and tablets [12] have also been suggested. Moreover, nanotechnology-based solutions have been 1570-0232/$ – see front matter © 2012 Elsevier B.V. All rights reserved. http://dx.doi.org/10.1016/j.jchromb.2012.10.034
-
Upload
independent -
Category
Documents
-
view
2 -
download
0
Transcript of Development and validation of HPLC method for analysis of dexamethasone acetate in microemulsions
Dc
Ja
b
4c
d
a
ARAA
KMLBMPD
1
esaufitr
F3
1h
Journal of Chromatography B, 911 (2012) 76– 83
Contents lists available at SciVerse ScienceDirect
Journal of Chromatography B
j ourna l ho me pag e: www.elsev ier .com/ l o cate /chromb
evelopment and validation of a HPLC method for the assay of dapivirine inell-based and tissue permeability experiments
osé das Nevesa,b,∗, Bruno Sarmentoa,b,c, Mansoor Amijid, Maria Fernanda Bahiaa
Laboratory of Pharmaceutical Technology, LTF/CICF, Faculty of Pharmacy, University of Porto, Rua de Jorge Viterbo Ferreira, 228, 4050-313, Porto, PortugalCICS – Centro de Investigac ão em Ciências da Saúde, Department of Pharmaceutical Sciences, Instituto Superior de Ciências da Saúde-Norte, CESPU, Rua Central de Gandra 1317,585-116, Gandra, PortugalINEB – Instituto de Engenharia Biomédica, NEWTherapies Group, Rua do Campo Alegre, 823, 4150-180, Porto, PortugalDepartment of Pharmaceutical Sciences, School of Pharmacy, Northeastern University, 110 Mugar Life Sciences Building, 360 Huntington Avenue, Boston, MA 02115, USA
r t i c l e i n f o
rticle history:eceived 19 August 2012ccepted 1 October 2012vailable online xxx
eywords:icrobicides
iquid chromatographyox-Behnken designethod validation
olymeric nanoparticlesiphenylamine
a b s t r a c t
Dapivirine, a non-nucleoside reverse transcriptase inhibitor, is being currently used for the developmentof potential anti-HIV microbicide formulations and delivery systems. A new high-performance liquidchromatography (HPLC) method with UV detection was developed for the assay of this drug in differentbiological matrices, namely cell lysates, receptor media from permeability experiments and homogenatesof mucosal tissues. The method used a reversed-phase C18 column with a mobile phase composed oftrifluoroacetic acid solution (0.1%, v/v) and acetonitrile in a gradient mode. Injection volume was 50 �Land the flow rate 1 mL/min. The total run time was 12 min and UV detection was performed at 290 nm fordapivirine and the internal standard (IS) diphenylamine. A Box-Behnken experimental design was used tostudy different experimental variables of the method, namely the ratio of the mobile phase componentsand the gradient time, and their influence in responses such as the retention factor, tailing factor, andtheoretical plates for dapivirine and the IS, as well as the peak resolution between both compounds. Theoptimized method was further validated and its usefulness assessed for in vitro and ex vivo experimentsusing dapivirine or dapivirine-loaded nanoparticles. The method showed to be selective, linear, accurateand precise in the range of 0.02–1.5 �g/mL. Other chromatographic parameters, namely carry-over, lower
limit of quantification (0.02 �g/mL), limit of detection (0.006 �g/mL), recovery (equal or higher than90.7%), and sample stability at different storage conditions, were also determined and found adequatefor the intended purposes. The method was successfully used for cell uptake assays and permeabilitystudies across cell monolayers and pig genital mucosal tissues. Overall, the proposed method provides asimple, versatile and reliable way for studying the behavior of dapivirine in different biological matricesand assessing its potential as an anti-HIV microbicide drug.. Introduction
HIV/AIDS is one of the most important health, social andconomic global burdens of our days. Prevention, particular toexual transmission, is a keystone in the fight against infectionnd disease, but highly effective strategies are limited to condomse and sexual abstinence. Microbicides are products intendedor vaginal or rectal administration around the time of sexual
ntercourse in order to avoid the transmission of HIV and poten-ially other pathogens [1]. Despite several initial disappointingesults, recent success of a vaginal gel product containing 1% of∗ Corresponding author at: Laboratory of Pharmaceutical Technology, LTF/CICF,aculty of Pharmacy, University of Porto, Rua de Jorge Viterbo Ferreira, 228, 4050-13, Porto, Portugal. Tel.: +351 222 078 949; fax: +351 222 003 977.
E-mail address: [email protected] (J. das Neves).
570-0232/$ – see front matter © 2012 Elsevier B.V. All rights reserved.ttp://dx.doi.org/10.1016/j.jchromb.2012.10.034
© 2012 Elsevier B.V. All rights reserved.
the antiretroviral drug tenofovir boosted interest in the field [2].Alongside tenofovir and other promising compounds, dapivirine(TMC120; 4-[[4-[2,4,6-trimethylphenyl)amino]-2-pyrimidinyl]-amino]-benzonitrile) (Fig. 1) is one of the leading antiretroviralagents currently being tested for the development of anti-HIVvaginal microbicides [1]. Preclinical testing of this potent non-nucleoside reverse transcriptase inhibitor provided encouragingresults in terms of activity and toxicity for both vaginal and rectalapplications [3–5]. Moreover, recent clinical studies indicate thatdapivirine is safe and provides favorable pharmacokinetics whendelivered either as a vaginal gel or ring [6–8]. Two phase III clinicaltrials testing dapivirine vaginal rings are currently underway[9,10].
Different dosage forms/delivery systems have been proposedfor the vaginal administration of dapivirine. Alongside vaginal gelsand rings, others such as films [11] and tablets [12] have also beensuggested. Moreover, nanotechnology-based solutions have been

J. das Neves et al. / J. Chromat
Fig. 1. Chemical structure of (a) dapivirine and (b) diphenylamine (internals
anldmnmmtdsIntt(dsfm
dtiwtdma
2
2
ta(aapGUoli
Stock solutions of dapivirine and IS were prepared in ACN at a
tandard).
dvocated for the development of microbicides, namely becauseanosystems may provide controlled release, increased intracellu-
ar levels, and overall enhanced mucosal delivery of microbiciderugs [13]. Our group has recently reported on the develop-ent and in vitro characterization of dapivirine-loaded polymeric
anoparticles [14], which required drug assay in different biologicalatrices. A few high-performance liquid chromatography (HPLC)ethods with UV quantification have been briefly described in
he literature for dapivirine mainly for evaluating drug content orrug release from different pharmaceutical dosage forms/deliveryystems [15–17]. Two HPLC-UV methods validated according toCH guidelines have been reported by our group for polymericanoparticles [18] and by Gupta et al. for combination vaginalablets [19]. Also, liquid chromatography tandem mass spectrome-ry (LC–MS/MS) methods have been used for clinical study samplesgenital tissue, cervicovaginal lavage and plasma) [6,7,20] but noetails were provided on the method procedure. In one pre-clinicaltudy by Nuttall et al. [21] an LC–MS/MS method was describedor dosing dapivirine in the plasma and cervicovaginal tissue of
acaques and rabbits but validation parameters were not included.To our best knowledge, no previous report in the literature
etailed on the concurrently development and validation of a quan-itative bioanalytical HPLC method for assaying dapivirine, namelyn cell-based or tissue permeability experiments. In this article,
e describe the successful development, validation and applica-ion of a bioanalytical reversed-phase HPLC-UV method for dosingapivirine in cell lysates and permeability experiments across cellonolayers or mucosal tissues, using diphenylamine (DPA; Fig. 1)
s an internal standard (IS).
. Materials and methods
.1. Materials
Dapivirine (99.8%, w/w) was a kind offer from the Interna-ional Partnership for Microbicides (Silver Spring, MD, USA). DPAnd HPLC-grade acetonitrile (ACN) were purchased from MerckDarmstadt, Germany). HPLC-grade trifluoroacetic acid (TFA) wascquired from Sigma–Aldrich (St. Louis, MO, USA), Hank’s Bal-nced Salt Solution (HBSS) from Invitrogen (Carlsbad, CA, USA), andoloxamer 407 (Pluracare® F127 Prill) from BASF (Ludwigshafen,ermany). Water was prepared in-house by using a Simplicity® UVltrapure Water System (Millipore Corporation, Billerica, USA). All
ther chemicals and solvents were of analytical grade or equiva-ent. Prior to use, individual mobile phase solvents were degassedn an ultrasonic bath for 15 min.ogr. B 911 (2012) 76– 83 77
2.2. Cells and mucosal tissues
Caco-2 colorectal epithelial cells, VK2/E6E7 human vaginalepithelial cells, HeLa human cervical cells, J774A.1 mice mono-cyte/macrophages, and CaSki human cervical carcinoma cells wereobtained from ATCC (Manassas, VA, USA). DC-100 dendritic cellswere purchased from MatTek Corp. (Ashland, MA, USA), and periph-eral blood mononuclear cells (PBMCs) were isolated by densitygradient centrifugation from buffy coats of healthy adult donors.Cells were maintaining and used during experiments with appro-priate culture media, as previously described [5,14]. Pig vaginal andrectal mucosal tissues were obtained from a local slaughter houseimmediately after sacrifice. Tissues were maintained and trans-ported in RPMI-1640 medium (Invitrogen, Carlsbad, CA, USA), andused within 2 h.
2.3. Liquid chromatography instrumentation
Chromatographic runs were performed using a Dionex Ulti-mate 3000 system (Dionex Corporation, Sunnyvale, CA, USA)equipped with LPG-3400AB quaternary pump, WPS-3000TBPLanalytical autosampler, TCC-3000SD thermostated column com-partment, and DAD-3000 diode array detector. Results from runswere acquired and processed with the Chromeleon® chromatog-raphy management system (Version 6.80; Dionex Corporation).Separation was performed at 20 ◦C using a Waters Xterra® RP18separation column (Waters Corporation, Milford, MA, USA) with5 �m particle size, 4.6 mm internal diameter and 150 mm in length,and a Merck LiChrospher® 100 RP-18 guard column (Merck) with5 �m particle size.
2.4. Analytical matrices
Matrices processed for analysis included cell lysates and thereceptor media collected from either basolateral chambers ofTranswell® Permeable Supports (Corning, Inc., Tewksbury, MA,USA) or from receptor chambers of Franz cells during permeabilityexperiments across confluent cell monolayers or mucosal tissues,respectively. Also, mucosal tissues used during permeability exper-iments were collected and processed for drug assay.
Lysates from different cell types were obtained by treatingmonocultures grown in 6-well plates with a lysis buffer (10 mMTris–HCl, pH 7.4, 2 mM EDTA, pH 8.0, 150 mM NaCl, 0.876% (w/v)Brij® 97, 0.125% (w/v) Tween® 20, and one tablet/50 mL of proteaseinhibitor cocktail (cOmplete, Mini, EDTA-free; Roche Diagnos-tics, Indianapolis, IN, USA)) for 30 min at 4 ◦C. In the case ofcell monolayers grown in Transwell® Permeable Supports, thesupport membranes were carefully detached from Transwell®
plates, placed in 6-well plates and treated with the lysis buffer.In all cases, the lysis buffer was spiked with appropriate amountsof IS. Receptor media, comprising HBSS added with 0.2% (w/v)poloxamer 407, was obtained at different time-points from thebasolateral chamber of Transwell® Permeable Supports bearingeither Caco-2 or CaSki cell monolayers, or from the receptor cham-ber of Franz cells supporting mucosal tissue. Mucosal tissues frompermeability studies were washed thoroughly with HBSS and col-lected for further processing. Pools of cell lysates, basolateral mediaor mucosal tissues were established and used for validation pur-poses except if stated otherwise.
2.5. Stock solution and calibration standards
concentration of 1 mg/mL. Working solutions of different concen-trations were prepared immediately before sample preparation bydilution of stock solutions with ACN.

7 romat
raacwstcs1I(0d51I(bfi
2c
m1rrAurow
ttapaMUd
2
abaoslmfnsbteI(ta
8 J. das Neves et al. / J. Ch
Calibration standards were prepared differently for cell lysates,eceptor media and mucosal tissues. Drug-free cell lysates (200 �Lnd containing the IS) were centrifuged (13,000 rpm, 10 min, 4 ◦C)nd obtained supernatants mixed for 1 min with ACN (400 �L)ontaining different amounts of dapivirine by vortexing. Samplesere again centrifuged (13,000 rpm, 10 min, 4 ◦C), newly obtained
upernatants collected and filtered by 0.20 �m PTFE syringe fil-ers (National Scientific, Rockwood, TN, USA), and assayed. In thease of receptor media, drug-free samples (300 �L) obtained fromimulated permeability experiments were mixed by vortexing for
min with the same volume of ACN containing the drug andS at the desired concentrations. Samples were then centrifuged13,000 rpm, 10 min, 4 ◦C), supernatants collected and filtered by.20 �m PTFE syringe filters, and assayed. As for mucosal tissues,rug-free samples (around 500 mg) were processed by adding00 �L of ACN containing the drug and IS and homogenizing for0 min in a Ultra-Turrax T25 homogenizer (Janke and Kunkel Type,KA, Staufen, Germany). Tissue homogenates were then centrifuged13,000 rpm, 10 min, and 4 ◦C), supernatants collected and filteredy 0.20 �m PTFE syringe filters, and assayed. Calibration standardsor all matrices were prepared at a final concentration of 0.1 �g/mLn IS.
.6. Development and optimization of chromatographiconditions
Chromatographic analysis was performed in gradient mode. Theobile phase, comprising TFA 0.1% (v/v) and ACN, was pumped at
mL/min. After sample injection (50 �L), the initial TFA 0.1%:ACNatio was progressively changed over a period of time (furthereferred to as ramp time) until reaching a final TFA 0.1%:ACN ratio.fter the ramp time, the final TFA 0.1%:ACN ratio was kept constantntil minute nine, changing back again to the initial TFA 0.1%:ACNatio over one minute and kept constant until the end of the run inrder to stabilized the column for subsequent runs. Total run timeas 12 min. UV detection of both dapivirine and IS was at 290 nm.
A 3-factor, 3-level Box-Behnken experimental design was usedo optimize the experimental HPLC factors (or variables), namelyhe initial and final TFA 0.1%:ACN ratios, and the ramp time. Evalu-ted responses included the retention factor (k′), tailing factor (T),eak resolution (R), and theoretical plates (N) for both dapivirinend IS. Optimization was performed using a cell lysate pool matrix.initab® software (v. 15.1.20.0; Minitab Inc., State College, PA,SA) was used for the generation and analysis of the experimentalesign.
.7. Method validation
The method was validated in order to concur with the FDA [22]nd the recently released EMA [23] guidelines on the validation ofioanalytical methods. Evaluated parameters included selectivitynd carry-over effect, lower limit of quantification (LLOQ) and limitf detection (LOD), linearity of calibration curve, accuracy, preci-ion, recovery and stability. Selectivity was studied by running ateast 10 different blank individual samples (i.e. not pooled) of tested
atrices and by comparing results with chromatograms obtainedor drug- and IS-spiked samples. Also, the interference of blankanoparticles and individual components of nanoparticles [14] wastudied by spiking blank samples. Carry-over effect was evaluatedy injection of a spiked sample at the maximum considered concen-ration of dapivirine (1.5 �g/mL) followed by a blank sample andvaluation of the responses at the retention time of dapivirine and
S. The LLOQ and LOD were determined based on the signal-to-noiseS/N) ratio. The calibration curve was obtained in triplicate fromhe response (ratio between the area of dapivirine and IS peaks)gainst the nominal concentration of dapivirine of eight standardogr. B 911 (2012) 76– 83
solutions (0.02, 0.03, 0.06, 0.1, 0.3, 0.6, 1, 1.5 �g/mL) by the leastsquares linear regression. Linearity was evaluated by visual analy-sis of the plots, calculation of the correlation coefficient (R2), backcalculation of concentrations of individual calibration standards,and analysis of the response factors (i.e. ratio between the responseand nominal concentration of each standard sample). Within-run(or intra-day) and between-run (or inter-day) accuracy and preci-sion were determined using five different spiked samples for eachof four different concentration levels (LLOQ, low level, middle leveland high level). Accuracy was expressed as the measured concen-tration and recovery (percentage of the nominal concentration),while precision was defined by the relative standard deviation(RSD). Recovery was determined at four concentration levels (LLOQ,low level, middle level and high level) by comparing the results forextracted standard samples with those of non-extracted standardsamples, i.e. blank samples to which the drug and IS were addedonly after sample processing. The stability of dapivirine in differ-ent matrices was assessed at two levels (low and high), namelyafter 72 h at room temperature, three 24 h freeze–thawing cycles(−20 ◦C/20 ◦C) over 7 days, and 14 days at −20 ◦C. Also, stability wasdetermined for prepared samples stored in the autosampler dur-ing 48 h, and for the stock solutions of dapivirine and IS (1 mg/mL)stored at room temperature and away from light during one month.
2.8. Method applicability
Developed method was used to study cell-associated drug lev-els and cell monolayer/mucosal tissue permeability of dapivirineeither as free drug or associated to poloxamer-modified poly-caprolactone (PEO-PCL) nanoparticles. Dapivirine-loaded PEO-PCLnanoparticles were produced by nanoprecipitation as previouslydescribed [14]. In the case of cell-based studies, dapivirine ordapivirine-loaded PEO-PCL nanoparticles were dispersed in cellculture media at a concentration of 1 �M (expressed in dapivirine)and incubated with cells (0.5–3.75 × 10⁵/well) in 6-well plates for1 h at 37 ◦C/5% CO2. Cells were then washed trice with PBS, pH 7.4,and cell lysates obtained and processed as described for calibrationstandards. Protein content of cell lysates was also assessed using acolorimetric-based commercial kit (Pierce® BCA Protein Assay Kit,Thermo Scientific, Rockford, IL, USA).
The permeability of free or nanoparticle-associated dapivirinewas studied across cell monolayers (CaSki or Caco-2) grown inTranswell® Permeable Supports and pig vaginal or rectal mucosaltissues mounted in Franz cells. In the case of monolayers, the freedrug or nanoparticles were dispersed in 1.5 mL of HBSS at a finaldapivirine concentration of 5 �M and placed in the apical cham-ber; the basolateral chamber was filled with 2.5 mL of HBSS addedwith 0.2% (w/v) poloxamer 407. In the case of mucosal tissues, thefree drug or nanoparticles were dispersed in a simulated vaginalfluid (SVF) [24] or PBS pH 7.4 at a concentration of 0.02% (w/v) indapivirine and placed in the donor chamber, while the receptorchamber was filled with 8 mL of PBS pH 7.4 added with 0.2% (w/v)poloxamer 407. Samples from the basolateral chamber or recep-tor chamber were collected after 2 h, processed as described forcalibration standards and assayed for dapivirine. Apparent perme-ability coefficients (Papp in cm s−1) were calculated according to thefollowing equation:
Papp = Q
A × C × t(1)
where Q is the total amount of permeated drug (�g), A the dif-fusion area, C the concentration of dapivirine (�g cm3) in the
apical or donor chamber at time zero, and t the time of exper-iment (s). Further, monolayers mounted on Transwell® supportsor mucosal tissues from Franz cells were thoroughly washed withHBSS, processed as stated for calibration standards and assayed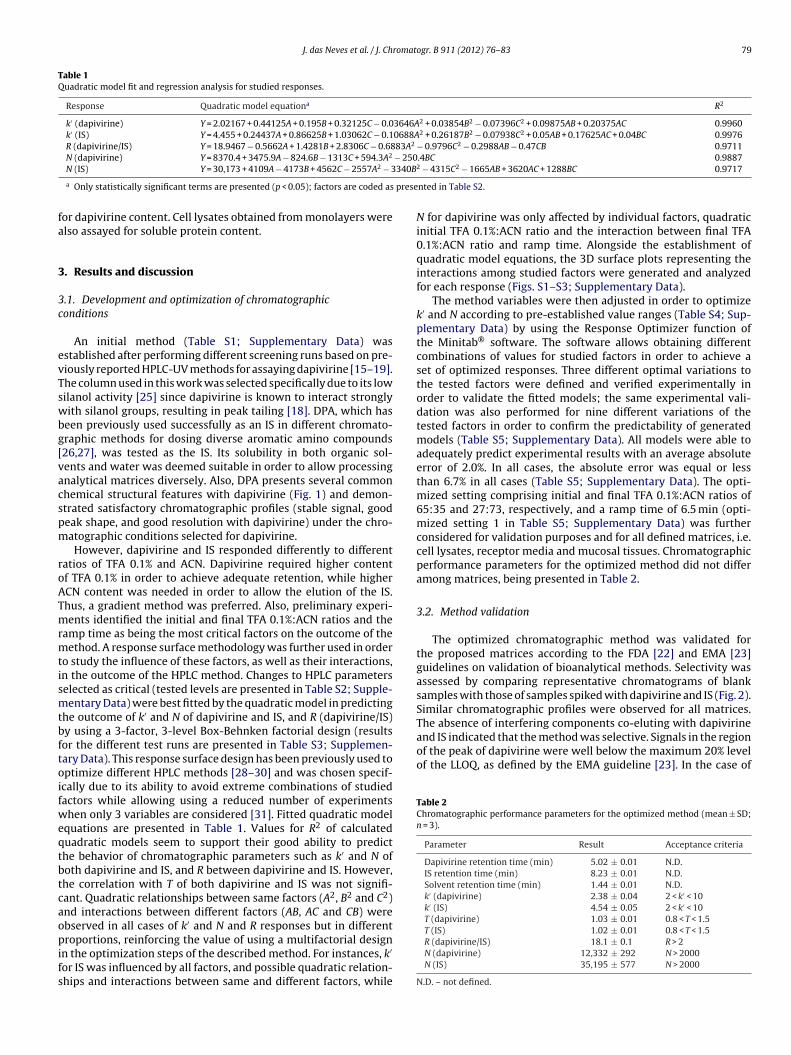
J. das Neves et al. / J. Chromatogr. B 911 (2012) 76– 83 79
Table 1Quadratic model fit and regression analysis for studied responses.
Response Quadratic model equationa R2
k′ (dapivirine) Y = 2.02167 + 0.44125A + 0.195B + 0.32125C − 0.03646A2 + 0.03854B2 − 0.07396C2 + 0.09875AB + 0.20375AC 0.9960k′ (IS) Y = 4.455 + 0.24437A + 0.86625B + 1.03062C − 0.10688A2 + 0.26187B2 − 0.07938C2 + 0.05AB + 0.17625AC + 0.04BC 0.9976R (dapivirine/IS) Y = 18.9467 − 0.5662A + 1.4281B + 2.8306C − 0.6883A2 − 0.9796C2 − 0.2988AB − 0.47CB 0.9711N (dapivirine) Y = 8370.4 + 3475.9A − 824.6B − 1313C + 594.3A2 − 250.4BC 0.9887
340B
prese
fa
3
3c
evTswbg[vacspm
roATmrmtismtbftoifweqtbtcaopifs
and IS indicated that the method was selective. Signals in the regionof the peak of dapivirine were well below the maximum 20% levelof the LLOQ, as defined by the EMA guideline [23]. In the case of
Table 2Chromatographic performance parameters for the optimized method (mean ± SD;n = 3).
Parameter Result Acceptance criteria
Dapivirine retention time (min) 5.02 ± 0.01 N.D.IS retention time (min) 8.23 ± 0.01 N.D.Solvent retention time (min) 1.44 ± 0.01 N.D.k′ (dapivirine) 2.38 ± 0.04 2 < k′ < 10k′ (IS) 4.54 ± 0.05 2 < k′ < 10T (dapivirine) 1.03 ± 0.01 0.8 < T < 1.5T (IS) 1.02 ± 0.01 0.8 < T < 1.5
N (IS) Y = 30,173 + 4109A − 4173B + 4562C − 2557A2 − 3
a Only statistically significant terms are presented (p < 0.05); factors are coded as
or dapivirine content. Cell lysates obtained from monolayers werelso assayed for soluble protein content.
. Results and discussion
.1. Development and optimization of chromatographiconditions
An initial method (Table S1; Supplementary Data) wasstablished after performing different screening runs based on pre-iously reported HPLC-UV methods for assaying dapivirine [15–19].he column used in this work was selected specifically due to its lowilanol activity [25] since dapivirine is known to interact stronglyith silanol groups, resulting in peak tailing [18]. DPA, which has
een previously used successfully as an IS in different chromato-raphic methods for dosing diverse aromatic amino compounds26,27], was tested as the IS. Its solubility in both organic sol-ents and water was deemed suitable in order to allow processingnalytical matrices diversely. Also, DPA presents several commonhemical structural features with dapivirine (Fig. 1) and demon-trated satisfactory chromatographic profiles (stable signal, goodeak shape, and good resolution with dapivirine) under the chro-atographic conditions selected for dapivirine.However, dapivirine and IS responded differently to different
atios of TFA 0.1% and ACN. Dapivirine required higher contentf TFA 0.1% in order to achieve adequate retention, while higherCN content was needed in order to allow the elution of the IS.hus, a gradient method was preferred. Also, preliminary experi-ents identified the initial and final TFA 0.1%:ACN ratios and the
amp time as being the most critical factors on the outcome of theethod. A response surface methodology was further used in order
o study the influence of these factors, as well as their interactions,n the outcome of the HPLC method. Changes to HPLC parameterselected as critical (tested levels are presented in Table S2; Supple-entary Data) were best fitted by the quadratic model in predicting
he outcome of k′ and N of dapivirine and IS, and R (dapivirine/IS)y using a 3-factor, 3-level Box-Behnken factorial design (resultsor the different test runs are presented in Table S3; Supplemen-ary Data). This response surface design has been previously used toptimize different HPLC methods [28–30] and was chosen specif-cally due to its ability to avoid extreme combinations of studiedactors while allowing using a reduced number of experimentshen only 3 variables are considered [31]. Fitted quadratic model
quations are presented in Table 1. Values for R2 of calculateduadratic models seem to support their good ability to predicthe behavior of chromatographic parameters such as k′ and N ofoth dapivirine and IS, and R between dapivirine and IS. However,he correlation with T of both dapivirine and IS was not signifi-ant. Quadratic relationships between same factors (A2, B2 and C2)nd interactions between different factors (AB, AC and CB) werebserved in all cases of k′ and N and R responses but in different
roportions, reinforcing the value of using a multifactorial designn the optimization steps of the described method. For instances, k′
or IS was influenced by all factors, and possible quadratic relation-hips and interactions between same and different factors, while
2 − 4315C2 − 1665AB + 3620AC + 1288BC 0.9717
nted in Table S2.
N for dapivirine was only affected by individual factors, quadraticinitial TFA 0.1%:ACN ratio and the interaction between final TFA0.1%:ACN ratio and ramp time. Alongside the establishment ofquadratic model equations, the 3D surface plots representing theinteractions among studied factors were generated and analyzedfor each response (Figs. S1–S3; Supplementary Data).
The method variables were then adjusted in order to optimizek′ and N according to pre-established value ranges (Table S4; Sup-plementary Data) by using the Response Optimizer function ofthe Minitab® software. The software allows obtaining differentcombinations of values for studied factors in order to achieve aset of optimized responses. Three different optimal variations tothe tested factors were defined and verified experimentally inorder to validate the fitted models; the same experimental vali-dation was also performed for nine different variations of thetested factors in order to confirm the predictability of generatedmodels (Table S5; Supplementary Data). All models were able toadequately predict experimental results with an average absoluteerror of 2.0%. In all cases, the absolute error was equal or lessthan 6.7% in all cases (Table S5; Supplementary Data). The opti-mized setting comprising initial and final TFA 0.1%:ACN ratios of65:35 and 27:73, respectively, and a ramp time of 6.5 min (opti-mized setting 1 in Table S5; Supplementary Data) was furtherconsidered for validation purposes and for all defined matrices, i.e.cell lysates, receptor media and mucosal tissues. Chromatographicperformance parameters for the optimized method did not differamong matrices, being presented in Table 2.
3.2. Method validation
The optimized chromatographic method was validated forthe proposed matrices according to the FDA [22] and EMA [23]guidelines on validation of bioanalytical methods. Selectivity wasassessed by comparing representative chromatograms of blanksamples with those of samples spiked with dapivirine and IS (Fig. 2).Similar chromatographic profiles were observed for all matrices.The absence of interfering components co-eluting with dapivirine
R (dapivirine/IS) 18.1 ± 0.1 R > 2N (dapivirine) 12,332 ± 292 N > 2000N (IS) 35,195 ± 577 N > 2000
N.D. – not defined.

80 J. das Neves et al. / J. Chromatogr. B 911 (2012) 76– 83
F L IS,
c
Itwwsaw
lpduwa
sRtaamLr
0amtre0ioon
ig. 2. Chromatograms of (a) spiked sample with 0.3 �g/mL dapivirine and 0.1 �g/marry-over. Presented samples are from cell lysates.
S, interference values were lower than the maximum accepted byhis last guideline (5%). Moreover, selectivity was also maintainedhen formulation components of nanoparticles and nanoparticlesere spiked in matrices. The absence of further peaks in spiked
amples seems to indicate that spiked compounds do not absorbt around 290 nm or are not retained in the column, being elutedith the solvent.
Peak areas at the retention time of dapivirine were around oress than 7% of the one for the LLOQ of dapivirine when blank sam-les were analyzed after running a sample containing 1.5 �g/mLapivirine and IS (Fig. 2d). Also, no signal for the IS was observednder the same conditions. This indicated that the carry-over effectas negligible and inferior to the 20% and 5% limits for dapivirine
nd IS, respectively, as defined by the EMA guideline [23].The LLOQ and LOD were determined by sequential dilution of
amples (n = 5) with blank matrices and analysis of the S/N ratio.atios of 10:1 and 3:1 are routinely considered for calculatinghe LLOQ and LOD, respectively [32]. Thus, LLOQ was determineds 0.02 �g/mL and LOD estimated at 0 0.006 �g/mL. These valuesre considerably lower than the ones determined for a HPLC-UVethod previously developed by our group (LLOQ = 0.24 �g/mL and
OD = 0.08 �g/mL as determined from the standard deviation of theesponse and the slope of the calibration curve) [18].
Calibration curves were established in the range of.02–1.5 �g/mL in order to include the LLOQ and fulfill therray of concentrations expected during the application of theethod. Analysis of linearity was performed by the visual inspec-
ion of the calibration curves, as well as the calculation of theegression equation and R2 (Table 3). Individual R2 values forach replicate of the calibration curve were equal or higher than.9991 for all considered matrices, thus suggesting good linearity
n the considered range. Also, the back calculated concentrationsf individual calibration standards presented deviations equalr less than 15% (equal or less than 20% for the LLOQ) from theominal values (Table S6; Supplementary Data), as defined by both
(b) blank sample, (c) spiked sample at LLOQ of dapivirine and 0.1 �g/mL IS, and (d)
FDA and EMA guidelines [22,23]. However, and even if commonlyused for assessing the quality of linear regressions, the use of R2
as a true pointer of linearity has been questioned [33]. Therefore,the assessment of linearity was reinforced by the analysis of theresponse factors plot. The near zero slope of the curve and RSDvalues below 2% across all concentrations tested reinforced thelinearity of the calibration curve (Table 3) [34].
The within-run and between-run accuracy and precision resultsare presented in Table 4. In the case of accuracy, the percentagedeviation of the mean measured concentration from the nominalconcentration for all levels ranged from −1.4% to +9.5% in within-and between-runs and for both considered matrices. These valuesare below the maximum 15% deviation allowed (20% in the case ofLLOQ) by both FDA and EMA guidelines [22,23]. In the case of pre-cision, the within- and between-run RSD values varied from 1.7%to 10.2% for all levels and both matrices, again within the 15% (20%for the LLOQ) deviation considered acceptable as per FDA and EMAguidelines. Thus the method was accepted as accurate and precise.
Table 5 presents the recovery values for dapivirine of the devel-oped method upon sample processing. Values ranged from 90.7%to 102.0% when free dapivirine was used and were comparablebetween different matrices. In order to discard possible differencesin drug extraction during sample processing, drug recovery wasalso tested when using dapivirine-loaded nanoparticles. Resultsshowed no differences when compared to the free drug, with recov-ery values in the range of 93.2–98.4% (Table 5). Overall, theseresults indicated that the extraction of the drug was nearly com-plete for all matrices during sample processing. Lastly, the stabilityof dapivirine in different matrices and under different conditions ispresented in Table 6. Deviations from nominal concentrations wereless or equal than 4.2%, below the maximum of 15% defined in by
EMA [23]. Also, dapivirine and IS were stable in stock solutions of1 mg/mL, presenting recovery percentages of 101.7% (RSD = 1.3%)and 100.8% (RSD = 1.7%), respectively, upon 3 months at room tem-perature and protected from light.
J. das Neves et al. / J. Chromatogr. B 911 (2012) 76– 83 81
Table 3Results for linear regression and response factors analysis.
Cell lysates Receptor media Mucosa tissues
Regression equationa R = 12.069(±0.059) × C − 0.0281(±0.0400) R = 10.816(±0.025) × C + 0.0008(±0.0168) R = 12.414(±0.048) × C − 0.0299(±0.0325)R2 0.99985 0.99998 0.99991Response factors slope 0.1304 −0.1603 0.2762Response factors RSD 1.6% 1.9% 1.8%
a Mean results (n = 3; standard error is indicated in brackets); R – response (area ratio between dapivirine and IS); C – concentration (�g/mL).
Table 4Accuracy and precision results (n = 5).
Matrix Nominal concentration (�g/mL) Within-run Between-runa
Measuredconcentration(�g/mL)
Recovery (%) RSD (%) Measuredconcentration(�g/mL)
Recovery (%) RSD (%)
Cell lysates 0.02 0.022 108.8 8.4 0.021 107.0 10.20.05 0.052 104.9 5.7 0.053 106.5 5.60.75 0.770 102.7 4.6 0.740 98.7 5.81.2 1.18 98.6 3.3 1.19 99.3 4.7
Receptor media 0.02 0.022 109.5 5.0 0.021 106.5 7.60.05 0.052 103.9 5.3 0.051 101.7 4.30.75 0.768 102.3 1.7 0.768 102.4 2.61.2 1.23 102.5 2.2 1.22 101.8 3.1
Mucosal tissues 0.02 0.021 106.4 10.3 0.021 107.1 7.40.05 0.052 103.8 8.7 0.052 104.2 6.30.75 0.731 97.4 6.1 0.742 99.0 7.1
10
3
zefdaecap
stas4lu4
TR
1.2 1.25
a Three runs determined in different days.
.3. Method applicability
The ability of dapivirine-loaded PEO-PCL nanoparticles (200 nm,eta potential −30 mV and 13% (w/w) drug loading) [14] to promotenhanced intracellular/cell associated drug levels as compared toree dapivirine are presented in Fig. 3. Overall, significantly higherrug levels were achieved with nanoparticles, except for CaSkind VK2/E6E7 cells. In particular, the noticeably higher drug lev-ls obtained in HIV target cells (PBMCs, macrophages and dendriticells) seem particular relevant and suggest that nanoparticles wereble to provide targeted delivery of dapivirine to these cells in aassive fashion.
In the case of cell monolayer permeability experiments,mall but significant differences (p < 0.05; 2-tailed Student’s t-est for independent samples) were observed for dapivirine whenssociated to nanoparticles or in the free form. Dapivirine pre-ented Papp values (mean ± SD) of 3.70 × 10⁻⁶ ± 0.36 × 10⁻⁶ and
.44 × 10−6 ± 0.26 × 10⁻⁶ cm s−1 for CaSki and Caco-2 cell mono-ayers, respectively, when dapivirine-loaded nanoparticles weresed; in the case of the free drug, these results increased to.84 × 10−6 ± 0.28 × 10⁻⁶ and 5.26 × 10⁻⁶ ± 0.38 × 10⁻⁶ cm s−1 for
able 5ecovery results (n = 5).
Matrix Nominal concentration (�g/mL) FreRe
Cell lysates 0.02 90.05 100.75 91.2 9
Receptor media 0.02 90.05 90.75 91.2 9
Mucosal tissues 0.02 100.05 90.75 91.2 9
4.0 5.3 1.20 100.2 5.4
CaSki and Caco-2 cell monolayers, respectively. Even if higher,the values found in this study are in order with those pre-viously reported for free dapivirine in Caco-2 cell monolayers(2.14 × 10⁻⁶ ± 0.81 × 10⁻⁶ cm s−1) [35].
The retention of dapivirine at cell monolayers/mucosal tissueswas also determined. The amount of dapivirine assayed in CaSkicell monolayers was 0.56 ± 0.06 and 0.16 ± 0.02 �g/mg of proteinfor nanoparticles and free drug, respectively. In the case of Caco-2, a similar trend was observed: 0.70 ± 0.06 and 0.38 ± 0.08 �g/mgof protein for nanoparticles and free drug, respectively. These dataindicate that nanoparticles were able to improve drug retentionat the monolayers. In the case of both vaginal and rectal mucosaltissues, the amount of associated drug was successfully determinedbut characterized by a wide variation between different sampleswith values ranging from 0.8 to 20.6 �g/g of tissue. Previous workby Akil et al. [36] using human cervical tissue mounted in Franz cellsfound retention levels of dapivirine of 33–96 �g/g of tissue, which
are higher than the ones found in this study. These differences maybe related to the diverse set-up (e.g. the amount of dapivirine in thedonor compartment was 100 �g) and tissue origin. Also, we did notobserve differences when using dapivirine-loaded nanoparticles ore-dapivirine Dapivirine-loaded nanoparticlescovery (%) RSD (%) Recovery (%) RSD (%)
2.7 9.2 97.3 3.82.0 5.4 93.6 5.90.7 6.7 98.4 4.70.7 6.7 93.4 3.37.1 4.9 95.6 7.74.9 5.3 96.6 2.75.1 1.7 93.2 3.23.0 2.2 94.3 3.60.2 5.6 97.4 6.87.6 5.8 96.7 2.93.9 5.7 98.4 6.54.1 5.2 96.0 2.7

82 J. das Neves et al. / J. Chromatogr. B 911 (2012) 76– 83
Table 6Stability of dapivirine samples in different matrices and conditions (n = 3).
Condition Matrix Nominal concentration (�g/mL) Recovery (%) RSD (%)
72 h/room temperature Cell lysates 0.05 97.3 4.91.2 101.2 1.7
Receptor media 0.05 100.6 4.01.2 99.7 2.0
Mucosal tissues 0.05 99.5 4.01.2 98.9 1.7
14 days/−20 ◦C Cell lysates 0.05 100.5 14.01.2 98.1 3.0
Receptor media 0.05 102.2 1.91.2 98.0 5.6
Mucosal tissues 0.05 99.0 13.51.2 102.4 7.2
Freeze–thawinga Cell lysates 0.05 97.0 4.61.2 97.8 1.2
Receptor media 0.05 104.2 8.01.2 100.8 4.0
Mucosal tissues 0.05 108.5 4.11.2 100.8 5.3
48 h/in autosampler Cell lysates 0.05 103.3 4.41.2 101.3 4.4
Receptor media 0.05 100.9 2.01.2 101.6 2.1
Mucosal tissues 0.05
1.2
a Three freeze–thawing cycles, where samples were frozen at −20 ◦C for at least 24 h a
Fig. 3. Intracellular/cell associated levels of dapivirine in different cell types fordrug-loaded PEO-PCL nanoparticles (NPs) and the free drug after 1 h incubation(dapivirine initial concentration was 1 �M). Columns represent mean values andv(s
fbif
4
vBtmdaiea
ertical bars the standard deviation (n = 3). (*) denotes a significant differencep < 0.05) of mean results as assessed by 2-tailed Student’s t-test for independentamples.
ree drug, or among different types of tissue (vaginal or rectal). Theroad variation found is most probably related to inconsistencies
n tissue preparation, particularly sample thickness, and deservesurther work in refining the Franz cell permeability set-up.
. Conclusions
A new bioanalytical HPLC-UV method was developed andalidated for the assay of the antiretroviral drug dapivirine. Theox-Behnken experimental design was shown useful in optimizinghe proposed method, allowing for multivariate analysis with a
inimal number of experiences. An optimized method was vali-ated according to both FDA and EMA guidelines on bioanalytical
ssays and was shown to be selective, linear, accurate and precisen the range of 0.02–1.5 �g/mL. Also, the amount of carry-overffect, LLOQ, LOD, recovery and sample stability were determinednd found adequate for the purposes of the method and/or in105.3 5.0101.7 5.6
nd thawed at 20 ◦C (performed over 7 days).
accordance with guidelines. The method was successfully appliedto the assay of dapivirine in cell-based assays and permeabilityexperiments through both cell monolayers and mucosal tissues.Thus, the hereby proposed HPLC-UV method provides a simple,versatile and reliable approach to the assay dapivirine in differentbiological matrices.
Acknowledgements
José das Neves gratefully acknowledges Fundac ão para aCiência e a Tecnologia, Portugal for financial support (grantSFRH/BD/43393/2008). The authors express their gratitude toMarta Salgueirinho at Carneiro & Salgueirinho, Lda., Trofa, Portugal,for providing pig vaginal and rectal mucosa samples.
Appendix A. Supplementary data
Supplementary data associated with this article can be found, inthe online version, at doi:10.1016/j.jchromb.2012.10.034.
References
[1] K.K. Ariën, V. Jespers, G. Vanham, Rev. Med. Virol. 21 (2011) 110.[2] Q. Abdool Karim, S.S. Abdool Karim, J.A. Frohlich, A.C. Grobler, C. Baxter, L.E.
Mansoor, A.B. Kharsany, S. Sibeko, K.P. Mlisana, Z. Omar, T.N. Gengiah, S.Maarschalk, N. Arulappan, M. Mlotshwa, L. Morris, D. Taylor, Science 329 (2010)1168.
[3] Y. Van Herrewege, J. Michiels, J. Van Roey, K. Fransen, L. Kestens, J. Balzarini, P.Lewi, G. Vanham, P. Janssen, Antimicrob. Agents Chemother. 48 (2004) 337.
[4] C. Herrera, M. Cranage, I. McGowan, P. Anton, R.J. Shattock, Antimicrob. AgentsChemother. 53 (2009) 1797.
[5] Y. Gali, O. Delezay, J. Brouwers, N. Addad, P. Augustijns, T. Bourlet, H. Hamzeh-Cognasse, K.K. Ariën, B. Pozzetto, G. Vanham, Antimicrob. Agents Chemother.54 (2010) 5105.
[6] A.M. Nel, P. Coplan, J.H. van de Wijgert, S.H. Kapiga, C. von Mollendorf, E.Geubbels, J. Vyankandondera, H.V. Rees, G. Masenga, I. Kiwelu, J. Moyes, S.C.Smythe, AIDS 23 (2009) 1531.
[7] J. Romano, B. Variano, P. Coplan, J. Van Roey, K. Douville, Z. Rosenberg, M. Tem-merman, H. Verstraelen, L. Van Bortel, S. Weyers, M. Mitchnick, AIDS Res. Hum.Retroviruses 25 (2009) 483.
[8] A.M. Nel, S.C. Smythe, S. Habibi, P.E. Kaptur, J.W. Romano, J. Acquir. Immune
Defic. Syndr. 55 (2010) 161.[9] International Partnership for Microbicides, First efficacy trial of a microbicidering to prevent HIV is underway, available from: http://www.ipmglobal.org/publications/first-efficacy-trial-microbicide-ring-prevent-hiv-underway(accessed 17.07.12).

romat
[
[
[
[
[
[
[
[
[
[[
[
[
[
[[[
[
[
[
[
[
[[[
[
Timmerman, W. Van den Broeck, F. Vanhoutte, G. Van’t Klooster, M. Vinkers, Y.Volovik, P.A. Janssen, Drugs R. D. 5 (2004) 245.
J. das Neves et al. / J. Ch
10] Microbicides Trials Network, ASPIRE – a study to prevent infection witha ring for extended use, available from: http://www.mtnstopshiv.org/news/studies/mtn020/backgrounder (accessed 31.07.12).
11] A. Akil, M.A. Parniak, C.S. Dezzutti, B.J. Moncla, M.R. Cost, M. Li, L.C. Rohan, DrugDeliv. Transl. Res. 1 (2011) 209.
12] A.D. Woolfson, M.L. Umrethia, V.L. Kett, R.K. Malcolm, Int. J. Pharm. 388 (2010)136.
13] J. das Neves, M.M. Amiji, M.F. Bahia, B. Sarmento, Adv. Drug Deliv. Rev. 62 (2010)458.
14] J. das Neves, J. Michiels, K.K. Arien, G. Vanham, M. Amiji, M.F. Bahia, B. Sarmento,Pharm. Res. 29 (2012) 1468.
15] R.K. Malcolm, A.D. Woolfson, C.F. Toner, R.J. Morrow, S.D. McCullagh, J. Antimi-crob. Chemother. 56 (2005) 954.
16] K.M. Gupta, S.M. Pearce, A.E. Poursaid, H.A. Aliyar, P.A. Tresco, M.A. Mitchnik,P.F. Kiser, J. Pharm. Sci. 97 (2008) 4228.
17] B.B. Saxena, Y.A. Han, D. Fu, P. Rathnam, M. Singh, J. Laurence, S. Lerner, AIDS23 (2009) 917.
18] J. das Neves, B. Sarmento, M.M. Amiji, M.F. Bahia, J. Pharm. Biomed. Anal. 52(2010) 167.
19] J. Gupta, A. Othman, J. Qihai Tao, S. Garg, Curr. Pharm. Anal. 7 (2011) 21.20] V.A. Jespers, J.M. Van Roey, G.I. Beets, A.M. Buve, J. Acquir. Immune Defic. Syndr.
44 (2007) 154.21] J.P. Nuttall, D.C. Thake, M.G. Lewis, J.W. Ferkany, J.W. Romano, M.A. Mitchnick,
Antimicrob. Agents Chemother. 52 (2008) 909.22] Food and Drug Administration, Guidance for Industry. Bioanalytical Method
Validation, Rockville, MD, USA, 2001.23] European Medicines Agency, Guideline on Bioanalytical Method Validation,
London, United Kingdom, 2011.
[
ogr. B 911 (2012) 76– 83 83
24] D.H. Owen, D.F. Katz, Contraception 59 (1999) 91.25] U.D. Neue, K. Tran, A. Mendez, P.W. Carr, J. Chromatogr. A 1063 (2005) 35.26] M. Torrens, C. Castillo, L. San, E. del Moral, M.L. Gonzalez, R. de la Torre, Drug
Alcohol Depend. 52 (1998) 193.27] H.S. Shin, J.G. Kim, Y.J. Shin, S.H. Jee, J. Chromatogr. B Analyt. Technol. Biomed.
Life Sci. 769 (2002) 177.28] N.M. de Aragão, M.C. Veloso, M.S. Bispo, S.L. Ferreira, J.B. de Andrade, Talanta
67 (2005) 1007.29] Y. Zhou, J.Z. Song, F.F. Choi, H.F. Wu, C.F. Qiao, L.S. Ding, S.L. Gesang, H.X. Xu, J.
Chromatogr. A 1216 (2009) 7013.30] D. Awotwe-Otoo, C. Agarabi, P.J. Faustino, M.J. Habib, S. Lee, M.A. Khan, R.B.
Shah, J. Pharm. Biomed. Anal. 62 (2012) 61.31] S.L. Ferreira, R.E. Bruns, H.S. Ferreira, G.D. Matos, J.M. David, G.C. Brandao, E.G.
da Silva, L.A. Portugal, P.S. dos Reis, A.S. Souza, W.N. dos Santos, Anal. Chim.Acta 597 (2007) 179.
32] J. Vidal, A. Jardy, Anal. Chem. 71 (1999) 2672.33] J.M. Sonnergaard, Int. J. Pharm. 321 (2006) 12.34] R. LoBrutto, T. Patel, in: Y. Kazakevich, R. LoBrutto (Eds.), HPLC for Pharmaceu-
tical Scientists, Wiley, Hoboken, NY, 2007, pp. 455–502.35] P. Lewi, E. Arnold, K. Andries, H. Bohets, H. Borghys, A. Clark, F. Daeyaert, K. Das,
M.P. de Bethune, M. de Jonge, J. Heeres, L. Koymans, J. Leempoels, J. Peeters, P.
36] A. Akil, M. Cost, B. Devlin, L.C. Rohan, Dapivirine tissue levels and distributionin human cervical tissue ex vivo after exposure to dapivirine vaginal film, in:2012 International Microbicides Conference, Sydney, Australia, 2012.


![Astrocytic tracer dynamics estimated from [1-11C]-acetate PET measurements](https://static.fdokumen.com/doc/165x107/6334cca03e69168eaf070c95/astrocytic-tracer-dynamics-estimated-from-1-11c-acetate-pet-measurements.jpg)