Mnferrite nanoparticles via reverse microemulsions: synthesis and characterization
11
RESEARCH PAPER Mn–ferrite nanoparticles via reverse microemulsions: synthesis and characterization Alessandra Scano • Guido Ennas • Francesca Frongia • Aurelio La Barbera • M. Arturo Lo ´pez-Quintela • Giaime Marongiu • Giorgio Paschina • Davide Peddis • Martina Pilloni • Carlos Va ´zquez-Va ´zquez Received: 19 April 2010 / Accepted: 21 December 2010 / Published online: 20 January 2011 Ó Springer Science+Business Media B.V. 2011 Abstract Mn–ferrite nanoparticles were synthesized by thermal treatment at 800 °C of manganese and iron oxo-hydroxides obtained via water-in-oil microemul- sions consisting of n-hexanol as continuous phase, cetyl trimethyl ammonium bromide (CTAB) as the cationic surfactant and aqueous solutions of metal salts and precipitant agent (tetramethyl ammonium hydroxide) as reagents. Nanoparticles were synthesized using a multi- microemulsion approach. Two different co-precipitation routes are described depending on the Fe(II) or Fe(III) precursor salts. The influence of salt concentration and digestion process on the final products was examined. The nanoparticles were characterized by X-ray diffrac- tion accompanied by Rietveld analysis, transmission electron microscopy, thermal analysis, infrared spectros- copy, and SQUID magnetometry. In all the synthesis reported in this study MnFe 2 O 4 was observed only after thermal treatment at 800 °C of the as-prepared precur- sors. Almost spherical nanocrystalline MnFe 2 O 4 ranging from 12 to 39 nm was obtained starting from chlorides or mixed chloride–sulfate salts as precursors. Low values of reduced remanent magnetization (M r /M s ) and coercive field (H c ) induce to believe that a fraction of superpara- magnetic particle is present at room temperature. Keywords Superparamagnetic materials Nanocrystalline materials Nanoparticles Microemulsion Introduction In the last decades nanoparticles have considerably attracted the attention of researchers for their unique physical and chemical properties that differ significantly from those of the bulk material, due to their extremely small size and large specific surface (Pikethy 2004; Li et al. 2003). In the field of nanomaterials, ferrite nanoparticles have received increased attention due to good catalytic activity in water splitting for hydrogen production (Alvani et al. 2005) and for their magnetic properties, which can lead to a broad range of Electronic supplementary material The online version of this article (doi:10.1007/s11051-010-0205-y) contains supplementary material, which is available to authorized users. A. Scano (&) Centro de Ingenieria Avanzada de Superficies, AIN, C/San Cosme y San Damian, Cordovilla, 31191 Pamplona, Spain e-mail: [email protected] A. Scano G. Ennas F. Frongia G. Marongiu G. Paschina D. Peddis M. Pilloni Dipartimento di Scienze Chimiche, Universita ` di Cagliari, 09042 Monserrato, Cagliari, Italy A. La Barbera ENEA C. R. Casaccia, 00123 Rome, Italy M. A. Lo ´pez-Quintela C. Va ´zquez-Va ´zquez Departamento de Quı ´mica Fı ´sica, Facultad de Quı ´mica, Universidad de Santiago de Compostela, Santiago de Compostela, 15782 Galicia, Spain 123 J Nanopart Res (2011) 13:3063–3073 DOI 10.1007/s11051-010-0205-y
-
Upload
independent -
Category
Documents
-
view
2 -
download
0
Transcript of Mnferrite nanoparticles via reverse microemulsions: synthesis and characterization
RESEARCH PAPER
Mn–ferrite nanoparticles via reverse microemulsions:synthesis and characterization
Alessandra Scano • Guido Ennas • Francesca Frongia • Aurelio La Barbera •
M. Arturo Lopez-Quintela • Giaime Marongiu • Giorgio Paschina •
Davide Peddis • Martina Pilloni • Carlos Vazquez-Vazquez
Received: 19 April 2010 / Accepted: 21 December 2010 / Published online: 20 January 2011
� Springer Science+Business Media B.V. 2011
Abstract Mn–ferrite nanoparticles were synthesized
by thermal treatment at 800 �C of manganese and iron
oxo-hydroxides obtained via water-in-oil microemul-
sions consisting of n-hexanol as continuous phase, cetyl
trimethyl ammonium bromide (CTAB) as the cationic
surfactant and aqueous solutions of metal salts and
precipitant agent (tetramethyl ammonium hydroxide) as
reagents. Nanoparticles were synthesized using a multi-
microemulsion approach. Two different co-precipitation
routes are described depending on the Fe(II) or Fe(III)
precursor salts. The influence of salt concentration and
digestion process on the final products was examined.
The nanoparticles were characterized by X-ray diffrac-
tion accompanied by Rietveld analysis, transmission
electron microscopy, thermal analysis, infrared spectros-
copy, and SQUID magnetometry. In all the synthesis
reported in this study MnFe2O4 was observed only after
thermal treatment at 800 �C of the as-prepared precur-
sors. Almost spherical nanocrystalline MnFe2O4 ranging
from 12 to 39 nm was obtained starting from chlorides or
mixed chloride–sulfate salts as precursors. Low values of
reduced remanent magnetization (Mr/Ms) and coercive
field (Hc) induce to believe that a fraction of superpara-
magnetic particle is present at room temperature.
Keywords Superparamagnetic materials �Nanocrystalline materials � Nanoparticles �Microemulsion
Introduction
In the last decades nanoparticles have considerably
attracted the attention of researchers for their unique
physical and chemical properties that differ significantly
from those of the bulk material, due to their extremely
small size and large specific surface (Pikethy 2004;
Li et al. 2003). In the field of nanomaterials, ferrite
nanoparticles have received increased attention due to
good catalytic activity in water splitting for hydrogen
production (Alvani et al. 2005) and for their magnetic
properties, which can lead to a broad range of
Electronic supplementary material The online version ofthis article (doi:10.1007/s11051-010-0205-y) containssupplementary material, which is available to authorized users.
A. Scano (&)
Centro de Ingenieria Avanzada de Superficies,
AIN, C/San Cosme y San Damian, Cordovilla,
31191 Pamplona, Spain
e-mail: [email protected]
A. Scano � G. Ennas � F. Frongia � G. Marongiu �G. Paschina � D. Peddis � M. Pilloni
Dipartimento di Scienze Chimiche, Universita di Cagliari,
09042 Monserrato, Cagliari, Italy
A. La Barbera
ENEA C. R. Casaccia, 00123 Rome, Italy
M. A. Lopez-Quintela � C. Vazquez-Vazquez
Departamento de Quımica Fısica, Facultad de Quımica,
Universidad de Santiago de Compostela, Santiago de
Compostela, 15782 Galicia, Spain
123
J Nanopart Res (2011) 13:3063–3073
DOI 10.1007/s11051-010-0205-y
applications, from medicine and pharmacy to electron-
ics and mechanics. Moreover, the magnetic properties
of ferrites, as well as the others iron oxides, change
considerably when they are prepared as nanoparticles.
Metal oxide nanoparticles have been prepared through
several routes, including mixed oxides (Magnetic
Materials Producers Association, Chicago, IL, 1997),
sol–gel (Seki et al. 1988), hydrothermal processing
(Komarneni et al. 1988), ion-exchange resin manufac-
ture (Lee et al. 2003), decomposition of metal organic
precursors or polyols (Feldmann 2001; Feldmann and
Jungk 2001; Feldmann 2003; Ammar et al. 2001;
Rajamathi et al. 2002), spray pyrolysis, and by calcina-
tion of hydroxides co-precipitated from solutions of
pertinent salts (Tourinho et al. 1990; Kodama et al.1996;
Chen et al. 1996). Co-precipitation of hydroxides from
different inorganic bases (Tourinho et al. 1990; Kodama
et al.1996; Chen et al. 1996; Davies et al. 1993; Morales
et al. 1999; Babes et al. 1999; Shen et al. 1999; Carpenter
et al. 1999; Misra et al. 2004) and subsequent calcination
is the simplest method and when carried out in a
microemulsion system it permits the control of the
particles shape and size distribution. Microemulsions
are colloidal ‘‘nano-dispersions’’ of water in oil (or oil in
water) stabilized by a surfactant film. The surfactant
molecules spontaneously adsorb at interfaces and
separate the organic and the aqueous phases, thus
decreasing the interfacial tension. The system is opti-
cally transparent and thermodynamically stable. It
exhibits a dynamic structure of nanosized-aqueous
droplets which are in constant deformation, breakdown
and coalescence via the percolation process. If during
this process two reverse micelles containing reactants
exchange the contents of their aqueous cores, chemical
reaction takes place inside the micellar cores giving rise
to products of nearly uniform size and shape. The size of
the droplets can be modulated varying the water/
surfactant molar ratio (named W0). The underlying
concept behind this technique is the use of these
nanoreactors, through appropriate control of the syn-
thesis parameters, to produce tailor-made product down
to a nanoscale level (Lopez-Quintela 2003; Pileni 2003).
In this work, the synthesis of MnFe2O4 by thermal
treatment of oxo-hydroxide precursors obtained by
water-in-oil microemulsions is reported. Microemul-
sions consisted of n-hexanol as the continuous phase,
cetyl trimethyl ammonium bromide (CTAB) as the
cationic surfactant, and aqueous solutions of metal
salts and precipitant agent (tetramethyl ammonium
hydroxide) as reagents. Since the synthesis conditions
may affect the chemical, structural, and physical
properties of the mixed oxide nanoparticles, the influ-
ence of the different salts, their concentration, and
digestion process on the final products was examined.
Experimental
Synthesis
Chemicals were used without further purification.
n-Hexadecyl trimethyl ammonium bromide (CTAB,
C19H42NBr, 99 wt%), 1-hexanol (C6H13OH, [98 wt%),
iron (II) chloride tetrahydrate (FeCl2�4H2O, [98 wt%),
manganese (II) chloride tetrahydrate (MnCl2�4H2O,
99 wt%), tetramethyl ammonium hydroxide penthahy-
drate ((CH3)4NOH)�5H2O,[97 wt%), hydrogen peroxide
aqueous solution (H2O2, 30 wt%) were purchased from
Fluka. Manganese sulfate monohydrate (MnSO4�H2O,
98 wt%), hydrochloric acid solution (HCl, 37 wt%),
sulfuric acid (H2SO4, 99.8 wt%), and absolute ethanol
(C2H5OH 99.8 wt%) were purchased from Carlo Erba.
Iron (III) chloride (FeCl3�6H2O,[97 wt%) was purchased
from Alfa Aesar and iron (II) sulfate (FeSO4�7H2O,
99.5–102.0 wt%) from Merck. Fresh bidistillate and
deoxygenated water was used.
For the synthesis of MnFe2O4, the reaction was
carried out in a microemulsion with a CTAB/H2O/n-
hexanol weight ratio of 14:7:79 and a W0 molar ratio
([water]/[surfactant]) of 10. These values were selected
according to the phase diagram and literature (Hicks
2004; Ahmad and Friberg 1972), in order to secure the
formation of reverse micelles in the nanometric range.
Two co-precipitation routes were followed: in the first
route, Mn2? and Fe2? salts were used, while in the
second Fe2? salt was substituted by Fe3?.
In the first route microemulsion (I), containing an
acidic (pH 2) Fe2? and Mn2? aqueous solution, where
the Fe2?/Mn2? molar ratio was fixed to 2, was rapidly
mixed (2 min) under N2 atmosphere with microemul-
sion (II), containing an aqueous solution of the
precipitating agent. Iron and manganese chlorides
and sulfates were used as precursor salts in order to
investigate the anionic influence. The final pH was 11.
This resulted in co-precipitation of Fe(OH)2 and
Mn(OH)2 with the formation of the iron-manganese
oxyhydroxide. Microemulsion (III), containing H2O2,
was then rapidly added in order to oxidize the ferrous
3064 J Nanopart Res (2011) 13:3063–3073
123
ions. The resulting mixture was vigorously stirred and
the colloidal precipitate was centrifuged, washed with
ethanol to remove excess surfactant and unreacted
reagent and, dried in the oven at 40 �C. The as-
prepared samples were calcined up to 800 �C in
argon atmosphere and MnFe2O4 was obtained accord-
ing to the overall equation:
Mn2þ þ 2Fe2þ þ 6OH� þ 1=2O2 �!800 �C
MnFe2O4
þ 3H2O
ð1ÞThe effect of concentration, digestion, and tem-
perature on the final product was also taken into
account. Experimental synthesis conditions are
reported in Table 1. In Tables 1 and 2, and through-
out the body of text, syntheses labeled with the letter
‘‘A’’ refer to the use of Fe(II) salt while letter ‘‘B’’
refers to the use of Fe(III) salt. Letters A or B are
followed by the anionic symbol. ‘‘c’’ refers to high
metal concentration. Quoted numerical values refer to
temperature (�C) when different from room temper-
ature (RT).
In the second route starting from Mn2? and Fe3?
salts, microemulsion (I), containing an acidic (pH 2)
stoichiometric Fe3? and Mn2? aqueous solution
where the Fe3?/Mn2? molar ratio is 2, was mixed
with microemulsion (II), containing an aqueous
solution of the precipitating agent. Three preparations
were carried out with this procedure to obtain
MnFe2O4, according the following reaction:
Mn2þ þ 2Fe3þ þ 8OH� �!800 �CMnFe2O4 þ 4H2O:
ð2Þ
Molar concentrations of the starting solutions used in
the syntheses are shown in Table 2.
Characterization
Structural characterization was carried out by X-ray
powder diffraction (Seifert 93000) with a conven-
tional 0-20 Bragg–Brentano focalising geometry,
CuKa wavelength, graphite monochromator on the
diffracted beam and scintillation counter. Qualitative
analysis of XRD spectra was determined using the
PDF database (PCPDF-WIN, JCPDS-International
Center for Diffraction Data, Swarthome, PA) and
average crystallite sizes of the samples were calcu-
lated using the Scherrer equation. The calibration was
performed by means of a standard silicon sample and
using the Warren correction. For each XRD spectrum
different significant peaks was analyzed. Quantitative
phase analysis of selected sample were also evaluated
by the Rietveld method using the MAUD software
(Lutterotti et al. 1999) and recommended fitting
procedures were adopted (Young 1995). Structural
models of the identified phases were obtained by
inorganic crystal structure database (ICSD, Kar-
lsruhe, Germany). Lattice parameters, average crys-
talline size, and weight content of each phase were
refined. Weighted pattern agreement index Rwp was
less than 0.2 for all fitted samples.
Microscopical analysis was carried out by trans-
mission electron microscopy (TEM) with a JEOL
200CX microscope, working at 200 kV. The samples
Table 1 Compositions of the starting solutions
Sample [FeCl2]/M [MnCl2]/M [FeSO4]/M [MnSO4]/M [(CH3)4NOH]/M Digestion
A–Cl 0.066 0.033 0.45
A–Cl–c 0.133 0.066 1
A–Cl–c–50 0.133 0.066 1
A–SO4 0.066 0.033 0.45
A–Cl–SO4 0.066 0.033 0.45 x
A–Cl–SO4–35 0.066 0.033 0.6 x
A–Cl–SO4–c–50 0.25 0.125 1.69 x
Table 2 Compositions of the starting solutions
Sample [FeCl3]/M [MnCl2]/M [(CH3)4NOH]/M
B–Cl–c 0.266 0.133 1
B–Cl 0.133 0.066 1
B–Cl–50 0.133 0.066 1
J Nanopart Res (2011) 13:3063–3073 3065
123
for TEM analysis were dispersed in ethanol and
ultrasonicated. They were then dropped onto a copper
grid, allowed to dry and later viewed on the TEM.
Average particle size was obtained by dark field
images, measuring the average diameter of about 150
particles in different parts of the grid.
The thermal analysis (TG-SDTA) was performed
in an 851 Mettler-Toledo STAR System. TG-DTA
measurements were performed in argon flow (30 mL/
min) using a platinum crucible from room tempera-
ture up to 800 �C, with a 10 �C/min ramp rate.
DC magnetization measurements were performed
with a Quantum Design SQUID magnetometer
(Hmax = 5 T). The sample, in the form of powders,
was immobilized in an epoxy resin in order to prevent
any movement of the nanoparticles during the
measurements. The magnetization loops are mea-
sured up to 2 T.
Results
Bivalent precursor salts
Use of chlorides or sulfates as precursor salts
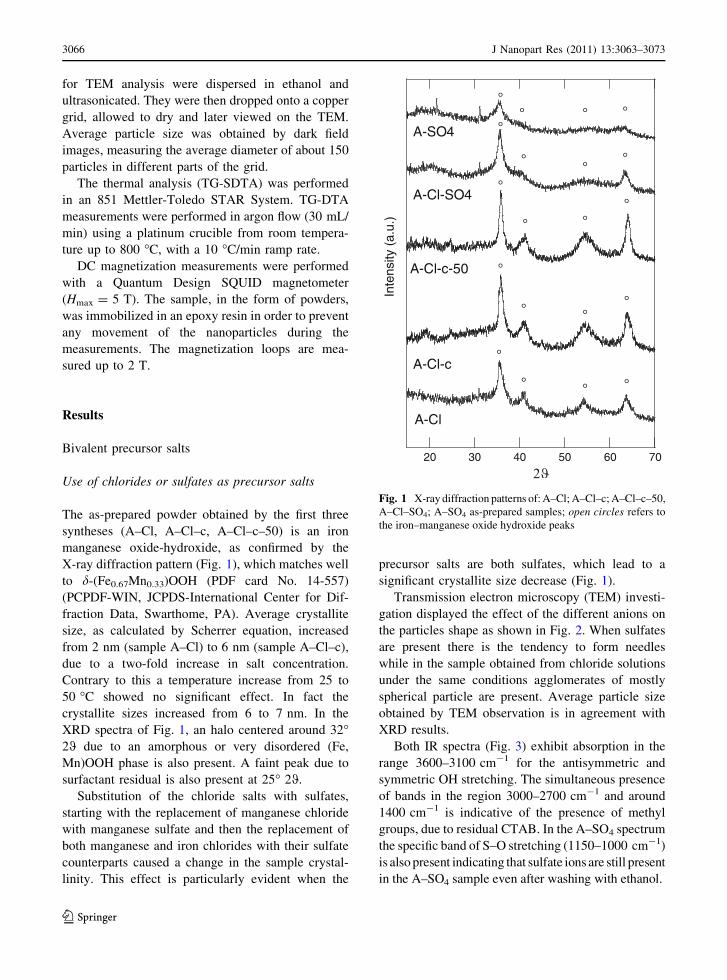
The as-prepared powder obtained by the first three
syntheses (A–Cl, A–Cl–c, A–Cl–c–50) is an iron
manganese oxide-hydroxide, as confirmed by the
X-ray diffraction pattern (Fig. 1), which matches well
to d-(Fe0.67Mn0.33)OOH (PDF card No. 14-557)
(PCPDF-WIN, JCPDS-International Center for Dif-
fraction Data, Swarthome, PA). Average crystallite
size, as calculated by Scherrer equation, increased
from 2 nm (sample A–Cl) to 6 nm (sample A–Cl–c),
due to a two-fold increase in salt concentration.
Contrary to this a temperature increase from 25 to
50 �C showed no significant effect. In fact the
crystallite sizes increased from 6 to 7 nm. In the
XRD spectra of Fig. 1, an halo centered around 32�20 due to an amorphous or very disordered (Fe,
Mn)OOH phase is also present. A faint peak due to
surfactant residual is also present at 25� 20.
Substitution of the chloride salts with sulfates,
starting with the replacement of manganese chloride
with manganese sulfate and then the replacement of
both manganese and iron chlorides with their sulfate
counterparts caused a change in the sample crystal-
linity. This effect is particularly evident when the
precursor salts are both sulfates, which lead to a
significant crystallite size decrease (Fig. 1).
Transmission electron microscopy (TEM) investi-
gation displayed the effect of the different anions on
the particles shape as shown in Fig. 2. When sulfates
are present there is the tendency to form needles
while in the sample obtained from chloride solutions
under the same conditions agglomerates of mostly
spherical particle are present. Average particle size
obtained by TEM observation is in agreement with
XRD results.
Both IR spectra (Fig. 3) exhibit absorption in the
range 3600–3100 cm-1 for the antisymmetric and
symmetric OH stretching. The simultaneous presence
of bands in the region 3000–2700 cm-1 and around
1400 cm-1 is indicative of the presence of methyl
groups, due to residual CTAB. In the A–SO4 spectrum
the specific band of S–O stretching (1150–1000 cm-1)
is also present indicating that sulfate ions are still present
in the A–SO4 sample even after washing with ethanol.
20 30 40 50 60 70
Inte
nsity
(a.
u.)
A-Cl
A-Cl-c
A-Cl-c-50
A-Cl-SO4
A-SO4
°° ° °
°
° °°
°
° °°
°
°
°
° °
°°
°
Fig. 1 X-ray diffraction patterns of: A–Cl; A–Cl–c; A–Cl–c–50,
A–Cl–SO4; A–SO4 as-prepared samples; open circles refers to
the iron–manganese oxide hydroxide peaks
3066 J Nanopart Res (2011) 13:3063–3073
123
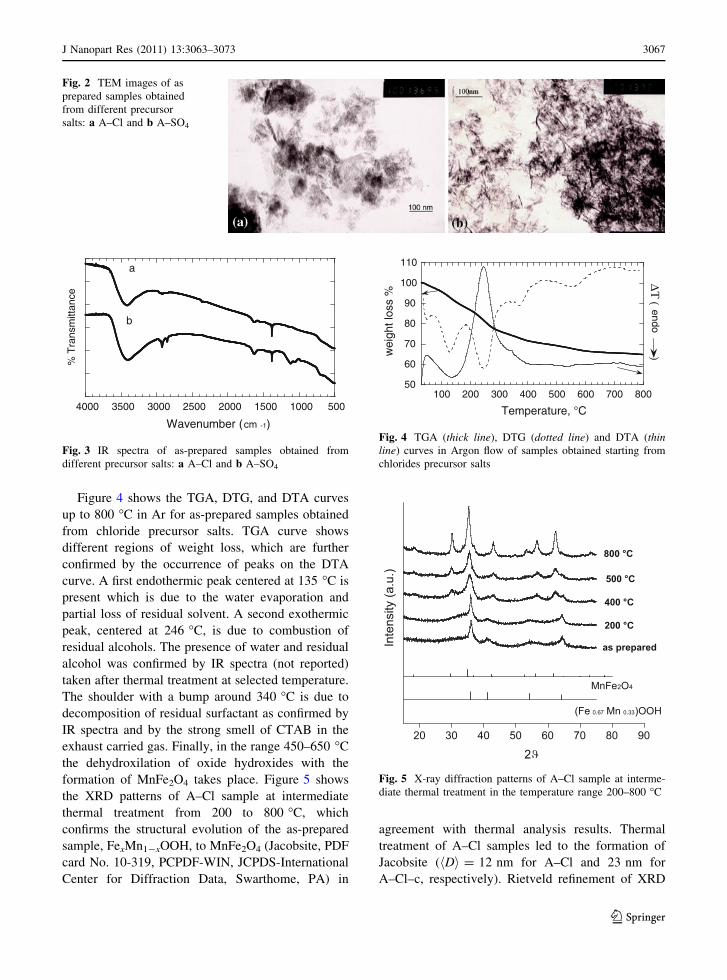
Figure 4 shows the TGA, DTG, and DTA curves
up to 800 �C in Ar for as-prepared samples obtained
from chloride precursor salts. TGA curve shows
different regions of weight loss, which are further
confirmed by the occurrence of peaks on the DTA
curve. A first endothermic peak centered at 135 �C is
present which is due to the water evaporation and
partial loss of residual solvent. A second exothermic
peak, centered at 246 �C, is due to combustion of
residual alcohols. The presence of water and residual
alcohol was confirmed by IR spectra (not reported)
taken after thermal treatment at selected temperature.
The shoulder with a bump around 340 �C is due to
decomposition of residual surfactant as confirmed by
IR spectra and by the strong smell of CTAB in the
exhaust carried gas. Finally, in the range 450–650 �C
the dehydroxilation of oxide hydroxides with the
formation of MnFe2O4 takes place. Figure 5 shows
the XRD patterns of A–Cl sample at intermediate
thermal treatment from 200 to 800 �C, which
confirms the structural evolution of the as-prepared
sample, FexMn1-xOOH, to MnFe2O4 (Jacobsite, PDF
card No. 10-319, PCPDF-WIN, JCPDS-International
Center for Diffraction Data, Swarthome, PA) in
agreement with thermal analysis results. Thermal
treatment of A–Cl samples led to the formation of
Jacobsite (hDi = 12 nm for A–Cl and 23 nm for
A–Cl–c, respectively). Rietveld refinement of XRD
Fig. 2 TEM images of as
prepared samples obtained
from different precursor
salts: a A–Cl and b A–SO4
5001000150020002500300035004000
% T
rans
mitt
ance
Wavenumber (cm -1)
a
b
Fig. 3 IR spectra of as-prepared samples obtained from
different precursor salts: a A–Cl and b A–SO4
50
60
70
80
90
100
110
100 200 300 400 500 600 700 800w
eigh
t los
s %
Temperature, °C
ΔΤ ( )
endo
Fig. 4 TGA (thick line), DTG (dotted line) and DTA (thinline) curves in Argon flow of samples obtained starting from
chlorides precursor salts
20 30 40 50 60 70 80 90
Inte
nsity
(a.u
.)
MnFe2O4
(Fe 0.67 Mn 0.33)OOH
as prepared
200 °C
400 °C
500 °C
800 °C
Fig. 5 X-ray diffraction patterns of A–Cl sample at interme-
diate thermal treatment in the temperature range 200–800 �C
J Nanopart Res (2011) 13:3063–3073 3067
123
data for A–Cl samples thermally treated to 800 �C
were carried out and the results are summarized in
Table 3. The lattice parameter obtained, 0.8442 nm,
is in agreement with literature data for bulk poly-
crystalline Jacobsite (0.8440–0.8500 nm, PCPDF-
WIN, JCPDS-International Center for Diffraction
Data, Swarthome, PA; Kodama et al. 1996).
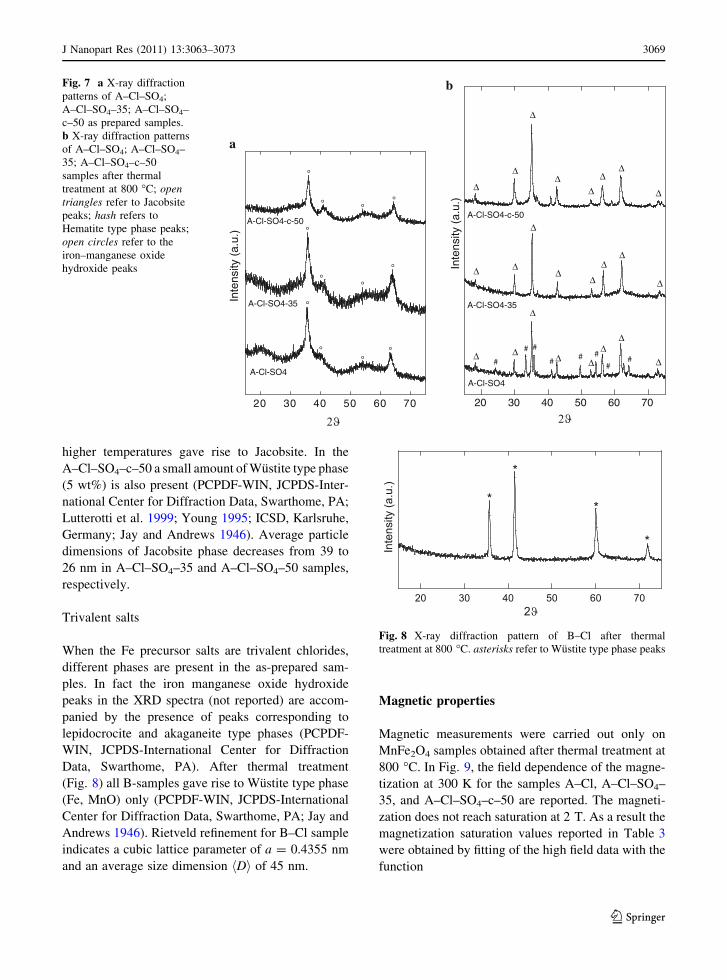
When the precursor salts are both sulfates thermal
treatment leads to the formation of a hematite type phase
while in the case of sulfate and chloride precursor
salts both Jacobsite and hematite phases are present
(Fig. 6). Rietveld refinement gave (Table 3) 70 wt%
of Jacobsite (lattice parameter a = 0.8500 nm, hDi =
45 nm) and 30 wt% of hematite type phase, rhombo-
hedral a-(Fe,Mn)2O3 (PCPDF-WIN, JCPDS-Interna-
tional Center for Diffraction Data, Swarthome, PA)
with a hDi = 78 nm.
Influence of digestion using mixed sulfate
and chloride as precursor salts
As-prepared samples A–Cl–SO4, A–Cl–SO4–35 and
A–Cl–SO4–c–50 were subjected to a digestion pro-
cess. The first sample was digested for 17 h at RT. The
other two were digested for the same time at 35 �C,
and at 50 �C, respectively. Figure 7a shows the X-ray
diffraction patterns of digested samples. The digested
samples are apparently similar to the ones obtained in
the A-syntheses without digestion. The final product of
the syntheses is an iron–manganese oxide hydroxide
with a hDi = 7 nm. Differences between the three
digested samples appear after thermal treatment at
800 �C (Fig. 7b). In fact Rietveld refinement of the
sample digested at room temperature, thermally
treated to 800 �C showed a mixture of Jacobsite
(70 wt% and hDi = 45 nm) and hematite type phases
(30 wt% and hDi = 78 nm). Samples digested at
Table 3 Rietveld refinement and magnetic measurement results on selected samples
Sample Jacobsite Wustite type Hematite type hDi(nm)
Hc
(Oe)
Ms
(emu/g)
Mr/Ms
a0 (nm) wt% a0 (nm) wt% a0(nm) c0 (nm) wt%
A–Cl 0.8442 (1) 100 (2) 12 60 41 (1) 0.09
A–Cl–SO4 0.8500 (1) 70 (1) 45
0.5030 (1) 1.3730 (5) 30 (1) 78
A–Cl–SO4–c–35 0.8466 (1) 100 (2) 39 80 65 (2) 0.20
A–Cl–SO4–c–50 0.8499 (1) 95 (2) 26 80 45 (1) 0.09
0.4428 (1) 5 (2) 22
B–Cl 0.4355 (1) 100 (2) 45
XRD Rietveld refinements are given in Supporting Information
20 30 40 50 60 70
Inte
nsity
(a.
u.)
Δ Δ
Δ
ΔΔ
ΔΔ
Δ
ΔΔ
Δ
ΔΔ
ΔΔ Δ
Δ Δ
Δ
Δ Δ Δ Δ Δ
##
# # ##
####
# ## # #
# ### #
A-SO4
A-Cl-SO4
A-Cl
A-Cl-c-50
Fig. 6 X-ray diffraction patterns of: a A–SO4 b A–Cl–SO4;
c A–Cl, and d A–Cl–c–50 samples after thermal treatment at
800 �C; open triangles refer to Jacobsite peaks; hash refers to
the Hematite type phase peaks
3068 J Nanopart Res (2011) 13:3063–3073
123
higher temperatures gave rise to Jacobsite. In the
A–Cl–SO4–c–50 a small amount of Wustite type phase
(5 wt%) is also present (PCPDF-WIN, JCPDS-Inter-
national Center for Diffraction Data, Swarthome, PA;
Lutterotti et al. 1999; Young 1995; ICSD, Karlsruhe,
Germany; Jay and Andrews 1946). Average particle
dimensions of Jacobsite phase decreases from 39 to
26 nm in A–Cl–SO4–35 and A–Cl–SO4–50 samples,
respectively.
Trivalent salts
When the Fe precursor salts are trivalent chlorides,
different phases are present in the as-prepared sam-
ples. In fact the iron manganese oxide hydroxide
peaks in the XRD spectra (not reported) are accom-
panied by the presence of peaks corresponding to
lepidocrocite and akaganeite type phases (PCPDF-
WIN, JCPDS-International Center for Diffraction
Data, Swarthome, PA). After thermal treatment
(Fig. 8) all B-samples gave rise to Wustite type phase
(Fe, MnO) only (PCPDF-WIN, JCPDS-International
Center for Diffraction Data, Swarthome, PA; Jay and
Andrews 1946). Rietveld refinement for B–Cl sample
indicates a cubic lattice parameter of a = 0.4355 nm
and an average size dimension hDi of 45 nm.
Magnetic properties
Magnetic measurements were carried out only on
MnFe2O4 samples obtained after thermal treatment at
800 �C. In Fig. 9, the field dependence of the magne-
tization at 300 K for the samples A–Cl, A–Cl–SO4–
35, and A–Cl–SO4–c–50 are reported. The magneti-
zation does not reach saturation at 2 T. As a result the
magnetization saturation values reported in Table 3
were obtained by fitting of the high field data with the
function
20 30 40 50 60 70
Inte
nsity
(a.
u.)
°
° °°
°
°°
°
°
°°
°
A-Cl-SO4
A-Cl-SO4-35
A-Cl-SO4-c-50
20 30 40 50 60 70
Inte
nsity
(a.
u.)
#
# #
## #
##
Δ Δ
Δ
ΔΔ
ΔΔ
Δ
Δ
Δ
Δ
ΔΔ
ΔΔ
Δ
Δ Δ
Δ
Δ ΔΔ
Δ
Δ
A-Cl-SO4-c-50
A-Cl-SO4-35
A-Cl-SO4
a
bFig. 7 a X-ray diffraction
patterns of A–Cl–SO4;
A–Cl–SO4–35; A–Cl–SO4–
c–50 as prepared samples.
b X-ray diffraction patterns
of A–Cl–SO4; A–Cl–SO4–
35; A–Cl–SO4–c–50
samples after thermal
treatment at 800 �C; opentriangles refer to Jacobsite
peaks; hash refers to
Hematite type phase peaks;
open circles refer to the
iron–manganese oxide
hydroxide peaks
20 30 40 50 60 70
Inte
nsity
(a.u
.)
*
*
*
*
Fig. 8 X-ray diffraction pattern of B–Cl after thermal
treatment at 800 �C. asterisks refer to Wustite type phase peaks
J Nanopart Res (2011) 13:3063–3073 3069
123
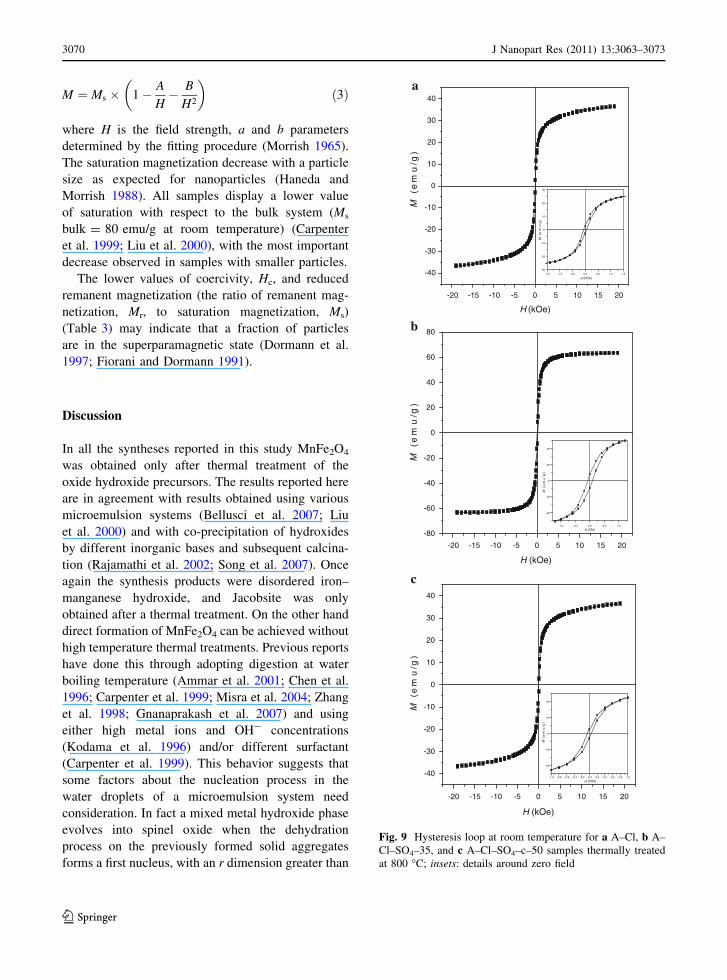
M ¼ Ms � 1� A
H� B
H2
� �ð3Þ
where H is the field strength, a and b parameters
determined by the fitting procedure (Morrish 1965).
The saturation magnetization decrease with a particle
size as expected for nanoparticles (Haneda and
Morrish 1988). All samples display a lower value
of saturation with respect to the bulk system (Ms
bulk = 80 emu/g at room temperature) (Carpenter
et al. 1999; Liu et al. 2000), with the most important
decrease observed in samples with smaller particles.
The lower values of coercivity, Hc, and reduced
remanent magnetization (the ratio of remanent mag-
netization, Mr, to saturation magnetization, Ms)
(Table 3) may indicate that a fraction of particles
are in the superparamagnetic state (Dormann et al.
1997; Fiorani and Dormann 1991).
Discussion
In all the syntheses reported in this study MnFe2O4
was obtained only after thermal treatment of the
oxide hydroxide precursors. The results reported here
are in agreement with results obtained using various
microemulsion systems (Bellusci et al. 2007; Liu
et al. 2000) and with co-precipitation of hydroxides
by different inorganic bases and subsequent calcina-
tion (Rajamathi et al. 2002; Song et al. 2007). Once
again the synthesis products were disordered iron–
manganese hydroxide, and Jacobsite was only
obtained after a thermal treatment. On the other hand
direct formation of MnFe2O4 can be achieved without
high temperature thermal treatments. Previous reports
have done this through adopting digestion at water
boiling temperature (Ammar et al. 2001; Chen et al.
1996; Carpenter et al. 1999; Misra et al. 2004; Zhang
et al. 1998; Gnanaprakash et al. 2007) and using
either high metal ions and OH- concentrations
(Kodama et al. 1996) and/or different surfactant
(Carpenter et al. 1999). This behavior suggests that
some factors about the nucleation process in the
water droplets of a microemulsion system need
consideration. In fact a mixed metal hydroxide phase
evolves into spinel oxide when the dehydration
process on the previously formed solid aggregates
forms a first nucleus, with an r dimension greater than
-1.5 -1.0 -0.5 0.0 0.5 1.0 1.5
-30
-20
-10
0
10
20
30
H (kOe)
M (
em
u/g
)
-20 -15 -10 -5 0 5 10 15 20
-40
-30
-20
-10
0
10
20
30
40
H (kOe)
M (
em
u/g
)
-1.0 -0.5 0.0 0.5 1.0
-40
-20
0
20
40
M (
em
u/g
)
H (Oe)
-20 -15 -10 -5 0 5 10 15 20
-80
-60
-40
-20
0
20
40
60
80
M (
em
u/g
)
H (kOe)
-1.0 -0.8 -0.6 -0.4 -0.2 0.0 0.2 0.4 0.6 0.8 1.0
-20
-10
0
10
20
M (
em
u/g
)
H (kOe)
-20 -15 -10 -5 0 5 10 15 20
-40
-30
-20
-10
0
10
20
30
40
M (
em
u/g
)
H (kOe)
a
b
c
Fig. 9 Hysteresis loop at room temperature for a A–Cl, b A–
Cl–SO4–35, and c A–Cl–SO4–c–50 samples thermally treated
at 800 �C; insets: details around zero field
3070 J Nanopart Res (2011) 13:3063–3073
123
the r* critical one (Cushing et al. 2004; Jolivet 2000;
Cornell and Schwertmann 1996, 2000). Successive
growth occurs by both solid-state transformation and
through the Ostwald ripening process at the cost of
particles with dimensions below r*. According to the
hypothesis that a first oxide germ nucleates from the
hydroxide phase by an oxolation mechanism, it would
grow until complete phase transformation only if it
reaches and overcomes its critical dimension
r�OX(OX = oxide phase). With a constant metal con-
tent, the change in the composition of the precipitated
precursor particle is accompanied by a shrinkage in
volume, so that the new oxide phase is not able to
reach its critical dimension r�OX and the mixed oxide
does not form. Dehydration process is also governed
by oxolation equilibrium, which depends on water,
OH- and metal ion activities, solubility product
constant Kps (Gnanaprakash et al. 2007). In the
presence of a microemulsion the concentration of
surfactant can influence the final product.
It is worth noting the behavior of samples obtained
when the precursor salts are both sulfates. Generally
iron and manganese cations form complexes that
condense via two basic mechanisms (olation or oxola-
tion), depending on the nature of the coordination
sphere of the cations (Jolivet et al. 2004). In the
presence of chloride the hydrolysis of metal ions begins
with the formation of simple hydroxy complexes, as
monomers and dimers and this step is followed by their
polymerization. The next step in the process is the
formation of oxo-bridges (oxolation mechanism) with
the development of the final structures. The final step is
loss of water and internal crystallization. The presence
of sulfate inhibits the oxolation process (Dousma et al.
1979). This could influence the sample crystallinity,
leading to the formation of small particles, which form
acicular aggregates.
Moreover, thermal treatment leads always to
hematite in absence of digestion when sulfate salts
are used as starting materials. The synthesis per-
formed with Fe3? salts gave rise to mixtures of metal
hydroxide, as the results of a two steps precipitation.
In fact when Fe(III) and Mn(II) are both present,
precipitation cannot occur simultaneously because of
the lower Kps of iron (III) oxyhydroxide (between
10-39 and 10-42) compared to those of Fe(II) and
Mn(II) (10-14 and 10-16), Mn(II) oxyhydroxide
begins to precipitate when Fe(III) oxyhydroxide has
been generated (Gnanaprakash et al. 2007). In this
case a core–shell structure is formed and only through
a severe digestion process it is possible to obtain a
mixed oxide. Contrary to this the close proximity of
Kps values of Mn(II) and Fe(II) oxyhydroxide leads to
their co-precipitation, thus favoring intermixing.
Moreover, in the B samples, where Fe(III) is used,
the presence of residual carbon, due to CTAB
decomposition during thermal treatment, could
reduce oxyhydroxide to Wustite type phase. The
calculated lattice parameter by Rietveld refinement,
0.4355 nm, is in agreement with a reported stoichi-
ometry of Fe0.66Mn0.33O (Jay and Andrews 1946).
The MnFe2O4 spinel structure can be depicted as
(Mn1-iFei)[MniFe2-i]O4 where round and square
bracket denote tetrahedral site occupancy (A) and
octahedral site occupancy (B), respectively, and i rep-
resent the inversion parameter (Zhang et al. 1998). In
MnFe2O4 samples prepared at low temperature the
occupancy of A and B sites is random and depends on
the stoichiometric Fe/Mn ratio (2:1). In fact the
divalent and trivalent cations occupy the site for which
they have higher crystal field stabilization energy
(CFSE) (West 1999). Although Fe(III) and Mn(II) ions
have zero CFSE at low temperature and can occupy
either A and B sites, many authors indicate that there
are significant differences in site preference energy at
high temperature and therefore the ions move to a
stable position. In fact the inversion degree for
MnFe2O4 samples prepared in different ways and with
different average size, but thermally treated over
600 �C, remain almost constant and close to 25%.
(Carta et al. 2009; Liu et al. 2000; Song et al. 2007;
Zhang et al. 1998; Jeyadevan et al. 2000; Harrison et al.
1957). This observation can be used to easily compare
MnFe2O4 samples prepared in different ways, in
particular their interesting magnetic properties.
In all the samples a fraction of superparamagnetic
particles may be present at room temperature, as
shown by low value of Mr/Ms and Hc. A reduction of
saturation magnetization is observed with respect to
the bulk material. In principle, this can be due to
vacancies and/or modification of the lattice parame-
ters or to the presence of non-collinear spin structure
(i.e. spin-canting). The Rietveld refinement of the
XRD spectra induce to believe that any substantial
structural modification are present with respect to the
bulk material, then the most likely reason for the
J Nanopart Res (2011) 13:3063–3073 3071
123
decrease of saturation magnetization seems to be
the presence of spin-canting, as already reported in
literature (Coey 1971; Peddis et al. 2008). It should
also be noted that the Ms values obtained show that
they could be suitable for drug delivery applications
(Pankhurst et al. 2003).
Conclusions
Microemulsion is a convenient technique to produce
nanocrystalline ferrite and is an obstacle in aggregation
and coarsening of particles during thermal treatment. A
new method for the formation of nanocrystalline
MnFe2O4 was achieved by co-precipitation of manga-
nese and iron oxo-hydroxides in water/oil microemul-
sions and subsequent thermal treatment 800 �C in
argon. In this work, MnFe2O4 was only obtained after
thermal treatment of the oxide hydroxide precursors.
The best results were obtained in the Water/CTAB/
Hexanol system with initial concentrations of 0.066 M
and 0.033 M solutions of FeCl2 and MnCl2 at room
temperature, and 0.066 M and 0.033 M solutions of
FeSO4 and MnCl2 after a digestion at 35 �C. The
nanoparticles are spherical in shape and have an
average diameter of 12 and 39 nm, respectively.
Acknowledgment This study was supported by MIUR
(Ministero Istruzione Universita e Ricerca) in the frame of
TEPSI project and by Fondazione Banco di Sardegna. D. Peddis
was granted by RAS (Regione Sardegna – Centro regionale di
Programmazione) co-founded by PO Sardegna FSE 2007-2013
sulla L.R.7/2007 ‘‘Promozione della ricerca scientifica e
dell’innovazione tecnologica in Sardegna’’. We want also to
thank Dr Darragh Gaffney, MSSI (Material and Surface Science
Institute), University of Limerick, Ireland, for helpful discussion.
References
Ahmad SI, Friberg S (1972) Catalysis in micellar and liquid-
crystalline phases. I. System water-hexadecyltrimethyl-
ammonium bromide-hexanol. J Am Chem Soc 94:
5196–5199
Alvani C, Ennas G, La Barbera A, Marongiu G, Padella F,
Varsano F (2005) Synthesis and characterization of
nanocrystalline MnFe2O4: advances in thermochemical
water splitting. Int J Hydrog Energy 30:1407–1411
Ammar S, Helfen A, Jouini N, Fievet F, Rosenman I, Villain F,
Molinie P, Danot M (2001) Magnetic properties of
ultrafine cobalt ferrite particles synthesized by hydrolysis
in a polyol medium. J Mater Chem 11:186–192
Babes L, Denizot B, Tanguy G, Le Jeune JJ, Jallet P (1999)
Synthesis of iron oxide nanoparticles used as MRI con-
trast agents: a parametric study. J Colloid Interface Sci
212:474–482
Bellusci M, Canepari S, Ennas G, La Barbera A, Padella F,
Santini A, Scano A, Seralessandri L, Varsano F (2007)
Phase evolution in synthesis of manganese ferrite nano-
particles. J Am Ceram Soc 90:3977–3983
Carpenter EE, O’Connor J, Harris VG (1999) Atomic structure
and magnetic properties of MnFe2O4 nanoparticles pro-
duced by reverse micelle synthesis. J Appl Phys 85:5175–
5177
Carta D, Casula MF, Falqui A, Loche D, Mountjoy G, San-
gregorio C, Corrias A (2009) A structural and magnetic
investigation of the inversion degree in ferrite nanocrys-
tals MFe2O4 (M = Mn, Co, Ni). Phys Chem C 113:8606–
8615
Chen JP, Sorensen CM, Klabunde KJ, Hadjipanayis GC,
Devlin E, Kostikas A (1996) Size-dependent magnetic
properties of MnFe2O4 fine particles synthesized by
coprecipitation. Phys Rev B 54:9288–9296
Coey JMD (1971) Noncollinear spin arrangement in ultrafine
ferrimagnetic crystallites. Phys Rev Lett 27:1140–1142
Cornell RM, Schwertmann U (2000) The iron oxide in the
laboratory. Wiley-VCH, NewYork
Cornell RM, Schwertmann U (1996) The iron oxide. Wiley-
VCH, NewYork
Cushing BL, Kolesnichenko VL, O’Connor C (2004) Recent
advances in the liquid- phase syntheses of inorganic
nanoparticles. J Chem Rev 104:3893–3946
Davies KJ, Wells S, Charles SW (1993) The effect of tem-
perature and oleate adsorption on the growth of maghe-
mite particles. J Magn Magn Mater 122:24–28
Dormann JL, Fiorani D, Tronc E (1997) Magnetic relaxation in
fine- particle systems. Advances in chemical physics. John
Wiley and Sons, New York, p XCVIII
Dousma J, Den Ottelander D, De Bruyn PL (1979) The influ-
ence of sulfate ions on the formation of iron (III) oxide.
J Inorg Nucl Chem 41:1565–1568
Feldmann C (2001) Preparation of nanoscale pigment particles.
Adv Mater 13:1301–1303
Feldmann C (2003) Polyol-mediated synthesis of nanoscale
functional materials. Adv Funct Mater 13:101–107
Feldmann C, Jungk H-O (2001) Polyol-mediated preparation of
nanoscale oxide particles. Angew Chem Int Ed 40:359–
362
Fiorani D, Dormann JL (1991) Conference proceedings of
Rome, Italy
Gnanaprakash G, Philip J, Raj B (2007) Effect of divalent
metal hydroxide solubility product on the size of ferrite
nanoparticles. Mater Lett 61:4545–4548
Haneda K, Morrish AH (1988) Noncollinear magnetic structure
of CoFe2O4 small particles. J Appl Phys 63:4258–4260
Harrison FW, Osmond WP, Teale RW (1957) Cation distrib-
utionand magnetic moment of manganese ferrite. Phys
Rev 105:865–866
Hicks T (2004) Preparation, characterization and activity of
mono-dispersed supported cataylsts. PhD. Thesis, Georgia
Institute of Technology, USA
ICSD Database (Inorganic Crystal Structure Database) (2007)
Karlsruhe, Germany
3072 J Nanopart Res (2011) 13:3063–3073
123
Jay AH, Andrews KW (1946) Composition of some binary
oxide systems. J Iron Steel Inst 152:15
Jeyadevan B, Tohji K, Nakatsuka K, Narayanasamy A (2000)
Irregular distribution of metal ions in ferrites prepared by
co-precipitation technique structure analysis of Mn–Zn
ferrite using extended X-ray absorption fine structure.
J Magn Magn Mater 217:99–105
Jolivet JP (2000) Metal oxide chemistry and synthesis. From
solution to solid state. Wiley, Chichester
Jolivet JP, Chaneac C, Tronc E (2004) Iron oxides chemistry.
From molecular clusters to extended solid networks.
Chem Commun 5:481–487
Kodama T, Ookubo M, Miura S, Kitayama Y (1996) Synthesis
and characterization of ultrafine Mn(II)-bearing ferrite of
type MnxFe3 - xO4 by coprecipitation. Mater Res Bull 31:
1501–1512
Komarneni S, Fregeau E, Breval E, Roy R (1988) Hydrother-
mal preparation of ultrafine ferrites and their sintering.
J Am Ceram Soc 71:C-26–C28
Lee Y, Rho J, Jung B (2003) Preparation of magnetic ion-
exchange resins by the suspension polymerization of
styrene with magnetite. J Appl Polym Sci 89:2058–2067
Li T, Deng Y, Song X, Jin Z, Zhang Y (2003) The formation of
magnetite nanoparticle in ordered system of the soybean
lecithin. Bull Korean Chem Soc 24:957–960
Liu C, Zuo B, Rondinone AJ, Zhang ZJ (2000) Reverse micelle
synthesis and characterization of superparamagnetic
MnFe2O4 spinel ferrite nanocrystallites. J Phys Chem B
104(6):1141–1145
Lopez-Quintela AM (2003) Synthesis of nanomaterials in mi-
croemulsions: formation mechanisms and growth control.
Curr Opin Colloid Interface Sci 8:137–144
Lutterotti L, Matthies S, Wenk HR (1999) MAUD: a friendly
Java program for material analysis using diffraction. IUCr
Newsl CPD 21:14–15
Misra RDK, Gubbala S, Kale A, Egelhoff WF Jr (2004) A
comparison of the magnetic characteristics of nanocrys-
talline Ni, Zn, and Mn ferrites synthesized by reverse
micelle technique. Mater Sci Eng 111:164–174
Morales MP, Veintemillas S, Montero MI, Serna CJ, Roig A,
Casas L, Martinez B, Sandiumenge F (1999) Surface and
internal spin canting in c -Fe2O3 nanoparticles. Chem
Mater 11:3058–3064
Morrish AH (1965) The physical principles of magnetism.
Wiley, New York
Pankhurst QA, Connelly J, Jones SK, Dobsonb J (2003)
Applications of magnetic nanoparticles in biomedicine.
J Phys D 36:R167–R181
PCPDF-WIN, JCPDS- International Center for Diffraction
Data (1998) Swarthome, PA
Peddis D, Mansilla MV, Morup S, Cannas C, Musinu A, Pic-
caluga G, Orazio F, Lucari F, Fiorani D (2008) Spin
canting and magnetic anisotropy in ultrasmall CoFe2O4
nanoparticles. J Phys Chem B 112:8507–8513
Pitkethy MJ (2004) Nanomaterials—the driving force. Mater
Today 7:20–29
Pileni MP (2003) Role of soft colloidal templates in the control
of size and shape of inorganic nanocrystals. Nat Mater. 2:
145–150
Rajamathi M, Ghosh M, Seshadri R (2002) Hydrolysis and
amine-capping in a glycol solvent as a route to soluble
maghemite gamma-Fe2O3 nanoparticles. Chem Commun
10:1152–1153
Seki M, Sato T, Usui S (1988) Observations of ultrafine
ZnFe2O4 particles with transmission electron microscopy.
J Appl Phys 63:1424–1427
Shen L, Laibinis PE, Hatton TA (1999) Bilayer surfactant
stabilized magnetic fluids: synthesis and interactions at
interfaces. Langmuir 15:447–453
(1997) Soft ferrites. A user’s guide, chap. 1, 2, and 6. Mag-
netic Materials Producers Association, Chicago, IL
Song Q, Ding Y, Wang ZL, Zhang ZJ (2007) Tunning the
thermal stability of molecular precursor for the nonhy-
drolytic synthesis of magnetic MnFe2O4 spinel nano-
crystals. Chem Mater 19:4633–4638
Tourinho FA, Franck R, Massart R (1990) Aqueous ferrofluids
based on manganese and cobalt ferrites. J Mater Sci 25:
3249–3254
West AR (1999) Basic solid state chemistry, 2nd edn. Wiley,
New York
Young RA (1995) The Rietveld method, IUCr monographs on
crystallography 5. Oxford University Press, Oxford
Zhang ZJ, Wang ZL, Chakoumakos BC, Yin JS (1998) Tem-
perature dependence of cation distribution and oxidation
state in magnetic Mn–Fe ferrite nanocrystals. J Am Chem
Soc 120:1800–1804
J Nanopart Res (2011) 13:3063–3073 3073
123