Structural studies of ionic liquid-modified microemulsions
9
Journal of Colloid and Interface Science 333 (2009) 782–790 Contents lists available at ScienceDirect Journal of Colloid and Interface Science www.elsevier.com/locate/jcis Structural studies of ionic liquid-modified microemulsions Oscar Rojas, Joachim Koetz ∗ , Sabine Kosmella, Brigitte Tiersch, Philipp Wacker, Markus Kramer Institut für Chemie, Universität Potsdam, Karl-Liebknecht-Strasse 24-25, Haus 25, 14476 Potsdam (Golm), Germany article info abstract Article history: Received 10 December 2008 Accepted 14 February 2009 Available online 23 February 2009 Keywords: Microemulsion Ionic liquid Poly(ethyleneimine) This work is focused on the influence of an ionic liquid (IL), i.e. ethyl-methylimidazolium hexylsulfate, on the spontaneous formation of microemulsions with ionic surfactants. The influence of the ionic liquid on structure formation in the optically clear phase region in water/toluene/pentanol mixtures in presence of the cationic surfactant CTAB was studied in more detail. The results show a significant increase of the transparent phase region by adding the ionic liquid. Conductometric investigations demonstrate that adding the ionic liquid can drastically reduce the droplet–droplet interactions in the L 2 phase. 1 H nuclear magnetic resonance ( 1 H NMR) diffusion coefficient measurements in combination with dynamic light scattering measurements clearly show that inverse microemulsion droplets still exist, but the droplet size is decreased to 2 nm. A more detailed characterisation of the isotropic phase channel by means of conductivity measurements, dynamic light scattering (DLS), 1 H NMR and cryo-scanning electron microscopy (SEM), allows the identification of a bicontinuous sponge phase between the L 1 and L 2 phase. When the poly(ethyleneimine) is added, the isotropic phase range is reduced drastically, but the inverse microemulsion range still exists. © 2009 Elsevier Inc. All rights reserved. 1. Introduction A microemulsion is a thermodynamically stable, optically clear isotropic dispersion of two immiscible liquids consisting of nano- droplets of one liquid in another, surrounded by a surfactant film. In such isotropic system, one can distinguish between different microemulsion phases: oil-in-water (L 1 ), reverse micellar water-in- oil (L 2 ), and the bicontinuous sponge phase [1]. The formation of the microemulsion is thermodynamically controlled, and the spon- taneous curvature H 0 of the surfactant film is one of the most essential parameters of the system. By adding a co-surfactant [2,3], changing the oil component [2,4,5], varying the temperature [5], adding polymers [6–8] or low molecular salts like NaCl [9,10] this parameter can be influenced. Recently, it was shown that other polar solvents could sub- stitute water in a microemulsion system, such as formamide, glycerol and dimethylformamide, which are immiscible in the oil phase [11]. These non-aqueous microemulsions have been already applied to cosmetics and can be used as a new kind of reaction media [12]. Another class of non-aqueous polar solvents are the so-called ionic liquids (IL). Ionic liquids can be understood as molten salts and offer quite interesting properties, such as non-volatility, suitable polarity, high ionic conductivity and thermal stability. Another interesting fea- * Corresponding author. E-mail address: [email protected] (J. Koetz). ture of IL’s is their easy regenerative power. Due to their adjustable solvent properties depending on the combination of an inorganic cation and inorganic or organic anion and their ecologically ben- eficial properties ionic liquids are receiving more and more atten- tion [13]. In this context the self-assembly of surfactants in contact with IL’s could lead to the formation of micelles [14–16], liquid crys- tals [17,18], gels [19,20], vesicles [21], and microemulsions [22, 23]. For example, the incorporation of ionic liquids into mi- celles with nonionic surfactants [24–27], ionic surfactants [28– 30], and zwitterionic surfactants [31] have shown significant changes in the critical micelle concentration (cmc), the aggre- gation number ( N agg ) and the size of the micelles in aqueous solutions. For instance, Gao et al. have studied the micelle for- mation with 1-butyl-3-methylimidazolium(bmim) hexafluorophos- phate in aqueous solution with the non-ionic surfactant Triton X-100 [24], whereas Eastoe reports the formation of ellipsoidal particles (IL-in-oil microemulsion droplets) in the mixture Triton X-100/[bmim][BF 4 ]/cyclohexane [23]. Hydrogen-bond interaction of the polar group of the surfactant and the imidazolium ring has been investigated by using spectroscopic measurements [25]. Freeze-fracture electron microscopy (FFEM), small angle neutron scattering (SANS), and dynamic light scattering (DLS) were used to determine the size and shape of the inverse IL-in-oil droplets in the ternary system TX-100/[bmim][BF 4 ]/ p-xylene [22,26,27]. DLS measurements show that the size of the aggregates increases on increasing the amount of IL [27]. In addition, it is already well 0021-9797/$ – see front matter © 2009 Elsevier Inc. All rights reserved. doi:10.1016/j.jcis.2009.02.039
-
Upload
independent -
Category
Documents
-
view
0 -
download
0
Transcript of Structural studies of ionic liquid-modified microemulsions

Journal of Colloid and Interface Science 333 (2009) 782–790
Contents lists available at ScienceDirect
Journal of Colloid and Interface Science
www.elsevier.com/locate/jcis
Structural studies of ionic liquid-modified microemulsions
Oscar Rojas, Joachim Koetz ∗, Sabine Kosmella, Brigitte Tiersch, Philipp Wacker, Markus Kramer
Institut für Chemie, Universität Potsdam, Karl-Liebknecht-Strasse 24-25, Haus 25, 14476 Potsdam (Golm), Germany
a r t i c l e i n f o a b s t r a c t
Article history:Received 10 December 2008Accepted 14 February 2009Available online 23 February 2009
Keywords:MicroemulsionIonic liquidPoly(ethyleneimine)
This work is focused on the influence of an ionic liquid (IL), i.e. ethyl-methylimidazolium hexylsulfate, onthe spontaneous formation of microemulsions with ionic surfactants. The influence of the ionic liquid onstructure formation in the optically clear phase region in water/toluene/pentanol mixtures in presenceof the cationic surfactant CTAB was studied in more detail. The results show a significant increase ofthe transparent phase region by adding the ionic liquid. Conductometric investigations demonstrate thatadding the ionic liquid can drastically reduce the droplet–droplet interactions in the L2 phase. 1H nuclearmagnetic resonance (1H NMR) diffusion coefficient measurements in combination with dynamic lightscattering measurements clearly show that inverse microemulsion droplets still exist, but the dropletsize is decreased to 2 nm. A more detailed characterisation of the isotropic phase channel by meansof conductivity measurements, dynamic light scattering (DLS), 1H NMR and cryo-scanning electronmicroscopy (SEM), allows the identification of a bicontinuous sponge phase between the L1 and L2 phase.When the poly(ethyleneimine) is added, the isotropic phase range is reduced drastically, but the inversemicroemulsion range still exists.
© 2009 Elsevier Inc. All rights reserved.
1. Introduction
A microemulsion is a thermodynamically stable, optically clearisotropic dispersion of two immiscible liquids consisting of nano-droplets of one liquid in another, surrounded by a surfactant film.In such isotropic system, one can distinguish between differentmicroemulsion phases: oil-in-water (L1), reverse micellar water-in-oil (L2), and the bicontinuous sponge phase [1]. The formation ofthe microemulsion is thermodynamically controlled, and the spon-taneous curvature H0 of the surfactant film is one of the mostessential parameters of the system. By adding a co-surfactant [2,3],changing the oil component [2,4,5], varying the temperature [5],adding polymers [6–8] or low molecular salts like NaCl [9,10] thisparameter can be influenced.
Recently, it was shown that other polar solvents could sub-stitute water in a microemulsion system, such as formamide,glycerol and dimethylformamide, which are immiscible in the oilphase [11]. These non-aqueous microemulsions have been alreadyapplied to cosmetics and can be used as a new kind of reactionmedia [12]. Another class of non-aqueous polar solvents are theso-called ionic liquids (IL).
Ionic liquids can be understood as molten salts and offer quiteinteresting properties, such as non-volatility, suitable polarity, highionic conductivity and thermal stability. Another interesting fea-
* Corresponding author.E-mail address: [email protected] (J. Koetz).
0021-9797/$ – see front matter © 2009 Elsevier Inc. All rights reserved.doi:10.1016/j.jcis.2009.02.039
ture of IL’s is their easy regenerative power. Due to their adjustablesolvent properties depending on the combination of an inorganiccation and inorganic or organic anion and their ecologically ben-eficial properties ionic liquids are receiving more and more atten-tion [13].
In this context the self-assembly of surfactants in contact withIL’s could lead to the formation of micelles [14–16], liquid crys-tals [17,18], gels [19,20], vesicles [21], and microemulsions [22,23]. For example, the incorporation of ionic liquids into mi-celles with nonionic surfactants [24–27], ionic surfactants [28–30], and zwitterionic surfactants [31] have shown significantchanges in the critical micelle concentration (cmc), the aggre-gation number (Nagg) and the size of the micelles in aqueoussolutions. For instance, Gao et al. have studied the micelle for-mation with 1-butyl-3-methylimidazolium(bmim) hexafluorophos-phate in aqueous solution with the non-ionic surfactant TritonX-100 [24], whereas Eastoe reports the formation of ellipsoidalparticles (IL-in-oil microemulsion droplets) in the mixture TritonX-100/[bmim][BF4]/cyclohexane [23]. Hydrogen-bond interactionof the polar group of the surfactant and the imidazolium ringhas been investigated by using spectroscopic measurements [25].Freeze-fracture electron microscopy (FFEM), small angle neutronscattering (SANS), and dynamic light scattering (DLS) were used todetermine the size and shape of the inverse IL-in-oil droplets inthe ternary system TX-100/[bmim][BF4]/p-xylene [22,26,27]. DLSmeasurements show that the size of the aggregates increases onincreasing the amount of IL [27]. In addition, it is already well

O. Rojas et al. / Journal of Colloid and Interface Science 333 (2009) 782–790 783
Scheme 1. Chemical structure of EMIM hexylsulfate.
known that surfactants can form micellar aggregations in ionic liq-uids. Evans et al. first reported the aggregation of cationic andnon-ionic surfactants in ethylammoniumnitrate [14,15].
Despite of its capacity to form inverse IL-in-oil microemulsions,alcohol as a cosurfactant incorporated into the surfactant film in-creases the region of the isotropic microemulsion phase [32]. Ingeneral, it is well known from w/o microemulsions, that cosur-factants can influence the spontaneous curvature of the surfactantfilm. James-Smith et al. have already shown that the maximumsolubilisation of water-in-oil and the highest rigidity of the inter-facial film occurs in a w/o microemulsion when the length of thesurfactant molecule equals the sum of molecular length of oil andalcohol [33]. In good agreement to this, the addition of water tothe IL microemulsion leads to an increase of the isotropic phaseregion.
However, investigations about ionic liquids incorporated intomicroemulsions stabilized by ionic surfactants are rather scarce.Recently Liu et al. investigated catanionic-based microemulsions inpresence of ionic liquids [34].
Taking into account that ionic liquids are of growing interest asgreen solvents with quite special properties our motivation was toformulate IL/water-based microemulsions as a new type of tem-plate for the nanoparticle formation.
Therefore, the goal of our research, presented here, was toincorporate the ionic liquid ethyl-methylimidazolium hexylsulfate([EMIM][hexylsulfate]), into SDS- and CTAB-based microemulsionsand to characterise structural changes in the isotropic phase bymeans of conductivity measurements, 1H NMR self-diffusion mea-surements, dynamic light scattering, rheology and cryo-high reso-lution scanning electron microscopy.
Another aspect was to incorporate polyelectrolytes into the IL-containing microemulsions.
Taken into account our knowledge about polyelectrolyte-modi-fied microemulsions [35,36] poly(ethyleneimine) (PEI) was addedto the microemulsion to prepare a new type of template for thenanoparticle formation. Noteworthy, that ionic liquids [37–39] aswell as polyelectrolyte-modified microemulsions [40,41] can besuccessfully used as a reaction medium for the nanoparticle for-mation. The given multi-component microemulsion systems can beused for example as a template phase for the synthesis of welldesigned gold nanoparticles, which are of special interest, e.g. asbright agent for two-photon luminescence imaging of cancer cellsand ultra-fine clusters for catalytic processes [42,43].
2. Experimental
2.1. Materials
Sodium dodecylsulfate (SDS) (>99%), was obtained from Roth.Toluene, cetyltrimethylammonium bromide (CTAB) (>99%) andpentanol were obtained from Fluka and were used without furtherpurification. The ionic liquid 1-ethyl-3-methylimidazolium n-hex-ylsulfate [EMIM][HexSO4] (98%) was purchased from Solvents In-novations.
Branched poly(ethyleneimine) PEI with a molecular weight of60,000 g mol−1 was purchased by Sigma while the PEI with Mw =5000 g mol−1 and Mw = 25,000 g mol−1 were obtained as a giftfrom Leibniz-Institut für Polymerforschung Dresden e.V.
2.2. Phase diagram
The isotropic phase was determined by titration of the oil/sur-factant mixture with the ionic liquid–water mixture (1:1) or thecorresponding aqueous polyelectrolyte solution at 25 ◦C. The pHvalue of the aqueous PEI solutions determined by a pH electrode(WTW) amounts to 11. After adding each drop, the mixture wastempered in a thermostatic bath to guarantee steady-state condi-tions of the optically clear solution.
2.3. Methods
2.3.1. Conductometric titrationThe conductivity was measured with a microprocessor conduc-
tometer LF 2000 (WTW) to evaluate the area of the isotropic phaserange at 25 ◦C. Each system was measured three times, and errorbars are incorporated in Fig. 5.
2.3.2. 1H NMR self-diffusion measurementA Bruker Avance 500 MHz spectrometer was used to deter-
mine the 1H NMR self-diffusion coefficients. 1H NMR spectra wererecorded with 32 k data points and zero filled to 64 k beforeprocessing. The sample temperature was kept constant at 298 ±0.1 K. The BPP-LED (bipolar pulse pair with longitudinal eddy cur-rent delay) pulse sequence with sinusoidal shaped gradients wasused [44]. The gradient strength G was increment linearly in 16–32 steps, starting from 1.9 G cm−1, to generate the 2D data ma-trix. The diffusion delay (D = 20–14 ms) and maximum gradientstrength (up to 180 G cm−1) were set up individually to achievemaximal dephasing. The duration of the gradient pulses δ werebetween 1 and 2 ms. Gradient calibration was done using a D2Osample with trace amounts of water and setting its self-diffusioncoefficient equal to 1.902 × 10⁻⁹ m2 s−1 [45]. For the calculationof the diffusion coefficient, the standard Bruker Software PackageXWIN-NMR 3.5 was used.
2.3.3. Cryo-high resolution scanning electron microscopy (Cryo-SEM)The structure of the optically clear microemulsion phase was
examined by Cryo-high resolution scanning electron microscopy(Cryo-SEM). Each sample was cooled by plunging into nitrogenslush at atmospheric pressure. The samples were freeze-fracturedat −180 ◦C, etched for 60 s at −98 ◦C, sputtered with platinum inthe GATAN Alto 2500 Cryo preparation chamber, and then trans-ferred into the Cryo-SEM.
2.3.4. Dynamic light scattering (DLS)The size and size distribution of the microemulsion droplets
were measured at 25 ◦C at a fixed angle of 173◦ (“backscatteringdetection”) by using a Nano Zetasizer 3600 (Malvern), equippedwith a He–Ne laser (λ = 633 nm; 4 mW) and a digital autocorrela-tor. For the multimodal peak analysis by intensity the refractiveindex of the water/IL mixture (1.4015), and the viscosity of thetoluene/pentanol mixture (η0 = 1.029 × 10⁻³ Pa s) was used.
2.3.5. RheologyRheological measurements were performed on a low stress
rheometer LS 100 (Physica), with a double-slit Couette geometryat 25 ◦C.
3. Results and discussion
3.1. Phase behavior
The quasi-ternary system (surfactant/toluene/IL–water) inFigs. S1 and S2 (supplementary information) is compared to thepentanol-containing system in Figs. 1 and 2, where the toluene

784 O. Rojas et al. / Journal of Colloid and Interface Science 333 (2009) 782–790
Fig. 1. Phase diagram of the system SDS/toluene–pentanol (1:1)/IL–water (1:1) in absence and presence of PEI (1%) of different molar mass at 25 ◦C.
Fig. 2. Phase diagram of the systems CTAB/toluene–pentanol (1:1)/IL–water (1:1) at 25 ◦C. A, B, C, D—points used for a more comprehensive characterisation, y′ , y′—characterisation line for the NMR measurements.
phase is partially substituted by a cosurfactant, i.e. pentanol. Inthe partial phase diagrams shown here, the areas marked in greycorrespond to the optically clear microemulsion phase range. Inthe presence of the anionic surfactant SDS (Fig. S1, supplemen-tary information) only two very small, separated phase ranges canbe observed, whereas in presence of the cationic CTAB the phaseranges are increased (Fig. S2, supplementary information). There-fore, one can expect the existence of an oil-in-water (L1) and awater-in-oil (L2) microemulsion. However, the tendency to form aL2 phase is more enhanced in the CTAB system.
That means especially in the CTAB-based system more watercan be solubilised into the inverse microemulsion droplets. Onecan assume that especially Coulombic interactions between thehead groups of CTAB and hexylsulfate are responsible for a morerigid surfactant film.
A significant increase of the isotropic phase range is observedin Figs. 1 and 2 by adding a cosurfactant (pentanol) in both sys-tems. In the SDS-based system at all mixing ratios between oil andwater an optically clear system results (Fig. 1). This phenomenoncan be explained by the increase in the aqueous solubilisation ca-pacity of the swollen micelles in combination with the change ofthe spontaneous curvature of the surfactant film [3,28]. Notewor-
thy, when the spontaneous curvature becomes zero (H0 = 0) theformation of a bicontinuous microemulsion becomes reasonable.
Similar effects are observed in Fig. 2 by using the cationicsurfactant CTAB, this means the formation of an isotropic phasechannel between the L1 and L2 phase. However, the major contri-bution for that effect seems to be coming from the ionic liquid.This “boostering” effect can be explained by enhancing a majorpacking of the surfactant molecules in the interface due to thepresence of the ionic liquid. Recently, Liu at al. have shown thatthe [bmim] [BF4] concentration can act as an effective interfacial-control parameter for tuning the formation of catanionic-basedmicroemulsions [34]. Based on SAXS and SANS measurements theauthors conclude that IL screen the lateral interactions in the filmvery efficiently. The IL pairs acts as strong cosurfactants. Takingthis into account, one can expect that the hexylsulfate of the IL,used by us, can be incorporated into the surfactant film, too. Gaoet al. demonstrated that a hydrogen-bonding network within thepalisade layer is formed when small amounts of water are addedto the IL-based microemulsion [46], whereas water molecules lo-cated in the periphery of the polar core lead to a decrease of thedroplet size [47].
Therefore, one can assume the formation of a palisade layer,schematised in Fig. 9. The IL plays a similar role like a cosurfac-

O. Rojas et al. / Journal of Colloid and Interface Science 333 (2009) 782–790 785
Fig. 3. Phase diagram of the system CTAB/toluene–pentanol (1:1)/IL–water (1:1) in presence of PEI (1%) of different molar mass at 25 ◦C.
Fig. 4. Conductivity of the CTAB and SDS-based microemulsions by titration with an aqueous solution in absence and presence of the ionic liquid at 25 ◦C.
tant, change the spontaneous curvature of the interfacial film, anddecrease the droplet size.
3.2. Polymer-modified microemulsion
Figs. 1 and 3 illustrate the effect on the phase diagram whenthe branched poly(ethyleneimine), is added to the system contain-ing SDS or CTAB, respectively.
By using the anionic SDS the addition of PEI does not sub-stantial affect the area of the isotropic microemulsion. Taking intoaccount that the pH value of the aqueous polymer solution was 11,Coulombic interactions between the amino groups of the PEI andthe sulphate SDS head groups can be neglected. Nevertheless, thepolymer can interact with the surfactant film by means of hy-drogen bonding, but this seems to be of minor relevance withregard to the spontaneous formation of a microemulsion. In con-sequence the isotropic phase range is not changed strongly, andonly a weak molecular weight effect is detectable. In general, itis well known that polymers of higher molar mass could inducea cluster formation [48]. When the PEI is added to the adequateCTAB-based system the isotropic phase range is limited only to theL2 phase range, as to be seen in Fig. 3. That means only the region
of the inverse microemulsion exists, but the solubilisation capac-ity of the inverse microemulsion droplets is decreased, drastically.The formation of a bicontinuous microemulsion is no longer possi-ble. The reason, therefore, has not been completely understood butone can assume a change in the structure of the interface, whichcan induce instability and phase separation. Moreover, there is nosignificant influence of the molecular weight of the PEI on thisprocess.
3.3. Phase characterisation
3.3.1. Electrical conductivityConductometric analysis is a useful technique to obtain infor-
mation on droplet–droplet interactions in water-in-oil microemul-sions. SDS-based microemulsions show the typical behaviour of asystem with a percolation boundary. That means at a low watercontent a non-percolated system exists, and only at a higher wa-ter content above 30% a steep jump in the conductivity indicatesthe percolation boundary due to dynamic processes of temporarycluster formation [8,49].
As to be seen in Fig. 4 the conductivity in the CTAB-basedmicroemulsion is increased upon water addition already at the

786 O. Rojas et al. / Journal of Colloid and Interface Science 333 (2009) 782–790
Fig. 5. Conductivity of the CTAB and SDS-based microemulsions by titration with the aqueous IL–solution in absence and presence of PEI at 25 ◦C.
Table 1Apparent self-diffusion coefficients in the system CTAB/toluene–pentanol (1:1)/IL–water (1:1) along the dilution line y′ .
Sample IL–water weightfraction in (%)
IL(109 m2 s−1)
Pentanol(109 m2 s−1)
Water(109 m2 s−1)
CTAB(109 m2 s−1)
Toluene(109 m2 s−1)
1 3.75 0.236 ± 0.001 0.567 ± 0.005 0.527 ± 0.002 0.197 ± 0.001 1.39 ± 0.022 8.75 0.146 ± 0.001 0.4212 ± 0.0003 0.3376 ± 0.0003 0.1205 ± 0.0001 1.276 ± 0.00063 12.5 0.106 ± 0.002 0.369 ± 0.003 0.257 ± 0.003 0.090 ± 0.002 1.05 ± 0.014 16.8 0.082 ± 0.003 0.292 ± 0.002 0.214 ± 0.002 0.066 ± 0.003 0.862 ± 0.0045 21.25 0.069 ± 0.003 0.232 ± 0.003 0.199 ± 0.004 0.048 ± 0.003 0.704 ± 0.0036 25.0 0.0643 ± 0.001 0.198 ± 0.002 0.204 ± 0.001 0.0419 ± 0.0008 0.603 ± 0.003
very beginning in the system and reaches a maximum, which isa characteristic feature of a percolated water-in-oil microemulsion.Surprisingly, the substitution of water by the ionic liquid in theCTAB-based microemulsion leads to a decrease of the conductiv-ity up to an ionic liquid–water content of 30%. Additional mea-surements in the water-based microemulsions in presence of 1 MNaCl show a decrease of the conductivity, but not yet a changeof the shape of the titration curve with a plateau value of about1.5 mS cm−1, as to be seen in Fig. 4. Therefore, one can concludethat the “IL-effect” could not only reduced to a “simple salt-effect”.That means droplet–droplet interactions are changed drastically byadding the ionic liquid. One can assume that the ionic liquid isincorporated into the surfactant film suppressing the dynamic pro-cess of temporary cluster formation at a lower content water–ionicliquid.
Between 27%–50% IL–water content, a pronounced increment ink is observed, apparently due to the change in the microstructureof the system. This argumentation can be reinforced by 1H NMRself-diffusion coefficient analysis, discussed later.
When PEI is added to the CTAB-based microemulsion the con-ductivity is increased proportional as to be seen in Fig. 5, dueto the higher ionic strength. Therefore, one can conclude thatthe droplet–droplet interactions are not changed significantly byadding the cationic polyelectrolyte. In the SDS-based system aquite different effect is observed. Fig. 5 shows that the incorpo-ration of the PEI leads to a shift of the percolation boundary, ex-emplary shown for the SDS-based system. One can assume that areduction in the size of the droplets lower the overlapping domainof the interface between two colliding droplets and thus producesa decrease in the attractive interaction, in similarity to previous re-sults observed by Suarez et al. [50] and our own results observedin polyelectrolyte-modified microemulsions [36,51].
3.3.2. 1H NMR self-diffusion coefficient measurements1H NMR self-diffusion coefficient measurements can be used as
a very sensitive method to investigate the microstructure, the typeof microemulsion, and phase transitions in microemulsions [52–55]. Especially the existence of a bicontinuous microemulsion canbe proved without doubt by this method.
In order to monitor changes in the L2 phase by decreasing thedroplet size with increasing surfactant concentration a microemul-sion area near to the oil corner was characterised along the dilu-tion line y′ , between 3.75 to 25% IL–water mixture.
In Table 1 the apparent self-diffusion coefficient of every com-ponent of the microemulsion is summarised and illustrated inFig. S3 (supplementary information). It can be seen that the appar-ent diffusion coefficients of CTAB, ionic liquid, pentanol and waterare smaller than the Dapp of toluene. However, these values aredecreased gradually when the IL–water content increase to 25%. Inthe case of water, Dw decreases and becomes constant at 16.8%of IL–water mixture. By plotting the reduced diffusion coefficientsone can see that the values are very small at about 0.1, in contrastto toluene and pentanol (Fig. 6). This is a typical behavior of smallwater droplets surrounded by the oil phase, and emphasizes theexistence of a water-in-oil microemulsion (L2 phase) at the pointsA, B and C.
On the other hand, measurements along the isotropic phasechannel (dilution line y′′ according to Fig. 2) by increasing theionic liquid–water content were analyzed to determine possiblechanges in the microstructure of the system. The apparent self-diffusion coefficient Dapp of each constituent was obtained fromthe measurements and summarised in Table 2. The data were plot-ted in Fig. S4 (supplementary information).
Starting at a low concentration of the aqueous solution (IL–water = 20%) water, ionic liquid, and pentanol exhibits low values

O. Rojas et al. / Journal of Colloid and Interface Science 333 (2009) 782–790 787
Fig. 6. Reduced self-diffusion coefficients (D/D0) as a function of IL–water (1:1) weight fraction.
Table 2Apparent self-diffusion coefficients in the system CTAB/toluene–pentanol (1:1)/IL–water (1:1) along the dilution line y′′ .
Sample IL–water weightfraction in (%)
IL(109 m2 s−1)
Pentanol(109 m2 s−1)
Water(109 m2 s−1)
CTAB(109 m2 s−1)
Toluene(109 m2 s−1)
1 20 0.062 ± 0.001 0.223 ± 0.002 0.187 ± 0.003 0.0460 ± 0.001 0.690 ± 0.0032 23 0.063 ± 0.002 0.212 ± 0.002 0.195 ± 0.004 0.0449 ± 0.002 0.650 ± 0.0053 30 0.0759 ± 0.0004 0.218 ± 0.003 0.231 ± 0.002 0.0498 ± 0.0001 0.617 ± 0.0054 40 0.1015 ± 0.0006 0.236 ± 0.005 0.303 ± 0.004 0.0549 ± 0.0002 0.561 ± 0.0035 50 0.1470 ± 0.0002 0.3070 ± 0.0006 0.4330 ± 0.0002 0.0615 ± 0.0003 0.464 ± 0.0036 60 0.191 ± 0.003 0.39 ± 0.01 0.579 ± 0.004 0.0609 ± 0.002 0.396 ± 0.0087 70 0.220 ± 0.0004 0.503 ± 0.003 0.698 ± 0.005 0.0542 ± 0.0004 0.27 ± 0.018 80 0.246 ± 0.002 0.63 ± 0.06 0.794 ± 0.003 0.0365 ± 0.0007 0.152 ± 0.0049 90 0.267 ± 0.0008 0.80 ± 0.04 0.877 ± 0.004 0.0322 ± 0.0005 0.133 ± 0.002
of Dapp whereas a relative high diffusion coefficient for the toluene(6.90×10⁻¹⁰ cm2 s−1) is found. This behaviour has been explainedbefore by the existence of reverse w/o microemulsion droplets dis-persed in a continuous oil phase. With the increase of the aqueoussolution, the self-diffusion coefficient of toluene (Dt) starts to de-crease and the Dapp values for water, pentanol and ionic liquidshow a pronounced increase. This phenomenon can be related toan increase in the size of the droplets and/or a change in themicrostructure of the system. In comparison, deviations in the dif-fusion coefficients of CTAB are very small, and only a very smallmaximum at the aqueous solution content of 50% can be observed.However, this maximum in DCTAB coincides with the point of inter-section between water and toluene curves. In general, the resultsshow that the surfactant is much more fixed in contrast to theother components, i.e. water, ionic liquid, and pentanol.
The sharp increase of the diffusion coefficients of water, ionicliquid and pentanol between 30 and 50% coincide with the steepjump in the conductivity curve. Therefore, both results seem toreinforce the argument of a change in the microstructure of thesystem due to percolation phenomena. In addition the toluene andwater curve are crossing at 50.7% IL–water content.
For detecting the transition to a bicontinuous microemulsion aplot of the reduced diffusion coefficients for water and toluene isused. It has to be mentioned here that Dw and Dt are stronglyreduced by the addition of ionic compounds and pentanol, respec-tively [55]. In Fig. 7 we used our experimental D0 values of theneat liquid components, which coincide to those reported in ref-erences [56,57], and therefore the reduced diffusion coefficients
for the continuous phase differ from unity. However, at low wa-ter content the reduced diffusion coefficients indicate the existenceof a water-in-oil microemulsion as already outlined before, andat high water content the D/D0 values are reverse, indicating anoil-in-water microemulsion. At a 1:1 mass ratio between the aque-ous and the oil phase (content of the aqueous phase = 50.7%) thewater and the oil diffusion are equal, which is a signature of a bi-continuous phase.
Moreover, it is surprising that the reduced self-diffusion co-efficients of the cosurfactant are larger than 1. However, thisphenomenon was already described in the literature by differ-ent authors [55,58]. For example in phosphatidylcholin-based mi-croemulsions this effect is much more pronounced and the re-duced diffusion coefficient of the cosurfactant hexanol increasesup to a value of 2 [54]. One can explain this behaviour only by amore pronounced diffusion of the cosurfactant in the mixture withan oil component.
In addition, the droplet size at the points A, B and C can becalculated according to the Stokes–Einstein equation:
R = kT
6 · π · η0 · Ds, (1)
where Ds is the weighted sum of the molecular diffusion withinthe droplet, k is the Boltzmann’s constant, T the absolute temper-ature, η0 is the viscosity of the toluene–pentanol mixture (1.029 ×10⁻³ Pa s) and R the aggregate radius.
The complex structure of the system studied here renders thecalculation of the aggregate radius and diffusion coefficient very

788 O. Rojas et al. / Journal of Colloid and Interface Science 333 (2009) 782–790
Fig. 7. Reduced self-diffusion coefficients (D/D0) in dependence of the IL–water weight fraction.
difficult, if not impossible. One can assume that the core of the in-verse micelle consists of water and surfactant head groups whereasthe interphase is formed by the hydrophobic tail of the surfactantaccording to [27]. However, the addition of ionic liquid and cosur-factant makes the system more complex. Taking into account thatEq. (1) will provide only a rough estimate of the particle size, thedroplet radius for the three different points of about 1 nm is com-parable to those data obtained from DLS measurements (compareSection 3.3.4).
3.3.3. Cryo-scanning electron microscopyCryo-SEM is a powerful method for visualising the structure of
microemulsions. Recently, we were able to show that this specialpreparation technique can be successfully used for the detectionof bicontinuous microemulsions in contrast to w/o microemul-sions [36,59].
To reinforce the results obtained by 1H NMR self-diffusion co-efficient measurements with regard to the changes in the mi-crostructures of the system CTAB/toluene–pentanol (1:1)/IL–water(1:1), two different points (C and D) were analysed by cryo-SEM. At point C (region of the inverse microemulsion) individualdroplets can be seen in the micrographs given in Fig. 8. Note-worthy, that under the conditions used here, it is not possible toidentify the individual droplets of about 2 nm in size. However, thestructure is changed drastically by characterising microemulsionsin the surrounding of the crossing point of the reduced diffu-sion coefficients demonstrated in Fig. 7. The cryo-SEM micrographat point D shows the typical structure of a sponge phase, whichmeans a network of micro-channels where the water and oil phasecoexist. This three-dimensional network is a characteristic featureof a bicontinuous microemulsion when all molecules in the systemhave full lateral mobility.
3.3.4. Dynamic light scattering (DLS)Dynamic light scattering is a useful method for detecting the
droplet size of microemulsions up to very small dimensions, whenthe scattering contrast (refractive index) is strong enough for asuccessful application of this method. Recently, it was shown thatDLS can be applied up to very small particle dimensions below1 nm in size [60]. The droplets size distribution was determinedby using the multimodal peak analysis by intensity. To checkthe reproducibility of the results at least 6 measurements weredone.
Fig. 8. Cryo-SEM micrographs of microemulsions at point C and D.
By characterising the CTAB-based microemulsion at point C amean droplet size of 5.6 ± 0.1 nm for the main fraction (averagepeak area of the main fraction = 90%) was obtained. By incorpo-rating the ionic liquid the particle dimensions are decreased, and
O. Rojas et al. / Journal of Colloid and Interface Science 333 (2009) 782–790 789
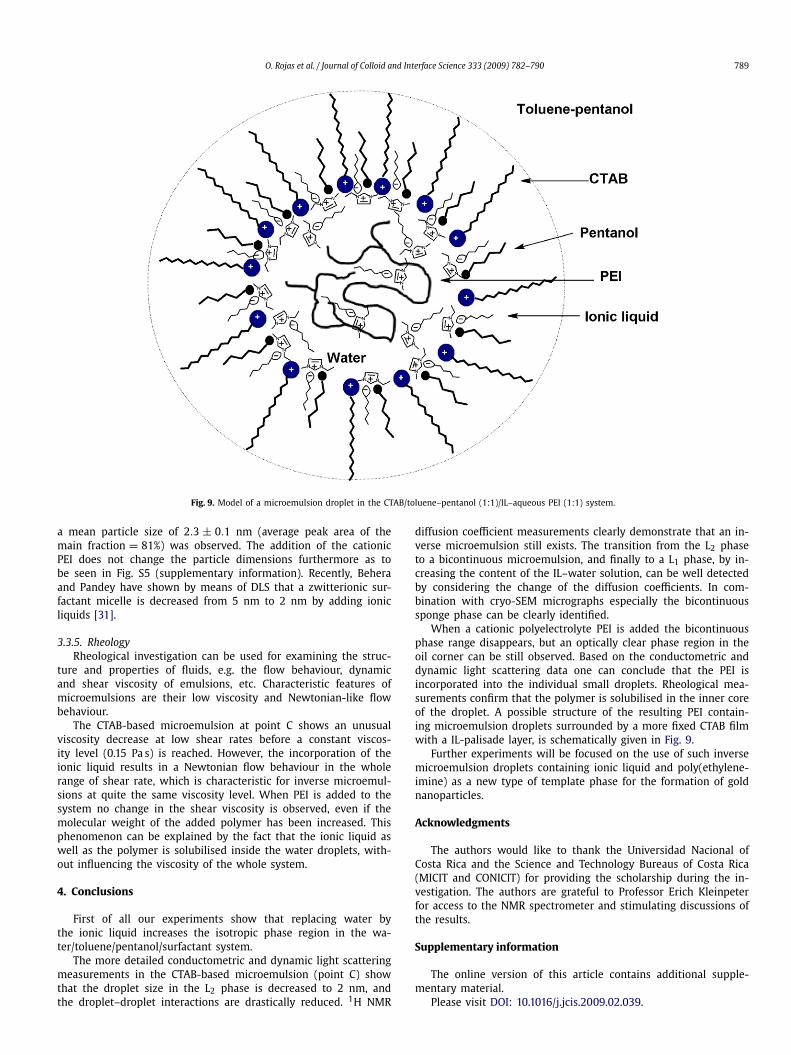
Fig. 9. Model of a microemulsion droplet in the CTAB/toluene–pentanol (1:1)/IL–aqueous PEI (1:1) system.
a mean particle size of 2.3 ± 0.1 nm (average peak area of themain fraction = 81%) was observed. The addition of the cationicPEI does not change the particle dimensions furthermore as tobe seen in Fig. S5 (supplementary information). Recently, Beheraand Pandey have shown by means of DLS that a zwitterionic sur-factant micelle is decreased from 5 nm to 2 nm by adding ionicliquids [31].
3.3.5. RheologyRheological investigation can be used for examining the struc-
ture and properties of fluids, e.g. the flow behaviour, dynamicand shear viscosity of emulsions, etc. Characteristic features ofmicroemulsions are their low viscosity and Newtonian-like flowbehaviour.
The CTAB-based microemulsion at point C shows an unusualviscosity decrease at low shear rates before a constant viscos-ity level (0.15 Pa s) is reached. However, the incorporation of theionic liquid results in a Newtonian flow behaviour in the wholerange of shear rate, which is characteristic for inverse microemul-sions at quite the same viscosity level. When PEI is added to thesystem no change in the shear viscosity is observed, even if themolecular weight of the added polymer has been increased. Thisphenomenon can be explained by the fact that the ionic liquid aswell as the polymer is solubilised inside the water droplets, with-out influencing the viscosity of the whole system.
4. Conclusions
First of all our experiments show that replacing water bythe ionic liquid increases the isotropic phase region in the wa-ter/toluene/pentanol/surfactant system.
The more detailed conductometric and dynamic light scatteringmeasurements in the CTAB-based microemulsion (point C) showthat the droplet size in the L2 phase is decreased to 2 nm, andthe droplet–droplet interactions are drastically reduced. 1H NMR
diffusion coefficient measurements clearly demonstrate that an in-verse microemulsion still exists. The transition from the L2 phaseto a bicontinuous microemulsion, and finally to a L1 phase, by in-creasing the content of the IL–water solution, can be well detectedby considering the change of the diffusion coefficients. In com-bination with cryo-SEM micrographs especially the bicontinuoussponge phase can be clearly identified.
When a cationic polyelectrolyte PEI is added the bicontinuousphase range disappears, but an optically clear phase region in theoil corner can be still observed. Based on the conductometric anddynamic light scattering data one can conclude that the PEI isincorporated into the individual small droplets. Rheological mea-surements confirm that the polymer is solubilised in the inner coreof the droplet. A possible structure of the resulting PEI contain-ing microemulsion droplets surrounded by a more fixed CTAB filmwith a IL-palisade layer, is schematically given in Fig. 9.
Further experiments will be focused on the use of such inversemicroemulsion droplets containing ionic liquid and poly(ethylene-imine) as a new type of template phase for the formation of goldnanoparticles.
Acknowledgments
The authors would like to thank the Universidad Nacional ofCosta Rica and the Science and Technology Bureaus of Costa Rica(MICIT and CONICIT) for providing the scholarship during the in-vestigation. The authors are grateful to Professor Erich Kleinpeterfor access to the NMR spectrometer and stimulating discussions ofthe results.
Supplementary information
The online version of this article contains additional supple-mentary material.
Please visit DOI: 10.1016/j.jcis.2009.02.039.

790 O. Rojas et al. / Journal of Colloid and Interface Science 333 (2009) 782–790
References
[1] D.F. Evans, H. Wennerström, The Colloidal Domain, VCH Publishers, New York,1994.
[2] R. Sripriya, K.M. Raja, G. Santhosh, M. Chandrasekaran, M. Noel, J. Colloid In-terface Sci. 314 (2007) 712.
[3] G. Palazzo, F. Lopez, M. Giustini, G. Colafemmina, A. Ceglie, J. Phys. Chem. B 107(2003) 1924.
[4] J. Bologh, U. Olsson, J.S. Pedersen, J. Dispersion Sci. Technol. 27 (2006) 497.[5] J. Koetz, J. Bahnemann, S. Kosmella, J. Polym. Sci. Part A Polym. Chem. 42
(2004) 742.[6] C. Note, J. Koetz, L. Wattebled, A. Laschewsky, J. Colloid Interface Sci. 308
(2007) 162.[7] T. Beitz, J. Koetz, G. Wolf, E. Kleinpeter, S.E. Friberg, J. Colloid Interface Sci. 240
(2001) 581.[8] C. Note, J. Koetz, S. Kosmella, Colloids Surf. A 288 (2006) 158.[9] D. Roux, A.M. Bellocq, M.S. Leblanc, Chem. Phys. Lett. 94 (2) (1983) 156.
[10] E.B. Abuin, M. A Rubio, E.A. Lissi, J. Colloid Interface Sci. 158 (1993) 129.[11] R.K. Mitra, B.K. Paul, Colloid Polym. Sci. 284 (2006) 733.[12] G. Broze, U.S. Patent 5,435,936 (1995).[13] P. Wasserscheid, T. Welton, Ionic Liquids in Synthesis, vols. 1, 2, Wiley–VCH,
Weinheim, 2008.[14] D.F. Evans, A. Yamauchi, R. Roman, E.Z. Casassa, J. Colloid Interface Sci. 88
(1982) 89.[15] D.F. Evans, A. Yamauchi, G.J. Wei, V.A. Bloomfield, J. Phys. Chem. 87 (1983)
3537.[16] K.A. Fletcher, S. Pandey, Langmuir 20 (2004) 33.[17] D.F. Evans, E.W. Kaler, W.J. Benton, J. Phys. Chem. 87 (1983) 533.[18] L.J. Wang, X. Chen, Y.C. Chai, J.C. Hao, Z.M. Sui, W.C. Zhuang, Chem. Commun.
(2004) 2840.[19] Y.Y. He, T.P. Lodge, Chem. Commun. (2007) 2732.[20] J. Lee, M.J. Panzer, T.P. Lodge, C.D. Frisbie, J. Am. Chem. Soc. 129 (2007) 4532.[21] J.C. Hao, A.X. Song, J.Z. Wang, X. Chen, W.C. Zhuang, F. Shi, Chem. Eur. J. 11
(2005) 3936.[22] H. Gao, J. Li, B. Han, W. Chen, J. Zhang, R. Zhang, D. Yan, Phys. Chem. Chem.
Phys. 6 (2004) 2914.[23] J. Eastoe, S. Gold, S.E. Rogers, A. Paul, T. Welton, R.K. Heenan, I. Grillo, J. Am.
Chem. Soc. 127 (2005) 7302.[24] Y. Gao, S. Han, B. Han, G. Li, D. Shen, Z. Li, J. Du, W. Hou, G. Zhang, Langmuir 21
(2005) 5681.[25] N. Li, Y. Gao, L. Zheng, J. Zhang, L. Yu, X. Li, Langmuir 23 (2007) 1091.[26] J. Li, J. Zhang, H. Gao, B. Han, L. Gao, Colloid Polym. Sci. 283 (2005) 1371.[27] Y. Gao, J. Zhang, H. Xu, X. Zhao, L. Zheng, X. Li, L. Yu, Chem. Phys. Chem. 7
(2006) 1554.
[28] K. Behera, S. Pandey, J. Phys. Chem. B 111 (2007) 13307.[29] K. Behera, S. Pandey, J. Colloid Interface Sci. 316 (2007) 803.[30] Z. Miskolczy, K. Sebok-Nagy, L. Biczók, S. Göktürk, Chem. Phys. Lett. 400 (2004)
296.[31] K. Behera, S. Pandey, J. Colloid Interface Sci. 331 (2009) 196.[32] S. Chen, F. Han, Y. Wang, J. Yan, Colloids Surf. A 317 (2008) 457.[33] M.A. James-Smith, K. Alfford, D.O. Shah, J. Colloid Interface Sci. 315 (2007) 307.[34] L. Liu, P. Bauduin, T. Zemb, J. Eastoe, J. Hao, Langmuir 25 (2009) 2055.[35] J. Koetz, J. Bahnemann, G. Lucas, B. Tiersch, S. Kosmella, Colloids Surf. A 250
(2004) 423.[36] C. Note, J. Koetz, S. Kosmella, J. Colloid Interface Sci. 302 (2006) 662.[37] H. Itoh, K. Naka, Y. Chujo, J. Am. Chem. Soc. 126 (2004) 3026.[38] A. Taubert, Acta Chim. Slov. 52 (2005) 168.[39] Z. Li, P. Rabu, P. Strauch, A. Mantion, A. Taubert, Chem. Eur. J. 14 (2008) 8409.[40] C. Note, S. Kosmella, J. Koetz, Colloids Surf. A 290 (2006) 150.[41] S. Lutter, J. Koetz, B. Tiersch, A. Boschetti-de-Fierro, V. Abetz, Colloids Surf.
A 329 (2008) 169.[42] N.J. Durr, T. Larson, D.K. Smith, B.A. Korgel, K. Sokolov, A. Ben-Yakar, Nano
Lett. 7 (4) (2007) 941.[43] M.C. Daniel, D. Astruc, Chem. Rev. 104 (2004) 293.[44] G. Wolf, E. Kleinpeter, Langmuir 21 (2005) 6742.[45] M. Holz, H. Weingärtner, J. Magn. Reson. 92 (1991) 115.[46] Y. Gao, N. Li, L. Zheng, X. Bai, L. Yu, X. Zhao, J. Zhang, M. Zhao, Z. Li, J. Phys.
Chem. B. 111 (2007) 2506.[47] Y. Gao, L. Hilfert, A. Voigt, K. Sundmacher, J. Phys. Chem. B 112 (2008) 3711.[48] W. Meier, Langmuir 12 (1996) 1188.[49] B.K. Paul, R.K. Mitra, J. Colloid Interface Sci. 295 (2006) 230.[50] M.J. Suarez, H. Lévy, J. Lang, J. Phys. Chem. 97 (1993) 9808.[51] T. Beitz, J. Koetz, S.E. Friberg, Prog. Colloid Polym. Sci. 111 (1998) 100.[52] U. Olsson, K. Shinoda, B. Lindman, J. Phys. Chem. 90 (17) (1986) 4083.[53] H. Walderhaug, J. Phys. Chem. B 111 (2007) 9821.[54] J. Koetz, N. Jagielski, S. Kosmella, A. Friedrich, E. Kleinpeter, Colloids Surf. A 288
(2006) 36.[55] U. Olsson, P. Ström, O. Söderman, H. Wennerström, J. Phys. Chem. 93 (1989)
4572.[56] M. Holz, S.R. Heil, A. Sacco, Phys. Chem. Chem. Phys. 2 (2002) 4740.[57] B. Lindman, P. Stilbs, M.E. Moseley, J. Colloid Interface Sci. 83 (1981) 569.[58] J. Koetz, C. Günther, S. Kosmella, E. Kleinpeter, G. Wolf, Prog. Colloid Polym.
Sci. 122 (2003) 27.[59] J. Baier, J. Koetz, S. Kosmella, B. Tiersch, H. Rehage, J. Phys. Chem. B 111 (2007)
8612.[60] M. Kaszuba, D. McKnight, M.T. Connah, F.K. McNeil-Watson, U. Nobbmann,
J. Nanopart. Res. 10 (2008) 823.