Ionic Liquid-Based, Liquid-Junction-Free Reference Electrode
1
This is an author generated post-print of the article: Lee, K.M., Ngoh, G.C, & Chua, A.S.M. (2015). Ionic
liquid-mediated solid acid saccharification of sago waste: Kinetic, ionic liquid recovery and solid acid catalyst
reusability study. Industrial Crops and Products, 77, 415-423. doi:10.1016/j.indcrop.2015.09.016
Ionic liquid-mediated solid acid saccharification of sago waste: Kinetic, ionic liquid
recovery and solid acid catalyst reusability study
Kiat Moon Lee, Gek Cheng Ngoh,* and Adeline Seak May Chua
Department of Chemical Engineering, Faculty of Engineering, University of Malaya, 50603
Kuala Lumpur, Malaysia
* Corresponding Author:
Dr. Gek Cheng Ngoh
Postal address: Department of Chemical Engineering, Faculty of Engineering, University of
Malaya, 50603 Kuala Lumpur, Malaysia
E-mail: [email protected]
Telephone: +603-7967 5301
Fax: +603-7967 5319

2
Abstract
Dissolved carbohydrate obtained from 1-butyl-3-methylimidazolium chloride ([BMIM]Cl)
pretreated sago waste was saccharified by Amberlyst 15 (A15) to study the kinetics of the
ionic liquid-mediated solid acid saccharification of the lignocellulosic biomass. Besides the
kinetics of both reducing sugars production and reducing sugars degradation reactions,
emphasis was given to the recovery and reusability of the ionic liquid and solid acid catalyst.
The hydrolysis reaction follows a first order sugars production-first order sugars degradation
reaction that agreed well with the generalized Saeman kinetic model. Both the rates of
reducing sugars production and degradation varied with temperature and catalyst loading.
Higher temperature and catalyst loading promoted the rates of sugars production reaction
more than the rate of degradation reaction. This is evident from the relatively larger rate
constant of sugars production (k1) than the rate constant of degradation (k2). The activation
energy for sugars production and degradation was 125.1 kJ mol-1
and 60.8 kJ mol-1
respectively. These values are lower than the literature reported values for sulfuric acid-
catalyzed saccharification confirming its employment suitability for reducing sugars
production. The good recovery of [BMIM]Cl and good reusability of A15 further
substantiated the feasibility of the process. The recovery of ionic liquid was improved by
employing a multiple step aqueous biphasic system in this study. Approximately 60% of the
ionic liquid was recovered by 3-step aqueous biphasic system. This finding is on par with the
reported literatures using aqueous biphasic system to recover ionic liquid. Equally robust, the
solid acid catalyst regained its saccharification performance after regeneration for a total of
three cycles.

3
Keywords: solid acid catalyst; ionic liquid; kinetics; starch; reducing sugars; product
recovery and reusability
1. Introduction
Sugars are abundantly available in the form of starch, cellulose and hemicellulose
carbohydrates in lignocellulosic biomass. Generally, acid-catalyzed saccharification reaction
is used to convert the carbohydrates to reducing sugars. With technological advancement,
many efficient acid catalytic systems such as strong acidic cation exchange resins (Kim et al.,
2005; Lanzafame et al., 2012; Marzo et al., 2012; Onda et al., 2008), H-type zeolites
(Lanzafame et al., 2012; Onda et al., 2008), heteropolyacids (Lanzafame et al., 2012) and
supported solid acids (Lanzafame et al., 2012; Onda et al., 2008) have been reported.
However, even with the strong acidic cation exchange resins as powerful catalysts for
saccharification (Kim et al., 2005; Kitano et al., 2009), the recalcitrant nature of biomass
prevents chemical transformation and results in low saccharification rate (Ballesteros et al.,
2008; Hu and Wen, 2008). This predicament has spurred the effort of researchers to employ
ionic liquids in biomass dissolution (Fort et al., 2007; Haykir et al., 2013; Kilpeläinen et al.,
2007; Li et al., 2010; Li et al., 2009; Mäki-Arvela et al., 2010; Sun et al., 2009; Yang et al.,
2013; Zavrel et al., 2009) to assist solid acid saccharification of biomass in the production of
reducing sugars (Dwiatmoko et al., 2010; Kim et al., 2010; Rinaldi et al., 2008; Watanabe,
2010; Lee et al., 2013).
Despite that the process scheme to produce reducing sugars via ionic liquid-mediated
solid acid saccharification of lignocellulosic biomass has been reported viable (Dwiatmoko et
al., 2010; Watanabe, 2010), the cost of ionic liquid and solid acid catalyst undermines the
economic feasibility of the process concerned. To alleviate the cost constraint, aqueous

4
biphasic systems (ABS) were attempted by researchers to separate and recover ionic liquid
(Gutowski et al., 2003). The two phase system generated by adding kosmotropic salt into
aqueous solution of ionic liquid was environmentally more benign than the conventional
extraction using organic solvents (Hatti-Kaul, 2000; Zaslavsky, 1995). On the other hand, the
reused solid acid catalyst regenerated with sulfuric acid (Rinaldi et al., 2010) to restore the
active sites for saccarification process had also indicated positive recovery performance.
The reaction kinetics of catalytic reaction is essential for process optimization and
reactor design. Hypothetically, solid acid saccharification of the dissolved carbohydrates in
ionic liquid is expected to have distinct kinetics. The well-known cellulose hydrolysis model
(Saeman, 1945) had been applied in hydrolysis of other carbohydrates such as starch (Barnali
et al., 2008) and hemicelluloses (Lu and Mosier, 2008). Based on the model, the present work
performed a kinetic study of a sequential ionic liquid-mediated solid acid catalytic reaction
on sago waste that has not been reported elsewhere. The effects of temperature and catalyst
loading on the production rate and degradation rate of reducing sugars were investigated. The
generalized Saeman kinetic model applied to fit the experimental data to determine the
kinetic parameters of the hydrolysis process. To study the overall process economic
feasibility, the recovery efficiency and reusability of ionic liquid and solid acid catalyst were
examined in this study.
2. Materials and methods
2.1. Materials
The sago waste supplied by CL Nee Sago Industries (Malaysia) was ground and
sieved into desired size of approximately 500 μm. Ionic liquid 1-butyl-3-methylimidazolium

5
chloride ([BMIM]Cl, ˃98.0% purity) was from Merck (Germany), Amberlyst 15 (A15) and
potassium phosphate (≥98% purity) were purchased from Sigma-Aldrich (USA). The
ultrapure water used was generated by Arium® 611UF system (Sartorius, Germany).
2.2. Saccharification of sago waste
Sago waste (15 mg) was dissolved in a test tube containing 1 g of [BMIM]Cl using an
oil bath (MC, Julabo, Germany) at 160oC for 1.75 h. The clear solution formed was added
with 5 ml of ultrapure water and the mixture was evenly mixed. The resultant solution,
known as prehydrolysate, was saccharified with A15 of 2% (w/v) to 10% (w/v) loading in the
oil bath at a desired temperature, range of 100oC to 140
oC for 5 h. The saccharified samples
were collected at predetermined time of 5, 10, 15, 30, 60, 120, 180, 240 and 300 min. The
liquid product, known as hydrolysate, once separated from the catalyst through gravity
settlement, was determined for its reducing sugars content using 3,5-dinitrosalicylic acid
(DNS) assay (Miller, 1959). All experiments were conducted in duplicate. The reducing
sugars yield was calculated using Equation (1):
Reducing sugars yield (%) = wRS / [1.11(ws+wc) + 1.14wh] × 100% (1)
where wRS represents the weight of reducing sugars, ws, wc and wh represent the weight of
starch, cellulose and hemicelluloses in sago waste, respectively. The values 1.11 and 1.14 are
the multiplication factors that convert the respective carbohydrate to its equivalent sugars
(Sluiter et al., 2011).

6
2.3. Measurement of protons concentration
The concentration of protons ([H+]) in the hydrolysate was determined by measuring
the pH of the solution according to Equation (2):
pH = - log10 [H+] (2)
The pH of the reaction solution was measured at room temperature using a pH meter (827 pH
lab, Metrohm, USA). Prior to use, the pH meter was calibrated using buffer solutions of pH
4.00, 7.00 and 9.00.
2.4. Hydrolysis kinetic model
The generalized Saeman model, i.e. two consecutive first order sugars production and
sugars degradation reaction as expressed in Equation (3), was applied to determine the
kinetics of solid acid saccharification of dissolved carbohydrates in ionic liquid.
Polymers 𝑘1 Monomers
𝑘2 Degradation products (3)
The polymers and monomers expressed in the equation respectively represent the
carbohydrates and the reducing sugars, while k1 and k2 are the rate constant for production
and degradation of reducing sugars respectively.
For an irreversible first order reaction, the model shown in Equation (3) can be
described in two differential equations as expressed in Equation (4) and (5):
rS = – dS/dt = – k1S (4)
rP = dP/dt = k1S – k2P (5)
where rS is rate of degradation of carbohydrate, rP is rate of production of reducing sugars, S
is concentration of carbohydrate, P is concentration of reducing sugars and t is reaction time.

7
By solving the differential equations, concentration of the reducing sugars as a function of
time can be determined using Equation (6):
P = Po × exp(–k2t) + So × k1/(k2 – k1) × (exp(–k1t) – exp(–k2t)) (6)
where the subscript o indicates the respective initial concentration.
The time required to reach maximum concentration of reducing sugars was calculated
using Equation (7). This equation is derived by setting the derivative of Saeman model,
Equation (6), to zero for maximum concentration of reducing sugars.
tmax = ln(k2/k1) / (k2 – k1) (7)
The dependence of the rate constants k on temperature can be expressed by Arrhenius
equation as in Equation (8):
k = A × exp(–Ea/RT) (8)
where A is the Arrhenius constant, Ea is the activation energy, R is universal gas constant
(8.314 J mol-1
K-1
) and T is the absolute temperature. The acid concentration and the rate
constant k at constant temperature is related as shown in the equation below (Saeman, 1945):
k = W [H+]
m (9)
where W is a constant, [H+] is the proton concentration and m is the gradient of line in
logarithm k against logarithm of [H+] plot. The kinetic parameters of the model were
determined using MATLAB R2009b (MathWorks Inc., USA).
2.5. Recovery of ionic liquid
Aqueous biphasic system (ABS) was employed to recover the ionic liquid from the
hydrolysate. Potassium phosphate solution of 80% (w/w) concentration was added to the
hydrolysate in a drop wise manner until a phase separation was observed via a change of
clear to turbid solution. The turbid solution formed two phases after centrifuged (Centrifuge

8
5810R, Eppendorf, Germany). For each drop of potassium phosphate solution added, the
mixture in the test tube was shaken and the resulting solution was examined for turbidity. The
amount of potassium phosphate added was recorded and also the volumes of the two phases
formed. A portion of the bottom phase of the biphasic system was withdrawn and subjected
to second step of extraction with potassium phosphate solution. In all the extraction steps
conducted, samples from both phases were taken and analyzed using high-performance liquid
chromatography (HPLC). A Hi-Plex H column equipped with appropriate guard column
(Agilent Technologies, USA) and a refractive index detector (Waters, USA) were used to
detect and quantify the amount of [BMIM]Cl in the sample. The column temperature was
maintained at 65oC and the mobile phase was filtered, degassed ultrapure water with flow
rate at 0.6 ml/min.
The extraction efficiency of ionic liquid, %Ei in a particular extraction step, i was
calculated according to Equation (10):
%Ei = [[BMIM]Cl]Ui × VUi / {[[BMIM]Cl]Ui × VUi + [[BMIM]Cl]Bi × VBi} × 100 (10)
where [[BMIM]Cl] is the concentration of ionic liquid, subscript U and B refer to the upper
and bottom phases in the ABS respectively, and V is the volume of the particular phase. The
total extraction efficiency of ionic liquid, %E was expressed in Equation (11):
%𝐸 = BMIM Cl 𝑈𝑖× 𝑉𝑈𝑖
𝑛𝑖=1 𝑚 BMIM Cl × 100 (11)
where n is the total number of extractions, m[BMIM]Cl is the total mass of [BMIM]Cl in the
hydrolysate prior to ABS.
2.6. Regeneration and reusability of solid acid catalyst
The solid acid catalyst Amberlyst 15 (A15) was regenerated according to the
procedure suggested by Rohm and Haas Company, USA. The spent A15 was collected and

9
loaded into a glass tube with a perforated end to create a catalyst bed. To initiate the
regeneration, A15 catalyst bed was flushed with sufficient amount of ultrapure water to
remove any unwanted chemical. The water was drained followed by pumping 10% (v/v)
sulfuric acid solution at a rate of 4 bed volumes (BVs) per hour until a total of 1.5 BVs of
sulfuric acid was passed through the catalyst bed. The rinsing of the bed was repeated with
ultrapure water to remove excess sulfuric acid from the catalyst. Rinsing was carried out at
the same flow rate as the regeneration flow rate until approximate 1 or 2 BVs of ultrapure
water had passed through the bed. The flow rate of the rinsing water was then increased to 12
BVs/h and continued until the effluent registered a pH of above 4. After the water had been
drained, catalyst was placed in an oven at 105oC overnight to remove water moisture. The
dried regenerated A15 was subsequently used for solid acid saccharification.
3. Results and discussion
3.1. Effects of temperature and catalyst loading on the rate of production and degradation
of reducing sugars
In this study, the sago waste sample contained 36.5 ± 1.2% (w/w) starch, 40.0 ± 2.2%
(w/w) cellulose, 13.1 ± 0.1% (w/w) hemicellulose and 4.5 ± 0.1% (w/w) lignin (Lee et al.,
2014). In view of its high carbohydrates content, sago waste is favorable for reducing sugars
production. The concentrations of reducing sugars during the course of hydrolysis at different
operational conditions are shown in Figure 1. An increase in reducing sugars concentration
was observed initially for all experimental conditions. This suggests a net production of
reducing sugars due to the rate of reducing sugars production was greater than the
degradation reaction. However, when the saccharification reaction was conducted for longer

10
than 180 min at 100oC, the concentration of reducing sugars remained constant, indicating the
production and degradation of sugars were progressed at the same rate. In the present study,
the hydrolysis of carbohydrate was performed in a batch test. Thus, the carbohydrates
decreased with the progression of hydrolysis as it gradually converted into reducing sugars.
Since reaction rate is proportional to reactant concentration, the rate of reducing sugars
production was reduced proportionally to the carbohydrate concentration. As hydrolysis of
carbohydrates produced more reducing sugars, rate of degradation would thus be increased.
Therefore, further reduction in the reducing sugars concentration had occurred. This
phenomenon was obvious at 120oC and 140
oC as shown in Figure 1 (b) and (c) respectively.

11
Fig. 1. Concentration of reducing sugars at different temperature and catalyst loading: (a)
100oC; (b) 120
oC; and (c) 140
oC.
At the same temperature, different catalyst loadings gave different profiles in reducing
sugars concentration over a period of time. At low temperature of 100oC and 120
oC,
concentration of reducing sugars reached maximum at a shorter time for a higher catalyst
loading. For instance, 10% catalyst loading took about 2 h to achieve maximum

12
concentration of reducing sugars, but 6% catalyst loading required 3 h at the same
temperature of 100oC (refer to Figure 1(a)). At higher temperature of 140
oC, three
investigated catalyst loadings reached maximum concentration of reducing sugars in less than
30 min. Due to degradation, the concentration of reducing sugars decreased as hydrolysis
reaction continues to take place. Higher catalyst loading experienced a greater extent of
degradation and resulted in lowest concentration of reducing sugars at the end of reaction
(refer to Figure 1(c)).
The study showed that different temperatures and different catalyst loadings produced
different profiles of reducing sugars concentration, which in turn suggests that these
parameters affect both the rates of production of reducing sugars and degradation of sugars.
These rates increased with temperature and acid concentration. The effect of the temperature
can be explained by the endothermic reaction of the hydrolysis process, whereby high
temperature favors the reaction (Jin et al., 2011). Meanwhile, an increase in the acid
concentration had increased the amount of protons available for hydrolysis at higher catalyst
loading. To elucidate the temperature and acid concentration effect on the reaction rates, a
detailed kinetic study was performed.
3.2. Determination of kinetic rate constants of reducing sugars production and
degradation
Having the sago waste dissolved in ionic liquid, the dissolved carbohydrates will be
uniformly hydrolyzed by the A15 during solid acid saccharification as each of the glycosidic
bonds in the carbohydrates has equal accessibility to the catalyst. To examine the kinetics of
solid acid saccharification of the dissolved carbohydrate, the generalized Saeman model
expressed in Equation (3) was applied. As shown in Figure 1, the experimental data was well

13
fitted into the Saeman model and the finding suggests that solid acid saccharification of the
dissolved carbohydrate is a pseudo-homogeneous irreversible first order reactions.
Even though the hydrolysis reaction follows that of the Saeman model, solid acid
saccharification of dissolved carbohydrate is expected to have different values for their
kinetic parameters. The kinetic rate constants, k1 and k2 in Equation (6) were determined by
fitting the experimental data to the equation with the aid of MATLAB. The values obtained
for each operational condition were tabulated in Table 1. The accuracy of the rate constants
generated by MATLAB were verified by the low values of the sum of square (less than 0.15)
between the concentration of the reducing sugars predicted by the model and the
concentration of the reducing sugars determined from the experiment. The rate constants of
sugars production (k1) are higher than the rate constants of sugars degradation (k2) implies
that the operational conditions favored the reducing sugars production over the reducing
sugars degradation.

14
Table 1
Rate constants for reducing sugars production and degradation
Temperature
(oC)
Catalyst loading
(%, w/v)
k1 × 102
(min-1
)
k2 × 103
(min-1
)
k1/k2
100 2 0.545 0.221 24.6
6 1.32 0.224 58.9
10 1.63 0.228 71.6
120 2 4.39 0.312 141
6 9.87 0.379 260
10 11.8 0.405 291
140 2 23.1 0.771 300
6 59.5 1.79 332
10 105 2.56 410
k1: rate constant of sugars production reaction; k2: rate constant of sugars degradation
reaction.
It can be seen from Table 1 that the higher the reaction temperature and acid
concentration, the higher is the kinetic rate constant. This is as previously explained in which
the endothermic reaction and the high availability of protons promoted the hydrolysis
reaction. The rate constant for sugars production (k1) increased more with the increase in
temperature than the increase in catalyst loading. An increase of 20oC from either 100
oC to
120oC or 120
oC to 140
oC at any catalyst loading, a five-fold to nine-fold increment in k1
values was obtained. Nevertheless, an increment of approximately two-fold was observed
when catalyst loading increased from 2% to 6% or 6% to 10% at all temperature investigated.

15
Hence, elevation of the operational temperature is a better option to enhance the production
of reducing sugars.
The selectivity factor, i.e. the ratio of reducing sugars production rate constant to
degradation rate constant (k1/k2) presented in Table 1, was used to evaluate the efficiency of
different operational conditions in saccharification. The highest selectivity factor of 410 was
observed at 140oC and 10% catalyst loading. The hydrolysis conducted at the mentioned
conditions achieved maximum concentration of reducing sugars at the shortest time of 6 min
but did not give the highest concentration at the end of the experiment as shown in Figure 1.
This is because the rate of reaction is only affected by the rate constant and the concentration
of reactant. As no reducing sugars can be produced when all the carbohydrates had been
completely utilized with the possible degradation of sugars continued to take place, highest
concentration of reducing sugars would not be obtained toward the end of reaction. In brief, a
high selectivity factor promotes the production of reducing sugars provided that the reaction
time is kept within the maximum production of reducing sugars to avoid degradation. Table 2
shows the maximum time required to achieve the highest concentration of reducing sugars
(tmax) at different reaction conditions. The values of tmax are good references for selecting
suitable operational conditions to achieve high reducing sugars yields. In this study, it is
advantageous to conduct the hydrolysis reaction at high temperature as it gave maximum
amount of reducing sugars at relatively shorter time range, i.e. 6 min to 25 min when
hydrolysis was conducted at 140oC compared to 48 min to 114 min for 120
oC and a much
longer time range of 265 min to 613 min was required at 100oC.

16
Table 2
Time taken to achieve maximum concentration of reducing sugars
Temperature
(oC)
Catalyst
loading
(%, w/v)
Time to achieve
maximum concentration
of reducing sugars, tmax
(min)
Maximum
concentration of
reducing sugars
(mg/ml)
Maximum
reducing
sugars yield
(%)
100 2 613 2.18 72.8
6 314 2.33 77.8
10 265 2.35 78.5
120 2 114 2.41 80.5
6 57 2.45 81.8
10 48 2.45 81.8
140 2 25 2.45 81.8
6 10 2.46 82.1
10 6 2.46 82.1
3.3. Determination of kinetic parameters in the rate constants
Arrhenius equation as expressed in Equation (8) was used to study the effect of
temperature on the rate constants. To determine the kinetic parameters, i.e. the Arrhenius
constants and activation energies of the reactions, natural logarithmic of rate constant (ln k)
versus reciprocal of absolute temperature (1/T) were plotted as illustrated in Figure 2. Based
on the figure, activation energy and Arrhenius constant for both the sugars production and the
sugars degradation reactions were determined and listed in Table 3. The average activation
energy of sugars production and sugars degradation was 125.1 ± 7.0 kJ mol-1
and 60.8 ± 19.1
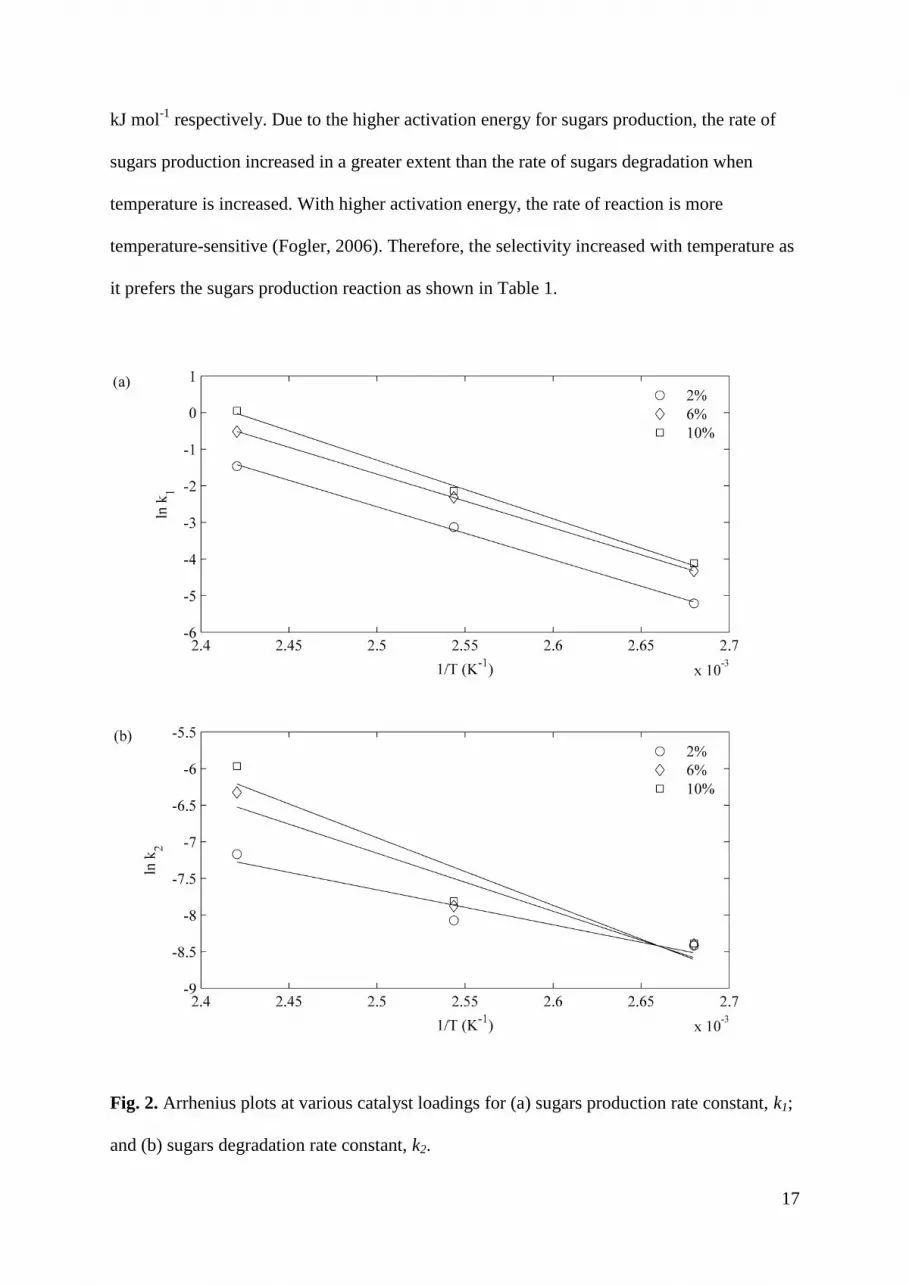
17
kJ mol-1
respectively. Due to the higher activation energy for sugars production, the rate of
sugars production increased in a greater extent than the rate of sugars degradation when
temperature is increased. With higher activation energy, the rate of reaction is more
temperature-sensitive (Fogler, 2006). Therefore, the selectivity increased with temperature as
it prefers the sugars production reaction as shown in Table 1.
Fig. 2. Arrhenius plots at various catalyst loadings for (a) sugars production rate constant, k1;
and (b) sugars degradation rate constant, k2.

18
Table 3
Activation energies and Arrhenius constants for sugars production and degradation rate
constants at various catalyst loadings
Catalyst
loading
(%, w/v)
Sugars production reaction Sugars degradation reaction
Arrhenius
constant, A
(min-1
)
Activation
energy, Ea
(kJ mol-1
)
R2 Arrhenius
constant, A
(min-1
)
Activation
energy, Ea
(kJ mol-1
)
R2
2 3.82 × 10¹⁴
120.2 0.9987 7.23 × 10 39.7 0.9223
4 1.62 × 10¹⁵
122.1 1.0000 3.18 × 10⁵ 65.9 0.9087
6 6.57 × 10¹⁶
133.1 0.9966 1.02 × 10⁷ 76.8 0.8988
Average 125.1 60.8
The activation energy for sugars production in this study was close to the one reported
by Kumoro et al. (2008) for sago waste that was hydrolyzed with diluted sulfuric acid. When
compared to other researchers’ works employing different biomass, the reported activation
energy was 171.6 kJ mol-1
, 151.5 kJ mol-1
and 179.5 kJ mol-1
for dilute acid hydrolysis of
corn stover (Bhandari et al., 1984), cellulose (Girisuta et al., 2007) and Douglas fir (Saeman,
1945) respectively. In comparison, the present study has lower activation energy for sugars
production. This could have been attributed to the variation in structural and chemical
composition of the lignocellulosic biomass applied (Canettieri et al., 2007; Ranganathan et
al., 1985). In sago waste, approximately 40% of its total carbohydrate is starch and the
remaining is of cellulose and hemicellulose (Lee et al., 2014). Starch is composed of
branched polymeric chains of D-glucose linked by α-1,4-glycosidic or α-1,6-glycosidic bonds,
whereas the building block of cellulose is long linear polymeric D-glucose units linked by β-
1,4-glycosidic bonds. The branched polymeric chains of starch can be readily hydrolyzed

19
compared to the long linear polymeric chains of cellulose. Thus, starchy lignocellulosic
biomass like sago waste is more susceptible to hydrolysis reaction which requires lower
activation energy for reducing sugars production.
Similarly, lower activation energy of sugars degradation reaction in the present study
compared to those reported by Saeman (1945) and Girisuta et al. (2007) respectively at 139.9
kJ mol-1
and 152.2 kJ mol-1
. When compare the rate constant k2, the literature reported values
0.0029 min-1
to 0.00795 min-1
(Aguilar et al., 2002) and 0.00585 min-1
to 0.118 min-1
(Saeman, 1945) are higher than the values obtained in this study (0.0002 min-1
and 0.0026
min-1
). The lower k2 values indicates that reducing sugars degrading rate is relatively slow.
This suggests that the problem of sugars degradation at high temperature encountered in
sulfuric acid saccharification can be resolved by employing solid acid saccharification on
ionic liquid dissolved carbohydrates. Such employment not only improves the sugars yield
from biomass but also assists the subsequent fermentation as inhibitory effect on
microorganism by degraded sugars products is minimized (Delgenes et al., 1996; Kootstra et
al., 2009; Larsson et al., 1999; Sreenath and Jeffries, 2000; Taherzadeh et al., 1999).
To investigate the effect of acid concentration on reducing sugars yield, different
catalyst loadings were applied to the saccharification reaction. As reported by Dwiatmoko et
al. (2010), the presence of ionic liquid solution induces the release of protons (H+) from the
SO3H functional groups attached to the A15 solid acid catalyst. Since the mobile H+ ions
released into the hydrolysate are responsible for the homogeneous saccharification reaction, it
was based on when investigate the effect of acid concentration on the rate constant. The
amount of H+ ions released was determined by measuring the pH of the hydrolysate. Table 4
presents the amount of acid sites, the quantity of H+ ions in the hydrolysate and the
percentage of H+ released into the hydrolysate at specific catalyst loading.

20
Table 4
Protons (H+) release from A15 at various catalyst loadings
Catalyst
loading
(%, w/v)
Amount of
acid sites a
(mmol)
pH of resultant
solution
Amount of H+ ions in
hydrolysate
(mmol)
Percentage of
H+ released
b
(%)
2 0.23 1.240 0.14 62.6
6 0.69 0.815 0.38 55.5
10 1.15 0.605 0.62 54.0
a Concentration of acid sites in Amberlyst 15 = 4.6 mmol/g
b Percentage of H
+ released = Amount of H
+ ions in hydrolysate / Amount of acid sites × 100
Table 4 shows that the amount of H+ ions released was lower than the number of acid
sites present in the catalyst. This implies that not all the H+ bonded to the catalyst was
released into the hydrolysate. The percentage of H+
ions released into the hydrolysate
decreased as the catalyst loading increased. This could be due to insufficient ionic liquid in
the hydrolysate to induce all the H+ ions to be released from the acid sites at a high catalyst
loading. As stated earlier, the H+ ions used for saccharification should be of the mobile H
+
ions that present in the hydrolysate. Therefore, only the concentration of H+ ions in
hydrolysate was taken into consideration to study the effect of acid concentration on kinetic
rate constants.
The plot of logarithm k versus logarithm of H+ concentration as shown in Figure 3
was used to correlate the acid concentration to sugars production and degradation rate
constants. The kinetic parameter, m, that describes the effect of H+ concentration towards rate
constant was determined from the gradient of the graph (refer to Equation (9)) and the values
obtained at various operating conditions are tabulated in Table 5. All the m values shown are
less than 2, which is comparable with those reported in the literature (Saeman, 1945; Lu and

21
Mosier, 2008). The m values for k2 are lower than the corresponding value of k1 suggests that
acid concentration might not have affected the sugars degradation significantly compared to
its effect on the sugars production reaction.
Fig. 3. Logarithmic plots of rate constant versus H+ concentration at various temperature for
(a) sugars production rate constant, k1; and (b) sugars degradation rate constant, k2.

22
Table 5
The m values for sugars production and degradation rate constants at various temperatures
Temperature
(oC)
Sugars production reaction Sugars degradation reaction
m R2 m R
2
100 0.7732 0.9789 0.0202 0.9284
120 0.6973 0.9741 0.1814 0.9931
140 1.0239 0.9976 0.8267 0.9989
3.4. Recovery of ionic liquid and recyclability of solid acid catalyst
In this study, 80% potassium phosphate solution was used to create an aqueous
biphasic system (ABS) to separate and recover the ionic liquid used for the dissolution of
carbohydrates. The separation performance is presented in Table 6. Estimated 39.6% of
[BMIM]Cl was being extracted from the upper phase after the first extraction. The ionic
liquid extraction efficiency obtained was low compared to those reported in the literatures
which range between 60% to 75% (Wu et al., 2008). This can be explained by the different
ionic liquid solution concentrations used in the reported work whereby potassium phosphate
solution concentration was manipulated according to the targeted concentration of ionic
liquid solution. Whereas the ionic liquid solution used in this study was resulted from the
dissolution-saccharification reaction at fixed concentration which only requires a fixed
concentration of potassium phosphate solution to create an ABS. This might have resulted in
poor extraction efficiency of [BMIM]Cl. Due to the constraint of applying different
concentrations of potassium phosphate, a multiple step extraction of ionic liquid was
attempted to enhance its recovery. After three extractions, 59.7% of [BMIM]Cl was

23
recovered. This signifies the adoption of multiple step ABS to recover the [BMIM]Cl from
the hydrolysate is feasible.
Table 6
Recovery of [BMIM]Cl in the multistep aqueous biphasic system
No. of extraction, i Extraction efficiency
In particular extraction step, i (%Ei) Total (%E)
1 39.6 ± 1.1 39.6
2 16.1 ± 1.8 49.3
3 20.5 ± 4.2 59.7
Once the ionic liquid pretreated sago waste had been saccharified, the solid acid
catalyst was regenerated with sulfuric acid. Figure 4 shows that the saccharification
performance of the regenerated solid acid catalyst was similar to that of the fresh catalyst;
whereas the saccharification performance of the non-regenerated catalyst had decreased after
each cycle. The regenerated catalyst can be reused for three times with its saccharification
performance unaltered. This finding agrees well with the result reported by Rinaldi et al.
(2010). The regeneration process regained the saccharification performance of the catalyst
through the mechanism in which the H+ ions from the sulfuric acid was displaced the ionic
liquid cations that attached to the SO3- groups to retrieve its sulfonic groups (Dwiatmoko et
al., 2010). Therefore, the used solid acid catalyst can maintain the saccharification efficiency
with proper regeneration.

24
Fig. 4. Reducing sugars recovery from sago waste by regenerated A15 and unregenerated
A15.
4. Conclusions
Solid acid saccharification of the ionic liquid pretreated sago waste follows the first order
sugars production-first order sugars degradation reaction. The hydrolysis favors the
production of sugars monomers over the competing sugars degradation reaction. Higher
saccharification temperature and catalyst loading gave higher rates of reactions with
temperature having a greater effect in both rates of reactions. Even though reducing sugars
degradation is inevitable, its degree of degradation compared to that of the sulfuric acid
saccharification is considerably insignificant. The study also demonstrated that the used ionic

25
liquid and solid acid catalyst could be recovered and reused. Approximately 60% of ionic
liquid can be recovered using a 3-step ABS, while the regenerated solid acid catalyst
exhibited same saccharification performance after being used for three cycles. The high ionic
liquid recovery and good catalyst reusability signify the economic feasibility of ionic liquid-
mediated solid acid saccharification system.
Acknowledgement
Financial support provided by University of Malaya under grant no. RP002B-13AET is
greatly acknowledged.
References
Aguilar, R., Ramírez, J.A., Garrote, G., Vázquez, M., 2002. Kinetic study of the acid
hydrolysis of sugar cane bagasse. J. Food Eng. 55, 309-318.
Ballesteros, I., Ballesteros, M., Manzanares, P., Negro, M.J., Oliva, J.M., Sáez, F., 2008.
Dilute sulfuric acid pretreatment of cardoon for ethanol production. Biochem. Eng. J.
42, 84-91.
Barnali, B., Basu, R.K., Ash, S.N., 2008. Kinetic studies on acid catalysed hydrolysis of
starch. Journal of Scientific & Industrial Research 67, 295-298.
Bhandari, N., Macdonald, D.G., Bakhshi, N.N., 1984. Kinetic studies of corn stover
saccharification using sulphuric acid. Biotechnol. Bioengin. 26, 320-327.
Canettieri, E.V., Rocha, G.J.M., Carvalho, J.A., Silva, J.B.A., 2007. Evaluation of the
kinetics of xylose formation from dilute sulfuric acid hydrolysis of forest residues of
Eucalyptus grandis. Ind. Eng. Chem. Res. 46, 1938-1944.

26
Delgenes, J.P., Moletta, R., Navarro, J.M., 1996. Effects of lignocellulose degradation
products on ethanol fermentations of glucose and xylose by Saccharomyces
cerevisiae, Zymomonas mobilis, Pichia stipitis, and Candida shehatae. Enzyme
Microb. Technol. 19, 220-225.
Dwiatmoko, A.A., Choi, J.W., Suh, D.J., Suh, Y.-W., Kung, H.H., 2010. Understanding the
role of halogen-containing ionic liquids in the hydrolysis of cellobiose catalyzed by
acid resins. Appl. Catal., A 387, 209-214.
Fogler, H.S., 2006. Elements of chemical reaction engineering; Prentice Hall PTR: New
Jersey.
Fort, D.A., Remsing, R.C., Swatloski, R.P., Moyna, P., Moyna, G., Rogers, R.D., 2007. Can
ionic liquids dissolve wood? Processing and analysis of lignocellulosic materials with
1-n-butyl-3-methylimidazolium chloride. Green Chem. 9, 63-69.
Girisuta, B., Janssen, L.P.B.M., Heeres, H.J., 2007. Kinetic study on the acid-catalyzed
hydrolysis of cellulose to levulinic acid. Ind. Eng. Chem. Res. 46, 1696-1708.
Gutowski, K.E., Broker, G.A., Willauer, H.D., Huddleston, J.G., Swatloski, R.P., Holbrey,
J.D., Rogers, R.D., 2003. Controlling the aqueous miscibility of ionic liquids: aqueous
biphasic systems of water-miscible ionic liquids and water-structuring salts for recycle,
metathesis, and separations. J. Am. Chem. Soc. 125, 6632-6633.
Hatti-Kaul, R., 2000. Aqueous two-phase systems: methods and protocols; Human Press:
New Jersy.
Haykir, N.I., Bahcegul, E., Bicak, N., Bakir, U., 2013. Pretreatment of cotton stalk with ionic
liquids including 2-hydroxyl ethyl ammonium formate to enhance biomass digestibility.
Ind. Crops Prod. 41, 430-436.
Hu, Z., Wen, Z., 2008. Enhancing enzymatic digestibility of switchgrass by microwave-
assisted alkali pretreatment. Biochem. Eng. J. 38, 369-378.

27
Jin, Q., Zhang, H., Yan, L., Qu, L., Huang, H., 2011. Kinetic characterization for
hemicellulose hydrolysis of corn stover in a dilute acid cycle spray flow-through
reactor at moderate conditions. Biomass Bioenerg. 35, 4158-4161.
Kim, S.-J., Dwiatmoko, A.A., Choi, J.W., Suh, Y.-W., Suh, D.J., Oh, M., 2010. Cellulose
pretreatment with 1-n-butyl-3-methylimidazolium chloride for solid acid-catalyzed
hydrolysis. Bioresour. Technol. 101, 8273-8279.
Kim, Y., Hendrickson, R., Mosier, N., Ladisch, M.R., 2005. Plug-flow reactor for continuous
hydrolysis of glucans and xylans from pretreated corn fiber. Energy Fuels 19, 2189-
2200.
Kilpeläinen, I., Xie, H., King, A., Granstrom, M., Heikkinen, S., Argyropoulos, D.S., 2007.
Dissolution of wood in ionic liquids. J. Agric. Food Chem. 55, 9142-9148.
Kitano, M., Yamaguchi, D., Suganuma, S., Nakajima, K., Kato, H., Hayashi, S., Hara, M.,
2009. Adsorption-enhanced hydrolysis of β-1,4-glucan on graphene-based amorphous
carbon bearing SO3H, COOH, and OH groups. Langmuir 25, 5068-5075.
Kootstra, A.M.J., Mosier, N.S, Scott, E.L., Beeftink, H.H., Sanders, J.P.M., 2009.
Differential effects of mineral and organic acids on the kinetics of arabinose
degradation under lignocellulose pretreatment conditions. Biochem. Eng. J. 43, 92-97.
Kumoro, A.C., Ngoh, G.C., Hassan, M., Ong, C.H., Teoh, E.C., 2008. Conversion of fibrous
sago (Metroxylon sagu) waste into fermentable sugar via acid and enzymatic
hydrolysis. Asian Journal of Scientific Research 1, 412-420.
Lanzafame, P., Temi, D.M., Perathoner, S., Spadaro, A.N., Centi, G., 2012. Direct conversion
of cellulose to glucose and valuable intermediates in mild reaction conditions over
solid acid catalysts. Catal. Today 179, 178-184.

28
Larsson, S., Palmqvist, E., Hahn-Hägerdal, B., Tengborg, C., Stenberg, K., Zacchi, G.,
Nilvebrant, N.-O., 1999. The generation of fermentation inhibitors during dilute acid
hydrolysis of softwood. Enzyme Microb. Technol. 24, 151-159.
Lee, K.M., Ngoh, G.C., Chua, A.S.M., Yoon, L.W., Ang, T.N., Lee, M.-G., 2014.
Comparison study of different ionic liquid pretreatments in maximizing total reducing
sugars recovery. BioResources 9(1), 1552-1564.
Lee, K.M., Ngoh, G.C., Chua, A.S.M., 2013. Process optimization and performance
evaluation on sequential ionic liquid dissolution-solid acid saccharification of sago
waste. Bioresour. Technol. 130, 1-7.
Li, C., Knierim, B., Manisseri, C., Arora, R., Scheller, H.V., Auer, M., Vogel, K.P.,
Simmons, B.A., Singh, S., 2010. Comparison of dilute acid and ionic liquid
pretreatment of switchgrass: Biomass recalcitrance, delignification and enzymatic
saccharification. Bioresour. Technol. 101, 4900-4906.
Li, Q., He, Y.-C., Xian, M., Jun, G., Xu, X., Yang, J.-M., Li, L.-Z., 2009. Improving
enzymatic hydrolysis of wheat straw using ionic liquid 1-ethyl-3-methyl imidazolium
diethyl phosphate pretreatment. Bioresour. Technol. 100, 3570-3575.
Lu, Y., Mosier, N.S., 2008. Kinetic modeling analysis of maleic acid-catalyzed hemicellulose
hydrolysis in corn stover. Biotechnol. Bioeng. 101, 1170-1181.
Mäki-Arvela, P., Anugwom, I., Virtanen, P., Sjöholm, R., Mikkola, J.P. 2010. Dissolution of
lignocellulosic materials and its constituents using ionic liquids – A review. Ind.
Crop. Prod. 32, 175-201.
Marzo, M., Gervasini, A., Carniti, P., 2012. Hydrolysis of disaccharides over solid acid
catalysts under green conditions. Carbohydr. Res. 347, 23-31.
Miller, G.L., 1959. Use of dinitrosalicylic acid reagent for determination of reducing sugars,
Anal. Chem. 31, 426-428.

29
Onda, A., Ochi, T., Yanagisawa, K., 2008. Selective hydrolysis of cellulose into glucose over
solid acid catalysts. Green Chem. 10, 1033-1037.
Ranganathan, S., Macdonald, D.G., Bakhshi, N.N., 1985. Kinetic studies of wheat straw
hydrolysis using sulphuric acid. The Canadian Journal of Chemical Engineering 63,
840-844.
Rinaldi, R., Meine, N., vom Stein, J., Palkovits, R., Schüth, F., 2010. Which controls the
depolymerization of cellulose in ionic liquids: the solid acid catalyst or cellulose?
ChemSusChem 3, 266-276.
Rinaldi, R., Palkovits, R., Schüth, F., 2008. Depolymerization of cellulose using solid
catalysts in ionic liquids. Angew. Chem. Int. Ed. 47, 8047-8050.
Saeman, J.F., 1945. Kinetics of wood saccharification - Hydrolysis of cellulose and
decomposition of sugars in dilute acid at high temperature. Industrial & Engineering
Chemistry 37, 43-52.
Sluiter, A., Hames, B., Ruiz, R., Scarlata, C., Sluiter, J., Templeton, D., Crocker, D., 2011.
Determination of structural carbohydrates and lignin in biomass (pp. 18). Golden,
Colorado National Renewable Energy Laboratory.
Sreenath, H.K., Jeffries, T.W., 2000. Production of ethanol from wood hydrolyzate by yeasts.
Bioresour. Technol. 72, 253-260.
Sun, N., Rahman, M., Qin, Y., Maxim, M.L., Rodriguez, H., Rogers, R.D., 2009. Complete
dissolution and partial delignification of wood in the ionic liquid 1-ethyl-3-
methylimidazolium acetate. Green Chem. 11, 646-655.
Taherzadeh, M.J., Niklasson, C., Lidén, G., 1999. Conversion of dilute-acid hydrolyzates of
spruce and birch to ethanol by fed-batch fermentation. Bioresour. Technol. 69, 59-66.
Watanabe, H., 2010. The study of factors influencing the depolymerisation of cellulose using
a solid catalyst in ionic liquids. Carbohydr. Polym. 80, 1168-1171.

30
Wu, B., Zhang, Y.M., Wang, H.P., 2008. Aqueous biphasic systems of hydrophilic ionic
liquids + sucrose for separation. Journal of Chemical & Engineering Data 53(4), 983-985.
Zaslavsky, B.Y., 1995. Aqueous two-phase partitioning: physical chemistry and bio-
analytical applications; Marcel Dekker: New York.
Yang, D., Zhong, L.-X., Yuan, T.-Q., Peng, X.-W., Sun, R.-C., 2013. Studies on the
structural characterization of lignin, hemicelluloses and cellulose fractionated by ionic
liquid followed by alkaline extraction from bamboo. Ind. Crops Prod. 43, 141-149.
Zavrel, M., Bross, D., Funke, M., Büchs, J., Spiess, A.C., 2009. High-throughput screening
for ionic liquids dissolving (ligno-)cellulose. Bioresour. Technol. 100, 2580-2587.
Copyright © 2022 FDOKUMEN


![Survey of renewable chemicals produced from lignocellulosic biomass during ionic liquid pretreatment [2013]](https://static.fdokumen.com/doc/165x107/6333905f9d8fc1106803de76/survey-of-renewable-chemicals-produced-from-lignocellulosic-biomass-during-ionic.jpg)