Norwegian Sami differs significantly from other Norwegians according to their HLA profile
11
Tissue Antigens ISSN 0001-2815 Norwegian Sami differs significantly from other Norwegians according to their HLA profile H. F. Harbo 1,2 , M. E. Riccio 3 , ˚ A. R. Lorentzen 2,4 , E. Utsi 5 , K.-M. Myhr 6,7 , S. I. Mellgren 8,9 , S. T. Fl ˚ am 4 , E. Thorsby 4 , A. Sanchez-Mazas 3 & B. A. Lie 4 1 Department of Neurology, Oslo University Hospital, Ullev˚ al, Oslo, Norway 2 Department of Neurology, Faculty Division Ullev ˚ al University Hospital, University of Oslo, Oslo, Norway 3 Laboratory of Anthropology, Genetics and Peopling History (AGP), University of Geneva, Geneva, Switzerland 4 Institute of Immunology, Oslo University Hospital, Rikshospitalet, Oslo, Norway 5 Karasjok Heart Center, Karasjok, Norway 6 Department of Neurology, Haukeland University Hospital, Bergen, Norway 7 Department of Clinical Medicine, Section of Neurology, University of Bergen, Bergen, Norway 8 Department of Neurology, University Hospital of North Norway, Tromsø, Norway 9 Department of Clinical Medicine, University of Tromsø, Tromsø, Norway Key words genetic diversity; human leukocyte antigen; Norwegian; population genetics; Sami Correspondence Hanne F. Harbo, MD, PhD Department of Neurology Oslo University Hospital Ullev ˚ al 0407 Oslo Norway Tel: +47 9954 6680 Fax: +47 2302 7455 e-mail: [email protected] Received 02 July 2009; revised 15 October 2009; accepted 20 November 2009 doi: 10.1111/j.1399-0039.2009.01425.x Abstract This study reports extensive genomic data for both human leukocyte antigen (HLA) class I and II loci in Norwegian Sami, a native population living in the northwest of Europe. The Sami have a distinct culture and their own languages, which belong to the Uralic linguistic family. Norwegian Sami (n = 200) were typed at the DNA level for the HLA-A, -C, -B, -DRB1 and -DQB1 loci, and compared with a non- Sami Norwegian population (n = 576). The two populations exhibited some common genetic features but also differed significantly at all HLA loci. The most significantly deviating allele frequencies were an increase of HLA-A*03, -B*27, -DRB1*08 and -DQB1*04 and a decrease of HLA-A*01, C*01, -DRB1*04 and -DQB1*02 among Sami compared with non-Sami Norwegians. The Sami showed no deviation from Hardy–Weinberg equilibrium. The hypothesis of selective neutrality was rejected at all loci except for the A- and C - loci for the Sami. HLA haplotype frequencies also differed between the two populations. The most common extended HLA haplotypes were A*02-B*27-C*01-DR*08-DQB1*04 in the Sami and A*01-B*08-C*07-DR*03- DQB1*02 in the other Norwegians. Genetic distance analyses indicated that the Norwegian Sami were highly differentiated from other Europeans and were most closely related to Finns whose language also belongs to the Uralic linguistic family. In conclusion, the Norwegian Sami and the non-Sami Norwegians were significantly different at all HLA loci. Our results can be explained by the fact that the two populations have different origins and that the Sami population has remained smaller and more isolated than its neighbors. Introduction The Sami are a native population living in the northwest of Europe, mostly the northern part of Norway, Sweden and the Kola Peninsula of Russia, where their ancestors have inhabited before the present national borders were drawn. The Sami have a distinct culture and more recently their own political organization. There are several Sami languages, which all belong to the Uralic linguistic family (Ethnologue, Languages of the World, http://ethnologue.com). According to the Sami Act, a person is considered as Sami if he/she has at least one parent or grandparent who learned Sami as his/her mother tongue and who considers himself/herself as Sami (http://www.lovdata.no). The Sami population of Norway has traditionally been living in small communities in the northernmost counties Troms and Finnmark, but 23% of the Sami who took part in the last Norwegian political election (autumn 2005) were living in other parts of Norway. Based on statistical informa- tion from Norwegian authorities (http://www.ssb.no/samer), approximately 40,000 Sami currently live in Norway, compared with 20,000 in Sweden, 7,500 in Finland and 2,000 © 2009 John Wiley & Sons A/S · Tissue Antigens 75, 207–217 207
Transcript of Norwegian Sami differs significantly from other Norwegians according to their HLA profile
Tissue Antigens ISSN 0001-2815
Norwegian Sami differs significantly from other Norwegiansaccording to their HLA profileH. F. Harbo1,2, M. E. Riccio3, A. R. Lorentzen2,4, E. Utsi5, K.-M. Myhr6,7, S. I. Mellgren8,9, S. T. Flam4,E. Thorsby4, A. Sanchez-Mazas3 & B. A. Lie4
1 Department of Neurology, Oslo University Hospital, Ulleval, Oslo, Norway2 Department of Neurology, Faculty Division Ulleval University Hospital, University of Oslo, Oslo, Norway3 Laboratory of Anthropology, Genetics and Peopling History (AGP), University of Geneva, Geneva, Switzerland4 Institute of Immunology, Oslo University Hospital, Rikshospitalet, Oslo, Norway5 Karasjok Heart Center, Karasjok, Norway6 Department of Neurology, Haukeland University Hospital, Bergen, Norway7 Department of Clinical Medicine, Section of Neurology, University of Bergen, Bergen, Norway8 Department of Neurology, University Hospital of North Norway, Tromsø, Norway9 Department of Clinical Medicine, University of Tromsø, Tromsø, Norway
Key words
genetic diversity; human leukocyte antigen;Norwegian; population genetics; Sami
Correspondence
Hanne F. Harbo, MD, PhDDepartment of NeurologyOslo University HospitalUlleval0407 OsloNorwayTel: +47 9954 6680Fax: +47 2302 7455e-mail: [email protected]
Received 02 July 2009; revised 15 October2009; accepted 20 November 2009
doi: 10.1111/j.1399-0039.2009.01425.x
Abstract
This study reports extensive genomic data for both human leukocyte antigen (HLA)class I and II loci in Norwegian Sami, a native population living in the northwestof Europe. The Sami have a distinct culture and their own languages, which belongto the Uralic linguistic family. Norwegian Sami (n = 200) were typed at the DNAlevel for the HLA-A, -C, -B, -DRB1 and -DQB1 loci, and compared with a non-Sami Norwegian population (n = 576). The two populations exhibited some commongenetic features but also differed significantly at all HLA loci. The most significantlydeviating allele frequencies were an increase of HLA-A*03, -B*27, -DRB1*08 and-DQB1*04 and a decrease of HLA-A*01, C*01, -DRB1*04 and -DQB1*02 amongSami compared with non-Sami Norwegians. The Sami showed no deviation fromHardy–Weinberg equilibrium. The hypothesis of selective neutrality was rejected atall loci except for the A- and C - loci for the Sami. HLA haplotype frequencies alsodiffered between the two populations. The most common extended HLA haplotypeswere A*02-B*27-C*01-DR*08-DQB1*04 in the Sami and A*01-B*08-C*07-DR*03-DQB1*02 in the other Norwegians. Genetic distance analyses indicated that theNorwegian Sami were highly differentiated from other Europeans and were mostclosely related to Finns whose language also belongs to the Uralic linguistic family.In conclusion, the Norwegian Sami and the non-Sami Norwegians were significantlydifferent at all HLA loci. Our results can be explained by the fact that the twopopulations have different origins and that the Sami population has remained smallerand more isolated than its neighbors.
Introduction
The Sami are a native population living in the northwest ofEurope, mostly the northern part of Norway, Sweden andthe Kola Peninsula of Russia, where their ancestors haveinhabited before the present national borders were drawn.The Sami have a distinct culture and more recently theirown political organization. There are several Sami languages,which all belong to the Uralic linguistic family (Ethnologue,Languages of the World, http://ethnologue.com). Accordingto the Sami Act, a person is considered as Sami if he/she
has at least one parent or grandparent who learned Sami ashis/her mother tongue and who considers himself/herself asSami (http://www.lovdata.no).
The Sami population of Norway has traditionally beenliving in small communities in the northernmost countiesTroms and Finnmark, but 23% of the Sami who took partin the last Norwegian political election (autumn 2005) wereliving in other parts of Norway. Based on statistical informa-tion from Norwegian authorities (http://www.ssb.no/samer),approximately 40,000 Sami currently live in Norway,compared with 20,000 in Sweden, 7,500 in Finland and 2,000
© 2009 John Wiley & Sons A/S · Tissue Antigens 75, 207–217 207

HLA profile of Norwegian Sami H. F. Harbo et al.
in Russia, although other sources give slightly different num-bers (http://www.samer.se). Exact information about the num-ber of Sami is unavailable because many Sami presumablyhave not registered in official registries.
The origin of the Sami population is still debated andto some degree unknown. A recently published review byRoss et al. (1) concluded that the Sami population couldhave received genetic contributions from Continental Europe,Eastern Europe and Asia. The Sami population probablyoccupied the Atlantic coast of Scandinavia soon after thelast glacial period (i.e. about 10,000 year before present) andwas later pushed northward by other population groups. Thepopulation of the northernmost Sami communities is todayoften concentrated in specific regions, like the city of Karasjokin Norway (1,313 Sami above 18 years registered during the2005 election) (www.ssb.no).
The first study of the human leukocyte antigen (HLA)polymorphism in Sami (n = 176) was performed as early asin 1971 (2). At that time, serological typing for just someHLA-A and -B antigens was possible. These studies showeda significantly increased frequency of HLA-A3, -A9, -B22and -B27 and a significantly reduced frequency of HLA-A1,-A8 and -B12 among Norwegian Sami compared with non-Sami Norwegians. A recent study of Swedish Sami foundthat allele frequencies of the HLA-A, -B, -DRB1, -DQB1and -DQA1 loci were significantly different in pairwise testsbetween northern Sami (n = 154), southern Sami (n = 130)and non-Sami (n = 252) Swedish cohorts (3). Some allelesthat were common in Sami were also common in otherEuropean populations, whereas other alleles frequently foundin Sami in the Swedish study were more characteristic ofAsian populations (3). A study of Russian Sami (n = 81)from the north-european part of Russia has also showndeviations in allele and haplotype frequencies for HLA class IIalleles (4), but a common aboriginal component with twoother Russian ethnic groups was indicated in their ancestry.Thus, HLA studies have shown both specific and commonfeatures between Sami and non-Sami populations; however,further studies are warranted, in particular, in Norwegian Samias they were previously investigated only by serological HLAclass I typing.
Epidemiological studies indicate different rates of immune-related diseases in Sami compared with the non-Sami Norwe-gian population, such as multiple sclerosis (MS) (5), atopicdisease (6) and ankylosing spondylitis (AS) (7). Our previousstudy has showed an association between the low frequencyof MS in the Norwegian Sami population and a low fre-quency of the MS-predisposing haplotype HLA-DRB1*1501-DQB1*0602 (5).
In this study, our aim was to provide a more detailedcharacterization of HLA class I and class II loci in theSami population in order to investigate the relationshipsbetween Sami and non-Sami Norwegians as well as withother European populations, and to establish a basis for
further studies on both histocompatibility and HLA-diseaseassociations.
Materials and methods
Sami individuals
Sami individuals were recruited at Karasjok Heart Centerin Finnmark (n = 200). These individuals have previouslybeen included in studies on the polymorphisms of the IL-10and Fc-γ receptor genes and in a study of MS in the Samipopulation (5, 8, 9). For the present study, this sample setwas typed with genomic methods for the HLA-A, -B , -C ,-DRB1 and -DQB1 loci. The Norwegian Sami individualsserologically typed for HLA-A and -B antigens in a previousstudy (2) were no longer available for study. All the Samiindividuals included in the present study had four grandparentswho spoke Sami as their first language. All lived in Finnmarkor Troms; the mean age was 64.9 years and 49% were females.None of them suffered from immune-related diseases; theirhealth status was otherwise not known. Included individualshave given informed, written consent as approved by theregional Ethics Committee of Northern Norway.
Non-Sami Norwegian individuals
Norwegian non-Sami individuals (n = 576) were randomlycollected among healthy blood donors recruited through theNorwegian Bone Marrow Donor Registry, Oslo, Norway.These individuals were recruited from all over Norway; theiraverage age was 43 years and 58% were females.
Other European populations
To compare the Sami and the non-Sami Norwegians withother European populations, we used HLA data from the12th and 13th International Histocompatibility Workshops(http://www.ihwg.org/) as well as published data from theliterature.
Genomic HLA-typing and statistical analysis
DNA was purified from peripheral blood samples using Bacc-2-kit (GE Health Care-Amersham Europe, Oslo, Norway).DNA typing of the HLA -A, -B, -C -DRB1, -DQB1 lociwas performed either by using the sequence specific oligonu-cleotide method, by allele-specific amplification using sequenc-ing specific primers (Dynal, Oslo, Norway) (10), or bysequencing using an ABI3730 capillary sequencer (AppliedBiosystems, Foster City, CA) and the ASSIGNSBT v3.2.7bsoftware (Conexio Genomics, Applecross, Australia). TheDNA typing was performed at a two or four digit resolu-tion, depending on which technique was used. An overviewof the alleles observed in the Sami population is given inTable S1, Supporting Information. In order to make all data
208 © 2009 John Wiley & Sons A/S · Tissue Antigens 75, 207–217
H. F. Harbo et al. HLA profile of Norwegian Sami
comparable to study interpopulation relationships, alleles at allloci where recoded into their corresponding broad specificitieswith two-digit resolution.
The GENE[RATE] computer programs (http://geneva.unige.ch/generate, (11)) were used to estimate allele and haplotypefrequencies. Linkage disequilibrium (LD) was analyzed bothby estimating D′ coefficients and corresponding P-valuesfor each pair of alleles and by testing the global asso-ciation of each pair of loci. These analyses were per-formed by GENE[RATE], FSTAT (version 2.9.3.2) and ARLEQUIN
(3.1 version) (12), respectively. The test for Hardy–Weinbergequilibrium (HWE) as well as Ewens–Watterson’s neutral-ity test (EW), which is based on Ewens sampling theoryunder the infinite allele’s model (13, 14), were performed byARLEQUIN. This program was also used to estimate pairwisegenetic distances among populations as FST -based geneticdistances for short divergence times (i.e. Reynold’s dis-tance). Multidimensional-scaling analyses (MDS) among sev-eral European populations, including the Sami and the non-Sami Norwegians, and the correlation between geographic andgenetic distances (tested by a Mantel test (15)) were per-formed using the NTSYSPC Ver. 2.10m software (AppliedBiostatistics Inc) (16).
Results
Allele frequencies
Most HLA alleles were detected in both Sami and non-SamiNorwegians, with comparable frequencies for A*10, A*11,B*40, C*04, C*06, C*07, C*12, DRB1*01, DQB1*03 andDQB1*05. A slightly reduced number of alleles were foundin the Sami at the -B , -C and -DRB1 loci; but except B*14,B*21, C*08 and C*16, most of the alleles only detectedamong non-Sami Norwegians were very rare (frequency <
1% for B*41, B*42, B*47, B*48, B*70, DRB1*10). At lociHLA-A and -DRB1, most alleles exhibited a significantlydifferent frequency between the two populations (Table 1).HLA-DQB1 data at four digit solution also showed differentfrequencies between the two populations (data not shown).The most significantly deviating alleles (P < 0.0001) wereHLA-A*01, A*03, A*19, B*16, B*27, C*01, C*05, C*08,DRB1*04, DRB1*07, DRB1*08, DRB1*09, DQB1*02 andDQB1*04.
Haplotype frequencies and LD
A high number of two-locus haplotypes were found in bothpopulations, but most of them were uncommon (frequency <
1%) because of the large number of possible allele combina-tions. The most frequent haplotypes (Table 2) were generallydifferent between the Sami and the non-Sami Norwegians,except for the pair HLA-B-C, where B*07-C*07 was themost frequent in both populations (0.19 and 0.14, respec-tively). Overall, strong LD was observed across the HLA loci
Table 1 Allele frequencies at loci HLA-A, -B, -C, -DRB1 and -DQB1 forthe Sami and non-Sami Norwegian populations
Non-Sami Sami
HLA-A n = 576 n = 192 P-value
∗01 0.152 0.065 4.50 × 10−6
∗02 0.343 0.273 1.20 × 10−2
∗03 0.155 0.289 2.90 × 10−8
∗09 0.103 0.18 1.50 × 10−4
∗10 0.047 0.034 ns∗11 0.053 0.044 ns∗19 0.106 0.026 1.50 × 10−7
∗28 0.041 0.089 5.50 × 10⁻⁴
Non-Sami Sami
HLA-B n = 576 n = 168 P-value
∗05 0.037 0.018 ns∗07 0.148 0.194 5.00 × 10−2
∗08 0.122 0.054 1.80 × 10−4
∗12 0.135 0.066 3.70 × 10−4
∗13 0.011 0.003 ns∗14 0.027 0 6.60 × 10−4
∗15 0.111 0.155 3.60 × 10−2
∗16 0.02 0.071 1.80 × 10−5
∗17 0.034 0.051 ns∗18 0.027 0.003 4.50 × 10−3
∗21 0.017 0 1.10 × 10−2
∗22 0.01 0.027 2.70 × 10−2
∗27 0.075 0.155 2.50 × 10−5
∗35 0.091 0.06 ns∗37 0.014 0.003 ns∗40 0.113 0.143 ns∗41 0.004 0 ns∗42 0.001 0 ns∗47 0.003 0 ns∗48 0.002 0 ns∗70 0.001 0 ns
Non-Sami Sami
HLA-C n = 557 n = 185 P-value
∗01 0.043 0.151 7.20 × 10−11
∗02 0.061 0.032 3.40 × 10−2
∗03 0.216 0.251 ns∗04 0.101 0.095 ns∗05 0.083 0.008 5.50 × 10−9
∗06 0.066 0.06 ns∗07 0.308 0.33 ns∗08 0.038 0 6.20 × 10−6
∗12 0.031 0.035 ns∗14 0.009 0.011 ns∗15 0.016 0.024 ns∗16 0.02 0 2.30 × 10−3
∗17 0.009 0.003 ns
in both populations (Table S2, Supporting Information). Allpairs of loci were found to be in significant LD (P < 0.0001after Bonferroni correction for multiple haplotypes) except
© 2009 John Wiley & Sons A/S · Tissue Antigens 75, 207–217 209
HLA profile of Norwegian Sami H. F. Harbo et al.
Table 1 Continued
Non-Sami Sami
HLA-DRB1 n = 572 n = 200 P-value
∗01 0.116 0.1 ns∗02 0.157 0.105 1.00 × 10−2
∗03 0.124 0.06 2.40 × 10−4
∗04 0.223 0.08 1.80 × 10−11
∗05 0.073 0.113 1.50 × 10−2
∗06 0.143 0.223 2.90 × 10−4
∗07 0.093 0.025 2.40 × 10−6
∗08 0.049 0.223 1.80 × 10−21
∗09 0.014 0.073 3.80 × 10−8
∗10 0.009 0 7.20 × 10⁻²
Non-Sami Sami
HLA-DQB1 n = 296 n = 200 P-value
∗02 0.179 0.063 5.50 × 10−8
∗03 0.345 0.338 ns∗04 0.047 0.225 3.30 × 10−17
∗05 0.147 0.138 ns∗06 0.282 0.238 ns
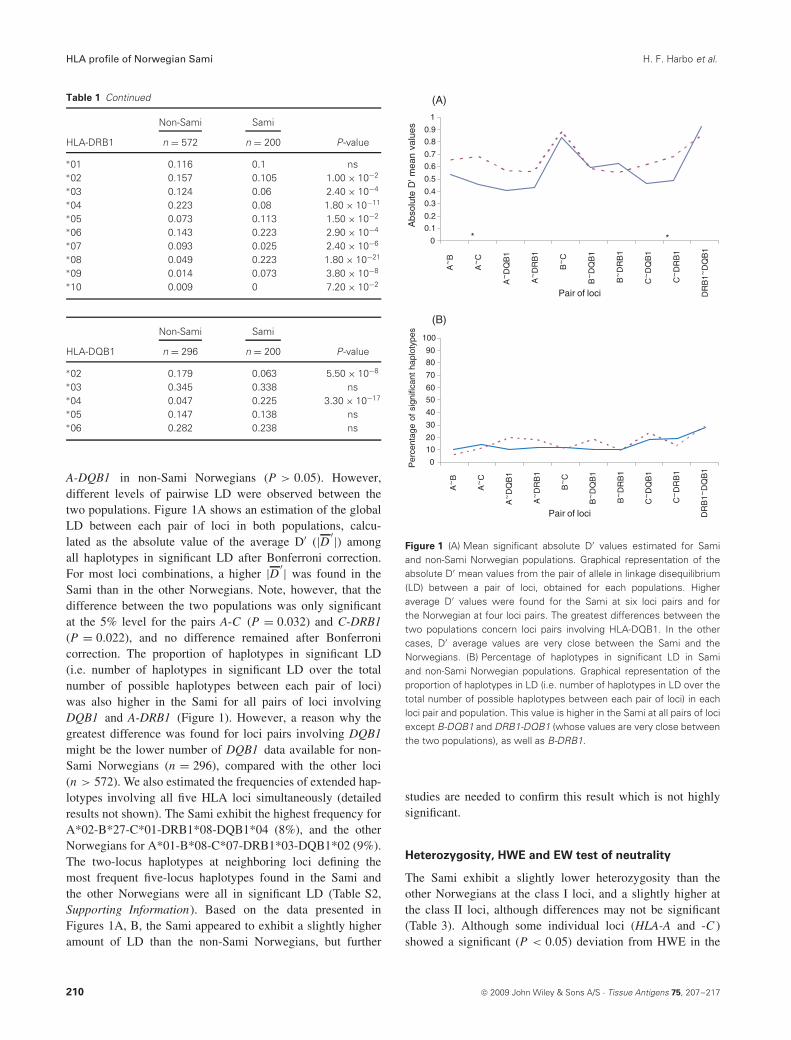
A-DQB1 in non-Sami Norwegians (P > 0.05). However,different levels of pairwise LD were observed between thetwo populations. Figure 1A shows an estimation of the globalLD between each pair of loci in both populations, calcu-lated as the absolute value of the average D′ (|D ′|) amongall haplotypes in significant LD after Bonferroni correction.For most loci combinations, a higher |D ′| was found in theSami than in the other Norwegians. Note, however, that thedifference between the two populations was only significantat the 5% level for the pairs A-C (P = 0.032) and C-DRB1(P = 0.022), and no difference remained after Bonferronicorrection. The proportion of haplotypes in significant LD(i.e. number of haplotypes in significant LD over the totalnumber of possible haplotypes between each pair of loci)was also higher in the Sami for all pairs of loci involvingDQB1 and A-DRB1 (Figure 1). However, a reason why thegreatest difference was found for loci pairs involving DQB1might be the lower number of DQB1 data available for non-Sami Norwegians (n = 296), compared with the other loci(n > 572). We also estimated the frequencies of extended hap-lotypes involving all five HLA loci simultaneously (detailedresults not shown). The Sami exhibit the highest frequency forA*02-B*27-C*01-DRB1*08-DQB1*04 (8%), and the otherNorwegians for A*01-B*08-C*07-DRB1*03-DQB1*02 (9%).The two-locus haplotypes at neighboring loci defining themost frequent five-locus haplotypes found in the Sami andthe other Norwegians were all in significant LD (Table S2,Supporting Information). Based on the data presented inFigures 1A, B, the Sami appeared to exhibit a slightly higheramount of LD than the non-Sami Norwegians, but further
(A)
0
0.1
0.2
0.3
0.4
0.5
0.6
0.7
0.8
0.9
1
A~
B
A~
C
A~
DQ
B1
A~
DR
B1
B~
C
B~
DQ
B1
B~
DR
B1
C~
DQ
B1
C~
DR
B1
DR
B1~
DQ
B1
Pair of loci
Abs
olut
e D
' mea
n va
lues
* *
(B)
0
10
20
30
40
50
60
70
80
90
100
A~
B
A~
C
A~
DQ
B1
A~
DR
B1
B~
C
B~
DQ
B1
B~
DR
B1
C~
DQ
B1
C~
DR
B1
DR
B1~
DQ
B1
Pair of loci
Per
cent
age
of s
igni
fican
t ha
plot
ypes
Figure 1 (A) Mean significant absolute D′ values estimated for Samiand non-Sami Norwegian populations. Graphical representation of theabsolute D′ mean values from the pair of allele in linkage disequilibrium(LD) between a pair of loci, obtained for each populations. Higheraverage D′ values were found for the Sami at six loci pairs and forthe Norwegian at four loci pairs. The greatest differences between thetwo populations concern loci pairs involving HLA-DQB1. In the othercases, D′ average values are very close between the Sami and theNorwegians. (B) Percentage of haplotypes in significant LD in Samiand non-Sami Norwegian populations. Graphical representation of theproportion of haplotypes in LD (i.e. number of haplotypes in LD over thetotal number of possible haplotypes between each pair of loci) in eachloci pair and population. This value is higher in the Sami at all pairs of lociexcept B-DQB1 and DRB1-DQB1 (whose values are very close betweenthe two populations), as well as B-DRB1.
studies are needed to confirm this result which is not highlysignificant.
Heterozygosity, HWE and EW test of neutrality
The Sami exhibit a slightly lower heterozygosity than theother Norwegians at the class I loci, and a slightly higher atthe class II loci, although differences may not be significant(Table 3). Although some individual loci (HLA-A and -C )showed a significant (P < 0.05) deviation from HWE in the
210 © 2009 John Wiley & Sons A/S · Tissue Antigens 75, 207–217

H. F. Harbo et al. HLA profile of Norwegian Sami
Table 2 Pairwise linkage disequilibrium between human leukocyte antigen loci from Sami and non-Sami Norwegian populations for the most frequenthaplotypes (>0.05 at least for one population), where Freq is the frequency of haplotypes, D is the linkage of disequilibrium and χ2 the chi-squarevalue with significance levels
Non-Sami Norwegian Sami Norwegian
Haplotypes Freq D′ P-value Freq D′ P-value
A∗01 B∗08 0.09 0.64 1.50 × 10−82 0.03 0.46 6.80 × 10−12
A∗02 B∗07 0.05 0.009 ns 0.04 −0.32 nsA∗02 B∗12 0.07 0.21 7.60 × 10⁻⁵ 0.01 −0.46 nsA∗02 B∗15 0.06 0.25 4.60 × 10⁻⁵ 0.06 0.13 nsA∗02 B∗27 0.03 0.069 ns 0.12 0.73 2.30 × 10−19
A∗02 B∗40 0.05 0.096 ns 0 −1 5.10 × 10−6
A∗03 B∗07 0.06 0.27 1.20 × 10⁻¹⁸ 0.13 0.51 9.80 × 10−13
A∗03 B∗15 0.02 −0.16 ns 0.06 0.16 nsA∗09 B∗16 0.01 0.19 7.90 × 10⁻³ a 0.06 0.81 1.00 × 10−17
A∗09 B∗40 0.02 0.063 4.3 × 10⁻² a 0.05 0.21 9.20 × 10−4
A∗28 B∗12 0.01 0.034 ns 0.06 0.84 3.60 × 10−42
B∗07 C∗07 0.14 0.87 2.10 × 10−73 0.19 0.95 3.10 × 10−32
B∗08 C∗07 0.12 0.93 1.60 × 10−68 0.04 0.5 1.90 × 10−3
B∗12 C∗05 0.07 0.85 1.50 × 10−106 0.01 1 8.00 × 10−8
B∗12 C∗07 0.01 −0.7 1.90 × 10⁻⁹ 0.06 0.86 8.40 × 10−9
B∗15 C∗03 0.09 0.78 4.50 × 10−70 0.12 0.74 3.90 × 10−20
B∗17 C∗06 0.03 0.75 1.10 × 10−68 0.05 1 3.20 × 10−64
B∗27 C∗01 0.03 0.64 2.00 × 10−56 0.14 0.97 3.60 × 10−59
B∗35 C∗04 0.08 0.84 3.10 × 10−152 0.06 1 9.50 × 10−49
B∗40 C∗03 0.1 0.82 5.10 × 10−76 0.12 0.82 3.20 × 10−22
B∗07 DRB1∗02 0.09 0.56 1.80 × 10−76 0.08 0.78 1.30 × 10−22
B∗07 DRB1∗05 0.01 −0.45 ns 0.07 0.54 4.50 × 10−13
B∗08 DRB1∗03 0.1 0.81 3.10 × 10−162 0.03 0.53 5.90 × 10−19
B∗15 DRB1∗04 0.06 0.44 3.90 × 10⁻²³ 0.01 0.001 nsB∗15 DRB1∗06 0.02 0.032 ns 0.07 0.28 3.70 × 10−5
B∗15 DRB1∗08 0.01 0.064 ns 0.06 0.23 1.00 × 10−3
B∗27 DRB1∗08 0.01 0.11 2.20 × 10⁻³ a 0.11 0.62 1.50 × 10−19
B∗35 DRB1∗01 0.05 0.47 4.40 × 10−43 0.03 0.5 1.40 × 10−12
B∗40 DRB1∗06 0.04 0.22 1.60 × 10⁻¹⁰ 0.07 0.32 1.10 × 10⁻⁵
DRB1∗01 DQB1∗05 0.11 1 4.00 × 10−195 0.1 0.94 1.30 × 10−55
DRB1∗02 DQB1∗06 0.16 1 4.90 × 10−128 0.1 0.87 1.10 × 10⁻²⁶
DRB1∗03 DQB1∗02 0.13 0.98 1.60 × 10−169 0.06 1 2.80 × 10−85
DRB1∗04 DQB1∗03 0.22 0.99 9.60 × 10−143 0.08 0.95 3.50 × 10⁻¹⁵
DRB1∗05 DQB1∗03 0.07 1 1.80 × 10−41 0.11 1 1.90 × 10⁻²³
DRB1∗06 DQB1∗06 0.12 0.73 5.40 × 10−62 0.14 0.51 5.60 × 10⁻²³
DRB1∗07 DQB1∗02 0.05 0.63 5.40 × 10−39 0 0.04 nsDRB1∗08 DQB1∗04 0.05 1 4.60 × 10−241 0.22 1 9.70 × 10−88
DRB1∗09 DQB1∗03 0.02 1 2.20 × 10⁻⁹ 0.07 1 4.70 × 10⁻¹⁵
ns, not significant (P > 0.05).aNot significant after Bonferronil’s correction.
Sami, the deviation did not remain significant after Bonferronicorrection on the whole set of loci (Table 3). By contrast,HWE was rejected after Bonferroni correction in the non-SamiNorwegians as the P-value for HLA-A remained significant(Table 3).
According to the EW test, the hypothesis of selectiveneutrality was rejected at all loci for both populations, exceptat the HLA-C locus in the Sami population (Table 4). In allcases, the observed homozygosity (F -value) was lower thanthe expected, meaning an excess of heterozygotes, as oftenobserved for HLA loci.
Population differentiations
MDS was performed for each locus among a set of Europeanpopulations (Table S3, Supporting Information) including theSami and the other Norwegians (Figures 2–6).
At the HLA-A locus (Figure 2), the Sami differed sig-nificantly from all other populations and were geneticallycloser to the Finns (Fst = 0.0083, P < 0.05) and Czech(Fst = 0.0162, P < 0.001) than to the other Norwegians(Fst = 0.0255, P < 0.001). The non-Sami Norwegians wereundifferentiated from the Czech (Fst = 0.0008, P = ns),
© 2009 John Wiley & Sons A/S · Tissue Antigens 75, 207–217 211
HLA profile of Norwegian Sami H. F. Harbo et al.
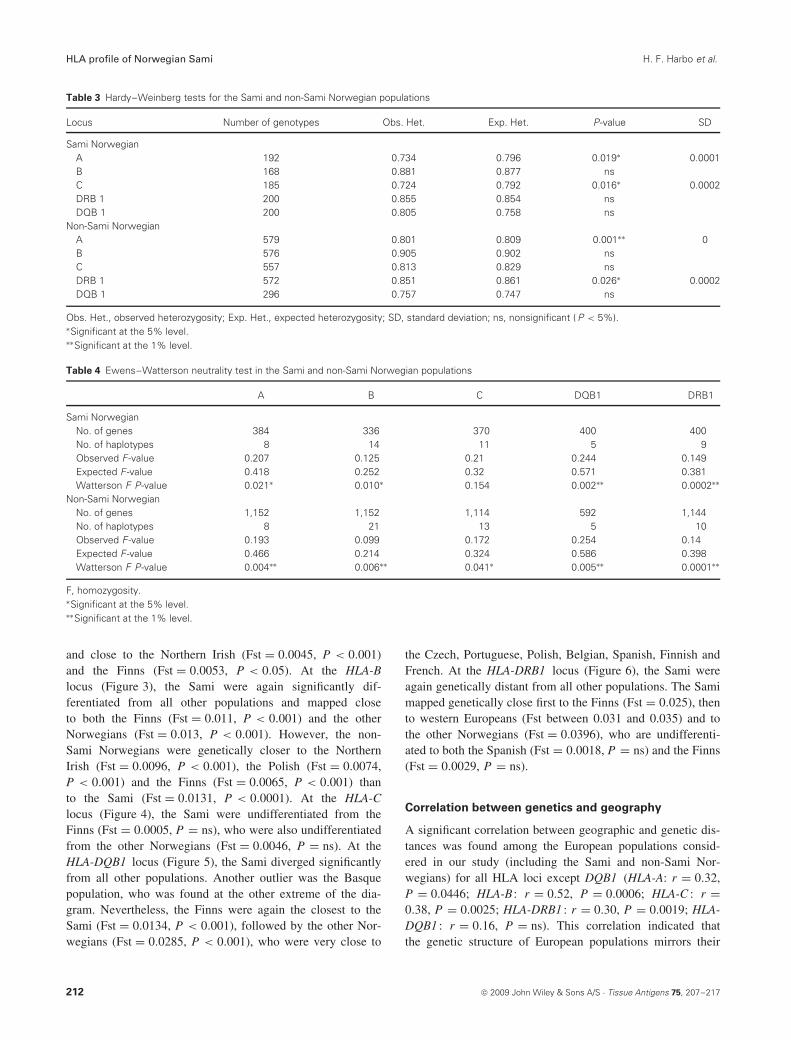
Table 3 Hardy–Weinberg tests for the Sami and non-Sami Norwegian populations
Locus Number of genotypes Obs. Het. Exp. Het. P-value SD
Sami NorwegianA 192 0.734 0.796 0.019∗ 0.0001B 168 0.881 0.877 nsC 185 0.724 0.792 0.016∗ 0.0002DRB 1 200 0.855 0.854 nsDQB 1 200 0.805 0.758 ns
Non-Sami NorwegianA 579 0.801 0.809 0.001∗∗ 0B 576 0.905 0.902 nsC 557 0.813 0.829 nsDRB 1 572 0.851 0.861 0.026∗ 0.0002DQB 1 296 0.757 0.747 ns
Obs. Het., observed heterozygosity; Exp. Het., expected heterozygosity; SD, standard deviation; ns, nonsignificant ( P < 5%).∗Significant at the 5% level.∗∗Significant at the 1% level.
Table 4 Ewens–Watterson neutrality test in the Sami and non-Sami Norwegian populations
A B C DQB1 DRB1
Sami NorwegianNo. of genes 384 336 370 400 400No. of haplotypes 8 14 11 5 9Observed F-value 0.207 0.125 0.21 0.244 0.149Expected F-value 0.418 0.252 0.32 0.571 0.381Watterson F P-value 0.021∗ 0.010∗ 0.154 0.002∗∗ 0.0002∗∗
Non-Sami NorwegianNo. of genes 1,152 1,152 1,114 592 1,144No. of haplotypes 8 21 13 5 10Observed F-value 0.193 0.099 0.172 0.254 0.14Expected F-value 0.466 0.214 0.324 0.586 0.398Watterson F P-value 0.004∗∗ 0.006∗∗ 0.041∗ 0.005∗∗ 0.0001∗∗
F, homozygosity.∗Significant at the 5% level.∗∗Significant at the 1% level.
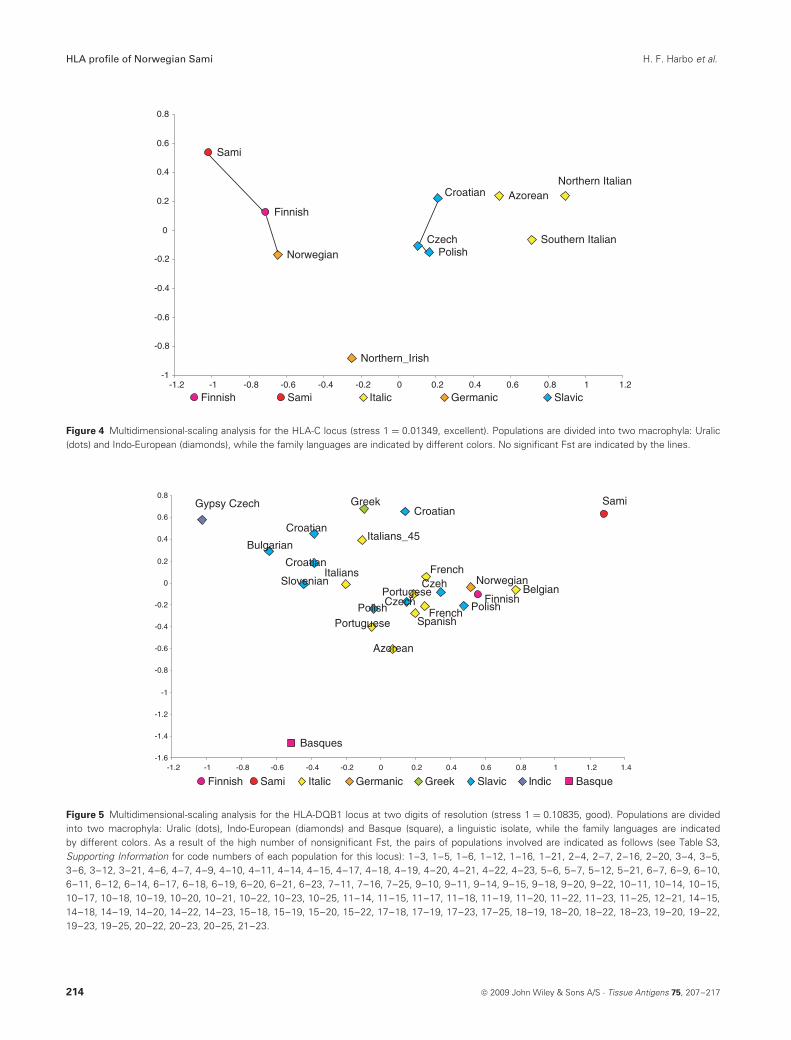
and close to the Northern Irish (Fst = 0.0045, P < 0.001)and the Finns (Fst = 0.0053, P < 0.05). At the HLA-Blocus (Figure 3), the Sami were again significantly dif-ferentiated from all other populations and mapped closeto both the Finns (Fst = 0.011, P < 0.001) and the otherNorwegians (Fst = 0.013, P < 0.001). However, the non-Sami Norwegians were genetically closer to the NorthernIrish (Fst = 0.0096, P < 0.001), the Polish (Fst = 0.0074,P < 0.001) and the Finns (Fst = 0.0065, P < 0.001) thanto the Sami (Fst = 0.0131, P < 0.0001). At the HLA-Clocus (Figure 4), the Sami were undifferentiated from theFinns (Fst = 0.0005, P = ns), who were also undifferentiatedfrom the other Norwegians (Fst = 0.0046, P = ns). At theHLA-DQB1 locus (Figure 5), the Sami diverged significantlyfrom all other populations. Another outlier was the Basquepopulation, who was found at the other extreme of the dia-gram. Nevertheless, the Finns were again the closest to theSami (Fst = 0.0134, P < 0.001), followed by the other Nor-wegians (Fst = 0.0285, P < 0.001), who were very close to
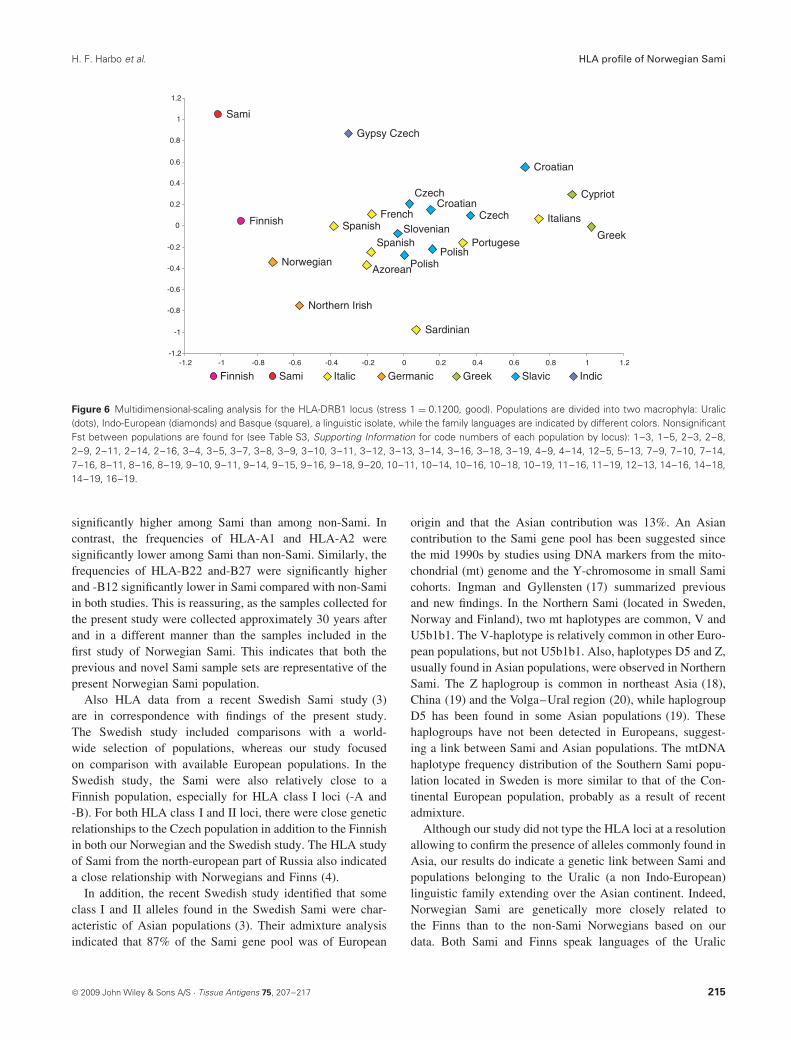
the Czech, Portuguese, Polish, Belgian, Spanish, Finnish andFrench. At the HLA-DRB1 locus (Figure 6), the Sami wereagain genetically distant from all other populations. The Samimapped genetically close first to the Finns (Fst = 0.025), thento western Europeans (Fst between 0.031 and 0.035) and tothe other Norwegians (Fst = 0.0396), who are undifferenti-ated to both the Spanish (Fst = 0.0018, P = ns) and the Finns(Fst = 0.0029, P = ns).
Correlation between genetics and geography
A significant correlation between geographic and genetic dis-tances was found among the European populations consid-ered in our study (including the Sami and non-Sami Nor-wegians) for all HLA loci except DQB1 (HLA-A: r = 0.32,P = 0.0446; HLA-B : r = 0.52, P = 0.0006; HLA-C : r =0.38, P = 0.0025; HLA-DRB1 : r = 0.30, P = 0.0019; HLA-DQB1 : r = 0.16, P = ns). This correlation indicated thatthe genetic structure of European populations mirrors their
212 © 2009 John Wiley & Sons A/S · Tissue Antigens 75, 207–217

H. F. Harbo et al. HLA profile of Norwegian Sami
Finnish
Sami
Portuguese
Azorean
Northern Irish
Norwegian
Greek
Cypriot
Czech
Croatian
Polish
-0.8
-0.6
-0.4
-0.2
0
0.2
0.4
0.6
0.8
-1.4 -1.2 -1 -0.8 -0.6 -0.4 -0.2 0 0.2 0.4 0.6 0.8 1 1.2
Finnish Sami Italic Germanic Greek Slavic
Figure 2 Multidimensional-scaling analysis for the HLA-A locus (stress 1 = 0.06271, good). Populations are divided into two macrophyla: Uralic (dots)and Indo-European (diamonds), while the family languages are indicated by different colors. Non-significant Fst are indicated by the black lines.
FinnishSami
Portuguese
Azorean
Northern Irish
Norwegian
Greek
Cypriot
Czech
CroatianPolish
-0.6
-0.4
-0.2
0
0.2
0.4
0.6
0.8
1
-1.2 -1 -0.8 -0.6 -0.4 -0.2 0 0.2 0.4 0.6 0.8 1 1.2
Finnish Sami Italic Germanic Greek Slavic
Figure 3 Multidimensional-scaling analysis for the HLA-B locus (stress 1 = 0.03918, excellent). Populations are divided into two macrophyla: Uralic(dots) and Indo-European (diamonds), while the family languages are indicated by different colors. No significant Fst are indicated by the lines.
geographic location. On the other hand, most r coefficientswere low, suggesting that geography alone does not explainthe HLA genetic structure.
Discussion
We present here for the first time genomic HLA datafor a Norwegian Sami ethnic group, comparing them withsimilar data from non-Sami Norwegians, as well as with
other European populations. The two Norwegian populationsexhibited some common features, but they also showedsignificant differences in both allele and two-locus haplotypefrequencies and differed significantly from each other at allHLA loci.
The HLA data presented in this paper correspond well withthe findings in the early study by Thorsby et al. of NorwegianSami (2). Both in the present study as well as in the earlierstudy, the allele frequencies for HLA-A3 and HLA-A9 were
© 2009 John Wiley & Sons A/S · Tissue Antigens 75, 207–217 213
HLA profile of Norwegian Sami H. F. Harbo et al.
Finnish
Sami
Azorean
Southern Italian
Northern Italian
Norwegian
Northern_Irish
Polish
Croatian
Czech
-1
-0.8
-0.6
-0.4
-0.2
0
0.2
0.4
0.6
0.8
-1.2 -1 -0.8 -0.6 -0.4 -0.2 0 0.2 0.4 0.6 0.8 1 1.2
Finnish Sami Italic Germanic Slavic
Figure 4 Multidimensional-scaling analysis for the HLA-C locus (stress 1 = 0.01349, excellent). Populations are divided into two macrophyla: Uralic(dots) and Indo-European (diamonds), while the family languages are indicated by different colors. No significant Fst are indicated by the lines.
Finnish
Sami
Italians
Italians_45
French
Portugese
Spanish
Belgian
PortugueseFrench
Azorean
Norwegian
Greek
Croatian
Croatian
Croatian
Czech
Bulgarian
Polish
CzehSlovenian
Polish
Gypsy Czech
Basques-1.6
-1.4
-1.2
-1
-0.8
-0.6
-0.4
-0.2
0
0.2
0.4
0.6
0.8
-1.2 -1 -0.8 -0.6 -0.4 -0.2 0 0.2 0.4 0.6 0.8 1 1.2 1.4
Finnish Sami Italic Germanic Greek Slavic Indic Basque
Figure 5 Multidimensional-scaling analysis for the HLA-DQB1 locus at two digits of resolution (stress 1 = 0.10835, good). Populations are dividedinto two macrophyla: Uralic (dots), Indo-European (diamonds) and Basque (square), a linguistic isolate, while the family languages are indicatedby different colors. As a result of the high number of nonsignificant Fst, the pairs of populations involved are indicated as follows (see Table S3,Supporting Information for code numbers of each population for this locus): 1–3, 1–5, 1–6, 1–12, 1–16, 1–21, 2–4, 2–7, 2–16, 2–20, 3–4, 3–5,3–6, 3–12, 3–21, 4–6, 4–7, 4–9, 4–10, 4–11, 4–14, 4–15, 4–17, 4–18, 4–19, 4–20, 4–21, 4–22, 4–23, 5–6, 5–7, 5–12, 5–21, 6–7, 6–9, 6–10,6–11, 6–12, 6–14, 6–17, 6–18, 6–19, 6–20, 6–21, 6–23, 7–11, 7–16, 7–25, 9–10, 9–11, 9–14, 9–15, 9–18, 9–20, 9–22, 10–11, 10–14, 10–15,10–17, 10–18, 10–19, 10–20, 10–21, 10–22, 10–23, 10–25, 11–14, 11–15, 11–17, 11–18, 11–19, 11–20, 11–22, 11–23, 11–25, 12–21, 14–15,14–18, 14–19, 14–20, 14–22, 14–23, 15–18, 15–19, 15–20, 15–22, 17–18, 17–19, 17–23, 17–25, 18–19, 18–20, 18–22, 18–23, 19–20, 19–22,19–23, 19–25, 20–22, 20–23, 20–25, 21–23.
214 © 2009 John Wiley & Sons A/S · Tissue Antigens 75, 207–217
H. F. Harbo et al. HLA profile of Norwegian Sami
Finnish
Sami
Italians
Sardinian
French
Portugese
Spanish
Spanish
Azorean
Northern Irish
Norwegian
Greek
Cypriot
Croatian
CroatianCzech
Polish
Czech
Slovenian
Polish
Gypsy Czech
-1.2
-1
-0.8
-0.6
-0.4
-0.2
0
0.2
0.4
0.6
0.8
1
1.2
-1.2 -1 -0.8 -0.6 -0.4 -0.2 0 0.2 0.4 0.6 0.8 1 1.2
Finnish Sami Italic Germanic Greek Slavic Indic
Figure 6 Multidimensional-scaling analysis for the HLA-DRB1 locus (stress 1 = 0.1200, good). Populations are divided into two macrophyla: Uralic(dots), Indo-European (diamonds) and Basque (square), a linguistic isolate, while the family languages are indicated by different colors. NonsignificantFst between populations are found for (see Table S3, Supporting Information for code numbers of each population by locus): 1–3, 1–5, 2–3, 2–8,2–9, 2–11, 2–14, 2–16, 3–4, 3–5, 3–7, 3–8, 3–9, 3–10, 3–11, 3–12, 3–13, 3–14, 3–16, 3–18, 3–19, 4–9, 4–14, 12–5, 5–13, 7–9, 7–10, 7–14,7–16, 8–11, 8–16, 8–19, 9–10, 9–11, 9–14, 9–15, 9–16, 9–18, 9–20, 10–11, 10–14, 10–16, 10–18, 10–19, 11–16, 11–19, 12–13, 14–16, 14–18,14–19, 16–19.
significantly higher among Sami than among non-Sami. Incontrast, the frequencies of HLA-A1 and HLA-A2 weresignificantly lower among Sami than non-Sami. Similarly, thefrequencies of HLA-B22 and-B27 were significantly higherand -B12 significantly lower in Sami compared with non-Samiin both studies. This is reassuring, as the samples collected forthe present study were collected approximately 30 years afterand in a different manner than the samples included in thefirst study of Norwegian Sami. This indicates that both theprevious and novel Sami sample sets are representative of thepresent Norwegian Sami population.
Also HLA data from a recent Swedish Sami study (3)are in correspondence with findings of the present study.The Swedish study included comparisons with a world-wide selection of populations, whereas our study focusedon comparison with available European populations. In theSwedish study, the Sami were also relatively close to aFinnish population, especially for HLA class I loci (-A and-B). For both HLA class I and II loci, there were close geneticrelationships to the Czech population in addition to the Finnishin both our Norwegian and the Swedish study. The HLA studyof Sami from the north-european part of Russia also indicateda close relationship with Norwegians and Finns (4).
In addition, the recent Swedish study identified that someclass I and II alleles found in the Swedish Sami were char-acteristic of Asian populations (3). Their admixture analysisindicated that 87% of the Sami gene pool was of European
origin and that the Asian contribution was 13%. An Asiancontribution to the Sami gene pool has been suggested sincethe mid 1990s by studies using DNA markers from the mito-chondrial (mt) genome and the Y-chromosome in small Samicohorts. Ingman and Gyllensten (17) summarized previousand new findings. In the Northern Sami (located in Sweden,Norway and Finland), two mt haplotypes are common, V andU5b1b1. The V-haplotype is relatively common in other Euro-pean populations, but not U5b1b1. Also, haplotypes D5 and Z,usually found in Asian populations, were observed in NorthernSami. The Z haplogroup is common in northeast Asia (18),China (19) and the Volga–Ural region (20), while haplogroupD5 has been found in some Asian populations (19). Thesehaplogroups have not been detected in Europeans, suggest-ing a link between Sami and Asian populations. The mtDNAhaplotype frequency distribution of the Southern Sami popu-lation located in Sweden is more similar to that of the Con-tinental European population, probably as a result of recentadmixture.
Although our study did not type the HLA loci at a resolutionallowing to confirm the presence of alleles commonly found inAsia, our results do indicate a genetic link between Sami andpopulations belonging to the Uralic (a non Indo-European)linguistic family extending over the Asian continent. Indeed,Norwegian Sami are genetically more closely related tothe Finns than to the non-Sami Norwegians based on ourdata. Both Sami and Finns speak languages of the Uralic
© 2009 John Wiley & Sons A/S · Tissue Antigens 75, 207–217 215
HLA profile of Norwegian Sami H. F. Harbo et al.
linguistic family and probably share a common geographicorigin. To explain the Sami genetic relatedness with the otherScandinavian populations, language is thus a better predictorthan geography.
At a broader geographic level (i.e. within Europe), how-ever, genetic distances are correlated to geographic dis-tances for all HLA loci. A correlation between geneticsand geography in Europe was previously found for theY-chromosome (21), HLA-C (22, 23) and single-nucleotidepolymorphisms (SNPs) (24). Interestingly, the sharpest HLAgenetic variation (although this is less clear at the HLA-DQB1locus) is observed between populations located in northernand in southern/southeastern regions, suggesting that HLAgenetic variation is structured along that specific direction inEurope. In agreement with our results, a previous study on theHLA-C locus data showed a genetic boundary delimited by anortheast–southwest axis across the continent, hence separat-ing eastern Mediterranean populations from western Europeanpopulations, and partly corresponding to a geographic barrier(i.e. the Alps) (23).
The Sami have remained more isolated than their neigh-boring Norwegian and other Scandinavian populations, whounderwent higher levels of gene flow. This may explain someof our observations, for example, a lower number of alleleswere detected in the Sami at some loci (HLA-B, -C , -DRB1 ),which would be a result of genetic drift. Of course, an alter-native explanation is that the non-Sami Norwegian sampleincluded almost three times as many individuals than the Samisample. Note, for example, that an equal number of HLA-DQB1 alleles were detected in both populations when similarnumbers of individuals were tested. On the other hand, LDbetween HLA loci was generally found to be higher in Samithan in non-Sami Norwegians, which is a clear signature ofgenetic drift and isolation in the Sami. Previous studies basedon SNPs and autosomal microsatellite markers in SwedishSami (25, 26) also showed a high level of LD, in agreementwith our results. The fact that HWE was rejected for non-Sami Norwegians (even after Bonferroni correction) may alsobe explained by the fact that they have been more exposed togenetic admixture.
Altogether, the results discussed above suggest that despitea probable effect of balancing selection acting on mostHLA loci (as attested here by the significant results of theEW neutrality tests), the HLA variation observed in Europehas mainly been shaped by migration history (27–29). Bothpopulation expansions following linguistic differentiations anddifferent levels of gene flow because of geographic boundariesand cultural isolation has left significant signatures throughoutthe continent.
The implications for disease and health of the differentHLA frequencies observed in Sami compared with other pop-ulations are unclear, but one may suspect that these geneticdifferences – probably because of some rapid genetic driftin the Sami – may contribute to the different frequencies of
several autoimmune diseases observed in Sami compared withother populations. For instance, we have observed a muchlower frequency of MS in Norwegian Sami (approximately30 MS cases per 105 Sami) compared with other Norwegians(approximately 150 MS cases per 105 Norwegians) in our pre-vious study of MS in Norwegian Sami (5). This observationwas related to a low frequency of the MS-associated HLADRB1*1501-DQB1*0602 haplotype in Sami (0.086) com-pared with other Norwegians (0.163). Interestingly, 3 of the11 Sami MS patients available for genotyping carried the MS-associated DRB1*15-DQB1*06 haplotype corresponding toan allele frequency of 0.14, that is, increased in comparisonwith the general Sami population. Similarly, it is interesting tonote that the prevalence of AS seems higher in the NorwegianSami population compared with other Norwegians, which willbe in accordance with the significantly higher frequency of thestrongly AS-associated HLA-B*27 allele we observed amongNorwegian Sami. Indeed, a population survey of the Samipopulation of Karasjok and Kautokeino in Norway showed aprevalence of AS of 1.8%, which is increased compared withthe general prevalence of approximately 0.25% (7). Also fortransplantation immunology, the results of this study mightbe important by documenting that relatively rare alleles inEurope are more common in the Sami. Based on these find-ings, it seems important to recruit Sami individuals to bonemarrow donor registries.
In conclusion, the Norwegian Sami and the other Nor-wegians are significantly different at all HLA loci. Geneticdistance analyses performed on a set of European populationsindicate that the Norwegian Sami are differentiated from theother Europeans but more closely related to the Finns, whoselanguage, like Sami, belongs to the Uralic linguistic family.Our results can be explained by the fact that the Sami andother Norwegian populations are from different origins andthat the Sami population has remained smaller and more iso-lated than its neighbors.
Acknowledgments
All individuals contributing to this study are warmly thanked.This study was supported by the Norwegian Research Council,South-Eastern Norway Regional Health Authority, the OddFellow MS Society of Norway, Medinnova, the Multiple Scle-rosis Society of Norway, University of Oslo and Universityof Tromsø. The Norwegian Bone Marrow Donor Registry isacknowledged for collaboration providing the Norwegian con-trol material. Anne Spurkland and Frode Vartdal are thankedfor support. The help of the technical staff at the Institute ofImmunology, Oslo University Hospital, Rikshospitalet, Nor-way is warmly appreciated, and especially we acknowledgeTone Aarskaug for help with HLA-typing of the Sami sam-ples. AS-M and MER are supported by the Swiss FNS (grant#3100A0-112651).
216 © 2009 John Wiley & Sons A/S · Tissue Antigens 75, 207–217
H. F. Harbo et al. HLA profile of Norwegian Sami
References
1. Ross AB, Johansson A, Ingman M, Gyllensten U. Lifestyle,genetics, and disease in Sami. Croat Med J 2006: 47: 553–65.
2. Thorsby E, Bratlie A, Teisberg P. HL-A polymorphism ofNorwegian Lapps. Tissue Antigens 1971: 1: 137–46.
3. Johansson A, Ingman M, Mack SJ, Erlich H, Gyllensten U.Genetic origin of the Swedish Sami inferred from HLA class Iand class II allele frequencies. Eur J Hum Genet 2008: 16:1341–9.
4. Evseeva I, Spurkland A, Thorsby E et al. HLA profile of threeethnic groups living in the North-Western region of Russia.Tissue Antigens 2002: 59: 38–43.
5. Harbo HF, Utsi E, Lorentzen AR et al. Low frequency of thedisease-associated DRB1*15-DQB1*06 haplotype maycontribute to the low prevalence of multiple sclerosis in Sami.Tissue Antigens 2007: 19: 299–304.
6. Selnes A, Bolle R, Holt J, Lund E. Atopic diseases in Samiand Norse schoolchildren living in northern Norway. PediatrAllergy Immunol 1999: 10: 216–20.
7. Johnsen K, Gran JT, Dale K, Husby G. The prevalence ofankylosing spondylitis among Norwegian Samis (Lapps).J Rheumatol 1992: 19: 1591–4.
8. Torkildsen O, Utsi E, Harbo HF, Mellgren SI, Vedeler CA,Myhr KM. Ethnic variations of IL-10 polymorphisms in a Samiand Norwegian population. Scand J Immunol 2005: 62: 71–4.
9. Torkildsen O, Utsi E, Mellgren SI, Harbo HF, Vedeler CA,Myhr KM. Ethnic variation of Fc gamma receptorpolymorphism in Sami and Norwegian populations.Immunology 2005: 115: 416–21.
10. Spurkland A, Celius EG, Knutsen I, Beiske A, Thorsby E,Vartdal F. The HLA-DQ(alpha 1*0102, beta 1*0602)heterodimer may confer susceptibility to multiple sclerosis inthe absence of the HLA-DR(alpha 1*01, beta 1*1501)heterodimer. Tissue Antigens 1997: 50: 15–22.
11. Nunes JM. Tools for analysing ambiguous HLA data. TissueAntigens 2007: 69(Suppl 1): 203–5.
12. Excoffier L, Laval G, Schneider S. Arlequin (version 3.0): Anintegrated software package for population genetics dataanalysis. Evol Bioinform Online 2005: 1: 47–50.
13. Ewens WJ. The sampling theory of selectively neutral alleles.Theor Popul Biol 1972: 3: 87–112.
14. Watterson GA. The homozygosity test of neutrality. Genetics1978: 88: 405–17.
15. Mantel G. The detection of disease clustering and ageneralized regression approach. Cancer Res 1967: 27.
16. Rohlf FJ. Statistical power comparisons among alternativemorphometric methods. Am J Phys Anthropol 2000: 111:463–78.
17. Ingman M, Gyllensten U. A recent genetic link between Samiand the Volga-Ural region of Russia. Eur J Hum Genet 2007:15: 115–20.
18. Schurr TG, Sukernik RI, Starikovskaya YB, Wallace DC.Mitochondrial DNA variation in Koryaks and Itel’men:population replacement in the Okhotsk Sea-Bering Sea regionduring the Neolithic. Am J Phys Anthropol 1999: 108: 1–39.
19. Yao YG, Zhang YP. Phylogeographic analysis of mtDNAvariation in four ethnic populations from Yunnan Province:new data and a reappraisal. J Hum Genet 2002: 47: 311–8.
20. Tambets K, Rootsi S, Kivisild T et al. The western and easternroots of the Saami–the story of genetic “outliers” told bymitochondrial DNA and Y chromosomes. Am J Hum Genet2004: 74: 661–82.
21. Rosser ZH, Zerjal T, Hurles ME et al. Y-chromosomaldiversity in Europe is clinal and influenced primarily bygeography, rather than by language. Am J Hum Genet 2000:67: 1526–43.
22. Buhler S, Sanchez-Mazas A. De l’Europe a l’Inde: structuregenetique et diversite des populations de part et d’autre deleurs frontieres geographiques et culturrelles. Antropo 2006:11: 249–59.
23. Buhler S, Megarbane A, Lefranc G, Tiercy JM,Sanchez-Mazas A. HLA-C molecular characterization of aLebanese population and genetic structure of 39 populationsfrom Europe to India-Pakistan. Tissue Antigens 2006: 68:44–57.
24. Lao O, van Duijn K, Kersbergen P, de Knijff P, Kayser M.Proportioning whole-genome single-nucleotide-polymorphismdiversity for the identification of geographic populationstructure and genetic ancestry. Am J Hum Genet 2006: 78:680–90.
25. Johansson A, Vavruch-Nilsson V, Edin-Liljegren A,Sjolander P, Gyllensten U. Linkage disequilibrium betweenmicrosatellite markers in the Swedish Sami relative to aworldwide selection of populations. Hum Genet 2005: 116:105–13.
26. Kaessmann H, Zollner S, Gustafsson AC et al. Extensivelinkage disequilibrium in small human populations in Eurasia.Am J Hum Genet 2002: 70: 673–85.
27. Meyer D, Thomson G. How selection shapes variation of thehuman major histocompatibility complex: a review. Ann HumGenet 2001: 65: 1–26.
28. Sanchez-Mazas A. An apportionment of human HLA diversity.Tissue Antigens 2007: 69: 198–202.
29. Solberg OD, Mack SJ, Lancaster AK, Single RM, Tsai Y,Sanchez-Mazas A, Thomson G. Balancing selection andheterogeneity across the classical human leukocyte antigenloci: a meta-analytic review of 497 population studies. HumanImmunol 2008: 69: 443–64.
Supporting Information
The following supporting information is available for thisarticle:
Table S1 Human leukocyte antigen alleles observed in theSami population.
Table S2 Pairwise linkage disequilibrium between humanleukocyte antigen loci from Sami and non-Sami Norwegianpopulations for the most frequent haplotypes (>0.05 atleast for one population), where Freq is the frequency ofhaplotypes, D is the Linkage disequilibrium and χ2 is thechi-square value with significance levels.
Table S3 Data source speared by locus.Please note: Wiley-Blackwell is not responsible for the
content or functionality of any supporting materials suppliedby the authors. Any queries (other than missing material)should be directed to the corresponding author for the article.
© 2009 John Wiley & Sons A/S · Tissue Antigens 75, 207–217 217