Comprehensive analysis of 20q13 genes in ovarian cancer identifies ADRM1 as amplification target
11
Comprehensive Analysis of 20q13 Genes in Ovarian Cancer Identifies ADRM1 as Amplification Target Marlena S. Fejzo, 1 * Judy Dering, 1 Chuck Ginther, 1 Lee Anderson, 1 Lilian Ramos, 1 Christine Walsh, 2 Beth Karlan, 2 and Dennis J. Slamon 1 1 Department of Medicine, Division of Hematology/Oncology,University of California, Los Angeles, Los Angeles,CA 90095 2 Department of Obstetrics and Gynecology, Division of Gynecologic Oncology,Cedars Sinai Medical Center, Los Angeles,CA 90048 Approximately 25,000 ovarian cancers are diagnosed in the US annually, and 75% of cases are in the advanced stage when they are largely incurable. There is a critical need for improved early detection tools and development of novel treat- ments. Because chromosome band 20q13 is a commonly DNA amplified region in ovarian cancer and increase in 20q13 copy number may be an early event, we examined the DNA amplification and RNA expression pattern of 239 microarray probes mapping to this region with the goal of identifying gene(s) associated with ovarian cancer. Using Agilent expression microarray analysis and FISH to tumor tissue arrays, we narrowed the candidates to 19 genes that were consistently over- expressed in a subset of tumors amplified for both ZNF217 and TPD54, although, interestingly the candidates do not include these two amplified genes. Unsupervised clustering of 225 ovarian samples with respect to RNA expression of these 19 genes allowed identification of a 20q-amplified subset of 51 (23%) tumors and this subset was significantly corre- lated with poor outcome. Of the 19 candidate genes in this subset, ADRM1 overexpression was the most highly correlated with amplification, was amplified in a higher percentage of tumors than ZNF217 and TPD54, and was significantly upregu- lated with respect to stage, recurrence and metastasis. In addition, overexpression of ADRM1 correlates significantly with shorter time to recurrence and overall survival. Functional analysis is now warranted to determine whether ADRM1 is a target for early screening and/or therapy for ovarian cancer. V V C 2008 Wiley-Liss, Inc. INTRODUCTION Ovarian cancer is the leading cause of death from gynecologic malignancy accounting for 15,000 deaths in the US annually. The disease is identified primarily in its advanced stage when it is largely incurable. New approaches for detection and therapy are warranted. Numerous studies of ovarian cancer by both con- ventional and array-based comparative genomic hybridization show that 20q is one of the most fre- quent sites of amplification in ovarian cancer with amplicons most commonly reported to map to chromosome band 20q13 (Sonoda et al., 1997; Tanner et al., 2000). Gains of chromosome band 20q13 have been described to occur in as many as 70% of serous ovarian carcinomas (Kim et al., 2007). Additionally, in a study of 17 expression profiling studies of ovarian carcinoma, 20q had the most significant overexpression of all chromosomal regions (Israeli et al., 2005). A number of candidate genes on 20q13 in ovarian cancer have been studied, including PTPN1, ZNF217, CYP24A1, EEF1A2, PTK6/BRK, BTAK, and MYBL2, but to date, the biological target(s) of 20q amplification in ovarian cancer have not been irrefutably confirmed (Zhou et al., 1998; Tanner et al., 2000; Watanabe et al., 2002; Lee, 2003; Anderson et al., 2006; Schmandt et al., 2006; Li et al., 2007). There is also evidence that genes on 20q play an early role in the development of ovarian cancer as although amplification of 20q13 is most frequent in high grade tumors (Sonoda et al., 1997) and have not been reported to our knowledge in borderline tumors; however, gains of 20q have been identified in borderline tumors (Wolf et al., 1999; Shridhar et al., 2001) and 20q13 was found to be part of a homogeneously staining region in immortalized normal human ovarian surface epithelial cells (Li et al., 2007). This suggests that overexpressed genes on 20q may prove useful not only as prog- nostic markers and therapeutic targets, but also in developing early diagnostic tools. *Correspondence to: Marlena Schoenberg Fejzo, 5535 MRL Bldg, Slamon Lab, 675 Charles E. Young Dr. South, Los Angeles, CA 90095, USA. E-mail: [email protected] Received 5 March 2008; Accepted 4 June 2008 DOI 10.1002/gcc.20592 Published online 9 July 2008 in Wiley InterScience (www.interscience.wiley.com). V V C 2008 Wiley-Liss, Inc. GENES, CHROMOSOMES & CANCER 47:873–883 (2008)
-
Upload
independent -
Category
Documents
-
view
4 -
download
0
Transcript of Comprehensive analysis of 20q13 genes in ovarian cancer identifies ADRM1 as amplification target

Comprehensive Analysis of 20q13 Genes in OvarianCancer Identifies ADRM1 as Amplification Target
Marlena S. Fejzo,1* Judy Dering,1 Chuck Ginther,1 Lee Anderson,1 Lilian Ramos,1 Christine Walsh,2
Beth Karlan,2 and Dennis J. Slamon1
1Departmentof Medicine,Division of Hematology/Oncology,Universityof California,Los Angeles,Los Angeles,CA 900952Departmentof Obstetrics and Gynecology,Division of Gynecologic Oncology,Cedars Sinai Medical Center,Los Angeles,CA 90048
Approximately 25,000 ovarian cancers are diagnosed in the US annually, and 75% of cases are in the advanced stage when
they are largely incurable. There is a critical need for improved early detection tools and development of novel treat-
ments. Because chromosome band 20q13 is a commonly DNA amplified region in ovarian cancer and increase in 20q13
copy number may be an early event, we examined the DNA amplification and RNA expression pattern of 239 microarray
probes mapping to this region with the goal of identifying gene(s) associated with ovarian cancer. Using Agilent expression
microarray analysis and FISH to tumor tissue arrays, we narrowed the candidates to 19 genes that were consistently over-
expressed in a subset of tumors amplified for both ZNF217 and TPD54, although, interestingly the candidates do not
include these two amplified genes. Unsupervised clustering of 225 ovarian samples with respect to RNA expression of
these 19 genes allowed identification of a 20q-amplified subset of 51 (23%) tumors and this subset was significantly corre-
lated with poor outcome. Of the 19 candidate genes in this subset, ADRM1 overexpression was the most highly correlated
with amplification, was amplified in a higher percentage of tumors than ZNF217 and TPD54, and was significantly upregu-
lated with respect to stage, recurrence and metastasis. In addition, overexpression of ADRM1 correlates significantly with
shorter time to recurrence and overall survival. Functional analysis is now warranted to determine whether ADRM1 is a
target for early screening and/or therapy for ovarian cancer. VVC 2008 Wiley-Liss, Inc.
INTRODUCTION
Ovarian cancer is the leading cause of death
from gynecologic malignancy accounting for
�15,000 deaths in the US annually. The disease is
identified primarily in its advanced stage when it is
largely incurable. New approaches for detection
and therapy are warranted.
Numerous studies of ovarian cancer by both con-
ventional and array-based comparative genomic
hybridization show that 20q is one of the most fre-
quent sites of amplification in ovarian cancer with
amplicons most commonly reported to map to
chromosome band 20q13 (Sonoda et al., 1997;
Tanner et al., 2000). Gains of chromosome band
20q13 have been described to occur in as many as
70% of serous ovarian carcinomas (Kim et al.,
2007). Additionally, in a study of 17 expression
profiling studies of ovarian carcinoma, 20q had the
most significant overexpression of all chromosomal
regions (Israeli et al., 2005). A number of candidate
genes on 20q13 in ovarian cancer have been
studied, including PTPN1, ZNF217, CYP24A1,EEF1A2, PTK6/BRK, BTAK, and MYBL2, but to
date, the biological target(s) of 20q amplification in
ovarian cancer have not been irrefutably confirmed
(Zhou et al., 1998; Tanner et al., 2000; Watanabe
et al., 2002; Lee, 2003; Anderson et al., 2006;
Schmandt et al., 2006; Li et al., 2007).
There is also evidence that genes on 20q play an
early role in the development of ovarian cancer as
although amplification of 20q13 is most frequent in
high grade tumors (Sonoda et al., 1997) and have
not been reported to our knowledge in borderline
tumors; however, gains of 20q have been identified
in borderline tumors (Wolf et al., 1999; Shridhar
et al., 2001) and 20q13 was found to be part of a
homogeneously staining region in immortalized
normal human ovarian surface epithelial cells (Li
et al., 2007). This suggests that overexpressed
genes on 20q may prove useful not only as prog-
nostic markers and therapeutic targets, but also in
developing early diagnostic tools.
*Correspondence to: Marlena Schoenberg Fejzo, 5535 MRLBldg, Slamon Lab, 675 Charles E. Young Dr. South, Los Angeles,CA 90095, USA. E-mail: [email protected]
Received 5 March 2008; Accepted 4 June 2008
DOI 10.1002/gcc.20592
Published online 9 July 2008 inWiley InterScience (www.interscience.wiley.com).
VVC 2008 Wiley-Liss, Inc.
GENES, CHROMOSOMES & CANCER 47:873–883 (2008)

To date, a comprehensive analysis of genes map-
ping to 20q13 in ovarian cancer has never been
done. In this study, we use tissue arrays and
expression arrays to analyze genes on chromosome
band 20q13 with respect to amplification, expres-
sion, outcome, and stage in an effort to identify
markers for early detection, novel therapeutic mol-
ecules, and biological targets of 20q13 amplifica-
tion in ovarian cancer.
MATERIALS ANDMETHODS
Overview
In this study, 225 ovarian samples were used for
Agilent Expression Microarray Analysis and among
these, 170 samples were placed on a tissue array
for analysis by fluorescence in situ hybridization
(FISH) and immunohistochemistry (IHC). In addi-
tion, 168 RNAs were run on Northern blots for
expression analysis. Table 1 shows a breakdown of
the total sample number, the number of analyzable
samples, the number of analyzable tumors, and the
number of analyzable normal tissue for each
experiment and method used in this study. A num-
ber of samples were not analyzable by FISH, IHC,
and Northern blot analysis due to technical diffi-
culties, such as high background signal in
FISH and IHC, and RNA degradation for North-
ern analysis.
Tissue
About 225 ovarian samples were snap frozen in
liquid nitrogen and divided into pieces for RNA
processing (225 samples) and frozen tissue array
(170 samples). Overall, the samples consisted of
normal, benign, and malignant tissues with the pri-
mary source being ovarian Stage III papillary se-
rous adenocarcinomas that recurred in less than 12
months (Tables 2 and 3). All tumors were collected
under an IRB approved protocol and all patients
consented to study participation.
Frozen Tissue Array
Frozen tissue arrays were prepared as described
previously (Schoenberg Fejzo and Slamon, 2001).
Briefly, 170 samples were embedded in OCT
Compound (Sakura Finetek USA, Torrance, CA)
on dry ice. Biopsies 1 mm in diameter and 5 mm in
TABLE 1. Study Overview of Total Sample Number in Each Analysis
Experiment Total No. Analyzed No. Tumor No. Normal No.
Agilent expression microarray 225 225 211 14Frozen tumor tissue microarray 170 N/A 157 13ZNF217 FISH 170 85 76 9TPD54 FISH 170 81 72 9ADRM1 FISH 170 77 68 9ADRM1 IHC 170 118 105 13ADRM1 Northern blot 168 127 124 3
TABLE 2. Clinical Characteristics of 225 Ovarian Samples
Characteristic No. of patients (%)
Age<60 years old 111 (49.3)�60 years old 96 (42.7)Missing 18 (8.0)
StageI 28 (12.4)II 11 (4.9)III 111 (49.3)IV 27 (12.0)Normal and benign 20 (8.9)Other 3 (1.3)Missing 25 (11.1)
Recurrence�12 months 75 (33.3)>12 months 53 (23.6)NED 45 (20.0)Normal and benign 20 (8.9)Missing 32 (14.2)
NED, no evidence of disease.
TABLE 3. Histological Subtypes
Histology No. of patients (N 5 225)
Papillary serous 132Endometrioid 15Clear cell 6Mucinous 6Malignant mixed Mullerian tumor 6Transitional cell 2Squamous cell 2Metastasis 4Borderline papillary serous 8Borderline mucinous 4Benign 6Normal 14Other 2Missing 18
Genes, Chromosomes & Cancer DOI 10.1002/gcc
874 FEJZO ETAL.
depth were isolated and placed into a frozen OCT
array mold, using a Tissue Arrayer (Beecher Instru-
ments, Sun Prairie, WI). Four micron sections
were cut using a cryostat and the Instrumedics
Transfer Tape System for frozen tissue.
FISH
FISH to tissue microarray slides was performed
as described previously (Schoenberg Fejzo and
Slamon, 2001). ZNF217 (Abbott Molecular, Des
Plaines, IL), TPD52L2 BAC RP11-2559F2, and
ADRM1 BAC RP11-1023E23 (Invitrogen, Carls-
bad, CA) DNA was isolated using the Qiagen
Plasmid Maxi kit (Qiagen, Huntsville Alabama)
and labeled using the Vysis labeling kit (Abbott
Molecular), denatured, and hybridized overnight at
378C to 4 lm sections of the frozen tissue arrays
pre-fixed in 3:1 methanol:acetic acid and pre-dena-
tured for 2 min in 70% formamide/2xSSC at 708C.Slides were washed in 50% formamide/2xSSC for
15 min and in 2xSSC for 8 min at 448C. Samples
were counterstained with DAPI and scored as posi-
tive for amplification if they had either (a) greater
than eight copies per nucleus in at least 20 cells, or
had (b) uncountable clusters of signals suggestive
of an amplicon in 20 or more cells.
RNA and Expression Microarray
RNA was isolated, using the Qiagen RNEasy
protocol and quantitated using a Nanodrop Spec-
trophotomer (Agilent Technologies, Santa Clara,
CA). 750 ng of high quality total RNA with RIN
(RNA Integrated Numbers) greater than 8.0 was
labeled with cyanine 5-CTP or cyanine 3-CTP,
using the Low RNA Input Fuorescent Linear
Amplification Kit (Agilent Technologies), purified
on RNeasy Mini columns (Qiagen), and hybridized
to Agilent Human 1AV2 expression arrays (using a
mixed reference containing equal amounts of each
of the first 106 tumor samples for tumors). Slides
were incubated for 16–17 hr at 608C and washed
using the SSPE method described in the Agilent
60-mer Oligo Microarray Processing Protocol, Ver-
sion 2.1. Slides were treated with Agilent Stabiliza-
tion and Drying Solution, a wash used to protect
the dyes from ozone degradation. Slides were
scanned using the Agilent 2565BA Scanner. The
Agilent Feature Extraction Software (version 7.5.1)
that prepares data taken from the slides for export
was used with the following modifications: (1) local
background used, (2) special detrend OFF, (3)
adjust background globally OFF, (4) red autoesti-
mate OFF, and (5) green autoestimate OFF. The
output of the Feature Extraction software allowed
microarray data to be transferred from the scanner
into Rosetta Resolver for analysis.
Northern Blot
About 124 tumors and 3 normal tissues had suffi-
cient RNA quantity and quality for Northern blot
analysis. 5 lg of RNA were separated on 1% dena-
turing gels and probed with a P32-labeled frag-
ment of the ADRM1 gene (bases 421–1,080, Ref.
Seq. NM_007002). The blots were stripped and re-
probed with a GAPDH probe as a loading control.
Expression signals were compared with a standard
(SKOV3 RNA) run on each blot and scored as 0–
31 expression.
Immunohistochemistry
IHC was performed on frozen tissue arrays con-
taining 157 ovarian tumor samples and 13 normal
ovarian tissues. Frozen tissue arrays were fixed in
100% methanol and ADRM1 protein was detected
using a rabbit polyclonal antibody (PTG, 11468-1-
AP) diluted to 2.5 ll out of 750 ll, and detected
using DAB as described previously (Schoenberg
Fejzo and Slamon, 2001). Tissue staining was
scored from 0 to 31 based on the darkest staining
area of the section.
Statistical Analysis
Data in the form of log ratios or fold change of
signal from individual tumor to signal from the ref-
erence mix were used for analysis. Rosetta Re-
solver software was used for clustering and statisti-
cal analysis. For clustering analysis, the sequence
and experiment ratio algorithm used was agglomer-
ative, the heuristic criteria used was average link,
with the metric type being cosine correlation. The
data threshold requirements were that there is a
1.5-fold or greater difference in expression of a par-
ticular RNA in at least one experiment, with a P-value � 0.01. Error weighed one-way ANOVA,
using the Bonferroni multiple test correction
method was used to determine variance. Variance
of the mean plots was derived from ANOVA. Sta-
tistica (Statsoft, Tulsa, OK) was used to generate
Kaplan Meier Curves and Box Plots. The Fisher’s
Exact Test (Fisher, 1922) was used to determine
correlations between expression values determined
by Expression microarray and Northern blot analy-
sis or IHC.
Genes, Chromosomes & Cancer DOI 10.1002/gcc
875ADRM1 20q13 TARGET IN OVARIAN CANCER
RESULTS
FISH to Tissue Microarray
First we performed FISH with two candidate
genes on chromosome band 20q13. ZNF217 (51.6
MB on UCSC Genome Browser, http://genome.
ucsc.edu/) was chosen because it is centrally located
in, and a strong candidate oncogene for, an ampli-
con in breast cancer mapping in this region (Collins
et al., 1998). We also chose TPD54 (61.9) because it
is located close to the telomere of 20q13 and its
homologue, TPD52, is amplified and overexpressed
in a subset of ovarian cancers (Byrne et al., 2005).
Identifying tumors in our database that were ampli-
fied for both these genes would allow identification
of tumors in our database that may have a large
amplicon, or multiple small amplicons spanning
over 10 MB of 20q13. Although amplicons between
these two genes and proximal and distal to them
would be missed by this approach, the tumors
amplified for both these genes would serve as a
starting point for identifying genes mapping in this
region that were consistently overexpressed in the
co-amplified tumors. Thus, we performed FISH
with a BAC probe containing ZNF217 and a BAC
probe containing TPD54 on tumor tissue microar-
rays to identify amplified tumors and estimate
20q13 amplification in our ovarian tumor bank.
ZNF217 had high copy number or amplification in
16 out of 76 tumors analyzed (21%) and TPD54 had
a high copy number or amplification in 11 out of 72
(15%) tumors analyzed. Nine tumors of 72 (13%)
were high copy number or amplified for both
ZNF217 and TPD54. Amplification was not unique
to any specific histological subtype. As expected,
none of 9 normal ovarian samples analyzed by
FISH with either probe were amplified. Samples
with high levels of stroma often had background
signals and were not analyzable; in addition, some
samples were missing, had weak signals, or did not
have enough cells to include in the FISH analysis.
20q13 Expression Analysis
The expression level of 239 probes on the array
mapping to 214 known genes on 20q13 (from
40,134,807 to 62,377,837 Mb, UCSC Genome
Browser) were analyzed in 5 ovarian papillary se-
rous carcinomas that were amplified by FISH for
both ZNF217 and TPD54 compared with 5 normal/
benign and 5 non-amplified ovarian papillary se-
rous carcinomas. For consistency we used only the
co-amplified papillary serous primary tumors for
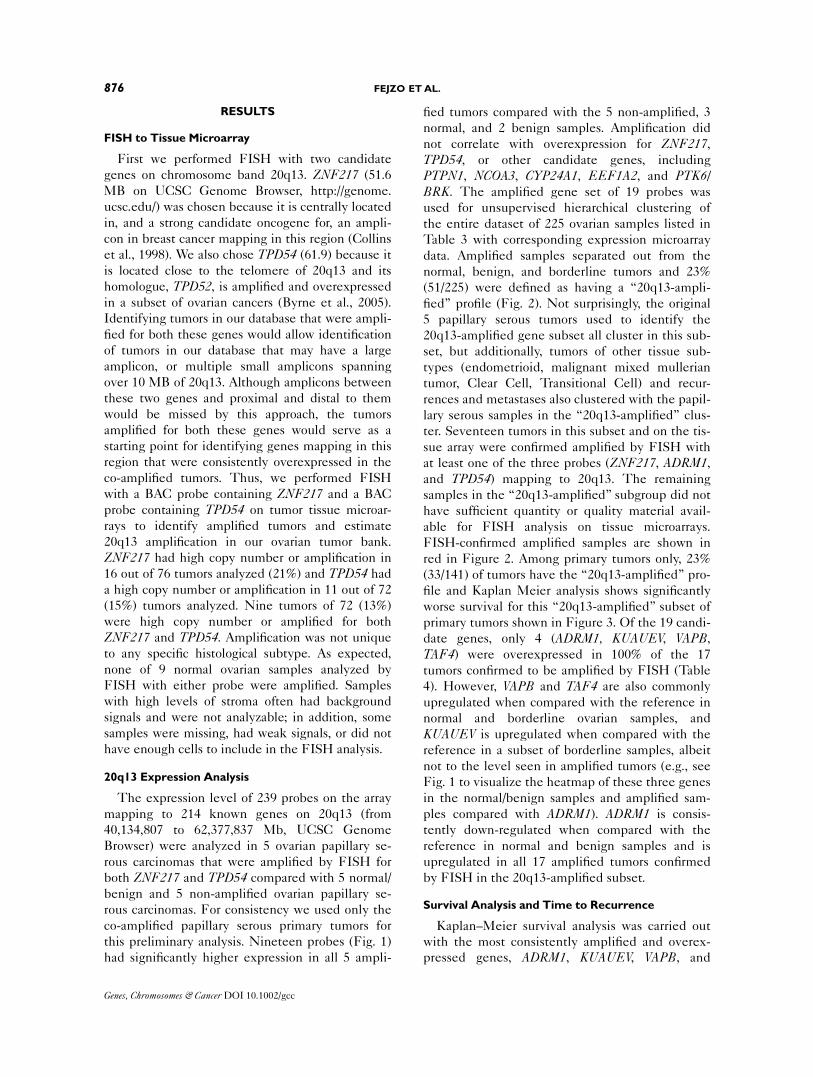
this preliminary analysis. Nineteen probes (Fig. 1)
had significantly higher expression in all 5 ampli-
fied tumors compared with the 5 non-amplified, 3
normal, and 2 benign samples. Amplification did
not correlate with overexpression for ZNF217,TPD54, or other candidate genes, including
PTPN1, NCOA3, CYP24A1, EEF1A2, and PTK6/BRK. The amplified gene set of 19 probes was
used for unsupervised hierarchical clustering of
the entire dataset of 225 ovarian samples listed in
Table 3 with corresponding expression microarray
data. Amplified samples separated out from the
normal, benign, and borderline tumors and 23%
(51/225) were defined as having a ‘‘20q13-ampli-
fied’’ profile (Fig. 2). Not surprisingly, the original
5 papillary serous tumors used to identify the
20q13-amplified gene subset all cluster in this sub-
set, but additionally, tumors of other tissue sub-
types (endometrioid, malignant mixed mullerian
tumor, Clear Cell, Transitional Cell) and recur-
rences and metastases also clustered with the papil-
lary serous samples in the ‘‘20q13-amplified’’ clus-
ter. Seventeen tumors in this subset and on the tis-
sue array were confirmed amplified by FISH with
at least one of the three probes (ZNF217, ADRM1,and TPD54) mapping to 20q13. The remaining
samples in the ‘‘20q13-amplified’’ subgroup did not
have sufficient quantity or quality material avail-
able for FISH analysis on tissue microarrays.
FISH-confirmed amplified samples are shown in
red in Figure 2. Among primary tumors only, 23%
(33/141) of tumors have the ‘‘20q13-amplified’’ pro-
file and Kaplan Meier analysis shows significantly
worse survival for this ‘‘20q13-amplified’’ subset of
primary tumors shown in Figure 3. Of the 19 candi-
date genes, only 4 (ADRM1, KUAUEV, VAPB,TAF4) were overexpressed in 100% of the 17
tumors confirmed to be amplified by FISH (Table
4). However, VAPB and TAF4 are also commonly
upregulated when compared with the reference in
normal and borderline ovarian samples, and
KUAUEV is upregulated when compared with the
reference in a subset of borderline samples, albeit
not to the level seen in amplified tumors (e.g., see
Fig. 1 to visualize the heatmap of these three genes
in the normal/benign samples and amplified sam-
ples compared with ADRM1). ADRM1 is consis-
tently down-regulated when compared with the
reference in normal and benign samples and is
upregulated in all 17 amplified tumors confirmed
by FISH in the 20q13-amplified subset.
Survival Analysis and Time to Recurrence
Kaplan–Meier survival analysis was carried out
with the most consistently amplified and overex-
pressed genes, ADRM1, KUAUEV, VAPB, and
Genes, Chromosomes & Cancer DOI 10.1002/gcc
876 FEJZO ETAL.
TAF4. Survival Analysis on all 143 primary ovarian
tumors with outcome data reveals ADRM1 overex-
pression [ADRM1 log (ratio) � 0] correlates signifi-
cantly (P 5 0.018) with poor survival (Fig. 4).
There is no correlation between poor survival and
overexpression for the other three genes (KUAUEVP 5 0.174, VAPB P 5 0.898, and TAF4 P 5 0.471).
Overexpression of ADRM1 also significantly corre-
lated with poor survival (P 5 0.043) when analyz-
ing the histological subset of 103 papillary serous
tumors with outcome data, and again, there is no
correlation between overexpression and poor sur-
vival for the other three genes. Finally, analysis of
time to recurrence and overexpression of ADRM1in 141 tumors with information on recurrence
shows a significant correlation (P 5 0.018) between
ADRM1 overexpression and shorter time to recur-
rence (and no such correlation was found in an
analysis of time to recurrence for the other three
genes). There is no correlation between overex-
pression of ADRM1, KUAUEV, VAPB, and TAF4and time to recurrence in the papillary serous sub-
group with recurrence data (N 5 100).
Identification of Amplicons Including ADRM1 That
Do Not Extend to ZNF217 or TPD54
ADRM1 was overexpressed in some tumors that
were not amplified for ZNF217 and TPD54. There-
Figure 2. Clustering the tumors with respect to expression of the 19 candidate genes shows 51 tumors(23%) clustered in an amplified and overexpressed subgroup. Tumor names in red were confirmed by FISHto be amplified at 20q13.
Figure 1. 20q13 genes upregulated in amplified tumors. 20q13 geneexpression levels were compared in a subset of 5 normal/benign ovariansamples, 5 non-amplified ovarian tumors (NOT AMP), and 5 ovariantumors with both ZNF217 and TPD54 amplification (Z1D AMP). Thisstudy identified 19 genes consistently upregulated in tumors shown tohave amplification for both ZNF217 and TPD54 BAC probes. Note:ZNF217 and TPD54 do not show a pattern consistent with amplificationand overexpression, but were included for comparison purposes. Addi-tionally, the expression microarray had two different probes for thegenes ZFP64, C20orf40, and KIAA1847. For these genes, only one of thetwo probes correlated with overexpression, but both clones are shown.
Genes, Chromosomes & Cancer DOI 10.1002/gcc
877ADRM1 20q13 TARGET IN OVARIAN CANCER

fore, a BAC probe for ADRM1 was prepared and
FISH was performed to determine whether there
were tumors with amplicons around ADRM1 that
did not include ZNF217 and TPD54. ADRM1 was
amplified in more tumors than ZNF217 and
TPD54, as 16/68 or 24% of tumors in our dataset
are amplified for ADRM1, consistent with the per-
centage of tumors (23%) in the ‘‘20q13-amplified’’
subset. Thus, while most 20q13 amplification in
our dataset (whether one large amplicon or sepa-
rate amplicons) include either ZNF217 and
ADRM1, or ADRM1 and TPD54, or all three genes,
three tumors were amplified for ADRM1 only, (i.e.,
were not amplified for ZNF217 or TPD54), suggest-ing an amplicon in these tumors around ADRM1 at
60 MB that does not extend proximally to 52 MB
(ZNF217), nor distally to 62 MB (TPD54).
Analysis of ADRM1 Expression by Northern Blot
Analysis and IHC
About 124 tumor RNAs and 3 normal ovarian
RNAs were prepared for Northern blot analysis
and probed with a P32-labeled ADRM1 probe. 20%
were scored as 31, 39% were scored as 21, 38%
were scored as 11, and 3% were scored as 01. The
normal ovarian tissues were scored as 01 and 11.
Among the 51 tumors in the microarray subset of
20q amplified tumors shown in Figure 2, 35 tumors
(95%) were scored as upregulated (21 or 31) for
ADRM1, 2 tumors were scored as down-regulated
(11) and 14 tumors did not have sufficient RNA
quantity necessary for Northern blot analysis. In
addition, IHC was performed on frozen tissue
arrays. Among 170 samples, 118 were scored for
Figure 3. Amplified subset correlates significantly with poor overall survival (P 5 0.05). 141 patientswere included in the analysis. Blue is survival in patients (N 5 64) with ‘‘amplified’’ primary tumors and redis survival in patients (N5 77) with ‘‘non-amplified’’ primary tumors.
TABLE 4. Genes Upregulated in FISH-Confirmed AmplifiedTumors in ‘‘Amplified’’ Subset
GENE Upregulated (%) Upregulated (N)
ADRM1 100 17
VAPB 100 17
KUAUEV 100 17
TAF4 100 17
STAU 94 16ATP5E 94 16c20orf40 94 16KIAA1847 94 16KIAA1847 94 16SS181L 94 16UBE2C 88 15ARFGEF2 88 15ZNF313 88 15PFDN4 88 15STK6 88 15RAE1 88 15C20orf20 88 15PSMA7 88 15c20orf40 82 14ZFP64 82 14TPD52L2 76 13ZFP64 65 11ZNF217 53 9MYBL2 47 8
Genes, Chromosomes & Cancer DOI 10.1002/gcc
878 FEJZO ETAL.

ADRM1 protein expression as 0–31; the remaining
52 samples were not analyzable because they were
either partially or completely lost during process-
ing, had background signal, or were of poor quality.
Thus, 105 ovarian tumor samples and 13 normal
ovarian tissues were scored for IHC. Among
tumors, 25% were scored as 31, 33% were scored
as 21, 32% were scored as 11, and 10% were
scored as 01. Among the 13 normal ovarian tissues,
2 were scored as 21, 4 were scored as 11, and 7
were scored as 01. The staining by IHC shows
expression consistent with nuclear and cytoplasmic
staining as suggested by the manufacturer’s data-
sheet, although tissue morphology is of poor qual-
ity on frozen sections (Fig. 5).
There were 2 normal ovarian tissues serving as
negative controls on the tissue microarray that had
corresponding samples analyzed by expression
microarray and Northern blot, and these samples
had both negative values on expression microarray
(21.77-fold change and 21.51-fold change) and
were scored as 01 or 11 by IHC and Northern
Figure 4. Kaplan–Meier overall sur-vival analysis reveals significantly (P <0.02) worse survival for tumorsexpressing high levels of ADRM1. 143patients were included in the analysis.Blue (Group 1) is survival for patients(N 5 60) with primary tumorsexpressing microarray values of log(ratio) � 0, and red (Group 2) is sur-vival for patients (N 5 83) with pri-mary tumors expressing microarrayvalues of log (ratio) < 0.
Figure 5. ADRM1 IHC to tissuemicroarray shows high expression inamplified, recurrent, and metastaticsamples.
Genes, Chromosomes & Cancer DOI 10.1002/gcc
879ADRM1 20q13 TARGET IN OVARIAN CANCER
blot. Conversely, the two highest expressing sam-
ples by Northern blot analysis that were also avail-
able for IHC and expression microarray were
scored as 31 by IHC and had values of 2.83-fold
and 2.26-fold expression, among the top 10 highest
expressing tumors by expression microarray, and
thus served as positive controls. Additionally,
expression by each method was divided into high
expression (defined as 21 or 31 by Northern or
IHC, and >1.03-fold by expression microarray),
and low expression (defined as 01 or 11 by North-
ern or IHC, and �1.03-fold by expression microar-
ray). Expression analysis by Northern blot analysis
and IHC were compared with microarray values.
Expression analysis by Northern and expression
microarray was available for 126 samples and for
IHC and expression microarray for 83 samples.
Expression levels by both methods were highly
significantly (P < 0.00001) correlated to the expres-
sion microarray levels for both methods (r 5 0.5 for
Northern vs. expression microarray and r 5 0.4 for
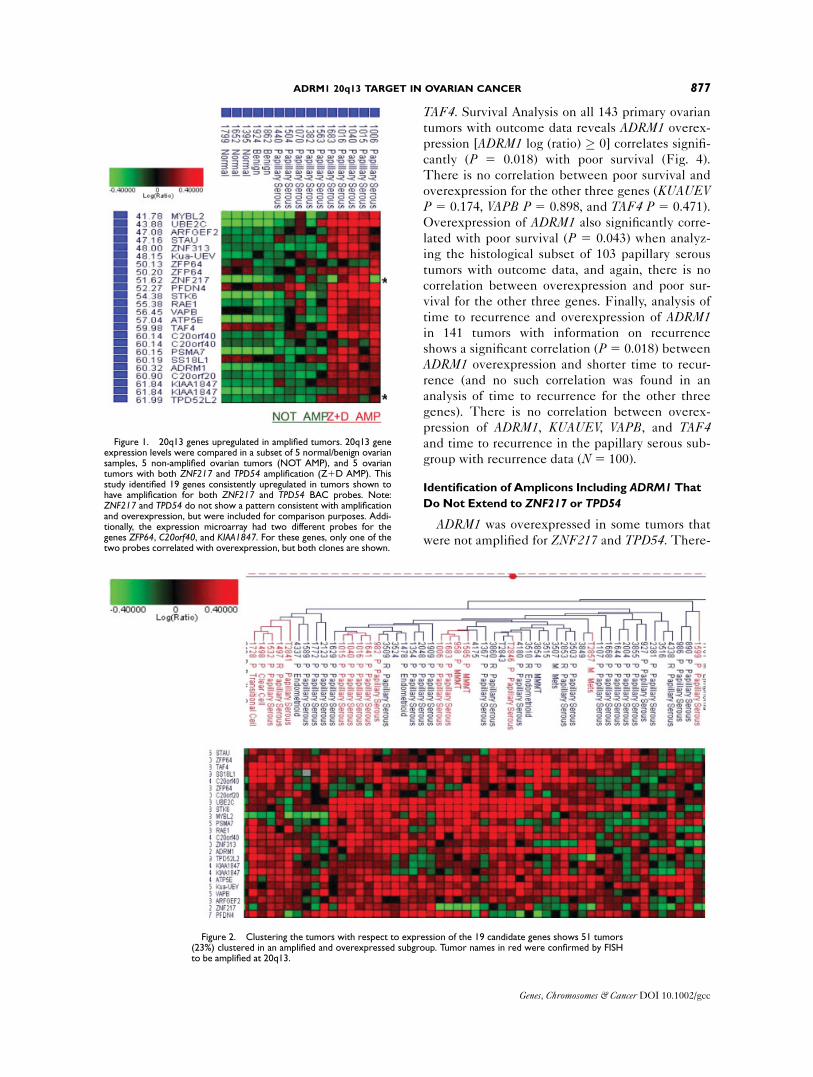
IHC vs. expression microarray). In addition, when
Kaplan Meier survival analysis was performed
comparing the survival in 78 patients with high
expressing (31) primary tumors by Northern blot
analysis versus normal/low expressing primary
Figure 6. Kaplan–Meier overall sur-vival analysis reveals significantly (P <0.02) worse survival for tumorsexpressing high levels of ADRM1 byNorthern blot analysis. 78 patientswere included in the analysis. Blue(Group 0) is survival for patients (N 565, with primary tumors expressingNorthern blot scores of 01, 11, or21, and red (Group 1) is survival forpatients (N 5 13) with primary tumorsexpressing a Northern blot score of31.
Figure 7. ADRM1 log ratio of RNAexpression levels shows that ADRM1 issignificantly increased with respect tostatus and stage. ADRM1 expression issignificantly increased in early Stages Iand II tumors when compared with nor-mal and benign tissue, significantlyincreases in Stages III and IV tumorswhen compared with Stages I and II,and significantly increases in recur-rences compared with Stages III and 1V,F(3,189) 5 18.0765, P 5 0.0000.Included in the analysis were 20 normaland benign samples, 31 primary Stages Iand II, 117 primary Stages III and IV, and27 recurrences. Four metastatic sam-ples (not included in the box plot)ranged in expression levels similar torecurrence levels (20.05 to 0.34, Me-dian 5 0.19).
Genes, Chromosomes & Cancer DOI 10.1002/gcc
880 FEJZO ETAL.
tumors (01, 11, 21), there is again a significant (P5 0.019) correlation of high ADRM1 expression
and poor survival, supporting the survival analysis
by expression microarray (Fig. 6).
Although ADRM1 expression detected using IHC
to tumor tissue microarrays confirms high expression
at the protein level in amplified, recurrent, and met-
astatic samples (Fig. 5), Kaplan–Meier’s survival
analysis was not significant by IHC. This is possibly
due to the fact that many high expressing tumors by
Northern blot analysis and expression microarray
were scored as 21 by IHC.
ADRM1 Expression Increases with Respect
to Stage and Recurrences
The average expression of ADRM1 in normal
and benign tumors, Stages I and II tumors, Stages
III and IV tumors shows expression of ADRM1 is
significantly increased when compared with normal
and benign samples in early stage tumors and is
upregulated even more in Stages III and IV
tumors, with the highest upregulation in recur-
rences and metastases (Fig. 7).
ADRM1 is Significantly Upregulated in
Recurrences and Metastases
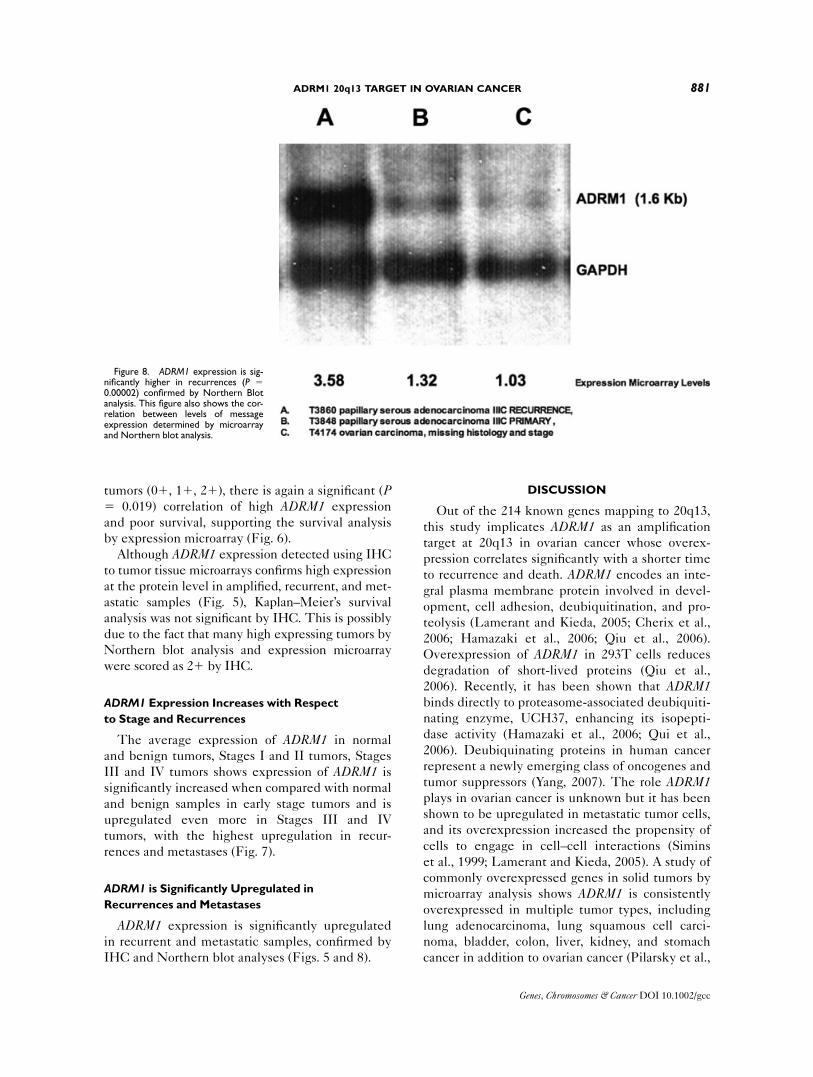
ADRM1 expression is significantly upregulated
in recurrent and metastatic samples, confirmed by
IHC and Northern blot analyses (Figs. 5 and 8).
DISCUSSION
Out of the 214 known genes mapping to 20q13,
this study implicates ADRM1 as an amplification
target at 20q13 in ovarian cancer whose overex-
pression correlates significantly with a shorter time
to recurrence and death. ADRM1 encodes an inte-
gral plasma membrane protein involved in devel-
opment, cell adhesion, deubiquitination, and pro-
teolysis (Lamerant and Kieda, 2005; Cherix et al.,
2006; Hamazaki et al., 2006; Qiu et al., 2006).
Overexpression of ADRM1 in 293T cells reduces
degradation of short-lived proteins (Qiu et al.,
2006). Recently, it has been shown that ADRM1binds directly to proteasome-associated deubiquiti-
nating enzyme, UCH37, enhancing its isopepti-
dase activity (Hamazaki et al., 2006; Qui et al.,
2006). Deubiquinating proteins in human cancer
represent a newly emerging class of oncogenes and
tumor suppressors (Yang, 2007). The role ADRM1plays in ovarian cancer is unknown but it has been
shown to be upregulated in metastatic tumor cells,
and its overexpression increased the propensity of
cells to engage in cell–cell interactions (Simins
et al., 1999; Lamerant and Kieda, 2005). A study of
commonly overexpressed genes in solid tumors by
microarray analysis shows ADRM1 is consistently
overexpressed in multiple tumor types, including
lung adenocarcinoma, lung squamous cell carci-
noma, bladder, colon, liver, kidney, and stomach
cancer in addition to ovarian cancer (Pilarsky et al.,
Figure 8. ADRM1 expression is sig-nificantly higher in recurrences (P 50.00002) confirmed by Northern Blotanalysis. This figure also shows the cor-relation between levels of messageexpression determined by microarrayand Northern blot analysis.
Genes, Chromosomes & Cancer DOI 10.1002/gcc
881ADRM1 20q13 TARGET IN OVARIAN CANCER
2004), suggesting that this gene may be a potential
target in many tumor types.
This study shows amplification as a major mech-
anism of upregulation of ADRM1 and shows
expression increases with tumor stage and recur-
rence. The fact that Stages I and II tumors can also
express levels of ADRM1 above normal along with
evidence that ADRM1 may be secreted (Wang
et al., 2004), suggest ADRM1 may have potential as
a marker for early detection of ovarian cancer. In
addition, because ADRM1 expression is highest in
recurrences and metastases, it may also serve as a
marker to screen for ovarian cancer recurrence and
metastasis.
Interestingly, the genes ZNF217 and TPD54shown to be amplified by FISH in this study, are
not consistently overexpressed in amplified sam-
ples and thus, although they may play a role in
ovarian cancer, they are not likely to be amplifica-
tion targets. While the other 18 genes detected to
correlate with amplification in this study cannot be
completely ruled out as candidates, ADRM1 had
the most consistent expression pattern. In addition,
while most tumors with ADRM1 amplification and
overexpression also overexpressed STK6, becauseof our large dataset, we were able to identify a
small subset of tumors with amplicons that did not
include overexpression of STK6. Our findings are
supported by a recent CGH array study of ovarian
cancer that found 20q13.33, where ADRM1 maps,
but distal to STK6, to be the most frequent site of
gain on 20q in more than 70% of chemoresistant as
well as chemosensitive tumors (Kim et al., 2007).
Finally, it is important to note that this study
focused on 20q13 genes and there may be addi-
tional amplicons on chromosome 20 proximal to
20q13 and on 20p involved in ovarian cancer.
In conclusion, this study narrows the candidates
for 20q13 amplification to 19 genes whose overex-
pression correlates with amplification and poor out-
come in ovarian cancer. Furthermore, this study
suggests ADRM1 as the most likely candidate for
driving the 20q13 amplicon. Overexpression of
ADRM1 by both expression microarray and North-
ern blot analysis correlates significantly with
shorter survival time; thus, ADRM1 is a marker for
poor prognosis in ovarian cancer. Admittedly, while
in general the expression of the protein by IHC
correlated with the expression levels detected by
Northern blot and expression microarray, the lack
of correlation of expression by IHC on tissue
microarray with poor survival suggests future work
may be necessary to perfect the quantitative analy-
sis by IHC.
Finally, future studies are now warranted to
determine whether this gene may be added to the
newly emerging list of oncogenes involved in the
deubiquitination–proteasome pathway and whether
it may play a role in ovarian cancer and other tumor
types as a diagnostic marker and target for cancer
therapy. Of particular interest will be whether
ADRM1-amplified tumors are particularly sensitive
to the novel class of drugs targeting the ubiquitin–
proteasome pathway.
REFERENCES
Anderson MG, Nakane M, Ruan X, Kroeger PE, Wu-Wong JR.2006. Expression of VDR and CYP24A1 mRNA in human tumors.Cancer Chemother Pharmaco 57:234–240.
Byrne JA, Balleine RL, Schoenberg Fejzo M, Mercieca J, ChiewYE, Livnat Y, St Heaps L, Peters GB, Byth K, Karlan BY, SlamonDJ, Harnett P, Defazio A. 2005. Tumor protein D52 (TPD52) isoverexpressed and a gene amplification target in ovarian cancer.Int J Cancer 117:1049–1054.
Cherix N, Froquet R, Charette SJ, Blanc C, Letourneur F, Cosson P.2006. A Phg2-ADRM1 pathway participates in the nutrient-con-trolled developmental response in Dictyostelium. Mol Biol Cell17:4982–4987.
Collins C, Rommens JM, Kowbel D, Godfrey T, Tanner M, HwangSI, Polikoff D, Nonet G, Cochran J, Myambo K, Jay KE, Froula J,Cloutier T, Kuo WL, Yaswen P, Dairkee S, Giovanola J, Hutchin-son GB, Isola J, Kallioniemi OP, Palazzolo M, Martin C, EricssonC, Pinkel D, Albertson D, Li WB, Gray JW. 1998. Positional clon-ing of ZNF217 and NABC1: Genes amplified at 20q13.2 andoverexpressed in breast carcinoma. Proc Natl Acad Sci USA95:8703–8708.
Fisher RA. 1922. On the interpretation of v2 from contingencytables, and the calculation of P. J Roy Stat Soc 85:87–94.
Hamazaki J, Iemura S, Natsume T, Yashiroda H, Tanaka K, MurataS. 2006. A novel proteasome interacting protein recruits the deu-biquitinating enzyme UCH37 to 26S -proteasomes. EMBO J25:4524–4536.
Israeli O, Goldring-Aviram A, Rienstein S, Ben-Baruch G, Korach J,Goldman B, Friedman E. 2005. In silico chromosomal clusteringof genes displaying altered expression patterns in ovarian cancer.Cancer Genet Cytogenet 160:35–42.
Kim SW, Kim JW, Kim YT, Kim JH, Kim S, Yoon BS, Nam EJ, KimHY. 2007. Analysis of chromosomal changes in serous ovarian car-cinoma using high-resolution array comparative genomic hybrid-ization: Potential predictive markers of chemoresistant disease.Genes Chromosomes Cancer. 46:1–9.
Lamerant N, Kieda C. 2005. Adhesion properties of adhesion-regu-lating molecule 1 protein on endothelial cells. FEBS J 272:1833–1844.
Lee JM. 2003. The role of protein elongation factor eEF1A2 in ovar-ian cancer. Reprod Biol Endocrinol 1:69.
Li P, Maines-Bandiera S, Kuo WL, Guan Y, Sun Y, Hills M, HuangG, Collins CC, Leung PC, Gray JW, Auersperg N. 2007. Multipleroles of the candidate oncogene ZNF217 in ovarian epithelialneoplastic progression. Int J Cancer 120:1863–1873.
Pilarsky C, Wenzig M, Specht T, Saeger HD, Grutzmann R. 2004.Identification and validation of commonly overexpressed genes insolid tumors by comparison of microarray data. Neoplasia 6:744–750.
Qiu XB, Ouyang SY, Li CJ, Miao S, Wang L, Goldberg AL. 2006.hRpn13/ADRM1/GP110 is a novel proteasome subunit that bindsthe deubiquitinating enzyme, UCH37. EMBO J 25:5742–5753.
Schmandt RE, Bennett M, Clifford S, Thornton A, Jiang F, Broad-dus RR, Sun CC, Lu KH, Sood AK, Gershenson DM. 2006. TheBRK tyrosine kinase is expressed in high-grade serous carcinomaof the ovary. Cancer Biol Ther 5:1136–1141.
Schoenberg Fejzo M, Slamon DJ. 2001. Frozen tumor tissue micro-array technology for analysis of tumor RNA, DNA, and proteins.Am J Pathol 159:1645–1650.
Shridhar V, Lee J, Pandita A, Iturria S, Avula R, Staub J, MorrisseyM, Calhoun E, Sen A, Kalli K, Keeney G, Roche P, Cliby W, LuK, Schmandt R, Mills GB, Bast RC, Jr, James CD, Couch FJ,
Genes, Chromosomes & Cancer DOI 10.1002/gcc
882 FEJZO ETAL.

Hartmann LC, Lillie J, Smith DI. 2001. Genetic analysis of early-versus late-stage ovarian tumors. Cancer Res 61:5895–5904.
Simins AB, Weighardt H, Weidner KM, Weidle UH, Holzmann B.1999. Functional cloning of ARM-1, an adhesion-regulating mole-cule upregulated in metastatic tumor cells. Clin Exp Metastasis17:641–648.
Sonoda G, Palazzo J, du Manoir S, Godwin AK, Feder M, YakushijiM, Testa JR. 1997. Comparative genomic hybridization detectsfrequent overrepresentation of chromosomal material from 3q26,8q24, and 20q13 in human ovarian carcinomas. Genes Chromo-somes Cancer 20:320–328.
Tanner MM, Grenman S, Koul A, Johannsson O, Meltzer P, PejovicT, Borg A, Isola JJ. 2000. Frequent amplification of chromosomalregion 20q12-q13 in ovarian cancer. Clin Cancer Res 6:1833–1839.
Wang P, Mariman E, Keijer J, Bouwman F, Noben JP, Robben J,Renes J. 2004. Profiling of the secreted proteins during 3T3-L1
adipocyte differentiation leads to the identification of novel adi-pokines. Cell Mol Life Sci 61:2405–2417.
Watanabe T, Imoto I, Katahira T, Hirasawa A, Ishiwata I, Emi M,Takayama M, Sato A, Inazawa J. 2002. Differentially regulatedgenes as putative targets of amplifications at 20q in ovarian can-cers. Jpn J Cancer Res 93:1114–1122.
Wolf NG, Abdul-Karim FW, Farver C, Schrock E, du Manoir S,Schwartz S. 1999. Analysis of ovarian borderline tumors usingcomparative genomic hybridization and fluorescence in situhybridization. Genes Chromosomes Cancer 25:307–315.
Yang JM. 2007. Emerging roles of deubiquitinating enzymes inhuman cancer. Acta Pharmacol Sin 28:1325–1330.
Zhou H, Kuang J, Zhong L, Kuo WL, Gray JW, Sahin A, BrinkleyBR, Sen S. 1998. Tumour amplified kinase STK15/BTAK inducescentrosome amplification, aneuploidy and transformation. NatGenet 20:104–106.
Genes, Chromosomes & Cancer DOI 10.1002/gcc
883ADRM1 20q13 TARGET IN OVARIAN CANCER