Hazard Vulnerability Risk Assessment of District Gilgit, Gilgit ...
Upload
khangminh22Category
view
2download
0
ASSESSMENT OF SEISMIC VULNERABILITY OF REINFORCED CONCRETE BUILDINGS:
A CASE STUDY OF SELECTED BUILDINGS CONSTRUCTED IN ADDIS ABABA
DANIEL GETACHEW GEBREYOHANNES
A THESIS SUBMITTED TO THE SCHOOL OF GRADUATE STUDIES
OF ADDIS ABABA UNIVERSITY
In Partial Fulfillment of the Requirements For The Degree of Master of Science In
Civil Engineering
April 2011

ADDIS ABABA UNIVERSITY SCHOOL OF GRADUATE STUDIES
ADDIS ABABA INSTITUTE OF TECHNOLOGY DEPARTMENT OF CIVIL ENGINEERING
ASSESSMENT OF SEISMIC VULNERABILITY OF REINFORCED CONCRETE BUILDINGS:
A CASE STUDY OF SELECTED BUILDINGS CONSTRUCTED IN ADDIS ABABA
DANIEL GETACHEW GEBREYOHANNES APRIL 2011
Approved by Board of Examiners
odoshell Date
E.s.oydL) &/~o~V)(0 0,5,lo S) WI f Internal Examiner Date
G I~ 'i;eLv..v~~ 03!o£ / W-f~~ External Exarr6llef S1 ature Date
7.~ hL1~ "i Chairman JiSignature - Date
11

iii
Acknowledgement
First I thank God for giving me the abilities, courage and drive to complete this thesis
work.
My deepest gratitude then extends to Dr. Adil Zekaria for his encouragement and
guidance throughout the thesis work starting from the very beginning. I would like to
thank him for his suggestion of this thesis topic and great effort in coordinating the
purchase of the IDARC 2D software.
I would like to deeply express my gratitude to Dr. Eva Rose, Managing Director of AAIT,
for providing electronic payment to facilitate the purchase of the IDARC 2D software for
the Civil Engineering Department of Addis Ababa Institute of Technology.
I would like to thank the people who provide the construction drawings of the selected
case study buildings. Without their help this work could have not been real.
Finally I would like to thank Eng. Dereje Assefa for allowing me to use his office, for
gaining internet access and computer accessories that actually add great help to
accomplish this work and further giving me access to a licensed version of ETABS
Version 9 analysis software.

iv
Contents
Acknowledgement iii
Contents iv
List of Figures vi
List of Tables vii
List of Appendices viii
Abstract ix
1. Introduction 1
1.1. Background 1
1.2. Objectives 2
1.3. Application of results 2
1.4. Delimitation and Limitations of the study 2
2. Literature Review 3
2.1. Seismic Risk 3
2.2. Seismic Hazard 3
2.3. Seismic Vulnerability 6
2.4. Limit state of Performance 7
2.5. Structural Assessment 8
2.5.1. Information for Structural Assessment 8
2.5.1.1. General information and history 8
2.5.1.2. Required input data 8
2.6. Nonlinear Dynamic Analysis 11
2.7. Modelling for Nonlinear Dynamic Analysis 12
2.7.1. Structural modeling 13
2.7.2. Member Modeling 14
2.7.3. Hysteretic Modeling 17
2.7.3.1. Stiffness Degradation 18
2.7.3.2. Strength Decay 20
2.7.3.3. Slip or Pinching 20

v
2.8. IDARC2D (A Program for the Inelastic Damage Analysis of Structures) 21
2.9. Seismic Hazard Level of Addis Ababa 24
3. Methods and Procedures 26
3.1. Assumptions 26
3.2. Procedures 26
3.3. Case Studies 27
3.4. Artificial Earthquake 27
4. Results 29
4.1. Building Mass for Seismic 29
4.2. Damaged Index of Frames (Bed rock acceleration, αo = 0.05, 0.07&0.10) 29
4.3. Damage state and Time History Results 38
5. Discussions 41
6. Conclusions and Recommendations 43
6.1. Conclusions 43
6.2. Recommendations 43
References 45
Appendices 47

vi
List of Figures Figure 2-1 Information flow and those involved in the earthquake risk reduction process ....... 4 Figure 2-2 Direct and indirect earthquake effects ...................................................................... 5 Figure 2-3 Levels of structural modelling for earthquake response analysis ........................... 15 Figure 2-4 Structural Model Examples ..................................................................................... 16 Figure 2-5 Single-component model ........................................................................................ 17 Figure 2-6 Dual-component model ........................................................................................... 17 Figure 2-7 Elastoplastic hysteretic models for steel structures: ............................................... 18 Figure 2-8 Stiffness degrading model by Clough (1966). ........................................................ 19 Figure 2-9 Stiffness degrading model by Takeda et al. (1970). ............................................... 19 Figure 2-10 Strength decay in a column (Ozcebe and Saatcioglu 1989). ................................. 20 Figure 2-11Hysteretic model incorporating pinching and strength decay (Takayanagi and Schnobrich 1976). ..................................................................................................................... 21 Figure 2-12 Structural Model definition by (Reinhorn et.al, 2009) .......................................... 22 Figure 3-1 Artificially generated wave data ............................................................................. 28 Figure 3-2 Response spectrum Comparison ............................................................................. 28 Figure 4-1 Damage state notations ........................................................................................... 38 Figure 4-2 Case study 1X (αo = 0.05) ....................................................................................... 38 Figure 4-3 Time History for Stories – Case Study 2X-Frame .................................................. 39 Figure 4-4 Case study 2X (αo = 0.05) ....................................................................................... 39 Figure 4-5 Case study 3Y (αo = 0.05) ....................................................................................... 40 Figure 4-6 Time History for Stories – Case Study 3Y- Frame ................................................. 40 Figure 4-7 Time History for Stories – Case Study 4X- Frame ................................................. 40

vii
List of Tables Table 2.1 Limit state of performance according to EC-8 and ATC-40 .................................... 7 Table 2.2 Information Required For Preliminary Seismic Evaluation When Original Construction drawings Are Available ........................................................................................ 9 Table 2.3 Information Required For Preliminary Seismic Evaluation When Original Construction Drawings are Not Available ................................................................................. 9 Table 2.4 Information Required For Detailed Seismic Evaluation When Original Construction Drawings are Available ........................................................................................................... 10 Table 2.5 Information Required For Detailed Seismic Evaluation When Original Construction Drawings are Not Available .................................................................................................... 10 Table 3.1 Available information of case studies ....................................................................... 27 Table 4.1 Seismic mass of IDARC 2D and ETABS ................................................................. 29 Table 4.2 Case Study 01 – Damage index ................................................................................ 30 Table 4.3 Case Study 02 – Damage index ................................................................................ 30 Table 4.4 Case Study 03 – Damage index ................................................................................ 31 Table 4.5 Case Study 04 – Damage index ................................................................................ 31 Table 4.6 Case Study 01 – Damage analysis Park & Ang αo = 0.05 ........................................ 32 Table 4.7 Case Study 01 – Damage analysis Park & Ang αo = 0.07 ........................................ 32 Table 4.8 Case Study 01 – Damage analysis Park & Ang αo = 0.10 ........................................ 33 Table 4.9 Case Study 02 – Damage analysis Park & Ang αo = 0.05 ........................................ 33 Table 4.10 Case Study 02 – Damage analysis Park & Ang αo = 0.07 ...................................... 34 Table 4.11 Case Study 02 – Damage analysis Park & Ang αo = 0.10 ...................................... 34 Table 4.12 Case Study 03 – Damage analysis Park & Ang αo = 0.05 ...................................... 35 Table 4.13 Case Study 03 – Damage analysis Park & Ang αo = 0.07 ...................................... 35 Table 4.14 Case Study 03 – Damage analysis Park & Ang αo = 0.10 ...................................... 36 Table 4.15 Case Study 04 – Damage analysis Park & Ang αo = 0.05 ...................................... 36 Table 4.16 Case Study 04 – Damage analysis Park & Ang αo = 0.07 ...................................... 37 Table 4.17 Case Study 04 – Damage analysis Park & Ang αo = 0.10 ...................................... 37

viii
List of Appendices
Appendix A - Program Verification ....................................................................................... 48 Appendix B - Modified Park & Ang Damage Model ............................................................... 52 Appendix C - Input for Program Verification .......................................................................... 55 Appendix D - Case Study Structural Drawings ........................................................................ 58

ix
Abstract This thesis is conducted to evaluate seismic vulnerability and investigate nonlinear
behaviors of existing reinforced concrete buildings constructed in Addis Ababa. The paper
examines four structures using nonlinear dynamic analysis software (IDARC 2D ver. 7.0).
Each of these structures will be analyzed for three peak ground accelerations of 0.05g,
0.07g and 0.10g.
The finding of this research is that two of the four buildings will collapse immediately
when an earthquake (of intensity 0.05g, 0.07g and 0.10g) occurs. It is also found that the
other two buildings resist the seismic loads that will occur during an earthquake and the
story force deformation time history responses of these two buildings show stiffness
degradation, strength decay and pinching behaviors of reinforced concrete structures.
It was concluded that some of the buildings deform beyond the limit of linearly elastic
range and due to the high damage of the main structural elements, the buildings will no
longer give service or a total collapse will occur after earthquake. It is recommended to
evaluate seismic vulnerability of the existing buildings in Addis Ababa based on nonlinear
analysis procedures.
Keywords: Seismic Vulnerability; Nonlinear Dynamic Analysis; Stiffness Degradation;
Strength Decay; Pinching

1
1. Introduction
1.1. Background
EBCS-8 states, the purpose of the code is to ensure that, in the event of earthquakes,
human lives are protected, damage is limited and structures important for civil protection
remain operational. But the question in most structural engineers’ mind is
a) “Are the buildings constructed in Ethiopia sufficiently designed to withstand
intense ground shaking?”
b) “How do buildings actually perform in the event of an earthquake?”
Although buildings designed according to our code are expected to perform sufficiently
well to prevent the loss of life under seismic loads equal to those they were designed for,
how they will actually perform in the event of an earthquake is largely unknown. The
actual case is that most buildings are expected to deform beyond the limit of linearly
elastic behavior when subjected to strong ground shaking and the ensuing dynamic
instability can cause excessive structural damage, and even overall collapse.
Seismic vulnerability is the expected degree of damage to a given structure at risk
resulting from a given level of seismic hazard. Vulnerability assessment can be observed
vulnerability or predicted vulnerability. Observed vulnerability is based on statistics of
past earthquake damage. And predicted vulnerability refers to assessment of expected
performance of buildings based on engineering computations and design specifications or,
if no other method is available, on engineering judgment. Predicted vulnerability is more
suitable for area of low and moderate seismicity. Since no major damaging earthquake has
occurred in Ethiopia in recent times, vulnerability assessment from observed damage
patterns are not available.
Nonlinear dynamic earthquake analysis is the most adequate and comprehensive analysis
procedure to evaluate the nonlinear seismic response of structures. The nonlinear response
of buildings to the highest level of accuracy can be assessed by making use of non-linear
dynamic analysis procedure.
2
1.2. Objectives
The objective of this thesis work is to:
a) Evaluate the damage extent of selected buildings constructed in Addis Ababa
during an earthquake
b) Investigate the nonlinear behavior of the case study buildings during the
earthquake
c) To introduce a program for the inelastic damage analysis of reinforced concrete
structures.
1.3. Application of results
The results associated with this thesis work pinpoint the risk associated with analysis
considering only the linear behavior of reinforced concrete. The results are a wakeup call
for structural engineers because buildings need to be designed with the expectation that
buildings will undergo some cracking, yielding and damage during an intense earthquake.
1.4. Delimitation and Limitations of the study
Delimitations
a) Due to the scarcity of building data, only four structures are used to carry out the
study
b) The available damage analysis software, IDARC 2D, is not user friendly especially
the input section.
c) Only ribbed slab system building are considered.
d) Structural detailing was not checked against the recommendations of EBCS-2 and
EBCS-8.
Limitations
a) Because of the limited amount of time and scope, the evaluation of the buildings is
limited to damage analysis
b) Only three of the case study buildings have architectural data.
c) The owners of the buildings cannot be made public because of owner’s interest.
d) While performing this research site visit of the buildings is not made.

3
2. Literature Review
2.1. Seismic Risk
Risk is defined as the expected losses (of lives, persons, injured, property damaged, and
economic activity disrupted) due to particular hazard for a given area and reference
period. Base on mathematical calculations risk is the product of hazard and vulnerability
(Marfai and Njagih, 2002).1 (Dowrick, 2009) defines seismic risk as the probability that
social or economic consequences of earthquakes will equal or exceed specified values at a
site, at several sites, or in an area, during a specified exposure time. Risk statements are
thus given in quantitative terms. 2 Dowrick further describes seismic risk as an outcome of
seismic hazard as described by the relationship of the form
Seismic Risk = Seismic Hazard * Vulnerability * Value
- Where Vulnerability is the amount of damage, induced by a given degree of
hazard, and expressed as a fraction of the value of the damaged item under
consideration
- Value is the asset at risk that is threatened by the earthquake
Another statement by (Elghazouli, 2009) states that seismic risk is often considered as the
convolution of seismic hazard, exposure and vulnerability. Exposure refers to the people,
buildings, infrastructure, commercial and industrial facilities located in an area where
earthquake effects may be felt; exposure is usually determined by planners and investors,
although in some cases avoidance of major geo-hazards may lead to relocation of new
infrastructure. 3 Figure 2-1 shows a flow chart for the information flow and those involved
in the earthquake risk reduction process.
2.2. Seismic Hazard
Seismic hazard is any physical phenomenon (ground shaking, ground failure) associated
with an earthquake that may produce adverse effects on human activities. Seismic hazards
1 M. A. Marfai And J.K. Njagih, 2002, Vulnerability Analysis And Risk Assessment For Seismic And Flood Hazard In Turialba City, Costa Rica, p.3 2 D. Dowrick, 2009, Earthquake Resistance Design And Risk Reduction, pp.1-2 3 A. Elghazouli, 2009, Seismic Design of Buildings to Eurocode 8,pp.6

4
are the potentially damaging effects of earthquake at a particular location, which may
include surface rupture, tsunami run-up, liquefaction and landslides, although the most
important cause of damage on a global scale is earthquake induced ground shaking
(Elghazouli, 2009). 1
Figure 2-1 Information flow and those involved in the earthquake risk reduction process2
Figure 2.2 shows direct and indirect effects of earthquake described by (Elnashai and
Sarno, 2008). Hazards may be either purely descriptive terms or quantitatively evaluated,
1 A. Elghazouli, 2009, Seismic Design of Buildings to Eurocode 8,pp.6 2 D. Dowrick, 2009, Earthquake Resistance Design And Risk Reduction, Figure 1.1

5
depending on the needs of situation (Dowrick, 2009).1 From an earthquake engineer’s
perspective, hazard can be quantified but not reduced (Elnashai and Sarno, 2008). 2
Figure 2-2 Direct and indirect earthquake effects3
Seismic hazard assessments are attempts to forecast the likely future seismic activity rates
and strengths, based on knowledge of the past and present, and significant uncertainties
arise partly because the processes involved are not fully understood and partly because
relevant data are generally scarce and variable in quality (Dowrick, 2009). 4The process of
assessing seismic hazards starts with the identification of potential seismic sources, which
are related to tectonic settings of a certain region. In assessing seismic sources, a plot map 1 D. Dowrick, 2009, Earthquake Resistance Design And Risk Reduction, pp.1 2 A. Elnashai And L. Sarno, 2008, Fundamentals of Earthquake Engineering,p.32 3 A. Elnashai And L. Sarno, 2008, Fundamentals of Earthquake Engineering, Figure 1.22 4 D. Dowrick, 2009, Earthquake Resistance Design And Risk Reduction, pp.3

6
showing seismic events, local faults and tectonic events are the main tools (Marfai and
Njagih, 2002).1 According to (Dowrick, 2009), for design or risk assessment purposes the
assessment of seismic hazard consists of the following basic steps: 2
a. Definition of the nature and locations of earthquake sources;
b. Magnitude–frequency relationships for the sources;
c. Attenuation of ground motion with distance from source;
d. Determination of ground motions at the site having the required probability of
exceedance.
2.3. Seismic Vulnerability
As stated by (Marfai and Njagih, 2002), vulnerability, which is a key topic in risk
analysis, is defined as the degree of loss to a given element or set of elements resulting
from the occurrence of a natural disaster.3 The same author states, vulnerability to
earthquakes in urban areas is largely related to building design and quality since it is these
houses, which collapse and injure people. The nature of the construction and the materials
used will greatly influence the kind of injuries inflicted.4
According to (Elghazouli, 2009), seismic vulnerability is the susceptibility of structures to
earthquake effects and is generally defined by the expected degree of damage that would
result under different levels of seismic demand; this is the component of the risk equation
that can be controlled by engineering design.5
Seismic vulnerability of structures varies as a function of construction materials and
earthquake action-resistance system employed. However, causes of fatalities and extent of
damage depend to a great extent on the type of constructions and the density of population
in the area (Elnashai and Sarno, 2008). 6Earthquake can cause devastative effects in terms
1 M.A. Marfai And J. K. Njagih, 2002, Vulnerability Analysis And Risk Assessment For Seismic And Flood Hazard In Turialba City, Costa Rica, pp.8 2 D. Dowrick, 2009, Earthquake Resistance Design And Risk Reduction, pp.3 3 M. A. Marfai And J. K. Njagih, 2002, Vulnerability Analysis And Risk Assessment For Seismic And Flood Hazard In Turialba City, Costa Rica, pp.12 4 M. A. Marfai And J K. Njagih, 2002, Vulnerability Analysis And Risk Assessment For Seismic And Flood Hazard In Turialba City, Costa Rica, pp.13 5 A. Elghazouli, 2009, Seismic Design of Buildings to Eurocode 8,pp.6 6 A. Elnashai And L. Sarno, 2008, Fundamentals of Earthquake Engineering,pp.34
7
of loss of life and livelihood. The destructive potential of earthquake depends on many
factors such as:
a) Size of an event
b) Focal depth and Epi-central distance
c) Topographical conditions
d) Local geology
Vulnerability can be both evaluated and reduced, by measures of retrofitting. It can also be
reduced by other means, such as long-term land use management and education (Elnashai
and Sarno, 2008).1
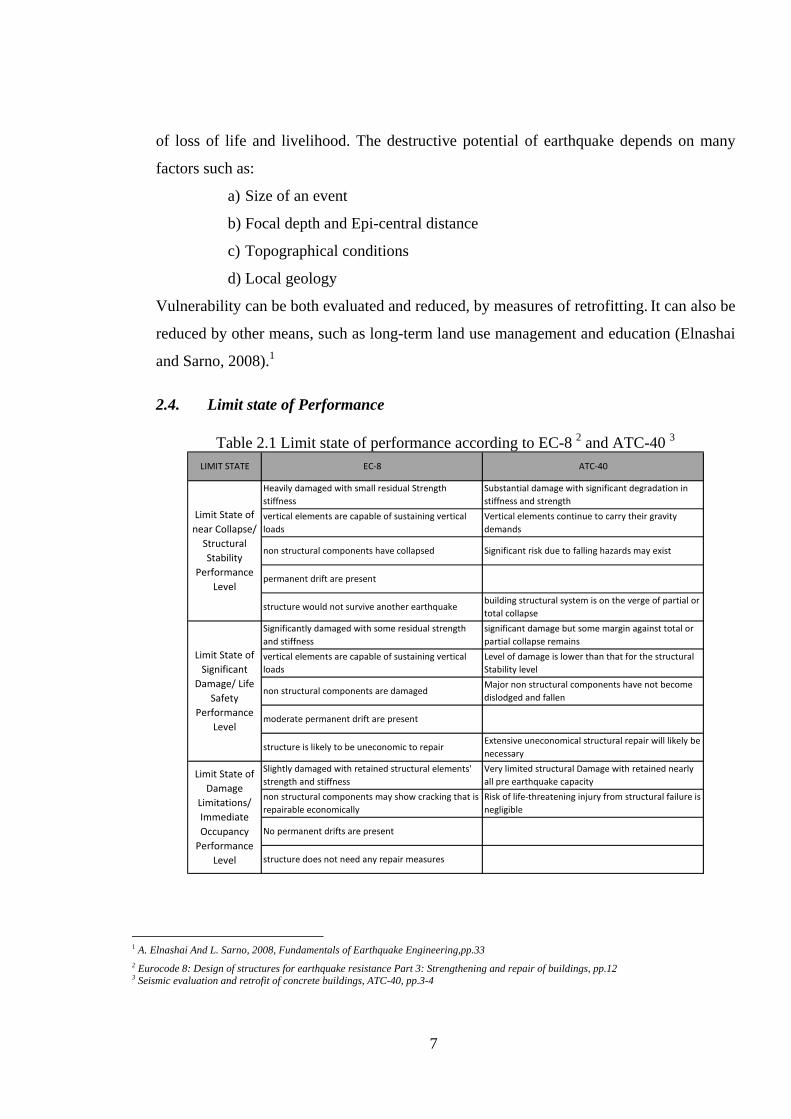
2.4. Limit state of Performance
Table 2.1 Limit state of performance according to EC-8 2 and ATC-40 3
vertical elements are capable of sustaining vertical loads
non structural components have collapsed
permanent drift are present
vertical elements are capable of sustaining vertical loads
non structural components are damaged
LIMIT STATE
Limit State of near Collapse/ Structural Stability
Performance Level
Limit State of Significant
Damage/ Life Safety
Performance Level
Limit State of Damage
Limitations/ Immediate Occupancy Performance
Level
Extensive uneconomical structural repair will likely be necessary
ATC‐40
Vertical elements continue to carry their gravity demands
Significant risk due to falling hazards may exist
Level of damage is lower than that for the structural Stability level
Major non structural components have not become dislodged and fallen
Very limited structural Damage with retained nearly all pre earthquake capacity
Risk of life‐threatening injury from structural failure is negligible
EC‐8
Heavily damaged with small residual Strength stiffness
structure would not survive another earthquake
Substantial damage with significant degradation in stiffness and strength
building structural system is on the verge of partial or total collapse
Slightly damaged with retained structural elements' strength and stiffness
Significantly damaged with some residual strength and stiffness
structure is likely to be uneconomic to repair
non structural components may show cracking that is repairable economically
moderate permanent drift are present
No permanent drifts are present
structure does not need any repair measures
significant damage but some margin against total or partial collapse remains
1 A. Elnashai And L. Sarno, 2008, Fundamentals of Earthquake Engineering,pp.33 2 Eurocode 8: Design of structures for earthquake resistance Part 3: Strengthening and repair of buildings, pp.12 3 Seismic evaluation and retrofit of concrete buildings, ATC-40, pp.3-4
8
2.5. Structural Assessment
EC-8 defines assessment as a quantitative procedure by which it is checked whether an
existing undamaged or damaged building can resist the design seismic load combination
as specified in the code. It further states that, assessment is made for individual buildings,
in order to decide about the need for structural intervention and about the strengthening or
repair measures to be implemented. 1
2.5.1. Information for Structural Assessment
2.5.1.1.General information and history
In assessing the earthquake resistance of existing structures, taking also into account the
effects of actions in other design situations, the input data shall be collected from available
records, relevant information, field investigations and, in most cases, from in-situ and/or
laboratory measurements and tests (EC-8).2
2.5.1.2.Required input data
The seismic evaluation of existing concrete buildings depends on data collection as a
factual basis. The data collection process includes acquisition of available documents,
field observations, field investigations, materials testing, and documentation. While the
extent of the data acquisition process will vary from building to building and will depend
on the availability of drawings and the level of evaluation being performed, i.e.
preliminary evaluation, detailed evaluation and analysis, or preparation of final retrofit
construction documents (ATC-40) 3. It further states, accurate building information is
necessary, in any event, in the following areas:
a) Building geometry, configuration, and mass (including structural, architectural and
mechanical systems)
b) Elements of the seismic load path, including frames, walls, diaphragms,
foundations, and connections
1 Eurocode 8: Design of structures for earthquake resistance Part 3: Strengthening and repair of buildings, pp.22 2 Eurocode 8: Design of structures for earthquake resistance Part 3: Strengthening and repair of buildings, pp.14 3 Seismic evaluation and retrofit of concrete buildings, ATC-40, Section 5-12

9
c) Configuration and layout of structural members, including size of members, size of
reinforcing, tie spacing, splice locations, and concrete cover
d) Properties of the materials used in the structural system, such as concrete and steel
reinforcing
e) Anchorage of nonstructural elements
Tables 2.1 through 2.4 summarize the data collection process as it relates to availability
of drawings and level of evaluation (ATC-40).
Table 2.2 Information Required For Preliminary Seismic Evaluation When Original Construction drawings Are Available 1
Yes No
X
X
X
X
X
X
X
X
X
X
X
X
X
X
Rebound hammer testing
Aggregate Testing
Reinforcement testing
Reinf. Location verification
Nonstructural exploration
Structural calculations
Site seismicity, geotechnical report
Foundation report
Prior seismic assessment reports
Condition survey of building
Alteration and as built assessment
Walk through dimensioning
Nonstructural walk through
Core testing
Identify falling hazards, weight
Unless concrete appears substandard
Unless concrete appears substandard
Unless Insufficient Info. On drawings
Helpful but updated report should be done
Helpful but not essential
Helpful but not essential
Unless required by undocumented alterations
RequiredCommentItem
Helpful but not essential
Table 2.3 Information Required For Preliminary Seismic Evaluation When Original Construction Drawings are Not Available 2
Yes NoXXXX
XXXXX
X
XXXX
Reinforcement testingReinf. Location verification Could be helpfulNonstructural exploration
Core testing Minimum 2 per floor, 8 per building
Rebound hammer testingCould be helpful, especially if concrete appears Substandard
Aggregate Testing Several cores
Alteration and as built assessmentWalk through dimensioning Sufficient to define primary elementsNonstructural walk through Identify falling hazards, weight
Foundation report Could minimize scope of site workPrior seismic assessment reports Could minimize scope of site workCondition survey of building
RequiredComment
Structural calculations Could minimize scope of site workSite seismicity, geotechnical report Could minimize scope of site work
Item
1 Seismic evaluation and retrofit of concrete buildings, ATC-40, Table 5.1 2 Seismic evaluation and retrofit of concrete buildings, ATC-40, Table 5.2

10
Table 2.4 Information Required For Detailed Seismic Evaluation When Original Construction Drawings are Available 1
Yes NoXXXX
XX
XXXXX
X
X
X
Reinforcement testing Optional
Reinf. Location verification Pachometer@ 10% of critical locations, visual @ 2 locations
Nonstructural explorationVerify anchorage and bracing conditions for components sensitive to building performance
Core testing Minimum 2 per floor, 8 per buildingRebound hammer testing Minimum 8 per floor, 16 per buildingAggregate Testing Each core
Alteration and as built assessmentWalk through dimensioning Spot checking is appropriateNonstructural walk through Identify falling hazards, weight
Foundation report Helpful but not essentialPrior seismic assessment reports Helpful but not essentialCondition survey of building
ItemRequired
Comment
Structural calculations Could be helpfulSite seismicity, geotechnical report Helpful but not essential
Table 2.5 Information Required For Detailed Seismic Evaluation When Original Construction Drawings are Not Available 2
Yes NoXXXX
XX
X
XXXXXX
X
Reinforcement testing 2 per typeReinf. Location verification Pachometer for all critical elements, visual on 25%
Nonstructural exploration Verify anchorage and bracing conditions for components sensitive to building performance
Core testing Minimum 2 per floor, 8 per buildingRebound hammer testing Minimum 8 per floor, 16 per buildingAggregate Testing Each core
Alteration and as built assessment
Walk through dimensioningMust be done very thoroughly, particularly if structure will be retroffited
Nonstructural walk through Identify falling hazards, weight
Foundation report Helpful but not essentialPrior seismic assessment reports Helpful but not essentialCondition survey of building
ItemRequired
Comment
Structural calculations Could be helpfulSite seismicity, geotechnical report Helpful but not essential
Similarly, EC-8 recommends the following inputs as requirement for structural
assessment.
a) Identification of the structural system and of its compliance with the regularity
criteria in 4.2.3 of EN 1998-1. The information should be collected either from on
site investigation or from original design drawings, if available. In this latter case,
1 Seismic evaluation and retrofit of concrete buildings, ATC-40, Table 5.3 2 Seismic evaluation and retrofit of concrete buildings, ATC-40, Table 5.4
11
information on possible structural changes since construction should also be
collected.
b) Identification of the type of building foundations.
c) Identification of the ground conditions
d) Information about the overall dimensions and cross-sectional properties of the
building elements and the mechanical properties and condition of constituent
materials.
e) Information about identifiable material defects and inadequate detailing.
f) Information on the seismic design criteria used for the initial design, including the
value of the force reduction factor, if applicable.
g) Description of the present and/or the planned use of the building (with identification
of its importance category).
h) Re-assessment of variable loads considering the use of the building.
i) Information about the type and extent of previous and present structural damages, if
any, including earlier repair measures.1
2.6. Nonlinear Dynamic Analysis
Nonlinear dynamic earthquake analysis is the most adequate and comprehensive analysis
procedure to evaluate the nonlinear seismic response of structures (Sam Lee, 2008).2
Another statement by (Paolo Bazzurro, 2009) states that nonlinear dynamic earthquake
analysis is today the current state-of-the-art methodology for predicting building response
to earthquake ground motion.3
According to (Wilson, 2002) the major advantage of using the forces obtained from a
dynamic analysis as the basis for a structural design is that the vertical distribution of
forces may be significantly different from the forces obtained from an equivalent static
load analysis. Consequently, the use of dynamic analysis will produce structural designs
that are more earthquake resistant than structures designed using static loads.4
1 Eurocode 8: Design of structures for earthquake resistance Part 3: Strengthening and repair of buildings, pp.14-15 2 S. Lee, 2008, Nonlinear Dynamic Earthquake Analysis of Skyscrapers by ABAQUS, pp.1 3 P. Bazzurro, 2009, Nonlinear Dynamic Analysis—a Step Advance in Assessing the Vulnerability of Buildings to Earthquake Ground Motion, pp.4 4 E. L. Wilson,2002, Three-Dimensional Static and Dynamic Analysis of Structures, pp.17-1

12
For dynamic analysis the loading time history is divided into a number of small time
increments, whereas, in the static analysis, the lateral force is divided into a number of
small force increments. During a small time or force increment, the behavior of the
structure is assumed to be linear elastic. As nonlinear behavior occurs, the incremental
stiffness is modified for the next time or load increment. Hence, the response of the
nonlinear system is approximated by the response of a sequential series of linear systems
having varying stiffnesses (Anderson, 2000).1
2.7. Modelling for Nonlinear Dynamic Analysis
Nonlinear time-history analyses are a very powerful tool, provided they are supported by
proper approximations and modelling. The analysis is inherently complex and may be
very time consuming (Pecker, 2007).2 Many engineers use large values for element
properties when modeling rigid parts of structures. This can cause large errors in the
results for static and dynamic analysis problems. In the case of nonlinear analysis the
practice of using unrealistically large numbers can cause slow convergence and result in
long computer execution times (Wilson, 2002).3
Mathematical modeling of a structure, for the purpose of structural analysis, can be done
in a variety of different ways depending on the method of analysis adopted. In a general
sense, modeling involves the representation of a structure by elements to which physical
and material characteristics are assigned and the appropriate loading is applied or
transmitted. There are three stages of modeling that an analyst has to go through prior to
performing a dynamic analysis: (Saatcioglu and Humar, 2002) 4
a) structural modeling
b) member modeling and
c) hysteretic modeling (for nonlinear analysis)
1 J. C. Anderson,2000 Seismic Design Handbook, Dynamic Response of Structures.pp.231 2 A. Pecker,2007 Advanced Earthquake Engineering Analysis, pp.64 3 E. L. Wilson,2002, Three-Dimensional Static and Dynamic Analysis of Structures, pp.7-3 4 M. Saatcioglu and J. Humar(2002), Dynamic analysis of buildings for earthquake resistant design. Proposed Earthquake Design Requirements of the NBCC, pp 344
13
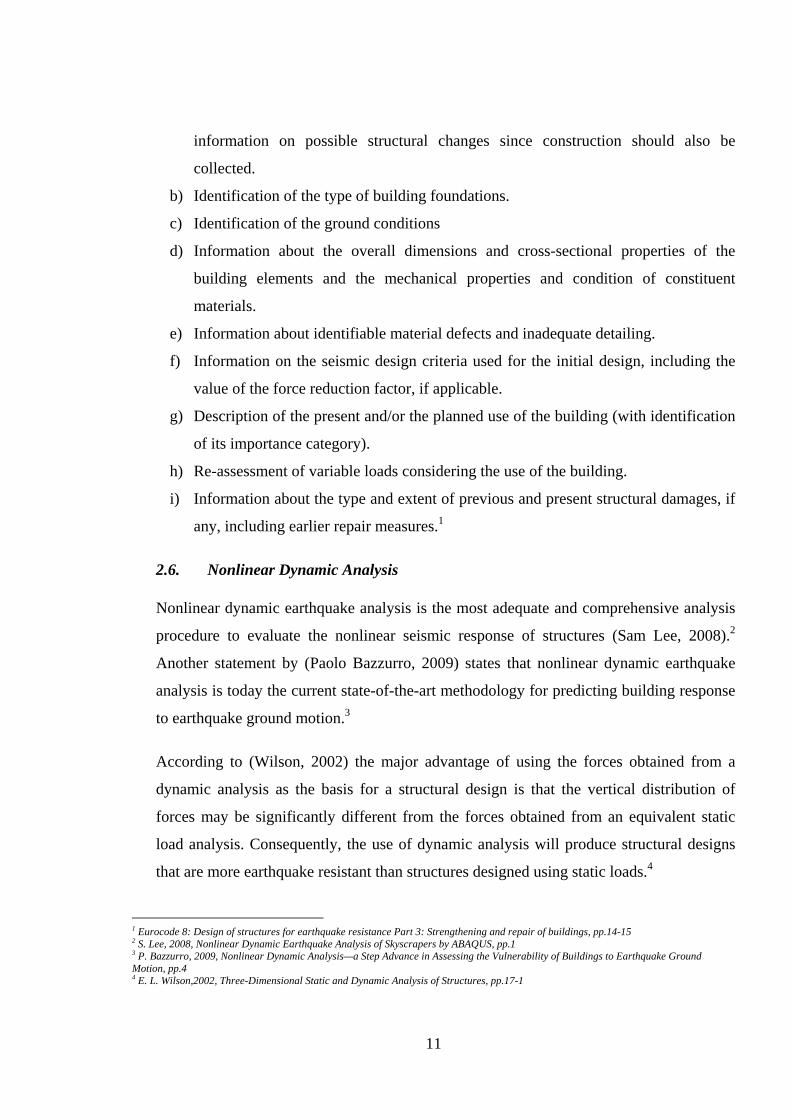
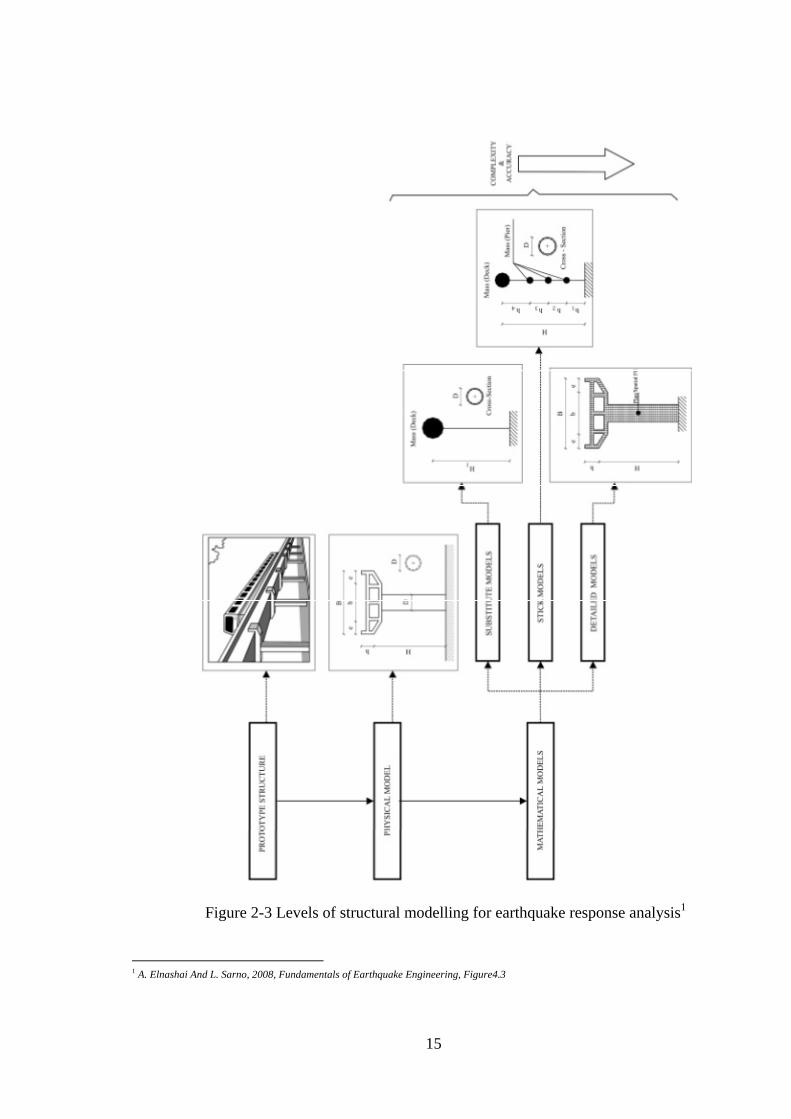
2.7.1. Structural modeling
Structural models are idealizations of the prototype and are intended to simulate the
response characteristics of systems. Three levels of modelling (see figure 2-3) are
generally used for earthquake response analysis, substitution model, stick model and
detailed model (Elnashai and Sarno, 2008).1
Substitute models are idealized as an equivalent single degree of freedom system or
‘substitute system’. Four parameters are needed to define the substitute system: effective
mass, effective height, effective stiffness and effective damping. The height defines the
location of the equivalent or effective mass of the substitute system.2 Stick models consist
of multi degree of freedom systems in which each element idealizes a number of members
of the prototype structure. In multi - storey building frames, each storey is modelled by a
single line of finite elements representing the deformational characteristics of all columns
and their interaction with beams. For three - dimensional models, the stick element relates
the shear forces along two horizontal orthogonal directions and the storey torque to the
corresponding inter - storey translations and rotations, respectively.
Detailed models include general finite elements idealizations in which structures are
discretized into a large number of elements with section analysis or spatial elements in 2D
or 3D. Such a modelling approach allows representation of details of the geometry of the
members, and enables the description of the history of stresses and strains at fibers along
the length or across the section dimensions. In the detailed modelling approach, beams
and columns of frames are represented by flexural elements, braces by truss elements, and
shear and core walls by 2D elements, such as plates and shells (Elnashai and Sarno,
2008).3
(Saatcioglu and Humar, 2002) illustrate the modeling of common forms of buildings
structures with line elements (see Figure 2-4). In frame and frame-wall interactive systems
the vertical elements such as columns and flexure-dominant structural walls are
1 A. Elnashai And L. Sarno, 2008, Fundamentals of Earthquake Engineering,pp.191 2 A. Elnashai And L. Sarno, 2008, Fundamentals of Earthquake Engineering,pp.191 3 A. Elnashai And L. Sarno, 2008, Fundamentals of Earthquake Engineering,pp.192

14
represented by vertical line elements, and the horizontal elements such as beams, and slab
diaphragms are represented by horizontal line elements as shown in figure 2-4a and figure
2-4e. Sometimes shear panels, like shear walls and in-fill panels, as well as bracing
elements are modeled by diagonal struts and ties as shown in figure 2-4b, 2-4c and 2-4d.1
2.7.2. Member Modeling
Force-deformation characteristics of individual members, essential for structural analysis
are specified through member models. In a linear dynamic analysis, members are modeled
by elastic line elements. In a nonlinear analysis, each member is idealized as an elastic
line element with inelastic springs at the ends. The springs account for potential plastic
hinges at member ends (See Figure 2-5). This model was developed by (Giberson, 1967)
and it is known as the “single-component model”. The main disadvantage of the single-
component model is the assumption that fixes the location of the point of contra flexure
for the purpose of inelastic deformation computations. The single-component model is
therefore regarded as an approximate and yet reasonably accurate member model
(Saatcioglu and Humar, 2002).2
The other inelastic model (See Figure 2-6) proposed by (Clough and et.al, 1966) is known
as the “two component model” (Reinhorn and et.al, 2009).The elastic member accounted
for the strain hardening characteristics of the reinforcing steel, while the elastic perfectly
plastic member for the yielding of the reinforcement (Reinhorn and et.al, 2009)3. This
dual-component model, however, is applicable to structural members that exhibit
elastoplastic behavior without any stiffness degradation (Saatcioglu and Humar, 2002) 4.
1 M. Saatcioglu and J. Humar (2002), Dynamic analysis of buildings for earthquake resistant design. Proposed Earthquake Design Requirements of the NBCC, pp 344 2 M. Saatcioglu and J. Humar (2002), Dynamic analysis of buildings for earthquake resistant design. Proposed Earthquake Design Requirements of the NBCC, pp 346 3A.M. Reinhorn et.al, 2009, IDARC2D Version 7.0:A Program for the Inelastic Damage Analysis of Structures,pp.12 4 M. Saatcioglu and J. Humar (2002), Dynamic analysis of buildings for earthquake resistant design. Proposed Earthquake Design Requirements of the NBCC, pp 346
15
Figure 2-3 Levels of structural modelling for earthquake response analysis1
1 A. Elnashai And L. Sarno, 2008, Fundamentals of Earthquake Engineering, Figure4.3

16
(a) (b)
(c) (d)
(e)
Figure 2-4 Structural Model Examples1
1 M. Saatcioglu and J. Humar(2002), Dynamic analysis of buildings for earthquake resistant design. Proposed Earthquake Design Requirements of the NBCC, Figure 7

17
Figure 2-5 Single-component model1
Figure 2-6 Dual-component model2
2.7.3. Hysteretic Modeling
Modeling the hysteretic behavior of structural elements is one of the core aspects of a
nonlinear structural analysis program (Reinhorn and et.al, 2009)3. Dynamic inelastic
response history analysis requires realistic conceptual models that can simulate strength,
stiffness, and energy-dissipation characteristics of members (Saatcioglu and Humar,
2002)4. Hysteretic models can be broadly classified into two types – Polygonal Hysteretic
models (PHM) and Smooth Hysteretic Models (SHM) (Sivaselvan and Reinhorn, 1999).5
The PHM refers to models based on piecewise linear behavior. Such models are most
often motivated by actual behavioral stages of an element or structure, such as initial or
elastic behavior, cracking, yielding, stiffness and strength degrading stages, crack and gap
closures etc. On the other hand, the SHM refers to models with continuous change of
1 M. Saatcioglu and J. Humar(2002), Dynamic analysis of buildings for earthquake resistant design. Proposed Earthquake Design Requirements of the NBCC, Figure 8 2 M. Saatcioglu and J. Humar(2002), Dynamic analysis of buildings for earthquake resistant design. Proposed Earthquake Design Requirements of the NBCC, Figure 9 3A.M. Reinhorn et.al, 2009, IDARC2D Version 7.0:A Program for the Inelastic Damage Analysis of Structures,pp.61 4 M. Saatcioglu and J. Humar, 2000, Dynamic analysis of buildings for earthquake resistant design. Proposed Earthquake Design Requirements of the NBCC, pp 350 5 M..V Sivaselvan and A.M. Reinhorn,1999), Hysteretic Models for Cyclic Behavior of Deteriorating Inelastic Structures , pp 2

18
stiffness due to yielding, but sharp changes due to unloading and deteriorating behavior
(Reinhorn and et.al, 2009).1
2.7.3.1.Stiffness Degradation
According to (Saatcioglu and Humar, 2002), most hysteretic models consist of a primary
curve (backbone curve), which can be computed analytically by well established
procedures of mechanics, and a set of empirical rules that define the branches of loading,
unloading, and reloading under reversed cyclic loading. The primary curve provides an
envelope of hysteresis loops of force–deformation relationships. Therefore, it provides a
convenient means of defining the strength boundary for modeling purposes. Hysteretic
rules within the strength boundary (primary curve) simulate the actual member behavior,
often as observed during tests.2
Structural steel elements exhibit elastoplastic behavior, with unloading and reloading
branches of hysteresis loops parallel to the initial elastic branch. The post-yield slope of
the primary curve may reflect steel strain hardening with a post-yield rigidity
approximately equal to 0.5–5% of the elastic rigidity (See Figure 2-7). 3
Figure 2-7 Elastoplastic hysteretic models for steel structures:
(a) Zero post-yield rigidity; (b) with strain hardening
1A.M. Reinhorn et.al, 2009, IDARC2D Version 7.0:A Program for the Inelastic Damage Analysis of Structures,pp.61 2 M. Saatcioglu and J. Humar, 2000, Dynamic analysis of buildings for earthquake resistant design. Proposed Earthquake Design Requirements of the NBCC, pp 350 3 M. Saatcioglu and J. Humar, 2000, Dynamic analysis of buildings for earthquake resistant design. Proposed Earthquake Design Requirements of the NBCC, pp 351

19
Unlike structural steel elements, reinforced concrete develops stiffness degradation under
inelastic deformation reversals. The degradation of stiffness takes place during reloading
and unloading as evidenced by reductions in the slopes of corresponding force–
deformation hysteresis loops. The degradation in stiffness increases at a varying rate,
usually as a function of the number of cycles and the level of peak deformations attained.
A simple hysteretic model (See Figure 2-8) was developed by Clough (1966),
incorporating stiffness degradation into a perfectly elastoplastic response (Saatcioglu and
Humar, 2002) 1.
Figure 2-8 Stiffness degrading model by Clough (1966).
Figure 2-9 Stiffness degrading model by Takeda et al. (1970).
An improved degrading stiffness model (See Figure 2-9) was developed by Takeda et al.
(1970) with a trilinear primary curve (Saatcioglu and Humar, 2002). The reloading points 1 M. Saatcioglu and J. Humar, 2000, Dynamic analysis of buildings for earthquake resistant design. Proposed Earthquake Design Requirements of the NBCC, pp 352

20
in the model are aimed at the response point at previous maximum deformations.
Unloading slopes are reduced as a function of the previous maximum deformation; hence
the stiffness degradation is introduced in a more refined manner as compared to the
Clough model. 1
2.7.3.2.Strength Decay
An important feature of hysteretic response is strength decay. Structural members exhibit
progressive loss of strength under relatively high levels of inelastic deformation cycles.
Figure 2-10 illustrates a strength decay obtained in a concrete column under reversed
cyclic loading by (Ozcebe and Saatcioglu, 1989). The degree of strength decay depends
on many parameters, including the governing deformation mode, concrete confinement,
shear strength, loading history, and level of axial load. Early and rapid strength decay can
have a very significant effect on structural response and, if not considered in hysteretic
modeling, can lead to significant errors in dynamic analysis. 2
Figure 2-10 Strength decay in a column (Ozcebe and Saatcioglu 1989).
2.7.3.3.Slip or Pinching
Slip or pinching occurs as a result of crack closure, bolt slip, etc (Sivaselvan and
Reinhorn, 1999).3 Hysteresis loops of both steel and reinforced concrete members
1 M. Saatcioglu and J. Humar, 2000, Dynamic analysis of buildings for earthquake resistant design. Proposed Earthquake Design Requirements of the NBCC, pp 352 2 M. Saatcioglu and J. Humar, 2000, Dynamic analysis of buildings for earthquake resistant design. Proposed Earthquake Design Requirements of the NBCC, pp 352 3 M..V Sivaselvan and A.M. Reinhorn,1999), Hysteretic Models for Cyclic Behavior of Deteriorating Inelastic Structures , pp 14

21
generally show a marked change in slope during reloading. In steel members this may be
attributed to the slippage of a bolt or a rivet until the force is completely reversed. The
change in slope in concrete elements is associated with opening and closing of cracks
under cyclic loading (Saatcioglu and Humar, 2002) 1. Strength decay and pinching of
hysteresis loops were modeled by Takayanagi and Schnobrich (1976), who modified the
Takeda et al. model to incorporate features that are prevalent in shear and bar slip, as
illustrated in Figure 2-11 (Saatcioglu and Humar, 2002) 2.
Figure 2-11Hysteretic model incorporating pinching and strength decay (Takayanagi and
Schnobrich 1976).
2.8. IDARC2D (A Program for the Inelastic Damage Analysis of Structures)
The computer program IDARC was introduced in 1987 as a two-dimensional analysis
program to study the non-linear response of multistory reinforced concrete. The program
was developed assuming that floor diaphragms behave as rigid horizontal links, therefore,
only one horizontal degree of freedom is required per floor. This approach greatly reduces
the total computational effort. Therefore, the building is modeled as a series of plane
frames linked by a rigid horizontal diaphragm. Each frame is in the same vertical plane,
and no torsional effects are considered. Since the floors are considered infinitely rigid,
identical frames can be simply lumped together, and the stiffness contributions of each
1 M. Saatcioglu and J. Humar, 2000, Dynamic analysis of buildings for earthquake resistant design. Proposed Earthquake Design Requirements of the NBCC, pp 352 2 M. Saatcioglu and J. Humar, 2000, Dynamic analysis of buildings for earthquake resistant design. Proposed Earthquake Design Requirements of the NBCC, pp 353

22
typical frame factored by the number of duplicate equal frames. Input is only required for
each of the typical frames (Reinhorn et.al, 2009) 1.
Version 7.0 of IDARC includes the following types of structural elements (Reinhorn and
et.al, 2009)2:
a) Column elements
b) Beam elements
c) Deep beam and column elements
d) Rocking column elements
e) Shear wall elements
f) Edge column elements
g) Transverse beam elements
h) Rotational spring elements
i) Visco-elastic damper elements
j) Friction damper elements
k) Hysteretic damper elements
l) Infill panel elements
m) Element moment releases
Figure 2-12 Structural Model definition by (Reinhorn et.al, 2009) 3
1A.M. Reinhorn and et.al, 2009, IDARC2D Version 7.0:A Program for the Inelastic Damage Analysis of Structures,pp.3 2A.M. Reinhorn and et.al, 2009, IDARC2D Version 7.0:A Program for the Inelastic Damage Analysis of Structures,pp.11 3A.M. Reinhorn and et.al, 2009, IDARC2D Version 7.0:A Program for the Inelastic Damage Analysis of Structures, Figure 3.1

23
The primary modelling technique employed in the computer program IDARC is the
representation of the overall behavior of components in terms of macro models. Each
component of the structural system is discretized into a series of macro elements: beam-
column elements whose inelastic behavior is characterized by a primarily flexural
response, shear-wall elements that may deform inelastically in the plane of the diaphragm,
and inelastically rotational springs that may be attached at any node. Special-purpose
elements such as viscoelastic braces and other friction devices for hysteretic energy
dissipation were also developed. The reliability of the macroelements is enhanced through
the introduction of distributed flexibility models which account for the effects of spread
plasticity (Reinhorn and Kunnath). Nonlinear material behavior is specified by means of a
generic hysteretic force-deformation model that incorporates stiffness degradation,
strength deterioration and pinching or bond-slip effects. 1
The program evaluates the nonlinear response of the structure under the following four
possible analysis options (Reinhorn et.al, 2009) 2:
a) Incremental Nonlinear Static Monotonic Analysis
b) Incremental Nonlinear Static-Adaptive (Pushover) Analysis
c) Nonlinear Quasi-static Analysis
d) Eigenvalue Analysis
e) Nonlinear Dynamic Analysis
The user may select any of the four options for the analysis, or a combination of a
nonlinear static analysis with any of the three other analysis options. In this thesis work,
nonlinear dynamic analysis option is selected because the nonlinear response of buildings
to the highest level of accuracy can be assessed by making use of non-linear dynamic
analysis procedure.
The final response quantities are expressed in terms of damage indices that provide
engineers with a qualitative interpretation of the analysis. Important researches have been
carried out to develop damage indicators to qualify the response of structures. The current
1A.M. Reinhorn and S.Kunnath, 1994, IDARC2D:A Program for the Inelastic Damage Analysis of Reinforced Concrete Structures,pp.29 2A.M. Reinhorn and et.al, 2009, IDARC2D Version 7.0:A Program for the Inelastic Damage Analysis of Structures,pp.3

24
release of IDARC incorporates three models for damage indices: (i) a modified Park &
Ang model (Park et al., 1984; Kunnath et al.1992b), introduced in the previous releases of
the program, (ii) a new fatigue based damage model introduced by Reinhorn and Valles
(1995), based on Bracci (1990), and (iii) an overall damage qualification based on the
variation of the fundamental period of the structure.
The Park & Ang and the fatigue based damage model can be used to calculate different
damage indices: element, story (subassembly), and overall building damage. However, for
the story and overall damage indices the ultimate inter-story deformation or top story
displacement are required, as well as the corresponding story yield shear force or base
shear yield force level. To determine an estimate of the story and overall damage indices,
weighting factors were introduced based on the energy absorption in the different
structural elements or entire stories substructure.
The program IDARC includes the option to determine the response of the structure at
instants during the analysis. Several types of response snapshots can be specified:
a) Displacement profile.
b) Element stress ratios.
c) Structural collapse state.
d) Damage indices.
e) Dynamic characteristics (eigenvalue analysis).
Response snapshots can be requested by the user during pushover, quasi-static or dynamic
analysis. Default snapshots will be reported, if requested by the user, for the first crack,
yield or failure observed in any column, beam or shear wall in the structure during the
analysis.
2.9. Seismic Hazard Level of Addis Ababa
According to EBCS-8:1995, Addis Ababa is located in zone’2’ on the seismic hazard map
of Ethiopia. Due to the recent area expansion of the Addis Ababa, some areas like Akaki,
which is categorized as zone’3’, are included in the city. In EBCS-8:1995 peak ground
acceleration of 0.05g and 0.07g are given for zone’2’ and zone’3’ respectively. But codes
25
like (UBC-97, 1997)1 and other researches done by (Kebede and Asfaw, 1996) 2 and
(Radius, 1999)3 give higher peak ground accelerations. This significant difference of peak
ground accelerations brings questions regarding the validity of the peak ground
accelerations given by EBCS-8:1995. (Kassegne, 2006)4 proposed a more conservative
zoning than the EBCS-8:1995 be adopted that increases the peak ground acceleration to at
least 0.10g – 0.12g.
1International Conference of Building Officials (ICBO), 1997, Uniform Building Code. 2F. Kebede and L. Asfaw, 1996, “Seismic Hazard Assessment for Ethiopia and the Neighboring Countries”, Sinet – Ethiopian Journal of Science, 19(1) 3IDNDR RADIUS Project, 1999, Addis Ababa Case Study, Final Report, Prepared by Addis Ababa RADIUS Group. 4S.K Kassegne , 2006, Proposed Considerations for Revision of EBCS-8:1995 for Conservative Seismic Zoning and Stringent Requirements for Torsionally Irregular Buildings, pp.6

26
3. Methods and Procedures
3.1. Assumptions
The following assumptions were made to formulate the research problem and develop the
analyses models
a. It is assumed that the case study buildings are constructed according to the
original drawings provided by the designer.
b. It is assumed that the case study buildings are designed for bedrock
acceleration (αo = 0.05).
c. It is assumed that the structures are designed according to EBCS and EBCS8,
but the structural detailing was not checked against the recommendations of
EBCS-2 and EBCS-8.
3.2. Procedures
a. Collect information on the selected case study buildings.
b. Evaluate if the collected data is sufficient enough to carry out seismic
evaluation of the buildings.
c. Generate artificial accelerogram that gives response spectrum compatible with
EBCS 8 design spectrum.
d. Model the buildings using IDARC analysis software.
e. Analyze the IDARC 2D building model x-direction frames for bed rock
acceleration, αo = 0.05.
f. Analyze the IDARC 2D building model y-direction frames for bed rock
acceleration, αo = 0.05.
g. Evaluate the damage indices analysis results of IDARC 2D.
h. Present the analysis result of selected elements at first crack, first yield and at
collapse, if any.
i. Present the time history of stories and damage state of frames graphically.
j. Re-analyze each model for bedrock acceleration, αo = 0.07 and repeat steps e
to i.
k. Re-analyze each model for bedrock acceleration, αo = 0.1 and repeat steps e to
i.

27
3.3. Case Studies
There are four case study structures considered in this thesis work. The buildings are
located in Addis Ababa city. The four case study buildings will be analyzed for two
design earthquake with peak ground acceleration 0.05g and 0.07g. A conservative peak
ground acceleration of 0.10g is also used in the analysis to evaluate the performance of the
case study buildings for seismic hazard which is higher than the design earthquake.
The information required according to Table 2.2 is not fully available for some of the case
studies. The assumption that the buildings are constructed according to the original design
will cover up information like condition survey of building, alteration and as built
assessment and non structural walk through. The available information besides the
structural drawings of the four case studies is shown in Table 3.1. The structural drawings
of the buildings are included in the appendix.
Table 3.1 Available information of case studies
01 02 03 04
No Yes Yes Yes
No No No No
No Yes No No
No No No No
Yes No No No
No No No No
No No No No
No No No No
No No No No
No No No No
No No No No
No No No No
No No No No
No No No No
Item
Structural calculations
Site seismicity, geotechnical report
Alteration and as built assessment
Walk through dimensioning
Nonstructural walk through
Foundation report
Prior seismic assessment reports
Condition survey of building
Reinforcement testing
Reinf. Location verification
Nonstructural exploration
Core testing
Rebound hammer testing
Aggregate Testing
CASE STUDIES
3.4. Artificial Earthquake
Ground motions used in seismic response of structure include various characteristics
depending on fault mechanism of earthquake, wave propagation, and amplification of soil
type. It is a difficult task to quantitatively examine all affecting factors. In seismic design,
design response spectrum generally represents its characteristics. Therefore, in this study,
an artificial accelerogram that gives compatible response spectrum with the EBCS-8-1995

28
design spectrum was developed and used for analysis. The artificial acceleration is shown
in Figure 3.1 and the response spectrum developed is compared with the EBCS8-8-1995
design spectrum on Figure 3.2.
‐10.00
‐8.00
‐6.00
‐4.00
‐2.00
0.00
2.00
4.00
6.00
8.00
10.00
0.00 1.00 2.00 3.00 4.00 5.00 6.00 7.00 8.00 9.00 10.00
Art. A
ccleration
m/s
2
time,s
Art. Accleration m/s2
Figure 3-1 Artificially generated wave data
0.000
0.500
1.000
1.500
2.000
2.500
3.000
0.00 0.50 1.00 1.50 2.00 2.50 3.00
Spectral Acceleration/Groun
d Acceleration
Period T (s)
RESPONSE‐SPECTRUM
EBCS‐8
ARTIFICIAL EQ
Figure 3-2 Response spectrum Comparison

29
4. Results
4.1. Building Mass for Seismic
The weight used for seismic analysis in the IDARC 2D is slightly higher as compared to
the ETABS analysis result. The result is summarized in table 4.1.
Table 4.1 Seismic mass of IDARC 2D and ETABS
IDARC 2D‐X FRAME IDARC 2D‐Y FRAME ETABS 3D‐EQX ETABS 3D‐EQY
21261.43 21261.43 20850.00 20850.00
24927.83 24927.83 24386.36 24386.36
10448.31 10455.91 10150.88 10150.88
11660.57 11660.57 11450.06 11450.06
WEIGHT USED FOR SEISMIC ANALYSIS (KN)CASE STUDIES
04
01
02
03
4.2. Damaged Index of Frames (Bed rock acceleration, αo = 0.05, 0.07&0.10)
The damage index of the building at first crack and first yield of columns and beams and
also at collapse of the building, if any, is reported in the IDAR 2D analysis result and
summarized in Table 4.2 - Table 4.5.
The after earthquake degree of damage, damage state for service, usability condition and
the expected appearance of each case study are shown in Table 4.6 - Table 4.17.
It is observed that
a) Case Study-01 fails for both X and Y direction frame analysis at an early
stage of the earthquake
b) Case study-02 and Case Study-03 perform well for both X and Y direction
frame analysis.
c) Case study-04 performs well for X direction frame analysis but fails for Y
direction frame analysis.

30
Table 4.2 Case Study 01 – Damage index
COLUMN (CRACK)
0.005 0.128 0.005 0.128 0.005 0.128
BEAM (CRACK)
0.005 0.128 0.005 0.128 0.005 0.128
COLUMN (YIELD)
0.01 2.11 0.01 2.11 0.01 2.11
BEAM (YIELD)
‐ 2.11 ‐ 2.11 ‐ 2.11
COLUMN (AFTER EQ)
0.02 2.11 0.02 2.11 0.02 2.11
BEAM (AFTER EQ)
0.02 2.11 0.02 2.11 0.02 2.11
COLUMN (CRACK)
0.005 0.057 0.005 0.057 0.005 0.057
BEAM (CRACK)
0.005 0.057 0.005 0.057 0.005 0.057
COLUMN (YIELD)
0.01 0.167 0.01 0.167 0.01 0.167
BEAM (YIELD)
0.01 0.167 0.01 0.167 0.01 0.167
COLUMN (AFTER EQ)
0.02 1.2 0.02 1.2 0.02 1.2
BEAM (AFTER EQ)
0.02 1.2 0.02 1.2 0.02 1.2
Y‐FRAME
TIME OF FIRST CRACK OR YIELD OR COLLAPSE(s) , αo
= 0.07
Damage Index
TIME OF FIRST CRACK OR YIELD OR COLLAPSE(s) , αo
= 0.10
Damage Index
CASE STUDY 01
ELEMENTTIME OF FIRST CRACK OR YIELD OR COLLAPSE(s) , αo
= 0.05
Damage Index
X‐FRA
ME
Table 4.3 Case Study 02 – Damage index
COLUMN (CRACK)
8.815 0.051 6.125 0.002 2.72 0.002
BEAM (CRACK)
6.735 0 3.085 0 2.08 0
COLUMN (YIELD)
‐ 0.033 ‐ 0.021 ‐ 0.065
BEAM (YIELD)
7.99 0.033 6.89 0.021 6.745 0.065
COLUMN (AFTER EQ)
‐ 0.053 ‐ 0.064 ‐ 0.079
BEAM (AFTER EQ)
‐ 0.053 ‐ 0.064 ‐ 0.079
COLUMN (CRACK)
9.025 0.031 3.34 0.003 2.655 0.002
BEAM (CRACK)
3.075 0 2.965 0 1.895 0
COLUMN (YIELD)
‐ 0.015 ‐ 0.025 ‐ 0.016
BEAM (YIELD)
6.85 0.015 6.75 0.025 3.09 0.016
COLUMN (AFTER EQ)
‐ 0.032 ‐ 0.044 ‐ 0.068
BEAM (AFTER EQ)
‐ 0.032 ‐ 0.044 ‐ 0.068
Y‐FRAME
TIME OF FIRST CRACK OR YIELD OR COLLAPSE(s) , αo
= 0.07
TIME OF FIRST CRACK OR YIELD OR COLLAPSE(s) , αo
= 0.10
Damage Index
CASE STUDY 02
ELEMENTTIME OF FIRST CRACK OR YIELD OR COLLAPSE(s) , αo
= 0.05
Damage Index
Damage Index
X‐FRA
ME

31
Table 4.4 Case Study 03 – Damage index
COLUMN (CRACK)
5.255 0.020 4.635 0.018 3.995 0.018
BEAM (CRACK)
3.915 0 1.475 0 1.29 0.016
COLUMN (YIELD)
‐ 0.013 ‐ 0.018 7.575 0.092
BEAM (YIELD)
4.75 0.013 4.63 0.018 5.445 0.058
COLUMN (AFTER EQ)
‐ 0.028 ‐ 0.048 ‐ 0.093
BEAM (AFTER EQ)
‐ 0.028 ‐ 0.048 ‐ 0.093
COLUMN (CRACK)
5.245 0.019 4.64 0.018 3.995 0.018
BEAM (CRACK)
3.93 0 3.38 0 1.275 0
COLUMN (YIELD)
‐ 0.017 ‐ 0.017 ‐ 0.016
BEAM (YIELD)
5.22 0.017 4.62 0.017 3.96 0.016
COLUMN (AFTER EQ)
‐ 0.033 ‐ 0.052 ‐ 0.089
BEAM (AFTER EQ)
‐ 0.033 ‐ 0.052 ‐ 0.089
TIME OF FIRST CRACK OR YIELD OR COLLAPSE(s) , αo
= 0.07
TIME OF FIRST CRACK OR YIELD OR COLLAPSE(s) , αo
= 0.10
Damage Index
Y‐FRA
ME
X‐FRA
ME
CASE STUDY 03
ELEMENTTIME OF FIRST CRACK OR YIELD OR COLLAPSE(s) , αo
= 0.05
Damage Index
Damage Index
Table 4.5 Case Study 04 – Damage index
COLUMN(CRACK)
4.87 0.024 3.605 0.004 2.525 0.01
BEAM (CRACK)
1.325 0 1.28 0 0.945 0
COLUMN (YIELD)
‐ 0.017 ‐ 0.018 7.545 0.125
BEAM (YIELD)
4.68 0.017 4.06 0.018 3.995 0.022
COLUMN (AFTER EQ)
‐ 0.053 ‐ 0.089 ‐ 0.134
BEAM (AFTER EQ)
‐ 0.053 ‐ 0.089 ‐ 0.134
COLUMN (CRACK)
0.005 0.275 0.005 0.275 0.005 0.275
BEAM (CRACK)
0.005 0.275 0.005 0.275 0.005 0.275
COLUMN (YIELD)
0.005 0.275 0.005 0.275 0.005 0.275
BEAM (YIELD)
0.005 0.275 0.005 0.275 0.005 0.275
COLUMN (AFTER EQ)
0.01 1.2 0.01 1.2 0.01 1.2
BEAM (AFTER EQ)
0.01 1.2 0.01 1.2 0.01 1.2
X‐FRA
ME
TIME OF FIRST CRACK OR YIELD OR COLLAPSE(s) , αo
= 0.10
Damage Index
Y‐FRAME
TIME OF FIRST CRACK OR YIELD OR COLLAPSE(s) , αo
= 0.07
CASE STUDY 04
ELEMENTTIME OF FIRST CRACK OR YIELD OR COLLAPSE(s) , αo
= 0.05
Damage Index
Damage Index

32
Table 4.6 Case Study 01 – Damage analysis Park & Ang αo = 0.05
COLUMN (CRACK)
0.005 0.128 Slightly Serviceable UsableUndeformed/ uncracked
BEAM (CRACK)
0.005 0.128 Slightly Serviceable UsableUndeformed/ uncracked
COLUMN (YIELD)
0.01 2.11 Collapse Collapse UnusableLoss of shear/ axial capacity
BEAM (YIELD)
‐ 2.11 Collapse Collapse UnusableLoss of shear/ axial capacity
COLUMN (AFTER EQ)
0.02 2.11 Collapse Collapse UnusableLoss of shear/ axial capacity
BEAM (AFTER EQ)
0.02 2.11 Collapse Collapse UnusableLoss of shear/ axial capacity
COLUMN (CRACK)
0.005 0.057 Slightly Serviceable UsableUndeformed/ uncracked
BEAM (CRACK)
0.005 0.057 Slightly Serviceable UsableUndeformed/ uncracked
COLUMN (YIELD)
0.01 0.167 Slightly Serviceable UsableUndeformed/ uncracked
BEAM (YIELD)
0.01 0.167 Slightly Serviceable UsableUndeformed/ uncracked
COLUMN (AFTER EQ)
0.02 1.2 Collapse Collapse UnusableLoss of shear/ axial capacity
BEAM (AFTER EQ)
0.02 1.2 Collapse Collapse UnusableLoss of shear/ axial capacity
Degree of Damage
Damage State
(Service)Usability Appearance
X‐FRA
ME
Y‐FRAME
CASE STUDY 01
ELEMENTTIME OF FIRST CRACK OR YIELD OR COLLAPSE(s) , αo
= 0.05
Damage Index
Table 4.7 Case Study 01 – Damage analysis Park & Ang αo = 0.07
COLUMN (CRACK)
0.005 0.128 Slightly Serviceable UsableUndeformed/ uncracked
BEAM (CRACK)
0.005 0.128 Slightly Serviceable UsableUndeformed/ uncracked
COLUMN (YIELD)
0.01 2.11 Collapse Collapse UnusableLoss of shear/ axial capacity
BEAM (YIELD)
‐ 2.11 Collapse Collapse UnusableLoss of shear/ axial capacity
COLUMN (AFTER EQ)
0.02 2.11 Collapse Collapse UnusableLoss of shear/ axial capacity
BEAM (AFTER EQ)
0.02 2.11 Collapse Collapse UnusableLoss of shear/ axial capacity
COLUMN (CRACK)
0.005 0.057 Slightly Serviceable UsableUndeformed/ uncracked
BEAM (CRACK)
0.005 0.057 Slightly Serviceable UsableUndeformed/ uncracked
COLUMN (YIELD)
0.01 0.167 Slightly Serviceable UsableUndeformed/ uncracked
BEAM (YIELD)
0.01 0.167 Slightly Serviceable UsableUndeformed/ uncracked
COLUMN (AFTER EQ)
0.02 1.2 Collapse Collapse UnusableLoss of shear/ axial capacity
BEAM (AFTER EQ)
0.02 1.2 Collapse Collapse UnusableLoss of shear/ axial capacity
Degree of Damage
Damage State
(Service)Usability Appearance
CASE STUDY 01
ELEMENT
X‐FRA
ME
Y‐FRAME
TIME OF FIRST CRACK OR YIELD OR COLLAPSE(s) , αo
= 0.07
Damage Index

33
Table 4.8 Case Study 01 – Damage analysis Park & Ang αo = 0.10
COLUMN (CRACK)
0.005 0.128 Slightly Serviceable UsableUndeformed/ uncracked
BEAM (CRACK)
0.005 0.128 Slightly Serviceable UsableUndeformed/ uncracked
COLUMN (YIELD)
0.01 2.11 Collapse Collapse UnusableLoss of shear/ axial capacity
BEAM (YIELD)
‐ 2.11 Collapse Collapse UnusableLoss of shear/ axial capacity
COLUMN (AFTER EQ)
0.02 2.11 Collapse Collapse UnusableLoss of shear/ axial capacity
BEAM (AFTER EQ)
0.02 2.11 Collapse Collapse UnusableLoss of shear/ axial capacity
COLUMN (CRACK)
0.005 0.057 Slightly Serviceable UsableUndeformed/ uncracked
BEAM (CRACK)
0.005 0.057 Slightly Serviceable UsableUndeformed/ uncracked
COLUMN (YIELD)
0.01 0.167 Slightly Serviceable UsableUndeformed/ uncracked
BEAM (YIELD)
0.01 0.167 Slightly Serviceable UsableUndeformed/ uncracked
COLUMN (AFTER EQ)
0.02 1.2 Collapse Collapse UnusableLoss of shear/ axial capacity
BEAM (AFTER EQ)
0.02 1.2 Collapse Collapse UnusableLoss of shear/ axial capacity
Degree of Damage
Damage State
(Service)Usability Appearance
CASE STUDY 01
ELEMENT
X‐FRA
ME
Y‐FRAME
TIME OF FIRST CRACK OR YIELD OR COLLAPSE(s) , αo
= 0.10
Damage Index
Table 4.9 Case Study 02 – Damage analysis Park & Ang αo = 0.05
COLUMN (CRACK)
8.815 0.051 Slightly Serviceable UsableUndeformed/ uncracked
BEAM (CRACK)
6.735 0 None Undamaged UsableUndeformed/ uncracked
COLUMN (YIELD)
‐ 0.033 Slightly Serviceable UsableUndeformed/ uncracked
BEAM (YIELD)
7.99 0.033 Slightly Serviceable UsableUndeformed/ uncracked
COLUMN (AFTER EQ)
‐ 0.053 Slightly Serviceable UsableUndeformed/ uncracked
BEAM (AFTER EQ)
‐ 0.053 Slightly Serviceable UsableUndeformed/ uncracked
COLUMN (CRACK)
9.025 0.031 Slightly Serviceable UsableUndeformed/ uncracked
BEAM (CRACK)
3.075 0 None Undamaged UsableUndeformed/ uncracked
COLUMN (YIELD)
‐ 0.015 Slightly Serviceable UsableUndeformed/ uncracked
BEAM (YIELD)
6.85 0.015 Slightly Serviceable UsableUndeformed/ uncracked
COLUMN (AFTER EQ)
‐ 0.032 Slightly Serviceable UsableUndeformed/ uncracked
BEAM (AFTER EQ)
‐ 0.032 Slightly Serviceable UsableUndeformed/ uncracked
Usability AppearanceDegree of Damage
Damage State
(Service)
X‐FRA
ME
Y‐FRAME
CASE STUDY 02
ELEMENTTIME OF FIRST CRACK OR YIELD OR COLLAPSE(s) , αo
= 0.05
Damage Index

34
Table 4.10 Case Study 02 – Damage analysis Park & Ang αo = 0.07
COLUMN (CRACK)
6.125 0.002 Slightly Serviceable UsableUndeformed/ uncracked
BEAM (CRACK)
3.085 0 None Undamaged UsableUndeformed/ uncracked
COLUMN (YIELD)
‐ 0.021 Slightly Serviceable UsableUndeformed/ uncracked
BEAM (YIELD)
6.89 0.021 Slightly Serviceable UsableUndeformed/ uncracked
COLUMN (AFTER EQ)
‐ 0.064 Slightly Serviceable UsableUndeformed/ uncracked
BEAM (AFTER EQ)
‐ 0.064 Slightly Serviceable UsableUndeformed/ uncracked
COLUMN (CRACK)
3.34 0.003 Slightly Serviceable UsableUndeformed/ uncracked
BEAM (CRACK)
2.965 0 None Undamaged UsableUndeformed/ uncracked
COLUMN (YIELD)
‐ 0.025 Slightly Serviceable UsableUndeformed/ uncracked
BEAM (YIELD)
6.75 0.025 Slightly Serviceable UsableUndeformed/ uncracked
COLUMN (AFTER EQ)
‐ 0.044 Slightly Serviceable UsableUndeformed/ uncracked
BEAM (AFTER EQ)
‐ 0.044 Slightly Serviceable UsableUndeformed/ uncracked
TIME OF FIRST CRACK OR YIELD OR COLLAPSE(s) , αo
= 0.07
Damage Index
CASE STUDY 02
ELEMENT
X‐FRA
ME
Y‐FRAME
Degree of Damage
Damage State
(Service)Usability Appearance
Table 4.11 Case Study 02 – Damage analysis Park & Ang αo = 0.10
COLUMN (CRACK)
2.72 0.002 Slightly Serviceable UsableUndeformed/ uncracked
BEAM (CRACK)
2.08 0 None Undamaged UsableUndeformed/ uncracked
COLUMN (YIELD)
‐ 0.065 Slightly Serviceable UsableUndeformed/ uncracked
BEAM (YIELD)
6.745 0.065 Slightly Serviceable UsableUndeformed/ uncracked
COLUMN (AFTER EQ)
‐ 0.079 Slightly Serviceable UsableUndeformed/ uncracked
BEAM (AFTER EQ)
‐ 0.079 Slightly Serviceable UsableUndeformed/ uncracked
COLUMN (CRACK)
2.655 0.002 Slightly Serviceable UsableUndeformed/ uncracked
BEAM (CRACK)
1.895 0 None Undamaged UsableUndeformed/ uncracked
COLUMN (YIELD)
‐ 0.016 Slightly Serviceable UsableUndeformed/ uncracked
BEAM (YIELD)
3.09 0.016 Slightly Serviceable UsableUndeformed/ uncracked
COLUMN (AFTER EQ)
‐ 0.068 Slightly Serviceable UsableUndeformed/ uncracked
BEAM (AFTER EQ)
‐ 0.068 Slightly Serviceable UsableUndeformed/ uncracked
TIME OF FIRST CRACK OR YIELD OR COLLAPSE(s) , αo
= 0.10
Damage Index
CASE STUDY 02
ELEMENT
X‐FRA
ME
Y‐FRAME
Degree of Damage
Damage State
(Service)Usability Appearance

35
Table 4.12 Case Study 03 – Damage analysis Park & Ang αo = 0.05
COLUMN (CRACK)
5.255 0.020 Slightly Serviceable UsableUndeformed/ uncracked
BEAM (CRACK)
3.915 0 None Undamaged UsableUndeformed/ uncracked
COLUMN (YIELD)
‐ 0.013 Slightly Serviceable UsableUndeformed/ uncracked
BEAM (YIELD)
4.75 0.013 Slightly Serviceable UsableUndeformed/ uncracked
COLUMN (AFTER EQ)
‐ 0.028 Slightly Serviceable UsableUndeformed/ uncracked
BEAM (AFTER EQ)
‐ 0.028 Slightly Serviceable UsableUndeformed/ uncracked
COLUMN (CRACK)
5.245 0.019 Slightly Serviceable UsableUndeformed/ uncracked
BEAM (CRACK)
3.93 0 None Undamaged UsableUndeformed/ uncracked
COLUMN (YIELD)
‐ 0.017 Slightly Serviceable UsableUndeformed/ uncracked
BEAM (YIELD)
5.22 0.017 Slightly Serviceable UsableUndeformed/ uncracked
COLUMN (AFTER EQ)
‐ 0.033 Slightly Serviceable UsableUndeformed/ uncracked
BEAM (AFTER EQ)
‐ 0.033 Slightly Serviceable UsableUndeformed/ uncracked
CASE STUDY 03
ELEMENTTIME OF FIRST CRACK OR YIELD OR COLLAPSE(s) , αo
= 0.05
Damage Index
X‐FRA
ME
Y‐FRA
ME
Degree of Damage
Damage State
(Service)Usability Appearance
Table 4.13 Case Study 03 – Damage analysis Park & Ang αo = 0.07
COLUMN (CRACK)
4.635 0.018 Slightly Serviceable UsableUndeformed/ uncracked
BEAM (CRACK)
1.475 0 None Undamaged UsableUndeformed/ uncracked
COLUMN (YIELD)
‐ 0.018 Slightly Serviceable UsableUndeformed/ uncracked
BEAM (YIELD)
4.63 0.018 Slightly Serviceable UsableUndeformed/ uncracked
COLUMN (AFTER EQ)
‐ 0.048 Slightly Serviceable UsableUndeformed/ uncracked
BEAM (AFTER EQ)
‐ 0.048 Slightly Serviceable UsableUndeformed/ uncracked
COLUMN (CRACK)
4.64 0.018 Slightly Serviceable UsableUndeformed/ uncracked
BEAM (CRACK)
3.38 0 None Undamaged UsableUndeformed/ uncracked
COLUMN (YIELD)
‐ 0.017 Slightly Serviceable UsableUndeformed/ uncracked
BEAM (YIELD)
4.62 0.017 Slightly Serviceable UsableUndeformed/ uncracked
COLUMN (AFTER EQ)
‐ 0.052 Slightly Serviceable UsableUndeformed/ uncracked
BEAM (AFTER EQ)
‐ 0.052 Slightly Serviceable UsableUndeformed/ uncracked
TIME OF FIRST CRACK OR YIELD OR COLLAPSE(s) , αo
= 0.07
Damage Index
CASE STUDY 03
ELEMENT
X‐FRA
ME
Y‐FRA
ME
Degree of Damage
Damage State
(Service)Usability Appearance

36
Table 4.14 Case Study 03 – Damage analysis Park & Ang αo = 0.10
COLUMN (CRACK)
3.995 0.018 Slightly Serviceable UsableUndeformed/ uncracked
BEAM (CRACK)
1.29 0.016 Slightly Serviceable UsableUndeformed/ uncracked
COLUMN (YIELD)
7.575 0.092 Slightly Serviceable UsableUndeformed/ uncracked
BEAM (YIELD)
5.445 0.058 Slightly Serviceable UsableUndeformed/ uncracked
COLUMN (AFTER EQ)
‐ 0.093 Slightly Serviceable UsableUndeformed/ uncracked
BEAM (AFTER EQ)
‐ 0.093 Slightly Serviceable UsableUndeformed/ uncracked
COLUMN (CRACK)
3.995 0.018 Slightly Serviceable UsableUndeformed/ uncracked
BEAM (CRACK)
1.275 0 None Undamaged UsableUndeformed/ uncracked
COLUMN (YIELD)
‐ 0.016 Slightly Serviceable UsableUndeformed/ uncracked
BEAM (YIELD)
3.96 0.016 Slightly Serviceable UsableUndeformed/ uncracked
COLUMN (AFTER EQ)
‐ 0.089 Slightly Serviceable UsableUndeformed/ uncracked
BEAM (AFTER EQ)
‐ 0.089 Slightly Serviceable UsableUndeformed/ uncracked
TIME OF FIRST CRACK OR YIELD OR COLLAPSE(s) , αo
= 0.10
Damage Index
CASE STUDY 03
ELEMENT
X‐FRA
ME
Y‐FRA
ME
Degree of Damage
Damage State
(Service)Usability Appearance
Table 4.15 Case Study 04 – Damage analysis Park & Ang αo = 0.05
COLUMN(CRACK)
4.87 0.024 Slightly Serviceable UsableUndeformed/ uncracked
BEAM (CRACK)
1.325 0 None Undamaged UsableUndeformed/ uncracked
COLUMN (YIELD)
‐ 0.017 Slightly Serviceable UsableUndeformed/ uncracked
BEAM (YIELD)
4.68 0.017 Slightly Serviceable UsableUndeformed/ uncracked
COLUMN (AFTER EQ)
‐ 0.053 Slightly Serviceable UsableUndeformed/ uncracked
BEAM (AFTER EQ)
‐ 0.053 Slightly Serviceable UsableUndeformed/ uncracked
COLUMN (CRACK)
0.005 0.275 Minor Serviceable UsableModerate to
Severe Cracking
BEAM (CRACK)
0.005 0.275 Minor Serviceable UsableModerate to
Severe Cracking
COLUMN (YIELD)
0.005 0.275 Minor Serviceable UsableModerate to
Severe Cracking
BEAM (YIELD)
0.005 0.275 Minor Serviceable UsableModerate to
Severe Cracking
COLUMN (AFTER EQ)
0.01 1.2 Collapse Collapse UnusableLoss of shear/ axial capacity
BEAM (AFTER EQ)
0.01 1.2 Collapse Collapse UnusableLoss of shear/ axial capacity
Degree of Damage
Damage State
(Service)Usability Appearance
X‐FRA
ME
Y‐FRAME
CASE STUDY 04
ELEMENTTIME OF FIRST CRACK OR YIELD OR COLLAPSE(s) , αo
= 0.05
Damage Index

37
Table 4.16 Case Study 04 – Damage analysis Park & Ang αo = 0.07
COLUMN(CRACK)
3.605 0.004 Slightly Serviceable UsableUndeformed/ uncracked
BEAM (CRACK)
1.28 0 None Undamaged UsableUndeformed/ uncracked
COLUMN (YIELD)
‐ 0.018 Slightly Serviceable UsableUndeformed/ uncracked
BEAM (YIELD)
4.06 0.018 Slightly Serviceable UsableUndeformed/ uncracked
COLUMN (AFTER EQ)
‐ 0.089 Slightly Serviceable UsableUndeformed/ uncracked
BEAM (AFTER EQ)
‐ 0.089 Slightly Serviceable UsableUndeformed/ uncracked
COLUMN (CRACK)
0.005 0.275 Minor Serviceable UsableModerate to
Severe Cracking
BEAM (CRACK)
0.005 0.275 Minor Serviceable UsableModerate to
Severe Cracking
COLUMN (YIELD)
0.005 0.275 Minor Serviceable UsableModerate to
Severe Cracking
BEAM (YIELD)
0.005 0.275 Minor Serviceable UsableModerate to
Severe Cracking
COLUMN (AFTER EQ)
0.01 1.2 Collapse Collapse UnusableLoss of shear/ axial capacity
BEAM (AFTER EQ)
0.01 1.2 Collapse Collapse UnusableLoss of shear/ axial capacity
Degree of Damage
Damage State
(Service)Usability Appearance
X‐FRA
ME
Y‐FRAME
CASE STUDY 04
ELEMENTTIME OF FIRST CRACK OR YIELD OR COLLAPSE(s) , αo
= 0.07
Damage Index
Table 4.17 Case Study 04 – Damage analysis Park & Ang αo = 0.10
COLUMN(CRACK)
2.525 0.01 Slightly Serviceable UsableUndeformed/ uncracked
BEAM (CRACK)
0.945 0 None Undamaged UsableUndeformed/ uncracked
COLUMN (YIELD)
7.545 0.125 Slightly Serviceable UsableUndeformed/ uncracked
BEAM (YIELD)
3.995 0.022 Slightly Serviceable UsableUndeformed/ uncracked
COLUMN (AFTER EQ)
‐ 0.134 Slightly Serviceable UsableUndeformed/ uncracked
BEAM (AFTER EQ)
‐ 0.134 Slightly Serviceable UsableUndeformed/ uncracked
COLUMN (CRACK)
0.005 0.275 Minor Serviceable UsableModerate to
Severe Cracking
BEAM (CRACK)
0.005 0.275 Minor Serviceable UsableModerate to
Severe Cracking
COLUMN (YIELD)
0.005 0.275 Minor Serviceable UsableModerate to
Severe Cracking
BEAM (YIELD)
0.005 0.275 Minor Serviceable UsableModerate to
Severe Cracking
COLUMN (AFTER EQ)
0.01 1.2 Collapse Collapse UnusableLoss of shear/ axial capacity
BEAM (AFTER EQ)
0.01 1.2 Collapse Collapse UnusableLoss of shear/ axial capacity
Degree of Damage
Damage State
(Service)Usability Appearance
CASE STUDY 04
ELEMENT
X‐FRA
ME
Y‐FRAME
TIME OF FIRST CRACK OR YIELD OR COLLAPSE(s) , αo
= 0.10
Damage Index

38
4.3. Damage state and Time History Results
Time history of selected stories and damage state of building frames are shown on Figure
4.2 through 4.7.
Figure 4-1 Damage state notations
(a) First Beam Yield and First Column crack at t = 0.005s - Frame 06
(b) First Column yields at t = 0.01s - Frame 06
Figure 4-2 Case study 1X (αo = 0.05)

39
‐1500.0
‐1000.0
‐500.0
0.0
500.0
1000.0
1500.0
‐20.00 ‐10.00 0.00 10.00 20.00 30.00
Force
Deformation
CS2X‐STORY 02 αo = 0.05
‐1500.0
‐1000.0
‐500.0
0.0
500.0
1000.0
1500.0
‐20.00 ‐10.00 0.00 10.00 20.00 30.00
Force
Deformation
CS2X‐STORY 02 αo = 0.07
‐1500.0
‐1000.0
‐500.0
0.0
500.0
1000.0
1500.0
‐20.00 ‐10.00 0.00 10.00 20.00 30.00
Force
Deformation
CS2X‐STORY 02 αo = 0.10
Figure 4-3 Time History for Stories – Case Study 2X-Frame
(a) (b) (c)
(a) First Beam cracks at t = 6.375s - Frame 02
(b) First Beam yields at t = 7.990s - Frame 02
(c) First Column cracks at t = 8.815s - Frame 05
Figure 4-4 Case study 2X (αo = 0.05)

40
(a) (b) (c)
(a) First Beam cracks at t = 3.930s - Frame 01&08
(b) First Beam yields at t = 5.220s - Frame 01&08
(c) First Column cracks at t = 5.245s - Frame 05 Figure 4-5 Case study 3Y (αo = 0.05)
‐850.0
‐650.0
‐450.0
‐250.0
‐50.0
150.0
350.0
550.0
750.0
‐40.00 ‐30.00 ‐20.00 ‐10.00 0.00 10.00 20.00 30.00 40.00
Force
Deformation
CS3Y‐STORY 02 αo = 0.05
‐850.0
‐650.0
‐450.0
‐250.0
‐50.0
150.0
350.0
550.0
750.0
‐40.00 ‐30.00 ‐20.00 ‐10.00 0.00 10.00 20.00 30.00 40.00
Force
Deformation
CS3Y‐STORY 02 αo = 0.07
‐850.0
‐650.0
‐450.0
‐250.0
‐50.0
150.0
350.0
550.0
750.0
‐40.00 ‐30.00 ‐20.00 ‐10.00 0.00 10.00 20.00 30.00 40.00
Force
Deformation
CS3Y‐STORY 02 αo = 0.10
Figure 4-6 Time History for Stories – Case Study 3Y- Frame
‐725.0
‐525.0
‐325.0
‐125.0
75.0
275.0
475.0
675.0
‐15.00 ‐10.00 ‐5.00 0.00 5.00 10.00 15.00
Force
Deformation
CS4X‐STORY 01 αo = 0.05
‐725.0
‐525.0
‐325.0
‐125.0
75.0
275.0
475.0
675.0
‐15.00 ‐10.00 ‐5.00 0.00 5.00 10.00 15.00
Force
Deformation
CS4X‐STORY 01 αo = 0.07
‐725.0
‐525.0
‐325.0
‐125.0
75.0
275.0
475.0
675.0
‐15.00 ‐10.00 ‐5.00 0.00 5.00 10.00 15.00
Force
Deformation
CS4X‐STORY 01 αo = 0.10
Figure 4-7 Time History for Stories – Case Study 4X- Frame

41
5. Discussions
Case study 01
a) Fails at the beginning of the earthquake which indicates loss of structural capacity
without dissipating the input energy generated by the earthquake.
b) All stories show linear relationship of force-deformation response.
c) Stiffness degradation, strength decay and pinching are not observed in any of the
force-deformation response.
d) Similar force-deformation relationship is observed for different bed rock
acceleration ratio.
Case study 02
a) Performs well for all three bed rock acceleration ratio which indicates the building
frames are capable of dissipating input energy much higher than the design input.
b) For both direction frames, the stiffness degradation, strength decay and pinching
behaviors in the force-deformation response increase from bottom story to top
story.
c) For both direction frames, the stiffness degradation, strength decay and pinching
behaviors in the force-deformation response increase with increasing bed rock
acceleration ratio.
Case study 03
a) Performs well for all three bed rock acceleration ratio which indicates the building
frames are capable of dissipating input energy much higher than the design input.
b) For both direction frames, the stiffness degradation, strength decay and pinching
behaviors in the force-deformation response increase from bottom story to top
story.
c) For both direction frames, the stiffness degradation, strength decay and pinching
behaviors in the force-deformation response increase with increasing bed rock
acceleration ratio.

42
Case study 04
a) For X frames, the stiffness degradation, strength decay and pinching behaviors in
the force-deformation response increase from bottom story to top story.
b) For X frames, the stiffness degradation, strength decay and pinching behaviors in
the force-deformation response increase with increasing bed rock acceleration
ratio.
c) Y frames fail at the beginning of the earthquake which indicates loss of structural
capacity without dissipating the input energy generated by the earthquake.
d) For Y frames, stiffness degradation, strength decay and pinching are not observed
in any of the force-deformation response.
e) For Y frames, similar force-deformation relationship is observed for different bed
rock acceleration ratio.

43
6. Conclusions and Recommendations
6.1. Conclusions
Seismic vulnerability of selected buildings constructed in Addis Ababa was assessed
based on three different bed rock acceleration ratios. Nonlinear dynamic analysis was
performed on four different reinforced concrete structures using IDARC 2d software.
From the results,
• It is observed that nonlinear dynamic analysis procedure captures the nonlinear
characteristics of reinforced concrete buildings.
• Considering the results shown for case study 01 and 04, it is observed that the
buildings deform beyond the limit of linearly elastic range and due to the high
damage of the main structural elements, the buildings will no longer give service
or a total collapse will occur after earthquake.
• Case study 04 fails for Y direction analysis because the frames in this direction
are weak. The X direction frame performs well and shows visible nonlinear
behaviors.
• Considering the results shown for case study 02 and 03, it is observed that the
structures are capable of withstanding earthquake with high bedrock acceleration
ratio greater than the design value.
• The force deformation time history of case study 02 and 03 shows significant
stiffness degradation and strength decay because of the cracking and yielding of
their structural members. Pinching behaviors are also observed which are caused
by the closing and opening of cracks of reversal loading.
• Even though the IDARC 2D software is helpful in capturing the nonlinear
behavior of the case study buildings, it lacks considering torsional effects caused
by non symmetric buildings.
6.2. Recommendations
• It is recommended that nonlinear dynamic analysis procedures shall be used for
seismic evaluation of existing buildings.

44
• Out of the four case study buildings considered in this study, 50% are found to be
insufficient to resist the earthquake load induced on them. Therefore the author
strongly suggests the evaluation of existing buildings constructed in Addis Ababa
because if an earthquake of the expected intensity occurs, the result may be
catastrophic.
• It is observed that the input process of IDARC 2D needs too many lines in text
format. And also gathering the output is time taking. Therefore, further
developments need to be done on the pre-processor and post-processor to save
time and avoid input errors.
• It is also recommended that the Ethiopian building code standards include
provisions that address strengthening of buildings.
• Finally the author suggests that such a study shall further be conducted on large
number of buildings located in different sub cities of Addis Ababa, in order to get
a detailed and realistic damage map of the city.

45
References
1. A. Elghazouli. (2009) Seismic Design of Buildings to Eurocode 8, Spon Press,
London and New York.
2. A. Elnashai and L. Sarno. (2008) Fundamentals of Earthquake Engineering, John
Wiley & Sons, Ltd., United Kingdom.
3. A. Pecker. (2007) Advanced Earthquake Engineering Analysis, Springer Wien
NewYork., USA.
4. A.M. Reinhorn et.al. (2009) IDARC2D Version 7.0: A Program for the Inelastic
Damage Analysis of Structures, University at Buffalo, USA.
5. D. Dowrick. (2009) Earthquake Resistance Design and Risk Reduction, 2nd edn, John
Wiley & Sons, Ltd., United Kingdom.
6. Ethiopian Building Code Standard: EBCS-8 Design of Structures for Earthquake
Resistance. (1995) Ministry of Works and urban Development, Addis Ababa.
7. Eurocode8. (2003) Design of structures for earthquake resistance Part 3: Strengthening
and repair of buildings, European Committee for Standardization, European Standard.
8. European Standard Eurocode 8: Design of Structures for Earthquake Resistance – Part
1: General Rules, Seismic Actions and Rules for Buildings. (2003) European
Committee for Standardization, Brussels.
9. E. L. Wilson. (2002) Three-Dimensional Static and Dynamic Analysis of Structures,
Computers and Structures, Inc., USA.
10. IDNDR RADIUS Project. (1999) Addis Ababa Case Study, Final Report. Addis
Ababa RADIUS Group, Ethiopia.
11. International Conference of Building Officials. (1997) Uniform Building Code,
Whittier, CA.
12. J.C. Anderson. (2000) Seismic Design Handbook, Dynamic Response of Structures,
University of Southern California, USA.
13. M.A Marfai and J.K. Njagih. (2002) Vulnerability Analysis And Risk Assessment For
Seismic And Flood Hazard In Turialba City, Costa Rica, International Institute for
Geo-information Sciences and Earth Observation (ITC), Enscheda Netherlands.

46
14. M. Saatcioglu and J. Humar. (2002) Dynamic analysis of buildings for earthquake
resistant design. Proposed Earthquake Design Requirements of the NBCC, Canada.
15. M.V Sivaselvan and A.M. Reinhorn. (1999) Hysteretic Models for Cyclic Behavior of
Deteriorating Inelastic Structures University at Buffalo, USA.
16. P. Bazzurro. (2009) Nonlinear Dynamic Analysis—a Step Advance in Assessing the
Vulnerability of Buildings to Earthquake Ground Motion.
17. S.K Kassegne. (2006) Proposed Considerations for Revision of EBCS-8:1995 for
Conservative Seismic Zoning and Stringent Requirements for Torsionally Irregular
Buildings, EACE’s Zede Research Journal.
18. S. Lee. (2008) Nonlinear Dynamic Earthquake Analysis of Skyscrapers by ABAQUS,
CTBUH 8th World Congress.

47
Appendices

48
Appendix A - Program Verification
A comprehensive study of lightly reinforced frame structures was the subject of numerous
investigations at the State University of New York at Buffalo (Bracci, 1992), and at
Cornell University (El-Altar, 1990). A 1:3 scaled model was constructed, tested,
retrofitted and re-tested using simulated earthquake motion generated by the shaking table
at SUNY/Buffalo. The model reflects a “slice” of a long structure with three-bay frames in
the transverse direction. The “slice” has two parallel lightly reinforced frames as indicated
by the model representation in the plan view in Figure A.1. Essential geometrical data and
reinforcement details are also shown in the figure. Attained concrete strength were 4000
psi, 3000 psi and 3500 psi at the first, second and third story levels respectively, with an
elastic modulus of 2700 ksi, 2300 ksi and 2530 ksi, respectively. The steel had an average
yielding strength of 65 ksi after annealing with modulus of elasticity of approximately
29000 ksi. Additional details about the structure and the testing can be found in Bracci
(1992).
The model was tested by a sequence of ground (table) motions reflecting a low level
earthquake (PGA=0.05g), a moderate earthquake (PGA=0.20g) and a severe earthquake
(PGA=0.30g). The ground motion was obtained by scaling the acceleration time history of
Taft (1952) N21E component. Only two sets of results are presented here.
The main purpose of this study was to investigate the effectiveness of using identified
component properties from separate sub-assemblage tests in predicting the dynamic
response of the total structure. The data set used for in this example is presented in
Appendix C. Only the second run at a measured peak acceleration of 0.22g is included,
since the basic data is the same for both runs, with the exception of the initial stiffness and
the input ground motion. As indicated, the data was derived entirely from the results of
separate interior and exterior beam-column sub-assemblage tests which provided
information on yield strength and hysteretic behavior. No attempt was made to fit the
observed shaking table response.

49
The comparisons of displacements for the top story during the mild and moderate
earthquakes are shown in Figure A.2 and A.3. IDARC predictions show good agreement
for both peak values and the total response history. The comparison includes predictions
by DRAIN-2D and SARCF. More data on observed behavior in terms of deformations,
stresses and damage mechanisms are reported in Bracci (1992).
Figure A. 1

50
Figure A. 2 Comparison with other programs – low intensity (0.05g)

51
Figure A. 3 Comparison with other programs – moderate intensity (0.22g)

52
Appendix B - Modified Park & Ang Damage Model
The Park & Ang damage model (Park et al., 1984) was incorporated in IDARC since the
original release of the program (Park et al., 1987). Furthermore, the Park & Ang damage
model is also an integral part of the three parameter hysteretic model since the rate of
strength degradation is directly related to the parameter β described below (Park et al.,
1987).
The original Park & Ang damage index for a structural element is defined as:
(B.1)
Where δm is the maximum experienced deformation; δu is the ultimate deformation of the
element; Py is the yield strength of the element; ∫ dEh is the cumulative hysteretic energy
absorbed by the element during the response history; and β is a model constant parameter.
A value of 0.1 for the parameter β has been suggested for nominal strength deterioration
(Park et al., 1987). The Park & Ang damage model accounts for damage due to maximum
inelastic excursions, as well as damage due to the history of deformations. Both
components of damage are linearly combined.
Three damage indices are computed using this damage model:
1. Element damage index: column, beams or shear wall elements.
2. Story damage index: vertical and horizontal components and total story
damage.
3. Overall building damage.
Equation B.1 is the basis for the modified damage index developed for this program,
although some considerations need to be taken into
account as shown below.
(B.2)

53
Where Eh is a total cumulative hysteretic energy: ∫ dEh. Direct application of the damage
model to a structural element, a story, or the overall building requires the determination of
the corresponding overall element, story, or building ultimate deformations. Since the
inelastic behavior is confined to plastic zones near the ends of some members, the relation
between element, story or top story deformations, with the local plastic rotations is
difficult to establish. For the element end section damage, the following modifications to
the original model were introduced in IDARC version 3.0
(Kunnath et al., 1992b):
(B.3)
Where θm is the maximum rotation attained during the loading history; θu is the ultimate
rotation capacity of the section; θr is the recoverable rotation when unloading; My is the
yield moment; and Eh is the cumulative dissipated energy in the section. The overall
element damage is defined as the biggest damage index of the end sections.
Two additional damage indices are defined as follows: (i) story and (ii) overall damage
indices which are computed using weighting factors based on the hysteretic energy
dissipated at component and story levels respectively:
(i) Story Damage
(B.4)
(ii) Overall Damage
(B.5)
Where

54
Where λi are the energy weighting factors; and Ei are the cumulative energy absorbed by
the component or story “i”.
The Park & Ang damage model has been calibrated using a database of observed
structural damage of nine reinforced concrete buildings (Park et al., 1986). Table B.1
presents the calibrated damage index with the degree of observed damage in the structure.
Table B.1 Interpretation of overall damage index (Park et al., 1986)

55
Appendix C - Input for Program Verification
Analysis of 1:3 Scale Three Story Model 0.2g Control Data 3,1,0,0,0,0,0,1,1 Element types 6,1,0,0,0,0,0,0,0,0 Element data 12,9,0,0,0,0,0,0,0 Unit system 1 Floor elevations 45.0, 93.0, 141.0 Number of duplicate frames 2 No of column lines 4 Nodal weights 1, 1, 3.375, 3.375, 3.375, 3.375 2, 1, 3.375, 3.375, 3.375, 3.375 3, 1, 3.375, 3.375, 3.375, 3.375 Env generation option 1 Hysteretic Control 2 1, 1, 10.0, 0.01, 0.08, 1.0, 0 2, 1, 15.0, 0.01, 0.08, 1.0, 0 Column input option 1 Column data 1 1, 10, 20, 50, 48.0,3.0,3.0 1, 45400.0, 843.0, 10.0, 18.0, 0.00200, 0.006, 0.88 10.0, 18.0, 0.00200, 0.006, 0.88 1, 45400.0, 843.0, 10.0, 18.0, 0.00200, 0.006, 0.88 10.0, 18.0, 0.00200, 0.006, 0.88 1 2, 10, 20, 50, 48.0,3.0,3.0 1, 45400.0, 843.0, 10.0, 22.0, 0.00200, 0.006, 0.88 10.0, 22.0, 0.00200, 0.006, 0.88 1, 45400.0, 843.0, 10.0, 22.0, 0.00200, 0.006, 0.88 10.0, 22.0, 0.00200, 0.006, 0.88 1 3, 10, 20, 50, 48.0,3.0,3.0 1, 45900.0, 900.0, 10.0, 22.0, 0.003, 0.006, 0.87 10.0, 22.0, 0.003, 0.006, 0.87

56
1, 45900.0, 900.0, 10.0, 22.0, 0.003, 0.006, 0.87 10.0, 22.0, 0.003, 0.006, 0.87 1 4, 10, 20, 50, 48.0,3.0,3.0 1, 45900.0, 900.0, 14.0, 29.0, 0.003, 0.006, 0.87 14.0, 29.0, 0.003, 0.006, 0.87 1, 45900.0, 900.0, 14.0, 29.0, 0.003, 0.006, 0.87 14.0, 29.0, 0.003, 0.006, 0.87 1 5, 10, 20, 50, 45.0,0.0,3.0 1, 45200.0, 960.0, 12.0, 28.0, 0.003, 0.008, 0.88 12.0, 28.0, 0.003, 0.008, 0.88 1, 45200.0, 960.0, 12.0, 28.0, 0.003, 0.008, 0.88 12.0, 28.0, 0.003, 0.008, 0.88 1 6, 10, 20, 50, 45.0,0.0,3.0 1, 45200.0, 960.0, 16.0, 38.0, 0.003, 0.008, 0.88 16.0, 38.0, 0.003, 0.008, 0.88 1, 45200.0, 960.0, 16.0, 38.0, 0.003, 0.008, 0.88 16.0, 38.0, 0.003, 0.008, 0.88 Beam input type 1 Beam data 1 1, 72.0, 2.0, 2.0 2, 140000.0, 15.0, 30.0, 0.001, 0.01, 1.71 30.0, 70.0, 0.001, 0.01, 1.71 2, 140000.0, 15.0, 30.0, 0.001, 0.01, 1.71 30.0, 70.0, 0.001, 0.01, 1.71 Column connectivity 1,1,1,1,2,3 2,2,1,2,2,3 3,2,1,3,2,3 4,1,1,4,2,3 5,3,1,1,1,2 6,4,1,2,1,2 7,4,1,3,1,2 8,3,1,4,1,2 9,5,1,1,0,1 10,6,1,2,0,1 11,6,1,3,0,1 12,5,1,4,0,1 Beam connectivity 1,1,3,1,1,2 2,1,3,1,2,3 3,1,3,1,3,4

57
4,1,2,1,1,2 5,1,2,1,2,3 6,1,2,1,3,4 7,1,1,1,1,2 8,1,1,1,2,3 9,1,1,1,3,4 Type of Analysis 3 Static loads 0,0,0,0 Dynamic Analysis Control Data 0.2, 0.0, 0.001, 30.0, 1.2, 3 Wave data 0, 0, 4100,0.01 TAFT - EARTHQUAKE wave05.dat SNAPSHOT CONTROL DATA 0 0,0,0,0,0 Output options 1, 0.01, 3 JELAS.PRN Hys output 0,0,0,0,0,0

58
Appendix D - Case Study Structural Drawings

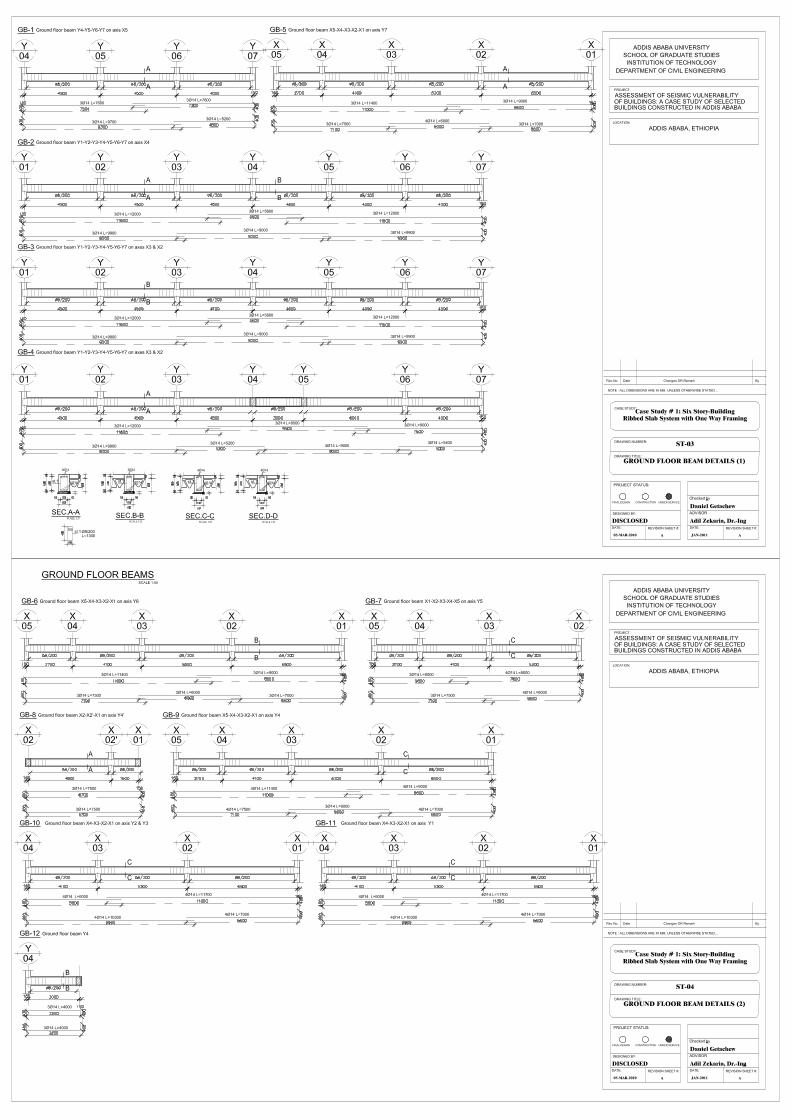


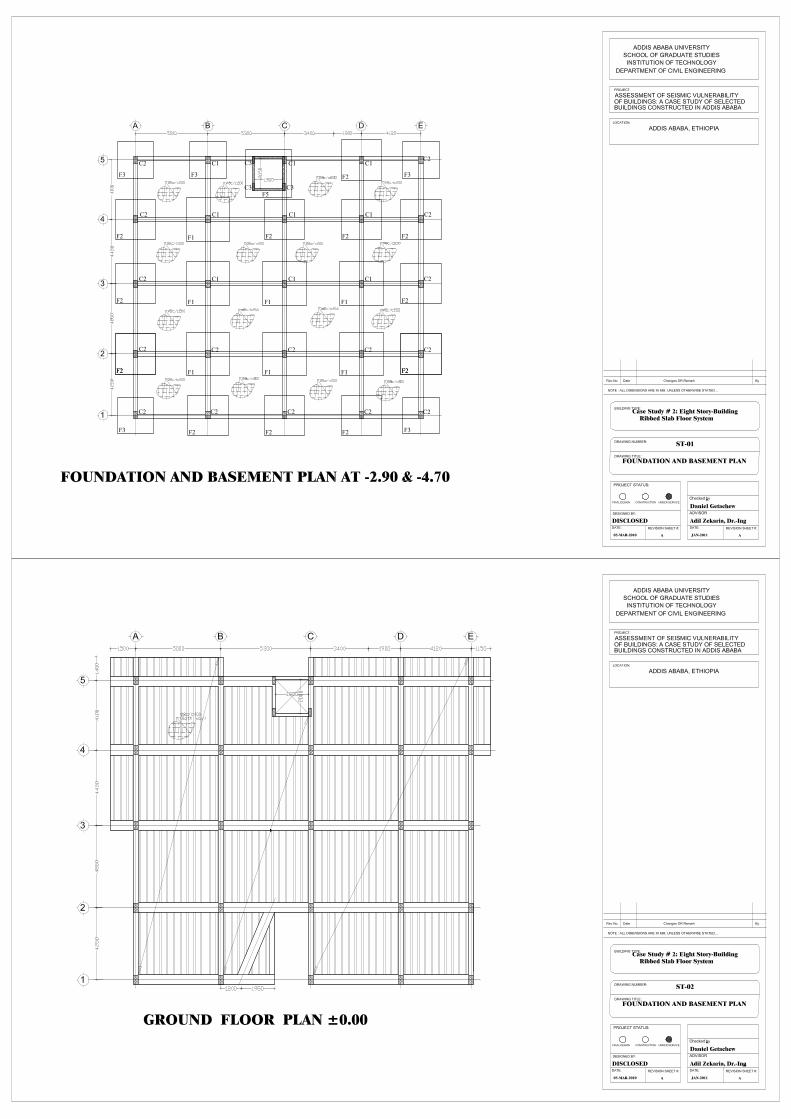
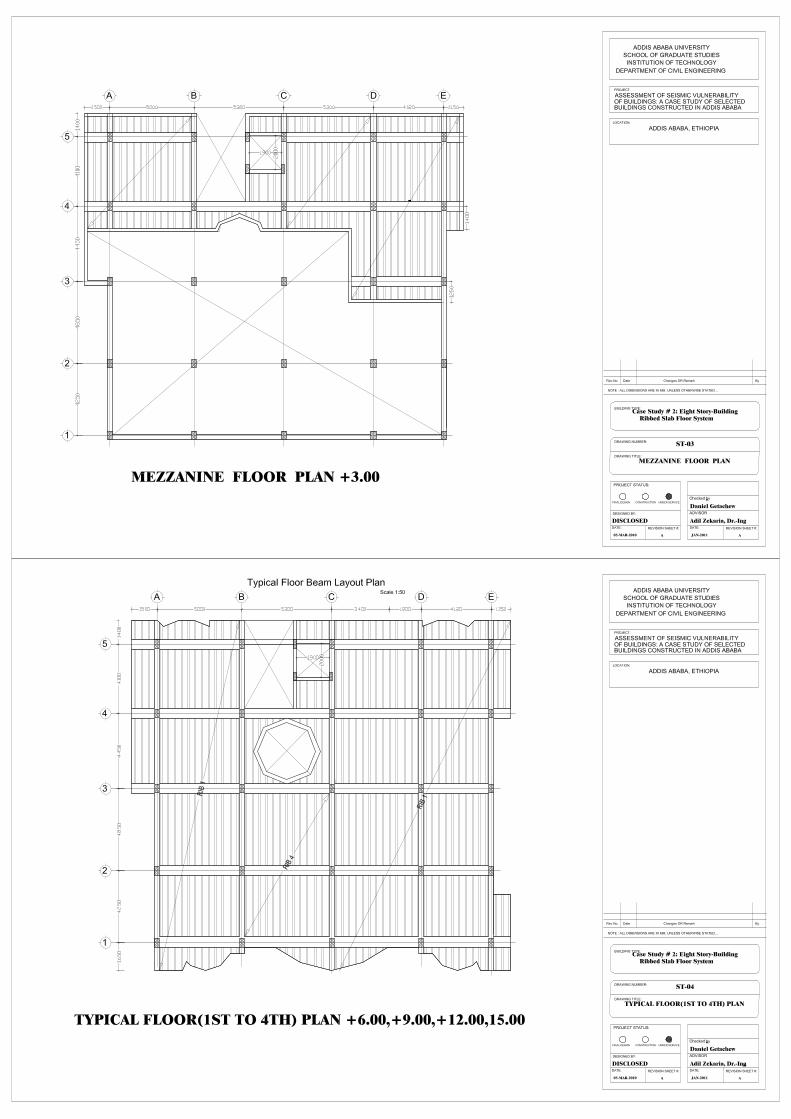

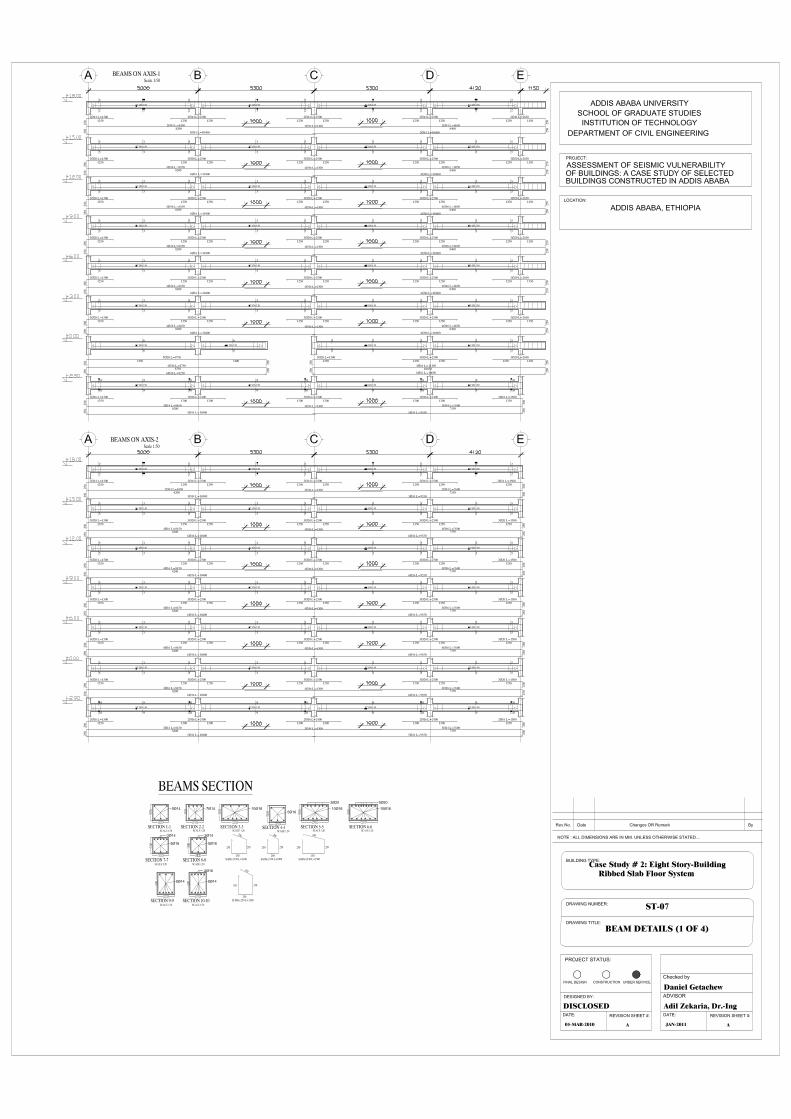


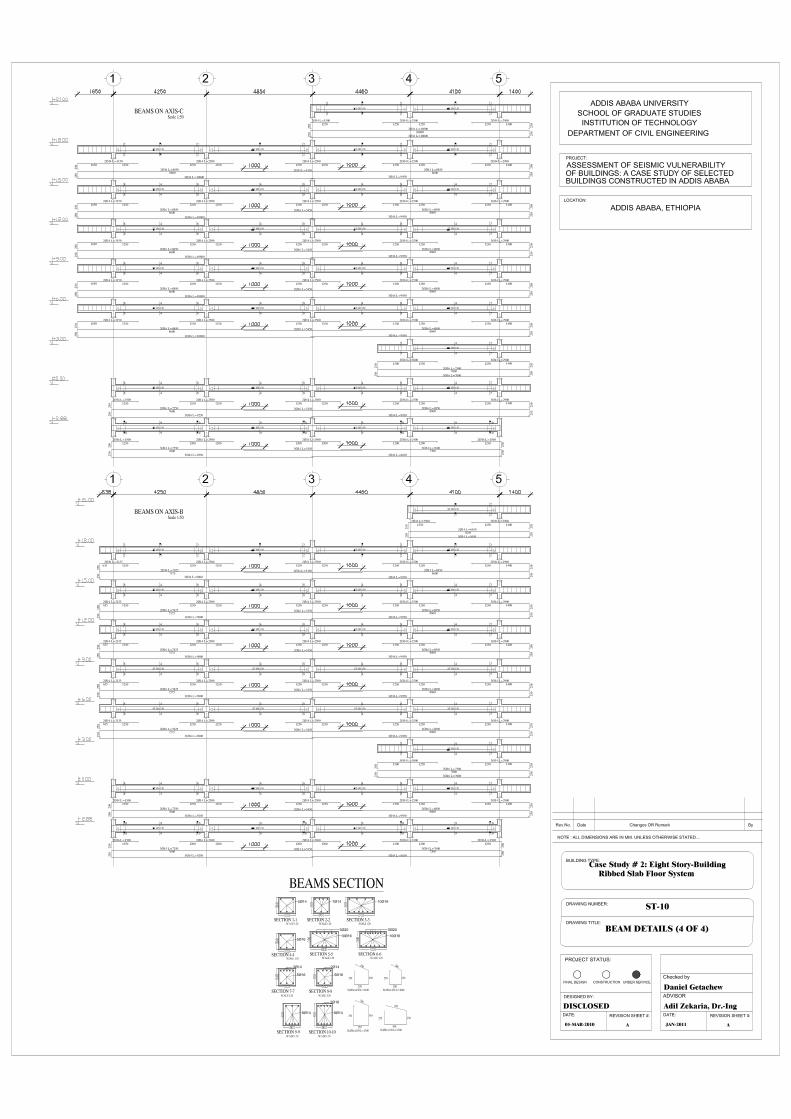


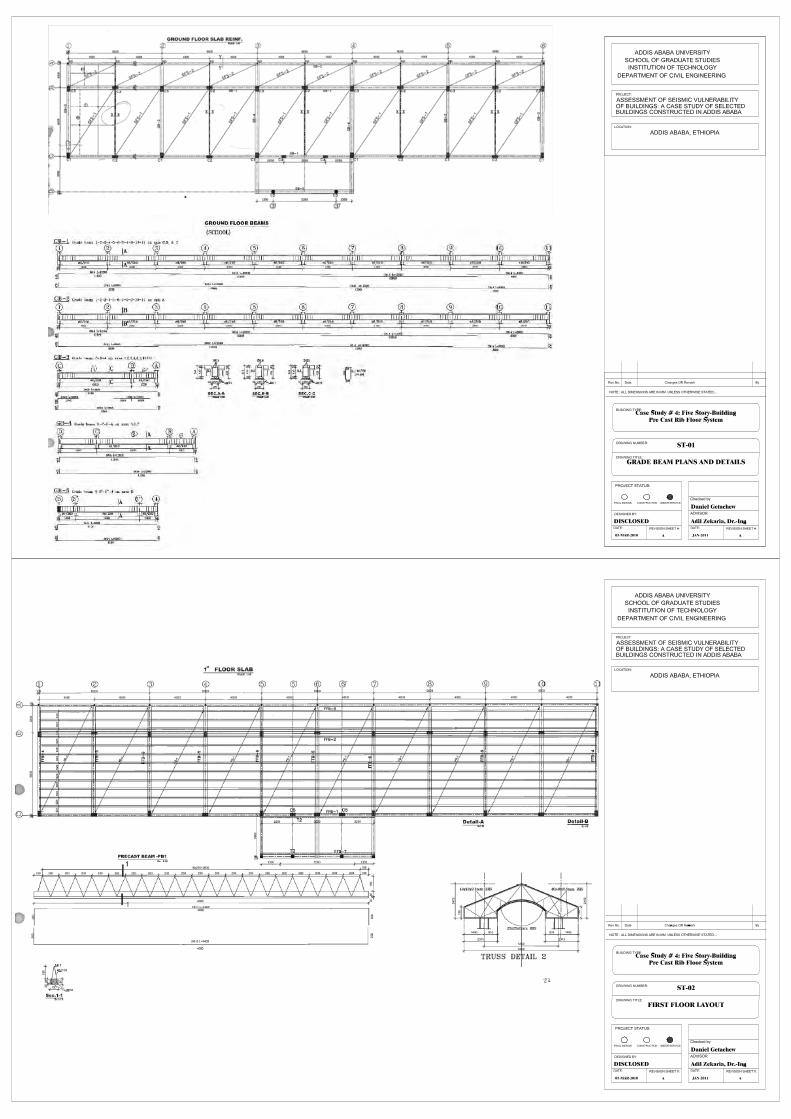
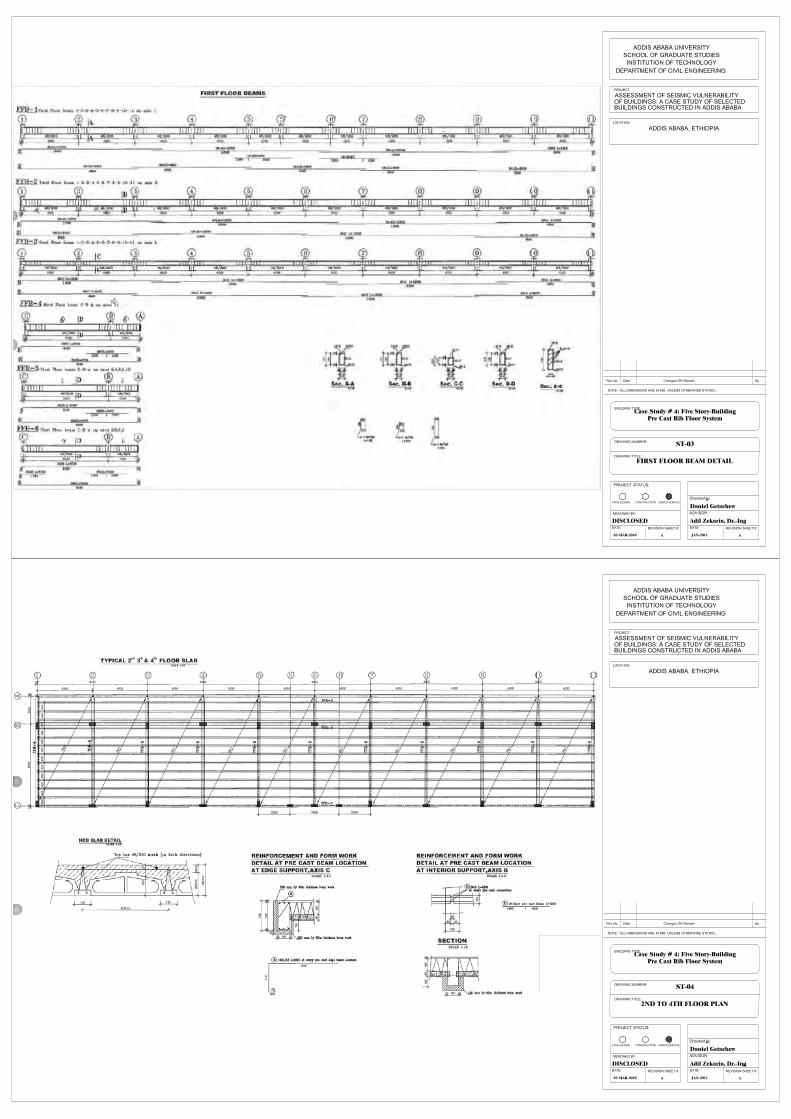


DECLARATION
This thesis is my original work and has not been presented for a degree in any other
university, and that all sources ofmaterial used for the thesis have been duly acknowledged.
NAME: DANIEL GET CH W GEBREYOHANNES
SIGNATURE: ~~~tt--------
PLACE: ADDIS A ABA INSTITUTE OF TECHNOLOGY, ADDIS ABABA
UNIVERSITY
DATE OF SUBMISSION: MAY, 2011
78
Copyright © 2022 FDOKUMEN