vulnerability assessment : forest eco system - Centre for ...
26
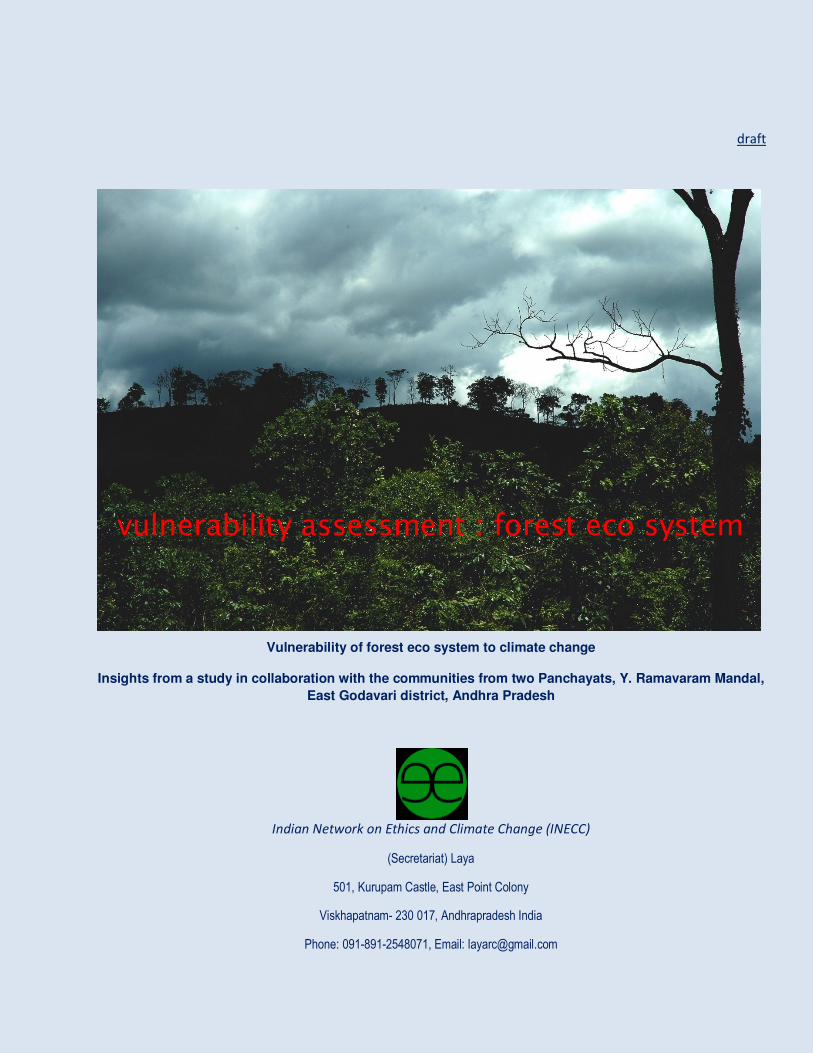
draft Vulnerability of forest eco system to climate change Insights from a study in collaboration with the communities from two Panchayats, Y. Ramavaram Mandal, East Godavari district, Andhra Pradesh Indian Network on Ethics and Climate Change (INECC) (Secretariat) Laya 501, Kurupam Castle, East Point Colony Viskhapatnam- 230 017, Andhrapradesh India Phone: 091-891-2548071, Email: [email protected] vulnerability assessment : forest eco system
-
Upload
khangminh22 -
Category
Documents
-
view
2 -
download
0
Transcript of vulnerability assessment : forest eco system - Centre for ...
draft
Vulnerability of forest eco system to climate change
Insights from a study in collaboration with the communities from two Panchayats, Y. Ramavaram Mandal,
East Godavari district, Andhra Pradesh
Indian Network on Ethics and Climate Change (INECC)
(Secretariat) Laya
501, Kurupam Castle, East Point Colony
Viskhapatnam- 230 017, Andhrapradesh India
Phone: 091-891-2548071, Email: [email protected]
vulnerability assessment : forest eco system

Field survey and FGDs Observer Facilitation & reporting Staff of Laya Dominic D’souza, Laya Sanjay Khatua
Team leader, field study & data processing: K. Koteswara Rao of Laya
Strategic inputs Nafisa Goga D’souza, INECC
Freelancer, developmental research & communication
Email:[email protected] Email: [email protected] Email:[email protected]
Vulnerability Assessment: Forest Eco System
Vulnerability Assessment: Forest Eco system
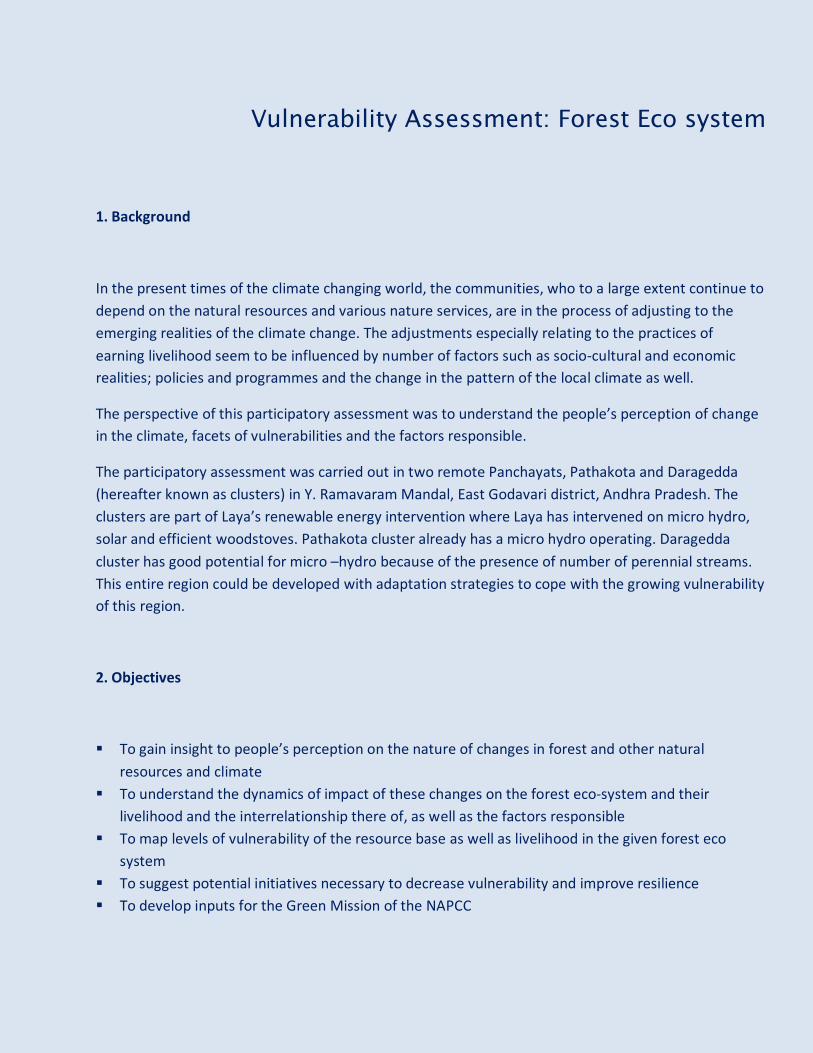
1. Background
In the present times of the climate changing world, the communities, who to a large extent continue to
depend on the natural resources and various nature services, are in the process of adjusting to the
emerging realities of the climate change. The adjustments especially relating to the practices of
earning livelihood seem to be influenced by number of factors such as socio-cultural and economic
realities; policies and programmes and the change in the pattern of the local climate as well.
The perspective of this participatory assessment was to understand the people’s perception of change
in the climate, facets of vulnerabilities and the factors responsible.
The participatory assessment was carried out in two remote Panchayats, Pathakota and Daragedda
(hereafter known as clusters) in Y. Ramavaram Mandal, East Godavari district, Andhra Pradesh. The
clusters are part of Laya’s renewable energy intervention where Laya has intervened on micro hydro,
solar and efficient woodstoves. Pathakota cluster already has a micro hydro operating. Daragedda
cluster has good potential for micro –hydro because of the presence of number of perennial streams.
This entire region could be developed with adaptation strategies to cope with the growing vulnerability
of this region.
2. Objectives
� To gain insight to people’s perception on the nature of changes in forest and other natural
resources and climate
� To understand the dynamics of impact of these changes on the forest eco-system and their
livelihood and the interrelationship there of, as well as the factors responsible
� To map levels of vulnerability of the resource base as well as livelihood in the given forest eco
system
� To suggest potential initiatives necessary to decrease vulnerability and improve resilience
� To develop inputs for the Green Mission of the NAPCC

2. Methodology
� The clusters were purposefully selected because the livelihood to a large extent has remained
forest dependent and there was not any major external intervention affecting the ecosystem.
� House census covering all the villages (29) in both the clusters and collection of village level
information and observation through FGD with help of pre-structured schedules in 15 sample
villages representing the geo-physical and socio economic features – 5 and 10 villages from
Pathakota and Daragedda clusters, respectively. This was carried out by the Laya field staff under
supervision of team leaders and accompanied by the Facilitator and the Observer.
� Review of the emerging trends and in-depth follow up in 6 villages, 3 villages from each cluster
involving FGD and physical transect, done by key field staff, the Facilitator and the Observer from
Laya. People’s perception and understanding were given priority.
� To understand the dynamics, the study focused on the following:
- Livelihood practices over the last six decades and the factors responsible
-Community perception of change in the climate, impact and coping process
-Gain insight relating to the way forward and linkage to the larger picture arising out of the
climate change concerns
3. Profile of the community, resource base and the livelihood
� So far as the day to day livelihood is concerned, the social groups, to a large extent have moved
away from their distinctive social traits and in various stages of settled agriculturalists (from
being shifting cultivators on hills).However, the livelihood practices have to a large extent
remained the forest eco system based without migration and external services
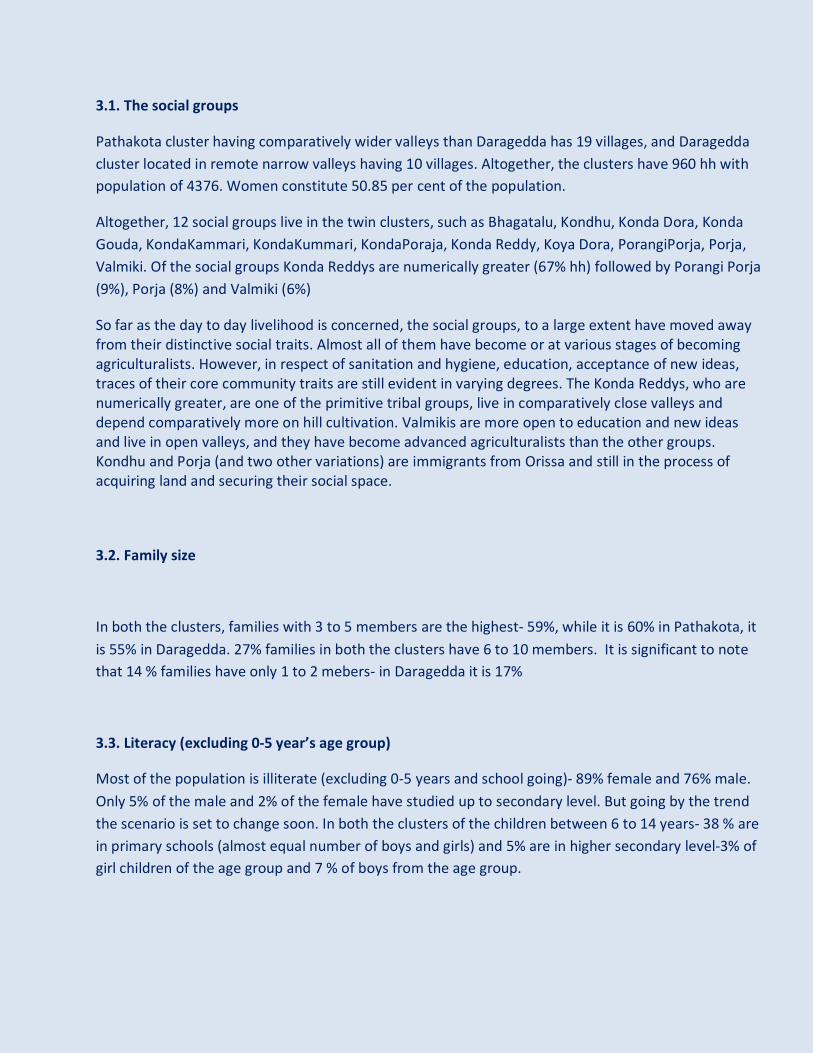
3.1. The social groups
Pathakota cluster having comparatively wider valleys than Daragedda has 19 villages, and Daragedda
cluster located in remote narrow valleys having 10 villages. Altogether, the clusters have 960 hh with
population of 4376. Women constitute 50.85 per cent of the population.
Altogether, 12 social groups live in the twin clusters, such as Bhagatalu, Kondhu, Konda Dora, Konda
Gouda, KondaKammari, KondaKummari, KondaPoraja, Konda Reddy, Koya Dora, PorangiPorja, Porja,
Valmiki. Of the social groups Konda Reddys are numerically greater (67% hh) followed by Porangi Porja
(9%), Porja (8%) and Valmiki (6%)
So far as the day to day livelihood is concerned, the social groups, to a large extent have moved away
from their distinctive social traits. Almost all of them have become or at various stages of becoming
agriculturalists. However, in respect of sanitation and hygiene, education, acceptance of new ideas,
traces of their core community traits are still evident in varying degrees. The Konda Reddys, who are
numerically greater, are one of the primitive tribal groups, live in comparatively close valleys and
depend comparatively more on hill cultivation. Valmikis are more open to education and new ideas
and live in open valleys, and they have become advanced agriculturalists than the other groups.
Kondhu and Porja (and two other variations) are immigrants from Orissa and still in the process of
acquiring land and securing their social space.
3.2. Family size
In both the clusters, families with 3 to 5 members are the highest- 59%, while it is 60% in Pathakota, it
is 55% in Daragedda. 27% families in both the clusters have 6 to 10 members. It is significant to note
that 14 % families have only 1 to 2 mebers- in Daragedda it is 17%
3.3. Literacy (excluding 0-5 year’s age group)
Most of the population is illiterate (excluding 0-5 years and school going)- 89% female and 76% male.
Only 5% of the male and 2% of the female have studied up to secondary level. But going by the trend
the scenario is set to change soon. In both the clusters of the children between 6 to 14 years- 38 % are
in primary schools (almost equal number of boys and girls) and 5% are in higher secondary level-3% of
girl children of the age group and 7 % of boys from the age group.

3.4. Housing
One of the major visible changes over the last two decades has been the shift from short term- housing
(requiring major change in 10 years) to long term housing with brick/ stone walls, use of seasoned
timber and tile/ACC roof. In both the clusters 95% houses have been renovated /redesigned to long
duration ones- 96% in Pathakota and 92% in Daragedda. In both the clusters only 5% houses have
thatched roof with short-term structures.
3.5. Access to land
� In both the clusters total land comprised of 5675 acres ( patta, non-patta and shifting)- 4092.54
acres in Pathakota and 1582 acres in Daragedda.
� Of the total land, 45% are patta land, 24% non-patta land and 28% shifting cultivation land.
� While there is not much difference in the percentage of patta land 46% and 44% in Patahakota and
Daragedda, respectively; the shifting cultivation land comprise of 25% of the total land in Pathakota
and 45% of the total land in Daragedda.
� In both the clusters 80% households have access to one or more type of land – 66% families have
access to patta land,36% families have access to non-patta land and 62% families have access to
shifting cultivation.
� However, there is significant difference between the clusters. While in Pathakota 89% families have
access to one or more type of land, in Daragedda it is 65%. In case of patta land,while 68% of
families in Pathakota have access to patta alnd , in Daragedda it is 62%. In case of non-patta land, in
Patahakota and Daragedda it is 47% and 17% respectively. In case of shifting cultivation 54%
families in Pathakota and 77% families in Daragedda have access to shifting cultivation land.
Average land per family (in acres)
� In both the clusters average patta land per family is 4.9 acres ( average 4.54 & 3.22 acres
respectively in Pathakota and Daragedda), non patta land 3.92 acres ( average 4.11 acres & 2.98
acres repectively in Pathakota and Daragedda) and shifting cultivation land 2.89 acres (averge 3.12
acres & 2.61 acres in Pathakota and Daragedda respectively)- average land per family is 5.92 acres (
average 6.7 acres & 4.5 acres respectively in Pathakota and Daragedda)
� Extent of possession of different types of land varies - in combination of all types of land about 8%
families have up to 1 acre of lands; 34 % have 1 to 3 acres, 25% have 3to 5 acres, 27% 5 to 10 acres
and 6% have more than 10 acres.
In context of the patta lands 8% families have up to 1 acre, 36% have 1 to 3 acre; 22% have 3 to 5
acres; 14 % have 5 to 10 acres and 2 % have more than 10 acres. And, in case of non-patta lands 6%

have up to 1 acres, 19% have 1 to 3 acres, 13% have 3 to 5 acres; 7% have 5 to 10 acres and less
than 1 % have more than 10 acres. And in case of the shifting cultivation land 17% families have up
to 1 acre, 40% have 1 to 3 acres, 14% have 3 to 5 acres, 6% have 5 to 10 acres and less than 1 %
have more than 10 acres.
Land as per family size
Possession of land varies as per the family size. Families with 1 to 2 members have 4.88 acres and 2.95
acres, respectively in Pathakota and Daragedda; similarly families with 3 to 5 members respectively
have 5.54 and 3.66 acres families with 6 to 10 members respectively have 6.03 and 4.17 acres and
families with 11 to 15 members have 13.75 and 14 acres respectively in Patahakota and Daragedda
clusters.
3.6. Livelihood sources: what they do for a living
3.6.1. Rearing of livestock
In both the clusters, 52% families have cows- average 2.21 (59% in Pathakota and 41% in Daragedda);
58% families have bullocks –average 2.48( 68% in Pathakota and 42% in Daragedda), 2.29% families
have buffaloes- average 2.18 (only in Pathakota); 56% families have goats- average 3.39(57% in
Pathakota and 53% in Daragedda); 2.60 % families have pigs- average 2.44 (mostly in Pathakota) and
73% families have poultry- average 4 (72% in Pathakota and 73% in Daragedda)
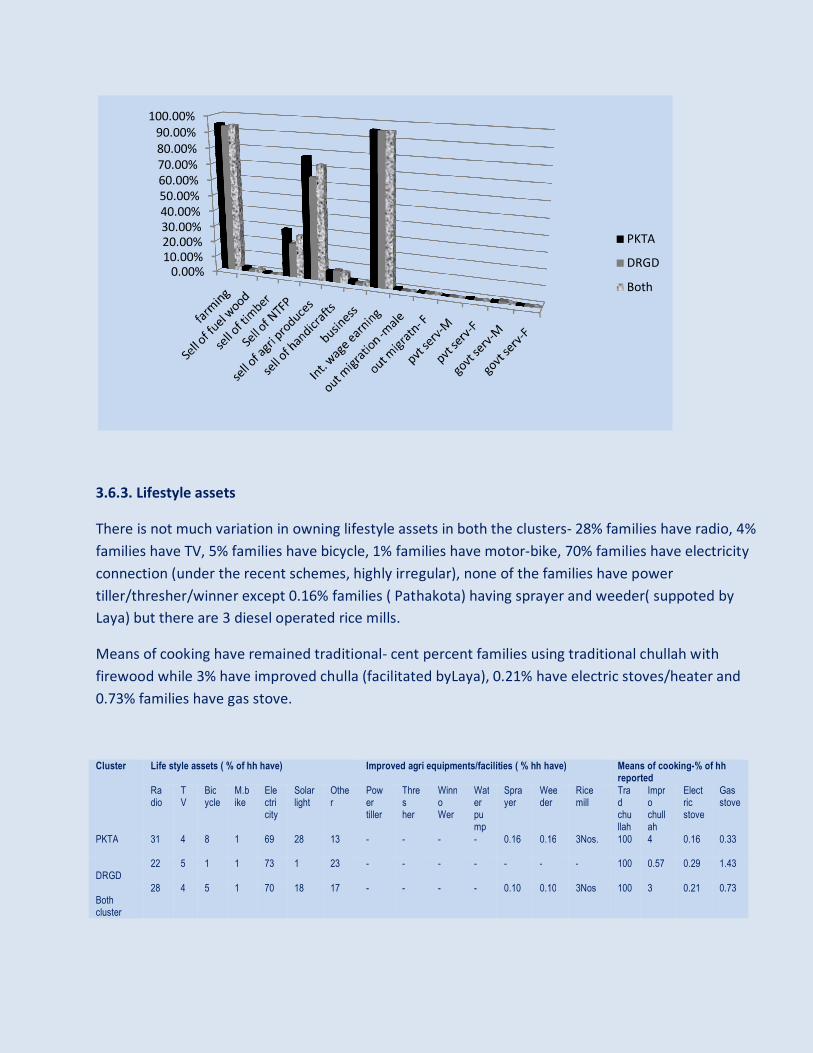
3.6.2. Other livelihood earning activities
In both the clusters 94% families are engaged in farming ( 95% in Pathakota and 93% in Daragedda),
27% families collect & sell NTFP ( 31% in Pathakota and 22% in Daragedda); 73% families sell some
amount of agricultural produces( 78% in Pathakota and 65% in Daragedda); 96 % families do internal
wage earning ( mostly working for each other, almost same in both the clusters), 7% families do some
handicraft (mostly bamboo- almost same in both the clusters).
Other activities done by very small percentage of families include- fuel wood selling 2%, selling of
timber 0.42%, business 2%, out migration- male 0.83% and female 0.52%; private service male 0.83%,
female 0.52%, government service- male 94% and female 0.52%
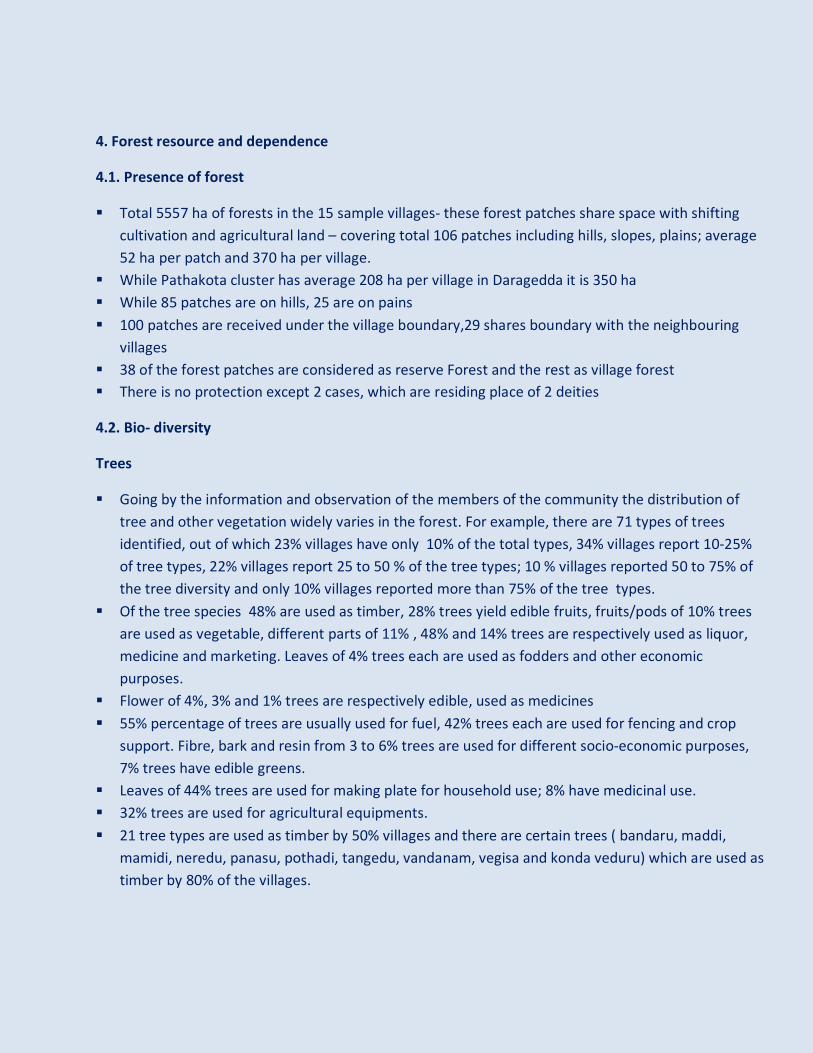
3.6.3. Lifestyle assets
There is not much variation in owning lifestyle assets in both the clusters- 28% families have radio, 4%
families have TV, 5% families have bicycle, 1% families have motor-bike, 70% families have electricity
connection (under the recent schemes, highly irregular), none of the families have power
tiller/thresher/winner except 0.16% families ( Pathakota) having sprayer and weeder( suppoted by
Laya) but there are 3 diesel operated rice mills.
Means of cooking have remained traditional- cent percent families using traditional chullah with
firewood while 3% have improved chulla (facilitated byLaya), 0.21% have electric stoves/heater and
0.73% families have gas stove.
Cluster Life style assets ( % of hh have) Improved agri equipments/facilities ( % hh have) Means of cooking-% of hh reported
Radio
TV
Bicycle
M.bike
Electricity
Solar light
Other
Power tiller
Thres her
Winno Wer
Water pump
Sprayer
Weeder
Rice mill
Trad chullah
Impro chullah
Electric stove
Gas stove
PKTA 31 4 8 1 69 28 13 - - - - 0.16 0.16 3Nos. 100 4 0.16 0.33
DRGD
22 5 1 1 73 1 23 - - - - - - - 100 0.57 0.29 1.43
Both cluster
28 4 5 1 70 18 17 - - - - 0.10 0.10 3Nos 100 3 0.21 0.73
0.00%10.00%
20.00%
30.00%
40.00%
50.00%
60.00%
70.00%
80.00%
90.00%
100.00%
PKTA
DRGD
Both
4. Forest resource and dependence
4.1. Presence of forest
� Total 5557 ha of forests in the 15 sample villages- these forest patches share space with shifting
cultivation and agricultural land – covering total 106 patches including hills, slopes, plains; average
52 ha per patch and 370 ha per village.
� While Pathakota cluster has average 208 ha per village in Daragedda it is 350 ha
� While 85 patches are on hills, 25 are on pains
� 100 patches are received under the village boundary,29 shares boundary with the neighbouring
villages
� 38 of the forest patches are considered as reserve Forest and the rest as village forest
� There is no protection except 2 cases, which are residing place of 2 deities
4.2. Bio- diversity
Trees
� Going by the information and observation of the members of the community the distribution of
tree and other vegetation widely varies in the forest. For example, there are 71 types of trees
identified, out of which 23% villages have only 10% of the total types, 34% villages report 10-25%
of tree types, 22% villages report 25 to 50 % of the tree types; 10 % villages reported 50 to 75% of
the tree diversity and only 10% villages reported more than 75% of the tree types.
� Of the tree species 48% are used as timber, 28% trees yield edible fruits, fruits/pods of 10% trees
are used as vegetable, different parts of 11% , 48% and 14% trees are respectively used as liquor,
medicine and marketing. Leaves of 4% trees each are used as fodders and other economic
purposes.
� Flower of 4%, 3% and 1% trees are respectively edible, used as medicines
� 55% percentage of trees are usually used for fuel, 42% trees each are used for fencing and crop
support. Fibre, bark and resin from 3 to 6% trees are used for different socio-economic purposes,
7% trees have edible greens.
� Leaves of 44% trees are used for making plate for household use; 8% have medicinal use.
� 32% trees are used for agricultural equipments.
� 21 tree types are used as timber by 50% villages and there are certain trees ( bandaru, maddi,
mamidi, neredu, panasu, pothadi, tangedu, vandanam, vegisa and konda veduru) which are used as
timber by 80% of the villages.

� Other tree types which are used by more than 50% villages include:
Use Types Name of the trees Edible 6trees Chintha, mamidi, neredu, panasa,tangedu, veduru Vegetable 3 trees Mamidi, pedabusi,thani, thellaguma Liqur 2 trees Mamidi, panasa Medicine 1tree Neredu Marketed-fruits, pods
1tree Chintha
Fodder 2 trees Mamidi, panasa Fuel 13 trees Are nara,bandaru,maddi,mamidi,neredu,tangedu,thada,vegisa, velama Fencing 9 trees Busi, maddi, pothadi,sirimanu, tangedu, thada, veduru, vegisa, velama Crop support 10 trees Busi, dadduga, maddi, pothadi, sirimanu, tangedu, thada, veduru, vegisa,
vellama Fibre 2 trees Arenara, gugillam nara Edible green leaves
2 trees Pavati akulu, munuga
Medicinal 1 tree Vegisa Agri equipment 12 trees Bandaru, dadduga, maddi, mollika,neredu, vegisa, vellama, veduru, panasa,
pothadi,thada, vandanam
� No doubt, preference of great percentage of villages on certain trees for multiple purposes poses
threat to those trees
Bushes
� Of the 62 types of bushes identified, 10% are used as small timber; fruits /pods of 23% bushes are
edible. Parts of 53% bushes are used of medicine. 21%, 13% and 11% bushes are respectively used
for fuel, fencing and crop support. Leavers of 29% creepers are used for plates for household use
and leaves of 44% buses are used for medicinal purposes.
Creepers/ herbs/ grass/tuber/mushrooms
� Of the 51 creepers identified, fruits/pods of 25%, 71% and 31% are respectively edible, used for
medicine and marketed. Similarly, flower of 8% and 2% creepers are respectively used for medicine
and marketed. 8%, 4% and 2 % of the creepers are used for fuel, fencing and crop support. Leaves
of 78% creepers are used for medicines.
� Of the 20 herbs/shrubs identified 95% are edible. Fruits/pods 5% each and 20% are respectively
used for medicine, marketing and fodder.
� Of the 15 grass varieties identified 7% and 100% are respectively marketed and used as fodder.
There are 20 and 28 varieties of tubers and mushrooms which are edible.
Variation in the use of plant diversity between two clusters: sign of gradual departure from Adivasi
ways !
If we make a cursory comparison between the two clusters, people in Daragedda (34 varieties)use
more varieties of trees for timber than Patahkota ( 26 varieties); same trend in case of fruits/pods as
edibles( 19 and , 13 types of trees, respectively), liquor ( respectively 11 and 4 types) and medicine (
respectively 32 and 17 types).
Similarly, in case of the other major use of the different parts of the trees, Daragedda cluster uses
greater number of trees types than Pathakota; for example, for fuel, fencing crop support and farm
equipment Daragedda respectively uses 34, 28 25 and 19 types against 23, 15 , 17 and 14 types
respectively in use in Pathakota. The common observation we could make is that going socially
upwardly Patahkota people are becoming choosy and selective ( long lasting, better finish, taste) and
have stated outsourcing while the majority in Daragedda in remote narrow valleys are less choosy and
less concerned about the long-lasting aspect. The trend sticks to the most of the other uses of plant
diversity.
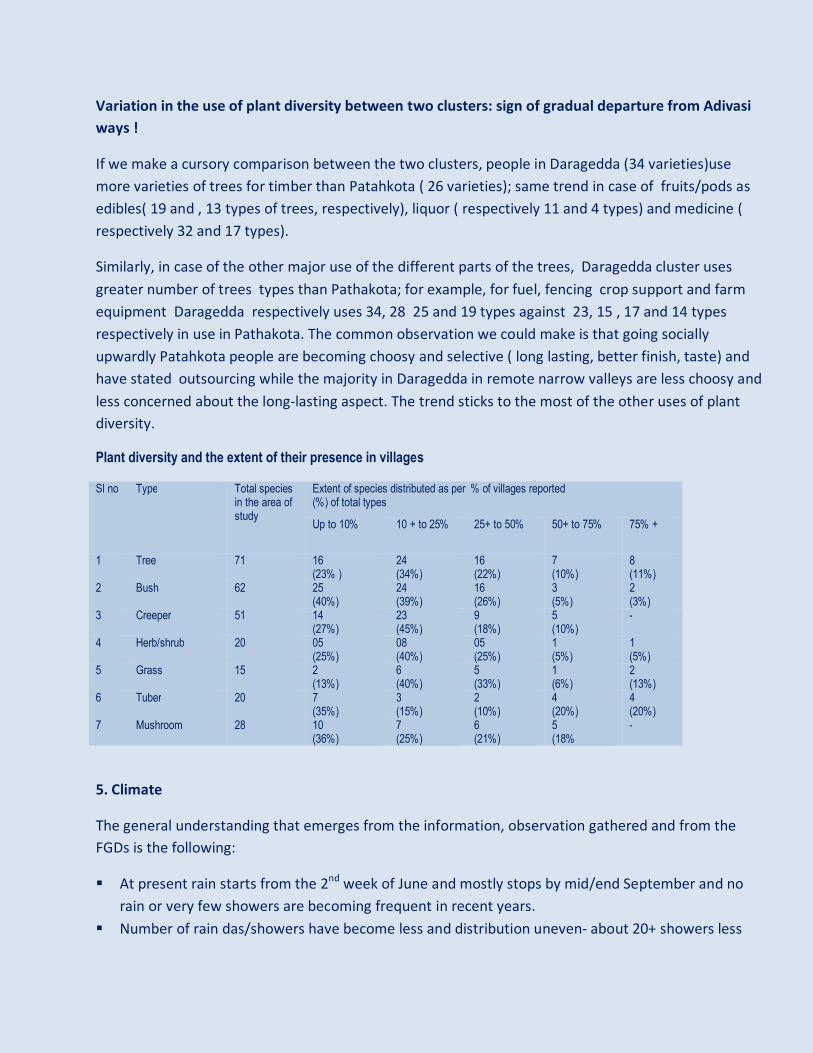
Plant diversity and the extent of their presence in villages
Sl no Type Total species in the area of study
Extent of species distributed as per % of villages reported (%) of total types
Up to 10% 10 + to 25% 25+ to 50% 50+ to 75% 75% +
1 Tree 71 16 (23% )
24 (34%)
16 (22%)
7 (10%)
8 (11%)
2 Bush 62 25 (40%)
24 (39%)
16 (26%)
3 (5%)
2 (3%)
3 Creeper 51 14 (27%)
23 (45%)
9 (18%)
5 (10%)
-
4 Herb/shrub 20 05 (25%)
08 (40%)
05 (25%)
1 (5%)
1 (5%)
5 Grass 15 2 (13%)
6 (40%)
5 (33%)
1 (6%)
2 (13%)
6 Tuber 20 7 (35%)
3 (15%)
2 (10%)
4 (20%)
4 (20%)
7 Mushroom 28 10 (36%)
7 (25%)
6 (21%)
5 (18%
-
5. Climate
The general understanding that emerges from the information, observation gathered and from the
FGDs is the following:
� At present rain starts from the 2nd
week of June and mostly stops by mid/end September and no
rain or very few showers are becoming frequent in recent years.
� Number of rain das/showers have become less and distribution uneven- about 20+ showers less

� Continuous rains for couple of days are happening only in some years
� Rain from October to March becoming very unpredictable
� Winter arrives about one month late (towards mid November) and leaves about one month early (
by February)
� Period of dry months increased – some years no rain or negligible rain for about 6 months
� Over the last 17 years there were 7 years of crop failure due to excess rainfall ( 3years) and deficit
rainfall ( 4 years)
Pattern of rainfall over last 20 years years General impact
Rain starting 1st/2nd week of June and ending mid October
13 years
Suitable to all the crops, crops grown well, standard yield, NTFP available, water available in streams post rainy season
Rain starting mid June and ending 1st week of sept-2009,2002,2001,2000 (deficient rainfall and uneven distribution)
4 years
Production of all the food grains badly affected including pulses. Broom grass did not grow well. Post rainy season, there was little flow in the streams.
Rain starting 1st week of June and ending 1st week of November (excess rainfall- 1993, 1995, 2005)
3 years
Substantial decrease in all crops except paddy. There was no impact on the availability of NTFP. Steady water flow in the streams post rainy season.
Weather pattern- now and then
Month At present Situation 20 years back
January -Extreme cold Towards the middle of the month-27% villages reported -towards end of the month light showers-40 to 67% vill. reported -Years of no rain in month of January have been frequent
--Extreme cold - Rains towards the middle of the month, 2-3 light showers- 100% villages
February -Rain towards the middle of the month- 1-2 light showers-27- 67%villages --Years of no rain in month of February have been frequent -Winter ends by last of the moth and day temperature increases- 60% villages
-Cold remains - Rains towards the middle of the month, 2-3 light showers- 100% villages
March - 1-2 light showers-67% villages -In some years does not rain - Temperature increases
-rains at the beginning of the month-47%, rains for 1-2 days40%, light shower-73% -Just cold ends by 2nd week
April -Rains 3-5 days, heavy showers-67% -No rain or 2-3 light showers-33% villages -Temperature steadily increases
-rains towards end of the month for about 3-5 days-100%, heavy shower-40%, lots of lightning-60% -Temperature begins to increse
May -rains towards end of the month, 3-5 heavy showers-67% villages -Temperature at its peak
-rains towards the middle of the month-47%, towards end of the month-40%; -rains for 3-5 days47%, heavy shower-53%, lots of lightning-47%
June -rains towards the middle of the month-100% -rains towards the middle of the month for 6 to 10 days,
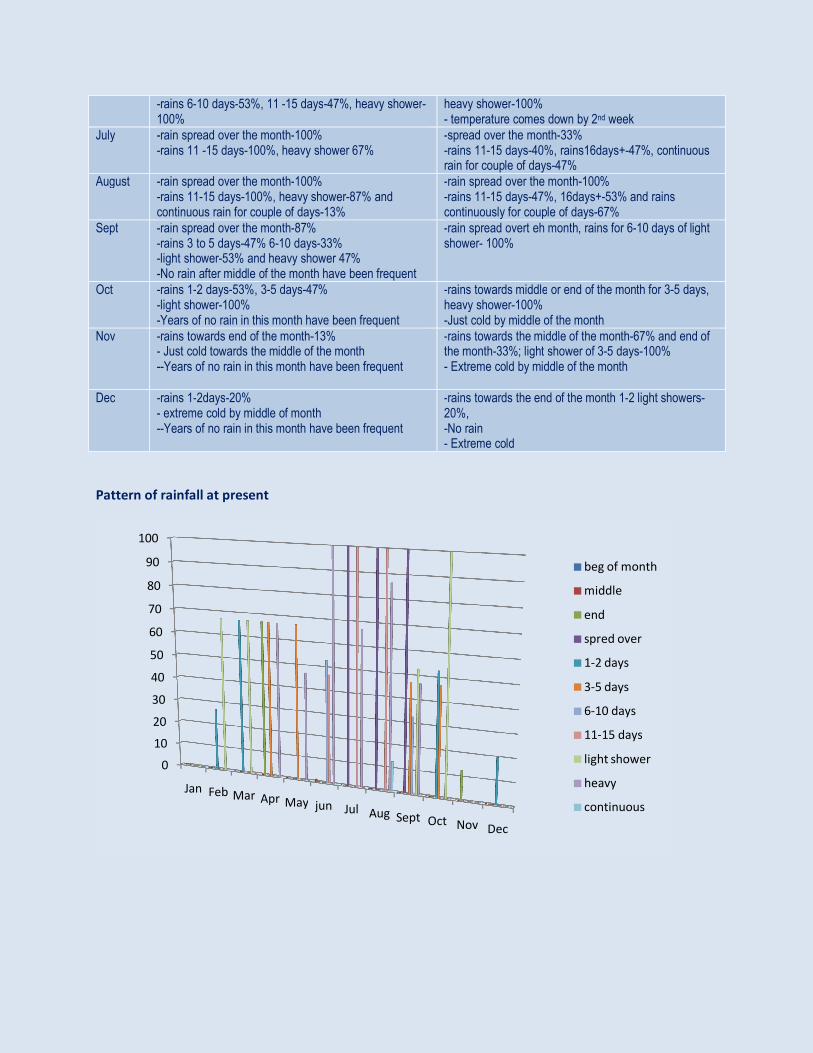
-rains 6-10 days-53%, 11 -15 days-47%, heavy shower-100%
heavy shower-100% - temperature comes down by 2nd week
July -rain spread over the month-100% -rains 11 -15 days-100%, heavy shower 67%
-spread over the month-33% -rains 11-15 days-40%, rains16days+-47%, continuous rain for couple of days-47%
August -rain spread over the month-100% -rains 11-15 days-100%, heavy shower-87% and continuous rain for couple of days-13%
-rain spread over the month-100% -rains 11-15 days-47%, 16days+-53% and rains continuously for couple of days-67%
Sept -rain spread over the month-87% -rains 3 to 5 days-47% 6-10 days-33% -light shower-53% and heavy shower 47% -No rain after middle of the month have been frequent
-rain spread overt eh month, rains for 6-10 days of light shower- 100%
Oct -rains 1-2 days-53%, 3-5 days-47% -light shower-100% -Years of no rain in this month have been frequent
-rains towards middle or end of the month for 3-5 days, heavy shower-100% -Just cold by middle of the month
Nov -rains towards end of the month-13% - Just cold towards the middle of the month --Years of no rain in this month have been frequent
-rains towards the middle of the month-67% and end of the month-33%; light shower of 3-5 days-100% - Extreme cold by middle of the month
Dec -rains 1-2days-20% - extreme cold by middle of month --Years of no rain in this month have been frequent
-rains towards the end of the month 1-2 light showers-20%, -No rain - Extreme cold
Pattern of rainfall at present
0
10
20
30
40
50
60
70
80
90
100
Jan Feb Mar Apr May jun Jul Aug Sept Oct Nov Dec
beg of month
middle
end
spred over
1-2 days
3-5 days
6-10 days
11-15 days
light shower
heavy
continuous
6. Vulnerability
The general understanding that emerges from the assessment is that livelihood practices at present is
almost fully dependent on the different components of a forest ecosystem and already the seasonal
production and the practice itself has become vulnerable to climatic and socio economic factors and
some of the resource base have become vulnerable. Some of the practices which are sustainable are
also vulnerable.
It also shows that the ‘vulnerability’ is beyond poverty, marginalization, or the present state of
livelihood it involves a predictive aspect what may happen under progressive changing conditions or
the chain impacts.
The insight from the assessment indicates that the communities living in the midst of bounties of
nature with their indigenous wisdom are not adequately prepared to hold to their resources and utilize
them to live matching with the present realities without facilitation. Though they live in seemingly
uniform eco-system there are numerous micro variations in relation to resources and socio cultural
practices and accordingly their vulnerability, resilience varies.
Going by the trend with the coming generation and the change in the level of aspiration and other
complex characteristic including present living condition, social governance, networking, etc. it entails
to recognize social vulnerability that could potentially provide additional trigger to climate related
vulnerabilities.
There is also a clear realization that the vulnerability conditions are themselves determined by
processes and factors that are apparently quite distant from the impact - vulnerability variables are
inherently connected with livelihoods -lower vulnerability is likely when livelihoods are adequate and
sustainable. In other words, the less vulnerable are those who are more capable in their capacity to
cope and recover.
6.1. Aspects of vulnerability (harvested from people’s perception)
6.1.1. Vulnerability of forest ( regeneration)
Climate fluctuation
� High temperature, summer rains, humus and moisture in the soil is required (
f.exp.tangedu,nallajeedi)
� Low rainfall affects germination ( trees include : vegisa, maddi,bandaru, dadduga, vandanam,
thada, venki, burugu, anem, thurayipoolu, thani, thadi, karaka, sirimanu, velama veduru, busi,
korikibusi, gumpena, garuvu, edakulapala,edakulapala, usiri, sommitha, peddabusi nallamaddi,
mussidichekka, etc), rain crucial in June July months, spring/summer rain helps
� Humus and reasonable rain required for germination ( mamidi,neredu,mollika, thummi,
panasa,bodda,tumika, nepalam, guggilamnara,arenara chintha, naramamidi,tharipi, raavi, etc)
� For bushes like Pathalagaradi- good humus and low temperature is required, as well as shady
area, germination affected in case of low rainfall
� Rain required in September and October for survival growth of regenerated plants
� Decreasing of broom-grass in low rainfall years
Decrease of birds animals which help in regeneration
While 8% seeds are spread and germinated by self, 14%, 5% spread and regenerate with help of
wind and bird, respectively. Similarly, 27%, 10% and 9% plants spread and regenerate by self and
with help of wind, bird and animals, respectively. Some plants spread and regenerate through
combination of 3 factors- self, bird & animal( 7%), self wind & animal(5%), self wind & animal 3%,
self, wind, bird and animals 5% and wind and animals(4%)
Of the 148 plants people could share their observation, 76% are spred / regenerated by seeds 32%
by rhizome and 5 % by both
� People identified 6 animals who help in regeneration by eating and shitting. The wild animals
include - wild sheep, Bisons, Sambar, Spotted deer, Bear and kurudupillulu. The trees they help in
regeneration include- Busi, Korkibusi,Neredu, Parimi, Panasa, Mammidi, Garrikigaddi, Kopurigaddi,
Vempalli, Nallajeedi, etc
� Similarly, they have identified 12 birds (including peacock and mynah) which help in the similar
fashion- eat and shit. The trees which they help in regeneration include Busi, Parimi, Kota Parimi,
Neredu, and other edible fruit plants

� Animal and bird population are decreasing due to a combination of factors- hunting and change in
the weather
Particulars Numbers identified
Status Remark
Wild animal sighted in forest
18 72% the animals have been decreasing due to hunting ,Forest cutting and weather change (f.exp squirrel)
People hunt 12 wild animals during winter and summer, mostly by bow and arrow or trap Hunting is relatively higher in Daragedda cluster - more of tribal culture
Bees 4 major types of the 20 varieties people describe
There is almost 50% reduction due to longer dry period, temperature rise and change in the crop pattern and forest cutting
Birds 64 People observe decrease of 40 to 75%in case of 94 % of birds. Decrease in their number is attributed to hunting and weather change
Similarly, people hunt 8 varieties of birds especially during summer season by nets, gum and stick
6.1.2. Vulnerability of Livelihood
Over exploitation of forest resources (and change triggered by climate fluctuation)
� Broom grass is decreasing due to forest fire and over exploitation
� Cultivation of food grains decreased in podu lands- because of soil erosion and repeated crop
failure due to rainfall fluctuation
� Bamboo in nearby hills decreasing affecting bamboo based craft. Fencing in farm land is also
affected
� Difficulty in getting seasoned wood for doors, furniture; also difficult in getting choice trees for
farm tools
� Felling of forest by the immigrants for agri lands
� Decrease in fruit, fibre, mushroom, fuel and fencing material in nearby hills ( felling of trees
nearby for agri land)
� Gradual increase in conversion of forest to agricultural land , selected felling of trees, mass felling for
shifting cultivation since long
� Specific trees used for multiple purposes
� Species almost disappeared from forestt / very less include- neredu, panasa, daduga, veduru, vegia,
vasaka, kinnerea, velamma, gummadi, karaka, thani, busi, gumpena, usiri, pothadi,bandaru, zelugu,
sinduga, tadisa, erugudu, kondachippuru, chinnem, anem, etc
� Some trees are found only at the upper reach- tangedu, maddi,sinnem, sinduga,vandanam, panasa,
mamidi, etc on some of the hill forests

� Amount of land occupied for agriculture have been constantly increasing by 2010 36 % of hill forests are
cleared partially or fully and changed from podu to settled agriculture.
Case of 102 hill-forest identified in 15 sample villages which are in different degree of cultivation,
observation
Status of degradation % of hill forests
Entire hill has already converted to agri. land 30% of fill-forests
Small portion of the forest exist as considered sacred
2%
Forest in varying degree of degradation from middle to top, rest are used for podu/shifting cultivation
25%
Relatively good forest growth, not ye used for shifting or settled cultivation but villagers do collect timber and other materials
23%
No podu/shifting cultivation but forest highly degraded due to over exploitation
3%
No forest at the bottom of the hills- converted to agricultural land 19%
Routine extraction from forest
� Huge amount of materials extracted regularly
Purpose Frequency of extraction Quantity extracted per fam / % vill. Responded
House building Once in 5-10 years -Wall- 60+logs per fam-60% vill, 1ton + 40% vill - Super structure/roof-60 logs above- 60%, 2 tons + 40% - door- 5 logs-100% -Furniture-60 logs+ 40%, 30 logs +-13%, 2 tons above-47% vill
Agri. Equipment Once in 2 to 5 years 20 logs +-60% ,2 tons+-40% vill
Homestead fencing Once in 1 to 2 years 2tons+ 60% vill,-1ton + 40% vill
Agri. Fencing Once in every year 5tons+-60% vill,1ton + -40% vill
Crop support Once in every year 40 logs +-40% vill, -20 logs +47% vill,-5 logs-13% vill.
Fire wood Once in a year- 20% vill. -Every week-33% vill -In winter/summer-46%
-5 ton+-27%, 2 ton +-73% vill
Mulching Once in every year 10 to 20 kg
Fodder Almost every day 5 to 20 kg

Cropping (food security)
� Wet paddy cultivation is decreasing because of rainfall fluctuation (after the peak following settled
cultivation), at present cultivated in 66% villages so also the Budama rice (dry land paddy is
cultivated in 80% villages). Except little millet and finger millet (cultivated in all villages) other
millets are cultivated in 7 to 40% villages due crop failure (late rain, excess rain, also change in
choice). Sorghum is cultivated only in 47% villages.
Streams
� Flow substantially reduced during the year of low rainfall for example 2006 and 2009 and there was
conflict in two villages ( Gurraputhompadam and Jalimadugla in Pathakota) over sharing of
information over irrigation for khariff paddy.
� Over exploitation of forest at stream sources
Streams
Cluster No. of villages Seasonality Distant travel Management
Pathakota 5 villages 14 (11 perennial) Travel between 0.5 kms to 11 kms There are 8 check dams on the streams Water used for agriculture, washing, drinking
no management
Daragedda 10 village 27 steams (26 perennial)
Travel between 1 to 15 kilometers There 7 check dams Mostly used for agriculture, washing, drinking
No management
Socio cultural
� As gathered from the discussion and collected information it appears that the agriculture is in
transition to more organized form of cultivation and adjustment to the changing climate and needs
of livelihood.
� Rearing of small animals decreasing due to lack of manpower ( including increasing number of
children attending schools) and death due diseases ( dysentery)
� The Adivasi way of living is changing indicated by settled agriculture, change in cropping pattern,
education, housing, exposure, lifestyle assets, cash needs and the level of aspiration
� Desire to have more land

� Considerable percentage of families have only 1-2 members ( 14%) and 8% and 34% families have
1-3 acres of land ( limited capacity)
6.2. Coping
� Due to repeated crop failure to a large extent caused by rainfall fluctuation, the trend now is to
keep buffer as far as possible by acquiring more land by clearing forest
� Growing pulses in shifting cultivation land and slope lands at the foothills using moisture and as
buffer to crop failure because of late rain, low rainfall (Nelachikkudu and Sriram chikudu, etc). Black
gram, red gram, Kidney beans ( red) are cultivated in 80 to 100% villages
� Cashew plantation at the foot hills/slope lands
� Rubber plantation ( ITDA)
� Citrus orchard (ITDA support, failed due to pest attack Daragedda village)
� Fly ash brick used for BPL housing, thatched roofs are replaced by Mangalore tiles and ACC roofs
� Exploitation of distant forest for matured / choice trees for door, furniture and agri tools
� Live fencing/bio fencing
� SRI method
Summary of vulnerability
� Livelihood resources-
Hill lands- soil degradation triggered by over exploitation, absence of land development low / excess
rainfall, prolonged dry conditions
Forest- over exploration, regeneration affected due to climatic fluctuation, decrease of elements that
help in regeneration, non- forest activities due to insecurities in conventional livelihood activities’,
selective extraction, unsustainable practices of extraction, lack of management
Cropping pattern: climatic fluctuation, loss of fertility, change in need, change in socio-cultural aspects
Streams- over exploitation of forest at source, climatic fluctuation
Livelihood practices- change in need, change in socio- cultural aspects
� Socio cultural- overall change in the society, exposure, govt. policies and programmes, education,
change in aspiration
� Climate change appear to have been working as overarching trigger to take decisions in favour of
change, to cope in unsustainable way ( creating buffer land assets)

7.1. Rationale
The potential initiatives delineated below have the following rationale:
� The livelihood of the communities living in the micro forest eco system under the study have undergone
a number of complex changes in relation to the benchmark from 5 to 6 decades before. The
dependence then was primarily of gathering materials from the forest and one of the typical tribal
practice of crop growing- podu cultivation. Hence the fluctuation in the weather did not matter much –
since the food habit and other needs were at basic level and largely integrated to forest, the forest was
used as the backup.
� Over the years, the population has increased and there has been significant shift in the practice of
livelihood –more inclined to land based production, buying from the market, use of cash and the social
security systems, etc.. Hence, the fluctuation in production matters significantly, and as delineated
earlier, has wide spread impact. The major coping up mechanism so far have been increase the amount
of podu cultivation, clearing of more forest to increased land based cultivation, change in crop growing
practice, which have potential to be counterproductive in near future. The life style has changed;
considerable percentage of children at present purse education at different boarding schools outside
the region. Traditional values and practices are fast degrading.
7.potential initiatives to address the vulnerabilities
in the micro-forest eco-system

� The region present wide range of opportunities: bountiful resources are not used or grossly
underutilized; farming to a large extent it has remained organic; almost zero outmigration and
engagement in service sector. At the same time, for the community in transition, number of practice
show tell tale signs of being unsustainable: podu cultivation , routine extraction of huge amount of
materials from forest for fuel, fencing and crop support ,selective felling of trees for timber for
construction of long duration houses and furniture. Another emerging challenge would be the semi
educated youth with different aspiration and orientation to livelihood.
� Going by the benchmark of the weather shared by the senior farmers there have been significant
change and the relatively new cultivators are yet to fine tune their practices to the changing climate.
� This entire region could be developed as pilot to gain insight and develop different models involving
adaptation strategies in context of sustainable development and concerns of changing climate – taking
advantage of the hitherto zero carbon livelihood , repository of traditional practices and wisdom, large
network of perennial streams, low dependence on cash economy, not so degraded forests, different
tribal communities, etc. to contribute to wider replication and dissemination of models of eco system
based sustainable development matching to the present realities while indirectly contributing to the
mitigation process capacity building of the generation next.
7.2. Potential initiatives
7.2.1. Developing the livelihood resources and improve the livelihood practices
� Terracing of the hill land, leveling and bunding of the slopes on the foot hills
� Gravity irrigation of the terraced lands using water from the streams/runoffs
� Sustainable use of the hills- from top to bottom ( combination of crops/tree growing ,etc)
� Identification of best practices ( seed, crop rotation, cultural) and developing models to address the present
needs
� Development of land use models for different ‘micro’ regions with distinct features
7.2.2. Protection and scaling up of the zero carbon practices
� Identification and popularization of best seeds
� Initiate and popularize effective organic nutrients, soil enrichment, pest control, improved crop growing
methods, such as SRI
� Stream and run-off based irrigation

People got land entitlement right up to the top of the hills; will there be soil to make any use of them!
7.2.3. Reduction of the unsustainable practices
� Develop and popularize live fencing with suitable plants
� Need based plantation to prevent/reduce felling for routine needs ( fuel, fencing, building)
� Terraced cultivation instead of podu
� Awareness on sustainable methods of NTFP extraction
� Popularize fuel saving improved cooking systems
7.2.4. Making the forests productive to address the diverse needs of the communities sustainably
� Strategic stocking of the trees, plants, tubers, herbs, etc in the forest to meet the diverse needs
� Conservation and selective regeneration of trees which have been extensively degraded
� Conservation and selective regeneration of trees and plants of economic and cultural importance to the
local community
7.2.5. Management of the resources
� Identification of the resources ( forest, streams, hills) that belong to the village, Panchayat and the region
� Development of different management models- including inter-Panchayat- and facilitating management
� Development of strategic plans for different hills and facilitating community regulation
� Protection and management of stream sources and sacred forests, community forests
� Community regulation of forest clearance for new lands
7.2.6. Coping with the changing climate
� Identification of appropriate seeds and practices and development of different crop rotation for different
type of land to address potential vulnerability
� Improve in seeds storage practice to address vulnerability
� Improve in the response mechanism to maximize from the rains and the moisture
� Improve soil moisture retention capacity
� Improve stream and run-off based irrigation potential
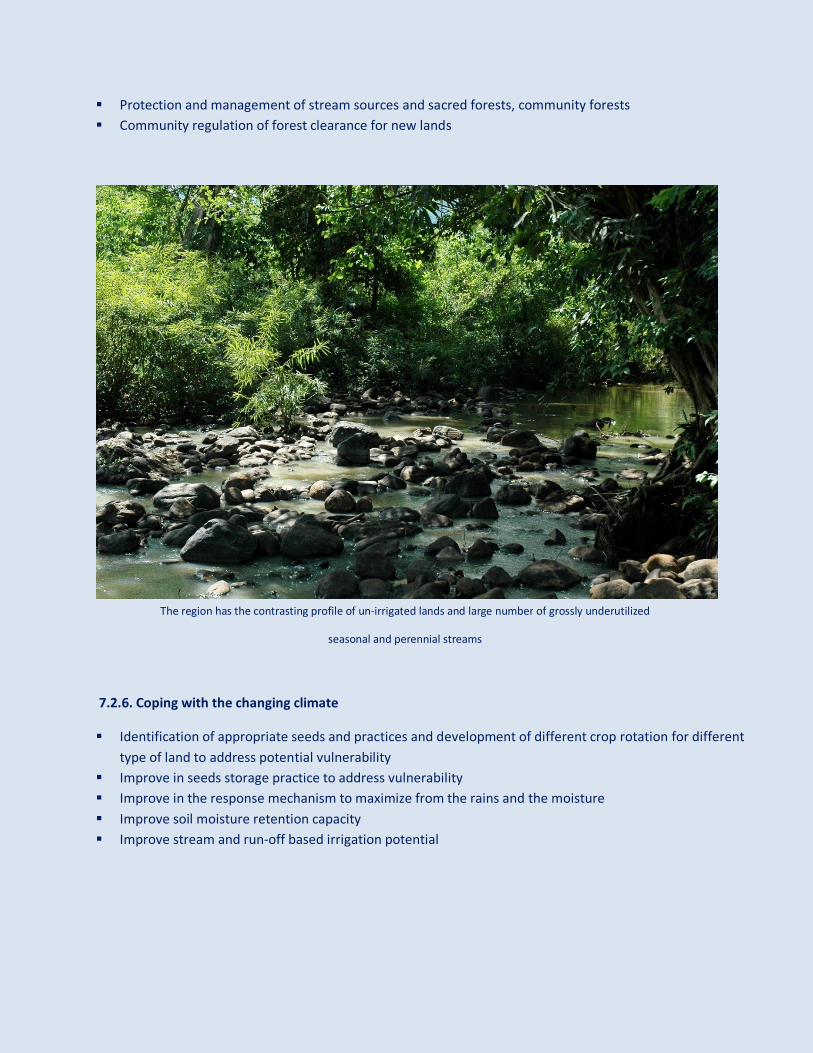
The region has the contrasting profile of un-irrigated lands and large number of grossly underutilized
seasonal and perennial streams

7.2.7. Eco-system based education and the capacity building
� Making the community aware of the micro and macro concerns relating the changing climate
� Making the community aware regarding the opportunities to address the changing climate
� Building the capacity to develop, utilize and manage the low carbon farming method, alternative zero
carbon technology, water management, forest management, etc
� Identification of the ecosystem based resources, skills relevant to the educated and semi educated youth
and their capacity building
� Educating the future generation of the resources and the dynamics of the forest eco systems and the
sustainable opportunities for improved livelihood
7.2.8. Macro linkage
� The insights in a way mirror the dynamics in the livelihood of 300 million tribal and other people
depend on forest for their subsistence and livelihood. Potential use include influencing policies/
programmes like Green India Mission, which envisages taking up afforestation /eco-restoration in
India to 20 million ha over 10 years leading to additional carbon sequestration of 43 million tons
CO2-e annually by the year 2020. Similarly, Reducing Emissions from Deforestation and Forest
Forests are being cleared for more land, as buffer for future; where to draw the line !

Degradation (REDD+) aims at carbon sequestration. These entail the tress to stay longer in the
forest. Considering the routine livelihood needs and amount of extraction the insight from these
assessments could be used to help redesign the programmes from community point of view.
� Models for wider replication and dissemination of the experience
� Regulated forest for harvesting ensures that rest the forest are not felled , only usufruct products are
extracted ( carbon sink )
� Low carbon farming
� Inter-Panchayat water, forest and hill management
� Stocking and regeneration of trees, plants, tubers, herbs, etc as per the need of the people ( Green India
mission)
� Up scaling community based alternative zero carbon technology ( cooking, lighting, processing,
irrigating, soil enriching, etc)
� Marketing of organic products, processing and end use of forest resources, alternative technology, etc-
appraisal of policies, programmes, technologies and feeding system to the community level
Future generation, time to ensure that they do not become ‘guest’ inhabitants in their own society

List of Participants in VA
Sl no
Name of the persons Identification Remark
1 Mr. K. Koteswara Rao Coordinator, Natural Resource Management Survey Facilitator, Mapping, Data collection
2 Dr. R. Venugopal Rao Forestry Specialist, Science and Technology Technical aspects in puts
3 Mr. L. Mallikharjuna Rao Coordinator, Documentation Documentation and Data collection
4 Mr. M. Satyanarayana Coordinator, Information Technology Photo documentation and
HHcensus Data Processing
5 Mrs. B. Sindu Data entry operator, Addateegala Village schedules and HH sample
schedules Data entry
6 Mr. Siddharth D’Souza Coordinator, Climate Change - DEO Pilot survey
7 Mr. V. Ravindra Area Coordinator, Paderu Data collection and interviews
8 Mr. M. Veeru Naidu Field Coordinator, Natural Resource
Management, Paderu
Data collection of Village
schedules and HH sample survey
9 Mr. Saramkota Balaraju Community member(Elder group), Patahakota Sharing of cultural aspects
10 Mr. B.Chellayya
Field Coordinator, DEO Addateegala Logistics, Data collection and data
entry
11 Mr Sadala Baburao
Field assistant DEO, Pathakota Cluster Logistics and Data collection
12 Ms Saramkota Lingamma Field assistant DEO,Pathakota Cluster Women leader
13 Mr. Kadabala Kameswara
reddy
Field assistant NRM, Daragedda Mapping and Data collection
14 Mr. Kadabala.Chiranjeevi Community member HH census data collection
15 Mr S.Sathish Reddy Community member HH census data collection
16 Mr S.Dalapathireddy
Community member HH census data collection
17 Mrs. Kakuri Rajyalakshmi
Women field assistant NRM unit, Tungamadugula HH census Data collection
18 Mrs. Kunjam Veeralakshmi Women field assistant NRM unit, Tunikelapadu HH census Data collection
19 Ms P.Prasanthi
Women field assistant NRM unit, Aradikota HH census Data collection
20 Ms K.Narayanamma Women field assistant NRM unit, Bandamamidi HH census Data collection
21 Ms K.Varahalamma Women field assistant NRM unit, Peddakodapalli HH census Data collection
22 Ms P.Varalakshmi Women field assistant NRM unit, Puruguduputtu HH census Data collection
23 Mr Murla Sureshreddy Field assistant NRM, Ravulapadu HH census Data collection
24 Mr Murla Lakshmanareddy Field assistant NRM, Pulusumamidi HH census Data collection
25 Mr Kunjam Ramarao Field assistant NRM, Peddaulempadu HH census Data collection
26 Ms P.Lakshmi Women field assistant NRM unit, Utlapalem HH census Data collection
27
Mr Pallala Neelamreddy
Field assistant NRM, Pasaruginni HH census Data collection
28 Mr Ulli Simhachalam Field assistant NRM, Durupalli HH census Data collection
29 Mr Vanthala Anandh Field assistant NRM, Sariyapalli HH census Data collection
30 Mr Vanthala Kamalakar Field assistant NRM, Kullubha HH census Data collection
31 Mr P.Sathibabu Field assistant NRM, Kandamamidi HH census Data collection
32 Mr. Dominic D’ Souza Laya resource person Observer
33 Mr. Sanjay Khatua Freelnacer- developmental reseach &
communication
Facilitator