The Psychology of Buildings: Computational Cognitive Strategies for Interactive Buildings
Upload
independentCategory
view
0download
0
ORI GIN AL PA PER
Seismic risk assessment of buildings in Izmir, Turkey
Kasım A. Korkmaz Æ Ayhan Irfanoglu Æ Ali H. Kayhan
Received: 1 September 2008 / Accepted: 24 August 2009 / Published online: 23 September 2009� Springer Science+Business Media B.V. 2009
Abstract Izmir, the third largest city and a major economic center in Turkey, has more
than three million residents and half million buildings. In this study, the seismic risk in
reinforced concrete buildings that dominate the building inventory in Izmir is investigated
through multiple approaches. Five typical reinforced concrete buildings were designed,
modeled and assessed for seismic vulnerability. The sample structures represent typical
existing reinforced concrete hospital, school, public, and residential buildings in Izmir. The
seismic assessments of the considered structures indicate that they are vulnerable to
damage during expected future earthquakes.
Keywords Izmir � Reinforced concrete � Buildings � Seismic risk assessment �Nonlinear analyses � Probabilistic assessment
1 Introduction
Heavy destruction caused by the 1999 Marmara (Mw = 7.4) and the 1999 Duzce
(Mw = 7.2) earthquakes in northwestern Turkey and the 2003 Bingol (Mw = 6.4) in
eastern Turkey has increased interest in seismic risk assessment of building stock in urban
areas in Turkey. A comparison of the building, structural system and damage types
reported by various researchers indicate that the basic features and the vulnerabilities of the
reinforced concrete structures that sustained heavy damage or collapsed were similar. It is
reported that majority of the damaged and partially or totally collapsed buildings were
K. A. Korkmaz (&)Civil Engineering Department, Suleyman Demirel University, Isparta, Turkeye-mail: [email protected]
A. IrfanogluSchool of Civil Engineering, Purdue University, West Lafayette, IN, USAe-mail: [email protected]
A. H. KayhanCivil Engineering Department, Pamukkale University, Denizli, Turkeye-mail: [email protected]
123
Nat Hazards (2010) 54:97–119DOI 10.1007/s11069-009-9455-3
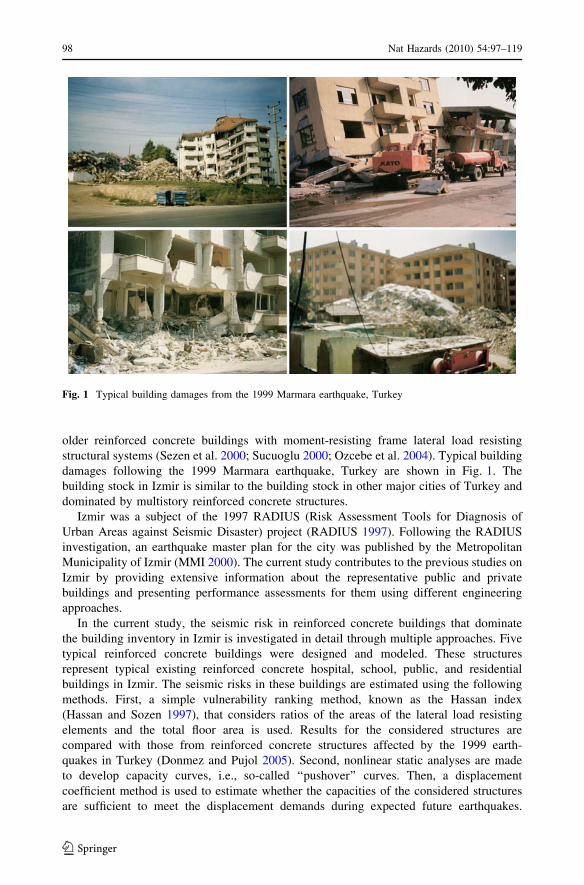
older reinforced concrete buildings with moment-resisting frame lateral load resisting
structural systems (Sezen et al. 2000; Sucuoglu 2000; Ozcebe et al. 2004). Typical building
damages following the 1999 Marmara earthquake, Turkey are shown in Fig. 1. The
building stock in Izmir is similar to the building stock in other major cities of Turkey and
dominated by multistory reinforced concrete structures.
Izmir was a subject of the 1997 RADIUS (Risk Assessment Tools for Diagnosis of
Urban Areas against Seismic Disaster) project (RADIUS 1997). Following the RADIUS
investigation, an earthquake master plan for the city was published by the Metropolitan
Municipality of Izmir (MMI 2000). The current study contributes to the previous studies on
Izmir by providing extensive information about the representative public and private
buildings and presenting performance assessments for them using different engineering
approaches.
In the current study, the seismic risk in reinforced concrete buildings that dominate
the building inventory in Izmir is investigated in detail through multiple approaches. Five
typical reinforced concrete buildings were designed and modeled. These structures
represent typical existing reinforced concrete hospital, school, public, and residential
buildings in Izmir. The seismic risks in these buildings are estimated using the following
methods. First, a simple vulnerability ranking method, known as the Hassan index
(Hassan and Sozen 1997), that considers ratios of the areas of the lateral load resisting
elements and the total floor area is used. Results for the considered structures are
compared with those from reinforced concrete structures affected by the 1999 earth-
quakes in Turkey (Donmez and Pujol 2005). Second, nonlinear static analyses are made
to develop capacity curves, i.e., so-called ‘‘pushover’’ curves. Then, a displacement
coefficient method is used to estimate whether the capacities of the considered structures
are sufficient to meet the displacement demands during expected future earthquakes.
Fig. 1 Typical building damages from the 1999 Marmara earthquake, Turkey
98 Nat Hazards (2010) 54:97–119
123
Third, nonlinear dynamic analyses using a series of artificial ground motion data com-
patible with the design response spectra of the current (2007) Turkish seismic code
(‘‘design-basis earthquakes’’) and considering two site soil classes are made to get
another set of performance estimates. Finally, probabilistic evaluations are made to
provide performance likelihoods during design-basis earthquakes expected in the future.
2 Seismic setting
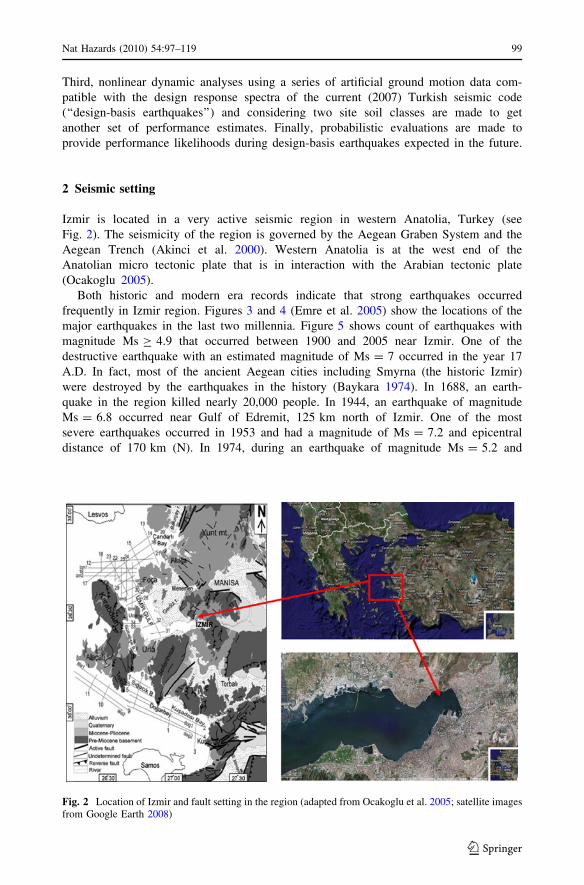
Izmir is located in a very active seismic region in western Anatolia, Turkey (see
Fig. 2). The seismicity of the region is governed by the Aegean Graben System and the
Aegean Trench (Akinci et al. 2000). Western Anatolia is at the west end of the
Anatolian micro tectonic plate that is in interaction with the Arabian tectonic plate
(Ocakoglu 2005).
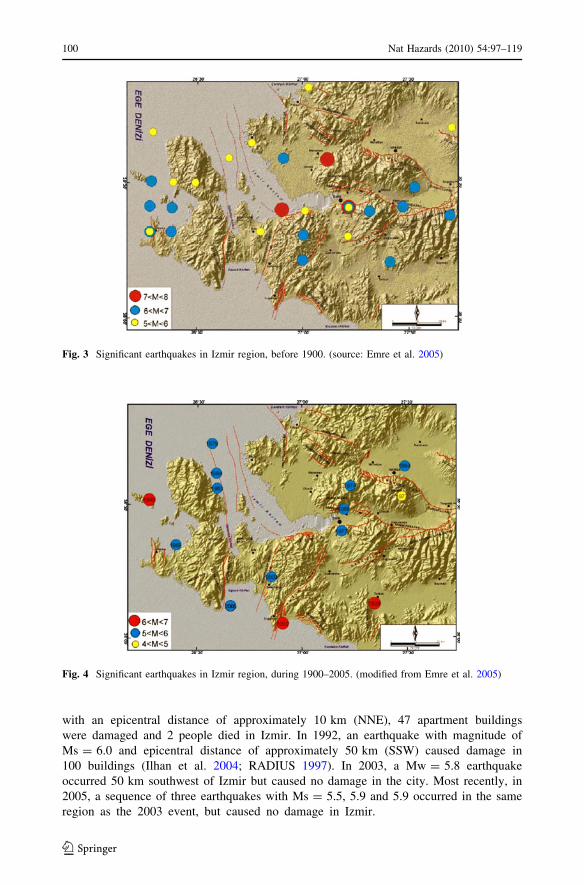
Both historic and modern era records indicate that strong earthquakes occurred
frequently in Izmir region. Figures 3 and 4 (Emre et al. 2005) show the locations of the
major earthquakes in the last two millennia. Figure 5 shows count of earthquakes with
magnitude Ms C 4.9 that occurred between 1900 and 2005 near Izmir. One of the
destructive earthquake with an estimated magnitude of Ms = 7 occurred in the year 17
A.D. In fact, most of the ancient Aegean cities including Smyrna (the historic Izmir)
were destroyed by the earthquakes in the history (Baykara 1974). In 1688, an earth-
quake in the region killed nearly 20,000 people. In 1944, an earthquake of magnitude
Ms = 6.8 occurred near Gulf of Edremit, 125 km north of Izmir. One of the most
severe earthquakes occurred in 1953 and had a magnitude of Ms = 7.2 and epicentral
distance of 170 km (N). In 1974, during an earthquake of magnitude Ms = 5.2 and
Fig. 2 Location of Izmir and fault setting in the region (adapted from Ocakoglu et al. 2005; satellite imagesfrom Google Earth 2008)
Nat Hazards (2010) 54:97–119 99
123
with an epicentral distance of approximately 10 km (NNE), 47 apartment buildings
were damaged and 2 people died in Izmir. In 1992, an earthquake with magnitude of
Ms = 6.0 and epicentral distance of approximately 50 km (SSW) caused damage in
100 buildings (Ilhan et al. 2004; RADIUS 1997). In 2003, a Mw = 5.8 earthquake
occurred 50 km southwest of Izmir but caused no damage in the city. Most recently, in
2005, a sequence of three earthquakes with Ms = 5.5, 5.9 and 5.9 occurred in the same
region as the 2003 event, but caused no damage in Izmir.
Fig. 3 Significant earthquakes in Izmir region, before 1900. (source: Emre et al. 2005)
Fig. 4 Significant earthquakes in Izmir region, during 1900–2005. (modified from Emre et al. 2005)
100 Nat Hazards (2010) 54:97–119
123
3 Building characteristics
3.1 Profile of structures in Izmir
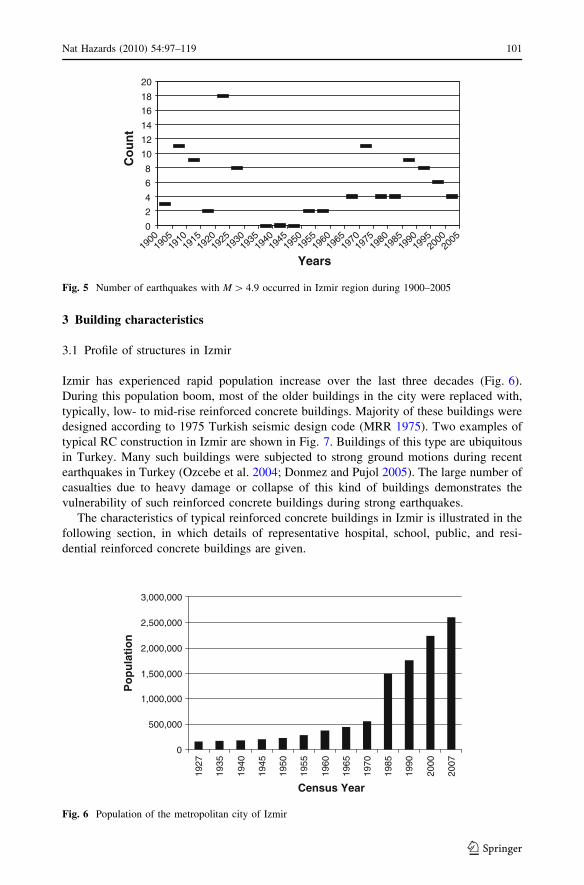
Izmir has experienced rapid population increase over the last three decades (Fig. 6).
During this population boom, most of the older buildings in the city were replaced with,
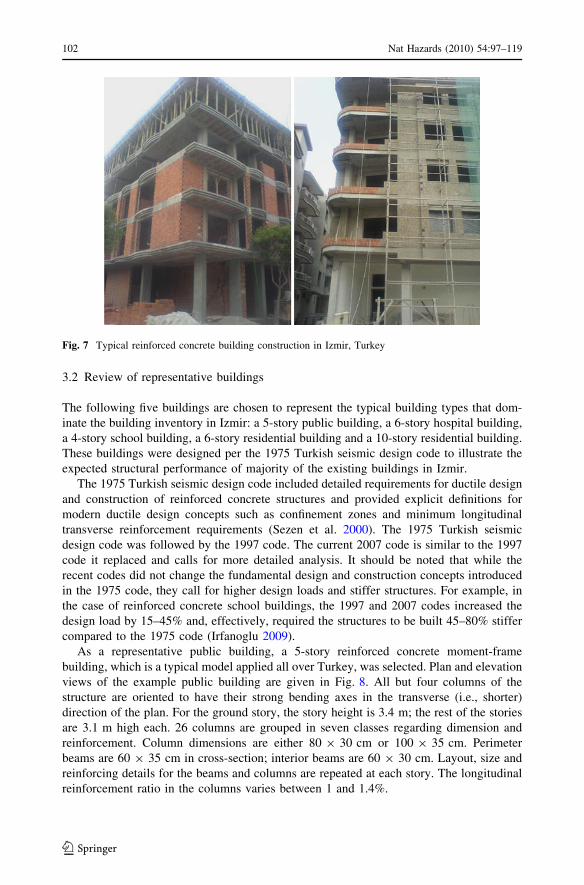
typically, low- to mid-rise reinforced concrete buildings. Majority of these buildings were
designed according to 1975 Turkish seismic design code (MRR 1975). Two examples of
typical RC construction in Izmir are shown in Fig. 7. Buildings of this type are ubiquitous
in Turkey. Many such buildings were subjected to strong ground motions during recent
earthquakes in Turkey (Ozcebe et al. 2004; Donmez and Pujol 2005). The large number of
casualties due to heavy damage or collapse of this kind of buildings demonstrates the
vulnerability of such reinforced concrete buildings during strong earthquakes.
The characteristics of typical reinforced concrete buildings in Izmir is illustrated in the
following section, in which details of representative hospital, school, public, and resi-
dential reinforced concrete buildings are given.
0
2
4
6
8
10
12
14
16
18
20
1900
1905
1910
1915
1920
1925
1930
1935
1940
1945
1950
1955
1960
Years
Co
un
t
1965
1970
1975
1980
1985
1990
1995
2000
2005
Fig. 5 Number of earthquakes with M [ 4.9 occurred in Izmir region during 1900–2005
0
500,000
1,000,000
1,500,000
2,000,000
2,500,000
3,000,000
1927
1935
1940
1945
1950
1955
1960
1965
1970
1985
1990
2000
2007
Census Year
Po
pu
lati
on
Fig. 6 Population of the metropolitan city of Izmir
Nat Hazards (2010) 54:97–119 101
123
3.2 Review of representative buildings
The following five buildings are chosen to represent the typical building types that dom-
inate the building inventory in Izmir: a 5-story public building, a 6-story hospital building,
a 4-story school building, a 6-story residential building and a 10-story residential building.
These buildings were designed per the 1975 Turkish seismic design code to illustrate the
expected structural performance of majority of the existing buildings in Izmir.
The 1975 Turkish seismic design code included detailed requirements for ductile design
and construction of reinforced concrete structures and provided explicit definitions for
modern ductile design concepts such as confinement zones and minimum longitudinal
transverse reinforcement requirements (Sezen et al. 2000). The 1975 Turkish seismic
design code was followed by the 1997 code. The current 2007 code is similar to the 1997
code it replaced and calls for more detailed analysis. It should be noted that while the
recent codes did not change the fundamental design and construction concepts introduced
in the 1975 code, they call for higher design loads and stiffer structures. For example, in
the case of reinforced concrete school buildings, the 1997 and 2007 codes increased the
design load by 15–45% and, effectively, required the structures to be built 45–80% stiffer
compared to the 1975 code (Irfanoglu 2009).
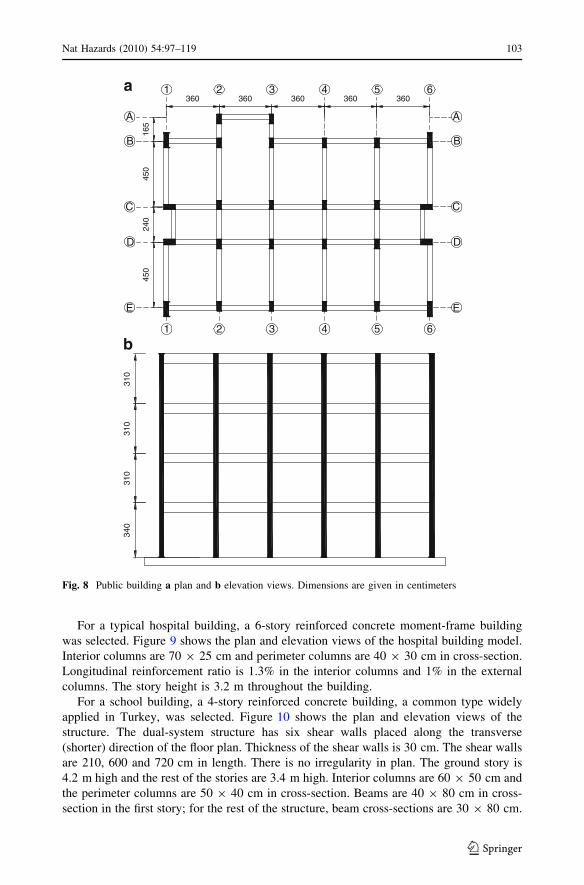
As a representative public building, a 5-story reinforced concrete moment-frame
building, which is a typical model applied all over Turkey, was selected. Plan and elevation
views of the example public building are given in Fig. 8. All but four columns of the
structure are oriented to have their strong bending axes in the transverse (i.e., shorter)
direction of the plan. For the ground story, the story height is 3.4 m; the rest of the stories
are 3.1 m high each. 26 columns are grouped in seven classes regarding dimension and
reinforcement. Column dimensions are either 80 9 30 cm or 100 9 35 cm. Perimeter
beams are 60 9 35 cm in cross-section; interior beams are 60 9 30 cm. Layout, size and
reinforcing details for the beams and columns are repeated at each story. The longitudinal
reinforcement ratio in the columns varies between 1 and 1.4%.
Fig. 7 Typical reinforced concrete building construction in Izmir, Turkey
102 Nat Hazards (2010) 54:97–119
123
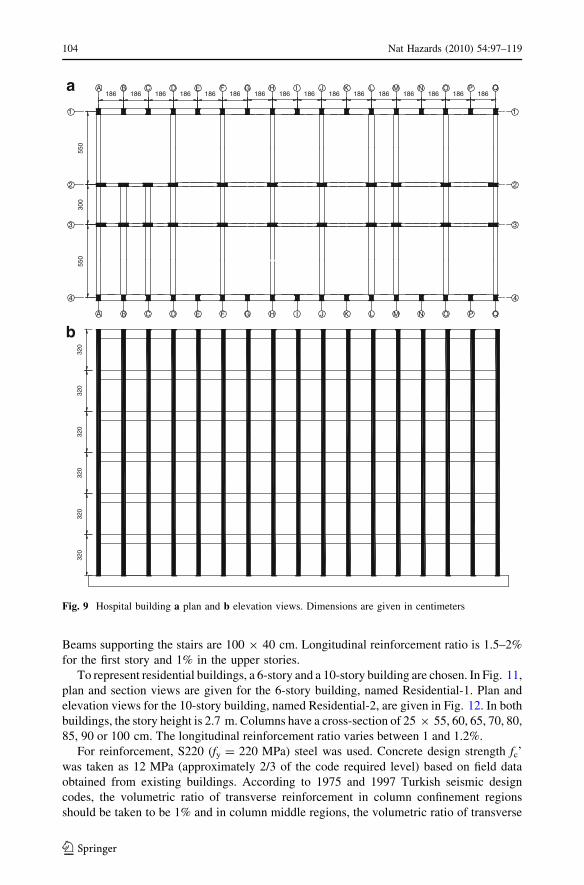
For a typical hospital building, a 6-story reinforced concrete moment-frame building
was selected. Figure 9 shows the plan and elevation views of the hospital building model.
Interior columns are 70 9 25 cm and perimeter columns are 40 9 30 cm in cross-section.
Longitudinal reinforcement ratio is 1.3% in the interior columns and 1% in the external
columns. The story height is 3.2 m throughout the building.
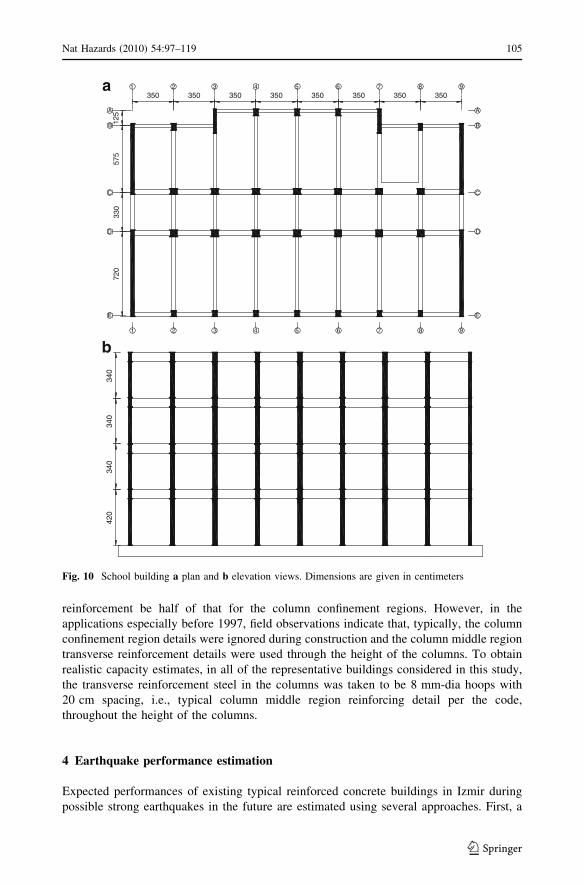
For a school building, a 4-story reinforced concrete building, a common type widely
applied in Turkey, was selected. Figure 10 shows the plan and elevation views of the
structure. The dual-system structure has six shear walls placed along the transverse
(shorter) direction of the floor plan. Thickness of the shear walls is 30 cm. The shear walls
are 210, 600 and 720 cm in length. There is no irregularity in plan. The ground story is
4.2 m high and the rest of the stories are 3.4 m high. Interior columns are 60 9 50 cm and
the perimeter columns are 50 9 40 cm in cross-section. Beams are 40 9 80 cm in cross-
section in the first story; for the rest of the structure, beam cross-sections are 30 9 80 cm.
165
450
240
450
360360360360360
A
B
C
D
EE
D
C
B
A
1 2 3 4 5 6
654321
340
310
310
310
a
b
Fig. 8 Public building a plan and b elevation views. Dimensions are given in centimeters
Nat Hazards (2010) 54:97–119 103
123
Beams supporting the stairs are 100 9 40 cm. Longitudinal reinforcement ratio is 1.5–2%
for the first story and 1% in the upper stories.
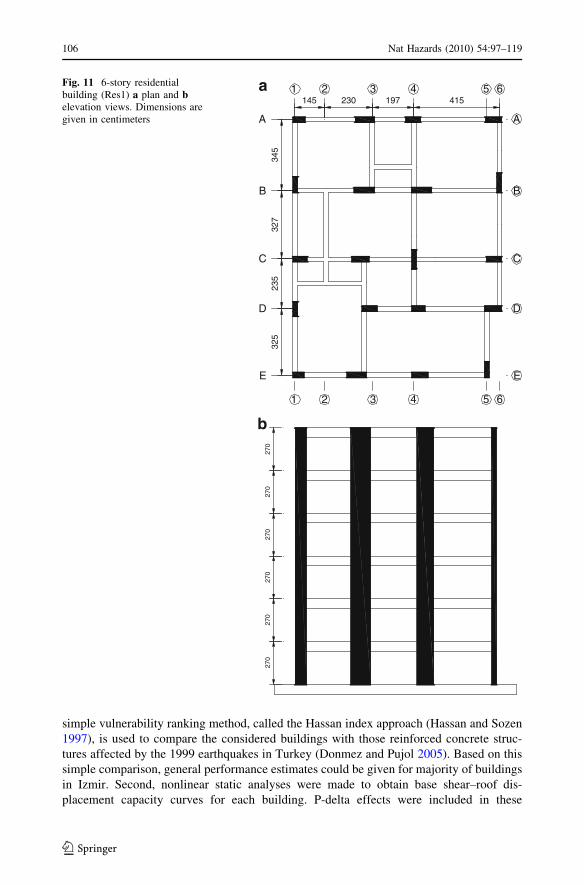
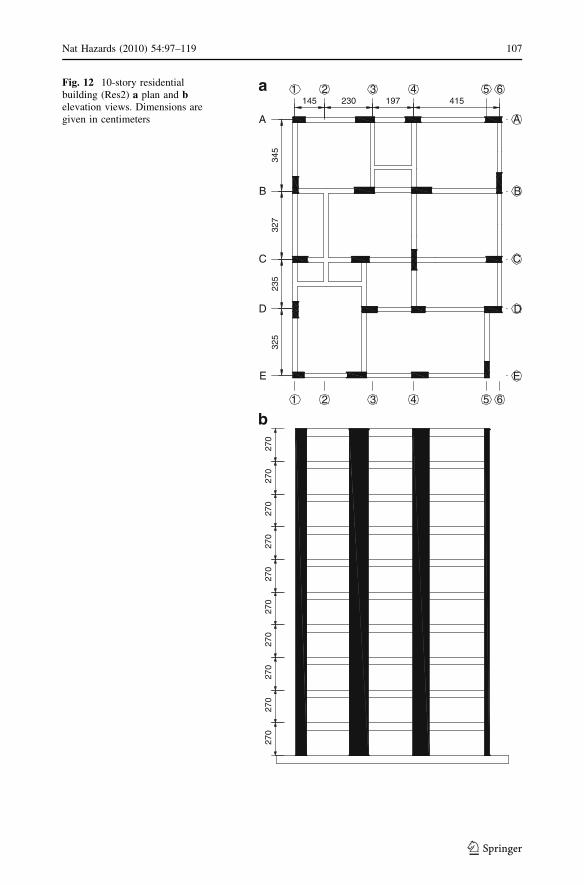
To represent residential buildings, a 6-story and a 10-story building are chosen. In Fig. 11,
plan and section views are given for the 6-story building, named Residential-1. Plan and
elevation views for the 10-story building, named Residential-2, are given in Fig. 12. In both
buildings, the story height is 2.7 m. Columns have a cross-section of 25 9 55, 60, 65, 70, 80,
85, 90 or 100 cm. The longitudinal reinforcement ratio varies between 1 and 1.2%.
For reinforcement, S220 (fy = 220 MPa) steel was used. Concrete design strength fc’was taken as 12 MPa (approximately 2/3 of the code required level) based on field data
obtained from existing buildings. According to 1975 and 1997 Turkish seismic design
codes, the volumetric ratio of transverse reinforcement in column confinement regions
should be taken to be 1% and in column middle regions, the volumetric ratio of transverse
A
A
B
B
C
C
D
D
E
E
F
F
G
G
H
H
I
I
J
J
K
K
L
L
M
M
N
N
O
O
P
P
Q
Q
44
33
22
11
550
300
550
186 186 186 186 186 186 186 186 186 186 186 186 186 186 186 186
320
320
320
320
320
320
a
b
Fig. 9 Hospital building a plan and b elevation views. Dimensions are given in centimeters
104 Nat Hazards (2010) 54:97–119
123
reinforcement be half of that for the column confinement regions. However, in the
applications especially before 1997, field observations indicate that, typically, the column
confinement region details were ignored during construction and the column middle region
transverse reinforcement details were used through the height of the columns. To obtain
realistic capacity estimates, in all of the representative buildings considered in this study,
the transverse reinforcement steel in the columns was taken to be 8 mm-dia hoops with
20 cm spacing, i.e., typical column middle region reinforcing detail per the code,
throughout the height of the columns.
4 Earthquake performance estimation
Expected performances of existing typical reinforced concrete buildings in Izmir during
possible strong earthquakes in the future are estimated using several approaches. First, a
BB
AA
CC
DD
EE
9
9
8
8
7
7
6
6
5
5
4
4
3
3
2
2
1
1
350 350 350 350 350 350 350 350
720
330
575
125
340
340
340
420
a
b
Fig. 10 School building a plan and b elevation views. Dimensions are given in centimeters
Nat Hazards (2010) 54:97–119 105
123
simple vulnerability ranking method, called the Hassan index approach (Hassan and Sozen
1997), is used to compare the considered buildings with those reinforced concrete struc-
tures affected by the 1999 earthquakes in Turkey (Donmez and Pujol 2005). Based on this
simple comparison, general performance estimates could be given for majority of buildings
in Izmir. Second, nonlinear static analyses were made to obtain base shear–roof dis-
placement capacity curves for each building. P-delta effects were included in these
A A
1
1
2
2
4
4
5
5
6
6
D D
3
3
E E
C C
B B
145 230 197 415
325
235
327
345
270
270
270
270
270
270
a
b
Fig. 11 6-story residentialbuilding (Res1) a plan and belevation views. Dimensions aregiven in centimeters
106 Nat Hazards (2010) 54:97–119
123
A A
1
1
2
2
4
4
5
5
6
6
D D
3
3
E E
C C
B B
145 230 197 415
325
235
327
345
270
270
270
270
270
270
270
270
270
270
a
b
Fig. 12 10-story residentialbuilding (Res2) a plan and belevation views. Dimensions aregiven in centimeters
Nat Hazards (2010) 54:97–119 107
123
so-called ‘‘pushover’’ analyses. Then, a displacement coefficient method-based determin-
istic analysis was used to estimate whether the capacity of the considered buildings would
meet the displacement demands. Two different site soil classes, known as Soil Z2 that is
similar to class B soil of FEMA, 356 (FEMA 2000) and Soil Z3 that is similar to class C
soil of FEMA, 356, are considered in the analyses. The chosen two soil types refer to
typical soil sites in southern and eastern parts of Izmir (MMI 2000) on which majority of
the buildings were constructed during the boom during 1970s and early 2000s. There are
pockets of areas with soft soil conditions (Z4) along the southern and eastern parts of the
shoreline and over a large region in the recently developed northwestern region of Izmir.
To obtain another set of performance estimates, a series of nonlinear dynamic analyses are
made for each structure and considering the two site soil types. For these dynamic anal-
yses, artificial ground motion data (‘‘design-basis earthquakes’’) compatible with the
design response spectra of the current (2007) Turkish seismic design code (MPWS 2007)
are generated and used. Finally, probabilistic evaluations for drift levels are made to
provide performance likelihoods during design-basis earthquakes expected in the future.
4.1 Hassan index-based vulnerability ranking
Hassan and Sozen (1997) have proposed a measure called the priority index to rank
reinforced concrete buildings with moment-frame and/or shear wall structural systems in
seismic vulnerability. Since the 1992 Erzincan earthquake in Turkey, performances of
several hundred buildings affected by strong earthquakes have been reviewed using the
priority index (Ozcebe et al. 2004; Donmez and Pujol 2005; Gur et al. 2009). The priority
index for a building is computed as the ratio of ‘‘effective’’ column and wall cross-
sectional areas to the total floor area of the building:
Priority Index ¼ Column IndexþWall Index ð1Þ
Column Index ¼ 1
2
AcolumnPAfloor
ð2Þ
Wall Index ¼ARC walls þ 1
10Amasonrywalls
PAfloor
ð3Þ
where Acolumn is the cross-sectional area of all columns at base level, ARC walls is the cross-
sectional area of reinforced concrete walls at base level, Amasonry walls is the cross-sectional
area of masonry walls filling entire frame bays and RAfloor is the summation of floor areas
above the base of the structure (Hassan and Sozen 1997). The wall index is calculated
considering the axes of the reinforced concrete walls and the infill walls for each principal
plan direction. The lower of the two priority indices for a building is chosen to represent
the building.
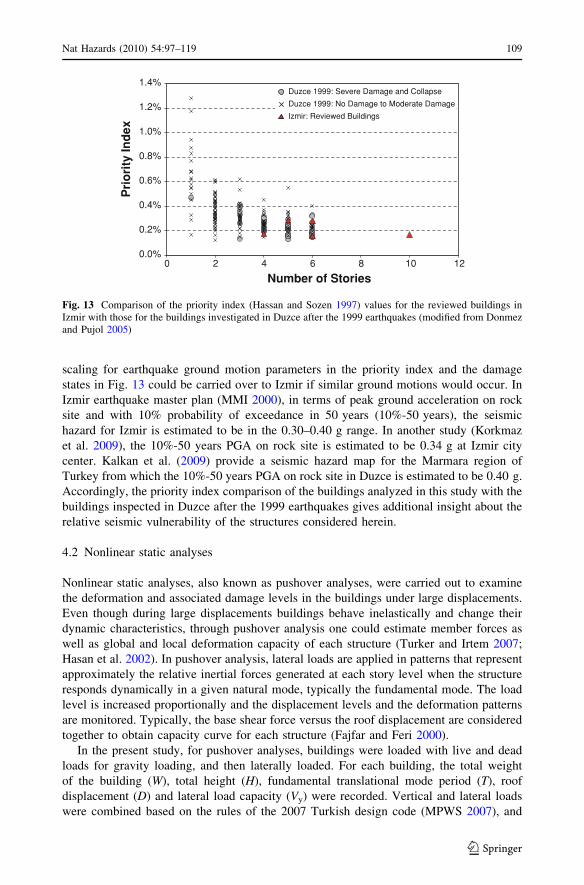
In Fig. 13, priority index values for the buildings reviewed for this study are compared
with those for the buildings in Duzce inspected after the 1999 earthquakes (Donmez and
Pujol 2005). As the graph in Fig. 13 indicates, the priority index values for buildings in
Izmir are not higher than for those in Duzce. The comparison indicates that if buildings in
Izmir were to experience ground motions similar to those in 1999 in Duzce (Donmez and
Pujol 2005), heavy damage and collapse could be expected. According to the seismic
hazard zonation map of Turkey (MPWS 1996), referred to in the 2007 Turkish seismic
design code (MPWS 2007), both Izmir and Duzce are considered among the highest
seismic hazard areas and given Zone 1 classification. It should be noted that there is no
108 Nat Hazards (2010) 54:97–119
123
scaling for earthquake ground motion parameters in the priority index and the damage
states in Fig. 13 could be carried over to Izmir if similar ground motions would occur. In
Izmir earthquake master plan (MMI 2000), in terms of peak ground acceleration on rock
site and with 10% probability of exceedance in 50 years (10%-50 years), the seismic
hazard for Izmir is estimated to be in the 0.30–0.40 g range. In another study (Korkmaz
et al. 2009), the 10%-50 years PGA on rock site is estimated to be 0.34 g at Izmir city
center. Kalkan et al. (2009) provide a seismic hazard map for the Marmara region of
Turkey from which the 10%-50 years PGA on rock site in Duzce is estimated to be 0.40 g.
Accordingly, the priority index comparison of the buildings analyzed in this study with the
buildings inspected in Duzce after the 1999 earthquakes gives additional insight about the
relative seismic vulnerability of the structures considered herein.
4.2 Nonlinear static analyses
Nonlinear static analyses, also known as pushover analyses, were carried out to examine
the deformation and associated damage levels in the buildings under large displacements.
Even though during large displacements buildings behave inelastically and change their
dynamic characteristics, through pushover analysis one could estimate member forces as
well as global and local deformation capacity of each structure (Turker and Irtem 2007;
Hasan et al. 2002). In pushover analysis, lateral loads are applied in patterns that represent
approximately the relative inertial forces generated at each story level when the structure
responds dynamically in a given natural mode, typically the fundamental mode. The load
level is increased proportionally and the displacement levels and the deformation patterns
are monitored. Typically, the base shear force versus the roof displacement are considered
together to obtain capacity curve for each structure (Fajfar and Feri 2000).
In the present study, for pushover analyses, buildings were loaded with live and dead
loads for gravity loading, and then laterally loaded. For each building, the total weight
of the building (W), total height (H), fundamental translational mode period (T), roof
displacement (D) and lateral load capacity (Vy) were recorded. Vertical and lateral loads
were combined based on the rules of the 2007 Turkish design code (MPWS 2007), and
0.0%
0.2%
0.4%
0.6%
0.8%
1.0%
1.2%
1.4%
0 2 4 6 8 10 12
Number of Stories
Pri
ori
ty In
dex
Duzce 1999: Severe Damage and Collapse
Duzce 1999: No Damage to Moderate Damage
Izmir: Reviewed Buildings
Fig. 13 Comparison of the priority index (Hassan and Sozen 1997) values for the reviewed buildings inIzmir with those for the buildings investigated in Duzce after the 1999 earthquakes (modified from Donmezand Pujol 2005)
Nat Hazards (2010) 54:97–119 109
123
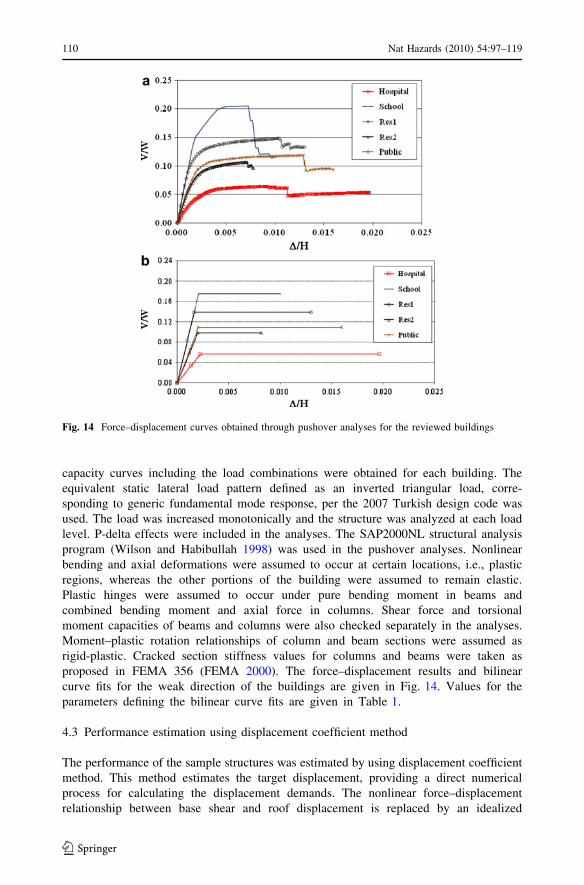
capacity curves including the load combinations were obtained for each building. The
equivalent static lateral load pattern defined as an inverted triangular load, corre-
sponding to generic fundamental mode response, per the 2007 Turkish design code was
used. The load was increased monotonically and the structure was analyzed at each load
level. P-delta effects were included in the analyses. The SAP2000NL structural analysis
program (Wilson and Habibullah 1998) was used in the pushover analyses. Nonlinear
bending and axial deformations were assumed to occur at certain locations, i.e., plastic
regions, whereas the other portions of the building were assumed to remain elastic.
Plastic hinges were assumed to occur under pure bending moment in beams and
combined bending moment and axial force in columns. Shear force and torsional
moment capacities of beams and columns were also checked separately in the analyses.
Moment–plastic rotation relationships of column and beam sections were assumed as
rigid-plastic. Cracked section stiffness values for columns and beams were taken as
proposed in FEMA 356 (FEMA 2000). The force–displacement results and bilinear
curve fits for the weak direction of the buildings are given in Fig. 14. Values for the
parameters defining the bilinear curve fits are given in Table 1.
4.3 Performance estimation using displacement coefficient method
The performance of the sample structures was estimated by using displacement coefficient
method. This method estimates the target displacement, providing a direct numerical
process for calculating the displacement demands. The nonlinear force–displacement
relationship between base shear and roof displacement is replaced by an idealized
Fig. 14 Force–displacement curves obtained through pushover analyses for the reviewed buildings
110 Nat Hazards (2010) 54:97–119
123
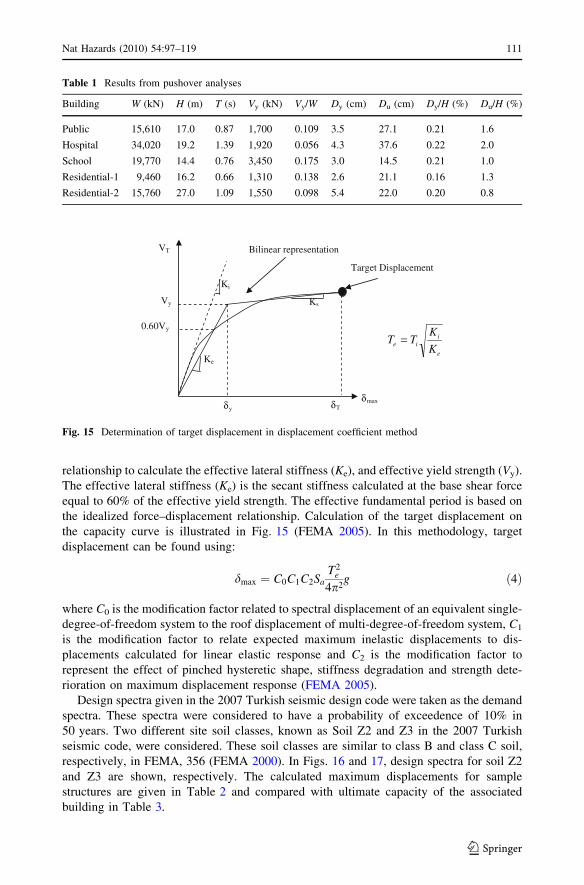
relationship to calculate the effective lateral stiffness (Ke), and effective yield strength (Vy).
The effective lateral stiffness (Ke) is the secant stiffness calculated at the base shear force
equal to 60% of the effective yield strength. The effective fundamental period is based on
the idealized force–displacement relationship. Calculation of the target displacement on
the capacity curve is illustrated in Fig. 15 (FEMA 2005). In this methodology, target
displacement can be found using:
dmax ¼ C0C1C2SaT2
e
4p2g ð4Þ
where C0 is the modification factor related to spectral displacement of an equivalent single-
degree-of-freedom system to the roof displacement of multi-degree-of-freedom system, C1
is the modification factor to relate expected maximum inelastic displacements to dis-
placements calculated for linear elastic response and C2 is the modification factor to
represent the effect of pinched hysteretic shape, stiffness degradation and strength dete-
rioration on maximum displacement response (FEMA 2005).
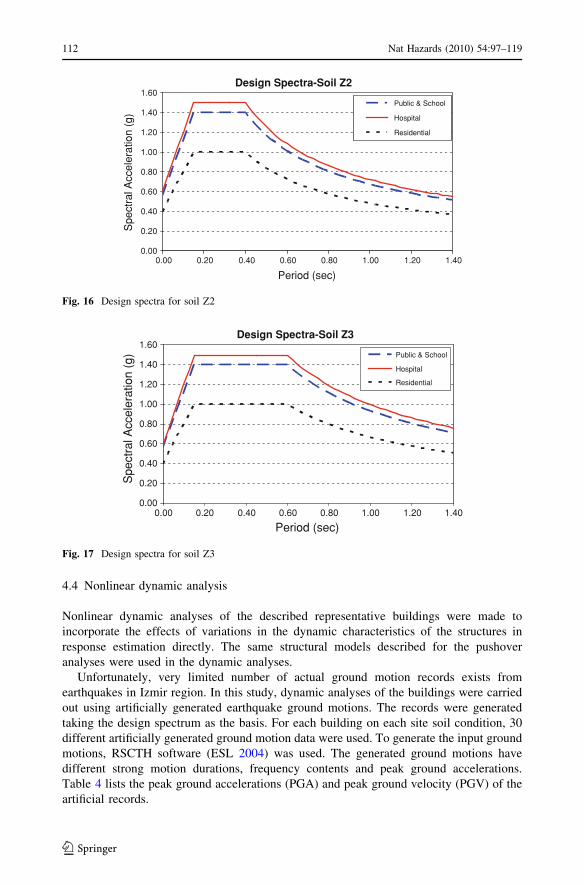
Design spectra given in the 2007 Turkish seismic design code were taken as the demand
spectra. These spectra were considered to have a probability of exceedence of 10% in
50 years. Two different site soil classes, known as Soil Z2 and Z3 in the 2007 Turkish
seismic code, were considered. These soil classes are similar to class B and class C soil,
respectively, in FEMA, 356 (FEMA 2000). In Figs. 16 and 17, design spectra for soil Z2
and Z3 are shown, respectively. The calculated maximum displacements for sample
structures are given in Table 2 and compared with ultimate capacity of the associated
building in Table 3.
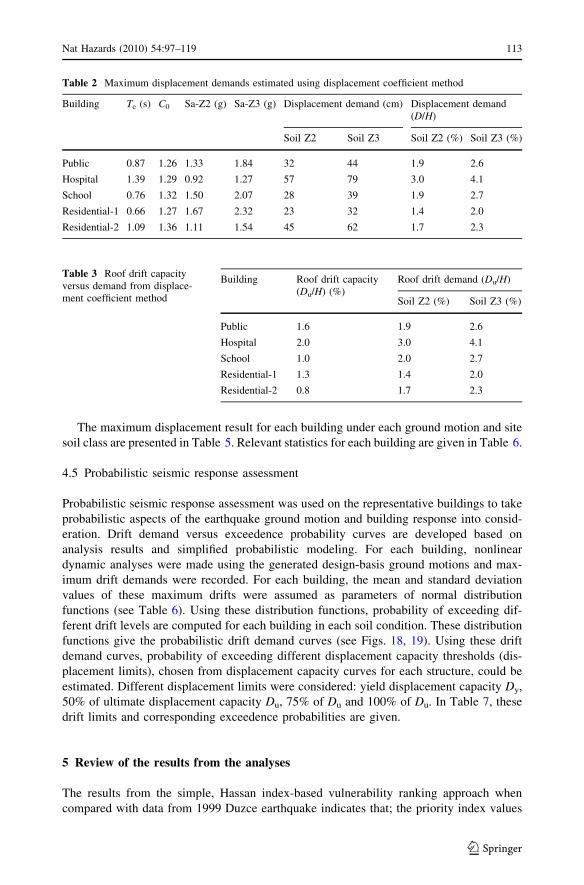
Table 1 Results from pushover analyses
Building W (kN) H (m) T (s) Vy (kN) Vy/W Dy (cm) Du (cm) Dy/H (%) Du/H (%)
Public 15,610 17.0 0.87 1,700 0.109 3.5 27.1 0.21 1.6
Hospital 34,020 19.2 1.39 1,920 0.056 4.3 37.6 0.22 2.0
School 19,770 14.4 0.76 3,450 0.175 3.0 14.5 0.21 1.0
Residential-1 9,460 16.2 0.66 1,310 0.138 2.6 21.1 0.16 1.3
Residential-2 15,760 27.0 1.09 1,550 0.098 5.4 22.0 0.20 0.8
e
iie K
KTT =
0.60Vy
Ks
Target Displacement
Ke
δy δT
Vy
VT
δmax
Ki
Bilinear representation
Fig. 15 Determination of target displacement in displacement coefficient method
Nat Hazards (2010) 54:97–119 111
123
4.4 Nonlinear dynamic analysis
Nonlinear dynamic analyses of the described representative buildings were made to
incorporate the effects of variations in the dynamic characteristics of the structures in
response estimation directly. The same structural models described for the pushover
analyses were used in the dynamic analyses.
Unfortunately, very limited number of actual ground motion records exists from
earthquakes in Izmir region. In this study, dynamic analyses of the buildings were carried
out using artificially generated earthquake ground motions. The records were generated
taking the design spectrum as the basis. For each building on each site soil condition, 30
different artificially generated ground motion data were used. To generate the input ground
motions, RSCTH software (ESL 2004) was used. The generated ground motions have
different strong motion durations, frequency contents and peak ground accelerations.
Table 4 lists the peak ground accelerations (PGA) and peak ground velocity (PGV) of the
artificial records.
Design Spectra-Soil Z2
0.00
0.20
0.40
0.60
0.80
1.00
1.20
1.40
1.60
0.00 0.20 0.40 0.60 0.80 1.00 1.20 1.40
Period (sec)
Spe
ctra
l Acc
eler
atio
n (g
)
Public & School
Hospital
Residential
Fig. 16 Design spectra for soil Z2
Design Spectra-Soil Z3
0.00
0.20
0.40
0.60
0.80
1.00
1.20
1.40
1.60
0.00 0.20 0.40 0.60 0.80 1.00 1.20 1.40
Period (sec)
Spe
ctra
l Acc
eler
atio
n (g
) Public & School
Hospital
Residential
Fig. 17 Design spectra for soil Z3
112 Nat Hazards (2010) 54:97–119
123
The maximum displacement result for each building under each ground motion and site
soil class are presented in Table 5. Relevant statistics for each building are given in Table 6.
4.5 Probabilistic seismic response assessment
Probabilistic seismic response assessment was used on the representative buildings to take
probabilistic aspects of the earthquake ground motion and building response into consid-
eration. Drift demand versus exceedence probability curves are developed based on
analysis results and simplified probabilistic modeling. For each building, nonlinear
dynamic analyses were made using the generated design-basis ground motions and max-
imum drift demands were recorded. For each building, the mean and standard deviation
values of these maximum drifts were assumed as parameters of normal distribution
functions (see Table 6). Using these distribution functions, probability of exceeding dif-
ferent drift levels are computed for each building in each soil condition. These distribution
functions give the probabilistic drift demand curves (see Figs. 18, 19). Using these drift
demand curves, probability of exceeding different displacement capacity thresholds (dis-
placement limits), chosen from displacement capacity curves for each structure, could be
estimated. Different displacement limits were considered: yield displacement capacity Dy,
50% of ultimate displacement capacity Du, 75% of Du and 100% of Du. In Table 7, these
drift limits and corresponding exceedence probabilities are given.
5 Review of the results from the analyses
The results from the simple, Hassan index-based vulnerability ranking approach when
compared with data from 1999 Duzce earthquake indicates that; the priority index values
Table 3 Roof drift capacityversus demand from displace-ment coefficient method
Building Roof drift capacity(Du/H) (%)
Roof drift demand (Du/H)
Soil Z2 (%) Soil Z3 (%)
Public 1.6 1.9 2.6
Hospital 2.0 3.0 4.1
School 1.0 2.0 2.7
Residential-1 1.3 1.4 2.0
Residential-2 0.8 1.7 2.3
Table 2 Maximum displacement demands estimated using displacement coefficient method
Building Te (s) C0 Sa-Z2 (g) Sa-Z3 (g) Displacement demand (cm) Displacement demand(D/H)
Soil Z2 Soil Z3 Soil Z2 (%) Soil Z3 (%)
Public 0.87 1.26 1.33 1.84 32 44 1.9 2.6
Hospital 1.39 1.29 0.92 1.27 57 79 3.0 4.1
School 0.76 1.32 1.50 2.07 28 39 1.9 2.7
Residential-1 0.66 1.27 1.67 2.32 23 32 1.4 2.0
Residential-2 1.09 1.36 1.11 1.54 45 62 1.7 2.3
Nat Hazards (2010) 54:97–119 113
123

for buildings in Izmir are not higher than for those in Duzce and Izmir has an important
earthquake risk for a possible future earthquake.
The soil class is found to have a significant effect on displacement demands and
therefore on the expected performance of each structure.
According to displacement coefficient method results, for the public building, maximum
global drift demand is 0.019 for Z2 soil class and 0.026 for Z3 soil class. The maximum
global drift capacity of the public building was calculated as 0.010. Accordingly, the public
Table 4 Peak ground motion parameters for the generated earthquake data used in nonlinear dynamicanalyses
Eq.No.
Soil Z2 Soil Z3
Public &school
Hospital Residential Public &school
Hospital Residential
PGA(g)
PGV(cm/s)
PGA(g)
PGV(cm/s)
PGA(g)
PGV(cm/s)
PGA(g)
PGV(cm/s)
PGA(g)
PGV(cm/s)
PGA(g)
PGV(cm/s)
1 70 44 54 44 44 31 58 48 73 54 46 27
2 67 37 65 50 46 33 66 49 70 54 54 39
3 59 45 54 55 44 31 61 51 68 69 44 39
4 60 37 68 44 43 34 61 54 62 48 43 34
5 54 41 60 45 41 30 64 59 64 55 51 49
6 59 44 60 40 41 36 71 65 63 51 47 37
7 67 45 68 43 43 30 62 52 67 51 46 44
8 68 42 76 48 42 32 63 51 63 53 49 37
9 60 38 62 38 48 26 68 74 64 54 44 36
10 64 35 72 42 45 28 59 39 69 58 48 33
11 49 40 69 46 39 27 58 45 66 76 55 47
12 56 38 69 46 40 28 67 49 66 76 44 46
13 60 41 58 36 46 30 63 50 65 56 42 44
14 57 38 64 47 43 28 58 55 61 66 43 34
15 54 42 68 48 40 29 58 55 62 58 47 39
16 59 40 64 46 42 27 54 50 74 55 49 40
17 61 38 68 51 44 29 57 46 82 53 41 35
18 57 50 58 47 41 33 61 52 62 66 55 35
19 67 41 60 38 43 25 71 64 73 60 41 40
20 57 40 58 51 42 31 62 56 69 49 49 36
21 61 44 59 43 44 31 64 48 66 49 42 42
22 61 44 58 47 42 34 68 61 76 46 41 40
23 59 33 70 49 47 28 65 48 63 57 46 43
24 60 39 67 53 44 28 64 44 74 51 48 35
25 65 35 59 53 47 34 61 57 66 66 46 41
26 56 46 63 44 40 32 67 44 65 54 43 39
27 55 41 64 40 46 29 58 67 65 54 41 37
28 65 42 64 40 46 29 56 64 66 62 41 38
29 57 39 66 46 48 25 57 48 63 64 46 38
30 68 46 64 52 44 28 70 64 73 56 45 41
114 Nat Hazards (2010) 54:97–119
123
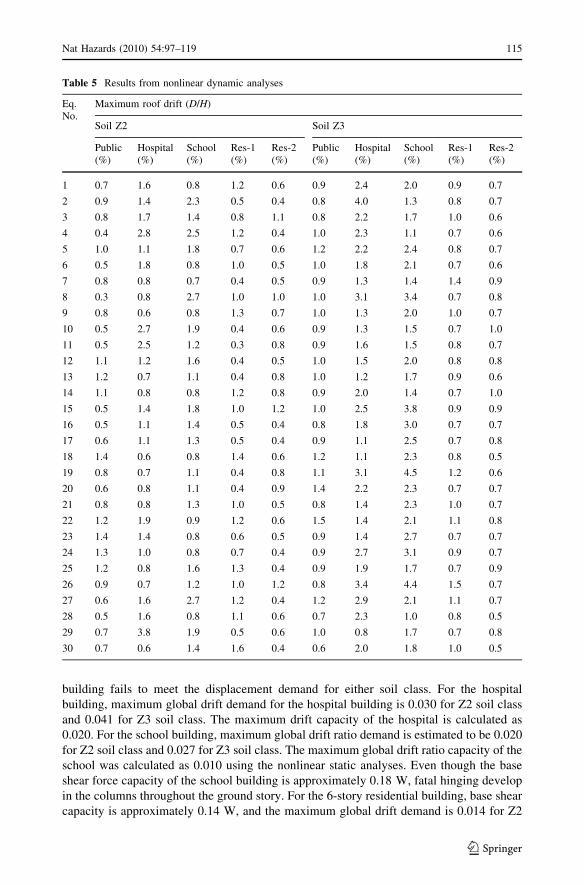
building fails to meet the displacement demand for either soil class. For the hospital
building, maximum global drift demand for the hospital building is 0.030 for Z2 soil class
and 0.041 for Z3 soil class. The maximum drift capacity of the hospital is calculated as
0.020. For the school building, maximum global drift ratio demand is estimated to be 0.020
for Z2 soil class and 0.027 for Z3 soil class. The maximum global drift ratio capacity of the
school was calculated as 0.010 using the nonlinear static analyses. Even though the base
shear force capacity of the school building is approximately 0.18 W, fatal hinging develop
in the columns throughout the ground story. For the 6-story residential building, base shear
capacity is approximately 0.14 W, and the maximum global drift demand is 0.014 for Z2
Table 5 Results from nonlinear dynamic analyses
Eq.No.
Maximum roof drift (D/H)
Soil Z2 Soil Z3
Public(%)
Hospital(%)
School(%)
Res-1(%)
Res-2(%)
Public(%)
Hospital(%)
School(%)
Res-1(%)
Res-2(%)
1 0.7 1.6 0.8 1.2 0.6 0.9 2.4 2.0 0.9 0.7
2 0.9 1.4 2.3 0.5 0.4 0.8 4.0 1.3 0.8 0.7
3 0.8 1.7 1.4 0.8 1.1 0.8 2.2 1.7 1.0 0.6
4 0.4 2.8 2.5 1.2 0.4 1.0 2.3 1.1 0.7 0.6
5 1.0 1.1 1.8 0.7 0.6 1.2 2.2 2.4 0.8 0.7
6 0.5 1.8 0.8 1.0 0.5 1.0 1.8 2.1 0.7 0.6
7 0.8 0.8 0.7 0.4 0.5 0.9 1.3 1.4 1.4 0.9
8 0.3 0.8 2.7 1.0 1.0 1.0 3.1 3.4 0.7 0.8
9 0.8 0.6 0.8 1.3 0.7 1.0 1.3 2.0 1.0 0.7
10 0.5 2.7 1.9 0.4 0.6 0.9 1.3 1.5 0.7 1.0
11 0.5 2.5 1.2 0.3 0.8 0.9 1.6 1.5 0.8 0.7
12 1.1 1.2 1.6 0.4 0.5 1.0 1.5 2.0 0.8 0.8
13 1.2 0.7 1.1 0.4 0.8 1.0 1.2 1.7 0.9 0.6
14 1.1 0.8 0.8 1.2 0.8 0.9 2.0 1.4 0.7 1.0
15 0.5 1.4 1.8 1.0 1.2 1.0 2.5 3.8 0.9 0.9
16 0.5 1.1 1.4 0.5 0.4 0.8 1.8 3.0 0.7 0.7
17 0.6 1.1 1.3 0.5 0.4 0.9 1.1 2.5 0.7 0.8
18 1.4 0.6 0.8 1.4 0.6 1.2 1.1 2.3 0.8 0.5
19 0.8 0.7 1.1 0.4 0.8 1.1 3.1 4.5 1.2 0.6
20 0.6 0.8 1.1 0.4 0.9 1.4 2.2 2.3 0.7 0.7
21 0.8 0.8 1.3 1.0 0.5 0.8 1.4 2.3 1.0 0.7
22 1.2 1.9 0.9 1.2 0.6 1.5 1.4 2.1 1.1 0.8
23 1.4 1.4 0.8 0.6 0.5 0.9 1.4 2.7 0.7 0.7
24 1.3 1.0 0.8 0.7 0.4 0.9 2.7 3.1 0.9 0.7
25 1.2 0.8 1.6 1.3 0.4 0.9 1.9 1.7 0.7 0.9
26 0.9 0.7 1.2 1.0 1.2 0.8 3.4 4.4 1.5 0.7
27 0.6 1.6 2.7 1.2 0.4 1.2 2.9 2.1 1.1 0.7
28 0.5 1.6 0.8 1.1 0.6 0.7 2.3 1.0 0.8 0.5
29 0.7 3.8 1.9 0.5 0.6 1.0 0.8 1.7 0.7 0.8
30 0.7 0.6 1.4 1.6 0.4 0.6 2.0 1.8 1.0 0.5
Nat Hazards (2010) 54:97–119 115
123
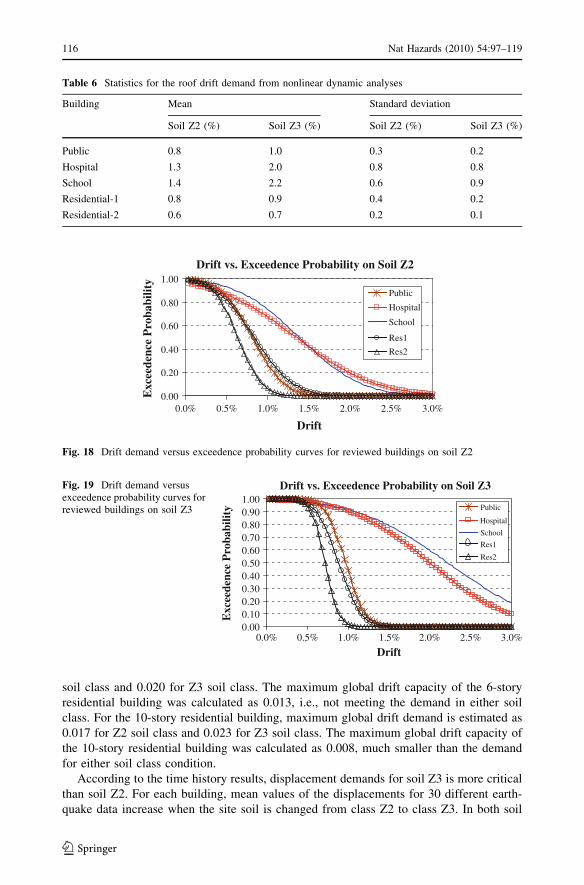
soil class and 0.020 for Z3 soil class. The maximum global drift capacity of the 6-story
residential building was calculated as 0.013, i.e., not meeting the demand in either soil
class. For the 10-story residential building, maximum global drift demand is estimated as
0.017 for Z2 soil class and 0.023 for Z3 soil class. The maximum global drift capacity of
the 10-story residential building was calculated as 0.008, much smaller than the demand
for either soil class condition.
According to the time history results, displacement demands for soil Z3 is more critical
than soil Z2. For each building, mean values of the displacements for 30 different earth-
quake data increase when the site soil is changed from class Z2 to class Z3. In both soil
Table 6 Statistics for the roof drift demand from nonlinear dynamic analyses
Building Mean Standard deviation
Soil Z2 (%) Soil Z3 (%) Soil Z2 (%) Soil Z3 (%)
Public 0.8 1.0 0.3 0.2
Hospital 1.3 2.0 0.8 0.8
School 1.4 2.2 0.6 0.9
Residential-1 0.8 0.9 0.4 0.2
Residential-2 0.6 0.7 0.2 0.1
Drift vs. Exceedence Probability on Soil Z2
0.00
0.20
0.40
0.60
0.80
1.00
0.0% 0.5% 1.0% 1.5% 2.0% 2.5% 3.0%
Drift
Exc
eede
nce
Pro
babi
lity
Public
Hospital
School
Res1
Res2
Fig. 18 Drift demand versus exceedence probability curves for reviewed buildings on soil Z2
Drift vs. Exceedence Probability on Soil Z3
0.000.100.200.300.400.500.600.700.800.901.00
0.0% 0.5% 1.0% 1.5% 2.0% 2.5% 3.0%
Drift
Exc
eede
nce
Pro
babi
lity Public
Hospital
School
Res1
Res2
Fig. 19 Drift demand versusexceedence probability curves forreviewed buildings on soil Z3
116 Nat Hazards (2010) 54:97–119
123
types, the mean displacement demand for the hospital building is higher than those for the
other buildings. For the public building, displacement demands are 0.8% (=14 cm) and
1.0% (=17 cm) for soil Z2 and soil Z3, respectively. For the hospital building, mean values
of displacement demands are 1.3% (=26 cm) and 2.0% (=39 cm) for Soil Z2 and Soil Z3,
respectively. For the school building, displacement demands are 1.4% (=20 cm) and 2.2%
(=32 cm) for Soil Z2 and Soil Z3, respectively. For the 6-story residential building, dis-
placement demands are around 0.8–0.9% (=14 cm) for each soil class. For the 10-story
residential building, displacement demands are 0.6% (=17 cm) and 0.7% (=19 cm) for Soil
Z2 and Soil Z3, respectively.
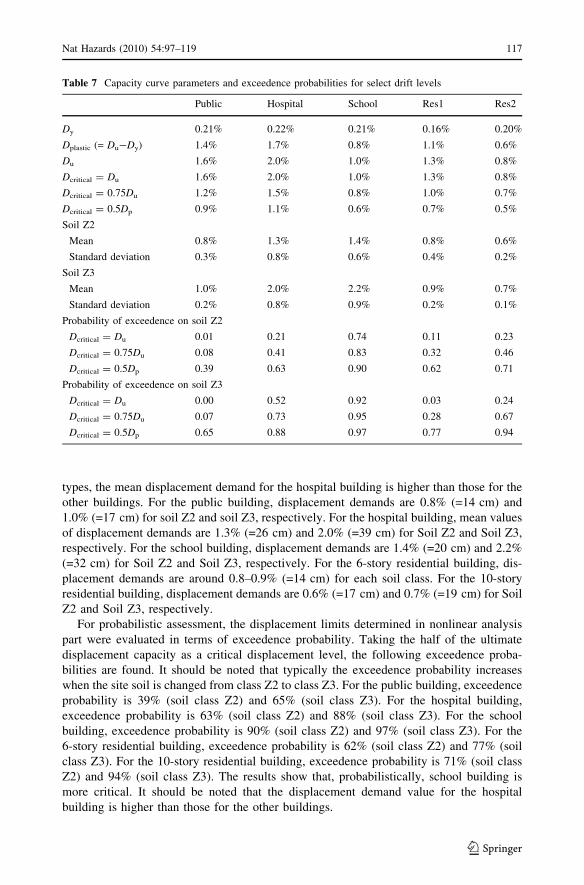
For probabilistic assessment, the displacement limits determined in nonlinear analysis
part were evaluated in terms of exceedence probability. Taking the half of the ultimate
displacement capacity as a critical displacement level, the following exceedence proba-
bilities are found. It should be noted that typically the exceedence probability increases
when the site soil is changed from class Z2 to class Z3. For the public building, exceedence
probability is 39% (soil class Z2) and 65% (soil class Z3). For the hospital building,
exceedence probability is 63% (soil class Z2) and 88% (soil class Z3). For the school
building, exceedence probability is 90% (soil class Z2) and 97% (soil class Z3). For the
6-story residential building, exceedence probability is 62% (soil class Z2) and 77% (soil
class Z3). For the 10-story residential building, exceedence probability is 71% (soil class
Z2) and 94% (soil class Z3). The results show that, probabilistically, school building is
more critical. It should be noted that the displacement demand value for the hospital
building is higher than those for the other buildings.
Table 7 Capacity curve parameters and exceedence probabilities for select drift levels
Public Hospital School Res1 Res2
Dy 0.21% 0.22% 0.21% 0.16% 0.20%
Dplastic (= Du-Dy) 1.4% 1.7% 0.8% 1.1% 0.6%
Du 1.6% 2.0% 1.0% 1.3% 0.8%
Dcritical = Du 1.6% 2.0% 1.0% 1.3% 0.8%
Dcritical = 0.75Du 1.2% 1.5% 0.8% 1.0% 0.7%
Dcritical = 0.5Dp 0.9% 1.1% 0.6% 0.7% 0.5%
Soil Z2
Mean 0.8% 1.3% 1.4% 0.8% 0.6%
Standard deviation 0.3% 0.8% 0.6% 0.4% 0.2%
Soil Z3
Mean 1.0% 2.0% 2.2% 0.9% 0.7%
Standard deviation 0.2% 0.8% 0.9% 0.2% 0.1%
Probability of exceedence on soil Z2
Dcritical = Du 0.01 0.21 0.74 0.11 0.23
Dcritical = 0.75Du 0.08 0.41 0.83 0.32 0.46
Dcritical = 0.5Dp 0.39 0.63 0.90 0.62 0.71
Probability of exceedence on soil Z3
Dcritical = Du 0.00 0.52 0.92 0.03 0.24
Dcritical = 0.75Du 0.07 0.73 0.95 0.28 0.67
Dcritical = 0.5Dp 0.65 0.88 0.97 0.77 0.94
Nat Hazards (2010) 54:97–119 117
123
It should be noted that Akkar et al. (2005) developed displacement-based fragility
functions for two to five stories high ordinary concrete buildings based on probabilistic
review of information from performance of 32 structures affected by the 1999 Duzce
earthquake. They have developed performance level estimates under various levels of
shaking intensity, expressed in terms of PGV, using equivalent single-degree-of-freedom
systems. In our study, we have used detailed nonlinear numerical models for the buildings
and considered only design-basis earthquakes. The performance estimates we have
obtained, in terms of overall drift levels, for the 5-story public building under design-basis
earthquake agrees with the range of equivalent event estimates deduced from the perfor-
mance curves provided in Akkar et al. (2005). However, in the case of the 4-story school
building, we estimate that the school building would perform worse than that estimated by
Akkar et al. for 4-story buildings. The 4-story building they considered had shear walls in
both plan directions, but the school building we have considered had no shear walls active
along the plan longitudinal direction. We believe that is a major source of difference due to
the fact that lateral load resisting systems consisting of moment-frames with unreinforced
hollow clay-tile infill walls have very limited displacement capacity. In fact, the extremely
poor performance of school buildings with moment-frame systems with unreinforced
hollow clay-tile infill walls during the 1999 Duzce and the less intense 2003 Bingol,
Turkey earthquakes have been documented extensively (Gur et al. 2009).
6 Conclusion
In this study, the expected earthquake performance of typical reinforced concrete buildings
in Izmir, Turkey is investigated using different estimation approaches. Results from the
assessments indicate that considered type of existing reinforced concrete buildings in Izmir
face risk of poor performance, including heavy damage or collapse, during possible strong
earthquakes in the future.
References
Akinci A, Eyidogan H, Gokturkler G, Akyol N, Ankaya O (2000) Investigation of the seismic activity andseismic hazard of Izmir city and its vicinity. Earthquake Risk Assessment of West Anatolian Sym-posium, p.231
Akkar S, Sucuoglu H, Yakut A (2005) Displacement-based fragility functions for low- and mid-rise ordinaryconcrete buildings. Earthq Spectra 21(4):901–927
Baykara T (1974) The city of Izmir and its history, vol 2. Ege University Archeology Institute Press, IzmirDonmez C, Pujol S (2005) Spatial distribution of damage caused by the 1999 earthquakes in Turkey. Earthq
Spectra 21(1):53–69Emre O, Ozalp S, Dogan A, Ozaksoy V, Yildirim C, Goktas F (2005) Active faults in the vicinity of Izmir
and their earthquake potentials [in Turkish], Report No: 10754, Geological Studies Department,General Directorate of Mineral Research and Exploration, Ankara, Turkey
ESL Software (2004) RSCTH: software program for generating artificial earthquake data. http://civil.eng.buffalo.edu/engseislab/products.htm, Engineering Seismology Laboratory, State University andBuffalo, New York
Fajfar P, Feri MA (2000) Nonlinear analysis method for performance based design. Earthq Spectra16(3):573–592
Federal Emergency Management Agency [FEMA] (2000) FEMA 356: prestandard and commentary for theseismic rehabilitation of buildings. NEHRP Guidelines, Washington D.C
Federal Emergency Management Agency [FEMA] (2005) FEMA 440: improvement of nonlinear staticseismic analysis procedures. NEHRP Guidelines, Washington D.C
118 Nat Hazards (2010) 54:97–119
123
Google Earth, Satellite Image web page (2008) Visited on July 24, 2008. http://maps.google.com/maps?ll=38.442537,27.095737&z=10&hl=en&t=h
Gur T, Pay AC, Ramirez JA, Sozen MA, Johnson AM, Irfanoglu A, Bobet A (2009) Performance of schoolbuildings in Turkey during the 1999 Duzce and 2003 Bingol earthquakes. Earthq Spectra 25(2):239–256
Hassan AF, Sozen MA (1997) Seismic vulnerability assessment of low-rise buildings in regions withinfrequent earthquakes. Am Concr Inst Struct J 94(1):31–39
Hasan R, Xu L, Grierson DE (2002) Push-over analysis for performance-based seismic design. J Struc Eng80:2483–2493
Ilhan T, Utku M, Ozyal N, Utku Z (2004) Earthquake risk of Izmir region. Dokuz Eylul University MarineScience Institute Press, Izmir
Irfanoglu A (2009) Performance of template school buildings during earthquakes in Turkey and Peru.J Perform Constr Facil 23(1):5–14
Kalkan E, Gulkan P, Yilmaz N, Celebi M (2009) Reassessment of probabilistic seismic hazard in theMarmara region. Bull Seismol Soc Am 99:2127–2146
Korkmaz KA, Deniz A, Irfanoglu A (2009) Probabilistic seismic hazard assessment for Izmir, Turkey. PureAppl Geophys, in review
Metropolitan Municipality of Izmir [MMI] (2000) Izmir earthquake master plan. http://www.izmir.bel.tr/izmirdeprem/izmirrapor.htm, Metropolitan Municipality of Izmir publication, Izmir, Turkey
Ministry of Public Works and Settlement [MPWS] (1996) Seismic hazard map of Turkey. Ankara, TurkeyMinistry of Public Works and Settlement [MPWS] (2007) Specifications for structures to be built in disaster
areas, the 2007 seismic design code [in Turkish]. Ankara, TurkeyMinistry of Reconstruction and Resettlement [MRR] (1975) Specifications for structures to be built in
disaster areas, the 1975 seismic design code. English translation. Earthquake Research Institute,Ankara, Turkey
Ocakoglu N, Demirbag E, Kuscu I (2005) Neotectonic structures in Izmir gulf and surrounding regions(Western Turkey): evidences of strike-slip faulting with compression in the Aegean extensionalregime’’, Marine Geology
Ozcebe G, Ramirez J, Wasti ST, Yakut A (2004) 1 May 2003 Bingol earthquake engineering report. Rep.no. 2004/1, TUB_ITAK SERU Structural Engineering Research Unit, Ankara, Turkey
RADIUS (1997) Risk assessment tools for diagnosis of urban areas against seismic disaster Izmir earthquakemaster program. Bogazici University Kandilli Observatory, Istanbul
Sezen H, Elwood KJ, Whittaker AS, Mossalam KM, Wallace JW, Stanton JF (2000) Structural engineeringreconnaissance of the August 17, 1999 earthquake: Kocaeli (Izmit), Turkey. Pacific EarthquakeEngineering Research Center, PEER Report 2000/09, Berkeley, CA
Sucuoglu H (2000) The 1999 Kocaeli and Duzce-Turkey earthquakes. Middle East Technical University,Ankara
Turker K, Irtem E (2007) An effective load increment method for multi modal adaptive pushover analysis ofbuildings. Struct Eng Mech 25(1):53–73
Wilson E, Habibullah A (1998) SAP2000NL integrated finite element analysis and design of structures basicanalysis. Reference Manual, Computers and Structures, Berkeley, CA
Nat Hazards (2010) 54:97–119 119
123
Copyright © 2022 FDOKUMEN