
Application of ANN to explore the potential use of natural ventilation in buildings in Turkey
9
Application of ANN to explore the potential use of natural ventilation in buildings in Turkey Tahir Ayata * , Erol Arcaklıog ˘lu, Osman Yıldız Kırıkkale University, Faculty of Engineering, 71451 Campus, Kırıkkale, Turkey Received 8 November 2005; accepted 19 May 2006 Available online 12 July 2006 Abstract Indoor natural ventilation provides both the circulation of clear air and the decrease of indoor temperature, especially, during hot summer days. In addition to openings, building dimensions and position play a significant role to obtain a uniform indoor air velocity distribution. In this study, the potential use of natural ventilation as a passive cooling system in new building designs in Kayseri, a mid- size city in Turkey, was investigated. First, indoor air velocity distributions with respect to changing wind direction, magnitude and door openings were simulated by the FLUENT package program, which employs finite element methods. Using the simulated data an arti- ficial neural network (ANN) model was developed to predict indoor average and maximum air velocities. The simulations produced by FLUENT show that the average indoor air velocity is generally below 1.0 m/s for the local prevailing wind directions. The simulations results suggest that, in addition to the orientation of buildings in accordance with prevailing wind directions, a proper indoor design of buildings in the area can significantly increase the capability of air ventilation during warm summer days. It was found that a high cor- relation exists between the simulated and the ANN predicted data indicating a successful learning by the proposed ANN model. Overall, the evaluation of the network results indicated that the ANN approach can be utilized as an efficient tool for learning, training and pre- dicting indoor air velocity distributions for natural ventilation. Ó 2006 Elsevier Ltd. All rights reserved. Keywords: ANN; Natural ventilation; FLUENT; Thermal comfort; Wind speed; Turkey 1. Introduction Natural ventilation can be utilized as an effective passive cooling system to significantly reduce energy used by air conditioning systems in buildings. Building design with good natural ventilation in urban areas is challenging, because the surroundings have a significant impact on the wind pattern and indoor air velocity. In dense areas, where buildings often block each other from the wind, a hot microclimate is created during relatively warm periods of time. Significant benefits from natural ventilation can be obtained provided that buildings are oriented towards prevailing wind directions in a staggered manner. As known that linear alignments of buildings result in a wind shadow leading to a low pressure area at the back of each building. In order to eliminate such problems and also for an effective use of natural ventilation in buildings, city planners and building designers should seriously take prevailing local wind directions into consideration. In addition to the build- ing orientation, the ratio of building dimensions (i.e., length and width) is an important factor in determining the amount of natural ventilation. Olgyay [1] suggests that the optimal ratio for a house in hot and humid climates is 1:1.7, with long sides facing north and south. In Turkey, inner room ventilation during summer days is generally carried out through door and window openings. The main purpose of natural ventilation is to obtain as much as fresh and clear air, which eventually brings the room temperature down for thermal comfort and transfers 1359-4311/$ - see front matter Ó 2006 Elsevier Ltd. All rights reserved. doi:10.1016/j.applthermaleng.2006.05.021 * Corresponding author. Tel.: +90 318 357 35 71x1216; fax: +90 318 357 24 59. E-mail addresses: [email protected], [email protected] (T. Ayata). www.elsevier.com/locate/apthermeng Applied Thermal Engineering 27 (2007) 12–20
Transcript of Application of ANN to explore the potential use of natural ventilation in buildings in Turkey

www.elsevier.com/locate/apthermeng
Applied Thermal Engineering 27 (2007) 12–20
Application of ANN to explore the potential use of naturalventilation in buildings in Turkey
Tahir Ayata *, Erol Arcaklıoglu, Osman Yıldız
Kırıkkale University, Faculty of Engineering, 71451 Campus, Kırıkkale, Turkey
Received 8 November 2005; accepted 19 May 2006Available online 12 July 2006
Abstract
Indoor natural ventilation provides both the circulation of clear air and the decrease of indoor temperature, especially, during hotsummer days. In addition to openings, building dimensions and position play a significant role to obtain a uniform indoor air velocitydistribution. In this study, the potential use of natural ventilation as a passive cooling system in new building designs in Kayseri, a mid-size city in Turkey, was investigated. First, indoor air velocity distributions with respect to changing wind direction, magnitude and dooropenings were simulated by the FLUENT package program, which employs finite element methods. Using the simulated data an arti-ficial neural network (ANN) model was developed to predict indoor average and maximum air velocities. The simulations produced byFLUENT show that the average indoor air velocity is generally below 1.0 m/s for the local prevailing wind directions. The simulationsresults suggest that, in addition to the orientation of buildings in accordance with prevailing wind directions, a proper indoor design ofbuildings in the area can significantly increase the capability of air ventilation during warm summer days. It was found that a high cor-relation exists between the simulated and the ANN predicted data indicating a successful learning by the proposed ANN model. Overall,the evaluation of the network results indicated that the ANN approach can be utilized as an efficient tool for learning, training and pre-dicting indoor air velocity distributions for natural ventilation.� 2006 Elsevier Ltd. All rights reserved.
Keywords: ANN; Natural ventilation; FLUENT; Thermal comfort; Wind speed; Turkey
1. Introduction
Natural ventilation can be utilized as an effective passivecooling system to significantly reduce energy used by airconditioning systems in buildings. Building design withgood natural ventilation in urban areas is challenging,because the surroundings have a significant impact on thewind pattern and indoor air velocity. In dense areas, wherebuildings often block each other from the wind, a hotmicroclimate is created during relatively warm periods oftime. Significant benefits from natural ventilation can beobtained provided that buildings are oriented towards
1359-4311/$ - see front matter � 2006 Elsevier Ltd. All rights reserved.
doi:10.1016/j.applthermaleng.2006.05.021
* Corresponding author. Tel.: +90 318 357 35 71x1216; fax: +90 318 35724 59.
E-mail addresses: [email protected], [email protected](T. Ayata).
prevailing wind directions in a staggered manner. As knownthat linear alignments of buildings result in a wind shadowleading to a low pressure area at the back of each building.In order to eliminate such problems and also for an effectiveuse of natural ventilation in buildings, city planners andbuilding designers should seriously take prevailing localwind directions into consideration. In addition to the build-ing orientation, the ratio of building dimensions (i.e., lengthand width) is an important factor in determining theamount of natural ventilation. Olgyay [1] suggests that theoptimal ratio for a house in hot and humid climates is1:1.7, with long sides facing north and south.
In Turkey, inner room ventilation during summer days isgenerally carried out through door and window openings.The main purpose of natural ventilation is to obtain asmuch as fresh and clear air, which eventually brings theroom temperature down for thermal comfort and transfers
T. Ayata et al. / Applied Thermal Engineering 27 (2007) 12–20 13
the body heat through forced convection exceeding the nat-ural convection boundaries.
Passive cooling design elements are mostly neglected inmodern city planning and building designs. In general,local seasonal wind patterns are not taken into consider-ation at planning and design of living environments.Although doors and windows can easily provide naturalventilation for thermal comfort, but they usually are notconsidered in this context by designers. It is also importantto note that high air velocity and irregular airflow distribu-tion within living spaces may not serve a comfortable livingcondition. Actually, for a thermally comfortable environ-ment, indoor air velocity should be about 0.4 m/s withthe upper limit of 1 m/s at which the airflow starts to pickup light objects [2].
According to the ASHRAE standards the upper limit ofcomfortable temperature in living environments is 26 �C[2]. The so-called equivalent temperature reduction (ETR)defined by Lechner [3] represents the temperature increasenecessary to maintain the same thermal sensation with agiven air velocity. According to the author, for example,the ETR is 1.1, 1.9 and 3.3 �C at air velocities of 0.2, 0.4and 1 m/s, respectively.
In the design of office buildings, computerized optimiza-tion models have been developed for different climaticregions to minimize the energy consumption [4]. The AHS-RAE comfort standards for inadequately planned build-ings in warm climatic regions were studied and thesuitability of different building design strategies and thepassive cooling systems in different climates were assessed[5]. The potential use of natural ventilation in new housedesigns in Thailand was explored and it was found that athermally comfortable indoor environment can be achievedin houses in a Bangkok suburb during 20% of the year [6].
Various studies using fuzzy logic (FL), artificial neuralnetwork (ANN) and adaptive neuro-fuzzy inference sys-tems (ANFIS) predicting and control techniques have beenapplied to natural ventilation of buildings. For example,fuzzy controllers were more successful to produce a tem-perature closer to the set-point temperature for naturalventilation than that of conventional controllers [7–9].An ANN model was developed to predict air pressure coef-ficients across the openings in a light weight single-sidednaturally ventilated test room [10]. Combining the twotechniques, an ANFIS model was proposed to obtain ductand pipe networks and optimal differential pressure setpoints based on limited sensor information by consideringvariation of cooling load of each end user [11].
In this study, the applicability of natural ventilation as apassive cooling system was investigated in modern build-ings in Kayseri, located at 38.44�N and 35.29�W, usingmodel simulations of indoor air velocity by FLUENT. Inthe city, a moderate climate prevails during the summermonths of June, July and August with the air temperaturevarying between 33 and 36 �C during the daytimes and therelative humidity ranging from 50% to 56%. Using the sim-ulated data for different building dimensions wind speed
and directions an ANN model was developed to predictindoor average and maximum air velocities. Further pre-dictions were performed for additional scenarios. Theadvantage of using ANN formulations is that they onlyconsist of basic mathematical operations, which require les-ser computational time.
The simulation of indoor air velocity by FLUENT wasdescribed in Section 2 followed by the evaluation of simu-lation results in Section 3. The ANN model application tothe simulated data was presented in Section 4, ANN pre-diction results and discussion were provided in Section 5,and finally, the conclusions were given in Section 6.
2. Numerical solution
The continuity equation for a two dimensional fluid flowfor steady state conditions in the Cartesian coordinates isgiven as follows:
oðquÞoxþ oðqvÞ
oy¼ 0 ð1Þ
in which u and v are velocity components in x and y direc-tions and q is the fluid density.
The momentum equations for x and y axes are defined as
q uouoxþ v
ouoy
� �¼ � oP
oxþ o
oxl 2
ouox� 2
3
ouoxþ ov
oy
� �� �� �
þ o
oyl
ouoyþ ov
ox
� �� �þ X
q uovoxþ v
ovoy
� �¼ � oP
oyþ o
oyl 2
ovoy� 2
3
ouoxþ ov
oy
� �� �� �
þ o
oxl
ouoyþ ov
ox
� �� �þ Y
ð2Þwhere P is the pressure and l is the dynamic viscosity of thefluid [12].
The velocity distribution of the incompressible fluid isobtained from the continuity and the momentum equa-tions. The analytical solution of the problem is not possiblebecause of inhomogeneous differential equations. There-fore, numerical methods are applied to the solution of thistype of problems. In this study, the FLUENT softwareprogram was used for the numerical calculations. The pro-gram employs finite element methods in solving the differ-ential equations.
3. Indoor air velocity simulations by FLUENT
Unfortunately, as in many places in Turkey, most mod-ern buildings in Kayseri have been designed without muchattention to natural ventilation. In addition to misalign-ment of buildings with prevailing wind directions, windblockage by upstream buildings seriously deteriorates aircirculation in many neighborhoods. In the city, the prevail-ing wind during the summer months comes from three pre-dominant directions, namely, north–north-west (NNW),
0
50
100
150
200N
NNE
NE
ENE
E
ESE
SE
SSE
S
SSW
SW
WSW
W
WN
NW
NNW
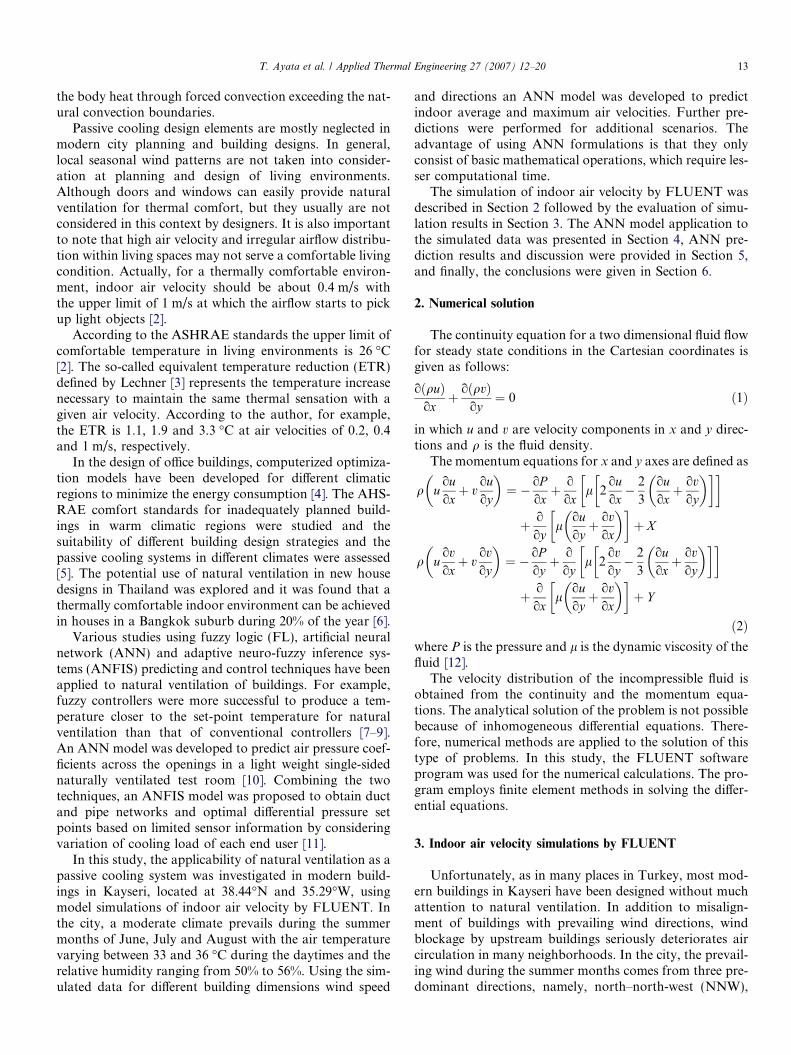
Fig. 1. The prevailing wind directions with the total number of hourlywind flows during summer between 10 and 18 h in Kayseri.
14 T. Ayata et al. / Applied Thermal Engineering 27 (2007) 12–20
north-west (NW) and west-north (WN). Fig. 1 displays theprevailing wind directions and the number of hourly windflows in June, July and August during the daytimes (i.e.,from 10 to 18 h). The wind speed measured at 10 m heightfrom the ground level ranges from 1.6 to 3.2 m/s in alldirections during the daytimes [13].
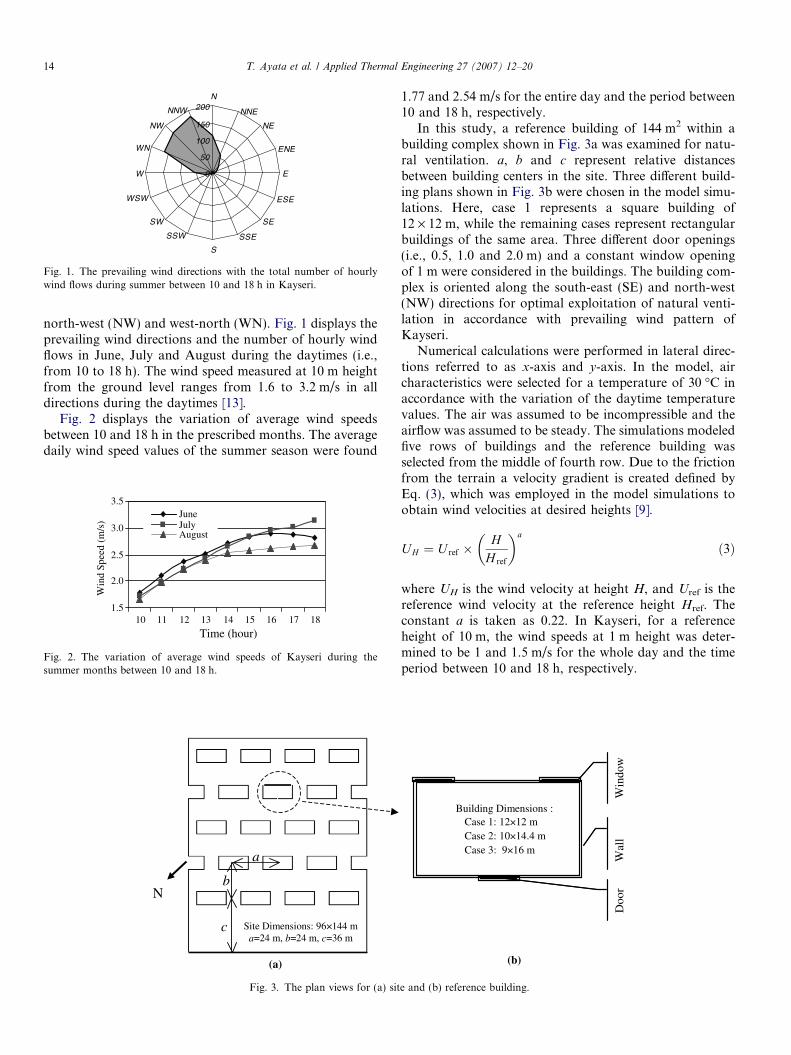
Fig. 2 displays the variation of average wind speedsbetween 10 and 18 h in the prescribed months. The averagedaily wind speed values of the summer season were found
1.5
2.0
2.5
3.0
3.5
10 11 12 13 14 15 16 17 18
Time (hour)
Win
d Sp
eed
(m/s
)
JuneJulyAugust
Fig. 2. The variation of average wind speeds of Kayseri during thesummer months between 10 and 18 h.
Site Dimensions: 96×144 ma=24 m, b=24 m, c=36 m
(a)
N
a
b
c
Fig. 3. The plan views for (a) sit
1.77 and 2.54 m/s for the entire day and the period between10 and 18 h, respectively.
In this study, a reference building of 144 m2 within abuilding complex shown in Fig. 3a was examined for natu-ral ventilation. a, b and c represent relative distancesbetween building centers in the site. Three different build-ing plans shown in Fig. 3b were chosen in the model simu-lations. Here, case 1 represents a square building of12 · 12 m, while the remaining cases represent rectangularbuildings of the same area. Three different door openings(i.e., 0.5, 1.0 and 2.0 m) and a constant window openingof 1 m were considered in the buildings. The building com-plex is oriented along the south-east (SE) and north-west(NW) directions for optimal exploitation of natural venti-lation in accordance with prevailing wind pattern ofKayseri.
Numerical calculations were performed in lateral direc-tions referred to as x-axis and y-axis. In the model, aircharacteristics were selected for a temperature of 30 �C inaccordance with the variation of the daytime temperaturevalues. The air was assumed to be incompressible and theairflow was assumed to be steady. The simulations modeledfive rows of buildings and the reference building wasselected from the middle of fourth row. Due to the frictionfrom the terrain a velocity gradient is created defined byEq. (3), which was employed in the model simulations toobtain wind velocities at desired heights [9].
UH ¼ U ref �H
H ref
� �a
ð3Þ
where UH is the wind velocity at height H, and Uref is thereference wind velocity at the reference height Href. Theconstant a is taken as 0.22. In Kayseri, for a referenceheight of 10 m, the wind speeds at 1 m height was deter-mined to be 1 and 1.5 m/s for the whole day and the timeperiod between 10 and 18 h, respectively.
(b)
Win
dow
Wal
l D
oor
Building Dimensions :Case 1: 12×12 mCase 2: 10×14.4 mCase 3: 9×16 m
e and (b) reference building.
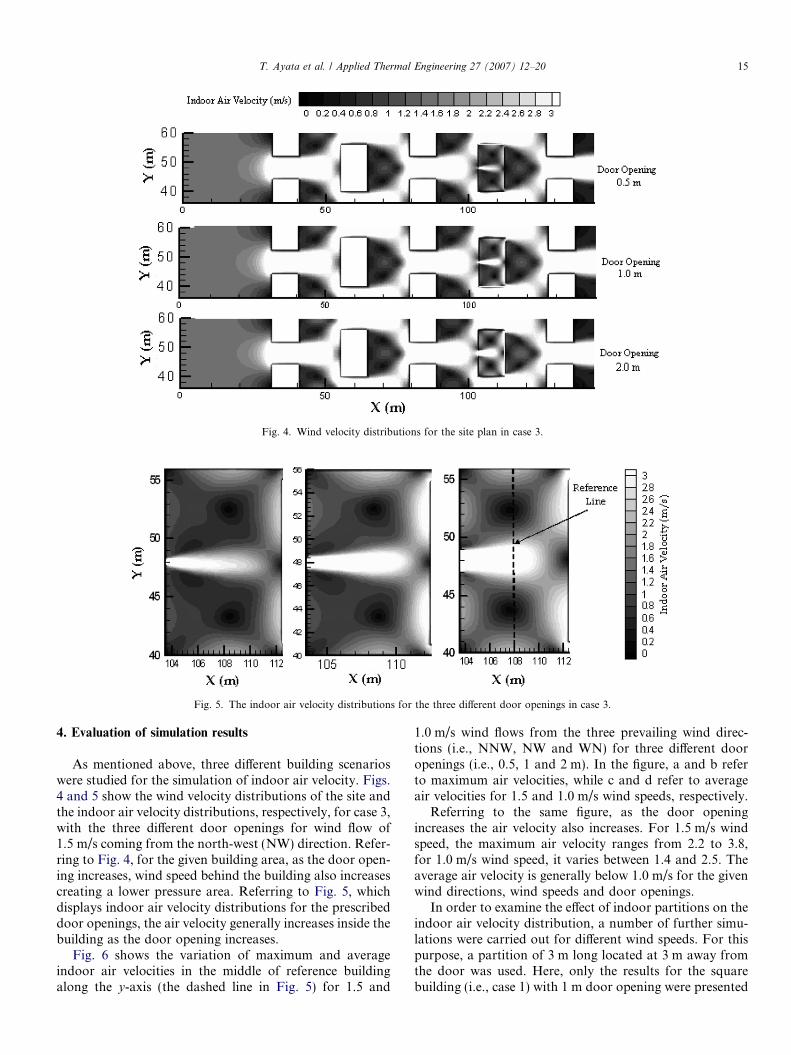
Fig. 4. Wind velocity distributions for the site plan in case 3.
Fig. 5. The indoor air velocity distributions for the three different door openings in case 3.
T. Ayata et al. / Applied Thermal Engineering 27 (2007) 12–20 15
4. Evaluation of simulation results
As mentioned above, three different building scenarioswere studied for the simulation of indoor air velocity. Figs.4 and 5 show the wind velocity distributions of the site andthe indoor air velocity distributions, respectively, for case 3,with the three different door openings for wind flow of1.5 m/s coming from the north-west (NW) direction. Refer-ring to Fig. 4, for the given building area, as the door open-ing increases, wind speed behind the building also increasescreating a lower pressure area. Referring to Fig. 5, whichdisplays indoor air velocity distributions for the prescribeddoor openings, the air velocity generally increases inside thebuilding as the door opening increases.
Fig. 6 shows the variation of maximum and averageindoor air velocities in the middle of reference buildingalong the y-axis (the dashed line in Fig. 5) for 1.5 and
1.0 m/s wind flows from the three prevailing wind direc-tions (i.e., NNW, NW and WN) for three different dooropenings (i.e., 0.5, 1 and 2 m). In the figure, a and b referto maximum air velocities, while c and d refer to averageair velocities for 1.5 and 1.0 m/s wind speeds, respectively.
Referring to the same figure, as the door openingincreases the air velocity also increases. For 1.5 m/s windspeed, the maximum air velocity ranges from 2.2 to 3.8,for 1.0 m/s wind speed, it varies between 1.4 and 2.5. Theaverage air velocity is generally below 1.0 m/s for the givenwind directions, wind speeds and door openings.
In order to examine the effect of indoor partitions on theindoor air velocity distribution, a number of further simu-lations were carried out for different wind speeds. For thispurpose, a partition of 3 m long located at 3 m away fromthe door was used. Here, only the results for the squarebuilding (i.e., case 1) with 1 m door opening were presented
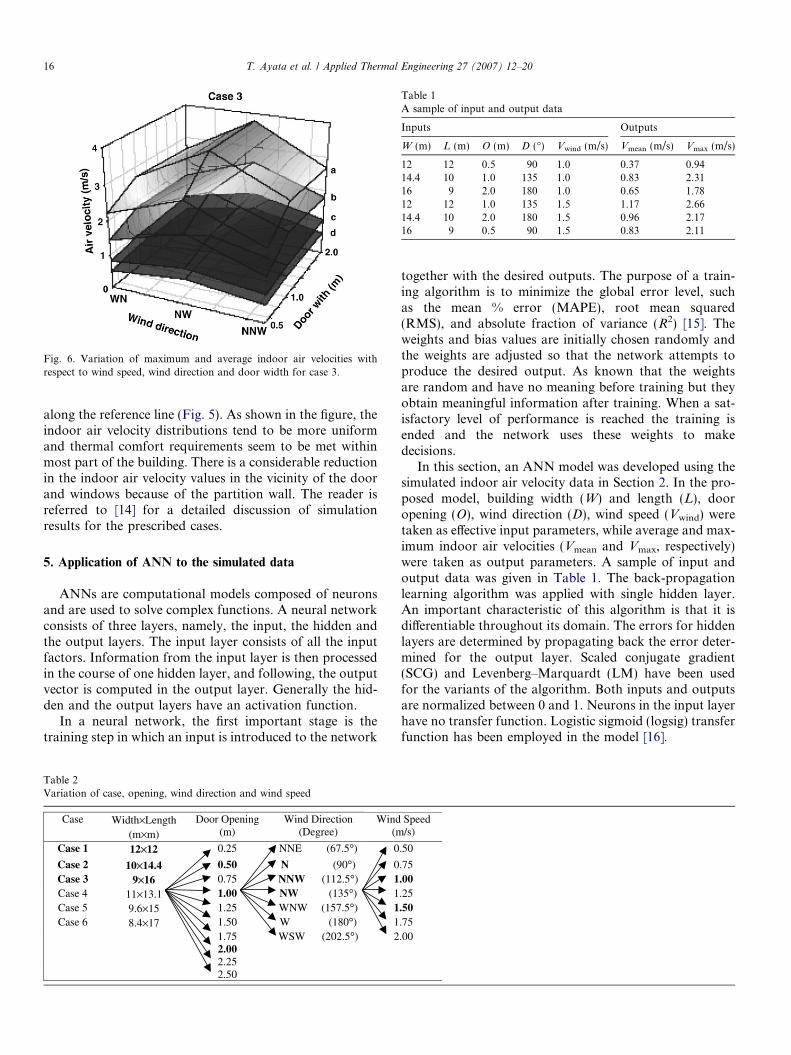
Fig. 6. Variation of maximum and average indoor air velocities withrespect to wind speed, wind direction and door width for case 3.
Table 1A sample of input and output data
Inputs Outputs
W (m) L (m) O (m) D (�) Vwind (m/s) Vmean (m/s) Vmax (m/s)
12 12 0.5 90 1.0 0.37 0.9414.4 10 1.0 135 1.0 0.83 2.3116 9 2.0 180 1.0 0.65 1.7812 12 1.0 135 1.5 1.17 2.6614.4 10 2.0 180 1.5 0.96 2.1716 9 0.5 90 1.5 0.83 2.11
16 T. Ayata et al. / Applied Thermal Engineering 27 (2007) 12–20
along the reference line (Fig. 5). As shown in the figure, theindoor air velocity distributions tend to be more uniformand thermal comfort requirements seem to be met withinmost part of the building. There is a considerable reductionin the indoor air velocity values in the vicinity of the doorand windows because of the partition wall. The reader isreferred to [14] for a detailed discussion of simulationresults for the prescribed cases.
5. Application of ANN to the simulated data
ANNs are computational models composed of neuronsand are used to solve complex functions. A neural networkconsists of three layers, namely, the input, the hidden andthe output layers. The input layer consists of all the inputfactors. Information from the input layer is then processedin the course of one hidden layer, and following, the outputvector is computed in the output layer. Generally the hid-den and the output layers have an activation function.
In a neural network, the first important stage is thetraining step in which an input is introduced to the network
Table 2Variation of case, opening, wind direction and wind speed
Case Width×Length(m×m)
Door Opening (m)
Wind Direction (Degree)
Wind(m
Case 1 12×12 0.25 NNE (67.5°) 0
Case 2 10×14.4 0.50 N (90°) 0Case 3 9×16 0.75 NNW (112.5°) 1Case 4 11×13.1 1.00 NW (135°) 1Case 5 9.6×15 1.25 WNW (157.5°) 1Case 6 8.4×17 1.50 W (180°) 1
1.75 WSW (202.5°) 22.002.25 2.50
together with the desired outputs. The purpose of a train-ing algorithm is to minimize the global error level, suchas the mean % error (MAPE), root mean squared(RMS), and absolute fraction of variance (R2) [15]. Theweights and bias values are initially chosen randomly andthe weights are adjusted so that the network attempts toproduce the desired output. As known that the weightsare random and have no meaning before training but theyobtain meaningful information after training. When a sat-isfactory level of performance is reached the training isended and the network uses these weights to makedecisions.
In this section, an ANN model was developed using thesimulated indoor air velocity data in Section 2. In the pro-posed model, building width (W) and length (L), dooropening (O), wind direction (D), wind speed (Vwind) weretaken as effective input parameters, while average and max-imum indoor air velocities (Vmean and Vmax, respectively)were taken as output parameters. A sample of input andoutput data was given in Table 1. The back-propagationlearning algorithm was applied with single hidden layer.An important characteristic of this algorithm is that it isdifferentiable throughout its domain. The errors for hiddenlayers are determined by propagating back the error deter-mined for the output layer. Scaled conjugate gradient(SCG) and Levenberg–Marquardt (LM) have been usedfor the variants of the algorithm. Both inputs and outputsare normalized between 0 and 1. Neurons in the input layerhave no transfer function. Logistic sigmoid (logsig) transferfunction has been employed in the model [16].
Speed/s)
.50
.75
.00
.25
.50
.75
.00
0.0
1.0
2.0
3.0
40 42 44 46 48 50 52 54 56y-axis (m)
Indo
or a
ir v
eloc
ity
(m/s
)
No partition
Partition
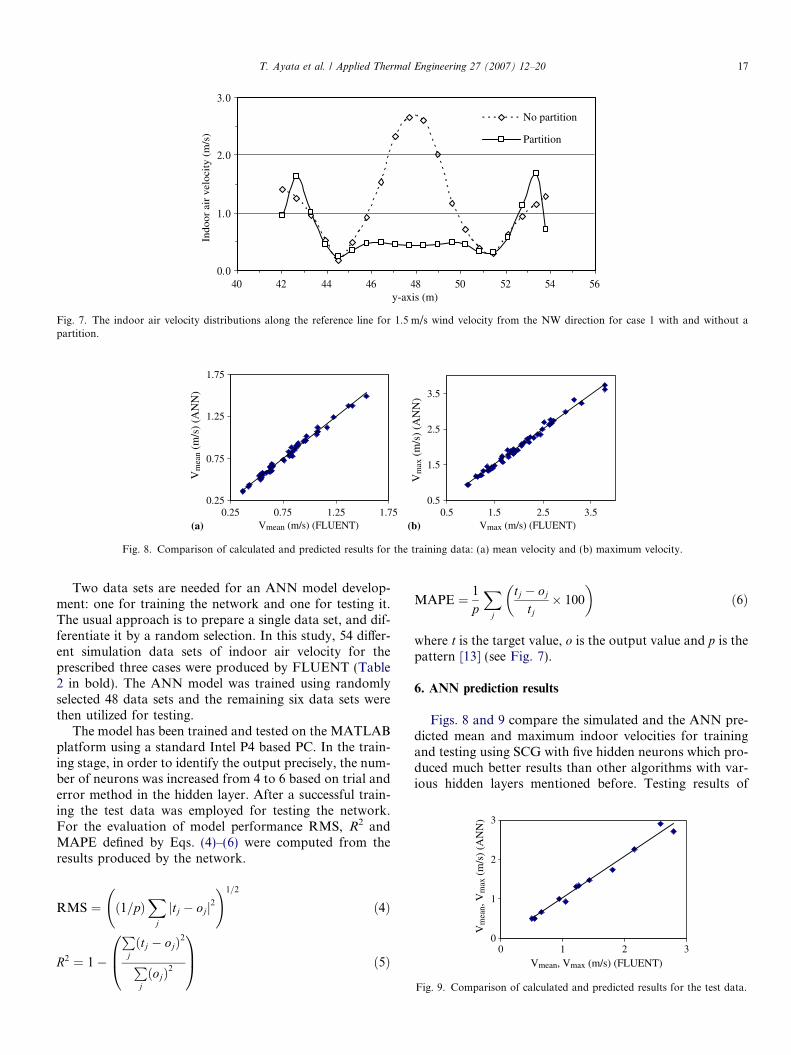
Fig. 7. The indoor air velocity distributions along the reference line for 1.5 m/s wind velocity from the NW direction for case 1 with and without apartition.
0.25
0.75
1.25
1.75
0.25 0.75 1.25 1.75Vmean (m/s) (FLUENT)
Vm
ean
(m/s
) (A
NN
)
0.5
1.5
2.5
3.5
0.5 1.5 2.5 3.5Vmax (m/s) (FLUENT)
Vm
ax (
m/s
) (A
NN
)
(a) (b)
Fig. 8. Comparison of calculated and predicted results for the training data: (a) mean velocity and (b) maximum velocity.
0
1
2
3
0 1 2 3Vmean, Vmax (m/s) (FLUENT)
Vm
ean,
Vm
ax (
m/s
) (A
NN
)
Fig. 9. Comparison of calculated and predicted results for the test data.
T. Ayata et al. / Applied Thermal Engineering 27 (2007) 12–20 17
Two data sets are needed for an ANN model develop-ment: one for training the network and one for testing it.The usual approach is to prepare a single data set, and dif-ferentiate it by a random selection. In this study, 54 differ-ent simulation data sets of indoor air velocity for theprescribed three cases were produced by FLUENT (Table2 in bold). The ANN model was trained using randomlyselected 48 data sets and the remaining six data sets werethen utilized for testing.
The model has been trained and tested on the MATLABplatform using a standard Intel P4 based PC. In the train-ing stage, in order to identify the output precisely, the num-ber of neurons was increased from 4 to 6 based on trial anderror method in the hidden layer. After a successful train-ing the test data was employed for testing the network.For the evaluation of model performance RMS, R2 andMAPE defined by Eqs. (4)–(6) were computed from theresults produced by the network.
RMS ¼ ð1=pÞX
j
jtj � ojj2 !1=2
ð4Þ
R2 ¼ 1�
Pjðtj � ojÞ2PjðojÞ2
0B@
1CA ð5Þ
MAPE ¼ 1
p
Xj
tj � oj
tj� 100
� �ð6Þ
where t is the target value, o is the output value and p is thepattern [13] (see Fig. 7).
6. ANN prediction results
Figs. 8 and 9 compare the simulated and the ANN pre-dicted mean and maximum indoor velocities for trainingand testing using SCG with five hidden neurons which pro-duced much better results than other algorithms with var-ious hidden layers mentioned before. Testing results of
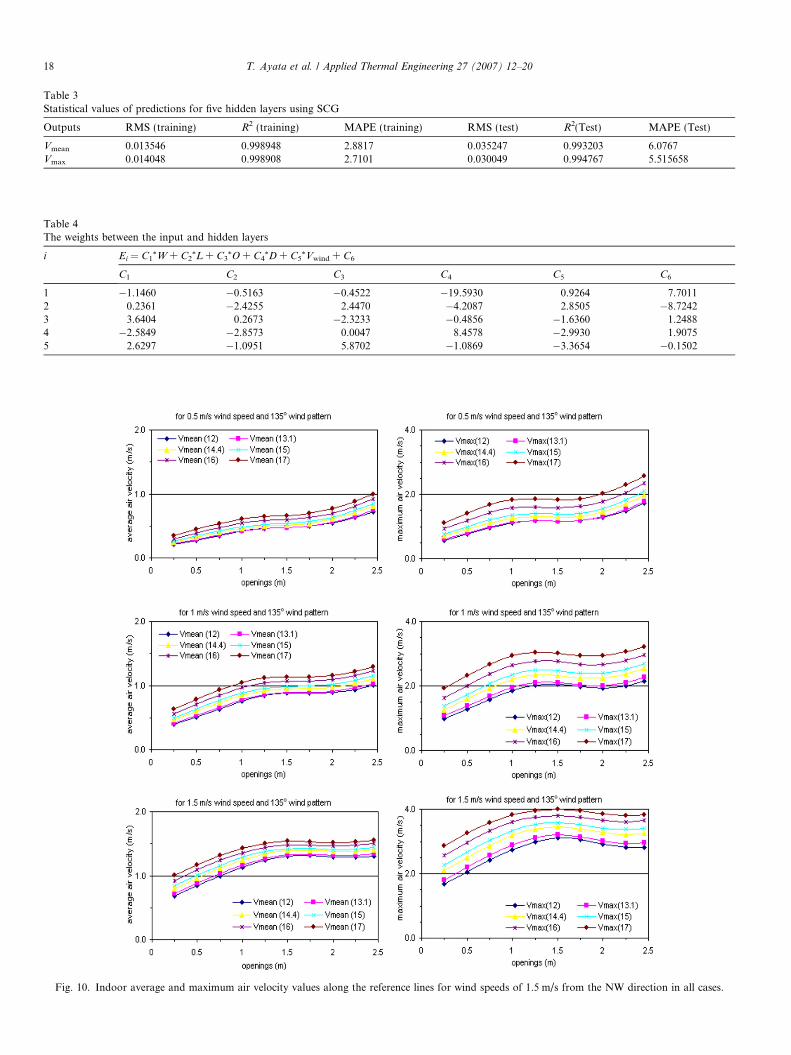
Fig. 10. Indoor average and maximum air velocity values along the reference lines for wind speeds of 1.5 m/s from the NW direction in all cases.
Table 3Statistical values of predictions for five hidden layers using SCG
Outputs RMS (training) R2 (training) MAPE (training) RMS (test) R2(Test) MAPE (Test)
Vmean 0.013546 0.998948 2.8817 0.035247 0.993203 6.0767Vmax 0.014048 0.998908 2.7101 0.030049 0.994767 5.515658
Table 4The weights between the input and hidden layers
i Ei = C1*W + C2
*L + C3*O + C4
*D + C5*Vwind + C6
C1 C2 C3 C4 C5 C6
1 �1.1460 �0.5163 �0.4522 �19.5930 0.9264 7.70112 0.2361 �2.4255 2.4470 �4.2087 2.8505 �8.72423 3.6404 0.2673 �2.3233 �0.4856 �1.6360 1.24884 �2.5849 �2.8573 0.0047 8.4578 �2.9930 1.90755 2.6297 �1.0951 5.8702 �1.0869 �3.3654 �0.1502
18 T. Ayata et al. / Applied Thermal Engineering 27 (2007) 12–20
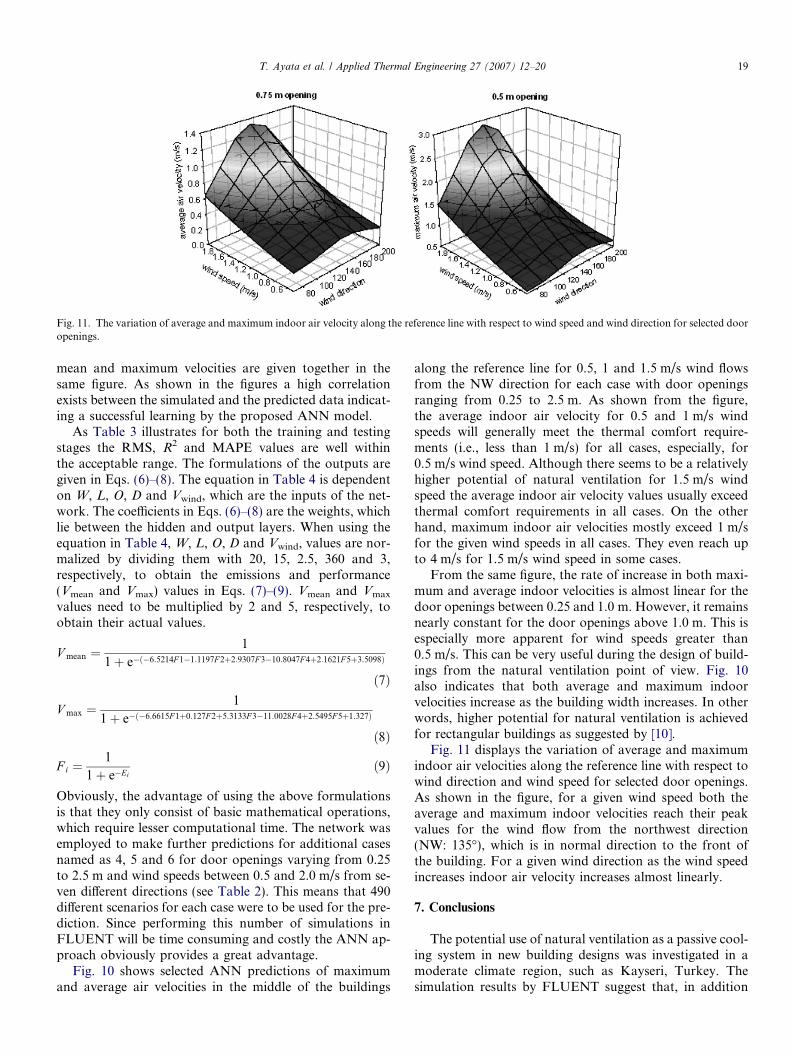
Fig. 11. The variation of average and maximum indoor air velocity along the reference line with respect to wind speed and wind direction for selected dooropenings.
T. Ayata et al. / Applied Thermal Engineering 27 (2007) 12–20 19
mean and maximum velocities are given together in thesame figure. As shown in the figures a high correlationexists between the simulated and the predicted data indicat-ing a successful learning by the proposed ANN model.
As Table 3 illustrates for both the training and testingstages the RMS, R2 and MAPE values are well withinthe acceptable range. The formulations of the outputs aregiven in Eqs. (6)–(8). The equation in Table 4 is dependenton W, L, O, D and Vwind, which are the inputs of the net-work. The coefficients in Eqs. (6)–(8) are the weights, whichlie between the hidden and output layers. When using theequation in Table 4, W, L, O, D and Vwind, values are nor-malized by dividing them with 20, 15, 2.5, 360 and 3,respectively, to obtain the emissions and performance(Vmean and Vmax) values in Eqs. (7)–(9). Vmean and Vmax
values need to be multiplied by 2 and 5, respectively, toobtain their actual values.
V mean ¼1
1þ e�ð�6:5214F 1�1:1197F 2þ2:9307F 3�10:8047F 4þ2:1621F 5þ3:5098Þ
ð7Þ
V max ¼1
1þ e�ð�6:6615F 1þ0:127F 2þ5:3133F 3�11:0028F 4þ2:5495F 5þ1:327Þ
ð8Þ
F i ¼1
1þ e�Eið9Þ
Obviously, the advantage of using the above formulationsis that they only consist of basic mathematical operations,which require lesser computational time. The network wasemployed to make further predictions for additional casesnamed as 4, 5 and 6 for door openings varying from 0.25to 2.5 m and wind speeds between 0.5 and 2.0 m/s from se-ven different directions (see Table 2). This means that 490different scenarios for each case were to be used for the pre-diction. Since performing this number of simulations inFLUENT will be time consuming and costly the ANN ap-proach obviously provides a great advantage.
Fig. 10 shows selected ANN predictions of maximumand average air velocities in the middle of the buildings
along the reference line for 0.5, 1 and 1.5 m/s wind flowsfrom the NW direction for each case with door openingsranging from 0.25 to 2.5 m. As shown from the figure,the average indoor air velocity for 0.5 and 1 m/s windspeeds will generally meet the thermal comfort require-ments (i.e., less than 1 m/s) for all cases, especially, for0.5 m/s wind speed. Although there seems to be a relativelyhigher potential of natural ventilation for 1.5 m/s windspeed the average indoor air velocity values usually exceedthermal comfort requirements in all cases. On the otherhand, maximum indoor air velocities mostly exceed 1 m/sfor the given wind speeds in all cases. They even reach upto 4 m/s for 1.5 m/s wind speed in some cases.
From the same figure, the rate of increase in both maxi-mum and average indoor velocities is almost linear for thedoor openings between 0.25 and 1.0 m. However, it remainsnearly constant for the door openings above 1.0 m. This isespecially more apparent for wind speeds greater than0.5 m/s. This can be very useful during the design of build-ings from the natural ventilation point of view. Fig. 10also indicates that both average and maximum indoorvelocities increase as the building width increases. In otherwords, higher potential for natural ventilation is achievedfor rectangular buildings as suggested by [10].
Fig. 11 displays the variation of average and maximumindoor air velocities along the reference line with respect towind direction and wind speed for selected door openings.As shown in the figure, for a given wind speed both theaverage and maximum indoor velocities reach their peakvalues for the wind flow from the northwest direction(NW: 135�), which is in normal direction to the front ofthe building. For a given wind direction as the wind speedincreases indoor air velocity increases almost linearly.
7. Conclusions
The potential use of natural ventilation as a passive cool-ing system in new building designs was investigated in amoderate climate region, such as Kayseri, Turkey. Thesimulation results by FLUENT suggest that, in addition
20 T. Ayata et al. / Applied Thermal Engineering 27 (2007) 12–20
to the orientation of buildings according to prevailing winddirections, a proper indoor design of buildings in the areacan significantly increase the capability of air ventilationduring warm summer days. The evaluation of simulationsindicated that average indoor velocity values generally meetnatural ventilation conditions for the three different build-ing scenarios with 1 and 1.5 m/s wind velocities. It wasshown that as the building width increases the maximumair velocity values also increase providing higher potentialfor natural ventilation. An important finding of this studyis that a rectangular building with 1:1.7 dimensional ratioas suggested by Olgyay [1] for hot and humid climates, alsoseems to be an optimal choice for natural ventilation inKayseri where a moderate climate prevails.
An ANN model was developed for the prediction ofboth average and maximum indoor air velocities simulatedby FLUENT. A high correlation existed between thesimulated and the predicted mean and maximum indoorvelocity data indicating a successful learning by the pro-posed ANN model. Overall, the evaluation of the networkresults indicated that the ANN approach can be utilized asan efficient tool for learning, training and predicting indoorair velocity distributions for natural ventilation.
Further studies can be performed by increasing thenumber of air entrance and exit sections, changing doorand window dimensions and adding extra partition walls.
References
[1] V. Olgyay, Design with Climate: A Bioclimatic Approach toArchitectural Regionalism, Princeton University Press, Princeton,NJ, 1963.
[2] ASHRAE, Thermal Environmental Conditions for Human Occu-pancy. ASHRAE Standard 55a-1995 ASHRAE, Atlanta, 1995.
[3] N. Lechner, Heating, Cooling, Lighting: Design Method for Archi-tects, John Wiley Press & Sons, New York, 1991.
[4] M.S. Al-Hamoud, Optimum thermal design of office buildings,International Journal of Energy Research 21 (10) (1997) 941–957.
[5] B. Givoni, Comfort, climate analysis and building design guidelines,Energy and Buildings 18 (1) (1992) 11–23.
[6] C. Tantasavasdi, J. Srebric, Q. Chen, Natural ventilation design forhouses in Thailand, Energy and Buildings 33 (2001) 815–824.
[7] M.M. Eftekhari, L.D. Marjanovic, Application of fuzzy control innaturally ventilated buildings for summer conditions, Energy andBuildings 35 (2003) 645–655.
[8] M. Eftekhari, L. Marjanovic, P. Angelov, Design and performance ofa rule-based controller in a naturally ventilated room, Computers inIndustry 51 (2003) 299–326.
[9] G. Fraisse, J. Virgone, J.J. Roux, Thermal control of a discontinu-ously occupied building using a classical and a fuzzy logic approach,Energy and Buildings 26 (1997) 303–316.
[10] S. Kalogirou, M. Eftekhari, L. Marjanovic, Predicting the pressurecoefficients in a naturally ventilated test room using artificial neuralnetworks, Building and Environment 38 (2003) 340–399.
[11] L.L. Wenjian, C. Lihua, Li X. Shujiang, Y. Chai Soh, Hvac systemoptimization in building section, Energy and Buildings 37 (2005) 11–22.
[12] F.P. Incropera, D.P. DeWitt, Fundamentals of Heat and MassTransfer, fourth ed., John Wiley & Sons, New York, 1996.
[13] The State Meteorology Department, Ankara, Turkey, 2004.[14] T. Ayata, O. Yıldız, Investigating the potential use of natural
ventilation in new building designs in Turkey, Energy and Buildings38 (2006) 959–963.
[15] Matlab Version 6.0 Online Manual. Available from: <www.mathworks.com>.
[16] A. Sozen, E. Arcaklıoglu, Prediction of solar potential in Turkey,Applied Energy 80 (2005) 35–45.