Deteriorated seismic capacity assessment of RC bridge piers ...
25
Deteriorated seismic capacity assessment of RC bridge piers in corrosive environment M. Domaneschi 1* , A. De Gaetano 1 , J.R. Casas 2 , G.P. Cimellaro 1 1 Politecnico di Torino, Department of Structural, Geotechnical and Building Engineering, Turin, Italy * Corresponding Author: Corso Duca degli Abruzzi, 24, 10129 Turin (TO), Italy. [email protected] 2 Universitat Polit` ecnica de Catalunya, Department of Civil and Environmental Engineering, Barcelona, Spain ABSTRACT: The coupled effects of corrosion and earthquake action on bridges piers are investigated in this study. Starting from a literature review to collect existing corrosion models, a bridge overpass is selected to perform seismic analyses. It allows to assess the degrading seismic capacity of the bridge pier at different periods due to general and pitting corrosion. The selected bridge structure belongs to the class of motorway overpass, that is a frequently used structural system all around the world. Consequently, the development of a suitable and effective tool for an in-depth degradation analysis of this type of system, with the identification of the most appropriate time for restoration, is of paramount importance to guarantee continuous serviceability and safety. KEYWORDS: Bridges; Reinforce Concrete; Corrosion; Earthquake; Capacity 1 INTRODUCTION Nowadays, seismic study of corroded reinforced concrete (RC) elements is a matter of increasing concern, in particular for links such as bridges in infrastructural networks, which are in service in earthquakes affected areas. Indeed, the Western world has an extensive bridge heritage that is in service for several decades and it is therefore subjected to decay and degradation. However, the existing bridges themselves, despite their advanced age, are still essential to support and develop the community life. Their decommissioning represents a strong impact event for the economy, logistics, sustainability and in general on the societal activities. Furthermore, bridge structures play a key role during seismic emergencies, as they are strategic to ensure the timeliness
-
Upload
khangminh22 -
Category
Documents
-
view
6 -
download
0
Transcript of Deteriorated seismic capacity assessment of RC bridge piers ...

Deteriorated seismic capacity assessment of RC bridge piers in corrosive
environment
M. Domaneschi1∗, A. De Gaetano1, J.R. Casas2, G.P. Cimellaro1
1Politecnico di Torino, Department of Structural, Geotechnical and Building Engineering, Turin, Italy
∗ Corresponding Author: Corso Duca degli Abruzzi, 24, 10129 Turin (TO), Italy. [email protected]
2Universitat Politecnica de Catalunya, Department of Civil and Environmental Engineering, Barcelona, Spain
ABSTRACT: The coupled effects of corrosion and earthquake action on bridges piers are investigated in
this study. Starting from a literature review to collect existing corrosion models, a bridge overpass is selected
to perform seismic analyses. It allows to assess the degrading seismic capacity of the bridge pier at different
periods due to general and pitting corrosion. The selected bridge structure belongs to the class of motorway
overpass, that is a frequently used structural system all around the world. Consequently, the development of a
suitable and effective tool for an in-depth degradation analysis of this type of system, with the identification
of the most appropriate time for restoration, is of paramount importance to guarantee continuous serviceability
and safety.
KEYWORDS: Bridges; Reinforce Concrete; Corrosion; Earthquake; Capacity
1 INTRODUCTION
Nowadays, seismic study of corroded reinforced concrete (RC) elements is a matter of increasing concern, in
particular for links such as bridges in infrastructural networks, which are in service in earthquakes affected
areas. Indeed, the Western world has an extensive bridge heritage that is in service for several decades and it is
therefore subjected to decay and degradation. However, the existing bridges themselves, despite their advanced
age, are still essential to support and develop the community life. Their decommissioning represents a strong
impact event for the economy, logistics, sustainability and in general on the societal activities. Furthermore,
bridge structures play a key role during seismic emergencies, as they are strategic to ensure the timeliness

Deteriorated seismic capacity assessment of RC bridge piers in corrosive environment
response and efficiency of emergency operations.
Corrosion of RC elements can occur in two forms: general and pitting. Both are harmful to the structural
performance and may appear through concrete spalling. However, no clear evidence of the phenomenon below
the concrete surface can be also verified. Many efforts have been made to model corrosion phenomena in RC
structures but there is still a need to apply such models to investigate the structural behavior under corrosion
effects [1, 2, 3]. It is of particular interest when such degradation phenomena are coupled to specific hazard
conditions, as seismic action. Thus, there is major and increasing interest to identify reliable methodologies to
assess the most appropriate restoration time and remaining service life of existing infrastructure.
Several works from literature are focused on the experimental study of deteriorated RC columns under
earthquake loading and their strengthening adopting different techniques ([4, 5]) . The basic idea is to repair
and use again deteriorated RC elements due to aging and earthquake actions, as an important way to achieve a
sustainable use of resources. This is of particular interest for bridges in infrastructural networks.
Other researchers [6, 7] investigated corroded RC elements subjected to ground motion focusing on peculiar
aspects. They are the shear response of RC columns by developing empirical equations (calibrated against a
corroded columns database where all specimens failed in shear)[6], and the cumulative damage of RC columns
after multiple earthquakes neglecting pitting corrosion contribution [7].
The strength reduction of coastal bridge piers in the marine environment focusing on the effects of non-
uniform corrosion along the height of bridge piers was also investigated by Guo et al. [8]. Nevertheless, this
study especially focuses on the effects of non-uniform corrosion along the height of pier, including a tidal zone.
Quantitative frameworks were also developed to assess life-cycle reliability and resilience of deteriorating
reinforced concrete bridges under seismic ground motions [9, 10]. They approach the problem through sim-
plified models, i.e. the longitudinal rebars buckling of piers as the sole limit state when estimating its failure
probability [9], and using statistic data [10].
Probabilistic approaches to predict the lifetime seismic performance of corrosion deteriorated RC bridges
[11] and their seismic fragility estimate [12] are also presented in literature.
The previously mentioned studies on seismic performance assessment of corroded bridges made meaningful
advancements in this field of research. However, they don’t provide much knowledge on capacity and ductility
reduction of bridge piers because of individual and coupled contribution of general and pitting corrosion. On
the contrary, this contribution explores these aspects, and in particular deepens the seismic capacity of the pier
by considering the associated effects of axial and bending moments through interaction diagrams and Bresler’s
domains.
This work deals with the development of a suitable methodology to assess the degraded seismic performance

Deteriorated seismic capacity assessment of RC bridge piers in corrosive environment
of existing RC bridges to identify the most appropriate time for restoration. In particular, the study is focused on
the seismic performance of a bridge pier exposed to both general and pitting corrosion. The proposed method-
ology is then tested on a new highway overpass located in Messina (South Italy) close to the sea and designed
to deal with seismic action.
The investigation analyses the performance of the bridge that decreases over the service life (100 years)
due to the effects of general and pitting corrosion. This aspect is of interest because designing a bridge by
considering corrosion and performance losses is crucial to prevent abrupt collapses and limited durability [13].
Thus, this paper aims to contribute to the assessment of the seismic performance degradation for a widespread
structural class, such as highway overpasses. In particular, it is focused on the pier degradation, that is considered
among the most critical element in a bridge under seismic actions [14, 11, 15, 16].
Starting from a literature review to highlight the existing corrosion models (Section 2), a bridge pier is
selected to perform seismic analyses (Section 3). The existing corrosion model studied by [17] has been adopted
and applied to the RC element. The bridge model is evaluated through static and modal analyses, as described
at Section 4 according to the Italian standard [18] and the Eurocode [19]. Section 5 shows the corrosion effects
on steel reinforcements area and yield strength for the selected RC pier [20, 21]. The reduction of the ductility
performance is also considered [22] as well. The structural assessment is performed by computing interaction
and Bresler’s domains. Finally, concluding remarks and suggestions for future developments are presented at
Section 6.
2 CORROSION MODELS
Corrosion of embedded reinforcing steel is a dangerous phenomenon that affects reinforced concrete (RC) struc-
tures. Corrosion may initiate when the chloride concentration around the steel reinforcement overcome a certain
threshold that induces the protective film dissolution. When the steel bars corrosion develops significantly, it
may affect the structural serviceability and safety by reducing the cross sectional area of the steel reinforcements
and of the the whole RC member by spalling the concrete cover, [3].
Corrosion can be distinguished into two types: general and pitting. General corrosion concerns a substantial
area of reinforcement with roughly uniform metal loss over the reinforcing bar. It produces rust staining on the
concrete cover, that can be identified rather easily during technical inspections of the structural element [1].
On the other hand, pitting corrosion is localized in small areas of reinforcement but the steel area loss is larger.
In particular, in chloride environments, several investigations [17] demonstrated how pitting corrosion could
be more harmful than the general one. Furthermore, pitting corrosion is more difficult to be noticed during the
inspection because produces little rust staining on the concrete surface [1]. In addition, corrosion is exacerbated

Deteriorated seismic capacity assessment of RC bridge piers in corrosive environment
if the structure is located in a marine environment, because corrosion develop quickly and is characterized by
both general and pitting characteristics in association [2].
When reinforcement corrosion occurs and progresses, the concrete cover may fail due to the associated ex-
pansion of the embedded bars. The consequent induced tensile stresses can generate cracks along the rebar
axis. Furthermore, corrosion reduces the cross-sectional area of reinforcing bars, the resistance capacity and the
ductility performance [20, 21]. From a structural point of view, corrosion affects shear and moment capacity,
tension stiffening and, consequently, deflection. Plastic rotation capacity is influenced as well and this can affect
seismic capacity, up to collapse [13].
In the following, the analytical approach that has been followed to assess capacity degradation of RC piers is
detailed. It makes reference to consolidated analytical procedures from literature.
2.1 Analytical approach
In order to quantify corrosion effects to structural performance, a method has been recently proposed by [17].
It aims to obtain the residual reinforcement diameter d(t) using Equation (1) and the residual pitting depth p(t)
at time t using Equation (9). Finally, the residual cross-sectional area of steel reinforcement A(t) due to general
corrosion, is determined by Equation (2), as follows [23, 24]:
d(t) = d0 − 2
∫ t
tcorr
λ(t)dt (1)
A(t) =π
4[d(t)]2 (2)
Where d0 represents the initial diameter of the reinforcement bars.
Subsequently, as suggested by [25], a hemispherical model of a pit is used as shown in Figure 1.
Figure 1: Hemispherical model due to pitting effect of RC structures
The net cross-sectional area of reinforcement bars, A(t), due to pitting corrosion in a reinforcing bar with a

Deteriorated seismic capacity assessment of RC bridge piers in corrosive environment
diameter d0 can be computed as follows:
A(t) =
πd04
−A1 −A2 p(t) ≤√22d0
A1 −A2
√22d0 < p(t) ≤ d0
0 p(t) > d0
(3)
The parameters can be set by the following relations, where p(t) = pitting depth at any time t expressed by
Equation (9).
A1 =1
2
(θ1
(d02
)2
− a
∣∣∣∣d02 − p(t)2
d0
∣∣∣∣)
(4)
A2 =1
2
(θ2p(t)
2 − ap(t)2
d0
)(5)
a = 2p(t)
√1−
(p(t)
d0
)2
(6)
θ1 = 2arcsin
(a
d0
), θ2 = 2arcsin
(a
2p(t)
)(7)
2.2 Corrosion process
The chloride-induced reinforcement corrosion process could be summarized into three main phases as Figure 2
illustrates [26, 27]:
Figure 2: Phases of corrosion process of reinforcing steel
In the initiation phase, the access of chloride ions occurs in the steel reinforcement. This phase lasts when
the concentration of chloride ions at the reinforcement surface becomes major than a threshold value. Once
the corrosion initiation time, tcorr, has been reached, the corrosion propagation phase begins. Subsequently,
the deterioration process can occur in two possible corrosion forms: pitting and general. Finally, at the initial
cracking time, tcr, i.e. the time in which the concrete cover cracks, the deterioration phase starts and proceeds
up to the severe cracking time, tWcr, when eventually the bridge service life ends. Once the values of tcr and
tWcr are found, the whole corrosion rate model can be obtained by applying the following analytical method.

Deteriorated seismic capacity assessment of RC bridge piers in corrosive environment
2.2.1 Corrosion rate model
The corrosion rate, applied to both general and pitting corrosion conditions, is described by the corrosion rate
function, λ(t). Experimental studies highlighted how λ(t) varies during the service life, being affected by many
parameters [28, 29, 30, 31]. As a consequence, the function can be split into three phases as follows:
1. The first phase, λ1(t): from the initial corrosion to the initial cracking;
2. The second phase, λ2(t): from the initial cracking to severe concrete cracking, it is assumed to increase
with time linearly;
3. The third phase, λ3(t): after severe concrete cracking.
λ(t) =
λ1(t) tcorr < t ≤ tcr
(t− tcr) · λ3(tWcr)−λ1(tcr)tWcr−tcr
+ λ1(tcr) tcr < t ≤ tWcr
λ3(t) t > tWcr
(8)
The corrosion rate function, described in Figure 3, starts sharply at the corrosion time and then decreases
during the first few years. Subsequently, the corrosion rate varies more slowly and reaches a nearly uniform
value until the initial cracking time, tcr.
The model proposed by [32] is adopted to simulate the corrosion rate that was derived using a regression anal-
ysis based on experimental studies over a 5-year period in service conditions, which could only concern the
initial phase before concrete cracking [17].
According to recent studies [33, 31], after this preliminary phase the corrosion rate function shows a large
continuous increase and crack growth, as concrete cracking leads to chlorides access, with oxygen and water.
After reaching a peak value, λ(t) reduces slowly and reaches a steady state in critical cracking condition. This
behavior is due to the difficulty that moisture and oxygen have to attain the steel reinforcement surface. In the
paper by [17] a case study is used in order to apply the proposed corrosion rate model [34, 17, 35, 36].
In the present paper, the corrosion rate model of the paper by [17] for the splash zone has been implemented.
Subsequently, a comparison has been performed in order to check if the herein developed Matlab model cor-
responds to the one implemented in [17]. As shown in Figure 3, a satisfactory comparison can be noted, i.e.
the continuous black curve obtained by the developed Matlab code and the white points from the literature [17]
case study. The curve refers to the splash zone only. This outcome allows to develop the same corrosion rate
model to the bridge pier discussed in Section 3.

Deteriorated seismic capacity assessment of RC bridge piers in corrosive environment
Figure 3: Comparison between corrosion rate obtained by Matlab and points in the paper by Cui et al.
2.2.2 General corrosion
The general corrosion model consists in a uniform distribution of area loss. The residual reinforcement diameter
at time t can be determined by Equation (1) and the residual cross-sectional area of reinforcement at any time t
by Equation (2), respectively.
2.2.3 Pitting corrosion
It is the primary cause for marine chloride-induced corrosion under service conditions. The model proposed by
[1] has been taken into account to simulate the development of pitting corrosion. In the model, pitting corrosion
is assumed to take a hemispherical form as shown in Figure 1. It represents the pitting depth that expands with
time, denoted by p(t) at any time t and expressed by:
p(t) = R
∫ t
tcorr
λ(t)dt (9)
Where R = 7.1 is the amplification factor representing the ratio between maximum and uniform corrosion
penetration. Moreover, A(t) is the net cross-sectional area of reinforcement bars that depends on the pitting
depth expansion. A(t) can be computed by Equation (3). A positive correlation was found between the residual
area obtained by Matlab and the points in the paper by [17].
3 MOTORWAY OVERPASS
3.1 Geometry
The selected application is a frequently used structural system with several existing examples in critical in-
frastructures. The bridge case study accounts for a motorway overpass. The platform is made up of a 7.5 m
Deteriorated seismic capacity assessment of RC bridge piers in corrosive environment
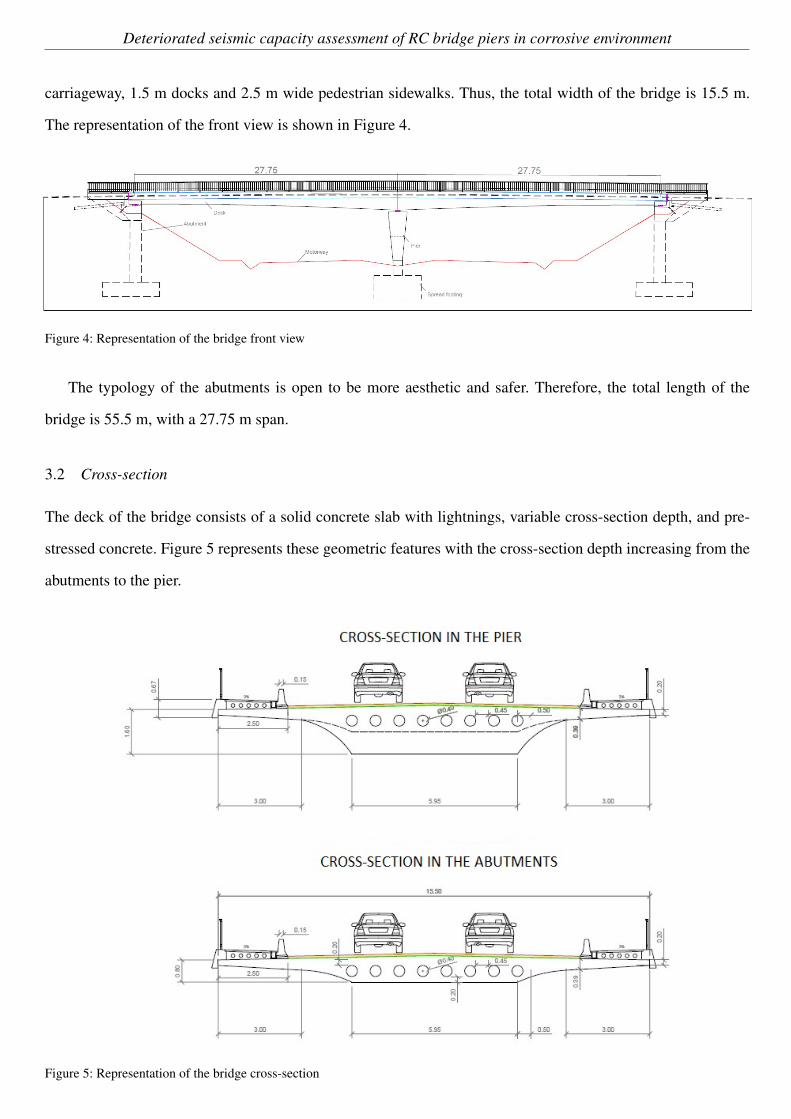
carriageway, 1.5 m docks and 2.5 m wide pedestrian sidewalks. Thus, the total width of the bridge is 15.5 m.
The representation of the front view is shown in Figure 4.
Figure 4: Representation of the bridge front view
The typology of the abutments is open to be more aesthetic and safer. Therefore, the total length of the
bridge is 55.5 m, with a 27.75 m span.
3.2 Cross-section
The deck of the bridge consists of a solid concrete slab with lightnings, variable cross-section depth, and pre-
stressed concrete. Figure 5 represents these geometric features with the cross-section depth increasing from the
abutments to the pier.
Figure 5: Representation of the bridge cross-section

Deteriorated seismic capacity assessment of RC bridge piers in corrosive environment
The benefit of the variable depth approach is the optimization of material and a major aesthetic appeal of
the bridge. To determine the variable depth geometry, two design conditions have been used:
1. Depth above the pier: H = L/20 = 1.57m
2. Depth above the abutments: H = L/40 = 0.78m
Following these conditions, the variable cross-section depth has been determined.
3.3 Pier
The piers regards among the most critical elements for bridge structures in earthquake conditions [14, 11, 15,
16]. This becomes more evident in two-span bridges such that one under study, where the pier essentially affects
the structural equilibrium. The geometry is based mainly on both the architectural and structural aspects. The
pier cross section changes with the height in two different shapes. It is trapezoidal in the elevation with major
base at the top and Y-shaped in the transverse section, wherein each arm has a support device. Additionally, from
a structural point of view, the base area (1.70m2) has been chosen to fit the foundation. Thus, a rectangular shape
(1.00 x 1.70 m) has been chosen with the longest side in the direction of the cross section. The height of the
pier is 6.70 m. The bifurcation of the Y-shaped arms allows to increase the distance between the supports of
the deck in order to have greater stability. The type of pier foundation has been chosen as a rigid spread footing
(Figure 6). It has been assumed that the soil has good mechanical characteristics already close to the surface.
Thus, Figure 6 provides an overview of the pier geometry along with the FE model, which is further discussed
at Section 4.
3.4 Support devices
In order to perform the design of the support devices, an iterative procedure has been chosen respecting the
values of deformations according to the standard EN 1337 [37]. The vertical actions, rotation and imposed
longitudinal displacements have been determined by SAP2000. Neoprene pads allow a smooth and uniform
transfer of load from the deck to the substructure and beam rotation at the bearing due to beam deflection. This
kind of supports have no movable parts, thus thermal deformations are absorbed by the pad itself. Steel layers
reinforcements characterize the elastomeric bearing to limit the bulging effect.
Elastomeric bearings NZ 700x700x5(10+3) and NZ 600x600x7(12+3) have been chosen as support device in
the pier and the abutments, respectively.

Deteriorated seismic capacity assessment of RC bridge piers in corrosive environment
Figure 6: 3D pier geometry (left) and finite element model (right)
4 BRIDGE MODELLING
4.1 Finite element model
A FEM (finite element model) of the motorway overpass has been performed using the software SAP2000. This
model is used to analyze the bridge under loading conditions.
The 2-span bridge has been modelled as continuous beam. Each span has been partitioned into six different
sections in order to obtain a more accurate discretization. As discussed at Section 3, the deck consists of a
variable section increasing from the abutments to the pier. In the six cross sections of the deck, each mechanical
and geometrical property, i.e, the area, moment of inertia, and torsional stiffness, has been computed. In detail,
the cross sectional areas spans from 7.9 m2 to 13.45 m2, the torsion constants from 0.48 m4 to 1.81 m4, and
the moments of inertia with respect to the horizontal and vertical axes in the range 0.89-8.44 m4 and 2.4-10.25
m4, respectively. A frame element has been adopted for modelling the Y-shaped pier, thereby the related shape
function is a spline curve. Figure 6 shows the 3D pier model that consists of two arms and a vertical shaft, each
one discretized in four different sections. The sectional parameters (area, torsion constant, moments of inertia
with respect to the longitudinal and transversal axes) adopted for the vertical shaft span within the following
ranges: 3.3-1.7 m2, 1.27-0.35 m4, 0.46-0.14 m4 and 1.86-0.4 m4. Focusing on the pier’s arms, the sectional
parameters have been assumed within the following ranges: 2.5-1.6 m2, 0.85-0.39 m4, 0.39-0.23 m4 and 0.69-
0.23 m4.
The deck and the pier nodes are connected using rigid body constraints in series with the neoprene pads (Figure
6). Those constraints rigidly link the centroid of the deck and the upper nodes of the neoprene pads, in turn

Deteriorated seismic capacity assessment of RC bridge piers in corrosive environment
connected to the Y-shaped pier upper nodes. All degrees of freedom (6 DOF) are constrained by the rigid
body region. This hypothesis reasonably assumes that the deformations between the rigidly linked nodes are
negligible compared to those that develop in the other elements of the bridge, i.e. the two main spans, the pier
and the neoprene pads. The same approach has been adopted for the connection between the abutment and the
deck at the bridge extremities, where the rigid region is defined between the deck spine and the upper nodes of
the neoprene pads.
The neoprene pads have been modeled through link elements, which consist in two elastic springs (in both the
longitudinal and transversal directions), while in the vertical direction the link element rigidly supports vertical
loads. The adopted springs stiffness at the pier and at the abutment has been assumed 17140 kN/m and 7460
kN/m, respectively (EN 1337 [37]).
Because of a detailed description of the soil-structure-interaction is beyond the scopes of the present study,
the bridge model is rigidly constrained to the ground. However, a comprehensive discussion on the effect of
different foundation types for the seismic performance of bridge piers can be found in Conti et al. (2020) [38].
4.2 Seismic analysis
The motorway overpass is assumed located in Sicily, the largest island in Southern Italy. In particular, a site close
to the Strait of Messina has been selected as characterized by a high seismic hazard. According to the current
Italian standard for constructions, it belongs to the first seismic category, associated to the highest intensity,
among four. Seismic analysis follows the Italian standard [18], and also the European standard, EN 1998-2
Eurocode 8 [19]. It has been performed according to the actions related to SLV (Life-saving limit state), that
belongs to ultimate limit state, as prescribed by NTC2018 for static linear analysis. It must be verified that the
individual structural elements and the whole structure have sufficient strength capacity to satisfy the demand
for the SLV (Life-saving limit state). The standards prescribe a ductile behavior for the cross-section of the
structural elements. The inelastic dissipative behavior must be regarding the flexural type, with the exclusion
of possible mechanisms of shear failure, because this failure is brittle and thus, ductility would not be fulfilled.
For this reason, the “capacity design” criterion is used [18]. Therefore, an adequate behavior factor, q, is chosen
according to the table of the standard, Eurocode 8 [19]. In this case, a ductile category is chosen to ensure
structure ductility in order to prevent the earthquake actions. The response spectra (Figure 7) have been obtained
using the Italian NTC2018 regulation [18]. In addition, the horizontal PGA is equal to 0.332 g, the vertical PGA
is 0.258 g, and thus it is quite high. Consequently, this highlights the importance of an accurate seismic analysis.
Once the earthquake parameters are known, they can be inserted into the software SAP2000 as the typology of
the “response spectrum” load. Accordingly, they can be combined as the standard suggests, i.e. the situation in

Deteriorated seismic capacity assessment of RC bridge piers in corrosive environment
which the longitudinal component (x) is greater, as follows:
Exd + 0.3Eyd + 0.3Ezd (10)
Where:
• Exd = earthquake longitudinal component
• Eyd = earthquake transverse component
• Ezd = earthquake vertical component
Figure 7: Horizontal and vertical component of the response spectra
4.3 Loads combination
Subsequently, loads combination has been performed by considering all loads with their own partial safety
coefficients reported in Table 1. In this case, seismic combination expressed by Equation (11) has been applied

Deteriorated seismic capacity assessment of RC bridge piers in corrosive environment
Table 1: Summary of the whole loads combination
Combo name Case name Scale factor [-]seism x Earthquake x 1seism x Braking force 0seism x Earthquake y 0,3seism x Earthquake z 0,3seism x Live load 0seism x Wind 0seism x Snow 0,5seism x No-structural load 1seism x DEAD 1
according to the standard [18]. The deformed shape of the bridge has been obtained.
E +G1 +G2 + P + ψ21 ·Qk1 +
+ψ22 ·Qk2 + ψ23 ·Qk3 + . . . (11)
4.4 Modal analysis
Modal analysis is an important aspect of bridge diagnostics. It studies the dynamic properties of systems in the
frequency domain. It uses the overall mass and stiffness of a structure to find the various periods in which the
structure naturally resonates. For this reason, modal analysis makes possible to show all vibration modes of
the bridge. In earthquake engineering, knowing these periods of vibration is fundamental. The goal of modal
analysis in structural mechanics is to determine the natural mode shapes and frequencies. It is common to
use the finite element method (FEM) to perform this kind of analysis, as shown in this study. Obviously, the
motorway overpass has several vibration modes with different periods and frequencies, but here only the three
most significant modes are illustrated.
Figures 8-9-10 show all three main vibration modes of the bridge. In blue, the deformed shape is depicted, by
contrast in green there is the undeformed shape, as follows:
1. The first mode depicts the longitudinal movement of the structure;
2. The second mode represents the transverse movement of the structure;
3. The third vibration mode accounts for the transverse and opposite movement of the abutments. On the
contrary, the pier is almost stationary.

Deteriorated seismic capacity assessment of RC bridge piers in corrosive environment
Figure 8: 1st vibration mode (T = 1.516 s;f = 0.659 Hz)
Figure 9: 2nd vibration mode (T = 1.505 s;f = 0.664 Hz)
Figure 10: 3rd vibration mode (T = 1.176 s;f = 0.851 Hz)
4.5 Computation of steel reinforcement area
Computation of steel reinforcement area regards only the pier because it represents the most seismic-affected
element. For this reason, longitudinal and transverse steel reinforcement is required. The reinforcement located
at the base has been designed by means of the capacity design criterion. In addition, longitudinal and transverse

Deteriorated seismic capacity assessment of RC bridge piers in corrosive environment
reinforcement are characterized by a φ32 and φ14 diameter bar, respectively. Figure 11 illustrates only the
longitudinal reinforcement to highlight better this configuration. The concrete cover is equal to: dc = 50 mm.
The materials used in the RC pier are reported in Table 2.
Figure 11: Longitudinal reinforcement in Section A and B (see also Figure 6).
Table 2: Materials adopted in the RC pier
Material Typology Compressive design strength
Concrete C40/50 fcd =40γc
= 26.67 MPa
Steel B450C fyd =450γs
= 391.3 MPa
4.6 Application of the corrosion model to the case study
The procedure of this methodology is to apply the corrosion model discussed and validated in Section 2 to the
bridge case study presented above. The motorway overpass is located in an atmospheric zone and 1 km from the
sea. Given that surface chloride concentrations vary significantly with the distance from the coastline, Chinese
durability assessment code for concrete structures (CECS) [39] provides a more detailed model for reinforced
concrete exposed to marine environments based on data collected in several field investigations. The CECS-
recommended parameters to perform the analysis are compatible with the location of the bridge case study as
those used by [17]. It should be noted that these parameters are only applicable to Portland cement.
In this paper, the loss percentage regarding the area of reinforcement is around 26.57% and 40.17% in the case
of general and pitting corrosion analysis, respectively, as shown in Figure 12. The obtained results are in good
agreement with those from [17] highlighting a significant reduction in cross-sectional area in atmospheric zone.
In terms of percentage, the lost area of reinforcement is around 53.06% according to [17], in case of pitting
corrosion. This depends on the lowest distance from the sea. In addition, [17] selected a case study on the
seaside (0 km from the sea). In contrast, in the bridge case study of this paper the distance is 1 km. Thus, Table

Deteriorated seismic capacity assessment of RC bridge piers in corrosive environment
3 numerically reports the experimental data on A(t) which decrease with time in both situations. It can be seen
from Figure 12 that the steel cross-sectional area reduction of pitting corrosion exceeds the general corrosion
after 60 years and then, the gap between them increases quickly with time.
Figure 12: Comparison of pitting and general corrosion
Table 3: Experimental data of residual steel area changing with time
t [years] A(t) general [mm2] A(t) pitting [mm2]0 804 80420 773 79740 715 74460 668 66580 627 577100 591 481
Moreover, the reduction of the reinforcement yield strength along the service life of the bridge is considered
as well. The decrease can be implemented using equations proposed by [21]. This can be expressed by:
f(t) = (1.0− 0.005Qcorr) f0 (12)
Where:
• f(t) = yield strength of corroded reinforcement at time t due to pitting corrosion
• f0 = yield strength of non-corroded reinforcement (450 MPa)
• Qcorr = corrosion percent (%) of reinforcement in terms of area loss
The loss percentage regarding the yield strength of steel bars is shown in Figure 13. It is estimated about 20%
over the service life of the bridge (100 years). The reduction of the residual capacity of corroded reinforcement
depends on both the local attack penetration on the reinforcement surface and stress concentration in the pitting

Deteriorated seismic capacity assessment of RC bridge piers in corrosive environment
Figure 13: Reduction in yield strength of steel bars
surface. Corrosion leads to a reduction in steel ductility as well, which can effectively be represented by ultimate
strain. A significant ductility analysis and discussion on the study was presented by [22] that investigated the
reinforcement ultimate strain at different degrees of corrosion. The researchers observed that the time-variant
function for steel ultimate strain can be expressed by:
εu(t) = (1.0− 0.0137Qcorr)εu0 (13)
Where:
• εu(t) = ultimate strain of corroded reinforcement at time t due to pitting corrosion
• εu0 = ultimate strain of non-corroded reinforcement equal to 0.0675 for the B450C steel
• Qcorr = corrosion percent (%) in terms of area loss
The reduction of εu(t), which changes with time, is 54.96% in terms of percentage (Figure 14). This means that
more than half of the initial ultimate strain is lost during the service life of the bridge. In fact, the ultimate strain
of corroded reinforcement decreases up to 0.0304, as shown in Figure 14.

Deteriorated seismic capacity assessment of RC bridge piers in corrosive environment
Figure 14: Reduction in ultimate strain of steel bars
5 INTERACTION AND BRESLER’S DOMAINS
5.1 Interaction domains
As discussed above, the structural capacity of the bridge can be affected by degradation due to corrosion. This
section aims to assess the structural capacity over the service life of the bridge. Additionally, the reduction of
the ductility performance has been considered to check the effect of seismic action on the motorway overpass
along 100 years. Structural analysis is based on the use of interaction and Bresler’s domains. An interaction
domain is a safety zone represented by the geometric locus of M-N pairs that define the strength limits of the
cross-section of a structural member under combined compression and bending [40]. Figures 15-16 show the
interaction domains for the most significant situations, which change with time related to 0, 20, 40, 60, 80, 100
years of the service life of the bridge case study. In contrast, the star symbol represents the design point.
Figure 15: Interaction domain My −N of Section A due to general (left) and pitting (right) corrosion
Deteriorated seismic capacity assessment of RC bridge piers in corrosive environment
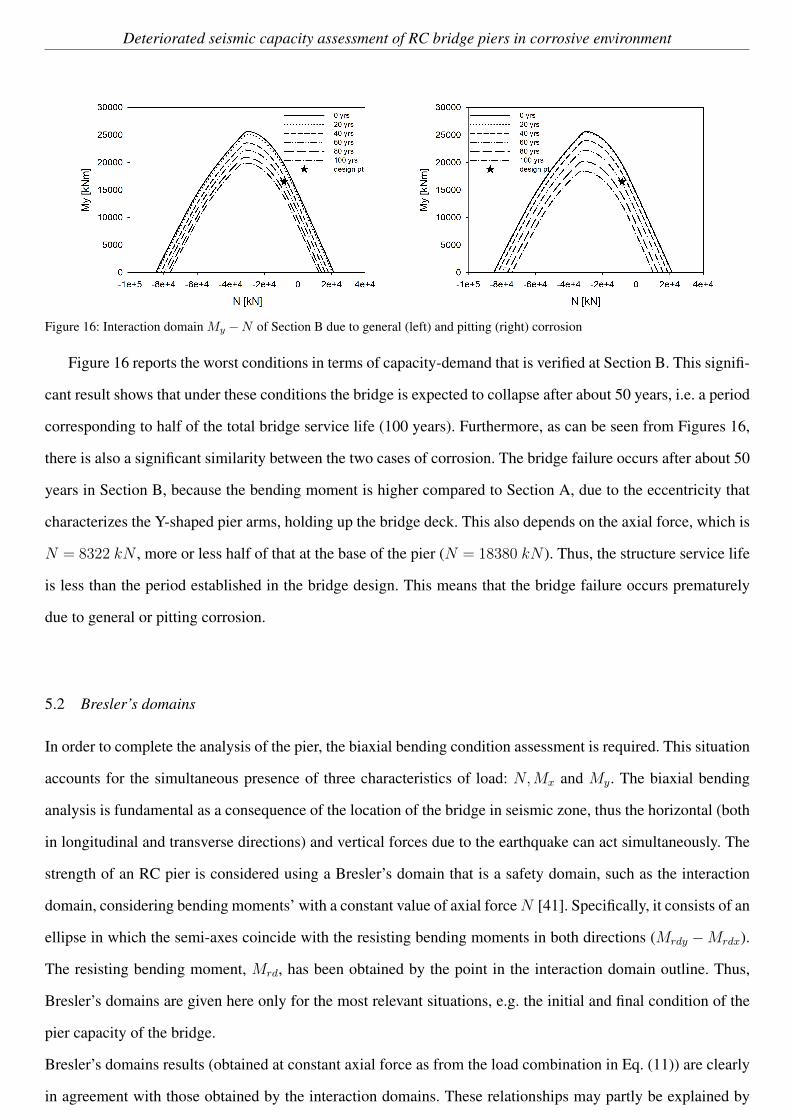
Figure 16: Interaction domain My −N of Section B due to general (left) and pitting (right) corrosion
Figure 16 reports the worst conditions in terms of capacity-demand that is verified at Section B. This signifi-
cant result shows that under these conditions the bridge is expected to collapse after about 50 years, i.e. a period
corresponding to half of the total bridge service life (100 years). Furthermore, as can be seen from Figures 16,
there is also a significant similarity between the two cases of corrosion. The bridge failure occurs after about 50
years in Section B, because the bending moment is higher compared to Section A, due to the eccentricity that
characterizes the Y-shaped pier arms, holding up the bridge deck. This also depends on the axial force, which is
N = 8322 kN , more or less half of that at the base of the pier (N = 18380 kN ). Thus, the structure service life
is less than the period established in the bridge design. This means that the bridge failure occurs prematurely
due to general or pitting corrosion.
5.2 Bresler’s domains
In order to complete the analysis of the pier, the biaxial bending condition assessment is required. This situation
accounts for the simultaneous presence of three characteristics of load: N,Mx and My. The biaxial bending
analysis is fundamental as a consequence of the location of the bridge in seismic zone, thus the horizontal (both
in longitudinal and transverse directions) and vertical forces due to the earthquake can act simultaneously. The
strength of an RC pier is considered using a Bresler’s domain that is a safety domain, such as the interaction
domain, considering bending moments’ with a constant value of axial forceN [41]. Specifically, it consists of an
ellipse in which the semi-axes coincide with the resisting bending moments in both directions (Mrdy −Mrdx).
The resisting bending moment, Mrd, has been obtained by the point in the interaction domain outline. Thus,
Bresler’s domains are given here only for the most relevant situations, e.g. the initial and final condition of the
pier capacity of the bridge.
Bresler’s domains results (obtained at constant axial force as from the load combination in Eq. (11)) are clearly
in agreement with those obtained by the interaction domains. These relationships may partly be explained by
Deteriorated seismic capacity assessment of RC bridge piers in corrosive environment
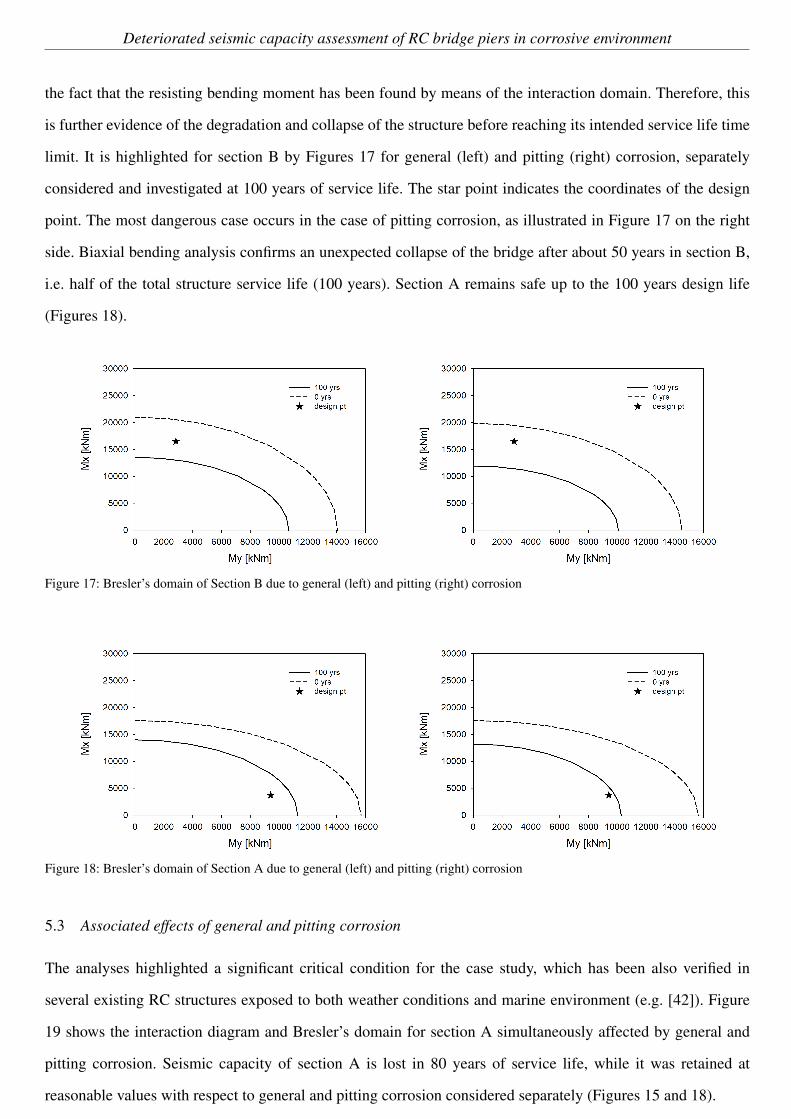
the fact that the resisting bending moment has been found by means of the interaction domain. Therefore, this
is further evidence of the degradation and collapse of the structure before reaching its intended service life time
limit. It is highlighted for section B by Figures 17 for general (left) and pitting (right) corrosion, separately
considered and investigated at 100 years of service life. The star point indicates the coordinates of the design
point. The most dangerous case occurs in the case of pitting corrosion, as illustrated in Figure 17 on the right
side. Biaxial bending analysis confirms an unexpected collapse of the bridge after about 50 years in section B,
i.e. half of the total structure service life (100 years). Section A remains safe up to the 100 years design life
(Figures 18).
Figure 17: Bresler’s domain of Section B due to general (left) and pitting (right) corrosion
Figure 18: Bresler’s domain of Section A due to general (left) and pitting (right) corrosion
5.3 Associated effects of general and pitting corrosion
The analyses highlighted a significant critical condition for the case study, which has been also verified in
several existing RC structures exposed to both weather conditions and marine environment (e.g. [42]). Figure
19 shows the interaction diagram and Bresler’s domain for section A simultaneously affected by general and
pitting corrosion. Seismic capacity of section A is lost in 80 years of service life, while it was retained at
reasonable values with respect to general and pitting corrosion considered separately (Figures 15 and 18).

Deteriorated seismic capacity assessment of RC bridge piers in corrosive environment
Figure 19: Interaction domain My −N (left) and Bresler’s domain (right) of Section A due the associated effects of general andpitting corrosion
6 CONCLUSIONS
The aim of the present investigation was to examine the combined effect of reinforcement corrosion and seis-
mic action on an RC pier of a motorway overpass. The bridge is located in Sicily, that is a highly seismic zone
in a marine environment. Previous research performed by [17] was followed, changing the deterioration input
parameters according to the bridge site. Thus, general and pitting corrosion analysis was applied to steel rein-
forcing bars obtaining the residual cross-sectional area of reinforcement as well as the mechanical properties
(yielding stress and ultimate strain) of corroded reinforcing steel. This study has found that a collapse is envis-
aged over time. It is shown that under these conditions the bridge is expected to collapse after about 50 years,
i.e. a period corresponding to half of the total bridge service life (100 years). The time to depassivation of the
reinforcing steel by the effect of chloride attack is around 10 years. Furthermore, pitting corrosion results the
most demanding in terms of seismic capacity degradation with respect to general corrosion. However, the asso-
ciated effects of both general and pitting corrosion verifies the worst condition. These results were demonstrated
using interaction diagrams and Bresler’s domains.
The unpredictability of the seismic event and the resulting impossibility to completely avoid hazard at the site
show the necessity to prevent an unexpected collapse of the structures. The proposed methodology may be
useful to predict the degradation of the seismic capacity of existing and planned bridges. It takes into account
corrosion and performance losses in order to prevent abrupt collapse, ensure effective maintenance and, thus,
reasonable durability. A bridge designed so that does not suffer from corrosion can withstand seismic action
for which it was designed. On the other hand, when pitting corrosion occurs, the service life of the structure
is shorter than the period planned at the design stage. If the structure is placed in a marine environment, fail-
ure occurs more quickly because corrosion is aggravated. The deterioration model applied in this bridge case
study takes also into account the distance from the sea. This study involves the possibility to close or plan the

Deteriorated seismic capacity assessment of RC bridge piers in corrosive environment
infrastructure maintenance in time. This can be possible by following the analytical methodology in this paper,
which concerns the maintenance of existing and planned bridges, to preserve their safe conditions and estimate
the most appropriate restoration time.
An uncontrolled factor in the study is that corrosion can also affect bonding, thus increasingly reducing ductility
and safety performance. Bridge design details are also based on bond strength and confinement capacity of the
reinforcing bars. However, in a corroded structure bond strength and confinement capacity can decrease due to
the transverse reinforcement area loss, and concrete cover cracking and spalling. Although all ductility require-
ments were respected through the design details, bond strength ductility requirements are beyond the scope of
the present investigation and were not considered in the study. Future research could usefully investigate bond-
ing failure effects in bridge corrosion processes.
Another issue that could be explored by future research is the variation of internal forces throughout the ser-
vice life of the bridge due to corrosion. After some level of corrosion, concrete spalling produces a smaller
cross-section, which translates into reduced inertia and stiffness. As this stiffness reduction may not be homo-
geneous in the whole structure, a redistribution of internal forces can appear along time. Another consequence
of concrete spalling is a reduction in response capacity due to the loss of concrete in the structural element.
REFERENCES
[1] Dimitri V Val. “Deterioration of strength of RC beams due to corrosion and its influence on beam relia-bility”. In: Journal of Structural Engineering 133.9 (2007), pp. 1297–1306.
[2] Dimitri V Val and Mark G Stewart. “Life-cycle cost analysis of reinforced concrete structures in marineenvironments”. In: Structural safety 25.4 (2003), pp. 343–362.
[3] Mattias Blomfors et al. “Engineering bond model for corroded reinforcement”. In: Engineering Struc-tures 156 (2018), pp. 394–410.
[4] H. Huang et al. “Seismic performance of predamaged RC columns strengthened with HPFL and BSPunder combined loadings”. In: Engineering Structures 203 (2020). DOI: 10.1016/j.engstruct.2019.109871.
[5] S. Raza et al. “Strengthening and repair of reinforced concrete columns by jacketing: State-of-the-artreview”. In: Sustainability (Switzerland) 11.11 (2019). DOI: 10.3390/su11113208.
[6] J.-G. Xu et al. “Analytical modeling of corroded RC columns considering flexure-shear interaction forseismic performance assessment”. In: Bulletin of Earthquake Engineering (2019).
[7] Z. Cui, A. Alipour, and B. Shafei. “Structural performance of deteriorating reinforced concrete columnsunder multiple earthquake events”. In: Engineering Structures 191 (2019), pp. 460–468. DOI: 10.1016/j.engstruct.2019.04.073.
[8] A. Guo et al. “Structural strength deterioration of coastal bridge piers considering non-uniform corrosionin marine environments”. In: Earthquake Engineering and Engineering Vibration 17.2 (2018), pp. 429–444.
[9] M. Akiyama, D.M. Frangopol, and H. Matsuzaki. “Life-cycle reliability of RC bridge piers under seis-mic and airborne chloride hazards”. In: Earthquake Engineering and Structural Dynamics 40.15 (2011),pp. 1671–1687.

Deteriorated seismic capacity assessment of RC bridge piers in corrosive environment
[10] B.S. Vishwanath and S. Benerjee. “Life-Cycle Resilience of Aging Bridges under Earthquakes”. In: Jour-nal of Bridge Engineering 24.11 (2019). DOI: 10.1061/(ASCE)BE.1943-5592.0001491.
[11] Fabio Biondini, Elena Camnasio, and Alessandro Palermo. “Lifetime seismic performance of concretebridges exposed to corrosion”. In: Structure and Infrastructure Engineering 10.7 (2014), pp. 880–900.
[12] D.-E. Choe et al. “Seismic fragility estimates for reinforced concrete bridges subject to corrosion”. In:Structural Safety 31.4 (2009), pp. 275–283.
[13] J Cairns, Y Du, and D Law. “Structural performance of corrosion-damaged concrete beams”. In: Maga-zine of Concrete Research 60.5 (2008), pp. 359–370.
[14] B.A. Olmos, J.M. Jara, and M. Jara. “Influence of some relevant parameters in the seismic vulnerabilityof RC bridges”. In: Earthquake and Structures 3.3-4 (2012), pp. 365–381.
[15] C. Zelaschi, R. Monteiro, and R. Pinho. “Parametric Characterization of RC Bridges for Seismic Assess-ment Purposes”. In: Structures 7 (2016), pp. 14–24.
[16] M.C. Djemai, M. Bensaibi, and F.Z. Halfaya. “The effect of type and height of piers on the seismicbehavior of reinforced concrete bridges”. In: International Journal of Engineering Research in Africa 41(2019), pp. 79–87.
[17] Fengkun Cui et al. “Seismic fragility analysis of deteriorating RC bridge substructures subject to marinechloride-induced corrosion”. In: Engineering Structures 155 (2018), pp. 61–72.
[18] NTC. “Norme Tecniche per le Costruzioni”. In: Decree of the Minister of the Infrastructures 14 (2018).
[19] CEN. Eurocode 8: Design of Structures for Earthquake Resistance, Part 2: Bridges. 2005.
[20] Abdullah A Almusallam. “Effect of degree of corrosion on the properties of reinforcing steel bars”. In:Construction and Building Materials 15.8 (2001), pp. 361–368.
[21] YG Du, LA Clark, and AHC Chan. “Residual capacity of corroded reinforcing bars”. In: Magazine ofConcrete Research 57.3 (2005), pp. 135–147.
[22] PS Zhang, M Lu, and XY Li. “The mechanical behaviour of corroded bar”. In: Journal of IndustrialBuildings 25.257 (1995), pp. 41–44.
[23] Do-Eun Choe et al. “Probabilistic capacity models and seismic fragility estimates for RC columns subjectto corrosion”. In: Reliability Engineering & System Safety 93.3 (2008), pp. 383–393.
[24] Do-Eun Choe et al. “Seismic fragility estimates for reinforced concrete bridges subject to corrosion”. In:Structural Safety 31.4 (2009), pp. 275–283.
[25] Dimitri V Val and Robert E Melchers. “Reliability of deteriorating RC slab bridges”. In: Journal ofstructural engineering 123.12 (1997), pp. 1638–1644.
[26] Kyosti Tuutti. Corrosion of steel in concrete. Cement-och betonginst., 1982.
[27] Palle Thoft-Christensen. “Corrosion and cracking of reinforced concrete”. In: Life-Cycle Performance ofDeteriorating Structures: Assessment, Design and Management. 2004, pp. 26–36.
[28] Thierry Vidal, Arnaud Castel, and Raoul Francois. “Corrosion process and structural performance of a 17year old reinforced concrete beam stored in chloride environment”. In: Cement and Concrete Research37.11 (2007), pp. 1551–1561.
[29] T Liu and RW Weyers. “Modeling the dynamic corrosion process in chloride contaminated concretestructures”. In: Cement and Concrete Research 28.3 (1998), pp. 365–379.
[30] CQ Li. “Life-cycle modeling of corrosion-affected concrete structures: propagation”. In: Journal ofStructural Engineering 129.6 (2003), pp. 753–761.
[31] Yingshu Yuan, Jianhua Jiang, and Tao Peng. “Corrosion process of steel bar in concrete in full lifetime”.In: ACI Materials Journal 107.6 (2010), p. 562.
[32] Kim Anh T Vu and Mark G Stewart. “Structural reliability of concrete bridges including improvedchloride-induced corrosion models”. In: Structural safety 22.4 (2000), pp. 313–333.
Deteriorated seismic capacity assessment of RC bridge piers in corrosive environment
[33] Chong Cao, Moe MS Cheung, and Ben YB Chan. “Modelling of interaction between corrosion-inducedconcrete cover crack and steel corrosion rate”. In: Corrosion Science 69 (2013), pp. 97–109.
[34] M Sigit Darmawan and Mark G Stewart. “Spatial time-dependent reliability analysis of corroding pre-tensioned prestressed concrete bridge girders”. In: Structural Safety 29.1 (2007), pp. 16–31.
[35] Yutao Pang et al. “Seismic fragility analysis of cable-stayed bridges considering different sources ofuncertainties”. In: Journal of Bridge Engineering 19.4 (2013), p. 04013015.
[36] M Barbato, Q Gu, and JP Conte. “Probabilistic push-over analysis of structural and soil-structure sys-tems”. In: Journal of structural engineering 136.11 (2010), pp. 1330–1341.
[37] Agostino Marioni. “The European standard EN 1337 on structural bearings”. In: 6th World Congress onJoints, Bearings and Seismic Devices Systems for Concrete Structures, ACI. 2006.
[38] R. Conti et al. “Seismic performance of bridge piers: caisson vs pile foundations”. In: Soil Dynamics andEarthquake Engineering 130 (2020).
[39] CECS. “Code for durability assessment of concrete structures”. In: Beijing (China) (2007).
[40] P. ROCHA and K. SILVA. “Construction of the interaction curve of concrete-encased composite columnsbased on the deformation domains of reinforced concrete sections”. In: Revista IBRACON de Estruturase Materiais 8 (Aug. 2015), pp. 447–466.
[41] Ji Hyeon Kim and Hae Sung Lee. “Reliability assessment of reinforced concrete rectangular columnssubjected to biaxial bending using the load contour method”. In: Engineering Structures 150 (2017),pp. 636–645.
[42] M. Morgese et al. “Post-collapse analysis of Morandi’s Polcevera viaduct in Genoa Italy”. In: Journal ofCivil Structural Health Monitoring 10.1 (2020), pp. 69–85.

Deteriorated seismic capacity assessment of RC bridge piers in corrosive environment
7 FIGURES CAPTIONS
1. Hemispherical model due to pitting effect of RC structures
2. Phases of corrosion process of reinforcing steel
3. Comparison between corrosion rate obtained by Matlab and points in the paper by Cui et al.
4. Representation of the bridge front view
5. Representation of the bridge cross-section
6. 3D pier geometry and modelling on SAP2000
7. Horizontal and vertical component of the response spectra
8. 1st vibration mode (T = 1.516 s;f = 0.659 Hz)
9. 2nd vibration mode (T = 1.505 s;f = 0.664 Hz)
10. 3rd vibration mode (T = 1.176 s;f = 0.851 Hz)
11. Longitudinal reinforcement in Section A and B (see also Figure 6).
12. Comparison of pitting and general corrosion
13. Reduction in yield strength of steel bars
14. Reduction in ultimate strain of steel bars
15. Interaction domain My −N of Section A due to general corrosion
16. Interaction domain Mx −N of Section A due to pitting corrosion
17. Interaction domain Mx −N of Section B due to general corrosion
18. Interaction domain Mx −N of Section B due to pitting corrosion
19. Bresler’s domain of Section B due to general corrosion
20. Bresler’s domain of Section B due to pitting corrosion
21. Bresler’s domain of Section A due to general corrosion
22. Bresler’s domain of Section A due to pitting corrosion