SEISMIC VULNERABILITY OF BUILDING BY CONSIDERING THE EFFECT OF VISCOELASTIC DAMPERS USING PUSHOVER...
13
International journal of Engineering Research-Online A Peer Reviewed International Journal Articles available online http://www.ijoer.in Vol.2., Issue.3., 2014 49 SHAMANTH KUMAR M et al SEISMIC VULNERABILITY OF BUILDING BY CONSIDERING THE EFFECT OF VISCOELASTIC DAMPERS USING PUSHOVER ANALYSIS SHAMANTH KUMAR M 1 , SYED AHAMED RAZA 2 , Dr. N S KUMAR 3 1 Post Graduation Student (Structural Engineering), Ghousia College of Engineering, Ramanagaram, Karnataka. India. 2 Assisitant Professor, Department of Civil Engineering, Ghousia College of Engineering, Ramanagaram, Karnataka. India. 3 Professor, Department of Civil Engineering, Ghousia College of Engineering, Ramanagaram, Karnataka. India INTRODUCTION Earthquakes results from the sudden movement of tectonic plates in the earth's crust. The movement takes place at fault lines, and the energy released is transmitted through the earth in the form of waves that causes ground motion many miles from the Epicentre. Regions adjacent to active fault lines are the most prone to experience earthquakes. These waves arrive at various instants of time, have different amplitudes and carry RESEARCH ARTICLE ISSN: 2321-7758 Article Received: 05/06/2014 Article Revised on: 16/06/2014 Article Accepted on:21/06/2014 SHAMANTH KUMAR M ABSTRACT An earthquake is the result of a sudden release of energy in the Earth's crust that creates seismic waves. Earthquakes can create serious damage to structures. The structures, already built are vulnerable to future earthquakes. The damage to structures causes deaths, injuries, economic loss, and loss of functions. Earthquake risk is associated with seismic hazard, vulnerability of buildings, exposure. Seismic hazard quantifies the probable ground motion that can occur on site. Vulnerability of buildings is important in causing risk to life.In the present study, analytical investigation of a symmetrical building (SMRF Type) situated in seismic Zone-V of India, in accordance with IS 1893-2002(part-1), is taken as an example and the various analytical approaches (linear static and nonlinear static analysis) are performed on the building to identify the seismic demand and also pushover analysis is performed to determine the performance levels, and Capacity spectrum of the considered, also Base Shear is compared for G+5 and G+11 storey building models in both X and Y directions by using Finite Element Software Package ETAB’s 13.0 version. Key words: Earthquakes, Pushover analysis, Symmetrical building, Performance levels, Capacity Demand and Performance point.
Transcript of SEISMIC VULNERABILITY OF BUILDING BY CONSIDERING THE EFFECT OF VISCOELASTIC DAMPERS USING PUSHOVER...

International journal of Engineering Research-Online
A Peer Reviewed International Journal Articles available online http://www.ijoer.in
Vol.2., Issue.3., 2014
49 SHAMANTH KUMAR M et al
SEISMIC VULNERABILITY OF BUILDING BY CONSIDERING THE EFFECT OF
VISCOELASTIC DAMPERS USING PUSHOVER ANALYSIS
SHAMANTH KUMAR M1, SYED AHAMED RAZA2, Dr. N S KUMAR3
1Post Graduation Student (Structural Engineering), Ghousia College of Engineering, Ramanagaram,
Karnataka. India. 2Assisitant Professor, Department of Civil Engineering, Ghousia College of Engineering,
Ramanagaram, Karnataka. India. 3Professor, Department of Civil Engineering, Ghousia College of Engineering, Ramanagaram,
Karnataka. India
INTRODUCTION
Earthquakes results from the sudden movement of tectonic plates in the earth's crust. The movement takes
place at fault lines, and the energy released is transmitted through the earth in the form of waves that causes
ground motion many miles from the Epicentre. Regions adjacent to active fault lines are the most prone to
experience earthquakes. These waves arrive at various instants of time, have different amplitudes and carry
RESEARCH ARTICLE ISSN: 2321-7758
Article Received: 05/06/2014 Article Revised on: 16/06/2014 Article Accepted on:21/06/2014
SHAMANTH KUMAR M
ABSTRACT
An earthquake is the result of a sudden release of energy in the Earth's crust
that creates seismic waves. Earthquakes can create serious damage to structures. The
structures, already built are vulnerable to future earthquakes. The damage to
structures causes deaths, injuries, economic loss, and loss of functions. Earthquake risk
is associated with seismic hazard, vulnerability of buildings, exposure. Seismic hazard
quantifies the probable ground motion that can occur on site. Vulnerability of buildings
is important in causing risk to life.In the present study, analytical investigation of a
symmetrical building (SMRF Type) situated in seismic Zone-V of India, in accordance
with IS 1893-2002(part-1), is taken as an example and the various analytical approaches
(linear static and nonlinear static analysis) are performed on the building to identify the
seismic demand and also pushover analysis is performed to determine the
performance levels, and Capacity spectrum of the considered, also Base Shear is
compared for G+5 and G+11 storey building models in both X and Y directions by using
Finite Element Software Package ETAB’s 13.0 version.
Key words: Earthquakes, Pushover analysis, Symmetrical building, Performance levels,
Capacity Demand and Performance point.

International journal of Engineering Research-Online
A Peer Reviewed International Journal Articles available online http://www.ijoer.in
Vol.2., Issue.3., 2014
50 SHAMANTH KUMAR M et al
different levels of energy. The size of the earthquake can be measured by Magnitude (M) which was obtained
by recording the data of motions on seismograms. This can be measured by an MMI scale (Modified Mercalie
Intensity). The Buildings, which appeared to be strong enough, may crumble like houses of cards during
earthquakes and deficiencies may be exposed. Experience gained from the Bhuj earthquake of 2001
demonstrates that the most of buildings collapsed were found deficient to meet out the requirements of the
present day codes.
The seismicity, seismic or seismic activity of an area refers to the frequency, type and size of earthquakes
experienced over a period of time. Recent research has focused on ways to supplement the damping capacity
of earthquake resistant structures. Structures with increased damping will experience decreased elastic
response during an earthquake. This reduced response results in less non-structural damage and occupant
discomfort. The purpose of this work is to review the work done in these areas by previous researchers. As
indicated in the introduction, the focus of this research is on damping systems which use Viscoelastic dampers
to achieve high levels of damping.
CURRENT PRACTICE
Currently, FEMA 356 (Prestandard and commentary for the seismic rehabilitation of buildings) andFEMA 440
(Improvement of Nonlinear Static Seismic Analysis Procedures). The focus is on anticipated recommendations
to improve inelastic analysis procedures as currently documented in FEMA 356 and ATC 40 serve as the source
documents for future design code. Based on performance-based design methodology, FEMA 356 specifies the
following procedures in the design for an existing building to be retrofitted by energy dissipation dampers.
• Preliminary design, including sizing of the devices
• Device prototype testing
• Final design of the rehabilitated building to meet the target performance level.
For the performance-based design, a structural analysis is needed to obtain the building seismicperformance.
Although there are four analysis procedures specified in FEMA 356 Prestandard, the linear static procedure is
the most efficient for preliminary design purpose. To account for the damping from adding VED’s, FEMA 356
specifies a damping modification factor to reduce the seismic effect (pseudo lateral load in a given horizontal
direction) on the structure.
METHODS OF SEISMIC EVALUATION
There are different methods of analysis provides different degrees of accuracy. Currently seismic
evaluation of buildings can be divided into two categories:
a. Qualitative method
b. Analytical method
QUALITATIVE METHODS
The Qualitative methods are based on the available background information on the structures, past
performance of the similar structures under severe earthquakes, visual inspection report and some non-
destructive test results, etc.
ANALYTICAL METHODS
Analysis methods are broadly classified as linear static, linear dynamic, nonlinear static and nonlinear dynamic
methods.
LINEAR STATIC ANALYSIS (EQUIVALENT STATIC ANALYSIS)
In linear static procedures the building is modelled as an equivalent single degree of freedom (SDOF) system
with a linear static stiffness and an equivalent viscous damping. The seismic input is modelled by an equivalent
lateral force with the objective to produce the same stresses and strains as the earthquake it represents.
This procedure does not in and require dynamic analysis, however, it accounts for the dynamics of building in
an approximate manner. The static method is a simplest one; it requires less computational effort and is based
on formulae given in code of practice. First, the design Base Shear is computed for the whole building and it is

International journal of Engineering Research-Online
A Peer Reviewed International Journal Articles available online http://www.ijoer.in
Vol.2., Issue.3., 2014
51 SHAMANTH KUMAR M et al
then distributed along the height of buildings. The lateral forces at each floor level, thus obtained are
distributed to individual lateral load resisting elements. The procedure generally used for the
Equivalent static analysis is explained below:
(i) Determination of fundamental natural period
(Ta) of the buildings Ta = 0.075*h0.075
Moment resisting RC frame building without brick infill wall.
Ta = 0.085*h0.075
Moment resisting steel frame building without brick infill walls.
Ta = 0.09*h /√d All other buildings, including moment resisting RC frame building with brick infill
walls.
Where,
h - Is the height of the building in meters
d- Is the base dimension of building at plinth levelin m, along the considered direction of lateral force.
(ii) Determination of base shear (VB) of the building
VB = Ah×W
Where,
Ah=Z*I*Sa/2Rg is the design, horizontal seismiccoefficient, which depends on the seismic zone. Factor (Z),
importance factor (I), response,reduction factor (R) and the average response acceleration coefficients (Sa/g).
Sa/g in turn depends on the nature of foundation soil (rock, medium or soft soil sites), natural period and the
damping of the structure.
(iii) Distribution of design base shear
The design Base Shear VB thus obtained shall be distributed along the height of the building as per the
following expression:
Where, Qi is the design lateral force,
Wi is the seismic weight,
Hi is the height of the ith floormeasured from the base and n is the number of stories in the building.
NONLINEARSTATIC ANALYSIS (PUSHOVER ANALYSIS)
The pushover analysis of a structure is a static non-linear analysis under permanent vertical loads and
gradually increasing lateral loads. The load is incrementally increased in accordance with a certain predefined
pattern. The analysis is carried out up to failure, thus it enables determination of collapse load and ductility
capacity. On a building frame, plastic rotation is monitored, and a plot of the total Base Shear versus
Displacement in a structure is obtained by this analysis that would indicate any premature failure or weakness.
PERFORMANCE OBJECTIVES
A performance objective has two essential parts - a damage state and a level of seismic hazard. Seismic
performance is described by designating the maximum allowable damage state (performance level) for an
identified seismic hazard (earthquake ground motion). A performance objective may include consideration of
damage states for several levels of ground motion and would then be termed a dual or multiple-level
performance objective.
The target performance objective is split into Structural Performance Level (SP-n, where n is the designated
number) and Non-structural Performance Level (NP-n, where n is the designated letter). These may be
specified independently; however the combination of the two determines the overall Building Performance
level shown in Fig 1. Structural Performance Levels is shown in the Table 1:

International journal of Engineering Research-Online
A Peer Reviewed International Journal Articles available online http://www.ijoer.in
Vol.2., Issue.3., 2014
52 SHAMANTH KUMAR M et al
TABLE 1: STRUCTURAL PERFORMANCE LEVELS
PERFORMANCE LEVELS STRUCTURAL PERFORMANCE NON-STRUCTURAL
PERFORMANCE
Operational (O) Very light damage. No permanent
drift Substantially original strength
and stiffness.
Negligible damage.
Immediate
Occupancy(IO)
Light damage. No permanent drift, Substantially
original strength & stiffness. Minor cracking.
Elevators can be restarted. Fire protection
operable.
Power and other utilities are
available. Equipment’s and
content secure may not
operate due to mechanical.
Life Safety (LS) Moderate damage. Some permanent drift.
Residual strength & stiffness in all stories. Gravity
elements function.
Building may be beyond economical
repair.
Falling hazard. mitigated
But extensive system damage.
Collapse
Prevention (CP)
Severe damage. Large permanent
Drifts. Little residual strength &
Stiffness, Gravity elements function.
Some exits blocked, Building near
Collapse.
Extensive damage
Fig 1: Force Deformation for Performance Levels
The owner, architect, and structural engineer then decide upon the desired condition of the structure after a
range of ground shakings, or Building Performance Level. The Building Performance Level is a function of the
post event conditions of the structural and non - structural components of the structure.
DESCRIPTIONS OF THE BUILDING CONSIDERED
The structure used in this study is a building of reinforced concrete of 6 storeys with 4 bays along longitudinal
direction and 2 bays along transverse direction (Fig.2, Fig.3 and Fig.4.). The beams are of sections 0.4mx
0.5m and the columns are of sections 0.4mx0.7m and the height of each storey is 3m with the thickness of the
slab is 125mm. Live load on the roof and slab is 2 kN/m2
and floor finishes is 1.5 kN/m2 .Concrete cube
compressive strength,fck = 30 N/mm2 (M30).Characteristic strength of reinforcing steel, fy = 415 N/mm
2
(Fe415).Modulus of Elasticity of concrete, E = 27.386 kN/mm2.Unit weight of concrete = 25 kN/m
3.It is
assumed that the inherent damping ratio of the structure is 5%.

International journal of Engineering Research-Online
A Peer Reviewed International Journal Articles available online http://www.ijoer.in
Vol.2., Issue.3., 2014
53 SHAMANTH KUMAR M et al
Fig 2: Plan of 6 Storey Building Modelled (from ETABS 13.0)
Fig3: Elevation of 6 Storey Building Modelled (a)MODEL 1 - Bare frame (b) MODEL 2 - Building with VED’s
throughout(c)MODEL 3 - Building with VED’s atExternal Periphery (d) MODEL 4 - Building with VED’s
alternately placed in vertical manner for the storeys along X-X direction (from ETABS 13.0).
Fig 4: Elevation of 6 Storey Building Modelled (a) MODEL 1- Bare frame (b) MODEL 2-Building with VED’s
throughout (c) MODEL 3- Building with VED’s External Periphery (d) MODEL 4- Building with VED’s alternately
placed in vertical manner for the storeys along Y-Y direction (from ETABS 13.0).

International journal of Engineering Research-Online
A Peer Reviewed International Journal Articles available online http://www.ijoer.in
Vol.2., Issue.3., 2014
54 SHAMANTH KUMAR M et al
Fig 5: 3-D view of 6 Storey Building Modelled (a)MODEL 1 - Bare frame (b) MODEL 2 - Building with VED’s
throughout(c)MODEL 3 -Building with VED’s External Periphery (d)MODEL 4 -Building with VED’s alternately
placed in vertical manner for the storeys along Y-Y direction (from ETABS 13.0).
RESULTS AND DISCUSSIONS
Following results are tabulated and graphically plotted for the different parameters.
TABLE 2: Storey Stiffness for G+5 Building Models along Longitudinal direction EQ X
NO OF STOREY MODEL 1 MODEL 2 MODEL 3 MODEL 4
6 260372.011 8772892.39 7623793.92 681040.39
5 301325.313 13078807 13930075 13633897
4 305123.182 16606030 19916440 1042704.95
3 311360.988 21489530 28614351 28003290
2 346009.222 59931062 52013088 1043801.22
1 628075.825 3.252E+10 1.714E+10 1.204E+10
Fig 6: Storey Stiffness profile for SMRF building models in Zone-V at each floor level in longitudinal direction by
EQX
International journal of Engineering Research-Online
A Peer Reviewed International Journal Articles available online http://www.ijoer.in
Vol.2., Issue.3., 2014
55 SHAMANTH KUMAR M et al
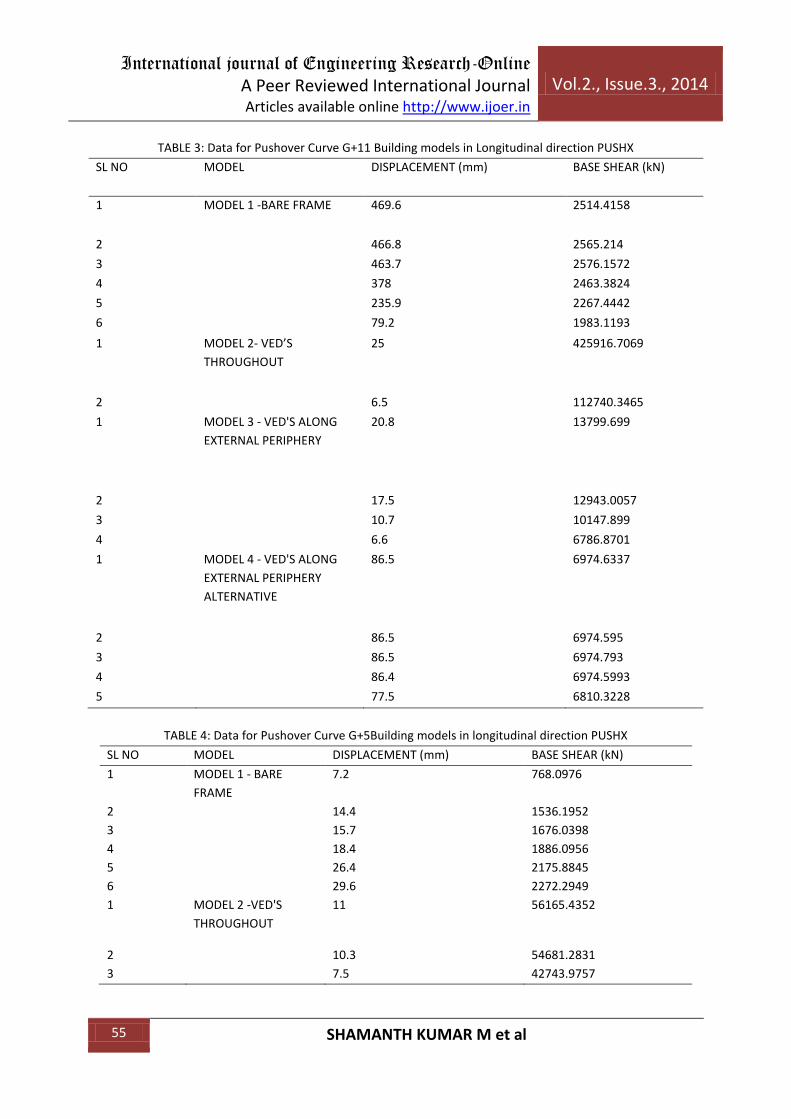
TABLE 3: Data for Pushover Curve G+11 Building models in Longitudinal direction PUSHX
SL NO MODEL DISPLACEMENT (mm) BASE SHEAR (kN)
1 MODEL 1 -BARE FRAME 469.6 2514.4158
2 466.8 2565.214
3 463.7 2576.1572
4 378 2463.3824
5 235.9 2267.4442
6 79.2 1983.1193
1 MODEL 2- VED’S
THROUGHOUT
25 425916.7069
2 6.5 112740.3465
1 MODEL 3 - VED'S ALONG
EXTERNAL PERIPHERY
20.8 13799.699
2 17.5 12943.0057
3 10.7 10147.899
4 6.6 6786.8701
1 MODEL 4 - VED'S ALONG
EXTERNAL PERIPHERY
ALTERNATIVE
86.5 6974.6337
2 86.5 6974.595
3 86.5 6974.793
4 86.4 6974.5993
5 77.5 6810.3228
TABLE 4: Data for Pushover Curve G+5Building models in longitudinal direction PUSHX
SL NO MODEL DISPLACEMENT (mm) BASE SHEAR (kN)
1 MODEL 1 - BARE
FRAME
7.2 768.0976
2 14.4 1536.1952
3 15.7 1676.0398
4 18.4 1886.0956
5 26.4 2175.8845
6 29.6 2272.2949
1 MODEL 2 -VED'S
THROUGHOUT
11 56165.4352
2 10.3 54681.2831
3 7.5 42743.9757
International journal of Engineering Research-Online
A Peer Reviewed International Journal Articles available online http://www.ijoer.in
Vol.2., Issue.3., 2014
56 SHAMANTH KUMAR M et al
1 MODEL 3 - VED'S
ALONG EXTERNAL
PERIPHERY
15.1 38674.5347
2 11.6 33598.2734
3 11.2 33242.6283
4 10.9 32852.411
1 MODEL 4- VED'S
ALTERNATE TO
EXTERNAL PERIPHERY
TO STOREY
62.7 8889.2007
2 62.7 8843.9842
3 59.7 8805.4758
4 13.8 6713.5756
5 12.3 6555.416
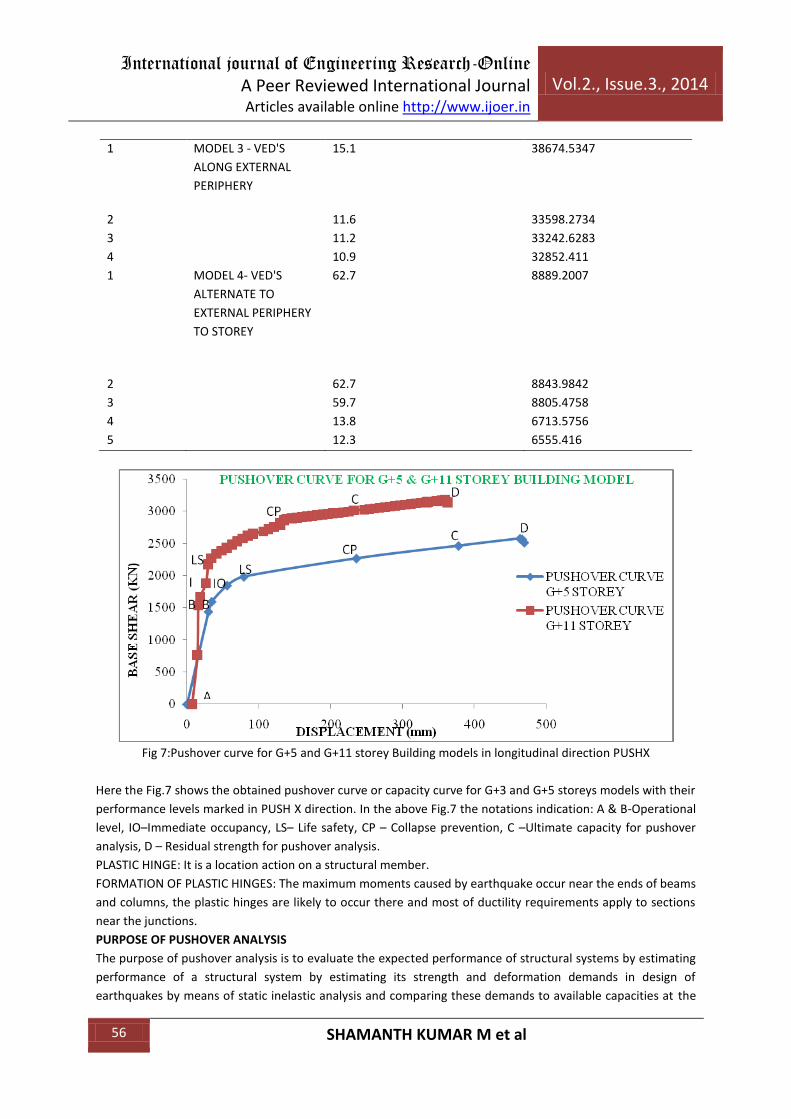
Fig 7:Pushover curve for G+5 and G+11 storey Building models in longitudinal direction PUSHX
Here the Fig.7 shows the obtained pushover curve or capacity curve for G+3 and G+5 storeys models with their
performance levels marked in PUSH X direction. In the above Fig.7 the notations indication: A & B-Operational
level, IO–Immediate occupancy, LS– Life safety, CP – Collapse prevention, C –Ultimate capacity for pushover
analysis, D – Residual strength for pushover analysis.
PLASTIC HINGE: It is a location action on a structural member.
FORMATION OF PLASTIC HINGES: The maximum moments caused by earthquake occur near the ends of beams
and columns, the plastic hinges are likely to occur there and most of ductility requirements apply to sections
near the junctions.
PURPOSE OF PUSHOVER ANALYSIS
The purpose of pushover analysis is to evaluate the expected performance of structural systems by estimating
performance of a structural system by estimating its strength and deformation demands in design of
earthquakes by means of static inelastic analysis and comparing these demands to available capacities at the

International journal of Engineering Research-Online
A Peer Reviewed International Journal Articles available online http://www.ijoer.in
Vol.2., Issue.3., 2014
57 SHAMANTH KUMAR M et al
performance levels of interest. The evaluation is based on an assessment of important performance
parameters, including global drift, inter-storey drift, inelastic element deformations (either absolute or
normalized with respect to a yield value), deformations between elements, and element connection forces (for
elements and connections that cannot sustain inelastic deformations). The inelastic static pushover analysis
can be viewed as a method for predicting seismic force and deformation demands, which accounts in an
approximate manner for the redistribution of internal forces that no longer can be resisted within the elastic
range of structural behaviour. The pushover isexpected to provide information on many response
characteristics that cannot be obtained from an elastic static or dynamic analysis.
Table 5: Performance levels for G+5 Building Model in longitudinal direction PUSHX
STEP
NO
MODEL FRAME TYPE HINGE TYPE
(kN-m)
HINGE TYPE (kN-
m)
HINGE STATE HINGE
STATUS
A MODEL 1 BEAM M2 M3
1 - 0 A to ≤ B A to ≤ IO
2 - 0 A to ≤ B A to ≤ IO
3 - 0 A to ≤ B A to ≤ IO
4 - 0 A to ≤ B A to ≤ IO
5 - 1.571*10-6 A to ≤ B A to ≤ IO
B.1 COLUMN 0 -4.084 A to ≤ B A to ≤ IO
2 0 -8.0908 A to ≤ B A to ≤ IO
3 0 -8.8339 A to ≤ B A to ≤ IO
4 0 -10.1778 A to ≤ B A to ≤ IO
5 1.21*10-6 -14.4094 A to ≤ B A to ≤ IO
The above Table 5 indicates the range of overall performance level of G+5 storey building model in PUSH X
direction which lies in between A to IO.
Table 6: Performance levels for G+11 Building Model in longitudinal direction PUSHX
STEP
NO
MODEL FRAME TYPE HINGE TYPE
(kN-m)
HINGE TYPE(kN-
m)
HINGE STATE HINGE
STATUS
A MODEL 1 BEAM M2 M3
1 - 0 A to ≤ B A to ≤ IO
2 - 0 A to ≤ B A to ≤ IO
3 - -54.7 A to ≤ B A to ≤ IO
4 - -0.0003 A to ≤ B A to ≤ IO
5 - 0.0382 A to ≤ B A to ≤ IO
B.1 COLUMN 0 -6.7153 A to ≤ B A to ≤ IO
2 0 -7.4554 A to ≤ B A to ≤ IO
3 2.84*10-6 -9.0458 A to ≤ B A to ≤ IO
4 -0.0003 -9.8968 A to ≤ B A to ≤ IO
5 0.0355 -14.8345 A to ≤ B A to ≤ IO
The above Table 6 indicates the range of overall performance level of G+11 storey building model in PUSH X
direction which lies in between A to IO.

International journal of Engineering Research-Online
A Peer Reviewed International Journal Articles available online http://www.ijoer.in
Vol.2., Issue.3., 2014
58 SHAMANTH KUMAR M et al
Performance Point of the Building using Capacity Spectrum Method
Performance point can be obtained by superimposing capacity spectrum and demand spectrum and the
intersection point of these two curves is performance point. Fig 8 shows superimposing demand spectrum and
capacity spectrum.
Fig 8: Performance Point of the Building using Capacity Spectrum Method
The Table 7 shows the Data for Performance pointin longitudinal direction (PUSH X) for G+5 storey building
models.
Table 7: Performance point for G+5 Storeys Building model along longitudinal direction
STEP NO MODEL SPECTRAL DISPLACEMENT (mm) SPECTRAL ACCELERATION (g)
1 MODEL 1 5.6 0.272850
2 11.3 0.269474
3 12.3 0.265125
4 14.5 0.261869
5 21.1 0.259388
6 23.7 0.252925
7 27.3 0.242693
8 33.2 0.210994
9 39.1 0.187447
10 45.0 0.172173
11 50.9 0.086087
0
100
200
300
400
0 10 20 30 40 50 60
SP
EC
TR
AL
AC
CE
LE
RA
TIO
N (S
a)
SPECTRAL DISPLACEMENT (Sd)
PERFORMANCE POINT FOR G+5 STOREY ALONG LONGITUDINAL
DIRECTION
CAPACITY CURVE
DEMAND CURVE
10-3
Fig 9: Performance point for G+5 storey building model by combining capacity spectrum model by combining
capacity spectrum in Push X direction

International journal of Engineering Research-Online
A Peer Reviewed International Journal Articles available online http://www.ijoer.in
Vol.2., Issue.3., 2014
59 SHAMANTH KUMAR M et al
Fig 10: Capacity spectrum for G+5 Building Model along longitudinal direction (from ETABS 13.0)
Fig 11: Plastic Hinge Levels Obtained for G+5 storey model along longitudinal direction (from ETABS 13.0)
The above Fig 11shows the location of plastic hinges formed for different performance levels in their final step
of analysis for PUSH X direction.

International journal of Engineering Research-Online
A Peer Reviewed International Journal Articles available online http://www.ijoer.in
Vol.2., Issue.3., 2014
60 SHAMANTH KUMAR M et al
Table 8: Comparison of Base Shear for all two building models in both longitudinal and transverse direction for
both equivalent static analysis and pushover analysis
STOREY NOS MODELS BASE SHEAR ( kN)
EQ X PUSH X EQ Y PUSH Y
G+5 STOREY MODEL 1 807.3855 3137.9805 807.3855 1943.28
MODEL 2 972.7215 55358.9719 972.7215 57612.57
G+11 STOREY MODEL 1 967.1842 2557.671 967.1836 1666.346
MODEL 2 1471.604 422859 1041.0448 1213930
Fig 12: Comparison of Base shear for G+5 building model for both linear static and nonlinear static analysis
Fig 13: Comparison of Base shear for G+11 building model for both linear static and nonlinear static analysis
CONCLUSION
1. The results obtained in terms of pushover demand, capacity spectrum and plastic hinges gave an
insight into the real behaviour of structures.
2. The overall performance level for G+5 and G+11 storey Building Models were found betweenA-IO.
The hinge status and location has been determined and it is noted that most of the hinges begin to
form in A-IO range.
3. The performance point is determined for G+5 storey Building Models in PUSH X direction at Sa =
0.27448g,Sd = 52.8mm and Shear = 2.5491kN.

International journal of Engineering Research-Online
A Peer Reviewed International Journal Articles available online http://www.ijoer.in
Vol.2., Issue.3., 2014
61 SHAMANTH KUMAR M et al
4. Base Shear increases with the increase in mass and number of storeys of building; also Base Shear
obtained from pushover analysis is nearly thrice for both G+5 and G+11 storey Building Models than
the Base Shear obtained from Equivalent Static Analysis.
REFERENCES
[1] Applied Technology Council (ATC-40) (1996) prepared a report on Seismic evaluation and retrofit of
concrete buildings sponsored by California Safety Commission.
[2] Ashraf Habibullah and Stephen Pyle, (Published in Structure Magazine, Winter, 1998)“Practical Three
Dimensional Nonlinear Static Pushover Analysis”.
[3] Federal Emergency Management Agency (FEMA 273) NEHRP GUIDLINES (1997) developed a set of
technically sound, nationally applicable guidelines (with commentary) for the seismic rehabilitation of
buildings.
[4] Federal emergency management agency (FEMA 356), Nov 2000, is a report on Prestandard and
commentary for the seismic rehabilitation of buildings prepared by American society of civil
engineers.
[5] IS 1893-2002(Part-1), “Criteria for Earthquake resistant design of structures”, General provisions and
buildings, Bureau of Indian Standards, New Delhi.
[6] Mrugesh D. Shah and Sumant B. Patel, “Non-linear static Analysis of R.C. Frames”, (2011).
[7] Ri-Hui Zhang1 and T. T. Soong, Member, ASCE “Seismic Design of Viscoelastic Dampers for Structural
Applications” J. Struct. Eng. 1992.118:1375-1392.
[8] Savita.V.Athani, Dyavanal.S.S and Dr.Annigeri.S.A. (2009), “performance based seismic evaluation and
retrofitting of multi-storeyed buildings”
[9] Syed Ahamed, Dr. Jagadish.G.Kori (2013), “Performance Based Seismic Analysis of an Unsymmetrical
Building Using Pushover Analysis”
[10] Uniform Building Code (UBC), Vol-2 (1997).
[11] Zdzislaw Pawlak, Roman Lewandowski, “Optimization of Structures equipped with Viscoelastic
Dampers Modelled using the Fractional Order Derivatives ”Corfu, Greece, 25–28 May 2011.