A Study on Pushover Analysis using Capacity Spectrum ...
13
16 th World Conference on Earthquake Engineering, 16WCEE 2017 Santiago Chile, January 9th to 13th 2017 Paper N° 45(Abstract ID) Registration Code: S-XXXXXXXX A Study on Pushover Analysis using Capacity Spectrum Method based on Eurocode 8 Rahul Leslie 1 , Naveen A P 2 1 (Corresponding Author) Assistant Director, Buildings Design, DRIQ, Kerala PWD, Trivandrum, India. [email protected] 2 Assistant Professor, Department of Civil Engineering, St. Thomas College of Engineering and Technology, Chengannur, India. [email protected] Abstract The performance of a structural system under seismic action can be evaluated by resorting to non-linear static analysis. This involves the estimation of the structural strength and available capacities and the comparison with the deformation demands at desired performance levels. Seismic evaluation of existing structures and of the proposed design for new structures can be done based on Non-linear Static Procedure popularly known as Pushover Analysis (PoA). The ‘Iterative Procedure (Optional)’ mentioned in Eurocode 8 (EC8) has been developed to an EC8 based Capacity Spectrum Method (CSM) procedure and is investigated here. Since commercial packages, including SAP2000 which was used for this investigation, has no facility for conducting an EC8 based CSM, a method was developed, and the procedure is programmed in VB-Script and embedded in MS-Excel. The paper also attempts to investigate the Consecutive Modal Pushover (CMP) analysis, using the EC8 based CSM procedure developed. Although the procedure for CMP in its original paper was a Displacement Coefficient Method based one, a trial-and-error procedure is being followed here for adapting the procedure for a CSM based approach. The study includes modeling of a typical realistic building and determination of Performance Point for both conventional single mode PoA as well as for CMP, both using VB-Script program developed for the EC8 based CSM procedure. The verification of results is done by comparing results with the Non-linear Time History analysis. The procedure developed for the EC8 based CSM – the method for plotting the Locus of the Performance Point and consequent determination of the Performance Point – is also explained in detail, step-by-step. Keywords — Pushover Analysis, Eurocode 8, Capacity Spectrum Method, Consecutive Modal Pushover, SAP2000, RC Building.
-
Upload
khangminh22 -
Category
Documents
-
view
2 -
download
0
Transcript of A Study on Pushover Analysis using Capacity Spectrum ...

16th World Conference on Earthquake Engineering, 16WCEE 2017
Santiago Chile, January 9th to 13th 2017
Paper N° 45(Abstract ID)
Registration Code: S-XXXXXXXX
A Study on Pushover Analysis using Capacity Spectrum Method based on Eurocode 8
Rahul Leslie1 , Naveen A P2
1(Corresponding Author) Assistant Director, Buildings Design, DRIQ, Kerala PWD, Trivandrum, India. [email protected] 2Assistant Professor, Department of Civil Engineering, St. Thomas College of Engineering and Technology, Chengannur, India.
Abstract The performance of a structural system under seismic action can be evaluated by resorting to non-linear static analysis. This involves the estimation of the structural strength and available capacities and the comparison with the deformation demands at desired performance levels. Seismic evaluation of existing structures and of the proposed design for new structures can be done based on Non-linear Static Procedure popularly known as Pushover Analysis (PoA). The ‘Iterative Procedure (Optional)’ mentioned in Eurocode 8 (EC8) has been developed to an EC8 based Capacity Spectrum Method (CSM) procedure and is investigated here. Since commercial packages, including SAP2000 which was used for this investigation, has no facility for conducting an EC8 based CSM, a method was developed, and the procedure is programmed in VB-Script and embedded in MS-Excel.
The paper also attempts to investigate the Consecutive Modal Pushover (CMP) analysis, using the EC8 based CSM procedure developed. Although the procedure for CMP in its original paper was a Displacement Coefficient Method based one, a trial-and-error procedure is being followed here for adapting the procedure for a CSM based approach.
The study includes modeling of a typical realistic building and determination of Performance Point for both conventional single mode PoA as well as for CMP, both using VB-Script program developed for the EC8 based CSM procedure. The verification of results is done by comparing results with the Non-linear Time History analysis. The procedure developed for the EC8 based CSM – the method for plotting the Locus of the Performance Point and consequent determination of the Performance Point – is also explained in detail, step-by-step.
Keywords — Pushover Analysis, Eurocode 8, Capacity Spectrum Method, Consecutive Modal Pushover, SAP2000, RC Building.

16th World Conference on Earthquake Engineering, 16WCEE 2017
Santiago Chile, January 9th to 13th 2017
1. Introduction Nonlinear Static Procedure (NSP) of analysis also known as Pushover analysis (PoA) is a simple method for prediction of non-linear behavior of the structure under seismic loads. PoA is a performance based method where one determines the performance state from some preset condition, one of them being the intersection of the two estimated quantities, viz., seismic demand and seismic capacity. Seismic demand gives an estimation of the earthquake effects whereas seismic capacity shows the capacity of the structure to resist these earthquake effects. PoA can be done using software packages such as SAP2000, MIDAS/Gen and STAAD.Pro, which provides the facility to conduct the procedure. In general, PoA is a technique in which the structure is subjected to a monotonically incrementing lateral load which approximately represents the relative inertia forces generated at centers of masses for each storey. The structure is thus gently “pushed over”, resulting in the formation of cracks, yielding and hinge formations in the structural members and finally failure of various structural components. Always, Non-Linear Time History Analysis (NL-THA) using ground motion records gives a more realistic solution for seismic assessment. But the procedure is cumbersome compared to PoA and hence impractical for day to day design in a Structural Consultancy environment.
The PoA procedure recommended in Eurocode 8 (EC8) [5] is a modified form of N2 method [7]. Generally, Capacity Spectrum Method (CSM) refers to procedures described in ATC-40 [3] (later improved in FEMA 440 [4]). The method described in EC8 is a Target Displacement approach, although different from that of the Displacement Coefficient Method (DCM) described in FEMA 356 [10] (also later improved in FEMA 440). CSM has the advantage of being graphical nature, providing the ability to visualize the relationship between demand and capacity in the process of determining the point where this capacity spectrum “breaks through” the earthquake demand. This paper attempts to conduct PoA using the ‘Iterative Procedure (Optional)’ of EC8 (Annex B, B.5), which can be developed into a CSM based procedure.
The conventional PoA is restricted to single mode response. The method is valid for low to mid-rise buildings where the behavior is dominated by fundamental vibration mode. It is of significance to take into account of higher mode effects in pushover analysis of tall buildings. Many methods have been proposed for inclusion of higher modes in the analysis which includes the Consecutive Modal Pushover (CMP), among others (like Modal Pushover Analysis, Incremental Response Spectrum Analysis, Adaptive Modal Combination Procedure, etc). The EC8 based CSM analysis procedure developed is being applied for both conventional single mode PoA as well as the Consecutive Modal PoA in this investigation. The maximum base shear values are compared to the corresponding values from NL-THA for verifying the results. The developed program is coded in VB Script and embedded in MS Excel.
2. Methodology The method for the present study consists of three stages. (1) a structure is modeled in the analysis package of SAP2000, (2) then the PoA of the structure is conducted and the pushover curve (base shear, Vb vs roof top displacement, Δrt) is obtained. (3) the Performance Point is obtained using the developed program, and the results are compared with those of the NL-THA done.
2.1 Modeling of the structure The structure chosen for the investigation is an eight storey hospital building, with tower (staircase) room
and machine room for the elevator at the roof (Fig. 1). The plan area of the building is 24m x 12m (Fig. 2). All beams along longitudinal direction (longitudinal frames) and along transverse direction (cross frames) are assigned with geometric cross-sections of 0.23m x 0.50m and 0.23m x 0.60m respectively. All secondary beams are assigned with cross-sections of 0.23m x 0.40m and the slab thickness is taken as 0.1m. A cross-section of 0.30m x 0.60m is assigned to columns, with fixed supports at base and the typical floor height is 3.6m. In the structure modeled, P-M-M hinges are inserted to column elements since the axial force (P) and bi-axial moments (M2 & M3) interaction surface can describe the yielding of a column under combined axial, strong-axis, and weak-axis bending under varying axial loads. Flexural hinges (known as M3 hinges in SAP2000) are assigned to
2
16th World Conference on Earthquake Engineering, 16WCEE 2017
Santiago Chile, January 9th to 13th 2017
the beam elements [6]. Medium soil condition is assumed as the site condition of the structure, for which the Response spectra of medium soil as given in [8] is considered for the analysis.
2.2 Determination of Pushover Curve using SAP2000 A load combination of 1.0DL + 0.25LL<3kN/m^2 + 0.5LL >3kN/m^2 [8] is considered for the non-linear static
analysis of the structure in the gravity direction. DL stands for Dead load and LL stands for Live or Imposed load, with the subscripts representing the range of area load intensity included in each case.
Fig. 1 - 3D view of the building modeled in SAP2000.
Fig. 2 - Typical floor plan of the building (bold lines show beams supporting masonry walls, while dotted lines
show location of beams with no masonry walls supported).
3

16th World Conference on Earthquake Engineering, 16WCEE 2017
Santiago Chile, January 9th to 13th 2017
Table 1 - Base Shear vs roof top displacement applied on the structure along Y direction
Step Displacement
(m)
Base Force
(kN)
0 0 0
1 0.001926 543.146
2 0.007649 1742.245
3 0.008834 1867.018
4 0.012405 2010.878
5 0.021779 2187.3
6 0.06537 2595.896
7 0.081666 2658.411
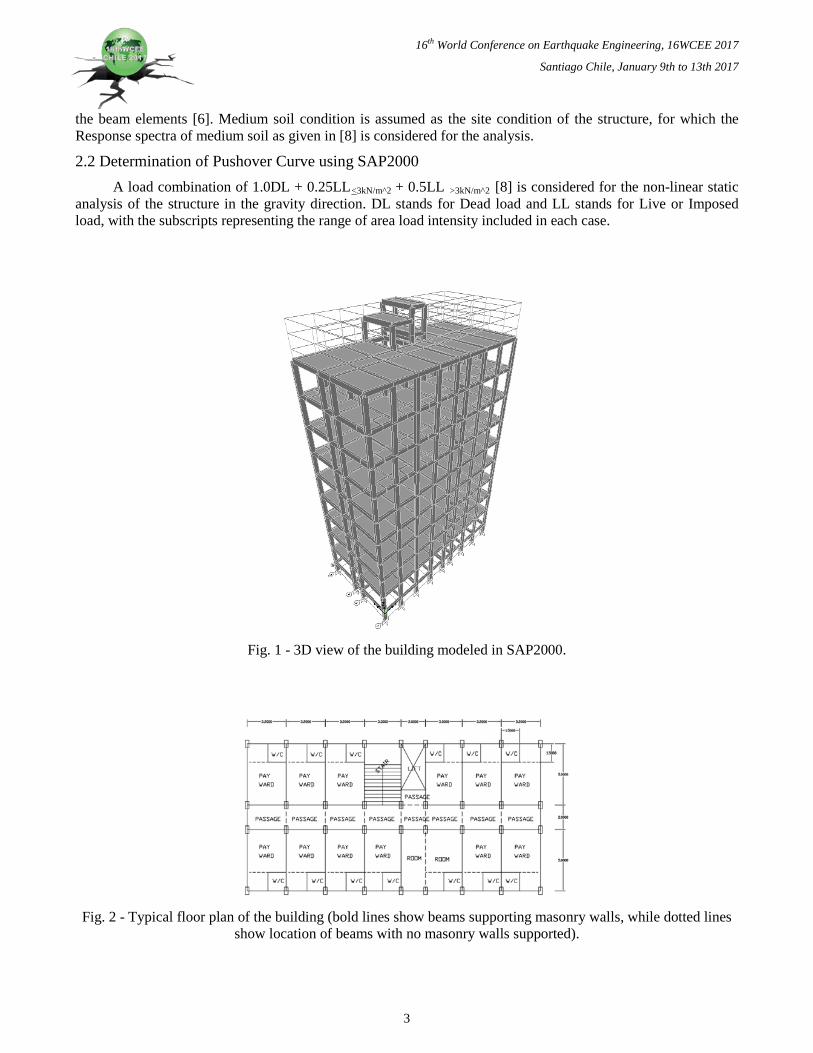
2.3 Conventional single-mode PoA As a continuation to the analysis with gravity loads, the PoA is continued with the lateral ‘push’, for which the analysis is done twice – with the lateral push being in the x and y directions in each case (designated as Push X and Push Y) with the lateral load distribution based on the fundamental modes in the respective directions. The pushover curve obtained from the analysis of the structure in y-direction (transverse direction) is shown (Table 1, Fig. 3).
2.4 Consecutive Modal PoA (CMP) The CMP as described in its original paper[2] is to be done in three steps – first, a PoA with an inverted triangle lateral load, then second, a two-mode Consecutive PoA, and third a three-mode Consecutive PoA.
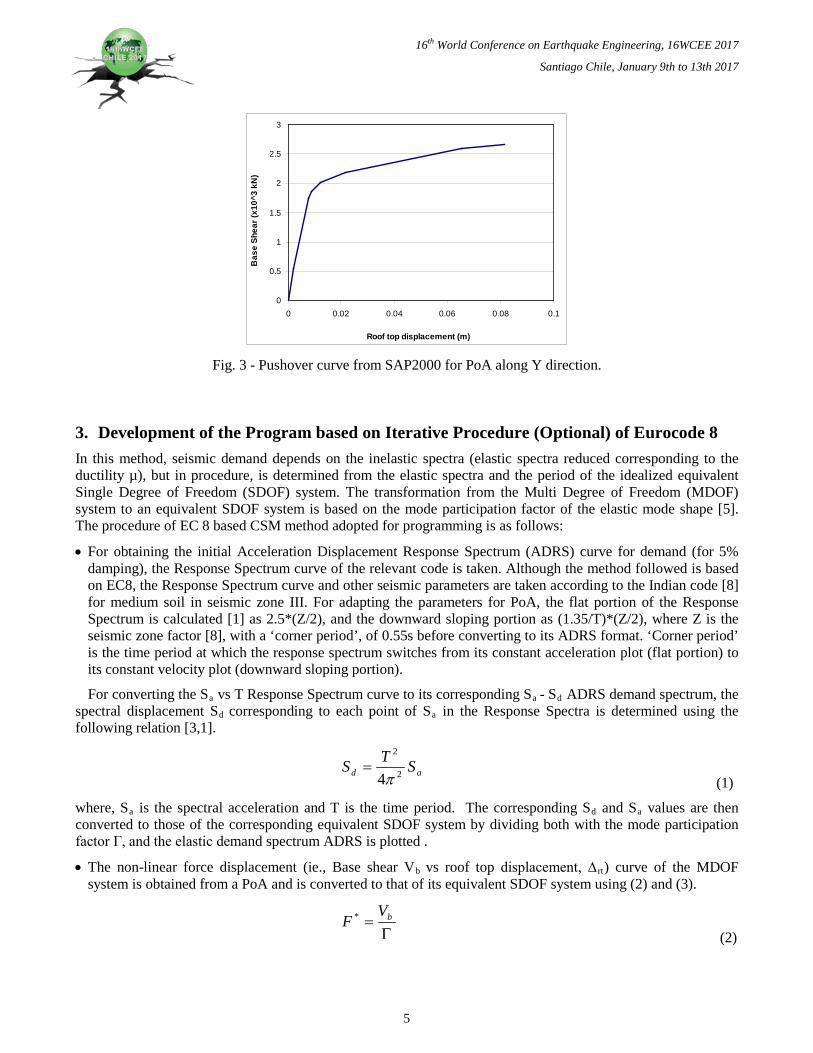
Since the effective time period of the building is below 2.2s; as per the CMP procedure one need to consider only two stages PoA (ie., considering the first two modes). However, in this investigation, the analysis was conducted in three-stages (ie., considering the first three modes in the respective directions – Fig. 4) for better accuracy.
For method of conducting a multistage PoA in SAP2000 is as follows: first, a lateral push with the 1st mode in Y-direction, designated ‘Push Y1’ is done as the first stage PoA. The 2nd stage PoA (designated Push Y2 with the 2nd mode in Y-direction) is analyzed as a continuation of Push Y1 and Push Y3 with the 3rd mode in Y-direction is done as a continuation of Push Y2. The summation of the corresponding displacement increment values gives the target displacement (δt) of the structure.
4
16th World Conference on Earthquake Engineering, 16WCEE 2017
Santiago Chile, January 9th to 13th 2017
0
0.5
1
1.5
2
2.5
3
0 0.02 0.04 0.06 0.08 0.1
Roof top displacement (m)
Bas
e Sh
ear (
x10^
3 kN
)
Fig. 3 - Pushover curve from SAP2000 for PoA along Y direction.
3. Development of the Program based on Iterative Procedure (Optional) of Eurocode 8 In this method, seismic demand depends on the inelastic spectra (elastic spectra reduced corresponding to the ductility µ), but in procedure, is determined from the elastic spectra and the period of the idealized equivalent Single Degree of Freedom (SDOF) system. The transformation from the Multi Degree of Freedom (MDOF) system to an equivalent SDOF system is based on the mode participation factor of the elastic mode shape [5]. The procedure of EC 8 based CSM method adopted for programming is as follows:
• For obtaining the initial Acceleration Displacement Response Spectrum (ADRS) curve for demand (for 5% damping), the Response Spectrum curve of the relevant code is taken. Although the method followed is based on EC8, the Response Spectrum curve and other seismic parameters are taken according to the Indian code [8] for medium soil in seismic zone III. For adapting the parameters for PoA, the flat portion of the Response Spectrum is calculated [1] as 2.5*(Z/2), and the downward sloping portion as (1.35/T)*(Z/2), where Z is the seismic zone factor [8], with a ‘corner period’, of 0.55s before converting to its ADRS format. ‘Corner period’ is the time period at which the response spectrum switches from its constant acceleration plot (flat portion) to its constant velocity plot (downward sloping portion).
For converting the Sa vs T Response Spectrum curve to its corresponding Sa - Sd ADRS demand spectrum, the spectral displacement Sd corresponding to each point of Sa in the Response Spectra is determined using the following relation [3,1].
ad STS 2
2
4π=
(1)
where, Sa is the spectral acceleration and T is the time period. The corresponding Sd and Sa values are then converted to those of the corresponding equivalent SDOF system by dividing both with the mode participation factor Γ, and the elastic demand spectrum ADRS is plotted .
• The non-linear force displacement (ie., Base shear Vb vs roof top displacement, ∆rt) curve of the MDOF system is obtained from a PoA and is converted to that of its equivalent SDOF system using (2) and (3).
Γ= bV
F *
(2)
5
16th World Conference on Earthquake Engineering, 16WCEE 2017
Santiago Chile, January 9th to 13th 2017
Γ∆
= rtd *
(3)
0
1
2
3
4
5
6
7
8
9
10
-1.5 -1 -0.5 0 0.5 1 1.5
Stor
ies Mode 1
Mode 2
Mode 3
Storey Mode-1 Mode-2 Mode-3
Gnd Floor. 0.026 -0.079 0.121
1st Floor 0.165 -0.483 0.703
2nd Floor 0.311 -0.814 0.944
3rd Floor 0.452 -0.958 0.612
4th Floor 0.584 -0.883 -0.097
5th Floor 0.703 -0.614 -0.749
6th Floor 0.806 -0.208 -0.949
7th Floor 0.901 0.328 -0.424
8th Floor 0.966 0.772 0.45
General Roof 1 1 1
Fig. 4 - The first three mode shapes of the building in Y-direction (Table shown on right)
.
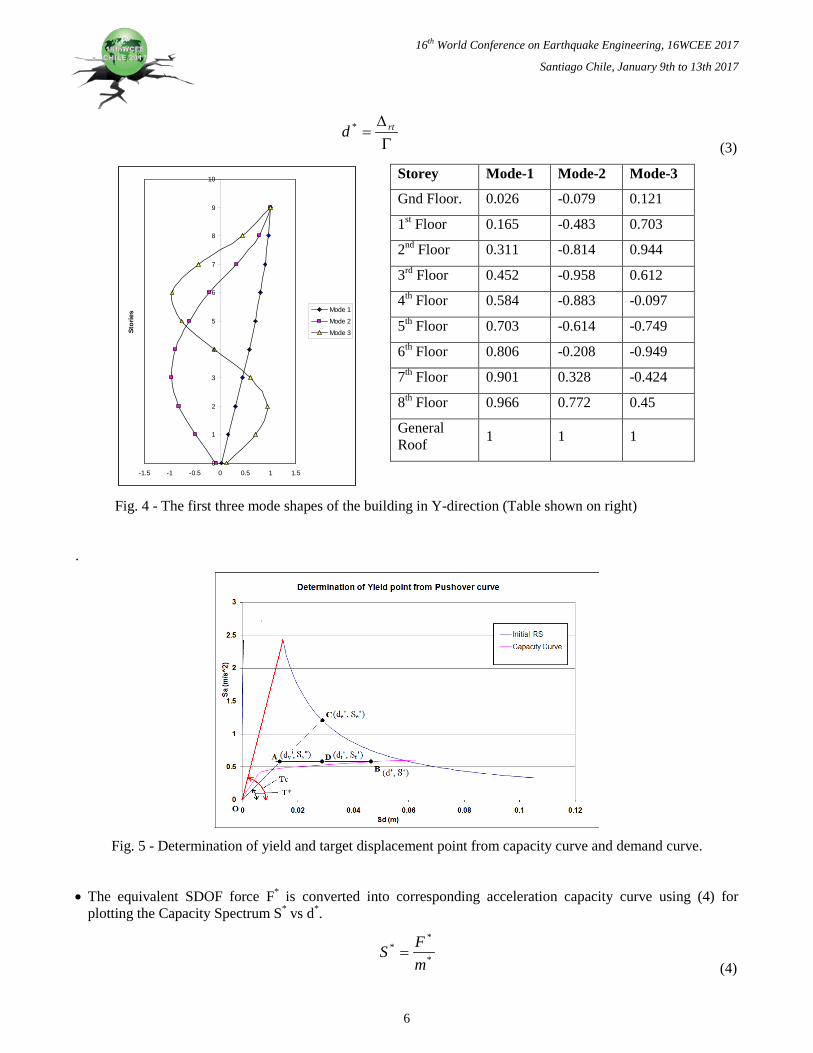
Fig. 5 - Determination of yield and target displacement point from capacity curve and demand curve.
• The equivalent SDOF force F* is converted into corresponding acceleration capacity curve using (4) for plotting the Capacity Spectrum S* vs d*.
*
**
mFS =
(4)
6

16th World Conference on Earthquake Engineering, 16WCEE 2017
Santiago Chile, January 9th to 13th 2017
where m* is the equivalent mass of the structure. All terms denoted in EC8 in F* are converted to its corresponding spectral accelerations (viz., F* to S* and Fy
* to Sy*) for use in this paper using (4).
• For each point (d*, S*) on the pushover curve, the yield points (dy*, Sy
*) are determined by equivalent bilinear representation (idealized elasto- perfectly plastic) on equivalent Pushover curve (S* vs. d*), by (5) where Sy
* = S* and Atot = Area beneath the pushover curve up to the point under consideration (denoted in EC8 as Em*).
−= *
** 2y
toty S
Add
(5)
In Fig. 5, the point ‘B’ marks the point under consideration, (d*, S*) and the point ‘A’ marks the corresponding yield point, (dy
*, Sy*). The time period of the idealized SDOF system corresponds to the slope from origin to
point ‘A’ and is [5],
*
** 2
y
y
Sd
T π= (6)
• The intersection ordinate of the initial stiffness line with Initial ADRS of demand curve (shown by ‘C’ (de*,
Se*)) is determined. Then, based on the conditions described below, the target displacement, dt
*, (marked as the point ‘D’ in Fig. 5) corresponding to point ‘B’ under consideration is determined.
For determining the Target ductility μs corresponding to point ‘B’ (Fig.5), having known the Response Reduction factor Rμ (equal to Se
*/Sy* ), one of the two relations can be used, based on whether the value of T*
(the SDOF time period of the elastic portion of the bi-linear curve) is less than or greater than the ‘corner’ time period Tc.
For T* < Tc:
( ) 11 * +−=
TTR c
ssµ (7)
where, Tc is the corner time period, which is the time period at which the response spectrum switches from its constant acceleration plot (flat portion) to its constant velocity plot (downward sloping portion). Having known the ductility μs corresponding to point ‘B’, the corresponding target displacement can be found as represented by point ‘D’ (dt
*, St* in Fig. 5), by relation
**yst dd µ= (8)
subject to the condition that dt* need not be greater than 3de
*.
For T* > Tc: **et dd = (9)
St* is equal to Sy
* for both the above cases.
7
16th World Conference on Earthquake Engineering, 16WCEE 2017
Santiago Chile, January 9th to 13th 2017
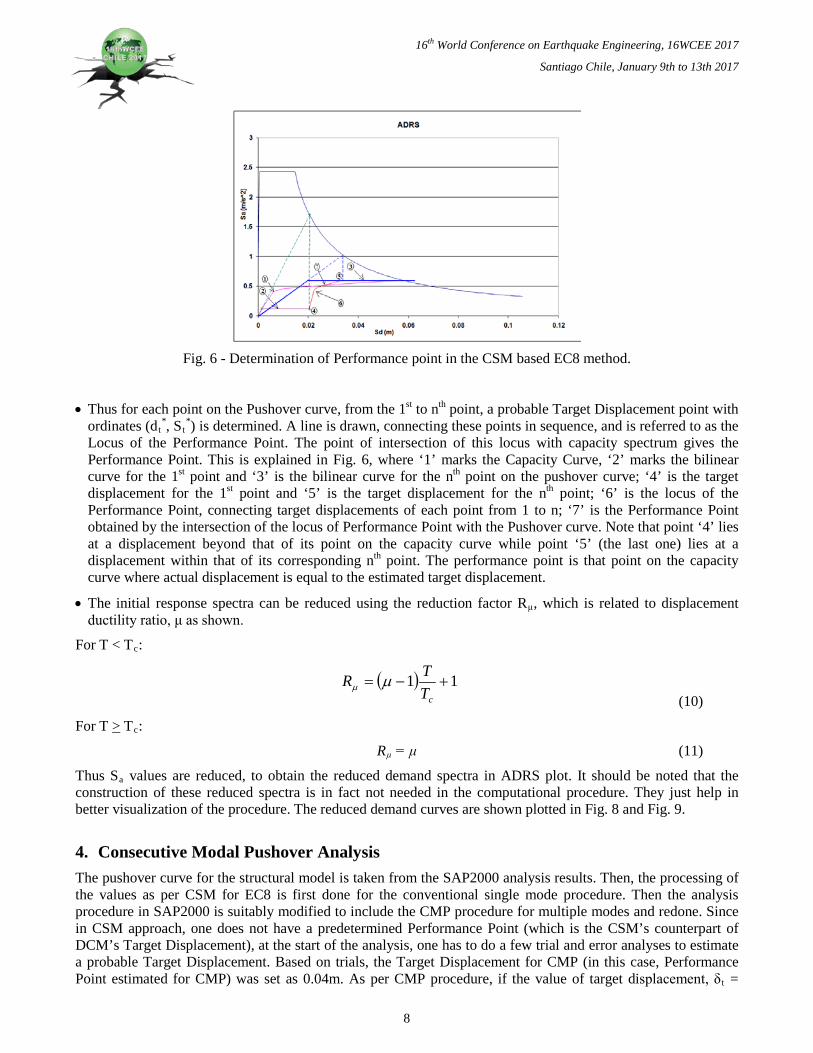
Fig. 6 - Determination of Performance point in the CSM based EC8 method.
• Thus for each point on the Pushover curve, from the 1st to nth point, a probable Target Displacement point with ordinates (dt
*, St*) is determined. A line is drawn, connecting these points in sequence, and is referred to as the
Locus of the Performance Point. The point of intersection of this locus with capacity spectrum gives the Performance Point. This is explained in Fig. 6, where ‘1’ marks the Capacity Curve, ‘2’ marks the bilinear curve for the 1st point and ‘3’ is the bilinear curve for the nth point on the pushover curve; ‘4’ is the target displacement for the 1st point and ‘5’ is the target displacement for the nth point; ‘6’ is the locus of the Performance Point, connecting target displacements of each point from 1 to n; ‘7’ is the Performance Point obtained by the intersection of the locus of Performance Point with the Pushover curve. Note that point ‘4’ lies at a displacement beyond that of its point on the capacity curve while point ‘5’ (the last one) lies at a displacement within that of its corresponding nth point. The performance point is that point on the capacity curve where actual displacement is equal to the estimated target displacement.
• The initial response spectra can be reduced using the reduction factor Rμ, which is related to displacement ductility ratio, μ as shown.
For T < Tc:
( ) 11 +−=
cTTR µµ
(10)
For T > Tc:
Rμ = μ (11)
Thus Sa values are reduced, to obtain the reduced demand spectra in ADRS plot. It should be noted that the construction of these reduced spectra is in fact not needed in the computational procedure. They just help in better visualization of the procedure. The reduced demand curves are shown plotted in Fig. 8 and Fig. 9.
4. Consecutive Modal Pushover Analysis The pushover curve for the structural model is taken from the SAP2000 analysis results. Then, the processing of the values as per CSM for EC8 is first done for the conventional single mode procedure. Then the analysis procedure in SAP2000 is suitably modified to include the CMP procedure for multiple modes and redone. Since in CSM approach, one does not have a predetermined Performance Point (which is the CSM’s counterpart of DCM’s Target Displacement), at the start of the analysis, one has to do a few trial and error analyses to estimate a probable Target Displacement. Based on trials, the Target Displacement for CMP (in this case, Performance Point estimated for CMP) was set as 0.04m. As per CMP procedure, if the value of target displacement, δt =
8

16th World Conference on Earthquake Engineering, 16WCEE 2017
Santiago Chile, January 9th to 13th 2017
0.04m; then the values of displacement increments are 0.0321, 0.0038 and 0.0041 m respectively for ur1, ur2, and ur3 calculated as per procedure explained in the next section. These values are set in SAP2000 for the three stages of the analysis.
In SAP2000, direct facility for processing results of CMP is not presently available, and neither is the facility for the EC8 based CSM method.
4.1 Procedure of CMP The procedure of CMP consists of PoA with a displacement control at the top of the building. The PoA is
implemented according to the following sub-steps until the total target displacement at the roof; δt is reached [2].
The PoA is performed in three stages. In the first stage, nonlinear static analysis is implemented using invariant lateral forces proportional to s1
* = mφ1 until the displacement increment at the roof reaches ur1 = α1δt , where α1 is the effective mass participation ratio for the 1st mode, φ1.
The second stage of this analysis starts from stressed and deformed state at the last step of the previous stage, and the analysis continues with lateral forces proportional to s2* = mφ2 until the displacement increment at the roof reaches ur2 = α2δt , where α2 is the effective mass participation ratio for the 2nd mode, φ2
Thereafter, the third (last) stage is carried out using lateral force distribution according to s3* = mφ3 until
the displacement increment at the roof reaches ur3 = (1- α1 - α2)δt.
The results are than tabulated and cumulative of Vb vs Δrt is obtained.
5. Non-Linear Time History Analysis For verification of the PoA results (of both conventional single-mode PoA and CMP), a Non-Linear Time History Analysis (NL-THA) is done on the structural model. The NL-THA is done with accelerograph (Fig. 7) generated to be compatible with the Response spectra of the Indian seismic design code [8] using a computer program [9].
Fig. 7 - Accelerograph compatible with IS 1893(Part 1)- 2002 Response spectra.
For NL-THA, SAP2000 uses Hilber-Hughes-Taylor method. From the NL-THA results, the maximum base shear of the structure is obtained as 2049kN.
9
16th World Conference on Earthquake Engineering, 16WCEE 2017
Santiago Chile, January 9th to 13th 2017
6. Discussion of Results In this study, the seismic demand is applied independently in X and Y directions, consequently two separate analyses are performed for each direction. The response spectrum of Medium soil, Zone III [8] is considered for the seismic demand, assuming that the damping due to soil structure interaction is negligible (damping taken as 5%).
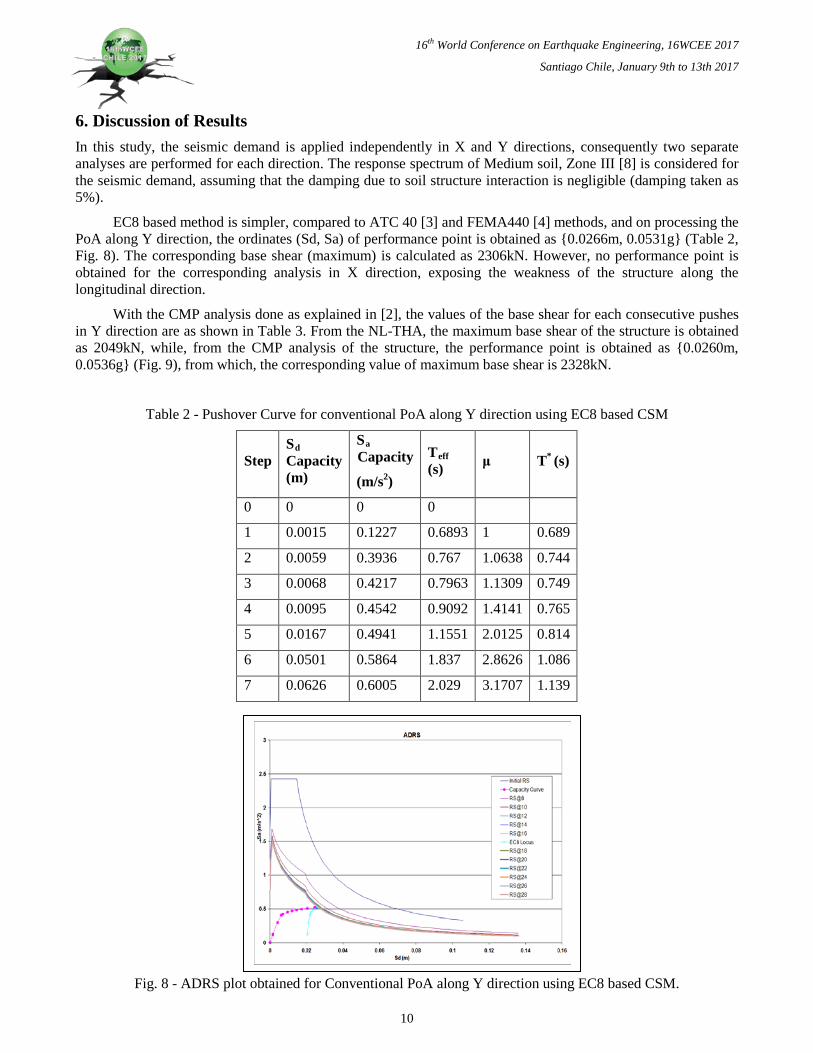
EC8 based method is simpler, compared to ATC 40 [3] and FEMA440 [4] methods, and on processing the PoA along Y direction, the ordinates (Sd, Sa) of performance point is obtained as {0.0266m, 0.0531g} (Table 2, Fig. 8). The corresponding base shear (maximum) is calculated as 2306kN. However, no performance point is obtained for the corresponding analysis in X direction, exposing the weakness of the structure along the longitudinal direction.
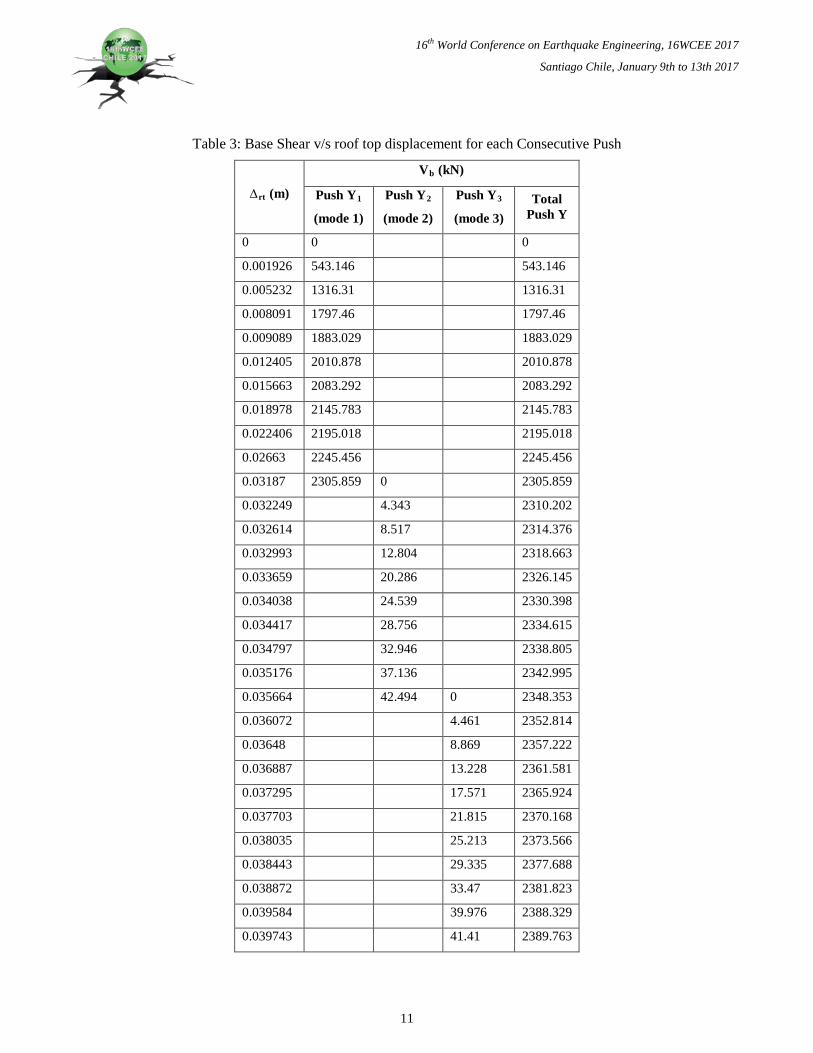
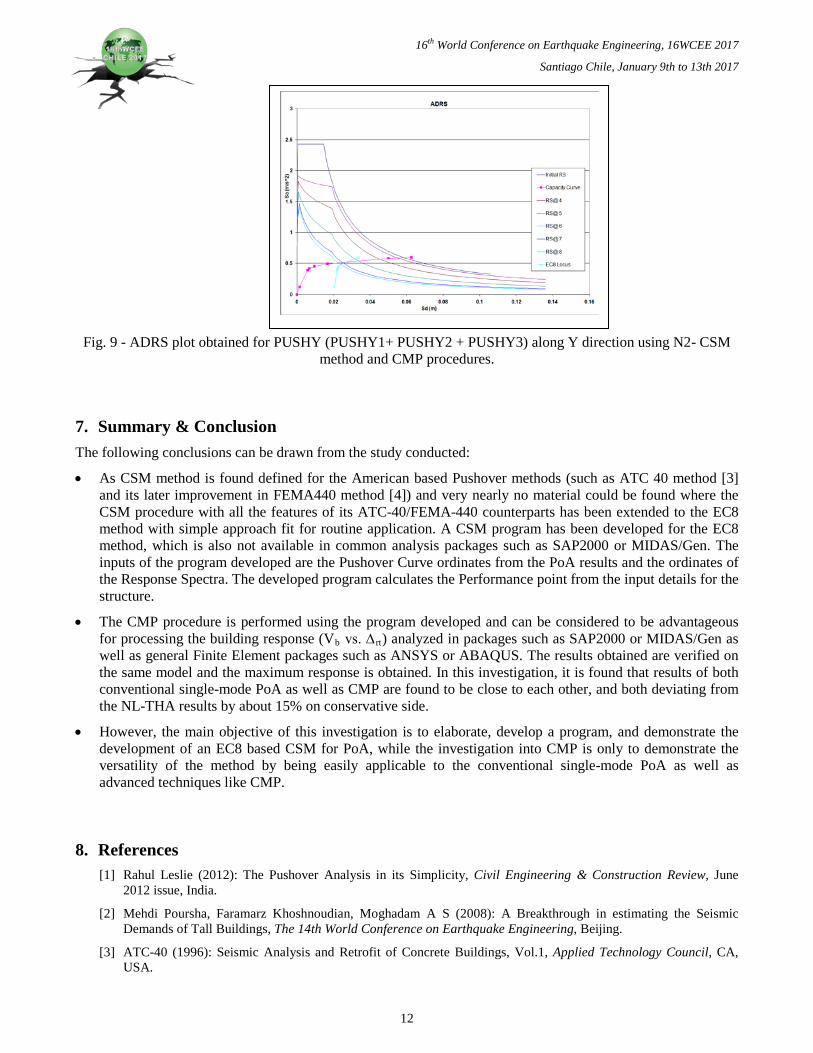
With the CMP analysis done as explained in [2], the values of the base shear for each consecutive pushes in Y direction are as shown in Table 3. From the NL-THA, the maximum base shear of the structure is obtained as 2049kN, while, from the CMP analysis of the structure, the performance point is obtained as {0.0260m, 0.0536g} (Fig. 9), from which, the corresponding value of maximum base shear is 2328kN.
Table 2 - Pushover Curve for conventional PoA along Y direction using EC8 based CSM
Step Sd Capacity (m)
Sa Capacity
(m/s2)
Teff (s) μ T* (s)
0 0 0 0
1 0.0015 0.1227 0.6893 1 0.689
2 0.0059 0.3936 0.767 1.0638 0.744
3 0.0068 0.4217 0.7963 1.1309 0.749
4 0.0095 0.4542 0.9092 1.4141 0.765
5 0.0167 0.4941 1.1551 2.0125 0.814
6 0.0501 0.5864 1.837 2.8626 1.086
7 0.0626 0.6005 2.029 3.1707 1.139
Fig. 8 - ADRS plot obtained for Conventional PoA along Y direction using EC8 based CSM.
10
16th World Conference on Earthquake Engineering, 16WCEE 2017
Santiago Chile, January 9th to 13th 2017
Table 3: Base Shear v/s roof top displacement for each Consecutive Push
∆rt (m)
Vb (kN)
Push Y1
(mode 1)
Push Y2
(mode 2)
Push Y3
(mode 3) Total
Push Y
0 0 0
0.001926 543.146 543.146
0.005232 1316.31 1316.31
0.008091 1797.46 1797.46
0.009089 1883.029 1883.029
0.012405 2010.878 2010.878
0.015663 2083.292 2083.292
0.018978 2145.783 2145.783
0.022406 2195.018 2195.018
0.02663 2245.456 2245.456
0.03187 2305.859 0 2305.859
0.032249 4.343 2310.202
0.032614 8.517 2314.376
0.032993 12.804 2318.663
0.033659 20.286 2326.145
0.034038 24.539 2330.398
0.034417 28.756 2334.615
0.034797 32.946 2338.805
0.035176 37.136 2342.995
0.035664 42.494 0 2348.353
0.036072 4.461 2352.814
0.03648 8.869 2357.222
0.036887 13.228 2361.581
0.037295 17.571 2365.924
0.037703 21.815 2370.168
0.038035 25.213 2373.566
0.038443 29.335 2377.688
0.038872 33.47 2381.823
0.039584 39.976 2388.329
0.039743 41.41 2389.763
11
16th World Conference on Earthquake Engineering, 16WCEE 2017
Santiago Chile, January 9th to 13th 2017
Fig. 9 - ADRS plot obtained for PUSHY (PUSHY1+ PUSHY2 + PUSHY3) along Y direction using N2- CSM method and CMP procedures.
7. Summary & Conclusion The following conclusions can be drawn from the study conducted:
• As CSM method is found defined for the American based Pushover methods (such as ATC 40 method [3] and its later improvement in FEMA440 method [4]) and very nearly no material could be found where the CSM procedure with all the features of its ATC-40/FEMA-440 counterparts has been extended to the EC8 method with simple approach fit for routine application. A CSM program has been developed for the EC8 method, which is also not available in common analysis packages such as SAP2000 or MIDAS/Gen. The inputs of the program developed are the Pushover Curve ordinates from the PoA results and the ordinates of the Response Spectra. The developed program calculates the Performance point from the input details for the structure.
• The CMP procedure is performed using the program developed and can be considered to be advantageous for processing the building response (Vb vs. ∆rt) analyzed in packages such as SAP2000 or MIDAS/Gen as well as general Finite Element packages such as ANSYS or ABAQUS. The results obtained are verified on the same model and the maximum response is obtained. In this investigation, it is found that results of both conventional single-mode PoA as well as CMP are found to be close to each other, and both deviating from the NL-THA results by about 15% on conservative side.
• However, the main objective of this investigation is to elaborate, develop a program, and demonstrate the development of an EC8 based CSM for PoA, while the investigation into CMP is only to demonstrate the versatility of the method by being easily applicable to the conventional single-mode PoA as well as advanced techniques like CMP.
8. References [1] Rahul Leslie (2012): The Pushover Analysis in its Simplicity, Civil Engineering & Construction Review, June
2012 issue, India.
[2] Mehdi Poursha, Faramarz Khoshnoudian, Moghadam A S (2008): A Breakthrough in estimating the Seismic Demands of Tall Buildings, The 14th World Conference on Earthquake Engineering, Beijing.
[3] ATC-40 (1996): Seismic Analysis and Retrofit of Concrete Buildings, Vol.1, Applied Technology Council, CA, USA.
12

16th World Conference on Earthquake Engineering, 16WCEE 2017
Santiago Chile, January 9th to 13th 2017
[4] FEMA 440 (2005): Improvement of Nonlinear Static Seismic Analysis Procedures, Applied Technology Council, USA.
[5] BS EN 1998-1: 2004 (2004): Eurocode 8: Design of structures for earthquake resistance- Part 1: General rules, seismic actions and rules for buildings, British Standards, Bressel, UK.
[6] CSI Analysis Reference Manual for SAP2000 (2010), CSi, Berkeley, California, USA.
[7] Peter Fajfar (2000): A Nonlinear Analysis Method for Performance Based Seismic Design, Earthquake Spectra, Vol. 16, No.3, pp 573-592,.
[8] IS 1893 Part-I (2002): Indian Standard- Criteria for Earthquake Resistant Design of Structures, Bureau of Indian Standard, New Delhi, India.
[9] Ashok Kumar (2004): Software for Generation of Spectrum Compatible Time History, 13th World Conference on Earthquake Engineering, Canada.
[10] FEMA 356 (2000): Prestandard and Commentary for Seismic Rehabilitation of Buildings, Federal Emergency Management Agency, Washington DC, USA.
13