Post Bruno's Bankruptcy Planning: An Analysis of Taxable ...
Upload
universityofgujratCategory
view
0download
0
STRATEGIC CAPACITY
PLANNING
Engr. Muhammad Sajid
Lecturer
Department of Chemical Engineering, UOG
1

CAPACITY PLANNING
Capacity is the upper limit or ceiling on the load that an operating unit can handle.
The basic questions in capacity handling are: What kind of capacity is needed?
How much is needed?
When is it needed?
2
TYPES OF CAPACITY PLANNING OVER TIME HORIZON
3
Sa
ba
Ba
hou
th –
UC
O
Add Facilities Add equipment
Schedule Jobs Schedule Personnel Allocate Machinery
Sub-Contract Add Equipment Add Shifts
Long Range Planning
Intermediate Range Planning
Short Range Planning
Modify Capacity Manage with existing
Capacity
*
*
*Limited options
Add Personnel
Build or Use Inventory

DEFINITIONS AND MEASUREMENTS
Capacity: The “throughput,” or number of units a facility
can hold, receive, store, or produce in a period of
time.
Design Capacity: Maximum theoretical output
Effective Capacity: Capacity a firm can expect to receive given
its product mix, methods of scheduling,
maintenance, scrap, personal time.
Actual Output: What is actually being produced, in units.
4

DEFINITIONS AND MEASUREMENTS
Efficiency: Actual Output / Effective Capacity
(Actual Output in units / Standard Output in
units)
Utilization: Actual Output / Design Capacity
(Hours used / Total hours available)
5

SIMPLE EXAMPLE A dentist assistant schedules a patient every 10 minutes.
This dentist treated 40 patients today.
The dentist works 8 hours a day.
The office is set up to handle a maximum of 60 patients a
day.
What is the efficiency of this dentist office?
What is the utilizations of this dentist office?
6

7
Actual output 36 units/day Efficiency = = = 90% Effective capacity 40 units/ day Utilization = Actual output = 36 units/day = 72%
Design capacity 50 units/day
EFFICIENCY/UTILIZATION EXAMPLE
Design capacity = 50 trucks/day
Effective capacity = 40 trucks/day
Actual output = 36 units/day

SPECIAL REQUIREMENTS FOR MAKING GOOD CAPACITY DECISIONS
Forecasting demand accurately
Cycles; overestimating growth; seasons; complementary
products
Building for change
Understanding capacity increments
Finding the optimal operating level (volume)
8

9
DETERMINANTS OF EFFECTIVE CAPACITY
Facilities
Product and service factors
Process factors ( output quality )
Human factors
Operational factors ( late delivery for the raw materials )
Supply chain factors
External factors

UNDERSTANDING CAPACITY INCREMENTS
10
Expected Demand Expected Demand
Expected Demand Expected Demand
Time in Years Time in Years
Time in Years Time in Years
De
ma
nd
D
em
an
d
De
ma
nd
D
em
an
d
New Capacity
New Capacity New Capacity
New Capacity
Capacity leads demand with an incremental expansion Capacity leads demand with a one-step expansion
Capacity lags demand with an incremental expansion Attempts to have an average
capacity, with an incremental
expansion

ECONOMIES OF SCALE
11
Cost
per
un
it
0
Small plant Medium
plant Large
plant
Output rate

TOOLS FOR CAPACITY DECISIONS 1. Break-even Analysis
Single-product case Break-even in units: Break-even in Dollar
Sales:
2. Decision Theory
Decision Making Tools
3. Financial Analysis Net Present Value (NPV):
4. Queueing / Waiting lines
(Simulation)
Ni
FNPV
)1(
Cost VariablePrice
Cost Fixed Total
Saba Bahouth – UCO
Price
Cost Variable1
Cost Fixed Total

COST-VOLUME RELATIONSHIPS
13
Am
ou
nt
($)
BEP
(Quantity in units) 0

CROSSOVER CHART
14
Fixed cost - Process A
Fixed cost - Process B
Fixed cost - Process C
Process A: low volume, high variety
Process B: Repetitive
Process C: High volume, low variety
Process C Process B Process A Quantity
Cost

BREAK-EVEN PROBLEM WITH STEP FIXED COSTS
15
Quantity
$
Revenues
TC
1 machine 2 machines 3 machines

ASSUMPTIONS OF COST-VOLUME ANALYSIS
1. One product is involved
2. Everything produced can be sold
3. Variable cost per unit is the same regardless of volume
4. Fixed costs do not change with volume
5. Revenue per unit constant with volume
6. Revenue per unit exceeds variable cost per unit
16

MANAGING EXISTING CAPACITY
17
Vary staffing
Change equipment
& processes
Change methods
Redesign the product for
faster processing
Capacity Management
• Vary prices
• Vary promotion
• Change lead times
(e.g., backorders)
• Offer complementary
products
Demand Management

PLANNING SERVICE CAPACITY
Need to be near customers Capacity and location are closely tied
Inability to store services Capacity must be matched with timing of
demand
Degree of volatility of demand Peak demand periods
18

19
FINANCIAL ANALYSIS
Cash Flow - the difference between cash received
from sales and other sources, and cash outflow for
labor, material, overhead, and taxes.
Present Value - the sum, in current value, of all
future cash flows of an investment proposal.
20
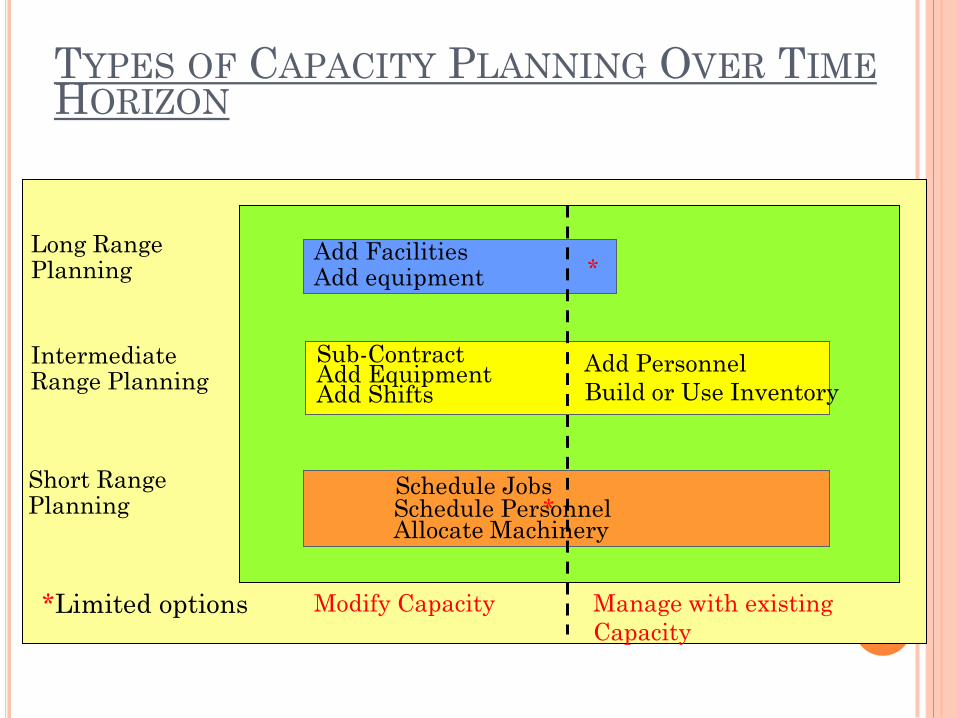
A department works one eight hour shift ,250 days a
year, and has these figures for usage of a machine that
is being considered :
Product
Annual
Demand
Standard processing time
per unit (hr.)
#1
#2
#3
400
300
700
5.0 8.0 2.0
21
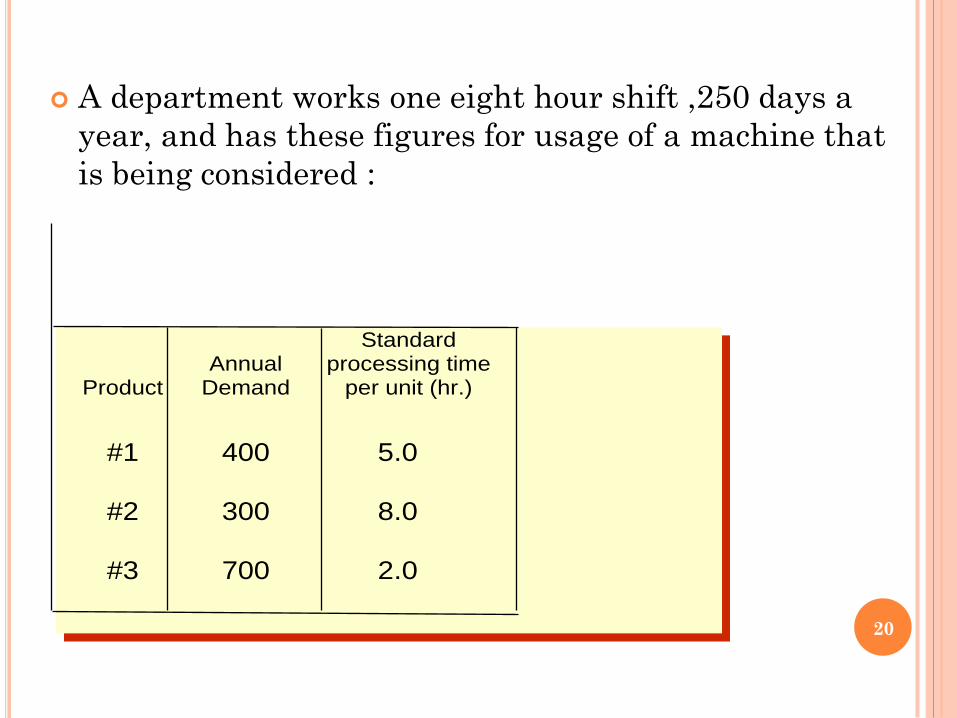
CALCULATING PROCESSING REQUIREMENTS
Product
Annual
Demand
Standard
processing time
per unit (hr.)
Processing time
needed (hr.)
#1
#2
#3
400
300
700
5.0
8.0
2.0
2,000
2,400
1,400 5,800

22
Annual capacity =8× 250=2000
Number of machines required =5800÷ 2000=2.9
Copyright © 2022 FDOKUMEN