EFFICIENCY ANALYSIS OF A PLANNING PROCESS IN ...
180
EFFICIENCY ANALYSIS OF A PLANNING PROCESS IN CHEMICAL INDUSTRY Master thesis – R.M.T. van Oss…. 1176072….
-
Upload
khangminh22 -
Category
Documents
-
view
1 -
download
0
Transcript of EFFICIENCY ANALYSIS OF A PLANNING PROCESS IN ...
EFFICIENCY ANALYSIS
OF A PLANNING PROCESS
IN CHEMICAL INDUSTRY
Master thesis – R.M.T. van Oss….
1176072….
TU Delft Master thesis project – R.M.T. van Oss
EFFICIENCY ANALYSIS OF A
PLANNING PROCESS IN
CHEMICAL INDUSTRY
3/4/2011 IMPROVING THE PLANNING PROCESS OF THE
POLYOLS’ SUPPLY CHAIN USING LEAN SIX SIGMA
Bsc. R.M.T. van Oss – [email protected] - 1176072
Efficiency analysis of a planning process in chemical industry
Fo
rew
ord
3
Composition of the graduation committee:
Prof. dr. ir. A. Verbraeck, Chairman
Section of System Engineering
Dr. S. van Splunter, 1st
supervisor
Section of System Engineering
Dr. ir. S.A. Meijer, 2nd
supervisor
Section of Policy Analysis, Organisation Law and Gaming
Drs. N. Gunay-Dogan, External supervisor
Production Specialist Shell CVP – Pernis
Thesis SPM5910
Bsc. Ralph M.T. van Oss
Delft, February 25th
, 2011
Delft University of Technology
Faculty of Technology, Policy and Management
System Engineering, Policy Analysis and Management (SEPAM)
TU Delft Master thesis project – R.M.T. van Oss
Foreword “Every day you make progress. Every step may be fruitful. Yet there will be stretch out before you an
ever-lengthening, ever-ascending path. You know you will never get to the end of the journey.”
-Sir Winston Churchill-
(1874 – 1965)
This Master Thesis is performed for the study System Engineering, Policy Analysis and Management
at the faculty of Technology, Policy and Management at Delft University of Technology. The thesis
was concerned with improving the planning process of the polyols’ supply chain, executed at the CVP
department at Shell Pernis. Even though improving a planning process is not a new phenomenon,
this thesis does apply Lean Six Sigma on an unique supply chain in the process industry and makes
use of an interactively SIPOC (Supplier, Input, Process, Output, Customer) workshop. The results of
the workshop provide an complete overview of the different process steps within the supply chain,
which can be used as platform to define opportunities for improvement. Handling these
opportunities result in better insights in processes and an increased performance of the supply chain.
This report consists of four parts. The first part introduces in chapter 1 the problem situation, the
current performance of the CVP department at Shell Pernis, the scope and the research question.
The readers who are only interested in the results should read further at part 4, chapter 14, which
contains the conclusions of the research. The second part, which is described in chapter 3 and 4,
consists of analyses of the problem environment and defines the complete supply chain in detail,
which enables opportunity framing. The third part, which is described in chapter 5 till 13, selects and
processes four opportunities in order to improve the current performance. The DMAIC (Define,
Measure, Analyze, Improve, Control) development steps are applied on these opportunities, to set
up and structure four individual projects.
During this thesis project I was very well guided by the four members of my graduation committee.
For this, I want to thank my university supervisors; Alexander Verbraeck, Sander van Splunter and
Sebastiaan Meijer. Constructive comments during many meetings constantly safeguarded the
progress of the project. Special thanks goes to my supervisor at Shell Pernis, Nazire Gunay-Dogan.
Day in day out she did realize me of my performances and during the project she came with a lot of
helpful observations. I also would like to thank all other involved Shell employees for their unvarying
support during this project, and for creating an unforgettable, enjoyable and learning experience. I
really appreciate all support and effort that all supervisors have provided, which lead to this final
product.
Finally, I thank all interviewees for their time and effort and everyone who supported me during the
last six months and who was willing to read sections of my thesis in order to improve this final report.
In den Pluym, February 25th
, 2011
Ralph van Oss
Efficiency analysis of a planning process in chemical industry
Ma
na
ge
me
nt
Su
mm
ary
5
Management Summary Based on a detailed overview of the planning processes of the supply chain of polyols, created during
an interactive workshop with all key stakeholders involved, ten opportunities were defined to
improve the current performance of the supply chain. Four opportunities were selected, based on
ease of implementation and impact. Individual improvement projects were started to use the
opportunities to improve the performance of the supply chain.
The four executed projects are focused on feedback on delivery of raw materials, insights in tasks of
the logistics coordinator, delays of laboratory analyses and optimal balance between flexibility and
inventory.
The first project focused on elimination of unexpected production delays, caused by unexpected
shortages of raw materials. New communication structures and standards were designed and
secured in the organization to improve the feedback on deliveries of raw materials to the logistics
coordinator and production administrator. Besides this internal solution, the performances of the
suppliers are monitored during the coming weeks, which enables externally focused follow up
actions, to improve the performance of the suppliers of raw materials.
The second project goal was to improve the insights in the tasks of the logistics coordinator, which
makes it easier to replace the logistics coordinator during middle and long term absences. Flow
diagrams provide insights in the tasks of the logistics coordinator on different aggregated levels. The
detailed description also defines the constraints, that should be taken into account when the
production planning is created and when production is monitored. A Recommendation for future
improvement is to integrate the production planning, raw material planning, loading availability list
and a laboratory list, including all samples with priorities. An integrated excel file could automatically
controls all necessary input, and decreases the chance of problems causes by inattentions.
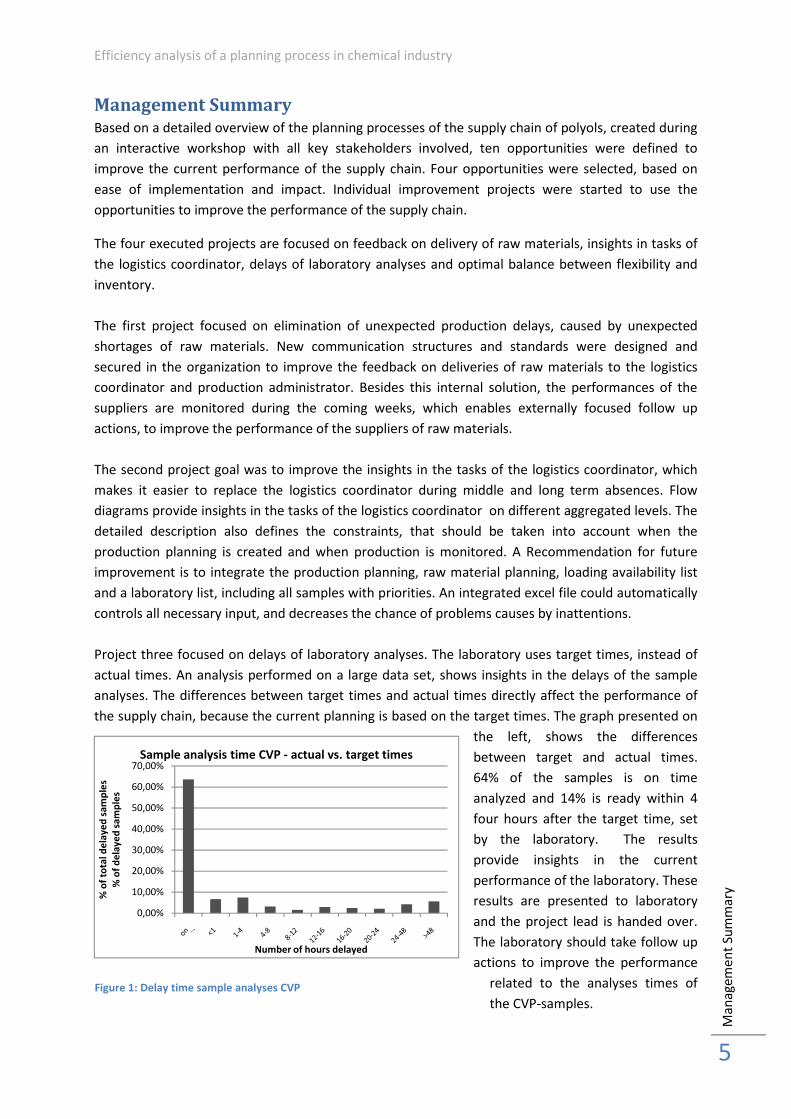
Project three focused on delays of laboratory analyses. The laboratory uses target times, instead of
actual times. An analysis performed on a large data set, shows insights in the delays of the sample
analyses. The differences between target times and actual times directly affect the performance of
the supply chain, because the current planning is based on the target times. The graph presented on
the left, shows the differences
between target and actual times.
64% of the samples is on time
analyzed and 14% is ready within 4
four hours after the target time, set
by the laboratory. The results
provide insights in the current
performance of the laboratory. These
results are presented to laboratory
and the project lead is handed over.
The laboratory should take follow up
actions to improve the performance
related to the analyses times of
the CVP-samples.
0,00%
10,00%
20,00%
30,00%
40,00%
50,00%
60,00%
70,00%
% o
f to
tal
de
lay
ed
sa
mp
les
% o
f d
ela
ye
d s
am
ple
s
Number of hours delayed
Sample analysis time CVP - actual vs. target times
Figure 1: Delay time sample analyses CVP
TU Delft Master thesis project – R.M.T. van Oss
The results of the third project are direct inputs for the last project. The project focused on an
optimal balance between flexibility and inventory. The current planning philosophy tries to minimize
the total time between production and delivery to trucks/ships. A value stream map analyzed the
necessary steps of the supply chain of polyols and indicated an average value added time of 69,5
hours. It also showed that the majority of processes are executed in a fixed sequence. The last
process step of this fixed sequence; delivery to the customer, is directly planned after the moment
that the sample analysis is expected. For this reason, delays occurred in earlier process steps in the
supply chain, directly negatively affect the perceived performance by the supplier. The results on the
sample analyses times and the results of a research on various plants impact, are arguments to apply
a different planning philosophy. Recommended is to build in slack time between the expected
moment that the tanks are freed for sale and the moment deliveries are planned. This diminishes the
number of issues experienced by the carriers and customers and thus improves the perceived
reliability of the supply chain.
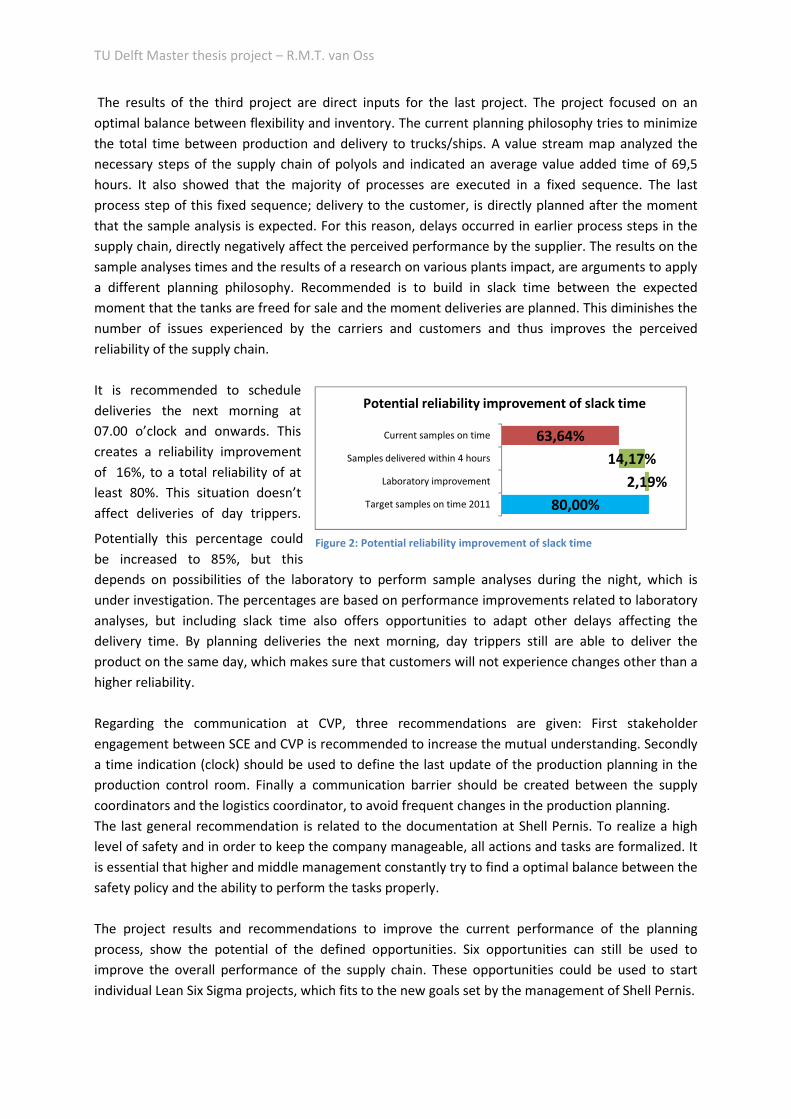
It is recommended to schedule
deliveries the next morning at
07.00 o’clock and onwards. This
creates a reliability improvement
of 16%, to a total reliability of at
least 80%. This situation doesn’t
affect deliveries of day trippers.
Potentially this percentage could
be increased to 85%, but this
depends on possibilities of the laboratory to perform sample analyses during the night, which is
under investigation. The percentages are based on performance improvements related to laboratory
analyses, but including slack time also offers opportunities to adapt other delays affecting the
delivery time. By planning deliveries the next morning, day trippers still are able to deliver the
product on the same day, which makes sure that customers will not experience changes other than a
higher reliability.
Regarding the communication at CVP, three recommendations are given: First stakeholder
engagement between SCE and CVP is recommended to increase the mutual understanding. Secondly
a time indication (clock) should be used to define the last update of the production planning in the
production control room. Finally a communication barrier should be created between the supply
coordinators and the logistics coordinator, to avoid frequent changes in the production planning.
The last general recommendation is related to the documentation at Shell Pernis. To realize a high
level of safety and in order to keep the company manageable, all actions and tasks are formalized. It
is essential that higher and middle management constantly try to find a optimal balance between the
safety policy and the ability to perform the tasks properly.
The project results and recommendations to improve the current performance of the planning
process, show the potential of the defined opportunities. Six opportunities can still be used to
improve the overall performance of the supply chain. These opportunities could be used to start
individual Lean Six Sigma projects, which fits to the new goals set by the management of Shell Pernis.
63,64%
80,00%
14,17%
2,19%
Current samples on time
Samples delivered within 4 hours
Laboratory improvement
Target samples on time 2011
Potential reliability improvement of slack time
Figure 2: Potential reliability improvement of slack time
Efficiency analysis of a planning process in chemical industry
Ma
na
ge
me
nt
Su
mm
ary
7
Contents Foreword .................................................................................................................................................................................... 4
Management Summary .............................................................................................................................................................. 5
Part I - Introduction ........................................................................................................................................................ 12
1. Introduction .................................................................................................................................................................... 13
1.1 Problem exploration ............................................................................................................................................. 14
1.2 Research questions ............................................................................................................................................... 17
1.3 Towards the research questions ........................................................................................................................... 17
1.4 Report Structure ................................................................................................................................................... 18
2. Methodology .................................................................................................................................................................. 20
2.1 Introduction .......................................................................................................................................................... 20
2.2 Literature reviews ................................................................................................................................................. 20
2.3 Applied methodology ............................................................................................................................................ 23
2.4 Conclusions ........................................................................................................................................................... 26
Part II - Analyses .............................................................................................................................................................. 27
3. Network Analysis ............................................................................................................................................................ 28
3.1 Introduction .......................................................................................................................................................... 28
3.2 Tamed vs. untamed problems .............................................................................................................................. 28
3.3 Stakeholders ......................................................................................................................................................... 29
3.4 Mapping the formal relations ............................................................................................................................... 30
3.5 Interest, aims and problem perceptions ............................................................................................................... 33
3.6 Mapping the dependencies .................................................................................................................................. 35
3.7 Conclusions ........................................................................................................................................................... 36
4. Exploration of the processes within the supply chain .................................................................................................... 37
4.1 Introduction .......................................................................................................................................................... 37
4.2 Mapping the ‘as is’ processes ............................................................................................................................... 37
4.2.1 7 steps linear process flow .......................................................................................................................... 38
4.2.2 SIPOC overview ........................................................................................................................................... 39
4.2.3 Value Stream Map ....................................................................................................................................... 42
4.3 Conclusions ........................................................................................................................................................... 43
4.4 Evaluation - Part II Analyses ................................................................................................................................. 44
Part III -DMAIC ................................................................................................................................................................. 45
5. DMAIC preparation - Mapping the most relevant opportunities ................................................................................... 46
5.1 Introduction .......................................................................................................................................................... 46
5.2 Listing the opportunities ....................................................................................................................................... 46
5.3 Defining the opportunities .................................................................................................................................... 47
5.4 Ranking and prioritizing the most relevant opportunities ................................................................................... 51
5.5 Conclusions ........................................................................................................................................................... 52
6. DMAIC Methodology - set up four individual projects ................................................................................................... 54
6.1 Introduction .......................................................................................................................................................... 54
TU Delft Master thesis project – R.M.T. van Oss
6.2 DMAIC - Development phases of a project ........................................................................................................... 55
6.2.1 Define - Explaining the most relevant opportunities in more detail ........................................................... 56
6.2.2 Measure – Gathering insights...................................................................................................................... 56
6.2.3 Analyze – Identify the root causes .............................................................................................................. 56
6.2.4 Improve – Create solutions ......................................................................................................................... 57
6.2.5 Control – Test and make the solution robust .............................................................................................. 58
6.3 Start projects ......................................................................................................................................................... 61
6.3.1 Make the performance improvement initiatives successful ....................................................................... 61
6.3.2 Project teams – Early stakeholder involvement .......................................................................................... 62
6.3.3 Process design ............................................................................................................................................. 63
6.4 Conclusions ........................................................................................................................................................... 63
7. Project 1: Feedback delivery of raw materials ................................................................................................................ 64
7.1 Introduction .......................................................................................................................................................... 64
7.2 Define .................................................................................................................................................................... 64
7.3 Measure ................................................................................................................................................................ 67
7.4 Analyze .................................................................................................................................................................. 67
7.5 Improve ................................................................................................................................................................. 68
7.5.1 Execute and implement project .................................................................................................................. 72
7.6 Control and monitor ............................................................................................................................................. 74
7.7 Conclusions ........................................................................................................................................................... 78
8. Project 2: Insights in tasks logistics coordinator ............................................................................................................. 79
8.1 Introduction .......................................................................................................................................................... 79
8.2 Define .................................................................................................................................................................... 79
8.3 Measure ................................................................................................................................................................ 80
8.4 Analyze .................................................................................................................................................................. 81
8.5 Improve ................................................................................................................................................................. 81
8.6 Control .................................................................................................................................................................. 84
8.7 Conclusions ........................................................................................................................................................... 84
9. Project 3: Delays of laboratory analyses ......................................................................................................................... 85
9.1 Introduction .......................................................................................................................................................... 85
9.2 Define .................................................................................................................................................................... 85
9.3 Measure ................................................................................................................................................................ 86
9.4 Analyze .................................................................................................................................................................. 87
9.5 Improve ................................................................................................................................................................. 89
9.6 Control .................................................................................................................................................................. 90
9.7 Conclusions ........................................................................................................................................................... 90
10. Project 4: Optimal balance between inventory and flexibility of the supply chain ................................................... 91
10.1 Introduction .......................................................................................................................................................... 91
10.2 Define .................................................................................................................................................................... 91
10.3 Measure ................................................................................................................................................................ 94
Efficiency analysis of a planning process in chemical industry
Ma
na
ge
me
nt
Su
mm
ary
9
10.4 Analyze .................................................................................................................................................................. 94
10.5 Improve ................................................................................................................................................................. 96
10.6 Control .................................................................................................................................................................. 99
10.7 Conclusions ......................................................................................................................................................... 100
11. Project evaluation .................................................................................................................................................... 101
11.1 Introduction ........................................................................................................................................................ 101
11.2 Project 1: Feedback of delivery of raw materials ................................................................................................ 101
11.3 Project 2: Insights in tasks logistics coordinator ................................................................................................. 102
11.4 Project 3: Delays of laboratory analyses ............................................................................................................. 102
11.5 Project 4: Optimal balance between flexibility and inventory ............................................................................ 103
11.6 Projects related research evaluation and recommendations ............................................................................. 104
11.6.1 Dealing with the multi-actor environment ................................................................................................ 104
11.6.2 Document the process for future use ....................................................................................................... 105
11.6.3 Recommendations for future change........................................................................................................ 105
11.6.4 Communication and documentation......................................................................................................... 105
11.7 Results in context ................................................................................................................................................ 107
11.8 Conclusions and recommendations .................................................................................................................... 108
12. Transfer knowledge to the organization .................................................................................................................. 110
12.1 Introduction ........................................................................................................................................................ 110
12.2 Knowledge transfer to the organization ............................................................................................................. 110
12.3 Knowledge transfer model .................................................................................................................................. 111
12.4 Conclusions ......................................................................................................................................................... 115
13. DMAIC methodology evaluation .............................................................................................................................. 117
13.1 Introduction ........................................................................................................................................................ 117
13.2 Evaluation on the theoretical method ................................................................................................................ 117
13.3 Conclusions ......................................................................................................................................................... 119
Part IV -Conclusions and recommendations ................................................................................................................. 121
14. Conclusions and recommendations ......................................................................................................................... 122
14.1 Introduction ........................................................................................................................................................ 122
14.2 Research conclusions and recommendations ..................................................................................................... 122
14.3 General conclusions and recommendations ....................................................................................................... 126
14.4 Effects on the organization ................................................................................................................................. 127
14.5 Reflection on theoretical methodologies ............................................................................................................ 129
14.6 Replication .......................................................................................................................................................... 130
14.7 Reflection ............................................................................................................................................................ 131
14.8 Future research ................................................................................................................................................... 132
Overview of figures and tables ............................................................................................................................................... 133
Appendices ............................................................................................................................................................................. 135
Appendix 1- schematic overview production units ........................................................................................................... 135
Appendix 2.1 – stakeholder analysis ................................................................................................................................. 136
TU Delft Master thesis project – R.M.T. van Oss
2.1 – stakeholder analysis ............................................................................................................................................. 136
2.1 – stakeholder analysis ............................................................................................................................................. 139
2.2 Formal card of involved stakeholders ..................................................................................................................... 139
Appendix 3 – SADT analysis ............................................................................................................................................... 142
3.1 Interaction ‘as is’ ..................................................................................................................................................... 142
3.2 Interaction ‘to be’ ................................................................................................................................................... 142
3.3 SADT........................................................................................................................................................................ 143
3.4 A0 planning process ................................................................................................................................................ 144
3.5 A1 Commercial ........................................................................................................................................................ 145
3.6 A2 Supply ................................................................................................................................................................ 146
3.7 A3 Production ........................................................................................................................................................ 147
3.8 A4 Filling and dispatch ............................................................................................................................................ 148
3.9 A5 Transportation ................................................................................................................................................... 148
Appendix 4 – SIPOC (Suppliers Inputs Process Outputs Customers) ................................................................................. 149
Appendix 5 – Overview of the opportunities..................................................................................................................... 153
Appendix 6 – Ranking the opportunities ........................................................................................................................... 156
Appendix 7 – Overview of delayed samples ...................................................................................................................... 158
Appendix 8 – Overview of analyses performed 24/7 ........................................................................................................ 163
Appendix 9 – Overview of the interviews, training days TU Delft meetings ..................................................................... 164
Appendix 10 – Insights in tasks logistics coordinator ........................................................................................................ 166
Appendix 11 – Monitored data ......................................................................................................................................... 171
Appendix 12 – List of abbreviations .................................................................................................................................. 172
Appendix 13 – Project Charters ......................................................................................................................................... 173
Literature ........................................................................................................................................................................... 177

Efficiency analysis of a planning process in chemical industry
Ma
na
ge
me
nt
Su
mm
ary
11
TU Delft Master thesis project – R.M.T. van Oss
Part I -
Introduction
Efficiency analysis of a planning process in chemical industry
Intr
od
uct
ion
13
1. Introduction Royal Dutch Shell, commonly known as Shell, is the largest energy company and the second largest
company in the world measured by revenues and is one of the six oil and gas “supermajors”. Shell
operates more than 44.000 service stations worldwide, produces around 3.1 million barrels of oil
equivalent per day and has operations in over 90 countries (Shell 2009).
Shell has indicated five core businesses: exploration and production (the upstream), gas and power,
refining marketing (the downstream), chemicals (also downstream) and trading and shipping. The
downstream generates a third of Shell’s profits worldwide and is known about its global network of
more than 40.000 petrol stations and its 47 oil refineries (Shell 2010).
One of the 47 oil refineries is Shell Pernis, located near Rotterdam in the Netherlands. The refinery at
Shell Pernis is the largest in Europe and one of the world’s largest. The refinery is located on an
industrial complex covering around 425 hectares, where crude oil from various continents is
processed and where products are manufactured for the global market. Besides oil products, also
base chemicals are manufactured on the site. Two out of the nine business units are dedicated to
chemical related products (Shell 2010).
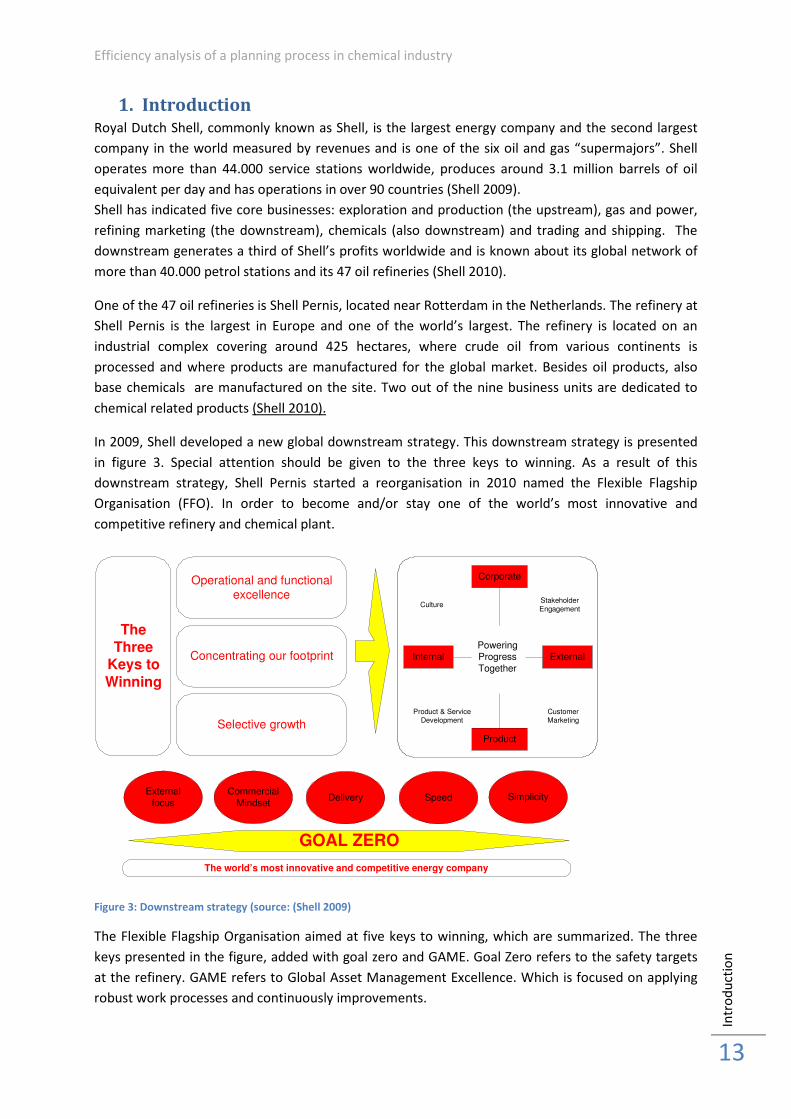
In 2009, Shell developed a new global downstream strategy. This downstream strategy is presented
in figure 3. Special attention should be given to the three keys to winning. As a result of this
downstream strategy, Shell Pernis started a reorganisation in 2010 named the Flexible Flagship
Organisation (FFO). In order to become and/or stay one of the world’s most innovative and
competitive refinery and chemical plant.
Figure 3: Downstream strategy (source: (Shell 2009)
The Flexible Flagship Organisation aimed at five keys to winning, which are summarized. The three
keys presented in the figure, added with goal zero and GAME. Goal Zero refers to the safety targets
at the refinery. GAME refers to Global Asset Management Excellence. Which is focused on applying
robust work processes and continuously improvements.
Selective growth
Concentrating our footprint
Operational and functional excellence
PoweringProgress
Together
The
Three Keys to
Winning
Internal External
Corporate
Product
CultureStakeholder Engagement
Customer Marketing
Product & Service Development
External
focus
Commercial
MindsetDelivery Speed Simplicity
The world’s most innovative and competitive energy company
GOAL ZERO
TU Delft Master thesis project – R.M.T. van Oss
As a result of the Flexible Flagship Organisation many people changed position in middle- and higher
management, because everybody had to apply again on a position at Shell Pernis. At all levels, also
on the operational level, new goals were set. Management aimed at site wide introduction of
structural improvements.
The FFO of course also effected one of the two chemical units, called CVP (Chemische Verladingen
Polyolen). The CVP unit consists of three plants; Phoenix, Flexibles and Sannest, all producing polyols
(See appendix 1). Polyols are polymers, which are used as main building materials for a wide range of
products in the polymer industry; e.g. dashboards, steering wheels, memory foam (tempur),
polyethuraan (PUR) foam, isolation, etc. The main use of polyols is as reactants to make other
polymers. A secondary use is to create monomeric polyols or polymeric polyols, such as polyesters or
polyethers.
Besides the production of polyols, CVP is also responsible for the filling and dispatch of chemical
products. The combination of transportation and manufacturing combined within one unit, offers
possibilities to analyze and improve the planning processes of both the production and
transportation of chemical products. Besides the production and transportation departments two
other elements are of importance in this supply chain, namely the commercial and supply
departments. These tasks are performed by Shell Chemicals Europe (SCE), located at Rotterdam
Alexandrium. SCE is among others, responsible for the sales and supply of polyols, produced and
transported at CVP.
CVP also applied the FFO strategy and focused on the five keys to winning. This research focuses on
one of these keys to winning, namely operational excellence. CVP indicated several areas within the
supply chain that could be organised more effectively. To be able to concretise and define these
areas in more detail, CVP decided to perform research in order to create opportunities and realise a
more robust supply chain by striving to eliminate waste within the production and planning.
1.1 Problem exploration
The Flexible Flagship Organization formulated five keys to winning in order to increase the overall
performance of Shell Pernis. One of the first actions of Shell Pernis management was to create the
possibility and a platform for everybody to set up small projects based on a Lean perspective, in
order to eliminate waste in the organization. Many small projects were executed resulting in a cost
reduction millions of dollars since the start of this waste reducing initiative. These projects have two
main goals, first of all creating a focus on simplifying processes in general, secondly to create
awareness by the employees on all levels, in order to make a difference (Shell 2010). This perception
is useful during this project, because it shows that there is room and support to improve.
CVP as a unit shares the earlier presented five keys to winning in order to increase the performance.
A very important key to winning for CVP is operational and functional excellence. In this case, several
departments are involved, namely commercial at SCE, supply at SCE, manufacturing at CVP and filling
and dispatch at CVP. Although the four departments have one common high level goal, viewpoints of
these departments are different, which creates different approaches to achieve this high level goal.
These different approaches create many opportunities for improvement, for example by creating
Efficiency analysis of a planning process in chemical industry
Intr
od
uct
ion
15
more alignment and by improving the linkages between the different elements of the four
departments.
Various management indications, originated at different parts the supply chain, indicate that the
operation of the supply chain is not at an outstanding level. Planning and other logistic processes are
too sensitive to disruptions at the moment. When the supply chain is this sensitive, disruptions are
directly causing production delays, delivery delays, extra costs and demurrage. For this reason should
the sensitivity to disruptions be minimized.
The origins of these disruptions, and how to manage the implications of these disruptions, need to be
determined. The involvement of four departments in the supply chain poses an additional challenge:
all have the same end goal, but they have different optimal paths to reach the goals. These different
approaches create a situation in which all departments define different causes and reasons for the
disruptions. Communication on a high level, covering all departments, should be improved before it
is possible to precisely define the impact of the disruptions on the whole supply chain. This problem
is reinforced because the perceived causes of the disruptions are not shared enough by the different
departments of the supply chain and for this reason are not perceived as mutual problems.
The previous paragraph explained the difficulties of categorizing the disruptions. However, initial
interviews with management of the four different divisions of the supply chain, enabled
categorization of the possible disruptions into four different broad groups. Each category indicates
problems related to planning and scheduling activities within the supply chain.
The first category is the responsibility of SCE, the second, third and fourth group are the
responsibility of CVP production and the last group is the responsibility of CVP filling and Dispatch.
1 Changes in production plan � caused by decisions taken by SCE Commercial or necessary
reasons.
2 (Non-) availability of raw materials � planning or delivery problems
3 Production problems � quantity or quality related problems
4 Delivery to customer � problems with schedules and planning from customer and producer
sides
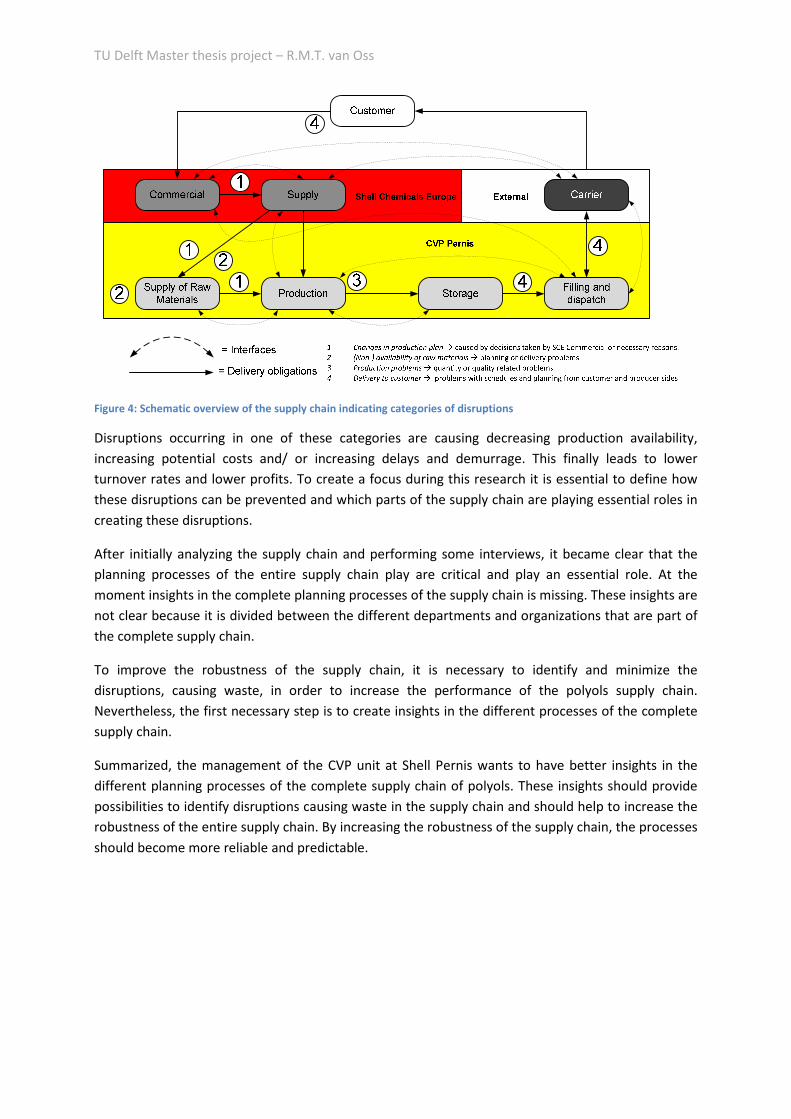
The context of these categories of disruptions is defined using a schematic overview of the supply
chain, presented schematically in figure 4. The red part of the figure indicates SCE, consisting of a
commercial department and a supply department. The yellow part of the figure defines the parts of
the supply chain of CVP, consisting of a filling and dispatch department and a manufacturing
department. Finally the carriers and the customer are defined. These are both external actors, but
mentioned because they are part of the project till a certain degree. Besides the colours, also
different arrows are used. The striped arrows indicate all kinds of interfaces. This can be by delivery
of a document, but also by using other modes of communication. The second arrow represents a
delivery obligation, including one exception; this is a linear obligation from the beginning of the
supply chain till the end, with the customer as starting and end point. The numbers besides the
arrows indicate the position and location of the possible disruptions, indicated in four categories and
presented and explained above.
TU Delft Master thesis project – R.M.T. van Oss
Figure 4: Schematic overview of the supply chain indicating categories of disruptions
Disruptions occurring in one of these categories are causing decreasing production availability,
increasing potential costs and/ or increasing delays and demurrage. This finally leads to lower
turnover rates and lower profits. To create a focus during this research it is essential to define how
these disruptions can be prevented and which parts of the supply chain are playing essential roles in
creating these disruptions.
After initially analyzing the supply chain and performing some interviews, it became clear that the
planning processes of the entire supply chain play are critical and play an essential role. At the
moment insights in the complete planning processes of the supply chain is missing. These insights are
not clear because it is divided between the different departments and organizations that are part of
the complete supply chain.
To improve the robustness of the supply chain, it is necessary to identify and minimize the
disruptions, causing waste, in order to increase the performance of the polyols supply chain.
Nevertheless, the first necessary step is to create insights in the different processes of the complete
supply chain.
Summarized, the management of the CVP unit at Shell Pernis wants to have better insights in the
different planning processes of the complete supply chain of polyols. These insights should provide
possibilities to identify disruptions causing waste in the supply chain and should help to increase the
robustness of the entire supply chain. By increasing the robustness of the supply chain, the processes
should become more reliable and predictable.
Efficiency analysis of a planning process in chemical industry
Intr
od
uct
ion
17
1.2 Research questions
The main research question is divided into two parts. Sub-questions are defined, to answer the two
main research questions.
1. What are the main factors affecting, positively or negatively, the planning process of the
defined supply chain (of CVP and SCE) and what is the impact of these factors?
1.1 What are the relevant state of the art theories and practices to analyze supply chains
and to identify waste and disruptions within organizations and supply chains?
1.2 Which processes being performed within the commercial, production and
transportation part of the supply chain are relevant for the planning process?
1.3 What are the most significant disruptions and waste within the processes of the CVP
commercial, production and transportation unit and which causes can be identified?
The first question aims at a logical first step in the process, namely identify, describe and analyze the
relevant processes. As previously explained is there not enough documentation or knowledge of the
planning processes affecting and/or operating in multiple departments.
Because the question is too broad to answer at once, three sub-questions are formulated. A
combination of answers on the three sub questions provides the answer on the first main question.
2. Which solutions and/or recommendations can be formulated to make the planning process
of the supply chain (of CVP and SCE) more predictable and reliable (robust) and how should
these findings be implemented?
2.1 Which recommendations and possible solutions can be generated to improve the
planning processes of the commercial, production and/or transportation division and
eliminate waste?
2.2 What steps are necessary to implement the solutions and recommendations and how
could these processes be replicated?
The second question is a follow up on the first question, in other words, the answer and results of
the first question are the inputs for the second question. After the relevant processes and most
relevant waste within the supply chain has been identified, these opportunities can be analyzed and
improvements can be proposed. Again the sub questions are used to help answering the second
main question. Sub question 2.2 creates additional academic value, because it shows how the
theories and methods used during the research can be used again, in other words; replication of the
research project.
1.3 Towards the research questions
In order to provide answers on the research questions, several steps should be taken. It is now
possible to explain these steps more concrete.
Figure 4 already visualized the involvement of several divisions of Shell Nederland in the complete
supply chain of polyols. As explained before, sufficient insights in the processes are missing at the
moment, which is causing unclearness about responsibilities within the supply chain.
The planning of the production plays an essential and central role in the supply chain of polyols.
However, it are also process steps that cover all departments. More insight in these planning
processes is necessary to increase the robustness of the complete supply chain, reduce the impact of
disruptions and create more clearness about responsibilities when the ideal situation changes. For
TU Delft Master thesis project – R.M.T. van Oss
this reason the first step during this research is to focus on the identification of these planning
processes. An important focus point during this research is the involvement of all departments. The
insights gained during this research should also create follow up actions after the project is finished.
To be able to define the processes and come up with solutions in order to increase the robustness of
the supply chain, literature will be applied. At the moment Shell already makes use of theories to
make it easier to identify the ‘stream’ of processes. Insights in the ‘stream’ is necessary to improve
these processes. The main process improvement method used by Shell Pernis is Lean thinking, also
called Lean manufacturing. This method is also applied by the earlier mentioned small lean projects.
Lean focuses on the identification and elimination of waste (Nave 2002). A main step in Lean thinking
is the identification of the value stream. Lean is flow focused and could be used to define and identify
the different flows of the supply chain (Abdulmalek and Rajgopal 2007). This method will also be
leading during this research, in order to visualize and define the different streams and to be able to
create a clear overview of the different steps affecting the logistics planning processes.
Lean Thinking will be combined with Six Sigma theories, in order to deal with criticism on the lean
thinking method and to maximize the performance improvement. Lean Six Sigma, as the combination
is called, uses strong points of both theories and focuses on customers to be happy by producing
quality products and services with the required speed.
These (value) streams and Lean Six Sigma thinking make it also easier to define the main disruptions
and create solutions and recommendations to diminish the impact and frequency of the problems, in
other words eliminate the waste. Supply Chain Management theories will be applied parallel to Lean
Six Sigma methods during the project, in order to come up with more detailed solutions that will
optimize the Supply chain. Attention should be given to the strategically, tactical and operational
levels of the organisation (Simchi-Levi, Kaminsky et al. 2003).
It is now possible to define and summarize the four different phases during the research:
I. Present clear documentation of the most relevant logistic planning processes of the supply
chain, including the commercial and supply parts, which are the responsibility of SCE.
II. Identify the main disruptions causing waste and inefficiencies within the logistical supply
chain, and define the processing causing it.
III. Provide recommendations and possible solutions for future change that diminish the impact
and frequency of the disruptions.
IV. Document this process (procedures) for future use, advice in implementation steps and
advice in replication of the research.
1.4 Report Structure
The report is structured in four main parts. Part I –Introduction, describes an introduction in chapter
1 and provides the methodology, including a literature review in chapter 2. Part II – Analyses applies
this methodology on the case study of Shell Pernis – CVP. Chapter 3 analyzes the network and
explains the stakeholder environment. Chapter 4 identifies and maps the processes of the planning
process of the polyols’ supply chain. Part III – DMAIC, starts at chapter 5 and applies the DMAIC
structure to execute the projects. Chapter 5 builds further on the previous chapters and maps the
most relevant opportunities. Chapter 6 goes further into detail on the DMAIC methodology, applied
to start and process four projects. Chapter 7 – 10 describe the four projects, based on the five DMAIC
development phases. The control phase includes the monitored results of an implemented pilot
project. Chapter 11 evaluates the projects. Chapter 12 provides a framework how to transfer the
Efficiency analysis of a planning process in chemical industry
Intr
od
uct
ion
19
knowledge, gathered in the projects, to the organization. The overarching chapter 13 is the last
chapter of this part and reflects and evaluates the DMAIC method generically. Finally, part IV –
conclusions, consist of chapter 14, conclusion and recommendations, which summarizes the findings
and draw conclusions on the executed research.
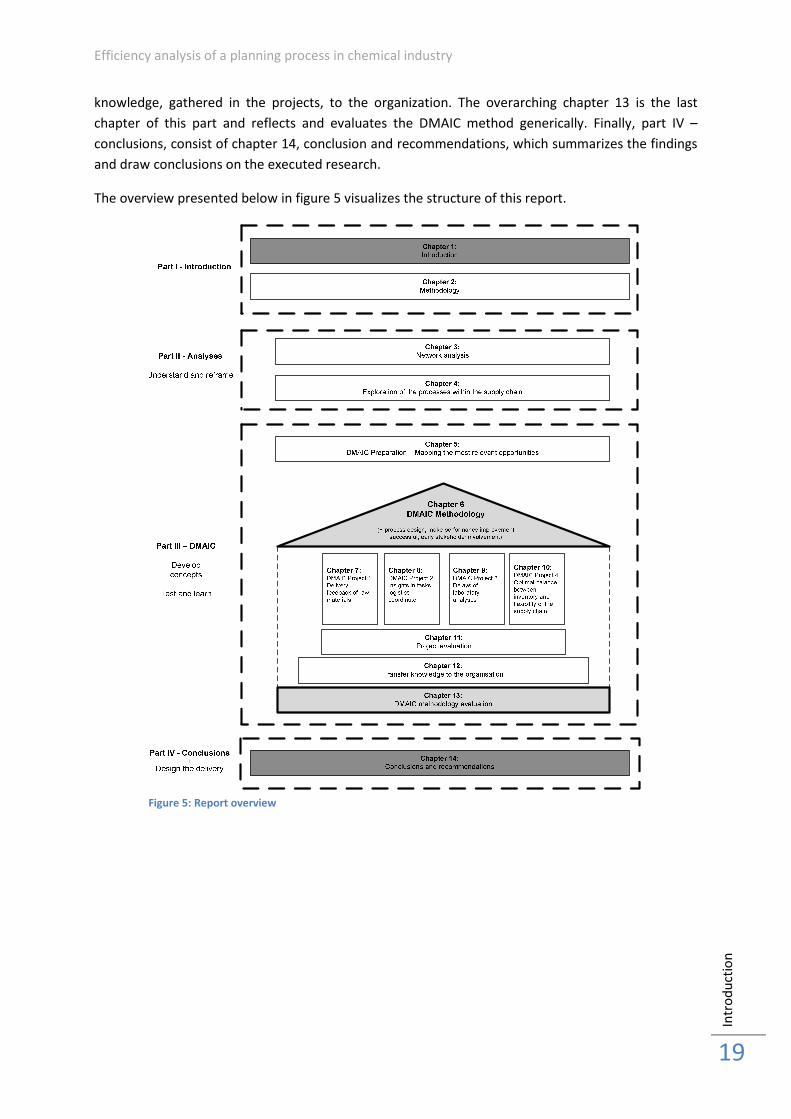
The overview presented below in figure 5 visualizes the structure of this report.
Figure 5: Report overview
TU Delft Master thesis project – R.M.T. van Oss
2. Methodology
2.1 Introduction
To answer the research questions it is necessary to apply the right method. A method or theoretical
framework introduces a logical sequence of several steps. These are used to process certain steps in
order to provide clear answers on the main research questions. This chapter introduces the main
literature used during this research. The literature provides a handheld during the project and also
creates more opportunities to reflect in general on the methods used, evaluate the results and
describe possibilities to replicate some of the process steps.
Chapter 1 introduced the Flexible Flagship Organization. This reorganization of Shell Pernis was
executed to become more competitive and profitable by reducing unnecessary operational costs and
by creating selective growth. In order to create operational excellence and eliminate unnecessary
costs, Shell introduced small lean projects focused on quick wins in order to increase the operational
performance, called ‘BOB-Projects’1. Lean thinking (Shell 2010) was broadly introduced to Shell
personnel to create support and optimize the result of these lean projects.
This chapter first provides a literature review in paragraph 2.2 and focuses in paragraph 2.3 on the
applied methods.
2.2 Literature reviews
The management of Shell Pernis broadly introduced lean thinking to Shell personnel in the last years.
Lean thinking is a performance improvement method that is applicable for the research in this thesis,
as the goal of this research is to improve the current performance of the supply chain of polyols.
However, Lean thinking is not the only theory or improvement method that suits this research. This
paragraph first provides some background on lean thinking, followed by information on other
theories which could be applied in order to create useful results during this research.
In 1990, Womack, Jones et al. (Womack, Jones et al. 2007) published a book called ‘The Machine
That Changed the World: The Story of Lean production’. This book tells the story of the Japanese
answer on standardized automobile parts of Henry Ford by introducing the Toyota Model, called
Lean Manufacturing (Abdulmalek and Rajgopal 2007). Lean is focused on cost reduction by
eliminating non-value added activities. In other words, trying to maximize the reduction of waste.
Miller (2005) defines lean as using less to do more, by determining the value of any given process by
distinguishing value added steps from non value added ad eliminating waste so that ultimately every
step adds value to the process.
Because Shell is already using the Lean thinking method, this technique is well supported and
understood within the organisation. A second advantage is that the research phases mentioned
earlier can be compared with a typical Lean approach, by performing the first phase; the
identification of waste, the second phase; the elimination of waste and also more or less the third
phase; implement, sustain and replicate (Unknown 2010).
Besides these positive effects, there is also criticism on the Lean method. The main criticisms are
summarized in the following points; Lean has a lack of consideration for human factors, a lack of
strategic perspective, it has a relative inability to cope with variability, it means laying off people, it is
only for manufacturing and Lean only works in certain environments (Bevan, Westwood et al. 2005).
To deal with this criticism other process improvement methods, that are capable of compensating
the criticism, can be used in addition to Lean thinking.
1 BOB = Balast OverBoord - projects
Efficiency analysis of a planning process in chemical industry
Me
tho
do
log
y
21
A possible compensating method is the Six Sigma method focuses on reduction of variation, which
will solve process and business problems and increases quality. By using a set of statistical tools to
understand the fluctuation process, management can begin to predict the expected outcome of that
process (Unknown 2004); (Schroeder, Linderman et al. 2008). Several typical Six Sigma tools are very
useful during different phases of the research. For example the SIPOC (Supplier Input Proces Output
Customer) tool, which can be used to identify and define ‘as is’ processes.
However there is also criticism on Six Sigma. The most important criticism are summarized as follows;
Six Sigma does not consider system interaction, processes are improved independently, there is a
lack of consideration of human factors, it is over detailed and complicated for some tasks, it is
focusing on quality and the final criticism is that the goal of Six Sigma is absolute (Bevan, Westwood
et al. 2005).
So the question should be asked, can both methods be used at the same time to increase the
benefits and relevance of the theories for this project? And are the criticism on both methods be
diminished by using a combination of methods? This answer can be given with help of some
background information and experiences on possible combinations of these methods. First of all to
make sure, it is clear that both methods can be used to improve business processes and can be
applied on this thesis! Nave (2002), provides theoretical background to compare these methods and
provide a handheld to choose one of these methods.
However, his conclusion that these theories all creating different benefits is not fully supported.
Webber State University at Utah (Pirasteh and Horn 2010) introduced and claimed that a
combination of Process Improvements methods deliver higher results than usage of these
methodologies individually (Pirasteh and Horn 2009; Pirasteh and Horn 2010). So this statement
provides an answer on the question mentioned earlier, namely: Applying a combination of Lean
thinking and Six Sigma theories will create benefits and deliver higher results.
Applying a combination of Lean and Six Sigma is not an innovation and already happens a lot. Shell
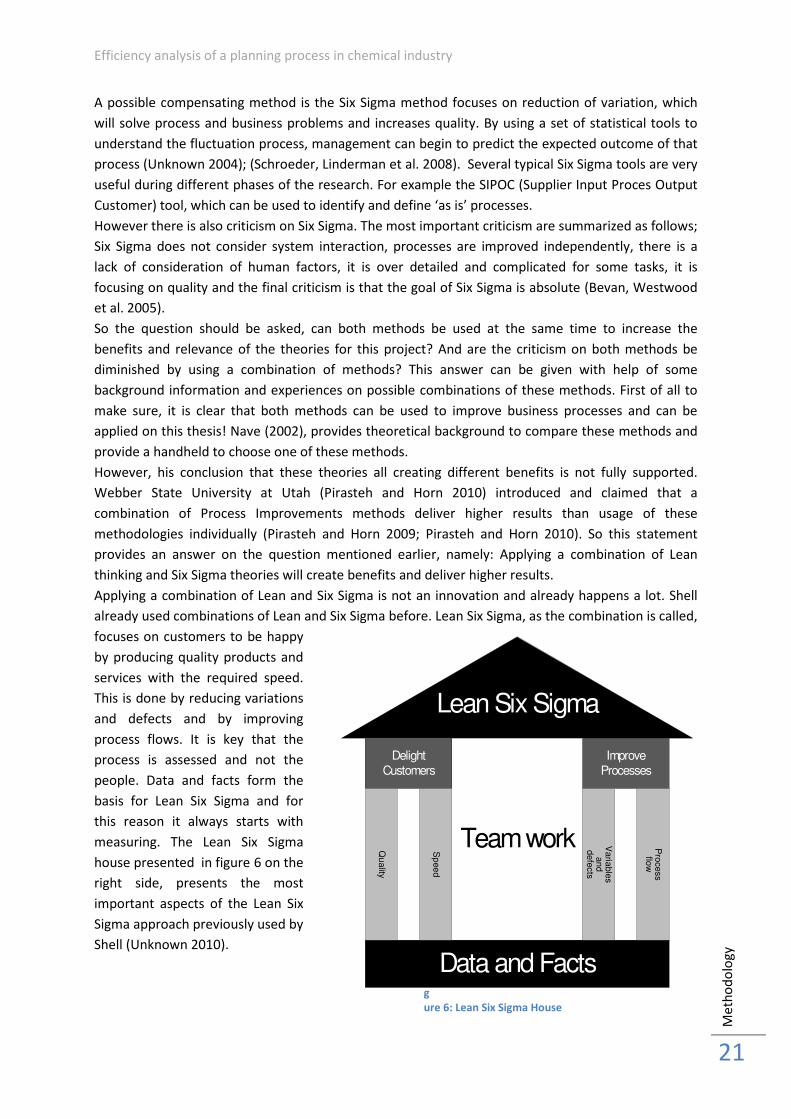
already used combinations of Lean and Six Sigma before. Lean Six Sigma, as the combination is called,
focuses on customers to be happy
by producing quality products and
services with the required speed.
This is done by reducing variations
and defects and by improving
process flows. It is key that the
process is assessed and not the
people. Data and facts form the
basis for Lean Six Sigma and for
this reason it always starts with
measuring. The Lean Six Sigma
house presented in figure 6 on the
right side, presents the most
important aspects of the Lean Six
Sigma approach previously used by
Shell (Unknown 2010).
F
i
g
ure 6: Lean Six Sigma House
Lean Six Sigma
Delight
Customers
Improve
Processes
Team work
Data and Facts
Qu
ality
Sp
ee
d
Varia
ble
s
and
defe
cts
Pro
cess
flow
TU Delft Master thesis project – R.M.T. van Oss
The combination of these methods is successful because it combines the focus of Lean on reducing
waste and increasing speed with the focus of Six Sigma on improving quality and performance on
critical customer requirements and reducing costs. It reduces criticism given earlier in this paragraph,
by incorporating the best of Lean and the best of Six Sigma. The focus on the speed of Lean and on
the quality of Six Sigma are better together. But also the combination of common sense (Lean) and
common science (Six Sigma) offers the potential to achieve uncommon results (Bevan, Westwood et
al. 2005).
Lean provides several tools to define waste in the organisation, Shell uses a Lean tool; TIMWOOD
(Shingo 1989), which makes a distinction between value-added time and non-value added time. Shell
also uses DMAIC (define, measure, analyze, improve control)z (Frahm 2003), a Six Sigma tool to
define more clear solutions for our problems and to provide standards in process steps of projects.
These performance improvement methods can be combined with Supply Chain Management
methods. What do these improvement methods have to do with the supply chain? The short answer
is everything (James 2004), because both Lean Six Sigma and Supply chain Management focus on
performance improvement and can help to improve the efficiency of a supply chain.
A huge amount of literature can be found on supply chain management. Supply chain management
spans the entire network from initial source to the ultimate customer (Omta, Trienekens et al. 2001;
Tan 2001) and is defined as a set of approaches utilized to efficiently integrate suppliers,
manufactures, warehouses and stores. This integration is done in a way that merchandise is
produced and distributed at the right quantities, to the right locations and at the right time, in order
to minimize system wide costs while satisfying service level requirements (Simchi-Levi, Kaminsky et
al. 2003). Control and coordination of stocks and material flows, exchange of information and the
associated managerial and operational activities are the subject of study in Supply Chain
Management (Meijer 2009).
Supply chain management should be combined with Lean Six Sigma thinking in order to diminish the
effects of the disruptions occurring in the supply chain. Focus points in supply chain management are
minimizing the system wide costs, while maintaining a certain service level and dealing with
uncertainty. In order to optimize the Supply chain, attention should be given to the strategic, tactical
and operational levels of the organisation (Simchi-Levi, Kaminsky et al. 2003). James (2004) provides
a 12 steps Lean Six Sigma method that will lead to a clear map of processes feeding into and through
a company before being realized by the customer. Martin (2007) describes a 10 Step solution process
for Lean Six Sigma for Supply Chain Management. Both methods can help to define the steps that
should be taken during this research and will be taken into account in formulating the steps in
paragraph 2.3.
The above discussed methods and tools already take a lot of aspects to optimise a planning process
of a supply chain into account. Specific attention during this research should be given to moments or
process steps, where communication and coordination between divisions and/or departments play
an important role. An example in this supply chain are the process steps containing interfaces
between SCE and CVP. Lazzarini, Chaddad et al. (2001) describe two viewpoints used for analyzing
supply across the borders of a firm. First the supply chain perspective and secondly the supply
network perspective, which they call ‘netchains’, useful in the following chapter of this thesis. It is
very important to analyze and optimize the different ‘transfer’ moments of information and/or
Efficiency analysis of a planning process in chemical industry
Me
tho
do
log
y
23
goods. This step focuses more on organization, management and coordination mechanisms within
organizations.
Woodward (Mintzberg 1983) talks about coordination divided in process, piece and mass production.
To come up with solutions and recommendations, the coordination between divisions and
departments within the supply chain also requires extra attention. A significant part of the waste in
this case seems to be contained within organizational and coordination issues. This waste is
especially located at issues where several departments within one organization, all with different
goals and perceptions, are involved.
A theory that could be used as handheld is rooted in the new institutional theory transaction cost
economics (Williamson 1998), with the four level framework of economics of institutions. It specifies
three major characteristics of transactions, namely frequency, uncertainty and asset specificity. New
institutional economics offers tools for analyzing interactions between organizational forms of supply
of goods and the institutional environment in which they are embedded (Menard 2000).
Finally there are some important management theories necessary to apply during this research. One
of the main aims of this project is to define the most relevant disruptions and create opportunities to
improve the robustness of the supply chain. McIntyre (2010) states that most initiatives start to fail
because they fail to start! According to him is one of the hardest things to do in many organizations,
to set up a successful change initiative. In order to successful set up change initiatives, he defines
seven essential steps. These steps are focused on building a strong core team, a project team
(McIntyre 2010).
After executing these seven steps, the opportunities can be seen as a small projects within a large
project that should be processed. Project management methods are necessary to manage these
projects and create successful end results. To help predict and control the schedule, budget, scope,
resources and tasks. However, one of the main reasons for failures of projects is because the changes
they are aiming at, are structured as projects, with clear goals, tight schedules and targets. In a
Network however, a project approach has limited significance, because the parties will not
automatically accept the latter’s problem definition, aims and plan. And many projects have to deal
with significant uncertainties, leading to surprises in the execution phase of the project. For this
reason, the opportunities should also be approached by spending attention to process steps, in other
words, the rules of the game (Bruijn, Heuvelhof et al. 2003). For this reason process and project
management methods will be applied. Sometimes less obvious and in a more intrinsic way, but their
share in gaining successful results should not be underestimated.
The above discussed literature and methods provide enough guidance during this research to analyze
the problems and come up with solutions and recommendations in order to increase the robustness
of the supply chain. The different steps that should be executed during this research are based on
the literature described above and presented below. When a step needs certain tools or extra
literature background to process it in order to be able to come up with improvements, these will be
added and explained in the corresponding chapter.
2.3 Applied methodology
The Lean Six Sigma method will be used as leading theory during this research. Normally five steps
are taken, which depends on the leading theory. DMAIC (Define, Measure, Analysis, Improve and
Control) is used by Six Sigma (Harry 1994) and identification of the value stream is applied by Lean
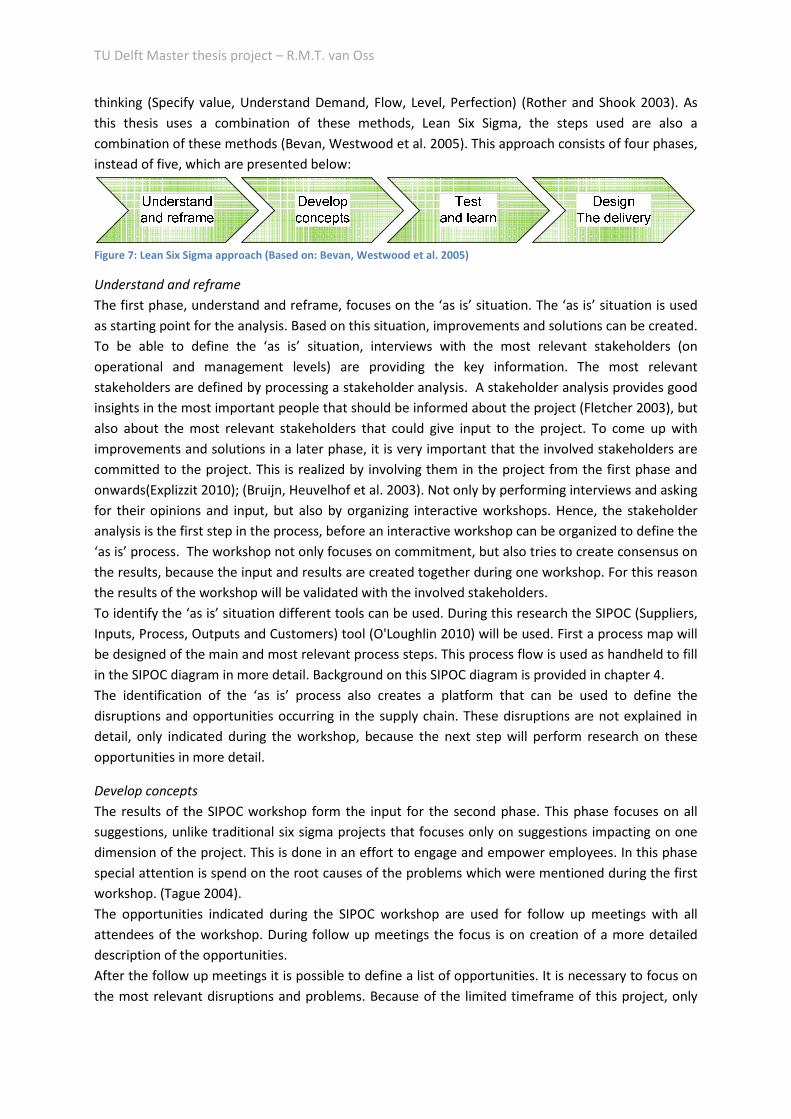
TU Delft Master thesis project – R.M.T. van Oss
thinking (Specify value, Understand Demand, Flow, Level, Perfection) (Rother and Shook 2003). As
this thesis uses a combination of these methods, Lean Six Sigma, the steps used are also a
combination of these methods (Bevan, Westwood et al. 2005). This approach consists of four phases,
instead of five, which are presented below:
Figure 7: Lean Six Sigma approach (Based on: Bevan, Westwood et al. 2005)
Understand and reframe
The first phase, understand and reframe, focuses on the ‘as is’ situation. The ‘as is’ situation is used
as starting point for the analysis. Based on this situation, improvements and solutions can be created.
To be able to define the ‘as is’ situation, interviews with the most relevant stakeholders (on
operational and management levels) are providing the key information. The most relevant
stakeholders are defined by processing a stakeholder analysis. A stakeholder analysis provides good
insights in the most important people that should be informed about the project (Fletcher 2003), but
also about the most relevant stakeholders that could give input to the project. To come up with
improvements and solutions in a later phase, it is very important that the involved stakeholders are
committed to the project. This is realized by involving them in the project from the first phase and
onwards(Explizzit 2010); (Bruijn, Heuvelhof et al. 2003). Not only by performing interviews and asking
for their opinions and input, but also by organizing interactive workshops. Hence, the stakeholder
analysis is the first step in the process, before an interactive workshop can be organized to define the
‘as is’ process. The workshop not only focuses on commitment, but also tries to create consensus on
the results, because the input and results are created together during one workshop. For this reason
the results of the workshop will be validated with the involved stakeholders.
To identify the ‘as is’ situation different tools can be used. During this research the SIPOC (Suppliers,
Inputs, Process, Outputs and Customers) tool (O'Loughlin 2010) will be used. First a process map will
be designed of the main and most relevant process steps. This process flow is used as handheld to fill
in the SIPOC diagram in more detail. Background on this SIPOC diagram is provided in chapter 4.
The identification of the ‘as is’ process also creates a platform that can be used to define the
disruptions and opportunities occurring in the supply chain. These disruptions are not explained in
detail, only indicated during the workshop, because the next step will perform research on these
opportunities in more detail.
Develop concepts
The results of the SIPOC workshop form the input for the second phase. This phase focuses on all
suggestions, unlike traditional six sigma projects that focuses only on suggestions impacting on one
dimension of the project. This is done in an effort to engage and empower employees. In this phase
special attention is spend on the root causes of the problems which were mentioned during the first
workshop. (Tague 2004).
The opportunities indicated during the SIPOC workshop are used for follow up meetings with all
attendees of the workshop. During follow up meetings the focus is on creation of a more detailed
description of the opportunities.
After the follow up meetings it is possible to define a list of opportunities. It is necessary to focus on
the most relevant disruptions and problems. Because of the limited timeframe of this project, only
Efficiency analysis of a planning process in chemical industry
Me
tho
do
log
y
25
the most relevant problems can be analyzed. This list should be prioritized, by ranking the
opportunities on input vs. output. The ranking will be based on time, resources and cost vs. support
and impact. The opportunities can be seen as small projects. This portfolio of projects focuses on a
well balanced mix of quick wins and more complex long term projects. The next step is to set up
small project teams and create commitment to realize improvement on the different opportunities.
Test and learn
When the disruptions and problems are identified, the improvement phase starts. The highest
ranked opportunities will be improved by starting small projects. Lower ranked opportunities are not
completely neglected but are followed up in a different way. These opportunities are mentioned, so
actions can be taken in the future or parallel to this project. The goal of this third phase; test and
learn, is to develop appropriate improvement plans, by using the comprehensive toolbox that Lean
Six Sigma offers. The use of these tools are in more detail explained in chapter 5 and 6. The projects
also make use of supply chain theories and organizational methods. These methods also have a role
in solving issues and occurring problems in more detail in the supply chain.
The effects of the problems and disruptions can be diminished and solved in different ways. This will
depend on the opportunity. Specific steps are explained in the corresponding paragraphs in chapter
5, 6, 7 and 8.
A small part of the Develop Concepts phase and the Test and Learn phase focuses in this research on
the development of the four individual projects. The steps described in this part of the research, are
similar to the DMAIC steps. This is a logical consequence, because the theory of Bevan, Westwood et.
al. (2005) is partly based on the Six Sigma theory. However, the DMAIC steps are commonly known at
the organization. For this reason, both theories are combined. The complete research applies the
four steps method and phases of the individual projects, are structured with help of the DMAIC
steps.
Design the delivery
This phase designs the foundations for sustaining the gains. By implementing the solutions where
possible and otherwise formalizing the solutions and recommendations, it is ensured that
information and findings are not lost. By monitoring the implementation where possible, using e.g.
score cards, it becomes possible to evaluate the implemented solutions and recommendations.
At the end phase of this research, the commitment created during the projects should be fully used,
by handing over the lead of the necessary projects to another team member.
This method will finally lead to concrete results that improve the robustness of the supply chain,
some projects already implemented and monitored, and some needing follow up actions.
As already partly mentioned, the methodology described above will be used as a handheld to identify
these disruptions and problems. In order to solve these issues and come up with improvements and
define the root causes etc. extra background information is necessary. The previous paragraph
already introduced extra literature. When certain methods or theories are applied, this will be
explained in the corresponding paragraph. The four main phases are used as a general handheld
during the whole research.
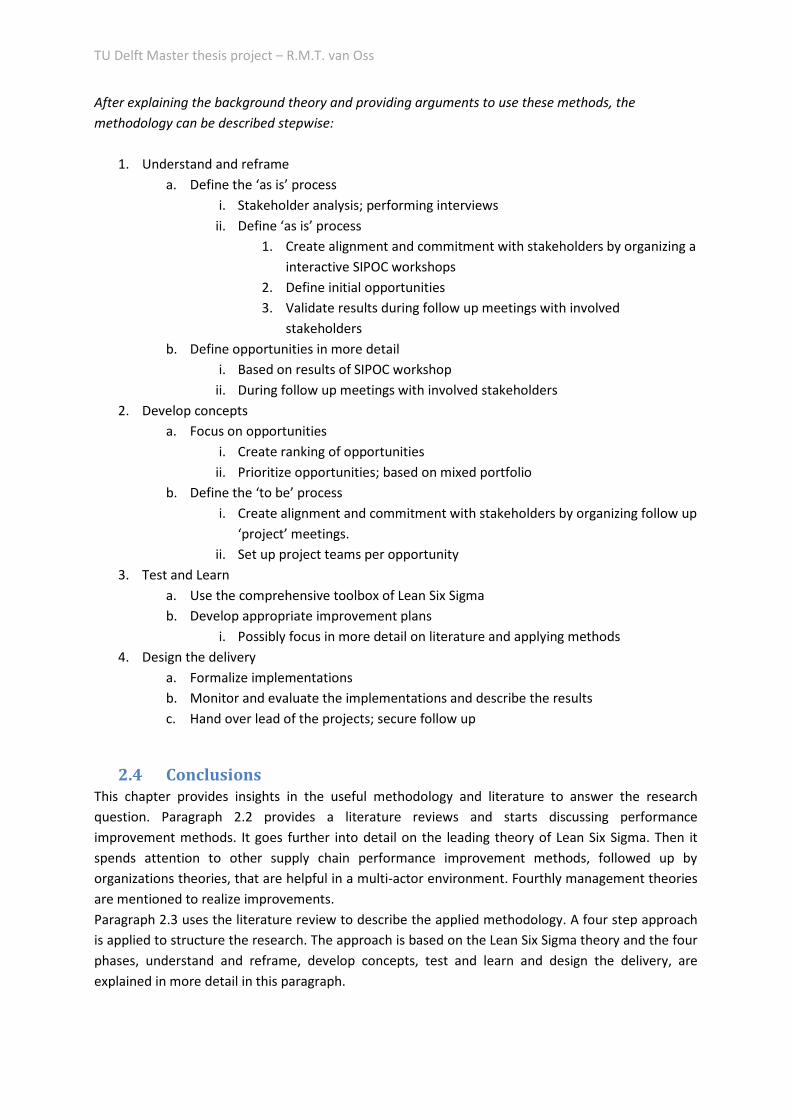
TU Delft Master thesis project – R.M.T. van Oss
After explaining the background theory and providing arguments to use these methods, the
methodology can be described stepwise:
1. Understand and reframe
a. Define the ‘as is’ process
i. Stakeholder analysis; performing interviews
ii. Define ‘as is’ process
1. Create alignment and commitment with stakeholders by organizing a
interactive SIPOC workshops
2. Define initial opportunities
3. Validate results during follow up meetings with involved
stakeholders
b. Define opportunities in more detail
i. Based on results of SIPOC workshop
ii. During follow up meetings with involved stakeholders
2. Develop concepts
a. Focus on opportunities
i. Create ranking of opportunities
ii. Prioritize opportunities; based on mixed portfolio
b. Define the ‘to be’ process
i. Create alignment and commitment with stakeholders by organizing follow up
‘project’ meetings.
ii. Set up project teams per opportunity
3. Test and Learn
a. Use the comprehensive toolbox of Lean Six Sigma
b. Develop appropriate improvement plans
i. Possibly focus in more detail on literature and applying methods
4. Design the delivery
a. Formalize implementations
b. Monitor and evaluate the implementations and describe the results
c. Hand over lead of the projects; secure follow up
2.4 Conclusions
This chapter provides insights in the useful methodology and literature to answer the research
question. Paragraph 2.2 provides a literature reviews and starts discussing performance
improvement methods. It goes further into detail on the leading theory of Lean Six Sigma. Then it
spends attention to other supply chain performance improvement methods, followed up by
organizations theories, that are helpful in a multi-actor environment. Fourthly management theories
are mentioned to realize improvements.
Paragraph 2.3 uses the literature review to describe the applied methodology. A four step approach
is applied to structure the research. The approach is based on the Lean Six Sigma theory and the four
phases, understand and reframe, develop concepts, test and learn and design the delivery, are
explained in more detail in this paragraph.
Efficiency analysis of a planning process in chemical industry
Me
tho
do
log
y
27
Part II -
Analyses
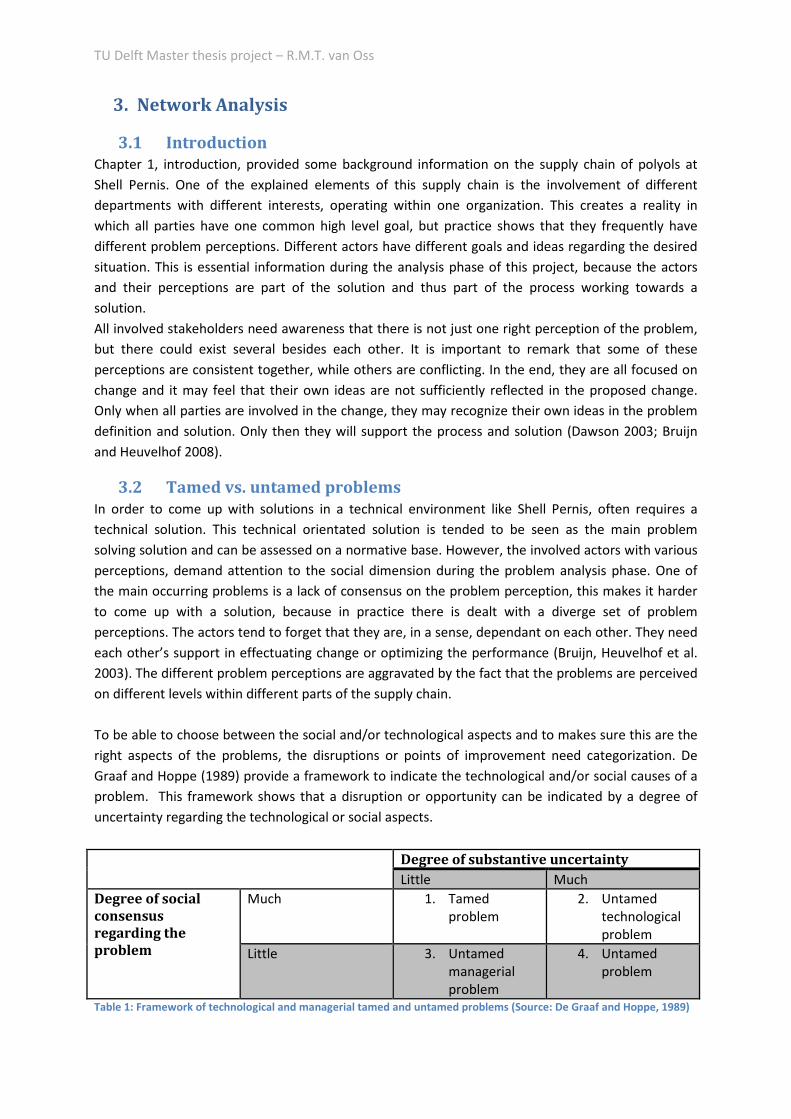
TU Delft Master thesis project – R.M.T. van Oss
3. Network Analysis
3.1 Introduction
Chapter 1, introduction, provided some background information on the supply chain of polyols at
Shell Pernis. One of the explained elements of this supply chain is the involvement of different
departments with different interests, operating within one organization. This creates a reality in
which all parties have one common high level goal, but practice shows that they frequently have
different problem perceptions. Different actors have different goals and ideas regarding the desired
situation. This is essential information during the analysis phase of this project, because the actors
and their perceptions are part of the solution and thus part of the process working towards a
solution.
All involved stakeholders need awareness that there is not just one right perception of the problem,
but there could exist several besides each other. It is important to remark that some of these
perceptions are consistent together, while others are conflicting. In the end, they are all focused on
change and it may feel that their own ideas are not sufficiently reflected in the proposed change.
Only when all parties are involved in the change, they may recognize their own ideas in the problem
definition and solution. Only then they will support the process and solution (Dawson 2003; Bruijn
and Heuvelhof 2008).
3.2 Tamed vs. untamed problems
In order to come up with solutions in a technical environment like Shell Pernis, often requires a
technical solution. This technical orientated solution is tended to be seen as the main problem
solving solution and can be assessed on a normative base. However, the involved actors with various
perceptions, demand attention to the social dimension during the problem analysis phase. One of
the main occurring problems is a lack of consensus on the problem perception, this makes it harder
to come up with a solution, because in practice there is dealt with a diverge set of problem
perceptions. The actors tend to forget that they are, in a sense, dependant on each other. They need
each other’s support in effectuating change or optimizing the performance (Bruijn, Heuvelhof et al.
2003). The different problem perceptions are aggravated by the fact that the problems are perceived
on different levels within different parts of the supply chain.
To be able to choose between the social and/or technological aspects and to makes sure this are the
right aspects of the problems, the disruptions or points of improvement need categorization. De
Graaf and Hoppe (1989) provide a framework to indicate the technological and/or social causes of a
problem. This framework shows that a disruption or opportunity can be indicated by a degree of
uncertainty regarding the technological or social aspects.
Degree of substantive uncertainty
Little Much
Degree of social
consensus
regarding the
problem
Much 1. Tamed
problem
2. Untamed
technological
problem
Little 3. Untamed
managerial
problem
4. Untamed
problem
Table 1: Framework of technological and managerial tamed and untamed problems (Source: De Graaf and Hoppe, 1989)
Efficiency analysis of a planning process in chemical industry
Ne
two
rk A
na
lysi
s
29
1. Tamed problem: There is no social or technological uncertainty regarding this problem. E.g.: A broken valve or pump has to be
repaired.
2. This is a problem which all the stakeholders share the opinion that it is a problem, but there is not a technological solution for it.
E.g.: The reliability of the units has to be 100%.
3. This is a problem with no technological complexity but with a lot of social resistance regarding the problem. E.g.: Who should be
responsible during a Off-spec procedure.
4. These problems have both technological and social uncertainty. E.g.: What is the best sequence to produce polyols.
Strategies to find solutions for problems in category 2, 3 and 4 aim to shift these problems to
category 1. In other words, change an untamed problem in a tamed problem. During projects it
depends on the problem how this should be done. Some points of improvement or disruptions deal
with uncertainty on both a technological and a social dimension. Technological solutions can often be
presented in a normative way. This can convince actors of the nature of a problem and creates
support to work to a technological better future. However social solutions are more complex and
need more insight on the social context of the involved stakeholders in the supply chain (Fletcher
2003). Insights in the network should be clear in order to:
• Identify interests and perceptions of actors, to prevent unexpected resistance during the
project.
• Provide an analysis in which the involved actors recognize themselves. As a result it supports
the cooperation during the next phases in order to diminish or solve the problem.
• Create a stakeholder analysis, which maps and defines the positions, interests, resources
and relations of actors. This provides a good overview of possible involvement and input of
actors during the analyses of problems and also offers insights in the chances and threats
that the actors have to offer.
3.3 Stakeholders
To create more insights in the social dimension of this project, it is necessary to define the relevant
stakeholders. To come up with a list of relevant stakeholders and to be able to categorize them, it is
important to first perform a quick actor scan (Bruijn and Heuvelhof 2008), which identify the actively
involved actors in the planning process of the polyol supply chain. The second step should define the
actors that have power to influence and play a role regarding the solution of the problem. Then other
resources of actors involved should be defined, which are important to the come up with points of
improvement. The last step should analyze which actors are not participating actively, but are
affected by the problems and actions taken (Fletcher 2003). Because the exact disruptions and points
of improvement are not specified at this moment, the results are based on problems affecting the
planning of the polyols supply chain in general. Chapter 5 specifies the disruptions and explains the
social dimension in more detail.
Before going into more detail on the stakeholders, it is important to remember that there are four
different departments involved in the supply chain. These departments are explained and introduced
in chapter 1. They are: Commercial, Supply, Manufacturing (CVP-P) and Filling and Dispatch (CVP-
F&D).
The following actors are identified by providing answers to the goals stated above. The actor which is
stated under the department, is directly affected by the related department:
TU Delft Master thesis project – R.M.T. van Oss
Management
1. Production Unit Manager - CVP
2. Production Supervisor – CVP-P
3. Production Specialists production – CVP-P
4. Production Supervisor filling and dispatch – CVP F&D
5. Production specialist filling and dispatch – CVP F&D
6. Supply manager – Supply
7. Product managers – Commercial
Executive employees
8. Team leaders– CVP-P and CVP-F&D
9. Operators– CVP-P, CVP-F&D and Shift 6.
10. Logistics planner – CVP
11. Supply coordinators – Supply
12. Customer Relation Centre representatives – Supply
13. Traffic office employees – CVP-F&D
External parties
14. Raw material and adjuvant suppliers
15. Carriers (including shipping companies)
Cross organizational parties
16. HSSE supervisor Table 2: Stakeholder overview
1. Production Unit manager is accountable for the daily operation of the CVP unit. He has to approve new initiatives.
2. Production Supervisor is responsible for the day to day operation of production, direct responsible for executive employees of
manufacturing and in charge of the resources planning.
3. Production specialists (2) of production are responsible for long and midterm improvements.
4. Production Supervisor of filling and dispatch is responsible for the day to day operation, direct responsible for executive
employees and in charge of the resources planning of F&D.
5. Production Specialist of F&D is responsible for long and midterm improvements.
6. Supply manager is accountable for the day to day operation of the supply department.
7. Product Managers are responsible for the demand forecast and long term strategy of several product groups, inclusive polyols.
They have a commercial focus and this is also the place where the demand of customers is processed.
8. Team leaders are responsible for a team on the floor (5-8 persons). During the day there are eight hours shifts for F&D and
production. Shift 6 is responsible for a small part of filling and dispatch and is only during day times on the site.
9. Operators operate and control the units and load stations.
10. Logistics planner translates the production planning received from supply into a running planning.
11. The supply coordinators translate the demand and capacity forecast in a production planning.
12. The CRC representatives inform customers on changes and deliveries regarding deliveries of polyols.
13. Traffic office employees are responsible for the paperwork, timeslots and entrance and exits of the haulers on the site.
14. Suppliers of materials supply ordered raw materials, which is necessary input for production.
15. The carriers or haulers, including shipping companies, transfer the product to the customer
16. HSSE supervisor is responsible for the Health Safety Security and Environment on the site. An important aspect at Shell Pernis.
New initiatives need approval on HSSE aspects.
3.4 Mapping the formal relations
Behavior and power of actors are based on a formal and informal position within an organization.
Knowledge of both positions is necessary to understand their environment and behavior. The
stakeholder analysis presented in appendix 2.1 is based on interviews and documents. This input
made it possible to map the formal and informal relations. The formal relations are mapped in a
formal card in appendix 2.2 – stakeholder analysis. Because it is difficult to interpret the formal card
at once, a simpler version is presented below. This simpler version also shows informal relations. The
model can help to identify the mutual relations within the organization. The model is being used

Efficiency analysis of a planning process in chemical industry
Ne
two
rk A
na
lysi
s
31
when defining opportunities in chapter four, because the model can help to analyze the role of
communication within the organization related to the opportunity.
Figure 8: Organizational chart of the formal and informal relations within the polyols’ supply chain
The organizational chart presented above in figure 8, provides clear and easy insights in the formal
and informal relations between the involved stakeholders. Some interesting conclusions are drawn
based on this chart. Hierarchy in the organization is the first aspect shown by the organizational
chart. For this research the Production Unit manager is of special interest. The PU-manager has direct
contact with the four management divisions. But the PU–manager has no formal power over the
supply and commercial (SCE) departments and stakeholders. This could effects the current process,
e.g. does this lack of formal power have direct effects on the processes and especially on the
possibilities to use recovery measures? Are there any contacts between the PU-manager at CVP and
higher management at SCE? What enables the PU-manager to, when necessary, control the
management of SCE? These questions are answered, when the opportunities are processed and the
communicational aspects are reflected per opportunity.
Besides the role of the PU-manager and the high degree of hierarchy in the organization, the
communication lines with the management not only exist on one level in the organization, but
basically on all levels. Also interdepartmental communication does not only exist on a management
level: there are several interdepartmental communication lines, for example between the product
manager of commercial and the supply coordinators at the supply department.
The last interesting aspect showed by this organizational chart is the important and central position
of the logistics coordinator. This is an operational function within the organization, but centrally
located, and many people rely on this person to gather critical information.
TU Delft Master thesis project – R.M.T. van Oss
Formal card vs. organizational chart
The formal card is based on an analysis performed in the beginning of the project. At that time,
insights were missing to define informal important communication lines. The formal card is mostly
based on available organizational charts and basic input generated during interviews. The questions
asked during these interviews were not focused on informal communication lines, but more on
formal positions in the organization. However, an actor scan is a continuous activity (Bruijn,
Heuvelhof et al. 2003) and requires updating.
Not only formal relations are important in the complete process of operating the supply chain: many
people gather information using informal relations. Informal does not mean in this case that
communication is not about business, but it is not according the formal ways, as shown in the formal
card.
This informal information gathering can be an explanation for miscommunications in the supply
chain. Figure 6 proves that informal information gathering is used by several functions in this
network at the moment. This can be a risk, because the quality and frequency of informal relations.
In addition, informal information sharing is more dependent on the persons involved: when certain
persons on positions change, this often effects informal relations, possibly leading to information
losses.
The most important informal relations existing in the organization can now be defined. This is done
by comparing figure 8, the organizational chart of informal and formal relations within the
organization with figure 41, the formal card of involved stakeholders presented in appendix 2.2. The
four informal relations are defined below.
One of the informal relations is between the product manager at the commercial department and
other personnel in working at CVP. The product manager formally only has direct communication to
the PU manager. But the current product manager used to be a production specialist at CVP and has
a lot of experience and contacts at CVP. The product manager has informal contact with the
management of CVP of production and filling and dispatch. Formally these relations do not exist,
because the product manager has insights in targets that are not useful for the production facilities.
Another informal relation is between the logistics coordinator (production planner) and the PTL and
operators of the filling and dispatch department. Formally information sharing between these
persons is not directly, but via the supervisors. However, in practice there are informal relations that
share information. By doing this on a frequent base, it creates an increasing importance of the
function of the logistics coordinator. Because this function slowly becomes a critical link in the web.
When this person is not available, key information is missing because the informal information flows
are not formalized and thus not shared anymore.
The other two informal relations are between the logistics coordinator and the supply coordinators.
This relation is also defined as an formal relation. However, the communication is very frequent and
the content of the communication is bad structured. Both players have a lot of tacit knowledge,
which is used during the process. This creates a informal relation, which is used to fulfill formal tasks.
The last informal relation indicated in the figure is between the production specialist of
manufacturing at CVP and the supply coordinators. The production specialist often uses this source
to gather information about decisions taken at SCE. Formally this information should be transferred
via management levels.
Efficiency analysis of a planning process in chemical industry
Ne
two
rk A
na
lysi
s
33
These four informal relations are the most important ones and for this reason indicated the
overview. There are more informal contacts within the organization, but they are not crucial for the
process or directly affect the process. The example of the logistics coordinator makes clear that
informal communication could be a threat to the organization, because it is not documented. In
addition, when people change their position or are not available, necessary critical information
sharing will be lost, which has negative consequences for the performance of the supply chain.
3.5 Interest, aims and problem perceptions
Contrary to the previous step, this paragraph explicitly focuses on the formal relations between the
stakeholders, their interests, aims and problem perceptions. These are all presented in Appendix 2;
stakeholder analysis. Interests are the most guiding values pursued by stakeholders. The aims are
directly connected to the interests of the actor, in contrast to the problem perception. Aims indicate
what an actor in a certain situation would want to reach and which changes it want or does not
wants to reach. Both are presented below.
The Production Unit manager (1) wants to guarantee continuity and efficiency of the production unit
by realizing the targeted goals. The management of CVP – production (2) also wants continuity and
efficiency of the production unit. However, their focus point is to decrease the sensitivity of
disruptions and decrease cost. The Management of CVP – filling and dispatch (3) has the same
interests as the management of the production part of CVP, but they also want to maximize the
satisfaction by carriers and indirect by the customers. Their aim is also on decreasing the sensitivity
to disruption and decreasing cost. Interests of the management of SCE – commercial (4) are
continuity, efficiency and maximizing customer satisfaction and maximizing profit. To realize this,
they are aiming on maximizing the turnover rate, the flexibility and minimizing the costs. The
management of SCE – Supply (5) has the same interests as the commercial management, but they
are aiming on minimal sensitivity to disruptions and maximizing the customer satisfaction by doing
so. The different managements within this supply chain all have similar goals, but from different
perceptions and different aims. However, clear communication should make it possible to get on the
same track. There are besides the management related functions also a number of executive related
functions. The stakeholder analysis identified 8 different executive functions. First of all are the team
leaders of the production teams (6) an important actor. They want to produce the order list within
the given timeframe and they are aiming on increasing performance of the polyols production units
and want to reduce the reliability issues. They are directly responsible of the operators. The
operators (7) aims and interests are the same, they want maximum output of their part of the
production process. Crucial input is provided by the production planner (8). As presented in the
previous paragraph, the production planner has a crucial position in the network. He wants to
produce the order list within the given timeframe and maximize the continuity and efficiency. His aim
is to increase the performance of the polyols production. Besides the manufacturing executive
employees there are also employees focusing on the filling and dispatch part of the supply chain.
They also have a team leader (11) and operators (10), which have the same interests and goals as the
team leader and operators of production. The Filling and Dispatch department also has a traffic office
(9). The Traffic Office wants to realize the order list within the given timeframe and maximize the
continuity and efficiency. They are aiming to increase the performance by reducing time on site and
queues of trucks. The executives employees of commercial are positioned as customer relation
center (12). They want to maximize customer satisfaction and optimize contact with the customers.
They are aiming on optimizing the communication and coordination between order and delivery.
TU Delft Master thesis project – R.M.T. van Oss
Supply has two coordinators supply chain (13), they are responsible for the production planning and
their interest is at maximizing customer satisfaction and profit. They try to realize this by optimizing
coordination between production, filling and dispatch and the customer. During normal
circumstances they are very important for communication and harmonization between the different
departments. There are also some cross organization parties identified, less important during this
research. This are the HSSE supervisors (14), which are aiming on maximum safety on site: goal zero.
Their aim is to optimize a safe work environment and provide clarity about life saving rules. Other
cross organization parties are the management of Shell Pernis (15), reliability engineer (16),
maintenance engineer (17). Their interests are explained in appendix 3 and are not very important
factors for this research. The last group of actors is indicated as external parties. Several actors in this
group are important for the processes. First of all the raw materials suppliers (18). Their interest is to
produce and deliver on time, with lowest cost. And they are aiming on delivery on maximum profit.
Carrier or haulers (18) are interested in maximizing the volume, minimizing cost, maximizing
flexibility and maximizing time slots. They are aiming for maximum profit and customer satisfaction.
Also the customer is identified as external party (19). The interests of the customer are minimal
product price and on time delivery. Finally the refinery at Moerdijk - supplier of PO/EO (20) is
important during the processes. Their input is crucial for the supply chain and they are interested in
continuity and efficiency. And are aiming on delivery on time with the lowest cost.
Besides interests and aims the stakeholders also have problem perceptions. These problem
perceptions are the visions of the actors over the nature of the problem or the current situation. The
most important ones are presented below, the others can be found in appendix 2; stakeholder
analysis. The problem perception of the PU manager (1) is that the performance can always be
better. The rest of the management (2,3,4 and 5) perceives the problem as a production process that
is too sensitive of disruptions: the supply chain is not robust enough. The operators (7) and team
leaders (8) perceive under performance as the problem. The logistics planner (9) has a problem with
the production planning that is changed too often. His decisions are based on knowledge, but he
can’t be missed, because other people don’t have the same knowledge. The traffic office (10) has
problems with communications with departments about delivery delays and the time on site of
trucks can still be reduced. The supply chain coordinators (14) are experiencing problems with short
term changes caused by spot market and/or commercial reasons. Finally the carrier or haulers (18)
are experiencing problems with scheduling because they cannot always exactly predict their arrival
time.
Conclusion
The interests, aims and most relevant problem perceptions of the involved stakeholders presented
also define several conflicting interests. While the managements want to realize their targets and
maximize the performances, there are other actors which have opposed interests. Although the
different managers of the departments have one high common level goal, there are differences in
lower level, operational, goals. These differences are logical and explained above, but should be kept
in mind when the opportunities are processed.
The group of operators, including the team leaders, are a potential actor group with conflicting
interests. They want to minimize issues by creating higher buffers, higher storages and better
maintenance, so that they are not interrupted by a lack of materials and have to deal less with
quality related issues. These interests are more individual focuses compared to the management
interests and aims. The so called ‘local’ optimizations are conflicting with the overall objectives.
Efficiency analysis of a planning process in chemical industry
Ne
two
rk A
na
lysi
s
35
In addition to this conflict, there are also a number of stakeholders focusing on customer satisfaction,
while others don’t deal with this problem. This also creates local optimizations, because here are
tradeoffs between on time delivery and maximum output of the units with less reliability. A third
obvious tension between different local optimizations and problem perceptions is between the
logistics planner and supply coordinator on one side and the commercial management on the other.
Short term changes are necessary for optimal commercial results, but affect the complete planning
and production process.
The identified contrasts and local optimizations evolving out of this analysis and conclusion are used
to identify the different perceptions on the opportunities that will be identified in chapter 5. The
insights on these different perceptions can be used to understand the different positions of involved
stakeholders and to come up with better fitting solutions.
3.6 Mapping the dependencies
Before the processes and opportunities are defined, the stakeholder analysis need to be completed.
The formal relations, the interests, aims and problem perceptions of the stakeholders are defined,
but the dependencies between the actors are missing. Insights in these dependencies prevent
friction in a later stadium, avoiding undesired results of the implemented measures, especially
because it seems that a lot of problems are caused because of a lack of optimal communication. The
overview with dependencies is defined by mapping all the important resources of actors for the
planning process of the supply chain and to what extent these are replicable by others. This enables
to examine which actors are critical in order to improve the planning process and diminish the impact
of disruptions (Hermans and Thissen 2008).
In order to optimize the planning processes, the actors need resources to improve parts of the supply
chain. Some of these actors are very replaceable, while others are hard to replace.
All management related stakeholders are hard or almost impossible to replace. Most of the executive
employees have a tacit knowledge or essential information or education to perform their tasks, so on
the short term they are not replaceable, but on the long term or in small groups, they can be
replaced. The majority of the cross organizational actors can be replaced, because they have
resources and necessary information to operate and maintain the supply chain, but on the long term,
or in small groups, they can also be replaced. The external parties are partly replaceable. Without a
carrier or supplier of raw materials it is not possible to operate the supply chain. However, there are
more suppliers and carriers available. So on the short till middle term, alternatives can be found.
Customers are scarce and are not replaceable. The government cannot be replaced and the permits
are necessary to operate. The delivery of EO/PO is also necessary and cannot be replaced.
The previous paragraph mentions the actors that are critical for the processes. So it is important to
analyze which stakeholders are dedicated to the problem. Furthermore , whether these stakeholders
have common or conflicting perceptions needs to be defined. The stakeholders that have conflicting
perceptions, interests and/or aims, but are critical and dedicated, are essential actors (Hermans
2004). Dialogue with these actors is important. However, in this research the interests of the
customer are monitored and included in perception of the commercial management.
The actors that are both critical and dedicated are very important in order to improve the planning
process. However, table 3, presented below, indicates the executive employees as non-critical. This is
from the perspective that they can be replaced, but their cooperation and input is critical to succeed
during this project.
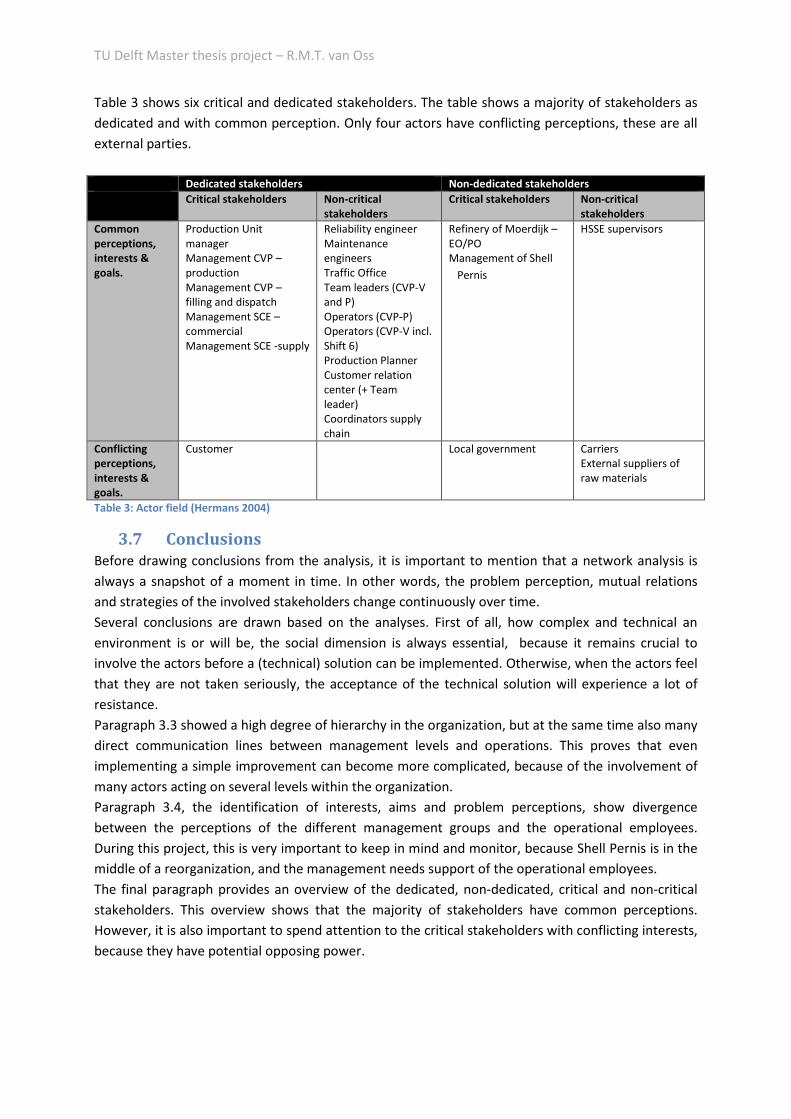
TU Delft Master thesis project – R.M.T. van Oss
Table 3 shows six critical and dedicated stakeholders. The table shows a majority of stakeholders as
dedicated and with common perception. Only four actors have conflicting perceptions, these are all
external parties.
Dedicated stakeholders Non-dedicated stakeholders
Critical stakeholders Non-critical
stakeholders
Critical stakeholders Non-critical
stakeholders
Common
perceptions,
interests &
goals.
Production Unit
manager
Management CVP –
production
Management CVP –
filling and dispatch
Management SCE –
commercial
Management SCE -supply
Reliability engineer
Maintenance
engineers
Traffic Office
Team leaders (CVP-V
and P)
Operators (CVP-P)
Operators (CVP-V incl.
Shift 6)
Production Planner
Customer relation
center (+ Team
leader)
Coordinators supply
chain
Refinery of Moerdijk –
EO/PO
Management of Shell
Pernis
HSSE supervisors
Conflicting
perceptions,
interests &
goals.
Customer
Local government
Carriers
External suppliers of
raw materials
Table 3: Actor field (Hermans 2004)
3.7 Conclusions
Before drawing conclusions from the analysis, it is important to mention that a network analysis is
always a snapshot of a moment in time. In other words, the problem perception, mutual relations
and strategies of the involved stakeholders change continuously over time.
Several conclusions are drawn based on the analyses. First of all, how complex and technical an
environment is or will be, the social dimension is always essential, because it remains crucial to
involve the actors before a (technical) solution can be implemented. Otherwise, when the actors feel
that they are not taken seriously, the acceptance of the technical solution will experience a lot of
resistance.
Paragraph 3.3 showed a high degree of hierarchy in the organization, but at the same time also many
direct communication lines between management levels and operations. This proves that even
implementing a simple improvement can become more complicated, because of the involvement of
many actors acting on several levels within the organization.
Paragraph 3.4, the identification of interests, aims and problem perceptions, show divergence
between the perceptions of the different management groups and the operational employees.
During this project, this is very important to keep in mind and monitor, because Shell Pernis is in the
middle of a reorganization, and the management needs support of the operational employees.
The final paragraph provides an overview of the dedicated, non-dedicated, critical and non-critical
stakeholders. This overview shows that the majority of stakeholders have common perceptions.
However, it is also important to spend attention to the critical stakeholders with conflicting interests,
because they have potential opposing power.
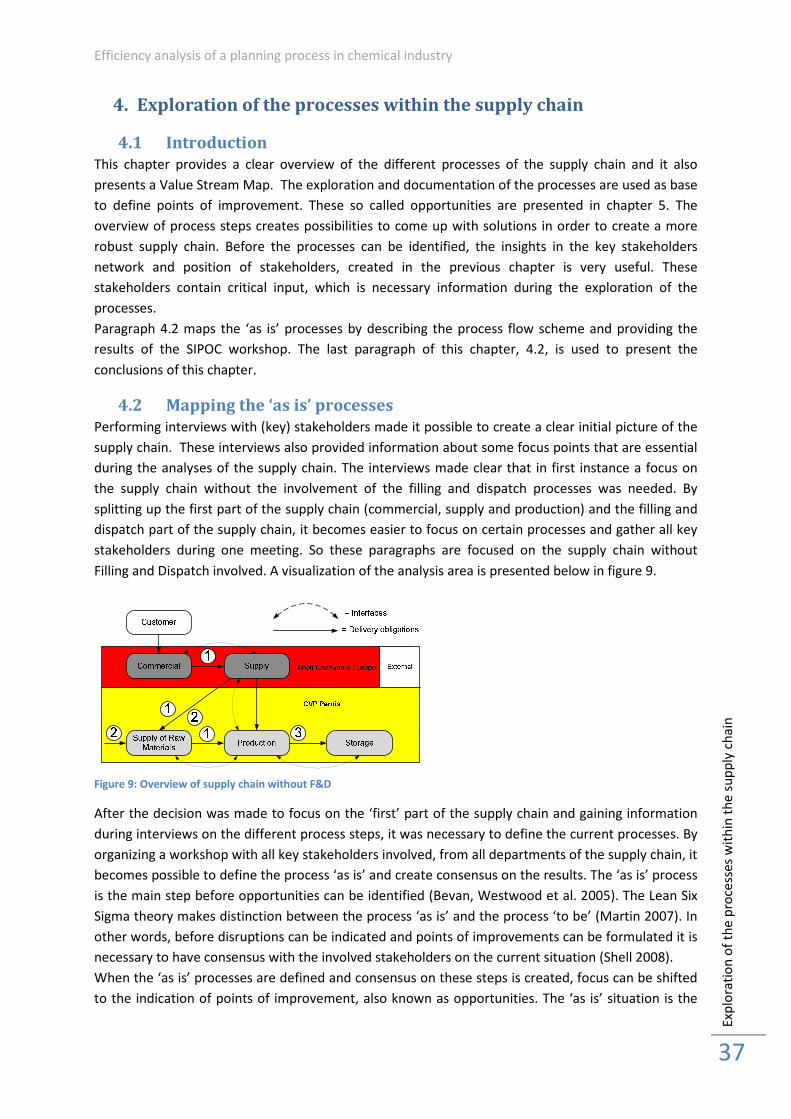
Efficiency analysis of a planning process in chemical industry
Exp
lora
tio
n o
f th
e p
roce
sse
s w
ith
in t
he
su
pp
ly c
ha
in
37
4. Exploration of the processes within the supply chain
4.1 Introduction
This chapter provides a clear overview of the different processes of the supply chain and it also
presents a Value Stream Map. The exploration and documentation of the processes are used as base
to define points of improvement. These so called opportunities are presented in chapter 5. The
overview of process steps creates possibilities to come up with solutions in order to create a more
robust supply chain. Before the processes can be identified, the insights in the key stakeholders
network and position of stakeholders, created in the previous chapter is very useful. These
stakeholders contain critical input, which is necessary information during the exploration of the
processes.
Paragraph 4.2 maps the ‘as is’ processes by describing the process flow scheme and providing the
results of the SIPOC workshop. The last paragraph of this chapter, 4.2, is used to present the
conclusions of this chapter.
4.2 Mapping the ‘as is’ processes
Performing interviews with (key) stakeholders made it possible to create a clear initial picture of the
supply chain. These interviews also provided information about some focus points that are essential
during the analyses of the supply chain. The interviews made clear that in first instance a focus on
the supply chain without the involvement of the filling and dispatch processes was needed. By
splitting up the first part of the supply chain (commercial, supply and production) and the filling and
dispatch part of the supply chain, it becomes easier to focus on certain processes and gather all key
stakeholders during one meeting. So these paragraphs are focused on the supply chain without
Filling and Dispatch involved. A visualization of the analysis area is presented below in figure 9.
Figure 9: Overview of supply chain without F&D
After the decision was made to focus on the ‘first’ part of the supply chain and gaining information
during interviews on the different process steps, it was necessary to define the current processes. By
organizing a workshop with all key stakeholders involved, from all departments of the supply chain, it
becomes possible to define the process ‘as is’ and create consensus on the results. The ‘as is’ process
is the main step before opportunities can be identified (Bevan, Westwood et al. 2005). The Lean Six
Sigma theory makes distinction between the process ‘as is’ and the process ‘to be’ (Martin 2007). In
other words, before disruptions can be indicated and points of improvements can be formulated it is
necessary to have consensus with the involved stakeholders on the current situation (Shell 2008).
When the ‘as is’ processes are defined and consensus on these steps is created, focus can be shifted
to the indication of points of improvement, also known as opportunities. The ‘as is’ situation is the
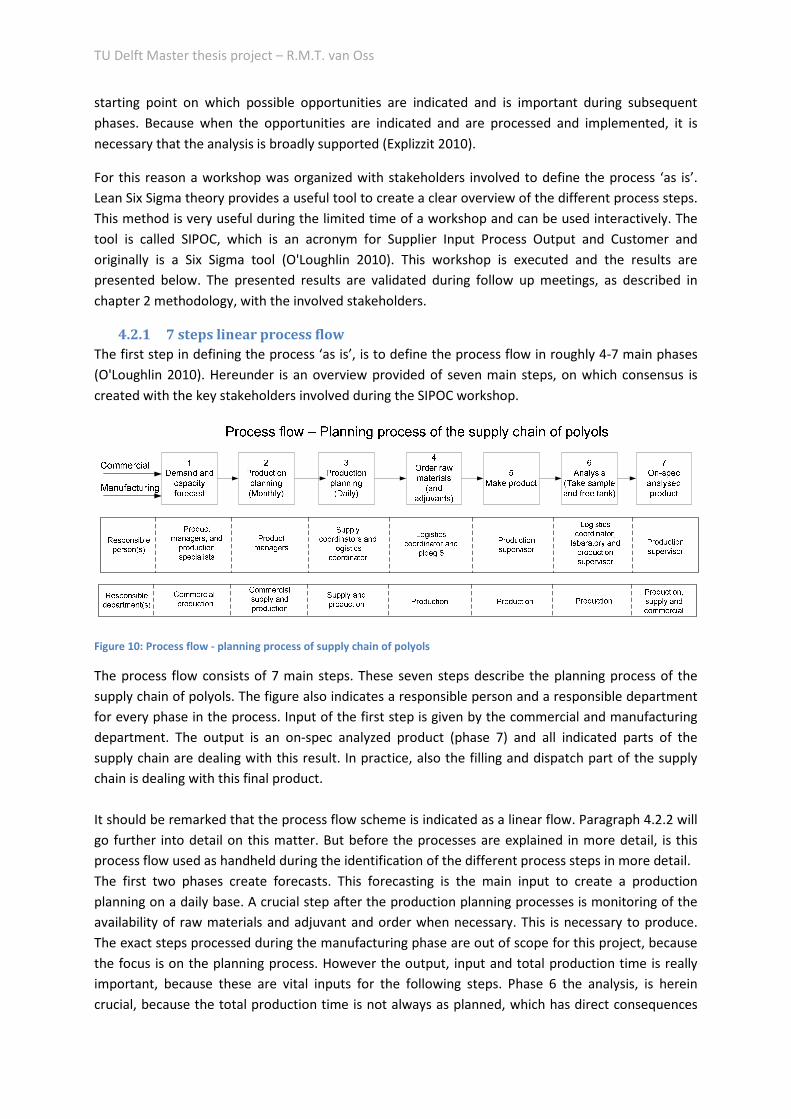
TU Delft Master thesis project – R.M.T. van Oss
starting point on which possible opportunities are indicated and is important during subsequent
phases. Because when the opportunities are indicated and are processed and implemented, it is
necessary that the analysis is broadly supported (Explizzit 2010).
For this reason a workshop was organized with stakeholders involved to define the process ‘as is’.
Lean Six Sigma theory provides a useful tool to create a clear overview of the different process steps.
This method is very useful during the limited time of a workshop and can be used interactively. The
tool is called SIPOC, which is an acronym for Supplier Input Process Output and Customer and
originally is a Six Sigma tool (O'Loughlin 2010). This workshop is executed and the results are
presented below. The presented results are validated during follow up meetings, as described in
chapter 2 methodology, with the involved stakeholders.
4.2.1 7 steps linear process flow
The first step in defining the process ‘as is’, is to define the process flow in roughly 4-7 main phases
(O'Loughlin 2010). Hereunder is an overview provided of seven main steps, on which consensus is
created with the key stakeholders involved during the SIPOC workshop.
Figure 10: Process flow - planning process of supply chain of polyols
The process flow consists of 7 main steps. These seven steps describe the planning process of the
supply chain of polyols. The figure also indicates a responsible person and a responsible department
for every phase in the process. Input of the first step is given by the commercial and manufacturing
department. The output is an on-spec analyzed product (phase 7) and all indicated parts of the
supply chain are dealing with this result. In practice, also the filling and dispatch part of the supply
chain is dealing with this final product.
It should be remarked that the process flow scheme is indicated as a linear flow. Paragraph 4.2.2 will
go further into detail on this matter. But before the processes are explained in more detail, is this
process flow used as handheld during the identification of the different process steps in more detail.
The first two phases create forecasts. This forecasting is the main input to create a production
planning on a daily base. A crucial step after the production planning processes is monitoring of the
availability of raw materials and adjuvant and order when necessary. This is necessary to produce.
The exact steps processed during the manufacturing phase are out of scope for this project, because
the focus is on the planning process. However the output, input and total production time is really
important, because these are vital inputs for the following steps. Phase 6 the analysis, is herein
crucial, because the total production time is not always as planned, which has direct consequences
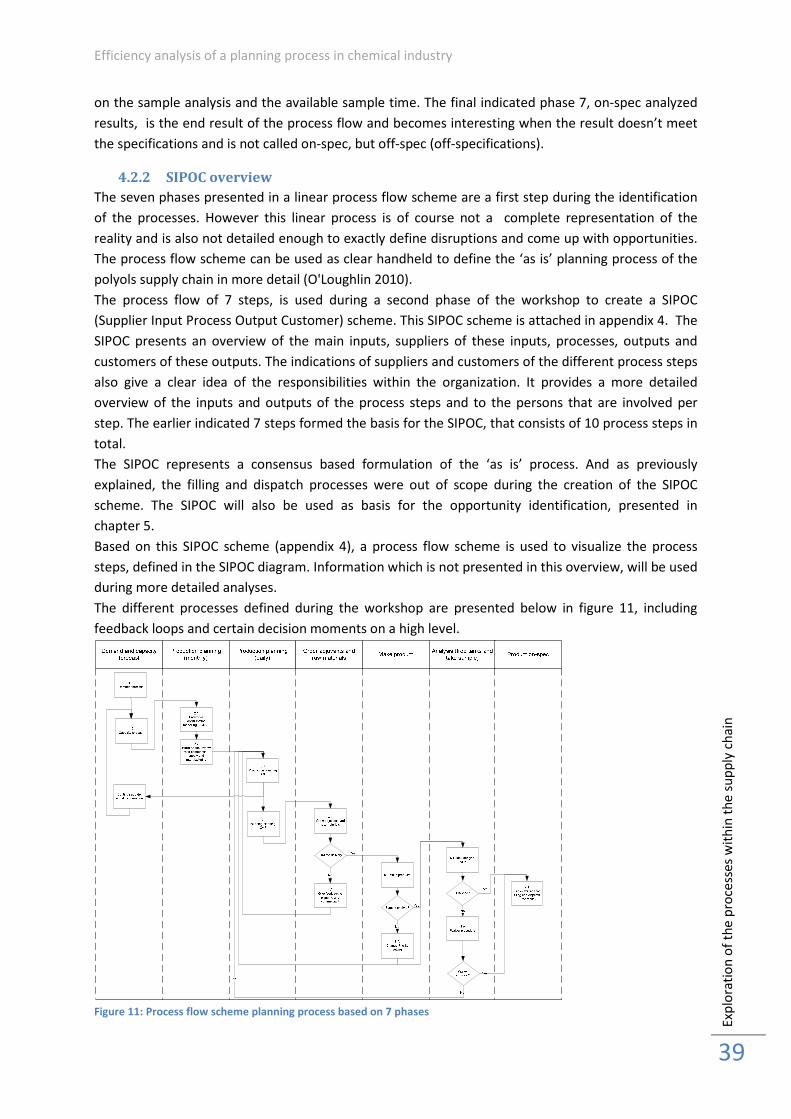
Efficiency analysis of a planning process in chemical industry
Exp
lora
tio
n o
f th
e p
roce
sse
s w
ith
in t
he
su
pp
ly c
ha
in
39
on the sample analysis and the available sample time. The final indicated phase 7, on-spec analyzed
results, is the end result of the process flow and becomes interesting when the result doesn’t meet
the specifications and is not called on-spec, but off-spec (off-specifications).
4.2.2 SIPOC overview
The seven phases presented in a linear process flow scheme are a first step during the identification
of the processes. However this linear process is of course not a complete representation of the
reality and is also not detailed enough to exactly define disruptions and come up with opportunities.
The process flow scheme can be used as clear handheld to define the ‘as is’ planning process of the
polyols supply chain in more detail (O'Loughlin 2010).
The process flow of 7 steps, is used during a second phase of the workshop to create a SIPOC
(Supplier Input Process Output Customer) scheme. This SIPOC scheme is attached in appendix 4. The
SIPOC presents an overview of the main inputs, suppliers of these inputs, processes, outputs and
customers of these outputs. The indications of suppliers and customers of the different process steps
also give a clear idea of the responsibilities within the organization. It provides a more detailed
overview of the inputs and outputs of the process steps and to the persons that are involved per
step. The earlier indicated 7 steps formed the basis for the SIPOC, that consists of 10 process steps in
total.
The SIPOC represents a consensus based formulation of the ‘as is’ process. And as previously
explained, the filling and dispatch processes were out of scope during the creation of the SIPOC
scheme. The SIPOC will also be used as basis for the opportunity identification, presented in
chapter 5.
Based on this SIPOC scheme (appendix 4), a process flow scheme is used to visualize the process
steps, defined in the SIPOC diagram. Information which is not presented in this overview, will be used
during more detailed analyses.
The different processes defined during the workshop are presented below in figure 11, including
feedback loops and certain decision moments on a high level.
Figure 11: Process flow scheme planning process based on 7 phases
TU Delft Master thesis project – R.M.T. van Oss
To explain the complete planning process of the supply chain in more detail, all the process steps are
explained below. The defined feedback loops and decision moments are further explained and
attention is given to the other aspects defined in the SIPOC scheme; the inputs, outputs, customers
and suppliers.
The input to describe these steps in more detail is partly gathered during the SIPOC workshop, but
also during follow up interviews with the involved stakeholders.
1.1 Demand forecast
The demand forecast is generated by the product managers, based on the seasonality, expected
customer demand and expected availability. The expected customer demand is based on the,
growth, expectations and strategy formulated by the product managers. The demand forecast in
kt/grade is the final output of this first process step. This output is generated for all different units
(Flexibles, CASE and Sannest) per year and per month. The customers of this process are the
production specialists that are using it to define the capacity forecast.
1.2 Capacity forecast
The capacity forecast is supplied by the production specialists. The output of this process consists of
a technical availability of the units translated in kt/day and an output of PO and EO in kt/yr. These
figures are based on demand forecast generated in step 1.1, reliability performance in % including
turnarounds (maintenance stops) and they also need input from SCE on the availability of PO and EO.
The output of this step is finally provided to the supply manager.
2.1 Enterprise optimalisation modeling (GMOS)
The product managers are able to generate production volumes for one of the units, based on the
demand and capacity forecast, the inventory and a specific demand planning of a special dedicated
customer (Huntsman). With help of an Enterprise optimalisation tool are the production volumes
generated. These volumes are input for production specialists, commercial product managers and
supply coordinators.
2.2 Hand shake; review with commercial, supply and manufacturing
The production volumes of the Sannest and the flexible unit are generated with help of a handshake
process. This handshake process is nothing more than a meeting with key stakeholders involved.
Input for this handshake process is inventory, monthly demand update in the Enterprise
optimalisation tool, the demand forecast and the capacity forecast. This input is supplied by all parts
of the supply chain, but the commercial product managers are leading in this process. The customers
of the output; the production volumes of the Sannest and the Flexible units, is input for the
production specialists of manufacturing, the commercial product managers and the supply
coordinators. This output is again important for the production specialists, commercial product
managers and supply coordinators.
3.1 Production planning SCE
The supply coordinators are responsible for the production planning on a daily base. Necessary input
is inventory (daily), updated demand forecasts based on hand shakes and daily updated info by email
or phone. This production planning includes a planning indicating the batches and number of
grades/day. This production planning is used by the logistics coordinator.
Efficiency analysis of a planning process in chemical industry
Exp
lora
tio
n o
f th
e p
roce
sse
s w
ith
in t
he
su
pp
ly c
ha
in
41
3.2 Running planning CVP
The running planning is created by the logistic coordinator. He is located at the control room of the
production facilities and uses as input the production planning of step 3.1 , the actual performance of
the units and the inventory. The actual performance of the units includes stops or delays caused by
maintenance etc. Based on these inputs the running planning is created. The running planning
consists of an overview which tanks are free for filling and dispatch, a list with samples that should be
directed to the laboratory and with a running planning that indicates the number of batches/grade
per unit. This output is transferred to the operations of CVP and to the laboratory.
4.1 Order Adjuvant and raw materials
The logistics coordinator uses the running planning, the recipes of the different grades, the inventory
of raw materials and the delivery times of raw materials to create an order list of the raw materials.
This list is created in excel and input for operations, in this case ‘Shift 6’. ‘Shift 6’ orders and handles
the deliveries of raw materials from this point onwards.
5.1 Make products
It is not of the research’s interest how the products are exactly made. But it is very important what
the impact is of delayed or cancelled productions. To be able to make products a daily updated
running planning provided by the logistics coordinator, a resource planning delivered by the
production supervisor and enough raw materials supplied by ‘Shift 6’ are necessary. These inputs are
necessary materials for quite complicated chemical processes, which produces a product in tanks
ready for analysis. The responsible person of this output is the production supervisor of
manufacturing.
6.1 Tank analysis; RLP
When the production is completed, the tanks are circulating for a pre-described time. After this
circulation time a sample is taken by operations. This sample gets a priority 1,2 or 3, on which is
decided by the logistics coordinator in cooperation with the supply coordinators. The sample is then
ready for analysis. The result of this analysis is ready after a couple of hours, depending on the
priority, and visible in LIMS. A software program used by the laboratory. This result is necessary input
for the production supervisor.
7.1 Tank available for filling and dispatch (free tanks)
Depending on the result, an on-spec or off-spec result is visible in LIMS or GSAP. GSAP only shows a
positive or negative result, LIMS also shows the specification of the result. When the result is
positive, the tanks are free for usage and on-spec product is available in the tanks for sale, or to
deliver to the customer. In other words, it can be used by the last part of the supply chain, the filling
and dispatch part. This result is necessary input for the production supervisor of filling and dispatch.
All key stakeholders were involved during the development of the schemes representing this part of
the supply chain. They all agreed on the defined process as presented above and presented in
appendix 4. The level of detail of this SIPOC overview, which represents the process ‘as is’, can now
be used to define and to identify possible disruptions and opportunities in the process. Possibly it is
necessary to define some process steps in more detail for further analysis. But analyzing these
processes in more detail is done selective after the identification of disruptions and/or points of
TU Delft Master thesis project – R.M.T. van Oss
improvements. As a result the SIPOC scheme will in first instance be used to define possible
disruptions and/or points of improvements.
4.2.3 Value Stream Map
The description of the ‘as is’ process presented above provides the opportunity to define a Value
Stream Map. A Value Stream Map is a lean manufacturing technique used to analyze the flow of
materials and information currently required to bring a product or service to a consumer (Shell
2010). It can be used in any process that needs an improvement (Rother and Shook ; Rother and
Shook 2003). Mapping the value stream means that all the flows within the polyols supply chain, (e.g.
all the production process activities, both value adding and non-value adding) required to produce
polyols, need to be identified and the relationships between the physical and information flows have
to be mapped. This tool is made to understand how materials and information flows throughout an
organization deliver value to the customer (Serrano, Ochoa et al. 2008).
The Value Stream Map shows the sequence of all necessary production process steps. Before
improvements can be made on the supply chain, it is necessary to get an impression of the lead
times and buffer sizes within the supply chain. Each step in the supply chain is indicated in a box. The
steps are based on the SIPOC, which is used as input for the VSM (Shell 2008). The box contains
specifications of the specific process; CT (Cycle Time/process), CO (Change Over time), Uptime and
sometimes the dependencies of the speed of the process. The triangles represent the stocks in
between. It is very difficult to define the volumes and times for these stocks, but they give an
indication of moments where stocks are necessary, which can be defined as non-value added time.
The Values Stream Map shows a minimal production time of 69,5 hours. This is based on the
minimum times per process and can be defined as value-added time. The suppliers and customers
are represented with a truck. In the upper middle, the production control is indicated, this regulates
the whole process.
Based on this Value Stream Map can be concluded that the non-value added time, which is not
specified in this diagram, should have a focus during the improvement phase. An improved planning
process can reduce the non-value added time, which will improve the total performance of the
supply chain. Because this research focus on the planning process and not on improvement e.g. of
the production process.
However, figure 12 provides a clear overview of the process and total value-added time. But it was
not possible to define the non-value added times. Partly caused by the fact that they are too
divergent. The non-value added times are represented by the triangles, representing inventories.
Although, the durations of these non-value added steps are not specified, it is possible to draw some
conclusions. The first and second triangles represent the inventory of raw materials. A raw material
planning tries to optimize this, but it could be a focus point to optimize this duration.
The third moment of inventory is defined as product in tanks, waiting for availability of pumps. A
pump is necessary to circulate a tank. Pumps are also necessary to deliver products. In the majority
of the tanks, the pump is the bottleneck in this process. For this reason, tanks are often circulated
during the night, when deliveries are not planned. This creates an unnecessary delay when the
planning is changed, based on this bottleneck.
The fourth moment of inventory is defined as product in tanks. This is the case after circulation,
when the product is waiting for the tank analysis. The tank analysis is executed by the laboratory as
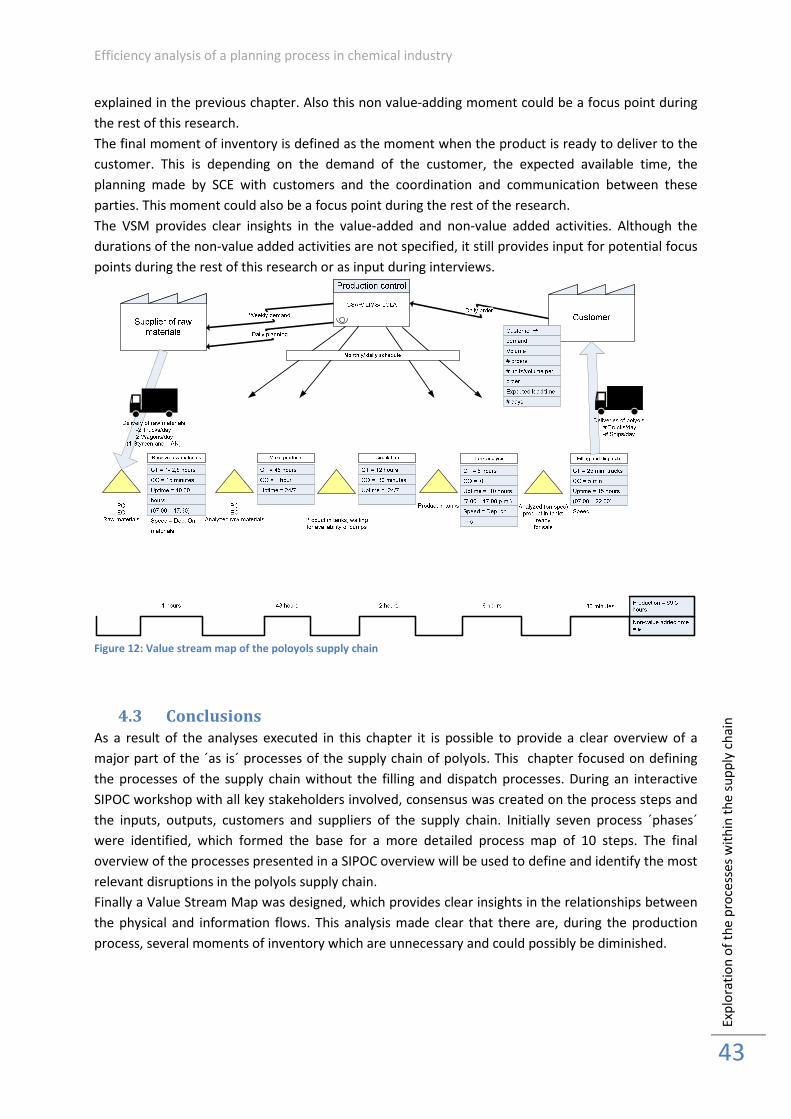
Efficiency analysis of a planning process in chemical industry
Exp
lora
tio
n o
f th
e p
roce
sse
s w
ith
in t
he
su
pp
ly c
ha
in
43
explained in the previous chapter. Also this non value-adding moment could be a focus point during
the rest of this research.
The final moment of inventory is defined as the moment when the product is ready to deliver to the
customer. This is depending on the demand of the customer, the expected available time, the
planning made by SCE with customers and the coordination and communication between these
parties. This moment could also be a focus point during the rest of the research.
The VSM provides clear insights in the value-added and non-value added activities. Although the
durations of the non-value added activities are not specified, it still provides input for potential focus
points during the rest of this research or as input during interviews.
Figure 12: Value stream map of the poloyols supply chain
4.3 Conclusions
As a result of the analyses executed in this chapter it is possible to provide a clear overview of a
major part of the ´as is´ processes of the supply chain of polyols. This chapter focused on defining
the processes of the supply chain without the filling and dispatch processes. During an interactive
SIPOC workshop with all key stakeholders involved, consensus was created on the process steps and
the inputs, outputs, customers and suppliers of the supply chain. Initially seven process ´phases´
were identified, which formed the base for a more detailed process map of 10 steps. The final
overview of the processes presented in a SIPOC overview will be used to define and identify the most
relevant disruptions in the polyols supply chain.
Finally a Value Stream Map was designed, which provides clear insights in the relationships between
the physical and information flows. This analysis made clear that there are, during the production
process, several moments of inventory which are unnecessary and could possibly be diminished.

TU Delft Master thesis project – R.M.T. van Oss
4.4 Evaluation - Part II Analyses
After finalizing the conclusions of chapter 4, it is now possible to evaluate part II of this research;
Analyses. The next chapter starts with part III – DMAIC and uses the information of this part to
define and process opportunities.
Chapter three introduced several theories to perform a network analysis. The framework provided by
Graaf and Hoppe (1989) provided useful input to offer clarity about potential categorization of
problems. The rest of chapter three focused on defining relations and positions of stakeholders,
which created necessary insights, useful during the rest of the project. Mapping the dependencies
between stakeholders (Hermans and Thissen 2008) and defining an actor field (Hermans 2004)
provided critical information for the rest of the project. It provides insights in the stakeholder that
should be invited to join the next phase of this research and it makes it possible to put extra effort in
specific stakeholders during the next phase. Stakeholder management is a crucial element during this
research to make sure the research leads to performance improvements.
Chapter four focused on the exploration of the processes within the supply chain. A Lean Six Sigma
tool, called SIPOC, was applied to gather these insights. This tool made it possible to identify and
visualize the processes. SIPOC was interactively applied during a workshop, a method which was
similar described by O’Loughlin (2010). Several steps were added to the normal SIPOC method, to
converge the information provided by the stakeholders and to limit the amount of information
generated by the stakeholders (Kessler 2004). The additional steps were essential to make the
stakeholder participation successful. The analyses steps, executed as preparation, made sure that the
workshop leader had enough insights to lead the workshop strictly, which avoided information
overloads.
By changing the suggested approach and start to define a main process flow before the detailed
process was defined in more detail, the goal of the workshop became more clear for the attendances
of the workshop and improved the final results. Also the decision to start defining the last process
and go backward, during the identification of the process flow, created more guidance and clarity
during the workshop. This created a clear endpoint which saved a lot of valuable time.
Verifying and validating these results using POCIS instead of SIPOC, (which means starting with the
processes) made sure that the input of stakeholders was structured. The defined processes were
used as guideline and again converge the output delivered by the stakeholders.
The insights in the processes and the clear overview of the processes, provide a very good platform
to define opportunities for improvement on, which will be done in the next chapter.
The Value Steam Map was a useful tool to present the sequence of the processes and the total time.
It provided useful insights to communicate and present information to involved stakeholders. If more
specific information would have been available on non-value added time, the tool could have been
more useful, because optimal situation could have been calculated in a more quantitative way.
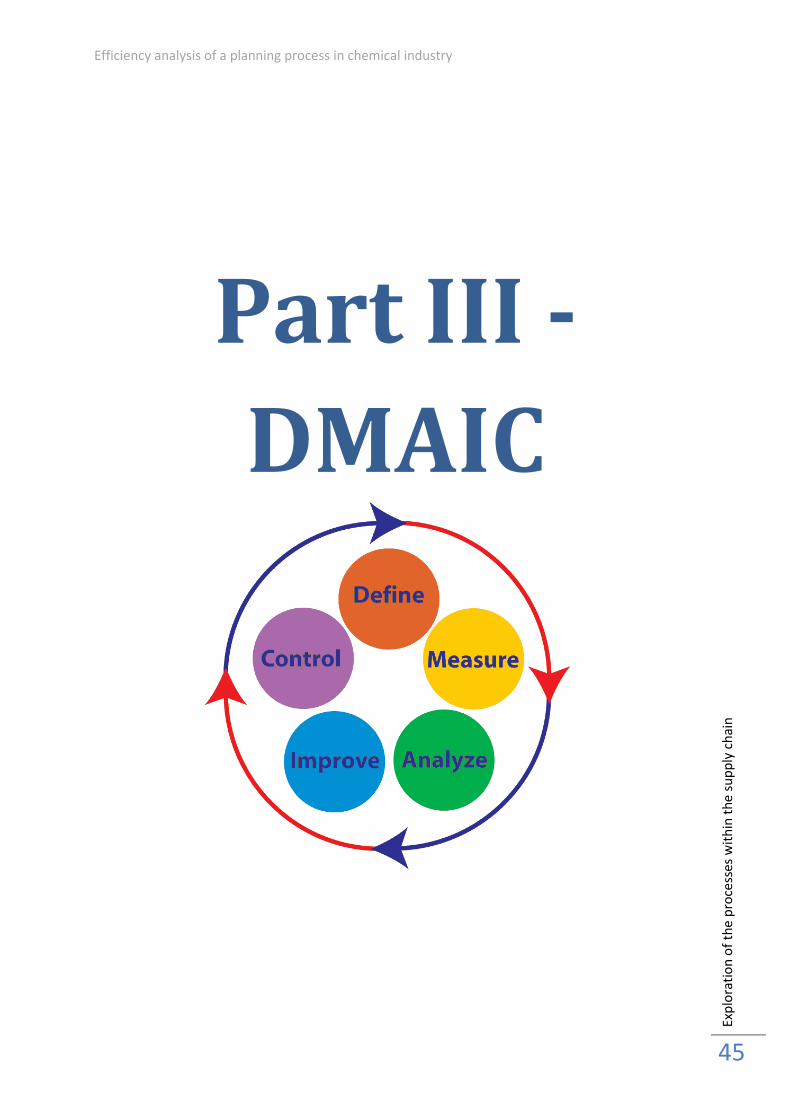
Efficiency analysis of a planning process in chemical industry
Exp
lora
tio
n o
f th
e p
roce
sse
s w
ith
in t
he
su
pp
ly c
ha
in
45
Part III -
DMAIC
TU Delft Master thesis project – R.M.T. van Oss
5. DMAIC preparation - Mapping the most relevant opportunities
5.1 Introduction
It is now possible to identify the most relevant disruptions. Chapter 2, methodology, already
explained how the most relevant disruptions can be defined and identified.
Chapter 1, introduction, defined four categories of opportunities or disruptions. These categories
were based on information gathered during interviews with stakeholders on management level of
the four different departments acting within the supply chain. These four categories can still be used
to categorize the opportunities that will be identified in this chapter. These categories are shortly
repeated below.
1 Changes in production plan � caused by decisions taken by SCE Commercial or necessary
reasons.
2 (Non-) availability of raw materials � planning or delivery problems
3 Production problems � quantity or quality related problems
4 Delivery to customer � problems with schedules and planning from customer and producer
sides
It is not possible to explore all disruptions and define all opportunities within the planning process of
the supply chain of polyols due to the limited timeframe of this research. As stated in the research
question, the most relevant disruptions will be indicated and analyzed. Different types of disruptions
and points of improvements can be considered.
This chapter will do the necessary preparations, before the DMAIC project can be started. The
choices made to select certain points of improvement, which will be analyzed, are explained.
Paragraph 5.2 will explain the considered types of opportunities and points of improvement. The
third paragraph defines the opportunities in more detail. Paragraph 5.4 ranks and prioritizes the
opportunities, followed by conclusions in paragraph 5.5.
5.2 Listing the opportunities
Based on the results of chapter four it is now possible to define opportunities to improve the
complete process. Problems are the main input to define opportunities. Before the opportunities can
be defined and explained in more detail, it is necessary to explain the process steps and decisions
made, which finally lead to a complete list with opportunities. The previous chapters resulted in an
analysis which finally lead to a consensus based overview of the complete planning process of the
supply chain. This overview is used to define the opportunities on.
Previous chapters already explained a wide supported feeling to improve certain process steps
related to the planning process. Based on the network analysis presented in chapter 3, all
stakeholder related to one of the process steps, were involved during the SIPOC workshop. This
directly provides the best possible argument to use the SIPOC workshop also to define the
opportunities.
The consensus based overview of the process steps provides a useful starting point to start a
discussion with the involved stakeholders. By starting to evaluate the process at the last process step
and going backwards (O'Loughlin 2010), this proves vagueness when previous steps are not clear or
simple don’t fit. This a structured and easy method indicates the most important problems. The
involvement of all stakeholders make it possible to directly create consensus on the defined
Efficiency analysis of a planning process in chemical industry
DM
AIC
pre
pa
rati
on
- M
ap
pin
g t
he
mo
st r
ele
va
nt
op
po
rtu
nit
ies
47
problems. This interactive method was used during this research. During the research five problems
were identified.
These problems were not explained in detail, but the involved stakeholders agreed on the problems
mentioned. The problems differed in size, complexity, etc., but they also had different stakeholders.
Which were defined during the workshop. Based on the results of the workshop, it was possible to
gain more detailed background on the problems by performing interviews with the (key)
stakeholders. A combination of the gathered input made it possible to define opportunities. Five
opportunities were defined during the workshop, on which all stakeholders agreed. For this reason
they are all included in the overview presented in the next paragraph. Including these opportunities
in the rest of the research also creates follow up actions, and creates a feeling with the stakeholders
that their input given during the workshop is taken seriously.
However, the list of five opportunities created during the SIPOC workshop didn’t represent a
complete overview of all possible opportunities. Interviews with management and stakeholders on
an operational level indicated insights on potential problems and/or points of improvement. These
indications were used during follow up interviews and based on these interviews more problems
were defined. Many problems were indicated which were not related to the planning process and
the process steps presented in the previous chapter. These problems were not taken into account.
The problems related to the planning process were taken into account and indications provided by
the management were valued as more important than indications made by operational employees.
Finally, this evolved in a list of five widely supported opportunities, supported by several employees
on a management level and also by employees on a operational level.
These five opportunities were the only ones mentioned by at least two managers and also
mentioned by employees on a operational level. It was not necessary to make a selection, because
only these five opportunities were mentioned and fitted this requirement.
The Lean Six Sigma theory describe as first step in the define phase of DMAIC that the opportunities
should be validated before they are further processed. The purpose of this validation phase is to
create a definition of a valid and important business task for the project that the future project team
and key stakeholders can agree on. This can be done by describing the opportunities in more detail
and finally produce a project description (Shell 2002-2008).
The overview of opportunities presented in the next paragraph still doesn’t provide a complete list of
opportunities of the planning process. This was given the limited time of the research not possible
and also not the goal. However, the process explained above, provide arguments to assume these
ten opportunities as the ten most relevant ones.
5.3 Defining the opportunities
Chapter 2 Methodology, already explained how the opportunities should be identified and defined.
Chapter 4 presented and explained the results gathered during a interactive SIPOC workshop. The
results presented the ‘as is’ processes of the planning process of the polyols’ supply chain. All
stakeholders agreed with the results, in other words, the results are validated by the involved
stakeholders.
During the workshop initially five opportunities were defined. Some involved stakeholders used
follow up meetings to initialize other issues. These issues were explained to all involved stakeholders
during a presentation to the management. Other key stakeholders were personally informed during
follow up meetings. Figure 13, presented below, shows the ten formulated opportunities. The five
opportunities presented on the left (dark grey) evolved directly out of the workshop, the other five
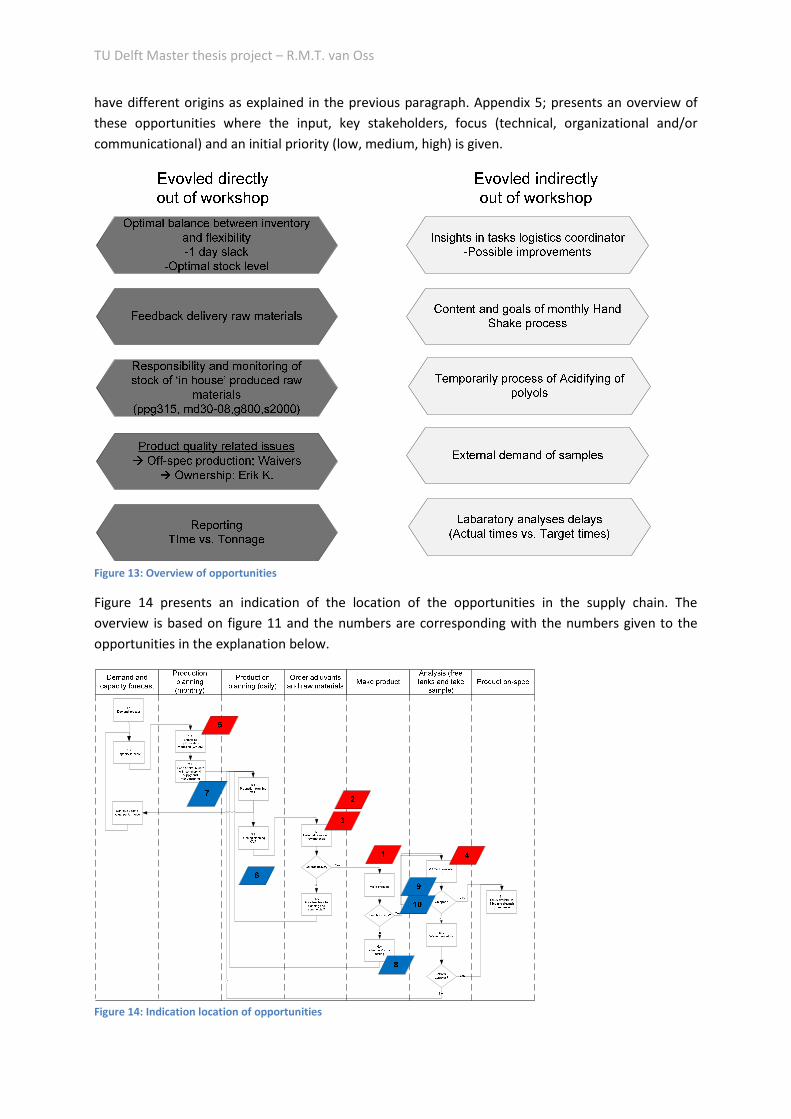
TU Delft Master thesis project – R.M.T. van Oss
have different origins as explained in the previous paragraph. Appendix 5; presents an overview of
these opportunities where the input, key stakeholders, focus (technical, organizational and/or
communicational) and an initial priority (low, medium, high) is given.
Figure 13: Overview of opportunities
Figure 14 presents an indication of the location of the opportunities in the supply chain. The
overview is based on figure 11 and the numbers are corresponding with the numbers given to the
opportunities in the explanation below.
Figure 14: Indication location of opportunities

Efficiency analysis of a planning process in chemical industry
DM
AIC
pre
pa
rati
on
- M
ap
pin
g t
he
mo
st r
ele
va
nt
op
po
rtu
nit
ies
49
Evolved directly out of the SIPOC workshop
1. Optimal balance between inventory and flexibility
This opportunity can be divided into two parts.
a. Create extra slack
This part of the opportunity is to perform research on the possibilities to create one
extra day of slack between production and delivery of the products, in order to
decrease the effects of delays in production, sample analysis, etc. on the supply
chain. Key stakeholders are the supply coordinators, customer relation center and
logistics coordinator. Other important stakeholders are also the production and
filling and dispatch supervisor and the product manager.
b. Find optimal balance between inventory and flexibility of the supply chain
This is the most complex opportunity defined in the list. At the moment the supply
chain is very sensitive to all kind of disruptions. Finding an optimal balance between
inventory and flexibility of the supply chain could identify the need for more
flexibility. At the moment this is not clear. Almost all stakeholders are involved with
this project. This could be a long term project during this research, possible a project
that is handed over after performing the first steps.
2. Feedback delivery of raw materials
This opportunity can be defined as a opportunity that could be implemented on the short
term. Intern communication should be improved and is the most important aspect of this
opportunity. Beside a solving solution, should also attention paid to a problem preventing
solution, by performing research on incentives to avoid delays in deliveries.
Key stakeholders are the operators of Shift 6, the supplier of raw materials, production
supervisor and the logistics coordinator.
3. Responsibility and monitoring stock levels 'in house’ produced raw materials
This opportunity can also be defined as a quick win. Some ‘raw materials’ necessary for
production of certain grades are produced at the units. Monitoring of the stock levels is
necessary to avoid too low stock levels, which causes production problems. At the moment
this monitoring and on time producing process of new products is executed on an optimal
level and should be improved. Ownership and tasks related to this problem are not clear
defined and this could be a major part of the solution. Key stakeholders are supply
coordinators and logistics coordinator.
4. Quality related issues
The quality related issues can also be divided into two opportunities. But for both
opportunities are already project team in place to solve these issues. So further explanation
is not necessary.
a. Off-spec production (Waiver procedure)
b. Ownership
5. Reporting, time vs. tonnage
This opportunity is created during a discussion between the supply, commercial and
production departments. Reporting in tonnage is essential for the supply and commercial
departments, because they are selling and transporting tonnages. However the
manufacturing department actually demands availability of their units in production time
and not tonnage, because this is not always the same. So to evaluate the targets etc. in a
TU Delft Master thesis project – R.M.T. van Oss
more optimal way, both could be necessary. On the other hand, only when this will not cost
too much effort. Key players are Production specialist, production manager and the supply
manager.
Evolved indirectly out of the SIPOC workshop
6. Insights in tasks logistics coordinator
This opportunity was the initial trigger to start this project. The logistics coordinator has a lot
of tacit knowledge and is crucial for the complete planning process of the supply chain. But
insights in his tasks are not available. His tacit knowledge is especially focused on the existing
constraints, necessary during the creation of the planning process. By providing the insights
in the tasks of the logistics coordinator, it also becomes possible to make improvements. Two
possible improvements are already identified; integrate raw material planning into the
production planning and integrate four different documents into one clear sheet.
Key players are the production supervisor, logistics coordinator of course and the supply
coordinators.
7. Content and goals of monthly Hand Shake process
The Hand Shake process defines during telecom sessions an initial monthly production
forecast. Commercial, Supply and the Manufacturing departments are involved in this
process, which is only started a couple of months ago. All stakeholders involved defined
possible improvements to optimize this process. The main question during this project is, is
extra analysis necessary to improve the process? Or will the process on the short term
automatically improve without the input of this project?
Key players are management of commercial, supply and manufacturing.
8. Temporarily process of Acidifying of polyols
Currently they are building a new unit at CVP, to produce acidified polyols, called the
staircase project. Commercial already sells acidified polyols, which creates demand for a
temporarily process of blending normal polyols into acidified polyols. This is not operating on
an optimal level at the moment. Focus points of this opportunity could be quality and
process related improvements or communicational improvements. Only the last category
could be interesting for this project. On the other hand, high interesting is a temporarily
process?
Key players are the manufacturing operators, production specialist of manufacturing and the
logistics coordinator.
9. External demand of samples
Samples have to be tapped by the operators of manufacturing. Sometimes ‘external parties’,
like the research centre in Amsterdam, demand high amounts of samples. This causes extra
work and is often unplanned. This problem could be solved by implementing some barriers
or by planning properly. This opportunity could also be defined as a quick win.
Key stakeholders are laboratory, external parties, operators of manufacturing and logistics
coordinator.
10. Delays of laboratory analyses
The samples that are analyzed can be presented with three different priorities, 1,2 or 3.
Depending on the priority the laboratory set target times. Sometimes the samples are
delayed and not delivered on the promised target time. This creates discussion between
using target times or using actual or real times.
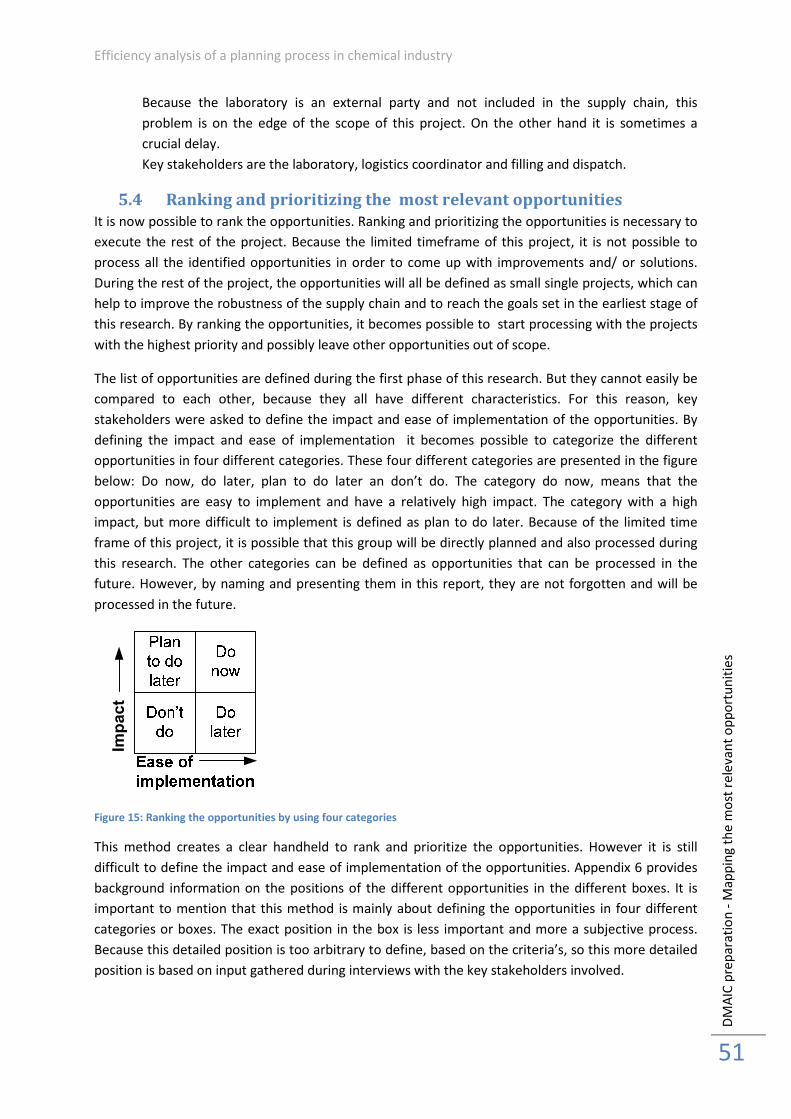
Efficiency analysis of a planning process in chemical industry
DM
AIC
pre
pa
rati
on
- M
ap
pin
g t
he
mo
st r
ele
va
nt
op
po
rtu
nit
ies
51
Because the laboratory is an external party and not included in the supply chain, this
problem is on the edge of the scope of this project. On the other hand it is sometimes a
crucial delay.
Key stakeholders are the laboratory, logistics coordinator and filling and dispatch.
5.4 Ranking and prioritizing the most relevant opportunities
It is now possible to rank the opportunities. Ranking and prioritizing the opportunities is necessary to
execute the rest of the project. Because the limited timeframe of this project, it is not possible to
process all the identified opportunities in order to come up with improvements and/ or solutions.
During the rest of the project, the opportunities will all be defined as small single projects, which can
help to improve the robustness of the supply chain and to reach the goals set in the earliest stage of
this research. By ranking the opportunities, it becomes possible to start processing with the projects
with the highest priority and possibly leave other opportunities out of scope.
The list of opportunities are defined during the first phase of this research. But they cannot easily be
compared to each other, because they all have different characteristics. For this reason, key
stakeholders were asked to define the impact and ease of implementation of the opportunities. By
defining the impact and ease of implementation it becomes possible to categorize the different
opportunities in four different categories. These four different categories are presented in the figure
below: Do now, do later, plan to do later an don’t do. The category do now, means that the
opportunities are easy to implement and have a relatively high impact. The category with a high
impact, but more difficult to implement is defined as plan to do later. Because of the limited time
frame of this project, it is possible that this group will be directly planned and also processed during
this research. The other categories can be defined as opportunities that can be processed in the
future. However, by naming and presenting them in this report, they are not forgotten and will be
processed in the future.
Impact
Figure 15: Ranking the opportunities by using four categories
This method creates a clear handheld to rank and prioritize the opportunities. However it is still
difficult to define the impact and ease of implementation of the opportunities. Appendix 6 provides
background information on the positions of the different opportunities in the different boxes. It is
important to mention that this method is mainly about defining the opportunities in four different
categories or boxes. The exact position in the box is less important and more a subjective process.
Because this detailed position is too arbitrary to define, based on the criteria’s, so this more detailed
position is based on input gathered during interviews with the key stakeholders involved.
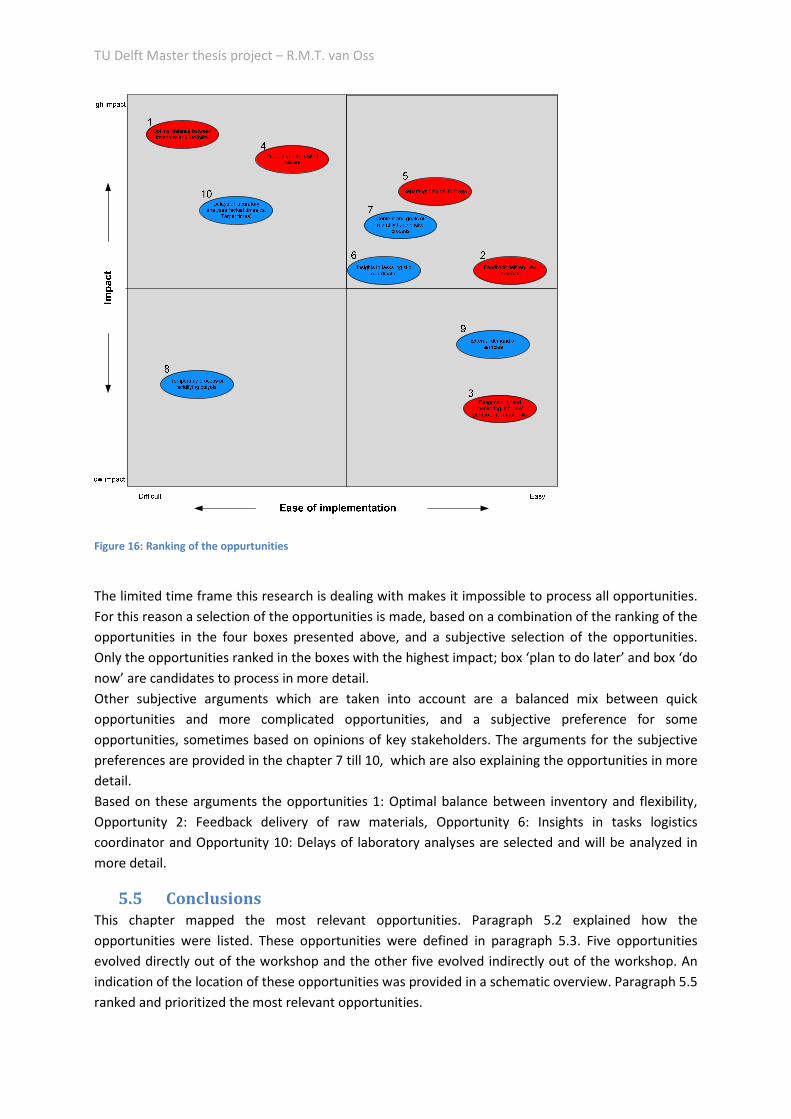
TU Delft Master thesis project – R.M.T. van Oss
Figure 16: Ranking of the oppurtunities
The limited time frame this research is dealing with makes it impossible to process all opportunities.
For this reason a selection of the opportunities is made, based on a combination of the ranking of the
opportunities in the four boxes presented above, and a subjective selection of the opportunities.
Only the opportunities ranked in the boxes with the highest impact; box ‘plan to do later’ and box ‘do
now’ are candidates to process in more detail.
Other subjective arguments which are taken into account are a balanced mix between quick
opportunities and more complicated opportunities, and a subjective preference for some
opportunities, sometimes based on opinions of key stakeholders. The arguments for the subjective
preferences are provided in the chapter 7 till 10, which are also explaining the opportunities in more
detail.
Based on these arguments the opportunities 1: Optimal balance between inventory and flexibility,
Opportunity 2: Feedback delivery of raw materials, Opportunity 6: Insights in tasks logistics
coordinator and Opportunity 10: Delays of laboratory analyses are selected and will be analyzed in
more detail.
5.5 Conclusions
This chapter mapped the most relevant opportunities. Paragraph 5.2 explained how the
opportunities were listed. These opportunities were defined in paragraph 5.3. Five opportunities
evolved directly out of the workshop and the other five evolved indirectly out of the workshop. An
indication of the location of these opportunities was provided in a schematic overview. Paragraph 5.5
ranked and prioritized the most relevant opportunities.

Efficiency analysis of a planning process in chemical industry
DM
AIC
pre
pa
rati
on
- M
ap
pin
g t
he
mo
st r
ele
va
nt
op
po
rtu
nit
ies
53
Figure 18: ranking of the opportunities, presented the ten different opportunities categorized into
four different boxes. Interviews with stakeholders and extra analyses formed the main input to be
able to create this diagram. Based on this figure 18, which is supported by the analyzes presented in
appendix 6, it is possible to prioritize the opportunities. The ranking is used in order to start
improvement projects, all separately organized and focused on one of the opportunities.
Four opportunities were selected and form the basis for the following chapters. The opportunities
are: Opportunity 1: Optimal balance between inventory and flexibility, Opportunity 2: Feedback
delivery of raw materials, Opportunity 6: Insights in tasks logistics coordinator and Opportunity 10:
Delays of laboratory analyses are selected and will be analyzed in more detail.
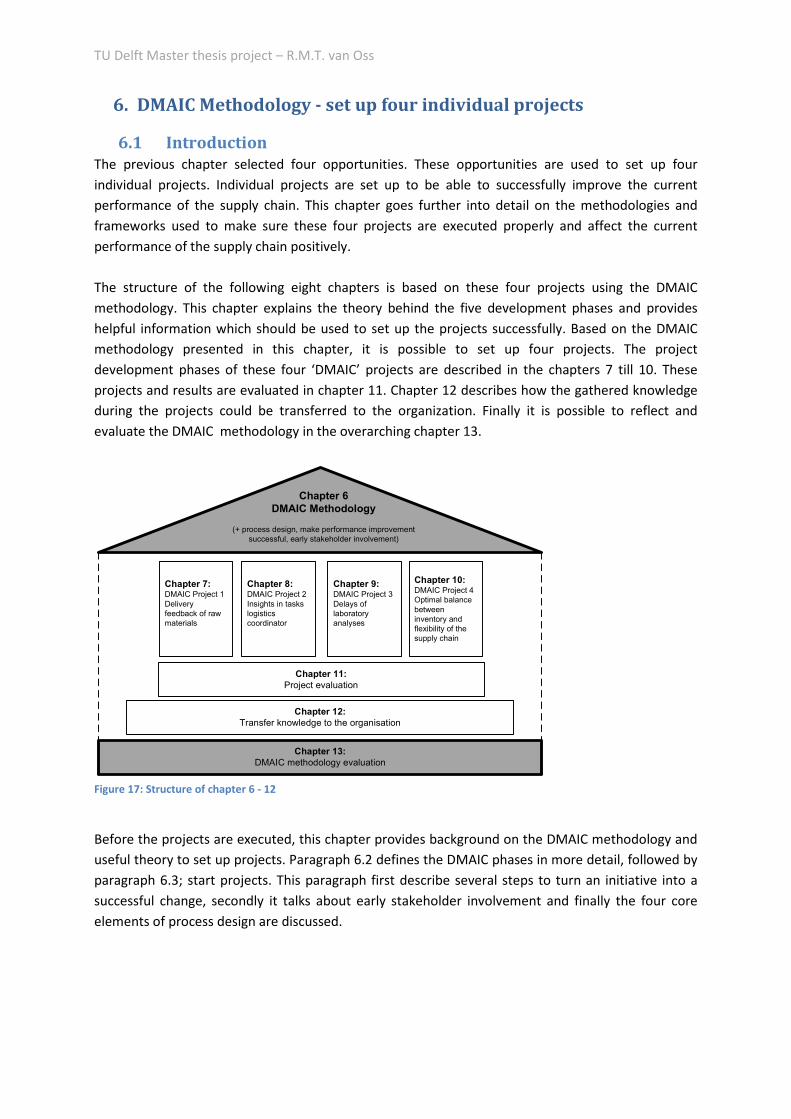
TU Delft Master thesis project – R.M.T. van Oss
6. DMAIC Methodology - set up four individual projects
6.1 Introduction
The previous chapter selected four opportunities. These opportunities are used to set up four
individual projects. Individual projects are set up to be able to successfully improve the current
performance of the supply chain. This chapter goes further into detail on the methodologies and
frameworks used to make sure these four projects are executed properly and affect the current
performance of the supply chain positively.
The structure of the following eight chapters is based on these four projects using the DMAIC
methodology. This chapter explains the theory behind the five development phases and provides
helpful information which should be used to set up the projects successfully. Based on the DMAIC
methodology presented in this chapter, it is possible to set up four projects. The project
development phases of these four ‘DMAIC’ projects are described in the chapters 7 till 10. These
projects and results are evaluated in chapter 11. Chapter 12 describes how the gathered knowledge
during the projects could be transferred to the organization. Finally it is possible to reflect and
evaluate the DMAIC methodology in the overarching chapter 13.
Chapter 7:DMAIC Project 1
Delivery
feedback of raw
materials
Chapter 8:DMAIC Project 2
Insights in tasks
logistics
coordinator
Chapter 9:DMAIC Project 3
Delays of
laboratory
analyses
Chapter 10: DMAIC Project 4
Optimal balance
between
inventory and
flexibility of the
supply chain
Chapter 13:
DMAIC methodology evaluation
Chapter 6
DMAIC Methodology
(+ process design, make performance improvement
successful, early stakeholder involvement)
Chapter 12:
Transfer knowledge to the organisation
Chapter 11:
Project evaluation
Figure 17: Structure of chapter 6 - 12
Before the projects are executed, this chapter provides background on the DMAIC methodology and
useful theory to set up projects. Paragraph 6.2 defines the DMAIC phases in more detail, followed by
paragraph 6.3; start projects. This paragraph first describe several steps to turn an initiative into a
successful change, secondly it talks about early stakeholder involvement and finally the four core
elements of process design are discussed.
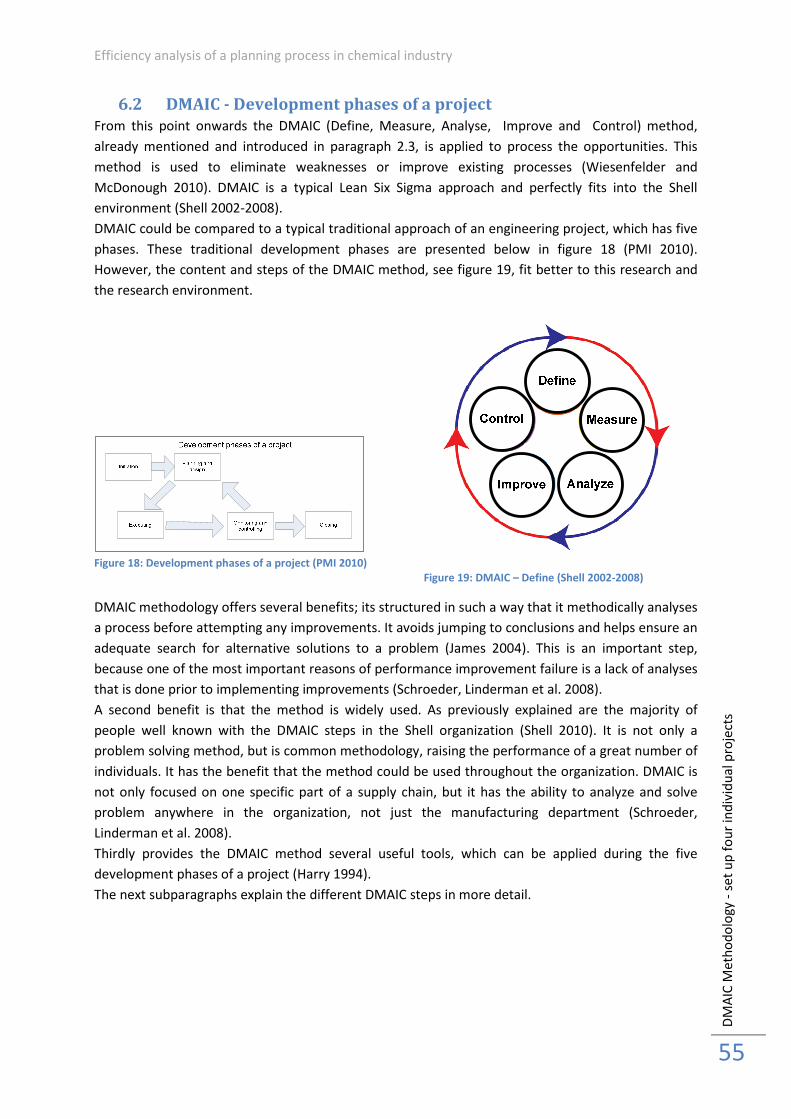
Efficiency analysis of a planning process in chemical industry
DM
AIC
Me
tho
do
log
y -
se
t u
p f
ou
r in
div
idu
al
pro
ject
s
55
6.2 DMAIC - Development phases of a project
From this point onwards the DMAIC (Define, Measure, Analyse, Improve and Control) method,
already mentioned and introduced in paragraph 2.3, is applied to process the opportunities. This
method is used to eliminate weaknesses or improve existing processes (Wiesenfelder and
McDonough 2010). DMAIC is a typical Lean Six Sigma approach and perfectly fits into the Shell
environment (Shell 2002-2008).
DMAIC could be compared to a typical traditional approach of an engineering project, which has five
phases. These traditional development phases are presented below in figure 18 (PMI 2010).
However, the content and steps of the DMAIC method, see figure 19, fit better to this research and
the research environment.
Figure 18: Development phases of a project (PMI 2010)
Figure 19: DMAIC – Define (Shell 2002-2008)
DMAIC methodology offers several benefits; its structured in such a way that it methodically analyses
a process before attempting any improvements. It avoids jumping to conclusions and helps ensure an
adequate search for alternative solutions to a problem (James 2004). This is an important step,
because one of the most important reasons of performance improvement failure is a lack of analyses
that is done prior to implementing improvements (Schroeder, Linderman et al. 2008).
A second benefit is that the method is widely used. As previously explained are the majority of
people well known with the DMAIC steps in the Shell organization (Shell 2010). It is not only a
problem solving method, but is common methodology, raising the performance of a great number of
individuals. It has the benefit that the method could be used throughout the organization. DMAIC is
not only focused on one specific part of a supply chain, but it has the ability to analyze and solve
problem anywhere in the organization, not just the manufacturing department (Schroeder,
Linderman et al. 2008).
Thirdly provides the DMAIC method several useful tools, which can be applied during the five
development phases of a project (Harry 1994).
The next subparagraphs explain the different DMAIC steps in more detail.
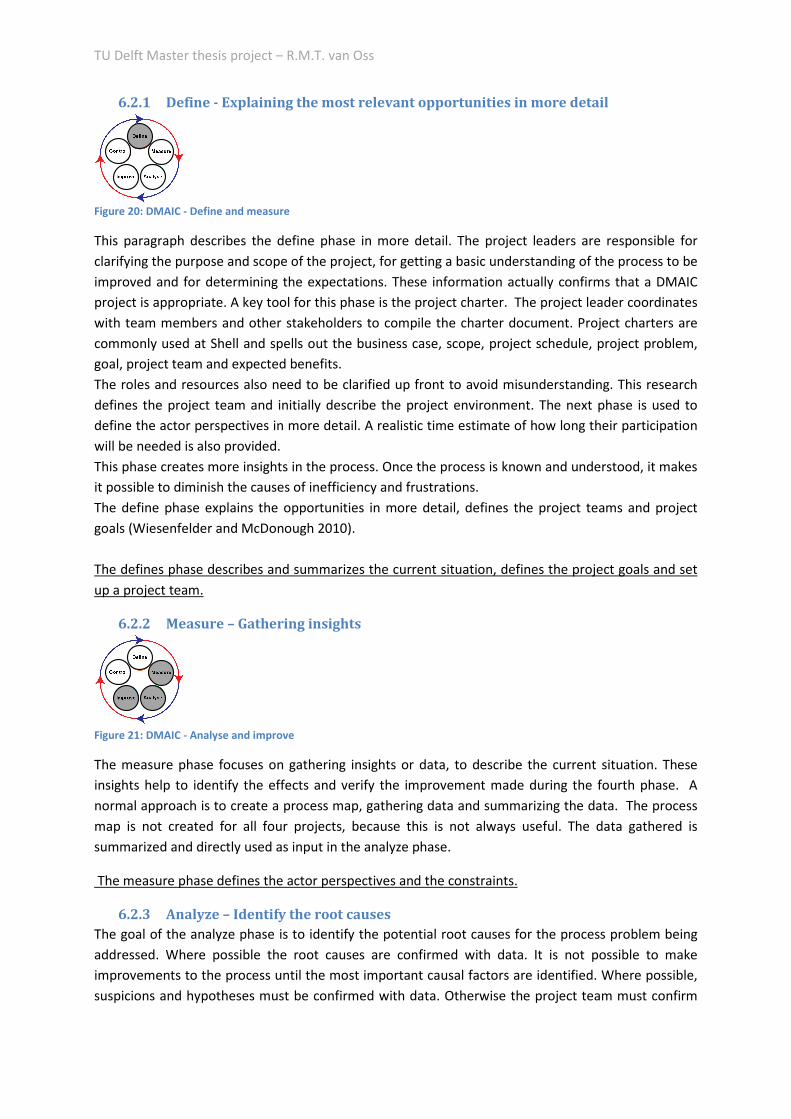
TU Delft Master thesis project – R.M.T. van Oss
6.2.1 Define - Explaining the most relevant opportunities in more detail
Figure 20: DMAIC - Define and measure
This paragraph describes the define phase in more detail. The project leaders are responsible for
clarifying the purpose and scope of the project, for getting a basic understanding of the process to be
improved and for determining the expectations. These information actually confirms that a DMAIC
project is appropriate. A key tool for this phase is the project charter. The project leader coordinates
with team members and other stakeholders to compile the charter document. Project charters are
commonly used at Shell and spells out the business case, scope, project schedule, project problem,
goal, project team and expected benefits.
The roles and resources also need to be clarified up front to avoid misunderstanding. This research
defines the project team and initially describe the project environment. The next phase is used to
define the actor perspectives in more detail. A realistic time estimate of how long their participation
will be needed is also provided.
This phase creates more insights in the process. Once the process is known and understood, it makes
it possible to diminish the causes of inefficiency and frustrations.
The define phase explains the opportunities in more detail, defines the project teams and project
goals (Wiesenfelder and McDonough 2010).
The defines phase describes and summarizes the current situation, defines the project goals and set
up a project team.
6.2.2 Measure – Gathering insights
Figure 21: DMAIC - Analyse and improve
The measure phase focuses on gathering insights or data, to describe the current situation. These
insights help to identify the effects and verify the improvement made during the fourth phase. A
normal approach is to create a process map, gathering data and summarizing the data. The process
map is not created for all four projects, because this is not always useful. The data gathered is
summarized and directly used as input in the analyze phase.
The measure phase defines the actor perspectives and the constraints.
6.2.3 Analyze – Identify the root causes
The goal of the analyze phase is to identify the potential root causes for the process problem being
addressed. Where possible the root causes are confirmed with data. It is not possible to make
improvements to the process until the most important causal factors are identified. Where possible,
suspicions and hypotheses must be confirmed with data. Otherwise the project team must confirm
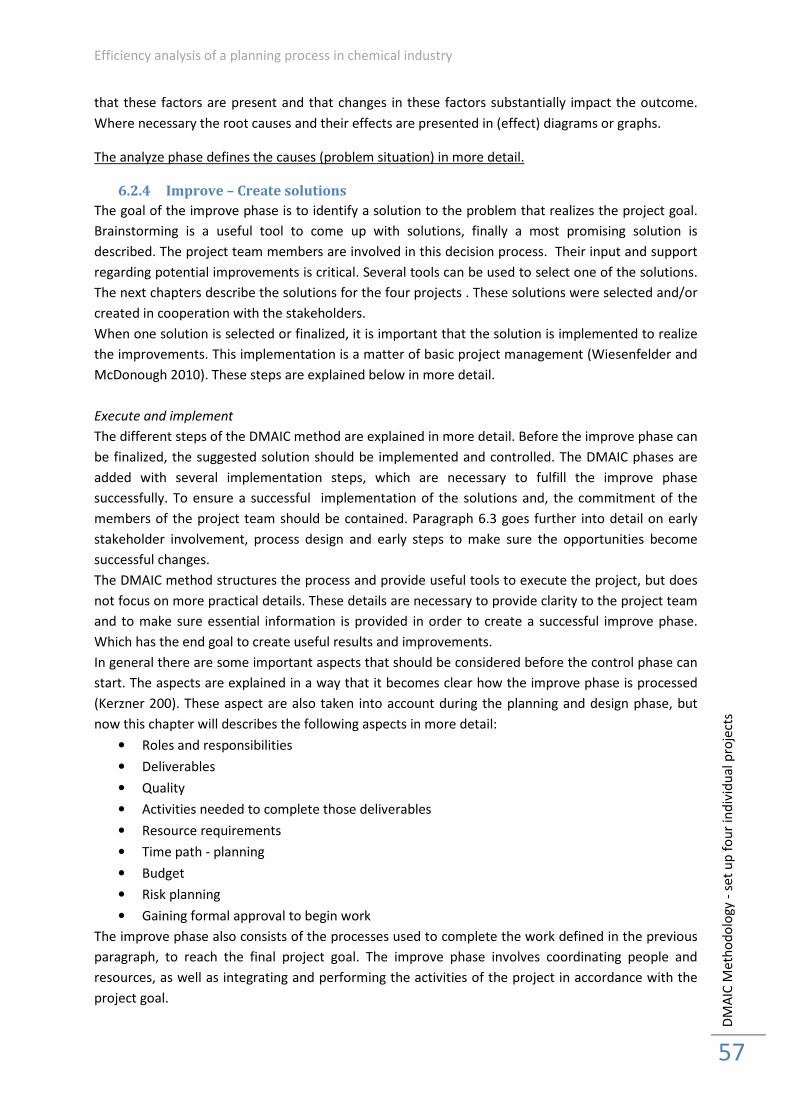
Efficiency analysis of a planning process in chemical industry
DM
AIC
Me
tho
do
log
y -
se
t u
p f
ou
r in
div
idu
al
pro
ject
s
57
that these factors are present and that changes in these factors substantially impact the outcome.
Where necessary the root causes and their effects are presented in (effect) diagrams or graphs.
The analyze phase defines the causes (problem situation) in more detail.
6.2.4 Improve – Create solutions
The goal of the improve phase is to identify a solution to the problem that realizes the project goal.
Brainstorming is a useful tool to come up with solutions, finally a most promising solution is
described. The project team members are involved in this decision process. Their input and support
regarding potential improvements is critical. Several tools can be used to select one of the solutions.
The next chapters describe the solutions for the four projects . These solutions were selected and/or
created in cooperation with the stakeholders.
When one solution is selected or finalized, it is important that the solution is implemented to realize
the improvements. This implementation is a matter of basic project management (Wiesenfelder and
McDonough 2010). These steps are explained below in more detail.
Execute and implement
The different steps of the DMAIC method are explained in more detail. Before the improve phase can
be finalized, the suggested solution should be implemented and controlled. The DMAIC phases are
added with several implementation steps, which are necessary to fulfill the improve phase
successfully. To ensure a successful implementation of the solutions and, the commitment of the
members of the project team should be contained. Paragraph 6.3 goes further into detail on early
stakeholder involvement, process design and early steps to make sure the opportunities become
successful changes.
The DMAIC method structures the process and provide useful tools to execute the project, but does
not focus on more practical details. These details are necessary to provide clarity to the project team
and to make sure essential information is provided in order to create a successful improve phase.
Which has the end goal to create useful results and improvements.
In general there are some important aspects that should be considered before the control phase can
start. The aspects are explained in a way that it becomes clear how the improve phase is processed
(Kerzner 200). These aspect are also taken into account during the planning and design phase, but
now this chapter will describes the following aspects in more detail:
• Roles and responsibilities
• Deliverables
• Quality
• Activities needed to complete those deliverables
• Resource requirements
• Time path - planning
• Budget
• Risk planning
• Gaining formal approval to begin work
The improve phase also consists of the processes used to complete the work defined in the previous
paragraph, to reach the final project goal. The improve phase involves coordinating people and
resources, as well as integrating and performing the activities of the project in accordance with the
project goal.
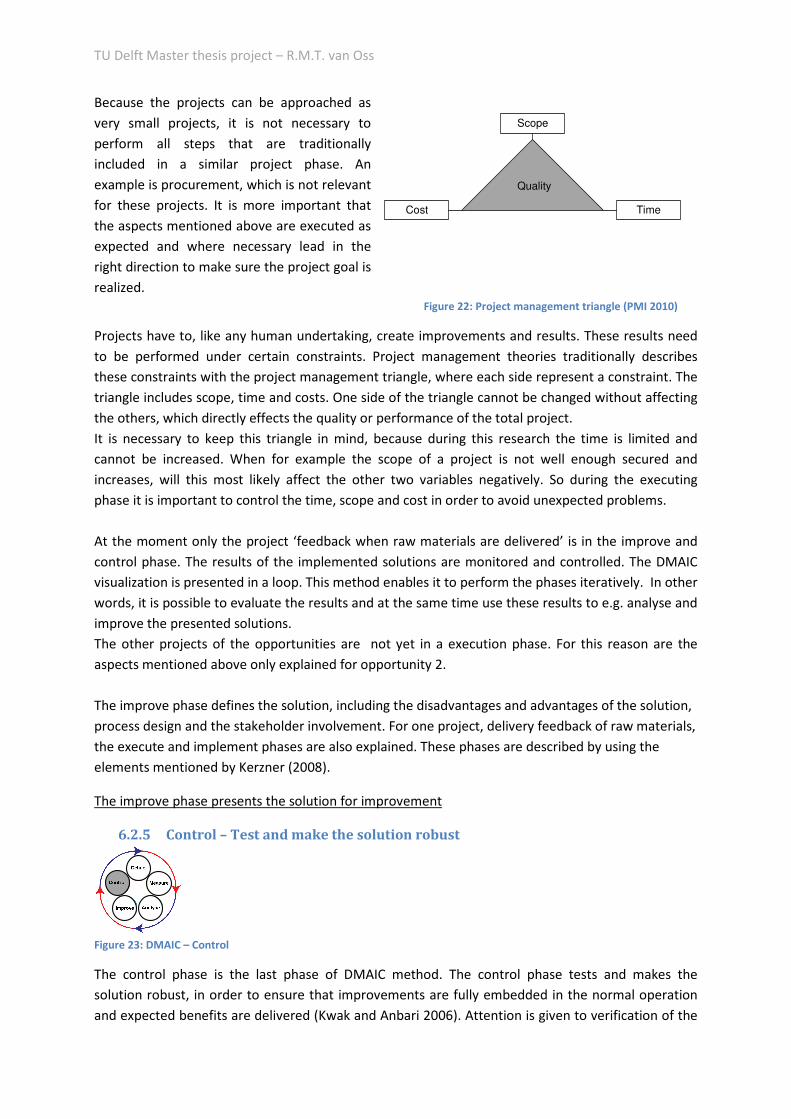
TU Delft Master thesis project – R.M.T. van Oss
Because the projects can be approached as
very small projects, it is not necessary to
perform all steps that are traditionally
included in a similar project phase. An
example is procurement, which is not relevant
for these projects. It is more important that
the aspects mentioned above are executed as
expected and where necessary lead in the
right direction to make sure the project goal is
realized.
Figure 22: Project management triangle (PMI 2010)
Projects have to, like any human undertaking, create improvements and results. These results need
to be performed under certain constraints. Project management theories traditionally describes
these constraints with the project management triangle, where each side represent a constraint. The
triangle includes scope, time and costs. One side of the triangle cannot be changed without affecting
the others, which directly effects the quality or performance of the total project.
It is necessary to keep this triangle in mind, because during this research the time is limited and
cannot be increased. When for example the scope of a project is not well enough secured and
increases, will this most likely affect the other two variables negatively. So during the executing
phase it is important to control the time, scope and cost in order to avoid unexpected problems.
At the moment only the project ‘feedback when raw materials are delivered’ is in the improve and
control phase. The results of the implemented solutions are monitored and controlled. The DMAIC
visualization is presented in a loop. This method enables it to perform the phases iteratively. In other
words, it is possible to evaluate the results and at the same time use these results to e.g. analyse and
improve the presented solutions.
The other projects of the opportunities are not yet in a execution phase. For this reason are the
aspects mentioned above only explained for opportunity 2.
The improve phase defines the solution, including the disadvantages and advantages of the solution,
process design and the stakeholder involvement. For one project, delivery feedback of raw materials,
the execute and implement phases are also explained. These phases are described by using the
elements mentioned by Kerzner (2008).
The improve phase presents the solution for improvement
6.2.5 Control – Test and make the solution robust
Figure 23: DMAIC – Control
The control phase is the last phase of DMAIC method. The control phase tests and makes the
solution robust, in order to ensure that improvements are fully embedded in the normal operation
and expected benefits are delivered (Kwak and Anbari 2006). Attention is given to verification of the
Scope
TimeCost
Quality
Efficiency analysis of a planning process in chemical industry
DM
AIC
Me
tho
do
log
y -
se
t u
p f
ou
r in
div
idu
al
pro
ject
s
59
solution. The solution should be mistake proof. The control phase helps to realize this (Pirasteh and
Horn 2010). A pilot project is an important element in the control phase, the monitored data enables
verification of the improvement project.
It is possible to add two extra steps or phases to the control phase of the DMAIC, namely standardize
and integrate (James 2004). These two phases make it easier to transfer the knowledge to the
organization in the future.
These steps are included in this control step. The standardize phase and integrate phase are
described hereunder, but first the control steps are described for the project. When these steps are
properly executed, more generic knowledge can be transferred to the organization.
The five most important goals of the control phase are to implement improvements on a pilot basis,
confirm that the change is an improvement, set up process management system, manage change in
workplace, prepare for withdrawal and transfer learning to wider organization.
Nine steps are defined to make sure the five goals of the control phase are realized and the
standardize and integrate steps are also included. These nine steps are:
• Pilot project
• Monitoring the pilot project
• Verify improvement
• Establish process monitoring
• Hand over process management
• Implement new process
• Identify opportunities for standardization, integration and replication
• Confirm benefits
• Close project and recognize team
These aspects are the key purpose of control. When these so called countermeasures are properly
executed, they avoid failures of the project (Shell 2002-2008). All nine countermeasure is explained
in more detail below:
Pilot project
Pilot projects are used as a risk-reduction action. Pilot projects try things out on a small scale
wherever possible. For a specified temporarily period the new process will be watched very closely
for signs of troubles and for opportunities to refine the details of the solution. This process is called
monitoring and is executed after a certain predefined pilot period.
It is important that the involved stakeholders are engaged and that the pilot activities are carefully
planned. The stakeholders should be briefed and trained where necessary, because they should be
able to set up a data collection plan.
Monitoring the pilot project
Monitoring encompasses the tracking of processes, so that information on their state can be easily
seen, and insights on the performance of one or more processes can be provided (DeCarlo 2009). The
degree of monitoring depends on what information the business wants to evaluate and how business
wants it to be monitored (Kohlbacher 2009). By monitoring this specific project, the goal is to
optimize the current process performance and where needed applying enhancements in the design
of the process. Because this finally lead to overall greater business value (Liegener 2010)
TU Delft Master thesis project – R.M.T. van Oss
The results are gathered and presented in Appendix 11. Based on these monitored results and
interviews with the key stakeholders, it is possible to evaluate the effectiveness of the project and to
come up with possible improvements of the current process.
Verify improvement
The purpose of this step is to provide evidence that the new process is an improvement over the old.
It is possible to draw conclusions, based on the so called control data gathered before and during the
pilot project. Based on this control data the status of the improvement can be verified.
Establish process monitoring
To ensure that stability is maintained and to provide a basis for continual improvement, it is
necessary that the process is monitored, also after transferring the project to the organization. To
make sure this monitoring is done properly, one of the involved project members should be made
responsible for this monitoring process. The project members are well enough committed to the
project that they also have self interests in performing this task.
Hand over process management
The purpose of this stage is to complete the hand-over of a successful improvement, so that it is
sustained and improved further by the involved stakeholders. Process documentation defines in
appropriate detail how the selected solution in the process should be used. The definition of the
process owners and process workers and their roles and responsibilities during the process are
important aspect of this process documentation.
Implement new process
The purpose of this step is to get the improved process up and running in the routine operation. The
previous steps are necessary before the process can be implemented. The result of these steps is a
tested and formalized new process. After successfully executing these steps, the new process can be
implemented in the organization, but not before all stakeholders involved are updated by the
changes. After implementing the new process, it is important to build in a control step, to make sure
that the new processes changes are executed.
Identify opportunities for standardization, integration and replication
To create maximum output of this project, it is important to suggest other application areas of this
project. Keywords in this process are standardize and integrate. With standardize is meant; spread
the gains and integration means; spread the thinking.
Spreading the gains as well as spreading the thinking makes it easier to replicate the processes.
Spreading the gains create support to replicate the projects, while spreading of the thinking increases
acceptance and understanding of the process steps. Replication is focused on the expansion of a
successful solution across a greater number of branches with identical or very similar processes (Shell
2002-2008).
Confirm benefits
The goal of this step is to confirm the benefits realized by the project. It is necessary to present and
share the results of an executed project. This makes sure that the effort put in the project is
appreciated and valued, which enables future possibilities to replicate or execute new projects.
Efficiency analysis of a planning process in chemical industry
DM
AIC
Me
tho
do
log
y -
se
t u
p f
ou
r in
div
idu
al
pro
ject
s
61
Close project and recognize team
The goal of this step is to withdraw from the project as team lead, but not before a review of team’s
own learning is done and transferred to the wider organization. The main focus is on the
performance and learning points of the team lead, but this is presented more elaborated in the
reflection of the complete research. Finally it is important to recognize the team for the
improvements realized. Recognition motivates the involved persons to start a new project.
The control phase describes the nine steps taken to successfully realize performance improvements.
6.3 Start projects
The five DMAIC steps, which help to make improvements to an existing process are described and
explained in more detail. The introduction of this chapter already introduced the individual projects
which will be set up to process the opportunities and realize changes. Paragraph 6.2.1 presents seven
steps to successfully realize performance improvement and paragraph 6.2.2 focuses on early
stakeholder involvement. The final paragraph introduces the four core elements of a process design.
Processes will be designed and managed during all four projects, to maximize the potential benefits
of the projects.
6.3.1 Make the performance improvement initiatives successful
To make sure that the four selected opportunities become successful initiatives, which realize
improvements of the performance of the supply chain, seven steps defined by (McIntyre 2010),
which are already introduced in Chapter 2; methodology, are used.
The selected opportunities are used to improve the current planning process of the supply chain of
polyols, as defined in chapters 1 and 2 of this thesis. In paragraph 2.4; literature reviews, McIntyre
(2010) already defined a methodology to successfully create performance improvement initiatives.
According to him, a necessary execution because most initiatives start to fail because they fail to
start! He defines setting up a successful change initiative, as one of the hardest things to do in
organizations. Mainly because creating change is not seen as integral to the future success of the
organization, but also because people often don't know how to do it. Although at least some of the
opportunities seem easy to implement, change is necessary to realize improvements. McIntyre
(2010), defines seven steps to set up a successful initiative.
1. Assign an accountable Sponsor
2. Identify a suitable Project Manager
3. Clearly articulate objectives and how they will be achieved
4. Get the buy in of the key stakeholders
5. Build a strong core team
6. Develop a realistic plan
7. Communicate the plan
These seven steps are used in this research to successfully create improvements. However, step 1 is
not applicable during this research. Step 2 is defined in chapter 7. The objectives of the four
opportunities are presented in the next paragraph, how they will be achieved is further explained in
the next chapter. The buy in of stakeholders was done during the SIPOC workshop. By creating the
opportunities together, a consensus based results directly created support of the key stakeholders to
be involved during the improvement phases. The core team, which are called project teams, and a
realistic plan to successfully realize improvements, are also defined in chapter 7.
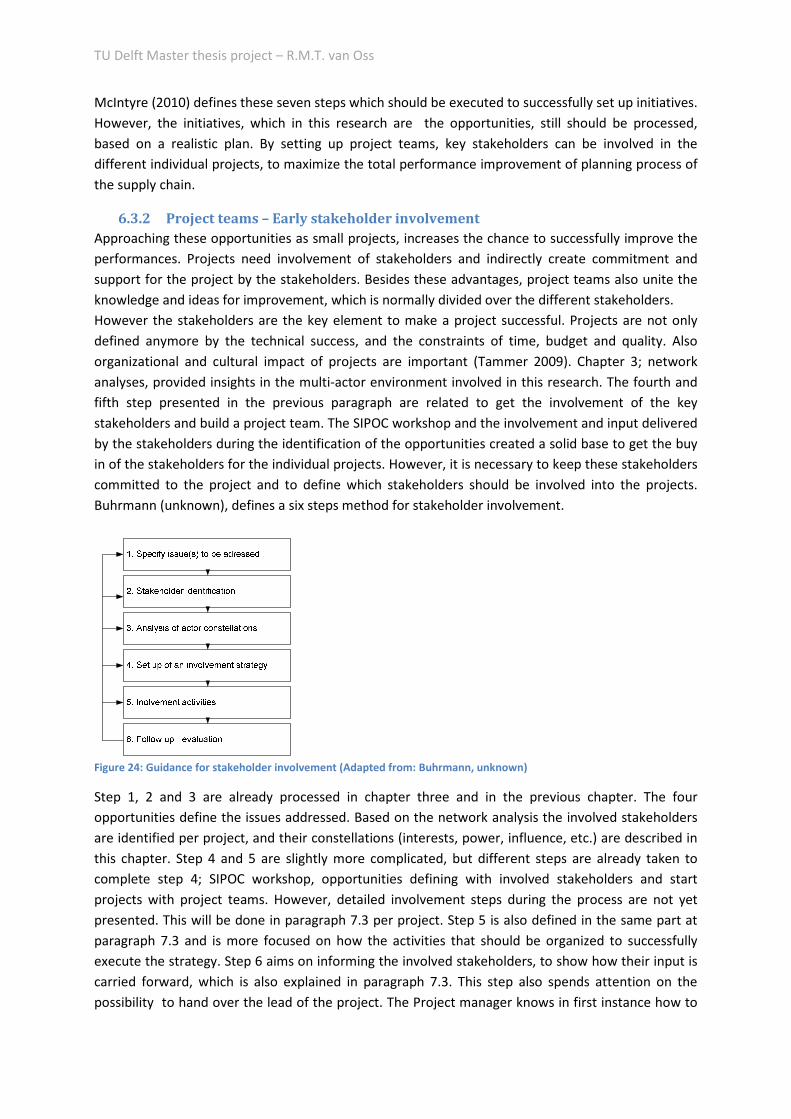
TU Delft Master thesis project – R.M.T. van Oss
McIntyre (2010) defines these seven steps which should be executed to successfully set up initiatives.
However, the initiatives, which in this research are the opportunities, still should be processed,
based on a realistic plan. By setting up project teams, key stakeholders can be involved in the
different individual projects, to maximize the total performance improvement of planning process of
the supply chain.
6.3.2 Project teams – Early stakeholder involvement
Approaching these opportunities as small projects, increases the chance to successfully improve the
performances. Projects need involvement of stakeholders and indirectly create commitment and
support for the project by the stakeholders. Besides these advantages, project teams also unite the
knowledge and ideas for improvement, which is normally divided over the different stakeholders.
However the stakeholders are the key element to make a project successful. Projects are not only
defined anymore by the technical success, and the constraints of time, budget and quality. Also
organizational and cultural impact of projects are important (Tammer 2009). Chapter 3; network
analyses, provided insights in the multi-actor environment involved in this research. The fourth and
fifth step presented in the previous paragraph are related to get the involvement of the key
stakeholders and build a project team. The SIPOC workshop and the involvement and input delivered
by the stakeholders during the identification of the opportunities created a solid base to get the buy
in of the stakeholders for the individual projects. However, it is necessary to keep these stakeholders
committed to the project and to define which stakeholders should be involved into the projects.
Buhrmann (unknown), defines a six steps method for stakeholder involvement.
Figure 24: Guidance for stakeholder involvement (Adapted from: Buhrmann, unknown)
Step 1, 2 and 3 are already processed in chapter three and in the previous chapter. The four
opportunities define the issues addressed. Based on the network analysis the involved stakeholders
are identified per project, and their constellations (interests, power, influence, etc.) are described in
this chapter. Step 4 and 5 are slightly more complicated, but different steps are already taken to
complete step 4; SIPOC workshop, opportunities defining with involved stakeholders and start
projects with project teams. However, detailed involvement steps during the process are not yet
presented. This will be done in paragraph 7.3 per project. Step 5 is also defined in the same part at
paragraph 7.3 and is more focused on how the activities that should be organized to successfully
execute the strategy. Step 6 aims on informing the involved stakeholders, to show how their input is
carried forward, which is also explained in paragraph 7.3. This step also spends attention on the
possibility to hand over the lead of the project. The Project manager knows in first instance how to

Efficiency analysis of a planning process in chemical industry
DM
AIC
Me
tho
do
log
y -
se
t u
p f
ou
r in
div
idu
al
pro
ject
s
63
execute the projects, but the project team offers the possibility to transfer the lead when time
constraints demand this. Finally this complete involvement strategy of stakeholders is evaluated in
chapter 9.
6.3.3 Process design
The reasons to set up project teams and the benefits of working with project teams are now clear,
but it is also important to define how these projects should be organized. To create successful
projects a process management approach is necessary. This process management approach
addresses the requirements of a good process by explaining the four core elements of a process
design. These elements are taken into account during the set-up and execution phases of the
projects (Bruijn, Heuvelhof et al. 2003).
Figure 25: Four core elements of a process design (Adapted from: Bruijn, Heuvelhof et al. 2003)
1. Openness – open attitude of the initiator is necessary. Other parties are offered an
opportunity to take part in shaping the agenda and the decision making.
2. Protection of core values – Participants need to perceive a safe environment. This is only
possible when the core values of the participants are protected.
3. Progress – Openness and protection of the core values may stall the process. Therefore
incentives for progress and momentum should be build in.
4. Substance – To avoid too much focus on keeping the process going, a need for arrangements
that lead to sufficient substantive input into the process is necessary.
The process designs of the different projects all need to include these four core elements. However,
every project is different and for this reason a trade-off between the core values is necessary. Per
project the process will be designed and explained, based on these four core elements.
6.4 Conclusions
This chapter described the methodology used to successfully set up four projects. The five
development phases of the DMAIC methodology, which helps to make improvements to the current
supply chain, were explained in paragraph 6.2. Paragraph 6.3 introduced three methodologies, which
are added/ included to the DMAIC steps. These methodologies make sure the performance
improvement initiative becomes successful. They describe the advantages of early stakeholder
involvement and introduce the four core elements of a process design.
The next four chapters describe the four individual project. DMAIC and the other three theories will
be applied on the four projects, in order to realize improvements.
TU Delft Master thesis project – R.M.T. van Oss
7. Project 1: Feedback delivery of raw materials
7.1 Introduction
Chapter 5 defined and ranked ten opportunities. Based on this ranking four opportunities were
selected, which will be processed in the following chapters as four individual projects. The previous
chapter provided background information on theories and methodologies to be able to successfully
set up and process these projects in order to improve the current performance of the supply chain.
This chapter will come up with solutions and recommendations to solve or minimize the problems
related to project 1: feedback of delivery of raw materials. Employees are involved in the projects as
project team members, to make sure that follow up actions are taken and the project is finished.
This project is focused on the feedback delivery of raw materials. Paragraph 7.2 describes the define
phase, paragraph 7.3 goes further into detail on the measure phase, 7.4 describes the analyze phase
and 7.5 the improve phases. Paragraph 7.6 describes the last phase; the control phase. The control
phase is executed for this research. A pilot project is executed and the monitored results are included
in the control phase. The final paragraph 7.7 presents conclusions.
7.2 Define
Paragraph 5.2 already provided some background information on this opportunity. This paragraph
already explained that this opportunity is related to communicational problems. Process flow
schemes are useful to explain this opportunity in more detail.
The block on the top right in figure 26, presents the location in the supply chain of this zoomed
overview. This is a small part of figure 11, process 4.1. The rest of the figure, defines these steps
between 3.2 and 4.1 more detailed. The figure defines the process steps executed to make products
based on the demand orders at SCE and all main steps in between.
Figure 26: Overview of steps opportunity 6; feedback delivery of raw materials
Efficiency analysis of a planning process in chemical industry
Pro
ject
1:
Fe
ed
ba
ck d
eliv
ery
of
raw
ma
teri
als
65
Figure 27 defines the two red blocks in more detail and is based on interviews performed with key
stakeholders and analyses of documented procedures in task descriptions. The visualization in figure
27 is defined on a task level, where all decisions and tasks are represented in this process flow
scheme. This visualization directly points out that the problem is caused by missing feedback which is
not delivered by Shift 6. This conclusion makes it is possible to come up with a solution. However, the
cause of the problems is still not entirely defined. Because the lack of feedback of Shift 6 causes
problems in the supply chain, but when the raw materials are always delivered on time, the feedback
is not necessary. In other words, a preventive solution could also be a possibility by performing
research on the causes of the delays in deliveries of raw materials.
Figure 27: Opportunity 6 Problem identification
Figure 26 and 27 are used to share information with the key stakeholders. These interviews gave
more insights in the problem in a broader context. As explained can the lack of providing feedback of
Shift 6 be seen as the direct cause of the problem. However, Shift 6 has to provide feedback because
the delivery of raw materials is not 100% reliable. These issues are also included in the research
performed in paragraph 6.2.
Based on the results of this analysis, it is possible to set up a project team with the key players
involved. Inform them on the issues and opportunities and define new communication standards etc.
Summarized
It is the responsibility of the logistics coordinator to make sure that there is enough raw material
available to produce. Key stakeholders in this process are the Production administrator and the
operators of Shift 6. Sometimes these deliveries of raw materials are critical for the production
TU Delft Master thesis project – R.M.T. van Oss
process. When ordered materials are not delivered and feedback on these issues is not shared, this
directly creates production problems and delays. In order to improve this opportunity, it can be
approached from two perspectives. A solving solution and a preventive solution.
Project goal
Unnecessary production delays are caused by an unexpected shortage of raw materials. Analysis of
this problem should first of all provide a clear solution to improve the communication between the
different stakeholders and secondly should the analysis provide insights in a preventive solution, to
minimize the unexpected shortages of raw materials, which negatively effects the production
planning.
Project team
To improve the current situation and come up with solutions and recommendations, it is also
necessary to set up a project team. The project team consist of the key stakeholders. The project
team consist of three team members. Shift 6 was not directly included in the project team, because
via the Production administrator, which used to be a member of Shift 6, all necessary information
was gathered. But Shift 6 was constantly informed during the project of necessary actions etc. It is
also possible at this project to hand over the role of project team leader:
• Project team leader
• Logistics coordinator
• Production administrator
o Shift 6
Actor perspectives
The most important actors are also part of the project team. Only one actor, which is not included in
the project team, also plays a key role in this process. This is the Senior Buyer located at the central
office at Shell Pernis. This person makes the mid- and long-term agreements with the carriers. When
delivery problems which are caused by the carriers occur on a frequent base, this person is informed
and is then responsible to take action and improve this process. The Senior Buyer is only interested in
the performance of the carriers. At the moment this performance is not monitored in a structured
way. The lack of up to date information makes it more difficult to assess the carriers on their
performance.
The logistics coordinator is responsible for available raw materials. He monitors the stock levels and
create a order list of the raw materials. His main interest is to have a clear picture of the current
situation at all times. So when unexpected changes occur, he has to be informed.
The production administrator orders the raw materials, based on the order list. He is also direct
contact person for Shift 6.
The operators of Shift 6 receive the trucks and are responsible for unloading process of these trucks.
Their main interest is a situation which enables them to unload all the trucks within their shift.
Preferably the arrivals of the trucks are in that situation on time.
Efficiency analysis of a planning process in chemical industry
Pro
ject
1:
Fe
ed
ba
ck d
eliv
ery
of
raw
ma
teri
als
67
7.3 Measure
It is now possible to start the measure, analyze and improve phases. The previous paragraph defined
the project goal. After performing an analysis on this opportunity during this project, it is necessary
to be able to answer the main question: How is it possible to improve the reliability of the supply of
raw materials? This question will be answered by focusing on the feedback provided during the
delivery of raw materials.
Constraints
The most important constraints, related to this subject, are mentioned beneath. To improve the
feedback of delivery of raw materials these constraints should be taken into account, before a
solution can be created.
-Shift 6 is available till 17.45 p.m.
-Suppliers of raw materials should be on the site at Pernis before 14.00 p.m.
-Suppliers who deliver raw materials cannot book a time slot, because these are not available. The
main barrier to use existing time slots systems is the varying unloading times, depending on the
product and ordered volume.
7.4 Analyze
Causes (Problem situation)
To come up with solutions, It is necessary to have clear insights in the issues and problems causing
the delays. As already explained are two categories defined:
• A lack of information sharing between Shift 6 to the logistics coordinator and/or production
administrator.
• Disorganized deliveries of raw materials by the suppliers.
After performing interviews with the key stakeholders the following points of attention became
clear. They are all contributing to the main problem, but can be split up in internal and external
points of attention:
Internal:
-There is no standardized communication between Shift 6 and the logistics coordinator and/or the
production administrator. Because the production administrator and logistics coordinator are located
in the same office, they have contact on a frequent base and information sharing between these two
persons is not an issues. At the moment the necessary information is not received by one of these
persons.
-There is a lack of control on the deliveries processed by Shift 6 and the information send by them.
Because not all deliveries are critical for the production process, canceled or delayed deliveries are
only notified when they create changes.
-Receiving and handling the raw materials are not the core tasks of Shift 6. This is a reason why Shift
6 sometimes forgets to provide the necessary feedback. This is aggravated by the fact that the
persons of Shift 6 is changing quite often and there is no stable responsible person which can be used
as contact point.
- It is Shift 6 that decides if they want to unload this truck after it arrives at 14.00 hr. Because the
shift of Shift 6 ends at 17.45 hr. it means that they have to work longer to finish the process.
TU Delft Master thesis project – R.M.T. van Oss
-Delays and canceled deliveries are not documented and monitored. As previously explained,
disables this focused actions.
External
-The supplier of raw materials officially has to confirm the order via the production administrator,
but the suppliers not always confirm these orders. Necessary follow up actions are not always
properly executed. Sometimes the supplier arrives without a confirmation, sometimes it doesn’t
arrives because the confirmation is not send. This depends on the company.
-Trucks arriving after 14.00 p.m. are officially delayed, but delays are not always officially
communicated by the suppliers.
7.5 Improve
Solution
To minimize the unexpected problems caused by unavailability of raw materials, the points of
attention/issues mentioned above are taken into account. Most of these issues are related to
communicational failures, which directs solutions also in this direction.
The issues also make clear that external and internal directed solutions are necessary. Both solutions
will be explained below.
External
One of the findings of the analyses was the lack of documentation of previous problems with the
suppliers of raw materials. This makes it very difficult to create a externally aimed solution. All
external issues are related to punctuality of the suppliers. They are aware of the necessary
confirmations etc., but they are not acting in accordance with these agreements.
To improve the current behavior of the suppliers, it requests an increase of consciousness from the
suppliers. To reach this:
• Incentives are created to send updates and confirmation from the supplier
• Incentive are created to deliver on time.
These incentives are build into the contracts in the future. Input is generated by the production
administrator monitors, which monitors and document the current performances of the suppliers.
But because this will take a while, the production administrator also send an email to notify the
suppliers of our focus on this matter, and explains to the suppliers of the new procedures.
The senior buyer, will use the documentation on the mid-term to create incentives.
A long-term solution is to start using time slots for the trucks of the suppliers of raw materials as
well. Currently Shell Pernis is using time slots for loading trucks on the site, but this is still in a start-
up phase. Time slots will also create an incentive to be on time.
Internal
Standardized control on deliveries of raw materials is necessary to avoid unexpected problems with
available materials. The following measures are necessary to improve the current situation:
• Extra daily control executed by the production administrator on the deliveries of raw
materials. This person performs an extra check at Shift 6 at 14.00 hr. The moment that all
trucks should be arrived at the site.
Efficiency analysis of a planning process in chemical industry
Pro
ject
1:
Fe
ed
ba
ck d
eliv
ery
of
raw
ma
teri
als
69
o This control task is backed up by the Logistics Coordinator when the Production
Administrator is out of office.
o When the Logistics Coordinator is out of office, his tasks are backed up by the
production supervisor.
o Necessary actions are, when necessary, escalated to the production supervisor or to
the production specialist.
o The actions are secured in the checklist of the PTL.
• On January 2011 a new function of assistant team leader of Shift 6 is created. This person will
be closely involved in the tasks of the logistics coordinator and the production administrator.
During the next months will become clear which tasks and control functions can be
transferred to this person.
• Start monitoring cancellations and delays of deliveries of raw materials from this moment
onwards. This enables better insights in the problems and creates argumentation to design
more precise incentives and actions. Background information and argumentation on this
matter is already provided above in the external focused solutions.
o Shift 6, Logistics Coordinator and Production Administrator should document delays
and cancellations of deliveries.
o Finally this information is escalated to the Senior Buyer.
Figure 28 provides an schematic overview of all the process steps related to the feedback on the
delivery of raw materials. The green parts of the figure define necessary extra steps compared to the
current situation. These steps are representing the internal solutions, as explained above.
TU Delft Master thesis project – R.M.T. van Oss
Figure 28: Delivery of raw materials - Overview of process steps
Advantages
-Extra controlling measures minimize chance of production delays caused by non availability of raw
materials.
-Extra control by the production administrator creates an incentive for Shift 6 to focus more on the
deliveries of raw materials.
-Measures doesn’t need investments, only change of working.
Efficiency analysis of a planning process in chemical industry
Pro
ject
1:
Fe
ed
ba
ck d
eliv
ery
of
raw
ma
teri
als
71
-Control measures are more robust, because the tasks are backed up and not depending on one
person anymore.
-Monitoring provides insights in effectiveness of measures and creates possibilities for purposeful
follow up actions and also for future external focused actions.
-Actions are secured in the PTL task list.
Disadvantages
-External focused measures are not included.
-Focus tends to shift after successful implementation of controlling measures.
Process – project team
The project team of this opportunity only consists of two key stakeholders; Logistics coordinator and
the production administrator, one stakeholder that has to be constantly informed; Shift 6 and a
project team leader who is in the lead of the project. The project team leader initialized the project
and has to make sure that the stakeholders are committed to the project. After the start-up phase it
should be possible to hand over the lead of the project to one of the key stakeholders.
Paragraph 7.2 already defined four core elements of a process design, which is necessary to
implement the solutions.
Openness: The core elements are already used during the design phase of the solutions. A first
meeting was set-up to initialize the problem in more detail. Together with the key stakeholder the
problem was exactly defined. The next step was performed by the project team leader by performing
some critical interviews with other stakeholders involved. The output was a complete problem
description, which send to the key stakeholders on which they agreed on. Based on this problem
description a follow up meeting was set up to initialize solutions where everybody could gave input.
Protection of core values: All actors involved in this project are also directly involved in the project
solution. For this reason it was not so difficult to protect their core values. The most important
aspect was that they all joined the project on a voluntary base, because they experienced the
negative effects of the project. By monitoring the solution very strict it creates also exit options to
quit the project or at least change the action. Because the center of excellence of this project is
located at the execution phase and not at the design phase, this exit option protects their core
values.
Progress: The progress was already safeguarded by the involvement of a project team leader. This
person is responsible for the progress and results and has the power to control and direct the
project. Because there was no monitored data, an internal solution was created to gain a quick win
and experience improvements on the short term. Monitoring and evaluating the results will enables
external focused actions on the long term.
Substance: The substance of the progress is partly safeguarded by the monitoring process which
proves that improvements are realized. However, it is a relatively small project, so it is important to
keep up the speed of the project realization in order to keep the interests of the key stakeholders. By
using the skills of the project team leader in combination with the experiences on the subject of the
key stakeholders, the key stakeholders are kept interested and stay focused.
TU Delft Master thesis project – R.M.T. van Oss
Stakeholder involvement
Because this project is only dealing with two main stakeholders besides the project team leader, the
involvement strategy is not that complicated. The commitment for the project was already created
during earlier phases. Several involvement activities are organized to keep this involvement. The
most important elements of the stakeholder involvement are hereunder described (Buhrmann
unknown).
• When are the stakeholders involved
The logistics coordinator and the production administrator will be involved from the
beginning of the project, shift six will be involved after the measure phase.
• Roles and responsibilities of the stakeholders in the project team
The project team members only provide input and information. Where necessary they
execute the new tasks designed in the presented solution. The project team leader is
responsible to use the input to design solutions and is responsible for the progress of the
research. He is also responsible for updating the key stakeholders.
• Required skills
The project team leader should be able to keep the progress going and he has to keep a right
balance between quality, budget and the time constraints.
• Reporting procedures
The project team leader is responsible to set up project team meetings which are used to
report the progress. These meetings will be organized on frequent basis, this is not
periodically defined, but based on results. At least four times are team meetings planned;
after the measure, analyze, improve and control step.
The project meetings which are used to report the progress, are also used as involvement activities.
One final meeting is planned, when the project is finalized or handed over, to evaluate the process,
so all involved stakeholders can learn from it. This is also a incentive to keep committed.
When the project is not finished, the lead of the project will be handed over to the logistics
coordinator, who will involve the other stakeholder in the same was described.
7.5.1 Execute and implement project
The solution for this project is presented above. To be able to realize the performance
improvements, the project should be executed and implemented. Below are the most important
elements described to make the implementation successful:
• Roles and responsibilities
These are already explained in more detail in paragraph 7.2. All stakeholders are involved from the
start of the project.
• Deliverables
The most important short term deliverable is a new internal procedure which describes a controlling
mechanism to avoid unexpected problems related to the availability of raw materials caused by
problems with the delivery of raw materials.
Long term deliverables are based on the monitoring data and are externally focused. The long term
deliverables should include external agreements with the suppliers to diminish the delays and
cancelled deliveries caused by them.
Efficiency analysis of a planning process in chemical industry
Pro
ject
1:
Fe
ed
ba
ck d
eliv
ery
of
raw
ma
teri
als
73
• Quality
The quality aspects are secured in two ways, namely by measuring and controlling the quality.
Measuring will be done by executing an intensive monitoring procedure. All unexpected problems
are monitored and documented. Problems are defined as remarked by new procedure, accidently
remarked and not remarked. The documentation will provide clear insights in the quality of the new
procedure. Problems encountered outside the new procedure say something about the quality of the
new procedure.
By securing the new procedure in a checklist, the level of quality effected by the new procedure is
guaranteed.
• Activities needed to complete those deliverables
The solution is presented and the planning and design phase is finalized. The project team is
committed, so the first necessary activity is to gain formal approval to start the project.
The second step is informing and updating Shift 6 of the findings and intentions of this project. Their
commitment is also important as previously explained in paragraph 7.2.
The third step is to formalize the new procedure and secure the new tasks in checklists of the
operational team leader. These procedures are formalized in BBS (work instruction) procedures.
The senior buyer is informed of the start of the project. When the lead of the project is transferred,
she will be important to realize external solutions.
All key stakeholders should start performing their new tasks, including daily monitoring and
documenting the status of the delivery of raw materials.
Meetings are planned to evaluate the performance and improvements of the new procedure.
Where necessary changes are made to optimize the new procedures.
The project lead is transferred to the logistics coordinator, which is responsible to organize a meeting
after 3 months of monitoring including the senior buyer. External solutions and measures are taken
to improve the performance of the suppliers.
• Resource requirements
The resources required are mainly labor. It costs extra time to perform the new tasks. However,
minimization of unexpected problems also saves time.
Next to this two more resources are required. First of all an operational checklist to secure and
control the execution of the tasks. And finally an excel sheet to document and monitor the current
performance.
• Time path – planning
Paragraph 7.5 previously explained the importance to keep the time path short. This is strengthened
by the limited timeframe of this research. Implementation on the short term makes it possible to use
the monitored data and make when necessary changes on the new procedure.
Week 50, 2010: Formalization and implementation of the new pilot procedure
Week 50 , 2010 – week 2, 2011: Monitoring the performance
Week 52, 2010: Short meeting to evaluate the performance and new procedure
Week 2, 2011: Monitored data is analyzed and based on this data meeting is organized. Possible
changes are made. New procedure is formalized
Week 6, 2011: Project lead is transferred to the logistics coordinator. (key)-stakeholders are
informed.
TU Delft Master thesis project – R.M.T. van Oss
• Budget
The budget of this project is very low. Investments are not needed.
• Risk planning
The risk of this project is very low. The new procedures are extra controlling measures. They only
form barriers to avoid unexpected problems. It is possible to change quickly to the old procedures
when necessary.
• Gaining formal approval to begin work
As explained by the activities, formal approval is gained by the production supervisor and the
supervisor of Shift 6. By presenting them the details of the solution, there approval will be gained.
Because they were updated and involved during this research. First during the opportunity framing,
secondly during the design and planning phase and finally they can approve the new procedures.
7.6 Control and monitor
The control phase is executed for this project: ‘feedback delivery of raw materials’. The project steps
described and executed in the control phase of this project, can be used as an example to perform
similar steps for the other projects.
This paragraph execute the control steps which are explained in more detail in paragraph 6.2.5. The
eight steps should be taken to avoid failure of the project. The content of these so called ‘counter
measures’ are explained below. Step one of these eight steps consists of a pilot project. The second
step evaluates the results of this pilot project by evaluating the monitored results.
Pilot project
It is necessary to start a pilot project in this case. The pilot study will take 4 weeks and the results are
monitored and documented per category in an excel file. The pilot study is based on the solution
presented in figure 28: Delivery of raw materials – Overview of the process steps. All project team
members were involved and committed to the pilot project. The next steps evaluate the presented
solution, based on the monitored results gathered during this pilot project.
Monitoring the pilot project
The project goal of the pilot project is to diminish and finally eliminate the unexpected shortages of
raw materials which give a negative effect on the production planning. By focusing on the short term
on internal solutions, new communication structures and standards were defined. The key
stakeholders; the logistics coordinator, production administrator and Shift 6, were committed from
the beginning of the project and were closely involved during all project phases.
One of the actions of the new process consists of documenting the findings and unexpected events.
This forms the basis for this evaluation and is the main input for the monitored data. A remark should
be made on the total monitoring time of four weeks. This time allowed for monitoring and
evaluating short term improvements. For evaluation & monitoring of knowledge transfer on the
longer term, another evaluation and monitoring project needs to be initiated, which is outside the
scope of this thesis.
Commitment to the project
The monitored results presented in appendix 11, show that the key stakeholders still are committed
to the project and the new process. By executing the control steps build into the new process, the

Efficiency analysis of a planning process in chemical industry
Pro
ject
1:
Fe
ed
ba
ck d
eliv
ery
of
raw
ma
teri
als
75
problems are noticed in an earlier stadium, which makes it possible to take preventive actions in
order to avoid unexpected delays and problems.
Results
These four weeks proved that it is possible to notify the problems in an earlier stadium. To be able to
identify a trend line of the occurrences, four weeks of data are not enough to draw conclusions on
the frequency of these occurrences, especially because historical data are missing. One of the new
process steps is focused on creating data which is necessary information for the senior buyer, who is
responsible for the contracts and performances of the suppliers, to take measures to improve the
performance of the external party, the supplier. The project initially focuses on feedback
improvement, in order to avoid unexpected problems. Since the start of the new process, no
unexpected problems are occurred anymore. Concluding, the process implementation was
successful, however the optimal situation is not yet reached.
Gaps
The feeling of the key stakeholders involved is that they are still missing important information.
Although the results show no unexpected problems anymore, they sometimes have the feeling that
they hear problems or delays accidently. Apparently shift 6 is not aware of the importance of sharing
all problems related to the delivery of raw materials, so this should be a point of attention in the near
future.
The monitored data show four trucks which were not on time and were send away. Two trucks are
not arrived on the agreed date. It also shows that these delays are occurred at four different
suppliers. Based on this data can thus be concluded that it is not a problem of one supplier, but it is
more general problem. Besides this, the data also shows that there are especially problems with the
deliveries of GB240-01 and Sorbitol.
The data does not show which measures are directly taken to minimize the direct effects and/or if
there is made a trade off to send the truck away or unload it. This information is necessary for the
senior buyer and should be added from this moment on to the monitored data.
Input gathered during the interviews with the key stakeholders provide answers on several
questions. Because the monitored time was only four weeks, the key stakeholders still remembered
the issues. A longer timeframe makes this more difficult. The key stakeholders told that most trucks
were sent away in coordination with the logistics coordinator, however when he could not be
reached, shift 6 made its own decisions.
The data also shows some temperature related issues. These are normal during very cold weather
circumstances like the four weeks in which the data was monitored.
Improve
The problems encountered should be used to improve the developed process. This document
provides the input for a follow up meeting in which this should be done. Reflecting on the proposed
new process and tasks of the key stakeholders, the proposed process represented in figure 28;
Delivery of raw materials – Overview of process steps, includes all necessary steps. The results show
that it works, however there are some points of attention discussed above that need attention. The
senior buyer should be involved during a follow up action after three months, when enough data is
gathered to take actions to improve the performance of the suppliers. Based on these results it is
possible to verify improvement.
TU Delft Master thesis project – R.M.T. van Oss
Verify improvement
The results of the monitored pilot project described above, provides the input to verify the
improvement of this DMAIC project. The project goal; to minimize the unexpected shortages of raw
materials, which negatively effects the production, is at least partly realized. The involved
stakeholders are all enthusiastic about the results and have the feeling that the current situation is
improved. At the moment there are no unexpected delays anymore. However, the goal is not
completely realized, because the results of the pilot study still show problems with late arrivals of
trucks. Control data was not available before the pilot study started, so it is difficult to make
conclusions based on the results of the pilot study. As defined in the previous chapter, follow up
action taken by the senior buyer are necessary to change the behavior of the suppliers. The senior
buyer is already introduced in a previous chapter and responsible for the contract and contact on a
higher level with the supplier.
Establish process monitoring
The logistics coordinator is end-responsible to monitor the continual improvement of the system.
The production administrator monitors the performance of the deliveries of raw materials.
Periodically meetings are planned the next 6 months to evaluate the current performance and
performance improvement. A format in excel to monitor the performance is necessary, to make sure
that the same details and complete information are monitored every day. It is possible to add or
delete a demand of information, based on the results of the pilot project. Monitoring the results is an
iterative process during the next six months and when necessary for a longer period, this depends on
the quality of the information and the conclusions that can be drawn on the information.
Hand over process management
The most important input for this step is the documentation provided in the figure 28: feedback
delivery of raw materials – overview of the process steps. This figure provides the new process in
appropriate detail, including roles and responsibilities. The logistics coordinator is, as previously
explained, the process owner. The production administrator and Shift 6 are the involved process
workers. This means that it is clear to the logistics coordinator and other stakeholders involved, that
the Logistics Coordinator has the responsibility to ensure that workers have authority to change the
process. In addition, the Logistics Coordinator also ensures that the change is properly controlled and
documented.
The next paragraph goes further into detail on transferring information to the organization. It is
essential that common and well known Shell procedures are used. The Lean Six Sigma method
already is familiar to the organization. In addition, project charters and BBS procedures are used by
Shell.
Implement new process
The extra action taken in this process is to secure the actions by designing a controlling mechanism in
the organization. This is done by including new actions, presented in figure 7.5, in the task list of the
PTL, which is the daily head of operations.
Efficiency analysis of a planning process in chemical industry
Pro
ject
1:
Fe
ed
ba
ck d
eliv
ery
of
raw
ma
teri
als
77
Identify opportunities for standardization, integration and replication
The project could be an example for other communicational related problems or opportunities. The
chapters of this report describes the different project phases clearly and also make clear how
commitment should be created by involved stakeholder.
Because several units at Shell Pernis are dealing with deliveries (of raw materials) by truck, the
monitoring methods to measure the performance, could be used by more units. By using one generic
monitoring method for all units, this creates better insights in the performance of the suppliers and
offers the opportunity to compare the performance at different units. Which is more effective for the
senior buyers, who are responsible for the contracts with the suppliers.
When other units are experiencing same sort of problems related to the feedback of deliveries, this
project and the measures taken can be used as an example. The measures taken probably need small
changes, however using same methods, tools and background information, will increase the speed of
the project significantly.
Confirm benefits
The pilot project provides insights in the benefits. However, the plan was set-up to create hard and
soft benefits. The main focus of the project was on soft benefits. Communication improved in and
around the process. This has a positive effect on the working environment. Less unexpected
situations occur, which lowers stress and increases customer satisfaction. The hard benefits delivered
by this project are the labor costs and demurrage. In the news situation unexpected situations are
reduced, this also affects the extra labor hours; necessary hours spend to change the production
planning. The second hard benefit is the decrease in demurrage. When unexpected production
changes are diminished, this effects the delayed deliveries and thus demurrage time for ships and
trucks.
Besides the soft and hard benefits which are directly related to the goals of the project, the project
has delivered some indirect benefits. First of all it delivered process documentation for the new
process, second results of the pilot project, thirdly an update on the involvement of the stakeholders,
fourthly a project story and finally suggestions for standardizations and replication to apply similar
methods on comparable problems.
Close project and recognize team
As explained, it is possible to evaluate all team members personally. However, the project was not
really complicated, so the project performance is only overall evaluated during a last session. Several
learning points are formulated, presented below:
-The speed of the project execution was positive
-The project documents were clear and provided good insights in the new process.
-Not all stakeholders were informed and updated at every stage of the project. Especially Shift 6
could have been involved more directly into the project. The idea was that this was done via the
production administrator, however he was formally not part of Shift 6 anymore.
-The senior buyer should have been involved more directly into the project and from the beginning.
-Communication was now mostly executed indirectly via the project team lead. A forum for
discussion should have created the opportunity for all involved stakeholders to directly address
issues to all team members, instead of via the project team lead.
At the end of the evaluation session, the appreciation and recognition was communicated to the
team members.
TU Delft Master thesis project – R.M.T. van Oss
7.7 Conclusions
All five development phases of DMAIC are executed and presented in this chapter. The define phase
stated the project goal as follows: Unnecessary production delays, caused by an unexpected shortage
of raw materials, should be diminished. The first phase also gave insights in the current situation and
set up a project team, consisting of a project team leader, logistics coordinator and the production
administrator and shift 6.
The measure phase provided insights in the actor perspectives. It became clear that the
communication between the production administrator and the logistics coordinator on one side and
shift 6 on the other side, needed improvement. This phase also gave insights in the constraints,
which provided insights in the agreements with the suppliers and working hours of shift 6.
The analyze phases provided insights in the problem situation and causes in more detail. The
problem situation was divided into external and internal causes. Two main causes were identified; a
lack of information sharing and disorganized deliveries of raw materials by the suppliers.
A solution was presented to improve the current situation. The solution was also internally and
externally focused. It provided a new framework to improve the information sharing and it is started
to monitor the current performance of the suppliers. Based on the monitored data, future actions
are taken to improve their performance.
The control phase was also executed. Nine steps were taken to avoid failure of the project and
described. A pilot project was started and implemented, based on the monitored results,
improvements to the suggested solution were made. The new improved solution was implemented.
The execution and implementation steps, executed during the improve, are based on steps described
by Kerzner (2008). The descriptions of these steps makes it possible to replicate these processes. The
control steps taken, based on Shell (2008), are also presented in the chapter above and can also be
replicated during other projects. Chapter 13, will evaluate the methodology in more detail, which
makes it possible to learn from this project and replicate the improved development phases.
Efficiency analysis of a planning process in chemical industry
Pro
ject
2:
Insi
gh
ts i
n t
ask
s lo
gis
tics
co
ord
ina
tor
79
8. Project 2: Insights in tasks logistics coordinator
8.1 Introduction
This chapter explains and describes the five development phases of the DMAIC methodology for the
second project. The second project is focused on the insights in tasks of the logistics coordinator. The
same structure of the chapter is used as in chapter 7. However, not all project development phases
were executed, because the project was not implemented. For this reason the chapter describes the
define, measure, analyze and improve phases.
Paragraph 8.2 describes the define phase, paragraph 8.3 goes further into detail on the measure
phase. Paragraph 8.4 and 8.5 describe respectively the analyze and improve phases. The control
phase is described in paragraph 8.6 and finally paragraph 8.7 presents conclusions.
8.2 Define
This opportunity was the initial argument and trigger to start this research. During the last summer
many employees of the CVP unit planned their holidays during the same weeks. The reorganization
which took place earlier this year caused a parallel holiday planning by some persons executing
critical functions. This created a situation in which the logistics coordinator was on holiday together
with experienced operators, and where the tasks of the logistics coordinator couldn’t be replaced
and executed properly by the production supervisor. Who was responsible to fill in his tasks during
holidays. This created a need to define insights in the tasks of the logistics coordinator, so it is
possible to replace this person when he is not able to perform his tasks.
The logistics coordinator is responsible to translate the production planning into a running planning.
The production planning sent and created at SCE by the supply coordinators is used as main input. In
consultation with the supply coordinators, the current situation at the units of CVP and other
constraints of the units are taken into account in order to realize a achievable running planning. The
logistics coordinator is beside this main task also responsible for the availability of the raw materials.
The function of logistics coordinator is created years ago. The same person is fulfilling this function
since the start. His focus was not on documenting his tasks which created a lack of documentation of
his tasks. Next to that, the logistics coordinator is very experienced at CVP and has a lot of tacit
knowledge. This enables him to solve many problems, but other people are missing this tacit
knowledge when they have to replace him.
Important colleagues are the supply coordinators. In consultation with them they are together
responsible for the creation of the production and running planning.
Documentation and visualization are necessary to define the tasks of the logistics coordinator. The
knowledge is for a major part gained by the logistics coordinator, so one of the challenges will be to
let him tell and explain his tasks and let him share his knowledge.
Summarized
The logistics coordinators fulfills a critical function in the supply chain of polyols. At the moment a
lack of documentation of his tasks makes it difficult to replace this person in order to operate the
units on a optimal level. Clear documentation and visualization of the tasks of the logistics operator
should improve the insights in his tasks and avoid future problems replacing this function and person.
Project goal
TU Delft Master thesis project – R.M.T. van Oss
Improving the insights in the tasks of the logistics coordinator by creating a structured visualization
and documentation of the tasks of the logistics coordinator. The documentation makes it easier to
replace the logistics coordinator when this person is not available. During the information gathering
with the key stakeholders, attention is also given to possible points of improvement related to the
tasks of the logistics coordinator.
Project team
Before it is possible to come up with solutions and recommendations it is necessary to set up a
project team. All key stakeholders involved in this project should also be involved in the project
team. This project team consist only of three members. The role of the project team leader should be
performed by a extra person, because the logistics coordinator describes his own role and the
production supervisor should test the documentation, based on his experience to replace the
logistics coordinator. So the third person is necessary, to describe and document the tasks of the
logistics coordinator.
• Project team leader
• Logistics coordinator
• Production supervisor
Actor perspectives
There are two main stakeholders involved in this project. The most important actor is the logistics
coordinator. This person is extremely experienced at CVP. He gained, during many years of
experience, a lot of tacit knowledge. From his perspective it is important to share this tacit
knowledge and to make sure that his tasks are backed up when he is not available to execute his
tasks. However it is difficult to share all his knowledge, because many tasks seems so logical because
he has executed them for many years.
The second actor involved is the production supervisor. His main interest is to visualize and
document the critical tasks performed by the production supervisor. His absence during the last
summer made clear that insights in the tasks of the logistics coordinator is missing to execute all the
critical tasks in a proper way when he is not available.
Besides these actors are also the supply coordinators involved. They have contact on a frequent base
(daily) with the logistics coordinator and are aware of some of the tasks executed by the logistics
coordinator. They can be used as information source, but are not part of the project team.
The actor perspectives are not conflicting, however they have both slightly different expectations.
The challenge will be to gather enough information from the logistics coordinator to be able to
document all the critical steps in a simple and clear way.
8.3 Measure
The previous paragraph defined the problem in more detail. The main question is how can future
problems be avoided when the logistics coordinator is not available to perform his tasks? With focus
on creating more insights in the tasks of the logistics coordinator.
Constraints
Efficiency analysis of a planning process in chemical industry
Pro
ject
2:
Insi
gh
ts i
n t
ask
s lo
gis
tics
co
ord
ina
tor
81
There is only one really important constrain which is related to the logistics coordinator. Because the
success of this opportunity is depending on the input and information provided by him. His available
time for this project will be important for the success of this project.
8.4 Analyze
Causes (problem situation)
The real causes for this problem situation are already previously mentioned and explained. The main
cause will be shortly repeated. The reason is the lack of documentation on the tasks of the logistics
coordinator. The function of logistics coordinator was created a couple of years ago. During the last
years the logistics coordinator slowly developed his own working manners and tasks in order to make
sure that the units are operating in a optimal way. Many years of experience created a lot of tacit
knowledge, which is used to perform the tasks. A lack of documentation of this tasks makes it
difficult to replace this function properly.
8.5 Improve
Solution
The improve phase describes the designed solution. The solution focuses on visualization and
documentation of the tasks performed by the logistics coordinator. After performing several
interviews with key stakeholders and performing some analysis on other comparable documentation
and procedures of tasks of employees, is chosen to use process flow diagrams. The process flow
diagrams make it possible to define the different tasks clear and simple in a schematic overview.
Explanation per process step can be defined in more detail, which makes it also possible to define
some complex tasks in a simple and clear overview.
Figure 29 presented below provides an overview of the main tasks executed by the logistics
coordinator. Every step is explained in more detail in Appendix 10.
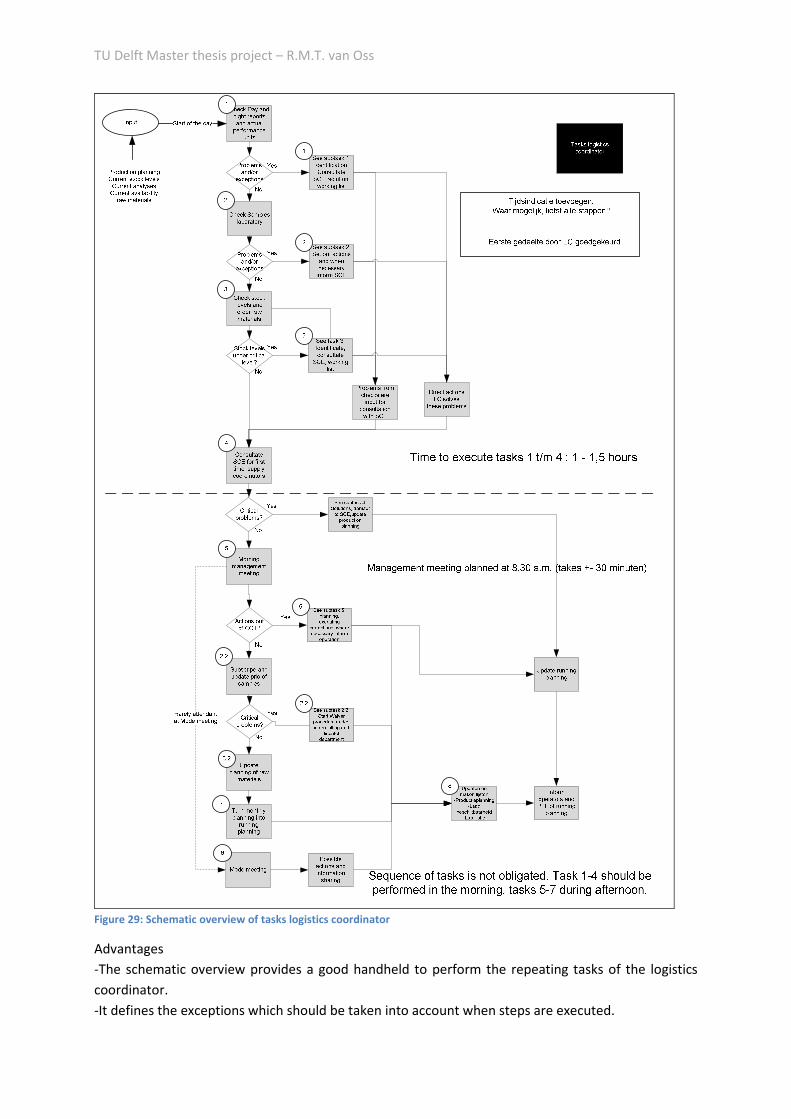
TU Delft Master thesis project – R.M.T. van Oss
Figure 29: Schematic overview of tasks logistics coordinator
Advantages
-The schematic overview provides a good handheld to perform the repeating tasks of the logistics
coordinator.
-It defines the exceptions which should be taken into account when steps are executed.
Efficiency analysis of a planning process in chemical industry
Pro
ject
2:
Insi
gh
ts i
n t
ask
s lo
gis
tics
co
ord
ina
tor
83
-It makes it possible to perform all critical tasks of the logistics coordinator, which should enable
optimal operations of the unit.
Disadvantages
-It is impossible to write down all the tacit knowledge gained by the logistics coordinator.
-Unexpected situations are hard to document. Only the normal routine tasks are captured in the
documentation. When the logistics coordinator will replaced definitively, it still needs some overlap
time with the current logistics coordinator, to get feeling with handling some unexpected situations.
Process – project team
During this project there are only three persons involved of which one person is the real key
stakeholder during the process; the logistics coordinator. The logistics coordinator contains the
experience and knowledge which has to be documented and visualized by the project team leader.
The role of the production supervisor is more an assessing role, this person is not directly involved in
the project. So the core values are less of importance during this project, and mostly aimed at the
cooperation between the logistics coordinator and the project team leader.
Openness: Openness is the key core value in this project. Because the logistics coordinator has to
have the feeling that he can give insights in all his tasks. By being a critical listener as project team
leader the best possible environment is created. Several meetings should be planned and progress
on documentation should be shared. This way the logistics coordinator is constantly updated about
the project and experiences a open environment.
Protection of core values: The logistics coordinator should be able to change the process, an exit
option is not really possible because all stakeholders are necessary for the project. The
documentation should only be send to other stakeholders when the key stakeholders agree on this.
Progress: The project team leader will ensure that there is enough progress and results are delivered.
However it is important that there is a right balance of the total duration of the project. The project
cannot be too short, because the logistics coordinator is not able to share all his tacit knowledge at
once. But the project cannot take too long because the interest will lose. By splitting up the tasks the
idea of quick wins is created.
Substance: The substance is safeguarded by the production supervisor. His experience and expertise
will be used to check the content and can direct the project during when necessary.
Stakeholder involvement
This project is most of the time dealing with only one main stakeholders besides the project team
leader. The commitment for the project was already created during earlier phases. Several
involvement activities are organized to keep this involvement. The most important elements of the
stakeholder involvement are hereunder described (Buhrmann unknown).
• When are the stakeholders involved
The logistics coordinator is the key element in this project. He is involved at the start of the
project. The production supervisor is only involved at the start of the project to define his
interests and at the end to evaluate and assess the project results.
• Roles and responsibilities of the stakeholders in the project team
The logistics coordinator only provide input and information. The project team leader is
responsible to use the input to design a schematic overview of the insights in the tasks of the
logistics coordinator. He is also responsible for the progress of the research and keep the
TU Delft Master thesis project – R.M.T. van Oss
stakeholder updated of the progress. An important role in this project is to keep the logistics
coordinator committed, because he is the key information holder.
• Required skills
The project team leader should be able to keep the progress going and he has to keep a right
balance between quality, budget and the time constraints. The logistics coordinator has to be
able to explain his tasks in detail.
• Reporting procedures
The project team leader is responsible to set up project team meetings which are used to
report the progress. Only one finalizing meeting will be organized with the complete project
team. Other meetings will be organized on frequent basis not periodically planned, but based
on results and availability of the logistics coordinator.
The project meetings which are used to report the progress, are also used as involvement activities.
One final meeting is planned, when the project is finalized and the results are secured, to evaluate
the process. The involvement of the production supervisor creates an incentive for the logistics
coordinator to stay committed.
When the control phase is not yet finished, the project lead could when necessary be handed over to
the production supervisor. lead who will make sure that the project is finalized.
8.6 Control
The control phase is, as previously explained, not executed for this project. The project findings and
project documentation is formalized and secured in the organization. During middle and/or long
term periods of absence of the logistics coordinator, could the documentation be controlled.
8.7 Conclusions
Four of the five development phases of DMAIC are executed and presented in this chapter. The
define phase stated the project goal as follows: In order to avoid future problems during absence of
the logistics coordinator, insights in his tasks should be created and a clear documentation is
necessary. The first phase also gave insights in the current situation and set up a project team,
consisting of a project team leader, logistics coordinator and the production supervisor of
manufacturing.
The measure phase provided insights in the actor perspectives and the constraints. It became clear
that the logistics coordinator was a crucial link in this process and that the involved actors
perspectives and interests were not conflicting.
The analyze phases provided insights in the problem situation and causes in more detail. During the
last years the logistics coordinator slowly developed his own working manners and tasks to make
sure that the units are operating in an optimal way.
To improve the current situation, insights were generated. The focus of the documentation was on
clear visualization of the tasks performed by the logistics coordinator.
It was not possible to execute the control step, because this can only be done during middle or long
term absence of the logistics coordinator. However, all project findings were transferred to the
logistics coordinator and production supervisor. The production supervisor is in the lead during
middle or long term absence to test the solution and make improvements when necessary.
Efficiency analysis of a planning process in chemical industry
Pro
ject
3:
De
lays
of
lab
ora
tory
an
aly
ses
85
9. Project 3: Delays of laboratory analyses
9.1 Introduction
This chapter explains and describes the five development phases of the DMAIC methodology for the
third project. The third project is focused on the delays of laboratory analyses; target times vs. actual
times. The structure of the previous two chapters is used again. Not all project development phases
were executed, because the project is used as opportunity framing for the laboratory. For this reason
the chapter describes the define, measure and analyze phases. The results of these phases are
presented to the laboratory. After this presentation, the project including follow up actions, was
transferred to the laboratory.
Paragraph 9.2 describes the define phase, paragraph 9.3 goes further into detail on the measure
phase. Paragraph 9.4 and 9.5 describe respectively the analyze and improve phases. The control
phase is described in paragraph 9.6 and finally paragraph 9.7 presents conclusions.
9.2 Define
This opportunity is selected because it has a high impact and it is related to opportunity 1. Necessary
insights in the delays of the laboratory are required to be able to define the potential benefits of the
first opportunity; changing the flexibility of the supply chain. But it is difficult to process this
opportunity entirely, because of involvement of the laboratory. As defined in chapter 3, the
laboratory is located on the edge of the scope of this research. Because the laboratory is a different,
independent department with an own organization at Shell Pernis. CVP as chemical unit, is only
responsible for a minor part of all the tasks of the laboratory. Another argument to not process this
opportunity entirely is that the laboratory is also reorganizing at the moment.
For this reason, only the opportunity framing of this opportunity is executed. The analysis will be
presented and some recommendations are given to improve the process in the future, or at least
new targets are defined that could help to improve the performance of the laboratory to CVP. The
analysis will also be presented to the focal point of the laboratory. However, a project team will not
be formed, so this will be presented as a follow up action with the rest of the recommendations.
As already explained in paragraph 5.2, target times are used by the laboratory to define the expected
time to deliver a analysis of a sample. In practice there is a difference between actual analysis time
and target time of the analysis. But the exact difference between these times is unknown. When the
analysis of a sample is delayed, this could have consequences for the entire supply chain. Because
planned deliveries are experiencing delays, tanks are not emptied according to plan and several
other parts of the supply chain are experiencing consequences caused by the delay of the analysis.
Necessary insights are missing at the moment to define the seriousness of the problem. Especially
because the laboratory is an external unit, a thorough analysis of their results is necessary.
Summary
The laboratory is currently working with target analysis times instead of actual analysis times. This
creates uncertainty within the supply chain of polyols and sometimes has negative effects on the
performance of the supply chain. Necessary insights are missing to define these problems more
precisely.
TU Delft Master thesis project – R.M.T. van Oss
Project goal
Perform an analysis which shows the differences between target analysis times set by the laboratory
and actual analysis times. Based on this analysis and created insights it should be possible to make
recommendations to the laboratory and inform them. When necessary the project lead will be
handed over to the focal point of the laboratory.
Project team
As previously explained is no project team set up for this opportunity. The results of the analysis will
be communicated and presented to CVP and finally when necessary to the focal point of the
laboratory. Below are the keys stakeholders involved listed, but they cannot be defined as project
members:
• Intern who is performing the analyses
• Production specialist
• Laboratory focal point
Actor perspectives
It is very clear that there are two different actor perspectives. This involves out of the different
interests of both stakeholders. The production specialist is interested in a sample analysis as quick a
possible, but more important, as reliable as possible. This has two aspects, the first one is a quality
aspect, which is not taken into account and the second aspect is a time aspect. Is the sample ready
on the time that it is expected to be ready. The perspective of the production specialist is that the
laboratory is a service, which should create no extra delays and/or problems.
The opinion of the laboratory focal point is that they are performing better than used to be and they
are still working on improvements. By working with target times, they can offer the fastest services
as possible, but not always. They have never seen an analysis that they are not performing well
enough.
9.3 Measure
Paragraph 9.2 already explained the problem in more detail. The goal of this opportunity is slightly
different than by the other opportunities, caused by the involvement of the laboratory which is
explained in chapter 5.
The main question is: What is the current performance of the laboratory related to analyses done for
CVP? At the moment involved stakeholders have the feeling that there is a difference between actual
analysis times and target analysis times, but this is not based on data analyses.
Constraints
The laboratory has some hard constraints. The most important ones are capacity related, which is a
argument why samples are not always delivered on time. The second one is a constrain related to
CVP. CVP is one of the two chemical units at Shell Pernis. The chemical units are not as big as the oil
units are at Shell Pernis. In other words, they are less important and have a much lower turnover
rate. This creates a situation in which the interests and wishes of CVP are less important than the
wishes of the oil units for the laboratory. Because sometimes decisions are necessary, they are often
made in advantage of the oil units.
Other constraints are the delivery time of CVP and the operational hours of the laboratory. CVP is
depending on their production progression and can only provides samples after the production is
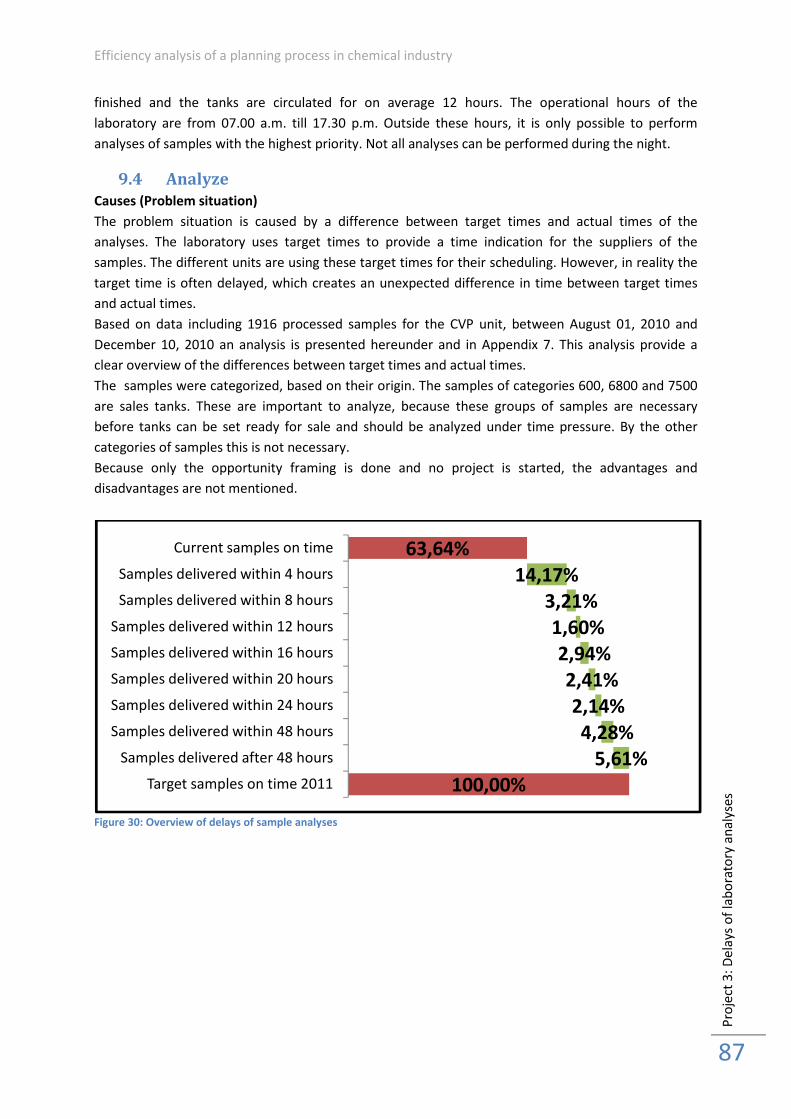
Efficiency analysis of a planning process in chemical industry
Pro
ject
3:
De
lays
of
lab
ora
tory
an
aly
ses
87
finished and the tanks are circulated for on average 12 hours. The operational hours of the
laboratory are from 07.00 a.m. till 17.30 p.m. Outside these hours, it is only possible to perform
analyses of samples with the highest priority. Not all analyses can be performed during the night.
9.4 Analyze
Causes (Problem situation)
The problem situation is caused by a difference between target times and actual times of the
analyses. The laboratory uses target times to provide a time indication for the suppliers of the
samples. The different units are using these target times for their scheduling. However, in reality the
target time is often delayed, which creates an unexpected difference in time between target times
and actual times.
Based on data including 1916 processed samples for the CVP unit, between August 01, 2010 and
December 10, 2010 an analysis is presented hereunder and in Appendix 7. This analysis provide a
clear overview of the differences between target times and actual times.
The samples were categorized, based on their origin. The samples of categories 600, 6800 and 7500
are sales tanks. These are important to analyze, because these groups of samples are necessary
before tanks can be set ready for sale and should be analyzed under time pressure. By the other
categories of samples this is not necessary.
Because only the opportunity framing is done and no project is started, the advantages and
disadvantages are not mentioned.
Figure 30: Overview of delays of sample analyses
63,64%
100,00%
14,17%
3,21%
1,60%
2,94%
2,41%
2,14%
4,28%
5,61%
Current samples on time
Samples delivered within 4 hours
Samples delivered within 8 hours
Samples delivered within 12 hours
Samples delivered within 16 hours
Samples delivered within 20 hours
Samples delivered within 24 hours
Samples delivered within 48 hours
Samples delivered after 48 hours
Target samples on time 2011
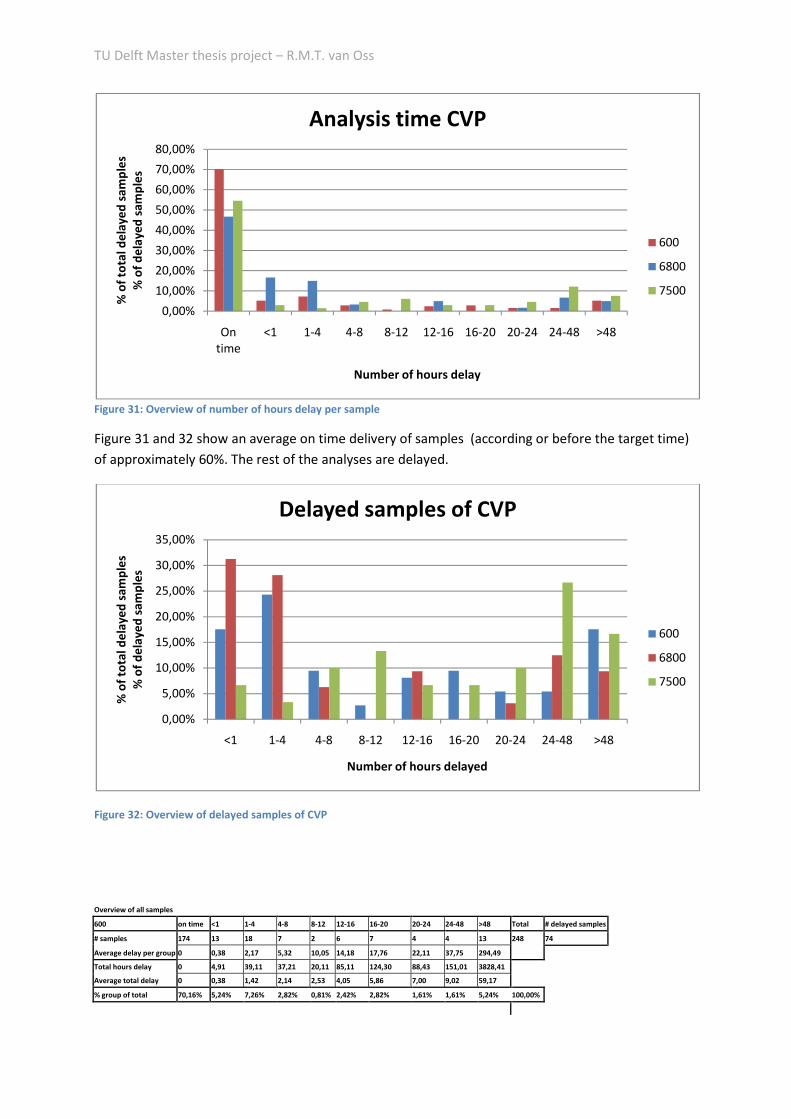
TU Delft Master thesis project – R.M.T. van Oss
Figure 31: Overview of number of hours delay per sample
Figure 31 and 32 show an average on time delivery of samples (according or before the target time)
of approximately 60%. The rest of the analyses are delayed.
Figure 32: Overview of delayed samples of CVP
Overview of all samples
600 on time <1 1-4 4-8 8-12 12-16 16-20 20-24 24-48 >48 Total # delayed samples
# samples 174 13 18 7 2 6 7 4 4 13 248 74
Average delay per group 0 0,38 2,17 5,32 10,05 14,18 17,76 22,11 37,75 294,49
Total hours delay 0 4,91 39,11 37,21 20,11 85,11 124,30 88,43 151,01 3828,41
Average total delay 0 0,38 1,42 2,14 2,53 4,05 5,86 7,00 9,02 59,17
% group of total 70,16% 5,24% 7,26% 2,82% 0,81% 2,42% 2,82% 1,61% 1,61% 5,24% 100,00%
0,00%
10,00%
20,00%
30,00%
40,00%
50,00%
60,00%
70,00%
80,00%
On
time
<1 1-4 4-8 8-12 12-16 16-20 20-24 24-48 >48
% o
f to
tal
de
lay
ed
sa
mp
les
% o
f d
ela
ye
d s
am
ple
s
Number of hours delay
Analysis time CVP
600
6800
7500
0,00%
5,00%
10,00%
15,00%
20,00%
25,00%
30,00%
35,00%
<1 1-4 4-8 8-12 12-16 16-20 20-24 24-48 >48
% o
f to
tal
de
lay
ed
sa
mp
les
% o
f d
ela
ye
d s
am
ple
s
Number of hours delayed
Delayed samples of CVP
600
6800
7500
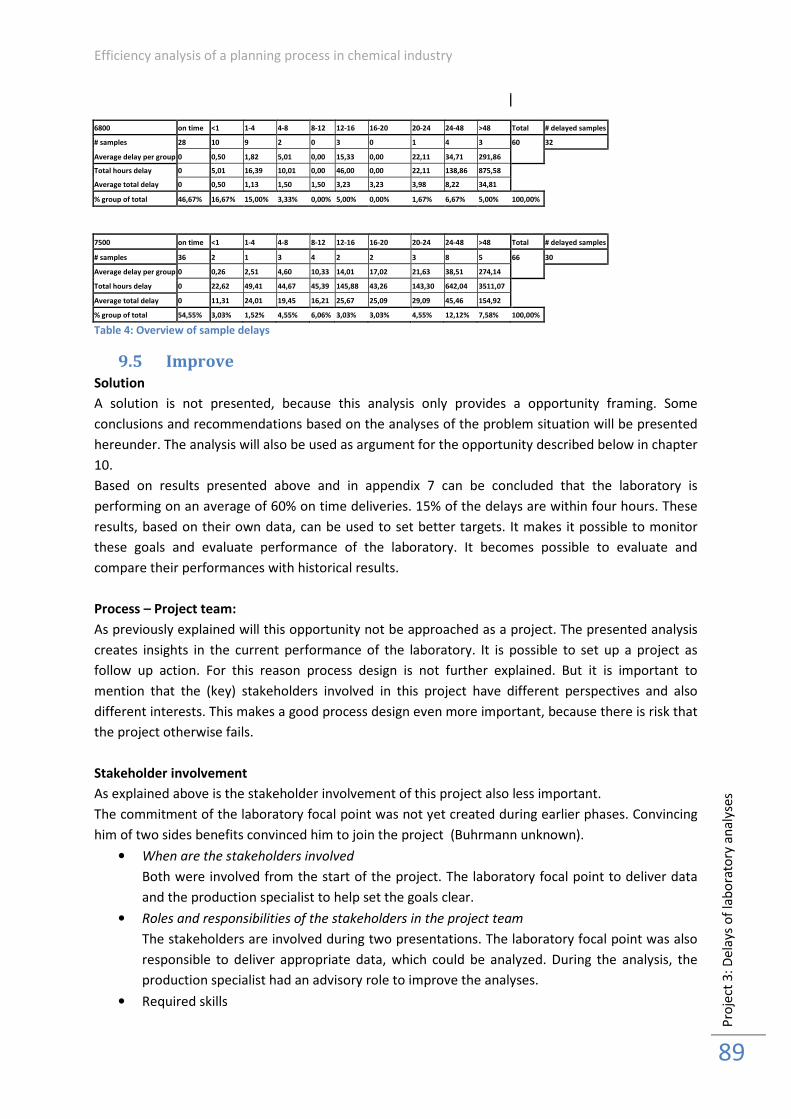
Efficiency analysis of a planning process in chemical industry
Pro
ject
3:
De
lays
of
lab
ora
tory
an
aly
ses
89
6800 on time <1 1-4 4-8 8-12 12-16 16-20 20-24 24-48 >48 Total # delayed samples
# samples 28 10 9 2 0 3 0 1 4 3 60 32
Average delay per group 0 0,50 1,82 5,01 0,00 15,33 0,00 22,11 34,71 291,86
Total hours delay 0 5,01 16,39 10,01 0,00 46,00 0,00 22,11 138,86 875,58
Average total delay 0 0,50 1,13 1,50 1,50 3,23 3,23 3,98 8,22 34,81
% group of total 46,67% 16,67% 15,00% 3,33% 0,00% 5,00% 0,00% 1,67% 6,67% 5,00% 100,00%
7500 on time <1 1-4 4-8 8-12 12-16 16-20 20-24 24-48 >48 Total # delayed samples
# samples 36 2 1 3 4 2 2 3 8 5 66 30
Average delay per group 0 0,26 2,51 4,60 10,33 14,01 17,02 21,63 38,51 274,14
Total hours delay 0 22,62 49,41 44,67 45,39 145,88 43,26 143,30 642,04 3511,07
Average total delay 0 11,31 24,01 19,45 16,21 25,67 25,09 29,09 45,46 154,92
% group of total 54,55% 3,03% 1,52% 4,55% 6,06% 3,03% 3,03% 4,55% 12,12% 7,58% 100,00%
Table 4: Overview of sample delays
9.5 Improve
Solution
A solution is not presented, because this analysis only provides a opportunity framing. Some
conclusions and recommendations based on the analyses of the problem situation will be presented
hereunder. The analysis will also be used as argument for the opportunity described below in chapter
10.
Based on results presented above and in appendix 7 can be concluded that the laboratory is
performing on an average of 60% on time deliveries. 15% of the delays are within four hours. These
results, based on their own data, can be used to set better targets. It makes it possible to monitor
these goals and evaluate performance of the laboratory. It becomes possible to evaluate and
compare their performances with historical results.
Process – Project team:
As previously explained will this opportunity not be approached as a project. The presented analysis
creates insights in the current performance of the laboratory. It is possible to set up a project as
follow up action. For this reason process design is not further explained. But it is important to
mention that the (key) stakeholders involved in this project have different perspectives and also
different interests. This makes a good process design even more important, because there is risk that
the project otherwise fails.
Stakeholder involvement
As explained above is the stakeholder involvement of this project also less important.
The commitment of the laboratory focal point was not yet created during earlier phases. Convincing
him of two sides benefits convinced him to join the project (Buhrmann unknown).
• When are the stakeholders involved
Both were involved from the start of the project. The laboratory focal point to deliver data
and the production specialist to help set the goals clear.
• Roles and responsibilities of the stakeholders in the project team
The stakeholders are involved during two presentations. The laboratory focal point was also
responsible to deliver appropriate data, which could be analyzed. During the analysis, the
production specialist had an advisory role to improve the analyses.
• Required skills
TU Delft Master thesis project – R.M.T. van Oss
The project team leader should be able to analyze the data and come up with a solution. A
balance between quality and time is necessary.
• Reporting procedures
The project team leader is responsible to set up project team meetings which are presents
the result and finally should convince the laboratory focal point of taking follow up actions.
Two presentation are planned, one to present initial results and a second one to present
more focused results.
As previously explained is the project lead could handed over to the laboratory focal point, who will
make sure that the project is finalized.
9.6 Control
The control phase was not executed, because the project was executed as opportunity framing for
improvements made by the laboratory. After presenting the results to the laboratory, the project
was transferred to them.
9.7 Conclusions
Three of the five development phases of DMAIC are executed completely and presented in this
chapter. The fourth and fifth are not executed, because this project was executed as opportunity
framing for the laboratory. The laboratory is an independent operating organization at Shell Pernis.
For this reason, the insights of the analyses are presented to the laboratory and they use it to take
action and improve their performance.
The define phase stated the project goal as follows: Perform an analysis which shows the differences
between target times and actual times set by the laboratory. The first phase also gave insights in the
current situation and set up a project team, consisting of an intern, who performed the analyses, a
production specialist of CVP manufacturing and the laboratory focal point.
The measure phase provided insights in the actor perspectives and the constraints. It became clear
that two involved actors have different perspectives and different interests, although they have the
same high level goal. The constraints of the laboratory are more complicated than expected. They
deal with capacity constraints. They cannot process all analyses 24/7 and sometimes they are forced
to make tradeoffs between the oil departments and chemical departments.
The analyze phases provided insights in the problem situation and causes in more detail. It analyzed a
large data set of sample deliveries, which provided insights in the current performance of the
laboratory and the differences between target times and actual times.
The insights created in the first phases of this project created a clear opportunity for improvement.
However, as previously explained, the independent status of the laboratory made it impossible to
implement a solution. For this reason, in combination with the complexity of the laboratory
processes, the results were presented to the laboratory as opportunity framing. The insights gave
enough detailed insights to improve the current performance. The involvement of the laboratory
focal point and his commitment to the project in the first three phases, made it easy to transfer the
project and give good confidence that this opportunity framing will result in future performance
improvements.
Efficiency analysis of a planning process in chemical industry
Pro
ject
4:
Op
tim
al
ba
lan
ce b
etw
ee
n i
nve
nto
ry a
nd
fle
xib
ilit
y o
f th
e s
up
ply
ch
ain
91
10. Project 4: Optimal balance between inventory and flexibility of
the supply chain
10.1 Introduction
This chapter explains and describes the five development phases of the DMAIC methodology for the
second project. The fourth project is focused on an optimal balance between inventory and flexibility
of the supply chain. To create this optimal balance, this project focuses on the potential to build in
slack time in the supply chain. The same structure of the chapter is used as in chapter 7. However,
not all project development phases were executed, because the project was not implemented. For
this reason the chapter describes the define, measure, analyze and improve phases.
Paragraph 10.2 describes the define phase, paragraph 10.3 goes further into detail on the measure
phase. Paragraph 10.4 and 10.5 describe respectively the analyze and improve phases. The control
phase is described in paragraph 10.6 and finally paragraph 10.7 presents conclusions.
10.2 Define
Figure 16 ranking of the opportunities defines this opportunity in box ‘plan to do later’ and classifies
it as the one with the highest impact and with the lowest ease of implementation. This classification
is first of all caused by the fact that many factors are influencing this opportunity and secondly
because very elaborated analyses could be necessary to define the optimal balance between
inventory and flexibility of the supply chain. A third argument is that performing these analyses is
extra difficult, because the necessary data is hardly or not at all available.
Create extra slack in the supply chain
However, the balance between inventory and flexibility of the supply chain could also be improved
without finding the optimal balance point between inventory and flexibility of the supply chain, but
by searching for available improvements in the current system and methods. To be able to define
improvements, more detailed insights of the current balance methods between inventory and
flexibility are necessary. Special attention is given to the current flexibility of the supply chain,
namely influenced by the planning process.
Paragraph 5.3 already divided this opportunity in 1a and 1b. Where 1a was defined as create extra
slack in the supply chain and 1b as finding the optimal balance between inventory and flexibility. In
collaboration with key stakeholders is decided to focus on opportunity 1a.
The current situation can be explained as follows. The supply coordinators located at the supply
department at SCE are responsible for the production planning process. They create an initial
production planning in cooperation with the logistic coordinator of the manufacturing department at
CVP. This production planning forms the basis for the running planning, which is used by the
manufacturing department. The Customer Relation Center (CRC) located at SCE creates timeslots,
based on (the production planning) the expected availability of products and the stock levels in the
tanks. The CRC informs the customers/carriers of these available timeslots and is responsible for the
contact about changes with the customer/carriers. The goal of the CRC is trying to maximize the
number of pick up orders within an minimum amount of time. In other words, they try to minimize
the inventory, by creating available time slots for the carriers as soon as possible.
The CRC is responsible to execute a strategy, set by the management of the supply and commercial
department. To argue against this strategy, it is necessary to explain the consequences of this
TU Delft Master thesis project – R.M.T. van Oss
strategy. The main consequence of this philosophy is that the supply chain is dealing with a very tight
schedule. Under ideal circumstances, this is positive, because keeping inventory and producing more
than direct necessary are two of the seven categories of waste defined in the lean manufacturing
tool used by Shell; TIMWOOD (Shingo 1989). The tight schedule helps to keep the inventory as low as
possible and tries to minimize over production. However, current operations proves that there are
also some disadvantages of this philosophy, because the right balance is necessary and a too tight
schedule could create problems and waste as well. These disadvantages occur when the ideal
planned situation changes, caused by problems or delays in the production, analysis or filling and
dispatch parts of the supply chain. TIMWOOD defines unnecessary movement and waiting times also
as waste. For this reason a right balance is necessary.
Before the situation is described in more detail, it is important to understand the main steps of the
manufacturing process. The production is executed at different units and different grades can be
produced at each unit. Each grade defines a different product, with different characteristics. Not only
sales characteristics etc., but also different batch cycle times, circulation times etc. The planning is
based on the expected production time plus the circulation time of the tanks. When the production
and circulation of the tanks are completed, a sample of the final product must be analysed at the
laboratory before it is possible to start the filling and dispatch process. A visualisation of this process
can be find at figure 12; value stream map.
After analyzing these processes presented above and performing interviews with stakeholders, it is
now possible to conclude that two main processes are responsible for the majority of the problems
and issues occurring in the supply chain. The first problem are caused by delays or product quality
issues occurring during the manufacturing processes. The second main reason of issues is caused by
delays or problems with the analyses of the samples.
Product quality related problems and specific production delays are not in the scope of this project,
because they are too much focused on the production processes itself, instead of a focus on the
planning process of the supply chain. It is always possible to improve the production process,
because it will be impossible to reach a 100% reliable manufacturing process.
A second argument to avoid focus on the improvement of the production processes is that there are
already people trying to improve these processes. There are two production specialists at CVP
committed to the mid- and long-term improvements of the product quality and production processes
of the units. Plus there is also a technology department, which tries to improve specific parts of the
current manufacturing processes.
So this narrows our focus on the direction of improvements for this opportunity. In general there are
two ways of solving problems as explained above. The first option is by eliminating the direct cause
and secondly by minimizing the effects of the problems and issues occurring anyway. Eliminating the
direct cause is very difficult because this is, as previously explained, highly related to the production
processes. But minimizing the effects caused by the problems is possible. At the moment the supply
chain is very sensitive to delays and other issues, caused by the strategy to apply a very tight
planning in the supply chain. The planning is based on expected production times, circulation times
and analyzing times. The sum of these times, including a small buffer, are the main input for the
supply coordinators when they create a planning.
Efficiency analysis of a planning process in chemical industry
Pro
ject
4:
Op
tim
al
ba
lan
ce b
etw
ee
n i
nve
nto
ry a
nd
fle
xib
ilit
y o
f th
e s
up
ply
ch
ain
93
When the tanks are circulated and ready for analysis, a sample is taken and send to the laboratory.
The laboratory needs a certain amount of time to process a sample. This depends on the priority of
the sample, determined by the responsible person at the CVP manufacturing department. This
priority is based on the planning, or in other words the planned time of delivery. A higher priority
costs extra money and it is impossible to send all samples with a high priority, because of the
constrained possibilities of the laboratory. Because the priority is based on the planning, the priority
is indirectly determined by the supply coordinators at SCE.
The laboratory is fully active during daytimes, from 07.00 till 17.00. The laboratory is the rest of the
day and night only partly available to execute analyses. See appendix 8 for a overview of the tests
which could be executed during the night.
These constraints create a situation where in the majority of cases, samples are brought to the
laboratory during the morning. These samples with a normal priority are ready at 16.00 or earlier. So
trucks and ships are planned on the same day as the analysis is performed, from 16.00 and onwards.
Summarized
When problems or delays occur during one of the necessary steps before the filling and dispatch
process can be performed, this directly affects carriers or customers, because the scheduled delivery
will be directly affected. In other words, during non-ideal circumstances the planning is too tight,
which has directly negative effects on the carriers and/or customers. Because it is a highly complex
process to produce and analyze polyols, the supply chain experiences many delays etc. caused by
various reasons.
Project goal
This explanation creates the possibility to define the main goal of this project: In order increase the
reliability of the polyols supply chain and diminish the number of issues experienced by the carriers
and customers, slack time between the expected moment that tanks are freed for sale and the time
that deliveries are scheduled, should be included in the planning process.
Project team
The first step to come up with solutions and recommendations, is as already explained, to set up a
project team. All key stakeholders involved in this opportunity should also be involved in the project
team. For this reason the project team consist of six member and one project team leader. The role
of the project team leader can be performed by a extra person or by one of the six member of the
project team:
• Project team leader
• Production specialists
• Product manager
• Logistics coordinator
• Supply coordinator
• Laboratory focal point
• Manager of the Customer Relation Center
TU Delft Master thesis project – R.M.T. van Oss
Actor perspectives
The most important actors are already defined above and are part the project team. However, the
different actor perspectives can be divided into two main groups. First of all the actors involved at
SCE, supply and commercial and the second group of actors involved at CVP.
The first group has two main interests: Minimize costs, maximize profit. Because keeping inventory
costs money, they aim on low inventory and want to minimize the throughput time in the supply
chain. However they are interested in a right balance between minimal costs and reliability. Because
in the end it is also about the customer satisfaction. Higher inventory increases the reliability.
The second group are all actors involved at CVP. They want to produce the best quality and achieve
their targets. So extra flexibility and slack time in the supply chain is welcome, because this reduces
the stress and time pressure to produce and deliver polyols.
10.3 Measure
Paragraph 10.2 already explained the problem in more detail. The main question is how to diminish
the effects, caused by delays in one of the necessary steps performed earlier in the supply chain.
With focus on delays caused during the production or analysis phases.
Constraints
To improve the process, it is necessary to have insights in the current constraints. The four
departments, explained in paragraph 10.2, have different interests. The constraints define the
possibilities without opinions influenced by stakeholders interests.
-Customers demand products on short term. This creates a situation where the maximum amount of
time between production and filling and dispatch is constrained.
-Customer and carriers are often using ‘day trippers’. These carriers arrive late on the day (after
16.00) to transfer the product the next day directly to the customer.
-Extra slack time in the processes and the planning process does not diminish the pressure on the
system. Delivery of products is still demanded. However, it creates possibilities to solve issues on the
short term, before the carriers and customer are necessarily informed and experiencing delays.
-The laboratory is responsible for the analyses of the samples. Some of the analyses can be
performed 24 hours per day, but during normal circumstances the laboratory is only available during
07.00 and 16.00.
10.4 Analyze
Causes (Problem situation)
To come up with solutions, it is necessary to have insights in the issues and problems causing the
delays. As already explained is it possible to define three categories of issues:
• Production problems, causing delays
• Product quality issues, causing delays and need follow up actions
• Sample analysis problems, causing delays, sometimes need follow up actions
Information on these issues is very scarce. However, figure 33 presents an overview of production
problems, based on data material gathered by SCE – commercial department . Figure 33 shows the
dependency of the polyols supply chain on a much broader supply chain. The polyols supply chain
depends on the amount of EO and PO, which is delivered by Shell Moerdijk. Six categories of
problems are mentioned, on which the grey one is related to production problems caused by the
polyols units. This are the production problems and product quality issues stated above.

Efficiency analysis of a planning process in chemical industry
Pro
ject
4:
Op
tim
al
ba
lan
ce b
etw
ee
n i
nve
nto
ry a
nd
fle
xib
ilit
y o
f th
e s
up
ply
ch
ain
95
This figure is deleted for reasons of confidentiality
Figure 33: Various Plants Impact PO Derivatives (Polyols) Performance (Ven 2010)
Figures are known, including impact in time of issues on the PO Derivatives performance in lost kilo
ton PO Derivatives. This information is based on analyses, interviews and email information. Impact
is defined as time required to go back to normal operations. Not normal operations are noticed by
SCE and Manufacturing staff (stress, additional work, etc) and by the customers (product allocations,
uncertainty on product and quality, etc).
Figure 33 presents six categories of issues impacting the performance of the supply chain. Further
research shows a significant share of polyols plant related issues. Especially the polyols plant related
issues create delays at the end of the supply chain, which are, with the current tight schedule,
directly noticed by the customer.
The significant share of polyols plant related issues, show the evidence that there are production
problems causing delays, which legitimates a change of philosophy.
Based on the data gathered by SCE – commercial department, they already made some conclusions
about the performance of Shell 2010. In 2010 CVP was not been able to supply products they wanted
in quantities they wanted. Shell was not as reliable anymore, because they have been dealing with
quality problems. And most important; they changed the delivery date of products very often (Ven
2010). This performance can be compared to the Shell Customer Proposition stated at their site: ‘We
supply globally and reliably, good quality products’ (Unknown 2010).
After providing data and arguments on the production problem, the first two problem categories;
production problems and product quality issues, are explained. The last category is about delays in
the sample analysis. The laboratory is currently working with target times instead of real delivery
times. Already defined as opportunity 10; delays of laboratory analyses. Figure 34 presents a
overview of the delayed samples. The delays are compared to the target time set by the laboratory.
The available data used starts at August 01, 2010 and ends at December 10, 2010. In total 1916 tests
of samples were used as data set. Appendix 7 shows the results of this analysis. A remark is
necessary, because the averages delays are higher caused by several analyses which were more days
delayed, which is not comparable to reality. It is possible to delete these samples from the data set,
but this was not necessary because the results were still useful enough to provide arguments to
change the planning philosophy and build in slack.
The graph below presents the results for the samples 600, 6800 and 7500. These are the most
important categories to analyze. Because this are samples taken from the tanks filled with products
ready to use by the filling and dispatch department. The other analyses are not taken under time
pressure. These three categories represents the analyses of the samples which are necessary at
16.00 o’clock.
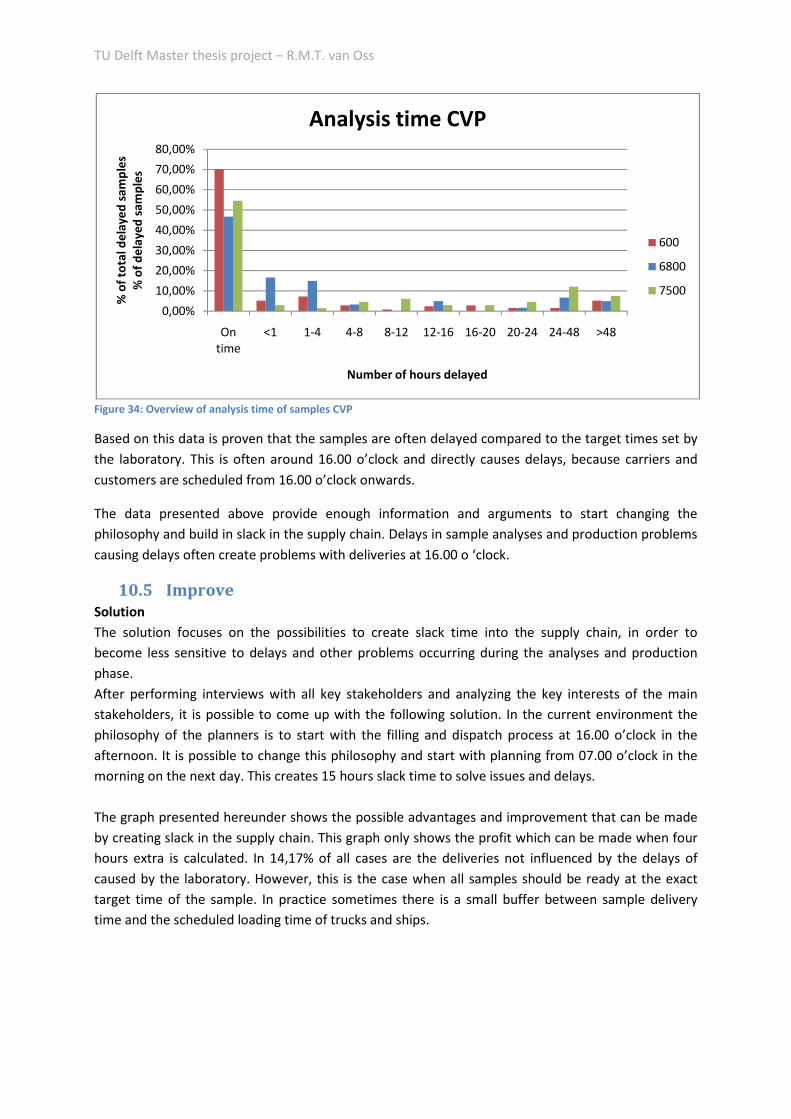
TU Delft Master thesis project – R.M.T. van Oss
Figure 34: Overview of analysis time of samples CVP
Based on this data is proven that the samples are often delayed compared to the target times set by
the laboratory. This is often around 16.00 o’clock and directly causes delays, because carriers and
customers are scheduled from 16.00 o’clock onwards.
The data presented above provide enough information and arguments to start changing the
philosophy and build in slack in the supply chain. Delays in sample analyses and production problems
causing delays often create problems with deliveries at 16.00 o ‘clock.
10.5 Improve
Solution
The solution focuses on the possibilities to create slack time into the supply chain, in order to
become less sensitive to delays and other problems occurring during the analyses and production
phase.
After performing interviews with all key stakeholders and analyzing the key interests of the main
stakeholders, it is possible to come up with the following solution. In the current environment the
philosophy of the planners is to start with the filling and dispatch process at 16.00 o’clock in the
afternoon. It is possible to change this philosophy and start with planning from 07.00 o’clock in the
morning on the next day. This creates 15 hours slack time to solve issues and delays.
The graph presented hereunder shows the possible advantages and improvement that can be made
by creating slack in the supply chain. This graph only shows the profit which can be made when four
hours extra is calculated. In 14,17% of all cases are the deliveries not influenced by the delays of
caused by the laboratory. However, this is the case when all samples should be ready at the exact
target time of the sample. In practice sometimes there is a small buffer between sample delivery
time and the scheduled loading time of trucks and ships.
0,00%
10,00%
20,00%
30,00%
40,00%
50,00%
60,00%
70,00%
80,00%
On
time
<1 1-4 4-8 8-12 12-16 16-20 20-24 24-48 >48
% o
f to
tal
de
lay
ed
sa
mp
les
% o
f d
ela
ye
d s
am
ple
s
Number of hours delayed
Analysis time CVP
600
6800
7500
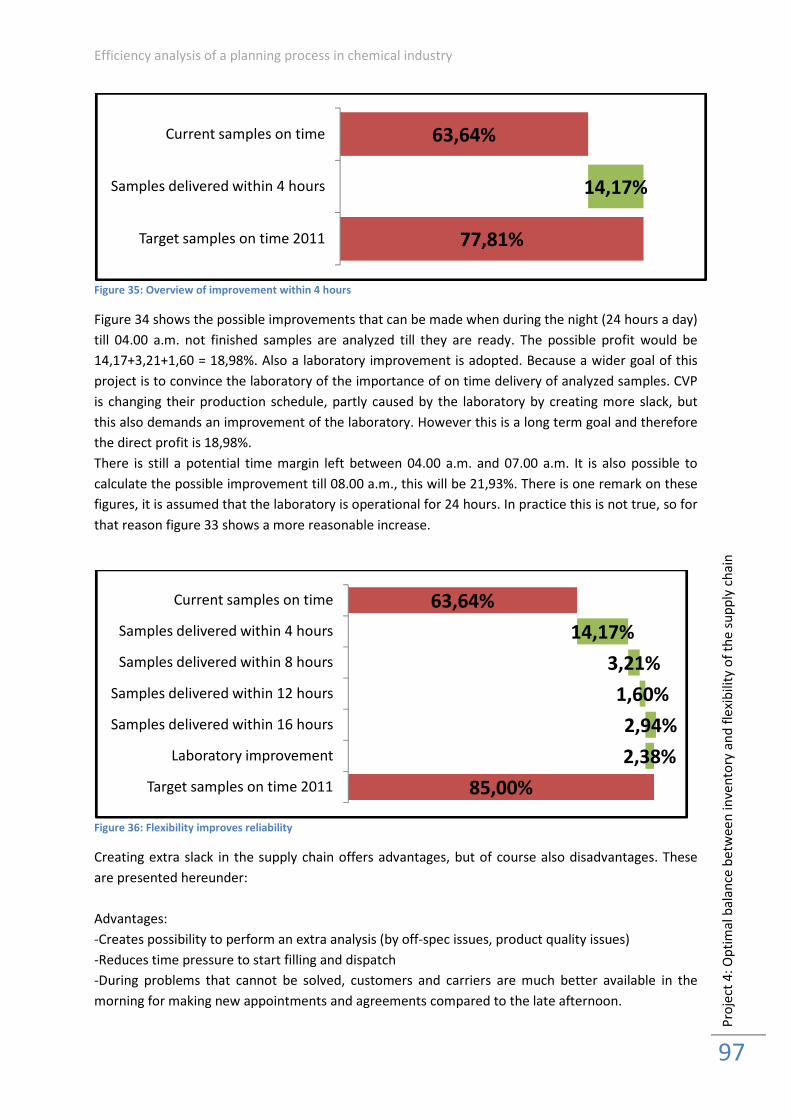
Efficiency analysis of a planning process in chemical industry
Pro
ject
4:
Op
tim
al
ba
lan
ce b
etw
ee
n i
nve
nto
ry a
nd
fle
xib
ilit
y o
f th
e s
up
ply
ch
ain
97
Figure 35: Overview of improvement within 4 hours
Figure 34 shows the possible improvements that can be made when during the night (24 hours a day)
till 04.00 a.m. not finished samples are analyzed till they are ready. The possible profit would be
14,17+3,21+1,60 = 18,98%. Also a laboratory improvement is adopted. Because a wider goal of this
project is to convince the laboratory of the importance of on time delivery of analyzed samples. CVP
is changing their production schedule, partly caused by the laboratory by creating more slack, but
this also demands an improvement of the laboratory. However this is a long term goal and therefore
the direct profit is 18,98%.
There is still a potential time margin left between 04.00 a.m. and 07.00 a.m. It is also possible to
calculate the possible improvement till 08.00 a.m., this will be 21,93%. There is one remark on these
figures, it is assumed that the laboratory is operational for 24 hours. In practice this is not true, so for
that reason figure 33 shows a more reasonable increase.
Figure 36: Flexibility improves reliability
Creating extra slack in the supply chain offers advantages, but of course also disadvantages. These
are presented hereunder:
Advantages:
-Creates possibility to perform an extra analysis (by off-spec issues, product quality issues)
-Reduces time pressure to start filling and dispatch
-During problems that cannot be solved, customers and carriers are much better available in the
morning for making new appointments and agreements compared to the late afternoon.
63,64%
77,81%
14,17%
Current samples on time
Samples delivered within 4 hours
Target samples on time 2011
63,64%
85,00%
14,17%
3,21%
1,60%
2,94%
2,38%
Current samples on time
Samples delivered within 4 hours
Samples delivered within 8 hours
Samples delivered within 12 hours
Samples delivered within 16 hours
Laboratory improvement
Target samples on time 2011
TU Delft Master thesis project – R.M.T. van Oss
-Pressure on loading slots reduces. Because trucks are no longer (or less) using a loading slot without
getting products.
-Extra flexibility reduces the pressure on the involved employees, which reduces the stress factor.
This advantage is related to HSSE and the work environment.
-The pressure of delivery shifts from moment of delivery to hours before delivery. Customers and
carriers will not experience this pressure, so the perceived reliability of Shell increases.
-Carriers waiting on the site declare waiting cost. In the new situation waiting times on the site are
minimized.
-Maximum production runs can still be scheduled, because the production planning does not change.
-Investments are not necessary. Only a change of philosophy and planning is necessary.
-Pre loading with high risks (by initial off-spec of product quality) are not necessary anymore.
-The laboratory can perform many analyses continue (also at night)
-During the night the Operational Team Leader can be made responsible to perform some necessary
actions.
-It proves how seriously the problems with the laboratory are for CVP. It creates a possibility to
demand improvements of the laboratory.
Disadvantages:
-At 16.30 p.m. day workers are going home. So the problems should be solved before people are
leaving the office.
-The risk exist that problems and issues are transferred to the next morning, instead of using the
slack time.
-The laboratory cannot perform all analyses continuously.
Process – project team
This project has many stakeholders and also the problem itself is very complex as previously
explained. This increases the value of spending attention to design a proper process design. Again
attention is given to the four core values.
Openness: Because many stakeholders are involved, it is the responsibility of the project team leader
to keep all key stakeholders updated and committed to the project. Updates, by emails, telecoms or
during personal meetings face to face are necessary to create openness and share the findings. It is
necessary that all involved stakeholders can comment on these findings and that there is room for
discussion between the different stakeholders. The first phase is to identify the interests of the
stakeholders and try to find out what the possibilities are. This is already done in define phases in the
paragraph 10.2. This paragraph, 10.4, starts analyzing. Before decisions can be made based on this
analysis, everybody should be involved during a meeting in which the findings are presented and the
direction of the solution is defined. This creates openness and makes sure all parties are involved.
Protection of core values: Because many stakeholders are involved in this project, it is very important
that their core values are protected. The feeling should be created that nobody is forced to adopt a
certain behavior to make certain choices against their will. This will be done by offering an exit rule.
In other words, the stakeholders are asked to find out what the potential future possibilities are, but
they can wait with cooperating definitively till the end of the project.
Progress: The project team leader is responsible for the progress and results. This is more difficult
compared to the other projects, because many stakeholders are involved and they have different
interests. The main challenge is to create early participation. By performing many interviews with all
Efficiency analysis of a planning process in chemical industry
Pro
ject
4:
Op
tim
al
ba
lan
ce b
etw
ee
n i
nve
nto
ry a
nd
fle
xib
ilit
y o
f th
e s
up
ply
ch
ain
99
stakeholders involved, early commitment is created. By splitting the opportunity in complex study to
the optimal balance and building in slack, a win situation is delivered on the short term. Follow up
analyses could define the optimal balance point of flexibility and inventory. By involving SCE at the
start up phase of this project and get their support, it becomes possible to generate results. The
analysis is performed and enough arguments are here to build in slack time, it is necessary to
organize a meeting where everybody can share their expectations and constraints. Based on this
meeting new deadlines are set to make sure enough progress is realized.
Substance: It is possible that the focus of the project shifts during the different phases of the project.
Research and analyses of different parts of the supply chain are necessary to create a complete
analyses and this urges sometimes focus on a certain part. Because many stakeholder on a
management level are involved, it is important to visualize and argument the findings of the analyses
strict and careful. Based on these findings follow up actions are required. Substance can be
supported by the knowledge brought by all the involved stakeholders. It is not always necessary to
create solutions, but to combine the ideas of the involved stakeholders. By doing so, the role of
stakeholders is necessary and important and the project team leader creates enough substance by
combining these inputs.
Stakeholder involvement
This project is dealing with several stakeholders. The commitment for the project was already
created during earlier phases. Several involvement activities are organized to keep this involvement.
The most important elements of the stakeholder involvement are hereunder described (Buhrmann
unknown).
• When are the stakeholders involved
After analyzing the data and when the problems were identified, all stakeholders were
involved during individual meetings.
• Roles and responsibilities of the stakeholders in the project team
All stakeholders are part of the process and should agree with the recommended project
solution/ planning philosophy. The project team leader is responsible to define the solution
and create enough support to implement the new design.
• Required skills
The project team leader should be able to keep the progress going and he has to keep a right
balance between quality, budget and the time constraints. The most important skill of the
project team leader in this project is stakeholder management.
• Reporting procedures
The project team leader is responsible to set up project team meetings which are used to
report the progress. Only one finalizing meeting will be organized with the complete project
team. Other meetings will be organized individually and updates are send to the key
stakeholders in this project.
The final project meetings is used to present the designed solution. The project lead could, when
necessary, be handed over to the supply manager.
10.6 Control
The control phase is not executed for this project. The project findings and solutions to improve the
current situation are presented and recommended to the involved team members. The project
members take follow up actions and will execute the control phase when the decision is taken to
TU Delft Master thesis project – R.M.T. van Oss
implement the recommended solution. The control phase will then start with a pilot project. Based
on the monitored results of the pilot study, improvement are made or the decision is taken to not
implement the proposed solution.
10.7 Conclusions
Four of the five development phases of DMAIC are executed and presented in this chapter. The
define phase stated the project goal as follows: In order to increase the reliability of the polyols
supply chain and diminish the number of issues experienced by the carriers and customers, slack
time between the expected moment that tanks are freed for sale and the time that deliveries are
scheduled, should be included in the planning process. The first phase also gave insights in the
current situation and set up a project team, consisting of a project team leader, production
specialists, product manager, logistics coordinator, supply coordinator, laboratory focal point and
manger of the customer relation center.
The measure phase provided insights in the actor perspectives and the constraints. It became clear
that SCE and CVP have different interests, although they have common high level goal. The
constraints are limiting the delivery times and possibilities to build in slack time.
The analyze phases provided insights in the problem situation and causes in more detail. First insights
are given in production and production quality related problems and secondly insights are provided
in the performance of the laboratory and the effects on the reliability of deliveries of the polyols’
supply chain.
To improve the current situation, a solution is presented. This solution includes slack time from 16.00
hr till 07.00 hr the next morning. Slack time has many advantages, but also some disadvantages, for
this reason these are both mentioned.
It was not possible to execute the control step, because it was not possible to implement the solution
within the limited time frame. All project findings were transferred to the production supervisors and
presented to all project team members. The production supervisor is in the lead to take follow up
actions.
Efficiency analysis of a planning process in chemical industry
Pro
ject
ev
alu
ati
on
101
11. Project evaluation
11.1 Introduction
The previous four chapters described the five development phases of the DMAIC projects. Chapter 6
introduced and described the DMAIC methodology, added with some theoretical background which
help to start projects. These methodologies are evaluated generically in chapter 13.
This chapter focuses on the evaluation of the project results and other findings, not related to the
methods, but worth mentioning.
Paragraph 11.2 till 11.5 evaluate the four project first individually. Followed by more general
recommendations and conclusions related to the projects in paragraph 11.6. This paragraph first
discusses the multi actor environment, secondly it spends attention to document the process for
future use. The third sub-paragraph presents recommendations for future change and this paragraph
ends with evaluation and recommendation of communication and documentation within the
organization. Paragraph 11.7 sets the results in context, followed by conclusions in the final
paragraph 11.8.
11.2 Project 1: Feedback of delivery of raw materials
This project is the most elaborated project of all, because it was the only project that was also
completely implemented. Chapter 7 already discussed the results and findings of this project in detail
in the control phase. The project proved that it was related to other problems. Fail in feedback of
delivery of raw materials potentially results in production problems. However, solving these
problems also directly showed other problems. For example improving and structuring the feedback
process from shift 6 to the logistics coordinator shows that there are also problems with the
performances of suppliers.
First some remarks are made on the stakeholder involvement. The pilot project executed in the
control phase, provided insights in the result of the implemented solution. The logistic coordinator
initiated this project during the workshop, which increased his commitment and support during the
development phases. The production administrator was also committed, but less than the logistics
coordinator. By frequently organizing meetings and showing the progress, it was tried to keep their
commitment and support. The four core elements of a process design were used and applied during
the meetings. Shift 6 was informed of the progress and steps made, but were not involved
intensively. After executing the pilot project, it became clear that the senior buyer also played an
important role in the process. She could have gave more insights in the performance of the suppliers
and has the position to influence their behavior. If would have been better to involve her in a earlier
stadium.
The results of the pilot study were satisfying. The steps were secured in the organization by adding
them to checklists. This makes sure the necessary actions are executed every day. During the project
it was necessary to set a clear scope, because the involved team members tended to include more
problems. The project goal defined at the start of the project was useful to keep the scope.
All five development phases were executed during this project. The control phase is only executed in
this project. However, the steps are described in a way that this project can be used to replicate the
control phase in other projects. The nine phases makes it possible to replicate these. The other
phases are also defined in a way it is possible to replicate these steps or apply the steps on similar
projects.
TU Delft Master thesis project – R.M.T. van Oss
11.3 Project 2: Insights in tasks logistics coordinator
A second project was started by providing insights in the tasks of the logistics coordinator. Because
the results of this project can only be monitored and evaluated during nonattendance of the logistics
coordinator for a longer term, the results of this project couldn’t be monitored and evaluated during
the limited time of this research. By successful formalizing the outputs of the project in Shell
procedures, it required an official control and approval of two assessors. The first long term
nonattendance of the logistics coordinator provide possibilities to monitor and evaluate the current
results of the project.
Although there is no monitored data available, the project process can be evaluated. Before the
project was started, the management of Shell Pernis was already focused on the tasks related to the
logistics coordinator. The logistics coordinator knew this fact and was really committed to make the
research successful. During the project it became clear that the Logistics Coordinator is an important
link in the web of CVP. He provides crucial information and makes decisions which affect the
performance of CVP. It is remarkable that within CVP a situation is created in which one person
communicates critical information with many people, but that insights in his task were almost
completely missing.
The project was successful in creating these insights and secured these findings by formalizing them
in official procedures. A constant trade off during the project was the level of detail. Defining and
visualizing all knowledge of the logistics coordinator was not useful and endless, but certain insights
in his tacit knowledge was critical for a complete overview. Finally this trade off was solved with help
of other actors. It is necessary that they are able to perform the tasks of the Logistics Coordinator
during his absence.
The process steps of this project are explained elaborately in chapter 8 and the methods are
explained in chapter 6. However, replication of this particular project is more difficult, because it was
really focused on one person. The majority of information was gathered during interviews with the
Logistics Coordinator and it was not possible to standardize these conversations.
The projects also showed that by solving one problem, other problems come to light. Insights in tasks
of the logistics coordinator were gathered, but during the project also new points of improvement
became apparent. E.g. communication that could be improved, which is explained in more detail in
paragraph 11.6.4. It was not possible to deal with these extra problems, the limited timeframe of the
research made it necessary to focus on the problems within the defined scope.
11.4 Project 3: Delays of laboratory analyses
The third project was focused on the delays of samples handled by the laboratory. A difference
between target times, used by the laboratory and actual times, relevant to CVP initialized this
opportunity. An elaborated analysis of a large data set (1916) of actual sample times compared to
target times, created clear insights and offered an opportunity for follow up actions. The
independent status of the laboratory and the small influence from CVP on the laboratory made it
impossible to finish this project. However the clear structured analysis, unambiguous results and a
well received presentation of these results generated a nice opportunity for follow up actions in the
near future initialized and lead by the laboratory.
This project was obviously more focused on analyzing data and needed less involvement of actors,
compared to the other three projects. During the project, the laboratory was a very important
stakeholder. This relation was different than other relations with actors that were directly involved
with CVP, because the laboratory is an independent organization at Shell Pernis. The relation was
Efficiency analysis of a planning process in chemical industry
Pro
ject
ev
alu
ati
on
103
built on creating benefits for both sides. The analyses presented at an early stage created useful
insights for the laboratory and were well received, which created support and commitment during
the rest of the project.
During this project more complexities were experienced than expected at the beginning. The project
scope was even more important than with other projects, because the laboratory was on the edge of
the research scope and could be perceived as an external party. Extra problems could not be
changed and should not be dealt with. For this reason, this border was more strict and the project
focused more on analyses of data. This resulted in a situation where other problems were less
perceived and included, compared to the other three projects. The analyses are presented to the
laboratory and follow up actions and improvements are expected from their site, because they now
have good insights in the delays, which they didn’t expected.
The process steps are described in detail. The project steps taken can be replicated, because the data
was delivered by the laboratory. This enables a situation in which data could be uniform delivered or
used by other units at Shell Pernis, in order to create similar analyses. These analyses provides better
insights in current performances and potential points of improvement.
11.5 Project 4: Optimal balance between flexibility and inventory
The final project was focused on the optimal balance between flexibility and inventory. Under normal
circumstances was a minimum amount of time planned between production and delivery to trucks
and/ or ships. This created a critical time path in which production delays or analysis delays directly
had consequences on the carriers and/or customers. The analysis executed at the previous project
about samples delays, already provided a good argument to build in more flexibility. After
consultation of all key stakeholders involved, a new planning philosophy was designed. This new
planning method created more room between the end of production and the moment of delivery.
This ‘slack time’ has a minimum negative effect on the availability of products and a significant
increase in the reliability and performance of the supply chain. During normal circumstances
deliveries were planned from 16.00 p.m. and onwards, in the new situation deliveries are planned
from 07.00 a.m.. Which still makes it possible for day trippers to deliver the products on the same
day as before, because they drive directly to the customers instead of the next morning. Because
many stakeholders were involved in this complex project, it was not possible to complete this project
given the limited research time. The new philosophy is agreed on with all stakeholders and
recommended. However, time was too short to implement and evaluate the results, in order to
evaluate and optimize the new planning method. The project team lead is transferred to the
production specialist of manufacturing, who will take follow up actions and finalize the project when
the results are available.
The project is not implemented during this project, which also makes it impossible to monitor the
results of this project. However, it is possible to evaluate the project process. This was probably the
most complicated project to create support on, because building in slack time in a supply chain is
actually a philosophy that is against the Lean Six Sigma theory. Lean defines inventory as one of the
seven wastes (Rother and Shook 2003), but the clear analysis presented in this document, together
with support of many involved stakeholders showed insights in positive effects of slack time and an
increased inventory. Within the limited time, the created support was not enough to start
implementation of this project. Many stakeholders were involved and it was a too complex issue to
realize the implementation within the limited timeframe of this project. It should be remarked that
managing the stakeholders was at least as importance as developing the analysis during this project.
TU Delft Master thesis project – R.M.T. van Oss
The different departments involved in this project all had different preferences, which made it more
difficult to create alignment in time. However, the results and ideas are well received and supported,
the project lead is handed over, so all steps are taken in order to implement the suggested measures
in the near future.
The process of this project is explained in detail, but a big part of this project was related to
stakeholder management. Stakeholder management is less easy to document. The previous chapters
spend attention to this stakeholder management, by e.g. describing a process design, based on the
four core elements, defining up front the actor field etc., but the soft skills are less easy to document.
How to build up relations, how to use an independent position within an organization to bring actors
together etc. is more difficult to map. For this reason the project steps can easily be replicated, but
handling the relations and create support for the project outside the official described process
design, will need soft skills that cannot be documented. And thus the results of similar projects like
this, will also depend on the team lead and his/her position in the organization.
Before the evaluation of this particular project can be finalized, should be remarked that also during
this project new problems came to light. Slack time changes the current planning method, which
potentially demands extra steps and actions of the laboratory, e.g. working times at the laboratory
and sample analyses constraints created new problems. Based on this project can be concluded that
changes are often perceived as problems or that changes results in problems with the existing
constraints of the current system.
11.6 Projects related research evaluation and recommendations
After elaborating in detail on the results of the four executed projects, it is also useful to spend
attention to project related research evaluations and recommendations, which are not specifically
related to one of the four projects. This paragraph addresses some major points of attention, which
could be mentioned after executing the projects, but which are not directly related to one specific
project.
11.6.1 Dealing with the multi-actor environment
A main element during the four projects, was to manage the involved stakeholders. In the second
part of this thesis, an elaborated network analyses was executed to deal with the multi-actor
environment. After executing the four projects, it is possible to evaluate the usefulness of this
network analyses and to define possible points of improvements for future research.
Chapter three presented the elaborated network analysis and showed the multi-actor environment.
This provided clear insights in the most important stakeholders. Based on these insights it was tried
to create wide support by the involved stakeholders for the opportunities, which made it easier to
create commitment for the individual projects. Several measures were taken during this research to
optimize the stakeholder management. The SIPOC workshop was the first measure taken to create
consensus on the processes of the supply chain. These stakeholders were also involved in the follow
up phase, which defined the opportunities.
These opportunities were widely supported by the involved stakeholders, which made it easier to
create commitment for the individual projects. These steps created the expected and satisfying
results and are recommended to replicate during the future replication.
However, there were also some problems experienced related to the multi-actor environment. The
network analysis showed four different departments, located at two different locations. During the
research this was also experienced as a barrier. It was more difficult than expected at the start of the
project, to create support at all four departments for implementation of a project. The focus of the
Efficiency analysis of a planning process in chemical industry
Pro
ject
ev
alu
ati
on
105
individual projects was at the CVP - Pernis location, which made it more difficult to get enough
insights at the SCE - Rotterdam Alexandrium location.
After performing these four projects, some comments can be made on the organizational and formal
chart presented in figure 8 and appendix 2 . The organizational chart defines formal and informal
relations, but in reality there are much more informal relations between the stakeholders. These
relations are important, because project ideas and solutions are shared between these relations. If
the project leader is not aware of these relations, it becomes more difficult to communicate
effectively. This should be solved in the future by executing the network analysis iteratively, and by
creating network analyses per project, at the start of a project, involving the project team members.
11.6.2 Document the process for future use
This thesis described the executed process steps of the four projects in more detail. First the
methodology was explained in chapter 6 and secondly chapter 7 -10 applied the methodology on the
four projects and described the project steps by step. The documentation of these process steps,
makes the approach of this thesis universally applicable within comparable environments.
Based on this research can be concluded that improving a planning process, with the goal to create a
more reliable and predictable supply chain, is an ongoing process. The project started with the
identification of opportunities and listed ten opportunities. Four opportunities were further
processed in order to improve the supply chain, but six opportunities are still left.
Other problems were encountered during the execution of the projects, showing elimination of
opportunities does not result in a waste free supply chain without disruptions. Improving the
performance of the supply chain will be an ongoing process. Now this research is executed once and
all steps are documented clearly in this report, the process can be replicated in the future.
11.6.3 Recommendations for future change
The analysis phase defined ten opportunities. Four opportunities were used to start projects for
improvement of the current supply chain. During the projects, it became clear that many of the
problems in the supply chain are the results of other problems. In other words, many problems and
thus opportunities are related to each other. This means that the effect of some of the minor
problems may look small, but once analyzing and looking further it becomes clear that these small
problems cause other problems, which again cause other problems, and so on. For this reason all
opportunities should be taken seriously, because a small change can have big impact on the
complete system. Although all opportunities could have a big impact, prioritizing the opportunities is
useful, because limited time or resources can force a selection of the opportunities.
11.6.4 Communication and documentation
Findings related to two elements that are not directly linked to one of the four projects, but that are
worth full mentioning are communication and documentation. These findings are presented below
and are based on information gathered in part II – analyze and in part III, information gathered
during the execution of the four projects.
Communication
• The most insights related to communication are gathered at the CVP departments and not at
the SCE departments. Communication between actors within the organization is mainly
formalized. In the current situation many reoccurring scheduled meetings should keep
everybody updated and roles and responsibilities are very clear and formalized. However,
TU Delft Master thesis project – R.M.T. van Oss
caused by this high standard of formalization, people try to keep the units running on an
optimal way. Because the management is not always available and the formal way is time
intensive, decisions are sometimes taken without informing the management as agreed on
before.
• Critical information is shared between the logistics coordinator at CVP and one of the supply
coordinators located at SCE. Together they decide on the production planning, which is
based on a monthly handshake process. The production planning does influence all following
processes and is a critical process in the whole system. The supply coordinators and the
logistics coordinator have contact on a highly frequent basis. This means that they have
several times a day contact by phone and also send each other many confirmation emails.
When problems occur or changes seem necessary, they immediately get in contact and
change plans, mostly on the short term. Because the threshold to get in contact with each
other is almost zero, it is also easier to make changes. The effect is that changes are made
frequently.
An advantage of this approach is that both employees are very experienced and reacting
quickly, many problems are avoided by changing plans and keeping contact on a highly
frequent basis. However, root causes of the problems are not mentioned, shared and/or
diminished. So existing issues are not always solved.
By implementing a higher threshold to get in contact with each other, for example a
maximum of two telecoms per day, a situation is created in which only really necessary
changes are made. Not necessary changes are solved within time between the telecoms and
issues are probably more frequently solved. This could improve the predictability of the
planning of the supply chain.
• The logistics coordinator has a crucial role in the planning process of the supply chain. At the
moment he is the daily link related to planning, between the commercial and supply
departments at SCE, and the production department at CVP. Because this role is mainly
fulfilled by one person, it is crucial that he communicates changes very clear to all
stakeholders involved.
By sending emails to large groups of people, necessary information is shared. But does the
information also reach the key stakeholders, because not everybody is reading emails
instantly. The operators are not included in the emails, they are updated by a new hard copy
production planning, hanged in the control room. However, it is not visual when the planning
is updated. This could be improved by showing the time that the production planning
changed. Sending emails could be improved by calling the key stakeholders and directly
update them.
• The communication between SCE and CVP departments is not performing on a optimal level.
There are restrictions between communication of the commercial department and the
departments at CVP, because of potential conflicts of interests. But there are also natural
restrictions, mostly created by the different locations of the departments of CVP and SCE.
Because the different departments have different interests, openness between the actors is
very important. The four core elements of a process design are explained in paragraph 6.3.3.
These can also be used for the SCE and CVP departments. At the moment it is especially
about openness, because it is not always clear what the interest of the other departments
are. In the end, everybody has the same end goal, namely optimization of the performance
of the complete supply chain. However, the main issue is that everybody has their sub-
Efficiency analysis of a planning process in chemical industry
Pro
ject
ev
alu
ati
on
107
interests. By creating openness about each other’s interest and goals, the understanding is
increased. This understanding creates commitment to each other’s projects. When
information is not completely shared, actions are not always understood, which makes
cooperation less likely.
Documentation
• The logistics coordinator uses four different documents to create and update the production
planning. The four documents are a load availability list, a production planning, a laboratory
list including all samples with priorities and a raw materials planning. All documents provide
necessary insights, however it is possible to connect or integrate them. Integration improves
the possibilities to control the actions. This will be illustrated by the next example: At the
moment the raw materials planning is based on the production planning. Based on this
planning, and a combination of the tacit knowledge of the logistics coordinator, the raw
materials planning is updated. This tacit knowledge enables the logistics coordinator to make
estimations on usage of volumes of raw materials, depending on the production planning.
However, integration between these documents is missing, so the correctness is also not
controlled. An integration of documents make it also more easy to replace the logistics
coordinator. When documents are automatically coupled, they control each other, which
increases the reliability and predictability of the planning process. Which was the main goal
this research. Besides this advantage the tasks of the logistics coordinator become more
transparent which makes it also easier to replace the logistics coordinator, which was a sub
goal of this research; create better insights in this tasks.
• This recommendations is the most generic recommendation of this research and more
focused on the work environment at Shell Pernis or even Shell worldwide. Almost every task
at Shell is described in procedures. It is often necessary to fill in a pre-described and/or
formalized document to approve or get approval for a certain process step or action. The
reasons for this formalization of process steps are highly related to safety measures and the
gigantic dimensions of the company. They are most of the times necessary and serve their
goals, however there should be a constant focus of the management team of CVP to monitor
and evaluate the degree of this formalization. During many interviews signs were received
from employees about an environment which is dealing with over-formalization. This creates
an environment in which behavior starts where people try to avoid these rules and
legislations.
11.7 Results in context
It is now possible, after a elaborated evaluation on different aspects of the research projects, to set
the results in context. The results of the research project can be split into several parts; results of the
analysis, individual project results, general recommendations and a less measurable result, which can
be defined as a certain consciousness created at the organization, caused by the execution of a
research executed by an independent person. The results of the analyses are discussed in this
chapter and not in a previous part of this research, because it was necessary to executed the four
projects, before the usefulness of the analyses became clear.
The results of the analysis phase is surprisingly useful. The phase brought different departments
together and provided insights in their common goal and all process steps executed in the complete
TU Delft Master thesis project – R.M.T. van Oss
supply chain. Besides the detailed description, the insights created better understanding between
the different departments. It offered the opportunity to improve certain aspects and successfully
realize change. Also on the long term, when this project is finished, could this common
understanding of the processes be helpful in order to start improvement projects, which are
overlapping two or more departments.
The individual projects resulted in concrete results. The implemented project already proved its
benefits, but also the other projects presented useful analyses which could improve the performance
of the supply chain in the near future. The insights in the tasks of the logistics coordinator help to
increase the reliability of the supply chain, because problems to replace this function are now
intercepted by using the schematic flow diagrams. The analyses of the delays of lab samples help the
laboratory to more specifically improve their performance. Although the project is not implemented
yet, it already created support at the laboratory. This was an unexpected result of this research,
because at the start of the project the laboratory was defined as an external stakeholder, on the
edge of the scope of this research. The final project resulted in a new presented planning philosophy,
which already has support in the organization. Unfortunately it is not implemented yet, but if the
recommendations are implemented, this will be an unexpected good result. Unexpected, because it
has a significant impact on the whole supply chain, and not only on one aspect or department.
However, the fact that three of the four projects are not implemented or monitored yet, set the
results also in context. Although there is confidence that these project are finished in the near future,
the results would have been more worth full when they were all implemented.
Next to these concrete results, also less measurable results are gained during the research. Some
recommendations provided on documentation and communication are useful. However, at the
beginning of the project it seems that everything and every process could be improved. During the
project it became clear that all processes are related and linked to other processes, which creates
many constraints and made it not so easy to create changes as it was on first sight. By executing
projects in intensive cooperation with some stakeholders, they learned at least a bit to apply some
methods and theories. For example creating insights in the tasks of the logistics coordinator and
visualizing them with help of schematic flow diagrams, was also useful for the Logistics Coordinator.
Next to that, a different and independent viewpoint is provided and shared with them during six
months. This independent viewpoint confronted the organization with their current performance
and ideas. Sometimes it forced them to explain their methods and provide arguments for it, but
probably more important, at the same time they evaluated the usefulness of these ideas and
methods.
11.8 Conclusions and recommendations
This chapter evaluated the projects results and findings in detail on a low aggregated level. The
second, third, fourth and fifth paragraph evaluated the four projects. It evaluated the stakeholder
involvement, experienced complexities, results and the replication possibilities of the projects.
Where possible it provides advices for improvements and does suggestions to organize follow up
meetings, to finalize or monitor the project.
Paragraph 11.6 presented projects related research evaluation and provided recommendations
where possible. It started to describe how to document the process for future use, then it provide
recommendations for future change. It also focused on two more general elements of the
organization, namely documentation and communication. After evaluating these elements, four
Efficiency analysis of a planning process in chemical industry
Pro
ject
ev
alu
ati
on
109
recommendations related to communication, and two recommendations related to documentations
are described.
Paragraph 11.7 set the results of the project in context. It is concluded that only one out of four
projects, was successfully monitored and implemented.
TU Delft Master thesis project – R.M.T. van Oss
12. Transfer knowledge to the organization
12.1 Introduction
The previous chapters focused on the five development phases of the four individual projects and
evaluated the results of these project. Project 1 was implemented and the control phase was
executed for this project. Eight steps were taken to finalize the project and ensure it became
successful. The results of these projects and more general findings gathered during the research,
should be transferred to the organization. This paragraph focuses on steps and methods to transfer
the knowledge to the organization.
Paragraph 12.2 describes the knowledge transfer to the organization, paragraph 12.3 presents and
describes the knowledge transfer model and the last paragraph 12.4 presents the conclusions.
12.2 Knowledge transfer to the organization
The first step of transferring knowledge is taken in chapter 7, by executing the control phase and
close out of a project. These steps can be applied on all projects which are in the control phase. The
limited timeframe forced this research to define follow up actions, because it was not possible to
bring all projects to the control phase and finalize them. The nine described steps (Shell 2008) are
possible to replicate and enable the implementation of the projects. Finally they will come to the
control phase, which makes sure that the results are ready to transfer to the organization. This
chapter describes the steps necessary to transfer the knowledge gathered during the research to the
organization. Information is not confused with knowledge: Information might be thought of as facts
or understood data; however knowledge has to do with flexible and adaptable skills (Stake 2005).
Argote and Ingram (2000) define knowledge transfer as “the process through which one unit (e.g.
group, department) is affected by the experience of another”. How well knowledge remains broadly
accessible within a firm, depends upon the nature of that knowledge: from where or whom it comes,
who gets it and the organizational context within which any transfer occurs. Szulanski (1996)
compares and refers to Stickiness, a concept that derives from the difficulty of circulating fluid
around an oil refinery, including effects of the fluid’s native viscosity.
Blackler (1995) defines five knowledge types, which are useful to define the best method to transfer
the knowledge: embrained, embodied, encultured, embedded and encoded knowledge.
Embedded, encoded and embodied knowledge are the most important knowledge types generated
during this research, which should be transferred to the organization. Embodied knowledge is action
orientated and consists of contextual practices. It is more of a social acquisition. How individuals
interact and interpret their environment, creates this non-explicit type of knowledge. Embedded
knowledge is explicit and resides within systematic routines. It relates to the relationships between
role, technologies, formal procedures and emergent routines within a complex system. Finally
encoded knowledge could be useful to formalize and transfer specific knowledge to the organization.
This type of knowledge deals more with the transmission, storage and interrogation of knowledge.
The first necessary step before the knowledge gained during this research can be transferred, is to
identify the knowledge holder(s). The knowledge holders of this research are known. The key
stakeholders involved during the four individual projects, are up to date on all decisions taken and
arguments to take these decisions. These project members are used by the independent researcher,
which has the lead in this research and is the key knowledge holder, to transfer knowledge to. The
project supervisor also has certain knowledge, but this will not be directly used during this
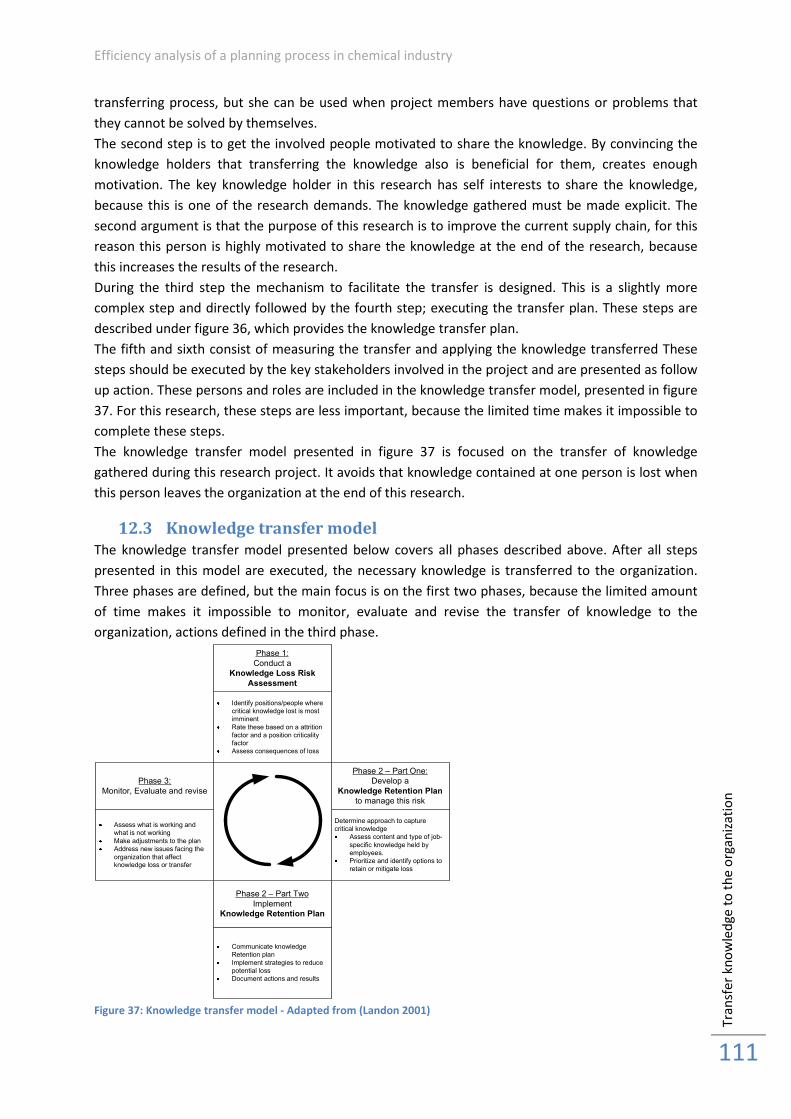
Efficiency analysis of a planning process in chemical industry
Tra
nsf
er
kn
ow
led
ge
to
th
e o
rga
niz
ati
on
111
transferring process, but she can be used when project members have questions or problems that
they cannot be solved by themselves.
The second step is to get the involved people motivated to share the knowledge. By convincing the
knowledge holders that transferring the knowledge also is beneficial for them, creates enough
motivation. The key knowledge holder in this research has self interests to share the knowledge,
because this is one of the research demands. The knowledge gathered must be made explicit. The
second argument is that the purpose of this research is to improve the current supply chain, for this
reason this person is highly motivated to share the knowledge at the end of the research, because
this increases the results of the research.
During the third step the mechanism to facilitate the transfer is designed. This is a slightly more
complex step and directly followed by the fourth step; executing the transfer plan. These steps are
described under figure 36, which provides the knowledge transfer plan.
The fifth and sixth consist of measuring the transfer and applying the knowledge transferred These
steps should be executed by the key stakeholders involved in the project and are presented as follow
up action. These persons and roles are included in the knowledge transfer model, presented in figure
37. For this research, these steps are less important, because the limited time makes it impossible to
complete these steps.
The knowledge transfer model presented in figure 37 is focused on the transfer of knowledge
gathered during this research project. It avoids that knowledge contained at one person is lost when
this person leaves the organization at the end of this research.
12.3 Knowledge transfer model
The knowledge transfer model presented below covers all phases described above. After all steps
presented in this model are executed, the necessary knowledge is transferred to the organization.
Three phases are defined, but the main focus is on the first two phases, because the limited amount
of time makes it impossible to monitor, evaluate and revise the transfer of knowledge to the
organization, actions defined in the third phase.
Identify positions/people where
critical knowledge lost is most
imminent
Rate these based on a attrition
factor and a position criticality
factor
Assess consequences of loss
Phase 1:
Conduct a
Knowledge Loss Risk
Assessment
Determine approach to capture
critical knowledge
Assess content and type of job-
specific knowledge held by
employees.
Prioritize and identify options to
retain or mitigate loss
Phase 2 – Part One:
Develop a
Knowledge Retention Plan
to manage this risk
Communicate knowledge
Retention plan
Implement strategies to reduce
potential loss
Document actions and results
Phase 2 – Part Two
Implement
Knowledge Retention Plan
Assess what is working and
what is not working
Make adjustments to the plan
Address new issues facing the
organization that affect knowledge loss or transfer
Phase 3:
Monitor, Evaluate and revise
Figure 37: Knowledge transfer model - Adapted from (Landon 2001)
TU Delft Master thesis project – R.M.T. van Oss
Phase 1: Knowledge Loss Risk Assessment
This phase is focused on the identification of all relevant knowledge gathered during this research,
which should be transferred to the organization or otherwise experiences consequences of loss. Next
to this it is also necessary to define the key persons where critical knowledge lost is most imminent.
The essential knowledge gathered during this research will be listed hereunder and sequentially
presented, based on the sequence of the appearance in this report:
• Elaborated network analysis
• Detailed description and overview of all relevant steps in the planning process of the supply
chain. A result of an interactively executed workshop.
• A list of five opportunities, as a direct result of the SIPOC workshop
• A list of ten opportunities, as a result of the SIPOC workshop and several interviews
performed during the research. Including a ranking of the opportunities, based on ease of
implementation and impact on the organization.
• Four projects which are started, based on the opportunities.
o Feedback delivery raw materials
o Insights in tasks logistics coordinator
o Delays of laboratory analyses
o Optimal balance between flexibility and inventory
• Communication
o Formalized procedures
o Information sharing between logistics coordinator and supply coordinators
o Production planning update
o Communication between departments of CVP and SCE
• Documentation
o Four different documents used by Logistics coordinator
o Work environment; procedures
• Replication
o Process description to enable replication of the research
o Description of process improvements
The following key persons should be updated with the findings of this research. Only the
management functions should be updated on all findings. The other functions can only be updated
with knowledge related to their function:
• Management team of CVP (Manufacturing and Filling and Dispatch)
o Production Unit Manager
o Production supervisors
o Production specialists
• Management of SCE
o Commercial: Product manager
o Supply: Supply manager
• CVP Operational
o Logistics Coordinator
o Production Administrator
o Head operation Projects & TA Support
o (Senior Buyer)

Efficiency analysis of a planning process in chemical industry
Tra
nsf
er
kn
ow
led
ge
to
th
e o
rga
niz
ati
on
113
• SCE Operational
o Supply coordinators
o Focal Point Customer Relation Center
• Laboratory
o Laboratory focal point
The knowledge transfer method presented above, also prescribes to assess the consequences of loss
of knowledge. Trade offs were made before, during the creation of the list. So, all information is
necessary to transfer to the organization.
Phase 2 – I: Develop a Knowledge Retention Plan
The second phase uses the information presented in the first phase to determine the approach to
capture the critical knowledge. It is necessary to transfer all knowledge which is gathered during this
research and which is presented above. However, the results of the four individual projects contain
the majority of the key information.
This thesis already documented all findings and most of the time the findings are also visualized with
help of figures or tables. Under normal circumstances knowledge can be classified as either explicit
or tacit. Tacit knowledge is what we know, but it has not or cannot always be articulated. The
visualization used in this research makes it easier to transfer the tacit knowledge and redefines tacit
knowledge in explicit knowledge. Explicit knowledge can be readily transferred to others (Landon
2001). Figure 38 presented below describes different knowledge transfer practices. Difference
practices are used for explicit and tacit knowledge.
Figure 38: Knowledge transfer; explicit vs. implict and tacit. Based on (Landon 2001)
This research also dealt with different sorts of knowledge. E.g. creating insights in the tasks of the
logistics coordinator could also be renamed as creating insights in the tacit knowledge of Logistics
Coordinator. This thesis already described and visualized most of the findings. Visualized findings can
be transferred as explicit knowledge. The measures presented below are not specifically focused on
transferring implicit and tacit knowledge, because during the research most tacit knowledge was , as
already explained, visualized. Only point 5 is using tacit knowledge. Because this point is assuming
that the tacit knowledge contained by the project members is enough to finish the projects. These
capabilities are more difficult to define and the steps that should be taken to process the projects are
for this reason not exactly defined.
TU Delft Master thesis project – R.M.T. van Oss
To be able to retain or at least diminish the loss of knowledge, the following measures are taken and
together form the main input for the knowledge retention plan:
1. All findings are described and presented in this thesis document. However, this document is
too elaborated to transfer the knowledge purposefully.
2. A management summary is created, to make sure that key knowledge is shared. This
management summary will be send to all stakeholders involved on a management level.
3. The projects are all summarized and presented in project charters, which are added to the
appendix. These project charters are commonly used by Shell, which minimizes barriers to
read them and understand the findings.
4. Process flows schemes are used in the majority of cases to visualize processes. Because
process flows schemes are also commonly used by Shell, it minimizes the barriers to
understand the results.
5. Project teams are set-up, in order to transfer the lead of the project before the project is
finished. Other team members are fully informed and capable of finishing the project.
6. Results of finished projects are secured in formal procedures (BBS3 procedures).
7. Extra tasks and actions, which are a result of the research, are secured in task lists of
operational team leaders.
8. All critical stakeholders mentioned above are invited to join the final presentation, which
includes a summary of the most important research findings which is necessary to share.
9. All analyses, findings and results are iteratively shared with the key stakeholders. So all
results are expected, which avoids unexpected resistance of stakeholders.
10. All these measures are more successful when the knowledge is shared by the involved
stakeholders to a larger group of people. Spreading the knowledge with enthusiasm and
carry out the message of success will increase the group of informed people (Shell 2008).
Phase 2 – II: Implement Knowledge Retention Plan
The stakeholders that should be involved in the knowledge transfer are known. The knowledge that
should be transferred is also known, and the steps necessary to transfer the knowledge are
described. So only one question is remaining, how could the knowledge retention plan be
implemented? This thesis already describes the steps taken and the methods used to transfer the
knowledge. The measures taken to transfer the knowledge described above are hereunder
sequential presented. This figure represents the different implementation steps to transfer the
knowledge to the organization. Four different phases are defined; the research findings are described
first, then these are summarized and visualized in formats that are commonly used within the
organization, the results and new process steps/ actions are secured in the organization and finally all
is presented in a final presentation. The final presentation also explains the knowledge retention
plan, making sure all key stakeholders are informed about the availability of the information.
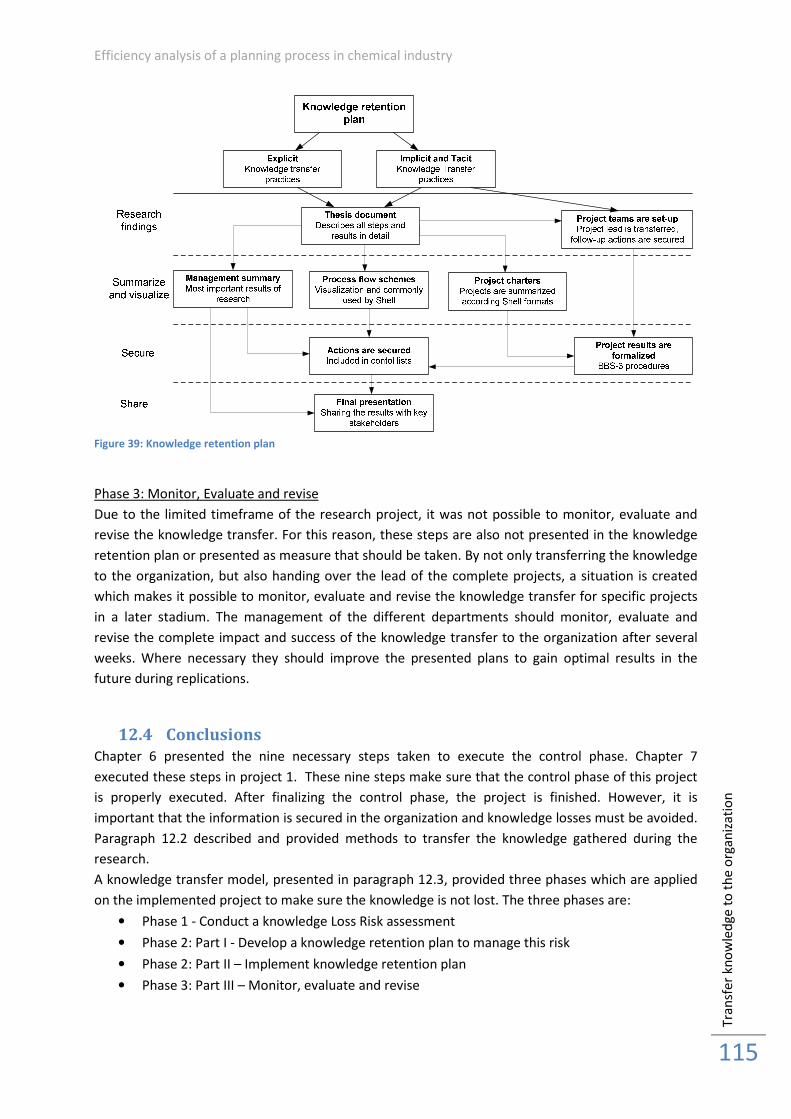
Efficiency analysis of a planning process in chemical industry
Tra
nsf
er
kn
ow
led
ge
to
th
e o
rga
niz
ati
on
115
Figure 39: Knowledge retention plan
Phase 3: Monitor, Evaluate and revise
Due to the limited timeframe of the research project, it was not possible to monitor, evaluate and
revise the knowledge transfer. For this reason, these steps are also not presented in the knowledge
retention plan or presented as measure that should be taken. By not only transferring the knowledge
to the organization, but also handing over the lead of the complete projects, a situation is created
which makes it possible to monitor, evaluate and revise the knowledge transfer for specific projects
in a later stadium. The management of the different departments should monitor, evaluate and
revise the complete impact and success of the knowledge transfer to the organization after several
weeks. Where necessary they should improve the presented plans to gain optimal results in the
future during replications.
12.4 Conclusions
Chapter 6 presented the nine necessary steps taken to execute the control phase. Chapter 7
executed these steps in project 1. These nine steps make sure that the control phase of this project
is properly executed. After finalizing the control phase, the project is finished. However, it is
important that the information is secured in the organization and knowledge losses must be avoided.
Paragraph 12.2 described and provided methods to transfer the knowledge gathered during the
research.
A knowledge transfer model, presented in paragraph 12.3, provided three phases which are applied
on the implemented project to make sure the knowledge is not lost. The three phases are:
• Phase 1 - Conduct a knowledge Loss Risk assessment
• Phase 2: Part I - Develop a knowledge retention plan to manage this risk
• Phase 2: Part II – Implement knowledge retention plan
• Phase 3: Part III – Monitor, evaluate and revise

TU Delft Master thesis project – R.M.T. van Oss
Only the first two phases of this model were executed and gave satisfying results. The third phase
couldn’t be executed yet, because this includes long term actions and monitors, evaluates and
revises the knowledge transfer plan after 2 till 3 months. At the moment, the knowledge transfer is
just finished, so the results of this knowledge transfer are not known. For this reason, the fourth
phase is defined as a follow up action and will be executed by the project team.
Efficiency analysis of a planning process in chemical industry
DM
AIC
me
tho
do
log
y e
va
lua
tio
n
117
13. DMAIC methodology evaluation
13.1 Introduction
Chapter two introduced the Lean Six Sigma theory as leading methodology during this research. This
decision fitted perfectly to the work environment at Shell Pernis. Since the FFO Shell Pernis focuses
on Lean Six Sigma thinking. Lean Six Sigma methods are well known at middle and higher
management of Shell Pernis and employees on an operational level are also familiar with Lean Six
Sigma projects and tools. This made it more easy to apply these methods (Shell 2008).
To structure the four individual projects, the classical Lean Six Sigma structure called DMAIC was
applied. After executing the four projects and evaluating the results, it is now possible to evaluate
the pros and cons of DMAIC.
This chapter evaluates the methodologies used during the DMAIC projects. Obviously this evaluation
is focused on the DMAIC methodology, but the three theories that helped to start the projects and
create successful performance improvement changes, are also evaluated.
Paragraph 13.2 evaluates the theoretical methods and paragraph 13.3 presents conclusion based on
the evaluation of the DMAIC methodology.
13.2 Evaluation on the theoretical method
Chapter five started with preparation steps in order to set up the four DMAIC projects. The ten
opportunities were identified and ranked. The ranking was based on information gathered by
stakeholders and analyses performed. The input of stakeholders was very important in this research
and the limited timeframe of the research prohibited to apply an extensive MCDA method. This
made it more difficult to define exact weights on stakeholders’ opinions. However, the involvement
of the stakeholders during these preparations steps, resulted in a high initial commitment and
support to start four DMAIC projects.
Chapter six introduced and explained the DMAIC methodology, which was applied on the four
projects in chapter 7 till 10. The underlying assumption of DMAIC, that problem solving follows
predictable steps (Schroeder, Linderman et al. 2008), is confirmed during this research. During the
four projects, the five development phases went naturally from one phase to another. The DMAIC
phases helped to guide this process, but without DMAIC structuring the processes similar steps
would have been executed as well. DMAIC helped to explain the current step of the project, but even
more important, it especially provided insights to the involved project members and other
stakeholders in the next steps. Although the five steps are logical steps, the DMAIC structure helped
to avoid jumping to conclusions and ensured an adequate search for alternative solution to a
problem (Harry 1994).
The DMAIC method places emphasis on integrating specific tools into each step of the method
(Schroeder, Linderman et al. 2008). By adding additional steps from other methods and theories
during start up, improve and control phases to the four projects, they were less focused on
integrating specific tools into each step of the DMAIC method. However, all projects still applied
DMAIC tools, which delivered useful results.
DMAIC normally involves different organizational members at different steps in the method
(Schroeder, Linderman et al. 2008). The four projects executed in this research were relatively small.
This created a situation in which all project team members were involved in the majority of the
project meetings and project development phases. This could have been executed more efficiently,
TU Delft Master thesis project – R.M.T. van Oss
especially in the fourth project, by splitting the project team during project meetings. It was clear
that during the measure, analyze and improve phases, the process owners were more involved in the
project compared to the define and control phase. In these phases, employees on a management
level were more involved.
This is not the only remark about the DMAIC method related to stakeholder participation (Kwak and
Anbari 2006). DMAIC does not exactly prescribes how to involve the stakeholders during the
different development phases of the project. DMAIC is not focused on stakeholder participation.
During the projects, two theories were used to deal with stakeholders. First the theory of de Bruijn,
Heuvelhof et. al (2003), which defines the key elements of a proper process design. A process design
was developed for every project, which spend attention to the four core elements. The four core
elements of this process design were presented during the first meeting of a project and helped to
keep the stakeholders committed to the projects. By discussing these four elements, it became clear
that everyone was interested in the same high level goal; overall performance improvement. It also
made sure that core values were protected, which is a benefit for everyone and diminished the
chance that stakeholders leave the project and stop supporting it. Secondly, six steps for guidance for
stakeholder involvement (Buhrmann unknown) were used, to make sure the stakeholders were
involved in the projects in a proper way. This also helped to keep them committed to the projects.
Based on the four executed projects could be concluded that both methods were useful during the
project meetings and created an open situation between the project leader and the other project
team members. It created and kept the support and commitment of the stakeholders to the projects.
During future replications of similar projects it is advised to gather extra information on stakeholder
management and/or stakeholder involvement methods and theories. These could probably be
combined with the DMAIC structure and increases the results.
After evaluating general aspects of the DMAIC method, it is possible to evaluate the DMAIC method
step by step.
The define phase introduced the project, described the project goal and created a project team. The
analyses executed in the first part of this research helped to start up the projects. As previously
stated in the evaluation of part II – analyses, a SIPOC workshop is recommended to execute again.
SIPOC created initial support and commitment to start the individual projects.
The ranking of the opportunities legitimated the decision to start the projects. Most stakeholders
were already involved during the first part of the research, which made it easier to get their support
and commitment.
During the define phase, DMAIC tools were used. Process flow schemes created insights in the
current situation and processes. Process flow schemes were useful to share findings to the complete
project team or explain problems during interviews (Harry 1994). In projects where process flow
schemes were not used, it was more difficult to keep within the scope of the project.
The measure phase analyzed the project in more detail. It focused on the actor perspectives of the
involved stakeholders and it defined the constraints of the current process per project. The analyze
phase used the input of the previous two phases and defined the problem situation, by identifying
the causes of the problems. It was not always clear where the measure phase ended and the analyze
phase started. According to the theory should the measure phase be used to gather data and
quantify the problem/opportunity. The analyze phase should find the root cause by delving into
details (Yeh, Cheng et al. 2007). In practice, data was gathered and analyzed, which most of the times
indirectly showed the root cause of the problems. The transition point was not always clear. The
Efficiency analysis of a planning process in chemical industry
DM
AIC
me
tho
do
log
y e
va
lua
tio
n
119
DMAIC development phases of the four project were similarly presented in this report, which made it
even more difficult to split the measure and analyze phases.
The research did not apply specific tools in the measure phase. These were all included in the analyze
phase, but these phases were not always perfect split. The analyze phase used several tools to
present and analyze data and information. Tables and histograms were used to show insights in the
performance of the systems. The tools or similar tools are recommended in these phases of projects.
The improve phase developed solutions to diminish or eliminate the defined problems. It identified
advantages and disadvantages of proposed solutions. For one project it also described how the
project should be executed and implemented. Nine, more practical focused aspects (Kerzner 2008),
were taken into account to structure the execution and implementation of the project.
Support and commitment are very important in this phase of the project. Changes are necessary to
realize improvements, and they can only become successful when the proposed changes are
supported by the key stakeholders. During the four projects it was possible to involve the key
stakeholders often, because the project teams were small enough. Project 4, which had a larger
project team, showed that it is almost impossible to keep everybody directly updated during the
project if project team are bigger. It is recommended to apply tools to deal with this issue. These
tools can be used to involve stakeholders more directly, by e.g. organizing a workshop (Harry 1994).
When the solution is designed, it is recommended to involve all project team members in this
process. A similar method could be applied as during the identification of the opportunities. This
results in more support and commitment when the changes should be implemented and executed.
The control phase, which was only executed for the first project, tests and makes the solution robust.
It used nine steps to avoid failure of the project during this phase (Shell 2008). These nine steps were
essential to realize successful changes. The pilot project was a crucial step during the control phase
of project 1. It showed that the solution was not perfect and that new problems come to light, when
other problems are solved. The earlier defined scope and project goal were used to keep the scope
strictly and determine the new problems as ‘out of scope’ problems.
The four projects were not all finished and implemented during this research. However, it was
possible to transfer the project lead after finishing one of the five phases. The involved project
members are able to take follow up actions and realize successful changes in the near future. DMAIC
helps to transfer the lead, because DMAIC does not focuses on the people (Bevan, Westwood et al.
2005), but on the processes.
It is possible to replicate the projects. Based on the described DMAIC methodology in chapter 6, the
described execution of these steps in chapter 7 -10 and the evaluation of this method in this chapter,
it is also possible to make improvements to the future processes.
13.3 Conclusions
This chapter evaluated the DMAIC methodology, including theories and steps which were added to
the DMAIC method during one of the five development phases. The evaluation was based on
insights gathered during the execution of the four DMAIC projects. The first part of paragraph 13.2
focused on more general related elements of the DMAIC methodology. It spend attention to the
benefits and challenges related to the structure DMAIC provides, the tools of DMAIC and to the
stakeholder involvement in combination with DMAIC.
The second part of this paragraph evaluated specifically the five development phases. It draw the
following conclusions: The preparation steps before the define phase were useful to start the

TU Delft Master thesis project – R.M.T. van Oss
projects and create support and commitment. The measure and analyze phase were not always
strictly divided. Support and commitment are especially important during the improve phase, when
change is necessary. DMAIC tools could help to keep or get the support and of the involved
stakeholders. Finally the control phase was useful. Based on nine practical focused aspects,
improvements to the designed solution where made. It also helped to critically reflect on the earlier
defined scope, when new problems come to light during the execution of a pilot project.
Efficiency analysis of a planning process in chemical industry
DM
AIC
me
tho
do
log
y e
va
lua
tio
n
121
Part IV -
Conclusions and
recommendations
TU Delft Master thesis project – R.M.T. van Oss
14. Conclusions and recommendations
14.1 Introduction
This final chapter draws conclusions on the complete research. Chapter 11 already evaluated the
project results and chapter 13 the DMAIC method. This chapter uses this information and other input
gathered during the research to answer the main research questions, provide general conclusions,
reflect on the research and provide recommendations for future research and replication.
The first paragraph provides answers on the main research questions and draws conclusions on the
concrete results generated by the individual executed projects. The second paragraph spends
attention to the research conclusions and recommendations, followed by the third paragraph which
describes general conclusions and recommendations. Paragraph 14.4 describes the effects on the
organization. Paragraph 14.5 goes further into detail on possibilities to replicate the complete
research. Paragraph 14.6 reflects on the process and paragraph 14.7 provides as last paragraph of
this thesis, recommendations for future research.
14.2 Research conclusions and recommendations
A planning process is a crucial factor within a supply chain. In a supply chain all process steps are
somehow depending on a previous process step and at the same time they are essential input for a
subsequent process step. A planning tries to optimize the sequence of these process steps in order to
realize a maximum performance of the supply chain. This performance can be defined in volume,
profit, but also in reliability or another performance indicator. The performance indicator can vary
per supply chain. It is even possible that several indicators are important.
The supply chain of polyols at Shell Pernis, on which the research was performed, included four main
departments: Commercial, Supply, Manufacturing and a Filling and dispatch department. These four
departments are located at different offices on different locations and all have different perspectives
and perceptions on the current performance of the supply chain. At the start of the research only a
fuzzy overview of the processes of the supply chain was available. It demanded cooperation between
the four departments to create a complete overview of all process steps. Identification of the
perspectives, interests and perceptions of the stakeholders involved helped to define this detailed
overview.
All this information is necessary to answer the first main research question: What are the main
factors affecting, positively or negatively, the planning process of the defined supply chain (of CVP
and SCE) and what is the impact of these factors? To be able to answer this question, three sub-
questions were defined, which combined provide the answer on the first main research question.
1. What are the relevant state of the art theories and practices to analyze supply chains and to
identify waste and disruptions within organizations and supply chains?
The answer on the first sub-question is extensively provided in chapter 2. Six Sigma and Lean
manufacturing theories were combined into the so called Lean Six Sigma approach, which was
leading during this research. This theory provided several tools, e.g. SIPOC, process flow diagrams,
value stream map, DMAIC and waterfall graphs. Other performance improvement methods and
theories, which are focused on supply chain management, were added to this Lean Six Sigma
approach. These theories formed the basis to analyze the supply chain and identify the waste. In the
third part of this research four projects were started. These projects applied other theories and
frameworks as well, to clarify certain aspects in more detail.
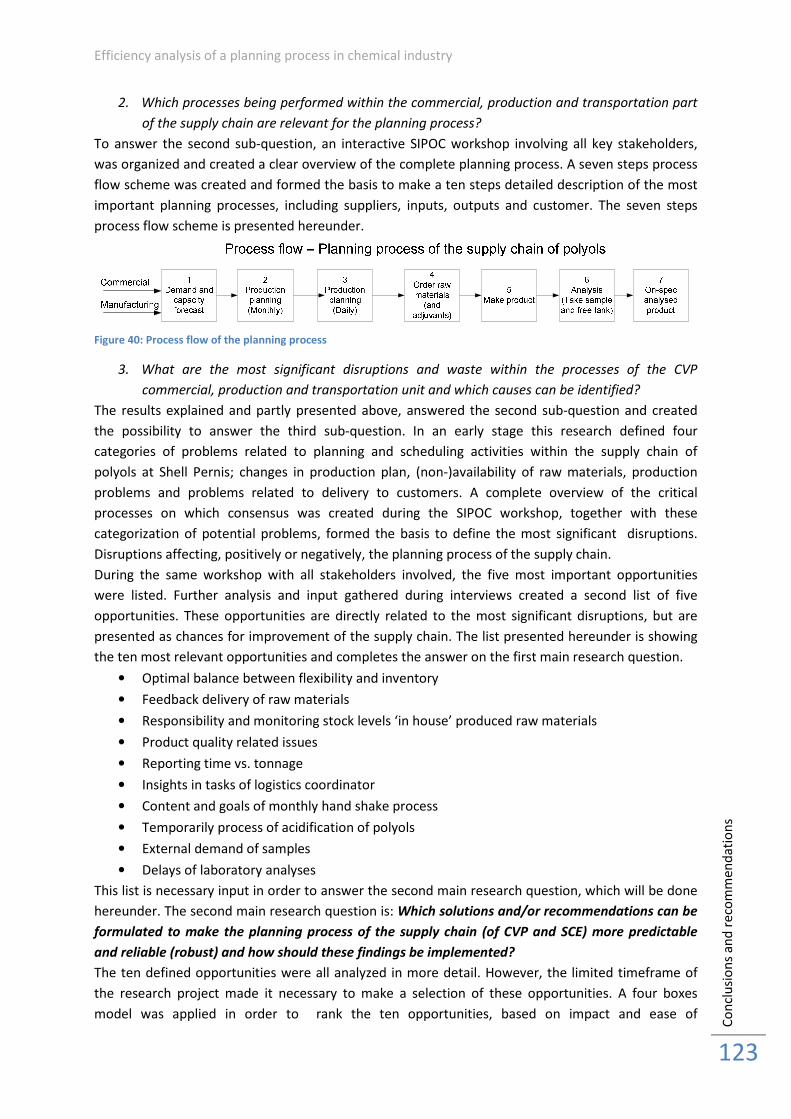
Efficiency analysis of a planning process in chemical industry
Co
ncl
usi
on
s a
nd
re
com
me
nd
ati
on
s
123
2. Which processes being performed within the commercial, production and transportation part
of the supply chain are relevant for the planning process?
To answer the second sub-question, an interactive SIPOC workshop involving all key stakeholders,
was organized and created a clear overview of the complete planning process. A seven steps process
flow scheme was created and formed the basis to make a ten steps detailed description of the most
important planning processes, including suppliers, inputs, outputs and customer. The seven steps
process flow scheme is presented hereunder.
Figure 40: Process flow of the planning process
3. What are the most significant disruptions and waste within the processes of the CVP
commercial, production and transportation unit and which causes can be identified?
The results explained and partly presented above, answered the second sub-question and created
the possibility to answer the third sub-question. In an early stage this research defined four
categories of problems related to planning and scheduling activities within the supply chain of
polyols at Shell Pernis; changes in production plan, (non-)availability of raw materials, production
problems and problems related to delivery to customers. A complete overview of the critical
processes on which consensus was created during the SIPOC workshop, together with these
categorization of potential problems, formed the basis to define the most significant disruptions.
Disruptions affecting, positively or negatively, the planning process of the supply chain.
During the same workshop with all stakeholders involved, the five most important opportunities
were listed. Further analysis and input gathered during interviews created a second list of five
opportunities. These opportunities are directly related to the most significant disruptions, but are
presented as chances for improvement of the supply chain. The list presented hereunder is showing
the ten most relevant opportunities and completes the answer on the first main research question.
• Optimal balance between flexibility and inventory
• Feedback delivery of raw materials
• Responsibility and monitoring stock levels ‘in house’ produced raw materials
• Product quality related issues
• Reporting time vs. tonnage
• Insights in tasks of logistics coordinator
• Content and goals of monthly hand shake process
• Temporarily process of acidification of polyols
• External demand of samples
• Delays of laboratory analyses
This list is necessary input in order to answer the second main research question, which will be done
hereunder. The second main research question is: Which solutions and/or recommendations can be
formulated to make the planning process of the supply chain (of CVP and SCE) more predictable
and reliable (robust) and how should these findings be implemented?
The ten defined opportunities were all analyzed in more detail. However, the limited timeframe of
the research project made it necessary to make a selection of these opportunities. A four boxes
model was applied in order to rank the ten opportunities, based on impact and ease of
TU Delft Master thesis project – R.M.T. van Oss
implementation. The ranking enabled a selection of four opportunities, which were processed in
more detail. These opportunities are: optimal balance between flexibility and inventory, feedback
delivery of raw materials, insights in tasks logistics coordinator and delays of laboratory analyses.
These four opportunities were used to provide answer on the fourth sub-question:
4. Which recommendations and possible solutions can be generated to improve the planning
processes of the commercial, production and/or transportation division and eliminate waste?
In order to answer the fourth sub-question, project teams were set up per opportunity to improve
the planning process. The project structure contained five phases; Define, Measure, Analyze,
Improve and Control (DMAIC). Extra attention was given to the stakeholders involved by creating a
process design which focused on four core elements; openness, protection of core-values, progress
and content.
The most important findings of the four projects are presented hereunder per project:
Project 1: Feedback delivery of raw materials
One project is completed during this research, namely the project called: delivery of feedback of raw
materials. The project goal was to diminish and finally eliminate the unexpected shortages of raw
materials, caused by a lack of feedback of deliveries, which created a negative effect on the
production planning. By focusing on short term internal solutions, new communication structures
and standards were defined. The key stakeholders; the logistics coordinator, production
administrator and Shift 6, were committed to the project from the start and were closely involved
during all project phases. Several evaluations sessions optimized the solutions. Since the start of the
project, delays and non-deliveries are monitored, which creates better insights and make it possible
to execute follow up actions. These follow up actions are more externally focused and could create
long term improvements.
Project 2: Insights in tasks logistics coordinator
A second project was focused on creating insights in the tasks of the logistics coordinator. Because
the results of this project can only be monitored and evaluated during nonattendance of the logistics
coordinator for a longer term, the results of this project couldn’t be monitored and evaluated during
the limited time of this research. The outputs of the project are successfully formalized and secured
in Shell procedures, which required an official control and approval of two assessors. The first long
term nonattendance of the logistics coordinator provide possibilities to monitor, evaluate and
improve the current results of the project.
Project 3: Delays of laboratory analyses
The third project was focused on the delays of samples processed by the laboratory. Differences
between target times used by the laboratory, and actual times relevant to CVP, initialized this
opportunity. An elaborated analysis of a large data set (1916) of actual sample times compared to
target times, created clear insights and offered an opportunity for follow up actions. The
independent status of the laboratory and the small influence from CVP on the laboratory, made it
impossible to finish this project. However, the clear structured analysis, unambiguous results and a
well received presentation of these results by the laboratory, generated a nice opportunity for follow
up actions in the near future. These actions should be initialized and lead by the laboratory. Possible
Improvements can be expected on the midterm.
Project 4: Optimal balance between inventory and flexibility of the supply chain
The results of this third project were not only used as opportunity framing to improve the
performance of the laboratory, the results of the actual analysis times of the samples were also a
direct argument used in the fourth project. This project was focused on the optimal balance between
Efficiency analysis of a planning process in chemical industry
Co
ncl
usi
on
s a
nd
re
com
me
nd
ati
on
s
125
flexibility and inventory. Under normal circumstances a minimum amount of time was planned
between production and delivery to trucks and/ or ships. This created a critical time path in which
even short production or analysis delays, directly negatively affected the delivery to the carriers
and/or customers. The analysis showing the differences between target times and actual times was
also a significant argument to make the supply chain more flexible. After consultation of all key
stakeholders involved, a new planning philosophy was developed. This new planning method created
more room between the end time of production and the moment of delivery, with a minimum
negative effect on the availability of products, and a significant increase in the reliability and
performance of the supply chain perceived by the customers. During normal circumstances deliveries
were planned at 16.00 p.m. and onwards. In the new situation deliveries are planned the next
morning at 07.00 a.m. But, it still is possible to deliver the products on the same day as before using
day trippers. In the new situation day trippers drive on the same day to the customers, instead of the
next morning. It was not possible to implement and complete this project given the limited research
time, mainly caused by the involvement of many stakeholders and the complexity of the project. The
new philosophy is supported by the stakeholders involved. However, time was too short to
implement and evaluate the results, in order to optimize the new planning philosophy where
necessary. In order to get the project implemented, the project team lead is transferred to the
production specialist, who will take follow up actions to finalize the project.
The results of the projects and the solutions presented above provide answers on the fourth sub
question and also partly on the fifth sub-question. It is important to remark that the lead of the
projects is handed over to project team members. The project charters defined in appendix 13, were
used to hand over the project properly. The fifth sub-question is presented below.
5. What steps are necessary to implement the solutions and recommendations and how could
these processes be replicated?
The explanation presented above already described the status of the projects. This described the
implementation steps partly and defined where necessary follow up actions per project to finalize
the implementation.
To complete the answer on sub-question five, the gathered information should be transferred to the
organization. A knowledge retention plan divides knowledge into explicit and implicit knowledge.
Four phases, containing eight steps are defined to transfer the knowledge to the organization and
avoid knowledge losses. Chapter 11 and 13 evaluated the complete research and provided insights in
points of improvement and strong aspects of this research. The most important conclusions are that
the Lean Six Sigma method fitted perfectly to the organization and the interactive SIPOC workshop
created significant results and maximized the benefits of stakeholder participation. However, the
ranking method of the opportunities and the management of stakeholders should be improved next
time. These recommendations, together with the described analyses and project steps, make it
possible to replicate the complete research. These findings together provide an answer on sub-
question 5.
The answer on sub-question 5, combined with the answer on sub-question 4, answers the second
main research question. Although the research questions are answered, there are still 6 other
opportunities defined which are only presented as opportunities for improvement. This research
defines these opportunities as potential improvements of the supply chain of polyols at Shell Pernis .
TU Delft Master thesis project – R.M.T. van Oss
14.3 General conclusions and recommendations
Based on the findings done during the research, it also possible to draw some general conclusions
and recommendation. The previous paragraph focused on more concrete results; the output of the
individual projects. The four projects delivered the most concrete results and recommendations.
However, during the research also more general insights were created and more general focused
analyses were executed. This makes it possible to draw some general conclusions and
recommendations, which are not directly related to one of the four projects.
Many stakeholders of the polyols’ supply chain were interviewed during the past six months. Their
input, together with the experience gathered during training days and other experiences, make it
possible to draw conclusions and come up with recommendations for improvement.
First three recommendations are made related to the process of the research, followed by content
related recommendations
The first recommendations is related to stakeholder management. Next time, the network analyses
should be performed iteratively during the research. This makes it possible to start performance
improvement project earlier. And this makes sure that all formal and informal relations are captured
and the project leader is aware of these relations. This enables optimal communication between
project members during the execution of the individual projects.
The second recommendation is related to several steps which were taken to deal with the multi-
actor environment and resulted in satisfying results. The following three steps are recommended
during replication of a similar project; first an interactive SIPOC workshop should be organized to
create stakeholder participation and define the processes. Secondly the stakeholders should be
involved in defining opportunities and finally the stakeholders should be involved at the start of the
individual projects.
The third recommendation is to change the location where the research is executed more often. This
creates varying insights from different departments and increases commitment to realize changes by
all stakeholder involved.
The following recommendations are more content related. The fourth recommendation is related to
the function of the logistics coordinator. The logistics coordinator is a crucial link in communication
related to the planning of the supply chain and in the communication between CVP-P and SCE supply.
This crucial role is currently fulfilled by one person. In cooperation with the supply coordinators the
planning is created and more important, changed when necessary. Continuously information sharing
between the logistics coordinator and the supply coordinators during working days, create a
situation in which barriers do not exist anymore to make changes in the planning. These changes
have serious consequences for the performance of the supply chain and affect many stakeholders.
Continuous updates and information sharing between these stakeholders can be prohibited or
diminished by implementing a minimal barrier to contact each other. This forces the supply
coordinators and logistics coordinator to start searching for other options, before changes are made
to the production planning.
A fifth recommendations is related to the previous problem. The communication to the operating
teams about changes in the production planning, coming from the logistics coordinator should be
made more obvious. In the current situation these changes are not actively shared with the
operators. A clock in the control room, defining the moment of the last update, makes this
information sharing more clear.
Efficiency analysis of a planning process in chemical industry
Co
ncl
usi
on
s a
nd
re
com
me
nd
ati
on
s
127
A sixth recommendation is also related to communication and focuses on information sharing.
Updates which contain necessary information for other involved stakeholders are now send by group
emails. This is not a specific problem of one employee, but more a general problem at Shell Pernis.
Emails and especially group emails containing important information are sometimes not read,
because employees are dealing with an overload of email traffic. Forums and central storage facilities
are introduced, but not used in a proper way at the moment. The higher management should
promote these facilities, because at the moment information sharing of key information is sub-
optimal.
A final recommendation related to communication is about the relation between SCE and CVP. One
of the four core elements of a process design is not applied properly. Sufficient openness is missing,
partly caused by a lack of knowledge about each other’s interests and tasks. Openness creates
understanding of each other’s actions and creates commitment to help solving problems from both
sides.
Two recommendations can be added related to documentation. The first recommendation is related
to the tasks of the Logistics Coordinator. Currently this person is using four individual data sheets to
create necessary insights in the production planning. These four related documents should be
integrated into one excel file. This makes it easier to replace the logistics coordinator and
automatically controls the executed steps.
The second recommendation has a more generic focus and is related to the formalized
communication at Shell Pernis. Safety standards are very important at Shell Pernis. To realize a high
level of safety and in order to keep the company manageable, all actions and tasks are formalized.
During the research it became clear that it is essential that the higher and middle management
constantly try to find a optimal balance between the safety policy and the ability to perform the tasks
properly.
14.4 Effects on the organization
The previous paragraph discussed and answered the main research questions and provided more
general research recommendations. This paragraph describes in more detail the effects of the
research on the organization.
The project started six months ago, initiated by the fact that insights were missing in the processes of
the complete polyols´ supply chain. The logistics coordinator was seen as a important element in the
supply chain, but specific insights in his tasks were missing as well. Six months later, insights in the
processes of the supply chain were created with involvement of key stakeholders working at four
different departments of the supply chain. These insights were visualized and made the key
stakeholders more conscious of the fact that the four different departments all have the same high
level goal, although they have different low level interests.
The network analysis provided for the first time an interdepartmental overview of the stakeholders’
relations and positions, including informal relations. This also helped to make the involved
stakeholder more conscious of the importance of communication and cooperation between the
departments.
The SIPOC workshop illustrated the benefits of stakeholder participation in performance
improvement projects. The SIPOC workshop created initial support and commitment, which made it
easier to start the individual projects.
TU Delft Master thesis project – R.M.T. van Oss
Ten opportunities were defined which could improve the performance of the supply chain. Four of
them were processed as individual projects. The concrete results of these projects are already
discussed, however the projects also created less concrete results which affected the organization.
Project 1: Feedback delivery of raw materials
The first project increased the reliability of the supply chain, by diminishing the chance on
unexpected shortages of raw materials. New communication structures and standards were designed
and secured in the organization to improve the feedback on deliveries of raw materials to the
logistics coordinator and production administrator. Besides the concrete realized improvements, it
made operational employees conscious of the importance of monitoring results. Monitored results
are necessary to change behavior of external parties, e.g. suppliers. The project also illustrated that
even small issues can have significant effects on the total performance. The involved project
members were enthusiastic to take follow up actions. By transferring the lead of the project to the
logistics coordinator, he has the possibility to illustrate his capability of executing Lean Six Sigma
projects.
Project 2: Insights in tasks logistics coordinator
The second project created insights in tasks of logistics coordinator and formalized these tasks. This
increased the reliability, because his tasks can now be executed during periods of middle and long
term absences. The detailed description also defines the constraints, that should be taken into
account when the production planning is created and when production is monitored. A
recommendation for future improvement is already provided in paragraph 14.3. Besides the
concrete results, less other results were gathered during this project, mainly because the project
team was small and the project was focused on one person. However, process flow schemes were
used to describe tasks. This method was well received by employees acting on all levels and could be
used as an example to describe other functions in the future. All insights were shared with the
production supervisor and supply coordinators. These persons deal on a frequent basis with the
logistics coordinator and can use the insights to improve processes or communication between each
other.
Project 3: Delays of laboratory analyses
The third project framed an opportunity to the laboratory to improve the performance related to
sample analyses of CVP samples. It showed that only 64% of the current samples is on time at the
moment, and 14% is ready within 4 four hours after the target set by the laboratory. The insights
were presented to the laboratory. Although there are no official actions taken by the laboratory at
the moment, involved stakeholders noticed improvements of the laboratory. Since the presentation
of the results, the laboratory directly informs CVP when samples are delayed. The project also
showed that data analyses can provide unexpected insights. The results of the data analyses
surprised the involved stakeholders. This also illustrated an important learning point that information
gathered during interviews always is coloured.
Project 4: Optimal balance between flexibility and inventory
The final project involved all departments of the supply chain. The analyses showed that including
slack time in the supply chain would significantly increase the perceived reliability of the supply
chain. This could create a performance increase of 16%, without affecting deliveries of day trippers.
Efficiency analysis of a planning process in chemical industry
Co
ncl
usi
on
s a
nd
re
com
me
nd
ati
on
s
129
Potentially this percentage could be increased to 85%, but this depends on possibilities of the
laboratory to perform sample analyses during the night.
At the start of the project, many skeptical opinions did not believe that it was possible to realize
agreements between the different departments. By involving all departments in one project, it
showed that it is possible to create consensus between the departments. It also demonstrated the
organization that an increased collaboration between the departments could lead to performance
improvements.
It is now possible to summarize the effects on the organization. The four departments involved in the
Polyols supply chain experienced benefits of the increased insights in the processes of the supply
chain. The research increased the consciousness that all departments have one high level common
goal. The results of the four projects were useful and already have impact on the current
performance of the supply chain or will have impact in the near future, after executing some follow
up actions.
The performed research could be used as example to illustrate the potential of small Lean Six Sigma
projects. This fits perfectly into the new improvement performance strategy at Shell Pernis; to
motivate operational employees to initialize and start small individual performance improvement
projects.
14.5 Reflection on theoretical methodologies
The previous paragraphs answered the research questions and presented some general
recommendations and conclusions. Before reflecting on the complete research and going into more
detail on possibilities to replicate the research, the theoretical methodologies are evaluated.
This paragraph only evaluate the leading theory and two methods or tools used in this paper. First
Lean Six Sigma as leading theory is evaluated. Secondly the paragraph goes in more detail on the
benefits and challenges of the SIPOC workshop, finally DMAIC is evaluated. DMAIC was already
elaborately evaluated in chapter 13 and SIPOC in paragraph 4.4. For this reason only the most
important conclusions are repeated.
Chapter two introduced the Lean Six Sigma theory as leading methodology during this research. This
decision fitted perfectly to the work environment at Shell Pernis. Since the FFO Shell Pernis focused
on Lean thinking. Lean Six Sigma methods are well known at middle and higher management of Shell
Pernis, which made it more easy to apply several methods, because they were understood.
The project applied in first instance a Lean Six Sigma approach based on Bevan, Westwood et. al.
(2005) to define four major phases during the complete research. In a later phase the classical Lean
Six Sigma structure called DMAIC was applied, because this was a common applied approach at Shell
Pernis (Shell 2008).
The combination of Lean Manufacturing and Six Sigma was useful in this research. The focus on
quality improvement and speed both delivered benefits during this research (Bevan, Westwood et al.
2005). The limited timeframe of the research forced to focus on speed, but major parts of the
research was focused on quality related problems. The applied tools were already evaluated. Tools
originated from Six Sigma and Lean manufacturing showed significant results. Other methods or
theories can be easily added to the leading Lean Six Sigma method, which is valuable benefit. During
the execution of the projects, these extra methods were useful.
TU Delft Master thesis project – R.M.T. van Oss
Challenges of the Lean Six Sigma method became apparent during the execution of the projects and
when the SIPOC workshop was organized. These challenges are included in the evaluations on the
DMAIC and SIPOC methods. Tools/ Methods which are part of Lean Six Sigma.
The SIPOC workshop created successful results. It maximized the benefits of stakeholder
participation in the research. Several steps were added to the normal SIPOC method. This used the
benefits of stakeholder participation and minimized the challenges. These steps avoided an overload
of divergent information generated by the stakeholders and resulted in an useful platform to define
opportunities on. The involvement of the stakeholders this early in the process created support and
commitment, which was useful during the execution of the projects.
DMAIC was useful to structure the projects and commonly used by Shell. The five development
phases made it easier to explain the steps to the involved stakeholders. Although the steps are
following a logical sequence, which are almost automatically processed. By adding theories helpful to
start projects and using DMAIC/ Lean Six Sigma tools, DMAIC was successful and delivered significant
results. Next time the measure and analyze phase should be more strictly split up.
14.6 Replication
The previous paragraphs presented conclusions and defined strong and weak elements of this
research. Based on these conclusions, added with some more details on the replication steps, should
it be possible to replicate this research.
It is possible to divide replication of the research into four main parts; part 1; introduction, part II can
be defined as; the exploration of the processes of the supply chain, the third part can be defined as;
using the defined opportunities to improve the current planning process of the supply chain and
finally the last part is focused on transferring the information and defining the most important
research conclusions.
This report explains all process steps in detail, which makes it more easy to replicate the research.
The first phase defines the problem situation and discusses the methodology and theory used. The
methods and tools applied can also be used in replicated projects. The second part of this research
can be replicated by performing interviews, but the most important results are generated during a
SIPOC workshop. All chapters do not only describe the process steps in detail, but they also provide
sources which refer to elaborated explanations on the steps, e.g. applying the SIPOC tool in small and
large groups, interactively and non-interactively.
The third part of the research is focused on four projects. By applying the same DMAIC structure on
all projects, it becomes easier to replicate these processes. Again the sources refer to more
elaborated explanations on the steps taken. This makes it possible to replicate the process steps
which are less elaborately explained. For example to develop a process design, including the four
core elements.
The fourth part goes further into detail on transferring information to the organization and avoiding
knowledge losses. Several frameworks and standardized steps can be replicated to gain similar
results.
So far the research is very good replicable and the methods and tools explained in the chapters can
be applied in order to replicate similar projects. However stakeholder involvement and getting their
commitment is more difficult and differs per project. Stakeholder involvement also depends on many
soft factors which are not the same for every research. The four core elements of a process design
helped to deal with stakeholders and to be able to involve them in projects. E.g. during this research
Efficiency analysis of a planning process in chemical industry
Co
ncl
usi
on
s a
nd
re
com
me
nd
ati
on
s
131
the work environment was very open and most people were ready to put in time and effort, because
this was presented as core element in an early phase. However, it will always depends on the
stakeholders involved. These soft skills are less easy to define. For this reason stakeholder
management should always be a point of attention, when a similar research or parts of the research
are replicated.
14.7 Reflection
Till this moment on, this chapter mainly summarized the research results and answered the main
research questions. However, reflection on the research itself is also necessary to maximize the
output of this research. Even though the research presented some promising results in defining
opportunities and starting and executing projects in order to improve the supply chain, also some
critical remarks regarding the process can be made here.
The research was constantly dealing with a limited time frame. The time constraint influenced many
decision during the project. E.g. the number of processed projects. Next time, the analyses should be
executed faster or iterative. This creates more time to process opportunities. On the other hand,
arguments can also be provided that the time spend on these first tasks is justifiable, because
understanding a new environment and a completely new industry takes a lot of time. It took three
months before the analysis phase was finished and improvement projects started. During the first
weeks the output produced was lower than during the rest of the research. New procedures, new
processes and a new environment took time to adapt and understand. This was extra difficult
because many stakeholders were involved, all with different opinion and interests.
Stakeholder management and management of expectations of these stakeholders need
improvement. Many stakeholders were involved and put effort into the project, however they also
demanded output and results. Updating these stakeholders on a more frequent level could have
been useful to show the progress and results of the research, in order to create more commitment.
The network analysis performed in chapter 3, showed this involvement and provided insights in the
roles and interests of these stakeholders. If these insights were gathered earlier, this could have
made it less difficult to manage the stakeholders and diminished the ‘scope creep’ during the first
months.
A subsequent planned second workshop was cancelled and followed up by more focused project
meetings with less stakeholders involved. The results of the new approach were satisfying, however
it could have saved a lot of energy when this approach was designed up front and the second
workshop was not planned. On the other hand, a more concrete approach working towards results
during the time in between the workshops, could have created a situation in which it was not
necessary to cancel the workshop.
The scope of the research narrowed, as a result of the first workshop. The first workshop narrowed
the scope of the research in order to maximize the results and to avoid the involvement of too many
stakeholders during one workshop. Due to a limited timeframe and satisfying results of this first
workshop, the scope was kept narrowed and less time was spend on issues and improvements at the
filling and dispatch department. This is not a big issue, when it is properly communicated. However,
communication and management of stakeholders related to this issues could have been improved.
After finalizing the analysis phase, ranking the opportunities was the next difficult step of this
project. A trade off was necessary between creating output as fast as possible and presenting clear
arguments to rank the opportunities. Finally a balanced approach was found by using a four boxes
TU Delft Master thesis project – R.M.T. van Oss
model, but more time could have been spent on the analysis, the input gathered during interviews
with key stakeholders was, because of a lack of a grounded analysis, of vital importance.
The final difficulty perceived, is related to the implementation of the individual projects. Before the
project solutions could be implemented, support of the stakeholders was of vital importance. By
applying process theories of de Bruijn and Heuvelhof (2008) and using other theories, a well
structured approach was defined. However, the research project did not succeed to realize
implementations of the four projects. It was too complicated to create enough alignment by all key
stakeholders to implement the projects within the given time constrain.
The most satisfying part of the project was the interactive SIPOC workshop. During a morning
session, attended by all key stakeholders involved, the preparations and information gathered during
interviews came together, resulting in a detailed overview of the complete processes and several
points of improvement. The created motivation of the stakeholders and other preparations done up
front, together with a clear and structured designed workshop based on methods and literature, all
perfectly came together during one session, which produced very satisfying results. The essential
preparations up front, made it possible to understand the input and lead the workshop in the
direction which was determined up front.
14.8 Future research
After evaluating, concluding and reflecting on the complete research, it is now possible to define
recommendation for future research.
An important recommendation is to execute the defined follow up actions of the four projects.
Significant effort is put into the analysis and start of the project, minor future efforts can realize
implementations of these projects and increase the current performance of the supply chain.
Secondly, attention should be given to the six remaining opportunities. The origin of these six
opportunities is explained elaborately and also background information on the opportunities is
provided. These opportunities should be processed as individual projects. The project lead should be
handed to involved stakeholders per opportunity, possibly to stakeholders on operational levels.
Furthermore some extra effort can put into the project of the delayed samples. The data on the
delays of the sample analysis are accurate, however it does not shows the differences compared to a
deadline of 16.00 o’clock and the actual time. These insights are an improvement and better insights
than the current analysis, however a tradeoff between input and benefit is necessary.
Besides future research related to the performance improvement projects, it is also possible to
perform future research on the possibilities to involve stakeholders in project where Lean Six Sigma
is applied as leading methodology. This research illustrated that a SIPOC workshop could deliver
significant and satisfying results. It described the steps taken in detail and provided benefits and
challenges of these methods. Future research should be executed on the possibilities to increase
stakeholder participation, which is qualitatively focused, in the quantitative focused Lean Six Sigma
methodology (Kessler 2004).
The final recommendation is to frequently use students to execute a research project at Shell Pernis.
An independent opinion and independent executed research is very useful within the current
environment at Shell Pernis. It provides new insights and could for example critically evaluate one of
the points of attention mentioned in this chapter.
Efficiency analysis of a planning process in chemical industry
Ov
erv
iew
of
fig
ure
s a
nd
ta
ble
s
133
Overview of figures and tables
Figure 1: Delay time sample analyses CVP .............................................................................................. 5
Figure 2: Potential reliability improvement of slack time ....................................................................... 6
Figure 3: Downstream strategy (source: (Shell 2009) ........................................................................... 13
Figure 4: Schematic overview of the supply chain indicating categories of disruptions ...................... 16
Figure 5: Report overview ..................................................................................................................... 19
Figure 6: Lean Six Sigma House ............................................................................................................. 21
Figure 7: Lean Six Sigma approach (Based on: Bevan, Westwood et al. 2005) ..................................... 24
Figure 8: Organizational chart of the formal and informal relations within the polyols’ supply chain 31
Figure 9: Overview of supply chain without F&D .................................................................................. 37
Figure 10: Process flow - planning process of supply chain of polyols ................................................. 38
Figure 11: Process flow scheme planning process based on 7 phases ................................................. 39
Figure 12: Value stream map of the poloyols supply chain .................................................................. 43
Figure 13: Overview of opportunities ................................................................................................... 48
Figure 14: Indication location of opportunities ..................................................................................... 48
Figure 15: Ranking the opportunities by using four categories ............................................................ 51
Figure 16: Ranking of the oppurtunities ................................................................................................ 52
Figure 17: Structure of chapter 6 - 12 ................................................................................................... 54
Figure 18: Development phases of a project (PMI 2010) ...................................................................... 55
Figure 19: DMAIC – Define (Shell 2002-2008) ....................................................................................... 55
Figure 20: DMAIC - Define and measure ............................................................................................... 56
Figure 21: DMAIC - Analyse and improve .............................................................................................. 56
Figure 22: Project management triangle (PMI 2010) ............................................................................ 58
Figure 23: DMAIC – Control ................................................................................................................... 58
Figure 24: Guidance for stakeholder involvement (Adapted from: Buhrmann, unknown) .................. 62
Figure 25: Four core elements of a process design (Adapted from: Bruijn, Heuvelhof et al. 2003) ..... 63
Figure 26: Overview of steps opportunity 6; feedback delivery of raw materials ................................ 64
Figure 27: Opportunity 6 Problem identification .................................................................................. 65
Figure 28: Delivery of raw materials - Overview of process steps ........................................................ 70
Figure 29: Schematic overview of tasks logistics coordinator .............................................................. 82
Figure 30: Overview of delays of sample analyses ................................................................................ 87
Figure 31: Overview of number of hours delay per sample .................................................................. 88
Figure 32: Overview of delayed samples of CVP ................................................................................... 88
Figure 33: Various Plants Impact PO Derivatives (Polyols) Performance (Ven 2010) ........................... 95
Figure 34: Overview of analysis time of samples CVP ........................................................................... 96
Figure 35: Overview of improvement within 4 hours ........................................................................... 97
Figure 36: Flexibility improves reliability ............................................................................................... 97
Figure 37: Knowledge transfer model - Adapted from (Landon 2001) ............................................... 111
Figure 38: Knowledge transfer; explicit vs. implict and tacit. Based on (Landon 2001) ..................... 113
Figure 39: Knowledge retention plan .................................................................................................. 115
Figure 40: Process flow of the planning process ................................................................................. 123
Figure 41: Schematic overview of production units ............................................................................ 135
Figure 42: Formal card of involved stakeholders ................................................................................ 139
Figure 43: Interaction 'as is'................................................................................................................. 142
TU Delft Master thesis project – R.M.T. van Oss
Figure 44: Interaction 'to be' ............................................................................................................... 142
Figure 45: SADT - A0 ............................................................................................................................ 143
Figure 46: SADT – A0 Planning process ............................................................................................... 144
Figure 47: SADT - A1 Commercial ........................................................................................................ 145
Figure 48: SADT - A2 Supply ................................................................................................................ 146
Figure 49: SADT - A3 Supply ................................................................................................................ 147
Figure 50: SADT - A4 filling and dispatch ............................................................................................. 148
Figure 51: SADT - A5 transportation.................................................................................................... 148
Figure 52: Legenda of boxes ................................................................................................................ 156
Figure 53: MCA total overview ............................................................................................................ 156
Figure 54: MCA group 1 - succesfactor based on frequency of occurence ......................................... 157
Figure 55: MCA group 2 - succesfactor based on forecast and evaluation quality ............................. 157
Figure 56: MCA group 3 - succesfactor based on flexibility of supply chain in general ...................... 157
Figure 57: Insights Logistics Coordinator - Subtask 1 .......................................................................... 166
Figure 58: Insights Logistics Coordinator - Subtask 2 .......................................................................... 166
Figure 59: Insights Logistics Coordinator - Subtask 3 .......................................................................... 167
Figure 60: Insights Logistics Coordinator - Subtask 4 .......................................................................... 167
Figure 61: Insights Logistics Coordinator - Subtask 5 .......................................................................... 168
Figure 62: Insights Logistics Coordinator - Subtask 6 .......................................................................... 168
Figure 63: Insights Logistics Coordinator - Subtask 7 .......................................................................... 169
Figure 64: Insights Logistics Coordinator - Subtask 8 .......................................................................... 170
Figure 65: Project Charter - Insight in tasks LC .................................................................................... 173
Figure 66: Project Charter - Feedback delivery of Raw Materials ....................................................... 174
Figure 67: Project Charter - Delayed samples analyses CVP ............................................................... 175
Figure 68: Project Charter - Optimal balance between flexibility and inventory ............................... 176
Table 1: Framework of technological and managerial tamed and untamed problems (Source: De
Graaf and Hoppe, 1989) ........................................................................................................................ 28
Table 2: Stakeholder overview .............................................................................................................. 30
Table 3: Actor field (Hermans 2004) ..................................................................................................... 36
Table 4: Overview of sample delays ...................................................................................................... 89
Table 5: Stakeholder analysis .............................................................................................................. 138
Table 6: Stakeholder analysis - Resources ........................................................................................... 141
Table 7: Output SIPOC workshop ........................................................................................................ 152
Table 8: Overview of the opportunities .............................................................................................. 155
Table 11: Overview of performed interviews ..................................................................................... 165
Table 12: Overview of training days .................................................................................................... 165
Table 13: Monitored data - deliveries raw materials .......................................................................... 171
Table 14: List of abbreviations ............................................................................................................ 172
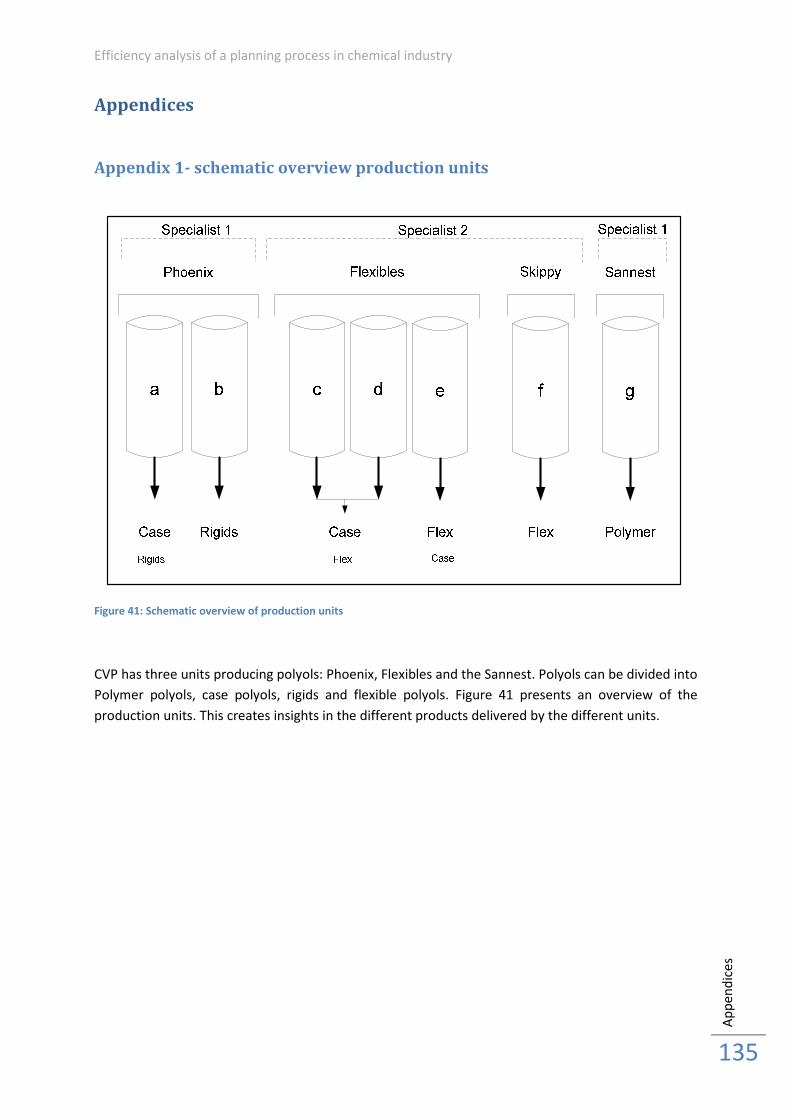
Efficiency analysis of a planning process in chemical industry
Ap
pe
nd
ice
s
135
Appendices
Appendix 1- schematic overview production units
Figure 41: Schematic overview of production units
CVP has three units producing polyols: Phoenix, Flexibles and the Sannest. Polyols can be divided into
Polymer polyols, case polyols, rigids and flexible polyols. Figure 41 presents an overview of the
production units. This creates insights in the different products delivered by the different units.
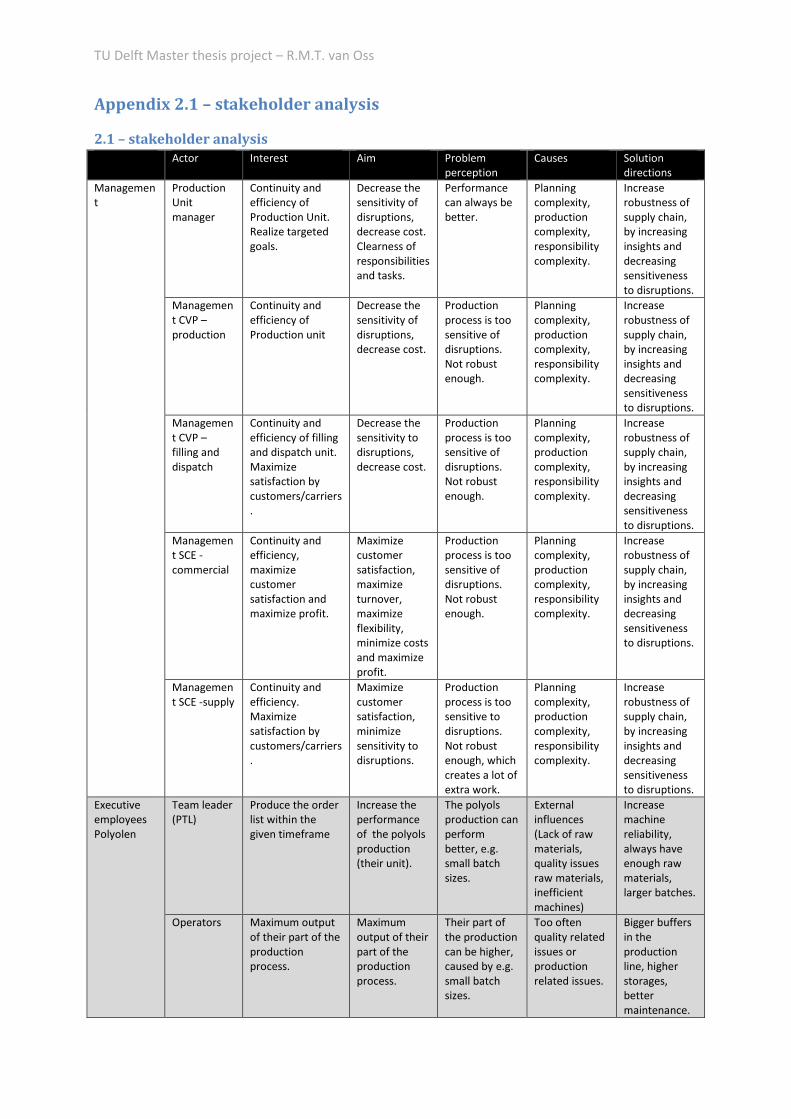
TU Delft Master thesis project – R.M.T. van Oss
Appendix 2.1 – stakeholder analysis
2.1 – stakeholder analysis
Actor Interest Aim Problem
perception
Causes Solution
directions
Managemen
t
Production
Unit
manager
Continuity and
efficiency of
Production Unit.
Realize targeted
goals.
Decrease the
sensitivity of
disruptions,
decrease cost.
Clearness of
responsibilities
and tasks.
Performance
can always be
better.
Planning
complexity,
production
complexity,
responsibility
complexity.
Increase
robustness of
supply chain,
by increasing
insights and
decreasing
sensitiveness
to disruptions.
Managemen
t CVP –
production
Continuity and
efficiency of
Production unit
Decrease the
sensitivity of
disruptions,
decrease cost.
Production
process is too
sensitive of
disruptions.
Not robust
enough.
Planning
complexity,
production
complexity,
responsibility
complexity.
Increase
robustness of
supply chain,
by increasing
insights and
decreasing
sensitiveness
to disruptions.
Managemen
t CVP –
filling and
dispatch
Continuity and
efficiency of filling
and dispatch unit.
Maximize
satisfaction by
customers/carriers
.
Decrease the
sensitivity to
disruptions,
decrease cost.
Production
process is too
sensitive of
disruptions.
Not robust
enough.
Planning
complexity,
production
complexity,
responsibility
complexity.
Increase
robustness of
supply chain,
by increasing
insights and
decreasing
sensitiveness
to disruptions.
Managemen
t SCE -
commercial
Continuity and
efficiency,
maximize
customer
satisfaction and
maximize profit.
Maximize
customer
satisfaction,
maximize
turnover,
maximize
flexibility,
minimize costs
and maximize
profit.
Production
process is too
sensitive of
disruptions.
Not robust
enough.
Planning
complexity,
production
complexity,
responsibility
complexity.
Increase
robustness of
supply chain,
by increasing
insights and
decreasing
sensitiveness
to disruptions.
Managemen
t SCE -supply
Continuity and
efficiency.
Maximize
satisfaction by
customers/carriers
.
Maximize
customer
satisfaction,
minimize
sensitivity to
disruptions.
Production
process is too
sensitive to
disruptions.
Not robust
enough, which
creates a lot of
extra work.
Planning
complexity,
production
complexity,
responsibility
complexity.
Increase
robustness of
supply chain,
by increasing
insights and
decreasing
sensitiveness
to disruptions.
Executive
employees
Polyolen
Team leader
(PTL)
Produce the order
list within the
given timeframe
Increase the
performance
of the polyols
production
(their unit).
The polyols
production can
perform
better, e.g.
small batch
sizes.
External
influences
(Lack of raw
materials,
quality issues
raw materials,
inefficient
machines)
Increase
machine
reliability,
always have
enough raw
materials,
larger batches.
Operators
Maximum output
of their part of the
production
process.
Maximum
output of their
part of the
production
process.
Their part of
the production
can be higher,
caused by e.g.
small batch
sizes.
Too often
quality related
issues or
production
related issues.
Bigger buffers
in the
production
line, higher
storages,
better
maintenance.
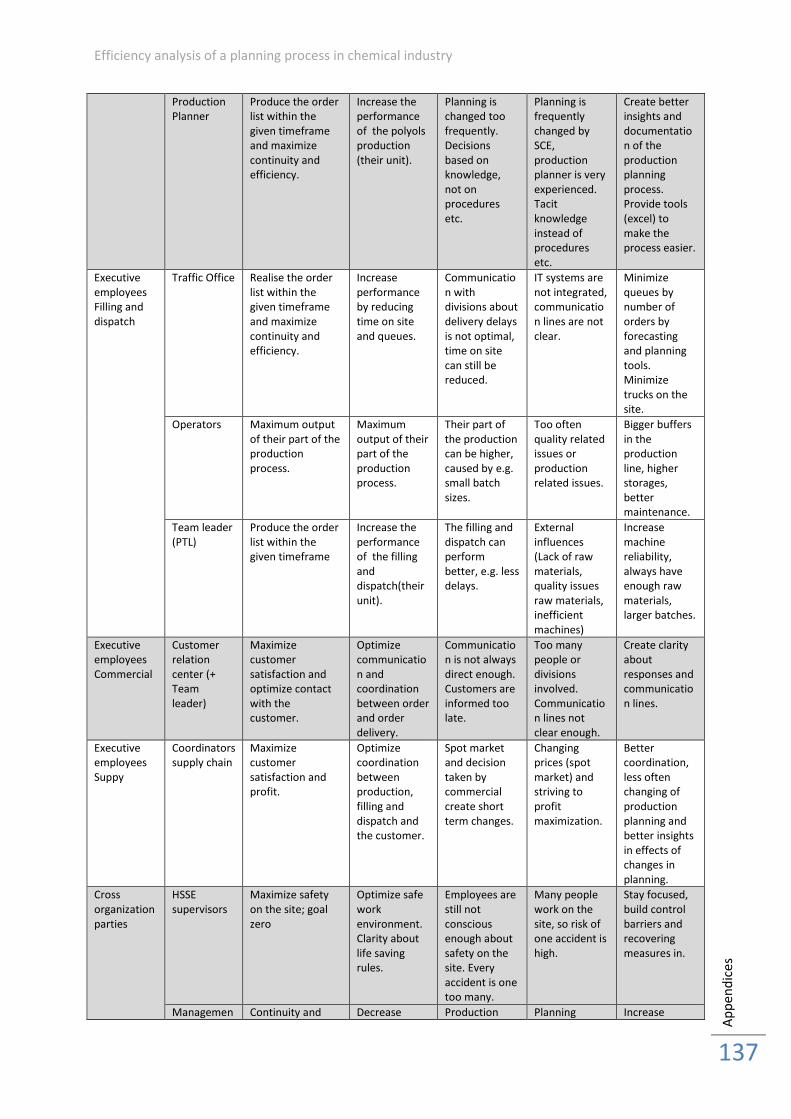
Efficiency analysis of a planning process in chemical industry
Ap
pe
nd
ice
s
137
Production
Planner
Produce the order
list within the
given timeframe
and maximize
continuity and
efficiency.
Increase the
performance
of the polyols
production
(their unit).
Planning is
changed too
frequently.
Decisions
based on
knowledge,
not on
procedures
etc.
Planning is
frequently
changed by
SCE,
production
planner is very
experienced.
Tacit
knowledge
instead of
procedures
etc.
Create better
insights and
documentatio
n of the
production
planning
process.
Provide tools
(excel) to
make the
process easier.
Executive
employees
Filling and
dispatch
Traffic Office Realise the order
list within the
given timeframe
and maximize
continuity and
efficiency.
Increase
performance
by reducing
time on site
and queues.
Communicatio
n with
divisions about
delivery delays
is not optimal,
time on site
can still be
reduced.
IT systems are
not integrated,
communicatio
n lines are not
clear.
Minimize
queues by
number of
orders by
forecasting
and planning
tools.
Minimize
trucks on the
site.
Operators Maximum output
of their part of the
production
process.
Maximum
output of their
part of the
production
process.
Their part of
the production
can be higher,
caused by e.g.
small batch
sizes.
Too often
quality related
issues or
production
related issues.
Bigger buffers
in the
production
line, higher
storages,
better
maintenance.
Team leader
(PTL)
Produce the order
list within the
given timeframe
Increase the
performance
of the filling
and
dispatch(their
unit).
The filling and
dispatch can
perform
better, e.g. less
delays.
External
influences
(Lack of raw
materials,
quality issues
raw materials,
inefficient
machines)
Increase
machine
reliability,
always have
enough raw
materials,
larger batches.
Executive
employees
Commercial
Customer
relation
center (+
Team
leader)
Maximize
customer
satisfaction and
optimize contact
with the
customer.
Optimize
communicatio
n and
coordination
between order
and order
delivery.
Communicatio
n is not always
direct enough.
Customers are
informed too
late.
Too many
people or
divisions
involved.
Communicatio
n lines not
clear enough.
Create clarity
about
responses and
communicatio
n lines.
Executive
employees
Suppy
Coordinators
supply chain
Maximize
customer
satisfaction and
profit.
Optimize
coordination
between
production,
filling and
dispatch and
the customer.
Spot market
and decision
taken by
commercial
create short
term changes.
Changing
prices (spot
market) and
striving to
profit
maximization.
Better
coordination,
less often
changing of
production
planning and
better insights
in effects of
changes in
planning.
Cross
organization
parties
HSSE
supervisors
Maximize safety
on the site; goal
zero
Optimize safe
work
environment.
Clarity about
life saving
rules.
Employees are
still not
conscious
enough about
safety on the
site. Every
accident is one
too many.
Many people
work on the
site, so risk of
one accident is
high.
Stay focused,
build control
barriers and
recovering
measures in.
Managemen Continuity and Decrease Production Planning Increase
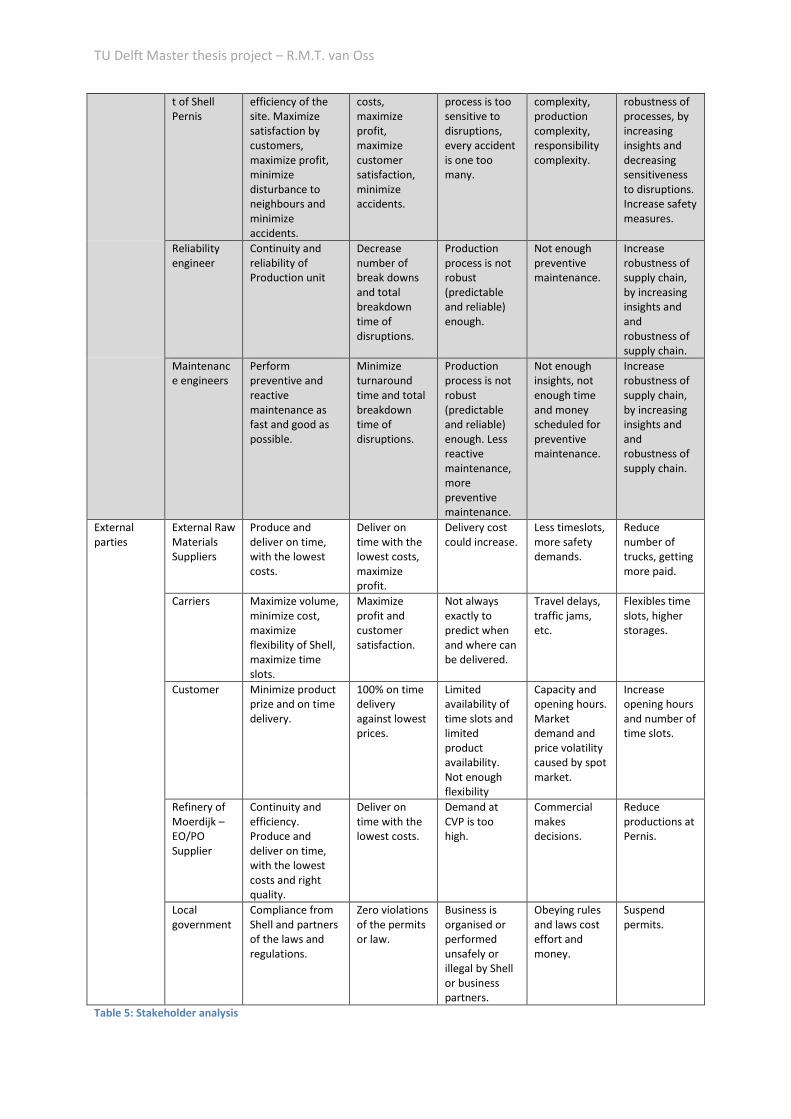
TU Delft Master thesis project – R.M.T. van Oss
t of Shell
Pernis
efficiency of the
site. Maximize
satisfaction by
customers,
maximize profit,
minimize
disturbance to
neighbours and
minimize
accidents.
costs,
maximize
profit,
maximize
customer
satisfaction,
minimize
accidents.
process is too
sensitive to
disruptions,
every accident
is one too
many.
complexity,
production
complexity,
responsibility
complexity.
robustness of
processes, by
increasing
insights and
decreasing
sensitiveness
to disruptions.
Increase safety
measures.
Reliability
engineer
Continuity and
reliability of
Production unit
Decrease
number of
break downs
and total
breakdown
time of
disruptions.
Production
process is not
robust
(predictable
and reliable)
enough.
Not enough
preventive
maintenance.
Increase
robustness of
supply chain,
by increasing
insights and
and
robustness of
supply chain.
Maintenanc
e engineers
Perform
preventive and
reactive
maintenance as
fast and good as
possible.
Minimize
turnaround
time and total
breakdown
time of
disruptions.
Production
process is not
robust
(predictable
and reliable)
enough. Less
reactive
maintenance,
more
preventive
maintenance.
Not enough
insights, not
enough time
and money
scheduled for
preventive
maintenance.
Increase
robustness of
supply chain,
by increasing
insights and
and
robustness of
supply chain.
External
parties
External Raw
Materials
Suppliers
Produce and
deliver on time,
with the lowest
costs.
Deliver on
time with the
lowest costs,
maximize
profit.
Delivery cost
could increase.
Less timeslots,
more safety
demands.
Reduce
number of
trucks, getting
more paid.
Carriers Maximize volume,
minimize cost,
maximize
flexibility of Shell,
maximize time
slots.
Maximize
profit and
customer
satisfaction.
Not always
exactly to
predict when
and where can
be delivered.
Travel delays,
traffic jams,
etc.
Flexibles time
slots, higher
storages.
Customer Minimize product
prize and on time
delivery.
100% on time
delivery
against lowest
prices.
Limited
availability of
time slots and
limited
product
availability.
Not enough
flexibility
Capacity and
opening hours.
Market
demand and
price volatility
caused by spot
market.
Increase
opening hours
and number of
time slots.
Refinery of
Moerdijk –
EO/PO
Supplier
Continuity and
efficiency.
Produce and
deliver on time,
with the lowest
costs and right
quality.
Deliver on
time with the
lowest costs.
Demand at
CVP is too
high.
Commercial
makes
decisions.
Reduce
productions at
Pernis.
Local
government
Compliance from
Shell and partners
of the laws and
regulations.
Zero violations
of the permits
or law.
Business is
organised or
performed
unsafely or
illegal by Shell
or business
partners.
Obeying rules
and laws cost
effort and
money.
Suspend
permits.
Table 5: Stakeholder analysis
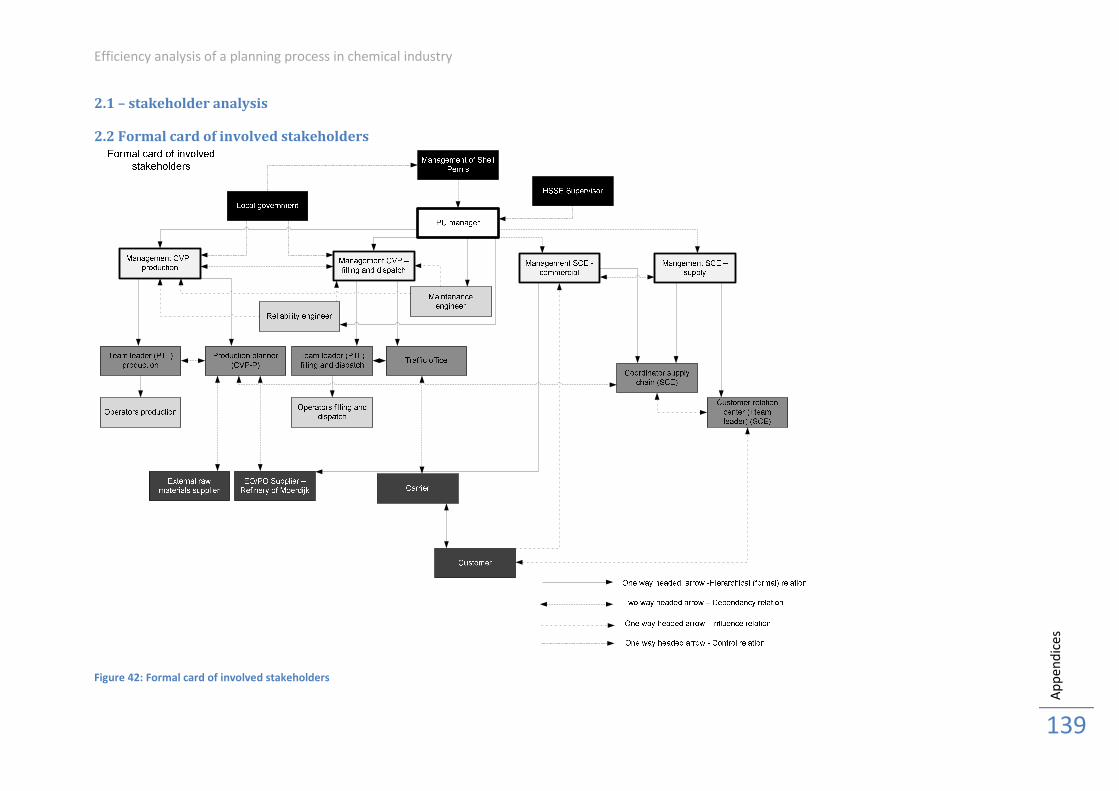
Efficiency analysis of a planning process in chemical industry
Ap
pe
nd
ice
s
139
2.1 – stakeholder analysis
2.2 Formal card of involved stakeholders
Figure 42: Formal card of involved stakeholders
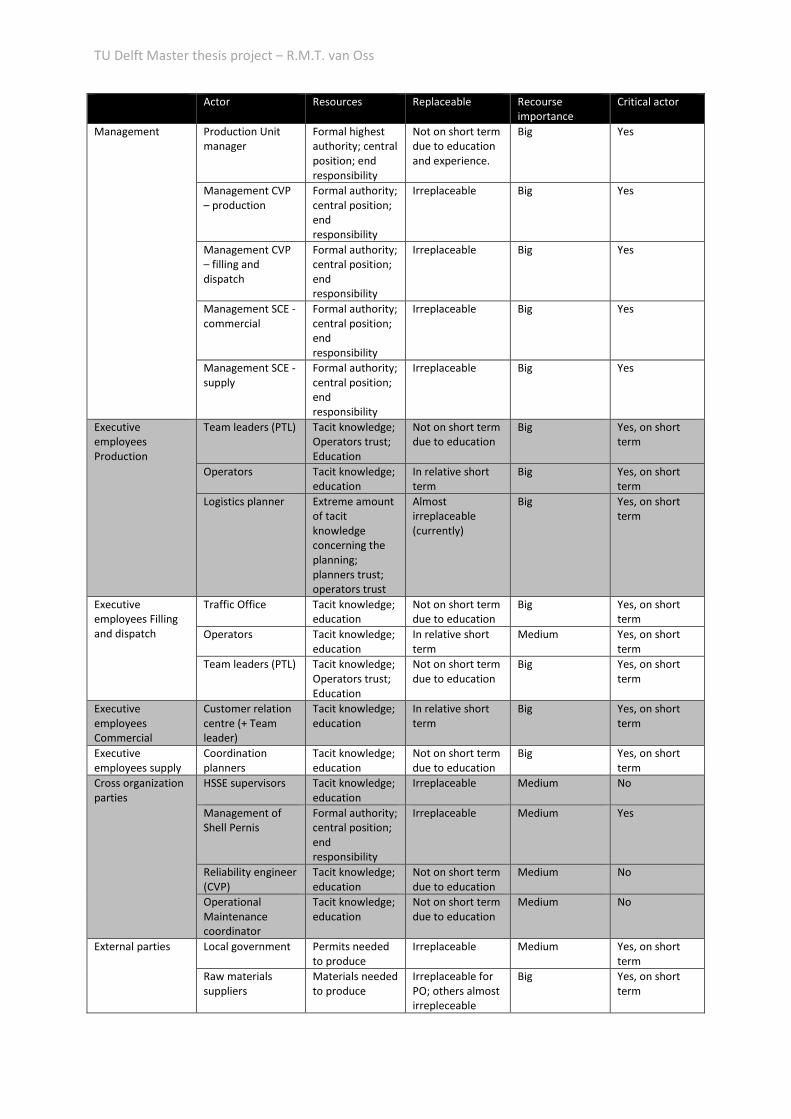
TU Delft Master thesis project – R.M.T. van Oss
Actor Resources Replaceable Recourse
importance
Critical actor
Management Production Unit
manager
Formal highest
authority; central
position; end
responsibility
Not on short term
due to education
and experience.
Big Yes
Management CVP
– production
Formal authority;
central position;
end
responsibility
Irreplaceable Big Yes
Management CVP
– filling and
dispatch
Formal authority;
central position;
end
responsibility
Irreplaceable Big Yes
Management SCE -
commercial
Formal authority;
central position;
end
responsibility
Irreplaceable Big Yes
Management SCE -
supply
Formal authority;
central position;
end
responsibility
Irreplaceable Big Yes
Executive
employees
Production
Team leaders (PTL)
Tacit knowledge;
Operators trust;
Education
Not on short term
due to education
Big Yes, on short
term
Operators
Tacit knowledge;
education
In relative short
term
Big Yes, on short
term
Logistics planner Extreme amount
of tacit
knowledge
concerning the
planning;
planners trust;
operators trust
Almost
irreplaceable
(currently)
Big Yes, on short
term
Executive
employees Filling
and dispatch
Traffic Office Tacit knowledge;
education
Not on short term
due to education
Big Yes, on short
term
Operators Tacit knowledge;
education
In relative short
term
Medium Yes, on short
term
Team leaders (PTL) Tacit knowledge;
Operators trust;
Education
Not on short term
due to education
Big Yes, on short
term
Executive
employees
Commercial
Customer relation
centre (+ Team
leader)
Tacit knowledge;
education
In relative short
term
Big Yes, on short
term
Executive
employees supply
Coordination
planners
Tacit knowledge;
education
Not on short term
due to education
Big Yes, on short
term
Cross organization
parties
HSSE supervisors
Tacit knowledge;
education
Irreplaceable Medium No
Management of
Shell Pernis
Formal authority;
central position;
end
responsibility
Irreplaceable Medium Yes
Reliability engineer
(CVP)
Tacit knowledge;
education
Not on short term
due to education
Medium No
Operational
Maintenance
coordinator
Tacit knowledge;
education
Not on short term
due to education
Medium No
External parties Local government Permits needed
to produce
Irreplaceable Medium Yes, on short
term
Raw materials
suppliers
Materials needed
to produce
Irreplaceable for
PO; others almost
irrepleceable
Big Yes, on short
term
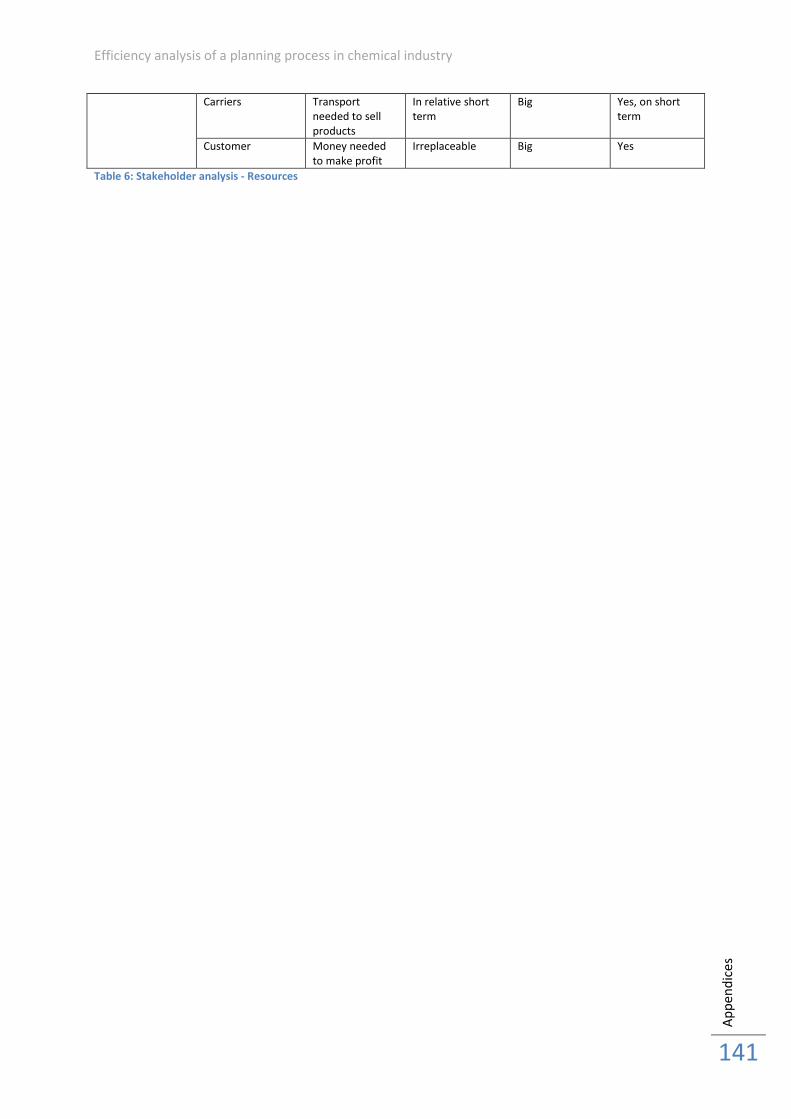
Efficiency analysis of a planning process in chemical industry
Ap
pe
nd
ice
s
141
Carriers Transport
needed to sell
products
In relative short
term
Big Yes, on short
term
Customer Money needed
to make profit
Irreplaceable Big Yes
Table 6: Stakeholder analysis - Resources
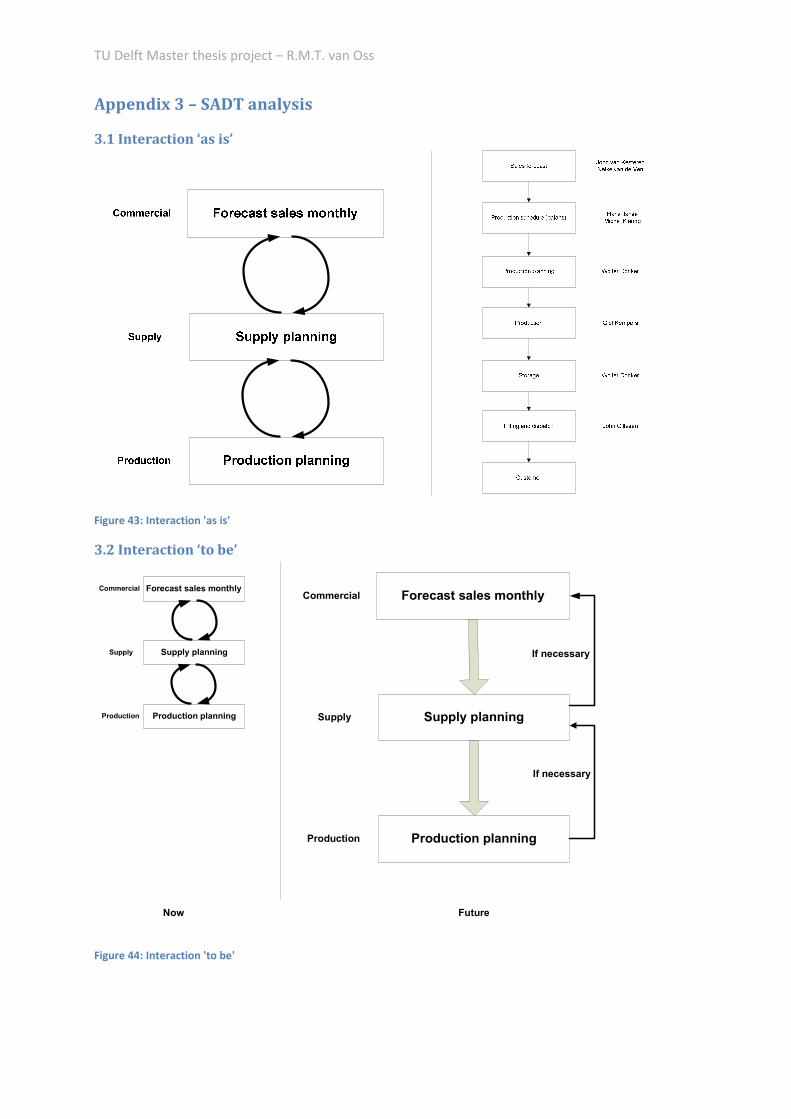
TU Delft Master thesis project – R.M.T. van Oss
Appendix 3 – SADT analysis
3.1 Interaction ‘as is’
Figure 43: Interaction 'as is'
3.2 Interaction ‘to be’
Forecast sales monthly
Supply planning
Production planning
Commercial
Production
Supply
Forecast sales monthly
Supply planning
Production planning
Commercial
Production
Supply
If necessary
If necessary
Now Future
Figure 44: Interaction 'to be'
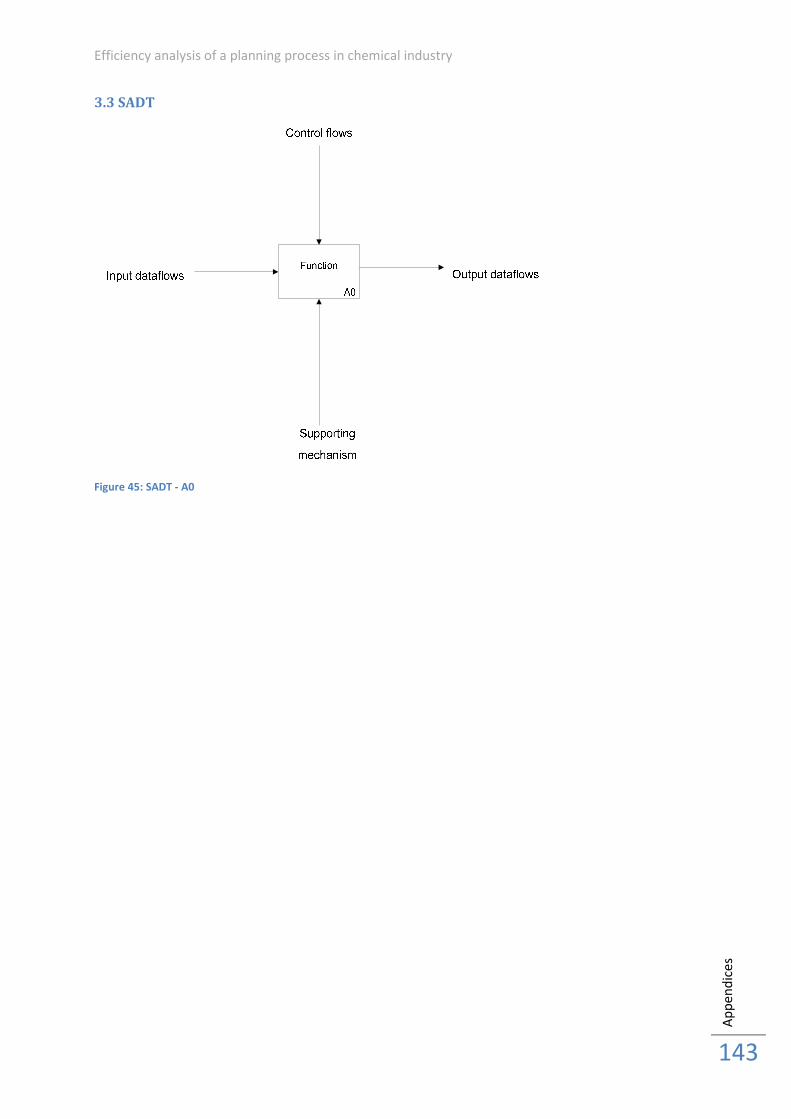
Efficiency analysis of a planning process in chemical industry
Ap
pe
nd
ice
s
143
3.3 SADT
Figure 45: SADT - A0
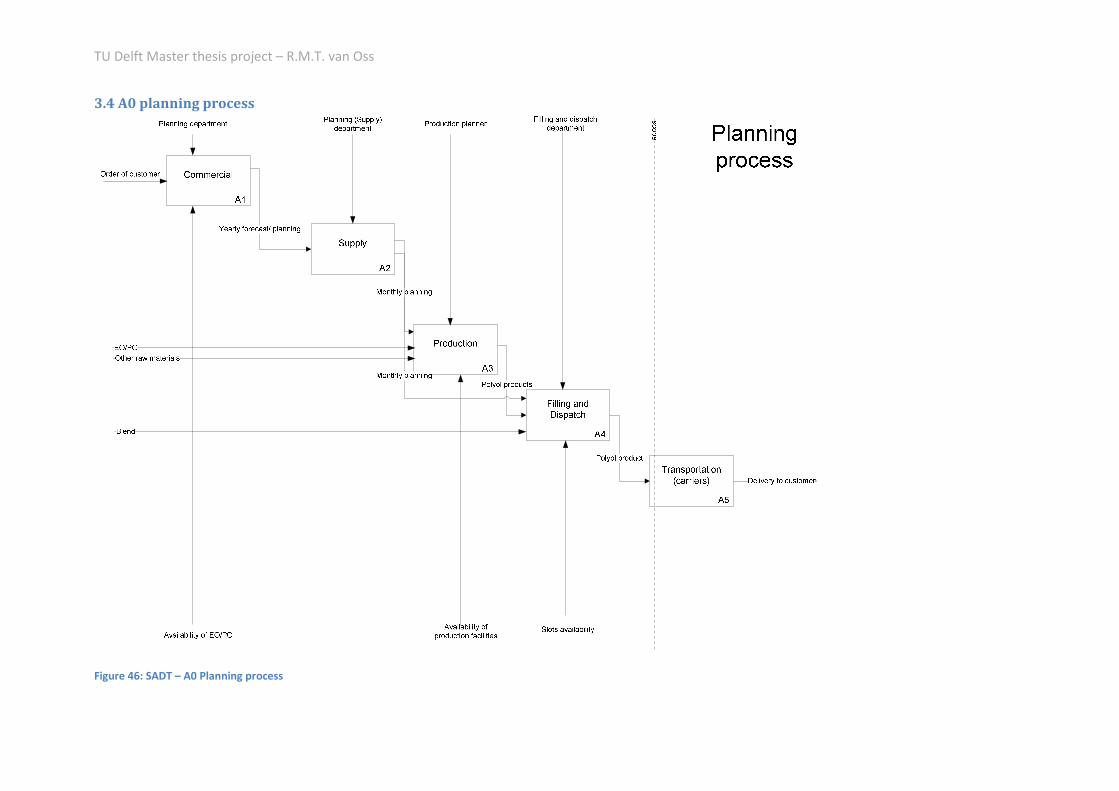
TU Delft Master thesis project – R.M.T. van Oss
3.4 A0 planning process
Figure 46: SADT – A0 Planning process
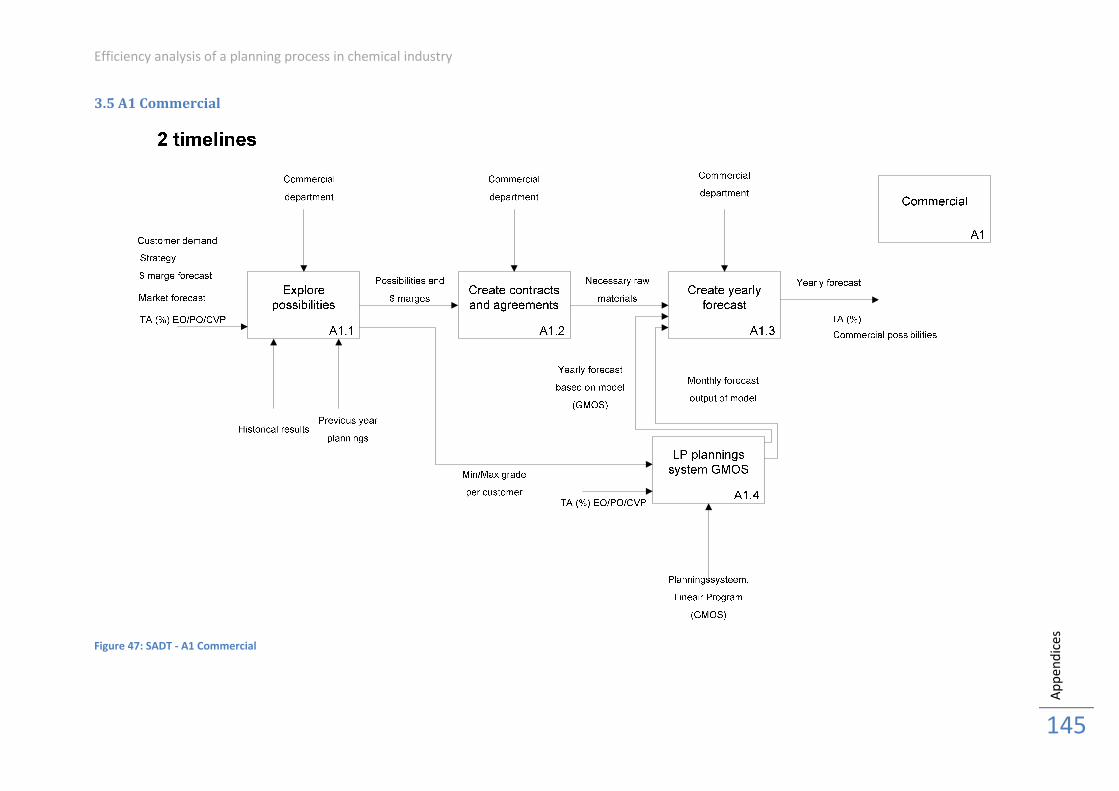
Efficiency analysis of a planning process in chemical industry
Ap
pe
nd
ice
s
145
3.5 A1 Commercial
Figure 47: SADT - A1 Commercial
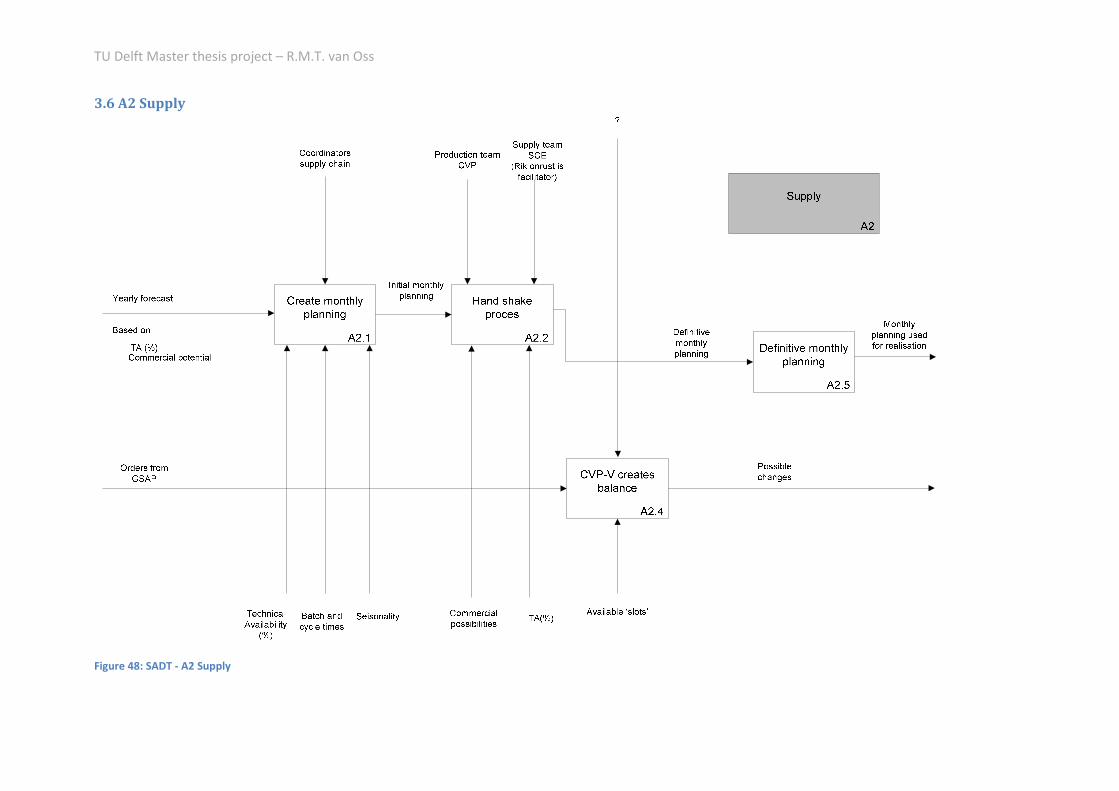
TU Delft Master thesis project – R.M.T. van Oss
3.6 A2 Supply
Figure 48: SADT - A2 Supply
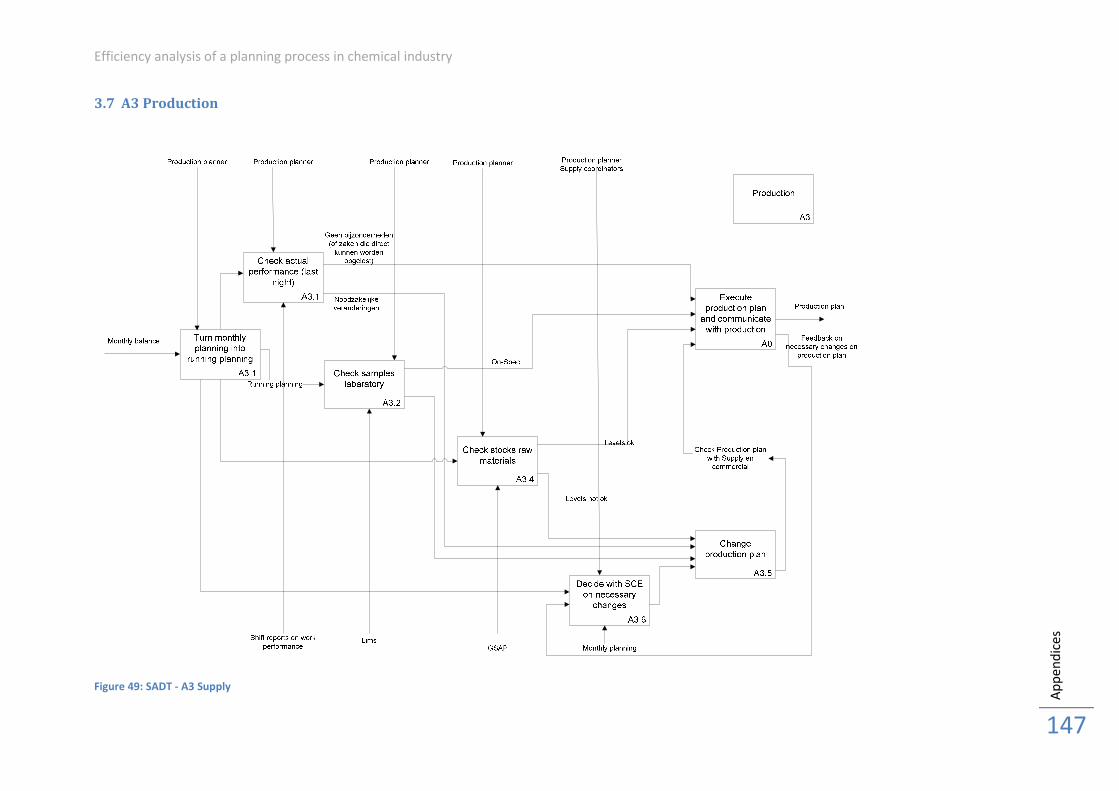
Efficiency analysis of a planning process in chemical industry
Ap
pe
nd
ice
s
147
3.7 A3 Production
Figure 49: SADT - A3 Supply

TU Delft Master thesis project – R.M.T. van Oss
3.8 A4 Filling and dispatch
Figure 50: SADT - A4 filling and dispatch
3.9 A5 Transportation
Figure 51: SADT - A5 transportation
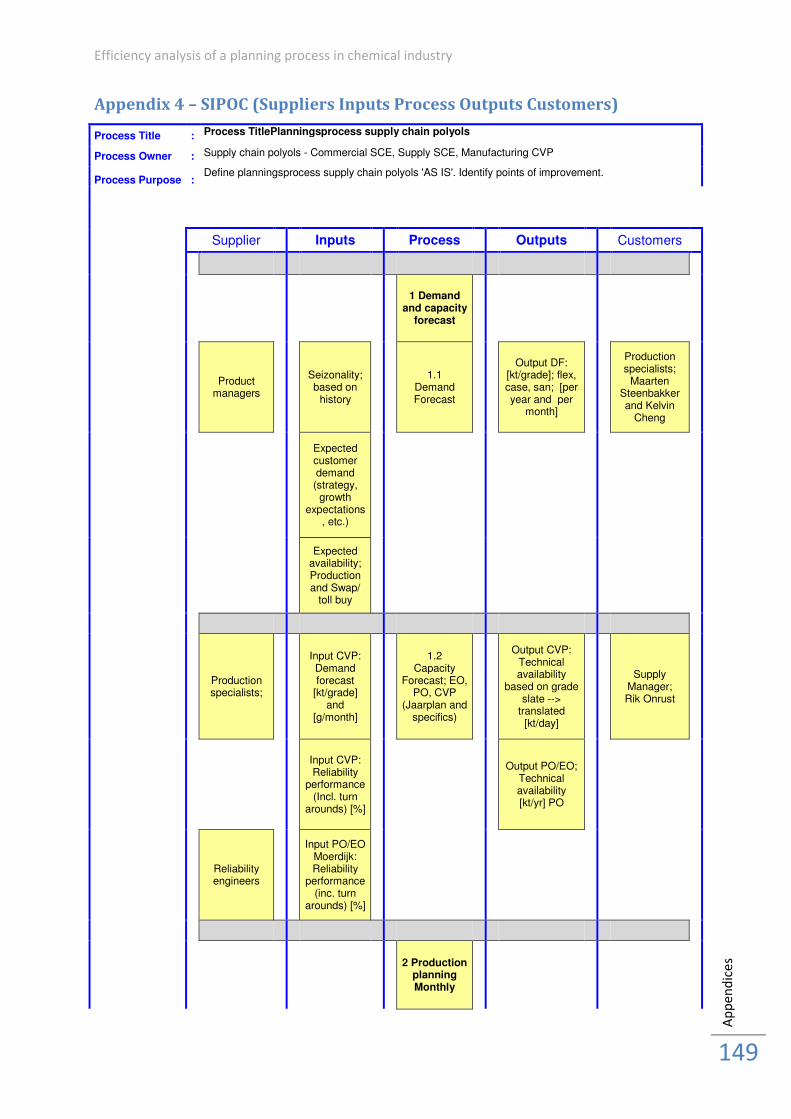
Efficiency analysis of a planning process in chemical industry
Ap
pe
nd
ice
s
149
Appendix 4 – SIPOC (Suppliers Inputs Process Outputs Customers)
Process Title : Process TitlePlanningsprocess supply chain polyols
Process Owner : Supply chain polyols - Commercial SCE, Supply SCE, Manufacturing CVP
Process Purpose : Define planningsprocess supply chain polyols 'AS IS'. Identify points of improvement.
Supplier Inputs Process Outputs Customers
1 Demand and capacity
forecast
Product
managers
Seizonality; based on
history
1.1 Demand Forecast
Output DF: [kt/grade]; flex, case, san; [per year and per
month]
Production specialists;
Maarten Steenbakker and Kelvin
Cheng
Expected customer demand (strategy,
growth expectations
, etc.)
Expected availability; Production and Swap/
toll buy
Production specialists;
Input CVP: Demand forecast
[kt/grade] and
[g/month]
1.2 Capacity
Forecast; EO, PO, CVP
(Jaarplan and specifics)
Output CVP: Technical availability
based on grade slate -->
translated [kt/day]
Supply Manager; Rik Onrust
Input CVP: Reliability
performance (Incl. turn
arounds) [%]
Output PO/EO; Technical availability [kt/yr] PO
Reliability engineers
Input PO/EO Moerdijk: Reliability
performance (inc. turn
arounds) [%]
2 Production planning Monthly
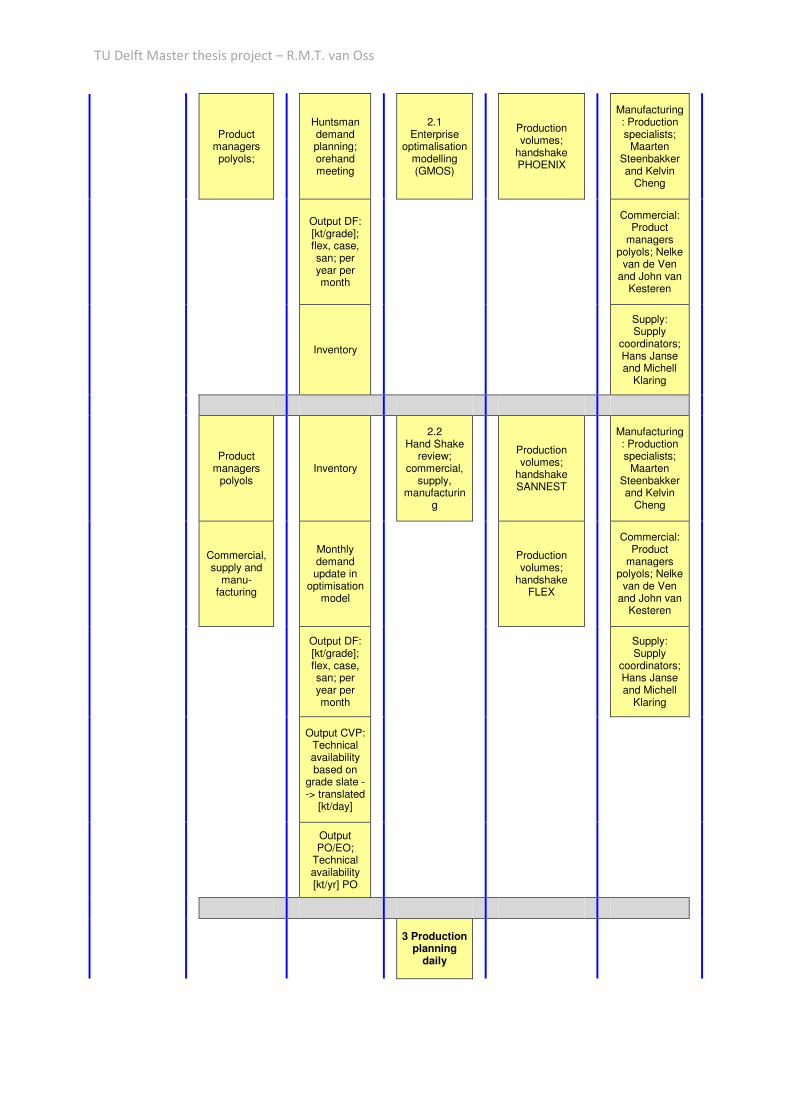
TU Delft Master thesis project – R.M.T. van Oss
Product
managers polyols;
Huntsman demand planning; orehand meeting
2.1 Enterprise
optimalisation modelling (GMOS)
Production volumes;
handshake PHOENIX
Manufacturing: Production specialists;
Maarten Steenbakker and Kelvin
Cheng
Output DF: [kt/grade]; flex, case, san; per year per month
Commercial: Product
managers polyols; Nelke
van de Ven and John van
Kesteren
Inventory
Supply: Supply
coordinators; Hans Janse and Michell
Klaring
Product
managers polyols
Inventory
2.2 Hand Shake
review; commercial,
supply, manufacturin
g
Production volumes;
handshake SANNEST
Manufacturing: Production specialists;
Maarten Steenbakker and Kelvin
Cheng
Commercial, supply and
manu-facturing
Monthly demand update in
optimisation model
Production volumes;
handshake FLEX
Commercial: Product
managers polyols; Nelke
van de Ven and John van
Kesteren
Output DF: [kt/grade]; flex, case, san; per year per month
Supply: Supply
coordinators; Hans Janse and Michell
Klaring
Output CVP: Technical availability based on
grade slate --> translated
[kt/day]
Output PO/EO;
Technical availability [kt/yr] PO
3 Production planning
daily
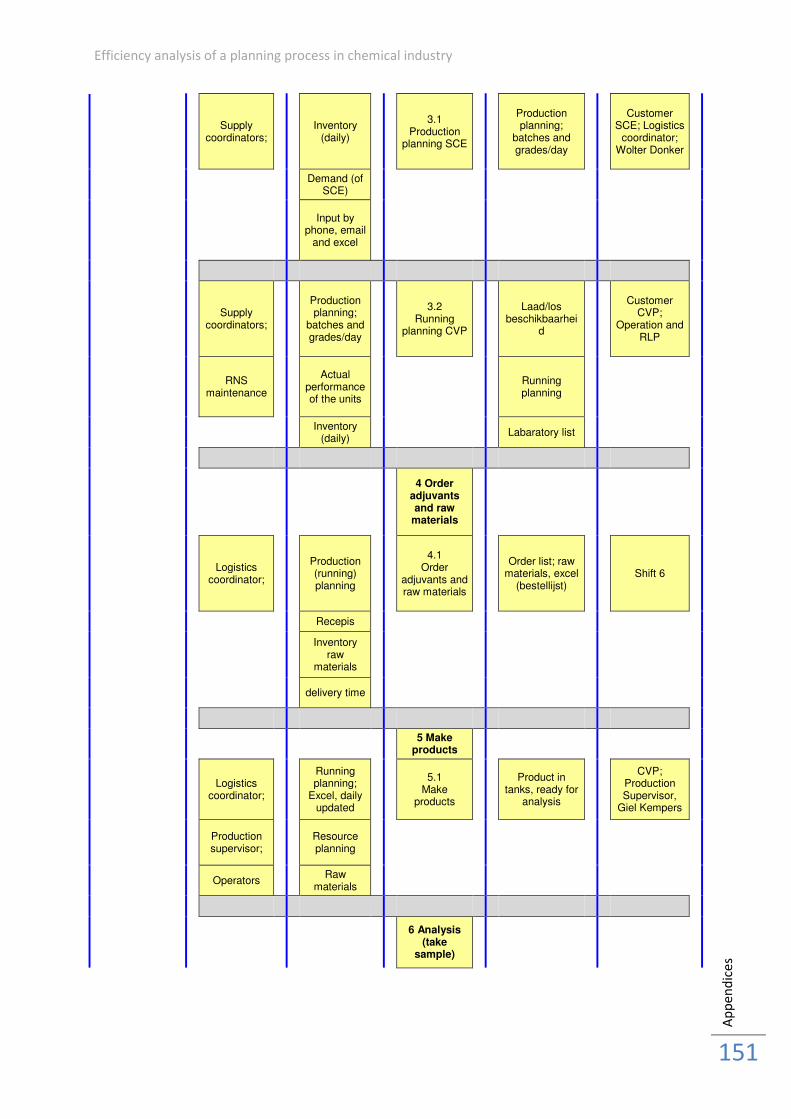
Efficiency analysis of a planning process in chemical industry
Ap
pe
nd
ice
s
151
Supply
coordinators;
Inventory (daily)
3.1 Production
planning SCE
Production planning;
batches and grades/day
Customer SCE; Logistics
coordinator; Wolter Donker
Demand (of SCE)
Input by phone, email
and excel
Supply
coordinators;
Production planning;
batches and grades/day
3.2 Running
planning CVP
Laad/los beschikbaarhei
d
Customer CVP;
Operation and RLP
RNS
maintenance
Actual performance of the units
Running planning
Inventory (daily)
Labaratory list
4 Order adjuvants and raw
materials
Logistics
coordinator;
Production (running) planning
4.1 Order
adjuvants and raw materials
Order list; raw materials, excel
(bestellijst)
Shift 6
Recepis
Inventory raw
materials
delivery time
5 Make products
Logistics
coordinator;
Running planning;
Excel, daily updated
5.1 Make
products
Product in tanks, ready for
analysis
CVP; Production Supervisor,
Giel Kempers
Production supervisor;
Resource planning
Operators
Raw materials
6 Analysis (take
sample)
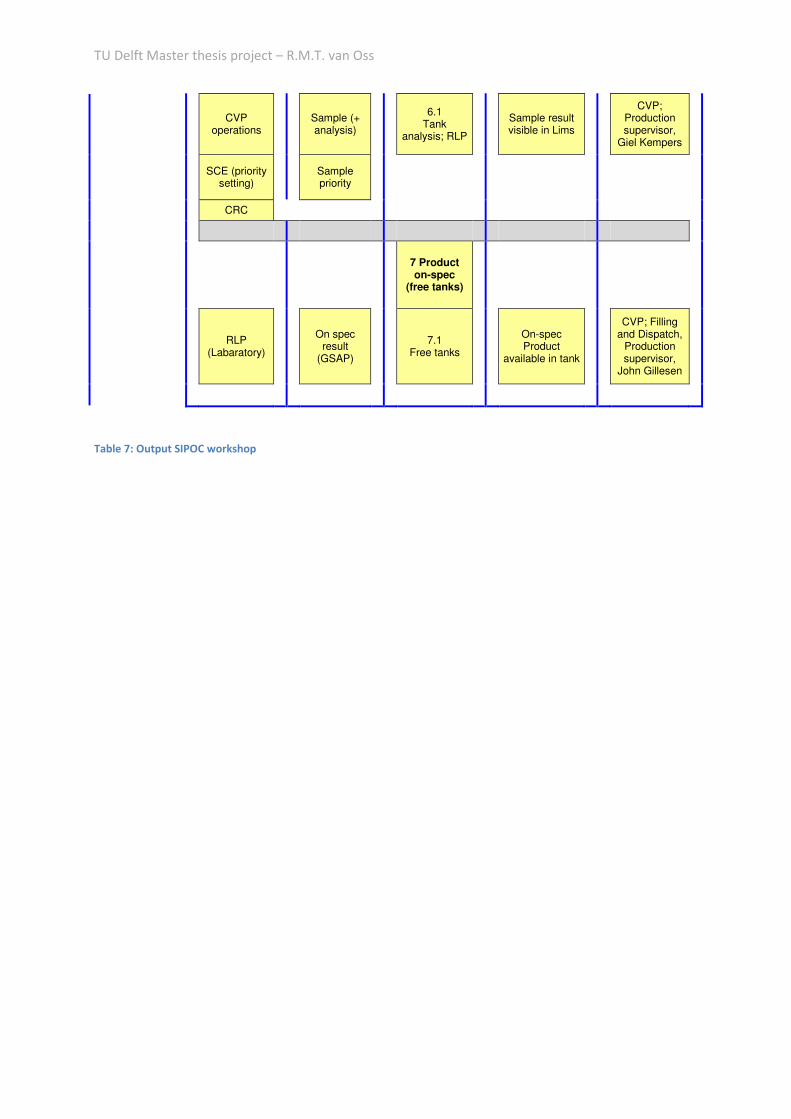
TU Delft Master thesis project – R.M.T. van Oss
Table 7: Output SIPOC workshop
CVP
operations
Sample (+ analysis)
6.1 Tank
analysis; RLP
Sample result visible in Lims
CVP; Production supervisor,
Giel Kempers
SCE (priority
setting)
Sample priority
CRC
7 Product on-spec
(free tanks)
RLP
(Labaratory)
On spec result
(GSAP)
7.1
Free tanks
On-spec Product
available in tank
CVP; Filling and Dispatch,
Production supervisor,
John Gillesen
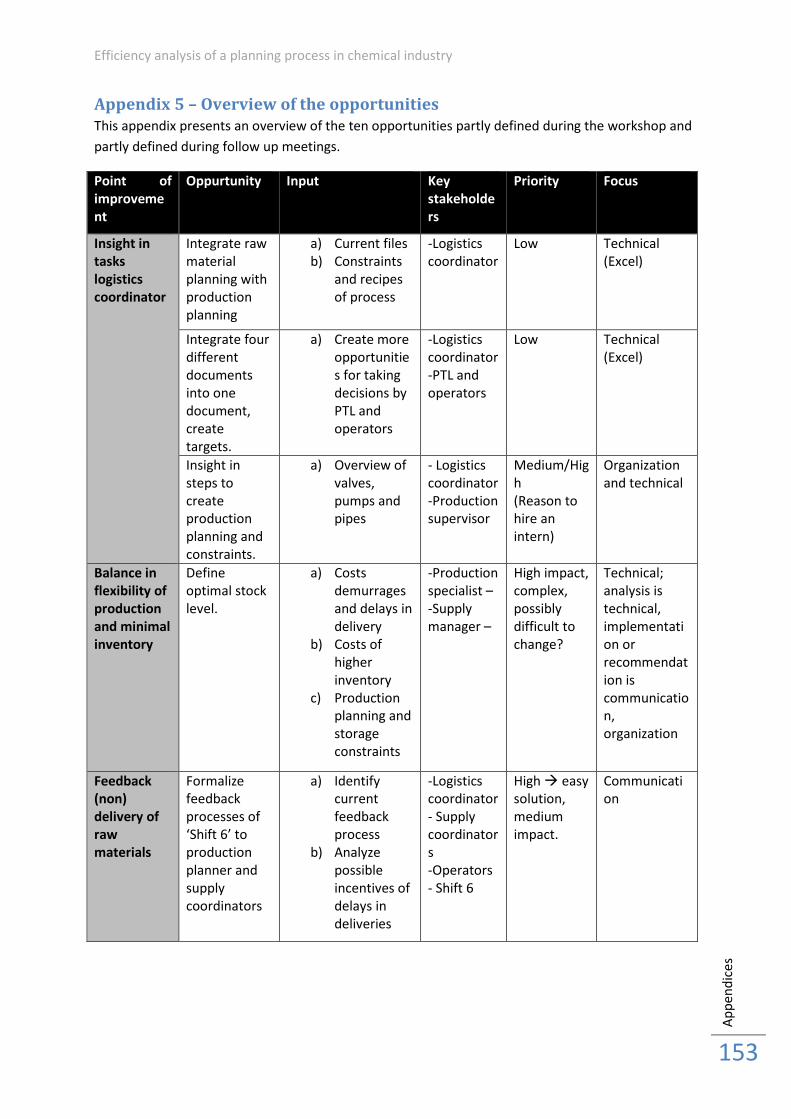
Efficiency analysis of a planning process in chemical industry
Ap
pe
nd
ice
s
153
Appendix 5 – Overview of the opportunities
This appendix presents an overview of the ten opportunities partly defined during the workshop and
partly defined during follow up meetings.
Point of
improveme
nt
Oppurtunity Input Key
stakeholde
rs
Priority Focus
Insight in
tasks
logistics
coordinator
Integrate raw
material
planning with
production
planning
a) Current files
b) Constraints
and recipes
of process
-Logistics
coordinator
Low Technical
(Excel)
Integrate four
different
documents
into one
document,
create
targets.
a) Create more
opportunitie
s for taking
decisions by
PTL and
operators
-Logistics
coordinator
-PTL and
operators
Low Technical
(Excel)
Insight in
steps to
create
production
planning and
constraints.
a) Overview of
valves,
pumps and
pipes
- Logistics
coordinator
-Production
supervisor
Medium/Hig
h
(Reason to
hire an
intern)
Organization
and technical
Balance in
flexibility of
production
and minimal
inventory
Define
optimal stock
level.
a) Costs
demurrages
and delays in
delivery
b) Costs of
higher
inventory
c) Production
planning and
storage
constraints
-Production
specialist –
-Supply
manager –
High impact,
complex,
possibly
difficult to
change?
Technical;
analysis is
technical,
implementati
on or
recommendat
ion is
communicatio
n,
organization
Feedback
(non)
delivery of
raw
materials
Formalize
feedback
processes of
‘Shift 6’ to
production
planner and
supply
coordinators
a) Identify
current
feedback
process
b) Analyze
possible
incentives of
delays in
deliveries
-Logistics
coordinator
- Supply
coordinator
s
-Operators
- Shift 6
High � easy
solution,
medium
impact.
Communicati
on
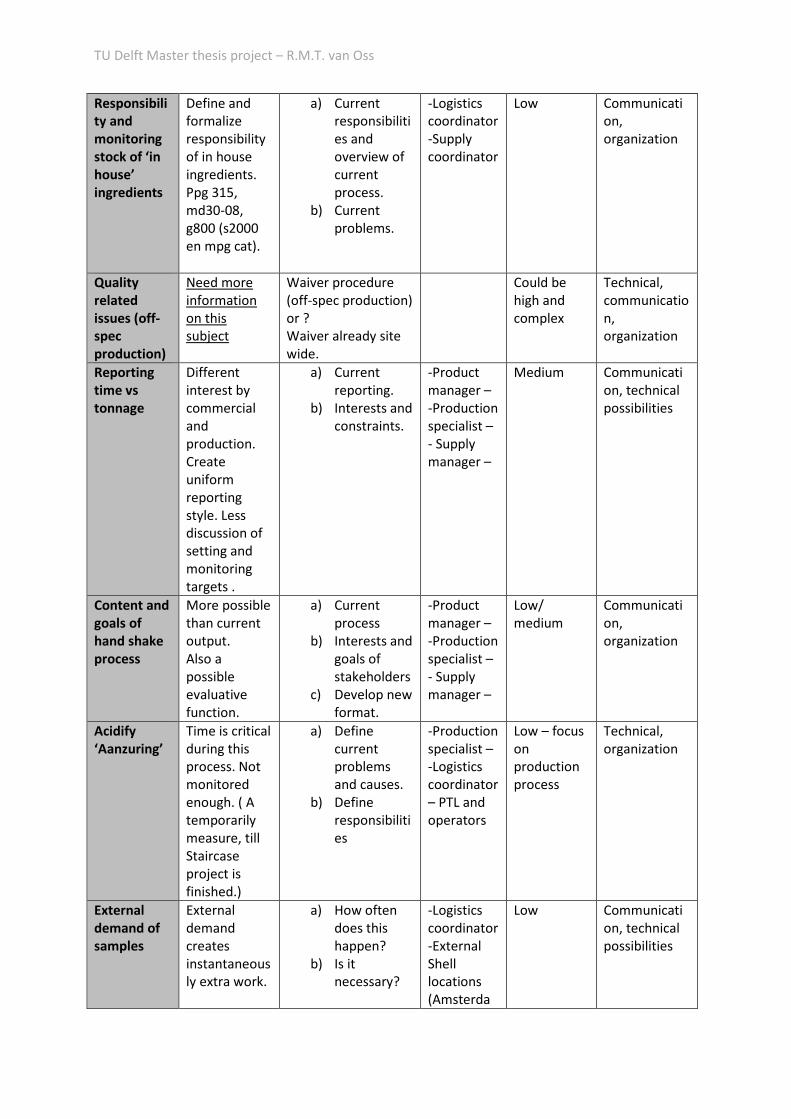
TU Delft Master thesis project – R.M.T. van Oss
Responsibili
ty and
monitoring
stock of ‘in
house’
ingredients
Define and
formalize
responsibility
of in house
ingredients.
Ppg 315,
md30-08,
g800 (s2000
en mpg cat).
a) Current
responsibiliti
es and
overview of
current
process.
b) Current
problems.
-Logistics
coordinator
-Supply
coordinator
Low Communicati
on,
organization
Quality
related
issues (off-
spec
production)
Need more
information
on this
subject
Waiver procedure
(off-spec production)
or ?
Waiver already site
wide.
Could be
high and
complex
Technical,
communicatio
n,
organization
Reporting
time vs
tonnage
Different
interest by
commercial
and
production.
Create
uniform
reporting
style. Less
discussion of
setting and
monitoring
targets .
a) Current
reporting.
b) Interests and
constraints.
-Product
manager –
-Production
specialist –
- Supply
manager –
Medium Communicati
on, technical
possibilities
Content and
goals of
hand shake
process
More possible
than current
output.
Also a
possible
evaluative
function.
a) Current
process
b) Interests and
goals of
stakeholders
c) Develop new
format.
-Product
manager –
-Production
specialist –
- Supply
manager –
Low/
medium
Communicati
on,
organization
Acidify
‘Aanzuring’
Time is critical
during this
process. Not
monitored
enough. ( A
temporarily
measure, till
Staircase
project is
finished.)
a) Define
current
problems
and causes.
b) Define
responsibiliti
es
-Production
specialist –
-Logistics
coordinator
– PTL and
operators
Low – focus
on
production
process
Technical,
organization
External
demand of
samples
External
demand
creates
instantaneous
ly extra work.
a) How often
does this
happen?
b) Is it
necessary?
-Logistics
coordinator
-External
Shell
locations
(Amsterda
Low Communicati
on, technical
possibilities
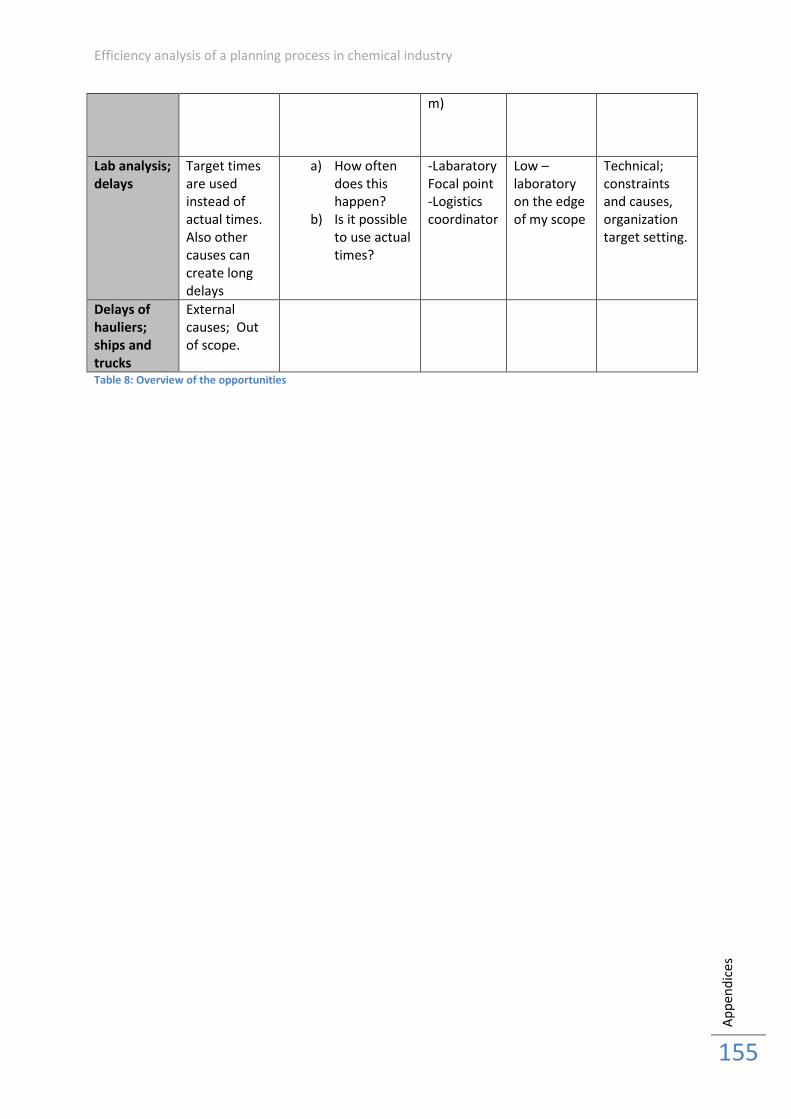
Efficiency analysis of a planning process in chemical industry
Ap
pe
nd
ice
s
155
m)
Lab analysis;
delays
Target times
are used
instead of
actual times.
Also other
causes can
create long
delays
a) How often
does this
happen?
b) Is it possible
to use actual
times?
-Labaratory
Focal point
-Logistics
coordinator
Low –
laboratory
on the edge
of my scope
Technical;
constraints
and causes,
organization
target setting.
Delays of
hauliers;
ships and
trucks
External
causes; Out
of scope.
Table 8: Overview of the opportunities
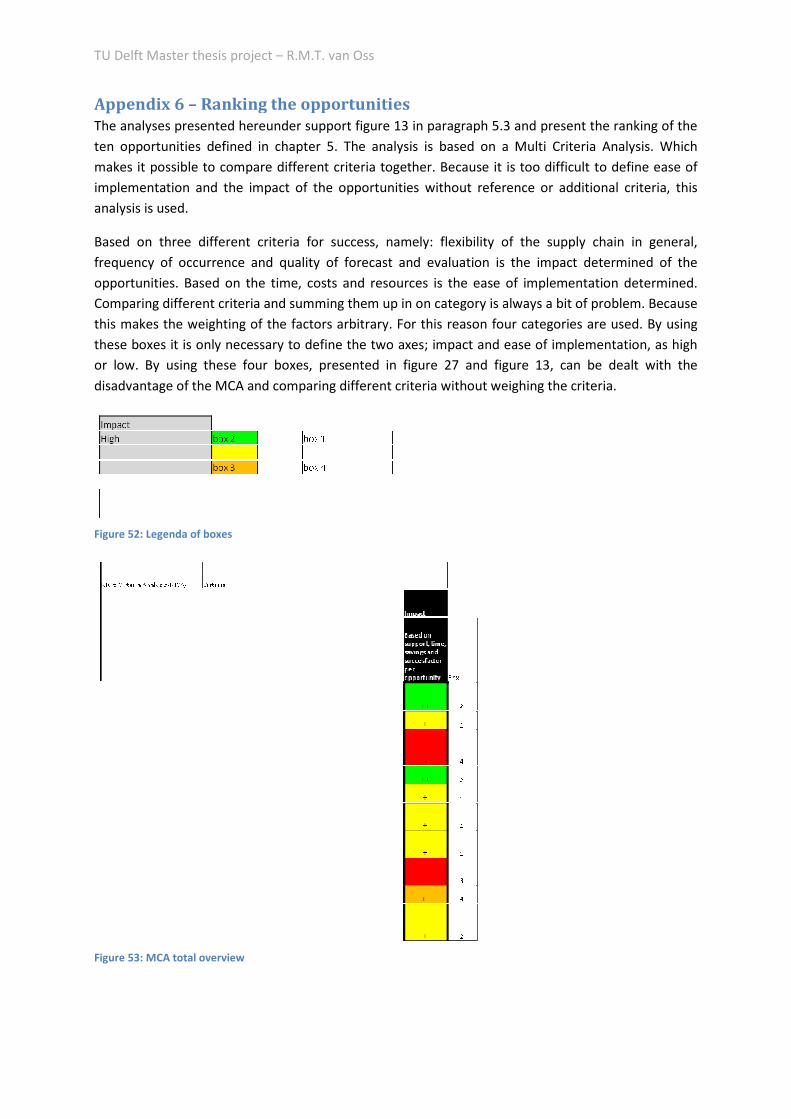
TU Delft Master thesis project –
Appendix 6 – Ranking the opportunities
The analyses presented hereunder support figure 13 in paragraph 5.3 and present the ranking of the
ten opportunities defined in chapter 5. The analysis is based on a Multi Criteria Analysis. Which
makes it possible to compare different criteria together. Because it is too difficult to define ease of
implementation and the impact of the opportunities without reference or additional criteria, this
analysis is used.
Based on three different criteria for success, nam
frequency of occurrence and quality of forecast and evaluation is the impact determined of the
opportunities. Based on the time, costs and resources is the ease of implementation determined.
Comparing different criteria and summing them up in on category is always a bit of problem. Because
this makes the weighting of the factors arbitrary. For this reason four categories are used. By using
these boxes it is only necessary to define the two axes; impact and e
or low. By using these four boxes, presented in figure 27 and figure 13, can be dealt with the
disadvantage of the MCA and comparing different criteria without weighing the criteria.
Figure 52: Legenda of boxes
Figure 53: MCA total overview
R.M.T. van Oss
Ranking the opportunities
The analyses presented hereunder support figure 13 in paragraph 5.3 and present the ranking of the
ten opportunities defined in chapter 5. The analysis is based on a Multi Criteria Analysis. Which
le to compare different criteria together. Because it is too difficult to define ease of
implementation and the impact of the opportunities without reference or additional criteria, this
Based on three different criteria for success, namely: flexibility of the supply chain in general,
frequency of occurrence and quality of forecast and evaluation is the impact determined of the
opportunities. Based on the time, costs and resources is the ease of implementation determined.
rent criteria and summing them up in on category is always a bit of problem. Because
this makes the weighting of the factors arbitrary. For this reason four categories are used. By using
these boxes it is only necessary to define the two axes; impact and ease of implementation, as high
or low. By using these four boxes, presented in figure 27 and figure 13, can be dealt with the
disadvantage of the MCA and comparing different criteria without weighing the criteria.
The analyses presented hereunder support figure 13 in paragraph 5.3 and present the ranking of the
ten opportunities defined in chapter 5. The analysis is based on a Multi Criteria Analysis. Which
le to compare different criteria together. Because it is too difficult to define ease of
implementation and the impact of the opportunities without reference or additional criteria, this
ely: flexibility of the supply chain in general,
frequency of occurrence and quality of forecast and evaluation is the impact determined of the
opportunities. Based on the time, costs and resources is the ease of implementation determined.
rent criteria and summing them up in on category is always a bit of problem. Because
this makes the weighting of the factors arbitrary. For this reason four categories are used. By using
ase of implementation, as high
or low. By using these four boxes, presented in figure 27 and figure 13, can be dealt with the
disadvantage of the MCA and comparing different criteria without weighing the criteria.
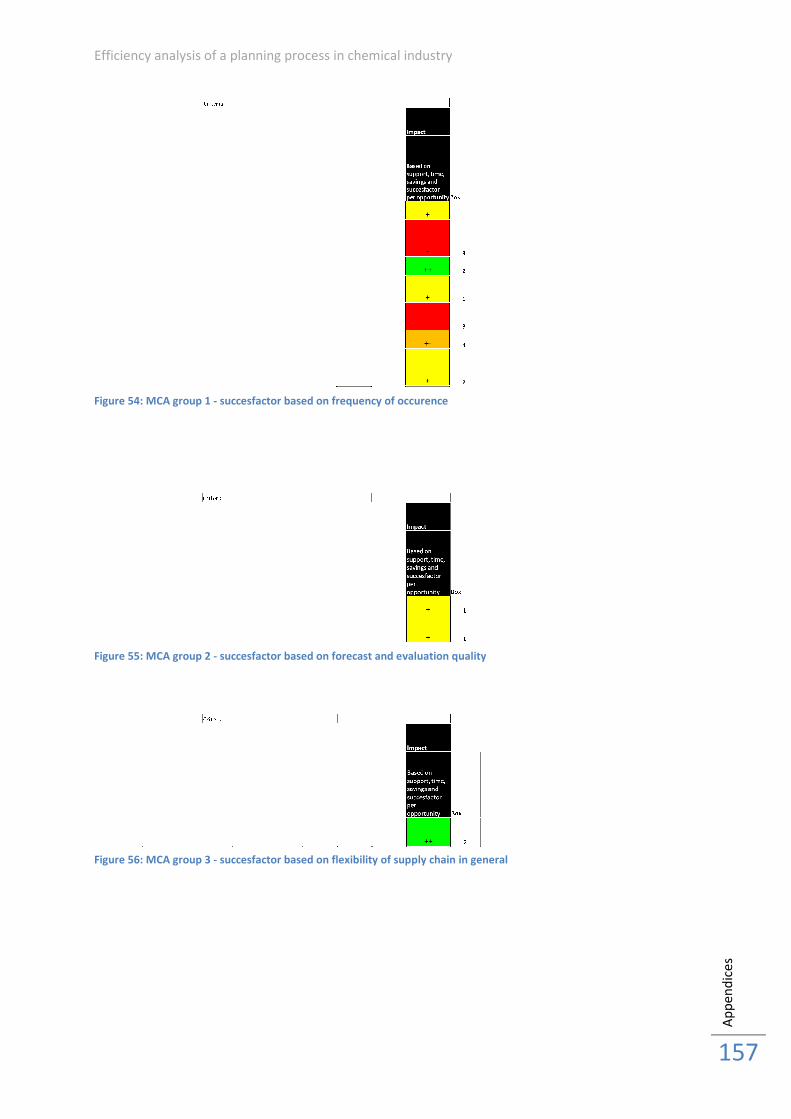
Efficiency analysis of a planning process in chemical industry
Figure 54: MCA group 1 - succesfactor based on frequency of occurence
Figure 55: MCA group 2 - succesfactor based on forecast and
Figure 56: MCA group 3 - succesfactor based on flexibility of supply chain in general
Efficiency analysis of a planning process in chemical industry
succesfactor based on frequency of occurence
succesfactor based on forecast and evaluation quality
succesfactor based on flexibility of supply chain in general
Ap
pe
nd
ice
s
157

TU Delft Master thesis project – R.M.T. van Oss
Appendix 7 – Overview of delayed samples
This part of the appendix is deleted for reasons of confidentiality
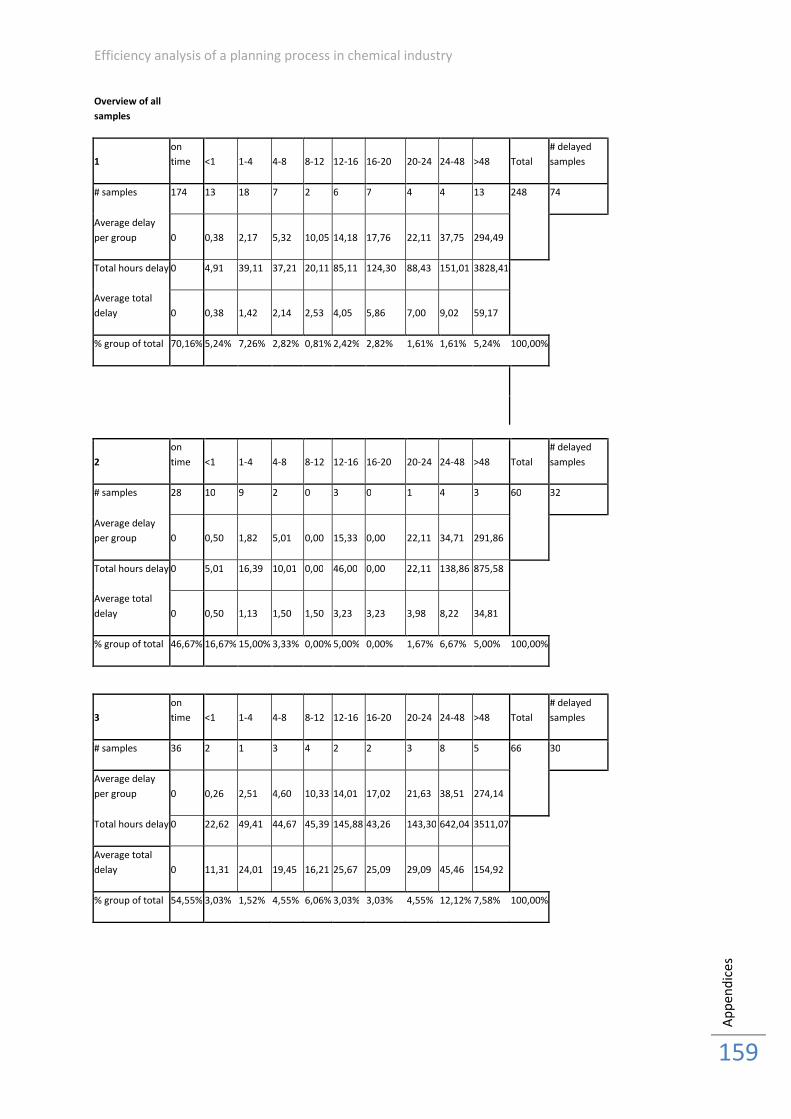
Efficiency analysis of a planning process in chemical industry
Ap
pe
nd
ice
s
159
Overview of all
samples
1
on
time <1 1-4 4-8 8-12 12-16 16-20 20-24 24-48 >48 Total
# delayed
samples
# samples 174 13 18 7 2 6 7 4 4 13 248 74
Average delay
per group 0 0,38 2,17 5,32 10,05 14,18 17,76 22,11 37,75 294,49
Total hours delay 0 4,91 39,11 37,21 20,11 85,11 124,30 88,43 151,01 3828,41
Average total
delay 0 0,38 1,42 2,14 2,53 4,05 5,86 7,00 9,02 59,17
% group of total 70,16% 5,24% 7,26% 2,82% 0,81% 2,42% 2,82% 1,61% 1,61% 5,24% 100,00%
2
on
time <1 1-4 4-8 8-12 12-16 16-20 20-24 24-48 >48 Total
# delayed
samples
# samples 28 10 9 2 0 3 0 1 4 3 60 32
Average delay
per group 0 0,50 1,82 5,01 0,00 15,33 0,00 22,11 34,71 291,86
Total hours delay 0 5,01 16,39 10,01 0,00 46,00 0,00 22,11 138,86 875,58
Average total
delay 0 0,50 1,13 1,50 1,50 3,23 3,23 3,98 8,22 34,81
% group of total 46,67% 16,67% 15,00% 3,33% 0,00% 5,00% 0,00% 1,67% 6,67% 5,00% 100,00%
3
on
time <1 1-4 4-8 8-12 12-16 16-20 20-24 24-48 >48 Total
# delayed
samples
# samples 36 2 1 3 4 2 2 3 8 5 66 30
Average delay
per group 0 0,26 2,51 4,60 10,33 14,01 17,02 21,63 38,51 274,14
Total hours delay 0 22,62 49,41 44,67 45,39 145,88 43,26 143,30 642,04 3511,07
Average total
delay 0 11,31 24,01 19,45 16,21 25,67 25,09 29,09 45,46 154,92
% group of total 54,55% 3,03% 1,52% 4,55% 6,06% 3,03% 3,03% 4,55% 12,12% 7,58% 100,00%
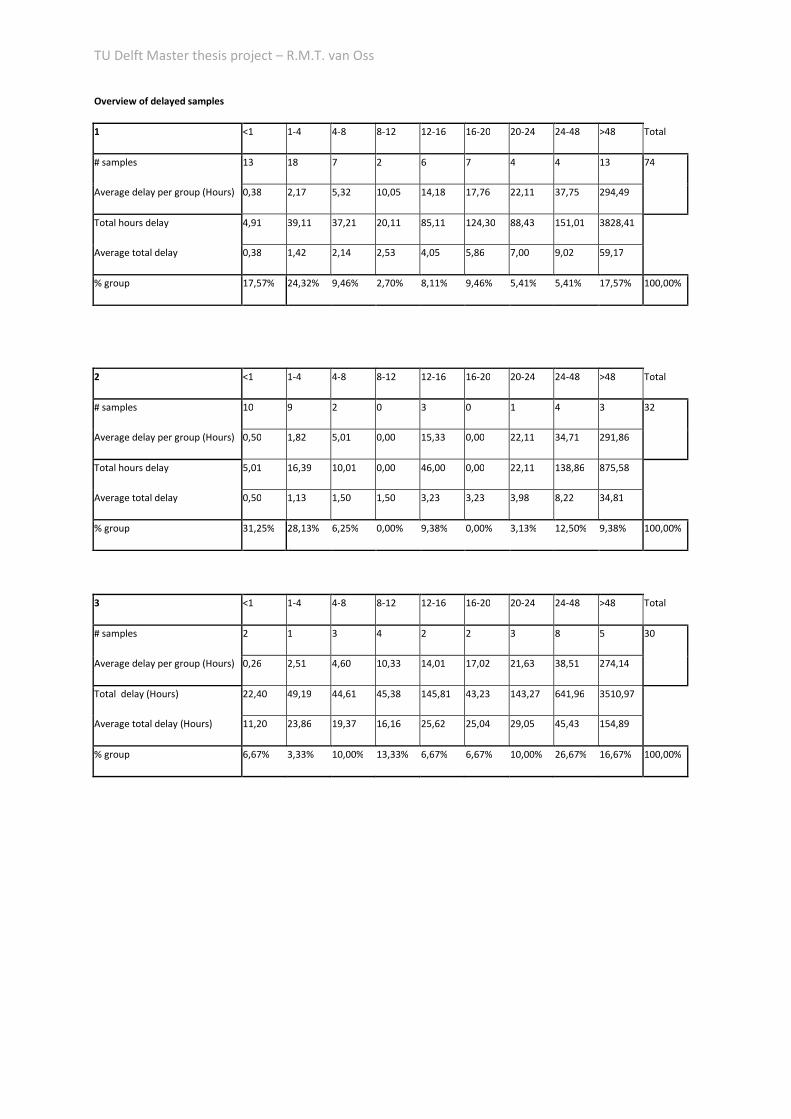
TU Delft Master thesis project – R.M.T. van Oss
Overview of delayed samples
1 <1 1-4 4-8 8-12 12-16 16-20 20-24 24-48 >48 Total
# samples 13 18 7 2 6 7 4 4 13 74
Average delay per group (Hours) 0,38 2,17 5,32 10,05 14,18 17,76 22,11 37,75 294,49
Total hours delay 4,91 39,11 37,21 20,11 85,11 124,30 88,43 151,01 3828,41
Average total delay 0,38 1,42 2,14 2,53 4,05 5,86 7,00 9,02 59,17
% group 17,57% 24,32% 9,46% 2,70% 8,11% 9,46% 5,41% 5,41% 17,57% 100,00%
2 <1 1-4 4-8 8-12 12-16 16-20 20-24 24-48 >48 Total
# samples 10 9 2 0 3 0 1 4 3 32
Average delay per group (Hours) 0,50 1,82 5,01 0,00 15,33 0,00 22,11 34,71 291,86
Total hours delay 5,01 16,39 10,01 0,00 46,00 0,00 22,11 138,86 875,58
Average total delay 0,50 1,13 1,50 1,50 3,23 3,23 3,98 8,22 34,81
% group 31,25% 28,13% 6,25% 0,00% 9,38% 0,00% 3,13% 12,50% 9,38% 100,00%
3 <1 1-4 4-8 8-12 12-16 16-20 20-24 24-48 >48 Total
# samples 2 1 3 4 2 2 3 8 5 30
Average delay per group (Hours) 0,26 2,51 4,60 10,33 14,01 17,02 21,63 38,51 274,14
Total delay (Hours) 22,40 49,19 44,61 45,38 145,81 43,23 143,27 641,96 3510,97
Average total delay (Hours) 11,20 23,86 19,37 16,16 25,62 25,04 29,05 45,43 154,89
% group 6,67% 3,33% 10,00% 13,33% 6,67% 6,67% 10,00% 26,67% 16,67% 100,00%
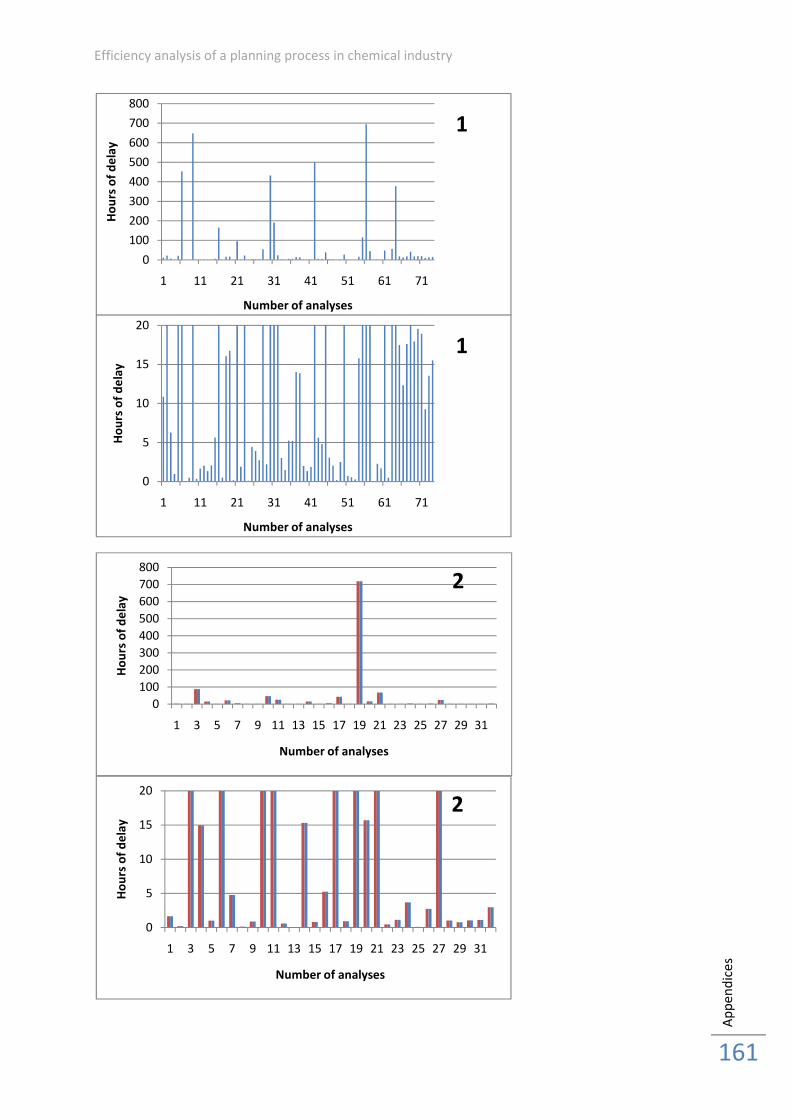
Efficiency analysis of a planning process in chemical industry
Ap
pe
nd
ice
s
161
0
100
200
300
400
500
600
700
800
1 11 21 31 41 51 61 71
Ho
urs
of
de
lay
Number of analyses
1
0
5
10
15
20
1 11 21 31 41 51 61 71
Ho
urs
of
de
lay
Number of analyses
1
0
100
200
300
400
500
600
700
800
1 3 5 7 9 11 13 15 17 19 21 23 25 27 29 31
Ho
urs
of
de
lay
Number of analyses
2
0
5
10
15
20
1 3 5 7 9 11 13 15 17 19 21 23 25 27 29 31
Ho
urs
of
de
lay
Number of analyses
2
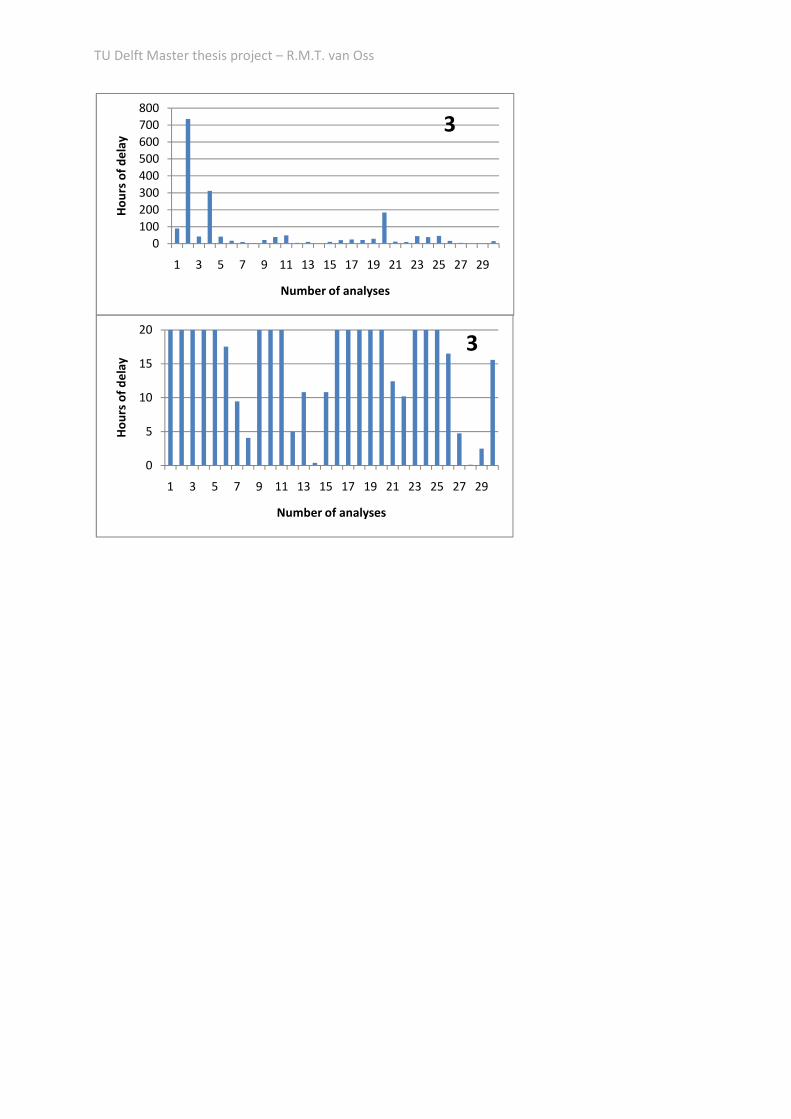
TU Delft Master thesis project – R.M.T. van Oss
0
100
200
300
400
500
600
700
800
1 3 5 7 9 11 13 15 17 19 21 23 25 27 29
Ho
urs
of
de
lay
Number of analyses
3
0
5
10
15
20
1 3 5 7 9 11 13 15 17 19 21 23 25 27 29
Ho
urs
of
de
lay
Number of analyses
3
Efficiency analysis of a planning process in chemical industry
Ap
pe
nd
ice
s
163
Appendix 8 – Overview of analyses performed 24/7
This appendix is deleted for reasons of confidentiality
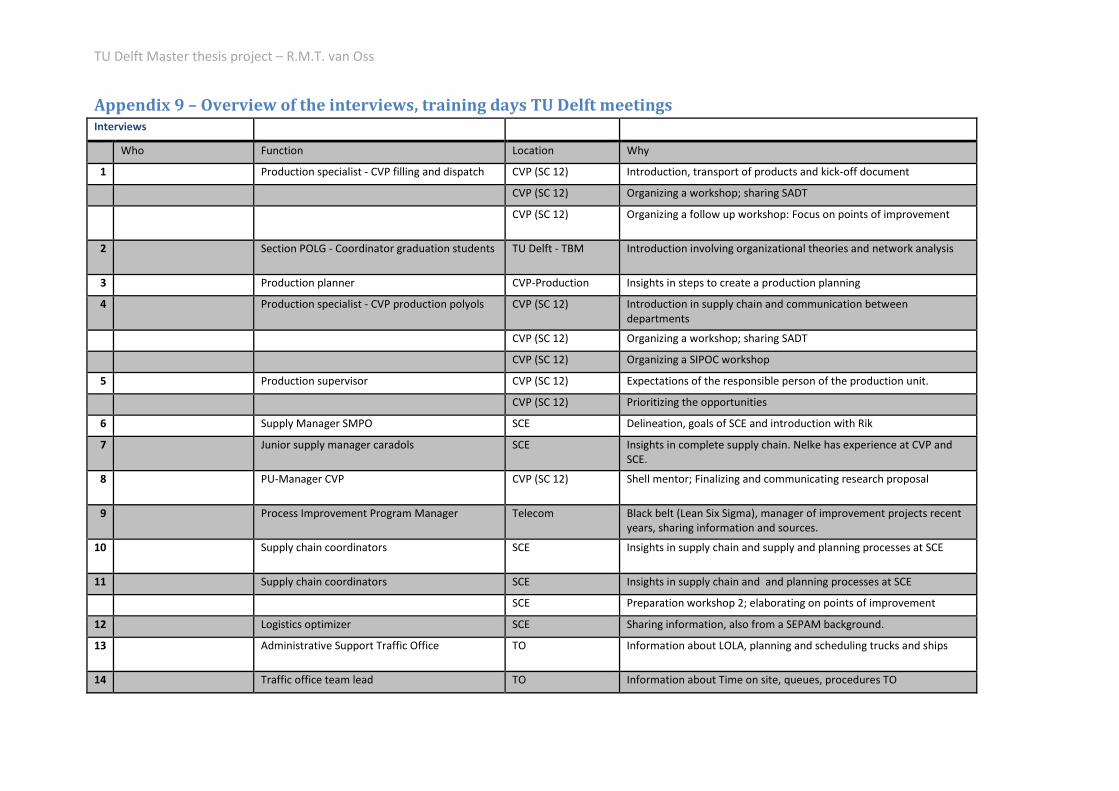
TU Delft Master thesis project – R.M.T. van Oss
Appendix 9 – Overview of the interviews, training days TU Delft meetings Interviews
Who Function Location Why
1 Production specialist - CVP filling and dispatch CVP (SC 12) Introduction, transport of products and kick-off document
CVP (SC 12) Organizing a workshop; sharing SADT
CVP (SC 12) Organizing a follow up workshop: Focus on points of improvement
2 Section POLG - Coordinator graduation students TU Delft - TBM Introduction involving organizational theories and network analysis
3 Production planner CVP-Production Insights in steps to create a production planning
4 Production specialist - CVP production polyols CVP (SC 12) Introduction in supply chain and communication between
departments
CVP (SC 12) Organizing a workshop; sharing SADT
CVP (SC 12) Organizing a SIPOC workshop
5 Production supervisor CVP (SC 12) Expectations of the responsible person of the production unit.
CVP (SC 12) Prioritizing the opportunities
6 Supply Manager SMPO SCE Delineation, goals of SCE and introduction with Rik
7 Junior supply manager caradols SCE Insights in complete supply chain. Nelke has experience at CVP and
SCE.
8 PU-Manager CVP CVP (SC 12) Shell mentor; Finalizing and communicating research proposal
9 Process Improvement Program Manager Telecom Black belt (Lean Six Sigma), manager of improvement projects recent
years, sharing information and sources.
10 Supply chain coordinators SCE Insights in supply chain and supply and planning processes at SCE
11 Supply chain coordinators SCE Insights in supply chain and and planning processes at SCE
SCE Preparation workshop 2; elaborating on points of improvement
12 Logistics optimizer SCE Sharing information, also from a SEPAM background.
13 Administrative Support Traffic Office TO Information about LOLA, planning and scheduling trucks and ships
14 Traffic office team lead TO Information about Time on site, queues, procedures TO
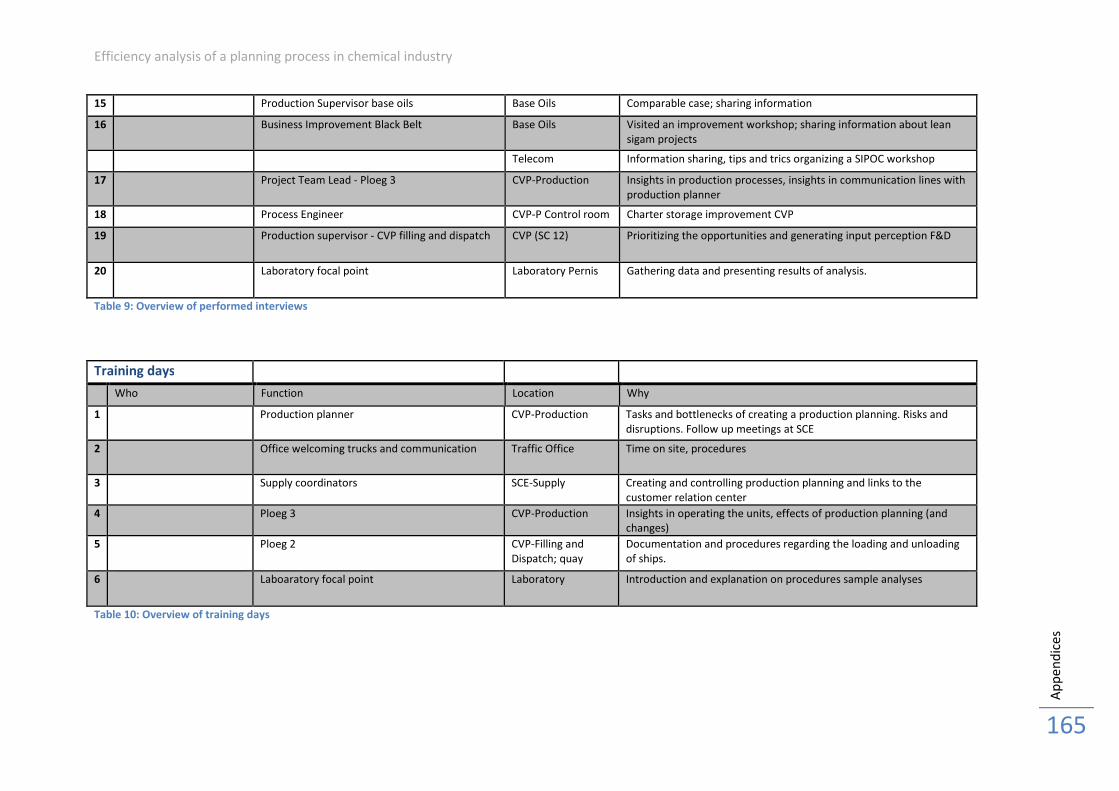
Efficiency analysis of a planning process in chemical industry
Ap
pe
nd
ice
s
165
15 Production Supervisor base oils Base Oils Comparable case; sharing information
16 Business Improvement Black Belt Base Oils Visited an improvement workshop; sharing information about lean
sigam projects
Telecom Information sharing, tips and trics organizing a SIPOC workshop
17 Project Team Lead - Ploeg 3 CVP-Production Insights in production processes, insights in communication lines with
production planner
18 Process Engineer CVP-P Control room Charter storage improvement CVP
19 Production supervisor - CVP filling and dispatch CVP (SC 12) Prioritizing the opportunities and generating input perception F&D
20 Laboratory focal point Laboratory Pernis Gathering data and presenting results of analysis.
Table 9: Overview of performed interviews
Training days
Who Function Location Why
1 Production planner CVP-Production Tasks and bottlenecks of creating a production planning. Risks and
disruptions. Follow up meetings at SCE
2 Office welcoming trucks and communication Traffic Office Time on site, procedures
3 Supply coordinators SCE-Supply Creating and controlling production planning and links to the
customer relation center
4 Ploeg 3 CVP-Production Insights in operating the units, effects of production planning (and
changes)
5 Ploeg 2 CVP-Filling and
Dispatch; quay
Documentation and procedures regarding the loading and unloading
of ships.
6 Laboaratory focal point Laboratory Introduction and explanation on procedures sample analyses
Table 10: Overview of training days
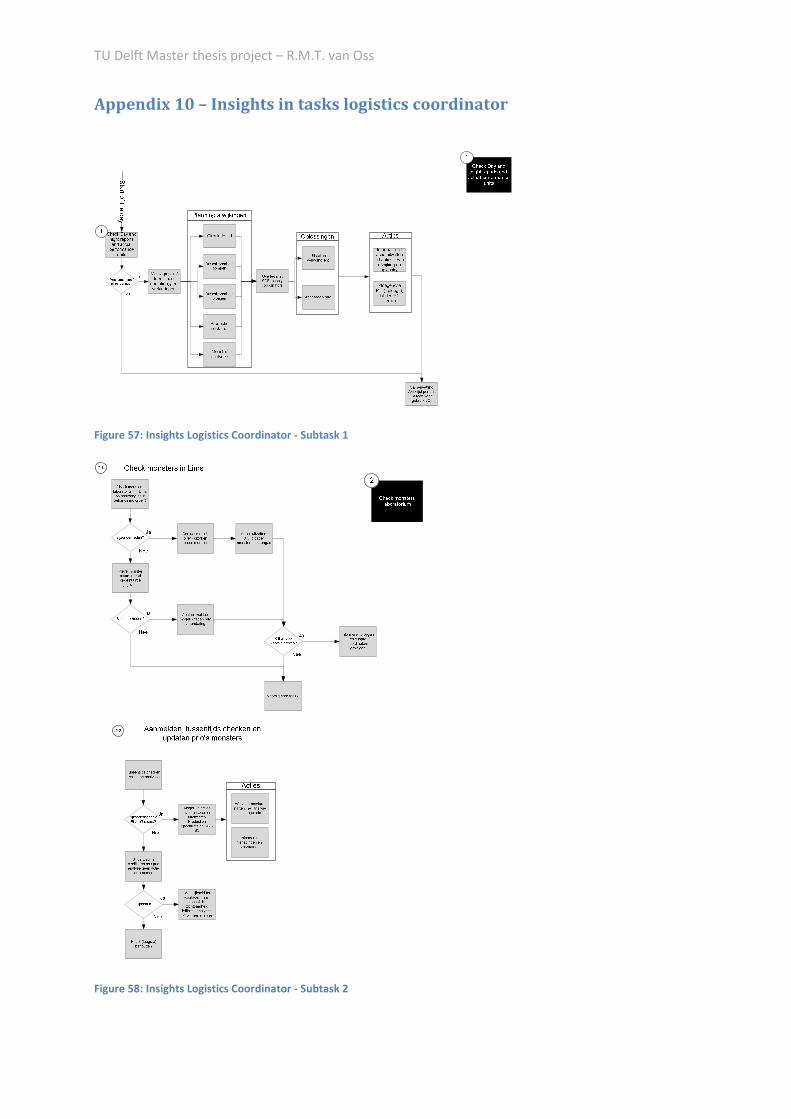
TU Delft Master thesis project – R.M.T. van Oss
Appendix 10 – Insights in tasks logistics coordinator
Figure 57: Insights Logistics Coordinator - Subtask 1
Figure 58: Insights Logistics Coordinator - Subtask 2
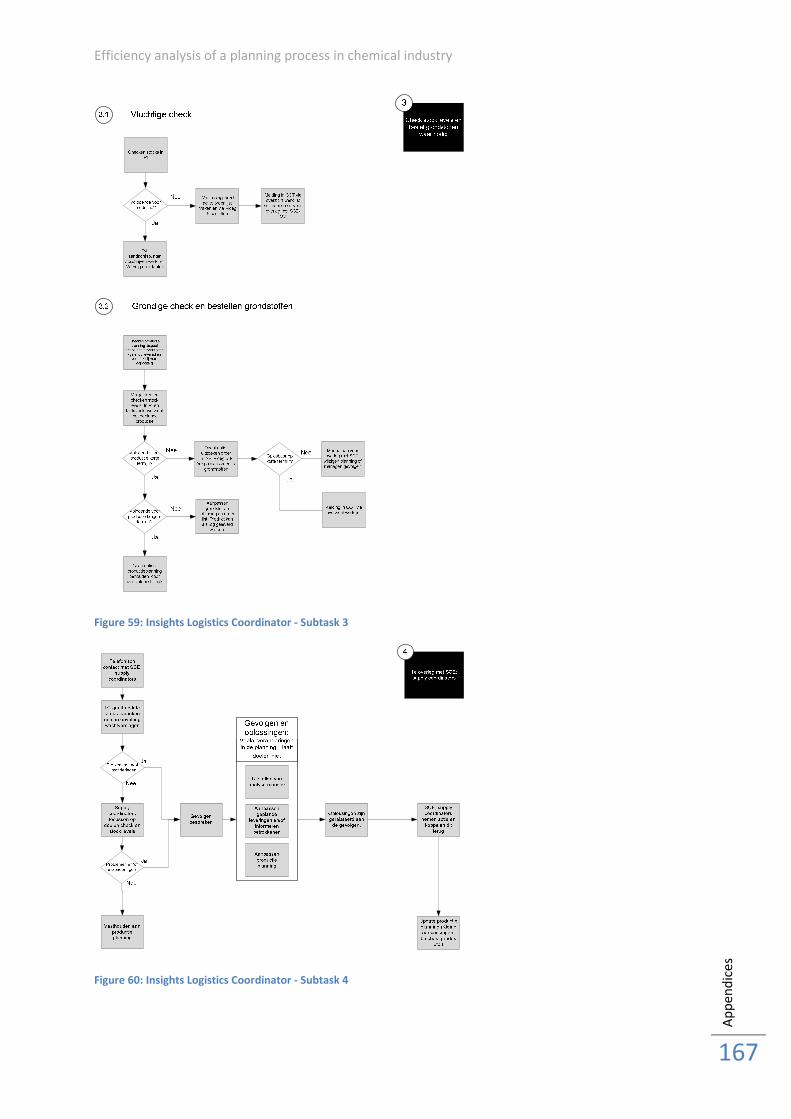
Efficiency analysis of a planning process in chemical industry
Ap
pe
nd
ice
s
167
Figure 59: Insights Logistics Coordinator - Subtask 3
Figure 60: Insights Logistics Coordinator - Subtask 4
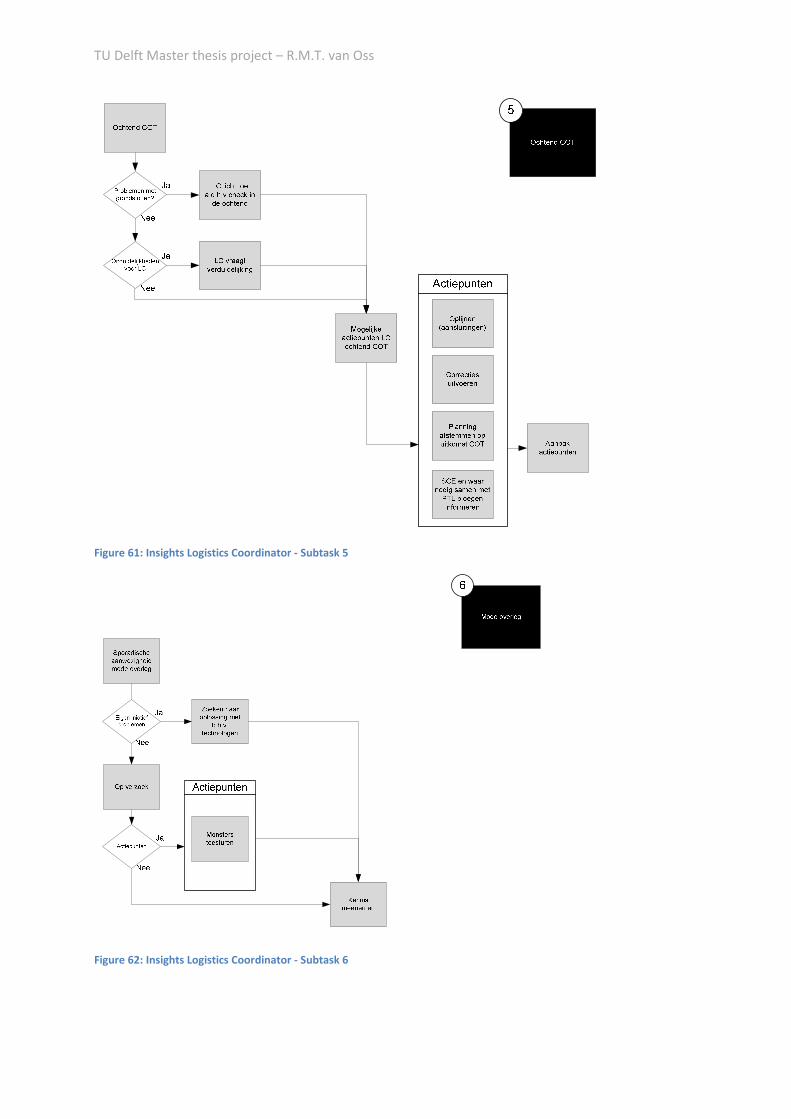
TU Delft Master thesis project – R.M.T. van Oss
Figure 61: Insights Logistics Coordinator - Subtask 5
Figure 62: Insights Logistics Coordinator - Subtask 6
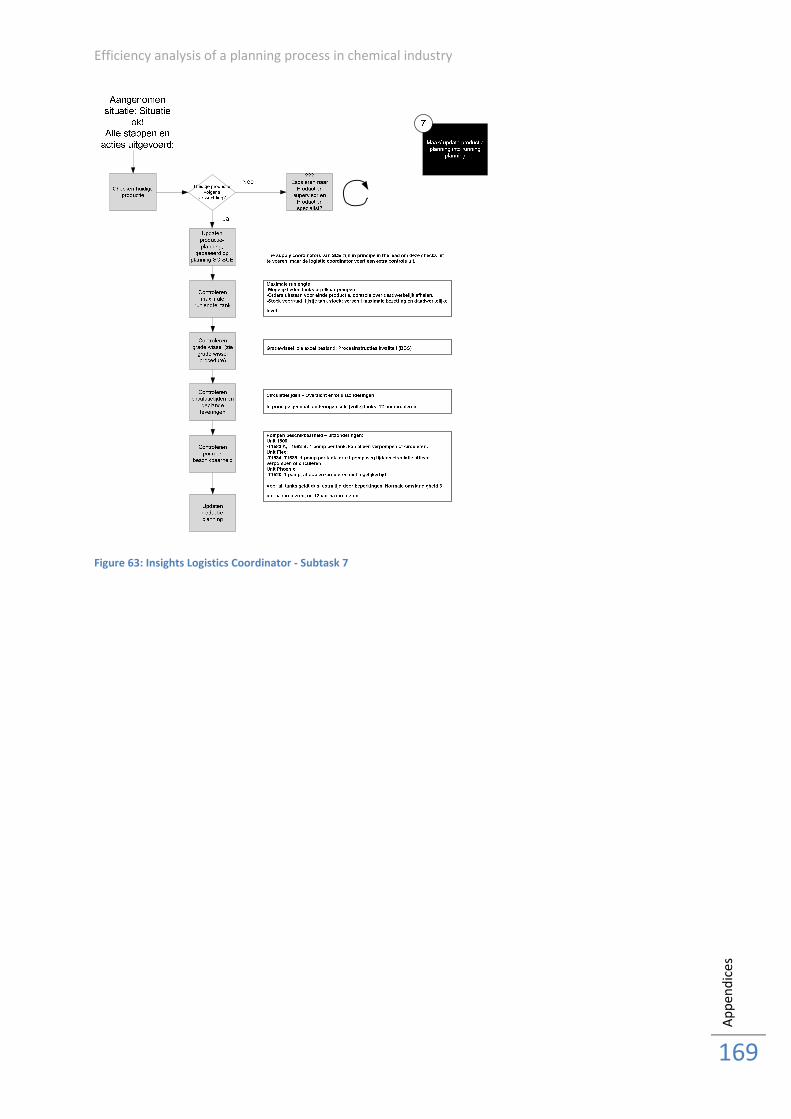
Efficiency analysis of a planning process in chemical industry
Ap
pe
nd
ice
s
169
Figure 63: Insights Logistics Coordinator - Subtask 7
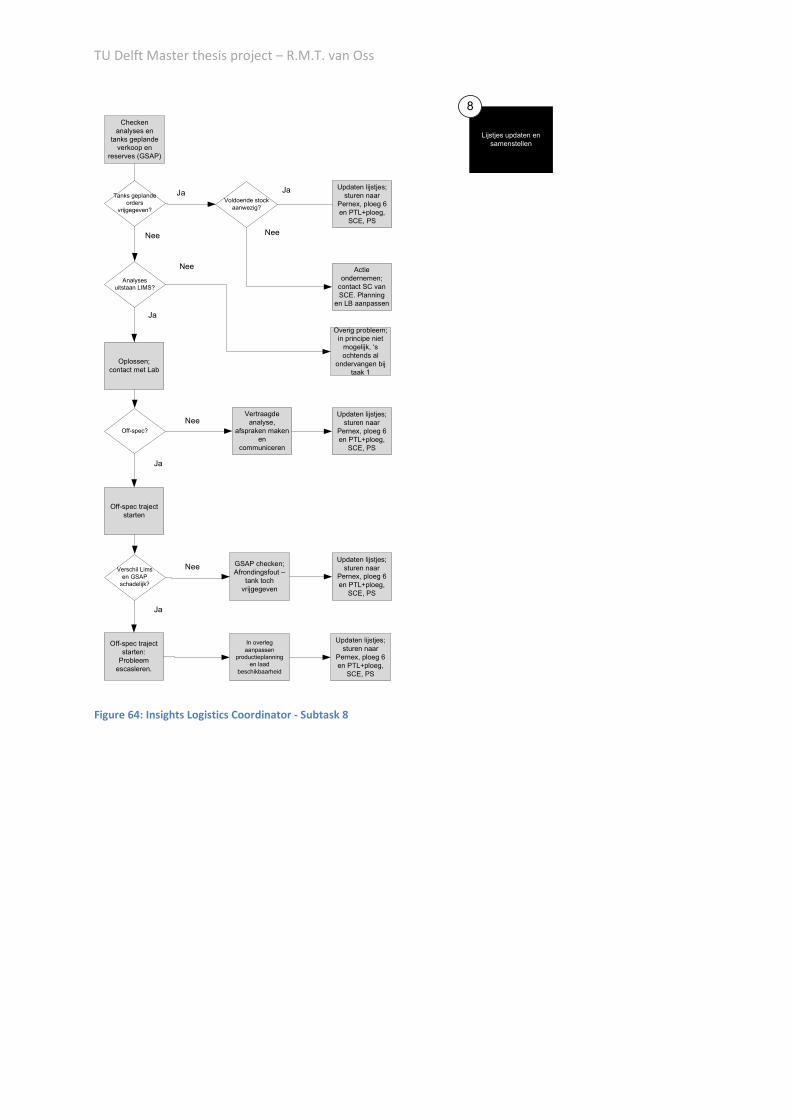
TU Delft Master thesis project – R.M.T. van Oss
Lijstjes updaten en
samenstellen
8
Checken
analyses en
tanks geplande
verkoop en
reserves (GSAP)
Tanks geplande
orders
vrijgegeven?
Ja
Nee
Voldoende stock
aanwezig?
Ja
Nee
Analyses
uitstaan LIMS?
Ja
Nee
Oplossen;
contact met Lab
Off-spec?
Ja
Nee
Off-spec traject
starten
Vertraagde
analyse,
afspraken maken
en
communiceren
Updaten lijstjes;
sturen naar
Pernex, ploeg 6
en PTL+ploeg,
SCE, PS
Actie
ondernemen;
contact SC van
SCE. Planning
en LB aanpassen
Overig probleem;
in principe niet
mogelijk, ‘s
ochtends al
ondervangen bij
taak 1
Updaten lijstjes;
sturen naar
Pernex, ploeg 6
en PTL+ploeg,
SCE, PS
Off-spec traject
starten:
Probleem
escasleren.
Verschil Lims
en GSAP
schadelijk?
Ja
Nee GSAP checken;
Afrondingsfout –
tank toch
vrijgegeven
Updaten lijstjes;
sturen naar
Pernex, ploeg 6
en PTL+ploeg,
SCE, PS
In overleg
aanpassen
productieplanning
en laad
beschikbaarheid
Updaten lijstjes;
sturen naar
Pernex, ploeg 6
en PTL+ploeg,
SCE, PS
Figure 64: Insights Logistics Coordinator - Subtask 8

Efficiency analysis of a planning process in chemical industry
Ap
pe
nd
ice
s
171
Appendix 11 – Monitored data
The table below presents monitored data on the deliveries of raw materials at CVP-P. It provides data based on three monitored weeks.
This appendix is deleted for reasons of confidentiality
Table 11: Monitored data - deliveries raw materials
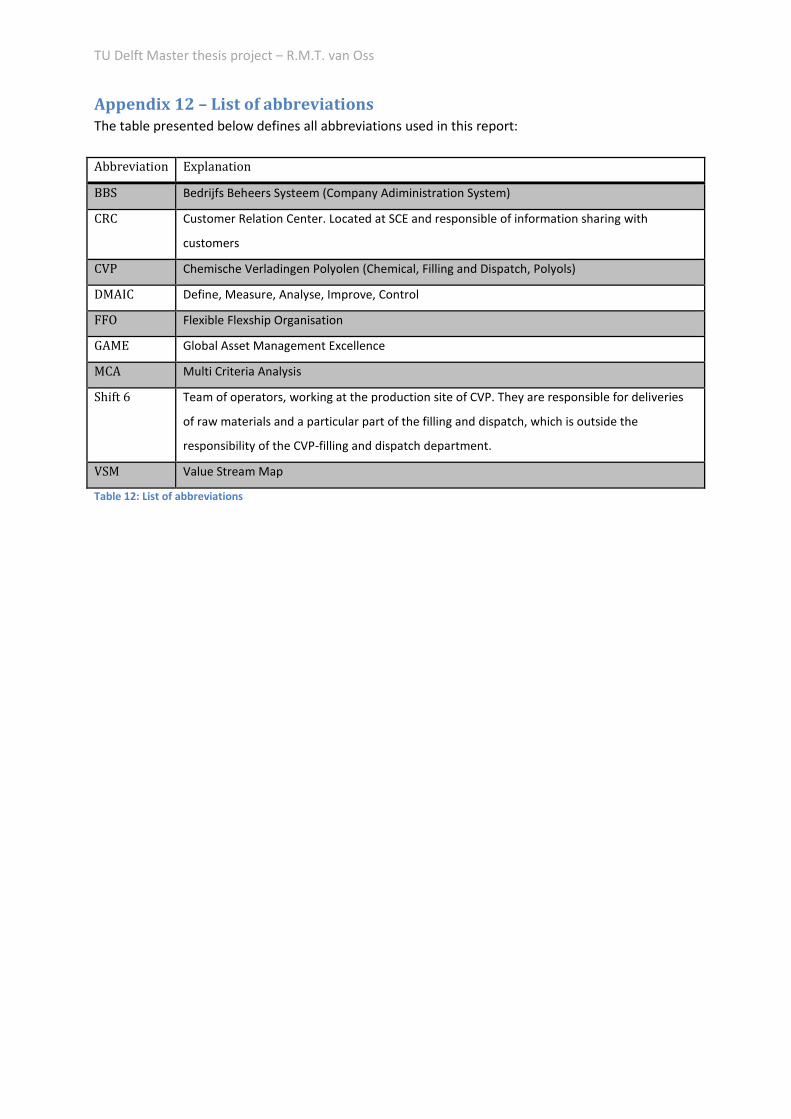
TU Delft Master thesis project – R.M.T. van Oss
Appendix 12 – List of abbreviations
The table presented below defines all abbreviations used in this report:
Abbreviation Explanation
BBS Bedrijfs Beheers Systeem (Company Adiministration System)
CRC Customer Relation Center. Located at SCE and responsible of information sharing with
customers
CVP Chemische Verladingen Polyolen (Chemical, Filling and Dispatch, Polyols)
DMAIC Define, Measure, Analyse, Improve, Control
FFO Flexible Flexship Organisation
GAME Global Asset Management Excellence
MCA Multi Criteria Analysis
Shift 6 Team of operators, working at the production site of CVP. They are responsible for deliveries
of raw materials and a particular part of the filling and dispatch, which is outside the
responsibility of the CVP-filling and dispatch department.
VSM Value Stream Map
Table 12: List of abbreviations
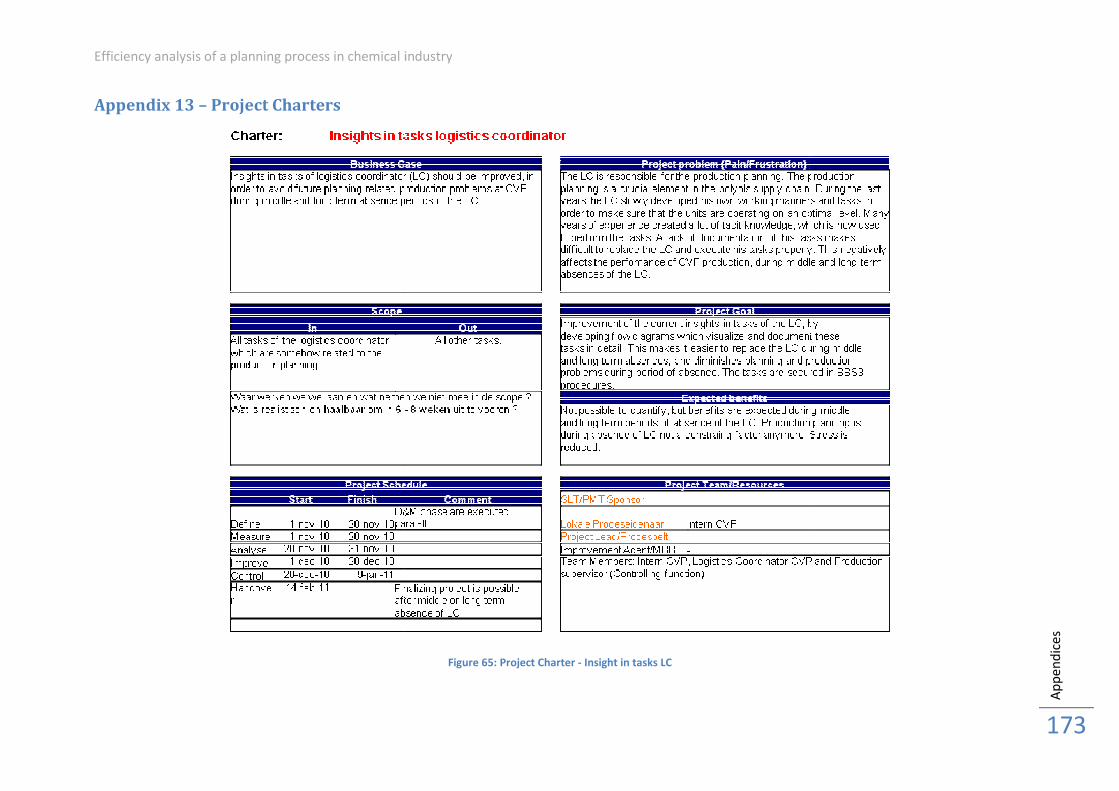
Efficiency analysis of a planning process in chemical industry
Appendix 13 – Project Charters
Efficiency analysis of a planning process in chemical industry
Figure 65: Project Charter - Insight in tasks LC
Ap
pe
nd
ice
s
173
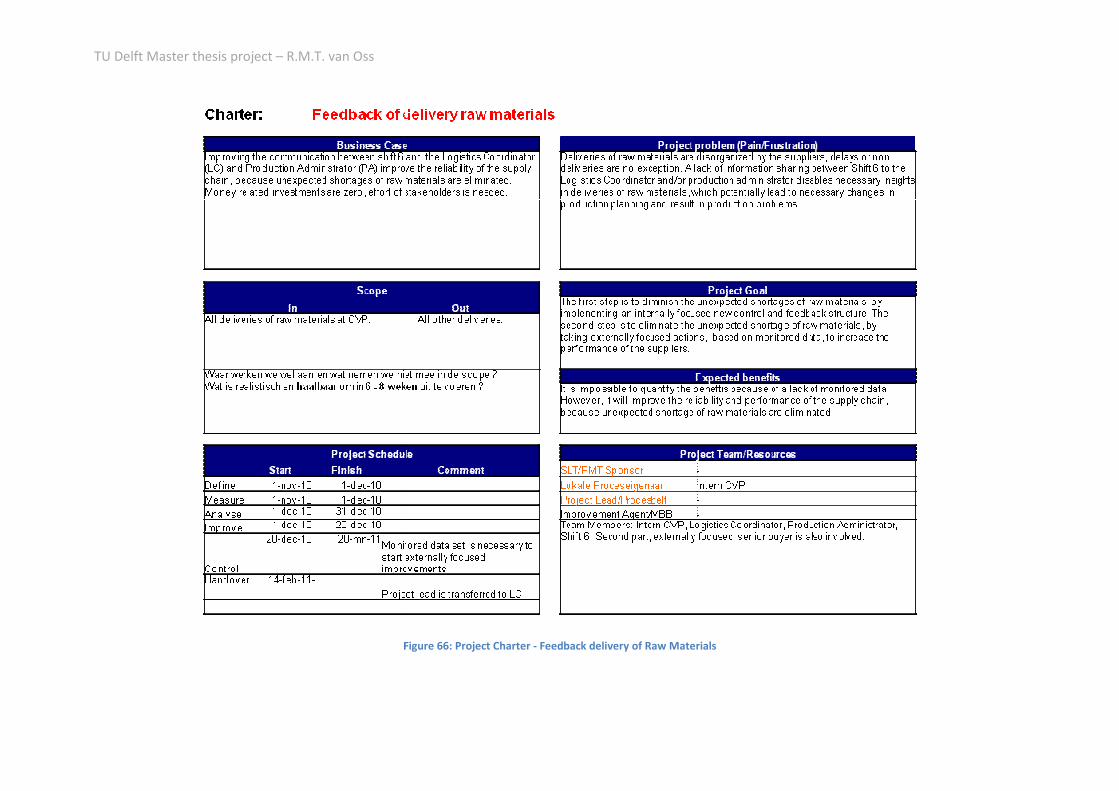
TU Delft Master thesis project – R.M.T. van Oss
Figure Figure 66: Project Charter - Feedback delivery of Raw Materials
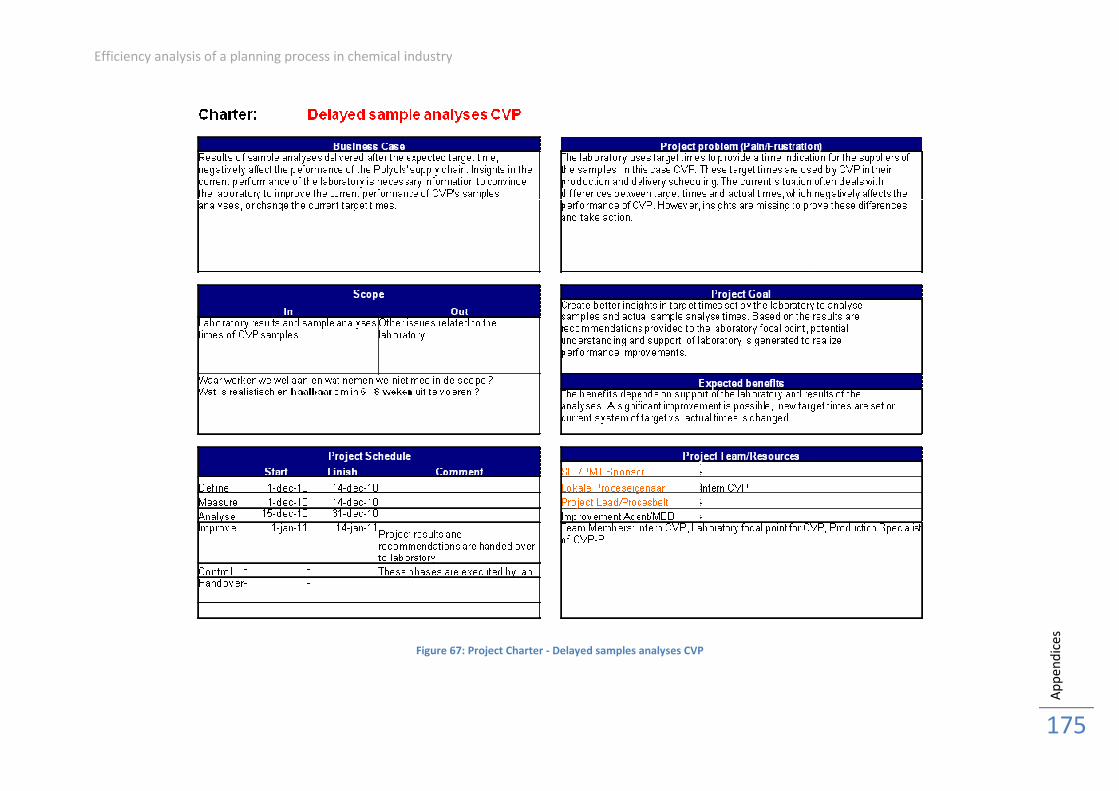
Efficiency analysis of a planning process in chemical industry
Efficiency analysis of a planning process in chemical industry
Figure 67: Project Charter - Delayed samples analyses CVP
Ap
pe
nd
ice
s
175
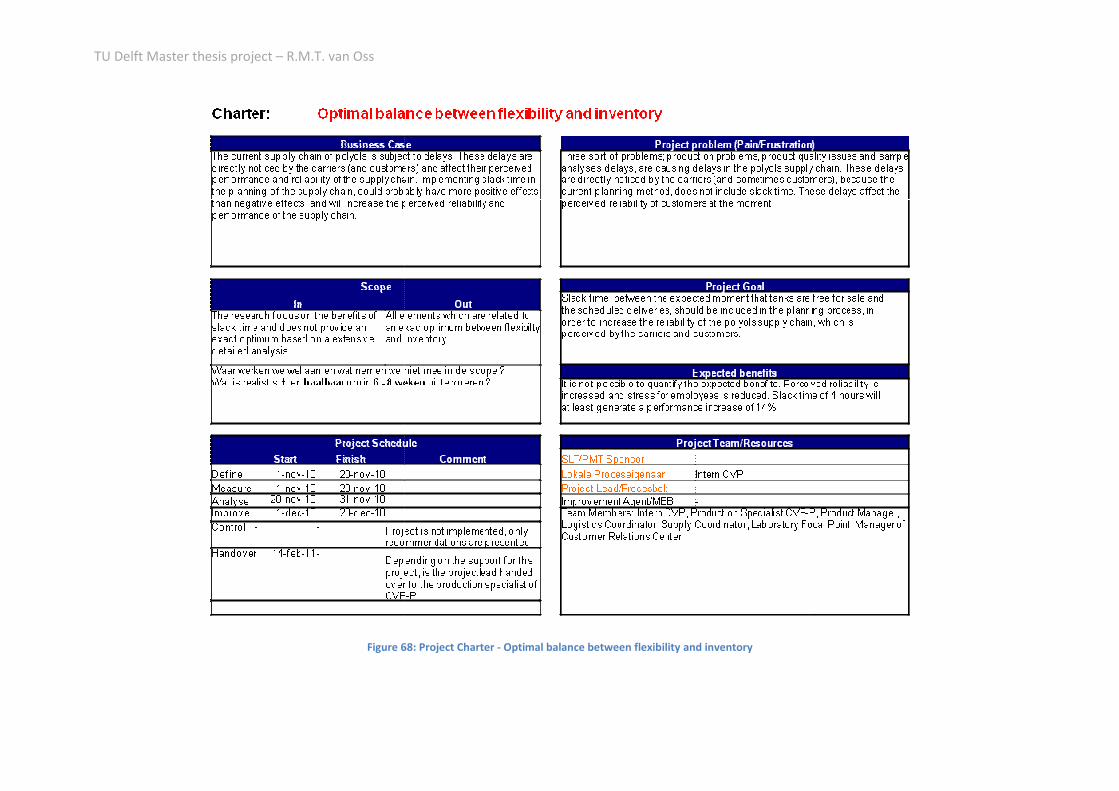
TU Delft Master thesis project – R.M.T. van Oss
Figure 6868: Project Charter - Optimal balance between flexibility and inventory

Efficiency analysis of a planning process in chemical industry
Ap
pe
nd
ice
s
177
Literature
Abdulmalek, F. A. and J. Rajgopal (2007). "Analyzing the benefits of lean manufacturing and value
stream mapping via simulation: A process sector case study." Elsevier: International Journal
Production Economics 107: 223-236.
Argote, L. and P. Ingram (2000). "Knowledge transfer: A Basis for Competitive Advantage in Firms."
Organisational Behavior and Human Decision Processes 82: 150-169.
Bevan, H., N. Westwood, et al. (2005). "Lean Six Sigma: some basic concepts." NHS institute for
Innovation and improvement.
Blackler, F. (1995). "Knowledge, Knowledge Work and Organizations: An Overview and
Interpretation." Organization Studies 6(1021-1046).
Bruijn, H. d., E. t. Heuvelhof, et al. (2003). Process management, Why project Management Fails in
Complex Decision Making. Dordrecht, Springer Heidelberg.
Bruijn, J. D. and E. t. Heuvelhof (2008). Management in networks, on multi-actor decision making.
London, Routledge.
Buhrmann, S. (unknown). "Guidance for Stakeholder Involvement." CIVITAS-CARAVEL project.
Dawson, P. (2003). Reshaping change, a processual perspective. London, Routledge.
DeCarlo, A. L. (2009). "Lean Six Sigma, BPM, and SOA: Accelerating Bottom Line Benefits."
InformationWeek: Business Technology.
Explizzit (2010). "Wij maken expliciet en bespreekbaar wat impliciet voelbaar is." from
http://www.explizzit.nl/producten/stakeholdermanagement.php.
Fletcher, A. (2003). "Mapping the stakeholder perceptions for a third sector organization." Journal of
Intellectual Capital 4(4): 505-527.
Frahm, S. (2003). "Six Sigma: Wher is it now? ." Supply Chain Management: an information digest for
the SCM professional. from http://scm.ncsu.edu/public/facts/facs030624.html.
Graaf, H. v. d. and R. Hoppe (1989). Beleid en politiek, een inleiding tot de beleidswetenschap en de
beleidskunde. Muiderberg, Coutinho.
Harry, M. (1994). "The Visioin of Six Sigma: Tools and Methods for Breakthrough." Sigma Publishin
Company.
Hermans, L. M. (2004). SPM 2110: Analyse van complexe omgevingen, TU Delft.
Hermans, L. M. and W. A. H. Thissen (2008). "Actor analysis methods and their use for public
analysts." European Journal of Operational Research.
James, D. S. (2004). "Six Sigma and Supply Chain excellence." Quality Digest.
TU Delft Master thesis project – R.M.T. van Oss
Kerzner, H. (200). Project Management: A Systems Approach to Planning, Scheduling, and Controlling
Wiley.
Kerzner, H. (2008). Project Management: A Systems Approach to Planning, Scheduling, and
Controlling Wiley.
Kessler, B. L. (2004). "Stakeholder Participation: A synthesis of current literature." National Marine
Protected Areas Center.
Kohlbacher, M. (2009). "The effects of Process Orientation on Customer Satisfaction, Product Quality
and Time-Based Performance." Internation Conference of the Strategic Management Society.
Kwak, Y. H. and F. T. Anbari (2006). "Benefits, obstacles, and future of six sigma approach." Elsevier:
Technovation 26: 708-715.
Landon, J. (2001). "The Tennessee Valley Authority’s Knowledge Transfer Program."
Lazzarini, S. G., F. G. Chaddad, et al. (2001). "Integrating supply chain management and network
analysis: the study of netchains." Journal on Chain and Network Science 1: 7-22.
Liegener, B. (2010). "S-Cube Knowledge Model: Business Process Optimization." from http://www.s-
cube-network.eu/km/terms/b/business-process-optimization.
Martin, J. W. (2007). Lean Sigma for Suppy Chain Management The 10 Step Solution Process. New
York, McGraw-Hill Companies.
McIntyre, M. (2010). "Setting Up Succesful Performance Improvement Iniatives." from
www.articlesnatch.com/Article/Setting-Up-Succesful-Performance-Improvement-Iniatives/100470.
Meijer, S. (2009). The organisation of transactions. Wageningen, Academic Publisher.
Menard, C. (2000). "Institutions, Contracts and Organisations: Perspectives from New Institutional
Economics." Edward Elgar.
Miller, D. (2005). "Going Lean in Healthcare."
Mintzberg, H. (1983). Structures in fives: designing effective organizations. Den Haag, Academic
services.
Nave, D. (2002). "How to compare Six Sigma, Lean and the Theory of Constraints." Quality Progress.
O'Loughlin, E. F. M. (2010). "Problem-Solving Techniques #9 - SIPOC Diagrams." National College of
Ireland. from http://www.youtube.com/watch?v=W6ebq-fcyE.
Omta, S. W. F., J. H. Trienekens, et al. (2001). "Chain and network science: a research framework."
Journal on Chain and Network Science 1: 1-6.
Pirasteh, R. M. and S. Horn (2009). "The Many Sides Of TLS - Using the TOC, Lean and Six Sigma for
multidementional results." APICS 16(10): 28-31.
Pirasteh, R. M. and S. Horn (2010). "Integration of Lean, Six Sigma & TOC Improves Performance."
Industry Weeks April 12: 2012.
Efficiency analysis of a planning process in chemical industry
Ap
pe
nd
ice
s
179
PMI (2010). A guide to the Project Management Body of Knowledge: 27-35.
Rother, M. and J. Shook Learning to See: Value-Stream Mapping to create value and eliminate muda.
Rother, M. and J. Shook (2003). "Value Stream Mapping to create value and eliminate muda." The
lean enterprise institue.
Schroeder, R. G., K. Linderman, et al. (2008). "Six Sigma: Definition and underlying theory." Elsevier:
Journal of operations management 26: 536-554.
Serrano, I., C. Ochoa, et al. (2008). "Evaluation of the value stream mapping in manufacturing system
redesign." International journal of Production Research 46: 4409-4430.
Shell (2009). "Current position Shell Pernis ". from
http://sww.shell.com/downstream/manufacturing/pernis/management_documentation/ffo/info_ffo
_vs1612.html.
Shell (2009). "Shell at a glance." from http://www.shell.com/home/content/aboutshell/at_a_glance/.
Shell (2010). "Learning from Lean." from
http://swww.shell.com/home/news/solhighlights/1008835640.
Shell (2010). "Shell our flexible flagship - Ballast Over Boord."
Shell (2010). "Sww.shell.com/downstream/manufacturing/pernis/about/organisation.html ".
Shell (2010). "www-static.shell.com."
Shell, I. L. (2002-2008). Lean Six Sigma Green Belt.
Shell, I. L. (2008). Lean Six Sigma Green Belt.
Shingo, S. (1989). "A study of the Toyota Production System."
Simchi-Levi, D., P. Kaminsky, et al. (2003). Designin and Managing the Supply Chain. New York, The
McGraw-Hill Companies.
Stake, R. E. (2005). Qualitative Case Studies; The SAGE Handbook of qualitative Research, Thousand
Oaks.
Szulanski, G. (1996). "Exploring internal stickiness: Impediments to the transfer of best practice
within the firm." Strategic Management Journal 17(27-43).
Tague, N. R. (2004). "Seven Basic Quality Tools". The Quality Toolbox." American Society for Quality.
from http://www.asq.org/learn-about-quality/seven-basic-quality-tools/overview/overview.html.
Tammer, M. D. (2009). "Early stakeholder involvement in projects." PM World Today XI(IV).
Tan, K. C. (2001). "A framework of supply chain management literature." European Journal of
Purchasing & Supply Management 7: 39-48.
TU Delft Master thesis project – R.M.T. van Oss
Unknown, A. (2004). "What is Six Sigma?" Reinforced P;astics.
Unknown, A. (2010). "Learning from Lean." Shell online. from
http://sww.shell.com/home/news/solhighlights/1008835640.
Unknown, A. (2010) Shell Nederland Chemie B.V.
Ven, N. v. d. (2010). "PO & Derivatives (PODer): Challenges over time."
Wiesenfelder, H. and M. McDonough (2010). "Introduction to DMAIC." Bright Hub - The Hub for
Bright Minds.
Williamson, O. E. (1998). "Transaction cost economics How it works; where it is headed." The
Economist 146.
Womack, J. P., D. T. Jones, et al. (2007). The Machine that changed the world: The story of Lean
production. New York, Harper Collins Publishers.
Yeh, D.-Y., C.-H. Cheng, et al. (2007). "A modified two-tuple FLC model for evaluating the
performance of SCM: By the Six Sigma DMAIC process." Elsevier: 1027-1034.