
EPIC Trial Planning Process - Western Power Distribution
89
EPIC Trial Planning Process Project Deliverable: Work Package 2 – Deliverable 1 Part 1 – Existing process review and future EPIC process design Part 2 – EPIC Trial Plan Date: 11/06/2021 Version: Final
-
Upload
khangminh22 -
Category
Documents
-
view
1 -
download
0
Transcript of EPIC Trial Planning Process - Western Power Distribution

EPIC Trial Planning Process
Project Deliverable: Work Package 2 – Deliverable 1
Part 1 – Existing process review and future EPIC process design
Part 2 – EPIC Trial Plan
Date: 11/06/2021
Version: Final

Page 2 EPIC Trial Planning Process and Trial Plan (WP2 D1)
This report
was produced
for
Project EPIC
Issue date 11/06/2021
Version Final
Written by: Regen
Approved by:
Regen, Bradninch Court. Exeter, EX4 3PL
T +44 (0)1392 494399 E [email protected] www.regen.co.uk
Registered in England No: 04554636
All rights reserved. No part of this document may be reproduced
or published in any way (including online) without the prior
permission of Regen

Page 3 EPIC Trial Planning Process and Trial Plan (WP2 D1)
Table of contents
1. Document purpose and associated project deliverable .................................................................. 5
2. Summary of existing planning processes .............................................................................................. 6
2.1. Electricity network processes .............................................................................................................................. 6
2.2. Gas network processes ........................................................................................................................................ 11
2.3. Local authority master planning processes ................................................................................................. 14
2.4. Comparison of planning processes ................................................................................................................ 15
3. Overview of future EPIC planning process ......................................................................................... 17
3.1. Introduction and objectives ............................................................................................................................... 17
3.2. EPIC Process overview .......................................................................................................................................... 18
4. Trial Process Stage I: Opportunity identification and area selection ........................................ 20
4.1. Identify the opportunity ...................................................................................................................................... 20
4.2. Define Strategic Planning Area selection criteria ...................................................................................... 21
4.3. Map the Strategic Planning Areas to the energy networks .................................................................. 21
4.4. Stage I – outputs, roles and processes overview ....................................................................................... 22
5. Trial Process Stage II: Data preparation .............................................................................................. 24
5.1. Define the scope of data collection ................................................................................................................ 24
5.2. Engage with local authority stakeholder(s) ................................................................................................. 26
5.3. Outline the use-cases to be used in the cost benefit analysis stage ................................................. 27
5.4. Define the data required to test the use-cases (sensitivities and scenarios) ................................. 27
5.5. Define baseline network modelling scenario ............................................................................................ 27
5.6. Create the disaggregated baseline dataset ................................................................................................. 28
5.7. Stage II – outputs, roles and processes overview ..................................................................................... 29
6. Trial Process Stage III: Energy Requirements Plan creation ......................................................... 31
6.1. Gather stakeholder evidence and requirements ....................................................................................... 31
6.2. Update dataset to reflect local energy plan requirements .................................................................... 32
6.3. Stage III – outputs, roles and processes overview .................................................................................... 33
7. Trial Process Stage IV: Network analysis ............................................................................................. 35
7.1. Run the gas network analysis ............................................................................................................................ 35
7.2. Run the LV analysis ................................................................................................................................................ 36
7.3. Run the HV analysis .............................................................................................................................................. 39
7.4. Stage IV – outputs, roles and processes overview .................................................................................... 41
8. Trial Process Stage V: Investment and options appraisal ............................................................. 44
8.1. Define the network investment options ....................................................................................................... 44
Page 4 EPIC Trial Planning Process and Trial Plan (WP2 D1)
8.2. Incorporate the use-cases .................................................................................................................................. 45
8.3. Run the use-cases through the CBA tool ..................................................................................................... 46
8.4. Stage V – outputs, roles and processes overview ..................................................................................... 47
9. Trial Process Stage VI: Strategic Area Energy Planning (completion) ...................................... 49
10. EPIC Trial Plan ........................................................................................................................................... 50
11. Description of draft CBA trial use-cases in Project EPIC ........................................................... 51
11.1. Definition of each use-case ................................................................................................................................ 52
11.2. Use-case data structure and data sharing ................................................................................................... 55
12. Data inputs and exchanges that are common across all use-cases ..................................... 56
13. EPIC Trial Plan Details ............................................................................................................................ 57
13.1. Trial Plan Run 1: Baseline Scenario.................................................................................................................. 57
13.2. Trial Plan Run 2: Use-case 1 ............................................................................................................................... 58
13.3. Trial Plan Run 3: Use-case 2 ............................................................................................................................... 59
13.4. Trial Plan Run 4: Use-case 3 ............................................................................................................................... 60
13.5. Trial Plan Run 5: Use-case 4 ............................................................................................................................... 61
13.6. Trial Plan Run 6: Use-case 5 ............................................................................................................................... 62
13.7. Potential Additional Trial Plan Runs ............................................................................................................... 63
13.8. Trial Plan Expected Runs within Network Analysis Tools ....................................................................... 64
14. Appendix 1: WECA policies summary .............................................................................................. 66
15. Appendix 2: Building blocks summary ............................................................................................ 69
16. Appendix 3: Glossary .............................................................................................................................. 73
17. Appendix 4: Options for applying energy efficiency ................................................................. 75
17.1. Energy efficiency in national scenarios ESO FES 2021 and CCC.......................................................... 75
17.2. Current DFES/Shaping sub-transmission process ..................................................................................... 75
17.3. EPIC Energy Efficiency Process Options ........................................................................................................ 78
17.4. High level – GB electricity system peaks and annual demand ............................................................. 83
18. Appendix 5: Draft specification for managing new developments for modelling ......... 87

Page 5 EPIC Trial Planning Process and Trial Plan (WP2 D1)
1. Document purpose and associated project deliverable
This document compares the existing planning processes for the gas and electricity
networks, as well as the engaged local authorities, and presents a new EPIC process
approach to generating a local energy plan with local stakeholders and strategically
assessing the investment options for both the gas and electricity networks.
The aim of the Energy Planning Integrated with Councils (EPIC) project is to develop a
process that considers the impacts on both the electricity and gas networks and reflects
the strategic ambitions of the local authority to enable better investment outcomes. This
approach may result in lower overall cost to the consumer, improved risk management
and also enable local partners to realise their own strategic outcomes including net zero
decarbonisation, economic growth, industrial strategy and wider societal benefits.
This report is the Planning Process Report and EPIC Trial Plan which is the first deliverable
for work package 2 of the EPIC project. This report includes:
A review of the existing energy planning processes
The design for the EPIC planning process
A summary of the investment strategies to be modelled
The variations within the network modelling
The necessary data sensitivities and exchanges

Page 6 EPIC Trial Planning Process and Trial Plan (WP2 D1)
2. Summary of existing planning processes
There are many different types of planning processes conducted within the energy
networks, unitary authorities and West of England Combined Authority (WECA). The
analysis of existing processes for project EPIC has focused specifically on those planning
processes involved with the future planning of energy networks and future energy
requirements that will impact on the energy networks. For example, this includes:
Western Power Distribution’s (WPD) Distribution Future Energy Scenario (DFES)
and shaping sub-transmission processes
Wales and West Utilities (WWU) network analysis and investment appraisal process
WECA and Local Authority infrastructure master planning
This project has also considered other planning processes that will require changes to
energy requirements and therefore network impacts; such as, energy efficiency
deployment plans, Electric Vehicle (EV) charging and transportation and future heat
strategies. The analysis of existing processes has necessarily been high level, with the
intention to focus on the key points of contact between the networks and local authorities
which would be enhanced or changed by the new EPIC planning process.
2.1. Electricity network processes
2.1.1. Forecasting and scenario analysis
Process overview
Distribution Future Energy Scenarios (DFES) are high granularity, primary substation level
scenario forecasts which provide a projection for the growth (or reduction) of energy
generation (low carbon and conventional), demand and storage technologies which are
expected to connect to the GB electricity distribution networks out to 2050. DFES also
includes projections for new housing growth and increase in commercial and industrial
developments, energy efficiency and other network load elements. The scenarios used in
the WPD DFES are aligned with those used in the Electricity System Operator (ESO) Future
Energy Scenarios (FES)1.
1 https://www.nationalgrideso.com/future-energy/future-energy-scenarios Accessed: May 2021

Page 7 EPIC Trial Planning Process and Trial Plan (WP2 D1)
Figure 1 Overview of the WPD DFES process – taken from the ‘WPD Methodology’ slides2
Stakeholder engagement
For WPD, DFES forms part of an integrated network planning and investment appraisal
process. DFES datasets, informed by stakeholder engagement, allow network planners to
model and analyse different future load scenarios. They also provide a key data resource
and evidence base to enable network strategy teams to appraise different investment
options and develop the business case necessary to support future investment, including
regulated business plans.
Stakeholder engagement is a key part of the DFES process and has been a major
development over the last five years. The annual DFES cycle is major point of engagement
between the networks and stakeholders and has enabled WPD to take a more proactive
approach to network planning. It has also opened up the possibility of bringing
stakeholders into the network planning and engagement process. Stakeholders are
engaged through three main routes:
DFES workshops and engagement events
Bilateral discussions with project developers
Local authority policy and new housing development data gathering
2 https://www.westernpower.co.uk/downloads-view-reciteme/228142 Accessed: May 2021
Page 8 EPIC Trial Planning Process and Trial Plan (WP2 D1)
Relationship to the ESO FES
The WPD DFES is intended to be a bottom-up analysis of a changing energy system at a
regional and sub-regional level aligning with the national ESO FES framework but reflecting
regional and local factors.
It is, therefore, inevitable that there will be some variance between the DFES view and the
national ESO FES view. Regional and sub-regional variations tend to fall under a number
of factors including:
Resource availability – e.g. land space for a solar farm or wind resource.
Historic factors related to the uptake of technologies which, in some cases, may be a
good indicator of future growth but, in other cases, may be a false friend. For example,
high solar growth in the south west may not be a good indicator for the future since
many of the best sites have been taken and this is reflected in a lower pipeline of
projects compared to, for example, the East Midlands.
Political factors such as the region’s net zero ambitions, strategic plans and planning
processes.
Stakeholder input (including from the GDNO), local area energy plans and strategies.
Baseline and pipeline factors. The DFES will pay particular attention to the pipeline
of projects which are actually being developed and especially those with network
connection agreements. This means that, particularly in the shorter term, DFES analysis
will tend to be influenced more by the pipeline than the long term scenario. Pipeline
factors are perhaps the most significant source of variation in the short term.
Uptake rates. Even when the National ESO scenario is used as a benchmark we can
already see variations across regions, for example, in terms of EV growth and uptake
rates (especially in the short term). These variations may be expected to reduce over
time.
Scope of the DFES
The WPD DFES is reported to Electricity Supply Areas (ESAs), which are defined as ‘the
geographical area supplied by a Primary Substation (which contains WPD-owned
distribution substations) providing supplies at a voltage below 33 kV, or a customer directly
supplied at 132, 66 or 33 kV or by a dedicated Primary Substation’. These ESAs are also split
by local authority boundaries meaning that the data can be viewed as local authority totals,
or by primary substation totals. In the WPD DFES 2020 the forecasts are reported at yearly
intervals from 2020 to 2035, and reported at 5-yearly intervals from 2035 to 2050. The
technologies included in the analysis are chosen to align to the Open Networks set of
standardised technology names, referred to as ‘building blocks’, as used in the ESO FES3 .
3 https://data.nationalgrideso.com/future-energy-scenarios/future-energy-scenario-fes-building-
block-data/r/building_block_definitions# Accessed April 2021.
Page 9 EPIC Trial Planning Process and Trial Plan (WP2 D1)
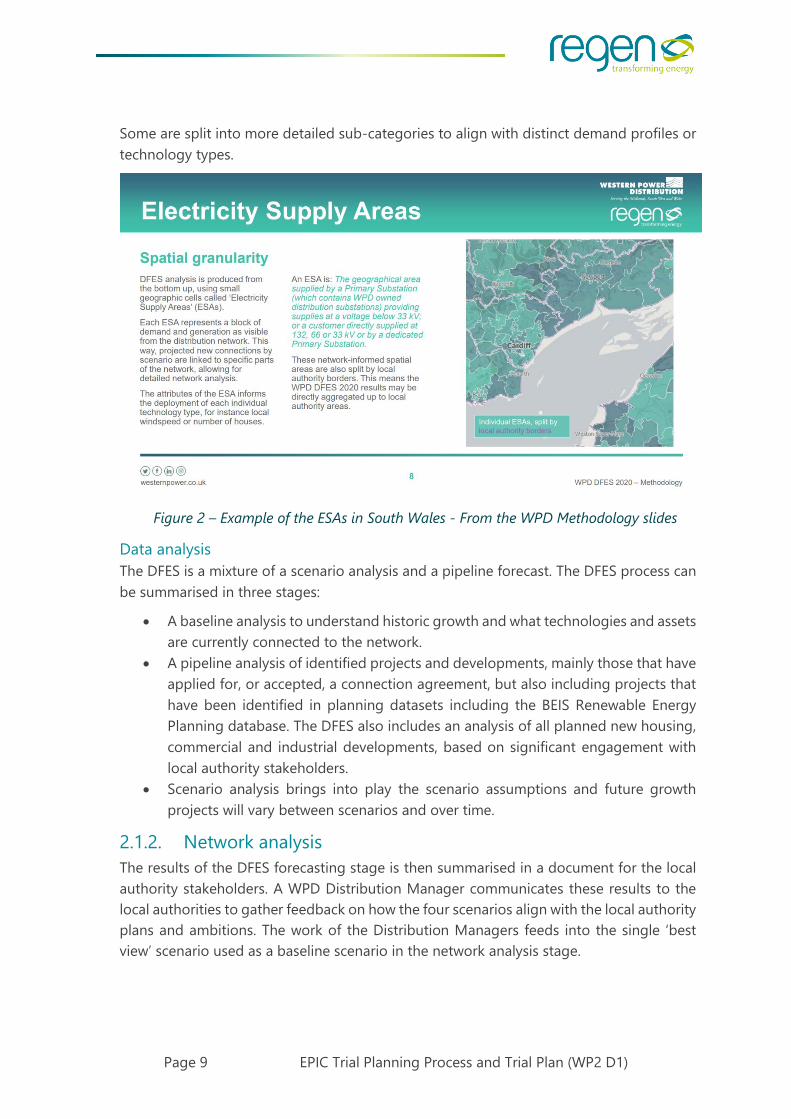
Some are split into more detailed sub-categories to align with distinct demand profiles or
technology types.
Data analysis
The DFES is a mixture of a scenario analysis and a pipeline forecast. The DFES process can
be summarised in three stages:
A baseline analysis to understand historic growth and what technologies and assets
are currently connected to the network.
A pipeline analysis of identified projects and developments, mainly those that have
applied for, or accepted, a connection agreement, but also including projects that
have been identified in planning datasets including the BEIS Renewable Energy
Planning database. The DFES also includes an analysis of all planned new housing,
commercial and industrial developments, based on significant engagement with
local authority stakeholders.
Scenario analysis brings into play the scenario assumptions and future growth
projects will vary between scenarios and over time.
2.1.2. Network analysis
The results of the DFES forecasting stage is then summarised in a document for the local
authority stakeholders. A WPD Distribution Manager communicates these results to the
local authorities to gather feedback on how the four scenarios align with the local authority
plans and ambitions. The work of the Distribution Managers feeds into the single ‘best
view’ scenario used as a baseline scenario in the network analysis stage.
Figure 2 – Example of the ESAs in South Wales - From the WPD Methodology slides

Page 10 EPIC Trial Planning Process and Trial Plan (WP2 D1)
The existing process is currently undergoing some changes. Up until 2020, the forecast
data would be combined with asset and customer behavioural data4 to produce a detailed
study which highlighted network points that may face future constraints. This study is
published as the ‘Shaping Sub Transmission’ process5 and the output data feeds into
flexibility and constraint management signposting, as well as network strategy forecasting
models and network insights for the 132 kV, 66 kV and 33kV networks across WPD.
As an output from the shaping sub transmission process, a report detailing recommended
reinforcement strategies per primary substation is produced.
Data sources for WPD network planning include:
An appropriate network model
The underlying demand capacity on each Bulk Supply Point (BSP) and categorisation
of primary substations into a few generic types with given profiles
The forecast capacity of each Distributed Generation (DG) asset and new demand on
each BSP and primary substation
Half-hourly profiles for each type of demand and DG
The appropriate ratings of network components
Existing network automation and manual switching schemes (‘corrective actions’)
2.1.3. Investment appraisal
The output of the network analysis is an understanding of the potential constraints on the
network under different scenarios and different contingencies. This is used to determine
where WPD-led flexibility services could be used to help the operation of the distribution
network, or where conventional reinforcement may be required. In some cases, neither
flexibility services or reinforcement are required but additional network reconfiguration
prior to planned maintenance work can be sufficient to prevent a network issue. The
identification of possible solutions to the network constraints identified by the network
analysis does not lend itself to automation but requires the knowledge and experience of
network engineers. The output from the network analysis will be used by WPD to publish
a Network Development Plan in 2022.
4 https://www.westernpower.co.uk/downloads-view-reciteme/303103 Accessed: May 2021 5https://www.westernpower.co.uk/smarter-networks/network-strategy/strategic-investment-
options-shaping-subtransmission Accessed: April 2021

Page 11 EPIC Trial Planning Process and Trial Plan (WP2 D1)
Figure 3 - WPD Publications relating to the forecasting and network analysis process for
EHV and 132kV networks6
2.2. Gas network processes
2.2.1. Forecasting
WWU have conducted a Regional Future Energy Scenarios (Regional FES)7 innovation
project which aligned with the ESO FES scenarios and building blocks where possible, and
run ‘High Growth’ and ‘Low Growth’ demand forecasting scenarios which feed in to the
gas network long term development strategy and informed aspects of the RIIO-GD2
business plan.
The ‘High Growth’ scenario is based on continued growth of flexible generation, and linear
growth of domestic market. Whereas ‘Low Growth’ accounts for the uncertainty
surrounding gas in new homes post 2025 and the possibility of a re-direction away from
gas-fired flexible generation.
The outcomes of the Regional FES project are used as the basis for producing joint
GDN/DNO scenarios for the regions where networks have the same geography. For the
Regional FES innovation project, the network was disaggregated into 63 Gas Supply Areas
(GSAs) within WWU south West Local Distribution Zone (LDZ) and 37 GSAs within WWU
Wales N&S LDZs.
6 https://www.westernpower.co.uk/downloads-view-reciteme/303103 Accessed: May 2021 7https://www.wwutilities.co.uk/media/3868/regional-growth-scenarios-for-gas-and-heat.pdf
Accessed: May 2021

Page 12 EPIC Trial Planning Process and Trial Plan (WP2 D1)
For the WWU Regional FES, four workshops were held in Exeter, Bristol, Cardiff and
Llandudno with over 150 delegates representing industry, DNOs, consumers, academia,
Welsh Government, local authorities and community organisations attending. The project
also engaged directly with other key organisations and WWU’s connected customers and
collated data and information from several regional sources including, for example, local
development plans.
Regional and local factors are used in the Regional FES to inform the uptake and location
of new customer connections. These include resource and feedstock availability, uptake of
domestic heating technologies, planned new housing and C&I developments, local
authority policies and planning permission records.
2.2.2. Network analysis
Long term demand forecasts are developed and fed into network modelling to determine
the gas storage requirement and therefore to identify constraints.
Data sources for WWU network planning include:
Distribution (<7bar):
Annual demands (AQs) for each meter point from Xoserve are used to derive a peak 6
minute demand for each meter point through aa Demand Derivation System (DDS).
Connected System Exit Point demands are modelled where Independent Gas
Transporters connect to the network.
Postcode data is used to apply these demands to relevant nodes in analysis models,
where numerous demands are aggregated together.
Set pressures at Pressure Reduction Installations (PRIs) and District Governor outlets.
Pipeline data from a GIS mapping system (diameter, wall thickness, material etc).
Several supply and demand types such as power generation, CNG fuelling stations and
biomethane are modelled manually when the connection agreements or grid capacity
arrangements are formed.
Information from engagement with local authorities is used to model potential future
demands on 5-year forecast models.
Local Transmission Systems (LTS):
Peak 1-in-20 demand values (output from forecasting process).
Hourly demand profiles for a range of demand levels (eg. >19mcm/d, 18-19mcm/d
etc), to reflect how within-day profiles change at or away from peak demand.. These
are based on several years of telemetered data..
Non-daily metered (NDM) demand data is uplifted from the distribution system
models to establish how forecast 1-in-20 demand is split across Pressure Reduction
Installations (PRI).
Daily metered demand data from Xoserve, which is added to the NDM demand.
Pipeline data from GIS system (diameter, wall thickness, material etc).
Pressure data (maximum operating pressure) to impose limits on pressure cycling to
drive line pack storage.

Page 13 EPIC Trial Planning Process and Trial Plan (WP2 D1)
Offtake and PRI capacities are stored separately, component-by-component, and
compared with peak-hour demand to identify constraints.
Several supply and demand types such as power generation, Compressed Natural Gas
(CNG) fuelling stations and biomethane are modelled manually as per the distribution
networks.
Several tools are used by WWU in the forecast and investment option appraisal process.
These include the Asset Investment Optimisation tool which was used to derive the GD2
plans, and the Pathfinder Plus tool, which analyses current energy data and future options,
assessing the viability of any decarbonisation approach and its impact on gas network
capacity and storage requirements. The Pathfinder Plus tool also defines the implications
of energy investment plans, showing their impact on energy reliability, and the resultant
carbon emissions. This tool is used by WWU in support of the Zero 20508, HyHy9 and Gas
Goes Green projects10.
2.2.3. Investment appraisal
Once network constraints have been identified by the network modelling, the
reinforcement or interruption requirement is determined. Reinforcement for new demand
connections (i.e. specific reinforcement), and reinforcement driven by constraints found in
network models during updates (general reinforcement) is typically approached on a ‘just
in time’ basis to avoid uneconomic investment, although the funding for this is pre-
arranged for each price control period based on WWU’s forecasts.
However, in each instance the reinforcement is reviewed to identify enhancement
opportunities; for example, if further local demand increase is expected or future mains
replacement schemes are planned then this could be considered ‘one-touch’. When
designing reinforcement for a power generation site in Ebbw Vale recently, for example,
WWU became aware that numerous other large demand customers were planning to
connect and so the final design took those sites into account.
‘Strategic’ investment approaches typically only apply to planned work such as mains
replacement and maintenance activities, where whole-life cost (WLC) and cost benefit
analysis (CBA) approaches can be applied to deliver work as economically as possible.
8 https://www.regen.co.uk/project/net-zero-south-wales/ Accessed: May 2021 9 https://www.smarternetworks.org/project/nia_wwu_060 Accessed: May 2021 10 https://sgn.co.uk/about-us/future-of-gas/gas-goes-green Accessed: May 2021

Page 14 EPIC Trial Planning Process and Trial Plan (WP2 D1)
2.3. Local authority master planning processes
2.3.1. Master planning process overview
The West of England Combined Authority (WECA) is made up of Bath & North East
Somerset, Bristol and South Gloucestershire Councils. Working with their partners
including the West of England Local Enterprise Partnership (LEP) and North Somerset
Council, WECA’s primary objective is to drive economic growth within the region and part
of their investment fund is allocated towards master planning in areas of the region which
have been identified as requiring significant infrastructure investment.
WECA are currently undertaking two strategic master planning projects; one for South
West Bristol and one for the North Fringe area in Filton. The infrastructure in scope for
these master planning projects primarily comprises transport (including walking and
cycling), utilities, green infrastructure and any health, education or training infrastructure
needs that have spatial implications.
The overarching aims of the infrastructure master planning projects are similar but the
specific objectives for the North Fringe area are described below as an example:
To provide an evidence-based programme of proposed infrastructure investments
and interventions that enable transformational change
To provide a blueprint for high-quality, well-connected and environmentally
sustainable housing growth
To deliver the future spatial growth and strategic priorities of the Local Industrial
Strategy
To consider how ‘net zero carbon’ could be achieved through infrastructure
investment to match Local Political declarations and those of Central Government
To integrate sustainable travel solutions
The methodology that is being employed for the North Fringe area to create the
infrastructure masterplan can be divided into three main phases:
Phase 1: Produce the baseline report. This phase involves the development of a
baseline evidence base, which provides a review of the existing infrastructure
provision and capacity within the area and establishes a housing and economic
development baseline.
Phase 2: Develop vision and objectives, engage stakeholders, develop options and
consider suitability for business case development. This phase builds upon the
baseline report and considers the range of possible infrastructure interventions.
Phase 3: Reach agreement on the infrastructure masterplan proposal(s) that will
inform the Local Plan.
Producing the business cases for interventions takes place after the content of the
infrastructure masterplan has been created and agreed by the stakeholders.
It should be noted that strategic master planning projects are not part of the usual
planning process but are one-off projects commissioned for specific areas (usually as a
Page 15 EPIC Trial Planning Process and Trial Plan (WP2 D1)
result of an area being identified as requiring significant infrastructure investment). If the
EPIC process is to be used in other areas that are not part of a strategic master planning
project then it will be necessary to refer to the regular planning processes; for example,
local plans develop by local and unitary authorities and, for other WECA areas, the Spatial
Development Strategy (SDS). These local policies set the framework for the master
planning process and some of the wider WECA policies that are likely to have an impact
on the energy network are summarised in Appendix 1: WECA policies summary.
If the EPIC process is found to have the greatest benefit when applied to strategic master
planning projects then this would result in there being two complementary planning
processes. The existing network led process would continue which focusses on EHV and
132kV networks and uses local authority data for the entire licence area combined with the
complete DFES data set. The EPIC process could be applied where the local authority has
identified specific infrastructure growth and/or low carbon policies that may have a
significant network impact. For example, as more detailed greater detail information was
available from the master plan or greater detail results in greater detail were required (e.g.
additional use case and sensitivity analysis or a greater view of the local impacts at HV and
LV.).
2.3.2. Engagement with network operators
As local authority stakeholders develop policy, there may be engagement with the energy
networks where DNO \ GDN approval is needed. However, for many wider decarbonisation
policies, such as improving building efficiency, there may be no engagement with the
network operator.
As part of the long term planning processes, the DNO and GDN collects data on new
housing and C&I developments and seeks to validate this with local authority stakeholders.
Furthermore, high level information on decarbonisation planning is included in these
processes.
2.4. Comparison of planning processes
2.4.1. Timelines
Both WPD and WWU have an annual cycle of forecasting demand and generation on the
network and use this to inform either investment in the network or in flexibility services.
The Open Networks WS4 P5 ‘Coordinated Regional Data Gathering’ Final Report (May
2020)11 states:
11 ENA Open Networks Template (energynetworks.org) Energy Networks Association – Published May
2020, accessed April 2021.

Page 16 EPIC Trial Planning Process and Trial Plan (WP2 D1)
“as there is no alignment for when regional data is updated by Local Authorities or used by
networks, it is challenging to standardise a process such that the same regional data is used
by networks without the risk of updated information being available.”
Based on this finding, the standardised process for EPIC is not proposed to have a regular
timeframe, but to take the most recent local authority data regarding policies and new
housing and C&I development at the point of producing the local energy plan.
2.4.2. Data inputs
There are some areas of commonality between the data requirements by the energy
networks for their forecasting and network analysis processes. Both networks require
connection forecasts, paired with profiles for demand and generation, as well as asset data
such as pipeline diameter or substation headroom.
The energy networks have existing profiles, however consistent assumptions and profiles
between the energy networks may need to be developed where the technologies connect
to both networks, as is the case with hybrid heat pumps.
The technology building blocks are used to inform the technology types used by WPD in
the DFES, however in some places the DFES splits the technology types into more detailed
categories than the standard building blocks. Several technology types are not currently
defined within the building block technology list for many gas network connected
technologies, for example domestic gas-networked boilers.
Both WPD and WWU have used the same scenarios as used in the ESO FES, though these
can change between years and the regional DFES process for WWU is not an annual
process. WPD use the four DFES scenarios, but also combine these to create a single ‘best
view’ scenario.
The geographic areas analysed in the forecasting process by both networks do not align
with each other as these are informed by the pipes and wires constituting the energy
networks. However, both geographic area systems in the WWU Regional FES and WPD
DFES 2020 included a local authority split running across the network-informed areas,
providing some comparative capabilities for stakeholders.
2.4.3. Stakeholder engagement
Both WPD and WWU engaged with local authority stakeholders as part of the DFES and
Regional FES processes. This is done on a per-licence area basis, often through full-day
workshops or webinars. WWU also engages with major gas users to inform pre-forecast
demand figures as part of the process set out in the Uniform Network Code.
Both WPD and WWU analyse local authority new development data as part of the DFES
and Regional FES processes. This is completed on a per-local authority basis, and involves
analysis and validation of new development data with the local authority.

Page 17 EPIC Trial Planning Process and Trial Plan (WP2 D1)
3. Overview of future EPIC planning process
3.1. Introduction and objectives
The EPIC project seeks to test the hypothesis that developing an integrated local energy
requirements plan at a lower level of granularity, which considers the impacts on both the
electricity and gas networks, and reflects direct input from local authority development
and master plans, will enable better investment outcomes for both the networks and
regional stakeholders.
As part of the current process to create the DFES, gas and electricity utilities reflect local
and regional factors as well as information from local authority development and
decarbonisation plans. However, although local authorities are consulted and input data
into the DFES process, such as new development data for housing and commercial sites,
the DFES scenarios are based largely on national future energy scenario projections and
do not wholly adopt or incorporate the details of local authorities’ development plans for
specific areas. There is also a practical limitation that the DFES is conducted for entire
licence areas, and for the electricity networks this is done within a tight window of three to
four months after the publication of the annual FES.
It is therefore recognised that, while the DFES process provides an overall basis for network
planning, it may not provide the necessary detail for specific investments and may not
reflect the local authority plans and expectations of future energy requirements for specific
areas, such as, for example, an enterprise zone or strategic development area. Similarly
local authorities may benefit from a different selection of use cases being modelled
focussing on variations to the assumed “best view“ scenario rather than modelling
scenarios that are not considered likely by the local authority, and providing a view of
investments at HV and LV is expected to provide additional value.
This document sets out the EPIC project’s proposal for a new process and a new way of
working for electricity and gas distribution networks to work with local authorities to create
a more granular local energy requirements that can be then be incorporated into the DFES
and network analysis.
The objective of this new, standardised process is to enable the development of an energy
requirements and network investment plan for the selected Strategic Planning Area (SPAs).
SPAs are intended to be small enough to allow detailed analysis within a limited timeframe,
but large enough to contain a number of development sites and a variety of future (multi-
vector) energy opportunities that would allow the appraisal of different investment
strategies, as well as non-network solutions. It is envisaged that these areas would already
be of strategic interest to local authority partners, perhaps as part of a master planning
area, enterprise zone or strategic development area. It is not intended that the EPIC process
would attempt to cover entire local authorities, or be used in areas which are not subject
to strategic development, and which would be better covered by the existing network
planning processes.

Page 18 EPIC Trial Planning Process and Trial Plan (WP2 D1)
A key objective of the EPIC process is to enable a joint planning and network investment
appraisal exercise to be conducted with limited resources within a short time period, with
engagement lasting from weeks to a couple of months. This requires a high degree of
process and data automation and, if the trial is successful, could enable the EPIC process
to be adopted as a business as usual activity for gas and electricity networks, and
potentially a new form of customer service for local authorities and regional bodies.
The data and analysis produced by the EPIC process should be of sufficient detail and
robustness to be used as part of an investment appraisal process, and potentially to justify
investment in network assets or non-network solutions.
3.2. EPIC Process overview
The starting point for the EPIC process is to use the existing DFES, and other sources of
network data, to create a strawman or “best view” plan that is disaggregated to a lower
level of granularity on the low voltage network. This “best view” plan is then used as a
starting point to engage with local authority partners, and to incorporate local authority
planning data and other inputs to create a strategic area energy requirements plan. The
strategic area requirement plan, including any sensitivities and scenarios, is then subject to
network analysis, using a new set of automated analysis tools and use of the ENA’s whole
system Cost Benefit Analysis (CBA) tool, to conduct an options appraisal exercise and to
create a network investment plan.
The EPIC integrated planning process therefore differs from, and is not intended to replace,
the concept of a Local Area Energy Plan (LAEP)12, both in terms of its starting point, scope,
resource commitment and timescales. For example, the EPIC process is a detailed review
of an area within a local authority, whereas a LAEP process may involve a wider review of
a local authority area. The EPIC integrated planning process also differs from the
investment planning product produced as part of Open Networks Workstream 4. Although
the EPIC process also involves gathering local authority data to update network investment
plans, the scale and scope is different, with a much more granular area of focus as part of
Project EPIC. The EPIC process does not cover all of the recommended elements of a LAEP
process, but could run alongside, or follow, the development of a LAEP, using LAEP data
as a key input. This would allow the networks to efficiently respond to LAEP’s at a network
level and to incorporate LAEP inputs into their network analysis processes.
12 Local Area Energy Plan methodology developed by the Energy System Catapult and CSE see
https://es.catapult.org.uk/reports/local-area-energy-planning/ Accessed: April 2021

Page 19 EPIC Trial Planning Process and Trial Plan (WP2 D1)
There are six core EPIC process stages as illustrated below and described in the rest of this
report:
I. Opportunity identification and area selection
II. Data Collection
III. Local Energy (requirements) Planning
IV. Network analysis
V. Investment and options appraisal
VI. Local Energy Planning (completion)
There are four key stakeholders whose input, feedback and review is required throughout all
the process stages to ensure a successful outcome. For the purposes of this document, these
roles are generically described (local authority stakeholder(s), DNO network planner, GDN
network planner and a new process analyst role) and will need to be assigned appropriately
prior to commencement of the process. Other roles including those of distribution and area
managers are also described throughout the process.
The following sections in this report focus on each of these process stages and detail the sub-
process steps within the stage, step through the roles and responsibilities for each of the four
key stakeholder groups and the required data flows and, finally, summarise the outputs for
each of the process stages.

Page 20 EPIC Trial Planning Process and Trial Plan (WP2 D1)
4. Trial Process Stage I: Opportunity identification and area
selection
4.1. Identify the opportunity
It is envisaged that the starting point for the EPIC process would be the identification,
either by the networks or by a local authority partner, of an opportunity to work together
to create an integrated energy plan for a particular area. Identification of an opportunity
could also come from engagement with wider regional bodies such as a combined
authority, local enterprise partnership or work done by an regional Energy Hub.
The identification of the opportunity could come from a variety of sources
Engagement during and following the annual DFES and network planning process
The results and recommendations from a LAEP
Local authority infrastructure master planning
A local heat and energy efficiency strategy
Transport planning
Page 21 EPIC Trial Planning Process and Trial Plan (WP2 D1)
Opportunities to conduct an EPIC joint plan could also come from the identification that
an area is network constrained and/or is subject to a number of new development projects.
Once an opportunity has been identified the first step in this process is the selection of
one or more Strategic Planning Areas (SPAs). The selection and definition of the SPAs
should ideally be undertaken in partnership with the local stakeholders, other networks
and councils, allowing the rationale of each party to be considered. Collaboration will also
improve the tailoring of the SPA, potentially mapping it more closely onto network supply
areas.
4.2. Define Strategic Planning Area selection criteria
A SPA should be designated in an area where it can deliver significant impact on energy
demand, generation and required infrastructure. Other considerations may include:
Diversity of specific geography and land use, for example, industrial, domestic, urban
and rural settings
A range of energy requirements including those for new developments
Planned energy efficiency measures
Opportunities for energy generation and green gas
Opportunities for heat networks
Current and future transport infrastructure and requirements
Opportunities for flexibility and energy storage
By the end of the SPA selection process, the boundaries of the SPA(s) should be signed-
off by the relevant local stakeholders and energy networks.
4.3. Map the Strategic Planning Areas to the energy
networks
The boundaries of the SPA as agreed with the local stakeholders are unlikely to align
directly with either gas or electricity network areas. Therefore, a larger area than the SPA
will be defined for the process of networks analysis i.e., incorporating full primary
substation areas or ESAs.
Entire network areas which intersect the SPA are required to be analysed, though the data
gathering should be done at a level as to be potentially aggregated either to network area
or SPA. For the gas networks, this high granularity is important as household connection
projections will be analysed at a postcode level. Injections into the gas network from
outside the SPAs will also have an impact on the assets using the gas network inside the
SPAs, at a range of pressure levels.
Network topology data from the energy networks DNO is required for this process, as well
as a count of customers to postcode level. This network mapping process may become
iterative as the original SPA boundaries may be ‘fuzzy’ and therefore could be altered
slightly to include or exclude certain developments or network areas that only partially fall

Page 22 EPIC Trial Planning Process and Trial Plan (WP2 D1)
within the SPA. The network areas should be shared in a widely accessible format, as not
all project partners will have access to GIS software.
Figure 4 Illustration of ESA and SPA boundaries: the green areas are the complete ESAs that
need to be analysed for the specific SPA outlined here in red.
4.4. Stage I – outputs, roles and processes overview
4.4.1. Outputs for this stage
The outputs that need to be agreed and signed off at this stage are:
The rationale for selecting the SPA and consensus on why the area would benefit from
undertaking the EPIC process
The SPA boundaries
o Data type: GIS-readable file, such as a geopackage or shapefile
The wider SPA boundaries for the energy networks
o Data type: GIS-readable file, such as a geopackage or shapefile or could be a
list of primaries or postcodes which are within the network areas for
assessment.

Page 23 EPIC Trial Planning Process and Trial Plan (WP2 D1)
4.4.2. Stage I – roles and processes overview
Stage I
Roles and responsibilities
Local authority stakeholder(s)
The role of the local authority stakeholder(s) is to review the SPA specification process to
ensure that it is adequate for the needs of local stakeholders in realising their own strategic
aims.
DNO network planner
The role of the DNO network planner is to provide the electricity network perspective in
reviewing the SPA process to help define the boundaries of the SPA This involves providing
network hierarchy data so that the wider network-informed SPA borders can be produced.
GDN network planner
The role of the GDN network planner is to provide the gas network perspective in reviewing
the SPA process. This involves providing network hierarchy data so that the wider network-
informed SPA borders can be produced.
Process analyst
The local energy plan process analyst is not a role that currently exists within network
planning. However, the role of a process analyst could be completed by the networks as
part of this approach and there are accountabilities for local area energy planning within
WWU’s net zero team structure, for example..
The role of the process analyst at this stage is to combine the input from the local
stakeholders and network stakeholders and produce draft and final SPA boundary files.
Data flows
Local authority stakeholder(s)
Could provide the initial area selection boundaries, otherwise no data input required at this
stage. Shapefile data received for draft and final SPA boundaries.
DNO network planner
Needs to provide network topology data to create the wider SPA boundaries. Shapefile data
received for draft and final SPA boundaries.
GDN network planner
Needs to provide network topology data to create the wider SPA boundaries. Shapefile data
received for draft and final SPA boundaries.
Process analyst
The role of a process analyst can be completed by the networks as part of this approach.
The process analyst receives network topology data from the DNO and GDNO network
planners.

Page 24 EPIC Trial Planning Process and Trial Plan (WP2 D1)
5. Trial Process Stage II: Data preparation
5.1. Define the scope of data collection
The initial data collection period is completed with a signed off version of the full list of
building blocks, the starting scenario from regional DFES data, and an agreed timescale.
5.1.1. Building blocks scope
The forecast datasets produced are designed to reflect what is used in current network
planning processes by both the gas and electricity networks. The ‘building blocks’ as
defined by the ENA Open Networks project and used in the National Grid ESO FES13 are
13 https://data.nationalgrideso.com/future-energy-scenarios/future-energy-scenario-fes-building-
block-data/r/building_block_definitions# Accessed April 2021.
Page 25 EPIC Trial Planning Process and Trial Plan (WP2 D1)
proposed to be used as the technology types, plus several gas-network relevant
technologies such as gas boilers and gas network injection. These are also consistent with
the technology building blocks in the existing forecasting processes for WWU and WPD.
Additional building blocks or factors may be included with the agreement of all parties,
such as energy efficiency demand reduction factors. Of the full list of building blocks, many
may only connect to the energy networks in some areas of the country. For example,
marine technologies or offshore wind may not be relevant for a local energy plan in
Birmingham. However, a full building block list is used to allow for best replicability.
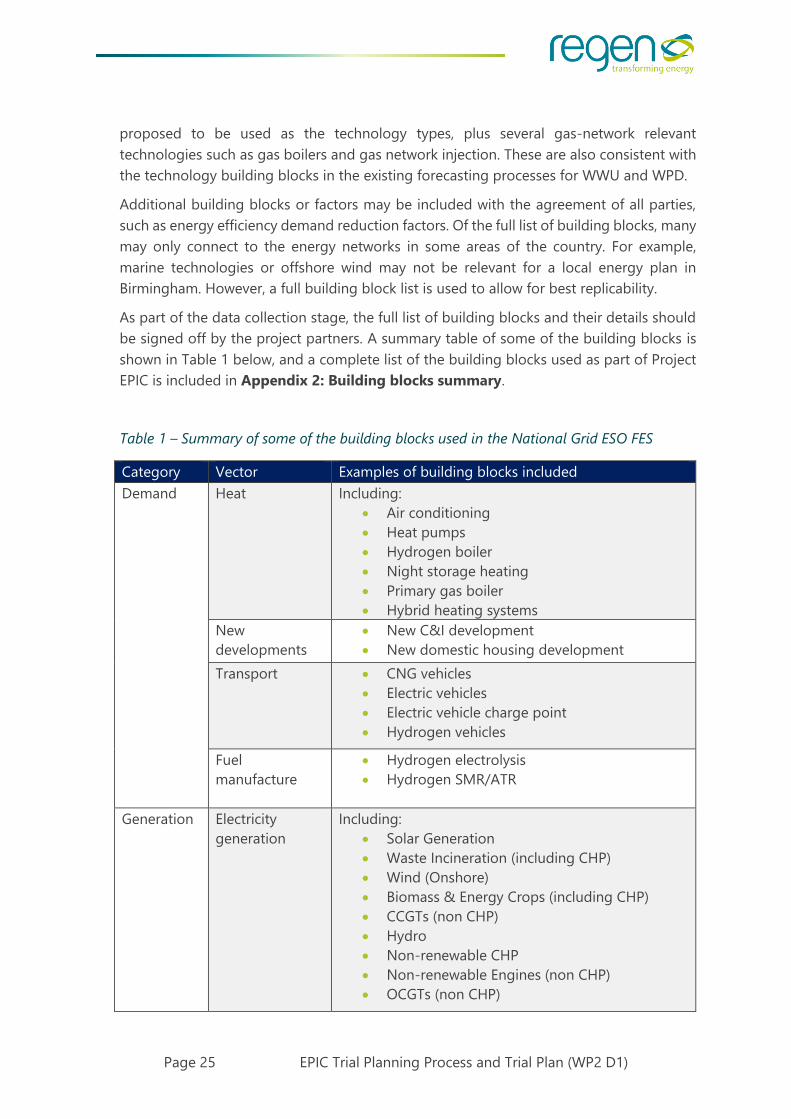
As part of the data collection stage, the full list of building blocks and their details should
be signed off by the project partners. A summary table of some of the building blocks is
shown in Table 1 below, and a complete list of the building blocks used as part of Project
EPIC is included in Appendix 2: Building blocks summary.
Table 1 – Summary of some of the building blocks used in the National Grid ESO FES
Category Vector Examples of building blocks included
Demand Heat Including:
Air conditioning
Heat pumps
Hydrogen boiler
Night storage heating
Primary gas boiler
Hybrid heating systems
New
developments
New C&I development
New domestic housing development
Transport
CNG vehicles
Electric vehicles
Electric vehicle charge point
Hydrogen vehicles
Fuel
manufacture
Hydrogen electrolysis
Hydrogen SMR/ATR
Generation
Electricity
generation
Including:
Solar Generation
Waste Incineration (including CHP)
Wind (Onshore)
Biomass & Energy Crops (including CHP)
CCGTs (non CHP)
Hydro
Non-renewable CHP
Non-renewable Engines (non CHP)
OCGTs (non CHP)

Page 26 EPIC Trial Planning Process and Trial Plan (WP2 D1)
Renewable Engines (Landfill Gas, Biogas)
Injection
Fuel injection Biomethane/bioSNG injection
Hydrogen injection
Electricity
storage
Electricity
storage
Energy storage
5.1.2. Starting database scope
The starting point for network analysis will be the energy networks’ regional scenarios and
DFES documentation, projecting the growth of supply and demand building block
technologies. Rather than repeating four scenarios in the local energy plan, a single “best
view” scenario should be considered, reflecting the network analysis process of the DNO /
GDN. An alternative view may also be used, to show a secondary scenario in the options
appraisal stage.
5.1.3. Timescale scope
The local energy plan projections can be taken out to 2050 to reflect the ESO FES. However,
a focus can be placed on the nearest network planning periods, ED2 and ED3. The DFES
data from WPD is produced yearly to 2035, and in five year stages from 2035 to 2050.
It is envisaged that the EPIC process will be most useful looking at energy requirements
and network impacts over the period of 10 to 15 years. This will allow sufficient horizon
scanning to consider anticipatory and strategic investments, but within a timeframe where
very local and specific data can be used to evidence and justify investment.
5.2. Engage with local authority stakeholder(s)
Several datasets from local authorities are collected as part of the Regional FES and DFES
processes but may be updated with supplementary data or reviewed as part of an
additional validation stage as part of this process. The data collected includes:
New domestic and commercial & industrial developments within the SPA
boundaries:
o Including the location, scale, and expected build timeline.
Plans for new heat networks within the SPA boundaries.
Plans for energy efficiency improvement schemes.
Page 27 EPIC Trial Planning Process and Trial Plan (WP2 D1)
The outputs of this stage cover evidenced local policies and a database of planned new
developments in the SPAs. These will be used to inform data decisions in later stages of
this process, or used to directly update the forecast database.
5.3. Outline the use-cases to be used in the cost benefit
analysis stage
Rather than model multiple scenarios with widely varying datasets, a limited number of
use-cases should be defined. These use-cases are used to test the network implications of
specific decisions made by local authority stakeholder(s) creating local policy, of energy
networks choosing investment options, or are included to incorporate future uncertainties
in the projections.
These use-cases should be informed and led by engagement with the local authority
stakeholder(s), and agreed before the data disaggregation process. Examples of the use-
cases could be heat pump uptake in new build homes with or without energy efficiency
improvements.
5.4. Define the data required to test the use-cases
(sensitivities and scenarios)
To include the data required to test the use-cases, various scenarios or sensitivities are
included in the input dataset which may be used as part of the cost benefit analysis process.
1. Differing ‘scenarios’ cover the variation in the ‘volumes’ of certain building blocks
i.e. number of connections.
2. Differing network analysis ‘sensitivities’ cover the variation in the ‘behaviour’ of
certain building blocks, e.g. their profiles and other key variables. (It is likely that
these profiles will come from the networks.)
3. Differing CBA analysis sensitivities that can be applied during the investment
options appraisal process e.g. discount rates, costs of carbon, inflation etc.
These variations should be developed in workshops with the local authority partners and
signed off by all parties.
5.5. Define baseline network modelling scenario
Rather than four scenarios for the SPAs, a single view should be created that can be
reviewed by local authority stakeholders and improved with local evidence. Ideally, the
default view should reflect the forecasts currently used by networks in their investment
appraisal studies.
For WPD, this represents the ‘best view’ and covers most of the building blocks of the
study. The gas network relevant building blocks can be updated to include the projections
used by the gas network in their investment appraisal studies, though logical consistency

Page 28 EPIC Trial Planning Process and Trial Plan (WP2 D1)
between the scenarios is important. A second scenario, or an alternative view may be
included to reflect some of the sensitivities desired by local authority stakeholder(s).
5.6. Create the disaggregated baseline dataset
5.6.1. Rationale for a disaggregated dataset
Once the baseline network modelling scenario datasets are combined, the geographic /
network level may need to be disaggregated to a more granular level. This creates a straw-
man dataset which can then be aggregated up to higher levels (i.e. an SPA) and updated
with evidence from local authority stakeholder(s), while reflecting the current forecasts or
demand modelling used by the energy networks.
The method and level of disaggregation needs to be agreed in a workshop between the
process analysts and the energy networks, then signed off by relevant parties for each
building block. The methods of disaggregation are likely to be based on customer counts
at each level, combined with network informed factors such as load data or off-gas
customer counts. The output of this stage is a full building block dataset at the lowest
spatial level possible for the SPAs in the study.
5.6.2. Requirements for the disaggregation process
For Project EPIC, the building blocks are disaggregated to postcode, distribution
substation, HV feeder, or primary substation, depending on the technology type. This split
is informed by at which level the building block may connect to the energy network, or at
which level the data is needed for network analysis.
For the electricity networks, the lowest level is defined as distribution substation areas split
by number of customers on each postcode. The data required for this from the electricity
networks is a count of customers (by profile class) by distribution substation and postcode.
(Only count of customers and LCTs by profile class by distribution substation are relevant.)
Data is also needed covering the network hierarchy linking these distribution substations
to HV feeders up to primary substations (the DFES level). A single distribution substation
may serve multiple postcodes and though the DNO may analyse this data aggregated to
distribution substation, the postcode split is retained as this is useful for GDN and local
authority purposes.
Much social or energy data may not be available at postcode, the postcode level
projections therefore is more a representation of customer counts at each postcode and
may take proportional splits from Output Area (OA), Lower Super Output Area (LSOA) or
other data sources for the purpose of being able to aggregate by postcode or distribution
substation.
For building blocks relevant to the gas network, it is agreed for Project EPIC to project
these as changes on a baseline at postcode level for the numbers of technologies which
connect at the distribution level (< 7 bar). It should be noted that the majority of domestic
and commercial heat connects to the low pressure networks, whilst large commercial,

Page 29 EPIC Trial Planning Process and Trial Plan (WP2 D1)
industry, green gas injection and flexible power generation are more likely to connect to
the MP (<2bar), IP (<7bar) and occasionally HP (>7bar) depending on proximity. The data
required for this is a list of postcodes, provided by the process analyst, and customer
counts for each of these provided by the gas network.
At the end of this process, a complete “best view” draft dataset should have been created
covering projections for each building block at the appropriate level of disaggregation. A
second scenario representing an alternative view may also be included.
5.7. Stage II – outputs, roles and processes overview
5.7.1. Outputs for this stage
The outputs that need to be signed off at this stage are:
The sensitivities included as part of the dataset - signed off by all parties
o Data type: included as a column in the dataset (could be in XLSX, CSV or SQL)
The first draft dataset of DFES / regional FES data disaggregated to the agreed voltage
/ pressure levels.
o Data type: dataset in excel or other format.
5.7.2. Stage II – roles and data flows overview
Stage II
Roles and responsibilities
Local authority stakeholder(s)
The role of the local authority stakeholder(s) at this stage is to provide or review local data
relating to new housing and C&I developments.
DNO network planner
The role of the DNO network planner at this stage is to review and sign off the data scope
including the technology types, timeline, baseline, sensitivities, and methods of DFES data
disaggregation.
GDN network planner
The role of the GDN network planner at this stage is to review and sign off the data scope
including the technology types, timeline, baseline, sensitivities, and methods of Regional
gas FES data disaggregation.
Process analyst
The role of the process analyst at this stage is to create the baseline dataset at the correct
level that will be reviewed and updated by the local authorities in the next stage. The
baseline dataset will be structured as agreed and include the sensitivities and scenarios.
Data flows
Local authority stakeholder(s)

Page 30 EPIC Trial Planning Process and Trial Plan (WP2 D1)
The local authority stakeholder(s) can share data with the project team that will inform the
scenarios and sensitivities, such as whether a heat network is being planned. Data on the
planned new developments of housing and C&I properties is also required by the process
analyst.
DNO network planner
The DNO network planner needs to provide the most recent DFES data to the process
analyst, as well as defining the default network investment scenario that relates to the local
areas in study. The DNO also needs to provide network customer data to facilitate the
disaggregation process, including customer counts by voltage level, profile class and
postcode.
GDN network planner
The GDN network planner needs to provide up to date forecast data (could be regional FES
for instance) to the process analyst, as well as network customer data at postcode level to
facilitate the disaggregation process.
Process analyst
The role of a process analyst can be completed by the networks as part of this approach.
The process analyst needs to combine and disaggregate recent DFES / regional gas FES data
including options for scenarios and sensitivities to create a final draft dataset.

Page 31 EPIC Trial Planning Process and Trial Plan (WP2 D1)
6. Trial Process Stage III: Energy Requirements Plan creation
6.1. Gather stakeholder evidence and requirements
Local stakeholders are engaged throughout the steps to choose the SPAs and data
sensitivities. This stage covers the discussions and engagement with local stakeholders
specifically relating to the creation of a local energy plan.
Input from the local authority stakeholders can be categorised covering the following
sections:
Policies and plans relating to specific developments of new housing or C&I
properties
Policies and plans relating to building fabric efficiency improvements
Plans for large energy projects such as a heat networks, wind and solar
Plans for low-carbon transport or electric vehicle infrastructure
Planning policies related to the use of fossil fuels including fossil generation
6.1.1. Stakeholder data gathering
In preparation for the EPIC planning workshops the process analyst will engage with local
authority stakeholders to gather strategic area planning data. This data will include:

Page 32 EPIC Trial Planning Process and Trial Plan (WP2 D1)
Details of new housing and commercial and industrial developments
Plans for EV charging and other transport energy requirements
Energy efficiency and building retrofit plans
Details of heat network developments
Plans to decarbonise heat both on public and private properties
Plans to support or deploy renewable energy generation or storage projects
6.1.2. Strategic area engagement workshops
For the EPIC trial process it is intended run two iterations of workshops for each of the
strategic areas. The objective of the first workshop will be to review the baseline DFES data
for the SPA and agree the quantitative updates to the data informed by local policies and
local ambitions with the local and unitary authority stakeholders.
Topics to discuss at the first workshop will include:
Confirm the new developments (domestic, commercial and industrial) that are
planned for the SPA
Discuss the energy efficiency and/or building retrofit schemes that are in place
Talk through what large energy projects (including generation, storage and heat
networks) are planned for the SPA
Review the plans for EV infrastructure/low carbon transport plans
Discuss the policies that are in place which might impact future generation with
fossil fuels
Talk through the plans for decarbonisation of heat (both in public and private
property)
The objective of the second workshop will be for us to present the newly updated DFES
data and gain stakeholder agreement that the data accurately reflects local policy as well
as confirming the use-cases that will be analysed for each SPA
6.2. Update dataset to reflect local energy plan
requirements
Quantitative and locational data is required to input into the local energy plan and update
the initial draft building block dataset. This data is requested by the local energy plan
process analyst and used to create the local energy plan. The changes and updates can be
discussed and confirmed at a workshop with the local stakeholders.
The intention is to identify a single “best view” requirements plan however it is likely that
a small number of alternative scenarios and sensitivities will be identified. For the EPIC Trial
Plan these scenarios and sensitivities are identified in part two of this report.
By the end of this step the updates to the “best view” scenario draft dataset should be
discussed and agreed by all parties. It may be appropriate to caveat that the local energy
requirements plan is not a commitment from the local authority to adopting the
Page 33 EPIC Trial Planning Process and Trial Plan (WP2 D1)
development described but an agreement that it describes the most representative
scenario for the area.
The draft dataset is focused on the energy network impacts for the SPAs, wider system-
balancing needs at a national scale are assumed to be managed as the dataset is unlikely
to represent a significant departure from the bounds of the ESO FES. The risk that the
results fall outside of manageable system-balancing needs cannot be reduced to zero but
mitigated by a review of the output datasets.
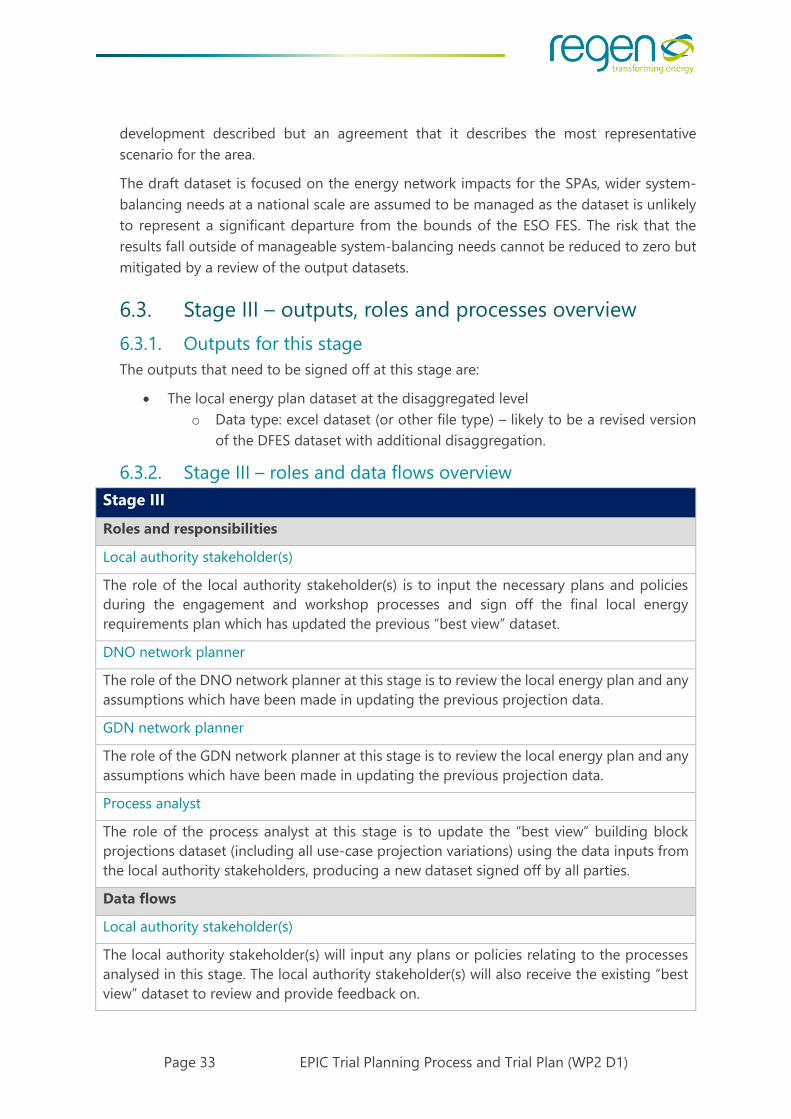
6.3. Stage III – outputs, roles and processes overview
6.3.1. Outputs for this stage
The outputs that need to be signed off at this stage are:
The local energy plan dataset at the disaggregated level
o Data type: excel dataset (or other file type) – likely to be a revised version
of the DFES dataset with additional disaggregation.
6.3.2. Stage III – roles and data flows overview
Stage III
Roles and responsibilities
Local authority stakeholder(s)
The role of the local authority stakeholder(s) is to input the necessary plans and policies
during the engagement and workshop processes and sign off the final local energy
requirements plan which has updated the previous “best view” dataset.
DNO network planner
The role of the DNO network planner at this stage is to review the local energy plan and any
assumptions which have been made in updating the previous projection data.
GDN network planner
The role of the GDN network planner at this stage is to review the local energy plan and any
assumptions which have been made in updating the previous projection data.
Process analyst
The role of the process analyst at this stage is to update the “best view” building block
projections dataset (including all use-case projection variations) using the data inputs from
the local authority stakeholders, producing a new dataset signed off by all parties.
Data flows
Local authority stakeholder(s)
The local authority stakeholder(s) will input any plans or policies relating to the processes
analysed in this stage. The local authority stakeholder(s) will also receive the existing “best
view” dataset to review and provide feedback on.

Page 34 EPIC Trial Planning Process and Trial Plan (WP2 D1)
DNO network planner
No input data is required from the DNO network planners at this stage, however the DNO
network planner will review the updated local energy plan and sensitivities dataset from the
process analyst.
GDN network planner
No input data is required from the GDN network planners at this stage, however the GDN
network planner will review the updated local energy plan and sensitivities dataset from the
process analyst.
Process analyst
The process analyst at this stage will share the “best view” dataset with the local authority
stakeholder(s) and then receive data from the local authority stakeholders to create the local
energy plan dataset. The process analyst will share the local energy plan dataset at the
appropriate disaggregated level ready for the next stage of network analysis. (and for
sensitivities)

Page 35 EPIC Trial Planning Process and Trial Plan (WP2 D1)
7. Trial Process Stage IV: Network analysis
7.1. Run the gas network analysis
Typical gas demand modelling is run on an automated system taking Xoserve data
combined with network topology data. The standardised trial process from Project EPIC
will be a more manual look at the changes in technology connections at postcode level,
while including the inflows from areas of the network outside the SPAs. In order to
manually alter modelled demands, the GDN network planner will be required to export
baseline demand from the modelling software, alter them based on the data provided,
then re-import them into the model. As the nodes used to group individual meter points
together do not correspond to postcodes, a lookup will need to be performed using data
from the DDS system, which lists demands on a per property basis, against a node number
and postcode.
The data inputs will consist of forecast data for building block technology connections,
potentially including energy or volume values as well as numbers of connections. Network
data and data on potential new customer connections can be provided by the GDN to the
process analyst for this stage. The exact structure and scope of the data inputs is undefined
at the moment and will be decided as part of the trial going forward.

Page 36 EPIC Trial Planning Process and Trial Plan (WP2 D1)
A further part of the process requiring further definition is the treatment of new demands
identified by the local energy plan, particularly where these are remote from the existing
gas network which would make it more challenging to attribute demands to nodes. There
is an expectation that a workaround can be implemented using DDS software, but spatial
data may be required alongside the demand data. Network extensions are not currently
expected to be modelled, as this would require design and costing input from additional
teams within the GDN.
Having imported the demand data, the LP model will then be run, and results compiled to
identify impacts on network pressures particularly at network extremities, to identify
reinforcement requirements. This process will be repeated across all models covering
demands and assets within the SPAs. Further analysis will then be done on the IP/MP
model, with revised demands based on uplift from the LP model and changes to any direct
connections affected by the local energy plan. This process will be repeated for the HP
network – although a view may need to be taken on whether changes in demand are
sufficient to warrant this. Through the course of the above process, revised flows through
relevant governors and PRIs will be gathered, to be checked against capacity data to
identify upgrade requirements.
7.2. Run the LV analysis
7.2.1. Brief description of methodology
The current LV analysis process is run by WPD in the LV analysis tool NIFT. Data inputs are
provided from the DNO or process analyst in the form of .csv. The input data covers the
building block forecasts for the distribution substations in the area.
In the current process, the forecast data is supplied at ESA level and then assigned using
an apportionment algorithm, however this data may be provided already disaggregated
to distribution substation level. Partner sign-off will be required on these input tables.
The WPD LV analysis tool (NIFT) already contains asset data for the WPD licence areas,
supplied during the development of the Network Assessment Tool as part of Electric
Nation (2016 -19). The asset data, customer numbers and demand profiles (using ACE 49
style p and q profiles) are assessed for all LV networks within the study area using a Debut
assessment to assess both thermal and voltage issues in each of the study years. Additional
asset data such as transformer size and cable costs are also required data inputs. The NIFT
tool also carries out some high level assessment of the confidence level relating to the
asset data (e.g. is the feeder abnormally long, or count of customers very high). As a result
of this assessment, if the data quality/confidence in the data is low then discussions with
WPD may be needed to cover any more recently available data.
7.2.2. Data inputs
For each distribution substation the DNO provides a count of customers by profile class as
well as the Estimated Annual Consumptions (EAC) for each profile class are provided. The
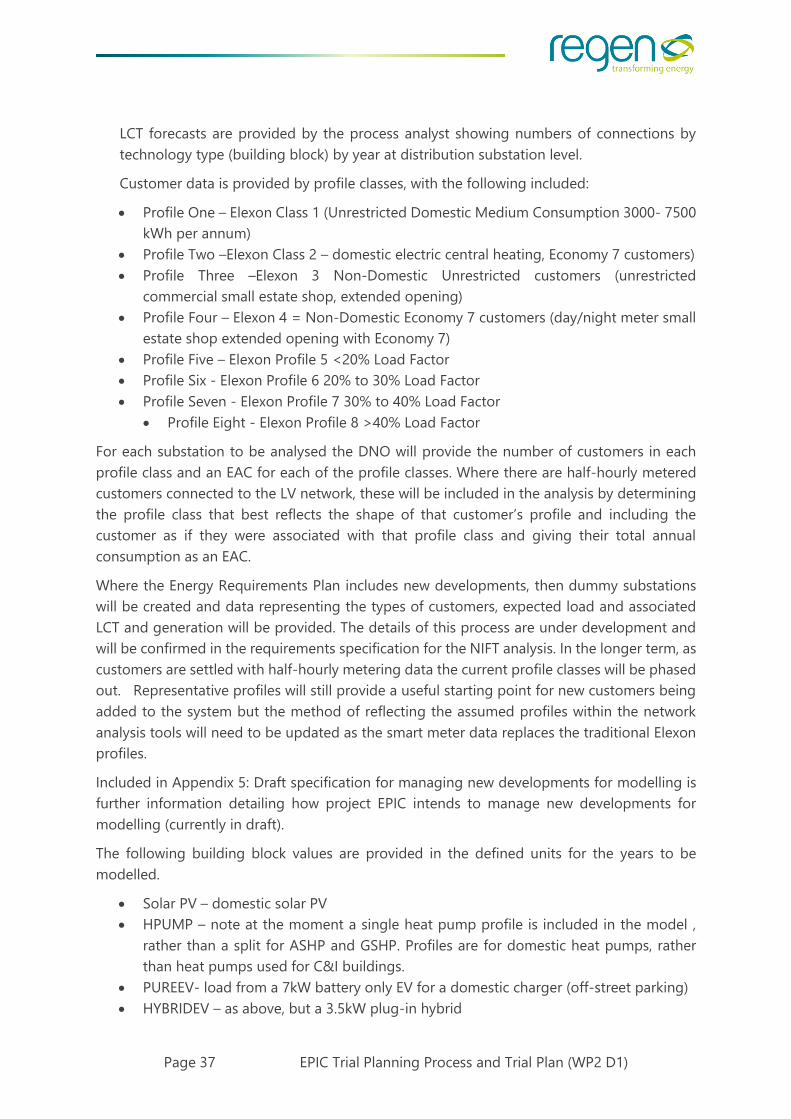
Page 37 EPIC Trial Planning Process and Trial Plan (WP2 D1)
LCT forecasts are provided by the process analyst showing numbers of connections by
technology type (building block) by year at distribution substation level.
Customer data is provided by profile classes, with the following included:
Profile One – Elexon Class 1 (Unrestricted Domestic Medium Consumption 3000- 7500
kWh per annum)
Profile Two –Elexon Class 2 – domestic electric central heating, Economy 7 customers)
Profile Three –Elexon 3 Non-Domestic Unrestricted customers (unrestricted
commercial small estate shop, extended opening)
Profile Four – Elexon 4 = Non-Domestic Economy 7 customers (day/night meter small
estate shop extended opening with Economy 7)
Profile Five – Elexon Profile 5 <20% Load Factor
Profile Six - Elexon Profile 6 20% to 30% Load Factor
Profile Seven - Elexon Profile 7 30% to 40% Load Factor
Profile Eight - Elexon Profile 8 >40% Load Factor
For each substation to be analysed the DNO will provide the number of customers in each
profile class and an EAC for each of the profile classes. Where there are half-hourly metered
customers connected to the LV network, these will be included in the analysis by determining
the profile class that best reflects the shape of that customer’s profile and including the
customer as if they were associated with that profile class and giving their total annual
consumption as an EAC.
Where the Energy Requirements Plan includes new developments, then dummy substations
will be created and data representing the types of customers, expected load and associated
LCT and generation will be provided. The details of this process are under development and
will be confirmed in the requirements specification for the NIFT analysis. In the longer term, as
customers are settled with half-hourly metering data the current profile classes will be phased
out. Representative profiles will still provide a useful starting point for new customers being
added to the system but the method of reflecting the assumed profiles within the network
analysis tools will need to be updated as the smart meter data replaces the traditional Elexon
profiles.
Included in Appendix 5: Draft specification for managing new developments for modelling is
further information detailing how project EPIC intends to manage new developments for
modelling (currently in draft).
The following building block values are provided in the defined units for the years to be
modelled.
Solar PV – domestic solar PV
HPUMP – note at the moment a single heat pump profile is included in the model ,
rather than a split for ASHP and GSHP. Profiles are for domestic heat pumps, rather
than heat pumps used for C&I buildings.
PUREEV- load from a 7kW battery only EV for a domestic charger (off-street parking)
HYBRIDEV – as above, but a 3.5kW plug-in hybrid

Page 38 EPIC Trial Planning Process and Trial Plan (WP2 D1)
PUREEVTOU – load from a 7kW battery only EV for a domestic charger (off-street
parking) for an active responder to a Time of Use tariff where charging is delayed until
the end of the evening/early hours of the morning (randomised start time between
22:00 and 02:00)
HYBRIDEVTOU – as above but for a 3.5kW PHEV
New build domestic customers/dwellings
New I&C customers/floorspace
Additionally, data provision may include provision of alternate load profiles or other data
to be used for sensitivity analysis, for example, variants of heating profiles reflecting the
impact of time of use tariffs and/or thermal stores.
Similarly, the input data will need to be specify variables such as the investment strategy
to be applied. For example, in the case of the ‘just-in-time’ investment strategy the NIFT
would select the next incremental transformer size available whereas under the ‘fit-for-the-
future’ investment strategy, the largest available transformer size may be selected.
The count of customers by profile class data is provided by the DNO, the LCT forecasts are
provided by the process analyst.
Currently, this is the full list of technologies assessed as part of the NIFT tool – additional
building blocks would need to be discussed with the process analyst. The asset data,
customer numbers and demand profiles (using ACE 49 style p and q profiles)are assessed
for all LV networks within the study area using a Debut assessment to assess both thermal
and voltage issues in each of the study years.
7.2.3. Data outputs
Outputs from the NIFT tool are in .csv format, are configurable and can be summarised in
PowerBI views. The configuration of the output will need to consider what outputs from
the LV modelling is required as an input to the HV. This will include, as a minimum, the
load profiles for the distribution substations in different years. The NIFT tool can also
analyse potential solutions to the constraints identified. Information about transformer
upgrades where the NIFT has identified the need to increase transformer capacity may
need to be passed to the HV modelling tool to avoid double-counting of network
upgrades. The attributes of each solution are defined including features such as headroom
released, CAPEX and OPEX cost, which year a solution becomes available and its lifetime.
Additional metrics may be required to support the use of other values in the ENA Whole
System CBA tool, for example, to assess the benefits of changing a transformer relative to
using flexibility services then the improved transformer condition should be taken into
account by reflecting the improved health index and lower risk of failure and associated
Customer Interruptions (CI) and Customer Minutes Lost (CML). Included in the NIFT tool is
a modelling system to find the optimum solution set for the constraints identified. The
means by which the data is validated for each year will be included in the HV and LV
automation tool specification documents (WP2 D3 and D4).

Page 39 EPIC Trial Planning Process and Trial Plan (WP2 D1)
7.3. Run the HV analysis
7.3.1. Brief description of methodology
For each year in the forecast period, the modelled system is updated with new customer
network locations and forecasted connections. In some cases, this will be provided by the
dummy substations created to support the analysis in the NIFT tool. New connections
associated with certain building blocks will be assumed to result in the creation of a new
HV connection e.g. larger scale generation, rapid EV charging stations etc. The connection
location of these new connections will be determined based on geographical location data
provided as part of the Energy Requirements Planning (section 6). These will either take
the form of:
New HV connections into existing HV feeders based on either closest substation
or feeder depending on the HV network data available.
Dedicated HV connections back to the closest Primary Substation where the new
connection exceeds typical capacities determined by HV network planners.
Network analysis will take place with two variants;; top-down and bottom-up which allows
for the impact of the different approaches to be determined.
Top-down analysis is more consistent with the current method to model HV
networks which is to take the SCADA measurements for a HV feeder and pro-rata
the observed load between the HV connected customers and distribution
substations to generate profiles at these nodes to be used for power flow analysis.
Bottom-up analysis will use the load profiles generated within the NIFT and will
ensure greater consistency with the LV analysis, but risks the expected profiles not
summating to the observed measured loads and therefore having a reduced
accuracy.
For the top-down analysis, the measurement data provides a base measurement which
must then be updated for subsequent years to reflect the changes in the various building
blocks. This can be achieved by adding scaled profiles for load, generation and storage
technology in the same way that the adjustments are made to primary substation profiles
for the network analysis underlying the shaping subtransmission reports. The profile
changes for the various building blocks are captured in the customer behaviour profiles
and assumptions report14. There may be a need to apply correction factors as the profiles
included in this report are relevant for the level of customer diversity observed at a primary
substation and the diversity for an individual HV feeder / distribution substation would be
expected to be less.
14 https://www.westernpower.co.uk/downloads-view-reciteme/303103 Accessed: May 2021

Page 40 EPIC Trial Planning Process and Trial Plan (WP2 D1)
Power flow analysis is completed for the system to identify any areas with constraints and
to understand the scale and duration of the constraints. These constraints will be based
on thermal and voltage constraints but not take into consideration limitations from fault
currents which are driven by developments across the higher voltage system.
From the constraints, configurable resolution options can be identified. For example,
upgrade distribution transformer, upgrade cable/overhead line capacity, split the load of
a HV feeder by extending the primary busbars to include a new circuit breaker and
installing new assets to connect the overloaded feeder allowing the load to be split. As the
manual assessment of investment options would be too time-consuming to be viable, the
generation of these investment options will be automated and will not include detailed
circuit lengths and paths that would be generated by a network planner. At this stage,
inputs can be configured based on the use-cases that have been identified as inputs for
the cost benefit analysis stage. For example, the assumed availability and cost of flexibility
services can be varied.
The power flow analysis is then repeated with the identified resolution options to assess
impact on the network. Thus, while the network analysis and investment option generation
are separate stages within the overall EPIC process, where these are performed by the same
analysis tool then they will be carried out together.
7.3.2. Data inputs
For the bottom-up approach, the following data inputs are required and should be
specified with the project partners (this is a topic of ongoing discussion between the
Project EPIC stakeholders):
Load modifications at HV/LV substations
o An output from the LV network analysis (NIFT)
Existing demand increase / reduction for large customers connected to the existing
11kV feeder network
New large customers connecting into existing or new 11kV feeders and their
expected locations
o From the updated disaggregated DFES dataset
o Any correction factors required to adjust for the lower level of diversity
observed on individual HV feeders.
Dummy substation data reflecting new developments expected to result in
additional distribution substations being created (including their expected
locations).
There are also top-down data inputs at this stage:
Primary substation demand profiles including the primary transformers and the HV
feeders. Existing metrics used for load distribution on the 11kV feeder network (eg.
transformer/connection capacities or maximum demand as appropriate)
Volumes of additional load/generation and storage for different years (from the
WPD DFES)

Page 41 EPIC Trial Planning Process and Trial Plan (WP2 D1)
The profiles used to translate additional DFES volumes to modified load profiles
(from the customer behaviour profiles and assumptions report15)
Any correction factors required to adjust for the lower level of diversity observed
on individual HV feeders compared to primary substations
As for the LV analysis, any variants in network profiles would need to be provided to
the tool as well as the specific network investment strategy to be applied when
generating the network investment options.
7.3.3. Data outputs
The HV feeder network analysis can output data in various ways, but will be configured to
align with the DNO internal approach for network analysis. As for the LV analysis, the
outputs will include an assessment of the network issues that are predicted, their location,
duration and scale, their type (voltage or thermal). Similarly, the information for the
network options generated by the tool will include the fields required for inclusion in the
Cost Benefit Analysis tool, i.e. year, CAPEX cost and any network benefits in terms of health
index, reduction in CML/CI. or reduction in technical losses.. The likely output data format
is .csv.
7.3.4. EHV caveat
It should be noted that EHV analysis is not included at this stage and the resulting
investment options appraisal therefore only covers part of the overall investment required.
It may be useful to compare the resulting profile of the primary substations (having
undergone the EPIC process) to the primary profiles used for the strategic sub-
transmissions planning to examine the difference.
7.4. Stage IV – outputs, roles and processes overview
7.4.1. Outputs for this stage
The outputs that need to be signed off at this stage for the LV, HV and gas networks:
A set of electricity network constraints, the location, date and duration that
constraints arise, and potential solutions if that is an agreed output at this stage,
including the capacity / storage / distribution additions to solve constraint.
o Output as .csv with list of substations and constraints
Predicted load profiles/changes in capacity to support a more granular network
capacity forecast map
Output from the gas network analysis, to include a set of potential network
upgrades required.
15 https://www.westernpower.co.uk/downloads-view-reciteme/303103 Accessed: May 2021

Page 42 EPIC Trial Planning Process and Trial Plan (WP2 D1)
Capacity requirements from the upstream system whether import or export which
would (in a whole system model) be used to model additional green or green gas
to be available for import. Could also be capacity requirements for exporting
distributing generation / green gas
7.4.2. Stage IV – roles and data flows overview
Stage IV
Roles and responsibilities
Local authority stakeholder(s)
There is no requirement of local stakeholder time during this stage.
DNO network planner
The role of the DNO network planner at this stage is to review the LV and HV analysis process
and ensure that the outputs are compatible within the DNO business-as-usual approach.
The DNO network planner may also be required to provide network data. It is likely that
different DNO network planners may need to be involved depending on the voltage levels
being analysed. For example, LV planners, 11kV planners and network strategy planners.
GDN network planner
The role of the GDN network planner at this stage is to review the gas network analysis
process and ensure that the outputs are compatible within the GDN business-as-usual
approach. The GDN network planner may also be required to provide network data.
Process analyst
The role of the LV process analyst will be to take the disaggregated forecast data at
distribution substation level and a count of customers and assess the impact on the LV
network.
The role of the HV process analyst will be to take the disaggregated forecast data at HV
feeder level and assess the impact on the HV network.
The role of the gas network process analyst will be to take the disaggregated forecast data
and assess the impact on the gas network.
Data flows
Local authority stakeholder(s)
There are no data flows to or from the local authority stakeholder(s) during this stage.
DNO network planner
The DNO network planner may need to provide network asset data to the process analysts,
as well as existing demand trends and other network data.
GDN network planner
The GDN network planner may need to provide network asset data to the process analysts,
as well as existing demand trends and other network data.

Page 43 EPIC Trial Planning Process and Trial Plan (WP2 D1)
Process analyst
The LV process analyst will receive distribution substation level forecast data, network asset
data and customer profile data to use in the assessment of the impact on the LV network.
The HV process analyst will receive HV-feeder level forecast data, top down primary
substation demand data from WPD, and the results of the LV analysis to assess the impact
on the HV network.
The gas network process analyst will receive the disaggregated forecast data, use network
flow data and new customer location data to assess the impact on the gas network.

Page 44 EPIC Trial Planning Process and Trial Plan (WP2 D1)
8. Trial Process Stage V: Investment and options appraisal
8.1. Define the network investment options
The various network investment options under review will inform the identification of the
use-cases for the cost benefit analysis stage. Three network investment option strategies
are presented below, however other specific options may also be included.
8.1.1. ‘Just in time’ investment
The ‘just in time’ approach broadly aligns with the baseline approach of making individual
network investments only as and when network demand becomes apparent and
connections applications are made. This approach minimises risk and regret cost, but
foregoes the opportunity to harness economies of scale and economies for combining
investments. It may also prove to be more expensive over the longer term potentially
requiring multiple network upgrades.

Page 45 EPIC Trial Planning Process and Trial Plan (WP2 D1)
8.1.2. ‘One touch’ investment
Under a ‘one touch’ strategy, investment is made as demand becomes apparent and
connections are triggered but network assets are then future proofed by building in
additional capacity to meet the anticipated growth in demand.
8.1.3. ‘Strategic’ investment
A ‘strategic’ investment strategy entails taking a more holistic approach to look at the
totality of energy requirements across multiple sites and customers and developing a
proposal to make anticipatory investment to unlock net zero and regional economic
growth opportunities. This implies taking more risk but also seizing the opportunity to
combine investments, harness economies of scale and collaboration.
8.2. Incorporate the use-cases
The use-cases have been defined in stage II of the process, based on discussion with local
authority stakeholder(s). The use-cases are designed to assist with decision making
between different approaches by comparing the benefits of investment options generated
for each approach. At this stage, additional data that isn’t included in the disaggregated
dataset is provided by the gas and electricity network planners and incorporated by the
process analyst in the individual runs of the cost benefit analysis model. This input data
includes monetised risks, standardised values of flexibility, and traditional asset
reinforcement. For the most part, costs for asset replacement are included in the LV and
HV modelling, with the potential for scaled variations in the CBA tool.
Once the data is prepared for the use-case runs of the cost benefit analysis tool, the
process analyst combines these to explore the impacts of each.
Initial use-cases that have been identified include:
Just in time’ vs. ‘fit for the future’: a BAU network upgrade to meet immediate
demand/load, or invest in upgraded assets to meet longer term future demand.
Network asset vs. flexibility solution: an asset intervention/upgrade, or contract
a flexibility solution to delay or avoid asset intervention.
On-street chargers vs. rapid charging hubs: support local charging by deploying
a number of low voltage residential on-street chargers, or a smaller number fast
charging hubs connected to 11kv feeders.
Energy efficiency as a network benefit: explore use of energy efficiency to reduce
network (peak) demand and delay network upgrades
GDN input. Hybrid heat pumps as a network benefit: using the gas network and
hybrid heat pumps to reduce peak electricity demand and electricity network costs.
Explore impacts on CO2 emissions and gas network costs.
Comparing the results for different areas for different approaches is not intended to
provide a definitive answer that option A is always better than option B but rather show

Page 46 EPIC Trial Planning Process and Trial Plan (WP2 D1)
the difference for a given location, scenario and year. This knowledge will then be used to
optimise the selection of investment options for the whole area which may well be a
mixture of different approaches in different locations.
8.3. Run the use-cases through the CBA tool
8.3.1. Incorporate Network Analysis Cost Data
The key input required to run the CBA tool model is a set of costs data, including capital
expenditure, operating expenditure and cashflow, for each of the network options and
sensitivities.
8.3.2. Apply other CBA inputs and variables
The variables need defining for each use-case, and processed using a CBA tool so that the
outputs can be used by the local authority and energy network stakeholders. Many of the
variables are already pre-confirmed within the ENA Whole System CBA tool (and
summarised in the second deliverable for work package two in project EPIC ‘EPIC
Investment Options Appraisal Tool Specification’, these will be confirmed and sensitivities
added as needed.
Table 2 Cost sensitivity analysis will include the following items
Value Comment Default value , variants
Assumed Weighted
Average Cost of
Capital
The default value will reflect the
ED1 price control for electricity.
Gas investment analysis will use
the value from their latest price
control. (Will an updated value be
available in our timescales?)
Inflation / discount
rate
Cost benefit
analysis values
Carbon
Value of CO2 savings
Cost of flexibility
services
Investment options for flexibility
services will be based on the
current value of flexibility services,
this may be expected to fall as the
market becomes more liquid.
The ENA Whole System CBA tool also includes facilities for analysing the tipping point.
These will be examined for each use case.

Page 47 EPIC Trial Planning Process and Trial Plan (WP2 D1)
8.3.3. Run through the CBA tool for each use-case and sensitivity
The typical outputs from the CBA tool is a set of costed investment options, with economic
and societal costs/benefits on an annual basis.
8.3.4. Analyse and report outputs
The Project EPIC Work Package two, deliverable two (titled EPIC Investment Options
Appraisal Tool Specification) will outline the functionality of the CBA tool and further
details of the process of running the ENA Whole System CBA tool will be available as that
is published.
8.4. Stage V – outputs, roles and processes overview
8.4.1. Outputs for this stage
The outputs that need to be signed off at this stage are:
The output of the ENA Whole System CBA tool for each of the use-cases that have
been selected and defined in Stage II.
8.4.2. Stage V – roles and data flows overview
Stage V
Roles and responsibilities
Local authority stakeholder(s)
The role of the local authority stakeholder(s) at this stage is to inform and review the use-
cases which form the inputs to the cost benefit analysis.
DNO network planner
The role of the DNO network planner at this stage is to review the various investment
options that inform the use-cases, and to provide input data for the cost benefit analysis.
GDN network planner
The role of the GDN network planner at this stage is to review the various investment options
that inform the use-cases, and to provide input data for the cost benefit analysis.
Process analyst
The role of the process analyst at this stage is to take the outputs of the network analysis
stage to define the use-cases with stakeholder input, and use these as inputs for the cost
benefit analysis process.
Data flows
Local authority stakeholder(s)
At this stage there are no datasets required by the local authority stakeholder(s).
DNO network planner

Page 48 EPIC Trial Planning Process and Trial Plan (WP2 D1)
Costed data inputs for each step of the cost benefit analysis process is required from the
DNO, as defined in the CBA tool.
GDN network planner
Costed data inputs for each step of the cost benefit analysis process is required from the
GDN, as defined in the CBA tool.
Process analyst
The process analyst receives the outputs from the network analysis stages, plus any
additional data required to define the use-cases. They will then combine these with the
costed data inputs to use within the CBA tool.

Page 49 EPIC Trial Planning Process and Trial Plan (WP2 D1)
9. Trial Process Stage VI: Strategic Area Energy Planning
(completion)
Having run through the previous five stages of the process for the selected strategic areas,
the data projections and detailed analysis should be available to develop the Local Energy
Plan which can include:
The expected selection of network investments including justification for their
selection / omission of other options,
results of sensitivity analysis,
results of variants of the energy scenario e.g. with or without a major investment
such as a heat network
A commentary on the levels of certainty within the plan
This data and these plans can then be used by the DNOs and GDNs to assess their networks
and enable investment decisions to be made that supports the ambitions of the local
authorities in the selected strategic areas. It may be prudent for the Local Energy Plan to
also include signposting to potential investment strategies (for example, co-investment).
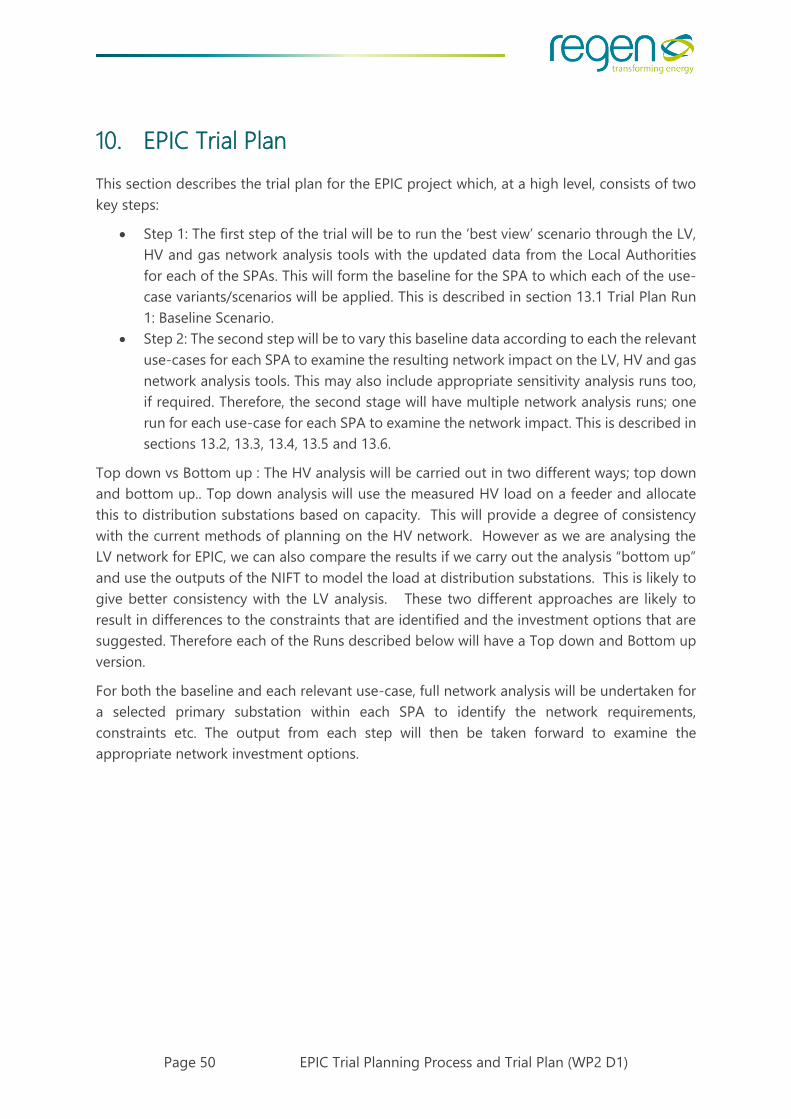
Page 50 EPIC Trial Planning Process and Trial Plan (WP2 D1)
10. EPIC Trial Plan
This section describes the trial plan for the EPIC project which, at a high level, consists of two
key steps:
Step 1: The first step of the trial will be to run the ‘best view’ scenario through the LV,
HV and gas network analysis tools with the updated data from the Local Authorities
for each of the SPAs. This will form the baseline for the SPA to which each of the use-
case variants/scenarios will be applied. This is described in section 13.1 Trial Plan Run
1: Baseline Scenario.
Step 2: The second step will be to vary this baseline data according to each the relevant
use-cases for each SPA to examine the resulting network impact on the LV, HV and gas
network analysis tools. This may also include appropriate sensitivity analysis runs too,
if required. Therefore, the second stage will have multiple network analysis runs; one
run for each use-case for each SPA to examine the network impact. This is described in
sections 13.2, 13.3, 13.4, 13.5 and 13.6.
Top down vs Bottom up : The HV analysis will be carried out in two different ways; top down
and bottom up.. Top down analysis will use the measured HV load on a feeder and allocate
this to distribution substations based on capacity. This will provide a degree of consistency
with the current methods of planning on the HV network. However as we are analysing the
LV network for EPIC, we can also compare the results if we carry out the analysis “bottom up”
and use the outputs of the NIFT to model the load at distribution substations. This is likely to
give better consistency with the LV analysis. These two different approaches are likely to
result in differences to the constraints that are identified and the investment options that are
suggested. Therefore each of the Runs described below will have a Top down and Bottom up
version.
For both the baseline and each relevant use-case, full network analysis will be undertaken for
a selected primary substation within each SPA to identify the network requirements,
constraints etc. The output from each step will then be taken forward to examine the
appropriate network investment options.

Page 51 EPIC Trial Planning Process and Trial Plan (WP2 D1)
11. Description of draft CBA trial use-cases in Project EPIC
The project EPIC stakeholders have developed five draft use-cases which represent the current
options for sensitivity testing and investment options appraisal in the Project EPIC trial. It
should be noted however that these use cases are still to be tested and reviewed with local
authority stakeholders and informed by specific local plans and projects. Therefore, these use-
cases may be modified after discussions with the local authorities at the workshops scheduled
for late May. An overview of these use cases is shown in Figure 5.
Two of the CBA uses cases are intended to focus on investment options that could be made
by the networks, including an option to invest in a “fit for the future” network asset and the
option to use flexibility as an alternative to network investment. The remaining three draft use
cases are focused around decisions that may be taken by local authorities on their planning
for modes of EV charging, energy effeciency and choice of low carbon heating solutions.
Figure 5 Overview of potential use-cases in Project EPIC
The CBA use cases will be trialled using the ENA Whole System Cost Benefit Analysis Tool. The
design specification for the use of the CBA tool will be documented in EPIC project deliverable
Work Package 2 Deliverable 2,, Investment option appraisal tool specification

Page 52 EPIC Trial Planning Process and Trial Plan (WP2 D1)
A final decision will be taken as to which use cases to trial in each SPA. This will depend on the
results of energy requirements planning as well as the network analysis. The intention however
is that each use case will be trialled in at least one SPA.
11.1. Definition of each use-case
11.1.1. Use-case 1: On-street EV chargers vs. rapid charging EV hubs
This use-case tests the network impacts of different electric vehicle charging strategies by
varying the location, number and power rating of public chargers to deliver the same
amount of energy to electric vehicles in the SPA. By varying the connection voltage and
also power capacity of the charger connections, different impacts on the network can be
assessed. There are two main scenarios within this use-case:
A higher number of low-voltage on-street chargers connected to LV distribution
sub-stations.
Relatively fewer ‘fast’ chargers connected to an 11kV feeder
To compare the expected impact of managing peak loading, we will model each of these
scenarios under a constrained (or Time of Use) loading and an unconstrained loading.
This use-case will be presented within the input distribution substation / HV feeder
projections dataset as two distinct scenarios varying the number of chargers. Each charger
archetype has a set assumed average connection capacity and the profiles of each of the
two charger types, though distinct, are not varied themselves as part of the trial runs.
The cost benefit analysis is expected to focus on the difference in EV charger capital and
operating costs, as well as the difference in network investment that would be required.
Previous engagement with local authority stakeholders suggests that hydrogen and CNG
vehicles are not a major part of their low-carbon transport plans. Those that do include
this technology tend to do so for commercial vehicles only and therefore, are likely to have
a smaller impact on the networks when compared to EV rollout projections. However, this
will be confirmed with the local authorities for project EPIC in the upcoming workshops.
11.1.2. Use-case 2: Energy efficiency as a network benefit
This use-case tests the network impacts of different proliferation levels of energy efficiency
improvements in the built environment driven by local plans and policies in each of the
SPAs. This use case is aligned with Ofgem’ guidelines that networks should consider
measures to manage demand and reduce peak demand, as well as flexibility, as a means
to reduce network costs.
“We anticipate that DNOs will work with suppliers, aggregators, local authorities, and other
third parties to develop mutually beneficial proposals. These might include working with local
councils to identify priority areas to upgrade the energy efficiency of buildings to proactively
help to curb demand growth.” Ofgem RIIO-ED2 Business Plan Guidance
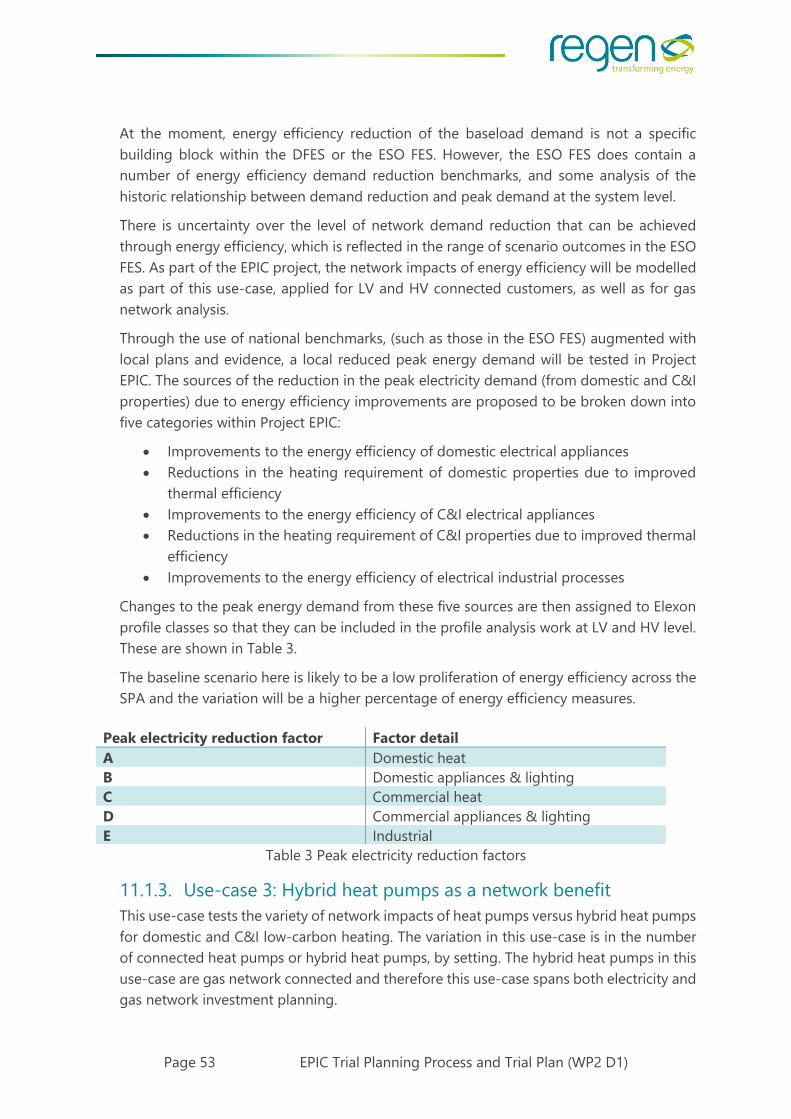
Page 53 EPIC Trial Planning Process and Trial Plan (WP2 D1)
At the moment, energy efficiency reduction of the baseload demand is not a specific
building block within the DFES or the ESO FES. However, the ESO FES does contain a
number of energy efficiency demand reduction benchmarks, and some analysis of the
historic relationship between demand reduction and peak demand at the system level.
There is uncertainty over the level of network demand reduction that can be achieved
through energy efficiency, which is reflected in the range of scenario outcomes in the ESO
FES. As part of the EPIC project, the network impacts of energy efficiency will be modelled
as part of this use-case, applied for LV and HV connected customers, as well as for gas
network analysis.
Through the use of national benchmarks, (such as those in the ESO FES) augmented with
local plans and evidence, a local reduced peak energy demand will be tested in Project
EPIC. The sources of the reduction in the peak electricity demand (from domestic and C&I
properties) due to energy efficiency improvements are proposed to be broken down into
five categories within Project EPIC:
Improvements to the energy efficiency of domestic electrical appliances
Reductions in the heating requirement of domestic properties due to improved
thermal efficiency
Improvements to the energy efficiency of C&I electrical appliances
Reductions in the heating requirement of C&I properties due to improved thermal
efficiency
Improvements to the energy efficiency of electrical industrial processes
Changes to the peak energy demand from these five sources are then assigned to Elexon
profile classes so that they can be included in the profile analysis work at LV and HV level.
These are shown in Table 3.
The baseline scenario here is likely to be a low proliferation of energy efficiency across the
SPA and the variation will be a higher percentage of energy efficiency measures.
Table 3 Peak electricity reduction factors
11.1.3. Use-case 3: Hybrid heat pumps as a network benefit
This use-case tests the variety of network impacts of heat pumps versus hybrid heat pumps
for domestic and C&I low-carbon heating. The variation in this use-case is in the number
of connected heat pumps or hybrid heat pumps, by setting. The hybrid heat pumps in this
use-case are gas network connected and therefore this use-case spans both electricity and
gas network investment planning.
Peak electricity reduction factor Factor detail
A Domestic heat
B Domestic appliances & lighting
C Commercial heat
D Commercial appliances & lighting
E Industrial

Page 54 EPIC Trial Planning Process and Trial Plan (WP2 D1)
To compare the expected impact of managing peak loading, we will model each of these
scenarios under a constrained (or Time of Use) loading and an unconstrained loading.
We will not include a sensitivity run comparing air source and ground source heat pumps
as this data required is not yet available. This may, however, be something to consider in
the future.
11.1.4. Use-case 4: ‘Just in time’ vs. ‘Fit for the future’ investment
Use Case 4 is intended to explore the options available to networks to make low risk short
term network upgrades to support the current and near term demand, versus options to
invest upgraded assets to meet future and anticipated demand in the longer term.
These options are defined as two network investment strategies:
A “just in time” strategy which is able to meet the near term requirements of new
connection customers and short term demand
A “fit for the future” strategy which considers network upgrades to meet future
demand growth
The investment strategies will be run for each of the SPA scenario plan strategies.
The CBA is expected to focus on the analysis of the comparative costs and benefits of the
two strategies including:
Capital costs
Operating costs
Potential flexibility requirements
Risk of regret expenditure
Risk of loss of customer service
Carbon savings and benefits.
11.1.5. Use-case 5: Network asset versus flexibility solution
Use Case 5 is intended to explore the options available to networks to use flexibility
services as an alternative to a network asset or to use flexibility to delay network
investment.
It is likely that the use case will compare three potential strategies
A straight asset investment option
A flexibility option
A flexibility option for a time period and a later asset investment
The investment strategies will be run for each of the SPA scenario plan strategies.
The CBA is expected to focus on the analysis of the comparative costs and benefits of the
three strategies including:
Capital costs
Operating costs
The value of flexibility optionality

Page 55 EPIC Trial Planning Process and Trial Plan (WP2 D1)
Risk of regret expenditure
Risk of loss of customer service
Carbon savings and benefits.
Recognising that WPD is already appraising flexibility options using a different Common
Evaluation Methodology (CEM) CBA tool, the proposed modelling approach for flexibility
within the EPIC project will be necessarily straightforward. For the identified network issues,
we will calculate the exceedance for each half hour and total up the MWh ( or more likely
KWh) of service requirement which is then costed at a flat rate e.g. £300/MWh. This
approach should generate useful learning of the potential value of flexibility on the HV
network which is not currently modelled with the CEM tool (which is restricted to 33kV and
above).
11.2. Use-case data structure and data sharing
The use-cases in Project EPIC are to be included in the database structure in one of three
places.
Scenario variations: used to represent a variation in the technology type or total
number (or capacity) of connections to the energy networks. For example, this
includes a variation between hybrid heat pumps and heat pumps.
Profile variations: used to represent a variation in the demand profile of a building
block technology type. The specific way this is realised is dependent on the network
analysis tool, however this includes representing variations in underlying electricity
demand due to improvements in energy efficiency.
Network Investment ‘strategies’: used to represent the variation in costs from
either different investment options, or, from the scenario or profile variations. This
is included as different input costs in the CBA tool.

Page 56 EPIC Trial Planning Process and Trial Plan (WP2 D1)
12. Data inputs and exchanges that are common across all
use-cases
For the LV, HV and gas network analysis, a single projection dataset will be produced at
the relevant geographic scale. This is the base scenario which will be varied according to
the use-cases in which, aside from the specific case being tested, all of the input data
remains the same.
Each run of the network analysis may include up to five use-cases. In some cases this will
mean multiple runs with different input data. However, in other cases it may involve a
single run.
Timeframe
Across all use-cases the timeframe is from the baseline year (2021) yearly out to 2035, with
the option to include 5-year steps from 2035 to 2050.
Base scenarios
The default scenarios are based on the WPD best view, taken from one of the four WPD
DFES WPD 2021 scenarios. These will be updated with local evidence from the local
authority stakeholders but, outside of the use-case variations, follow a single projection by
building block, relevant geography, and by year.
Building blocks
The technology categories to be used in Project EPIC are as defined in the building blocks
summarised in Appendix 2: Building blocks summary.
Geographic areas
The three SPAs used in Project EPIC are as defined in WP1 D1: the Area Selection
Document. The network analysis run at LV and HV will be run for a single Primary
substation area for each of the SPAs.
New homes and C&I properties
The build rate for identified new homes and C&I properties (as previously assessed in the
WPD DFES 2020) is the same across the use-cases and is benchmarked to balance between
the average historic build rates in the local area and the planned build rates going forward.

Page 57 EPIC Trial Planning Process and Trial Plan (WP2 D1)
13. EPIC Trial Plan Details
The trial plan described here provides details of the ‘trial runs’ for each use-case and the data
variations required. It should be noted that this is provisional as the use-cases still need to be
discussed and agreed with the local authorities at the workshops that are scheduled for late
May.
13.1. Trial Plan Run 1: Baseline Scenario
Run 1
Baseline scenario
Scenario variation
Project
EPIC SPA
SW Bristol Y or N. Primary substation TBC
N Bristol Y or N. Primary substation TBC
Bath
Enterprise
Zone
Y or N. Primary substation TBC
Description
DFES data disaggregated down to LV, HV and gas network
level updated with local plans and policies.
This is a single scenario and will be the scenario against
which all other use-cases are compared.
Outputs
The outputs from this run are the network impacts of the
baseline scenario and will be used as the baseline
comparator for each of the subsequent use-cases.
For a full list of outputs, please see WP2, D2 investment
option appraisal tool specification (first circulated
21/05/21).
Additional
detail
LV NA
HV NA
Gas NA

Page 58 EPIC Trial Planning Process and Trial Plan (WP2 D1)
13.2. Trial Plan Run 2: Use-case 1
Run 2
On-street EV chargers vs rapid charging EV hubs
Scenario variation
Project
EPIC SPA
SW Bristol Y or N. Primary substation TBC
N Bristol Y or N. Primary substation TBC
Bath
Enterprise
Zone
Y or N. Primary substation TBC
Description
The input variations to the baseline data will be number of
chargers, the power rating of chargers (inherent in the
type of charger itself) and network location of chargers.
There are two scenarios to be tested:
Scenario 1 is a high number of on-street chargers
connected to the LV network, and a low number of
rapid charging hubs connected to the HV network.
(This may align to the baseline scenario.)
Scenario 2 is a low number of on-street chargers
connected to the LV network, and a higher number of
rapid charging hubs connected to the HV network,
relative to scenario 1.
We will then include a sensitivity value to account for
managed (or constrained) charge profiles for each
scenario. For example, using the assumption that
Time-Of-Use tariffs or charging control systems will
manage peak loads to an extent, reducing the impact
on the network
Outputs
The outputs of the network analysis at this stage need to
be input to the CBA tool as network asset intervention
costs (CAPEX, OPEX etc). Other CBA tool costs such as the
cost of the charger are also inputs but don't come from
the network analysis stage.
For a full list of outputs, please see WP2, D2 investment
option appraisal tool specification (first circulated
21/05/21).
Additional
detail LV
This dataset is provided by Regen to EA Technology as a
.csv of projected connections by distribution substation by
year, with two scenarios to be run in their network analysis
tool.

Page 59 EPIC Trial Planning Process and Trial Plan (WP2 D1)
HV
The HV analysis will also take LV network analysis outputs
as an input.
This dataset is provided by Regen to PSC as a .csv of
projected connections by HV feeder by year, with two
scenarios to be run in their network analysis tool.
Gas
13.3. Trial Plan Run 3: Use-case 2
Run 3
Energy efficiency as a network benefit
Profile variation
Project
EPIC SPA
SW Bristol Y or N. Primary substation TBC
N Bristol Y or N. Primary substation TBC
Bath
Enterprise
Zone
Y or N. Primary substation TBC
Description
The input variation to the baseline data will be a reduction
in the peak electricity demand, varying the categories laid
out in section 11.1.2 and assigned to relevant Elexon
profile classes. Two scenarios will be tested:
Scenario 1: A revised peak electricity profile on the LV,
HV and gas networks, taking into account typical
energy efficiency improvements. (This may align to the
baseline scenario.)
Scenario 2: A revised peak electricity profile on the LV,
HV and gas networks, networks taking into account
higher than average energy efficiency improvements
in each of the categories laid out in section 11.1.2
Outputs
The outputs of the network analysis at this stage need to
be input to the CBA tool as network asset intervention
costs (CAPEX, OPEX etc).
This trial run will account for both gas and electricity
network asset intervention costs.
For a full list of outputs, please see WP2, D2 investment
option appraisal tool specification (first circulated
21/05/21).

Page 60 EPIC Trial Planning Process and Trial Plan (WP2 D1)
Additional
detail
LV
In the NIFT, the changes to peak demand are varied
through changing the annual demand and choosing the
level to which this will impact the peak demand. This
dataset is provided by Regen to EA Technology as a .csv
of projected connections by distribution substation by
year, with two scenarios to be run in their network analysis
tool.
HV
The HV analysis will also take LV network analysis outputs
as an input.
This dataset is provided by Regen to PSC as a .csv of
projected connections by HV feeder by year, with two
scenarios to be run in their network analysis tool.
Gas
The input variations for the gas network analysis for this
run are profile based and won’t be included in the
postcode level dataset.
13.4. Trial Plan Run 4: Use-case 3
Run 4
Hybrid heat pumps as a network benefit
Scenario variation
Project
EPIC SPA
SW Bristol Y or N. Primary substation TBC
N Bristol Y or N. Primary substation TBC
Bath
Enterprise
Zone
Y or N. Primary substation TBC
Description
The input variations to the baseline data will be heat
pump and hybrid heat pump deployment projections. Two
scenarios will be tested:
Scenario 1 will have high heat pump deployment, and
low hybrid heat pump deployment. (This may align to
the baseline scenario.)
Scenario 2 will have relatively lower heat pump
deployment, and higher hybrid heat pump
deployment.
The variation between building blocks does not vary
where on the electricity network these heat pumps will
connect.
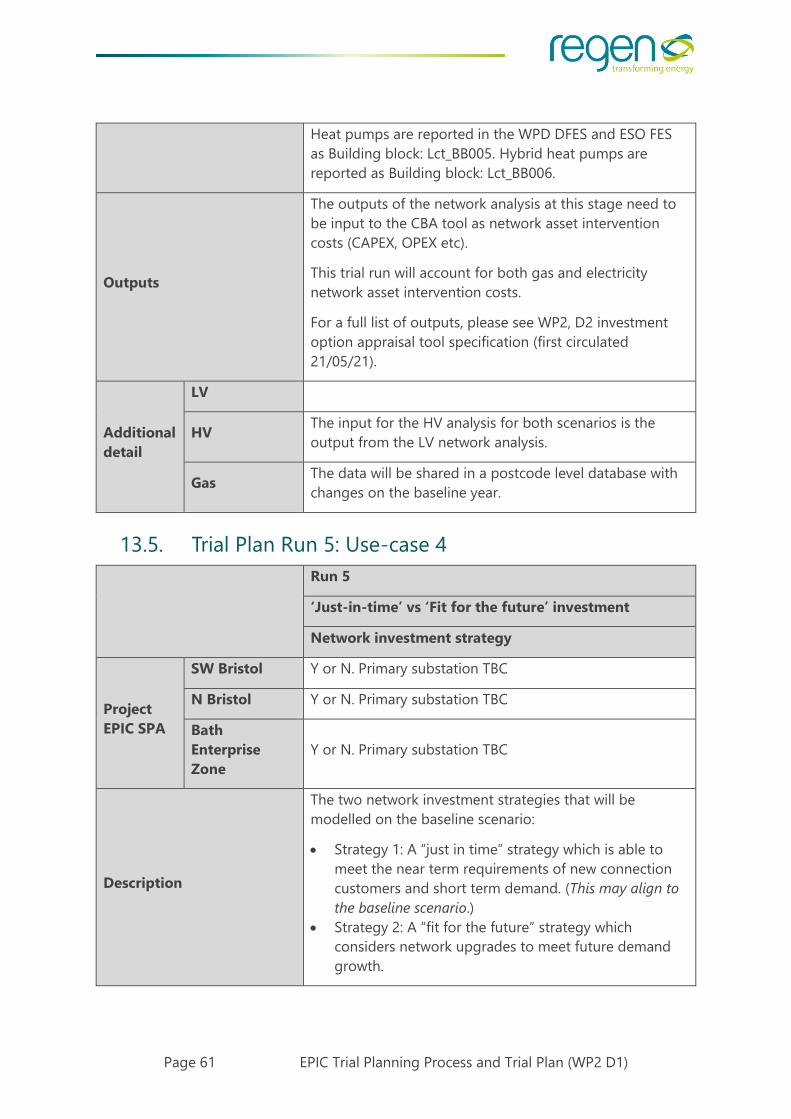
Page 61 EPIC Trial Planning Process and Trial Plan (WP2 D1)
Heat pumps are reported in the WPD DFES and ESO FES
as Building block: Lct_BB005. Hybrid heat pumps are
reported as Building block: Lct_BB006.
Outputs
The outputs of the network analysis at this stage need to
be input to the CBA tool as network asset intervention
costs (CAPEX, OPEX etc).
This trial run will account for both gas and electricity
network asset intervention costs.
For a full list of outputs, please see WP2, D2 investment
option appraisal tool specification (first circulated
21/05/21).
Additional
detail
LV
HV The input for the HV analysis for both scenarios is the
output from the LV network analysis.
Gas The data will be shared in a postcode level database with
changes on the baseline year.
13.5. Trial Plan Run 5: Use-case 4
Run 5
‘Just-in-time’ vs ‘Fit for the future’ investment
Network investment strategy
Project
EPIC SPA
SW Bristol Y or N. Primary substation TBC
N Bristol Y or N. Primary substation TBC
Bath
Enterprise
Zone
Y or N. Primary substation TBC
Description
The two network investment strategies that will be
modelled on the baseline scenario:
Strategy 1: A “just in time” strategy which is able to
meet the near term requirements of new connection
customers and short term demand. (This may align to
the baseline scenario.)
Strategy 2: A “fit for the future” strategy which
considers network upgrades to meet future demand
growth.

Page 62 EPIC Trial Planning Process and Trial Plan (WP2 D1)
Outputs
The CBA tool inputs for this are the outputs from the
network analysis in run 1 (the baseline scenario), for the
gas and electricity network asset interventions. CAPEX and
OPEX costs for both "just in time" and "fit for the future"
are required.
For a full list of outputs, please see WP2, D2 investment
option appraisal tool specification (first circulated
21/05/21).
Additional
detail
LV
HV
Gas
13.6. Trial Plan Run 6: Use-case 5
Run 6
Network asset vs Flexibility solution
Network investment strategy
Project
EPIC SPA
SW Bristol Y or N. Primary substation TBC
N Bristol Y or N. Primary substation TBC
Bath
Enterprise
Zone
Y or N. Primary substation TBC
Description
This use case will compare two potential strategies will be
modelled on the baseline scenario:
Strategy 1: A straight asset investment option. (This
may align to the baseline scenario.)
Strategy 2: A flexibility option. The flexibility option will
be threshold based and assigned a financial threshold
value. If this value is exceeded a reinforcement will
then be triggered.
Outputs
The CBA tool inputs for this are the outputs from the
network analysis in run 1, for the gas and electricity
network asset interventions. CAPEX, OPEX, and the value
of flexibility optionality are all required as inputs to the
CBA tool.
LV

Page 63 EPIC Trial Planning Process and Trial Plan (WP2 D1)
Additional
detail
HV
Gas
13.7. Potential Additional Trial Plan Runs
Having taken into account feedback from the first set of workshops with the local
authorities, some additional sensitivities may be included (and will be confirmed at the
second set of workshops held shortly):
SW Bristol SPA: A higher-than-average deployment of ground mounted solar PV.
BEZ SPA: Network investment brought forward to 2030 (rather than the 2050
default in the baseline scenario). If modelled, this will not be a sensitivity within the
DFES data but will use the ENA Whole System CBA tool to determine the impact of
bringing forward the CAPEX investment prior to 2030.

Page 64 EPIC Trial Planning Process and Trial Plan
13.8. Trial Plan Expected Runs within Network Analysis Tools
For every Primary substation the following runs will be carried out in the PSC HV network analysis tool. For every run both reinforcement and flexibility
options will be calculated and the comparisons will take place in the CBA tool by comparing the reinforcement and flexibility options for a subset of
results.
The analysis runs for the NIFT are given by the rows requiring bottom up analysis.
Run number Baseline / use case Use case scenario Sensitivity variant
top down/ bottom up
1 Baseline n/a Default balance of managed and unmanaged charging TD
2 Baseline n/a Default balance of managed and unmanaged charging BU
3 Use Case 1 - EV High on street charging Default balance of managed and unmanaged charging TD
4 Use Case 1 - EV High on street charging Default balance of managed and unmanaged charging BU
5 Use Case 1 - EV Low on street charging Default balance of managed and unmanaged charging TD
6 Use Case 1 - EV Low on street charging Default balance of managed and unmanaged charging BU
7 Use Case 1 - EV High on street charging Sensitivity value of managed charging BU
8 Use Case 1 - EV Low on street charging Sensitivity value of managed charging BU
9 Use case 2 - Energy Efficiency Baseline energy efficiency N/A TD
10 Use case 2 - Energy Efficiency Baseline energy efficiency N/A BU
11 Use case 2 - Energy Efficiency High energy efficiency N/A TD
12 Use case 2 - Energy Efficiency High energy efficiency N/A BU
13 Use Case 3 - Heat Pumps Baseline HP allocation N/A TD

Page 65 EPIC Trial Planning Process and Trial Plan (WP2 D1)
14 Use Case 3 - Heat Pumps Baseline HP allocation N/A BU
15 Use Case 3 - Heat Pumps Baseline HP allocation Sensitivity value of AS vs GS BU
16 Use Case 3 - Heat Pumps Baseline HP allocation Sensitivity value of managed charging BU
17 Use Case 3 - Heat Pumps Hybrid Heat Pumps N/A TD
18 Use Case 3 - Heat Pumps Hybrid Heat Pumps N/A BU
19 Use Case 4 - Investment Strategy Baseline Just In Time N/A TD
20 Use Case 4 - Investment Strategy Baseline Just In Time N/A BU
21 Use Case 4 - Investment Strategy Fit for the Future N/A TD
22 Use Case 4 - Investment Strategy Fit for the Future N/A BU
23 Use Case 5 – Flexibility Solution High flexibility threshold N/A TD
24 Use Case 5 – Flexibility Solution High flexibility threshold N/A BU
25
Potential additional use case for SW Bristol SPA
High ground-mounted solar deployment N/A TD
26
Potential additional use case for SW Bristol SPA
High ground-mounted solar deployment N/A BU

Page
66
EPIC Trial Planning Process and Trial Plan
14. Appendix 1: WECA policies summary
The information in this table summarises some of the wider WECA policies that are likely
to have an impact on the energy network and was correct at the time of writing (April,
2021). It is included here as an example to illustrate the variety of local authority policies
that are likely to feed in to the EPIC process.
Relevant
policy
Status Relevant outputs Policy
update
next
due
Freque
ncy of
update
s
Any
engagement
with WPD
Local
Industrial
Strategy
Publish
ed
WoE Local Industrial Strategy Summe
r 2021?
Unkno
wn
Unknown
WECA EV
Charging
Strategy
In
develop
ment
Strategic plan for EV charging
infrastructure
Summe
r 2021
Unkno
wn
None yet
WECA
Decarbo
nisation
of
Transpor
t
Strategy
In
develop
ment
Approach to decarbonisation of
transport as transport authority
Autum
n 2021
Quarter
ly via
Transp
ort
Board
None yet
Joint
local
Transpor
t Plan
Publish
ed
https://travelwest.info/projects/joint-
local-transport-plan
Report
to
Transp
ort
Board
June
2021
As
require
d via
Transp
ort
Board
None yet
Spatial
Develop
ment
Strategy
In
develop
ment
Once adopted will set the strategic
planning policy framework and key
diagram for future housing,
employment and infrastructure
provision in the WECA area.
https://www.westofengland-
ca.gov.uk/west-of-england-strategic-
planning/
Spatial
Develo
pment
Strateg
y
In
develo
pment
Once adopted
will set the
strategic
planning policy
framework and
key diagram for
future housing,
employment
and
infrastructure
provision in the
WECA area.

Page 67 EPIC Trial Planning Process and Trial Plan (WP2 D1)
https://www.wes
tofengland-
ca.gov.uk/west-
of-england-
strategic-
planning/
Climate
Emergen
cy Action
Plan
Publish
ed
https://westofengland-
ca.moderngov.co.uk/documents/s220
0/CE%20Action%20Plan.pdf
June
2021
Progres
s
update
d every
6
months
none
Mass
Transit
SOBC
Summe
r 2021
MetroWe
st and 10
Year Rail
Delivery
Plan
Metro
West in
develop
ment.
10 Year
Rail
Deliver
y Plan
publish
ed.
https://travelwest.info/projects/metro
west
Improved rail connections across
region
Station enhancements and step free
access
Freight study into new intermodal
terminals and express hubs
Spring
2022
Bi-
monthl
y to
Strateg
ic Rail
Steerin
g
Group
None yet
Renewab
le Energy
Resource
Assessme
nt
In draft Identify renewable generation
opportunity across area as well as
identify ambition
Spring
2021
Likely
update
d as
part of
Local
Plan
evidenc
e
reviews
None yet
Infrastru
cture and
Investme
nt
Delivery
Plan
In
develop
ment
Will provide the evidence baseline for
the SDS by assessing the sufficiency
of the current and planning
infrastructure projects to support
existing and planned growth.
Likely
to be
update
d
annuall
y
Initial
engagement on
known existing
capacity
constraints and
sharable
mapping (and
other) data.

Page 68 EPIC Trial Planning Process and Trial Plan (WP2 D1)
Low
Carbon
Challeng
e Fund
Grant
Scheme
Local Energy Scheme – approx. 6 MW
of renewable energy in 5-6
projects. 4 MW project in Avonmouth
in development.
Green Business Grants – likely 1 MW
of renewable energy in scattered
rooftop solar PV sites across the
region.
LCCF
will run
from
July
2019 -
March
2023
Individual
project
applicants to
contact WPD
where DNO
approval
needed.
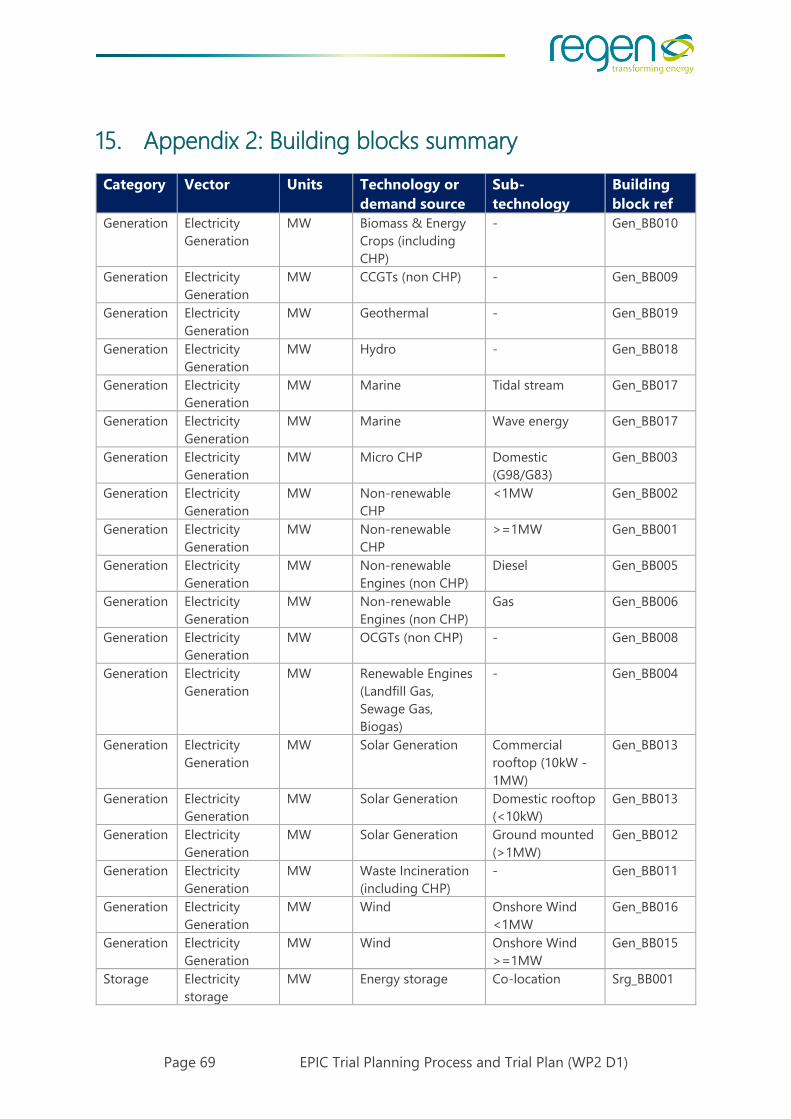
Page 69 EPIC Trial Planning Process and Trial Plan (WP2 D1)
15. Appendix 2: Building blocks summary
Category Vector Units Technology or
demand source
Sub-
technology
Building
block ref
Generation Electricity
Generation
MW Biomass & Energy
Crops (including
CHP)
- Gen_BB010
Generation Electricity
Generation
MW CCGTs (non CHP) - Gen_BB009
Generation Electricity
Generation
MW Geothermal - Gen_BB019
Generation Electricity
Generation
MW Hydro - Gen_BB018
Generation Electricity
Generation
MW Marine Tidal stream Gen_BB017
Generation Electricity
Generation
MW Marine Wave energy Gen_BB017
Generation Electricity
Generation
MW Micro CHP Domestic
(G98/G83)
Gen_BB003
Generation Electricity
Generation
MW Non-renewable
CHP
<1MW Gen_BB002
Generation Electricity
Generation
MW Non-renewable
CHP
>=1MW Gen_BB001
Generation Electricity
Generation
MW Non-renewable
Engines (non CHP)
Diesel Gen_BB005
Generation Electricity
Generation
MW Non-renewable
Engines (non CHP)
Gas Gen_BB006
Generation Electricity
Generation
MW OCGTs (non CHP) - Gen_BB008
Generation Electricity
Generation
MW Renewable Engines
(Landfill Gas,
Sewage Gas,
Biogas)
- Gen_BB004
Generation Electricity
Generation
MW Solar Generation Commercial
rooftop (10kW -
1MW)
Gen_BB013
Generation Electricity
Generation
MW Solar Generation Domestic rooftop
(<10kW)
Gen_BB013
Generation Electricity
Generation
MW Solar Generation Ground mounted
(>1MW)
Gen_BB012
Generation Electricity
Generation
MW Waste Incineration
(including CHP)
- Gen_BB011
Generation Electricity
Generation
MW Wind Onshore Wind
<1MW
Gen_BB016
Generation Electricity
Generation
MW Wind Onshore Wind
>=1MW
Gen_BB015
Storage Electricity
storage
MW Energy storage Co-location Srg_BB001

Page 70 EPIC Trial Planning Process and Trial Plan (WP2 D1)
Storage Electricity
storage
MW Energy storage Domestic
Batteries (G98)
Srg_BB001
Storage Electricity
storage
MW Energy storage Grid services Srg_BB002
Storage Electricity
storage
MW Energy storage High Energy User Srg_BB001
Injection Fuel injection MWh Biomethane/bioSN
G injection
Gas network
injection
-
Injection Fuel injection MWh Hydrogen injection Gas network
injection
-
Demand Fuel
manufacture
MW Hydrogen
electrolysis
- -
Demand Fuel
manufacture
MW Hydrogen SMR/ATR - -
Demand Heat Number
of
Air conditioning - Lct_BB014
Demand Heat Number
of
Direct electric
heating
- -
Demand Heat Number
of
Gas boiler Non-domestic -
Demand Heat Number
of
propertie
s
Heat network - gas
boiler
Domestic Lct_BB009
Demand Heat Number
of
propertie
s
Heat network - gas
boiler
Non-domestic Lct_BB009
Demand Heat Number
of
propertie
s
Heat network - gas
CHP
Domestic Lct_BB009
Demand Heat Number
of
propertie
s
Heat network - gas
CHP
Non-domestic Lct_BB009
Demand Heat Number
of
propertie
s
Heat network -
Ground Source
Heat Pump
Domestic Lct_BB009
Demand Heat Number
of
propertie
s
Heat network -
Ground Source
Heat Pump
Non-domestic Lct_BB009
Demand Heat Number
of
Heat pumps C&I - Hydrogen
hybrid
-
Demand Heat Number
of
Heat pumps Domestic - Gas
hybrid
Lct_BB006
Demand Heat Number
of
Heat pumps Domestic -
Hydrogen hybrid
-
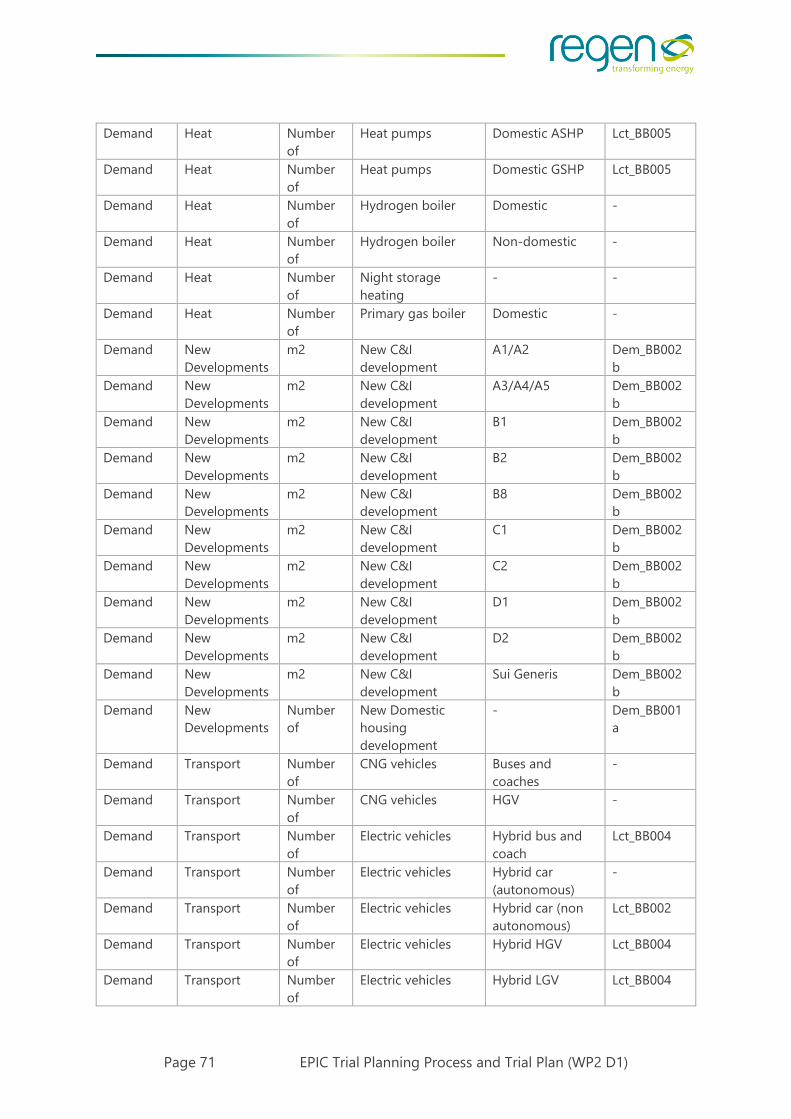
Page 71 EPIC Trial Planning Process and Trial Plan (WP2 D1)
Demand Heat Number
of
Heat pumps Domestic ASHP Lct_BB005
Demand Heat Number
of
Heat pumps Domestic GSHP Lct_BB005
Demand Heat Number
of
Hydrogen boiler Domestic -
Demand Heat Number
of
Hydrogen boiler Non-domestic -
Demand Heat Number
of
Night storage
heating
- -
Demand Heat Number
of
Primary gas boiler Domestic -
Demand New
Developments
m2 New C&I
development
A1/A2 Dem_BB002
b
Demand New
Developments
m2 New C&I
development
A3/A4/A5 Dem_BB002
b
Demand New
Developments
m2 New C&I
development
B1 Dem_BB002
b
Demand New
Developments
m2 New C&I
development
B2 Dem_BB002
b
Demand New
Developments
m2 New C&I
development
B8 Dem_BB002
b
Demand New
Developments
m2 New C&I
development
C1 Dem_BB002
b
Demand New
Developments
m2 New C&I
development
C2 Dem_BB002
b
Demand New
Developments
m2 New C&I
development
D1 Dem_BB002
b
Demand New
Developments
m2 New C&I
development
D2 Dem_BB002
b
Demand New
Developments
m2 New C&I
development
Sui Generis Dem_BB002
b
Demand New
Developments
Number
of
New Domestic
housing
development
- Dem_BB001
a
Demand Transport Number
of
CNG vehicles Buses and
coaches
-
Demand Transport Number
of
CNG vehicles HGV -
Demand Transport Number
of
Electric vehicles Hybrid bus and
coach
Lct_BB004
Demand Transport Number
of
Electric vehicles Hybrid car
(autonomous)
-
Demand Transport Number
of
Electric vehicles Hybrid car (non
autonomous)
Lct_BB002
Demand Transport Number
of
Electric vehicles Hybrid HGV Lct_BB004
Demand Transport Number
of
Electric vehicles Hybrid LGV Lct_BB004

Page 72 EPIC Trial Planning Process and Trial Plan (WP2 D1)
Demand Transport Number
of
Electric vehicles Hybrid
motorcycle
Lct_BB002
Demand Transport Number
of
Electric vehicles Pure electric bus
and coach
Lct_BB003
Demand Transport Number
of
Electric vehicles Pure electric car
(autonomous)
-
Demand Transport Number
of
Electric vehicles Pure electric car
(non
autonomous)
Lct_BB001
Demand Transport Number
of
Electric vehicles Pure electric HGV Lct_BB003
Demand Transport Number
of
Electric vehicles Pure electric LGV Lct_BB003
Demand Transport Number
of
Electric vehicles Pure electric
motorcycle
Lct_BB001
Demand Transport Number
of
EV Charge Point Car parks Lct_BB012a
Demand Transport Number
of
EV Charge Point Destination Lct_BB012a
Demand Transport Number
of
EV Charge Point Domestic off-
street
Lct_BB010a
Demand Transport Number
of
EV Charge Point Domestic on-
street
Lct_BB010a
Demand Transport Number
of
EV Charge Point En-route / local
charging stations
Lct_BB013a
Demand Transport Number
of
EV Charge Point En-route national
network
Lct_BB013a
Demand Transport Number
of
EV Charge Point Fleet/Depot Lct_BB011a
Demand Transport Number
of
EV Charge Point Workplace Lct_BB011a
Demand Transport Number
of
Hydrogen vehicles Buses and
coaches
-
Demand Transport Number
of
Hydrogen vehicles HGV -

Page 73 EPIC Trial Planning Process and Trial Plan (WP2 D1)
16. Appendix 3: Glossary
BSP Bulk Supply Point
CAPEX Capital Expenditure
CBA Cost Benefit Analysis
CEM Common Evaluation Methodology
CI Customer Interruptions
CML Customer Minutes Lost
CNG Compressed Natural Gas
DFES Distribution Future Energy Scenarios
DNO Distribution Network Operator
DG Distributed Generation
EAC Estimated Annual Consumption
EPIC Energy Planning Integrated with Councils
ESA Electricity Supply Area
ESO Electricity System Operator
EV Electric Vehicle
FES Future Energy Scenarios
GDN Gas Distribution Network
GDPR General Data Protection Regulation
GIS Geographical Information System
GSA Gas Supply Area
HV High Voltage
LCT Geographic Information System
LDZ Local Distribution Zone
LSOA Lower Super Output Area
LTS Local Transmission System
LV Low Voltage
mcm/d millions of standard cubic metres per day
NDN Non-Daily Metered
NIFT Network Investment Forecasting Tool

Page 74 EPIC Trial Planning Process and Trial Plan (WP2 D1)
OA Output Area
OPEX Operational Expenditure
PRI Pressure Reduction Installations
SCADA Supervisory Control And Data
Acquisition
SPA Strategic Planning Area
WECA West of England Combined Authority
WLC Whole Life Cost
WPD Western Power Distribution
WWU Wales and West Utilities

Page 75 EPIC Trial Planning Process and Trial Plan (WP2 D1)
17. Appendix 4: Options for applying energy efficiency
17.1. Energy efficiency in national scenarios ESO FES 2021
and CCC
At the moment, energy efficiency reduction of the baseload demand is not a specific
building block within the DFES or the ESO FES.
The ESO FES does contain a number of energy efficiency demand reduction benchmarks,
and some analysis of the historic relationship between demand reduction and peak
demand at the system level. A summary of the ESO energy efficiency demand reduction
estimates/assumptions are shown in Table 4
The FES demand reduction assumptions, in the net zero scenarios, are broadly consistent
with the Committee on Climate Changes projections for the 4th and 5th Carbon Budgets
and show the majority of energy efficiency improvements were projected to occur by the
early 2030s, particularly within the non-domestic sector, facilitating low carbon fuel
switching and smart, flexible electricity consumption in the later 2030s and 2040s. The
concentration of energy efficiency gains within a relatively short timeframe reflects the
current slow uptake (also the focus on fuel poverty which tends enable latent demand),
followed by a rapid sprint from 2025 to 2035 in order to meet the governments targets,
and the 5th and 6th carbon budgets.
There is uncertainty over the level of demand reduction that can be achieved through
energy efficiency, which is reflected in the range of scenario outcomes. Early demand
reduction in the scenarios is driven by the non-domestic sector, with the expectation that
private and public sector energy efficiency measures will be complete by the early 2030s
in the net zero scenarios, as per the CCC’s Sixth Carbon Budget. Domestic heat demand,
in contrast, has historically proved more difficult to reduce through energy efficiency
measures, and rollout occurs mainly in the later 2020s and 2030s. Across the scenarios, the
impact of energy efficiency on non-domestic energy demand by 2030 was projected to be
on average 50% higher than the impact on domestic heat demand.
17.2. Current DFES/Shaping sub-transmission process
Within the current DFES and Shaping Sub-transmission process network planners do not
apply an energy efficiency improvement per se, but they do apply an assumption regarding
a reduction in baseload peak demand, which is based on an extrapolation of the historic
reduction in peak demand, as measured at licence area level.
This high level assumption applies a degree of overall demand reduction but is not specific
to an individual geography, and therefore does not represent the targets or ambition of
individual local authorities.
WPD is aware of this limitation and is planning to do more work in the area of energy
efficiency; this may become a separate internal project in 2021. Other DNO’s have also

Page 76 EPIC Trial Planning Process and Trial Plan (WP2 D1)
started work to better forecast both the annual and peak demand impacts of energy
efficiency but this is fairly new and emerging. See for example Regen’s work with SSEN to
produce a sub-regional analysis of energy efficiency potential.
Within Wales and West’s planning process future energy efficiency is similarly applied at a
high level without a specific geographic or sectorial breakdown.
Part of the challenge for both networks is to get an accurate estimate of actual demand at
the low voltage network, or Non-daily metered for gas, level. It is especially difficult to
separate out the different classes of commercial and industrial demand sources, and to
isolate efficiency impacts.
Some “living lab” type studies are being undertaken estimate the potential efficiency
changes from specific measures.

Page 77 EPIC Trial Planning Process and Trial Plan (WP2 D1)
Scenario Scenario energy efficiency description S
tead
y P
rog
ress
ion
Energy efficiency improves incrementally at business-as-usual rates, resulting
in a very low level of energy efficiency uptake throughout the scenario
timeframe.
Building fabric and behavioural change reduce heat demand per household
by around 10% by 2050. Domestic appliance and lighting efficiency sees a
similar level of improvement.
Scotland does not meet its 2045 net zero target in this scenario.
Syst
em
Tra
nsf
orm
ati
on
Low levels of societal change results in fairly low energy efficiency uptake,
especially in terms of more intrusive retrofit measures and behaviour
change.
Building fabric and behavioural change reduce heat demand per household
by around 15-20% by 2050. Domestic appliance and lighting efficiency sees
a similar level of improvement.
In this scenario, energy efficiency targets such as those set in the UK Clean
Growth Strategy are not met, with around 10% energy efficiency
improvement in the non-domestic sector by 2030, but Scotland and the UK
meet their net zero targets through more centralised, government-driven
technological solutions such as hydrogen heating.
Co
nsu
mer
Tra
nsf
orm
ati
on
Consumer transformation features high levels of societal change and
consumer engagement, resulting in high levels of energy efficiency across
domestic, commercial and industrials sectors. This includes the rollout of
more intrusive retrofit solutions in existing buildings, supporting the
widescale electrification of heat, and high levels of behaviour change as
people look to reduce their energy consumption.
Building fabric and behavioural change reduce heat demand per household
by around 25-30% by 2050. Domestic appliance and lighting efficiency sees
a similar level of improvement.
In this scenario, energy efficiency targets such as those set in the UK Clean
Growth Strategy are met, with over 20% energy efficiency improvement in
the non-domestic sector by 2030, and Scotland and the UK meet their net
zero targets through high levels of electrified heat and transport combined
with renewable energy generation.
Lead
ing
the W
ay
The Leading the Way scenario see’s extremely high levels of consumer
ambition, societal change and technological development, resulting in very
high levels of energy efficiency.
Building fabric and behavioural change reduce heat demand per household
by around 36% by 2050. Domestic appliance and lighting efficiency sees a

Page 78 EPIC Trial Planning Process and Trial Plan (WP2 D1)
Table 4 Energy efficiency demand reduction assumptions FES 2021
17.3. EPIC Energy Efficiency Process Options
The EPIC project would like to scenario plan energy efficiency at a more granular level.
Possibly at the level of each strategic planning area, or at the level of primary sub-station
(Electricity supply area, ESA).
The options for the EPIC project are summarised below.
Option 1 would be easiest, but may not be in the spirit of local planning and would be
of limited interest to WECA And the Local Authorities.
Option 2 or 3 would provide a greater degree of local input and would be forward
looking albeit still based on high level assumptions and benchmarks
Option 4 would require additional analysis of EPC data but could be included, if that
analysis was then reflected in the network modelling
Option 5, is not in scope but has been recorded as it may be applicable for future
studies in cases where comprehensive building stock analysis has already been
undertaken.
A key question however is how any projection of future (annual) energy efficiency would
be converted into a projection of peak energy demand at ESA level. Regen has undertaken
some high level benchmark analysis of the relationship between demand reduction and
peak demand.
This is however a complex area and the relationship between efficiency and peak demand
can be impacted by: changes in energy usage, changes in the types of demand user,
behavioural changes, latent demand factors (e.g. for those in fuel poverty) and flexibility
factors, in addition to energy efficiency. There are however some rules of thumb that could
be applied and which would be sufficient to prove the concept for the purposes of the
EPIC trial see Table 5. These could then be improved upon through further studies.
It would also be possible to take a conservative benchmark as an interim approach for EPIC
pending the new work that WPD is undertaking. So, for example, looking at the ESO FES
data a 10% EE reduction by 2030 in annual domestic demand may lead to a 4% reduction
in peak load. But do we think that’s correct, or would it be OK for a trial project like EPIC?
slightly higher level of improvement, driven by very ambitious changes to
consumer behaviour and engagement in this scenario.
In this scenario, energy efficiency targets such as those set in the UK Clean
Growth Strategy and carbon budgets are exceeded, with well over 20%
energy efficiency improvement in the non-domestic sector by 2030, and the
Scotland and the UK meet their net zero target marginally ahead of
schedule.

Page 79 EPIC Trial Planning Process and Trial Plan (WP2 D1)
Key Questions
1) For WECA and LA’s – what energy efficiency targets or projections have been made
for the strategic areas? Do these warrant individual analysis?
2) For PSC and EAT – how would energy efficiency demand reduction projections be
network modelled? Do you have a better methodology convert annual efficiency into
a peak demand reduction?
3) For WPD and WWU – what level of historic demand data can be provided?

Page 80 EPIC Trial Planning Process and Trial Plan
Option Basis of energy
efficacy projection
How would this be calculated
and applied?
Advantages / Disadvantages How would peak
demand be
calculated
1 EPIC could do
something similar to
the current process and
extrapolate the
historic peak demand
reduction at either:
1a - licence area,
1b - Local Authority
1c - ESA.
Calculation would be based on
historic peak demand trendline.
This would be input as a variable
within the HV and LV network
planning tools.
A high and low sensitivity could
be applied
An advantage here, apart from being easiest
would be to not overlap or pre-empt the
work that WPD is doing.
A disadvantage is that we would not then be
reflecting the EE plans, targets and ambition
of the LA’s (assuming they have these).
Also historic demand reduction factors for
electricity (mainly appliances and lighting)
may not apply when we think about the
electrification of heat
Trends are affected by other factors such as
changing customer numbers in an area.
Additionally measured peak demand at
primary substation (ESA) would need
disaggregation and manipulation to create
values for Local Authorities due to boundary
differences.
This method gives a
forward projection of
peak demand
reduction based on
historic trend
2 Create a new high
level annual Local
Energy Efficiency
reduction factor
for each EPIC
This could be based on This would allow a greater degree of local
input and a forward looking EE reduction
factor
Peak demand
reduction could be
based on high level
benchmark analysis
of the relationship

Page 81 EPIC Trial Planning Process and Trial Plan (WP2 D1)
strategic area (or
Local Authority)
3 sets of high level;
variables, for each
strategic area.
Potentially broken
down by New and
existing buildings
a) national benchmarks and then
flexed to LA areas depending on
the level of ambition
b) based on workshop input from
Local Authorities
EE demand reduction could be
entered as a network modelling
variable with a high and low
sensitivity.
Network planners, EAT and PSC
would then have to consider
how to reflect that annual factor
in the network models as it
impacts peak demand.
This would still be quite high level and
based on benchmarks and workshop
input rather than by bottom-up analysis.
Some cross checking against national and
other regional projections would be used
to provide evidence and justification.
between annual
energy efficiency and
peak demand based
on the ESO FES and
other national
estimates
But they are very
high level
benchmarks and are
contentious.
3 Create a Local EE
factor for each
strategic area broken
down be the key
demand sources
a) Domestic heat,
b) Domestic
appliances &
lighting,
c) Commercial heat,
d) commercial
appliances &
lighting
e) Industrial.
Same top-down approach as
option 2 but the demand
reduction projections would be
broken down by the main
demand sources.
It is likely that benchmarks
would have to be applied.
This would give a better breakdown by
demand source and could aid a more
accurate projection of peak demand shift.
Peak demand impact
would have to be
estimated and this is
not straight forward.
Breakdown by
demand source
would require
additional analysis of
the baseload demand
by MPAN (electricity)
and by daily metered
demand.
See below

Page 82 EPIC Trial Planning Process and Trial Plan (WP2 D1)
4 Create a more local EE
demand reduction
factor for each
ESA(Primary)
separately based on
an analysis of EPC
data.
Broken down by main
demand sources:
a) Domestic heat,
b) Domestic
appliances &
lighting,
c) Commercial heat,
d) commercial
appliances &
lighting
e) Industrial.
EPC analysis combined with a set
of scenario assumptions about
EPC performance improvement
can be used to produce a more
evidenced set of energy efficacy
demand reduction projections
by demand source.
.
Would provide a more evidenced set of EE
reduction factors at a lower level of
granularity for each primary/ ESA
Would allow a better analysis of scenario
outcomes and an analysis of the potential
demand reduction for each ESA
Peak demand impact
would have to be
estimated and this is
not straight forward.
Breakdown by
demand source
would require
additional analysis of
the baseload demand
by MPAN (electricity)
and by daily metered
demand.
See below
5
Not in
Scope
Another approach,
which is outside the
current scope, would
be to do a full building
stock analysis using
street level data of the
sort produced by EST
and CSE.
This is not in the scope of EPIC
but, for replication, it could be a
data source in some areas if this
has already been done.
Only applicable if this analysis has already
been done.
Peak demand impact
would have to be
estimated and this is
not straight forward.
See below

Page 83 EPIC Trial Planning Process and Trial Plan
17.4. High level – GB electricity system peaks and annual
demand
At the highest level, historic data from the GB electricity system as a whole can indicate a
relationship between peak demand and annual consumption:
Figure 6 National Grid ESO FES historic system peak and annual demand, 2005-2019
This shows a fairly consistent 1:2 ratio (a factor of 0.5) between peak electricity demand
reduction and annual demand reduction for nationwide electricity consumption over the
last 15 years. Annual demand has dropped by 18% over this timeframe, while peak demand
has dropped by 9%.
However, this wholesale view includes aspects not related to energy efficiency; for example,
the increased level and sophistication of industrial Triad (TNuoS peak charge) avoidance
has sought to reduce demand at peak half-hourly periods without reducing annual
consumption. Similarly, the continuing shift towards a service-based economy will have
resulted in changes to non-domestic electricity demand profiles.
The NGESO FES data does provide this historic data broken down by residential,
commercial and industrial sector (it is not clear how this breakdown is modelled):
0%
10%
20%
30%
40%
50%
60%
70%
80%
90%
100%
2005 2006 2007 2008 2009 2010 2011 2012 2013 2014 2015 2016 2017 2018 2019
FES GB electricity annual demand vs system peak: 2005-2019
TOTAL - Indexed to 2005
Peak Annual

Page 84 EPIC Trial Planning Process and Trial Plan (WP2 D1)
Table 5 - High Level Energy Efficiency to Peak Electricity Demand Reduction Factors
High Level Energy Efficiency to Peak Electricity Demand Reduction Factors
Suggested peak
electricity reduction
factor benchmarks
Based on
Overall Baseload
electricity demand
across all demand
sources
0.5
(i.e. 10% energy
efficiency leads to a
5% peak demand
reduction)
Overall FES numbers
Literature review
Domestic
appliances and
lighting
0.8 to 1.0 ESO FES analysis
Domestic heat (only
energy efficiency)
0.3 to 0.4 ESO FES and
Literature review
Domestic heat
including smarter
appliances, TOUT
DSR, Thermal
storage
0.5 to 0.9 ESO FES and
Literature review
Commercial
domestic and
appliances
Unclear from the FES
evidence likely to be
in the range 0.5 to
0.7
Best guess based on historic FES
data and domestic analysis
Commercial Heat 0.4 to 0.7 Best guess based on historic FES
data and domestic heat analysis.
Generally, commercial buildings
have greater potential and
incentive than domestic
buildings to avoid peak demand.
Industrial Demand Varies greatly by
Range 0.2 to 0.7
Suggested mid point
is 0.45
ESO FES analysis
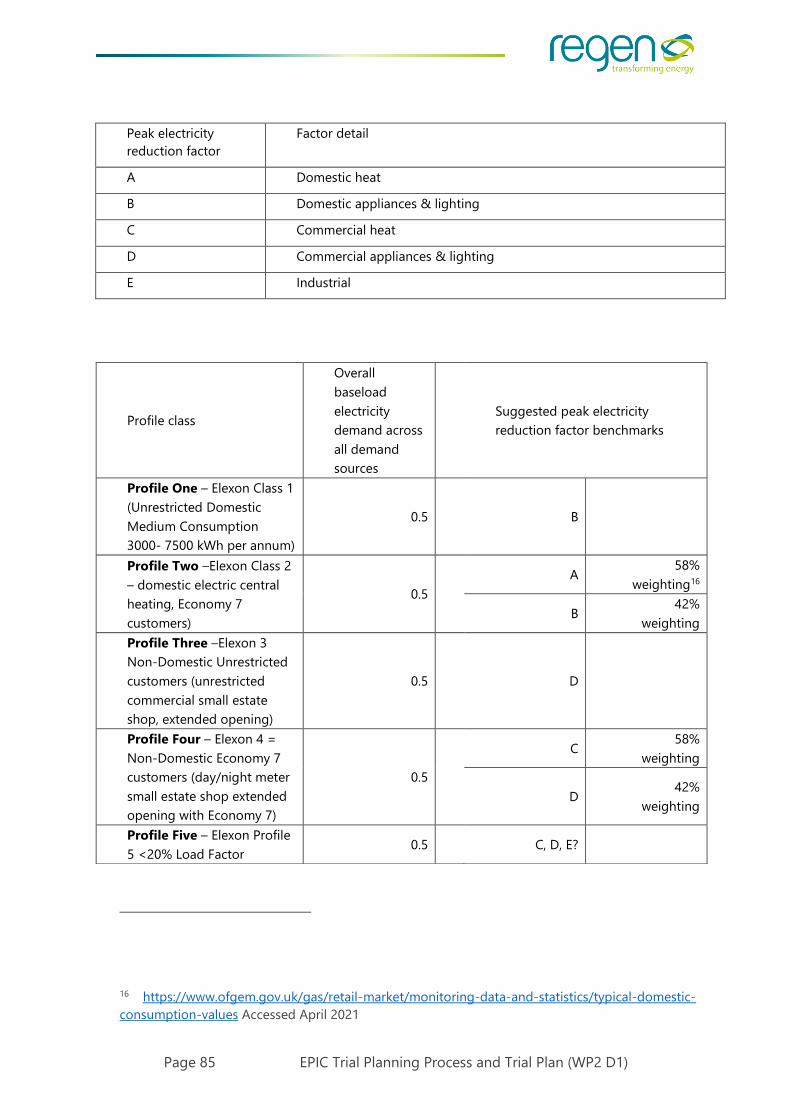
Page 85 EPIC Trial Planning Process and Trial Plan (WP2 D1)
Peak electricity
reduction factor
Factor detail
A Domestic heat
B Domestic appliances & lighting
C Commercial heat
D Commercial appliances & lighting
E Industrial
16 https://www.ofgem.gov.uk/gas/retail-market/monitoring-data-and-statistics/typical-domestic-
consumption-values Accessed April 2021
Profile class
Overall
baseload
electricity
demand across
all demand
sources
Suggested peak electricity
reduction factor benchmarks
Profile One – Elexon Class 1
(Unrestricted Domestic
Medium Consumption
3000- 7500 kWh per annum)
0.5
B
Profile Two –Elexon Class 2
– domestic electric central
heating, Economy 7
customers)
0.5
A
58%
weighting16
B 42%
weighting
Profile Three –Elexon 3
Non-Domestic Unrestricted
customers (unrestricted
commercial small estate
shop, extended opening)
0.5
D
Profile Four – Elexon 4 =
Non-Domestic Economy 7
customers (day/night meter
small estate shop extended
opening with Economy 7)
0.5
C
58%
weighting
D 42%
weighting
Profile Five – Elexon Profile
5 <20% Load Factor 0.5
C, D, E?

Page 86 EPIC Trial Planning Process and Trial Plan (WP2 D1)
Profile Six - Elexon Profile 6
20% to 30% Load Factor 0.5
C, D, E?
Profile Seven - Elexon
Profile 7 30% to 40% Load
Factor
0.5
C, D, E?
Profile Eight - Elexon
Profile 8 >40% Load Factor 0.5
C, D, E?

Page 87 EPIC Trial Planning Process and Trial Plan (WP2 D1)
18. Appendix 5: Draft specification for managing new
developments for modelling
Where the local plan includes new developments, a simplifying assumption will be made
that the new premises will be supplied by new distribution substations, rather than by
connecting additional premises to existing distribution substations.
The DFES data gives new development information as number of domestic properties or
square footage of the categories of non-domestic building. These building blocks are
associated with a new development via a unique new development name. For each new
development the expected maximum load associated with the new premises will be
calculated and the number of distribution substations will be calculated based on an
assumed maximum load per distribution substation e.g.750 kVA ( to be confirmed with
WPD planners)
Once the number of new distribution substations for the development is confirmed these
will be distributed as evenly as possible geographically across the area of the development.
Dummy data for each dummy substation will need to include
1) The number of customers in each Elexon profile class
2) The average EAC per PC
3) The number of heat pumps
4) The average consumption for the heat pumps
5) The number of EV chargers
6) The average consumption for the EV chargers
Where new customers would normally be half-hourly metered, e.g. hospital, larger shops,
larger schools then these will be modelled using the closest non-domestic Elexon Profile (
3-8) based on the categorisation of the non-domestic property type e.g. A1, A2 and the
profiles for these customers as given in the customer behaviour document. In these cases
as well as the closest profile an estimate of the EAC value would also need to be provided.
This can be obtained by estimating the maximum demand using the square footage and
load/square footage value from the customer behaviour document and then converting
from maximum demand to annual consumption based on the ratio for that profile class.
New developments will be assumed to be to a high standard and therefore may have lower
estimated annual consumptions reflecting higher building efficiency, the use of energy
efficient lighting and a higher likelihood of energy efficient appliances. Similarly the
average heat pump consumption may be lower due to higher building standards and
modern control systems.
As new developments will be assumed to include LCTs such as heat pumps and EVs then
they will not be allocated additional units in subsequent years. This is a useful

Page 88 EPIC Trial Planning Process and Trial Plan (WP2 D1)
simplification as there would be insufficient data for the dummy substations to drive the
allocation of LCTs in the same way as existing substations.
These new developments can be used to show the different impact between applying
efficiency improvements to properties that are already high efficiency compared to
average buildings.
Profiles for dummy subs will be passed to the HV modelling tool as will the expected
substation location. The PSC tool will associate each dummy sub with the nearest HV
feeder and depending on the data available in the WPD SINCAL model this will either be
based on:
Physically nearest existing 11kV feeder
Shortest route along an existing road network (Dijkstra’s algorithm)

Page 89 EPIC Trial Planning Process and Trial Plan
This report was produced for Project EPIC
Issue date -
Version Final
Written by: Regen
Approved by:
-
Regen,
Bradninch Court.
Exeter,
EX4 3PL
+44 (0)1392 494399
regen.co.uk
Registered in England No: 04554636
All rights reserved. No part of this document may
be reproduced or published in any way (including
online) without the prior permission of Regen.