Implementation of Pushover Analysis for Seismic Assessment ...
21
buildings Article Implementation of Pushover Analysis for Seismic Assessment of Masonry Towers: Issues and Practical Recommendations Rafael Shehu Citation: Shehu, R. Implementation of Pushover Analysis for Seismic Assessment of Masonry Towers: Issues and Practical Recommendations. Buildings 2021, 11, 71. https://doi.org/10.3390/ buildings11020071 Academic Editor: Rita Bento Received: 5 January 2021 Accepted: 12 February 2021 Published: 16 February 2021 Publisher’s Note: MDPI stays neutral with regard to jurisdictional claims in published maps and institutional affil- iations. Copyright: © 2021 by the author. Licensee MDPI, Basel, Switzerland. This article is an open access article distributed under the terms and conditions of the Creative Commons Attribution (CC BY) license (https:// creativecommons.org/licenses/by/ 4.0/). Department of Civil and Environmental Engineering, Politecnico Di Milano, 20133 Milan, Italy; [email protected] Abstract: Seismic assessment is a paramount issue and a valuable instrument towards the conserva- tion of vulnerable structures in seismic prone regions. The past seismic events have highlighted the vulnerability of masonry towers that is exhibited by severe structural and nonstructural damages or even collapses. The preservation of existing structures, mainly focused on the built heritage, is emerging and imposing substantial enhancements of numerical methods, including pushover analysis approaches. The accuracy of the estimated seismic capacity for these structures is correlated with the assumed strategies and approximations made during the numerical modeling. The present paper concerns those aspects by exploring the limitations and possibilities of conceiving pushover analysis in the finite element method environment. The most crucial target is tracing in a pushover capacity curve the corresponding initiation of structural damages, maximum load-bearing capacity, and the ultimate displacement capacity. Different recommendations for achieving this target have been proposed and illustrated for practical utilization. Three representative geometrical towers, adopting three different materials and five different load patterns, are investigated in this study. The load pattern’s role and necessity of the displacement-like control approach for the pushover analysis are exploited. This paper highlights the load-bearing capacity overestimation when the force-controlled are implemented. The material model influences the achievement of softening branch with a distinguishable displacement capacity. Keywords: masonry structures; towers; seismic assessment; pushover analysis 1. Introduction Seismic assessment is becoming an obligatory procedure for existing structures in seismic regions and, in particular, those with a high level of expected seismic risk. Many factors of the construction typology, material deterioration, and the nature of earthquakes make their capacity estimation quite uncertain. A relatively low level of seismic safety characterizes the built stock as compared to the in-force earthquake engineering practice requirements. When considering that many structures of the built stock belong to the historical and architectural heritage, it is mandatory to utilize advanced and accurate ap- proaches [1–6]. The objects of this paper are masonry towers, typical bell towers, fortresses, or chimneys. However, the practitioners can extend many of the treated aspects of numeri- cal procedures to a vast range of structural topologies while considering the similarities and the generalist approach of pushover analyses implementation. Masonry towers are very peculiar structural typologies, and they are typically con- ceived to withstand only vertical loads, as it occurs for all historical masonry construc- tions [7–16]. Therefore, their seismic vulnerability is expected to be high and particular attention should be paid to their seismic assessment toward a preservation approach. Two are the main aspects that lead to an expected high vulnerability, respectively, the masonry material’s poor mechanical properties in tension and the geometric features like slender- ness, irregularities, and openings. Additionally, the soil-structure interaction, inclination, and adjacent structures have a significant influence on their structural response. Some Buildings 2021, 11, 71. https://doi.org/10.3390/buildings11020071 https://www.mdpi.com/journal/buildings
-
Upload
khangminh22 -
Category
Documents
-
view
0 -
download
0
Transcript of Implementation of Pushover Analysis for Seismic Assessment ...

buildings
Article
Implementation of Pushover Analysis for Seismic Assessmentof Masonry Towers: Issues and Practical Recommendations
Rafael Shehu
�����������������
Citation: Shehu, R. Implementation
of Pushover Analysis for Seismic
Assessment of Masonry Towers:
Issues and Practical
Recommendations. Buildings 2021, 11,
71. https://doi.org/10.3390/
buildings11020071
Academic Editor: Rita Bento
Received: 5 January 2021
Accepted: 12 February 2021
Published: 16 February 2021
Publisher’s Note: MDPI stays neutral
with regard to jurisdictional claims in
published maps and institutional affil-
iations.
Copyright: © 2021 by the author.
Licensee MDPI, Basel, Switzerland.
This article is an open access article
distributed under the terms and
conditions of the Creative Commons
Attribution (CC BY) license (https://
creativecommons.org/licenses/by/
4.0/).
Department of Civil and Environmental Engineering, Politecnico Di Milano, 20133 Milan, Italy;[email protected]
Abstract: Seismic assessment is a paramount issue and a valuable instrument towards the conserva-tion of vulnerable structures in seismic prone regions. The past seismic events have highlighted thevulnerability of masonry towers that is exhibited by severe structural and nonstructural damagesor even collapses. The preservation of existing structures, mainly focused on the built heritage,is emerging and imposing substantial enhancements of numerical methods, including pushoveranalysis approaches. The accuracy of the estimated seismic capacity for these structures is correlatedwith the assumed strategies and approximations made during the numerical modeling. The presentpaper concerns those aspects by exploring the limitations and possibilities of conceiving pushoveranalysis in the finite element method environment. The most crucial target is tracing in a pushovercapacity curve the corresponding initiation of structural damages, maximum load-bearing capacity,and the ultimate displacement capacity. Different recommendations for achieving this target havebeen proposed and illustrated for practical utilization. Three representative geometrical towers,adopting three different materials and five different load patterns, are investigated in this study.The load pattern’s role and necessity of the displacement-like control approach for the pushoveranalysis are exploited. This paper highlights the load-bearing capacity overestimation when theforce-controlled are implemented. The material model influences the achievement of softeningbranch with a distinguishable displacement capacity.
Keywords: masonry structures; towers; seismic assessment; pushover analysis
1. Introduction
Seismic assessment is becoming an obligatory procedure for existing structures inseismic regions and, in particular, those with a high level of expected seismic risk. Manyfactors of the construction typology, material deterioration, and the nature of earthquakesmake their capacity estimation quite uncertain. A relatively low level of seismic safetycharacterizes the built stock as compared to the in-force earthquake engineering practicerequirements. When considering that many structures of the built stock belong to thehistorical and architectural heritage, it is mandatory to utilize advanced and accurate ap-proaches [1–6]. The objects of this paper are masonry towers, typical bell towers, fortresses,or chimneys. However, the practitioners can extend many of the treated aspects of numeri-cal procedures to a vast range of structural topologies while considering the similaritiesand the generalist approach of pushover analyses implementation.
Masonry towers are very peculiar structural typologies, and they are typically con-ceived to withstand only vertical loads, as it occurs for all historical masonry construc-tions [7–16]. Therefore, their seismic vulnerability is expected to be high and particularattention should be paid to their seismic assessment toward a preservation approach. Twoare the main aspects that lead to an expected high vulnerability, respectively, the masonrymaterial’s poor mechanical properties in tension and the geometric features like slender-ness, irregularities, and openings. Additionally, the soil-structure interaction, inclination,and adjacent structures have a significant influence on their structural response. Some
Buildings 2021, 11, 71. https://doi.org/10.3390/buildings11020071 https://www.mdpi.com/journal/buildings
Buildings 2021, 11, 71 2 of 21
of these features highlight a limited capacity of simplified global approaches, like thoseprescribed in the Guideline for Cultural Heritage Seismic Assessment (DPCM) [17], foraddressing the complexity of the tower’s response. Regardless of the analytical method-ology, a fundamental task is the estimation of the uncertain parameters (both materialproperties and boundary conditions) affecting the structural behavior [18–21]. A multidis-ciplinary approach by means of advanced investigations and simulations is deemed to bemostly recommended aiming to identify the possible active failure modes during seismicevents [22–31]. A comprehensive approach to seismic safety would include a processfrom diagnostic investigations to advanced numerical simulations, including out-of-planelocal analyses.
This research focuses on pushover analysis as a widely used approach in the seis-mic assessment of masonry towers. Geometrical features and structural regularity arefavorable for the successful application of nonlinear static methods, but besides that, thelimitations of pushover analysis in masonry structures are well-known by the scientificcommunity [32–39]. The numerical procedure requires the definitions of many parameters,like the material model, model mesh refinement, applied load distribution pattern, etc.Consequently, the results are directly affected by the chosen parameters. The key issuein the accuracy of pushover methods is the nature of the lateral load applied, which iswhether a force or a displacement [40].
Herein, it is not claimed to address all of the aspects above because it would requireinvestigating a larger number of case studies. The geometry and the material propertiesselection in this research are based on a broad research practice. The focus is on differ-ent approaches that a nonlinear static analysis could be conceived in any FEM softwarepackage. The influence of geometry, material properties, and load pattern is investigated.In this study, the simulations are performed with the Abaqus CAE software [41], whichprovides a wide variety of modeling options for simulating the nonlinearity of masonrystructures. Some key aspects of addressing the seismic assessment of masonry towers havebeen gathered from the simulations. The found remarks may be easily implemented bypractitioners or researchers in order to obtain more accurate and realistic results.
2. Pushover Analysis
Pushover analysis is a very utilized approach in earthquake engineering and one ofthe most accurate tools for estimating structure’s seismic safety, either new or existingones. Thenceforth, a correct implementation is essential and it should meet many criteria.There exist many approaches on the implementation and application of pushover analysisconsidering, (i) different load patterns [42–44]; (ii) the inclusion of higher modes [45];(iii) adaptive load patterns [46]; and (iv) force vs. displacement control [40], etc., aimingto obtain a capacity curve that would mimic more realistically the seismic behavior ofthe structure. It is a common approach that is adopted by many practices to considerthe pushover analysis as completed if the capacity curve is determined for values of thecontrolled displacement ranging between zero and the value corresponding to 150% of thetarget displacement [43]. Another approach is to consider the capacity until the reductionof at least 15%, the maximum obtained base shear [44]. When considering that a brittlefailure is very prone in typical masonry structures, it should be expected that a realisticbehavior of the simulations should exhibit an apparent softening behavior. The role ofnumerical simulations in this regard becomes very crucial. The peculiarity of the masonrymaterial, with a relatively low tensile strength and brittle failure in shear, makes the overallmodeling and analysis process not an easy task [32].
2.1. Load Patterns
This section describes different load patterns that could be used in a pushover analysis.They influence the seismic assessment of the structures in terms of the pushover capacitycurve shape, as will be discussed in the following sections. Five different load patternshave been considered for the simulations, see Figure 1. These load patterns are familiar

Buildings 2021, 11, 71 3 of 21
for the readers, as they are adopted by several technical codes [43,47,48] and widelyapplied for masonry towers. For simplicity, this article adopts the following names for eachload pattern.
Buildings 2021, 11, x FOR PEER REVIEW 3 of 22
This section describes different load patterns that could be used in a pushover anal-ysis. They influence the seismic assessment of the structures in terms of the pushover ca-pacity curve shape, as will be discussed in the following sections. Five different load pat-terns have been considered for the simulations, see Figure 1. These load patterns are fa-miliar for the readers, as they are adopted by several technical codes [43,47,48] and widely applied for masonry towers. For simplicity, this article adopts the following names for each load pattern. • P1—inverse triangular shape body forces are applied along the height of the tower. • P2—a concentrated lateral load is applied at the top of the tower. • P3—a lateral displacement is applied at the top of the tower. A constraint is imple-
mented for the top nodes in order to avoid localized damages. • P4—an inverse triangular shape acceleration is applied along the height of the tower.
The acceleration is progressively incremented in a quasi-static fashion. Quasi-static analyses can be conducted in Abaqus for linear or nonlinear problems, and inertial effects can be neglected [41]. The equilibrium formulation of this analysis is given by Equation (1). This approach allows for mimicking any shape for any required load patterns and it is suitable for applying the modal pushover analysis. 𝑴 𝒙 𝑪 𝒙 𝑲 𝒙 𝑴 𝒓 𝑢 (1)
• P5—a progressively incremental acceleration is applied at the base of the tower. The base is not fixed, and the imposed inertial forces exhibit the equivalent seismic forces due to wave propagation in the solid. This approach only mimics the nonlinear dy-namic simulations in an incremental fashion, without load cycles. The equilibrium formulation of this analysis is given by Equation (2). The implemented loads resem-ble seismic loads induced by a ground acceleration at the base and, thenceforth, the structural response is a combination of the wave propagation and inertial forces. This approach could not mimic different shapes of load patterns and it is not very stable due to the induced oscillation of the structure. 𝑴 𝒙 𝑪 𝒙 𝑲 𝒙 0𝒖 (2)𝑴—mass matrix, 𝑪—damping matrix, 𝑲—stiffness matrix, 𝒙—displacement vec-
tor, 𝒓—shape vector, and 𝑢—induced acceleration. The first load pattern (P1) represents the classical distribution of seismic forces, and the conducted analyses are force-con-trolled. The second (P2) and third (P3) are considered here to show the difference between a force-controlled and displacement-controlled analysis, respectively. The fourth (P4) would represent a classical force distribution implemented with a displacement con-trolled fashion, and the fifth load pattern (P5) is here for comparison purposes.
P1 P2 P3 P4 P5
Figure 1. Graphical representation of the considered load patterns.
2.2. Pushover capacity curve shape
Figure 1. Graphical representation of the considered load patterns.
• P1—inverse triangular shape body forces are applied along the height of the tower.• P2—a concentrated lateral load is applied at the top of the tower.• P3—a lateral displacement is applied at the top of the tower. A constraint is imple-
mented for the top nodes in order to avoid localized damages.• P4—an inverse triangular shape acceleration is applied along the height of the tower.
The acceleration is progressively incremented in a quasi-static fashion. Quasi-staticanalyses can be conducted in Abaqus for linear or nonlinear problems, and inertialeffects can be neglected [41]. The equilibrium formulation of this analysis is given byEquation (1). This approach allows for mimicking any shape for any required loadpatterns and it is suitable for applying the modal pushover analysis.
M..x + C
.x + K x = −M r
..u (1)
• P5—a progressively incremental acceleration is applied at the base of the tower. Thebase is not fixed, and the imposed inertial forces exhibit the equivalent seismic forcesdue to wave propagation in the solid. This approach only mimics the nonlineardynamic simulations in an incremental fashion, without load cycles. The equilibriumformulation of this analysis is given by Equation (2). The implemented loads resembleseismic loads induced by a ground acceleration at the base and, thenceforth, thestructural response is a combination of the wave propagation and inertial forces. Thisapproach could not mimic different shapes of load patterns and it is not very stabledue to the induced oscillation of the structure.
M..x + C
.x + K x = −
{0..u
}(2)
M—mass matrix, C—damping matrix, K—stiffness matrix, x—displacement vector,r—shape vector, and
..u—induced acceleration. The first load pattern (P1) represents the
classical distribution of seismic forces, and the conducted analyses are force-controlled.The second (P2) and third (P3) are considered here to show the difference between aforce-controlled and displacement-controlled analysis, respectively. The fourth (P4) wouldrepresent a classical force distribution implemented with a displacement controlled fashion,and the fifth load pattern (P5) is here for comparison purposes.
2.2. Pushover Capacity Curve Shape
As previously mentioned, the seismic assessment, according to a pushover analysis,is influenced by many parameters that, consequently, change the quality of the pushovercurve. The following describes notable characteristics of the capacity curves, see Figure 2,

Buildings 2021, 11, 71 4 of 21
according to the considered load patterns. The three significative points of the pushover ina capacity curve are the yield point (A), the maximum load-bearing capacity (B), and themaximum allowable displacement (C). In principle, these points should indicate the limitstates of the structure, and they could also be empirically defined by code limitations, asmentioned in the beginning of Section 2. The most desired output would be to tackle thesepoints from an obtained pushover capacity curve. However, it does not always occur and,as described in this section, the load pattern plays a substantial role. Numerous analyseshave been conducted, as will be detailed in the next section, and an extract of them isreported in Figure 2 just for highlighting the characterizing features for each load pattern.
Buildings 2021, 11, x FOR PEER REVIEW 5 of 22
(a) (b)
Figure 2. Characteristics of the pushover curves according to the load pattern; (a) load pattern according to P1, P2 and P3, (b) load pattern according to P4 and P5.
• P5: provides a time history nonlinear dynamic curve that is similar to the classic pushover capacity curves. This curve is influenced by the damping parameters and the velocity of the applied load. The initial branch of the capacity curves shows some oscillations due to the tower's elastic dynamic response, as will be shown in the fol-lowing sections. It can be noted that the initial stiffness of the structure is slightly different from the other cases, due to the nature of the stiffness matrix that is derived from equation (2). In general, it can be noted that the role of parameters highly influ-ences the shape and quality of the capacity curve. Thenceforth, it is not recommended to be applied massively, but it is worth highlighting that this approach provides crit-ical aspects of the structure's seismic response.
3. Case studies 3.1. Geometry
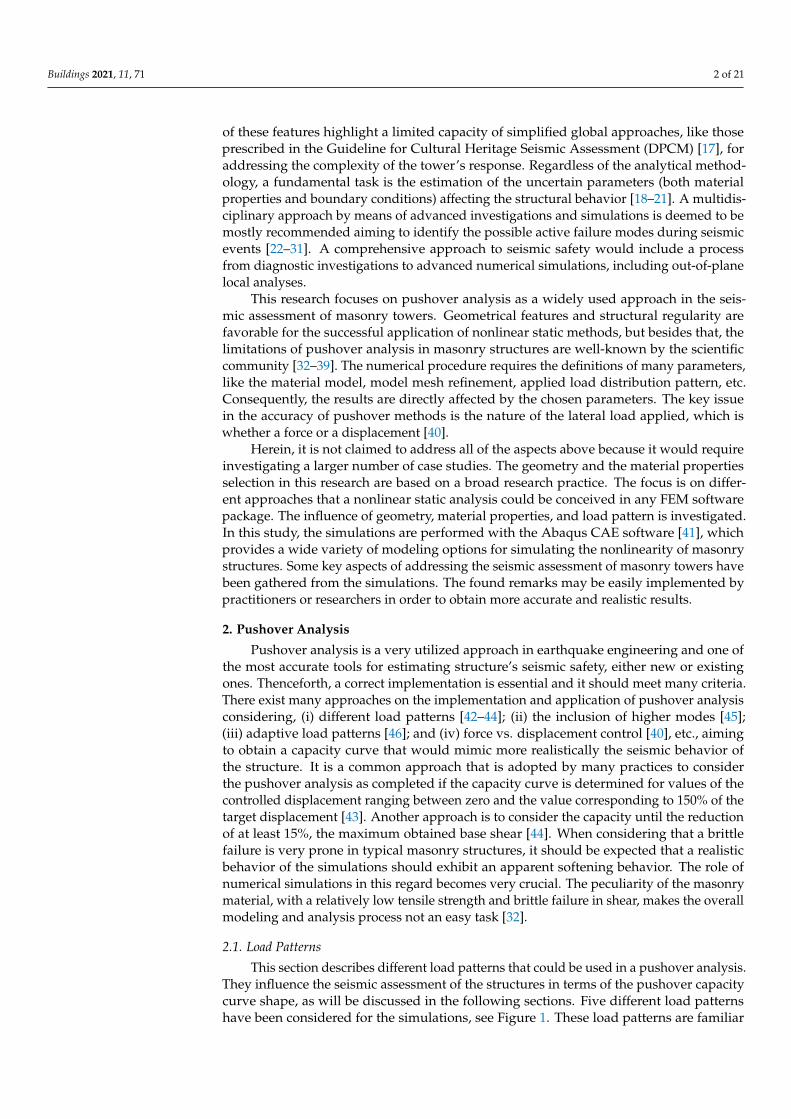
A representative typical masonry tower geometry has been derived from a data bank of selected research papers dealing with seismic assessment and structural health moni-toring of masonry towers in the Italian territory [51–62]. Figure 3 summarizes the geomet-ric features of the towers in terms of their slenderness, height, and external base width. A representative tower is chosen for implementing the pushover analysis to address the herein treated issues, i.e., the role of the material, the role of geometry, and load pattern. The chosen tower's basic geometrical properties are: a) height of H = 40 m, b) base b = 7 m, and c) a constant wall section thickness of t = 1.3 m. Among these basic parameters, there are several other parameters, like horizontal elements, openings, belfry, inclination, soil-structure interaction, and adjacent structure interaction, which strongly influence the structure's seismic behavior. This study does not cover all of these parameters. Many of them are out of the scope of this study for providing a practical framework for the imple-mentation of pushover analysis on an accuracy basis. Some of the above-mentioned key features to take under consideration are concluded in three case studies. The three towers have been conceived, as follows, see Figure 4. Tower 1 represents a hollow structure with the given described geometry as above. This approach conforms with the geometry used for the simplified analysis of masonry towers, as described in the guidelines for cultural heritage assessment and preservation under seismic actions [9]. Tower 2 includes some openings along with the height of the tower and vaults according to a typical construction
Figure 2. Characteristics of the pushover curves according to the load pattern; (a) load pattern according to P1, P2 and P3,(b) load pattern according to P4 and P5.
• P1: the base shear of the capacity curve has an increasing trend while the top dis-placement increases. This is the main drawback of the force-controlled approach,which cannot provide a reliable estimation of structures’ maximum load-bearing ca-pacity (point B), as it does not show decreasing values. Consequently, the maximumdisplacement should be empirically estimated, rather than estimating it from thegraph itself.
• By confronting the P2 and P3, see Figure 2a, the pushover curve is identical until thecollapse point is identified by the P3 approach (point C). In contrast, the P2 approachcontinues to provide a slight increment of the load-bearing capacity, as occurred withP1. These two cases are directly comparable and highlight the benefits and quality ofthe displacement-control simulations. As can be noted, an empirical estimation mightoverestimate the maximum allowable top displacement.
• P4: is comparable to the P1 in terms of the globally applied seismic loads; however,this approach incorporates a displacement control by imposing the increment of theapplied acceleration. It can be noted that this approach provides all three points. Forillustration, Figure 2b plots the results from two different materials. The materialnoted M1 has a perfect elastoplastic behavior while M2 has a multilinear with soft-ening behavior (the details are provided in Section 3.2). The material’s role is crucialin providing the ultimate displacement, while, in terms of maximum load-bearingcapacity, the presented cases show various similarities. It is worth highlighting thatthe maximum residual displacement can be empirically estimated between 0.4–0.8% ofthe total height, according to [49], or 0.5% according to code recommendations, [24,50].For illustration, it is deliberately is chosen that this empirical approach could overesti-mate the deformation capacity of the towers, see Figure 2a point C of P3 and Figure 2bpoint C of P4(M2).
Buildings 2021, 11, 71 5 of 21
• P5: provides a time history nonlinear dynamic curve that is similar to the classicpushover capacity curves. This curve is influenced by the damping parameters andthe velocity of the applied load. The initial branch of the capacity curves showssome oscillations due to the tower’s elastic dynamic response, as will be shown inthe following sections. It can be noted that the initial stiffness of the structure isslightly different from the other cases, due to the nature of the stiffness matrix thatis derived from Equation (2). In general, it can be noted that the role of parametershighly influences the shape and quality of the capacity curve. Thenceforth, it is notrecommended to be applied massively, but it is worth highlighting that this approachprovides critical aspects of the structure’s seismic response.
3. Case Studies3.1. Geometry
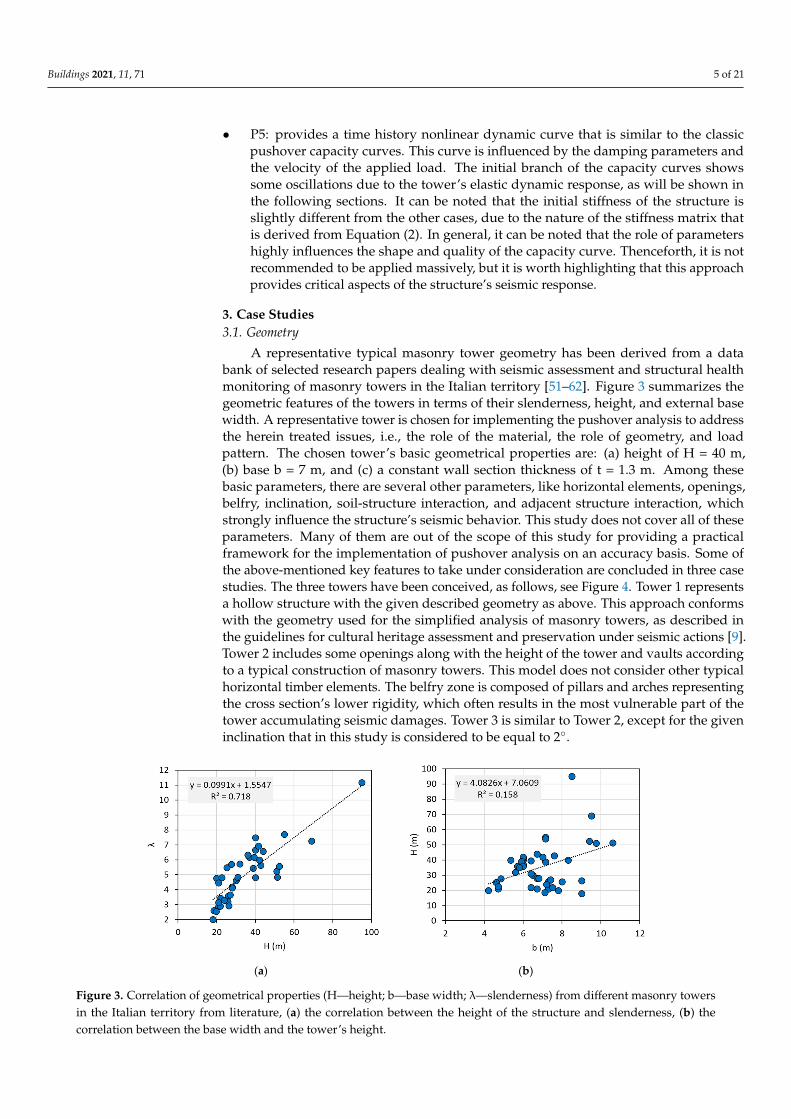
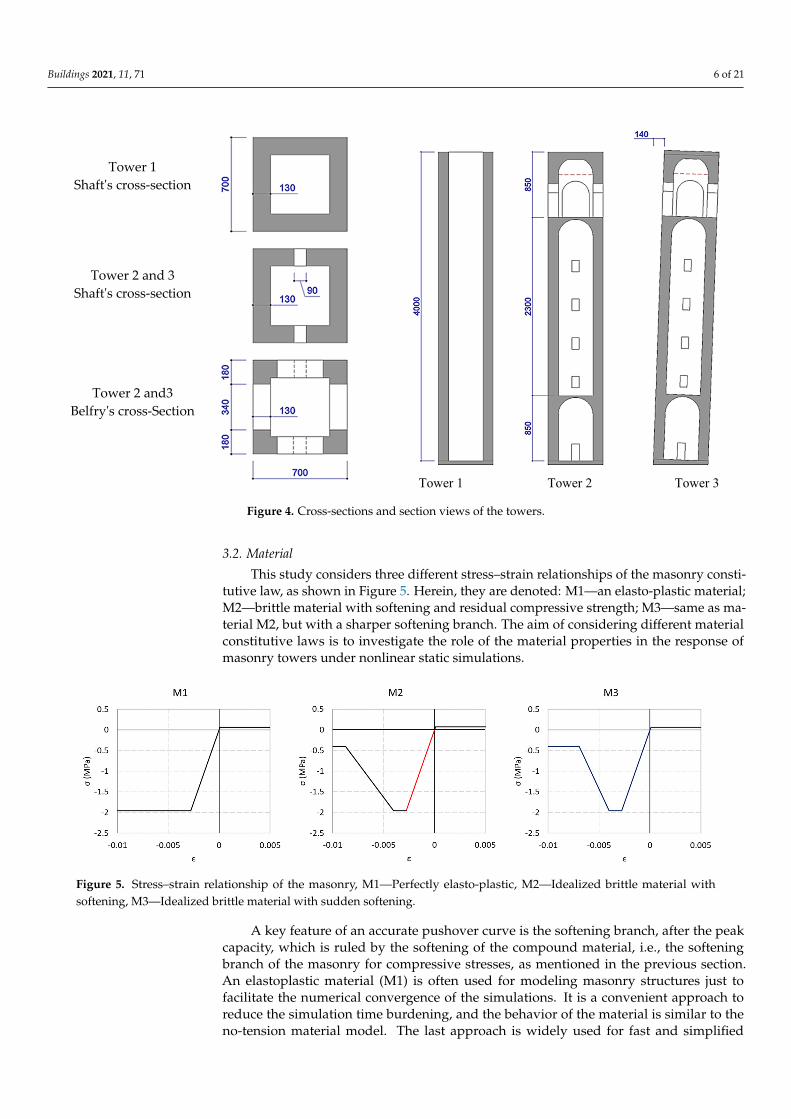
A representative typical masonry tower geometry has been derived from a databank of selected research papers dealing with seismic assessment and structural healthmonitoring of masonry towers in the Italian territory [51–62]. Figure 3 summarizes thegeometric features of the towers in terms of their slenderness, height, and external basewidth. A representative tower is chosen for implementing the pushover analysis to addressthe herein treated issues, i.e., the role of the material, the role of geometry, and loadpattern. The chosen tower’s basic geometrical properties are: (a) height of H = 40 m,(b) base b = 7 m, and (c) a constant wall section thickness of t = 1.3 m. Among thesebasic parameters, there are several other parameters, like horizontal elements, openings,belfry, inclination, soil-structure interaction, and adjacent structure interaction, whichstrongly influence the structure’s seismic behavior. This study does not cover all of theseparameters. Many of them are out of the scope of this study for providing a practicalframework for the implementation of pushover analysis on an accuracy basis. Some ofthe above-mentioned key features to take under consideration are concluded in three casestudies. The three towers have been conceived, as follows, see Figure 4. Tower 1 representsa hollow structure with the given described geometry as above. This approach conformswith the geometry used for the simplified analysis of masonry towers, as described inthe guidelines for cultural heritage assessment and preservation under seismic actions [9].Tower 2 includes some openings along with the height of the tower and vaults accordingto a typical construction of masonry towers. This model does not consider other typicalhorizontal timber elements. The belfry zone is composed of pillars and arches representingthe cross section’s lower rigidity, which often results in the most vulnerable part of thetower accumulating seismic damages. Tower 3 is similar to Tower 2, except for the giveninclination that in this study is considered to be equal to 2◦.
Buildings 2021, 11, x FOR PEER REVIEW 6 of 22
of masonry towers. This model does not consider other typical horizontal timber elements. The belfry zone is composed of pillars and arches representing the cross section's lower rigidity, which often results in the most vulnerable part of the tower accumulating seismic damages. Tower 3 is similar to Tower 2, except for the given inclination that in this study is considered to be equal to 2°.
(a) (b)
Figure 3. Correlation of geometrical properties (H—height; b—base width; λ—slenderness) from different masonry towers in the Italian territory from literature, (a) the correlation between the height of the structure and slenderness, (b) the correlation between the base width and the tower’s height.
Tower 1 Shaft's cross-section
Tower 2 and 3 Shaft's cross-section
Tower 2 and3 Belfry's cross-Section
Tower 1 Tower 2 Tower 3
Figure 4. Cross-sections and section views of the towers.
3.2. Material This study considers three different stress–strain relationships of the masonry con-
stitutive law, as shown in Figure 5. Herein, they are denoted: M1—an elasto-plastic mate-rial; M2—brittle material with softening and residual compressive strength; M3—same as
Figure 3. Correlation of geometrical properties (H—height; b—base width; λ—slenderness) from different masonry towersin the Italian territory from literature, (a) the correlation between the height of the structure and slenderness, (b) thecorrelation between the base width and the tower’s height.
Buildings 2021, 11, 71 6 of 21
Buildings 2021, 11, x FOR PEER REVIEW 6 of 22
of masonry towers. This model does not consider other typical horizontal timber elements. The belfry zone is composed of pillars and arches representing the cross section's lower rigidity, which often results in the most vulnerable part of the tower accumulating seismic damages. Tower 3 is similar to Tower 2, except for the given inclination that in this study is considered to be equal to 2°.
(a) (b)
Figure 3. Correlation of geometrical properties (H—height; b—base width; λ—slenderness) from different masonry towers in the Italian territory from literature, (a) the correlation between the height of the structure and slenderness, (b) the correlation between the base width and the tower’s height.
Tower 1 Shaft's cross-section
Tower 2 and 3 Shaft's cross-section
Tower 2 and3 Belfry's cross-Section
Tower 1 Tower 2 Tower 3
Figure 4. Cross-sections and section views of the towers.
3.2. Material This study considers three different stress–strain relationships of the masonry con-
stitutive law, as shown in Figure 5. Herein, they are denoted: M1—an elasto-plastic mate-rial; M2—brittle material with softening and residual compressive strength; M3—same as
Figure 4. Cross-sections and section views of the towers.
3.2. Material
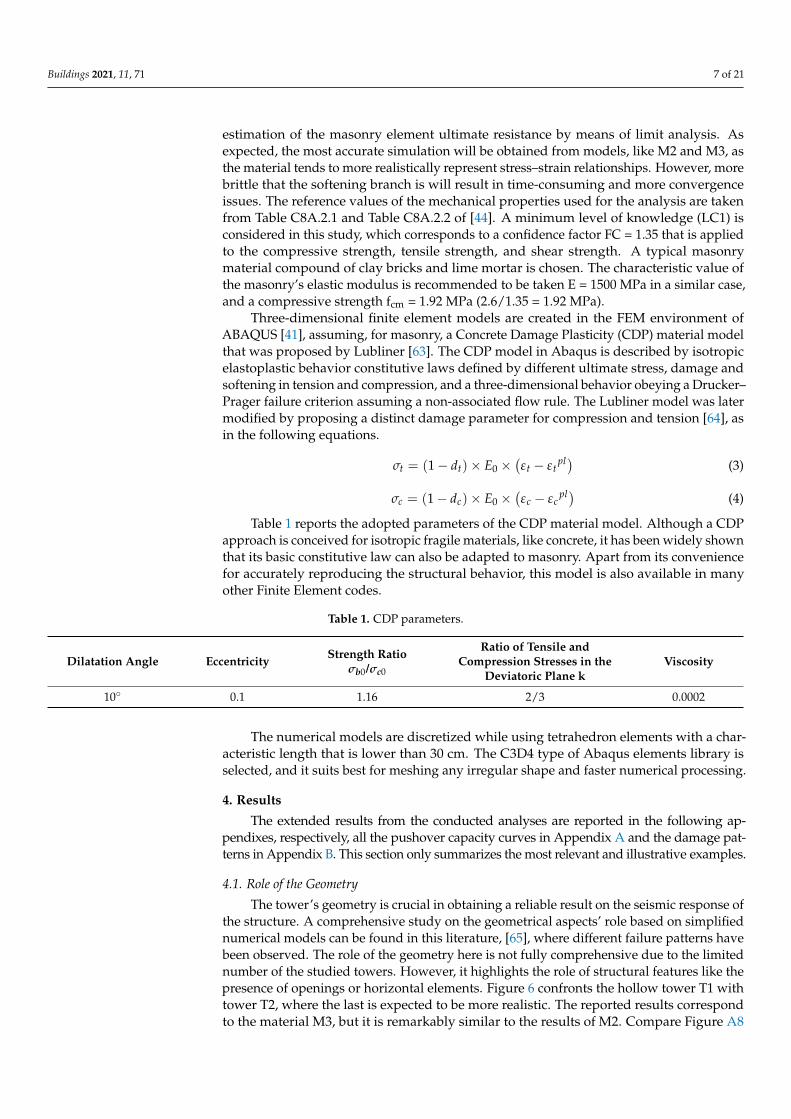
This study considers three different stress–strain relationships of the masonry consti-tutive law, as shown in Figure 5. Herein, they are denoted: M1—an elasto-plastic material;M2—brittle material with softening and residual compressive strength; M3—same as ma-terial M2, but with a sharper softening branch. The aim of considering different materialconstitutive laws is to investigate the role of the material properties in the response ofmasonry towers under nonlinear static simulations.
Buildings 2021, 11, x FOR PEER REVIEW 7 of 22
material M2, but with a sharper softening branch. The aim of considering different mate-rial constitutive laws is to investigate the role of the material properties in the response of masonry towers under nonlinear static simulations.
A key feature of an accurate pushover curve is the softening branch, after the peak capacity, which is ruled by the softening of the compound material, i.e., the softening branch of the masonry for compressive stresses, as mentioned in the previous section. An elastoplastic material (M1) is often used for modeling masonry structures just to facilitate the numerical convergence of the simulations. It is a convenient approach to reduce the simulation time burdening, and the behavior of the material is similar to the no-tension material model. The last approach is widely used for fast and simplified estimation of the masonry element ultimate resistance by means of limit analysis. As expected, the most accurate simulation will be obtained from models, like M2 and M3, as the material tends to more realistically represent stress–strain relationships. However, more brittle that the softening branch is will result in time-consuming and more convergence issues. The ref-erence values of the mechanical properties used for the analysis are taken from Table C8A.2.1 and Table C8A.2.2 of [44]. A minimum level of knowledge (LC1) is considered in this study, which corresponds to a confidence factor FC = 1.35 that is applied to the com-pressive strength, tensile strength, and shear strength. A typical masonry material com-pound of clay bricks and lime mortar is chosen. The characteristic value of the masonry's elastic modulus is recommended to be taken E = 1500 MPa in a similar case, and a com-pressive strength fcm = 1.92 MPa (2.6/1.35 = 1.92 MPa).
Figure 5. Stress–strain relationship of the masonry, M1 – Perfectly elasto-plastic, M2 – Idealized brittle material with softening, M3 – Idealized brittle material with sudden softening
Three-dimensional finite element models are created in the FEM environment of ABAQUS [41], assuming, for masonry, a Concrete Damage Plasticity (CDP) material model that was proposed by Lubliner [63]. The CDP model in Abaqus is described by isotropic elastoplastic behavior constitutive laws defined by different ultimate stress, damage and softening in tension and compression, and a three-dimensional behavior obeying a Drucker–Prager failure criterion assuming a non-associated flow rule. The Lu-bliner model was later modified by proposing a distinct damage parameter for compres-sion and tension [64], as in the following equations. 𝜎 1 𝑑 𝐸 𝜀 𝜀 (3)𝜎 1 𝑑 𝐸 𝜀 𝜀 (4)
Table 1 reports the adopted parameters of the CDP material model. Although a CDP approach is conceived for isotropic fragile materials, like concrete, it has been widely
Figure 5. Stress–strain relationship of the masonry, M1—Perfectly elasto-plastic, M2—Idealized brittle material withsoftening, M3—Idealized brittle material with sudden softening.
A key feature of an accurate pushover curve is the softening branch, after the peakcapacity, which is ruled by the softening of the compound material, i.e., the softeningbranch of the masonry for compressive stresses, as mentioned in the previous section.An elastoplastic material (M1) is often used for modeling masonry structures just tofacilitate the numerical convergence of the simulations. It is a convenient approach toreduce the simulation time burdening, and the behavior of the material is similar to theno-tension material model. The last approach is widely used for fast and simplified
Buildings 2021, 11, 71 7 of 21
estimation of the masonry element ultimate resistance by means of limit analysis. Asexpected, the most accurate simulation will be obtained from models, like M2 and M3, asthe material tends to more realistically represent stress–strain relationships. However, morebrittle that the softening branch is will result in time-consuming and more convergenceissues. The reference values of the mechanical properties used for the analysis are takenfrom Table C8A.2.1 and Table C8A.2.2 of [44]. A minimum level of knowledge (LC1) isconsidered in this study, which corresponds to a confidence factor FC = 1.35 that is appliedto the compressive strength, tensile strength, and shear strength. A typical masonrymaterial compound of clay bricks and lime mortar is chosen. The characteristic value ofthe masonry’s elastic modulus is recommended to be taken E = 1500 MPa in a similar case,and a compressive strength fcm = 1.92 MPa (2.6/1.35 = 1.92 MPa).
Three-dimensional finite element models are created in the FEM environment ofABAQUS [41], assuming, for masonry, a Concrete Damage Plasticity (CDP) material modelthat was proposed by Lubliner [63]. The CDP model in Abaqus is described by isotropicelastoplastic behavior constitutive laws defined by different ultimate stress, damage andsoftening in tension and compression, and a three-dimensional behavior obeying a Drucker–Prager failure criterion assuming a non-associated flow rule. The Lubliner model was latermodified by proposing a distinct damage parameter for compression and tension [64], asin the following equations.
σt = (1 − dt)× E0 ×(εt − εt
pl) (3)
σc = (1 − dc)× E0 ×(εc − εc
pl) (4)
Table 1 reports the adopted parameters of the CDP material model. Although a CDPapproach is conceived for isotropic fragile materials, like concrete, it has been widely shownthat its basic constitutive law can also be adapted to masonry. Apart from its conveniencefor accurately reproducing the structural behavior, this model is also available in manyother Finite Element codes.
Table 1. CDP parameters.
Dilatation Angle Eccentricity Strength Ratioσb0/σc0
Ratio of Tensile andCompression Stresses in the
Deviatoric Plane kViscosity
10◦ 0.1 1.16 2/3 0.0002
The numerical models are discretized while using tetrahedron elements with a char-acteristic length that is lower than 30 cm. The C3D4 type of Abaqus elements library isselected, and it suits best for meshing any irregular shape and faster numerical processing.
4. Results
The extended results from the conducted analyses are reported in the following ap-pendixes, respectively, all the pushover capacity curves in Appendix A and the damage pat-terns in Appendix B. This section only summarizes the most relevant and illustrative examples.
4.1. Role of the Geometry
The tower’s geometry is crucial in obtaining a reliable result on the seismic response ofthe structure. A comprehensive study on the geometrical aspects’ role based on simplifiednumerical models can be found in this literature, [65], where different failure patterns havebeen observed. The role of the geometry here is not fully comprehensive due to the limitednumber of the studied towers. However, it highlights the role of structural features like thepresence of openings or horizontal elements. Figure 6 confronts the hollow tower T1 withtower T2, where the last is expected to be more realistic. The reported results correspondto the material M3, but it is remarkably similar to the results of M2. Compare Figure A8

Buildings 2021, 11, 71 8 of 21
with Figures A9 and A11 with Figure A12. Initially, a concentration of damage in the zoneunder compression (tracked by the P4 and P5 load pattern approach) can be observed. Thishighlights the possibility that the initiation of the collapse mechanism could result fromcombined compressive and shear stresses, which is not the most intuitive one when dealingwith low tensile strength materials. Case P1 highlights the damage that is extensivelyspread in the tensile zone. Besides the load pattern influence, this overall behavior is alsoaffected by the ratio of the cross-section, the wall thickness, and the slenderness. It is worthnoting is that the concentration of the damages is not close to the base, but almost to 1/4 ofthe height. This effect is also observed in a real case study, San Giorgio Tower in Ferrara(Italy). Because of the geometry and the present inclination of the tower, many conductednonlinear time history analyses have highlighted the initiation of a failure pattern with adiagonal crack shape in the compressed side located almost closes to the 1/4 of the tower’sheight [26].
Buildings 2021, 11, x FOR PEER REVIEW 9 of 22
inclination, while considering that the highest registered inclination for masonry towers is approximately 4°. Thenceforth, this reduction of the base shear is justified also consid-ering that, for an inclination angle 𝛼 arctan 0.7125/𝜆 , the towers lose their stability from the self-weight [66]. However, the most important output is the oscillations from conducting a full nonlinear dynamic analysis (i.e., P5), see Figure 7, Tower 3 case.
T1-P1 T1-P4-B T1-P4-C T1-P5-B T1-P5-C
T2-P1 T2-P4-B T2-P4-C T2-P5-B T2-P5-C
Figure 6. Damage pattern comparison between the hollow tower (Tower T1) in the upper images and the "realistic tower" (Tower T2) in the lower images respectively for the points defined in Sec-tion 2.2.
As expected, a full nonlinear dynamic will cause oscillations of the structure during the initial steps of the numerical simulation, where it occurs that the structure is in the elastic phase. These observed oscillations in the initial branch, which are clearly distin-guishable for Tower 3 in see Figure 7, make it difficult to segregate a linear branch repre-senting the elastic phase of the pushover capacity curve. Approaching the pushover anal-ysis according to the herein considered P5 load pattern is not always reliable for obtaining pushover capacity curves, as mentioned in the previous paragraph.
4.2. Role of damping The following results are referred to as the P5 load pattern alone, as the other ap-
proaches are strictly static where the role of damping is completely eliminated. Applying a full dynamic simulation for mimicking a pushover analysis will result in an oscillation behavior, as mentioned in the previous section. Two approaches can be followed for de-creasing this effect: i) modifying the damping properties of the material and ii) applying a quasi-static analysis approach [41]. Figure 8 shows the results from the first approach. It can be observed that, by increasing the material damping, the oscillation is faded propor-tionally. However, the most significant disadvantage is that this approach falsely in-creases the load resisting capacity. The resultant pushover curve becomes alike with a
Figure 6. Damage pattern comparison between the hollow tower (Tower T1) in the upper images and the “realistic tower”(Tower T2) in the lower images respectively for the points defined in Section 2.2.
The role of the geometry is also represented here by the presence of openings, which isdemonstrated by an apparent vertical cracking passing through the openings, see Figure 6.This result implies the necessity to address a more detailed numerical approach model,where the simplified ones, as proposed in [9,10], could fail to distinguish the most proneactive mechanism.
In terms of load-bearing capacity, i.e., the maximum base shear, the present casestudies do not indicate a very substantial difference, ranging between 2–2.5 MN. On theother hand, the inclination significantly decreases the load-bearing capacity, which, for thepresent tower (T3), ranges between 1.4–2.2 MN. An inclination of 2◦ is considered to bea high inclination, while considering that the highest registered inclination for masonrytowers is approximately 4◦. Thenceforth, this reduction of the base shear is justified also

Buildings 2021, 11, 71 9 of 21
considering that, for an inclination angle α ≈ arctan(0.7125/λ), the towers lose theirstability from the self-weight [66]. However, the most important output is the oscillationsfrom conducting a full nonlinear dynamic analysis (i.e., P5), see Figure 7, Tower 3 case.
Buildings 2021, 11, x FOR PEER REVIEW 10 of 22
simulation of force-controlled or with elasto-plastic materials where the softening branch is missing.
Figure 7. Pushover capacity curves under P1, P4 and P5 load patterns for (top to bottom) Tower 1, Tower 2 and Tower 3 respectively
Figure 7. Pushover capacity curves under P1, P4 and P5 load patterns for (top to bottom) Tower 1,Tower 2 and Tower 3 respectively.
As expected, a full nonlinear dynamic will cause oscillations of the structure during theinitial steps of the numerical simulation, where it occurs that the structure is in the elasticphase. These observed oscillations in the initial branch, which are clearly distinguishable
Buildings 2021, 11, 71 10 of 21
for Tower 3 in see Figure 7, make it difficult to segregate a linear branch representing theelastic phase of the pushover capacity curve. Approaching the pushover analysis accordingto the herein considered P5 load pattern is not always reliable for obtaining pushovercapacity curves, as mentioned in the previous paragraph.
4.2. Role of Damping
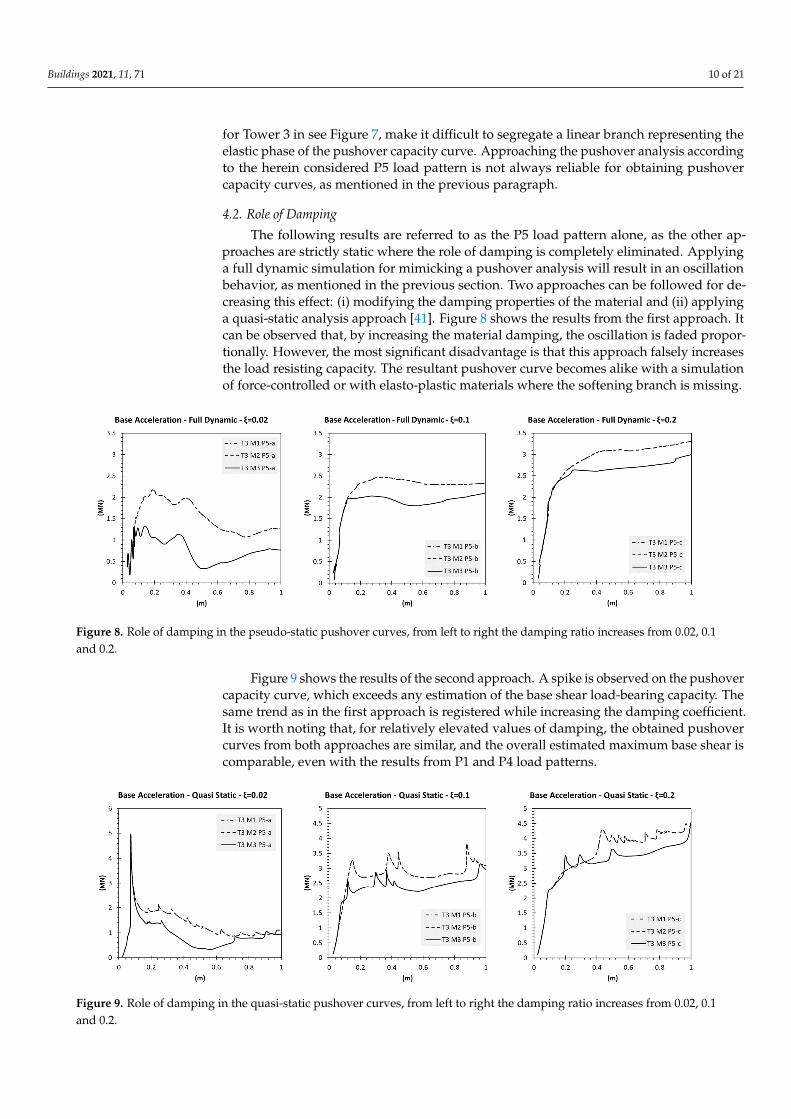
The following results are referred to as the P5 load pattern alone, as the other ap-proaches are strictly static where the role of damping is completely eliminated. Applyinga full dynamic simulation for mimicking a pushover analysis will result in an oscillationbehavior, as mentioned in the previous section. Two approaches can be followed for de-creasing this effect: (i) modifying the damping properties of the material and (ii) applyinga quasi-static analysis approach [41]. Figure 8 shows the results from the first approach. Itcan be observed that, by increasing the material damping, the oscillation is faded propor-tionally. However, the most significant disadvantage is that this approach falsely increasesthe load resisting capacity. The resultant pushover curve becomes alike with a simulationof force-controlled or with elasto-plastic materials where the softening branch is missing.
Buildings 2021, 11, x FOR PEER REVIEW 11 of 22
Figure 8. Role of damping in the pseudo-static pushover curves, from left to right the damping ratio increases from 0.02, 0.1 and 0.2
Figure 9 shows the results of the second approach. A spike is observed on the push-over capacity curve, which exceeds any estimation of the base shear load-bearing capacity. The same trend as in the first approach is registered while increasing the damping coeffi-cient. It is worth noting that, for relatively elevated values of damping, the obtained push-over curves from both approaches are similar, and the overall estimated maximum base shear is comparable, even with the results from P1 and P4 load patterns.
Figure 9. Role of damping in the quasi-static pushover curves, from left to right the damping ratio increases from 0.02, 0.1 and 0.2.
4.3. Role of material Regarding the material properties, the role of the tensile strength is not investigated
here, but it is acknowledged as a parameter that strongly influences the load-bearing ca-pacity. The compressive strength here is exposed to control both the bearing capacity and the damage pattern, as discussed in Section 4.1. A comparable response is registered for the M1 (elasto-plastic) and the M2 (elasto-plastic with softening) in terms of the capacity curve and damage pattern, refer to Appendix A and B, respectively. For a force-controlled pushover, the differences are negligible. Hence, if the nonlinear static analysis is imple-mented based on a force-controlled approach (in the absence of implementing a displace-ment-controlled due to a software constrain), the stress–strain relationship shape might be transcurred. Instead, the focus should be on other ruling parameters. The difference between an M2 and M3 type is quite visible for displacement-controlled alike approaches,
Figure 8. Role of damping in the pseudo-static pushover curves, from left to right the damping ratio increases from 0.02, 0.1and 0.2.
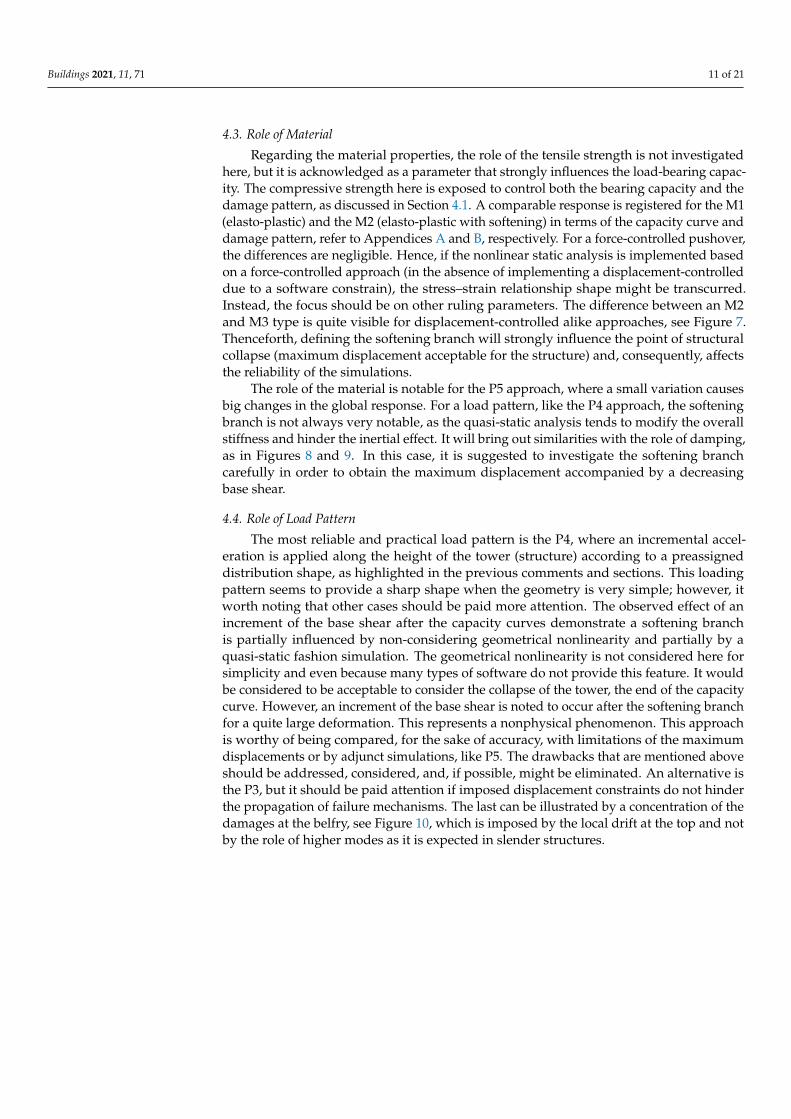
Figure 9 shows the results of the second approach. A spike is observed on the pushovercapacity curve, which exceeds any estimation of the base shear load-bearing capacity. Thesame trend as in the first approach is registered while increasing the damping coefficient.It is worth noting that, for relatively elevated values of damping, the obtained pushovercurves from both approaches are similar, and the overall estimated maximum base shear iscomparable, even with the results from P1 and P4 load patterns.
Buildings 2021, 11, x FOR PEER REVIEW 11 of 22
Figure 8. Role of damping in the pseudo-static pushover curves, from left to right the damping ratio increases from 0.02, 0.1 and 0.2
Figure 9 shows the results of the second approach. A spike is observed on the push-over capacity curve, which exceeds any estimation of the base shear load-bearing capacity. The same trend as in the first approach is registered while increasing the damping coeffi-cient. It is worth noting that, for relatively elevated values of damping, the obtained push-over curves from both approaches are similar, and the overall estimated maximum base shear is comparable, even with the results from P1 and P4 load patterns.
Figure 9. Role of damping in the quasi-static pushover curves, from left to right the damping ratio increases from 0.02, 0.1 and 0.2.
4.3. Role of material Regarding the material properties, the role of the tensile strength is not investigated
here, but it is acknowledged as a parameter that strongly influences the load-bearing ca-pacity. The compressive strength here is exposed to control both the bearing capacity and the damage pattern, as discussed in Section 4.1. A comparable response is registered for the M1 (elasto-plastic) and the M2 (elasto-plastic with softening) in terms of the capacity curve and damage pattern, refer to Appendix A and B, respectively. For a force-controlled pushover, the differences are negligible. Hence, if the nonlinear static analysis is imple-mented based on a force-controlled approach (in the absence of implementing a displace-ment-controlled due to a software constrain), the stress–strain relationship shape might be transcurred. Instead, the focus should be on other ruling parameters. The difference between an M2 and M3 type is quite visible for displacement-controlled alike approaches,
Figure 9. Role of damping in the quasi-static pushover curves, from left to right the damping ratio increases from 0.02, 0.1and 0.2.
Buildings 2021, 11, 71 11 of 21
4.3. Role of Material
Regarding the material properties, the role of the tensile strength is not investigatedhere, but it is acknowledged as a parameter that strongly influences the load-bearing capac-ity. The compressive strength here is exposed to control both the bearing capacity and thedamage pattern, as discussed in Section 4.1. A comparable response is registered for the M1(elasto-plastic) and the M2 (elasto-plastic with softening) in terms of the capacity curve anddamage pattern, refer to Appendices A and B, respectively. For a force-controlled pushover,the differences are negligible. Hence, if the nonlinear static analysis is implemented basedon a force-controlled approach (in the absence of implementing a displacement-controlleddue to a software constrain), the stress–strain relationship shape might be transcurred.Instead, the focus should be on other ruling parameters. The difference between an M2and M3 type is quite visible for displacement-controlled alike approaches, see Figure 7.Thenceforth, defining the softening branch will strongly influence the point of structuralcollapse (maximum displacement acceptable for the structure) and, consequently, affectsthe reliability of the simulations.
The role of the material is notable for the P5 approach, where a small variation causesbig changes in the global response. For a load pattern, like the P4 approach, the softeningbranch is not always very notable, as the quasi-static analysis tends to modify the overallstiffness and hinder the inertial effect. It will bring out similarities with the role of damping,as in Figures 8 and 9. In this case, it is suggested to investigate the softening branchcarefully in order to obtain the maximum displacement accompanied by a decreasingbase shear.
4.4. Role of Load Pattern
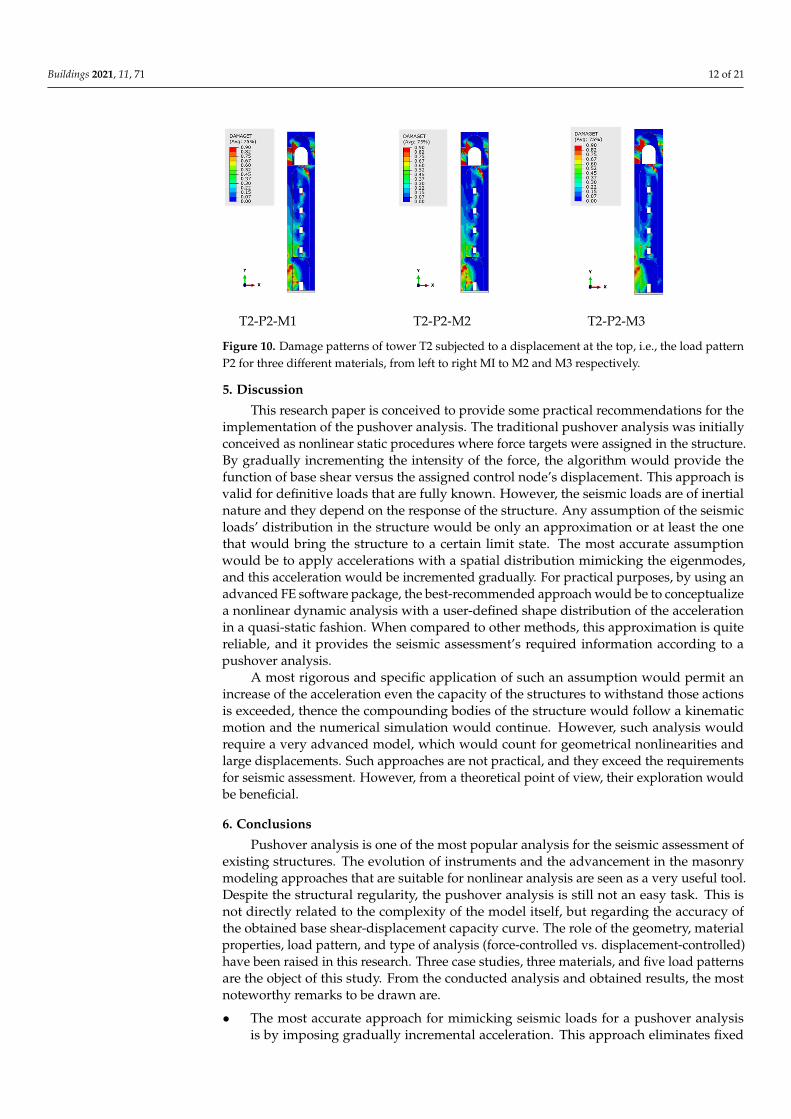
The most reliable and practical load pattern is the P4, where an incremental accel-eration is applied along the height of the tower (structure) according to a preassigneddistribution shape, as highlighted in the previous comments and sections. This loadingpattern seems to provide a sharp shape when the geometry is very simple; however, itworth noting that other cases should be paid more attention. The observed effect of anincrement of the base shear after the capacity curves demonstrate a softening branchis partially influenced by non-considering geometrical nonlinearity and partially by aquasi-static fashion simulation. The geometrical nonlinearity is not considered here forsimplicity and even because many types of software do not provide this feature. It wouldbe considered to be acceptable to consider the collapse of the tower, the end of the capacitycurve. However, an increment of the base shear is noted to occur after the softening branchfor a quite large deformation. This represents a nonphysical phenomenon. This approachis worthy of being compared, for the sake of accuracy, with limitations of the maximumdisplacements or by adjunct simulations, like P5. The drawbacks that are mentioned aboveshould be addressed, considered, and, if possible, might be eliminated. An alternative isthe P3, but it should be paid attention if imposed displacement constraints do not hinderthe propagation of failure mechanisms. The last can be illustrated by a concentration of thedamages at the belfry, see Figure 10, which is imposed by the local drift at the top and notby the role of higher modes as it is expected in slender structures.
Buildings 2021, 11, 71 12 of 21
Buildings 2021, 11, x FOR PEER REVIEW 12 of 22
see Figure 7. Thenceforth, defining the softening branch will strongly influence the point of structural collapse (maximum displacement acceptable for the structure) and, conse-quently, affects the reliability of the simulations.
The role of the material is notable for the P5 approach, where a small variation causes big changes in the global response. For a load pattern, like the P4 approach, the softening branch is not always very notable, as the quasi-static analysis tends to modify the overall stiffness and hinder the inertial effect. It will bring out similarities with the role of damp-ing, as in Figure 8 and Figure 9. In this case, it is suggested to investigate the softening branch carefully in order to obtain the maximum displacement accompanied by a decreas-ing base shear.
4.4. Role of load pattern The most reliable and practical load pattern is the P4, where an incremental acceler-
ation is applied along the height of the tower (structure) according to a preassigned dis-tribution shape, as highlighted in the previous comments and sections. This loading pat-tern seems to provide a sharp shape when the geometry is very simple; however, it worth noting that other cases should be paid more attention. The observed effect of an increment of the base shear after the capacity curves demonstrate a softening branch is partially in-fluenced by non-considering geometrical nonlinearity and partially by a quasi-static fash-ion simulation. The geometrical nonlinearity is not considered here for simplicity and even because many types of software do not provide this feature. It would be considered to be acceptable to consider the collapse of the tower, the end of the capacity curve. How-ever, an increment of the base shear is noted to occur after the softening branch for a quite large deformation. This represents a nonphysical phenomenon. This approach is worthy of being compared, for the sake of accuracy, with limitations of the maximum displace-ments or by adjunct simulations, like P5. The drawbacks that are mentioned above should be addressed, considered, and, if possible, might be eliminated. An alternative is the P3, but it should be paid attention if imposed displacement constraints do not hinder the propagation of failure mechanisms. The last can be illustrated by a concentration of the damages at the belfry, see Figure 10, which is imposed by the local drift at the top and not by the role of higher modes as it is expected in slender structures.
T2-P2-M1 T2-P2-M2 T2-P2-M3
Figure 10. Damage patterns of tower T2 subjected to a displacement at the top, i.e. the load pattern P2 for three different materials, from left to right MI to M2 and M3 respectively.
5. Discussion This research paper is conceived to provide some practical recommendations for the
implementation of the pushover analysis. The traditional pushover analysis was initially conceived as nonlinear static procedures where force targets were assigned in the struc-ture. By gradually incrementing the intensity of the force, the algorithm would provide the function of base shear versus the assigned control node’s displacement. This approach
Figure 10. Damage patterns of tower T2 subjected to a displacement at the top, i.e., the load patternP2 for three different materials, from left to right MI to M2 and M3 respectively.
5. Discussion
This research paper is conceived to provide some practical recommendations for theimplementation of the pushover analysis. The traditional pushover analysis was initiallyconceived as nonlinear static procedures where force targets were assigned in the structure.By gradually incrementing the intensity of the force, the algorithm would provide thefunction of base shear versus the assigned control node’s displacement. This approach isvalid for definitive loads that are fully known. However, the seismic loads are of inertialnature and they depend on the response of the structure. Any assumption of the seismicloads’ distribution in the structure would be only an approximation or at least the onethat would bring the structure to a certain limit state. The most accurate assumptionwould be to apply accelerations with a spatial distribution mimicking the eigenmodes,and this acceleration would be incremented gradually. For practical purposes, by using anadvanced FE software package, the best-recommended approach would be to conceptualizea nonlinear dynamic analysis with a user-defined shape distribution of the accelerationin a quasi-static fashion. When compared to other methods, this approximation is quitereliable, and it provides the seismic assessment’s required information according to apushover analysis.
A most rigorous and specific application of such an assumption would permit anincrease of the acceleration even the capacity of the structures to withstand those actionsis exceeded, thence the compounding bodies of the structure would follow a kinematicmotion and the numerical simulation would continue. However, such analysis wouldrequire a very advanced model, which would count for geometrical nonlinearities andlarge displacements. Such approaches are not practical, and they exceed the requirementsfor seismic assessment. However, from a theoretical point of view, their exploration wouldbe beneficial.
6. Conclusions
Pushover analysis is one of the most popular analysis for the seismic assessment ofexisting structures. The evolution of instruments and the advancement in the masonrymodeling approaches that are suitable for nonlinear analysis are seen as a very useful tool.Despite the structural regularity, the pushover analysis is still not an easy task. This isnot directly related to the complexity of the model itself, but regarding the accuracy ofthe obtained base shear-displacement capacity curve. The role of the geometry, materialproperties, load pattern, and type of analysis (force-controlled vs. displacement-controlled)have been raised in this research. Three case studies, three materials, and five load patternsare the object of this study. From the conducted analysis and obtained results, the mostnoteworthy remarks to be drawn are.
• The most accurate approach for mimicking seismic loads for a pushover analysisis by imposing gradually incremental acceleration. This approach eliminates fixed
Buildings 2021, 11, 71 13 of 21
patterns of loads, which constrain the damage distributions. Many software providesthe implementation of this approach in a quasi-static fashion.
• If the practitioner or researcher implements a force-based approach, the role of thematerial is less relevant when compared to other features of the structure.
• The geometry’s role, like horizontal diaphragms, openings, and inclination, stronglyinfluences the shape of the damage pattern. Consequently, the seismic capacityis affected.
• The softening in the stress-strain relationship in compression plays a crucial role inestimating the tower’s lowest load-bearing capacity (near collapse) and the maximumallowable deformation. It is recommended that the softening branch should be sharper.Otherwise, a smooth softening fades to tackle the realistic failure of the tower.
Funding: This research received no external funding.
Institutional Review Board Statement: Not applicable.
Informed Consent Statement: Not applicable.
Data Availability Statement: The data presented in this study are available on request from thecorresponding author.
Conflicts of Interest: The author declares no conflict of interest.
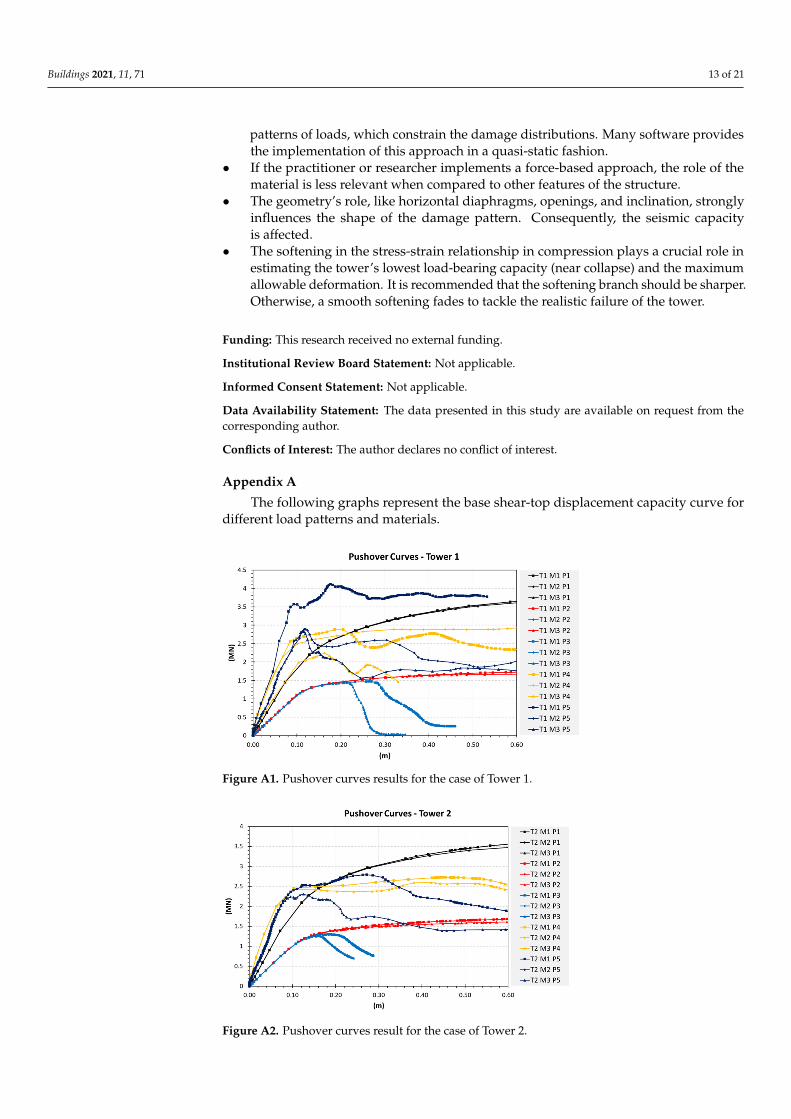
Appendix A
The following graphs represent the base shear-top displacement capacity curve fordifferent load patterns and materials.
Buildings 2021, 11, x FOR PEER REVIEW 14 of 22
Appendix A The following graphs represent the base shear-top displacement capacity curve for
different load patterns and materials.
Figure A1. Pushover curves results for the case of Tower 1.
Figure A2. Pushover curves result for the case of Tower 2.
Figure A1. Pushover curves results for the case of Tower 1.
Buildings 2021, 11, x FOR PEER REVIEW 14 of 22
Appendix A The following graphs represent the base shear-top displacement capacity curve for
different load patterns and materials.
Figure A1. Pushover curves results for the case of Tower 1.
Figure A2. Pushover curves result for the case of Tower 2. Figure A2. Pushover curves result for the case of Tower 2.
Buildings 2021, 11, 71 14 of 21Buildings 2021, 11, x FOR PEER REVIEW 15 of 22
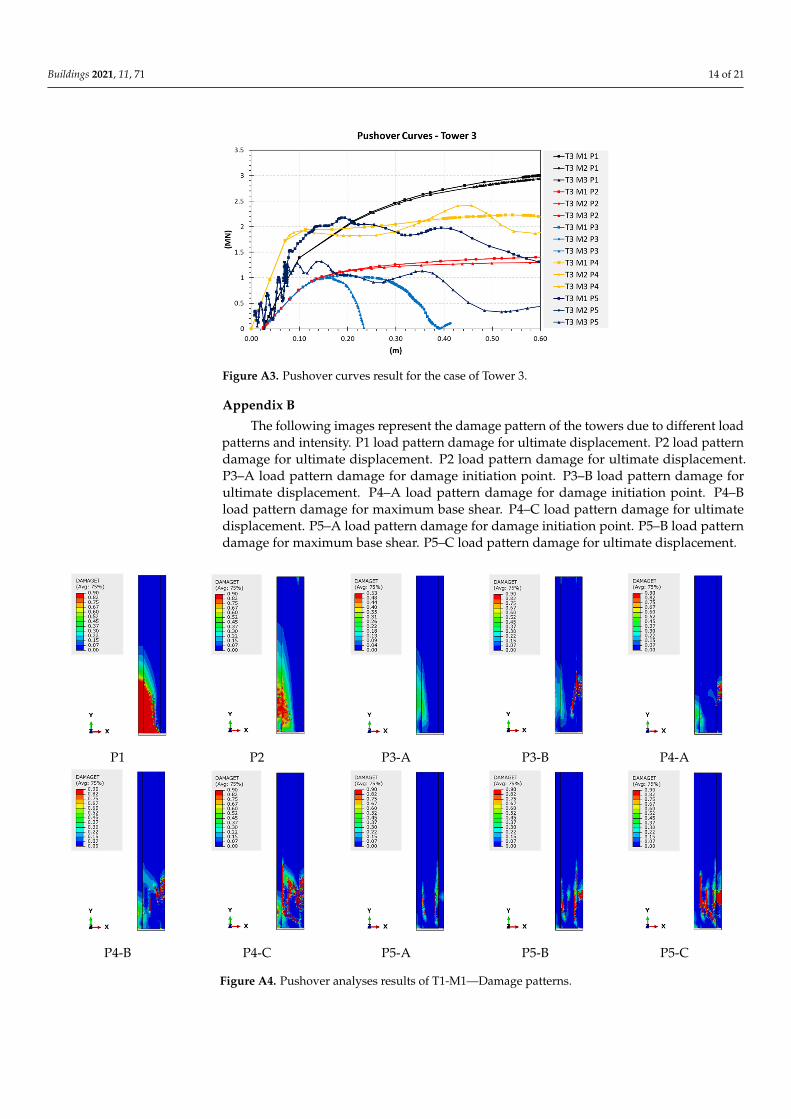
Figure A3. Pushover curves result for the case of Tower 3.
Appendix B The following images represent the damage pattern of the towers due to different
load patterns and intensity. P1 load pattern damage for ultimate displacement. P2 load pattern damage for ultimate displacement. P2 load pattern damage for ultimate displace-ment. P3–A load pattern damage for damage initiation point. P3–B load pattern damage for ultimate displacement. P4–A load pattern damage for damage initiation point. P4–B load pattern damage for maximum base shear. P4–C load pattern damage for ultimate displacement. P5–A load pattern damage for damage initiation point. P5–B load pattern damage for maximum base shear. P5–C load pattern damage for ultimate displacement.
P1 P2 P3-A P3-B P4-A
P4-B P4-C P5-A P5-B P5-C
Figure B1. Pushover analyses results of T1-M1—Damage patterns.
Figure A3. Pushover curves result for the case of Tower 3.
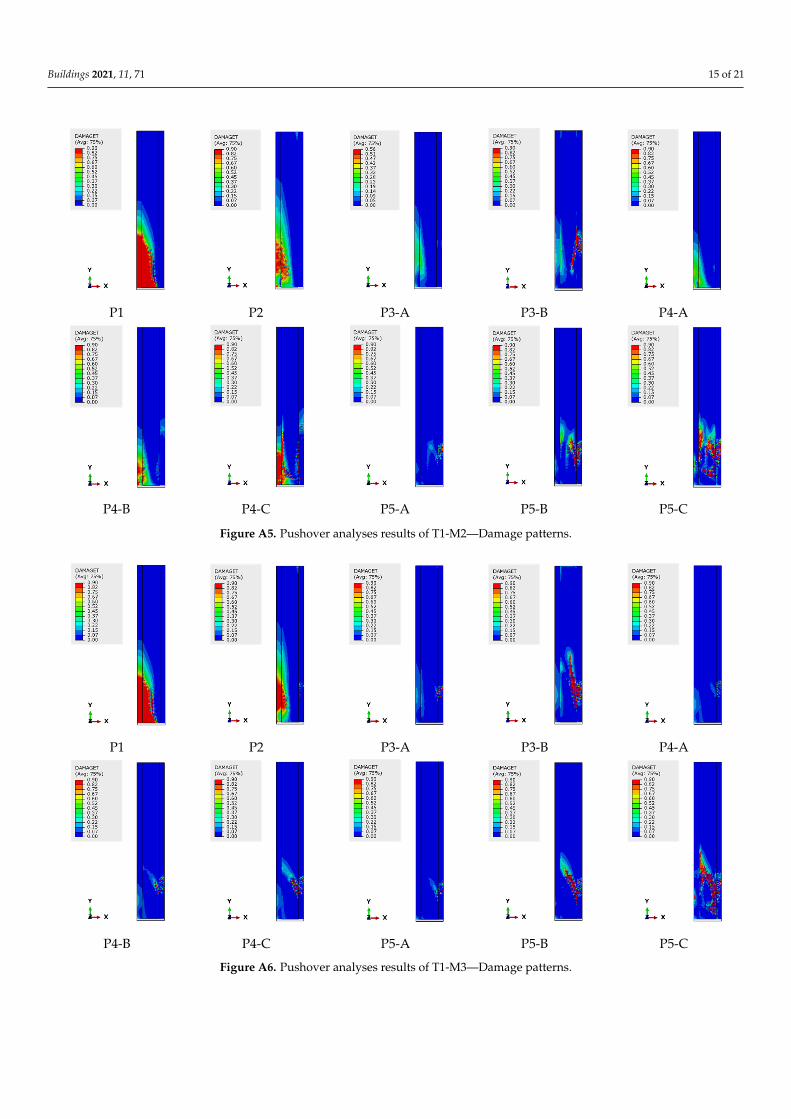
Appendix B
The following images represent the damage pattern of the towers due to different loadpatterns and intensity. P1 load pattern damage for ultimate displacement. P2 load patterndamage for ultimate displacement. P2 load pattern damage for ultimate displacement.P3–A load pattern damage for damage initiation point. P3–B load pattern damage forultimate displacement. P4–A load pattern damage for damage initiation point. P4–Bload pattern damage for maximum base shear. P4–C load pattern damage for ultimatedisplacement. P5–A load pattern damage for damage initiation point. P5–B load patterndamage for maximum base shear. P5–C load pattern damage for ultimate displacement.
Buildings 2021, 11, x FOR PEER REVIEW 15 of 22
Figure A3. Pushover curves result for the case of Tower 3.
Appendix B The following images represent the damage pattern of the towers due to different
load patterns and intensity. P1 load pattern damage for ultimate displacement. P2 load pattern damage for ultimate displacement. P2 load pattern damage for ultimate displace-ment. P3–A load pattern damage for damage initiation point. P3–B load pattern damage for ultimate displacement. P4–A load pattern damage for damage initiation point. P4–B load pattern damage for maximum base shear. P4–C load pattern damage for ultimate displacement. P5–A load pattern damage for damage initiation point. P5–B load pattern damage for maximum base shear. P5–C load pattern damage for ultimate displacement.
P1 P2 P3-A P3-B P4-A
P4-B P4-C P5-A P5-B P5-C
Figure B1. Pushover analyses results of T1-M1—Damage patterns. Figure A4. Pushover analyses results of T1-M1—Damage patterns.
Buildings 2021, 11, 71 15 of 21Buildings 2021, 11, x FOR PEER REVIEW 16 of 22
P1 P2 P3-A P3-B P4-A
P4-B P4-C P5-A P5-B P5-C
Figure B2. Pushover analyses results of T1-M2—Damage patterns.
P1 P2 P3-A P3-B P4-A
P4-B P4-C P5-A P5-B P5-C
Figure B3. Pushover analyses results of T1-M3—Damage patterns.
Figure A5. Pushover analyses results of T1-M2—Damage patterns.
Buildings 2021, 11, x FOR PEER REVIEW 16 of 22
P1 P2 P3-A P3-B P4-A
P4-B P4-C P5-A P5-B P5-C
Figure B2. Pushover analyses results of T1-M2—Damage patterns.
P1 P2 P3-A P3-B P4-A
P4-B P4-C P5-A P5-B P5-C
Figure B3. Pushover analyses results of T1-M3—Damage patterns. Figure A6. Pushover analyses results of T1-M3—Damage patterns.

Buildings 2021, 11, 71 16 of 21Buildings 2021, 11, x FOR PEER REVIEW 17 of 22
P1 P2 P3-A P3-B P4-A
P4-B P4-C P5-A P5-B P5-C
Figure B4. Pushover analyses results of T2-M1—Damage patterns.
P1 P2 P3-A P3-B P4-A
P4-B P4-C P5-A P5-B P5-C
Figure B5. Pushover analyses results of T2-M2—Damage patterns.
Figure A7. Pushover analyses results of T2-M1—Damage patterns.
Buildings 2021, 11, x FOR PEER REVIEW 17 of 22
P1 P2 P3-A P3-B P4-A
P4-B P4-C P5-A P5-B P5-C
Figure B4. Pushover analyses results of T2-M1—Damage patterns.
P1 P2 P3-A P3-B P4-A
P4-B P4-C P5-A P5-B P5-C
Figure B5. Pushover analyses results of T2-M2—Damage patterns. Figure A8. Pushover analyses results of T2-M2—Damage patterns.

Buildings 2021, 11, 71 17 of 21Buildings 2021, 11, x FOR PEER REVIEW 18 of 22
P1 P2 P3-A P3-B P4-A
P4-B P4-C P5-A P5-B P5-C
Figure B6. Pushover analyses results of T2-M3—Damage patterns.
P1 P2 P3-A P3-B P4-A
P4-B P4-C P5-A P5-B P5-C
Figure B7. Pushover analyses results of T3-M1—Damage patterns.
Figure A9. Pushover analyses results of T2-M3—Damage patterns.
Buildings 2021, 11, x FOR PEER REVIEW 18 of 22
P1 P2 P3-A P3-B P4-A
P4-B P4-C P5-A P5-B P5-C
Figure B6. Pushover analyses results of T2-M3—Damage patterns.
P1 P2 P3-A P3-B P4-A
P4-B P4-C P5-A P5-B P5-C
Figure B7. Pushover analyses results of T3-M1—Damage patterns. Figure A10. Pushover analyses results of T3-M1—Damage patterns.
Buildings 2021, 11, 71 18 of 21Buildings 2021, 11, x FOR PEER REVIEW 19 of 22
P1 P2 P3-A P3-B P4-A
P4-B P4-C P5-A P5-B P5-C
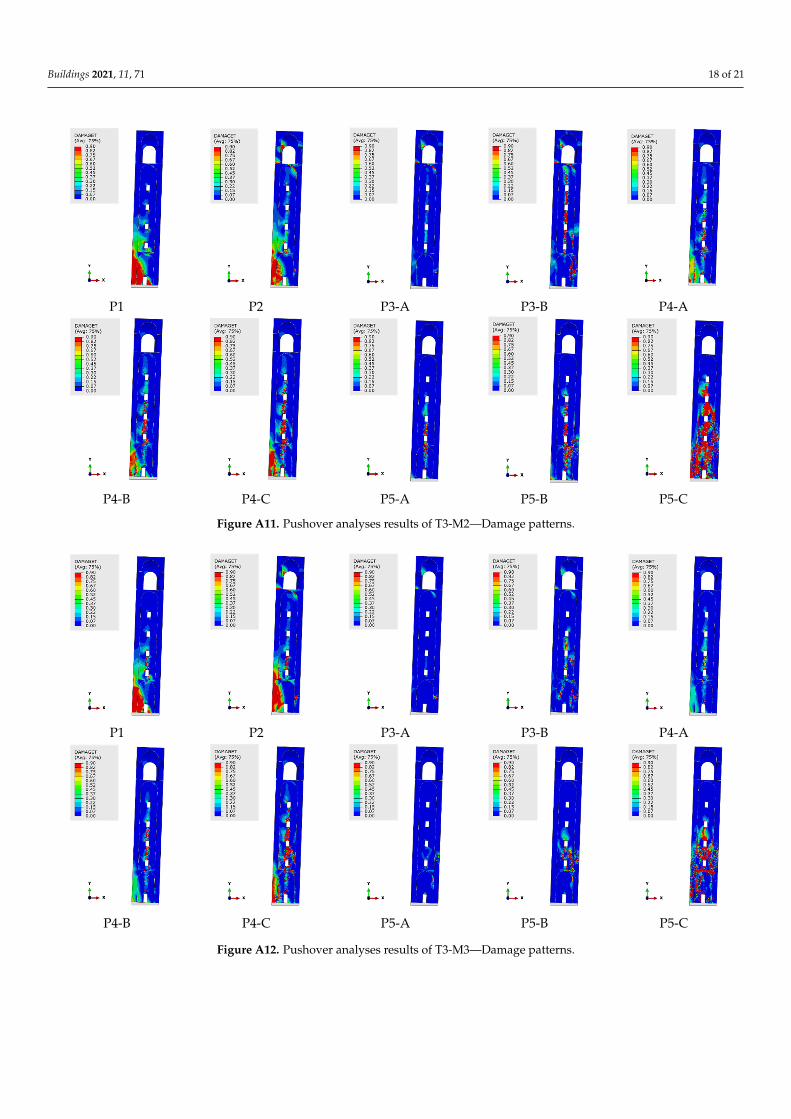
Figure B8. Pushover analyses results of T3-M2—Damage patterns.
P1 P2 P3-A P3-B P4-A
P4-B P4-C P5-A P5-B P5-C
Figure B9. Pushover analyses results of T3-M3—Damage patterns.
References 1. Asteris, P.G.; Moropoulou, A.; Skentou, A.D.; Apostolopoulou, M.; Mohebkhah, A.; Cavaleri, L.; Rodrigues, H.; Varum, H.
Stochastic vulnerability assessment of masonry structures: Concepts, modeling and restoration aspects. Appl. Sci. 2019, 9, 243, doi:10.3390/app9020243.
Figure A11. Pushover analyses results of T3-M2—Damage patterns.
Buildings 2021, 11, x FOR PEER REVIEW 19 of 22
P1 P2 P3-A P3-B P4-A
P4-B P4-C P5-A P5-B P5-C
Figure B8. Pushover analyses results of T3-M2—Damage patterns.
P1 P2 P3-A P3-B P4-A
P4-B P4-C P5-A P5-B P5-C
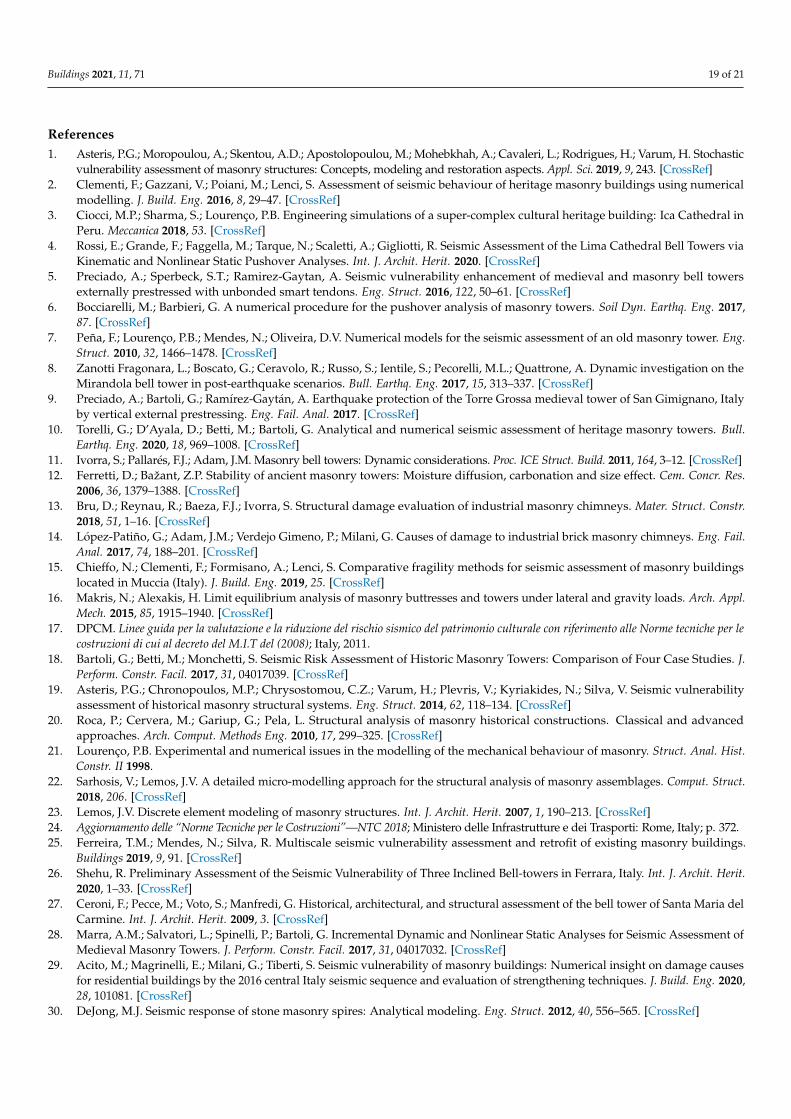
Figure B9. Pushover analyses results of T3-M3—Damage patterns.
References 1. Asteris, P.G.; Moropoulou, A.; Skentou, A.D.; Apostolopoulou, M.; Mohebkhah, A.; Cavaleri, L.; Rodrigues, H.; Varum, H.
Stochastic vulnerability assessment of masonry structures: Concepts, modeling and restoration aspects. Appl. Sci. 2019, 9, 243, doi:10.3390/app9020243.
Figure A12. Pushover analyses results of T3-M3—Damage patterns.
Buildings 2021, 11, 71 19 of 21
References1. Asteris, P.G.; Moropoulou, A.; Skentou, A.D.; Apostolopoulou, M.; Mohebkhah, A.; Cavaleri, L.; Rodrigues, H.; Varum, H. Stochastic
vulnerability assessment of masonry structures: Concepts, modeling and restoration aspects. Appl. Sci. 2019, 9, 243. [CrossRef]2. Clementi, F.; Gazzani, V.; Poiani, M.; Lenci, S. Assessment of seismic behaviour of heritage masonry buildings using numerical
modelling. J. Build. Eng. 2016, 8, 29–47. [CrossRef]3. Ciocci, M.P.; Sharma, S.; Lourenço, P.B. Engineering simulations of a super-complex cultural heritage building: Ica Cathedral in
Peru. Meccanica 2018, 53. [CrossRef]4. Rossi, E.; Grande, F.; Faggella, M.; Tarque, N.; Scaletti, A.; Gigliotti, R. Seismic Assessment of the Lima Cathedral Bell Towers via
Kinematic and Nonlinear Static Pushover Analyses. Int. J. Archit. Herit. 2020. [CrossRef]5. Preciado, A.; Sperbeck, S.T.; Ramirez-Gaytan, A. Seismic vulnerability enhancement of medieval and masonry bell towers
externally prestressed with unbonded smart tendons. Eng. Struct. 2016, 122, 50–61. [CrossRef]6. Bocciarelli, M.; Barbieri, G. A numerical procedure for the pushover analysis of masonry towers. Soil Dyn. Earthq. Eng. 2017,
87. [CrossRef]7. Peña, F.; Lourenço, P.B.; Mendes, N.; Oliveira, D.V. Numerical models for the seismic assessment of an old masonry tower. Eng.
Struct. 2010, 32, 1466–1478. [CrossRef]8. Zanotti Fragonara, L.; Boscato, G.; Ceravolo, R.; Russo, S.; Ientile, S.; Pecorelli, M.L.; Quattrone, A. Dynamic investigation on the
Mirandola bell tower in post-earthquake scenarios. Bull. Earthq. Eng. 2017, 15, 313–337. [CrossRef]9. Preciado, A.; Bartoli, G.; Ramírez-Gaytán, A. Earthquake protection of the Torre Grossa medieval tower of San Gimignano, Italy
by vertical external prestressing. Eng. Fail. Anal. 2017. [CrossRef]10. Torelli, G.; D’Ayala, D.; Betti, M.; Bartoli, G. Analytical and numerical seismic assessment of heritage masonry towers. Bull.
Earthq. Eng. 2020, 18, 969–1008. [CrossRef]11. Ivorra, S.; Pallarés, F.J.; Adam, J.M. Masonry bell towers: Dynamic considerations. Proc. ICE Struct. Build. 2011, 164, 3–12. [CrossRef]12. Ferretti, D.; Bažant, Z.P. Stability of ancient masonry towers: Moisture diffusion, carbonation and size effect. Cem. Concr. Res.
2006, 36, 1379–1388. [CrossRef]13. Bru, D.; Reynau, R.; Baeza, F.J.; Ivorra, S. Structural damage evaluation of industrial masonry chimneys. Mater. Struct. Constr.
2018, 51, 1–16. [CrossRef]14. López-Patiño, G.; Adam, J.M.; Verdejo Gimeno, P.; Milani, G. Causes of damage to industrial brick masonry chimneys. Eng. Fail.
Anal. 2017, 74, 188–201. [CrossRef]15. Chieffo, N.; Clementi, F.; Formisano, A.; Lenci, S. Comparative fragility methods for seismic assessment of masonry buildings
located in Muccia (Italy). J. Build. Eng. 2019, 25. [CrossRef]16. Makris, N.; Alexakis, H. Limit equilibrium analysis of masonry buttresses and towers under lateral and gravity loads. Arch. Appl.
Mech. 2015, 85, 1915–1940. [CrossRef]17. DPCM. Linee guida per la valutazione e la riduzione del rischio sismico del patrimonio culturale con riferimento alle Norme tecniche per le
costruzioni di cui al decreto del M.I.T del (2008); Italy, 2011.18. Bartoli, G.; Betti, M.; Monchetti, S. Seismic Risk Assessment of Historic Masonry Towers: Comparison of Four Case Studies. J.
Perform. Constr. Facil. 2017, 31, 04017039. [CrossRef]19. Asteris, P.G.; Chronopoulos, M.P.; Chrysostomou, C.Z.; Varum, H.; Plevris, V.; Kyriakides, N.; Silva, V. Seismic vulnerability
assessment of historical masonry structural systems. Eng. Struct. 2014, 62, 118–134. [CrossRef]20. Roca, P.; Cervera, M.; Gariup, G.; Pela, L. Structural analysis of masonry historical constructions. Classical and advanced
approaches. Arch. Comput. Methods Eng. 2010, 17, 299–325. [CrossRef]21. Lourenço, P.B. Experimental and numerical issues in the modelling of the mechanical behaviour of masonry. Struct. Anal. Hist.
Constr. II 1998.22. Sarhosis, V.; Lemos, J.V. A detailed micro-modelling approach for the structural analysis of masonry assemblages. Comput. Struct.
2018, 206. [CrossRef]23. Lemos, J.V. Discrete element modeling of masonry structures. Int. J. Archit. Herit. 2007, 1, 190–213. [CrossRef]24. Aggiornamento delle “Norme Tecniche per le Costruzioni”—NTC 2018; Ministero delle Infrastrutture e dei Trasporti: Rome, Italy; p. 372.25. Ferreira, T.M.; Mendes, N.; Silva, R. Multiscale seismic vulnerability assessment and retrofit of existing masonry buildings.
Buildings 2019, 9, 91. [CrossRef]26. Shehu, R. Preliminary Assessment of the Seismic Vulnerability of Three Inclined Bell-towers in Ferrara, Italy. Int. J. Archit. Herit.
2020, 1–33. [CrossRef]27. Ceroni, F.; Pecce, M.; Voto, S.; Manfredi, G. Historical, architectural, and structural assessment of the bell tower of Santa Maria del
Carmine. Int. J. Archit. Herit. 2009, 3. [CrossRef]28. Marra, A.M.; Salvatori, L.; Spinelli, P.; Bartoli, G. Incremental Dynamic and Nonlinear Static Analyses for Seismic Assessment of
Medieval Masonry Towers. J. Perform. Constr. Facil. 2017, 31, 04017032. [CrossRef]29. Acito, M.; Magrinelli, E.; Milani, G.; Tiberti, S. Seismic vulnerability of masonry buildings: Numerical insight on damage causes
for residential buildings by the 2016 central Italy seismic sequence and evaluation of strengthening techniques. J. Build. Eng. 2020,28, 101081. [CrossRef]
30. DeJong, M.J. Seismic response of stone masonry spires: Analytical modeling. Eng. Struct. 2012, 40, 556–565. [CrossRef]

Buildings 2021, 11, 71 20 of 21
31. Shakya, M.; Varum, H.; Vicente, R.; Costa, A. Empirical Formulation for Estimating the Fundamental Frequency of SlenderMasonry Structures. Int. J. Archit. Herit. 2016, 10, 55–66. [CrossRef]
32. D’Altri, A.M.; Sarhosis, V.; Milani, G.; Rots, J.; Cattari, S.; Lagomarsino, S.; Sacco, E.; Tralli, A.; Castellazzi, G.; de Miranda,S. Modeling Strategies for the Computational Analysis of Unreinforced Masonry Structures: Review and Classification. Arch.Comput. Methods Eng. 2020, 27, 1153–1185.
33. Degli Abbati, S.; D’Altri, A.M.; Ottonelli, D.; Castellazzi, G.; Cattari, S.; de Miranda, S.; Lagomarsino, S. Seismic assessment ofinteracting structural units in complex historic masonry constructions by nonlinear static analyses. Comput. Struct. 2019, 213,51–71. [CrossRef]
34. Milani, G.; Shehu, R.; Valente, M. Seismic Assessment of Masonry Towers by Means of Nonlinear Static Procedures. Procedia Eng.2017, 199, 266–271. [CrossRef]
35. Parisi, F.; Augenti, N. Uncertainty in seismic capacity of masonry buildings. Buildings 2012, 2, 218. [CrossRef]36. Amari, K.; Abdessemed Foufa, A.; Cheikh Zouaoui, M.; Uva, G. Seismic Vulnerability of Masonry Lighthouses: A Study of the
Bengut Lighthouse, Dellys, Boumerdès, Algeria. Buildings 2020, 10, 247. [CrossRef]37. Croce, P.; Landi, F.; Formichi, P. Probabilistic Seismic Assessment of Existing Masonry Buildings. Buildings 2019, 9, 237. [CrossRef]38. Guadagnuolo, M.; Nuzzo, M.; Faella, G. The Corpus Domini Bell Tower: Conservation and Safety. Procedia Struct. Integr. 2018,
11. [CrossRef]39. Magenes, G. A method for pushover analysis in seismic assessment of masonry buildings. In Proceedings of the 12th World
Conference on Earthquake Engineering, New Zealand Society for Earthquake Engineering, Upper Hutt, New Zealand, 30January–4 February 2000.
40. Pintucchi, B.; Zani, N. Effectiveness of nonlinear static procedures for slender masonry towers. Bull. Earthq. Eng. 2014, 12,2531–2556. [CrossRef]
41. Simulia, D.S. Abaqus 6.14 documentation 2014.42. Federal Emergency Management Agency. Prestandard and Commentary for the Seismic Rehabilitation of Buildings; FEMA: Washington,
DC, USA, 2000.43. European Committee for Standardization. Eurocode 8: Design of Structures for Earthquake Resistance—Part 1; CEN: Brussels,
Belgium, 2014; Volume 3.44. Istruzioni per l’applicazione dell’ Aggiornamento delle “Norme tecniche per le costruzioni”; Ministero delle Infrastrutture e dei Trasporti:
Rome, Italy; Volume 35, p. 337.45. Goel, R.K.; Chopra, A.K. Role of higher-“mode” pushover analyses in seismic analysis of buildings. Earthq. Spectra 2005, 21,
1027–1041. [CrossRef]46. Antoniu, S.; Pinho, R. Development And Verification Of A Displacement-Based Adaptive Pushover Procedure. J. Earthq. Eng.
2004, 8, 643–661. [CrossRef]47. NTC-18 Explicative Notes: Part 8- Costruzioni Esistenti; 2017.48. Applied Technology Council. Seismic Evaluation and Retrofit of Concrete Buildings; ATC: Redwood City, CA, USA, 1996.49. Valente, M.; Milani, G. Nonlinear dynamic and static analyses on eight historical masonry towers in the North-East of Italy. Eng.
Struct. 2016, 114, 241–270. [CrossRef]50. European Committee for Standardization. Eurocode 6—Design of Masonry Structures—Simplified Calculation Methods for Unreinforced
Masonry Structures. Part 1-1 General Rules for Reinforced Unreinforced Masonry Structures; EN 1996-1; CEN: Brussels, Belgium, 2005.51. Casolo, S.; Milani, G.; Uva, G.; Alessandri, C. Comparative seismic vulnerability analysis on ten masonry towers in the coastal Po
Valley in Italy. Eng. Struct. 2013, 49, 465–490. [CrossRef]52. Valente, M.; Milani, G. Effects of Geometrical Features on the Seismic Response of Historical Masonry Towers. J. Earthq. Eng.
2017, 1–33. [CrossRef]53. Giannini, R.; Pagnoni, T.; Pinto, P.E.; Vanzi, I. Risk analysis of a medieval tower before and after strengthening. Struct. Saf. 1996,
18, 81–100. [CrossRef]54. Bernardeschi, K.; Padovani, C.; Pasquinelli, G. Numerical modelling of the structural behaviour of Buti’s bell tower. J. Cult. Herit.
2004, 5, 371–378. [CrossRef]55. Carpinteri, A.; Lacidogna, G. Damage evaluation of three masonry towers by acoustic emission. Eng. Struct. 2007. [CrossRef]56. Saisi, A.; Gentile, C.; Guidobaldi, M. Post-earthquake continuous dynamic monitoring of the Gabbia Tower in Mantua, Italy.
Constr. Build. Mater. 2015. [CrossRef]57. Milani, G.; Shehu, R.; Valente, M. Seismic vulnerability of leaning masonry towers located in Emilia-Romagna region, Italy:FE
analyses of four case studies. AIP Conf. Proc. 2016, 1790, 130002. [CrossRef]58. Valente, M.; Milani, G. Seismic assessment of historical masonry towers by means of simplified approaches and standard FEM.
Constr. Build. Mater. 2016, 108, 74–104. [CrossRef]59. Bartoli, G.; Betti, M.; Marra, A.M.; Monchetti, S. Semiempirical Formulations for Estimating the Main Frequency of Slender
Masonry Towers. J. Perform. Constr. Facil. 2017, 31, 04017025. [CrossRef]60. Palermo, M.; Silvestri, S.; Gasparini, G.; Baraccani, S.; Trombetti, T. An approach for the mechanical characterisation of the Asinelli
Tower (Bologna) in presence of insufficient experimental data. J. Cult. Herit. 2015, 16, 536–543. [CrossRef]61. Pesci, A.; Casula, G.; Boschi, E. Laser scanning the Garisenda and Asinelli towers in Bologna (Italy): Detailed deformation
patterns of two ancient leaning buildings. J. Cult. Herit. 2011, 12, 117–127. [CrossRef]

Buildings 2021, 11, 71 21 of 21
62. Ferraioli, M.; Miccoli, L.; Abruzzese, D. Dynamic characterisation of a historic bell-tower using a sensitivity-based technique formodel tuning. J. Civ. Struct. Health Monit. 2018, 8, 253–269. [CrossRef]
63. Lubliner, J.; Oliver, J.; Oller, S.; Oñate, E. A plastic-damage model for concrete. Int. J. Solids Struct. 1989, 25, 299–326. [CrossRef]64. Lee, J.; Fenves, G.L. Plastic-Damage Model for Cyclic Loading of Concrete Structures. Eng. Mech. 1998, 124, 892–900. [CrossRef]65. Sarhosis, V.; Milani, G.; Formisano, A.; Fabbrocino, F. Evaluation of different approaches for the estimation of the seismic
vulnerability of masonry towers. Bull. Earthq. Eng. 2017, 16. [CrossRef]66. Heyman, J. Leaning towers. Meccanica 1992, 27, 153–159. [CrossRef]