SEISMIC HAZARD AND USE OF STRONG MOTION TIME HISTORIES FOR DAM SEISMIC ANALYSES
10
1 SEISMIC HAZARD AND USE OF STRONG MOTION TIME HISTORIES FOR DAM SEISMIC ANALYSES Gabriele FIORENTINO 1 , Luca FURGANI 2 , Camillo NUTI 3 , Fabio SABETTA 4 ABSTRACT The seismic risk due to large dams collapse is particularly high and needs to be assessed even for the largest expected earthquake. The Italian seismic code (NTC2008) prescribes high return periods to compute the response spectrum: 1950 years return period for existing dams and 2500 years return period for new dams. In areas with a strong seismic activity, the Code requests a detailed seismo- tectonic study and a Seismic Hazard Assessment in order to define the target spectra. Historically, there are two methods to perform a Seismic Hazard Assessment, PSHA (Probabilistic Seismic Hazard Assessment) and DSHA (Deterministic Seismic Hazard Assessment). In this work a hybrid procedure is used (Sabetta et al., 2012), combining various aspects of both methods for four Italian dam sites with different seismicity. In order to perform nonlinear dynamic analyses, the selection and the adjustment of spectrum-compatible accelerograms is done using two different approaches, matching or simply scaling the real earthquake registrations. As demonstrated by the experience, the sliding at the base of concrete gravity dams is one of the failures mechanism produced by past earthquakes. To evaluate the influence of the seismic action, a sensitivity analysis is done assuming an equivalent SDOF system able to take into account fluid- foundation-structure interaction as theorized by Fenves & Chopra (1986) and the sliding at the base. The nonlinear response of a concrete gravity dam against the four dam sites seismic actions is evaluated. The results of nonlinear dynamic analyses are also compared with the simplified method proposed by Nuti & Basili (2009). INTRODUCTION Concrete gravity dams represent a relevant part of the 500 large dams existing in Italy. Most of them were built following obsolete design criteria, so they need to be verified with modern seismic analyses as prescribed in the Code. Considering the large number of concrete dams in Italy, simplified methods to quickly evaluate the seismic safety could be essential. These methods can be used for preliminary analyses. More advanced analyses, able to take into account fluid-foundation-structure interactions and nonlinear behavior have to be performed for the most vulnerable dams. A very important step in the evaluation of the seismic response of a dam is the definition of the seismic input. The Italian code requires that the seismic safety should be assessed for different limit states; the two main for existing dams are those associated with minor damages and with the uncontrolled release of water, corresponding to earthquakes with 100 and 1950 years of return period. In the following the collapse limit state is investigated. In seismic areas where PGA > 0,15 g for a 475 1 PhD student, University of Roma Tre, Rome, [email protected] 2 PhD student, University of Roma Tre, Rome, [email protected] 3 Professor, University of Roma Tre, Rome, [email protected] 4 Seismic Hazard Service Director, Civil Protection Department, Rome, [email protected]
Transcript of SEISMIC HAZARD AND USE OF STRONG MOTION TIME HISTORIES FOR DAM SEISMIC ANALYSES

1
SEISMIC HAZARD AND USE OF STRONG MOTION TIME
HISTORIES FOR DAM SEISMIC ANALYSES
Gabriele FIORENTINO1, Luca FURGANI
2, Camillo NUTI
3, Fabio SABETTA
4
ABSTRACT
The seismic risk due to large dams collapse is particularly high and needs to be assessed even for the
largest expected earthquake. The Italian seismic code (NTC2008) prescribes high return periods to
compute the response spectrum: 1950 years return period for existing dams and 2500 years return
period for new dams. In areas with a strong seismic activity, the Code requests a detailed seismo-
tectonic study and a Seismic Hazard Assessment in order to define the target spectra.
Historically, there are two methods to perform a Seismic Hazard Assessment, PSHA
(Probabilistic Seismic Hazard Assessment) and DSHA (Deterministic Seismic Hazard Assessment).
In this work a hybrid procedure is used (Sabetta et al., 2012), combining various aspects of both
methods for four Italian dam sites with different seismicity. In order to perform nonlinear dynamic
analyses, the selection and the adjustment of spectrum-compatible accelerograms is done using two
different approaches, matching or simply scaling the real earthquake registrations.
As demonstrated by the experience, the sliding at the base of concrete gravity dams is one of the
failures mechanism produced by past earthquakes. To evaluate the influence of the seismic action, a
sensitivity analysis is done assuming an equivalent SDOF system able to take into account fluid-
foundation-structure interaction as theorized by Fenves & Chopra (1986) and the sliding at the base.
The nonlinear response of a concrete gravity dam against the four dam sites seismic actions is
evaluated. The results of nonlinear dynamic analyses are also compared with the simplified method
proposed by Nuti & Basili (2009).
INTRODUCTION
Concrete gravity dams represent a relevant part of the 500 large dams existing in Italy. Most of them
were built following obsolete design criteria, so they need to be verified with modern seismic analyses
as prescribed in the Code. Considering the large number of concrete dams in Italy, simplified methods
to quickly evaluate the seismic safety could be essential. These methods can be used for preliminary
analyses. More advanced analyses, able to take into account fluid-foundation-structure interactions
and nonlinear behavior have to be performed for the most vulnerable dams.
A very important step in the evaluation of the seismic response of a dam is the definition of the
seismic input. The Italian code requires that the seismic safety should be assessed for different limit
states; the two main for existing dams are those associated with minor damages and with the
uncontrolled release of water, corresponding to earthquakes with 100 and 1950 years of return period.
In the following the collapse limit state is investigated. In seismic areas where PGA > 0,15 g for a 475
1 PhD student, University of Roma Tre, Rome, [email protected]
2 PhD student, University of Roma Tre, Rome, [email protected]
3 Professor, University of Roma Tre, Rome, [email protected]
4 Seismic Hazard Service Director, Civil Protection Department, Rome, [email protected]
2
years return period, the Code requests a specific seismo-tectonic study and a Seismic Hazard
Assessment in order to define the target spectra. For low seismicity zones the seismic hazard used for
common structures is accepted. On the basis of the Bulletin 148 issued by ICOLD, the seismic action
must be evaluated both through a DSHA and a PSHA.
PSHA combines the uncertainties in distance, magnitude and local intensity parameters to
obtain the hazard curves, which give the occurrence rate for each value of the chosen intensity
parameter. DSHA considers all the possible seismic sources that can affect the site to look for the
worst possible scenario (Kramer,1996). A "Controlling Earthquake" must be chosen to represent the
seismic scenario.
In literature it is frequent to find debates about which method is the most suitable for the
evaluation of earthquake ground motions (Bommer, 2002). Some authors suggest instead to combine
the methods using an "hybrid" approach. This is very useful when there is a need to perform direct
integration analyses using acceleration time histories. The hybrid approach consists in finding a
controlling earthquake which has a response spectrum compatible with the Uniform Hazard Spectrum
(UHS), using the disaggregation of hazard (Bazzurro & Cornell, 1999).
As it was stated before, both methods compute the earthquake ground motion parameters
adopting Ground Motion Predictive Equations (GMPEs). The ground motion parameters are generally
assumed to be lognormally distributed and this can create difficulties for both PSHA and DSHA in
sites where seismicity is very high, because, for high return periods, the intensity parameters lie in the
tail of the probability distribution and appropriate upper bounds must be chosen to truncate the
GMPEs.
In the first part of this study the spectra evaluated with these different approaches are reported
and compared for four different Italian dam sites. Starting from these spectra, the purpose of the paper
is to perform a sensitivity analysis on the base sliding response of gravity dams. For each site and for a
concrete gravity dam, the base sliding response using two sets of strong motion time histories was
evaluated. The first set consists of 7 scaled time histories obtained with the REXEL code (Iervolino et
al., 2009). This program searches in the strong-motion database the records with some specific
characteristics compatible with the reference spectrum. In particular the records are simply scaled so
that the average spectral values approximate the target spectra in an assigned range of structural
periods. In the second set of time histories, the same 7 natural records previously selected were
modified with SEISMOMATCH (Hancock et al. 2006) by means of wavelets. The response of the
dam can be affected by the number of scaled signals considered. To show this evidence, two additional
30 accelerograms sets obtained with REXEL were used.
Finally the seismic response of a dam was evaluated by mean of non linear dynamic analyses on
a SDOF simplified model of the dam (Nuti e Basili 2010). The non-linearity of the response is
considered by putting a slider at the base of the SDOF system, considering a Coulomb frictional
behavior.
CASE STUDIES
The hazard assessment and the evaluation of seismic response is performed for 4 Italian dam sites
having a PGA> 0,15g for a return period of 475 and therefore requiring a seismic hazard assessment.
Sites are described in Table 1.
Table 1. Dam sites considered for seismic action evaluation
Site Location (Region) PGA for Tr=475 yrs PGA for Tr=1950 yrs
A Piemonte 0,15g 0,25g
B Toscana 0,22g 0,35g
C Abruzzo 0,26g 0,42g
D Calabria 0,27g 0,46g

G.Fiorentino, L.Furgani, C.Nuti, F.Sabetta
3
SEISMIC HAZARD ASSESSMENT
PSHA
The PSHA was made using CRISIS software (Ordaz, 2007). In this work we chose to use the Italian
seismogenic zonation ZS9, used by INGV to draw up the seismic hazard map of Italy (Meletti et al.
2004). The ICOLD Bulletin 148 prescribes to consider the zones located within a distance variable
from 100 to 300 km from the site. We can point out that the difference in hazard considering 100 km
or 200 km is negligible, so we considered 100 km (Ordaz, 2004).
In the calculation of the recurrence relations, the catalog completeness period was taken into
account. As we pointed out before, the requested return period for the seismic design of a dam
corresponds to 1950 years , while the completeness period is hardly greater than 1000 years. So it is
straightforward to suppose that the largest magnitude of the catalogue is not the maximum magnitude
that can take place at a site. For this reason the maximum magnitude was raised by 0.5 units in each
seismogenic zone.
The estimate of the ground motion parameters, was carried out using SP96 predictive equation
(Sabetta & Pugliese, 1996). For high return periods the intensity parameters lie on the tail of the
distribution, so it is needful to introduce upper bounds (PEGASOS Project 2004; Sabetta et al. 2005).
In the literature it is possible to find various methods to truncate the predictive equations, for
example truncating at a certain number of standard deviations (PEGASOS project, 2004). Proposals
range from 2 to 4,5 standard deviations (Bommer, 2002). For this work a truncation at 3σ was chosen.
Uniform Hazard Spectra (UHS) were computed. As the UHS don't give any information about
the earthquake which generated the spectrum, the disaggregation of hazard was performed (Bazzurro
& Cornell, 1999).
DSHA
A preliminary examination of the historic seismicity of each site was made, searching in the Database
of Individual Seismogenic Sources, DISS 3.1.1 (Basili et al.,2008) for the faults capable to generate an
earthquake compatible with the disaggregation results. Then we investigated the historical and
instrumental seismicity in order to find a controlling earthquake for each of the case studies. For one
of them, Site C, we found a recent controlling earthquake with time history records, which is the
record of the mainshock of 2009 l'Aquila Earthquake. For the other cases, we chose historical
earthquakes. In Table 2 the results of this step are reported.
Table 2. Controlling Earthquakes
Site Controlling earthquake Magnitude M Distance R (km)
A Alpi Marittime 1644 5.8 22
B Monterchi 1352 6.0 16
C L’Aquila 2009 6.7 15
D Calabria 1638 7.0 22
The influence of the random variability in the ground-motion prediction, generally indicated as
a fraction ε of the standard deviation of the GMPE, may play a very important role in comparing
probabilistic and deterministic assessments. Since the equations used to predict the ground motion are
probabilistic, it is actually impossible to perform a fully deterministic evaluation of the seismic hazard.
No specific indication is given in the literature (Bommer and Abrahamson 2006; Sabetta et al.
2005; Krinitzsky 2002) about the fraction of sigma to be used in the deterministic assessment. In order
to get spectra comparable with the probabilistic ones, we selected ε from 1,2 to 1,5. The acceleration
response spectra were calculated using two different GMPE related to Italian data, SP96 (Sabetta &
Pugliese 1996) and ITA10 (Bindi et al., 2010). Spectra were calculated considering a rigid soil
condition for SP96 and class site A for ITA10.

4
Figure 1 shows the response spectra computed by the previously described procedure. For each
dam site the following spectra are reported:
- Response spectrum n.1: Italian Code response spectrum (NTC 1950 years);
- Response spectrum n.2: PSHA calculated with CRISIS2007 software using SP96 GMPE;
- Response spectra n.3 and n.4: deterministic spectra computed, with the magnitude and
distance of the controlling earthquake (Table 2), respectively with ITA10 and with SP96
GMPEs. In case of Site B and Site C sites, the response spectra of accelerograms recorded close
to the dam are also reported as reference.
While the PSHA response spectra are slightly smaller than the Italian Code spectrum for all
the cases, some differences are observed in deterministic response spectra: the largest values were
obtained for Site D, whereas the smallest are observed for Site A. These results are consistent with
the seismicity of the sites.
0.0
0.2
0.4
0.6
0.8
0 0.5 1 1.5 2 2.5 3 3.5 4
Sp
ectr
al
acc
ele
rati
on
(g)
Period (s)
Site A
1-NTC 1950 years
2-PSHA CRISIS TR=1950 years
3-DSHA Mw=5,85 R=24 km (ITA10)
4-DSHA Mw=5,85 R=24 km (SP96)
0.0
0.2
0.4
0.6
0.8
1.0
0 0.5 1 1.5 2 2.5 3 3.5 4
Sp
ectr
al
acc
ele
rati
on
(g
)
Period (s)
Site B
1-NTC 1950 years
2-PSHA CRISIS TR=1950 years
3-DSHA Mw=6 R=15,7 km (ITA10)
4-DSHA Mw=6 R=15,7 km (SP96)
5-Record Casentino 2010 Mw=4,7 R=2,6 km
0.0
0.2
0.4
0.6
0.8
1.0
1.2
1.4
0 0.5 1 1.5 2 2.5 3 3.5 4
Sp
ectr
al
acc
ele
rati
on
(g
)
Period (s)
Site C
1-NTC 1950 years
2-PSHA CRISIS 1950 years
3-DSHA Mw=6.7 R=15 km (ITA10)
4-DSHA Mw=6,7 R=15 km (SP96)
5-Record L'Aquila 2009 Mw=6,5 R=4,5 km
0.0
0.2
0.4
0.6
0.8
1.0
1.2
1.4
0 0.5 1 1.5 2 2.5 3 3.5 4
Sp
ectr
al
acc
ele
rati
on
(g
)
Period (s)
Site D
1-NTC 1950 years
2-PSHA CRISIS TR=1950 years
3-DSHA Mw=7 R=22 km (ITA10)
4-DSHA Mw=7 R=22 km (SP96)
Figure 1: Response spectra on rigid soil for 4 sites
SELECTION OF THE ACCELERATION TIME HISTORIES
Direct integration analyses were performed using acceleration time histories. The Italian Code
prescribes that the accelerograms must be selected or generated matching the target response spectrum
obtained with 5% damping. If sets of 7 or more time histories are used, it is possible to consider the
average of the effects. If there are less than 7 accelerograms in the set, the most unfavorable effects
must be considered. Anyhow sets must be formed by at least 3 accelerograms.
In this work two methods to generate accelerograms were used to understand how much the
accelerograms selection or generation methodology can affect the response of dams.
For all the sites the responses for two different sets of accelerograms were computed. The first 7
accelerograms set was obtained using REXEL software (Iervolino et al., 2009), adopting the Italian
Code spectrum as target spectrum. The software scales the accelerograms until their average response
spectra matches the target spectrum. A preliminary analysis can be performed, specifying the ranges of
magnitude and distance in which we want to search for records. This is generally based on the
disaggregation of the hazard and on the parameters of the controlling earthquake. In areas with high
seismicity, like Site D, it is more difficult to find records with the specified magnitude and distance.

G.Fiorentino, L.Furgani, C.Nuti, F.Sabetta
5
The second set was formed by the same 7 time histories generated with REXEL but modified
with Seismomatch, a software that uses wavelets to modify the acceleration time histories (Hancock et
al., 2006) in order to achieve spectrum-compatibility. For this step too the chosen target spectrum was
the Italian Code.
Also the number of scaled signals can affect the response of a structure. To show this evidence,
two additional 30 accelerograms sets obtained with REXEL were used, for the two sites with the
lowest and the greatest seismicity, respectively Site A and Site D.
Figure 2 shows the results of the first two sets for Site D. It can be seen that the records
modified with Seismomatch are very close to the target spectrum, while those generated with REXEL
show a much larger scatter.
0.0
0.4
0.8
1.2
1.6
2.0
2.4
0 0.5 1 1.5 2 2.5 3 3.5 4
Sp
ectr
al
acc
ele
rati
on
(g)
Period (s)
Target spectrum NTC 1950 years000198 Matched000410 Matched004675 Matched006277 Matched006335 Matched006500 Matched007142 Matched
0.0
0.4
0.8
1.2
1.6
2.0
2.4
0 0.5 1 1.5 2 2.5 3 3.5 4
Sp
ectr
al
acc
ele
rati
on
(g)
Period (s)
Target spectrum NTC 1950 yearsAverage spectrum000198 Scaled000410 Scaled004675 Scaled006277 Scaled006335 Scaled006500 Scaled007142 Scaled
-0.60
-0.40
-0.20
0.00
0.20
0.40
0.60
0 1 2 3 4 5 6 7 8 9 10 11 12 13 14 15 16 17 18 19 20 21 22 23 24 25 26 27 28 29 30
a(g
)
T(s)
006335 Scaled
006335 Matched
Figure 2: Results of the two methods used to obtain acceleration time histories for Site D: (top left) records
modified with Seismomatch to match the 1950 years Italian Code Spectrum and (top right) records scaled with
REXEL. (bottom) Comparison between the scaled and the matched version of the accelerogram labelled as 6335.
EVALUATION OF RESPONSE
The seismic response of a concrete gravity dam can be studied with different approaches. As
expressed by prof. V.E. Saouma “in the simplest case, a spreadsheet is all that is needed, at the other
end a supercomputer (or massively parallel one) is essential”. To better highlight the importance of
accelerograms, in this work a simplified approach was chosen.
The dam was represented by an equivalent Single Degree of Freedom (SDOF) system. The
properties of the SDOF were defined in accordance with Fenves and Chopra theory (1986) which
studies the effects of fluid-foundation-structure interactions. According to this, the mass was increased
to take into account reservoir contribution, the stiffness was modified to reproduce the effects of the
interaction with the foundation and the damping was increased to consider both the contribution of
fluid and soil. To evaluate the residual displacement produced during the earthquake, a sled was
introduced at the base of the system. A frictional sliding resistance was used for this scope. An angle
of friction of 45° (with no cohesion) was chosen to emphasize the differences between the time
histories defined before. When the base shear produced by the earthquake overpasses the sliding
resistance, the dam slides. At the end of the earthquake the residual displacement can be evaluated.
The system depicted in Figure 3 was analyzed using the open source program “Opensees”.
6
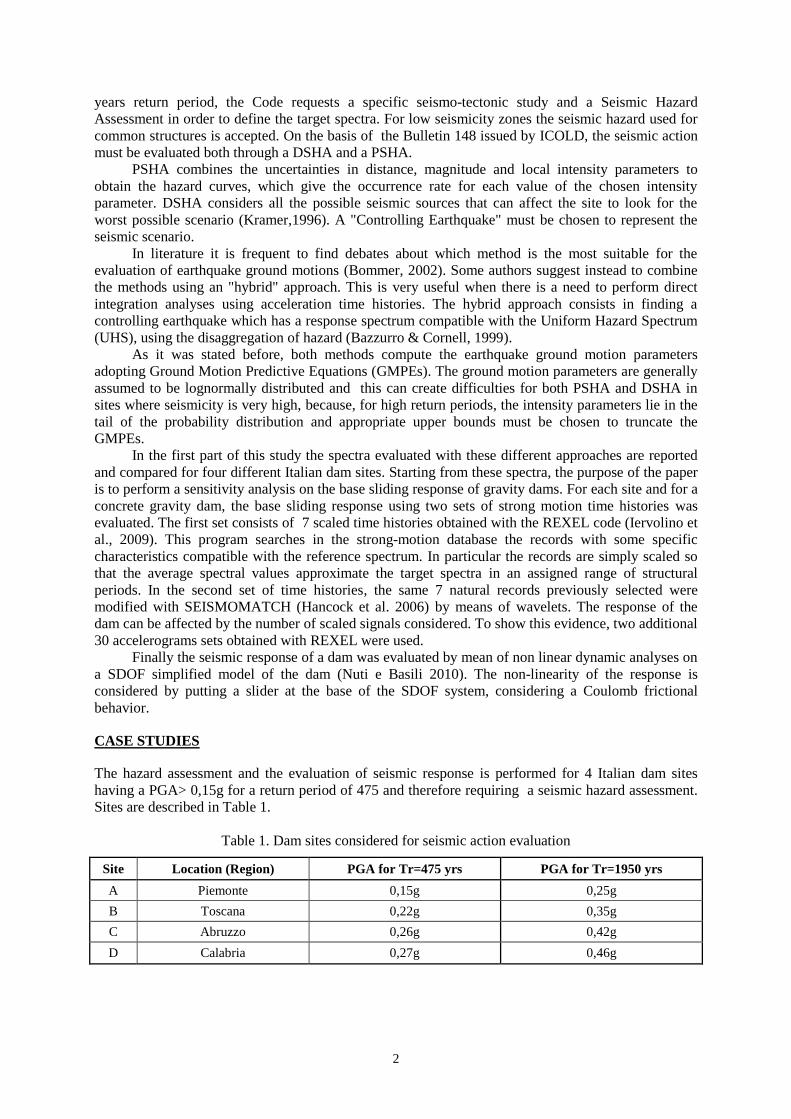
A total of 123 dynamic nonlinear analyses were performed with different ground motion inputs
and the same dam case study. The dam considered is 87 m high, has an upper width of 5 m and a
down-stream slope of 0.7. The density of the concrete is 23.90 kN/m3 and the elastic modulus is 23.64
GPa. The period of the structure if empty corresponds to 0.21 sec. whereas, considering the maximum
level of water, the equivalent period becomes 0.29 sec and the damping 7%.
Figure 3: SDOF equivalent system proposed by Nuti and Basili (2010).
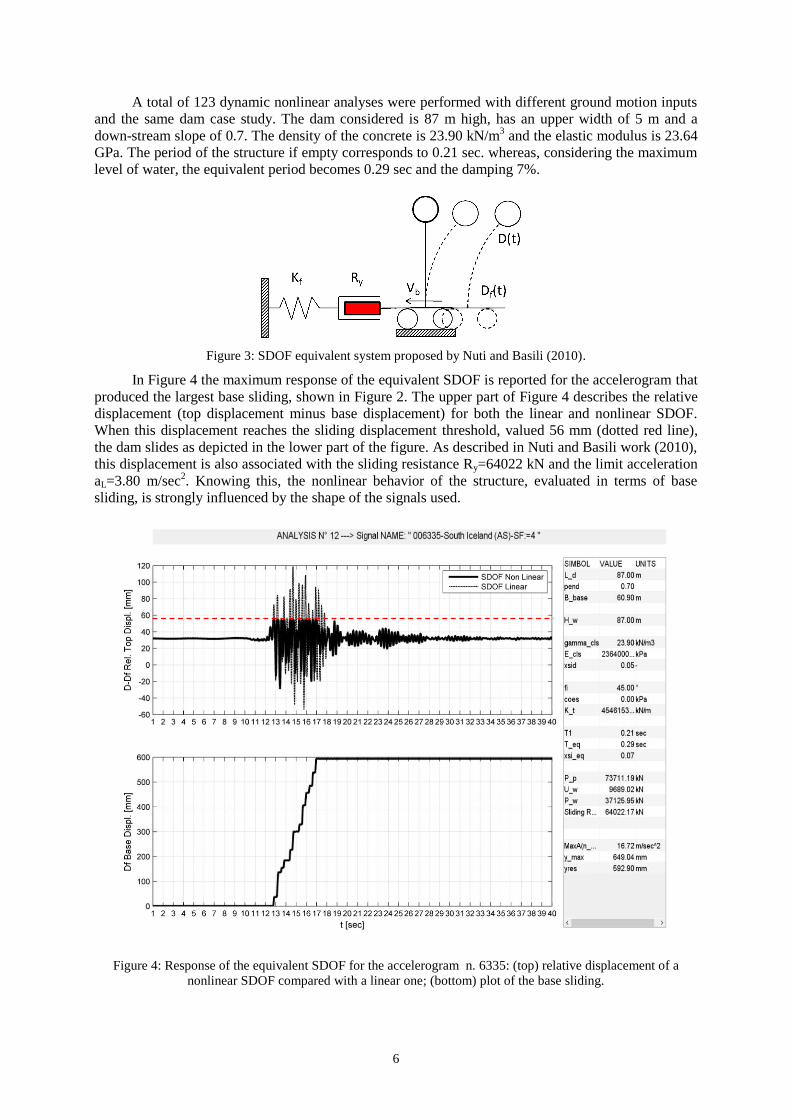
In Figure 4 the maximum response of the equivalent SDOF is reported for the accelerogram that
produced the largest base sliding, shown in Figure 2. The upper part of Figure 4 describes the relative
displacement (top displacement minus base displacement) for both the linear and nonlinear SDOF.
When this displacement reaches the sliding displacement threshold, valued 56 mm (dotted red line),
the dam slides as depicted in the lower part of the figure. As described in Nuti and Basili work (2010),
this displacement is also associated with the sliding resistance Ry=64022 kN and the limit acceleration
aL=3.80 m/sec2. Knowing this, the nonlinear behavior of the structure, evaluated in terms of base
sliding, is strongly influenced by the shape of the signals used.
Figure 4: Response of the equivalent SDOF for the accelerogram n. 6335: (top) relative displacement of a
nonlinear SDOF compared with a linear one; (bottom) plot of the base sliding.

G.Fiorentino, L.Furgani, C.Nuti, F.Sabetta
7
To avoid the uncontrolled release of water, the base displacement cannot reach values
incompatible with the hydraulic seal of the vertical joints between the blocks of the dam. For this
reason the residual slip must be limited. It is worth to note that the base sliding can also produce a
beneficial reduction of the stresses in the dam, it can be viewed as a damper for the dam.
In Table 3 the results obtained for the seismic signals evaluated for the four dam sites are
reported. For each site, 7 matched accelerograms and 7 scaled signals, compatible with the NTC target
spectra for the collapse limit state, were used. For each analysis the code associated to the signal, the
scale factor, the spectral acceleration Se(T), the maximum absolute displacement Dmax and the residual
slip are reported. The average values of the sliding displacements are also reported.
Table 3. Results obtained of matched and scaled seismic signals
MATCHED SIGNALS SCALED SIGNALS
N CODE Se(T)
[m/sec2]
Dmax
[mm]
Slip
[mm] CODE
Se(T)
[m/sec2]
Dmax
[mm]
Slip
[mm]
Sit
e A
(PG
A=
0.2
5 g
)
1 000055x-EQ:=22 5.3 66 10 000055-Friuli-SF:=0.7 6.1 79 23
2 000368x-EQ:=23 6.6 65 9 000368-Lazio - Abruzzo-SF:=3.9 5.6 70 14
3 000661x-EQ:=28 5.5 65 9 000661-Umbria - Marche-SF:=2.3 7.1 84 28
4 006327x-EQ:=28 6.2 76 20 006327-South Iceland (AS)-SF:=2 3.1 50 0
5 006333x-EQ:=106 6.1 76 20 006333-South Iceland (AS)-SF:=9 3.3 52 0
6 006335x-EQ:=106 6.9 85 29 006335-South Iceland (AS)-SF:=2.2 9.1 182 126
7 007142x-EQ:=111 6.3 71 15 007142-Bingol (Turkey)-SF:=0.8 8.6 153 96
AVERAGE 16 AVERAGE 41
Sit
e B
(PG
A=
0.3
5 g
)
1 000055x-EQ:=22 7.7 110 54 000055-Friuli-SF:=1 8.4 129 73
2 000604x-EQ:=23 8.1 101 45 000604-Umbria Marche-SF:=16.1 7.6 97 41
3 006270x-EQ:=28 8.6 83 27 006270-South Iceland-SF:=5.2 7.0 70 14
4 006332x-EQ:=28 7.6 112 56 006332-South Iceland (AS)-SF:=0.7 9.3 119 63
5 006349x-EQ:=106 7.9 164 108 006349-South Iceland (AS)-SF:=0.4 7.0 62 6
6 007142x-EQ:=106 7.4 126 70 007142-Bingol (Turkey)-SF:=0.7 6.8 84 28
7 007187x-EQ:=111 6.3 108 52 007187-Avej (Iran)-SF:=0.8 8.6 208 152
AVERAGE 59 AVERAGE 54
Sit
e C
(PG
A=
0.4
2 g
)
1 000055x-EQ:=22 10.8 170 114 000055-Friuli-SF:=1.2 12.6 228 172
2 000198x-EQ:=23 11.4 139 83 000198-Montenegro-SF:=2.3 14.0 247 191
3 000234x-EQ:=28 10.7 196 140 000234-Montenegro (AS)-SF:=6.1 9.9 218 162
4 004674x-EQ:=28 9.8 193 137 004674-South Iceland-SF:=1.3 11.5 243 187
5 006332x-EQ:=106 11.0 192 136 006332-South Iceland (AS)-SF:=0.8 11.1 151 95
6 006333x-EQ:=106 11.2 200 144 006333-South Iceland (AS)-SF:=20.5 7.6 191 135
7 007142x-EQ:=111 11.5 306 250 007142-Bingol (Turkey)-SF:=0.8 8.1 133 77
AVERAGE 143 AVERAGE 146
Sit
e D
(PG
A=
0.4
6 g
)
1 000198x-EQ:=22 12.0 154 98 000198-Montenegro-SF:=2.6 15.6 312 256
2 000410x-EQ:=23 11.5 192 136 000410-Golbasi (Turkey)-SF:=11.9 10.3 143 87
3 004675x-EQ:=28 7.6 117 61 004675-South Iceland-SF:=3.5 8.5 129 73
4 006277x-EQ:=28 10.7 311 255 006277-South Iceland-SF:=1.3 17.6 412 356
5 006335x-EQ:=106 11.2 245 189 006335-South Iceland (AS)-SF:=4 16.7 649 593
6 006500x-EQ:=106 10.4 351 295 006500-Duzce (Turkey)-SF:=0.9 10.4 250 194
7 007142x-EQ:=111 10.6 354 298 007142-Bingol (Turkey)-SF:=0.9 9.1 179 122
AVERAGE 190 AVERAGE 240

8
Starting from these results it is possible to observe that:
- base sliding increases with seismicity of the dam sites ranging from no slip to a maximum slip
of 593 mm for the “006335-South Iceland” signal;
- the maximum slip obtained for matched signals is lower than the maximum displacement of
scaled signals;
- the average values of base displacement are always lower for matched than for scaled signals,
except the case of Site B.
As remarked before, results are strongly affected by the signal shape. As shown in Figure 4 the
“6335” code signal, associated to the “South Iceland” earthquake, has a great number of peaks close to
the PGA value. Conversely the signal that produces the lower effects for scaled Site D records is the
“4675” signal, another South Iceland record.
İn order to evaluate the safety requirements of the dam in accordance with the Code, the
averages of the results obtained for the 7 set of ground motion are taken as reference. These values
have to be compared with the minimum sliding that can affect the hydraulic seal of the vertical joints.
In absence of indication 100 mm is assumed. Considering this and the preliminary analyses results,
only Site C and Site D earthquakes seem capable to produce uncontrolled release of water and for
these reason they need more advanced analysis.
The selection of the accelerograms strongly influences the results of non linear analyses. The 7
signals derived from the matching obtained with Seismomatch software, are closer to the target
spectrum and the results obtained are also closer.
Another aspect of the accelerograms selection is the number of scaled signal to use. A minimum
of 7 to a maximum of 30 are commonly used. The effect on the results is evaluated for the two sites
with the lower and higher seismicity. The mean values obtained using 30 accelerograms for Site A and
Site D are respectively 26 mm and 196 mm.
It is interesting to compare the average, standard deviation and covariance (COV) obtained for
all the groups of spectrum compatible signals used. Table 4 suggests that the matched signals exhibit a
significantly lower COV than the scaled signals.
Table 4. Statistics of the residual base displacement obtained for all the group of signals used
Signal Group Average
[mm]
St. Dev.
[mm]
COV
Site A - 7 Matched Signals (NTC) 16 7 0.47
Site B - 7 Matched Signals (NTC) 59 25 0.43
Site C - 7 Matched Signals (NTC) 143 52 0.36
Site D - 7 Matched Signals (NTC) 190 96 0.50
Site A - 7 Scaled Signals (NTC) 41 50 1.21
Site B - 7 Scaled Signals (NTC) 54 50 0.92
Site C - 7 Scaled Signals (NTC) 146 45 0.31
Site D - 7 Scaled Signals (NTC) 240 185 0.77
Site A - 30 Scaled Signals (NTC) 26 35 1.37
Site D - 30 Scaled Signals (NTC) 196 136 0.69
The results confirm the great influence of signal selection on nonlinear behaviour. This is only
partially reduced considering matched instead of simply scaled signals or changing the number of
signals used. There is a sort of uncertainty on the value of the residual slip. This can be evaluated with
the use of simplified dynamic non linear analyses. In the light of this scattering, for preliminary checks
the order of magnitude seems to be more important.
It has to be remarked that there are simplified methods, based on equivalent static forces which
can avoid the use of dynamic nonlinear analyses. The example of the Nuti and Basili simplified
method is reported hereafter. In this method the demand, the capacity and the response of the dam are
G.Fiorentino, L.Furgani, C.Nuti, F.Sabetta
9
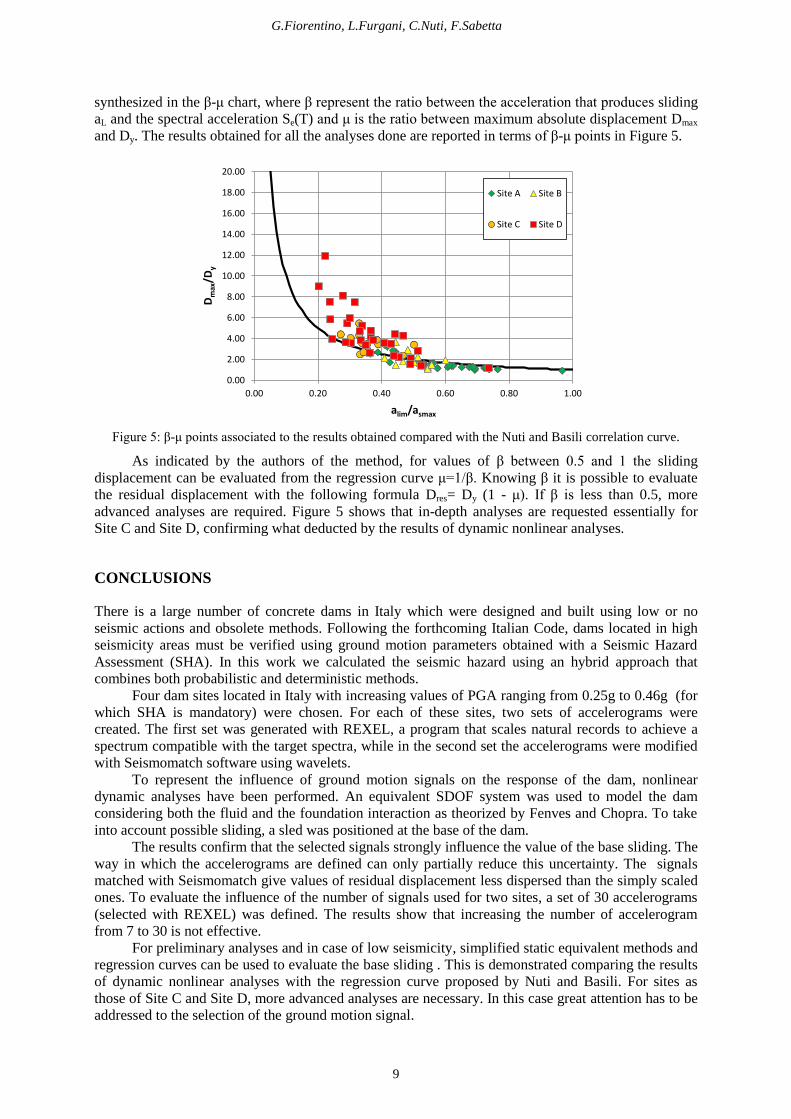
synthesized in the β-μ chart, where β represent the ratio between the acceleration that produces sliding
aL and the spectral acceleration Se(T) and μ is the ratio between maximum absolute displacement Dmax
and Dy. The results obtained for all the analyses done are reported in terms of β-μ points in Figure 5.
0.00
2.00
4.00
6.00
8.00
10.00
12.00
14.00
16.00
18.00
20.00
0.00 0.20 0.40 0.60 0.80 1.00
Dmax/D
y
alim/asmax
Site A Site B
Site C Site D
Figure 5: β-μ points associated to the results obtained compared with the Nuti and Basili correlation curve.
As indicated by the authors of the method, for values of β between 0.5 and 1 the sliding
displacement can be evaluated from the regression curve μ=1/β. Knowing β it is possible to evaluate
the residual displacement with the following formula Dres= Dy (1 - μ). If β is less than 0.5, more
advanced analyses are required. Figure 5 shows that in-depth analyses are requested essentially for
Site C and Site D, confirming what deducted by the results of dynamic nonlinear analyses.
CONCLUSIONS
There is a large number of concrete dams in Italy which were designed and built using low or no
seismic actions and obsolete methods. Following the forthcoming Italian Code, dams located in high
seismicity areas must be verified using ground motion parameters obtained with a Seismic Hazard
Assessment (SHA). In this work we calculated the seismic hazard using an hybrid approach that
combines both probabilistic and deterministic methods.
Four dam sites located in Italy with increasing values of PGA ranging from 0.25g to 0.46g (for
which SHA is mandatory) were chosen. For each of these sites, two sets of accelerograms were
created. The first set was generated with REXEL, a program that scales natural records to achieve a
spectrum compatible with the target spectra, while in the second set the accelerograms were modified
with Seismomatch software using wavelets.
To represent the influence of ground motion signals on the response of the dam, nonlinear
dynamic analyses have been performed. An equivalent SDOF system was used to model the dam
considering both the fluid and the foundation interaction as theorized by Fenves and Chopra. To take
into account possible sliding, a sled was positioned at the base of the dam.
The results confirm that the selected signals strongly influence the value of the base sliding. The
way in which the accelerograms are defined can only partially reduce this uncertainty. The signals
matched with Seismomatch give values of residual displacement less dispersed than the simply scaled
ones. To evaluate the influence of the number of signals used for two sites, a set of 30 accelerograms
(selected with REXEL) was defined. The results show that increasing the number of accelerogram
from 7 to 30 is not effective.
For preliminary analyses and in case of low seismicity, simplified static equivalent methods and
regression curves can be used to evaluate the base sliding . This is demonstrated comparing the results
of dynamic nonlinear analyses with the regression curve proposed by Nuti and Basili. For sites as
those of Site C and Site D, more advanced analyses are necessary. In this case great attention has to be
addressed to the selection of the ground motion signal.

10
ACKNOWLEDGEMENTS
The present work is partially carried out within the activities of AT2 – LR 2 – Task 2.2.1 of the
ReLuis-DPC Executive Project 2010-2013, whose financial support is greatly appreciated.
REFERENCES
Basili R, Valensise G, Vannoli P, Burrato P, Fracassi U, Mariano S, Tiberti MM, Boschi E (2008) The database of
individual seismogenic sources (DISS), version 3.1.1. Tectonophysics, doi:10.1016/j.tecto.2007.04.014 Bazzurro P and Cornell CA (1999): Disaggregation of seismic hazard, Bulletin of the Seismological Society of
America, Vol. 89, No. 2, 501-520
Bindi D, Pacor F, Luzi L, Puglia R, Massa M, Ameri G, Paolucci R (2011): Ground Motion Prediction Equations
Derived from the Italian Strong Motion Database, Bulletin of Earthquake Engeenering 9:1899–1920
Bommer JJ (2002): Deterministic Vs. Probabilistic Seismic Hazard Assessment: An Exaggerated And Obstructive
Dichotomy, Journal of Earthquake Engineering, 6:S1, 43-73
Fenves G and Chopra AK (1986): Simplified analyses for earthquake resistant design of concrete gravity dam,
Earthquake Engineering Research Center, University of California, Berkeley
Hancock J, Watson-Lamprey J, Abrahamson NA, Bommer JJ, Markatis A, McCoy E, Mendis R (2006): "An
improved method of matching response spectra of recorded earthquake ground motion using wavelets”,
Journal of Earthquake Engineering, Vol. 10, 67–89
Kramer SL (1996). Geothecnical Earthquake Engineering, Prentice-Hall International Series in Civil Engineering
and Engineering Mechanics, Prentice-Hall, Upper Saddle River, New Jersey
ICOLD (1989) Bulletin n.72, Selecting seismic parameters for large dams, guidelines
Iervolino I, Galasso C, Cosenza E (2009): REXEL: computer aided record selection for code-based seismic
structural analysis, Bulletin of Earthquake Engineering, 8:339-362
Nuti C and Basili M (2009): Seismic simulation and base sliding of concrete gravity dams, Computational Method
in Earthquake Engineering, 21:427-454
Ordaz M, Aguilar A, Arboleda J ( (2007): CRISIS2007 – A Program for computing Seismic Hazard
Ordaz M (2004), "Some integrals useful in probabilistic seismic hazard analysis", Bulletin of the Seismological
Society of America, Vol. 94, No.4, pp. 1510-1516
PEGASOS Project (2004): Probabilistic Seismic Hazard Analysis for Swiss Nuclear Power Plant Site, Final
Report Volume 5, 65-66, Wettingen
Sabetta F, Naso G, Pagliaroli A (2012): Selezione dell'input per simulazioni numeriche ai fini della microzonazione
sismica, Proceedings of 31° GNGTS National Conference, Potenza, 20-22 Novembre 2012
Sabetta F, Lucantoni A, Bungum H, Bommer JJ (2005): Sensitivity of PSHA results to ground-motion prediction
relations and logic-tree weights, Soil Dyn. Earthquake Eng. 25, 317–329
Sabetta F and Pugliese A (1996): Estimation of response spectra and simulation of nonstationary earthquake
ground motion, Bulletin of the Seismological Society of America, Vol.86, 337-352