
Influence of large dam on seismic hazard in low seismic region of Ulu Padas Area, Northern Borneo
33
ORIGINAL PAPER Influence of large dam on seismic hazard in low seismic region of Ulu Padas Area, Northern Borneo Ade Faisal • Taksiah A. Majid • Fauziah Ahmad • Felix Tongkul • Syafrina Mayang Sari Received: 4 January 2010 / Accepted: 2 February 2011 / Published online: 25 February 2011 Ó Springer Science+Business Media B.V. 2011 Abstract The seismic hazard assessment of a site that lies in the low seismic region affected by the future existence of a large dam has been given less attention in many studies. Moreover, this condition is not addressed directly in the current seismic codes. This paper explains the importance of such information in mitigating the seismic hazard properly. Ulu Padas Area in Northern Borneo is used as an example for a case study of a site classified as a low seismic region. It is located close to the border of Malaysia, Brunei Darussalam, and Indonesia and may have a large dam in the future as the region lies in hilly geography with river flow. This study conducts probabilistic and deterministic seis- mic hazard analyses, and reservoir-triggered seismicity of a site affected by the future existence of a large dam. The result shows that the spectrum acceleration of the maximum design earthquake for the investigated site in the Ulu Padas Area in Northern Borneo is taken from the reservoir-triggered seismicity earthquake at short periods and from the current condition at longer periods. Keywords Northern Borneo Á Seismic hazard Á Low seismic region Á Large dam effect 1 Introduction In most cases, the seismic effect on infrastructures (i.e., buildings) built on a site in a low seismic region is neglected as there is no or few evidence showing its harmful effect on the Ade Faisal Á T. A. Majid (&) Á F. Ahmad Disaster Research Nexus, School of Civil Engineering, Universiti Sains Malaysia (USM), 14300 Nibong Tebal, P. Pinang, Malaysia e-mail: [email protected] F. Tongkul School of Science and Technology, Universiti Malaysia Sabah (UMS), No. 2073 Locked Bag, 88999 Kota Kinabalu, Sabah, Malaysia Ade Faisal Á S. M. Sari Fakultas Teknik, Universitas Muhammadiyah Sumatera Utara (UMSU), Jl. Mukhtar Basri No. 3, Medan 20318, Indonesia 123 Nat Hazards (2011) 59:237–269 DOI 10.1007/s11069-011-9748-1
-
Upload
independent -
Category
Documents
-
view
1 -
download
0
Transcript of Influence of large dam on seismic hazard in low seismic region of Ulu Padas Area, Northern Borneo
ORI GIN AL PA PER
Influence of large dam on seismic hazard in low seismicregion of Ulu Padas Area, Northern Borneo
Ade Faisal • Taksiah A. Majid • Fauziah Ahmad • Felix Tongkul •
Syafrina Mayang Sari
Received: 4 January 2010 / Accepted: 2 February 2011 / Published online: 25 February 2011� Springer Science+Business Media B.V. 2011
Abstract The seismic hazard assessment of a site that lies in the low seismic region
affected by the future existence of a large dam has been given less attention in many
studies. Moreover, this condition is not addressed directly in the current seismic codes.
This paper explains the importance of such information in mitigating the seismic hazard
properly. Ulu Padas Area in Northern Borneo is used as an example for a case study of a
site classified as a low seismic region. It is located close to the border of Malaysia, Brunei
Darussalam, and Indonesia and may have a large dam in the future as the region lies in
hilly geography with river flow. This study conducts probabilistic and deterministic seis-
mic hazard analyses, and reservoir-triggered seismicity of a site affected by the future
existence of a large dam. The result shows that the spectrum acceleration of the maximum
design earthquake for the investigated site in the Ulu Padas Area in Northern Borneo is
taken from the reservoir-triggered seismicity earthquake at short periods and from the
current condition at longer periods.
Keywords Northern Borneo � Seismic hazard � Low seismic region � Large dam effect
1 Introduction
In most cases, the seismic effect on infrastructures (i.e., buildings) built on a site in a low
seismic region is neglected as there is no or few evidence showing its harmful effect on the
Ade Faisal � T. A. Majid (&) � F. AhmadDisaster Research Nexus, School of Civil Engineering, Universiti Sains Malaysia (USM),14300 Nibong Tebal, P. Pinang, Malaysiae-mail: [email protected]
F. TongkulSchool of Science and Technology, Universiti Malaysia Sabah (UMS), No. 2073 Locked Bag,88999 Kota Kinabalu, Sabah, Malaysia
Ade Faisal � S. M. SariFakultas Teknik, Universitas Muhammadiyah Sumatera Utara (UMSU), Jl. Mukhtar Basri No. 3,Medan 20318, Indonesia
123
Nat Hazards (2011) 59:237–269DOI 10.1007/s11069-011-9748-1
people in its recorded earthquake history. In the past decade, the increasing demand for an
environment secured from natural hazards has led many researchers to investigate the level
of seismic hazard in low seismic regions around the world, such as Germany, Belgium,
Spain, Singapore, West Malaysia, Thailand, and the Korean Peninsula (Leydecker and
Kopera 1999; Atakan et al. 2000; Balendra et al. 2002; Petersen et al. 2004; Han and Choi
2007; Lantada et al. 2010; Ornthammarath et al. 2010). Their studies were based on the
historical evidence of extensive damage and loss caused by a predominantly stable plate
(i.e., intra-plate) and of low seismic regions experiencing infrequent earthquakes
(Anbazhagan et al. 2009). Given the absence or insufficient documentation of the occur-
rence of killer earthquakes in low seismic regions, there is no proper code regulating the
involved parties in the development of structures in some countries in this region. This
absence may give rise to problems in the future if it is not handled carefully, particularly
when the creation of large dams is an option for water reserve and electrical power in
developing countries (e.g., Malaysia and Brunei Darussalam). However, the common plan
of development of large dams in a low seismic region is not in line with or is not even
embedded in the development of their own seismic code.
Northern Borneo, a region where the borders of three countries namely Malaysia,
Brunei Darussalam, and Indonesia lie, is affected by both regional and local earthquakes.
Significant earthquakes from the Sulu and Celebes seas are periodically felt as slight
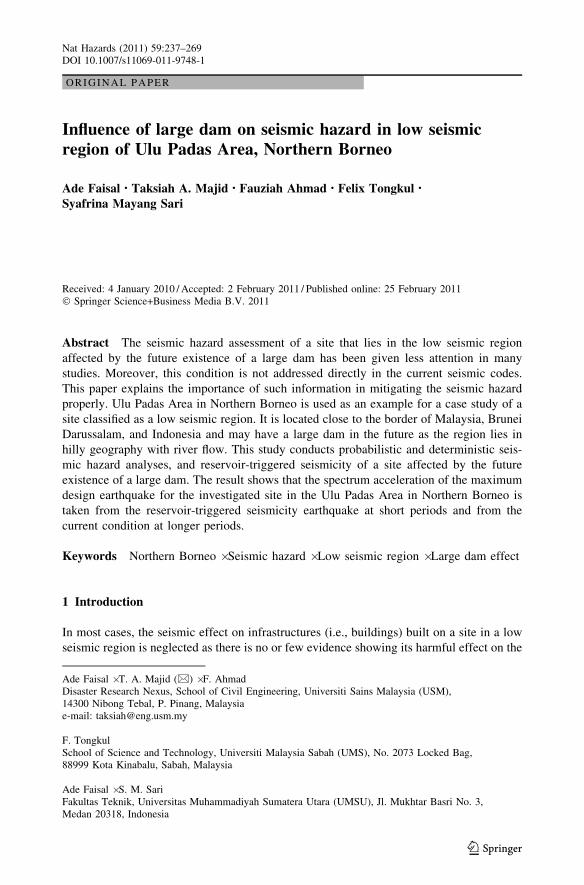
tremors in Sabah. The NEIC (2007) earthquake database shows a total of 221, with M [ 6
within 1,000 km from Kota Kinabalu since 1973 (Fig. 1). The source of regional earth-
quakes for Sabah comes from the active subduction zones marked by the Manila Trench,
Negros Trench, Sulu Trench, Cotabato Trench, and North Sulawesi Trench.
From 1897 until today, about 28 local light to moderate earthquakes are recorded
onshore Sabah and about 33 earthquakes are recorded offshore of Sabah (South China Sea,
Sulu Sea, and Celebes Sea). The earthquakes have magnitudes ranging from Mb 4.0 to 5.8.
The epicenters of the earthquakes are concentrated on the East Coast of Sabah, around the
Lahad Datu and Ranau area. The earthquakes are mainly shallow in depth (\70 km),
whereas those offshore tend to be intermediate (70–200 km) in depth. The local earth-
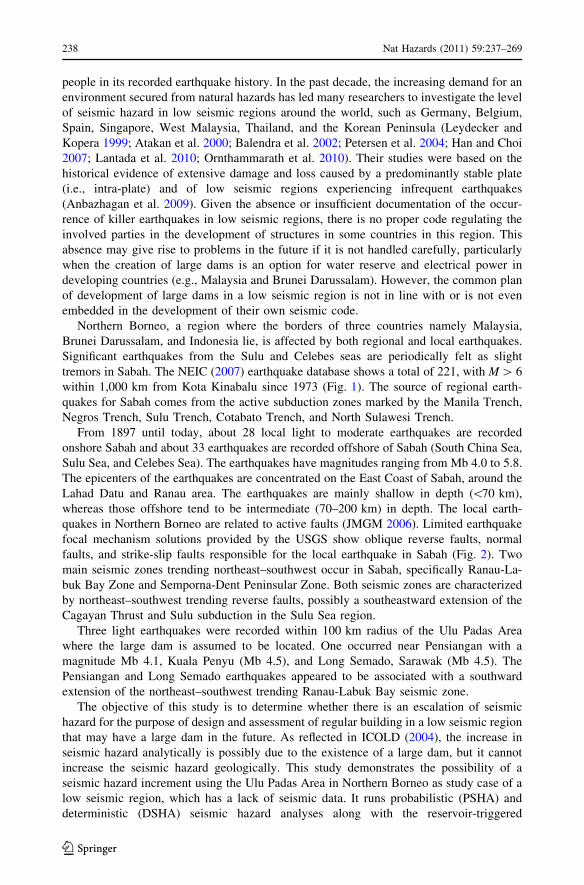
quakes in Northern Borneo are related to active faults (JMGM 2006). Limited earthquake
focal mechanism solutions provided by the USGS show oblique reverse faults, normal
faults, and strike-slip faults responsible for the local earthquake in Sabah (Fig. 2). Two
main seismic zones trending northeast–southwest occur in Sabah, specifically Ranau-La-
buk Bay Zone and Semporna-Dent Peninsular Zone. Both seismic zones are characterized
by northeast–southwest trending reverse faults, possibly a southeastward extension of the
Cagayan Thrust and Sulu subduction in the Sulu Sea region.
Three light earthquakes were recorded within 100 km radius of the Ulu Padas Area
where the large dam is assumed to be located. One occurred near Pensiangan with a
magnitude Mb 4.1, Kuala Penyu (Mb 4.5), and Long Semado, Sarawak (Mb 4.5). The
Pensiangan and Long Semado earthquakes appeared to be associated with a southward
extension of the northeast–southwest trending Ranau-Labuk Bay seismic zone.
The objective of this study is to determine whether there is an escalation of seismic
hazard for the purpose of design and assessment of regular building in a low seismic region
that may have a large dam in the future. As reflected in ICOLD (2004), the increase in
seismic hazard analytically is possibly due to the existence of a large dam, but it cannot
increase the seismic hazard geologically. This study demonstrates the possibility of a
seismic hazard increment using the Ulu Padas Area in Northern Borneo as study case of a
low seismic region, which has a lack of seismic data. It runs probabilistic (PSHA) and
deterministic (DSHA) seismic hazard analyses along with the reservoir-triggered
238 Nat Hazards (2011) 59:237–269
123
seismicity (RTS) to define the maximum design earthquake (MDE) to the area when there
is a possibility of building a large dam in the future.
2 Geological settings and structural geology
2.1 Seismotectonic setting
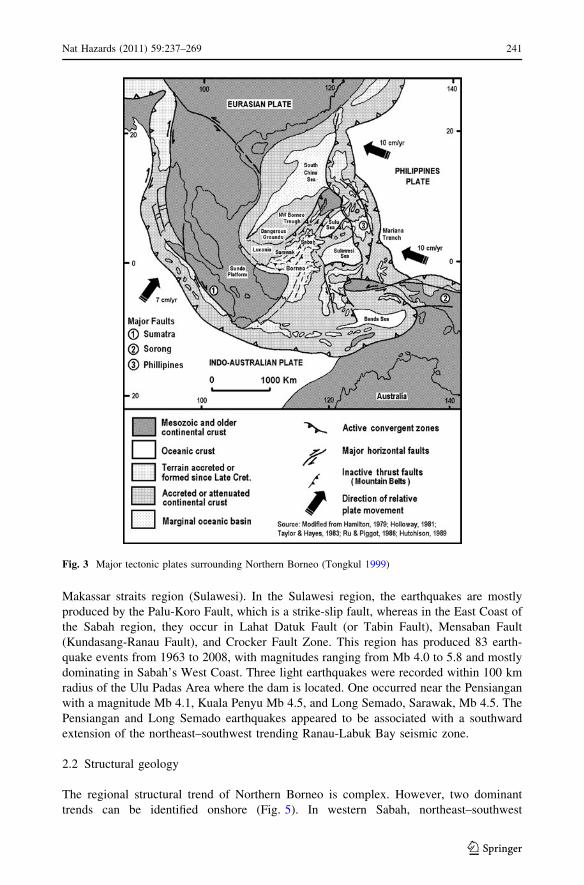
Three major tectonic plates rim Northern Borneo, namely the Eurasian Plate to the North,
the Indian-Australian plate to the West and South, and the Pacific-Philippine Sea Plate to
the East (Fig. 3). The GPS measurement of Michell et al. (2000) shows that the three plates
converge at different directions and rates. The Sundaland and South China Sea Basin
(stretched continental margin) of the Eurasian Plate slides to southeastward at a rate of
about 5 cm/year, whereas the Indian-Australian and the Philippine Sea-Pacific Plates move
northerly at a rate of about 7 cm/year and 10 cm/year, respectively. Active subduction
zones and strike-slip faults are associated with the interactions of these three tectonic
plates.
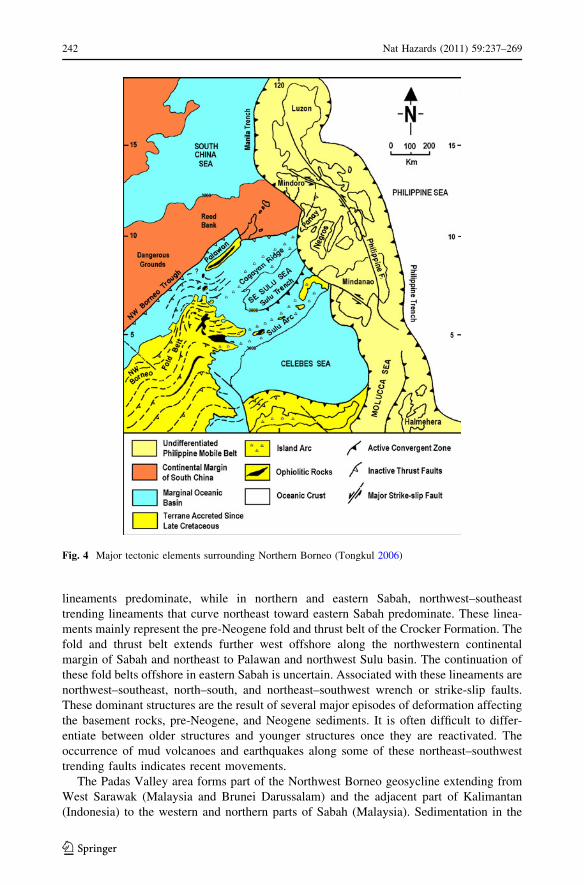
Northern Borneo sits on the semi-stable South China Sea Basin and is, to a certain
extent, influenced by the active mobile belts in Sulawesi and the Philippines (Fig. 4). The
active Sulu Trench subduction zone continues to East Sabah. Similarly, the active Palu
Fault in Sulawesi appears to continue to East Sabah. Walpersdorf et al. (1998) show that
Fig. 1 Seismicity surrounding Northern Borneo based on USGS/NEIC and JMG Databases. Earthquakesonshore Northern Borneo are associated with NE–SW trending faults
Nat Hazards (2011) 59:237–269 239
123
the GPS measurement of movement across the Palu-Koro fault exhibits a 3.4 cm/year
sinistral strike-slip movement. In the South China Sea, the northwest Borneo Trough,
which was probably once associated with subduction zone, is not seismically active. Active
thrust faults found along the trough may mostly be associated with sedimentary loading
and slumping or crustal shortening.
Large dam and Ulu Padas Area sites are assumed to be situated above a low-seismically
active region with no active fault found crossing the site. Earthquake events demonstrate
that the closest hypocentral event to Ulu Padas Area is 55 km for earthquake Mb 4.5. Some
lineaments are found near the Ulu Padas Area. Unfortunately, no field investigation report
has been found to confirm whether the lineaments are related with Quaternary fault
activity. Meng (1999), however, shows that Quaternary alluvium exists at the Tenom
region near the site and dam based on Tongkul’s (1993, 1997) studies. We assumed that the
lineaments trending from North to South might be related with Quaternary or recent
tectonic activities, which are supported by Mb 4.5 earthquake 55 km away from the site.
No information on the length of the rupture surface (or slip length) of the active fault’s
segment is found in this case.
Seismicity within a radius 500 km from the Ulu Padas Area is dominated by shallow
earthquakes (depth \ 70 km), which mostly occur in the East Coast of Sabah and in the
Fig. 2 Focal mechanism solutions of shallow earthquake around Northern Borneo associated with reverse,normal, and strike-slip faults. Focal mechanism based on JMGM (2006)
240 Nat Hazards (2011) 59:237–269
123
Makassar straits region (Sulawesi). In the Sulawesi region, the earthquakes are mostly
produced by the Palu-Koro Fault, which is a strike-slip fault, whereas in the East Coast of
the Sabah region, they occur in Lahat Datuk Fault (or Tabin Fault), Mensaban Fault
(Kundasang-Ranau Fault), and Crocker Fault Zone. This region has produced 83 earth-
quake events from 1963 to 2008, with magnitudes ranging from Mb 4.0 to 5.8 and mostly
dominating in Sabah’s West Coast. Three light earthquakes were recorded within 100 km
radius of the Ulu Padas Area where the dam is located. One occurred near the Pensiangan
with a magnitude Mb 4.1, Kuala Penyu Mb 4.5, and Long Semado, Sarawak, Mb 4.5. The
Pensiangan and Long Semado earthquakes appeared to be associated with a southward
extension of the northeast–southwest trending Ranau-Labuk Bay seismic zone.
2.2 Structural geology
The regional structural trend of Northern Borneo is complex. However, two dominant
trends can be identified onshore (Fig. 5). In western Sabah, northeast–southwest
Fig. 3 Major tectonic plates surrounding Northern Borneo (Tongkul 1999)
Nat Hazards (2011) 59:237–269 241
123
lineaments predominate, while in northern and eastern Sabah, northwest–southeast
trending lineaments that curve northeast toward eastern Sabah predominate. These linea-
ments mainly represent the pre-Neogene fold and thrust belt of the Crocker Formation. The
fold and thrust belt extends further west offshore along the northwestern continental
margin of Sabah and northeast to Palawan and northwest Sulu basin. The continuation of
these fold belts offshore in eastern Sabah is uncertain. Associated with these lineaments are
northwest–southeast, north–south, and northeast–southwest wrench or strike-slip faults.
These dominant structures are the result of several major episodes of deformation affecting
the basement rocks, pre-Neogene, and Neogene sediments. It is often difficult to differ-
entiate between older structures and younger structures once they are reactivated. The
occurrence of mud volcanoes and earthquakes along some of these northeast–southwest
trending faults indicates recent movements.
The Padas Valley area forms part of the Northwest Borneo geosycline extending from
West Sarawak (Malaysia and Brunei Darussalam) and the adjacent part of Kalimantan
(Indonesia) to the western and northern parts of Sabah (Malaysia). Sedimentation in the
Fig. 4 Major tectonic elements surrounding Northern Borneo (Tongkul 2006)
242 Nat Hazards (2011) 59:237–269
123

geosycline continued in the Padas Valley area throughout the Oligocene and toward the
end of Miocene period. The material deposited is considered to include two distinct facies,
the Crocker Formation, which is dominantly arenaceous, and the Temburong Formation,
which is mainly argillaceous. The major part of these sedimentary deposits is composed of
flysch-type sandstone and shale.
3 Method of analysis
The site-specific seismic hazard assessment for Ulu Padas Area in Northern Borneo (inside
the State of Sabah, Malaysia) that will be having a large dam consists of the following
general steps: (1) assessing the available data of the geology of earthquake fault and dam
site; (2) selecting the suitable attenuation relationship; (3) collecting the earthquake event
data (catalog study); (4) PSHA; 5) DSHA; and 6) RTS analysis. Ulu Padas Area is located
at coordinate longitude of 115.8� East and latitude 4.8� North. The large dam is assumed to
be built somewhere near the active fault at downstream of Ulu Padas Area and will have a
water level height of 120 m in its reservoir, water volume of 700–1,000 9 106 m3, and
reservoir length of about 8–10 km. No active fault was assumed beneath the large dam and
Fig. 5 Structural elements surrounding Northern Borneo (Tongkul 1993). Several NE–SW trending strike-slip faults cut through the Paleogene and Neogene sediments
Nat Hazards (2011) 59:237–269 243
123

Ulu Padas Area. The closest hypocentral distance of the active fault to the investigated site
is 3 km.
3.1 Selection of predicted attenuation relationship
For evaluation, attenuation relationships are selected from available predictive relation-
ships published from 1980 to 2008 based on the seismology criteria proposed by Cotton
et al. (2006). The complete report of some published predictive relationships (for
1980–2002) is well explained in Douglas (2003). The selection is also limited to those
formulas that are available in the PSHA program. The range of applicability of the eleven
selected attenuation models is explained in the results section.
The weighting of the selected model follows the Scherbaum et al.’s (2005) method to
obtain proper ranking. However, this study only employed a partial procedure that was
applied in Scherbaum et al. as Ulu Padas Area as a target model has very little information
related to its seismologic properties. In this study, the weights are assigned to some
indicators in the candidate attenuation equations, which reflect the relative confidence of
the analyst in each of the models providing the best estimate for ground motions con-
sidered in the hazard analysis. The criteria used reflect the reliability of the equation to
predict ground motions at a particular response frequency and for a given range of mag-
nitudes and distances in the host region.
Based on the available tectonic and seismologic knowledge of the Ulu Padas Area site,
we used some parameters as criteria in selecting the suitable attenuation model, namely
magnitude Mb 4.0–6.2, hypocentral distance R \ 500 km, shallow crustal earthquake
(normal, reverse, and strike-slip faults), rock site, intraslab earthquake, and stable conti-
nental region. We used a dam fundamental frequency within the range of 4–15 Hz as an
additional indicator. We also assumed that intraslab earthquakes within the considered
radius from the site are much like the Central Europe or East/Central US earthquakes. The
shear wave velocity of the bedrock of site was assumed to be 760 m/s, which lies within
the range of soft rock to hard rock types of NEHRP 2000 (BSSC 2001).
The information on the knowledge base and the target condition is used to assign a
descriptive measure of quality for each equation and category. Such measures may be
Good, Fair, or Poor (quantitatively equal to 3, 2, or 1, respectively). The weights of this
model are called Expert’s Weight and are considered as Scenario 1 in the selection of the
attenuation model. For Scenario 2, we assume no treat is done to differentiate the relative
degrees of applicability of the equations and assigns equal weights; this is called Equal
Weight. Scenario 3 employs weights without any scientific criteria, which are randomly
generated weights assigned with the term Random Weight. To emphasize the use of non-
overlapping data sets but still cover roughly the same geographic regions as the full set of
attenuation models, an additional scenario is defined by only using attenuation models
representing four regions: Worldwide, Europe, Eastern North/Central-Eastern North
America (ENA/CENA), and Western North America (WNA). This is Scenario 4, which we
call Independence Weight. The final weight is obtained by summing up the scenario’s
weights and normalizing them with the total weight. We rank the eleven attenuation
models suitable for the Ulu Padas Area based on this Final Weight and use them in the
logic tree analysis.
In DSHA, the use of single attenuation model is commonly practiced. However, the
application or conversion of single model of a region to the different region would
introduce epistemic uncertainty since the relationship of model is theoretically valid in
terms of its derivation and empirical basis (Scherbaum et al. 2005). The epistemic
244 Nat Hazards (2011) 59:237–269
123

uncertainty due to conversion of model from high to low seismic (other) region could
artificially increase the hazard as well (Wiemer et al. 2009). Therefore, this study
employed a composite model using eleven attenuation relationships that selected and
weighted based on the procedure as proposed by Scherbaum et al. (2005) in order to reduce
the uncertainty and to be more comparable with the uniform hazard spectra of PSHA. The
criterion was based only on site condition as well as magnitude and distance range. The
maximum credible earthquake (MCE) ranged from Mb 4.1 to 5.4, while the hypocentral
distance ranged from 55 to 160 km. The investigated site was assumed at bedrock with
760 m/s of shear wave velocity.
3.2 Deterministic method
A site-specific DSHA is generally conducted through the following steps (Reiter 1990;
Krinitzsky 1995, 2002):
– Conduct the identification and characterization of all earthquake sources with their
source-to-site distance that may affect the site and that are capable of producing
significant ground motion.
– Choose the appropriate ground motion model (attenuation function) to predict the
ground motion parameters at the site as a function of magnitude, distance, and site
condition.
– Select the earthquake that produces the strongest level of motion (also called the
controlling earthquake) by comparing the motion produced by the earthquake
magnitude and its source-to-site distance identified in the previous step.
– Characterize the hazard at the site using the peak ordinates of the response spectrum
acceleration. Select the largest earthquake event that can be reasonably expected to
occur for each source and assign it as the maximum credible earthquake (MCE), which
is usually taken at the median or the median-plus-one-standard-deviation (84th-
percentile) value. For critical structures, such as a dam, the mean-plus-one-standard-
deviation value can be selected if the site is near a very active fault (FEMA 2005).
– Select analogous accelerogram records considering the magnitude, distance, fault
mechanism, and site condition to represent the earthquake excitation at the site.
According to ICOLD (1989), an MCE is generally defined as an upper bound of the
expected magnitude or as an upper bound of the expected earthquake intensity. A DSHA or
probabilistic method can be used to evaluate the MCE (FEMA 2005; ICOLD 1989). The
MCE is used as the largest possible earthquake along a recognized fault under the presently
known or presumed tectonic framework (FEMA 2005). However, the earthquake coming
from the result of the PSHA may become the MCE. In practice of large dam seismic
analysis, this MCE is considered to have a return period earthquake (RPE) of several
thousand years, typically 10,000 years in a region of low to moderate seismicity, and is
defined probabilistically (Wieland 2004, 2005). ICOLD (2004) suggests to use the term
safety evaluation earthquake (SEE) rather than to use MCE in seismic risk analysis of large
dam. However, we kept using term MCE since the intention is for the site and it is
commonly used in practice.
In this study, we regard all faults as potential sources for future earthquakes if they have
proven or probable evidence for movement in about 35,000 to 100,000 years (FEMA
2005) or Quaternary time (ICOLD 1989). However, the very limited existing fault activity
information in Ulu Padas Area, Northern Borneo, results in major uncertainties on the
average fault slip rate, rupture length of the fault, magnitude of earthquakes associated
Nat Hazards (2011) 59:237–269 245
123

with past fault movements, average surface faulting earthquake recurrence interval, and
time of the last coseismic surface fault rupture. These uncertainties make the prediction of
maximum earthquake in DSHA using the seismologic parameters (rupture length, width, or
area) impossible to apply. The intensity report within the area of the site and large dam site
is not available as well. Hence, MCE on the bedrock for the investigated site is determined
using the available historical earthquakes from recent event catalogs (1963–2008).
3.3 Probabilistic method
In general, the PSHA is comprised of the following five steps (Reiter 1990; McGuire
2004):
– Identify all earthquake sources capable of producing damaging ground motions.
– Characterize the distribution of earthquake magnitudes (the rates at which earthquakes
of various magnitudes are expected to occur).
– Characterize the distribution of source-to-site distances associated with potential
earthquakes.
– Predict the resulting distribution of ground motion intensity as a function of earthquake
magnitude, distance, and so on.
– Combine uncertainties in earthquake size, location, and ground motion intensity using
the calculation known as the total probability theorem.
– Define the controlling earthquakes by disaggregating the total hazard for all point
considered in spectrum acceleration.
Earthquake sources can be faults, which are typically planar surfaces identified
through various means such as observations of past earthquake locations and geological
evidence. As individual faults in the Northern Borneo region are not identified clearly,
earthquake sources are described by area regions in which earthquakes may occur
anywhere within a radius 500 km [ICOLD (1983) indicates at least 300 km] from the
Ulu Padas Area.
Once all possible sources are identified, we identified the distribution of magnitudes
and source-to-site distances associated with earthquakes from each source. The distri-
bution of earthquake sizes in a region is assumed to follow the Gutenberg–Richter
recurrence law (Gutenberg and Richter 1944). The Gutenberg–Richter’s constants are
estimated using the statistical analysis of historical earthquake event observations pro-
vided by USGS. As the observed events are truncated in maximum and minimum
earthquake magnitude, Mmin B M B Mmax, the exponential recurrence model is used in
determining the number of earthquake magnitude CM per unit time following McGuire
(2004). The maximum likelihood of the activity rate is assumed under Poisson’s
distribution. Further explanation of the method can be found in McGuire (2004). The
EZ-FRISKTM (RiskEngineering Inc 2008) program is used in the probabilistic seismic
hazard analysis.
ICOLD (1989) and FEMA (2005) state that the MCE of a dam, in this study we apply to
the site, may come from an earthquake based on the result of the PSHA result. As this
study deals with low seismic hazard, we selected the controlling earthquake on the bedrock
from PSHA 475 years RPE as MCE. For comparison purpose, the controlling earthquake
from 2,475 years RPE is presented as well. In moderate earthquakes, especially earth-
quakes with a magnitude of more than 6, the DHSA result in determining the peak ground
acceleration (PGA) is mostly higher that the result of PSHA.
246 Nat Hazards (2011) 59:237–269
123
3.3.1 Epistemic uncertainty
In seismic hazard analyses, epistemic uncertainty is used to limit data (often very limited)
and is considered by using alternative models and/or parameter values for the source
characterization and ground motion attenuation relation. For each combination of alter-
native models, the hazard is recomputed resulting in a suite of alternative hazard curves. As
an area of low-to-moderate seismicity, for example Northern Borneo, is often the case
wherein many equations are needed to capture the epistemic uncertainty, this gives greater
significance to the issue of selecting these equations rather than to assign their relative
weightings subsequently (Sabetta et al. 2005).
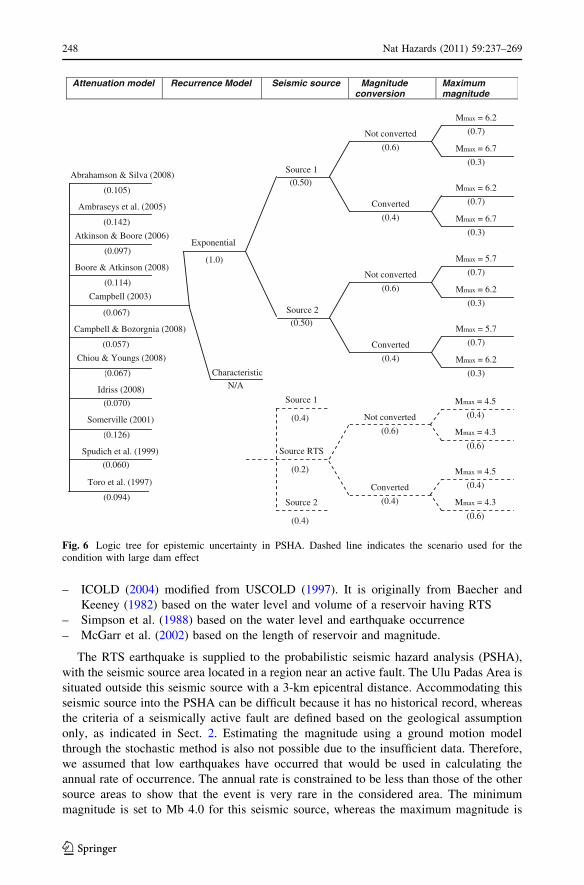
This study develops the logic tree to be incorporated with PSHA to capture epistemic
uncertainty, as shown in Fig. 6. There are four main epistemic uncertainties: recurrence
model, seismic source, magnitude conversion, and maximum magnitude. No characteristic
recurrence model is used in this analysis. The weighting process of this logic tree is
influenced greatly by Scherbaum et al.’s (2005) study. The weighting value of the atten-
uation model comes from the previous attenuation selection process. There are 78 sce-
narios of epistemic uncertainty for the current condition and 131 scenarios for the
condition with the large dam effect employed in this study. The weight from attenuation
model selection is used in weighting the attenuation model uncertainty. The maximum
magnitude is added ?0.5 to capture the uncertainty of this parameter (McGuire 2004). The
magnitude scale conversion cannot be avoided and hence Utsu (2002) relationship is used.
Since the conversion contributes another uncertainty in the analysis, a weight of 0.6 is
given when the magnitude is not converted. It means that the Mb values in the earthquake
catalog are assumed to be the same with Mw, which is the formal magnitude scale used in
most considered attenuation models.
3.4 Reservoir-triggered seismicity
The artificially induced phenomena related to the impoundment of bodies of water known
as RTS is mostly linked with normal and strike-slip fault. If the causative fault is already
critically stressed, it is logical to consider that the increase in shear stresses and the
reduction in effective normal stresses due to the weight of water reservoir and additional
pore pressures, respectively, can trigger seismic activity. In cases of normal and strike-slip
faults, this influence has a tendency to place the representative Mohr circle nearer to the
failure slope, such as a decrease in shear strength along the fault (ICOLD 2004). From a
worldwide standpoint, only a small number of reservoirs impounded by large dams have
triggered known seismic activity.
Currently, the RTS phenomena are not a clear knowledge that can be used in predicting
seismic hazard for seismic design and/or seismic assessment of a dam. It has significantly
high aleatory and epistemic uncertainties. It is a clear and widely accepted fact that a
rigorous analysis to predict a reliable magnitude and location of RTS is hardly feasible,
considering the nature of the parameters involved (USCOLD 1997; FEMA 2005; ICOLD
2004). In this study, the seismic potential at Ulu Padas Area was assumed to be governed
by its tectonic conditions and would not be increased by RTS (ICOLD 2004). A prediction
of the occurrence and magnitude of RTS is based on recent information related to the
reverse fault activity near the dam site, reservoir water level height of 120 m, volume of
reservoir of 700–1,000 9 106 m3, and reservoir length of 8–10 km.
Using the above-mentioned facts, we predict the RTS using recent information mainly
from the cases of RTS in the following references:
Nat Hazards (2011) 59:237–269 247
123
– ICOLD (2004) modified from USCOLD (1997). It is originally from Baecher and
Keeney (1982) based on the water level and volume of a reservoir having RTS
– Simpson et al. (1988) based on the water level and earthquake occurrence
– McGarr et al. (2002) based on the length of reservoir and magnitude.
The RTS earthquake is supplied to the probabilistic seismic hazard analysis (PSHA),
with the seismic source area located in a region near an active fault. The Ulu Padas Area is
situated outside this seismic source with a 3-km epicentral distance. Accommodating this
seismic source into the PSHA can be difficult because it has no historical record, whereas
the criteria of a seismically active fault are defined based on the geological assumption
only, as indicated in Sect. 2. Estimating the magnitude using a ground motion model
through the stochastic method is also not possible due to the insufficient data. Therefore,
we assumed that low earthquakes have occurred that would be used in calculating the
annual rate of occurrence. The annual rate is constrained to be less than those of the other
source areas to show that the event is very rare in the considered area. The minimum
magnitude is set to Mb 4.0 for this seismic source, whereas the maximum magnitude is
Attenuation model Recurrence Model Seismic source Magnitude conversion
Maximum magnitude
Mmax = 6.7
(0.3)
Mmax = 6.2
(0.7) Not converted
(0.6)
Mmax = 6.7
(0.3)
Mmax = 6.2
(0.7) Converted
(0.4)
Mmax = 6.2
(0.3)
Mmax = 5.7
(0.7) Not converted
(0.6)
Mmax = 6.2
(0.3)
Mmax = 5.7
(0.7) Converted
(0.4)
Source 1
(0.50)
Source 2
(0.50)
(1.0)
Exponential
N/A
Characteristic
Abrahamson & Silva (2008)
(0.105)
Ambraseys et al. (2005)
(0.142)
Atkinson & Boore (2006)
(0.097)
Boore & Atkinson (2008)
(0.114)
Campbell (2003)
(0.067)
Campbell & Bozorgnia (2008)
(0.057)
Somerville (2001)
(0.126)
Spudich et al. (1999)
(0.060)
Toro et al. (1997)
(0.094)
Chiou & Youngs (2008)
(0.067)
Idriss (2008)
(0.070)
Mmax = 4.3
(0.6)
Mmax = 4.5
(0.4) Not converted
(0.6)
Mmax = 4.3
(0.6)
Mmax = 4.5
(0.4) Converted
(0.4)
Source RTS
(0.2)
Source 2
(0.4)
Source 1
(0.4)
Fig. 6 Logic tree for epistemic uncertainty in PSHA. Dashed line indicates the scenario used for thecondition with large dam effect
248 Nat Hazards (2011) 59:237–269
123
taken from the predicted RTS earthquake. The b-value, a Gutenberg–Richter constant that
describes the relative likelihood of large and small earthquakes, of the RTS source is
normally higher than its regional seismicity (Gupta 2002). Hence, the additional events
with magnitude slightly higher than minimum magnitude are estimated and adjusted so that
the b-value of the RTS source is higher than those of source areas 1 and 2.
Given that this procedure introduces significant uncertainties, we assigned a lower
weighted value to the RTS seismic source than to the other seismic sources areas. We also
assumed that two magnitudes govern the RTS seismic source, Mb 4.5 and Mb 4.3 with
weighted values of 0.4 and 0.6, respectively, to reduce the excessive superiority of the
short-distance events introduced by the maximum magnitude to the total seismic hazard.
This also led us to lower the weighted RTS seismic source compared with the other sources
(Fig. 6).
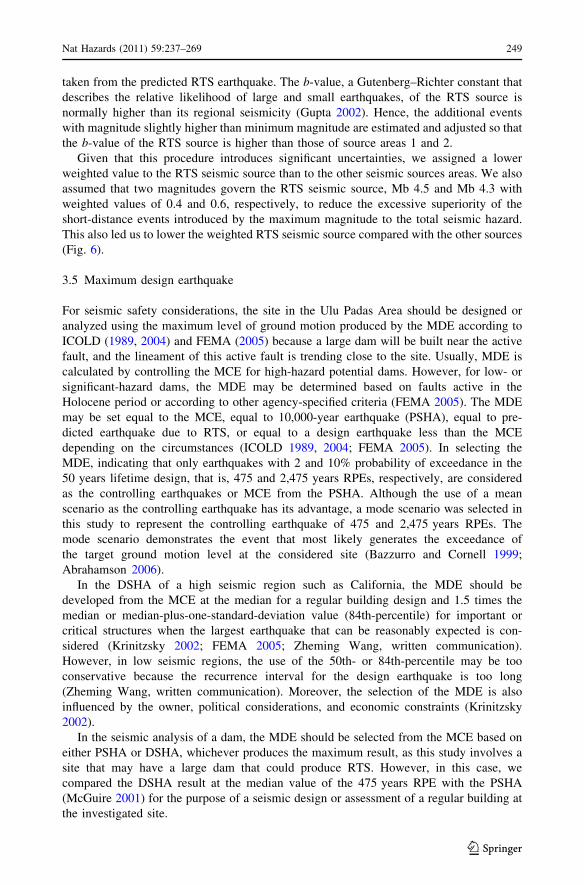
3.5 Maximum design earthquake
For seismic safety considerations, the site in the Ulu Padas Area should be designed or
analyzed using the maximum level of ground motion produced by the MDE according to
ICOLD (1989, 2004) and FEMA (2005) because a large dam will be built near the active
fault, and the lineament of this active fault is trending close to the site. Usually, MDE is
calculated by controlling the MCE for high-hazard potential dams. However, for low- or
significant-hazard dams, the MDE may be determined based on faults active in the
Holocene period or according to other agency-specified criteria (FEMA 2005). The MDE
may be set equal to the MCE, equal to 10,000-year earthquake (PSHA), equal to pre-
dicted earthquake due to RTS, or equal to a design earthquake less than the MCE
depending on the circumstances (ICOLD 1989, 2004; FEMA 2005). In selecting the
MDE, indicating that only earthquakes with 2 and 10% probability of exceedance in the
50 years lifetime design, that is, 475 and 2,475 years RPEs, respectively, are considered
as the controlling earthquakes or MCE from the PSHA. Although the use of a mean
scenario as the controlling earthquake has its advantage, a mode scenario was selected in
this study to represent the controlling earthquake of 475 and 2,475 years RPEs. The
mode scenario demonstrates the event that most likely generates the exceedance of
the target ground motion level at the considered site (Bazzurro and Cornell 1999;
Abrahamson 2006).
In the DSHA of a high seismic region such as California, the MDE should be
developed from the MCE at the median for a regular building design and 1.5 times the
median or median-plus-one-standard-deviation value (84th-percentile) for important or
critical structures when the largest earthquake that can be reasonably expected is con-
sidered (Krinitzsky 2002; FEMA 2005; Zheming Wang, written communication).
However, in low seismic regions, the use of the 50th- or 84th-percentile may be too
conservative because the recurrence interval for the design earthquake is too long
(Zheming Wang, written communication). Moreover, the selection of the MDE is also
influenced by the owner, political considerations, and economic constraints (Krinitzsky
2002).
In the seismic analysis of a dam, the MDE should be selected from the MCE based on
either PSHA or DSHA, whichever produces the maximum result, as this study involves a
site that may have a large dam that could produce RTS. However, in this case, we
compared the DSHA result at the median value of the 475 years RPE with the PSHA
(McGuire 2001) for the purpose of a seismic design or assessment of a regular building at
the investigated site.
Nat Hazards (2011) 59:237–269 249
123

3.6 Selection of input ground motion
Earthquake ground motion represents the regional seismicity from a source mechanism to
the path effect and then to the site effect. For instance, as the magnitude increases, the more
the low frequency motion tends to exhibit increasingly in the frequency bandwidth and
decreasingly in the corner frequency. The ground motion for seismic design and assess-
ment is much influenced by the characteristics of the ground motion dependent on the
various building design and assessment assumptions (McGuire 2004; Douglas and Aochi
2008). A great uncertainty that poses great challenges is thereby introduced. To demon-
strate the effect of a large dam on the seismic hazards of a site in a low seismic region, the
selection of ground motion for engineering purposes is also discussed in this study. The
common method regulated in many seismic codes for engineering design (e.g., CEN 2004;
ASCE 2007) is used, which consists of a selection of the ground motion records from an
online available database based on seismologic parameters (Bommer and Acevedo 2004),
such as the fault mechanism, magnitude, hypocentral distance, site condition (general
rock), frequency bandwidth, and duration. Afterward, matching the MDE spectra using
spectra-matching method (Abrahamson 1992; Hancock et al. 2006) using the SeismoMatch
software (Seismosoft 2009) is performed.
In generating the synthetic ground motion through spectral-matching, frequency and
duration are the strong motion parameters that should be considered. Given that the
complete characteristics of the RTS strong motion are rarely reported in the literature, we
assumed that a high frequency is dominant in the RTS ground motion because it is similar
to a natural earthquake motion produced by low-magnitude near-field earthquakes. The
RTS earthquake is also associated with local seismicity and a very shallow event (Chadha
et al. 1997; Talwani 1997). A natural ground motion with a longer distance in a seismic
region without RTS is not easy to assume because it is associated with a distant earthquake
containing a complex frequency type due to the travel path and site effects. We also
considered the RTS motion to have a short duration (uniform duration type) of less than
10 s, whereas a natural ground motion for distant earthquakes has a long duration. A short-
duration event is related to a low magnitude and a short epicentral distance (Kramer 1996;
Bommer and Martinez-Pereira 1999). The event was also selected based on the RTS
aftershock earthquake M 4.5 at the Hsinfengkiang Dam in China (Bolt and Cloud 1974)
and earthquakes with various durations as reported by Dobry et al. (1978) and Kramer
(1996). The strong motion record was selected from the Internet Site for European Strong-
Motion Data (ISESD) (Ambraseys et al. 2001) and the PEER Strong Motion Database
(PEER 2000).
4 Analyses and discussion
4.1 Selected attenuation model
We selected eleven attenuation models, namely Abrahamson and Silva (2008), Ambraseys
et al. (2005), Atkinson and Boore (2006), Boore and Atkinson (2008), Campbell (2003),
Campbell and Bozorgnia (2008), Chiou and Youngs (2008), Idriss (2008), Somerville et al.
(2001), Spudich et al. (1999), and Toro et al. (1997). These models are dominated by the
model on the rock site condition and with a magnitude type of moment magnitude (Mw).
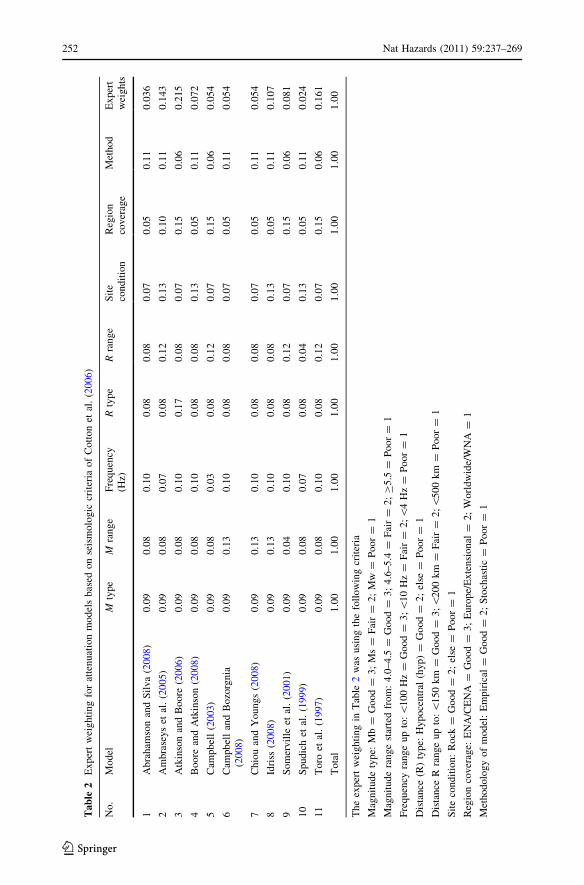
The assumed validity range of the above criteria is fully explained in Table 1. In Tables 2
and 3, we show our scores and the weights for each attenuation model that represents
250 Nat Hazards (2011) 59:237–269
123
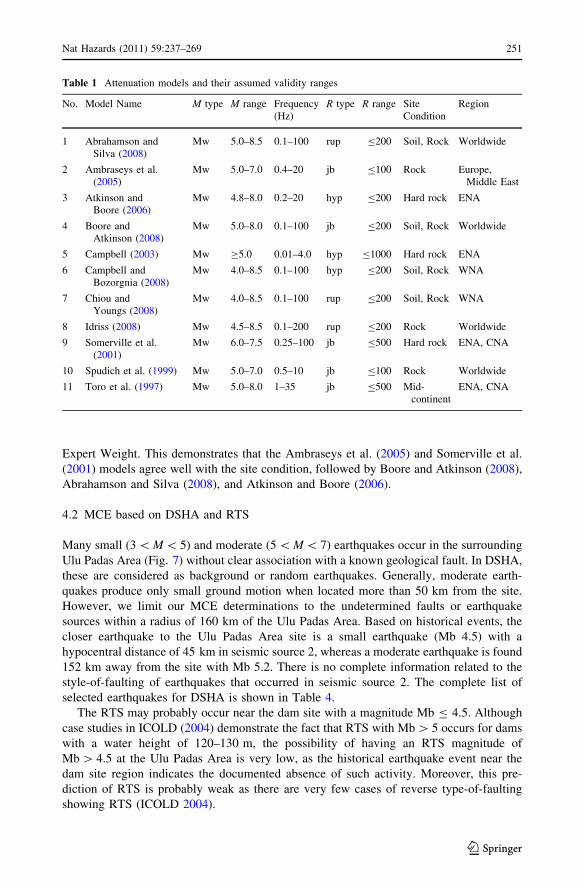
Expert Weight. This demonstrates that the Ambraseys et al. (2005) and Somerville et al.
(2001) models agree well with the site condition, followed by Boore and Atkinson (2008),
Abrahamson and Silva (2008), and Atkinson and Boore (2006).
4.2 MCE based on DSHA and RTS
Many small (3 \ M \ 5) and moderate (5 \ M \ 7) earthquakes occur in the surrounding
Ulu Padas Area (Fig. 7) without clear association with a known geological fault. In DSHA,
these are considered as background or random earthquakes. Generally, moderate earth-
quakes produce only small ground motion when located more than 50 km from the site.
However, we limit our MCE determinations to the undetermined faults or earthquake
sources within a radius of 160 km of the Ulu Padas Area. Based on historical events, the
closer earthquake to the Ulu Padas Area site is a small earthquake (Mb 4.5) with a
hypocentral distance of 45 km in seismic source 2, whereas a moderate earthquake is found
152 km away from the site with Mb 5.2. There is no complete information related to the
style-of-faulting of earthquakes that occurred in seismic source 2. The complete list of
selected earthquakes for DSHA is shown in Table 4.
The RTS may probably occur near the dam site with a magnitude Mb B 4.5. Although
case studies in ICOLD (2004) demonstrate the fact that RTS with Mb [ 5 occurs for dams
with a water height of 120–130 m, the possibility of having an RTS magnitude of
Mb [ 4.5 at the Ulu Padas Area is very low, as the historical earthquake event near the
dam site region indicates the documented absence of such activity. Moreover, this pre-
diction of RTS is probably weak as there are very few cases of reverse type-of-faulting
showing RTS (ICOLD 2004).
Table 1 Attenuation models and their assumed validity ranges
No. Model Name M type M range Frequency(Hz)
R type R range SiteCondition
Region
1 Abrahamson andSilva (2008)
Mw 5.0–8.5 0.1–100 rup B200 Soil, Rock Worldwide
2 Ambraseys et al.(2005)
Mw 5.0–7.0 0.4–20 jb B100 Rock Europe,Middle East
3 Atkinson andBoore (2006)
Mw 4.8–8.0 0.2–20 hyp B200 Hard rock ENA
4 Boore andAtkinson (2008)
Mw 5.0–8.0 0.1–100 jb B200 Soil, Rock Worldwide
5 Campbell (2003) Mw C5.0 0.01–4.0 hyp B1000 Hard rock ENA
6 Campbell andBozorgnia (2008)
Mw 4.0–8.5 0.1–100 hyp B200 Soil, Rock WNA
7 Chiou andYoungs (2008)
Mw 4.0–8.5 0.1–100 rup B200 Soil, Rock WNA
8 Idriss (2008) Mw 4.5–8.5 0.1–200 rup B200 Rock Worldwide
9 Somerville et al.(2001)
Mw 6.0–7.5 0.25–100 jb B500 Hard rock ENA, CNA
10 Spudich et al. (1999) Mw 5.0–7.0 0.5–10 jb B100 Rock Worldwide
11 Toro et al. (1997) Mw 5.0–8.0 1–35 jb B500 Mid-continent
ENA, CNA
Nat Hazards (2011) 59:237–269 251
123
Tab
le2
Exper
tw
eighti
ng
for
atte
nuat
ion
model
sbas
edon
seis
molo
gic
crit
eria
of
Cott
on
etal
.(2
00
6)
No
.M
od
elM
type
Mra
ng
eF
req
uen
cy(H
z)R
typ
eR
ran
ge
Sit
eco
nd
itio
nR
egio
nco
ver
age
Met
ho
dE
xp
ert
wei
ghts
1A
bra
ham
son
and
Sil
va
(20
08)
0.0
90
.08
0.1
00
.08
0.0
80
.07
0.0
50
.11
0.0
36
2A
mbra
sey
set
al.
(20
05)
0.0
90
.08
0.0
70
.08
0.1
20
.13
0.1
00
.11
0.1
43
3A
tkin
son
and
Bo
ore
(20
06)
0.0
90
.08
0.1
00
.17
0.0
80
.07
0.1
50
.06
0.2
15
4B
oo
rean
dA
tkin
son
(20
08)
0.0
90
.08
0.1
00
.08
0.0
80
.13
0.0
50
.11
0.0
72
5C
amp
bel
l(2
00
3)
0.0
90
.08
0.0
30
.08
0.1
20
.07
0.1
50
.06
0.0
54
6C
amp
bel
lan
dB
ozo
rgn
ia(2
00
8)
0.0
90
.13
0.1
00
.08
0.0
80
.07
0.0
50
.11
0.0
54
7C
hio
uan
dY
ou
ng
s(2
00
8)
0.0
90
.13
0.1
00
.08
0.0
80
.07
0.0
50
.11
0.0
54
8Id
riss
(20
08)
0.0
90
.13
0.1
00
.08
0.0
80
.13
0.0
50
.11
0.1
07
9S
om
erv
ille
etal
.(2
00
1)
0.0
90
.04
0.1
00
.08
0.1
20
.07
0.1
50
.06
0.0
81
10
Sp
ud
ich
etal
.(1
99
9)
0.0
90
.08
0.0
70
.08
0.0
40
.13
0.0
50
.11
0.0
24
11
To
roet
al.
(19
97)
0.0
90
.08
0.1
00
.08
0.1
20
.07
0.1
50
.06
0.1
61
To
tal
1.0
01
.00
1.0
01
.00
1.0
01
.00
1.0
01
.00
1.0
0
Th
eex
per
tw
eig
hti
ng
inT
able
2w
asu
sin
gth
efo
llo
win
gcr
iter
ia
Mag
nit
ud
ety
pe:
Mb
=G
oo
d=
3;
Ms
=F
air
=2
;M
w=
Po
or
=1
Mag
nit
ud
era
ng
est
arte
dfr
om
:4
.0–
4.5
=G
oo
d=
3;
4.6
–5
.4=
Fai
r=
2;
C5
.5=
Po
or
=1
Fre
quen
cyra
ng
eu
pto
:\1
00
Hz
=G
oo
d=
3;\
10
Hz
=F
air
=2
;\4
Hz
=P
oor
=1
Dis
tan
ce(R
)ty
pe:
Hy
po
centr
al(h
yp
)=
Go
od
=2
;el
se=
Po
or
=1
Dis
tan
ceR
ran
ge
up
to:\
15
0k
m=
Go
od
=3
;\2
00
km
=F
air
=2
;\5
00
km
=P
oor
=1
Sit
eco
nd
itio
n:
Ro
ck=
Go
od
=2
;el
se=
Po
or
=1
Reg
ion
cover
age:
EN
A/C
EN
A=
Go
od
=3;
Euro
pe/
Exte
nsi
onal
=2
;W
orl
dw
ide/
WN
A=
1
Met
ho
do
logy
of
mod
el:
Em
pir
ical
=G
oo
d=
2;
Sto
chas
tic
=P
oor
=1
252 Nat Hazards (2011) 59:237–269
123
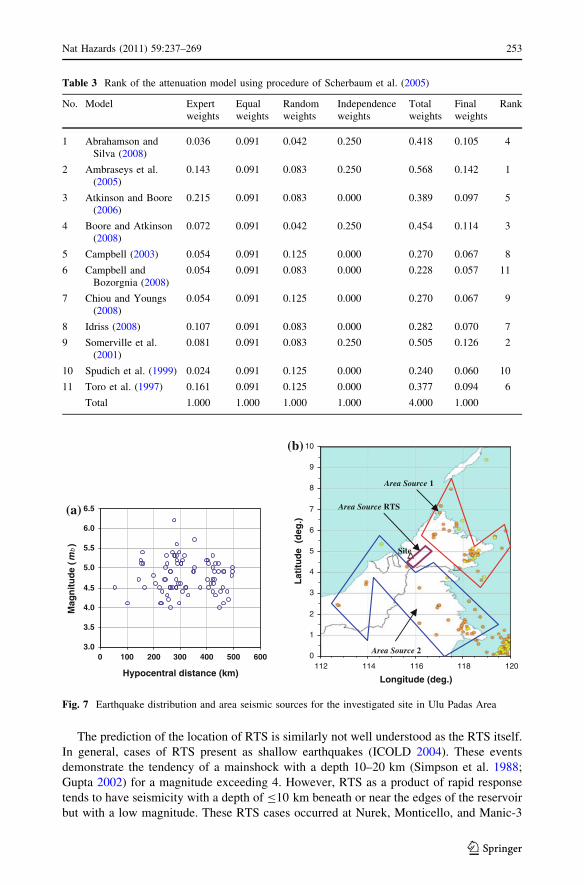
The prediction of the location of RTS is similarly not well understood as the RTS itself.
In general, cases of RTS present as shallow earthquakes (ICOLD 2004). These events
demonstrate the tendency of a mainshock with a depth 10–20 km (Simpson et al. 1988;
Gupta 2002) for a magnitude exceeding 4. However, RTS as a product of rapid response
tends to have seismicity with a depth of B10 km beneath or near the edges of the reservoir
but with a low magnitude. These RTS cases occurred at Nurek, Monticello, and Manic-3
Table 3 Rank of the attenuation model using procedure of Scherbaum et al. (2005)
No. Model Expertweights
Equalweights
Randomweights
Independenceweights
Totalweights
Finalweights
Rank
1 Abrahamson andSilva (2008)
0.036 0.091 0.042 0.250 0.418 0.105 4
2 Ambraseys et al.(2005)
0.143 0.091 0.083 0.250 0.568 0.142 1
3 Atkinson and Boore(2006)
0.215 0.091 0.083 0.000 0.389 0.097 5
4 Boore and Atkinson(2008)
0.072 0.091 0.042 0.250 0.454 0.114 3
5 Campbell (2003) 0.054 0.091 0.125 0.000 0.270 0.067 8
6 Campbell andBozorgnia (2008)
0.054 0.091 0.083 0.000 0.228 0.057 11
7 Chiou and Youngs(2008)
0.054 0.091 0.125 0.000 0.270 0.067 9
8 Idriss (2008) 0.107 0.091 0.083 0.000 0.282 0.070 7
9 Somerville et al.(2001)
0.081 0.091 0.083 0.250 0.505 0.126 2
10 Spudich et al. (1999) 0.024 0.091 0.125 0.000 0.240 0.060 10
11 Toro et al. (1997) 0.161 0.091 0.125 0.000 0.377 0.094 6
Total 1.000 1.000 1.000 1.000 4.000 1.000
3.0
3.5
4.0
4.5
5.0
5.5
6.0
6.5
Hypocentral distance (km)
Mag
nit
ud
e (m
b)
0
1
2
3
4
5
6
7
8
9
10
0 100 200 300 400 500 600112 114 116 118 120
Longitude (deg.)
Lat
itu
de
(d
eg.)
Area Source 1
Area Source 2
Site
Area Source RTS(a)
(b)
Fig. 7 Earthquake distribution and area seismic sources for the investigated site in Ulu Padas Area
Nat Hazards (2011) 59:237–269 253
123
dams (Simpson et al. 1988). Delayed response types of RTS often have seismicity with
larger magnitudes and deeper depths (C10 km), with distances sometimes extending to 10
or more km from the reservoir.
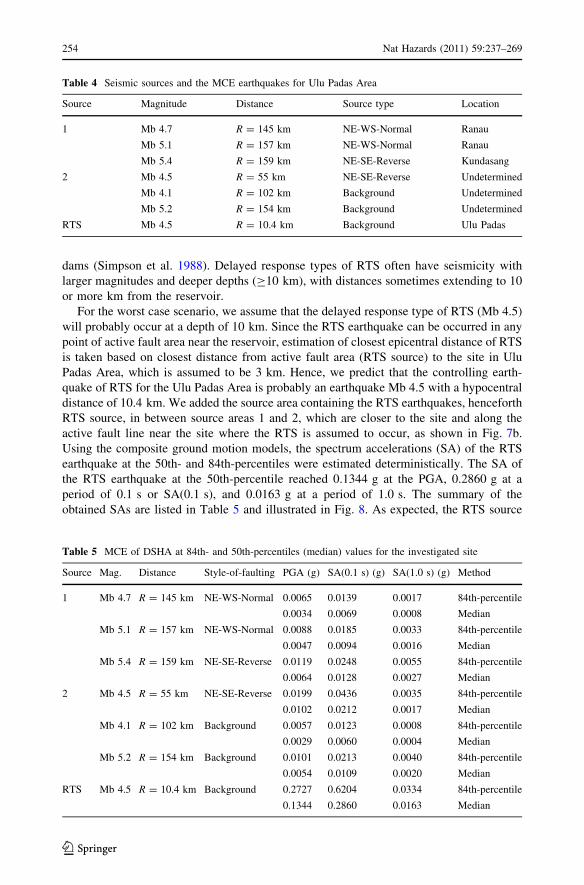
For the worst case scenario, we assume that the delayed response type of RTS (Mb 4.5)
will probably occur at a depth of 10 km. Since the RTS earthquake can be occurred in any
point of active fault area near the reservoir, estimation of closest epicentral distance of RTS
is taken based on closest distance from active fault area (RTS source) to the site in Ulu
Padas Area, which is assumed to be 3 km. Hence, we predict that the controlling earth-
quake of RTS for the Ulu Padas Area is probably an earthquake Mb 4.5 with a hypocentral
distance of 10.4 km. We added the source area containing the RTS earthquakes, henceforth
RTS source, in between source areas 1 and 2, which are closer to the site and along the
active fault line near the site where the RTS is assumed to occur, as shown in Fig. 7b.
Using the composite ground motion models, the spectrum accelerations (SA) of the RTS
earthquake at the 50th- and 84th-percentiles were estimated deterministically. The SA of
the RTS earthquake at the 50th-percentile reached 0.1344 g at the PGA, 0.2860 g at a
period of 0.1 s or SA(0.1 s), and 0.0163 g at a period of 1.0 s. The summary of the
obtained SAs are listed in Table 5 and illustrated in Fig. 8. As expected, the RTS source
Table 4 Seismic sources and the MCE earthquakes for Ulu Padas Area
Source Magnitude Distance Source type Location
1 Mb 4.7 R = 145 km NE-WS-Normal Ranau
Mb 5.1 R = 157 km NE-WS-Normal Ranau
Mb 5.4 R = 159 km NE-SE-Reverse Kundasang
2 Mb 4.5 R = 55 km NE-SE-Reverse Undetermined
Mb 4.1 R = 102 km Background Undetermined
Mb 5.2 R = 154 km Background Undetermined
RTS Mb 4.5 R = 10.4 km Background Ulu Padas
Table 5 MCE of DSHA at 84th- and 50th-percentiles (median) values for the investigated site
Source Mag. Distance Style-of-faulting PGA (g) SA(0.1 s) (g) SA(1.0 s) (g) Method
1 Mb 4.7 R = 145 km NE-WS-Normal 0.0065 0.0139 0.0017 84th-percentile
0.0034 0.0069 0.0008 Median
Mb 5.1 R = 157 km NE-WS-Normal 0.0088 0.0185 0.0033 84th-percentile
0.0047 0.0094 0.0016 Median
Mb 5.4 R = 159 km NE-SE-Reverse 0.0119 0.0248 0.0055 84th-percentile
0.0064 0.0128 0.0027 Median
2 Mb 4.5 R = 55 km NE-SE-Reverse 0.0199 0.0436 0.0035 84th-percentile
0.0102 0.0212 0.0017 Median
Mb 4.1 R = 102 km Background 0.0057 0.0123 0.0008 84th-percentile
0.0029 0.0060 0.0004 Median
Mb 5.2 R = 154 km Background 0.0101 0.0213 0.0040 84th-percentile
0.0054 0.0109 0.0020 Median
RTS Mb 4.5 R = 10.4 km Background 0.2727 0.6204 0.0334 84th-percentile
0.1344 0.2860 0.0163 Median
254 Nat Hazards (2011) 59:237–269
123
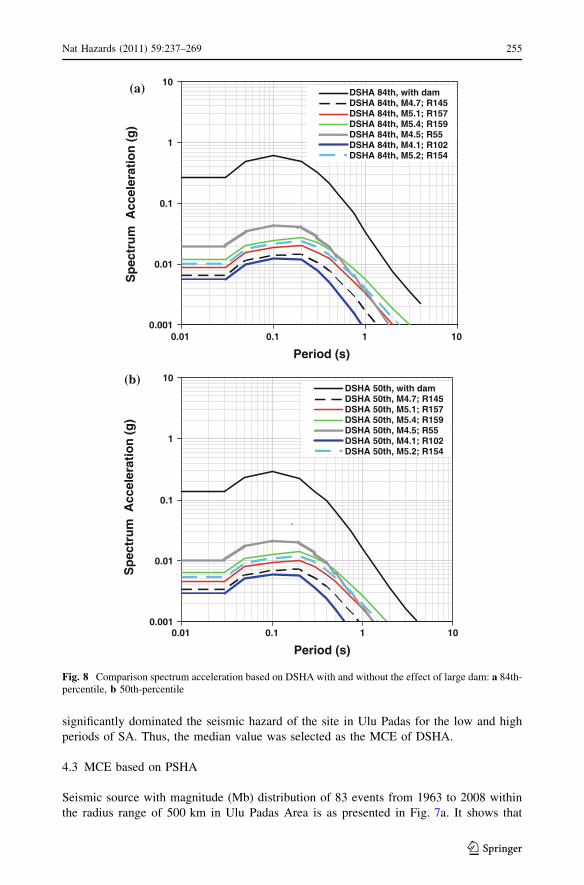
significantly dominated the seismic hazard of the site in Ulu Padas for the low and high
periods of SA. Thus, the median value was selected as the MCE of DSHA.
4.3 MCE based on PSHA
Seismic source with magnitude (Mb) distribution of 83 events from 1963 to 2008 within
the radius range of 500 km in Ulu Padas Area is as presented in Fig. 7a. It shows that
(a)
(b)
0.001
0.01
0.1
1
10
Period (s)
Sp
ectr
um
Acc
eler
atio
n (
g)
DSHA 84th, with dam DSHA 84th, M4.7; R145DSHA 84th, M5.1; R157DSHA 84th, M5.4; R159DSHA 84th, M4.5; R55DSHA 84th, M4.1; R102DSHA 84th, M5.2; R154
`
0.001
0.01
0.1
1
10
0.01 0.1 1 10
0.01 0.1 1 10
Period (s)
Sp
ectr
um
Acc
eler
atio
n (
g)
DSHA 50th, with damDSHA 50th, M4.7; R145DSHA 50th, M5.1; R157DSHA 50th, M5.4; R159DSHA 50th, M4.5; R55DSHA 50th, M4.1; R102DSHA 50th, M5.2; R154
`
Fig. 8 Comparison spectrum acceleration based on DSHA with and without the effect of large dam: a 84th-percentile, b 50th-percentile
Nat Hazards (2011) 59:237–269 255
123

earthquake clusters are grouped in hypocentral distances of 200–300 km and 400–500 km.
Very few earthquakes occur within the distance 0–100 km compared with the previous
distance range. The western side of Ulu Padas Area appears to contribute seismicity more
than the eastern side. The earthquake distribution in the site region is divided into two area
sources, as shown in Fig. 7b. It has earthquakes with a minimum magnitude of Mmin 4 and
a maximum magnitude of Mmax 6.2 for source 1 and Mmax 5.7 for source 2. Both area
sources have low dense scattered distribution of seismicity. In this study, the effect of
catalog completeness of earthquake event to the b-value of Gutenberg–Richter law is
neglected. Area sources 1 and 2 have a Gutenberg–Richter constant of a- and b-values,namely 4.970 and 0.773, and 5.775 and 0.9805, respectively.
To accommodate the large dam effect in PSHA, we include RTS source using an area
seismic source as discussed previously. The source has Mmax 4.5, which is based on
predicted RTS, and assumed Mmin 4.0. Moreover, the study has assumed two M 4.1 as the
additional events in order to get the b-value higher than the value in source 1 and 2. It was
also aimed to reach the annual rate lower than other sources. Hence, 5.371 and 1.188 of
a- and b-values were selected for RTS source, respectively. The annual rates of occurrence
for earthquake magnitude M equal or more than Mmin, k(M [ Mmin), for sources 1 and 2
are depicted in Fig. 7b. Based on the bounded exponential recurrence law, the annual rate
of occurrence (km) for area seismic sources 1 and 2 within the hypocentral distance
R \ 500 km is found to be very close at 1.512 and 1.539, respectively (Fig. 9). This
explains why the number of earthquake events for both area sources 1 and 2 is very close as
well. RTS seismic source is estimated having 1.058 of annual rate within the hypocentral
distance R \ 200 km. In this study, no characteristic occurrence model was employed as
the maximum magnitude in the area was less than 7.0. The annual rate of earthquake in the
RTS seismic source has lower rate than other seismic sources.
Given that the PSHA was used to evaluate the seismic hazard of the site in Ulu Padas
Area with and without a large dam effect, the analysis was performed twice. The disag-
gregation was conducted using bins of width 0.1 in magnitude, 10 km in hypocentral
distance, and 0.2 in epsilon (e). A number of scenarios are adopted for each case of PSHA
to cover the epistemic uncertainty, as shown in the logic tree in Fig. 6, due to the lack of
seismologic knowledge of the site. We assigned a 0.5 weight to the seismic sources 1 and 2
for the PSHA case without a large dam effect, and 0.4 for the PSHA case with a large dam
effect. We set the weighted RTS seismic source to 0.2 because it has no record of seis-
micity, making it more uncertain than the other sources (Fig. 6). The maximum magnitude
in the RTS seismic source was given a weight of 0.4 for Mb 4.5 and 0.6 for Mb 4.3 because
the RTS Mb 4.5 is unlikely, as discussed in the previous section, and also to overcome the
uncertainty of excessively increasing the hazard propagated by a short hypocentral distance
(Fig. 6).
The total seismic hazard to the Ulu Padas Area is depicted in Fig. 10. This figure
demonstrates the eleven selected attenuation models contributing to the total seismic
hazard for the site as well. Although we weighted low, the Toro et al. (1997) model
produces a superior PGA hazard to the site, while the Atkinson and Boore (2006) model is
inferior to the others. Among the attenuation models, the Ambraseys et al. (2005) model
that has the highest weight tends to underestimate and overestimate the PGA hazard
significantly in frequent and rare earthquakes, respectively. This indicates that the
Ambraseys’ model produces a lower ground motion in a low-magnitude (or long-distance)
earthquake and higher ground motion in a high-magnitude (or short-distance) earthquake
than the other attenuation models.
256 Nat Hazards (2011) 59:237–269
123
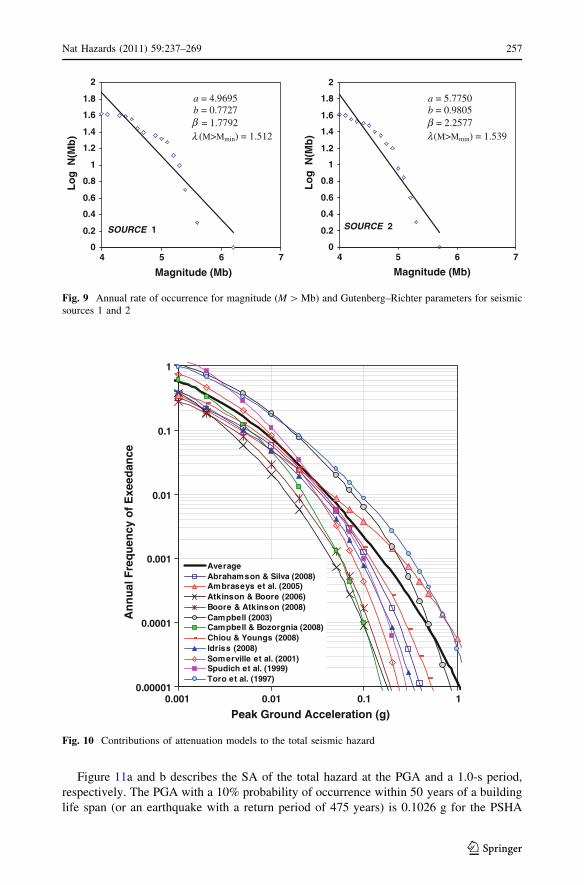
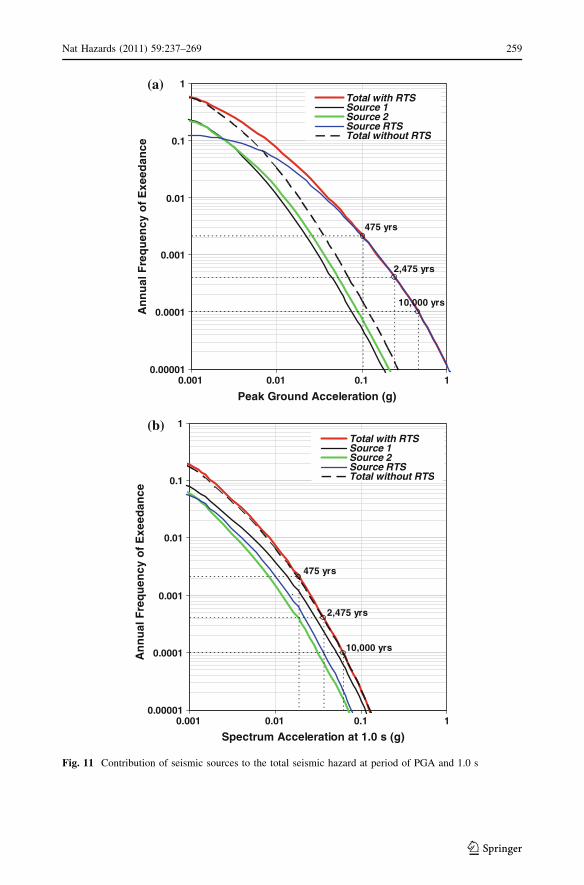
Figure 11a and b describes the SA of the total hazard at the PGA and a 1.0-s period,
respectively. The PGA with a 10% probability of occurrence within 50 years of a building
life span (or an earthquake with a return period of 475 years) is 0.1026 g for the PSHA
y = -0.7727x + 4.9695
0
0.2
0.4
0.6
0.8
1
1.2
1.4
1.6
1.8
2
Magnitude (Mb)
Lo
g N
(Mb
)
y = -0.9805x + 5.775
0
0.2
0.4
0.6
0.8
1
1.2
1.4
1.6
1.8
2
4 5 6 7 4 5 6 7
Magnitude (Mb)
Lo
g N
(Mb
)
SOURCE 1 SOURCE 2
a = 4.9695 bβλ
= 0.7727 = 1.7792 (M>Mmin) = 1.512
a = 5.7750 b = 0.9805
= 2.2577 (M>Mmin) = 1.539
βλ
Fig. 9 Annual rate of occurrence for magnitude (M [ Mb) and Gutenberg–Richter parameters for seismicsources 1 and 2
0.00001
0.0001
0.001
0.01
0.1
1
0.001 0.01 0.1 1
Peak Ground Acceleration (g)
An
nu
al F
req
uen
cy o
f E
xeed
ance
AverageAbrahamson & Silva (2008)Ambraseys et al. (2005)Atkinson & Boore (2006)Boore & Atkinson (2008)Campbell (2003)Campbell & Bozorgnia (2008)Chiou & Youngs (2008)Idriss (2008)Somerville et al. (2001)Spudich et al. (1999)Toro et al. (1997)
Fig. 10 Contributions of attenuation models to the total seismic hazard
Nat Hazards (2011) 59:237–269 257
123
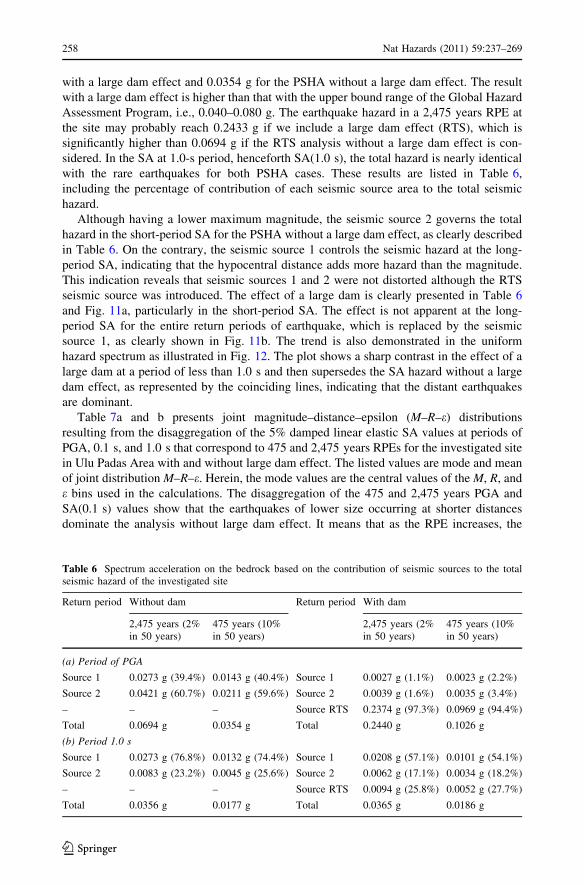
with a large dam effect and 0.0354 g for the PSHA without a large dam effect. The result
with a large dam effect is higher than that with the upper bound range of the Global Hazard
Assessment Program, i.e., 0.040–0.080 g. The earthquake hazard in a 2,475 years RPE at
the site may probably reach 0.2433 g if we include a large dam effect (RTS), which is
significantly higher than 0.0694 g if the RTS analysis without a large dam effect is con-
sidered. In the SA at 1.0-s period, henceforth SA(1.0 s), the total hazard is nearly identical
with the rare earthquakes for both PSHA cases. These results are listed in Table 6,
including the percentage of contribution of each seismic source area to the total seismic
hazard.
Although having a lower maximum magnitude, the seismic source 2 governs the total
hazard in the short-period SA for the PSHA without a large dam effect, as clearly described
in Table 6. On the contrary, the seismic source 1 controls the seismic hazard at the long-
period SA, indicating that the hypocentral distance adds more hazard than the magnitude.
This indication reveals that seismic sources 1 and 2 were not distorted although the RTS
seismic source was introduced. The effect of a large dam is clearly presented in Table 6
and Fig. 11a, particularly in the short-period SA. The effect is not apparent at the long-
period SA for the entire return periods of earthquake, which is replaced by the seismic
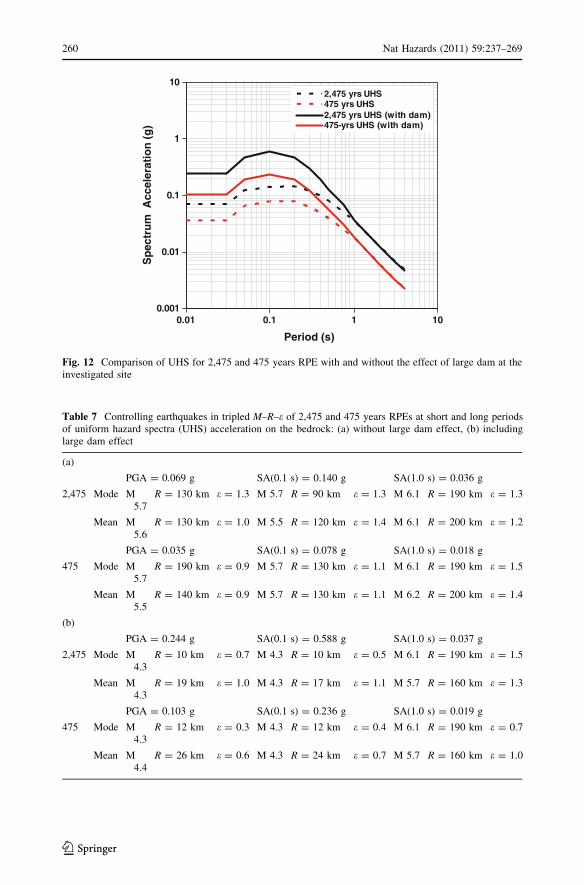
source 1, as clearly shown in Fig. 11b. The trend is also demonstrated in the uniform
hazard spectrum as illustrated in Fig. 12. The plot shows a sharp contrast in the effect of a
large dam at a period of less than 1.0 s and then supersedes the SA hazard without a large
dam effect, as represented by the coinciding lines, indicating that the distant earthquakes
are dominant.
Table 7a and b presents joint magnitude–distance–epsilon (M–R–e) distributions
resulting from the disaggregation of the 5% damped linear elastic SA values at periods of
PGA, 0.1 s, and 1.0 s that correspond to 475 and 2,475 years RPEs for the investigated site
in Ulu Padas Area with and without large dam effect. The listed values are mode and mean
of joint distribution M–R–e. Herein, the mode values are the central values of the M, R, and
e bins used in the calculations. The disaggregation of the 475 and 2,475 years PGA and
SA(0.1 s) values show that the earthquakes of lower size occurring at shorter distances
dominate the analysis without large dam effect. It means that as the RPE increases, the
Table 6 Spectrum acceleration on the bedrock based on the contribution of seismic sources to the totalseismic hazard of the investigated site
Return period Without dam Return period With dam
2,475 years (2%in 50 years)
475 years (10%in 50 years)
2,475 years (2%in 50 years)
475 years (10%in 50 years)
(a) Period of PGA
Source 1 0.0273 g (39.4%) 0.0143 g (40.4%) Source 1 0.0027 g (1.1%) 0.0023 g (2.2%)
Source 2 0.0421 g (60.7%) 0.0211 g (59.6%) Source 2 0.0039 g (1.6%) 0.0035 g (3.4%)
– – – Source RTS 0.2374 g (97.3%) 0.0969 g (94.4%)
Total 0.0694 g 0.0354 g Total 0.2440 g 0.1026 g
(b) Period 1.0 s
Source 1 0.0273 g (76.8%) 0.0132 g (74.4%) Source 1 0.0208 g (57.1%) 0.0101 g (54.1%)
Source 2 0.0083 g (23.2%) 0.0045 g (25.6%) Source 2 0.0062 g (17.1%) 0.0034 g (18.2%)
– – – Source RTS 0.0094 g (25.8%) 0.0052 g (27.7%)
Total 0.0356 g 0.0177 g Total 0.0365 g 0.0186 g
258 Nat Hazards (2011) 59:237–269
123
2,475 yrs
475 yrs
10,000 yrs
0.00001
0.0001
0.001
0.01
0.1
1
Peak Ground Acceleration (g)
An
nu
al F
req
uen
cy o
f E
xeed
ance
Total with RTSSource 1Source 2Source RTSTotal without RTS
(a)
2,475 yrs
475 yrs
10,000 yrs
0.00001
0.0001
0.001
0.01
0.1
1
0.001 0.01 0.1 1
0.001 0.01 0.1 1
Spectrum Acceleration at 1.0 s (g)
An
nu
al F
req
uen
cy o
f E
xeed
ance
Total with RTSSource 1Source 2Source RTSTotal without RTS
`
(b)
Fig. 11 Contribution of seismic sources to the total seismic hazard at period of PGA and 1.0 s
Nat Hazards (2011) 59:237–269 259
123
0.001
0.01
0.1
1
10
0.01 0.1 1 10
Period (s)
Sp
ectr
um
Acc
eler
atio
n (
g)
2,475 yrs UHS 475 yrs UHS2,475 yrs UHS (with dam)475-yrs UHS (with dam)
Fig. 12 Comparison of UHS for 2,475 and 475 years RPE with and without the effect of large dam at theinvestigated site
Table 7 Controlling earthquakes in tripled M–R–e of 2,475 and 475 years RPEs at short and long periodsof uniform hazard spectra (UHS) acceleration on the bedrock: (a) without large dam effect, (b) includinglarge dam effect
(a)
PGA = 0.069 g SA(0.1 s) = 0.140 g SA(1.0 s) = 0.036 g
2,475 Mode M5.7
R = 130 km e = 1.3 M 5.7 R = 90 km e = 1.3 M 6.1 R = 190 km e = 1.3
Mean M5.6
R = 130 km e = 1.0 M 5.5 R = 120 km e = 1.4 M 6.1 R = 200 km e = 1.2
PGA = 0.035 g SA(0.1 s) = 0.078 g SA(1.0 s) = 0.018 g
475 Mode M5.7
R = 190 km e = 0.9 M 5.7 R = 130 km e = 1.1 M 6.1 R = 190 km e = 1.5
Mean M5.5
R = 140 km e = 0.9 M 5.7 R = 130 km e = 1.1 M 6.2 R = 200 km e = 1.4
(b)
PGA = 0.244 g SA(0.1 s) = 0.588 g SA(1.0 s) = 0.037 g
2,475 Mode M4.3
R = 10 km e = 0.7 M 4.3 R = 10 km e = 0.5 M 6.1 R = 190 km e = 1.5
Mean M4.3
R = 19 km e = 1.0 M 4.3 R = 17 km e = 1.1 M 5.7 R = 160 km e = 1.3
PGA = 0.103 g SA(0.1 s) = 0.236 g SA(1.0 s) = 0.019 g
475 Mode M4.3
R = 12 km e = 0.3 M 4.3 R = 12 km e = 0.4 M 6.1 R = 190 km e = 0.7
Mean M4.4
R = 26 km e = 0.6 M 4.3 R = 24 km e = 0.7 M 5.7 R = 160 km e = 1.0
260 Nat Hazards (2011) 59:237–269
123
controlling earthquakes become slightly greater in M and occur closer to the investigated
site. However, this is not the case for M–R of SA(1.0 s), which tends to be equal for 475
and 2,475 years RPEs (Table 7b).
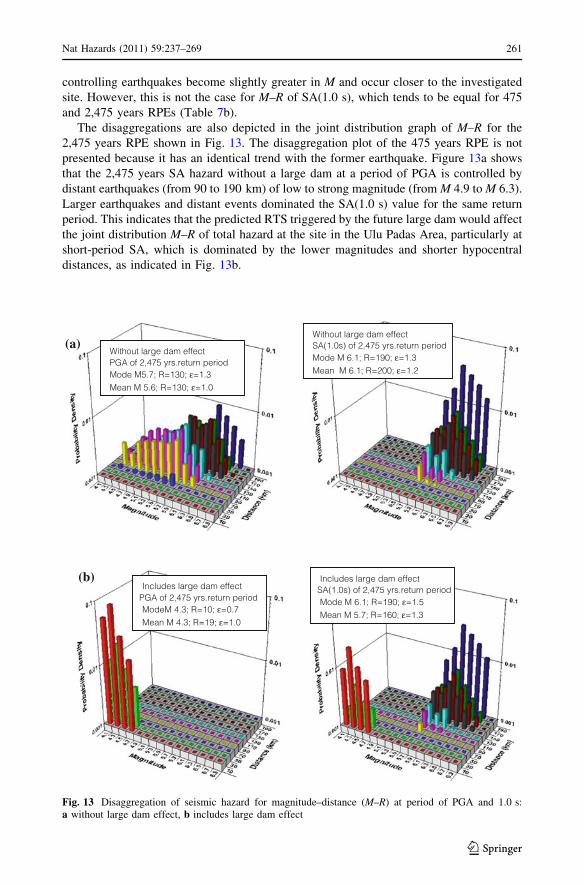
The disaggregations are also depicted in the joint distribution graph of M–R for the
2,475 years RPE shown in Fig. 13. The disaggregation plot of the 475 years RPE is not
presented because it has an identical trend with the former earthquake. Figure 13a shows
that the 2,475 years SA hazard without a large dam at a period of PGA is controlled by
distant earthquakes (from 90 to 190 km) of low to strong magnitude (from M 4.9 to M 6.3).
Larger earthquakes and distant events dominated the SA(1.0 s) value for the same return
period. This indicates that the predicted RTS triggered by the future large dam would affect
the joint distribution M–R of total hazard at the site in the Ulu Padas Area, particularly at
short-period SA, which is dominated by the lower magnitudes and shorter hypocentral
distances, as indicated in Fig. 13b.
(a)
(b)
Without large dam effectPGA of 2,475 yrs.return periodMode M5.7; R=130; ε=1.3Mean M 5.6; R=130; ε=1.0
Without large dam effectSA(1.0s) of 2,475 yrs.return periodMode M 6.1; R=190; ε=1.3Mean M 6.1; R=200; ε=1.2
Includes large dam effectPGA of 2,475 yrs.return periodModeM 4.3; R=10; ε=0.7Mean M 4.3; R=19; ε=1.0
Includes large dam effectSA(1.0s) of 2,475 yrs.return periodMode M 6.1; R=190; ε=1.5Mean M 5.7; R=160; ε=1.3
Fig. 13 Disaggregation of seismic hazard for magnitude–distance (M–R) at period of PGA and 1.0 s:a without large dam effect, b includes large dam effect
Nat Hazards (2011) 59:237–269 261
123

Analyzing mode e behavior with SA period for 2,475 years RPE does not explain any
particular trend. That is, both values of mode and mean e from the analysis with and
without large dam neither increase nor decrease regularly with increasing spectral period.
Unlike the mode and mean values of e from PSHA with large dam, mode and mean values
of e from the PSHA without large dam tend to increase as the return period of earthquake
increases. For instance, the mean values of e is in the range of 0.6–1.0, where the e range
means that the dominant ground motions are within 0.4r of the median for a 475 years
RPE, whereas the 2,475 years RPE is in the range of 1.0–1.3. Hence, we can conclude that
the effect of RTS of a large dam probably distorts the increasing trend of mode and mean
values of e. For the 475 years RPE, the local event contributing the most to the SA hazard
with a large dam effect at the PGA period corresponds to the mode scenario, M 4.3,
R = 12 km, and e = 0.3, whereas the 2,475 years RPE corresponds to a slightly shorter
distance mode scenario, M 4.3, R = 10 km, and e = 0.7. The contribution of the regional
earthquake to the SA hazard at a period of 1.0 s for both cases is mainly associated with the
mode and mean scenarios having magnitudes of 5.7–6.2 at distances between 160 and
200 km.
4.4 Effect of large dam on the maximum design earthquake
We compared the MCEs from the PSHA (SA in Table 7) and DSHA (Table 5) to define
the MDE (McGuire 2001). For brevity, the SA of the governed MCE are presented in one
graph, as shown in Fig. 14, indicating that the SA at the PGA period are generally similar
to the DSHA with a large dam at the 84th-percentile and the 2,475 years RPE, i.e.,
0.2727 g and 0.2440, respectively. The trend is the same for SA at a longer period of up to
1.0 s. This indicates that the predicted RTS earthquake, Mb 4.5 and R = 10.4 km, will
probably occur at a return period longer than 2,475 years or have more than 2.0% of
the probability of exceedance within a 50-year building life span. Without a large dam, the
DSHA controlling earthquake, Mb 4.5 and R = 55 km, seems to be more frequent than the
475 years earthquake, Mw 4.3 and R = 12 km. This earthquake trend tends to occur rarely
at more than 1.0 s of the SA period when compared with the seismic hazard that considers
a large dam effect. The median SA, or the 50th-percentile, has a similar pattern to the SA at
the 84th-percentile, using the 475 years earthquake as the point of comparison. The median
0.001
0.01
0.1
1
10
0.01 0.1 1 10
Period (s)
Sp
ectr
um
Acc
eler
atio
n (
g)
DSHA 84th (with dam)DSHA 50th (with dam)DSHA 84thDSHA 50th2,475 yrs UHS (with dam)475 yrs UHS (with dam)2,475 yrs UHS475 yrs UHS
Fig. 14 Comparison ofspectrum acceleration of UHSand DSHA at 84th- and 50th-percentiles with and without theeffect of large dam
262 Nat Hazards (2011) 59:237–269
123
SA of DSHA probably has a RPE of between 475 and 2,475 years. The analysis without a
large dam gives the PGA range of 0.022–0.034 g for the 475 and 2,475 years earthquakes,
respectively. In contrast, it is almost twice as high as the 84th-percentile DSHA at a range
of 0.006–0.020 g.
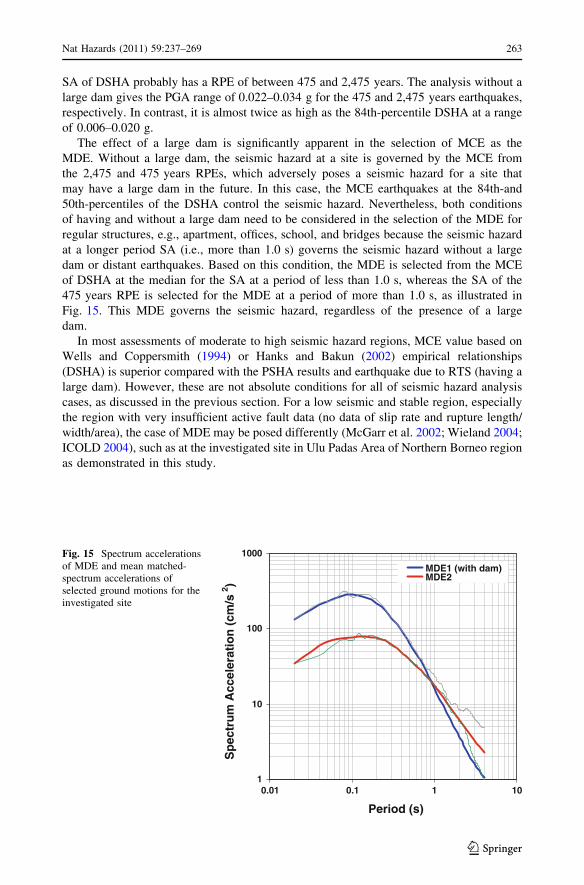
The effect of a large dam is significantly apparent in the selection of MCE as the
MDE. Without a large dam, the seismic hazard at a site is governed by the MCE from
the 2,475 and 475 years RPEs, which adversely poses a seismic hazard for a site that
may have a large dam in the future. In this case, the MCE earthquakes at the 84th-and
50th-percentiles of the DSHA control the seismic hazard. Nevertheless, both conditions
of having and without a large dam need to be considered in the selection of the MDE for
regular structures, e.g., apartment, offices, school, and bridges because the seismic hazard
at a longer period SA (i.e., more than 1.0 s) governs the seismic hazard without a large
dam or distant earthquakes. Based on this condition, the MDE is selected from the MCE
of DSHA at the median for the SA at a period of less than 1.0 s, whereas the SA of the
475 years RPE is selected for the MDE at a period of more than 1.0 s, as illustrated in
Fig. 15. This MDE governs the seismic hazard, regardless of the presence of a large
dam.
In most assessments of moderate to high seismic hazard regions, MCE value based on
Wells and Coppersmith (1994) or Hanks and Bakun (2002) empirical relationships
(DSHA) is superior compared with the PSHA results and earthquake due to RTS (having a
large dam). However, these are not absolute conditions for all of seismic hazard analysis
cases, as discussed in the previous section. For a low seismic and stable region, especially
the region with very insufficient active fault data (no data of slip rate and rupture length/
width/area), the case of MDE may be posed differently (McGarr et al. 2002; Wieland 2004;
ICOLD 2004), such as at the investigated site in Ulu Padas Area of Northern Borneo region
as demonstrated in this study.
1
10
100
1000
0.01 0.1 1 10
Period (s)
Sp
ectr
um
Acc
eler
atio
n (
cm/s
2 )
MDE1 (with dam)MDE2S
Fig. 15 Spectrum accelerationsof MDE and mean matched-spectrum accelerations ofselected ground motions for theinvestigated site
Nat Hazards (2011) 59:237–269 263
123
4.5 Effect of the large dam on the selection of ground motion
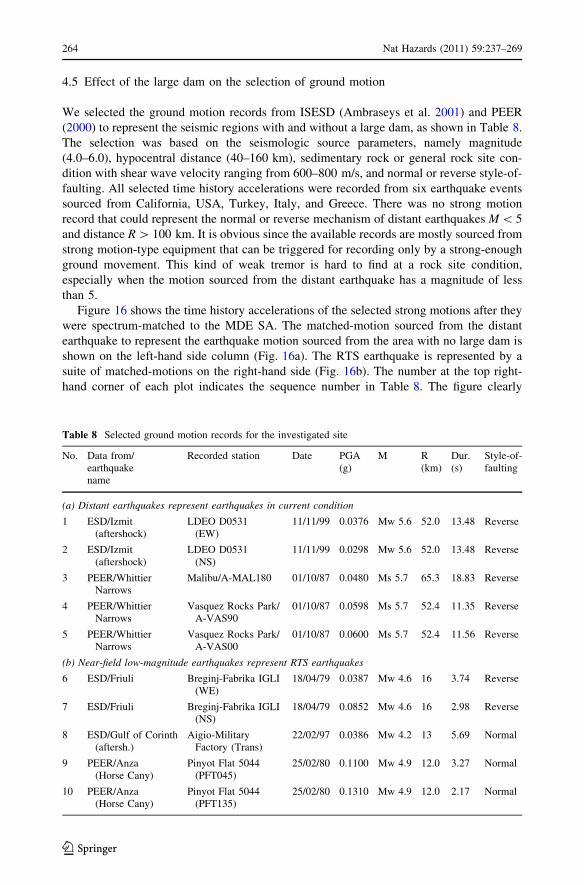
We selected the ground motion records from ISESD (Ambraseys et al. 2001) and PEER
(2000) to represent the seismic regions with and without a large dam, as shown in Table 8.
The selection was based on the seismologic source parameters, namely magnitude
(4.0–6.0), hypocentral distance (40–160 km), sedimentary rock or general rock site con-
dition with shear wave velocity ranging from 600–800 m/s, and normal or reverse style-of-
faulting. All selected time history accelerations were recorded from six earthquake events
sourced from California, USA, Turkey, Italy, and Greece. There was no strong motion
record that could represent the normal or reverse mechanism of distant earthquakes M \ 5
and distance R [ 100 km. It is obvious since the available records are mostly sourced from
strong motion-type equipment that can be triggered for recording only by a strong-enough
ground movement. This kind of weak tremor is hard to find at a rock site condition,
especially when the motion sourced from the distant earthquake has a magnitude of less
than 5.
Figure 16 shows the time history accelerations of the selected strong motions after they
were spectrum-matched to the MDE SA. The matched-motion sourced from the distant
earthquake to represent the earthquake motion sourced from the area with no large dam is
shown on the left-hand side column (Fig. 16a). The RTS earthquake is represented by a
suite of matched-motions on the right-hand side (Fig. 16b). The number at the top right-
hand corner of each plot indicates the sequence number in Table 8. The figure clearly
Table 8 Selected ground motion records for the investigated site
No. Data from/earthquakename
Recorded station Date PGA(g)
M R(km)
Dur.(s)
Style-of-faulting
(a) Distant earthquakes represent earthquakes in current condition
1 ESD/Izmit(aftershock)
LDEO D0531(EW)
11/11/99 0.0376 Mw 5.6 52.0 13.48 Reverse
2 ESD/Izmit(aftershock)
LDEO D0531(NS)
11/11/99 0.0298 Mw 5.6 52.0 13.48 Reverse
3 PEER/WhittierNarrows
Malibu/A-MAL180 01/10/87 0.0480 Ms 5.7 65.3 18.83 Reverse
4 PEER/WhittierNarrows
Vasquez Rocks Park/A-VAS90
01/10/87 0.0598 Ms 5.7 52.4 11.35 Reverse
5 PEER/WhittierNarrows
Vasquez Rocks Park/A-VAS00
01/10/87 0.0600 Ms 5.7 52.4 11.56 Reverse
(b) Near-field low-magnitude earthquakes represent RTS earthquakes
6 ESD/Friuli Breginj-Fabrika IGLI(WE)
18/04/79 0.0387 Mw 4.6 16 3.74 Reverse
7 ESD/Friuli Breginj-Fabrika IGLI(NS)
18/04/79 0.0852 Mw 4.6 16 2.98 Reverse
8 ESD/Gulf of Corinth(aftersh.)
Aigio-MilitaryFactory (Trans)
22/02/97 0.0386 Mw 4.2 13 5.69 Normal
9 PEER/Anza(Horse Cany)
Pinyot Flat 5044(PFT045)
25/02/80 0.1100 Mw 4.9 12.0 3.27 Normal
10 PEER/Anza(Horse Cany)
Pinyot Flat 5044(PFT135)
25/02/80 0.1310 Mw 4.9 12.0 2.17 Normal
264 Nat Hazards (2011) 59:237–269
123
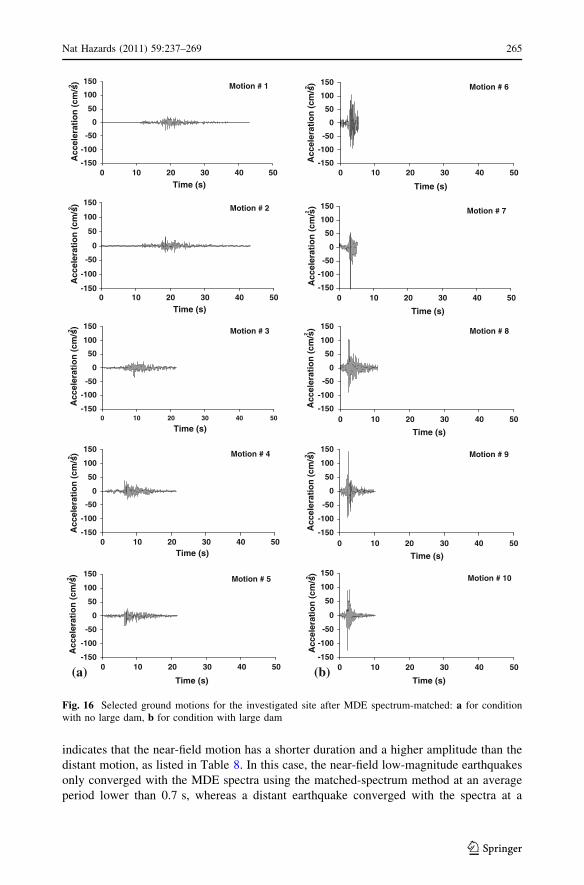
indicates that the near-field motion has a shorter duration and a higher amplitude than the
distant motion, as listed in Table 8. In this case, the near-field low-magnitude earthquakes
only converged with the MDE spectra using the matched-spectrum method at an average
period lower than 0.7 s, whereas a distant earthquake converged with the spectra at a
Motion # 1
-150
-100
-50
0
50
100
150
0 10 20 30 40 50
Time (s)
Acc
eler
atio
n (
cm/s2 )
Motion # 6
-150
-100
-50
0
50
100
150
0 10 20 30 40 50
Time (s)
Acc
eler
atio
n (
cm/s2 )
Motion # 2
-150
-100
-50
0
50
100
150
0 10 20 30 40 50
Time (s)
Acc
eler
atio
n (
cm/s2 )
Motion # 7
-150
-100
-50
0
50
100
150
0 10 20 30 40 50
Time (s)A
ccel
erat
ion
(cm
/s2)
Motion # 3
-150
-100
-50
0
50
100
150
0 10 20 30 40 50
Time (s)
Acc
eler
atio
n (
cm/s2 ) Motion # 8
-150
-100
-50
0
50
100
150
0 10 20 30 40 50
Time (s)
Acc
eler
atio
n (
cm/s2
)
Motion # 4
-150
-100
-50
0
50
100
150
0 10 20 30 40 50Time (s)
Acc
eler
atio
n (
cm/s2 ) Motion # 9
-150
-100
-50
0
50
100
150
0 10 20 30 40 50
Time (s)
Acc
eler
atio
n (
cm/s2 )
Motion # 5
-150
-100
-50
0
50
100
150
0 10 20 30 40 50
Time (s)
Acc
eler
atio
n (
cm/s2 ) Motion # 10
-150
-100
-50
0
50
100
150
0 10 20 30 40 50
Time (s)
Acc
eler
atio
n (
cm/s2 )
(a) (b)
Fig. 16 Selected ground motions for the investigated site after MDE spectrum-matched: a for conditionwith no large dam, b for condition with large dam
Nat Hazards (2011) 59:237–269 265
123

period of up to 2.0 s. This indicates that a near-field low-magnitude earthquake has rich
higher frequency than a distant earthquake.
In structural engineering, particularly for flexible structures (defined as those having a
fundamental period greater than 1.0 s), the effect of a large dam on the seismic hazard may
not be apparent compared with the condition without a large dam. This shows that the
existing rigid structures (buildings with a fundamental period lesser than 1.0 s) at the site
are those that will be very vulnerable if a large dam will be constructed close to the active
fault, because most of these structures were built based on the gravity load design using the
British Standard. The regular brick-masonry houses, which are normally non-engineered
constructions, are especially vulnerable. The seismic hazard discussed in this study is PGA
on the bedrock (or rock) that does not include the local site effect. The local site effect may
increase the PGA because of the soil effect, surface topography effect, and basin effect. For
instance, the local soil at the site may amplify the motion up to 1.6 times the PGA on the
bedrock according to Eurocode 8, and the crest of a ridge may amplify the average
acceleration of about 2.5 times the average base acceleration (Kramer 1996). These are
clearly not good signs for a regular building at the investigated site.
5 Conclusion
This study addressed the issue of whether any escalation of the seismic hazard could
transpire in a low seismic region where a large dam may be constructed in the future. The
seismic hazard is dedicated to a seismic design and assessment of a regular building at the
site. The Ulu Padas Area in Northern Borneo is selected as a low seismic region that has a
documented absence of earthquake history. We ran PSHA and DSHA in accordance with
the RTS analysis to define the MCE and then determined the MDE. The large dam is
assumed to have a water volume of 700–1,000 9 106 m3 with a water level height of
120 m.
The surrounding Ulu Padas Area can be classified as a background seismic source area
and can be divided into two source areas, namely source areas 1 and 2. These seismic
sources propagate tremors on the site bedrock with a PGA ranging from 0.0029 to 0.0102 g
based on the DSHA result at the median or 50th-percentile in their earthquake histories and
are associated with low to moderate earthquake events, Mb 4.1–5.4, with 55–159 km
hypocentral distances. The composite model from 11 ground motion models is employed
in this case. The seismic hazard in the Ulu Padas Area, particularly in the investigated site,
may increase to about 13 times based on the DSHA when a large dam is built near the fault
line due to a predicted Mb 4.5 earthquake at a hypocentral distance of 10.4 km sourced
from the RTS phenomenon. In the 84th-percentile of the DSHA or considering the worst
case scenario, the reservoir could trigger a PGA of 0.2727 g on the bedrock of the
investigated site.
Based on the PSHA, the seismic source areas 1 and 2 in the surrounding Ulu Padas Area
have 0.773 and 0.9805 b-values of the Gutenberg–Richter constant, respectively, whereas
the b-value of the RTS source is assumed to be 1.188. The annual rate of occurrence for
source areas 1 and 2 is very close to each other and are higher than that of the RTS source.
Based on the regional earthquake history, the maximum magnitude for source areas 1 and 2
and the RTS source are 6.2, 5.7, and 4.5, respectively, whereas the minimum magnitude is
4.0 for all sources. The analysis reveals that a 475 years RPE could produce 0.0354 g of
PGA on the bedrock in the current seismic hazard level and could be increased to 2.9 times
when propagated by an RTS earthquake when a future large dam is built. However, the
266 Nat Hazards (2011) 59:237–269
123
effect of a large dam on the seismic hazard may not be visible at periods of SA longer than
1.0 s. As the consequence, the MDE can be affected significantly by the future existence of
a large dam. Therefore, the SA of the MDE for a regular building with a period of less than
1.0 s must be taken from the median value of the DSHA. Moreover, the SA of a 475 years
RPE from the current condition (without a large dam effect) must also be considered as the
MDE, particularly at SA periods of more than 1.0 s. Consequently, this affects the
selection of the ground motion for the seismic design and assessment of regular buildings.
Acknowledgments Authors wish to acknowledge the financial support given by Universiti Sains Malaysiathrough the Zamalah Fellowship and the Universiti Sains Malaysia Research University PostgraduateResearch Grant Scheme during the study. In this study, some helpful efforts in providing articles byDr. Martin Wieland and supporting data by Ranhill Sdn. Bhd. are acknowledged. The authors would alsolike to thank the two anonymous referees for their valuable comments in the earlier version of this paper.
References
Abrahamson NA (1992) Non-stationary spectral matching. Seismol Res Lett 63:30Abrahamson NA (2006) Seismic hazard assessment: problem with current practice and future development.
In: Proceeding of the 1st European conference on earthquake engineering and seismology, Geneva,Switzerland, 3–8 September 2006, Paper No: K2
Abrahamson NA, Silva WJ (2008) Summary of the Abrahamson & Silva NGA ground motion relations.Earthq Spectr 24:67–97
Ambraseys N, Smit P, Sigbjornsson R, Suhadolc P, Margaris B (2001) Internet-site for European strong-motion data. http://www.isesd.cv.ic.ac.uk, EVR1-CT-1999-40008, European Commission, Directorate-General XII, Environmental and Climate Programme, Bruxelles, Belgium
Ambraseys NN, Douglas J, Sarma SK, Smit PM (2005) Equations for the estimation of strong groundmotions from shallow crustal earthquakes using data from Europe and the Middle East: horizontal peakground acceleration and spectral acceleration. Bull Earthq Eng 3:1–53
Anbazhagan P, Vinod JS, Sitharam TG (2009) Probabilistic seismic hazard analysis for Bangalore. NatHazards 48:145–166
ASCE (2007) ASCE/SEI Standard 41–06, Seismic rehabilitation of existing buildings (including Supple-ment 1). American Society of Civil Engineers, Reston
Atakan K, Midzi V, Moreno Toiran B, Vanneste K, Camelbeeck T, Meghraoui M (2000) Seismic hazard inregions of present day low seismic activity: uncertainties in the paleoseismic investigations along theBree Fault Scarp (Roer Graben, Belgium). Soil Dyn Earthq Eng 20:415–427
Atkinson GM, Boore DM (2006) Earthquake ground-motion prediction equations for eastern NorthAmerica. Bull Seismol Soc Am 96:2181–2205
Baecher BG, Keeney RL (1982) Statistical examination of reservoir induced seismicity. Bull Seismol SocAm 72:553–569
Balendra T, Lam NTK, Wilson JL, Hong KH (2002) Analysis of long-distance earthquake tremors and baseshear demand for buildings in Singapore. Eng Struct 24:99–108
Bazzurro P, Cornell CA (1999) Disaggregation of seismic hazard. Bull Seismol Soc Am 89:501–520Bolt BA, Cloud WK (1974) Recorded strong motion on the Hsinfengkiang Dam, China. Bull Seismol Soc
Am 64:1337–1342Bommer JJ, Acevedo A (2004) The use of real earthquake accelerograms as input to dynamic analysis.
J Earthq Eng 8:43–91Bommer JJ, Martinez-Pereira A (1999) The effective duration of earthquake strong motion. J Earthq Eng
3:127–172Boore DM, Atkinson GM (2008) Ground-motion prediction equations for the average horizontal component
of PGA, PGV, and 5%-damped PSA at spectral periods between 0.01 s and 10.0 s. Earthq Spectr24:99–138
BSSC (2001) NEHRP recommended provisions for seismic regulations for new buildings and otherstructures 2000 Edition, part 1- provisions (FEMA 368). Building Seismic Safety Council, Wash-ington, DC
Campbell KW (2003) Prediction of strong ground motion using the hybrid empirical method and its use inthe development of ground motion (attenuation) relations in eastern North America. Bull Seismol SocAm 93:1012–1033
Nat Hazards (2011) 59:237–269 267
123
Campbell KW, Bozorgnia Y (2008) NGA ground motion model for the geometric mean horizontal com-ponent of PGA, PGV, PGD and 5% damped linear elastic response spectra for periods ranging from0.01 to 10 s. Earthq Spectr 24:139–171
CEN (2004) European standard EN 1998–1:2004 Eurocode 8: design of structures for earthquake resistance,part 1: general rules, seismic actions and rules for buildings. Comite Europeen de Normalisation,Brusells
Chadha RK, Gupta HK, Kumpel HJ, Mandal P, Rao AN, Kumar N, Radhakrishna I, Rastogi BK, Raju IP,Sarma CSP, Satyamurthy C, Satyanarayana HVS (1997) Delineation of active faults, nucleationprocess and pore pressure measurements at Koyna (India). Pure Appl Geophys 150:551–562
Chiou BSJ, Youngs RR (2008) Chiou-Youngs NGA ground motion relations for the geometric meanhorizontal component of peak and spectral ground motion parameters. Earthq Spectr 24:173–215
Cotton F, Scherbaum F, Bommer JJ, Bungum H (2006) Criteria for selecting and adjusting ground-motionmodels for specific target applications: applications to Central Europe and rock sites. J Seismol10:137–156
Dobry R, Idriss IM, Ng E (1978) Duration characteristics of horizontal components of strong-motionearthquake records. Bull Seismol Soc Am 68:1487–1520
Douglas J (2003) Earthquake ground motion estimation using strong-motion records: a review of equationsfor the estimation of peak ground acceleration and response spectral ordinates. Earth-Sci Rev61:43–104
Douglas J, Aochi H (2008) A survey of techniques for predicting earthquake ground motions for engineeringpurposes. Surv Geophys 29:187–220
FEMA (2005) Federal guidelines for dam safety: earthquake analyses and design of dams. FEMA 65.Building Seismic Safety Council, Washington, DC
Gupta HK (2002) A review of recent studies of triggered earthquakes by artificial water reservoirs withspecial emphasis on earthquakes in Koyna, India. Earth-Sci Rev 58:279–310
Gutenberg B, Richter CF (1944) Frequency of earthquakes in California. Bull Seismol Soc Am 34:185–188Han S-W, Choi Y-S (2007) Seismic hazard analysis in low and moderate seismic region-Korean peninsula.
Struct Saf 30:543–558Hancock J, Watson-Lamprey J, Abrahamson NA, Bommer JJ, Markatis A, McCoy E, Mendis R (2006) An
improved method of matching response spectra of recorded earthquake ground motion using wavelets.J Earthq Eng 10:67–89
Hanks TC, Bakun WH (2002) A bilinear source-scaling model for M–log A observations of continentalearthquakes. Bull Seismol Soc Am 92:1841–1846
ICOLD (1983) Seismicity and dam design. Bulletin 46, International Commission on Large DamsICOLD (1989) Selecting seismic parameters for large dams—guidelines and recommendations. Bulletin 72,
International Commission on Large DamsICOLD (2004) Reservoir and seismicity: state of knowledge. Bulletin 137, International Commission on
Large DamsIdriss IM (2008) An NGA empirical model for estimating the horizontal spectral values generated by
shallow crustal earthquakes. Earthq Spectr 24:217–242JMGM (2006) Study on the seismic and tsunami hazards and risks in Malaysia. Report on the geological and
seismotectonic information of Malaysia submitted to ASM (unpublished)Kramer SL (1996) Geotechnical earthquake engineering. Prentice-Hall, Upper Saddle RiverKrinitzsky EL (1995) Deterministic versus probabilistic seismic hazard analysis for critical structures. Eng
Geol 40:1–7Krinitzsky EL (2002) How to obtain earthquake ground motions for engineering design. Eng Geol 65:1–16Lantada N, Irizarry J, Barbat AH, Goula X (2010) Seismic hazard and risk scenarios for Barcelona, Spain,
using the Risk-UE vulnerability index method. Bull Earthq Eng 8:201–229Leydecker G, Kopera JR (1999) Seismological hazard assessment for a site in Northern Germany, an area of
low seismicity. Eng Geol 52:293–304McGarr A, Simpson D, Seeber L (2002) Case history of induced and triggered seismicity. In: Lee WHK,
Kanamori H, Jennings PC, Kisslinger C (eds) International handbook of earthquake and engineeringseismology, 81st edn. Academic Press, Amsterdam, pp 647–661
McGuire RK (2001) Deterministic vs. probabilistic earthquake hazards and risks. Soil Dyn Earthq Eng21:377–384
McGuire RK (2004) Seismic hazard and risk analysis. Earthquake Engineering Research Institute, BerkeleyMeng LK (1999) Geological setting of Sabah. In: The petroleum geology and resources of Malaysia,
Petroliam Nasional Berhad (PETRONAS), Kuala LumpurMichell GW, Becker M, Angermann D, Reigber C, Reinhart E (2000) Crustal motion in E- and SE-Asia
from GPS measurements. Earth Planets Sp 52:713–720
268 Nat Hazards (2011) 59:237–269
123
NEIC (2007) Earthquake database. National Earthquake Information Center. Available at http://neic.usgs.gov/neic/epic
Ornthammarath T, Warnitchai P, Worakanchana K, Zaman S, Sigbjornsson R, Lai CG (2010) Probabilisticseismic hazard assessment for Thailand. Bull Earthq Eng. doi:10.1007/s10518-010-9197-3
PEER (2000) PEER strong motion database. Available at: http://peer.berkeley.edu/smcat/Petersen MD, Dewey J, Hartzell S, Mueller C, Harmsen S, Frankel AD, Rukstales K (2004) Probabilistic
seismic hazard analysis for Sumatra, Indonesia and across the Southern Malaysian Peninsula.Tectonophysics 390:141–158
Reiter L (1990) Earthquake hazard analysis: issues and insights. Columbia University Press, New YorkRiskEngineering Inc (2008) EZ-FRISKTM version 7.3, software for earthquake ground motion estimation:
user manual, Boulder, ColoradoSabetta F, Lucantoni A, Bungum H, Bommer JJ (2005) Sensitivity of PSHA results to ground-motion
prediction relations and logic-tree weights. Soil Dyn Earthq Eng 25:317–329Scherbaum F, Bommer JJ, Bungum H, Cotton F, Abrahamson NA (2005) Composite ground-motion models
and logic trees: methodology, sensitivities, and uncertainties. Bull Seismol Soc Am 95:1573–1593Seismosoft (2009) SeismoMatch version 1.0.2. Available at: http://www.seismosoft.com/Simpson DW, Leith WS, Scholz CH (1988) Two types of reservoir-induced seismicity. Bull Seismol Soc
Am 78:2025–2040Somerville P, Collins N, Abrahamson N, Graves R, Saikia C (2001) Ground motion attenuation relations for
the central and eastern United States. US Geological Survey, Award 99HQGR0098 final reportSpudich P, Joyner WB, Lindh AG, Boore DM, Margaris BM, Fletcher JB (1999) SEA99: a revised ground
motion prediction relation for use in extensional tectonic regimes. Bull Seismol Soc Am 89:1156–1170Talwani P (1997) On the nature of reservoir-induced seismicity. Pure Appl Geophys 150:473–492Tongkul F (1993) Tectonic control on the development of the Neogene basins in Sabah. Malaysia. Geol Soc
Malays Bull 33:95–103Tongkul F (1997) Polyphase deformation in the Telupid area, Sabah, Malaysia. J Asian Earth Sci
15:175–183Tongkul F (1999) Regional geological correlation of Paleogene sedimentary rocks between Sabah and
Sarawak. Geol Soc Malays Bull 43:31–39Tongkul F (2006) The structural style of Lower Miocene sedimentary rocks, Kudat Peninsula, Sabah. Geol
Soc Malays Bull 49:119–124Toro GR, Abrahamson NA, Schneider JF (1997) Models of strong ground motions from earthquakes in
central and eastern North America: best estimates and uncertainties. Seismol Res Lett 68:41–57USCOLD (1997) Reservoir triggered seismicity. United States Committee on Large Dams, ReportUtsu T (2002) Relationships between magnitude scales. In: Lee WHK, Kanamori H, Jennings PC, Kisslinger
C (eds) International handbook of earthquake and engineering seismology, 81st edn. Academic Press,Amsterdam, pp 733–746
Walpersdorf A, Vigny C, Subarya C, Manurung P (1998) Monitoring of the Palu-Koro fault (Sulawesi) byGPS. Geophys Res Lett 25:2313–2316
Wells DL, Coppersmith KJ (1994) New empirical relationships among magnitude, rupture length, rupturewidth, rupture area, and surface displacement. Bull Seismol Soc Am 84:974–1002
Wieland M (2004) Earthquake safety of concrete dams and seismic design criteria for major dam projects.ICOLD publication
Wieland M (2005) Review of seismic design criteria of large concrete and embankment dams. In: Pro-ceeding of 73rd Annual Meeting of ICOLD, Tehran, Iran, 1–6 May, 2005
Wiemer S, Giardini D, Fah D, Deichmann N, Sellami S (2009) Probabilistic seismic hazard assessment ofSwitzerland: best estimates and uncertainties. J Seismol 13:449–478
Nat Hazards (2011) 59:237–269 269
123