AMBIENT SEISMIC NOISE AT BROADBAND SEISMIC STATIONS OF BULGARIAN NATIONAL DIGITAL SEISMIC NETWORK...
14
Bulgarian Geophysical Journal, 2011, Vol. 37 National Institute of Geophysics, Geodesy and Geography, Bulgarian Academy of Sciences 48 AMBIENT SEISMIC NOISE AT BROADBAND SEISMIC STATIONS OF BULGARIAN NATIONAL DIGITAL SEISMIC NETWORK (BNDSN) L. Dimitrova, S. Nikolova National Institute of Geophysics, Geodesy and Geography – Bulgarian Academy of Sciences, Acad, G.Bonchev str., bl.3, 1113 Sofia, Bulgaria,[email protected], [email protected] Abstract. The main goal of this study is to evaluate ambient seismic noise at the Bulgarian National Digital Seismic Network (BNDSN) stations equipped with new broadband seismometers. In order to compare the performance of the network against international standards a detail analysis of the noise was performed using method and software that are applied in the international practice. To estimate the distribution of power spectral density (PSD) of the noise over the wide frequency band probability density function (PDF) was calculated. Annual, frequency, seasonal and diurnal analyses were performed. The levels of the ambient seismic noise were determined and the full range of the factors influencing the quality of the data and the performance of a seismic station were analyzed. The estimated PSD functions were compared against two global models (NHNM and NLNM) for high and respectively low noise levels. The results show that estimated PSDes fall within NLNM and NHNM for all of the BNDSN stations and the Bulgarian seismic stations belong to the medium noise level stations worldwide. It has been shown in the study that the seismic noise analysis is very useful tool for evaluation performance of the BNDSN seismic broadband stations. Key words Ambient seismic noise, Power spectral density, Probability density function, Bulgarian seismic stations Introduction Important precondition for development of seismology and correct interpretation of the seismic waves is the high quality of the seismic observations. Primarily this is achieved by installation of good quality equipment at the seismic stations. During the last 15 years high performance digital seismic systems were developed and became available on the global market at affordable price for scientific community. Narrow band low sensitive seismic sensors were replaced by high sensitive broadband seismometers. New digital
Transcript of AMBIENT SEISMIC NOISE AT BROADBAND SEISMIC STATIONS OF BULGARIAN NATIONAL DIGITAL SEISMIC NETWORK...
Bulgarian Geophysical Journal, 2011, Vol. 37 National Institute of Geophysics, Geodesy and Geography, Bulgarian Academy of Sciences
48
AMBIENT SEISMIC NOISE AT BROADBAND SEISMIC STATIONS OF
BULGARIAN NATIONAL DIGITAL SEISMIC NETWORK (BNDSN)
L. Dimitrova, S. Nikolova
National Institute of Geophysics, Geodesy and Geography – Bulgarian Academy of Sciences, Acad, G.Bonchev str., bl.3, 1113 Sofia, Bulgaria,[email protected], [email protected]
Abstract. The main goal of this study is to evaluate ambient seismic noise at the Bulgarian National Digital Seismic Network (BNDSN) stations equipped with new broadband seismometers. In order to compare the performance of the network against international standards a detail analysis of the noise was performed using method and software that are applied in the international practice. To estimate the distribution of power spectral density (PSD) of the noise over the wide frequency band probability density function (PDF) was calculated. Annual, frequency, seasonal and diurnal analyses were performed. The levels of the ambient seismic noise were determined and the full range of the factors influencing the quality of the data and the performance of a seismic station were analyzed. The estimated PSD functions were compared against two global models (NHNM and NLNM) for high and respectively low noise levels. The results show that estimated PSDes fall within NLNM and NHNM for all of the BNDSN stations and the Bulgarian seismic stations belong to the medium noise level stations worldwide. It has been shown in the study that the seismic noise analysis is very useful tool for evaluation performance of the BNDSN seismic broadband stations.
Key words Ambient seismic noise, Power spectral density, Probability density function, Bulgarian seismic stations
Introduction
Important precondition for development of seismology and correct interpretation of the seismic waves is the high quality of the seismic observations. Primarily this is achieved by installation of good quality equipment at the seismic stations. During the last 15 years high performance digital seismic systems were developed and became available on the global market at affordable price for scientific community. Narrow band low sensitive seismic sensors were replaced by high sensitive broadband seismometers. New digital
L. Dimitrova, S. Nikolova: Ambient seismic noise at broadband seismic stations of Bulgarian …
Bulgarian Geophysical Journal, 2011, Vol. 37 49
acquisition systems have been developed to support both field and base station operation. The developed analysis software enables easily to account for digitizer-sensor transfer functions and to display waveforms in real displacement, velocity or acceleration.
Secondly, the data quality at a particular station is influenced by the level of ambient seismic noise. For defining the station performance it is very important to estimate the baseline level of the Earth noise at each existing station or during a new site selection.
Complete modernization of the Bulgarian National Seismic Network has been accomplished within one month in 2005. Modern digital equipment was installed in all existing analogue stations. These stations were built in the last century after thorough site selection and were equipped with short-period seismometers. The upgraded network consists of 14 stations equipped with: 13 RefTek High Resolution Broadband Seismic Recorders – model DAS 130-01/3, the datalogger Quanterra 380 (installed in 1996 in station VTS by project PLATO1/MEDNET) and broad-band seismometers (Table 1). After modernization it was very important to evaluate overall performance of the digital broadband seismic stations and to tune accordingly the automatic detection process to the noise levels. This study presents an approach to estimate ambient seismic noise, artefacts and episodic cultural noise that are related to station operation and affect the quality of data. Regular assessment of the noise levels is very useful approach as for characterizing the current performance of the Bulgarian broadband stations as well as for site selection of new stations.
Method
The method of McNamara & Bulland (2004) was applied and the software code PDFSA (McNamara & Boaz 2005) was used to evaluate ambient seismic noise at the BNDSN seismic stations. This approach calculates probability density function (PDF) to estimate distribution of power spectral density (PSD) of the noise in a wide frequency range from 0.01Hz to the Niquist frequency. The advantage of the method is that there is no need to filter data from earthquakes, gaps, spikes, calibrations pulses etc. Such kind of “disturbing” signals in the seismic data has low-level probability of occurrence while ambient noise reveals itself as a signal with high probability occurrence. McNamara & Buland (2004) give the total power spectral density by:
22
kk YN
tP
∆= (1)
The total power, as it is given in (1), is the square of the amplitude spectrum with a normalization factor of Nt /2∆ , t∆ is the sample interval, N is the number of samples
in a time series segment and 1,...,2,1 −= Nk . Usually the seismic noise is measured in
respect to the ground acceleration. The PSD of the noise is also displayed against the ground acceleration. It is more useful to express the PSD in dB relative to a base acceleration 1 m/s2. In this case the PSD is expressed by the following equation: PSD = 10log10 (m
2/sec4)/Hz [dB] (2)
L. Dimitrova, S. Nikolova: Ambient seismic noise at broadband seismic stations of Bulgarian …
50 Bulgarian Geophysical Journal, 2011, Vol. 37
That way it is easy to compare the PSD estimations to the low noise model (NLNM) and high noise model (NHNM) (Peterson, 1993).
Input seismic data
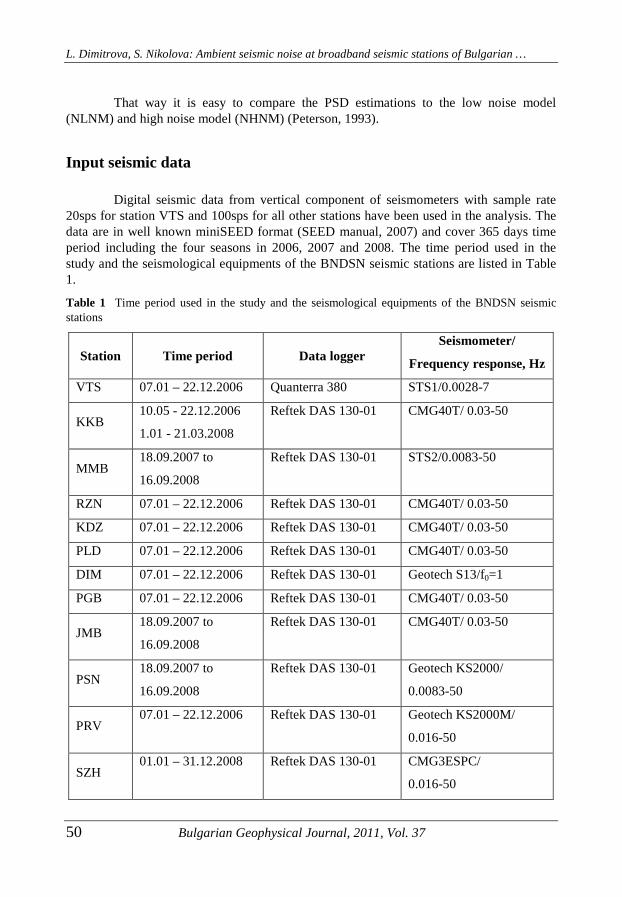
Digital seismic data from vertical component of seismometers with sample rate 20sps for station VTS and 100sps for all other stations have been used in the analysis. The data are in well known miniSEED format (SEED manual, 2007) and cover 365 days time period including the four seasons in 2006, 2007 and 2008. The time period used in the study and the seismological equipments of the BNDSN seismic stations are listed in Table 1.
Table 1 Time period used in the study and the seismological equipments of the BNDSN seismic stations
Station Time period Data logger Seismometer/
Frequency response, Hz
VTS 07.01 – 22.12.2006 Quanterra 380 STS1/0.0028-7
KKB 10.05 - 22.12.2006
1.01 - 21.03.2008
Reftek DAS 130-01 CMG40T/ 0.03-50
MMB 18.09.2007 to
16.09.2008
Reftek DAS 130-01 STS2/0.0083-50
RZN 07.01 – 22.12.2006 Reftek DAS 130-01 CMG40T/ 0.03-50
KDZ 07.01 – 22.12.2006 Reftek DAS 130-01 CMG40T/ 0.03-50
PLD 07.01 – 22.12.2006 Reftek DAS 130-01 CMG40T/ 0.03-50
DIM 07.01 – 22.12.2006 Reftek DAS 130-01 Geotech S13/f0=1
PGB 07.01 – 22.12.2006 Reftek DAS 130-01 CMG40T/ 0.03-50
JMB 18.09.2007 to
16.09.2008
Reftek DAS 130-01 CMG40T/ 0.03-50
PSN 18.09.2007 to
16.09.2008
Reftek DAS 130-01 Geotech KS2000/
0.0083-50
PRV 07.01 – 22.12.2006 Reftek DAS 130-01 Geotech KS2000M/
0.016-50
SZH 01.01 – 31.12.2008 Reftek DAS 130-01 CMG3ESPC/
0.016-50
L. Dimitrova, S. Nikolova: Ambient seismic noise at broadband seismic stations of Bulgarian …
Bulgarian Geophysical Journal, 2011, Vol. 37 51
PVL 07.01 – 22.12.2006 Reftek DAS 130-01 CMG40T/ 0.03-50
MPE 20.06.2007 to
18.06.2008
Reftek DAS 130-01 CMG3ESPC/
0.016-50
Selection of different time intervals for analysis on stations MPE, PSN, JMB and KKB is due to the later installation of broad-band seismometers on those stations. The PDF and PSD of the seismic noise are estimated in frequency range from 0.01Hz (100s) to the Niquist frequency - 10Hz (0.1s) for seismic station (SS) VTS and 50Hz (0.02s) for all other stations. The calculated results are plotted together with the NLNM and NHNM models. We made following analyses of the obtained results on the ambient seismic noise:
♦ annual analysis – using 365 days long data over all seasons; ♦ frequency analysis – a year average PSD mode estimates divided in 3 frequency
intervals are mapped for all BNDSN stations. ♦ seasonal analysis –data used are 4 three-month long periods – 23 December – 21
March - winter, 22 March – 19 June – spring, 20 June – 17 September – summer, 18 September – 22 December - autumn,
♦ diurnal analysis – data used are accumulated in daily and nightly bins from ten-days periods over the four seasons;
The PSD mode values are used in the noise analysis. These are typical values that represent the most often observed noise levels at the seismic stations and give an estimation of the equipment performance. During the analysis the range of periods from 0.02s/0.1s to 100s is divided into two sub-periods:
1. The periods longer than 1s, where the microseisms are spread; 2. The periods shorter than 1s, where the most common noise sources are
due to human activities.
Results
Annual analysis
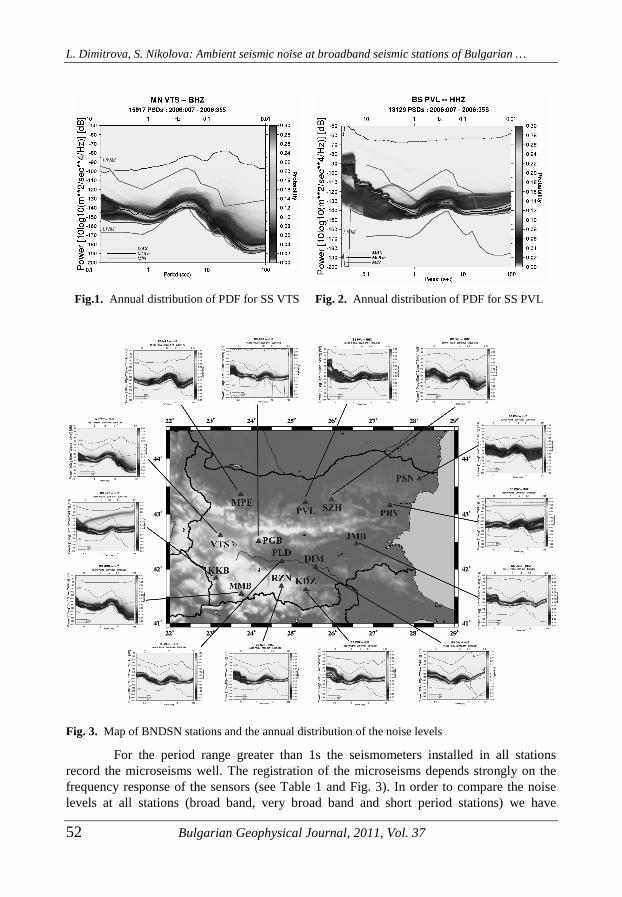
Fig. 1 and Fig. 2 are two extreme examples of the annual PDF distribution of the seismic noise at the BNDSN stations. SS VTS is one of the quietest stations and SS PVL is one of the noisiest Bulgarian stations. The PSD mode curve is plotted in black color in Fig. 1 and Fig. 2. The annual plots for all stations are mapped in Fig. 3.
The mode values of PSD for most stations follow closely the NLNM up to 10-15dB higher) at periods around 1 sec – predominantly observed period of P waves at local and regional earthquakes thus proving high sensitivity of the network to the seismic events at these epicentral distances. The only exceptions are the mode values for stations PSN, PRV and JMB that are more than 20 dB from NLNM. These stations are the closest ones to the Black sea shore which is the strongest source of microseismic noise at these frequencies.
L. Dimitrova, S. Nikolova: Ambient seismic noise at broadband seismic stations of Bulgarian …
52 Bulgarian Geophysical Journal, 2011, Vol. 37
Fig.1. Annual distribution of PDF for SS VTS Fig. 2. Annual distribution of PDF for SS PVL
Fig. 3. Map of BNDSN stations and the annual distribution of the noise levels
For the period range greater than 1s the seismometers installed in all stations record the microseisms well. The registration of the microseisms depends strongly on the frequency response of the sensors (see Table 1 and Fig. 3). In order to compare the noise levels at all stations (broad band, very broad band and short period stations) we have
L. Dimitrova, S. Nikolova: Ambient seismic noise at broadband seismic stations of Bulgarian …
Bulgarian Geophysical Journal, 2011, Vol. 37 53
reduced the investigated range to an interval from 1s to 10s. The mode values of the PSD at the southern (KKB, MMB, RZN, KDZ) and central Bulgarian stations (VTS, PGB, PLD, DIM without SS JMB) are closer to the NLNM in comparison with the stations in northern part of Bulgaria (PSN, PRV, STZ, PVL and MPE) (Fig. 3). The double frequency peak is moved towards the shorter periods at northern stations. This is clearly seen at SS PSN and PRV while at stations PVL and STZ this tendency is weaker. The close proximity of Black Sea to the SS PSN (30-35км to South and East) and to SS PRV (about 40km in eastern direction) is a reason for this displacement. High frequency noise produced by storms and surf in the Black Sea rapidly reduces within several ten kilometers in distance when microseisms propagate on land.
For periods below 1s each station has own noise distribution model depending on specific noise sources (Dimitrova, 2009) (Fig. 1, Fig. 2 and Fig. 3). The most significant noise sources are often related to human activities at or near the Earth surface. The noise levels have higher values as close as disturbing sources are situated to the seismic station and spread over the shorter periods. The noise for the period range below 0.15s is due to the activities in the building of the station or as a result of vibrations occurring near the station (Christoskov & Holub, 1964). The high power noise level is caused by human activities within SS RZN, MMB and PSN and such one close to the station PGB. The typical urban noise is observable in PSD plots of stations PLD, JMB and DIM (Fig. 3). For example, SS PLD is situated in the central part of Plovdiv (city with population of about 500 000 inhabitants) and is located near a high traffic street. Seismic station PVL is built on the dam bank where often the dam “Gorsko Kosovo” machineries run (Dimitrova & Nikolova, 2009). The mode PSD reaches values as high as -90dB (Fig. 2). Station KDZ is situated on the dam “Kurdzhali” bank as well. The dam machineries run there rarely and the produced high noise levels have very low probability of occurrence. The mode PSD values here are close to the minimum ones. The mode PSD curve is almost equal to the minimum curve when noise sources in or near the station are not presented. This pattern is observed also in the noise distribution for the stations MPE, PRV and KKB in the period range below 0.15s (Fig. 3).
A higher noise levels in the range of periods between 0.15s – 0.3s are caused by traffic along the big city streets (Christoskov & Holub, 1964) and the influence of close interurban highways is well seen in distribution of PSD of stations PLD, DIM, PRV, STZ and PSN (Fig. 3).
The noise produced by industrial objects situated in the vicinity of the stations MMB, MPE and PGB covers the periods 0.3s, 0.4s till 1s and looks like rectangle (Fig. 3).
We have made two types of evaluations to compare the noise levels at all stations: ♦ The minimum and maximum mode values of PSD for the periods below 1s
are calculated and the stations are rated. The quietest stations are MPE, VTS и MMB and the noisiest stations are PGB, PVL и JMB.
♦ We have calculated the average mode value of all stations for the period range 0.1-1s and compared this value against the average NLNM value for that range. The average mode value for SS MPE is the closest one to the average NLNM value. It is higher with 20.1dB than the low model. The average mode value of PSD for SS PVL is 38.2dB higher than NLNM.
In this period range (0.1-1s) McNamara et al. (2005) have calculated a new global
L. Dimitrova, S. Nikolova: Ambient seismic noise at broadband seismic stations of Bulgarian …
54 Bulgarian Geophysical Journal, 2011, Vol. 37
mode value which is about 20dB higher than the NLNM. We can rate the BNDSN stations based on the increasing of the difference between observed mode PSDs at each stations with this global value (in order of increasing) as follows: MPE, KDZ, MMB, RZN, KKB, DIM, VTS, PSN, PGB, PRV, STZ, JMB, PLD and PVL. SS MPE is the quietest station which has mode values of the noise power about 0.1dB higher than the new global mode values. The greatest deviation of about 18.2dB is observed in mode levels of SS PVL.
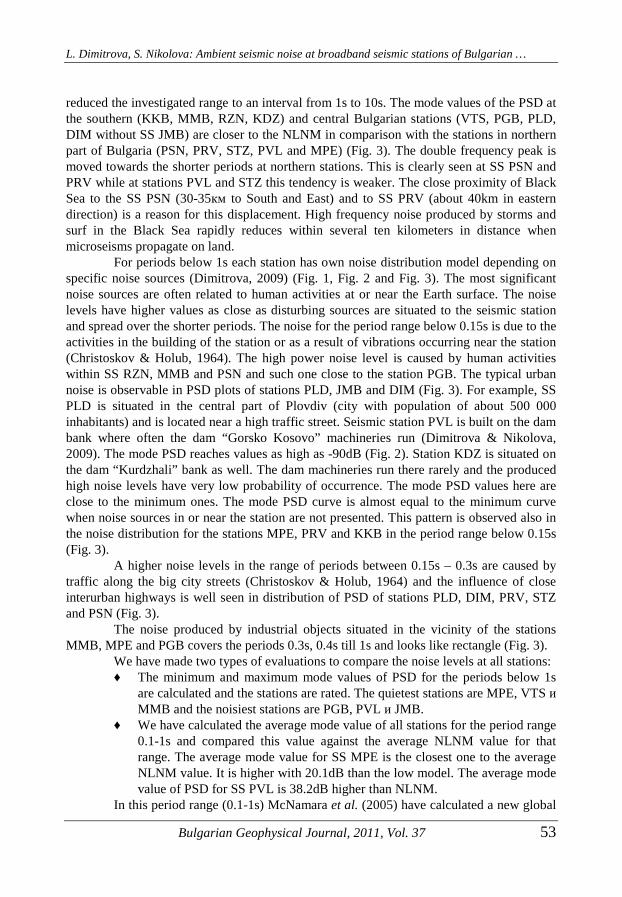
Fig. 4 presents the annual mode power distribution estimates for all Bulgarian seismic stations plotted together with NLNM and NHNM ones.
Fig. 4. Mode PSD curves of BNDSN stations together with NLNM and NHNM
For periods less than 10s curves all BNDSN stations fall within NLNM and NHNM. At longer periods the noise at some stations increases because of sensor frequency response characteristics or seismometer malfunctioning. Annual PSD estimates show that the Bulgarian seismic stations have low to medium noise levels. This finding proves the proper site selection and good performance of the seismological equipment.
Frequency analysis
In order to study the noise variation as a function of geographic location of the Bulgarian seismic stations the period interval from 10s to 0.1/0.02s is divided into three sub-intervals: from 0.03s to 0.15s, from 0.16s to 0.76s and from 1.8s to 8s. We have used a year long PSD mode estimates for all stations. The estimates have been averaged and
L. Dimitrova, S. Nikolova: Ambient seismic noise at broadband seismic stations of Bulgarian …
Bulgarian Geophysical Journal, 2011, Vol. 37 55
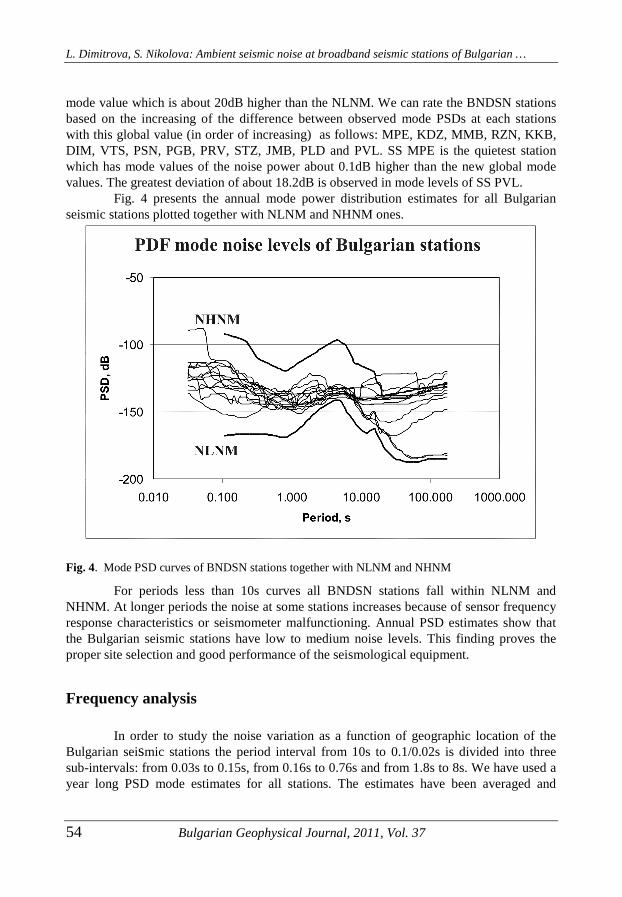
mapped. The noise power distribution in the sub-interval of the microseisms from 1.8s to 8s is shown in Fig. 5.
The eastern and northern Bulgarian stations and SS PLD have higher noise levels within range from -133dB to -136dB than southern stations and SS VTS and SS PGB which noise values are lower and vary from -138dB to -140dB. The closest to the Black Sea stations PSN and PRV have the highest noise levels respectively -131dB and -132dB. This is due to the Black Sea storms especially during the winter and autumn. The noise levels in this period band depend on the geological condition as well.
Fig. 5. The noise power distribution of the average PSD mode values in the sub-interval from 1.8s to 8s
We should expect that microseisms, caused by severe weather in Adriatic and especially Aegean Sea, which is located 80-100km from the southern Bulgarian stations, will increase the noise levels at these stations. The stations in southern part of Bulgaria, SS VTS and SS PGB are located in mountains where inhomogeneous structure and existing fault zones cause attenuation of long period seismic signals. This is why the noise levels at southern stations, VTS and PGB are not influenced by storms in Adriatic and Aegean Seas. The northern seismic stations and JMB are situated in big valleys which are open to the Black Sea and the microseisms spread with low attenuations in distance (Gutenberg, 1911).
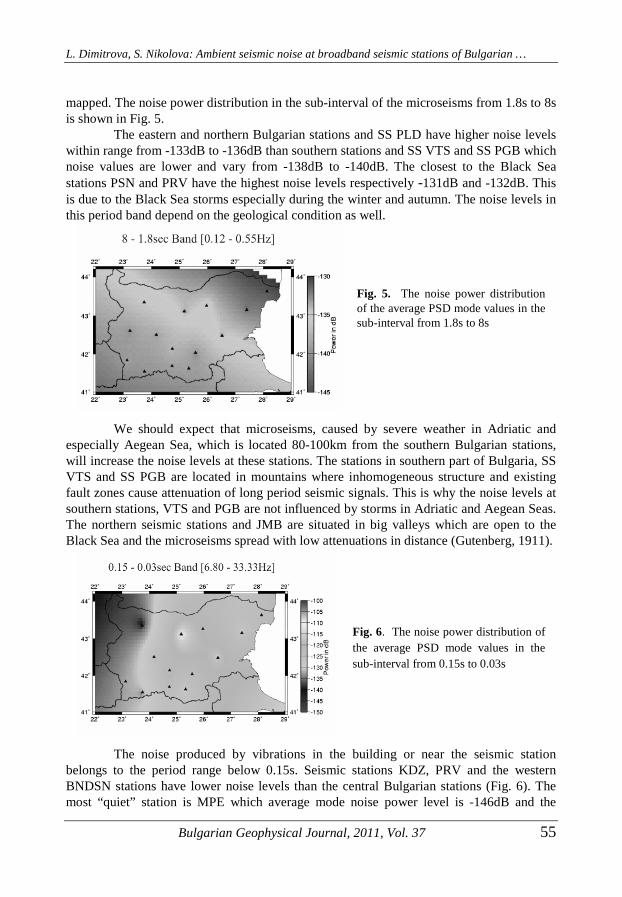
Fig. 6. The noise power distribution of the average PSD mode values in the sub-interval from 0.15s to 0.03s
The noise produced by vibrations in the building or near the seismic station belongs to the period range below 0.15s. Seismic stations KDZ, PRV and the western BNDSN stations have lower noise levels than the central Bulgarian stations (Fig. 6). The most “quiet” station is MPE which average mode noise power level is -146dB and the
L. Dimitrova, S. Nikolova: Ambient seismic noise at broadband seismic stations of Bulgarian …
56 Bulgarian Geophysical Journal, 2011, Vol. 37
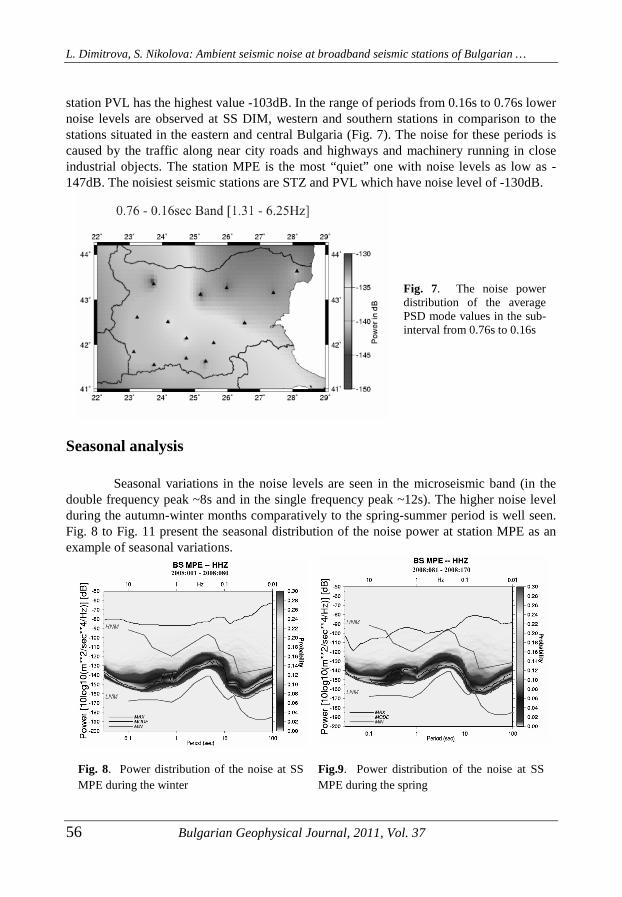
station PVL has the highest value -103dB. In the range of periods from 0.16s to 0.76s lower noise levels are observed at SS DIM, western and southern stations in comparison to the stations situated in the eastern and central Bulgaria (Fig. 7). The noise for these periods is caused by the traffic along near city roads and highways and machinery running in close industrial objects. The station MPE is the most “quiet” one with noise levels as low as -147dB. The noisiest seismic stations are STZ and PVL which have noise level of -130dB.
Fig. 7. The noise power distribution of the average PSD mode values in the sub-interval from 0.76s to 0.16s
Seasonal analysis
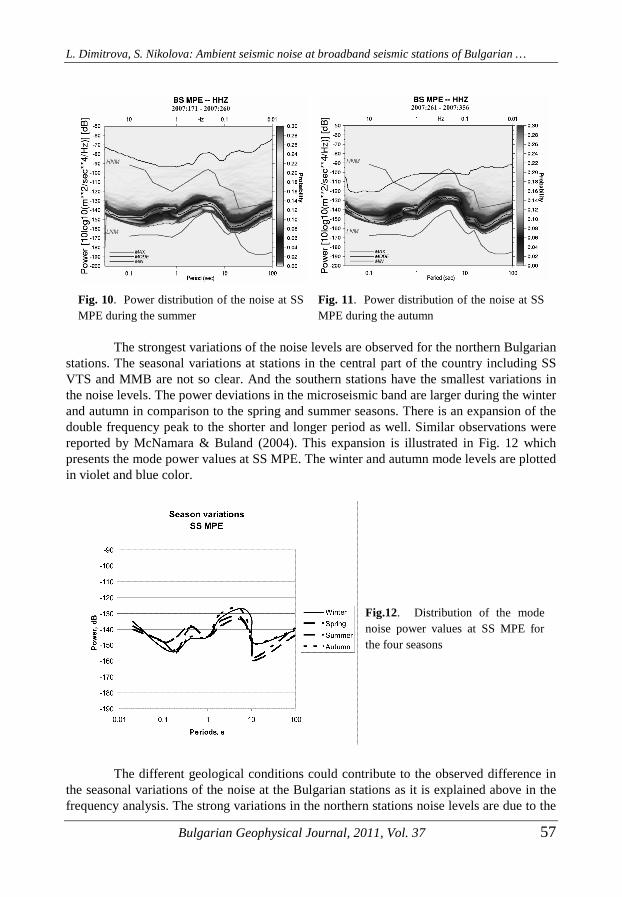
Seasonal variations in the noise levels are seen in the microseismic band (in the double frequency peak ~8s and in the single frequency peak ~12s). The higher noise level during the autumn-winter months comparatively to the spring-summer period is well seen. Fig. 8 to Fig. 11 present the seasonal distribution of the noise power at station MPE as an example of seasonal variations.
Fig. 8. Power distribution of the noise at SS MPE during the winter
Fig.9. Power distribution of the noise at SS MPE during the spring
L. Dimitrova, S. Nikolova: Ambient seismic noise at broadband seismic stations of Bulgarian …
Bulgarian Geophysical Journal, 2011, Vol. 37 57
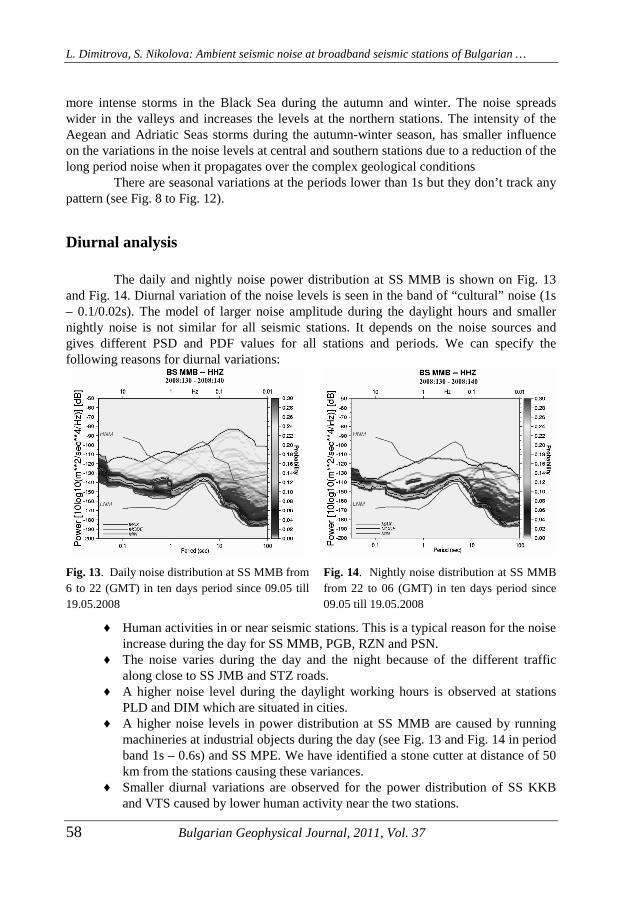
Fig. 10. Power distribution of the noise at SS MPE during the summer
Fig. 11. Power distribution of the noise at SS MPE during the autumn
The strongest variations of the noise levels are observed for the northern Bulgarian stations. The seasonal variations at stations in the central part of the country including SS VTS and MMB are not so clear. And the southern stations have the smallest variations in the noise levels. The power deviations in the microseismic band are larger during the winter and autumn in comparison to the spring and summer seasons. There is an expansion of the double frequency peak to the shorter and longer period as well. Similar observations were reported by McNamara & Buland (2004). This expansion is illustrated in Fig. 12 which presents the mode power values at SS MPE. The winter and autumn mode levels are plotted in violet and blue color.
Fig.12. Distribution of the mode noise power values at SS MPE for the four seasons
The different geological conditions could contribute to the observed difference in the seasonal variations of the noise at the Bulgarian stations as it is explained above in the frequency analysis. The strong variations in the northern stations noise levels are due to the
L. Dimitrova, S. Nikolova: Ambient seismic noise at broadband seismic stations of Bulgarian …
58 Bulgarian Geophysical Journal, 2011, Vol. 37
more intense storms in the Black Sea during the autumn and winter. The noise spreads wider in the valleys and increases the levels at the northern stations. The intensity of the Aegean and Adriatic Seas storms during the autumn-winter season, has smaller influence on the variations in the noise levels at central and southern stations due to a reduction of the long period noise when it propagates over the complex geological conditions
There are seasonal variations at the periods lower than 1s but they don’t track any pattern (see Fig. 8 to Fig. 12).
Diurnal analysis
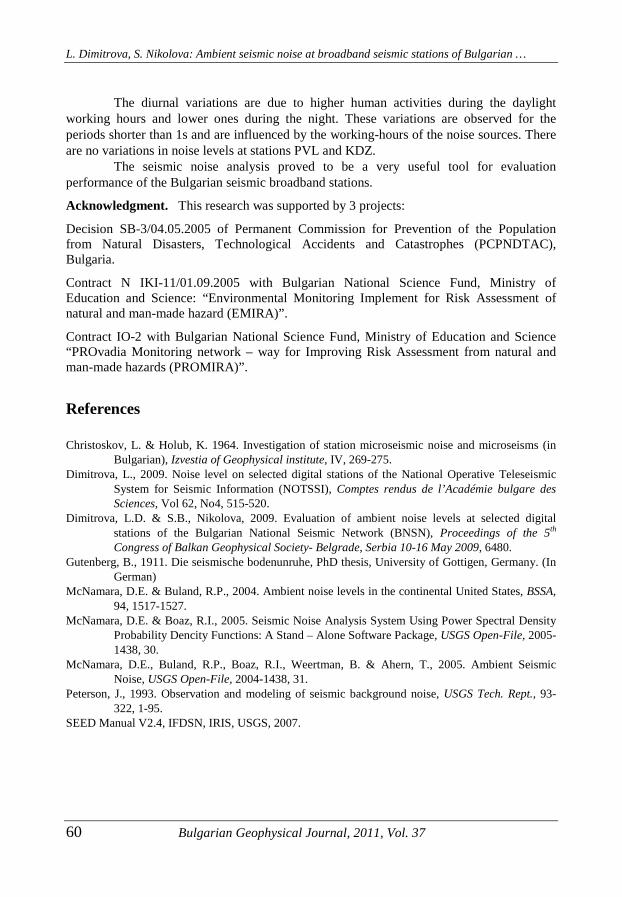
The daily and nightly noise power distribution at SS MMB is shown on Fig. 13 and Fig. 14. Diurnal variation of the noise levels is seen in the band of “cultural” noise (1s – 0.1/0.02s). The model of larger noise amplitude during the daylight hours and smaller nightly noise is not similar for all seismic stations. It depends on the noise sources and gives different PSD and PDF values for all stations and periods. We can specify the following reasons for diurnal variations:
Fig. 13. Daily noise distribution at SS MMB from 6 to 22 (GMT) in ten days period since 09.05 till 19.05.2008
Fig. 14. Nightly noise distribution at SS MMB from 22 to 06 (GMT) in ten days period since 09.05 till 19.05.2008
♦ Human activities in or near seismic stations. This is a typical reason for the noise increase during the day for SS MMB, PGB, RZN and PSN.
♦ The noise varies during the day and the night because of the different traffic along close to SS JMB and STZ roads.
♦ A higher noise level during the daylight working hours is observed at stations PLD and DIM which are situated in cities.
♦ A higher noise levels in power distribution at SS MMB are caused by running machineries at industrial objects during the day (see Fig. 13 and Fig. 14 in period band 1s – 0.6s) and SS MPE. We have identified a stone cutter at distance of 50 km from the stations causing these variances.
♦ Smaller diurnal variations are observed for the power distribution of SS KKB and VTS caused by lower human activity near the two stations.

L. Dimitrova, S. Nikolova: Ambient seismic noise at broadband seismic stations of Bulgarian …
Bulgarian Geophysical Journal, 2011, Vol. 37 59
♦ There are no variations in noise levels at stations PVL and KDZ due to 24 hour mode of exploitation of the machinery at the near industrial objects.
There are no diurnal variations for single and double-frequency peaks for all BNDSN stations.
Conclusion
The study presents an application of the method of McNamara & Bulland (2004) and the software code PDFSA which were used to determine power spectral density function (PSD) of the background noise and to evaluate the probability density function (PDF) for the stations of BNDSN. The levels of the ambient seismic noise were determined and the full range of factors influencing the quality of the data and the performance of the seismic stations was analyzed. The estimated PSD functions are compared against two models for high (NHNM) and low (NLNM) noise that are commonly used in seismological practice for seismic station monitoring qualities assessment.
Annual, frequency, seasonal and diurnal analyses of the noise levels at BNDSN stations were carried out using mode PSD.
The annual analysis shows that for microseismic periods the noise levels are higher at the northern Bulgarian stations than at stations in the central and southern Bulgaria. This is clearly observed at SS PRV and PSN which are situated near Black Sea. The noise levels depend on the different geological conditions of the seismic stations as well. The northern stations and JMB are situated in big open to the Black Sea valleys and microseisms spread wider into the land. The southern and central stations are located in more complex geological conditions and microseisms caused by storms in the Black Sea in East, in the Aegean Sea in South and in the Adriatic Sea in West attenuate quickly.
For the periods of “cultural” noise the power distribution depends on the type of noise sources and as a rule is related to human activities at or near the Earth surface. The stations MPE, VTS and MMB have the lowest mode noise levels while the noisiest stations are PGB, PVL и JMB.
The performed frequency analysis in the study enables presentation of the noise variations as a function of geographic location of the Bulgarian seismic stations into three sub-intervals: from 0.03s to 0.15s, from 0.16s to 0.76s and from 1.8s to 8s. The analysis shows that in the period interval of the microseisms the noise levels are as higher as the station is closer situated to the Black Sea. The Aegean and Adriatic Seas don’t affect the noise levels. For the other two sub-intervals of periods the values of the noise levels are higher if the “cultural” noise sources are near the stations.
The estimated PSD for all of the BNDSN stations fall between NLNM and NHNM. The obtained herein results show that the Bulgarian seismic stations belong to the mid-level noise stations worldwide.
The seasonal variations are seen in the microseismic band. The noise levels increase during the winter and autumn months and decrease in summer and spring seasons. An expansion of the double-frequency peak is observed. These variations are due to higher intensity of the Black Sea storms during the autumn and winter.
L. Dimitrova, S. Nikolova: Ambient seismic noise at broadband seismic stations of Bulgarian …
60 Bulgarian Geophysical Journal, 2011, Vol. 37
The diurnal variations are due to higher human activities during the daylight working hours and lower ones during the night. These variations are observed for the periods shorter than 1s and are influenced by the working-hours of the noise sources. There are no variations in noise levels at stations PVL and KDZ.
The seismic noise analysis proved to be a very useful tool for evaluation performance of the Bulgarian seismic broadband stations.
Acknowledgment. This research was supported by 3 projects:
Decision SB-3/04.05.2005 of Permanent Commission for Prevention of the Population from Natural Disasters, Technological Accidents and Catastrophes (PCPNDTAC), Bulgaria.
Contract N IKI-11/01.09.2005 with Bulgarian National Science Fund, Ministry of Education and Science: “Environmental Monitoring Implement for Risk Assessment of natural and man-made hazard (EMIRA)”.
Contract IO-2 with Bulgarian National Science Fund, Ministry of Education and Science “PROvadia Monitoring network – way for Improving Risk Assessment from natural and man-made hazards (PROMIRA)”.
References
Christoskov, L. & Holub, K. 1964. Investigation of station microseismic noise and microseisms (in Bulgarian), Izvestia of Geophysical institute, IV, 269-275.
Dimitrova, L., 2009. Noise level on selected digital stations of the National Operative Teleseismic System for Seismic Information (NOTSSI), Comptes rendus de l’Académie bulgare des Sciences, Vol 62, No4, 515-520.
Dimitrova, L.D. & S.B., Nikolova, 2009. Evaluation of ambient noise levels at selected digital stations of the Bulgarian National Seismic Network (BNSN), Proceedings of the 5th Congress of Balkan Geophysical Society- Belgrade, Serbia 10-16 May 2009, 6480.
Gutenberg, B., 1911. Die seismische bodenunruhe, PhD thesis, University of Gottigen, Germany. (In German)
McNamara, D.E. & Buland, R.P., 2004. Ambient noise levels in the continental United States, BSSA, 94, 1517-1527.
McNamara, D.E. & Boaz, R.I., 2005. Seismic Noise Analysis System Using Power Spectral Density Probability Dencity Functions: A Stand – Alone Software Package, USGS Open-File, 2005-1438, 30.
McNamara, D.E., Buland, R.P., Boaz, R.I., Weertman, B. & Ahern, T., 2005. Ambient Seismic Noise, USGS Open-File, 2004-1438, 31.
Peterson, J., 1993. Observation and modeling of seismic background noise, USGS Tech. Rept., 93-322, 1-95.
SEED Manual V2.4, IFDSN, IRIS, USGS, 2007.
L. Dimitrova, S. Nikolova: Ambient seismic noise at broadband seismic stations of Bulgarian …
Bulgarian Geophysical Journal, 2011, Vol. 37 61
Сеизмичен шум в широколентовите станции на Българската национална цифрова сеизмична мрежа (БНЦСМ)
Л. Димитрова, С. Николова
Резюме. Основната цел на статията е да оцени сеизмичния шум в станциите на Българската национална цифрова сеизмична мрежа (БНЦСМ), оборудвани с нови широколентови сеизмометри. Извършен е детайлен анализ на сеизмичния шум като са приложени метод и софтуер, използвани в световната практика. По този начин са оценени сеизмичните станции на БНЦСМ по отношение на международните критерии за качество на станции. За да се оцени разпределението на мощността на шума (PSD) е изчислена вероятностната функция на разпределение (PDF) в широк честотен диапазон. Извършени са годишен, сезонен, денонощен и честотен анализи на разпределението на шума. Оценени са нивото на сеизмичен шум и факторите, които влияят върху качеството на сеизмичния сигнал във всички станции. Получените нива на мощността на шума са сравнени с двата глобални модела за ниско (NLNM) и високо (NHLM) ниво на мощността на сеизмичен шум. Резултатите показват, че българските сеизмични станции принадлежат към станциите в световен план със средно до ниско ниво на мощността на шума. Изчисляването на разпределението на мощността на шума е полезно средство за оценка не само на качеството на сеизмичния сигнал, но и за работоспособността на сеизмичната станция като цяло.