Extended ATA telescope with outrigger stations
16
ATA memo 79 : 2009-June-01 MCHW Extended ATA telescope with outrigger stations Melvyn Wright, Rick Forster, Jack Welch, & Don Backer Radio Astronomy laboratory, University of California, Berkeley, CA, 94720 ABSTRACT The ATA 42 with outrigger antennas provides a unprecedented opportunity to de- velop essential technology for SSA and for SKA. The ATA 42 can image, and form multiple beams within a wide FOV; cross correlation with outrigger antennas produces a pencil beam over the full FOV of the 6m antennas. Adding outrigger stations to the ATA provides some long baselines and higher angu- lar resolution. With only a few long baselines, the high resolution data has low weight resulting in a composite synthesized beam of high resolution sitting on top of a lower resolution plateau from the ATA-42 station beam. A high resolution beam without the low resolution plateau can be obtained by down- weighting the ATA-42 stations using uniform weighting at the cost of reduced sensitivity. Good HA coverage is required to obtain these beams. With only 2 HA coverage the synthesized beams have higher sidelobes, and confusion in complex fields of view. The fitted beam size, flux and brightness sensitivity, and sidelobe levels are tabulated. For position determination of high brightness targets, the synthesized beam sidelobe levels are less important. To realize the full potential as a Phased Array Passive Radar Tracking System some key technical developments need to be completed. 1. INTRODUCTION The current ATA-42 antenna array has a maximum antenna separation of 323 m giving an angular resolution ∼ 220 × 110 ′′ at 1430 MHz with equal (natural) weighting of the uv data. The angular resolution can be enhanced by uniform weighting the uv data giving an angular resolution ∼ 130 × 80 ′′ at the cost of reduced sensitivity. Adding existing BIMA-A stations to the ATA-42 provides a maximum antenna separation of 1872 m giving much higher angular resolution. With only a few long baselines, the high resolution data has low overall weight resulting in a composite synthesized beam with a high resolution sitting on top of a lower resolution plateau from the ATA-42 station beam. The greatly enhaced angular resolution is attractive for locating high brightness targets and subtracting strong compact sources to reduce confusion in complex fields of view. In this memo we analyze the beam size, flux and brightness sensitivity, and sidelobe levels.
-
Upload
khangminh22 -
Category
Documents
-
view
0 -
download
0
Transcript of Extended ATA telescope with outrigger stations
ATA memo 79 : 2009-June-01 MCHW
Extended ATA telescope with outrigger stations
Melvyn Wright, Rick Forster, Jack Welch, & Don Backer
Radio Astronomy laboratory, University of California, Berkeley, CA, 94720
ABSTRACT
The ATA 42 with outrigger antennas provides a unprecedented opportunity to de-
velop essential technology for SSA and for SKA. The ATA 42 can image, and form
multiple beams within a wide FOV; cross correlation with outrigger antennas produces
a pencil beam over the full FOV of the 6m antennas.
Adding outrigger stations to the ATA provides some long baselines and higher angu-
lar resolution. With only a few long baselines, the high resolution data has low weight
resulting in a composite synthesized beam of high resolution sitting on top of a lower
resolution plateau from the ATA-42 station beam.
A high resolution beam without the low resolution plateau can be obtained by down-
weighting the ATA-42 stations using uniform weighting at the cost of reduced sensitivity.
Good HA coverage is required to obtain these beams. With only 2 HA coverage the
synthesized beams have higher sidelobes, and confusion in complex fields of view. The
fitted beam size, flux and brightness sensitivity, and sidelobe levels are tabulated.
For position determination of high brightness targets, the synthesized beam sidelobe
levels are less important. To realize the full potential as a Phased Array Passive Radar
Tracking System some key technical developments need to be completed.
1. INTRODUCTION
The current ATA-42 antenna array has a maximum antenna separation of 323 m giving an
angular resolution ∼ 220 × 110′′ at 1430 MHz with equal (natural) weighting of the uv data. The
angular resolution can be enhanced by uniform weighting the uv data giving an angular resolution
∼ 130 × 80′′ at the cost of reduced sensitivity.
Adding existing BIMA-A stations to the ATA-42 provides a maximum antenna separation of
1872 m giving much higher angular resolution. With only a few long baselines, the high resolution
data has low overall weight resulting in a composite synthesized beam with a high resolution sitting
on top of a lower resolution plateau from the ATA-42 station beam.
The greatly enhaced angular resolution is attractive for locating high brightness targets and
subtracting strong compact sources to reduce confusion in complex fields of view. In this memo we
analyze the beam size, flux and brightness sensitivity, and sidelobe levels.
– 2 –
2. Results
ATA observations were simulated with the MIRIAD using a standard imaging scripts
($MIR/demo/ata/mfs.csh) which generates uv data for an antenna configuration and im-
ages a point source. The beam size, flux and brightness sensitivity, and sidelobe levels are tabulated.
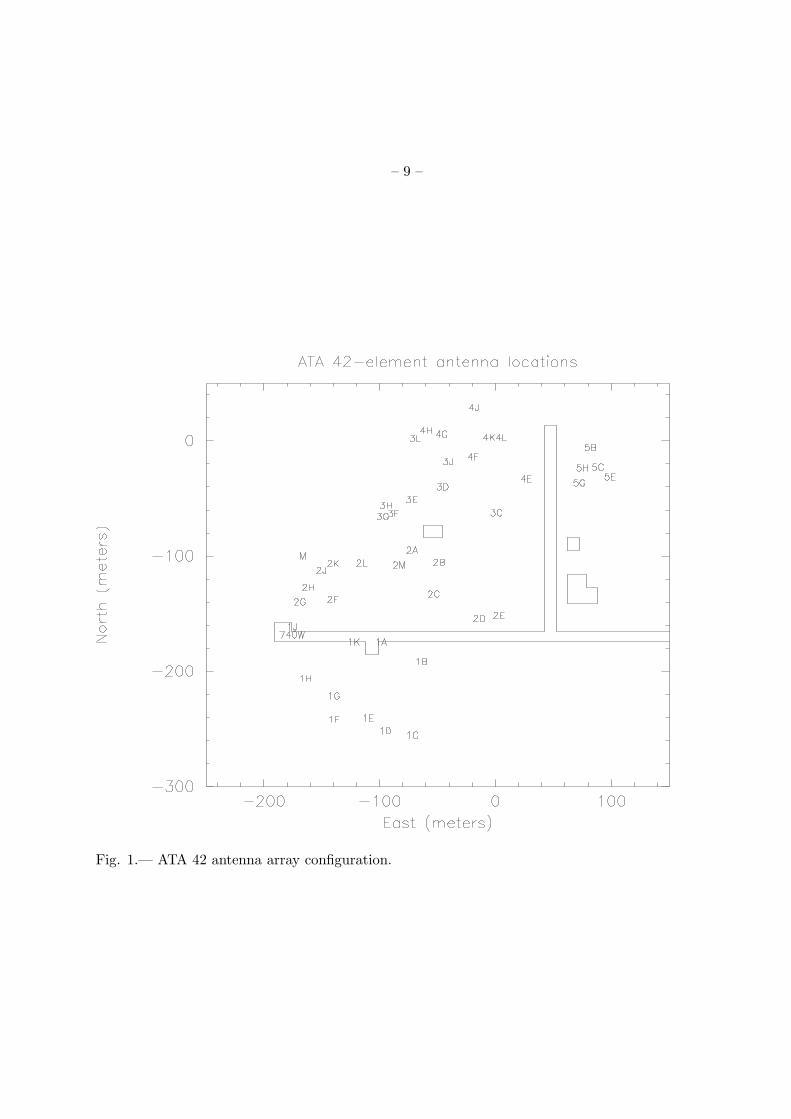
Figure 1 shows the ATA 42 antenna array configuration.
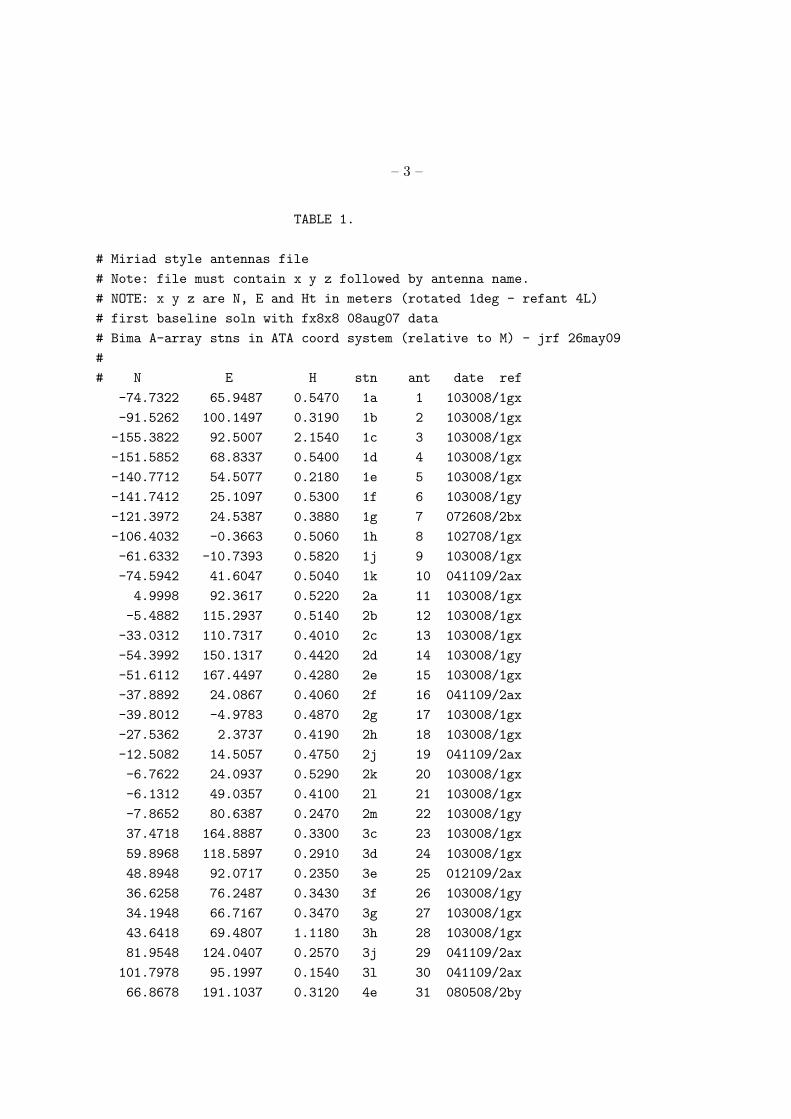
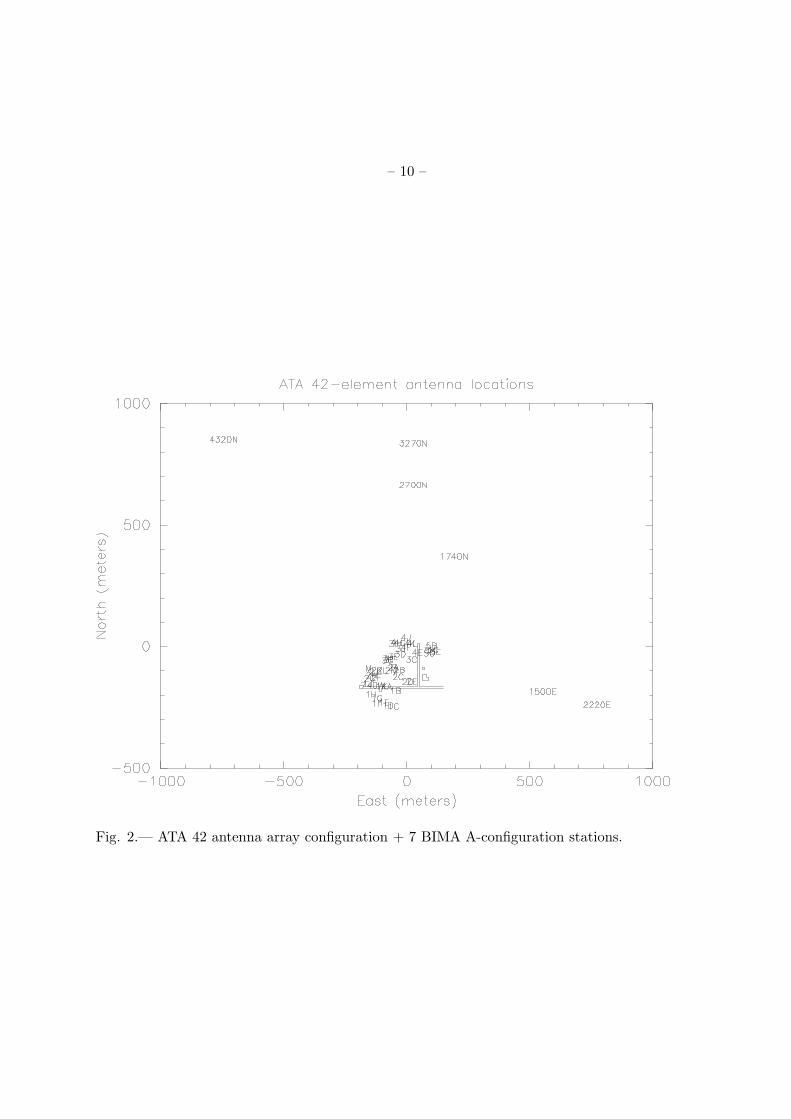
Seven stations from the BIMA A-configuration were added to the ATA-42 antenna array. The
antenna positions and station names are listed in Table 1, below. Figure 2 shows the ATA 42
antenna array configuration + 7 BIMA A-configuration stations.
With only a few long baselines, the high resolution data has low weight resulting in a composite
synthesized beam of high resolution sitting on top of a lower resolution plateau from the ATA-42
station beam.
A high resolution beam without the low resolution plateau can be obtained by down-weighting
the ATA-42 stations using uniform weighting of the uv data, at the cost of reduced sensitivity.
Good HA coverage is required to obtain these beams. With only 2 HA coverage the synthesized
beams have higher sidelobes, which will result in confusion in complex fields of view.
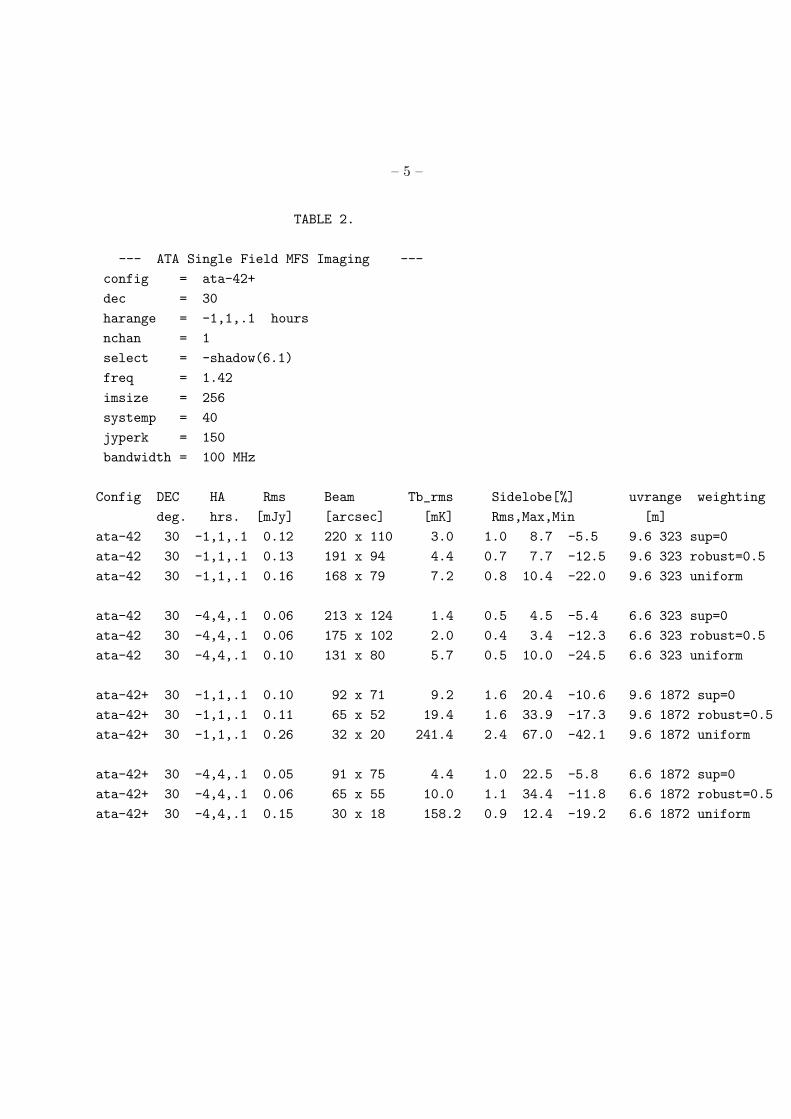
The results are tabulated in Table 2 below for natural, robust and uniform weighting of the
uv data.
For position determination of high brightness targets, the synthesized beam sidelobe levels are
less important.
– 3 –
TABLE 1.
# Miriad style antennas file
# Note: file must contain x y z followed by antenna name.
# NOTE: x y z are N, E and Ht in meters (rotated 1deg - refant 4L)
# first baseline soln with fx8x8 08aug07 data
# Bima A-array stns in ATA coord system (relative to M) - jrf 26may09
#
# N E H stn ant date ref
-74.7322 65.9487 0.5470 1a 1 103008/1gx
-91.5262 100.1497 0.3190 1b 2 103008/1gx
-155.3822 92.5007 2.1540 1c 3 103008/1gx
-151.5852 68.8337 0.5400 1d 4 103008/1gx
-140.7712 54.5077 0.2180 1e 5 103008/1gx
-141.7412 25.1097 0.5300 1f 6 103008/1gy
-121.3972 24.5387 0.3880 1g 7 072608/2bx
-106.4032 -0.3663 0.5060 1h 8 102708/1gx
-61.6332 -10.7393 0.5820 1j 9 103008/1gx
-74.5942 41.6047 0.5040 1k 10 041109/2ax
4.9998 92.3617 0.5220 2a 11 103008/1gx
-5.4882 115.2937 0.5140 2b 12 103008/1gx
-33.0312 110.7317 0.4010 2c 13 103008/1gx
-54.3992 150.1317 0.4420 2d 14 103008/1gy
-51.6112 167.4497 0.4280 2e 15 103008/1gx
-37.8892 24.0867 0.4060 2f 16 041109/2ax
-39.8012 -4.9783 0.4870 2g 17 103008/1gx
-27.5362 2.3737 0.4190 2h 18 103008/1gx
-12.5082 14.5057 0.4750 2j 19 041109/2ax
-6.7622 24.0937 0.5290 2k 20 103008/1gx
-6.1312 49.0357 0.4100 2l 21 103008/1gx
-7.8652 80.6387 0.2470 2m 22 103008/1gy
37.4718 164.8887 0.3300 3c 23 103008/1gx
59.8968 118.5897 0.2910 3d 24 103008/1gx
48.8948 92.0717 0.2350 3e 25 012109/2ax
36.6258 76.2487 0.3430 3f 26 103008/1gy
34.1948 66.7167 0.3470 3g 27 103008/1gx
43.6418 69.4807 1.1180 3h 28 103008/1gx
81.9548 124.0407 0.2570 3j 29 041109/2ax
101.7978 95.1997 0.1540 3l 30 041109/2ax
66.8678 191.1037 0.3120 4e 31 080508/2by
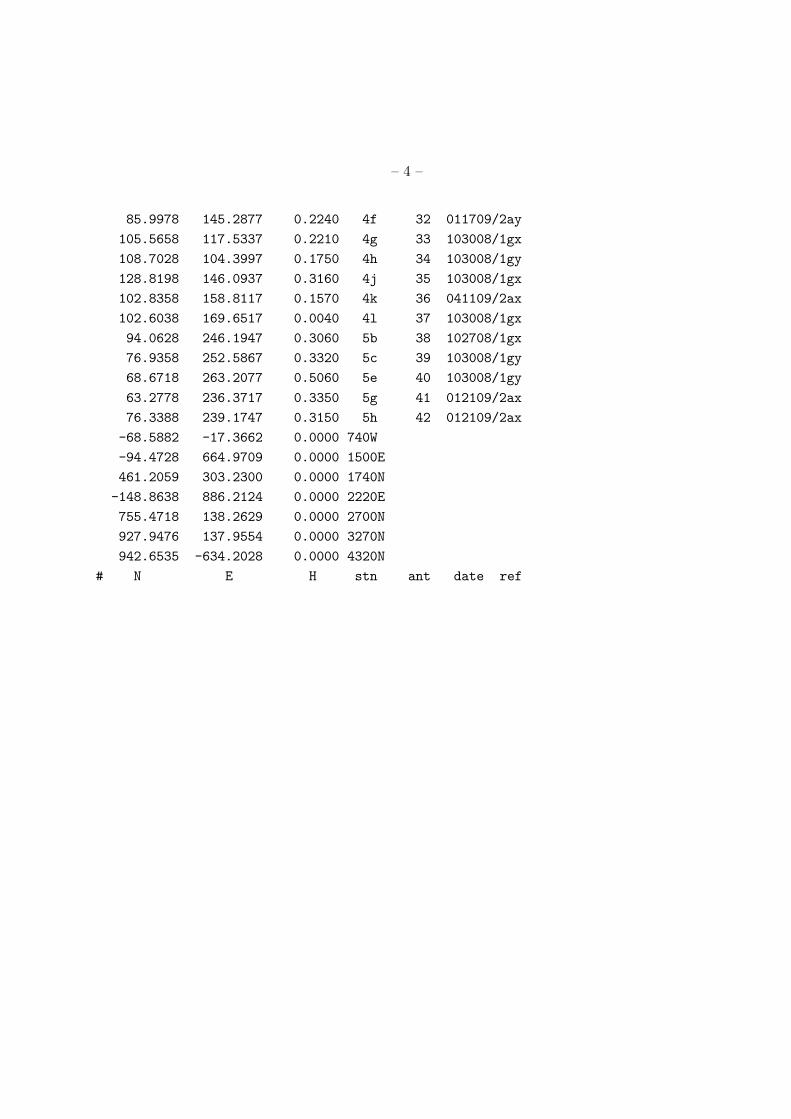
– 4 –
85.9978 145.2877 0.2240 4f 32 011709/2ay
105.5658 117.5337 0.2210 4g 33 103008/1gx
108.7028 104.3997 0.1750 4h 34 103008/1gy
128.8198 146.0937 0.3160 4j 35 103008/1gx
102.8358 158.8117 0.1570 4k 36 041109/2ax
102.6038 169.6517 0.0040 4l 37 103008/1gx
94.0628 246.1947 0.3060 5b 38 102708/1gx
76.9358 252.5867 0.3320 5c 39 103008/1gy
68.6718 263.2077 0.5060 5e 40 103008/1gy
63.2778 236.3717 0.3350 5g 41 012109/2ax
76.3388 239.1747 0.3150 5h 42 012109/2ax
-68.5882 -17.3662 0.0000 740W
-94.4728 664.9709 0.0000 1500E
461.2059 303.2300 0.0000 1740N
-148.8638 886.2124 0.0000 2220E
755.4718 138.2629 0.0000 2700N
927.9476 137.9554 0.0000 3270N
942.6535 -634.2028 0.0000 4320N
# N E H stn ant date ref
– 5 –
TABLE 2.
--- ATA Single Field MFS Imaging ---
config = ata-42+
dec = 30
harange = -1,1,.1 hours
nchan = 1
select = -shadow(6.1)
freq = 1.42
imsize = 256
systemp = 40
jyperk = 150
bandwidth = 100 MHz
Config DEC HA Rms Beam Tb_rms Sidelobe[%] uvrange weighting
deg. hrs. [mJy] [arcsec] [mK] Rms,Max,Min [m]
ata-42 30 -1,1,.1 0.12 220 x 110 3.0 1.0 8.7 -5.5 9.6 323 sup=0
ata-42 30 -1,1,.1 0.13 191 x 94 4.4 0.7 7.7 -12.5 9.6 323 robust=0.5
ata-42 30 -1,1,.1 0.16 168 x 79 7.2 0.8 10.4 -22.0 9.6 323 uniform
ata-42 30 -4,4,.1 0.06 213 x 124 1.4 0.5 4.5 -5.4 6.6 323 sup=0
ata-42 30 -4,4,.1 0.06 175 x 102 2.0 0.4 3.4 -12.3 6.6 323 robust=0.5
ata-42 30 -4,4,.1 0.10 131 x 80 5.7 0.5 10.0 -24.5 6.6 323 uniform
ata-42+ 30 -1,1,.1 0.10 92 x 71 9.2 1.6 20.4 -10.6 9.6 1872 sup=0
ata-42+ 30 -1,1,.1 0.11 65 x 52 19.4 1.6 33.9 -17.3 9.6 1872 robust=0.5
ata-42+ 30 -1,1,.1 0.26 32 x 20 241.4 2.4 67.0 -42.1 9.6 1872 uniform
ata-42+ 30 -4,4,.1 0.05 91 x 75 4.4 1.0 22.5 -5.8 6.6 1872 sup=0
ata-42+ 30 -4,4,.1 0.06 65 x 55 10.0 1.1 34.4 -11.8 6.6 1872 robust=0.5
ata-42+ 30 -4,4,.1 0.15 30 x 18 158.2 0.9 12.4 -19.2 6.6 1872 uniform
– 6 –
3. Discussion
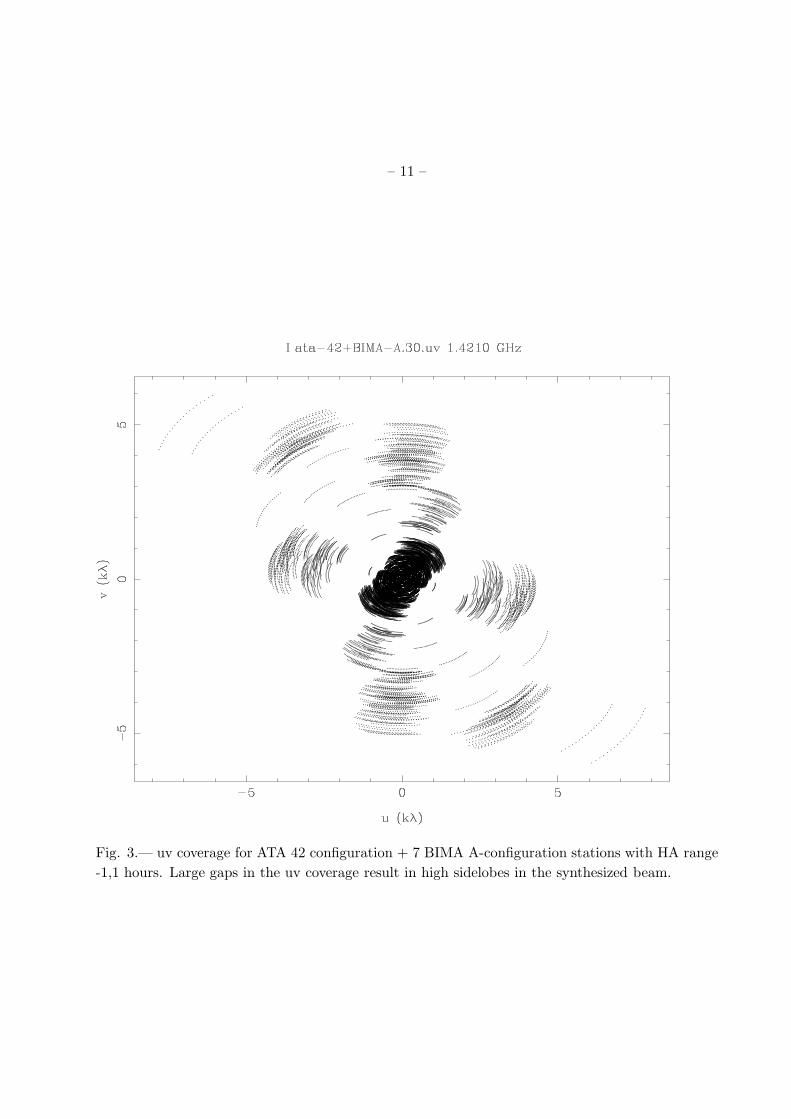
Figure 3 shows the uv coverage for ATA 42 configuration + 7 BIMA A-configuration stations
with HA range -1,1 hours. Large gaps in the uv coverage result in high sidelobes in the synthesized
beam.
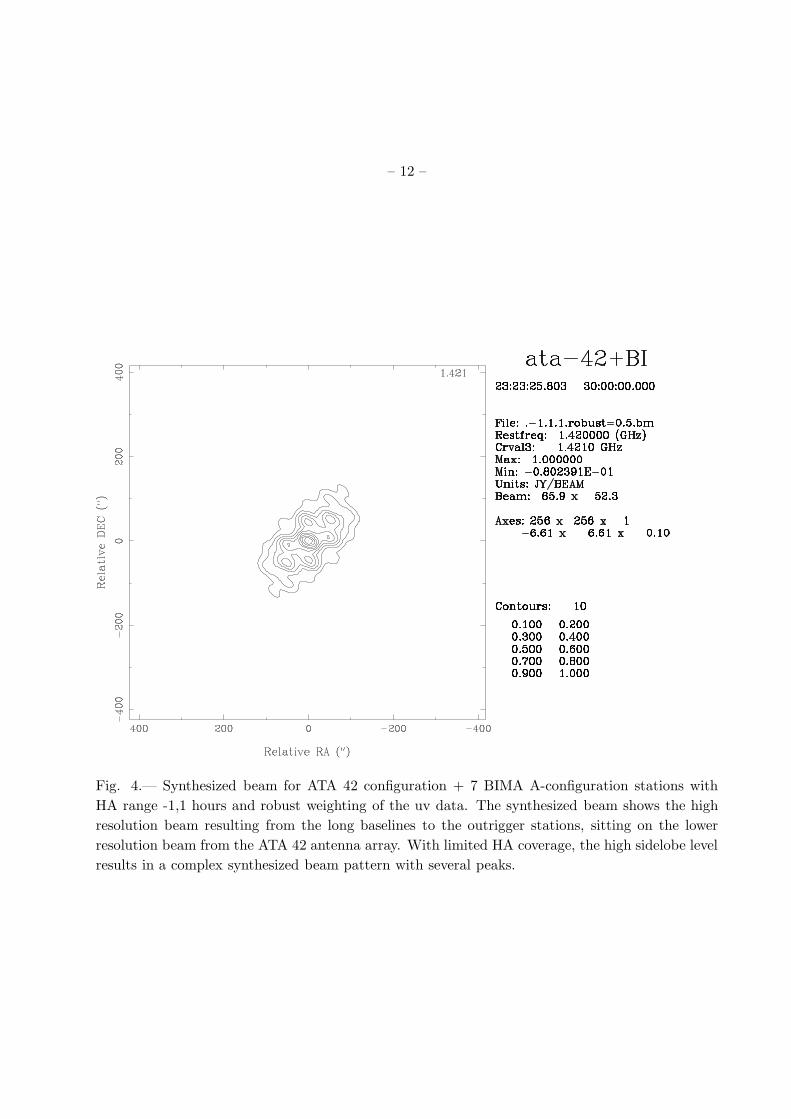
Figure 4 shows the synthesized beam for ATA 42 configuration + 7 BIMA A-configuration
stations with HA range -1,1 hours and robust weighting of the uv data. The synthesized beam
shows the high resolution beam resulting from the long baselines to the outrigger stations, sitting
on the lower resolution beam from the ATA 42 antenna array. With limited HA coverage, the high
sidelobe level results in a complex synthesized beam pattern with several peaks.
Figure 5 shows the synthesized beam for ATA 42 configuration + 7 BIMA A-configuration
stations with HA range -1,1 hours and uniform weighting of the uv data. Uniform weighting of the
uvdata down weights the ATA 42-antenna data, and attenuates the lower resolution beam from the
ATA 42 antenna array. With limited HA coverage, the high sidelobe level still results in a complex
synthesized beam pattern with several peaks.
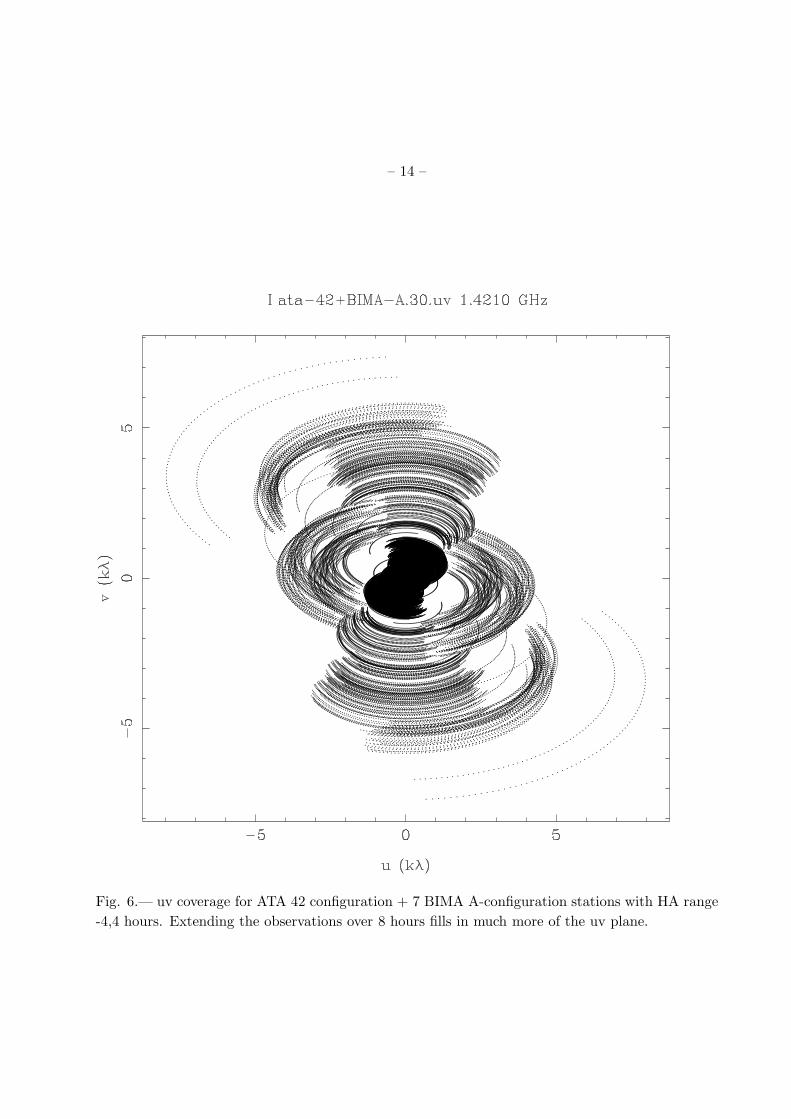
Extending the observations over 8 hours fills in much more of the uv plane and reduces the
sidelobe level. Figure 6 shows the uv coverage for ATA 42 configuration + 7 BIMA A-configuration
stations with HA range -4,4 hours.
Figure 7 shows the synthesized beam for ATA 42 configuration + 7 BIMA A-configuration
stations with HA range -4,4 hours and robust weighting of the uv data. The synthesized beam
shows the high resolution beam resulting from the long baselines to the outrigger stations, sitting
on the lower resolution beam from the ATA 42 antenna array. With good HA coverage, the sidelobe
level is reduced and the synthesized beam pattern has a single well defined peak.
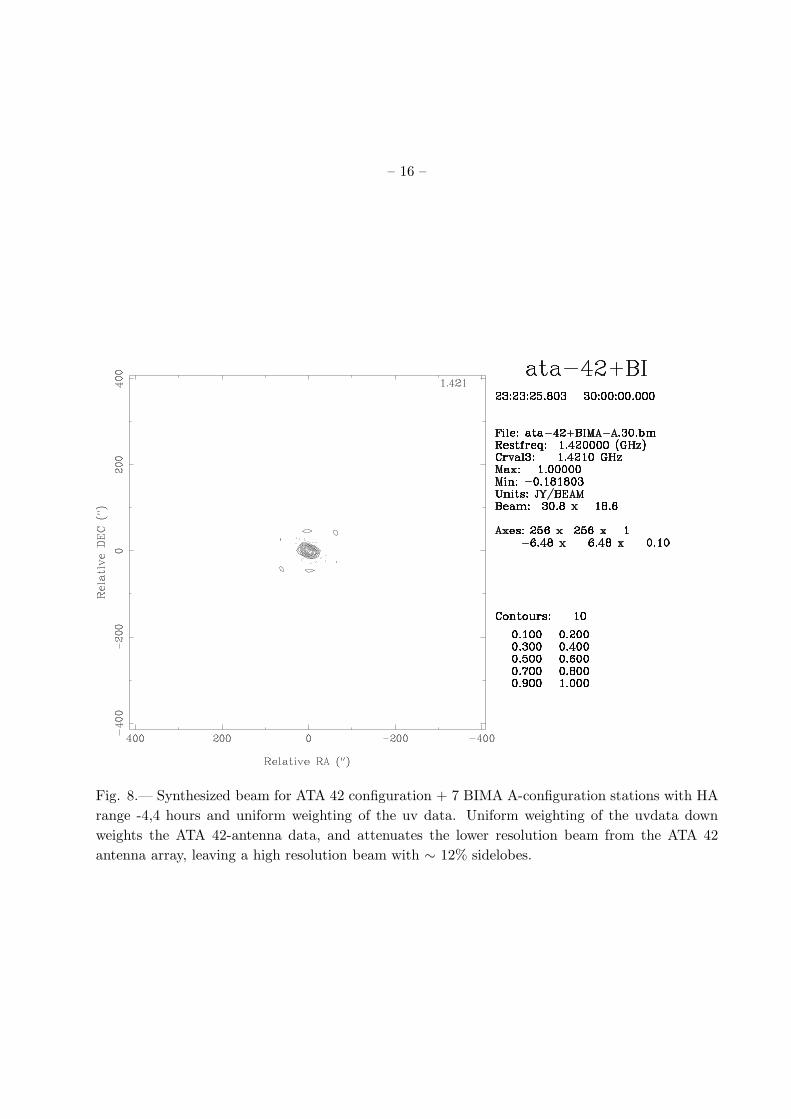
Figure 8 shows the synthesized beam for ATA 42 configuration + 7 BIMA A-configuration
stations with HA range -4,4 hours and uniform weighting of the uv data. Uniform weighting of the
uvdata down weights the ATA 42-antenna data, and attenuates the lower resolution beam from the
ATA 42 antenna array, leaving a high resolution beam with ∼ 12% sidelobes.
3.1. Station beamforming
The ATA-42 antenna data could be combined in a beamformer and the data from the resulting
station beam cross correlated with the seven outrigger antennas. This is similar to the SKA station
beam approach for arrays with large numbers of antennas, and has the advantage of greatly reducing
the number of cross correlations and the data rate from the correlator.
Cross correlating a phased array station beam (ATA-42, SKA stations etc) with individual
antennas on longer baselines provides an anti-aliasing feature by attenuating signals outside the
phased array voltage pattern. There is still confusion from the phased array beam sidelobes, of
– 7 –
course, but with on-line control of the weighting in the phased array, or with full fast dump corre-
lation, there are lots of things we can do to suppress, and deconvolve unwanted aliased responses
to reduce confusion. We can develop these techniques on the ATA telescope.
There are several advantages if all the cross correlations of individual antennas can be pre-
served. (i) The field of view is then the full primary beam of the individual antennas. (ii) The
primary beam of the individual antennas is well defined, whereas the primary beam for the station
beam depends on the direction of the source, and the weighting of the antennas contributing to
the station beam. (iii) The uv coverage with all cross correlations is much better. Each of the
outrigger antennas paints a broad swath across the uv plance with the diameter of the ATA-42
antenna configuration.
3.2. Phased Array Passive Radar Tracking System
The ATA 42 with outrigger antennas provides a unprecedented opportunity to develop essential
technology for SSA and for SKA. The ATA 42 can image, and form multiple beams within a wide
FOV; cross correlation with outrigger antennas produces a pencil beam over the full FOV of the
6m antennas.
1. Outrigger antennas on the ATA-42 provide antenna separations up to 1800 m and much
higher resolution for tracking satellites.
2. The beamformer can have multiple phased array targets at multiple frequencies.
3. A fast dump correlator with multiple phase centers provides much better uvcoverage and
hence reduction of confusion in a cluttered FOV – better for SKA imaging and for SSA.
4. Passive radar, using some antennas pointing on the target sources and some pointed at
powerful satellites to provide reference phase screens for the ATA-42 phased array.
5. The phased ATA-42 array voltage pattern can be weighted to produce nulls. Cross correla-
tion with the outrigger antennas preserves these nulls.
Some key technical developments needed, and partially in place :
• 10 GbE digital output from phased array.
• station beamforming by feeding the digital output from phased array into the correlator.
• long delays and fast fringe rate tracking for low orbit targets.
• cross correlation at multiple phase centers.
• real time DSP and imaging.
• system integration.
– 8 –
3.3. Software correlation
With access to digital voltage data in software, at appropriately narrow bandwidth, one can
likely see all GPS signals simultaneously albeit with confused phasing in sidelobes that one would
need to learn about before any use could be made of such a sensor. We are doing hemispheric
imaging with the Epoch of Re-ionization telescope (PAPER), but there we have simple hemispheric,
single-lobe beam pattern. We can see the entire ORBCOM constellation of satellites at 137 MHz.
– 9 –
Fig. 1.— ATA 42 antenna array configuration.
– 10 –
Fig. 2.— ATA 42 antenna array configuration + 7 BIMA A-configuration stations.
– 11 –
Fig. 3.— uv coverage for ATA 42 configuration + 7 BIMA A-configuration stations with HA range
-1,1 hours. Large gaps in the uv coverage result in high sidelobes in the synthesized beam.
– 12 –
Fig. 4.— Synthesized beam for ATA 42 configuration + 7 BIMA A-configuration stations with
HA range -1,1 hours and robust weighting of the uv data. The synthesized beam shows the high
resolution beam resulting from the long baselines to the outrigger stations, sitting on the lower
resolution beam from the ATA 42 antenna array. With limited HA coverage, the high sidelobe level
results in a complex synthesized beam pattern with several peaks.

– 13 –
Fig. 5.— Synthesized beam for ATA 42 configuration + 7 BIMA A-configuration stations with
HA range -1,1 hours and uniform weighting of the uv data. Uniform weighting of the uvdata
down weights the ATA 42-antenna data, and attenuates the lower resolution beam from the ATA
42 antenna array. With limited HA coverage, the high sidelobe level still results in a complex
synthesized beam pattern with several peaks.
– 14 –
Fig. 6.— uv coverage for ATA 42 configuration + 7 BIMA A-configuration stations with HA range
-4,4 hours. Extending the observations over 8 hours fills in much more of the uv plane.

– 15 –
Fig. 7.— Synthesized beam for ATA 42 configuration + 7 BIMA A-configuration stations with
HA range -4,4 hours and robust weighting of the uv data. The synthesized beam shows the high
resolution beam resulting from the long baselines to the outrigger stations, sitting on the lower
resolution beam from the ATA 42 antenna array. With good HA coverage, the sidelobe level is
reduced and the synthesized beam pattern has a single well defined peak.
– 16 –
Fig. 8.— Synthesized beam for ATA 42 configuration + 7 BIMA A-configuration stations with HA
range -4,4 hours and uniform weighting of the uv data. Uniform weighting of the uvdata down
weights the ATA 42-antenna data, and attenuates the lower resolution beam from the ATA 42
antenna array, leaving a high resolution beam with ∼ 12% sidelobes.