Atmospheric mercury at mediterranean coastal stations
16
Environ Fluid Mech (2008) 8:101–116 DOI 10.1007/s10652-007-9047-2 ORIGINAL ARTICLE Atmospheric mercury at mediterranean coastal stations Ingvar Wängberg · John Munthe · David Amouroux · Maria E. Andersson · Vesna Fajon · Romano Ferrara · Katarina Gårdfeldt · Milena Horvat · Yaacov Mamane · Ety Melamed · Mathilde Monperrus · Nives Ogrinc · Osnat Yossef · Nicola Pirrone · Jonas Sommar · Francesca Sprovieri Received: 19 February 2007 / Accepted: 26 November 2007 / Published online: 14 December 2007 © Springer Science+Business Media B.V. 2007 Abstract Mercury in air has been measured at five coastal Mediterranean sites, involving measurements in Spain, France, Italy, Slovenia and Israel. Four two-weeks long measure- ments campaigns were performed at the five sites. The measurements were carried out during autumn 2003 and winter, spring and summer 2004. Total gaseous mercury/elemental gaseous mercury, particulate mercury and divalent gaseous mercury were measured in parallel at the five sites. The activities constituted a subtask of the EU funded MERCYMS research project, which also included Mediterranean Sea cruises where both mercury in air and water were measured. The result from an evaluation of all the coastal air data is presented. Mercury concentrations from the different sites are compared with similar data obtained in northern Europe and elsewhere. The result shows that the background concentration of mercury in Mediterranean coastal air is lower than earlier anticipated. Background concentrations of TGM, RGM and TPM corresponded to 1.75–1.80 ng m −3 , 1–13 and 3–23 pg m −3 , respec- tively. The measurements also showed that the mercury concentration occasionally can be I. Wängberg (B ) · J. Munthe Environmental Effects & Atmospheric Chemistry, IVL, Swedish Environmental Research Institute, Aschebergsgatan 44, Goteborg 40014, Sweden e-mail: [email protected] D. Amouroux · M. Monperrus Laboratoire Chimie Analytique Bio Inorganique Et Environnement (LCABIE), Université de Pau et des Pays de l’Adour, Pau, France M. E. Andersson · K. Gårdfeldt · J. Sommar Department of Chemistry, Göteborg University, Göteborg, Sweden V. Fajon · M. Horvat · N. Ogrinc Jožef Stefan Institute, Ljubljana, Slovenia R. Ferrara Institute of Biophysics of the National Research Council (CNR-IB), Pisa, Italy Y. Mamane · E. Melamed · O. Yossef Department of Civil Engineering, Israel Institute of Technology (TECHNION), Haifa, Israel N. Pirrone · F. Sprovieri Institute for Atmospheric Pollution of the National Research Council (CNR_IIA), Rende, Italy 123
Transcript of Atmospheric mercury at mediterranean coastal stations

Environ Fluid Mech (2008) 8:101–116DOI 10.1007/s10652-007-9047-2
ORIGINAL ARTICLE
Atmospheric mercury at mediterranean coastal stations
Ingvar Wängberg · John Munthe · David Amouroux ·Maria E. Andersson · Vesna Fajon · Romano Ferrara ·Katarina Gårdfeldt · Milena Horvat · Yaacov Mamane ·Ety Melamed · Mathilde Monperrus · Nives Ogrinc ·Osnat Yossef · Nicola Pirrone · Jonas Sommar ·Francesca Sprovieri
Received: 19 February 2007 / Accepted: 26 November 2007 / Published online: 14 December 2007© Springer Science+Business Media B.V. 2007
Abstract Mercury in air has been measured at five coastal Mediterranean sites, involvingmeasurements in Spain, France, Italy, Slovenia and Israel. Four two-weeks long measure-ments campaigns were performed at the five sites. The measurements were carried out duringautumn 2003 and winter, spring and summer 2004. Total gaseous mercury/elemental gaseousmercury, particulate mercury and divalent gaseous mercury were measured in parallel at thefive sites. The activities constituted a subtask of the EU funded MERCYMS research project,which also included Mediterranean Sea cruises where both mercury in air and water weremeasured. The result from an evaluation of all the coastal air data is presented. Mercuryconcentrations from the different sites are compared with similar data obtained in northernEurope and elsewhere. The result shows that the background concentration of mercury inMediterranean coastal air is lower than earlier anticipated. Background concentrations ofTGM, RGM and TPM corresponded to 1.75–1.80 ng m−3, 1–13 and 3–23 pg m−3, respec-tively. The measurements also showed that the mercury concentration occasionally can be
I. Wängberg (B) · J. MuntheEnvironmental Effects & Atmospheric Chemistry, IVL, Swedish Environmental Research Institute,Aschebergsgatan 44, Goteborg 40014, Swedene-mail: [email protected]
D. Amouroux · M. MonperrusLaboratoire Chimie Analytique Bio Inorganique Et Environnement (LCABIE), Université de Pau et desPays de l’Adour, Pau, France
M. E. Andersson · K. Gårdfeldt · J. SommarDepartment of Chemistry, Göteborg University, Göteborg, Sweden
V. Fajon · M. Horvat · N. OgrincJožef Stefan Institute, Ljubljana, Slovenia
R. FerraraInstitute of Biophysics of the National Research Council (CNR-IB), Pisa, Italy
Y. Mamane · E. Melamed · O. YossefDepartment of Civil Engineering, Israel Institute of Technology (TECHNION), Haifa, Israel
N. Pirrone · F. SprovieriInstitute for Atmospheric Pollution of the National Research Council (CNR_IIA), Rende, Italy
123

102 Environ Fluid Mech (2008) 8:101–116
very high in some areas due to local anthropogenic emissions. It is proposed that diurnalvariation in RGM concentrations observed during situation with nocturnal inversion merelyis an effect of meteorology rather than due to local photochemistry.
Keywords Atmospheric mercury · Mercury deposition · RGM · TGM · TPM
List of AbbreviationsRGM Reactive gaseous mercuryTGM Total gaseous mercuryTPM Total particulate mercuryGEM Gaseous elemental mercury (Hg0)CVAFS Cold vapour atomic fluorescence spectrometer
1 Introduction
Mercury is a toxic element which is present in the atmosphere. Most of the atmosphericmercury exists in the gaseous phase and due to its relatively long residence time it can betransported globally. The background concentration is slightly below 2 ng m−3 in the north-ern hemisphere [1]. The most dominant mercury species is gaseous elemental mercury GEM(i.e. Hg0), which often constitutes 98% or more of the total content of mercury in air. Atmo-spheric mercury rarely constitutes a direct risk to human health. The principal environmentalconcern regarding mercury is its ability to be converted to methylmercury which occurs bynatural biological processes. Methylmercury is highly toxic and can bio-concentrate morethan a million-fold in the food chain. This has resulted in regulatory fish consumption guide-lines and health advisories in Scandinavia and North America [2]. Atmospheric mercury hasboth natural and anthropogenic sources and is believed to have increased by a factor of 3since industrialisation [3]. The atmospheric residence time of GEM is believed to be in theorder of 1 year. GEM can be dry deposited on land and vegetation, but the most efficientremoval process is via oxidation in the atmosphere. Reactive gaseous mercury (RGM) is anoxidation product of Hg0. RGM is found in both the gaseous and the particulate phase aswell as in rainwater. However, the exact chemical composition of RGM is not known. RGMis operationally defined, as the fraction of gaseous mercury that can be sampled using a cer-tain measurement method. Lately, a KCl-denuder technique has proven to be efficient and isnow commonly used. The term reactive mercury denotes a class of divalent mercury species,which like for example HgCl2 readily undergoes reduction to Hg0 by Sn2+ in HCl solution.Particulate mercury or total particulate mercury (TPM) can be determined by sampling onfilters and may constitute RGM or Hg0 adsorbed onto particles. TPM is often associatedwith soot [4] and can undergo long-range transport whereas RGM easily dry or wet depositsdue to its hydrophilic character. Oxidised mercury deposited to terrestrial or aquatic envi-ronments may be reduced back to Hg0 and re-emitted to the atmosphere. Hence, sea surfacewater is often supersaturated regarding elemental dissolved mercury and the oceans consti-tute a significant source of GEM. Thus, mercury cycling in the environment is complex.During the last 20 years, concern regarding mercury pollution has led to increased researchefforts to describe the atmospheric pathways of mercury. In order to derive cost-efficientcontrol strategies, it is necessary to have quantitative information on emissions, air transportand deposition of mercury. An important part of this information is measurement data of
123

Environ Fluid Mech (2008) 8:101–116 103
atmospheric mercury species which can be used for source–receptor calculations using re-gional atmospheric models.
This paper describes the outcome of co-ordinated measurements of atmospheric mercuryperformed at five coastal Mediterranean sites, within the MERCYMS research project fundedby the Fifth Framework Programme, Environment and Climate, of the European Commis-sion. MERCYMS focussed on atmospheric cycling of mercury in the Mediterranean SeaBasin and contained measurements and modelling activities. The aim of this paper is topresent and discuss the results of four two-week long measurements campaigns performedduring autumn 2003 and winter, spring and summer 2004 in Spain, France, Italy, Sloveniaand Israel.
2 Experimental
2.1 Coastal measurement sites
The five measurement sites are shown in Fig. 1. Site 1, Cabo de Creus is a peninsula on thenorthern Spanish Mediterranean coast (42◦19.2′ N, 3◦18.9′ E, 23 m a.s.l.). The measurementswere conducted at the EMEP station Cabo de Creus that is managed by the Spanish Ministe-rio de Medio Ambiente. Site 2 is located on the northern side of the Thau Lagoon in France(43◦25′ N, 3◦35′ E). Site 3, Piran in Slovenia (45◦32.9′ N, 13◦33.0′ E) is situated at the Gulfof Trieste in the northern Adriatic Sea. Site 4, S. Lucido, is situated on the Thyrrenian coastof Calabria in Italy (39◦25′ N, 16◦0.0′ E, 15 m a.s.l.). Site 5, Neve Yam (32◦40′ N, 34◦56′
E, 5 m) is located on a beach 20 km south of the city of Haifa in Israel. The time schedulesof each campaign are shown in Table 1. The measurement periods were chosen to cover fourseasons.
Fig. 1 MERCYMS coastal measurement sites
Table 1 Time schedule ofmeasurement campaigns
Coastal campaigns Start date Stop date
Autumn 2003 2003-10-20 2003-11-03Winter 2004 2004-01-19 2004-02-02Spring 2004 2004-04-26 2004-05-10Summer 2004 2004-07-19 2004-08-02
123
104 Environ Fluid Mech (2008) 8:101–116
2.2 Measurement methods
2.2.1 TGM
TGM was measured using the manual Au trap method at sites 2, 3 and 5. This methodis described elsewhere [5,6] and will only briefly be explained here. Air at a flow rate200–400 ml min−1 is drawn through a quartz glass tube (14 cm long, inner diameter 0.4 cm)containing a gold surface. Elemental mercury in the air is quantitatively adsorbed throughamalgamation with the gold. The air volume is measured by a calibrated volume meter. TheAu-traps are analysed by thermal desorption at 400–500◦C. The desorbed mercury is trans-ferred by means of an argon flow and detected by a Tekran (Model 2500) mercury vapouranalyser. This instrument uses a cold vapour atomic fluorescence spectrometer (CVAFS) todetect the mercury vapour. The analysis procedure applied includes two desorpiton steps, i.e.“double amalgamation” followed by CVAFS detection. Double amalgamation is inferred toimprove the precision of the analysis. The detection limit regarding a 12 h sample is normallybetter than 0.03 ng m−3.
At sites 1 and 4 TGM was measured by a Tekran Model 2537 A Mercury Vapour Ana-lyzers. This instrument also constituted a vital part of the experimental set-up to measureRGM at site 1 and RGM and TPM at site 4 as is described below. The principles and perfor-mance of the instrument are well documented in the literature [7,8]. Only a brief descriptionis given here. The technique is based on amalgamation on Au-traps and mercury detectionwith CVAFS. The instrument contains two Au-traps. Air is drawn through FEP tubing to theinstrument by an internal pump. The flow rate can be set between 0.5 and 1.5 l min−1 by amass flow controller. The air is first passed via a 0.47 µm particle membrane filter and thenthrough one of the Au-traps. After in this case 5 min sampling time the instrument switchesto sample on the second Au-trap. The first trap is analysed by thermal desorption and CVAFSdetection. The result is stored on a PC together with the time and date of the measurement.After analysis the Au-trap is cooled by an internal fan and is then ready for an additionalmeasurement cycle. Hence, 5 min continuous TGM values are obtained. The detection limitat normal operation (5 min sampling time and a flow rate of 1.5 l min−1) is below 0.1 ng m−3.The TGM concentration is calculated using sample air volumes corresponding to 273 K and1.013 × 105 Pa.
2.2.2 TPM
Open phase AES mini traps [9,10] were used to measure TPM at all coastal sites except atsite 4. A quartz micro-fibre filter of 7 mm diameter is housed in a quartz glass tube of 140 mmlength. The filter is supported by a screen grid made from pure nickel. The sampling deviceserves as both particulate trap and pyrolyzer for airborne particulate species. Air is drawnthrough the quartz tube at a flow rate of 3–5 l min−1. After sampling, the Hg content is ana-lysed via pyrolysis where the trap is heated to 800–900◦C in a stream of argon. In this step,all mercury is decomposed to Hg0 and subsequently transferred to the gas phase. To improvethe sensitivity the mercury vapour is first concentrated on an Au-trap which then is thermallydesorbed and Hg0 is detected with CVAFS. To avoid disturbances from other matter (e.g.,PAH) that also may give rise to fluorescence a pyrolysis oven was placed in-between theTPM-trap and Au-trap in the gas line. Tekran (Model 2500) mercury vapour analysers wereused as detectors. The sample device has a theoretical cut-off of 7 µm at a wind speed of4 m s−1. The detection limit is typically 2–3 pg m−3 for 24 h sampling time.
123

Environ Fluid Mech (2008) 8:101–116 105
2.2.3 Manual RGM measurements
A manual method to measure RGM was used at sites 1, 2, 3 and 5. The efficiency of thismethod has recently been tested [11]. Sample air, at a flow rate of 10 l min−1, is drawn througha quartz glass annular denuder whose inner surface is coated by KCl. Divalent gaseous Hgcompounds (i.e., HgX2(g) where X = Cl−, Br−, . . .) adsorbs onto the KCl crystal surface,whereas elemental mercury and small particles do not. The denuder inlet is equipped with animpactor with a 2.5 µm cut-off. Denuders (URG-2000-30CD) and inlets (URG-2000-30 K,URG-2000-30PASS) where obtained from the URG company, USA. During sampling thedenuder is maintained at 50◦C (to protect the KCl coating from humidity) in an electricallyheated housing. The denuder package is placed at an open outdoor place with the intake 1.5–2 m above the ground. Directly after sampling the denuders were brought to a field laboratoryfor analysis. In the analysis step the denuders were purged with N2 or Ar and electricallyheated to 500◦C. During heating the divalent mercury decomposes forming gaseous Hg0
which is concentrated by collection on an Au-trap. In the final step the Au-trap is thermallydesorbed in a stream of argon and the Hg0 vapour is detected by CVAF. Tekran 2500 orTekran 2537 A instruments where used at all sites for analysing the manual RGM samples.The detection limit for a 12 h sample (air flow rate of 10 l min−1) is in the order of 1–2 pg m−3
based on 3× standard deviation of blanks.
2.2.4 Mercury multi-speciation
At site 4 collection and analysis of Hg0, RGM and TPM was accomplished using an auto-mated system combining the analytical capability of the Tekran (Toronto, Canada) Model2537 A cold vapour atomic fluorescence spectrometer (CVAFS), Tekran Model 1130 spe-ciation unit, and Tekran Model 1135 Hg(p) unit [11]. This system uses the same principlefor determining RGM as the manual method described above. But it is also equipped with aquartz glass filter to collect fine particles. The Tekran speciation system was configured tocollect 2 h RGM and Hg(p) samples onto the quartz KCl-coated annular denuder and quartzfilter assembly, respectively. During the 2 h RGM and Hg(p) sampling period, 5 min Hg0
samples were continuously quantified by the 2537 A analyzer. After the 2 h sampling period,one hour analysis procedure began by flushing the 1130 and 1135 systems with mercury freeair. The quartz filter assembly was then heated to 800◦C and the quartz annular denuder wassubsequently heated to 500◦C. The Hg(p) and RGM collected on the quartz filter and annulardenuder, respectively, were thermally decomposed into the mercury free air stream and quan-tified as Hg0. The KCl-coated annular denuders were replaced weekly. The Tekran 2537 Aanalyzer was calibrated on a daily basis using the internal permeation tube. The permeationtube in the Tekran 2537 A instruments was calibrated just prior to the study as described inLandis et al. [11] using a Tekran model 2505 primary calibration unit. The total flow ratewas 10 l min−1 and the detection limit under the operating conditions used was <2 pg m−3.
At site 1 an automatic method was used to measure RGM during the spring and sum-mer campaigns. The principle of this method is similar to that described above and it alsouses an inlet and an annular denuder from URG. This in-house built instrument has beendescribed earlier [12,13]. During the present measurements the device was used to measureRGM and GEM only. The particulate unit was not used. RGM was sampled at a flow rateof 9.6–10.2 l min−1. Part of the air from the denuder was fed to a Tekran Model 2537 Ainstrument (flow rate 1.5 l min−1) to measure GEM. RGM samples were collected with afrequency of one sample every 6 h during the spring measurements. At each such cycleRGM was collected for 315 min (5.25 h) and 45 min was used for analysis. The detection
123

106 Environ Fluid Mech (2008) 8:101–116
limit, determined as 3× standard deviation of blanks was 0.8 pg m−3. During the summercampaign RGM samples was collected with a frequency of one sample every 3 h. In eachmeasurement cycle RGM was collected during the first 125 min period followed by 55 minanalysis. The detection limit obtained was 4 pg m−3, calculated as 3× standard deviation ofblanks.
2.2.5 Mercury bulk deposition
Mercury deposition was measured at site 1. A bulk sampler was installed to collect monthlyprecipitation samples for mercury analysis. The collector is made from borosilicate glass andconsists of a funnel connected, via a glass capillary, to a receiving bottle, of 500 ml volume[14]. The glass equipment is housed in a tube made from HDPP. The glass utensils were acidcleaned in the laboratory before use and maintained at the site by rinsing with MQ-waterbetween samples. To preserve mercury during sampling 2.5 ml 12 M HCl was added to thereceiver. The rain samples were brought to the IVL laboratory in Sweden for analysis. Theanalytical procedure consisted of acid digestion, reduction with Sn(II)chloride followed bypurge and trap and CVAFS detection [14].
2.3 Summary of methods and sampling schedule
The methods used at the various sites are summarised in Table 2. The sampling time sched-ules applied with manual and automatic sampling systems are shown in Table 3. The ratherthorough sampling schedule shown could not be fulfilled at all sites during all the campaigns.Hence, during some campaigns the measurement frequencies were lower at some sites.
The NOAA HYSPLIT (HYbrid Single-Particle Lagrangian Integrated Trajectory) modelwas used to calculate backward trajectories for the evaluation of results from the varioussites. The calculations were made interactively using the service provided by NOAA on theWeb site: http://www.arl.noaa.gov/ready/hysplit4.html.
Table 2 Methods
Sites TGM/GEM RGM TPM
1 Automatic measurementswith 5 min time resolution,Tekran Model 2537 A
Manual 12 h samples onKCl annular denuders.Automatic measurementsduring the spring andsummer campaigns
Manual 24 h samples onTPM mini-traps
2 Manual Au traps 2 hsamples
Manual 12 h samples onKCl annular denuders
Manual 12 h samples onTPM mini-traps
3 Manual Au traps 12 hsamples (24 h duringwinter)
Manual 12 h samples onKCl annular denuders (24 hduring winter)
Manual 12 h samples onTPM mini-traps (24 h duringwinter)
4 Automatic measurementswith 5 min time resolution,Tekran Model 2537 A
Automatic sampling on KClannular denuders using theTekran 1130 speciation unit
Automatic sampling of fineparticulate mercury, usingthe Tekran 1130 speciationunit
5 Manual 12 h samples onKCl denuders
Manual 12 h samples onTPM mini-traps
123
Environ Fluid Mech (2008) 8:101–116 107
Table 3 Sampling time schedule
Specie Manual Automatic
TGM Two 12 h average samplesper 24 h period, starting7:30 and 19:30 UTC
Continuous 5 min averagesamples yielding 288samples per 24 h period
RGM Two 12 h average samplesper 24 h period, starting7:30 and 19:30 UTC
One 2 h sample per every3 h period, alternatively one5.25 h sample per every 6 hperiod
TPM Two 12 h average samplesper 24 h period, starting7:30 and 19:30 UTC
One 2 h sample per every3 h period
3 Results
3.1 Variation in mercury concentrations between sites
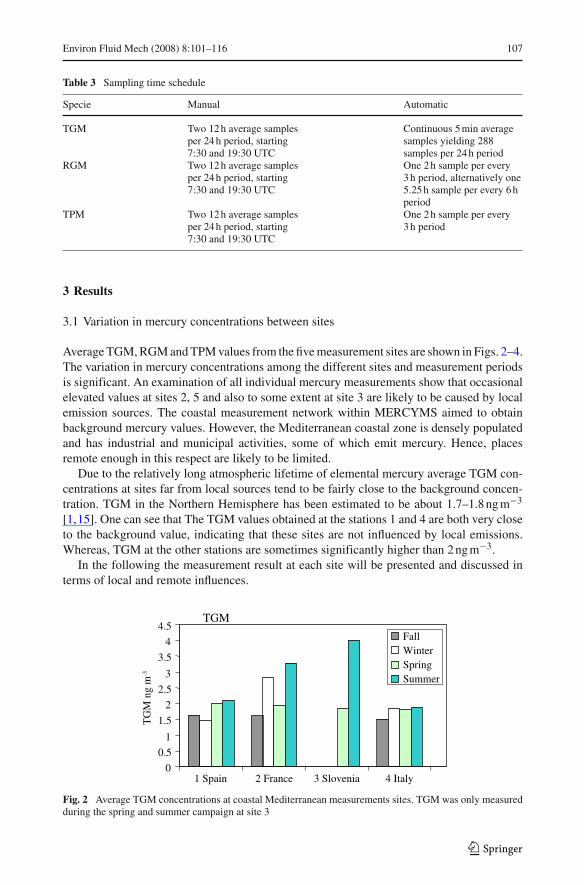
Average TGM, RGM and TPM values from the five measurement sites are shown in Figs. 2–4.The variation in mercury concentrations among the different sites and measurement periodsis significant. An examination of all individual mercury measurements show that occasionalelevated values at sites 2, 5 and also to some extent at site 3 are likely to be caused by localemission sources. The coastal measurement network within MERCYMS aimed to obtainbackground mercury values. However, the Mediterranean coastal zone is densely populatedand has industrial and municipal activities, some of which emit mercury. Hence, placesremote enough in this respect are likely to be limited.
Due to the relatively long atmospheric lifetime of elemental mercury average TGM con-centrations at sites far from local sources tend to be fairly close to the background concen-tration. TGM in the Northern Hemisphere has been estimated to be about 1.7–1.8 ng m−3
[1,15]. One can see that The TGM values obtained at the stations 1 and 4 are both very closeto the background value, indicating that these sites are not influenced by local emissions.Whereas, TGM at the other stations are sometimes significantly higher than 2 ng m−3.
In the following the measurement result at each site will be presented and discussed interms of local and remote influences.
00.5
1
1.52
2.53
3.54
4.5
1 Spain 2 France 3 Slovenia 4 Italy
FallWinterSpringSummer
TG
M n
g m
-3
TGM
Fig. 2 Average TGM concentrations at coastal Mediterranean measurements sites. TGM was only measuredduring the spring and summer campaign at site 3
123

108 Environ Fluid Mech (2008) 8:101–116
0
10
20
30
40
50
1 Spain 2 France 3 Slovenia 4 Italy 5 Israel
RGM
RG
M p
g m
-3
191Fall
WinterSpringSummer
Fig. 3 Average RGM concentrations from five coastal Mediterranean sites
1 Spain 2 France 3 Slovenia 4 Italy 5 Israel0
20
40
60
80
100 TPM
TPM
pg
m-3
FallWinterSpringSummer
662
Fig. 4 Average TGM concentrations from five coastal Mediterranean sites. No TPM measurements wereperformed at site 3 during the autumn campaign
As mentioned above TGM values at site 1 are fairly low. This is also the case for RGM andTPM as shown in Figs. 3 and 4. According to meteorological data from site 1 and calculatedback trajectories the predominant wind direction is NNW, i.e., from continental Europe. Thisoccurred 50–74% of the time depending on season. Hence, the air quality at the site is toa great deal influenced by that of the continent rather than of the Mediterranean Sea. Indi-vidual RGM values ranged from 0 to 19 pg m−3 with the highest obtained during summerand autumn. The total average is as low as 1–2 pg m−3. Relevant background data on RGMconcentrations in Europe and elsewhere are scarce. However, since RGM is scavenged bywet aerosols and by deposition on vegetation we have reasons to believe that the averagebackground concentrations normally are low. A more detailed discussion on RGM is madebelow. In contrast to RGM the atmosphere constitutes an efficient means for transport ofmercury bound to the particulate phase. Measurements in Northern Europe show that TPMsources in East and Central Europe can be traced at sites as distant as 500–800 km. The TPMvalues obtained at station 1 were between 2 and 30 pg m−3. The total average TPM from allcampaigns is 9.9 pg m−3. This value is similar to average TPM concentration (11.0 pg m−3)measured at the Råö EMEP station in Sweden during 2001–2004. The Råö data correspondsto the background level of TPM in southern Sweden.
Back trajectories calculated for site 2 clearly showed that this station more or less is dom-inated by the same wind fields as at station 1. The high mercury concentrations occasionallyencountered at the site are therefore likely to be due to local emissions. This conclusion isalso supported by observations of occasions where both stations are receiving air masses ofbasically the same origin but RGM and TPM measured at site 2 are 10 times higher than at
123

Environ Fluid Mech (2008) 8:101–116 109
site 1. A municipal incinerator located near the city of Meze 4–5 km east of the measure-ment site constitutes a conceivable mercury source. In addition contributions from local coalpowered stations for electricity generation may also be responsible.
The Slovenian station, site 3, is unique since it is situated near the most mercury contam-inated area in the Mediterranean Sea. The river Isonzo runs into the Gulf of Trieste and iscontaminated with respect to mercury. This river is a tributary of the River Idrijca to whichmercury from the mining area of Idrija has been discharged for nearly 500 years. The Hg(tot)concentration in the river has recently been measured and varies between 1 and 174 µg m−3
[16,17]. Due to the mercury discharge via river Isonzo the Hg concentration in the waterbody and in the sediments are much higher than elsewhere in the Mediterranean Sea. Hence,measurements of dissolved gaseous mercury (DGM) in Gulf of Trieste made during spring2004 showed that DGM also is very high [18]. Concentrations of TGM appear to be elevatedduring the summer campaign. TGM values in the range 2.0–16.4 ng m−3 with an average ashigh as 4.0 ng m−3 were observed. None of the other atmospheric species measured seemhigh enough to indicate significant local anthropogenic emission such as at site 2. The highestTGM values occurred during daytime with calm winds from the north that passed the Gulfof Trieste before entering the measurement site and it is possible that the elevated TGM wasdue to emission from the Sea.
The Italian station, site 4, can be characterised as a background station. The averageTGM from all campaigns is 1.75 ng m−3. Both RGM and fine particulate mercury are low,2.6 and 2.7 pg m−3, respectively. According to calculated back trajectories winds from thewest are dominating but winds from the north also occur frequently. Westerly wind meansMediterranean air whereas wind from the north involves trajectories over land.
At the Israelian station, site 5, very high TPM and RGM values were often encountered.A back trajectory analysis showed that wind masses reaching the station often had a Med-iterranean Sea origin, but often passed over land (e.g., along the coast) before reaching themeasurement site. Some of the occasions with elevated TPM and RGM are evidently con-nected to trajectories over land and the high mercury concentrations observed are then pre-sumably due to local emissions. The prevailing wind fields were different during the summercampaign, however. Then air masses of Mediterranean origin entered directly to the mea-surement site during the whole campaign. This is also reflected in the mercury concentrationsmeasured. Hence, the lowest TPM were obtained during summer. RGM is still comparablyhigh 8 ± 9 pg m−3, but resembles RGM values obtained from summer ship measurements,see below. As shown in Fig. 3 this parameter varied very much among the campaigns withthe lowest (2.2 ± 4 pg m−3) observed during the winter.
Monthly mercury wet deposition and precipitation amounts were measured during theperiod November 2003–October 2004 at the Spanish site. No measurements were made dur-ing December 2003 and September 2004, however. The total precipitation amount collectedduring the measurement period was 272 mm. This is high compared to the average yearlyprecipitation amounts at the site, which was 222 mm during 1999–2001. The mercury wetdeposition obtained from the 10 months of rain sampling amounted to 6.1 µg m−2. Sincesome rain may have had fallen during September and December, as well, the total deposi-tion during the whole 12 month period is likely to have been somewhat higher. An estimatebased on precipitation statistics and the average Hg(tot) content in rain obtained from thepresent measurements suggests that the total deposition was 6–8 µg m−2. To our knowledgeno measurements of mercury in precipitation in the Mediterranean area has been performedearlier. However, the present value is similar to those obtained at northern European EMEPstations. Average mercury deposition from 1999 to 2002 at five EMEP stations, one in theNetherlands, two in Northern Germany and two in Southern Sweden lies in a narrow range
123

110 Environ Fluid Mech (2008) 8:101–116
from 6.2 to 7.9 µg m−2 year−1 [19]. On the other hand, the mercury concentration in rainseems to be much higher at Cabo de Creus than at the northern sites. The average mercuryconcentration in rain was as high as 23 µg m−3, which can be compared with 9–11 µg m−3
found at the northern European sites.
3.2 Measurement quality
Standard methods for measurements of RGM and PM are yet not available. Hence, obtainingaccurate measurement constituted one of the challenges in this project. Here some reflectionsare made regarding measurement methods. Some comments on the present RGM result incomparison to those obtained during previous measurements are also made.
As described above, a manual denuder technique to measure RGM was used at most ofthe sites. An automatic method, based on the same denuder technique was used at site 4during all campaigns and also at site 1 during the spring and summer campaigns. To comparethe two methods parallel measurements were performed at site 1 and the result is shown inFig. 5. Both data series show the same general trend but the automatic measurements yieldedon average 50% higher values. However, due to the low concentrations encountered the con-dition for the comparison was not ideal. Several values were under the detection of limit(1 pg m−3) of both methods. A broader concentration range would probably have yielded amore conclusive result. An almost exact match between manual and automatic measurementshas been reported from a similar comparison [11].
The present background RGM concentrations are much lower than earlier reported fromthe Mediterranean area [10]. In the previous investigation mist chambers were used to measureRGM. However, RGM is still an operationally defined parameter and different measurementmethods may give different results [11,20]. In view of recent findings and developmentregarding RGM measurements, we now have reason to believe that the former RGM valueswere overestimated.
Total particulate mercury was measured using open phase TPM mini traps at all sites exceptat site 4 as explained above. The Tekran values correspond to small particles (<2.5µm),whereas the TPM mini traps collect both the fine particles and part of the coarse fraction. Par-allel TPM and Tekran 1135 samples (performed during Mediterranean Sea cruises) showedthat the mini trap measurements tend to yield higher values [21]. Open phase measurements
0
2
4
6
8
10
26 0400:00
28 0400:00
30 0400:00
02 0500:00
04 0500:00
06 0500:00
08 0500:00
Manual
Automatic
RG
M p
g m
-3
Fig. 5 Time series of RGM measured at the Spanish site during spring 2004. The manual samples constitutedof continuous 12 h RGM samples. With the automatic method a sample with 5.25 h collection sample wasobtained during each 6 h period
123

Environ Fluid Mech (2008) 8:101–116 111
0
5
10
15
20
25
30
35
19/300:00
21/300:00
23/300:00
25/300:00
27/300:00
29/300:00
31/300:00
2/4 00:00
0
5
10
15
20
25
30TPM (Mini-trap)Coarse tot mass - Σ(E)Fine tot mass - Σ(E)
TPM
pg
m-3
Part
icle
sµg
m-3
Fig. 6 Time series of TPM (mini-trap) concentrations and Dichotomous measurements of fine (<2.5µm)and coarse (2.5–10 µm) soot particles. The TPM measurements have a temporal resolution of from 12 to 24 h.The particle data consist of 24 h measurements
would yield higher values if a significant part of the particulate mercury is associated to coarseparticles. Since, particles also were collected using a Dichotomous sampler this hypothesiscould be tested. Two size fractions, fine (<2.5µm) and coarse (2.5–10 µm) were analysedin respect to Na, Mg, Al, Si, P, S, Cl, K, Ca, Ti, V, Cr, Mn, Fe, Co, Ni, Zn, Se, Br, Pbusing of XRF [22]. Due to windy conditions, 15% of the total particle mass constituted ofsea salt (NaCl). The TPM values were compared with various mass fractions including totalmass of fine and coarse salt particles and the mass of the fine and coarse fractions of totalmass −!
(E), where!
(E) is the sum of analysed elements (µg m−3). Total mass −!(E)
corresponds presumably to the most part of soot particles.The best fit with TPM was obtained for the soot fractions and the result is shown in
Fig. 6. Hence, not too surprising, the slightly elevated TPM values appear to be associ-ated with soot, implying an anthropogenic origin. This conclusion is also supported by theobservation of an anti-correlation between time series of TPM and fine and coarse sea saltfractions. As shown in Fig. 6, the TPM peak at the 31 of March is associated with fineparticulate soot only. Whereas the large peak at the 25 of March could be due to both fineand coarse soot particles. This TPM peak occurred when cruising near the coast of Algeriareceiving strong northern winds from the continent. According to HYSPLIT backtrajectorycalculation, the polluted air had been transported 600 km over the Mediterranean Sea beforeentering to the measurement site. Hence, it can be concluded that the peak observed the 25March constituted an example of long range transport of particulate mercury. On the 31stof March the ship had a position close to the Albanian coast receiving winds of coastal andinland origin from Greece. The slightly elevated TPM observed may then be of more localcharacter.
Landis et al. [11] have suggested that open phase particle measurements for determin-ing particulate mercury may give erroneous results in the presence RGM. Laboratory andfield experiments indicated that RGM could adsorb onto soot particles on the filters. Thiswould especially apply to measurements in urban environments with RGM concentrations>15 pg m−3 [1]. No evidence for this artifact could be seen when examining the present dataincluding those from sites 2 and 5. However, it can be noted that the technique with RGMdenuder and filter pack in series, which was used at site 4, has the advantage of entirelyavoiding such possible errors.
123

112 Environ Fluid Mech (2008) 8:101–116
4 Discussion
Measurement data gathered from the campaigns suggests that real TGM background con-centrations were measured at sites 1 and 4. Average TGM concentrations from these stationswere 1.80 and 1.75 ng m−3, respectively. Also ship measurements, performed within theMERCYMS project, yielded similar values. The average TGM concentration obtained froma three week long cruise on the Mediterranean Sea during August 2003 was 1.96 ng m−3 [21].An average value of 1.75 ng m−3 was obtained during a two-week long cruise in March–April2004 [21].
The present values can be compared to 1.72 ng m−3 which corresponds to the averageTGM concentration obtained at Mace Head on the west coast of Ireland during 1998–2004[15]. This value is assumed to reflect the northern hemispherical background TGM concen-tration. Yearly averages between the different years from 1999 to 2003 were found to bewithin the narrow range 1.65–1.79 ng m−3. The Mediterranean TGM values presented hereresemble the Mace Head data and although they do not correspond to full year averages itsuggest that the background TGM concentration in the Mediterranean basin is close to thatof the northern hemispherical background. However, one difference can be noted. Accordingto Kock et al. [15] the Mace Head data shows a seasonal variation with significantly highervalues during the cold season compared to summer. The difference is about 0.15 ng m−3
and is suggested to mainly be a result of lower mixing height during the cold season incombination with higher Hg emissions due to combustion of fossil fuels. The present datafrom the Mediterranean area shows an opposite trend with higher concentrations during thesummer as shown in Fig. 2. This is also reflected in the ship measurements. The reason forthe difference between northern Europe and the Mediterranean area is not clear but may bean effect of evasion of Hg0 from the sea surface [18].
The TGM at sites 2 and 3 greatly exceeds the background TGM concentration as shownin Fig. 2. Site 2 appears to be close to anthropogenic sources of mercury since not only TGM,but also RGM and TPM often are very high. The concentrations measured there are probablyonly valid in the very local area. Dispersion calculations of plumes from point sources ofmercury (e.g., chlor-alkali producers) show that even major emission sources only have avery local impact [12]. The result from site 3 is more difficult to interpret, but since TGMis the only species which is higher than normal, emission from the sea is conceivable asmentioned above.
Information on concentrations of RGM in background air in Europe and elsewhere is lim-ited. To our knowledge no continuous measurements of this species have been performed.This means that annual average background concentrations are not available, for example.The result of the present measurements suggests that the average RGM in Mediterraneancoastal background air is quite low. Total averages from the coastal sites 1, 3 and 4 (whichare considered to represent background air) are in the range 2–6 pg m−3 with individual val-ues ranging from under the detection limit to 45 pg m−3. The highest values were obtained atsite 3 during the summer campaign. The RGM values obtained from ship measurements aresomewhat higher than the coastal values. Average RGM of 8 and 6 pg m−3 were obtained atthe summer cruise 2003 and the spring cruise 2004, respectively [21].
The limiting factor regarding tropospheric build-up of RGM concentrations is its ability tobe removed from the atmosphere via washout and dry deposition. Hence, the importance oflong range transport is restricted. However, RGM is probably formed in the free tropospherevia photochemical oxidation of elemental mercury. The exact chemical mechanism is notknown, but Hg0 is presumably oxidised by OH and/or halogen radicals. RGM sometimesshows a diurnal variation as has been observed at a coastal site in southern Sweden and at
123
Environ Fluid Mech (2008) 8:101–116 113
0.0
2.0
4.0
6.0
8.0
10.0
25/10 00:00 26/10 00:00 27/10 00:00 28/10 00:00 29/10 00:000
10
20
30
40
50
60RGM Ozone
RG
M p
g m
-3
O3 p
pb
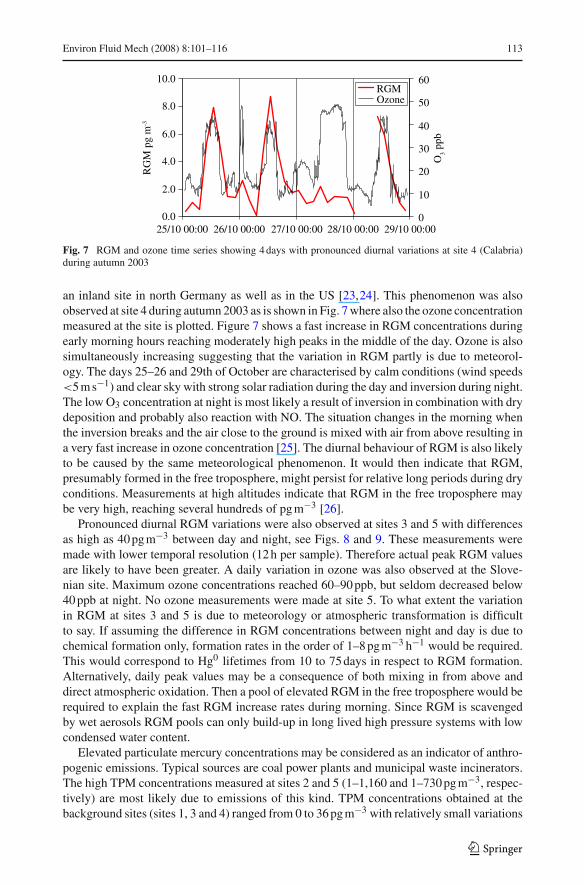
Fig. 7 RGM and ozone time series showing 4 days with pronounced diurnal variations at site 4 (Calabria)during autumn 2003
an inland site in north Germany as well as in the US [23,24]. This phenomenon was alsoobserved at site 4 during autumn 2003 as is shown in Fig. 7 where also the ozone concentrationmeasured at the site is plotted. Figure 7 shows a fast increase in RGM concentrations duringearly morning hours reaching moderately high peaks in the middle of the day. Ozone is alsosimultaneously increasing suggesting that the variation in RGM partly is due to meteorol-ogy. The days 25–26 and 29th of October are characterised by calm conditions (wind speeds<5 m s−1) and clear sky with strong solar radiation during the day and inversion during night.The low O3 concentration at night is most likely a result of inversion in combination with drydeposition and probably also reaction with NO. The situation changes in the morning whenthe inversion breaks and the air close to the ground is mixed with air from above resulting ina very fast increase in ozone concentration [25]. The diurnal behaviour of RGM is also likelyto be caused by the same meteorological phenomenon. It would then indicate that RGM,presumably formed in the free troposphere, might persist for relative long periods during dryconditions. Measurements at high altitudes indicate that RGM in the free troposphere maybe very high, reaching several hundreds of pg m−3 [26].
Pronounced diurnal RGM variations were also observed at sites 3 and 5 with differencesas high as 40 pg m−3 between day and night, see Figs. 8 and 9. These measurements weremade with lower temporal resolution (12 h per sample). Therefore actual peak RGM valuesare likely to have been greater. A daily variation in ozone was also observed at the Slove-nian site. Maximum ozone concentrations reached 60–90 ppb, but seldom decreased below40 ppb at night. No ozone measurements were made at site 5. To what extent the variationin RGM at sites 3 and 5 is due to meteorology or atmospheric transformation is difficultto say. If assuming the difference in RGM concentrations between night and day is due tochemical formation only, formation rates in the order of 1–8 pg m−3 h−1 would be required.This would correspond to Hg0 lifetimes from 10 to 75 days in respect to RGM formation.Alternatively, daily peak values may be a consequence of both mixing in from above anddirect atmospheric oxidation. Then a pool of elevated RGM in the free troposphere would berequired to explain the fast RGM increase rates during morning. Since RGM is scavengedby wet aerosols RGM pools can only build-up in long lived high pressure systems with lowcondensed water content.
Elevated particulate mercury concentrations may be considered as an indicator of anthro-pogenic emissions. Typical sources are coal power plants and municipal waste incinerators.The high TPM concentrations measured at sites 2 and 5 (1–1,160 and 1–730 pg m−3, respec-tively) are most likely due to emissions of this kind. TPM concentrations obtained at thebackground sites (sites 1, 3 and 4) ranged from 0 to 36 pg m−3 with relatively small variations
123

114 Environ Fluid Mech (2008) 8:101–116
0
10
20
30
40
50
25/0700:00
26/0700:00
27/0700:00
28/0700:00
29/0700:00
30/0700:00
31/0700:00
1/0800:00
RG
M p
g m
-3
Fig. 8 Diurnal variation in RGM concentrations measured at site 3 during the summer campaign 2004.The time series consist of successive 12 h samples, measured during 8:30–19:30 and 19:30–8:30 (UTC) thefollowing day
0
5
10
15
20
25
30
35
40
19/0700:00
21/0700:00
23/0700:00
25/0700:00
27/0700:00
29/0700:00
31/0700:00
2/0800:00
4/0800:00
RG
N p
g m
-3
Fig. 9 Diurnal variation in RGM concentrations measured at site 5 during the summer campaign 2004.The time series consist of successive 12 h samples, measured during 8:30–19:30 and 19:30–8:30 (UTC) thefollowing day
between campaigns. Background TPM is probably to the most part also of anthropogenicorigin, but can also be formed by e.g., adsorption of RGM onto atmospheric aerosols of bothanthropogenic and natural origin. Total averages from sites 1 and 3 were 9.9 and 11.8 pg m−3,respectively whereas mercury on the fine particulate fraction as measured at site 4 was muchlower 2.7 pg m−3. The TPM data from the background coastal sites is very similar to thatobtained from ship measurements. Average TPM-mini trap values from the summer-2003and the spring-2004 cruises were 8.5 and 7.9 pg m−3 [21], which indicates that backgroundconcentrations in the Mediterranean area are close to 10 pg m−3. This resembles the back-ground air TPM concentration measured at a coastal site in Sweden during 2001–2004, whereyearly average TPM values of 7.4–14.1 pg m−3 were obtained. As mentioned above, the airreaching the Israelian site during the summer campaign appeared to be of pure Mediterraneanorigin. However, the TPM concentrations were quite high as shown in Fig. 10. The averageTPM (23 pg m−3) is about 2–3 times as high as those from the cruises.
5 Conclusions
Average background TGM concentrations in the Mediterranean area are confined to1.7–1.8 ng m−3 and resemble those of northern Europe. Higher concentrations were, how-ever, found in local urban areas. The measurements indicate a seasonal effect with somewhat
123

Environ Fluid Mech (2008) 8:101–116 115
19/0700:00
21/0700:00
23/0700:00
25/0700:00
27/0700:00
29/0700:00
31/0700:00
2/0800:00
4/0800:00
TPM
pg
m-3
0
10
20
30
40
50
60
70
80
Fig. 10 TPM time series obtained during summer 2004 at the coastal site in Israel
higher TGM concentrations during summer. However, the amount of data gathered during theproject is too limited to be conclusive on this point. The average background concentrationof RGM is likely to be fairly low, <10 pg m−3. The variation in RGM concentrations cansometimes be quite dynamic with peak concentrations in the middle of the day and minimumat night. The diurnal behaviour of RGM is likely to be due to meteorology rather than tolocal photochemical oxidation of Hg0. A tendency of higher RGM concentrations duringsummer can be discerned. Background TPM values are similar to those measured at a site insouthern Sweden. The overall results show that background concentration of mercury in theMediterranean area is more similar to that in northern Europe than earlier anticipated.
Acknowledgements The MERCYMS research project was funded by the European Commission, DGResearch, 5th Framework Programme on Energy Environment and Sustainable Development. Key Actionon “Sustainable Marine Ecosystems (Contr. No. EVK3–2002–00070).
References
1. Slemr F, Brunke E-G, Ebinghaus R, Temme C, Munthe J, Wängberg I, Schroeder W, Steffen A, BergT (2003) Worldwide trend of atmospheric mercury since 1977. Geophys Res Lett 30(10):1561
2. Schroeder WH, Munthe J (1998) Atmospheric Murcury–an overwiew. Atmos Environ 32:809–8223. Lamborg CH, Fitzgerald WF, O’Donnell J, Torgersen T (2002) A non-steady-state compartment model
of global-scale mercury biochemistry with interhemispheric atmospheric gradients. Geochimica et Cos-mochimica Acta 66(7):1105–1118
4. Wängberg I, Munthe J, Ebinghaus R, Gårdfeldt K, Iverfeldt Å, Sommar J (2003) Distribution of TPM inNorthern Europe. Sci Total Environ 304:53–59
5. Bloom NS, Fitzgerald WF (1988) Determination of volatile mercury species at the picogram level bylow-temperature gas chromatography with cold vapor atomic fluorescence detection. Anal Chimica Acta209:151–161
6. Brosset C (1987) The behaviour of mercury in the physical environment. Water Air Soil Pollut 34:145–166
7. Ebinghaus R, Jennings SG, Schroeder WH, Berg T, Donaghy T, Guentzel J, Kenny C, Kock HH, KvietkusK, Landing W, Munthe J, Prestbo EM, Schneeberger D, Slemr F, Sommar J, Urba A, Wallschläger D,Xiao Z (1999) International field intercomparison measurements of atmospheric mercury species at MaceHead, Ireland. Atmos Environ 33:3063–3073
8. Munthe J, Wängberg I, Pirrone N, Iverfeldt Å, Ferrara R, Costa P, Ebinghaus R, Feng X, Gårdfelt K,Keeler G, Lanzillotta E, Lindberg SE, Lu J, Mamane Y, Nucaro E, Prestbo E, Schmolke S, Schroeder WH,Sommar J, Sprovieri F, Stevens RK, Stratton W, Tuncel G, Urba A (2001) Intercomparison of methodsfor sampling and analysis of atmospheric mercury species. Atmos Environ 35:3007–3017
9. Lu JY, Schroeder WH, Berg T, Munthe J, Schneeberger D, Schaedlich FA (1998) Device for Samplingand Determination of Total Particulate Mercury in Ambient Air. Anal Chem 70:2403–2408
123

116 Environ Fluid Mech (2008) 8:101–116
10. Wängberg I, Munthe J, Pirrone N, Iverfeldt Å, Bahlman E, Costa P, Ebinghaus R, Feng X, Ferrara R,Gårdfeldt K, Kock H, Lanzillotta E, Mamane Y, Mas F, Melamed E, Nucaro E, Osnat Y, Prestbo E,Sommar J, Spain G, Sprovieri F, Tuncel G (2001) Atmospheric mercury distribution in Northern Europeand in the Mediterranean Region. Atmos Environ 35:3019–3025
11. Landis MS, Stevens RK, Schaedlich F, Prestbo EM (2002) Development and characterisation of an annu-lar Denuder methodology for the measurement of divalent inorganic reactive gaseous mercury in ambientair. Environ Sc Tech 36:3000–3009
12. Wängberg I, Barregard L, Sällsten G, Haeger-Eugensson M, Munthe J, Sommar J (2005) Emissions, dis-persion and human exposure of mercury from a Swedish chlor-alkali plant. Atmos Environ 39:7451–7458
13. Sommar J, Wängberg I, Berg T, Gårdfeldt K, Munthe J, Richter A, Urba A, Wittrock F, SchroederWH (2007) Circumpolar transport and air-surface exchange of atmospheric mercury at Ny-Ålesund(79◦N), Svalbard, spring 2002. Atmos Chem Phys 7:151–166
14. Berg T, Dye C, Hanssen JE, Krognes T, Munthe J, Reissell A, Schaug J, Schmidbauer N, Semb A, TørsethK, Uggerud HT, Aas A, Aasarød K, Lisbeth Berntsen L (2002) EMEP manual for sampling and chemicalanalysis http://www.nilu.no/projects/ccc/manual/index.html
15. Kock HH, Bieber E, Ebinghaus R, Spain TG, Thees B (2005) Comparison of long-term trends and sea-sonal variations of atmospheric mercury concentrations at the two European coastal monitoring stationsMace Head, Ireland, and Zingst, Germany. Atmos Environ 39:7549–7556
16. Ogrinc N (2006) Final MERCYMS report. Pirrone Nicola Institute for Atmospheric Pollution of theNational Research Council (CNR-IIA) Division of Rende, c/o UNICAL-Polifunzionale, 87036 Rende,Italy
17. Hines ME, Jadran F, Isaac A, Horvat M (2006). Microbial mercury transformations in marine, estuarineand freshwater sediment downstream of the Idrija Mercury Mine, Slovenija. Appl Geochem 21:1924–1939
18. Andersson M E, Gårdfeldt K, Wängberg I, Sprovieri F, Pirrone N, Lindqvist O (2007) Seasonal and dailyvariation of mercury evasion at coastal and off shore sites from the Mediterranean Sea. Marine Chemistry104:214–226
19. Wängberg I, Munthe J, Berg T, Ebinghaus R, Kock HH, Temme C, Bieber E, Spain TG, Stolk A (2007)Trends in air concentration and deposition of mercury in the coastal environment of the North Sea Area.Atmospheric Environment (in press)
20. Sheu G-R, Mason RP (2001) An examination of methods for the measurements of reactive gaseous mer-cury in the atmosphere environ. Sci Tech 35:1209–1216
21. Sprovieri F, Pirrone N (2007) Spatial ditribution of atmospheric mercury species at off-shore sites of theMediterranean Sea. EFM (Submitted for publication) (this issue)
22. Mamanne et al. (2006) Final MERCYMS report. Pirrone Nicola Institute for Atmospheric Pollution of theNational Research Council (CNR-IIA) Division of Rende, c/o UNICAL-Polifunzionale, 87036 Rende,Italy
23. Munthe J, Wängberg I, Iverfeldt Å, Lindqvist O, Strömberg D, Sommar J, Gårdfeldt K, Petersen G,Ebinghaus R, Prestbo E, Larjava K, Siemens V (2003) Distribution of atmospheric mercury species inNorden Europe: final results from the MOE project. Atmos Environ 37(1):9–20
24. Lindberg SE, Stratton WJ (1998) Atmospheric mercury speciation: concentrations and behaviour of reac-tive gaseous mercury in ambient air. Environ Sci Technol 32:49–57
25. Garland JA, Derwent RG (1979) Destruction at the ground and the diurnal cycle of concentration of ozoneand other gases. Quarterly J Roy Meteorol Soc 105:169–183
26. Landis MS, Lynam MM, Stevens RK (2005) In: Nicola P, Mahaffey KR (eds) Dynamics of mercurypollution on regional and global scales: atmospheric processes and human exposures around the world,Chapter-7. Springer, ISBN 0-387-24493-X
123