Are cadmium, lead and mercury concentrations in mosses across Europe primarily determined by...
13
SOILS, SEC 5 • SOIL AND LANDSCAPE ECOLOGY • RESEARCH ARTICLE Are cadmium, lead and mercury concentrations in mosses across Europe primarily determined by atmospheric deposition of these metals? Winfried Schröder & Marcel Holy & Roland Pesch & Harry Harmens & Ilia Ilyin & Eiliv Steinnes & Renate Alber & Yuliya Aleksiayenak & Oleg Blum & Mahmut Coşkun & Maria Dam & Ludwig De Temmerman & Marina Frolova & Marina Frontasyeva & Laura Gonzalez Miqueo & Krystyna Grodzińska & Zvonka Jeran & Szymon Korzekwa & Miodrag Krmar & Eero Kubin & Kestutis Kvietkus & Sébastien Leblond & Siiri Liiv & Sigurður Magnússon & Blanka Maňkovská & Juha Piispanen & Åke Rühling & Jesus Santamaria & Zdravko Spiric & Ivan Suchara & Lotti Thöni & Viktor Urumov & Lilyana Yurukova & Harald G. Zechmeister Received: 5 February 2010 / Accepted: 10 May 2010 / Published online: 26 May 2010 # Springer-Verlag 2010 Abstract Purpose This study aimed at investigating correlations between heavy metal concentrations in mosses and modelled deposition values as well as other site-specific and regional characteristics to determine which factors primarily affect cadmium, lead and mercury concentrations in mosses. The resulting relationships could potentially be used to enhance the spatial resolution of heavy metal deposition maps across Europe. Materials and methods Modelled heavy metal deposition data and data on the concentration of heavy metals in naturally growing mosses were integrated into a geographic informa- tion system and analysed by means of bivariate rank correlation analysis and multivariate decision trees. Modelled deposition data were validated annually with deposition measurements at up to 63 EMEP measurement stations within the European Monitoring and Evaluation Programme (EMEP), and mosses were collected at up to 7,000 sites at 5- year intervals between 1990 and 2005. Results and discussion Moderate to high correlations were found between cadmium and lead concentrations in mosses Responsible editor: Nicole Mathers W. Schröder : M. Holy : R. Pesch (*) Department of Landscape Ecology, University of Vechta, PO Box 1553, 49356 Vechta, Germany e-mail: [email protected] H. Harmens Centre for Ecology and Hydrology Bangor, LL57 2UW Bangor, Gwynedd, UK I. Ilyin Meteorological Synthesising Centre East of EMEP, Krasina pereulok, 16/1, 123056 Moscow, Russia E. Steinnes Department of Chemistry, Norwegian University of Science and Technology, 7491 Trondheim, Norway R. Alber Environmental Agency of Bolzano, 39055 Laives, Italy Y. Aleksiayenak International Sakharov Environmental University, Minsk, Belarus O. Blum National Botanical Garden, Academy of Science of Ukraine, Timiryazevs’ka St, 1, 01014 Kiev, Ukraine M. Coşkun Canakkale Onsekiz Mart University, 17100 Çanakkale, Turkey M. Dam Food, Veterinary and Environmental Agency, Falkavegur 6, 100, Tórshavn, Faroe Islands, Denmark L. De Temmerman Veterinary and Agrochemical Research Centre, Leuvensesteenweg 17, 3080 Tervuren, Belgium J Soils Sediments (2010) 10:1572–1584 DOI 10.1007/s11368-010-0254-y
-
Upload
independent -
Category
Documents
-
view
0 -
download
0
Transcript of Are cadmium, lead and mercury concentrations in mosses across Europe primarily determined by...

SOILS, SEC 5 • SOIL AND LANDSCAPE ECOLOGY • RESEARCH ARTICLE
Are cadmium, lead and mercury concentrations in mossesacross Europe primarily determined by atmosphericdeposition of these metals?
Winfried Schröder & Marcel Holy & Roland Pesch & Harry Harmens & Ilia Ilyin &
Eiliv Steinnes & Renate Alber & Yuliya Aleksiayenak & Oleg Blum & Mahmut Coşkun &
Maria Dam & Ludwig De Temmerman & Marina Frolova & Marina Frontasyeva &
Laura Gonzalez Miqueo & Krystyna Grodzińska & Zvonka Jeran & Szymon Korzekwa &
Miodrag Krmar & Eero Kubin & Kestutis Kvietkus & Sébastien Leblond & Siiri Liiv &
Sigurður Magnússon & Blanka Maňkovská & Juha Piispanen & Åke Rühling &
Jesus Santamaria & Zdravko Spiric & Ivan Suchara & Lotti Thöni & Viktor Urumov &
Lilyana Yurukova & Harald G. Zechmeister
Received: 5 February 2010 /Accepted: 10 May 2010 /Published online: 26 May 2010# Springer-Verlag 2010
AbstractPurpose This study aimed at investigating correlations betweenheavy metal concentrations in mosses and modelled depositionvalues as well as other site-specific and regional characteristicsto determine which factors primarily affect cadmium, lead andmercury concentrations in mosses. The resulting relationshipscould potentially be used to enhance the spatial resolution ofheavy metal deposition maps across Europe.Materials and methods Modelled heavy metal depositiondata and data on the concentration of heavy metals in naturally
growing mosses were integrated into a geographic informa-tion system and analysed by means of bivariate rankcorrelation analysis and multivariate decision trees. Modelleddeposition data were validated annually with depositionmeasurements at up to 63 EMEPmeasurement stations withinthe European Monitoring and Evaluation Programme(EMEP), and mosses were collected at up to 7,000 sites at 5-year intervals between 1990 and 2005.Results and discussion Moderate to high correlations werefound between cadmium and lead concentrations in mosses
Responsible editor: Nicole Mathers
W. Schröder :M. Holy :R. Pesch (*)Department of Landscape Ecology, University of Vechta,PO Box 1553, 49356 Vechta, Germanye-mail: [email protected]
H. HarmensCentre for Ecology and Hydrology Bangor,LL57 2UW Bangor, Gwynedd, UK
I. IlyinMeteorological Synthesising Centre East of EMEP,Krasina pereulok, 16/1,123056 Moscow, Russia
E. SteinnesDepartment of Chemistry,Norwegian University of Science and Technology,7491 Trondheim, Norway
R. AlberEnvironmental Agency of Bolzano,39055 Laives, Italy
Y. AleksiayenakInternational Sakharov Environmental University,Minsk, Belarus
O. BlumNational Botanical Garden, Academy of Science of Ukraine,Timiryazevs’ka St, 1,01014 Kiev, Ukraine
M. CoşkunCanakkale Onsekiz Mart University,17100 Çanakkale, Turkey
M. DamFood, Veterinary and Environmental Agency,Falkavegur 6, 100,Tórshavn, Faroe Islands, Denmark
L. De TemmermanVeterinary and Agrochemical Research Centre,Leuvensesteenweg 17,3080 Tervuren, Belgium
J Soils Sediments (2010) 10:1572–1584DOI 10.1007/s11368-010-0254-y

and modelled atmospheric deposition of these metals:Spearman rank correlation coefficients were between 0.62and 0.67, and 0.67 and 0.73 for cadmium and lead,respectively (p<0.001). Multivariate decision tree analysesshowed that cadmium and lead concentrations in mosseswere primarily determined by the atmospheric deposition ofthese metals, followed by emissions of the metals. Low tovery low correlations were observed between mercuryconcentrations in mosses and modelled atmospheric depo-sition of mercury. According to the multivariate analyses,spatial variations of the mercury concentration in mosseswas primarily associated with the sampled moss species and
not with the modelled deposition, but regional differencesin the atmospheric chemistry of mercury and correspondinginteractions with the moss may also be involved.Conclusions At least for cadmium and lead, concentrationsin mosses are a valuable tool in determining and mappingthe spatial variation in atmospheric deposition acrossEurope at a high spatial resolution. For mercury, morestudies are needed to elucidate interactions of differentchemical species with the moss.
Keywords Biomonitoring . Cadmium .
Correlation analysis . Deposition . Lead .Mercury .Moss
M. FrolovaLatvian Environment, Geology and Meteorology Agency,Maskavas Str. 165,Riga LV 1019, Latvia
M. FrontasyevaJoint Institute for Nuclear Research,6 141980 Dubna, Russia
L. G. Miqueo : J. SantamariaUniversity of Navarra,Irunlarrea No 1,31008 Pamplona, Spain
K. GrodzińskaInstitute of Botany, Polish Academy of Sciences,Lubicz 46,31512 Krakow, Poland
Z. JeranDepartment of Environmental Sciences, Jožef Stefan Institute,Jamova 39,1000 Ljubljana, Slovenia
S. KorzekwaUniversity of Opole,Opole, Poland
M. KrmarFaculty of Science, University of Novi Sad,Obradovica 4,21000 Novi Sad, Serbia
E. Kubin : J. PiispanenFinnish Forest Research Institute,Kirkkosaarentie 7,91500 Muhos, Finland
K. KvietkusInstitute of Physics,Savanoriu Ave 231,02300 Vilnius, Lithuania
S. LeblondMuséum National d’Histoire Naturelle,57 rue Cuvier, Case 39,75005 Paris, France
S. LiivTallinn Botanic Garden,Kloostrimetsa tee 52,11913 Tallinn, Estonia
S. MagnússonIcelandic Institute of Natural History,Hlemmur 3,125 Reykjavík, Iceland
B. MaňkovskáInstitute of Landscape Ecology, Slovak Academy of Science,Štefánikova Str. 3,814 99 Bratislava, Slovakia
Å. RühlingHumlekärrshultsvägen 10,572 41 Oskarshamn, Sweden
Z. SpiricOikon Ltd., Institute for Applied Ecology,Avenija V. Holjevca 20,10020 Zagreb, Croatia
I. SucharaSilva Tarouca Research Institute for Landscape and OrnamentalGardening,Kvetnove namesti 391,252 43 Průhonice, Czech Republic
L. ThöniFUB-Research Group for Environmental Monitoring,Postfach 1645,8640 Rapperswil, Switzerland
V. UrumovSaints Cyril and Methodius University,P.O. Box 162, 1000 Skopje, FYR Macedonia
L. YurukovaBulgarian Academy of Sciences, Institute of Botany,Acad. G. Bonchev Str., Block 23,1113 Sofia, Bulgaria
H. G. ZechmeisterUniversity of Vienna,Althanstraße 14,1090 Vienna, Austria
J Soils Sediments (2010) 10:1572–1584 1573

1 Introduction
Atmospheric deposition of heavy metals can pollute soilsand sediments and can have severe ecological impacts suchas bioaccumulation or loss of biodiversity (Aleksander-Kwaterczak and Helios-Rybicka 2009; Morvan et al. 2008;Mulder and Breure 2006; Norr and Riepert 2007).Therefore, deposition measurements are key to soil moni-toring (Schröder et al. 2004) and are needed for spatialestimations of soil contamination through atmosphericdeposition (Zheng et al. 2008). Soil contamination byatmospheric deposition of heavy metals can affect humanhealth indirectly via bioaccumulation and biomagnificationin the food chain (Task Force on Health 2007). Further-more, chronic exposures to heavy metals can have seriousdirect health effects in the long run, even at low depositionlevels (Fergusson 1991). Thus, deposition measurementsare relevant not only for soil monitoring but also for humanbiomonitoring issues (Hettelingh et al. 2008; Markert et al.2008; Morvan et al. 2008; Pesch et al. 2009; Schröder et al.2004). The main threats to human well-being are associatedwith arsenic (As), cadmium (Cd), lead (Pb) and mercury(Hg). Therefore, these substances are primarily targeted byinternational legislative bodies. In 1996, the Organisationfor Economic Co-operation and Development (OECD)1
agreed to phase out many uses of lead, and in 1998, theUnited Nations Economic Commission for Europe added aProtocol on Heavy Metals to the Convention on Long-Range Transboundary Air Pollution (LRTAP).
Gases and particulates released to the atmosphere fromcombustion sources, such as motor vehicles, slash burningand industrial sources, contain heavy metal compounds,which can undergo complex chemical reactions in theatmosphere and fall to the earth as wet deposition (rain,snow), occult deposition (cloud, fog) or dry deposition (dryparticles, gas). Airborne chemicals can travel long distancesfrom their sources and can therefore affect ecosystems overbroad spatial scales and at locations far from the emissionsources. Depending on their lifetimes, the respectivecompounds have different possible transport distances.After atmospheric deposition, the toxic metals can beaccumulated in the environmental compartments andtissues of living organisms, increasing the risk of harmfuleffects (Seinfeld and Pandis 2006). According to the TaskForce on Health of the Long-Range Transboundary AirPollution Convention, the health risks of atmospheric Cd,Hg and Pb depositions occur via accumulation in cropsused for animal and human consumption. As Cd shows
strong similarities with the micronutrient zinc (Zn), it canreplace Zn in many biological tissues, where it can bind upto ten times more strongly than Zn. The direct toxicity ofCd is lower than its cumulative toxicity. The margin ofsafety between the present daily intake of Cd in the diet andthe intake that can result in adverse effects is very narrow(Task Force on Health 2007). Pb in the natural environmentis usually tightly bound in the organic top soil layer(humus). Therefore, uptake via roots into plants is relativelysmall, but direct atmospheric deposition may contributesignificantly to the lead concentration in plants, includingcrops (Harmens et al. 2005). In mammals, it acts as acumulative poison and a well-known neurotoxin (TaskForce on Health 2007). Hg and many of its compounds(methylmercury) are strongly toxic to most kinds oforganisms, and the toxicity depends on its speciation.Methylmercury bioaccumulates in the food chain, andhumans are primarily exposed to methylmercury via fishin the diet; the main target organs are kidneys and thecentral nervous system.
Under the LRTAP convention, a broad framework forco-operative action on reducing the impact of air pollutionand negotiating concrete measures to control emissions ofair pollutants through legally binding protocols wasestablished. In this process, the main objective of theEuropean Monitoring and Evaluation Programme (EMEP)is to regularly provide governments and subsidiary bodiesunder the LRTAP Convention with qualified scientificinformation to support the development and furtherevaluation of the international protocols on emissionreduction. The EMEP has three main tasks: collection ofemission data, measurements of air and precipitation qualityand modelling of atmospheric transport and deposition ofair pollutions. In order to control the atmospheric emissionsof heavy metals, 36 parties to the LRTAP Conventionsigned the Protocol on Heavy Metals targeting Cd, Pb andHg. EMEP provides the Executive Body of the Conventionwith information on depositions and transboundary trans-port of heavy metals within the geographical scope of theparticipating countries. The coordination and quality assur-ance of chemical air quality and precipitation measurementsare carried out at the Chemical Coordinating Centre (CCC).The model development for heavy metals and persistentorganic pollutants is the responsibility of the Meteorolog-ical Synthesising Centre-East (MSC-E). The depositionmodelling results are basic information for the calculationof critical load exceedances by the Co-ordination Centre forEffects (CCE) of the Working Group on Effects (Slootweget al. 2005). The CCE is responsible for the modelling andmapping of critical levels and loads and air pollutioneffects, risks and trends as well as for the integratedassessment of effects of air pollution on biodiversity inEuropean natural areas, including Natura 2000 sites. The
1 OECD is one of the world's largest and most reliable sources ofcomparable statistics and economic and social data. OECD collectsdata, monitors trends, analyses and forecasts economic developmentsand researches social changes or evolving patterns in trade, environ-ment, agriculture, technology and taxation.
1574 J Soils Sediments (2010) 10:1572–1584

CCE provides effect-based support to European air pollu-tion abatement policies.
Cd, Hg and Pb were targeted in the 1998 AarhusProtocol as the environment and human health wereexpected to be most at risk from adverse effects of thesemetals (VROM 2007). Parties of the LRTAP Conventionperform wet heavy metal deposition monitoring at about60–70 sites across Europe within the framework of EMEP.There are around 30 stations measuring concentrations ofCd and Pb in air and precipitation and about 20 stationswhere at least one form of Hg is measured. However, thespatial coverage of the EMEP network is sparse. Thedeposition measurement sites are spread over a largegeographical area, so that, e.g., in the year 2006, Germanywas represented by six stations recording Cd and Pb andtwo stations measuring Hg concentrations in air andprecipitation (Ilyin et al. 2008).
Measurement data are located at individual sites. In orderto characterise the deposition patterns over the entire EMEPdomain, atmospheric deposition modelling is needed. TheEMEP model results are essential inputs to the modellingand mapping of critical load exceedance (Spranger et al.2008) and integrated assessment models (Schöpp et al.1999) and have been crucial to a number of emissioncontrol agreements, e.g., the European Union NationalEmissions Ceilings Directive. The EMEP/MSC-E regionalmodel of heavy metals airborne pollution (MSCE-HM) hasbeen developed to calculate transboundary fluxes, toperform deposition modelling and source attribution andto analyse trends. By attempting to evaluate a spatial modellike MSCE-HM with a broad grid size of 50 km×50 km,problems with evaluating the model results by use ofdeposition measurements with a low spatial density are tobe expected. Thus, the key concern of future works is toenhance the spatial resolution of deposition modelling andmapping because it is essential that the model respondscorrectly to emission changes in order to trust its ability topredict concentrations and depositions (Simpson et al.2006). One step to reaching this aim is to compare themodelled spatial trends with observations from networksmonitoring phenomena closely related to deposition andoperating at a high spatial resolution. One such network isthe European heavy metals in mosses biomonitoringnetwork, which measures heavy metal concentrations inmosses at up to 7,000 sites. The European moss surveys areconducted also under the LRTAP Convention and are partof the International Co-operative Programme on Effects ofAir Pollution on Natural Vegetation and Crops (ICPVegetation; Harmens et al. 2008).
To quantitatively characterise the indicative value ofmosses as biomonitors of atmospheric deposition, correla-tion analyses are needed (Ellenberg et al. 1991; Litz 2000).This study aimed at investigating whether the data from the
European moss surveys could potentially be used in thefuture to provide deposition maps of Cd, Hg and Pb at ahigh spatial resolution. To this end, the correlationsbetween the concentrations of the respective heavy metalsin mosses and modelled deposition values were examined.To determine what factors primarily influence the heavymetal concentration in mosses, data on Cd, Hg and Pb totaldeposition, calculated by using the EMEP MSCE-HMmodel, the respective concentrations in mosses and dataon land characteristics at and around the moss samplingsites were integrated into the analyses.
2 Materials and methods
2.1 Modelling heavy metals depositionby using the MSCE-HM atmospheric transport model
For modelling deposition of heavy metals, the MSCE-HMatmospheric transport model was used. The model resultswere verified via comparison with measured values ofheavy metals included in the EMEP monitoring programmein 1999. Detailed information about the sites and themeasurement methods is found in Aas and Breivik (2008).However, major trend analysis for Europe is available fromaround 1990 when trace metals in either precipitation or airor both were measured at 42 sites in Europe. In 1990, onlytwo sites had co-located air and precipitation measurementsfor lead. Co-location is important for better understandingthe deposition and transport processes. In 2005, there were29 sites measuring trace metals in both air and precipitation,and altogether there were 63 measurement sites whereof 18sites measured at least one form of mercury (Aas andBreivik 2008). Nevertheless, there are still too fewmonitoring sites in Europe to have a satisfactory spatialdistribution over the whole EMEP domain. There are veryfew measurement sites in eastern and southern Europe,especially for mercury. In addition, too few sites providedata for heavy metals in both air and precipitation. Theadopted EMEP monitoring strategy for 2010–2019 (EB.AIR/GE.1/2009/15) and the EU’s daughter directive onheavy metals and polycyclic aromatic hydrocarbons isexpected to improve this situation (Pacyna et al. 2009).Measurements of Cd, Hg and Pb concentrations in air andprecipitation and of wet deposition fluxes are carried out inthe EMEP background monitoring network coordinated bythe CCC. One important measure to check the data qualityis a laboratory ring test. The intercomparison reported byAas and Breivik (2008) is representative for the 2006 data.The analytical performance for most elements and labora-tories is satisfactory for Cd and Pb, which are the prioritymetals (Ilyin et al. 2008). As for Hg, in 2005, fieldintercomparison of Hg measurements was carried out at
J Soils Sediments (2010) 10:1572–1584 1575
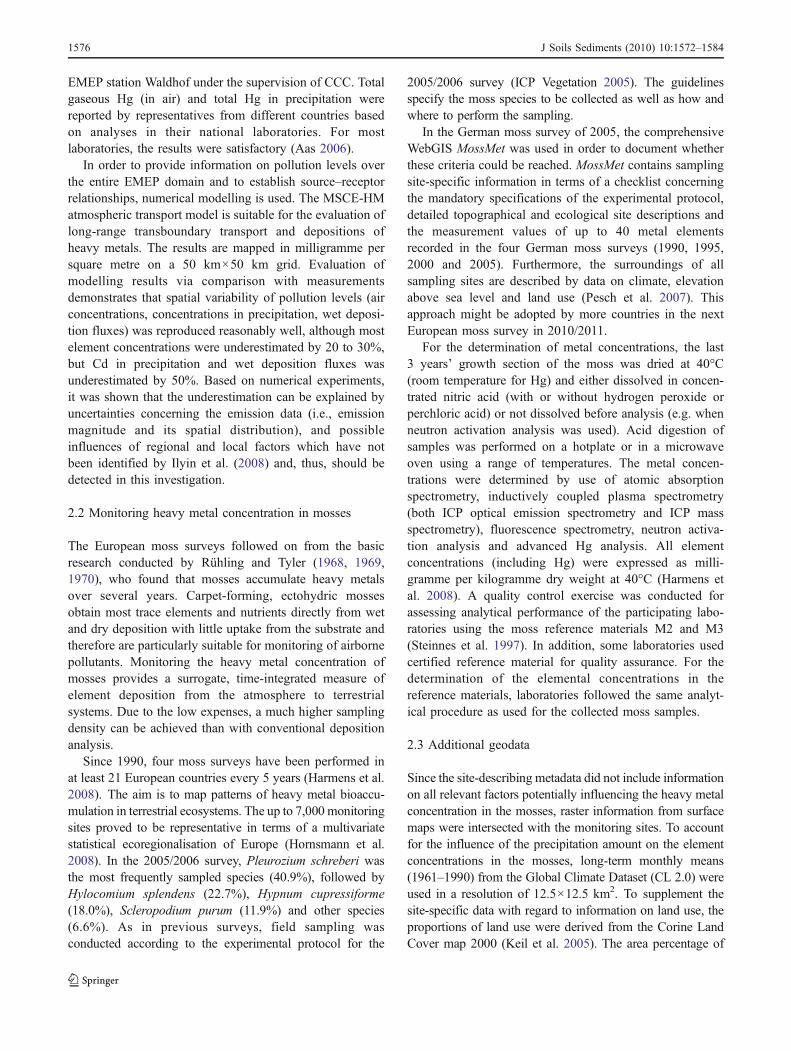
EMEP station Waldhof under the supervision of CCC. Totalgaseous Hg (in air) and total Hg in precipitation werereported by representatives from different countries basedon analyses in their national laboratories. For mostlaboratories, the results were satisfactory (Aas 2006).
In order to provide information on pollution levels overthe entire EMEP domain and to establish source–receptorrelationships, numerical modelling is used. The MSCE-HMatmospheric transport model is suitable for the evaluation oflong-range transboundary transport and depositions ofheavy metals. The results are mapped in milligramme persquare metre on a 50 km×50 km grid. Evaluation ofmodelling results via comparison with measurementsdemonstrates that spatial variability of pollution levels (airconcentrations, concentrations in precipitation, wet deposi-tion fluxes) was reproduced reasonably well, although mostelement concentrations were underestimated by 20 to 30%,but Cd in precipitation and wet deposition fluxes wasunderestimated by 50%. Based on numerical experiments,it was shown that the underestimation can be explained byuncertainties concerning the emission data (i.e., emissionmagnitude and its spatial distribution), and possibleinfluences of regional and local factors which have notbeen identified by Ilyin et al. (2008) and, thus, should bedetected in this investigation.
2.2 Monitoring heavy metal concentration in mosses
The European moss surveys followed on from the basicresearch conducted by Rühling and Tyler (1968, 1969,1970), who found that mosses accumulate heavy metalsover several years. Carpet-forming, ectohydric mossesobtain most trace elements and nutrients directly from wetand dry deposition with little uptake from the substrate andtherefore are particularly suitable for monitoring of airbornepollutants. Monitoring the heavy metal concentration ofmosses provides a surrogate, time-integrated measure ofelement deposition from the atmosphere to terrestrialsystems. Due to the low expenses, a much higher samplingdensity can be achieved than with conventional depositionanalysis.
Since 1990, four moss surveys have been performed inat least 21 European countries every 5 years (Harmens et al.2008). The aim is to map patterns of heavy metal bioaccu-mulation in terrestrial ecosystems. The up to 7,000 monitoringsites proved to be representative in terms of a multivariatestatistical ecoregionalisation of Europe (Hornsmann et al.2008). In the 2005/2006 survey, Pleurozium schreberi wasthe most frequently sampled species (40.9%), followed byHylocomium splendens (22.7%), Hypnum cupressiforme(18.0%), Scleropodium purum (11.9%) and other species(6.6%). As in previous surveys, field sampling wasconducted according to the experimental protocol for the
2005/2006 survey (ICP Vegetation 2005). The guidelinesspecify the moss species to be collected as well as how andwhere to perform the sampling.
In the German moss survey of 2005, the comprehensiveWebGIS MossMet was used in order to document whetherthese criteria could be reached. MossMet contains samplingsite-specific information in terms of a checklist concerningthe mandatory specifications of the experimental protocol,detailed topographical and ecological site descriptions andthe measurement values of up to 40 metal elementsrecorded in the four German moss surveys (1990, 1995,2000 and 2005). Furthermore, the surroundings of allsampling sites are described by data on climate, elevationabove sea level and land use (Pesch et al. 2007). Thisapproach might be adopted by more countries in the nextEuropean moss survey in 2010/2011.
For the determination of metal concentrations, the last3 years’ growth section of the moss was dried at 40°C(room temperature for Hg) and either dissolved in concen-trated nitric acid (with or without hydrogen peroxide orperchloric acid) or not dissolved before analysis (e.g. whenneutron activation analysis was used). Acid digestion ofsamples was performed on a hotplate or in a microwaveoven using a range of temperatures. The metal concen-trations were determined by use of atomic absorptionspectrometry, inductively coupled plasma spectrometry(both ICP optical emission spectrometry and ICP massspectrometry), fluorescence spectrometry, neutron activa-tion analysis and advanced Hg analysis. All elementconcentrations (including Hg) were expressed as milli-gramme per kilogramme dry weight at 40°C (Harmens etal. 2008). A quality control exercise was conducted forassessing analytical performance of the participating labo-ratories using the moss reference materials M2 and M3(Steinnes et al. 1997). In addition, some laboratories usedcertified reference material for quality assurance. For thedetermination of the elemental concentrations in thereference materials, laboratories followed the same analyt-ical procedure as used for the collected moss samples.
2.3 Additional geodata
Since the site-describing metadata did not include informationon all relevant factors potentially influencing the heavy metalconcentration in the mosses, raster information from surfacemaps were intersected with the monitoring sites. To accountfor the influence of the precipitation amount on the elementconcentrations in the mosses, long-term monthly means(1961–1990) from the Global Climate Dataset (CL 2.0) wereused in a resolution of 12.5×12.5 km2. To supplement thesite-specific data with regard to information on land use, theproportions of land use were derived from the Corine LandCover map 2000 (Keil et al. 2005). The area percentage of
1576 J Soils Sediments (2010) 10:1572–1584

urban, forested and agricultural land use categories in aradius of 1, 5, 10 and 25 km (for forests and agriculture) or1, 5, 10, 25, 50, 75 and 100 km (for urban areas) aroundeach raster cell was calculated and then projected onto eitherthe 1×1 or 2×2 km2 grid cells (Table 1). The marine cationeffect (Berg and Steinnes 1997) was assessed in terms of thedistances of the monitoring sites to the coastlines of theAtlantic Ocean and the Baltic, Black and Mediterranean Sea.
The correlation analyses included the Cd, Hg and Pbconcentrations in mosses recorded in the European mosssurveys 1990, 1995, 2000 and 2005 (Harmens et al. 2008),the EMEP modelled total depositions of these metals andadditional data listed in Table 1. The additional data setsinclude four site-specific characteristics as documented bythe participating countries and 20 regional characteristicsthat might influence the heavy metal accumulation inmosses (Berg and Steinnes 1997; Herpin et al. 2004;Schröder et al. 2008; Zechmeister et al. 2003). In theClassification and Regression Trees (CART), these site-specific and regional characteristics are referred to aspredictors (Section 3). For the metal concentrations inmosses, the median for each of the 50×50 km2 EMEPraster cells was used for the correlation analysis.
2.4 Statistical analysis
Bivariate correlation coefficients were computed to indicatethe strength and direction of the statistical relationshipbetween the metal concentrations in mosses and theassumed influencing factors such as the modelled deposi-tions. In this investigation, we decided to compute theSpearman rank correlation coefficient rs because the metalconcentrations mostly proved not to be normally distribut-ed. Although this non-parametric correlation method is lesspowerful than parametric methods if the assumptionsunderlying the latter are met, it is less likely to givedistorted results when the assumptions fail. The coefficient
rs amounts for −1, if the two rankings are completely inopposite agreement, rs equals 0 if the rankings are com-pletely independent and +1 if there is an outright agreementbetween the two rankings. Within the interval [−1, +1] thestrength of correlation was classified according to Hagl(2008). Accordingly, rs values <|0.2| are very low, between |0.2| and |0.5| low, from |0.5| to |0.7| moderate, between |0.7|and |0.9| high and > |0.9| very high. Statistical significancerefers to how general a relationship is and the likelihoodthat the observed relationship occurred by chance.
In addition to non-parametric correlation analyses,CART as introduced by Breiman et al. (1984) were usedto analyse the multivariate correlations between the metalconcentrations in the mosses and characteristics of thesurroundings of the sampling sites such as modelleddepositions and land cover. CART does not make anyassumptions regarding the distribution of the data and canuse an explanatory variable more than once, so it is able towork with multiple interrelated data. CART can revealhierarchical and non-linear relationships among one depen-dent variable (metal concentration in the mosses) andseveral describing variables (site specific and regionalcharacteristics listed in Table 1) by sub-dividing a hetero-geneous data set into more homogeneous sub-sets (classesor nodes) by a series of nested binary “if-then-else” splits.Each split maximises the homogeneity of the dependentvariable. Each possible binary split for all variables isevaluated recursively for the best class separation untilhomogeneous end nodes are reached. The predictor selectedis the one for which the two new classes have the greatestwithin-group similarity for the response variable. The twonew classes are then examined separately, with respect toeach of the predictor variables, to see if they can be splitagain. The resulting dendrogram can have multiplebranches, each of which represents a path to a particularcombination of independent variables defining variablesub-spaces.
Predictor Resolution Data Source
Moss species Site specific
Altitude Site specific
Analytical method Site specific
Distance to sea Site specific
Precipitation 12.5 km×12.5 km CRU
Population density 100 m×100 m EEA
Agricultural land use (1, 5, 10, 25 km radius) 1 km×1 km EEA
Forestal land use (1, 5, 10, 25 km radius) 1 km×1 km EEA
Urban land use (1, 5, 10, 25, 50 km radius) 1 km×1 km EEA
Urban land use (75, 100 km radius) 2 km×2 km EEA
Total deposition of Cd, Hg and Pb 50 km×50 km MSC-E
Table 1 Site-specific andregional predictors used forcorrelation analyses
CRU Climatic Research Unit(http://www.cru.uea.ac.uk), EEAEuropean Environment Agency(http://www.eea.europa.eu),MSC-E Meteorological Synthe-sising Centre-East of EMEP(http://www.msceast.org)
J Soils Sediments (2010) 10:1572–1584 1577

3 Results
3.1 Correlations between deposition values of Cd, Hgand Pb and their concentrations in mosses
The rank correlation coefficients computed for the relationsbetween the total deposition of Cd, Hg and Pb on the one handand the concentrations of the respective elements in mossessampled in the framework of the moss survey 2005/2006 onthe other hand are presented in Fig. 1. The total deposition ofCd and Pb and their concentrations in mosses were moder-ately to highly correlated: the correlation coefficients for Cdare 0.65 for the year of sampling and 0.63 for the 3-yearaccumulation period, respectively (p<0.001). For Pb, thecorrelation coefficient was 0.73, both for the year ofsampling and the 3-year accumulation period (p<0.001). Incontrast to Cd and Pb, the correlations for Hg deposition andconcentration in mosses were low to very low (year ofsampling: rs=0.17, 3-year accumulation period: rs=0.20, p<0.001). Further correlations of the moss data with regionalcharacteristics are listed in Table 2. These are low or very lowthroughout. Remarkably, the correlation coefficients of theelement concentrations in mosses and the proportion of urbanland use increased with increasing radius. For agricultural andforested land uses, this tendency was less distinct.
3.2 Multivariate correlations
Most natural phenomena do not interact with only oneinfluencing factor as assumed in bivariate correlationstatistics but with several ones. Such multivariate relationsbetween the heavy metal concentrations in mosses and site-specific and regional land characteristics (see Table 1) wereanalysed using CART. As an example, the results of theCART analysis are shown for Cd concentrations in mosses
in 2005/2006. The root node of the dendrogram for Cd(Fig. 2) shows the statistical distribution of the concen-trations in mosses sampled at 5,411 sites throughout Europewith a mean value of 0.16 mg Cd kg−1 moss dry weight.The total atmospheric deposition of Cd during the year ofsampling is the statistically most powerful predictor for theCd concentration in mosses. At sites with total Cddeposition below 38 mg m−2 y−1, the mean tissue Cdconcentration in moss equals 0.13 mg Cd kg−1 (node 1),
Fig. 1 Spearman rankcorrelation coefficients (rs)between total atmosphericdeposition of Cd, Hg and Pb andtheir concentration in mossessampled in 2005/2006, wheretotal atmospheric deposition waseither calculated for the year ofsampling or accumulated overthe 3 years before sampling.Rank correlation coefficients forconcentrations of Cd, Hg and Pbin depositions and mossessampled in 2005/2006
Table 2 Spearman rank correlation coefficients between Cd, Hg andPb concentration in mosses sampled in 2005/2006 and regionalcharacteristics
Predictor rs (Cd) rs (Hg) rs (Pb)
Altitude 0.19 0.02 0.37
Population density 0.08 −0.03 0.17
Precipitation −0.05 0.17 0.11
Distance to sea 0.25 −0.02 0.22
Agricultural land use (1 km radius) 0.33 −0.18 0.31
Agricultural land use (5 km radius) 0.15 −0.03 0.22
Agricultural land use (10 km radius) 0.23 −0.04 0.31
Agricultural land use (25 km radius) 0.25 −0.03 0.33
Forested land use (1 km radius) 0.12 −0.02 0.06
Forested land use (5 km radius) 0.13 −0.02 0.05
Forested land use (10 km radius) 0.13 −0.04 0.04
Forested land use (25 km radius) 0.11 −0.07 0.02
Urban land use (1 km radius) 0.11 −0.03 0.11
Urban land use (5 km radius) 0.27 −0.08 0.29
Urban land use (10 km radius) 0.34 −0.09 0.35
Urban land use (25 km radius) 0.38 −0.12 0.39
Urban land use (50 km radius) 0.40 −0.14 0.42
Urban land use (75 km radius) 0.42 −0.16 0.43
Urban land use (100 km radius) 0.42 −0.16 0.43
1578 J Soils Sediments (2010) 10:1572–1584

whereas at sites exceeding this deposition value the mean is0.25 mg Cd kg−1 (node 2). The sampling sites grouped innode 1 are further split by the anthropogenic and naturalemissions (total emissions) from land in the year ofsampling into two subsets of sampling sites, i.e. samplingsites with total Cd emissions ≤0.47 and >0.47 mg m−2 y−1.The sampling sites from node 2 are split further by the totalCd deposition in the year of sampling.
The CART analysis for Pb (dendrogram not shown in thispaper) was based on moss specimens sampled at 5,345 sitesthroughout Europe. Their mean value accounts for1.37 mg Pb kg−1 moss dry weight. The total atmosphericdeposition of Pb during the year of sampling is thestatistically most powerful predictor for the Pb concentrationin mosses. At sites with total Pb deposition below781 mg m−2 y−1, the mean tissue Pb concentration of mossesequals 0.77 mg Pb kg−1 (node 1) whereas at sites exceeding
this deposition value the mean is 1.69 mg Pb kg−1 (node 2).The sampling sites grouped in node 1 are further split byanthropogenic emissions from land in the 3 years prior tosampling into two subsets of sampling sites, i.e. samplingsites with total Pb emissions ≤40.8 and >40.8 mg m−2 y−1.The sampling sites from node 2 are split further by theapplied digestion technique during chemical analysis.
For Hg in 2005/2006, CART identified the sampled mossspecies, the altitude of the sampling sites, the analyticalmethod used as well as the ratio of urban land uses in thesurroundings of the sampling sites and the total Hg depositionas relevant factors (Hg dendrogram not shown in this paper).Considering the four moss surveys conducted to date (1990,1995, 2000, 2005), the most powerful predictor for the Cd andPb concentrations in mosses was the total deposition in theyear of sampling. For Hg, the very low variances were bestexplained by different analytical methods.
Fig. 2 CART dendrogram of factors associated with Cd concentrations in mosses sampled in 2005/2006. Total Cd deposition and emissions referto the year of sampling
J Soils Sediments (2010) 10:1572–1584 1579

4 Discussion
Measurements of the metals cadmium, lead and mercury inair and precipitation are carried out by the EMEPmonitoring network. As this network covers only a limitedpart of Europe and at a low density, modelling based onemission and deposition data is necessary to assess heavymetal pollution levels for the entire EMEP region. Althoughthe calculated depositions of heavy metals correlate wellwith measured values, in general, the modelled levels of Cdand Pb underestimate measurements by 30% to 50% and20% to 30%, respectively (Ilyin et al. 2007). Underestima-tion is most significant in some regions of central Europeand northern Scandinavia and most likely due to uncertain-ties in the emissions data. In addition, it is likely that thedeposition monitoring network is too sparse. For Hg, thedifference between the modelled and measured values doesnot exceed ±15% for air concentrations and ±45% forconcentrations in precipitation (Ilyin et al. 2008).
The moss monitoring network provides measurementdata at a much higher spatial resolution than the EMEPmonitoring network, and the moss data can provide anadditional indication of the performance of the MSC-EHeavy Metal model. This study shows that the concen-trations of Cd and Pb in mosses is moderately to highlycorrelated with the EMEP modelled total deposition, andmultivariate analyses confirmed that the Cd and Pbconcentration in mosses was primarily determined by thetotal atmospheric deposition in the year of sampling.Therefore, mosses are a valuable tool for determiningspatial and temporal variations in atmospheric depositionsat a high spatial resolution across Europe, at least for Cdand Pb. For Hg, the correlations are low to very low. As Hgin ambient air is predominantly found in the vapour phaseand has a residence time of the order of 1 year, it has to beconsidered as a “global pollutant” (Schroeder and Munthe1998) without distinct spatial deposition patterns (Steinneset al. 2003). Multivariate analysis indicated that the Hgconcentration in mosses is primarily determined by theanalytical technique, but the sampled moss species playsalso a major role. The former might reflect that the deter-mination of Hg is analytically still more challenging thanthat of Cd and Pb, and Hg measurement values havetherefore higher uncertainties.
It seems more likely, however, that the lack ofcorrelation between modelled deposition values for Hgand observed concentrations in moss may relate to thespecific chemistry of Hg and corresponding interactionswith the moss. In Scandinavia, the Hg deposition asmeasured by precipitation analysis showed a steep declinefrom south to north (Iverfeldt 1991), similar to that of othermetals predominantly supplied by long-range atmospherictransport. In moss collected in Norway during the same
period, however, the Hg level was fairly uniform with nodistinct south–north gradient (Steinnes and Andersson,1991). This geographical distribution of Hg has beenconfirmed in more recent moss surveys (Berg et al. 2003)and indicates that wet deposition of Hg2+ alone cannot beresponsible for the geographical distribution observed. Themoss must also be able to retain dry deposited Hg0 to a sig-nificant extent, especially in the central and northern parts ofthe country where the wet deposition of Hg is very low andsummer temperatures are moderate to low (Steinnes et al.2003). It may be assumed that the deposition pattern de-picted by the moss survey is a better measure of the net Hgsupply to the terrestrial ecosystem than what is indicatedfrom wet deposition measurements or model calculations.
Another phenomenon not covered by the model calcu-lations but possibly adding to the Hg deposition in the northof Europe is the Arctic Mercury Depletion Events, firstdiscovered by Schroeder et al. (1998). During the polarspring, episodic events occur where Hg0 in air is oxidisedto reactive species, subsequently deposited on the groundand able to interact with any ground vegetation. Recently, itwas shown that such episodes also may contribute toincreased Hg deposition in northern Norway (Berg et al.2008) and possibly explain part of the elevated Hgconcentrations observed in moss.
For Cd and Pb, this investigation corroborates asignificant positive correlation between the modelled totaldeposition and concentration in mosses for all the mosssurvey years. Although the Cd and Pb concentration inmosses is primarily determined by atmospheric deposition,local heavy metal emission sources and environmentalfactors and the use of different moss species contribute tothe scatter in the relationships observed. Whereas EMEPmeasurement stations are located in so-called backgroundareas of heavy metal deposition, i.e. areas representative forthe EMEP task of estimating long-range transboundaryheavy metal pollution, mosses are also sampled in relativelypolluted areas. Indeed, in a previous pilot study for 2000, acomparison between Pb concentrations in mosses andmodelled total lead deposition for selected EMEP grid cellsin Scandinavia where Pb deposition is primarily determinedby long-range transport showed a very high correlation of0.91 (Ilyin and Travnikov 2005). This correlation was muchhigher than the one found for the whole of Europe, wherethe correlation was 0.56. In the current study, thecorrelations between Cd and Pb concentrations in mossesand in precipitation collected at EMEP stations was rs=0.66(n=30) and rs=0.76 (n=28), respectively. Pesch andSchröder (2009) reported correlations between metal con-centrations in mosses and in deposition samples collectedwithin and outside of forests and between metal concen-trations in mosses and deposition values modelled at thenational scale in Germany (Gauger et al. 2008). In
1580 J Soils Sediments (2010) 10:1572–1584

Germany, the strength of correlation proved to be metalspecific and to depend on the method of depositionmeasurement: high and very high correlations exist betweenthe concentrations of As and Cd in mosses and wet onlydeposition collected in 2004 and 2005 (rs=0.6 and rs=1,respectively, n=6). The positive correlations between themetal concentration in mosses and in deposition measuredin the open field at ICP Forests Level II sites in 1998, 1999and 2000 were mostly low for Cd (0<rs≤0.5, n=18), Cu(0<rs≤0.5, n=17), Pb (0.3≤rs≤0.5, n=18) and Zn (rs=0.5,n=27). The correlations between throughfall depositionvalues and moss concentrations were low for Cd (0<rs≤0.2, n=20), Cu (rs=0.3, n=17) and Pb (0<rs≤0.1, n=21)and moderate in case of Zn (0.3≤rs≤0.6, n=32). Thecorrelations of the concentrations of Cd and Pb in mossesand the corresponding modelled deposition values for theterritory of Germany (1997, 1998, 1999, 2000, 2003, 2004)did not exceed rs=0.4 and varied with time and thedeposition process modelled. The highest correlations werefound between the Cd and Pb concentrations in totaldeposition and mosses and in dry deposition and mosses.The comparison of the correlations between moss data anddeposition values modelled at the national (Germany) aswell as the European level show that spatial-scale issuesrequire further investigation.
In this study, the main factors positively correlated withthe Cd concentration in mosses in 2005 as identified byCART analyses were the total atmospheric deposition of Cdduring the year of sampling and total emissions from landin the year of sampling. Additional factors identifiedincluded analytical technique, sampled moss species andpercentage of urban land use around the moss samplingsites. These findings from the European moss monitoringcampaign in 2005 were similar to those from the monitor-ing campaigns in 1990, 1995 and 2000. The CART analysisof the data from the survey 1995 revealed that the analyticaltechnique has to be considered when comparing theanalytical results: Cd concentrations detected by means ofdata instrumental neutron activation analysis are higherthan those derived by inductively coupled plasma emissionspectroscopy, graphite furnace atomic absorption spectrom-etry, flame atomic absorption spectrometry, inductivelycoupled plasma mass spectrometry or electrothermal atomicabsorption spectrometry. For 1995, the distance of thesampling sites to the sea was also identified as a factorpositively correlated with Cd accumulation in mosses.Furthermore, it may happen that precipitation amounts arenegatively correlated with the Cd concentration in mosses(moss survey 2000), too.
Multivariate analyses with CART show that for the mosssurvey 2005 the total deposition of Pb is the mostsignificant predictor for the Pb concentrations in themosses, followed in the second tree level by the total
emissions and the digestion method applied. Concerning allfour moss surveys conducted in 1990, 1995, 2000 and2005, the total deposition in the year of sampling is the farmost important predictor as identified by CART and alsothe highest bivariate correlations are shown between thetotal deposition and the Pb concentrations in the mosses.
An initial comparison of the temporal trends in totalatmospheric deposition of heavy metals and their concen-trations in mosses showed similar trends for all the threemetals investigated: at a European scale, the total EMEPmodelled deposition of Cd, Pb and Hg as well as theirconcentrations in mosses has declined between 1990 (1995for Hg) and 2005 by 70%, 41% and 30% and 73%, 46% and20%, respectively (Gusev et al. 2009; Harmens et al. 2009).
For Cd and Pb, the statistical analyses confirmed thataccumulation of these metals in mosses is primarily de-termined by their atmospheric deposition and that mossescan therefore be used as biomonitors. However, correlationscannot be expected to equal 1 since both processes are notidentical—in fact, they represent coupled processes in thecomplex chain of emission, transport, deposition andaccumulation (Lindberg and Turner 1988). This complexchain of processes and especially the deposition andaccumulation processes vary considerably not only overtime but also across spatial scales (Fränzle et al. 1995;Harmens et al. 2008). In this physical and chemical context,the juxtaposition of element sources and sinks in landscapesis the major determinant of overall element fluxes. In theframework of these fluxes, connections between landscapecomponents can be complex and sometimes counter-intuitive (Diehl and Beard 2009).
Considering element fluxes through the ecosystems inthe light of ecological stoichiometry exhibits strongrelationships between flux rates as measured, e.g. as wet,dry or total deposition and bioaccumulation. The highvariability of bioaccumulation is based on the site-specificand regional conditions and on the ability of the mosses toflexibly adjust growth rate and cellular allocation to fit thelocal site conditions. The metals deposited interact with themosses both physically by adsorption and desorption andchemically by ligation, forming complexes with donor sitesavailable in biomass, and by displaying catalytic functions inmetalloproteins in the case of essential trace elements. Thus,the organotrophic bioconcentration of metals in the organs ofplants depends on the chemical properties of the metal, itsdistribution in the different horizons of the vegetation or soilsand the biochemical structure of the plant organelles or organsaffected. Therefore, quantitative landscape evaluations interms of, for example, deposition and accumulation measure-ments are difficult and need a well-designed experimental andstatistical concept (Fränzle and Schimming 2008). Thisconcept must ensure that the data derived from the diverseprocesses such as deposition or accumulation of metals to
J Soils Sediments (2010) 10:1572–1584 1581

vegetation can be linked based on spatial neighbourhoodrelations and geostatistical surface estimation. Additionally,by use of the map on Ecological Land Classes of Europe(Hornsmann et al. 2008), it could be corroborated that theEuropean moss surveys rely on a high spatial resolutioncovering the broad range of ecological conditions in terms ofclimate, soil texture, elevation and natural vegetation acrossEurope.
5 Conclusions
Deposition modelling needs to be enhanced with regard tospatial resolution to improve their predictive power.Deposition monitoring networks are too sparse to servethis aim. Using the correlations between modelled heavymetal atmospheric depositions and their concentrationsmeasured in mosses, deposition maps could be improvedwith regard to their spatial resolution within the frameworkof a regression kriging approach (Hengla et al. 2007; Odehet al. 1995). Considering the intrinsic uncertainties of theEMEP model (Ilyin and Travnikov 2005) and uncertaintiesassociated with heavy metal emission data and potentiallimitations in the use of moss data as monitors ofatmospheric deposition (Harmens et al. 2008), the mossand deposition data agree reasonably well, at least forcadmium and lead. This exercise may be regarded as across validation of moss data and EMEP model data, bothbecause of potential limitations in the use of mosses asmonitors of atmospheric heavy metal deposition and due touncertainties in the modelled heavy metal deposition(including uncertainties in emissions) (Harmens et al.2009).
The moss survey is the only European environmentalprogramme that enables detecting the spatial variability ofthe metal deposition in terrestrial ecosystems in a way thatcan be proven to be geostatistically valid. This can beachieved because the moss surveys rely on a fairly well-designed biomonitoring scheme based on a natural receptorfor atmospheric deposition fulfilling the following criteria:readily identifiable in the field; widely distributed withinthe geographical range of predicted emissions; easy tosample repeatedly throughout time to capture temporalvariability; affordable, where the cost of sampling, includ-ing the cost of any laboratory analyses that may follow,should be such that sufficient replicates and statisticalrigour can be obtained (Osborn et al. 2000; Pakeman et al.2000). However, because of the natural variability of theenvironment, large numbers of samples are needed to meetthe required statistical precision. Thus, a statistically soundmethod places stringent constraints on the sampling design.Knowledge of the potential confounding factors thatmodify direct and indirect responses of the monitored
receptors to air pollutants is crucial. According to Bealey etal. (2008), approaches such as the moss surveys areappropriate to those regulatory regimes aimed at preventingthe quality of the environment from deteriorating orensuring that its quality is enhanced.
References
Aas W (2006) Data quality 2004, quality assurance and fieldcomparisons. EMEP/CCC report 4/2006
Aas W, Breivik K (2008) Heavy metals and POP measurements, 2006.EMEP/CCC-Report 4/2008
Aleksander-Kwaterczak U, Helios-Rybicka E (2009) Contaminatedsediments as a potential source of Zn, Pb and Cd for river systemat the historical metalliferous ore mining and smelting industryarea in South Poland. J Soils Sediments 9:13–22
Bealey WJ, Long S, Spurgeon DJ, Leith I, Cape JN (2008) Reviewand implementation study of biomonitoring for assessment of airquality outcomes. Bristol, Environment Agency, 170 pp. (ScienceReport SC030175/SR2)
Berg T, Steinnes E (1997) Use of mosses (Hylocomium splendens andPleurozium schreberi) as biomonitors of heavy metal deposition:from relative to absolute values. Environ Pollut 98:61–71
Berg T, Hjellbrekke A, Rühling Å, Steinnes E, Kubin E, Larsen MM,Piispanen J (2003) Absolute deposition maps of heavy metals forthe Nordic countries based on moss surveys. Report TemaNord2003:505. Nordic Council of Ministers, Copenhagen, p 35
Berg T, Aspmo K, Steinnes E (2008) Transport of Hg fromatmospheric mercury depletion events to the mainland of Norwayand its possible influence on Hg deposition. Geophys Res Letters35:L09802
Breiman L, Friedmann JA, Olshen RA, Stone CJ (1984) Classificationand regression trees. Wadsworth, Belmont
Diehl MS, Beard K (2009) Spatial analysis of atmospheric depositionand terrestrial accumulation of mercury within Acadia NationalPark. In: Northeastern section—44th annual meeting (22–24March 2009), session no. 48: GIS applications in geoscienceteaching, research and map production. Spatial InformationSciences Engineering, University of Maine, Orono (http://gsa.confex.com/gsa/2009NE/finalprogram/abstract_155805.htm)
Ellenberg H, Arndt U, Bretthauer R, Ruthsatz B, Steubing L (1991)Biological monitoring. Signals from the environment. Vieweg,Braunschweig
Fergusson JE (1991) The heavy elements: chemistry, environmentalimpact and health effects. Pergamon, Oxford
Fränzle O, Schimming CG (2008) Element fluxes in atmosphere,vegetation and soil. In: Fränzle O, Kappen L, Blume HP,Dierssen K (eds) Ecosystem organization of a complex land-scape. Long-term research in the Bornhöved Lake District,Germany. Springer, Berlin
Fränzle O, Straškraba M, Jørgensen SE (1995) Ecology andecotoxicology. Ullmann´s encyclopedia of industrial chemistry,vol B7. VCH, Weinheim, pp 19–154
Gauger T, Haenel HD, Rösemann C, Dämmgen U, Bleeker A,Erisman JW, Vermeulen AT, Schaap M, Timmermanns RM A,Builtjes PJH, Duyzer JH (2008) National implementation of theUNECE Convention on Long-range Transboundary Air Pollution(Effects). Part 1: Deposition loads: Methods, modelling andmapping results, trends. BMU/UBA 204 63 252. UBA-Texte 38/08. ISSN 1862-4804
Gusev A, Iliyn I, Rozovskaya O, Shatalov V, Sokovych V, TravnikovO (2009) Modelling of heavy metals and persistent organic
1582 J Soils Sediments (2010) 10:1572–1584

pollutants: new developments. EMEP/MSC-East Technical Re-port 1/2009. http://www.msceast.org
Hagl S (2008) Schnelleinstieg Statistik—Daten erheben, analysieren,präsentieren. Haufe, Freiburg
Harmens H, Mills G, Hayes F, Williams P, De Temmerman L, PeschR, Schröder W, and other participants of ICP Vegetation (2005)Air pollution and vegetation. ICP Vegetation Annual Report2004/2005. UNECE ICP Vegetation Coordination Centre, Centrefor Ecology and Hydrology, Bangor, UK. Available at http://icpvegetation.ceh.ac.uk. Accessed 18 May 2009
Harmens H, Norris D, Pesch R, Schröder W, and other participants ofthe moss survey (2008) Spatial and temporal trends in heavymetal accumulation in mosses in Europe (1990-2005).Programme Coordination Centre for the ICP Vegetation, Centrefor Ecology and Hydrology, Bangor, UK. Available at http://icpvegetation.ceh.ac.uk. Accessed 18 May 2009
Harmens H, Mills G, Hayes F, Jones L, Norris D, Cooper D, and theparticipants of ICP Vegetation (2009) Air pollution and vegetation.ICPVegetation annual report 2008/2009. ISBN: 978-0-9557672-9-6
Hengla T, Heuvelink GBM, Rossiter DG (2007) About regression-kriging: from equations to case studies. Comput Geosci 33(10):1301–1315
Herpin U, Siewers U, Markert B, Rosolen V, Breulmann G, Bernoux M(2004) Second German heavy-metal survey by means of mosses,and comparison of the first and second approach in Germany andother European countries. Environ Sci Pollut Res 11:57–66
Hettelingh JP, Posch M, Slootweg J (2008) Critical load, dynamicmodelling and impact assessment in Europe: CCE Status Report2008, Coordination Centre for Effects, Netherlands Environmen-tal Assessment Agency. Available at www.pbl.nl/cce. Accessed18 May 2009
Hornsmann I, Pesch R, Schmidt G, Schröder W (2008) Calculation ofan Ecological Land Classification of Europe (ELCE) and itsapplication for optimising environmental monitoring networks.In: Car A, Griesebner G, Strobl J (eds) Geospatial Crossroads @GI_Forum '08: Proceedings of the Geoinformatics ForumSalzburg. Wichmann, Heidelberg, pp 140–151
ICP Vegetation (2005) Heavy metals in European mosses: 2005/2006survey. Monitoring manual. ICP Vegetation Coordination Centre,Centre for Ecology and Hydrology, Bangor
Ilyin I, Travnikov O (2005) Modelling of heavy metal airborne pollutionin Europe: evaluation of the model performance. EMEP/MSC-ETechnical Report 8/2005. Meteorological Synthesizing Centre-East,Moscow, Russian Federation. http://www.msceast.org
Ilyin I, Rozovskaya O, Travnikov O, Aas W, Hettelingh JP, Reinds GJ(2008) Heavy Metals: Transboundary Pollution of the Environ-ment. EMEP Status Report 2/2008. Norwegian Institute for AirResearch, Kjeller, Meteorological Synthesizing Centre-East,Moscow, Norwegian Meteorological Institute, Oslo, Coordina-tion Centre for Effects, Bilthoven
Iverfeldt Å (1991) Occurrence and turnover of atmospheric mercuryover the Nordic countries. Water Air Soil Pollut 56:251–265
Keil M, Kiefl R, Strunz G (2005) CORINE land cover 2000 -Germany. Final Report, German Aerospace Center, GermanRemote Sensing Data Center, Oberpfaffenhofen
Lindberg SE, Turner RR (1988) Factors influencing atmosphericdeposition, stream export, and landscape accumulation of tracemetals in forested watersheds. Water Air Soil Pollut 39:123–156
Litz HP (2000) Multivariate statistische Methoden. OldenbourgWissenschaftsverlag, München
Markert B, Wünschmann S, Fränzle S, Wappelhorst O, Weckert V,Breulmann G, Djingova R, Herpin U, Lieth H, Schröder W, SiewersU, Steinnes E, Wolterbeek B, Zechmeister H (2008) On the roadfrom biomonitoring to human health aspects—monitoring atmo-spheric heavy metal deposition by epiphytic/epigenetic plants:present status and future needs. Int J Environ Poll 32:486–498
Morvan X, Saby NP, Arrouays D, Le Bas C, Jones RJ, Verheijen FG,Bellamy PH, Stephens M, Kibblewhite MG (2008) Soilmonitoring in Europe: a review of existing systems and require-ments for harmonisation. Sci Total Environ 391:1–12
Mulder C, Breure AM (2006) Impact of heavy metal pollution onplants and leaf-miners. Environ Chem Lett 4:83–86
Norr C, Riepert F (2007) Bioaccumulation studies with Eisenia fetidausing an established degradation test system. J Soils Sediments7:393–397
Odeh IOA, McBratney AB, Chittleborough DJ (1995) Further resultson prediction of soil properties from terrain attributes: heterotopiccokriging and regression-kriging. Geoderma 67(3–4):215–226
Osborn D, Weeks JM, Hankard P, Dale L (2000) Potential uses ofbiomonitoring in pollution control—an introductory guide.Environment Agency Technical Report, p 319
Pacyna JM, Pacyna EG, Aas W (2009) Changes of emissions andatmospheric deposition of mercury, lead, and cadmium inEurope. Atmos Environ 43:117–127
Pakeman R, Osborn D, Hankard P (2000) Plants as biomonitors ofatmospheric pollution: a review of their potential use inintegrated pollution control. Environment Agency TechnicalReport, p 318
Pesch R, Schröder W (2009) Long-term monitoring of the metalaccumulation in forests measured by use of the moss technique.Europ J Forest Res. doi:10.1007/s10342-009-0298-y
Pesch R, Schröder W, Mohr K, Matter Y, Kleppin L, Holy M, GoeritzA, Genßler L (2007) Moos-Monitoring 2005/2006: Schwerme-talle IV und Gesamtstickstoff. R&D Project 205 64 200, FinalReport, on behalf of the Federal Environment Agency, Dessau
Pesch R, Schmidt G, Schröder W, Conrad A, Kolossa-Gehring M,Feigenspahn S, Utermann J (2009) Das Potenzial raumbezogenerDaten im Human-Biomonitoring am Beispiel des Kinder-Umwelt-Surveys. In: Strobl J, Blaschke T, Griesebner G (eds) AngewandteGeoinformatik 2009. Wichmann, Heidelberg, pp 248–257
Rühling A, Tyler G (1968) An ecological approach to the leadproblem. Botaniska Notiser 121:321–343
Rühling A, Tyler G (1969) Ecology of heavy metals—a regional andhistorical study. Botaniska Notiser 121:248–259
Rühling A, Tyler G (1970) Sorption and retention of heavy metals inthe woodland moss Hylocomium splendens (Hedw.). Br Et SchOikos 21:248–342
Schöpp W, Amann M, Cofala J, Heyes C, Klimont Z (1999)Integrated assessment of European air pollution emission controlstrategies. Environ Modell Softw 14:1–9
Schroeder WH, Munthe J (1998) Atmospheric mercury—an overview.Atmos Environ 32(5):809–822
Schroeder WH, Anlauf KG, Barrie LA, Lu JY, Steffen A, SchneebergerDR, Berg T (1998) Arctic springtime depletion of mercury. Nature394:331–332
Schröder W, Pesch R, Schmidt G (2004) Soil monitoring in Germany.Spatial representativity and methodical comparability. J SoilsSediments 4:49–58
Schröder W, Pesch R, Englert C, Harmens H, Suchara I, ZechmeisterHG, Thöni L, Maňkovská B, Jeran Z, Grodzinska K, Alber R(2008) Metal accumulation in mosses across national boundaries:uncovering and ranking causes of spatial variation. EnvironPollut 151:377–388
Seinfeld JH, Pandis SN (2006) Atmospheric chemistry and physics.From air pollution to climate change, 2nd edn. Wiley, Hoboken
Simpson D, Fagerli H, Hellsten S, Knulst JC, Westling O (2006)Comparison of modelled and monitored deposition fluxes of sulphurand nitrogen to ICP-forest sites in Europe. Biogeosciences 3:337–355
Slootweg J, Hettelingh JP, Posch M, Dutchak S, Ilyin I (2005) Criticalloads of cadmium, lead and mercury in Europe. CoordinationCenter for Effects and EMEP/MSC-East. Report 259101015/2005, Bilthoven, ISBN 90-6960-119-2
J Soils Sediments (2010) 10:1572–1584 1583

Spranger T, Hettelingh JP, Slootweg J, Posch M (2008) Modelling andmapping long-term risks due to reactive nitrogen effects. Anoverview of LRTAP convention activities. Environ Pollut154:482–487
Steinnes E, Andersson EM (1991) Atmospheric deposition of mercuryin Norway: temporal and spatial trends. Water Air Soil Pollut56:391–404
Steinnes E, Rühling Å, Lippo H, Mäkinen A (1997) Referencematerial for large-scale metal deposition surveys. Accredit QualAssur 2:243–249
Steinnes E, Berg T, Sjøbakk TE (2003) Temporal and spatial trends inHg deposition monitored by moss analysis. Sci Total Environ304:215–219
Task Force on Health (2007) Health risks of heavy metals from long-range transboundary air pollution.World Health Organization, Bonn
VROM (2007) Heavy metal emissions, depositions, critical loads andexceedances in Europe. In: Hettelingh JP, Sliggers J (eds) DutchMinistry of Housing, Spatial Planning and the Environment,Directorate for Climate Change and Industry
Zechmeister HG, Grodzinska K, Szarek-Lukaszewska G (2003)Bryophytes. In: Markert BA, Breure AM, Zechmeister HG(eds) Bioindicators & biomonitors—principles, concepts andapplications. Elsevier, Amsterdam
Zheng YM, Chen TB, He JZ (2008) Multivariate geostatisticalanalysis of heavy metal in topsoils from Beijing, China. J SoilsSediments 8:51–58
1584 J Soils Sediments (2010) 10:1572–1584