THESE de DOCTORAT D'ETAT
253
THESE de DOCTORAT D'ETAT es Sciences Naturelles présentée à l'Université Pierre et Marie Curie - Paris 6 - par Mireille HEYRAUD pour obtenir le grade de DOCTEUR es SCIENCES Sujet de la thèse: Contribution à l'étude du polonium-210 et du plomb-210 dans les organismes marins et leur environnement soutenue le 29 Juin 1982 devant le jury composé de : M.T.M. BEASLEY M. P. BOUGIS M. R.D. CHERRY M. R. CHESSELET M. S.W. FOWLER M. R NIVAL
-
Upload
khangminh22 -
Category
Documents
-
view
0 -
download
0
Transcript of THESE de DOCTORAT D'ETAT

THESE de DOCTORAT D'ETAT es Sciences Naturelles
présentée
à l'Université Pierre et Marie Curie - Paris 6 -
par Mireille HEYRAUD
pour obtenir le grade de DOCTEUR es SCIENCES
Sujet de la thèse:
Contribution à l'étude du polonium-210 et du plomb-210
dans les organismes marins et leur environnement
soutenue le 29 Juin 1982
devant le jury composé de :
M.T.M. BEASLEY
M. P. BOUGIS
M. R.D. CHERRY
M. R. CHESSELET
M. S.W. FOWLER
M. R NIVAL
Avant-propoû
Je souhaite exprimer toute ma reconnaissance à Monsieur le Professeur ?. BOUGIS pour l'intérêt soutenu qu'il a toujours manifesté au cours de l'élaboration de ae mémoire, m'accordant très généreusement son temps et son aide. Monsieur le Professeur F. BIVAL a bien voulu accepter de faire partie de ce jury . je Ven remercie très vivement.
C'est un plaisir tout particulier cour moi de remercier Monsieur le Professeur B.D. CHERRI sane qui ce travail n'aurait jaunie été entrepria et encore moins achevé. Qu'il trouve ici l'expression de ma tree profanât gratitude pour son enseignement précieux, son inlassable patience et l'aide amicale qu'il m'a toujours accordée.
Monsieur le Professeur T.M. BEASLEI était Directeur du Laboratoire International de Radioactivité Marine de l'Agence Internationale de l'Energie Atomique au moment ou ae travail a été commencé } il m'a incitëeâ l'entreprendre, m'a initiée aus rudimenta de chimie nécessaires pour le mener à bien et m'a toujours témoigné une grande confiance. Je lui adresse mes plus vifs remerciements et suie tree heureuse qu'il ait accepté de faire partie de ce jury malgré Véloignement.
Monsieur Jî. CHESSELET, Directeur de Recherche au CNRS a bien voulu juger ae travail quand il a été achevé, après m'avoir prodigué conseile, encouragements et sympathie au cours de son élaboration qu'il a toujours suivie avec intérêté Je l'en remercie tree sincèrement et j'apprécie le tempe précieux qu'il a au trouver pour moi en dépit de ses activités multiples.
Je voudrais exprimer ici mon amicale reconnaissance 5 Monsieur S.W. FOWLER, Chef du groupe de Biologie du Laboratoire de l'Agence Internationale de l'Energie Atomique, pour avoir accepté de faire partie de ce jury et pour tout ce qu'il m'a appris au cours de nombreuses années de travail en commun.
Certains des résultats présentée dans ce mémoire - l es mesures par spectramétrie a et par absorption atomique- sont dus a l'obligeance de J.J. HIGGO et de J.D. SMITE. Je tiens 3 leur exprimer à tous deux ma très amicale gratitude.
Mes remerciementa vont aussi a S. tf. FOWLEE, J, LA ROSA et S, 5TABESZAIC qui m'ont fourni lea échantillons recueillis dona dea pïèges & e&lùnenta ainsi qu'à X. BUMS et S. .DOt/DLE aûeo qui ont &bû réalisées les manipulations de biochimie.
V Je tiens également à remercier Af. TKEZLtE qui a dactylographié le manuscrit avec un grand soin et J. LA ROSA qui a realist lea figures.
* Enfin j e ne saurais oublier lea Équipages du Xarotneff -rie la Station Zoologique de Villefranéhe- ni ceux de la Phyealie et de la Winaretta Singer -du Muste océanographique de Monaco- que je remercie ds leur aide amicale.

I
SOMMAIRE
Pages
INTRODUCTION 1
CHAPITRE I . 2 1 0 P 0 , Z 1 0 P B DANS L'ENVIRONNEMENT MARIN. ETAT OES CONNAISSANCES ACTUELLES 3
1 .1 . Introduction. Historique. Généralités 3 210
1.1. Découverte du Po 3 1.2. Généralités 3 1.3. L e 2 1 0 P o 4
210 1.4. Premiers travaux sur le comportement biologique du Po.. 4
1.2. Le 2 1 0 P o , 2 1 0 P b dans la mer 5
2 . 1 . Origine du 2 1 0 P b , 2 1 0 P o 5 210 210
2.2. Pb, Po dans la couche superficielle des océans 6 2.3. Temps de résidence du Pb, Po dans la couche superfi
cielle des océans 8 2.4. Conclusion : résumé des principaux points ]g 210 210
1.3. Po, Pb dans les organismes marins. 11 3.1. Les mesures 11 3.2. Les données existantes 11 3.3. Conclusions. Questions qui se posent 13
CHAPITRE II. 2 1 0 P 0 , Z 1 0 P B OANS LE ZOOPLANCTON 15
II. 1. Introduction 15

II
11.2. 2 1 0 P o , 2 1 0 Pb dans le microplancton (/200 iiir) 17
2.1. Le neuston 17
2.2. Z 1 0 Po , 2 I 0 Pb dans le microplancton (/200 un* JCopëpodes.... 18
2.3. Conclusions 21
11.3. Po, Pb dans le macrozooplancton 21
3.1. Choix de Meganyctlphanes norvegica 21
3.2. Z 1 0 P o , 2 1 0 P b chez M. norvegica 22 210
3.3. Concent-ation en Po et Ingestion de nourriture en fonction de la ta i l l e chez ^1. norvegica 23
210 3.4. Localisation du Po chez H. norvegica 26 3.5. Le ' Po dans les contenus gastriques de H. norvegica 26
210 3.6. Le Po dans 1*hépatopancréas de H. norvegica : concen
tration, "turnover time" 30 11.4. Conclusions 36
CHAPITRE III. 2 1 0 P 0 , 2 1 0 P B DANS LA GLANDE DISESTIVE OU HEPATOPANCREAS 38
111.1. Introduction : la glande digestive ou hépatopancréas. 38 210 210
111.2. Po, Pb chez quelques crustacés et mollusques céphalopodes 39
2.1. Crustacés et mollusques céphalopodes pélagiques 40 2.2. Crustacés et mollusques céphalopodes benthiques 42 2.3. Thon 43
111.3. Discussion des résultats 43 3.1. Po, Pb dans les animaLX entiers 43 3.2. 2 1 0 P o , 2 1 0 P b chez les calmars 46 3.3. Facteurs de concentration et hépatopancréas 47
111.4. Conclusions 4g
Ill
CHAPITRE IV. Z 1 0 P 0 , 2 1 0 P B CHEZ LES CREVETTES 51
tV.l. Introduction 51
210 210 IV.Z. Po, Pb chez les crevettes et dans leur hëpatopancréas... 53
2.1. Résultats 53 210
2.2. Discussion des résultats : possibilité d 'ut i l iser le Po comme un traceur biologique naturel 57
2.3. Subdivision des résultats 59 210
2.4. Le Po chez les pénaêidês et les caridés 60
2.5. Effet de la profondeur 62
2.6. Crevettes provenant du Golfe (Koweit) 62
2.7. Crevettes d'estuaires et rivières 63
2.8. Variations saisonnières 64 210
2.9. Les résultats obtenus avec le Pb 6* IV.3. Conclusions 65
CHAPITRE V. 2 1 0 P0 ET AUTRES ELEtŒNTS DANS L 'HËPATOPANCREAS 66
V. l . Introduction 66
210 V.2. Mesures concomitantes du Po et d'autres éléments dans 1'hëpa
topancréas 66 21 n
2.1. Po et autres émetteurs « 66
2.2. 2 1 0 P o , 2 1 0 P b et éléments stables 69
V.3. Métaux et métal loi des dans les hëpatopancréas. 69
3.1. Données de la littérature : FC, FE, Classification 69
3.2. Comparaison des données obtenues dans 1'hëpatopancréas du
calmar Nototodarus gouldi avec les données de la littéra
ture 73
3.3. Discussion sur les éléments du 4e groupe du tableau 31 Po/S ? 75

IV
V.4. Quelques notes trës préliminaires sur l'aspect biochimique de -nrn •
la question du Po dans l'hépatopancréas 76
CHAPITRE VI. BIOGEOCHMIE DU Z 1 0 P 0 , Z 1 0 P B DANS LA COUCHE SUPERFICIELLE
DES OCEANS 7a
V I . 1 . Introduction: les particules dans Veau de mer. 78
1 .1 . Origine, quantité, composition 78
1.2. Les grosses particules : leur importance dans les f lux 79
1.3. 2 1 0 P o , 2 1 0 P b dans les particules 82
1.4. Conclusion 84
VI.?.. 2 1 0 P o , 2 1 0 P b dans le matériel recueilli par des pièges 3 sédi
ments 84
2.1. Le matériel récolté 84
2.2. Résultats et discussion 86
2.3. Conclusion 93
VI.3. R81e des produits particulaires du zooplancton (feces) dans le
transport du '''"po, Pb de la couche de surface vers la pro-
deur 93
3.1. Modèle : 93
3.2. Mesures et résultats 94
3.3. Po, Pb dans les feces du zooplancton 95
3.4. Critiques du modèle u t i l i sé 97
3.5. Concl usion 102
V I .4 . Po, Pb dans la microcouche de surface et Thyponeuston.. m?
4 . 1 . Introduction 102
4.2 . Po, 1 0Pb dans la micrçcouche de surface et Thyponeus
ton 103
4.3. Biomasse et enrichissement de l'eau en Po 107
Protocole expérimental 107
Résultats obtenus 109

V
VI .5• "Bio-transformation" du Po dans l'eau de mer 112
5 . 1 . Matériel u t i l i s é , protocole experimental ] ]2
5.2. Résultats 1 1 3
VI .6 . Résumé et conclusions 119
CHAPITRE V I I . DOSE D'IRRADIATION 121
V I I . 1 . Introduction : brèves généralités sur les rayonnements i o n i
sants 121
1.1. Catégories de rayonnements ionisants 121
1.2. Unités employées en dosimétrie 121
VII.2. Estimation des doses d'irradiation auxquelles sont soumis les
organismes marins : radioactivité naturelle, radioactivité ar
tificielle. 122
2 . 1 . Premières estimations, d'après la radioactivité naturel le . . 122
2.2. Irradiation interne, irradiation externe : sources possibles 122
2.3. Dose absorbée (rad) et équivalent de dose (rem) 123
210 V I I . 3 . Dose d'irradiation interne due au Po 123
3 . 1 . Quelques chiffres 123
3.2. Utilité de telles estimations cornue termes de comparaison.. 124
CONCLUSIONS GENERALES 126
BIBLIOGRAPHIE 129
ANNEX! : PUBLICATIONS DONT L S REFERENCES SUIVENT :
CHERRY, R.D., S.H. FOULER, T.H. BEASLEY and M. HEYRAUD. Polonium-210 :
i ts vertical oceanic transport by zooplankton metabolic act iv i ty .
Mar. Chen., I, 105-110 (1975).
HEYRAUD, M., S.W. FOWLER, T.M. BEASLEY and R.O. CHERRY. Polonium-210 in
euphausiids : a detailed study. Mar. B io l . , 34, 127-136 (1976).

VI
HIGGO, J . J . H. , R.O. CHERRY, N. HEYRAUD and S.W. FOULER. Rapia removal
of plutonium from the oceanic surface layer by zooplankton faecal
pel lets. Nature, 265, 623-624 (1977).
BEASLEY, T.M., H. HEYRAUD, J.J.W. HIGGO, R.D. CHERRY and S.W. FOWLER. 2 1 0 P o and 2 1 0 P b in zooplankton fecal pellets. Mar. B i o l . , 44,
325-328 (1978).
HEYRAUD, M. Food ingestion and digestive transit time in the euphauslid
Heganyctiphanes norvegica as a function of animal size. J . Plankton
Res., 1, 301-311 (1979).
HEYRAUD, H. and R.D. CHERRY. Polonium-210 and lead-210 In marine food
chains. Har. B io l . , 52, 227-236 (1979).
FOWLER, S.W. and H. HEYRAUD. Biologically-transformed zinc and i ts
avai labi l i ty for bioaccumulation by marine organisms. In : Manage
ment of environment. B. Patel , ed. Wiley Eastern Ltd. New Delhi (1980)
HIGGO, J.J.W., R.D. CHERRY, H. HEYRAUD, S.W. FOWLER and T.M. BEASLEY.
Vertical oceanic transport of alpha-radioactive nuclides by zoo-
plankton fecal pellets. In : Natural radiation environment I I I .
T.F. Gesell and W.H. Lowder, eds. U.S. Department of Energy (1980).
CHERRY, R.O. and H. HEYRAUD. Polonium-210 content of marine shrimp :
variation with biological and environmental factors. Mar. B i o l . , 65^
165-175 (1981).
GUARY, J .C . , J.J.W. HIGGO, R.D. CHERRY and M. HEYRAUD. High concentrations
of transuranics and natural radioactive elements in the branchial hearts
of the cephalopod Octopus vulgaris. Mar. Ecol. Prog. Ser . , £ , 123-126
(1SB1}.
CHERRY, R.D. and M. HEYRAUD. Evidence of high natural radiation dose
domains in mid-water oceanic organisms. Science (accepté pour
publication).

UNITES EMPLOYEES
Pour présenter nos résultats, nous avons ut i l isé les unités les plus
communément employées e. radioactivité de préférence â celles du Système
International (SI) encore assez peu répandues.
Dans les échantillons biologiques, les résultats sont donnés en
picocuries (pCi), soit 2,22 désintégrations par minute (dpm) alors que
l 'un i té du SI est le becquerel (Bq), soit 1 désintégration par seconde.
Le facteur de conversion est donc 1 pCi = 3,7 x 10 Bq. Dans le Chapitre
V I , nos résultats sont exprimés en dpm afin de fac i l i te r les comparaisons
avec les autres travaux publiés sur la géochlmie du Pc, Pb.
De même en dosimétrie (Chapitre V I I ) , nous avons u t i l i sé le rad, qui
se dé f in i t ccmtne l'absorption de 100 ergs d'énergie par grainne de matériel,
alors que l 'uni té du SI est le gray (Gy) correspondant a l'absorption de _2
1 joule par kilogramme. Le facteur de conversion est donc 1 rad = 10 Gy.
I N T R O D U C T I O N
L'étude de la radioactivité « dans l'environnement marin, longtemps
négligée, suscite depuis une vingtaine d'années un intérêt croissant.
L'introduction possible en milieu marin dans un avenir proche de quantités 239 240 241
accrues d'émetteurs at a r t i f i c i e l s , tels que le Pu, Pu, Am, due
à l ' intensif ication des programmes nucléaires dans de nombreux pays indus
t r i a l i s é s , donne lieu à des débats souvent passionnés qui ont pr is , depuis
la crise de l'énergie, une importance encore plus grande. Une des préoccupa
tions majeures des détracteurs des programnes électro-nucléaires concerne les
effets pos .t'es 9 long terme des émetteurs et. à demi-vie longue ainsi intro
duits dansle «l l ieu et le risque éventuel de retour i l'homme de ces nuclêides
par l'interméJsaire des chaînes alimentaires. De telles questions méritent
considération et déjà en 1971 dans un important t rava i l , le RIME Report
(Radioactivity in the Marine Environment), 30WEN et a l • (p. 208) ou
TEMPLETO:! et a l . (leurs conclusions) insistaient sur l'Importance d'une
meilleure connaissance des émetteurs « naturels pour fournir un terme de
comparaison si l'on voulait évaluer les effets possibles i long terme des
émetteurs ex a r t i f i c i e l s .
Depuis ,1a revue de CHERRY et SHANNON (1974), ""he Alpha-radioactivity
of marine organisms" a f a i t le point sur cette question, montrant sans ambi-210
guitê possible que parmi les émetteurs of naturels, le Po é t a i t de très
loin le plus Important et constituait la source principale de la dose de
radiation interne reçue par les organismes marins. Cette synthèse évaluait
- 2 -
de façon critique les travaux parus sur cette question, â la fois nombreux
et dispersés, la grande majorité de ces travaux ayant trait S des mesures 210
fai tes dans des organismes entiers, soit du Po, soit d'autres émetteurs».
Outre son aspect pratique, comma terme de référence de la dose de 210
radiation reçue par les organismes marins, la question du Po (et de son 210
précurseur le Pb) présente également un aspect scientifique plus large,
plus "académique" et a déjà f a i t l 'objet en partie ou totalement de quatre
thèses de doctorat d'état (PhO) : celles de BCASLEV (1969), de SW'iNÛN (1970)
ou celles de BACON (1976) e t de BENNINGER ( . 7 6 ) . Ces thèses, de même que 210 210
les publications sur le Po, Pb en milieu marin, envisagent la question
sous deux angles très différents : i l s'agit soit d'une étude systématique
des deux éléments dans les organismes, soit d'une étude des déséquilibres
radioactifs dans l'eau de mer e t da l 'u t i l isat ion de ces déséquilibres comme
traceur de phénomènes gèochimiques.
Notre but ic i est double : tout d'abord, étudier la question sous son
angle biologique, de façon à compléter certaines lacunes que la revue de
CHERRY et SHANNON faisaient apparaître : en particulier des mesures concomi-210
tantes, dans une même espèce, du Po et des autrts émetteurs<* naturels 210
ou a r t i f i c ie ls pour évaluer la contribution du Po à la radioactivité 210
totale de cette espèce ; une étude détaillée du Po et de ses voies 210
d'entrée dans les premiers niveaux trophiques ; une étude du Po non pas
dans des organismes entiers, maïs de sa distribution dans les différents
organes et plus spécialement dans la glande digestive ou hëpatopancrêas.
Dans une deuxième partie e t â part ir de ces études, dont la plupart 210
portent aussi sur le Pb, nous essayerons d'évaluer le rôle de la biologie
dans le devenir du Po, Pb dans la mer : en particulier le rôle des
particules biogêniques (comme les fèces du zooplancton) dans le transpart
vertical des deux éléments ou bien encore le role de neuston -c'est-à-dire
les organismes planctoniques qui vivent dans ou juste au-dessous de la micro-210 210
couche de surface -dans une êvntual le transformation du Po, Pb dès
leur introduction dans le milieu marin. I l nous semble en e f fe t que l'étude
des interactions réversibles organismes/milieu pourra conduire â une meilleure
compréhension de la question qui doit être envisagée dans son ensemble.
f 1
CHAPITRE I . 2 1 0 P 0 , n ° P B DANS L'ENVIRONNEMENT MARIN.
ETAT DES CONNAISSANCES ACTUELLES.

- 3 -
1.1 INTRODUCTION : HISTORIQUE. GENERALITES.
1 .1 . Découverte du polonium.
Le polonium est le premier élément qui a été découvert grâce â des
mesures de radioactivité, e t c'est à Marie CURIE que revient ce grand
mérite. En 1898, au cours d'une Stuck- sur les composés de l'uranium et
du thorium, e l le constate que "deux minéraux d'uranium : la pechblende
(oxyde d'urane) et la chalcolite (phosphate de cuivre et d'uranyle) sont
beaucoup plus actifs que l'uranium lui-même. Ce f a i t est très remarquable
e t porte 5 croire qi>° ces -hêraux peuvent contenir un élément beaucoup
plus actif que l'uranium." (SKLODOWSKA-CURIE, 1898). Au -ours d'un travail
ul tér ieur, e l le montre que l 'un de ces éléments est le polonium, qu'elle
nomme ainsi en souvenir de son pays d'origine. Quelques années plus tard,
en trai tant des tonnes de résidu de minerai d'urane par des méthodes
chimiques classiques, e l l e réussit, avec DEBIERNE, à isoler du polonium à
l ' é ta t très concentré, "sur deux milligrammes de matière environ" et a
mettre en évidence un dégagement d'hélium (CURIE et DEBIERNE, 1910). I l est
vraissamblable que ces 2 mg n'étaient pas du polonium pur, ce qui représen
te ra i t une radioactivité de 10 C i , mais l 'act iv i té n'en é t a i t pas moins
assez considérable, puisque les auteurs, dans ce même t r a v a i l , mentionnent
"Au cours des expériences un curieux effet des rayons a été constaté. Le
polonium étant conservé 3 sec dans une petite capsule de quartz, celle-ci
s'est trouvée fendillée en un grand nombre d'endroits en face de la
substance". Toujours dans ce même ar t ic le , les auteurs indiquent une durée
de 140 jours pour la demi-vie du polonium et i l s prédisent qu ' i l doit
donner du plomb stable.
1,2. SénëraMtés.
Le polonium se rouve dans le groupe Via de la classif ication pério
dique des éléments, en compagnie de l'oxygène, du soufre, du sélénium et
du tel lure. A la différence des autres éléments du groupe, le polonium
ne possède pas d'isotope stable ; par contre, i l existe dans la nature
plusieurs isotopes radioactifs, tous émetteurs* à demi-vie très courte, 210
un seul ayant une demi-vie de plus de quelques minutes, le Po, dernier
produit radioactif de la série de l'uranium.
Dans cette série, on trouve deux autres isotopes du polonium, le
Po, demi-vie 3,1 minutes, énergie « 6,00 Kev et le Po, demi-vie -4
1,6 x 10 secondes, énergie « 7,69 Kev.
- 4
Dans la série du thorium, i l existe deux isotopes du polonium, le
Po, demi-vie 0,15 secondes, énergie» 6,78 Mev et le Po, demi-vie
3,00 x 10 secondes, énergie « 8,78 Mev.
Enfin, dans la série des actinides, on trouve un isotope du polonium, 215 -3
le Po, demi-vie 1,78 x 10 secondes, énergieo< 7,38 Mev.
En olus des isotopes naturels que nous venons de voir, d'autres sont
produits artif iciellement ; i l existe en tout 27 isotopes du polonium de 208 209
masse 192 a 218. Parmi ceux-ci, le Po et le Po sont les plus intéres
sants ; i l s sont obtenus par bombardement du plomb ou du bismuth dans un
cyclotron, i ls ont une demi-vie de 2,9 et 103 ans et une énergie et de 5,11
e t 4,88 Mev, respectivement et sont util isés comme traceurs.
210 Comme nous l'avons déjà noté, le Po est le seul isotope naturel du
polonium ayant une demi-vie assez longue, 138 jours. Sa place dans la série
de l'uranium est la suivante : 2 3 ^ 2 3 4 T h ^ 2 3 4 P a j ^ 3 , U ^ 2 3 0 T h ^ 2 6 R a ^ 2 2 R n ^ 1 8 P o « #
2 W P b ^ 2 l 4 8 i ^ 2 l 4 P o ^ 2 l 0 P b ^ 2 l 0 B 1 ± >
2 l 0 P o « J 0 6 P b (stable) 210
L'énergiem du Po est de 5,31 Mev, son activité spécifique de
4,5 Ci/iïig . Sur une base de poids, c'est l'un des éléments les plus rares ; 210
la concentration en Po du minerai d'uranium est de l 'ordre de 0,1 mg/tonne. ?io
La très haute act ivi té spécifique du Po rend extrêmement d i f f i c i l e le travai l avec des quantités pondérables de cet isotope, ce qui explique
que jusqu'en 1944 (a l'exception du remarquable travail de CURIE et DEBIERNE
déjà d t ê ) toutes les études sur la chimie du polonium ont été faites avec
dïs traces (BAGNALL, 1953). 210
1.4. Premiers travaux sur 1e comportement biologique du Po.
210 Les premiers travaux sur le comportement biologique du Po sont ceux
de LACASSAGNE et LATTES (1924a), qui uti l isent une technique spéciale d'auto-210
historadiographie. I ls injectent du Po à une lapine gravide et six jours
après l ' In ject ion, l'animal est sacrifié et des fragments des différents
organes sont prélevés, f ixés , coupés au microtome. Les coupes sont montées
et colorées, tandis que le restant du bloc à inclusion est appliqué sur une
plaque photographique ; après quelques jours d'exposition, les auteurs ob
tiennent des autoradiographies des organes.
Déjà dans ce premier a r t i c le i l s notent que la f ixat ion du polonium
s'est fai te électivement sur certains organes de "captation, f i l t ra t ion et

- 5 -
élimination des substances étrangères au milieu sanguin" te ls que la
corticale du rein, la rate, les formations lymphoides, l'appendice, le
fo ie . Les clichés montrent en outre une forte concentration en Po au
niveau des vil losités placentaires, par contre presque rien ne passe chez
le foetus.
Cet art icle est suivi d'une série d'autres (LACASSAGNE et LATTES,
1924b, c, d) qui confirment les premières données obtenues, en particulier
la présence de polonium dans tous les organes ou tissus étudiés e t dans
les cellules du système reticuloendothelial plus particulièrement.
I l est assez remarquable, en l isant la revue de KOROZ et PARFENOV 210
(1972) sur "Metabolism and biological effects of Po", de constater que
prés de trente ans se passent, après ces premiers travaux réalisés en 1924,
avant que d'autres études ne soient faites sur le même sujet. Ces études
d'ai l leurs confirment le bien-fondé des premières observations de LACASSAGNE
210
et LATTES sur l'accumulation prépondérante du Po dans le système reticulo
endothelial. En outre, dans leurs conclusions, les auteurs notent que dans
le cas du polonium,.le concept d'"organe critique" n'est pas valable, du
f a i t que cet élément se f ixe dans la plupart des organes et t issus, du f a i t
aussi que l 'atteinte neuro-endocrinienne et vasculaire est très importante,
ce qui est un effet caractéristique du polonium. Pour les différentes raisons
que nous venons brièvement d'évoquer : haute activité spécifique, ubiquité
dans l'organisme, le polonium est extrêmement toxique et la concentration
maximum admissible est deO,03/jC1 pour l'organisme humain (CIPR, 1968), ce qui
correspond à 6,B x 10 g ou 2 xlO atomes. Quelques chiffres cités par
8AGNALL (1963) I l lustrent bien cette haute toxicité : pour l'oxyde de
carbone le niveau admissible dans l ' a i r est de 100 mg/m', pour l 'acide •s 210 -11 "ï
prussique i l est de 10 mg/m , alors que pour le Po i l est de 4 x 10 mg/mJ.
1.2. 2 1 C P 0 , Z 1 0 PB DANS LA MER.
2 . 1 . Origine du 2 1 0 P o , 2 1 ° P b .
Dans la série de l'uranium-238, le radon, gazeux, s'échappe constamment
a part i r de la surface des terres émergées vers l'atmosphère où i l donne
des produits-fils radioactifs, suivant le schéma :
2 2 2 R n * . 2 1 8 P o , , _ 2 1 4 P b , 2 M B 1 6 " V j s J ^ P b * ^ B i J i J ^ P o * 2 0 6 P b 3.Ji ' 2.1' ~T zs-' >.i-f a-»? s,i • l ï î j * Ces produits de f i l i a t i o n , chimiquement réactifs, vont être immédiate
ment associés aux aérosols atmosphériques qui, sous forme sèche ou bien
entraînés par les précipitations (p lu ie , neige), vont retomber a la surface
de la terre . On peut estimer l e temps de résidence des aérosols dans l ' a t
mosphère grâce l la mesure des déséquilibres entre les radio-éléments qui 210 210 210
leur sont associés. Parmi ceux-ci, le " P b , Bi et le Po sont les
plus u t i l i sés , ayant une demi-vie assez longue. Les preniêres mesures qui
ont été faites sont celles de BURTON et STEWART (1960) qui , u t i l isant le 222 210
couple Rn- Pb, calculent un temps de résidence atmosphérique de 1 a 210 210
9 jours pour les aérosols. En u t i l i sant le couple Pb- Po, un temps de résidence d'une vingtaine de jours est estimé et avec le couple z l o p b - Z 1 0 B i , ce temps de résidence est de l'ordre de 5 jours (TUREKIAN
et a l . , 1977). Mime si le temps de résidence des aérosols dans 1'atmosphère
est sujet S discussion, i l est toujours trop court pour que l 'équi l ibre
soit a t te int entre le 2 1 0 P o et l e 2 1 0 P b ; le rapport 2 1 0 P o / Z 1 0 P b dans l'eau 210
de pluie et les particules atmosphériques, sources des retombées de Pb
I la surface des océans, est de l'ordre de 0,1 (BURTON et STEWARD, 1960 ;
LAMBERT et NEZAHI, 1965) et la source principale du 2 1 0 P o dans l'eau de 210
mer sera sa production in situ par décroissance radioactive du Pb. 210
Dans l'eau de surface, le Pb est surtout d'origine atmosphérique, en profondeur 11 est surtout produit par décroissance radioactive du
Ra, par l'intermédiaire du 2 2 2 R n . 210
Le flux de Pb retombant à la surface de la terre n'est pas uniforme,
comme le montrent les différentes données groupées par TUREKIAN et al_;_ (1977).
I I existe des variations avec la la t i tu te (hémisphère Nord, hémisphère Sud),
avec la longitude, les valeurs les plus élevées se rencontrant à l 'est du
continent asiatique- de Tordre de 2 dpra (désintégrations par minute)/airvan
(FUKUDA et TSUNOGAI, 1975), alors qu'en Europe occidentale ce f lux est de
0,5 i 0,7 dpm/cm2/an, soit 16 à 22 atomes/min/cm2 (LAKBERT et NEZAMI, 1965 ;
PEIRSON et al.,1966) les retombées "sèches" représentant environ la moitié
des retombées totales (TUREKIAN et a]_., 1977).
210 210 2.2 . Po, Pb dans la couche superficielle des océans.
Les premières mesures du Pb dans T>au de mer sont celles de RAMA
et al_. (1961) qui notent que la concentration trouvée dans l'eau de surface,
0,12 dpm/1, est inférieure à la concentration calculée, 1,6 dpm/1, d'après
les retombées atmosphériques du Pb et sa production in s i tu à part ir Ju
Ra. Pour estimer le flux atmosphérique du 2 1 0 P b , ces auteurs ut i l isent 222
un flux de Rn de 42 at/min/cm? de terres émergées ce qui correspond i des 210
retombées de Pb de 42/3 (les terres émergées représentant environ 1/3 de
la surface totale de la t e r r e ) , soit 14 at/min/cm'. Cette valeur théorique 210
est proche de la valeur obtenue en mesurant le Pb dans l'eau de pluie, 7 ?
5 dpm/1 en moyenne soit 8 x 10 a t / 1 , ce qui correspond â 15 at/min/cm
si on considère que les précipitations annuelles sont de 1 m. Un te l flux
de 15 at/min/cm va résulter en une addition de 0,05 dpm/l/an dans l'eau
de mer de la couche superficiel le (100 m de profondeur) â laquelle i l faut
ajouter la production In situ & par t i r du Ra, 0,003 dpm/l/an (en 226 14
prenant une concentration de Ra de 4 à 5 x 10 g/1) . S ' i l n'y a pas de
transfert entre la couche superficiel le et la profondeur, on doit trouver
une concentration en 2 1 0 P b de l'eau de surface de (0,05 + 0,003)/0,032 »l,6dpm/l.
La deuxième constatation que font les auteurs est qu' i l existe une 210
concentration en Pb en profondeur supérieure S c e l l , trouvée en surface 210
et i l s calculent un temps de résidence du Pb dans la couche superfic ie l le de 2 ans environ, dû au f a i t que le plomb est enlevé de cette couche par suite de son association â des particules d'origine biogénique.
210 210 Le premier travail important et détail lé sur le Po P Î le Pb
dans l'eau de mer est celui de SHANNON et a l . (1970) dam; l'hémisphère ~"~ ~~ 210
Sud, qui trouvent une concentration moyenne de 0,084 jpm/l pour le Pb 210
et une concentration de 0,044 dpm/1 pour le PJ . Uti l isant ces valeurs j
mesurées et un apport atmosphérique de 5 at/min/cm (11 s 'agi t de l'hémisphère Sud et la superficie des terres émergées est environ 1/3 de celle de l'hémisphère Nord) et une production in situ de 0,067 at/min/1 â par t i r du Ra, 11s calculent un temps de résidence dans la couche super
f l u 210 f i c i e l l e de 5 ans pour le Pb et de 0,6 an pour le Po. C'est aussi dans ce œsmc art icle que sont données les premières concentratirms â la
210 210 fois du Po et du Pb publiées dans le phytoplancton et le zooplancton, qui montrent des concentrations en polonium toujours plus hautes que celles
210 210 du plomb, les rapports Po/ Pb étant d'environ 3 pour le phytoplancton et 12 pour le zooplancton.
Depuis ces premiers art ic les (RAMA et a^., 1961 ; SHANNON et al_., 1970)
et plus particulièrement pendant ces dernières années, les travaux sur le 210 210
Pb, Po dans l'eau de mer se sont multipliés et nous allons essayer de voir quels sont les principaux points qui s'en dégagent.
210 210
1) Po et Pb ne sont pas er. équilibre dans l'eau de mer, le
rapport Po/Pb dans la couche superficielle étant toujours inférieur â 1,
le plus souvent voisin de 0,5-0,6 (SHANNON et al_. • 1970 ; BACON at_al_-,
1976 -, NOZAKI et a l . , 1976 ; NOZAKI e t TSUNOGAI, 1976.)

210 2) Bien que des activités dues aux retombées du Pb atmosphérique
(ne provenant pas de la décroissance in situ du Ra) soient décelables
jusqu'à une profondeur de 500 m au moins (BACON et aj_., 19/6) , les concen-210
trations en Pb dans la couche superficielle sont toujours inférieures
aux valeurs théoriques que Ton devrait y trouver si le plomb demeurait
sous forme soluble. Pour expliquer cet appauvrissement, une association 210
du Pb avec des particules sédimentant rapidement hors de cette couche est invoquée (RAMA et a l • , 1961) ; un phénomène analogue se passe pour le 2 1 0 P o , encore plus prononcé (SHANNON et a l . . , 1970 ; TUREKIAN et al_., 1974 ;
KHARKAR et a U , 1976 ; NOZAKI e t TSUNOGAI, 1976 ; NOZAKI e t al_., 1976 ;
iHOMSON et TUREKIAN, 1976).
2.3. Temps de résidence du Po, Pb dans la couche superficielle
des océans.
Si l'on considère que les océans sont constitués de deux compartiments :
une couche superficielle de 100 m environ (UHL ou upper mixed layer des
auteurs anglosaxons) bien mélangée où se trouve concentrée la plus grande
partie de l 'act iv i té biologique et une couche profonde, on doit avoir, S
l 'équi l ibre , dans la couche de surface :
(1) = x Pb NPb + KPb NPb (2)
2Î0 210 222
00 Po, Pb, Rn sont le Po, Pb, Rn ; X leurs constantes radioactives ;
1 l'apport atmosphérique, N ies concentrations (en atomes) e t K la probabilité
par unité de temps qu'un atome a de disparaître de cette couche superficielle
par n'Importe quel processus autre que la décroissance radioactive. 210
L'apport atmosphérique du Po pouvant être considéré comme négligeable, 210 210
une mesure des activités en Po, Pb de l'eau de mer permet de connaître Po 210
Rs = i r ^ e t de calculert p „ , l e temps de résidence du Po, qui se Pb „
1 Pn R #3\ déf in i t comme ^ • u / ? M , soit T p = - j S • l '
KPo APbNPb *PoNPo n *Po ( 1 ~ R s > 2in
Le temps de résidence du Po dans la couche superficielle est de
l 'ordre de 0,6 an, valeur trouvée par la plupart des auteurs (SHANNON
et a l . , 1970 ; BACON et a l . , 1976 ; NOZAKI et TSUNOGAI, 1976 -, NOZAKI
et al., 1976). ~~ 210
Les valeurs trouvées pour le temps de résidence du Pb, varient, lar contre, beaucoup plus : 2 ans (RAMA et al_., 1961), 5 ans (SHANNON et al-.

1970), 0,6 â 1,7 an (NOZAKI et a K , 1976), 0,5 a 1 an (NOZAKI et TSUN0GAI,
1976), 2,5 ans (BACON et al_., 1976).
Ces variations importantes sont en nrande partie le r e f l e t de l ' incer-210
titude associée au terme Ipi, , c'est-â-dire l'apport atmosphérique du Pb.
Comme nous l'avons déjà noté, cet apport atmosphérique varie suivant
les conditions géographiques, atmosphériques, e t c . . (Turekian et a l . ,
1977). Afin de tourner la d i f f i c u l t é , TUREKIAN et a l . (1974) ont proposé 210
d 'u t i l i ser l'équation (2) pour calculer i D h . En supposant que Po et 210
Pb sont enlevés de la couche superficiel le, transportés par les mêmes particules, le rapport d = - Ï 5 va être l i é aux facteurs de concentration
210 210 ^rb du Po, Pb dans ces particules. Util isant le plancton comme "particule"
210 210 transportant le Po, Pb et les activités dans l'eau de mer correspondantes, i l s uti l isent pourt* une valeur moyenne de 20 et calculent ainsi un
210 2 2 f lux atmosphérique de Pb de 0,05 dpm/cm /an (1,6 at/min/cm ) dans le Pacifique Ouest ; 0,1 dpm/cnrVan (3,2 at/min/cm) dans l 'Atlantique Sud et
2 ? 0,076 dpm/cm /an (2 , * at/min/cn ) dans la mer des Caraïbes. Ces apports atmosphériques correspondent S des temps de résidence de 24, 9,4 et 2C ans
210 210
respectivement pour le Pb et 1,2, 0,4 et 1 an pour le Po. Comparés
aux temps de résidence habituellement calculés, ces temps sont trop longs.
Dans un travail ultérieur, KHARKAR et aj_. (1976), les auteurs concluent
que les particules transportant le Po et le Pb ne peuvent pas être
le zooplancton où le rapport Po/Pb est en moyenne de 20, beaucoup trop haut.
NOZAKI et al_. (1976) mesurant la distribution du 2 1 0 P o , Z 1 0 P b dans les
eaux de surface du Pacifique Nord, le long d'une radiale a l lant de Tokyo à
San Diego trouvent dans le centre du Pacifique un temps de résidence de 1,7 an 210 210
pour le Pb et de 0,6 an pour l e Po. Ces temps de résidence, que l'on peut calculer d'après leurs données, sont beaucoup plus courts le long des
210 cStes 00 la concentration en particules augmente (<u 0,6 an pour le Pb, m 0,2 an pour le Z 1 0 P o ) .
THOMSON et TUREKIAN (1976) notent que les déséquilibres Z 1 0 P b / Z Z 6 R a et 210 210
Po/ Pb dans le Pacifique Sud sont beaucoup plus marqués 3 une station
située dans une zone d'upwelling a très haute productivité qu'en dehors de
cette zone.
Enfin, un important a r t ic le de BACON et a l . (1976) rapporte un grand 210 210
nombre de mesures du Po, Pb dissous et particulaires (> 0,4 /m) dans l'Atlantique Tropical Nord d'oO i l ressort un certain nombre de points
210 importants : (1) dans les cent premers mètres i l existe un déf ic i t du Po

- 10 -
210 par rapport au Pb ; (2) les particules, par contre, sont enrichies
210 en Po (rapport Po/Pt-2) ; (3) entre 100 et 300 mètres i l existe un
enrichissement en .?o dissous, environ 67 % du Po particulaire étant 210
"recyclé" alors que la proportion correspondante de Pb n'est que de
5 ï ;(!) leurs données permettent aux auteurs de calculer un temps de rési -210
dence du Po dissous de 0,6 an dans la couche superficielle et de 2,5 210
anr pour le Pb.
En profondeur, les temps de résidence, plus incertains, sont beaucoup
plus longs : de Tordre de 100 ans pour le Pb, 2 ans pour le Po
(THOMSON et TUREKIAN, 1976), ou bien 20-95 ans pour le Z 1 0 P b , environ 4 ans 210 210
pour le Po (BACON et aj_. 1976) ou bien encore, pour le " Pb, 96 ans
(NOZAKI et TSUNOGAI, 1976) e t les modèles proposés pour l i e r les temps de
résidence de ces deux nucléides à leur association à des petites particules
(retenues sur les f i l t r e s de 0,4 jjm) ne sont pas satisfaisants, la vitesse
de sédimentation de ces petites particules étant beaucoup trop lente pour
expliquer les transferts.
2.4. Conclusions. Résumé des points principaux.
210 210 Toutes les données sur le Po, Pb dans la couche de surface suggèrent
l'importance de l'association de ces nucléides avec la phas: particulaire
dans l'eau de mer, association qui va déterminer leur temps de résidence. 210
Ces temps de résidence ne sont pas les mêmes pour le Po (0,6 an environ) 210
que pour le Pb (autour de 2 ans) e t s ' i l existe presque toujours un 210 210
déf ic i t du Po dissous par rapport au Pb, les particules, par contre, ont un rapport Po/Pb supérieur â 1 , voisin de 2.
I l est d'ailleurs Intéressant de considérer l'évolution du rapport 210 210
Po/ Pb 5 partir de l ' introduction des deux élémentsidans la mer : i l
est d'environ 0,1 dans l'eau de pluie ; 0,5 dans l'eau de mer ; 2 dans les
particules ; 3 dans le phytoplancton ; 20 dans le zooplancton. Ce sont
évidemment des valeurs moyennes qui n'en sont pas moins assez significatives. 210 22fi
Ceci, jo int au f a i t que les déséquilibres observés entre le Pb/ Ra et le P o / P b dans l'eau sont d'autant plus marqués que la productivité
est plus élevée, nous amène à considérer untenant l'aspect biologique de
la question.

11 -
1.3. 2 1 0 P 0 ,
3 . 1 . Les mesures.
Le polonium, en solution acide, possède la propriété particulière de
se déposer spontanément sur une f e u i l l e d'argent (CURIE, 1925, citée dans
CURIE et JOLIOT, 1931). Les détails de la technique étant donnés par
a i l l eurs , nous nous bornerons donc i c i à en évoquer les grandes lignes. 210
Pour analyser le Po dans les échantillons biologiques, i l suf f i t
de les minéraliser par un traitement par l'acide nitrique-perchlorique
suivi d'acide chlorhydrique & chaud et de les mettre en solution dans de
l 'acide chlorhydrique de normalité vojlue dans laquelle on suspend un
disque d'argent (MILLARD, 1963). Le temps de déposition, la température î
laquelle on opère, 1a normalité de l 'acide chlorhydrique varient quelque
peu suivant les auteurs, mais quels que soient les détai ls, après quelques
heures, essentiellement tout l e polonium se trouve déposé sur le disque d'Ag
dont l ' ac t iv i té peut alors être mesurée par comptage <rt total en ut i l isant
comme scinti l lateur le ZnS (Ag) (HALLDEN et HARLEY, 1960). Les béchers dans
lesquels se trouve la solution de déposition sont gardés quelques mois, 210
temps au bout duquel le Pb présent à l'origine dans l 'échantil lon a 210
donné du Po, qui est déposé dans les mêmes conditions que précédemment
e t compté ; un calcul simple permet de connaître les quantités des deux
nuclei des dans l'échantillon au moment où i l a été récolté. La technique
est simple, rapide, f iable ; e l l e ne nécessite aucune séparation chimique
compliquée et son rendement est de 98 - 2 t .
3 ,2. Les données existantes.
Pratiquement toutes les références ayant t ra i t aux données publiées
sur les concentrations en Po (et Pb) dans les organismes marins sont
contenues dans la revue de CHERRY et SHANNON (1974) "The Alpha-Radioactivity
of marine organisms". Elles sont nombreuses, parues dans un laps de temps
assez court, une dizaine d'années, puisque les premières mesures sont celles
de CHERRY (1364) dans le plancton. Nous allons essayer de classer ces données
sous un certain nombre de rubriques pour dégager une idée générale cohérente
de la question, voir quels sont les points les plus importants et ceux qui
nécessitent l'acquisition de données complémentaires. Pour ce- fa i re , nous
ferons de très larges emprunts â la revue précitée ajoutant les quelques
résultats parus depuis 1974.

- 12 -
- Dans tous les échantillons biologiques ou Po, Pb ont été
analysés, le rapport Po/Pb est supérieur à l 'unité, indiquant une accumu-210
lation sélective du • Po, puisque le rapport Po/Pb dans l'eau de mer
est de l'ordre de 0,5. Ce fait avait déjà été noté par CHERRY (1964) faisant les premières mesures dans un échantillon de plancton. A notre
connaissance, 11 n'existe qu'une exception à cette régie, cel le citée par
F0L50H et BEASLEY (1973) où dans l a partie intern» de l'algue géante
Pélagophycus porra ce rapport est de 0,02-0,03.
- Les mesures dans le phytoplancton sont très peu nombreuses
(SHANNON et a l . , 1970 ; SHANNON e t CHERRY, 1967 ; FOLSOM et BEASLEY,
1973 ; BENNET et CARPENTER, 1979) e t parmi ces données, celles de
FOLSOM et BEASLEY ont été obtenues dans des conditions un peu particulières :
i l s ont analysé un échantillon constitué principalement de dinoflagellés
provenant d'une "marée rouge" e t trouvé une concentration extrêmement 2ÎD
faible en Po, moins de 0,10 pCi/kg de poids f ra is , alors que les valeurs
trouvées par les autres auteurs sont beaucoup plus élevées, entre 40 et ?in ?in
170 pCi/kg de poids f ra is . Le rapport P o / P b dans le phytoplancton
est de l'ordre de 3.
- Pratiquement toutes les mesures faites dans le zooplancton l 'ont été
sur des animaux entiers (MARSOEN, 1964 ; HILL, 1965 ; H0LT2MAN, 1969 ;
SHANNON et al_., 1970 ; SHANNON et CHERRY, 1969 ; SCHELL et al_., 1973 ;
FOLSOM et BEASLEY, 1973 ; TUREKIAN et a K , 1974 i KHARKAR et al_., 1976)
et les valeurs obtenues varient entre 80 et 3000 pCi/kg de poids f r a i s ,
avec une valeur "typique" de 400 pCi/kg (CHERRY et SHANNON, 1974). Une
seule valeur existe pour la "mîisa viscérale" d'un organisme plane tonique
où HOFFMAN et aj_. (1974) rapportent une concentration de 3200 pCi/kg de
poids f ra is chez un euphausiacê.
Les concentrations en z l 0 P o sont donc plus hautes dans le zooplancton
que dans le phytoplancton et le rapport Po/Pb y est très nettement supérieur.
Ce rapport est de l'ordre de 10 dans les échantillons de zooplancton péché
dans les régions près des continents, de 20 a 30 au centre des océans.
- Chez les autres invertébrés, on trouve aussi de hautes concentrations 210
en Po, plus particulièrement dans les viscères et surtout dans un organe
que possèdent les crustacés et les mollusques, l'hépatopancréas. L'hèpato-
pancrL s est une glande annexe du tube digestif qui a de nombreuses fonctions
(sécrétion enzymatique, absorption, excrétion) sur laquelle nous reviendrons
în détail par la suite. Dans cet organe, les concentrations crouvëes par

- 13 -
CHERRY et al_. (1970) chez la langouste, par BEASLEÏ et i l - (U73) chez une
espèce de crevette, par FOLSOM et a K (1974) chez l'ormeau et l e l ièvre
de mer varient de 1300 â 30 OOu pCi/kg de poids f ra is . C'est une gamme
qui semble très étendue, en f a i t i l est intéressant de noter que les
valeurs les plus élevées se trouvent chez les deux crustacés analysés,
alors que les valeurs les plus basses se rencontrent chez les deux
mollusques, tous deux herbivores.
Seuls BEASLEY et a l . ont mesuré le Pb dans leur échantillon
d'hépatopancrêas, le rapport Po/ Pb est de 70.
- Chez les vertébrés, enfin, poissons et mammifères, les concentrations 210
en Po sont là aussi élevées, avec des variations importantes suivant
les organes ou tissus analysés. La plus notable de ces variations est la
concentration extrêmement haute trouvée par FOLSOH et al_. (1973) dans le
caecum pylori que de thon, de l 'ordre de 30 000 pCi/kg de poids f r a i s .
Un récent art icle de PENTREATH et aU (1979) f a i t apparaître une
très nette différence qui semble exister entre les poissons osseux et les 210
poissons cartilagineux, ces derniers ayant des concer.traticis en Po
environ 10 fois plus basses que les téléostéens. 210 210
Chez les poissons, le rapport Po/ Pb est du même ordre que chez
les invertébrés, de 10 â 30 environ.
3.3. Conclusions. Questions gui se posent.
210 Ces hautes concentrations en Po trouvées dans tous les organismes
marins, déjà assez remarquables en elles-mêmes, le deviennent encore
davantage si l'on considère le nombre d'atomes que les animaux ont à leur
disposition dans l'eau de mer. Une concentration moyenne de 25 x 10" pCi/1 210
correspond i 16 atomes de Po/ml, 100 fois moins que le nombre d'atomes 210
de Pb dans un volume identique. Or, nous l'avons vu, les rapports d 'act i
vi té Po/Pb dan; les animaux sont de 10 à 70, ce qui correspond, en atomes, 210
à des rapports dt 600 i 4000. Cette accumulation préférentielle du Po 210
par rapport au Pb par les organismes est vraie aussi par rapport à tous les autres émetteurs « naturels ou a r t i f i c ie ls contenus dans l 'eau de mer,
comme en témoigne le tableau des facteurs de concentration trouvés dans le
zooplancton ou les muscles de poissons présenté dans la revue de CHERRY et 210
SHANNON (1974). Les facteurs de concentration du Pa sont supérieurs d'un
à deux ordres de grandeur à ceux du 2 Z 6 R a , Z 3 0 T h , Z Z B T h , 2 3 8 U , 2 3 9 P u ;
seul le facteur de concentration du Th dans le zooplancton est du même

- 14 -
ordre, mais i l s'agit d'échantillons différents. La plupart des données
contenues dans la revue précitée ont d'ailleurs été obtenues dans des
endroits géographiques différents ou dans des espaces différentes.
On peut se demander quelles sont les raisons d'une te l l e sélect ivi té 210
dans l'accumulation du Po et pour essayer de répondre 3 cette question,
i l est souhaitable et nécessaire d'acquérir des données plus nombreuses
et surtout plus détaillées dans les premiers maillons de la chaîne alimen
ta i re en part icul ier , c'est-â-dire dans le zooplancton. I l serait bon non 210
seulement ds connaître, dans une même espèce, les concentrations en Po
et de les comparer 3 celles des autres émetteurs « mesurés en même temps,
mais encore, toujours dans cette même espèce, de voir si la localisation
des différents nuclêides est la même. Cela pourrait ainsi donner une idée 210
de la voie d'entrée du Pc et d 'établ i r si e l le est la même que pour les
autres éléments.
Une autre question qui mérite l 'attention est celle des concentrations
extrêmes trouvées dans certains organes, en particulier l'hépatopancrëas pin
des crustacés. Les deux mesures de Po connues -une chez la crevette, une
chez la langouste- sont-elles la régie ou l'exception ? Est-ce une particu
l a r i t é des crustacés, ou bien est-ce un phénomène général dans l'hépatopan
crëas ? Dans ce dernier cas, quel en est le mécanisme et quelles en sont
les implications en terme de dose de radiation reçue par l'organe, par les
cellules ? Est-ce qu'un tel phénomène s'applique aux autres émetteurs* su 210
bien e s t - i l particulier au Po, qu'en es t - i l des autres éléments ? De tel les concentrations dans les matériaux biologiques doivent nêces-
210 sairement se ref léter dans le cycle gëochimique du Po. I l serai t intéressant de connaître quels sont les effets que de telles concentrations peuvent
710 avoir sur le temps de résidence du Po dans la couche superficiel le ; des
210 210 mesures simultanées du Po, Pb dans les produits par t icu la tes du zooplancton devraient permettre de mieux comprendre l'importance du paramètre
210 biologique dans la gêochimie des deux éléments. De même, une étude du Po, 210
Pb dans la microcoucha de surface, à l ' inter-face air-eau, e t dans le
neuston peut contribuer 3 une meilleure compréhension des tout premiers méca
nismes qui interviennent dans la transformation et le transport des deux
éléments dans la colonne d'eau.
f
CHAPITRE II. " U P 0 ET ""PB DANS LE ZnOPLAMCTON.
15 -
I I . 1 . IKTROBUCTION.
On désigne sous le terme très général de plancton l'ensemble des organismes pélagiques végétaux ou animaux qui sont entrainés par les mouvements des masses d'eau, par opposition au nectnn capable de nager vigoureusement.
Le plancton végétal, ou phytoplancton, est autotrophe, c 'est-à-dire qu'il est capable de fabriquer sa propre substance à partir de l'eau et du C02, en présence de lumière. Pour cette raison, sa distribution en profondeur dans la mer est limitée aux quelques mètres superficiels où es t concentrée toute la production primaire. Il n'en est pas de même du zoo-plancton, ou plancton animal, qui lui est hêtêrotrophe et se nourrit de substance organique déjà synthétisée, so i t par f i l t rat ion de particules -cellules du phytoplancton ou autres - so i t par prédation. Le zooplattcton est constitué de très nombreuses espèces animales, pratiquement tous les phylums sont représentés dans le plancton so i t temporairement soi t en permanence, e t une classification doit plus ou moins être faite suivant la t a i l l e des organismes. Ainsi, peut-on distinguer (BOUGIS, 1974) le microzooplancton = <200jum
le pet i t mësoplancton = entre 200 fjm e t 10 mm récolté sur tissu à maille de 200 jm.
le grand mësoplancton = récolté sur t issus à maille de 1 mm le macrozooplancton = de 2 à 10 cm, récolté en même temps que le necton.
En ce qui nous concerne, nous serons plus spécialement intéressés
ici par le pe t i t mêsoplancton que pour des raisons pratiques nous appellerons "m1croplancton"/200 juin, constitué en très grande majorité de copépodes, récolté avec des f i le ts a plancton de 200/jm environ de vide de maille, par opposition au "macroplancton" constitué essentiellement par les eunhausiacés e t les crevettes pélagiques, récoltés avec le chalut pélagique IKMT (Isaacs-Kidd mid water trawl).
Les copépodes en effet représentent la majorité de la biomasse (+ de 50 %) dans les eaux de surface (VINOGRADOV, 1970) et , parmi le macroplancton, les euphausiacés constituent aussi une part importante (~10 %) de cette blomasse (FRANQUEVILLE, 1970), de plus les longues migrations verticales journalières qu'effectuent ces derniers les rendent particulièrement
Intéressants canne vecteurs potentiels d'éléments introduits a la surface ?in 210
des océans. C'est le cas en particulier du Po et du Pb puisque, comme
- 16 -
210 nous l'avons déjà mentionné, dans la couche superficielle le Pb est surtout d'origine atmosphérique et le Po provient de la décroissance
210 radioactive de ce Pb. Une autre catégorie de plancton est à ce t i t re particulièrement digne
d'intérêt , c'est le neuston qui v i t dans les quelques premiers centimètres
de la couche superficielle des océans, où sa biomasse est importante
(ZAITSEV, 1971).
Si 1"on veut essayer de comprendre les interactions du Po, Pb
aves les organismes marins, i l semble indispensable de commencer par
examiner ce qui se passe à ce niveau, et c'est ce que nous nous proposons
ae faire dans ce chapitre.
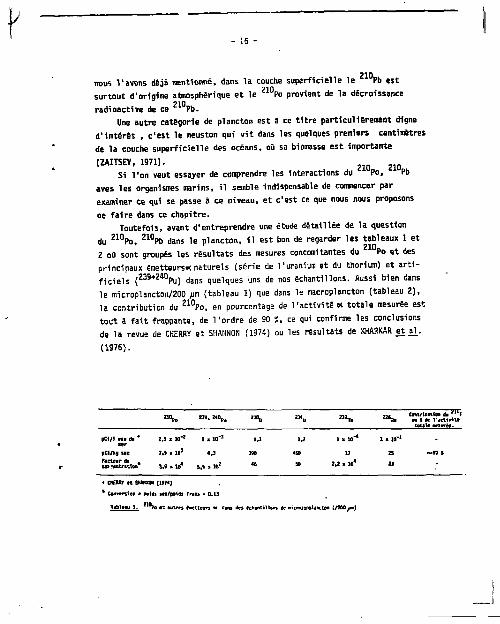
Toutefois, avant d'entreprendre une étude détaillée de la question du Z 1 0 Po, 2 1 0Pb dans le plancton, i l est bon de regarder les tableaux 1 et 2 où sont groupés les résultats des mesures concomitantes du Po et des principaux émetteurs* naturel s (série de l'uranium et du thorium) et a r t i f ic ie ls ( Z 3 9 + Z ' l 0 Pu) dans quelques uns de nos échantillons. Aussi bien dans le microplancton/200 jum (tableau 1) que dans le macroplancton (tableau 2), la contribution du Z 1 0 Po, en pourcentage de l ' ac t i v i té» totale mesurée est tout é f a i t frappante, de l'ordre de 90 S, ce qui confirme les conclusions de la revue de CHERRY et SHANNON (1974) ou les résultats de KHARKAR et al_. (1976).
^ _ _ _ _ total* myrte.
P « / 1 H I I de * 2.S x M " ' 1 x 10~ 3 1.1 1 J 1 » 10" 4 1 x 10" 1
K r pCf/kg n e 7.5 * 10 3 4.3 390 *W 1? 25 ~9D S
SfSmW 3.9 * 1D« 5.G » 10* * M W » M* 33
4 OffBRï t t SHJUCtSN (197*)
* Conversion » poids sic/poids frais - 0.13
•s autre* taet lewi *t Cans des Echantillons 0e ci cnuso?! ancien (y îM^n)

- 17 -
^ P o ««f t , 2»u »*0 " 2 T h S 6 t e
Contribution flu *' Pn en t de Vutttfiu tauli murte.
pCI/1 can « * 2,5 x ID* 2 . i . i r » 1,1 1.2 l . l t f 4 1 « 10*1 -pCi/ig sec 1,1 * ID 3 0.7 U 27 0J 31 rJ 50 1
F*tUur Ot CMUntraticn 9.4 • ID 3 1,5 « W2 5 *.7 6,« s 10* 66 " • CHCHflT «t SHUNNCH (1974)
i CantersIon • a r i « sec/prfds frais • 0.21
Tioleju Z. 21°Fo et iiitrcs tmitteurs «{ d i l l HtoinvctiDha el narvegfca.
II.2. 2 1 0 P 0 , Z 1 0PB DAMS LE MICR0PLAWCT0N (/ZOO MICRONS)
2.1. Le neuston.
210 210 Des mesures concomitantes de Po, Pb dans la microcouche de
surface, prélevée i l 'a ide d'un tamis de Garett, l'eau de sous-surface
( ZO cm environ) e t l e neuston ont été faites pendant plus d'un an et
quelques uns des résultats obtenus sont résumés dans le tableau 3 , où 210 Z 10
sont présentées les concentrations en Po, ?b mesurées dans l e
neuston. Les résultats dans leur ensemble seront discutis par a i l l eurs ,
dans l a 2e partie de ce t ravai l (chapitre V I ) .
L'espèce la plus abondante e t la plus fréquemment rencontrée dans
nos échantillons est Anomalocera patersoni , un copépode d'assez grande
t a i l l e (1-Z mm), de couleur bleu sombre ; nous avons indiqué dans l e
tableau 3, outre les Anomalocera, les composantes principales de nos
échantillons. Les concentrations mesurées varient beaucoup, de 0,9 i
24 pCi/g pour le 2 l 0 P o , de 0,0Z S 2,5 pour le 2 1 0 P b , avec un rapport 210 210
Po/ Pb toujours supérieur 3 l ' un i té , pouvant a l ler de 2 3 100 suivant
les échantillons. Ces deux rapports "extrêmes" sont obtenus dans deux cas
part icul iers : le rapport 2 correspond 3 une concentration en Pb re la
tivement élevée de 2,5 pCi/g mesurée chez des insectes (non ident i f iés)
récoltés en grande quantité dans l'un de nos échantillons et le rapport
104 a été trouvé chez un siphonophore. D'une façon générale, les Anonta-
locera semblent avoir les concentrations en Po les plus hautes, même
si el les sont variables et les oeufs et larves les concentrations les
plus basses.
- 18 -
Date des pèches
Echantillon compose en majorité de
Z M p D *'°Pb Rapport
Po/Pb
25.2,1930 Copépodes. amphlpo-des, larves de poissons
12,7 - 0,7 2,2 i 0,1 6
24.4.1990 Copépodes, salpes, oeufs. Anomal ocera patersoni
Liononapnore {1 Individu)
0.9B - C O S
7.6 - O.S
2,1 - 0,2
0,02 t 0,01
0,26 - 0,05
0,02 t 0,01
49
29
104
3.5.19B0 Larves, oeufs 3,0 î 0.Z- 0,24 î 0,05 13
7.7.1980
1.8.1980
Anomalocera
patersoni
Anomalocera
17,8 t 0,4
9,9 • 0,3
0,20 • 0,02
0,16 t Q,Q2
09
55
2S.B.19E0 Anomalocara oatersoni insectes
10,3 t 0,5
6,1 - 0,9
D.3B t 0,05
2.5 - 1,2
27
2
29.9.1980 Anomalocera natersoni
6,B - 0,5 0,30 • 0,1Z 23
6.4.1991 Anamalocera (pur] oatersgni ~" Keste ou neustsn (Siphonophores.oeufs) o.as î o.os
0,5 - 0,2
0,03 - 0,02
39
26
9.S.19B1 Anamalocera patersoni «esce ou neuston
4,9 - 0,3
2,8 - 0,2
0,22 t 0,02
0,16 i 0,07
22
17
9.7.1981 Anomalocera patersoni
13,2 î 0,5
7,6 t 0,5
0,5 ï 0,2
0,4 - 0,2
25
Isopoûls
13,2 î 0,5
7,6 t 0,5
0,5 ï 0,2
0,4 - 0,2 22
Tableau 3 Po, w P b dans des êchar liions oa neuston (pCI/g sec.
- 1 écart-type)
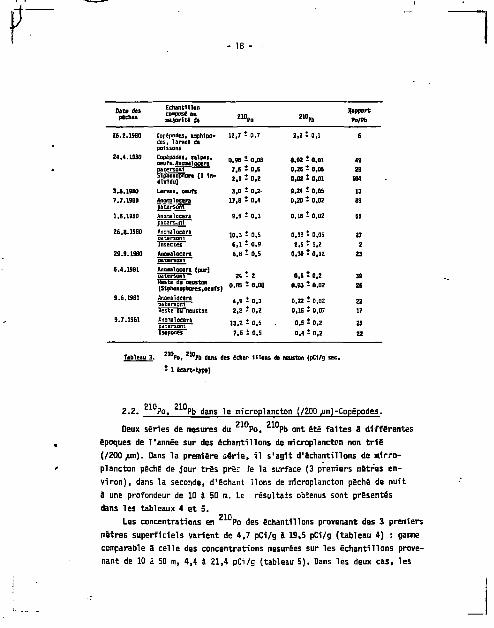
pin 210 Z.2. " Po, " u P b dans le nil crop! ancton (/200 .um) -Copépodes.
210 210 Deux séries de mesures du Po, Pb ont été faites 3 différentes
époques de l'année sur des échantillons de nricroplancton non t r i é (/Z00/um). Dans la première série, 11 s'agit d'échantillons de mlrro-plancton pêche de jour très prêr le la surface (3 premiers mètres environ), dans la seconde, d'échant lions de microplancton péché de nuit â une profondeur de 10 3 50 m. LE résultats obtenus sont présentés dans les tableaux 4 et 5.
210 Les concentrations en Po des échantillons provenant des 3 premiers mètres superficiels varient de 4,7 pC1/g â 19,5 pCi/g (tableau 4) : gamme ccmparabie â celle des concentrations mesurées sur les échantillons provenant de 10 â 50 m, 4,4 I 21,4 pCi/g (tableau 5). Dans les deux cas, les
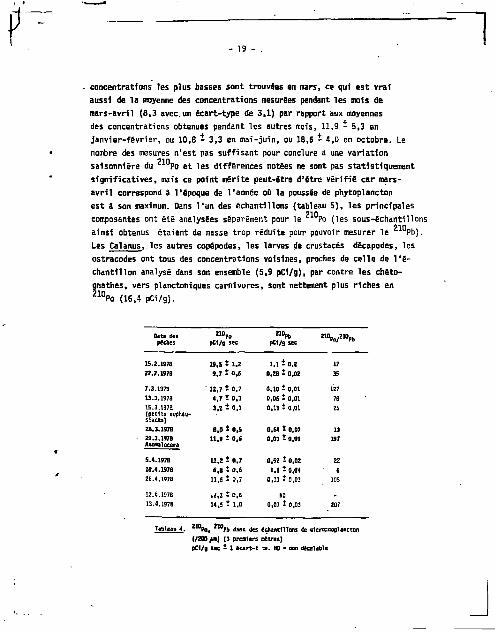
- 19 - .
concentrations les plus basses sont trouvées en mars, ce qui est vraf
aussi de la moyenne des concentrations mesurées pendant les mois de
mars-avril (8,3 avec un écart-type de 3,1) par rapport aux moyennes
des concentrations obtenues pendant les autres mois, 11,9 - 5,3 en
janvier-février, ou 10,8 - 3,3 en mai-juin, ou 18,6 * 4,0 en octobre. Le
nombre des mesures n'est pas suffisant pour conclure à une variation 21D
saisonnière du Po et les différences notées ne sont pas statistiquement
significatives, mais ce point mérite peut-être d'être vérifié car mars-
avril correspond à l'époque de l'année où la poussée de phytoplancton
est â son maximum. Oans l'un des échantillons (tableau 5), les principales 210
composantes ont été analysées séparément pour le Po (les sous-échantillons 210
ainsi obtenus étaient de masse trop réduite pour pouvoir mesurer le Pb).
Les Cal anus, les autres copépodes, les larves de crustacés décapodes, les
ostracodes ont tous des concentrations voisines, proches de celle de l'é
chantillon analysé dans son ensemble (5,9 pCi/g), par contre les chéto-
gnathes, vers planctoniques carnivores, sont nettement plus riches en 2 1 0 P o (16,4 pCi/g).
Date des 2M». 210.1, pèches pCI/g sec OC1/9 sec
19.5 t i , z 1 ,11 D.Z
9,7 t 0,6 0.28 - 0,02
' 12,7 * 0,7 0,10 S 0,01 1.7 t 0,3 0,06 i 0,01 3,2 t 0,1 0,13 î 0,01
8,0 • 0.5 0 .H î 0,07 11,9 t 0,6 0.03 - 0.01
11,2 t 0,7 0.52 t 0,02 6.8 111,5 1,1 î 0,g<
11.6 î 0,7 0,11 - 0,03
U.l î 0,5 m
14.5 • 1.0 0,07 - 0,03
Pu. Pb dans des échantillons de etcrazcaplanctc-A {/200 jumj (3 premiers metres) pCl/9 sec - 1 êca r t - t » . N9 * non décelable

- 20 -
18.3.1974 28.3.1974
5,6 î 0.3 0,25 *• '•"*
5.9 * 0.2 NH
Cil anus 50. 3> 7 " ° ' 5
Autres CopSpooM 5,4 - 0.» L«rv« * crustacés 6,8 - 1,0
OstrKodes s « ° " l ' 4
ChsettgnBthes 16.* - 2 - 3
t A * n i NK (.3.1575 M " 0 > l
31.S.197. 1 3 . 1 * 0 . 8 •«
31.5.1974 S.» * ° - 4
S.S.1974 M * O-4 ""
,e •, • 1 & 0.60 - 0,10 30.10.1973 « . 7 - 1.6 »•» , •
91 A t 1 2 0,61 - 0,0" 30.10.1973 " • • *"'
T.bltiU 5. f». 2W B n . a 0 l <n dans des 6cM»ti"oitt d> «Icroio-planct*.
1/200 un) (10-50 tâWM) p W , « = * 1 ê c r t - w » . «M • •"» • « " « •
De même que les concentrations en Po, les concentrations en Pb sont variables j i l semble toutefois que ces variations soient beaucoup plus prononcées dans les échantillons provenant des trois premiers mètres superficiels (tableau 4) que dans les autres. Ceci va avoir pour conséquence que les rapports Po/ Pb qui sont remarquablement constants, autour de 30, dans le microplancton pêche entre 10 et 50 m, varient beaucoup dans les échantillons plus superficiels, allant de S S 400. Cette dernière valeur a d'ailleurs été obtenut à partir d'un échantillon constitué en majorité d'Anormalocera paterspni, une espèce qui, corame nous l'avons déjà dit , fa i t partie du neuston et v i t habituellement dans les premiers 5 cm superficiels.

- 21 -
2.3. Conclusions.
Des résultats obtenus présentés dans les paragraphes précédents, on peut essayer de dégager les points principaux. (1) Le Po et d'autres émetteurs a naturels (U, Th, Ra) ou ar t i f ic ie ls 239
( P u ) ont été mesurés sur des échantillons de microplancton (/ZOO uni) 210
non t r ié et la contribution du Po i la radioactivité •* totale mesurée étai t de plus de 90 %. (2) I l semble qu' i l existe une variation saisonnière des concentrations
210 en Po dans le microplancton (/ZOO jum), avec une tendance à des concentrations plus basses quand la poussée de phytoplancton est 3 son maximum, mais le nombre des mesures est insuffisant pour permettra de savoir si les différences sont statistiquement significatives.
210 (3) Les concentrations en Po les plus élevées ont été trouvées chez des chétognathes, vers planctoniques carnivores et des Anomalocera patersoni, copépodes neustoniques à régime essentiellement carnivore.
210 210
(4) Le rapport Po/ Pb est toujours élevé, i l est beaucoup plus variable dans les échantillons de neuston et de microplanctcn provenant des 3 premiers mètres superficiels (où i l va de 2 à 400) que dans le microplancton péché entre 10 et 50 m (où ce rapport est voisin de 30).
I I . 3 . 2 1 0 P0, 2 1 0Pb DANS LE MACROZOOPLANCTON.
3.1. Choix de Meganyctiphanes norvegica.
Quelle que soit l'importance du microplancton (/200 p i ) en termes de biomasse et cornue représentant des premiers maillons de la chaine alimentaire, i l est nécessaire, si l'on veut se faire une idée plus précise des voies de transfert d'un élément, d 'ut i l iser des organismes plus gros, permettant, par des dissections, de localiser les sites d'accumulation et de suivre le devenir de cet élément dans les animaux eux-mêmes.
Pour ce faire, notre choix s'est porté sur un euphausiacê, Heganycti-phanes norvegica, et cela pour un certain nombre de raisons.
Les euphauslacés sont ces crustacés planctoniques qui sont très largement répandus dans toutes les mers du globe où i ls sont plus communément connus sous le terme de " k r i l l " , nom qui leur a été donné par les baleiniers norvégiens. I ls constituent en effet une part prépondérante de la nourriture des baleines, et aussi de nombreux poissons commercialement importants, tels que, entre autres, les thons, les maquereaux, les harengs, les morues.

- 22 -
La biomasse des euphausiacês est assez d i f f ic i le à estimer et e l l e varie
de façon importante suivant les régions ou les époques de l'année, mais
e l le représente toujours une fraction notable de la biornasse totale du
zooplancton, de 5 a 20 % suivant les auteurs (OIIORI, 1974 ; MAUCHLIHE et
FISHER, 1969 ; HAUCHLINE, 1980). En Méditerranée et plus part icul ière
ment en mer Ligure, M. norvegica est l'espèce dominante parmi les
euphausiacês (CASANOVA, 1974), représentant environ 12 % de la biowasse
du macrozooplancton (FRANQUEVILLE, 1975). Un certain nombre de travaux
effectués sur cette espèce dans le laboratoire (FOULER et a l . ,1971 a,
1971 b ; SHALL et FOULER, 1973 ; SHALL et a K , 1973) fournissent les
données biologiques indispensables - te ls que les taux de production de
mues, de feces, le taux d'ingestion de nourriture, e t c . - si Ton
veut apprécier quantitativement le flux d'un élément dans les animaux.
Les Meganyctiphanes, enfin, effectuent d'importantes migrations verticales
journalières, de l'ordre de 500 mètres ou plus, qui en font des vecteurs
potentiels pour le transfert d'éléments de la surface vers la profondeur.
Le jour, on les trouve, dans les zones de grands fonds à des profondeurs
de 500 à 1000 mètres et la nuit i l s fréquentent en masse les 100 premiers
mètres superficiels (CASANOVA, 1974).
3.2. 2 1 0 P o , Z 1 0 P b chez H. Norvegica.
210 210 ..es résultats d'un certain nombre de mesures du Po, Pb chez
11. nor/eqica sont réunis dans l e tableau 7. La valeur moyenne, plus ou
moins un écart-type, des concentrations est de 0,89 - 0,47 pCi/g sec
pour le Po et 0,06 - 0,05 pCi/g pour le °Pb, ce qui donne un rapport
Po/Pb d'environ 15. Comme pour le microplancton (/200 un) i par t i r
de ces quelques données, i l est impossible de t i rer des conclusions sur
d'éventuelles variations saisonnières des concentrations, d'autant que
ces concentrations varient, sans qu'une tendance claire puisse se dégager.
Mais 15 encore, la seule certitude, c'est l'accumulation préférentielle
du Po par rapport au Pb, avec des concentrations 5 à 40 fois
supérieures. L'étude détail lée va donc porter plus spécialement sur le 210
Po, pour essayer d'obtenir le maximum de données sur l 'o r ig ine , la cinétique, la localisation de l'élément e t , suivant les résultats obtenus,
dans les cas les plus intéressants seulement, des comparaisons avec le 210
Pb seront faites. Ces résultats ont f a i t l 'objet d'un ar t ic le paru dans Marine Biology (HEYRAU0 et a K , 1976), on va ic i rappeler les

principaux points et ajouter de nouvelles données obtenues depuis.
3.3. Concentrations en *" Po et ingestion de nourriture en fonction
de la t a i l l e de M. norveaica. 210
La gamme des concentrations en Po observée dans le tableau 7,
de 0,42 a 1,7 pCi/g, est sensiblement la mime que celle que l 'on 210
obtient si l 'on analyse le Po chez des animaux de ta i l l es différentes
(tableau 8 } . I l s 'agit dans ce dernier cas, H e H. norvegica provenant
d'une même pêche, séparés en différents groupes suivant leur grosseur.
I0Po pCi/s sec ™n Ki/g ™ Z 1°PO/Z 1°PO
Saptenire 1973 0,58 - 0,05 0,06 - 0,02 Septanere 1977 0.4Z - 0.04 NM Septensre 1977 0,72 - 0,06 0,02 - 0.01 Octobre 1973 1,5 - 0,1 NH Janvier 1974 0.53 • 0,03 0,03 - 0,01 Janvier 1977 0,BO * 0,03 0,15 - 0,01 Janvier 197S 1,2 - 0,1 NH Kart 1974 0,55 * 0,05 NH «ara 1977 1,7 * 0,1 > 0,04 t 0.01
ttyenne - 1 0" 0,69 * 0.47 0,05 - 0,05
Tableau 7. Po, Pb chez Heqanyctlpnanes norvegica [pC1/g sec - 1 ecart-t>pe). KM » non mure.
Si l'on porte en coordonnées logarithmiques les données contenues dans
le tableau 8, on obtient une relat ion sensiblement l inéaire entre les 210
concentrations en Po par unité de poids et le poids total des animaux:
les concentrations vont de 0,42 a 1,12 pCi/g sec chez des Heganyctiphanes
dont le poids varie de 77 â 20 mg sec. La pente de la droite ainsi obtenue
peut être calculée par la méthode des moindres carrés , e l le est de
-0,59 - 0,15. Le f a i t que la concentration relative pCi/g augmente quand
la t a i l l e des animaux diminue pourrait être dû à une adsorption de
l'élément sur la carapace : en e f f e t , chez les animaux les plus pe t i t s ,
l e rapport de surface/volume augmente (OSTERBERG et a]_., 1963) e t FOWLER
(1974) a obtenu une relation du même type avec le Fe, Mn, Zn chez

- 24 -
M. norvegica. Dans ces cas, Vadsorption des éléments sur la couche superf i c ie l le de la carapace était vraisemblablement le mécanisme en cause, comme en témoignent les concentrations très élevées trouvées dans les mues pour ces éléments, de 2 à 8 fois supérieures à celles trouvées chez les
?lfl animaux entiers (FOWLER, 1977). Pour le Po, 1'adsorption ne semble pas être importante, puisque les mues ont des concentrations beaucoup plus faibles (0,36 pCi/g, tableau 37) que chez les animaux entiers ou leurs carapaces (1 pCi/g environ, tableau 10). Par contre, 11 semble exister
210
une relation entre la concentration en Po par unité de poids et l ' i n gestion de nourriture par les 11. norvegica : la pente de -0,59 obtenue i c i est remarquablement proche de -0,58, valeur de la pente de la droite que l 'on obtient si l'on porte, toujours en coordonnées logarithnrfqi'ss, la ration journalière relative en fonction du poids -nez R. norvegica (tableau g et HEYRAUD, 1979). La ration journalière relative se déf in i t comme l'ingestion de nourriture par unité de poids et par jour et nous l'avons mesurée chez un grand nombre de Meganyctiphanes dont le poids a l l a i t de 7 à 70 mg sec, dans des conditions où la nourriture constituée d'Artemia était très abondante. Dans la limite de nos conditions expérimentales, la ration journalière relative est indépendante de la ration offerte ou de la ta i l le des proies, el le varie seulement suivant la ta i l le des Heganyctiphanes (HEYRAUD, 1979).
i d'anfoaux Longueur m
Poids moyen sec/animal • a *
4 pC1/g sec - 1 écart-type
3 38 76.7 0,42 t o,04
13 15 57.2 0.SS - 0,05 20 32 56 .a 0,56 t 0,04 19 30 4B.S 0,92 - 0,07 21 2B 30,1 0,75 - 0,06 55 25 24.8 0.9S - 0,00 «7 23 19,6 1,12 - 0,07
*F*cteur 4e conversion poids sec _ » poids frais pour les anlnam entiers • 4,74.
Tableau 8. Concentration en Po chez Meaanycslohanes nonregica en fonction de la tai l le.

Z5 -
Intervalle de poids (mg sec)
Poids moyen des anneaux utilises («g see £ I f f )
Poids moyen de nourriture Ingère/jour
(•g sec ± Iff)
Poids noyen de nourriture Ingère/ imita de poids H. norveqlcs/jour
[ngtsec 1 Tr/ng sec/3)
:lw*rî d'observations
S > 10 7.95 2,94 i 1,27 0,37 i 0,16 3 10 1 IS 12,3 t 1.4 5.04 t 1.84 0,41 t 0,15 21 20 a 25 24,1 I 0.4S 6.75 t 2,17 0,28 i 0,09 U 25 1 30 28.4 t 1.2 5.68 ± 2,56 0,20 t 0,09 7 30 1 35 33,0 t 0.8 5,94 t 1JB 0,18 t 0,06 27 as a m 35,8 i 1,3 6,99 t 2.21 0,19 t 0,06 22 so a ss 55 6.60 t 0,55 0,12 1 0,01 2 55 a 60 56,3 i 1.3 6.19 t 2.25 0,11 t 0,04 8 eo a 65 62,2 8 71 i 1.B7 0.14 î 0,03 4 65 a 70 67,6 10,80 1 2,70 0,16 î 0,04 3
t test entre 0.41 t 0,15 et 0.1B t 0,06 montre que '•a différence estsignifîcative (seuil de probabilité 0,01) t test entre 0,18 t 0.0S et 0,11 t 0,04 montre que la différence est significative (seuil de probabilité 0,01).
Tableau S. Ingestion de nourriture en fonction du poids chez Heganyctiphanes norvegiea.
Rapport - A , .,„*,,..* Contribution A s de ïwidTfrais/ pCI/fcg frais ^ « " « H i l'activité totale l'activité pgfrjs sec T r a i s M M I de l'animal totale
pCI/fcg frais
Estonie + Intestin 9,9 t l . l 4,08 2426 î 267 0,98 24 î 3 8.3 Itepatopancréas 23.6 i 1.8 3.51 67Z4 t 513 2a* • 151 1 12 52.1 Yeux 0,8 t 0,3 3.73 214 1 8 0 2,08 5 1 2 1.7 Muscles 0.24 1 0,02 4,74 51 t 4 43,0 2 2 Î 2 7.6 Carapace 1,04 2 0,07 4,25 245 ! 16 35.5 87 ! 6 30.1
1 Le total des chiffrai de cette colonne = 83,B S. La différence de 16,2 S r»;.-«i<nte 1< liquide interstiti*! perdu pendant la dissection.
Tableau 10. Concentration en Z l t ,Po des différents tissus^ou organes de Heganyctinhanes norvegiea
pCi/g sec t 1 écart-type.
- 26 -
210 3.4. Localisation ou r'o chez H. norvegica.
210 Le f a i t que les concentrations en Po et la ration journalière
relat ive varient suivant la même puissance négative fractionnaire du 210
poids chez 11. norvegica ne signif ie pas nécessairement que le Po
accumulé soit d'origine alimentaire. On peut toutefois considérer qu'une
relation de ce type suggère la possibi l i té d'une te l le origine, hypothèse
qui semble confirmée par les résultats présentés dans le tableau 10
obtenus â part ir de la dissection de 20 animaux. Les concentrations les 210
plus hautes en Po se trouvent dans le tube digestif, 9,9 pCi/g, et
surtout 1'hépatopancréas, 23,6 pCi/g, soit des concentrations d'un 3
deux ordres de grandeur supérieures 3 celles de la carapace ou des muscles,
qui sont respectivement de 1 e t 0,24 pCi/g. Le tractus digestif dans son
ensemble -estomac, intestin et hépatopancréas- ne représente qu'environ
3 S du poids total des Meganyctiphanes, i l n'en contient pas moins plus 210 — —
de 60 î du Po des animaux entiers. 210
3.5. Po dans les contenus gastriques de H. norvegica.
j i . norvegica, leurs contenus, et des échantillons de microplancton non
t r i é (/200 fm) péché en même temps que les euphausiacês ont été fai tes
â plusieurs reprises (tableau 11). I l s 'agit d'animaux récoltés la nuit
à différentes époques de l'année ou bien, dans un cas, la même nuit â
30 km de distance. I l est tout â f a i t remarquable de voir combien les 210
concentrations en Po trouvées dans les contenus gastriques varient
peu, la valeur moyenne (plus ou moins un écart-type) obtenue S par t i r
des quatres mesures effectuées est de 20,2 - 0,4 pCi/g. Un te l résultat
appelle quelques commentaires. 210
La concentration en Po des contenus gastriques dépend de deux 210
facteurs, run étant la concentration en Po de la nourriture ingérée,
le second l ' é ta t d'avancement de la digestion. Dans ce cas part icul ier ,
on peut sans doute négliger le second facteur : en ef fe t , nous avons pu
calculer que le "turnover time" de la nourriture, chez des animaux qui
se nourrissent activement, est court, de l'ordre de 1/2 heure chez
Meganyctiphanes (HEYRAUD, 1979). Les animaux ayant servi â la constitu
tion des échantillons du tableau 11 proviennent de pêches nocturnes,
effectuées en surface ; or, an mer Lînure c'est dans ces conditions que
l'on trouve le maximum d'estomacs pleins et que la nutrition est la plus
- 27 -
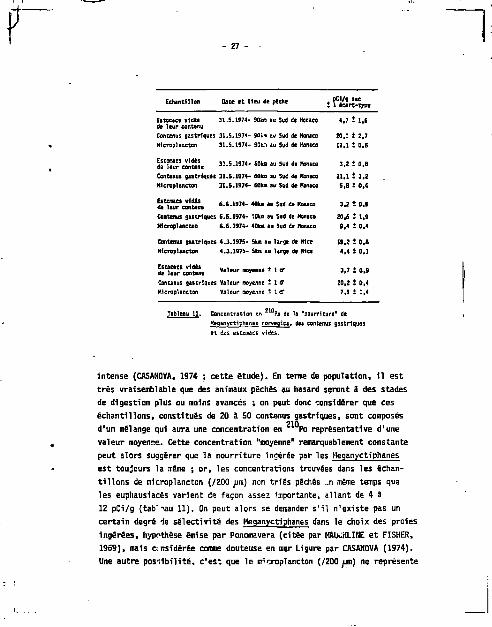
Échantillon Date e t l ieu de pèche + f écïrUwpe
Estosacs vides 3 1 . S . 1974- 9Qkn au Sud de Konsco 4,7 t 1,6
de Itur contenu Contenus gastriques 31.5.1974- 90ka au Sud de Monaco 20,C î 2,7 Mleroplaneton 31.S. 1974- 9Ûfci au Sud de Monaco 12,1 î 0,B
d?lS?conïenu 31.5.1974- 60ka au Sud d. Hon.» 3.2 t O.B
Contenus gastriques 31.5.1974- 60ka au Sud àt Honaco 21,1 î 3,2 Hlcroplancton 31.5.1974- 60km au Sud de Honaco 5,8 t 0,4
« f u u r ^ o î S , 6 - 6 - U M - " t a •» *•* ft " " " » « * ° - S
Contenus gastriques 6.6.1974- *tOkn au Sud de Monaco 20,6 î 1,9 Hlcroplancton 6.6.1974- 40ka au Sud de Honaco 9,4 î 0,4
Contenus gastriques 4.3.1975- 5kn au large de Nice 19.2 t Q.B Hlcroplancton 4.3.1975- 5km au large de Nice 4,4 t 0»1
Ï C Ï Ï L M-"—*»r U t U Contenus gastriques Valeur moyenne î l e " 28,2 t 5,4 Hlcroplancton Valeur rwyenne t Iff 7,5 i 1,4
Tableau U . Concentration en Po de la 'nourriture' de Keqanyctiphanes narweolca. des contenus gastriques et des estomacs vices.
intense (CASANOVA, 1974 ; cette étude). En terme de population, 11 est très vraisemblable que des animaux péchés au hasard seront a des stades de digestion plus ou moins avancés ; an peut donc considérer que ces
échantillons, constitués de 20 à SO contenus gastriques, sont composés 210 d'un mélange qui aura une concentration en Po représentative d'une
valeur moyenne. Cette concentration "moyenne" remarquablement constante peut alors suggérer que la nourriture ingérée par les Heganyctiphanes est toujours la même ; or, les concentrations trouvées dans les échanti l lons de microplancton (/200 /jm) non triés péchés ..n même temps que les euphausiacés varient de façon assez importante, allant de 4 I 12 pCi/g (tab'-'au 11). On peut alors se demander s'il n'existe pas un certain degré de sélectivité des Heganyctiphanes dans le choix des proies ingérées, hypothèse émise par Ponomavera (citée par KAuufl-INE et FISHER, 1969), mais onsidérée comme douteuse en mer Ligure par CASANOVA (1974). Une autre posilbil itë, c'est que le lir-çroplancton (/200 /m) ne représente

- 28 -
pas la majorité du régime de 11. norvegica. Des débris de copêpodes,
ostracodes, chaetognathes ont été trouvés dans les contenus gastriques
de cet euphausiacé (CASANOVA, 1974) donnant ainsi la preuve qu ' i l s font
partie du régime alimentaire de cette espèce, mais les auteurs qui ont
examiné à la loupe binoculaire ou au microscope des contenus gastriques
de Meganyctiphanes mentionnent toujours la présence d'une "bouillie"
opaque non identifiable (NEMOTO, 1968 ; MAUCHLINE et FISHER, 1969 ;
CASANOVA, 1974 ; nos propres observations). Les H. norvenica sont omni
vores (MAUCHLINE et FISHER, 1969 ; CASANOVA, 1974-) et il est
vraisemblable que cette "bouil l ie", constituée de phytoplancton, dét r i tus ,
particules de toutes sortes dans des proportions mal connues constitue la
part la plus importante du régime, alors que -comme CASANOVA (1974) l ' ava i t
déjà mentionné- les restes de crustacés ont tendance à être surestimés, par
le seul fa i t qu'i ls sont plus longs à digérer et restent identifiables plus
longtemps. 210
Dans un cas particulier, la concentration en Po des contenus gastriques a été trouvée plus élevée, de l 'ordre de 37 à 39 pCi/g sec. Il s ' ag i t dans ce cas de deux lots de M. norvegica péchés 1 l'aube entre 300 et 600 m : un premier lot constitué de gros Individus (poids moyen 47 mg sec), l ' au t re d'individus nettement plus pet i ts (15 mg sec).
Dans ces deux lo ts , les estomacs pleins ont été analysés ; les concentrat ions en Po trouvées sont de 15,7 - 0,8 pCi/g sec chez les gros e t de 14,4 - 1,5 pCi/g sec chez les pet i ts (tableau 12). La concentration des contenus gastriques, calculée en soustreyant la contribution des parois de l'estomac (tableau 11) i l ' a c t i v i t é des estomacs pleins, es t de 39,0 - 3,0 pCi/g e t 36,5 î 4,8 pCi/g chez les gros ou petits Heganyctiphanes, respectivement. Une fois de plus, ces concentrations sont très remarquablement proches, ce qui semble confirmer les données de CASANOVA (1974) qui mentionne qu ' i l n'existe pas de différence qualitative entre l t régime des adultes et des jeunes chez cette espèce. Par contre, i l est a noter que les concentrations trouvées dans ces deux lots sont environ le double de celles présentées dans le tableau 11, différence qui peut sans doute s'expliquer par la différence des conditions de pêche. Il s 'agi t 1c1, comme nous l'avons d i t , d'animaux péchés â l'aube, â une profondeur de 300 à 600 m. A cette profondeur, i l es t vraisemblable que la contribution des détritus et des particules te l les que les feces de zooplancton ou autres dans les contenus gastriques
910 augmente par rapport aux autres composantes. La concentration en - Po de
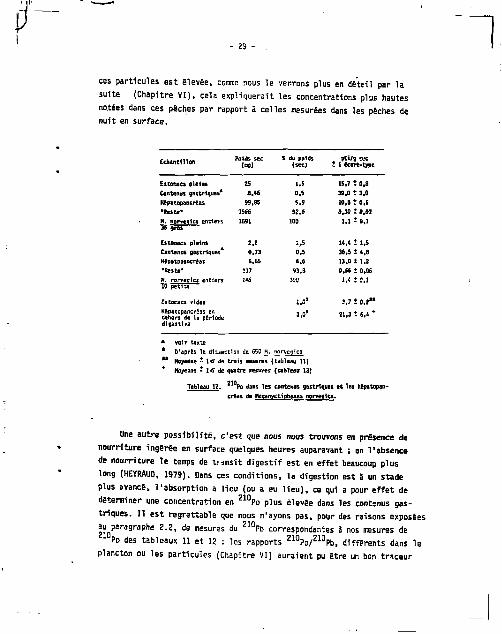
- 29 -
ces particules est élevée, comme nous le verrons plus en dêteil par la suite (Chapitre VI), cela expliquerait les concentrations plus hautes notées dans ces pêches par rapport à celles mesurées dans les pêches de nuit en surface.
Echanti l lon ' " I * , " ' ï du pplds
(sec) 3 p W 9 suc
1 éc t r t - t yp t
Estoawcs pleins 25 1.5 15,7 t 0.8 Contenus gastriques* 8.46 0,5 39,0 t 2.0
Hêpatopsnertas 99,85 5,9 10,8 î 0,6
"Reste" 1566 92 ,6 0,30 t 0,03 H. norveqlca ent iers 1691 36 gros
100 1.1 S 0,1
Estâmes pleins 2 ,2 î ,5 14.4 î 1,5 Contenus gastriques* 0,73 0,5 36,5 î «,8 Hepatppencreas 6,65 0.6 13,0 î 1,2 •Reste ' 137 S3TB 0,56 î 0,05 M. norveqlca ent iers 146 TO pe t i ts
100 î . i : o.i
Estomacs vides 1,0" 3,7 î 0,9™ Hepatopancrêas en dehors de la période digest ive
3 . 0 ' 31,3 î 6,4 *
* vo i r texte
* D'après la dissection de 650 H narvegica
* * Hoyerme » 1 «r de t ro is mesures ( tableau 11)
* Moyenne * I f f de quatre mesures ( tab leau 13)
Tableau 12. Po dans les contenus gastriques e t les hepatopan
crêas de Meqanyctiphanes nprveolça
Une autre possibil ité, c'est que nous nous trouvons en présence de nourriture ingërêe en surface quelques heures auparavant ; en l'absence de nourriture le temps de transit digestif est en effet beaucoup plus long (HEYRAUD, 1979). Dans ces conditions, la digestion est à un stade plus avancé, l'absorption a lieu (ou a eu l ieu) , ce qui a pour effet de
déterminer une concentration en 2 1 0 P o plus élevée dans les contenus gas-o
au paragraphe 2.2, de mesures du 210
Po des tableaux 11 et 12 : les plancton ou les particules (Chapitre VI) auraient pu être un bon traceur
triques. Il est regrettable que nous n'ayons pas, pour des raisons exposées au paragraphe 2.2, de mesures du z l 0 P b correspondantes à nos mesures de
Po des tableaux 11 et 12 : les rapports Z 1 0 Po/ Z 1 I J Pb, différents dans le

30
de l 'origine de la nourriture dont étaient constitués les contenus
gastriques.
En période de digestion avancée 1 'hêpatopancrëas est 1,5 à 2 fois -
plus volumineux que chez des Heganyctiphanes â jeun (tableau 12). Cette
augmentation de poids est due â une sécrétion d'enzymes et â une absorp
tion des metabolites au cours de la digestion et e l le va avoir pour 210
conséquence une diminution de la concentration en Po dans cet organe,
qui est en moyenne de 20 pCi/g (tableau 13) ; c'est d'ai l leurs la concen
trat ion que Von obtient d'après les résultats du tableau 12 si on les
multipl ie par 2 ou 1,5 pour "corriger" l'augmentation de poids en période
digestive constatée chez les gros ou petits animaux. Cette relat ive constance 210
de la concentration en Po de Vhêpatopancrëas de M. norvegica est e l le
aussi digne qu'on l'examine plus en détai l .
210 3.6. Po dans l'hêpatopancrëas de H. norvegica : concentration,
"turnover time". 210 Le Po a été analysé dans cinq échantillons d'hêpatopancrëas de
M. norvegica péchés à différentes époques de l'année, et, dans deux de — 21D ces échantillons des mesures de Pb ont été faites. I l est c la i r que là encore, on se trouve en présence d'une accumulation préférentiel le du 210
Po, avec un rapport Po/Pb bien supérieur à l 'unité.
Une de ces cinq valeurs, celle obtenue en septembre 1977, est nette
ment inférieure aux autres concentrations et , selon que l'on t ient compte
ou non de cette valeur, la concentration moyenne, plus ou moins un écart-
type, du Po dans 1'hêpatopancrëas est de 18 - 10 ou de 21 - 6 pC1/g sec.
Dans l'échantillon de septembre 1977, le poids des hêpatopancrëas
représentait 6,2 % du poids total des Méganyctiphanes, ce qui semble indi
quer que nous nous trouvions en présence d'animaux en période digestive ;
mais même si l'on "corrige" la concentration obtenue pour tenir compte de
l'augmentation de poids, on obtient une conrentration de 7,6 pCi/g, encore
nettement plus basse que toutes les autres valeurs mesurées. Ceci, joint
au f a i t que d'autres hêpatopancrëas de crevettes pélagiques (Sergestes
arcticus, Pasiphaea sivado) pêchées en même temps que les Heganycti phanes 210
avaient tous des concentrations en Po plus basses que cel le , rencontrées habituellement suggère qu'on se trouvait sans doute dans des conditions
un peu particulières de nourriture au cours de cette pèche de septembre 1977. 210
I l semble bien, en e f fe t , que les concentrations assez constantes en Po
des contenus gastriques ou du tissu de l'hêpatopancrëas (tableau 11 et 13)

31 -
Echantillon Animal ent ie r Hepatopancreas
• î u p . ™n
Octobre 1973 1.5 • 0.1 NX 25 t 1,9 m Janvier 1977 0,B î 0,03 0,15 t 0,01 11 t 0,6 0,£B t 0,07 Hars 1977 1.7 î 0,1 > 0,04 i 0,01 25 ! 1,3 0,13 t 0,04 Septenùre 1977 0,41 î 0.04 m 3,7 î 0,5 NH Janvier 1978 l . î t 0,1 NX 2 2 Î I Kl
Moyenne î l<r 1.1 î 0.5 - 18 t 10 ou 21 î 6 ' 0,41 t 0,39
1 Voir texte
Tableau 12. Concentration en Po, Pb dans les anirau entiers ec
les hépatepancrËas de HeganyctlPhanes nprveoica.
{PCV9 sec • 1 ecert-type) *W • non stesure.
soient le résultat d'une sorte d'équilibre qui s'établirait â partir Po ingéré dans la nourriture et que les concentrations trouvées du
210, 2în
dans Vhipatopancrëas refléteraient le Po absorbé à partir de cette nourriture. Afin de tester cette hypothèse, une expérience a été réalisée en laboratoire, ayant pour but de mesurer le "turnover time" du Po (aux niveaux naturels, sans ut i l i ser de traceur) dans l'hépatopancrëas de H. norvegica. Pour ce faire, des H. norvegica sont disséqués s i tô t après
— 21(1 la pêche, à bord du bateau, et la concentration en Po mesurée alors dans l'hépatopancrëas, représentant la concentration au temps t 0 , est considérée cornue 100 %. Les animaux provenant de la même pèche sont ramenés au laboratoire, gardés a l'obscurité dans des bocaux d'eau de mer a 13°C et nourris pendant des périodes allant de 2 â 18 jours d'Artemia salina
710
ayant une concentration très basse en Po (0,5 3 1,Z pCi/g sec) . Après 2, 3, 6 ou 18 jours, un certain nombre de Heganyctiohanes sont disséqués et les concentrations en * Po de l'hépatopancrëas sont exprimées en pourcentage de l'activité au temps 0. Pour des raisons pratiques l'expérience a été réalisée en plusieurs fo is , et les résultats des trois séries expérimentales sont réunis dans le tableau 14. Si l'on porte en coordonnées semi-logarithmiques les pourcentages de l'activité résiduelle trouvée dans l'hépatopancrëas en fonction du temps, on obtient une droite (figure 1).

f 32
1 0 0 1 -
#
3 10 12 TEMPS Jours
14 16 18 20
210 F ig . 1 . Meganyctiphanes rr rvegica. Demi-vie biologique di Po dans 1'hépatopanc^éas.
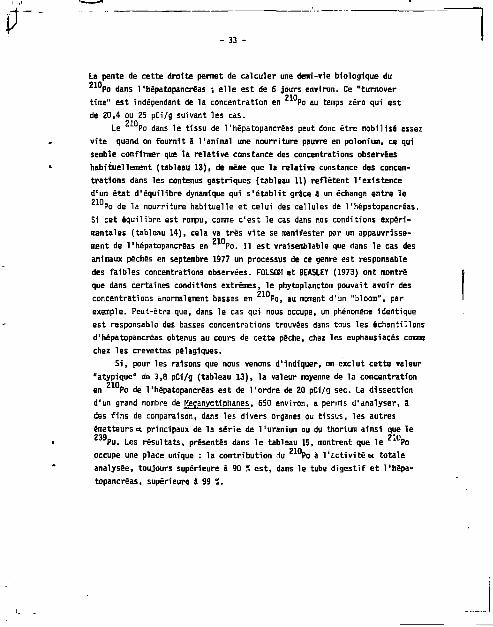
La pente de cette droite permet de calculer une demi-vie biologique du 210
Po dans 1'hépatopancrêas ; elle est de 6 jours environ. Ce "turnover 210
time" est indépendant de la concentration en Po au temps zéro qui est de 20,4 ou 25 pCi/g suivant les cas.
210 Le Po dans le tissu de 1'hépatopancrêas peut donc être mobilisé assez
vite quand on fournit â l'animal une nourriture pauvre en polonium, ce qui
semble confirmer que la relat ive constance des concentrations observées
habituellement (tableau 13), de même que la relative constance des concen
trations dans les contenus gastriques (tableau 11) reflètent l'existence
d'un état d'équilibre dynamique qui s 'é tab l i t grâce â un échange entre le 210
Po de la nourriture habituelle et celui des cellules de 1'hépatopancrêas. S1 cet équilibre est rompu, comme c'est le cas dans nos conditions expérimentales (tableau 14), cela va très v i te se manifester par un appauvrisse-
gin ment de 1'hépatopancrêas en Po. I l est vraisemblable que dans le cas des
animaux pêches en septembre 1977 un processus de ce genre est responsable
des faibles concentrations observées. FOLSOM et BEASLEY (1973) ont montré
que dans certaines conditions extrêmes, 1e phytoplancton pouvait avoir des 210
concentrations anormalement basses en Po, au moment d'un "bloom", par exemple. Peut-être que, dans le cas qui nous occupe, un phénomène Identique
est responsable des basses concentrations trouvées dans tous les échantillons
d'hépatopancrêas obtenus au cours de cette pêche, chez les euphausiacés comme
chez les crevettes pélagiques.
S i , pour les raisons que nous venons d'indiquer, on exclut cette valeur
"atypique" de 3,8 pCi/g (tableau 13) , la valeur moyenne de la concentration 210
en Po de 1'hépatopancrêas est de l 'ordre de 20 pCi/g sec. La dissection
d'un grand nombre de Meganyctiphanes, 650 environ, a permis d'analyser, â
des fins de comparaison, dans les divers organes ou tissus, les autres
émetteurs«t principaux de la série de l'uranium ou du thorium ainsi que le 239 21U
Pu. Les résultats, présentés dans le tableau 15, montrent que le Po 210
occupe une place unique : la contribution iu Po à l 'éct iv i têet totale analysée, toujours supérieure â 90 % est , dans le tube digestif e t 1'hépa
topancrêas, supérieure l 99 ï .

$ ^ 34
Date de la _ , - HfipatopancrËas pèche " u P o pCi/g SEC t 1 écart-type
H. norveqlca
To-lnroedlatement après la pêche
Janv er 19 7B 19,9 î 1,5 100
T - 2 Jours 14,9 î l.H 75
H. norvegfca To»immematement
après la pêche
Septembre 1977 3,fl - 0,4 100
T • 3 jours 2,7 + 0,3 71
T • 6 jours 1,3 + 0,2 34
H. norvegîca Hars 1977 "To-inineQiatement
après la pêche 24,9 t 1,3 T - 13 jours 3,7 t 0,5
* Ar terni a « 0,5 î 0,1 ou 1,2 î 0,2 pCi/g sec de 2 1 0 P o .
Tableau 14. Meganycttphanes norveglca : "Turnover t i ra" du * Po
dans l'hepatopancrëas, après un regime pauvfce en z * D Pt
constitué d'Artenria.*
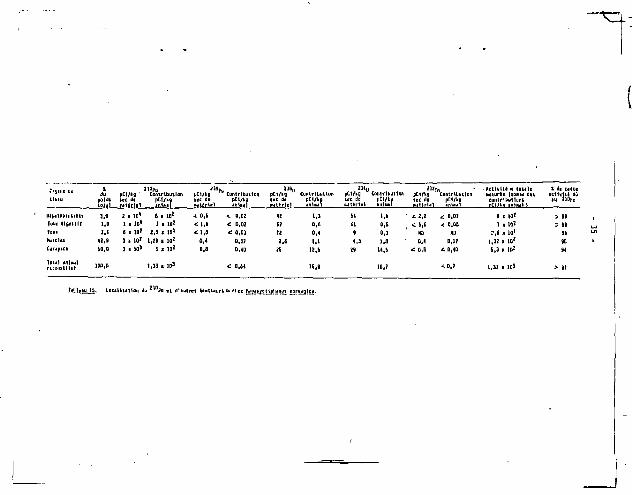
t l u u
X llDpo du pCI/kg Contribution
poldt tec di pCl/ko l o l i ) r j l l r l t l i n t M l
pCtAfl tec it • . i t t r U l
Contrtbuitpo pcvu • M u i sa
A D,5 *. 0,0! l i
< l , 6 £ D,D2 » •C 1,0 < 0,01 l i 0,4 0,17 :.< 0,0 0,40 IS
pt l /ky ice as M l ê r U I
Caiilrluullun pCIAa
' " i n pCI/Lg Contribution ice d i pCI/kg • i i t t r l » ! «nlml
. Ac t tu t t ca l o u l c n«:iurie l ioni i t d«t contr l t iu i lani «fi?
Mi (••toe t in r l i i
lu t* d lge i t l t
HuicUi
1,0 I i ID* 6 K 10*
1.0 1 i 10* I t 1Û*
l , i t • to? z.i * IO1
42.9 1 i 10 1 1.29 x 10*.
SO.O ) i 10 1 5 x 10*
1M.0 1.33 X ]D 3
I . I 12.S
M ' £ 2.2 £ 0.0Î 6 * t0> > IS
Û.S 1 cM < 0,06 1 1 10l > SV
0.3 NO NO ?, ï • 10> lb
1.Û 0,4 0.17 1,32 X 10* so 11,» < 0,B £ 0 , 4 0 5,3 » ID 1 SI
T«'j'.f«u l i . U u l l u i t o n du Fo i l d ' l u t re* tmctlsuri «K e l i« [Vj;;yttJji l i<Jiui rmrvejlcj
36 -
I t . 4. CONCLUSIONS.
210 Au terme de cette étude du Po dans le zooplancton, on peut dégager
un certain nombre de points. Certains confirment des données antérieures
obtenues par différents auteurs, d'autres sont nouveaux et tout en contri
buant à répondre S certaines questions, i l s amènent â s'en poser d'autres.
- Dans les échantillons de microplancton non t r ié (/ZOO um) l'accumulation 210 '
du Po est sélective : 90 % ou plus de l ' a c t i v i t é » mesurée dans ces échantillons sont dus au polonium. Ce polonium n'est pas "supporté" par
210 son précurseur le Pb ; le rapport Po/Pb est toujours bien supérieur â
l ' un i té , de l'ordre oe 30 dans les échantillons péchés à 20-30 métrés de
profondeur, plus variable, de 6 à 400 dans les échantillons plus superficiels.
Dans un des sous-échantillons de microplancton, la concentration la 210
plus élevée en Po se trouve chez les chëtognathes (Sagitta) , vers plane-toniques carnivores ; i l en est de même chez les Anomalocera, copêpodes carni vores. - Dans l'euphausiacé Heganyctiphanes norvegica, pris comme organisme
représentatif du macrozooplancton,on a aussi un rapport Po/Pb> 10 et plus 2 11)
de 90 % de l 'act iv i té <x mesurée dus au Po ; une étude détai l lée a
permis de montrer l'importance primordiale de la nourriture comme source du 210
Po chez cette espèce : i l existe une relation linéaire (en coordonnées logarithmiques) entre l'ingestion de nourriture par unité de poids et le
210 poids des animaux, d'une part, et la concentration en Po et le poids
des animaux, d'autre part. Les deux droites ont une pente identique,
-0,58 dans un cas, -0,59 dans l 'aut re .
Le tractus digestif et l'hëpatopancrëas, qui ne représentent ensemble
que 4 S environ du poids total des Heganyctiphanes contiennent plus de 210 .
60 S du Po des animaux entiers, dont 50 % dans l'hëpatopancrëas. Les contentus gastriques d'animaux obtenus dans les mêmes conditions de pèche
210 ont des concentrations en Po élevées et remarquablement constantes mais
différentes entre la nuit en surface ou le jour en profondeur.
- Une nourriturt pauvre en Po permet de remobiliser aisément le Po
contenu dans les cellules de l'hëpatopancrëas et on a pu ainsi mesurer un 210
"turnover time" du Po dans cet organe, qui est de l'ordre de 6 jours. 210
- La question du Po dans 1'hépatopancrias (de M. norvegica) présente un
double intérêt : non seulement les concentrations trouvées sont hautes,
20 pCi/g sec en moyenne, confirmant ainsi les observations de CHERRY et

- 37 -
SHANNON (1974) â propos des 3 mesures existantes dans cet organe, chez d'autres invertêhrés, au moment ou cette étude a été commencée, mais en outre on a pu montrer qu' i l s'agit d'une accumulation sélective de l 'é lément : plus de 99 % de l 'act iv i té o< totale mesurée (série de l'uranium
239 210 et du thorium, Pu) dans cet organe, est due au Po. Là encore, i l
2tû ?in s'agit de Po non "supporté" par le Pb, le rapport Po/Pb atteint 200 dans un de nos échantillons.
Au vu de ces résultats, i l nous a paru intéressant d'étudier systé-210 ?in
matiquement le Po, Pb dans les hépatopancréas d'invertébrés marins afin de véri f ier si ces hautes concentrations sont la régie générale et , dans l 'affirmative, d'essayer d'en comprendre les raisons.

\
CHAPITRE III - 2 1 0 P O , 2 1 0 P B DAPS LA GLANDE DIGESTIVE (HEPATOPANCREAS)

- 38 -
I I I . l . INTRODUCTION : LA GLANDE DIGESTIVE OU HEPATOPANCREAS.
Le terme d' "hépatopancréas" a été vivement critique par VAN WEEL
(1974) qui lu i préfère le terme de "glande digestive" ou "glande médio-
intestinale", se casant sur le f a i t qua ci-t organe ne peut être assimilé
ni i un fo ie , ni â un pancréas de vertébré comme son nom le la isserai t
supposer. Quoi qu' i l en soi t , c 'est un terme qui est largement u t i l i s é par
la plupart des auteurs et en part icul ier ceux qui font autorité en la ma
t i è re , te l que VONK (I960) pour les crustacés ou BIDDER (1966) pour les
céphalopodes et pour cette raison, nous utiliserons cette dénomination.
C'est à ces auteurs que nous empruntons l'essentiel de ce qui sui t .
- Chez les crustacés, 1'hépatopanrrëas est une glande paire qui communique
par 2 canaux avec l ' intest in moyen juste en arrière de l'estomac. La glande
est constituée par un ensemble de tubules terminés en culs-de-sacs dont les
lumières communiquent entre elles et. vont finalement s'ouvrir dans le canal
principal par lequel les sécrétions s'écoulent dans l ' Intest in moyen. Les
cellules qui bardent les tubules sont de deux types principaux : les
"R-cells", â fonction de stockage, des graisses et du glycogène en particu
l i e r , qui sont considérées comme des cellules absorbantes. Le deuxième type
de cellules sont les cellules sécrétrices, ou "B-cells" qui contiennent
des granules enzymatiques et une large vacuole. Les sécrétions enzymatiques
sont déversées dans la lumière des tubules, soit de façon holocrine, par
destruction de la cellule sécrétrice, soit de façon mérocrine, auquel cas
la cellule n'est pas détruite mais régénère son contenu.
L'hépatopancréas des crustacés a donc au cours de la digestion plusieurs
fonctions : sécrétion, absorption, stockage : i l sécrète les enzymes qui sont
amenées par les canaux dans l ' in tes t in moyen et l'estomac où une partie de
la digestion prend place. Les plus grosses particules résultant de la t r i
turation et de la digestion des aliments dans l'estomac vont être dirigées,
par une sorte d'entonnoir, vers l ' i n tes t in ; les plus fines seulement pénè
trent par les canaux dans 1 'hépatopancréas où l'absorption a l i e u , ainsi
que le -tockage des matériaux "le réserve. Ces matériaux seront ensuite re
mobilisés et utilisés suivant les besoins, au cours de la mue ou de la for
mation des produits sexuels par exemple.
- Chez les mollusques céphalopodes, "foie" et "pancréas" sont nettement
séparés, mais les canaux sont communs. L'origine paire de 1a glande au cours
du développement est reflétée par le f a i t qu'i l existe deux canaux hépato-
pancréatiques, qui passent de chaque côté de l ' intestin pour s'unir en un seu
canal s'ouvrant au sommet du caecum.

- 39 -
!.e foie est un organe volumineux, compact, constitué par un amas de tubules dont les plus importants seulement s'ouvrent dans une paire de sinus larges qui parcourent la longueur de l'organe pour aboutir aux canaux hépatopancréatiques. Le pancréas est plus petit, d'un blanc crêneux -, chez Octopus i l est à l'intérieur de la capsule hépatique, chez Loiigo e t Sepia il se présente sous la forme d'un amas de tissu spongieux greffé au niveau des canaux hCpatiques.
Les cellules du foie sont, là aussi, de différents types : chez Octopus on trouve des cellules sécrétrices, des cellules absorbantes et des cellules excrétrices contenant une grande vacuole appelées "cellules 5 boules". Chacune des cellules passe alternativement par ces différentes formes, suivant une activité rythmique. Des cellules semblables ont été décrites chez Sepia, oO on trouve aussi des cellules a granulations calcaires associées i la formation de V "os". Par contre, le foie de Loiigo n'a qu'un type de cellules, oD les fonctions sécrétrices et excrétrices se combinent.
Chez les trois espèces, l'histologie du pancréas est la même, avec des cellules basses bordant les tubules dont même les plus petits possèdent une lumière. - La digestion commence dans l'estomac et se termine soit dans le caecum, soit dans le foie. Les enzymes nécessaires à la digestion gastrique et caecale sont produites par l'hépatopancréas, et amenées indépendamment soit i l'estomac, soit au caecum ce qui rend possible la digestion concomitante dans ces deux organes. L'absorption a lieu dans le caecum chez les trois espèces e t , chez Octopus et Sepij. dans le foie, mais pas chez Loiigo. Ceci explique que la digestion soit plus rapide chez Loligo (4-6h) ou le foie peut sécréter continuellement les enzymes nécessaires alors que chez Octopus et Sepia les fonctions sécrétrices sont interrompues pendant l'absorption allongeant la durée de la digestion (15-20h).
III. 2. 2 1 0 P 0 , 2 1 0 PB CHEZ QUELQUES CRUSTACES ET MOLLUSQUES CEPHALOPODES.
Po et °Pb ont été analysés chez un certain nombre de crustacés et mollusques céphalopodes pélagiques ou benthlques, de façon à étudier le devenir des deux iléments dans les animaux entiers, leurs muscles et surtout leurs hépatopancrëas. Le but de l'étude est triple : (1) avoir une idée globale sur l'évolution des concentrations S des niveaux trophiques différents (2) connaître ces concentrations dans les muscles, qui représentent
- 4C -
la partie des ai.imaux consommée par l'homme (3) voir si les hautes concentrations précédemment trouvées dans des hépatopancrêas sont la règle générale. De plus, quelques échantillons de thons fraîchement capturés au large de Monaco ont également été analysés, en particulier le caecum pylorique oit F0.S0M et a l . (1972) avaient rapporté des concentrations
210
exceptionnellement élevées en Po.
Z . l . Crustacés et mollusques céphalopodes pélagiques.
Une partie des résultats, obtenus dans le plancton, a déjà été présentée dans le chapit * précédent (Tableaux 5, 6, 7, 10 et 13). Les concentrations
21D 210 en Po, Pi mesurées chez des crevettes pélagiques provenant des mêmes pêches nocturnes que les Meganyctiphanes norvegica sont résumées dans le tableau 16. Tr is points principaux se dégagent de l'examen de ce tableau : (1) les concentrations en Po sont particulièrement élevées dans les crevettes du genre Serges tes, aussi bien dans les animaux entiers que, surtout, dans 2ur hépatopancrêas.
210
(2) Les concen rations en Po trouvées dans les muscles sont basses, dans tous les cas i ifêrieures à 1 pCi/g. Le Pb n'a pu être décelé dans au:un des êchantillo s de muscle analysés, on a donc supprimé cette colonne dans le tableau et ndiquê seulement une limite inférieure pour la concentration de l'animal en .ier dans les cas où un échantillon de muscle a été prê'evé. (3) Comme cela a déjà été signalé pour les résultats obienus chez M. m,rvegica, tous les êchar-:mons provenant de la pêche de septembre 1977 ont des
210 concentrations en Po nettement plus basses que les concentrations habituelles.
Les rêsu'tats obtenus chez le calmar, Loligo vulgaris sont présentés dans le tableau 17. Ces résultats semblent à première vue assez surprenants, si l'on compare la première et la deuxième série de calmars de l'Atlantique 00 les concen rations en Po et les rapports Po/ Pb sont tout I fa i t différents. Cette question sara discutée plus en détail par la suite, qu' i l nous suffise ci de dire que le.; calmars de l'Atlantique (le série) avaient été congelés sur un temps inconnu. Si , pour cette raison, on ne t ient pas compte des ré ultats obtenus avec cette première série d'échantillons, on peut, l i encore constater les très hautes concentrations trouvées dans
210 1 'hépatopancrêas. I l semble d'autre part que les concentrations en Pb soient plus élevées dans les échantillons provenant de l'Atlantique que dans ceux de Méditerranée.

- 41 -
iniNl anttar 2 W* ™to r/s
HtpBtopinci*»
ScpUabra 1977 Segtnârv 1977
I 1977 t 1977 t 1977
I-197S
Kirs 1977
Saptcserv 1977
Havenan 1977
Jân»i«r 1ÎJB
a j • o,i > 0.02 - 0,01 1,2 : o.i a,02 : a.oi I J Î 0,1 p, a.C4 * a.ai 1.6 ± 0.1 0.04 ± 0.01 1.3 : o,i 0,05 £ 0,01 2.1± 0,1 0,03 Î 0.01
21 ±1 » 0.03 - 0.01 14 : i O.DS : o.oi n : i o.i5 : o.oi
4,2 0,13 - 0.01 m m 4,6 0,14 S 0,01
4,6 0.7* • 0,03
13 : l 0.03 - 0.01 M KB
27 ÎZ 0.36 t 0.07 M em
28 = 2 0.61 t 0.09 4BÎZ 0.7] ; 0.07
162 t 4 0.09 ; o.ge
Juin U77 4.4 0,20 ! 0.C4
* F/S • rapport paidl fnls/pglds I K ira . non neutre.
Tableau B. 2 1 0 Fo. Z 1 0Po chez des Puiahm ec Sereettej. era<ritui plUqfqvej (WditemaCs) pCI/g sic Î 1 tcirC-tm.
Wdf tl> 'ante
Fi ir ier 1977 [5 ) '
«°Pb
4,3 Î 1,8 >0,004 Î 0,003 (2,1 . 7.1) (nd -> 0.508]
l!lMt<>?lflCf*>l
*.6 01 - « 0.1& * 0.1Ï (46 - 164) {nd - 0.3Z)
AtUnttqut lft» leri* (S) 1 4.4 0.11 Î 0.01 ?0,05 î O.H 4.4 0,05 Î 0,02 0.01 - 0.01 4.2 3.7 - 2.9 0.79 - 0.44
(0.11 - fl.H) (0,03 * 0*0) (0,03 - 0,06) (nd - 0.02) (l.fi - 8.7) (0.34 - 1.4)
4.4 3.7 Î 0.6 »0,t3 S BJ& 4.4 0,66 i 0.16 0,02 ± 0.OZ 3.3 62 Î 12 0,69 * 0.SZ (2.B - 4,1) frO.Ol -/O.oaj (0.«7 - O.SO) (nd - 0,04) (49 - 73) (0,27 - 1,6)
" fn « npport poids fniï/poîdï ne . m • nee «wart, ni • non «Mil . ( ) nwrtrt de ïFfclwni-
Ttblutt 17, ! 1 0 Po . ! W P b c!»i U « I M P . loi tea wltirit. [pCWs *« î "W"» l I *=»t-*»P* " •"*« P"**«*«- « des concentrations M I T H I ) .

- 42 -
2.2. Crustacés et mollusques céphalopodes benthiques.
210 210 Toutes les concentrations en Po, Pb mesurées chez des crustacés
et céphalopodes benthiques sont groupées dans le tableau 18.
Il s'agit, parmi les crustacés, de décapodes : crevettes du genre
Palaemon ou Lysmata, langoustines - Nephrops norvegicus -, crabes - Carcinus
maenas - et de stcmatopodes -5quil1a mantis-. Les molluques céphalopodes
appartiennent aux genres Octopus, Eledone et Sepia.
L'examen du tableau 18 montre que 13 encore, les concentrations les 21D
plus hautes en Po se trouven : dans 1 • hépatopancréas, plus particulièrement
ch»z les crevettes et -dans un as tout au moins- la langoustine. Chez les
céphalopodes, Vhépatopancréas '-es seiches est nettement plus riche en 210
Po que celui des poulpes ; cr.d est encore plus net en ce qui concerne
le 2 1°Pb. Dans tous les échant i l lons de muscle analysés, les concentrations
210 210 trouvées sont basses, aussi bien pour l e Po que pour l e Pb.
H*"its»nertti
i v«=m le t tuudiu 3.2 7.7 î g , ! >o,io * o,n Pi iKTn i c m b r i a.2 *.« : o,l > 0,05 : o.: i brcïnus QiciUl 2.6 i.a t q.i 0,14 t 0,1.1
Seshrçm n a r m i u i 3.7 7.4 t 0.3 0,18 î 0.0' fi»
Souilla sinttf 3.6
6.2
4 .1 : o , i
2.4 t 0,1
0,05 î 0.01
Cctseus fliloirts
3.6
6.2
4 .1 : o , i
2.4 t 0,1 o,i5 : o.oi i?*tioJ a*i g Craput wileirti 6,1 2.0 t 0,1 o.oa : o,oi
Stall -rfHçliKlU
Sipfi -rfflclniH» (cayennes) uJ g
1.9 t O . l ^0.03 £0,01
4.7 t 0.1 0,23 S 0.01
4.5 î 0 ,1 0,23 + ».--.
2.9 * 0 . 1 > 0 . H Î 0 . 0 1
* F/S • np; j r t poîdt fnî i /poids tec, na> * non nsurt. nd •
Tialnu IB. ! 1 0 P o . Z 1 D P6 Oiez o-.*- ** erutucts «
(aCï/g lec - 1 éClrt t/pa).
3.4
4 .1
4.Z
4,4
0.11 * fl.02
0,30 t 0,02
0.60 ± 0,03
0,47 T 0.13
m
ad
ad
0,04 t 0.01
0.02 ï OM ta
2.S
3.0
4,2
3,6
72 î 2
92 î 3
U : l
147 1 7 51 t 2 49 t 2
0,15 - 0 .07
0.ZG t a . i o
0,04 : o . a i
0.83 t O.G* 0.18 ï O.OS 0.Z5 t 0 .05
S.S 0,23 1 0,02 0.C9 - 0.01 3.0 23 t 1 i,o : c i
4.9 0,11 î- 0,02 0,007 : u , a u 3.0 a : i 0,£3 t Q.Q4
5.2
4 .3
0.21 t 0.02
a,u : o.oi Bd
0,02 : o.oi
2,6
3.2
13 î i
63 ï l
0.Z2 î 0 ,02
1.9 î 0 . 1
4.S 0,13 Î 0,02 0.007 i O.0OZ 3.4 54 : i Z.O t 0 . 1
3.3 0.06 t 0,01 nd 3.3 « : i 1.7 t D.I
w i « c * î é .
M usque Cc?httd;aUf b t n t h i ^ î t (WditerrMièe
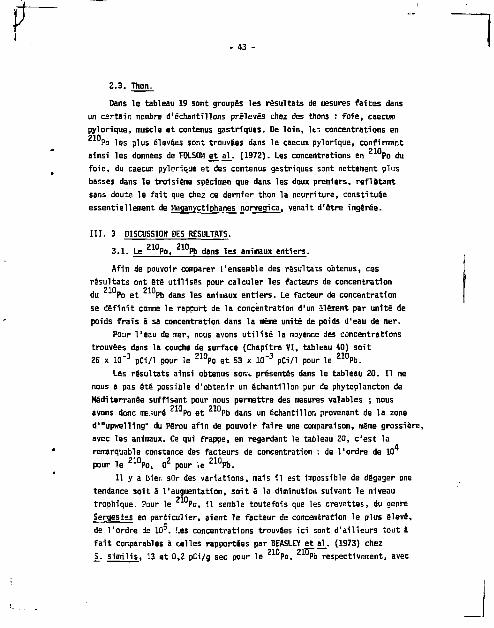
- 43 -
2.3. Thon-
Dans le tableau 19 sont groupés les résultats de mesures fa i tes dans
un certain nombre d'échantillons prélevés chez des thons : f o i e , caecum
pylorique, muscle et contenus gastriques. De lo in , I ts concentrations en 210
Po las plus élevées sont trouvées dans le caecum pylorique, confirmant ?io
ainsi les données de F0LSOM et a l . (1972). Les concentrations en Po du fo ie , du caecur pylorique et des contenus gastriques sont nettement plus
basses dans le troisième spécimen que dans les deux premiers, ref létant
sans doute le f a i t que chez ce dernier thon la nourriture, constituée
essentiellement de Meganyctiphanes norvegica, venait d'être ingérée.
I I I . 3 DISCUSSION DES RESULTATS.
Afin de pouvoir comparer l'ensemble des résultats obtenus, ces
résultats ont été util isés pour calculer les facteurs de concentration
du Po et Pb dans les animaux entiers. Le facteur de concentration
se déf in i t comme le rapport de la concentration d'un âlëment par unité de
poids f ra is â sa concentration dans la même unité de poids d'eau de iter.
Pour l'eau de mer, nous avons u t i l i sé la moyenne des concentrations
trouvées dans la couche de surface (Chapitre V I , tableau 40) soit
26 x 10" 3 pCi/1 pour le 2 1 0 P o et 53 x 10" 3 pCi/1 pour le 2 1 0 P b .
Les résultats ainsi obtenus sont, présentés dans le tableau 20. I l ne
nous a pas été possible d'obtenir un échantillon pur de phytoplancton de
Méditerranée suffisant pour nous permettre des mesures valables ; nous 210 210
avons donc me-.urë Po et Pb dans un échantillon provenant de la zone
d"*upwening" du Pérou afin de pouvoir fa i re une comparaison, même grossière,
avec les animaux. Ce qui frappe, en regardant le tableau 20, c 'est la
remarquable constance des facteurs de concentration : de Tordre de 10
pour le 2 1 0 P o , 0 2 pour le 2 1 0 P b .
I l y a bier. sûr des variations, mais i l est impossible de dégager une
tendance soit à l'augmentation, soit 8 la diminution suivant le niveau 210
trophique. Pour le Po, 11 semble toutefois que les crevettes, du genre
Sergestes en particulier, aient le facteur de concentration l e plus élevé,
de l'ordre de 10°. Les concentrations trouvées ici sont d'ai l leurs tout â
f a i t conparables â celles rapportées par BEASLEY et a l . (1973) chez 210 2fô~ ~ *
S_. s imi l is , 13 et 0,2 pCI/g sec pour le Po, Pb respectivement, avec

- 44
Fofc Caecum pylorlque untinui giitflques Huscle Echantillon PotdS V ; s Z 1 0 p ( J 2 I Q p B F/S ZIQ^ MO^ Aipect !lu> 0 2I0 p „ F / s 210 p o 2
Than n- IE 12 kg 3.5 14.5 *. 0.7 0 .03*0 ,01 4.8 1 « Î 5 Q.CB * 0.01 1/2 liquide 7,0 Î 0.6 nd 3,7 0.34 Î 0.02
Than n* IS IB kg 3,9 1B.S * O.B 0,03 2 0,01 4.6 JQ5 t 5 n,05 J 0,01 liquide fi.fi - 0,B 0,OG *• 0,06 3.6 0.(6 - 0.04
Than n- 'J 12 kg 3,5 B.9 ! 0,G 0,02 J 0,01 4,4 41 1 3 0,03 Î 0,01 is l lde" 2.B i OJ 0.12 * D.OZ no r»a
*F/S • rapport potdi frali/potds i t e . w* » nw wwurfc nd » nan deceit* Ktiorifc de HeginyctlBhwei norveqica.
Tableau 19 - dint quelques échantillons de thon Thunnus thymm (KMIumnte) (pCI/g sec - 1 écart-type).
Organisms ™P= pCt/kg poids f r a i s rc
ZlOpb
pd/sg po<m frais FC
Rapport
" " p . / ^ r b
Phytoplincton * 6W 3 X 10⁴ 90 la x i o ! 7
ttsoinyctlDhinas oorveqica
ûctflDui vulgaris
200
350
1 X 10⁴
1 X 10⁴
13
19
3 x 10 z
4 X l 0 Z
là
10 PaslDhïM slvario 350 1 X ÎO 4 9 2 X l 0 * 40 Cletlane aldnnandll 370 1 X 10⁴ > S > 1x10² 02 Cardnus naenss 690
050
3 X 1114
3 X 1 0 4
S4
U
U x 10 1
2 « 1 0 2
13 Lollqo vul earls
690
050
3 X 1114
3 X 1 0 4
S4
U
U x 10 1
2 « 1 0 2 77 Seo1a ûfflcliulis 940 4 X M 4 44 9 x 10* 21 Souilla nantis 1140
1400
• U 1400
2400
5 X 10⁴
6 X 1 0 4
S X 1 0 4
10 X 104
14
S2
>31
3 x 1 0 * > 3 x 10*
10x10*
>S x 102
ai Palaenon serrstus
1140
1400
• U 1400
2400
5 X 10⁴
6 X 1 0 4
S X 1 0 4
10 X 104
14
S2
>31
3 x 1 0 * > 3 x 10*
10x10*
>S x 102
sa Mlcrozaaplancton non ti ( / 2QQJM)
Lystnita s&tlcaudata
1140
1400
• U 1400
2400
5 X 10⁴
6 X 1 0 4
S X 1 0 4
10 X 104
14
S2
>31
3 x 1 0 * > 3 x 10*
10x10*
>S x 102
27
77 Sereestes aretleus 4900 88 ia x 10Z 5S SercBstai SD 4900 20 X 10 4 23 5 x l O 2 213
'Echantillon de phytoplancton du Pérou. z l 0 Po : 6.4 ï 0,4 pct/s sec et ! M P b i 0,9 i 0,1 pCf/g sec. Rapport poids frais/poids sec ~ 10.
Tableau 20. Facteur de concentration du z l o r o . z ! 0 Pb et rapporta ! I 0 Po/ 2 l , > Pb chez des orsanlsoes narlns pélagiques ou benthlques. Concentration dans l'eau de œr : 26 x 10"3 pCi/1 de 2 !°Po. 53 x 10"3 pC1/l de

45 -
Organ.1 stwi Z 1 D P O
p d / k g poids f r a i s EC
Z 1 ° P b
pCi/xg poids frais PC
Rapport
" " P O / ™ »
Eledane a.dravandll sooo î , l J 85 2 x 10³ S3
HeoanyctiDhanes norvegica
5100
5200
2 « 1 0 s
3 » 105
120
13
2 x 1 0 s
0,3 X 10?
43
C a r d nus maenis
5100
5200
2 « 1 0 s
3 » 105
120
13
2 x 1 0 s
0,3 X 10? 400
Octoous vulgar is 7500 3 I 10s 200 6 X 10³ 27
PaslDhaea s.vado 7800 3 x 10* 120 2x 10³ 05
Soui l la mantis '.4DD0 5 x 10s 70 1 X 10³ 200
Seoia o f f i c i n a l i s 16000 7 x Ml' S70 11 X 103 28
Neghrtms norveqlcus 24000 9 x 10 s 120 2x10³ ZOO
Lol lCD vuloaiMs 30000 12 x 10s 120 2 xlOÎ 250
Ivsmata setlcaudats 31000 13 x 10s S I X103 480
Pilaemm seiratus 37000 IS x 10s 100 2 x 10³ 370
Servestes arct ieus 59000 24 x ID 5 2000 «0 > 103 30
Seroestes sp. 61000 24 x 105 300 SxK)3 200
TablEâu 2 1 . Facteurs de concentration du I ™Po. "°Pb et ripport. a 0 Po/ Z I °Pb
dans l'hepatopancrtas d'organlsms marins pelagfaues ou benthlquss
(Tableau 20).
210 210 un rapport Po/ Pb de 65. Nos valeurs moyennes sont de 21 et
?10 ?1D 0,3 pCI/g, avec un rapport Po/ Pb de 70. De même, on peut rapprocher les concentrations trouvées Ici chez les crevettes du genre Paslphaea,
210 1,4 pCi/g de Po en moyenne, de celles trouvées par les auteurs précités chez des crevettes du même genre, 3 -Ci/g.
Cette différence notable dans les concentrations est d'ailleurs assez surprenante et diffici le 3 expliquer : les crevettes du genre Sergestes et Pasiphaea ont en effet un mode de vie très proche, elles occupent la même niche écologique et , apparemment, ont la même nourriture. Peut-être faut-il
210 voir dans la différence des concentrations en Po le reflet de la différence qui existe dans le mode de digestion de ces deux genres de crevettes. Les Sergestes, en effet, qui sont des Penaldës possèdent un moulin gastrique, ce qui leur permet d'ingérer des proies de différentes grosseurs sans les dila-cérer, la dilacëration prenant place 5 l'intérieur de l'estomac. Chez les

46 -
Pasiphaea, qui sont ties Caridês, le moulin gastrique n'existe pas et
l ' ingestion de nourriture ne se f a i t qu'après dilacération des proies
en petits fragments par les pièces buccales (OriORI, 1974).
De même, i l existe des différences dans les habitudes alimentaires
des céphalopodes qui, par a i l leurs , ont un régime similaire : ainsi les
seiches e t les calmars ont tendance â ingérer rapidement de plus gros
morceaux de proies que les poulpes (BIDDER 1950, BIDDER 1966 ; BOUCAUD-
CAMQU, 1973 ; WELLS, 1978) et dans ce cas aussi, on trouve des concentra
tions en Po plus élevées chez Loiigo et Sepia que cher Octopus ou
Eledone.
Comme nous l'avons vu (tableaux 10, 13, 16, 18) les concentrations 21 n
les plus hautes en Po se trouvent dans 1'hêpatopancrêas. Or, c est un tissu fragi le et mou qui se l iquéf ie très vite (BIDDER, 1965 ; nos
observations), i l est donc possible qu'au moment de la dilacêraiion fine
de la proie, des morceaux d'hépatopancréas ne soient pas ingérés ou bien 210
encore qu' i ls perdent une partie de leur Po avant de l i t r e . Le résultat 210
net serai t qu'à partir d'une même proie, la quantité de Po ingérée serait
supérieure chez les animaux qui avalent de gros morceaux de nourriture. Ce
n'est qu'une hypothèse, qui demande â être vérif iée.
Dans le tableau ZD, nous n'avons pas u t f i s é les résultats obtenus avec
les calmars de l'Atlantique ( le sér ie ) . En ef fe t , comme nous l'avons déjà
mentionné, ces calmars avaient été congelés pendant un temps incornu. Or, 210
non seulement les concentrations en Po étaient basses, mais encore le
rapport Po/ Pb é ta i t de Tordre de 2 , bien plus faible que celui
obtenu chez les calmars de Méditerranée. Ces faits suggéraient un temps de
congélation très long et ce temps a pu être calculé en ut i l isant l'équation
habituelle j ^ ^ - »
210 dans laquelle An = 4,3 pCi/g et A = 0,06 pCi/g, soit l 'act iv i té en Po non "supporté" au temps t^(tableau 1?) et à = 0,005/j . Le temps ainsi
210 trouvé est de l'ordre de 850 jours. (La décroissance du Pb, minime
en 2 ans n'a délibérément pas été prise en considération) Comme moyen de
vér i f icat ion, nous nous sommes procuré des calmars de l'Atlantique f r a î
chement pêches et nous les avons immédiatment analysés, obtenant des résul
tats tout 3 f a i t comparables â ceux trouvés dans les spécimens de Méditer
ranée. Le même calcul que celui décri t précédemment nous a permis d'estimer
en -
un temps de congélation de 820 jours, en utilisant pour A0 : 3,7 pCi/g (tableau 17). La tlatation" par la "po des nourritures marines congelées semble une très bonne méthode, â condition toutefois d'avoir une estimation assez precise de l'activité au temps zéro.
210 3.3. Po : facteur de concentration et hëpatopancréas.
W00DHEAD (1973), CHERRY et SHANNON (1974) avaient déjà attiré l'attention sur le fait que pour les émetteurstt des mesures dans les animaux entiers ne reflètent que très imparfaitement ce qui se passe réellement (en termes de dose de radiation), en particulier dans le cas où la distribution n'est
210 pas homogène. Très clairement, ces remarques s'appliquent au Po et on peut s'en rendre ooipte en regardant le tableau 20.
Si l'on prend par exemple le cas des céphalopodes, tous semblent avoir sensiblement le même facteur de concentration : 3 x 10* chez Loiigo, 1 x 10* chez Octopus ou Eledone, 4 x 10* chez Sepia. Or, si l'on regarde le tableau 21, les facteurs de concentration trouvés dans Thëpatopancréas sont, eux, très différents : de Tordre de 10^ chez les poulpes, près de 10 6 chez les seiches,ils sont de 10 5 ou plus chez les calmars. Ce que le facteur de concentration du Po de l'animal entier reflète, c 'est , en fai t , ce qui se passe au niveau de Vhëpatopancréas. La figure 2 montre, en effet, qu'entre 50 et 95 % du Po contenu dans l'animal entier se trouve dans son hëpatopancréas. Il est aussi intéressant de constater que
210 chez tous les animaux benthiques analysés, plus de 75 % du Po se trouve dans cet organe, qui est proportionnellement plus massif que celui des animaux pélagiques. Pour en revenir â l'exemple des céphalopodes, Vhêpa-topancréas de calmar représente environ 2 S du poids total, alors que chez le poulpe ou la seiche ce pourcentage est de 6 à 8 S, ce qui explique les résultats obtenus pour les facteurs de concentration des animaux entiers.
210 En ce qui concerne le facteur de concentration du Po dans Vhëpa
topancréas 11 est, suivant les cas, de un â deux ordres de grandeur supérieur â celui de l'ar.imal entier (tableau 21). Les facteurs de concentration de Tordre de 10° se trouvent chez les crevettes (I l'exception des
210 Pasiphaea) et chez les calmars. Pour le Pb, la situation semble différente, avec un facteur de concentration assez uniforme de Tordre de 10r dans tous les échantillons, avec peut-être une légère tendance à être un peu supérieur chez la seiche. La valeur de 40 x 10^ mentionnée pour les Sergestes arcticus est, en effet, suspecte. Cette valeur est obtenue en

\ 48
100 r-
ÊP 25
4 5 6 7 8 S POIDS HEPATOPANCREAS C%)
10
Fig. 2. Corrélation entre l 'activité en Po de 1'hépatopancréas (exprimée en pourcentage de l'activité de l'animal entier) et le poids de 1 'hépatopancréas (exprimé en pourcentage du poids de l'animal entier). (,) Animaux pélagiques (») Animai" benthiques.

- 49 -
faisant la moyenne des deux concentrations trouvées (tableau 16), 210
l'une de ces concentrations étant 11 pC1/g, ce qui, pour le Pb, et d'après nos autres résultats, est exceptionnellement haut.
210 La technique qui nous permet d'analyser le Pb est basée sur
210 e e
la mesure des concentrations en Po au moment de la 1 et de la 2 disposition quelques mois après. Le rendement d'extraction et déposition du Z 1 0 P o est de 98 - 2 %, i l suffit donc que du Z 1 0 Po n'ait pas été entièrement déposé la I e fois pour qu'il entache les résultats d'une erreur au moment de la 2 e déposition ; ceci est particulièrement vrai quand le rapport Po/ Pb est très haut, ce qui est le cas des Sergestes•
Si l'on ne tient pas compte, provisoirement, et pour les raisons que nous venons d'indiquer, des résultats obtenus chez Seroestes arcticus,
210 210 " on peut voir que le rapport Po/ Pb dans 1'hépatopancrêas varie de 43 a 480 ; les rapports inférieurs â 100 se trouvant chez Heganyctiphanes, Pasiphaea et les céphalopodes benthiques, dans les autres cas la moyenne de ce rapport est de l'ordre de 300. Un rapport d'activité de 300 implique un rapport, en atomes, de 5. Or, nous l'avons vu, dans l'eau de mer le
210 210 rapport des atomes de Po 8 ceux de Pb est de l'ordre de 0,01, ces
210 chiffres indiquent donc que les atomes de Po sont accumulés préféren-210 tiellement 3 ceux du Pb par 1 'hépatopancrêas par un facteur voisin de 500.
Une te l le affinité est difficilement compréhensible, d'autant plus qu'il s'agit d'un élément qui n'est pas bioloriouement essentiel. Afin de nous assurer qu'il ne s'agissait pas d'un artefact dû, en fait , S l'accumulation
210 210 de Bi, (précurseur direct du Po) nous avons mesuré celui-ci dans un certain norbre d'échantillons d'hépatopancrêas. Ces échantillons ont été prélevés chez des animaux vivants, anesthésiês par le froid, disséqués et analysés au=.-.itôt. Les résultats sont présentés dans le tableau 22, i l s
210 indiquent clairement que c'est bien le Po qui est accumulé sélectivement, 210
les niveaux du Bi étant i peu près du même ordre que ceux du 210 Pb. III. 4. CONCLUSIONS.
210 210 De cette étude du Po, Pb chez des crustacés et mollusques céphalo
podes pélagiques ou benthiques, on peut dégager un certain nombre de points. (1) Dans les animaux entiers, les facteurs de concentration sont remarqua-
A 210 ? 210 blement constants : de l'ordre de ".0* pour le Po, 10 pour l e Pb. Le
210 210 rapport Po/ Pb des concentrations mesurées est toujours supérieur â 10, pouvant aller jusqu'à 200.

(2) Les concentrations trouvées dans les muscles sont basses, inférieures
S 1 pCi/g sec pour le Po (facteur de concentration de l 'ordre de 1 0 3 ) , 210
souvent non mesurables pour le Pb dans les échantillons analyses. 210
(3) Les facteurs de concentration du Po de tous les échantillons d'hê-
patopancréas analysés sont élevés, de Tordre de 10 ; chez les calmars et
les crevettes (â l'exception de Pasiohaea) ce facteur est de 10 . Pour le Pb 1 ; recteur de concentration est de 10 environ.
210 210 (4) Les rapports Po/ Pb dans Vhëpatopancrâas sont élevés, de 30 î 500. Ces rapports sont plus bas chez les céphalopodes benthiques que chez les céphalopodes pélagiques.
210 210 Le rapport Po/ Pb est un "out i l " très fiable : une "anontnalie"
dans ce rapport a a t t i ré notre attention et nous a permis de calculer le
temps de congélation de calmars vendus dans le commerce. L'examen de ces
rapports (tableau 21) je t te quelque doute sur la validité des mesures du 210
Pb dans deux cas (Carcinus naenas et Sergestes arcticus). (5) Les très hautes concentrations mesurées pour le Po ne sont pas dues
210 i une production "in situ" £ par t i r de son précurseur igmëdiat l e B i , i l
210 s agi t d'une accumulation préférentiel le de Po.
Echantillon ™I» "°U ™P.
Penaeus kerathurus 0,05 t 0,10 0,3 ±0,1 30 t 1
Eledone aldrevandfl 0,4 * 0,1 0.S ± 0,1 32 t 2
Lollqo vulqarli NH < 0,3 t 0,2 270 t 6
m c 0,4 î 0,3 114 1 3 KH •c 0.6 i 0,2 333 t T
NH - non assuré
Tableau 22. Concentration en J 1 V 2 1 ° B i r t 2 1 1 1
>0 d'un certain
noftbre d'échantillons d'hâpatopancréu de crustacés et collusqties céphalopodes. pCI/g ste î 1 «cart-type.
f*
CHAPITRE IV . ' 1 U P 0 , t l u P B CHEZ LES CREVETTES.
- 51 -
I Ï . 1 . INTRODUCTION.
Les crevettes sont des crustacés décapodes qui appartiennent â la supersection des Macroures, Natantia, i l en existe deux superfamilles, les Penaeidês et les Caridés. Au point de vue évolution, les Penaeidês sont considérés comme les représentants les plus primitifs des crustacés décapodes, apparaissant au Permien (270 millions d'années) et Trias (225 millions d'années) alors que les Caridés seraient d'apparition plus récente, au Jurassique (190 millions d'années) (WICKINS, 1976). La majorité des Penaeidês sont marins, mais i l existe chez de nombreuses espèces -aussi bien parmi les Penaeidêr que les Caridés- de grandes possibilités d'osmo-régulation, leur permettant de supporter d'importantes variations de salinité (0H0RI, 1974 ; WICKINS, 1976).
Dans la supersection des Macroures, Natantia, i l existe environ 1940 espèces, dont moins de 210 sont pélagiques (0MORI, 1974). Mais malgré ce nombre relativement restreint d'espèces, les crevettes pélagiques représentent une part non négligeable de la biomasse du micronecton. Ainsi, FOXT0N et ROE (1974) mentionnent que dans certaines zones océaniques les crustacés décapodes représentent un tiers de cette biomasse. AIZAWA (1974) étudiant le plancton de la colonne d'eau de 0 â 1000 m dans le Pacifique Nord Ouest, donne, comme chiffre moyen de la biomasse des crevettes, environ 10 %, tout â f a i t comparable à celle des euphausiacés, des poissons et des chaeto-gnathes. Cette proportion est sujette â de grandes variations suivant l'heure et la profondeur..Ainsi la nuit , entre 0 et 200 m, la biomasse des crevettes représente 3 % environ de la biomasse totale, entre 400-600 m, 14 S, entre 600-800 m, 38 %, devenant ainsi la biomasse la plus importante après les copépodes, au dessous de 200 m. Le jour, le; crevettes sont très rares au dessus de 400 m, leur abondance maximum se situant entre 400 et 600 m, alors qu'au dessous de 600 mètres i l n'y a pratiquement pas de di f férence avec la nuit. Ces chiffres donnés par AIZAWA (1974) pour le Nord Ouest Pacifique sont tout â fa i t comparables â ceux d'OMORI (1974) pour les régions sub-tropicales et tropicales des océans en général : 10 % environ de la biomasse du zooplancton et 15-25 % de la biomasse du micronecton dans la colonne d'eau de 0 â 1000 m. Suivant la latitude, la biomasse varie et les concentrations les plus élevées se trouvent 3 des profondeurs différentes : °rtre 1000 et 3000 m dans les régions subarctiques, entre 200 et 500 m entre 30° et 10" N et entre 1000 et 2000 m dans les

- 52 -
régions êquatoriales. Ces variations sont dues à la différence de
température e t de pénétration de la lumière qui existe aux différentes
lat i tudes, facteurs qui influent sur la biomasse des crevettes de même
que la quantité de nourriture dans l a couche superficielle sus-jacente
00 certaines espèces se nourrissent. En e f f e t , quelle que soit la l a t i -
» tude, la distribution de la bionasse est différente de jour et de nui t ,
témoignant ainsi d'importantes migrations verticales journalières.
• Suivant l'amplitude de ces migrations on peut dist-'quer (OMORI, 1974)
des crevettes épi pélagiques, mésopélagiques et bathypëlagiques. Les
crevettes épipélagiques et mésopélagiques effectuent des migrations de
l'ordre de 100 à 400 m par jour et l e niveau qu'elles quittent la nuit
au cours de ces migrations est occupé par le groupe qui normalement v i t
à un niveau plus profond. Quant aux crevettes bathypëlagiques, certaines
effectuent des migrations de faible amplitude (50 m), d'autres ne migrent
pas.
Dans le schéma de ces migrations, tous les auteurs s'accordent â
reconnaître que la nuit entre 400 et 700 m 11 existe un niveau où la
biomasse est minimum. Ce niveau correspond aussi à un changement de faune
reflète par une pigmentation différente des crevettes : les crevettes épi-
pélagiques, à moitié rouges avec des chromatophores ventraux sont alors
remplacées par des crevettes entièrement rouge sombre, mesopelaji"ues
profondes ou bathypëlagiques. (FOXTON, 1970 ; AIZAWA, 1974 ; CMORI, 1974).
Grâce S leurs migrations verticales, les crevettes pélagiques forment un
mai 1lon important entre le plancton de surface qui sert de nourriture, pr in
cipalement la nuit aux espèces épi et mêsopëlagiques, et les espèces méso-
pélagiques profondes et bathypêlagioues qui ne migrent jamais jusqu'aux 210 210
couches de surface. Une étude détai l lée de la question du ' Po (et Pb) chez les crevettes nous a semblé intéressante l plusieurs t i t res :
210 « (1) les concentrations en Po sont en général très hautes chez les cre
vettes et plus particulièrement dans leur hépatopancrêas, cowne nous l'avons
vu d'après un nombre limité de cas, dans le chapitre précédent
(2) on a vu aussi qu'une très grande différence dans les concentrations
trouvées peut exister, dans le cas des Sergestes et Pasiphaea, par exemple,
qui pourtant occupent la même niche écologique : cette différence est-e l le
fortui te ou bien la retrouve-t-on si l 'on compare systématiquement le 210
Po chez les Pénaeidés et les Caridés ? 210
(3) le Po peut-il être ut i l isé corane un traceur biologique naturel , du

- 53 -
régime al imentaire des crevettes en p a r t i c u l i e r ? Ce régime a l imenta i re ,
plus spécialement pour les crevettes mésopëlagiques profondes, est souvent
mal connu, d'après des examens dE contenus gastriques pas toujours iden
t i f i a b l e s .
(4) Etant donné que la biomasse des crevettes pélagiques représente une
par t importante de la biomasse du zooplancton et micronecton et que Les
crevettes effectuent des migrations ver t ica les journal ières de grande am
p l i t u d e , e l les peuvent jouer un rô le non négligeable dans le t ranspor t
ve r t i ca l du £ i - P o , clu?b.
2 . 1 . Résultats.
Vas résultats ont fait l'objet d'une publication où ils sont discutés
en détail (CHERRY et HEYRAUD, 1981). Nous allons ici rappeler les princi
paux points de l'étude, en y ajoutant quelaues résultats très récents, 210
ar su. t en cours d'acquisition actuellement. Les concentrations en Po, 1 ' 'Po des crevetxes entières sont présentées dans le tableau 23 où les
•?i espèces analysées sont disposées dans un ordre croissant quant â leur
concentration er. Po. Parmi ces 31 espèces, 16 sont des pénaéidés, 15
des caridés ; la gamme des concentrations trouvées va de 0,42 â 45,1 pCi/g,
c'est donc une gamme très large et nous avons utilisé la médiane pour
analyser nos résultats. Cette médiane, pour les 31 concentrations mesurées
est de 8,0 pCi/g sec. Parmi les 15 espèces qui ont des concentrations au
dessous de la médiane, 12 sont des caridés, 3 des pénaéidés, alors que
parmi les 15 qui ont des concentrations supérieures â la médiane, 12 sont
des pénaéidés, 3 s'ont des cari dés. La médiane pour les pénaéidés est de
19,1 pCi/g et pour les caridés de 5,2 pCi/g sec. Dans le tableau 23' sont 210 210
résumés les résultats pour le Po, Pb dans les hépatopancréas de ces 210
méfies crevettes. La médiane, pour les concentrations en Po dans les
27 cas où T hépatopancréas a pu être disséqué, est de 85 pCi/g sec. Parmi
les 13 espèces chez qui 1? concentration mesurée est inférieure à la mé
diane, 10 sont des caridés, 3 sont des pénaéidés, alors que parmi les 13
espèces qui ont des concentrations supérieures à la médiane, 10 sont des
pénaéidés, 3 sont des caridés. Dans 1'hépatopancréas la médiane pour les
pénaéidés est de 197 oCî/g sec, pour les caridés de 65 pCi/g sec. 210
Pour le Pb, la médiane, pour la concentration des animaux entiers 210 210
est de 0,12 pCi/g sec et pour le rapport Po/ Pb, de 77 ; pour

Hems Catégorie
* Or ig ine
N d
echa ™Po Z l 0 f t Pa/Pb
P i laeean l o n a i r o s t r l s C l P 2 0,42 - 0,06 0,02 * 0,01 21
Paslohaes s lvada C2
Pi
H
H
fi 1.3 i 0.5
2,9 i 0,2
0,03 î 0,01
0,14 î 0,09
43
Penaeus kerathurus C2
Pi
H
H
fi 1.3 i 0.5
2,9 i 0,2
0,03 î 0,01
0,14 î 0,09 21
Cranaon v u l g a r i s Cl P,H 3.3 t 2,5 0,06 î 0,03 55
H o u r e n s l f e r u s c? H 3,t- î 0,1 0.04 î 0 ,01 90
Palaerron se r ra tus Cl P.H 4,0 î 1,0 0,05 t 0,01 eo Phl locneras ecMnu la tus Cl M 4.9 î 0,2 nd -Alnheus dent ioes Cl M 5.1 t D,3 0,15 ï 0,10 32
Acanwechvra Delaolca c? y. 2 5,2 t 2,S 0,07 î 0 , 0 * 74
Pasichaea n u l t l d e n t a t a c? H 1 5,4 î 0,3 0 ,0* ï 0.Q1 135
Lysmata se t i cauda ta Cl H 5 6 ,1 t 1,5 0,17 î o . : o 3fl
PontocaHs l a c a i e l Cl H 2 G,6 î 0,5 0,74 î 0,0a S
Se raesus roOustus P? K 2 6,6 t 1,4 0,05 î 0,02 132
Pandalus Jordant Cl
P?
0
H
fi
2
7,0 î 1,3
7,2 î 1,6
0,14 î 0,07
0,75 î 0.05
50
Seroestes carn icu lum Cl
P?
0
H
fi
2
7,0 î 1,3
7,2 î 1,6
0,14 î 0,07
0,75 î 0.05 10
Penaeus semtsulcatus P i K 8,0 i 0,3 0,01 î 0,01 BOO
Funchal la woodward) P? H 8,1 î 0,3 0,04 t 0 ,01 202
P les i on i ka so . c 2
P2
Pi
H
H
K
10,4 ; 0,4
12.3 î 5,2
13.3 t 0,5
Û.19 î 0 ,01
0,14 î 0,09
0,07 t 0 ,01
55 "
Paraoenaeus I c n o i r o s t r i s c 2
P2
Pi
H
H
K
10,4 ; 0,4
12.3 î 5,2
13.3 t 0,5
Û.19 î 0 ,01
0,14 î 0,09
0,07 t 0 ,01
B8
Hetaoenaeus s t s b b l n q i
c 2
P2
Pi
H
H
K
10,4 ; 0,4
12.3 î 5,2
13.3 t 0,5
Û.19 î 0 ,01
0,14 î 0,09
0,07 t 0 ,01 ISO
S y s t e l l a s o i s d e b l l t s C4 N 14,0 î 0,7 0,12 î 0,07 117
Acanthenhyra auadr isplnosa C4 N 14,0 t 0,7 0.0S t 0,03 280
Serqeï tes S D . P? H 19.0 t 1,0 0.09 î 0,02 211 .
A r i s t eus antenna tus P2 H 19,2 i 4,7 C,25 t 0,12 74
Sercestes a r c t l e u s P? H 19,3 t 6,2 0,32 J. 0,55 60
Metaoenaeus a f f l n i s P3 K 22.0 * 0,6 0,11 î 0,02 200
ParacenaeoDsIs s t y l i f e r a P3 K 22,5 î 1,2 0,07 t 0,02 321
Hetaoenaeus monoceros P2
n H
H
23.6 t 3,3 38,5 î 2,5
0,58 i 0,48
0,27 t 0,05
41
Serqestes n rehens iHs P2
n H
H
23.6 t 3,3 38,5 î 2,5
0,58 i 0,48
0,27 t 0,05 143
Sergestes s o . P4 N 43.0 t 2,0 0.14 î 0,05 307
Gennadas eleoans P4 K 45.1 t 4,3 1,04 t 1.19 43
*P • Penaelde *s eus-catégor ies • t - Car i de
1 • c û t i e r 2 • pé lag ique
3 .Koweï t 4 - pélagique i ro fcnd
• «
* * O r i g i ne : P " P lymiu th . H • N a t a l .
H - Méd i te r ranée. K > Koweït
0 • Oregon.
TABLEAU 23. 2 1 D P 0 " « P S chez les c r e v e t t e s (pCi /g se i 1 Ecar t - type)
'pd« non décelé

55 -
NOMS Cft egorle Origine a a
N d'
echa. ™fc 2 1 ° P b Po/Pb
Palaemon l o n q l n s t r f s <=1 P 2.4 • 0 , 1 0.05 ! 0.02 4B
Paslptiaea slvade c? H 29 t IB 0,37 t 0,35 70
Penaput kerathurus f l H SO * 6 1,7 ! l .B 29
Cranqon vulgar is ' I M 20 t 3 0,60 t 0.50 33
Llow* ensfferas c? H « tz 0,23 S 0,12 1B3
Palaeraan l e r r a t u s Cl P.H as t 26 0,G3 î D.5B 135
PMlocheras eeMnulatus Cl H 117 î 5 nd -Alsheus dentlbes Cl H 70 t 6 nd -Acantheohvra pelaglca cz
H « t 8 ni -Pasluhaea rauitldentata c? H 29 î 2 0,2? ! 0,03 142
Lysnata setlcaudata Cl H 73 1 2 4 0,70 t 0,88 94
Pontoearis lacazei Cl H 65 t 4 1.1 t 0,4 59
Seroestes robustus '2 H 42 ± 3 0,29 t 0,13 145
Pandalus Jûrdanl Cl 0 SS î 19 0,42 t 0,10 157
îerce i tes carnlculua '? H 197 t 17 31 = 2 G
Penaeus sealsulcatus '3 K 142 î 6 0,14 t 0,05 1014
FunchaHa woaduardl '! H 47 î 2 0,22 i 0,04 214
Pleslonlka se. c? H 343 t IB 4 ,1 t 0,6 B4
ParaBinaeui lona l ros tMs '? K 241 S 141 1,3 t 1,0 1B5
Metaoanaeus i tebh lng l ' l K 291 ± 11 1,5 t 0,2 194
Svstellasois d c b l U s C4 H - - -Aeaflthephyra quadrtsplnosa Cd H 242 t 14 nd -Sergestes sp. ' 2 H 225 t 9 1.1 t 0.2 205
Aristeus antennatus f? H 102 t S I 0,51 î 0,30 200
Seroestes arct lcus r? H 2 166 S 6 S.5 t 7,7 30
Hetaoenaeus a f f i n l s ' i K 1 S60 t 14 1,1 t 0,2 509
Parapenaeeesls S t y U f e r a ' i K 0 - - -Hetaoenaeus mnocerps '? K 2 303 2 35 16,3 t 16,2 IS
Seroestes prehensHfs ' t N Q - - -Sergestes sp. f* H 1 745 Z 35 5,4 t 2 ,1 138
Gennadas eleuans ' t H 1 41S t 22 3,3 i 0,6 125
nd. * e t " > v o i r tableau 23 .
Table j 2 3 ' . 2 1 0 P o . 2 1 0 P b dans rhêjatcDancréas de crevettes.

- 56 -
l'hêpatoDancrêas, cette médiane est de 0,78 pCi/g sec et le rapport 210 210
Po/ Pb 138. Là encore, on observe une tendance pour les valeurs obtenues chez les pênaëidés à être au-dessus de la médiane et pour celles obtenues chez les caridês à être au-dessous, mais ce n'est pas aussi net
210 que dans le cas du Po. Alors que dans les tableaux 23 et 23' sont présenties les valeurs
moyennes quand plusieurs échantillons d'une même esnèce ont été analysés, dans le tableau 24 sont présentées les valeurs individuelles uti l isées pour calculer ces moyennes, dans quatre espèces pëchées en Méditerranée : Sergestes arcticus, Pasiphaea sivado, Gennadas elegans et Acanthephyra pelagica. Ces quatre genres constituent une part très importante de la biomasse des crevettes pélagiques dans toutes les mers : Pacifique (OMORI, 1974 ; AIZAWA, 1974), Atlantique (FOXTON, 1970 ; LAGARDERE, 1975), Méditerranée enfin où d'après l'étude de VU 00(1978) les deux premières de ces espèces représentent plus de 88 S de la biomasse des crevettes en mer Ligure. Elles sont "superficielles" trouvées la nuit en surface, dans les 100 premiers mètres, alors que parmi les crevettes "profondes", Gennadas elegans est l'espèce dominante mais on trouve aussi bon nombre d'Acanthephyra pel agica. Dans un cas comme dans l'autre, les concentrations en Po mesurées sont nettement plus hautes chez les pênaëidés (Sergestes et Gennadas) que chez les caridês (Pasiphaea et Acanthephyra). Les concentrations mesurées en septembre 1977 et ju i l l e t 1979 sont plus basses que celles obtenues à d'autres époques de l'année. Nous avions déjà mentionné (Chapitre II) que les concentrations en Po mesurées chez des Heganyctiphanes norvegica provenant de la même pêche de septembre 1977 étaient également basses. Certains des résultats présentés dans les tableaux 23 et 23' ont été obtenus au cours de ces pêches (en partie ou en totalité) , 11 s'agit de ceux de : Pasiphaea sivado, Acanthephyra pelagica, Sergestes robustus, Sergestes comiculum, Funchalia woodwardi, Aristeus antennatus et Sergestes arcticus. On devra tenir compte de ce fait dans la discussion des résultats, et i l est bon de noter que des 4 pênaëidés qui avaient des concentrations au-dessous de la médiane (soît dans les animaux entiers soit dans leur hëpato-
210 pancréas), trois proviennent de ces pêches. Les données pour le Pb ne sont pas présentées dans le tableau 24 car trop limitées ; de façon générale
210 la tendance est la même que pour le Po, avec les valeurs mesurées chez les pênaëidés supérieures à celles mesurées chez les caridês et des valeurs plus basses en septembre 1977 et ju i l l e t 1979.
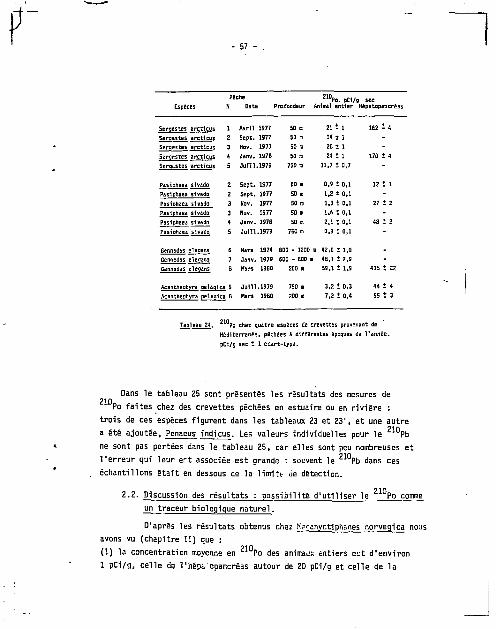
ro. pu /g sec Espèces H Date Profondeur Animal entier Hépatopancrèas
Seraestes arctlcus 1 Avril 1S77 50 0 21 t i 162 - 4
Serqestes Brctlcus 2 Sept. 1577 50 m » t 1 -Serqestes arctlcus 3 Hov. 1977 50 a 26 1 1 -Seraestes arctlcus 4 J a m . 1978 50 m Z1 t 1 170 t 4
Sergi-stes arctlcus 5 Julll .1979 750 D 11.7 t 0.7 -Paslphaea slvada 2 Sept. 1977 50 m 0,9 t 0,1 12 î 1
Paslghaea slvada 2 Sept. 1977 S0 m 1,2 ± 0,1 -Pasiphaea slvado 3 Nov. 1977 50 g 1,1 î 0,1 27 î 2
Pasiphaea slvada 3 Nov. 1977 50 m 1.6 t 0,1 -Pasiphaea slvada 4 Janv. 1978 50 m 2,1 : 0,1 4B î 2
Pasiphaea sivado S Julll.1979 750 m 0.9 î 0,1 -Gennadas elegans 6 Mars 1974 BOO - '1Z0O m 42,0 t 1,0 . Gennadas eleaans 7 Janv. 1979 600 - B00 m 4a.1 1 2,9 -Gennadas eleaans B Hars 19ao 200 m 59,1 t 1,9 415 t 22
Acantheohyra oelag ca 5 Julll .1979 750 m 3,2 t 0,3 44 t 4
Acanthephyra pelaalca H Hars 19BQ 200 in 7,2 t 0.4 55 t 3
Tableau 24. pu chez quatre espèces de crevettes provenant de
Méditerranée, pechëes a différentes époques de l 'année.
pCi/g sec î 1 écart-type.
210, Dans le tableau 25 sont présentes les résultats des mesures de
Po fai tes chez des crevettes pëchëes en estuaire ou en rivière :
t rois de ces espèces figurent dans les tableaux 23 et 23 ' , et une autre
a été ajoutée, Penaeus indicus. Les valeurs individuelles pour le Pb
ne sont pas portées dans le tableau 25, car elles sont peu nombreuses e t
l ' e r reur qui leur er t associée es t grande •. souvent le 2 1 0 P b dans ces
échantillons é ta i t en dessous de la limite cie détection.
2.2. Discussion des résultats : possibil i té d 'ut i l iser le Po comme
un traceur biologique naturel .
D'après les résultats obtenus chez Keçanyctiphanes norvegica nous
avons vu (chapitre II) que :
(1) la concentration moyenne en Po des animaux entiers e ï t d'environ
1 pCi/g, celle de Vhëpô opancréas autour de 20 pCi/g et celle de la

- 58 -
nourr i ture entre 4 e t 12 pCi /g, 210
(2) de plus, la concentration en PD de contenus gastriques de M. norvegica
pëchées en profondeur (38 pCi/g) est environ le double de celle de contenus
gastriques d'animaux péchés en surface (20 pCi/g), 210
(3) enf in l e Po contenu dans 1 'hépatopancrëas, qui représente plus de 50 % du Po to ta l des animaux en t i e r s , a un "turnover time" de T o r d r e de
210 6 j ou rs , e t r e f l è t e la concentration en Po de la nourr i ture ingérée par les Meganyctiphanes.
I l est t rès vraisemblable que s i l a nourr i ture est la source p r i n c i -210 pale du Po chez les euphausîacës, i i en sera de même chez les autres
crustacés marins. Les résul tats obtenus i c i chez les crevettes montrent 210 que leurs concentrations en Po sont en général élevées, part icul ièrement
hautes chez les pénaëidës, comme en témoigne l a médiane de 19,1 pC:'g
dans les animaux entiers et de 197 pCi/g dans les hépatopancrëas. Cela 210
implique une concentration en Po de leur nourr i ture entre 20 et
200 pCi/g en moyenne. Les études sur le régime alimentaire des crevettes
pélagiques sont basées principalement sur l'examen des contenus gastriques
(AIZAWA, 1974 ; FOXTON et ROE, 1974 ; OHORI, 1974 ; LAGARDERE, 1972, 1975) ;
cet te technique est précieuse, mais présente deux défauts pr incipaux,
souvent mentionnés par les auteurs qui l ' u t i l i s e n t eux-mêmes. Le premier,
c 'es t que pendant que le f i l e t est t ra îné ou pendant sa remontée, les a n i
maux capturés ont la poss ib i l i t é de se nour r i r ; le deuxième, c 'es t que
certaines composantes du régime, bien iden t i f i ab les et longues à digérer
( te l s que des f rustu les de diatomées ou des restes de carapaces ou d'appen
dices de crustacés) auront tendance à ê t re surestimées par rapport à d 'au
tres composantes non ident i f iab les e t qui ne sont presque jamais visual isées
dans les contenus'gastriques (c 'es t l e cas par exemple des feces d'animaux 210 planctoniques). C'est à ce t i t r e que les mesures de Po peuvent apporter
un complément d' information : i l ex is te t r o i s "sources" possibles de nour-210
r i t u r e avec un contenu en Po entre 20 et 200 pCi/g : les feces d'animaux
planctoniques (chapitre V I ) . les grosses part icules en suspension, r iches
en carbone organique (25 S environ du poids sec) et qui ont des concentra-Pin
t ions en £ i U P o de 100 à 300 pCi/g sec (BISHOP et a l . . , 1977), ou Vhépatopancrëas de crevettes lui-même (tableau 2 3 ' ) . Or, ces t ro i s composantes ne peuvent ê t re ident i f iées par l'examen de contenu gastriques, et pour cela leur importance re la t i ve dans l e régime des crevettes " in s i t u " es t d i f f i c i l e à évaluer. GM0RI (1974) mentionne que les crevettes mësopëlagiques

- 59 -
-•• ...ues "presque certainement ingèrent les feces d'animaux êpipélagiques avant qu'ils ne se brisent" et la coprophagie chez certaines crevettes a été prouvée expérimentalement (FRANKENBERG et SMITH Jr., 1967) ; de plus, nous avons observé qu'en cas de cannibalisme (dans le f i l e t au moment de sa remontée, au bien en laboratoire) Vhêpatopancrêas est mangé sé lect i vement.
Espèces Date Origine
2 u P u pCi/9 sec Animal entier Hepatopancreas
Penaeus Indieus Mal 1979 E 1,97 t 0.08 12,3 i o.a Penaeus Indieus Ha1 1979 E 0,99 t 0,05 6,3 t 0,4 Penaeus Indtcus Bat 1979 E 2.3 - 0,1 -Penaeus indieus Sept. 1979 E • Z,2 î 0,1 -Peiueus 1nd1cus Julll .Août 1979 H 24,2 t 0,9 310 1 13 Penaeus indiens Juill.Août 1979 H 21,9 î 1.1 19S j 12 Teiueus indiens Jutll.AoOt 1979 H - 339 t 10
Granqon vulqaris Hars 1979 E 1,5 -0,1 21 t 1 Granaon vulaaris Mars 1979 E 1,4 t 0,1 17 t l Granomi vulaaris Nov. 19B0 H 4,0 t 0.2 2 3 Î 1 Granqon vulqaris NOV. 1980 H 6,0 t 0,3 -PeUemon lonqirestris Mars 1979 II 0,46 t 0.01 . Palaenun lonqirostris Hars 1979 R 0,38 î 0,02 2,4 î 0,1
Palaemon serratus Avril 1979 E 3,3 t O.Z 77 î 4 Palaeiron serratus Avril 1979 E 3,0 t 0,1 55 t 1 Palaemon serratus Avril 1977 H ' 4.» t 0.1 92 t 3 Palaemm serratus juin, usa H 5,1 t 0,1 116 t S
Tableau 25 . Pu chez des crevettes d'estuaire. de ner ou de
rivière (E, H, R) pC1/g sec î 1 écart-type.
Avant de discuter les résultats obtenus en tenant compte de ce qui vient d'être dit , une sub-division de ces résultats semble nécessaire pour faci l i ter leur discussion.
210 2.3. Sub-division des résultats obtenus pour le Po.
Suivant la provenance des crevettes, nous les avons classées sous quatre rubriques différentes : côtiêres, pélagiques, Koweït et pélagiques
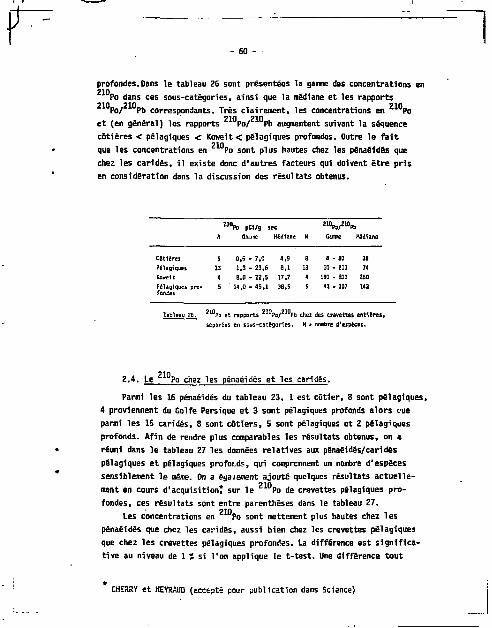
- 60 -
profondes. Dans 1e tableau 26 sont présentées la gamme des concentrations en 210
Po dans ces sous-catégories, ainsi que la médiane et les rapports Po/ Pb correspondants. Très clairement, les concentrations en Po
210 210 et (en général) les rapports Po/ Pb augmentent suivant la séquence
côtiêres < pélagiques < Koweit< pélagiques profondes. Outre le f a i t 210
que les concentrations en Po sont plus hautes chez les pénaéidês que
chez les caridês, i l existe donc d'autres facteurs qui doivent être pris
en considération dans la discussion des résultats obtenus.
I 1 0 P o pCl/g SEC 2 I W°P i .
M Gajane Médiane N Canute Médiane
Cot leres 9 0.5 - 7.0 4,9 a S - 80 35 Pélagiques 13 1,3 • 23,6 8,1 13 10 - 211 74 Koweït 4 B.O - 22,5 17,7 4 190 - 800 250
Pélagiques fendes
p ro - 5 14,0 - 4 5 , 1 3B.5 5 43 • 307 143
Tableau 26. Z 1 0 P „ e t rappor ts z " P o / z l 0 P b che2 des crevettes en t i è res ,
2.4. le Po chez les pénaéidês et les caridês.
Parmi les 16 pénaéidês du tableau 23, 1 est côtier, 8 sont pélagiques,
4 proviennent du Golfe Persique e t 3 sont pélagiques profonds alors vue
parmi les 15 caridês, 8 sont côt iers, 5 sont pélagiques et 2 pélagiques
profonds. Afin de rendre plus comparables les résultats obtenus, on a
réuni dans le tableau 27 les données relatives aux pënaëidês/caridës
pélagiques et pélagiques profoi.ds, qui comprennent un nombre d'espèces
sensiblement l e même. On a également ajouté quelques résultats actuel le
ment en cours d'acquisition? sur l e Po de crevettes pélagiques pro
fondes, ces résultats sont entre parenthèses dans le tableau 27.
Les concentrations en Po sont nettement plus hautes chez les
pénaéidês que chez les caridês, aussi bien chez les crevettes pélagiques
que chez les crevettes pélagiques profondes. La différence est s igni f ica
t ive au niveau de 1 S si l'on applique le t - t es t . Une différence tout
CKEaRY et KEYSAUO (accepté pour publication dans Science)

- 61
N Game Kedlanc Moyenne - 1 ecart-type
Carides pélagiques S Fenieides pelattques 8
Cartdet pélagiques 2 profonds > t
Fenalidës pélagiques 3 profonds . «
1.1 - « . • ' 5,2 G.S - 23.S 15.7
14,0 - 14,0 14,0
(8 - M) (J. 5) 3B.5 - 45,1 41.0 (21 - 10B) (35)
S,2 Î 3,3 14,4 - 6,7 14,0 t 0,7*
(11,3 i Z.B) 42,2 ! 3,4
. (SO.O : 35,9) erreur eaperimentale
Tableau Z7. Po chez des crevettes entiires cucparalson entre Penaeides/Carides pélagiques ou pélagiques profonds (pC1/g sec) N - nocbre d'espèces ( ) résultats en cours d'acquisition.
aussi notable et encore plus importante se dégage de l'examen du tableau 24, où (si l 'on néglige les valeurs "atypiques" de septembre 1977 et j u i l l e t 1979), les concentrations en Z 1 0 Po des Sergestes sont 15 fois plus hautes que celles des Pasiphaea et les concentrations des Sennadas sont 7 fois plus hautes que celles des Acanthephyra•
Four expliquer ces différences chez Sergestes et Pasiphaea, nous avons déjà mentionné (chapitre I I I ) les différences dans les façons de se nourrir des pënaëidés et caridës : les premiers, qui possèdent lin "moulin gastrique" peuvent ingérer entières des proies assez grosses alors que les seconds dilacèrent leurs proies avec leurs pièces bucales avant de les ingérer ; ceci peut être S l 'origine d'une différence dans la quantité de
Po ingérée si une partie du 2 1 0 Po est "perdue" au cours de la dilacëra-t ion. LAGARDERE (1975) et VU 00(1978) mentionnent un autre fa i t qui peut avoir une certaine Importance. Les Sergestes, Gennadas et Pasiphaea en Méditerranée se nourrissent tous la nuit dans les couches de surface, mais en outre les deux premières espèces -â la différence de la troisième- se nourrissent aussi le jour, en profondeur. En effet, elles possèdent des appendices thoracïques qui leur permettent de f i l t re r l'eau et d 'u t i l iser ccmme nourriture les particules en suspension ; or, nous avons déjà mentionné
- 62 -
210 que ces particules sont très riches en Po, ce qui pourrait expliquer
les différences notées.
2.5. Effet de la profondeur.
Cette hypothèse est êtayée par les résultats obtenus chez les 15
espèces n.ésopélagiques profondes (tableau 27) qui toutes ont des concen-210 tratiens en "o élevées, aussi bien les caridés que les pënaëidës.
Les différences observées entre les concentrations des espèces pélagiques
par rapport aux espèces pélagiques profondes sont significatives au niveau
de 1 2 (d'après le t-test) chez les caridés comme chez les pênaéidês. Cela 210
implique une nourriture plus concentrée en Po chez les espèces pélagiques profondes et cela est tout I fa i t compatible avec les Idées généralement admises sur le régime de ces crevettes, à propos duquel OMORI (197*) d i t "feeding of adult shrimps changes from a lower trophic level to a higher one with increasing depth of the distribution" opposant ainsi les espèces superficielles qui se nourrissent principalement de copépodes herbivores et d'euphausiacês aux espèces profondes, omnivores,qui sont "probably biased towards a carnivorous diet because the particulate matter available to them wi l l only be the sinking dead bodies of organisms, casts and faecal pellets plus associated bacteria. Carnivorous copepods, ostracods, medusae and chaetognaths are the main constituents of the gut contents of bathypela-gic species". Or, d'après ce que nous avons vu précédemment, le passage d'un régime herbivore à un régime carnivore et riche en détritus va s'accom-
210 pagner d'une ingestion accrue de Po.
2.6. Echantillons provenant du Golfe (Koweit). 210
Ces échantillons ont tous des concentrations en Po très élevées, voisines de celles des pénaëidês pélagiques profonds, et un rapport 210 210
Po/ Pb particulièrement haut. S1 l'on compare les résultats obtenus chez les crr.vettes du Golfe avec ceux obtenus chez Penaeus kerathurus,
2To" — — — .
les différences notées dans les concentrations en Po sont difficilement explicables. Les cinq espèces en effet sont des crevettes benthiques, qui vivent à faible profondeur, leur t a i l l e , leur mode de vie et leur régime sont tout a fa i t comparables (ENOHOTO, 1971 ; BEN MUSTAPHA, 1977), pourtant
210 les crevettes du Golfe ont des concentrations en Po quelque six fois supérieures a celle mesurée dans l'espèce provenant de Méditerranée, aussi bien dans les animaux entiers que dans Vhêpatopancrëas (tableaux 23, 23').

- S S
I I est possible qu'une te l le différence puisse s'expliquer par des niveaux 210
en Po anormalement hauts dans le Golfe Persique, eux-mêmes dus aux
intenses activités pétrolières de cette région. En ef fet , au cours de * 210 210
mesures de routine du Po, Pb dans l'eau de pluie et les particules
atmosphériques (chapitre VI) nous avons pu noter qu'en hiver, des cendres
provenant de cheminées où étai t brûlé du mazout avaient une concentration 9 10
élevée en ' Po (16 pCi/g) ; l'analyse du mazout lui-même a permis de 210
mesurer une concentration de 1,7 pCi/1 de Po. I l serait certainement 2*0 210
intéressant d'avoir des mesuras de Po, Pb dans Veau du Golfe et
i l ne serai t sans doute pas surprenant de trouver que dans cette région
particulière l'apport anthropogénique est notable.
2 .7. Estuaires.
En e f f e t , nous avons longuement parlé dans ce chapitre et dans les
chapitres précédents de l'importance primordiale de la nourriture comme
source de Po dans les organismes marins ; i l n'en reste pas moins qu'à 210
l 'or igine, la source du Po dans la nourriture elle-même est l'eau de
mer. Normalement, les concentrations en Po, Pb de l'eau de mer
varient peu (SHANNON et al_., 1970 ; CHERRY et SHANNON, 1974 ; BACON et al_.,
1976 ; NOZAKI et TSUNOGAI, 1976 ; cette étude - chapitre VI) mais i l est
possible -e t nous avons l ' intention de le vér i f ier - que dans certains cas,
comme celui du Golfe, cette variation soi t importante. Oe même, les résul
tats que nous obtenons chez des crevettes d'estuaire ou de r i v iè re , chez
qui les concentrations en Po sont nettement plus basses que celles
assurées dans la même espèce en mer (tableau 25) , att irent l 'attention
sur un autre aspect de la question, c'est-à-dire la forme chimique du 210
Po dans l'eau de mer. En e f fe t , d'après les quelques rares mesures qui 210
existent, les concentrations en Po dans les rivières sont du même ordre qu'en mer (PARFENOV, 1974), pourtant des différences frappantes existent
210 dans les concentrations en Po présentées dans le tableau 25. Ces
différences ne sont pas sans rappeler celles qui existent dans l'accumula
tion des éléments à l 'é ta t de traces par le phytoplancton oO les organis
mes f i l t reurs suivant que cas éléments sont sous forme ionique ou sous
forme de complexes organiques (DAVIES, 19711). I l est possible que la 210
"disponibilité'' du Po pour son accumulation par les organismes varie-en raison inverse de la quantité de matière organique "complexante" (conne les acides humiques par exemple, SHOUOVITZ et al_., 1978) contenue dans l 'eau : cela expliquerait les résultats présentés dans le tableau 25
- 64 -
210 ou ceux du tableau 26 où nous avons vu que les concentrations en Po
chez les crevettes var ient de manière croissante des crevettes d 'es tua i re
aux crevettes côt iêres aux crevettes pélagiques aux crevettes mésopélaglques 210
profondes. Cette question de la forme chimique du Po dans l 'eau de mer
e t de sa " d i s p o n i b i l i t é " sera d ' a i l l e u r s de nouveau abordée dans l e
chapitre V I .
Z.b. Var iat ions saisonnières.
Nous avons déjà mentionné les résu l ta ts obtenus en septembre 1977 e t 210
j u i l l e t 1979 où les concentrations en Po mesurées étaient plus basses
qu'habituel lement. Pour expliquer les résu l ta ts de septembre 1977, nous
avons évoqué (chapitre I I I ) la p o s s i b i l i t é qu'un "bloom" de phytoplancton
part icul ièrement pauvre en Po a i t des répercussions tout au long de l a
chaîne a l imenta i re . De te l les var ia t ions saisonnières avaient déjà été
mentionnées par BEASLEY et al_ (1973) chez Panda!us jo rdan i , Pasiphaea
paci f ica e t Sergestes s i m i l i s , chez qui les valeurs les plus basses é ta ient
mesurées en j u i l l e t . Nos échanti l lons de P_. jordani nous ont été envoyés
d'Oregon par l e Dr. BEA5LEY ; I l s ' a g i t de crevettes pêchées en j u i l l e t e t
les concentrations que r.ouswons mesurées, 7 pCi /g , sont identiques 5 cel les
rapportées par BEASLEY et al_ (1973), 6 pC i /g , pour leurs échant i l lons de
ce même mois, alors qu'aux autres époques de l'année i l s obtiennent des
concentrations de 10 i 17 pCi/g. Une di f férence dans le régime al imentaire
es t -e l l e responsable de ces var ia t ions , ou bien s ' a r t - i l d'une va r ia t i on
saisonnière du contenu en matière organique de l 'eau de mer (DAUMAS, 1976) 7
Des mesures concomitantes du Po e t de l a chlorophylle dans les contenus
gastriques pourraient sans doute aider â répondre à cette question.
210 Ces résu l ta ts sont moins nombreux e t moins précis que ceux du Po ;
d'après lp tableau ZB, on peut vo i r qu'en général , l a tendance est l a même 210
que pour l e Po, les concentrations chez les pénaêidés étant plus hautes
que chez les car idés. En ce qui concerne l a di f férence entre les concentra
t ions des espèces pélagiques e t pélagiques profondes, e l l e n'apparai t pas
clairement d'après les résul tats rapportés dans l e '.ableau 28 où l ' e r r e u r
associée aux valeurs moyennes est t rès grande ; i l semble tou te fo i s , d'après
les t j u t premiers résul tats d'une autre sér ie de mesures actuellement en 210 210
cours, qu'une t e l l e dif férence ex i s te , avec un rapport Po/ Pb r e l a t i v e ment bas chez les espèces mésoaélagiques profondes.

- 65 -
Médiane Moyenne - 1 écart-type
Carides pftlagiques S 0,03 - 0,19 0.04 0,07 • 0,07
Penaâldes pélagiques 8 0.04 - 0,75 0,20 0,28 î 0,26 Cari dé j pélagiques 2 profonds
0.05 - 0,12 0.09 0,09 t 0,05
PeniÉldis pélagiques 3 profonds
0,14 - 1.04 0,27 0.4B - 0,49
Tableau 28. 2 1 0 Pb chez des crevettes entières comparaison entre Pênaéldfis/Carldes pélagiques ou pélagiques profonds (pC1/9 sec) H - nnabre d'espSces
V I . 3 . CONCLUSIONS.
210 Las concentrations en Po mesurée* chez 31 espèces de crevettes
couvrent une gamme très large, de 0,4 à plus de 40 pCi/g. Les variations
observées peuvent être associées à des facteurs biologiques ou â des fac-210
teurs l iés î l'environnement : les pënaéidés sont plus riches en Po
que les caridês et les concentraticns augmentent quand an va des espèces
d'estuaires< cât ières< pélagiques < pélagiques profondes. Les variations 210
observées peuvent être reliées à la quantité de Po contenue dans le
régime alimentaire et les résultats indiquent que les feces d'animaux
planctoniques, la matière organique en suspension, l'hêpatopancrêas
d'autres crevettes, constituent une part importante du régime des crevettes
mësopêlagiques profondes. Certains résultats obtenus chez des crevettes
vivant dans les estuaires ou en r i v i è r e , e t d'autres i certaines époques
de l'année suggèrent que la forme chimique du Po dans l'eau de mer (plus
particulièrement soncfegré d'association avec la matière organique dissoute)
peut être un facteur important gouvernant son accumulation par les
organismes.
CHAPITRE V.
- 66 -
V . I . INTRODUCTION.
Au cours des chapitres precedents, nous avons vu que les hëpatopancrêas 210
des organismes marins avaient des concentrations en Po particulièrement
élevées et chaque fois que des comparaisons étaient possibles, i l é ta i t 210
c la ir que l'accumulation du Po é ta i t préférentielle par rapport S celle
de "es prédécesseurs dans la série radioactive. Ainsi (tableau 22) les 210 210
rapports Po/ Bi vont de 40 S 900, indiquant sans ambiguïté que le 210
Po mesuré dans les hëpatopancrêas n'a pas été produit in situ par la
décroissance du Bi. De même, le rapport Po/ Pb, qui est de 50
en moyenne dans l'hépatopancréas de Heganvctiphanes norvegica (tableau 13)
varie de 30 I 500 dans les hëpatopancrêas de crustacés ou de mollusques
céphalopodes pélagiques ou benthiques (tableau 21) et la médiane de ce
rapport est de 138 dans les hëpatopancrêas des 27 espèces de crevettes
où i l a pu être mesuré. Cet enrichissement, pour indiscutable qu ' i l soit
n'en est pas moins difficilement explicable. En ef fe t , comme nous l'avons 210
déjà mentionné, l 'act iv i té spécifique du Po est très élevée (0,22 mg/Ci), les activités mesurées ic i dans les hëpatopancrêas ne re -
210 présentent donc qu'un poids infime de l'élément. De plus, le Po n'étant
pas un élément bialogiqueroent essentiel , on comprend assez mal cette
a f f in i té particulière qu' i l présente pour les matériaux biologiques et
plus particulièrement pour le tissu hépatopancréatique. Ce phénomène es t - i l
part icul ier au Po, ou bien d'autres éléments se comportent-ils de la
même façon ? Pour essayer de répondre 3 cette question tous nous proposons
d 'ut i l iser une double approche : la première consiste 3 mesurer, dans
l e même hëpatopancrêas, un certain nombre d'éléments en même temps que le 210
Po. La deuxième fa i t usage du plus grand nombre possible de données
dêjé publiées sur les métaux/natalloi des dans les hëpatopancrêas d'orga
nismes marins en général, de façon à voir si le Po se comporte comme
certains de ces éléments e t , par analogie, 3 en t i re i des indications sur
le comportement du Po lui-même, qui n'est pratiquement pas connu.
V.2. MESURES COMCOKITAHTES DU Z 1 0 P 0 ET D'AUTBES ELEMENTS DANS L'HEPATO-
PAMCREAS.
2 . 1 . Po et autres émetteurs** .
Nous avons déjà vu que chez Meuanyctiphanes norvegica la contribution
du Po 3 l 'act iv i té ;. totale mesurée dans l'hépatopancréas é t a i t de

Tordre de 99 % (tableau 15). Il s 'agissait , outre le 1 0 Po, du 239+Z40pu> 238 U ( 234^ 232^ D e s m s u m d o 226 R a ^ ^ p f l s ^ f a i t e s
dans Thépatopancrêas, mais il est peu vraisemblable que sa contribution y soit très importante, car dans l'animal entier la concentration en
Ra était du même ordre que celle de l'uranium, soit environ quarante Z10 fois inférieure à celle du Po (tableau 2) .
Dans le tableau 29 sont présentés les résultats de mesures faites dans T hépatopancrêas du poulpe, Octopus vulgaris pour les émetteurs c< 2 4 1 t a , 2 3 9 + 2 4 0 P u , 2 3 2 Th, 2 1 0 P o e t l T ^ P b . U encore nous pouvons
210 constater que la contribution du Po à l ' ac t iv i té totale mesurée est de Tordre de 95 % et cette contribution est supérieure à 99,9 % si ""on
ne t ient compte que de l ' ac t iv i té ex. . Si Ton considère les facceurs ue concentration, i l s sont de Tordre de 10 pour TAm, le Pu, le Th, de
10* pour le Pb et de 10 5 pour le Po.
Il est intéressant de noter que chez ces mêmes poulpes, un facteur
de concentration identique, de Tordre de 10 ,a été trouvé pour les cinq éléments dans les coeurs h^anchiaux, témoignant d'une accumulation préférentielle de TAm, Pu, Th par ces organes, alors que l'accumulation du Pb y est sensiblement la même que dans T hépatopancrêas. Par contre le
Po, l u i , est nettement plus concentré dans Thépatopancrêas.
Cane en tri lion (pCi/kg i ec ) Ticlcun it cffnceitriltaA *
F/S* ! « l t e 239 . 240^ 232^ Z10 p ( j 2 1 0 ? 0 Hl^ m « W ? u 2 3 ^ 110, , 210^
3,1 0,53 î 0.06 2.2 ï 0.6 2.2 î 0.3 2700 t ZOO I9O00 l ZOOO 5 i 10 z 7 i 10* « * 10* 2 * 10* S i I 0 !
>»aport poidi f r s i s / p s i d i sec
* Cl leulé ï en prenant corse ac£iiri:t dini l ' u u de etr entière - Wlfa - O.ÛS7 c M"3 pCt/1 e t ï 3 9 * 2i09u - 1,03 » W" 3 pCi/!
(fUWt e t • ! - . 19Î6) Z 3 Z I h ; 2 t W * pCi/1 (CHEMT * l Sm.*TCW, I3Ï«) a n P & : 33 » W 3 pCi/1 e t Z 1 C fc» : 3« x 10" 3 pCi/1
(HEWUO e t CHEHW. 1979).
Tableau 29. Concentration» en M 1 A s . n 9 * M 0 P u . 2 3 2 T h . Z l l , P h e t n 0 f t » ce l'hêpatapiflcrtas d'Oçtawï «u lmHs
e t facteurs de concentration correspondants. D'après GUAflT e t i K (1991).

- 68 - .
Poids des " u P o
193 203 - 7 238 153 î 5 255 181 î 5 279 269 ± 7 347 187 ± 6 355 150 î 5 430 ? 209 î 7 484 ? 312 t 10 541 147 + 5 590 404 î 14 615 299 î 10 682 374 t 13 718 1*6 î 5 793 212 t 8
x ±lo =2-"2t85 (n=14) 206 371 t 1Z 213 658 ± 21 235 142 ± E 243 159 ± 8 285 234 t 10 301 (T 466 ± 15 382 245 t 9 466 374 î 12 478 179 i 6 517 348 i 12 734 346 i 12 772 297 i 9
x î l o =3181146 (n=;2 X i l a=271+123 (n=26)
Tableau 29'• 2 1 0 P o , 2 1 0 P b ?;?totodaru« i
2 1 ° p b pCi/g sec
2 1 0 P o / 2 1
1,5 t 0,1 138 0,47 t 0,05 326 0,40 i 0,05 453 0,63 î 0,06 427 0,34 t 0,04 550 0,23 t 0,04 652 0,60 ± 0,07 348 0,63 t 0,07 495 0,36 î 0,05 408 0,64 t 0,08 631 0,67 î 0,07 446 2,1 î 0,1 178 0,45 t 0,06 324 1,4 î 0,1 151
x î l o =0,74+0,54 (n-14) 1,9 ± 0,2 191
0,97 î 0,08 678 0,87 î 0,07 163 0,62 t 0..H 256 0,86 î 0,11 270 0,87 î 0,08 536 0,58 ± 0,07 422 0,75 î 0,07 499 0,81 î 0,08 221 1,3 î 0,1 268
0,64 î 0,06 54D 0,97 t 0,15 306
tlo =0,93Î0,36 (n =12) îla =0,83Î0,47 (n =26)
dans l'hépatopancréas de Calmar, puldi. pCi/g sec t 1 écart-type.

69 -
2.2.
Le Po e t le Pb ont été analysés dans une trentaine d'hêpato-
pancréas de calmars,Mototodarisgouldi, en même temps qu'un cer ta in nombre
d'éléments s tab les, Ag, A l , Ca, Cd, Cu, Fe, Mg, Mn e t Zn. Les échan t i l
lons, en provenance d 'Aust ra l ie , nous ont été fournis par le Dr. D. SMITH
qui s 'es t chargé des analyses des éléments stables par absorption atomique. 210 210
- Les résu l ta ts des analyses du Po, Pb sont présentés dans l e 210
tableau 2 9 ' . Les concentrations en Po sont, dans tous les cas, t rès élevées, supérieures â 1C pCi/g, pouvant a l l e r jusqu'à plus de 600 pC i /g ,
avec une moyenne de 271 - 123 pCi/g ; l a concentration moyenne en Pb
est de 0,83 - 0,47 pCi/g et l e rapport 2 1 0 P o / 2 1 0 P b 380 - 162 (moyennes -
210 210
un écar t - type) . Les concentrations en Po, Pb sont, d'une façon géné
ra le , plus basses chez les femelles (232 - 86 et 0,74 - 0,54) que chez
les mâles (318 - 146 et 0,93 - 0 ,36) , les différences toutefois ne sont
pas stat ist iquement s ign i f i ca t i ves et r e f l è t en t sans doute l e f a i t que la
masse de 1'hépatopancréas représente un pourcentage plus élevé de la masse
to ta le de l 'animal chez les femelles (4 ,7 S) que chez les mâles (3 ,4 S) .
I l n 'ex is te aucune correlat ion entre les concentrations en Po, Pb et
le poids t o t a l des calmars, tout au moins dans la gamme de poids des animaux u t i l i s é s i c i .
210 - I l n 'ex is te pas non plus de cor ré la t ion entre les concentrations en Po
e t ce l les des éléments stables analysés, par contre, 11 existe une co r rê la -210 210
t ion entre les concentrations en Po e t les concentrations en Pb
( r = 0,38 ; 0,0S< P < 0,10), bien q u ' e l l e ne so i t pas nettement s i g n i f i
ca t i ve .
V.3. METAUX ET METALLOÏDES DAMS LES HEPATOPANCREAS.
3 . 1 . Données de la l i t t é r a t u r e . FC, F I , C lass i f ica t ion.
Dans l e tableau 30 sont regroupées les données concernant les concen
t ra t ions en éléments dans les hépatopancréas d'organismes marins. La com
p i l a t i on de ces données a été grandement f a c i l i t é e par l ' u t i l i s a t i o n des
bibl iographies d'EISLER (1973) puis EISLER e t al_. (1975, 1978, 1979),
très complètes, qui nous ont permis de passer en revue pratiquement tout
ce qui a été publié sur la quest ion. Dans l a très grande majori té des
cas, i l s ' a g i t d'ëléiœnts stables, nous avons ajouté au tableau nos propres
données pour le 2 1 0 B i , 2 1 0 P b , 2 1 0 P o e t 2 3 9 P u , 2 3 2 T h , mtm. Dans la
première colonne est donnée la gamine des valeurs mesurées, dans l a deuxième
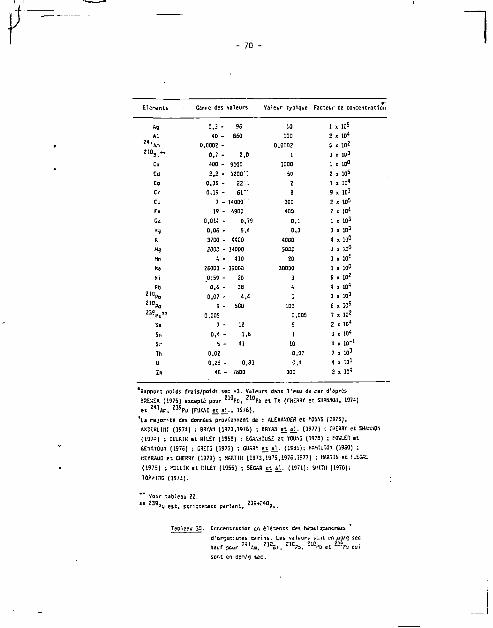
- 70 -
Eléments Gaime des valeurs Valeur typique Facteur de concentration
Ag 0.3 - 96 10 1 x 10⁵
Al 10 - B60 100 2 * 1 0 *
2*i. 0,0002 - 0.QC02 5 x 1 0 *
"C- 0,7 - 2.0 1 3 x l D 3
Ca 400 - 9000 1000 1 x 1 0 °
Cd 2,2 - 1200": 50 2 i lu*
Co 0.36 - 22'.: 2 1*10*
Cr 0,1S - 6 1 " a 9 x 1 0 3
Cu 7 - I4D0O " 300 2 . 1 0 5
Fe 19 - 490D 400 7 * 1 0 *
Gd 0,014 - 0,79 o.: I x 103
Hg 0,06 - 5,4 0,3 3 x 1Q3
K 3700 - 44C0 «00 4 x 10°
Hg 2003 - 14000 5000 1 * 10°
Hn 4 - 410 20 3 X 10*
Na 25003 - 33DDÛ 30030 1 x 10°
Ni _0;59 - 20 3 6 x 1 0 *
Pb 0,6 - 3a 4 4 x 10*
2 l 0 P o 0,07 - 4.1 1 3 x 10³
2 1 0 P o 9 - 500 103 6 x 10⁵
2 3 9 P u " 0,005 0,005 7 x 10²
Se 7 - 12 9 2 x 10⁴
Sn 0,4 - 1.5 1 3 xlQ*
Sr 5 - 41 10 4 x 10*1
Th 0,02 0,02 7 * l û 3
U o.zs - 0,83 0,4 4 x Ifll
Zn 16 - 7800 300 2 x 10*
Rapport poids f r a i s / p o i d s sec - 3 . Valeurs dans l ' eau de -cer d'après
BREWER (1975) excepté pour Z 1 0 P o . Z 1 0 P b e t Th (CHERRY et 5HAHMKJ, 1974)
e t 2 4 l f c n , 2 3 9 P u (FUKAI et a l . . . 1976).
*La ma jo rUe des données proviennent de : ALEXANDER e t YOUNG (1976).
AKKRLII I I (1974) ; BRTATC (1973.1976) ; BRYAH e t al_. (1977) ; CHERRY et SHAKlDn
(197-:) ; CULKIK e t RILEY (1952) ; EGAî-HOllSE e t YCUNG (1978) ; FOWLER e t
fl£:iAT0L'« (1976) ; GREIG (1975) ; GUARY e t al_- (1581) ; HAMILTON (19SQ) ;
KEYRAUO e t CHERRT (1979} ; HART III (1973,1975.1975.1977) ; fAHTIN e t FLEGM.
(1975) -, H u u i f i e t RILEY (1SS6) ; SEGAR e t al_. (1971); SMITH (1970);
TOPPING (1973).
Vo i r tableau 22.
" 3 5 ? u e s t , s t r i c tement p a r l a n t , 2 3 5 + : 4 0 P u .
TeDleau 30. CGncentraticn en êlê ' -ents Ses fceoatjpancréas
d'orr j î r . i sises rcarins. Les valeurs sc.it e n / : ; / ; sec
« » f p e r « ' A » . 2 1 = 5 i . J , C ? o . " » « , n " ' ? , , „ f
sont en dpn/g sec.

- 71 -
une valeur "typique*. La gamme est parfois très large, allant jusqu'à
trois ordres de grandeur, comme dans le cas du cuivre par exemple et
le choix d'une valeur typique est sans doute e'itaché d'une certaine
subjectivité. Une gamme aussi large se conçoit toutefois très bien, si
l'on t ient compte du fa i t qu'i l s'agit d'animaux comprenant des mollusques
(gastéropodes, lamellibranches, céphalopodes) e t des crustacés.
Dans le cas du Cu, les valeurs les plus élevées se trouvent chez les
céphalopodes dont le sang contient des concentrations en hémocyanlne
plus élevées que celui des autres mollusques ou crustacés (PROSSER et
BROWN, 1962), ce qui peut expliquer en partie les grandes variations
trouvées pour cet élément. Le cas du cuivre est un cas extrême, i l
existe d'autres métaux pour lesquels la gamme est large, 11 s'agit en
particulier du Fe, Un, Ag, Zn, Cd. Malgré cela, le choix d'un ordre de
grandeur pour la valeur typique ne nous a jamais posé de problème particu
l i e r et nous semble tout à f a i t acceptable pour les besoins de notre argu
ment. En ut i l isant ces valeurs typiques, on a pu calculer les facteurs de
concentrations des éléments dans l'hépatopancréas, soit
p c _ concentration/unité poids f ra is concentration/unite be poids d'eau ae mer
210 Le facteur de concentration le plus élevé est celui du Po, suivi
de près par Ag, Cu, Cd.
Le concept de facteur de concentration est criticable dans bien des
cas. En e f fe t , i l est assez exceptionnel d'avoir des valeurs concomitantes
dans le tissu et l'eau de mer ûG l'animal a été péché, de plus dans la
plupart des cas, les animaux sont côtiers alors que les valeurs dans l'eau
de mer sont celles mesurées au large. I l nous a semblé plus profitable
d 'ut i l iser un autre concept, celui de facteur d'enrichissement., pour compa
rer ce qui se passe dans l'hépatopancréas et dans d'autres domines océani
ques -biologiques ou pas-.
Ce facteur d'enrichissement (FE) est beaucoup ut i l isé par les géo-
chimistes, 11 se définit comme
F E = X/Al échantillon
X/Al écorce terrestre
Ainsi la concentration d'un élément dans un échantillon est normalisée par
rapport à l'aluminium, le matériel de référence étant Vécorce terrestre ;
le F£ pour l'aluminium est par définit ion 1 .
^ . 'act iv i té spécifique du plomb calculée d'aprè"s nos valîurs typiques, 0.25 ifm/^g^ 8 fois plus basse que celle de l'eau de mer, 2 dpm/„g (CHESSELET, communication personnelle), reflète probablement l ' incert i tude bien connue des mesures de ?b stable. '

72 -
P l * g e 1 s e d i ments profonds
Facet de IOO-plancton •
Particule! atmosphériques
Zooplancun Hepatopancress d'organisées
sarins * • *
Se 7 > 10"1 6 x 10"1 B x 10"' 2 . 1 0 ° _ Th Z»W>° S X 10"1 2 x 1 0 ° 4 x 1 0 ° 2X10°
Fe 1 x 1 0 ° 2 x 1 0 ° i l 10° 6 X 1 0 ° 6 . 1 0 °
Hn
NI
1 . 1 0 °
1 x 10" J
9 x 1 0 ' 1
2 x 1 0 °
2 x 1 0 °
4 x 1 0 °
7 . 1 0 °
7 x 10 1
2 x in 1
3 a 10 1
Co 9 x 1 0 " 1 2 x 1 0 ° 2 , 1 0 ° 2 x 10 ! 7 x 10 1
Cr 1 x 1 0 ° 2 X 1 0 ° 7 . 1 0 ° 2 x 101 7 x 101
Ca 3 x 1 0 ° 1 x 1 0 1 2 X 1 0 ° < x 10 2 Z x lu 1
Sr 2 x 1 0 ° 1 x 1 0 1 - 2 x 10³ 2 X 10 1
U
K
a x w"1
1 x 1 0 °
3 x 1 0 °
1 x 1 0 ° 2 x 1 0 °
1 * 10 2
4 x 10 2
1 x 1 0 2
2 x 1 0 2
«9 1 x 1 0 ° 2 x 1 0 ° 7 . 1 D ° 4 x 10 2 2 x 1 0 2
Na • 3 x 1 0 ° S x 10 1 3 x 10 3 1 X I 0 3
Pb 2 ! ° P b
" 9 P o
3 x ID2
1 X 1 0 1
4 x 1 0 1
6 x I D 1
4 x 10 2
2 X 10 3
2 x 10 2
7 X 10 2
2 x 10 2
a x l o 3
3 x I 0 2
4 x I D 2
8 X 1 0 2
In 1 X 101 S X 1 0 1 8 x 10 1 2 « 1 0 3 3 X 1 0 3
«3
2 1 °Po
3 x 1 0 °
4 x 10 2
2 x ID 1
2 a I S 1
8 x 1 0 1
5 x 10 2
B x 101
2 x 10 2
3 X I D 3
4 x ID2
4 x 10 :
3 x I D 3
« x 1 0 3
4 x M)'
«9 - 1 x 1 0 2 2 x 10 2 5 X 10³ I x l O 5
Cd < 7 , 1 0 ° 2 x i n 2 7 X 10 2 1 x 1 0 * 2 a 1 0 5
Se • S x l O 2 1 x 10* 4 x ! 0 4 2 a > 0 5
i • .- " 3 x 10 4 "
* SPENCER fit * ]_• (197BJ J A! ï fiOÛflO / ig/g sec.
+ Tableaux 1)2 e t 33.
"ZGU-ES e t a t . (1974} i OUC£ e t a l . (1975} , BUAT-MENARO et CHE55ELET (1979) 2 1 0 P h e t ^ P u (HÛOGE et a l . . , 1978} avec 2 1 0 P o / Z W ? b 0 , 1 (LAMBERT e t a K , 1979}.
•H-CHEÎtflY e t SHASXÛH (1974] ; H1GS0 e t al_. (19Ê0) ; HARTlfi (1979) ; KARTIN e t KifiitR
^(1973) -, FOUUR (1977) ; GOLQKABER e t KAPLAN (1974J.A1 . 100 ua/g sec...
Concentrât.uns dans l 'ecarce ter rest re TAVL0R(1964), Al > 82300 Jfg/g. Z 1 D P o . Z l 0 P b sont supposés être en équi l ibre r a d i o a c t i f avec a a U . I l n'existe
pas de données pour An e t Pu dans l 'écorce t e r r e s t r e , les de nées pour
l e sol de TKEtK r t a K (1930) ont Été u t i l i s é e s comète approximation.
Tableau 3 1 . Facteurs d'enrichissement (FE) des alésants dans divers
matériaux océaniques.

- 73 -
L'aluminium est bas dans les matériaux biologiques (BENNET et
CARPENTER, 1979) s t 1e facteur d'enrichissement d'un élément sera d 'autant
plus élevé que l 'élément prendra une par t plus act ive dans les cycles
biologiques. Le tableau 31 résume toutes ces données, qui ont été arrangées
dans un ordre généralement croissant de haut en bas et de gauche â d r o i t e .
On peut, d'après les ch i f f res obtenus pour les facteurs d 'enr ich isse
ment, séparer les éléments contenus dans l e tableau en quatre grands
groupes. Dans l e premier, le facteur d'enrichissement e r t de 1 ou i n f é r i e u r
â 1 , on trouve l e scandium et le thorium (e t l 'aluminium, par d é f i n i t i o n ) .
Ceci est v ra i pour tous les matériaux considérés : ceux recue i l l i s par un
pièae à sédiments profond, les feces du zooplancton, les part icules a t
mosphériques, le zooplancton et les hêpatopancréas d'organismes marins. Ces
éléments ne prennent pas une part act ive dans les processus biologiques.
Dans le deuxième groupe, on trouve les r t a u x de t r ans i t i on , Fe, Mn, N i ,
Co, Cr, avec un facteur d'enrichissement de Tordre de 10 dans l e zooplanc
ton et les hêpatopancréas. Dans le t ro is ième groupe, on trouve Ca, Sr, U,
K, Hg, Na, tDus des éléments avec un t rès long temps de résidence, de
l ' o rd re de 10 ans (BREWER, 1975), dont l 'enrichissement, peu marqué dans
les par t icu les océaniques ou atmosphériques est par contre élevé dans le
plancton et -à un moindre degré- les hêpatopancréas. Enf in , dans le qua-210
tnême groupe on trouve l e Pb et l e Pb, l e Pu, Zn, Hg, Cu, Po, Ag, Cd,
Se, avec des facteurs d'enrichissement élevés dans tous les matériaux b i o
logiques e t t rès élevés dans l 'hêpatopancréas, plus part icul ièrement cei...
du Po, Ag, Cd, Se, pour lesquels un FE de 10-10 est trouve, s o i t un
ordre de grandeur supérieur 5 celu i du zooplancton.
3 .2. Comparaison des données obtenues dans 1'hêpatopancréas du calmar
Nototcdarus gouldj avec les données de la l i t t é r a t u r e .
A «es f i n s de comparaison, nous avons regroupé dans le tableau 3 1 ' les
résu l ta ts obtenus dans nos échanti l lons de calmar et les valeurs que nous
avions choisies comme "typiques" d'après l a gamme des valeurs publiées
(tableau 30). L'examen des deux premières colonnes du tableau 3 1 ' montre q u ' i l
existe un bon accord entre les concentrations précédemment choisies et cel les
mesurées I c i , sauf pour l 'aluminium, dont la concentration est en dehors
de l a gamme des valeurs publiées ; ceci a pour conséquence de rendre encore
plus hauts les facteurs d'en» ichissement, le plus êl^-vê de tous étant i c i
ce lu i du 2 1 0 P o .
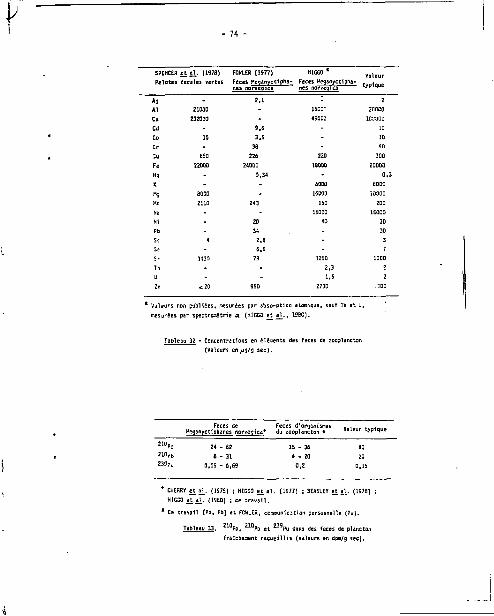
- 74
SPENCER e t a U Ï W M Ï FOWLER (1977) HIGGO* V t l K | r
Pelotes fécales vertes Feces Keganyctlpha- Feces Keganyctipha- t v n 1 o i i e
nés norveoica nés norveqica typique
Zioao - I6c;- zooco 232000 - 490CÛ 1C3D0Q
"u eso 226 220 200
Fe 22000 24000 18000 20000
Hg • 0,34 - 0.3
K - - 6QDO 6000
Hg BDCO - 16O03 10300
Mil 2110 243 150 200
1 Valeurs non publiées, mesurées par absorption atomique, sauf Th et U,
mesurées par spectroxetrie a (HIGGO e£ al^, I960).
Tableau 32 - Concentrations en éléments des feces de zooplancton (Valeurs en /jg/g sec) .
Feces de Feces d'organismes Heganyctiphanes norvegica* du zooplancton *
"°P0 24 - 62 15 - 36
aïOHb 6 - 3 1 4 - 2 0
239 P u 0,05 - 0,69 0,2
* CHERRY e t al_. (1975) i HIGGO e t a K (1977) ; BEASIEY e t al_. (1978) ;
HIGGO e t a_h (19E0) : ce t r a v a i l .
1 Ce t r a v a i l (Pu , Pb) e t FOULER, communica t ion p e r s o n n e l l e ( P u ) .
Tableau 3 3 . 2 1 0 F o . 2 1 G P b e t Z 3 9 P u t a n s des feces de p l a n c t o n
f r a î c h e m e n t r e c u e i l l i s ( v a l e u r s en dpm/g s e c ) .

- 75 -
E U w n t
Concentrations dans en ^jg/g see cu dom/g
JWpti
'hepatopancreas sec pour 2 1 0 p O i
Faeceur d'enrlchlsseoent dans I'hepatopanerees
0'après l e Tableau 30
H fiouldi a 0'après l e
Tableau 31 N. Gouldl
* 9 10 3 1 « 1 0 s i X 10 s
Al ICO 7 1 x 100 1 x 1 0 °
Cd so 40 ! > 10 s 2 X l o t
Ci 1000 GOO 2 x 10 1 2 X I 0 2
Cu 300 100 4 X 10 3 2 x 10 4
Fe 400 700 6 I 100 1 X 10²
«9 5000 2000 ! . 10 2 1 X 10³
Xn 20 4 2 X 10l S X 10 l S 1 0 P b 1 1.5 4 X i d 2 9 x 10³
2 1 0 P n 100 SOD 4 x ! 0 8 3 I I D 6
Zn 300 700 3 x 10 3 1 I 10S
* Hedlanes.
Tableau 3 1 ' . Comparaison des données obtenues dans l 'hëpato-
pancreas de Hototadarus qouldl avec les données
de la l i t t é r a t u r e .
3.3. Discussion sur Tes éléments du Ce groupe du tableau 3 1 . Po/5 7
Un f a i t Intéressant émerge quand on regarde les éléments en compagnie
desquels se trouve le Po dans le 4e groupe du tableau 31 . La plupart
des éléments stables de ce groupe ont déjà été rapprochés â différentes
occasions : sur l e plan géochimique i l s ont êtê classés comme chalcophiles
(c 'est-a-dire ayant tendance à être associés au soufre) (WHITFIELD, 1979) ;
11s sont tous très toxiques (WOOD, 1974) ; i l s ont des facteurs d'enrichis
sement élevés dans les particules de l'océan (WALLACE et al_., 1977 ; BUATV
MENARO e t CHESSELET, 1979) ; i l s sont volat i les et appartiennent a un groupe
d'éléments pour lesquels la possibil ité d'un flux a partir de la surface
de la mer vers l'atmosphère a été suggérée (LANTZY et MACKENSIE, 1979).
I l est doomage qu' i l n'existe pas de mesures du S dans les hêpatopan-
créus. De te l les mesures pourraient être intéressantes, car d'après les
données qui existent dans le zoaplancton où la concentration trouvée est
de Tordre de 9000 ^ig/g (GOLDKABER et KAPLAN, 1974), on peut calculer un
:-"E de 3 x 10 , ce qui, dans notre tableau 31 , met le S très prés du Cd, Se.
Or, dans le tableau périodique des elements, le Po se trouve dans la
même colonne que le S, Se, Te. De plus, une interaction Po/S est for te
ment suggérée par un certain nombre de fa i ts qui ne sont pas nécessaire
ment des preuves mais n'en méritent pas moins d'être notés : en 1965, 210
HILL avait déjà évoqué la possibilité d'une association du Po avec des
protéines contenant de nombreux groupes SH. LAHZOLA et a l . (1973), à la
suite d'une expérience fai te chez le rat suggèrent que le groupe SH de la
cysteine peut être un site de liaison du 2 1 0 P o . PONIKAROVA et POPOV (1978) ?10 127
rapportent l'incorporation du " Po et du Te dans la structure molécu
laire de la cystine dans une expérience de laboratoire sur une plante.
Enfin, des éléments tels que Ag, Cd, Cu, Hg et Zn qui se trouvent en 210
compagnie du Po dans notre tableau oi,t tous été décrits cornue ayant la possibilité d'être associés avec les métallothionêines (CHERIAN et
GQYER, 1978). Les mêtallothionéines sont des metaHoprotéinés de pet i t
poids moléculaire ( , v l O ) contenant environ 30 % de cysteine, qui ont
été isolées pour la première fois en 1957 du cortex rénal de cheval par
HARGOSHES et VALLEE (Kstallothionein, 1978), mais qui se trouvent aussi
chez les vertébrés et invertébrés marins (OLAFSON et THOMPSON, 1974 ;
OLAFSON et a]_., 1979 a et b ; NOEL-LAMBOT, 1976 ; TALBOT et MAGEE, 1978).
Leur rôle n'est pas encore très bien connu, mais OLAFSON et aj_ (1979b) ont
montré que leur synthèse pouvait être induite dans Vhëpatopancrëas d'or
ganismes marins par injection de métaux tels que Cd ou Zn. I l a été suggéré
que cette synthèse pourrait avoir pour but de complexer et de "séquestrer"
5 l ' in tér ieur des cellules le métal en cause, l'empêchant de circuler dans
tout l'organisme et diminuant ainsi sa tox ic i té . Oe même "the existence of
selenomethionine in plants and microorganisms is generally regarded as
established with considerable certainly" (GAHTHER, 1974). I l est bien év i
dent que tout cet ensemble de fai ts ne constitue pas une preuve de l ' ex is
tence d'une "paloniomethianine" mais i l est à noter que les mêtallothionéines
se trouvent chez les vertébrés surtout dans le foie, le rein (Metallo-
thionein, 1978) ou chez les invertébrés dans 1 'hëpatopancrêas (OLAFSON,
1979a et b) e t que ces organes contiennent aussi les plus hautes concentra-210
tions en Po.
V.4. QUELQUES NOTES TRES PRELIMINAIRES SUR L'ASPECT BIOCHIMIQUE OE LA
QUESTION OU ''"'PO DAMS L'HEPATOPAMCREAS.
Cette question est en ce moment à l'étude, nous ne la mentionnons
donc ici que pour mémoire.

- 77 -
210
- Une associat ion du Po avec la f r ac t i on protéïque de Thêpatopancréas
semble fortement probable, d'après nos résu l ta ts obtenus chez l e calmar :
1'hêpatopancréas de calmars fraichement péchés est disséqué et homogénéisé
immédiatement. Après une première cent r i fugat ion pour éliminer les gros 210 débris c e l l u l a i r e s , le surnageant (qui cont ient 80 % du Po de Vhamo-
génat) est soumis à l ' ac t ion du su l fa te d'ammonium qui précipi te les pro
té ines: après une nouvelle c e n t r i f u g a t i o n , ^ / 90 % du Po se trouve asso
cié au p r é c i p i t é .
- Une ext ract ion des l ip ides de Vhêpatopancréas de poulpe par l a méthode 210 du chloroforme-mêthanol a montré que l e Po n'est pas associé aux l i p i d e s .
Ce résu l ta t semble confirmé par une expérience biologique f a i t e avec des
crevet tes, Lysmata seticaudata, soumises à un jeûne de quelques j ou rs . Dans
ces condi t ions, le poids de Thêpatopancréas (en pourcentage du poids t o t a l )
diminue avec l e temps (10,2 % au temps t o , 8,3 % au temps t=2j e t 7,8 %
au temps t = 9 j ) , alors que la concentration en Po augmente (36,6 - 1,8 pCi/g
au temps to ; 50,8 - 1,6 pCi/g au temps t=2 j et 52,4 - 2,0 pCi/g au temps
t=9j).
L'hêpatopancréas est un organe où les réserves ( l i p i des , glycogëne)
sont accumulées (V0NX, 1960) ; i l n 'est donc pas inconcevable qu'au cours
du jeûne, ces réserves étant mobilisées pour assurer les besoins métabo
l iques, on observe une augmentation r e l a t i v e de la concentration en Po
consécutive à la diminuticr. de poids de l 'organe. Cette expérience avec
des animaux à jeun peut être considérée comme un complément de ce l le f a i t e
chez Meganyctiphanes norvegica, où nous avions vu (chapitre I I ) qu'un
régime à base de nourr i ture pauvre en Po permet de "remobil iser" le 210
Po de 1'hêpatopancréas avec une 1/2 vie biologique de 6 jours environ.
\
CHAPITRE V I . BIOGEOCHI'lIE DU " u P O , t l u P B DANS LA
COUCHE SUPERFICIELLE DES OCEANS.

78 -
V I . l . INTRODUCTION : LES PAR'i K.ULES DANS L'EAU DE HER.
1 .1 . Origine, quantité composition.
Les particules en suspension Cans l'eau de mer peuvent être soit
introduites à part i r de la terre, soit produites in s i tu . Dans ce para
graphe et le suivant, de très larges emprunts sont faits â KRI5HNA5WAMI
et UL ( in press), â BUAT-HENARD et CHESSELE1 (1979) et â FOWLER {in press).
Les particules d'origine terrigêne peuvent ?tre introduites en mer
transportées ps,;" les rivières (~2 x 1 0 " g/an), las vents (-v-5 x 10 1 g/an)
ou les systèmes glaciaires (~ 5 x 1 0 1 6 g / ïn ) .
Les particules produites in situ peuvent être biogênes 'JU inorganiques.
La productivité organique des océans est de l 'ordre de 10*° g/an dans les
eaux de surface et la grande majorité de la matière organique ainsi formée
est recyclée à l ' in tér ieur des océans, soit par broutage par le zooplanc
ton, soit par l 'action des bactéries. Ce processus peut être très rapide
et on peut estimer que le "turnover time" est en moyenne de Tordre de
quelques semaines pour recycler cette matière organique particulaire. A la
limite des particules organiques et inorganiques, sont les particules de
baryte en suspension mises en évidence par DEHAIRS ej: al_. (1980); enfin
des particules inorganiques peuvent être produites in situ par des réac
tions chimiques, c'est le cas, entre autres, des oxydes de fer et manganèse.
Quelle que soit leur origine, ces particules sont très fines et ne
représentent qu'une masse infime, qui se chif fre en ppb (parties par
b i l l ion , soit 10"9). La technique la plus employée pour les séparer de
l'eau de mer est la f i l t r a t i o n , le plus souvent sur f i l t res Nucleopore de
0,4 ;;..,.
On peut ainsi recuei l l i r des quantités de particules qui varient
suivant la profondeur, suivant la latitude nu encore suivant qu'on se
trouve dans une région océanique ou plus près des côtes, ces variations
étant liées aux variations de la productivité biologique. On peut consi
dérer qu'en moyenne, dans les eaux de surface, les quantités obtenues
varient de 10 â 1000 /jg/kg : ell.is sont de plus de 100 ug/kg sur la cSte
ouest des continents et aux hautes lat i tudes, minimum dans les régions
équatoriales, Intermédiaires dans les réyiùu* tempérées. Au dessous de
500 m, ces quantités sont de l'ordre de 10 9 30 ug/kg, avec des varia
tions qui ref lètent plus ou moins ce qui se passe en surface. En profon
deur, (>3CC0 m), on peut avoir une resuspension des sédiments du fond
qui, suivent la nature du fond et suivant l'importance des courants
- 79 -
profonds, va se traduire par des concentrations en particules de 50 S 100^jg/kg, ce phénomène est sensible jusqu'à une hauteur d'environ 1000 m au dessus du fond.
Les particules biogênes sont surtout composées de carbone qui représente â peu près 25 ï de leur poids (ce qui correspond â environ 50 % de matière organique) de CaC03 et de S102. Un bon indicateur de l 'origine des particules est 1'aluminium particulaire. Le contenu en Al des par t i cules dans les eaux de surface est de Tordre de 164 ng/kg en moyenne, soit environ 0,19 % de leur poids, alors que l'abondance moyenne dans l'écorce terrestre est de 8,2 S. r.eci indique que dans les eaux de surface, les particules sont surtout biogènes. Ce fa i t n'est pas démenti par les facteurs d'enrichissement (FE » X/Al dans les particules / X/Al dans l'écorce terrestre) parfois extrêmement élevés trouvés pour certains éléments â l 'état de traces dans ces particules, bien que la cause de ces enrichissements ne soit pas connue avec certitude.
1.2. Les grosses particules. Leur importance dans les f lux.
La plupart des travaux qualitatifs et quantitatifs des chimistes et géochimistes en milieu marin ont t ra i t uniquement aux petites particules (quelques microns) qui, en masse, sont les plus Importantes et on a longtemps considéré que ces petites particules contrôlaient les flux des éléments ou de matière de la surface vers la profondeur. Ce n'est que depuis une vingtaine d'années que l'importance des grosses particules (sêdimen-tant rapidement) dans ces f'ux a été reconnue, â l'origine grâce â des preuves indirectej. Ces grosses particules -parmi elles les pilotes fécales du zooplancton- ne sont pas recueillies quantitativement par les méthodes de prélèvement habituelles qui font appel â la f i l t ra t ion de volumes réduits d'eau de mer prélevée I l 'aide de bouteilles Niskin ; c'est sans doute la raison pour laquelle leur rôle a été très longtemps sous-estimé (McCAVE, 1975). C'est à OSTERBERG et a l . (1963) que revient le mérite d'avoir pour la première fois émis l'hypothèse que les pelotes fécales d'animaux planctoniques pouvaient Stre le mécanisme de transport expliquant que des radionuclides i demi-vie courte, Zr - s5Nb et
• Ce provenant d'explosions atomiques atmosphériques, se retrouvaient, quelques mois seulement après leur introduction en milieu marin, dans des holothuries vivant sur les sédiments â 2S00 métrés de profondeur. I ls calculent un temps de transit de 7 â 12 jours pour atteindre cette profondeur, ce qui implique une vitesse de sédimentation de 400 â 700 m/jour.
80
tout â f a i t incompatible avec un t ranspor t par les pet i tes par t icu les
dont la v i tesse de sédimentation n 'est que de quelques mitres par an.
Quelques années après, les travaux de SMAYDA (1971) et de SCHRADER
(1971) a t t i r e n t l ' a t t en t i on sur le rô le joué par les-feces du zooplancton
pour accélérer la vitesse de sédimentation de diatomées ou coccol i thes
trouvés in tac ts â de grandes profondeurs.
Dans ces années 70, toute une sér ie d 'a r t i c les inportants dans ce
domaine apparaissent. LOHHAH e t a l . (1971) suggèrent que les produi ts
p a r t i c u l a t e s du zooplancton (feces, mues, carcasses,..) peuvent ê t re l e
mécanisme le plus important pour recycler e t transporter hors de l a couche
de surface les rad ionuc l ides qui y sont i n t rodu i t s . Toute une série de
travaux réal isés chez Meganyctiphanes norvegica, un euphausiacè p r i s
comme organisme représentat i f du macrozooplancton (FOWLER e t a l . , 1971a,
1971b ; FOWLER s SMALL, 1972) permettent aux auteurs (SMALL et al_., 1973)
de développer un modèle pour q u a n t i f i e r l e rô le respect i f des produi ts
p a r t i c u l a t e s (feces, mues, oeufs, carcasses) ou de l 'excrét ion soluble
dans l ' é l im ina t i on d'un élément chez cet te espèce. I l s démontrent a ins i
l ' importance prépondérante des feces comme voie d 'é l iminat ion du Zn
(90 %) e t ensuite comme mécanisme de transport de l 'élément hors de l a
couche de surface (SMALL & FOULER, 1973).
En 1975, l a revue de McCAVE met l 'accent sur l ' importance des
grosses par t i cu les , sédimentant rapidement, dans les f lux de matière par
t i c u l a t e , et leur hypothèse est b ientô t confirmée par les résu l ta ts de
BISHOP e t aK (1977) qui ( u t i l i s a n t une technique de f i l t r a t i o n de t rès
grands volumes d'eau) calculent que 99 % de ces f lux sont associés aux
par t icu les de plus de 5 3 ^ (constituées de feces et matière fécale surtout)
qui ne représentent pourtant que 4 % de l a masse to ta le des pa r t i cu les .
CHERRY e t aK (1978) montrent q u ' i l ex is te une intéressante cor ré la t ion
entre les facteurs de concentration dans les fjces du zooplancton d'un
bon nombre d'éléments -calculés d'après les mesures de FOWLER (1977)- et
leur temps de résidence océanique, les facteurs de concentration les plus
hauts correspondant aux temps de résidence les plus courts et inversement.
Les pelotes fécales produites en surface par le zooplancton peuvent
en e f f e t at teindre dp grandes profondeurs et leur présence a été signalée
dans le matériel r ecue i l l i par des pièges è sédiments placés à d i f férentes
profondeurs dans la colonne d'eau (KNAUER et a K , 1979), y compris près
du fond, â plus da 5000 metres (WIE5E e t a_K, 1976 ; HONJO, 1978 ;

F 81 -
SPENCER et al_., 1978 ; BREWER et a K , 1980).
Enfin un récent article (FELLOWS et a K , 1981) compare la distribution,
la production et le flux du carbone organique dans les petites particules
(recueillies par filtration) ou les grosses (recueillies par des pièges a
sédiments) et montre que la biomasse (carbone "vivant" estimé par des
mesures d'ATP) associée 3 ces dernières est cent fois plus importante que
celle asscciée aux fines particules.

- 82 -
1.3. 2 1 0 P o , 2 1 0 P b dans les particules.
En contraste avec tout ce qui vient d'être rappelé sur l'importance
des grosses particules dans les flux -so i t en termes de masse, soit dans
le flux des éléments- i l est surprenant de constater combien peu de données
quantitatives existent sur ces grosses particules. Ceci bien sûr ref lète
la d i f f icu l té de les recuei l l i r in situ et ce n'est que depuis peu que
l 'u t i l i sa t ion de pièges â sédiments le permet. 210 210
Quelles sont les vues généralement admises sur le Po, Pb dans
les particules ?
Des les premiers travaux sur le Pb (MIA et a K , 1961) puis le 2 1 0 P o , 2 1 0 P b {SHANNON et al_., 1970) dans l'eau de mer, les auteurs ont
reconnu l'importance de leur association avec des particules sédimentant
rapidement, ce qui avait pour conséquence d'entraîner un temps de rés i
dence court pour ces éléments dans la couche de surface. L'origine bio
logique de ces particules é ta i t admise et vu l ' a f f in i té particulière du 2 1 0 P o pour le plancton (CHERRY. 1964 ; MARSDEN, 1964 ; HILL, 1965 ;
HOLTIMAN, 1969 ; SHANNON et al_., 1970), le temps de résidence beaucoup
plus court pour le Po (0,6 an) que pour le Pb (5 ans) n 'éta i t pas
surprenant. SHANNON e^ aj_ (1970) toutefois mentionnaient déjà dans ce
premier ar t ic le que le plancton seul ne pouvait être la cause de (ces)
temps de résidence aussi courts, qui auraient nécessité un "turnover
time" extrêmement rapide du plancton.
Par la suite, un certain nombre de travaux (travaux du programme
GE0SECS, 1976) ont confirmé ces premières estimations -moins de 1 an pour
le Po, 1 a 5 ans pour le Pb- des temps de résidence et les art ic les
de TUREKIAN et al_ (1974) puis KHARKAR et al_. (1976) ont aussi confirmé
que le plancton ou des débris de plancton non modifié ne pouvaient être
le mécanisme de transfert du Po, Pb de la couche de surface vers la
profondeur.
Tous les articles que nous avons cités portent sur des mesures de
' Po, Pb totaux dans l'eau de mer. Les seuls articles détaillés sur le
Po, Pb particulates et dissous dans la colonne d'eau de la surface
jusqu'au fond sont ceux de BAC0M et al_. (1976), BACON (1977), BAC0M et a]_.
(1980a) , BACON et »]_. (1980b) et i l s ont t r a i t aux petites particules
retenues par f i l t ra t ion de 40 à 200 1 d'eau sur f i l t r e Nucleopore au
Mil 11 pare de 0,4 jim.

- 83 -
A l'exception de l'une de ces études (BACON et a K , 1980b) qui a
été fa i te dans une zone très particulière au nord du Venezuela (Cariaco
Trench), les autres.l 'ont été dans l 'Atlantique tropical {ceux de 1976,
1977) ou Nord (1980) et ce sont de ceux-là que nous allons essayer de
t i re r les points principaux.
- La majorité du Z 1 0 P o , Z 1 0 Pb (80 à 90 %} est sous forme dissoute sur
toute la hauteur de la colonne d'eau.
- Dans la couche de surface, i l existe toujours un déséquilibre entre Z 1 0 P o , 2 1 0 P b : le rapport Po/Pb est < 1 pour le 2 1 0 P o , 2 1 0 P b totaux et
dissous, ce rapport est, par contre, toujours > 1 dans les particules. 210
- A une profondeur d'environ 300 m, 60 % environ du Po particulalre est "recyclé" et repasse sous forme dissoute alors que ce phénomène est
210 minime pour le Pb.
710 210 - En profondeur Po, Pb sont en quasi-équilibre, le rapport Po/Pb é tan t< 1 dans la phase dissoute,> 1 dans la phase particulalre. De
210 22S plus i l existe un très net déséquilibre entre le Pb et le Ra,
210 que les auteurs expliquent par un "réservoir" pour le Pb au niveau du fond ; le "sinking-scavenging model" proposé par CRAIG et al (1973)
210 ne permet pas d'expliquer les flux de Pb en profondeur, â cause de la
vitesse de sédimentation beaucoup trop lente des petites particules.
Ces principaux points, qui sont ceux-là mêmes mentionnés par
BACON et aj_. (1980a) ont t r a i t aux petites particules. Comment la prise
en considération des grosses particules changerait-elle leurs conclusions
quelle est la place fa i te aux particules biogènes dans ces discussions et
ces modèles ? Leur rôle est souvent mentionné mais très peu discuté nour
la couche de surface, totalement passé sous silence en profondeur.
Outre le f a i t que la vitesse de sédimentation des petites particules
est trop lente (quelques mètres par an) pour expliquer les déséquilibres
observés par une simple adsorption du Po, Pb sur ces petites par t i
cules, on peut faire un certain nombre de remarques qui ncus semblent
importantes : 210 210
- la première a t ra i t aux très hautes concentrations en Po, Pb
mesurées par SPENCER et a l . (1978) dans le matériel de leur piège à
sédiments profond ,242 pCi/g et 158 pCi/g en moyenne, respectivement-ou
bien par BREMER et a l . (1980), de 47 à 396 pCi/g pour le Z 1 0 P o et de 210
43 a 214 pCi/g pour le Pb suivant la profondeur. Oe telles concentra
tions ne sont pas "typiques" des concentrations habituellement observées

84
dans les sédiments, de l'ordre de 10-15 pCi/g, avec un rapport Po/Ph
d e ~ l (BEASLEY et al_., 1973).
- la deuxième remarque a t r a i t au rapport Po/Pb, toujours supérieur à
1 al lant jusqu'à 8, que ce soit dans les petites particules (BACON, 1977 -,
BISHOP et a l . , 1977) ou dans les grosses (SPENCER et a l . , 1978 ; BREHER ""710
et aJN, 1980). Connaissant l ' a f f i n i t é particulière du Po pour les
matériaux biologiques où le rapport Po/Pb est toujours > 1 on est tenté
de voir dans ces rapports élevés l ' indication d'une origine biogénique
â ces particules, d'autant plus que ces rapports sont d'autant plus hauts
(BACON, 1977 ; BACON et al_., 1981a) qu ' i l s'agit de zones 3 productivité
plus élevée.
- enfin, une dernière remarque concernant le récent article de FELLOWS
et aK (1981), qui met l'accent sur l'importance des flux de carbone
"vivant" associés aux grosses particules -100 fois plus importants que
ceux associés aux petites- non seulement en surface mais plus encore en
profondeur, nous semble d'une importance toute particulière et n'est
peut-être pas sans lien avec le f a i t que les rapports Po/Pb sont toujours
supérieurs â l 'uni té , dans toute la hauteur de la colonne d'eau.
1.4. Conclusions.
Après avoir passé en revue et souligné l'importance des grosses p a r t i
cules dans les transports des éléments et leur f lux, puis les vues génëra-
lenient admises sur le Po, Pb dans l'eau de mer, nous nous proposons
maintenant d'essayer d'évaluer quel est le rôle de la biologie dans leur
transport e t leur transfonnation. Pour cela nous utiliserons trois approches
le matériel recueil l i par des pièges à sédiments, l ' itude des produits par-
t iculaires du zooplancton et enfin le rôle d'organismes planctoniques
VI .2 . 2 1 0 P 0 , 2 1°PB DANS LE MATERIEL RECUEILLI PAR DES PIEGES A SEDIMENTS.
2 . 1 . Le matériel récolté.
210 Pendant une période de deux ans ( juin 1978-mai 1980) le Po et le
210
Pb ont été mesurés dans le matériel recueilli par un piège â sédiments
ancré à 200 m de profondeur â environ 2 milles au large de Monaco. Le
collecteur se trouve à 100 m de la surface (fig. 3), il est laissé en
place pour des périodes allant de 1 semaine à 1 mois. En outre, dans trois
cas, un piège â sédiments dérivant librement (STARESINIC et al., 1978)
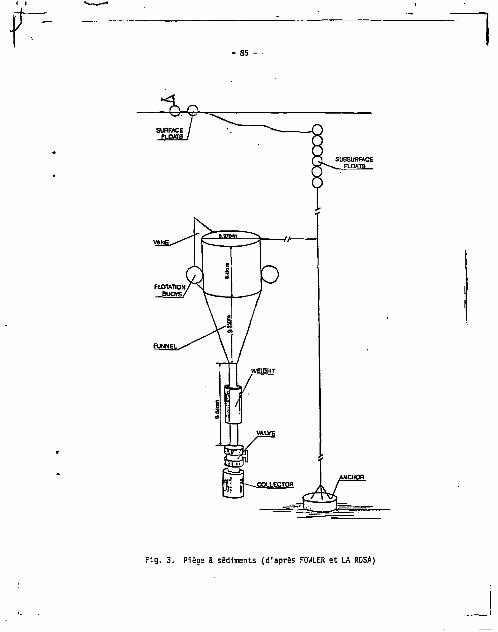
85
SUBSURFACE FLOATS
Fig. 3. Piège 9 sediments (d'après FOWLER et LA ROSA)

- 86 -
pendant 12 à 18 heures S 50 m de la surface a été ut i l isé. Suivant
l'époque de l'année, l'aspect des échantillons varie, contenant une pro
portion plus ou moins grande de sédiments ou de matière amorphe, parfois
des quantités notables de feces reconnaissables. Les échantillons re
cuei l l is sont lyophilisés et analysés pour le Po, °Pb ; en outre
des mesures d'aluminium par absorption atomique ont été faites dans
quelques cas (HIGGO, résultats non publiés) et quelques estimations du
contenu en matière organique ont été obtenues par calcination des
échantillons â 450° C.
2.2. Résultats et discussion.
Les résultats obtenus sont présentés dans le tableau 34.
- Les flux de matière particulaire, exprimés en g sec/mVjour varient de
0,17 à 5 ,8 , les valeurs les plus hautes correspondant à des périodes où
les chutes de pluie étaient particulièrement abondantes, comme cela a
été le cas en janvier-février 1979 (THEIN et al_., 1980). Les concentra
tions en Po, Pb varient, par contre, assez peu : 21,4 î 9,2 dpm/g
pour le Po et 24,6 - 7,9 dpm/g pour le Pb. L'écart-type re la t ive
ment grand pour le Po est dû en f a i t â deux valeurs assez exception-
. nelles, Tune très basse (mai 1979. â 30 m de la surface) l 'autre très
élevée ( j u i l l e t 1979) et les moyennes et icarts-types recalculés en ne
tenant pas compte de ces deux valeurs "atypiques" sont de 20,9 î 6,9 dpm/g
pour le Po, alors qu'i ls demeurent pratiquement inchangés pour le Z 1 0 P b , 24,9 - 7,4 dpm/g.
210 210 - Le rapport Po/ Pb est, dans la très grande majorité des cas, i n
férieur â l ' un i té , ce qui est quelque peu surprenant. En e f fe t , comme nous ?lû 210
l'avons déjà rappelé, le rapport Po/ Pb est 7 1 dans les petites particules (BACON, 1977 ; BACON et al_., 1980a) ou les grosses (BISHOP
rtal.., 1977 ; SPENCER et al_., 1978 ; BREHER et »]_., 1980). De plus, le
matériel récolté par notre piëge a un contenu en matière organique assez
faible (de 3 à 21 % du poids sec) alors que le contenu en Al est élevé
(autour de 5 S). De tels chiffres ne correspondent pas aux valeurs données par
KRISHNASWAMI et LAL (in press) comme typiques des concentrations trouvées
dar.j la matière particulaire des eaux de surface (soit 50 % de matière
organique et 0,2 % d'Al) ou celles mesurées dans le seston par BRUN-
C0TTAH et al^ (1976) en Méditerranée, au large, sur la radiale Bice-Calvi
(58 " de matière organique, moins de 1 S d'Al) ; de tels chif fres, par

Date \ Profondeur m
: n«, ; "V, ;g/mz/Jour ; dpw/g * dpra/g ; *"Wcn. •: '
8 - 12/6/19» 100 0.77 15,1 - 1,8 21,1 - 6,0 0.7 : 0,2 < - 24/7/1978 I0U 0,64 15.S 1 1 , 3 25,1 i 1,8 0,6 ! 0 , 1
2] - 28/8/1978 too 0,40 18,2 t 1,6 33,7 ! 3,1 0.5 « 0.1 1 - 16/10/1978 100 0.77 22,2 t 1,8 34,9 i 2,7 0,6 1 0,1
10/1/19/9 * 50 1.8 26,0 ! 4.2 41,1 Î «,7 0,6 4 0,1 Janv/rcvr. 19/9 100 5.3 19,5 t 2,0 22,4 t 2,0 0,9 4 O.I 14/1 - 23/2/1979 loo 5,8 13,5 t 0,7 20,9 t 1,6 0,7 1 0.1 19 - 2B/2/1979 100 2.3 15,1 ± 0 . 7 24,9 4 1.8 0.5 4 O.t 27/4 - 7/5/1979 100 1.2 10.9 4 1.B 33,3 t 2.4 0.6 4 0.1 8 - 21/5/Î979 100 0,49 15,3 4 0,9 28,6 t 2,0 0,5 • 0.1
22 - 29/S/1979 30 0.IB 6.1 ! 1,1 7,7 4 1.2 0,8 4 0.2 22 - 29/5/1979 150 0.17 14.2 4 2,2 18,0 4 3,0 0.8 î 0.2 22 - 29/5/1979 230 0,29 25.1 t 3,1 19,5 4 2.0 1.3 -' 0,2 4 • 13/6/1979 100 0,30 23,3 4 2,7 11,5 4 1,5 2,0 t 0.3
26/5 - 3/7/1979 ICO 0.46 51,3 4 4,7 32,0 4 2,4 1.6 4 0.2 11 - 19/7/1S79 100 0,70 44;6 î 2,9 25,7 4 2,7 1.6 4 0,2 30/1 - 6/2/1900 100 4,3 16.0 ! 2,7 24,6 4 2,0 0,7 « 0,1 6 - 12/2/1980 100 3.9 11.1 t 2,2 21,3 4 l ,a 0,5 4 0,1
12 - 25/2/1980 WO 0,54 13,5 t 1,8 18,6 * 2,0 0.7 ! 0,1 3 - 4/3/1330 • 50 1.5 27,8 4 2,9 33,1 4 2.7 0,8 1 0,1
10 - 11/3/1980 * 50 0,28 24,2 t 2,7 10,0 4 2,2 2.4 4 0,6 20/3 - 8/4/1980 100 3,2 19,8 4 2,4 28,6 4 2,2 0,7 t 0,1 8 - 18/4/1980 100 0.7S 23,1 t 2,4 23,5 4 2,2 1,0 I 0,1
18 - 28/4/1980 100 0,68 23,3 4 3,6 10,9 t 1,3 1.3 4 0,2 18 - 28/4/11110 150 0,93 28,0 t 1,8 19,8 4 1,3 1,4 4 0,1 28/4 - 5/5/1980 100 0,43 26,4 t 4,7 35,3 4 1,8 0.7 ! 0.1 5 - 12/5/19BU 1141 0,25 23,j 4 t,l 32,1 ! 3,3 0.7 ! u . l
12 - 19/5/1980 100 0.25 24,9 4 2,0 25,8 4 2,9 1,0 4 0.1 19 - 29/5/1980 100 1.4 15,3 4 1,1 21,3 t 1,6 0,7 i 0.1
"hatTere or-g<miqtic en I ilu poids
""Aluminium en % 4u poids
"facteur d'enrl" FT [ cMssement *ent : nO_ o : ! i a p Q
2 1 0 Pb :dp»/**/J : dp/n/m /J
5,9 5,0 5,6 5,9 4.7 5,6 3,S 1.3
11,6 16.2 9,9 16.1 7,3 13.5
17,1 26.9
46,8 74,0 103,4 118.7 7B.3 121,2 34,7 S7 è3 22.7 40,0 7.5 14,0
68,8 105,8 43,3 63,1
7,3 10,0 41.7 49,7 6,8 7,0
63,4 91,5 17,3 7,6 16,2 12,9 26,0 18,4 11,4 15.2 5.8 3,1 5,2 6,5
21,4 29,8
Tableau 34. Materiel recueill i par des pièges s sédiments en HeriUerrAntia. dpm/9 sec - 1 écart-type *- pfeges 1 sédiments dérivants. Les autres : rixes.

S" -
contre, sont plus proches de ceux mesurés par BRUN-COTTAN et a l . ( i b i d ) ,
38 S de matière organique, 4 % d'Aï dans les échantillons de seston
des stations plus prés de la côte (15 milles environ) où l'apport t e r r i -
gène est encore important.
Les facteurs d'enrichissement du Po, Pb par rapport à l ' é -
corce terrestre ont été calculés dans les cas où les concentrations en
Al sont connues. Pour calculer ces facteurs d'enrichissement
F E _ 2 1 0 P o ou 2 1 0 Pb/Al échantillon
Po ou Pb/Al êcorce terrestre
on a ut i l isé les valeurs de TAYLOR (1964) pour l'ëcorce terrestre, soit 210 21fl
82300uo/gpour l 'Ai et pour le Pc, Pb, supposés être en équilibre 210
avec l'uranium, 1,98 dpm/g. Les facteu's d'enrichissement pour le Pb varient assez peu (moyenne = 1 8 - 7 ) alors que les variations sont plus importantes pour le Po (moyenne 19 i 13) et les facteurs d'enrichissement les plus élevés correspondent aux échantillons qui ont un rapport 21fl 210
Po/ Pb supérieur â l 'unité (Fig. 4 ) . I l existe une corrélation entre
le rapport Po/ Z 1 0 Pb et le facteur d'enrichissement pour le Po
(coefficient de corrélation 0,77, P iO.Ol ) alors qu'il n'en existe aucune
pour le Z 1 0 P b . ?in 2in
Un rapport Po/ Pb supérieur â l 'uni té est la règle dans les 210
matériaux biologiques et cela, Joint à un FE plus élevé pour le "Po
dans ces échantillons nous semble indiquer que dans ces cas la contribution
des particules biogéniques est plus importante dans le matériel récolté
qu'elle ne T e s t habituellement.
- Afin de tester la possibilité d'une éventuelle "perte" du Po plus 210
importante que celle du Pb par les particules recueill ies, qui pourrait 210 210
expliquer ces rapports Po/ Pb < 1 , dans un certain nombre de cas le 210 210
Po et le Pb ont été analysés dans l'eau du collecteur. Les résultats
obtenus sont présentés dans le tableau 35. Pour les trois premiers échan
t i l lons , l'eau a été analysée non f i l t r é e après décantation des particules,
dans les deux derniers après f i l t r a t i o n sur i,Z/im Dans tous les cas on
trouve un enrichissement de l'eau en Po, Pb par rapport aux concen
trations habituellement mesurées (tableau 40) ou trouvées le même jour
sur des échantillons d'eau prélevés par bouteille Niskin 3 la même profon
deur que les pièges (valeurs entre parenthèses sur le tableau 35) . On peut
ainsi calculer que les particules ont perdu, suivant les cas, de 2 S 15 5
de leur Po pendant leur séjour dans le collecteur, la perte du Pb

? 89
•50r-
40
30 fi a.
UJ
u. 20
10
Po/pb
Fig. 4. Corrélation entre le facteur d'enrichissement et le
rapport Po/Pb dans le matériel recueilli par un piège à sêdinsnts.

- 90 -
trap» de rt,0„r tah** Poids 210^ z M p f c p a / , , , 210,,,, MOp,, p„ , n , p e r 4 u p a r ,„ p.^
D * t t J S ! ! ! ^ «rollarttur particule» •djr.n Eau dpVo Partlcults Z W Pi> Z 1 D P b n c v r w * U t r e g _ _ _ _ _ ^ _ _ _ ^ _ ^ _ _
27/4-7/5/1979 10 J J 0,65 M l - 0.09 4.69 ± D.07 2,0 - 0.3 18,9 - 1.» 33,3 Î Z.4 O.B t 0.1 8.8 2,4
8-Î1/S/197» 13 J 1 0.3S 1.D4 - 0,09 1,35 1 0 .07 O.B - 0,1 15,3 ± 0,9 2B.6 - 2.0 0,5 * D.I 15,1 IO.G
11-19/7/1979 8 J 1 C.lfi 0.3S - 0.04 1.40 - 0.07 0,9 i 0 ,2 41,« * 2,9 25,7 ï Z.7 1,6 t 0 ,2 u z .g
10-11/3/1960 IB h 3.Z 0 ,0» 0.053 - O.OB ft.,? * 0.0'* 0.7 Î 0.1 2 4 , 2 - 2 . 7 1 0 , 0 * 2 , ! 2 .4 Î 0,6 8 ,3 p u décelât (0,355 : o,ou)p.:a + :..oaj
4-1Z/3/198D B J 0,5 0,D8> -0,431 * O.OB QHS : 0,073 0.8 - 0.2 25,3 - 2 4 34,5 ± 2,8 0.7 * 0,1 7.7 7.7 (0.073 Z 0.011)PJ)7al 0.DZ2)
* Soustraire de ces valeurs «esuraes la valeur des concentrations qui le trouvent dans l'eau dt mer : pour les 3 prwsiers
échantillons on a pris la moyenw des concentrations de la couche de sont-surfici, sa't pour Po et 2 I 0 F b 0,057 - 0,019 dpn/1
* t 0,125 - 0,023 Stm/1 respect!vc=ent (tableau 40). Pour les 2 derniers, valeurs ( ) seiurees la min* jour (bouteille Niskin
1 la neme profondeur).
Tableau 35 - ï l 0 P o , î l D P i dans le eïtériel recueilli par del pièges t Stdinnts et (Uni l 'eiu des collecteur-!.
tjpB î 1 et*rt-tjpe.
est légèrement inférieure (non décelable jusqu'à 10 S). Dans aucun des cas la "perte" des deux nuclëides par les particules ne peut être la cause des rapports Z 1 0 Po/ Z 1 0 Pb bas trouvés dans nos échantillons, - Comment les flux de Pb associé à ces particules recueillies à 100 m (tableau 34) se comparent-ils avec les flux de Pb introduit â la surface S partir de l'atmosphère ?
Pendant un an, le 2 1 0Po et le 2 1 D Pb ont été analysés dans l'eau de pluie et les particules recueillies dans un collecteur p'k'Cê sur un to i t a Monaco. Les volumes des précipitations mensuelles ainsi que les flux de 210
Pb correspondants sont présentés dans le tableau 36. I l existe une bonne corrélation (r = 0,89 , P*. 0.0Q1) entre les flux de 2 l 0 Pb et les précipitations { f i g . 5) ; l'ordonnée à l 'origine de la droite de corrélation ainsi

f - 91
1000 r
i ? 5 0 0 -
100
10 20 40 50 60 70 Lître/m'/Mois
BO
Fig. 5. Corrélation entre les retombées de Pb et les précipitations

Precipitations
Avril 1S80 41,7 402
Mai 1930 57.6 1057 Juin ISSU 39,1 522
Jui l le t 19BQ 4.3 20 Août I960 54,0 801 Septemore 1980 18.3 417 Octobre 1980 107 102B Hoverare 1980 50,7 613 Dêce=ùre 1980 1.1 13 Janvier 1981 10,9 169 Février 19B1 18.5 535 Mars 1931 68,3 948
dpn/nrVj " 18 (Bayenne)
Tableau 36 • Le ! 1°Pb dans l'eau de plu e.
obtenue représente, d'après TUREKIAN et a]_. (1977) l e f l u x des retombées
"sèches", qui est dans notre cas de 131 dpm/^/mois , s o i t 1/4 environ de
la valeur moyenne. A une occasion, en août 19BD, l e 2 1 0 P b a été mesuré
dans ces retombées sèches recue i l l i es sur une plaque de te f lon placée près
du col lecteur d'eau de p l u i e , pendant une période de 14 jours où les p réc i
p i tat ions éta ient nu l l es . Le f lux de Z 1 0 P b calculé a été pendant cette
période de 21 dpm/n-2, une valeur un peu in fé r ieu re a l a valeur théorique
obtenue d'après l a l i g . ie de régression (~60 dpm/n.2), mais maigri tou t du
même ordre de grandeur.
Etant donné que les f l u x de Z 1 0 P b associé aux par t icu les (tableau 34)
ou aux p réc ip i ta t ions (tableau 36) var ient d'un mois 5 l ' a u t r e , on ne peut
u t i l i s e r , pour les comparer, que les valeurs annuelles de ces f l u x . On
obtient a i n s i , pour le 2 1 0 P b ataosphêrique, 18 dpm/m^/j e t pour le f lux qui
qu i t t e l a couche de surface associé aux par t icu les 34 dpm/m2/j. Si l e 2 1 0 P b

- 93 -
226 produit i n s i t u par décroissance radioact ive du Ra est d'environ
0,8 dpm/mz/j dans la colonne d'eau de 100 m (RAMA et al__, 1961 : 0,003 dpm/ l /an) , ou do i t avo i r , à l ' é q u i l i b r e : 34 = 18 + U,8 + x ,
x représentant un apport de Pb provenant d'une autre source. Cet
apport, qui est de Tordre de 15,2 dpm/nr/j provient vraisemblablement
de matériaux terrigènes : cet te hypothèse semble êtayëe par les f l u x
t rès élevés obtenus en j a n v i e r - f é v r i e r 1979 au moment d'une t rès f o r t e
crue du Var (tableau 34) et par le f a i t que des rapports 2 i 0 P o / 2 1 0 P b
de 0,7 à 1 sont communs dans les sols (PARFENÛV, 1924).
2 .3 . Conclusion.
Les rapports Po/ Pb bas, in fé r ieu rs â 1 dans la t rès grande
major i té des cas, obtenc dans l e matér ie l r ecue i l l i à 100 m de l a sur
face par un piège à sédiments ancré à 2 mi l les de la côte par 200 m de
fond ne sont pas caractérist iques des rapports habituellement mesurés
dans la matière par t i cu la i re dans l 'eau de mer ; de plus, les fa ib les
proportions de matière organique et les for tes proportions d'aluminium
mesurées dans nos échanti l lons semblent indiquer que l 'apport ter r igène 210
est i c i important. Ce f a i t est confirmé par des f lux de Pb qu i t t an t
la couche super f i c ie l le associé à ces part icules supérieurs aux f l u x 210 210
calculés d'après les apports de Pb atmosphérique et de Pb produi t
i n s i t u ; la différence entre ces f l u x a permis .d'estimer à 45 S environ
la cont r ibut ion de matière terr igène dans nos échanti l lons.
V I .3 . ROLE DES PRODUITS PARTICULATES DU ZDOPLAHCTON, ET PLUS PARTICULIE
REMENT DES FECE5, DANS LE TRANSPORT DU 2 l 0 P 0 , 2 1 0 PB DE LA COUCHE DE
SURFACE VERS LA PROFONDEUR.
3.1. Modèle.
Le modèle que nous avons u t i l i s é pour étudier le rôle du zooplancton 210
dans l a transformation du Po e t son transport hors de la couche de sur
face par les part icules q u ' i l produi t es t une adaptation de ce lu i développé
par SMALL e t a l . (1973) e t appliqué par SMALL e t FOWLER (1973) au cas du Zn
en mer L igure. Ce modèle a été développé chez Meganyctiphanes norvegica, un
euphausiacé pr is comme organisme représentat i f du zooplancton. Essent ie l le
ment, l ' i d é e est l a suivante : un élément incorporé par les organismes sera
en pa r t i e retenu, en part ie é l iminé, s o i t sous forme par t i cu la i re ( feces,
mues, oeufs) , so i t sous forme so lub le . L 'é l iminat ion t o t a l e , Xç sera a ins i

- 94
la somme de différentes voies d'élimintation auxquelles on peut attribuer une
importance relative si l'on connait les concentrations de l'élément dans
les différents produits particulaires et les aninaux entiers ( Q) et leur
taux de production par unité de poids et par unité de temps ( ç ) . On
peut alors éc-ire : X i = Vf + Vm + Ox0x + lW W
où 0 - , Q > 0 i Q, sont les concentrations mesurées dans les feces,
mues, oeufs, animaux entiers et p f , p , o , sont leur taux de pro
duction, par unité de poids et par jour , p représentant la fraction
soluble de l'élément Incorporé éliminée par jour. Nous ne sonnes intéres
sés ic i que par les produits part iculaires, nous ne tiendrons donc pas
compte de 9 a P e dans le calcul de X que nous appellerons
désormais X E . Connaissant X on peut estimer quelle est la contribution des
P particules produites par le zooplancton vivant au temps d'enlèvement
210 total du Po de la couche superf iciel le . Ce temps d'enlèvement total
se déf in i t comme 1/R, R étant la probabilité par unité de temps qu'un 210
atome de Po a de disparaitre de la couche superficielle par n'importe
quel processus autre que la décroissance radioactive {SHANNON et al.. •
1970) ; R représente la somme de plusieurs termes qui sont autant de
"routes'1 ou mécanismes possibles et si R représente la contribution des
produits particulaires du zooplancton vivant on peut écrire :
1/R = T = _ £ _ (2)
• 210 où C est la concentration du Pc dans l'eau de mer et W représente la
biomasse du zooplancton dans le même volume d'eau.
3 .2 . Mesures et résultats.
Dans le tableau 37 sont réunies les différentes données nécessaires au calcul de X c .
p 210 Les quantités Q , qui représentent les concentrations en Po des
mues, oeufs et feces de Heganyctiphanes norvegica sont mesurées par analyse
du " u P o dans ces différents produits particulaires (CHERRY et a l . . , 1975
et tableau 38) alors que les taux de production sont ceux obtenus par
SMALL et a l . (1973) chez cette espèce. L'examen du tableau 37 montre que
l 'élimination du Po par les feces, 4,76 dom/g sec d'animal/jour repré
sente plus de 99 3 de l'élimination totale de l'élément par les différents
produits particulaires.
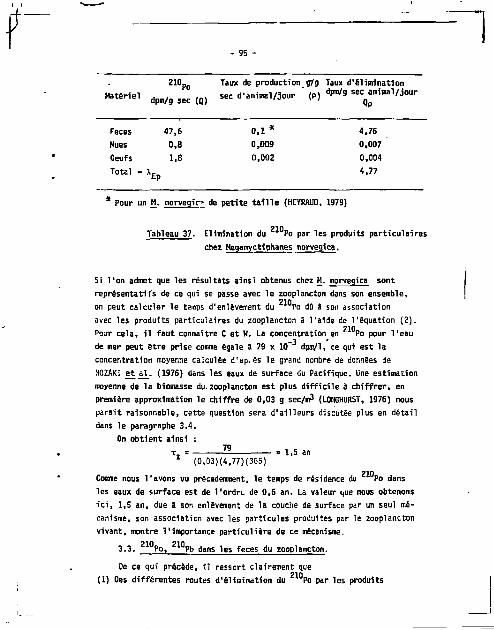
- 95 -
Matériel
210„ Taux de production g7g Taux d'élimination
dpm,g sec (Q) » « -•animaVôour ' (P) W se^n ima l / jour
Feces 47,6 0 ,1 * 4,76
Mues 0,8 0,009 0,007
Oeufs 1,8 0,002 0,004
Total «= h p 4,77
* Pour un M. norvegic de petite t a i l l e (HEÏRAUD, 1979)
210 Tableau 37. Elimination du Po par les produits particulaires
chez Meganyctiphanes norvegica.
Si l'on admet que les résultats ainsi obtenus chez M. norveqica sont
représentatifs de ce qui se passe avec le zooplancton dans son ensemble, 210
on peut calculer le temps d'enlèvement du Po dû â son association avec les produits particulaires du zooplancton â l'aide de l'équation ( 2 ) .
?10 Pour cela, i l faut connaître Z et W. La concentration en Po pour Veau
de mer peut être prise comme égale â 79 x 10" dpm/1, ce qui est la
concentration moyenne calculée d'ap. es le grand nombre de données de
NOZAKI e t jil_. (1976) dans les eaux de surface du Pacifique. Une estimation
moyenne de la biomasse du zooplancton est plus d i f f i c i l e à ch i f f rer , en
première approximation le chiffre de 0,03 g sec/m3 (LONGHURST, 1976) nous
parait raisonnable, cette question sera d'ai l leurs discutée plus en détail
dans le paragraphe 3.4.
On obtient ainsi : 7 9 1,5 an
' (0,03)(4,77)(365)
210 Comme nous l'avons vu précédemment, le temps de résidence du Po dans
les eaux de surface est de l'ordrL de 0,6 an. La valeur nue nous obtenons
i c i , 1,5 an, due S son enlèvement de la couche de surface par un seul mé
canisme, son association avec les particules produites par le zooplancton
vivant, montre l'importance particulière de ce mécanisme.
210 210 3 .3 . Po, Pb dans les feces du zooplancton.
De ce qui précède, i l ressort clairement que 210
(1) Des différentes routes d'élimination du Po par les produits
- 96 -
'10 210 tant, â l 'équi l ibre , dans la couche superf iciel le , le bilan du " Po, Pb
part iculates du zooplancton, de loin l 'élimination par les feces est la
plus importante. 210
(2) Le transport vertical du Po de la couche de surface vers la profondeur par les feces du zooplancton est un mécanisme qui joue un rôle non
négligeable dans la disparition rapide de l'élément de cette couche. 210
En es t - i l de même pour le Pb ?
Nous avons déjà rappelé, dans le chapitre I , les équations reprësjn-
" 1 0 Po, " "
(1) rPb + XRn NRn " X Pb HPb + KPb NPb (2)
21il 210 222 où Po, Pb, Rn sont le Po, Pb Rn, \ leurs constantes de décroissance radioactive (par an), I les flux atmosphériques (at/min/cm';et N les nombres d'atomes. K (par an) est la probabilité par unité de temps qu'un atome a de disparaitre de cette couche par n'importe quel processus
autre que la décroissance radioactive. I„„, dans l'équation (1) est nê-210 gligeable, i l s'en suit que pour calculer le temps de résidence du Po
dans la couche de surface ( T . „ = 1/K D „) , i l suff i t de connaître R c , le ?m 9in
rapport d 'act ivi té du Po/ Pb dans cette couche et
TP0 * X p o (1-R S) < 3 ) Dans l'équation ( 2 ) , Ip|,, l 'apport atmosphérique du Pb est variable
et d i f f i c i l e à connaître exactement. Pour tourner la d i f f icu l té , TUREKIAN
et al_. (1974) ont proposé d 'ut i l iser l'équation (2) pour estimer I p b , ce
qui est faisable si l'on connait K p ( ) . Supposant que Po et Pb disparaissent
de la couche superficielle transportés par les mêmes particules, les
auteurs notent que le rapport Kp /K p . est alors 116 aux facteurs de concen
trations des nucléides dans les particules qui les transportent. Si c'est
le cas, on peut écrire
KP0 "PO . QPn e t
K P° . "P
KPb NPb" QPb KPb R s
où Q - et Q p . sont les concentrations en atomes de Po, Pb dans
les particules et R» le rapport de leur act iv i té . BACON e^al_. (1976) ont
mesuré Po, Pb particulaire et dissous et trouvé un rapport de 2 dans les
particules de la couche superficielle dans l'Atlantique equatorial nord ;
i ls ont ainsi pu calculer une valeur de I ^ de 20 at/min/cnf, ce qui est
en bon accord avec les valeurs théoriques estimés par TUREKIAN et aK (1977).

- 97 -
210 210 Nous avons f a i t des mesures concomitantes du Po, Pb dans un
certain nombre d'échantillons de feces de M. norvegica et les résultats
obtenus sont présentés dans le tableau 38. La valeur moyenne, - un
écart-type est de 49 * 11 dpm/g pour le Po (n = 4, seuls les échantillons
où le Pb a été mesuré en même temps sont uti l isés ic i ) et de 23 - 7 dpm/g
pour le Pb, ce qui nous donne un rapport de 2,2 î 0,3. Un tel rapport
est donc très voisin de celui mesuré par BACON et a\_. (1976) dans la ma
tière par t i cu la te des eaux de l 'Atlantique nord et n'est pas incompatible
avec l ' idée que les feces pourraient être l'une de ces populations de par
ticules responsables du transport des deux nucléides hors de la couche
superf iciel le. 210
Si c'est le cas, quel est le temps d'enlèvement du Pb de la couche
de surface, associé aux feces du zooplancton ?
Ce temps peut être calculé comme nous l'avons fa i t précédemment pour 210
le Po, d'après l'équation (2) du paragraphe 3 .1 . avec * E - Q f P f
seulement. Uti l isant pour C une valeur de 0,138 dpm/1 (NOZAKI et al_., 1976),
t ) f = 2 3 - 7 dpm/g, p. = 0,10 g/g animal/jour et W = 0,03 g/m 3, on obtient
' Pbf 138
(23)(0,1)(0,03)(365) 5,5 ans
210 Pour le Po, étant donné que plus de 99 S de X, était dû à q f p . ,
la valeur précédemment calculée de 1,5 an ne change pas. 210
Ces valeurs obtenues i c i , 5,5 ans pour le Pb, 1,5 an pour le 210
Po sont environ le double des valeurs habituellement admises pour le temps
de résidence total des deux éléments dans la couche de surface, ce qui
suggère que ce mécanisme de transport par les feces du zooplancton est
responsable pour moitié environ de l'enlèvement des deux élêcen^s de cette
couche.
3.4. Critiques du modèle u t i l i s é .
L'obtention de ces résultats n'est possible qu'en faisant un certain
nombre de suppositions. 210 210
(1) La première c'est que les concentrations en Po, Pb et les
rapports Po/Pb obtenus dans les feces de Veuphausiacé Heqanyctiphanes
norvegica sont représentatifs des concentrations et rapports existant
dans les feces du zooplancton dans son ensemble.
(2) La deuxième, c'est que le t?ux de production de feces, par gramme
d'animal et par jour, obtenu expérimentalement chez fi. norvegica, peut

1 Organismes Z 1 0 P o
dpm/g sec
2 1 0 P b dpm/g sec
Rapport Z 1 0Po/ 2 1°Pb
Meganyctiphanes
norvegica 37 * 14
44 + 4
5 3 * 5
4 2 * 3
Copépodes 2D * 2
67 - 4
Salpa maxima 3 5 * 7
Sergestes arcticus 1 5 * 4 et Pasiphaea sivado
1 5 * 4
"Anchovetta" (Pérou) 17 * 3
Crevettes mésopela- ^ -QQ
giques profondes
3 1 * 4
14 * 4
22 * 2
26 * 3
ran
nra
nra
20- * 10
pas encore connu
2.-0
2,6
2,0
2,0
1,8
3,8
2,1
210 210
Tableau 3B - Po, Pb dans les feces de Meganyctiphanes
norvegica (euphausiacë) et d'autres organismes du
zooplancton ou du micronecton,dpm/g sec - 1 écart-
type.
s 'appl iquer au zooplancton en gênerai .
(3) La t ro is ième, c 'es t que l a valeur moyenne de la blomasse du zooplancton
est de l ' o r d r e de 0,03 g sec/m 3 .
Ces supposit ions sont-e l les va lab les , ou bien encore y - a - t - i l une 210
autre façon d ' a r r i ve r â une estimation du temps d'enlèvement du Po,
Pb de la couche super f i c ie l l e par leur association avec les feces du
zooplancton ?
- Pour v é r i f i e r la va l i d i t é de la première supposit ion, nous avons analysé 210 210
Po e t Pb dans les feces d'un ce r ta in nombre d'organismes du p lancton,

tels que des Êopépodes, des salpes ou bien encore des crevettes pélagiques
et des "anchovetta" qui tous représentent une partie importante de la
biomasse. Les résultats obtenus sont contenus dans la deuxième partie
du tableau 38. L'examen de ces résultats montre qu'aussi bien les concen
trations que les rapports Po / Pb mesurés ne sont pas Incompatibles
avec l ' idée que les feces de 11. norvegica fournissent des données qui
peuvent s'appliquer à d'autres organismes. Les copépodes, en e f f e t ,
représentent une part très importante de la biomasse du zooplancton dans
la couche de surface ; d'autre part les feces de salpes et du zooplancton
gélatineux, de par leur vitesse de sédimentation t r is rapide jouent un
grand rôle dans les flux verticaux de matière organique (BRULAND et
SILVER, 1981). Le rapport 2 1 0 P o / 2 1 0 P b dont la moyenne, - un écart-type,
est de 2,2 - 0,3 dans les feces de H. norvegica est de 2,5 - 0,9 quand
on ut i l ise tous les rapports du tableau 38.
- Estimation de la production journalière de feces par le plancton.
D'après les résultats obtenus par TANIGUCHI (1973) dans des zones très
différentes du Pacifique, la ration journalière des herbivores, R,
(mg C/m 2/jour) est liée à la production primaire P (mg C/m2/jour) sui
vant la relation
R = k Pb
où k et b sont des constantes, avec k = 1,02 et b = 0,997, très proches
de l 'un i té . On peut donc dire que la ration journalière ingérée par le
zooplancton herbivore est proportionnelle à la production primaire.
D'autre part, l'excrétion par les feces peut s'exprimer par (R-AR) où A
est le coefficient d'assimilation (PARSONS et a U , 1977). Une valeur
moyenne de 0,7 pour ce coefficient, est généralement admise (C0N0VER, 1966 ;
NIVAL et aj_., 1975). Connaissant P la production primaire on peut donc
calculer E en mg sec/cmz/an en ut i l isant la relation poids de C = 0,4 poids
sec (BEERS, 1966 j NIVAL et a K , 1975). C'est ce que nous avons f a i t dans
la première partie du tableau 39, avec, pour la production primaire, les
valeurs de PYTHER (1969) correspondant aux zones océaniques, aux zones
près des continents ou aux zones d' "upwelling'. On obtient ainsi respec
tivement, pour ces différentes zones, des valeurs pour f p 0 ( f i de 4,2 ;
2,1 ; 0,7 ans et pour T p b ( f ) 15,7 ; 8,1 ; 2,7 ans. Selon TANIGUCHI
(1973), la biomasse des herbivores représente suivant les cas 30 à 80 %
de la biomasse totale du zooplancton ; si on prend un chiffre moyen de
50 ï on doit donc diviser par 2 les valeurs de T , « et T „. ,^» ,
E x concentration en 2 1 ° P o , 2 1 0 P b des fecas est l'équivalent de Q_.f_. (p. 97)

Si P * production primaire "(ag- C/a 2 / J Î . R • ration Journal.ere» des herbivores {•»gC/*:f/j), a - Î.OÎ p 0 * 9 5 7
(TAHIGUCHl, 1973} e t herbivores > 30 1 80 I Au loapUtxtm t a u t ftvid) D'autre part £ {èliaination par Us feet») - H - M (PMSOaS et a l , , 1977} avec A • 0,? (COftWR, 1966) et C - 0,4 raids sec (BIERS, 1966). «fni « . * « « _ • *"*•
feces feces la cmjche de surface étés i n feces i . , , , T _ , . , h a m » » •Woe? t^laf « « • « « « • i f c n , ' R , ( 0
117 3,a (9
274 ' .5 49
B2Z 22.S 49
0,79 1.38 0,19 0,09 2.1
0,79 1.31 0,37 0 . » 1,1
0.Î9 1,36 1,1 0,52 0,4
7,7 9 lane océanique, RYMR (Î969)
4,1 f tttfte prés itei twit* nents .BlfHTER (]969)
),4 P lone d'upwelling, RYTHER (1969)
2e Partie Kos prealeres e3t.aat1oni-de T p o f f , , i p i , , « prtcedeawcat publiées ou estimation dam ce t ravai l .
9/»* feces g/9/4 <l,Wg « c feces s ^ i c e c l Ê S M f e c e s T ^ ^ i f t ( f J t , » , ^ ,
0.1 0,03fl 38,9 55 64 I - CHERRY et i L „ 1975 coiXentratTnt. aoyeftue es 2I8po de 3 échantUloas de feces
fl.î 0.Û38 59.9 55 83 - 0,7 - HCYRMJO et • . . , 1976 menus etbaiïtiTFons de feces, après correction pour la perte da z l 9J=o J par t t r ae ces feces.
0,1 0,03a 49 Z3 79 138 68 32 1,2 4,3 BCASUY et a h , 197B con cent riTf on moyenne en 2Ï0f>o,?lupb de 4 ê c h u t l r leai de feces frjiCtaŒat produits.
0.03 ( î ) 0,10 ( ï ) 49 23 79 138 54 25 1.5 5,S Voir texte
Tableau 39 - Rôle des feces da loopîaftctoa datss le teeps d'enlêveaeat d» * ft», l 8Pli de la ccucBe superficielle - Différentes méthodes de « l e a l .
- 101 -
ce qui nous donne des valeurs très proches de celles que nous avions
publiées précédemment et qui sont résumées dans la deuxième partie du
tableau 39.
SASAKI e t NISHIZAUA (1981), ut i l isant des pièges à sédiments placés
a différentes profondeurs ont mesuré les f lux de matière part iculate au
lai je des côtes du Japon. Plus de 90 % des grosses particules sont des
feces ou du ntëtêriel d'origine fécale e t le flux maximum mesuré à 100 m,
418 mgC/m2/j représente environ 1/3 de la production primaire dans la
zone euphotique où est placé le piège. L'approximation E c? 0,3 P
que nous avons fa i te (tableau 39) se trouve donc étayée par les mesures
des auteurs japonais.
La nette diminution des valeurs calculées pour Tpj, / « (tableau 33)
quand on va des régions océaniques aux régions proches des continents est
â rapprocher des valeurs mesurées et calculées par NOZAKI et a l . (1976) 210
pour le temps de résidence du Pb dans le Pacifique, le long d'une radiale
allant de Tokyo à 5an Diego (1,7 et 0,6 an, respectivement).
Dans la dernière ligne du tableau 39 ( I l e partie) les chiffres ut i l isés
pour la biomasse du zooplancton et la production journalière de feces sont
différents de ceux util isés précédemment dans nos publications. En e f f e t ,
une valeur moyenne 0,1 g sec/m3 pour la biomasse, qui avait été choisie
d'après PARSONS (1972), est sans doute quelque peu surestimée et e l le a
été remplacée par 0,03 g/m3 obtenue d'après L0NGHURST (1976) en ut i l isant
un rapport poids frais/poids sec de 8. D'autre part, un taux de production
de feces de 0,038 g/g animal/j, qui a été mesuré chez des Meganyctiphanes
norvegica adultes n'est sans doute pas représentatif du taux de production
da feces par les organismes du zooplancton dans son ensemble. En e f f e t , i l
a été montré (HEYRAUD, 1979) que dans une même espèce, ce taux est d'autant
plus élevé que les animaux sont plus pe t i t s , et que dans des espèces d i f
férentes comme, par exemple, euphausiacés et copépodes le taux de production
est plus haut dans l'espèce la plus pet i te . Comme les copépodes repré
sentent une très large part de la biomasse du zooplancton, i l nous
semble plus indiqué de choisir pour le taux de production de feces une
valeur plus élevée que celle uti l isée précédemment. Une production jour
nalière de feces de 0,1 g/g/j implique (avec un coefficient d'assimilation
de 0,7) une ration journalière de 0,3 g/g. B0UGIS (1971) c i te , chez les
copépodes, des taux d'ingestion de 58 à 340 % de leur poids ; PAFFEMH0FFER
et HARRIS (1979) des taux de 140 3, 25 à 480 %, 63 à 148 3, 80 S 146 %
- !u? -
suivant les auteurs et les conditions expérimentales. Quand les taœc
d ' ingest ion de nourr i ture sont t rès élevées, l e coe f f i c ien t d 'ass imi la
t ion diminue (COKQVER, 1966) ce n'est sans doute pas le cas lorsque
l ' i nges t ion est de 30 % du po ids / j , une valeur assez basse comparée à
cel les que nous venons de c i t e r . Notre choix de 0,1 g/g/ j pour la
production de feces nous semhli donc j u s t i f i é et sans doute même quelque
peu sous-estimé.
3.5. Conclusion.
Les estimations que nous avons précédemment pubiiées sur le rô le des
produits pa r t i cu la i res du zooplancton dans l e t r - n s p r r l ver t ica l du 2 1 Q P o hors de l a couche super f i c ie l le (CHERRY et d l . , 1975 ; HEYRAUD et a l . ,
210 210 1976) ou des feces du zooplancton dans l e t ransport du Po, Pb
(BEASLEY e_t a]_., 1978) étaient obtenues à l ' a i de d'un modèle fa isant
appel à un cer ta in nombre de supposit ions. Nous avons examiné cr> t i que-
ment les d i f f é ren ts termes de ce modèle e t r e f a i t les calculs en u t i l i
sant une approche plus large et légèrement d i f fé ren te . Les résul tats que
nous obtenons a ins i confirment l ' importance des feces du zooplancton
comme vecteurs des deux éléments pour les transporter rapidement hors
de la couche de surface ; ce mécanisme est responsable pour moit ié environ
de leur d i spa r i t i on des 100 premiers mètres.
VI .4 . * 1 U P 0 , £ 1 U PB DANS LA MICROCOUCHE DE SURFACE ET L'HYPONEUSTON.
4 . 1 . In t roduct ion .
L'importance de la microcouche de surface (100 premiers microns
environ) e t des tout premiers centimètres de la colonne d'eau a été long
temps méconnue. Depuis une quinzaine d'années, tou te fo is , cette lacune
a été comblée ^ t ce domaine a été intensivement exploré aussi bien par
les chimistes u,ue par les b io log is tes . Très sommairement, on peut d i re
que la microcouche se caractér ise, par rapport à l 'eau de sous-surface,
par un enrichissement e n matière organique et nn éléments-trace (HARVEY
et 3URZELL, 1972 ; SZEKIELDA et al_., 1972). Au point de vue biologique,
les premiers centimètres possèdent des t r a i t s qui leur sont propres.
ZAITSEV (1971) f a i t une très bonne synthèse de cette question, dont on
ret iendra i c i les points principaux. Ce qui caractérise les 5 premiers
centimètres de l a colonne d'eau, c 'es t une bioniasse élevée, avec abondance
de bactér ies , de microorganisines, de t rès nombreux organismes mort?.

- 103 -
(surtout crustacés planctoniques) et enfin un enrichissement important
en matière organique dissoute (HOD) dérivée du métabolisme et/ou de la
décomposition des organismes qui s'y trouvent. Comme nous l'avons vu 210 210
précédemment, le sort du Po dans l'eau de mer (et celui du Pb à un degré moindrejest intimement l i é aux processus biologiques ; de plus
210 comme la source principale du Pb dans les premiers mètres de la colonne
d'eau est surtout atmosphérique, nous avons jugé ut i le d'étudier en
détail le Po, Pb dans la micro-couche de surface et i'hyponeuston,
cette catégorie de plancton vivant juste sous la surface. Pratiquement 210 210
rien n'sst connu en ef fet sur le Po, Pb dans la microcouche de
surface, mis i ; a r t le bref art icle de BACON et ELZERMAN (1980) qui ne
contient qu'un nombre limité de données et aucune sur le plan biologique.
210 210 4 .2 . Po, Pb dans la microcouche de surface et I'hyponeuston.
Des prélèvements concomitants de la microcouche de surface, à l 'aide
d'un f i l e t de GARETT [196E), de l'eau de sous-surface (20 cm environ)
et de I'hyponeuston ont été faits aussi souvent que posslhle pendant une
période al lant de février 1980 à j u i l l e t 1961. Une longue immobilisation
du bateau due 3 des raisons techniques suivie d'une période oO l 'é ta t de
la r"x n 'éta i t pas propice au prélèvement de la microcouche sont respon
sables de Vabsenc d'échantillons pendant l'automne 1980 et l 'hiver 1981.
Les résultats obtenus sont présentés dans le tableau 40. A l'examen de
ce tableau un certain nombre de faits apparaissent : 210
(1) les concentrations en Po sont toujours plus élevées dans la micro-
couche que dans l'eau de sous-surface, ce qui n'est pas toujours le cas
pour le Z 1 0 P b ,
(2) ces concentrations sont très variables suivant les saisons dans la
microcouche, ou elles sont en moyenne ( - 1 écart-type) 0,086 - 0,063 pCi/1
pour le Po et de 0,077 - 0,050 pour le Pb, alors qu'elles sont plus
constantes a 20 centimètres de profondeur : 0,026 - 0,008 pCi/1 pour le Z 1 0 P o et 0,053 - 0,016 ûCi/1 pour le Z 1 0 P b ,
(3) le rapport Po/ Z 1 0 Pb qui est de 1,2 - 0,5 dans la microcouche est
inférieur S l 'uni té dans la couche de sous-surface, 0,5 - 0,3,
(4) les concentrations en °Po, Pb mesurées dans les échantillons
d'hyponeuston sont elles aussi variables suivant les saisons et suivant
les espèces dominantes présentes dans les échantillons : les Anomalocera,
copépodes bleus trouvés dans 8 sur 10 de nos échantillons ont des

i,G
Echantillon Échantillon constitue pCI/g sec „ . micracouche - pCi/l eau de surface - nCt/1
dm e, «j-Hit d. iwn mn '}%•«• ™n 2iopb IV/H, mn Slop,, •%/%
P.- 26/2/1980 CapVdes, esjlllfpodel 12.7 * 0,7 2,2 ! 0,1 e 0,038 * 0,006 0,0)4 ! 0,009 0.5 * 0,1 0,019 * 0,005 0.057 * 0",009 0,3 * 01 larves de prissent | Cgpipodes, s i lpcs . oeufs 0.90 * 0,00 0,02 ! 0,01 49 0,15? * 0,010 0,156 * 0,012 1,0 ! 0,1 0,025 * 0,005 0,052 - O.00B 0,5 * 0,1
P4-24/4/19QÛ Anpnalocera paterson' 7 , 6 - 0 , 5 0 , 2 6 - 0 , 0 5 29 Slpinnoptior» (1 in- 2,08 - 0,15 0,020 * 0,001 104 ilivldu)
F,- 3/5/1900 Urnes, « u f l 3,0 * 0,2 0.24 * 0.05 12,5 0,050 - 0,007 0,042 * 0,008 1,2 * 0,3 0,030 * 0,005 0,042 * 0,008 0,7 * 0,2 P 6 - 7/Î/19B0 Anoialocera paterMnl 1 7 . 8 * 0 , 4 0,20 ! 0.02 69 0,225 ! 0,012 0,169*0,013 . ' , 1 - 0 , 1 0,044-0,008 0.052*0,008 0.8 ! 0.2 P 7 - l/B/1950 Anlwialpccra paterson! 9.9 * D;3 0 . 1 6 * 0 , 0 2 55 0 ,060-0 ,005 0,059 * O.OOB 1 , 0 * 0 , 2 0,021-0,005 0,075"* 0,010 0 . 3 * 0 . 1 P.- 28/0/1980 Anonalocera paterson! 1 0 , 3 - 0 , 5 0,30 ! 0,06 27 ^
Insectes— 6.11 - 0,94 2 49 * 1,20 2.5 " • ° 5 1 " • o l " 0 , M 3 " • M " '••* 0 , a " • o u "•™ 5 " • 0 5 ° 0 , 0 1 l > "• 4 ° ' 1
P,- 2S/9/19BO /iimmlocert Mterspnl 6 , 0 - 0 , 5 0.30 ! 0 12 23 0,039*0,005 0,050*0,088 0 , 8 * 0 , 2 0 ,021*0 ,005 .0 ,076*0 ,008 0 , 4 * 0 . 1 P..-6/4/1961 «nnimloccr» (pur) 24 * 2 0,6 * 0,2 39 ,
HyoPneuston (reste) 0,85 * O.DB 0,03 * 0,02 26 0,064 * 0,007 0.056 * 0.010 1,1 * 0.2 0,018 * 0.004 0,0.;7 * O.OOB 0.4 * 0.1
P n -9/6/1981 AnoiMlocer. pitersonl 4 . 9 * 0 , 3 0 ,22*0 ,02 22 , , ,097*0,00) 0,041 * 0,013 2 . 3 * 0 . 8 0.02B* 0,004 0,026*0,013 1 , 1 * 0 . 6 Hyponeuston (reste) 2,9 * 0,2 0.16 * 0,07 17
P,j-9/7/1981 «Mulocera pitersonl 11.2 * 0.5 0 . 5 * 0 , 2 25 0 . 2 0 * 0,02 0,153 * 0,008 1.3 * 0,2 0,127 '- 0,004 0.032 * 0.006 0.9 * 0.2 liopodes 1.6 * 0,5 0,4 * 0.2 22
Moyenne * «nomloceri seuleiient 11,6 * 6.3 0,33 * 0.15 39 * 21 0.085 * 0,063 0,0)7 * 0,050 1,2 * 0,5 0,025 * 0,088 0,053 * 0,016 0,5 * 0,3 1 écart-type A u t r K t d , M l ) ) ) O T t ,wZ t 4 > 3 0 j 4 4 t 0 ,B6 36 * 37
(sauf insectes)
Tablem 40 - î l 0 P o ,
pC1/l * 1 6cart-type.
- 105 -
concentrations en 2 1 0Po de 11,8 - 6,3 pCi/g et de 0,31 - 0,15 pCi/g de 210
Pb, la plus haute concentration trouvée correspondant â un échant i l lon
pur d'Anomalocera t r i é s à la main un par un (échant i l lon PlO),
(5) les autres organismes présents dans nos échanti l lons d'hyponeuston 210 210
sont généralement moins riches en Po (e t à un degré moindre en Pb)
que les Anomalocera,
(5) un échant i l lon consti tué d'insectes a une haute concentration en 210
Pb, avec 1 rapport Po/Pb de 2,5, le plus bas de tous.
Etant donné que les concentrations var ient beaucoup aussi bien dans
l 'eau que dans les échanti l lons de plancton, nous avons calculé
(tableau 41) les facteurs de concentration des échanti l lons constitués
en majori té d'Anomalocera ; le facteur de concentration le plus haut 2 1 ° - • -. puu,-
seul échant i l lon vraiment pur d'Anomalocera ; dans les autres et facteur
est de To rd re de HT pour le ^ 1 0 P o , 10 2 pour le Pb, avec des va r ia
tions qui r e f l è t e n t sans doute la proport ion plus ou moins grande
d'Anomalocera dans l ' échan t i l l on . 210 210
Si l ' on calcule les rapports des concentrations en Po et Pb
mesurées dans l a microcouche par rapport aux concentrations correspon
dantes dans l 'eau de sous-surface, on cb t i en t (moyenne - 1 écart-type)
3,1 - 1,5 pour l e 2 1 0 P o et 1,5 - 1,0 pour l e 2 1 0 P b . Ces rapports sont
représentés graphiquement dans la f igure 6 en même temps que les var ia
tions de la biomasse récoltée dans les 5 premiers centimètres. Ces
derniers ch i f f r es ne sont d 'a i l l eu rs qu'une approximation : on a u t i l i s é
pour ca lcu ler l e volume d'eau f i l t r é l a surface immergée du f i l e t , la
vitesse du bateau et l e temps pendant lequel l e f i l e t é ta i t t r a i né , s o i t
t ro i s causes possibles d 'erreur. Quelles que soient les imperfections de
la méthode u t i l i s é e pour estimer la biomasse, les ch i f f res obtenus sont
comparables pu isqu ' i l s sont tous entachés de la même erreur. L'examen 210 210 de la f igu re 6 montre que les enrichissements en Po, Pb mesurés
dans la micro-couche par rapport à l 'eau de surface sont d'autant plus élevés que l a biomasse est plus importante ; ceci est surtuut vrai pour
210 le Po dont les facteurs d'enrichissement sont toujours nettement 210 supérieurs à ceux du Pb.
Au vu de ces résu l ta ts , on est t rès tenté de voir une re la t ion de
cause à e f f e t entre la présence d'une biomasse importante et l ' e n r i c h i s -
nous allons essayer de

FEV. MARS AVRIL MAI JUIN JU1L. AOUT SEPT,
19B0
AVRIL JUN AOUT OCT.
— - 1 9 8 1
DEC
Fig , 6. Relation entre les rapports desconcentrations en 2 1 0 P o , Z 1 0 P b dé l 'eau de la n1crocouche/eau ZO cm
au-dessous et la biomasse de 1'hyponeuston : var iat ions saisonnières.

- 107 - •
Date Facteur de concentration Z1°!>0 Z 1 0 Pb
24/4/1980 0,9 X 10 4 2,5 x 10 2
7/7/1980 1,3 X 10 4 1,8 x 10 2
1/8/198D 2,4 x ID4 2,7 x ID2
26/8/1980 2,9 x 10 4 8,2 x 10 2
Z9/9/1980 2,0 X 10 4 4,8 x 10 2
6/4/1981 5,9 x 10 4 12 x 10 2
9/6/*9bl 0,9 x 10 4 6,4 x 10 2
Tableau 41 210
- Facteurs de concentration du Po, Z 1 0 Pb dans les échantillons contenant
des Anontalocera , calculés d'après les
données du tableau 40 (Rapport poids
frais/poids s e c ~ 9 ) .
montrer qu'une t e l l e relation existe effectivement et de voir quels
en sont les mécanismes.
210 4 .3 . Biomasse et enrichissement de l'eau en Po.
- Protocole expérimental.
S i tôt le f i l e t à plancton remonté 3 bord du bateau, le contenu du
collecteur est transféré dans un seau de plastique, le collecteur
est ensuite rincé avec de Veau de mer prise en surface qui est ajoutée
au contenu du seau. Les animaux séjournent dans cette eau de 2 a 4 h ;
après ce laps de temps i l s sont tamisés sur un morceau de f i l e t â
plancton de maille appropriée, puis sêchés et analysés. L'eau dans l a
quelle i l s ont séjourné est f i l t r é e sur f i l t r e millipore 1,2 um e t le 210
f i l t r e e t l e f i l t r a ' , sont analysés séparément pour mesurer le Po, 210
Pb qu ' i ls contiennent. Dans deux cas, la f i l t ra t ion sur 1,2 ,um est
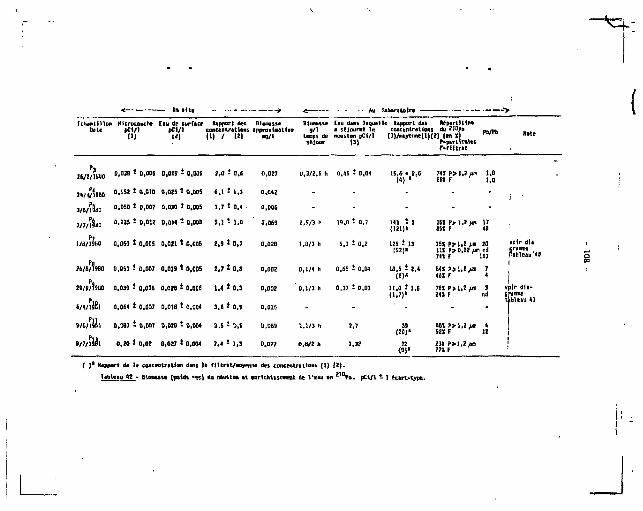
< In s i t» Au laboratoire —
Hheiitlllon Hicrocouche Cau de surface Rapport det Btoaesse BUaeasse Cau dans laquelle Rapport des WperUUpo Date PC1/Ï pCI/l concentrations snoroaiMatfve g/1 a séjourné le concentrations du «IBpo V n l P h
(1) il) 11) / ( i | ain/1 temps de neuston pCt/l (])/p«»enne(l|(2) (en 1) ' séjour (1) P»partieu)cf
F.flltrat
it/i/vma
n/viiia
Ut/fat
7/7/iSao
D.03B ! 0,006 0,019 * 0.DOS 2,0 - 0.6 0,027
0,15! t 0,010 0.02S - 0,005 6,1 - 1,1 0.042
0,050 - 0,007 0,010 * 0.0DS 1,7 • 0,1 . 0,000
0,225 - D.QU 0,044 - 0,003 5,1 - 1,0 0,0»
'1950 0,060 - 0,005 D.021 t 0.0D5 2,9 - 0,7 0.02S
21/B/Î9B0
29/9/I9BO
6/'/ls8l
9/6/lJJl
S77/19I1
0,051 - 0,007 0,019 ! 0,005 2,7 - D,B 0,002
0,039 i 0,005 0,020 * 0,005 1,4 * 0,3 0,002
0,064 t 0,007 0,018 t 0,004 3,5 * 0,9 0,015
0,097 2 0,007 0.02B - 0,004 3,5 • D,6 0,069
0,20 t 0,02 0,027 * 0,004 7,4 * 1,3 0,077
0,3/2.S h 0.45 * 0,04
2,9/3 r- 19.0 î 0,7
1,0/1 h 5,1 t 0,2
0,1/4 11 0,65 t 0,04
0,1/1 h 0,37 i 0,03
1,1/3 h
0,8/2 »
2.7
1,32
15,6 « 2,6 (4) '
(121)«
125 t 13 (S2)«
10,5 ! 2,4 (S)*
11,0 i l.S f i .7)«
(20)"
12 <9)>
74 tP> l ,2 / i» 1.0 261 F 1,0
151 P > l . ! i m 17 B5I F 45
151 P? 1.2 Jim 20 111 P>D.!2/im nd 74» F 1U
5(1 P> 1,2^» 7 4SI F 4
76«P>1.2/«l 3 241 F nd
45X P? 1,2 iiffl 4 521 F 12
vplr diagramme tableau 43
{ »• Kapport de la concentration dans le flltrat/noyeroie des concentra tiens (1) (2) .
Tableau 42 • Blonsse (poids « K Ï du neuston e t enrichissaient de l'eau en ! , 0 P o . pCI/1 ± 1

- 109 -
suivie d'une autre f i l t ra t ion sur 0,22 jim, soit immédiatement, soit
24 h après et les deux f i l t res et les f i l t r a t s sont analysés.
- Résultats.
L'ensemble des résultats obtenus pour chaque collection, in ,situ
puis au laboratoire suivant le protocole qui vient d'être décrit, est
résumé dans le tableau 42. Les deux premières colonnes de la partie 210
gauche du tableau montrent les concentrations en Po de la microcouche et de l'eau de surface mesurées in s i tu (d'après les données du tableau 40) , la troisième colonne les rapports de ces concentrations et la quatrième une estimation approximative de la biomasse contenue dans les 5 premiers centimètres de la colonne d'eau.
ta partie droite du tableau 42 est consacrée a ce qui a été f a i t
au laboratoire avec ces mêmes échantillons, e l le résume les conditions
expérimentales et les résultats obtenus dans ces conditions : biomasse et 210
temps de séjour dans l'eau du neustan, concentration en Po de l'eau dans laquelle a séjourné le neuston, rapport de la concentration de cette
eau à la moyenne des concentrations mesurées in situ le même jour, 210
répartition du Po (S assoicé aux particules > 1,2 um, % associé au 210 2ln
f i l t r a t ) et rapports Po/ Pb correspondants. Les troisièmes colonnes du tableau 42, partie gauche in s i tu , partie droite au laboratoire,
peuvent être comparées : dans un cas comme dans 1'autre on constate un net
enrichissement en Po de l'eau qui , en coordonnées logarithmiques,
est proportionnel à la biomasse (Fig. 7 ) . Le coefficient de corrélation
est de 0,74 in situ (avec P<0,01) alors qu'au laboratoire ce coefficient
est de 0,89 ( P < 0,001).
Dans les conditions expérimentales ut i l isées, la biomasse varie de
0,1 â 2,9 g/1 e t le temps de séjour est de 2 à 4 h. Afin de comparer les
résultats obtenus on peut calculer l ' a c t i v i t é "perdue" par la biomasse
par unité de poids et par unité de temps (d'après le tableau 42, partie
droite, colonne 1 et 2) . On obtient ainsi une valeur moyenne de
1,2 i 0,6 pCi/g/hr pour le 2 1 0 P o total ou de 0,7 - 0,6 pC1/g/hr pour l e 210 210
Po "soluble" ( f i l t r a t ) . I l n'existe pas de corrélation entre le Po 210
total perdu et la biomassse d'une part, iu le Po perdu et la concentra-210
tion en Po du neuston d'autre part. : ' semble par contre qu'il existe
une corrélation entre le Po "soluble" excrété et la biomasse ?in
(r = 0,84 ; P< 0,01 ) ou entre le Po "soluble" excrété et la concen-210
tration en i u Po de la biomasse (r = 0,74 ; P < 0,05 ) . En f a i t , i l

-"c
1000 Po JJ couche Po eau du Neuston
" Po sous surface po(x,u couche, sous surface)
t ° *r „ 1 0 0 - D jS
-z. ^T
g J T ^
S j T
Œ K . / o D z „ Oj/r
UJ 10 o j r
H • _• — o * -"- -— y<
o ^—-- ," in ^ — • UJ a - « P 1
cr O a
RAP
1 1 1 1 1 1 ' 1
0.001 0.01 0.1 1 10 • In Situ BIOMASSE (mg sec/l)
100 1000 10000 • o Au Laboratoire
21D Fig. 7. Corrélation entre l'enrichissement en Po de l'eau et la bioinasse des animaux.

- m -
n'existe aucune corrélation si l'on exclut l'échantillon Pg qui correspond à la fois â la biomasse la plus élevée ( ~ 3 g/1) et à la concentration
210 210
en Po la plus forte {"» 18 pCi/g). Les quantités moyennes de Po total ou "soluble" excrété, recalculées sans tenir compte de l'échantillon Pc deviennent 1,0 - 0,4 et 0,5 - 0,3 pCi/g/hr respectivement.
210 Nous avons employé le terme de Po "soluble" de façon quelque 210 peu arbitraire, le définissant comme la fraction du Po qui n'est pas retenue par une membrane filtrante de porosité 1,2 pi. Dans un cas (Echantillon P7) après filtration sur 1,2 um le f i l trat qui contenait 85 % du 210
Po a été re-fi ltrë immédiatement sur un f i l tre millipore 0,22 um, on 210 a alors trouvé que 11 % du Po était retenu sur le deuxième f i l tre . Dans
un autre cas (Echantillon Pg) après filtration sur 1,2 jm le f i ltrat a été laissé (couvert) pendant 24 h à la température ambiante puis re-filtrâ
210 sur 1,2 um et immédiatement après sur 0,22 pm : la proportion de Po associé aux particules était alors de 95 S, se répartissant ainsi - 74 ï avec des particules> 1,2 /um, 21 % avec des particules > 0,22 um. Ces deux expériences sont résumées sous forme de diagramme dans le tableau 43. Elles nous semblent Intéressantes à plusieurs titres : (1) el les confirment que la définition habituellement admise de la fraction "soluble" ( < 0,4 jum) ou "parti cul aire" (?0,4pm) est quelque peu arbitrai Nous avons ici uti l isé 1,2pm et 0,22 um parce que c'est l'ordre de grandeur de la majorité des bactéries marines (0GURA,1974),la filtration sur 0,22 um étant souvent utilisée pour obtenir de l'eau de mer stéri le .
(2) le fait que 24 h après filtration sur 1,2 um, le filtrat gardé a l'abri 210
de l 'air contienne I nouveau 74 % du Po associé à des particules retenues sur 1,2 um et 20 S associé à des particules retenues sur 0,22 jum semble indiquer l'Importance des transformations que subit l'élément dans un laps de temps assez court (3) la ta i l l e des particules en cause, l e fa i t que le milieu n'était pas Stérile et qu'il était probablement enrichi en matière organique provenant du métabolisme et/ou de la décomposition des organismes qui y avaient séjourné suggèrent que les bactéries peuvent jouer un rôle important dans ces transformations.

- nz -
Biomasse - 1,8 g/1-3 h. (P7)
Anomalocera vivants
(en majorité)
Biomasse = 0,2 g/1-20 h. ( P M )
Anomal ocera morts
Particules > 1,2 um 15 ï
F i l t r a t f i l t r é 85 % sur 0,22 um
11 % sur 74 % particules>0,22 /um f i l t r a t
Particules > 1,2 11 52%
F i l t r a t f i l t r é sur 0,22 11m
39 % sur 9 % particules>0,22 /um f i l t r a t
F i l t râ t de Pg laissé 24 h 5 la température ambiante puis re - f i l t r ë
Particules
Particules
F i l t ra t
1,2 p i 74 ! 0,22 jm 21
5
Tableau 43 . - Eau du neuston, particules, f i l t r a t : répartition
du Z 1 0 P o (%), voir les tableaux 42 et 44.
VI . 5. "BIO-TRANSFORMATIOH" OU 2 1 0 P 0 DANS L'EAU DE MER.
5 . 1 . Matériel u t i l i sé , protocole expérimental.
Les expériences décrites dans le paragraphe précédent ont montré
que les organismes de l'hyponeuston -dans le cas particulier composé
principalement d'Anomal ocera vivants- "perdent" du z l o P o qui enrichit 210
l'eau dans laquelle les animaux séjournent -, ce Po se trouve 3 la
fois sous forme de particules ( ;? 1,2 um et 0,22 /jm) et dans le f i l t r a t .
Une autre série d'expériences ayant pour but d'élargir et compléter les
données obtenues avec l'hyponeuston a été f a i t e , faisant appel à des
copépodes (pêches en surface à ~ 1 m de profondeur environ) vivants ou
morts, à des Anomalocera morts et à des Artemia. Le choix des Artemia
a été dicté par des raisons pratiques : i l nous a été possible de nous
- 113 -
les procurer en grande quantité aux Salins du Midi, de prendre en
même temps de l'eau in situ et de les garder ensuite dans cette même eau
vivants, en très bonne condition, pendant plusieurs jours ce qui aurait
été extrêmement d i f f i c i l e -si non impossible- avec des copépodes. Cela 210
nous a permis de suivre le devenir du Po dans les animaux et dans l 'eau.
5.2. Résultats
Les résultats de ces trois séries d'expériences sont résumés dans le
tableau 44. De l'examen de ce tableau et des comparaisons qui peuvent être
faites avec les résultats obtenus précédemment (tableau 42) on peut dire
que : 210
(1) chez Anomaloepra, le taux de perte du Po est sensiblement le même
chez les animaux morts (0,6 pCi/g/hr, tableau 44) que celui mesuré quand
les animaux sont vivants (1,2 - 0,6 pCi/g/hr en moyenne, tableau 42) ou que celui obtenu avec d'autres copépodes vivants ( /» 1 pCi/g/hr, tableau 44)
210 (2) la répartit ion du Po entre les différentes tai l les de particules varie avec le temps, en particulier on peut comparer la proportion de 210
Po associée aux particules comprises entre 1,2 p i et 0,22 ^m = minimum
(9 % du tota l ) quand les Anomalocera sont en majorité vivants après 3 h,
cette proportion est de 35 S environ après 20 h quand les Anomalocera
sont morts (tableaux 43 et 44) . Une te l l e évolution n'est pas sans rappeler
celle prenant place dans le f i l t r a t de l 'échantil lon Pg laissé 24 h à la 210
température ambiante puis r e - f i l t r é et où on avait alors 95 % du Po associé à des particules. C'est pour cette raison que nous avons groupé
dans le tableau 43, sous forme de diagramme, ces différents résultats.
De la même façon, on obtient avec l 'échantil lon Pi? un résultat comparable, 210
puisque la proportion de Po particulaire qui est de 30 % après un séjour dans l'eau de 5 h des copépodes vivants passe S 94 % après 24 h quand la
proportion des copépodes morts augmente.
(3) Dans le f i l t r a t de l'échantillon P 1 4 (Anomalocera morts), 90 % du 210
Po se trouve sous une forme non dialysable. Le sac a dialyse u t i l i sé
est destiné 3 la séparation de poids moléculaires de l'ordre de 6000 à
8000. Une expérience préliminaire d 'u l t ra - f i l t ra t ion a été f a i t e , e l l e
est résumée sous forme de diagramme dans le tableau 45. Elle a été réalisée
avec des copépodes vivants péchés à environ 1 m de profondeur, gardés
pendant 3 h dans un volume de 2,3 1 d'eau de mer. Après f i l t ra t ion sur
1,2 um, le f i l t r a t a été séparé en 2 : une partie conservée au rêfr igéra-210
teur pendant 8 jours a été alors f i l t r é e sur 0,22 ^m ; 83 ï du Po
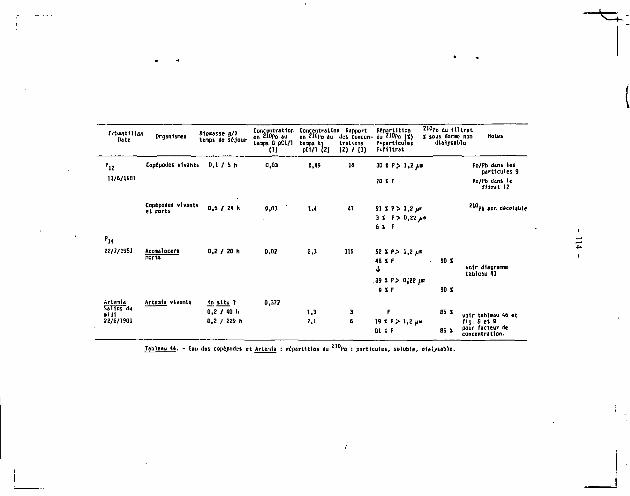
R k „ , „ , _,, Concentration Concentration Bapport Repartition 2 1 0 Po du f i l trat Organismes ?!„„; 5„ ?(!„,.» en ZlDPo au en ?10po au des concen- du 2)&Po (X) I sous fonw non Hôtes
temps ao séjour % 0 p C i / 1 t e m p s trations Particules dtalysablc (1) pCi/l (Z) (2) / (1) F-fOtrat
P., Copcpodes vivants 0,1 / S h
ii/6/isai
0,03 0,49 1G 30 X P > 1,2 fia
70 X F
Po/Pb dans les particules 9
91 X P> l,Z;jra 3 S P> 0,22 ^m fi X F
luPb non décelable
22/7/1981 Anomalocert morts
Artctnla Artemia vivants rt situ 7
SIÎns * Û.I / « „ 2Z/6/1901 0,2 / 229 fi
52 X Pp 1,2 /Ji>
48 X F
1 39 X P> a,22pm
9 XF
19 X P> 1,2 fin 81 X F
voir diagramme tableau 43
voir tableau 46 et fig. a et 9
I - pour facteur de concentration.
Tableau 44. - Eau dos copêpodes et Artemia : répartition du " Po : particules, soluble, dtalysablc.
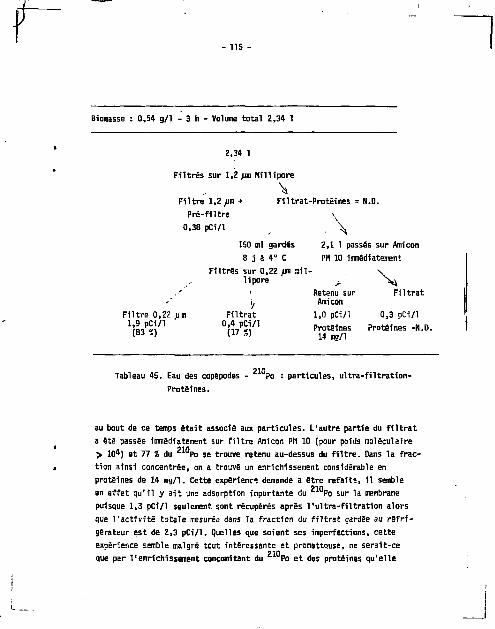
- 115 -
Biomasse : 0,54 g/1 - 3 h - Volume total 2,34 1
2,34 1
Filtrés sur 1,2 pm Millipore
Fi l t re l.Z^jm + Filtrat-Protéines = N.D.
Pré - f i l t re N
0,38 pCi/1 • \ 150 ml gardés 2,1 1 passés sur Amicon
8 j 5 4" C PH 10 immédiatement
Filtrés sur 0,22 jum a i l l ipore > N*
,' >j
Retenu sur Amicon
F i l t r a t 1
F i l t re 0,22 um 1,9 pC1/l
(83 %)
Fi l t ra t 0,4 pCi/1
(17 S)
1,0 pCi/1
Protéines 14 mg/1
0,3 pCi/1 '
Protéines -N.D.
Tableau 45. Eau des copêpodes
Protéines.
210. Po : particules, u l t ra- f i l t rat ion-
au bout de ce temps était associé aux particules. L'autre partie du f i l t r a t a été passée immédiatement sur f i l t r e Amicon PH 10 (pour poids moléculaire > 104) et 77 % du z l Po se trouve retenu au-dessus du f i l t r e . Dans la fraction ainsi concentrée, on a trouvé un enrichissement considérable en protéines de 14 mg/1. Cette expérience demande a être refaite, 11 semble
210
en effet qu' i l y a i t une adsorption importante du Po sur la membrane puisque 1,3 pCi/1 seulement sont récupérés après Vul t ra- f i l t rat ion alors que l 'act iv i té totale mesurée dans la fraction du f i l t r a t gardée au r é f r i gérateur est de 2,3 pCi/1. Quelles que soient ses imperfections, cette expérience semble malgré tout intéressante et prometteuse, ne serait-ce
210 que par l'enrichissement concomitant du Po et des protéines qu'elle

- 116 -
montre, et l ' a ssoc ia t i on de 83 % (au moins) du Po avec un poids
moléculaire > 10 000 et/ou des bactér ies.
(4) Le but de l 'expér ience réalisée avec les Artemia é t a i t de su iv re , 210
avec le temps, l ' é v o l u t i o n du Po à la fo i s dans les animaux et dans
l 'eau. Les résu l ta t s sont présentés dans l e tableau 46. Un f a i t t rès 210
notable, tou t d 'abord, c 'es t la haute concentration en Po de l 'eau
dans laquel le v ivent les Artemi a in s i t u = 0,372 pC i / 1 . Nous ignorons
quelle est exactement l a biomasse des Artemi a, mais nous avons pu nous
rendre compte de v isu qu 'e l le do i t ê t re t rès élevée ; cette haute
concentration dans l 'eau est â rapprocher de cel les que nous avons obte
nues en labora to i re {tableaux 42 et 44) ou notées dans la micro-couche 210 de surface ( tableau 40). L'évolut ion des concentrations en Po des
Artemi a en fonc t ion du temps est à première vue assez déroutante
(tableau 46, F i g . 8 ) . , e l l e l ' e s t moins s i on s u i t l 'évo lu t ion de l a 210
concentration en Po de l 'eau (tableau 46, F i g . 9) et si l 'on calcule
les facteurs c'e concentration (tableau 46, F i g . 8 ) . Bien que l 'eau, en 210
fonction du temps s 'enr ich isse régulièrement en Po, le facteur de
concentration des Artemia diminue. I l semble donc que ce * Po "perdu"
ne so i t pas " r é u t i l i s a b l e " par les animaux. En f a i t , au bout de 40 h et 210
de 229 h, 85 % du Po dans l e f i l t r a t de l 'eau é t a i t sous une forme
Temps (heures)
Z 1 0 P o pCi/g sec
2 1 ° P 0 pCï/1 eau
Facteur de concentration Facteur de concentrât!on calculs avec le 210po dialysahle seulement [ -15 S du total)
0 78 î 3 0,372 Z.l x 10 4
11 93 1 4 (0.375) 1.2 x 10 4
19 97 î 5 (0,95) 1,0 x 10*
40 46 1 2 1 . 3 * 0,35 x 10 4 2,4 x 10 4
65 54 î 2 (M) 0.3B x 1Q4
89 43 i Z (1.5) 0.2B x 10 4
229 63 - 2 Z.l * 0,30 x 10 4 2.0 x 10⁴
EL X non d i a l y s a b l e
( ) d 'après l a courbe , l es autres » mesurés.
• Pe r te du Po par Artemi a : enr ichissement en Po de V e a u dans l aque l l e
i l s sé jou rnen t , en fonc t ion du temps. Facteur de concent ra t ion .

o&50 •8 pi
c UJ
ÏJ-<
o u-
1 0 0 Ê C " " V
50 100 150 TEMPS (heures)
200 230
210 010 Fig. 8. Arterni a: concentration en Po et facteur de concentration du Po, exprimes en
pourcentage des valeurs au temps to. (x) facteur de concentration calculé avec la 210
fraction dialysable du Po contenu dans l'eau (voir texte et F1g. 9 ) .

118
• s . o
5 10 TEMPS (Jours)
15
Fig. 9. Conce tratlon en Po de l'eau dans laquelle ont sêjou "né les Ar terni a.
- 119 -
non dialysable (PM> 6000 - 8000) ; si l'on re-caicule le facteur de 210
concentration en ut i l isant seulement les 15 % dialysables du Pg ans
l'eau on s'aperçoit que le facteur de concentration demeure constant
(tableau 46, Fig. 8 et 9) .
V I . 6. RESUME ET CONCLUSIONS OU CHAPITRE V I .
Dans cette section, l ' intérêt a été plus particulièrement centré sur le rôle joué par des organismes vivants (ou morts) stir le devenir du ?io 2in
5 o , Pb dans la couche de surface des océans. (1) Par l ' intermédiaire des particules a u ' i l produit -et plus part icul ièrement les feces- l e zooplancton est responsable de la disparition rapide
210 210 du Po, Pb de la couche superficiel le. Si les feces étaient le seul vecteur pour transporter les deux éléments vers lu profondeur, les temps
pectivement de 1,5 et 5 ans, soit â peu près le double des temps de rés i
dence habituellement estimés, résultant de l'association des deux éléments
avec l'ensemble des particules. 210 210
Le rapport Po/ Pb dans les faces du zooplancton est de Z environ,
ce qui est également le rapport qu'on peut calculer d'après les données de
BACON et al^. (1976) dans les petites particules dans l'eau de mer ou celles
de SPEMCER et a l . (1978), BREWER et a l . (1980) dans des particules recueil l ies 2 1 A 2TD~
par des pièges 5 sédiments. Po, Pb ont été mesurés dans les feces
d'organismes du zooplancton représentant une biomasse Importante en général
(cnpépodes, euphausiacês et â un moindre degré décapodes planctoniq'.ies) ou
dans une zone particulière (anchovetta dans la zone d'"upwelling" du Pérou)
ou bien encore dans les feces de salpes qui , par leur vitesse de sédimen
tation élev£e peuvent jouer un grand rôle dans les flux. 210 210
(2) Une étude détail lée du Po, Pb dans la microcouche de surface et
l'hyponeuston a permis de mettre en évidence plusieurs faits : le rapport 210 210
Po/ Pb est toujours supérieur à 1 dans la microcouche, alors que 20 cm au-dessus i l est toujours inférieur à l 'uni té . La microcouche est
210 toujours plus concentrée en Po que l'eau de surface (rapport 1,4 â 6,1
suivant les saisons), ceci n'est pas toujours vrai pour le Pb (rapport
0,8 à 3 , 3 ) . De plus, i l existe une bonne corrélation entre ces rapports
élevés et la biomasse de l'hyponeuston récoltée le même jour, ce qui suggère 210 210
que la microcouche est enrichie en Po, Pb par les organismes qui y vivent.

- 120 -
210 (3) Une tel le hypothèse a été confirmée par G?S mesures de Po (au niveau
naturel) faites en laboratoire dans l'eau et la biomasse ; elles ont permis
de montrer que le polonium é ta i t "perdu" par des copépodes vivants ou marts
ou des Artemia vivants à un taux sensiblement du même ordre, de 0,2 â 210 1 pCi/g/hr. Ce Po "perdu" par les animaux se retrouve dans l'eau a la
foi5 sous forme de particules (1,2 juin ; 0,22 uni) ou dans le f i l t r a t et sa
distribution relative varie avec le temps et l ' é ta t physiologique des ani-210
maux : la proportion de Po particulaire est minimum quand le plancton
est vivant, el le augmente quand i l s'agit de plancton mort ou que le f i l
t ra t (après f i l t r a t ion sur 1,2 uni) est laissé à la température ambiante 210
pendant 24 h. De plus 85 à 90 S de Po du f i l t r a t est associé avec des
composés de poids moléculaire élevé, non dialysables ( > 8000 - 10000),
sans doute avec des protéines comme semble l'indiquer une expérience prê l i -210 minaire d 'u l t ra- f i l t ra t ion . Ce Po n'est pas immédiatement re-disponible
pour une rêaccumulation par les animaux, par contre la fraction dialysable
semble l 'être . Ces derniers résultats ne sont pas sans rappeler des résul
tats antérieurs que nous avions obtenus avec le Zn (FOWLER et HEYRAUD, 1981).
(4) A partir de ces résultats on peut essayer de schématiser ainsi le devenir
Zooplancton ^ -
! Particules;» 1,2 ira Bactéries ' ' F i l t r a t < 0,22 um ' «r-1,2 - 0,22,11m.*-. PM> 8000-10000 - -r Dialysable -
où les flèches en t ra i ts pleins figurent les résultats obtenus expérimentale
ment et celles en point i l lé des voies de transformation possibles (ou proba-210
blés) du Po d'une forme à une autre. Ce n'est pour l ' instant qu'une
tentative d'interprétation que nous nous proposons de vér i f ier et compléter
expérimentalement.
Un tel schêi-a peut être rapp.-oche de celui de EPPLEY et a_K (1981) sur
le devenir de la matière organique dissoute (DOC) et ses Interactions avec le
plancton : t~
1-183 /an Phyto-Mierozooplankton "- Macrozooplankton > 183 p
* _ .v
0,2-0,6 um Bacter ia - ' DOC." o — . » ^ h„ - * * • FiltratP Removed by -ft*-I n •> .™ screening <c 0,2 um 3

f
CHAPITRE VII - DOSE D'IRRADIATION.

- 121 -
V I I . 1 . INTRODUCTION : BREVES GENERALITES SUR LE5 RAYONNEMENTS IONISANTS.
1.1. Catégories de rayonnements ionisants.
"Quelle que soit la nature des particules et rayonnements émis (par
un élément radioact i f ) , le mécanisme de leur action sur la matière réside
dans un transfert de leur énergie cinétique â la substance qu'i ls pénètrent
et dan* laquelle i l s provoquent des phénomènes d'ionisation" (ANCELLIN, 1979).
L'effet néfaste d'un rayonnement sur la matière vivante dépendra donc
à la fols de l'énergie de ce rayonnement et de son parcours dans la matière
qui lui-même dépendra de la masse et de la charge des particules qui le
composent. On peut ainsi distinguer :
- le rayonnement tu , composé de particules de masse relativement élevée
(masse 4, noyau d'He), de haute énergie, peu pénétrant (quelques dizaines
de jum) mais très ionisant:
- le rayonnement Ç) , composé d'électrons, plus pénétrant que le rayonnemento<
(quelques millimètres) mais moins ionisant.
- le rayonnement "X*, composé de photons de masse nulle, c'est un rayonnement
de nature électromagnétique très pénétrant (quelques mètres) mais peu ionisant.
- A ces trois types de rayonnement auxquels peuvent être soumis les organis
mes marins, i l faut ajouter celui provenant des rayons cosmiques dont les
effets, i la surface de la mer, peuvent être rapprochés de ceux des rayon
nements p et Y .
1.2. Unités employées en dosimétrie.
L'unité en dosimétrie est le rad, qui se définit comme l'absorption de
100 ergs d'énergie par gramme de matériel.
L'autre unité, qui rend mieux compte de l ' e f f e t ultime des radiations
au point de vue biologique, est le rem (Roentgen equivalent man). Ce n'est
pas exactement une dose d'irradiation, c'est un équivalent de dose. Le rem
n'est autre que le rad multiplié par un "facteur de qualité" qui t ient
compte des différents taux de transfert d'énergie associés aux différents
types de rayonnements, en m&ne temps que de leurs effets biologiques. Ce
facteur est de 1 pour les rayonnements (s , "€ et les rayons cosmiques -,
pour le rayonnèrent « , un chiffre de 10 a été longtemps u t i l i sé , chif fre
qui est sans doute sous-estimé et en réal i té plus près de 20 (CIPR, 1977).
HILL (1965) a noté que oar un accident arithmétique commode, pour le 210
Po une concentration exprimée en pCi/kg de poids frais est sensiblement équivalente à une dose d'Irradiation exprimée en mrem/an. Cela implique que

toute l 'énerg ie èalse par la p a r t i e l l e a est absorbée dans l t t i s s a
concerne.
f i t . 2. Estimnow SES DOSES D'IRHAPHTIOW wxquaiES sont soums LES Qtemsms wwms : «pioreTivm «TUKLLE, RADIO«CTI<ITE wm-r ic iem.
2 . 1 . Preaneres estimations, d'après l a rad ioac t iv i té na tu re l l e .
Un des preeriers a r t i c l es t r a i t a n t de ce t te question est ce lu i de
FOLSCM e t HMSXY (1957) où les auteurs ca lcu la ient les doses d ' i r r a d i a t o r .
auiQueltes é ta ien t souris les organisa»» «Brins d'après les sources
erternes (rayons co l i ques dans les 100 , reaviers «êtres surtout ,
potassiu»-40 dans l'environnement) e t i m tmes {potasslu»-40) ; i l s a r r i
vaient a ins i a l a conclusion que le « i l i e nar in - tout par t i ra i iéresent
su oe i l de 10Û i de profondeur- é t a i t un c waine ou la rad ioact iv i té é t a i t
«xtreseneiît f a i b l e .
l.Z. I r r ad ia t i on in terne, I r rad ia t ion enterae : sources passibles.
En 1971, deu* a r t i c l es importants sont présentes en «ese taaps au
Synpesia» de Seat t le organisé par l 'S l rA (Agence internat ionale de l 'Energie
Ataœidae) sur la "Contamination radioactive ce l'environnement sa r in " ; 11
l ' a o l t des i r t l c l e s de FOLSOM et SEASLEY (1973) et de MOOWOtO (1973).
Sur la base des nouvelles données acquises sur les concentrations en ro
trotfvtes dans cer ta ins organisas aar ins , H1.SÛI1 e t SEASLEY a t t i r e n t
l ' a t „ * . t 1on sur cet te source importante d ' i r r a d i a t i o n Interne dans le
ca la i ! des doses reçues par ces organisées, tan i s ojie *OT€A0 compare
les doses provenant des d i f férentes fornes de r« l i s a c t i v i t i , naturel le
Su a r t i f i c i e l l e . U t i l i s a n t des fornes géonétriqu s s impl i f iées pour repré-
sent i r les diverses catégories d'organlssies -phyt p l anc ton , zseplancton,
crustacés, • c l l u s o i a s , poissons- t t calculer les ases d ' i r rad ia t i on
aamut l les i l s sont souari s • W0OHEN) arr ive a la conclusion que les doses
d ' i r rad ia t ion {e»pri«fes es radj dues i la r ad ioac t i v i t é a r t i f i c i e l l e
(représentée sr l i ic ipa 'eaeat par les retapées ataossMriques ayant su)»i
les essais d'araes nucléaires) sont sensiblement éc les i ce l les dues 1 la
rad ioact iv i té nature I l e ( " u P o e t W l incorporés tu : les organisées
.Sur tou t ) .

- 123 -
2.3. Dose absorbée frad) et équivalent de dose (rem).
Comme CHERRRY et SHANNON (1974) le font remarquer au terne de leur
revue, des doses d'irradiation exprimées en rad ne donnent pas une éva
luation réal iste de la situation puisqu'elles ne tiennent pas compte du
facteur de qual i té , 20 fois plus élevé pour les ëmettteurs oc que pour les
@ et If .
Cette remarque peut s'appliquer 5 d'autres publications parues
sur cette question (BLAYLOCK et TRABALKA, 1378 ; AMIARD-TRIQUET et AMIARD,
1980) où, même si e l l e est mentionnée, la part fa i te S la radioactivité cv
naturelle est minime, comparée à celle consacrée à des études expérimen
tales ut i l isant des rayonnements ^ ou X e t conduisant souvent â des
résultats contradictoires -ou pour le moins controversés-.
V I I . 3 . DOSE D'IRRADIATION INTERNE QUE AU 2 1 0 P 0 .
3 . 1 . Quelques chiffres.
Pour estimer la dose d'irradiation interne impliquée par les concentra
tions en Po mesurées au cours de ce t r a v a i l , nous utiliserons le facteur
de conversion : pCi/kg de poids frais = mrem/an, qui est rapide et commode ;
i l faut toutefois noter que cela entraine une sous-estimation de la dose
reçue puisqu'un te l calcul ut i l ise un facteur de qualité de 10 et non de 20
pour le rayonnement» (HILL, 1965).
On peut ainsi calculer (tableau 47) l 'ordre de grandeur de la dose
d'irradiation interne reçue par quelques uns des crustacés analysés pour 210
le Po au cours de ce t ravai l . Pour les animaux entiers cet ordre de
grandeur va de 0,2 3 9 rem/an et pour les hëpatopancréas de 7 8155 rem/an.
Dans les deux cas, ce sont les crevettes pélagiques profondes (pënaëidês)
qui sont soumises aux plus fartes doses d' i rradiat ion. De telles doses ne
sont toutefois pas exceptionnnelles, puisqu'on peut calculer que celles
reçues par 1 ' hëpatopancréas du cflmar Nototodarus gooldi sont, en moyenne
de 90 rem/an ou Men encore celles reçues par le caecum pylorique du thon
Thunnus thynnus, de 29 rem/an.
A des fins de comparaison, on notera ic i que la dose d'irradiation
naturelle reçue par l'homme est de Tordre de 100 mrem/an ! ANCELLIN
(1979) cite un chiffre moyen de 170 mrem/an, dont 12 S seulement corres
pondent â une irradiation interne. L'organe soumis a la plus forte dose
d'irradiation chez l'homme est le poumon, qui reçoit une dose de l'ordre
de 400 mrem/an.

ftnisuu t entiers Hépatapsncréis pCi/g sec sreo/an pCi/g sec wern/jn
Arteoia 80 aooo Copépodes « 1400 Euphausfaces
narvetnca l 200 20 7000
Oecapotfe» ; ensemble de crevettes
S 1600 85 zsooo
taHdes S 1000 66 22000
Pens Jiies u 3S0Û 197 66Û0O
Crt-.ettes profondes {* £00 m)
39 7800 30E 1020QQ
CiHdès 14 2800 14/ 4S0CO
Pénaéidès 43 aeoo 465 1S5CC0
Rapport poids r r a i s / e o i û 3 sec : Arteaia o la ; Copépodes » a ; H.norveo.ica, crevettes - S : Keoatopancreas * 3 .
Taoleau » - Doses de radiation does lu ? 1 ° » : ordres de jracdeur calculés au cours de ce travail d'après les cancellations myennes itesurees
3.2. Ut i l i té de te l les estimations comme termes de comparaison.
Parmi les éléments radioactifs produits par l'homme et introduits
dans le milieu marin, i 1 en est un qui est une source de préoccupation
majeure pour l ' avenir , i l s ' ag i t du plutonium. Il existe plusieurs isotopes 239 du plutonium, dont le plus important, i c i , es t le Pu. C'est en effet
un émetteurex i 1/2 vie très longue (2,4 x 10 ans) qui a d'abord été
introduit en mer par les retombées atmosphériques consécutives à son
in t roduct ion dans l'atmosphère par les essais de bombes atomiques. Ces
essais ont maintenant pratiquement cessé, mais les autres sources de 239
Pu en milieu marin, même si e l les sont soumises à des contrôles rigou
reux, peuvent devenir de plus en plus importantes dans le futur : i l
s 'agit des centrales nucléaires et des centres de retraitement des combus
tibles i r radiés . En outre, on parle de plus en plus de se débarrasser
des déchets radioactifs en les enfouissant au fond de la mer. 239
Pour pouvoir contrôler le devenir de ce Pu en mer e t plus particulièrement les effets possibles de son accumulation par les animaux, i l est nécessaire d'avoir des termes de comparaison qui peuvent être fournis par les émetteurs « naturels auxquels les organismes ont été soumis depuis toujours. Parmi ceux-ci, le Po est certainement le meilleur choix.
- 1Z5 -
Comme nous l'avons vu précédemment, dans les trois cas où des mesures
concourttatntes d'émetteurs o{ naturels et a r t i f i c i e l s ont été faites
(échantillons de zooplancton non t r i é , échantillons de Meganyctiphanes
norvegica, hépatopancrêas de poulpe), la contribution du Po 9 la
radioactivité « totale mesurée éta i t de 90 % ou plus. De plus, sa
mesure est faci le ; e l le ne nécessite ni technique chimique compliquée
ni appareillage onéreux et les concentrations élevées existant dans les
organismes marins font qu' i l n'est pas nécessaire d'analyser de grandes
quantités d'échantillon pour faire des mesures exactes.
Enfin, les données présentées dans le tableau 47 montrent très
clairement que la radioactivité -.aturelle -même représentée par le seul 210
Po- f a i t du milieu marin un domaine où les organismes sont soumis à des doses d' irradiat ion élevée, y compris ceux qui vivent en profondeur.
- K 6 -
CONCLUSIONS GENERALES
210 210
Au terme de ce travail sur le Po, Pb dans les organismes
marins et leur environnement, on peut essayer de résumer les principaux
points qui se sont dégagés de l'étude et voir quelles questions nouvelles
se posent.
210 1) Le rôle du Po comme source majeure de la dose de rridiation interne
naturelle reçue par les organismes marins a été confirmé, ues mesures 210
concomitantes du Po et des principaux émetteurs « naturels (série de
V U ou du Th) ou a r t i f i c ie ls ( 2 3 9 + Z 4 0Pu)dans des échantillons de
microzooplancton f/200 um) ou de macrozooplancton (suphausiacês, 210
Heganyctiphanes norvegica) ont montré que la contribution du Po à la
radioactivité n totale mesurée est de plus de 90 %. Clairement, le choix 210
du Po comme terme de référence pour évaluer U s effets possibles â
long terme d'émetteurs c< ar t i f ic ie ls semble tout indiqué.
2} Dans un organe particulier, la glande digestive ou hêpatopancréas de 210
crustacés ou de mollusques céphalopodes, l a contribution du Po à la
radioactivité ec totale mesurée est de plus de 95 %. La dose de radiation
interne reçue par cet organe, du seul f a i t des très hautes concentrations 210
en Po, est de plusieurs dizaines de rem/an en moyenne, elle peut a l ler
jusqu'à 300 rem/an chez certaines crevettes mêsopêlagiques profondes. Les
organismes marins -y compris ceux qui vivent en profondeur- sont soumis
i des doses de radiation qui, loin d'être fa ib les, comme on l 'a cru jusqu'à
ces dix dernières années, sont au contraire particulièrement élevées. Cet
aspect de la question mériterait peut-être qu'on l'étudié de plus près,
en particulier chez des crustacés comme les crevettes où les gonades et
1'hêpatopancréas sont en contact intime : une recherche systématique
des anomalies chromosomiques pourrait être Intéressante.

- 127 -
Z1Q 3) Une étude détaillée du Po chez l'euphausiacé Meganyctiphanes
vin norvegica a permis de montrer que la source principale du Po chez
210 ce crustacé é t a i t la. nourriture. Le Po contenu dans l'hëpatopancrëas (plus de 50 ï du Po total de l'animal) est facilement "ré-mobilisable"
210 si on fournit aux Heqanyctiphanes un régime pauvre en Po, le
"turnover time" du Po dans cet organe est de 6 jours environ. De 210
même, djs études des concentrations en Po des contenus gastriques ont
montré que ces concentrations sont très voisines dans des lots d'animaux
péchés dans les mêmes conditions mais peuvent varier du simple ou double
si l'on compare des lots captures dans des conditions différentes de
temps et de profondeur.
210
4) L'ut i l isat ion passible du Po comme traceur biologique naturel,
des régimes alimentaires en part icul ier , des animaux mésopélagiques
profonds semble indiquée d'apris les résultats que nous avons obtenus
chez les crevettes s plus spécialement pour évaluer l'importance rela
tive dans ces régimes des détritus et de la matière organique en sus
pension, une t e l l e évaluation étant pratiquement impossible d'après
l'examen des contenus gastriques. Nous avons l ' intention d'étudier cette 210
question en combinant des mesures de Po et de chlorophylle dans des contenus gastriques d'euphauslacés ou chez des copëpodes et de suivre
ainsi les variations saisonnières de leur régime, qui sont issez peu
connues.
5) Le facteur d'enrichissement d'un élément (normalisé par rapport à
l'aluminium dans Têchantillon/êcorce terrestre) peut être un bûn témoin
de l'Importance des processus biologiques dans le devenir de cet élément 210
en mer. Le facteur d'enrichissement du Po augmente quand on va des particules, aux feces d'animaux pélagiques, au plancton, à l'hëpatopan
crëas. Les facteurs d'enrichissement d'un certain nombre d'éléments, tels
que le Cd, l 'Ag, le Se suivent une évolution comparable et sont du même 210
ordre de grandeur que celui du Po.
6) Un autre bon témoin, dans le domaine marin, pour évaluer l'importance 210 210
des processus biologiques est l'étude du rapport Po/ Pb et de son
évolution : ce rapport est de 0,1 dans les précipitations atmosphériques,
> 1 dans la microcouche de surface, 0,5 dans l'eau de mer, ~ 2 dans
les particules (petites ou grosses), 20 S 30 dans le plancton. Ce rapport,
toujours > 1 dans la microcouche de surface (alors qu' i l est toujours &. 1
20 cm au dessous) a a t t i ré l 'attention sur l'importance des phénomènes

- 128 -
biologiques qui prennent place à ce niveau : i l existe une nette
corrélation entre la blâmasse du neuston, au cours de l'année, et
l'enrichissement en. Po (et en Pb, à un degré moindre) de la mi-
crocouche de surface. Ce Po contenu dans l'eau ainsi enrichie par
la bioraasse semble, d'après les tout premiers résultats récemment
obtenus, être l i é à des composés de poids moléculaire > 6000-8000 ;
i l semble également que son association avec les bactéries soit impor
tante . Nous avons l ' intention de pounuivre l'étude de cette question
afin de voir, si ces résultats se vér i f ient , ce qu' i ls impliquent en
termes de f lux du 2 1 0 P o , 2 1 0 P b .

- 129 -
BIBLIOGRAPHIE
AIZAWA, Y. Ecological studies of micronektonic shrimps (Crustacea,
Oecanoda) i n the western north Pac i f i cBu l l . Ocean. Res. Ins t .
Univ. Tokyo, £ , 1-61 (1974).
ALEXANDER, G.C. and D.R. YOUNG. Trace metals i n southern Cal i fornia
mussels. Marine P o l l . B u l l . , 7, 7-9 (1976).
AMIARO-TRIQUET, C. et J.C. AMIARD. Radioëcologie des mil ieux aquatiques.
Masson, Paris (1980).
AHCELLIN, J . , P. GUEGUENIAT et P. GERMAIN. Radioécologie marine. Etude
du devenir des rad ionuc l ides rejetês en mi l ieu marin et app l i
cations â la radioprotect ion. Eyrol les, Paris (1979).
ANDERLINI, V. The d i s t r i b u t i o n of heavy metals in the red abalone,
Ha l lo t is rufescens on the Cal i forn ia coast Arch.Environm. Contamln.
Tox ico l . , 2^ 253-265.(1974).
BACON, M.P. Appl icat ions of Pb-210/Ra-226 and Po-210/Pb-210 d isequ i l ib r ia
i n the study o f marine geochimical processes. Ph. D. Thesis,
Massachusetts I n s t i t u t e of Technology, Cambridge/Woods Hole (1976).
BACOH, M.P. Z 1 0 P b and 2 1 0 P o resul ts from F.S. "Meteor" cruise 32 in the
North A t l a n t i c . "Meteor" Forsch.-Ergeb., Reihe A, 19, 24-36 (1977).
BACON, M.P. and A.W. ELZERMAN. Enrichment of Z 1 0 P b and 2 1 0 P o in the sea-
surface microlayer. Nature, 284, 332-334 (1980).
BACON, M.P., P.S. BREWER, D.W. SPENCER, J.W. MURRAY and J . GOODARD.
tead-210, polonium-210, manganese and i ron i n the Cariaco Trench.
Oeep-Sea Res., 27 A, 119-135 (1980b).
BACON, M.P., O.W. SPENCER and P.G. BREMER. 2 1 0 P b / 2 2 6 R a and 2 1 0 P a / 2 1 0 P b
d i sequ i l i b r i a i n seawater and suspended pa r t i cu la te matter. Earth
Planet. S c i . L e t t . 32, 277-296 (1976).

BACON, H.P., D.W. SPENCER and P.G. BREMER. Lead-210 and poloniue-210
as marine geochesrical tracers : review and discussion of results
fro» the Labrador sea. In "Natural Radiation environnent I I I " ,
Houston, v o l . 1 , «73-501, U.S. Department of Energy. Conf-780422
(1980a).
BAGXALl, K.W. Le polonius. Endeavour, 22 . ol-64 (1963).
BEASLEY, T.H. Lead-210 in selected narine organisms. Ph. D. Thesis,
Oregon State University (1968).
BEASLEï, T .H . , R.J. EAaE and T.A. JOKELA. Polonium-210, lead-210 and
stable lead in narine organise». Q. Summ. Rep. Hlth Saf. Lab.,
N.Y. (Fa l l ou t Progm.) HASL-273, 2-36 (1973).
BEASLEY, T.M. , M. HEYRAUD, J.J.W. HIGGO, R.O. CHERRY and S.U. FOULER.
Po and Pb i n zooplancton fecal p e l l e t s . War. B i o ! . , 44,
325-328 (197B).
BEERS, J.F. Studies on the chemical composition of the major zooplankton
groups in the Sargasso sea o f f Bensuda. Linmol. Oceanogr., 11,
520-S28 (1966).
BEN HUSTAPHA, A. Observations biologiques sur Penaeus kerathurus
forskal et étude bioaétr ique. Ann. I ns t . Ocêanogr. Pêche Salambô,
13, 1-100 (1967).
BENHET, J.T. and R. CARPENTER. Concentrations and temporal variat ions of
Po, Pb and Al i n the surf zone ecosystem of Copalis Beach,
Washington. Est . coast. Bar. S c i . , 8 , 127-140 (1979).
BENNINGER, L.K. The uranium-series radionuclides as t racers of geochetnical
processes i n Long Is land Sound. Ph. 0. Thesis.Yale Universi ty (1976).
BIDDER, A.N. The d igest ive nechanisa of the european squids Lol igo vu lgar is ,
k- Forbesi, A l lo the i r t i s media and A. Subulata. Q. J l microsc. S c i . ,
9 1 , 1-44 (19S0).
BIDDER, A.H. Feeding and d igest ion in cephalopods. In "Physiology of
mollusca", K.W. WILBUR and C.H. YQNGE Eds., N.Y. Academic Press (1966).
. BISHOP, J .K .8 . , J.H. EDJONO, O.R. KETTEN, H.P. BACON and M.B. SILKERS.
The chemistry, biology and vertical flux of particulate matter fro»
the upper 400 a of the equatorial Atlantic Ocean.Deep-Sea Res., 2£,
SU-548 (1977).

- 131 -
BLAYLOCK, B.G. and J.R. TRABALKA. Evaluating the effects of ionizing
radiation on aquat-c organisms. In "Advances in radiation biology",
vol. 7, J .T. LETT and H. ADLER, Eds., H.Y. Academic Press (1978 ) .
BOUCAUD-CAMOU, E. Etude de l'appareil digestif de Sepia officinalis L.
(mollusque céphalopode). Essai d'analyse expérimentale des phéno
mènes digest i fs , Time I , 208 p. Thèse de Docteur es-Sdences
naturelles, Univer i té de Caen (1973).
BOUGIS, P. Ecologie du ilancton marin. Hasson et Cie, Paris (1974).
BREHER, P.G. Minor eleir,;nts in sea water. In "Chemical Oceanography",
Vol. 1 , J.P. RILEV and G. SKIRR0W, Eds., Academic Press, London
(1975).
BREHER, P.G., Y. NOZAKI, D.W. SPENCER and A.P. REER. Sediment trap
experiments in th deep north Atlantic : isotopic and elemental
fluxes. J . mar. Re;., 38_, 703-728 (1980).
BRULAND, K.W. and H.W. SILVER. Sinking rates of fecal pellets from
gelatinous zoopla. -ton (Salps, Pteropods, Ooliolids). Mar. B i o l . ,
63, 295-300 (1981'.
BRUN-COTTAH, J .C . , C. < 1PIN-M0NTEGUT et G. COPIN-H0NTEGUT. Conditions
estivales dans la iivergence de Méditerranée nord-occidentale. I .
Caractéristiques physiques et chimiques du Seston. Ann. Inst.
oceanogr. Paris, il, 21-31 (1976).
BRYAN, G.H. The occurr nee and seasonal variation of trace metals in the
scallops Pecten maximus (L.) and Chlamys opercularis ( L . ) . J . mar.
b io l . Ass. U.K., 43, 145-166 (1973).
BRYAN, G.W. Heavy meta contamination 1n the sea. In "Marine Pollution",
R. JOHNSTON Ed., Academic Press, London, New York, San Francisco (1976).
BRYAN, G.W., G.W. POTT; and G.R. FOSTER. Heavy metals in the gastropod
mollusc Haliotls luberculata ( L . ) . J . mar. b io l . Ass. U.K., 57,
379-390 (1977).
BUAT-HENARD P. and R. MESSELET. Variable influence of the atmospheric
flux on the trac metal chemistry of oceanic suspended matter. Earth
Planet. Sri Let" , 42 399-411 (1979).
BURTON, H.M. and N.G. STEWART. Use of long-lived natural radioactivity as
an atmospheric tracer. Nature, 186, 584-539 ( I960).

- 132 -
CASANOVA, B. Les euphausiacés de Méditerranée. (Systématique et dévelop
pement larvaire . Biogéographie et biologie) , 380 ,. Thèse de
Docteur es-sciences naturelles. Université de Provence, Aîx-Marseille
(1974).
CHERIAH, M.G. and R.A. GOYER. Minireview. Metallothioneins and their
role in the metabolism and toxicity of metals, Life Sciences, 23,
1-10 (1978).
CHERRY, R.D. Alpha-radioactivity of plankton. Nature, 203, 139-143 (1964).
CHERRY, R.D. and H. HEYRAUD. The polonium-210 content of marine shrimp :
variation with biological and environmental factors. Mar. Biol . , 6_5_,
165-175 (1981).
CHERRY, R.D. and L.V. SHANNON. The alpha radioactivity of marine organisas.
Atom. Energy Rev., Vienna, K, 1-45 (1974).
CHERRY, R.O., S.W. FOULER, T.H. BEASLEY and H. HEYRAUD. Polonium-210 ;
I ts vertical oceanic transport by zooplankton metabolic act ivi ty.
Mar. Chem., 3, 105-110 (1975).
CHERRY, R.D., J .J . W. HIGGO and S.W. FOWLER. Zooplankton fecal pellets and
element residence times in the ocean. Nature, 274,246-248 (1978).
CHERRY, R.D., M.H. SHAY and L.V. SHANNON. Natural «-radioact iv i ty concen
trations in bone and l iver from various animal species. Nature, 228,
1002-1003 (1970).
CIPR. Recommendations of the international commission on radiological
protection. Annals of the ICRP, Publication n° 26, Pergamon Press,
Oxford (1977).
CONOVER, R.J. Factors affecting the assimilation of organic matter by
zooplankton and the question of superfluous feeding. Limnol.
Oceanogr., 1 1 , 346-354 (1966).
CULKIN, F. and J.P. RILEY. The occurrence of gallium in marine organisms.
J. mar. b io l . Ass. U.K., 37, 607-615 (1958).
CURIE, I . et F. J0LIOT. Preparation des sources de polonium de grande
densité d 'act iv i té . J . Ch. phys., 28, 201-205 (1931).
CURIE, M. et A. DEBIERNE. Sur le polonium. C.R. Acae1. Sc1. Paris, 150,
386-389 (1910).

- 133 -
DAUMAS, R.A. Variations of par t icu la te proteins and dissolved amino
acids in coastal sea water, l iar. Chem., £ , 225-242 (1976).
DAVIES, A.G. Pol lut ion studies v/ith marine plankton. Part I I . Heavy
ra ta l s . Adv. mar. B i o l . , .15, 381-508 (1978).
DEHAIRS, F., R. CHESSELET and J . JEDWAB. Discrete suspended par t ic les
of bar i te and the barium cycle in the open ocean. Earth Planet.
Sc i . L e t t . , 49, 528-550 (1980).
DUCE, R.A., G.L. HOFFMAN and U.H. ZOLLER. Atmospheric t race metals at
remote northern and southern hemisphere s i tes : po l l u t i on or natural ?
Science, 187, 59-61 (1975).
EGANHOUSE, R.P. and D.R. VOUMG. 2 i s_- tu uptake of mercury by the in te r t i da l
.nussel Hyti lus ca l i fo rn ianus . H -ine Po l l . B u l l . , 9_, 214-217 (1978).
EISLER, R. Annotated bibl iography on biological ef fects o f metals in aquatic
environments (Nos 1-567), U.S. Environmental Protect ion Agency,
EPA-R3-73-007, 287 p.(1973).
EISLER, R. and M. WAPNER. Second annotated bibl iography on biological
effects of metals in aquatic environments (Nc: 568-1292), U.S.
Environmental Protect ion Ag»ncy 1^-600/3-75-008, 40D p. (1975).
EISLER, R., D.J. O'NEILL and G.H. TH0".'S0N. Third annotated bibliography
on biological e f fec ts of metals in aquatic environments (Nos 1293-
2246), U.S. Environmental Protection Agency EPA-600/3-78-005, 487 p.
(1978).
EISLER, R., R.M. ROSSOLL and G.A. ËABOUFY. Fourth annotated bibliography
on biological e f fec ts of metals in aquatic environments (Nos 2247-
3142), U.S. Environmental Protectio.i Agency EPA-600/3-79-084, 592 p.
(1979).
ENOM0T0, Y. Océanographie survey a.'.d biol igical study of shrimps in the
waters adjacent to the eastern coast; of the State of Kuwait. Bu l l .
Tokai Reg. Fish. Res. Lab. , 66, 1-74 '1971).
EPPLEY, R.U., S.G. HORRIGAN, F.A. FUHRWAN, E.R. BROOKS, C.C. PRICE and
K. SELLNER. Origins of dissolved organic mutter in southern Cal i fornia
coastal waters : exper nts on the roie of zooplankton. Mar. Ecol.
Prog. Ser., 6_, 149-159 (1981).
- 134 -
FELLOWS, D.A., D.M. KARL and G.A. KNfUER. Large particle fluxes and the
vertical transport of l iving carbon in the upper 1500 m of the
northeast Pacific.ocean. Deep-Sea Res., 28, 9Z1-936 (1981).
F0LS0M, T.R. and T.H. BEASLEY. Contribution from the alpha emitter,
polonium-ZIO, to the natural radiation environment of the marine
organisms. In "Radioactive contamination of the marine environment",
A. I .E.A. , Vienne, 625-632 (1973).
F0LS0M, T.R. and J.H. HARLEY. Comparison of some natural radiations
received by selected organims. In "The effects of atomic radiation
on oceanography and fisheries". Publication N° 551, National Academy
of Sciences National Research Council, Washington, D.C. (1957).
F0LS0H, T.R., K.M. WONG and V.F. HODGE. Some extreme accumulations of
natural polonium radioactivity observed 1n marine organisms. In
"The natural radiation environment I I . Houston, Texas", Texas Uni
versity Press, 863-882 (1974).
FOWLER, S.H. The effect of organism size on the content of certain trace
metals in marine zooplankton. Rapp. P.-v. Rêun. Comm. int . Explor.
scient. Her Hêditerr. , 22, 145-146 (1974).
FOWLER, S.W. Tçace elements in zooplankton particulate products. Nature,
269, 5-53 (1977).
FOWLER, S.W. Biological transfer and transport processes. In "Pollutant
transfer and transport in the sea", G. KULLENBERG Ed., CRC Press,
Boca Raton, Florida, 1-65 (1982).
FOWLER, S.W. and G. BENAYOUN. Accumulation and distribution of selenium
in mussel and shrimp tissues. Bull . Environm. Contamin. Toxicol.,
16, 339-346 (19"*6).
FOWLER, S.W. and M. h-tYRAUD. Biologically-transformed zinc and i ts avai
l ab i l i t y for bioaccumulation by marine organisms. In "Management of
environment", B. PATEL, Ed., Wiley Eastern L td . , New Dehli f l980).
FOULER, S.W. and L.F. S*ALL. Sinking rates of euphausiid fecal pellets.
Limnol. Oceanogr., JJ , 293-296 (1972).
FOWLER, S.W., G. BENAYOUN and L.F. SHALL. Experimental studies on feeding,
growth and assimilation in a Mediterranean euphausiid. Thalassia
jugosl . , 7, 35-47 (1971a).

- 135 -
FOWLER, S.U., L.F. SMALL and S. KECKES. Effect of temperature and size on
molting of euphausiid crustaceans. Mar. B i o l . , U.» 45-51 (1971b).
FOXTON, P. The vert ical distribution of pelagic Decapods (Crustacea :
Natantia) collected on the Sond cruise 1965. I . The Caridea. J . mar.
b io l . Ass. U.K., 50, 939-960 (1970).
F0XT0N, p. and H.S.J. ROE. Observations on the nocturnal feeding of some
mesopelagic Decapod Crustacea. Mar. B i o l . , 2£, 37-49 (1974).
FRANKENPCBG, D. and K.L. SMITH, Or. Coprophagy in marine animals. Limnol.
Oceanogr-, 12, 443-450 (1967).
FRANQUEVILLE, C. Macroplancton profond (Invertébrés) de la Méditerranée
nord-ocddentale! Thèse de Doctorat de Spécialité Marseille, 110 p.
(1970).
FUKAI, R., S. BALLESTRA and E. HOLM. Z 4 1 A B I in Mediterranean surface waters.
Nature, 264, 739-740 (1976).
FUKUDA, K. and S. TSUNOGAI. Pb-210 in precipitation in Japan and i ts
implication to the transport of continental aerosols across the
ocean. Tellus, 27, 514-521 (1975).
GANTHER, rl.E. Biochemistry of selenium. In "Selenium" R.C. ZINGAR0 and
U.C. COPPER, Eds., Van Nostrand Reinhold Co. N.Y. (1974).
GARETT, W.D. Collection of slick-forming materials from the sea surface.
Limnol. Oceanogr., 10, 602-605 (1965).
GOLDHABER, M.B. and I.R. KAPLAN. The sulfur cycle. In "The sea", vol. 5,
E.D. GOLDBERG Ed., J . -.Hey and sons, N.Y. (1974).
GREIG, R.A. Comparison of atomic absorption and neutron activation analyses
for the determination of si lver, chromium and zinc in various organisms.
Anal. Chem., 47, 1682-1684 (1975).
GUARY, J.C. , J.J.W. KIGGO, R.D.' CHERRY and M. HEYRAUO. High concentrations
of transuranics and naturi.1 radioactive element; in the branchial
hearts of the cephalopod Octopus vulgaris. Mar. Ecol. Prog. Ser., £ ,
123-126 (1981).
HALLDEN, N.A. and J.H. HARLEY. An improved alpha counting technique. Analyt.
Chem., 32, 1861-1863 (1960).
- 136 -
HAMILTON, E . I . Concentration and distribution of uranium in Mytilus edulis
and associated materials. Mar. Ecol. Prog. Sep., 2., 61-73 (1980).
HARVEY, G.M. and L.A. BURZELL. A simple microlayer method for small samples.
Limnol. Oceanogr., 17, 156-157 (1972).
HEYRAUD, M. Food ingestion and digestive t ransi t time in the euphauslid
Heganyctiphanes norvegica as a function of animal size. J . Plankton
Res., 1, 301-311 (1979).
HEYRAUO, M. and R.D. CHERRY. 2 1 0 P o and 2 1 0 P b 1n marine food chains. Mar.
B i o l . , 52, 227-Z36 (1979).
HEYRAUD, H-, S.W. FOWLER, T.H. BEASLEY and R.O'. CHERRY. Polonium-210 in
euphausiids : a detailed study. Mar. B i o l - , 34, 127-136 (1976).
HIGGO, J.J.W., R.O. CHERRY, M. HEYRAUD and S.W. FOWLER. Rapid reiroval of
plutonium from the oceanic surface layer by zooplankton faecal
pellets. Nature, 266, 623-624 (1977).
HIGGO, J.J.W., R.D. CHERRY, M. HEYRAUD, S.W. FOWLER and T.M. BEASLEY. The
vertical oceanic transport of alpha-radioactive nuclides by zooplankton
fecal pel lets. In "The natural Radiation Environment I I I " , Houston,
Vol .1 , 502-513, U.S. Department of Energy Conf-780422 ( I960).
HILL, C.R. Polonium-210 in man. Nature, 208, 423-428 (1965).
HODGE, V. , S.R. JOHNSON and E.D. GOLDBERG. Influence of atmospherically
transported aerosols on surface ocean water composition. Geochem. J . ,
12, 7-20 (1978).
HOFFMAN, F.L., Ï . F . HODGE and T.R. FOLSOM. Polonium radioactivity in certain
mid-water f ish of the eastern temporal Pacific.Health Phys., 26_,
65-70 (1974).
HOLTZMAN, R.B. Concentrations of the naturally occurring radionuclides
Ra, Pb, Po in aquatic fauna. In "Proc. 2nd nat. Symp.
Radioecology (Am. Arbor, 1967)" Rep. Conf-670503, 535-546 (1969).
HONJO, S. Sedimentation of materials in the Sargasso sea at a 5367 m deep
station. J . Bar. Ses., 36, 469-523 (1978).
KHARKAR, D.P., J . THOMSON and K.K. TUREKIAN. Uranium and thorium decay
series nuclides in plankton from the Caribbean. Limnol. Oceanogr., 21_,
294-299 (1976).

- 137 -
KNAUER, G.A., J.H. MARTIN and KM. BRULAND. Fluxes of particulate carbon,
nitrogen and phosphorus in the upper water column of the northeast
PacificDeep-Sea Res., 26, 97-108 (1979).
KRI5HNASHAMI, S. and D. LAL. Marine particles (to appear in "Ocean
Handbook", in press).
LACASSAGHE, A. , e t J .S. LATTES. Méthode auto-historadioagraphique pour
la détection dans les organes du polonium injecté. C-R. Acad. Sci.
Paris, J78, 488-490 (1924a).
LACASSAGNE, A. e t J.S. LATTES : C.R. Soc.Biol. , 90, 352 (1924b)
C.R. Soc.Biol., 90, 485 (1924c)
C.R. Soc.Biol., 90, 487 (1924d)
LAGARDERE, J.P. Recherches sur l'alimentation des crevettes da la pente
continentale marocaine. Tethys, 3_, 655-675 (1972).
LAGARDERE, J.P. Recherches sur l'alimentation des crevettes bathypëlagiques
du talus continental du golfe de Gascogne. Rev. Trav. Inst. Pêches
marit- , 39, 213-229 (1975).
LAMBERT, G. and M. NEZARI. Importance des retombées sèches dans le bilan
du plomb.210.Ann. Geophys. 2^, 245-251 (1965).
LAMBERT, G., A. BUISSON, J . SANAK and B. ARDOUIN. Modification of the
atmospheric polonium-210 to lead-210 rat io by volcanic emissions.
J . Geophys. Res., 84, 6980-6986 (1979).
LANTZY, R.J. and F.T. MACKENZIE. Atmospheric trace metils : global cycles
and assessment of man's impact. Geochim. cosmochim. Acta, 43_, 511-525
(1979).
LANZOU, E.E., M.E. ALLEGRIMI and D.M. TAYLOR. The binding of polonium-210
to rat tissues. Rad. Res., 56, 370-384 (1973).
LOWMAN, F.G., T.R. RICE and F.A. RICHARDS. Accumulation and redistribution
of radionuclides by marine organisms. In "Radioactivity in the marine
environment". National Academy of Sciences, Washington D.C. (1971).
MCCAVE, I .N. Vertical flux of particles in the ocean. Deep-Sea Res., 22,
491-502 (1975).
MACKENZIE, A.B. and R.D. SCOTT. Separation of bismuth-210 and nolonium-210
from aqueous solutions by spontaneous adsorption on copper fo i l s .
Analyst, 10*, 1151-1153 (1979).

- 138 -
MARSOEN, E. Radioactivity of same rocks, soi ls , plants and bones. In
"The natural radiation environment". University of Chicago Press,
807-8Z4 (1964) . .•
MARTIN, J.H. The possible transport of trace metals via moulted copepod
exoskeletons. Limnol. Oceanogr., 15, 756-761 (1970).
MARTIN, J.H. and A.R. FLEGAL. High copper concentrations in squid livers
in association with elevated levels of s i lver , cadmium and zinc.
Mar. B io l . , 30, 51-55 (1975).
MARTIN, J.H. and G. KNAUER. The elemental composition of plankton. Geochim.
cosmochim. Acta, 37, 1639-1653 (1973).
MARTIN, J-L.M. Iron metabolism 1n Cancer irroratus (Crustacean Decapoda)
during the intermalt cycle with special reference to iron in the g i l l s .
Comp. Biochem. Physiol., 46A, 123-129 (1973).
MARTIN, J-L.M. Le cuivre et le zinc chez Cancer irroratus (Say, 1817)
(Crustacé, Décapode) : métabolisme comparé au cours du cycle d' inter-
mue. Comp. Biochem. Physiol., 51A, 777-784 (1975).
MARTIN, J-L.M. Le métabolisme du manganèse chez Cancer irroratus (Say, 1817)
(Crustacé, Décapode). (1) Cahier de Biol- mar., XVII , 359-373 (1976).
MARTIN, J-L.M. Le métabolisme du magnésium chez Cancer irroratus (Say, 1817)
(Crustacé, Décapode). Ann. Inst, oceanogr. Paris, 53, 75-86 (1977).
MAUCHLINE, J . The biology of mysids and euphausiids. Adv. mar. B io l . , 1J3,
1-677 (1980).
MAUCHLINE, J . and L.R. FISHER. The biology of euphausiids. Adv. mar. B i o l . ,
7, 1-454 (1969).
METALLOTHIONEIN : Proceedings of the First International Meeting on metallo-
thionein and other low molecular weight metal-binding proteins.
Zurich, July 17-22, 1978. J.H.R. KAGI and M. NORDBERG Eds., BirkhaUser
Verlag Basel, Boston, Stuttgart (1979).
MILLARD, H.T., Jr . Quantitative radiochemical procedures for analysis of
polonium-210 and lead-210 in minerals. Analyt. Chem., 35_, 1017-1023
(1963).
M0R0Z, B.B. and Yu. 0. PARFEN0V. Metabolism and biological effects of
polonium-210. Atom. Energy Rev., Vienna, ^ 0 , 175-232 (1972).

- 139 -
HULLIN, J.B. and J.P. RILEY. The occurrence of cadmium in sea water and in marine organisms and sediments. J. mar. Res., 15, 103-122 (1956).
NEMOTO, T. Chlorophyll pigments in the stomach of euphausiids. J. oceanogr. Sqc. Japan, 24, Z53-260 (1968).
NIVAL, P., S. NIVAL et A. THIRIOT. Influence des conditions hivernales sur les productions phyto- et zooplanctoniques en Méditerranée nord-occidentale. V. Biomasse et production zooplanctonique - relations phyto-zooplancton. Mar. Biol., 31, 249-270 (197S).
NOEL-LAMBOT, F. Distribution of cadmium, zinc and copper in the mussel Hytilus edulis. Existence of cadmium-binding proteins similir to metallothioneins, Experientia, 3£, 324-326 (1976).
NOZAKI, Y. and S. TSUNOGAI. 2 2 6 Ra, 2 1 0 Pb and 2 1 0 P o disequilibria in the western north Pacific. Earth Planet.Sci. Lett. , 32, 313-321 (1976).
NOZAKI, Y., J. THOMSON and K.K. TUREKIAN. The distribution of 2 1 0 Pb and 210
Po in the surface waters of the Pacific ocean. Earth Planet. Sci. Lett., 32, 304-312 (1976).
OLAFSON, R.H. and J.A.J. THOMPSON. Isolation of heavy metal binding proteins from marine vertebrates, Mar. Biol., 28, 83-86 (1974).
OLAFSON, R.H., A. KEARNS and R.G. SIM. Heavy metal induction of metallo-thionein synthesis in the hepatopancreas of the crab Scylla serrata. Comp. Biochem. Physiol., 62B, 417-424 (1979b).
OLAFSON, R.W., R.G. SIM and K.G. BOTO. Isolation and chemical characterization of the heavy metal-binding protein metallothioneln from marine invertebrates. Comp. Biochem. Physiol., 62B, 407-416 (1979a).
OMORI, M. The biology of.pelagic shrimps in the ocean. Adv. mar. Biol., 12, 233-324 (1974).
OSTERBERG, C , A.G. CAREY Jr. and H. CURL Jr. Acceleration of sinking rates of radionuclides in the ocean. Nature, 200_, 1P76-1277 (1963).
0STER8ERG, C , L.F. SMALL and L. HUBBARD. Radioactivity in large marv.ie plankton as a function of surface area. Nature, litf, 883-884 (1963).
PAFFENHOFFLR, G.A. and R.P. HARRIS. Laboratory culture of marine holozoo-plankton and i t s contribution to studies of marine planktonic food webs. Adv. mar. Biol., .16, 211-308 (1979).
- 140 -
PARFENOV, Yu.D. Polonium-ZIO in the environment a-id in the human organism.
Atom. Energy Rev. Vienna, 12, 75-143 (1974).
PARSONS, T .F . , M. TAKAHASHI and B. HARGRAVE - Biological océanographie
proces:=s, 2nd Edition. Pergamon Press, Oxford (1977).
PEIRSON, D.H., R.S. CAMBRAY and G.S. SPICER. Lead-210 and polonium-210
in the atmosphere. Tellus, 18, 427-433 (1966).
PENTHREATH, R.J. , D.S. WOQDHEAD, B.R. HARVEY and R.D. IBBETT. A preliminary
assessment of some naturally-occurring radionuclides in marine orga
nisms (including deep sea fish) and the absorbed dose resulting from
them. In "Third OZCD/NEA Marine Radioecology Seminar" Tokyo (1979).
PONIKAROVA, T.M. and D.K. POPOV. Incorporation of poloni'im-210 and I ts
chemical analogues Into plant cystine- Radiobiologiya, 19_, 633-634
(1978).
PROSSER, C.L. and F.A. BROVM. Comparative animal physiology, 2nd Edition,
688 p. , W.B. Saunders Company, Philadelphia, London (1962).
Radioactivity in the Marine Environment, National Academy of Sciences (1971).
RAMA, M. KOIDE and E.D. GOLDBER. Lead-210 in natural waters. Science, 134,
98-99 (1961).
RYTHER, J.H. Photosynthesis and fish production In the sea. Science, 166,
72-76 (1969).
SASAKI, H. and S. NISHIZAWA. Vertical flux profiles of particulate material
1n the sea off Sanrlku. Mar. Ecol. Prog. Ser., 6_, 191-201 (1981).
SCHELL, W.R., T. JOKELA and R. EAGLE. Natural Z 1 0 P b and 2 1 D Po in a marine
environment. In "Radioactive contamination of the marine environment",
AIEA, Vienne, 701-724 (1973).
SCHRADER, H.J. Fecal pellets : role in sedimentation of pelagic diatoms.
Science, 174, 55-57 (1971).
SEGAR, D.A., J.D. COLLINS and J.P. RILEY. The distribution of the major and
some minor elements 1n marine animals. Part I I . Molluscs. J. mar. b io l .
Ass. U.K., £ 1 , 131-136 (1971).
SHANNON, L.V. Studies of alpha-radioactivity in the marine environment.Ph.D.Thesis
University of Cape Town (1970).

- H I -
SHANNON, L.V. and R.D. CHERRY. Polonium-210 in marine plankton. Nature, 216, 352-353 (1967).
SHANNON, L.V. and M.J. ORREN. A rapid method for the determination of polonium-210 and lead-210 in sea water. Anal. chin. Acta, 52, 166-169 (1970).
SHANNON, L.V., R.D. CHERRY and M.J. ORREN. Polonium-210 and lead-210 in the marine environment. Geochim. cosraochim. Acta, 3^, 701-711 (1970).
SHOLKOVITZ, E.R., E.A. BOYLE and N.B. PRICE. The removal of dissolved humic acids and iron during estuarine mixing. Earth Planet. Sci. Le t t . , 40, 130-136 (1978).
SKLQDOWSKA-CURIE, M. Rayons émis par les composés de l'urnanium et du thorium. C.R. Acad. Sci. Paris, 126, 1101-1103(1898).
SMALL, L.F. and S.W. FOWLER. Turnover and vertical transport of zinc by the euphausiid Meganyctiphanes norvegica in the Ligurian sea. Mar. B io l . , 18, 284-290 (1973).
SHALL, L.F., S.H. FOULER and S. KECKES. Flux of zinc through a macroplapk-tonic crustacean. In "Radioactive contamination of the marine environment", A . I .E .A. , Vienne, 437-452 (1973).
SMAYDA, T.J . Normal and accelerated sinking of phytoplankton in the sea. Marine Geol., 11 , 105-122 (1971).
SMITH, J.D. Tin in organisms and water in the gulf of Naples. Nature, 225, 103-104 (1970).
SPENCER, D.W., P.G. BREWER, A. FLEER, S. HONJO, S. KRISHNASWAMI and Y. N0ZAKI. Chemical fluxes from a sediment trap experiment in the deep Sargasso sea. J . mar. Res., 36_, 493-523 (1978).
STARESINIC, N., G.T. ROWE, D. SHAUGHNESSEY and A.J. WILLIAMS I I I . Measurement of the vert ical flux of particulate organic matter with a free-drift ing sediment trap. Limnol. Oceanogr., 23_, 559-563 (1978).
SZEKIELOA, K.H., S.L. KUPFERMAN, V. KLEMAS and D.F. POLIS. Element enrichment in organic films and foam associated with aquatic frontal systems. J . Seophys. Res., 77, 5278-5282 (1972).
TAL30T, V. and R.J. MAGEE. Naturally-occurring heavy metal binding proteins in invertebrates. Arch. Environm. Contain. Toxicol., _7, 73-81 (197B).
- 142 -
TANIGUCHI, A. Phytoplankton-zooplankton relationships in the western
Pacific ocean and adjacent seas. Mar. B i o l . , ZV, 115-121 (1973).
TAYLOR, S.R. Abundance of chemical elements in the continental crust :
a new table. Geochim cosmochim. Acta, 23, 1273-1285 (19B4).
THEIN, M. S. BALLESTRA, A. YAMATO and R. FUKAI. Delivery of transuranic
elements by rain to the Mediterranean sea. Geochim. cosmochint. Acta,
44, 1091-1098 (1980).
THOMSON, J . and K.K. TUREKIAN. 2 1 0 Po and Z 1 0 P b distributions in ocean
water profiles from the eastern south Pacif ic. Earth Planet. Sci.
Let t . , 32, 297-303 (1976).
TOPPING, G. Heavy metals in shellfish from.Scottish waters. Aquaculture,
1, 379-384 (1973).
TUREKIAN, K.K., O.P. KHARKAR and J . THOMSON. The fates of Z 1 0 Pb and Z 1 0 P o
in the ocean surface. J . Rech. atnras., 8_, 639-646 (1974).
TUREKIAN, K.K., Y. N0ZAKI and L.K. BENNINGFR. Geochemistry of atmospheric
radon and radon products. Am. Rev. Earth Planet, Sc i . , 5_, ?'?-255
(1977).
VAN WEEL, P.B. "Hepatopancreas " 7 Comp.Biochem. Physiol., 47A, 1-9 (1974).
VINOGRADOV, H.E. Vertical distribution of the oceanic zooplankton. Israel
program for scient i f ic translation, Jerusalem, 339 p. (1370).
VOHK, K.J. Digestion and metabolism. In "The physiology of Crustacea",
Vol. I , T.H. WATERMAN Ed., N.Y. Academic Press (1960).
VU DO, Q. Ecologie des crustacés micronectoniques dans l'écosystème super
f ic ie l du Bassin Liguro-Provençal : étude particulière das Décapodes
Natantia pélagiques. Thèse 3e Cycle, 140 p. Université Pierre et Marie
CURIE (Paris VI) (1978).
WALLACE, G.T., G.L. HOFFMAN and R.A. DUCE. The influence of organic matter
and atmospheric deposition on the particulate trace metal concentration
of northwest Atlantic surface seawater, Mar. Chem., 5_, 143-170 (1977).
WELLS, M.J. Octopus. Physiology and behaviour of an advanced invertebrate,
417 p. London : Chapman and Hall Ltd (1978).
WHITFIELD, M. The mean oceanic residence time (MORT) concept- a rat ional i
zation. Mar. Chem., 8_, 101-123 (1979).

- 143 -
HICKINS, J.F. Prawn biology and culture.Oceanogr. mar. b iu l . ann. Rev.,
14, 435-S07 (1976).
HIEBE, P.H., S.H. BQYO and C. WINSET. Particulate matter sinking to the
deep-sea floor a t 2000 m in the Tongue of the ocean, Bahamas, with
a description of a new sedimentation trap. J . mar. Res., 34 ,
341-354 (1976).
U000, J.M. Biological cycles for toxic elements in the environment, Science,
183, 1049-1052 (1974).
WDODHEAD, D.S. Levels of radioactivity in the marine environment and the
dose commitment to marine organisms. In "Radiovactive contamination
of the marine environment", p. 499-525, A . I .E .A . , Vienne (1973).
ZAITSEV, lu. P. Marine neustonology. Israël program for scientific trans
lations, Jerusalem, 207 p. (1971).
ZOILER, W.H., E.S. GLADNEY and R.A. DUCE. Atmospheric concentrations and
sources of trace metals at the South Pole, Science, 183_, 198-200 (1974).
ADDENDUM
CHERRY, R.D. and M. HEYRAUD. Evidence of high natural radiation dose
domains in raid-water oceanic organisms. Science (accepté pour publication
CIPR. Recommendations of the International Commission on Radiological
Protection. ICRP, Publication 10 (1968).
CRAIG, H., S. KRISHNASWAMI and B.L.K. SOHAYAJULU. 2 1 0 P b - 2 2 6 R a : radio
active disequilibrium in the deep sea. Earth Planet. Sci. Le t t . ,
17_, 295-305 (1973).
LACASSAGNE, A. et J , LATTES. Répartition du polonium (injecté sous la
peau) dans l'organisme de rats porteurs de greffes cancéreuses.
C. R. foc. B i o l . , SO, 352-353 (1924 b) .
LAC.ASSAGNE, A. et J . LATTES. Localisations histologiques spéciales du
polonium â l ' in tér ieur de certains organes. C.R. Soc. Biol . , 90_,
485-487 (1924 c ) .
LACASSAGNE, A. et J . LATTES. Localisation histologique du polonium â
l ' intér ieur des organes hemopoïétiques. C. F.. Soc. B io l . , 90,
4B7-489 (1924 d ) .

t 144
03URA, N. Molecular weight fracticnation of dissolved organic matter in coastal seawater by u l t raf i l t rat ion. Mar. B io l . , Z4, 305-31Z (1974).

t
ANNEXE

Menne Chemistry. 3(1975) 105-110 €) Elsevier Scientific Publishing Company. Amsterdam —Printed in The Netherlands
POLONIUM-210: ITS VERTICAL OCEANIC TRANSPORT BY ZOOPLANKTON METABOLIC ACTIVITY
K. D. CHERRY", S. W. FOWLER. T. M. BEA5LEY and M/HEYRAUD International Laboratory of Marine RadioaeHuity, IAEA. Music Octattojraphique, Principality of Monaco (Received October 18,1974;revision accepted January 21,1975)
ABSTRACT
Cherry, R. D., Fowler. S. W,, Beasley, T. M. and Heyraud. M-, 1975. Polonium.210: ils vertical oceanic transport by zooplankton metabolic activity. Mzr. Chem.. 3:105—11J.
An earlier work faued o n atmospheric input of ï , 0 P o io oceanic surface-waters, in situ production from its radioactive precursors and its measured equilibrium concentration has ihown thai l 0 ? o is removed from the upper mixed layer at a rapid rate, expressible by a turnover (or mean residence) time of 0.6 ycaxs. Since î , D P o is known to he highly concentrated in numerous marine species, a method was devised to assess the importance of ir.arine^zaoplanklon in removing this radio-nuctfde from the surface waters. Measure' ment* of * Po losses from living zooplanklon-ltiad to a rapid turnover time of the n*àet of 0.9 years due to zooplankton metabolic activity alone. It is shown experimentally that fical pellet deposition constitutes a major mechanism in transportinji the radionuclide from surface to deeper waters.
INTRODUCTION
The role of marine organisms in cycling trace elements in the sea has been investigated with increasing sophistication in recent years (Kuenzler, 1969; Lowman et al., 1971; Fowler et aL, 1973; Small and Fowler, 1973; Small et al., 1973). The need for detailed quantitative information concerning element transport in the marine biosphere has become apparent, and some progress has been made towards identifying the major transport routes of several trace elements. As might be expected, heavy metals and fission products have received particular attention in view of their status as pollutants. It seemed to us that the natuxaDy-Qccurring radionuclide s , ° P o deserved similar attention if only because of its clearly established importance as the major contributor to the radiation dose received by most marine organisms (Cherry and Shannon. 1974j.
* Permanent address: Physics Department, University of Cape Town, Rondcbosch. C. P., South Africa.

106
It has been sbowr that the removal rate of 1 , D P o from the upj sr mixed layer of the sea is rapid; a removal time of 0.6 years has been estimated (Shannon et al., 1970). The calculations which lead to this figure cf 0.6 years required only the equilibrium concentration o f 3 i e Pa in the mixed '.ayer and values for its input from the atmosphere and its in situ production from the decay of its radioactive precursors, the details jf the transport routes by which 2 1 0 Po is removed did not enter into the calculation. It is, however, w »ll-known that " ° Po is greatly enriched in marine organisms compared with seawater, concentration factors of 10 a or 10 ' being common (Cherry and Shannon, 1974). Simplistic reasoning alone suggests that biological removal might well be an important transport route f-om the upper mixed layer to deeper waters. We shall present d i ' a on 3 I D P o in a representative zooplanktonic species, the euphausiid Meganyctiphanes naruegica. which relate to this problem. Species similar to M. norvégien are widely distributed in the oceans, are significant in the overall marine biomass and form an important link in the pelagic food chain on an ocean-wide basis. Furthermore, previous publications (Fowler et al. t 1971a; Small et al., 1973) have provided the quantitative biological data which are needed before a particular zooplanktonic species can be used in a study such as the present one.
MODEL
Our geneial approach follows the model used by Small et al. (1973) and Small and Fowler (1973). In these papers the aim was to examine in detail the role of one significant zooplankton species, viz. the euphausiid M, norvégien, in the cycling, turnover and vertical transport of one biologically significant trace element, viz. zinc, in the ocean. They introduced the term "physiological flux", which referred to the flow of zinc through the living euphau-siids from the moment of uptake of the element to the moment af release of the element, and they calculated the physiological elimination rate, X E , of zinc from the animals. They pointed out thai .elease of an element from the living animal can be either particulate (feces, molts and eggs) or non-particu-late (inorganic ions and dissolved excretion products); \ E is simply the sum of the elimination rates from these different routes. We shall apply the same approach to the isotope " ° P o , We modify the notation of Small et al. (1973) slightly and express \ E thus:
>-E = Qi*t + QmPm + QxPx + QaPe (1) The Q values, Qr, Qm and Qx ore the 3 1 0 P o concentrations in released fecal pellets, molts and eggs respectively, and Q a is the concentration of the isotope in the who'e animal. The terms Pt, P m arid px represent the corresponding production rates of feces, molts and eggs; pe is the rate constant for excretion of dissolved , 1 0 P o from whole euphausiids. To minimize the effect of animal size differences, XE is expressed as a weight-specific rate. It should be noted that, our XE is an elimination rate for living animals only; if XE is required in

a population sense, a term allowing for 3 " P o loss due to mortality, or "carcass production", must be sdoed to the right hand side of eq. l .
MEASUREMENTS AND RESULTS
We have measured " ° Po at naturally occurring levels in specimens of M. norvégien as well as in the particulate products -which they release. Live euphausiids were collected between September 1973 and January 1974 off the Mediterranean coast between Monaco and Nice, France, and their particulate products retrieved in the laboratory by methods described previously (Fowler et al-, 1971b; Fowler and Small, 1972). Our a , ° Po separation pro* cedures were straightforward and uncomplicated (Millard, 1963); radioisotope measurements were made by total alpha counting using scintillation phosphors (Hallden and Harley, 1960). We found Q m , Qx and Q3 to be low at 0.80 ± 0.18,1.8 i 0.9 and 2.4 ± 0-2 dpm/g dry weight, respectively. The Qx value was based on a single collection; the Qm and Qz values are the means of determinations made on tw« separate collections. The errors quoted are experimental errors at the 2o level, and include the propagation of errors due to calibration, counting efficiency and background blanks as well as the statistical counting error of the sample itself. The natural spread between the two separate Qm values was small in comparison with the quoted error, while that between the two separate Q, values was approximately the same as the quoted error. We found Qi to be high at 38.9 z 20.4 dpm/g dry feces. This result is the mean of determinations made en three separate collections of natural fecal material. The error of this mean is also at the 2o level, but in this case has been calculated from the spread between the three values obtained; the experimental error is negligible in comparison with the natural spread.
For the production rates of particulate products, we used certain values previously obtained by Small et al. (1973} for AU naruegica in the Mediterranean, viz. pf * 0.038 g dry feces/g dry animal per day, p m = 0.009 g dry m ilt/g dry animal per day and a revised value of p x = 0.002 g dry eggs/gdry animal per day (during the et ..laying period only). To estimate the p e term we performed an experiment «idïlar to that described by Small et al. (1973) in which euphausiids, well-labelled with 3 I 0 P o at levels more than 100 times those found in natural samples, were allowed to excrete the isotope into clean seawater for several weeks. From 3 1 0 P o measurements periodically made on groups of two to four individuals, we found that soluble " ° P o excretion was best described by a single exponential with a rate constant of approximately 0.1 per day. The error on this value is difficult to estimate exactly, but it is less than 0.04 at the 2o level.
DISCUSSION AND CONCLUSION*
Substitution of the data from the two preceding paragraphs into eq.l
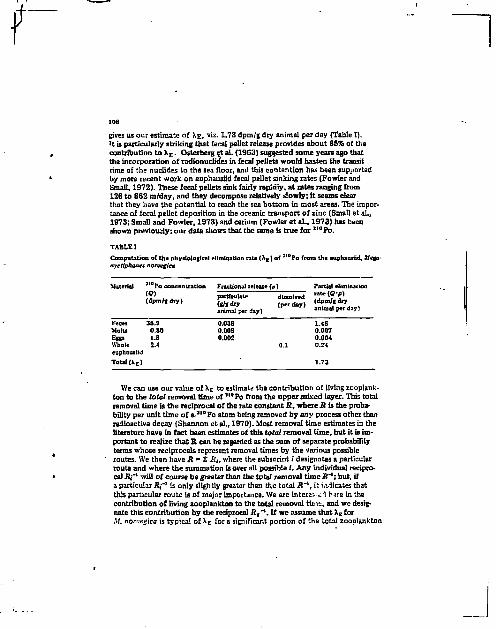
gives us our estimate of XE, viz. 1.73 dpm/g dry animal per day (Table I). It is particularly striking that fecal pellet release provides about 85% of the contribution to 1 E . Ostexberg et ai. (1963) suggested some years ago that the incorporation of radionuclides in fecal pellets would hasten the transit urne of the nuclides to the sea floor, and this contention has been supported by more recent work on euphausiid fecal pellet sinking rates (Fowler and Small, 1972). These fecal pellets sink fairly rspidiy, at rates ranging from 126 to 862 m/day, and they decompose relatively slowly; It seems clear that they have the potential to reach the sea bottom in most areas. The importance of fecal pellet deposition in the oceanic transport of zinc (Small et al., 1973; Small and Fowler, 1973) and cerium (Fowler et aL, 1973) has been shown previously; our data shows that the same is true for 3 t o F o .
Computation of the physiological elimination rate (A E ) of "' Pa from the euphausiid, Afega-nyctiphanes norvégien
Po concentration Fractional release (?) Partial elimination
! ? ' , .. , i-rttaht. dteol«d ™ t" (?"5 )
(dpm/Jdry) , , j (dp»/, dor l* ' ' anima! per dayl animal per day)
Feces 38.9 Molts 0.30 Eggs 1.8 Whole 2.4 euphausiid Total <AE)
0.038 1-48 0.007 0.004 0.24
We can use our value of \ E to estimate the contribution of living zooplankton to the total removal time of 3 l ° Po from the upper mixed layer. This total removal time Is the reciprocal of the rate constant i£, where R is the probability per unit time of a - , | 0 Po atom being removed by any process other than radioactive decay (Shannon et al., 1970). Most removal time estimates in the literature have in fact been estimates of this total removal time, but it is important to realize that R can be regarded as the sum of separate probability terms whose reciprocals represent removal times by the various possible routes. We then have R ~ S R(, where the subscript i designates a particular route and where the summation is over all possible i. Any individual reciprocal Rfl will of course be greater than the total removal time R~* ; but, if a particular J?/'1 is only slightly greater than the total R ~\ it iivlicates that this particular route is of major importance. We are uitere=-<- \ h ?re in the contribution of living zooplankton to the total removal tira:, and we designate this contribution by the reciprocal Uj" 1 . If we assume that XE for M. noruegica is typical of XE for a significant portion of the total zaoplankton

hiomass, we can use our value of XE to calculate Rz~l- The calculation is straightforward and we use the equation (Small and Fowler, 1973}: R>* " i f e ' , 2> C is the concentration of 3 1 0 P o in the upper mixed layer and W is the zooplankton biomass in the same volume. For C we shall use a typical oceanic value of 55 • 10" 3 dpm/1 (Cherry and Shannon, 1974), although we draw attention to the fact that the 3 1 0 P o concentration in seawater can vary regionally (Shannon et al., 1970). The - alue of W is more difficult to establish. Parsons (1972) discussed this controversial issue, and suggested that a figure of 0.15 g dry mass/m 3 could be regarded as an "average" zooplankton concentration. He pointed out that this figure was 15 times higher than the value used earlier by Jackson (1954), but presented convincing evidence in favour of the higher \*alue. We shall arbitrarily choose W to be 0.10 g dry mass/m3. Insertion of our XE value in eq.2 then gives the removal time due to zooplankton metabolic activity alone equal to 0.9 years. This is to be compared with 0.6 years, the estimate quoted earlier (Shannon et al., 1970) for the total removal time which takes all removal processes into consideration.
The implication that zooplankton metabolic activity — and fecal pellet removal in particular — plays an important role in the removal of 3 , 0 P o from the surface layers of the sea is clear. We realize that our estimate of 0.9 years will have to be raised if the value we have used for IV is too high; moreover, it will have to be raised still further if loss of Î I Q Po from fecal pellets prior to their leaving the upper mixed layer is appreciable. On the other hand, we have not considered A E on a population basis, and inclusion of a carcass production term to allow for removal by dead zooplankton would give a "total zooplankton removal time" lower than that due to zooplankton metabolic activity alone.
We have not considered here the route by which "°Po enters zooplankton. The similarity between the a u T o removal time and the recent estimate (Broecker et al., 1973) of 0.7 years for the thorium removal time suggests that 2 1 ° Po might be one of the "highly reactive substances" referred to by Broecker et al. (1973) and that marine plant matter might be implicated.
ACKNOWLEDGEMENTS
The Laboratory of Marine Radioactivity operates under a tripartite agreement between the International Atomic Energy Agency, the Government of the Principality of Monaco and the Océanographie Institute of Monaco. Support for the present work is gratefully acknowledged. One of us (A.D.C.) acknowledges support from the University of Cape Town and from the South African National Council for Océanographie Research. We thank Drs. I. Ophel, R. Fukai and E. K. Duursma for critical comments. Special thanks are also due to the Station Zoologique de Villefranche, France, for furnishing us the necessary ship tiir».

110
REFERENCES
Braecker, W. S„ Kaufman. A. and Trier, R. M., 1973. The residence time of thorium in nirface aeawaler and its implications regarding the rate of reactive pollutants. Earth Planet. Sri. Lett., 2 0 : 35—44.
Cherry, R. D. and Shannon, L. V., 1974. The alpha radioactivity of marine organisms. At. Energy Rev„ 12:1—45.
Fowler. S. W. and Small, L- F. , 1972. Sinking rales of euphausiid fecal pellets. Lhnnol. Oceanogr., 17: 293—295.
Fowler, S. W., Benayoun, G. and Small, L. F-. 1971a. Experimental studies on feeding, growth and assimilation in a Mediterranean euphausiid. Tholassia JugosL, 7 : 35—47.
Fowler, S. W., Small, L. F . and Keckes, S., 1971b. Effects of temperature and size on molting of euphausiid crustaceans. Mar. Biol., 11 : 45—51.
Fowler, S. W., Keyraud, M., Small. L. F. and Benayoun, G., 1973. Flux of 1 4 > Ce through a euphausiid crustacean. Mar. BioL. 2 1 : 317—325.
Hallden, N. A. and Harley, J . H., I960. An improved alpha counting technique. Anal. Chem., 32:1861—1863.
Jackson, P., 1954. Engineering and economic aspects of marine plankton harvesting. J. Cons„ 20:167—174.
Kucnzler, D. J., 1969. Elimination and transport of cobalt by marine zooplanklon. In: D. J. Nelson and F . C. Eveils (Editors}, Symposium on Radinecology (USAEC, Oak Ridge), pp. 483—492.
Lowman. F . G„ Rice, T. R. and Richards, F. A., 1971. Accumulation and redistribution of radionuclides by marine organisms. In: Radioactivity in the Marine Environment. National Academy of Sciences, Washington, D. C , pp. 161—199.
Millard Jr., H. T„ 1963. Quantitative radiochemical procedures for analysis of poloniutn-210 and Iead-212 in minerals. Anal. Chero.. 35:1017—1023.
Osterberg, C , Carey Jr., A. G. and Curl Jr., H., 1963. Acceleration of sinking rates of radionuclides in the ocean. Nature, 20D: 1276—1277.
Parsons, T. JL, 1972. Plankton as a food source. Underwater J., 4 : 30—37. Shannon, L. V., Cherry, R- D., and Orren, M. J., 1970. Polonium-210 and lead-210
in the marine environment. Geochlm. Cosmochim. Acta, 34: 701—711. Small, L. F . and Fowler, S. W., 1973. Turnover and vertical transport of zinc by the
euphausiid Meganyctiphanea norvégien in the Lïgurïan Sea. Mar. BioL, I S : 284—290. Small, L. F. , Fowler, S. W. and Keckes, S., 1973. Flux of zinc through a macroplanktonic
crustacean. In: Radioactive Contamination of the Marine Environment. IAEA, Vienna, pp. 4 3 7 - 4 5 2 .
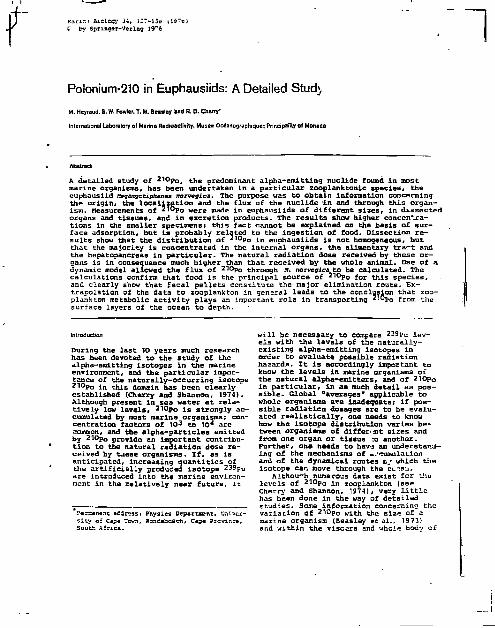
ï by Sçrinçar-Verlâg I9~é
Polonîum-210 in Euphausiids: A Detailed Stud}
M. Heyraud. S. W. Fowler, T. M. Qeasley and R 0 . Chery*
International Laboratory of Marine Radioactivity, Musée Océanographique: Prîncipafily of Monaco
Abstract
A detailed study of 2 1 0 P o , the predominant alpha-emitting nuclide found in most marine organisms, has been undertaken in a part icular zooplanktonic species* the euphausiid Hegant/czxphanes norvégien. The purpose was to obtain information concerning the origin, the localization and the flux of the nuclide in and through this organism. Measurements of 210po were made in euphausiids of different sizes, in dissected organs and tissues, and in excretion products. The resul t s show higher concen\ra-tions in the smaller specimens} this fact cannot be explained on the basis of surface adsorption, but i s probably related to the ingestion of food. Dissection r e sul t s show that the d is t r ibut ion of 2 , 0 P O in euphausiids i s not homogeneous, but that the majority is concentrated in the internal organs, the alimentary t r a r t and the hepatopancreas in pa r t i cu la r . The natural radiation dose received by these organs i s in consequence much higher than that received by the whole animal. Use of a dynamic model allowed the flux of 2 1 0 P o through M. norvegica to be calculated. The calculations confirm that food i s the principal source of 210po f o r this species, and clearly show that fecal pel lets constitute the major elimination route. Extrapolation of the data to zooplanJcton in general leads to the conclusion that zoo-plankton metabolic act ivi ty plays an important role in transporting 210po from the surface layers of the ocean to depth.
Introduction
During the last 10 years much research has been devoted to the study of the alpha-emit ting isotopes in the marine environment, and the par t icular importance of the naturally-occurring isotope 2 1 0 P o in this domain has been clearly established (Cherry and Shannon, 1974). Although present in sea water a t re latively low levels, 210po i s strongly accumulated by most marine organisms; concentration factors of 1C«3 to 104 are common, and the alpha-par t i d e s emitted by 210po provide an Important contribution to the natural radiation dose received by t.tese organisms. If, as is anticipated, increasing quanti t ies of the ar t i f ic ia l ly produced isotope 2 39pu are introduced into the marine environment in the relatively near future, i t
?er=an«nt address: Physics Department, Univers i t y a ï Cape Town, Bcncebosch, Cape Province, Soutiï Afr ica .
will be necessary to compare 239pu levels with the levels of the naturally-existing alpha-emitting isotopes in order to evaluate possible radiation hazards. I t i s accordingly important to know the levels in marine organisms of the natural alpha-emitters, and of 2i0p o
in par t icular , in as much detai l as poss ib le . Global "averages" applicable to whole organisms are inadequate; if possible radiation dosages are to be evaluated r e a l i s t i c a l l y , one needs to know how the isotope distribution varies between organisms of different sizes and from one organ or tissue :o another. Further, one needs to hav-a an understanding of the mechanisms of accumulation and of the dynamical routes &„' which the isotope can move through the oc^a'-i.
Althou-h numerous data exist for the levels of 210p0 £ n zooplankton (see Cherry and Shannon, 1974), very l i t t l e has been done in the way of detailed studies. Some information concerning the variation of 2 1 0 P o with the size of a marine organism (Beasley et ai., 1973) and within the viscera and whole body of
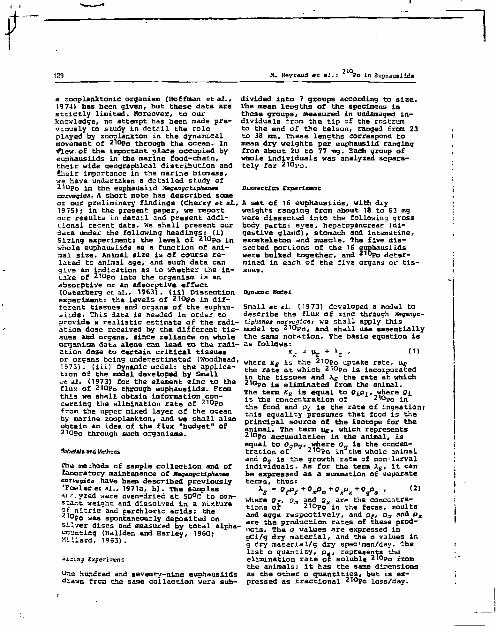
a zooplanktonic organism (Hoffman et al.t
1974) has been given, but these data are strictly limited. Moreover, to our knowledge, no attempt has been made previously to study in detail the role played by zooo lank ton in the dynamical movement of 2l0po through the ocean. In ifiew- of the important place occupied by euphausiids in the marine food-chain, their wide geographical distribution and (heir importance in the marine biomass, we have undertaken a detailed study of 210po in the euphausiid Meganyctiahanea narvagiea. A short note has described some of our preliminary findings (Cherry et ai., 1975); in the present paper, we report our results in detail and present additional recent data. We shall present our data under the following headings: (i) Sizing experiment: the level of Z10po £ n
whole euphausiids as a function of animal size. Animal size is of course related to animal age, and such data can give an indication as to whether the intake of 210po into the organism is an absorptive or an adsorptive effect (Osterberg ee al., 1963). (ii) Dissection experiment: the levels of 210po in different tissues an-3 organs of the euphiu-siids. This data is needed in order to provide a realistic estimate of the radiation dose received hy the different tissues and organs, since reliance on whole organism data alone can lead to the radiation dose to certain critical tissues or organs being underestimated (Waadhead, 1973). (iii) Dynamic model: the application of the model developed by Small st al. (1973) for the element zinc to the flux of 210p0 through euphausiids. From this we shall obtain information concerning the elimination rate of 210po from the upper mixed layer of the ocean by marine zooplankton, and we shall also obtain an idea of the flux "budget" of 2l0po through such organisms.
ttaterials and Methods
The methods of sample c o l l e c t i o n and of ï aoo ra ro ry maintenance of Xeganyctiphanes norvégien have been d e s c r i b e d p r e v i o u s l y 'Fowler et al., 1971a, b) . The samples ai f-. yzed were oven-dried a t SO°C t o cons t a n t weight and d i s s o l v e d i n a mixture of n i t r i c and p e r c h l o r i c a c i d s ; t h e ' d 1 0 P o was spontaneously d e p o s i t e d on s i l v e r d i s c s and measured by t o t a l alpha-ccun t ing (Haliden and Har l ey , 1960; M i l l a r d , 1963) .
î i i i . i j Txfori^en-
°".e hundred and seven ty -n ine euphaus i i d s drawn frcn t he same c o l l e c t i o n were sub
d i v i d e d i n t o 7 groups according to s i z e . The mean l e n g t h s of t he specimens i n t h e s e g r o u p s , measured i n undamaged i n d i v i d u a l s from t h e t i p of the rostrum to t he end of t h e t e l s an, ranged from 23 t o 38 mm. These l e n g t h s correspond t o mean d ry w e i g h t s pe r euphausl id rang ing from abou t 20 t o 77 mg. Zach group of whole i n d i v i d u a l s was analyzed s e p a r a t e l y for 2 1 ° P O .
Dissseticn Experiment
A s e t of 16 e u p h a u s i i d s , wi th dry weight's r a n g i n g from about 18 to 63 mg were d i s s e c t e d i n t o the following gross body p a r t s : e y e s , hepatopancreas {d i g e s t i v e g l a n d ) , stomach and i n t e n s t i n e , exoske le ton and musc l e . The f ive d i s s e c t e d p o r t i o n s of t he 16 euuhausi ids were bu lked t o g e t h e r , and 210p o d e t e r mined i n each of t h e f ive organs o r t i s s u e s .
Dynamic Model
Small e t al. [1973) developed a model to d e s c r i b e the f lux of zinc through xaganyc-tiphanes norvegica; we s h a l l apply t h i s model t o 2 1 ° P o , and s h a l l use e s s e n t i a l l y t h e same n a t a t i o n . The b a s i c equa t ion i s a s f o l l o w s :
where Ks i s t h e 2 l 0 p Q uptake r a t e , u$ the r a t e a t which 210p Q i s incorpora ted in the t i s s u e s and \ E t he r a t e a t which 2 i 0 p o i s e l i m i n a t e d from the animal . The terra KE i s e q u a l t o Q\pi, where o^ i s the c o n c e n t r a t i o n of 2 1 0 P O i n the food and p_£ i s the r a t e of i n g e s t i o n ; t h i s e q u a l i t y presumes t h a t food i s t he p r i n c i p a l s o u r c e of t h e i so tope for t he animal . The term \ig, which r e p r e s e n t s 210p 0 accumula t ion i n t he animal, i s equa l t o Ogpgt where og i s the concent r a t i o n of 2 1 0 P o i n t h e whole animal and Pg i s t he growth r a t e of n o n - l a r v a l i n d i v i d u a l s . As f o r t he term \ s , i t can be expressed a s a summation o f " s e p a r a t e t e rms , t h u s :
where Of, Qm and o x a r e the concen t ra t i o n s of 210po i n the feces , moults and eggs r e s p e c t i v e l y , and p ; , pa and p x
a r e t h e p r o d u c t i o n r a t e s of these p rodu c t s . The Q v a l u e s a r e expressed in pCi/g d ry m a t e r i a l , and the o values i n g dry m a t e r i a l / g dry spec*men/day. Che l a s t o q u a n t i t y , p t f , r ep re sen t s the e l i m i n a t i o n r a t a of s o l u b l e 2 , 0 ? o from the an ima l s ; i t has the saxe dimensions as t he o t h e r o q u a n t i t i e s , bu t i s expres sed a s f r a c t i o n a l 2 1 0 P o l o s s / d a y .

Hetfraui *: di. :
Table 1. œganycsiphanes norvegica. Concentra-ticr. of - ï o Po in euphausiids of different sizes. Experimental errors are given at the Xc level
Nusaer of Length Mean dry weight/ pCi/g dry specimens (nm) specimen (mg) a material
under natural conditions. In the l a t t e r exercise, the ful l stomachs were removed immediately after collection, and the stomach contents carefully taken by cutting the stomach wall*.
16.7 0.42 i 0.04 67.2 O.S8 ± 0.06 56.8 0.56 * 0.04 «B.S 0.92 i 0.07 30.1 o,7S ± 0.06 24.8 0.98 • O.OB 19.6 1.12 Î 0.07
Conversion factor to we- weight for whole individual = 4.74
Fecal pellets , moults and eggs released by Hegangcaiphanes norvégien specimens in the laboratory were collected and the 210pa concentrations Ofi Qm and Ox were determined. Qg is already known, as a function of animal s i z e , from the sizing experiment; Pf, p m and px are already known from the laboratory experiments of Fowler et al. (1971a) and Small et al. (1973) cr ». norvegica. To estimate p B , the rate of elimination of soluble 210?o, about 30 H. norvegica (dry weights from 16 to 29 mg) were placed individually in 750-ml bot t les containing sea water labelled with 210p 0 . t n e euphausiids were then fed with Arzemia salins which had been labelled previously in an identical solution of Z 1 0 p o . The uptake phase of 210po into the H. norvegica, via the dual food-water routes , was continued for 10 days. During th i s t ine groups of two or three euphausiids were sacrificed periodically and their 210po
contents measured. At the end of uptake the surviving specimens were transferred to bottles containing unlabelled sea water. This sea water was changed daily, and the euphausiids were fed daily on unlabelled A. salina. At intervals ranging from 2 to 7 days, groups of 2 to 4 ..ndi-viduals were sacrificed and thei r 2 1 0 p o contents measured. During both the uptake and elimination stages the temperature of the sea water was maintained constant at 13°C.
To determine u £ and KB, the quantit ies Dg. p j , Qg and Q± are needed. o is already known, as are p± and p„ (Mauch-line and Fisher, 1969; Smalleci i . , 1973). f?i, the concentration of 210 P o ^ n t ^ e
food eaten by Ksganycziphanes nazvegica, remains unknown. An estimate of o^ was made by determining 210p o ±n various samples of microplankton collected at the sa^e time as the ft. norvegica samples, and, further, by analyzing the stomach contents of it. norvegica specimens taken
Sizing Experxasnt
The concentrations of 2""0po found in the whole specimens of Jfeganyceinhanes norvegïca separated into different groups according to s ize are given in Table 1. If these data are plotted on log-log paper an approximately linear relationship i s seen to ex is t between the 210po concentrat ion per unit dry weight and the to t a l dry weight of the euphausiid. The concentration decreases from 1.12 i 0*07 pCi/g dry material to 0-42 ± 0.04 pCi/g dry material as the mean dry weight in creases from 19.6 to 76.7 mg; the calculated slope of the regression l ine i s -0.59 ± 0.15. The errors quoted for th i s data, as-for a l l similar data in th i s paper unless otherwise stated, are experimental errors at the lo level, and include the propagation of errors due to calibration, counting efficiency and background blanks as well as the s t a t i s t i c a l counting error of the sample i t self.
Dissection -Experiment
The dis t r ibut ion of 210po i n t h e different organs and tissues was found to be far from homogeneous, as can be seen from the data given in Tabla 2. The muscular mass, the eyes and the exoskeleton a l l contain 1 pCi/g dry material or l e s s , whereas the alimentary t rac t contains 9.9 i 1-1 pCi/g dry weight and the hepa-topancreas 23.6 ± 1 . 8 pCi/g dry material. Clearly, most of the 2l0po is concentrated in the internal organs, and in the hepatopancreas in par t icular . This organ, even though i t represents only about 2% of the total wet weight of the whole euphausiid, contains more than half of the 210po activity of the animal.
Dynamic «Gael
We need to find the three quantities Xf, U£ and K£ in Eq, (1), and we s t a r t with \B-
To calculate k£, we need the par t ia l fluxes, 0ot as given on the right-hand side of 5q. (2); a l l the data which allow us to calculate the flo values under different conditions of feeding

H. Heyraud c e al.: Po in Euphausiids
T a i l s 2, MsganycziphAnss norveçica. C o n c e n t r a t i o n of Exper imenta l e r r o r s a r e given a t t h e Lo l e v e l
Pa in v a r i o u s t i s s u e s and o rgans .
a d organs pCi/g dry n a t e r i a i
Watt dry pCi/kg we igh t wet r a t i o weight.
\ t o t a l C o n t r i b u t i o n t o * of t o t a l wet t o t a l a c t i v l ty of a c t i v i t y weight* euphaus i i d
(pCi/Jeg v e t weight)
0 . 9 8 24 t 3 8.3 2 .08 5 ± 2 1.7 2 .24 151 £ 12 52 .1
4 3 - O 22 ± 2 7.6 35 . S B7 * 6 30.1
A l i s a a t a r y t r a c t Eyes Hepacapancreas Muscle Sxoskeisi tan
9 .9 + 1.1 4 . 0 8 O.B ± 0 . 3 3 .73
23.& ± 1.8 3 .51 0.24± 0 .02 4 . 7 4 1.04+ 0 .07 4 .25
2426 ± 267 214 ± BO 6724 t 513 51 t 4 245 ± 16
Tr.a va lue s in t h i s colusn da n o t add up t o 100% b u t t o 8 3 . 8 1 , t h e d e f i c i e n c y of 16.2% rep re sen t s i n t e r s t i t i a l f l u i d l e s t d u r i n g t h e d i a a e e t i c n p r o c e s s .
Table 3 . yjàgznyctiphûnas norvégien. P a r t i a l f l u x e s , Oo, of 210po under v a r y i n g condi t ions of feeding and growth. E r r o r s , which a r e a t the la l e v e l , a r e d i s c u s s e d i n t e x t
L i n s Euznausi id d ry weight lag)
2I0p„ c o n c e n t r a t i o n
Iff) (pCi/g dry mate r i a l )
F r a c t i o n a l races P a r t i c u l a t e (9 dry m a t e r i a l / 9 d ry s ç e c i a e n / day)
( 0 ) Dissolved [ f r a c t i o n / day)
P a r t i a l £ luxa s (Op (pCi /g d r / s c e c i o e a / day)
Condi t ions
1 20 - So ° f - 17.S * 4 . 6 p , = 0 . 0 5 1 * 0 . 3 9 3 >3 ag d ry food; 12 h/day graz ing
Z 20 - So O f " 17.5 * 4 . 6 p . = 0-O3B S
f 2 0 .665 2 eg dry feed;
12 h/day graz ing
3 20 - 5a O f - 17.S • 4 . 6 0 , . 0 . 0 1 8 * Q.315 1 on d ry foodj 12 h/day graz ing
4 1 0 - 5 0 "»' 0.36± 0 .04 p = 0 . 0 0 9 3 O.0O3 -5 25 - Eo ».- O.B 1 0 . 4 P x = 0 .O02 b O.O02 During egg- lay ing
pe r iod
6 lfi - 29 °3-1.1 ± 0 . 1 p e = 0 . 1 2 3 0.13S -
7 5 - 2 5 °g - 1.1 ± 0 . 1 p = 0 . 0 6 0 C 0 .066 Maximum g rewth - r a t e
t 5 - 2 5 °g - 1.1 » 0 . 1 p = 0 . 0 3 0 3
»2 p = 0 . 0 t 5 a C
' 3
0 .033 Highest grawch-ra te
9 5 - 2 5 o*- i . i i o . i
p = 0 . 0 3 0 3
»2 p = 0 . 0 t 5 a C
' 3
0 . 017 Kean grevth—rate
10 5 - 2 5 °9- 1.1 • O. I p = 0 . 0 0 7 a
»4 O.OOB Hiniaum growth-race
a l l e t al. (1973J.
i ta f = 3 5 = a l l e t al. (1973) r e v i s e d , u s i n g new v a l u .*. .lorveç'ica eggs .
d ry we igh t :we t weight r a t i o f a r
(19591.

H
i ^ s *
TIME (Deys)
Pig . 1. Heganycziphanes aorvegica. Excret ion of s o l u b l e 2!Dp 0 . Bars r e p r e s e n t e x p e r i o e n t a l e r r o r s a t che l a l e v e l
Tafcie 4. xsganyctiphanes noxvagica. z ' ° P o conc e n t r a t i o n s in food, stomach c o n t e n t s , and stoma c h s . Expérimental e r n . r s a r e g iven a t the I s l e v e l
Date and Saisie p C i / a dry s i t e of ue ighc c o l l e c t i o n
28.111.1974; Sccaachs ana c o n t e n t s IS .7 Î 0 . B S km frem Micraplankum S.9 • 0 . 2
Mica Calanus helgolandicus 3.7 ± a.5 Mixed copepods ( l e s s
C. heXgolandicos) . S.4 + 0 . 8
Crustacean l a r v a e 6.B i 1.0 o s t r a c o d s 5 .0 i 1.4 Chaecognaths 16.4 t 2 . 3
31.V.1974; E=acied s t c o a e h s 4 .7 i 1.6 90 k s f ree Stooach c o n t e n t s 20.0 i 2 .7
Mcr.aco Microplankton 12.1 Î O.B
31.V.1974; Emptied s t o o a e h s 3.2 ± 0 .9 60 ka from Stonaeh c o n t a n t s 21.1 • 3.2
Monaco Microplankton 5.B * 0 .4
6.VI.1974; Enpt ied s tomachs 3.2 i 0 . 5 40 Jua fron Stomach concen t s M . 6 t 1.9
hanaco MicrcalankeoR 9.4 t 0 .4
4 . I I I . 1 9 7 5 t Stomach c o n t e n t s 19.2 J D.79 5 ka £rca Hicroolankean 4.4 + 0 . 1 3
Nice
Hear. v a l M s t s a a c h c o s t e s t a 20.2 t 0 .4 Hicrcplankton 7 . 5 ± 1.4
a n d g r o w t h a r e g i v e n i n T a o l e 3 . Qm a n d Qx, t h e 2 1 0 p o c o n c e n t r a t i o n s i n m o u l t s a n d e g g s , w e r e f o u n d t o b e low a t 0 . 3 6 ± 0 . 0 4 a n d 0 . 8 ± 0 . 4 p C i / q d r y m a t e r i a l , r e s p e c t i v e l y ; Qf, t h e 2 l 0 p a c o n c e n t r a t i o n i n f e c e s , w a s f o u n d t o b e h i g h a t 1 7 . 5 i 4 . 6 p C i / g d r y m a t e r i a l . T h e e r r o r s q u o t e d f o r t h e s e t h r e e v a l u e s n e e d some d i s c u s s i o n . T h e y a r e a g a i n a t t h e l a l e v e l * a n d i n t h e c a s e o f t h e e g g s , w h e r e o n l y o n e s a m p l e w a s a n a l y z e d , t h e e r r o r i s s i m p l y t h e e x p e r i m e n t a l c o u n t i n g e r r o r a s p r e v i o u s l y d i s c u s s e d . F o r t h e m o u l t s , w h e r e t w o s a m p l e s w e r e a n a l y z e d , t h e s a m e a p p l i e s , s i n c e t h e s p r e a d b e t w e e n t h e t w o v a l u e s o b t a i n e d was s m a l l i n c o m p a r i s o n w i t h t h e e x p e r i m e n t a l e r r o r . F o r t h e f e c a l p e l l e t s , h o w e v e r * t h e e x p e r i m e n t a l c o u n t i n g e r r o r w a s n e g l i g i b l e c o m p a r e d w i t h t h e n a t u r a l s p r e a d b e t w e e n t h e t h r e e s a m p l e s a n a l y z e d ; a c c o r d i n g l y , t h f e r r o r q u o t e d i n Of i s t h e s t a n d a r d e r r o r o f t h e m e a n c a l c u l a t e d f r o m t h e s p r e a a b e t w e e n t h e t h r e e v a l u e s o b t a i n e d . F o r 2 1 0 p o c o n c e n t r a t i o n i n t h e w h o l e a n i m a l , p _ , w e h a v e c h o s e n a v a l u e o f J . I i ' 0 - 1 pCi/g d r y m a t e r i a l , w h i c h i s a p p l i c a b l e t o t h e s m a l l e s t g r o u p s o f e u p h a u s i i d s i n T a b l e 1 . T h i s c h o i c e w a s m a d e b e c a u s e t h e s i z e o f t h e s e g r o u p s a p p r o a c h e d m o s t c l o s e l y t h e s i z e o f t h e s p e c i m e n s u s e d b y S m a l l e t al. ( 1 9 7 3 ) t o d e t e r m i n e t h e g r o w t h r a t e a n d t h e s i z e o f t h e s p e c i m e n s u s e d i n o u r e x c r e t i o n e x p e r i m e n t . T h e v a l u e s q u o t e d i n T a b l e 3 f o r Of» Pm a n û px, t h e r a t e s o f p r o d u c t i o n o f p a r t i c u l a t e p r o d u c t s , w e r e t a k e n d i r e c t l y f r o m S m a l l « a i . ( 1 9 7 3 ) , who h a d d e t e r m i n e d t h e s e q u a n t i t i e s e x p e r i m e n t a l l y On Maganyctipnanes norvegica f r o m t h e Med i t e r r anean Sea. The one remaining q u a n t i t y , t h e e l i m i n a t i o n r a t e pe of s o l u b l e 210po, was determined from our i s o t o p e e l i m i n a t i o n exper iment . The d a t a from t h i s exper iment a r e p l o t t e d i n F i g . 1 ; t h e e l i m i n a t i o n r a t e has been f i t t e d t o a s i n g l e e x p o n e n t i a l , and the r e g r e s s i on a n a l y s i s g i v e s p e = 0 .123 ± 0 .013 pe r day.
The q u a n t i t y u,g, t he 210p o i ncorpor a t e d in t h e t i s s u e s , i s s imply t he produc t OgPg. The va lue of o g has a l ready been d i s c u s s e d ; va r ious va lues of t he g r o w t h - r a t e p ? , under d i f f e r e n t c o n d i t i o n s , t aken from Smal la t ai. (1973) and from Mauchline and F i she r (1969), a r e a l s o g iven i n Table 3 . F i n a l l y , we need t o f ind t he 210p o i n g e s t i o n r a t e KB, which i s e q u a l t o OiPi- The food i n g e s t i o n r a t e P± depends on t h e a v a i l a b i l i t y of food; va lues for p i under va r ious c o n d i t i o n s have been given by Small e t a l . (1973) , and w i l l be quoted in the d i s c u s s i o n . T.n& r e s u l t s of our a t t e m p t s t o e s t i m a t e Oi a r e given i n Table 4 , which i s s p l i t i n t o 6 s e c t i o n s .

132 H. Heyraiji et al. s Po in Euphausiids
The f i r s t 5 sections correspond to 5 different sample collect ions. For the E;rst collection, the procedure differed fiom the other 4 in that no stomach contents were collected and in that part of the mixture was sorted microscopically into different zooplanktonic species . For the other 4 collections the stomachs
*were emptied and 210po measurements were made on the stomach contents. In the sixth section of the table we give the
'mean 210po concentration In che 5 micro-plankton mixtures and the mean 210po concentration in the 4 collections of stomach contents. The errors quoted for these means are not experimental errors , but are the standard «errors of the mean determined from the naturaj. spread between the samples. I t i s seen that 210po in the microzooplar.kton mixtures ranges from 4.4 to 12.1 pCi/g dry material/ with a mean of 7.5 ± 1.4 pCi/g dry mater i a l ; the 2 1 0 P o in the various organisms which constitute the f i r s t mixture vary even more widely, i .e» , from 3.7 to 16.4 pCi/g dry material. The stomach contents are seen to be higher in 210pa than the microplanktan mixtures in each of the five cases, the mean concentration being 20.2 ± 0.4 pCi/g dry material .
Discussion and Conclusions
Sizing Expezitxenc
The fact that the relative concentrations (in pCi/unit weight) increase aa the size of the euphausiids decreases could a t f i r s t sight be interpreted as indicating that surface adsorption plays an important role in the accumulation of the element. This interpretat ion would follow from the fact that the surface: volume ratio also increases with decreasing animal size (Osterberg et al. , 1963) . A similar relationship with size was found for zinc, iron and manganese in euphausiids [Fowler, 1974). in the case of these metals, the concentrations on the moults, which const i tute the superficial part of the tsxoskeleton, were between two and eight times higher than those in the entire animal (Fowler and Oregioni, 1974). For 2 1 0 P o , however, the situation is reversed; the concentrat ion of 0.36 pCi/g dry found in the vaults is considerably less than the concentrations of approximately 1 pCi/g found in the whole animal or in the exo-skeletcn. I t is therefore hichly unlikely that the accumulation of 2lOpo is primarily an adsorption phenomenon, and 2r.o-her interpretation of the sizing experiment data r.ust be sought.
Boyden (1974) studied the trace e lement content of molluscs as a function of s ize, and showed that for certain e le ments there existed a linear relationship, in logarithmic coordinates, between the to ta l element content and the v.eight of an animal. The slope of the regrtssion l ine was 0.77, which corresponds to a slope of -0.23 i f one plots , o:i the same logarithmic coordinates, the concentration of the element as a function Of animal weight. This coefficient of -0.23 i s to be compared with the value of -0.25 often found in relating many metabolic functions to body weight in poikilothermic animals. In the case of 2 1 °Po , a similar relationship exists , but the slope of the regression line relating concentration to body weight is -0.53 i 0.15, a value which is rather far removed from the generally accepted value of -0 .25.
Another poss ib i l i ty i s that our sizing experiment data can be interpreted on the basis of a specific and important biological function, i . e . , the food intake of the euphausiids- To our knowledge no study has been made in euphausiids of the relationship between food intake and body weight (or age) of the animal, but there are some data for related species. Thus, the data of Mul-l in and Brooks (1967) on Hftincaianus nasu-cus from the Copepodite I up to the final adult stage r e l a t e the logarithm of food intake per unit weight to the logarithm of the body weight with a regression l ine of slope of -0.54 ± 0.11, while the data of Paffenhc-fer (1971) for Cal an us helgolandious (from Copepadita I to the female adult) give a slope of -0*47 t 0.10. Moreover, the data of Kurenkov as quoted by Sushchenya (1970) give a value of -0.53 for the same slope in the crustacean predator Leandex oodescus. These values are in good agreement with our own sizing experiment data which show a relationship between 2 1 0 P o content per unit weight and body weight of the animal. The inference that our data suggest a d i rec t relat ionship between the food intake of an animal and i t s 2 1 0 P o content i s c lear ; th i s might imply that food i s the principal source of 210po for Hsçanycciphanes noevagica, a fact which we shall discuss in more detail with the aid of the model.
Dissection Experiment
The inhomocenei ty found in the distribution of 2l0p o j_n t j , e various organs and tissues of Xez3ii<jcz±phanes nor-.sgici comes as no surprise, since i t parallels closely the inhemegeneity round by pre-
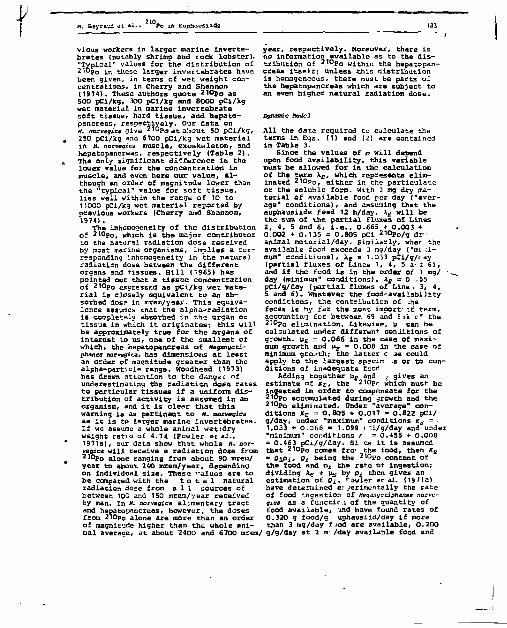
M. Keyrauâ et a i . : Po m Euphausiids
v ious workers in l a r g e r mar ine i n v e r t e b r a t e s (notably shrimp and rock l o b s t e r ) . "Typical" values for t he d i s t r i b u t i o n of 21up 0 i n these l a r g e r i n v e r t e b r a t e s have been given, in terms of wet w e i g h t conc e n t r a t i o n s , in Cherry and Shannon (1974) . These au thors q u o t e 2 1 0 p o a s
500 pCi/kg, 300 pCi/kg and 8000 pCi/kg wet ma te r i a l in marine i n v e r t e b r a t e s o f t t i s s u e , hard t i s s u e , and h e p a t o panc reas , r e s p e c t i v e l y . Our d a t a on ft. norvagica give 2 1 0 P o a t abou t 50 pCi /kg ,
. 250 pCi/kg ana 6700 pCi/kg wet m a t e r i a l in H. norvegîca muscle , e x o s k e l e t o n , and hep a t o pancreas, r e s p e c t i v e l y (Table 2 ) .
s The only s i g n i f i c a n t d i f f e r e n c e i s t he lower va lue for t h e c o n c e n t r a t i o n i n muscle , and even h e r e o u r v a l u e , a l though an order of magni tude lower than t h e " t y p i c a l " value fo r s o f t t i s s u e , l i e s well wi thin t h e range of 10 to 11000 pCi/kg wet m a t e r i a l r e p o r t e d by prev ious workers (Cherry and Shannon, *1974) .
The inhomogeneity of t h e d i s t r i b u t i o n of 210p 0 , which i s t h e major c o n t r i b u t o r to the n a t u r a l r a d i a t i o n dose r e c e i v e d by most marine organisms, i m p l i e s a cor responding inhomogeneity i n t h e n a t u r a l r a d i a t i o n dose between t h e d i f f e r e n t organs and t i s s u e s . H i l l (1965) has poin ted out t h a t a t i s s u e c o n c e n t r a t i o n of 210p 0 expressed as pCi /kg wet mater i a l i s c lo se ly e q u i v a l e n t t o an a b sorbed dose in mrem/year. Th i s equ iva lence assumes t na t the a l p h a - r a d i a t i o n i s completely absorbed i n t h e organ o r t i s s u e i n which i t o r i g i n a t e s ; t h i s w i l l be approximately t r u e fo r t h e o rgans of i n t e r e s t to u s , one of t h e s m a l l e s t of whichf t he hepatopancreas of Meçanycti-phanes narvegica, has d imensions a t l e a s t an order of magnitude g r e a t e r than the a l p h a - p a r t i c l e r a n g e . Woodhead (1973) has drawn a t t e n t i o n t o t h e dar.gei" of underest imat ing the r a d i a t i o n d o s s r a t e s t o p a r t i c u l a r t i s s u e s i f a uniform d i s t r i b u t i o n of a c t i v i t y i s assumed i n an organism, and i t i s c l e a r t h a t t h i s warning i s as p e r t i n e n t t o M. aasvegica as i t i s to l a r g e r marine i n v e r t e b r a t e s . i f WG assume a whale animal we t :d ry weight r a t i o of 4.74 (Fowler ec al.t
1971a), our data show t h a t whole M. nor-vegica w i l l rece ive a r a d i a t i o n dose from 2 l 0 p o alone ranging from abou t 90 rare»/ y e a r t o about 240 mrem/year , depending on ind iv idua l s i z e . These v a l u e s a r e t o be compared wi th t h e t o t a l n a t u r a l r a d i a t i o n dose from a l l s o u r c e s of between 100 and 150 mrem/year r ece ived by man. In «- naevagiea a l i m e n t a r y t r a c t and heoatopancreas , however, t h e doses from 2"Ï0po a lone a r e more than an order of magnitude h igher t han t h e whole a n i mal average, a t about 2400 and 6700 mrem/
133
y e a r , r e s p e c t i v e l y . Moreover, t h e r e i s no informat ion a v a i l a b l e as t o the d i s t r i b u t i o n of 210p a w i t h i n the hepatopanc r e a s i t s e l f ; u n l e s s t h i s d i s t r i b u t i o n i s homogeneous, t h e r e must be p a r t s of t he hepa topancreas which a r e s u b j e c t t o an even h i g h e r n a t u r a l r a d i a t i o n d o s e .
Dynsmic Model
All the d a t a r e q u i r e d to c a l c u l a t e the terms in Eqs . (1) and (2) a r e conta ined in Table 3 .
S ince t h e v a l u e s of D w i l l depend upon food a v a i l a b i l i t y , t h i s v a r i a b l e must be a l lowed f o r i n the c a l c u l a t i o n of t he term XE, which r e p r e s e n t s e l i m i n a t e d 2 l 0 p O r e i t h e r in the p a r t i c u l a t e or t he s o l u b l e form. With 2 mg dry mat e r i a l of a v a i l a b l e food pe r day ( "aver age" c o n d i t i o n s ) , and assuming t h a t t h e euphaus i ids feed 12 h /day , X£ w i l l be t h e sum of t h e p a r t i a l f luxes of L ines 2, 4. 5 and 6 , i . e . , 0 .665 + 0.003 + 0.002 + 0-135 = 0 .805 pCi 210p 0 / a d r -animal m a t e r i a l / d a y . S i m i l a r l y , wher the a v a i l a b l e food exceeds 3 mg/day ("mt ; i -mum" c o n d i t i o n s ) , XE = 1.033 pCi/g/c.ay ( p a r t i a l f l u x e s of Lines 1, 4, 5 a: 4 6 ) , and i f t he food i s in t he o rder of 1 mg/ • day (minimum" c o n d i t i o n s ) / Xe = o -55 pCl /g /day ( p a r t i a l f l uxes of L i n e . 3 , 4 , 5 and 6 ) . Whatever t he f o o d - a v a i l a b i l i t y c o n d i t i o n s , t h e c o n t r i b u t i o n of :he feces i s by f a r the most import.' .it: term, account ing fo r between 69 and PBB C* t h e 210p o e l i m i n a t i o n . Likewise , u can be c a l c u l a t e d under d i f f e r e n t c o n d i t i o n s of growth. u E = 0 .066 i n the case of maximum growth and Up = 0.008 i n the case of minimum growth; the l a t t e r c se could apply t o t he l a r g e s t speciir .5 or t o cond i t i o n s of i n a d e q u a t e food
Adding t o g e t h e r u f and *, g ives an e s t i m a t e of KE, t h e 210p c which must be i nges t ed i n o r d e r t o compensate fo r t h e 210p o accumulated dur ing growth and t h e 210p o e l i m i n a t e d . Under "average" cond i t i o n s KE = 0 .805 + 0.017 = 0.822 pCi / g /day, under "maximum" cond i t i ons K£ = 1.033 + 0 .066 » 1.099 T : i / g / d a y and under "minimum" c o n d i t i o n s n = 0 .455 + 0.008 = 0.463 p C i / g / d a y . Si ce i t i s assumed t h a t 210p o comes fro- the food, then KE 2 1 QiPi, Qi b e i n g the 2 l 0 p o con ten t of t h e food and o± t h e r a t e of i n g e s t i o n ; d i v i d i n g XE + u^ by o± then g ives an e s t i m a t i o n of o][. r o w l e r « a i . O S / l a ) have determined e: j e r i raen ta l ly the r a t e of food i n g e s t i o n of MeganyctlphanBs norve-gica as a func t ic .1 of the q u a n t i t y of food a v a i l a b l e , md have found r a t e s of 0.320 g food/g uphaus i id /day i f more than 3 tag/day r jod a r e a v a i l a b l e , O.200
' g /9 /day a t 2 m- /day a v a i l a b l e food and

M. Heycaud ec a l - : £ l w P o tn Euphausi lds
0.113 g/g/day at I rag/day available food. Using these data gives, for o^, estimates of 3.4, 4.1 and 4.1 pCi/g drj material, respectively- These values are to be compared with the 210po concentrations in mixed microplankton given in Table 4. I t is seen that: the values found in the mixed raicrozooplankton, which i s presumed to constitute the euphausiid food supply, range fron. 4.4 to 12.1 pCi/g dry material with a mean value of 7.5 pCi/g dry material. They are thus always larger than the values estimated from the model, and the question arises as to whether or not an important factor has been neglected in the estimates.
The two terms which make the major contribution to cu- estimate of x r are 3-p a and OfPf, and we consider possible sources of error in these terms. p e was determined using a tracer experiment, and the euphausiids were labelled from both water and food un t i l no further increase in the concentration factor was found. The concentration factors were 334 after 7 days, 383 after 6£ days and 258 after lO days, the l a s t value being explained by the fact that the sample concerned comprised individuals which had just moulted. Despite these precautions, such experiments are never ideal; in particular, the concentration factor was approximately 30 times smaller than the natural concentration factor of about 9C0O calculated ass tuning a "typical" concentration of 2 1 °po in sea water of 25 x 10 -3 çCi/1 (Cherry and Shannon, 1374) . I t is accordingly not impossible, in view of the inadequate labelling of the euphausiids, that our value of pe
might be in error. However, since the feces are by far the most important contributor ta k£, i t is mare likely that the source of error resides in the OfPf term.
He consider now whether our 0* value does indeed represent the actual"concentration in the feces, and we show that
1 there is good reason to believe that I t is substantially underestimated. The specimens used in our experiments were caught a t night and as soon as possible after returning to the laboratory they were placed in ba t t l es . The following day, about 12 h later , fecal pellets were removed from the sea water containing the euphausiids and kept in a small beaker of fresh sea water; to these were added subsequently fecal pellets produced in the animal containers aver a period of abc it 40 h. During this time the euphausiids were not fed, and af-er this time their digestive tracts were completely empty. Ths fecal pellets were then taken from the sea water, rinsed rapidly in d i s t i l l ed water.
weighed, dried and analyzed for 2 1 0 P o . The sample analyzed was thus n o t rep" res enta t ive of feces immediately after production, but represented instead a collection of fecal material which had been resident, in sea water for times ranging frcra O to 40 h. This procedure was necessary in order to obtain suff icient sample material , hut i t carried with i t the disadvantage that some of the 2 1 Q P o might have been lost from some of the fecal pe l le ts during their stay in the sea water. Tc t e s t this hypothes is a "leaching experiment" using a fresh collection of fecal material was performed. Fecal pellets wer- removed within 2 h after the euphausiids had been collected; after rinsing, drying and weighing, the resultant material was taken to const i tu te a "time zero" sample, the ^ 1 0 Po content of which was assumed to be 1005. After 12 h, a further collection of fecal material from the same specimens was made. This collection was divided into" three sub-samplesï the fir»t constituted a "Time 12 h" sample, and the other two were placed again in sea water for further periods before being collected to give "Time 36 h" and "Time 60 h" samples, respectively. These samples were analyzed for 210po and, even though problems were encountered with sample homogeneity, the general trend was c lear . 210po loss from the fecal pel lets was found to be about 21% after 12 P., 34% after 35 h and 41% after 50 h.
In view of the fact that the majority of the fecal pe l le t s were kept in water for about 36 h before analysis, our Og value of 17.5 pCi/g thus represents only about 66% of the 2i0p o content of freshly produced feces. After making the necessary correction, Of becomes about 27 pCi/g dry material , and this in turn leads to raised estimates of o^ of 5.9, 4.9 and 5.6 pCi/g drv food. These values can be matched by 210po Levels found in subsamales of microzaoplanktan (Tabl*. 4) ; a l l of these sub-samples have been found in tne gastr ic contents of .Tejanycciphanes aarvegi.cs (Casanova, 1974; and personal observation). Although th^s? estimates are s t i l l Lower than I he observed mean of 7.5 i 1.4 pCi/g mixed microsooplank-ton, i t can be seen that the 2 1 0 P a concentrations of mixed microzoaplankton are very variable . They range from 4.4 to 1?.i*pCi/g dry material, and our rais<.-d estimaces of Oi a l l fa l l at the lower end of th i s range. The attempt to "halance" Eq. (1) i s , therefore, at least reasonably successful and this lends support to our basic assumption tha t faad i s the principal source of 210?o ror eu-phausiics. We have, however, not been
' able to provide any direct experimental

evidence as to the importance of water intake as a source of 210p 0. i n view of the approximate nature of our calculations we cannot yet be certain that the 210p0 contribution from, water i s entirely negligible.
Two minor features are also worthy of comment: (i) In contrast to the variability of 2 1 °Po in the mixed microzaoplank-ton, the 2i0p o concentrations in stomach contents collected a t the same time as the microzooplankton are remarkably uniform at 20.2 t 0.4 pCi/g dry weight. I t i s not impossible that there i s a degree of selectivity in the choice of food by «eçanyctïpfcanes norvsçiza, and the data in Tan le 4 support th is hypothesis, ( i i) There is an increase in 210po content from miccozoopianfcton to stomach contents to freshly produced feces. Un a dry weight basis the respective concentrations of 2 10po are 7.5, 20.2 and 27 pCi/g; approximate wet-to-dry weignt ratios determined in the laboratory a l -Icw us to convert these values to a wet weight basis, giving 210po values of 1.0, 2.fl and 6.1 pCi/g wet microzooplank-ton, stomach contents and freshly-produced feces, respectively.
Finally, we must comment on the implications of our value of Xf as far as the elimination of 2 1 °Po from the upper mixed layer of the ocean by zoop lank ton is concerned. These have already been discussed in the short note (Cherry et ai., 1975) referred to ea r l i e r ; her.?, we shall repeat the argument briefly i-sing the revised data reported in this present paper. The t o t a l removal time of 210pD from the upper mixed layer has been estimated (Shannon et al,, 1970} to be about 0.6 years. This t o t a l removal time is the reciprocal of the rate constant a, where R i s the probability per unit time of a 2 1 Q P o atom being removed by a n y process other than radioactive d • &y. R can be regarded as the sum of separate probability terms whose reciprocals represent removal times by the various possible routes, and we can uje our value of kE to estimate one of these removal tines, i . e . , ^J 1» the removal time due to zooplankton metabolic activi ty alone. We use the simple equation given by Small and Fowler (1973):
- 1 (3)
where c is the concentration o.' 210 P O i n
the upper mixed layer and w i s the zoo-plankton biomass in the same volume. For c we use a typical oceanic value of 25 x 10-3 pCi/1 (Cherry ana Shannon, 1974) and for J we use 0.10 g dry nass/mS. The reasons for the choice of these values have been given previously (Cherry et aï-.
1975). We calculate XE as previously described for the case of "average"" food avai lab i l i ty , i . e . , we sum the par t ia l fluxes of Lines 2, «5, 5 and 6 in Table 3. Before doing th i s , however, we increase the par t ia l flux in Line 2 in order to allow for the fact that o f for f r e s h -1 y produced feces is 27 pCi/g and not 17.5 pCi/g. A As value of 1.17 pCi 210p o/ g dry animal/day results; insertion of th i s into Eg. (3) does, of course, imply that we are assuming that XE for Neganyc-ciphanas norvegica is typical of \E for the zooplankton biomass as a whole. The va l ue of flj1 which results from insertion of these values into Eq. ',3) i s 0.59 years.
The near-equaliry of this value to the estimate for ft-i, the total removal time, i s immediately obvious, but is a l most certainly coincidental - i; only in view of the uncertainties involved in our values of c, kr and, above a l l , w. We have, moreover,"not corrected for the fact tha t fecal pellets which are produced in the upper mixed layer wil l lose some 210po before leaving this layer, and this point needs some attention. The average sinking rate of euphausiid fecal pel lets i s about 40O ra/day (Fowler and Small, 1972); i f We assutae that the average fecal pel le t is Deduced at a depth of SO m, i t will take about 3 h to sink below an assumed upper mixed layer interface a t 100 m depth. Our "leaching experiment" Indicates that during this time about 5% of tho z l 0 P o content of the fecal pe l l e t wiil have been los t . This correction i s , therefore, likely to be small. Whatever the uncertainties, the general implication is clear: a^l makes a t l ea s t a major contribution to the t o t a l R~1, and i t seems safe to say that zooplankton metabolic activity — and tecal pe l l e t deposition in par t ic ular — plays an important role in the removal of 210po from the upper mixed layer.
In summary, our data indicate that: (i> food Is probably the main source of 210po for Heganyeciphanes norvegica/ ( i i j there is a wide degree of lnhomogeneity in the distr ibution of 2 1 0 P o between the various organs and tissues of H. nocvegieat ( i i i ) fecal pel lets are the main route by which 210po 1 S eliminated from ». norvégien (iv) zooplankton fecal pellets §lay an important role in the removal of
1 0 Po from the surface layer of the ocean.
Ackn&fledgaomnzs* The Internat icnal. Laboratory of Marine Radioactivity cperaces ur.der a tripartite agreeocnt between rne International Atc=ie Energy Aoeney, the Govarncsnt of th£
1
Principality of Konaco and the Océanographie inst i tute of Menace. Support for the present work is gratefully acknowledged. One of,us (RDC) acknowledges support from the University cf Cape Trwr. and from the South African national Council for océanographie Research. Special thanks are also due to the Station Zoologique, Villefranche, France, for pi '.ding the necessary ship time, to Mr. J. La Rasa for valuable technical assistance, and to Dr. G. Harvey for his c r i t i ca l eo:=ents en the manuscript.
^jterjture Cited
Seaslb/. T.H., B.J. Eagle and T.A. Jokela: t polcniua-210, lead-210 and stable lead in
parine organises. Q. Seen. Hap. Blth Saf. Lab., H.Y. (Fallout Pregm,) HASL - 273, 2-36 Î1973)
scycen, C.S.i Trace decent content and body •size ir. aollsscs. Mature, Lend. 75J, 311-314 W*7*l
Casmr/a, 3 . : Les euphausiacêa de Méditerranée (Systématique et dèvelopoenant larvaire. Sicgètgra^iie et biologie.), 380 pp. Thèse ce Docteur es-Sciences Naturelles, Université ze ?z=vô-ce, Aix-Marseille 1974
che-ty, K.D., S.W. Powler.. T.H. Beasley and H. Heyraui: Poloniu»-21Q: i t s vertical oceanic trans;, "art by zooplankton metabolic act ivi ty . car. Chen. J, 105-110 (197S)
-• ar.d L.v. Shannon: The alpha radioactivity of carine organisas. Atom. Energy Rev., Vienna 12, 1-45 (1974)
Fowler, S.w.i The effect of organism size on the contant of certain trace metals in marine zocular.'rfton. Rapp. P.-v. Re un, Cemmn in t . Exalcr. scient. M«r. M'editerr. 22, 145-145 (1974)
- , c. Benayoun and L.F. Small: Experimental studies on iceding, growth and assimilation in a Hudicerr^iean euphauaiid. Thalassia jugeai. J, 35-4, U°.'la)
- and a. Oxegieni: Elemental composition of zeeplankton and their particulate products. ir,: Activities of the International Laboratory of Marine Radioactivity, 1974 Report, IAEA-162. pp SS-62. Vienna: International Atomic Energy Agency 1974
- and L.F. Small: Sinking rates of euphausiid fecal pe l le t s . Li&naL. Oceancgr. 17, 293-296 (1972)
- and S. Kéckés: Effect? of temperature and • sise en molting of euphausiid crustace<^is.
Mar. Biol. 11, 45-5' (1971b)
Hat» cf final aanusrript acceptance! September
H. Heyram ez &!.: ?o in Suphausiids
Hallden, N.A. and J.H. Harley: An improved alpha counting technique. Analyt. Chem. 32, 1SS1-1663 (I960)
Hill , C.R.t Polonium-210 in man. Nature, Land. 208, 423-428 (19S5)
Hoffman, F.L. , V.F. Hodge and T.it. Foison: Polcniun radioactivity in LJ.' jin mid-water fish of the eastern temporal Pacific. Hlth Phys. 26. 65-70 (1974)
Kauchline, J. and L.H. Fisher: The biology of euphausiids. Adv. oar. Biol. 7, 1-454 [1969)
Millard, H.T., J r . : Quantitative radiochemical procedures for analysis of poloniuB-210 and lead-212 in minerals. Analyt. Chen. 35, I017-10Z3 (1963)
Kullin, H.H. and E.R. Brooks: Laboratory culture, growth rate and feeding behavior of a plank-tonic =arine copepod. Limnol. Oceanogr. 12, 657-666 (1967)
Osterberg, c , L.F. Snail and L. Hubbard: Radioactivity in large marine plankton as a function of surface area. Nature, Land. 197. 883-964 (1963)
Paffenhôfer, G.-A.t Grazing and ingestion rates of nauplii, copepodiâs and adults of the marine planktonic cocepod Caianus Aelaolandi-ctis. Mar. Biol. 11, 286-298 (1971)
Shannon, L.V., R.D. Cherry and H.J. Orren: Polonium-210 and lead-210 in the narine environment. Geochim. cosmochia. Acta 34, 70Ï-711 (1970)
Small., L.F. and S.H. Fowler: Turnover and vertical transport of zinc by the euphausiid Meganyctiphenes norveg-ica in the Ligurian Sea. Mar. Biol. IS, 2B4-290 (1973)
- - a n d S. i'éckës! Flux of zinc through a macro-planktcnic crustacean. In: Radioactive con-taainatien of the marine environment, pp 437-452. Vienna: International Atomic Energy Agency 1973
Sujhchenya, £,.: Food rations, metabolism and growth of crustaceans. In: Marine food chains, pp 127-141. Ed. by J.H. Steele. Edinburgh: Oliver s Boyd 19TO
Hocdhead, O.S.: Levels of radioactivity in the marine environnent and the dose commitment to racine organisas. In: Radioactive contamination of the marine environnent, pp 499-525. Vienna: International Atomic Energy Agency 1973
Dr* H. Heyraud International Laboratory of Marine Radioactivity Musée Océanographique Principality of Monaco
1975. Coieaunieated by J.M. Pères, «ars-sille

(Rtprlnud from Nature, Vol 244. No. 5603. pp. 6Ï3-624. April 14. 19771 t) Macmtlten Journals Ltd.. 1977
Rapid removal of plutonium from the oceanic surface layer by zooplankton faecal pellets
IT is possible that increasing quantities of plutonium will be 'introduced into the marine environment, so detailed knowledge of
the oceanic behaviour of this element is highly desirable. The levels of plutonium in sea wa';r and marine organisms have been
* established in a general way1'-, and suggestions have been made as lo possible transport mechanisms. Noshkin and Bowen J proposed a model which associates plutonium with a mixed population of particles, sinking at rates or 70-392 m y r - ' , and Faisant « al.* suggested that algae and, perhaps, the main phytaplankioric bioma» may have an important rale in determining tne chemical and physical forms of plutonium predominant in the ocean. The role of the zooplanktonic biomass has not been investigated in detail, but it is known (hat for several elements zooplankton metabolism may be an important biological factor in the removal ofthe elements fromine surface layerof the ocean todepth'- ' .The particular imparlance ofzooplankton faecal pellets in this process has been highlighted, and the faecal pellets of a common MO-planktomc species, the euphausiid Megaurciiphanes norvégien. have been shown to be rich in the important naturally-occurring alphu -miner " °Po when compared with whole organism levels ' '. We have performed a similar study for plutonium, and we report here thai .if. noncgico focal pellets are indeed relatively nch in plutonium, and suggest that zooplankton faecal pellet déposition michi be an important vector in the vertical oceanic transport of the élément.
The environmental levels of plutonium are extremely low, and collection or adequate sample material was a msjor problem; a faecal pellet collectign system was devised" which provided us with faecal pellet samples of about 100 mg dry mass. Oven-dried samples were arid-digesled, treated with hydrofluoric acid, and then subjected to previously described ion «change techniques1* lo isolate plutonium ; "*Pu was used as a spike. Thin sources were prepared and counted by z-spectroscopy. Exacting chemistry was necessary to achieve consistently low 'blank' counting rales, and long counting tunes were commonplace. The results are given in Table I, together with the "•"* a * 0 pu concentrations in whole euphausiids. euphausiid exoskdecons collected by dissecting 336 euphausiids. and in a bulk sample ofmicroptankton which serve as food for M. norvégien. We found thai the concentrations io faecal pellets, although varying widely, were two orders of magnitude larger than those in whole euphausiids and an order ofmagnuude higher than in the typical food organisms ; plutonium levels in the
• faecal pellets were in fact vastly in excess of those found in typical marine biological materials2.
Tabic 2 Flu* rates for various transfer modes of plu ionium through living euphausiidi *
Faecal p d k u 'Moults't Soluble excretion
0.011 0.032 0.006
'Thenuxrateslis led in this table and discussed in the text represent three ampul fluxes plus the assimilation. The sum of these four terms must of course equal the input flux rate, which represents the plutonium taken up by the animal from both uaisr and food. No information ahout the input via the water route is available, and at this stage only a crude estimate of the input front food can be made. This is done by multiplying the known food ingestion rates far St. narttçtca. namely between 0.113 and 0.320 g food per g dry animal per day Iref. 9 ], fay the plutonium concentration in micrapbnktfln given in Table t. The result is a'food only* input flux ratecf between 0.6 and 1.6 pQ plutonium per kg per day. which a of the sa;.; iwdcrofmagnitude but lwsihan lhc«Umaied totaloatpuinui rate of over S pCi per kg per day. Fairly wide variation of element concentrations from one mieraplankton sample to another is.howevcr,tobeupec[edI,:amore spécifie identic cation of the .If. nanegica food as well as further deierminationi of the plutonium content of faecal pellets «ill be needed before the flux balance can be cheeked accurately and the relative importance of the food and water intake routes assessed.
tThe flux via 'moults* quoted above is af course only an approximation, since the concentration in true moults may not necessarily be the same as in the exosketeions which formed our sample. We have not yet been able to collect euphausiid moults in sufficient quantity to detect plutonium, but we hope to do so in the future; it is. however, very unlikely that the ai «.kich we give in the text will be altered substantially.
What are the implications of these high concentrations in faecal pellets for the flux oT plutonium through living euphausiids? A plutonium atom ingested or absorbed by a living euphausiid can be eliminated from the animal by faecal pellet excretion, by moulting, by egg production or by soluble excretion ; alternatively, it can be assimilated during growth in one of the organs or tissues and remain in the animal. Wecalculate the flux of plutonium in a living euphausiid by using available biological data 9 for M. norvégien. Wc multiply the typical faeces production rate, 0.038 g dry faeces per g dry animal per day, by the mean plutonium concentration in faecal pellets given in Table 1. We multiply the moulting rate, 0.009 g dry moult per g dry animal per day, by the concentration in the euphausiid exoskeleton. Collection of eggs in sufficient quantity is an unrealistic task; fortunately, the egg production rate*- 1 0, about 0.002 g dry eggs per g dry animal per day. is low. and trace element concentrations in eggs are usually unexceptional. It is extremely unlikely that this term win contribute significantly la the flux. To estimate the loss by soluble excretion we performed experiments of a type previously described for other elements' °, usinglive euphausiids labelled with " T u , and found a soluble fractional excretion rate of 0.08 ±0.02 per day. This value
Table 1 Concentrations of"* * **°Pu in îouplaoklonic material and mLToplanklon
Whole euphauuios Euphausiid «oiWeton Euphausiid faecal pellets * M set o plankton *,
Vfn-dry weight ratio
1(17
—SIPS—" 0J2 tO.0K:0.«=0.08
• Each individual lielerminjiion is in fact ihe mean oft*o deierminjiions rr.jd; on the lv.o haltes of a split sample. * Hignfoacentraiiv'nxjrcenain trace elements' '» and radionuclides'* in fiscal material arauaht about hy bioiogieal amplification processes hate beea
noted ptewousiy. Target inaiihepiuiomumcancemrsiianifl the &^ factor again» J biologically oaji-ewenu.il element
îPfinc:pail> small emiucea, phyloplankion and demies collected with ôSfim mesh sixe plankton net along wid> the euphaufltds.
multiplied by the plutonium tncentration in whole euphausiids gives the flu* loss by soluble excretion. Finally, the amount of assimilated plutonium is obtained by multiply ing the wholeammal concentration by 0.015 g dry mass increase per g dry animal per d3y. an average growth rate for non-larval individuals.
The results of these flux calculations are given in Table 2. The complete dominance of the faecal pellet term is immediately obvious, and indicates that 99"/m or the plutonium taken up by M. norwgica is excreted in the faecal pellets. Euphausiid pellets sink fairly rapidly1 ' , at rates ranging from 126 to 862 m cT 1 , and they decompose relatively slowly1; it seems dear that they have the potential lo reach the sea bottom in most areas. If the .V. norvégien data can be considered as typical of the marine zooplankion biomass as a whole, we can make a rough estimate of the removal t ime 1 0 of plutonium Tram the upper mixed layer of the ocean by zooplanklon faecal petit,?* alone. We multiply the faecal pellet flux rate from Table 2 by 10~* kg m " \ a reasonable, if controversial, estimate' 0- 1**" of the dry zooplanktanic biomass in the upper mixed layer, and divide this product into 0.7 p Q m ~ \ a typical value (rcf. 2) of the " * * "°Pu concentration in surface sea water. Tbe result is 3.6 yr, a figure which one would like to compare with estimates or the removal lime of plutonium from the upper miaed layer by all routes. Unfortunately* direct quantitative estimates of this quantity are not available; the indications 1* 1 T are. however. that it is short—of the order of 1 yr. Our estimate for the removal unie due tozocplanktonic faecal pellets alone is of the same order, suggesting that faecal pellet removal has a significant role in the removal of plutonium from the surface layers of the sea. Investigations or possible competing removal routes (tb*- example sinking phyioplankton detritus, large inorganic particulate settling) are n>>;ded to substantiate this suggestion.
This work was supported partiaily by the South African National Council for Océanographie Research. W«. thank the Station Zoologique de Villefranche, France. Tor furnishing the necessary ship's lime.
J.J.W.HlOCO R. D. CHERRY
Physics Department, University of Cape Town, Rondebosch, C.P., South Africa
M. HEYRAUO S. W. FOWLER
international Laboratory af Marine Radioactivity, Musée Océanographique, Principality of Monaco
anxmd2D5cpuailicrl97A;*ccip(cd2F«bruM)i!*nT.
' OKtri.9LO.kSkia*!B,\-V, Atom Emir Rwy.lt.i-*in<P*\ > Naifafaa.V.W.ADa*f.V.T in*it*M(|w»GHH—iimwij/l*rV«fiT£»iif«niml,
•• Boatta.F-N.&KÛBt>.G A £«•«;.Oknpvn.rt.lTtMMIm» " HnriHd.U.F»kt,S.W.Bc*>«T.T.M.ACÏerr).iLD.((«r **f SO»-)»'' 1 "»).
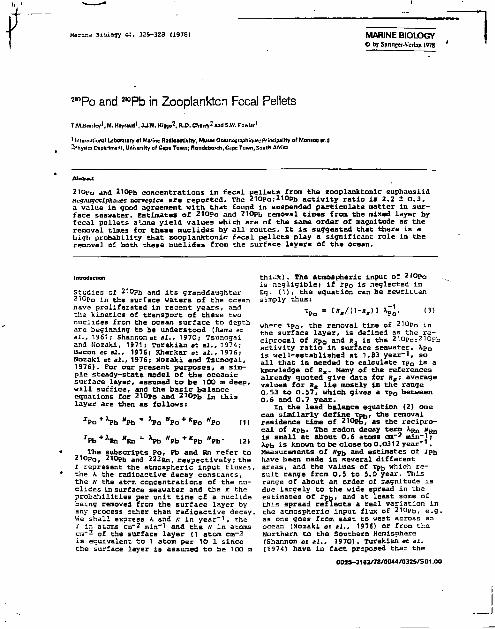
Harir.a Biais?? 44. 325-328 (197S) MARINE BIOLOGY © by Spnnçer-Verlag I978
2 , 0Po and 2 l 0Pb in Zooplanktcn Fecal Pellets
T-M-Bsailey 1, M. Hayraud 1, J J.W. H i g j o 2 , R.D. Cherry 2 and S.W. Fowler 1
1 International Laboratory of Marine Radioactivity, M U I M Océanographique; Principality of Monaco an d -Phyi ic i Department, Univerilty of Cape Town; Rondcbaich.Cape Town, Saut h Africa
Abnraci
Ziopo and 210pb concentrations in fecal pellets from the zooplanktonic euphausiid «eganyceiphaues norve?iea are reported. The 21opo:210pn activity ratio is 2.2 ± 0.3, a value in good agreement with that found in suspended particulate matter in surface seawater. Estimates of 210po and 21Qph removal times from the mixed layer by fecal pellets alone yield values which are of the same order of magnitude as the removal times far these nuclides by all routes. It is suggested that there is a high probability that zooplanktonic fecal pellets play a significant role in the removal of both these nuclides from the surface layers of the ocean.
Introduction
Studies of 210?b and i t s granddaughter 210po in the surface waters of the ocean have proliferated in recent years, and the kinetics of transport of these two nuclides from the Dcean surface to depth are beginning to be understood (Rama et al., 1961; Shannon et al./ 1970; Tsunogai and Nozaki, 1971 r Turekian «t ai . , 197-1; Bacon et si., 1976; Kharkar et al., 1976; Nozaki et al., 1976; Nozaki and Tsunogai, 1976). For our present purposes* a simple steady-state model of the oceanic surface layer* assumed to be 100 m deep, wi l l suffice, and the basic balance equations for 210po and 210pb in th i s layer are then as follows:
rPo**Pb ffPb = *Po wPo + *Po *Po (1)
JPb + 1an ffRn *" *Pb wPb + K P b wPb" [2) The subscripts Po, Pb and Rn refer to
210?o, 2l0pb and 222Rn, respectively ; the r represent the atmospheric input fluxes, the A. the radioactive decay constants, the N the atrm concentrations of the nuclides in surface seawater and the K the probabilities per unit time of a nuclide being removed from the surface layer by any process other than radioactive decay. We shall express k and K in year - 1 , the r in atcas est" 2 lain-1 and the tt in atoms C3-.-2 of the surface layer (1 atom cm-2 is equivalent to 1 atom per 10 1 since the surface layer is assumed to be 100 m
thi^k). The atmospheric input or 210D O is negligible; if ipo is neglected in Eg. [!}, the equation can be rewritten simply thus:
T P O = [ H a / d - f l s n * ; 0 , (3)
where ipo» the removal time of 2 1 QPo in the surface layer* is defined as the reciprocal of xp 0 and RS_ is the 21Qp0:2iopb activity ratio in surface seawater. kpQ is well-established at 1.83 year-!, so all that is needed to calculate T D 0 is a knowledge of Rs. Many of the references already quoted give data for n s; average values for Rs lie mostly in the range O.S3 to 0-S7, which gives a xp Q between 0.6 and 0.7 year.
in the lead balance equation (2) one can similarly define Tp D, the removal residence time of 210pb, as the reciprocal of Jfpb* The radon decay term Xjtn wHn is small at about 0.6 atoms cm'2 m±n~1; Apb is known to be close to 0.0312 year - 1. Measurements of iifpb and estimates of Jpb have been made in several different areas, and the values of xpb which result range from 0.5 to 5.0 year. This range of about an order of magnitude is due largely to the wide spread in the_ estimates of Ipb> and at least some oi this spread reflects a real variation in the atmospheric input flux of 2i0pb, e.g. as one goes from east to vest across an ocean (Nozaki ec al.r 1976) or from the Northern to the Southern Hemisphere (Shannon at al., 1970). Turekian et al. (1974) have in fact proposed that the
0025-3162/78/0044/0325/501.00

T.H. Béasl«y et ai.. Pb in Fecal Pellets
lead balance equation be used in the reverse fashion to predict xpb- If this i s to be done, tfpfa must be known; Turekian *t *1. assumed that the removal of 210po and 2 1 0 P b from the surface layer i s by unidirectional particulate transport and that both isotopes are transported by the same part icles . They pointed out that in this case the ra t io a = tfp0:JCpb would be related simply to the concentrat ion factors of 210Po and 210pb in
, the nuclide transporting particles» Zf we de no ce the atom concentrations of 2l0p o and 210pb in these par t ic les by
. &Po and opb» respectively, then i t follows from the definition of K together with the Turefcian et al. assumption that
APo "Po .
*Pb wPb
Po
and hence immediately that
(4)
(5)
where ft is the 210p 0-210 P b activity ratio in the particles. In a subsequent paper, Kharkar at *I, (1976) concluded that the actual flux of particles carrying these nuclides from the mixed layer to depth csnnot have the 210pOI2iopb ratio of bulk zooplankton; ap in zooplank-ton is too high, i.e., about 20; and this results in an unreasonably low estimate of i?b*
An important paper by Bacon et al. {1976J took the matter further; these workers measured both soluble and particulate 2 1 0 P o and 210pb in seawater. Their data for the surface layers of the north equatorial Atlantic Ocean gave Rp in the suspended particulate matter equal to 2.0; assuming that this matter is the agent by which both 210po and 2l0pb are removed from the mixed layer, they calculated jpb and obtained an acceptable value of about 20 atoms cm -2 min"i. The question which remains is how exactly 210po and 210pb in the oceanic surface layer are transferred from the dissolved to the particulate phase. Zooplankton
1 fecal pellets have already been proposed as contributors to the vertical oceanic transport of several elements (Osterberg ec al.. 1963; Fowler et al., 1973; Small and Fowler, 1973; Small ec al., 1973; Cherry et al., 1975); 2lOPo is one of them (Cherry et al., 197S). Moreover, there is now clear experimental evidence that fecal pellets can reach the ocean bottom as readily identifiable entities (Wiebe ez al., 1976). In this paper we present data for the concentrations of the 210po-210?b pair Lr. fecal pellets from the eu-phausiic .tetfanijczipiiar.es r.or-.-eçica; we show that these give rise to a value of a-which is very ciose to chat found by*"
Bacon ec ai. (1976) in the suspended par* ticulate matter in surface seawater.
Material! ind Mathods
Live «effarttfctifihanes norvégien were collected off the Mediterranean coast between Monaco and Nice, France/ and their fecal pel lets were retrieved in the laboratory using a previously described method (La Rosa, 1976). with this method, about 750 mg wet weight of fecal material of excellent consistency can be recovered from about 1000 euphausiids within 12 h of shipboard collection; the mate r i a l can legitimately be described as "freshly collected", and leaching problems are, accordingly, minimized. The pellets were acid-digested and 2 1 0 P 0 was plated on s i lver discs in the usual way (Millard, 1963; Plynn, 196B); the activi t i e s ffp0 Xp0 and opb *Pb were calculated from the alpha-particle count rates measured on tha discs (Hallden and Harley, 1960; Shann-jn et al., 1970) .
Reul» and Diicuisfon
The results are given in Table 1. Our previous work has shown that leaching of 210pg from the excreted fecal pellets of Heganyctiphanes norvégien prior to collection of the pellets can be significant (Heyraud et al. 1976); for all four samples listed in the table we estimate that the average time that the fecal material was in contact with seawater prior to collection was less than 6 h, and we consider that the leaching loss of 210po is not likely to have been more than about 10%. We have not yet been able to perform a leaching experiment for 210pb in fecal pellet material, but it is worth noting that Bacon et al. (1976) determined the net rates of transfer of 2 1 ûPb and 210pD between the particulate and dissolved phases in seawater at different depths. Their results indie e that in the 100 to 300 m subsurface layer 210po is fairly rapidly released from the particulate to the dissolved phase while there is very little transfer of 210pb from one phase to the other. The 100 to 300 m subsurface layer is the region in which the bulk of the fecal pellets are no longer being formed but through which they are falling! if the rate of leaching of 210po ?nd 210pb from fecal pellets is analogous to the rate of leaching of these nuclides from the particulate matter measured by Bacon et ai., then it is likely that the leaching of 210pb from our fecal pellet samples was negligible.
The arithmetic mean of t .e four 2l0p o ;
2i0?b activity ratios in Tisle 1, i.e., 2-2 ± 0.3, is essentially the same as the RB value of 2.0 found by Bacon ec ai.

Beasley et al. Pb in Fe=al P e l l e t s
Table 1. F.eÇanyctiph&nes norvegica. 210p 0 and ^lOp^ a c t i v i t i e s measured in fecal p e l l e t s . A l l e r r o r s quoted are a t the 1 o l e v e l . Those fo r the i.-.-îividual a a a p l e s i n c l u d e t h e propagat ion of t h e background b lank e r r o r as v e i l as t h e s t a t i s t i c a l count ing e r r o r of the sample i t s e l f ; those for the a r i t h m e t i c means a r e s t andard d e v i a t i o n s based on t h e sp read b e tween the 4 samples
Sample 2 1 0 p o 2 1 0 p o : 2 1 0 p h 2 1 0 p o ZlOpb 210p o : Z10ph Cdpm g d ry w e i g h t - ! ) (dpa g dry we igh t" 1J ( a c t i v i t y r a t i o )
2 . 1 ± 0 . 3
2 . 0 i 0 .4
2 . 0 ± 0 .3
2 . 7 + 1.3
Ari thmet ic mean
(1976) in the suspended particulate matter in surface seawater. It is moreover interesting *-a note that the absolute 210pvj activity in fecal pellet ash is similar to that found in the ash from the suspended particulate matter in sea-water. From information given by Krishna swam i e= ai. (1976), the 210?o content of Pacific water particulates is about 70 dpm g"l ash; using an ash content of 50% in dried fecal pellets (Fowler et al.. 1971), our Table 1 mean gives - 1 0?b in fecal pellets at 46 dpm g ash~1 . As Bacon et al. have shown, Rp = 2.0 gives values for Tp a, tpb
a n ^ -TPb which are in reasonable agreement with previous predictions [putting ffD - 2.0, B S = 0.55 and Wp£)A.DD = 1.3B atoms cm
-2 min-"* in Ecs. (3)", (5J and (2) gives xp 0 = 0.7 year, tp D = 2.4 years and ipb = 19 atoms cm~2 min - 1]. There is, accordingly, no inconsistency in terms of 210po:210pt, ratios if we assert that fecal pellets could participate in an important way in the vertical transport of 210po a n d 210pb from the surface layer to depth. This assertion does not, of course/ imply that fecal pellets are the o n l y removal mode for these nuclides ; the particulate suspended matter in seawater must include many components other than zooplanktanic fecal pellets. The R P particulate suspended matter will result from a composite, fractionally weighted average taken over all components, and data which would enable whis average to be calculated are not available. 0-e can, however, obtain an approximate idea of the relative importance of fecal pellet removal compared with other routes by estimating the removal times from the surface layer by fecal pellets alone. We designate these restricted removal times by adding a subscript /, and if must of = 3'J:59 be greater than the total t' to which we have already referred. The 2.0po equation will be given by the quan
tity of 210pa i n surface seawater divided by the feca1 pellet removal rate, thus:
, , WPb ^ b ,,, <">Pb- W / 0 p h x p b ' <6>
There will be an equivalent equation for 210p0. if i_e ÏJO zooplanktonic biomass in the surface ~/er and Pf is the production rate of fecal pellets by zooplank-ton. We take tfpD Pb t o b e 1-38 dpm per 10 1 [a mean value calculated from the comprehensive set of data of Nozaki er. al. (1976) for Pacific surface waters], Cpb Xp£ to be 23 dpm g dry weight"! (Table '< ; and p f to be 0.038 g fecal material g dry euphausiid~1 day"! (Small et al.1973) . H is the most controversial quantity in this equation; in a previous discussion (Cherry et al., 1975), we have given reasons for choosing w to be 1.0 x 10⁻³ g dry biomass per 10 1. Inserting these values in Eq. (6) gives (tf-)pb equal to 4.3 years. In the case of 210po, we take ffpo *Po to be 0.79 dpm per 10 1 (No2aki et al., 1976) and 0p o *Po to be 49 dpm g dry weight-1 (Table 1); we obtain (tf)p0
equal to 1.2 years. [We have previously estimated the 2i0po removal time due to zooplankton metabolic activity to be 0.9 year (Cherry et al., 1975), a value which was subsequently changed (Heyraud
' et al., 1976) to 0.6 year after allowing for. leaching of 210po from fecal pellets. These values differ from the (xf)p0 we have calculated here because (a) they allow for other forms of metabolic activity, such as cast molts and soluble excretion, in addition to fecal pellet excretion and (b) they were hased on slightly different values of «? D and 0p0.] Our estimates of 4.2 years and 1.2 years for (Tr)pi) and (Tf)po are to be compared with the total residence times tpb and Tp 0 at 2.4 years and 0.7 years, respectively. In both cases, the resi-
228 T.M. Béas Ley ec al.i °Po and Ph in Fecal Pellets
dence t imes due t o f e c a l p e l l e t s a l o n e a r e of t h e same order of magni tude b u t about 70 t o 90S l a rge r* t h u s imply ing t r .a t f e c a l p e l l e t s a r e r e s p o n s i b l e fo r t r a n s p o r t i n g about ha l f of b o t h t h e 2 1 0 ? O and the 2Tûp 0 from t h e s u r f a c e l a y e r t o dep th . I t x u s t , however, be emphas i z e d t h a t these e s t i m a t e s of (Tf)pb &nd (T/Jpo a re crudet an "average" zooplank-ton f eca l p e l l e t may not c o n t a i n t h e same 210p o and 2 1 0 p o c o n c e n t r a t i o n s as the p e l l e t s from Megaagctiphanes norvégien, l e ach ing problems may r e s u l t i n o u r o
V a l u e s being underes t imated and/ above a l l / t he value of y we have chosen i s s u b j e c t t o cons iderab le u n c e r t a i n t y . The
' o r d e r of magnitude agreement between t h e r and the t f i s , n o n e t h e l e s s , s a t i s f a c t o r y ; t h i s agreement p lus t h e f a c t t h a t t he 210po;2l6pb a c t i v i t y r a t i o i n t h e f eca l ma te r i a l i s a c c e p t a b l e s u g g e s t s t o us t h s t t s e r e i s a h-=h p r o b a b i l i t y t h a t z o c p l s - k t o n i c feca l p e l l e t s r l a y a s i g n i f i e s . t r o l e ir. the rénova i of bo th 2 l o r n a - c 2lOpb from the s u r f a c e l a y e r s cf the ccean. 210? 0 a .id 210pb measurements cr. fresr.ly c o l l e c t e d f e c a l p e l l e t s ; r e - rriKei socalanktcr. a re needed i n o r der t c s u b s t a n t i a t e our c o n c l u s i o n . S imi l a r measurements on f eca l m a t e r i a l c o l l e c t e d in t r aps - ;- va r ious d e p t h s i n t h e ocean -A-.JIC a l ; i,e very u s e f u l , a l though àilcwar. - ' i l l have t o ha made for l each ing problems when t h e à a t a i s i n t e r p r e t e d .
Acknowledgements. The Laboratory of Marine radioactivity operates under a t r i p a r t i t e agressent between the International Atomic Energy Agency, the Government of the Principality of Monaco a.-,d the Océanographie Ins t i tu te a t Monaco. The university of Cape Tcwn participants in this werk were supported by the South African national Cc.L-,cil for Océanographie Research. Support from the above bodies is gratefully acknowledged. Special thanks are due to the Station Zocloglgue cie Viilefranche, France, for furnishing the necessary ship-tise.
Litentur* Çhtd
Bacon, H.P., D.w. spencer and P.G, Brewer: 210pb/226Ra and 210p0/2l0pb dis equilibria in
t aeawater and suspended particulate nat ter . Earth planet. Sci, U t t e r s 32, 277-296 (1976J
Cherry, R.D., S.W- Fowler, T.M. Beasley and M. • Hevraud: Poloniua-210s i t s vert ical oceanic
t-ansport by zooplanktcn met'-bolic act ivi ty . Mar, Cheo. J, IOS-110 (1975)
Flyr.n, W.W.; The detersination of law levels of po?inius-21o in environmental materials. Analyiss chin. Acta 41, 221-227 [13631
?=wler, j ,w. , G. âenayour. ar.d L.F. S=ail: Experi-cer.ta: studies on feeding, çrcrjth and assiai-latior. z.T. a Keci^erranean ezshausiid. Thalas-s;a ;-j?ssl. 7, 35-47 (1571)
3ate of fi-i; =a-"scri?t aoceptar.ee: A'-içust 12,
-, M. Heyraud, L.F. Small and C. Benayoun: Flux of I 4 1Ce through a euphauslid crustacean. Kar. Biol. 21, 317-325 (1973)
Hallden, H.A. and J.H. Barley.: An improved alpha counting technique. Analyt. Chen. 32, 1B61-1663 (1960)
Heyraud, M. , S.W. Feuler, T.M. fie as ley and R.O. Cherry: Poleniua-21o in euphausiidsi a detailed study. Mar. Biol. 34, 127-136 [1976)
KharJtar, D.P., J. Thomson, K.K. Turekian and W. O. Forstex: Uranium and thorium decay series nuclides in plankton from the .Caribbean. Litanol. Oceanogr. 21, 294-29- (1976)
Krishnaswajni, S.. D. Lai and 8.L.K. Somayajulu: Investigations of gram quantities of Atlar.-.„z and Pacific surface particulates. Earth planet. Sci. Letters 32, 403-419 (1976)
La Rosa, J.i A simple system far recovering zoo-plankton ic faecal pellets In quantity. Deep-sea Res. 23, 995-997 (1976)
HI Hard, H.T., Jr.: Quantitative radiochemical procedures for analysis of polenium-210 and lead-210 in minerals. Analyt. Che». 35, 1017-1023 (1963)
Nozaki, Y-, J.J. Thomson end K.K. Turekian: The distribution of 2tCpb and 2l0p o in the surface waters of the Pacific Ocean. Earth planet. Set. Letters 32, 304-312 (15761
- and S. Tsunoçai: 226Ra, 210pD ^^ 210p0 ais-equilibria in the Western North Pacific. Earth planet. Sci. Letters 32, 313-321 (1976)
Osterberg, C , A-G. Carey and 0. Curl: Acceleration of sinking rates of radionuclides in the ocean. Mature, Land. 200, 1276-1277 (1963)
Raaa, M. Koide and E.D. Goldberg: Lead-210 in
natural waters. Science, N.Y. 134, 98-99 (1961) Shannon( L.V., R.D. Cherry and H.J. Orren: Pol;-
niUD-210 and lead-2lo in the marûe environment. Ceochlm. cosmochiin. Acta J4,7ol-711 (1970)
Snail, L.F. and S.W. Fowler; Turnover and vertical transport of zinc by the euphausiid >!ega~ nyctipti&nes norvegiea in the Liçurian Sea. Mar. Biol. IS. 2B4-290 (1972)
--and 5. Keckés: Flux of zinc through a macro-pi anktonic crustacean. In: Radioactive contamination of the marine environment, pp 437-452, Vienna: International Atoaic Energy Agency 1973
Tsunogai, S. and Y. Kozaki: Lead-2to and polo-niUJE-210 in the surface water of the Pacific. Geochen. J. 5, 165-173 (1971)
Turekian, K.K., D.P. Kharkar and J. ThomsonÎ The fate of 210p0 a n (j 210p0 in the ocean surface. J. Rech. Atmas. B, 639-646 (1974)
Hiebe, P.H., S.B. Boyd and C. Wingeti Particulate natter sinking to the deep-sea floor at 2000 m in the Tongue of the Ocean, Bahamas, with a description of a new sedimentation trap, J. mar. Res. 34, 341-354 (1976)
Dr. T.M, Beasley Marine Science Center Oregon State University Newport i Oregsr. 97365 USA
1S77. ccmunicated by J.M. Pérès, Marseille

Marine Uioloçy 5 - , MARINE BIOLOGY C- by ^DringerA'eriug 1979
Polonium-210 and Lead-210 in Marine Food Chains
M. Hayriud 1 md R.D. ChwrY^
* Internrtionai laboratory of Marine Radioactivity, Muitft Océanographique; Principality of Monaco, and ^Phytic* Department. Univentty of Capo Town; Honctaboich, Caps Province. South Africa
210po and 210Pb have been measured systematically in whole animals, muscle and hepatopancreas of crustaceans and of mol lus can cephalopods representative of a pelagic and benthic food chain. The same nuclides were also measured in liver, pyloric caecum, stomach contents and muscle of tuna. The concentration factors from sea water to whole animals were approximately constant along both food chains« being of the order of 10^ for 210po and 1o2 for 210pb, The highest concentration factors wera found in shrimp of the genus sergeszes. In muscle, the concentration factors were an order of magnitude less; in the hepatopancreas, they were an order of magnitude higher, reaching lo6 in shrimp of the genus ssrgestes. Such concentrations imply alpha-radiation^ doses of the order of 10 rem per year and more in this organ, which contains about* SO to 90.% of the 210po i n the whole animal in the 11 species analyzed. A detailed study of the intracellular behaviour of 210p0 in the hepatopancreas is clearly indicated. 210po can be used as a sensitive natural tracer in biological systems. Thus, feeding «eganyetipftanes narvegica, in the laboratory on food low in 210p0 i ed to an approximate value of about 6% days for the hiological half-life of 2l0pQ in the hepatopancreas of this euphausiid. Furthermore, the data on 210po a n a 2l0pb in the cephalopod hepatopancreas allowed the time of conservation of frozen squid which had been bought at the market to be estimated.
i..i> id union
T'->' -intity of experimental data for ural fallout nuclide 210po i n ma-ganisms greatly exceeds thi for
c . ner alpha-emitting nuclide (Cherry Shannon, 1974). Much of the data i s ,
h iver, rather scattered and fragmentary, and detailed studies of 210po in either .=. food chain (Beasley et al . , 1973; Hoffman ec aj . , 1974) or a particular organism (Folsom et al., 1972; Hey-raud seal., 1976) are few. On more than one count, 2l0n o i s nonetheless of part icu lar interest : not only i s i t concentrated in most marine organisms to a level much higher than the other alpha-emitters, natural or a r t i f i c i a l , but in certain organs really exceptional 210po
concentrations are found. The hepato-pancreas of crustaceans {Cherry et al . , 1970: Beasley era! . , 1973; Heyraud « aj., 1975) and the pyloric caecum of the tuna IFclsom ec aï., 1972) are noteworthy in this respec-, and the concentrations ob
served give r i se to alpha-radiation doses which can be more than two orders of magnitude higher than the average natural radiat ion dose to which man is exposed. It- seemed to us that i t would be worthwhile to undertake a systematic study of 210po and i t s beta-emitting grandparent 2 1 0 P b in marine organisms, not merely to add additional values to the already long l i s t of data, but with the following specific aims:
(1) To examine and compare the evolution of 210PO and 210pfa concentrations along the length of a pelagic and a benthic food-chain.
(2) To measure the concentration of 2l0p o and 2l0pb not only in the entire organism but also in the muscle tissue and the hepatopancreas of each organism studied. The l a t t e r additional measurement aims to establish the generality of high 2l0po concentrations in the marine hepatopancreas and to enable interspecific comparisons of a high radiation dose domain to be made; the former aims
OO25-3ie2'7S/0G52i10227/502.CO

228 « . Heyraud and B.D. Cherryt 2 1 0 ^ a n d 2 I O P b t n Marine Food Chains
to a l low an i n t e r s p e c i f i c comparison of the 2 1 0 P o content of that port ion of the organism which frequently contr ibutes to the human food supply.
(3) To try to est imate the turnover time of natural *10po in the hepatopan-c'reas, with a view of providing an i n d i c a t i o n of the s i t e and accumulation mechanism of the element i n t h i s organ.
Materials and Mathodt
The plank ton ic animals were obtained by f i s h i n g a t night of f Monaco or V i l l e -franche (France) using a 1 n plankton ne t (76 um aperture) for the microzoo-plankton and an Isaacs-Kidd mldwater trawl for the macrozooplankton. Cephalo-pods , some of Mediterranean and some of A t l a n t i c or ig in* were obtained from the l o c a l market, and the tuna by l i n e - f i s h ing o f f Monaco or Antibes (France) . Micro zooplank ton were measured whole , but the o ther animals were, where p o s s i b l e , d i s s e c t e d in to three samples comprising the hepatopancreas» a portion of iruscle and the "remainder", r e s p e c t i v e l y ; in a few c a s e s d i s s e c t i o n was into two samp l e s comprising the hepatopancreas and the "remainder" only. For the tuna, 4 samples were analyzed: l i v e r , p y l o r i c caecum, stomach contents and a port ion of muscLe.
A l l samples were oven-dried a t 50°C and d i g e s t e d in a mixture of n i t r i c and p e r c h l o r i c ac ids followed by hydrochlor i c a c i d . Polonium was then spontaneousl y d e p o s i t e d on a s i l v e r d i s c suspended i n o . 3 s HC1 a t 60°C for 16 h. The d i s c s were counted with ZnS(Ag) phosphores on a t o t a l alpha-counter (Hallden and Har-l e y , 1960) , and ZlOpo was determined (Black, 1961; Millard, 1963; Flynn, 1968) . After the f i r s t depos i t i on of polonium, the o . 3 N HCl s o l u t i o n s were kept for about 6 months. At the end of t h i s time the 2 1 0 p o , which had i n the i n t e r i m grown in from the 210pb which t h e s o l u t i o n s contained o r i g i n a l l y , was d e p o s i t e d on a new s i l v e r d i s c and counted as before; a simple ca lcu la t ion , then gave the I n i t i a l 210pb concentrat i o n . A reagent blank was prepared with each s e r i e s of samples.
To es t imate the turnover - t iae of 2 i 0 p o i n a hepatopancreas, specimens o f the euphausl id tf«gsnyeeipftafles nosvegica were kept i n the laboratory and fed for a reasonably long period on a c u l t u r e of Artssia salisa. containing very l i t t l e 21Qpo. For p r a c t i c a l reasons t h i s e x periment wag carr ied out wi th s e v e r a l b a t c h e s o f euphauaiids, the same procedure be ing followed each timet Immedia t e l y a f t e r c o l l e c t i o n , some .V. aorvegica
specimens were d i s s e c t e d on board ship into "hepatopancreas" and "remainder". Other x. nocvegica from the same c o l l e c t ion were taken to the laboratory, kept at 13°c in i n d i v i d u a l b o t t l e s of sea water and fed every day with A. saiina. After 2, 3 , 6 or 18 days , these euphau-s i i d s were d i s s e c t e d i n the same way as those c o n s t i t u t i n g the "time zero" samp l e . A l l the samples were then analyzed and the t i m e - v a r i a t i o n of 210po in the ' whole i n d i v i d u a l , the hepatopancrcas and the remainder was fo l lowed.
In order to be a b l e to estimate the concentrat ion f a c t o r s of 210po and '-lOpfa from sea water to the organism* and/or organs s t u d i e d , some Mediterranean sea water samples were taken during a cru i s e on USNS "Hayes" and were analyzed f o l lowing the method o f Shannon and Orren (1970). These u n f i l t e r e d samples were taken a t d i f f e r e n t depths using a Bodman b o t t l e , a c i d i f i e d Immediately, and kept in p l a s t i c cans p r i o r to a n a l y s i s .
Results
Pelagic Chain
The 210p o a n d 210pb concentrations found in the animals c o n s t i t u t i n g the pelagic chain are g iven i n Tables 1, 2 and 3. Whale-animal data were of course ca lcula ted by combining the value found for the "remainder" w i th those for the musc l e port ion and the hepatopancreas, due account being taken o f the weight proportion of each o f the three f rac t ions . In Table 1, the data for microzaoplank-ton, euphausl ids and p e l a g i c shrimps are grouped toge ther ; t h e s e cons t i tu te the f i r s t l i n k s o f t h e cha in a f ter phyto-plankton. Wa were unable to c o l l e c t a s u f f i c i e n t l y pure sanple of Mediterranean phytoplankton, but a sample c o l l e c t e d o f f the c o a s t of Peru was analyzed i n s t e a d . Examination of Table 1 revea ls three s a l i e n t f eatures : (1) The p a r t i c u l a r l y h igh 2 1 0 P Q concentrations i n shrimp of the genus Setgesces, in both the hejatopancreas and the wl.ole shrimp. (2) The r e l a t i v e l y low 210po values in the muscle of a l l animals , in contrast to the high va lues i n the hepatopancreas; 2 i 0 p o concentrat ions i n the hepatopancreas are two to three orders of magnitude higher than i n the muscle. The 210pb column has been omitted for muscle because 210pb could not be detected in any o i the samples analyzed; in consequence, only lower l i m i t s for the 210pb concentrat ion In whale animals could be ca lcu la ted i n t h o s e c a s e s where a muscle sample was. taken, (3) The lower-than-usual values found i n the animals c o l -

H e v r a u d and R-D. C h e r r y : 2 l 0 P 3 a n d - l O p b i n H a r m s Food C h a i n s
Tabla 1. K l a g i c chain . Concentration» at 2iOp Q ami 2IOpb IpCi n*I dry weight) i n sane crus ta ceans representat ive of Che f i r s t Links of a p e l a g i c food chain. E x p e r i o e n u l errors are a t th« la l e * e l , and include the propagat ion of the background blank error as « n i l a s the s t a t i s t i c a l cauntinq"error of the saep le i t s e l f , tia; not oeaacred; H;0 • wet:dry "wlqht r a t i o , Mo JlÛPb eau Id M detected in any or ttie o u s e l s saaples analyzed, t'o data were a v a i l a b l e for HedJ=«r-r i M i n pnytsplanltton, but In a soap le of Peruvian phytaplanktan the c D n c i n t r i U e n of !>°?o was 6.4 : 0 .4 pCi g- l dry walghc and 210?b was 0 .9 I O.l pel q~l dry weight
Saspla Hhole anIsaI Huicle Ueaa a l o p 0 11:0 l lDPo 21ÛPh H t B 210FO
Ueaa a l o p 0 2lc?a
Hined alcrc^ooplanktont October 1973 OcUStr 1973 9 . 4 21 .4 1 1 . 2 O.6HO.Q0 January 1374 7 . 0 7 .5 1 0 . 2 0.21ÎD.O2 January 1974 7 . 4 11.0 : o . : 0 , 3 0 » . 0 3 March 1974 &.£ 9 . 6 SO.3 0.2EÎ0.04
ffafanyceiphanrs sorveg i r a
oecanar 1973 3 . 7 1.5 ÎO.I 3 . 9 0.251Q.02 3 . 1 2511.9 January 1977 n a O. 6010.03 0 .15=0.01 e a n a n a 13*0.6 o.eaio.07 Harch 1977 n a 1.7 » . l >0.0410.01 n a 0.2TM.O4 n a 2611.3 D.1210.04 Septesber 1977 n s O.4110.04 n a n a n a n o 3 .7SJ .S n a
SipLSS»; 1377 res 0 .71*0 .06 a . a i l o . o i n a na n » n a r a
January 197 a r s i . ï 10 .1 n a n a n s a s 3211 s a
PaiipJjjp* iji/dda Saptesber 1377 3 . ? • . 9 1 0 . 1 iO .o2 io .o i 4 . 2 O.13Î0.O1 3 . 6 1311 D.031S.01 Saptesber 1977 3 . 9 1.2 ! • . ) 1 .02Î0.01 n e n a n a n a n a
Koueafier 1977 n a 1.3 10 .1 »Û.04Î0.Q1 4 . 6 0.1410.0I 3 . 3 2712 0 .36*0.07 Hevcaber 1977 n e 1-5 ID . 1 0 .04 tO. Ol n a n a n o n a n a
Hovesber 1977 1.3 10 .1 O.DSIO.OI n a 2B13 O.E313.D9 January I373 . n a J . I i o . i D.OJlO.OI n a • na n a 4512 0."513.07
5er?»jE*s a r c t i c t » March 1977 S . O 21*1 •0.0310.01 4 . B 0.7410.03 2.a 16214 D.09:o.04 Septasber 1977 3 . 9 1411 O.OSlO.Ol n a n_i n a 11a n a
Hav«=aer 1977 4 . 1 2611 O.lSlO.OI n a n s a s l i s n a
January 1975 n a 2411 1.3 10 .1 n a n a n a 17014 1111
Sirgestes sp . 3 . 9 1911 *0 .09 l0 .02 4 . 4 O.30Î0.04 3 . 7 22519 1.1 ÎD.2
Table 2 . taliga v u l g a r i s , Ceneaatracions a ï l l a ? a and 2'Cpo (pCt g~ l dry weight) l a d i e squ id , va lues c i t e d are c u m ; errors are standard d e v i a t i o n s based on eh* spread between saaples i range o f i n d i v i d u a l va lues i s çitrtui i n parentheses , na: not aeasurndt nd: not d e t e c t e d ! H:D •= wccidry weight r a t i o
Area and no. Hhole an laa l Muscle Kesa 0 - a i - r « s at saaples H;D <tt, B
JlOpb H : 0 -iQfo 210îb U i D 2 l 0 ? o ilOFb
Mediterranean (51 4 . 9 4 . 3 1 1 . 3 K . 1-7.1)
XJ,004l O.O03 ind»o.ooa]
4 . 4 n a n o 4 . 6 9114É 146-164)
0 . 1 6 * 0 . 1 : (nd-0.32)
A t l a n t i c F i r s t s e r i e s (S) 4 . 4 O . l l lO .Ol O.05 I 0 . 0 4 4 . 4 O.05Ï.0.02 0.O11C.O1 4 . 2 3 . 7 1 2 . 9 O. 79*0.44
(D . l l -O.12) IO.Dj - D.CB) ia.o3*o.oei (nd-O.OZ) t 1 . 6 - 8 . 7 ) IO. 34-1.4)
Secand s e r i e s t4i 4 .4 3 .7 M . 6 SO.OJ 1 0 . 0 1 4 . 4 0.66*0.1a o . c i i o . 0 2 3.3 62112 0.6910.62 (3.B -4 .11 CO.01 ->0.0S) (0 .47-0.90) (nd-O.04) 145-731 (0 .37-1 .6)
Table 3 . ~*:uRfluc thgestis. C=n csn tra Ci ens of 2 I O P s and 2IOPb CpCi g-1 dry veiahc) In l i v e r , p y l o r i c « e c u s , stocach t e n tan t s «ni suse la of the t-^ca. Exparisentai errors ara at Che la Uvtl and i n c i t e the propaeat icn of the baekarauna blank error as w e n as ttia s U u s t i « l countinq error at the t i = ? l e i t s e l f , na: cot ceasuredi ndi not detected) W:D • uet:dry ve içhr r a t i o
Welobfc Lirer Steasch contents HiD 210»a 21Dp^
T-jna s o . 16 12 k?
Tan* «=. :E :a K ;
r-in. so. 19 12 kq 3.6
14.523.7 O.031D.O1
IB.610.5 O.OSlO.O!
S .910 . . O.O^o.Dl
i401S 0.D31O.0) j l i q u i d 7.OlO.fi ni
l û î i i 0 .0510,0! l iquid e . e r a . o o . c 6 l 3 . c 6
41*3 0.031D.01 s o l i d ' 2.E10.3 0 .1213 .0?
O.34TO.02
0.4613.04

M. Heyraud and R.D. Charryj 2 1 0 P o and 2 1 °Pb in Marine Food Chains
l e c t e d in September 1977; a l l of t h e s e were c o l l e c t e d on the same n i g h t .
Table 2 summarizes t he r e s u l t s o b t a i n e d fo r the squid Loliga vulgaris. These a r e a t f i r s t s i g h t r a t h e r s u r p r i s i n g : t he d a t a Cor the Medi terranean s q u i d a r e i n good agreement with those f a r t he
"second s e r i e s of squid from the A t l a n t i c a s f a r a s 210p a i s concerned, and show 2lopo: 2">apb r a t i o s of about 1Û0 o r more, whereas those for the f i r s t A t l a n t i c s e r i e s seem t o be completely a t y p i c a l , w i t h low 2 1 0 p o con ten t s and v e r y low 210p O ;210pb r a t i o s of about 2 . As w i l l be d i s c u s s e d l a t e r , t h i s appa ren t anoma l y can be explained by the f a c t t h a t t h e f i r ^ t Aclant . ' .c -ser ies i n d i v i d u a l s had been frozen Tor an unknown p e r i o d be fo re a n a l y s i s . Other po in t s t o be noted in Table 2 a re t h a t t he 210p o l e v e l s i n t he hepatopancreas a r e once a g a i n h igh and t h a t the Ziûpb va lues a r e lower i n t h e Medi terranean than i n t h e A t l a n t i c specimens .
The Table 3 da t a c o n f i r a Folsom et, al,' s (1972) f inding cha t t he p y l o r i c caecim of t he tuna i s very r i c h i n 2 1 0 ? o . The lower concent rac ions found i n Tuna So. 19 a r e worthy of note ; t h i s specimen was caugh t on the sane day and i n p r a c t i c a l l y t he same place as Tuna No. 18, b u t t he appearance of the stomach cont a n t s I n d i c a t e s t h a t the food was i n a l e s s advanced phase of d i g e s t i o n t h a n i n the o t h e r two i n d i v i d u a l s .
t h a t both 2l0po and 210pb a r e c o n s i s t e n t l y h i g h e r i n t h e c u t t l e - f i s h than i n the octopus h e p a t o p a n c r e a s .
Turnover Time
The r e s u l t s from t h e d i f f e r e n t e x p e r i ments performed i n o r d e r to es t imate the tu rnover t ime of 2 iOp a i n the hepatopan-c reas of Heganyctiphanes norveçisa are c o l l e c t e d t o g e t h e r i n Tab le 5 . The concent r a t i o n s a t t ime z e r o can be taken as 100% and those a t t imes 2 , 3, 6 and 18 days expressed a s a pe rcen tage of t h e i r r e s p e c t i v e t i m e - a e r o v a l u e s . The hepatopancreas d a t a t h u s t r e a t e d a r e presented g r a p h i c a l l y i n F i g . ! ; a s i n g l e exponent i a l f i t g ives a " h a l t - l i f e " of 6.6 r 0.9 days as a measure of the turnover time of 210po i n t h e euphausi id hepatop a n c r e a s . The 210p o concen t r a t i ons in Art&aia sallna (Table 5) should be cots-pared wi th t h e c o n c e n t r a t i o n i n food-e a t e n by H. noxvegica i n t h e i r n a t u r a l s t a t a i n t he Med i t e r r anean ; t h i s has beer e s t ima t ed t o be 7.5 ± 1.4 pCi 5 " ' dry weight (Heyraud es al., 1976). The 1.2 pCi g - 1 d ry w e i g h t four.i i n t he A . salina used in t he March 1977 experiment i s not as low as one would l i k e i t to be, and the Day 18 d a t a p o i n t on F ig . 1 i s prcbably too h i g h i n consequence. Were t h i s p o i n t lower , t h e n the- e s t ima te for t he 210Po t u r n o v e r t i s ie would of course be lowered as w e l l .
SenCiic Chain
The r e s u l t s obta ined for t he b é n t h i c c h a i n , comprising shr imps, c r abs and e e -pha lopods , a r e given in Table 4 . Here a g a i n , t he h ighes t 21C?c c o n c e n t r a t i o n s a r e found i n t he s h r i a o , and i n t h e i r hepa topanc reas in p a r t i c u l a r . Mote too
Sea tracer
The 210po and 210p D c o n c e n t r a t i o n s found in the Medi te r ranean sea water samples a r e given i n Table 6. They a re unexcept i o n a l , both i n t e r r e of abso lu t e values and of t he s p r e a d obse rved (Cherry and Shannon, 1974).
Tabic 4 . Bcnthis s h u n - C=nc*nc.*eian* o f 2lQ7o and 2 I O R > (pCi 5 - ' dry v i e i l l e ) m ssea erustjc«j . i s and s s l l - j s c i n ï tphi loçod» repca l*ntat iv« nf a benchic food chain . &xpa£l=.«i*.eil e rrors act *E til» la l e v e l , and Include the propagation oT tha taaekoTatmd blank error t» ••'nil as che s c a c t i c i u l cou u n ? scror of Ehe Msple i u t l f . rjj t not d i u c t i d i w.D - - n c : d r / uaiqhc r a t i o
Saople ^ = u l Hgnjt3ojner**l W:Q JICpo : it ? . H;D •ifOPo JIOps M:0 ;iCpa t'tÛPb
Cyxnaca tttieauiiza 3.2 7.7 ta.2 * o . l û i o . o i Ï . 3 O. 1 120.02 nd 2 . 3 72*2 0.1523,37 Pjljénooe s cr f i c tu 3.2 i 6 * û . l »O.OSi3.0ï 4.1 Q.3023.02 nd 2 .S 92*3 O.Z6ZV.10 Cjrci.ius nav.ias 3.5 1.5 12.1 D . i - t r s . ^ : 4 .2 • . £ 0 * 0 . 3 9 0 .34 » . 3 1 3 . 0 1021 0.3423.31 07Z=put roi;J.-;* B.I 2 .4 ta.i A.1523.01 ;.. O. 2123.02 0 .0a 33.01 3 .a 2311 1'.3 23.1
«.: 2.Q =0.1 o . O s i o . ; i 4 .9 0 . ::t">. o ï 0.33*:3.COl 3.Q 2211 Q.5a-3.CJ
;.: 1.5TI3.C4 » O . = J : 3 . C ; 5.2 0 .2123 .0 ; ni 2 .5 1321 0 .22*0 .9 : 4.7 ; a . t a.ZJZO.si 4.3 o . : 3 : a . 3 l 0 .32 ZZ.il 3.2 1.2 : a . i
i s a a l l ! Sepii Ciiisir.Jiij i.~ i.i ; a . s 0 .3329 .21 •1.5 a . l ] * 0 . 0 2 T.^OTSO.MJ 3.4 = 42t 2.3 ; a . 1
Sept* sttisisjlu ï . ï : . = - 1 3 . 5 4 •o.nrs.oi 3.3 0.C623.31 n i 3 .3 4411 i . ' -j . i iiar^B)
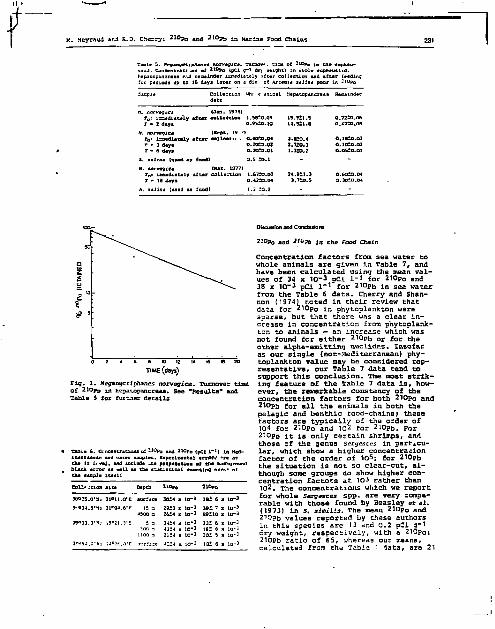
X . H e y r a u d a n d R - 3 - C h e r r y : 2 I 0 P o a n d 2 1 0 ^ , ^ M a r i n e F o o ( i c h a i n s
Taule S. Keginçciiph+n** norvégien. Tumovf - t i n e ef 3 l 0 p o in t h * euphau-s u d . Concentrât! -ns etf i t 0 P o fpCi g- l dr> weight) in whale «oph*uai id , hepatapancrea» e-.i reneinder l œ e d i a t e l y af ter c o l l e c t i o n and * ( t « r feeding far P*nod» up to IB dayi l acer on a die of Arceau M J J H J poor in - l °Po
! a n i o i l Htpatspansi Remainder
. narve-jicj (Jan. 1973] T a ; isaadiace' ly a t u r c o l l e c t i o n 1.5BÎO.09 r - 2 daya o . S S I o . l o
. norvégien ISept . 19 7 ) Ta: i s s c d i a u l y i l n r c o l l e e t i r . o . 4 o î o , 0 4 r - ] daya O.ÏOI3.QÎ T - & day» o . i a î a . o i
. s e j i n a (usad as foodl 0 . 5 i o . l
. norvej iea ttttt- 1977} T D ; t s a c d i a t a l y a f t a r c o l l e c t i o n I .6720.07 r - 13 day* o.tlio.QA
. saJina (used ai food) 1.2 ±0.2
0 . 1 B ± D . O 3 0.101O.O3 O.OS±D.01
TIME (days)
F i g . I . Meçanyctiiphanes n o r v e g r i c a . T u r n o v e r Hmi»
o f 2 l 0 p a m h e p a i . o p a n c r e a s . S e e " R e s u l t s " a n d
T a b l e S f o r î u î î a e r d e c a i l s
TaBla 6 . Concentrations of^lOpa and 210pn (pCi 1 - I J icerranean sea " « e t sa=pl«s . Expet izenta l «rratv the la l< v e l . and include J i e propagation of ttia blank « r ï d f as wall as che s t a t i s t i c a l count ing *rr taa sasp la Lcsel î
C a l l ' : t i an H t * Depth 210?© Î I O P S
30°ÏS.0'Mi l i a i l . a ' E surface 50l4 x t o - 3 3BÏ fi •
:9«33.3'!J; \A-l\.y%
i ta-3
. 10-3
Dûcuiston end Conduiïans
2 * ° P 0 a n d 2 / i ? i i „ C h e F o o d Cfcain
Concentration factors from sea water to whole animals are given in Table 7, and have been calculated using the mean values of 34 x 10-3 oCi 1-1 for 210po and 38 x 10-3 p c i 1-1" for 2i0ph in sea water from the Table 6 data. Cherry and Shannon (197-1) noted in their review that data for 210po in phytoplankton were sparse, but that there was a clear increase in concentration from phytoplank-ton to animals — an increase which was not found for ei ther 2 1 0pb or for the other alpha-emitting nuclides. Insofar as our single (non-Mediterranean) phytoplankton value may be considered representative, our Table 7 data tend to support th is conclusion. The most s t r ik ing feature of the Table 7 data i s , however, the remarkable constancy of the concentration factors for both 210p0 and 210pb for a l l the animals in both the pelagic and benthic food-chains; these factors are tyoically of the order of 104 for 210po and 102 for 210pb. For 210po i t is only certain shrimps, and those of the genus sergestes in particular , which show a higher concentration factor of the order of 1O5 ; for 210pb the si tuation i s not so clear-cut, a l though some groups do show higher concentration factors a t 103 rather than io2. The concentrations which we report for whole Jergesces spp. are very comparable with those found by Beasley et al. (1973) in S. slaiîis. The mean 210po and 21Qpb values reported by these authors in this species are 13 and 0.2 pCi g-1 dry weight, respectively, with a 210po: 2lopb rat io of 65, whereas our means, calculated frcn the Table 1 data, are 21
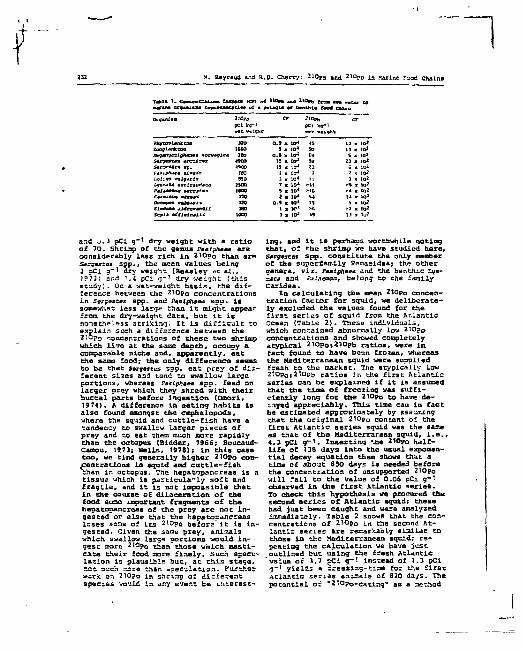
M. Heyraud and R,D. Chtrr/ : 2 * 0 p a and 2 l 0 P 3 t n «arine Food Chains
t U W O T t e n o£ !«»*> and ZWpSj î n s « s** M I X « p « U 4 i e ar Senthtc fiaod o u i n
OlIJOliSB 3 I 0 p 0
pet * r l
cr CF
Wqrtrtpljftxeaq 310 0 . 9 « W* 45 12 x tO> zoopLudccan IS60 S x 10* SO 11 X 10l .•teyjnycsfpft-ttv* norvB9i«« 390 a.a * to 4 19 5 x. lai Smtj**t** « c s i c s s 49QO t5 s tO 4 98 23 x IO* S w ^ e M c * tf. «eo 15 x t o 4 23 6 - 1Q* Pitipfue* tlvasto 360 I • l O 4 9 2 • IQl loliqo vnlçtxia BSO î * ID 4 11 3 x I 0 1
i ^ s a i U *«eieaurf*cj ISOQ T • 1 0 4 > ï l »» X 10* PiJiMfla» » # « * e u s IfiOO 5 x 10- >16 >4 x to* Carr-^nar H W U 710 2 K ÏO 4 54 14 x lQl ocsopu* v a J ç j r j s 320 0 . 3 x (0* 13 5 > to* Clmfcja* jJttraraKSUi 3ao 1 x IC' *& >2 x lOÎ Sepia ( r f f i c f a j i i * IOCS 3 x tO 4
« 13 * 1DÎ
and w-3 pCi g - 1 dry weight with a rat io of 70- Shriap of the genus Basipnaes are considerably less rich i a 21Qpo than are Sergestas spp., the mean values being 3 pCi g _ 1 dry weight (Beasley et a*., 1973) and 1.4 pCi g - 1 dry weight (this study}. On a wet-weight bas i s , the difference between the 210po concentrations in Sezjestes spp. and ?«ipftaea sop. i s somewhat less large than i t might appear from the dry-weight data, but i t is nonetheless striking. I t i s d i f f icu l t to explain such a difference between the 21Cpo ".oncentrations of these two shrimp which live a t the same depth, occupy a comparable niche and, apparently, eat the same food; the only difference seems to be that Seryestes spp. eat prey of different sizes and tend to swallow large portions, whereas ?asiphae* spp. feed on larger prey which they shred with their buccal parts before ingestion [Omori, 1974}. A difference in eating habits i s also found amongst the cephalopoda, where the squid and cut t le - f i sh have a tendency to swallow larger pieces of prey and to eat them much more rapidly than the octopus (Bidder, 1966; Boucaud-Camou, 1973; Hells, 1978); in th i s case too, we find generally higher 210PQ concentrat ions in squid and cu t t l e - f i sh than in octopus. The hepatnpancreas is a t issue which is particularly soft and f rag i le , and i t is not impossible that in the course of dilaceration of the food some important fragments of the hepatopancreas of the prey are not ingested or else that the hepatopancreas loses some of i t s 2i0pQ before i t is ingested. Given the sane prey, aniaals which swallow largs portions would ingest more 2 1 0 ? o than those which masticate their food more finely. Such speculation is plausible but, a t t h i s stage, net much ziore than speculation. Further work en 2i0?a in shrisp of different species would in any event be in teres t
ing, and I t i s perhaps worthwhile noting that , of the shrimp we have studied hare, Smrgesces spp. consti tute the only member of the super family Penaeidea,- the other genera, viz. Paslphaea and the benthic £ys-aaca and Palamea, belong to the family Caridea.
In calculating the mean 210po concentrat ion factor for squid, we deliberately excluded the values found Ear the f i r s t series of squid from the Atlantic Ocean (Table 2J. These individuals, which contained abnormally low 2î0po concentrations and shewed completely atypical 2!Opoi2lOpb ra t ios , were in fact found to have been frozen, whereas the Mediterranean squid were supplied fraah to the market. The «typically low 210p0îZlopb ra t ios in the f i r s t Atlantic series can be explained if i t is as sinned that the time of freezing was sufficiently long for the 210po to have decayed appreciably. This time can in fact be estimated approximately by assuming that the or iginal 210?o content of the f i rs t Atlantic series squid was the same as that of the Mediterranean squid, i . e . , 4.3 pCi g~1. Inserting »Jie 210po half-l i fe of 138 days into the usual exponent i a l decay equation then shows that a time of about 850 days i s needed before the concentration of unsupported 210po will fa l l to the value of 0.06 pCi g-1 observed in the f i r s t Atlantic ser ies . To check th i s hypothesis we procured the second ser ies of Atlantic squid; these had just been caught and were analyzed immediately- Table 2 shows that the concentrations of 2lOpo in the second Atlantic ser ies are re=arl<abiy siaiJUr to those in the Mediterranean squid; repeating the calculation we have just outlined but using the fresh Atlantic value of 3.7 pCi g" 1 instead of 4.3 pCi g-1 yields a freezing-time for the f i r s t Atlantic series animals of 820 days. The potential of "ïlopo-dating*' as a aethod
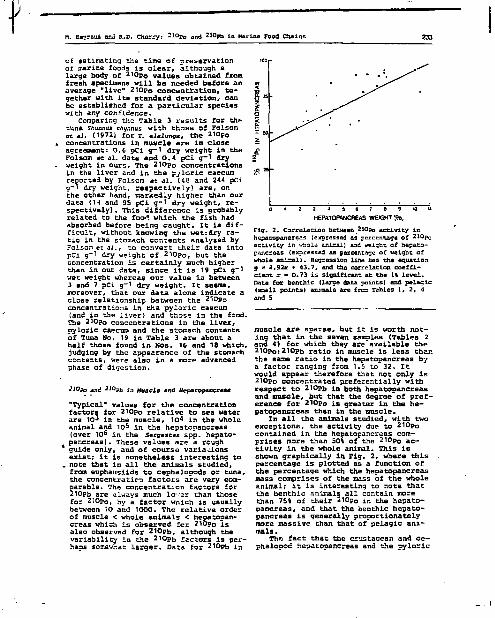
tie'/rauâ anâ î Cherryt 2 1 °Po and 2l0p a i n Marine Food Chains
of es t imat ing the t ime of p r e s e r v a t i o n of marine foods i s c lear , although a large body of 2l0p o values obtained from fresh specimens wi l l be needed before an average "live" 210PQ concentration* together with i t s standard deviation, can be established for a par t icu lar species with any confidence.
Comparing the Table 3 resul ts for the tuna Thunnas chynnus with those of Folsom ez aï. (1972) for r. aialunga, the 210po concentrations in muscle are in close agreement: 0.6 pCi g - 1 dry weight in the Folsom et al. data and 0.4 pCi g-1 dry weight in ours. The 210po concentrations in the l iver and in the pyloric caecum reported by Falsam et ai. (48 and 244 pCi g-i dry weight, respectively) are, on the other hand, markedly higher than aur data (14 and 95 pCi g-1 dry weight, respectively) . This difference i s probably related to the foo<* which the fish had absorbed before being caught. I t is difficult , without knowing the wetidry ratio in the stomach contents analyzed by Foison et al , , to convert their data into pCi g - 1 dry weight of 210po, but the concentration i s cer ta inly much higher than in our data, since i t i s 19 pCi g - l wee weight whereas our value i s between 3 and 7 pCi g - 1 dry weight. I t seems, moreover, that our data alone indicate a close relationship between the 210po concentrations in the pyloric caecum [and in the liver) and those in the food. The 210po concentrations in the l iver , pyloric caecum and the stomach contents of Tuna Ho. 19 in Table 3 are about a half those found in Nos. 16 and 18 which, judging by the appearance of the stomach contents, were also in a more advanced phase of digestion.
2t0pp and 3ÎOPb ^ Muscle and Hepacopancreas
"Typical" values for the concentration factors for 210po r e la t ive to sea water are 103 in the muscle, 104 in the whole animal and 10s in the hepatopancreas (over 10s in the Setgestes spp. hepatopancreas). These values are a rough guide only, and of course variations exist; i t is nonetheless interesting to
, note that in a l l the animals studied, from euphausiids to cephalopods or tuna, the concentration factors are very comparable. The concentration factors for 2i0pb are always much lo--er than those for 2l0po, by a factor wnich is usually between 10 and 1000. The relat ive order of muscle < whole animals < heoatapan-creas which is observed for 210po i s also observed for ZIOpb, although the variabili ty in the 210pD factors i s perhaps somewhat larger. Data for 210pn in
HEPATOPANCREAS WEIGHT'On,
Fig. 2. Correlation between 21 QPo activity in hepatopancreas (expressed as percentage o£ 210po
activity in whole anisai) and weight of hepatopancreas (expressed as percentage of «eight of whole anistal). Regression line has the equation y » 4.92* + 43.7, and the correlation coefficient x - 0.73 i s significant at the l l level . Data for benthic (large data points) and pelagic (saall points) aniaals are frc= Tables 1, 2, 4 and 5
muscle are sparse, but i t i s worth noting that in the seven samples (Tables 2 and 4) for which they are available the 2l0po:210pb ra t io in muscle i s less than the same ra t io in the hepatopancreas by a factor ranging from 1.5 to 32. I t would appear therefore that not only i s 210po concentrated preferentially with respect to 210pb in both hepatopancreas and muscle, but that the degree of preference for 210p0 i s greater in the hepatopancreas than in the muscle.
In a l l the animals studied, with two exceptions, the activity due to 210po contained in the hepatopancreas comprises more than SOI of the 210po act i v i t y in the whole animal. This i s shown graphically in Fig. 2, where th i s percentage i s plotted as a function of the percentage which the hepatopancreas mass comprises of the mass of the whole animal; i t is interesting to note that the benthic animals a l l contain more than 7S% of their 2l0g o in the hepato-pancreas, and that the benthic hepatopancreas i s generally proportionately more massive than that of pelagic an i mals.
The fact that the crustacean and ce -phalopoc hepatopancreas and the pyloric

234 H. Heyraud and
caecum of the tuna are exceptionally rich In 2 1 °Po i s intriguing on more than one count. Although the 2 1°l?o activity in these organs i s Indeed high, i t should be remembered that the mass of 210po involved i s very small; a 21QpQ activity of 10* pCi kg-1 wet weight corresponds to only 2 parts in 1015 by weight, and i t seems inconceivable that 2i0po could be a biologically essential trace element. Why, then, i s 210?Q accumulated to such high act ivi ty levels in these two organs? They are , moreover, two organs which are very different anatomically; what do they have in common with each other as far as 210po i 3 concerned? with what function of the organ, with what type of c e l l , i s 2l0p 0 associated? The crustacean hepatopancreas has secretory functions involving enzymes, functions of absorption and functions of storage, these different functions being carried out by different types of cel ls const i tut ing the tubules of the organ (Vonk, 1960; Bunt, 1968); the hepatopancreas allegedly plays a role in excretion as well (Parry, 1960). in the cephalopods we have analyzed the l iver and the pancreas seoarately, and i t is in the l iver that the high 210po concentrations are found; the concentrations in the pancreas are not exceptiona l , being about 3 to S pCi g-1 dry weight, in cephalapod l i v e r s , food reserves are accumulated and one again finds several forms of ce l l s - secretory, absorbant and excretory in the octopus and (with s l ight differences} in the cut t le-f ish, whereas in the squid only one cell-type, with both secretory and excretory functions, exis ts (Bidder, 1950, 1966). Finally, the pyloric caecum of fish plays a role in enzymatic secretion and in absorntion, of fats in part icular {Harrington, 1957; Phil l ips , 1969).
I t seems that 210po i s concentrated selectively in such organs, but a full explanation of the mechanism must await farther more detailed s tudies . At this stage i t is# however, worth mentioning two points which seem to indicate that th is concentration of 21Qpo i s not r e lated necessarily to the function of absorption; (i) the squid l iver does not have an absorptive function, but our measurements on the l iver of LaUgo vul-gaxis nonetheless show very high 210po levels; (ii) in a l l the cephalopods the caecum is an important s i t e of absorption, but analyses we have made of this organ show unexceptional 210po levels of the order of 1 to 2 pci g-1 dry weight.
Whatever the de ta i l s , one fact is clear: the hepatopancreas of narine crustaceans and cephalopods contains •
:.D. Chsrrys 2l0po a m j 2loPb in Marine Food chains
210po a t levels which are, exceptionally high by standards of the natural radiation environment. On the basis of the sparse data then available (Cherry et al., 1970; Foison eca i . , 1972) Beasley «cal . , 1973), Cherry and Shannon (1374) chose B000 pCi kg-1 wet weight as a "typical" value for 210po in the marine invertebrate hepatopancreas F the vali is they ci ted ranged from 1300 to >30i o pCi kg"'* wet weight, the "greater ^ans being due to a measurement in whi -ti unsupported 2l0po only was measured. Expressed on a wet weight basis, o i r va l ues for 210p0 in the hepatopancr is range from 3300 to 61000 pCi kg - They represent values from 11 different spec ies , and establish beyond doubt that high 2lOpo contents are the general rule in the hepatopancreas of marine crustaceans and cephalopods. Our data do ot indicate any substantial change in sie "typical" value of about 8000 pci Rç -1 wet weight, but they do show that tr, previous upper limit must be extends-: upwards. A concentration of about 6oe-0 pCi k g - 1 (wet weight) has been observed in three different sergestes spp. co l lect ions , and i t seems that this exceptional ly high level too must be regarded as the general rule for this genus. A comparative study of 210po in other animals from the super families Penaeidea and Caridea would be interesting and might bring to l i gh t other shrimp with concentra t ions similar to those found in the genus Sergestes.
Such elevated levels of 210p0 imply correspondingly elevated levels of the natural radiat ion dose received by the marine hepatopancreas. Hill (1965) has drawn a t ten t ion to the convenient a r i t h metical accident whereby a tissue concentration of 210po expressed as pCi kg-*1 wet weight becomes closely equivalent to an absorbed dose expressed in mrem year*~1 i f one assumes a re la t ive biological effectiveness of 10 for a l -
?ha-radiation. Using this , a "typical" 10po concentration of 8000 pCi k-î wet
weight in an hepatopancreas implies a radiation dose of 8 rem yeai—1, while a 5>rgestes-lifce 2 1 °Fo concentration of 6LOOO pci k g - 1 wet weight implies 60 rem year"*" to the organ. These doses should be compared with the typical to ta l natur a l radiat ion dose in man, which is generally assumed to be between 100 and 150 mrem year"*1, and with the atypically high doses of about 1 rem year" 1 r e ceived by the very small percentage of . mankind l iving in high radiation-dose areas. From our data i t seems clear that doses from 2l0p o alone of about 10 rem y e a r - 1 or more are the rule rather than the exception in the marine hepatopan-

K. Keyraud and R.D. Cherry: 2 l o Po and 210pD In Marine Food Chains
créas; this organ must consti tute one of the highest, if not the highest, widespread naturally-occurring radiation dose domains. A detailed study would appear to be warranted. Where exactly does 210po reside in the hepatopancreas cell and how is i t bound? why i s i *'- taken up so effectively in th i s organ? Does i t , for example, subst i tute for some essent i a l element in the protein reserves? Can any effects of the radiation dose be observed at the ce l lu la r level? A tenta-
# tive s ta r t has been made in th i s direction with a recent experiment invest i gating the in t race l lu la r location of
• ZIOpo in the hepatopancreas of the South African rock lobster; an association of 210po with the microsomal fraction i s indicated (Cherry et a i , , in press) .
Turnover Tise of 21°Po in the Hepatop&ncreas
The results obtained with Megantjcsi&ianes zorvegica fed in the laboratory with Arte-sna salin* indicate tha t the 2T0po in the hepatopancreas is eas i ly raobilizable if the euphausiics are fed on a diet depleted in 2 l o ? o . The A. salim we used had a 210po concentration of 0.5 to 1.2 pCi g~1 dry weight, i . e . , generally more than ten tines less than that found in the microzaoplanktan (Table 1) which must constitute an important part of the normal food of H. norvegica (Small and Fowler, 1973). Under these conditions the auphausiid "loses" about 10% per day of i t s 2T0pD, a value which corresponds to a "biological ha l f - l i f e " of about 6 Va days. I t i s very probable that , as in the case of tuna and thei r pyloric caeca, the 210po concentration measured in the crustacean hepatopanrreas r e flects faithfully the concentration in the food ingested during the same period. Under normal conditions, what i s measured is the resul t of a s ta te of approximate equilibrium, and the concentrations found are fa i r ly constant; if this equilibrium is disturbed by, for example, the arr ival of a bloom of phy-tcplankton part icular ly poor in 2lopo
, (Folsam and Beasley, 1973) , therr* could be a repercussion a l l along the food chain. This would explain why a l l the
• values we obtained from the September 1977 santples of ft. norvégien, Pasiphaea si-vads and Sergesces arccicu* are much lower than those found norma l ly i n t h e same species. I t is unfortunate that a sample c: microïaonlanîcton was not taken from the sar.e locality a t the same time to ccr.fiKT. this hypothesis) nonetheless i t rar.air.s plausible, and is in good agree--er.t with the resul ts attained by Hey-mi ez al. (1976) conceriing the impor
tance of food aa the source of 210pc in M. norvBffica. Finally, i t i s worth mentioning tha t another indication of a rapid turnover time of 210pQ in a marine hepatopancreas has been obtained in the cephalopods Octopus vulgaris and Elednnm a l -dravandii. L iv ing i n d i v i d u a l s of these species which had been kept alive for various time in the laboratory were anaesthetized and dissected; the 210p o
content of the hepatopancreas of each individual was then measured. Although these experiments were not sufficiently well controlled to be considered quantit a t i v e , they did nonetheless indicate a turnover time for 210p0 of the same order as that observed in the M. norvégien. i t seems clear that the 210po content of the hepatopancreas of a marine animal depends markedly on the 210po ingested by th«i animal in the days immediately
?r ior to dissection. Determinations of 10po made on animals which have been
kept al ive in the laboratory before analysis wi l l , therefore, not necessarily be an accurate reflection of the na t ural s i tua t ion , a caveat which applies to three of the Table 4 samples, i . e . , the two shrimps and the crab.
In conclusion, we can summarize the sa l ient features of our data as follows:
(1) Concentration factors for 210p0
and ZIOpb from sea water to whole animals are remarkably constant along both the pelagic and bentihie food-chains. Typical values are of the order of 101* for 210po (105 in shrimD) and TO2 for 210p b.
(2) As a rough guide, concentration factors for both isotopes are , for a l l species, an order of magnitude lower in muscle than in the whole animal.
(3) On the other hand, concentration factors in the hepatopancreas are general ly an order of magnitude higher than in the whole animal. For 210pof hepatopancreas concentration factors of about 103 are the general rule, and they r i s e to 106 in the genus sergestas. Further data on 210po levels in shrimp hepatopancreas from other genera would be interes t ing .
(4) The consistently elevated ziopo levels in the crustacean and the cepha-lopod hepatopancreas imply that these organs must constitute a high and widespread natural radiation-dose domain. A detailed study of the behaviour of 210p o
a t the intracel lular level in these organs becomes increasingly essent ia l .
(5) Our 210po data allowed us to estimate the time for which commercially purchased cephalopods had been frozen, and the turnover time of 210?o in & crustacean hepatopancreas. Measurements of 210po are simple and sensi t ive, and

M. Heyrauô and B.D. C h e r r y : - i a P o and 2*Opb i n n a r i n e Food C h a i n s
t h e p o t e n t i a l o f 2 1 0 p o a s a n a t u r a l t r a c e r i n m a r i n e b i o l o g i c a l s y s t e m s I s t o b e s t r e s s e d .
Acknavleâsetaents. The I n t e r n a t i o n a l Laborat o r y of Harine R a d i o a c t i v i t y o p e r a t e s under a t r i p a r t i t e agreement be tween t h e I n t e r n a t i o n a l Atonic Energy Agency, t h e Government of t h e P r i n c i p a l i t y of Monaco and t h e Océanographie I n s t i t u t e a t Monaco. The p r e s e n t work vas a l s o supported by the n a r i n e P o l l u t i o n Programme of t h e South African N a t i o n a l S c i e n t i f i c Programmes U n i t . He a r e g r a t e f u l t o C. Boyd and V. ïîniû f o r t h e p r o v i s i o n of t h e pfaytoplankton and tuna s a n -p l e s r e s p e c t i v e l y , and t o S.W. Fowlar and J . J . M . Siggo fo r c r i t i c a l comment» on t h e manusc r ip t .
Liitraiura Ciiad
Sarrington, E.J.W.: The -limentary canal and digestion, la: The physiology of fishes» vol. I. pp 109-161. 2d. by K.E. Bro«n. New ïork: Academic Press 195?
3easley, T.H,, R.J. Eagle and T.A. Jokela.- Pole— nltSB-210, lead-210 and stable lead in narine organism». Q. Susan, Rep. Blth Saf. Lab., N.Y. (Fallout Prags.J EASL-27J, 2-36 (1973)
3idder« A.M.: Tne digestive cechaniss of the European squids Lcliso vulgaris, t , forhesi, Allothaazis media and A. snoulata. Q* Jl aicrosc. Sci. 91, 1-44 (195o)
- Feeding and digestion in cephalopoda. In: Physiology of Mollusca, pp 97-124. Ed. by X. H» Wilbur and C M . ïonge. New yorki Academic Press 19SS
Black, S.C.i tow-level poloniua and radiolead analysis. fUth-Fhys. 7, 87-91 (1961)
aoocaad-Caaou, E.: Etude de l'appareil digestif de SBpi* officinalis L. (mollusque céphalopode]. Essai d'analyse expérimentale des phê-noaenes digestifs. T o n X. 20B pp. These de Oocteur es-Sciences Naturelles, Université de Caen 1973
Bunt, A,a.: An ultrastructural study of the he-patopanereas of Procambarus el&rkii [Girard) (Daeapoda, Astacidee). Crustaceans 15, 282-283 (1968)
Cherry, B.D., E.B.D. Dovdle and G. Toddt The intracellular sites of natural 2*opo in the lobster hepatopancreas. s. Afr. J. Sci. tin press)
- and L.V, Shannon: The alpha radioactivity of marine organisas. Atom. Energy Hev., Vienne
* 12, 1-45 U97<) - - and H.H. shays N a t u r a l a - r a d i o a c t i v i t y con
c e n t r a t i o n s i n bona and l i v e r f ro» v a r i o u s ' a n i m a i s p e c i e s . N a t u r e , Lend. 238, 1002-loo3
(1970)
• a t e of f i na l o a s u s c r i p t a c c e p t a n c e : March 23 ,
P ly tm, W.M. : The d e t e r a i n a c i o n of low l e v e l s o f p o l o n i o a ~ 2 l o in environmental m a t e r i a l s . A n a l y t i c a c h i a . Acta 43, 221-227 (1968)
F o i s o n , T R. and T.H. l e a S l ey ; C o n t r i b u t i o n s £ r o a t h e a lpha e m i t t e r , p a l o n i s a - 2 1 o , t o t h e n a t u r a l r a d i a t i o n enviromaent of t h e « f i f r o r g a n i s m s - xn* Radioac t ive contaminât i o n o f t h e m a r i n e env i ronnent , pp 625-832. V ienna : i n t e r n a t i o n a l Atonic Energy Agency 1973
- , K.K. Wong and v . p . Bodge: Soae e x t r e s e a c c u m u l a t i o n s of n a t u r a l polonium r a d i o a c t i v i t y obse rved in c e r t a i n oceanic o r g a n i s m s , in: The n a t u r a l r a d i a t i o n environment IX, pp 8 6 3 -B82. Hous ton , Texast Texas U n i v e r s i t y P r e s s 1972
B a l l d e n , K.A. and J . R . Bar ley : An l e p r o v e d a l p h a c o u n t i n g t e e h n l o u e , Analyt . Chem. 32, 1861 -1863 (I960)
Heyraud, M., S.w. Fowler, T-H. Beasley and H.D. C h e r r y ; ?o lon lu=-2 iS in eupn&usiids: a d e t a i l e d s t u d y . Kar. B i o l . 34, 127-136 (1976)
H i l l , C .R . : Poloniua-210 in nan . N a t u r e , Lond.
208, 423-428 (1955J Hoffman, F . L . . v . F . Bodge and T.R. P o l s o s : P o l o
n i u a r a d i o a c t i v i t y i n c e r t a i n a i d - w a t e r f i s h of t h e e a s t e r n temporal P a c i f i c . B l t h Phys . 26, 65 -7o (1974)
M i l l a r d , B . T . : Q u a n t i t a t i v e rad iochemica l p r o c e d u r e s fo r a n a l y s i s of poloniua-210 and l e a d -210 i n m i n e r a l s . Analyt . Ches. 3 5 , 1017-IO23 (1963)
OBBori, « . ; ifee b io logy of p e l a g i c shr imps i n t h e o c e a n . Adv. o a r . B i o l . 12, 233-324 (1974)
P e r r y , G . J E x c r e t i o n . l a s The phys io logy of C r u s t a c e a , Vol. Z. pp 341-3S3. Ed, by T .E , Waterman. New York: Academic Press I960
P h i l l i p s J r . , A.M.» n u t r i t i o n , d i g e s t i o n and energy u t i l i z a t i o n . Jn t F ish p h y s i o l o g y . V o l . I . pp 391-432 , Ed. by U.S . Soar and D . J . Haa-d a l i . Hew York: Academic Press 1969
Shannon, L.V. and K . J . Orren: A r a p i d method f o r t h e d e t e r m i n a t i o n of poloniua-210 and l e a d -210 i n s e a w a t e r . Analyt ica c h i a . Acta 52, 166-169 U9701
s m a l l , L.W. and s.W. Fowler: Turnover and v e r t i c a l t r a n s p o r t of z inc by the euphausi*d ttega-n u e t i p h a n e s norvegica i n t h e L i g u r i a n s e a . Mar. B i o l , ta, 284-290 (1973)
Vdnfc, H . J . Î O i g e s t i o n and metabolism. In: The p h y s i o l o g y o£~ Crus tacea , Vol . I . pp 2 9 1 - 3 U . Ed. by T . 3 . Ha te rsan . Hew York: Acadea ic P r e s s 1960
W e l l s , K . J . : Octopus . Physiology and behav iou r of an advanced i n v e r t e b r a t e , 417 p p . London: Chapman * H a l l L td . 1976
H i r e i l l e Beyraud I n t e r n a t i o n a l Labora tory of Marine R a d i o a c t i v i t y Musée Océanographie^» P r i n c i p a l i t y of Monaco
379. CoEaunicated by J.M. P e r e s , M a r s e i l l e
Ji iunal of TlanLion Rncarch Volume 1 Number A 1979
Food ingestion and digestive transit lime in the etiphausiid Meganyctiphanes norvégien as a function of animal size M.Heyraud
International Laboratory of Marine Radioactivity, Musée Océanographique, Monaco
(Received January 1979; revised August 1979; accepted November 1979)
Abstract. Laboratory «peri m en l s >*ith Mesanycitphanes norvegiea of different sizes (7 to 70 mg dryi fed OR Aeiemio laiina jho» that the ditty spécifie ingestion raie varies with animal «eight according IO a power law with a negative exponent of -0.38. This relation it used lo calcul»!e the production raie of faeces which is higher in the smaller individuals «hen expressed as a percentage of animal Hcwni: a comparison of the AJ_ norvegiea da» with published data for Catanus htttolamiim indicates that this rale is higher for the smaller species. Under the experimental conditions turd the digestive transit tune of food inM. nan/fgica is appreciably shorter in smaller animals (15 minutes versus 30 minutes]. The data, combined with other data previously obtained for the same species, show that (he metabolism of active, well-fed individual) is about three times higher than the sundard metabolism.
Introduction
In recent years it has been suggested repeatedly that paniculate products of biological origin play an important role in the vertical transport of radionuclides (Osierberg et al., 1963} and trace elements (Kuenzler, 1969; Lowman eral,, 1971). Using a model developed by Small et al. (1973) for the eupnausiid Meganyctiphanes norvégien, Cheny et al. (1975) and Hîggo et at. (1977, 1978) showed that zooplankton faeces played an imponani role in influencing the residence time of several alpha-emiuing.nuclides, both natural and artificial, in the upper mixed layer of the ocean. The importance of zooplankton faeces has been further highlighted by sediment-trap data (Wiebe et al., 1976; Honjo, 1978) which indicate thai some faeces produced in the surrace layer do indeed reach great depths in the ocean.
From consideration or the references just cited it emerges that quantitative data on food ingestion (and thence on faeces production) and on the food digestion time would be desirable and, indeed, are needed in order to evaluate more precisely the role of plankton in element transport. For this reason the present study of food-ingestion in Meganyctiphanes norvégien was undertaken, with animals representing a wide range of weights.
Methods Ingestion
Meganyctiphanes norvegica were caught off Nice at niuhl with an IKMT, sorted on board ship and, upon returning to the laboratory, were placed immediately in individual 750 ml glass jars filled with cotton filtered sea water. Jars were kept in the dark at 13.QZ 0.5*C. After a period of acclimatization to laboratory conditions (2 to 12 days) during which the animals were fed Anemia satina, euphausiids which had moulted once u ere u»ed Tor the experiment. The weights of ihe animals, taken at ihe XJttfl»mr!toa Reinexal Inc.. 2!D Hat StH 5irtei. Xtm York. U^A. IQI

M.Httratid
end of the experiment, ranged from 7 to 70 mg dry. To avoid significant weight variations during the experiment, animals were used at a maximum for only four days of the intermoult cycle; the approximately 24 hour period preceding moulting during which the animals do not eat (Lasker, 1966; Fowler et al., 197I) was thus avoided. \f. norvegica fed during the night on identical rations of living Anemia which were placed daily in each jar. A "control" jar containing only Anemia was included. To calculate the weight of the ration given to the animals, each day four samples of SO Anemia were rinsed with distilled water and their wet and dry weights recorded. The mean weight ( + Io)of an individual Anemia was then calculated and, depending on this weight, 50, 100 or 150 Anemia were added to each jar 'i such a way as to ensure that the ration given was always in excess of thai whicb it was possible for an animal to eat. The following morning the Anemia remaining in each jar, including the "control", were collected by filtration on Blutex nylon No. 26 (0.76 x 0.88 mm); this retained the Anemia either whole or partially consumed, but allowed the faeces to pass through. The Anemia thus recovered were rinsed with distilled water, dried at 70SC and weighed. The dry weight of the "control" Anemia was always slightly less (by about 6%) than the dry weight calculated from the ration given. This was almost certainly due to the fact that the Artemia emptied their digestive tracts during the night. The actual ration given to each animal was accordingly calculated as the mean of the estimated and weighed weights. The dry weight difference between this ration and the Anemia which were not eaten then gave the amuunt of food eaten per M. norvegica per day. At the end of the four-day period, the AI. norvegica were rinsed in distilled water and dried to constant weight at 70-C.
To ensure the statistical significance of the results a large number of animals representing a wide range of weights are needed. This poses problems as the size distribution of M. norvegica varies according to season. Thus it was not passible to obtain all the desired data from a single set of experiments and accordingly, three _ .ries of experiments were performed, the size of animals used in each depending on the size of the animals trawled. Transit time The dissection of 700 Meganyctiphanes norvegica, some starved and some with full stomachs, enabled the weights of full stomachs and empty stomachs to be calculated for animals of mean total weights 47 and 15 mg dry, respectively. From these stomach capacities and knowledge of the ration ingested, the number of fillings of the digestive tube could be estimated and thence the transit time of the food.
Results
Ingestion Results are presented in Table I in which individuals of Meganyaiphanes norvegica are grouped in weight intervals of 5 mg dry. The mean weights ff ilie food ingested per day (column 3) and of the food ingested per unit weight per day (column -4) are also given together with ±\a limits.
The relationship between the daily ingestion rate R and animal weight \V can be
3u:

f—A i f j •«•• wm w w > fi— hi M. MM nf*»
expressed as a power fraction R = aW»
Transforming to logarithms yields the haear forai lot R • loga + b n g W
from which the constants a and b oiay be calculated by the method of least squares. The regression equation thus obtained.
lot S « fl,17(±0.1J) + 0.42 (4O.OB lof W has a coefficient of correlation r = 0.93. The power expression thus becomes
R » 1.47 W»-" (I) and the specific ingestion rate R' is then
R" = _5_ > aWIM! - 1.47 W * " (21 W
Equation (2) is plotted in Figure 1.
I;—
OS
600s
AX-50 sx
n«.i
s n Win mg dry
R*. the ipecilic Saod iatestk» m* a d V , a*»eigsi of d*
Because the three ingestion experiiBeills were performed at different times, it was sot poss&le to have an *4rtewiât culture at the same stage of development for each experiment. Food ingestion by M. ftoruezkff of two différent sizes as a fanetian of u e she and quantity of Anemm (Table 11) show thai daOy specific infestioa rates do

M.Ilejniad
Table 1. Food ingestion as a function of weight in MeganyciipHanes norvégien.
weight range
tmg dry)
ID
Mean weigh) of animals u-ed
ime dry - Id)*
(3)
Man weight or food inge-ied/day (me dry - Id)
(3)
Mean weight of rood in£Oied/unii weight of
M. nanesica/day (tag dry - id/rag dry/day)
Number or
obicrvBiioi» n
13} S 10 10 7.95 (IJ 1.94 * [.27 0.37 - 0.16 3
10 ta 15 12.3 i 1.4 m SU t 1-84 0.41 = 0.15 21 • 20 WIS 24.1 = 0.5 (4) 6.75 i 2.17 0.2B - 0.09 11 23 ID 30 ISA ; 1 a <3) 5.68 i 2.56 0.20 - 0.09 7 30 it» 35 3Î.0 = 0.8 (S) 5.94 = 1.9? 0.IS - 0.06 27" 35 to 40 36.8 ± I J (7J 6.99 = 2.21 0.19 i 0.06 22 50 to 55 55.0 <l| 6.60 - 9.55 0.12 z. 0.01 2 55 ta 60 50.3 - 1.3 (2) 6.19 - 2.25 0.11 - 0.04 B" 60 to 65 62.2 <1) 8.71 ; 1.87 0.14 ± 0.O3 4 AS (a 70 6?-6 <l) 10.80 ± 2.70 0.16 ± 0.04 3
*i test between 0.41 • 0.15 and 0.IB - 0.06 show» that the difference is significant ai the 0.01 leveL t test between 0.18 - 0.06 and 0.11 * 0JJ4 shows ihai the différence ù significant ai the 0.01 level +1 ) Number of animals used.
Ingestion of food by Afeganyctiphanes norvegica as a function of the biomass of Anemia and the weight of the individual prey.
Mean weight of . Mean weight a( Mean weight ingested/ •nimaijused remta mrnass wet Anemia uni! «wight/day (mg dry = 1 A) i t a i n > (mj dry) '-nj dry/mg dry/day - U)
10.4 ± 0.6 0X7 + 0.01 0 J8 i 0.06 18.9 ± 2.8 0.17 ± OJC 0.40 i 0.17 19-0 ; 4.0 0.24 ± 0.05 0.49 + 0.D4
10.4 ± 04 0.07 ± 0.01 0.12 i 0.01 18.0 ± 04 0J6 * 0.01 0.12 ± 0.O4
not vary for rations in the range 10 to 19 mg dry (i.e. mean weight of an individual Anemia 0.07 or 0.36 mg dry).
Transit time The results of more than 600 dissections show that the empty stomach averaged l<ft of the total dry weight of a Meganvciipfianes ttorvegica Tor both large and small animals; dissections of animals with full stomachs showed that the full stomachs comprised, on average, 1.5°"» of the total dry weight of these animals. From this it was calculated thai the weight of the stomach contents was 0-24 mg for a A/.
304
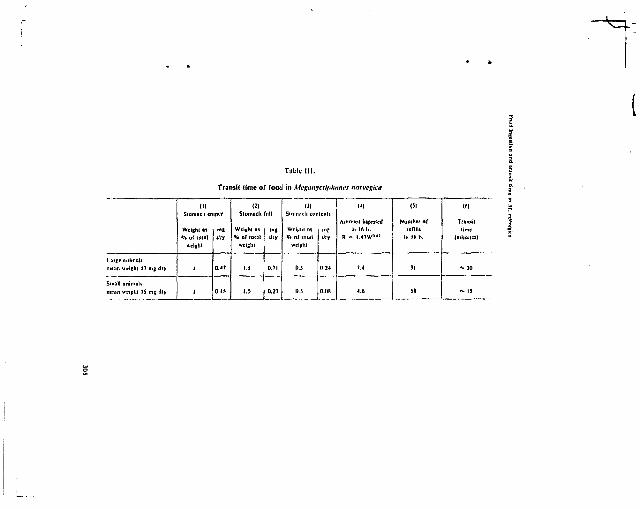
Tabic III.
Transit lime of food in Megatiycfiphanes narvegica
Siamacli empty Slomncli full
(3)
Slnni;idl «mlculJ
(11
Number of
(«I
Tfmt*ii
Weight as m i W E I U M i i mt Wel|;hl » nip In I M i . l ï l ï l l i nine
*4 of tola!
*clnhl
tlty V* of loïnî
welghi
Ury *>'« n i mm!
weifclH
ilry a = M n v n " ht if. it. jmimtfcsi
I.JiEc animals
tiic;in «e i | l i l 47 i n j dif i 0.17 I.S 0.71 D.3 0.24 7.4 31 - v ] 0
Smnll aniiunk
man «-«sin IS mg dry 1 0.15 1.5 0.2Î OS D.I1B 4.6 5H *• 13

norvegica of 47 mg and 0.08 mg for an individual of 15 mg; from equation {1) one calculated Tor these animals food ingestion rates per day of 7.4 mg and 4.6 mg, respectively. Since in our -xperimcntal design the animals feed only during the night, the time during which these "daily*' amounts of food are ingested is, at the most, 16 hours: in 16 hours a 47 me A/, norvegica will therefore fill its stomach 31 times, whereas a 15 mg animal will do so 58 times. These data are summarized in Table 111.
Discussion and Conclusions ingestion
In previous work on natural levels of polonium-210 in Meganyctiphanes norvegica, Heyraud et al. (1976) found that polonium concentrations varied with euphausiid weight according to the negative fractional power -0.59 and hypothesized that a direct relationship existed between polonium concentration and food ingestion. This hypothesis is given strong support by the value of -0.58 (equation (2)) found to relate daily specific ingestion rate an.i size.
The experimental data of previt'ts workers can be used to calculate the constants in equation (2) for other marine Crustacea: the values of (b-1) thus found are close to the value of -0.5S reported here for Meganyctiphanes norvegica. A value of -0.54 can be calculated from the data of Mullin and Brooks (1967) far Rhincalamu nasuius (from the copepodite 1 stage up to the female adult), while PaffenhoTer's 0971) data for Calanus hetgolandicus (again from the copepodite I staje up to the female adult) yield a value or -0.47. Samcoto (1976) showed, that the calories ingested, expressed as a percentage of the total calories in imphausiids. decreased as the Height of the animals increased and as the temperature of the water decreased. The slopes of the regression lines which he obtained were -0.61 at 15°C and -0.52 at 10°C for M. norvegica; the slope of -0.5S at I3°C found in the present study is seen to be in excellent agreement with Sameoto's figures.
Small et at., (1973) estimated an ingestion rate of 0.321 mg dry/mg dry animal/day for Meganyctiphanes norvegica of 25 trig dry weight which can be compared with the data reported in the present study: inserting 25 mg for W in equation (2) gives an R* of 0.23 mg dry/mg dry animal/day. it should be noted that both estimates correspond to maximum ingestion rales applicable under abundant food conditions; the data reported here (Table II) as well as the data of Fowler et at. (1971) imply that specific ingestion rates do not increase once the available food exceeds a certain level. The data of Fowler et al. stated that the ingestion rate of the euphausiids was maximum when the weight of individual Anemia was between 0.20 and 0.40 mg dry. but that this rate was lower with the smallest (0.10 mg dry) Anemia; the Table II data, on the other hand, show no difference in the euphausiid ingestion ,-ate with Anemia or0.07 and 0.36 mg dry respectively. This discrepancy is due aln.ost certainly to different experimental conditions: in the experiments reported here the large number of nauplii compensated for their small size, whereas in the Fowler et al, experiments the number of Artemiu used was much smaller, thus posing a prey-capture problem to the euphausiids and diminishing their ingestion rates. This possibility was mentioned by Lasker (1966) in his study of the ingestion of Anemia nauplii by Euphausia pacîjïca as a function of prey-density.
.'0o
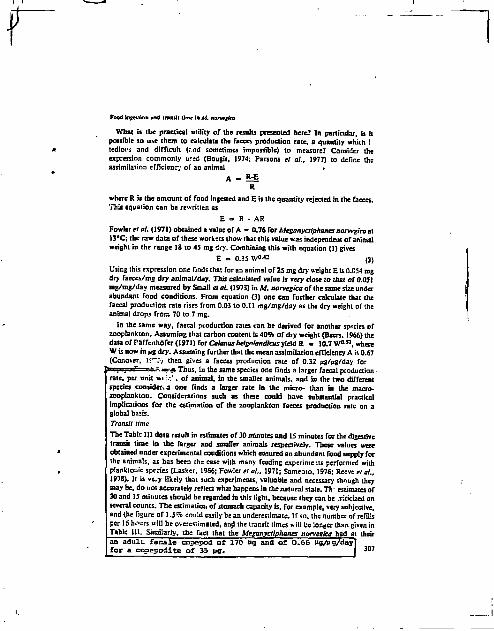
Food injEKtion »nd (remit time ia hi. norvegieo
What is the practical utility of the results presented here? In particular, is it possible to use them to calculate the faeces production rate, a quantity which Î tedioc.j and difficult (md sometimes impossible) to measure? Consider the expression commonly u.'ed (Bougis, 1974; Parsons et al., 1977) to define Ihe assimilation efficiency of an animal *
A = 5 £ R
where R is the amount of food ingested and E is the quantity rejected in the faeces. This equation can be rewritten as
E = R- AR Fowler et oL (1971) obtained a value of A = 0.76 for Meganyctiphana norvégien at 13°C; the raw data of these workers show thai this value was independent of animal weight in the range 18 to 45 mg dry. Combining this with equation (1) gives
E « 0.35 W0-« (3) Using this expression one finds that for an animal of 25 mg dry weight E is 0.0S4 mg dry faeces/ntg dry animal/day. This calculated value is very close to that of 0.051 mg/mg/day measured by Small et al. (1973) in M. narvegîca of the same size under abundant food conditions. From equation (3) one can further calculate that the faecal production rale rises from 0.03 to 0.11 mg/mg/day as the dry weight of the animal drops from 70 to 7 mg.
In the same way, faecal production rates can be derived for another species of zooplankton. Assuming that carbon content is 4D"Sb of dry weight (Beers. 1966) the data of PaffcnhOfer (1971) far Calanus helgalandicus yield R = 10.7 W f l J 3 , where W is now in fig dry. Assuming further that the mean assimilation efficiency A is 0.67 (Conover, IP") then gives a faeces production rate of 0.32 ug/ug/day for «c«pspo^=i;"-..t^-j» Thus, in the same species one finds a larger faecal production -rate, per unit wi '.-,' v of animal, in the smaller animals, and in the two different species considers one finds a larger rate in the micro- than in the macro-zooplanktan. Considerations such as these could have substantial practical implications for the estimation of the zooplankton faeces production rate on a global basis. Transit time
The Tabic III data result in estimates of 30 minutes and 15 minutes for the digestive transit time in the larger and smaller animals respectively. These values were obtained under experimental conditions which ensured an abundant food supply for the animals, as has been the case with many feeding experimeus performed with planktonic species (Lasker, 1966; Fowler et al.t 1971; Sameoio, 1976; Reeve et al., 1978). It is vt.y likely thai such experiments, valuable and necessary though they may be, do not accurately reflect what happens in the natural state. Th ' estimates of 30 and 15 minutes should be regarded in this light, because they can be .TiticLsed on several counts. The estimation of jtomach capacity is, for example, very subjective, and the figure of 1.5To could easily be an underestimate. If so, the number of refills per 16 hours will be overestimated, and the transit limes will be longer than given in Table 111. Similarly, the fact that the Meganyetiphanes norveeica had at their an adult f e n a l e copepod of 17D Ug and o f 0 .66 Hg/fc g/day | for a copepodite of 35 ug
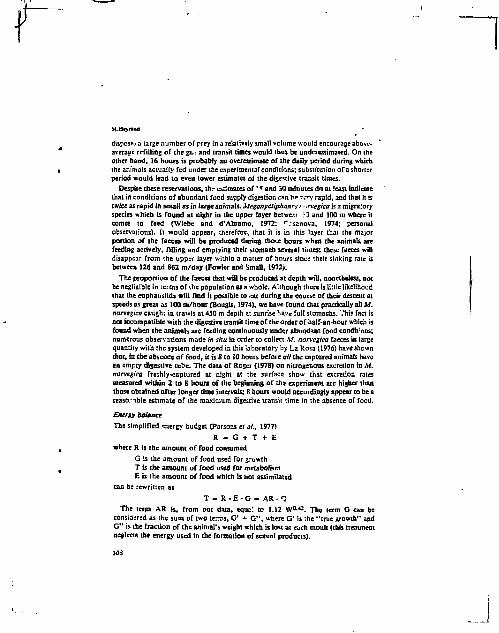
M.Hrjnud
disposai a large number or prey in a relatively small volume would encourage above-average refilling of the gi*; and transit times would thus be underestimated. On ihe other hand, 16 hours is probably an overestimate of the daily period during which the animals actually fed under the experimental conditions; substitution of a shorter period would lead to even lower estimates of the digestive transit times.
Despite these reservations, thr estimates of " * and 30 minutes do at least indicate that in conditions of abundant food supply digestion can h* *.\~ry rapid, and that it is twice as rapid in small as in large animals. Meganycttphanrs * •. wegica is a migratory species which is found at night in the upper layer beiwe.\T i3 and 100 m where it comes to feed (Wiebe and d'Abramo, 1972; r.-sanova, 1974; personal observations). It would appear, therefore, that it is in this layer that the major portion of the faeces will be produced during those hours when the animals are feeding actively, filling and emptying their stomach several limes; these faeces will disappear from the upper layer within a matter of hours since their sinking rate is between 126 and 862 m/day (Fowler and Small, 1972).
The proportion of the faeces that will be produced at depth will, nonetheless, not be negligible in terms of the population as a whale. Although there is little likelihood that the euphausiids will find it possible to -at during the course of their descent at speeds as great as 100 m/hour (Bougis, 1974), we have found that practically all Af. norvegica caught in trawls at 450 m depth at sunrise have full stomachs. This fact is not incompatible with the digestive transit time of the order of half-an-hour which is found when the animals are feeding continuously under abundant food conditions; numerous observations made in situ in order to collect St. norvegica faeces in large quantity with the system developed in this laboratory by La Rosa (1976) have shown that, in the absence of food, it is 8 to 10 hours before all the captured animals have an empty digestive tube. The data of Roger (1978) on nitrogenous excretion in A/. norvegica freshly-captured at night at the surface show that excretion rates measured within 2 to 8 hours of the beginning of ths experiment are higher than those obtained after longer rime intervals; 8 hours would accordingly appear to be a reaso.-ible estimate of the maximum digestive transit time in the absence of food.
Energy balance
The simplified energy budget (Parsons et al., 1977) R = G + T + E
where R is the amount of food consumed G is the amount of food used for growth T is the amount of food used for metabolism E is the amount of food which is not assimilated
can be rewritten as
T = R - E - G = A R - 0 The term AR is, from our data, equs". to 1.12 W 0- 4 2 . The term G can be
considered as the sum of two terms, G* 4- G", where G' is the "true growth" and G" is the fraction of the animal's weight which is lost at each moult (this treatment neglects the energy used in the formation of sexual products).
3ÛS
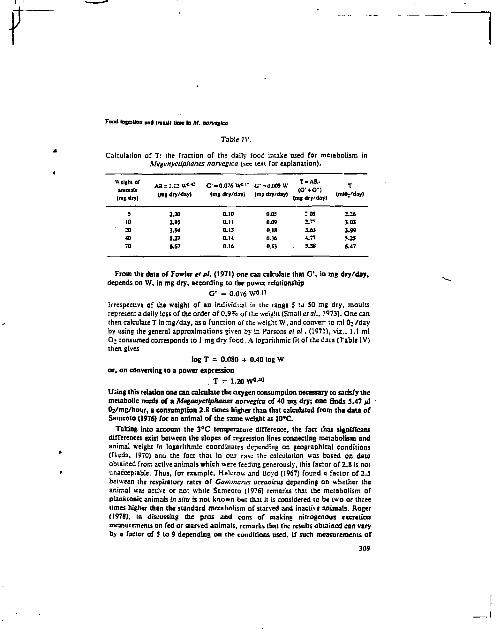
Food iDtcslloB mai Intuit time la M. norvégien
Table IV.
Calculation or T: the fraction of the daily food intake used for metabolism in Megunvctiphanes norvégien (see texi for explanation).
W c i ! h l
(
a r AR = 1.12 W"* G" =0X76 W»" G- =0.009 W ^ - A R -( T ^ . < m " d ^ d a y ) (mgdry/« a y> (^dry/dayl ^ ^ ^
2.20 0.10 0.05 :o5 2.26 2.95 0.11 0.09 2.7' 3.03 3.94 0.13 0.11! 3.63 3.99 5.27 0.14 0.36 4.77 5.25 6.67 0.16 0.6} 5.38 6.47
From the data Df Fowler vt ah (1971) one can calculate thai G\ in mg dry/day, depends on W, in mg dry, according to the power relationship
G* = 0.076 WO-H Irrespective of the weight of an individual in the range 5 tj 50 mg dry, moults represent a daily loss of the order of 0,9^0 of the weight (Small et al., ! 973). One can then calculate Tin mg/day.asa function of the weight W, andconver to nil OWday by using the general approximations given by in Parsons el al. (1971), viz., 1.1 mi O2 consumed corresponds to 1 mg dry food. A logarithmic fit of the data (Table IV) then gives
log T = 0.080 + 0.40 log W or, on converting to a power expression
. T = 1.20 WO-4*» Using this relation one can calculate the oxygen consumption necessary to satisfy the metabolic needs of a Meganyctlphanes norvégien of 40 mg dry; one finds 5.47 ul ' 02/mg/hour, a consumption 2.8 times higher than that calculated from the data of Sameoto (1976) for an animal of the same weight at 10*C.
Taking into account the 3°C temperature difference, the fact that significant differences exist between the slopes of regression lines connecting metabolism and animal weight in logarithmic coordinates depending on geographical conditions (Ikeda, 1970) ano the fact that in our case the calculation was based on data obtained from active animals which were feeding generously, this factor of 2.8 is not unacceptable. Thus, for example, Halerow and Boyd (1967) found a factor of 2.5 between the respiratory rates of Cammarus oceanicus depending on whether the animal was active or not while Sameoto (1976) remarks that the metabolism of planktonic animals in situ is not known but that it is considered to be two or three times higher than the standard metabolism of starved and inactive animals. Roger (1978), in discussing the pros and cons of making nitrogenous excretion measurements on fed or starved animals, remarks that the results obtained can vary by a factor of S to 9 depending on the conditions used. If such measurements of
309

M.Htjraud
either metabolism or nitrogenous excretion are taken to represent the in situ situation one must not neglrc. the fact that they are for the most part certainly underestimates if obtained From animals which are starved and inactive.
Acknowledgments
I thank C.M.Boyd, R.D.Cherry, S.W.Fowler and L.F.Small for critical comments. The Laboratory or Marine Radii^aivity operates under a tripartite agreement between the International Atomic Energy Aeency, the Government or the Principality of Monaco a* id the Océanographie Institute at Monaco. The Station Zoologique de ''tllefranche, France, furnished the necessary ship-time. Support from the above Mti is gratefully acknowledged. References
Been,J.F. ( 1956) Studies on the chemical composition of the major looplanttan groups in the Sargasso Sea off Bermuda. Limitât Oceanogr. II. 520-528.
Bougis.P. (1974) Ecologie du placion marin. Vol. II. Le Zaaplanclan. Maison ci Cic, éditeurs, Paris. Casanova,B. (1974) Le* Euphausiacés de Méditerranée (Systématique et dèieloppement larvaire.
Bioeeographie ei biologie), 380 pp. Thèse de Doeicur-cs-Scienees naturelles. Université de Provence, Aix-Marseille. So d'ordre C.N.R.S. A.O. 9446.
Cherry.R.D., Fowlcr.S.W., BcasIey.T.M. and Heyraud.M. (1975) Polonium-210: its venial oceanic transport by lOOphnklon metabolic aciiviiy. Mar. Chem. 3. 105-110.
Conoter.RJ. (19661 Factor» affecting ihr assimilation of organic matter by «oplanklon and the question or superfluous feeding. Limnol. Oceonogr. 11, 346-354.
Fowler.S.W., Benayoun.G. and Small.L.F. (1971) Experimental studies on feeding, growth and assimilation in a mediterranean euphausiid. Thalauia jugosl. 7. 35-47.
FowIer.S.W. and Small.L.F. (J9TZ) Sinking rates uT cuphausiid fecal pellets. Limnùl. Oceanosr. 17, 293-29B.
HaL-ratt.K. and Bo}d,C.M. (JS67) The oxygen consumption and swimming activity or the araphipod Gommants océaniens ai different temperatures. Comp. Biochem. Physia). 23, 2.33-242.
Heyraud.M.. Fo»ler.S.W.. Beasley.T.M. and Cherry.R.D. (1976) Potoniura-210 in euphautîidi: a detailed study. Star. BioL 3a, 127-136.
HigfO.JJ.W., Cherry.R.D., Heyraud.M. am. Fa*ler,5.W. (1977) Rapid removal of plutonium from the oceanic surface layer by iDoplankian faecal pellets. Nature 266. 623-624.
Higgo.JJ.W., Cherry.R.D., Heyraud.M., Fowlcr.5.W. and Beasley.T.M. (197S) The vertical oceanic transport of alpba-radioaciive nuclides by zooplankion faecal pellets. In "Natural radiation environment 111" Symposium in Houston, Texas, 23-28 April (in press).
Hon jo.S. ( 1978) Sedîmefl tation of materials in the Sargasso Sea at a 5367 m deep station. J. Mar. Se. 36. 469-492.
Ifeeda.T. (1970) Relationship between respiration rate and body size in marine plankton animals as a function of (he temperature of habitat. Bull. Far. Fish. Hokkaido Univ. 21. 91-112.
KuenzIer.DJ. (1969) Elimination and transport of cobalt by marine zooplankton. In: D.J.Netson and F.C.Evans (eds) Symposium on Radtoccology (USAEC. Oak Ridge) 4B3-492.
La RosaJ. (1976) A simple system for recovering zooplankianic faecal pellets in quantity. Deep Sea Res. 23.995-997.
Lasker.R. (1966) Feeding, growth, respiration and carbon utilization of a euphausiid crustacean. J. Fith. Jte. Board Can. 23, 1291-1317. Lowman.F.G., Rtce.T.ft. and Richards,F.A. (1971) Accumulation and redistribution of radionuclides by
marine organisms. In: Radioactivity in the marine environment. National Academy of Scicntti. Washington. D.C.. 161-199. Mullin.M.M. and Broobs.E-R. (1967) Laboraiory culture, growth rate and feeding behaviour of a
planktûnk ms îne copepgd. Limnol. Ocesnogr. 12. 657-666. 0»erbere.C. Carey.A.G.Jr. and Curl.H.Jr. (1965) Acceleration of sinking rates of radionuclides in the
ocean. Nature 200. 1276-1277. Paffefthafef.C.A. 0971} Crazing and inçenion rates oT nauplii. copcpodîds and adults of the marine
planktonic copeood Càlanui heltalcndina Mur. Biol. II. 2E6-298. P.rsonS.T.R.. Takahashi.M. and Harwa%c.B- (1977) Biological uccaniMraphic processes. Pef|amon
Press. 2nd Edition. R«*i*,M.R.. Walter.M.A. and Ikeda.T. (19781 Laboratory studies or ingestion of food and utilisation in
310
i
f
F« id ingtsiiuo and transit lime in M. norvégien
lotmie and icniaculaic etenophores. limita/. Oceaaogr. 23,740-751. Rocer.C. (1978) Azoic el phosphore chez nn crustacê macroplanctoniquc Megonyctlphanes narvejka
(M.5iri) (Euphausiacea): excretion minérales el constitution. J. exp. mar. BioL EcoL 33.57-83. Sameoio.D D. (1976) Respiration rates, energy budgets and moiling frequencies of ihree species of
euphauiiids found in the Gulf of St. Lawrence. J. Fish. Res. Board. Can. 33, 2568-2576. Small.L.F., Fc»Ier,5.W. and Keck es,S. (1973) Flu* of zinc through a macrcplanklonle crustacean. In:
Radioactive contamination of the marine environment, pp. 437-452, Vienna. IAEA. Wiebe.P.H. and d'Abramo.L- (1972) Distribution of eupbamiid assemblages in the Meduenancan Sea.
Afar. Biol. 15,139-149. Wiebt.P.H.. Boyd,S.H. and WingeuC (1976) Paniculate matter sinking to ihe deep-sea floor ai 2000 m
in the Toneue of the ocess, Bahamas, with a description of a n e * sedimentation trap. J, mar. Res. 34, H1-354.

Vertical Oceanic Transport *-A*"<v <vl. UWWOÛJV) of Alpha-Radioactive Nuclides *- '"M ^ t« .^) by Zooplankton Feca! Pellets
J. J. W. HIGGO," R. D. CHERRY." M. HEYRAUD.t S. W. FOWLER.t and T. M. BEASLEYJ •Physics Department, University at Cape Town, South Africa; flnternattonat Laboratory or Marine Radioactivity, Musée Océanographique, Monaco: {Marine Science Center, Oregon Sut* University, Newport, Oregon
ABSTRACT
The paper gives the results of research to explain the role played by marine plankton metabolism in the vertical oceanic transport of the alpha-emitting nuclides. The common Mediterranean euphausnd, Meganyettphenes norvégien, was selected as the typical zooplanktonic species that is the focus of this work. Measurements of 3 3 , ' 3 * ° ? u . " * U , " a T h , and a , 0 P o are reported in whole euphausiidx and in euphiusfid fecal pellets and molts. The resulting data are Inserted into a simple model that describes the flux of an element through a zooplanklonic animal. Concentrations of the nuclides concerned are high in fecal pellets, at levels which are typical of geological rather than biological material. It is suggested that zooplanktonic fecal pellets play a significant role in the vertical oceanic transport of plutonium, thorium, and polonium.
This paper gives the results of research to explain the role played by zooplankton metabolism in the vertical oceanic transport of the alpha-emitting nuclides. Data for 2 l °Po and 2 3 9 - 2 * 0 Fu have already been published (Cherry etal-, 1975; Heyraud etal., 1976; Hlggo et al., 1977; Beasley et al., 1978); these will be updated here and supplemented by data for " * U and " 2 T h . The common Mediterranean euphausiid, Meganyctîphanes norvégien, has been selected as the typical zooplanktonic species that is- the focus of this work. Species similar to M. noniegica are widely distributed in the oceans, are significant in the overall marine biomass, and form an important link in the pelagic food chain ou an ocean-wide basis. Furthermore,
502
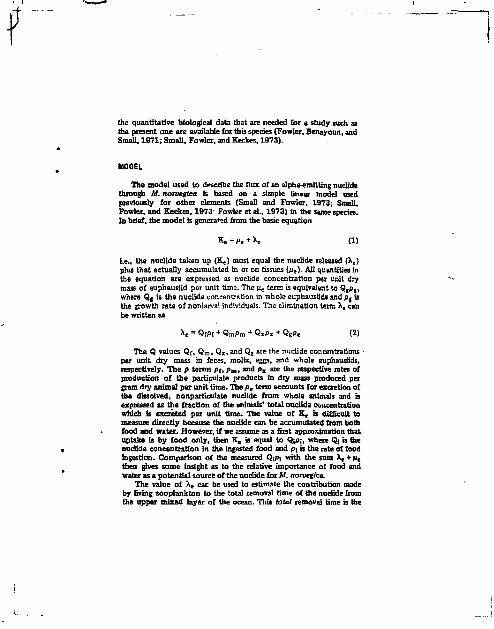
the quantitative biological data that are needed for a study such as the present one are available for this species (Fowler, Benayoun, and Small, 1971; Small, Fowler, and Keckes, 1973).
MODEL
The model used to describe the flux of an alpha-emitting nuclide through M. norvegica is based on a simple linear model used previously for other elements (Small and Fowler, 1973; Small, Fowler, and Keckes, 1973 Fowler et al., 1973) in the same species. In brief, the model is generated from the basic equation
K B = J I . + X « (1)
i.e., the nuclide taken up (Ke) must equal the nuclide released (Xe) plus that actually accumulated in or on tissues (p e ) . All quantities in the equation are expressed as nuclide concentration per unit dry mass of euphausiid per unit time. The JI* term is equivalent to QgPg, where Q e is the nuclide concentration in whole euphausijds and pf is the growth rate of nonlarval individuals. The elimination term Xe can be written as
K = QrPf + QmPm + Q*Px + QgP* (2)
The Q values Qf, Q m , Q x , and QE are the nuclide concentrations • per unit dry mass in feces, molts, eggs, and whole euphausiids, respectively. The p terms PI, p m , and p x are the respective rates of production of the particulate products in dry mass produced per gram dry animal per unit time. The pm term accounts for excretion of the dissolved, nonparticulate nuclide from whole animals and is expressed as the fraction of the animals* total nuclide concentration which is excreted per unit time. The value of K, is difficult to measure directly hecause the nuclide can be accumulated from both food and water. However, if we assume as a first approximation that uptake is by food only, then K^ is equal to QiP;, where Q; is the nuclide concentration in the ingested food and px is the rate of food ingestion. Comparison of the measured Qjpj with the sum \ + u e
then gives some insight as to the relative importance of food and water as a potential source of the nuclide for M. norvegica.
The value of X e can be used to estimate the contribution made by living zooplankton to the total removal time of the nuclide from the upper mixed layer of the ocean. This total removal time is the

504 HIGGO, CHERRY, HÊYHAUD. FOWLER. AND BEASLEY
reciprocal of thi^.rate constant R-, where R is the probability per unit time of a nuclide being removed by any process other than radioactive decay. The rate constant R can be regarded as the sum of separate probability terms whose reciprocals represent removal times by the various possible routes. We then have R " SRj, where the subscript i designates a particular route and whe-e the summation is over all possible i. We are interested here in the contribution of living zooplankton to the total R, and we designate this contribution by Rj. If we assume that X« for M. norvégien is typical of K for a significant portion of the total zooplankton biomass, then we can calculate Rj from the equation
K , = ^ (3,
where C is the concentration of the nuclide in the upper mixed layer and W is the zooplankton biomass in the same volume. Also, C is expressed as nuclide concentration per unit volume and W as dry mass per unit volume; R^-1 has the dimension of time, and can be called the ''zooplankton metabolic activity removal time." The removal time, R^*1, is of course greater than the total removal time R — ' . However, if it is only slightly greater than R — ' r it implies that removal by zooplankton metabolic activity is a route of major importance for the nuclide concerned.
EXPERIMENTAL TECHNIQUES AND RESULTS
To use the previously described uiudùl, v.c n^âd ta knew tha quantities Qf, Qmi Qx, Qg> Pf. Pm» Px> and p«. The quantities pf, p m , and px had been determined previously (Small, Fowler, and Keckes, 1973; Fowler, Benayoun, and Small, 1971; Fowler, Small, and Keckes, 1971) in laboratory experiments with M. noruegica. The remaining p quantity, pt, was determined by performing soluble excretion experiments of a type similar to those described previously for other elements (Small, Fowler, and Keckes, 1973). Living euphausiids were labeled by maintaining them in individual bottles filled with seawater spiked with the nuclide concerned, while the euphausiids were fed on artemia that had been spiked with the some nuclide. After about 2 weeks of uptake, the animals were transferred to bottles containing unlaheled seawater where they were fed with unlabeled artemia. The loss of the nuclide from the labeled animals was then followed for several weeks. Far the alpha-emitting nuclide experiments reported here, this was done by sacrificing animals at

OCEANIC TRANSPORT OF ALPHA-RADIOACTIVE NUCLIDES 505
regular intervals and determining the nuclide content of the whole animal by the total alpha-counting technique (Turner, Rsdley, and Mayneord, 1958; Cherry, 1964). The logarithm of the nuclide concentration was plotted ,s. time. In the case of a single (or a dominant] soluble excretion pathway, the slope of this curve was equal to r-pB. Five such experiments were performed, one for each of the five elements studied, and the results are given in Table 1.
TABLE 1 Fractional Dissolved Releases per Day, p«
Nuclide Releases ( p e ) pee day
3 3 6 Pu 0.08 ±0 .02 1 3 a U 0.65 + 0.09 " ° T h 0 .58±0 .0S 3 I 0 P o 0.123 ±0 .013
The four Q terms in Eq. 2 required that the concentrations of the nuclides of interest be measured at natural levels in whole euphau-siids and their particulate excretion products. These measurements •were simple for the nuclide * ' ° Po, which is present at relatively high levels In most marine biological materials (Cherry and Shannon, 1974) and for which the experimental procedures are very straightforward (Hallden and Harley, 1960; Millard, 1963; Flynn, 1968). The other alpha-emitting nuclides are present at much lower levels, and their determination was much more tedious. Collection of sufficient sample material was the primary problem; this achieved, samples were oven-dried at 100°C, wet ashed, and when necessary treated with hydrofluoric acid to dissolve silica. The alpha emitters were then isolated by ion-exchange and solvent-extraction procedures based on the methods described by Wong (1971) and Ku (1965). Spikes of a 3 b P u , Î 3 1 U , and 2 3 0 T h were used for the determination of chemical yields. The fact that the samples already contained some 3 3 Q T h at natural levels was a complicating factor which necessitated that each sample be split into two, the one half being spiked and the other not. Thin sources were prepared and counted alpha spectio* metrically. Exacting chemistry was necessary to achieve consistently low "blank" counting rates, and long counting times were commonplace.
The results for Qe and Q m are given in Table 2. Whole euphausiids were easy to collect, and the Qg data quoted represent the weighted means and standard deviations of three or four
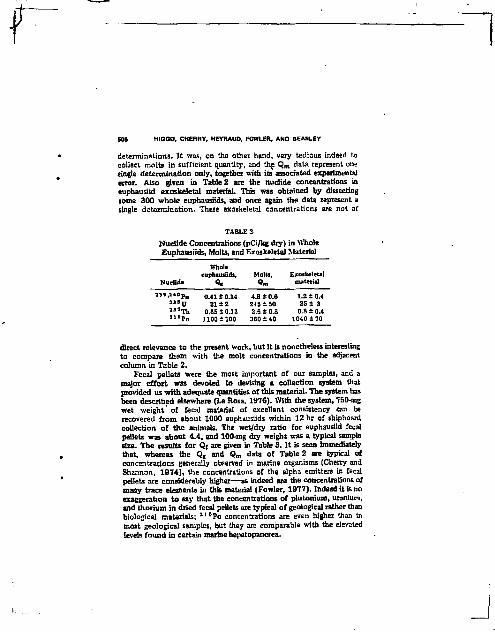
506 HlGGO, CHERRY. HEYHAUD, FOWLER, ANO BEASLEY
determinations. I t was, on the other hand, very tedious indeed to collect molts In sufficient quantify, and the Q m data represent one single determination only , together with its associated experimental error. Also given in Table 2 are the nuclide concentrations in euphauâid exoskeletal material. This was obtained by dissecting some 3 0 0 w h o l e euphausiids, and once again the data represent a single determination. These exoskeletal concentrations are not of
TABLES Nucl ide Concentrations (pCi/kg dry) in Whole Euphausiids, Molts, and Exoskeletal Material
Whole euphausâtk. Molts, Exoskeletal
Nuclide Q £ Q m material
3 j « , 2 4 0 P u o.«±O.X4 4.8±0.6 1-2*0.4 " * U 21±2 245 ±50 25± 3 î 3 1 T h 0.35±0.13 2.6±Q.S 0.8 + 0.4 3 1 °Po 1100 i100 360 ±40 1040 ± 70
direct relevance to the present work, but it is nonetheless interesting to compare them with the molt concentrations in the adjacent column in Table 2.
Fecal pellets were the most important of our samples, and a major effort was devoted to devising a collection system that provided us with adequate quantities of this material. The system has been described elsewhere (La Rosa, 1976). With the system, 750-mg wet weight of fecal material of excellent consistency can be recovered from about 1000 euphausiids within 12 hr of shipboard collection of the animals. The wet/dry ratio for euphauâid fecal pellets was about 4.4, and 100*mg dry weight was a typical sample size. The results for Q( are given in Table 3. It is seen immediately that, whereas the Q g and Q m data of Table 2 are typical of concentrations generally observed in marine organisms (Cherry and Shannon, 1974), the concentrations of the alpha emitters in fecal pellets are considerably higher—as indeed are the concentrations of many trace elements in this material (Fowler, 1977). Indeed it is no exaggeration to say that the concentrations of plutonium, uranium, and thorium in dried fecal pellets are typical of geological rather than biological materials; ï , 0 P o concentrations are even higher than in most geological samples, but they are comparable with the elevated levels found in certain marine hepatopancrea.
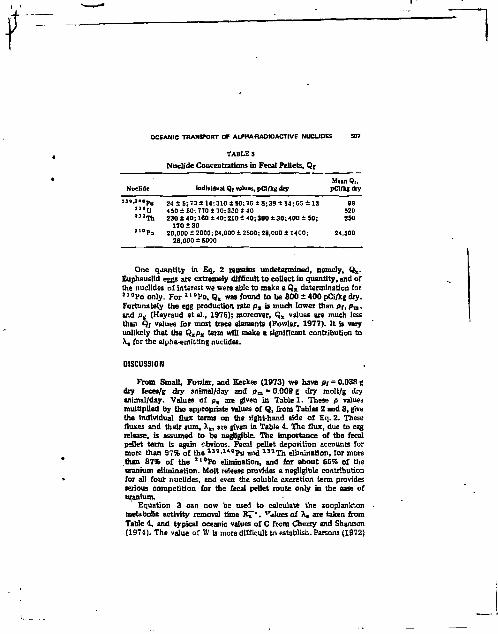
OCEANIC TRANSPORT OF ALPHA-RADIOACTIVE NUCLIDES 507
TABLE 3 Nuclide Concentrations in Fecal Pellets, Qr
Mean Qf, Nuclide Individual Q ( values, pCi/kg dry pCi/kg diy
: 3 , ' " ° P u 2< ± 5; 73 ± 14,310 ± SO; 76 ± 8;39 ± 1 4 ; 6 5 ± 13 98 « B U 450 ± 50; 770 ± 70; 330 t 40 520 > 3 1 T h 230 ± 4 0 ; 160 ± 40; 210 Î 40 ; 360 ± 3 0 ; 400 ± 50; 250
170 ± 30 3 1 0 P o 20,000 ± 2000; 24,000 ± 2500; 28,000 ± 1400; 24.500
26.000 ± 6000
One quantity in Eq. 2 remains undetermined, namely, Q x . EuphausUd eggs are extremely difficult to collect in quantity, and of the nuclides of interest we were able to make a Qx determination for 7 1 °Po only. For 2 1 °Po, Q x was found to be 800 ± 400 pCi/kg dry. Fortunately the egg production rate px is much lower than pt, pm, and p g (Heyraud et al., 1976); moreover, Q x values are much less than Qr values for most trace elements (Fowler, 1977). It is very unlikely that the QxPx term will make a significant contribution to \ for the alpha-emitting nuclides.
DISCUSSION
From Small, Fowler, and Keckes (1973) we have p r = 0.038 g dry feces/g dry animal/day and pm =0.009 g dry molt/g dry animal/day. Values of p« are given in Table 1. These p values multiplied by the appropriate values of Q, from Tables 2 and 3, give the individual flux terms on the right-hand side of Eq. 2. These fluxes and their sum, X„ are given in Table 4. The flux, due to egg release, is assumed to be negligible. The importance of the fecal pallet term is again cbvious. Fecal pellet deposition accounts for more than 97% of the "9.240p u ^ aaa-m elimination, for more man 87% of the 2 1 0 P o elimination, and for about 55% of the uranium elimination. Molt release provides a negligible contribution for all four nuclides, and even the soluble excretion term provides serious corapetition far the fecal pellet route only in the case of uranium.
Equation 3 can now be used to calculate the zooplankton metabolic activity removal time RT*. v4luesof Xe are taken from Table 4, and typical oceanic values of C from Cherry and Shannon (1974). The value of W is more difficult to establish. Parsons (1972)
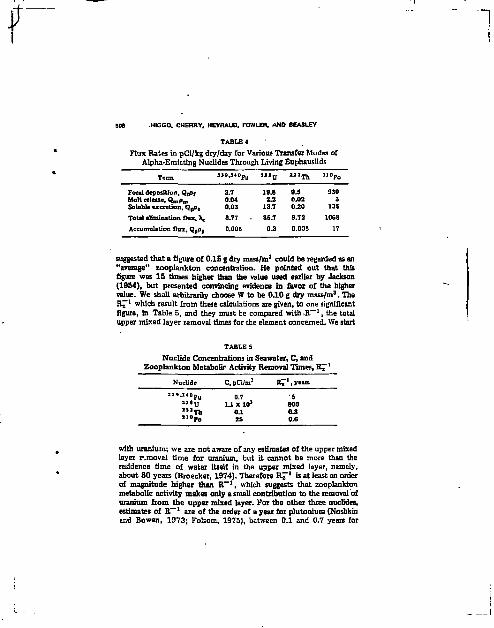
51» HIGGO. CHERRY, HEYRAUD. FOWLER. AND BEASLEY
TABLE 4 Flux Rates in pCi/kg dry/day for Various Transfer Modes of
Alpha-Emitting Nuclides Through Living Euphausiids
Tenn 13B,3*Opu »»u u 1 T h 1 , 0 P o
Fecal deposition, QfPf Molt release. Qmpm
Soluble excretion, QgO.
3.7 0.04 0.03
19.8 2J2
13.7
9.5 0.02 0.20
930 3
135
Total elimination flux, \ 3.77 35.7 9.72 1068
Accumulation flux, QaPg 0.006 0.3 0.005 17
suggested that a figure of 0.15 g dry mass/in3 could be regarded as an "average** zooplankton concentration. He pointed out that this figure was 15 times higher than the value used earlier by Jackson (1954), but presented convincing evidence in favor of the higher value. We shall arbitrarily choose W to be 0.10 g dry mass/m 3. The R 7 1 which result from these calculations are given, to one significant figure, in Table 5, and they must be compared with . R — I , the total upper mixed layer removal times for the element concerned. We start
TABLE 5 Nuclide Concentrations in Seawater, C, and
Zooplankton Metabolir Activity Removal Times, RT l
Nuclide . C, pCi/m3 R7* • V "
" » . « ° p u 0.7 -5 a 3 8 U 1J.X10 3 800 « 2 T h o.l 0.3 ' " p o 25 a e
with uranium; we are not aware of any estimates of the upper mixed layer removal time for uranium, but it cannot be more than the résidence time of water itself in the upper mixed layer, namely, about SO years (Broecker, 1974). Therefore R T 1 is at least an order of magnitude higher than K~ *, which suggests that zooplankton metabolic activity makes only a small contribution to the removal of uranium from the upper mixed layer. For the other three nuclides, estimates of R — l are of the order of a year for plutonium (Nosfakin and Bowen, 1973; Folsom, 1975), between 0.1 and 0.7 years for
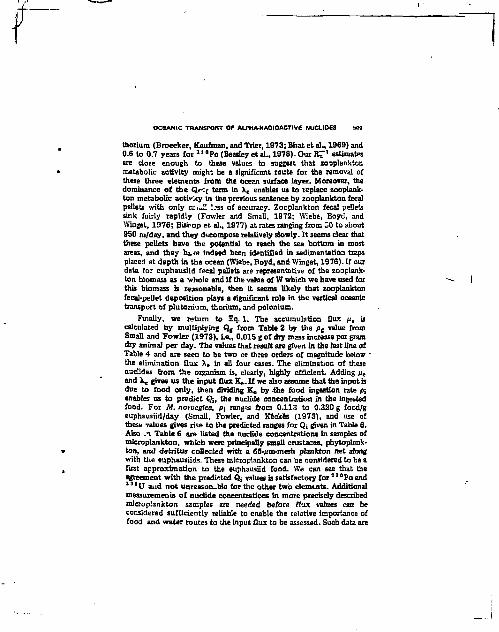
OCEANIC TRANSPORT OF ALPHA-RAO 10ACTIVE NUCLIDES 509
thorium (Broecker, Kaufman, and Trier, 1973; Bhat et al., 1969) and 0.6 to 0.7 years for * ' °Po (Beasley et al.» 1978). Our K^ 1 estimates are close enough to these values to suggest that zooplankton metabolic activity might be a significant route for the removal of these three elements from the ocezn surface layer. Moreover, the dominance of the Qrc; term in Xe enables us to replace zooplankton metabolic activity in the previous sentence by zooplankton fecal pellets with only cni*J! ÎJSS of accuracy. Zooplankton fecal pellets sink fairly rapidly (Fowler and Small, 1972; Wiebe, Boyd, and Winget, 1976; Bishop et al., 1977) at rates ranging from 30 to about 950 m/day, and they decompose relatively slowly. It seems clear that these pellets have the potential to reach the sea bottom in most areas, and they ht»-* indeed been identified in sedimentation traps placed at depth in the ocean (Wiebe, Boyd, and Winget, 1976). If oui data for euphausiid fecal pellets are representative of the zooplankton bioma5s as a "whole and if the value of W which we have used for this biomass is reasonable, then it seems likely that zooplankton fecal-pellet deposition plays a significant role in the vertical oceanic transport of plutonium, thorium, and polonium.
Finally, we return to Eq. 1. The accumulation flux fie is calculated by multiplying Q c from Table 2 by the p c value from Small and Fowler (1973), i.e., 0.015 g of dry mass increase per gram dry animal per day. The values that result are given in the last line of Table 4 and are seen to be two or three orders of magnitude below * the elimination flux Xe in all four cases. The elimination of these nuclides from the organism is, clearly, highly efficient. Adding u c
and Ac gives us the input flux K*. If we also assume that the input is due to food only, then dividing Kg by -the food ingestion rate p\ enables us to predict Qj, the nuclide concentration in the ingested food. For M. norvegica, p\ ranges from 0.113 to 0.320 g food/g euphausiid/day (Small, Fowler, and Keck&s (1973), and use of thesa values gives rise to the predicted ranges for Qi given in Table 6. Also ,*i Table 6 are listed the nuclide concentrations in samples of microplankton, which were principally small Crustacea, phytoplank* ton, and detritus collected with a 65*um-mesh plankton net along with the euphausiids. These microplankton can be considered to be a first approximation to the euphausiid food. We can see that the agreement with the predicted Q; values is satisfactory for 3 1 °Po and 1 3 B U aud not unreasonable for the other two elements. Additional measuremeuut of nuclide concentrations in more precisely described micraplankton samples are needed before flux values can be considered sufficiently reliable to enable the relative importance of food and water routes to the Input flux ta be assessed. Such data are
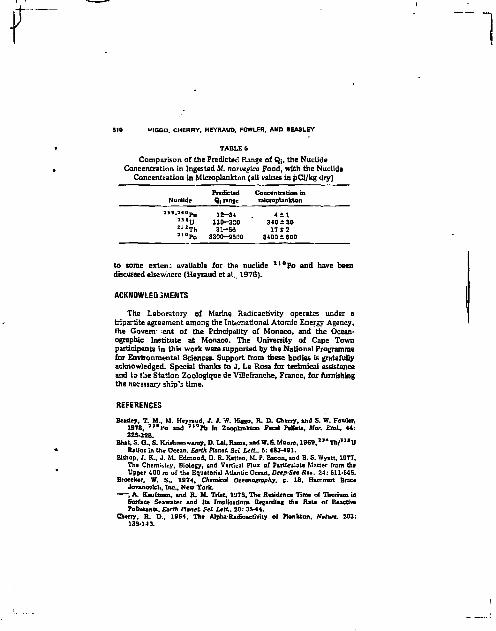
510 M|GGO. CHERRY, HEYRAUD, FOWLER, AMD 8EASLEY
TADLE G
Comparison of the Predicted Range of Qj, the Nuclide Concentration in Ingested M. noruegica Food, with the Nuclide
Concentration in Microplankton (all values in pCi/kg dry) Predicted Concentration in
Nuclide Q[ range micraplankton
" ' - " " P u 12-34 4 i l " B U 110-320 3 4 0 1 3 0 2 3 ! T h 31-86 17 ± 2 3 1 0 P o 3300-9500 3400 ±600
to some exten; available for the nuclide a t ° P o and have been discussed elsewhere (Heyraud et al.s 1976).
ACKNOWLEDGMENTS
The Laboratory of Marine Radioactivity operates under a tripartite agreement among the International Atomic Energy Agency, the Gavem- ent of the Principality of Monaco, and the Océanographie Institute at Monaco. The University of Cape Town participants in this work were supported by the National Programme for Environmental Sciences. Support from these bodies is gratefully acknowledged. Special thanks to J. La Rosa for technical assistance and to ttie Station Zoologique de Villefranche, Prance, for furnishing the necessary ship's time.
REFERENCES
Beasley, T. M., M. Heyraud, J. J. W. Htggo, R. D. Cherry, and S. W. Fowler, 1978, 3 , 0 P D and 3 > 0 P b in Zooplankton Fecal Pelleta, Mar. Eiol, 44: 325-328.
Bhat, S. G., S. Kruhnaswaray, D. Lai,Rama, and W.S.Moore, 1 9 6 9 , X 3 4 T h / , 3 B U Ratios in the Ocean, Earth Planet Sci Lett, 5: 483-491.
Bishop, J. K., J. M. Edmond, D. R. Ketten, M. P. Bacon, and B. S. Wyatt, 1977, Tht Chemistry, Biology, and Vertical Flux of Particulate Matter [ram the Upper 400 m of the Equatorial Atlantic Ocean, Deep-Seo Aex-. 24: 511-548.
Broeeker, W. S.. 1974, Chemical Oceanography, p. 18, Harcourt Bract Javanavich, Inc., New York. , A. Kaufman, and R. M. Trier, 1973. The Residence Time of Thorium in Surface Seawater and Its Implications Regarding the Rate of Reactive Pollutants, Earth Planet Scl Lett. 20: 35-44.
Cherry, R. D., 1964, The Alpha-Radioactivity or Plankton, Nature, 203: 139-143.

OCEANIC TRANSPORT OF ALPHA-RADIOACTIVE NUCLIDES 511
, S. W. Fowler. T. M. Beastey. and M. Heyraud, 1975, PoIontum-210: Its Vertical Oceanic Transport fay Zooplanktan Metabolic Activity. Afar. Chem., 3: 105-110. , and X*. V. Shannon, 1974, The Alpha Radioactivity or Marine Organisms, vit Energy Rev.. 12 :1-45 .
Flynn, W. W., 1968, The Determination of Low Levels of Polonium-210 in Environmental Materials, Anal. Chim. Acta, 4 3 : 221-227.
Folsom, T.. 197S. I>:<cus5Ïon on Papers Presented at Los Alamos Life Sciences Sytaponatu, Los Alamos. May 22—24,1974. Heclth Pays., 29 : 597, 611.
Fowler, S. W., 1977, Trace Elements in Zooplankton Particulate Products. Nature, 259 : 51-53. , G. Benayoun, and L. F. Small, 1971, Experimental Studies on Feeding, Growth and Assimilation in a Mediterranean Euphausiid, Thalasiia Jugosi, 7: 35-47. , M. Heyraud, L. F . Small, and G. Benayotn, 1973, Flux or I 4 1 Ce Through 3 Euphausiid Crustacean, Afar. Biol., 2 1 : 317-325. , and L. F. Small, 1972, Sinking Rates of Euphausiid Fecal Pellets, Limnol Occanogr,, 17: 293-296. . L. F. Small, and S. Keclces, 1971, Effects of Temperature and Size on Molting c f Euphausiid Crustaceans, Mar. Biol.. 1 : 45-51.
Halldcn, N. A., and J. H. Harley, I960, An Improved Alpha Counting Technique, AnaL Chem., 32: 1861-1863.
Heyraud. M., S. W. Fowler, T. M. Beasley, and R_ D. Cherry, 1975, Polonium-210 in Euphausiids: A Detailed Study, Mar. Biol.. 34: 127-135.
Higgo, J. J. W., R. D. Cherry, M. Heyraud, and S. W. Fowler, 1977, Rapid Removal o r Plutonium from the Oceanic Surface Layer by Zooplankton Faecal Pellets, Nature. 266: 623-624.
Jackson, P., 1954, Engineering and Economic Aspects of Marine Plankton Harvesting, J. Cons.. 2 0 : 167-174 .
Ku, T-L., 1965, An Evaluation of the " 4 U / " B U Method as a Tool for Dating Pelagic Sediments, J. Geophys. Res.. 70: 3457-3474.
La Rosa, J., 1976, A Simple System for Recovering Zooplanktonic Faecal Pellota in Quantity, Deep-Sea Res., 23 : 995-997.
Millard, Jr., H, T., 1963, Quantitative Radiochemical Procedures for Analysts of Polonium-210 and Lead-212 in Minerais, Anal Chenu. 35:1017-1023.
Noshkin, V. W., znd V. T. Bowen, 1973, Concentrations and Distributions of Long-Lived Fallout Radionuclides in Open Ocean Sediments, in Radioactive Contamination of the Marine Environment. Symposium Proceedings, Seattle, Wash-, July 10—14, 1972, pp. 671-686, STI/PUB/313, International Atomic Energy Agency, Vienna.
Parsons, T- H.„ 1972, Plankton as a Food Source, Underwater Jl, 4 : 30-37. Small. L. K . and 5 . W. Fowler, 1973, Turnover and Vertical Transport of Zinc
by the Euphausiid ifeganyctiph.anes norvégien in the Ligurian Sea, Mar. Biol. 1 8 : 2S4-290. , S. W. Fowler, and S. Këckès, 1973, Flux of Zinc Through a Maero-planktonic Crustacean, in Radioactiue Contamination af the Marine Environment. Symposium Proceedings, Seattle, Wash.. July 10—14, 1972, pp. 437-452, STI/PUB/313, International Atomic Energy Agency, Vienna.
Turner, R. C , J . M. Radley, and W. V. Mayneord, 1958, The Alpha-Ray Activity of Human Tissues, Br. J. Radiol., 3 1 : 397-406.
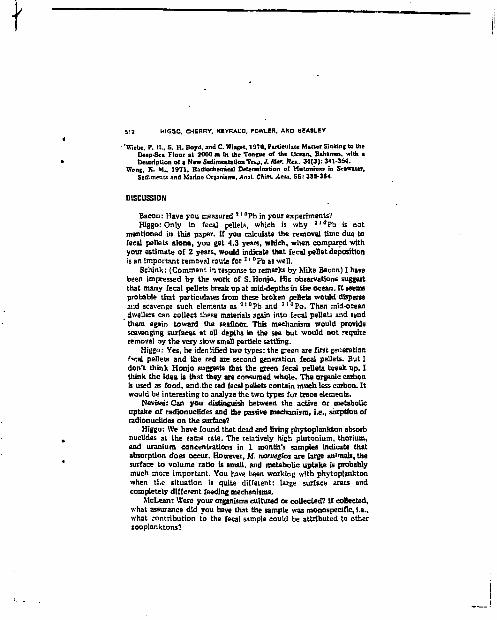
512 HIGGO. CHERHV, HEYRAUO, FOWLEH. AND BEASLEY
'Wiebe. P. H., S. H. Boyd, and C.WÎnget, 197S, Particulate Matter 5inking to the Deep-Sea Floor at 2000 m in the Tongue of the Ocean, Bahamas, with i Description or t New Sedimentation Trip, J. Mar. ftes.. 34(3): 341-354.
Wong, K. M., 1971, Radiochemical Determination of Plutonium in Seawater, Sediments and Marine Organisms, Anal. Cnim. Acta, 56: 355-364.
DISCUSSION
Bacon: Have you measured * ' DPb in your experiments? Higgo: Only in fecal pellets, which is why a i 0 P b is not
mentioned in this paper. If you calculate the removal time due to fecal pellets alone, you get 4.3 years, which, when compared with your estimate of 2 years, would indicate that fecal pellet deposition is an important removal route for 2 ' °Pb as well.
Schink: (Comment in response to remarks by Mike Bacon) I have been impressed by the work of S. Honjo. His observations suggest that many fecal pellets break up at mid-depths in the ocean. It seems probable that particulates from these broken pellets would disperse and scavenge such elements as 1 I 0 P b and 3 I 0 P o . Then mid-ocean dwellers can collect these materials again into fecal pellets and send them again toward the seafioor. This mechanism would provide scavenging surfaces at all depths in the sea but would not require removal oy the very slow small particle settling.
Higgo: Yes, he identified two types: the green are first generation ?-»cal pellets and the red are second generation fecal pellets. But 1 don't think Honjo suggests that the green fecal pellets, break up. I think the idea is that they are consumed whole. The organic carbon is used as food, and.the red fecal pellets contain much less carbon. It would be interesting to analyze the two types for trace elements.
Nevissi: Can you distinguish between the active or metabolic uptake of radionuclides and the passive mechanism, i.e., sorption of radionuclides on the surface?
Higgo: We have found that dead and living phytoplankton absorb nuclides at the same rate. The relatively high plutonium, thorium, and uranium concentrations In 1 month's samples indicate that absorption does occur. However, M. norucgîca are large animais, the surface to volume ratio is small, and metabolic uptake is probably much more important. You have been working with phytoplankton when the situation is quite different: large surface areas and completely different feeding mechanisms.
McLean: Were your organisms cultured or collected? If collected, what assurance did you have that the sample was monospecific, i.e., what contribution to the fecal sample could be attributed tc other zooplanktons?
f OCEANIC TRANSPORT OF ALPHA-RADIOACTIVE NUCLIDES 513
Higgo: M. norvégien are relatively large animals, and they swarm. We trawled using coarse nets that did not retain copepods, etc Any obvious intruders were reraoved'by hand, and the contribution by other zooplankton must have been negligible. Of course, this can be taken as a criticism of our experiments; we would like our fecal pellets to be representative of the whole zooplankton bîomass. Collecting material in traps set at different depths may be the answer, and we plan to do this in fhe near future. But you also have the problem that your samples will contain nonfecal matter.
i

Biologically-Transformed Zinc and Its Availability for Bioaccumiriatïon by
Marine Organisms
S.W. FOWLER and M. HEYRAUD
Introduction
One of the most important factors determining the relative bioavailability of trace metals in the aquatic environment is the physical and chemical form of the element (CROSS and SUNDA, 1978; WRIGHT. 1978; FOWLER, in
press). Dissolved metals may exist in different oxidation states or can associate with a variety of inorganic and organic ligands. These chemical species, with differing afSnitics for biological material, can significantly affect the degree of bioaccumulation of a given metal (CHIPMAN, 1966; BERNHARD and ZATTÊRA, 1969; KECKES et al, 1969; LOWMAN and TING,
1973; FOWLER and EENAYQUN, 1576; GEORGE and COOMBS, 1977) as well as
its toxicity (SUNDA et al., 1978). Recent studies on the physicochemical states of trace metals in sea water
have shown that zinc can exist in several different stable or meta-stable forms (PiRQ et ai, 1973; FUKAI et al, 1973). One of these forms which has been called the "complexed" fraction appears to be relatively stable and can only be broken down at low pH. In addition this fraction was found ID resist recombination with the ionic and "particulate" fraction, thus, it might form a sink with only limited availability to marine biota. If zinc or other metals which exist in a complexed state are biologically derived, the importance of ma ine biota as metal processors as well as accumulators becomes evident. Phytoplankton arc known to control the formation of organo-ziuc complexes as well as those of other metals (PILLAI et al.. 1971). Furthermore, different chemical forms of zinc excreted by zooplank-ton (KUENZLER, 1969) as well as polarographically determined fractions of zinc released by shrimp (SMALL et al., 1974} bave recently been reported. We performed a series of radiotracer experiments to further define the mode of formation of the complexed zinc fraction and to discern if this fraction, ones formed by biological means, is available for accumulation by marine biota.
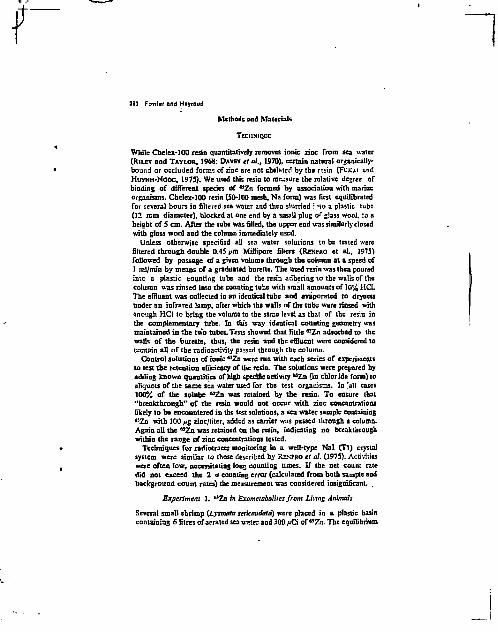
390 Fowler and Hayrsud
Methods and Materials
TECHNIQUE
While CheIex-100 resin quantitatively removes ionic zinc from sea water (RILEY and TAYLOR, 1968: DAVEY et al„ 1970), certain natural organically-bound or occluded forms of zinc are not chelated by the resin (FUKAT and HUYNH-NGOC, 1975). Wc used this resin to measure the relative degree of binding of different species of "Zn formed by association with marine organisms. Chclcx-100 resin (50-100 mesh, Na form) was first equilibrated for several hours in filtered sea water and then slurried ' no a plastic tube (12 mm diameter), blocked at one end by a small plug o*" glass wool, to a height of 5 cm. After the tube was filled, the upper end was similarly closed with glass wool and the column immediately used.
Unless otherwise specified all sea water solutions to be tested were filtered through double 0.45 pm. Millipore fillers (RENFRO et al., 1975) followed by passage of a given volume through the column at a speed of 1 ml/min by means of a graduated burette. The used resin was then poured into a plastic counting tube and the resin adhering to the walls of the Column was rinsed into ibe counting tube with small amounts of 10% HCI. The elmient was collected io an identical tube and evaporated to dryness under an infrared lamp, after which the walls of the tube were nosed with enough HCI to bring the volume to the same level as that of the resin in the complementary tube- la this way identical counting geometry was maintained in the two tubes. Tests showed that little "Zn adsorbed to the walls of the burette, thus, the resin and the effluent were considered to contain all of the radioactivity passed through the column.
Control solutions of ionic *!Zn were rua with each series of experiments to test the retention efficiency of the resin. The solutions were prepared by adding known quantities of high specific activity «Zn Cm chlor ide form) to aliquots of the same sea water used for the test organisms. In 'all cases 100% of the solube "Zn was retained by the resin. To ensure that "breakthrough" of the resin would not occur with zinc concentrations likely to be encountered in the test solutions, a sea water sample containing 6SZn with 100 /xg zinc/liter, added as carrier was passed through a column. Again all the "Zn was retained on the resin, indicating no breakthrough within the range of zinc concentrations tested.
Techniques for radiotracer monitoring in a well-type Nal (Tt) crystal system were similar to those described by RESFRO et al. (1975). Activities were often low, necessitating long counting times. If the net count rate did not exceed the 2 a counting error (calculated from both sample and background count rates) the measurement was considered insignificant. .
Experiment 1. "Zn in Exomctaboliies from Living Animals
Several small shrimp {Lysmata seticaudata) were placed in a plastic basin containing 6 litres ofaerated sea water- and 300 /iCi of w Zn. The equilibrium
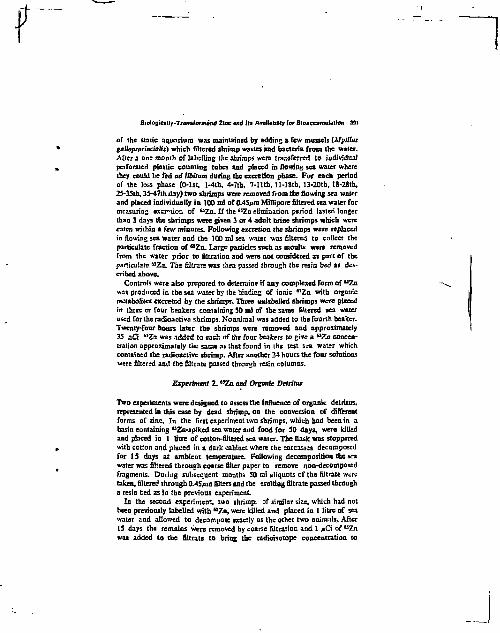
Sialagically-Transforménd Zinc and Us Avsilabilfy for Bioaccumulation 391
of the static aquarium was maintained by adding a few mussels (Afytllus gaUoprovinciolis) which filtered shrimp wastes and bacteria from the water. After a one month of labelling the shrimps were transferred to individual perforated plastic counting tabes and placed in flowing sea water where they could be fed ad libitum during the excretion phase. For each period of the loss phase (0-lst, I-4th, 4-7th, 7-Ilth, ll-18tb, 13-20th, l8-28th, 25-35th, 3S-47th day) two shrimps were removed from the flowing sea water and placed individually in 100 ml of 0.45pm Millipore filtered sea water for measuring excr-tion of "Zn. If the HZn elimination period lasted longer than 3 days the shrimps were given 3 or 4 adult brine shrimps which were eaten within a few minutes. Following excretion the shrimps were replaced in flowing sea water and the 100 ml sea water was filtered to collect the particulate fraction of "Zn. Large particles such as moults were removed from the water prior to filtration and were not considered as part of the particulate "Za. The filtrate was then passed through the resin bed as described above.
Controls were also prepared to determine if any completed form of "Zn uas produced in the sea water by the binding of ionic "Zo with organic metabolites excreted by the shrimps. Three unlabelled shrimps were placed m three or four beakers containing 50 ml of tbe same filtered sea water used for the radioactive shrimps, Noanimal was added to the fourth bealeer. Twenty-four hours later tbe shrimps were removed and approximately 35 nCi "Zn was added to each of the four beakers to give a w Zn concentration approximately the same as that found in the test sea water which contained the radioactive shrimp. After another 24 hours the four solutions were filtered and the filtrate passed through resin columns.
Experiment 2. "Zn and Organic Detritus
Two experiments were designed to assess the influence of organic detritus, represented in this case by dead shrimp, on the conversion of different forms of âne. In the first experiment two shrimps, which had been in a basin containing MZn-spiked sea water and food for SO days, were killed and placed in 1 litre of cotton-filtered sea water. The flask was stoppered with cotton and placed in a dark cabinet where the carcasses decomposed for 1S days at ambient temperature. Following decomposition the sea water was filtered through coarse filter paper to remove noordecomposed fragments. During subsequent months 50 ml aliquots of the filtrate were taken, filtered through 0.45pra filters and the esultimj filtrate passed through a resta bed as in tbe previous experiment.
In the second experiment, two shrimp; of similar size, which had not been previously labelled with "Zn, were killed and placed to 1 litre of sea water and allowed to decompose exactly as the other two animals. After 15 days the remains were removed by coarse filtration and 1 >»Ci of "Zn was added to the filtrate to bring the radioisotope concentration to
392 Fowler and Hayraud
approximately the same level as that in the water of the other treatment. Periodically 50 ml aliquots were withdrawn and Heated as outlined above.
Experiment 3. Bioavailability of Biologically Processed **Zn
Several shrimps and mussels were placed in a basia containing 5 litres of constantly aerated sea water with "Zn at a concentration of 10 **Ci/l. The basin was allowed to stand for S months. Salinity was maintained constant by periodic additions of doubte-dtstilled water. Anemia were frequently added as food for the shrimps. Otherwise the system remained untouched. Although very few animals died during the S months, some moults and weakened animals were also consumed by the shrimps. Following the conditioning period organisms were removed and the water filtered through 0.22 /*m membrane filters to remove all larger particulate matter as well as most bacteria. For a control, five liters of fresh sea water with the same salinity were also filtered through 0.22 /un filters and a sufficient amount of MZti added so that the radioisotope concentration was the same as that in the conditioned sea water. Aliquots of the control aod conditioned sea water were filtered through 0.22 pm filters and passed through the resin bed, to characterize any differences in MZu fractions present in the two waters.
Three uncontaminated shrimps and mussels in perforated plastic tubes were then placed in aliquats of each of the two sea waters and allowed to accumulate "Zn for two weeks. During this time the live animals were periodically monitored for u Zn and replaced in the appropriate basin for further uptake. The radioactivity in the basins was maintained relatively constant by occasional changes of the medium. At no time were the animals fed. This experiment was repeated with mussels, only this time the animals were dissected into shell, soft parts and byssus to assess relative uptake by these tissues.
Results and Discussion
EXPERIMENT 1. "Zn IN EXOMETABOLITES FROM LIVING ANIMALS
The results arc presented in Table 1. In almost all cases during the 47 day loss study, small but significant amounts of "Zn were present in a form thai was not retained by the resin. Controls using sea water conditioned with shrimp metabolities showed that all the "Zn was retained on the resin. This can be interpreted to mean that, at least during a 24 hour excretion period followed by 24 hours of ^Za—metabolite mixing, the complexed species which can go through the resin column was not formed externally in the sea water. It is perhaps significant that betweea day 7 and 11 when no complexed "Zn was found, both the experimental shrimp moulted, one several hours before being placed in the 100 ml sea water and the other

Biologically-Transformed Zinc and Us Availability for Btoaccumulation 393
Xmhle 1. Fractionation* gfExcrefed M Znbj Shrimp
Excretion period {days)
Particulate % of total "Zn excreted and
retained on 0.45 tun filter
FillraiB '„ filtrate % of filtrate m resin in effluent
7-1!
IMS 13-20 18-23 25-3S
35-47 Control 0-1
(with shrimp)
0-1 (without shrimp)
34 2B
3 " 4"* 00 0
97 3 99 1 98 2 97 3
•Particulate "Za refers to the amount of the lolal "Zn excreted into the sea water. Zinc-65 in the effluent and en tbe resin was computed as 3 percentage of the "Za in the filtrate. Individuals that died during excretion arc excluded.
•'Individuals that moulted just prior to or during excretion phase
1 hour after transfer. These shrimps become relatively inactive during their moulting period and generally neither eat nor defecate, hence, it is possible that the excretion of labelled metabolic products was reduced during these four days of inactivity which would account for the lack of complexed e Z n in the sea water.
Monitoring the "Zn content in the two individuals excreting radioisotope during the first 24 hours allowed the computation of excretion rates of the different forms of u Z n (Table 2). In this case large particles of fecal material were noted oa the bottom of the beakers, therefore filtration through 0.45 /un filters was preceded by co?*se prcfiltration through a Schleicher and Schutl blueband filter to trap tbe large bits of detritus. Total paniculate excretion was considered to be tbe sum of the amounts retained an the two dînèrent filters and therefore these values are not the same as those reported in Table I. It is noteworthy that particulate "Zn accounted for the greatest fraction of the total "Zn excreted. Since these shrimps had just recently been removed from the radioactive labelling basin, it is likely that M Zn labelled food was still present in the gut. Thus, although not

394 Fowler and Heyraud
tested, particulate excretion Tram these two individuals was probably much higher than that from the sonnais used during subsequent loss periods.
T*&ie2.Za-6SExmiian Kites htthtn Tern* ef**Zo. AiioSftowo m tht Percentage* oT the Total H Z a Excreted AttmwUble in Each Fraction. Rates
DdernlMiI O w lb* Urn Î4 H o n or Lacs
•*2a Fraojon % Cftbrilltp'S "*» 3£oT total M Zo conceairltian excreted eaeretcd per day
perd»CM M (Zih)
Shrimp J 2%nnip2 Shrimp 1 Shrimp 7 Tolal 7.1 Î J 100 100
Particulate 5.7 3S •0 8 7X2 Retained byOwiex l j 1.4 < K 2SS Kel leaned by
Qletac 0.1 04 1.0 1.0
EXPERIMENT 2 . « 2 a ANO ORGANIC DETRITUS
Table 3 shows the " Z n transformation which took place over a period of several months. The r t h u m i y large fraction of « Z n associated with particulate matter was undoubtedly due to the presence of bacteria. In both systems there was a steady decrease with time in the amount of complexed **Zn- This might have been due to the utifizatku of labelled organic
Tante 3. Zise-45 Transformation* ta Wanas GwiMaati J»y iha Presence of Dead Sirim»
-ZoUbeUedlhrimp Neo-labelled shrimp
Tunc %Toiat"2a %"Znon X*Znfo %T«aI t t Zii % - Z o o o %"Za (days) QHQ.4S|ua Cadet cfflaeni on 0.43 nm Chefe* la
fitter filwr cffliwni
3S 103
95 S » » S « M 10 20
O * 70 30
161 161
'Simples pre-filiered with coarse filler paper.

Biologically-Transformed Zinc and Its Availability for Bioaccumulation 395
substrates by bacteria with a subsequent release of «Zn in a form that was trapped On the resin. Nevertheless, for a relatively long time there existed a complexée form of u Zn either released by decaying labelled organic material or formed in vitro in the presence or decomposition products. The complexed «Zn did not appear stable but was slowly transformed to an ionic form possibly through bacterial action. A similar release of inorganic and organic forms of copper from decaying marine algae has recently been reported (SEEUNGER and EDWARDS, 1979).
EXPERIMENT 3. BIOAVAILABILITY OF BIOLOGICALLY-PROCESSED fiïZn
The different fractions of "Zn in the test sea waters are listed in Table 4. Zinc-65 uptake by both spades was significantly reduced in water containing the naturally complexed "Za (Figure 1). The relatively targe decrease (63% in shrimp and 25% in mussels) might not be due solely to the presumably unavailable complexed u Z n present (4A%). It is evident that some factor, not immediately apparent, also aided ia reducing sac accumulation from the conditioned sea water. This may be because Che!ex-100 can remove tbe more weakly complexed forms (either directed or formed rapidly in vitro) which might be less efficiently taken up by mussels and shrimps.
Tabic 4. Fraction* of "Za in Sua Waicr Used far Biological Uptake Experiments
Sea water % total °Zn Filtrate sample retained on 54 "Zn on Chelex % "Za la effluent
0.22 utn filler
Pre-conditioned SW \.z 95-6 ± 0 9 4.4 ± OJ Control SW <l.O 100 0
Table 5. Comparison of Mussel Whole Body Concentration Factors (CF) with those in tbe IndtTidual Tiuuts after M Z n Uptake in Two DiOerent Sea Waters. Three Mttsseb In roth Sea Water. CF *» "Zn/n; Wet Tissue (Annual) •¥• ««Zn/g Sua Water. Uptake Period was
13 Days
Mean CF
Sea water Whole body Shell Soft parts Byssus
Control (aa complexed "Za) MO 140 433 17629
Conditioned (4% naturally camplexed " Z a ) J32 156 3 1 3820
% reduction of "Zn uptake
in conditioned sea water 24ÎÎ 0 33'i 78%
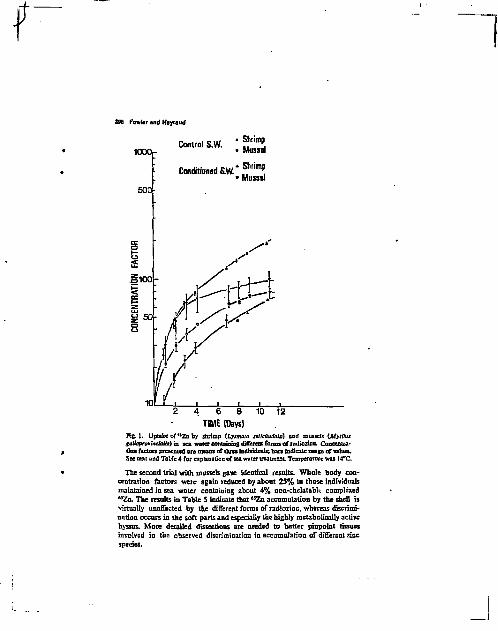
396 Fowlar and Heyraud
1000. Control S.W.
Conditioned S W
Shrimp Mussel
8 TIME (Days)
FiS. 1. Uptake of "Zn by shrimp {tysmaia stlleauJatai and mussels {Mytffus Saltaptviftdallsim sea water containing undent farms of xadioziac. Concentration factors presented are means oT three indtvidmls; bars indicate range oT values. See text and Table 4 for explanation of sea water treatment Temperature was 14"C
The second trial with mussels gave identical results. Whole body concentration factors were again reduced by about 2 5 % in those individuals maintained in sea water containing about 4% non-chelatablt complexed "Zn. The results in Tabic 5 indicate that « Z a accumulation by the shell is virtually unaffected by the different forms of radîozînc, whereas discrimination occurs in the soft parts and especially the highly tnetaboHcally active byssus. More detailed dissections are needed to better pinpoint tissues involved in the observed discrimination in accumulation of different zinc species.

Biologically-Transformed Zinc and Its Availability for Bioaccumulation 397
Several studies have reported that chelation metals reduces their availability to a variety of marine organism (SUKDA et al. 1978; CROSS and SUNDA, 1978; SEEUGER and EDWARDS, 1979). Specifically in the case of mussels the reduction in uptake of biologically-processed zinc noted in our studies is similar to the behaviour of EDTA-chelated zinc (KECKES et ai, 1969). On the other hand recent work has shown that cadmium chelated by a number of compounds is more available for uptake by mussels than the ionic species (GEORGE and COOMBS, 1977). Clearly, it would be instructive to examine the bioavailability of other biologically-processed metals for similar trends.
Another consequence of our results is worth emphasizing. Laboratory bioaccumulaticn studies often involve exposing organisms to radionuclides or heavy metals in water under static conditions. If uptake times are relatively long and biomass to water volume ratios high, it is probable that complexation between contaminant and exon-itabolites will occur thus rendering the element less available for uptake (FOWLER et al.t 1975; LtOMA, 1977). In view of our results with zinc, uptake experiments in static systems may greatly underestimate an organism's potential to accu-. mulatc ionic zinc. To avoid such artifacts, we suggest that long-term bioaccuraulation studies be carried out under essentially continuous-flow conditions.
Conclusions
We have shown that living and dead marine animals can produce a soluble species of complexed, possibly organically-bound, zinc. Furthermore, the fact that the uptake of this species is reduced relative to that of the ionic form suggests that zinc which has passed through biological cycles may be less available for bioaccumulatioa than zinc which has been directly introduced into the marine environment in inorganic forms. The radiotracer technique used in this study should prove useful in assessing the bioavailability of other biologically-processed metals.
References
Bernhaid, M. and Zaitera, A. 1969. A comparison between the uptake of radioaaive and stable zinc fay a marine unicellular alga. la D J . Nelson and F.C Evans (Eds-) Symposium on Radiotcalagy, 339-398, USAEC CONF 670303.
Oiipman, W.A. 1966. Uptake and accumulation oF chjoroïum-51 fay the dam. Tapa dcauBUus, in r-Iation to physical and chemical form. In Disposal of Radioactive Wants into Seat, Oceans and Surface Waters, 571-582, IAEA, Vienna.
Cross, F.A- and Sunda, W.G. 1978. Relationship between bioavailability of trace raeiab and gcochemicat processes in estuaries. In M.L. Wiley (Ed.) Estuarme Interazttam, Academic Pr^ss, New York, 429-442.
Davcy, E.W., Gentile, J.H., Erickson, S.J. and Betzu, P, 1970. Removal of trace roeials from marine culture media. Umnal. Occanagr. IS, 435-433.
39B FOWIBT and Hayraud
Fowler. S.w. Un press). Biological Processes. In GJCullenberg CEd.) Pollutant Tranrfer and Transport fn the Sea. CRC Tress, Pain Beach.
Fowler. S.W. and Benayoun, G. 1976. Influence of environmental factors on selenium flux in iv.o marine invertebrates. Mar, BioU 37,59-68.
Fowler. S„ Hcyraud, M. and Bcaslcy T.M. 1975. Experimental studies on plutonium kinetics in marine bïala. In: Impacts of Nuclear Releases into the Aquatic Environment, IAEA, Vienna. 157-177.
Fukai, R., and Huynh-Ngoc, L. 1975. Chemical forms of zinc in sea water. Problems and experimental methods. J . Oceenogr, Sac. Japan 31,179-191.
Fukai, R- Huynh-Ngoe, I_ and Murray, CN- 1972. Passible transformation of zinc Jîssûlvcd in Mediterranean coastal ses water. J. Oceanagr, Soe. Japan 19,44-4S.
George, S.G. and Coombs, TX. 1977. The effects of chelating agents on the upiakc and accumulation of cat-mum by Mytilus edutis. Mar. Biol. 39,261-266,
Keckes. S.. Ozrctic, B . and Xrajnovic, M. 1969. Metabolism of Zn-65 in mussels {Mytilus gaHoprorindalisLanui.VptakcoTZn-65.Rapp CamnuM.Mer,Medit.i9t 949-952.
Kvenzler. E J . 1969. Elimination of iodine, cobalt, iron and zinc by marine zooplanfcion. In: D J . Nelson and F . C Evans (Ed.) Symponum un Raahucohgy. 462-473, USAEC CONF 670503.
Lownun,F.G. and TirmH.Y. 1973. The state of cobalt in seawaler and its uptake by marine organisms and sedimenu. In: Radioactive CantamUatian ofthi Marine Earlratf aient. IAEA. Vienna 369-384.
Luoma, S.N. 1977. Physiological characteristics of mercury upiake by two cstuarine species. Mar. Biol. 41, 269-273.
Pfllai.T.N.V., Desai, M.V.M., Mathew, E., Ganapathy, S. and Ganguly. A-K. 1971. Organic materials in the marine environment and the associated metallic elements. Curr. Science, 40,75-SI.
Piro, A-, Bcrnhard, M., Bnniea, M. and Verzi, M. 1973. Incomplete exchange reaction between radioactive ionic zinc and stable natural line în ses water. In Radioactive Contamination of the Mattnc Environment. IAEA. Vienna, 29-45.
Renfro. W.C. Fowler, S.W., Heyraud, M- and La Rosa, 1.1975. The relative importance of food and water in lonl term zirtc-65 accumulation by marine biota. J. Fish. Res. Bd. Go. 32,1339-1345,
Riley, J-P. and Daylor. D . 196B. Chelating resins for the concentration of trace elements from sea water and ibeir analytical use in conjunction with atomic absorption spectrophotometry. Anal. Calm. Acta, 40,479-485.
Seeliger, U, and Edwards, P, 1979. Fate of biologically accumulated copper in growing and decomposing thall! of two beatbic red marine algae. J, Mar. Biol. Ass. U.K. 59, 227-238.
Small, L.F.. Keckes, S. and Fowler, S.W-1974. Excretion of différent forms or zinc by
the prawn Palaemon serratus fFennanft Linrnol. Oceonogr. 39,789-793. Sunda. W.G. Engel, and Thuotle, R.M. 1978. Effect of chemical speculum on toxicity
of cadmium lo grass shrimp Palaenmnetezpugio' Importance of free cadmium ion. Environ, Sei. Technol. 12,409-413.
Wright, D.A. 1978. Heavy metal accumulation by aquatic invertebrates Apol. Blot. 3, 331-394.

Mdîiin: Bi.>l>>â> P? Itô r r i l W l i MARINE BIOLOGY S SpnnKr-VertaE 1981
1
Polonium-210 Conlent of Marine Shrimp: Variation with Biological and Environmental Factors
R.D.CIitm* and M.Hcyraud
International Laburalanr nf Murine RiiifiuaciMty, Musée OirêanoEniphiqui. Principality of Monaco
Abstract
The concentrations of 1 , 0 P D and a i 0 P b were determined in more than 30 species of marine shrimp. Samples were collected in the years 1977 lu 1980: most were from the Mediterranean Sea near Monaco, the remainder from Kuwait. South Africa. USA and Great Britain. The median ,I."PL» concentration wa> 8.0 pCi g"1 dry wt in the whole nhnmp and S5 pCi g"' dry in the hepatopancreas: the cor-rei-pondine I W P o : s " P b jciivit\ ratios were 77 and 13S. rc-(pecmcK. The range of concentrations covered more than two orders of magnitude for hath nuclides. The variations in the levels of , l o P o . in particular, could be related to hio-K'gical and environmental factors: thus, penaeid shrimp sud î , n P o at median concentrations some three to four iimes higher than carid shrimp, and there was a steady increase in the median , , 0 P u concentration as one moved :r.itn «marine to coastal to pelagic to deep-pelagic species. • iJPi> levels were highest in 3 species of deep-pelagic r-irnaeids. where a median = l D F o concentration in the whole •hnmp of 43 pCi a - 1 dry wt was found. The natural radi--iion do,e received by the hepaiopancreas of such individ-•ia!% «ill be of the order of 100 rem per yr. Elevated " T o '*.!•» jlso found in 4 species collected near Kuwait. The
K» data are interpreted as indicating changes in the food i^ime of diiTerent shrimp: specifically it is suggested that •"'P.'-nch items such as hepaiopancreas, faecal pellets and • -rs.inic particulates are likely to he important in the diet of ••::ir.ip which feed ai depth in the ocean. It is suggested : " " ' ! c r ! h a l the uhimaie availability of I , 0 P o to ttuTfood-•• !-nn depends on ith farm in sea water, and the need for
*• rauihin concerning the degree of organic binding of " 1'" m natural waters in streaièd.
*•>••<: ir«m the ph>»ws Dsjunmeni. Uni^ersiiv of Cape
Introduction
It ih well-known that the natural radiation dose received bv most marine organisms is substantially higher ihan that received by man. and it is known further that this elevated dose is due. in most cases, to die incorporation of the naturally-occurring alpha-emitting radionuclide I I D P o in the organism itself (Cherry and Shannon. 1974). In a recent study involving a pelagic and benthic food chain (Heyraud and Cherry. 1979) it was shown that 1 1 0 P o concentration factors from sea water to whole organisms were approximately constant at about 10* along both food chains; it was confirmed further that l l o P o levels in the hepaiopancreas were generally an order of magnitude higher than in the whole organism, and those in the muscle an order of magnitude lower. The highest concentration factors found were in penaeid shrimp of the genus Serge&es; for these shrimp, the concentration factors in the hepr.topancreas reached 10*. Interestingly, the *"Po levels found in carid shrimp of the genus Pasiphaea were considerably lower than those in Sergestes spp., despite the tact that the species from both genera lived ai the same depth, occupied a comparable niche and, apparently, ate the same food. Shrimp constitute the supersection Katantia. which can be divided into three sections, viz. Penaeîdea. Caridea. and Amphionididea (Oman. 1974). Of these three, the third is the smallest and will not concern us here. From the point of view of evolution, the Penaeîdca are considered the most primitive of the crustacean Decapoda, having appeared in the Permian and the Triassic, whereas the Caridea appeared in the Jurassic (Wickins, 1976). The majority of -Penaeldea and Caridea are marinf but many species possess osmoregulatory- capabilities enabling them to support considerable variations of salinity (Omori. l q 74; Wickins. 1976). In lh- «upersection Natantia. some 1940 species exist. Although only 210 of these are pelagic, pelagic shrimp constitute a significant proportion of the toial 2oop!aniton plus micronekton biomass. Omori (1974). for example, suggests that shrimp comprise about 10S of the total 0 to
0025-3162- SI /0O65/0165/S 02.20
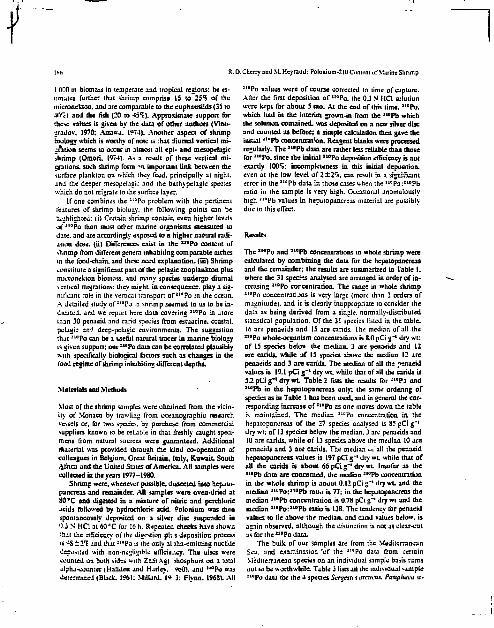
f Ihn R.I
I ODO m biomaas in temperate 2nd tropical regions: he estimates further that shrimp comprise 15 to 15% of the micronekton, and are comparable to the euphausHds (35 to W~c 1 and the rlsh (20 to 45 £è). Approximate support for these values is given by the data of other authors (Vinogradov. 1970; Aizawa. 1974). Another aspect of shrimp biology which is worthy of noie is :hat diurnal vertical migration seems to occur in almost all epi- and mesopelagic >hrimp (Omori. 1974]. As a result of these vertical mil l i o n s , such shrimp form ->n imporlanl link between the surface plankton on which they feed, principally at night, jnd the deeper mesopelasic and the bath}pelagic species which do not migrate to the surface layer.
If one combines the , t D P o problem with the pertinent tenures of shrimp biology, the following points can be highlighted: U) Certain shrimp contain even higher levels of "°Po than most other marine organisms measured 10 date, and are accordingly exposed to a higher natural radiation dose. (îi) Differences exist in the "°Po content of >hnmp from différent genera inhabiting comparable niches in the food-chain, and these need explanation, (til) Shrimp konsthute a significant part of the pelagic zooptankton plus micronekton biomass. and many species undergo diumal v ertieal migrations: they mishL In consequence, play a significant role in the vertical transport of l i 0 P o in the ocean. A detailed study of I I D P o in *nrimp seemed to us to be indicated, and we report here data covering z > °Po in more than 30 penueid and carid species from estuarine. coastal, pelagic an:* deep-pelagic environments. The suggestion '.hat - l 0 P o can be a useful natural tracer in marine biology is given support: our ï W P o data can be correlated plausibly ••Mih specifically biological factors such as changes in the fond regime of shrimp inhabiting different depths.
Materials and Methods
Most of the shrimp samples were obtained from the vicinity of Monaco by trawling from océanographie research vessels or, for two species, by purchase from commercial suppliers known to be reliable in that freshly caught specimens from natural sources were guaranteed. Additional material was provided through the kind co-operation of colleagues in Belgium. Great Britain, [taly, Kuwait, South Africa and the United Sûtes of America. All samples were collected in the years 1977-1980.
Shrimp were, whenever possible, dusected into hepaio-pancreas and remainder. All samples were oven-dried at 30 ' C and digested in a mixture of nitric and perchloric acids followed by hydrochloric acid. Polonium was then spontaneously deposited on a silver disc suspended in O.J N HCI at 6 0 3 C for 16 h. Repeated checks have shown that the efficiency of the digestion pli s deposition process is J 3 ± 2 ^ and that 1 1 0 P o is the only al iha-emilting nuclide deposited with non-negligible efficiency. The uiscs were counted on both sides with ZnSiAg) îhosphors on a total aiphai.-ot:n:er (HallJen and Hurley. ^cOJ. and "°Po vas determined (Black. 1961: Millard. V 3: Flynn. 19631. All
i.Cherry and M.Heyraud: Polonium-210 Content uf Marine Shrimp
1 1 0 P o values were of course corrected to time of capture. After the first deposition of "°Po, the 0.3 N HCI sutuliun were kept for about 5 mo. At the end of this time. l l 0 P o . which had in the interim grown-in from the 1 1 D Pb which the solution contained, was deposited on a new silver disc and counted as before; a simple calculation then gave the initial "°Pb concentraron. Reagent blanks were processed regularly. The ""Pb data are rather less reliable than those for "°Po. since the initial 1 1 0 P o deposition efficiency is not exactly 1005: incompleteness in this initial deposition. even at the low level of 2 ±2*S. can result in a significant error in the a " P b data in those cases when the "°Po:" D Pb ratio in the sample is very high. Occasional anomalously high , , 0 P b values in hepalopancreas material are possibly-due to this effect.
Results
The l l o P o and "°Pb concentrations in whole shrimp were calculated by combining die data for the hepaiopancreas and the remainder; the results are summarized in Table 1. where the 31 species analysed are arranged in order of increasing " D P o cor centra tion. The range in whole shrimp 1 1 D P o concentrations is very large (more than 2 orders of magnitude), and it is clearly inappropriate to consider the data as being derived from a single, normally-distributed statistical population. Of the 31 species listed in the table. 16 are penaeids and 15 are carids. The median of all the ™°Po whole-organism concentrations is 8.0 pCi g"1 dry wt: of IS species below the median. 3 are penaeids and 12 are carids. while of 15 *pecie* above the median 12 are penaeids and 3 are carids. The median of all the penaeid values is 19.1 pCi g"1 dry wt. while that of all the carids is 52 pCi g~ l dry w t Table 2 lists the results far i , g P o and 1 , 0 Pb in the hepalopancreas only; the same ordering of species as in Table 1 has been used, and in general the corresponding increase of I , B P o as one moves down the table 15 maintained. The median * 1 DPo concentration in the hepatopancreas of the 27 species analysed is 3? pCl g~ l
dry wt; of 13 species below the median. 3 are penaeids and 10 are carids, while of 13 species above the median 10 are penaeids and 3 are carids. The median m" all the penaeid hepalopancreas values is 197 pCi g~' dry wt. while that of all die carids ts about 66 pCt g~' dry WL Insofar as die "•Pb data are concerned, die median 1 , 0 P b concentration in the whole shrimp is aoout 0.12 pCi g' 1 dry wt. and the median m P o : , , 0 P b ratio U 77; in the hepatopancreas the median "°Pb concentration is 0.78 pCi g _ 1 dry wt and the median " ° P o : m P b ratio is 138. The tendency tor penaeid values to tie above the median, and cand values below, is azain observed, although the distinction is not as cleur-eut as for the " B P o data.
The bulk of our samples are from the Mediterranean Sea. and examination 'of the 1 1 0 P o data from certain Mediterranean species on an individual sample basis turns out 10 be w orthwhile. Tible 3 lists all the individual -ample "•Po data tor the -1 species Stfrjes/t t amicus. Pasiptsavti «-

R D Casfn .nJM H^t^uJ K-l->niu:nO 10 C.>mcni rt Marine Sismnr l(."
TjMe1. *"Ptf anJ " 'I 'h ÂHtaxnirjiKii» in «hule shrimp Catcecnution: P. PenaeiJc::; C.Caridca. Sub<ate|onti««n. I co«ul . 2. pe-Itpc: 2. Kuwait: -1. dccfi-pd.iii£. Orisin: P. Plvnuiulh: M. Mediterranean: O. Oreei'n. K. Kuwait: N. Saul Specie* lislcd in order of im.TejMns uaPa concentra mm S: no. of samples measured in each specie*. When .* > l.meari4nd standard denjuon «f^aJuei obtained are listed: when .V= 1. the result and its experimental standard déviation are listed, nd: nui détectable
S pi. ci Ci C a l e ç o n Orisin A' " • P u . " - M l . - ' P c : ( p C i r ' d r y w , , (pCi g" 1 dr> w u " • P b
Paliii'Kwn hiisinittns C , P 2 0.42 ± 0 . 0 6 0.02 ±0 .01 21 PtiiipiuiL-a MtiiJii C, M 6 1.3 ± 0 . 5 0.03 = 0.01 43 Penaitts kerathunis P, M 3 2.9 ± 0 . 2 0.14 ±0 .09 21 Criin'an Milgam c, P. M 4 3 J ± 2 . 5 0.06 ±0 .03 55 Liiliir emuferus c, M 1 3.6 ± 0 . 1 0.04 ±0 .01 90 PJbtmon urratus c, P. M 4 4.0 ± 1 . 0 0 . 0 5 = 0 01 B0 Phiiuclieras eclunulatus c, M 1 4.9 ± 0 . 2 nd _ Alphttin denitpes c, M 1 5.1 ± 0 . 3 0 .16=0.10 32 A iwtthirplivra pclueica c. M 2 5.2 + 2 . 8 0.07 ±0 .04 74 Pmivliiita muludeniaia c, M I 5.4 ± 0 . 3 0.04 ± 0 . 0 1 135 L\imw>-iûudata c, M 5 6.4 ± 1 . 5 0.17 ±0 .10 33 Pantotam htaza c, M 2 6.6 ± 0 . 5 0.74 ±0 .0? S S freest es rubrsitis p , M 2 6.6 ± 1 . 4 0.05 = 0 02 132 Pjndjhujnrdiini c, O 6 7.0 ± 1 . 3 0 .14=0.07 SO Statues xormculum p , M 2 7.2 = 1.* 0.75 ±0 .05 10 Ptniieus Stinnulcatui p , K 8.(1 = 0 3 0 . 0 1 = 0 01 800 Fundialia *ood*ardi Pj M S.l = 0 . 3 0.04 = 0.01 202 PSalonika sp. c, M 10.4 ± 0 . 4 0 .1910.01 ïï
Parapenaeus longtroiins p , M 12.3 ± 5 . 2 0.14 ±0 .09 BS Sfciapenaeus siebhinoi p , K 13.3 —0.5 0.07 ±0 .01 190 Sviullaipii debdu c 4
N 14.0 ± 0 . 7 0.12 ±0 .07 117 Actinthephyra quadmpmosa c. N 14.0 ± 0 . 7 0.05 = 0 03 280 Seriates sp. 1 P ; M 19.0 = 1 . 0 0.09 ±0 .02 211 Ansieusantemtaius P- M 19.2 ± 4 . 7 0.26 ±0 .12 74
Ser.-esies amicus p- M 19.3 ± 6 . 2 0 .32±0.55 60 Mi-itioeniieui jffinu p , K 22.0 ± 0 . 6 0.11 ±0 .02 200 PiiraDtniieorfij sntifera p , K 22-5 ± 1 . 2 0 .07=0.02 321 Mi-mvenoeui inomiteros p- N 23.0 ± 3 . 3 0.5 B ± 0 . 4 8 41 Serpettes ptehetuibi p . N 3S.5 ±2.5 0 .27=0 .05 143 Serines ip . 2 p . N 43.0 ± 2 . 0 O. I4±0OS 307 Genncddi tia^ani p. M 2 45 1 = 4 . 3 1.04=1.19 43
vado. Gét>nadas ulegtins. and Acamheplnrapelagica. Vu Do (1978) has made a detailed study of the ecology of micronektonic Crustacea in the Liguro-Provençal Basin of the Mediterranean, and he found that the first two of the above species contributed the overwhelming proportion ( > 88^) of the shnmp biomass in this region. He described them as "superficial" species, i.e., species found, at night. principally between *he surface and 50 to 100 m depth. In Table 3. the s ' 0 P o vulues in the penaeid 5". arcttcus are all clearly high in comparison with those in the carid P. iivaJn. Vu Do distinguished also "deep" species; the penaeid G. elegans was by far the most abundant in rtiis group, but one carid. Wi. A. pelugicu. was also found. Table 3 shows higher i l o P o in the penaeid than in the carid in this ecological niche as well.
A further feature that emerges from Table 3 is that there are certain occasions on which lower than usual 3 I B P o concentrations are observed in several of the shrimp species collected. Collection 2 (September, 1977) and Collection 5 Uuly. 19"9] are noteworthy in this respect. The low I 1 0 P o values found in Collection 2 applied to eu-phauMids as well as shrimp (Heyraud and Chcrrv. 19791. and it is likely that they «.ere 3 feature of the food-chain as
r. whole at that particular date. In discussing the results from Tables 1 and 2. it should be borne in mind that data from Collections 2 and 5 are likely to be anomalously low by a factor of about 2. The species for which some or all of the J 1 0 P o data were obtained from these two collections are: Pasiphea sivada, Acanihepfiym pelagica. Sergesies robusius, S. corniculum, Funchalia Kuodwardi, Arisieus an-tennatus. and 5. arcticuL It is interesting to note that of the fou; eenaeid species in Tables 1 and/or 2 which are 'a typical", in that they provide ; i D P o values which aie below rather than above the oveiall medians, three are to be found in the above list. Da ta for " D P b have not been given ir. Table 3 because they are too limited n be worthwhile citing on an individual sample basis. In a general wpy. however, they show the same irends as shown by the s " P o d a j . i.e.. penaeids higher than carids and Collections 2 and 5 lower than the others.
For three of the species listed in Tables 1 and 2. same or all of the samples measured were from estuanne or riverine rather than from trul) marine environments. The , 1 D P o data for these three species, plus a fourth. Penatus in-dicus, are siven in Table 4 on an individual sample basis. The estuarine and riverine samples are distinctly low in
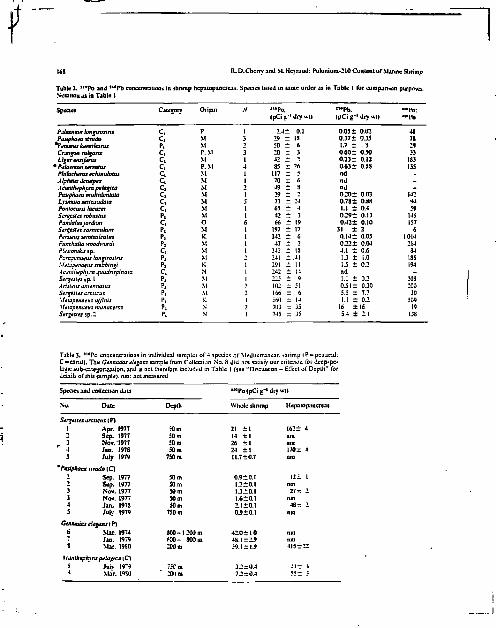
|(J3 ELD.Chenyand VLHevmud: Polonium-2I0CuntentufManncShrimp
Table L 1 , s P o and *"Pb cuncentratiiini in shrimp hcpaiopancrcas. Spetics listed in same order as in Tabic I for cutnpartMin purpihca. Notation as in Table t
Species (pCi -*' dry m l
"•Pb. IpCi g"' dry wtl
pjlaemim longuvsiru Pasiphaea sivdtto
*Penaeus ktrathurus Crangm vulgaris Liguretuiferus
• Piilaemon serrants Philochenu ethinufaius Atpheux Jentipm A canilntphyra pehigiea Posiphaea multidcntata Lyuntiia saicauJata Pomotans lacazei Serçestes robitstus Pandahuiordani Str^eatt eorniettttatr Pitnaeus semisulcatus Funchstia «••aodwartU P'.istomka sp. Paraptnaeus longirostris Mttaptfnaeut uebbinp Aijiuhephyra quadnspinoia Stratum 9 p. [ A riitmis am ennui us Serpsies arencus ^[tHapenantis affinis Uetapenueus munoceros S<tr«<tsies îp. 2
C, P, c, c, c, c, c, c, c, c,
2.4± 0.1 29 = IS 50 ± 6 20 = 3 42 ± 2 83 r 26
117 = 3 70 z: 6 4 9 •=• 3 29 ± 2 73 ± 24 65 ± 4 42 ± 3 66 ± 19
197 ± 17
0.05 ± 0.02 0.37 i 0.35 1.7 i . 3 0MZ 0.50 0.23 ± 0.12 0.63 ± 053 nd nd ml 0.20± 0.03 0.73 ± 0.SS 1.1 ± 0.4 0.29± 0.13 0.42+ 0.10
31 ± 2 0.14± 0.05 0.22± 0.04 4.1 ; 1.3
0.6 1.0
133 135
102 r 51 0 J 1 ± 0.30 200 166 = 6 5.5 = 7.7 30 560 r 14 1.1 ± 0.2 509 503 = 35 16 ±16 19 745 = 55 5.4 ± 2.1 133
Table}. lta?a concentrations in individual samples of 4 species of Mediterranean shrimp iP = pciueid; C s cand) . The Gennadas élégant sample from Culkcii.m No. 3 did not satisfy our criterion for dssp-pe-laaic iub-oieaorizalion. and is not therefore included in Table I (see "Discussion - Effect of Depth" Tor details of this sample}, nnt: nut measured
Species and collection data ' "PolpCig" 1 dry
Whole shrimp
wtl
No. Date Depth
' "PolpCig" 1 dry
Whole shrimp Hcpaiopuncreas
Seriates arcticta ( P) 1 Apr. 1977 10 m 21 ± 1 162 ± 4 2 Sep. 1977 30 m 14 ± 1 nm 3 Nov. 1977 50 m 26 + 1 nm 4 Jan. 1978 50m 24 ± 1 170- 4 5 July 1979 750 m 11.7 ±0.7 nm
'Paitphaaî tivado {Q 2 Sep. 1977 50m 0.9 ±0.1 I2± 1 2 Sep. 1977 50m L2±0.l nm 3 Nov. 1977 SO m U ± 0 . l 27— 2 3 Nov. 1977 50 m 1.6-^0.1 nm 4 Jan. 1973 50m 2.1+0.1 4Sr 2 S Jutv 1979 750 m 0.9 ±0.1 nm
Gtniuuiai depuis IP) fi Mar. 1974 $00-1 200 m 42.0 ••-1 0 not * Jan. 1979 f30- SOOm 4S l-""9 nm * Mar. 19S0 ICHm 59.1-1.9 4I5±22
ivjnthephira pxLigtcj [C\ 5 Juiv 19*4 ~;Cm 3 ' , -0 .4 443 4 * Mar. t*»S0 IBlm 7.2=0.4 55= 3
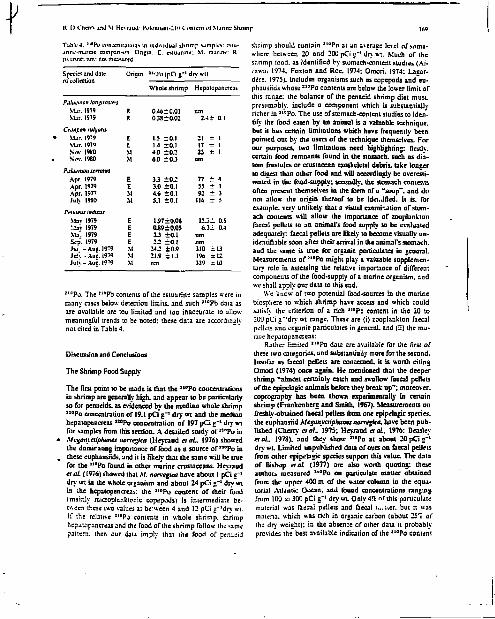
R D t'nern JÎÎJ M Heujuti: Pt»i\inium-21" Content nl Mjnn= Shnmj* 169
Tjhlt-4. f , , Pii ci«nL'cniuin>n!- in indmdujl ill rim p samples: »iu-jnnf-mjnne romparwin Origin. C. cMuanno. M, nurme: R. rt\ arms; nm: flOi mca«ur«J
Specie* and dale Origin "-'ftHpCi g*1 dry wi| pfuillection "
Whole shrimp Hepaiopanerea»
Mar. 1979 R O.Jb-0.01 nm Mar. 1979 R 0.3S±0.02 2.4 ± 0.
Crimean milium Mar. 1979 E 1.5 ±0.1 21 ± 1 Mar. I97M E 1.4 *0.1 17 ± 1 Nov USD M 4.0 ± 0 2 23 ± 1 Nov. 1980 M 6.0 ±0.3 nm
Pjliumott xrrralul Apr. 1979 E 3J ± 0 2 77 ± 4 Apr. 1979 E 3.0 ±0.1 55 ± 1 Apr. 1977 M 4.6 ±0.1 92 ± 3 Jul\ I9S0 M 3.1 ±0.1 116 ± 5
Peimeut int&eui Slav 1979 E 1.97*0.08 123± 0. Mav 1979 E 0.89±0.05 6.3± 0.-Ma. 1979 E 13 +0.1 mn S o . 1979 E 22 -0 .1 nm Jui -Aug 1979 M 24.2 ±0.9 310 ±13 JuK -Au!2 1979 M 31.9 ±1.1 196 ±12 Jul* - Aus 1979 M nm 339 ±10
I t D P o . The î I B P b conienis of the estuarine samples were in many cases below detection limits, and such *'°Pb data as are available are too limited and too inaccurate to allow meaningful trends to be noted: the» data are accordingly not cited in Table 4.
Discussion and Conclusions
The Shrimp Food Supply
The first point to be made is that the "°Po concentrations in shrimp are generally high, and appear to be particularly so for penaeids. as evidenced by the median whole shrimp 1 1 0 P o concentration of 19.1 pCi g~' dry wt and the median hepatopancreas *"Po concentration of 197 pCi g~' dry wi for samples from this section. A detailed study of î l D P o in
« Meganyctiphunes nonegica (Heyraud el al, I976) showed the dominating importance of food as a source of "°Po in
, these euphausiids. and it is likely that the same will be true for the " a P o found in other marine crustaceans. Heyraud et at. ( 1976) showed that St. noncgica have about I pCi g - ' dry wt in the whole organism and about 24 pCi g - 1 dry wi in the hepatopancrea^: the "°Po content of their food (mainly microplankionic copepods) is intermediate between these two values at beween 4 and 12 pCi g-'dry wt. If the relatée I , 0 P o uontems in whole shrimp, shrimp hejMtopancreas and the food of the shrimp follow the same pattern, then our d ju imply that the food of piminrid
shrimp should contain ""Pu at an average level of somewhere between 20 and 20U pCi g"'dry wi. Much of the shrimp food, as identified by stumuch-cnnieni studies (Ai-rawa.- 1974; Foxton and Roe. 1974: Omori. 1974; Lagar-dêre. I975). includes organisms such as copepods and eu-phausiids whose a , B P o contents are below the lower limit of this range: the balance of the penaeid shrimp diet must, presumably, include a component which is substantially richer in 3 1 0 P o . The use of stomach-content studies to identify the food eaten by an animal is a valuable technique, but it has certain limitations which have frequently been pointed out by the users of the technique themselves. For our purposes, two limitations need highlighting: firstlv. certain food remnants found in the stomach, such as diatom frustules or crustacean exoskelelal debris, take longer to digest than other food and will accordingly be overestimated in the food-supply: secondly, the stomach contents often present themselves in the form of a "soup", and do not allow the origin thereof to be idet.ùfied. Il is. for example, very unlikely that a visual examination of stomach contents will allow the importance of zouplankton faecal pellets to an animal's food supply to be evaluated adequately: faecal pellets are likely to became visually unidentifiable soon after their arrival in the animal's stomach, and the same is true for organic particulates in general. Measurements of "*Po might play a valuable supplementary role in assessing the relative importance of different components of the food-supply of a marine organism, and we shall apply our data to this end.
We know of two potential food-sources in the marine biosphere to which shrimp have access and which could satisfy the criterion of a rich "'Pa content in the 20 to 200 pCi g _ 1 dry wt range. These are (i) zooplankton faecal pellets and organic particulates in general, and (ii) the murine hcpaiopancreas:
Rather limited ï l 0 P o data are available for the first of these two categories, and substantially more for the second. Insofar as faecal pellets are concerned, it is worth citing Omori (1974) once again. He mentioned that the deeper shrimp "almost certainly catch and swallow faecal pellets of the epipelagic animals before they break up"; moreover, coprography has been shown experimentally in certain shrimp (Frankenberg and Smith. 1967). Measurements on freshly-obtained faecal pellets from one epipelagic species. the euphausiid Megattvaiphanes norvegica, have been published (Cherry etaL 1975; Heyraud aaL. 1976: Beosley etaL 1978). and they show "°Po at about 2 0 p C i g _ 1
dry wi. Limited unpublished data of ours on faecal pellets from other cpipelagic species support this value. The data of Bishop etal. (1977) are also worth quoting: these author^ measured l i 4 P o on paniculate matter obtained from the upper 400 m of the water column in the equatorial Atlantic Ocean, and found concentrations ranging from 100 to 300 pCi g"' dry wt. Only 4 3 o t i t i s paniculate material was Taecal pellets and faecal ï...uer. but it was material which was rich in organic carbon (about 25^ of the dry weight); in the absence of other data it probably provides the best available indication of the "°Po content

R.O.Cheiry jnd ,\ .Hevraud; Poloniuin-2IQCjn.ernof ManneShrimp
of particulate organic matter near the surface of the sea. .ilihoush it wi)) of course be biased because the distribution of "*Po between the inorganic and organic components is not known. Whatever the limitations of the present data, the indication is clean it is likely that faecal pellets, faecal matter and organic particulates contain suf
f ic ien t l l B P o to satisfy the 20 to 200 pCi 5"* dry wt range criterion which we have already mentioned.
We turn now to the situation in the hepatopancreas. * and it is seen immediately from the median values cited for
our Table 2 data (i.e.. 197 pCi g~' dry wt for penaeids. 66 ?Ci g"' dry wi for carids. and 35 pCi g* 1 dry wi overall) that the shrimp hepatopancreas is certainly sufficiently rich in 3 i 0 P o to satisfy the criterion. We are not aware of any reports in the literature which refer specifically to the sh r i „p hepatopancreas as a source of food for other shrimp, b>-: observations of our own are of some relevance. O n two occasions we have, on examining shrimp collected in a net after trawling, found amongst the live individuals a few dead ones which were intact and unspoiled except for the fact that the hepatopancreas was missing; the excision was generally so clean as to suggest that it had been eaten selectively, in preference to ihe rest of the body. We have observed the same situation, once, in a group 01'shrimp being kept alive in the laboratory for experimental purposes. Add to these observations of selectivity the fact that certain Shrimp, notably those from deeper waters, have frequently been described as predators (Omori. 1974), and the hypothesis that the hepatopancreas may provide a significant contribution to the shrimp food-supply is given support. We shall return to the question of the shrimp food-supply in later sections of the "Discussion"; a sub-caiegorizaiiun of the data is necessary before we do so.
Sub-Categorization of Data
Although from Tables I and 2 it seems at first sight that " " P o in penaeids is dearly higher than in carids. one must be careful 10 ensure that this difference does not reflect a dependence on a variable other than the two taxonomic
A sections themselves. It is for the purpose of investigating this problem in more detail that we have designated the 4 sub-categories in those two tables: coastal, pelagic Kuwait
* and deep-pelagic Identifying the Kuwait samples was no problem; they had ail been caught in the Gulf area. The deep pelagic sampies were those which, 10 our certain knowledge, were caught below 600 m depth. The subdivision of die remaining species into coastal and pelagic was sometimes more difficult; in most cases we knew die exact «te of capture and the distinction was fairly obvious, but on occasion the subdivision had to be made on the basis of the literature. This was not always unambiguous, and we had particular difficulty with the following species: Pan-Jalus jordani 1 Butler. 1964); Plesionika sp. (Lagardere. 1972. 1977V. Pjraptnctus bngrositis (Ljgardêre. 1972). •ind AriSKus amenr.atus ( lagardere. 1972; Omori. 1974). Our sub-ciiesorizalion between coastal and pelaaic is
Table5. , , 0 P o concentrations and *'"Po:"BPb activity ratio» in whale shrimp from various âub-caiegorics (>ee ~D>M.-us>iun - Sub-Categorization of Data" for details of mb-categorùaùonh .V; number a? species per sub-category
Subcategory
"•Po (pCi g" 1 Jiy wt) mpQ.iiopb Subcategory
.V Range Median ,V Range Median
CûJital 9 0 .4- 7.0 4.9 S S- SO 35 Pelade 11 I J - 2 3 . 6 3.1 13 l u - ï l l 74 Kuwait 4 S J Ï - ^ . 5 17.7 4 190-300 :eo Deep- 3 14.0-45.1 3S.5 3 43-307 143
pelidic
therefore not entirely objective, although we believe it is adequate for the purposes of the present discussion. Table 5 gives the median m P o concentrations and , , 0 P o : " D P b activity raJos in whole shrimp in various subcategories. The increasing trend in m P o tram coastal to pelagic to Kuwait to deep-pelagic is obvious, as is the fact that the " ° P o : " f l P b ratios show an approximately similar trend. Cleariv. there are factors other than the penaeid-carid difference which need to be taken into account: we shall try to separate the variables involved and to discuss them individually.
Penaeids Versus Caritls
Of the 16 penaeids listed in Table I. only 1 is coastal. 3 are pelagic. 4 are Kuwait, and 3 are deep pelagic: of the 15 carids. 3 are coastal. 5 are pelagic, and 2 are deep pelagic. The apparently higher " ° P o concentrations in penaeids could thus be a reflection of the imbalance in the number of species in the various sub-categories: die carids could be biased towards the low side because they include more coastal than pelagic species, whereas the penaetds could be biased towards the high side because they comprise mostly pelagic and Kuwait species. In Table 6 we compare the penaeid-carid difference within those two of the 4 subcategories where sufficient data exist for the comparison 10 be made. The " ° P o concentration in penaeids is significantly hisher Uian that in carids in both the pelagic and
Table 6. "°Po concent rations (pCis* 1 dry wt) in «hule >hnmp: penaeid-carid and pelagic-deep pelvic în«rcomparii*jns. .V; number of ïpecies measured: <n standard deviation
Sub-taicïory V Range Median Meander
Pdaac renaeidi 8 6.6-136 IS.7 U.4±6.7 Pelaaiccarids j 13 -10.4 5.1 12±3.J Deep^pelagic 3 38.5-4S.I 43.0 42.1=3.4
penaeids Deep-pelagic 2 W.0 -14.0 14 0 14.0=0.7 *
carids
* Experimental >ianiurd <ieviation of l iinak-saraplc Jerermi-rtjiion

R 0 ChcrrxaihJ M Hcwjud P:>u>nium-2U> Content of Mjnitc Shrimp m
Jeep-pelagic sub-categories. The levels or significance are belter than 1& in both categories if the conventional Student's Mest is used: they are better than IS in the pelagic sub-category and better than 105 in the deep-pelagic sub-category if the weaker, but more widely applicable, non-parametric Mann-Whitney t/-tesi (Siegel, 1956) b used. The hypothesis that the at0?o levels are indeed higher in penaeids than in carids is given further support by the individual sample data in Table 3. As already staled. Sergestes arcticus and Pasiphaea sivado occupy the same niche in the Mediterranean ecosystem, and the same is true for Gennadas eleçans and Acamhephyra pelagica (Vu Do. I97S): the use of these 4 species as a basis for discussion is given more generality because the 4 genera to which ihey belong constitute an important part of the shrimp biomass in the Pacific (Aizawa. 1974: Omori. 1974) and Atlantic ( Foxton and Roe. 1974: Lasardere. 1975) Oceans as well as in the Mediterranean Sea. The penaeid-carid differences in Table 1 ire even more striking than those in Table 6. In the former rale . S. amicus have 1 , D P o some 15 times higher than P. sivado (neglecting the "anomalous" Collections 2 and 5). while G. elegans is some 7 times higher than A. pelagica (again neglecting Collection 5); in the latter table, the penaeid-carid difference is a factor of about 3.
What is th : reason for the difference in "°Po levels between penaeidi 2nd carids? Insofar as the Table 3 data arc concerned, the difference can be explained, to at least same evient. on the basis of a size effect. The two penaeids in
1 jie 3 are both small in comparison with the two carids. and several authors (Foiuon and Roe. 1974: Lagardèrc. 1975) mention a tendency for small shrimp lo feed on copepods. whereas larger species can consume larger prey such as euphausiids. Since the *'°Po content of euphausiids is some 10 times lower than that o f copepods (Heyraud « at, 1976). this dietary tendency might well contribute to the higher 1 , 0 P o levels in the smaller shrimp. This argument cannot, however, explain the more general penaeid-carid differences in Table 6 since, for the data as a whole, no obvious penaeid-carid size difference exists. We return to the hypothesis that hepatopancreas, faeces and organic particulates constitute a significant fraction of the diet of certain shrimp, and we combine this hypothesis with two previously reported facts about shrimp eating habits. The first reflects a general penaeid-carid difference, viz. the fact that in the more primitive penaeids the internal gastric mill is better developed than in carids (Wickins, 1976). A difference in eating habits results, as has been discussed by several authors (Renfro and Pearcy, 1966; Omori, 1974: Wickins. 1976). Penaeids tend to swallow food items whole and break them up in their muscular guts, whereas carids tend to break up food in the mouth parts outside the bodv. If the hepatopancreas of other animals constitutes part of the shrimp food supply, then, since the hepaiopancreas is a particularly soft and fragile tissue, h is likely that this trim-ration process will .:sult in carids losing a certain amount of the i , a P o in their food before true ingestion takes place. I'enaeids. on the other hand, would tend to swallow large portions of hepaiopancreas without external mastication.
thus ensuring minimum a , 0 P o loss. The second fact is not. to our knowledge, documented as a general penaeid-carid difference, but concerns specifically the differences in feeding behaviour between Sergcsies arcticus and Gennadas elegans on the one hand, and Pasiphaea sivado on the other, as reported by Lagardère (1975) and Vu Do (1978). Alt three of these species feed in the surface layer of the Mediterranean at night, but it appears that the two penaetd species feed also during the day. at depth, whereas the carid species does not. Moreover, species of Sergestes and Gennadas possess thoracic appendages which allow them to filter water, whereas Pasiphaea species do not. In the course or this nitration process, particles in suspension, faeces, or-g nie aggregates, etc., are liable to be trapped and in-g sied, thereby adding a component which is relatively r :h in m P o to the food supply. If the differences reported t -tween these three species reflect a generalized difference r :tween penaeid and carid feeding habits, then a higher : "Po content in penaeids is to be expected.
Effect of Depth
We refer again to Table 6. where it is seen that the higher 1 1 0 P o levels in the deep-pelagic samples, already noticed in Table 5. are preserved when the penaeid-carid difference is taken into account The deep-pelagic data are sparse, and suffer the additional defect that they are based on samples crawn from only two oceanic regions: Systeilapsis debilis. Acamhephyra quadrispinosa, Sergestesprehensitis, and Ser-gestes sp. 2 were caught at between 800 and 1300 m in the Indian Ocean off the southeast coast of Natal. South Africa: the two Gennadas elegans specimens were caught in the Mediterranean at between 600 and 1 200 m. The deep-r-Haaic versus pelagic differences are nonetheless statisti-< illy significant: for the penaeids. ai better than the l x : vel by both the /-test and the {/-test: for the carids, at bet-i -r than the 15 level by the i-test and better than the 5 £ 1 Tel by the U-iesL More data are needed, but the indi-i nions are that shrimp in deeper waters, from at least : >me oceanic regions, are exposed to a particularly high i .attirai radiation regime. As such, they merit further discussion. We suggest that the explanation for the higher Ï I 0 P o ' vels in the deep-pelagic species lies once again in the food supply. The implication is that such species consume food richer in "°Po than do the surface species: such m implication is indeed reasonable io terms of the pub-ished data concerning shrimp feeding habits and our ivpothcsis that hepatopancreas. faeces, and organic par-iculates can make a significant contribution to the food-upply of certain shrimp. Yet again we cite Omori ( 1974). .i talking about the feeding regime of shrimp in general ic says "feeding of adult shrimps changes from a lower :rophic level to a higher one with increasing depth of the distribution." He goes on to contrast certain surface ihrimp. which "feed chiefly on herbivoroi M cope-
.oods and euphausiids", with the deeper .ivore* -vhich "are probably biased towards a carnivorous diet because the paniculate matter available to them will only be

R- D.Cherry and M.Hevraud: Polonium-210 Content nf Marine Shrimp
the sinking dead bodies of organisms, casts and fâecal pellets plus associated bacteria. Carnivorous copepods. ostra-cods. medusae, and chaetognaths are the main constituents of ihc gut contents of batiiypelagîc species." Such a change in feeding regime from surface to depth carries with it a change in the " °Po ingested. The food available w surface shrimp is largely herbivorous copepods and euphausiids. which are relatively low in l i a P o . Shrimp living ut deeper levels have a food supply which is Less readily available, and presumably have to predate and scavenge more widely. Their diet is more mixed, and includes several components which are relatively rich in l l 0 P o : faecal pellets, particulates in general, and the hepatopancreas of dead (or live) animals on which they prey, have already been mentioned in this respect [t is. moreover, likely that a diet of carnivorous animals is richer in " ° P o than one of herbivorous animals. In support of this we cite Ihe data of Hey-raud eial (1976): in one collection of surface Mediterranean plankton they were able to separate-out sub-samples of Calanus helgnlandicus. mixed copepods (less C hel-volandicus). crustacean larvae, ostracods and chaetognaths. The first four of these sub-samples contained " ° P o at between 3.7 and 6.3 pCi g ' 1 dry wt. whereas the chaetognaths' (the only purely carnivorous sub-sample) was some three times higher at 16.4 pCi g"1 dry WL
tn the light of the above discussion it is. therefore, to be expected that the deeper shrimp will, in general, have higher l i D P o contents, thus giving one confidence that the deep-pelagic samples we have measured, albeit Tew in number, do indeed reflect correctly the presence of a very high natural radiation domain in a significant component ci the mid-water pelagic bîamass. We have already commented (Heyraud and Cherry, 1979) on the possible implications of the high radiation doses received by Mediterranean Sergesta spp. shrimp and by their hcpaiopancreas m particular. For the deep pelagic penaeids even higher doses will be applicable. Unfortunately, we have been able to measure î , 0 P o in the hepatopancreas of only one of this sub-category, w - the Sergesies sp. 2 from the Indian Ocean, where the extraordinarily high value of 745 pCÎ g~* dry wt was obtained. The deep-pelagic penaeid whole-organism median concentration of 43 pCi g ' 1 dry wt is more soundly based: since i i a P o in the hepatopancreas of penaeids in general is abo'it 10 times higher than in the H hole organism, a median deep-pelagic penaeid hepatopancreas concentration of about 430 pCi g" 1 dry wt can be estimated. This is probably more realistic than the single 7J5 pCi g" 1 dry wt value measured: with a wel idry ratio of about 3 for the hepatopancreas. 430 pCi g " 1 dry wt implies 113 pCi g - 1 wet wt. or a radiation dose to the organ from " ° P o of 143 rem per yr (Hill. 1965). This dose estimate assumes a relative biological effectiveness of 10 for the alpha-radiaiion emitted by 1 M P o . The human organ which receives the highest natural radiation dose is the lung, at acout 0.4 rem per yr. Le., about 330 times lower than the cose from : , ° P o to the deep-sea penaeid hepatopancreas. Although invertebrates are generally much less radiosensitive than man. the possible consequences of such a hi^h
natural dose on an evolutionary time-scale should not be overlooked. Confirmation, or otherwise, of the «eneraiity of the b'-gh " ° P o values we have reported in deep-pelasic shrimp would appear to be of some importance.
A secondary point in connection with our deep-pelasic data is worthy of note: it concerns the species Gtnnadas etegans. In Table 1 we give the data obtained from two specimens trawled by day at between 600 and I 200 m: in Table 3 we have included in addition the data for u third specimen, trawled at night at 200 m. Oman (1974) classifies G. elegans amongst the deep mesapel:igic species which inhabit between 300 and I 000 m by day and between 550 and 750 m by Right; our third specimen was thus some 400 m higher in the water column than might have been expected. The situation in the Mediterranean insofar as the depth distribution of G. elegaiu is concerned, is however, know to be atypical (Vu Do. 1973), and we believe that this third specimen is indeed representative of a deep-pelagic species, even though it was trawled at only 200 m and does not satisfy our depth criteria tor me sub-categorization. The " * P o content of the whole ursnimm is very similar to that of the first two specimens, and it is satisfying to note that the 1 1 0 P o concentration of 415 pCi g*1 dry wt in the hepatopuncreas is close to the 430 pCi g - 1 dry wt we have estimated tbr the deep-pelagic penaeid hepatopancreas.
Kuwait 5nniples
There is of course always the possibility that regional variations exist between the , , 0 P o contents of shrimp from different oceanic areas, and specimens from Kuwait appear to reflect such a situation. Thus. Penaeus kemthuna (which we obtained in die Mediterranean) and the four Kuwait species are all benthtc penaeids of about the same size which live in shallow waters and have a comparable lifestyle and diet (Ben Mustapha. 1967; Euomoio. 1971). Their " • P o concentrations arc nonetheless strikingly different: the median I , 0 P o concentration is some 6 limes higher in the Kuwait samples than in P. keratkurus. in both the whole organism and the hepatopancreas. The Kuwait samples approach the deep pelagic species in their , 1 B P o levels, and their s , f l P o : , " P b ratios are remarkably high. We have been unable to identify any obvious murine biological factor which could explain these data plausibly, but the following speculation, bascu on a chance observation, is perhaps worth nouns. W hile measuring " B P o and " °Pb on a routine basis in atmospheric deposition by collecting total fall-out (rainwater and dry deposition) on a roof in Monaco, we noticed in January-February 1980 that the d r component contained a substantial contribution of material that appeared to be ash from oil-burning furnaces used to provide central heating for several buildings in the vicinity. The " ° P o content of this material wa* about 16 pCi g"' . which is very similar to the level of it pCi g ' ' found by Kaakinen *tal, (1973) in the etcctm-.uiu- precipitator outlet llv jsh from a coal.-llrsJ power plant On

R D t i i JIUMI Heif/oJ P,'lL.nium-:itit"i'niL-nt..iMJi
the hasi> of measurements of radium and thonum nuclides m coal and petroleum ash. it has heen assumed thai natural radioactive effluents from coal-fired power plants will be some 40 limes higher than those from oil-fired plants (Eisenbud and Petrow. 1964; Okamoto. 1978): if the , , D P o content of the respective ashes does not follow ihe same paitern. it may well he that this factor w.ill have to be modified - a point to he home in mind by those workers interested in comparing the relative radiation hazards of different fuel». We are not aware of published data concern-
» ins : , a P o cpneenlraiions in petroleum products, but we ha te measured - 1 0 Po in a single sample of domestic fuel oil and found a concentration of 1.7 ± 0 . 3 pCi l i t r e - 1 . This is
* some 70 limes higher than the usual 3 1 0 P o concentration in sea water, and we suggest that it is not impossible that the intensive petroleum-assiicialed activities in the Gulf area have resulted in higher-than-average , [ ° P o levels in sea wjier and/or the associated marine biota. Measurements o f î l 0 P o in a variety of samples from the Gulf would be of interest.
Estuaries
The loiv i l D p o conL-emraiions in the samples from estuarine environment* ha\e already been noted (Table 4). In one case, the species Pmiueus indicus. we were able to obtain samples from the same species ai different stages of de-v elopmeni. The estuanne samples « ere caught in Richards Bav. Natal. South Africa, and the marine samples on the Tueela Banks off the Natal coast. The larvae of P. indicus are produced in the open sea. where they undergo several weeks of development. During the latter stages they migrate into estuaries and metamorphose into typical btmthie shrimp. They spend about 12 to IS mo in estuaries, during which time they grow to sexual maturity. The adults approaching, or having reached, sexual maturity then migrate to the open sea where they produce the next generation. We see that the adult specimens, caught at sea. have 10 times as much ""Po as the smaller samples caught in Richards Bay. Although this could be a size effect (the Richards Bay samples were lower in weight by a factor of 7). it is unlikely that a size di(Terence alone could explain such a radical change in the I 1 0 P o concentration. No obvious difference in the n o P o concentration with species size is found in Table 1. as has been noted already; moreover, it is obvious that the other eszuarine samples are all striking!) low in I , a P o . The" median whole organism J 1 0 P o
« concentration in the estuarine or riverine samples is about 1.6 pCi a"1 dry wt: if we exclude these samples from Table 1 and calculate the median for the remaining samples in the coastal sub-category, we obtain a value of ahout 5.4 pCi g - 1 dry WL It appears that there is a steady tendency for the median "°Po concentration to increase, from 1.6 to 5.4 io S.l pCi g" 1 dry wi, as one goes from estuarine lo coiiul to pelagic environments. It is possible that this increa-e. and the low ""Po in estuarine shrimp in particular, may he related to the form in which 3 , 0 P o exists in the wa
ter in the different environments. Although the immediate source of , , 0 P o in shrimp is almost certainly in the food they eat. the ultimate source of 3 1 0 P o in the food will probably have been 3 1 0 P o in the water. Variations in the 3 , n P o content of sea water are relatively small (Shannon eial.. 1970: Cherry and Shannon. 1974: Bacon a al. 1976: Hev-raud and Cherry. 1979): moreover, the sparse d3ta which exist do not suggest that "°Po in river water {Parfenov. 1974) is at levels which are notably lower than in the ocean. More measurements of 3 , 0 P o in estuarine and river waters are needed, and we suggest further that attention should be paid to ihe farm in which soluble ï l o P o e.\ists in these waters. It is known, for example, that certain metal» are accumulated more strongly by phytoplankton and filter-feeding organisms when the metal is in an ionic state than when it is organically bound (Davies. 1978). Manx trace elements are indeed organically bound in estuarine environ men ts; if this is true for i l 0 P o as well, then the degree orup_ike of 3 , ° P o from water tbv whatever organisms, plant or y . m a L are responsible for the initial entry of I I O P o into the food-chain) could be less than it is in a truK marine environment. Perhaps the increase in 3 l 0P<i in shrimp we observe in going from estuarine to coastal to pelagic environments reflects, ultimately, the fact that there is in general a corresponding decrease in the dissolved organic content of the water medium.
Seasonal Effects
The low î l 0 P o data given in Table 3 for the shrimp collected in Collections 2 and 5 have already been noted. These two collections were both in summer, September 1977 and Julv 1979 respectively. In order to explain the September 1977 data, which were low in l l 0 P o in eu-phausiids as well as in shrimp, we invoked previously the hypothesis that the arrival of a bloom of phyioph<-(kio= particularly poor in I , 0 P o (Folsor. and Beasley, 1973) might have repercussions all along the food chain. This remains a possibility, but the fact that the situation recurred 2yr later suggests that there might be another, and more frequently occurring explanation, riz. a seasonal effect which results in generally lower m P o values in the summer. The data of Beasley ct al. (1973) i n r 3 , 0 P o i n Pandalus jordani show the same effect: in summer they found levels of 6 pCi g"' dry wt, whereas in autumn, winter, and spring ihey ranged from 10 to 17 pCî g"' dry w t It is interesting to note that our l l D P u values in P. jordani. measured in samples provided by Dr. Beasley and collected in July 1979, are in close agreement with the values Beasley et al. obtained in samples collected in Julv 1970. viz. 7 pCi g - 1
dry wi (our data) L-ompared wiih 6 pCi g - 1 dry wt (Beasley et ai. 1973). In two other species, n'r. Pasiphuea pacijlca and (apart from one exception) Sergestes similis. Beasley et ai also reported " ° P o concentrations which were lower in July than ui other seasons. The reason for such a seasonal effect is not clear: presumably it reflects a change in dietary composition in an earlv link in the food-chain dur-

174 R.D.Chcrry end M.Heyraud; Palonium-210Cement of Murine Shrimp
ing ihcsumm^r months. The l l 0 P o levels m phyîoplaakion are generally lower than those in zooplankton (Cherry and Shannon, 1974; Heyraud and Cherry. 1979), and it is possible thai in the summer months the diet of surface animals is relatively poorer in animal matter, as opposed to plant matter, than during the rest of the year. Casanova (1974) has Jiscussed briefly factors which might afiect the nutrition of cuphausiids: she refers to the stage of sexual mam-ntv and to the change which results in spring at the moment or the development of the phytoplankton bloom. Why ihis change should be reflected in the shrimp in summer rather than in spring is not clear. Perhaps the question of availability of 1 1 D P o at the initial s u a e of the food-chain, which we invoked in order to explain the estuarine d a n , is again a factor. Regular teasurements of * w P o in the same species extending over a period of at least a year will he tic=cied to investigate this seasonal problem mare thoroughly.
» n P b Data
[n view of the fact that the s " P b data are less reliable -and. from the marine biological paint of view, less interesting - than cho^e far l w P o . they are not worth discussing in the same detail. Certain features are nonetheless worthy of note:
(i) The well-known fact (Cheny and Shannon. 1974; Heyraud and Cherry. 1979) thai a " P b is considerably lower than " ° P o in marine organisms is once again verified. The median " • P o : * , - P b activity ratio of 138 in the hepato-pancreas decreases to 77 in whole shrimp, about 34 in microzooplankton. about 5 in phytoplankton. and unity or less in sea water (Shannon et at. 1970; Heyraud and Cherry. 1979). These striking changes En the activity rado must iuretv reflect a much greater degree of involvement in the marine biological cycle for I l 0 P o than f o r I , 0 P b .
(ii) Table 7 is the I 1 D P b analugue of Table 6. and at first sight is would appear that the penaeid-carid difference observed for " °Po is reflected in the " ° P b data as welL (n both the pelagic and deep-pelagic cases, the median (or mean) : i ° P b concentrations are higher in penaeids than in
• carids by a (actor of 4 or S. The statistical significance of these differences is, however, questionable: tn the pelagic
Tabic 7. ]'*Pb catictntatiaas I p G ï " ' dry wt| in whale shrimp: pcnacid-carid and pelagic-deep pelagic companions. .V: number of species measured; az standard déviation
Sub-category .V Ranse Median Mean ± a
Pdasic petueds i 004-0.75 0-0 0.:S±0.26 PeUsic cands J 0.0J-0.19 0.04 0.07r0.07 D«p-FelJi;e 3 0.14-1.04 0.Z7 0.431U-19.
perueidi Desp-çcàçc 2 0.0: - ') 12 0.09 O.WrO.05
Lands
case the levels of significance are better than 105 with both the M a t and the (/-test, but in the non-pelagic case they are not. The four Mediterranean species to which we have referred previously do give some support to a penaeid-carid difference in the l l 0 P b data: from Table 1 we see that if one compares Sergestes amicus with Posiphaea sivaiio. and Ctnnadas efegans with Acanthepkyro petagica. then in both cases the penaeid 1 1 0 P b content is higher than that in the carid by a faci.v of 10 of more.
(iii) The significantly higher , l , P o concentration in deep-pelagic as opposed to pelagic shrimp species is not apparent from the ; , ° P b data as summarized in Table 7. Data of a much higher quality for l i a P b would, however, be needed to establish whether or not there is a change in " • P b in shrimp with depth.
Conclusions
The concentrations of s u r P o in shrimp vary widely, covering a range of more than two orders of magnitude over the 31 species investigated. T h e variations observed can be related to biological and environmental factors; penaeids tend to be richer in " ° P o than carids. and *"Po concentrations tend to increase from estuarine to coastal to pelagic to deep-pelagic shrimp- The generality of the very high i W P o levels observed in a limited number of deep-pelagic species needs further investigation: the sparse data available suggest the existence of a particularly high natural radiation dose domain in at least some components of die deep-sea biosphere. The ï , 0 P o concentrations which are observed in shrimp can be explained plausibly in terms of variations in l l o P o in the food eaien by the shrimp concerned: the data suggest that items such as the hcpaiopancreas of other shri>>:p. zooplankton faecal pellets and organic particulates form an important part of the diet of shrimp which feed at depth in the ucean. Ultimaiely, the availability of I l D P o to the food-chain might well depend on its form in sea water, and information is needed as to the degree of organic binding which exists for " T o in estuarine as opposed to truly oceanic waters.
Acknowledgements. We are grateful to the following persons for supplying us with sample material or for advice and assistance: T. M. Beasley. P. Dauby. A. G. Davies. J. A. Day. D. L. Elder. A. Farmer. H. Gerhardt. B. Kens-ley. C. P. Mathews. T. P. McCIurg. M. A. Roeleveld and E. H. Schulie. We acknowledge further the friendly assistance of the crews of the "KorotnefF (Station Zoologiquc. Villefranche). the "Physalie" and the "Winaretta" (Mit.ee Océanographique. Monaco) in sample collection. The International Laboratory of Marine Radioactivity operates under a tripartite agreement between die International Atomic Energy Agency, the Government of the Principality n; Monaco and the Océanographie Institute at Monaco. The present work was also supported in its initial stages by .he Manne Pollution Programme of the South African National Scientific Programmes Unit.

R. D.Chcii} and M Ht-'wjuil. P<>i<'muni-21l> Content of Marine Shrimp )7%
Li te ra ture Cited
Aiiawa. Y - Ecological studies or micronckuinic shrimps (Crustacea. Decapoda) in ihc Western North Pacific. Bull. Ocean Res. InsLUmv.Tokvo 6.1-61(19741
Sawn. M. P.. D. W. Spencer and p. G. Brewer: " ° P b / " * R a and '• 'P(i . ' 1 "Pti disequilibria in *eawater and suspended particulate matter. Earth planet. Sci. Lett. 32,277-296 (1976)
Beaslev. T. M.. R. J. Eagle and T. A. Jokela: Polonium-210. lead-: i û and stable lead m marine orcanisms. Q. Summ. Rep. Hlth Saf Lab.. N.Y. (Fallout P r o e m . ) " H A S L - 2 7 3 . 2 -36 ( 1973)
Beaslev. T. M.. M. Hevraud. I 1. W. Hissa. R. D . Cherry and S "\V. Fowler J , , P o and " " P b in zoôpkinkton fecal pellets. Mjr. Biol. 44. 325-32S (197SJ
Ben Muwapha. A.: Observation» biologiques sur fenam keta-tliuru* FnrjLal et étude biumétnque. A.mis InsL nain, scient. t «h . Oceanogr. Pèch S a b m b ô 13.1 -10011967)
Bùhop. J. K. B_ J. M- Edmond. D. R. Kctten. M. P. Bacon and W. B. Silken: The chemistry, biology, and venical flux oCparticulate matter from die upper 400 m of the equatorial Atlantic Ocean. D«p-Sea Res. 24. 511-548 ( 1977)
Black. 5. C. Low-level polonium and radiolead analysis. Hlth
Phys. 7. 87-91 (1961) Butler! T. H.; Growth, reproduction and distribution of pandalid
shrimp* in British Columbia. J . Fish. Res. Bd Can. 21. 1403-1452(1964)
Casanova. B.: Les euphausiacés de Méditerranée (Systématique et développement larvaire. Biogeagraphie et biologie). 3S0 pp. Thê*e de Docuur-ës-Sciences naturelles. Université de Provence. AivMurseille 197*. iNo. d'ordre C.N.R.S- A.0.9446)
Cherry. R. D„ S. W. Fouler. T. M. Bcasley and M. Heyraud: Po-li>nium-210: il» vertical oceanic transport by zooplanklon metabolic activity. Mur. Chem. i . 105-110 ( 19751
Cherry. R. D. and L. V. Shannon: The alpha radioactivity of marine organisme Atom. Energy Rev_ Vienna 12.1-45(1974)
Davîes. A. G.: Pollution studies, with marine plankton. Pan 11.
Heavy metals. Adv. mar. Biol. 15, 381-508 1197S) Eisenbud. M. and H. G. Peiro*" Radioactivity in the atmospheric
effluents of power plants that use fossil fuels. Science. N.Y. 144.238-289(1964)
Enomoto. Y.: Océanographie survey and biological study of shrimps in the waters adjacent to the eastern coast* of the Slate or Kuwait. BuU.Tofcaireg. Fish. Res. Lab. 66. 1-74 (1971)
Flynn. VV. W.: The determination of low levels of polonium-210 in environmental materials. AnaHiica chin). Acta 43, 221-227 (1968)
Folwim. T. R. and T. M. Beasley: Contributions from the alpha emitter, polonium-210. to ihe natural radiation environment of the marine organisms. la: Radioactive contamination of the marine environment, pp 625-632. Vienna: International Atomic Energy Agency 1973
Fôttun. P. and H. 5. J. Roc: Observations on the noaural feeding nfsume raesopelagic decapod Crustacea. Mar. Biol. 28. 37-49 (197a)
Frankenbere. D. and K. L. Smith. Jr.: Coprophagy in marine animals. Urnnol. Oceanogr. 13, 443-450 ( 1967)
HalMcn. N. A. and J. H. Harlcv: An improved alpha counting technique. Analyu Chero. 32, ÎSAI-I863 (I960)
Heyraud. M. and R. D. Cherry: PoIonium-210 ami'tead-210 in marine food chains. Mar. BioL 52.227-236 (1979)
Heyraud. M_ S. W. Fowler. T . M. Beasley and R. D. Cherry: Po-looium-210 in euphausiids: a detailed study. Mar. Biol. 34. 127-136(1976)
Hill. C. R.: Poloniutn-210 in man. Nature, Lend. 208, 423-428 (1965)
Kaakinen. J. \V_ R, M. Jorden. M. H. Lawasani and R. £ . West: Trace clement behavior m coal-fired power plant. Envir. Sci. TechnoL 9.862-869 (1975)
Lagarderc. 1. P.: Recherches sur l'alimentation des crevette» d e la penle continentale marocaine. Téthys 3,655-675 ( 1972)
Lagardcrc, J. P - Recherches sur l'alimentation des crevettes baibvpêlasiques du talus continental du Golfe de Gascogne. Revue Trâv. Ins t (scient lech.) Pech. marit. 39. 213-22» (1975)
Lagardérc. J. P.: Recherches sur la distribution verticale et sur l'alimentation des crustacés décapodes facmhiques de la pente ainiînentale du Golfe de Gascogne. Bull. Cent. Êiud. Rech. scient. Biarritz IL 367-440(1977)"
Millard. H. T.: Quantitative radiochemical procedures f«ir analysis of poJcntum-210 and lead-210 în minerals. Anaki . Chem. 3*. 1017-1023(19631
Okarnoto. K.: Radioactive emissions Irani thermal pou,er plants. Paper presented ai the Third Annual Conference of the Australian Radiation Protection Society, held at the Untversitv of Sydney. 24-26 May, 1978
Omo'ri. M.: The biology of pelaeic shrimps in the ocean. Adv. mar.
Biol. 12.233-324 (1974) Parfenov. Yu. D-: PoIonitim-210 in the environment and in the
human organism. Atom. Energy Rev„ Vienna 12, 75-143 (1974)
Renfro. W. C. and \V. G. Pearcy: Food and feeding apparatus of two pelaaic shrimps. J. Fish. Res. Bd Can. 23. 1971-1975 (1966)
Shannon. L. W_ R. D . Cherry and M. J. Onen : PoIoniutn-210 and lead-210 in the marine environment. Gcochim. cosmo-chim. Acta 24. 701-711(1970)
Siegel. S.: Nun parametric statistics for the behavioral sciences.
312 pp. Tokyo: McGraw-Hill: Kogafcusha Ltd. 1956 Vinogradov. Jvi. E.: Venical distribution of the oceanic 200-
plankton. 339 pp . [Tntnsl. from Russian]. Jerusalem: Israel Program for Scientific Translations 1970
Vu Do. Q.: Ecologie des crustacés micronecioitiqucs d a m l'écosystème superficiel da Bassin Liguro-Provencal: étude particulière des décapodes Natann'a pélagiques. 140 pp. These 3 e
Cycle. Université Pierre et Marie Curie"(Paris VI) 1978 Wickins. J. F. : Piawn biology and culture. Oceanosr. mar. bîoL A.
Rev. K 435-507 (1976)
Date of final manuscript acceptance: September 14,1981. Communicated fay J. M. Pérès. Marseille

VoL 4: 123-126, «81 MA *'NE ECOLOGY - PROGRESS SERIES
Mar. EcoL Prog. Ser. Published January 31
SHORT NOTE
High Concentrations of Transuranics and Natural Radioactive Elements in the Branchial Hearts oi the Cephalopod
Octopus vulgaris J . - C Guary» , J . J . W . H I g g o 2 , R. D . Cherry** a n d M . H e y r a n d '
•laic niitloiul Laboratory «I Marin* H*dlo»ciltrtty. Mtnce Octmagr«phlqae. Monies tPhyila Department. University "I Cape Town. RandcbMdi. C P . South Alrice
ABSTRACT: Data are reported which show elevated levels oi plutonium and ameritium in die branchial hearts oi the common cephalopod Octopus vulgaris. These levels were verified in both a laboratory* experiment end in environmental samples. At the same time data for certain ttaturaUy-occumng radioactive isotopes al thorium, polonium and lead are given lor comparison. Attention is directed to the potential oi these smell organs as monitors o! transuranics and. probably, certain other elements in the marine environment.
The behaviour of transuranic elements in marine organisms is currently the subject of detailed study. Development of the nuclear industry will require that monitoring of plutonium, in particular, b e continued in marine samples, and the identification of organisms, or organs thereof, which consistently accumulate transuranics to elevated levels is a matter of importance. Investigations are usually of two types; either a laboratory investigation is carried out, in which animals are exposed to sea water and/or food labelled with an appropriate radioactive isotope (Vilquin et al., 1975; Guary and Fowler, 1977; Fowler and Guary, 1977), or measurements are made of the transuranic elements at the very low levels at which they are found in environmental samples {Pillai et a l , 1964, Noshkin, 1972; Higgo et aL, 1977). The former are less tedious, but their interpretation ia frequently ambiguous because it is very difficult to reproduce exactly in the laboratory such factors as the physico-chemical form of
+ the element and the partitioning of its m a d e of uptake into the animal via the alternative routes of food and water.
We report here the results of an investigation in which both approaches were used. Unambiguous confirmation was obtained of elevated levels of plutonium and ameridum in the branchial hearts of the common octopus; also reported are levels of certain naturally-
' On leave from the Physics ûepanment. University at Cape
occurring radioactive isotope-: of thorium, polonium and lead in the same organs. We suggest that these small organs have considerable potential as monitors of transurantcs and, probably, other elements in the environment-
Four individuals of the molluscan cephalopod Octopus vulgaris, ranging in wet weight from 80 to 140 g. were caught off Monaco. They '.vera placed in filtered and aerated sea water maintained at 13 " ± 1 C ; the sea water was spiked with ""Pu adjusted to the + 4 state (Fowler et al-, 1975) at 0.7 JcBq (20 nCi) 1~> for two of the cephalopods, and with ' " A m (assumed to be in the + 3 state) at 1 kBq [30 nCi) 1"' for the other two. Throughout a 15-d period the activity of the test animals was monitored regularly by gamma-spectrometry using a 3 ' Nal (Tl) crystal; at the end of this period the cephalopods were dissected and the concentrations of the nuclides in the various organs were measured. Details of the uptake phase, the many organs involved, etc., will be given elsewheret for our present purposes, the data given in Table 1 are of primary importance. They highlight the situation in the branchial hearts vis-a-vis the hepatapancreas; it is well-known that the latter organ accumulates many elements effectively. The high percentages of both nuclides in the branchial hearts, which constitute a mere 0.3 % by weight of the whole animal, are immediately apparent, as are the high concentration factors with respect to the labelled sea water. We next performed an elimination experiment. Four further Octopus vulgaris (300 to 400 g wet weight each) were placed in " ' P u and : , l A m labelled sea water far 10 d, under the same conditions as previously. Each individual was then transferred to flowing (unlahelled) sea water, and was fed daily with crabs and gamma-counted regularly. For both nuclides the loss curve showed a three component loss. The first component (representing desorption) was very rapid and contained about 24 % of the Pu and Am; the
2' Inter-3eseârch ai7i-afina;Bi.Tj0u4. (H23/S 02.00

Mar. EcoL Prog. Ser. A 123-126. 1981
T«ble 1. Octopus vulgaris. Concentration factors with respect to se* water (CF.) and distribution (%} of ^ P u and H , A m after a 15-d exposure to labelled sea water. Two animals were dissected for each radionuclide and their organs grouped for analysis.
Concentrations or the elements in sea water were: 0.7 kBq l - 1 for M , P m 1 kBq |~ ' for '"Am
Sample % of total-animal wet weight CF.
' "Pu % of total body burden CF.
" 'Am % of total body burden
Branchial hearts Hepalopanaeas Remainder Whole animal
03 2.9
96.8 100.0
9300 so 45 75
40.6 2-2
S7.2 100.0
7100 20 to 40
72.B 13
253 100.0
second and third components had biological half-lives of about l.B and 560 d and contained about 30 % and 46 % of the elements respectively. Differences between Am and Pu in the loss kinetics were minimal. After 70 d of loss the cephalopods were dissected and the nuclide tm^entrations measured. At this stage the branchial hearts were round to contain no less than flfl % of the ^ P u and 99 % of the 3 " A m in the whole animals. These high percentages reflect the very much slower loss of the elements from these organs than from the other organs and tissues of the cephalopod.
Our attention having been thus directed to the branchial hearts, we measured a 3 9 + M 0 P u and M , A m at environmental levels in further Oclapus vulgaris specimens. Measurements of the radionuclides ^ T h . v»Th. m T h , 2 , 0 P o and 2 , 0 P b were also made. Standard chemical extraction techniques were used (Millard, 1953; Ku. 1965; Flynn. 1968; Wong, 1971), followed by alpha-speclrometry with surface barrier detectors for Ara. Pu and Th and by alpha.counting with ZnS (Ag) phosphors (Hallden and Karley, 1960) for ""Po and
l l 5 P b . The data are summarized in Table 2. Several features are apparent: (f) High levels of 2 i l A m and 2 3 T P u in the branchial hearts are confirmed, (iij Concentration factors in the branchial hearts with, respect to sea water are close to those found in the laboratory exper iment (ill] Concentrations of the other three e lements in the branchial hearts are also high, and concentration factors are close to 10* for all five elements, despite their very different chemical properties, (iv) Concentrations of 2 1 0 P o , and to a lesser extent a w P b , are high in the hepatopancreas, as has been found previously (Cherry and Shannon, 1974; Heyraud and Cherry, 1979). Note that M , A m , ! B + I u l P i i and a 3 3 T h are, by contrast, concentrated to a much smaller extent in this organ than in the branchial hearts, (v) The percentages of M , A m and 239+"BPu jj , ^ e hepatopancreas and in the branchial hearts can be calculated. They differ from those found in the laboratory experiment, and these differences probably reflect the relative importance of the food and water upL ke routes.
Octopus vulgaris is a littoral species common in
Table 2. Octopus vulgaris. Concentrations of M 1 Am. a w - 3 * D Pu. m T h . , w P b ana M 0 P o in cephalopods collected in the littoral zone off Monaco. Far 3 w + I , 9 P u , means are of 3 samples comprising 4. $ and 54 individuals respectively: for 3 "Am, of 1 samples comprising 4 and S individuals respectively; for Th isotopes 1 sample of 54 individuals was split in two; for " T o and , w P b a single sample of 1 individual only was measured. Concentrations factors (CF.) were calculated assuming the following concentraUons in coastal sea water: M , A m . 2.1 X 10~ a mBqr , - : »»*» , < , Po,38 X 1 0 - 3 mBo l _ , - ; 5 K T h . 7 4 x lO-^mf lq l - ' " ; ™Pb. 1.4 mBq ] - ' • • • ; a , n Po, 1 J raBq l - , " \ Data for thorium isotopes ! W T h and s s , T h are not given, but all z w J l i / a , T h ratios were very dose to unity and all 3 " T b / i n T h ratios were between 1 and 2. For T h , 3 , a P b and 1 M P o errors ore standard deviations of the counting statistics, including propagation of the blank error; for w , A m and M , - 1 « P u the errors are whichever was die higher of either standard deviations of counting statistics of individual samples or standard deviation between the various
samples measured, run. = not measured. 1 mBq « 2 7 x 10~ J pCi
Wet/dry Radionuclide concentration (mH<j kg' 1 wel) ratio " 'Am «"- ' "Pu oi-m in> P b i i o P o
Concentration Factors (CF.) ' "Am « 9 * s »Pu ^ T h l l 0 Pb "°Po
Branchial 5.2 30±13 370±110 560±70 1370Q±700 24000±1500 1X10* 1X10' BxlO 1 1X10* 2X10* hearts Hepatopan- 3.1 1.1±0.7 25=7 26=4 322QQ+26DD 5B5000±24000 5X10 1 7X10' 4X1Q1 2X10* 5x10*
Remainder S3 0.3±0-l 0.3±0.1 4.4=0.7 n.m. 3000=300 1X101 a x i 0 D 6X10' n.m. 2X10 1
Reconstituted 5.7 0-S±0.1 2.2=0.4 6.3=0.7 n.m. 20OO0±700 2x10* 6 x l 0 : 9XI0 1 n-m. 2X10*
* Fukai et al. (1976) " Cherry and Shannon 11974)
' * * Heyraud and Cherry ( 1979)
Guarv et al.: High concern .-al ions of transuranics and natural radioactive elements in Octopus 125
temperate and tropical seas (Wells, 1978). Even though -the branchial hea.ts constitute a small fraction of the cephalopod, the concentrating powers of these organs are such that a mere gram or two (dry weight) , which can be obtained from 4 or 5 large individuals, is sufficient to allow the detection of J 4 , A m with a n error of about 25 % per sample. The potential of these organs as biological indicators ol transuranics and certain
1 natural radioactive elements is to be emphasized. The results of our experiments suggest that they act as a slow-turnover store which might serve as a long-term
* indicator of exposure. Further, it has b e e n shown recently that the branchial hearts concentrate certain other elements effectively, e. g. vanadium (Miramand and Guary, 19B0) and cobalt (Nakahara el al., 1979), with concentration factors of 3 X 10 3 and 2 x 10 4
respectively Interestingly, vanadium and cobalt seem to behave similarly to americium, plutonium and thorium in that they are less concentrated in the hepatopancreas than in the branchial hearts . The araiu.;,:-il hearts are organs with circulatory and excretory functions (Cuenoi, 1899; Turchini, 1923; Martin and Hamson, 1966). They are rich in iron (N'ardi and Ste-iberg, 1974] and this metal is localized in intracellular granules composed of purple-brown pigments or adenochromes (Fox and Updegraff, 1943). A recent laboralory experiment (Miramand and Guary, 19BJJ using autoradiography indicates a n association of ! " A m with these intracellular granules .
Perhaps we are dealing with a detoxificaUon system comparable to that which has been described for other molluscs (Coombs. 1977; Martoja e ta l - , 1977; Coombs and George, 1978). Many elements accumulated from sea water may be associated with the intracellular granules of the branchial hearts and thus rendered less susceptible to intoxicate the vital organs of the cephalopod. Quite apart from their potential as biological indicators of pollution, the branchial hearts of the octopus are worthy of further study on physiological grounds.
Acknowledgements. The International Laboratory ol Marine Radioactivity operates under a tripartite agreement between the International Atomic Energy Agency, the Government of
t the Pnnnpality of Monaco and the Océanographie Institute at Monaco. The present work was also supported by the Marine Pollution Programme of the South African National Scientific
• Programmes L'ait We thank 5. W. Fowler ant. A. Wallon for critical comments.
LITERATURE CITED
Cherry. R. D.. Shannon. I_ V. (1974). The alpha radioactivity of m aune organisms. Atom. Energy Rev. 12: 1—15
Cosmos. T. L 11977], Uptake and storage mechanisms of
heavy metals in marine organisms. Proc. Analyt. Div. Chem. Soc 14: 219-222
Coombs, T. L. George. S. G. (1978). Mechanisms of immobilization and detoxication of metals in marine organisms. In McLusky, D. 5., Berry, A. J. (eds) Physiology and
thaviour ol marine organisms. Pergamon Press, Oxford, pp 179-187
Cuenoi, l_ {1899). L'excrétion chez les Mollusques. Archs BioL, Paris 16: 49-96
Flynn. W. W. (1968). The détermination of low levels of pâlonium-ZlO in environmental materials. Anal. chim. Acta 43: 221-227
Fowler, S. W.t Heyraud, M- Beasley. T. M. (1975). Experimental stud its on plutonium kinetics in marine biota. In: Impacts of nuclezr releases into the aquatic environment. International Atomic Energy Agency, Vienna, pp. 157-177
Fowler, S. W.. Guary, J. C (1977). High absorption elficiency for ingested plutonium in crabs. Nature. Lend- 266: 827-828
Fox. D. L-, Updegraff. D. M. (1943). Adenochrome, a glandular pigment in the branchial hearts of the a crop us. Archs Biochem. 1: 339-356
Fukai, R-. Ballestra, S.. Holm, E. [1976). '"Americium in Mediterranean suri ace waters. Nature, Lond. 26-1; 739-740
Cuary. J. C. Fowler. S. W. (1977). Biokinetics ol neptuniun-237 in mussels and shrimp. Mar. Sri- Communs 3: 211-229
Hallden. N. A., Harley. J. H. (I960). An improved alpha counting technique. Analyt. Chem. 32: 1B61-1H63
Heyraud, M„ Cherry, R. D. (1979). Polonium-210 and lead-210 in marine food chains. Mar. Biol. 52: 227-236
Higgo. J. J. W.f Cherry, R. D.. Heyraud, M.. Fowler, S. W. (1977). Rapid removal of plutonium from the oceanic surface layer by zooplankton faecal pellets. Nature, Land. 266: 623-624
Ku, T. L. (1965). An evaluation of Ihe : ! ' U / D I U method as a tool for dating pelagic sediments. J. Geophys. Res. 70: 3457-3474
Martin. A- W., Harrison. F. M. (1966). Exaction. In Wilbur. K. M.. Yonge, C. M. (eds) Physiology of mollusca. Vol. H. Academic Press. New York, pp. 353-386
Martoja, M-, Lhonoré, X, Elkaim, B. (1977). Accumulations de métaux et de particules minérales dans les tissus mous de la caque comestible Cerasrodenna edule (Mollusque Eulamellibranche). Relation avec le milieu. C. r. hebd. Séanc. Acad. Sci., Paris 284 D: 1453-1456
Millard, H. T. (1963). Quantitative radiochemical procedures for analysis of polonium-210 and lead-210 in minerals. Anal. Chem. 35: 1017-1023
Miramand, P.. Guary, J. C. (19B0). High concentrations of some heavy metals in tissues ot the Mediterranean octopus. Bull, environ. Contain. Toxicol. 24: 7B3-788
V.:.;- and, P.. Guary. J. C. (19S1). Association ol Amend urn-241 with adenochromes in the branchial hearts of the cephalopod Octopus vulgaris. Mar. Ecol. Prog. Ser. 4: 127-129
Nakahara, M.. Koyonagi. T., Ueda, T., Shirrûu, C. (1979). Peculiar accumulation of cob alt-60 by thr branchial heart of octopus. Bull. Japan. Soc. scient. Fish. 45: 539
Nardi, G„ Steinberg. H. (1974). Isolation and distribution of adenochromels) in Octopus vulgaris. Comp. Biochem. Physiol. 48 3:453-461
Nos h kin. V (1372). Ecological aspects of plutonium dissémination In aquatic environments. Health Phys. 22: 537-549
Pillar. K. C. Smith. R. C , Folsom. T. R. (1964). Plutonium in the marine environment. Nature. Lond. 203: 553-571
f Mat. Ecol. Prog. Set. 4: 123-126.1981
Turchini. J. (1923). Cooltibution A rétude de l'histologie de la Energy Agency. Vienna, pp. 107-119 cellule rénale. L'excrétion unitaire chez les Mollusques. Wells. M. J. (1978). Octopus. Physiology end behaviour of an Aichs Morphol. gén, exp. 18:7-341 advanced invertebrate. Chapman & Hell. London
Vilquin. A.. Fowler. S. W„ Rentra. W.C, (1975). Procedures for Wong. K. W. (1971). Radiochemical determinations of radioecological studies with marine faenthic invertebrates. plutonium in sea water, sediments and marine organisms. In Design of radiotracer experiments in marine biological Anal. chfm. Acta 56: 355-164 systems, Techn. Rep. Ser. 167. International Aiomic

Evidence of High Natural Radiation Dose Domains in Mid-Hater
Oceanic Organisms
Abstract. Concentrations of the naturally-occurring radioactive nuclide Po have been determined in mid-water crustaceans and
210 fish from depths rown to 1500m. Unusually high Po levels are found in certain itegories of organisms which as a result constitute a part i ru la r ly high natural radiation dose domain. Particularly note' nrthy I s the si tuation in the hepatopancreas of mid-water penaeid shrimp, where the median Po concentration measured, 584 pci /g dry, implies a dose r a t e to the organ of about 195 rein/year. Thr r e s u l t s have implications [i) in terms of possible radiatior effects ( i i) as a baseline against which a r t i f i c ia l radios' Live nuclides can be compared and ( i i i ) as a potential techniqi i for studying the feeding behaviour of raid-water organisms.

Radon emanated from the Earth's crust decays in the atmosphere and gives r ise tD a na tura l radioactive fall-out of i t s descendants 2 l 0 P b , 2 1 0 3 i and the alpha-emitter X DPo (1). This fa l l -out i s deposited over the oceans as well as the continents, and i t i s ue l l -
210 known that Po i s par t icu la r ly concentrated by most marine organisns (2). As a r e su l t the n i tura l radiation dose received by such organisms i s usually substantially higher than that received
210 by nan. The published data for Po in marine organisms were reviewed in 1974 (2), and subsi_quent publications (3-8) have expanded the data base. Almost a l l of these data were obtained fro>s animals collected in surface or shallow waters, and only very limited information i s avai lable concerning material from greater
210 depths in the ocean (7, S) . We report here Po in several crustaceans and fish from depths down to 1500m and in a few deep
210 bcnthic crustaceans. The extremely high Po concentrations we find in some cases imply that certain categories of marine animals constitute a natural radiat ion dose domain which i s to our knowledge the highest yet reported. We believe that our data are of interest for diverse reasons: (i) The implications of the exposure of a section of the biosphere to a particularly high natural radiation dose over the ent i re period of biological evolution could be of fundamental importance ( i i ) .Low level radioactive waste i s already being dumped in the oceans on a small scale, and subseabed disposal in deep ocean sediments i s being considered as a high level waste disposal option (9) . The possible hazards arising from the uptake of a r t i f ic ia l radioéléments into marine organisms wi l l have to be assessed carefully, and such assessment wil l be d i f f icu l t because of the lack of radiation effects dati at the low ac t iv i ty levels likely to be encountered. Recourse to comparison with the natural 210 radiation dose seems inevi table , and since Po provides more than 90% of this dose to most marine organisms i 2 ) ' i t ' i s important ' that -our knowledge of Po levels in mid-water and deep-sea organisns be as complete as possible. ( i i i ) The involvement of Po in the oceanic biological cycle i s extensive, and the nuclide has been shown to be a useful t racer of marine biological processes (6, 8) .
The-data reported here support the suggestion that Po studies
can provide useful information about the feeding behaviour of
certain organisms. 2io
Our Po determinations were made using the standard 210
technique of acid-digestion, spontaneous deposition Df Po from .210
an acid solution onto a silver disc, and counting of the .. • 'Po
alpha-radioactivity on r.he d sc with ZnS(Ag) scintillation phosphors
(8, 10-12). The results of -ore than 70 measurements on whole
animals are reported in Table 1. AlDDst all the samples were
provided through the generos:ty of colleagues in other
institut " ms (13).
The Table 1 data are tc be compared with published data for
Po in the same categories of organisms from surface and shallow
waters. Our data for araphipods, copepods, euphausiids and mysiids
show levels which are gêner.' Il y comparable with the rather sparse
data from surface samples; ths significance of any differences
cannot be established until more data are available. More
interesting are the fish data. A typical value far Po in entire
fish, again mostly from surface waters, has been given as about
1.5pCi/g dry, with a range of published values extending from about
0.3 to 26 pCi/g dry (2). Only cur Gonostonatidae are at the
typical level; the other three families !.ave medians at or beyond
the upper end of the range repor ed for surface fish.
Pentreath et al. (7) reported Po in organs and tissues from fish
(Families Alepocephalidae, Gadida°, Hacrouridae and Squalidac)
caught at between 500 and 1250 metres, and found levels generally
similar to those observed for surface iish= IT. is clear that
level. Our data indicate that there are certain categories of mid-210
water fish which contain consistently high levels of Po. Host
interesting art the shrimp data. On the basis of only four species
of shrimp caught below 600m, we suggested recently (8) that mid-210
water shrimp sre significantly highei in Po than those from
surface waters. Nine more species are represented in the shrimp

3
from 610 to 1500m in Table 1, thirteen species from below 600m on an individual species basis.
210 In the mid-water penaeids Po ranges from 25 to 117pCi/g dry vith a median of 43 pCi/g; in eight species of pelagic penaeids from surface waters (8) the range was from 6.6 to 23 r6 pCi/g dry with a median of 15.7 pCi/g dry. The difference between the mid-water and surface medians is highly significant statistically (at better than 0.1% level, U-test). of the mid-water penaeids those from the
'210 genera Gennadas and Bentheopennema all have higher Po levels than those from the genus Serges tes. The same feature is In fact observed in the penaeids from 50-760m (not listed in Table 2) where a
210 single Gennadag sp. has Fo at 9B pCl/g dry while four species from the genus Sereestes contain between 11 and 33pCi/g dry. The mid-water car ids, range 9 to 21pCi/g dry and median 14pCi/g dry, also show
2X0 higher Fo levels than five carid species from surface waters (8) which range from 1.3 to lO.ApCi/g dry vith a median of 5.2pCi/g dry (median difference again statistically significant, 0.3% level, U-test). The penaeid-carid difference discussed previously (8) Is again very obvious; penaeids, more primitive In the evolutionary sense, show higher 210
Fo levels than car ids a t a l l three depths (Table 1 ) , The two solitary bathyp lag ic shrimp samples from 4000m are worthy of note in that they show Po a t levels typical of surface rather than of mid-
. water shrimp. Further measurements on deep-sea shrimp are needed to establish uhether or not t h i s i s generally t rue .
Me have i de r i i f i ed the following categories of marine organisms from tht 600-1500m mid-water region which appear to have consistently high whole animal Po contents: carid shrimp at about 14pCi/g dry, Sternoptychidae and Myctophidae fish at about 25pCi/g dry k Serges tes penaeid shrimp a t about 32pCi/g dry and penaeid shrimp from Gennadas 210 and Sentheoeennema at about 84pCi/g dry. Po i s non-unifartily distributed in the different t issues of marine organisms uith part icularly high levels in the hepatopancreas of crustaceans and cephalopods (2, 6, B) and in the l i v e r of fish (2, 7 ) . In ten cases we dissected out the hepstcpencreas of mid-water shrisp and found nedian levels of
*
4
584pCi/g dry and 128 pCi/g dry in penaeids and caride respectively. 210 The highest Fo yet recorded, to our knowledge, vas found in a
saaple' containing 5 individuals of Gennadas valens taken between 895 and 1010m in the mid-Atlantic: 138+8pCi/g dry in the whole animals and 856+51pCi/g dry in their hepatopancreas. The wet/dry ratio in the hepatopancreas is typically aoout 3, and the median raid-water penaeid hepatopancreas concentration of 5B4pCi/g dry converts to a
210 radiation dose rate from Po to this organ of about 195 rem/year assuming the conventional relative biological efficiency of 10 for the Po alpha-particle (14)= "Using the ICRP recommendation (15) of 20 for this factor would double the dose. Such doses are very large by human standards. That received by the lung, the human organ generally considered to receive on average the highest total natur.-l radiation dose, is almost three orders of magnitude lower at 0*4 rem/year (16). Han is, however, amongst the most radiosensitive organisms (17) and laboratory radio-resistance studies usually indicate that marine invertebrates are much less so (IS). It is unlikely that dose; in the hundred rem/year region will give rise to radiation effects in the hepatopancreas to the same extent as in a human tissue, but the possibility that such effects could be observed should not be overlooked. This is particularly true at the cellular level, and comparative cytological studies of shrimp hepatopancreas from differing natural radiation dose domains would be of interest. The evolutionary and genetic implications of these high doses could be profound. Is it possible that organisms erposed to high natural radiation doses over the long-time scale in the evolution of oceanic life have been selected to favour those genes responsible for radiation resistance? Would a particularly wide range in the natural radiation regime experienced by different categories of marine organisms 'and our data indicate that such a range does indeed exist) imply an equally wide range of radiosensitivity? Vhat effect would such a range have on the radiation resistance of narine ecosystems

f-
as a whole? The par t icu lar importance of increased research into the radiosensitivity of marine ecosystems was stressed in the RIME report (17) s decade ago. Detailed s tudies re la t ing Po levels to different niches of marine ecosystems might throw some l ight on this d i f f icul t topic*
Insofar as the use of Po levels for calculating the natural radiation dose baseline i s concerned, our data support conclusions of Pentreath e t a l . (7) -the natural radiation regime for organisms in the deep ocean i s unlikely to be
* any lower than that for coastal water organisms? of equal importance, i t i s unlikely to be constant. He have identified several categories of mid-water organisms which are exposed to high natura'. radiation regimes, but to date no evidence has been found of a category with a par t icular ly low regime. We have observed differences between shrimp at the surface as opposed to shrimp below 600m, between penaeids and car ids and between different families of f ish, and no doiiu others ex i s t .
Evidence indicates (4, 6, 8) that the main immediate source of
related to differences in feeding habi ts . These differences can be quite sophisticated. Thus the penaeid-carid difference already referred to may in certain cases re f lec t not a difference in the diet i t s e l f but in the way the
210 prey i s consumed; penaeids may lose less Po since they tend to swallow food items whole and break then up with their be t te r developed internal gastr ic mi l l , whereas carids tend t o break up food in the mou^h parts ouLside the body (6, 8) . The Table 1 data suggest that Po measurements can throw l ight on the feeding behaviour of f ish as well as shrimp: the animals high in
Po are likely to be de t r i t i vo res feeding on fecal pe l le t s or organic particulates which are r ich in . Po (19-22} or to be predators of a prey (e.g. a mid-water shrimp or select ive feeding on i t s hepatopancreas (8)) which i s Pa-rich. The low Po family, the Gonostomatidae, must have a
f completely different d i e t , low in Po; cppepods, perhaps. Sorting of fish according to genus and size prior to Po measurement could
provide a useful complement to the standard technique of stomach content examination in studies of f ish feeding behaviour.
Finally we mention t h a t the measurement technique used also gives data for Pb, the Po grandparent. These data are inherently less reliable than those far Po; levels of Pb in marine organises are much lower (2,6, 8) and errors are much larger .

In soae of the mid-water shrimp and fish samples, a conservative
assessment of errors led nonetheless to the conclusion that
Pb concentrations were frequently at more than lpCi/g dry, a
level rarely observed in surface shrimp and fish- In four samples 210
of bathypelagic carid shrimp we found Tellable Pb concentrations with a ran£e of 0.09 to 1.17 pCi/g dry and in one penaeid
210 0,65 pci/g dry; surface carids and penaeids have median Pb
concentrations of 0,04 and 0.20 pCi/g dry respectively (8). Xn the
benthic smphipods from the Central Pacific Pb xanrec fros. 0.6 to
5.3 pCi/g dry, median l.lpCi/g cry, while in surïace ssphi^ods
(23, and unpublished data of our own) the xanre ---as fro^ 0.2 to
1,5 pCi/g dry with a median of 0.5 pCi/g dry,. -Higher Ph levels
ir. cic-wster and deep sea orgBnisms, if confirmed, could have 210
inpliczzions for the overall geochemical balance of Pb in the 210
nre.ar.ic water column. In most of the cases where Pb was measured
there \-&s rareover a tendency for the Pa/ ?b activity ratio to
bs lower thsn in the correspondre surface animgls. The Fa/ Pb
ratio is very variable and ronges ever more than two orders of
nsgnitude in océanographie materials, Ttcsl pelleLs sne oceanic
particulates are rich in Po, and have a Po/ Tb ratio of about
2 (19-22); shrimp hepatopancreas have this ratio approaching
100 (6,S). Careful measurements of Po/ Pb activity ratios is
E-ic-water organisms might aid the assessment of the relative
contribution of detritus to an animal's diet-
P..D. Cherry*
K„ Heyrauc
International laboratory of Msrine Radioactivity, Musée Océanographique, Monaco.
E u ^ E r f ™ t h 6 ? h y S i C S D e ? E " « " . Bnivatsity of Cape x-va.

210 Table 1 . Po concentrat ions i n mid-water and deep b e n t h i c crustaceans and f i s h . A l l
measurements were made on whole animals; i n most c a s e s samples comprised several
i n d i v i d u a l s . Mid-Atlantic samples from the region 31-3SOR, 28-35°tf; Central P a c i f i c
samples from c lose to 31 K 159 W; where only- one f igura i s c i t e d for depth, samples
Jere from c l o s e to the ocean f l o o r . The major contr ibut ion t o the error i n an i n d i v i d u a l
determination i s usual ly the s t a t i s t i c a l counting error . Most of our errors are about
10%.
Category Orig in Depth, m No. of samples 210
Po, pCi/g dry
Range Median ~-
Penaeid shrimp Mid-AtIantic 610-1500 9 12-138 49 n H it 50-760 7 11-98 26 ii « Hudson Canyon 4000 1 18 18
Carid shrimp Mid-At lant ic 610-1500 * 10 9-21 14 ti II II 50-760 5 4-22 8
" « Hudson Canyon 4000 1 1.4 1.4 Fish, Gonostomatidae Mid-At lant ic 610-1500 2 0 . 5 - 1 . 4 1.0
« H 50-760 1 1.4 1.4 fish, Melamphaeidae » 610-1500 2 3-74 39 fish, Myctophidae and s ternoptychidae I I 610-1500 3 11-53 25
Myctophidae and
Seet-noptychidae H 50-760 3 22-30 24 ^Phipods Central P a c i f i c 6000 9 3-24 B
« Rockail Trench 0-2000 2 18-19 19 C oPepods Mid-At lant ic 610-1500 2 9-13 11 'ysiids * 610-1500 5 1.0-15 1.4 ^Phausiids » 610-1500 6 0 . 3 - 5 . 3 1.9

f Table 2. Po in whole shrinp caught below 600m depth. several Individuals.
In mast cases samples comprised
Superfaaily Species Origin Depth, m Ho. of Samples
Median a 0 P o , pCi/g dry
Penaeidae Gennadas valens Bentheogennena
Mid-Atlantic 610-1500 3 117
intermedia " " 1 84 Gennadas elevens Mediterranean 600-1200 2 45 Sereestes sp. Series tea
Natal 600-1300 1 43
prenensilis i> tt 1 39 Sereestes henseni Mid-Atlantic 610-1500 2 25 Sereestes robustus " " 1 25
Caridse Svstellasuis debilis " " 1 21 Pasiphaea se» " " 1 15 Aeantheohvra purpurea Acanthephyra
6 1*
auadrispinoza Ratal 800-1300 1 14 Svstellaspis debilis 'Acanthephyra
n 1 :.i4
pelagica Acanthencyra
Mid-Atlantic 610-1500 1 i l
arvlorostratis ™ " 1 9

References and Notes
H*.H. Burton and .N.G. Stewart , Nature 1B6, 564 (1960) .
R.D. Cherry and L.V. Shannon, Atom. Energy Rev. 12 , 3 (1974)
D,P. Kharkar, J . Thomson, K.K. Turekian, Limnol. Oceanogr. 21» 294 (1976)
M< Heyraud, 5.W. Fowler , T.M. Beasley , R.D. Cherry, Har. B i o l . 34 , 127 (1976)
J .T, Bennett and R. Carpenter, E s t . Coast._ Mar. S c i . 8 , 127 (1979)
M. Heyraud, R.D. Cherry, Har. B i o l . 52 , 227 (1979)
R.J. Pentreath, D . S . Woodhead, B.R. liarvey, R.D. Ibbe t t , paper presented at the Third OECD/NEA Marine Radioecology Seminar, Tokyo 1979
R.D. Cherry and M. Heyraud, Har. B i o l . 6 5 / 165 (1981)
CD. H o l l i s t e r , D.R. Anderson, G.R. Heath, Sc ience 213, 1321 (1961)
K.A. HaXlden and J . H . Harley, Anal. Chen. 3 2 , 1861 (I960) .
H.T. Mil lard, Anal . Chem. 35 , 1017 (1963)
W.W. Flynn, Anal . Chim. Acta 43, 221 (1968)
H.V. Angel gave u s a c c e s s t o the ex tens ive c o l l e c t i o n of crustaceans and f i s h c o l l e c t e d on the RJtS Discovery Cruise 120 i n Hay 1981. Be and h i s c o l l e a g u e s , J . Bad cock, F. Dooanski and H-R. Merrett a t the I n s t i t u t e of Océanographie Sc iences , Surrey gave f r e e l y of t h e i r expert i se i n a s s i s t i n g a s wi th s p e c i e s i d e n t i f i c a t i o n . The amphipods from the P a c i f i c were provided by R. Hess ler and C. Ingram of the Scripps I n s t i t u t i o n o f Oceanography, and the Rockal l Trench anphipods by P.A. T y l e r of the Univers i ty Col lege of Swansea. The deep b e n t h i c shrimp were provided by V.T. Boven of Woods Role Océanographie I n s t i t u t i o n . The Mediterranean and Natal samples are acknowledged i n ( 8 ) . We are most g r a t e f u l t o a l l the ind iv idua l s and i n s t i t u t i o n s i n v o l v e d .
C.R. H i l l , Kature 2 0 8 , 423 (1965)
Anon., i n Recommendations of the Internat iona l Commission on Radiologica? P r o t e c t i o n , Annals of the ÏCRP, Publ i ca t ion 26, (Fergaoon P r e s s , Oxford 1977) p . 53
United Nations S c i e n t i f i c Committee on the E f f e c t s of Atomic Radiation, i n Sources and Ef fec t s of I o n i s i n g Radiation (United Nations E. 77 , IX. 1 Mew ï o r k , 1977) p . 81
V.T. Bowen, J . S . O l s e n , C.L. Osterbarg, J . Bavera, in Radioact iv i ty in the Marine Environment (D-S. National Academy of Sc iences , Washington, 1971) p . 2 0 0 .
B,G. Blaylock and J,E. Trabalka, Adv. P.adiat. Biol, 7, 103 (1978)
T.K, Beasley, K. Heyraud, J.J.W. Hi g go, R.D. Cherry, S.V. Fowler, Kar. Biol. 44, 325 (197B)
J.K.S- Bishop, J.K. Edmond, D.R. Ketten, K.P. Bacon, W..B. S liter. Deer Ses Kes. 24, 511 (1977)
K,F. fcacon, D-W. Spencer, P.G. Brewer, Earth Planet Sci. Lett. 32, 277 (1S76)
D.K* Spencer, P.G. Brewer, A. Fleer, S. Honjo, S, KrishnasvsiLi, Y. Kosafci, J_. Mar* Res. 36, 493 (1&7B)
T, Kat'-anen and J.K. Kiettinen, paper presented at the Synposiuc on the Biology and Ecology of Poloniuc and P.aciolead» Sutton, Surrey, 1970.
7hc International Laboratory of Karine Radioactivity operates ur.ier a tripartite agreement between the International Atoxic îrisrgy Agency, the Government of the Principaliry of Monaco snd th= Orc-anographic Institute of Paris. We thank K. Burns and £,V. Fovler for critical consents»