THESE DE DOCTORAT Madame Galina Kondrateva
346
NNT : 2017SACLE022 THESE DE DOCTORAT DE L’UNIVERSITE PARIS-SACLAY PREPAREE A “UNIVERSITE D’EVRY-VAL-D’ESSONE” ECOLE DOCTORALE N° 578 Sciences de l’homme et de la société Spécialité de doctorat : Sciences de gestion Par Madame Galina Kondrateva Mobile application use in the tourism and restaurant industries: comparative study between France and Russia Thèse présentée et soutenue à « Paris », le « 13/10/2017 » : Composition du Jury : Mme Clergeau Cécile, Professeure des Universités, IAE Université de Nantes, Présidente du Jury M. Bidan Marc, Professeur des Universités, Ecole Polytechnique de l’Université de Nantes, Rapporteur M. Trinquecoste Jean-François, Professeur des Universités, IAE, Université de Bordeaux, Rapporteur M. Godelier Éric, Professeur des Universités, Ecole Polytechnique de l’Université Paris-Saclay, Examinateur Mme Ammi Chantal, Professeure, Telecom Ecole de Management, Directrice de thèse
-
Upload
khangminh22 -
Category
Documents
-
view
0 -
download
0
Transcript of THESE DE DOCTORAT Madame Galina Kondrateva

NNT : 2017SACLE022
THESE DE DOCTORAT DE
L’UNIVERSITE PARIS-SACLAY
PREPAREE A
“UNIVERSITE D’EVRY-VAL-D’ESSONE”
ECOLE DOCTORALE N° 578
Sciences de l’homme et de la société
Spécialité de doctorat : Sciences de gestion
Par
Madame Galina Kondrateva
Mobile application use in the tourism and restaurant industries:
comparative study between France and Russia
Thèse présentée et soutenue à « Paris », le « 13/10/2017 » :
Composition du Jury : Mme Clergeau Cécile, Professeure des Universités, IAE Université de Nantes, Présidente du Jury
M. Bidan Marc, Professeur des Universités, Ecole Polytechnique de l’Université de Nantes, Rapporteur
M. Trinquecoste Jean-François, Professeur des Universités, IAE, Université de Bordeaux, Rapporteur
M. Godelier Éric, Professeur des Universités, Ecole Polytechnique de l’Université Paris-Saclay, Examinateur
Mme Ammi Chantal, Professeure, Telecom Ecole de Management, Directrice de thèse


Acknowledgement
First of all I offer my sincerest, deep gratefulness to my supervisor, Professor Chantal Ammi, for
her valuable and appreciable guidance and advises, her extraordinary engagement and
enthusiasm, her fully involvement in my research. Her ability to inspire helped me a lot to
accomplish the research. I am very glad, that I could have Professor Chantal Ammi as my
supervisor and I really enjoyed doing research under her direction.
I would like to send my thanks to the members of the jury. My great thankfulness addresses to
the reporters, Professor Marc Bidan and Professor Jean-François Trinquecoste, for their detailed
comments on my research. I also address my acknowledgment to the examiners, Professor Cécile
Clergeau and Professor Éric Godelier, for their kindness and support.
I am very grateful to Dr. Wilsonn Labossiere for practical advises concerning the methodology
and especially to Dr. Patricia Baudier for help in many questions, for her time and support. They
really made me feel as a part of the research team.
I would like to thank CRM director of LaFourchette, Amélie Naudin, and general manager of
Resto, Daria Galkina, for their time to answer my questions.
I would like to express my thanks to all my friends in Russia and France, who were involved in
collecting data, as well as for their support and belief in me.
And finally, I send my thanks to my family and my partner for their support and understanding.
Without all help and support I had during these three years it would be difficult or impossible to
complete my thesis.


1
SOMMAIRE
LIST OF TABLES ............................................................................................................................................................ 5
LIST OF FIGURES .......................................................................................................................................................... 8
ABBREVIATIONS ........................................................................................................................................................ 10
GLOSSARY ................................................................................................................................................................. 12
GENERAL INTRODUCTION ......................................................................................................................................... 16
PART I: THEORETICAL ASPECTS .................................................................................................................................. 22
CHAPTER I: CONTEXT OF THE RESEARCH ................................................................................................................... 23
Introduction ............................................................................................................................................................. 24 I. Tourism and restaurant industry .......................................................................................................................... 24 I.1.1. Definition of Tourism ...................................................................................................................................... 25 I.1.2. Development of tourism. ................................................................................................................................ 25 I.1.3. Components of the tourism industry .............................................................................................................. 27 I.1.4. Food service and restaurant industry ............................................................................................................. 28 I. 3. Conclusion ......................................................................................................................................................... 30 II. Modern technologies. .......................................................................................................................................... 30 II.1. Internet ............................................................................................................................................................. 31 II.2. Networks services used in tourism .................................................................................................................... 31 II.2.1. Travel agent, tour operator, transportation, attraction and accommodation .............................................. 32 II.2.2. Tourist information and guiding services ...................................................................................................... 34 II.3. Big data in tourism ........................................................................................................................................... 34 II.4. Mobile technologies.......................................................................................................................................... 36 II.4.1. Mobile application ......................................................................................................................................... 36 II.4.2. Mobile technologies in tourism ..................................................................................................................... 38 II.5. Mobile technologies in restaurant industry ...................................................................................................... 40 II.6. Conclusion ......................................................................................................................................................... 41 III. The choice of the countries ................................................................................................................................. 42 III. 1. Russian Federation.......................................................................................................................................... 43 III.1.1. General Data to the country ......................................................................................................................... 43 III.1.2. Demography ................................................................................................................................................. 44 III.1.3. Economic crises ............................................................................................................................................. 45 III. 1.3.1. Structure of Russian GDP and the place of tourism industry. ................................................................... 47 III. 1. 4. Tourism industry ......................................................................................................................................... 48 III.1.4.1. Strategy of Tourism Development in the Russian Federation .................................................................... 49 III.1.4.2. Crises 2014 of outgoing tourism in Russia ................................................................................................. 50 III.1.5. Restaurant industry ...................................................................................................................................... 50 III.1.6. Mobile applications in Russia ....................................................................................................................... 51 III.1.7. Moscow ........................................................................................................................................................ 53 III.1.8. Conclusion ..................................................................................................................................................... 54 III. 2. France ............................................................................................................................................................. 55 III.2.1. General information about the country ........................................................................................................ 55 III.2.2. Demography ................................................................................................................................................. 56 III.2.3. Economy of France ....................................................................................................................................... 57 III. 2.3.1. Structural Crisis of French economy .......................................................................................................... 58 III. 2.3.2. Structure of GDP and place of tourism ..................................................................................................... 59 III.2.4. Tourism in France ......................................................................................................................................... 59 III.2.5. Restaurants France ....................................................................................................................................... 61 III.2.6. Mobile applications in France ....................................................................................................................... 63 III.2.7. Paris .............................................................................................................................................................. 65 III.3. Conclusion for countries .................................................................................................................................. 66 III.4. Choice of mobile applications in compared countries ..................................................................................... 68 III.4.1. Review of catering mobile applications in Russia. ........................................................................................ 69 III.4.2. Review of applications for table booking in France. ..................................................................................... 70 III.4.3. Chosen mobile applications for the research ................................................................................................ 71

2
III.4.3.1 Resto.ru ....................................................................................................................................................... 71 General information ................................................................................................................................................ 71 III.4.3.2. LaFourchette .............................................................................................................................................. 73 General information ................................................................................................................................................ 73
CHAPTER II: LITERATURE REVIEW .............................................................................................................................. 78
Introduction ............................................................................................................................................................. 79 I. The theories of technology adoption and usage................................................................................................... 79 I.1. Diffusion of innovation, Everett Rogers. ............................................................................................................ 80 I.1.1. Stages in the innovation-decision process. ..................................................................................................... 81 I.1.2. Types of adopters and the innovation-decision process ................................................................................. 84 I.1.3. Limitation of the theory diffusion of innovation. ............................................................................................ 85 I.2. Theory of reasoned action (TRA) by Martin Fishbein and Acek Ajzen (1975). ................................................... 87 I.2.1. The theory of planned behavior (TPB), Icek Ajzen (1985) ............................................................................... 89 I.2.2. Limitations of TBP ........................................................................................................................................... 91 I.3. The technology acceptance model by Fred D. Davis (1986) .............................................................................. 93 I.3.1. Comparison of TAM and TPB .......................................................................................................................... 95 I.3.2. Comparison of diffusion theory and TAM ....................................................................................................... 97 I.3.3. Theoretical extension of the technology acceptance model, TAM 2 .............................................................. 98 I.4. Unified Theory of Acceptance and Use of Technology (UTAUT), Venkatesh et al. (2003). .............................. 102 I.5. UTAUT2, Venkatesh et al. (2012). .................................................................................................................... 106 I.6. Mobile application usability, H. Hoehle and V. Venkatesh (2015). .................................................................. 108 I.7. Conclusion ........................................................................................................................................................ 116 II. Relationship marketing ...................................................................................................................................... 119 II.1. Definition ........................................................................................................................................................ 122 II.2. The Commitment-Trust theory of RM ............................................................................................................ 123 II.3. Interfirm Relationship Marketing Theory ...................................................................................................... 130 II.4. Interpersonal Relationship Marketing Theory ................................................................................................ 134 II.5. Multilevel relationships. ................................................................................................................................. 136 II.6. Information technology and RM ..................................................................................................................... 138 II.7. Conclusion. ...................................................................................................................................................... 139 III. Cultural theories. .............................................................................................................................................. 141 III.1. Cultural values concept in researched countries. .......................................................................................... 142 III.1.1. Orthodoxy, Autocracy and Nationality of Russia ........................................................................................ 142 III.1.2. Culture values of France ............................................................................................................................. 143 III.1.3. Conclusion ................................................................................................................................................... 145 III.2. Cultural dimensions theory by Gert Jan Hofstede (2001) .............................................................................. 145 III.3. Adoption of communication technologies and national culture, TAM and Hofstede’s cultural dimensions . 150 III.4. The role of culture in RM ............................................................................................................................... 152 III.5. Conclusion ...................................................................................................................................................... 158 IV. Final choice of constructs for the research model. ........................................................................................... 159 IV.1. Technology use constructs. ............................................................................................................................ 162 IV.2. Relationship marketing constructs. ............................................................................................................... 162 IV.3. Cultural dimensions of Hofstede.................................................................................................................... 163
CHAPTER III: CONCEPTUAL MODEL AND RESEARCH HYPOTHESIS ............................................................................ 165
Introduction ........................................................................................................................................................... 166 I.1. Conceptual model of the research ................................................................................................................... 166 I.2. Constructs and measuring items ..................................................................................................................... 167 I.2.1. Technology use ............................................................................................................................................. 168 I.2.2. Relationship marketing ................................................................................................................................. 171 I.2.3. Cultural dimensions. ..................................................................................................................................... 172 I.2.4. Moderating constructs ................................................................................................................................. 172 II. Hypotheses of the research. .............................................................................................................................. 174 II.1. Factors influencing the intention of mobile application use. .......................................................................... 175 II.1.1. Price value.................................................................................................................................................... 175 II.1.2. Facilitating conditions .................................................................................................................................. 175 II.1.3. Trust ............................................................................................................................................................. 176 II.1.4. Indulgence ................................................................................................................................................... 177

3
II.1.5 Mobile application usability.......................................................................................................................... 178 II.2. Factors influencing the use of mobile application. ......................................................................................... 179 II.2.1. Intention to use ............................................................................................................................................ 179 II.2.2. Mobile application usability ........................................................................................................................ 179 II.3. Outcome factors ............................................................................................................................................. 180 II.3.1. Mobile application usability ........................................................................................................................ 180 II.3.2. Continued intention to use .......................................................................................................................... 180 II.4. Moderation effects ......................................................................................................................................... 181 III. Conclusion ......................................................................................................................................................... 181
PART II: EXPERIMENTAL RESEARCH ......................................................................................................................... 183
CHAPTER IV: EPISTEMOLOGY AND METHODOLOGY OF THE RESEARCH .................................................................. 184
Introduction ........................................................................................................................................................... 185 I. Epistemological position and methodological approach. ................................................................................... 185 I.1. Epistemology ................................................................................................................................................... 185 I.2.1. Positivism. ..................................................................................................................................................... 186 I.2.2. Constructivism. ............................................................................................................................................. 187 I.2.3. Pragmatism. ................................................................................................................................................. 188 I.3. Choice and justification of epistemology ......................................................................................................... 189 II. Design of the research ....................................................................................................................................... 191 II.1 Hypothetico-deductive research process ......................................................................................................... 192 II.2. Comparative design ........................................................................................................................................ 197 III. Methodological approach................................................................................................................................. 198 III.1. Quantitative and qualitative research strategy ............................................................................................. 198 III.2. Quantitative research approach. ................................................................................................................... 200 III.3. Concepts and measurement instruments ...................................................................................................... 200 III.4 Survey ............................................................................................................................................................ 201 III.5. Online survey ................................................................................................................................................. 203 III.6. Sampling ........................................................................................................................................................ 204 III.7. Error in survey research ................................................................................................................................. 206 III.8.Conclusion ....................................................................................................................................................... 206 IV. Methodology to develop and validate variables and construct – Churchill paradigm ..................................... 207 IV.1. First phase - Specify domain of the construct ................................................................................................ 209 IV.2. Exploratory phase .......................................................................................................................................... 210 IV.3. Confirmatory phase ....................................................................................................................................... 218 V. Methodology to verify the research model - Structural equation modeling ..................................................... 219 V.1.Choice and justification of software. ............................................................................................................... 223 V.2. PLS-SEM approach and software choice. ....................................................................................................... 226 V.3. Conclusion ...................................................................................................................................................... 231
CHAPTER V: VALIDATION OF THE MODEL ................................................................................................................ 233
Introduction ........................................................................................................................................................... 234 I. Exploratory phase ............................................................................................................................................... 234 II. Pre-test of survey, statistical validation by SmartPLS ........................................................................................ 237 III.Conclusions ........................................................................................................................................................ 242
CHAPTER VI: RESEARCH RESULTS AND DISCUSSION. ............................................................................................... 243
Introduction ........................................................................................................................................................... 244 I. General model evaluation .................................................................................................................................. 244 I.1. Sampling characteristics .................................................................................................................................. 244 I.2. Validation of the measurement model ............................................................................................................ 250 I.2.1. Indulgence .................................................................................................................................................... 252 I.2.2. Continued intention to use ........................................................................................................................... 253 I.2.3. Use of mobile application ............................................................................................................................. 254 I.2.4. Price value..................................................................................................................................................... 255 I.2.5. Facilitating conditions ................................................................................................................................... 255 I.2.6. Trust .............................................................................................................................................................. 256 I.2.7. Intention to use ............................................................................................................................................. 257

4
I.2.8. Mobile application usability.......................................................................................................................... 257 I.2.9. Mobile application loyalty ............................................................................................................................ 258 I.3. Discriminant validity ........................................................................................................................................ 259 I.4.1. Percent of variance explained (R²) ................................................................................................................ 260 I.4.2. Size effect f² .................................................................................................................................................. 261 I.4.3. Model’s capability to predict (Q² and q²) ...................................................................................................... 263 I.4.4. Size effect of capability to predict q² ............................................................................................................ 264 I.4.5. Evaluation of parameters (Path coefficients and T-value)............................................................................ 265 I.4.6. Quality of the model - Goodness of fit .......................................................................................................... 266 I.4.7. Summary of results ....................................................................................................................................... 267 I.5. Moderation effects .......................................................................................................................................... 270 I.6. Validation of hypotheses ................................................................................................................................. 273 I.6.1 Factors influencing intention to use .............................................................................................................. 274 I.6.2. Factors influencing mobile application use .................................................................................................. 274 I.6.3. Outcome factors ........................................................................................................................................... 275 I.6.4. Moderation effects ....................................................................................................................................... 275 I.6.5. Conclusion about validation of the hypotheses. ........................................................................................... 276 II. Comparative study between France and Russia ................................................................................................ 277 II.1. Sub group France ............................................................................................................................................ 277 II.2. Sub group Russia............................................................................................................................................. 278 III. Discussion of the results ................................................................................................................................... 282 III.1. General model ............................................................................................................................................... 282 III.1.1. Factors influencing the intention to use the mobile application ................................................................ 282 III.1.2. Factors influencing the use of mobile application ...................................................................................... 285 III.1.3. Factors influencing outcomes ..................................................................................................................... 286 III.2. Comparison of French and Russian Models ................................................................................................... 286 III.2.1. Factors influencing the intention to use the mobile application ................................................................ 287 III.2.2. Factors influencing the use of mobile application ...................................................................................... 288 III.2.3. Factors influencing outcomes ..................................................................................................................... 288 IV. Conclusion ........................................................................................................................................................ 288
GENERAL CONCLUSION ........................................................................................................................................... 292
I. Contributions ...................................................................................................................................................... 293 I.1.Theoretical contributions .................................................................................................................................. 294 I.2.Managerial contributions ................................................................................................................................. 296 I.3. Professional contributions ............................................................................................................................... 297 II.Limitations .......................................................................................................................................................... 297 II.1. Limitations related to the context of the research ......................................................................................... 297 II.2. Limitations related to the conceptual model .................................................................................................. 298 II.3. Limitations related to the sampling ................................................................................................................ 298 II.4. Limitations related to the questionnaire ........................................................................................................ 298 II.5. Limitations related to the software application ............................................................................................. 299 III. Perspectives ...................................................................................................................................................... 299
REFERENCES ............................................................................................................................................................ 301
Sites consulted ....................................................................................................................................................... 331
ANNEXES ................................................................................................................................................................. 333

5
List of Tables
Table1: Population of Russia, million person
Table2: Russia mobile phones market value, 2011-2015
Table3: Russia mobile phones market segmentation: million handsets, 2015
Table4: Russia mobile phones market value forecast, 2015-2020
Table5: Population of Metropolitan France, million person
Table6: France: Selected Economic Indicators 2013–16
Table7: France mobile phones market value, 2011-2015
Table8: France mobile phones market segmentation: million handsets, 2015
Table9: France mobile phones market value forecast, 2015-2020
Table10: Reasons to visit Paris (leisure tourists), %
Table11: Top 10 Greater Paris cultural venues – 2014-2015 figures
Table12: Comparison of two countries
Table13: Conditions for cooperation with the restaurants (Russia)
Table14: Provided services for the restaurants
Table15: Adaptation of the TRA constructs for the mobile application’s use
Table16: Adaptation of the TPB constructs for the mobile application’s use
Table17: Selected constructs of TPB for the mobile application’s use
Table18: Selected constructs of TAM for the mobile application’s use
Table19: Comparison of constructs of TAM and TPB with examples of the
mobile application’s use
Table20: Comparison of constructs of TAM and diffusion theory with examples of the mobile
application’s use
Table21: Selected constructs of TAM2 for the mobile application’s use
Table22: Selected constructs of UTAUT for the mobile application’s use
Table23: Comparison between lafourchete and resto usability
Table24: Selected constructs of the technology’s use theories
Table25: Adaptation of the Commitment-Trust theory of RM for the mobile
application’s use
Table26: Adaptation of Interfirm Relationship Marketing theory for
the mobile application’s use
Table27: Adaptation of Interpersonal Relationship Marketing theory
for the mobile application’s use
Table28: Selected constructs of the RM theories

6
Table29: Hofstede’s dimensions
Table30: Hofstede’s dimensions and mobile application use
Table31: Selected constructs of the cultural theories
Table32: Final choice of the constructs
Table33: Key differences between indulgent and restrained societies
Table34: Measuring items for technology use aspects
Table35: Measuring items of relationship marketing aspect
Table36: Measuring items of cultural aspect
Table37: Measuring items of the moderating constructs
Table38: Synthesis of hypotheses
Table39: Four Worldviews Source
Table40: Positivism, Constructivism, Pragmatism in business research
Table41: Induction, Deduction, Combination
Table42: Fundamental differences between quantitative and qualitative research strategies
Table43: Example of measuring items development – mobile application loyalty
Table44: Experience survey
Table45: Modifications after the experts’ validation
Table46: Comparison CB-SEM and PLS-SEM approaches (adapted from Hair et al. 2011)
Table47: Model evaluation using SmartPLS 3 Pro
Table48: Loadings of the pretest
Table49: Loadings after deleted items
Table50: Reliability and validity
Table51: Cross-loadings
Table52: Root of AVE
Table53: Professional occupation and age of the responders
Table54: Frequency of visits
Table55: Duration of use
Table56: Geolocation function
Table57: Influence of promotions for the change of location
Table58: Loadings
Table59: Loadings after deleted items
Table60: Characteristics of the measurement items of indulgence
Table61: Characteristics of the measurement items of continued intention to use
Table62: Characteristics of the measurement items of use
Table63: Characteristics of the measurement items of price value

7
Table64: Characteristics of the measurement items of facilitating conditions
Table65: Characteristics of the measurement items of trust
Table66: Characteristics of the measurement items of intention to use
Table67: Characteristics of the measurement items of mobile application usability
Table68: Characteristics of the measurement items of mobile application loyalty
Table69: Cross loadings
Table70: Root square of AVE
Table71: R square
Table72: Size effect f square
Table73: Model’s capability to predict Q square
Table74: Size effect q square
Table75: Evaluation of parameters (Path coefficients and T-value)
Table76: Calculation of Goodness of fit
Table77: Duration of use
Table78: Frequency of visits
Table79: Place of use
Table80: Summary of the analysis results of the structural model
Table81: Summary of the hypotheses validation
Table82: Results of sub group France compared with general model
Table83: Results of sub group Russia compared with general model
Table84: Comparison of the results for general, French and Russian models
Table85: Comparison of hypotheses validation
8
List of figures
Figure1: Change in the international arrivals in the period from 1950 till 2012
Figure2: Out of home food market’s components
Figure3: Categories of tourism mobile applications
Figure4: The structure of gross value added in 2014
Figure5: Model of stages in the innovation-decision process
Figure6: Types of adopters
Figure7: Model of reasoned action by Martin Fishbein and Icek Ajzen
Figure8: Model of planned behavior by Icek Ajzen
Figure9: Technology acceptance model (TAM)
Figure10: Proposed TAM2 – extension of the technology acceptance model
Figure11: Unified Theory of Acceptance and Use of Technology (UTAUT),
Venkatesh et al. (2003).
Figure12: Unified Theory of Acceptance and Use of Technology 2,
Venkatesh et al. (2012)
Figure13: Steps for development of measurement instruments
of mobile application usability
Figure14: Structural model of the mobile application usability,
Venkatesh and Hoehle (2015).
Figure15: Relationship <holder – restaurant – user> in use of the mobile application
Figure16: The KMV Model of RM (Morgan and Hunt, 1994)
Figure17: Model of Interfirm Relationship Marketing, Palmatier
Figure18: Model of Interpersonal Relationship Marketing
Figure19: Multi-level exchange relationships
Figure20: Cultural dimension Hofstede & Minkov
Figure21: Hofstede’s dimension. Russia in comparison with France
Figure22: International RM framework.
Stephen A. Samaha, Joshua T. Beck, & Robert W. Palmatier (2012)
Figure23: Use of mobile application in restaurant industry: conceptual model of the research
Figure24: The research process by Sekaran and Bougie
Figure25: Dependent and independent variables
Figure26: Moderating variable

9
Figure27: Mediating variable
Figure28: Survey structure (Bryman and Bell, 2014)
Figure29: Process of web-based questionnaire diffusion
Figure30: Suggested procedure for developing better measures
(Gilbert A. Churchill, 1979)
Figure31:Scale validation
Figure32: Global model
Figure33: Reflective and formative relationships
Figure34: Collected data by country
Figure35: Results of research model with SmartPLS

10
Abbreviations
ATM – Automated Teller Machine
CAGR - Compound Annual Growth Rate
CARC - Compound Annual Rate of Change
CCI – Chambres de Commerce et d’industrie
CEN - European Committee for Standardization
CRM - Customer Relationship Management
CRS -Computer Reservations System or Central Reservation System
CWI - Centrum voor Wiskunde en Informatica (Center for Mathematics and Computer Science)
DNS – Domain Name System
FNC - Federal Commission for Networks
FTP – File Transfer Protocol
GDP – Growth Domestic Product
GDS - Global Distribution System
GIS - Geographic Information System
GNI - Groupement National des Indépendants de l’Hôtellerie Restauration
GPS - The Global Positioning System
HRI - Hotel Restaurants Institutions
HTML - Hypertext Markup Language
IDT - Innovation Diffusion Theory
IP - Internet Protocol
LBS - Location Based Services
LTE - Long-Term Evolution
C-TAM-TPB - Model Combining the Technology Acceptance Model and Theory of Planned
Behavior
MPCU - Model of PC Utilization
MM - Motivational Model
OECD – Organization of Economic Cooperation and Development
PLS-SEM – Partial Least Square Structural Equation Modeling
RBC - RossBusinessConsulting
RM - Relationship Marketing
SCT - Social Cognitive Theory
TCP / IP - Transmission Control Protocol / Internet Protocol
TDI -Theory of Diffusion of Innovation
TAM - Technology Acceptance Model

11
TPB - Theory of Planned Behavior
TRA - Theory of Reasoned Action
UTAUT - Unified Theory of Acceptance and Use of Technology
UNWTO – United Nations World Tourism Organization
VK – V Kontakte
VSM - Values Survey Module
WFTA - World Food Travel Association
Wi-Fi - Wireless fidelity
WOM - Word of Mouth
WTTC - World Travel and Tourism Council

12
Glossary
Accommodation is defined by European Committee for Standardization as “the
provision of at least sleeping and sanitary facilities”
Attraction and
Entertainment
include historic sites, heritage homes, museums, halls of fame,
art galleries, botanical gardens, aquariums, zoos, water parks,
amusement parks, casinos and cultural attractions
Backpacker in tourism: a person who travels with backpack
Budget rule (in Russia) the measure of Russian government to prevent budget deficit,
especially by low oil-prices.
Chain restaurants are restaurant establishments that are franchised in the large
number.
Commercial foodservice includes table service restaurants, self-service restaurants, quick
service restaurants, hotel establishments, transport foodservice
Communitainment
combination of two words “communication” and
“entertainment”, used by S.Khalaf (Flurry annual mobile
application study, 2016), to describe the phenomenon of huge
growth of social and messaging mobile applications’ use.
Consumerism desire to buy and own things
Culinary tourism the intentional, exploratory participation in the foodways of another –
participation including the consumption, preparation, and
presentation of the food item, cuisine, meal system, or eating style
considered to belong to a culinary system not one’s own.
Delivering catering business of providing food by delivery in consumer’s place.
Domestic tourism tourism inside home country

13
Fast Casual restaurants do not offer full table service with higher quality food than in
fast food restaurants
Fast food cheap, often hot food, quickly prepared and served in the restaurant
establishment
Fine-dining way of food consumption that usually takes places in expensive
restaurants, where good food is served in the formal way
Food tourism is an experiential trip to a gastronomic region, for recreational or
entertainment purposes, which includes visits to primary and
secondary producers of food, gastronomic festivals, food fairs,
events, farmers’ markets, cooking shows and demonstrations, tastings
of quality food products or any tourism activity related to food
Foodservice and
restaurant industry
is broad concept. It can include food sold to consumers for
preparation and consumption at home as well as the final
preparation of food for consumption away from home
Franchising is the practice of the right to use a firm's business model and
brand for a prescribed period of time, very known in restaurant
industry.
Gastronomic restaurants expensive restaurant establishment with gastronomic food,
prepared in the special way, usually by famous Chef
Horizontalization the process in French society of reducing the traditional
hierarchy
International tourism tourism across the countries
Leisure park is an amusement park
Orthodoxy one of the values of Russian society included communalism,

14
equality of people, spirituality
Ruble russian currency
Singularity one of the values in French society. It is manifested in the need
of admiration, critical evaluation, and wish of differentiation
Special way the concept in Russian philosophy, describing the special
position of Russian culture compared to Western cultures
Statehood one of the values of Russian society which includes the
“fetishizing” of state power
Street food food, cooked and sold in public places mostly outdoors for
immediate consumption
Technologization the dominated role of technology on modern society
The Triad "Orthodoxy,
Autocracy and
Nationality”
(Russian: Правосла́вие,
самодержа́вие,
наро́дность, Pravoslaviye,
Samoderzhaviye,
Narodnost
the corn concept of Russian culture proposed by Minister of
Education Sergey Uvarov in XIX century
Tour operators are companies providing package tours, which usually include
transportation, accommodation, catering and entertainment
Tourism
comprises the activities of persons traveling to and staying in
places outside their usual environment for not more than one
consecutive year for leisure, business and other purposes.
(“Recommendations on Tourism Statistics” by UNWTO and

15
UNSTAT, 1994)
Tourist traveler who travel to foreign countries by curiosity and
idleness, which are a kind of tour of the usually visited by their
fellow country
Transportation
is a service of transports: planes, trains, cars, boats, cruise ships
and others, used by tourists for travelling
Travel agents or travel
agencies
are companies engaged in selling and arranging transportation,
accommodations, tours, or trips for travelers.
Zapping the process in modern society which means desire the quick
change of everything.

16
General Introduction
Managerial background of the research
Smartphones, through their application stores, have created a new base of customers who constantly
surf on those platforms searching for new offers, but who also use the mobile versions of their
favorite websites, chat, share information and obtain new knowledge via smartphone.
Year over year the usage of mobile applications increases, becoming the source for data analytics.
The time spent on mobile applications increased in 2016 by 69% (Flurry Analytics annual mobile
applications study, 2016). Time spent in social and messaging applications grew by
394 percent over the past year. This phenomenon the analytics call “Communitainment” (Simon
Khalaf, senior vice president of Yahoo).
Tourism industry produces a big amount of data every day: tickets, hotel booking systems,
entertainments, maps and guiding systems, social networks, and restaurants bookings.
Restaurant industry has special position, on the one side it is regarded as a component of tourism
together with accommodation; on the other side it is the part of lifestyle and shopping.
The relationship between restaurant establishment and a client is often regarded as personal. Word
of mouth is the most powerful marketing tool for the restaurant management to win new clients, to
make client loyal, and to keep client loyal. Today the restaurant management should participate in
the “communitainment” to be in trend with new technologies. One of the way to organize this
communication process is for the restaurant management to participate in the digital mobile
restaurants guides, where the users can find information about the restaurant including menus and
contacts, where the users have tools of social communication like reviews, comments, ratings,
evaluations, where the users can do theirs choices without personal contacts to the restaurants. Such
mobile applications develop various tools to influence the choice of the consumer, in fact they can
change the consumers behavior, for example, instead of going out in usual place the consumer can
decide to try new restaurant establishment receiving interesting proposal from the mobile
application, or even get a table in the restaurant establishment automatically by being registered in a
specific program of the mobile application instead of calling and loosing time to find free table.
Mobile restaurant guide as an application gives the continuous access to the information. Even
when the restaurant establishment is closed, is not open yet, the users can check menus, pictures,
reviews and do their choices without waiting till the restaurant personal can answer the questions.
With discounts for the specific hours and days the restaurant can win clients in “dead” times, and
this information might be also available on the application. Mapping function allows finding place

17
next to the user and online booking allows booking the table immediately and fast. This easy
availability and economizing of time should increase the restaurants occupancy in general, but how
does it work in fact?
To clarify the degree of influence of the mobile application use in restaurant industry on the
consumer behavior this thesis proposes the research problem: Does the mobile application as
technology impact on the development of the restaurant industry?
We see that the mobile technology erases more and more boundaries between countries; we live in
the global information space. But still we speak about cultural/national differences, which include
different economical conditions, different traditions, and different behaviors.
The development of mobile technology as well as of restaurant industry is influenced firstly by the
purchasing power of population (how many people can effort to buy smartphone, how often they
can go out to eat in the restaurant). Eating out can be also the part of the culture: in some cultures
the trying the “cuisine” is important experience of leisure time, in others the place by itself is more
important (fancy, expensive place etc.). For the management of the mobile restaurants guides is
critically important to know, whether the behavior of their users in different cultures might be
different or not.
In this research we are aiming to compare two countries in the use of mobile applications in
restaurant industry.
France is known as a touristic goal number one in the world. Restaurant business occupies the
special place. Well developed and famous it attracts visitors from all around a world. The data
collected in the sectors gives big opportunity for analysis the consumer behavior.
Russia is the largest country according to its territory, from the economical side it is still regarded
as developing economy according to the International Monetary Fund's World Economic Outlook
Report (2016). The Russian tourism and restaurant industries have been experiencing a crisis since
2014.
The comparison of two countries with different levels of tourism and restaurant industries can give
us the possibility to see how the usage of mobile application can change the behavior of consumer,
what cultural and economical characteristics are by the importance, or whether the use of mobile
application erase the differences in the consumer behavior.
To clarify the problem of the research we investigated theories and models of various researchers in
the area of technology use, relationship marketing and culture.

18
Theoretical background of the research
Theoretically the research is based on three main theories: i) use of the technologies, ii) relationship
marketing theory, and iii) cultural theories. All the theories were chosen for building the research
model and taking in the account three categories of users of an application: the holder of the
application or provider, the restaurants, which use the application for selling and advertising their
services, and finally the consumers, the actual users of the application, who downloads, opens the
mobile applications and choose the restaurant establishment within a mobile application.
Firstly, we reviewed the theories of technology use. Mobile application is a part of modern
technology provided by mobile devices. Because the mobile application is the main object of our
research it is important to examine existing theories and models of the adoption and use of the
technologies.
We started with the Diffusion of Innovation (Rogers, 1962). Mobile application as technology has
been already around ten years in the market, but still in some industries the adoption and diffusion
of this technology is much slower than in others. As initial mobile technologies were implemented
for the communication reasons and still communication is the most used area of mobile technology.
Restaurant industry as part of “real” and not digital reality should have found the points of applying
of the mobile technology, so the mobile application went through the stage of being innovative in
this industry. Rogers wrote that “implementation (of the innovation) involves overt behavior
change” (Rogers, 1995, p. 173), which is conscious action to put innovation into practice. Outgoing
from the standpoint that implementation of the mobile application is a conscious reasoned action of
a restaurant establishment or an individual we regarded Theory of Reasoned Action (1975, 1980)
and its extension the Theory of Planed Behavior (Ajzen in 1985). With growing technology usage
predicting system use became an area of interest for research. Fred D. Davis proposed the
Technology Acceptance Model, which was based on principles adopted from Fishbein and Ajzen’s
Theory of Reasoned Action. Since the use of the mobile application is not just action or behavior,
but it is behavior performing the use of technology, we reviewed TAM (Davis, 1986) and its
extensions TAM2 (Venkatesh and Davis, 2000).
The most important for our research are Unified Theory of Acceptance and Use of Technology
(UTAUT) (Venkatesh et al. 2003) and its extension UTAUT2 (Venkatesh et al. 2012). Venkatesh et
al. (2003) developed UTAUT as a comprehensive synthesis of previous technology acceptance
research. The eight original models and theories of individual acceptance include the Theory of
Reasoned Action (TRA), Technology Acceptance Model (TAM), Motivational Model (MM),
Theory of Planned Behavior (TPB), Model Combining the Technology Acceptance Model and
Theory of Planned Behavior (C-TAM-TPB), Model of PC Utilization (MPCU), Innovation
Diffusion Theory (IDT), and Social Cognitive Theory (SCT).

19
UTAUT 2 as extension has two the most important for our research constructs hedonic motivation,
because the use of the mobile application in restaurant industry is the private use of the technology,
and price, because the mobile applications provide the bonuses and loyalty programs which add
value to use of them.
The last reviewed theory of technology use allowed us accomplishing our model with Mobile
application usability (Venkatesh and Hoehle, 2015). The preference of one about another mobile
application might be in the functionality, structure and design of each. Moreover this theory permits
comparing the use of two different mobile applications used in each country.
According to the reviewed technology use theories we pose the first research question:
How the mobile application’ use can standardize the consumer’s behavior by choice of
restaurants?
The usage of the mobile application gives the companies, in our case the restaurants and mobile
application providers, a huge data base of consumers, what makes important to build stable
relationship between restaurants and consumers. From that point of view the main theory of
relationship marketing is included in the theoretical part of the work.
The Commitment-Trust Theory of Relationship Marketing by Morgan and Hunt (1994) is one of
the most influential in Relationship Marketing. The commitment between mobile application holder
and restaurant might be easy purchasing of the advertising services; the commitment between
mobile application holder and final user might be the trustworthy information about all restaurant
establishments. And finally the commitment between restaurant and the user of mobile application
consists not only in expected services (food and beverage), but also adequacy of this services to the
information received in the mobile application. For our research trust is of high importance. The
complexity of trust is added through technology. The user should not only trust the company like
restaurant, he/she should also trust the technology.
The usage of mobile application, which contains the services of many restaurants and is used by
final customer, involves three actors. Firstly the application holder or provider builds up the
relationship with the restaurants or B to B relationship, where the exchange of mutually profitable
services takes place (Interfirm RM, Palmatier , 2007). The restaurant’s management tries to win final
users of the mobile application as a loyal client that means appearance of the Individual-to-
Individual relationship (Interpersonal RM, Palmatier, 2007). Moreover, the application holder obtains
the control over the data base of all final users of application, and also develops the Individual-to-
firm and the Individual-to-Individual relationships (Multi-level exchange Relationships in RM,
Palmatier , 2007).

20
According to reviewed Relationship Marketing Theory we pose the second research question:
How the mobile application as technology changes the relationship between restaurant and
client?
The comparison of two countries suggests that the cultural differences might have influence on the
use of the mobile application. The concept of cultural value impacts the behavior of the individuals,
so it can predict also the use of technology, implementation, adoption or rejection of it. The use of
any mobile application within one culture can be the same, for example all the users use mobile
application for gaming, or social networking, or searching for information. The cultural differences
start to be significant inside of the particular industry, in our case in the restaurant industry.
Many authors predict the equation of societies in connection with the development of new
technologies. We regarded cultural dimensions of Hofstede (Hofstede, Minkov, 2010) for
evaluating the differences between nations and cultures. This theory is based on the idea that the
cultural value may be distributed over six cultural dimensions. High technology is a major driving
force behind cultural change that leads to a similarity inside of different societies, but there is not
the evidence that it blurs the distinction by other dimensions. Moreover, it could lead to further
divergence during societies modernize technical experience, on the basis of already existing values.
We also reviewed Hofstede’s culture dimension theory by its implication in use of technology and
in relationship marketing.
According to reviewed theory of cultural dimensions we pose the third question of the research:
How cultural differences influence on the use of mobile application in restaurant industry?
Can the mobile application reduce or erase this difference?
Research design
This thesis is structured in two parts. The first part consists of three chapters: i) context of the
research, ii) theoretical background and literature review, iii) conceptual model and hypotheses of
the research.
First chapter presents the general context of the research. Firstly, we provide overlook of tourism
and restaurant industries and components of both. Secondly, the development of mobile technology
is regarded, with the particular view on the technologies important for the tourism and restaurant
industries. Thirdly, we present two countries starting with general information and economical
situations in both, and then characterizing the level of development of tourism and restaurant
industries and finally the development of mobile application market. In the end of this chapter we
present two mobile applications one for each country.

21
Second chapter focuses on the theoretical background, where all theories are reviewed
chronologically inside of three parts: i) technology use theories, ii) relationship marketing theory,
iii) cultural theories.
In the end of the first part of the research, in the third chapter we present our conceptual research
model with latent variables, measuring items, and moderating variables. We provide ten hypotheses
and four hypotheses of moderation.
Second part of the thesis consists of further three chapters: iv) epistemology and methodology of
the research, v) validation of the model, quantitative pretest vi) research results and discussions.
Fourth chapter concerns epistemology and methodology used in the research. Our research applies
epistemological position of positivism and hypothetico-deductive approach. For methodology we
employ quantitative approach, online questionnaire and convenience sampling methods. To develop
and validate variables Churchill paradigm is considered as methodology and structural equation
modeling particularly PLS-SEM is taken as the method to verify conceptual model and hypotheses.
In the fifth chapter we present exploratory phase with two interviews of the representatives of the
mobile application providers and the statistical validation of the conceptual model and measuring
items effectuated by pretest with SmartPLS application.
And in the last chapter the research results and discussion are presented, which involves sample
analysis, model and hypotheses validation, and for better understanding of the cultural differences
we analyze the countries’ subgroups and compare the results with the general model. The chapter
ends with discussion of findings in general sample and in both countries.
Finally, we present the contributions of the research, its limitations and perspectives in general
conclusion of the research.

22
Part I: Theoretical aspects

23
Chapter I: Context of the research

24
Introduction
The first chapter approaches the objectives of the research from three standpoints: tourism and
restaurant industry, development of information technologies implemented in these industries, and
cross-country analysis of Russia and France, including the situation in considered industries.
The chapter consists of three sections. In the first section the tourism and restaurant industries are
characterized. The second section reviews the information technologies. And the third section
observes two compared countries.
Tourism as a sector of economic activity contains many components, wherein the use of
technologies is well developed and it is producing a big amount of data interesting for researchers.
Anyway, the restaurant industry is often regarded as a part of tourism, as well as independent
business included in trade on the level of statistics.
Information technology is presented in this chapter from the historical point of view and point of
view of typology, in other words what kind of technologies are of interest for the research, and what
kind of technologies are used today in the tourism and restaurant industries.
The overlook at the economical, demographical, and political situation of the two compared
countries proposes the understanding of the backgrounds of development in both sectors: tourism
and technologies. It is apparent that the conditions are different in France and Russia; the countries
have not the same living standards, and belong to different economical categories according to the
International Monetary Fund (IMF Economic Review, 2015) and classification of economics of
World Bank (World Development Report, 2015). This might have influence on the use of
technologies as well as on the development of the researched domain – tourism and restaurant
industries.
And finally, the two different mobile applications are introduced, that are used in the presented
countries in the restaurant sector. Both mobile applications have the same goal to propose the users
the restaurant services.
In this way the first chapter answers the objectives of the research, forming the overture of the
mobile application use’ comparison in France and Russia
I. Tourism and restaurant industry
The first section of this chapter has a purpose to describe the tourism starting with definitions and
development of tourism worldwide.
Tourism today is a global phenomenon with a massive infrastructure. Its importance as a branch is
evident in its influences on society, politics, culture, and the economy. In the last decade consumer
behavior of the tourists changed under the development of information technologies. Tourism is one

25
of the sectors, where it is possible to collect the big data. The implementing of the mobile
applications is widely spread in tourism.
Restaurant industry is regarded as part of tourism on the one hand, but on the other hand it is part of
the big industry of foodservice. The smartphones’ usage influenced also on the behavior of the
restaurants’ clients, the information about restaurant’s establishments became easy to find.
I.1.1. Definition of Tourism
There are several terms used by describing the tourism, which are important to define first: travel,
displacement, departure, arrival, trip, tour etc.
Tourism is "the sum of the phenomena and relationships arising from the interaction of tourists,
business suppliers, host governments and host communities in the process of attracting and hosting
these tourists and other visitors" (Macintosh and Goeldner, 1986, 1995, Goeldner 2003).
In order to prevent the disaccords to define "Tourism", United Nations World Tourism Organization
(UNWTO) worked out following definition of tourism:
"Tourism comprises the activities of persons traveling to and staying in places outside their usual
environment for not more than one consecutive year for leisure, business and other purposes."
(“Recommendations on Tourism Statistics” by UNWTO and UNSTAT, 1994).
Tourism can be domestic or international, and international tourism has both incoming and
outgoing implications on a country's balance of payments. Today, tourism is a major source of
income for many countries, and affects the economy of both: the source and host countries.
I.1.2. Development of tourism.
Tourism as a mass social phenomenon started to develop after the Second World War, although the
roots of tourism go back to the deep past. Four stages can be remarked in the history of the
development of tourism. (Gyr, 2010).
The first stage: from antiquity to the beginning of the XIX century. In this period the main reason
for traveling were trade, pilgrimage, cure, and education.
The second stage: from the beginning of the XIX century to the beginning of the XX century. This
period is known as elite tourism, because only elite class could travel with the reason of pleasure
not for need. The first enterprise appeared specialized in manufacturing of tourist services. The
most important role in this stage had the development of transport.
The third stage: from the beginning of the XX century until World War II. The First World War,
economic depression 30s, and World War II had a negative impact on the development of tourism.
However, during this period there were elements of mass tourism, the beginning of the formation of
social tourism.

26
The fourth stage: after the Second World War to the present day. This stage is called the period of
mass tourism (See Figure 1).
Figure 1: Change in the international arrivals in the period from 1950 till 2012 (in millions)
Source: statistical charts and graphs on areppim.com
During this period tourism becomes widespread. From a luxury it becomes a necessity for the
majority of the population of industrialized countries. The industry of leisure and entertainment was
formed with its institutions, products, production cycle, methods of organization and management.
Following factors led to the development of tourism, especially mass tourism (Gyr, 2010):
• Growth of social wealth and income had a significant impact on the structure of consumer
spending. In many countries of Western Europe the growth of the gross annual income per
capita was accompanied by a decrease in the share of spending on food and goods.
However, the share of tourism in the structure of consumer expenditures of citizens grew
up.
• Reduction of working time and the growth of free time. Working time in the Western
countries declined from 2 350 hours per year in 1950 to 1716 hours in 1987. The average
vacation increased from 12 days in 1950 to 31 days in 1988.
• Progress in the development of road transports, aviation, communications and information
technologies was the major stimulus for the development of tourism and caused an
increase in the mobility of society. The prerequisites for this success were the
transportation construction, the development of air traffic and the reduce of the cost for
airline tickets, car boom and the availability of cars for the average consumer.

27
• Urbanization as a factor of tourism development led to the need of an individual to go out of
stressful city and spend vacation in relaxed places. Many researchers and sociologists say
that urban life style is distinguished by a stressful situation, an accelerated pace of life,
lack of contact with people. Therefore, tourism is for many people the ability to escape
from the stressful life in the city.
• Changing of cultural values of society. Tourism needs of an individual were changing.
Firstly the individuals went on holidays for having rest only, now the goals are complex.
This change is connected with the change in the theoretical concept of free time. First, in
50-ies., free time was used for restoring physical shape for work continuation. Then, in the
60-70-ies., free time was spent for the consumption of material goods, provided a growing
wealth of society. Finally, in the 80th it becomes apparent trend towards the use of free
time in order to obtain pleasure, to get as much as possible of new impression from life.
UNWTO published latest data for tourism number 2016 in press release # 17003 of the 17th of
January 2017. 2016 was the seventh year of sustainable growth following the 2009 global economic
and financial crisis. International tourist arrivals reached 1,235 million in 2016, a 3.9 % increase
over the previous year, according to the UNWTO World Tourism Barometer. 46 million more
tourists travelled internationally in 2016 compared to 2015.
Europe (+2%), the most visited region with over half of the world’s international tourists, was
affected by safety and security challenges. Northern Europe (+6%) and Central Europe (+4%) were
the most visited, while Southern and Mediterranean Europe arrivals grew only by 1 % (compared to
2015), Western Europe (0%) stagnated after three years of strong growth.
Except international tourism each country faces domestic tourism. Domestic tourism has positive
influence on the development of the general infrastructure in the country, on the development of the
hotels and restaurants services, transport modes and roads. Later we will see characteristics of the
both international and domestic tourism in compared countries.
I.1.3. Components of the tourism industry
As a mass industry the tourism has impact on many economical aspects, which are good to see in its
components. Tourism industry includes following components (OECD1 Tourism Trends and
Policies 2015):
- Travel agents or travel agencies are companies engaged in selling and arranging
transportation, accommodations, tours, or trips for travelers. Travel agencies can sell
1 OECD - The Organization for Economic Co-operation and Development. www.oecd.org

28
services from different tour operators, also arrange single trips for travelers, or provide
separately such services as transportation, accommodation, entertainment etc.
- Transportation is a service of transports: planes, trains, cars, boats, cruise ships and
others, used by tourists for traveling.
- Attraction and Entertainment include historic sites, heritage homes, museums, halls
of fame, art galleries, botanical gardens, aquariums, zoos, water parks, amusement parks,
casinos and cultural attractions. Many attractions are educational in nature, others are solely
for entertainment.
- Accommodation is defined by European Committee for Standardization as “the
provision of at least sleeping and sanitary facilities” (A dictionary of travel and tourism
terminology, 2005).
- Foodservice and restaurant industry
- Tourist information and guiding services include such components as touristic
offices, touristic guides, maps, excursions, audio guides, internet guides etc.
- Tour operators are companies providing package tours, which usually include
transportation, accommodation, catering and entertainment. Tour operators sell their
services directly or through travel agencies.
These components are whether the direct derivatives of the tourism (like travel agencies or tour
operators) or related branches which enjoyed significant influence of the tourism (like
transportation and restaurant industry).
In our research we will put attention on the restaurant industry, because the goal of this thesis is the
investigation of the mobile applications’ use in the restaurant business.
I.1.4. Food service and restaurant industry
One of the components of tourism industry is the foodservice and restaurant industry. Foodservice
is broad concept. It can include food sold to consumers for preparation and consumption at home as
well as the final preparation of food for consumption away from home. GIRA foodservice
suggested following components of the out of home food market (See Figure 2).
Commercial foodservice includes table service restaurants, self-service restaurants, quick service
restaurants, hotel establishments, transport foodservice. Other establishments like bars, night life,
vending etc belong also to commercial foodservices, but preparing and serving food are not their
priorities.

29
Figure 2: Out of home food market’s components
Source: GIRA foodservice, 2010
The restaurants and cafes segment was the industry's most lucrative in 2014, with total sales of
$1,213.1bn, equivalent to 44.3% of the industry's overall value. The fast food segment contributed
sales of $848.1bn in 2014, equating to 31% of the industry's aggregate value. The performance of
the industry is forecast to accelerate, with an anticipated CAGR2 of 6.8% for the five-year period
2014 - 2019, which is expected to drive the industry to a value of $3,805.8bn by the end of 2019.
Comparatively, the AsiaPacific and US industries will grow with CAGRs of 8.5% and 4.3%
respectively, over the same period, to reach respective values of $1,927.5bn and $842.1bn in 2019
(MarketLine, Industry Profile: Global Restaurants, 2015).
Two main trends impact the increase rate of restaurants are tourism and urbanization.
Food demand is rising with the growth of global population. Increasing urbanization and a general
migration from rural areas to urban areas is causing a change in lifestyle trends, and particularly
eating habits.
With increasing numbers of people working in office environments and growing family households
with two parents in the workforce, time to prepare food at home is limited. Consumers under time
constraints are opting to eat outside in cafés and restaurants, with price-conscious consumers often
turning to fast-food options such as mobile trucks and street stalls.
Specific impact on the restaurant industry has also such type of tourism as culinary tourism.
Culinary tourism as an academic concept appeared in the end of 20th century and developed in the
first decade of the 21st. Lucy Long (1998) was the first author, who published on the topic. She gave
her definition of culinary tourism as:
“The intentional, exploratory participation in the foodways of another – participation including the
consumption, preparation, and presentation of the food item, cuisine, meal system, or eating style
considered to belong to a culinary system not one’s own.”
2 CAGR - the compound annual growth rate

30
The World Food Travel Association (WFTA, 2015) refused the word “culinary” in the term
“culinary tourism” and substituted it with “food” and defines food tourism as:
“The pursuit and enjoyment of unique and memorable food and drink experiences, both far and near.”
One of the most utilized definition of food tourism used in the literature is that proposed by Hall
and Sharples (2003), according to which “food tourism is an experiential trip to a gastronomic region,
for recreational or entertainment purposes, which includes visits to primary and secondary producers of
food, gastronomic festivals, food fairs, events, farmers’ markets, cooking shows and demonstrations,
tastings of quality food products or any tourism activity related to food.”
Historically the two countries most associated with culinary tourism are Italy and France (Everett,
2016). These countries have developed and respected cuisines have native populations that are
knowledgeable and willing to travel within their own countries for food experiences. France boasts
historical and contemporary culture of wine consumption, strong family traditions of vineyards and
vintners. French cuisine has been declared a “world intangible heritage” by UNESCO (2010). Wine
tourism is one of the most dynamic industries.
Anyway, general trend to discover local cuisine of travel destination brought additional attention to
local restaurants in many countries. Thus, the development of the restaurant industry led to
development of marketing strategies of the management and above all to usage of modern
technologies.
I. 3. Conclusion
Started with providing primary services of the travelers’ needs, both, tourism and restaurant
industry changed first to luxury branches for reach and noble people in the end of 19th beginning of
the 20th centuries and then to the mass sectors.
Changes in social life such as reduction of working hours and higher salaries developed tourism and
restaurant industry to leisure. Phenomenon of quick serving restaurants appeared due to the
urbanization and to changes in the modern family’s structure. We can divide restaurant’s goers into
two groups: tourists, who discover the local food, and city’s residents, who is economizing time.
Culinary tourism became one of the popular types of tourism. Du to these facts the number of the
restaurant establishments increased rapidly. In our research we are going to see, how the restaurants
adapt themselves to the new time of modern technologies.
II. Modern technologies.
The development of the tourism industry is closely linked with the development of technologies.
The first stage of the evolution of mass tourism is associated with the development of transport, in
particular civil aviation. The mover of the 21st century’s tourism is clearly the Internet. The

31
appearance of a global network and online payment did information revolution in the tourism
industry.
In opposite restaurant industry is more conservative in its relationships with the clients. Only
several types of restaurant establishments really won in the global “Internetlization”, like quick
service restaurants, or take away services. In other restaurants types the relationships with a client
are difficult to replace with the technology. Nevertheless, the use of modern technologies became
important for the marketing strategy of the restaurant’s management.
This section is designed to introduce modern technologies, which have the biggest impact on the
development of the tourism and restaurant industry.
II.1. Internet
The history of Internet started in the middle of 60th in the USA, and in the early 90th the World
Wide Web is almost completely replaces the concept of the Internet (Leiner et al, 2009).
October 24, 1995 the Federal Commission for networks (FNC) adopted a resolution defining the
term "Internet". This definition was developed in consultation with members of the Internet
community and the owners of intellectual property rights. RESOLUTION: Federal Commission for
the networks unanimously agreed that the term "Internet" reveals the following definition. The term
"Internet" means the global information system that (i) is logically connected via a globally unique
address space based on the Internet Protocol (IP) or its subsequent extensions / add-ons; (ii) to
communicate with the protocol stack using Transmission Control Protocol / Internet Protocol (TCP
/ IP) or its subsequent extensions / add-ons and / or other IP-compatible protocols; and (iii) provide,
using or making accessible to the public or private level, the upper level services, built on the basis
of communication and related infrastructure, which is described herein.
II.2. Networks services used in tourism
Today there is a wide variety of services of Internet to ensure work with all types of resources. The
most interesting and popular among them are: Email, World Wide Web, Blogs, Web Forums, Wiki,
Online auctions and shops, Social networking and dating sites, Teleconferences and newsgroups
(Usenet), FTP service, Telnet service, DNS Service, IRC service etc.
Development of the Internet has given rise to a number of systems, without which today it is
difficult to imagine the tourism industry.
The usage of modern technologies in tourism due to the main features:
- the subject of sales in the tourism is a service,
- a touristic service is a complex of several services,

32
- touristic services provide a lot of information. The tourism industry is suited for the
implementation of modern information technologies because a touristic service at the time of
sale is just information.
Today it is possible to identify several key technologies that are already being used in tourism
industry. These technologies depend on the components of tourism.
II.2.1. Travel agent, tour operator, transportation, attraction and accommodation
Such components of tourism as travel agent, tour operator, transportation, attraction and
accommodation are direct users of a computer reservations system or central reservation system
(CRS). CRS is a computerized system used to store and retrieve information and conduct
transactions related to air travel, hotels, car rental, or activities. Originally designed and operated by
airlines, CRSes were later extended for the use of travel agencies. Major CRS operations that book
and sell tickets for multiple airlines are known as Global Distribution System (GDS).
Global Distribution System is global reservation system, based on the global integration of internal
databases and accounting systems (Schulz, 1996). These systems are an association of hotels that
provide information about themselves, show prices and availability with the help of back-office
established in hotels, or via the Internet. Thereby hotels are accessible to any user of the Internet,
what increases their sales. By booking the order goes directly to the service provider.
Characteristics of the main GDS:
SABRE established in 1960 by the airline «American Airlines», headquartered in SOUTHLAKE,
TX, USA, personnel - 6,500 people in 60 countries, resource - 420 airlines, 58,000 hotels, 53 car
rental companies, cruise 9 and 33 rail roads, 232 tour operators, users - 60,000 travel agencies.
AMADEUS founded in 1987 by three major European airlines - «Air France», «Iberia»,
«Lufthansa». Headquarter is located in Madrid, Spain (host - Erding, Germany), the staff - 4250
people., Resource - 470 airlines, 59,600 hotels, 48 car rental companies, all major cruises, railways,
ferries, insurance companies and tour operators hundreds users - more than 70,000 travel agencies
and airline counters.
GALILEO founded in 1987, owners - Air Lingus, Air Canada, Alitalia, Austrian Airlines, British
Airways, KLM, Olympic Airways, Swissair, TAP Air Portugal, United Airlines and US Airways,
headquartered in Parsippany, New Jersey, US, personnel - 3,000 people in 116 countries around the
world, a resource - 500 airlines, 51,000 hotels, 31 car rental company, all the major cruise lines,
tour operators 430 users - 47,000 travel agencies.
Another important role in tourism plays Internet technology to build customer relationships or
Customer Relationship Management (CRM). Collected and processed information about the clients

33
(the story of their travels, the average budget, needs and preferences) is used in order to specify for
clients their proposals, which are more likely to be accepted by them.
CRM-systems obtain important for functionalities for users, such as (Perna, Baraldi, 2014).:
- Contact management (customer information, history of contacts);
- Communication control (communication, its safety, etc.);
- Forecasting (sales prospects, forecast, marketing);
- Management of motivating factors to attract customers;
- Order management;
- Document management, development and implementation of standards, customizable
reports, information, and advertising materials;
- Analysis of sales;
- Product configuration;
- Encyclopedia of Marketing provides updated information on travel services, prices,
promotions, results of various studies and competitor information.
The evolution of electronic payments has been of great importance for tourism. American banks,
again for the first time in the world, were beginning to introduce electronic methods of money
transfer. In 1975, there were the first automatic teller machines for obtaining cash – ATMs in the
USA. Really revolutionary in the history of electronic money was the year of 1993, when Dr. David
Chaum, the head of cryptography in CWI3, the Dutch national research center, developed a software
solution – eCash technology for working with digital cash. ECash concept puts into practice the
concept of e-currency to pay for goods or services via computer networks, which had already spread
significantly by that time.
These days, electronic payment is a very common method for commercial transactions in the
tourism sector.
So the Internet provides tourists with many advantages when it comes to carrying out their
purchases:
• Speed and ease of access to tourism products and services;
• Price comparison ;
• Availability of reviews and comments from other visitors;
• Possibility of making a purchase 24 hours a day /365 days a year.
All these advantages explain the current increase in electronic sales in the tourism sector. Parallel to
this growth, the electronic payment market provides an opportunity for innovation in the ways in
which the tourism companies can obtain their income.
3 Centrum voor Wiskunde en Informatica (Center for Mathematics and Computer Science), Amsterdam, Holland

34
Hotels, flights, tours, car rentals and even restaurant reservations anywhere in the world can be
booked and paid via sites reservation systems. Online travel market worldwide is estimated today at
$ 300 billion. The main share falls on the United States, where more than 60% of all tourists prefer
independent booking and purchase tickets and hotels (Statistics and facts on the online travel
market, 2015).
II.2.2. Tourist information and guiding services
Internet provides many information resources for tourists, including websites of touristic offices,
video tours and guides, social networks (e. g. tripadvisor), blogs, official websites of cities and
destinations, online schedules for transports etc. Special service is provided by geographic
information system. A GIS4 is a computerized data management system used for encoding, storing,
processing, maintaining, analyzing and presenting data in association with their geophysical
location. It is a "geo-referenced" data analysis and presentation system. A GIS offers the possibility
of a structured data management, data access as well as efficient analysis procedures applied to the
data. GIS is used to compose information of a digital map base for printed maps, digital files for
Internet mapping, and digital files for mobile mapping, attractions map, and website with
interactive mapping.
II.3. Big data in tourism
In modern world, information is a strategic resource; because of this Big Data has great value.
Big Data is massive amounts of unstructured data from a variety of sources. These data amounts are
difficult to process by using traditional tools to work with databases and software. Key
characteristics of Big Data received the code name 5V - Volume, Variety, Velocity, Veracity, and
Value (Hilbert, 2013):
- Volume. According to forecasts of the consulting company IDC, by 2020 the world will
accumulate at least 40 trillion gigabytes of data.
- Variety. The number of information sources has increased with the progress, therefore, a
variety of data types grew also, that require different tools for collecting, storing and
processing.
- Velocity. The velocity of reading data from the media, their transmission over the Internet
and other communication channels, the level of computing power have to be as fast as
information flow is.
- Veracity. With an increasing amount of data it is important sorting information for the
selection of reliable data.
4 GIS – geographic information system

35
- Value. The value of information is a key parameter for business to evaluate the effectiveness
of investments in its processing.
Big Data appeared in the tourism industry thanks to the CRM system when service providers began
to collect data to improve the quality of services and increase sales.
Airlines and hotels have used information on purchases, buying preferences, data from social
networks to monetize their activities and to offer a more personalized service. Thus, Big data in
tourism today is used more often for: 1) improving the quality of service, 2) marketing and sales.
The list of big data sources is limitless, but they can be divided into three main groups (Mayer-
Schönberg, Cukier, 2013):
- Data from social networks. These include all the information obtained by monitoring customer
activity on social networks, pages viewed and comments on forums and so on.
- Data on transactions. Sources of information in this case are the invoices, payment orders,
receipts, statements and other financial documentation.
- The machine data. It consists of the sensors, cameras, technical equipment, web machines and
track user behavior online.
Data can also be divided into current and historical, to obtained from public and private sources, to
structured and unstructured.
The company InsightExpress did a study in 2013 on behalf of Cisco Systems5 in 18 countries
among the companies that collect, record, and analyze data. According to this study 60% of
respondents admit that Big Data solutions can improve decision-making processes and increase
competitiveness, but only 28% said that already receive real strategic advantages of the
accumulated information. Traditional methods of data processing are often useless when working
with Big Data. It was spent about $ 34 billion in 2013 for technologies of Big Data processing and
this sector created already 4, 4 million of jobs. Tools and algorithms for Big Data processing are
extremely diverse. Among them are the traditional methods of statistics and computer science, as
well as specially designed for Big Data software. This is a technique to identify the relationships
that allow predicting the behavior of consumers in a particular market segment, analysis tools for
social networks, machine learning algorithms, methods of analysis of spatial data, simulation
models, visualization tools, and many others. The most famous solution today is Hadoop, the
project of Foundation Apache Software Foundation. At present, almost all modern means of
analyzing Big Data provide integration with Hadoop.
5 Cisco Systems, Inc. (known as Cisco) is an American multinational technology conglomerate headquartered in San José, California, in the center
of Silicon Valley, that develops, manufactures, and sells networking hardware, telecommunications equipment, and other high-technology services and products. www.cisco.com

36
II.4. Mobile technologies
At the beginning of the XXI century progress of mobile devices started. The market consists of
laptops, cell phones, smartphones, tablets, in other words all the devices which can be moved or/and
taken to serve at any possible point and moment. In our research we will focused on the
smartphones as advanced cell phones that serve as computing devices in addition to being mobile
handsets and that run on an advanced operating systems.
Today's smartphones are systems for communication, with their choices of several types of wireless
connections. One of these is the Wi-Fi, used everywhere for wireless access to the Internet, building
local networks, etc. The standard Wi-FI was approved in 2009 and allowed to transmit data at
speeds up to 54 MBits / s (www.wi-fi.org ). First, the device operates with a data transfer protocol
for Wi-FI were located a few meters away from each other, but the distance to units grew quickly of
several hundred meters. At the moment there are data transmission technologies of Wi-Fi at a
distance of 100 km or more.
A huge impact on the usage of mobile devices and especially smartphones has had a development
of the mobile Internet (Hamill, Lasen, 2005).
The development of the mobile Internet went through four stages so called 4 Generations (G) and
resulted in 4G. Today, thanks to an ultra-modern technology LTE, the download speed in Internet
4G networks can be up to 150 Mbit/s. Besides higher speed, the fourth generation network is more
stable and has better signal quality. For customers this means a perfect quality of communication,
instant of loading of even fairly large files, the ability to enjoy streaming video in HD quality and
modern games in real time (Dahlman, Parkvall, Scold, 2013).
To meet the demand of consumer and business for wireless services, many providers are beginning
to deploy technology 4G. Service providers in many emerging markets are creating new mobile
infrastructure, and in some developed regions 4G technology supplement or replace solutions for
2G and 3G. In 2014, each 4G-compound generated in an average of 2.2 GB of mobile data traffic
per month. According to the annual study of Cisco Systems Ink, this figure will reach 5.6 GB by
2019, which is 5.4 times higher than the average volume of traffic generated by the connection, do
not use technology 4G (www.cisco.com ).
II.4.1. Mobile application
A mobile application is software products developed specifically for mobile devices, smartphones,
tablets or other mobile devices. Mobile applications are distributed through shops applications:
Apple App Store, Google Play, Windows Phone Store, BlackBerry App World and others. Mobile
applications help to solve various tasks starting from mobile mapping and receiving e-mail to
highly specialized functions. They are designed to make life easier for users of mobile devices. The

37
market for mobile applications was born in 2008. The first company, launched an innovative model
of distributing applications, has been Apple. Later Google came on this market, which created
serious competition for Apple.
Mobile application is not the same as a mobile website which is similar to any other website in that
it consists of browser-based HTML pages. The obvious characteristic that distinguishes a mobile
website from a standard site is in the design.
By contrast, mobile applications are actual applications that are downloaded and installed on mobile
device, rather than being rendered within a browser. Users visit device-specific stores such as
Apple’s App Store, Android Market or Blackberry App World to find and download application for
a given operating system. The application may pull content and data from the Internet, similar to a
website. Or it may download the content so it can be accessed without an Internet connection
(Holzer, Ondrus, 2011).
Mobile applications are a global phenomenon with mass consumer appeal. For example, Apple’s
App Store has reached 100 billion downloads in June 2015(Apple press info, 2015).
From games, social media and video to news, stock market and mind maps, the number of mobile
applications available in applications stores is constantly growing.
Across the globe, the mobile channel is growing fast. People in every country are buying more and
more advanced mobile devices, companies are launching smartphone applications by the thousands,
and businesses and consumers alike are using mobile phones for everyday activities (i.e., checking
the weather, taking advantage of discounts, shopping, or sending and receiving financial
information).
The success of smartphones and tablets and their applications is driven by several factors (Hamill,
Lasen, 2005):
• Increasing impact of mobile social networking,
• Emergence of new mobile platform Windows 8,
• Development of mobile payment systems and mobile banking,
• Changing consumption patterns, so called global mobilization. Mobile devices are becoming
more user-friendly for everyday tasks than computers.
• Reducing the cost of communication through mobile devices,
• Function of Geolocation,
• Penetration of high speed internet connection and its impact on the market of mobile
applications,
• E-commerce or mobile commerce.

38
Experts of J'son & Partners Consulting6 (2013) divided applications market in the following
segments:
✓ Content applications.
Today activities such as listening to music, watching a variety of films, videos and photos, as well
as reading digital books are the most accessible and convenient for users of mobile devices, so the
demand for this segment of mobile applications rises.
✓ Business Applications.
Business applications have become an essential tool for many users that will help them simplify
their job.
✓ Mobile Games.
Mobile games are the most demanded in the market of mobile applications.
✓ Mobile Social Networking.
Our research reviews the mobile applications used in the restaurant industry, on the one hand it is
content mobile applications, which provide the users necessary information, on the other hand such
mobile applications can be business tool for the restaurants.
II.4.2. Mobile technologies in tourism
Mobile technologies in tourism are used on the analogy of computer usage. Such computer’s
functions as calendar, notebook, e-books reader, internet access etc are available on tablets and
smartphones. Mobile applications have become one of the main trends in the development of
mobile technologies. The choice to use a mobile application or internet website is connected with a
tourist’s purposes.
Each category of the mobile applications has its level of engagement and customers’ loyalty. The
understanding of the audience for which a mobile application is designed influences the
implementation strategy and marketing.
Regarding frequency of use and loyalty (engagement), all applications can be divided into 4 groups
(J'son & Partners Consulting, 2013).
Group I includes the mobile applications that are used frequently and constantly. News and
communications - are the two categories included in this group.
Group II includes the applications which are used frequently, but in a limited period of time. They
are used “discretely”. Streaming music, dating and social games are typical categories of mobile
applications in this group.
6 J'son & Partners Consulting covers more than 30 market segment across Telecommunications, IT and Media. Consultancy
projects, analytical reports and data matrixes. http://json.ru/en/about/
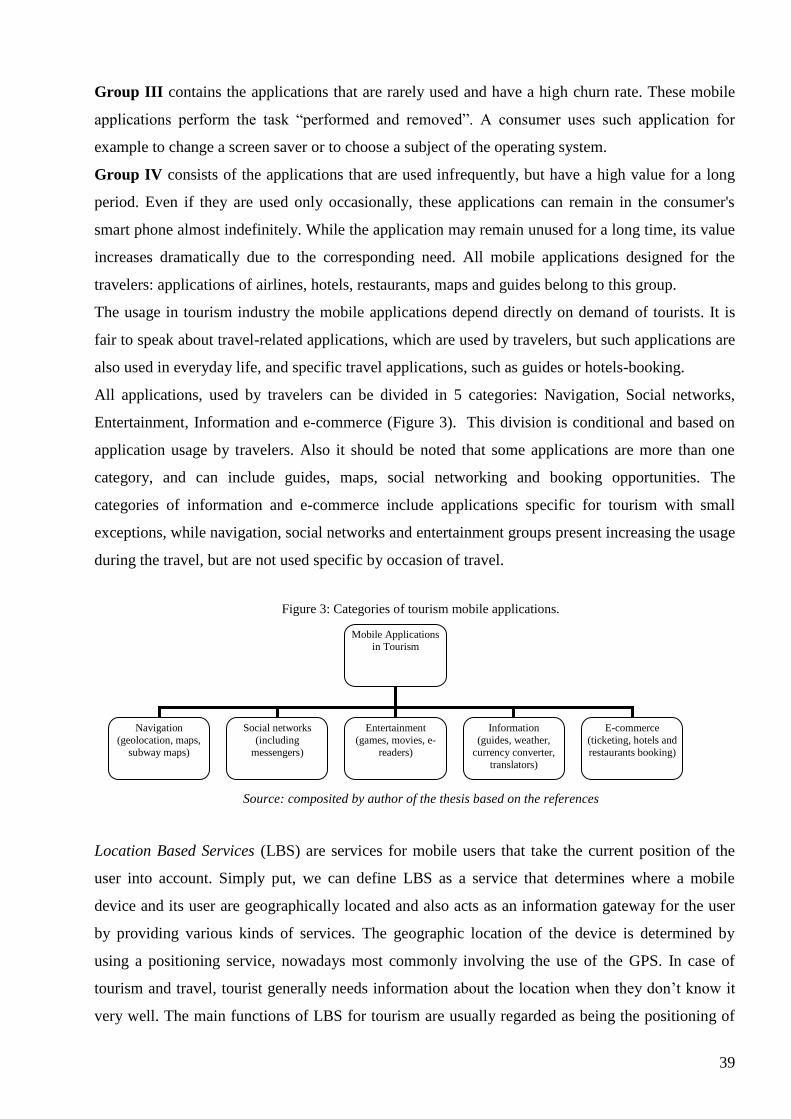
39
Group III contains the applications that are rarely used and have a high churn rate. These mobile
applications perform the task “performed and removed”. A consumer uses such application for
example to change a screen saver or to choose a subject of the operating system.
Group IV consists of the applications that are used infrequently, but have a high value for a long
period. Even if they are used only occasionally, these applications can remain in the consumer's
smart phone almost indefinitely. While the application may remain unused for a long time, its value
increases dramatically due to the corresponding need. All mobile applications designed for the
travelers: applications of airlines, hotels, restaurants, maps and guides belong to this group.
The usage in tourism industry the mobile applications depend directly on demand of tourists. It is
fair to speak about travel-related applications, which are used by travelers, but such applications are
also used in everyday life, and specific travel applications, such as guides or hotels-booking.
All applications, used by travelers can be divided in 5 categories: Navigation, Social networks,
Entertainment, Information and e-commerce (Figure 3). This division is conditional and based on
application usage by travelers. Also it should be noted that some applications are more than one
category, and can include guides, maps, social networking and booking opportunities. The
categories of information and e-commerce include applications specific for tourism with small
exceptions, while navigation, social networks and entertainment groups present increasing the usage
during the travel, but are not used specific by occasion of travel.
Figure 3: Categories of tourism mobile applications.
Source: composited by author of the thesis based on the references
Location Based Services (LBS) are services for mobile users that take the current position of the
user into account. Simply put, we can define LBS as a service that determines where a mobile
device and its user are geographically located and also acts as an information gateway for the user
by providing various kinds of services. The geographic location of the device is determined by
using a positioning service, nowadays most commonly involving the use of the GPS. In case of
tourism and travel, tourist generally needs information about the location when they don’t know it
very well. The main functions of LBS for tourism are usually regarded as being the positioning of
Mobile Applications in Tourism
Navigation
(geolocation, maps,
subway maps)
Social networks
(including
messengers)
Entertainment
(games, movies, e-
readers)
Information
(guides, weather,
currency converter,
translators)
E-commerce
(ticketing, hotels and
restaurants booking)

40
places, persons, and objects, routing between them, search for objects in nearby places such as
restaurants, shops, hotels, or points of interest, and information about traveling conditions, such as
traffic-related data. The application areas of LBS for tourism include mapping, tracking, routing,
traffic information, destination information, recreation spots, and for restaurant business it includes
functions “around me, next to me, where to eat, closest restaurants etc.” (GNSS market report, issue
4, 2015).
Social networks used by occasion of traveling can be divided in travel related social networks such
as tripadvisor, WAYN (Where Are You Now), and others. After social networks started the
geolocation service, it became popular to check in places, also when traveling. 47% of online
travelers visit social networking sites to influence destination selection (Google travel report, 2014).
E-commerce. According to the Travel report of company Criteo7, published in October 2016, the
frequency of travel bookings from mobile devices grew by 12 % in 2016, within 33% of all
bookings are dome by smartphones and 16 % by tablets. The popularity of mobile applications for
travel increased, so booking through applications or “in-app” represent 54% of all bookings from
mobile devices. Usage of mobile devices by hotels bookings has been depended on the period of
booking, by 58% of bookings made within last 24 hours the mobile devices were used, but by
booking in advance (more than 12 weeks) users prefer still PC, 18 % contra versa 82%. Globally
the leader of the mobile devices booking is Japan (38% of all bookings), while the highest over the
year growth showed Australia (36% more bookings done by mobile devices) (Croteo travel report,
2016).
Information services include guides, weather, currency converter, translators. Some services are
multi functional. Application can track of all itineraries for user. This includes hotels, flights, trains,
and any other travel documents needed to keep in order. Currency applications offer real time
exchange rates and take the guess work out of getting cash out of the ATM, bills dining out, and
converting foreign currencies back into the currency of the home country. And translators
applications have ability to use till 100 languages and immediately translation of the sings, names
and pointers.
Entertainment. According the tripadvisor8 report 38% of mobile phone users plays games on their
devices during the traveling. Except games e-books and videos belong to entertainment applications
(TripBarometer, 2016).
II.5. Mobile technologies in restaurant industry
A growing number of people are comparing restaurant menu items and their benefits on the
Internet. Also increasing number of people are making restaurant choices based on online reviews.
7 Company Criteo is one of the world leaders in technology for digital-advertising platforms. www.criteo.com 8 Tripadvisor: TripBarometer 2016, www.tripadvisor.com/TripAdvisorInsights

41
Restaurateurs' are using the Internet and social networking platforms to compete more effectively in
the restaurant marketplace. Internet and social networking sites help restaurants to communicate the
range and quality of food items served and thereby to reach out to a larger section of customers.
According to the survey of Deloitte Development LLC9 customers of restaurants are using not
really gladly the mobile applications. Less than one-fifth (18.9 percent, 2014) of survey respondents
have actually downloaded at least one restaurant application into their smartphones or tablets.
Concerns about security and “spam” may explain some customers’ reluctance to participate in
loyalty programs while others may see obstacles in the requirement to download mobile application
and manage user accounts. Deloitte Consulting LLP’s Travel, Hospitality, and Leisure practice
surveyed more than 4,000 restaurant customers in the U.S. who visited a fast service restaurant (fast
casual) at least four times, or a casual dining restaurant at least two times, in the prior 30 days. The
survey focused on dining behavior and attitudes, including customer engagement preferences,
restaurant choice behavior, and the effectiveness of loyalty programs.
The survey did not show particular evidence that the use of a restaurant application drives brand
loyalty. For example, only 37 percent of those who have downloaded a restaurant application said
they would serve as brand ambassadors for their most-frequented restaurant, compared to 38
percent of those who have not. Some 36 percent of those who have downloaded a restaurant
application say they have built a relationship with their most-frequented restaurant, compared to 30
percent who have not.
Despite these findings, restaurant organizations see great potential in the integration of traditional
loyalty programs into a mobile platform. Survey responses indicate that customers generally do not
want to engage in a dialogue with restaurants about their dining experiences and preferences.
Nevertheless the restaurant applications, which can provide the booking service in many
restaurants, not only in one, have become a recent trend. More than 14 million of bookings in the
world are done every day: 95% of them are made through a phone call, and only 5% - through the
Internet. The world's largest table-operator might be a service Opentable10.
II.6. Conclusion
Private mobile devices, smartphones and tablets, with stable Internet connection have change the
consumer behavior in many ways. The users of smartphones have habit to access immediately to
any kind of information. They can purchase goods and services at any moment they need or want.
Thus, companies adopt their marketing strategies to these changes to win loyalty of the customers.
Tourism is closely connected with development of technologies; mobile technologies cheapen the
9 Building consumer loyalty in the fast service and casual dining restaurant sector. Consumer survey findings, 2014 www.deloitte.com 10 OpenTable is an online restaurant-reservation service company founded by Chuck Templeton in 2 July 1998 and is based in San
Francisco, California. The service operates in 19 countries, including 6 European countries . www.opentable.com

42
expenses of the tourists and contribute the mass tourism. Through all private mobile devices and
mobile application huge amount of personal information is collected. Big Data is becoming the
important topic for scientists and business.
In our research we will focus on the usage of the mobile applications in the restaurant industry,
where the implementation of the mobile services depends on many factors. On the one hand the
personal contact and close relationship between restaurant and client are the most important; on the
other hand, restaurant management should adopt the strategy according to the user’s demand to
access information immediately.
III. The choice of the countries
For the research we have chosen two countries: Russia and France. I am from Russia and my
primary interest is to compare this country with France in the area of mobile application use in
tourism and restaurant industries. France is known for its cuisine and restaurants all over the world.
It’s one the most famous touristic destination, and French gastronomy was added by the UNESCO
to its list of the world’s intangible cultural heritage (2010).
The history of Russian restaurant industry was interrupted during the time of Soviet Union and
became a real business branch only in the beginning of the nineties of 20th century. Even if Russia is
attractive touristic destination for foreign tourist, short season because of difficult climate,
underdeveloped infrastructure, and visa issues make the access to the country limited.
Despite this apparent difference of two markets, the comparison of these two countries might be
interesting for many reasons:
- rush development of the touristic and restaurant industry in Russia lead in quick evolving of
consumption of these services;
- mobile technologies arrived in both countries at the same time in the 2008;
- impact of mobile technologies on the consumption of restaurant services is ambiguous:
which side is adopting technologies faster;
- how strong is cultural aspect in the restaurant industry, talking about mobile technologies.
The goal of this section is to give main characteristics of two countries, Russia and France,
underlining the economical development, and presenting tourism and restaurant industries in
details. The first look at both states will provide us the background information, which might be
used for analyzing the role of the tourism and restaurant industry in the economies.
For the comparison we will focus on two capitals, Moscow and Paris, and two mobile applications:
Resto and LaFourchette. This choice has been made based on comparability. Thus, Moscow and
Paris are capitals, and have similar characteristics, such as tourist flows and touristic attractions,

43
number of restaurant establishments, and from the point of view of countries’ structure in both
cases the power is centralized in the capitals, what simplify comparison of the standards of living.
More detailed information about both capitals will be presented in further sections of this chapter.
As for applications we have chosen two local brands, firstly because there is no restaurant mobile
application presented equal in both capitals, and secondly we have the intention to analyze culture
specification, which is better to see in local brands.
To indicate the comparability of chosen countries we describe each country by general information
including geopolitical structure and demography, economy and place of tourism and restaurant
industries in it. This information will allow us to specify the level of comparability, for example, the
size and population of Russia are much bigger than of France, but the development of tourism and
restaurant industries are higher in France than in Russia.
III. 1. Russian Federation
III.1.1. General Data to the country
Russia (Russian Federation) is the state in Eastern Europe and North Asia. It borders with North
Korea, China, Kazakhstan, Mongolia, Azerbaijan, Georgia, Ukraine, Belarus, Poland, Lithuania,
Latvia, Estonia, Finland and Northway. Russia is one of the biggest countries in the world with the
area of 17,075,400 km2.
Administrative-territorial structure of Russia has different types and levels. At present, the country
consists of 85 subjects of the Russian Federation (Russian regions), which are combined into nine
federal districts. In accordance with the Constitution Russian Federation consists of 22 republics, 9
territories, 46 regions, 3 federal cities (Moscow, St. Petersburg, since March 2014 -Sevastopol), 1
autonomous region, 4 autonomous districts.
Despite the fact, that Russia is divided in regions and each region has its own governmental units
and its own budget, the power is well centralized in Russia. This has impact on the development of
the regions; the most important regions for the country, mostly rich on natural resources enjoy the
attention of the central power, from the other side, very often all the revenues go directly to the
Moscow. On the level of the management all programs, plans, and directions of the regional
development are agreed firstly with the central government.

44
Picture 1: Map of Russian Federation,
source Wikipedia
According to the Constitution of Russia, the country is a federation and semi-presidential republic,
wherein the President is the head of state and the Prime Minister is the head of government. The
Russian Federation is fundamentally structured as a multi-party representative democracy, with the
federal government composed of three branches:
- Legislative: The bicameral Federal Assembly of Russia, made up of the 450-member State
Duma and the 166-member Federation Council, adopts federal law, declares war, approves treaties,
has the power of the purse and the power of impeachment of the President.
- Executive: The President is the Supreme Commander-in-Chief of the Armed Forces, can
veto legislative bills before they become law, and appoints the Government of Russia (Cabinet) and
other officers, who administer and enforce federal laws and policies. The president is elected by
universal suffrage for a six-year term.
- Judiciary: The Constitutional Court, Supreme Court and lower federal courts, whose judges are
appointed by the Federation Council on the recommendation of the President, interpret laws and
can overturn laws they deem unconstitutional.
III.1.2. Demography
According to the Federal State Statistics Service (Rosstat), the number of inhabitants of the Russian
Federation on the basis of the population census was 142 million 857 thousand people (population
census 2010). At the end of 2015 it increased to 146, 2 million. (See table 1). Russia occupies the
8th place in the world in terms of population.

45
The correlation of city’s and countryside residents is in Russia 74% and 26% respectively. There
are 2 386 cities and towns and 134 000 villages, 12 cities are of more than 1 million people large.
The population is concentrated mostly in The Central district (38.4 million people) and the least in
the Far East Federal District (6.3 million).
The most numerous nations are Russian (111 million people). Altogether there are more than 180
different national and ethnic groups in Russia.
Table 1: Population of Russia, million person
Year Total Men women
2004
144334 67072 77262
2005 143801 66696 77105
2006 143236 66302 76934
2007 142863 66052 76811
2008 142748 65976 76772
2009 142737 65961 76776
2010 142833 66015 76818
2011 142865 66050 76815
2012 143056 66176 76880
2013 143347 66353 76994
2014 143667 66547 77120
2015 146267 67771 78495
Source of information - The Demographic Yearbook of Russia, Federal State statistics service, 2016
Federal State Statistics Service (Rosstat) publishes the data for the level of education based on
population census 2010. So secondary education (high schools) in Russia has 18.2% of the
population, professional education (professional schools) – 37.8%, the higher education
(universities, higher schools) – 23.4%, and 0.5% of people have no education.
III.1.3. Economic crises
Russia is industrial-agrarian country, whose territory is divided into 11 economic regions (North,
Northwest, Central, Volga-Vyatka, Central Black Earth, Volga, North Caucasus, Urals, Western
Siberia, Eastern Siberia, and Far East).
Economy of Russian Federation has changed significantly after the collapse of the Soviet Union.
Over the past 25 years it has gone from being an isolated and centralized economy to a free market
economic system, which is integrated into the world economy. During the economic reforms of the
1990s most state-owned enterprises were privatized. Meanwhile, the protection of property rights in
Russia is still weak and not well developed, and the state intervenes easily in the private sector.
The first economic growth after the collapse of the Soviet Union in Russia took place only in 1997.
However, in the same year the Asian financial crisis began, which had a negative impact on the
Russian economy. This led to the fact that in 1998 the Government of Russia has failed to pay its
debts, which caused a sharp depreciation of the ruble and as a consequence a significant reduction

46
in the standard of living for citizens. Thus, the year 1998 went down in history as the year of the
crisis and a large outflow of capital from the country.
The economy started to recover in 1999. The main stimulus for economic growth was the low rate
of the ruble against the major world currencies, which had a positive impact on domestic production
and exports. From this point on began the period of sustained economic growth, what was possible
because of high oil prices.
Russian industry has been focused on the extraction of mineral resources from the very beginning
and the whole economic system was in direct dependence on the export of gas and oil. This
dependence has made Russia weak in the global economic crisis.
The crisis of 2008-2009 in Russia has affected the banking and financial sector, the oil sector, the
political situation. The main reasons were: 1) mortgage crisis in the US, 2) drop in oil prices, 3)
deterioration of the investment climate due to the military conflict with Georgia.
Starting with a collapse of three major Russian banks the crisis quickly spread to the real economy.
Capitalization of Russian companies decreased in September-November 2008 by three-quarters;
foreign exchange reserves fell by 25%. The financial crisis has reduced public confidence in banks
and led to an outflow of deposits. Companies began to file for bankruptcy. The negative process
began such as firing workers, sending them on forced administrative leave, reducing salaries. The
crisis had V-shaped character: rush fall down of revenues till the bottom of the crisis in December
2009 and two years of growing up afterwards.
After the world economic crisis 2008-2009, the government worked out the budget rule. Since
2013, this rule officially began to operate. The budget rule determines the maximum level of
expenditure budget, based on oil prices. The declared goal of the rule is to reduce Russian fiscal
policy’s dependence on cycles in the world economy. According to the official position of the
Russian Ministry of Finance, the budget rule reduces the dependence of the federal budget on the
state of world markets, and also provides a "safety cushion" in other words the insurance fund.
The 2014–15 financial crisis of the Russian economy showed the weakness of the budget rule, in
the first way, because of lack of time to do real savings. The new crisis is the result of two factors:
1) international economic sanctions imposed on Russia following Russia's annexation of Crimea
and presumed military presence in Ukraine; 2) the fall in the world price of oil in 2014. Russia's
GDP at the end of November 2014 went into minus the first time since 2009.
The economic crises of 1998 and 2008-2009 had direct impact on all branches of economy, but
particularly on tourism and restaurant industries, which are strongly depended on the purchasing
power of the population. In 1998 the inflation in the country arrived at more than 84,4% within 4
months. As consequences most of small and medium companies in the tourism and restaurant
industries went bankrupt, standard of living felt down. In the crises 10 years after (2008-2009) the

47
crises influenced deeper big industries and enterprises, while the small and middle companies, like
restaurants and touristic agencies adapted their supply to changes in the demand of the population:
in this period fast food and street food establishments grew up compared to fine-dining and
gastronomic restaurants. In outgoing tourism the agencies opened cheap destinations of low-cost
and all-included formats.
The recent crises of 2014-2015 had stronger impact on tourism and restaurant industries compared
to the crises of 2008-2009. The Ruble devaluation against the U.S. Dollar and Euro is one of the
factors influencing the industries. In 2014, the Russian ruble depreciated 70 percent to the U.S.
dollar. The weak ruble presents decrease of household spending, thus the prices for traveling and
outdoor eating became more expensive, pushing down key indicators of the industries. According to
the Russian Federal Statistics Service (Rosstat), consumer price inflation in 2014 rose by 11.4
percent. At the same time international political position of Russian government and caused by it
food embargo reduced interest of international investment and tourism of EU and other western
countries.
III. 1.3.1. Structure of Russian GDP and the place of tourism industry.
Nominal volume of Russia's GDP in 2016 amounted to 1433,36 billion of Euros (Rosstat), of which
gross value added - 86%, net taxes on products - 14%. GDP decrease was 0.2%. Structure of gross
value added by industries Russia can show the contribution of the most important industries
including catering and tourism and related branches (Figure 4).
Figure 4: The structure of gross value added in 2014.
Source: Rosstat, 2014
Agriculture, hunting and forestry - 4.0%
Fishing, fish farming - 0.2%
Mining and quarrying - 10.3%
Manufacturing - 15.6%
Production and distribution of electricity, gas and water - 3.4%
Construction - 6.5%
48
Wholesale and retail trade - 17.3%
Hotels and restaurants - 1.0%
Transport and communications - 8.7%
Financial activities - 5.3%
Transactions with real estate, renting and business activities - 12.2%
Public Administration - 6.5%
Education - 3.0%
Health care and social services - 4.1%
Other community, social and personal services - 1.8%
According to WTTC (World Travel and Tourism Council) the direct contribution of Travel and
Tourism in Russia to GDP was 14,78 billion of Euro (1.26% of total GDP) in 2016, and after the
fall by 5.2% in 2015 compared to 2014, the forecast shows first stability, so the prediction for 2017
stays by 0% of growth. Russian statics gives number of 3% and 6.5 % including the related
branches, such as hotels and restaurants (1.0%), transport and communications (8.7%), other
community, social and personal services (1.8%). After the comparing all dates, it is possible to
conclude, that there is no experience in Russian economy to count and to regard the tourism as an
independent branch of economy.
III. 1. 4. Tourism industry
Tourism in Russia is developing industry. The history of the development of tourism in Russia has
its own specialty. In Soviet times, it has been a problem for foreigners to get in the USSR ("Iron
Curtain"), particularly for tourism purposes, and at the same time domestic tourism was developed
as a strong tourist movement, focused mostly on the "wild" tourism (backpackers). In addition, the
Soviet resorts for the most part remained in the territory of modern Ukraine, Georgia, Abkhazia,
Armenia, Azerbaijan, Latvia, Estonia and Lithuania, and Russia lost this part of the tourism
infrastructure. For these reasons, and also because of the crisis 90s, there was almost no tourism at
the beginning of the XXI century. According to the preliminary data of Rosstat11, for 2015 Russia
took about 26,8 million international visitors. In 2015 the leadership was still by neighborhood
countries of former Soviet Union. Within other countries the biggest amount of tourists was from
Poland (1725000), Finland (1416000) and China (1122000).
Russian Federation Federal Law "About bases of tourist activity in the Russian Federation" defines
the tourism industry as "a complex of hotels and other accommodation, transport, catering, objects
of cognitive, business, health, sports and other purposes, organizations engaged in tourism and
travel agency activities, as well as organizations providing travel services and guide service.”
The tourist industry includes the following components(1996):
- organizers of tourism: touristic and travel agencies,
11 Federal State Statistic Service of Russian Federation, www.gks.ru

49
-companies providing accommodation services (hotels, motels, recreation, etc.),
- catering (restaurants, cafes, bars, etc.),
- transport companies (vehicle and aviation enterprises, railway, river and sea transport, etc.),
- tourist offices,
- production enterprises (production of tourist souvenirs, hotel furniture, camping equipment),
- trade enterprises (shops of tourist equipment and souvenirs),
- entertainment enterprises (theme parks, concert halls, clubs, halls of slot machines and other.),
- backpackers (hiking, climbing, cycling),
- tourism authorities (government agencies, public tourist organizations),
- educational, scientific, design agencies.
III.1.4.1. Strategy of Tourism Development in the Russian Federation
Tourism is regarded by the government as a source of financial income of the budget system of the
Russian Federation, as a way of increasing employment and quality of life, to maintain the health of
citizens, as a basis for the development of social and cultural environment and education, as well as
a powerful tool for education and moral formation of the platform of civil society.
In accordance with the list of orders of the President of the Russian Federation on the development
of inbound and domestic tourism in the Russian Federation dated July 30, 2013 Strategy of Tourism
Development in the Russian Federation was worked out for the period up to 2020 (hereinafter - the
Strategy).
The main objective of the development of tourism in the Russian Federation for the period up to
2020 is a comprehensive development of domestic and incoming tourism for economic, social and
cultural progress in all regions of the Russian Federation.
Effectuation of this objective requires the solution of following tasks:
- the formation of the information environment;
- comprehensive security in the area of tourism and sustainable development of the sphere of
tourist services;
- promotion of tourist products of the Russian Federation in the domestic and international
tourism markets;
- integration of tourist services provided by the Republic of Crimea and Sevastopol12, in tourism
management and professional tourist community of the Russian Federation.
12Sevastopol is a city located in the southwestern region of the Crimean Peninsula on the Black Sea. As a result of the 2014 Russian
annexation, the city is administered as a federal city of the Russian Federation, though Ukraine and most of the UN member
countries continue to regard Sevastopol as a city with special status within Ukraine.

50
The main problems of the tourism industry today include the high domestic prices and undeveloped
touristic infrastructure. In many ways, the high cost of travel in Russia is associated with the high
cost of transport services. The infrastructural problems cover all components of tourism: lack of
touristic offices in the cities, lack of accommodation and catering facilities.
Strategy of Tourism Development in the Russian Federation was developed to solve indicated
above problems. It provides the cluster approach, which is an advanced and effective mechanism to
focus both public authorities and private business initiatives for the creation of tourist infrastructure.
It started to create an information bank of tourist resources of the Russian Federation and to make it
available to potential tourists, to create tourist information centers in each region.
III.1.4.2. Crises 2014 of outgoing tourism in Russia
The year 2014 changed the point of view of tourism industry in Russia. The crisis of outgoing
tourism led to setting new priorities for business.
The collapse of the Russian tourist market began with a large company "Neva" (Saint-Petersburg).
Number of clients decreased during last several years, mostly because of rush development Internet
services, but the political and economical crises 2014 has put an end to the history of the company.
Up to 7000 clients of this travel company remained abroad without tickets and hotels. About 20000
customers count on the return of their funds for canceled trips.
"Wind Rose World" was the next company after "Neva", which failed to meet its obligations to
partners and customers. Then the collapse came. "Expo Tour", "Labyrinth", "Ideal Tour" and
many other large travel companies declared bankruptcy.
The crisis in the touristic industry was caused by ruble’s exchange rate, increasing of
independent traveling. Travel companies underestimated the economical risks.
Today since the fall in the industry in 2015 the tourism in Russia is stagnated and doesn’t show
the growth or decrease in numbers.
III.1.5. Restaurant industry
According to the Russian Federal Statistics Service (Rosstat), turnover of restaurants and cafes in
Russia fell by 5,5 percent to 396 billion of rubles (6.6 billion of Euros) in 2015. Thus, the year 2015
turned out to be a crisis for the Russian restaurant market.
In Russia, there are about 88,000 cafes, restaurants and other catering establishments, while the total
number of chain restaurants is about 11,000. According to research by RBC13 (Russian food market,
2015), about 29% of the Russian restaurant market present "fast food" segment, more than 25% of
13 RBC is a large Russian media group headquartered in Moscow. The company holds an informational agency
RosBusinessConsulting. RBC Research is a largest provider of business researches. www.research.rbc.ru

51
the market is taken by "street food", to restaurants are counted 19%, coffee houses and
confectionery - 14%, about 7% - takeaway food, 6% - Fast Casual restaurants. Chained restaurant
from lower-cost foodservice segments have successfully developed in recent years making
franchising one of the key expansion methods for foodservice chains in Russia. The total number of
franchises in Russian foodservice industry totaled 182 in 2013 and jumped to 203 in 2014 - up 11.5
percent. Currently there are 6,500 foodservice franchise outlets in Russia and its share is 8 percent
of total Russian restaurant market.
Russian food service industry faced several problems since the middle of 2014.
According to the new federal low smoking was prohibited in restaurants, cafes and bars on June 1,
2014. This had a negative impact on Russia’s growing coffee culture. Shortly afterwards, in August
2014, Russia banned a long list of food and agricultural products from Australia, Canada, Norway,
the United States and the European Union in response to the application of economic sanctions. The
immediate trade restrictions created a $9.5 billion gap in Russia’s food market. The foodservice
industry had to find new suppliers from non-affected countries. Creation of new channels led in
difficulties and growth of the final price to consumers. Russian restaurants depended on imported
food products ingredients from affected countries ranging from 15 percent to 80 percent. Moreover
the purchasing power of the people decreased because of weak ruble and low oil-prices, what led to
a decrease of spending for leisure like tourism, restaurants, and entertainments. Market analysts
showed that from 10 to 20 percent of all restaurants were closed in the first six months of 2015 due
to high food prices, to weak Russian ruble and to more careful spending by Russian consumers.
III.1.6. Mobile applications in Russia
The Russian mobile phones market experienced volume growth in recent years and had total
revenues of 5,1 million of Euro in 2015 (see Table 2).
The performance of the Russian market has been impacted by the country’s economic crisis.
Growth is expected to return in 2017, which should drive growth in the mobile market.
Table 2: Russia mobile phones market value, 2011-2015
Year RUB million EUR million % growth
2011 342,468 5,044.4 -
2012 374,026 5,509.2 9,2
2013 397,107 5,849.2 6,2
2014 358,989.2 5,287.2 9,6
2015 346,505.6 5,105.1 3,5
CAGR:2011-2015 0,3
Source: Marketline, 2016
While the mobile market in Russia is greatly inferior to the market size of the United States, Asia
and Europe, many experts share the view that it has significant growth potential. According to a

52
study J'son & Partners Consulting in 2015 the Russian market for mobile applications was
estimated at $ 440 million.
And analysts expect it to continue to grow. Research shows that more than 50% of users of tablets
and smartphones at least once a day to go online and start video applications every day and play
mobile games. It is also reported that 40% of mobile Internet users would rather lose the TV than a
smartphone.
Table 3: Russia mobile phones market segmentation: million handsets, 2015
Category 2015 %
Smartphone 29,051.8 87,9
Feature phone 4,017 12,1
Total 33,068.8 100
Source: Marketline, 2016
The increase will ensure factors such as the growing number of mobile devices, the rapid
development of 4G networks and a general development of consumer’s habits in the direction of
mobility (for example, mobile shopping, mobile banking and mobile payment systems, mobile
social networking and mobile instant messengers, geo-location services etc.).
Table 4: Russia mobile phones market value forecast, 2015-2020
Year RUB million EUR million % growth
2015 346,585.6 5,105.1 (3,5)
2016 344,552.5 5,075.1 (0,6)
2017 377,681.9 5,563.1 9,6
2018 393,144.1 5,790.8 4,1
2019 382,461.3 5,633.5 (2,7)
2020 688,622.8 5,724.2 1,6
CAGR:2015-2020 2,8
Source: Marketline, 2016
The company WapStart14 studied what applications use Russian tourists and travelers on their
mobile devices. In total 896 people participated in the study. 74, 7% of users use applications on
vacation and while traveling. The applications are used more often by women (56.4%) than by men
(43.6%). The most active age group of users is people aged 25 to 35 years (32.6%). The most active
social group is representatives of working professions (30.9%). In the categories of applications the
14 WapStart - owner of the largest mobile advertising network in Russia “Plus1 WapStart” and the catalog of mobile
websites and applications “Top WapStart”.

53
leading position take maps applications (59,5%). On the second place are games (58,9%). The most
useless applications during one traveling are business applications. They are used by only 5.7% of
respondents. This study shows the mobile application activity of Russian people during the
vacation. In our research we will investigate the behavior of Russian users in every-day life.
III.1.7. Moscow
Moscow is the capital of the Russian Federation with the territory of 1081 km². It has a population
of 12, 3 million of residents (official data of 2016), although a great number of both permanent and
temporary illegal migrants.
Already the most populous city in Europe, Moscow continues to grow. This is largely due to its
20% per annum economic growth, which attracts workers from other parts of Russia and
neighborhood countries of Ex-Soviet Union. As well as being a thriving economic center (boasting
more billionaires than any other city in the world), Moscow is also a center of the culture and
tourism with 17 million touristic arrivals (2015) announced by the department of national policies,
regional relations and tourism.
The main attraction of Moscow still remains the ensemble of the Moscow Kremlin and Red
Square — a unique complex of architectural monuments. The Moscow Kremlin is included into the
list of UNESCO Heritage Sites (1990). There is a number of excursions held in the Kremlin which
familiarize tourists with the architectural ensemble as well as the treasures of the Armory Chamber,
old Kremlin cathedrals, historic necropolis, collections of ancient icons and so forth.
In total, there are 450 museums in the city. Fine art lovers will be attracted by the State Pushkin
Fine Arts Museum, the State Tretyakov Gallery, Tretyakov Gallery at Krymsky Val and etc. Those
who are interested in natural sciences, take an opportunity to visit the State Darwin Museum, the
State Timiryazev Biological Museum and Orlov Paleontological Museum. Each museum offers
excursion programs for both for adults and children.
In addition to indoor museums, Moscow possesses unique architectural, artistic and landscape
cultural and educational facilities in the open air — Tsarytsyno and Kolomenskoe. Tsaritsyno is
former Royal estate built 1775; today it is the park and museum with the Grand Palace, the number
of pavilions and bridges around the main structure. Kolomenskoye is also the former Royal
residence. It is situated on the Southern part of Moscow’s shore on the Moskva River. Originally, it
was first mentioned in 1339 and became the favorite place of Russian Tsars. In 1539 the Ascension
church was built on the grounds of the Kolomeskoye village to mark the birth of one of Russia’s
most famous Tsar – Ivan the Terrible. It was the first stone church in Russia and was covered by
a tented roof.

54
Every day, 43 theatres open their doors to theatre-goers in Moscow. The best-known are the
Bolshoi Theatre, the Lenkom, the Chekhov Artistic Theatre, the Moscow Operetta Theatre and
many others.
According to Moscow government statistics, on the 1 January of 2015, there were 11,087 registered
foodservice establishments in the nation's capital, of which 7,651 were publicly accessible, and
3,436 were canteens at institutions and organizations, 2700 are regarded as restaurants (according to
Russian certification service GOST15 31985-2013 the restaurant is defined as “business that
provides food and leisure or non-leisure services to the consumer, with a wide range of complex
menu, including specialties; alcoholic, soft, hot and other kinds of beverages, confectionery and
bakery products, and other goods, including tobacco products”) . By the end of 2014 the total
Moscow foodservice decreased by 8 percent. One of the main reasons for this phenomenon is a
weak consumer purchasing power of the population. With a falling economy and depreciation ruble,
consumers ate out less to economize their spending. Moscow restaurateurs noticed a drop of
average check by 20-25 percent. Mid-range restaurants with average check up to 2,000 rubles
(27EUR) are the ones having the biggest drop in clientele while the lower cost (fast food) style
restaurants are reporting good sales.
III.1.8. Conclusion
With three serious economic crises (1998, 2008-2009, 2014-2015) since the collapse of Soviet
Union tourism and restaurant industries have been developed wide range of suggestions for all kind
of clients: from expensive exclusive services for oligarchs till cheap formats like all-included
packages, fast and street food. The most sensitive to crises clients group was always middle class,
so the number of casual dining restaurants decreased or changed after each crisis.
In the tourism industry the recent crisis was caused by ruble’s exchange rate, and by increasing
of independent traveling due to digitalization of the life.
Food embargo and weak consumer purchasing power of the population led to closure 10 to 20
percent of all restaurants in Russia in 2015. New market conditions pushed the restaurateurs to
search for local product suppliers and to change their price policy. New trend started to be the
Russian cuisine with old recipes for fine-dining restaurants, and simple well-known local specialties
for fast-food and street café and kiosk. Digitalization had less impact on restaurant industry
compared to tourism. But mobile applications could also play important role for the modern and
15 GOST refers to a set of technical standards maintained by the Euro-Asian Council for Standardization, Metrology and
Certification (EASC), a regional standards organization operating under the auspices of the Commonwealth of Independent States
(CIS).

55
future state of restaurant industry, if the restaurants are likely to adopt the new payment systems,
simplify services and build loyalty programs.
III. 2. France
III.2.1. General information about the country
France (The French Republic) is the state in the western part of the European continent. With the
area of 632 834 km2 (551 695 km2 of which are covered by Metropolitan France) France is the
largest state in EU. It shares its borders with Belgium and Luxembourg in the north, Germany,
Switzerland and Italy in the east, and with Spain in the south. The metropolitan territory has over 5
500 km of coastline stretching from the North Sea and along the Channel to the Atlantic Ocean in
the west, and along the Mediterranean in the south.
Picture 2: Map of the Metropolitan France
Source: geocurrent.info
For administrative purposes France is divided into 17 regions (régions) and Corsica. 12 regions and
Corsica are situated on mainland France (Metropolitan France) whereas the remaining five
comprise the oversea regions of Guadeloupe (Caribbean), French Guiana (South America),
Martinique (Caribbean), Mayotte, and Réunion (Indian Ocean).
France is further subdivided into districts (arrondissements) and cantons. The cantons serve an
electoral function at department levels as each and every canton elects one representative to the
Conseil Général. At the lowest administrative level, France comprises nearly communes. The
communes are governed by the mayor (maire, indirectly elected) and the municipal council (conseil
municipal, directly elected for a six-years term).

56
In addition to the five oversea regions, four additional oversea territories have the status of oversea
communities (collectivité d'outre-mer). These are French Polynesia, Nouvelle Caledonia (Pacific
Ocean), Saint-Pierre and Miquelon (Atlantic Ocean) and Wallis and Futuna (Pacific Ocean).
According to the constitution France is a republic. At this moment the Fifth Republic functions.
The Fifth Republic was established in 1958, and was largely the work of General de Gaulle - its
first president, and Michel Debré his prime minister. It has been amended 17 times. Though the
French constitution is parliamentary, it gave relatively extensive powers to the executive (President
and Ministers) compared to other western democracies.
Executive branch: The head of the state and head of the executive is the President, elected by
universal suffrage. Originally, a president of the Fifth Republic was elected for a 7-year term (le
septennat), renewable any number of times. Since 2002 the President has been elected for a 5-year
term (le quinquennat). Since the passing of the 2008 Constitutional reform, the maximum number
of terms a president can serve has been limited to two. The President appoints a prime minister,
who forms a government.
Legislative branch: The French parliament is made up of two chambers. The lower and principal
chamber of parliament is the Assemblée nationale, or national assembly; the second chamber is the
Sénat or Senate. Members of Parliament, called Députés, are elected by universal suffrage, in
general elections (élections législatives) that take place every five years. Senators are elected by
"grand electors", who are mostly other local elected representatives.
Judiciary branch: While the Minister of Justice, le Garde des Sceaux, has powers over the running
of the justice system and public prosecutors, the judiciary is strongly independent of the executive
and legislative branches. The official handbook of French civil law is the Code Civil. The
Constitutional Council, le Conseil constitutionnel, exists to determine the constitutionality of new
legislation or decrees. It has powers to strike down a bill before it passes into law, if it is deemed
unconstitutional, or to demand the withdrawal of decrees even after promulgation. The Council is
made up of nine members, appointed (three each) by the President of the Republic, the leader of the
National Assembly, and the leader of the Senate, plus all surviving former heads of state.
III.2.2. Demography
According to the National Institute of Statistics and Economic Studies (INSEE)16, with 714 683 000
inhabitants in 2016 (Table 5) France occupies the 20th place in the world in terms of population.
The urbanization of France reaches 85% and it increases by 1% per year. The three largest French
communes - Paris, Marseille and Lyon are divided into 45 municipal or urban districts: Paris has
20, Marseille has 16 and Lyon has 9 districts.
16 Institut national de la statistique et des études éconoliques. www.insee.fr

57
Table 5: Population of Metropolitan France, million person
Men women Total
2004 407 444 389 470 796 914
2005 409 516 390 707 800 223
2006 418 923 399 007 817 930
2007 411 208 392 561 803 769
2008 413 940 396 331 810 271
2009 412 089 392 723 804 812
2010 413 467 395 630 809 097
2011 402 592 386 436 789 028
2012 398 387 379 276 777 663
2013 387 686 369 946 757 632
2014 385 188 369 526 754 714
2015 373 941 356 886 730 827
2016 366 239 348 444 714 683
Source of information - insee.fr (Institut national de la statistique et des études économiques), 2016
The country's average life expectancy is 84, 82 years for woman and 78,45 for man (data for 2013).
III.2.3. Economy of France
The French economy is playing a leading role in the world economy. In terms of GDP, France
consistently ranked 5th in the world.
France has come over the global economic crisis 2008-2009 better than most other major
economies of the EU due to the relative stability of domestic consumer spending, a social politic,
and less dependency on falling demand for exports than in other countries.
A significant part of GDP amounts industrial production - 20%, it provides 24% of employment,
40% of investments and 80% of exports. France has significant reserves of minerals. This creates a
base for mining and heavy industry. Main industries: machine building (2.6% of world production),
chemical (fourth place in world exports), aerospace (France plays a leading role in the European
Space Agency), automotive (third in the world for the production of cars), food (by volume of
exports the second highest in the world after the United States), electronic, computer, shipbuilding,
electrical.
France is the largest agricultural producers in Western Europe. The share of agriculture accounted
for 1, 9 % of GDP (data 2013) it gave 25% of the production in the EU. France takes 1st place in
Western Europe by the volume of produced products and the 3rd place in the world after the United
States and Canada. It is the largest European producer of wheat, butter, beef, cheese (over 400
varieties). More than 50% of the products give livestock (cattle). Traditionally, there are a high

58
proportion of wine exports. French farmers are the main opponents of genetically modified products
in Europe, so French products traditionally highly valued because of the quality.
New technologies hold an important place in the developing sectors and are mostly supported by
large enterprises. France is also renowned for its luxury and tourism sector. It is the leading tourist
destination in the world.
III. 2.3.1. Structural Crisis of French economy
Despite a temporary improvement in 2010, France has not completely recovered from the global
financial crisis 2008. Despite the short-term measures, which were implemented by government,
France started to experience a structural crisis. This resulted in significant pessimism among the
population.
The business survey of INSEE («La reprise différée», Note de Conjoncture, 2014) demonstrated
factors that might explain the economic situation. First of all, the GDP was stagnating in real terms
together with steadily expanding of population this lead to decrease of GDP per capita. This
resulted in a declining income, but higher taxes to try to reduce various deficits, whether the budget
deficit, the social security deficit, or the foreign trade deficit. Furthermore, the variations of public
expenditure, especially social spending, are determined by both the increase in unemployment and
the changing household income. These various factors lead to rising public debt (as a proportion of
GDP) and budget deficit. In addition, changes in domestic consumption act as an obstacle on
growth but also on investment. The different phenomena work in conjunction to form the features
of an economy in a long-term crisis.
The issue of unemployment statistics is a central issue in the structural crises. In France, it is the
extent of unemployment that feeds a polemic. Unemployment rate dropped to 9.9 percent in the
June quarter of 2016 from 10.2 percent in the first quarter. It was the lowest jobless rate since the
September quarter 2012. Meanwhile, in metropolitan France only, the unemployment rate decreased
to 9.6 percent, as the number of unemployed declined by 74,000 to 2.8 million people unemployed.
It decreased across all age groups, particularly among youths.
It can therefore be seen that the crisis of the French economy was not just a short-term crisis but a
structural one, or, more precisely, a crisis that stems from the contradiction between its structures
(including demographics) and the framework imposed by the Euro Zone.
If the ingoing tourism is in France stable high, the impact of crises on the restaurant industry is the
consequence of decreasing purchasing power because of instability in the job market and
unemployment. That is good to see in the sensitivity of French users of mobile applications to
loyalty programs with discounts, collecting bonuses etc.

59
III. 2.3.2. Structure of GDP and place of tourism
The Gross Domestic Product (GDP) in France was worth EUR 2308 billion in 2016, reported by the
World Bank Group. The GDP value of France represents 4.56 percent of the world economy.
The direct contribution of Travel & Tourism to GDP was EUR80.4bn (3.7% of total GDP) in 2015,
and is forecast to rise by 2.9% in 2016, and to rise by 2.7%, from 2016-2026, to EUR107.6bn (4.2%
of total GDP) in 2026.
Table 6: France: Selected Economic Indicators 2013–16
2013 2014 2015 2016
(Proj.) (Proj.)
Real economy (change in percent) Real GDP 0.7 0.2 1.2 1.5
Nominal GDP (billions of euros) 2117 2132 2174 2224 Gross national savings (percent of GDP) 20.9 21.2 21.3 21.1
Gross domestic investment (percent of GDP) 22.3 22.2 21.7 21.6 Public finance (percent of GDP)
General government balance -4.1 -4.0 -3.8 -3.4 General government gross debt 92.3 95.6 97.3 98.2
Labor market (change in percent) Employment -0.2 0.2 0.5 0.7
Unemployment rate (in percent) 10.3 10.3 10.2 9.9 Balance of payments (in percent of GDP)
Exports of goods 20.7 20.6 23.8 24.5 Imports of goods -22.7 -22.2 -25.0 -25.9
Trade balance -2.0 -1.7 -1.2 -1.3
Source: Monetary Fund, 2015
The French economy is diversified across all sectors. The government has partially or fully
privatized many large companies, including Air France, France Telecom, Renault, and Thales.
However, the government maintains a strong presence in some sectors, particularly power, public
transport, and defense industries.
With at least 82 million foreign tourists per year, France is the most visited country in the world and
maintains the third largest income in the world from tourism. France's leaders remain committed to
a capitalism in which they maintain social equity by means of laws, tax policies, and social
spending that mitigate economic inequality. Despite stagnant growth and fiscal challenges, France's
borrowing costs have declined in recent years because investors remain attracted to the liquidity of
France’s bonds.
III.2.4. Tourism in France
Tourism is a fundamental sector in the French economy taking into account its contribution to the national
economy as well as the relative national employment rate.

60
The history of tourism in France began around 1760 in the south of France in Hyères, a winter
resort renowned by English people through its relatively mild Mediterranean climate. And the
conception of "gastronomic tourism" was born under Louis XIV (Voyage de Chapelle et de
Bachaumont, 1663).
But the tourism as we know it truly started in the 18th century, the term originally was taken from
the English word "tourist" or "round trip". In French, the term "tourist" (1803) was used to
designate "travelers who travel to foreign countries by curiosity and idleness, which are a kind of
tour of the usually visited by their fellow country" and "says especially English travelers in France,
Switzerland and Italy "(Littre). In 1838, the publication of Memoirs of a Tourist Stendhal
popularized this word (Adenis: Steps of a tourist in France). After 1815, travel was booming.
Finally, in 1841, appears the word "tourism", the same year that Thomas Cook opened in England
the first travel agency. In 1875 was opened "Comité des Promenades" in Gerardmer in the Vosges
and it was the first tourist office in France. Thereafter, many French tourist organizations appeared.
New transport vehicles made possible different forms of travel: the therapeutic tourism, the
discovery of the mountain, sea bathing, sports tourism. 1900 was published the first Michelin guide,
an innovative promotional tool: a guide to restaurants and useful addresses for motorists. The 20th
century confirmed the tourism trend, which went back to the law on paid holidays in 1936 and
which lasted in the development of mass tourism during the postwar boom.
With 84, 5 million visitors France kept its position as number one worldwide tourism destination in
2015 ahead of Spain and the United States, with a market share of 16 % in Europe. The total
spending of French and foreign tourists represented € 42,7 billion, representing 7,4% of France's
GDP, which makes the country rank third in the world in terms of revenue from tourism (Data of
Ministere de l’Economie, de l’Industire et du Numerique, 2015).
In 2009, "Atout France", Tourism Development Agency of France, was created under the
framework of the law of development and modernization of tourist services. This agency is a result
of the merger of ODIT France, tourism engineering agency established as a public interest group,
and Maison de la France, promotion agency of France abroad. Since then, the Agency contributes to
the implementation of public policies in favor of tourism, including the promotion of tourism in
France.
Tourism is one of the first surpluses in the balance of payments. It plays a major role in the national
economy. Being the first destination in the world cannot protect from competition or provide a
tourism policy. In its Communication to the Council of Ministers of 11 July 2012, the Minister for
Tourism presented the main directions of tourism policy, including the creation of a genuine
industry of tourism, capable of uniting all actors, as well as improving the quality of their offering.

61
The French touristic industry proposes wide choice of services: cultural heritage tourism, religious
tourism, health and wellness tourism, coastal tourism, adventure tourism, business and
congress/convention travel (MICE), sailing / sea cruising, wine and food tourism.
France has 37 sites inscribed in UNESCO's World Heritage List. It features cities of high cultural
interest (Paris,Toulouse, Strasbourg, Bordeaux, Lyon, and others), beaches and seaside resorts, ski
resorts, and rural regions (green tourism). Small and picturesque French villages of quality heritage
(such as Collonges-la-Rouge or Locronan) are promoted through the association Les Plus Beaux
Villages de France (litt. "The Most Beautiful Villages of France"). The "Remarkable Gardens" label
is a list of the over two hundred gardens classified by the French Ministry of Culture. This label is
intended to protect and promote remarkable gardens and parks.
III.2.5. Restaurants France
The restaurant market in France emerged in 2015 from the red zone after three years of recession
and a cumulative loss of 350 million customers and reached value of 70 billion of Euros.
Affected by the decline linked to the terrorist attacks, the French restaurant showed the loss in
turnover between 3% and 4.5%. Paris and the Côte d'Azur are the most affected areas. The GNI17
reported in quarterly economic report a decrease in turnover of restaurateurs of around 4.5% in
2016. Many professionals agree that the activity of the sector could tend towards stabilization at the
beginning of 2017.
The average meal expense decreased in 2014 to $10.76 (8.82 Euros), while the number of meals
served continued to increase. This is explained by the shift of consumers to lower-cost meals and
snack alternatives, such as fast food outlets, coffee shops, food trucks and carry-out chains. It also
reflects changes in snacking habits and a preference for cheap, fast but healthy meals. This is
increasing pressure on traditional and independent restaurants and cafes that are losing price-
conscious consumers.
The food industry is the leading industry in France. As a result of ongoing economic difficulties,
consumers continued to reduce spending in 2014, including expenditures in the food service sector.
According to the food consultant Gira Conseil, the global market for food consumption outside
home decreased by 0.3 percent in 2014, the first decrease in ten years. In addition to the economic
crisis, consumer expectations are changing, and the food service market is being forced to adapt.
Many traditional restaurant outlets are lagging behind in respect of investment, introducing new
concepts, service, and the quality/price ratio. While traditional restaurants, fast food outlets, and
hotels/resorts experienced sales declines in 2014, alternative food outlets increased their sales by
17 GNI - Groupement National des Indépendants de l’Hôtellerie Restauration

62
two percent. All types of food service outlets increased their prices to compensate, even though this
could potentially push customer visits down even further. Innovation in the market is dynamic, with
some outlets introducing new concepts, others seeking to boost wine consumption, some
highlighting their culinary specialties, and efforts to provide customers with fast and high-quality
services. Counter sales continue on a growth path. There are growing numbers of ethnic and exotic
cuisines, development of sweet snacks, creative work around bread outlets, and the arrival of
foreign outlets and other ready-to-eat foods.
The French Institute for Economic Statistics (INSEE) estimates the percentage of consumers eating
outside the home will reach 20 percent by 2020. Overall sales in the hotel, restaurant and institution
(HRI) sector have grown steadily over the past five years.
The commercial food service sector consists of:
- “Traditional restaurants”. This includes individual owner restaurants, multi-restaurant
companies, and large corporations, which represent nearly 57 percent of the commercial
foodservice sector. A large number of restaurants in and around Paris, and in other major
French cities, are medium/high end restaurants serving a wide range of traditional food,
although an increasing number specialize in cuisine from Asia, Africa, India, and the United
States. In 2013 and 2014, the increase in unemployment and decrease in purchasing power
pushed French consumers made budget cuts.
- “Cafeterias, Cafes and Brasseries” are operated by individuals, companies, and large
corporations. After over thirty years of decline, cafes and bars diversified to attract new
consumers. In rural areas, cafes are often the only businesses remaining and become a multi-
service point. In urban areas, they developed new activities and pay more attention to
decoration, cleanliness, and innovations.
- “Fast food outlets”, including street vendors: this segment represents the most dynamic and
promising sector (54 percent of sales of the sector) with an estimated four percent growth.
The sector operated by companies and large corporations has been able to better resist the
economic slowdown by combining price. For long, the term “fast food” has not had a very
good connotation in France. It recalled fat and “junk” hamburger food. Conscious of the
consumer demand for healthy/dietetic/organic products and balanced meals, the fast food
chains have re-invented the composition of their menus.
- “Delivering catering”, including ethnic (e.g., sushi): A competitive sector operated by
companies and large corporations, this growing segment of commercial catering is
comprised generally of delivery meals (mainly to companies) and pizza delivery (mainly to
households).

63
- “Hotels and resorts with restaurants”. These establishments are operated by individual
owners, companies or large corporations and account for about six percent of the
commercial catering market with over 18,500 restaurants.
- “Leisure parks”. France has about 90 leisure parks, which are worldwide known (f.e.
Disneyland Paris, Parc Asterix and Futuroscope).
Traditional ways of foodservice consumption based on the local culture, along with the economy
may lie behind them. Tourism continues to have a significant impact on consumer foodservice in
France, especially in popular tourist destinations, such as Paris and the Côte d’Azur. Overall, tourist
expenditure has been steadily increasing.
III.2.6. Mobile applications in France
The French mobile phones market value has been growing at a steady, strong rate over the period
2011-2015. A shift towards more expensive smartphones over the past few years, and the
subsequent movement away from cheaper feature phones, has driven up the average selling price of
mobile phones, allowing for the market to continue growing in value despite significant overall
volume declines.
The French mobile phones market grew by 4.4 per cent in 2015 and reached a value of 5,728.9
millions of Euro, representing a compound annual growth rate (CAGR)18 of 7.5 % between 2011
and 2015.
Table 7: France mobile phones market value, 2011-2015
Year EUR million % growth
2011 4,287.5 -
2012 4,574.5 6,7
2013 5,001.4 9,3
2014 5,489.0 9,7
2015 5,728.9 4,4
CAGR:2010-2014 7,5
Source: Marketline, 2016
The market volume increased with a CAGR of 2,9% between 2011 and 2015, to reach a total of
22,8 million handsets in 2015.
Smartphone sales had the highest volume in the French mobile phones market in 2015, with total
sales of 19,6 million handsets, equivalent to 85,9% of the market's overall volume. In comparison,
sales of feature phones had a volume of 3,2 million units in 2015, equating to 14,1% of the market
18 Compound Annual Growth Rate (CAGR) - business and investing specific term for the geometric progression ratio
that provides a constant rate of return over the time period.

64
total. While the majority of the market is accounted for by smartphones in France, it is worth noting
that the segment’s share of the total volume remains lower than in other mature Western European
markets, such as Germany and the UK.
Table 8: France mobile phones market segmentation: million handsets, 2015
Category 2015 %
Smartphone 19,6 85,9
Feature phone 3,2 14,1
Total 22,8 100
Source: Marketline, 2016
The performance of the market is forecast to decline, with an anticipated compound annual rate of
change (CARC) of 1,5% for the five-year period 2015 - 2020, which is expected to drive the market
to a value of 6,164.5 million of Euro by the end of 2020.
Table 9: France mobile phones market value forecast, 2015-2020
Year EUR million % growth
2015 5,728.9 4,4
2016 5,845.4 (2)
2017 5,960.8 (2)
2018 6,070.5 (1,8)
2019 6,136.8 (1,1)
2020 6,164.5 (0,5)
CAGR:2015-2020 (1,5)
Source: Marketline, 2016
According to market research of the French Mobile Marketing Association 53.8% of the French
population are mobile device users. This massive user base provides a huge market opportunity for
software applications publishers. However, while mobile device use is still growing, the demand for
mobile applications is slowing down. In France, June 2014 data showed that the majority of mobile
users download no more than two applications each and only 7% downloaded eight or more apps.
There is also a gap between downloading and actually using an application. According to the web
survey by Médiamétrie, only a quarter out of 50 downloaded applications is actually used.
In the tourism industry social networking and communications are dominating in the smartphone
activities in Europe, there are differences with regards to smartphone usage and internet penetration.
eMarketer notes the internet penetration in France with 74%. Email was most popular with around

65
81%, French consumers aged between 15 and 60. Search was also very important, 72% of French
consumers see that as an important online activity (eMarketer, 2014).
III.2.7. Paris
Paris is the capital of France with the territory of 762 km² (le Grand Paris). Statistically we often
can see information about Paris by itself and about Greater Paris (le Grand Paris), also when we
speak about tourism in Paris the data can include the whole region Ile-de-France. In this way Paris
has population of 2, 25 million of people (official data for 2013), Greater Paris has 6,8 million of
people and 18, 8% of country’s population (or 11, 96 million) have residence in Ile-de-France. In
our case we will use statistics concerning tourism and restaurant industry mostly in Greater Paris,
and sometimes the whole region of Ile-de-France.
Paris is the most popular destination in the world with 22,2 million visitors in 2015 and 46,7 million
in Ile-de-France (Office du Tourisme et des Congrиs de Paris, 2015). Tourists tax revenues brought
to the city budget 65,7 millions of Euros. The main attractions for tourists are world know museums
and monuments. Visiting the museums and discovering the city are the most popular reason to go to
Paris among leisure tourists (Table 10).
Table 10: Reasons to visit Paris (leisure tourists), %
Activity Discovering
Paris
Visiting
museums and
monuments
Shopping Gastronomy Parks and
gardens
Events and
shows
French 37,1 25,8 16,9 3,4 6,9 14,8
Foreigners 65,9 59,5 14,2 13,6 11,2 5,9
Total 54,9 46,3 15,2 9,6 9,5 9,4
Source: L’Office du Tourisme et des Congrès de Paris, www.parisinfo.com, 2015
In total there are 140 museums in Paris, including 3 of the world’s most visited museums: the Louvre,
Pompidou Centre, and Orsay Museum. The region possesses of 4,000 historical monuments, 402
cinemas, 355 theatres, 5 opera houses, 55 foreign cultural institutes.
In addition to indoor museums and historical places, Paris is surrounded by unique architectural and
cultural facilities, parks, castles, and outdoor monuments.
Paris is location for many important events, accepting business travelers and heads of governments.
All together 1004 congresses, 91 exhibitions and 407 salons have taken place in the French capital
in 2015.

66
Table 11: Top 10 Greater Paris cultural venues – 2014-2015 figures
2014 2015
1. Cathédrale Notre-Dame de
Paris*
14 300 000 13 600 000
2. Basilique du Sacré-Coeur de
Montmartre*
11 000 000 10 000 000
3. Musée du Louvre 9 134 612 8 422 000
4. Tour Eiffel 7 097 302 6 917 000
5. Musée d’Orsay 3 480 609 3 439 832
6. Centre Pompidou 3 450 000 3 060 000
7. Cité des sciences et de
l’industrie de la Villette
2 675 383 2 013 046
8. Chapelle Notre-Dame de la
Médaille Miraculeuse
2 000 000 2 000 000
9. Muséum national d’histoire
naturelle - Jardin des Plantes
2 077 718 1 886 919
10. Arc de Triomphe 1 751 046 1 760 694
Source: L’Office du Tourisme et des Congrès de Paris, www.parisinfo.com, 2015
Regarding the spending, leisure tourism generate 80,2% of Travel and Tourism GDP. Average
daily expenditure per tourist is 137 Euros, 33 (or 24%) of it is spent for food.
Rungis International Market, the world’s leading fresh produce market “Saveurs Paris Île-de-
France” is a regional food brand created to highlight close to 600 products and 70 kinds of fruit and
vegetables: Brie from Meaux, beer from the Vexin, honey and saffron from the Gâtinais, asparagus
from Argenteuil, Belle de Fontenay potatoes, etc.
According to CCI of Ile-de-France over 4,852 restaurants are working in the region, 109 among
them are starred restaurants, including 40% of France's 3-star restaurants.
III.3. Conclusion for countries
The crisis of outbound tourism in Russia contributes to the development of domestic tourism which
should lead to the development of internal infrastructure, which in turn will lead to an increase in
international tourists. But the tourism infrastructure needs the stable investments from two sides,
government and business. According to official data of Rosstat, the share of tourism in the overall
structure of paid services to the population currently stands at about 2%. It is almost not possible to
find data about investment in the tourism industry in Russia in official documents. Such information
is not available also in the federal statistical observation of the activities of organizations that
provide tourism services. Analyzing the official data, it should be noted that the largest share of
investments directed to the hotel industry as the most capital-intensive touristic area. Investments in
tourism enterprises and institutions tend to rise. However, their absolute value on the scale of

67
investment in the economy of the country is very small. Investment support must be long-term
objective of the development of tourism in Russia. It is the basis for the creation, preservation and
reproduction of tourist resources, as well as for the development of tourism infrastructure and
tourism industry.
France stays the number one destination for international tourist also with well developed domestic
tourism. With its combination of rich history and attractions, ski resorts and coastlines, France
ranks high in cultural and natural resources. These are complemented by its emphasis on
environmental sustainability, strongly enforced environmental regulation and a sustainable
approach to developing the travel and tourism industry. France is well connected, with developed
infrastructure for air transport, ground transport and tourism services facilities. Further development
of the sector would require improving the business environment, where taxation is relatively high.
In addition, safety and security according to European Standard is emerging as a sensitive issue that
needs to be addressed.
Taking into account the population and tourists in Moscow and Paris, we can see the almost the
same size of market (12,3 millions of residents and 17 millions of visitors in Moscow, and 6,8
million of residents and 22 millions of visitors in Greater Paris), but the quality of the market is
different. Prevailing role of the tourists in Paris (76% contra local population) facilitates the
development of restaurant services. More over the French gastronomy as shown in Table 10 is a
part of touristic attraction in French capital. In Moscow not only the number of tourist is lower
(56% contra local population), but also the purchasing power of residents decreased significantly in
the last two years.
It is important to notice, that the number of restaurant establishments is difficult to estimate in
Russian capital, official data count 11000 of foodservice companies, but this includes all kind of
facilities, which can sell prepared food, also supermarkets and cooking shops. For comparison we
will take into account the data of Russian catalog 2GIS19, which published the number of 2700
working restaurants different types (full-service, fast food, cafes, and bars).
Smartphone penetration in compared counties has the difference of 8,4% in favor of France.
The key figures, interesting for our research are given in the Table 12:
19 2GIS – Russian catalog of companies, www.2gis.ru

68
Table 12: Comparison of two countries.
Indicator France Russia
Territory, km2 632 834 17 075 400
Population, millions of people, 2015 66,3 146,2
GDP, billions of Euros, 2016 2308 1433
GDP per capita, 2016 42,384 26,109
Contribution of tourism to GDP,
billions of Euros, 2015
80,4 (3,7) 14,78 (1,28)
Ingoing tourism, foreigners, millions
of people
84,5 26,8
Restaurants industry revenues,
billions of Euros, 2015
70 6,6
Capital Paris Moscow
Population in capital (in million of
people)
6,8 (le Grand Paris) 13,5
Number of ingoing tourists in capital
(in millions of people), 2015
22,2 17
Number of restaurant establishment in
capital
4852 (Ile-de-France) 2700
Number of smartphones, millions of
handsets, 2015
19,6 (85,9%) 29,05 (87,9%)
Source: author of the thesis based on data above.
III.4. Choice of mobile applications in compared countries
The choice of the mobile applications in restaurant industry by country is directly influenced by the
following parameters:
a) Availability of various services.
An application "pizza delivery" will only be used when the user needs to order a pizza. But
in the case an application covers all services associated with restaurants (reservations, maps,
description, menus, delivery orders etc), the consumer will use the same application each
time some restaurant service is needed, because of that we will choose the mobile
applications with various services.
b) Updates, speed of downloading, usability.
Any outdated data in a source of information leads to the users churn. Because of a high
competition between different applications, the user will quickly find a replacement, rather
than to use an inconvenient, unreliable and out of date application.
c) Loyalty programs, bonuses and discounts.

69
The mobile application with only features such as search and contacts might be less
interesting for users, than that, which has additional services making users loyal. One of the
attractive functions might be discounts and bonus-systems, suggested by mobile application.
d) Internet connection availability in order to use an application
There is a set of services, which depends on the availability of Internet, such as online
booking, maps. However, a large number of services can be used without an Internet
connection that is especially convenient for the application for the reference data such as
contact information or menu.
In the food and restaurant industry are some of the most common categories of the applications to
find:
- Guidebooks for travelers, covering all necessary services, from booking tickets to restaurant
reservations. Typically, such applications have a geolocation function, the possibility to
leave reviews, addresses and phone numbers of the restaurants, pictures.
- Various maps and guides for certain cities, where the main function is to find the right place,
followed by the information about nearby cultural public places and monuments, as well
as the public catering locations.
- Specialized restaurants guides.
- Applications of the individual restaurants and chain restaurants, usually with electronic
menu, table reservation services, take-away ordering or delivery.
- Cookbooks, recipe collections often from the chefs of famous restaurants or restaurant
critics.
- Magazines with articles about cuisine and restaurants.
For our research the most interesting is to analyze specialized restaurants guides with loyalty
programs for clients. Firstly, we will focus on two capitals Moscow and Paris. Secondly, we will
take into account the residents of both cities. And thirdly, we need to investigate the mobile
application with various services to fulfill the tasks of the research.
III.4.1. Review of catering mobile applications in Russia.
The Russian catering mobile applications market is saturated with its diversity in the two major
cities (Moscow and St. Petersburg) compared to the rest of the country. Usually other big cities are
a part of the country’s guide application, often with incomplete information and lack of desired
functionality, such as table reservation, geolocation and other important services for users.
Together with worldwide services the local mobile applications are developing in Russia. The most
used are allcafe, resto.ru and stoliki.

70
- AllCafe. An application that will help to choose a restaurant, cafe or bar with a view of eating
habits, financial opportunities, locations, and many other parameters. In addition to searching the
restaurant on the map, it gives an opportunity to find a catering establishment by name, see the
reviews of people who have visited the institution previously, and leave a comment. Application
operates in 20 cities of Russia.
- RESTO.RU is promoted as national search engine for gourmands. Resto group suggests for the
users several services: website, guide-book, discount card and booking, working in 19 Russian
cities. According to the company’s data in total 17 millions of users utilize different services, the
booking service has around 2000 orders per day. Its application is an interactive restaurant guide
with navigation and updated content on a daily basis. It has about 5000+ downloads.
- Stoliki. Service specialized for table reservation in restaurants and cafes. Technologically highly
reliable and eliminates user disinformation. Customers are offered to choose the place, and fill out
an application and enter the verification code, and the information about booking is delivered by
SMS. Currently, the service has more than 15,000 catering establishments in 154 cities of Russia.
III.4.2. Review of applications for table booking in France.
French restaurants and food application market is high developed and saturated with suggestions.
For the review the three are regarded, Lafourchette, Michelin and OpenTable.
- Lafourchette operates with 12 000 restaurants (including the prestigious Alain Ducasse, Paul
Bocuse, Yannick Alleno, Anne-Sophie Pic etc.) and has more than 2 million Internet users who
have already booked more 20 million times. In May 2014, Lafourchette Group joined the
TripAdvisor, to build the world's leading tourism on the Internet. According to the company’s
statistics 1,3 mil. of users downloaded the mobile application and 25% of them are using the
application for booking the restaurants.
- Michelin has suggested its mobile offering. Now the app is free, and thanks to a partnership with
Bookatable.co.uk, you can browse and reserve from inside the application. So far, around a fifth of
Michelin’s restaurant recommendations are bookable in-application.
- When it comes to statistics, OpenTable free application still leads the way. It lists more than
30,000 restaurants worldwide, including France. Users can filter restaurants by cuisine type,
location or price range, and menus are usually available to browse. Recent OpenTable innovations
include Hot Tables, a service that automatically alerts to coveted late cancellations.

71
III.4.3. Chosen mobile applications for the research
The choice of the catering mobile application is done not according to the rating of the mobile
application in stores, and even not according to the functionality. The basic reason why we have
chosen the below presented mobile application is the availability of data and readiness of the
management to collaborate for this research.
III.4.3.1 Resto.ru
General information
The mobile application Resto.ru belongs to Resto Group, which exists on the Russian market of
Internet services since 1995. Head-office is located in Moscow.
Main specialization of the Group is creation and management of online projects in the restaurant
business, beauty industry, and in the market of banking products.
Resto.ru is the project of the Group, which includes website, mobile application, call-center and
table booking system. Resto.ru is an interactive restaurant guide with convenient navigation and
daily updated content. The last version of the website is designed as restaurant social network
(Annex 1).
Easy access, varied and detailed information, as well as advanced online capabilities make it
popular both among regular users of the Internet, and at key players in the market restaurant.
The business model consists from three main components: call-center, website and table booking
service collaborated with many others catering searching engines like tripadvisor, yandex, 2GIS etc.
(Annex 2, 3, 4). ZON is special program which is constructed for online booking. For now except
restaurants this booking system is working in many other services, like beauty salons, haircuts,
resorts etc.
Call-center was the first project, its success allowed the management to develop the service of
searching and booking afterwards in more recent technologies. In 1998 the company bought the
telephone number by the famous restaurateur in Moscow, that phone number united several popular
restaurants firstly. The target audience at that time referred to the rich Russians (nouvaux riches).
After the quick increase of the clients’ number the company started to sign the contracts to join the
other restaurants. Almost at the same time the Internet took its important place in the people’s life,
in this way the website as a guide in restaurant life was developed. The latest project is connected
with the development of the mobile devices and also the growth of the Internet in general. Table
booking online became demanded as contactless function focused on the easiness of use: user could
avoid of calling the restaurant but at the same time the bottom of booking could motivate him/her to
book table without any efforts. The bottom of table booking is presented not only on the original
website of the company but also on partners-websites and applications.

72
Mobile application functionality
The mobile application Resto.ru appeared in 2013 with simple design and minimum functions as an
additional service for the clients of the company.
First of all the user can or have to choose manually the city (the mobile application have
information about 19 cities in Russia). According to the city the client will have access to the list of
the restaurants, which he/she can choose by cuisine, average bill, location, or others (Annex 5, 6).
The user can create personal account, or if he/she has already one on the website Resto.ru subscribe
with his/her previous profile name and password. The mobile application can be used also without
personalization. The function to register with the facebook or VK20 profile is not available.
Geolocation is presented in two ways, first as “around me” function, second with location of the
“next metro”, what is very popular in Moscow for mobile applications of any kind. The mobile
application allows to book table with bottom “book the table”. The user can create the list of
favorite restaurants with a function “add to favorites”.
It is possible also to leave or to read reviews of the restaurants. Unfortunately many other functions,
which are available on the website, are not designed in the mobile application.
Loyalty program
Resto.ru doesn’t provide discounts in the restaurants, even if it publishes the existing discounts and
bonus available on restaurants (according to the partnership package see Table 12 below).
Nevertheless, resto.ru provides bonus points for bookings, done though its system ZON. This
system is working in the way, that the managing team possesses the information about each client
spending in the booked restaurant, so for each 100 rubles of the bill the client receives 10 bonus
points. The collected bonus points the client can exchange for gifts, provided by Resto.ru (not by
restaurants). It can be free dinner or free drink in the partner-restaurant, invitation for the party, or
some valuable gifts (bottle of wine, even household appliances).
Another part of the loyalty program aims the involving of the clients into active exchange of their
restaurant experiences through Resto.ru. Each client can get the specific status according to the
number of the restaurants booking done in the last 90 days: new visitor (3 booking for last 90 days),
amateur (3-5 bookings), profi (more than 5 bookings). According to the status the reviews of the
visitors are shown.
For promotion of the mobile application usage, company also provides specific gifts for booking
done specifically with mobile application (Annex 7).
20 VK – Russian social network, www.vk.com

73
Suggestions for restaurants (business)
The restaurants are included in the guide in different ways. For free all restaurants are included with
names and address, sometimes phone numbers, online booking is not possible and in this way the
client cannot collect the points of loyalty. Advanced type of cooperation can be bought in different
volumes (Table 13).
Table 13: Conditions for cooperation with the restaurants
Mini Standard Start* for new restaurants
Description Ok Ok Ok
Pictures of the interior Ok Ok Ok
Pictures of the dishes - 5 pictures 5 pictures
Menu Ok Ok Ok
Panoramic view Ok Ok Ok
News Ok Ok Ok
Searching priority Low Medium High
Gastronomic dictionary 2 words 5 words 5 words
Banner in the news ticker - 100000 displays 200000 displays
Contextual advertising - 500 clicks 2000 clicks
Special publishing Ok Ok Ok
Picture of the chef - Ok Ok
Receipt of the chef - Ok Ok
Group “new restaurants” - - Ok
Invitations cards for clients - 12 cards 4 cards in the first month
Bottom “I want to read
news of the restaurant”
- Ok Ok
Rubric “Discounts and
bonuses”
- - Ok
Export of the news to
facebook and VK
- Ok Ok
Price XXX XXX XXX
Source: resto.ru, 2017
III.4.3.2. LaFourchette
General information
LaFourchette belongs to Tripadvisor Group since 2014. The platform is majority owned since 2009
by Otium Capital. According to this investment holding, the site generated directly in the order of €
250 million in revenue for its restaurant partners and employs 190 people mainly in Paris and
Barcelona. Early 2014, it surpassed the 700,000 bookings per month.
Head-office is located in Paris.

74
Based in Paris and founded in 2007, La Fourchette is present in Spain with the brand "eltenedor"
and "thefork" in England. In total, the range has more than 36,000 restaurant partners in 11
countries (Annex 8).
Mobile application functionality
The mobile application Lafourchette appeared in 2013 with similar design and functions as on its
website.
First of all, the user can use mobile application registered or not registered. Nonregistered use is
limited in the way, that a user cannot collect the loyalty points, and by booking a restaurant
establishment the nonregistered user still have to do pre registration.
Second, the mobile application responds well the function of geolocation, usually suggesting as first
choice the restaurants next to the user, or in automatically in the city. Anyway the user can choose
the city manually, to check restaurants, for example, in the other city which is included in the data
base of lafourchette. Also, it is possible to do searching for the restaurant by cuisine, average bill,
location, or others.
The user can create personal account, or if he/she has already one on the website lafourchette
subscribe with his/her previous profile name and password. The function to register with the
facebook is well available too.
Geolocation, accept the above mentioned case, is presented as “around me” function. The mobile
application allows to book table with bottom “book the table”. The user can create the list of
favorite restaurants with a function “add to favorites”, and also see the history of his/her searching,
and of course history bookings (Annex 9-11).
It is possible also to leave or to read reviews of the restaurants. After the company was bought by
Tripadvisor, the user of the application can see the review and rating of the restaurant on
tripadvisor.
Loyalty program
There are two types of programs to motivate users to user regularly Lafourchette.
Firstly, restaurants can provide special offer.The user can get discount till 50% for the meal, if the
user books the restaurant by Lafourchette (Annex 12-14).
And secondly, collecting loyalty points, so called Yums. Every reservation made on the mobile
application (or website) bring the user 100 points (yums), than in different countries there are
different ways to spend the points, in France, each 1000 Yums =10 € discount.
Suggestions for restaurants (business)
The company proposes not only advertizing tool for the owner and managers of the restaurants
establishments, but also simple software for managing reservations. The usage of this software is
possible from any devise including tablet or smartphone. Software has functions of CRM and

75
booking. So on the one hand the team of the restaurant can see the occupancy rate of the
establishment, as well lead the booking history of the particular client. At the same time all
marketing tools are also available for the management. Provided by Lafourchette services are
presented in the Table 14.
Table 14: Provided services for the restaurants
FREE PRO PRO+
YOUR RESTAURANT PUBLISHED ON THEFORK + + +
YOUR RESERVATION BUTTON ON TRIPADVISOR + + +
YOUR RESERVATION BUTTON ON YOUR OWN WEBSITE + + +
YOUR OWN TURNKEY WEBSITE. + + +
INTELLIGENT RESERVATION MANAGEMENT SOFTWARE – THEFORK MANAGER STANDART STANDART ADVANCED
ELECTRONIC RESERVATION DIARY + + +
CENTRALIZE ALL YOUR BOOKINGS (ONLINE, PHONE, E-MAIL, WALK-
INS…)
+ + +
TRACK THE PROGRESS OF YOUR SERVICES IN REAL TIME + + +
MANAGE YOUR AVAILABILITY ONLINE + + +
MANAGE YOUR THEFORK WEB PAGE (MENUS, SPECIAL OFFERS, ETC.) + + +
MULTI-USER CONFIGURATION - + +
MONITOR AND CONTROL THE ACTIONS OF ALL USERS - + +
MANAGE RESERVATIONS AND SERVICES USING A PERSONALIZED
DINING ROOM PLAN
- + +
CUSTOMIZE THE TOOL TO THE REQUIREMENTS OF YOUR RESTAURANT - + +
STATISTICS AND PROGRESS REPORTS - + +
SEND SMS AND/ OR PERSONALIZED E-MAILS TO CONFIRM YOUR
RESERVATIONS
- + +
MANAGEMENT AND CUSTOMER LOYALTY TOOL – THEFORK MANAGER
AUTOMATICALLY SEND SATISFACTION SURVEYS TO YOUR
CUSTOMERS
+ + +
RESPOND TO CUSTOMER REVIEWS + + +
CUSTOMIZE YOUR CUSTOMER DATABASE AND THE INFORMATION
COLLECTED
- + +
EXPORT, DUPLICATE, AND IMPORT DATABASES - - +
SEGMENT YOUR DATABASE - - +
EASILY CREATE AND SEND E-MAIL CAMPAIGNS - - +
EASILY CREATE AND SEND SMS CAMPAIGNS - - +
Source: https://www.theforkmanager.com/fr/tarifs/
The restaurant can choose among three packages: free, pro and pro+ and use as well mobile
application, Lafourchette Manager (Annex 15).
Conclusion
Both companies (Resto and Lafourchette) represent the modern type of the restaurants’ catalog
using the new technologies and provide their services in the similar business model: free services
for users financed in two ways: restaurants subscriptions and electronic advertising on their
platforms. Both companies cover the restaurant establishments in capitals, as well both propose
their services in others cities, and in case of Lafourchette even in several countries.

76
The developing of the mobile devises such as smartphones and tablets necessitated both companies
to create the mobile applications together with the smartphone’s versions of webpage to reach users,
who doesn’t want to download the mobile application but still uses smartphone for bookings.
The design and functionality of Russian mobile application is developed in the very simple way.
Compared to the webpage and its smartphone’s version it lost network approach and availability to
reviews. The main idea of mobile application is to provide the possibility to find and book the table
in the restaurant establishment. For that the basic functions such as geolocation are working in the
manual and automatically ways.
Lafourchette kept the design and functionally of the webpage for the mobile application. And the
geolocation function became the most important in the mobile application. It included as well
possibility of the registration with facebook account to facilitate the access for users.
Both companies have well-developed CRM departments. The work inside of such departments is
divided by types of clients: users and restaurants. There are such ways of communications with
users: news-letters for subscribers, social networks, direct calling by phone (very well works in
Russia). The restaurants are in addition visited at least twice a year for renewing information about
menu and pictures of the establishment on the website and mobile application. The websites are
also designed as some kind of intranet for users and restaurateurs with personal profiles. The
difference between them is in the functionality. While the user has a set of functions personalized
for further search and booking, loyalty program statement and history of bookings, the restaurateur
can use the system for business goals, like analyze advertising effects, see the occupation of the
tables and also save the contacts of the clients, who has booked the table with the website or mobile
application.
The differences of the basic design of the mobile applications might result out of decision made by
the companies’ management regarding the real need and the way of use by different users.
The users of smartphones have habit to access immediately to any kind of information and the
restaurateurs supposed to adapt to this fact. In our research we will focus on the usage of the mobile
applications in the restaurant industry, where the implementation of the mobile services depends on
many factors. Some of these factors can be based on the economic situation in the country, some
factors depend on industry development, and some are connected with the cultural difference. And
what it is equally important, the new technology but itself impacts the process of adoption and
implementation. In the next chapter we will try to find the theoretical background of all factors,
which can have impact on the usage of mobile application in the restaurant industry.

77

78
Chapter II: Literature review

79
Introduction
The goal of this chapter is to discuss the theoretical basement for adoption of new technologies in
restaurant industry regarding to national, cultural differences.
The chapter is divided in three sections, each section concentrates on the theories and researches,
which are used for the developing of the research model:
- Use of technology,
- Relationship marketing,
- Cultural theories.
For understanding and explanation the usage of mobile application in the restaurant business it is
firstly important to examine existing theories and models of the technology adoption and usage.
Mobile application is made as a tool, which can replace the usual understanding of relationships
between restaurant’s establishment and customer, or final user of the applications where the
application’s holder plays the role of mediator. From that point of view, the theory of relationship
marketing is also included in the theoretical part of this thesis enunciating how the relationships
change between company and customers while using the technology.
The comparison of two countries suggests that the cultural differences might have influences on the
usage of the mobile application or frequency of eating outside. The cultural theories comprise
philosophical concepts of cultures which are different in both countries, as well as universal
cultures dimensions developed by Hofstede.
Those theoretical backgrounds answer the purpose to develop the hypotheses and the problem of
our research.
I. The theories of technology adoption and usage.
The mobile applications relate to information technology (IT) with several theories form the
conception of technology diffusion, acceptance, adoption, usage and after usage adoption/rejection.
Decision making process to use a new technology or innovation is complex and includes several
elements, which are to find in the different models of the researches during the last decades. Many
researches concern themselves with the phenomena of the technology adoption. To understand the
important variables for use of a mobile application as a technology, following models are regarded
in this thesis:
- Diffusion of innovation by E. Rogers (1962).
- Theory of reasoned action (TRA) by M. Fishbein and A. Ajzen (1975, 1980).
- Technology acceptance model by F. D. Davis (1986).

80
- Unified Theory of Acceptance and Use of Technology (UTAUT), V. Venkatesh et al. (2003)
and extended Unified Theory of Acceptance and Use of Technology (UTAUT2), V. Venkatesh
(2012).
- Mobile application Usability: Conceptualization and instrument development, H. Hoehle and V.
Venkatesh (2015)
This section presents the models chronically.
I.1. Diffusion of innovation, Everett Rogers.
Sociologist Everett Rogers in 1962 wrote a book in which he tried to explain the concept of
"diffusion of innovations", the spread of new ideas and technologies. The theory shows ways of
appearance of the product on the market that will be adopted and will spread in society. The key
concepts are:
Innovation includes ideas, processes and technology that the people find as new ones. It may be
something completely new, a fresh approach to an existing idea or the entrance of the idea the new
market. In our case it is the mobile application used in the restaurant industry.
Adopters are those who accept innovation. Rogers distinguishes five types of adopters: innovators,
early adopters, early majority, late majority and laggards. We have two categories of adopters:
professionals or restaurants, and nonprofessionals or final users. Obviously, the mobile application
should be adopted by both of the adopter’s categories.
The innovation-decision process is a five-step process, leading to the adoption / rejection of an idea
or technology. Probably the process of mobile application adoption/ rejection might be different
according to our types of adopters.
For Rogers, adoption is a decision of “full use of an innovation as the best course of action
available” and rejection is a decision “not to adopt an innovation”. Rogers defines diffusion as “the
process in which an innovation is communicated thorough certain channels over time among the
members of a social system”.
The spread of mobile applications within the restaurant industry presumes that inside of well known
relationships <restaurant-customer> the diffusion of innovation happened to be. This innovation in
our case is the use of the mobile application which provides several services, or replaces previous
tools for the same services for the restaurants clients, like online-booking instead of phone calling,
reviews and rating instead of word of mouth etc. But also the restaurants are the professional users
of the mobile application; with help of it the mobile application’s holder provides the restaurants its
services and tools, like advertising, CRM systems, call-centre etc, which also replace the previous
tools.

81
On the one side, we are interested to see, if the adoption/rejection of the innovation is different by
professional users and nonprofessional users of the same application. On the other side, our
research includes also cultural differences of two countries.
I.1.1. Stages in the innovation-decision process.
Diffusion scholars have long recognized that individual’s decision about an innovation is not an
instantaneous act. Rather, it is a process that occurs over time (Rogers, 1962). The model of the
innovation-decision process includes five stages (Figure 5):
Figure 5: Model of stages in the innovation-decision process
Source : Rogers, 1962
(1)Knowledge occurs when an individual is exposed to an innovation’s existence and gains some
understanding of how it functions. An individual can play a passive or active role in being exposed
to awareness-knowledge about an innovation. So a restaurant manager can learn about the mobile
application during the presentation by the salesperson of the mobile application holder, also he or
she can expose the awareness to every innovation concerning the restaurant business. The final user
of the mobile application can download it together with all others tools on the smartphone, and at
the same time he or she can have specific interest in the mobile applications about the restaurants.
According to Rogers there are three types of knowledge:
- Awareness-knowledge is information that an innovation exists. Today people use
smartphones and different mobile applications, what means, the people know that also the
mobile applications about the restaurants can exist.
- How-to knowledge consists of information necessary to use an innovation property. The
adopters understand how to use the mobile applications in general. If the particular mobile
82
application answers this understanding the mobile application tends rather to be adopted in
the future.
- Principles-knowledge consists of information dealing with the functioning principles
underlying how innovation works. In other words, the understanding how useful is the
innovation. The restaurant manager will rather adopt the mobile application for his/her
business, if he/she understands how this application can influence the wished results. Also
the final user who knows the functionality of the mobile application, such as table-booking,
discounts etc. will rather adopt it than not.
Knowing about the innovation is different from using it. Attitudes toward an innovation influence
the decision making about adoption of the innovation. The individual should not only know about
the innovation, he/she should regard the function of it as relevant to his/her particular situation.
(2) Persuasion occurs when an individual form a favorable or unfavorable attitude towards the
innovation. Persuasion has perceived characteristics of innovation
People do not just get used to something new. They make a conscious decision. This is something
deliberate. The theory of diffusion of innovation identifies five characteristics of the innovation:
- relative advantage, which determines how much better is the product/innovation compared with
the previous generation, or an analog. These changes may include improved services, improved
interface, reduced impact on the environment, saving money, saving of time etc. Mobile application
in restaurant industry is multifunctional. On the one hand, it replaces the direct contact with the
restaurant: online-booking instead of use of telephone. On the other hand it changes marketing
tools, such as for example word of mouth (WOM), which is important for the marketing in the
restaurants. It competes with analogs such as book-guides for restaurants, and general guides for
tourists (f.e. lonely planet, Michelin, tripadvisor).
- compatibility is an indicator of how innovation is assimilated in people's lives. Potential buyers
or users should be aware that new product or service is "compatible" with them. If new product or
service requires a lot of changes in their way of life, it is fated to failure. Innovations are successful
only when people are taking them in their lives imperceptible for themselves. The implementation
of the new technology in the restaurant business requires several decisions and changes in the
management, including the implementation of new software and new instructions and trainings of
the personal. But the final users of the mobile application are normally the users of any applications
that mean such kind of innovations is already assimilated in their lives.
- complexity and simplicity are the important things how people learn to use new product.
Complex innovations bring difficulties in their acceptance into life of people. Potential buyers or
users do not usually have enough time to deal with all the subtleties. The more intuitive is the new
product or service, the better it will go to the masses. Complexity and simplicity are important for

83
the mobile application use in any cases. The spread of the mobile application depends on the fact,
how easy is the use of it. For the restaurant client it is preferable to have confidence, that he/she can
have booked table at the right time, or that he/she can get the promised discount etc., in case of
technological failure, the clients can get strong negative emotions, which will push them to reject
the innovation.
- trialability is characteristic, showing how well people can explore new product or service before
purchasing it. This is important in making innovation. A user needs to know what represents new
product or service and even to make a "test drive." This is the main point of the demo versions and
beta releases. Potential buyers or users need to understand what their life will be after the adoption
of the new product or service. Speaking about the mobile applications we should notice, that the
final user can try the application only after he/she downloads it, but he/she can read the reviews, can
see instructions and pictures, how to use it before downloading. It is important to underline, that the
investigated mobile applications are free for downloading that means, that the person can easily
delete it, if he/she is not satisfied, without having any expenses. It is absolutely different for the
professional users, or restaurants, because they should buy for expensive price the services of the
mobile application holder. And as said before, the process requires additional software, and
trainings for the personal. So the holder of the application provides usually demo versions, free
trainings, free technical support in the beginning or complete solution for business.
- observability is the degree of visibility of the results of using the new product or service. Not all
users immediately accept innovations. Absolutely all types of users need to see the benefits of
adoption and use of innovation. The advantages and benefits of use of the mobile application in
restaurant industry are more observable for final users: saving time, easy access from smartphone,
discounts and clients program etc. For the professional use the benefits become observable only
with time, and are influenced usually by many other factors, which are not connected with the
mobile application at all. The task of the mobile application’ holder is to provide information for the
restaurants, which can be interpreted and used to make the decision of the technology’s
implementation.
(3) Decision occurs when an individual engages in activities that lead to a choice to adopt or reject
the innovation.
Adoption is a decision to make full use of an innovation as the best course of action available.
Rejection is a decision not to adopt an innovation.
(4) Implementation occurs when an individual puts an innovation into use. “Until the
implementation the innovation-decision process has been mental exercise” (Roger, Diffusion of
innovation, p.172).

84
But the implementation involves behavior change. Problems of implementation are much more
serious when the adopter is an organization rather than an individual. In the restaurant the
implementation of the mobile application leads in big changes for several departments: financial,
service, marketing. For the individuals it is just a new program on the smartphone, which will be
used occasionally
(5) Con firmation occurs when an individual seeks reinforcement of an innovation-decision already
made or reverses a previous decision to adopt or reject the innovation if exposed to conflicting
messages about the innovation.
The innovation-decision process is deferent for an organization and for an individual. All stages of
this process presented in the Roger model take more time and involve more complex decision when
the innovation is adopting by the organization. The investigation of these differences is important
for our research. Moreover both processes are closely related: the success of the adoption of the
mobile application in the restaurants depends on the numbers of the final users of the mobile
application what means on the adoption of this application by them. Moreover the final users can
adopt the mobile application only after the certain amount of the restaurants has already adopted
and implemented it as well as on the constant diffusion of the mobile application inside of the
catering, because the mobile application can be successful only if it provides information about a
big quantity of the establishments, creating the big choice for the final users. Regarding that, the
construct decision with both adoption and rejection of Rogers’s model might be interesting for the
future research model.
I.1.2. Types of adopters and the innovation-decision process
Another finding of Rogers’s theory affects the interest of marketing research. Rogers describes in
his study five types of users or adopters. In general, each category determinates when innovation
will be adopted (Figure 6).
Figure 6: Types of adopters
Source : Rogers, 1962

85
- Innovators. Typically, such people have a good income, interested in the science behind
innovation, and have a high status in their social group. Researchers say that 2.5% of the population
of people is innovators. Sometimes they set the direction of development, but the rest of the people
do not base on their opinion in the choice of technologies.
- Early adopters see the need for innovations or changes. They know that they need a specific
solution to a specific problem. Researchers notice that 13.5% of users belong to this category. As
well as innovators, they have a high income, more often they are well educated and can boast of
high social status.
- Early majority. It takes time before they want to adopt innovation. This will happen only when it
has already been tested by others. Early majority has less income; they do not so much affect the
society as innovators or early adopters, and, above all, less willing to take risks. 34% of all users are
early majority.
- Late majority. These people are skeptical to innovations and do not think to take them until the
early adopters and early majority do not prove the success of these products. It is believed that "late
majority" make up 34% of the total number of users. They have a small income, social status is
below average, and they have no impact on others.
- Laggards. They adopt innovation the last. Normally they should be almost forced to do it.
To identify, who belongs to which group, is very important for innovation-makers and for
marketing researcher. This will affect marketing and how to explore the different categories of
people. The diffusion of the mobile applications might involve restaurant’s clients in varies ways:
do loyal customers act as Innovators or mostly the foreign tourist who has already adopted another
similar application, and then the loyal clients suppose to be the early majority? Moreover, the
adopters of the technology within one culture are influenced by adopters of another cultures,
therefore not all type of adopters proposed by Rogers might be important or also presented equal in
selected countries.
I.1.3. Limitation of the theory diffusion of innovation.
This theory has been used successfully in many fields including communication, agriculture, public
health, criminal justice, social work, and marketing. There are several limitations of Diffusion of
Innovation Theory.
Firstly, the innovation-decision process explains how an innovation becomes adopted, rejected, or
abandoned. It does not, however, explain why one technology may be adopted over another.
Rogers’s diffusion of innovations proposes five factors that shape the rate and likelihood of
adoption. Some factors are inherent to the innovation, while others concern the adopters themselves
and their usage of the innovation. Secondly, the theory doesn’t count users, who stops to use an

86
innovation after the adoption (Bhattacherjee, 2001), and thirdly, also the types of adopters are under
the critics (Bardini, 1996). According to Bardini (1996) the major problematic issue is the method
of adopter categorization, or how to standardize categories of adopters through the time of adoption
(innovators, early adopters, early majority, late majority and laggards). Rogers does so by
employing a behaviorist attribute of adopters that he calls innovativeness but he admits that “such
classification is a simplification that aids the understanding of human behavior, although it loses
some information as a result of grouping individuals” (Rogers, 1995, p. 261). On the contrary,
Bardini argues that these categories of adopters constitute ‘ideal types,’ “conceptualizations based
on empirical observations and aiming to effectuate comparisons,” which are “supposedly explained
in terms of allegedly independent variables covering the socio-economic traits, the personality and
the communicational behavior of the studied individuals” (Bardini, 1996, p. 130). The problem with
categorizations is that they do not permit to conceive the possibility that the adopter may change her
or his mind. In fact, the adopter can decide even to reject an innovation at any time and not only
during decision-making. Thus, Boullier (1989) accuses Rogers of propagating a false and ‘positivist
vision of technology,’ according to which diffusion becomes effective only when innovation is
completed and it is restricted inside the process of being adopted, a vision which apprehends users
as passive subjects who either accept or reject innovations.
For our research, the diffusion of the mobile applications in the restaurant sector is the first step to
study the trial relationships <application’s holder – restaurants - customers> in two countries. It is
necessary to analyze national or cultural characteristic of adopters, if they act differently concerning
similar innovations in the restaurant sector. The Rogers’s model gives the standpoints: 1) the
adopters of the mobile applications in our case are the restaurants, using the service to attract
clients, to win new clients, to develop loyalty and others; 2) the adopters of the mobile applications
are also the final users, customers, who adopt/reject the usage of studied mobile applications; 3)
whether the mobile application is adopted or not, there are to explain, how to predict the adoption
by applications holder, should the applications holder of both countries use the same instruments.
Despite the mentioned limitations the Roger’s theory of diffusion of innovation gives us the
possibility to discuss such important issues as:
- the role of the mobile application’s holder in the spread of innovation;
- categorizing of professional adopters: what restaurants establishments adopted the mobile
applications first, and what was the role of the application’s holder to make them aware
about the innovation,
- categorizing of nonprofessional adopters, and how they become aware about the innovation.
Listed issues can lose of importance after the analysis of further theories and models, but we will
keep attention on them.

87
I.2. Theory of reasoned action (TRA) by Martin Fishbein and Acek Ajzen (1975).
Rogers wrote that “implementation (of the innovation) involves overt behavior change” (Rogers,
1995), which is conscious action to put innovation into practice. Outgoing from the standpoint that
implementation of the mobile application is a conscious reasoned action of a restaurant
establishment or an individual; it is necessarily to look at the Theory of reasoned action.
The theory of reasoned action, developed by Martin Fishbein and Acek Ajzen (1975, 1980),
proposes that the behavior depends on the intention of the person to perform or not to perform the
behavior.
Figure 7: Model of reasoned action by Martin Fishbein and Icek Ajzen
Source: Fishbein and Ajzen, 1975
Behavioral intention is determined, first of all, by positive or negative attitude toward the behavior.
The second determinant of behavioral intention is the subjective norm. The attitude towards an act
or a behavior is the individual’s positive or negative feeling about performing a behavior,
determined through an assessment of one’s beliefs. Subjective norm is defined as an individual’s
perception of whether people important to the individual think the behaviors should be performed.
The model of Reasoned Action separates behavioral intention from behavior and discusses the
factors that limit the influence of attitudes (or behavioral intention) on behavior. The model uses
two elements, attitude and norm, to predict behavioral intent.
Whenever the individual’s attitude leads the person to do an action but the norm suggests the
individual should do something else, both factors influence behavioral intent. Specifically, the
model of Reasoned Action predicts that behavioral intent is created or caused by these two

88
elements. Attitudes are expressed in the outcome evaluation, positive or negative judgments about
features of the behavior, and behavioral beliefs, beliefs about consequences of the behavior.
Subjective norms consist in normative beliefs, belief about whether referents approve or disapprove
of the behavior, and motivation to comply, motivation to do what salient referents think an
individual should do. The TRA is based on the assumption that an individual performs the behavior
consciously. It is designed to explain the behavior in the specific context.
Appropriate example in the context of mobile application in the restaurant sector would be:
a) behavior of the restaurant manager:
If the restaurant manager wants to attract new clients, he/she intends to use the mobile application
(Intention). Usage of mobile application is useful/not useful at all (Attitude). Most of the colleagues
are thinking that usage of the mobile application can be useful (Subjective Norm). Usage of mobile
application attracts new clients (Behavioral beliefs). Attraction of new clients can be useful/not
useful at all (Evaluation of behavioral outcomes). The owner of the restaurant thinks the restaurant
manager should use the mobile application (Normative beliefs). Concerning the restaurant he/she
wants to do what the owner thinks he/she should do (Motivation to complain).
b) behavior of the restaurant customer:
If he/she wants to choose the restaurant, he/she intends to use the mobile application (Intention).
Usage of mobile application is useful/not useful at all (Attitude). Most of his/her friends are
thinking that usage of the mobile application can be useful (Subjective Norm). Usage of mobile
application reduces his/her time to choose the restaurant (Behavioral beliefs). Reduction of the time
to choose a restaurant can be useful/not useful at all (Evaluation of behavioral outcomes). His/her
best friend/wife/husband thinks he/she should use the mobile application (Normative beliefs).
Concerning the restaurants he/she wants to do what his/her best friend/wife/husband thinks he/she
should do (Motivation to complain).
These examples can illustrate how the individual might make a decision about usage/not usage of
the mobile application, but because of its limits the model can work well for the business behavior,
where the intention and final performance have higher level of consciousness than the behavior of
an individual in personal affairs.
Table 15: Adaptation of the TRA constructs for the mobile application’s use
Construct Definition Example of Mobile application’s
use
Behavioral intention The individual’s decision to perform or
not the behavior
a) By choosing of the restaurant
individual is in the situation when
he/she can use mobile application
instead of other tools.

89
b) Because the mobile application is
more and more common, the
restaurant manager is in the situation
when he/she can use this application
as a marketing tool.
Attitude The individual’s positive or negative
feeling about performing a behavior
For both, the user and the restaurant
manager the use of mobile application
can be useful or not useful.
Subjective norm An individual’s perception of whether
people important to the individual think
the behaviors should be performed
Important referent’s opinion is more
significant for the restaurant manager,
because the use of mobile application
impacts the business.
Behavioral beliefs Beliefs about consequences of the
behavior
As consequences the advantages and
disadvantages can be regarded.
Advantages might be:
for the user: saving time, collecting
discounts etc.
for the restaurant manager: marketing
tools, collecting data, increase of the
occupancy rate etc.
Evaluation of behavioral outcomes Positive or negative judgments about
features of the behavior
Evaluation of given above advantages
and disadvantages.
Normative beliefs Belief about whether referents approve or
disapprove of the behavior
Same as for subjective norm, more
significant for the restaurant manager.
Motivation to complain Motivation to do what salient referents
think an individual should do
More significant for the restaurant
manager.
Source: completed by author of the thesis based on the references
I.2.1. The theory of planned behavior (TPB), Icek Ajzen (1985)
The theory of reasoned action was revised and extended by I. Ajzen in 1985. The main difference
between the models is that TRA does not consider perceived behavioral control. It predicts behavior
from attitudes and subjective norms, and is predictive in those situations where there are no
significant barriers to behavioral performance (Fishbein and Ajzen, 1975).
Perceived behavioral control influences the behavior when individual has the intention to perform a
behavior but the actual acting is stopped by lack of confidence or control over behavior.
This was a result of the opening of succession, according to which the behavior is not entirely
voluntary and controlled process, what led to the concept of "subjective control over behavior."
According to the TPB, the person commits the action, guided by three main factors:
- Behavioral beliefs. The persuasion concerning the possible consequences of certain behaviors.
- Normative beliefs, beliefs about the normative expectations of others.

90
- Control beliefs, beliefs about the presence of factors that may contribute to or hinder certain
behavior.
Figure 8: Model of planned behavior by Icek Ajzen
Source: Ajzen, 1985
These three factors of Ajzen are crucial in circumstances / projects / programs that require
behavioral change. Taken together, behavioral beliefs lead to the approval or disapproval of certain
behavior, normative beliefs - to subjective social pressure or subjective norm, and the control
beliefs give rise to subjective control over behavior. Combined with each other, the attitude toward
the behavior, subjective norm, and a perceived control over the behavior form behavioral intentions.
Generally, the positive attitude and subjective norms are stronger than the subjective control and
intention of the person to commit actions.
We can add Perceived behavioral control in the above given examples:
a) behavior of the restaurant manager:
Usage of mobile application will be difficult to put in the general operation system of the restaurant
(Perceived behavioral control). If he/she wants to, he/she can easily to implement the mobile
application in the general operation system of the restaurant (Control beliefs). How much control
does he/she have over the mobile application data? Little control/complete control (Perceived
power).
b) behavior of the restaurant customer:
Usage of mobile application is difficult/absolutely not difficult for him/her (Perceived behavioral
control). If he/she wants to, he/she can easily use the mobile application to choose the restaurant
(Control beliefs). How much control does he/she have over the usage the mobile application? Little
control/complete control (Perceived power).

91
Table 16: Adaptation of the TPB constructs for the mobile application’s use
(Since TPB is the extension of the TRA, only three additional constructs are given)
Construct Definition Example of Mobile application’s
use
Perceived behavioral control The intention to perform a behavior
but the actual acting is stopped by
lack of confidence or control over
behavior
a) User can hesitate to use the mobile
application if he/she believes that it is
too complicated compared with
relative advantages.
b) The restaurant manager can hesitate
to implement the application, because
of difficulties of integration it into the
financial system etc.
Control beliefs Beliefs that presence of factors that
may facilitate or impede performance
of a behavior.
If the user believes that he/she can use
the mobile application despite the
difficulties, he/ she will use it. The
same for the restaurant manager, who
can implement the new system
nevertheless the complexity.
Perceived power A person's perceived behavioral
control over each of given above
factors.
How much the user can control the
use of the mobile application, after
having the lack of confidence in the
system?
Source: completed by author of the thesis based on the references
I.2.2. Limitations of TBP
Regarding these examples we can do the same conclusion as before, the more consciously is the
behavior the better the model works. However, TRA and TPB are pragmatic theories. Both models
were used in several studies of usage of information technologies and innovations. TBP has
following limitations on explaining all mechanisms of the actual use of an innovation:
• It does not account for irrational variables in behavioral intention and motivation,
such as fear, threat, mood, or past experience. Irrational variables might be important for the
individuals using the mobile application.
• While it does consider normative influences, it still does not take into account
environmental or economic factors that may influence a person's intention to perform a
behavior. Economic factors influence the decision of the restaurants manager to implement
or not the mobile application as well as decision of the consumer to eat outside or not.

92
• It assumes that behavior is the result of a linear decision-making process, and does
not consider that it can change over time.
• While the added construct of perceived behavioral control was an important addition
to the theory, it doesn't say anything about actual control over behavior.
• The time frame between "intent" and "behavioral action" is not addressed by the
theory.
Because of its limits the TBP corresponds partly the goal of the research; the variables of attitude,
intention and behavior are of interest for this study.
So the implementation of the mobile application by the restaurant (behavior) depends on the aim
(intention) to change the business model resulted out the positive or negative evaluation (attitude)
of this business model. The use of the mobile application by individual (behavior) depends on the
desire (intention) to enjoy the advantages provided by this technology resulted out the positive or
negative evaluation (attitude) of this advantages. Behavioral control might be interesting in the
investigated case for restaurant use of mobile application, because the implementation of
technology brings certain difficulties in the work of the restaurant, and also there are several
decision makers with different level of influence. But it has very weak significance for the
individual use of the mobile application. For the research we need the construct which have impact
more or less on both types of users, therefore we will not take into account behavioral control by
now.
Table 17: Selected constructs of TPB for the mobile application’s use
Construct Definition Example of Mobile
application’s use
Limits for the mobile
application’s use
Intention The individual’s decision to
perform or not the behavior
Before the use the final user
and the restaurant manager are
in the situation to decide
whether the mobile application
should be used or not,
influenced by different factors.
This period can be decisive.
It is more convenient for the
professional use, when the
period before use (intention)
can be long and therefore
easy to analyze. The
individuals take decisions
concerning the use of mobile
application fast.
Attitude The individual’s positive or
negative feeling about performing
a behavior
Depending on the relative
advantages or perceived
difficulties to use the mobile
application, the final user as
well as restaurant manager can
develop the positive or negative
attitude about mobile
By now this construct is
very interesting.

93
application use. That will lead
in adoption or rejection of
mobile application, what is
important for our research.
Behavior Individual’s action The use of the mobile
application by itself.
-
Behavioral control The intention to perform a
behavior but the actual acting
is stopped by lack of
confidence or control over
behavior
All the factors which can
influence the intention to use
the mobile application:
complexity, efforts and others,
nevertheless the advantages of
the use.
Behavioral control is an
important, but it doesn't say
anything about actual
control over behavior.
Anyway it is more
significant for professional
use of the mobile
application.
Source: completed by author of the thesis based on the references
I.3. The technology acceptance model by Fred D. Davis (1986)
With growing technology usage predicting system use became an area of interest for many
researchers. Fred D. Davis proposed the technology acceptance model, which was based on
principles adopted from Fishbein and Ajzen’s theory of reasoned action. TAM replaced TRA’s
attitude measures with the two technology acceptance measures— perceived ease of use,
and perceived usefulness.
Figure 9: Technology acceptance model (TAM)
Source : Davis, 1986
Adopted from TRA the technology acceptance model explains the behavior of an individual
concerning the decision making about usage of the technology, in our case the mobile application. It
creates the basement for research of this phenomenon. TAM includes behavioral intention to use

94
directly influenced by perceived usefulness (Davis, Bagozzi and Warshaw, 1989), also perceived
ease of use has a small but significant influence on perceived usefulness and the main finding in the
research showed that both perceived usefulness and perceived ease of use have direct effect on
behavioral intention, thus eliminated the need for the attitude construct in TRA. Intention and
behavior are kept from the TRA, so it is no need to discuss them. More important is to regard the
new constructs and to try them for the use of the mobile application.
Perceived ease of use is defined as “the degree to which an individual believes that using a
particular system would be free of physical and mental effort” (Davis, 1989; Goodwin, 1987; Gould
et al., 1991; Hill, Smith & Mann, 1987). Perceived ease of use has direct influence on perceived
usefulness, but it is not mutual influence so perceived usefulness is not hypothesized to have an
impact on perceived ease of use. This construct determinates well the use of the technology,
because normally before the person starts to use any innovation, he or she estimates what
difficulties this use might bring with it. We already have discussed that the implementation of the
mobile application is connected with changes in the business model of the restaurant. From the
point of view of final user the mobile application with intuitive interface is likely to use than one
with complicated guides and instructions. So, perceived ease of use is important variable for our
research.
Perceived usefulness is defined as “the degree to which an individual believes that using a particular
system would improve his/her job performance” (Hellriegel et al., 1992). This variable is limited
by its definition. On the one hand the use of the mobile application in business improves the job
performance, but in our case it is not the performance of one particular person, and the decision
about use is made usually by owner of the business to develop relationships with the clients. On the
other hand for the final users the use of the mobile application has nothing in common with his/her
professional activity. So this mobile application is not relevant for the improvement of the job
performance. Therefore we will not take this variable.
The use of the mobile application is not just action or behavior; it is behavior performing the use of
technology. Since the constructs intention and behavior are adopted in TAM from TRA we keep
regarding them, however we also add the variable of perceived ease of use to our range of research,
because it describes the use of mobile application from the technological point of view.
Table 18: Selected constructs of TAM for the mobile application’s use
Construct Definition Example of Mobile application’s
use
Intention The individual’s decision to perform or
not the behavior
TAM is adopted for the technology’s
use, so is more convenient for our

95
research. Anyway, intention to use
mobile application as a construct is
useful for the professional use.
Behavior The individual’s action/ use of technology The use of mobile application by two
types of users: professionals and
nonprofessionals.
Perceived ease of use The degree to which an individual
believes that using a particular system
would be free of physical and mental
effort
The complexity of the mobile
application is not the same for the
final user and the restaurant manager,
because in the restaurant several
departments and systems can be
involved to serve the mobile
application.
Source: completed by author of the thesis based on the references
I.3.1. Comparison of TAM and TPB
Mathieson, (1991) did comparative study of these two theories: technology acceptance model and
the theory of planned behavior. According to this study, there are three main differences between
TAM and TPB (Mathieson, 1991, Peacock, Chin, Mathieson, 2001).
Degree of generality. TAM supposes that beliefs about usefulness and ease of use are always the
primary determinants of use decision. In TPB beliefs are specific to each situation. This difference
between models brings up following concerns. Firstly, here could be variables besides ease of use
and usefulness that predict intention. Secondly TAM’s constructs are measured in the same way in
every situation. TPB requires a pilot study to identify relevant outcomes. And thirdly, TAM does
not require the identification of a specific comparison behavior, but TPB items do.
Social variables. TAM does not explicitly include any social variables. Davis et al. (1989, 1998,
2007) pointed out that social norms are not independent of outcomes. The social norm in TPB may
still capture unique variance in intention.
Behavioral control. TAM and TPB treat differently behavioral control, referring to the skills,
opportunities, and resources needed to use the system. External control issues are not considered in
TAM in any obvious way. TPB taps the important control variables for each situation
independently, and is more likely to capture such situation-specific factors.
Mathieson concluded, that both the technology acceptance model and the theory of planned
behavior explain intention well. Although TAM explained more variance than TPB, the difference
is not large enough to conclude that one model is better than the other. However, TAM explains
attitude towards using technology much better than TPB. TAM supplies very general information
about ease of use and usefulness. TPB delivers more specific information, measuring the system’s
performance on various outcomes. The information TPB furnishes is probably more useful during

96
development and post-implementation evaluation than information TAM provides. Speaking about
the cost of using the models, TAM is easier to use than TPB; Davis has developed standard
instruments for TAM, while measures of TPB’s beliefs need to be developed for each context.
Using TAM as the starting point and comparing this model with the theory of reasoned action and
the theory of planned behavior V. Venkatesh and F. Davis extended the model to TAM2.
Table 19: Comparison of constructs of TAM and TPB with examples of the mobile application’s use
Findings Constructs
involved
Differences or similarities Mobile application’s
use TAM TPB
Degree of
generality
Usefulness, ease
of use, perceived
behavioral
control
-Constructs are
measured in the same
way in every situation.
-Only two outcomes
are important.
-Model does not
require the
identification of a
specific comparison
behavior.
Beliefs are specific to
each situation.
Model requires a pilot
study to identify relevant
outcomes.
Theory requires the
identification of a
specific comparison
behavior
Since mobile
application is a
technology, TAM
answers better the
need for our analysis.
Social variables Subjective
norm, normative
beliefs,
motivation to
complain
No explicit social
variables in TAM
The social norm may
capture unique variance
in intention.
Social variables of
TPB describe well the
professional use of
mobile application,
when the important
referents are really
involved in the process
especially of decision
making. Very weak in
nonprofessional use.
Behavioral control Behavioral
control, control
beliefs, perceived
power
No explicit variables of
behavioral control in
TAM
Theory describes the
important control
variables for each
situation independently,
and is more likely to
capture such situation-
specific factors.
Variables of
behavioral control
describe well the
professional use of
mobile application.
Intention Intention Both explain well intention Important construct for
our research by now.
Attitude Attitude No explicit variable of Ease of use and TAM gives better

97
attitude in TAM, but
the model explains
attitude towards using
technology much better
than TPB through ease
of use and usefulness.
usefulness are not
presented, theory needs
specific information,
measuring the system’s
performance on various
outcomes.
explanation of the use
of mobile application,
because it focuses on
the technological
aspects.
Cost - Easy to use because of
universal instruments.
Need to be adopted for
each context.
For our research the
universal instruments
for measurement are
better, because of
complex structure:
provider, restaurant,
final user in two
countries.
Source: completed by author of the thesis based on the references
I.3.2. Comparison of diffusion theory and TAM
The difference between these two theories, theory of diffusion of innovation and technology
acceptance model is based on the objectives of the models. Whereas TAM explains the usage of the
informational system, or technology, the theory of diffusion of innovation is focused on the process
of adoption an innovation. TDI helps to explain the behavior of adopters before the using the
technology, and moreover the theory doesn’t study the rejection of innovation after first adoption.
Besides TAM was originally designed specific for explanation of phenomenon of informational
system, while TDI was designed for the area of health and agriculture.
For our research TAM answers better the goal, because the mobile application is a part of
informational system, but it does not explain the spread of the innovation, what might be interesting
to look at. We are investigating the behavior of users in a well developed sector of catering, with
some traditional relationship between the restaurant establishment and restaurant clients. So, by
now we keep constructs from both theories.
Table 20: Comparison of constructs of TAM and diffusion theory with examples of the mobile application’s use
Findings Constructs involved Differences or similarities Mobile application’s
use TAM Diffusion theory
Objectives Usage of technology,
process of adoption an
innovation.
Model focuses on
the usage of the
technology.
Theory focuses on
the adoption an
innovation.
Since the mobile
applications we are
researching about, are
not the every first
mobile applications, we

98
cannot regard them as
real innovation.
Behavior Behavior Model explains
the usage by
itself.
Theory explains the
behavior before the
adoption/rejection of
the technology.
The goal of our
research is to
investigate the mobile
application use not the
decision making
process.
Area of the
researchers
- Technology, IT Agriculture, health Mobile application is
the technology, so the
TAM is better for our
research.
Source: completed by author of the thesis based on the references
I.3.3. Theoretical extension of the technology acceptance model, TAM 2
One of the important extensions brought to TAM is by Venkatesh and Davis, who proposed TAM
2. It was found out that TAM had limitations to explain the reasons for which an individual
perceives a technology useful. Venkatesh and Davis (Venkatesh, Davis, 2000) proposed additional
theoretical constructs explaining social influence processes and cognitive instrumental processes
(Figure 10).
Figure 10: Proposed TAM2 – extension of the technology acceptance model (TAM)
Source: Venkatesh, Davis, 2000
The basic Technology Acceptance Model was preserved with constructs of intention to use, usage
behavioral, perceived usefulness and perceived ease of use. Since these variables were discussed in
this thesis above, we will focus attention on new added constructs only.
TAM2 includes three social variables influencing the person in the decision to adopt/reject the
technology:

99
- subjective norm, which is adopted from TRA and defined as “person's perception that most
people who are important to him think he should or should not perform the behavior in question”
(Fishbein and Ajzen, 1975). Subjective norm is believed that people may use to choose to perform
the behavior under the opinion of the important referent (like the owner of the restaurant might have
that influence on the manager in the decision of usage the mobile application or not).
- image, defined as ‘the degree to which use of an innovation is perceived to enhance one's status
in one's social system” (Moor and Benbasat 1991). TAM 2 theorizes that subjective norm will
positively influence image, the important members of the person’s environment believe that he or
she should perform a behavior. The use of mobile application shows that the person is using the up-
to-date technologies, what surely strengthen his/her status in the modern social system, and this is
fair for both: professional use and nonprofessional use of the mobile application;
- voluntariness, is a moderating variable, defined as “the extent to which potential adopters
perceive the adoption decision to be non-mandatory” (Agarwal ans Prasad 1997, Hartwick and
Barki 1994, Moore and Benbasat 1991). An individual downloads the mobile application absolutely
voluntary. The restaurant manager can make the decision to implement the mobile application two-
way: non-mandatory, because he/she thinks, that it is good for the business, but also mandatory, in
case it is the decision of the owner, or of the executive group of managers.
Unless the social influence processes Venkatesh and Davis (2000) added four cognitive
instrumental determinants:
- job relevance, which is “individual's perception regarding the degree to which the target system
is relevant to his or her job” (Venkatesh and Davis, 2000). This is regarded as cognitive judgment
that has direct effect on perceived usefulness. This construct is important for the professional
adoption of the mobile application, but has no relevance for the individual use in our case;
- output quality, as the “degree to which an individual believes that the system performs his or her
job tasks well” (Venkatesh and Davis, 2000). In other words, the decision of usage is influenced by
the belief of positive or negative effect. Again the definition limits the use of this construct for our
research, because the mobile applications are used mostly for leisure by individuals. And from the
point of view of the professional use the case is not connected with job performance of one
particular person;
- result demonstrability, which means “tangibility of the results of using the innovation” (Moore
and Benbasat, 1991). Rather if the technology can give relevant results, but provides it in not clear
way, users of the technology are unlikely to understand how useful such a technology really is (e. g.
how to implement the received data base from the mobile application to the operation system of the
restaurant, or how much discounts the person can collect using the mobile application).

100
- perceived ease of use is taken from TAM as a direct determinant of perceived usefulness (Davis
et al., 1989). The easier is the technology to use the more increases the using of it. And as
mentioned before this variable is relevant for both users, professional and nonprofessional, and is of
interest for our research.
Venkatesh and Davis also added experience as a moderator variable into TAM2. Experience
measures the user’s experience of the technology, which will influence the perceived usefulness and
the intention to use the system trough subjective norm. Over the time the influence of subjective
norm will loose of importance because of the increasing experience. At the same time the
instrumental cognitive influence has no correlation with the experience, so users will continue to
confirm their job goals and consequences of the technology’s usage (job relevance). Thus, the
influence of important referent reduces over the time, as well as its impact on the intention to use
technology and perceived usefulness. We regarded the example, when the implementation of the
mobile application in the restaurant was influenced by the owner of the restaurant as an important
referent. Over the time this impact can decline, because the owner is not involved in the
management process, or because the restaurant manager faces difficulties to implement the
technology into the financial system, or because the technology works well and needs no more
positive reinforcement.
Since the TAM2 has a basement of TAM, we preserve still the constructs intention, behavior and
perceived ease of use, because they answer our interest. But not all added variables are relevant for
the use of the mobile application in the restaurant business. So, subjective norm might have
relevance for the professional use on the stage of decision making about the implementation of the
mobile application. But this relevance depends on the management structure of the establishment,
and it has weak influence for the final users. Image describes better the motivation to use the mobile
application for both categories of the users, because the mobile application is a part of the modern
social and professional lives. Voluntariness plays not big role in the use of the mobile application.
Inside of the instrumental determinants job relevance and output quality are limited by their
definitions, so they have restricted impact on the use of the mobile applications in our case. On the
contrary result demonstrability might be decisive for both cases of use of the mobile application,
because it contributes information about benefits and advantages of technology usage.
So, we keep regarding image, subjective norm and result demonstrability, as well as perceived
usefulness, because the chosen variables impact this construct directly.

101
Table 21: Selected constructs of TAM2 for the mobile application’s use
Construct Definition Example of Mobile application’s
use
Intention The individual’s decision to perform or
not the behavior.
We reserved this construct from TPB
and TAM. Anyway, intention to use
mobile application is more useful for
the professional use than for
nonprofessional.
Behavior The individual’s action/ use of
technology.
We reserved this construct from TPB
and TAM. We are regarding under the
behavior the use of mobile application
in the restaurant business.
Perceived ease of use The degree to which an individual
believes that using a particular system
would be free of physical and mental
effort.
We reserved this construct TAM. The
complexity of the mobile application
is not the same for the final user and
the restaurant manager, because in the
restaurant several departments and
systems can be involved to serve the
mobile application.
Image The degree to which use of an
innovation is perceived to enhance
one's status in one's social system.
The use of mobile application shows
that the person is using the up-to-date
technologies, what surely strengthen
his/her status in the modern social
system, and this is fair for both:
professional use and nonprofessional
use of the mobile application. It can
be interesting for our research.
Subjective norm Person's perception that most people
who are important to him think he
should or should not perform the
behavior in question.
We discussed similar variables in
TPB and TRA; the important
referents are more influential in the
professional use of mobile
application.
Result demonstrability Tangibility of the results of using the
innovation.
This construct has links with the
concept of advantages, like how to
implement the received data base
from the mobile application to the
operation system of the restaurant, or
how much discounts the person can
collect using the mobile application.
Therefore can be interesting for our

102
research.
Perceived usefulness The degree to which an individual
believes that using a particular system
would improve his/her job
performance.
Limited by its definition, but can be
interesting in general meaning of
relative advantages, which are
provided by using of the mobile
application, and which are not
connected with job for the final user,
like discounts, saving time etc.
Source: completed by author of the thesis based on the references
I.4. Unified Theory of Acceptance and Use of Technology (UTAUT), Venkatesh et al. (2003).
Venkatesh et al. (2003) developed UTAUT as a comprehensive synthesis of previous technology
acceptance research. The eight original models and theories of individual acceptance include the
Theory of Reasoned Action (TRA), Technology Acceptance Model (TAM), Motivational Model
(MM), Theory of Planned Behavior (TPB), Model Combining the Technology Acceptance Model
and Theory of Planned Behavior (C-TAM-TPB), Model of PC Utilization (MPCU), Innovation
Diffusion Theory (IDT), and Social Cognitive Theory (SCT).
Figure 11: Unified Theory of Acceptance and Use of Technology (UTAUT).
Source: Venkatesh et al. (2003)
UTAUT continues to regard the constructs of behavioral intention and behavior, as an action of the
technology’s use.

103
However, in UTAUT model seven constructs appeared to determine the intention of information
technology usage. Four constructs influence significant on the users acceptance and usage behavior
(performance expectancy, effort expectancy, social influence, facilitating conditions), and three
constructs are theorized not to be the direct determinants of behavioral intention (attitude towards
using technology, self-efficacy, and anxiety). The model operates also by four key moderators
(gender, age, voluntariness, and experience).
Performance expectancy is defined as the degree to which an individual believes that using a
particular system would improve his or her job performance. We discussed previously in the model
TAM2 the construct of perceived usefulness, which has the close definition. According to the
Venkatesh et al, performance expectancy is moderated by age and gender; particularly effect is
stronger by the younger men. For the usage of the mobile application in restaurant business the
construct of the performance expectancy has weak influence in general, because this kind of
application is used for leisure not for job. Even when we speak about the implementation of the
mobile application in the restaurant in the first way we mean adoption of the mobile application as a
marketing tool. The personal of the restaurant do not use the mobile application by itself, they use
the other system, like intranet etc, or they use nothing, if the services (like call-center, measurement
systems etc) are provided by the mobile application holder. Thus, the performance expectancy plays
no role, or very limited role for use of the mobile application in catering.
Effort expectancy is defined as the degree of simplicity associated with the use of a particular
system. Similar construct – perceived ease of use- we regarded in TAM and TAM2. This construct
is significant in both voluntary and mandatory usage contexts (the clients of the restaurant, and the
restaurant management). However it is significant only in the first period of use and is moderated
by experience. This period is different for the restaurant clients as mobile application user and for
the restaurants as establishment. Normally a person needs several minutes to download the mobile
application and to learn quickly how to use it. If the mobile application is too complicated, it will be
not used. Actually the user has already experiences with other mobile applications. But if this one is
a very first mobile application the user uses, the period will be longer. For the management of the
restaurant the decision is by itself complicated. But also the implementation of the system needs
changes in the inner systems of the restaurant. So it depends often on the services-packages
provided by application holder how long the restaurant will adopt the new system.
According Venkatesh et al. effort expectancy is moderated also by gender and age, so more silent
by women and older users.
Social influence is defined as the degree to which an individual perceives that others believe he or
she should use a particular system. Social influence as a direct determinant of behavioral intention
is represented as subjective norm in above discussed TRA, TPB, and TAM2. The individual’s

104
behavior is influenced by the way in which they believe others will view them as a result of having
used the technology (Venkatesh et al, 2003). According to Venkatesh et al, social influence is
significant always in not voluntary contexts (as in our case it is more important for the restaurant
than for an individual). The construct is moderated also by age and gender, so the effect is stronger
for older women particularly in mandatory setting in the starting period of usage.
For our research the concept of image used in TAM 2 is more significant than social influence. On
the one hand the use of any mobile application is regarded today as a normal behavior, but the
opinion of the important referent could be decisive for first decision making to use or not to use the
mobile application. On the other hand, the mobile application is regarded as a part of the modern
culture or way of life, the absence of the mobile application can influence negatively the image,
especially the image of the restaurant.
Facilitating conditions are defined as the degree to which an individual believes that an
organizational and technical infrastructure exists to support the use of a particular system. The
construct includes aspects of the technological and/or organizational environment that are designed
to remote barriers to use. In contradistinction to other mentioned constructs, facilitating conditions
have no significant influence on the behavioral intention, but direct impact on the usage, moderated
by experience and age. Thus, the effect will be stronger for older workers with increasing
experience.
This construct is very important for our research because it is connected with trust of clients over
the mobile application, which will replace traditional relationship between restaurant and client. So,
in case of problems with some services provided by the mobile application, the client prefers to
have support like for example call-center, or personal account in the mobile application to give
feedback, to receive improvements of the system and other help. The same situation is with
restaurant management, who prefers to have supporting organization providing services about
system. In this context the mobile application holder plays a very important role.
UTAUT does not include attitude, self-efficacy and anxiety as direct determinants.
Self-efficacy is defined as the degree to which an individual judges his or her ability to use a
particular system to accomplish a particular job or task.
Anxiety is defined as the degree of anxious or emotional reactions associated with the use of a
particular system.
Both are conceptually and empirically distinct from effort expectancy (perceived ease of use) and
have no direct effect on intention above and beyond effort expectancy (Venkatesh et al, 2003).
Attitude toward using technology is defined as an individual’s overall affective reaction to using a
system. This construct has similar definition as attitude toward behavior, which we regarded in
TRA and TPB. Empirically affective reactions may operate trough effort expectancy (Venkatesh

105
2000). The non-significance of the attitude has been reported in the presence of such constructs as
effort and performance expectancy. Given that Venkatesh et al excluded attitude, because the effort
and performance expectancy showed strong relationships with the behavioral intention.
In our research, effort and performance expectance are not significant, thus, we will not argue the
attitude to be significant as well.
All constructs in UTAUT are moderated by age, gender, experience, and voluntariness. We already
defined experience, and voluntariness in TAM2, and it is no need to give definition of age and
gender. For use of mobile application we keep the moderator of age, because this technology can be
related with the age of the user. Gender, experience and voluntariness are less important, moreover
experience and voluntariness play no significant role for the mobile application use.
We conclude that the construct of facilitating conditions is important to keep for the future research
model. The constructs of UTAUT assume professional usage of the technology. In the usage of
mobile application in the restaurant sector the variables are needed, which can predict the usage of
the technology from both standpoints, personal and professional usage of the mobile application. It
is for this reason that the model of the UTAUT 2 is more convenient for our research.
Table 22: Selected constructs of UTAUT for the mobile application’s use
Construct Definition Example of Mobile application’s
use
Behavioral intention The individual’s decision to perform or
not the behavior
The construct is adopted from TRA,
TPB, TAM, TAM2.
Behavior use The individual’s action/ use of technology The construct is adopted from TRA,
TPB, TAM, TAM2.
Facilitating conditions the degree to which an individual
believes that an organizational and
technical infrastructure exists to
support the use of a particular system
New construct in the model, has
important influence on the use
behavior. It is connected with trust of
clients over the mobile application,
which will replace traditional
relationship between restaurant and
client.
Age Variable of the moderation It can be used as moderator, because
the final users of the mobile
application have different level of
confidence in use of mobile
application and that can be connected
with age, but we need other
influential moderator and will keep
searching for it.
Source: completed by author of the thesis based on the references

106
I.5. UTAUT2, Venkatesh et al. (2012).
This version of the UTAUT is an extension of the basic model developed by Venkatesh et al.
(2012) to study the acceptance and use of technology in the context of individual consumption.
First, UTAUT 2 maintained four direct determinants (performance expectancy, effort expectancy,
social influence, and facilitating conditions) and three of key moderators (gender, age, and
experience). We will not define them again.
UTAUT2 is paying the particular attention to the consumer use context. This is very important for
our research, because the mobile applications in catering are used by the users for leisure mostly.
The professional usage is also presented in UTAUT2 through the constructs it kept from previous
model.
Figure 12: Unified Theory of Acceptance and Use of Technology 2, Venkatesh et al. (2012).
Source: Venkatesh et al. (2012)
The extended model integrated three additional key constructs, which actually help to develop
consumer use context – hedonic motivation, price value, and habit.
Hedonic motivation is defined as the fun or pleasure derived from using a technology, and it has
been shown to play an important role in determining technology acceptance and use (Brown and
Venkatesh, 2005; Venkatesh, Thong, Xu, 2012). In information systems research, such hedonic
motivation (conceptualized as perceived enjoyment) has been found to influence technology

107
acceptance and use directly (e.g., van der Heijden, 2004; Thong et al., 2006, Venkatesh, Thong, Xu,
2012). In the consumer context, hedonic motivation has also been found to be an important
determinant of technology acceptance and use (e.g., Childers et al., 2001, Brown and Venkatesh,
2005, O’Brien, 2010). The mobile applications which we are investigating contain not only the lists
of the restaurants, but also other possibilities like to leave reviews, to rate the best restaurants, to
check in the restaurant etc. Such kind of the functions are the part of the entertainment, so as more
similar services has the application, as stronger hedonic motivation of the users is.
Price Value. An important difference between a consumer use setting and the organizational use
setting, where UTAUT was developed, is that consumers usually bear the monetary cost of such use
whereas employees do not. The cost and pricing structure may have a significant impact on
consumers’ technology use. In marketing research, the monetary cost/price is usually
conceptualized together with the quality of products or services to determine the perceived value of
products or services (Zeithaml, 1988, Lai and Chen, 2011). The price value is positive when the
benefits of using a technology are perceived to be greater than the monetary cost and such price
value has a positive impact on intention. The researched mobile applications are free for
downloading. The importance of the price value can be regarded here as aggregated utility: benefits
collected by application’s use (discounts, loyalty programs, client’s points, gifts etc).
Habit has been defined as the extent to which people tend to perform behaviors automatically
because of learning (Limayem et al., 2007), while Kim et al. (2005) equate habit with automaticity.
Habit is important for the information technology use (Lally, Van Jaarsveld, Potts, Wardle, 2010)
and especially for mobile application use. On the one side, people use today the mobile applications
for everything: shopping, information, gaming, communication. On the other hand, restaurant sector
in general is pretty traditional sector; there is no particular need to use mobile application to go into
the restaurant (if it is not about delivery order). So modern generation makes it (uses applications)
also as a general habit to use any mobile application. It is regarded often as routine action and habit.
UTAUT2 correspond well the research goal to investigate the usage of the mobile application in the
restaurant sector. From the position of restaurant manager the usage of mobile application forces
performance expectancy, effort expectancy, price value and social influence, at the same time
hedonic motivation, social influence and habit explain the personal usage of the same mobile
application, and facilitating conditions influence well both of usage context.
The most important constructs for our research are facilitating condition, prices and habit,
moderated by age.

108
I.6. Mobile application usability, H. Hoehle and V. Venkatesh (2015).
As it presented in the first chapter there is a various range of the mobile applications in markets,
French and Russian, but not all mobile applications are used and demanded in the same way by
users. The market research suggested that the lack of usability has been identified as the important
factor influencing consumers’ decision to reject mobile applications (Deloitte, 2012). Based on this
the detailed consideration of the impact of the usability on the intention of use and use of the mobile
application is needed. H.Hoehle and V.Venkatesh conceptualized and developed the instruments of
measurement the usability of the mobile application. For that they followed the guidelines presented
by MacKenzie et al. (2011), which consist of 10 steps (Figure 13).
Figure 13: Steps for development of measurement instruments of mobile application usability
Source: MacKenzie et al. (2011)
To develop the construct concept Apple’s user experience guidelines was reviewed and analyzed.
The authors posed the questions about main usability criteria and keywords which are describing it
and are associated with it. On the basement of the open codes of the Apple’s guidelines the
constructs were defined and chosen. Since the interest of this thesis is in the analyses of the user’s
attitude and behavior about mobile application usability, we are going to present the final structural
model of the usability concept, and will not focus on all the steps of the measurement development
proposed by Venkatesh and Hoehle (2015).
The structural model includes first-order constructs and second-order constructs of usability and
shows the impact of the usability on the continued intention use and mobile application loyalty
(Figure 10). We suggest to define all constructs and to see their presence in the investigated mobile
applications as much as possible so far.
Mobile application usability is defined as the extent to which a mobile application can be used by
specified users to achieve specified goals with effectiveness, efficiency, and satisfaction in a
specified context of use (Venkatesh and Ramesh, 2006). In our research we regard the users of the
mobile application “Lafourchette” in Paris and users of the mobile application “Resto” in Moscow
(specified users), who are using the mobile applications for searching for the restaurant and for

109
booking tables in the restaurants (specified goals). In this way effectiveness refers to instruments
the mobile application has for searching and booking, efficiency refers to ability of the mobile
application to provide not only information but also for example bonuses, and satisfaction refers to
the user’s satisfaction with the functions of the mobile application. We investigate the leisure
context, when the mobile application is used for the having a meal in the restaurant. These mobile
applications can be used also in professional context, but in this case the managers of the restaurants
not really use the mobile application by itself, they use professional version of software. We also
research private use of the mobile application, not the corporative use (e. g. booking of the
restaurant for the business meeting etc.). Mobile application usability is not the same as mobile
device usability.
Figure 14: Structural model of the mobile application usability, Venkatesh and Hoehle (2015).
Source: Venkatesh and Hoehle (2015).

110
According to the research of Venkatesh and Hoehle (2015) mobile application usability is formed
by the second-order constructs like application design, applications utility etc, which consists in
their turn from first-order constructs also modeled using four reflective indicators. Recent ones are
not included in the structural model, but just shown as presented in blank quadrates (see the Figure
10).
First-order constructs.
Branding is the degree to which a user perceives that the mobile application integrates branding
appropriately, generally speaking whether the mobile application uses the brand’s colors or images.
In both mobile applications branding is presented well (see the pictures 3 and 4, 5 and 6) in the
meaning that the colors and firm-logo fit the colors and firm-logo used in the website of the
companies.
Picture 3: resto.ru – mobile aplication Picture 4: resto.ru- website

111
Picture 5: La fourchette –
mobile application
Picture 6: La fourchette – website
Data preservation is the degree to which a user perceives that the mobile application preserves data
automatically. Both applications have functions like your last booking, your last search etc, also in
the settings it’s possible to register and save the personal data (Picture 7 and 8). “Lafourchette” has
also a function to connect with facebook, what allows the user to save time by the registering, it is
also possible to skip this step and start to look for the restaurant establishment, but in this case the
data will be not conserved for further use.
Picture 7: Personal settings on the mobile application Resto

112
Picture 8: Personal settings on the mobile application Lafourchette
Instant start is the degree to which a user perceives that the mobile application starts instantly after
switching on it. Both applications need less than one second to start. But as we noticed before that
mobile application usability is not the same as mobile device usability the instant start can depend
on the model, inter alia, year of the devise and its operating system.
Orientation is the degree to which a user perceives that the mobile application displays information
well independent of whether the device is held horizontally or vertically. Both mobile applications
have ability to change orientation depending on the horizontally or vertically position. But
“Lafourchette” shows this ability only when the user regards the particular restaurant, on the main
page with the list of the restaurants this function is not available.
Collaboration is the degree to which a user perceives that the mobile application enables users to
connect with other individuals. Even if the website of resto.ru is designed as a social networks the
company hasn’t preserve this ability in the mobile application. “Lafourchette” has for example
function of leaving the reviews, what can be regarded as collaboration ability. In any cases as a part
of the tripadviser company, all the reviews the restaurant has on the tripadviser are shown on the
“Lafourchette” application.
Content relevance is the degree to which a user perceives that the mobile application focuses on the
most relevant content. On the assumption of the use context (searching and booking tables) both
applications focus only on contents connected with the restaurant issues.
Search is the degree to which a user perceives that the mobile application helps users to search for
information. In the mobile application “Resto.ru” the search function takes the priority place, also
the start page of the application consists only lines for searching. “Lafourchette” application uses
more advanced technology and functionality like bottom “around me”, what allows automatically
find the restaurant next door.
Aesthetic graphics is the degree to which a user perceives that the mobile application makes use of
aesthetic graphics. The first look at the both application gives the impression, that the mobile

113
application “Resto.ru” is very poor on the aesthetic graphics compared with “Lafourchette”.
“Resto.ru” has pictures and graphics only on the restarants’ pages, while “Lafourchette” uses more
advanced graphics through the whole application.
Realism is the degree to which a user perceives that the mobile application incorporates realistic
icons or pictures. Realistic pictures of the restaurants, dishes are presented in both mobile
applications.
Subtle animation is the degree to which a user perceives that the mobile application uses subtle
animation effectively. The mobile application “Resto.ru” has no animation. “Lafourchette” uses
videos, for example.
Control obviousness is the degree to which a user perceives that the mobile application deploys
controls that are immediately obvious. Unfortunately in the mobile application “Resto.ru” controls
are not obvious, even if the design and structure of the mobile application make impression of the
easy access to any information, to find out how to choose for example city of search is not obvious.
“Lafourchette” deploys obvious controls.
De-emphasis of user settings is the degree to which a user perceives that the mobile application de-
emphasizes user settings. “Resto.ru” has the same difficulty as for control obviousness, on the one
hand the mobile application is easy to use without personalization but at the same time the options
don’t provide primary functionality. “Lafourchette” is possible to use without personalized data (see
above).
Effort minimization is the degree to which a user perceives that the mobile application minimizes
the effort to input data. In general both applications minimize the efforts to input data.
Finger-size controls is the degree to which a user perceives that the mobile application deploys
finger-size controls. Both applications deploy finger-size controls.
Concise language is the degree to which a user perceives that the mobile application makes use of
concise language. Both mobile applications use the concise language well.
Standardized user-interface element is the degree to which a user perceives that the mobile
application deploys standardized user-interfaces that are commonly used by other mobile
application. Both mobile applications use the standardized user-interface elements, like search,
maps, booking.
User-centric terminology is the degree to which a user perceives that the mobile application deploys
user-centric terminology. No technical jargons are used in both mobile applications.
Logical path is the degree to which a user perceives that the mobile application presents
information logically and predictably. Mostly the information is presented logical and easy for users
to predict in both applications.

114
Top-to-bottom structure is the degree to which a user perceives that the mobile application displays
frequently used information on the top of the application. In the both mobile application the search
function is on the top position, what completely responds the task and use context.
This superficial analysis showed us availability of the different constructs in the mobile
applications, thus is important for the next step to choose the constructs which we can use
afterwards for our research model. The overall results of the comparison are indicated in the Table
9, where each of the first-order construct are estimated as “well presented”, “presented”, “poor
presented” for each mobile application.
Table 23: Comparison between lafourchete and resto usability
La Fourchette Resto.ru
well
presented
Presented poor
presented
Well
presented
presented poor
presented
Branding + +
Data preservation + +
Instant start + +
Orientation + +
Collaboration + +
Content relevance + +
Search + +
Aesthetic graphics + +
Realism + +
Subtle animation + +
Control obviousness + +
De-emphasis of user
settings
+ +
Effort minimization + +
Finger-size controls + +
Concise language + +
Standardized user-
interface element
+ +
User-centric terminology + +
Logical path + +
Top-to-bottom structure + +
Source: completed by author of the thesis based on the references
115
Second-order constructs:
Application design is the degree to which a user perceives that a mobile application is generally
designed well. Data preservation, instant start, orientation, and branding are proposed as first-order
constructs forming the design of the mobile application. And all of them are well presented or
presented in both mobile applications (see Table 10 above).
Application utility is defined as the degree to which a user perceives a mobile application generally
serves its purpose well. Content relevance, search, and collaboration are proposed as first-order
construct forming application utility of mobile applications. Search and collaboration are better
presented in “Lafourchette” application, than in “Resto” application.
User interface graphics is defined as the degree to which a user perceives a mobile application’s
user interface graphics to be effectively designed. Subtle animation, realism, and aesthetic graphics
are proposed as first-order constructs forming user interface graphics. “Resto” application has no
subtle animation and poor aesthetic graphics compared to “Lafourchette” application.
User interface input is the degree to which a user perceives that a mobile application allows easy
input of data. Finger-size controls, control obviousness, effort minimization, and de-emphasis of
user settings are proposed as first-order constructs forming user interface input. Except finger-size
controls the constructs are less presented in “Resto” application than in “Lafourchette”.
User interface output is the degree to which a user perceives that a mobile application presents
content effectively. User-centric terminology, concise language, short icon labeling, and
standardized user interface elements are proposed as first-order constructs forming user interface
output. All elements are well presented in both mobile applications.
User interface structure is the degree to which a user perceives that a mobile application is
structured effectively. Top-to-bottom structure ad logical path are proposed as first-order constructs
forming user interface structure. All elements are well presented in both mobile applications.
The structural model results showed 47 percent of the variance in continued intention to use mobile
application loyalty according to Venkatesh and Hoehle (2015). All second-order are significant and
three of them application design, application utility and user interface graphics displayed being the
strongest predictors. We already noticed that the interface graphics are poor presented in the mobile
application “Resto.ru”, thus to do fair comparison we need to keep equal elements of the usability.
In our case it will be application design and user interface structure to verify the mobile application
usability. We keep for the research model the constructs of the mobile application usability,
continued intention to use and mobile application loyalty, because they respond well the research
problem of this thesis.

116
I.7. Conclusion
In the Table 24 all the constructs are presented which are regarded as interesting for the future
model.
Table 24: Selected constructs of the technology’s use theories.
Construct Definition Theories Positive aspects Negative aspects Conclusion
1 Adopters Those who accept
innovation
Diffusion of
innovation
(Rogers)
The categorizing of
adopters gives the
marketer the possibility to
place products and
services.
In our case we can use
this concept, but not the
types of adopters. We
have professional and non
professional adopters.
The types of adopters
by Rogers are difficult
to predict, especially
in the mass market.
F.e. the user of the
mobile application are
eventually all users of
smartphone, who are
the early adopters of
one particular
application is not to
define.
Maybe
2 Decision
(adoption/
rejection)
A choice to adopt or reject
the innovation. Adoption is
a decision to make full use
of an innovation as the best
course of action available.
Rejection is a decision not
to adopt an innovation.
Diffusion of
innovation
(Rogers)
Rogers described decision
as one of the 5 steps in
technology adoption. The
decision is not the final
step, and after that the
person can also change
his/her decision.
In other theories this
step was replaced with
the behavioral
intention.
Not keeping
3 Attitude The individual’s positive or
negative feeling about
performing a behavior
TRA (M.
Fishbein, I.
Ajzen), TPB (I.
Ajzen),
TAM (Davis)
Attitude is expressing the
emotional aspect about
behavior (negative or
positive evaluation).
In later models has not
direct influence on the
intention or behavior,
is expressed through
others variables.
Not keeping
4 Intention The individual’s decision
about the use behavior
TRA (M.
Fishbein, I.
Ajzen), TPB (I.
Ajzen),
TAM (Davis),
TAM 2
(Venkatesh,
Davis), UTAUT
(Venkatesh et
al.), UTAUT2
(Venkatesh et
al.)
This construct is
presented in all models.
The two most
important construct for
our research have
direct impact on both
– intention and
behavior, so this
construct can be
removed in the future.
Maybe
5 Behavior,
or use
behavior
There is no exact definition
of behavior, or use
behavior: whether it is the
adoption, or
implementation, or usage.
TRA (M.
Fishbein, I.
Ajzen), TPB (I.
Ajzen),
TAM (Davis),
TAM 2
(Venkatesh,
Davis), UTAUT
(Venkatesh et
al.), UTAUT2
(Venkatesh et
al.)
This construct is
presented in all models.
Yes
6 Perceived
ease of use
The degree to which an
individual believes that
using a particular system
would be free of physical
and mental effort
TAM (Davis),
TAM 2
(Venkatesh,
Davis)
Important for the adoption
of the new technology.
More significant for the
professional use in our
case.
In general people have
habit to use mobile
applications, and
normally the
applications have
similar design, so this
variable is not
Not keeping

117
significant for our
research.
7 Image The degree to which use of
an innovation is perceived
to enhance one's status in
one's social system
TAM 2
(Venkatesh,
Davis)
Important for status in the
modern society – you use
the smartphone, you use
the mobile application,
you behavior in the
modern way.
The technology is not
new, so the image is
playing less significant
role for already known
technologies, than for
new.
Not keeping
8 Subjective
norm
An individual’s perception
of whether people important
to the individual think the
behaviors should be
performed
TRA (M.
Fishbein, I.
Ajzen), TAM 2
(Venkatesh,
Davis)
Important for professional
use
We will contact the
users and restaurants
who are already use
the mobile application.
And this construct is
important for the
period of
implementation.
Not keeping
9 Result
demonstra-
bility
Tangibility of the results of
using the innovation
TAM 2
(Venkatesh,
Davis)
Significant for the
professional use
In researched case
difficult to predict.
Not keeping
10 Perceived
usefulness
The degree to which an
individual believes that
using a particular system
would improve his/her job
performance
TAM 2
(Venkatesh,
Davis)
Significant for
professional use
The mobile
application in
restaurant sector is
used for leisure, so the
definition of this
construct makes it not
relevant for us.
Not keeping
11 Facilitating
conditions
The degree to which an
individual believes that an
organizational and technical
infrastructure exists to
support the use of a
particular system
UTAUT
(Venkatesh et
al.), UTAUT2
(Venkatesh et
al.)
Significant for both :
restaurant use and clients
use. The implementation
of the mobile application
replaces the traditional
relationships between
client and establishment.
The holder plays
significant role. Trust
becomes relevant.
In the models
(UTAUT and UTAUT
2) this construct is
moderated by
experience, meaning
that with time the
variable loses its
importance.
Yes
12 Hedonic
motivation
The fun or pleasure derived
from using a technology
UTAUT2
(Venkatesh et
al.)
Gives big push for the
application’s holder to
provide different
functions in the mobile
application, like sharing
pictures, leaving reviews
etc, so the user could have
fun, and come back to
application oftener.
Not relevant for
professional use, and
limited trough goals of
the individuals, f.e. the
goal is just to reserve
table, so hedonic
motivation is not
significant.
Maybe
13 Price value The monetary cost of
technology.
UTAUT2
(Venkatesh et
al.)
Decisive for
professionals. For
individual’s has no direct
meaning, can be
calculated as aggregated
benefits of discounts etc.
Researched mobile
applications are free
for download. But the
restaurants pay the
application’s holder to
have promotional
services.
Maybe
14 Habit The extent to which people
tend to perform behaviors
automatically because of
learning
UTAUT2
(Venkatesh et
al.)
The use of the mobile
application today is often
routine and habit. It is
important to see how this
construct influence on the
behavior concerning the
restaurants. E. g. do the
people use more such
kind of applications when
they travel or are in the
unknown place?
Yes
15 Mobile
application
usability
The extent to which a
mobile application can be
used by specified users to
achieve specified goals with
effectiveness, efficiency,
and satisfaction in a
Mobile
application
usability
(Venkatesh and
Ramesh, 2006).
Mobile application
usability plays important
role in the user’s decision
to continue the use of the
mobile application or not.
It also predicts the loyalty
As shown above the
mobile application we
are going to
investigate are not
equal in all elements
of the mobile
Yes

118
specified context of use of the users toward the
mobile application.
application usability.
16 Mobile
application
loyalty
Degree to which a user has
a deeply held commitment
to rebuy or repatronize a
mobile application.
Mobile
application
usability
(Venkatesh and
Hoehle, 2015
adapted from
Johnson et al.
2006)
Mobile application
loyalty can be the wished
outcome for the providers
of the mobile
applications, in this way
this construct plays
important role for
prediction of the user’s
behavior.
Yes
17 Continued
intention to
use
Degree to which a user feels
he/she will keep using a
mobile application.
Mobile
application
usability
(Venkatesh and
Hoehle, 2015
adapted from
Bhattacherjee
2001)
Continued intention to use
is the outcome, which can
explain the continued use
of the mobile application.
Yes
Source: completed by author of the thesis based on the references
Firstly, the concept of the adopters in Roger’s theory of diffusion was included in the list despite
the limitations of his definition and categorizing of adopters. We have two kinds of adopters –
professional and non-professional. This division is critical in our case, because not all of constructs
will work in the same way depending on who is adopting the mobile application. The Rogers
classification of adopters is not working in our model clearly, because the mobile application is
spread and adopted/rejected already.
The construct decision with both adoption and rejection of Roger’s model of stages in the
innovation-decision process were also kept for the future research model, but actually the construct
of intention of later models has replaced it. So we can exclude it out of our list.
Then the variables of attitude, intention and behavior were taken from the TRA and TPB. So the
implementation of the mobile application by the restaurant (behavior) depends on the aim
(intention) to change the business model resulted out the positive or negative evaluation (attitude)
of this business model. The use of the mobile application by individual (behavior) depends on the
desire (intention) to enjoy the advantages provided by this technology resulted out the positive or
negative evaluation (attitude) of this advantages. Attitude showed no significant influence in late
models and was replaced by more convenient constructs, so we will not keep it in our list.
In the following the models which are better related to the technologies, were reviewed. The use of
the mobile application is not just action or behavior; it is behavior performing the use of
technology. Variable of TAM perceived ease of use was added to our range of constructs, because
it describes the use of mobile application from the technological point of view. Since the TAM2 has
a basement of TAM, we preserved perceived ease of use and found of interest also image,
subjective norm and result demonstrability, as well as perceived usefulness. In ensuing researches
this construct were modified or lost their importance. So, image, subjective norm or social influence

119
(UTAUT/UTAUT2) are moderated by experience, but in case of the mobile application’s use are
not significant, because we admit, that the investigated mobile application is not the very first
mobile application used by the users, so the users feel confident to use such technology in general.
The effort and performance expectancy are typical for the professional use, but less important for
the individual use in the mobile application context. Facilitating conditions and habit moderated
by age might be significant for the mobile application use, so the younger people have stronger
habit to use mobile application in any context. Normally the user before they have habit to use
technology should trust this technology, and for that they should believe that some organization is
behind to support them.
All at all we keep by now three technological constructs for sure: use behavior, facilitating
conditions, and habit (see Table 11), but some of the constructs are still under the question, like
adopters, hedonic motivation, price value.
And finally the structural model of the mobile application usability was regarded. Mobile
application usability is considered as a predictor of the mobile application loyalty and continued
intention to use, the both can be viewed as wished outcomes for the mobile application provider and
explain the behavior of the users. We keep mobile application usability, mobile application loyalty,
and continued intention to use for the research model. In the next chapter the concept of loyalty
will be presented as an important part of the Relationship marketing.
II. Relationship marketing
The usage of mobile application, which contains the services of many restaurants and is used by
final customer, involves three actors. Firstly the application holder or provider builds up the
relationship with the restaurants or b2b relationship, where the exchange of mutually profitable
services takes place. The restaurants benefits in this case are connected however with the customers,
or the final users of the mobile application, that means appearance of the Individual-to-firm
relationship. Moreover, the application holder obtains the control over the data base of all final
users of application, and also develops the Individual-to-firm relationships. The use of technology,
mobile application, seems also to be not fully voluntary for both, but settled and ruled by provider.

120
Figure 15: Relationship <holder – restaurant – user> in use of the mobile application
Source: completed by author of the thesis based on the references
Traditional relationship has direct relation between customer and restaurant with mutual goals:
a) Customer wants to get service of providing food and beverage,
b) Restaurant wants to be chosen by customer for providing this service. We can describe
traditional steps of building relationship:
- Choice. Customer chooses the restaurant establishment often with help of WOM (word of
mouth), in other words with help of recommendation of important referents: friends, family
members; or advertising, when the restaurant establishment uses marketing tools to attract
customers.
- Taking in contact. In general customer can book the table in advance or not, he/she can call
in the restaurant to get know more details about menu, payments, happy hours or not etc.
- Service by itself.
- Feedback. After visiting the restaurant establishment customer participates more or less in
further marketing of the restaurant, so he/she can recommend/criticize the establishment to
his/her friends, family members, colleagues and other producing WOM; he/she can become
the loyal client thank to the loyalty program of the restaurant establishment etc.
In traditional relationship the marketing strategy of the restaurant establishment is of high
importance in all steps and demands efforts and financial investments. And sometime there are
difficulties to control the results of marketing activities for example on the step of feedback, when
the management of the restaurant can learn about non satisfaction of the client only occasionally or
many weeks and months after.
The technology of the interactive mobile application changed traditional relationship with
advantages and disadvantages for both parties. And what is important also, it brought third party in
the relationship – the holder of the mobile application, who plays the role of intermediary between
restaurant and client.
If we go back to the steps, we can see the changes (we assume that the customer is the user of
mobile application):
121
- Choice. Even if the customer learns about the restaurant establishment from his/her
important referents, the user of mobile application is checking the information on the mobile
application: reviews, rating, discounts, menus etc. The given information can change his/her
opinion to go into this or that restaurant or not.
- Taking contact. This step is eliminated completely (except some specific cases), because the
user can book table, get all kind of necessary information, and even pay with help of mobile
application.
- Service by itself. This step is the only one which stays not changeable in the relationship.
- Feedback. The mobile application gives the user possibility to leave reviews, pictures, share
information in social networks, check in (to show other users the visiting of the restaurant
establishment). On the one side, this possibility makes the user more active about his/her
experience with the restaurant (to share good impression or to criticize), on the other hand, it
gives the management of the restaurant control over the feedback – to get better rating, to
apologize in the bad situations and change the opinion of the client, to make changes in the
menu, service staff etc.
The interest of the restaurant is to develop the loyalty of the customer to its particular
establishment; the task of the provider is to develop the loyalty of each establishment included in
the mobile application and also to develop loyalty of the customer to its particular mobile
application. Consequently both are facing a new paradigm, which is the best way to explain with
the concept of relationships marketing.
Relationship Marketing is particularly relevant in a services context. Services are based on
interactive marketing, and, therefore, direct contact is necessary (Bitner, 1995, Gronroos, 2004,
2011, Wilson, Zeithaml, Bitner, Gremler, 2012). In fact, services marketing was the discipline that
first introduced Relationship Marketing in the 1970s after debates that the marketing mix was
insufficient for services (Möller and Halinen, 2000, Möller, 2013) requiring more interactive
processes. Customers view their perceptions of quality on the basis of satisfaction with their
relationship (Berry and Parasuram, 1993, Möller and Halinen, 2000, Ryu, Lee, Gon Kim, 2012,
Möller, 2013), again underlining the importance of Relationship Marketing. In services, customers
are active participants in the interaction, and trust and commitment are required constructs (Morgan
and Hunt, 1994, Aurier, N’Goala, 2010, Vivek, Beatty, Morgan, 2012).
The researched relationships between provider, restaurant and user of mobile application present the
interaction in which the key-products are services, but the use of technology eliminates the direct
contact entirely or partly. Not only technological aspect impacts the examined case, also culture
affects the relationships. Following issues of the Relationship Marketing Theory are discussed to
be used in the research model:

122
- Definition and roots of RM
- The Commitment-Trust theory of RM
- Interfirm RM
- Interpersonal RM
- Multi-level exchange Relationships in RM
- RM and information technology.
Technology changes the relationship between client and seller. On the plus side it simplifies the
access to products and services, as well as it simplifies for the seller attracting more clients; on the
minus side it eliminates the personal contact between seller and client, what can lead in the lack of
trust and loyalty as consequences. This influence we are going to investigate in our research.
II.1. Definition
Relationships marketing emerged as marketing discipline during the 1990s. The aspect of long-term
relationships with customers became of importance in mainstream marketing management and was
pointed out by several researchers (Christopher et al 1991, Ford, 1990, Gronroos, 1994, Parvatyar and
Shath 1997, Gronroos, 2011, Hall, Timothy, Duval, 2012 etc).
The domain that deals with “relationships,” termed relationship marketing and often attributed to
Berry (1983), has been defined in many different ways by researchers from various research
perspectives.
However three key aspects appear in all most significant definitions (e.g., Gronroos 1997, 2011;
Sheth and Parvatiyar, 2000).
The first aspect deals with stages of the relationship lifecycle. Relationships are regarded as dynamic
processes that develop over time through typical stages (Dwyer and Oh 1987, Wilson 1995, Park,
Kim, Kim, 2011).
The second key aspect deals with the target or the field of relationship marketing. Relationships can
be evaluated between individuals (person-to-person, interpersonal), between an individual and a
firm or group of people (person-to-firm, firm-to-person), and between firms (firm-to-firm,
interfirm).
The third aspect describes the benefits derived from relationship marketing activities. In other
words, does the success of relationship marketing efforts depend only on the perspective of the
implementer (e.g., seller), or must both parties’ outcomes be evaluated? In practice, relationship mar-
keting needs to generate benefits for both parties, even if one party’s benefit is limited to social
rewards, to achieve the implementers’ long-term performance objectives.
Integrating these three aspects results in the following definition:

123
Relationship marketing (RM) is the process of identifying, developing, maintaining, and terminating
relational exchanges with the purpose of enhancing performance. (Palmatier, 2008,).
Researchers from different disciplines have studied the impact of relationship on the individual’s
behavior. Many of these disciplines take central positions in the development of relationship
marketing.
The roots of marketing as well as relationship marketing are to find firstly in trade relationship.
Moller and Halinen (Moller and Halinen, 2000, Moller, 2013) proposed to regard the current
discussion of relationship marketing in four traditions: business marketing, marketing channels,
services marketing, database marketing, and direct marketing.
The database marketing and direct marketing tradition is best characterized as a practice. The
organization-customer relationship perspective is limited. Relationships are seen as long-term, but
efforts to develop their dynamism are restricted. The focus is on keeping customer loyal and
profitable in an efficient way (Moller and Halinen, 2000, Moller, 2013).
The service marketing tradition regards the relationship between individual consumer and the
service company personal. The service marketing is focused on service encounters and service
quality. Relationships are viewed primary from the point of management. The tradition paid little
attention to the context of relationship.
The marketing channels tradition centralizes on business relationships, and on economic exchange.
And finally, network tradition of business markets aims firstly at understanding and explaining
interaction behavior in a network context, secondly it attempts to explain the development of nets
relationships between actors, and thirdly it researches the development of markets from the
networks perspective. The analysis of the roots of relationship marketing makes clear two general
tractions, consumer-related and organizations-related one.
II.2. The Commitment-Trust theory of RM
The Commitment-Trust Theory of Relationship Marketing by Morgan and Hunt (1994) is one of
the most influential in Relationship Marketing. They theorized that “presence of relationship
commitment and trust is central to successful relationship marketing” (Morgan and Hunt, 1994).
This central role of commitment and trust is caused by the behavior of the marketer. Commitment
and trust encourage the marketer:
a) to work at preserving relationship investments by cooperating with exchange partner;
b) to resist attractive short-term alternatives in favor of the expected long-term benefits of
staying with existing partners;

124
c) to view potentially high risk actions as being prudent because of the belief that their partners
will not act opportunistically.
Therefore when both commitment and trust are presented they produce outcomes that promote
efficiency, productivity, and effectiveness.
Morgan and Hunt construed their framework as the key mediating variable (KMV) model of
relationship marketing (Figure 16).
Because relationship commitment and trust are the key constructs, they play the role of the
mediating variables between five important antecedents (relationship termination cost, relationship
benefits, shared values, communication, and opportunistic behavior) and five outcomes
(acquiescence, propensity to leave, cooperation, functional conflict, and decision-making
uncertainty).
Figure 16: The KMV Model of RM
Source: Morgan and Hunt, 1994
Relationship Commitment is defined as “an exchange partner believing that an ongoing relationship
with another is so important as to warrant maximum efforts at maintaining it” (Morgan and Hunt,
1994). In other words, the committed parties believe that the relationship is worth working on to
ensure that it endures indefinitely.
So, the mobile application holder believes that relationships with the user and restaurant are
important; therefore, for example, such services can be provided for free like technical support or
call center, or loyalty cards for users etc. At the same time the restaurant prefers to implement the
new system (mobile application) to be competitive and to win new clients.
Morgan and Hunt proposed that relationship commitment is central to relationship marketing.
Commitment has been long central in the social literature. Commitment also is viewed as critical in
the literatures of organizational and buyer behavior. Specific and important for this thesis is also the
concept of commitment regarded in the services relationship marketing, because the investigated

125
technology is implemented in the restaurant business, where the services play the most important
role. So, Berry and Parasuraman (1991) underlined that “relationships are built on the foundation
of mutual commitment”.
The commitment between mobile application holder and restaurant might be easy purchasing of the
advertising services; the commitment between mobile application holder and final user might be the
trustworthy information about all restaurant establishments. And finally the commitment between
restaurant and the user of mobile application consists not only in expected services (food and
beverage), but also adequacy of this services to the information received in the mobile application.
Trust. The second key variable of the Commitment-Trust theory is defined as “confidence in an
exchange partner’s reliability and integrity” (Morgan and Hunt, 1994, Chenet, Dagger, O'Sullivan,
2010, Gummesson, 2011, Vivek, Beatty, Morgan, 2012).
Like commitment, trust also has been studied in the social exchange literature. For example in
organizational behavior the study of norms of trust is considered a characteristic distinguishing
management theory from organizational economics. In services marketing Berry and Parasuraman
(1991) found that “customer-company relationships require trust. Effective service marketing
depends on the management of trust because the customer typically must buy a service before
experiencing it”.
For our research trust is of high importance. First, developed trust about the mobile application
expends also to the restaurants included in the mobile application (the user trust that the reviews are
fair, the rating is independent). And conversely the user can lose trust about the restaurant in case of
false information on the mobile application, or he/she can lose trust about the application in case of
false services received in the restaurant (f.e. the mobile application promises the discount for the
visit of the restaurant, but the restaurant refuses to give this discount; or the mobile application can
contain fake restaurant establishments, wrong addresses etc.). The complexity of trust is added
through technology. The person should not only trust the company like restaurant, it should also
trust the technology. As we discussed previously UTAUT2 model has the construct, facilitating
conditions, which says that the individuals might tend to believe in the technology if he/ she is sure
that the real company or person is behind this technology. In our case the mobile application holder
provides technical support for both: restaurant establishment, as well as for the final users.
So, trust is the first important variables of Relationship Marketing, which is to use in our future
model.
Trust impacts the relationship commitment directly, that is the committed parties with high level of
trust to each other will also commit themselves to such relationship. So Morgan and Hunt (1994)
theorized that trust is the main determinant of relationship commitment.

126
Morgan and Hunt (1994) indentified five antecedents of commitment and trust. They theorized that
a) relationship termination costs and relationship benefits directly influence the relationship
commitment, b) shared values impact both commitment and trust, c) communication and
opportunistic behavior directly influence trust and through trust indirectly influence on the
commitment ( because trust is the main determinant of the commitment).
Relationship termination costs. An assumption in the relationship marketing, that a terminated party
will seek an alternative relationship and have “switching cost”, which lead to dependence. For
example, the restaurant decided to use mobile application should to implement additional counting
system, or modify its own, or to do training for the personal etc; at the moment the restaurant
management decides to change the service provider, or to refuse the further use of the mobile
application it will have switching costs, for example for new software, new trainings etc. Even if the
management decided not to use another application, the spending which were already paid, would
be lost. On the contrary the user of the mobile application has no dependence on the mobile
application obviously. He/she can lose discount points, but it cannot be decisive.
Relationship benefits. In global market place the competition requires that firms often add
additional services, products, technologies, so it could add value to their own offerings. In other
words, the partners that deliver superior benefits will be highly valued; firms will commit
themselves to establishing, developing, and maintaining relationships with those partners. So the
restaurant establishment, which uses the mobile application, provides its client additional services
like online-booking, or online- payment etc. Probably the lack of such services is critically for some
of the users.
Shared value is “the extent to which partners have beliefs in common about what behaviors, goals,
and policies are important or unimportant, appropriate or inappropriate, and right or wrong”
(Morgan and Hunt, 1994). This concept is the only one that is consolidated to have direct impact on
both – commitment and trust (Porter, Hill, Pfitzer, Patscheke, Hawkins, 2011). The restaurant
manager will choose the mobile application holder that shares the same values to build long-term
relationship. Also the user will choose between several similar applications the one which
represents the values relevant for the user. For example, the traveler will choose probably rather the
application with advises from other travelers, the gourmet will choose mobile application with
reviews done by the restaurant critiques etc.
Communication. The main antecedent of trust is the communication, defined as “the formal as well
as informal sharing of meaningful and timely information between firms” (Anderson and Narus,
1990), of course not only between two firms, but between all participants of the relationship (Light,
McNaughton, 2014). Frequent and of high quality communication will result in the great trust.
Seldom and weak communication will result respectively in the lack of trust. In our case, the

127
traditional communication between restaurant establishments and customers is replaced by the
mobile application and communication leads in the updated information, perfectly organized
communication technologies, like online profile messages, SMS, or other way of information
exchanges.
Opportunistic behavior is defined as “self-seeking with guile” in the transaction cost analysis
literature (Williamson, 1975, Moeller, 2010). So, Morgan and Hunt theorized that believing that a
partner engages in opportunistic behavior will lead to decrease of trust. This variable influences also
the relation commitment but not directly, trust decreases because of opportunistic behavior of one
partner and after that the relationship commitment decreases as well. Using the mobile application
in the restaurant, we can imagine such situation, that the client of the restaurant, who is the user of
the mobile application, can ask for the discount, promoted in the application, but the restaurant
refuses that discount with any reason, in this case a) customer will not trust and probably stop to use
the application, if he/she just started to use it; 2) he/she will not trust this restaurant, if he/she used
the application many times and this service worked well before.
We will not use the antecedents in our model, but they are important for understanding of the
concept of trust and commitment.
Morgan and Hunt (1994) have chosen five qualitative outcomes, which promote the relationship
marketing success. They theorized that acquiescence and propensity to leave directly go out of
relationship commitment, functional conflict uncertainty are direct result of trust, and cooperation
arises directly from both relationship commitment and trust.
Acquiescence is “the degree to which a partner accepts or adheres to another’s specific requests or
policies (Morgan and Hunt, 1994). Acquiescence is influenced directly by relationship commitment
and through that by trust.
If we take the relationship commitment between restaurant and user: the restaurant is implementing
the mobile application to give the client the possibility to use its services etc. In this relationship
commitment, the restaurant makes more effort to build the relationship, than the client, so the
restaurant is acquiescent to the requests of the client. In the relationship between restaurant and
application holder the more acquiescent is the application holder, who is interested in the restaurant
as in a client.
Propensity to leave is the perceived likelihood that a partner will terminate the relationship in the
(reasonably) near future (Bluedorn, 1982, Bande, Fernández-Ferrín, Varela, Jaramillo, 2015).
Strong relationship commitment will minimize the risk that the partner will leave. In our case the
mobile application holder cannot control over the mobile application user, they can easily download
application, but also easily delete it from their smart phones. This outcome is fair only for B2B
relationship.

128
Cooperation refers to situation in which parties work together to achieve mutual goals (Anderson
and Narus, 1990, Marwell, Schmitt, 2013). Cooperation is the only one outcome influenced directly
by both relationship commitment and trust. A partner committed to the relationship will cooperate
with another member because of a desire to make the relationships work. After trust is established
in the relationships, both parties make efforts to succeed in the work together. Mobile application
holder build the relationship with the restaurant management, both parties have the goal to have as
much as possible of the final user of application: the restaurant will improve in this way the client’s
loyalty, for example, the holder will increase the number of downloads.
Functional conflict is relational disagreement which can be resolved amicable. Such conflicts
prevent stagnation, stimulate interest and curiosity. Functional conflicts may increase productivity
in relationship marketing (Gummesson, 2011). For the mobile application holder all kind of
feedback from the users can be functional conflict, because it will stimulate the technical
development of the application.
Decision-making uncertainty refers to the extent to which a partner (Edwards, 1954, Morgan and
Hunt, 1994, Hastie, Dawes, 2010, Polasky, Carpenter, Folke, Keeler2011):
a) has enough information to make key decision (f.e. to choose the restaurant inside of the
mobile application, the user has the prices, the addresses, the information about cuisine,
chef, discounts etc),
b) can predict the consequences of those decision (if the user has chosen the Chinese
restaurant he/she will not expect the pizzeria)
c) has confidence in those decisions (the user is sure that the application provides the correct
information, so he/she trusts the mobile application).
Trust decreases a partner’s decision-making uncertainty. So it is not necessary for the user of the
mobile application to check all the information he/she found about this or that restaurant on the
mobile application, after he/she confirmed his/her trust to this technology.
The described outcomes are important for this thesis because they show us significance of the trust
and commitment in the Relationship Marketing.
The Commitment-Trust theory of Relationship Marketing gives us the very important constructs for
our future model trust and commitment. The concept of trust has connection with technological
construct of facilitating condition which was chosen for our future research model. To understand
the role of both (trust and commitment) in the relationship between mobile application holder, user
and restaurant the regarding of interfirm and interpersonal relationship marketing theories is
needed.

129
Table 25: Adaptation of the Commitment-Trust theory of RM for the mobile application’s use.
Construct Antecedents Mobile application’s use Outcomes Mobile
application’s use
Relationship
commitment
Relationship
termination
costs
Important for professional
use.
Acquiescence The restaurant is
acquiescent to the request
of the client normally in
higher degree than vice
versa.
Relationship
benefits
The sum of all relative
advantages received from
the use of mobile
application.
Propensity to
leave
Important for the b2b
relationship, in our case
between provider and
restaurant. But actually,
also if the client stops the
use of mobile application,
he/she can stay the client of
the restaurant.
Relationship
commitment and Trust
Shared values For the user influence the
choice of the mobile
application, according to
the point of view
(traveling, discounts, and
critics).
Cooperation Provider and restaurant
manager work together to
attract clients; that is their
mutual goal.
Trust Communication The communication
between the restaurant and
client is replaced by the
mobile application, what
can influence significant
the trust between them.
Functional
conflict
The mobile application has
wide range of tools to
collect feedback from the
final users, as well as from
the restaurants.
Opportunistic
behavior
This antecedent influences
the trust to the mobile
application as a
technology also, the user
can ask, whether such
technology can provide the
real information and real
services in case of
opportunistic behavior f.e.
of restaurant personal. .
Uncertainty Uncertainty has significant
influence on the trust to the
mobile application.
Source: completed by author of the thesis based on the references

130
II.3. Interfirm Relationship Marketing Theory
Theory of interfirm relationship marketing investigates multiple interactions among people, or
network of relationships. Thus are in the area of network-based relationship marketing. The
network perspective introduces the fact, that not only relationship quality (trust and commitment)
influences on the exchange performance but also, relationship breadth (network density) and
relationship composition (network diversity/attractiveness). Integrating the network theory develops
an interfirm-specific RM framework (Palmatier, 2008).
Figure 17: Model of Interfirm Relationship Marketing,
Source : Palmatier, 2008
Seller’s RM activities consist of three principal drivers of RM effectiveness: relationship breadth,
quality and composition. Each of these drivers expresses a different and important aspect of
interfirm relationships and has a positive impact on the seller’s performance outcomes.
Relationship quality equalizes the concepts of the strength in the network theory. According to prior
research (Crosby, Evans, and Cowles 1990, Kumar, Sheer, and Steenkamp 1995, Rauyruen, Miller,
2007, Gummesson, 2011), the construct of relationship quality contains the interaction
characteristics required to create a strong relational bond, such as commitment, trust, reciprocity
norms, and exchange efficiency. So, commitment represents exchange partner’s desire to keep
valued relationships and thus their relational motivation toward partners. Trust generates confidence
in the partner’s future actions and supports cooperation. Reciprocity norms have pervasive impacts
on exchange behavior. Exchange efficiency enhances exchange performance. Basically, relationship
quality affects positively relationships performance.
In the researched case the interfirm relationship is created between restaurant establishment and
mobile application holder. In general the restaurant establishment pays for the services of mobile
application such as subscribed program of advertising, call-center or online-service of table-booking
(commitment), so the restaurant management expects high quality service, which can mean updated
information, true ratings etc (trust), and mobile application holder expects regular renewal of the

131
contract in case of satisfaction (reciprocity norms). And both are interested in the big amount of
mobile application users (exchange efficiency).
Relationship breadth represents the number of relational bonds with an exchange partner.
Interorganisational relationships with many interpersonal connections can uncover key information;
find profit – increasing opportunities, and resist destruction of individuals bond (like
reorganizations). Additionally, relationship breadth reflects the network concepts of network
density and degree centrality (Houston et al. 2004, Mende, Bolton, Bitner, 2013). Networks
interconnections positively affect cooperation, knowledge transfer, and communication efficiency.
In other words, a seller and customer with more interpersonal connections (i.e. breadth) enjoy better
access to information and sales opportunities and less disruption when contact personnel turnover,
which then results in increased exchange performance (Palmatier, 2008, Samaha, Palmatier, Dant,
2011).
Normally the exchange between restaurant establishment and mobile application holder takes place
through sales personal of the mobile application company and restaurant management. Often the
restaurant establishment has no marketing manager; these functions are in the responsibility of the
general manager, or sometimes the owner of the restaurant. In big restaurants or in restaurants
chains there are also specialists in marketing. So the mobile application company should adopt its
work with different kind of people, and try to have many different contacts to build strong network.
For example, the restaurant manager can change the establishment, so the new relationship with
another restaurant can be created through this person. Or the owner of one restaurant can open
another one and stay loyal to this mobile application company.
Relationship Composition refers to the decision making capability of relational contacts (Beck,
Palmatier, 2012). A portfolio with different and authoritative contacts increases a seller’s ability to
effect change in customer organization. This driver has similar meaning that relationship breadth.
So for the mobile application company is important to know all key people in the restaurant, or
restaurant chain.
Relationship breadth and composition may correlate positively, since is all else is equal, sellers with
more contacts have diverse contacts. These constructs may diverge if seller has many homogeneous
contacts or only few different (Beck, Palmatier, 2012).
Each of these three relational drivers represents different aspects of interferm relationships. All
together they reinforce one another and promote optimum relationships value.
Relationship strength identifies the interaction between relationship quality and relationship breadth.
The ability of interorganizational relationships to confront stress and conflict, as well as multiple
high quality rational bonds result in strong, resilient relationships (Palmatier, 2008, Samaha,
Palmatier, Dant, 2011). The interdependence between relationship quality and breadth works in the

132
way that many depthless contacts (greater breadth, low quality) protect weakly against stress of a
service failure. For examples, the mobile application company can have in its data base all the
contacts of the restaurant establishment, but the key people don’t trust the services of its particular
company or the technology in general, so in case of any technical problem (like false table-booking)
the restaurant establishment can close the contract.
Similarly, a single high-quality contact (high quality, low breadth) will not support the seller and
cannot influence a decision making group. The restaurant manager can be loyal to the mobile
application company, but if he/she has weak influence on the decision (sometimes the owner decide
about all financial investments), the company cannot create long term relationship till it has contact
with another person.
In contrast multiple high quality contacts (greater breadth and high quality) experience both rational
motivation (commitment, norms of reciprocity) and confidence (trust), and therefore support the
seller. The goal of the sales personal of the mobile application holder is to find for each restaurant
establishments the multiple contacts and build high quality relationships with them.
Relationship efficacy or interaction of relationship quality and composition captures an
interorganizational relation’s ability to achieve desired objectives. The seller can accomplish well
their selling strategies having high quality bonds and well structured contact composition.
Combination of high composition (a seller possess good contacts portfolio with key decision
makers) and low quality (weak interpersonal bonds) can result in the lack of information and
reciprocity debts. Relationship composition reflects the ability of seller’s contacts to establish
change; only high quality relationships can turn this potential into reality and enable the seller to
achieve its goals (Anderson and Narus 1991, Morgan and Hunt 1994, Palmatier, 2008, Samaha,
Palmatier, Dant, 2011, Beck, Palmatier, 2012). So, having all key people of the restaurant
establishment in data base only is not enough, if no one of these contacts is loyal to the propose of
the mobile application company.
Contrariwise, high quality contacts restricted to one functional area cannot allow the seller to
promote customer change (low relationships composition, high relationship quality). As said
before, sometimes the restaurant manager is not only one person who can decide about the
marketing budget, so the proposal of the mobile application company can stay without response.
Relationships efficacy positively affects seller performance outcomes.
The model clarifies that not only relationship quality but also two other drivers impact the interfirm
relationships on performance. It also shows the increased effect of the interaction of these drivers.
This model describes well the relationship between restaurant establishment and mobile application
holder, but it useless regarding the mobile application user. In general these relationships are
“simple” relationships between two companies about advertising/marketing services for the

133
restaurant. Nevertheless it is important for our research to see the place and role of trust and
commitment inside of this relationship.
Table 26: Adaptation of Interfirm Relationship Marketing theory for the mobile application’s use.
Construct Definition Mobile application’s use
Relationship quality Relationship quality contains the interaction
characteristics required to create a strong
relational bond, such as commitment, trust,
reciprocity norms, and exchange efficiency.
In general the restaurant establishment
pays for the services of mobile
application such as subscribed program
of advertising, call-center or online-
service of table-booking (commitment),
so the restaurant management expect
high quality service, which can mean
updated information, true ratings etc
(trust), and mobile application holder
expect regular renewal of the contract
in case of satisfaction (reciprocity
norms). And both are interested in the
big amount of mobile application users
(exchange efficiency).
Relationship breadth The number of relational bonds with an
exchange partner.
Normally the exchange between
restaurant establishment and mobile
application holder takes place through
sales personal of the mobile application
company and restaurant management.
Relationship Composition The decision making capability of relational
contacts.
For the mobile application company is
important to know all key people in the
restaurant, or restaurant chain.
Relationship strength The interaction between relationship quality
and relationship breadth.
The goal of the sales personal of the
mobile application holder is to find for
each restaurant establishments the
multiple contacts and build high quality
relationships with them.
Relationship efficacy Interaction of relationship quality and
composition.
Having all key people of the restaurant
establishment in data base only is not
enough, if no one of these contacts is
loyal to the propose of the mobile
application company.
Source: completed by author of the thesis based on the references

134
II.4. Interpersonal Relationship Marketing Theory
Most theoretical and empirical RM research relies on models of interfirm relationships, which then
extend to interpersonal or consumer research to suggest that the effects of RM on performance
depend on combination of trust and commitment (Grosby, Evans, and Cowles 1990, De Wulf,
Odekerken-Schröder, and Iacobucci 2001, Garbarino and Jonson 1999, Sirderschmukh. Singh, and
Sabol 2002, Palmatier, 2008, Samaha, Palmatier, Dant, 2011, Beck, Palmatier, 2012).
Interpersonal trust and commitment mediate interpersonal relationships as they do interfirm
relationships, but the explanation of interpersonal RM effectiveness must include other constructs
namely gratitude and norms of reciprocity (Palmatier 2008). At the same time relationship breadth
and composition become less important in interpersonal relationships (Figure 13).
We have already discussed in details the concepts of trust and commitment, so other constructs of
the model of Interpersonal Relationship Marketing are regarded to see their significance for our
research.
Figure 18: Model of Interpersonal Relationship Marketing
Source: Palmatier, 2008
Consumer gratitude. Retailing research say, consumers satisfy their obligation to sales personal by
purchasing (Dahl, Honea, and Manchnda 2005), which means the seller investment in RM makes
consumers feel grateful, which then stimulates them to participate in behaviors that improve sellers
performance (Palmatier, 2008, Beck, Palmatier, 2012). The constructs of commitment and trust
cannot be separated from the concept of gratitude, which positively influences judgments of trust.
Consumer gratitude increases short-term consumer purchasing behavior and also assists consumer
trust and reciprocity norms with long-term effects (Palmatier, 2008, Thomas, Skinner, 2010,
Samaha, Palmatier, Dant, 2011, Beck, Palmatier, 2012). In other words, gratitude represents
“starting mechanism” that influences social behavior as long as emotion lasts and then extends to

135
longer-term effects because it “builds the relationship” (Bartlett and De Steno, 2006) by stimulating
norms of reciprocity in consumer’s mind. Consumer’s gratitude increases RM performance in three
main ways:
(1) consumers purchase to satisfy their feeling of obligation, responding to RM –actuated feelings
of gratitude (Halinen, 2012).
The loyal client will visit the same restaurant especially if he/she has built already personal contact
with waiter, bartender, chef-cook or owner of the establishment, or with all. Feeling of obligation
will not allow him/her to change this establishment till the relationship stay stable.
(2) due to gratitude, the consumer trust and commitment increase and in this way relational
performance outcomes enhance (Raggio et al., 2014). Client of the restaurant can return to the
restaurant and become the loyal client if the personal of the restaurant establishment treat the clients
very welcomed, giving him/her the loyalty card with discount or free meal after several visits or
other propose etc.
(3) gratitude assists the development of norms of reciprocity over longer term and starts a
reciprocation cycle, which has long-term effects on consumer behaviors (Halinen, 2012). Loyal
client will not only return to the restaurant again and again, he/she will recommend it to all his/her
friends, family members, colleagues or random people occasionally. In return of his loyalty the
personal of the restaurant will try to propose a little bit more than just good food, like to keep the
favorite table for the client, to give small snacks/drinks for free, to inform about new menu etc.
Consumer norms of reciprocity. Various studies in different contexts support the importance of
reciprocity norms in decision process (Samaha, Palmatier, Dant, 2011, Halinen, 2012, Beck,
Palmatier, 2012). Norms of reciprocity are effective in RM context because consumer gratitude
increases responding to RM triggers, and thus it enforces the influence of norms on purchasing
decision. Consumers norm of reciprocity have long-term, positive effect on consumer purchasing
behavior that makes them important for success of RM activities (Beck, Palmatier, 2012).
As given in the example above, client’s gratitude develops the norm of reciprocity. What is
important to underline the client of the restaurant will expect some return from the restaurant, like if
he/she is visiting the establishment regular so he/she will expect to be recognized, for example, or
to get loyal card, etc. At the same time the breakdown of these norms from the side of the restaurant
leads probably in the rejection to visit the restaurant in the future.
The model of interpersonal RM integrates gratitude from psychology and norms of reciprocity from
sociology to present a framework in which two other relational drivers other than trust and
commitment influence performance (Palmatier, 2008, Halinen, 2012). Consumers’ gratitude and
norms of reciprocity take central role in interpersonal RM and help to explain the strong empirical
and managerial support for the impact of interpersonal relationships on the decision making.

136
The Model of Interpersonal Relationship Marketing theory is useful only for the relationship
between restaurant establishment and client and loses importance in the context of mobile
application use. Anyway it shows the role of trust and commitment and their influence on this
relationship.
Table 27: Adaptation of Interpersonal Relationship Marketing theory for the mobile application’s use.
Construct Definition Mobile application’s use
Consumer Commitment
and Trust
Consumer commitment is belief that an
ongoing relationship with seller is enough
important to participate in behaviors that
improve sellers performance. Consumer
trust is confidence in a seller’s reliability and
integrity.
Commitment of the restaurant’s client
makes him/her leave reviews about the
restaurant on the mobile application, or
grade it because client believes that it
can improve the relationship.
Restaurant’s client trusts the mobile
application as technology.
Consumer gratitude Obligation of consumer to sales personal by
purchasing.
Since the mobile application replaces
the personal contact on the first step in
the relationship between restaurant and
client, such tools as discounts or happy
hours can create the consumer
gratitude, but the long-term relationship
needs to have personal contact
according to the interpersonal RM
theory.
Consumer norms of
reciprocity
The concept in the sociology saying that one
should help those who have helped him/her
in the past and retaliate against those who
have been detrimental to his/her interests.
Such performances of client as leaving
reviews, or grading on the mobile
application represent the consumer
norms of reciprocity.
Source: completed by author of the thesis based on the references
II.5. Multilevel relationships.
The model of interfirm RM is described through relational quality (trust, commitment), breadth, and
composition. But each interfirm connection represents an interpersonal match, so the model of
interfirm relationship could be extend by integrating gratitude and reciprocity into a multilevel RM
model.
Relationships often develop and operate at multiple levels within one exchange (Figure 19).

137
Figure 19: Multi-level exchange relationships
Source: Palmatier, 2008
For example, firm 1 is a provider of mobile application, firm 2 is a restaurant. The two firms firstly
have interfirm relationships, the provider firm can develop specific relationships with the owner or
manager of the restaurant, having the person in the data base of loyal clients no matter if the
establishment by its self works or the manager changes the work-place (boundary spanner 1), in this
way the individual-to-firm relationship takes place. Also the owner or executive director of the
provider firm might have originally personal relationship with owner of the restaurant (boundary
spanner 2 and N). All this relationships can exist at the same time and actually will influence the
consumer purchasing behavior and outcomes.
Depending on the relationship level or target (individual, group), different processes influence the
RM according the social judgment theory (Hamilton and Sherman 1996, Lickel, Hamilton, and
Sherman, 2001, Crump, Hamilton, Sherman, Lickel, Thakkar, 2010, Bitektine, 2011). Consumers
judgments about individual salesperson form differently than their about the firm in general.
Consumer judges the individual’s action using all available or perceived information beginning
with the first meeting. In contrast the judgments about a firm episodic and demand less information.
Thus relationships with individuals (salesperson) have a greater direct effect on relational
behaviors, and also indirect impact on outcomes.
Another important difference between individual- and firm-level relationships involves the concept
of loyalty (Boora, Singh, 2011, Sabir, 2015). Individual-level relationships have a stronger impact
on behaviors and outcomes, but they also more sensitive to disruption as a result of individuals

138
employee turnover. The customer loyalty can be regarded as salesperson-owned loyalty, when the
consumer develops personal relationship with a specific person; seller-owned loyalty, loyalty to the
seller specifically, independent of the salesperson; and synergistic loyalty, loyalty arose by the
benefits which customer can have (Halinen, 2012, Beck, Palmatier, 2012)
Relationship between restaurant and client can be interpersonal (between client and
waiter//bartender/chef/owner) or individual-to-firm (when client is loyal to the place by itself), and
very seldom interfirm (in case when the particular company is the client of the restaurant: official
events, business dinner, special reception etc.). However the loyalty is indispensable aspect for the
relationship between restaurant and client, and because of the decisive role of individual (client)
such relationship are sensitive to disruption.
Relationship between client/user and mobile application holder is always individual-to-firm.
Moreover it is the relationship of the user with the technology, when the user doesn’t know any
person staying behind the technology. That means, that the user doesn’t develop personal
relationship, and as consequence his/her loyalty is very weak and based only on the benefits, which
the mobile application can provide (like comfortable interface, discounts, saving time etc.).
If we go back to the communication steps described in the beginning of this chapter, we will see
that three of them (choice, taking contact and feedback) are replaced in the traditional relationship
by mobile application. Thus, the mobile application takes important role in the Relationship
Marketing of the restaurant, and therefore the development of its relationship with the mobile
application holder will impact on its marketing program inside of the application. In other words, to
create high quality relationship with the client is possible with help of mobile application, if the
restaurant establishment can develop high quality relationship with the mobile application holder.
II.6. Information technology and RM
The use of IT in RM is increasingly important for this research, because mobile application is in the
heart of the relationships between restaurant management and clients. In contrast with interfirm,
individuals-to-firm or interpersonal relationships, where the IT is regarded as added service, in the
studied case the use of IT is actual service.
It is of significance for organizations to consider customer satisfaction with IT because this will
contribute toward satisfaction with the relationship, commitment to the relationship and trust or the
relationship – all key constructs in Relationship Marketing. Use of IT impacts on relationships,
particularly in terms of trust and commitment. Furthermore, if something went wrong with IT
services, customers require human beings to assist (Bitner, Ostrom & Meuter, 2002). Interaction is
necessary in relationship marketing, regardless of whether this interaction is face-to-face or not. As
we concluded in the section about the technology use, the construct of facilitating conditions

139
moderates use behavior of users. So, during the use of mobile application for the restaurant the user
should be sure, that in any failure cases there are the personal to support him/her. That is connected
with the concept of Self-Service Technology, and the mobile application is one of it. So if the
technology in our case the mobile application fails, the customer is often dissatisfied with both the
failure and resultant action by the firm; the way in which these problems are solved can have large
implications for customer evaluation of a firm as well as impacting on the overall perception the
customer has about the firm. As already mentioned above, a role of moderator in the relationship
between restaurant and client plays the mobile application holder, so this fact eliminates direct
impact on the relation. In other words, if in case of technology’s failure the responsibility takes the
mobile application holder and not the restaurant.
Trust and the resulting evaluation of the firm by a customer are fundamental in reducing perceived
risk in the service. Solving that problem in the technology use must be effective to build trust and
commitment in the relationship (Morgan and Hunt, 1994, Chenet, Dagger, O'Sullivan, 2010,
Gummesson, 2011, Vivek, Beatty, Morgan, 2012). Therefore, where there are problems with
technology, it is essential for marketers to deal with these issues effectively so as to maintain a
positive relationship. Moreover, dissatisfaction with technology use impacts on the customer’s
perception of the service delivery. This means that a complete understanding of technology
requirements is necessary in order to implement effective Relationship Marketing.
II.7. Conclusion.
Table 28 assumes the variables of RM, which are of interest for the use of mobile application in the
restaurant business.
In general only two of constructs so far are interesting for present research: trust and commitment.
Both are necessary variables of Relationship Marketing and therefore are presented in all RM-
strategies, also in ones provided by technology. Without trust the RM outcomes cannot be
developed, without commitment there is no object of RM. Two other constructs included in the
table 2 are taken from the Interpersonal model of RM because they enforce the variables of trust
and commitment and influence the performance, but they lose their significance in case of
technology’s use, so are probably not appropriate in the future model. We will keep them to see in
further research, if they become more important or not.
We already discussed the mobile application loyalty in the previous part. In Relationship Marketing
the loyalty is indispensable aspect for the relationship between restaurant and client, and because of the
decisive role of individual (client) such relationship are sensitive to disruption. In our case, when the
relationship are built through the mobile application the concept of loyalty is more important as loyalty

140
towards the technology, because we need to investigate the role which the mobile application can play
in the catering sector.
Table 28: Selected constructs of the RM theories.
Construct Definition Theories Positive aspects Negative
aspects
Conclu-
sion
1 Trust Confidence in an
exchange partner’s
reliability and integrity
The Commitment-
Trust Theory of
Relationship
Marketing. Morgan
and Hunt (1994),
Interfirm and
Interpersonal
Relationship
Marketing theories
(Palmatier, 2008,
Halinen, 2012, Beck,
Palmatier, 2012)
This construct is
important for all
kind of
technology’s use:
professional or
non professional.
Also is has
connection with
construct of
facilitating
conditions of
UTAUT 2.
- yes
2 Relation-
ship
commit-
ment
An exchange partner
believing that an
ongoing relationship
with another is so
important as to warrant
maximum efforts at
maintaining it.
An enduring desire to
maintain a valued
relationship
The Commitment-
Trust Theory of
Relationship
Marketing. Morgan
and Hunt (1994),
Interfirm and
Interpersonal
Relationship
Marketing theories
(Palmatier, 2008,
Halinen, 2012, Beck,
Palmatier, 2012)
The construct is
key one in the
RM. Especially
important for
services, which is
actually the use of
mobile
application.
This construct
plays more
significant role
in the
professional
relationship,
like interfirm. In
individual-to-
firm relationship
commitment is
often onsides.
Maybe
3 Consumer
Gratitude
Obligation of consumer
to sales personal by
purchasing
Interpersonal
Relationship
Marketing theory
(Palmatier, 2008,
Halinen, 2012, Beck,
Palmatier, 2012)
Influence
positively the
trust in long-term
relationship
Very seldom to
develop when
we speak about
use of mobile
application in
the restaurant
business
No
4 Consumer
Reciprocity
norms
The concept in the
sociology saying that
one should help those
who have helped
him/her in the past and
retaliate against those
who have been
detrimental to his/her
interests.
The Norm of
reciprocity: a
preliminary
statement, (Alvin W.
Gouldner, 1960,
Thomas, Skinner,
2010, Samaha,
Palmatier, Dant,
2011),
Interpersonal
Relationship
Marketing theory
(Palmatier, 2008,
Halinen, 2012, Beck,
Palmatier, 2012)
In the
interpersonal
relationship
influence rather
than trust and
commitment on
performance.
This concept is
limited in case
of technology
use.
No
Source: completed by author of the thesis based on the references

141
III. Cultural theories.
The cultural concept is necessary for our research to analyze whether the technology usage of
mobile application and RM is related to national or cultural specificity of the researched countries
or not. The main goal is to see firstly if there are critical differences, and secondly to choose which
differences might have influence on the consumer behavior.
There are many definitions of the culture. "Culture is the collective programming of the mind that
distinguishes the members of one group or category of people from others". (Hofstede, 2001). The
most common the term culture is used to refer to the culture of tribes or ethnic groups (in
anthropology), the nations (in political science, sociology and management) and organizations (in
sociology and management). Less researched is the culture of professional groups (engineers,
compared with accountants or representatives of various academic disciplines). The term also
applies to gender, age or social group.
The culture contains selected list of values, specific for the group. The classic concept of values in
anthropology was introduced by Kluckhohn and Strodtbeck (1961). According to them values
answer basic existential questions, helping to provide the meaning in the people’s lives. Economists
regarded values as quality of the objectives used in social exchange (Stingler, 1950, Spash, 2000,
Throsby, 2001, Davis, 2013, Von Wieser, 2013). So objectives have value but people have
preferences, which establish hierarchies of goods. Sociologists distinguished a different conception
of values. For them values are believed to help people ease the conflict between individual and
collective interests. Values are important because they guide people’s behavior within one culture
(Parsons and Shils, 1951, Hitlin, Piliavin, 2004, Schwartz, 2012). Despite the fact that the cultures
might be different, the researches worked out the universal values presented in all cultures to a
varying degree.
The concept of cultural value impacts the behavior of the individuals, so it can predict also the use
of technology, implementation, adoption or rejection of it. The use of any mobile application within
one culture can be the same, for example all the users use mobile application for gaming, or social
networking, or searching for information. The cultural differences start to be significant inside of
the sectors, in our case in the restaurant sector. Of course there might be differences in the culture
rites and rituals to visit the restaurant in general, e. g. according the occasions, or day-time, or
restaurant-types. For the present research the most important is the influence of the culture on the
use of technology, and RM.
To see the importance of the culture influence we are going to regard:
- The concept of the modern Russian values;
- The concept of the modern French values;
- Cultural dimension of Hofstede.

142
- Impact of Hofstede’s cultural dimension on technology use and on relationship marketing.
III.1. Cultural values concept in researched countries.
Firstly is it important to regard the basement of cultural values in both countries. During decades
the sociologists, philosophers and anthropologists developed the theories of cultural values. That
values influence the general processes inside of the country and they determinate as well the life of
individuals.
III.1.1. Orthodoxy, Autocracy and Nationality of Russia
In the XIX century the theory of official nationality of Russian empire appeared which determined
Russian cultural values for long time. "The Triad" Orthodoxy, Autocracy and Nationality
(Russian: Правосла́вие, самодержа́вие, наро́дность, Pravoslaviye, Samoderzhaviye, Narodnost′)
was originally proposed by Minister of Education Sergey Uvarov in his letter to subordinate
educators in April 2, 1833 (Miller, 2012) as the antithesis of the national motto of The French
Revolution "liberty, equality, fraternity" (фр. Liberté, Égalité, Fraternité). The motto gained wide
public recognition, and was supported by intellectuals like Mikhail Pogodin, Fyodor
Tyutchev and Nikolai Gogol.
The values of modern Russian society are a combination of values started in XIX century and soviet
values. V. Kotlarova (2010) distinguishes following cultural values of modern Russian society:
- Orthodoxy. For Orthodoxy such characteristic are typical: communalism, equality of people,
spirituality. Russian people perceive themselves more as a spiritual and religious community, and
not as ethnic. Communalism means a moral community, subordinated the interests of the church,
religion. In the bright meaning this values denies the materialistic activeness of the person.
- Nationalism as a love for people and for country. In Russian culture, nationality logically
combined with patriotism.
- Patriotism is understood as a sense of national pride, as a means of national identity, as a value,
which determines the life. For Russian culture patriotism has always been an indicator of their
value-ideological spirituality. Russian people used to love their country not for financial reward, but
because it was given to them by God, and because they were born here (V. Kotlarova, 2010).
- Triarchy of values: family, friendship and love. These values are promoted strongly by
government, through social programs of financial help for young families.
-Freedom. It should be noted that freedom of Russians is recognized as an asset due to existing
traditions and peculiarities of Russian mentality; not as a political or legal value (freedom of
thought or freedom of speech). Freedom as a key concept of the European mentality is not just a
choice for yourself, but also respect of the same rights of others, what means freedom for all,

143
protection of the freedom of others like your own. In the culture of the Russian people the main idea
of freedom includes in the first place a freedom concerning the one person and disinterest to other
people's freedom, disinterest in the wide meaning from indifference to repression.
- Statehood. For the culture of the Russian people the “fetishizing” of state power is typical.
Russian people lived many years with the idea of "people's king" (tsar), who is able to suffer for the
interests of the nation, to organize resistance to external enemies and protect people from arbitrary
action by bureaucrats. Therefore it is logical that the greatest value is the strength and stability of
the Russian state, the stability of society and the state as a strong guarantor of confidence in the
future.
Berdyaev (1992) noted that Russia is located in the middle of the two streams of world history - the
east and west; therefore Russian society is often characterized by a combination of the values of
Western and Eastern cultures in the wide meaning.
At the same time the philosophy of “special way” became famous between intellectuals in Russia.
An important impetus for that was the victory over Napoleon in the war of 1812. It became
obviously that despite the fact that Russian troops entered Paris, autocratic feudal Russia still could
not compete with Europe (Belyaev, 2012). The need for ideological and cultural compensation
increased, which is reflected in the slavophilistic idea of a "special way", highlights of which were
the glorification of Russia's past, its grand messianic vision of the future, revealing vices of
European civilization compared to Orthodox Russia.
The idea of a "special way" is understood as the implementation mechanism of the emerging
national idea, as a phenomenon, which replaced the perception of backwardness of the country
(Belyaev, 2010, Miller, 2012). The idea of “special way” became important again after the Soviet
Union collapse to protect the feeling of national proud.
The listed values show in the fist way that the Russian society tends to be traditional with strong
collectivistic characteristics. This finding proves dual impact on the penetration of the new
technologies in the wide meaning: on the one side the strong government control makes it easier to
spread and develop the technologies, but mostly thus which answer the needs of the state, on the
other side the individual use of the technology, what is the case of mobile application use, can be
much slower, because the personal achievements play limited role.
III.1.2. Culture values of France
According to G. Mermet (1996) the French society can be characterized by five main values:
community, authority, singularity, action, and pleasure.
Community. This value has historical roots, and it is characterized by a sense of belonging, a wish
to own, and the collective virtues.

144
Authority. This value is typical for older generation, and means the following instruction and rules
in professional life. It is characterized by the need in order, which decline in two modes: the
spiritual order and social order.
Singularity. This value is spread widely among younger generation and urbanites. It is manifested
in the need of admiration, critical evaluation, and wish of differentiation.
Action. This value means pragmatism, wish of power, and wish of conflict or confrontation. It is
more typical for urbanites, also pragmatism is peculiar more for older generation while wish of
power is peculiar more for young people, confrontation is more typical for men than for women.
Pleasure. This includes searching for impression, idealistic dream, cultural elevation.
G. Mermet (1996) considers also that for 30 years in France happened 7 revolutions:
individualization, feminization, globalization, technologization, consumerism, " horizontalization"
and "zapping".
Individualization refers to the increasing prevalence of I above We.
Feminization means not only the rule of women in the society, but also qualities and values,
which are traditionally considered as feminine (intuition, pacifism, humility, practicality).
Technologization influenced all sides of life. It freed and enslaved people at the same time.
Despite the fact that French people have negative attitude to globalization, this process affected
deeply the society.
Consumerism appeared together with high standards of life. Development of mass media, high
technologies, and ease of life had as consequences the desire to buy and own things.
For a long time, French society was upright, pyramidal and with a clear hierarchy. And while
authority and power distance are still very strong in the French society, the process of
horizontalization takes place little by little.
Professional, family, social and private lives now consist of rapid changes. People change easily
jobs, places to live, partners, habits and hobbies. A new word appeared “le zap”. “Zapping” of the
modern society means the quick change of everything.
Sociologist J.-L. Excousseau (2000) proposed to classify the French people in four generations. At
each generation corresponded different sensitivity:
- Generation of heritage. They were born before 1941. They experienced the Roaring Twenties,
the 1929 crash, wars, the appearance of "miraculous" the consumer society. This explains that this
generation is more interested in the possession - for "having" - by introspection. Hence they have
difficulty in transmitting the power.
- Generation of nature. Born between 1942 and 1967, they are individualistic and protesters. They
made May 68 against the consumer society. This is the generation of sexual freedom, feminism, and

145
the consolidation between the sexes. Having preserved their adventurous mindset, they get excited
today to the Exchange and the great capitalist thrill.
-Generation of networks. Born between 1968 and 1976, they are much less confidence in the ego.
Increasingly turned to the other, they organize networks to fight against certain failings of society.
Pragmatic and responsible, they are committed to ecology, against epidemics, poverty and
exclusion.
- Mosaic generation. Born after 1977, they live in a world where music and audiovisual media are
omnipresent. They were born in social changes and easily adapt to it. To feel comfortable in this
unstable world, they multiply their memberships in groups (music, skating club, Internet discussion
groups). They are a generation of miscegenation, open and infinite tolerance.
Listed values of French society are easy to correlate with variables of UTAUT2, such value as
pleasure is correlated with hedonic motivation, consumerism and pragmatism - with price value,
community - with social influence as well as singularity - with performance expectancy.
III.1.3. Conclusion
The overview of cultural values based on the philosophical and sociological points of view doesn’t
provide us useful construct for the researched model. Anyway the main findings are important for
the understanding of cultural dimension theory of Hofstede.
Firstly, we can conclude that this overview shows that two cultures have different basement of
modern values despite the process of globalization and spread of modern technologies.
Secondly, one of the purpose of this research to see whether the use of technology eliminate the
cultural differences or not. Therefore the comparison of two countries with different cultures is
more interesting.
And thirdly, the use of mobile application in the restaurant sector is a part of individual everyday
life, so the general cultural values can lose their meaning in everyday life, as for example, Russian
society is regarded as collectivistic, but it doesn’t mean that the people don’t have private property.
Anyway to research the impact on the use of technology and Relationship Marketing in the
restaurant business we should choose universal system of values or cultural characteristics,
therefore the cultural dimensions of Hofstede are more convenient for maintaining the experimental
integrity.
III.2. Cultural dimensions theory by Gert Jan Hofstede (2001)
Hofstede and Minkov (Hofstede, 2001, Hofstede and Minkov, 2010) developed the cultural
dimensions theory providing a systematic basis for evaluating the differences between nations and
cultures. The theory is based on the idea that the value may be distributed over six cultural

146
dimensions. Most of the information about the world's cultural values Hofstede received from a
survey conducted by IBM, the US technology and consulting corporation. Both countries Russia
and France are included in his survey, and the data can be used for our case. He suggested rating
system on a scale of 1 to 120.
Figure 20: Cultural dimension
Source: Hofstede & Minkov (2010).
These dimensions include:
Individualism vs. Collectivism: “the degree to which people in a society are integrated into groups”
(Hofstede, 2010). This dimension is not related to politics and concerns more groups than
individuals. Culture with individualism tends to greater importance of the achievement of personal
goals. In societies which are characterized by collectivism, social welfare is placed above personal
interests (Brewer, Venaik, 2011).
With a lower score of 39 Russia (Figure 21) has collectivistic culture. Family, friends and the
neighborhood are extremely important to get along with everyday life’s challenges. Relationships
are crucial in obtaining information, getting introduced or successful negotiations. Russians need to
be personal, authentic and trustful before one can focus on tasks and build on a careful to the
recipient, rather implicit communication style.
France, with a score of 71, is shown to be an individualist society. The French combination of a
high score on Power Distance (see below) and a high score on Individualism is rather unique. This
combination is not only unique, but it also creates a contradiction. For examples in the area of
customer services the French culture is poor in the eyes of all others individualistic cultures who
believe that the customer is king. The French are self-motivated to be the best in their trade. They,
therefore, expect respect for what they do, after which they are very much willing to serve you well.

147
Figure 21: Hofstede’s dimension. Russia in comparison with France.
Source http://geert-hofstede.com/
Power distance. According to Hofstede (2010) “power distance is the extent to which the less
powerful members of organizations and institutions (like the family) accept and expect that power
is distributed unequally". This dimension does not characterize the level of the distribution of power
in a given culture, but rather, it examines the perception of society. Low power distance index
means that the culture expects and accepts democratic relations with the power and all members of
the society are treated as equal. A high power distance index means that less power vested members
of the society take their place and realize the existence of formal hierarchical structures (Rinne,
Steel, Fairweather, 2012).
Russia, scoring 93, is a nation where power holders are very distant in society. The huge
discrepancy between the less and the more powerful people leads to a great importance of status
symbols.
France, with a score of 68, has high Power Distance in comparison with other countries in Europe.
Power like in Russia is centralized in the capital – Paris. Many comparative studies have shown that
French companies have normally one or two hierarchical levels more than comparable companies in
Germany and the UK.
Uncertainty avoidance. “Uncertainty Avoidance is not the same as risk avoidance; it deals with a
society's tolerance for ambiguity” (Hofstede, 2010). This dimension describes the public reaction to
unfamiliar situations, unexpected events, and the pressure for change. Culture, for which the index
is high, is less tolerant to changes and seeks to avoid the anxiety that brings uncertainty, by setting
strict rules, regulations and / or laws. The low index shows that the culture is more open to change,
and uses less of rules and laws (Myers, Tan, 2003, Litvin, Crotts, Hefner, 2004, Im, Hong, Kang,
2011).
Scoring 95 Russians feel very much threatened by ambiguous situations, as well as they have
established one of the most complex bureaucracies in the world. Detailed planning and briefing is

148
very common in negotiations. Russians prefer to have context and background information. As long
as Russians interact with people considered to be strangers they appear very formal and distant. At
the same time formality is used as a sign of respect.
At 86 French culture scores high on Uncertainty Avoidance too. As a consequence, the French are
good in developing complex technologies and systems in a stable environment, such as in the case
of nuclear power plants, rapid trains and the aviation industry. There is a strong need for laws, rules
and regulations to structure life. This, however, doesn’t mean that most French will try to follow all
these rules because of high score in individualism.
Masculinity vs. femininity. “Masculinity as a societal, not as an individual characteristic, refers to
the distribution of values between the genders which is another fundamental issue for any society,
to which a range of solutions can be found” (Hofstede, 2010). This dimension characterizes the
level of importance of traditional male values such as assertiveness, ambition, lust for power and
materialism, and traditional female values such as human relations, culture (De Mooij, Hofstede,
2011).
Russia’s relatively low score of 36 may surprise with regard to its preference for status symbols, but
these are in Russia related to the high Power Distance. Russians understate at workplace as well as
when meeting a stranger their personal achievements, contributions or capacities.
With a score of 43, France has also more Feminine culture. At face value this may be indicated by
its famous welfare system.
Long-term orientation vs. short-term orientation. This dimension describes the time horizon of
society. Culture, focused on short-term, value traditional methods, to devote much time to
developing relations and considering the whole time as a vicious circle. This means that the future
and the past are linked to each other, and that cannot be done today can be done tomorrow. The
opposite of this is a long-term orientation towards the future, at which time is considered as a
vector, and people tend to look to the future more than the present or interested in remembering the
past. Such a society is focused on achieving the goals and appreciates the results (Hofstede and
Bond, 1988, Hofstede, Minkov, 2011, Cannon, Doney, Mullen, Petersen2010).
With a very high score of 81, Russia is definitely a country with a pragmatic mindset. France
scores 63 in this dimension, making it pragmatic also.
Indulgence vs. restraint. This dimension describes the ability of culture to meet the immediate
needs and personal desires of society. In societies where restraint is a value prevail strict social rules
and norms, within which self-gratification constrained and are not encouraged (Hofstede, Minkov,
2010).
The Restrained nature of Russian culture is easily visible through its very low score of 20 on this
dimension. Societies with a low score in this dimension have a tendency to cynicism and

149
pessimism. Also, in contrast to Indulgent societies, restrained societies do not put much emphasis
on leisure time and control the gratification of their desires.
France scores in the middle 48, but 2, 5 more than Russia, but still lower than normally is expected.
This, in combination with a high score on Uncertainty Avoidance, implies that the French are less
relaxed and enjoy life less often than it is commonly assumed.
The Hofstede’s dimensions confirm some of our finding in previous section, like collectivistic
nature of culture, strong role of the state and government (power distance) in Russia, or singularity
(individualism) and authority (power distance) in France. Moreover the analyze of culture from the
point of view of Hofstede’s dimensions shows us also unexpected similarities in both countries like
almost the same score of uncertainty avoidance and domination of feminine characteristics.
Many authors (e. g. Martin, 1996, Leidner, Kayworth, 2006, Castells, 2011, Lyon, 2013, Webster,
2014) predict the equation of societies in connection with the development of new technologies.
High technology is a major driving force behind cultural change that leads to a similarity inside of
different societies, but there is not the evidence that it blurs the distinction by other dimensions.
Moreover, it could lead to further divergence during societies modernize technical experience, on
the basis of already existing values.
To choose significant constructs in Hofstede’s culture dimension theory we need to regard its
implication in use of technology and in relationship marketing.
Table 29: Hofstede’s dimensions.
Dimension Definition Score Conclusion
France Russia
Individualism vs.
Collectivism
The degree to which people
in a society are integrated
into groups.
71 39 Compared with Russia France is
individualistic culture, this
difference can be interesting for
our comparison.
Power distance Power distance is the extent
to which the less powerful
members of organizations
and institutions (like the
family) accept and expect
that power is distributed
unequally.
68 93 Stronger in Russian culture than
in French one, where it is still
pretty high compared with other
countries of EU. Visiting
restaurant is the personal issue,
so this dimension will probably
have weak significance for our
comparison.
Uncertainty
avoidance
Uncertainty Avoidance is not
the same as risk avoidance; it
deals with a society's
tolerance for ambiguity.
86 95 Both countries score high. This
similarity can be interesting.
Masculinity vs. Masculinity as a societal, not 43 36 Both countries are regarded as
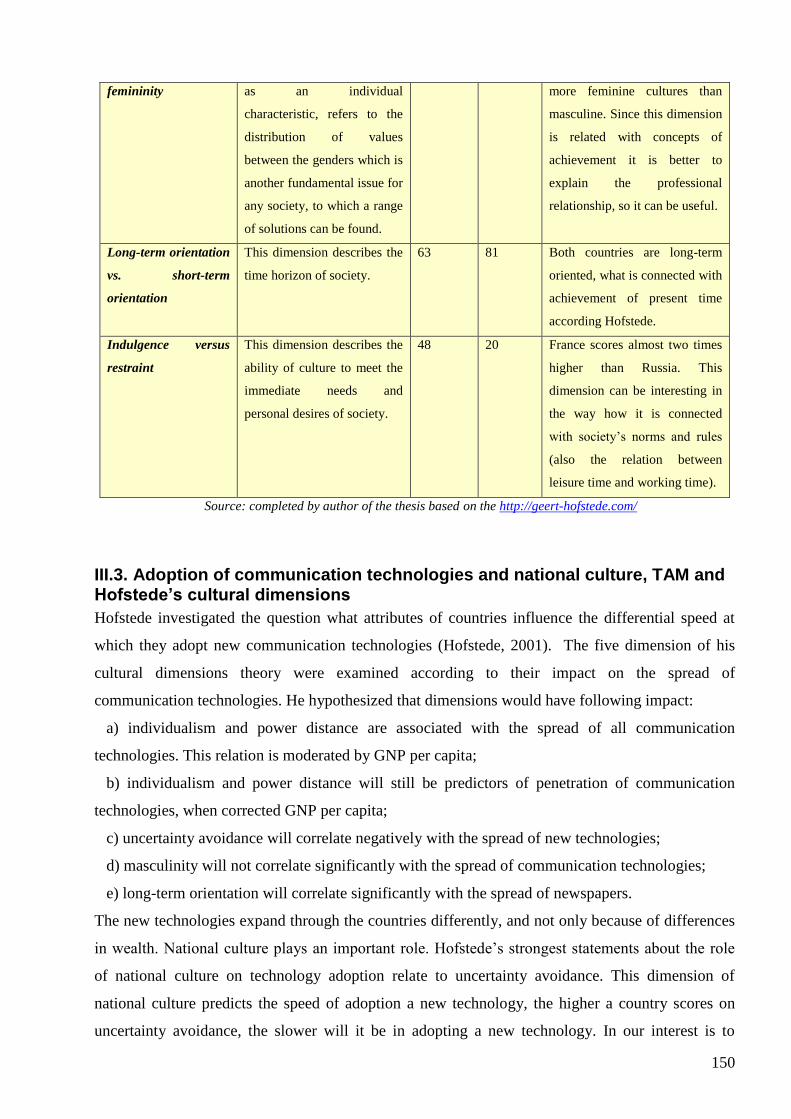
150
femininity as an individual
characteristic, refers to the
distribution of values
between the genders which is
another fundamental issue for
any society, to which a range
of solutions can be found.
more feminine cultures than
masculine. Since this dimension
is related with concepts of
achievement it is better to
explain the professional
relationship, so it can be useful.
Long-term orientation
vs. short-term
orientation
This dimension describes the
time horizon of society.
63 81 Both countries are long-term
oriented, what is connected with
achievement of present time
according Hofstede.
Indulgence versus
restraint
This dimension describes the
ability of culture to meet the
immediate needs and
personal desires of society.
48 20 France scores almost two times
higher than Russia. This
dimension can be interesting in
the way how it is connected
with society’s norms and rules
(also the relation between
leisure time and working time).
Source: completed by author of the thesis based on the http://geert-hofstede.com/
III.3. Adoption of communication technologies and national culture, TAM and Hofstede’s cultural dimensions
Hofstede investigated the question what attributes of countries influence the differential speed at
which they adopt new communication technologies (Hofstede, 2001). The five dimension of his
cultural dimensions theory were examined according to their impact on the spread of
communication technologies. He hypothesized that dimensions would have following impact:
a) individualism and power distance are associated with the spread of all communication
technologies. This relation is moderated by GNP per capita;
b) individualism and power distance will still be predictors of penetration of communication
technologies, when corrected GNP per capita;
c) uncertainty avoidance will correlate negatively with the spread of new technologies;
d) masculinity will not correlate significantly with the spread of communication technologies;
e) long-term orientation will correlate significantly with the spread of newspapers.
The new technologies expand through the countries differently, and not only because of differences
in wealth. National culture plays an important role. Hofstede’s strongest statements about the role
of national culture on technology adoption relate to uncertainty avoidance. This dimension of
national culture predicts the speed of adoption a new technology, the higher a country scores on
uncertainty avoidance, the slower will it be in adopting a new technology. In our interest is to

151
analyze the speed of adoption of the mobile application in one particular sector, restaurant sector.
From the standpoint that the technology by itself has been already adopted by users in both
countries, its adoption can be different depending on the sector. Restaurant business requires
personal relationship between restaurant establishment and client, so together with dimension of
uncertainty avoidance this relationship will slow down the adoption of the mobile application. Both
counties score high in the dimension of the uncertainly avoidance, what can mean that both cultures
prefer to build traditional relationship between seller and client, or prefer traditional instruments,
before they adopt new ones.
The level of penetration of the communication technologies Hofstede (2001) explains with
dimension of individualism/collectivism. In individualistic cultures this level is stronger than in
collectivistic ones. In our case this finding means, that once the mobile application was adopted by
the users, it can be used in all sectors easily in France with high score of individualism, and it can
be used with restrictions or occasionally in Russia with low score of individualism.
Power distance plays weak role. Both countries score relative high. The restaurant sector is regarded
as personal issue as well as use of mobile application, so this dimension is not important for us.
Wealth, individualism and small power distance are strongly correlated, but high individualism
predicts penetration of established communication technologies and Internet host even after
correcting for GNP/cap (Hofstede, 2001).
Masculinity correlates positively with the spread of devices for one-way communication (faxes),
and negatively with that of devices for two way communication (mobile phones). France and Russia
are feminine culture, and mobile application is the two way communication technology, so this
finding is not important for our research.
Long-term orientation was analyzed by Hofstede (2001) in his research with correlation with the
spread of newspapers, these findings are not important for our research.
Scoring 95 and 86 in uncertainty avoidance Russia and France have both slow speed of adoption a
new technology. In the dimension of individualism Russia scores very low (39 out of 120), that
means that it has weak level of penetration of the communication technology, conversely France is
with a score of 71, is shown to be an individualist society and has strong level of the technology
penetration. Thus, two dimensions are of importance for our research: uncertainty avoidance and
individualism/collectivism according to their impact on technology use.
Important finding presented in this research of Hofstede is that his findings are relevant even after
correcting for GNP/cap, because investigated countries have different level of economies (see 1
chapter).

152
Table 30: Hofstede’s dimensions and mobile application use.
Dimension Impact on technology use Mobile application use
Individualism/Collectivism The level of penetration of the
communication technologies is higher in
individualistic cultures.
France represents individualistic
culture while Russia is collectivistic
one. The penetration of the mobile
application in both countries is
different. We concluded that speed of
adoption can be relative the same, but
from the point of view of this
dimension, ones the technology is
adopted in France it can be used
everywhere with no difficulties, while
in Russian culture adopted technology
can be used only occasionally or in
restricted sectors.
Power distance Power distance plays weak role. Both countries score relative high. The
restaurant sector is regarded as personal
issue as well as use of mobile
application, so this dimension is not
important for us.
Uncertainty avoidance The higher a country scores on uncertainty
avoidance, the slower will it be in adopting a
new technology.
Russia and France score high,
concerning the mobile application use
we can conclude, that at the moment
this technology by itself has been
already adopted by both countries, but
it can mean, that the speed of mobile
application adoption will be slow in
one particular sector, in our case in the
restaurant sector.
Masculinity/Femininity Masculinity correlates positively with the
spread of devices for one-way
communication (faxes), and negatively with
that of devices for two way communication
(mobile phones).
Both cultures are feminine, and mobile
application is the two way
communication technology, so this
finding is not important for our
research.
Long-term orientation
/Short-term orientation
Correlates significantly with the spread of
newspapers.
News papers are not important for our
research.
Source: completed by author of the thesis based on the references
III.4. The role of culture in RM
In researched case the additional variables are the cultural dimensions, because the same type of
relationships can be different in two researched countries, for example we know already that

153
Russian culture as collectivistic one has weak level of penetration of the communication technology
(mobile application in our case) compared to France, but we are interested to analyze how for
example this dimension proceeds the Relationship Marketing, whether the aggregate impact of the
culture dimensions on both, technology and RM, will enforce difference between two counties or
eliminate it.
The comparison of two countries demands to analyze the role of culture in relationships marketing
as well. The research by Samaha, Beck, and Palmatier (2012) concerning The Role of Culture in
International Relationship Marketing is regarded to accomplish the analysis. For our research the
finding about cultural influence are of interest, rather than the international relationships. To
investigate the role of culture the researcher used the cultural dimension of Hofstede, what also is
lying behind the interest of our study.
A country’s culture shapes people’s perceptions, dispositions, and behaviors. Because RM
interactions are social exchanges, culture influences the norms, roles, and expectations of these
relationships. Culture also influences the types of socially engaging and disengaging emotional
processes that people experience (Kitayama, Mesquita, and Karasawa 2006.)
In the conceptual model (Figure 18) the moderating effects of each construct were tested in the
linkage with trust and commitment, or relational mediators. The Model has five relational
antecedents and two outcomes. The five antecedents are relationship investments, communication,
dependence on seller, seller expertise, and relationship duration.
Relationship investments capture the “seller’s time, effort, spending, and resources focused on
building a stronger relationship,” and communication refers to the “amount, frequency, and quality
of information shared between exchange partners” (Palmatier et al. 2006). Seller investments often
generate gratitude and cycles of reciprocation that increase trust and social bonds. Communication
increases trust and commitment (Rauyruen, Miller, 2007, Thomas, Skinner, 2010, Halinen, 2012,
Beck, Palmatier, 2012).
Dependence on seller refers to the “customer’s evaluation of the value of seller-provided resources
for which few alternatives are available from other sellers” (Palmatier et al. 2006, Beck, Palmatier,
2012).
Seller expertise is the “knowledge, experience, and overall competency of the seller” (Palmatier et
al. 2006, Beck, Palmatier, 2012). Expertise enhances relational mediators by increasing the
perceived credibility of seller claims and establishing the superiority of a seller in a market (Crosby,
Evans, and Cowles 1990, Gummesson, 2011).
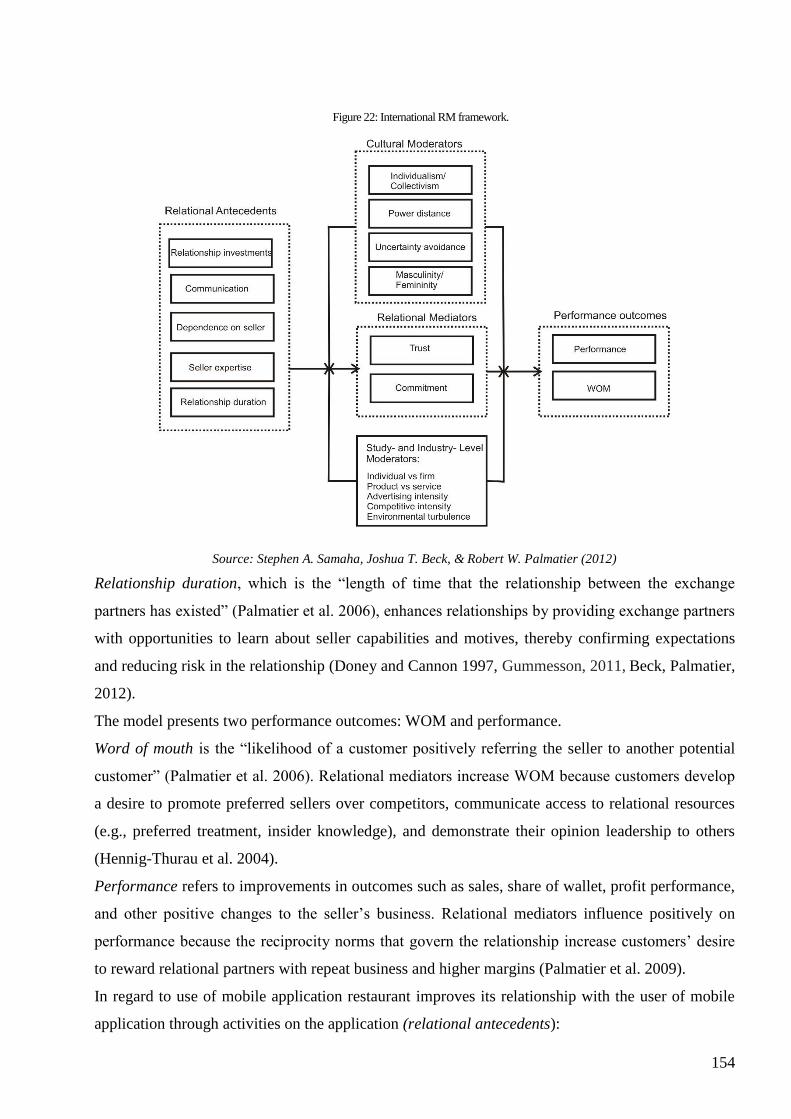
154
Figure 22: International RM framework.
Source: Stephen A. Samaha, Joshua T. Beck, & Robert W. Palmatier (2012)
Relationship duration, which is the “length of time that the relationship between the exchange
partners has existed” (Palmatier et al. 2006), enhances relationships by providing exchange partners
with opportunities to learn about seller capabilities and motives, thereby confirming expectations
and reducing risk in the relationship (Doney and Cannon 1997, Gummesson, 2011, Beck, Palmatier,
2012).
The model presents two performance outcomes: WOM and performance.
Word of mouth is the “likelihood of a customer positively referring the seller to another potential
customer” (Palmatier et al. 2006). Relational mediators increase WOM because customers develop
a desire to promote preferred sellers over competitors, communicate access to relational resources
(e.g., preferred treatment, insider knowledge), and demonstrate their opinion leadership to others
(Hennig-Thurau et al. 2004).
Performance refers to improvements in outcomes such as sales, share of wallet, profit performance,
and other positive changes to the seller’s business. Relational mediators influence positively on
performance because the reciprocity norms that govern the relationship increase customers’ desire
to reward relational partners with repeat business and higher margins (Palmatier et al. 2009).
In regard to use of mobile application restaurant improves its relationship with the user of mobile
application through activities on the application (relational antecedents):

155
- service package (relationship investment), so the restaurant can subscribe by the mobile
application company different services starting with basic package (just general information
about the restaurant) and till the advanced subscription (includes advertising, call-center,
online-booking etc);
- communication activities are depended on the restaurant management, some of the managers
control the communication inside of the application, answer the question of the users,
apologize in failure cases, provide additional information, some of the managers don’t
participate at all in the communication;
- restaurant manager can provide competitive information to win the users (dependence on
seller), for example special menu for children, additional discounts, happy hours etc.
- rating (seller expertise) is not direct the expertise provided by restaurant of course, but the
high rating inside of its group (e. g. best pizzerias) makes the restaurant expert in this area;
- how much the restaurant management respect the user’s history (relationship duration) on
the mobile application can give the restaurant advantages, for example whether the user is
active on the application, how many reviews he/she has left etc, whether he/she is registered
in the data base of the restaurant after visiting it etc.
As regarded outcomes the examples are:
- WOM: published reviews and grading of the restaurant by user after the visiting. The
management of the restaurant can promote this aspect giving small “gifts” for leaving
review or grading;
- Performance: the best performance for the restaurant would be when the user returns after
the first visiting of the restaurant, but also the “checking in” on the social networks, sharing
information, publishing pictures of meals etc are the desired activities, because they
positively/negatively change the business of the restaurant.
Moderating Role of Individualism–Collectivism in RM
Collectivist cultures may respond more positively to RM efforts compared with individualist
cultures, because they are more sensitive and responsive to RM norms. In collectivist cultures,
reciprocity norms and mutual interdependence manage relationships (Morishima and Minami 1983,
Hofstede, Minkov 2010, Brewer, Venaik, 2011).
Collectivists are more concerned with the collective wellbeing of their entire group, and members
rely on and work with one another to achieve mutually beneficial outcomes. Collectivists also are
more receptive to social bonding (the process of forming attachments with others) than members of
individualist cultures and value long-term group ties, similar to the ties binding extended families
(Triandis 1995, Hofstede, Minkov 2010, Brewer, Venaik, 2011). Thus, collectivism emphasizes

156
long-term social bonding and dependence, manifested as familiarity, friendship, long-term ties, and
close personal relationships (Williams, Han, and Qualls 1998).
In contrast, individualists prefer less close relationships that is preserved for self-serving (as
opposed to mutually beneficial) reasons (Steensma et al. 2000). Because individualists value
individual goals over group goals, they build and maintain relationships only to the extent that
doing so is instrumental to their individual goal achievement (Triandis 1989, 1995, Hofstede,
Minkov 2010, Brewer, Venaik, 2011). Relationships based on long-term social bonding and
dependence becomes more difficult to form, and the benefits associated with having strong
relationships decline.
Because long-term social bonding and interdependence are central to collectivist cultures, the RM
strategies and outcomes linked to long-term social bonding and dependence grow stronger
(positively moderated) in collectivist cultures but weaker (negatively moderated) in individualist
cultures. Five constructs in the model related to long-term social bonding and dependence are
affected by this cultural dimension: (1) communication, (2) dependence, (3) relationship duration,
(4) WOM, and (5) performance (Gupta, Harris, 2010).
Russia scores high in collectivisms, so the clients respond more positively RM efforts. In traditional
relationships the clients of the restaurant in Russia expect particular attention, if he/she has personal
contacts in the restaurant establishment; such situation is often to experience, when clients present
themselves booking table and underline their social connections. But in return they develop high
loyalty to the places. At the same time high score of collectivism means weak level of technology
penetration. All together that leads in weak trust to technology replacing traditional relationship.
For example, if the client books the table with helps of mobile application he/she can call in the
restaurant to check his/her booking.
France is individualistic country according the Hofstede’s dimension. The RM outcomes are weaker
here; the relationships are built to achieve personal goals. And at the same time the level of
technology penetration is strong. As result, the restaurant management can easily use RM activities
provided by mobile application enhancing the ones which give the personal benefits for the clients,
like discounts, “gifts”, promotions etc.
Moderating Role of Power Distance
Because customers are more opened to and accept status differences, when power distance
increases, status-based RM strategies should be more effective in high power distance cultures. In
cultures with higher power distance, status-based relationships become easier to form, and the
beneficial effects of relationships on status-based outcomes are stronger (Hofstede, Minkov 2010,
Rinne, Steel, Fairweather, 2012).

157
Power distance may moderate three relational constructs related to status in the model: seller
expertise, WOM, and performance.
Both countries score high in power distance, but Russia a little bit higher. Such tools of mobile
application like rating (seller expertise), reviews (WOM), or sharing information in social networks
(performance) should be respected and used by the restaurant management.
Power distance plays weak role in technology penetration and adoption.
Moderating Role of Uncertainty Avoidance
Because risk management has a central role in high uncertainty avoidance cultures, the RM
strategies linked to uncertainty reductions are more effective at building and maintaining
relationships in high uncertainty avoidance cultures and less effective in low uncertainty avoidance
cultures. In cultures with higher uncertainty avoidance, activities that reduce uncertainty make
relationships easier to form (Litvin, Crotts, Hefner, 2004, Hofstede, Minkov 2010).
The two relational constructs related to uncertainty reduction in the model that may be moderated
by uncertainty avoidance are seller expertise and relationship duration.
Both countries score high in this dimension. For the restaurant management using the mobile
application is important to participate in ratings, grading and pay attention on the user’s history in
the profiles. Moreover this dimension shows that the adoption of new technology is very slow.
Theoretically in both countries clients prefer to create traditional relationship with the restaurant
establishment.
Moderating Role of Masculinity–Femininity
The values of feminine cultures tend to band better with key relational processes, such as
reciprocation and mutuality. So when femininity increases, decisions should be more affected by
relationships factors. In cultures with higher masculinity, the beneficial effects of relationships on
outcomes are weaker (De Mooij, Hofstede, 2011).
Strong relationships drive outcomes (e.g., WOM, performance) are more effectively in feminine
than masculine cultures. Customers in feminine cultures likely reciprocate relational benefits
received from a seller, more purchases, or payments of higher prices. Alternatively, in more
masculine cultures, competitiveness, aggressiveness, and a lack of reciprocity undermine the
connection between relational bonds and positive outcome behaviors because customers are less
likely to reward sellers who provide relational benefits. Thus, customers in masculine cultures
spend little time or effort to provide WOM or other benefits to relationally linked sellers. Overall,
the positive effects of relationships on WOM and performance should decrease in masculine
cultures, which devalue reciprocating exchange partners for any relational benefits received (Gupta,
Harris, 2010).

158
Russia and France scores in the middle, but are more feminine culture than masculine.
Relationships outcomes are effective. Clients of the restaurants might leave likely the reviews and
share impression of visiting this or that restaurant establishment. So the management should control
the communication, and react on the positive/negative feedback.
This dimension is not correlating with the penetration or adoption of the technology.
In sum, the most significant difference between two countries is to find by now in the impact of
individualism/collectivism dimension on both: technology and RM activities. The combination of
high score in uncertainty avoidance and high level of collectivism makes the use of mobile
application in RM of the restaurant in Russia complicated. In contrast the individualistic culture of
France restricts the RM strategy in general even if it correlates positively with technology
penetration.
Moreover it seems to be important to add to selected constructs of RM two other constructs, WOM
and performance, as the resulting outcomes of mobile application use by user.
III.5. Conclusion
In the Table 31 the constructs of third section are listed. We included only the dimension of
Hofstede theory, because the first regarded philosophical and sociological cultural values were to
find in this dimension, and the Hofstede’s theory is universal for all countries, what gives the
possibility for comparison. Out of six dimensions the most significant are two: uncertainty
avoidance and individualism, because they have impact on both interesting for us aspects: use of
technology and RM.
The dimension of Indulgence is interesting to investigate in our thesis, even if it wasn’t regarded by
the reviewed authors, because the going out for having meal belongs to the leisure time. The
countries have different scores firstly, and secondary the food is an important part of the French
culture, when in Russia it is seen more as social aspect than the cultural.
Table 31: Selected constructs of the cultural theories.
Construct Definition Theories Positive aspects Negative aspects Conс-
lusion
1 Individualism the degree to which
people in a society are
integrated into groups
Cultural dimension.
Hofstede (2001,
2010, 2011)
Brewer, Venaik,
(2011).
Correlates with
both: technology
and RM
- Maybe
2 Power
Distance
the extent to which the
less powerful members
of organizations and
institutions (like the
family) accept and
expect that power is
distributed unequally
Cultural dimension.
Hofstede (2001,
2010, 2011)
Rinne, Steel,
Fairweather, (2012)
- High score of both
countries limit the
RM. No significance
for technology use
No
3 Uncertainty
avoidance
not the same as risk
avoidance; it deals
with a society's
Cultural dimension.
Hofstede (2001,
2010, 2011)
Correlates with
both: technology
and RM
- Maybe

159
tolerance for
ambiguity. The public
reaction to unfamiliar
situations, unexpected
events, and the
pressure for change
Litvin, Crotts,
Hefner, (2004)
4 Long (short)-term
orientation
time horizon of society Cultural dimension.
Hofstede (2001,
2010, 2011)
Cannon, Doney,
Mullen, Petersen,
(2010)
- This dimension is not
included in both
researches:
technology or RM
No
5 Masculinity as a societal, not as an
individual
characteristic, refers to
the distribution of
values between the
genders which is
another fundamental
issue for any society,
to which a range of
solutions can be found.
Cultural dimension.
Hofstede (2001,
2010, 2011)
De Mooij,
Hofstede, (2011)
Low masculinity of
both countries
impacts positively
the RM outcomes,
like WOM and
performance.
No significance for
technology use
No
6 Indulgence the ability of culture to
meet the immediate
needs and personal
desires of society.
Cultural dimension.
(Hofstede, Minkov,
2010, 2011)
DeMooij, Hofstede,
(2011)
This dimension
describes the
relation between
leisure time and
working time, and
going out in the
restaurants is a part
of the leisure time.
This dimension is not
included in both
researches:
technology or RM
Yes
Source: completed by author of the thesis based on the references
IV. Final choice of constructs for the research model.
In the beginning of this chapter in the section of technology use we distinguished between
professional and nonprofessional use of technology concerning of mobile application use. In RM
section we concluded that mobile application plays no role in relationship between mobile
application holder and restaurant, because it is just a product or new service to implement in the
restaurant business. From this standpoint the relationship between mobile application holder and
restaurant produces not big changes because of use of technology; it is just about new product and
is out of our interest.
In contrast the mobile application changes the relationship between client and restaurant
management, because the mobile application is a tool to interact with the clients who are the final
users of mobile application. The mobile application holder is playing the role of mediator in this
relationship.
Combining all the findings Table 19 presents all constructs selected for the research model of
mobile application use in the restaurant’s relationship marketing influenced by culture.

160
Table 32: Final choice of the constructs
Construct Definition Theories Positive aspects Negative aspects Conс-
Lusio
n
Technology’s use theories
1 Behavior, or
use behavior
In our research we will
understand under use behavior
the use of mobile application by
user
TRA (M. Fishbein, I.
Ajzen, 1975), TPB (I.
Ajzen, 1985),
TAM (Davis, 1986),
TAM 2 (Venkatesh,
Davis, 2000), UTAUT
(Venkatesh et al.,
2003), UTAUT2
(Venkatesh et al.,
2012)
This construct is
presented in all
models. The
culture dimensions
have direct impact
on this construct,
and it has central
position for the
RM.
There is no exact
definition of
behavior, or use
behavior. Is this
the adoption, or
implementation,
or usage.
Yes
2 Facilitating
conditions
the degree to which an individual
believes that an organizational
and technical infrastructure
exists to support the use of a
particular system
UTAUT (Venkatesh
et al., 2003),
UTAUT2 (Venkatesh
et al., 2012)
Significant for the
use of mobile
application and
correlate with the
trust concept of
RM.
In the models
(UTAUT and
UTAUT 2) this
construct is
moderated by
experience,
meaning that with
time the variable
loses its
importance. In
our case we will
try to do
correlation with
habit
Yes
3 Habit the extent to which people tend
to perform behaviors
automatically because of
learning
UTAUT2 (Venkatesh
et al., 2012) The use of the
mobile application
today is often
routine habit. It is
important to see
how this construct
influence on the
behavior
concerning the
restaurants. F.e. do
the people use
more such kind of
applications when
they travel or are in
the unknown
place? For us this
construct can play
the mediating role.
The concept of
habit is also
presented in the
construct of
facilitating
conditions,
therefore is not
necessary.
No
4 Price value the monetary cost of technology. UTAUT2 (Venkatesh
et al., 2012) Decisive for
professionals. For
individual’s has no
direct meaning, can
be calculated as
aggregated benefits
of discounts etc.
Researched
mobile
applications are
free for download.
But the
restaurants pay
the application’s
holder to have
promotional
services.
Yes
5 Mobile
application
usability
the extent to which a mobile
application can be used by
specified users to achieve
specified goals with
effectiveness, efficiency, and
satisfaction in a specified context
of use
Mobile application
usability (Venkatesh
and Ramesh, 2006,
Venkatesh and
Hoehle, 2015).
Mobile application
usability plays
important role in
the user’s decision
to continue the use
of the mobile
application or not.
It also predicts the
loyalty of the users
toward the mobile
application.
As shown above
the mobile
application we are
going to
investigate are not
equal in all
elements of the
mobile
application
usability.
Yes

161
6 Mobile
application
loyalty
Degree to which a user has a
deeply held commitment to
rebuy or repatronize a mobile
application.
Mobile application
usability
(Venkatesh and
Hoehle, 2015 adapted
from Johnson et al.
2006)
Mobile application
loyalty can be the
wished outcome
for the providers of
the mobile
applications, in this
way this construct
plays important
role for prediction
of the user’s
behavior.
Yes
7 Continued
intention to
use
Degree to which a user feels
he/she will keep using a mobile
application.
Mobile application
usability (Venkatesh
and Hoehle, 2015
adapted from
Bhattacherjee 2001)
Continued
intention to use is
the outcome, which
can explain the
continued use of
the mobile
application.
Yes
RM Consctucts
8 Trust Confidence in an exchange
partner’s reliability and integrity
The Commitment-
Trust Theory of
Relationship
Marketing. Morgan
and Hunt (1994)
This construct is
important for all
kind of
technology’s use:
professional or non
professional. Also
is has connection
with construct of
facilitating
conditions of
UTAUT 2.
- Yes
9 Relationship
commitment
An exchange partner believing
that an ongoing relationship with
another is so important as to
warrant maximum efforts at
maintaining it.
An enduring desire to maintain a
valued relationship
The Commitment-
Trust Theory of
Relationship
Marketing. Morgan
and Hunt (1994)
The construct is
key one in the RM.
Especially
important for
services, which is
actually the use of
mobile application.
This construct
plays more
significant role in
the professional
relationship, like
interfirm. In
individual-to-firm
relationship
commitment is
often onsides.
No
10 WOM “likelihood of a customer
positively referring the seller to
another potential customer”
Relationship
Marketing theory
(Palmatier et al. 2006)
One of the most
important RM
outcomes in the
mobile application,
created through
reviews and
grading/rating.
No
11 Performance refers to improvements in
outcomes such as sales, share of
wallet, profit performance, and
other positive changes to the
seller’s business.
Relationship
Marketing theory
(Palmatier et al. 2009)
Expressed in
continued
intention to use
No
Selected cultural dimensions of Hofstede’s theory
12 Individualism the degree to which people in a
society are integrated into groups
Cultural dimension.
Hofstede (2001)
Correlates with
both: technology
and RM
Not connected
with research
context
maybe
13 Uncertainty
avoidance
The public reaction to unfamiliar
situations, unexpected events,
and the pressure for change
Cultural dimension.
Hofstede (2001)
Correlates with
both: technology
and RM
Not connected
with research
context
maybe
Indulgence the ability of culture to meet the
immediate needs and personal
desires of society.
Cultural dimension.
(Hofstede & Minkov,
2010)
This dimension
describes the
relation between
leisure time and
working time, and
going out in the
restaurants is a part
of the leisure time.
This dimension is
not included in
both researches:
technology or RM
Yes
Source: completed by author of the thesis based on the references
162
IV.1. Technology use constructs.
Despite the fact that many of technology use constructs were defined and analyzed in the first
section of the chapter, we decided to keep only seven of them: four from the UTAUT2 and three
from the structural model of the mobile application usability.
Firstly, we keep the variable of use behavior as a key construct of research model. The mobile
application replaced the three out of four steps in the relationship between client and restaurant
establishment, so the use behavior of the mobile application user is key variables for our research.
We will define it as use of mobile application. We describe use of mobile application with
technology’s adoption and technology’s penetration. So the adoption characterizes the use from the
point of view of downloading of application, while penetration characterizes the actual use. In other
words the user can have on his/her smart phone the mobile application, but doesn’t use it because of
lack of trust. As a second variable we will include the intention to use, this variable precedes the
actual use. Many elements and aspects influence the user before he/she starts actual use.
Third variable of technology’s use we have chosen is the facilitating conditions, which correlates
with the concept of trust. Fourth variable to include is price value, we know, that both mobile
applications are free for downloading, because of that we will understand under this variable the
bonuses, financial or other benefits like gifts and loyalty cards. So, as much mobile applications are
used by the users, as confident they can feel using additional one. Otherwise stated, developed use
habit reduces the impact of facilitating conditions. In this way we eliminated the moderation of age,
finalizing that the duration of smartphone’s use is prior (because it develops habit to use mobile
application).
Three next variables are to keep from the structural model of mobile application usability. Mobile
application usability predicts continued intention to use and mobile application loyalty as two
wished outcomes of the use of the mobile application.
IV.2. Relationship marketing constructs.
The use of mobile application in the restaurant business context replaces the traditional relationship
between restaurant establishment and client. So, the restaurant management can use the mobile
application as a marketing tool and develop new relationships as well as reinforce relationship with
the loyal clients. From that point of view two of constructs of RM create the basement for the
successful relationship – trust and commitment. Both are influenced and changes by technology.
The mobile application holder plays here also significant role, because it is the mediator between
restaurant and client.
To make clear the importance of the technology in the relationship between restaurant
establishment and user we might include two relationship marketing outcomes. Word of mouth

163
(WOM) characterizes well the activity of mobile application user and is easy to experiment because
of such functions as reviews and grading inside of investigated mobile applications. Performance is
more complicated to define in our case: should it be any activities on the mobile application which
can positively/negatively change business of restaurant establishment, or number of loyal clients
perceived with help of mobile application. Anyway we already kept the mobile application loyalty
as an important construct for the research model. Even if this consctruct is taken out the
technological theories, it has connection with RM. To conclude we keep trust for the research
model and will add measurement items to the mobile application loyalty to describe the concept of
loyalty also from the point of view of relationship marketing.
IV.3. Cultural dimensions of Hofstede.
Two of six cultural dimensions can be included in our final research model, because both of them
have significant impact on technology’s use and on the relationship marketing, uncertainty
avoidance and individualism/collectivism. France and Russia score closely in uncertainty
avoidance and opposite in individualism/collectivism, because of that the combinations of scores
and their influence on technology’s use and relationship marketing provide us the possibility to
analyze differences in the mobile application use.
High uncertainty avoidance restricts the adoption of the technology, and at the same time makes
important such relational antecedents as seller expertise (rating) and relationship duration (user
history). Thus, probably the mobile application users will check the reviews, rating and grading
before to choose the restaurant, but still will prefer traditional WOM, or traditional way to take
contact. It can also result in longer process of adoption the mobile application.
High individualism impacts positively the penetration of technology, but reduces the significance of
the RM-antecedents and as result leads in weak RM outcomes. Combination of high individualism
and high uncertainty avoidance force from the restaurant management the appropriative activities
inside of the mobile application, so, obviously that one the user has adopted the mobile application
he/she will need positive reinforcement to continue the use, like discounts, promotions etc.
High collectivism has negative impact on the technology penetration. So the combination of both,
high uncertainty avoidance and high collectivism demands high involvement of the restaurant
management in the mobile application use, like to create the account, to control the reviews, to
control the comments etc.
Nevertheless we decided to choose another one variable of the cultural dimensions namely
Indulgence. On the one hand this variable wasn’t presented in researches neither in the connection
with the technology use nor in relationship marketing, but exactly this dimension shows well the
attitude of the users towards the leisure time, what is important for our context use – restaurant

164
industry. In this way the influence of the variable of Indulgence can predict the intention to use the
mobile application in the researched context. According to Hofstede’s countries comparison tool
France scored with 48 points and Russia – 20. That demonstrates cultural difference in leisure time
perception and self gratification. Key differences between indulgent and restrained cultures are
shown in the Table 33.
Table 33: Key differences between indulgent and restrained societies
Indulgent Restained
Higher percentage of very happy people Lower percentages of very happy people
A perception of personal life control A perception of helplessness; what happens to me is not
my own doing
Higher importance of leisure Lower importance of leisure
High importance of having friends Lower importance of having friends
Thrift is not very important Thrift is important
Loose society Tight society
More likely to remember positive emotions Less likely to remember positive emotions
Less moral discipline Moral Discipline
Positive attitude Cynicism
Higher percentage of people who feel healthy Lower percentage of people who feel healthy
Higher optimism More pessimism
More satisfying family life Less satisfying family life
Household tasks should be shared between partners Unequal sharing of household tasks is no problem
Loosely prescribed gender roles Strictly prescribed gender
In wealthy countries, less strict sexual norms In wealthy countries, stricter sexual norms roles
Smiling as a norm Smiling as suspect
Freedom of speech is viewed as relatively important Freedom of speech is not a primary concern
Maintaining order in the nation is not given a high
priority
Maintaining order in the nation is considered a high
priority
Lower numbers of police officers per 100.000 Higher numbers of police officers per 100.000
Population
Source: Hofstede et al. 2010
We selected the differences, which are influential in the restaurant context: percentage of very
happy people, importance of leisure, remembering of positive emotions, optimism/pessimism. We
assume that in culture with higher percentage of very happy people, higher importance of leisure,
higher ability to remember positive emotions and higher optimism people go more often out for
pleasure, therefore should use more often the mobile application. Moreover these values can
influence the intention to use, because of difference in expectations (for example, pessimistic point
of view can limit the intention to use, because of lack of trust etc.).
All together selected construct answer the purpose and problem of this thesis.
165
Chapter III: Conceptual model and research hypothesis

166
Introduction
Based on theoretical background and knowledge on use of technology, relationship marketing and
culture dimensions the conceptual model is proposed in this chapter of the thesis. The model
includes constructs from UTAUT 2 (Venkatesh et al., 2012), mobile application usability
(Venkatesh and Hoehle, 2015), Commitment-Trust theory of relationship marketing (Morgan and
Hunt, 1994) and cultural dimensions theory (Hofstede, 2010), as well the moderating constructs,
which are important for the use of mobile application in catering context. The hypotheses are
developed to clarify the relationships between the chosen constructs.
I.1. Conceptual model of the research
The conceptual model is developed based on following principals: (i) observation; (ii) desk-study
concerning theoretical and empirical researches on use of technology, relationship marketing and
cultural dimensions; (iii) consultation of experts and practitioners in marketing; and (iv) pre-test
with the mobile application users in France and Russia.
The use of mobile application is placed in the central position of the model, and based on this
position the factors influencing the use are regarded as well as results or outcomes of the use, like
loyalty and continued intention to use.
Figure 23: Use of mobile application in restaurant industry: conceptual model of the research.
The model is constituted by the following variables:
(i) Four variables are taken from the UTAUT 2 (Venkatesh et al., 2012), which shows the
adoption, intention to use and use of the mobile application in voluntary context. Thus the
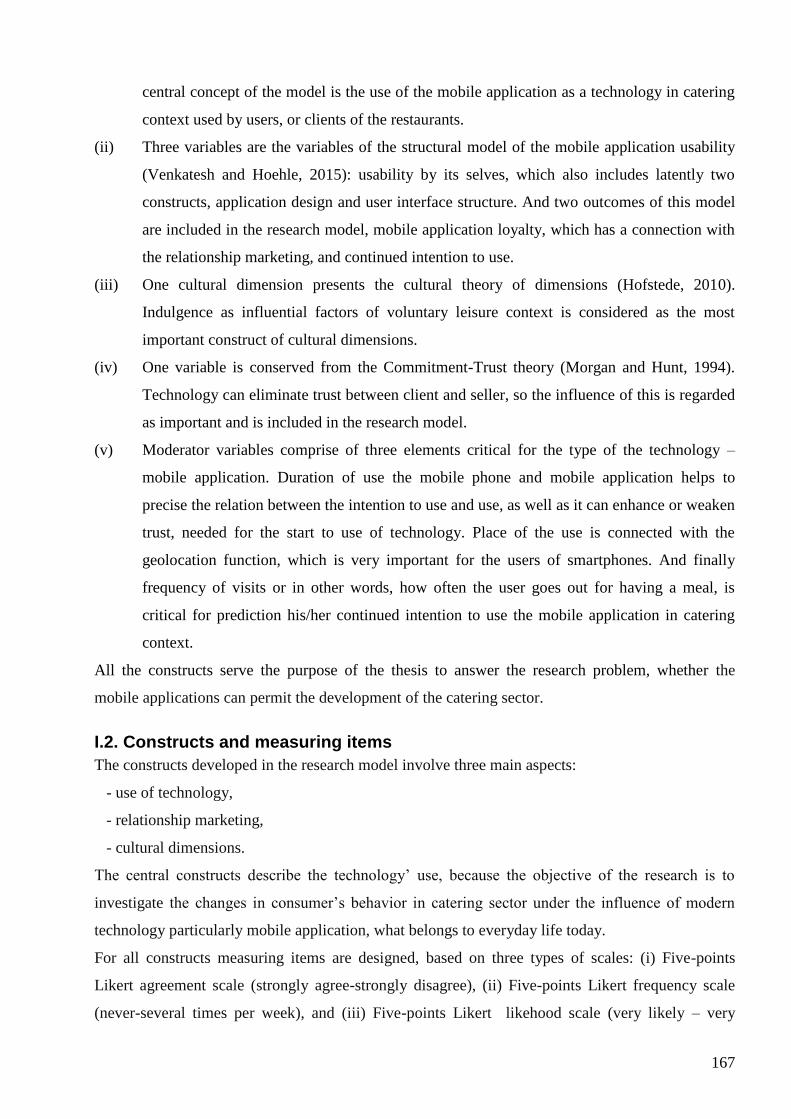
167
central concept of the model is the use of the mobile application as a technology in catering
context used by users, or clients of the restaurants.
(ii) Three variables are the variables of the structural model of the mobile application usability
(Venkatesh and Hoehle, 2015): usability by its selves, which also includes latently two
constructs, application design and user interface structure. And two outcomes of this model
are included in the research model, mobile application loyalty, which has a connection with
the relationship marketing, and continued intention to use.
(iii) One cultural dimension presents the cultural theory of dimensions (Hofstede, 2010).
Indulgence as influential factors of voluntary leisure context is considered as the most
important construct of cultural dimensions.
(iv) One variable is conserved from the Commitment-Trust theory (Morgan and Hunt, 1994).
Technology can eliminate trust between client and seller, so the influence of this is regarded
as important and is included in the research model.
(v) Moderator variables comprise of three elements critical for the type of the technology –
mobile application. Duration of use the mobile phone and mobile application helps to
precise the relation between the intention to use and use, as well as it can enhance or weaken
trust, needed for the start to use of technology. Place of the use is connected with the
geolocation function, which is very important for the users of smartphones. And finally
frequency of visits or in other words, how often the user goes out for having a meal, is
critical for prediction his/her continued intention to use the mobile application in catering
context.
All the constructs serve the purpose of the thesis to answer the research problem, whether the
mobile applications can permit the development of the catering sector.
I.2. Constructs and measuring items
The constructs developed in the research model involve three main aspects:
- use of technology,
- relationship marketing,
- cultural dimensions.
The central constructs describe the technology’ use, because the objective of the research is to
investigate the changes in consumer’s behavior in catering sector under the influence of modern
technology particularly mobile application, what belongs to everyday life today.
For all constructs measuring items are designed, based on three types of scales: (i) Five-points
Likert agreement scale (strongly agree-strongly disagree), (ii) Five-points Likert frequency scale
(never-several times per week), and (iii) Five-points Likert likehood scale (very likely – very

168
unlikely) (Mathieson, Doane, 2005). The survey is developed firstly in English, and then translated
into French and Russian languages.
I.2.1. Technology use
The aspect of technology use consists of two main subgroups: i) use of technology in voluntary
context (Unified Theory of Acceptance and Use of Technology 2, Venkatesh et al. 2012) and ii)
mobile application usability (Mobile Application Usability: Conceptualization and Instrument
Development, Venkatesh and Hoehle, 2015).
First construct, use of mobile application, is measured by Choice-question, where is needed to
precise the frequency of use according to the five points scale never-many times per week. The user
has to choose between use of the investigated mobile application (“Resto.ru” in Russia and
“Lafourchetee” in France), the website of the same company, the other similar mobile application,
and the other similar website. The question is adapted by Venkatesh, Thong, Xin Xu (2012).
Second construct, intention to use, is defined as individual’s decision to use mobile application, the
measuring item is adapted by the same authors as first one. There are three questions, contenting the
statements with five-point agreement scale “strongly agree- strongly disagree”. These statements
refer to investigate the plans of the user towards the mobile application.
Third construct, facilitating conditions refers to consumers’ perceptions of the resources and
support available to perform a behavior. Three of the questions disclose the technical difficulties of
the user, which he/she can face using the mobile application, and one question describes the
construct of habit, which was not included in the model, but was considered as important inside of
facilitating conditions. All questions are designed as statements, adapted by Venkatesh, Thong, Xin
Xu (2012) and estimated with five-point agreement scale.
Fourth construct, price value, is defined as the monetary cost of mobile application. Three
measuring items are designed to disclose the monetary value of mobile application for the user. In
our case the mobile application by its self’s doesn’t have a cost, but contra versa can provide
financial or nonfinancial benefits. From that point of view the questions are constituted to measure
the user’s attitude towards this benefits. All questions are adapted by Venkatesh, Thong, Xin Xu
(2012) and use the five-point agreement scale “strongly agree – strongly disagree”.
Next three constructs compose the mobile application usability aspect of the technology use.
Mobile application usability is defines as the extent to which a mobile application can be used by
specified users to achieve specified goals with effectiveness, efficiency, and satisfaction in a
specified context of use. It consists of two elements: application design and user interface structure.
The measuring items of these two elements supposed to disclose the attitude of the user toward the

169
mobile application usability. Each of the elements has two questions, adapted by Venkatesh and
Hoehle (2015) and estimated with five-point agreement statements.
Next construct, continued intention to use, is defined as degree to which a user feels he or she will
keep using a mobile application. The measuring items consist of three statements, estimated by
five-point agreement scale. The questions are adapted by Bhattacherjee (2001), Venkatech and
Goyal (2007), and Hoehle and Venkatesh (2015).
And last construct of the technology use theories is the mobile application loyalty, which is defined
as degree to which a user has a deeply held commitment to rebuy or repatronize a mobile
application. Three questions are aimed to disclose the loyalty of the user toward the mobile
application, adapted by Johnson et al., and Hoehle and Venkatesh (2015). The five point agreement
scale is used for estimation. The aspect of loyalty will be measured also from the point of view of
relationship marketing.
All the measuring items are presented in the Table 34.
Table 34: Measuring items for technology use aspects.
Construct Definition Question/Item Theoretical
justification
Use of technology
1 Use of mobile
application
Use of the mobile
application
Please choose your usage frequency for
each of the following by choosing the
restaurant:
a) mobile application N21
b) website of N22
c) other website
d) other mobile application
Frequency ranged from “never” to
“many times per week.”23
Wiswanath
Venkatesh
James Y.L.Thong
Xin Xu (2012)
2 Intention to use The individual’s
decision to use IS.
1. I intend to continue using
mobile application in the future.
2. I will always try to use mobile
application in my daily life.
3. I plan to continue to use mobile
application frequently.
Wiswanath
Venkatesh
James Y.L.Thong
Xin Xu (2012)
3 Facilitating
conditions
Refers to
consumers’
perceptions of the
resources and
support
available to
perform a behavior
1. I have resources (IOS, Android,
Wi-Fi) necessary to use mobile
application.
2. I have the knowledge necessary
to use the mobile application
3. I can get help from mobile
application provider when I
Wiswanath
Venkatesh
James Y.L.Thong
Xin Xu (2012)
21 Mobile application N will be replaced in the final questions by “lafourchette” for France and “resto” for Russia
22
Website N will be replaced in the final questions by “lafourchette” for France and “resto” for Russia
23 The range is designed as a table

170
have difficulties using mobile
application.
4. The use of mobile applications
has become a habit for me.
4 Price value The monetary cost
of technology.
1. The mobile application N is free
for downloading.
2. The bonuses provided by
mobile application N are
reasonable.
3. I use mobile application N to
enjoy promotions
Wiswanath
Venkatesh
James Y.L.Thong
Xin Xu (2012)
Usability
6 Mobile
application
Usability
Mobile application
usability is defined
as the extent to
which a mobile
application can be
used by specified
users to achieve
specified goals
with effectiveness,
efficiency, and
satisfaction in a
specified context
of use
(Venkatesh and
Ramesh, 2006)
Application design:
1. Overall, I think the mobile
application N is designed well
2. I am very satisfied with the
overall design of the mobile
application N.
Hoehle&Venkatesh
(2015)
User interface structure:
1. Overall, I think the mobile
application N structures
information effectively
2. I am very satisfied with the way
the mobile application N is
structured
Hoehle&Venkatesh
(2015)
7 Continued
intention o use
Degree to which a
user feels he or she
will keep using a
mobile application
1. I intend to continue using
mobile application rather than
discontinue its use.
2. My intentions are to continue
using mobile application than
use any alternative means.
3. If I could, I would like to
discontinue my use of mobile
application (reverse coded).
Bhattacherjee,
(2001)
Venkatech and
Goyal, (2007)
Hoehle&Venkatesh
(2015)
8 Mobile
application
loyalty
Degree to which a
user has a deeply
held commitment
to rebuy or
repatronize a
mobile application
1. I encourage friends and
relatives to be the customers of
the mobile application N
2. I will use more services offered
by the mobile application N in
the next few months/years
3. I consider the mobile
application N to be my first
choice
Johnson et al.,
(2006)
Hoehle&Venkatesh
(2015)
Source: completed by author of the thesis based on the references

171
I.2.2. Relationship marketing
Relationship marketing is the second aspect of the developed model. The use of mobile application,
which contains the services of many restaurants and is used by final customer, involves three actors.
Moreover the traditional relationship between client and restaurant is replaced or supplemented with
new technology of mobile application.
First construct of RM is trust, defined as confidence in an exchange partner’s reliability and
integrity. In our case it is the confidence in technology and technology provider. The measuring
items are adapted by Palmatier (2008) and designed as three statements, which the user should
answer with five point agreement scale. The purpose of the questions is to investigate how much the
users trust the mobile application and information given by the mobile application. Trust will
directly impact the intention to use of the mobile application.
The second construct belongs to mobile application loyalty, which we discussed in the
technological aspects of the researched model. Nevertheless the concept of loyalty can be predicted
not only because of the mobile application usability, what is shown above, but also be influenced by
other aspects, therefore we added two further measuring items adapted by Sirdeshmukh, Singh, and
Sabol (2001). These items are the only two which are using the five-point likehood scale.
The measuring items of relationship marketing aspect are presented in the Table 35.
Table 35: Measuring items of relationship marketing aspect
Construct Definition Items Theories
RM Constructs
1 Trust Confidence in an
exchange partner’s
reliability and
integrity
1. Mobile application N gives me
a feeling of trust.
2. The information provided by
mobile application N is always
honest.
3. Mobile application N is
trustworthy.
Palmatier (2008)
2 Loyalty
(Relationship
marketing)
Consumer’s desire
and intention to
continue a
relationship with
the company,
recommending it
and choosing it
from the market
Five-point scale very unlikely/very
likely
How likely are you to:
1. make more than in 50 % of
reservation in restaurants using
mobile application N?
2. use mobile application N the very
next time you choose the
restaurant?
Deepak
Sirdeshmukh,
Tagdip Singh and
Barry Sabol (2002)
Gremler, Brown,
(1996); Lovelock,
Wirtz, (1996)
Source: completed by author of the thesis based on the references
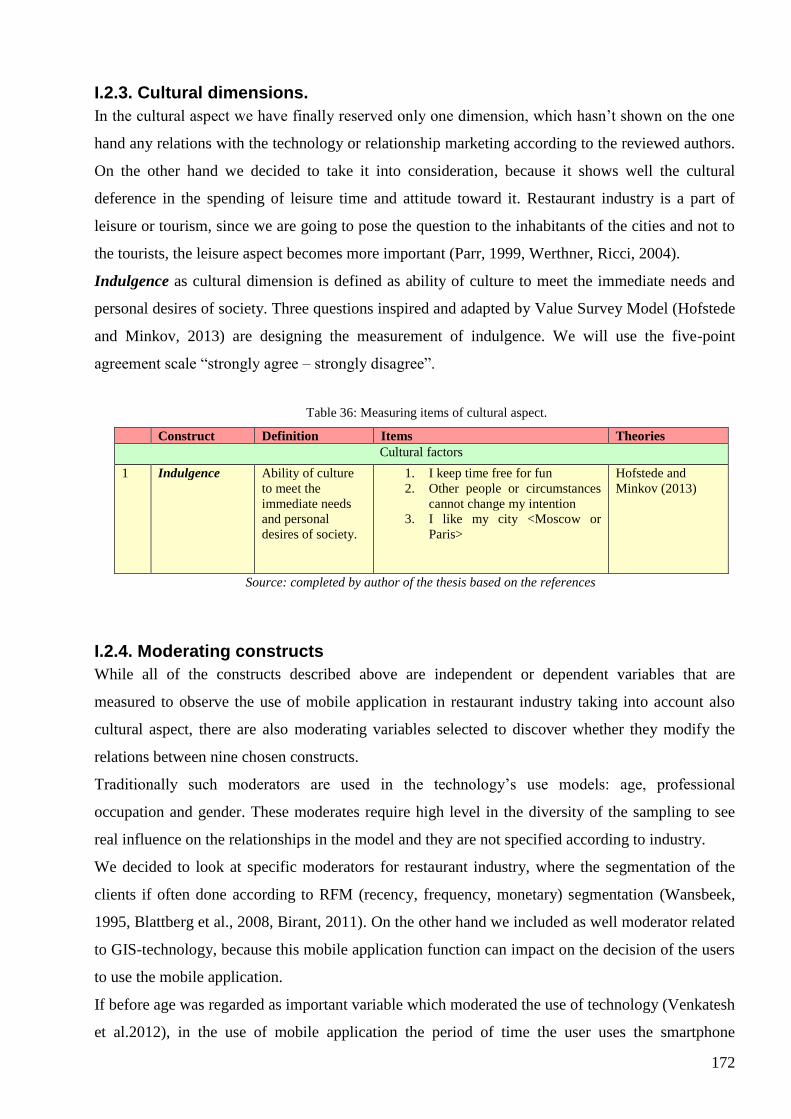
172
I.2.3. Cultural dimensions.
In the cultural aspect we have finally reserved only one dimension, which hasn’t shown on the one
hand any relations with the technology or relationship marketing according to the reviewed authors.
On the other hand we decided to take it into consideration, because it shows well the cultural
deference in the spending of leisure time and attitude toward it. Restaurant industry is a part of
leisure or tourism, since we are going to pose the question to the inhabitants of the cities and not to
the tourists, the leisure aspect becomes more important (Parr, 1999, Werthner, Ricci, 2004).
Indulgence as cultural dimension is defined as ability of culture to meet the immediate needs and
personal desires of society. Three questions inspired and adapted by Value Survey Model (Hofstede
and Minkov, 2013) are designing the measurement of indulgence. We will use the five-point
agreement scale “strongly agree – strongly disagree”.
Table 36: Measuring items of cultural aspect.
Construct Definition Items Theories
Cultural factors
1 Indulgence Ability of culture
to meet the
immediate needs
and personal
desires of society.
1. I keep time free for fun
2. Other people or circumstances
cannot change my intention
3. I like my city <Moscow or
Paris>
Hofstede and
Minkov (2013)
Source: completed by author of the thesis based on the references
I.2.4. Moderating constructs
While all of the constructs described above are independent or dependent variables that are
measured to observe the use of mobile application in restaurant industry taking into account also
cultural aspect, there are also moderating variables selected to discover whether they modify the
relations between nine chosen constructs.
Traditionally such moderators are used in the technology’s use models: age, professional
occupation and gender. These moderates require high level in the diversity of the sampling to see
real influence on the relationships in the model and they are not specified according to industry.
We decided to look at specific moderators for restaurant industry, where the segmentation of the
clients if often done according to RFM (recency, frequency, monetary) segmentation (Wansbeek,
1995, Blattberg et al., 2008, Birant, 2011). On the other hand we included as well moderator related
to GIS-technology, because this mobile application function can impact on the decision of the users
to use the mobile application.
If before age was regarded as important variable which moderated the use of technology (Venkatesh
et al.2012), in the use of mobile application the period of time the user uses the smartphone

173
becomes more relevant. As longer the user has the smartphone as quicker he/she can adopt new
mobile application for different purposes. The measuring items to estimate the duration are design
for two aspects: duration of the use of smartphone and duration of the use of mobile applications
and particularly investigated mobile application. The estimation requires the answers in periods.
That moderator we adapted and modified from the notion of recency of RFM segmentation.
Moderating construct, frequency of visits, which we define as frequency of going out with purpose
to have a meal, aims to disclose the effect on the relation between loyalty and continued intention to
use. As oftener the user goes out, as oftener he/she can to use the mobile application, or be loyal to
it, and finally to show stable intention to continue the use of the mobile application. In other case, if
the person goes out once a year, for example, it is no need for him/her to use specific mobile
application for choosing a restaurant. This moderator fully expresses the notion of frequency of
RFM segmentation.
Performance of complex geographic queries in geographic context (Lin, Kao, Lam, Tsai, 2014)
describes the location function of the technology and used actively in the tourism industry. Such
function became important on all applications connected with the searching of places. For
researched mobile applications use the place of use can be decisive moderator. Firstly, mobile
applications are used on the mobile devises, what often means not in the place with personal
computer thereby the search of information is possible only with mobile devise and supposed to
easier on the specialized application. Secondly, modern mobile applications suggest often the
function “next to me, around me” using the geoposition of the user. In this case the place of the use
can impact the relation between intention to use and use of the mobile application, if the mobile
application f.e. can propose promotions and happy hours. Regarding this points, the measuring
items are aimed to investigate, whether the user choose restaurant according to his/her geoposition,
or/and according to the promotions. To estimate the moderation effects we use four questions, made
as statement and required the five-point agreement scale answers.
Moderating constructs with their measuring items are presented in the Table 37.
Table 37: Measuring items of the moderating constructs.
Construct Definition Question/ Items Author
1 Duration of
use
Time period of use
of the smartphone
and the technology
of the mobile
application
1. How long are You using smart
phone (in years)?
2. How long are You using the
mobile application N?
3. How long are You using any
mobile application for choosing a
restaurant?
RFM segmentation
(Wansbeek, 1995,
Blattberg et al., 2008,
Birant, 2011)

174
2 Place of use The location of the
user before and
during the use of
the mobile
application
1. I use geolocation on mobile
application N when reserving the
restaurant
2. I check the promotions on mobile
application N in the restaurant
before entering it.
3. I prefer to go to the restaurant next
to me even there are no
promotions
4. I prefer to go to the long-run
restaurant because of promotions
on the mobile application
Lin, Kao, Lam, Tsai,
2014
3 Frequency of
visits
Frequency of going
out for having a
meal
1. How often You go out for
lunch/dinner
2. How often You go out for
lunch/dinner because of promotion
on the mobile application N
RFM segmentation
(Wansbeek, 1995,
Blattberg et al., 2008,
Birant, 2011)
II. Hypotheses of the research.
The hypotheses are statements expressing the relation between two or more measurable constructs
that have been developed in the above sections. They are considered as working instrument of
theory and tentative explanations that account for a set of facts and can be tested by further
investigation. The hypotheses are alternative, directional, and quantitative used to relate and
describe the variables of the research model.
The hypothesis of this research derive in deductive manners, what means, that they were formed by
selecting theories firstly, then presented in the form of statements leading to deductions and
accompanied by an argument.
Developing in deductive manners, the hypotheses of this thesis concentrate on the explanation of
mobile application use in catering context, taking into account aspects of relationship marketing and
cultural aspects.
175
II.1. Factors influencing the intention of mobile application use.
Before of actual use of mobile application the user experiences the situation to decide whether to
choose using of this application, or another one, or better to use website, or better to call a friend
and ask for advice. This situation is considered as intention to use. Different factors can influence
the user and change his/her intention in enhancing it or weaken it. The context of the mobile
application use is the catering, which we classified as leisure time. In this context the user is not
under the stress and has time to estimate all possibilities.
II.1.1. Price value
An important difference between a consumer use setting and the organizational use setting, where
UTAUT2 was developed, is that consumers usually bear the monetary cost of such use whereas
employees do not. The cost and pricing structure may have a significant impact on consumers’
technology use. In marketing research, the monetary cost/ price is usually conceptualized together
with the quality of products or services to determine the perceived value of products or services
(Zeithaml 1988). The price value is positive when the benefits of using a technology are perceived
to be greater than the monetary cost and such price value has a positive impact on intention. The
researched mobile applications are free for downloading. The importance of the price value can be
regarded here as aggregated utility: benefits collected by application’s use (discounts, loyalty
programs, client’s points, gifts etc).
Anyway, in case of free mobile applications price value can be strong predictor for the intention of
use the mobile application, if the mobile application provides the benefits and discounts. So in the
situation of choosing one of the search and booking means the decisive factor compared with others
would be the price value, therefore this study is supposed to test the relationship between price
value and intention to use the mobile application. It adapts the hypothesis of Venkatesh et al.
H1: Price value increases intention to use the mobile application. Users who believe to receive
financial or other profit using the mobile application will intent to use this mobile application.
II.1.2. Facilitating conditions
Facilitating conditions include aspects of the technological and/or organizational environment that
are designed to remote barriers to use. In contradistinction to other mentioned constructs,
facilitating conditions have no significant influence on the behavioral intention, but direct impact on

176
the usage, moderated by experience and age. Thus, the effect will be stronger for older workers with
increasing experience.
This construct is very important for our research because it is connected with trust of clients over
the mobile application, which will replace traditional relationship between restaurant and client. So,
in case of problems with some services provided by the mobile application, the client prefers to
have support like f.e. call-center, or personal account in the mobile application to give feedback, to
receive improvements of the system and other help. The same situation is with restaurant
management, who prefers to have supporting organization providing services about system. In this
context the mobile application holder plays a very important role.
We also put forward a hypothesis that facilitating conditions will impact not the use directly, as it
was discussed in UTAUT by Venkatesh et al, but in case of mobile application this construct will
impact firstly the intention to use the mobile application. As it was shown in the previous sections,
each of investigated mobile applications were developed from the website or other projects of the
companies known in the sector, thus will lead to increasing of the trust toward the mobile
application as a part of the company. In the situation of choosing the means to book table or to find
the information, the user will tend to select the already known company. And this belief to have
supporting organization will increase his/her intention to use investigated mobile application.
H2: Facilitating conditions impact positively trust. The mobile application users who believe
that supporting organization stays behind the mobile application develop trust quicker then
who don’t.
H3: Facilitating conditions impact positively the intention to use the mobile application. The
mobile application users who believe that supporting organization stays behind the mobile
application will rather to use it than not.
II.1.3. Trust
For our research trust is of high importance. First, developed trust about the mobile application
expends also to the restaurants included in the mobile application (the user trust that the reviews are
fair, the rating is independent). And conversely the user can lose trust about the restaurant in case of

177
false information on the mobile application, or he/she can lose trust about the application in case of
false services received in the restaurant (f.e. the mobile application promises the discount for the
visit of the restaurant, but the restaurant refuses to give this discount; or the mobile application can
contain fake restaurant establishments, wrong addresses etc.). The complexity of trust is added
through technology. The person should not only trust the company like restaurant, it should also
trust the technology. As we discussed UTAUT2 model has the construct, facilitating conditions,
which says that the individuals might tend to believe in the technology if he/ she is sure that the real
company or person is behind this technology. In our case the mobile application holder provides
technical support for both: restaurant establishment, as well as for the final users.
Trust impacts the intention of use, obviously the user will choose the mean he/she is confident in.
H4: Trust impacts positively the behavioral intention to use the mobile application. The
mobile application users, who have developed trust to mobile application’s provider, or
technology, intent to use mobile application more likely, than who have not.
II.1.4. Indulgence
The dimension of Indulgence connects the mobile application with cultural aspects of our research.
Catering context and mobile application use in this context belong to leisure time of the user. The
dimension of the indulgence describes the attitude of the culture toward the leisure time. As
consequence it can explain the differences in going out traditions, for example. The investigated
countries have different scores in this dimension according to Hofstede. In this way we can
hypothesize that the culture with higher score in Indulgence will tend to use more often the mobile
application to choose the restaurant, because generally this culture tends to spend more time for
leisure. The indulgence will impact the intention to use the mobile application, because in the
situation when the user has less time for leisure he/she will tend to use other mean to choose the
restaurant, like WOM, or choose all the time the same restaurant to be sure in quality of the
establishment. And in other way, if the user spends more time for leisure he/she will tend to try new
establishment, using also mobile application. The users from the cultures with the high score in
indulgence tend to use more often the mobile application to book a table in the restaurant. On the
countries’s level France scored more than two times higher (48) in this dimension than Russia (20).
We assume, that French users tend to use mobile application in restaurant context more likely than
Russians.

178
H5: High indulgence as cultural factor impacts positively the intention to use of the mobile
application.
II.1.5 Mobile application usability
In our research we regard the users of the mobile application “Lafourchette” in Paris and users of
the mobile application “Resto” in Moscow (specified users), who is using the mobile applications
for searching for the restaurant and for booking tables in the restaurants (specified goals). In this
way effectiveness refers to instruments the mobile application has for searching and booking,
efficiency refers to ability of the mobile application to provide not only information but also for
example bonuses, and satisfaction refers to the user’s satisfaction with the functions of the mobile
application. We investigate the leisure context, when the mobile application is used for the having a
meal in the restaurant. Users intent to use mobile application if they are satisfied with design and
information’s structure of the mobile application, as the elements of mobile application usability.
The positive impression of the mobile application usability impacts the preference of the users the
one application compared others, or mobile applications compared to other means.
The elements forming the mobile application design are branding, data preservation, instant start
and orientation, all of them can be estimated in two first second of using the mobile application.
Longer usage is needed to estimate the information’s structure, but anyway in the situation of
choosing the restaurant mobile application design will predict the intention to use the mobile
application strongly.
H6: Mobile application usability increases the behavioral intention to use the mobile
application.

179
II.2. Factors influencing the use of mobile application.
II.2.1. Intention to use
H7: Strong behavioral intention leads to the use of the mobile application.
After the user made the decision to use the mobile application, he/she is still under the factors
which can lead to rejection or continuation of mobile application usage. If the user developed the
strong behavioral intention under already discussed factors, he/she would use the mobile application
for the purpose to search for the restaurant establishment or to book a table in the restaurant. Strong
intention can be developed by attractive financial and nonfinancial benefits (price value), by using
the known company as provider of mobile application (trust), by clear information what to do in the
fail-cases (facilitating conditions), and by the feeling of having enough time for leisure so also for
the going out (indulgence).
All this relations lead to strong intention to use mobile application and as result in the actual use of
the mobile application.
II.2.2. Mobile application usability
Mobile application usability is formed from many elements. If the design of the mobile application
will impact the intention to use the mobile application, so the information structure will impact the
actual use of mobile application.
In the free mobile applications the mobile application usability should provide the information
needed by the users in the first place, else it will be easy to stop using the application and even to
delete it. Logical path and top-to-bottom structure are the elements forming the user interface
structure and answering the goal of the user to find necessary information easy and quickly. In this
way mobile application usability lead to the use of the mobile application.
H8: Mobile application usability leads to the use of the mobile application.

180
II.3. Outcome factors
The expected or desired outcomes of the use of mobile application are the mobile application
loyalty and continued intention to use of the mobile application.
II.3.1. Mobile application usability
User, who is satisfied with design and information’s structure of the mobile application, has a deep
commitment to repatronize a mobile application.
H9: Mobile application usability increases the mobile application loyalty.
Mobile application usability is a strong predictor of the mobile application loyalty. Known brand,
possible data preservation, instant start, and orientation not only impact the intention to use the
mobile application, but also preserve the wish to use it again. For example, after the user registered
him/herself on the mobile application, he/she start to be involved in the loyalty programs of the
mobile application, collecting benefits points. Preserved data of previous search allows the user to
get needed information quickly, so he/she will tend to use the mobile application again, developing
loyalty.
II.3.2. Continued intention to use
Mobile application loyalty leads to continued intention to use the mobile application. After the user
accepted and adopted the mobile application, he/she will choose all the time the chosen mobile
application in the similar situation of the decision making process. In this case the factors we
regarded before will loose their importance because of already developed loyalty. Such aspects as
trust, facilitating conditions, price value, or indulgence will be no anymore relevant in the decision
making.
H10: Mobile application loyalty moderated by frequency of visits leads to continued intention
to use the mobile application.

181
II.4. Moderation effects
The hypotheses of moderating effects are developed based on the context of the mobile application
use, namely leisure time and catering that incorporate the effects of the duration of the use, place of
the use and frequency of visits. Meanwhile, four hypotheses related to the effects of moderating
variables are formulated.
Hm1: Duration of the use moderates the relation between trust and intention of use
Hm2: Duration of the use moderates the relation between intention of use and use of the
mobile application.
Hm3: Place of use moderates the relation between intention of use and use of the mobile
application.
Hm4: Frequency of visits moderates relation between mobile application loyalty and
continued intention to use
III. Conclusion
Based on the theories and empirical researches on technology use, relationship marketing, and
cultural dimensions, the research model is developed with nine main variables and three moderator
variables. Nine main variables include price value, facilitation conditions, trust, indulgence,
intention to use, mobile application use, mobile application usability, mobile application loyalty,
and continued intention to use. Meanwhile duration of the use, place of the use, and frequency of
visits are the three moderating variables.
Ten hypotheses are developed concerning the mobile application use in the catering context. All the
hypotheses are synthesized in the Table 38.

182
Table 38: Synthesis of hypotheses.
Hypotheses
Factors influencing intention to use
H1 Price value increases intention to use the mobile application. Users who believe to receive financial or
other profit using the mobile application will intent to use this mobile application.
H2 Facilitating conditions impact positively trust. The mobile application users who believe that
supporting organization stays behind the mobile application develop trust quicker then who don’t.
H3 Facilitating conditions impact positively the intention to use the mobile application. The mobile
application users who believe that supporting organization stays behind the mobile application will
rather to use it than not.
H4 Trust impacts positively the behavioral intention to use the mobile application. The mobile application
users, who have developed trust to mobile application’s provider, or technology, intent to use mobile
application more likely, than who have not.
H5 Indulgence as cultural factor impacts positively the intention to use of the mobile application. The
users from the cultures with the high score in indulgence tend to use more often the mobile application
to book a table in the restaurant.
H6 Mobile application usability increases the behavioral intention to use the mobile application. Users,
who are satisfied with design and information’s structure of the mobile application, intent to use it.
Factors influencing the mobile application use
H7 Strong behavioral intention leads to the use of the mobile application.
H8 Mobile application usability leads to the use of the mobile application.
Outcomes factors
H9 Mobile application usability increases the mobile application loyalty. User who is satisfied with design
and information’s structure of the mobile application, has a deep commitment to repatronize a mobile
application.
H10 Mobile application loyalty moderated by frequency of visits leads to continued intention to use the
mobile application.
Moderation effects
Hm1 Duration of the use moderates the relation between trust and intention of use
Hm2 Duration of the use moderates the relation between intention of use and use of the mobile application.
Hm3 Place of use moderates the relation between intention of use and use of the mobile application.
Hm4 Frequency of visits moderates relation between mobile application loyalty and continued intention to
use

183
Part II: Experimental research

184
Chapter IV: Epistemology and methodology of the research

185
Introduction
This chapter discusses the research epistemology and methodology. Epistemological position of the
researcher not only defines his/her philosophical point of view towards the notion of knowledge,
but also determines the choice of methods to extract and to develop theories, to deal with the
knowledge. In this chapter we present our epistemological position of positivism and verify this
position through important issues of research design.
As methodological approach the quantitative approach is used in this thesis. We developed and
validated measuring items, construct and variables regarding the Churchill paradigm as
methodology. The verification of the conceptual model and hypotheses is based on the
methodology of structural equation modeling.
I. Epistemological position and methodological approach.
I.1. Epistemology
Epistemology aims determining the nature of knowledge and learning, learning opportunities, and
its connection with reality, the study of knowledge prerequisites, including the conditions for its
validity and truth (Creswell, 2012). The fundamental thesis of the relationship between the material
world and the knowledge of its material or subjective conditionality is the basis of the philosophical
understanding of epistemology, determining the context of a scientific approach to the study of
paradigms.
Epistemological position of the research helps to deal with the interaction of knowledge with truth
and belief by using the rules to describe reality.
Creswell (2012) suggests four different paradigms of science relating to ontology, epistemology and
methodology (Table 39).
Table 39: Four Worldviews Source
Positivism Constructivism
• Determination
• Reductionism
• Empirical observation and
measurement
• Theory verification
• Understanding
• Multiple participant meaning
• Social and historical construction
• Theory generation
Advocacy/Participatory Pragmatism
• Political
• Empowerment issue-oriented
• Consequences of actions
• Problem-centered

186
• Collaborative
• Change-oriented
• Pluralistic
• Real- world practice oriented
Source: Creswell, 2012
Positivism, constructivism and pragmatism are applied in management science.
David (1999) refers to the work of many researchers who have dealt with the epistemological and
methodological approaches specific to management sciences: Lewin (1951), Checkland (1984),
Argyris, Putnam and Smith (1985), Hatchuel and Molet (1986), Roy (1992), and Koenig (1997).
Different authors concluded and gave various opinions about the possible research classifications in
context to variety of methodologies used in the subject of management sciences. Cecez-
Kecmanovic (2007) concluded that there are the numerous methods of empirical research, which
encompasses the positivistic, interpretive and pragmatic paradigms. Chua (1986) identified the three
categories of research classifications i.e. positivistic, interpretive and pragmatic perspectives. In the
domain of management sciences the purpose of positivistic approach is to investigate and test the
theories and causal realities that predict the phenomenon which impact an organization. This
methodology relies on hypotheses/ hypothesis testing on the basis upon population sample (Myers,
2004). In the interpretative approach, researchers combined the results of their own subjective
opinion, considering the reality as a social product that cannot be understood independently of
society including researchers (Klein & Myers, 1999). Cecez-Kecmanovic (2007) believed that
instead of formulating conclusions as the established facts, interpretative research provides
interpretational analysis on the subject.
I.2.1. Positivism.
The positivist assumptions have represented the traditional form of research, and these assumptions
hold true more for quantitative research than qualitative one (Creswell, 2012). Positivists hold a
deterministic philosophy in which causes determine effects or outcomes. Thus, the problems
studied by positivists reflect the need to identify and assess the causes that influence outcomes, such
as found in experiments.
The knowledge that develops through a positivist lens is based on careful observation and
measurement of the objective reality that exists. This knowledge is objective, value free, or neutral
(Breen and Darlaston-John, 2008). There are laws and theories that govern the world, and these
need to be tested or verified so that we can understand the world. Thus, in the scientific method the
researcher begins with the theory, collects data, which either support or refuse the theory, and then
the researcher makes necessary revisions before additional tests are made.
Key assumptions of the positivist position (Phillips and Burbules, 2000, Breen and Darlaston-John,

187
2008, Creswell, 2012):
- Knowledge is conjectural, absolute truth can never be found. Thus, evidence established in
research is always imperfect and fallible.
- Research is the process of making claims and then refining or abandoning some of them for
other claims more strongly warranted.
- Data, evidence, and rational consideration shape knowledge. In practice, the researcher collects
information on instruments based on measures completed by the participants or by observations
recorded by the researcher.
- Research seeks to develop relevant, true statements, one that can serve to explain the situation
of concern or that describe the causal relationships of interest.
- Being objective is an essential aspect of competent inquiry; researcher must examine methods
and conclusions for bias.
Positivists assume that natural and social sciences measure independent facts about a single
apprehensible reality composed of discrete elements whose nature can be known and categorized
(Tsoukas, 1989, Guba and Lincoln, 1994, Patton, 2002, Breen and Darlaston-John, 2008). The
objectives of the research inquiry often include the measurement and analysis of causal
relationships between variables that are consistent across time and context. The primary data
collection techniques include controlled experiments and sample surveys, and outcomes orient and
assume natural laws and mechanisms, with the primary mode of the research inquiry being theory-
testing or deduction (Serakan, 2003, Serakan and Bougie, 2010, 2013). Data is usually collected in
a structured manner with the researcher not intervening in the phenomenon of interest and seeking
for theory testing in value-free generalizations. In other words, the data and its analysis are value-
free and data does not change because they are being observed.
Positivism as epistemological position in business research applies to the methods of the natural
science. Thus, the observed phenomenon is tested by developing of hypothesis, which can be
confirmed or rejected. The knowledge about the phenomenon is arrived by gathering facts,
reviewing theories.
I.2.2. Constructivism.
Constructivists hold assumptions that individuals seek understanding of the world in which they
live and work. Individuals develop subjective meaning of their experiences – meanings directed
toward certain objects or things. These meanings are varied and multiple, leading the researcher to
look for the complexity of views rather than narrowing meanings into a few categories or ideas

188
(Creswell, 2012). Watzlawick (1984), Von Glasersfeld (1988), and Jonassen (1991) share the
opinion that the observer creates reality by giving the meaning to what he/she observes. Dickerson
and Zimmerman (1996) postulate that all interpretations are equally valid ad long as it is
conditioned in context. The goal of the research is to rely as much as possible on the participant’s
views of the situation being studied.
The social effect was firstly excluded in constructivism (Held, 1990), the role of social and cultural
factors in the creation of individuals meaning was developed later, when the authors recognized,
that epistemology shows claims and opinions of individuals under the influences of theirs living
culture and societies (Owen, 1992).
Key assumptions of constructivists (Cambell, 1998, Crotty, 1998, Creswell, 2012):
- Meanings are constructed by human beings as they engage with the world they are interpreting.
- Humans engage with their world and make sense of it based on their historical and social
perspectives. Thus, qualitative researchers seek to understand the context or setting of the
participants through visiting this context and gathering information personally. They also
interpret what they find, an interpretation shaped by the researcher’s own experiences and
background.
- The basic generation of meaning is always social, arising in and out of interaction with human
community. The process of qualitative research is largely inductive, with the inquirer generating
meaning from the data collected in the field.
From a constructivist's perspective, truth is a construction which refers to a particular belief system
held in a particular context. Realities appear as multiple realities which are socially and
experientially based intangible mental constructions of individual persons. Meaning has more value
than measurement, for perception itself is the most important reality. Constructivism enquires about
the ideologies and values which lie behind a finding. Researching this created knowledge depends
on the interaction between interviewer and respondent, that is, the researcher has to be a ‘passionate
participant’' during his or her field work (Guba and Lincoln, 1994).
Constructivism is an alternative to the positivism epistemological paradigm that is influential in
business research. It is based on the point of view of the strategy, when the differences between
people and the objects are important to the research.
I.2.3. Pragmatism.
Pragmatism arises out of actions, situations, and consequences rather than antecedent conditions
(Creswell, 2012). Instead of focusing on methods, researchers emphasize the research problem and
use al approaches available to understand the problem.

189
Key assumptions (Cherryholmes, 1992, Morgan, 2007, Creswell, 2012):
- Pragmatism is not committed to any one system of philosophy and reality. This applies to mixed
method research in that inquirers draw liberally from both quantitative and qualitative
assumptions when they engage in their research.
- Individual researchers have a freedom of choice. In this way, researchers are free to choose the
methods, techniques, and procedures of research that best meet their needs and purposes.
- Truth is what works as the time. It is not based in a duality between reality independent of the
mind or within the mind.
- Pragmatists agree that research always occurs in social, historical, political, and other contexts.
- Pragmatists have believed in an external world independent of the mind as well as that lodged in
the mind.
- For the mixed method researcher, pragmatism opens the door to multiple methods, different
worldviews, and different assumptions, as well as different form of data collection and analysis.
Pragmatism as epistemological paradigm applies to the mixed-method in business research and is
used often in management science.
Table 40: Positivism, Constructivism, Pragmatism in business research:
Positivism Constructivism Pragmatism
Knowledge is conjectural, absolute
truth can never be found.
Meanings are constructed by
human beings, they are interpreting
the knowledge.
Truth is what works as the time.
Data, evidence, and rational
consideration shape knowledge.
Understanding the context through
visiting this context and gathering
information personally.
Different form of data collection
and analysis depending the
situation and need.
Examination of methods and
conclusions for bias.
Generation of meaning is always
social, arising in and out of
interaction with human
community.
Pragmatism opens the door to
multiple methods.
Quantitative method Qualitative method Mixed method
Source: completed by the author of thesis, based on different references above.
I.3. Choice and justification of epistemology
In our research positivism is considered as scientific paradigm. This choice is based on three
important points, including the object of the research, the nature of the data, and scientific traditions
in the previous researches:
1) A prime focus of the research is the behavior of consumers in the particular industry
(restaurant) influenced by information technology. Nevertheless, information technology (in
our case it is a mobile application) is the important object of the research. The phenomenon

190
of information technology forces the researcher to work with big amount of data, and to
treat this data statistically. In our research we have observed the fact of using the mobile
applications in the restaurant industry by consumers as part of existed reality. Mobile
technology is a part of the modern reality. As we presented in the context of the research,
the number of smartphones increases each year producing big data, and people use mobile
applications in their everyday life, also the restaurants as part of the reality and everyday life
tend to adapt and accept the mobile technology.
2) The nature of the data in the researched context is the second factor of the choice of the
positivist paradigm. Digital data is rather to measure with quantitative method than
qualitative.
3) The theoretical tradition is based in our research on three parts of theories:
- Technology’s use theory
- Culture dimensions theory, and
- Relationship marketing theory
❖ Technology’s use theory
The positivist vision is strong on the unit of the technology’s use theories.
Started with Rogers’s (1962) theory of technology diffusion the method of sampling and
statistically treatment of the results are used. On the step of observation the hypothesis and theories
are developed, which are confirmed or rejected on the empirical stage. In our researched following
theories are regarded:
➢ Theory of technology diffusion by Rogers(1962);
➢ Theory of Reasoned Action by Ajzen and Fishbein (1975);
➢ Theory of planned behavior by Ajzen (1985);
➢ Technology Acceptance Model by Devis (1986) and TAM2 by Devis and
Venkatesh(2000);
➢ United Theory of Acceptance and Use of Thechnology(UTAUT) and UTAUT2 by
Venkatesh et al.(2003,2012);
➢ Mobile Application Usability by Venkatesh and Hoehle (2015).
In all listed concepts sampling, statistical measurement and treatments using software are the
researching strategies. All theories have positivism scientific paradigm, with developing hypothesis
at the first step and empirical analyze based on the quantitative method.
❖ Cultural dimensions
Hofstede has as well positivistic point of view in his theory of cultural dimensions. His research
is based on 116000 survey responses in IBM units in approximately 60 countries (Hofstede,
2001, Hofstede, Minkov 2010).

191
❖ Relationship marketing
Theory of relationship marketing is the part of theoretical background of our research, which
includes both: quantitative and qualitative method, depending on the problem of the research.
Pragmatic scientific paradigm allows choosing corresponding means of collecting and interpreting
data. Methodological orientation includes differences in schools and directions, thus, the tradition
can emphasize on hypothetical-deductive reasoning, or understanding through qualitative research.
In our research we regarded:
➢ Commitment-Trust theory by Morgan and Hunt (1994) - hypothetical-deductive
reasoning;
➢ Interfirm Relationship marketing by Palmatier (2008) – hypothesis testing by
multivariate analysis;
➢ Interpersonal Relationship marketing by Palmatier (2008) – qualitative research;
➢ Multi-level Exchange Relationships in Relationship marketing by Palmatier (2008) -
both methods;
➢ The role of culture in Relationship Marketing by Samaha, Beck, and Palmatier
(2012) – hypothetical-deductive reasoning.
In this way we can conclude that positivism as scientific paradigm is our primary choice and has
been confirmed by object of the research, nature of data, and regarded theories.
II. Design of the research
Research design provides a framework for the collection and analysis of data. The choice of
research design shows the most important consideration given to a range of dimensions of the
research process.
Research design is an important tool of planning, substantiation, and practical guidance of the
research procedures. It allows identifying four main issues: 1) research questions or problem, 2)
theoretical corpus, 3) relevant data to collect, 4) ways to analyze and interpret data (Thiétart, 2007).
According to De Vaus (2001) research design is “a logical task, undertaken to ensure that the
evidence collected enables to answer questions or to test theories as unambiguously as possible”.
The researchers not only select a quantitative, qualitative or mixed methods, they also decide the
type of research inside of the selected methods.
The choice of the research design can be found either by the process of deduction or the process of
induction, or by a combination of the two. Induction is formation of the generalization derived from
examination of a set of particulars, while deduction is the identification of an unknown particular,
drawn from its resemblance to a set of known facts (Rotchild, 2006).

192
In other words, deduction is the process by which the researcher arrives at a reasoned conclusion by
logical generalization of a known fact (Sekaran, 2003). For example, we know that all users of the
website LaFourchette tend to download its mobile application. So, if a person is using the website
LaFourchette, we can say that he/she will very probably download this mobile application sooner or
later. Induction, on the other hand, is a process where the researcher observes certain phenomena
and on this basis arrives at conclusions (Sekaran, 2003). For example, we see that the participating
in bonus program of LaFourchette is the prime motivation for users to download its mobile
application. Therefore we can conclude that users download the mobile application LaFourchette to
participate in bonus program.
Table 41: Induction, Deduction, Combination
Induction Deduction Combination of both
Observation is prior; the researcher
observes certain phenomena and
on this basis arrives at conclusions.
Knowledge is prior; the researcher
arrives at a reasoned conclusion by
logical generalization of a known
fact.
Nothing is prior; the researcher
combines two processes depending
on the researched phenomena.
Source: completed by the author of thesis, based on different references above.
II.1 Hypothetico-deductive research process
When research is designed to test some specific hypothesized outcomes, the researcher begins with
reviewing the corresponded theories. The hypothesis is then generated. Based on this a research
project is designed to test the hypothesis. The results of the study help the researcher to deduce or
conclude if his/her hypothesis are confirmed or rejected. This method of starting with a theoretical
framework, formulating hypotheses, and logically deducing from the results of the study is known
as the hypothetico-deductive method (Serakan, 2003).
Hypothetico-deductive research process proposed by Sekaran and Bougie (2013) is presented on the
Figure 24:

193
Figure 24: The research process
Source: Sekaran and Bougie, 2013
Adapted the presented frame of research process by Serakan and Bougie we are designing our
research according to hypothetico-deductive process respecting following steps:
- Observation, or identifying a broad area of research,
- Preliminary information gathering (literature review),
- Theory formulation,
- Hypothesizing,
- Data collection,
- Data analysis,
- Data interpretation,
- Presentation of results (for example in the form of an article or the thesis and further
defense of the thesis).
Observation is the first stage, when the researcher notices that some changes are occurring and the
observed phenomena are seen to have potentially important consequences. In our case, the observed
phenomena occur when the behavior of the consumer changes influenced by developed mobile
technologies. Restaurants face the change in the obtaining of information, being reviewed
immediately, checking in with social networks, and online booking. The observation of phenomena
is presented in details in the Research Context, chapter I of this thesis. Firstly, we showed the
overlook of the tourism and restaurant industries, giving necessary definitions, historical references,

194
and modern state. Then, we looked into the development of the technology, that has the most
significant influence on these industries, and finally, we presented the context of two countries
Russia and France, underlining the development stage of both: technology and industries.
Preliminary information gathering involves the search for information to explain the observed
phenomenon, including the study of previous researches. Based on our research problem we
decided to focus on three theoretical backgrounds.
❖ Technology’s use theories, because the key-object of our research is the mobile application,
as a modern tool for both participants of the restaurant market: restaurant establishments and
restaurant clients. We reviewed:
- Diffusion of innovation, Everett Rogers (1962).
- Theory of reasoned action (TRA) by Martin Fishbein and Acek Ajzen (1975, 1980).
- The technology acceptance model by Fred. D. Davis (1986).
- Unified Theory of Acceptance and Use of Technology (UTAUT), Venkatesh et al. (2003).
- UTAUT2, Venkatesh et al. (2012).
- Mobile application usability, Venkatesh and Hoehle (2015)
We adopted and included in our model seven constructs of technology’s use theories.
❖ Relationship Marketing, because the interaction of restaurant establishment and its client
involves developing of relationship with such constructs as trust, commitment, end loyalty.
Here we reviewed:
- The Commitment-Trust theory of RM by Morgan and Hunt( 1994)
- Interfirm RM by Palmatier (2008)
- Interpersonal RM by Palmatier (2008)
- Multi-level exchange Relationships in RM by Palmatier (2008)
- The role of culture in Relationship Marketing by Stephen A. Samaha, Joshua T. Beck, & Robert
W. Palmatier (2012).
We adopted and included in our model two constructs of relationship marketing theory.
❖ Cultural dimensions theory, because we are going to compare the use of mobile applications
in two countries, Russia and France. Here we reviewed:
- Cultural dimensions theory by Gert Jan Hofstede (2001, 2010);
- Adoption of communication technologies and national culture, TAM and Hofstede’s (2001);
- The concept of the modern Russian values (Belyaev, 2010, Kotlarova, 2010);
- The concept of the modern French values (Mermet, 1996, Excousseau, 2000);

195
- Cultural dimension of Hofstede (2001, 2010);
- Impact of Hofstede’s cultural dimension on technology use and on relationship marketing
(2012).
We adopted and included in our model one construct of culture dimensions theory.
Theory formulation is the step when the information is integrated in the logical way, so the factors
which are important for the problem can be conceptualized and tested. The theoretical framework
presents chosen variables. According to Zikmund, Babin, Carr, and Griffin (2009) there are
variables in the research among which the researcher study relationships:
❖ Independent variable is the predictor variable which is supposed to be cause of change in
the dependent variable. In our research model independent variables are indulgence, price
value, facilitating conditions, and usability.
❖ Dependent variables in our research model are use, loyalty, continued intention to use.
Figure 25: Dependent and independent variables
❖ Moderating variable is one that has a strong contingent effect on the relationship between
independent and dependent variable (Sekaran, Bougie, 2010). In our research model
moderating variables are duration and place of the use, frequency of visits.
Figure 26: Moderating variable
❖ Mediating variable or intervening variable is one that provides a causal link between
independent and dependent variables (Serakan, Bougie, 2010). In our research model
mediating variables are trust, intention to use, loyalty.

196
Figure 27: Mediating variable
Hypothesizing is the next step, when the researcher based on the theoretical framework hypnotizes
the relationships among the chosen variables. The hypothesis fulfills three conditions (Cooper and
Schindler, 2006):
1) It is adequate for its purpose
2) It is testable
3) It is better than its rivals
In our research we have ten hypotheses and four hypotheses of moderation. In correspondence with
these three conditions the model and hypotheses are reviewed by experts, and after that they are
checked during the pretest inside of smaller sampling, enough for treatment with the software
SmartPLS3.
Further scientific data collection occurs when hypothesis are developed and pretested. Empirical
data for this study was collected in cooperation with two companies: Lafourchette in Paris and
Resto in Moscow. In this way the most important feature of the sampling is that all the responders
are registered as user one of the mobile application, depending on the city. The companies included
the survey in their news-letter and sent to all users in the areas of Paris in France and Moscow in
Russia.
In Data analysis step the data gathered are statistically analyzed to see of the hypothesis that were
developed have been supported. Hypotheses are tested through appropriate statistic software in our
case SmartPLS which is discussed in the section 4 of this chapter.
Interpretation is the process of arriving to conclusions by interpreting the meaning of the results.
Based on the deduction the researcher would make recommendations on problems’ solution.
Presentation depends on the type and goal of the research and can be done in form of an article,
thesis, or conference presentation.

197
II.2. Comparative design
Second important framework of our research is the comparison of two countries Russia and France;
therefore it is important to point out the features of comparative research design. Comparative
design involves the study using identical methods on two or more cases. It comprises the logic of
comparison so the researched phenomena are regarded in two or more different situations (Bryman
and Bell, 2015). Thus, the mobile application use can be observed and compared in different
situations of usage, like for example usage when online-shopping and usage of messengers, or two
different mobile applications can be observed and compared in the same usage situation. In any
case, the most important issue for researcher is to work out the criteria of comparison and preserve
the identical method of data collecting and interpreting.
One of the forms of comparative design is cross-cultural or cross-national research. Such research
occurs when researcher examines particular phenomena in two or more countries with intention
comparing his/her findings using the same research methods and instruments (Hantrais, 1996,
Harkness, Van de Vijver, & Mohler, 2003, Delva, Allen-Meares, & Momper, 2010). The goal
might be to explain similarities and differences or to strengthen awareness and understanding of the
phenomena in different national contexts. Cross-national research is the form of comparative design
which we are using in our study. The researched phenomenon is the mobile application use in the
restaurant industries of two countries - Russia and France. To accomplish the comparison the
national context is presented in three parts: general situation, industry’s development, and position
of the mobile technology today in each country (see more in the chapter I). Further two mobile
applications used in the restaurant sector are described in details. And cooperation with the
management of these applications is created.
Cross-cultural research regards culture as major explanatory variable that affects consumer
behavior. Nevertheless such research should not be treated as only concerned comparisons between
nations. The logic of comparison can be applied to a variety of situations to inform a number of
levels of analysis. In our researched model the important role of culture is added by theory of
cultural dimensions of Hofstede. In this way not only differences and similarities of use by different
groups of people can be regarded but also the cultural aspect is respected.
Important issues of cross-cultural comparison are connected often with data. Researcher should be
aware about that data are comparable in terms of categories and data collection methods. The need
to translate data collections instruments in the proper way. Even with correct translations there is
always the possibility of potential insensitivity to specific national or cultural contexts. In our case
after the development of the research model, the survey was worked out, and translated into both

198
languages in French and in Russian; the surveys have identical questions for both cases. The
sampling and data collecting methods are also identical in the way that the surveys are suggested in
the first line to the clients of the companies, in other words loyal or tending to be loyal users of
applications. Strict abidance of this requirement causes some difficulties in collecting data and
increases the length of the research. So, for example, we are limited in sample size because of low
activity of Russian responders.
Another issue in comparative research is achieving equivalence between the samples, variables, and
methods (McDonald, 2000). For example, in many cases nationality is used as a substitute of
culture, but differences in researched phenomena can apply to cultural attribute as well as to
national situation. For example what we could notice, the tradition to eat out of home is stronger in
France than in Russia, therefore the habit to search for the restaurant supposed to be less developed
in Russia. On the other hand the mobile technology came into the life of the people of both
countries about the same time. Other significant reason of different consumer behavior lies in the
category of income. The purchasing power in Russia is lower and it can also explain for example,
why people go out less in Russia than in France, but it does not influence the use of mobile
application in the situation of the restaurant choice.
Therefore the use of comparative design is in its ability to allow distinguishing characteristics of
two or more cases what is leading in theoretical reflections about contrasting findings.
III. Methodological approach
This section proposes presentation of methodological approach and the choice of methods for the
research.
III.1. Quantitative and qualitative research strategy
Scientific methodology distinguishes between quantitative and qualitative methodological
approach. The choice one above another determines the different methods of the research. The
quantitative/qualitative distinction is needed because it classifies means of the research:
measurements, data collecting and interpreting.
Creswell (2012) defines quantitative approach as “ one, in which the investigatory primarily uses
postpositive claims for developing knowledge…..employs strategies of inquiry such as experiments
and surveys, and collect data on predetermined instrument that yield statistic data”. Thus,
quantitative research is prerogative of the positivists, with linking variables, testing theories and
hypotheses, making predictions.
Qualitative approach focuses on exploring; categories are isolated and defined during research
process. Significant phenomena are supposed to be interpreted historically and culturally.

199
According to Creswell (2012) qualitative approach is “one in which the inquirer often makes
knowledge claims based primarily on constructivists perspectives…..It also sues strategies of
inquiry such as narratives, phenomenology, ethnography, grounded theory studies, or case studies.
The researcher collects open-ended, emerging data with the primary intent of developing them from
the data”.
Generally saying the difference between both approaches lies in the fact, that in quantitative
research the researchers use measurement and in qualitative one they do not, but from the
epistemological point of view these two research strategies are fundamentally different (Table 42).
Table 42: Fundamental differences between quantitative and qualitative research strategies.
Quantitative Qualitative
Role of theory in the research Deductive; testing of theory Inductive; generation of theory
Epistemology Natural science model, positivism Interpretivism
Ontology Objectivism Constructivism
Strength Precision because of quantitative
and reliable measurements
High control level because of
sampling and design
Ability to produce causal
statements in the use of controlled
experiments
Statistical techniques and
sophisticated analysis
Replicable
Have an insider view on the field
because of close involvement of the
researcher
Suggest possible relationships,
causes, effects, and dynamic
processes
Have new insight of knowledge
because of descriptive and narrative
style
Limitations Assumptions about the facts are
generalized to all cases
Result interpretation are subjective
Weak control over all variables
Problem in proves of validity and
reliability
Not replicable
No generalizations
Not anonymous
Source: adapted by Bryman and ball, 2015, Burns, 2000
Thus, quantitative research is a research strategy that emphasizes quantification in the collection
and analysis of data (Bryman and Bell, 2015). That means:
• A deductive approach to the relationship between theory and research, in which the theory is
testing.
• Practices and norms are adopted from natural scientific model. Positivism is the dominated
scientific paradigm.
• Reality is regarded as an external, objective one.
In opposite, qualitative research is a research strategy that usually emphasizes words rather that
200
quantification in the collection and analysis of data (Bryman and Bell, 2015). That means:
• An inductive approach to the relationship between theory and research, in which theory is
generating.
• Researchers interpret the reality. Interpretivism/constuctivism is the scientific paradigm.
• Reality is a part of individual’s creation.
Quantitative and qualitative researches represent different research strategies, in terms of the role of
theory, epistemological paradigm, and ontological concerns. However, the distinction can be not
strict and in this way the mixed method appears as research strategy. Anyway but by contrasting of
two approaches the researcher can easier make a decision of implementation one or another method
according to his/her research objectives.
III.2. Quantitative research approach.
Quantitative research was driven by investigators with the need to quantify data. A quantitative
research method involves a numeric or statistical approach to research design. Leedy and Ormrod
(2001) alleged that quantitative research is specific in its surveying and experimentation, as it builds
upon existing theories. The methodology of a quantitative research maintains the assumption of an
empiricist paradigm (Creswell, 2009). Data is used to objectively measure reality.
Quantitative research can be used in response to relational questions of variables within the
research. It begins with a problem statement and involves the formation of a hypothesis, through
literature review. Creswell (2009) states, quantitative research “employ strategies of inquiry such as
experimental and surveys, and collect data on predetermined instruments that yield statistical data”.
The findings from quantitative research can be predictive, explanatory, and confirming.
Quantitative research involves the collection of data so that information can be quantified and
subjected to statistical treatment in order to support or refute “alternate knowledge claims”
(Creswell, 2009). The researcher uses mathematical models as the methodology of data analysis.
Three historical trends pertaining to quantitative research include research design, test and
measurement procedures, and statistical analysis. Quantitative research also involves data collection
that is typically numeric and the researcher tends to use mathematical models as the methodology of
data analysis. Additionally, the researcher uses the inquiry methods to ensure alignment with
statistical data collection methodology.
III.3. Concepts and measurement instruments
Concepts are categories for organization of ideas and observations (Bulmer, 1984, Bryman and
Bell, 2015). If a concept is to be employed in quantitative research, it will be needed to measure it.

201
Once the concept is measured, it can be in the form of independent or dependent variables. In other
words, when conducting quantitative research, a researcher should have a clear understanding about
the concepts of research units and variables and how to measure them. Concepts provide the
explanation of an aspect of reality; they stay for phenomenon the researcher wants to explain. For
example, a concept of culture can be used as a possible explanation of mobile technology use in
cross-cultural research, or mobile technology use can be explained by the concept of mobile
application usability. When we start to investigate these issues we are likely to formulate hypothesis
connecting different concepts, but also we need to measure variables.
There are three main reasons for developing measurement instruments in quantitative research:
• Measurement allows delineating fine differences between people in terms of the
characteristic questions. So, we can find out people who are using the mobile applications
in their everyday life and distinguish them from the people who have never used or use
seldom the mobile applications.
• Measurement gives a consistent device for making such distinctions. A measurement device
provides a consistent instrument of evaluation.
• Measurement provides the basis for more precise estimates of the degree of relationship
between concepts.
In order to provide a measure of a variable, it is necessary to have measuring items that will stand
for the concept. There are a number of ways in which the measuring items can be devised:
• Through a question (or series of questions) that is part of structured interview schedule or
self-completion questionnaire.
• Trough the recording of individual’s behavior using structured observation schedule.
• Trough an examination of mass media content.
To confirm one concept or variable the researcher should examine it with variety of measuring
items to be sure that concept can be sufficient. In this case researcher uses multiple-item measures.
So, it is possible that single measuring item can incorrectly classify many individuals. For example,
due of wording of the question the misunderstanding of question can appear. Single measuring item
can be also too general, in this case another question is needed to precise the concept and to
decrease the level of generalization. Multiple-items help make the distinctions.
III.4 Survey
Survey is the way to collect data to validate the research model. According to Bryman and Bell
(2015) survey can be accomplished as structured interview or self-completion (self administrated)
questionnaire (see Figure 28).

202
Figure 28: Survey structure
Source: Bryman and Bell, 2014
The most significant difference between both lays in the presence or absence of interviewer during
the time, when the responder fulfills the questions.
In our research we use the self-completion questionnaire.
Self-completion questionnaires
Self-completion or self-administrated questionnaire is the instrument of survey, when responders
answer questions by completing questionnaire by themselves. It can have several forms:
- Supervised: in this case the questionnaire is completed on responder’s own but under the
supervision, for example in the class, or in the enterprise during the meeting. Supervisor does not
actively participate; nevertheless his/her presence can influence somehow the responder. Very often
in this type of self-completion questionnaire the participants have no or little choice to answer or
not, and as consequence supervised questionnaires have high response rate.
-Postal: a questionnaire is sent through the post to the responders and completed forms is usually
asked to be sent back, for this purpose the envelope with the address is included in the package. In
other cases the completed questionnaire can be deposit to the box in the office, super-market etc.
- Internet. Galan and Vernette (2000), Gueguen and Yami (2007) distinguish between two types of
Internet investigation: statistic and dynamic. In the statistic Internet investigation the researchers
use email to diffuse the questionnaire. Usually the questions are designed inside of the email text or
in the attached file. Kittleson (1995) assumes that email questionnaire has risk to be deleted because
of poor attraction power of responders, or it can be blocked by antivirus and antispam software. In
the dynamic investigation Internet but itself is used for diffusion of the questionnaire, which is

203
posted on a server, and then its address of uniform resource locator (URL) is sent to targeting
audience in different ways. The responders can open the questionnaire in the way they use Internet
(browser or mobile). Results are collected automatically (Alvarez and Van Beselaeree, 2003). This
kind of survey is very interactive and rich (Stanton, 1998).
In our research we use dynamic online questionnaire, particularly Google survey.
III.5. Online survey
Internet-based studies are roughly systematized in four categories (Reips, 2006): Internet-based
experiments, web surveys and questionnaires, Internet-based assessment, and nonreactive data
collection on the Internet. In a wider sense, studies about human activities on the Internet can also
be defined as Internet-based studies. The first Internet-based studies appeared in the middle of 1990
(Musch & Reips, 2000; Reips, 2006). Conducting studies via the Internet is considered a second
revolution in behavioral research, after the computer revolution in the late 1960s and early 1970s
that brought about many advantages over widely used paper-and-pencil procedures (e.g., automated
processes, heightened precision). Internet added the dimension of interactivity in research.
Although Internet-based studies have some inherent limitations due to a lack of control and
observation of conditions, they also have a number of advantages (Birnbaum, 2004; Kraut et al.,
2004; Reips, 2002; Schmidt, 1997). Some of the main advantages are that (1) researchers can
recruit and study large numbers of participants very quickly; (2) it is possible to collect and access
large data sets, and (3) the method is more cost-effective in time and space.
Many authors agree that the Internet is a viable option for conducting studies in the behavioral and
social sciences (Birnbaum, 2004; Joinson, McKenna, Postmes, & Reips, 2007; Kraut et al., 2004;
Musch & Reips, 2000; Reips, 2002, 2006). Care should be taken to properly implement an adequate
methodology suited for Internet-based studies (Reips, 2002) and consider potentially biasing effects
of technology (Schmidt, 2007). Two important issues for much of human interaction on and with
the Internet are: real and perceived privacy as well as trust (Buchanan, Joinson, Paine, & Reips,
2007; Eysenbach et al., 2004). Threats to privacy on the Internet reduce the willingness to look for
information online. Benefits like wider reach, better quality of data from truly voluntary
respondents, and a reduced tendency for socially desirable responding, reduced costs, and validated
tools for Internet-based research increase the use of the Internet-based survey.
Google Survey in Google forms application provides a fast way to create an online survey, with
responses collected in an online spreadsheet. As a tool for online survey Google forms has such
advantages as: voluntariness and anonymity of responding, what positively impacts the trust
towards the survey; easy to spread the link by publishing it or sending via email; free of charge,

204
Google forms is available for free. Nevertheless, the most important limitation of this tool is the
lack of control over the process of data collecting. In this way the researcher should be aware and
count the length of the time, he/she can need to accomplish the survey.
Figure 29: Process of web-based questionnaire diffusion
Source: adapted by Gueguen and Yami (2007)
III.6. Sampling
Consideration about sampling is very important in quantitative research. Generally speaking the
researcher should decide where, how and by whom he/she should collect the data for the analysis.
The collected data should allow the researcher generalize or not the findings. In order of
generalization of findings from the sample to the population, the sample must be representative
(Bryman and Bell, 2014). If we are researching the mobile application use, so surely we should
collect data from users of mobile applications, our research is in the restaurant industry, so the users
should not only use any of mobile applications, but actually the specific mobile applications, and on
the other hand they should be not only users of technology, they should also visit more or less often
the restaurants. And finally, one of the specificity of our research is the cultural comparison, so we
are obligated to collect data from different countries, else we will be not able to compare our
findings.
There are two main strategies of sampling: probability and non-probability.
Probability sample
a) Simple random sample is the most basic form of probability sample. With random sampling
each unit of population has an equal probability of inclusion in the sample. This is known as
sampling fraction and is expressed as
n/N
where n is the sample size and N is the population size. The key steps in the simple random
sample are:

205
- definition of population ( for example, users of mobile application Lafourchette living in
Paris region, French speaking)
- selection a comprehensive sampling frame (it is possible that our survey will responded by
people never used mobile application, or living in other cities in France, but these
responders are out of our frame)
- decision about sample size
- listing all corresponding population from 1 to N
- using the random numbers or a computer software generate random numbers, select n
different numbers that lie between 1 and N
- responders to which the n random numbers refer constitute the sample.
b) Systematic sample is a variation on the simple random sample. With this kind of sample
units are directly chosen from the sampling frame without reasoning to a table of random
numbers.
c) Stratified random sampling means stratifying the population by a criterion and selecting
either a simple random sample or a systematic sample from each of the resulting strata.
The advantage of the stratified sampling is that the resulting sample will be distributed in the
same way as population in terms of the stratifying criterion. This sampling is only feasible when
data are available that allow the ready identification of the members of the population.
d) Multi-stage cluster sampling occurs when the widely dispersed population is involved in the
survey. With cluster sampling the primary sampling unit is not the units of population to be
sampled but groupings of those units.
Cluster sampling is always a multi-stage approach. The advantage of multi-stage cluster
sampling lies in the possibility to interview geographically wide spread population.
Non-probability sampling
There are two main types of non-probability sample: the convenience and the quota samples.
a) A convenience sample is the one which is easy to access for the researcher. For example, to
complete our research we are cooperating with two companies – one in France and one in
Russia. These companies have access to their mobile application users directly, so that can
simplify our access to data base and declines non-response rate. According to Bryman and
Bell (2015), that kind of sample can cause a problem in generalizations of findings.
Nevertheless convenience sample become the norm in some research fields including
researches on consumer behavior. For our research where we need to investigate particular

206
situation of mobile application use the convenience sample provides a considerable
possibility for access to data base.
b) Quota sampling is used intensively in commercial research like market research and political
opinion polling. The goal of quota sampling is to produce a sample that reflects a population
in terms of the relative proportions of people in different categories. Good example of quota
sampling is focus groups in television or in marketing.
III.7. Error in survey research
The term “error” is employed on the number of occasions made of four main factors (Bryman and
Bell, 2015):
- Sampling error is the difference between a sample and the population from which it is selected. In
fact this error arises when the responders are not really representative sample. For example, if we
collect data for our research by people who are playing mobile games, on the one hand they are
users of the mobile applications, but it is not sure that they are going out in restaurants and use
appropriate mobile applications. And in opposite not all people who are going out frequently in
restaurants are users of mobile applications. Our task is to find representatives of both.
- Sampling-related error concern not only error in choosing of responders who are appropriate for
the questionnaire, but also inaccurate sampling and non-response.
- Data collection error is connected with implementation of the research process. It includes such
errors as poor wording in the questionnaire, mistakes in the administration of survey.
- Data processing error appears when the management of data is organized on the low level, or there
are mistakes in data coding.
- Non-response: a source of non-sampling error that is particularly likely to happen when
individuals are being sampled. It occurs whenever some members of the sample refuse to cooperate
cannot be contacted or for some reason cannot supply the required data
III.8.Conclusion
For our research we are using a convenience sample as strategy to collect data. Firstly, we cooperate
with companies which are providers of particular mobile applications in restaurant industry to
collect data with help of their data base where all users are registered. We consider that if the people
use specific mobile application for booking restaurants, they also are the clients of the restaurants.
Secondly, we use social networks and emailing to collect data, but also we note in the begging that
that survey is aimed for people who are using the mobile applications to search for or to book table
in the restaurants. The process is organized equally in both countries.

207
We are aware of the limits in generalization which can arise by using convenience sample (Bryman,
1989, Hooghe. 2010, Bryman and Bell, 2015). The findings from our study have applicability for
companies which are providers of mobile application in restaurant industry in two countries, and
this finding will be not applicable for mobile applications in others industries or countries.
IV. Methodology to develop and validate variables and construct – Churchill paradigm
In this section the methodology to develop and validate variables and constructs of research is
presented. The marketing researchers are often facing a problem how to measure, assess and
validate the variables. This problem is caused by the definition of measurement process, which
involves according to Nunnally (1967) « rules for assigning numbers to objects to represent
quantities of attributes». As Churchill (1979) pointed out in his article the attributes of objects that
are measured are not the objects by themselves, and there is no specifying of the rules by which the
numbers are assigned.
In an example construct C, such as “mobile application loyalty” in our research model, we can say
that every user can have at any time some “true” level of loyalty Xt. Each measurement we make
will produce an observed score Xₒ, equal to the object’s true score Xt. In the desired by researcher
situation differences between objects with respect to their Xₒ scores would be completely referable
to true differences. But in fact Xₒ score reflect also other differences (Selltiz, 1976):
- true differences on other stable characteristics ( person’s willingness to express his or her
true feelings, for example in the surveys where the person is responding anonymously the
level of honesty might be higher)
- differences due to situational factors ( where and how the interview is taken, in our survey
which is made online, we have no control above the circumstances of responding, and also
we can here technical aspects, whether the user answers with smartphone or PC, whether
she/he has stable Internet access etc.)
- differences due to variations in administration ( who is the interviewer, because we are using
convenience sample, we collaborate with the management of mobile applications, so the
understanding of user whether she/he is interviewed by the mobile application by itself or by
some random person in Internet can definitely affect the answer)
- differences due to sampling of items (e. g. our questionnaire is translated into French and
Russian, it is very possible that affect will be different because of choice of words in both
languages; also specific technical words can complicate the understanding of items)
- differences due to lack of clarity of measuring instruments (ambiguous questions, e.g. in the
first edition of our questionnaire we used the question “How long are you using mobile

208
application N” without giving the time periods, that caused the difficulty for responders to
count the years or months, as well as interpreting afterwards the results; thus, we added the
periods so the user can choose the closest)
- differences due to mechanical factors (e.g. incorrectly coding).
We described these factors with the possible examples concerning our case. Not all of them should
necessarily appear in every measurement we produced. Nevertheless, these factors distort the
observed scores away from the true score Xt. According to Churchill the relationship can be
expressed as:
Xₒ= Xt + Xs + XR
where:
Xs = systematic errors
XR = random errors
A measure is valid when the differences in observed scores reflect true differences on the
characteristic Xₒ= Xt. A measure is reliable to the extent independent but comparable measures of
the same construct of a given object agree. Reliability depends on how much of the variation in
scores is attributable to random or chance errors. The fundamental objective in measurement is to
produce Xₒ scores which approximate Xt scores as closely as possible.
The Churchill paradigm is applicable in marketing researches as our research is. It is also applicable
to multi-item measures, what is also respected in our research.
Churchill paradigm provides a framework to organize measures of reliability and validity of
variables and constructs, so the researcher can do decision about one or another.
Figure 26 shows the suggested procedure, which consists of 8 steps that should be followed and a
list of some calculations that should be performed in developing measures of constructs.
These eight steps correspond three phases:
- definition of conceptual domain of constructs,
- exploratory and
- confirmatory phases.
In the first phase there is only one step, actual formulating of the domain; steps two, three and four
explain exploratory phase; and steps 5-8 coincide the confirmatory phase. There are two steps to
collect data in the exploratory and confirmatory phases.

209
IV.1. First phase - Specify domain of the construct
On the first step of the Churchill paradigm researcher specifies the domain of the construct. This
should be done with help of literature in the researched domain. To illustrate importance of this step
we can use example construct of our research model mobile application loyalty.
In Relationship Marketing the concept of loyalty is indispensable aspect for the relationship
between client and company, it is defined as consumer’s desire and intention to continue a
relationship with the company, recommending it and choosing it from the market (Gremler, Brown,
1996; Lovelock, Wirtz, 1996), it is a degree of personal relationship caused by level of consumer’s
gratitude and norms of reciprocity. In the restaurant industry this concept concerns the personal of
the restaurant establishment (the chef, the administrator of the establishment, or the director) and
the client and is expressed in times the client returns to the establishment or/and to how many
people he/she will recommend the restaurant establishment.
In our case the technology, mobile application, changes the relationship between restaurant and the
client, proposing benefits, discounts and others. In this way we are more interested in the
measurement of the construct of loyalty regarding this concept as attitude of the user towards the
mobile application. Venkatesh and Hoehle define the mobile application loyalty as degree to which
a user has a deeply held commitment to rebuy or repatronize a mobile application. In other words,
how often the user opens the mobile application to book a table, or if the user tends to delete the
mobile application or keep it, etc.

210
Figure 30: Suggested procedure for developing better measures
Source: Gilbert A. Churchill, 1979
Regarding this example the domain of the construct “loyalty” consist of two constituting elements:
relationship marketing and technology use. The specifying of that necessitates us to measure this
construct with items of both.
IV.2. Exploratory phase
Generate sample of items
On this step the items are generated regarding the specified domain. This step is based on such
techniques as literature searches, experience surveys, insight-stimulating examples, and focus
groups. Each construct included in the research model should be measured through the items, which
are in the first place to find in the previous researches. That includes the exact definition of the
variables, dimensions and elements the variables have. Davis (1986) suggested using the conceptual
definitions of existing variables in the literature as a guide for development of measurement
instruments. The literature review preserves the validity of the measurement items (Straub et al.
2004).

211
The number of measurement items for each construct should be respected, classical test theory
recommends to develop 4 items pro construct (Devellis, 2003). More recent authors argue the
number of measurement items (Diamantopoulos, Sarstedt, Fuchs, Wilczynski, Kaiser, 2012; Yong,
Pearce, 2013). As a general guide, variables that have two or fewer items should be interpreted with
caution. Such variables is only considered reliable when the items are highly correlated with each
another (r > .70) but fairly uncorrelated with others.
The literature should indicate first how the variables are defined and how many dimensions or
components they have. On this step the first edition of questionnaire of our research was created.
Thus, in the example of mobile application loyalty we have extracted the measurement items of
previous researches and adapted them for our case, as it shown in the Table 43:
Table 43: Example of measuring items development – mobile application loyalty
Source: author of the thesis
On the first stage, the experts confirmed the model, hypotheses and questionnaire (Table 44).
Table 44: Experience survey
N Country Function Domain
1 France Researcher Information systems
2 France Researcher Information systems
3 France Researcher Marketing
Construct Measurement items Authors Final measurement items
Mobile
application
loyalty
1)I encourage friends and relatives
to be the customers of the mobile
application N
2)I will use more services offered by
the mobile application N in the next
few years
3)I consider the mobile application
N to be my first choice
Johnson et al.
2006
Hoehle&Ven
katesh, 2015
1)I encourage friends and relatives to
use mobile application (lafourchette,
resto)
2) I will use advantages of the mobile
application (laoruschette, resto) in the
next months.
3) I consider the mobile application
(lafourchette, resto) to be my first
choice when choosing the restourant
Loyalty
(Relationship
marketing)
How likely are you to
1) spend more than 50% of
your purchasing in the
shop?
2) Use this shop the very next
time you go for shopping?
Deepak
Sirdeshmukh,
Tagdip Singh
and Barry
Sabol (2002)
1. I make more than in 50 % of
reservation in restaurants using mobile
application (lafourchette, resto)
2. I use mobile application
(lafourchette, resto) the very next time
you choose the restaurant

212
4 France Researcher Marketing
5 France Researcher Information systems and Marketing
6 France Researcher Relationship Marketing, Tourism
7 France Marketing director of Lafourchette
France, Paris
Marketing practitioner on the domain
restaurant industry, mobile
application developer
8 Russia General manager of Resto group,
Moscow
Marketing practitioner on the domain
restaurant industry, mobile
application developer
9 Russia Marketing director of Philip Morris
International, Moscow
International marketing, consumer
behavior
10 Russia General manager of restaurant agency,
Vladivostok
Marketing practitioner on the domain
restaurant industry
11 Russia Marketing responsible in the online
journal “Far Post”, Vladivostok
Marketing practitioner on the domain
of relationship marketing
12 Russia Accountant in Best logistics group,
Moscow
consumer
13 Russia Commercial director Best logistics group,
Moscow
Consumer
14 Russia Student of medical university, Moscow Consumer
15 Russia Sport trainer of children, Moscow Consumer
16 Russia Housewife, Moscow Consumer
17 France Student of Business school, Paris Consumer
18 France Responsible of sales in Europe, Enerdis
company, Ile-de-France
Consumer
19 France Responsible of sales in France, Enerdis
company, Ile-de-France
Consumer
20 France Notary, Paris Consumer
21 France Dentist, Ile-de-France Consumer
22 France Lawyer, Paris Consumer
Source: author of the thesis
The composition of the experts was following: we included two responsible persons of the both
companies, Resto and Lafourchette, three other marketing practitioners, 6 researchers, and 11
consumers (5 from Russia and 6 from France).
The objectives of the expert evaluations are to check:
• Adequacy of the measurement items of the constructs
• Formulation of the questions (measurement items)
• Redundancy of the questions

213
This is important issues for the researcher, because the errors in the interpretation of the questions
can cause the errors in the data, if the formulation of the question does not meet the norms of
conversations (Krosnick, Li and Lehman, 1990).
After the expertise we did following changes:
1) According to the advice of researcher expert we added one moderating construct (place of
use), because the importance of geolocation’s function in the mobile application has became
significant, we should also check its effect on the intention to use the mobile applications in
restaurant industry. That was also confirmed by the representatives of Resto and
Lafourchtte.
2) Initial survey had 42 questions and two questions of social state of the responders (age and
profession). That number was found redundant by experts, especially marketing
practitioners and consumers. The repetitive questions we deleted.
For example, the constructs intention to use and continued intention to use have questions with
very close and repetitive meaning:
Intention to use The individual’s
decision to use IS.
4. I intend to continue using
mobile application in the future.
5. I will always try to use mobile
application in my daily life.
6. I plan to continue to use mobile
application frequently.
Wiswanath
Venkatesh
James Y.L.Thong
Xin Xu (2012)
Continued
intention o use
Degree to which a
user feels he or she
will keep using a
mobile application
4. I intend to continue using
mobile application rather than
discontinue its use.
5. My intentions are to continue
using mobile application than
use any alternative means.
6. If I could, I would like to
discontinue my use of mobile
application (reverse coded).
Bhattacherjee
(2001)
Venkatech and
Goyal, (2010)
Hoehle&Venkates,
(2015)
Thus, we deleted the question 3 and question 1 respectively from the final survey, but respecting the
minimum required number of measurement items for formative variables.
3) To better design we combined questions under the common point like in the example below.
Picture 9: Example of modifications of the questions.

214
4) Four questions were designed as questions with open, free answers:
For example,
3 How long are You using the mobile application N in years? (If
your answer on the previous question a) was other than never)
4 How long are You using any mobile application for choosing a
restaurant in years? (If your answer on the previous question d)
was other than never)
According to the advice of the experts we modified these questions and suggested choice incuded
several periods of time for better process of data treatment.
The experts suggested us to do modifications in the items, concerning the clear understanding of the
items, choice of words, quantity of items pro construct. After all items were carefully corrected, we
could start the collecting of actual data. The final questionnaires in both languages and with a
translation into English are in the Annex 16.
The summary of the changes is presented in the Table 45:
Table 45: Modifications after the experts’ validation
Initial model After the experts’ validation Changes
Structural model 9 latent variables: indulgence,
price value, facilitating
conditions, trust, intention to
use, use of mobile application,
mobile application usability,
mobile application loyalty,
continued intention to use and
two moderators: duration of
the use and frequency of
visits.
9 latent variables: indulgence, price
value, facilitating conditions, trust,
intention to use, use of mobile
application, mobile application
usability, mobile application loyalty,
continued intention to use and three
moderators: duration of the use,
frequency of visits, and place of use.
Moderator of place
of use
Survey 42 questions 34 questions Deleted repetitive

215
questions, questions
about time length
combined in one, not
clear questions
deleted.
Three open questions Modified to one question with
multiple choice
Picture 9
Not correct formulations, like
mobile application is free
Language’s modifications: f.e.:
mobile application is free for
downloading
Annex 16
For the composition of the questionnaire the researcher can use several types of the scale, Likert
scale, differential semantics, icons etc (Chandon and Bartikowski, 2004).
According to Churchill and Peter (1984) the accuracy of the scale depends on the number of
possible answers. In marketing the most often is used five-point and seven-point scales to give the
responders a possibility for answering the most honest and close to his/her experience (Vernette,
2011).
In our survey we used five-point Likert scale (Likert, 1932). There are two types of the suggested
semantic sentences: most of the questions require agreement-disagreement (strongly disagree,
disagree, neither agree not disagree, agree, strongly agree) weighted respectively from 1 till 5, and
several questions require to note frequency of use (never, less than once a month, several times per
month, once a week, several times per week) also weighted from 1(never) till 5 (several times per
week). One question in our survey is reverse (If I could, I would stop using of the mobile
application), weighted from 5 (strongly disagree) till 1(strongly agree). We added also in the
questionnaire two questions of social position (age and profession).
All questions we use are closed questions, because closed questions allow collecting standardized
data and avoiding bias of entering data (Evrard et all, 2009). In the very beginning we suggested 4
questions of free answers (How often do you use smartphone? How often do you go out for dinner?
etc.), inviting people to give their own answers, but the experts proposed us to change them for
scale (once a week, several times per week etc.), so the treatment of the data can be standardized.

216
Figure 31: Scale validation
Source : Adapted by Jolibert and Jourdan, 2011
Collect data
In the end of exploratory phase the first set of data is collected to purify the measurement items.
The way of the data collection can be chosen according the research method. The objective of the
researcher is to check reliability and validity of measurement items. This is made in statistical
analysis of reliability (Loadings, Cronbach’s alpha, composite reliability), as well as convergent and
discriminate validity.
We diffused the online survey, designed with google forms application, with help of Email and
publishing of the link on social networks. Before the treatment of the data with SmartPLS, we
coded the responses according to growth of agreement (Martin, 2009):
Strongly disagree 1
Disagree 2
Neither agree nor disagree 3
Agree 4
Strongly agree 5
The reverse questions were reverse coded:
Strongly disagree 5
Disagree 4
Neither agree nor disagree 3
Agree 2
Strongly agree 1
Purify the measure
The process of purifying a measure is focused on estimation of the score in case if all items in the
domain were used. In fact researcher does not use all items of the domain, but the sample of items.
In our research we do not use all measurement items suggested in previous works for the construct

217
loyalty for example, we adapted and specified the items for mobile application loyalty. According to
that the primary source of measurement errors might be the inadequate sampling of the domain
relevant items, and that should be purified on this step.
Coefficient Alpha, or Cronbach’s alpha
To verify the internal consistency of the items sample the researchers use coefficient alpha, known
in social sciences as Cronbach’s alpha (Cronbach, 1957). This coefficient should be the first
measure to assess the quality of the instruments. The square root of coefficient alpha is the
estimated correlation of the k-item test with errorless true scores (Nunnally, 1967).
Cronbach's alpha will generally increase as the correlations among test items increase, and is thus
known as an internal consistency estimate of reliability of test scores. Because correlations among
test items are maximized when all items measure the same construct, Cronbach's alpha is widely
believed to indirectly indicate the degree to which a set of items measures a single one-dimensional
latent construct. It is easy to show, however, that tests with the same test length and variance, but
different underlying factorial structures can result in the same values of Cronbach's alpha. Indeed,
several investigators have shown that alpha can take on quite high values even when the set of items
measures several unrelated latent construct (Nunnally, Berstein, 1967). As a result, alpha is most
appropriately used when the items measure different substantive areas within a single construct.
Alpha treats any covariance among items as true-score variance, even if items co varies for spurious
reasons. For example, alpha can be artificially inflated by making scales which consist of superficial
changes to the wording within a set of items or by analyzing speeded tests.
Factor Analysis
The main applications of factor analytic techniques are: (1) to reduce the number of variables and
(2) to detect structure in the relationships between variables, that is to classify variables. Therefore,
factor analysis is applied as a data reduction or structure detection method (the term factor analysis
was first introduced by Thurstone, 1931).
Confirmatory factor analysis. Structural Equation Modeling (SEM) allows you to test specific
hypotheses about the factor structure for a set of variables, in one or several samples (e.g., you can
compare factor structures across samples).
Correspondence analysis. Correspondence analysis is a descriptive/exploratory technique designed
to analyze two-way and multi-way tables containing some measure of correspondence between the
rows and columns. The results provide information which is similar in nature to those produced by
factor analysis techniques, and they allow you to explore the structure of categorical variables
included in the table. For more information regarding these methods, refer to Correspondence
Analysis.

218
IV.3. Confirmatory phase
Collect data
If during the first treatment of data the coefficient alpha is acceptable or better, the measures are
ready for new sample of data, but if not the researcher should take decisions to purify the
measurement instruments, in this case the constructs of the domain can be eliminated, changed, or
the new measurements items could be found etc. it can be also possible that sampling size or
sampling quality was not corresponding the requirements of the domain.
Assess reliability with new data
In the confirmatory phase, the researcher estimates the measurement instruments and develops the
norms.
Reliability refers to consistency of a measure of a construct. By the internal reliability the researcher
tries to find whether or not the items that compose the scale are consistent, in other words, whether
or not the scores on one item tend to be related to their scores on the other items.
Coefficient alpha is the basic statistic for determination of the reliability based on internal
consistency. Coefficient alpha does not adequately estimate errors caused by factors external to the
instruments. It is recommended thus to collect additional data to rule out the possibility that the
previous findings are due to chance, or to re-test, if the external factors such as different situations
over the time has less impact on responses.
Assess construct validity
Construct validity is most directly related to the question of what the instrument is measuring. The
preceding steps should produce an internally consistent or internally homogeneous set of items. To
establish the construct validity of a measure the researcher must determine the extent to which the
measure correlates with other measures designed to measure the same thing, and whether the
measure behaves as expected. As we have shown in our example with construct mobile application
loyalty.
Correlation with other measures.
According to fundamental principle in science any particular construct should be measured by two
or more different methods. Evidence of the convergent validity of measure is provided by the extent
to which it correlates highly with other methods designed to measure the same construct.
Except convergent validity the measures should have also discriminant validity, which is extent to
which the measure is novel and not simply a reflection of some other variable. One of the ways of
assessing the convergent and discriminant validity of a measure is through the multitrait-
multimethos matrix, which is a matrix of zero order correlations between different traits when each
of the traits is measured by different methods (Campbell and Fiske, 1959).
Expected or not behavior of the measures.

219
Internal consistency is a necessary but insufficient condition for construct validity. The final step is
to show that the measure behaves as expected in relation to other constructs. Does for example
mobile application loyalty really predict continued intention to use this mobile application? It is
expected that the loyal user tend to continue the usage of the same mobile application, but if not one
of the reasons of this unexpected construct behavior might lay in the incorrect or not sufficient
measurement items. The task of the researcher is to check the relationships among constructs, or
among measurement items, before conclusions.
Develop norms
As Churchill (1979) noticed in his paradigm the measuring instrument is not informative about the
position of a given object on the characteristic being measured. In other words it is not enough just
to measure constructs producing some scores; it is needed to develop some standards, with what it
will be possible to compare the scores. Technically it is a process of developing norms.
The norms can be developed when researcher compares scores of many cases, in this way the
quantity of the cases will show the stability and definition of the norm quality.
On our study we use structural equation modeling approach, thus, the developing norms is not a
constraint of our research.
V. Methodology to verify the research model - Structural equation modeling
The positivist paradigm of scientific research requires strong power techniques to test the
conceptual models and theories.
Structural Equation Modeling (SEM) is the second-generation multivariative data analysis method
that is often used in marketing and IS researches because this method provides the possibility to test
theoretically supported linear and additive causal models (Chin, 1998, Haenlein and Kaplan, 2004,
Statsoft, 2014). The use of SEM is increased because of developed software based on covariance
(e.g. LISREL) and on components (e.g. Smart PLS).
As Wynne W. Chin (1998) claims, SEM provides the researcher with the flexibility on:
- model relationships among multiple predictor and criterion variables;
- construct unobservable latent variables;
- model errors in measurements for observed variables;
- statistically test a priori substantive/theoretical and measurement assumptions against
empirical data.
Major applications of SEM include:

220
- causal modeling, or path analysis, which hypothesizes causal relationships among variables
and test the causal models with a linear equation system. Causal models can involve either
manifest variables, latent variables or both;
- confirmatory factor analysis, an extension of factor analysis in which specific hypotheses
about the structure of the factor loadings and correlations are tested;
- second order factor analysis, a variation of factor analysis in which specific the correlation
matrix of the common factors is itself factor analyzed to provide second order factors;
- regression models, an extension of linear regression analysis in which regression weights
may be constrained to be equal to each other, or to specified numerical values;
- covariance structure models, which are hypothesize that a covariance matrix has a particular
form;
- correlation structure models, which hypothesize that a correlation matrix has a particular
form.
Basic idea of SEM is in the testing whether variables are interrelated through a set of linear
relationships by examining the variances and covariances of the variables.
Graphical presentation of SEM
All variables are placed in the equation system in the path diagram, latent variables in ovals and
observed variables in squares. Each equation is represented on the diagram as follows: independent
variables have arrows pointing to the dependent variables; the weighting coefficient is placed above
the arrow. On the Figure 32 global model of SEM is presented:

221
Figure 32: Global model
Source: Joreskog(1970), Wold (1973)
Global model is composed of two submodels: inner or structural model which specifies
relationships among the independent and dependent latent variables, and outer or measurement
model, which specifies relationships among latent variables and their observed indicators/variables.
Our structural model consist of 9 latent variables, each of them has between two and five observed
variables, or measurement items.
To effectuate SEM applications the researcher needs to follow a five-step process (Chin, Peterson,
Brown, 2008):
- model specification;
- model identification;
- model estimation;
- model evaluation;
- model respecification.
On the model specification step two aspects are important: firstly the researcher should justify not
only indicated structural relationships but also not indicated (Boomsma, 2000). Our research model
was developed on basis on UTAUT2 model, which included such variable as age. We excluded this
variable of our research model, but still we kept the question about the age in the questionnaire. In
this way we can see later, if the variable of age has impact on mobile application use in the
restaurant sector or not. In other words the relationship between age and mobile application use is
not indicated.

222
Another aspect about which the researcher should concern is to justify whether relationships among
constructs are formative or reflective.
In a formative relationships the observed variables cause the construct, in reflective – constructs
cause the observed variables.
Figure 33: Reflective and formative relationships
Measurement item is classified as formative when is construed as
a) defining characteristics of the latent construct;
b) causing changes in the construct;
c) not sharing a common theme among themselves;
d) being fundamental to the definition of the construct;
e) not necessarily covarying;
f) not having the same antecedents and consequences.
Example in our model could be application design, utility, user interface graphics, input, output and
structure as formative measurements for mobile application usability construct, which are not
included in our model.
On the step of model identification the researcher verifies measurement and structural portions of
the model; both can cause problems with identification.
Normally three measurement items per construct are required for identification if the construct is
reflective. Contrary for formative construct it is possible to have less items, if reliability index is
higher than 0,7 (Diamantopoulos, Sarstedt, Fuchs, Wilczynski, Kaiser, 2012; Yong, Pearce, 2013).
When there are only two items per construct and each item is connected only to its construct,
identification can be achieved if there are structural connections among all the constructs. There are
four constructs in our model measured with only two items: trust, intention to use, mobile
application usability, and continue intention to use.

223
Next step of model estimation involves statistical methods to estimate model parameters. A variety
of methods is available for researcher: maximum likelihood (ML), generalized least squares (GLS),
weighted least squares (WLS), arbitrary distribution free (ADF), ordinary least squares (OLS), path
least squares (PLS).
After estimates are obtained the researcher evaluate model with indices. Many indices are
influenced by sample size such as the goodness-of-fit index (GFI) and adjusted goodness-of-fit
index (AGFI). Following indices are recommended (Garver and Mentzer, 1999) to use:
• Root mean square error of approximation (RMSEA) is an informative criterion in evaluating
model fit. It measures the divergence between observed and estimated covariance per degree
of freedom in terms of population, but not the sample. The range of the index lays between 0
and 1.
• Comparative fit index (CFI) is a noncentrality parameter-based index to overcome the
limitation of sample size effects. The value of the index ranges from 0 to 1, with 0.90
acceptable.
• Nonnormed fit index (NNFI), also known as Tucker-Lewis index compares a proposed
model’s fit to a nested baseline or zero-model. It measures degree of freedom from the
proposed model to the degree of freedom of the zero-model. The acceptable threshold of
NNFI is 0.90 or greater.
• Chi-square (χ²) is the most common methods of goodness-of-fit evaluating. Low χ² value,
indicating non significance, would point to good fit, because chi-square test is used to assess
actual and predicted matrixes. In this way low significance shows low differences between
actual and predicted matrixes. χ² test is sensitive to sample size.
More information about used indexes to estimate model is presented in the section PLS-approach of
this chapter.
On the step of model respecification the conceptual model can be modified according to the
evaluation of indices. Relatively few of the initially estimated structural equation models in
marketing studies remain intact (Chin, Peterson, Brown, 2008).
Modification of the model can concern adding or deleting paths, or both, or modification of indices.
Model modifications capitalize on knowledge of path values and chance characteristics in the data.
Anyway, modifying an initially estimated structural equation model reduces its generality and
requires that it should be validated with an independent sample.
V.1.Choice and justification of software.
There are several approaches to SEM and developed software to complete these approaches. The
first approach is covariance-based SEM (CB-SEM), to which apply such software packages as

224
AMOS, LISREL, EQS and MPLus. The second approach presents Partial Least Squares (PLS). PLS
focuses on the analysis of variance and can be effectuate by use of PLS-Graph, VusualPLS, Smart
PLS, and WarpPLS. The third approach is component-based SEM or Generalized Structured
Component Analysis (GSCA). This approach is conducted by VisualGSCA or a web-based
application GeSCA. Another way to perform SEM is use of Nonlinear Universal Structural
Relational Modeling (NEUSREL) which is processed by NEUSREL’s Causal Analytics software.
CB-SEM versus PLS-SEM
For many researchers SEM was long time equivalent to conducting covariance-based SEM analyses
using appropriating software; but SEM also should be regarded as another useful approach – partial
least square. PLS-SEM is causal modeling approach aimed at maximizing the explained variance of
the dependent latent variables (Hair et al, 2011). This is contrasting the CB-SEM’s objective of
reproducing the theoretical covariance matrix, without focusing on explained variance. PLS-SEM
has been increasingly applied in marketing and other business disciplines.
The distinction between CB-SEM and PLS-SEM concerns several important points of the research
(see Table 46):
• CB-SEM is appropriative method in case when research’s goals are theory testing and
confirmation, while PLS-SEM approach is better for prediction of key target constructs, or
exploratory goal. In our research the research goal concerns the prediction of variables:
mobile application use, continued intention to use and mobile application loyalty.
• PLS-SEM approach gives possibility to work efficient with wider range of sample size and
complex models. It has less restrictions about data, thus, it can address a broader range of
problems than CB-SEM approach.
• Measurements are less restrictive in PLS-SEM method, constructs with fewer items can be
used, than CB-SEM requires.
• PLS-SEM is useful when latent variables are used in subsequent analyses, which enable to
prioritize activities for potential improvements in managerial decisions.
• CB-SEM and PLS-SEM differ from statistical point of view, but PLS-SEM estimates can be
good proxies of CB-SEM results. PLS-SEM has higher statistical power compared to CB-
SEM.
Table 46: Comparison CB-SEM and PLS-SEM approaches (adapted from Hair et al. 2011)
CB-SEM PLS-SEM Our research model
Research goals
Theory testing, theory Prediction of key target constructs, Prediction of constructs: mobile

225
confirmation, comparison of
alternative theories
identifying of key construct application use, continued
intention of use. Identifying of key
construct impacting on mobile
application use.
Exploratory goal, or extension or existing
structural theory
Extension of UTAUT
Measurement model specification
Formative measures can be used,
but accounting for complex and
limiting specifications rules are
required
Formative constructs are part of the
structural model
Reflective
Additional specification is
required, such as covariation
Structural model
Complex structural model (many
constructs and indicators)
Nine constructs plus three
construct of moderation, twenty
one measurement items plus nine
measurement items of moderation
constructs.
Model is nonrecursive
Data characteristics and Algorithm
Data should meet the CB-SEM
assumption exactly
PLS-SEM is good approximation of CB-
SEM results
Normal data conditions Data are to some extent no normal
Sample size
Large data set Relatively low sample size
Minimum sample size should be equal to
the larger of the following: ten times the
largest number of formative indicators
used to measure one construct or ten
times the largest number of structural
path directed at a particular latent
construct in the structural model
Minimum sample size 50
responders
Model Evaluation
Latent variables in subsequent analysis
Global goodness-of-fit criterion
Measurement model invariance
Source: Hair et al, 2011
CB-SEM is widely applied in the field of social science and the preferred data analysis method in
cases when the sample size is large and the model is correctly specified. However, it is often
difficult for researcher to collect sufficient volume of data to meet the requirements of CB-SEM

226
approach and applicable software packages. The other problem which the researcher can face lays
in the exploratory objectives of the research when there is a lack of knowledge about the
relationships that exist among variables, and in this case researcher can not apply to CB-SEM and
prefer to effectuate the PLS approach.
For our research we have chosen the PLS-SEM approach, because of following important issues:
research goal to predict variables, it is possible to use small sample size, and to analyze sub groups,
and to test complex model. Also on the step of model evaluation, our intention is to use latent
variables in subsequent analysis. The objective of our research is to compare the cultural aspect of
the mobile application use. To reach this goal the data are collected in two countries. PLS approach
among mentioned before issues can allow effectuating the analyses in sub groups. In this way the
collected data can be analyzed in generalized way, but also according to national groups, age groups
etc.
V.2. PLS-SEM approach and software choice.
The basic PLS-SEM algorithm follows a two-stage approach. In the first stage, the latent variables
are estimated by scores of observed variables, proxies for structural model relationships among the
latent variables, scores of latent variables, coefficients in the measurement model. The second stage
calculates the final estimation of the outer weights and loadings as well as the structural model’s
path coefficient (Hair et al, 2011).
The path modeling procedure is called partial because the iterative PLS-SEM algorithm estimates
the coefficients for the partial ordinary least squares regression models in the measurement models
and the structural model.
PLS-SEM approach was developed in the 1960-s, but the first generation of software was
implemented in 1980-s with LVPLS 1.8. In 2000s the PLS-SEM approach became more and more
used in the researchers, what led to developing of more professional and useful software like PLS-
Graph, Visual PLS, SmartPLS.
In our research we are using SmartPLS 3 Professional developed by Ringle, C. M., Wende, S., and
Becker, J.-M. in 2015. SmartPLS software fits for researcher without strong computer science
background, what is one of the main advantages of the application.
Model evaluation in PLS-SEM approach
PLS-SEM evaluation follows two-step process, when the measurement models and structural model
are assessed separately.
227
Measurement model (outer model)
On the first step the measure’s reliability and validity are examined by certain criteria. On this step
the researcher should prove that the measures are adequate. This step is indicated as pretest of the
model, normally 30 percent of the original sample is recommended to run for the pretest, but not
less than required by used software (the pretest of our model if to find in the next chapter).
Reflective measurement models such as ours should be evaluated to their reliability and validity.
Cronbach’s alpha
Assessment of construct reliability includes the evaluation of construct internal consistence,
examined by Cronbach’s alpha, which is already presented in previous sections.
In marketing research Cronbach’s alpha is used most often to estimate reliability of constructs.
Its formula is:
α = (1 - )
k – number of measuring items;
σᵢ - standard deviation of the item;
- the variance of the observed total item’s scores.
Cronbach’s alpha vary between 0 (independent item) and 1 (completely correlated item), as closer
is this indicator to 1 as better is internal consistence. According to Nummaly and Bernstein (1994)
the minimum weight of Cronbach’s alpha should be 0.7. According to Peter (1979) the weight
between 0.5 and 0.6 is acceptable for exploratory researches.
Loadings
Each indicator’s reliability needs to be taken into account; each indicator’s absolute standardized
loading should be higher than 0.70, indicators between 0.40 and 0.70 should be removed from the
scale and thus leads to an increase on composite reliability above the suggested threshold value.
Rho
Rho of Joreskog and Rho of Dillon-Goldstein (composite reliability) are also the indexes used for
the evaluation of reliability of inner model. Rho of Joreskog is used in the algorithm of LISREL,
while Rho of Dillon-Goldstein in PLS. In both cases this index should be greater than 0.70
(Tenrnhaus et al, 2005).
The formula for the Rho is:
with >0

228
= ж + = ж +
Var (ж) = 1
- loading of indicator (item j)
- Error in the measure of the indicator j
Some authors (Devellis,2003, Jakobwicz, 2007) consider that Rho are to privilege compared to
Cronbach’s alpha, because their high sensibility towards the number of measurement items, what
can provide the instrument and methods of calculation, which might set the terms of errors.
Anyway, these two criteria are estimated after Cronbach’s alpha. The weight of 0.7 is considered as
reliable for the item, 0.6 for the exploratory research (Fornell and Larcker, 1981).
Reflective measurement models evaluation of validity focuses on convergent validity and
discriminant validity.
Average Variance Extracted (AVE)
For convergent validity researchers need to examine the average variance extracted (AVE). An
AVE value of 0.50 and higher indicates a sufficient degree of convergent validity (Fornell end
Larcker, 1981), meaning that the latent variable explains more than half of its indicator’s variance.
The formula is:
AVE =
лᵢ: standardized coefficient of the measure n: number of observed variables i
εᵢ: error in the measure of the indicator
Fornell-Larcker criterion and cross loadings
For the assessment of discriminant validity two indicators are to regard: the Fornell-Larcker
criterion and cross loadings. The Fornell-Larcker criterion (Fornell and Lacker, 1981) postulates
that a latent construct shares more variance with its assigned indicators than with another latent
variable in the structural model. In other words, the AVE of each latent constructs should be greater
than the latent construct’s highest squares correlation with any other latent construct. The cross
loadings mean that an indicator’s loading with its associated latent construct should be higher than
its loading with all remaining constructs.

229
Structural model (inner model)
According to Ringle et al. (2012) the structural model should be evaluated by researcher with R²,
Q², p-value, t-value, f square.
R²
The primary evaluation criteria for the structural model are R² measures and the level and
significance of the path coefficients.
In the prediction-oriented approach, the key target construct’s level of R² should be high. The
judgment of the level of R² depends on the research discipline. So R² results of 0.20 are considered
high in consumer behavior, R² values of 0.75 would be perceived high in success driver studies. In
marketing research R² values of 0.75, 0.50, or 0.25 in the structural model can be described as
substantial, moderate, or weak respectively (Hair et al, 2011). According to Chin (1998) R² weight
of 0.67 explains 67 % of construct’s variance and is substantial, 0.33 - 33% is moderate and 0.19 –
19 % is weak.
Path coefficients
The path coefficients of PLS structural model can be interpreted as standardized beta coefficients of
ordinary least squares regressions. Each path coefficient’s significance can be evaluated by means
of a bootstrapping procedure. Nonsignificant paths do not support a prior hypothesis; significant
paths support the proposed causal relationship.
f square
The impact of an observed variable on the explanation of the latent variable (R²) may be more or
less important to measure it. Researchers can calculate the size effect f² using the following
formula:
fІ =
and are the R² obtained according to whether the observed variable is used or
not.
According to Cohen (1988) f² with the weight 0.02 indicates a reliable effect, 0.15 – moderate
effect, and 0.35 - high effect.
Q² (Cross-validated redundancy)
Another assessment of structural model involves the model’s capability to predict. One of measure
of predictive relevance is the Stone-Geisser’s Q² (Geisser, 1974, Stone, 1974). This indicator

230
postulates that the model should be able to predict each endogenous construct’s indicators. The Q²
value is obtained by using a blindfolding procedure. This procedure is only applied to endogenous
latent constructs that have a reflective measurement model specification. The technique is the
omission of dth data point part and reuse of resulting assessments to predict omitted part. The
omission distance d must be chosen so that number of valid observation divided by d is not an
integer. d values between 5 and 10 are advantageous (Hair et al, 2011).
q²
Like for f² in order to determine in the model the part of the observed variable on the prediction of
another variable (Q²), the q² it is used, which is calculated:
qІ =
and are the Q² obtained according to whether the observed variable is used or
not. According to Cohen (1988) the q² with the weight 0.02 indicates a reliable effect, 0.15 –
moderate effect, and 0.35 – high effect.
t-value
Once the model is evaluated by the percentage of explained variance (R²), we must verify the
stability of the estimates using the calculation of the statistics t obtained by the resampling
procedure by bootstrapping (Hair et al, 2011). It is used the resampling to 5000 (De Souza Bido,
2012). The number of cases corresponds the size of the sampling. T-values should be greater than
1.96. After that we precede the estimation of the parameters, which should be minimum by 0.2 or
better by 0.3 (Chin, 1998).
p-value
The t-test can be used to measure the significance of the model: p-value. The minimum weight for
this value is fixed on 0.05; lower weights mean that the hypothesis zero can be rejected.
Particularly speaking, by estimation of parameters and significance t-value should be higher than
1.96 with p<0.05.
Quality of the model: Goodness-of-fit (GOF)
PLS does not estimate directly the global quality index Goodness-of-fit. Esposito (2010) proposes
following procedure for evaluation of the model global quality:
GOF =

231
According to Latan and Ghozali (2012) GOF within SmartPLS with the weight of 010 means
reliable quality, 0.25 – moderate quality, and 0.36 – high quality.
Another important aspect of structural model evaluation is heterogeneity of observation, which can
be threat to the PLS-SEM results validity. Different population parameters occur for different
subpopulations such as segments of consumers, firms, or countries. In our research we plan to use
the analysis of subgroups of consumers regarding the countries (Russia and France).
V.3. Conclusion
This research provides theoretical background in technology use theory, relationship management,
and cultural dimensions theory. It applies to positivism as epistemological paradigm and uses the
quantitative methods of research.
As sampling strategy this research implements the non-probability convenience sample, managing
in two ways: in cooperation with mobile application providers and publishing in social networks in
specific groups of mobile application users. The survey is designed as self-administrated online
questionnaire.
We have chosen PLS-SEM approach and appropriate SmartPLS software, because of three factors:
possibility to treat data of small sample size, sub group analysis, and complex structural model. We
are aware about possible limitation of findings generalization because of convenience sampling, and
will take it into account by doing practical implications.
Table 47 summaries the model evaluation that concerns our choice of approach and software.
Table 47: Model evaluation using SmartPLS 3 Pro
Indicator Meaning Results
Measurement models
Cronbach’s Alpha Internal consistency reliability 0.70 and higher
Rho Internal consistency reliability Higher than 0.70 (in exploratory
research 0.60 to 0.70 is acceptable)
Indicator “loadings” Reliability higher than 0.70
The average variance
extracted (AVE)
Convergent validity higher than 0.50
Square root of AVE Discriminant validity Square root of AVE of variables
should be higher than correlation of
that variables with others variables
Cross loadings Discriminant validity loading with its associated latent
construct should be higher than its

232
loading with all remaining
constructs
Structural model
R² values significance of the path
coefficients
0.67 – substantial, 0.35 – moderate,
0.19 – weak
Q² the model’s capability to
predict
Q² should be higher than 0. d values
- between 5 and 10
f² Effect of sampling size 0.02 – weak effect
0.15 – moderate effect
0.35 – high effect
Path coefficient t-value and p-
value
Estimation of parameters and
significance
t-value should be higher than 1.96
with p<0.5
q² Effect of sampling size 0.02 – weak effect
0.15 – moderate effect
0.35 – high effect
Goodness-of-fit (GOF)
Quality of the model 0.10 – weak quality
0.25 – moderate quality
0.36 – high quality
Adapted by Patricia Baudier

233
Chapter V: Validation of the model

234
Introduction
This chapter presents exploratory phase and statistical validation of the research and consists of two
sections. First section introduces analysis of two interviews with representatives of French and
Russian companies. Second section deals with statistical validation of the measurement model.
I. Exploratory phase
We accomplished two interviews with representatives of French and Russian companies to check
our research model and understand point of view of the companies-providers of the mobile
application use. Interview in France was organized personally in English language, interview in
Russia was organized par skype in Russian language.
We posed question to constructs of our model.
a) Factors influencing the intention to use
We started with technical questions, to see how the work inside of the company is organized. In our
model two constructs are connected with technical side of the application: facilitating conditions
and mobile application usability.
Concerning mobile application usability we asked:
“Do you have your own designers / web and mobile application developers?
How did you determine which functions should work? Did you do a survey before
development? Who first of all proposes changes: departments of CRM and marketing or the
developers themselves?”
LaFourchette: “yes we have a team dedicated to the mobile app and all developments are made by
this team. There are also product owners…. They prioritize which feature we want to perform the
app…… In fact the organization today of lafourchtte is … we have marketing team within we can
find an acquisition team, CRM team, brand team and strategic marketing team. The product team is
in charge of all the products and all data and is responsible for the development of the website and
mobile app so this is not in the marketing team”
Resto: “Yes, we have our own employees in the office and also specialists on outsourcing.
Normally decisions on implementation are taken after general discussion based on cost and
expediency. But the idea can bring anyone, including (and often) our customers”
From these answers we can conclude that French company has stronger technical department and
stronger hierarchy when it deals with the technical development. Russian company is more flexible
and depends on the cost of the technical development. Wenn we presented mobile application
usability, we already concluded that Russian mobile application has only critical necessary

235
functions to correspond the purposes of the users, while French mobile application is updated
according to the recent innovations in the mobile application development.
Concerning facilitating conditions we posed the question:
“How do you support clients in difficult situations? (with restaurants, who did not do booking
etc.)”
Lafourchette: “There is a plan that is defied for one year, now we collect what we call the irritating
factors so when the customer leaves review on the site the second page is a lot of questions, about
the restaurant experiences: did the restaurant have your booking when you arrived in the
restaurants, was the discount applied if not did you understand why, or not, did the restaurant meet
your expectations, what you saw on the fork etc etc. We collect that factors and thank to this data
we have dashboard, that is send to the what we call account manager because we have in the b2b
team lot of account managers that are responsible for X restaurants and so we send this report to
this account managers and they have to call each restaurant that has irritating factors their goal is
to decrease the number of irritating ”.
Resto: “We try not to allow such situations. In case of emergence, we have the opportunity to
immediately contact the restaurant management and resolve the situation”.
Russian company shows strong involvement in relationship marketing and tries to build personal
communications with all parts of the process, the priority is by the users. French company has also
well developed communications strategy, collecting constantly feedback from the users.
Price value is expressed in the loyalty programs in both companies. Due to these programs the users
can make positive decision, whether they want to use mobile application or not.
“What factors are decisive for users from your experience: loyalty program, information in
itself, some specific functions that are not available on other similar services?”
Lafourchette: “In fact discounts are totally part of product of our because it’s the way lafourchette
has been build ……. the idea was when the founder launched the fork (la fourchette) the idea was to
do some gift management with the restaurants so ………. when they (restaurants) know that their
service or their day service will be not full because they have fix fees, like the rent the room, the
location….. with discounts they have no empty room, this is the idea of lafourchette, the discounts,
after that we we launched the yums, the loyalty program ….. yums is one of this ways if we better
guide them etc etc all the service that we can provide to the customers should be useful but the
yums are one of this ways to make customers loyal because if when you book on the fork you win
yums and when you book using your phone you win nothing we think that is ”

236
Resto: “I think, first of all, the level of client support, that is, the confidence in the reliability of
booking, is important. In addition, we have special preferences in many restaurants,
This gives us the opportunity to book tables for our customers in those restaurants and those rush
hours that are not available to other services. Today our loyalty program consists as well in
assigning points to customers who booked and visited the restaurant. Points are summed up and
accumulated in the client's personal account. To exchange points it is possible on various gifts from
a box of sweets to a mobile phone”.
There are two different points of view on the value of the mobile application use in two companies,
connected probably with history of their development. French company was launched as discount
guide for restaurants, while Russian company made a prior task to support clients of the restaurants
and give them privileges.
b) Use of mobile application
To understand the use of mobile application we asked the question about competitive tools:
“What tools are from your point of view the main competitors for your mobile application?”
LaFourchette: “….what we currently see is that our main competitor is the phone, people reserve
restaurants when they go to restaurants but they don’t have the fork as reflex and they most of the
time they use their phone to reserve the restaurant….”
Resto: “The main competitor of booking is the very lack of booking. That is, the guest expects that
there is a table for him and there is nothing to book in advance…”
From the point of view of Russian company the lack of booking and low occupancy rate in
restaurants impacts also the use of mobile application. That is probably connected with the recent
economical crises we presented in the context of our research. The income of middle class in Russia
decreased and influenced the occupancy of the restaurants. In France the mobile application
competes primary with other tool, a phone, which is sometimes easier for the people, than to
effectuate the mobile applications booking.
c) Outcomes
Mobile application loyalty and continued intention to use
“How do you assess the loyalty of the user? By the amount of time he / she uses mobile
application for a month, a week, a year? By activity, such as reviews, ratings, and so on.”
Lafourchette: “we look at the bookings, the number of bookings the number and the frequency and
recency of the booking …….. so we call our loyal most loyal customers the lovers and the exact
definition is did at least booking in last month and more than three ……..so first one is starters
those, who did their first booking this month; after that we have the flirters this are those who did
a booking last month but didn’t book since three month before so they come, they go away etc. the

237
lovers the most loyal I think it’s more than three bookings during the three last months more one
booking a month and a booking last month and after that we have the decrease of the activity so we
have the cheaters, the breakers, the ex, etc etc etc so more the more time has spent since the last
booking more they will be dead, in fact. And we act on this on each segment differently so we have
some … for the starters we have welcoming program to welcome them we have yums to boost the
second booking , on the flirters we will more speak about mobile app for those who didn’t book on
mobile app because we know that the customers that use mobile app are more loyal so this is the
main ax of the communication and action on the flirters; after when we speak about cheaters,
breakers those who didn’t book since more than four –five months we have plan of kind of
reactivation plan who will reexplain them the advantages of the fork and at the end ask them do you
still want to receive our communication etc etc because I prefer to delete them rather than keep
them in my database ”
Resto: “We have a core audience; this is approximately 150,000 regular customers. We evaluate
their activity in bookings and reviews. On average, a loyal customer uses resto 3-5 times a week,
once a week he reviews.”
We assume that the big difference in estimations of who is loyal client is connected with the size of
the companies and restaurant market. It is smaller in Russia, so the clients enjoy personal attitude to
them from the side of the company and therefore use the services of the “resto” very often. In
opposite, French market is well developed and it is not possible to build the personal relationships
with them, therefore many clients use mobile application occasionally to get discount, so the loyal
clients are defined differently.
These interviews allowed us to understand better how the connection with users is structured inside
of the companies. We can see that Russian company pays more attention on the personal
relationships, while French company works very well with technical capabilities of the technology.
Some of the differences are connected with the histories of the companies.
II. Pre-test of survey, statistical validation by SmartPLS
This section presents the statistical validation of the measurement model of our research realized by
statistical pretest with SmartPLS application. As recommended by authors (Churchill, 1979, Chin,
1998, Serakan and Bougie, 2013, Hair at al., 2012) before to run statistical analysis of the
researched model, the measurement items should be purified and tested with the first sampling. The
running of pretest is aimed to evaluate the measurement items of the model. This is made to ensure
consistency, reliability and validity of the items. We have chosen convenience sample, one of the

238
important required criterion is for us, that responders should be real users of the researched mobile
application. Normally 30 percent of the original sample is recommended to run for the pretest, but
not less than required by used software. SmartPLS approach requires collecting the minimum
sample ten times bigger than the maximum measurement items directed to one latent variable
(Chin, 1998, Marcoulides and Saunders, 2006, Hair et al, 2011). Our biggest number of
measurement items is five (latent variable mobile application loyalty). To accomplish the pretest
with SmartPLS we collected 52 responders in France.
The final survey consists out of 30 questions and two question of social state of responders. This
survey was published online with help of google forms application
https://goo.gl/forms/Wow8SxBfSxMG8yVh2
Loadings
The first analysis allow us indentifying the measurement items with lower loadings (lower than
0.7), which should be deleted out of scale as no representative.
The abbreviations in the model are deciphered as follows: CITU – continued intention to use, FC –
facilitating conditions, INDUL – indulgence, ITU – intention to use, MAL – mobile application
loyalty, MAU – mobile application usability, PV – price value, TRUST – trust, UMA – use of
mobile application.
Table 48: Loadings of the pretest
CITU FC ITU PV TRUST INDUL LOYALTY USABILITY USE
CITU1 0,935
CITU2 0,775
FC1 0,900
FC2 0,894
FC3 0,305
INDUL1 0,769
INDUL2 0,271
INDUL3 0,884
ITU1 0,875
ITU2 0,948
MAL1 0,876
MAL2 0,791
MAL3 0,899
MAL4 0,842
MAL5 0,873
MAU1 0,959
MAU2 0,945
PV1 0,847
PV2 0,795
PV3 0,896
TRUST1 0,896
TRUST2 0,953
UMA1 0,953
UMA2 0,663
UMA3 0,672

239
Three constructs have poor measurement items: facilitating conditions (FC3), indulgence
(INDUL2) and use of mobile application (UMA2 and UMA3). To increase the composite weight
we should delete items with weight lower than 0.7. Our first concern is about the use of mobile
application, because this construct has three measurement items and two of them are weak.
According the rule we cannot delete both, so we decided to delete UMA3 only.
Table 49: Loadings after deleted items
CITU FC ITU PV TRUST INDUL LOYALTY USABILITY USE
CITU1 0,935
CITU2 0,775
FC1 0,904
FC2 0,960
INDUL1 0,767
INDUL3 0,886
ITU1 0,875
ITU2 0,948
MAL1 0,876
MAL2 0,791
MAL3 0,899
MAL4 0,842
MAL5 0,873
MAU1 0,960
MAU2 0,944
PV1 0,847
PV2 0,795
PV3 0,896
TRUST1 0,881
TRUST2 0,962
UMA1 0,975
UMA2 0,665
Still after modifications the measurement items of construct use of mobile application show poor
meanings. But this construct is one of central in our model. We regarded close into the answers and
found out that we can explain weakness of the measurement items by the sampling characteristics.
Our questionnaire is aimed for the user of the mobile application Lafourchette (French part of the
research), but for the pretest the participants were selected randomly, so we have many answers
“tres rarement” for the use of the mobile application and in this way this construct of the model
couldn’t be validated. That means that by collecting of the further data we should do strong
invitation to answer the questionnaire only if responders really use the selected application. And
before running the model we should also delete answers, which are negative for the use of mobile
application.
For other measurement items the loadings are higher than 0.7, we can conclude, that our
measurement items are reliable.
Reliability, consistency and validity

240
To verify the reliability, internal consistency and validity we looked at Cronbach’s alpha, Rho,
composite reliability and average variance extracted (AVE).
Table 50: Reliability and validity
Assessment of construct reliability includes the evaluation of construct internal consistence,
examined by Cronbach’s alpha. Three constructs showed weights lower than required meaning of
0.7: continued intention to use (CITU), indulgence and use of the mobile application.
Use of the mobile application
We already concluded that use of mobile application is central of the model and we should check it
again with convenient sample. Anyway the other indexes have sufficient weight. Rho of use is 1.4
(the minimum required is 0.7). Some authors (Devellis, 2003, Jakobwicz, 2007) consider that Rho
is to privilege compared to Cronbach’s alpha, because of high sensibility towards the number of
measurement items. The convergent validity examined by AVE of use is 0.697, what is higher than
required minimum (0.5). And composite reliability is 0.816, also higher than required 0.7.
Nevertheless, obviously the construct has problem with internal consistency, what we already
explained before.
Continued intention to use
Cronbach’s alpha by 0.667 of continued intention to use makes concerns about the internal
consistency, but because of the sufficient weights of Rho (0.822), composite reliability (0.848) and
AVE (0.737), we tend to explain it again with the sampling characteristics of the pretest. It is very
possible that responders who answered “tres rarement” for the use of mobile application are thought
to answer negatively for continued intention to use of the mobile application. Thus, we will not
delete it by now out of research model, but we will be aware for the collecting further data.
Indulgence
Cronbach's
Alpha rho_A
Composite
Reliability
Average
Variance
Extracted
(AVE)
CITU 0,667 0,822 0,848 0,737
FC 0,856 0,971 0,930 0,870
ITU 0,806 0,911 0,908 0,832
PV 0,814 0,887 0,884 0,718
TRUST 0,836 1,018 0,919 0,851
INDUL 0,553 0,590 0,813 0,687
LOYALTY 0,909 0,915 0,932 0,734
USABILITY 0,898 0,915 0,951 0,907
USE 0,652 1,406 0,816 0,697

241
Unfortunately we collected data for the pretest mostly among French responders, in this way it is
expected that the cultural construct will show low reliability. According Hofstede cultural
dimensions should not be used with a sample of respondents from one country. But essential to the
use of the cultural dimensions’ scores is that comparisons should be based on matched samples of
respondents: people similar on all criteria other than nationality that could systematically affect the
answers (Hofstede, Minkov, 2010).
We would like to run the model included this construct for the general analysis to see of it has
impact or not.
Discriminant validity
Table 51: Cross-loadings
CITU FC ITU LOYALTY USABILITY PV TRUST USE
CITU1 0,935 0,439 0,828 0,849 0,462 0,428 0,553 0,522
CITU2 0,775 0,151 0,469 0,477 0,536 0,433 0,600 0,365
FC1 0,358 0,904 0,285 0,217 0,107 0,158 0,189 0,142
FC2 0,360 0,960 0,493 0,404 0,138 0,131 0,149 0,276
ITU1 0,655 0,361 0,873 0,786 0,278 0,314 0,238 0,324
ITU2 0,782 0,430 0,949 0,784 0,450 0,370 0,420 0,621
MAL1 0,677 0,304 0,769 0,876 0,518 0,392 0,468 0,405
MAL2 0,627 0,334 0,652 0,791 0,425 0,405 0,450 0,419
MAL3 0,796 0,293 0,764 0,899 0,498 0,399 0,595 0,512
MAL4 0,644 0,280 0,655 0,842 0,395 0,375 0,338 0,619
MAL5 0,732 0,304 0,805 0,873 0,433 0,382 0,399 0,512
MAU1 0,581 0,147 0,431 0,540 0,960 0,274 0,630 0,248
MAU2 0,472 0,106 0,356 0,467 0,944 0,231 0,530 0,209
PV1 0,403 0,164 0,319 0,319 0,268 0,848 0,413 0,397
PV2 0,332 0,039 0,171 0,239 0,144 0,795 0,264 0,231
PV3 0,472 0,142 0,396 0,514 0,235 0,896 0,366 0,372
TRUST1 0,487 0,129 0,235 0,390 0,589 0,399 0,881 0,185
TRUST2 0,674 0,184 0,422 0,555 0,561 0,391 0,962 0,349
UMA1 0,556 0,305 0,591 0,592 0,282 0,368 0,306 0,975
UMA2 0,223 -0,087 0,178 0,271 0,003 0,388 0,191 0,665
As we can see continued intention to use shares more variance with indicators of another latent
variable not its own: the weight CITU – ITU2 and CITU – MAL3 is higher than CITU- CITU2. In
this way we should have real concern about this construct in our research model.

242
Table 52: Root of AVE
CITU FC ITU PV TRUST LOYALTY USABILITY USE
CITU 0,859
FC 0,383 0,933
ITU 0,796 0,438 0,912
PV 0,489 0,151 0,378 0,847
TRUST 0,650 0,176 0,379 0,423 0,922
loyalty 0,815 0,352 0,854 0,455 0,531 0,857
usability 0,557 0,134 0,416 0,267 0,613 0,532 0,952
use 0,531 0,238 0,549 0,412 0,310 0,574 0,241 0,835
Root of AVE of each latent constructs should be greater than the latent construct’s highest squares
correlation with any other latent construct, that rule is respected in our model.
III.Conclusions
The run of pretest allowed us to do modifications and raised some concerns about the research
model:
• Use of mobile application as the central construct has not sufficient measurement items,
because of that we should collect further data more carefully.
• Continued intention to use as construct showed weak significance in Cronbach’s alpha, and
cross loadings. Nevertheless, we decided to keep it for analysis. This decision is to explain by
the type of our sampling strategy: to accept responses only of truly users. Also we would like to
see the role of this construct in second country.
• Cultural aspects are included in our model by the construct of indulgence. Because the
collected data for pretest are predominantly from France we concluded that surely we cannot
use this construct in monoculture analysis, but we will try it for the whole set of data.
After the pretest we run the survey in both countries to collect data for further analysis.
243
Chapter VI: Research results and discussion.

244
Introduction
This chapter presents the results of our research. After the pretest we fulfilled the statistical analysis
of our research model. This analysis we effectuated in two phases according to researchers’
recommendations (Henseler et al, 2009). On the first phase we evaluated the reliability and validity
of the measurement model with the purpose to ensure the stability of psychometric model quality.
On the second phase we treated statistically our hypotheses of structural model.
The chapter consists out of three sections. First section presents the sampling characteristics. We
described the results of social state of responders, particularly age and professional occupation. We
also gave statistical information of mobile application use process, like duration of the use,
frequency of the restaurant visits. Another important statistical parameter we used describes the
situation of the mobile application use and the place of use.
Second section presents the results for general model, where the collected data of two countries
were analyzed together. All together we observed 244 answers.
The third section presents comparison between France and Russia. In the end we introduce the
comparison of the results: general model and French model and Russian model.
In the end we present the discussion of the results.
I. General model evaluation
The first section presents the sampling and mobile application use characteristics, and results of
general model.
I.1. Sampling characteristics
Collection of the data for our model was done in cooperation with two companies: Lafourchette in
France and Resto Group in Russia. The covered areas were Paris and Moscow. The used means
were: newsletters of both companies, groups of users on facebook and VK (Russian social
network). Despite this cooperation we collected not as much data as we hoped, because of low
users’ activity in Russia. We spent three months to finish the gathering of the data, in our case the
data in France were ready in three weeks, but the same process in Russia took three months. All
together we had for analysis 244 responds: 123 from Paris (France) and 121 from Moscow (Russia).
The average time the responder needed to answer the survey was between two and three minutes.
In our survey we used two parameters of social characteristics of the responders: age and
professional occupation (Table 58). The majority of responders (39.3%) are in the age 25-34 years.
We expected that this age group will be the most active in usage of mobile applications. Compared
to younger age groups in the age of 25-34 users have financial stability to go out for eating more

245
often, in this way they use mobile application more often. In the same time compared to older age
users have stronger habit to use technology including mobile applications.
Figure 34: Collected data by country:
Source: composed by author of the thesis according to the data
Professional occupation gives us the possibility to estimate social status and possible income of the
responders, because as we have clarified in the context (chapter I) the expenses for restaurant
belong to leisure and not to major household expenses. Thus, the representative of middle and
upper-middle classes will go out for lunch/dinner more often than others, therefore the use of
specialized mobile application will be more demanded.
Table 53: Professional occupation and age of the responders
Social
characteristics
Type France Russia Total %
Age >18 0 2 2 0.8
18-24 20 19 39 15.98
25-34 46 50 96 39.3
35-49 28 48 76 31.1
50-69 27 2 29 11.88
+70 2 0 2 0.8
Occupation manager/
entrepreneur
21 69 90 36.88
employee 67 14 81 33.2
student 21 23 44 18
No activity 2 6 8 3.28
Other 10 11 21 8.6
Source: composed by author of the thesis according to the data

246
The majority has marked their activity as manager/entrepreneur (90%) and employee (81%), what
confirmed the assumption about the importance of social status. According to the countries’
distribution the majority of Russian responders indicated their activity as manager/entrepreneur
while the majority of French responders chose employee. We can explain it with the decrease of
purchasing power in Russia due to current economical crises. We can conclude that income of the
Russian middle class decreased and had impact on the structure of personal expenses. As for age
there is also noticeable difference possible connected with the major occupation of Russians, the
responders between 35-49 years in Russia are more active than in France, and in both countries the
most active group is between 25-34 years. As mentioned above this group age corresponds to basic
conditions of usage of mobile applications in restaurant context: users have sufficient financial
resources to go out and developed habit to use mobile technologies.
Frequency of visits and duration of use
According to RFM segmentation (Wansbeek, 1995, Blattberg et al., 2008, Birant, 2011) we
included in our survey two questions to describe frequency as a number of visits in restaurants and
one question of recency, which is described as duration of use, the last component of RFM
segmentation, monetary, is less important because the mobile applications are free for download
and its meaning is included in our construct of price value.
First question of frequency describes the actual frequency of going out by responders; the second
question clarifies the frequency of visits by the mobile applications (Table 54).
Table 54: Frequency of visits
How often do you go out for
dinner/lunch?
France Russia Total %
Several times per week 18 30 48 19.7
One time per week 28 33 61 25
Several times per month 55 42 97 39.7
Less than one time in a month 21 16 37 15.1
Very seldom 1 0 1 0.4
How often do you go out because
of promotions on the mobile
application?
France Russia Total %
Several times per week 3 2 5 2.0
One time per week 8 4 12 4.9
Several times per month 23 34 59 24.1
Less than one time in a month 37 37 74 30.3
Very seldom 52 44 96 39.3
Source: composed by author of the thesis according to the data
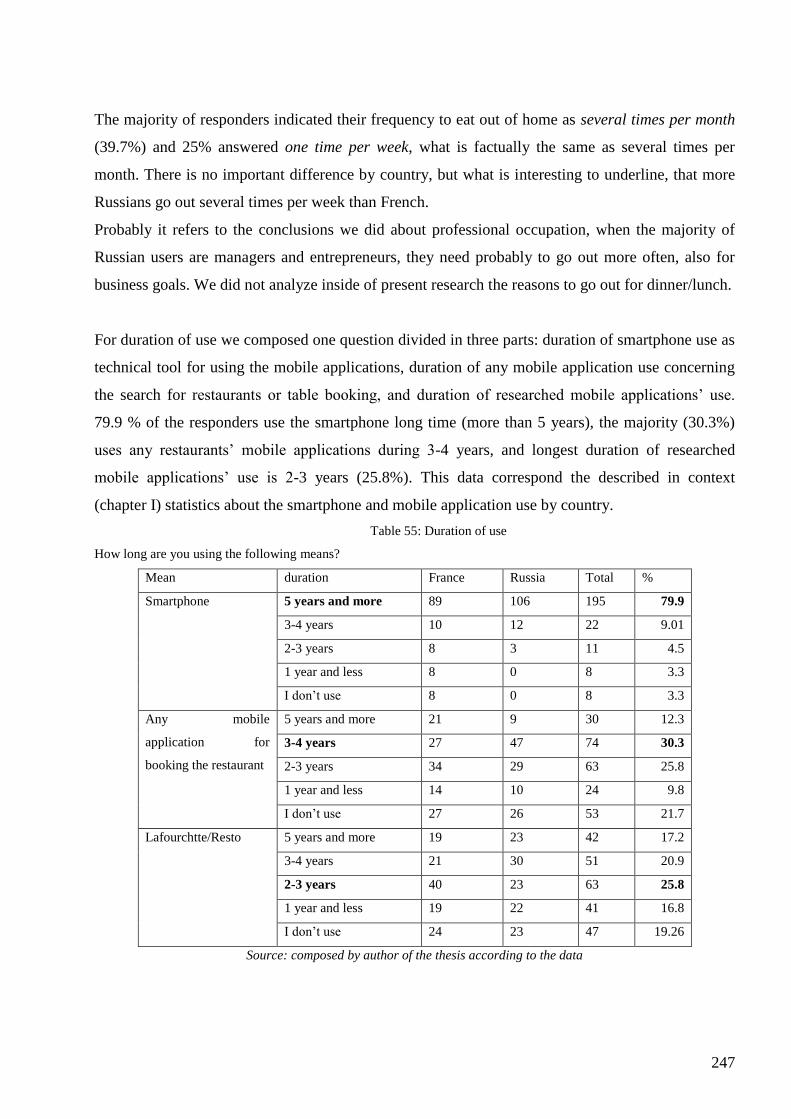
247
The majority of responders indicated their frequency to eat out of home as several times per month
(39.7%) and 25% answered one time per week, what is factually the same as several times per
month. There is no important difference by country, but what is interesting to underline, that more
Russians go out several times per week than French.
Probably it refers to the conclusions we did about professional occupation, when the majority of
Russian users are managers and entrepreneurs, they need probably to go out more often, also for
business goals. We did not analyze inside of present research the reasons to go out for dinner/lunch.
For duration of use we composed one question divided in three parts: duration of smartphone use as
technical tool for using the mobile applications, duration of any mobile application use concerning
the search for restaurants or table booking, and duration of researched mobile applications’ use.
79.9 % of the responders use the smartphone long time (more than 5 years), the majority (30.3%)
uses any restaurants’ mobile applications during 3-4 years, and longest duration of researched
mobile applications’ use is 2-3 years (25.8%). This data correspond the described in context
(chapter I) statistics about the smartphone and mobile application use by country.
Table 55: Duration of use
How long are you using the following means?
Mean duration France Russia Total %
Smartphone 5 years and more 89 106 195 79.9
3-4 years 10 12 22 9.01
2-3 years 8 3 11 4.5
1 year and less 8 0 8 3.3
I don’t use 8 0 8 3.3
Any mobile
application for
booking the restaurant
5 years and more 21 9 30 12.3
3-4 years 27 47 74 30.3
2-3 years 34 29 63 25.8
1 year and less 14 10 24 9.8
I don’t use 27 26 53 21.7
Lafourchtte/Resto 5 years and more 19 23 42 17.2
3-4 years 21 30 51 20.9
2-3 years 40 23 63 25.8
1 year and less 19 22 41 16.8
I don’t use 24 23 47 19.26
Source: composed by author of the thesis according to the data

248
GIS – technology, Place of use
In regards to geolocation function, the mobile application uses a geographic search to perform
complex geographic queries in geographic context (Lin, Kao, Lam, Tsai, 2014). In researched
mobile applications this function is presented as button “(restaurants) around me”. It allows to find
the restaurant establishment according attributes, like object type, object name with geographic
criterions like nearness, distance, location.
We composed four questions (Table 56) to see how the users use this function when they search for
restaurants inside of the researched mobile applications. First question is direct whether the
responders use or not the geolocation function and 46.3% do use. It is important to mention that
Russians use this function two times more than French.
Table 56: Geolocation function
I use geolocation function on the
mobile application
France Russia Total %
Totally agree 37 76 113 46.3
Agree 27 20 47 19.2
Neither agree nor disagree 26 11 37 15.1
Disagree 16 6 22 9.01
Totally disagree 17 8 25 10.2
Source: composed by author of the thesis according to the data
Three other questions describe how strong the mobile application can impact the choice of the user
with promotions and depending on the location of the user. The majority (34.4%) of the responders
do not check the promotions on the mobile application before they go out and this number is three
times higher in Russia than in France. This difference refers to the mobile applications’ images.
LaFourchette in Paris was made as discount mobile application and many users perceive it in the
first way as discount tool. Russian Resto was made as restaurant guide in the beginning, even if
they provide now days information about discounts, users do not perceive it as discount tool.
Also, the majority (37.3% agree and 19.6% totally agree) prefer to go to the next restaurant without
promotions rather than to go to the faraway restaurant because of promotions (31.1% totally
disagree, 17.6 % disagree).
In both cases the results are influenced by the dominant numbers of Russian responders, for
example 63 Russian responders do not check promotions compared to 21 of French. More or less
equal opinion responders have about restaurants “next door”: in both cities (Paris and Moscow)
responders prefer to go to close located places. And significant difference we can see in the
intention to change location according to the suggested by mobile application promotions: this

249
intention is higher among French responders than Russians. The attitude of the responders to the
loyalty programs suggested by the mobile applications we will see in the stage of the model
evaluation. This question aimed to study the attitude of the responders to the idea of changing
place/location caused by mobile application. We can assume that Russian responders as we showed
it are representative of upper-middle class mostly and are probably less motivated to change their
location.
Table 57: Influence of promotions for the change of location
I check promotions in the restaurant on the
mobile application before entering
France Russia Total %
Totally agree 17 8 25 10.2
Agree 30 30 60 24.59
Neither agree nor disagree 33 16 49 20
Disagree 22 4 26 10.6
Totally disagree 21 63 84 34.4
I prefer to go to the restaurant next to me even
if there are no promotions
France Russia Total %
Totally agree 24 24 48 19.67
Agree 37 54 91 37.3
Neither agree nor disagree 32 19 51 20.9
Disagree 23 19 42 17.2
Totally disagree 7 5 12 4.9
I prefer to go to faraway restaurant because of
the promotions
France Russia Total %
Totally agree 3 4 7 2.8
Agree 41 25 66 27
Neither agree nor disagree 28 24 52 21.3
Disagree 29 14 43 17.6
Totally disagree 22 54 76 31.1
Source: composed by author of the thesis according to the data
Location of the place and the function of “mapping” on the mobile application is important to the
users in both cities and it can be connected as well with the size of the city, traffic, public transports
and parking possibilities in the city center. In this way discount or promotion in the restaurant can
loose its importance compared to possible difficulties, but discounts and promotions can be
important by changing the choice if other conditions are more or less equal (e.g. to choose between
several restaurant establishments located equal faraway or equal close to the user).

250
We conclude that according to the sample characteristics the biggest difference appeared because of
the professional occupation of responders. In the further sections we will analyze the moderating
effect of the regarded parameters on the mobile applications’ use.
I.2. Validation of the measurement model
The abbreviations in the model are deciphered as follows: CITU – continued intention to use, FC –
facilitating conditions, INDUL – indulgence, ITU – intention to use, LOYALTY – mobile
application loyalty, USABILITY – mobile application usability, PRICE – price value, TRUST –
trust, USE – use of mobile application.
Table 58: Loadings
CITU FC INDUL ITU LOYALTY PRICE TRUST USABILITY USE
CITU1 0,864
CITU2 0,683
FC1 0,628
FC2 0,725
FC3 0,787
INDUL1 0,673
INDUL2 0,806
INDUL3 0,183
ITU1 0,918
ITU2 0,900
LOYALTY1 0,853
LOYALTY2 0,798
LOYALTY3 0,881
LOYALTY4 0,859
LOYALTY5 0,889
PRICE1 0,793
PRICE2 0,808
PRICE3 0,647
TRUST1 0,939
TRUST2 0,942
USABILITY1 0,960
USABILITY2 0,948
USE1 0,977
USE2 0,615
USE3 0,282
Source: SmartPLS report

251
Several loadings have lower values than required 0.70, so to continue we need to delete not reliable
items and see, if that improves the results (Roussel and Wacheux, 2005). CITU has only two
measurement items, so we will keep construct for the moment, to see other indexes.
We removed FC3, PRICE3 that increased the reliability of other items. The removal of the USE3
and INDUL3 did not only increase the values of other items, but even decreased the value of second
weak item. Thus, it is obvious that we need to delete the constructs of indulgence, use and
continued intention to use out of the researched model.
Table 59: Loadings after deleted items
CITU FC INDUL ITU LOYALTY PRICE TRUST USABILITY USE
CITU1 0,864
CITU2 0,683
FC1 0,851
FC2 0,945
INDUL1 0,666
INDUL2 0,821
ITU1 0,916
ITU2 0,902
LOYALTY1 0,853
LOYALTY2 0,798
LOYALTY3 0,881
LOYALTY4 0,859
LOYALTY5 0,889
PRICE1 0,884
PRICE2 0,746
TRUST1 0,934
TRUST2 0,947
USABILITY1 0,960
USABILITY2 0,948
USE1 0,978
USE2 0,611
Source: SmartPLS report
Before we do it according to the framework of our research we will effectuate the analysis of
psychometric characteristics of the measurement model construct by construct, after that we can
take final decisions. We start with this three constructs, which are under the question.

252
I.2.1. Indulgence
We have chosen the construct of indulgence from all cultural dimensions because this construct is
connected with self-gratification and relation between leisure time and work (Hofstede, 2011).
We were aware about the weakness of the measurement items of this latent variable after the
pretest; nevertheless we wanted to check its reliability and validity in the final sample with data
from two countries. Table 60 shows us the characteristics of the indulgence measurement items.
The construct indulgence is measured by three items. Internal consistency reliability is not strong
enough, the obtained values are much less than acceptable of 0,7: Cronbach’s alpha – 0,213 and
Rho 0,242. Composite reliability is 0.597, the required threshold is 0,7. Convergent validity
expressed in AVE is also much lower (0.379) than required minimum of 0.5. T-values for
measurement items are significant for INDUL1 and INDUL2, and not acceptable for INDUL3. As
mentioned before the removal of the weakest item INDUL3 did not increase significance of other
items.
Table 60: Characteristics of the measurement items of indulgence
Items Loadings T-value
INDUL1 0,673 2,452
INDUL2 0,806 2,947
INDUL3 0,183 0,548
Cronbach’s alpha 0,213
Rho 0,242
Composite
reliability
0,597
AVE 0,379
Source: SmartPLS and SPSS reports
Low weights of reliability and validity mean that the measurement items do not reflect the meaning
of the concept, in other words the construct which is measured by these items cannot be interpreted
inside of the researched model or will have poor significance for prediction.
The Values Survey Module manual (Hofstede, 2013) gives explanation of survey reliability,
underlining that answers on questions used to measure a country-level dimension do not necessarily
correlate across individuals. A reliability test like Cronbach’s alpha should in this case not be based
on individual scores but on country mean scores. Obviously this presupposes data from a sufficient
number of countries, in practice at least ten (Hofstede, Minkov, 2013). For comparison across fewer
countries the reliability of the VSM at the country level has to be taken for granted; it can indirectly
be shown through the validity of the scores in predicting dependent variables.

253
Taken into account this precision we compared the samplings of the responders and calculated
scores within the samplings. Thus, French sampling’s scored at 94 and Russian one at 85. These
scores are extremely high compared to national scores provided by Hofstede’s contries comparison
tool (France – 48, Russia – 20). Moreover according to calculated scores we cannot see cultural
difference in the dimension of indulgence. One of the reason might be in the sampling
characteristics, we showed above. Income and social status expressed in professional occupations of
the responders eliminate the cultural differences referred to concepts of leisure time and self
gratification. Also, we should admit, that the measurement items were not used in full that could
provoke the limitations in calculations. Anyway, the construct of indulgence could be useful to
evaluate the difference in attitude towards “going out”, but in our case we are more interested to
analyze the attitude towards the use of technology in the context of “going out”.
Thus, we have to delete the construct of indulgence out of our research model and continue the data
analysis without it.
I.2.2. Continued intention to use
Construct continued intention to use is measured only with two items CITU1 and CITU2, what is
possible in SmartPLS application (Ringle, Wende, Becker, 2015).
Loadings of the item CITU2 are lower than 0.7. Thus, according to the rule we should delete the
construct out of the researched model. But we decided to check indexes of reliability and validity
(Table 61).
Normally Cronbach’s alpha is used to measure internal consistency reliability, some researchers
suggest using composite reliability as replacement (Bagozzi and Yi, 1988, Hair et al., 2012). In this
case as we see the value of composite reliability is higher than required 0.7, by low weights of
Cronbach’s alpha (0.364) and Rho (0.395). AVE of the construct is higher than 0.50, thus the
convergent validity is sufficient.
T-values are higher than 9.0 what is much higher than 1.96 showing the significance of the items’
path coefficients.
Table 61: Characteristics of the measurement items of continued intention to use
Items Loadings T-value
CITU1 0,864 21,505
CITU2 0,683 9,624
Cronbach’s alpha 0,364
Rho 0,395
Composite reliability 0,753
AVE 0,607
Source: SmartPLS reports

254
The construct of continued intention to use is the outcome of the construct of mobile application
loyalty and has no connection or impact on other variables of the model, so we can keep it for the
moment to verify the impact of loyalty on it.
I.2.3. Use of mobile application
Latent variable use of mobile application is key-construct of our research model. It is measured
with three items: USE1, USE2, and USE3. First we deleted USE3 as the item with lowest loadings,
but its removal did not change the score of the second weak item USE2. Nevertheless, we checked
the validity and reliability of the measurement items (Table 62).
Table 62: Characteristics of the measurement items of use
Items Loadings T-value
USE1 0,977 25,671
USE2 0,615 5,236
USE3 0,282 1,758
Deleted item USE3
Cronbach’s alpha 0,605
Rho 1,452
Composite reliability 0,790
AVE 0,665
Source: SmartPLS reports
By lower Cronbach’s alpha (0,605) other weights are sufficient (composite reliability 0,790 and
AVE 0,665) or superior (Rho 1,452). T-values are highly significant (USE1=25,671, USE2=5,236).
Low level of reliability of the measurement items is to explain with the context of mobile
application use. This use is directly connected with times the responders go out to have food in the
restaurants, because only in this case they are in the context of use. At the same time the mobile
application use is competing here with other means like websites, Google, phone, and location of
the users (when the person chooses the restaurant establishment by seeing one next to him/her).
These two factors might influence on the answers and lead to lower weights of reliability.
Nevertheless, the construct even with low reliability can produce estimates of the relationships
among constructs in the confirmatory analysis (Little, Lindenberger, Nesselroad, 1999); our
research is an extension of the UTAUT2, where the use is main construct. Together with AVE
higher than 0,5, we can keep the construct of use of mobile application to analyze its relationships
with other variables.

255
I.2.4. Price value
Latent variable price value is measured with three items: PRICE1, PRICE 2, and PRICE3.
Loadings of PRICE3 are less than required (0,647). After the removal of this item the score of
PRICE1 and PRICE2 correspond the threshold of 0,7 (Table 63).
By lower Cronbach’s alpha (0,517) and Rho (0,558) other weights of composite reliability 0,790
and AVE 0,665 are sufficient. T-values are highly significant (PRICE1=11,481, PRICE2=12,376).
As mentioned before concerning Cronbach’s alpha and Rho we can still keep construct even with
lower scores of this coefficients, if composite reliability and AVE are higher than required
threshold.
Table 63: Characteristics of the measurement items of price value
Items Loadings T-value
PRICE1 0,793 11,481
PRICE2 0,808 12,376
PRICE3 0,647 6,717
Deleted item PRICE3
Cronbach’s alpha 0,517
Rho 0,558
Composite reliability 0,790
AVE 0,669
Source: SmartPLS reports
I.2.5. Facilitating conditions
The latent variable facilitating conditions had one weak measurement item – FC1. But after we
removed this item, the score of measurement item FC2 decreased till 0,648, what actually mean that
the construct should be deleted out of the model. Than we checked the scores removing each item in
rotation and found out, that by removing the item FC3 (initial score 0,787), loadings of the FC1 and
FC2 are well improved (Table 64). That gave us possibility to keep the latent variable of facilitating
conditions.
To understand why the removal of FC3 improves the weights of other measurement items we
analyzed the answers of the responders. In fact, most of the answers (104) on the question
corresponding item FC3 are neutral (neither agree nor disagree), while the answers on the other two
questions are mostly positive (agree or totally agree). Thus, the removal of measurement item with
mostly neutral/undecided responses increases the positive meaning of the other items.

256
Table 64: Characteristics of the measurement items of facilitating conditions
Items loadings Loadings after
removal
T-value
FC1 0,628 0,851 6,624
FC2 0,725 0,945 10,475
FC3 0,787 14,732
Deleted item FC3
Cronbach’s alpha 0,775
Rho 0,902
Composite reliability 0,894
AVE 0,809
Source: SmartPLS reports
T-values of FC1 and FC2 are much higher than required minimum of 1,96 (6,624 and 10,475).
Cronbach’s alpha is higher than 0,7, when Rho (0,902) and composite reliability(0,894) are much
stronger than thresholds. The convergent validity of the latent variable facilitating conditions
measured by AVE is 0,809, what is significantly higher than minimum of 0,5. The measurement
items are valid restoring 80% of variance.
I.2.6. Trust
We composed two items to measure the latent variable trust. Loadings of both items are much
higher than threshold of 0,7: TRUST1=0,939 and TRUST2 = 0, 942. T-values are higher than 64,
compared to minimum of 1,96 the weights are very significant (Table 65).
Table 65: Characteristics of the measurement items of trust
Items Loadings T-value
TRUST1 0,939 64,795
TRUST2 0,942 74,412
Deleted item Non
Cronbach’s alpha 0,870
Rho 0,870
Composite reliability 0,939
AVE 0,885
Source: SmartPLS reports
Cronbach’s alpha and Rho indexes scored the same 0,870, and composite reliability exceeded the
minimum of 0,7 with big advantage (0,939). The convergent validity of the latent variable trust
measured by AVE is 0,885, what is significantly higher than minimum of 0,5. The measurement
items are valid restoring 88% of variance.

257
I.2.7. Intention to use
There are two items measuring the latent variable intention to use: ITU1 and ITU2.
Table 66: Characteristics of the measurement items of intention to use
Items Loadings T-value
ITU1 0,918 72,267
ITU2 0,900 42,314
Deleted item Non
Cronbach’s alpha 0,790
Rho 0,795
Composite reliability 0,905
AVE 0,826
Source: SmartPLS reports
Loadings of both items are higher than threshold of 0,7: ITU1=0,918 and ITU2 = 0, 900. T-values
are higher than 42, compared to minimum of 1,96 the weights are very significant(Table 66).
Internal consistency reliability of intention to use is confirmed by Cronbach’s alpha (0,790) and
Rho (0,795) indexes. Composite reliability with the value of 0,905 exceeded the weight of 0,7. The
convergent validity of the latent variable intention to use measured by AVE is 0,826, what is
significantly higher than minimum of 0,5. The measurement items are valid restoring 82% of
variance.
I.2.8. Mobile application usability
We measured the latent variable mobile application usability with items USABILITY1 and
USABILITY2 (Table 67).
Table 67: Characteristics of the measurement items of mobile application usability
Items Loadings T-value
USABILITY1 0,960 140,098
USABILITY2 0,948 77,857
Deleted item Non
Cronbach’s alpha 0,902
Rho 0,912
Composite reliability 0,953
AVE 0,910
Source: SmartPLS reports
Loadings of both items are significantly higher than threshold of 0,7: USABILITY1= 0,960 and
USABILITY2=0,953. T-values are higher than 77 and 140, compared to minimum of 1,96 the
weights are extraordinary. Internal consistency reliability of mobile application usability is fully
confirmed by Cronbach’s alpha (0,902) and Rho (0,912) indexes. Composite reliability with the
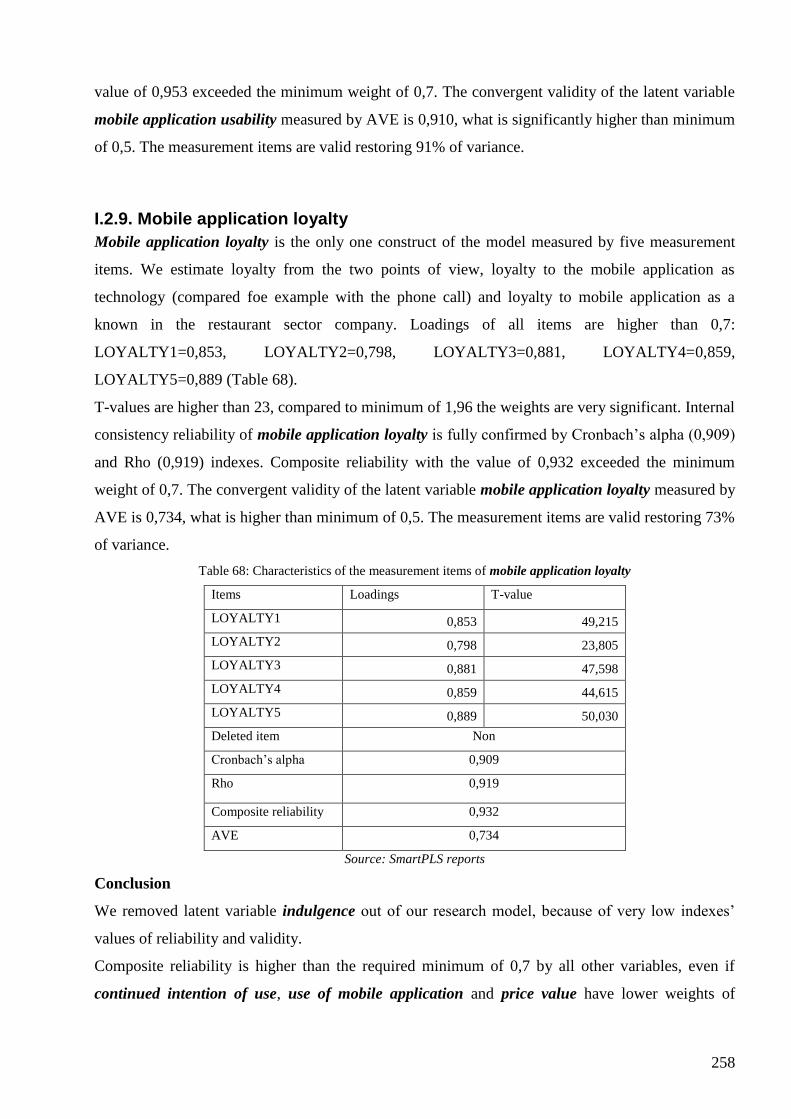
258
value of 0,953 exceeded the minimum weight of 0,7. The convergent validity of the latent variable
mobile application usability measured by AVE is 0,910, what is significantly higher than minimum
of 0,5. The measurement items are valid restoring 91% of variance.
I.2.9. Mobile application loyalty
Mobile application loyalty is the only one construct of the model measured by five measurement
items. We estimate loyalty from the two points of view, loyalty to the mobile application as
technology (compared foe example with the phone call) and loyalty to mobile application as a
known in the restaurant sector company. Loadings of all items are higher than 0,7:
LOYALTY1=0,853, LOYALTY2=0,798, LOYALTY3=0,881, LOYALTY4=0,859,
LOYALTY5=0,889 (Table 68).
T-values are higher than 23, compared to minimum of 1,96 the weights are very significant. Internal
consistency reliability of mobile application loyalty is fully confirmed by Cronbach’s alpha (0,909)
and Rho (0,919) indexes. Composite reliability with the value of 0,932 exceeded the minimum
weight of 0,7. The convergent validity of the latent variable mobile application loyalty measured by
AVE is 0,734, what is higher than minimum of 0,5. The measurement items are valid restoring 73%
of variance.
Table 68: Characteristics of the measurement items of mobile application loyalty
Items Loadings T-value
LOYALTY1 0,853 49,215
LOYALTY2 0,798 23,805
LOYALTY3 0,881 47,598
LOYALTY4 0,859 44,615
LOYALTY5 0,889 50,030
Deleted item Non
Cronbach’s alpha 0,909
Rho 0,919
Composite reliability 0,932
AVE 0,734
Source: SmartPLS reports
Conclusion
We removed latent variable indulgence out of our research model, because of very low indexes’
values of reliability and validity.
Composite reliability is higher than the required minimum of 0,7 by all other variables, even if
continued intention of use, use of mobile application and price value have lower weights of

259
Cronbach’s alpha or/and Rho they obtain good scores in the composite reliability. Sufficient scores
in composite reliability allow us to conclude that our measurement model is reliable.
AVE higher of 0,5 indicates good convergent validity of latent variables in our measurement model.
Measurement items of each particular variable are good connected with among themselves. Mobile
application usability explains 90% of the variance of its items, what is the strongest result, while
continued intention to use explains only 60 % of variance and is the weakest.
I.3. Discriminant validity
Discriminant validity studies the correlation and verifies whether this correlation is representative
or not. The observed variable should correlate with other observed variables of its associated latent
variable better than with observed variables of other latent variables.
For evaluation of discriminant validity we used cross loadings (Table 69) and root square of AVE
(Table 70).
The cross loadings mean that an indicator’s loading with its associated latent construct should be
higher than its loading with all remaining constructs.
Table 69: Cross loadings
CITU FC ITU LOYALTY PRICE TRUST USABILITY USE
CITU1 0,864 0,245 0,575 0,558 0,322 0,405 0,497 0,556
CITU2 0,683 0,201 0,387 0,384 0,314 0,397 0,402 0,215
FC1 0,178 0,851 0,218 0,246 0,154 0,174 0,195 0,153
FC2 0,313 0,945 0,318 0,368 0,195 0,317 0,311 0,219
ITU1 0,580 0,245 0,915 0,744 0,352 0,532 0,469 0,465
ITU2 0,566 0,317 0,903 0,581 0,359 0,447 0,453 0,429
LOYALTY1 0,613 0,332 0,626 0,853 0,428 0,577 0,573 0,523
LOYALTY2 0,410 0,307 0,558 0,798 0,354 0,541 0,454 0,397
LOYALTY3 0,561 0,306 0,670 0,881 0,453 0,630 0,510 0,517
LOYALTY4 0,458 0,239 0,593 0,859 0,474 0,522 0,451 0,571
LOYALTY5 0,559 0,319 0,673 0,889 0,475 0,605 0,558 0,537
PRICE1 0,356 0,171 0,369 0,431 0,884 0,422 0,385 0,379
PRICE2 0,301 0,152 0,259 0,412 0,746 0,371 0,349 0,228
TRUST1 0,421 0,280 0,468 0,600 0,437 0,934 0,604 0,382
TRUST2 0,529 0,264 0,544 0,664 0,473 0,947 0,716 0,411
USABILITY1 0,596 0,277 0,507 0,599 0,426 0,667 0,960 0,423
USABILITY2 0,505 0,283 0,458 0,543 0,428 0,679 0,948 0,341
USE1 0,545 0,233 0,514 0,628 0,425 0,464 0,448 0,978
USE2 0,211 0,036 0,176 0,196 0,043 0,066 0,042 0,611
Source: SmartPLS reports

260
All loadings are higher for observed variables of associated with them latent variable than of all
remaining variables. Even two lower loadings of CITU and USE are correlated better with second
observed variable of its latent variable, than with others.
Table 70: Root square of AVE
CITU FC ITU LOYALTY PRICE TRUST USABILITY USE
CITU 0,779
FC 0,287 0,899
ITU 0,631 0,308 0,909
LOYALTY 0,616 0,353 0,732 0,857
PRICE 0,403 0,198 0,391 0,511 0,818
TRUST 0,508 0,289 0,540 0,673 0,485 0,940
USABILITY 0,580 0,293 0,507 0,600 0,448 0,705 0,954
USE 0,527 0,213 0,492 0,596 0,383 0,422 0,403 0,816
Source: SmartPLS reports
The root square of AVE of each latent constructs is greater than the latent construct’s highest
squares correlation with any other latent construct.
We can conclude that measurement model demonstrates good discriminant validity of the latent
variables’ concepts
Conclusion
Our measurement model is completely reflective and as required has been evaluated to their
reliability and validity. First evaluation we proceeded with loadings, than we estimated construct
internal consistence with Cronbach’s alpha and Rho.
For convergent validity we examined the average variance extracted (AVE). And finally we
regarded cross loadings and root square of AVE for the assessment of discriminant validity.
Evaluation of outer model confirmed sufficient reliability and validity of our measurement items
and associated with them latent variables. We conclude that the measurement model is reliable and
valid.
I.4. Structural model
In this section we assess the structural or outer model and relationships between latent variables.
First we check percent of variance explained (R² and f²) and model’s capability to predict (Q² and
q²). Than we evaluate parameters (path coefficients, T-value and p-value). And finally we calculate
the quality of the model (Goodness of fit).
I.4.1. Percent of variance explained (R²)
R² evaluates percent of variance of endogenous latent variables. Obtained results of ITU, CITU and
LOYALTY are equal or higher than 35 percent: 0,354, 0,379 and 0,360 respectively. That indicates

261
that our research model explains 35% of these latent variables and according to Chin (1998) these
effects are moderate. The model explains only 27% of the endogenous variable USE, what
approximates moderate effect, but still is weak. TRUST is explained with less than 1% that is very
weak. In average the research model explains moderate the latent variables and relationships among
them (Table 71):
Table 72: R²
R Square
PRICE exogenous 0
FC exogenous 0
USABILITY exogenous 0
CITU endogenous 0,379 moderate
ITU endogenous 0,354 moderate
LOYALTY Endogenous 0,360 moderate
TRUST Endogenous 0,083 -weak
USE Endogenous 0,274 +weak
Source: SmartPLS reports
Since R2 is the percentage of response variable variation that is explained by its relationship with
one or more predictor variables, the obtained results show that facilitating conditions as a single
predictor of trust does not really explain it (1%), or in other words the collected data do not fit that
relationship. So, there is no real dependence between both: even if the user knows good how to use
mobile application it does not affect whether he/she trust this mobile application or not. Thus, trust
can be developed without knowledge about the mobile application technology. As for use it has two
predictor variables intention to use and usability. The main concern is nevertheless that even if the
users have the mobile application on their smartphones, it is not always the case that they use it, so
probably this two predictors are not enough to explain the use of mobile application, and it would
be reasonable to add other variables into the model in the future researches.
Anyway, even when R-squared is low, low P values still indicate a real relationship between the
significant predictors and the response variable (Frost, 2014). We will analyze P-values later in this
chapter.
I.4.2. Size effect f²
In order to determine in the model the part of the observed variable we calculated size effect f²
(Table 72).

262
Table 72: Size effect f²
Variables f² Effect
Intention to use Price value 0,020 weak
Facilitating conditions 0,027 weak-
Trust 0,063 weak+
Usability 0,030 weak
Use Intention to use 0,153 moderate
Usability 0,044 weak
Trust Facilitating conditions 0,091 weak+
Loyalty Usability 0,563 high
Continued intention to use Loyalty 0,611 high
Source: SmartPLS reports
a) Size effect f² of intention to use.
All the variables have weak size effect according to Cohen (1988) on the latent variable
intention to use. The greatest size effect has trust (0,063), the weakest – price value (0.020).
Other variables obtained following results: facilitating conditions (0,027) has size effect
approximating the minimum of 0,02, indicating very weak effect; usability obtained the result
0,30 and showed also weak effect. Thus, we can conclude that the most important size effect on
the latent variable intention to use has trust.
The low size of the effect of the variables facilitating conditions, trust, price value and
usability on the variable intention to use can be interpreted by the context of mobile application
use: choice and booking of the restaurants with mobile application. We have chosen these
variables after the literature review, but the strength of relationships between them and
intention to use above some other variables which we did not include into the model was not
obvious. Anyway, we will analyze later the path significance, because low size effect does not
mean that relationships are not significant.
b) Size effect f² of use.
There are two variables explaining use: intention to use and mobile application usability. The
greatest size effect between them has intention to use =0,153, this effect is moderate (Cohen,
1988).
Mobile application usability has weak size effect (0,044). Explanatory power expressed in size
effect shows the low dependence of use on functionality of mobile application; probably it is
connected with standardization in the mobile applications’ development today: usability could

263
have noticeable effect by innovations in the product development, or negative effect by outdated
usability.
c) Size effect f² of trust.
Latent variable trust is measured only by one latent variable: facilitating conditions which has
weak+ size effect f² 0,091.
As mentioned above, technical side of mobile application expressed in facilitating conditions
does not predict trust, so the size of this relationship is low.
d) Size effect f² of mobile application loyalty.
Latent variable mobile application loyalty is measured only by one latent variable: mobile
application usability which has high size effect f² 0,563.
e) Size effect f² of continued intention to use.
Latent variable continued intention to use is measured only by one latent variable: mobile
application loyalty which has high size effect f² 0,611.
I.4.3. Model’s capability to predict (Q² and q²)
The measure of predictive relevance is the Stone-Geisser’s Q² (Geisser, 1974, Stone, 1974). This
indicator postulates that the model should be able to predict each endogenous construct’s indicators.
This procedure is only applied to endogenous latent constructs that have a reflective measurement
model specification as we have.
Q² should be higher than 0 and tend to 1, as we can see in the Table 73 the highest capability to
predict has ITU (intention to use) with the value of 0,269 and the weakest capability to predict has
trust with the value of 0,073. Loyalty (0,260) and CITU (0,225) showed stronger capability than
use (0,149). All latent variables have scored higher than 0 showing that they are capable to predict.
Table 73: Model’s capability to predict Q²
Q²
CITU 0,225
ITU 0,269
LOYALTY 0,260
TRUST 0,073
USE 0,149
Source: SmartPLS reports

264
I.4.4. Size effect of capability to predict q²
To determine in the model the part of the observed variable on the prediction of another variable
(Q²), the q² it is used. The procedure of the obtaining the values of size effect q² requires removing
the paths of the model one by one and evaluation the changes of the values during that process. In
our model we could not follow this procedure for all variables, because endogenous latent variables
mobile application loyalty and continued intention to use have only one path connected to the
model, the removing of that path destroys the model.
Table 74: size effect q²
Variables Q² q² Effect
Intention to use Q² included 0,269
Q² without PRICE 0.263 0.008 No effect
Q² without FC 0.269 0 No effect
Q² without
TRUST
0.237 0.04 weak
Q² without
USABILITY
0.257 0.01 weak -
Use Q² included 0,149
Q² without ITU 0.081 0.07 weak
Q² without
usability
0.149 0 No effect
trust Q² included 0,073 0 No effect
Q² without FC
Source: SmartPLS reports
a) Size effect q² of intention to use
Latent variables trust and mobile application usability have weak size effect q² on the capability to
predict of latent variable intention to use: 0,04 and 0,01 respectively. Latent variables price value
and facilitating conditions showed no size effect q².
b) Size effect q² of use
Latent variable intention to use has weak size effect q² (0,07) on the capability to predict of latent
variable intention to use. Latent variable mobile application usability showed no size effect q².
c) Size effect q² of trust
Latent variable facilitating conditions showed no size effect q² on the endogenous latent variable
trust.
Conclusion for capability to predict

265
The model’s capability to predict is low with greatest value of 0,269. But even if we can conclude
that scores above zero show that its explanatory variables provide predictive relevance, the size
effects of latent variables demonstrated very weak or no size effects.
Price value does not have predictive power for intention to use, so benefits of mobile application
use do not influence on the decision to use or not to use the mobile application. There is no effect of
the size of relationship between facilitating conditions and intention to use, so users do not use
more actively mobile application because they possess technical knowledge about it. Weak size
effect we can see in the relationship between trust and intention to use, so mobile application as the
source of information does not develop trust by the users to enforce their intention to use. Usability
in the relationship with intention to use has no effect, so well developed functionality of the mobile
application is not the primer condition for intention to use it.
Concerning the use, the size of the effect of the intention to use on the use is weak, so intention to
use does not have predictive power over the use: even if the users have mobile application they do
not use it. And with no effect of size in the relationship between usability and use we can see that
good functionality of the mobile application do not predict the use of it.
There is no effect size in the relationship between facilitating conditions and trust, so the
knowledge above the technical side of the mobile application does not predict that the trust towards
the mobile application will be developed.
We can conclude that our model is explanatory and not predictive, we can explain the use of mobile
application with help of chosen variables, but to predict the use we would need to change variables
in the model.
I.4.5. Evaluation of parameters (Path coefficients and T-value).
After we evaluated the model by the percentage of explained variance (R²), we must verify the
stability of the estimates using the calculation of the statistics T obtained by the resampling
procedure by bootstrapping (Hair et al, 2011). By estimation of parameters and significance t-value
should be higher than 1.96 with p<0.05. The graphical presentation of the inner model is to find in
the Annex 17 and results are summarized in the Table 75.
Table 75: Evaluation of parameters (Path coefficients and T-value)
Path coefficient T Statistics P Values
FC -> ITU 0,138 2,042 0,042
FC -> TRUST 0,289 5,504 0,000
ITU -> USE 0,387 6,359 0,000
LOYALTY -> CITU 0,616 14,496 0,000
PRICE -> ITU 0,131 1,925 0,055
TRUST -> ITU 0,296 4,004 0,000

266
USABILITY -> ITU 0,199 2,319 0,021
USABILITY ->
LOYALTY 0,600 14,606 0,000
USABILITY -> USE 0,207 2,663 0,008
Source: SmartPLS reports
Intention to use
Trust explains strongly the intention to use the mobile application (path coefficient=0,296, T-
value=4,004; p=0,000) while mobile application usability has less but still significant impact on
intention to use with path coefficient=0,199 approximating to recommended 0,2 (Chin, 1998), T-
value=2,319; p=0,021. Path coefficient of facilitating conditions is 0,138 lower than 0,2, but T-
value =2,042 and p=0,0042 are still higher than thresholds, so the impact is weak, but still
acceptable. On the other hand price value has not significant impact on intention to use the mobile
application of the users (path coefficient=0,131, T-value=1,925; p=0,055).
Trust
The single latent variable facilitating conditions explains well the trust (path coefficient=0,289, T-
value=5,504; p=0,000).
Use of mobile application
The impact of the intention to use on use of mobile application is very strong (path
coefficient=0,387, T-value=6,359; p=0,000) while mobile application usability explains this
variable less strong but still significant (path coefficient=0,207, T-value=2,663; p=0,008).
Mobile application loyalty
Mobile application usability is the single latent variable predicting the mobile application loyalty in
our research model and with path coefficient = 0,600, T-value = 14,606 and p=0,000 has greatest
impact on this variable.
Continued intention to use
In turn mobile application loyalty explains significantly strong the variable continued intention to
use(path coefficient=0,616, T-value=14,496; p=0,000).
I.4.6. Quality of the model - Goodness of fit
To ensure the quality of our research model we calculated index of quality “Goodness of fit”.
For calculation we used data of R² and AVE obtained in SmartPLS (Table 76):
Table 76: Calculation of Goodness of fit
R ² AVE
PRICE exogenous 0 0,669
FC exogenous 0 0,809
USABILITY exogenous 0 0,910
CITU endogenous 0,379 0,607

267
ITU endogenous 0,354 0,826
LOYALTY endogenous 0,360 0,734
TRUST endogenous 0,083 0,884
USE endogenous 0,274 0,665
Average
0.29
0.763
Source: SmartPLS reports
According to Latan and Ghozali (2012) GOF within SmartPLS with the weight of 0,10 means
reliable quality, 0,25 – moderate quality, and 0,36 – high quality. Thus, we can conclude that our
research model has high quality with the weight of GOD equal 0,470.
Average of R² Average of AVE Goodness of fit
0.29 0.763 0.470- high
I.4.7. Summary of results
The analysis of structural model provided us relevant results of indicators: percent of variance
explained, model’s capability to predict, evaluation of parameters and model quality. The graphical
view of the results is presented on the Figure 35:
Figure 35: Results of research model with SmartPLS
Out of the Figure 35 we can conclude about three different effects among latent variables. We also
showed the removed variable of indulgence, the effect of this variable we did not evaluated,
because its reliability and validity were too weak to effectuate the further evaluation process.

268
1) No effect
Price value has low effect and explains weakly the intention to use (path coefficient=0,131, T-
value=1,925, p=0,055). Initial meaning of price value construct is connected with the price of the
technology. Mobile applications we have chosen are free to download and price value consists of
the benefits the use can receive by using the mobile application. In both mobile applications the use
can collect points and exchange them for gifts or discounts. We can conclude that these benefits are
not of high value for the users, so this construct does not explain the intention to use of mobile
application.
2) Weak effects:
• Construct facilitating conditions impacts weak on intention to use the mobile
application (path coefficient =0,138, T-value = 2,042, p=0,042). Facilitating
conditions as construct has a meaning of possession of technical knowledge about
mobile application as technology. Most of the users answered that mobile
technology became a part of their everyday life. We do not have in the data variance
of the answers to see, whether the users with developed knowledge use easier or
more active, or that this knowledge makes them tend to use more often these
particular mobile application. We can only conclude that facilitating conditions in
our case has weak impact on the intention to use mobile application.
• Mobile application usability explains weakly intention to use the mobile application
(path coefficient =0,199, T-value=2,319, p=0,021). Mobile application usability is
connected with functionally, design and structure of mobile application. There are
some standards in these components in all similar mobile applications, so probably
users do not pay attention on it if the mobile application fits typical functionally
design and structure. The impact could be seen in the innovative usability, or
negative effect could be seen in outdated usability.
3) Moderate and high effects:
• Facilitating conditions has upper moderate impact on trust (path coefficient = 0,298,
T-value=5,504, p=0,000). In previous section we obtained weak results for the
facilitating conditions’ capability to explain and predict trust. But the results in path-
coefficient and T-value show the stability of this relationship. Even if the facilitating
conditions as predictor is not relevant the developed knowledge about technology of
mobile application positively affect on the trust. In other case the lack of this
knowledge could lead to lack of trust in the mobile application.

269
• Trust has as well upper moderate impact on intention to use (path coefficient=0,296,
T-value=4,004, p=0,000). The relationship is stable; users with developed trust
towards the mobile application tend to use it.
• Intention to use explains strong the use of mobile application its impact is high (path
coefficient = 0,387, T-value = 6,359, p= 0,000). In previous section we noticed the
moderate explanatory and weak predictive effects of intention to use on the use of
mobile application. Path analysis showed the stability of this relationship. As
stronger is the intention to use the mobile application as more possible it will lead to
actual use of it.
• Mobile application usability has moderate impact on the use of mobile application
(path coefficient= 0,207, T-value =2,663, p=0,008). Explanatory and predictive
power in this relationship was also estimated as weak, but with path analysis this
relationship can be interpret as stable. That means: even if the users do not pay
attention on the usability as such, still outdated or in opposite very innovative
functionally of the mobile application can change their attitude towards the mobile
application.
• Mobile application usability has significantly strong effect on the mobile application
loyalty (path coefficient = 0,600, T-value = 14,606, p= 0,000). This relationship has
moderate explanatory and predictive effect, and very high stability. Even if the
mobile application usability is not relevant on the stage of decision about its use, it is
important for developing loyalty towards it. Poor usability can discourage the user
and he/she can easily change it for another one. Probably the high competing
conditions (mobile applications compete with each others, with phone, websites etc)
makes the mobile application usability important for being loyal.
• Mobile application loyalty impacts in the strongly significant way on the continued
intention to use (path coefficient = 0,616, T-value = 14,496, p = 0,000). Loyalty
leads to reuse of mobile application, in other words in continued intention to use.
In the next paragraph we will see the effect of moderation on the research model and evaluate
whether the moderator duration of use, frequency of visits and place of use effect the presented
relationships in the positive way or not.

270
I.5. Moderation effects
Our model has three moderator and four moderation relationships. In order to confirm the direction
of the moderating effect our sample was divided into three subsamples representing respondents
with high frequency of visits, long duration of use and significant place of use. These three
subsamples were analyzed independently and the results compared with initial data. While we put
forward the particular hypotheses concerning the moderating effect, we accepted also the
moderating effects on other weak relationships to see if the results can be improved, particularly on
the relationship between price value and intention to use.
We include two moderators adapted by RFM (Recency Frequency Monetary) segmentation
(Wansbeek, 1995, Blattberg et al., 2008, Birant, 2011): frequency as a number of visits in
restaurants and duration of use as component of recency. As evaluation we decided to use high
results: more often the users go out more significant should be effect on the model; as longer the
users use the mobile application as greater should be effect on the model.
Moderation effects of the duration of use
We assumed that duration of use should have positive impact on the relationships between trust and
intention to use, intention to use and use of mobile application (Table 77).
Trust -> intention to use
T-value and path coefficient increased a little bit under the moderation effect of duration of use (T-
value: before 4,004, after 4,015; path coefficient: before 0,296 after 0,326), but still this relationship
we can describe as upper moderate, not high. Thus, we conclude that the moderating effect of
duration of use on the relationship between trust and intention to use is positive, but not significant.
Table 77: Duration of use
Without duration of use With duration of use
Path
coefficient T Statistics Path coefficient T Statistics p-value
FC -> ITU 0,138 2,042 0,088 1,212 0,226
FC -> TRUST 0,289 5,504 0,280 4,460 0,000
ITU -> USE 0,387 6,359 0,403 6,446 0,000
LOYALTY -> CITU 0,616 14,496 0,606 13,785 0,000
PRICE -> ITU 0,131 1,925 0,139 1,843 0,066
TRUST -> ITU 0,296 4,004 0,326 4,015 0,000
USABILITY -> ITU 0,199 2,319 0,165 1,794 0,073
USABILITY ->
LOYALTY 0,600 14,606
0,585 11,986 0,000
USABILITY -> USE 0,207 2,663 0,203 2,643 0,008
Source: SmartPLS reports

271
Intention to use -> use of the mobile application
The moderation of the duration of use impacts positively but not strong the relationship between
intention to use and use of mobile application. T-value increased from 6,359 to 6,446, path
coefficient increased from 0,387 to 0,403. Thus, the relationship between intention to use and use of
mobile application are positively influenced by duration of use.
Other effects
There are not other positive effects of duration of use on the research model.
Moderation effects of the frequency of visits
We assumed that frequency of visits should have positive impact on the relationships between
mobile application loyalty and continued intention to use (Table 78).
Table 78: Frequency of visits
without frequency of visits With frequency of visits
Path
coefficient T Statistics Path coefficient T Statistics p-value
FC -> ITU 0,138 2,042 0,287 2,935 0,003
FC -> TRUST 0,289 5,504 0,276 2,815 0,005
ITU -> USE 0,387 6,359 0,551 6,856 0,000
LOYALTY -> CITU 0,616 14,496 0,799 26,412 0,000
PRICE -> ITU 0,131 1,925 0,080 0,777 0,438
TRUST -> ITU 0,296 4,004 0,275 2,385 0,017
USABILITY -> ITU 0,199 2,319 0,187 1,291 0,197
USABILITY ->
LOYALTY 0,600 14,606
0,608 8,794 0,000
USABILITY -> USE 0,207 2,663 0,115 1,064 0,288
Source: SmartPLS reports
Mobile application loyalty -> continued intention to use
Moderation effect of frequency of visits has great impact on the relationship between mobile
application loyalty and continued intention to use. T-value increased significantly from 14,496 to
26,412, path coefficient increased from 0,616 to 0,799. Thus, frequency of visits moderates the
relationship between mobile application loyalty and continued intention to use in the relevant way
and improves their correlation.
Other effects
Other significant moderation of frequency of visits we can notice in the impact on the relationship
between intention to use and use (T-value: before 6,359, after 6,856; path coefficient: before 0,387

272
after 0,551). This relationship was already described as strong, but moderation effect also improved
it.
Much relevant is the moderation effect of frequency of visits on the relationship between facilitating
conditions and intention to use, before we presented this relationship as weak with T-value 2,042
and path coefficient less than threshold 0,138. As moderator frequency of visits improved the
relationship: T-value 2,935 and path coefficient 0,283. So this relationship we can describe as
moderate.
Gis-technology
Geolocation function is a part of functionality in other word mobile application usability. Today it
is necessary function of any application which is providing the information of geographical location
in our case of restaurant establishments. The mobile application uses a geographic search to
perform complex geographic queries in geographic context (Lin, Kao, Lam, Tsai, 2014).
We included the moderator place of use to see how this function and geographical location are
important to the users. We estimate moderation effect of its significance: as higher are obtained
results as more relevant is the effect on the model.
Moderation effects of place of use
We assumed that place of use should have positive impact on the relationships between intention to
use and use of mobile application (Table 79).
Intention to use -> use of the mobile application
Place of use has small negative effect on the relationship between intention to use and use of mobile
application. T-value decreased from 6,359 to 6,317 and path coefficient decreased from 0,387 to
0,386. The moderation of place of use is not significant.
Table 79: Place of use
without place of use With place of use
Path
coefficient T Statistics Path coefficient T Statistics p-value
FC -> ITU 0,138 2,042 0,153 1,923 0,055
FC -> TRUST 0,289 5,504 0,309 5,164 0,000
ITU -> USE 0,387 6,359 0,386 6,317 0,000
LOYALTY -> CITU 0,616 14,496 0,602 13,748 0,000
PRICE -> ITU 0,131 1,925 0,152 2,097 0,037
TRUST -> ITU 0,296 4,004 0,267 3,179 0,002
USABILITY -> ITU 0,199 2,319 0,162 1,933 0,054
USABILITY ->
LOYALTY 0,600 14,606
0,574 11,969 0,000
USABILITY -> USE 0,207 2,663 0,186 2,328 0,020
Source: SmartPLS reports
Other effects

273
Significant effect appeared in the relationship between price value and intention to use by
moderation of place of use. T-value increased from 1,925, what is below the threshold of 1,96, to
2,097 what is acceptable(p=0,037). On the other hand path coefficient (0,152) is still less than
required minimum of 0,2. Thus, place of use impacts positively but not strong enough on the
relationship between price value and intention to use, this relationship are still not significant and
weak.
I.6. Validation of hypotheses
The research model was evaluated. In the first instance we studied the percentage of variance
explained (R²) and size effect (f²) of each endogenous latent variable as well as we analyzed
model’s capability to predict (Q²) and size effect (q²). In the second turn we made the evaluation of
parameters (path coefficient) and T-value as well as their significance to determinate the
relationships among latent variables. Finally, we calculated the index of model’s quality (Goodness
of fit). Then we verified the moderation effects of three moderating variables: duration of use,
frequency of visits and place of use.
We intent to confirm or to reject the hypotheses based on the obtained analysis results of our
structural model (Table 80):
Table 80: Summary of the analysis results of the structural model
Construct Predictive
construct
R² f² Path
coef
T
value
P
value
Q² q² H
Intention to
use
Indulgence Removed construct R
Intention to
use
0,379 0,269
Price value 0,020 0,131 1,925 0,055 0,008 O
Facilitating
conditions
0,027
0,138 2,042 0,042
0 V
Trust 0,063 0,296 4,004 0,000 0,04 V
Usability 0,030 0,199 2,319 0,021 0,01 V
Use 0,274 0,149
Intention to use 0,153 0,387 6,359 0,000 0,07 V
Usability 0,044 0,207 2,663 0,008 0 V
Trust Facilitating
conditions
0,083 0,091
0,289 5,504 0,000
0,073 0 V
Loyalty Usability 0,360 0,563 0,600 14,606 0,000 0,260 - V
Continued
intention to
use
Loyalty 0,379 0,611
0,616 14,496 0,000
0,225 - V
V-validated, R-rejected, O - not significant effect. Source: SmartPLS reports

274
I.6.1 Factors influencing intention to use
The impact on the intention to use mobile application is estimated according to following
hypotheses:
Factors influencing intention to use
H1 Price value increases intention to use the mobile application. Users who believe to receive financial
or other profit using the mobile application will intent to use this mobile application.
H2 Facilitating conditions impact positively trust. The mobile application users who believe that
supporting organization stays behind the mobile application develop trust quicker then who don’t.
H3 Facilitating conditions impact positively the intention to use the mobile application. The mobile
application users who believe that supporting organization stays behind the mobile application will
rather to use it than not.
H4 Trust impacts positively the behavioral intention to use the mobile application. The mobile
application users, who have developed trust to mobile application’s provider, or technology, intent to
use mobile application more likely, than who have not.
H5 Indulgence as cultural factor impacts positively the intention to use of the mobile application. The
users from the cultures with the high score in indulgence tend to use more often the mobile
application to book a table in the restaurant.
H6 Mobile application usability increases the behavioral intention to use the mobile application. Users,
who are satisfied with design and information’s structure of the mobile application, intent to use it.
Out of 6 hypotheses concerning the impact on the intention to use mobile application, four are
validated, one is rejected and one is to discuss.
• Facilitating conditions has upper moderate effect on the trust. Hypothesis H2 is validated.
• Facilitating conditions has weak impact on the intention to use which can be positively
moderated by the place of use and improve its significance. Thus, hypothesis H3 is
validated.
• Trust impacts very positively on the intention to use mobile application and increases its
effect with moderation of duration of use. Hypothesis H4 is validated.
• Mobile application usability has weak impact on the intention to use, but still this effect is
acceptable. Hypothesis H6 is validated.
• Price value showed not significant impact on the intention to use, but its significance
increased with the moderation by place of use. Still the obtained results are not high enough
to confirm the hypothesis, but it can be discussed. Hypothesis H1 is not validated but can be
discussed.
• We removed the construct indulgence out of our research model, because its measurement
constructs cannot measure it in the correct way. So, we did not evaluate the impact of
indulgence on the intention to use. Thus, hypothesis H5 is rejected.
I.6.2. Factors influencing mobile application use
The impact on the use of mobile application is estimated with following hypothesis:

275
Factors influencing the mobile application use
H7 Strong behavioral intention leads to the use of the mobile application.
H8 Mobile application usability leads to the use of the mobile application.
Both hypotheses H7 and H8 are validated.
• Intention to use has high impact on the use of mobile application and is increasing strongly
with moderating of the duration of use; on the other hand the moderating effect of pace of
use is negative: intention to use looses the significance for use of mobile application.
• Mobile application usability has moderate effect on use of mobile application which is also
negatively influenced by moderating of place of use.
I.6.3. Outcome factors
We have two outcomes in our research model: mobile application loyalty and continued intention to
use, which are evaluated by following hypotheses:
Outcomes factors
H9 Mobile application usability increases the mobile application loyalty. User, who is
satisfied with design and information’s structure of the mobile application, has a
deep commitment to repatronize a mobile application.
H10 Mobile application loyalty moderated by frequency of visits leads to continued
intention to use the mobile application.
Both hypotheses H9 and H10 are validated.
• The impact of mobile application usability on mobile application loyalty is highly
significant. The relationship is a little bit negative impacted by moderation of place of use
and duration of use.
• Mobile application loyalty has strong impact on continued intention to use, which increases
significantly by moderation of frequency of visits. Place of use and duration of use moderate
this relationship negatively, but not significant.
I.6.4. Moderation effects
We tested the moderation effects of duration of use, place of use and frequency of visits on the
particular relationships, but also we estimated their impacts on other relationships in the model with
intention to regard positive effects on the not significant or weak relationships. The moderating
effects are expressed in following hypotheses:

276
Moderation effects
Hm1 Duration of the use moderates the relation between trust and intention of use
Hm2 Duration of the use moderates the relation between intention of use and use of the
mobile application.
Hm3 Place of use moderates the relation between intention of use and use of the mobile
application.
Hm4 Frequency of visits moderates relation between mobile application loyalty and
continued intention to use
• Duration of use has small positive impacts on the relationship between trust and intention to
use and on the relationship between intention to use and mobile application use. These
effects are not strong enough to confirm the hypotheses Hm1 and Hm2, but it can be
discussed.
• Place of use has small negative effect on the relationship between intention to use and use of
mobile application, but this effect is too weak to confirm the hypothesis Hm3, so we
rejected it. On the other hand, positive effect appeared in the relationship between price
value and intention to use by moderation of place of use.
• Frequency of visits has very strong positive effect on the relationship between mobile
application loyalty and continued intention to use. We validate the hypothesis Hm4.
Significant negative effect had this moderator on the relationship between mobile
application usability and use of mobile application, decreasing this relationship till the
unacceptable threshold.
I.6.5. Conclusion about validation of the hypotheses.
The test of hypotheses of our research is effectuated with help of SmartPLS 3 application and SEM-
PLS approach. We succeed in evaluation, validation and acceptance of the structural model and
validated the hypotheses of the research. Out of fourteen hypotheses, nine are validated, three are
under the discussion and two are rejected. In the Table 81 the summary of the validation of
hypotheses of our research is presented. In the next section we will compare the results of general
model with models of France and Russia.

277
Table 81: Summary of the hypotheses validation
Hypotheses
Factors influencing intention to use
H1 Price value increases intention to use the mobile application. Users who believe to
receive financial or other profit using the mobile application will intent to use this
mobile application.
O
H2 Facilitating conditions impact positively trust. The mobile application users who
believe that supporting organization stays behind the mobile application develop
trust quicker then who don’t.
V
H3 Facilitating conditions impact positively the intention to use the mobile application.
The mobile application users who believe that supporting organization stays behind
the mobile application will rather to use it than not.
V
H4 Trust impacts positively the behavioral intention to use the mobile application. The
mobile application users, who have developed trust to mobile application’s provider,
or technology, intent to use mobile application more likely, than who have not.
V
H5 Indulgence as cultural factor impacts positively the intention to use of the mobile
application. The users from the cultures with the high score in indulgence tend to
use more often the mobile application to book a table in the restaurant.
R
H6 Mobile application usability increases the behavioral intention to use the mobile
application. Users, who are satisfied with design and information’s structure of the
mobile application, intent to use it.
V
Factors influencing the mobile application use
H7 Strong behavioral intention leads to the use of the mobile application. V
H8 Mobile application usability leads to the use of the mobile application. V
Outcomes factors
H9 Mobile application usability increases the mobile application loyalty. User, who is
satisfied with design and information’s structure of the mobile application, has a
deep commitment to repatronize a mobile application.
V
H10 Mobile application loyalty moderated by frequency of visits leads to continued
intention to use the mobile application.
V
Moderation effects
Hm1 Duration of the use moderates the relation between trust and intention of use To discuss
Hm2 Duration of the use moderates the relation between intention of use and use of the
mobile application.
To discuss
Hm3 Place of use moderates the relation between intention of use and use of the mobile
application.
R
Hm4 Frequency of visits moderates relation between mobile application loyalty and
continued intention to use
V
V-validated, R-rejected, O - not significant effect. Source: author of the thesis
II. Comparative study between France and Russia
We effectuated the analysis o the research model according two national sub groups: France and
Russia, with the purpose to compare the mobile application use in restaurant context. We had 123
responders in France and 121 in Russia, we realized our survey only in the capitals: in Paris and in
Moscow. This section presents the results.
II.1. Sub group France
To accomplish the comparison we calculated with SmrtPLS the weights of path coefficient, T-
Value and p. In the Table 82 we can see the results in comparison with general model:

278
Table 82: Results of sub group France compared with general model
General model French Model
Path
coefficient T Statistics Path coefficient T Statistics p-value
FC -> ITU 0,138 2,042 0,240 2,835 0,005
FC -> TRUST 0,289 5,504 0,229 3,392 0,001
ITU -> USE 0,387 6,359 0,541 8,138 0,000
LOYALTY -> CITU 0,616 14,496 0,817 30,380 0,000
PRICE -> ITU 0,131 1,925 0,216 2,434 0,015
TRUST -> ITU 0,296 4,004 0,137 1,501 0,134
USABILITY -> ITU 0,199 2,319 0,275 2,767 0,006
USABILITY ->
LOYALTY 0,600 14,606
0,544 7,492 0,000
USABILITY -> USE 0,207 2,663 -0,049 0,453 0,651
Source: SmartPLS reports
There are positive and negative significant effects in French model compared to general model:
Positive effects:
1) Price value has not significant impact on intention to use in general model, but the results of
French model are moderate (path coefficient=0,216, T-value=2,343, p=0,015).
2) Impact of facilitating conditions on intention to use has stronger effect in French model
(path coefficient=0,240, T-value=2,835, p=0,005)
3) The mobile application loyalty impacts the continued intention to use also much stronger in
French model than in general model (path coefficient=0,817, T-value=30,380, p=0,000).
Negative effects:
1) Trust lost its significant for intention to use completely in French model (path
coefficient=0,137, T-value=1,501, p=0,134).
2) Mobile application usability has no impact on the use of mobile application (path
coefficient=-0,049, T-value=0,453, p=0,651)
Thus, compared to general model the price value significance can allow us to confirm hypothesis of
its impact on the intention to use for French model, on the other hand we need to reject the
hypothesis of impact of mobile application usability on use of mobile application and impact of
trust on intention to use. Other effects are interesting but they do not validate or reject the
hypotheses differently that in general model.
II.2. Sub group Russia
There are positive and negative significant effects in Russian model compared to general model
(Table 83):

279
Table 83: Results of sub group Russia compared with general model
General model Russian Model
Path
coefficient T Statistics Path coefficient T Statistics p-value
FC -> ITU 0,138 2,042 -0,001 0,010 0,992
FC -> TRUST 0,289 5,504 0,675 9,857 0,000
ITU -> USE 0,387 6,359 0,192 2,045 0,041
LOYALTY -> CITU 0,616 14,496 0,514 7,796 0,000
PRICE -> ITU 0,131 1,925 0,033 0,329 0,743
TRUST -> ITU 0,296 4,004 0,630 5,558 0,000
USABILITY -> ITU 0,199 2,319 0,036 0,276 0,782
USABILITY ->
LOYALTY 0,600 14,606
0,642 10,497 0,000
USABILITY -> USE 0,207 2,663 0,461 5,728 0,000
Source: SmartPLS reports
Positive effects:
1) Facilitating conditions has strong impact on trust in Russian model (path coefficient=0,675,
T-value=9,857, p=0,000).
2) Mobile application usability has greater effect on use of mobile application (path
coefficient=0,461, T-value=5,728, p=0,000)
Negative effects:
1) Facilitating conditions lost their impact on intention to use in Russian model (path
coefficient=-0,001, T-value=0,010, p=0,992).
2) Intention to use impacts weakly the use of mobile application (path coefficient=0,192, T-
value=2,045, p=0,041).
3) Price value has no impact on intention to use (path coefficient=0,033, T-value=0,329,
p=0,743).
4) Mobile application usability has no effect on intention to use (path coefficient=0,036, T-
value=0,276, p=0,782).
In general, negative effects are strong in Russian model; according to the obtained results we can
reject three hypotheses for Russian model, which are valid for general and French models. Before
we discussed the hypotheses, we compared the results of three models (Table 84):

280
Table 84: Comparison of the results for general, French and Russian models.
General model Russian Model French Model
Path
coefficient T Statistics
Path
coefficient
T
Statistics
p-
value
Path
coefficient
T
Statistics p-value
FC -> ITU 0,138 2,042 -0,001 0,010 0,992 0,240 2,835 0,005
FC -> TRUST 0,289 5,504 0,675 9,857 0,000 0,229 3,392 0,001
ITU -> USE 0,387 6,359 0,192 2,045 0,041 0,541 8,138 0,000
LOYALTY ->
CITU 0,616 14,496
0,514 7,796 0,000
0,817 30,380 0,000
PRICE -> ITU 0,131 1,925 0,033 0,329 0,743 0,216 2,434 0,015
TRUST -> ITU 0,296 4,004 0,630 5,558 0,000 0,137 1,501 0,134
USABILITY ->
ITU 0,199 2,319 0,036 0,276 0,782 0,275 2,767 0,006
USABILITY ->
LOYALTY 0,600 14,606
0,642 10,497 0,000
0,544 7,492 0,000
USABILITY ->
USE 0,207 2,663
0,461 5,728 0,000
-0,049 0,453 0,651
There are only three hypotheses validated in all three models according to data in Table 85:
1) Facilitating conditions impact positively the trust; even if the weights are significantly
different in Russian and French models in both cases the obtained results are strong enough
to validate the hypothesis H2.
2) Mobile application loyalty impacts positively on continued intention to use the mobile
application. The difference in weights is almost twice higher in France than in Russia, but
still all values are correct to validate the hypothesis H10 in all models.
3) Mobile application usability impacts great the mobile application loyalty in both models. In
both models the effect is strong. Hypothesis H9 is validated in all models.
4) Intention to use has greater impact on use of mobile application in French model than in
Russian one, and even if the relationships are weak in Russian model, we can validate this
hypothesis H7 for both models.
Hypotheses validated in France and rejected in Russia:
1) Price value has strong impact on intention to use the mobile in French model and absolutely
no effect in Russian one. The hypothesis H1 is validated in France and rejected in Russia.
2) Facilitating conditions has moderate impact on intention to use the mobile application in
French model and no impact in Russian model. The hypothesis H3 is validated in France
and rejected in Russia.
3) Mobile application usability has moderate impact on intention to use the mobile application
in French model and no impact in Russian model. The hypothesis H6 is validated in France
and rejected in Russia.
Hypotheses validated in Russia and rejected in France:

281
1) Trust impacts very strong intention to use the mobile application in Russian model, but has
no effect in French model. The hypothesis H4 is validated in Russia and rejected in France.
2) Mobile application usability has great impact on the use of the mobile application in Russian
model and no effect in French model. The hypothesis H8 is validated in Russia and rejected
in France.
Thus, we can conclude that seven hypotheses are validated in French model and five are validated
in Russian model, the hypothesis H7 is under discussion in Russian model (Table 85).
Table 85: Comparison of hypotheses validation
Hypotheses
Factors influencing intention to use general fr ru
H1 Price value increases intention to use the mobile application.
Users who believe to receive financial or other profit using the
mobile application will intent to use this mobile application.
O V R
H2 Facilitating conditions impact positively trust. The mobile
application users who believe that supporting organization stays
behind the mobile application develop trust quicker then who
don’t.
V V V
H3 Facilitating conditions impact positively the intention to use the
mobile application. The mobile application users who believe
that supporting organization stays behind the mobile application
will rather to use it than not.
V V R
H4 Trust impacts positively the behavioral intention to use the
mobile application. The mobile application users, who have
developed trust to mobile application’s provider, or technology,
intent to use mobile application more likely, than who have not.
V R V
H5 Indulgence as cultural factor impacts positively the intention to
use of the mobile application. The users from the cultures with
the high score in indulgence tend to use more often the mobile
application to book a table in the restaurant.
R R R
H6 Mobile application usability increases the behavioral intention to
use the mobile application. Users, who are satisfied with design
and information’s structure of the mobile application, intent to
use it.
V V R
Factors influencing the mobile application use
H7 Strong behavioral intention leads to the use of the mobile
application.
V V O
H8 Mobile application usability leads to the use of the mobile
application.
V R V
Outcomes factors
H9 Mobile application usability increases the mobile application
loyalty. User, who is satisfied with design and information’s
structure of the mobile application, has a deep commitment to
repatronize a mobile application.
V V V
H10 Mobile application loyalty moderated by frequency of visits
leads to continued intention to use the mobile application.
V V V
V-validated, R-rejected, O - not significant effect. Source: author of the thesis

282
III. Discussion of the results
The purpose of the research is to study the mobile application use in the restaurant industry and
compare this use in two countries France and Russia regarding the research problem: Does the
mobile application as technology impact on the development of the restaurant industry?
We analyzed the mobile application use from three theoretical points of view: theories of
technology’s use, relationship marketing and cultural dimensions. Accordingly, we selected
indulgence, price value, facilitating conditions, mobile application usability and trust as factors
influencing the intention to use the mobile applications; intention to use and mobile application
usability as factors influencing the use of mobile applications and mobile application loyalty and
continued intention to use as outcomes.
We evaluated the general model with collected data in France and in Russia, then we estimated
French model and Russian model separately and after that we compared the results.
III.1. General model
III.1.1. Factors influencing the intention to use the mobile application
Intention to use precedes the actual use of mobile application. Many factors can influence the user
before he/she starts to use the mobile application. We have chosen factors from three parts of
reviewed theories: technology’s factors (UTAUT2, Venkatesh et al., 2012, Mobile application
usability, Venkatesh and Hoehle, 2015); relationship marketing’s factors (the Commitment-Trust
theory, Morgan and Hunt, 1994), and cultural factors (cultural dimension, Hofstede, Minkov, 2010).
Technology’s factors
In the initial model of UTAUT2 there are seven constructs which predict the intention to use:
performance expectancy, effort expectancy, social influence, facilitating conditions, hedonic
motivation, price value and habit (Venkatesh et al., 2012). Performance expectancy and effort
expectancy are related to professional use of technology only, therefore we excluded them out of
our analysis; social influence refers to the public use of technology (for example, users can be
influenced by their social groups in the choice of their smartphones, but much less influenced by the
choice of mobile applications they download, if this applications are for private use only, like
researched applications); hedonic motivation is limited, because of specific purpose to use the
mobile application (normally design could add pleasure into the use, and this aspect is expressed in
the construct of usability); habit is expressed in the construct of facilitating conditions, so is also
excluded out of the model. Finally, we decided to test two of the constructs for the use of mobile
application in the restaurant context: facilitating conditions and price value.

283
The researched mobile applications play the mediating role between final clients and restaurant
establishments, therefore the facilitating conditions is significant, so we put forward the hypothesis,
that belief in support and developed knowledge about the technology can enforce the intention of
users to use the mobile application.
Both mobile applications are free for downloading, we defined price value as possible benefits
suggested by the mobile applications. Thus, we assumed that belief of users in possible profit from
use of mobile application will enforce the intention to use the mobile application.
Our results showed that facilitating conditions has weak effect on the intention to use mobile
application, but it is increasing with moderation of frequency of visits. More often the users visit the
restaurants more often they use the mobile application as stronger they develop the knowledge
about the mobile application and its provider and the belief in the mobile application provider’s
capability to support them.
Price value has no significant impact on the intention to use the mobile application. This
relationship is increasing a little bit by moderation of place of use. Users are not sensitive to
promotions and bonuses during the choice of the restaurant, but they can check the propositions
before they enter the selected restaurant.
We added the mobile application usability as factor, which can impact on the intention to use the
mobile application. We assumed that users develop stronger intention to use the mobile application
if they are satisfied with its usability. Our results showed that actually mobile application usability
affects weak on the users’ intention to use the mobile application. The effect is weak but acceptable.
The mobile applications today have standardized choice of functions and design, on the stage of
decision about the use of one mobile application above another usability could have relevance in
two cases: first, if the mobile application had innovative functionality, users would pay attention on
it; and secondly, in opposite, if the mobile application had outdated usability not corresponding the
goal of the use, the users would reject it on the stage of the decision making.
The relationship between usability and intention to use mobile application deteriorates by the
moderation of frequency of visits. Users with high frequency of visits can be already familiar with
the application and do not pay attention on its usability.
Relationship marketing’s factors
The use of mobile application in the restaurant context replaces the traditional relationship between
restaurant establishment and client. So, the restaurant management can use the mobile application
as a marketing tool and develop new relationships as well as reinforce relationship with the loyal
clients. From that point of view two of constructs of RM create the basement for the successful
relationship – trust and commitment (Morgan and Hunt, 1994, Palmatier, 2008). Commitment
plays more significant role in the professional relationship, so our context commimant would be

284
important in the relationship between restaurant management and the mobile application’s
management, and less or not important for the users of the mobile application, so we decided to
choose trust as relationship marketing construct.
Trust expresses confidence in the relationship between partners, their reliability and integrity
(Morgan and Hunt, 1994, Gummesson, 2011, Vivek, Beatty, Morgan, 2012). In researched context
there are three objects towards which the user can develop trust: towards the mobile application as
technology, towards the mobile application’s provider as company and towards the restaurant
establishments listed in the mobile application. We tested the trust towards the mobile application
as technology and accordingly towards the provider; which provides that application. We assumed
that trust impacts on the intention to use the mobile application. After the test we verified this
hypothesis. If the user developed trust in technology and in the provider of this technology, he/she
intents to use it. Duration of use did not enforce that relationship as strong as we expected.
Additionally we connected facilitating conditions and trust, assumed that belief in the supporting
organization (provider of the mobile application) impacts positively on trust. Our results
demonstrated upper moderate effect of facilitating conditions on trust. Thus, knowledge about the
technology and belief in the supporting organization contribute to trust.
Cultural factors
Indulgence.
We assumed that indulgence impacts the intention to use the mobile application. French and
Russian users supposed to have different attitude towards the going out for dinner/lunch and in this
way their intention to use can be impacted by this cultural dimension.
On the stage of measurement model analysis the measurement items had low scores in reliability
and validity, so according to the recommendations of the authors (Chin, 1999, Chin, Peterson,
Brown, 2008, Hair et all, 2012) we had to delete this construct and not to take it into account. To
understand the situation we did calculations of the construct according to The Values Survey
Module manual (Hofstede, 2013). Obtained results demonstrated us extremely high scores
compared to national scores provided by Hofstede’s countries comparison tool (France – 94
compared to 48, Russia –84 compared to 20). In general in the dimension of indulgence both
samplings showed resemblance what we did not expected. One of the reasons might be in the
sampling characteristics, like income and social status expressed in professional occupations of the
responders. For comparative study the equivalence of the sampling is important (McDonald, 2000).
Initial condition for us was that all responders should be actual users of the researched mobile
applications. On the level of professional occupation Russian responders belong to upper-middle
class, what is according to income more a less could correspond to the French middle class

285
(depending on the branches), but the social status would be different. That erased the cultural
difference which was expressed in indulgence construct. Another reason can be in the measurement
items’ error (so the questions did not express fully the meaning of this construct in the restaurant
context).
As said before we did not find in the literature connection of indulgence and technology use, so we
adapted measurement items (questions) for our research, but our results showed that these items
cannot measure the indulgence in the correct way. Thus, we deleted the construct out of the model
on the phase of the evaluation of measurement model. The hypothesis was rejected.
III.1.2. Factors influencing the use of mobile application
We defined use behavior of UTAUT2 as use of mobile application. We described use of mobile
application with technology’s adoption and technology’s penetration. So the adoption characterizes
the use from the point of view of downloading of application, while penetration characterizes the
actual use. In other words the user can have on his/her smartphone the mobile application, but does
not use it because of any reason.
There are only two factors which we assumed to have an impact on the use of mobile application:
intention to use and mobile application usability.
The impact of intention to use on the use is confirmed by many researchers (Fishbein, Ajzen, 1975,
1980, Davis, 1986, Venkatesh, Davis, 2000, Venkatesh et al., 2003, 2012). However, we decided to
test it in the context of use of mobile application for particular purpose – searching for and booking
of the restaurants.
We assumed that intention to use will lead in the actual use of mobile application. Our results
validated completely the hypothesis, showing strong effect of intention to use on use of mobile
application. In addition, duration of use increased the relationship between intention to use and use.
Users who use long time the mobile application decide quicker to use it, so the transition between
intention to use and use is shorter. On the other hand, place of use had no effect on impact of
intention to use on actual use. The absence of the effects of place of use is to explain by the
questions, we included in the survey. We wanted to test, how the mobile application can motivate
the users to change their location. As we can conclude this impact is not confirmed. But still
according to our survey 46,3% of responders are using geolocation function of the mobile
application (see sampling characteristics section of this chapter).
Because we do research of mobile application use of two different mobile applications, we decided
to add mobile application usability as a factor influencing on the use of mobile application. Under
the mobile application usability we understand the extent to which a mobile application can be used

286
by specified (Russian and French) users to achieve specified goals (searching for restaurants and
booking tables) with effectiveness, efficiency, and satisfaction in a specified context of use
(restaurant context) (Venkatesh and Ramesh, 2006).
We assumed that mobile application usability impacts positively on the use of mobile application.
Our results confirmed that impact between them is moderate. However, frequency of visits
moderates this impact negatively. We can conclude that users who use mobile application often and
go out often do not pay attention on the mobile application usability.
III.1.3. Factors influencing outcomes
According to Venkatesh and Hohle (2015) mobile application usability can have direct effect on
mobile application loyalty and mobile application loyalty in its turn has impact on continued
intention to use. We added two question of relationship marketing (Sirdeshmukh, Singh and Sabol,
2002) to expand the construct of loyalty.
We assumed that satisfaction in mobile application usability increases mobile application loyalty.
Our results confirmed this hypothesis. The effect of usability on loyalty is very strong and
significant. Weak and moderate effects of mobile application usability on intention to use and use
are connected with expected usability, as we mentioned before, mobile applications are developed
by standards accepted for the type of the mobile application. But the strong impact of mobile
application usability on the mobile application loyalty shows the satisfaction of the users with the
mobile application. In other words, the users did not find “bugs” or mistakes in the usage, as well as
they did find all expected functions (like maps, pictures, online booking etc.), so they will prefer
this mobile application above another and develop loyalty.
As an outcome of mobile application loyalty the continued intention to use is developed when the
users have strong loyalty toward the mobile application and reuse it frequently. We assumed that
mobile application loyalty positively impacts on the continued intention to use.
The obtained results confirmed that hypothesis and showed significantly strong effect. Moreover
frequency of visits increased impact of loyalty on continued intention to use strongly. Users, who
often go out, reuse the mobile application also more often.
III.2. Comparison of French and Russian Models
Even if we deleted the cultural dimension out of our model we still can see cultural impact on the
mobile application use by the comparison of the research models in sub groups with SmartPLS
application.

287
III.2.1. Factors influencing the intention to use the mobile application
Technology’s factors
We have four hypotheses to evaluate technology’s factors influencing intention to use mobile
application: one of them is validated in both models, and three rejected in Russia and validated in
France. We would like to start with hypothesis valid in both models.
Even if we included the hypothesis of impact of facilitating conditions on trust in technology’s
factors, it concerns both: the technology by itself and the mobile application provider. Anyway,
there is no significant difference in results of two models: French users as well as Russian users
develop trust towards the mobile application if they have knowledge about the technology and
provider and if they have belief in support of mobile application provider.
Other technology’s factors have very weak or no impact in Russian model.
Price value has strong impact on intention to use the mobile application in French model and
absolutely no effect in Russian one. We can conclude that French users are more sensitive to
benefits provided by researched mobile application. But also we should admit that the history of
both mobile applications is deferent. So, French website and application are known firstly as
discount tool for restaurants, as the representative of Lafourchette mentioned, while Russian
website and application are known mostly as restaurant guide and only loyal clients could enjoy the
benefits in the past. Another explanation can be in sampling characteristic of Russian users,
between them 57% of responders noticed their occupation as manager/entrepreneur, the social
group which is less sensitive to benefits in Russia.
Even if impact of facilitating conditions on trust was validated in Russian model, facilitating
conditions has no impact on intention to use in this model compared to moderate effect in French
model. So, Russian users can develop trust towards the mobile application provider, but facilitating
conditions does not impact their intention to use mobile application.
Mobile application usability has moderate impact on intention to use the mobile application in
French model and no impact in Russian model. Russian users do not pay attention on the usability
of the mobile application at least on the stage of the decision about the use of mobile application.
Relationship marketing’s factors
Second hypothesis concerning trust found the validation in Russian model, trust impacts very strong
intention to use the mobile application in Russian model, in turn it has no effect in French model.
French users are not sensitive to relationship marketing’s factor and more sensitive to technological
functionality. In opposite, Russian users make the decision about use of the mobile application if
they trust technology and provider.

288
III.2.2. Factors influencing the use of mobile application
In both models intention to use leads to the actual use of the mobile application, the effect is
stronger in French model, but also valid in Russian model.
Mobile application usability has great impact on the use of the mobile application in Russian model
and no effect in French model. It is very interesting finding because in opposite usability has impact
on intention to use in France and no effect in Russia. Thus, Russian users are not influenced by
usability when they take decision about use of mobile application and strongly influenced during
the actual use. French users are strongly influenced by usability when they take the decision to use
but they stop to pay attention on it during the actual use.
III.2.3. Factors influencing outcomes
Both outcomes were validated in French and in Russian models.
Mobile application usability impacts great on the mobile application loyalty in both models. And
even if the impact of mobile application loyalty on continued intention to use is much stronger in
French model, the effect was also validated for Russian model.
IV. Conclusion
This chapter presented the results of our research. Firstly, we provided descriptive analysis of the
sampling characteristics according to professional occupation, age, FRM segmentation and situation
of use. The study involved 244 users from two countries: France and Russia.
Secondly, we evaluated general model in two phases: on the first phase the assessment of
measurement model was provided of measurement items in validity and reliability; on the second
phase we estimated structural model and obtained the results of correlation between latent variables.
In the end of this phase we confirmed or rejected hypotheses of our research. Out of fourteen
hypotheses, nine are validated, three are under the discussion and two are rejected.
Thirdly, we compared sub groups of France and Russia between each other and with general model.
We founded similarities and differences in the use of mobile application and evaluated hypotheses
for both models. Seven hypotheses are validated in French model and five are validated in Russian
model, one hypothesis is under the discussion in Russian model.
In the modern society mobile application as technology is strong marketing tool for business. The
comparison of two countries allowed us to resume findings and to clarify the research problem:
does the mobile application as technology impact on the development of restaurant industry:
✓ Mobile application should provide clear, easy and profitable benefits program to enforce the
mobile application use and motivate users to go out more often.

289
✓ Technical support is less important than personalization of the relationships. Today users
have developed knowledge about technology; use of mobile applications became a habit, but
personal attitude towards the clients and personal support increase trust towards the mobile
application.
✓ Users expect standardized design of mobile application. Innovative design can increase the
use of mobile applications, as well as errors can decrease it.
✓ Mobile application loyalty consists of two aspects: loyalty towards the mobile application
and towards the provider of this mobile application. In the mobile application use loyalty is
strongly connected with the technical characteristics of application.
✓ Continued intention to use the same mobile application refers to satisfaction in technical
characteristics of application and is direct outcome of mobile application loyalty.
Regarded listed findings we can answer the first research question: How the mobile application’
use can standardize the consumer’s behavior by choice of restaurants?
Technology deals always with standards, according to the type of mobile application there are also
technical standards expected by the users. In our findings we can see that mobile application loyalty
and continued intention to use are strongly impacted by technical characteristics of the mobile
application. Nevertheless, personalization is relevant in the relationships when we speak about
individuals-to-firm relationship (Palmatier, 2008). The use of mobile application can standardize
the consumer’s behavior in two ways: 1) with technical tools (all users use maps, online booking
etc.), 2) with profitable benefit program (information about actual promotions, or about availability
of the free tables etc.). In these two cases the behavior of users can be expected, or standard. The
personalization of the relationship is well developed in Russian case, what we could see in the
results concerning trust. But as we discussed with representative of French company, it is also the
primary goal today in French case. To conclude, the standardization is possible with technical tools
of mobile application, but is not relevant for development of business today.
Concerning the second question of our research: How the mobile application as technology
changes the relationship between restaurant and client?, the obtained results and findings did
not show us direct answers. Most of the restaurants do not use only one mobile application as
marketing tool: some have their own mobile applications, some use advertizing on searching
engines and presented on different restaurants guides. Anyway, our findings demonstrate the
relevance of the technical characteristics expressed in mobile application usability, loyalty and
continued intention to use. In this way the mobile application use can result in the more convenient
choices for the users, so the restaurant can get new client thanks to it, or loose clients because of it.

290
But the development of the relationships with clients who in fact visited the particular restaurant is
still the task of the restaurant management, and mobile application has relatively weak impact on it.
Comparison of two models in sub groups gives us the possibility to answer third question of the
research: How cultural differences influence on the use of mobile application in restaurant
industry? Can the mobile application reduce or erase this difference?
Cross-national comparison involves the primer analysis of the countries’ context. On this stage we
already found out that purchasing power is the most important aspect for the restaurant industry.
Recent economical crisis in Russia decreased personal income of population and as result people go
out less. It resulted in the sampling characteristics of the Russian users, who answered our survey;
most of them are representatives of upper-middle class that influenced probably the results of
Russian model.
We compared two different mobile applications with the same type of structure and with more or
less same functionality. The companies, providers of mobile applications, have different history of
business, developed with respect of local users’ demand, but these differences could also impact on
the obtained results.
Nevertheless, we can conclude, that use of mobile application in restaurant industry is definitely not
the same in France and Russia. The biggest distinction we noticed concerns the stage of decision
making (intention to use). On this stage technical side is important in France and not important in
Russia, and in opposite relationship marketing is important in Russia and not important in France.
As a result we can explain, why the Russian company prefers to build the relationship with users on
the personal level, and French company does not. But the use of mobile application can reduce
cultural differences on the later stage, as we could see the mobile application usability impacts on
mobile application loyalty which leads to reuse of mobile application (continued intention to use) in
both countries.
To resume, mobile application can impact on the development of the restaurant industry as a
marketing tool. It does not change in general the relationships between restaurants and clients, but it
can strengthen or decrease the restaurants’ business performance due to technical tools, which
economize users’ time, spending, efforts. The most significant cultural difference is on the decision
making stage, but with help of mobile application usability the mobile application can reduce this
difference on the actual use stage.
Next section will present general conclusion.

291

292
General conclusion

293
In this research we analyzed the use of mobile application in tourism and restaurant industries and
did cross-cultural comparison between Russia and France. This research has multidisciplinary
character and involves addresses the issues of marketing (relationship marketing), information
systems and culture.
To clarify the research problem we firstly presented research context, in which we regarded tourism
and restaurant industries, mobile technologies and countries’ characteristics.
Secondly, we reviewed theoretical aspects (technology’s use, relationship marketing and cultural
theories), what allowed us to develop conceptual research model and to include variables from three
parts of theory, and to form questionnaire. In the part of technology’s use theory we studied:
diffusion of innovation, theory of reasoned action (TRA), technology acceptance model (TAM and
TAM2), unified theory of acceptance and use of technology (UTAUT), and its extension
(UTAUT2), mobile application usability. In the relationship marketing we analyzed: the
commitment-trust theory, interfirm RM, interpersonal RM, multi-level exchange relationships. In
the part of cultural theory we examined: the concept of the modern Russian values, the concept of
the modern French values, and cultural dimensions. These theories were completed by the
interdisciplinary researches involving the adaption of cultural dimensions and relationship
marketing, cultural dimensions and technology.
On the next stage we accomplished two interviews with representatives of the two mobile
application providers, one in Paris and one in Moscow. After that we validated our model and
questionnaire with help of experts and effectuated the quantitative pretest of measurement model to
verify measurement items.
On the last stage we realized quantitative analysis with SmartPLS application, we completed
analysis of general model and two models of the researched countries and we compared the
obtained results. In the end we discussed our findings and answered on the research questions.
This section aims to give general conclusion of the research, where we present theoretical and
managerial contributions, limitations of the research and perspectives for future research in the field
of mobile application use in tourism and restaurant industries.
I. Contributions
This research is useful for both theory and practice. Theoretical contributions concern the
information systems, relationship marketing and cultural theory. Managerial contributions bring
practical knowledge for the companies, which provide the mobile applications in tourism and
restaurant industries.

294
I.1.Theoretical contributions
Our theoretical contributions address the use of mobile application in the tourism and restaurant
industry and cross-cultural comparison. We enlist support by the important researches done on the
field of technology’s use, relationship marketing and cultural theory. We united these three aspects
in one conceptual model and tested it.
Central object of our research is technology, particularly mobile application. The context of the
mobile application use is connected with services (restaurant), and involves the relationship
marketing to personalize the individual-to-technology relationships.
We modified the UTAUT2 model, excluded constructs performance expectancy, effort expectancy,
social influence, hedonic motivation, and habit as not relevant for our use context and added trust
from relationship marketing and mobile application usability. As outcomes we regarded mobile
application loyalty and continued intention to use.
According to our findings the contributions affect: 1) intention to use, 2) outcomes, 3) moderation
effect.
Intention to use
Between price value, facilitating conditions, trust and mobile application usability the strongest
effect on the intention to use has trust. Trust is the construct of relationship marketing. Thus, in the
context of mobile application use when the final service relates to individual-to-firm relationship
the priority is still in the relationship’s construct and not technology’s one. In the restaurant industry
where the competitiveness is high, personal relationship to the client is still high developed.
Another new construct we added as predictor of the intention to use is mobile application usability.
We validated the hypothesis, that usability impacts positively the intention to use, but the results
were lower than we expected. As conclusion we can resume that today the users have developed
good knowledge about mobile technology use and on the stage of decision making technical
characteristics play less important role than before, especially in the private use. That concerns the
use of already know mobile applications and typical ones. In case of innovative usability or new
mobile application, technical constructs should be tested first.
Outcomes
In opposite of intention to use as first stage of mobile application use, the outcomes are directly
connected with technical characteristics, what we confirmed with high results of the impact of
mobile application usability on mobile application loyalty and continued intention to use. Mobile
application market is highly competitive and usability can be very important for mobile application.

295
Usually it is free to download new application, then test it and it is easy to remove the application
from smartphone.
Moderating effects
We use two moderator of FRM segmentation, what is the part of the service marketing, and one
moderator related to the technology. Even if we collected information about age and occupation we
used data to characterize the samplings and not used them as moderator.
Duration of use expresses the recency in our model. Our strongest finding is in the relationship
between intention to use and use of mobile application, which are positively influenced by duration
of use.
Moderation effect of frequency of visits has great impact on the relationship between mobile
application loyalty and continued intention to use. And unexpected finding is the moderation effect
of frequency of visits on the relationship between facilitating conditions and intention to use,
because we could assume that as more often users go out as less support they need, but actually, as
more often they go out, as more often they use mobile application and in this way they develop
better knowledge about the technology.
Place of use presents Gis-technology and is a part of functionality of the mobile application. Place
of use has small negative effect on the relationship between intention to use and use of mobile
application, what is opposite of what we expected.
To resume, we suggest that moderation constructs which are important for use in the particular
industry are preferable than standard ones, in case if the sampling is relatively small and has small
variety, like in our case.
Culture
We did not mentioned before construct of cultural dimension, because we deleted it out of model.
Nevertheless our negative findings can be useful for further researcher.
As construct of cultural dimensions we have chosen indulgence, because this construct express the
attitude towards the leisure time and concept of self gratification, what we though can be important
for restaurant context. On the national level according to the national comparison tool of Hofstede,
the cultural difference between France and Russia is pretty significant (48 for France and 20 for
Russia). But in fact, the sampling characteristic showed us that users who participated in the survey
scored on the same level in this dimension, so this dimension has no relevant impact on the model.
Moreover we could not confirm reliability and validity of the measurement items, which probably
did not correspond to the model.

296
Cultural differences we found when we compared two models as sub groups. And our finding
concerns mostly the stage of the intention to use: Russian users are more sensitive to relationship
marketing and French users are more sensitive to technical constructs. That finding helped us to
contribute to the theory, that good balance between technical constructs and relationship marketing
on the stage of decision making (intention to use) can lead to the actual use of the mobile
application, particularly in the restaurant industry.
I.2.Managerial contributions
The use of mobile application was not so much researched in the context of restaurant industry;
normally it is regarded only from technical side and not from the side of relationship marketing. In
this way cultural differences are not always respected and standardized approach is preferred.
For companies, who is working on the international level, it is important to change point of view on
this subject and pay more attention on relationship marketing traditions for successful
performances. There are not so many researches with comparison of mobile application use
between Russia and France. Analysis of two countries allowed us to see in more details where the
management of companies in both cases could improve their marketing strategy.
In our research we have chosen factors of technology, relationship marketing and culture.
Following findings can be useful for the management:
• On the stage of decision making (intention to use) technical characteristics of the mobile
application loose their importance. It can be still important for the new clients, who just are
choosing the appropriate mobile application. Because we analyzed sampling of actual users,
who has already experienced the use. In the process of decision making which tools to use,
the technical support and usability are less relevant than usually is expected. Price value
which could be the decisive factor for intention had no importance. Trust on the other hand
demonstrated strong effect in intention to use. For the marketing strategy it could useful to
develop relationship marketing tools which are not connected directly with technical issues.
In fact technology by itself gives wide possibilities to involve users in process of use.
• In the stage of actual use mobile application usability in opposite becomes more important
for users and ends up in mobile application loyalty and continued intention to use. The
provider should respect this stage and renew information, design and functionally according
to the expectation of the users and branch’s needs.
• On the international level management of the companies should respect the cultural
traditions in the individual-to-firm relationships. In our comparison French users answered
well the benefits program and technical characteristics, while Russian users preferred

297
developed personal relationship and trust. We compared companies which are not working
in the compared countries, but the similar issues they can face in the regions where they are
presented as a brand.
• For French company we would recommend to pay more attention on the stage of intention
to use and enforce relationship marketing strategy. That can help to compete with other
similar tools for choice and booking of restaurants also on the international level.
• For Russian company we would recommend to develop stronger the mobile application
usability, not to loose clients on the stage of actual use and be able to compete with similar
mobile applications.
I.3. Professional contributions
On the level of professional use of our findings we address them to following deparments:
CRM department: the main task of the CRM is to develop tools contributing to personalization
and relationship marketing on the stage of decision making to use the mobile application.
Development department: this department should update mobile applications usability according
to the branch’s needs and users expectations.
Technical support: with development of the mobile application technology this department is less
and less important and deals only with possible “bugs”.
Restaurant management:
Indirectly our research involves restaurants as provider of actual service. For the restaurants the
researched mobile applications can be a marketing tool and attracts additional clients, but also can
be used as CRM instrument to strengthen the relationships with loyal clients. In the competitive
market such mobile applications can be also the reason to loose the loyal clients. It is important for
the restaurant management to be able to maintain the relationship with customers in the modern
world, where the mobile applications became the essential part of the people’s lives.
II.Limitations
As all researches our thesis faced the limitations. The limitations are related to the context of the
research, conceptual model, sampling, questionnaire, and software application.
II.1. Limitations related to the context of the research
There is one contextual limitation in our research. We have chosen as a field of the investigation
restaurant industry, even if we presented in details the tourism industry. By the choice of restaurant
industry we faced the limit that there are no one and the same mobile application equal developed in

298
both countries in Russia and France. Because of that we decided to compare two different mobile
applications, and added mobile application usability as factor which can reduce this limit.
II.2. Limitations related to the conceptual model
Our conceptual model was developed based on the multidisciplinary literature review including
technology’s use, relationship marketing and cultural dimensions.
Regarding the problem of the research we excluded several constructs which are usually presented
in the researches about technology’s use: performance expectancy, effort expectancy, social
influence, hedonic motivation, and habit and replaced the usual moderators with moderator related
to our subject. We also could not use in full all six cultural dimensions of Hofstede, because limits
in time. Ideal would be to analyze sampling groups with all dimensions using the VSM (Values
Survey Module) and then to add most relevant cultural dimensions into the model.
II.3. Limitations related to the sampling
Sampling size was limited by the Russian part. Dispite the fact that contacted people are using the
mobile application; it was difficult to obtain the responces and to collect data.
Russian users have no habit to participate in the scientific surveys and they demonstrated negative
attitude to the number of question (too much), in the future it’s better to organize such survey not
online, but with help of other methods, like “face to face”.
Characteristic of the sampling is related to the restaurant context; people who often go out and
therefore use more the mobile application are representatives on middle and upper-middle classes in
both countries that we could see by the age and professional occupation. For our research it was not
important to involve population of different social types, because we understand the specificity of
the usage context.
II.4. Limitations related to the questionnaire
The limitation related to our questionnaire concerns the length. Because of that we reduced in the
beginning the number of questions, what lead to the problem with measurement items for our
measurement model: we have three constructs with only two measurement items.
Another limitation of the questionnaire was the fact, that we analized two difirent applications; it
was also difficult to adapt questions in the way they would fit in both cases, and still be similar.
Some of the results are to explain because of this difference in mobile applications.

299
II.5. Limitations related to the software application
To test the model we used the SmartPLS 3 Professional. This software application is more and more
used in the researches and allows doing analysis with small sampling size and limited measurement
items. Also it is possible to examine sub groups, what was important for our comparison.
III. Perspectives
Our research opens the perspectives for future researches of the mobile application use in tourism
and restaurant industries in several aspects: contextual, theoretic, and methodological. It can be
extended to other geographical zones and involve comparison of many countries.
- Contextual aspect.
Mobile application use is well developed in the tourism, especially for booking tickets and hotels. It
would be interesting to test our research model in different components of tourism industry, only
for restaurant one, and compare the results between each others, what has more impact on the use
for example in the hotel industry compared to restaurant industry etc. The findings could be useful
for management in the tourism oriented companies. On the other hand we think it would be possible
to continue research in the restaurant industry and find for the same comparison between Russia and
France one mobile application, which is aimed to be presented in both countries.
- Theoretical aspect.
The longtime research could permit us to do analysis of the mobile application users of particular
mobile application in cultural dimensions using full Value Survey Model. That would permit to
include in the model cultural dimensions and return to our first conceptual model before we deleted
the dimension of indulgence.
We also would like to test other constructs of relationship marketing in their impact on the intention
to use mobile applications and investigate relationship marketing outcomes for final companies; in
our research it would restaurants.
We think that we can find better moderators according to the context of use. Many factors can
moderate the relationships inside of our model. Like for example for restaurant context it could be
time of use, because it would depend on time of the day, the day of the week, or even season etc.
-Methodological aspect.
Our model can be tested with another algorithm like LISREL for example or SPSS to complete the
research and verify its stability. To realize this we need to recheck our measurement model and
collect much more data.
- Geographical extension.

300
Our research interest stays by investigation of mobile application use in Russia and comparison of
this country with other countries. But also we are interested to accomplish an analysis of several
countries where one mobile application is presented, like Lafourchette in Europe. These results
would be interesting to compare with results obtained in France and Russia. In the future we could
extend our research to the Asian region, where the mobile application users are most active. We are
interested particularly in China, Japan and South Korea.

301
References

302
Adams, D. A., Nelson, R. R., & Todd, P. A. (1992). Perceived usefulness, ease of use, and usage of
information technology: a replication. MIS quarterly, 227-247.
Agarwal, R., & Karahanna, E. (2000). Time flies when you're having fun: Cognitive absorption and
beliefs about information technology usage. MIS quarterly, 665-694.
Agarwal, R., & Prasad, J. (1997). The role of innovation characteristics and perceived voluntariness
in the acceptance of information technologies. Decision sciences, 28(3), 557-582.
Ajzen, I. (1991). The theory of planned behavior. Organizational behavior and human decision
processes, 50(2), 179-211.
Ajzen, I. (2015). The theory of planned behaviour is alive and well, and not ready to retire: a
commentary on Sniehotta, Presseau, and Araújo-Soares. Health Psychology Review, 9(2), 131-137.
Ajzen, I., & Fishbein, M. (1977). Attitude-behavior relations: A theoretical analysis and review of
empirical research. Psychological bulletin, 84(5), 888.
Ajzen, I., & Fishbein, M. (1980). Understanding attitudes and predicting social
behavior. Englewood Cliffs, NJ: Prentice-Hall.
Ajzen, I., & Fishbein, M. (2005). The influence of attitudes on behavior. The handbook of
attitudes, 173, 221.
Akter, M. S., Upal, M., & Hani, U. (2008). Service quality perception and satisfaction: a study over
sub-urban public hospitals in Bangladesh. Journal of Services Research, 125.
Albarracin, D., Johnson, B. T., Fishbein, M., & Muellerleile, P. A. (2001). Theories of reasoned
action and planned behavior as models of condom use: a meta-analysis. Psychological bulletin,
127(1), 142.
Alekseeva D. A. (2016). Condition and tendencies of public catering development in Russia //
Scientific and methodical electronic magazine "Concept" 2016. – Т. 6. – С. 151–155. – URL:
http://e-koncept.ru/2016/56066.htm
Allen, Gary J., Albala, Ken (2007). The Business of Food: Encyclopedia of the Food and Drink
Industries. Greenwood.
Alsnih, R. (2006). Characteristics of web based surveys and applications in travel research. In
Travel survey methods: Quality and future directions (pp. 569-592). Emerald Group Publishing
Limited.
Ammi, C. (Ed.). (2009). Innovative Technology and Globalization. Cambridge Scholars
Publishing.
Ammi, C. (Ed.). (2013). Global consumer behavior. John Wiley & Sons.
Ammi, C. Culture and Diversity. Global Consumer Behavior, 53-66.
Ampt, E. S. (2003). Respondent burden. In Transport survey quality and innovation (pp. 507-521).
Emerald group publishing limited.

303
Anandarajan, M., Igbaria, M., & Anakwe, U. P. (2002). IT acceptance in a less-developed country:
a motivational factor perspective. International Journal of Information Management, 22(1), 47-65.
Anderson, J. C., & Gerbing, D. W. (1982). Some methods for respecifying measurement models to
obtain unidimensional construct measurement. Journal of marketing research, 453-460.
Anderson, J. C., & Gerbing, D. W. (1988). Structural equation modeling in practice: A review and
recommended two-step approach. Psychological bulletin, 103(3), 411.
Anderson, J. C., & Narus, J. A. (1990). A model of distributor firm and manufacturer firm working
partnerships. the Journal of Marketing, 42-58.
Andrews, D., Nonnecke, B., & Preece, J. (2003). Electronic survey methodology: A case study in
reaching hard-to-involve Internet users. International journal of human-computer interaction,
16(2), 185-210.
Armitage, C. J., & Conner, M. (2001). Efficacy of the theory of planned behaviour: A meta analytic
review. British journal of social psychology, 40(4), 471-499.
Aurier, P., & N’Goala, G. (2010). The differing and mediating roles of trust and relationship
commitment in service relationship maintenance and development. Journal of the Academy of
Marketing Science, 38(3), 303-325.
Avdimiotis, S., & Christou, E. (2004). GIS Applications In Tourism Planning “A Tool For
Sustainable Development Involving Local Communities”. Journal of Environmental Protection &
Ecology, 5(2), 457-468.
Baabdullah, A. M., & Williams, Y. K. D. M. D. (2013). Evaluating the unified theory of acceptance
and use of technology (UTAUT2) in the Saudi Arabian context. NASCENT CONNECTIONS 2013,
8.
Bachmann, D. P., Elfrink, J., & Vazzana, G. (1999). E-mail and snail mail face off in rematch.
Marketing Research, 11(4), 10.
Bagozzi, R. P. (1980). Causal models in marketing. New York: Wiley.
Bagozzi, R. P. (2007). The legacy of the technology acceptance model and a proposal for a
paradigm shift. Journal of the association for information systems, 8(4), 3.
Bagozzi, R. P., & Yi, Y. (2012). Specification, evaluation, and interpretation of structural equation
models. Journal of the academy of marketing science, 40(1), 8-34.
Bande, B., Fernández-Ferrín, P., Varela, J. A., & Jaramillo, F. (2015). Emotions and salesperson
propensity to leave: The effects of emotional intelligence and resilience. Industrial Marketing
Management, 44, 142-153.
Baptista, G., & Oliveira, T. (2015). Understanding mobile banking: The unified theory of
acceptance and use of technology combined with cultural moderators. Computers in Human
Behavior, 50, 418-430.
Bardini, T. (1996). Changement et réseaux socio-techniques: de l'inscription à l'affordance.
Réseaux, 14(76), 125-155.

304
Barki, H., & Hartwick, J. (1994). Measuring user participation, user involvement, and user attitude.
MIS quarterly, 59-82.
Barki, H., Titah, R., & Boffo, C. (2007). Information system use–related activity: an expanded
behavioral conceptualization of individual-level information system use. Information Systems
Research, 18(2), 173-192.
Bartlett, M. Y., & DeSteno, D. (2006). Gratitude and prosocial behavior: Helping when it costs
you. Psychological science, 17(4), 319-325.
Barua, P. (2013). The moderating role of perceived behavioral control: The literature criticism and
methodological considerations. International Journal of Business and Social Science, 4(10).
Baskerville, R. F. (2003). Hofstede never studied culture. Accounting, organizations and society,
28(1), 1-14.
Bazeley, P. (2008). Mixed methods in management research. Dictionary of qualitative management
research, 133-136.
Beaver, A. (2005). A dictionary of travel and tourism terminology. CABI.
Beck, J. T., & Palmatier, R. W. (2012). 16 Relationship marketing. Handbook on Business to
Business Marketing, 293.
Beck, J. T., & Palmatier, R. W. (2012). 16 Relationship marketing. Handbook on Business to
Business Marketing, 293.
Beck, J. T., Chapman, K., & Palmatier, R. W. (2015). Understanding relationship marketing and
loyalty program effectiveness in global markets. Journal of International Marketing, 23(3), 1-21.
Becker, J. M., Klein, K., & Wetzels, M. (2012). Hierarchical latent variable models in PLS-SEM:
guidelines for using reflective-formative type models. Long Range Planning, 45(5), 359-394.
Belyaev, A. (2012). The problem of Russia's “special way”. Gramota.
Bentler, P. M. (1990). Comparative fit indexes in structural models. Psychological bulletin, 107(2),
238.
Bentler, P. M., & Bonett, D. G. (1980). Significance tests and goodness of fit in the analysis of
covariance structures. Psychological bulletin, 88(3), 588.
Bentler, P. M., & Chou, C. P. (1987). Practical issues in structural modeling. Sociological methods
& research, 16(1), 78-117.
Berdyaev, N., & Bamford, C. (1992). The Russian Idea. SteinerBooks.
Berry, L. L. (1983). Relationship marketing. American Marketing Association.
Bhattacherjee, A. (2000). Acceptance of e-commerce services: the case of electronic
brokerages. IEEE Transactions on systems, man, and cybernetics-Part A: Systems and
humans, 30(4), 411-420.

305
Bhattacherjee, A., & Premkumar, G. (2004). Understanding changes in belief and attitude toward
information technology usage: A theoretical model and longitudinal test. MIS quarterly, 229-254.
Bidan, M., & Trinquecoste, J. F. (2010). Gouvernance et innovation à l'épreuve des technologies de
l'information. Management & Avenir, (4), 125-127.
Bidan, M., Rowe, F., & Truex, D. (2012). An empirical study of IS architectures in French SMEs:
integration approaches. European journal of information systems, 21(3), 287-302.
Birant, D. (2011). Data mining using rfm analysis. INTECH Open access publisher.
Bitektine, A. (2011). Toward a theory of social judgments of organizations: The case of legitimacy,
reputation, and status. Academy of management review, 36(1), 151-179.
Bitner, M. J. (1995). Building service relationships: it's all about promises. Journal of the Academy
of marketing science, 23(4), 246-251.
Bitner, M. J., Ostrom, A. L., & Meuter, M. L. (2002). Implementing successful self-service
technologies. The academy of management executive, 16(4), 96-108.
Blattberg, R. C., Kim, B. D., Neslin, S. A., Blattberg, R. C., Kim, B. D., & Neslin, S. A. (2008).
Multiple Campaign Management. Database marketing: analyzing and managing customers, 743-
780.
Bokhari, R. H. (2005). The relationship between system usage and user satisfaction: a meta-
analysis. Journal of enterprise information management, 18(2), 211-234.
Boomsma, A. (2000). Reporting analyses of covariance structures. Structural equation
modeling, 7(3), 461-483.
Boora, K. K., & Singh, H. (2011). Customer loyalty and its antecedents: A conceptual framework
understanding e-marketing–optimization of resources. Asia Pacific Journal of Research in Business
Management, 2(1), 151-164.
Bosnjak, M., Tuten, T. L., & Wittmann, W. W. (2005). Unit (non) response in web‐based access
panel surveys: An extended planned‐behavior approach. Psychology & Marketing, 22(6), 489-505.
Boullier, D. (1989). Du bon usage d'une critique du modèle diffusionniste: discussion-prétexte des
concepts de Everett M. Rogers. Réseaux, 7(36), 31-51.
Brewer, P., & Venaik, S. (2011). Individualism–collectivism in Hofstede and GLOBE. Journal of
International Business Studies, 42(3), 436-445.
Brown, S. A., & Venkatesh, V. (2005). Model of adoption of technology in households: A baseline
model test and extension incorporating household life cycle. MIS quarterly, 399-426.
Brown, S. A., Dennis, A. R., & Venkatesh, V. (2010). Predicting collaboration technology use:
Integrating technology adoption and collaboration research. Journal of Management Information
Systems, 27(2), 9-54.

306
Brown, S. A., Venkatesh, V., & Goyal, S. (2007). Expectation confirmation in technology adoption:
An examination of six competing theoretical models. In Under Review, available from: http://misrc.
umn. edu/workshops/2007/spring/Susan. pdf.
Brown, S. A., Venkatesh, V., & Goyal, S. (2012). Expectation confirmation in technology
use. Information Systems Research, 23(2), 474-487.
Brown, S. K. (2006). Structural assimilation revisited: Mexican-origin nativity and cross-ethnic
primary ties. Soc. F., 85, 75.
Bryman, A., & Bell, E. (2015). Business research methods. Oxford University Press, USA.
Bulmer, M. (1984). Facts, concepts, theories and problems. In Sociological Research Methods (pp.
37-50). Macmillan Education UK.
Bult, J. R., & Wansbeek, T. (1995). Optimal selection for direct mail. Marketing Science, 14(4),
378-394.
Callegaro, M., Manfreda, K. L., & Vehovar, V. (2015). Web survey methodology. Sage.
Campbell, D. T., & Fiske, D. W. (1959). Convergent and discriminant validation by the multitrait-
multimethod matrix. Psychological bulletin, 56(2), 81.
Candela, G., & Figini, P. (2012). The economics of tourism destinations. In The Economics of
Tourism Destinations (pp. 73-130). Springer Berlin Heidelberg.
Cannon, J. P., Doney, P. M., Mullen, M. R., & Petersen, K. J. (2010). Building long-term
orientation in buyer–supplier relationships: The moderating role of culture. Journal of Operations
Management, 28(6), 506-521.
Cardon, P. W., & Marshall, B. A. (2008). National culture and technology acceptance: The impact
of uncertainty avoidance. Issues in Information Systems, 9(2), 103-110.
Carlsson, C., Carlsson, J., Hyvonen, K., Puhakainen, J., & Walden, P. (2006, January). Adoption of
mobile devices/services—searching for answers with the UTAUT. In System Sciences, 2006.
HICSS'06. Proceedings of the 39th Annual Hawaii International Conference on (Vol. 6, pp. 132a-
132a). IEEE.
Castells, M. (2011). The rise of the network society: The information age: Economy, society, and
culture (Vol. 1). John Wiley & Sons.
Celhay, F., & Trinquecoste, J. F. (2015). Package graphic design: investigating the variables that
moderate consumer response to atypical designs. Journal of Product Innovation Management,
32(6), 1014-1032.
Chang, M. K. (1998). Predicting unethical behavior: a comparison of the theory of reasoned action
and the theory of planned behavior. Journal of business ethics, 17(16), 1825-1834.
Chang, M. K. (1998). Predicting unethical behavior: A comparison of the theory of reasoned action
and the theory of planned behavior. Journal of business ethics, 17(16), 1825-1834.
Chau, P. Y. (1996). An empirical assessment of a modified technology acceptance model. Journal
of management information systems, 13(2), 185-204.

307
Chen, S. C., Shing-Han, L., & Chien-Yi, L. (2011). Recent related research in technology
acceptance model: A literature review. Australian Journal of Business and Management Research,
1(9), 124.
Chenet, P., Dagger, T. S., & O'Sullivan, D. (2010). Service quality, trust, commitment and service
differentiation in business relationships. Journal of Services Marketing, 24(5), 336-346.
Cherryholmes, C. H. (1992). Notes on pragmatism and scientific realism. Educational
researcher, 21(6), 13-17.
Childers, T. L., Carr, C. L., Peck, J., & Carson, S. (2002). Hedonic and utilitarian motivations for
online retail shopping behavior. Journal of retailing, 77(4), 511-535.
Childers, T. L., Carr, C. L., Peck, J., & Carson, S. (2002). Hedonic and utilitarian motivations for
online retail shopping behavior. Journal of retailing, 77(4), 511-535.
Chin, W. (2000, December). Partial least squares for IS researchers: an overview and presentation
of recent advances using the PLS approach. In ICIS (Vol. 2000, pp. 741-742).
Chin, W. W. (1995). Partial least squares is to LISREL as principal components analysis is to
common factor analysis. Technology Studies, 2(2), 315-319.
Chin, W. W. (1998). The partial least squares approach to structural equation modeling. Modern
methods for business research, 295(2), 295-336.
Chin, W. W., & Newsted, P. R. (1999). Structural equation modeling analysis with small samples
using partial least squares. Statistical strategies for small sample research, 1(1), 307-341.
Chin, W. W., Peterson, R. A., & Brown, S. P. (2008). Structural equation modeling in marketing:
Some practical reminders. Journal of marketing theory and practice, 16(4), 287-298.
Chismar, W. G., & Wiley-Patton, S. (2003, January). Does the extended technology acceptance
model apply to physicians. In System Sciences, 2003. Proceedings of the 36th Annual Hawaii
International Conference on (pp. 8-pp). IEEE.
Christopher, M., Payne, A., & Ballantyne, D. (1991). Relationship marketing: bringing quality
customer service and marketing together. Heinemann, London
Churchill Jr, G. A. (1979). A paradigm for developing better measures of marketing
constructs. Journal of marketing research, 64-73.
Churchill Jr, G. A., & Peter, J. P. (1984). Research design effects on the reliability of rating scales:
A meta-analysis. Journal of marketing research, 360-375.
Churchill, G. A., & Iacobucci, D. (2006). Marketing research: methodological foundations. New
York: Dryden Press.
Chuttur, M. Y. (2009). Overview of the technology acceptance model: Origins, developments and
future directions. Working Papers on Information Systems, 9(37), 9-37.

308
Clergeau, C., & Violier, P. (2012). Le concept de cluster est-il soluble dans le tourisme?. Téoros.
Revue de recherche en tourisme, 31(31-2), 60-71.
Cobanoglu, C., Warde, B., & Moreo, P. J. (2001). A comparison of mail, fax and web-based survey
methods. International journal of market research, 43(4), 441.
Cohen, J. (1977). Statistical power analysis for the behavioural sciences (Rev. ed.). New York:
Academic.Consumer Research, 15, 325-343.
Cooper, D. R., & Schindler, P. S. (2006). Marketing research (p. 261). New York: McGraw-
Hill/Irwin.
Cooper, R. B., & Zmud, R. W. (1990). Information technology implementation research: a
technological diffusion approach. Management science, 36(2), 123-139.
Cortina, J. M. (1993). What is coefficient alpha? An examination of theory and applications.
Journal of applied psychology, 78(1), 98.
Couper, M. P. (2000). Review: Web surveys: A review of issues and approaches. The Public
Opinion Quarterly, 64(4), 464-494.
Couper, M. P., Traugott, M. W., & Lamias, M. J. (2001). Web survey design and administration.
Public opinion quarterly, 65(2), 230-253.
Coursaris, C., & Kim, D. (2006). A qualitative review of empirical mobile usability studies. AMCIS
2006 Proceedings, 352.
Creswell, J. W. (2009). Editorial: Mapping the field of mixed methods research. Journal of mixed
methods research, volume 3, number 2, 95-108
Creswell, J. W. (2013). Research design: Qualitative, quantitative, and mixed methods approaches.
Sage publications.
Creswell, J. W., & Zhang, W. (2009). The application of mixed methods designs to trauma
research. Journal of traumatic stress, 22(6), 612-621.
Criteo, Rapport d’activité sur le commerce mobile. 1er semestre 2016 France
Criteo, Travel Flash Report. October 2016 edition.
Cronbach, L. J. (1951). Coefficient alpha and the internal structure of tests. Psychometrika, 16(3),
297-334.
Cronbach, L. J. (1984). A research worker's treasure chest. Multivariate behavioral research, 19(2-
3), 223-240.
Cronbach, L. J., & Thorndike, R. L. (1971). Educational measurement. Test validation, 443-507.
Cronin, J. J., Brady, M. K., & Hult, G. T. M. (2000). Assessing the effects of quality, value, and
customer satisfaction on consumer behavioral intentions in service environments. Journal of
retailing, 76(2), 193-218.

309
Crosby, L. A., Evans, K. R., & Cowles, D. (1990). Relationship quality in services selling: an
interpersonal influence perspective. The Journal of marketing, 68-81.
Crotty, M. (1998). The foundations of social research: Meaning and perspective in the research
process. Sage.
Crump, S. A., Hamilton, D. L., Sherman, S. J., Lickel, B., & Thakkar, V. (2010). Group entitativity
and similarity: Their differing patterns in perceptions of groups. European Journal of Social
Psychology, 40(7), 1212-1230.
Cui, W. (2007). Comparison of methods of collecting data for research: Conventional methods and
electronic methods. Decision Sciences Institute, Southwest Region.
D. Raggio, R., M. Walz, A., Bose Godbole, M., & Anne Garretson Folse, J. (2014). Gratitude in
relationship marketing: theoretical development and directions for future research. European
Journal of Marketing, 48(1/2), 2-24.
Dahlman, E., Parkvall, S., & Skold, J. (2013). 4G: LTE/LTE-advanced for mobile broadband.
Academic press.
Davis Jr, F. D. (1986). A technology acceptance model for empirically testing new end-user
information systems: Theory and results (Doctoral dissertation, Massachusetts Institute of
Technology).
Davis, F.D. (1993). User acceptance of information technology: system characteristics, user
perception and behavioral impacts. Academic press limited.
Davis, J. B. (2013). The theory of the individual in economics: Identity and value. Routledge.
De Leeuw, D. (2005). To mix or not to mix data collection modes in surveys. Journal of official
statistics, 21(2), 233.
De Mooij, M., & Hofstede, G. (2011). Cross-cultural consumer behavior: A review of research
findings. Journal of International Consumer Marketing, 23(3-4), 181-192.
Debats, D. L., & Bartelds, B. F. (1996). The structure of human values: a principal components
analysis of the Rokeach Value Survey (RVS). Website: http://www. dissertations. ub. rug.
nl/FILES/faculties/ppsw/1996/dlhm debats/c5. pdf (Erişim: 05.12. 2011).
DeLone, W. H., & McLean, E. R. (1992). Information systems success: The quest for the dependent
variable. Information systems research, 3(1), 60-95.
Delva, J., Allen-Meares, P., & Momper, S. L. (2010). Cross-cultural research. Oxford University
Press, USA.
Demchenko, Y., De Laat, C., & Membrey, P. (2014, May). Defining architecture components of the
Big Data Ecosystem. In Collaboration Technologies and Systems (CTS), 2014 International
Conference on (pp. 104-112). IEEE.
Depreciation. Report Number: RFATO029, 15.12.2015

310
Des Horts, C. H. B., Isaac, H., & Leclercq, A. (2006). Adoption and appropriation: towards a new
theoretical framework. An exploratory research on mobile technologies in French companies (No.
hal-00664064).
Devis, F.D., Bagozzi, R.P and Warshaw, P.R. (1989) User acceptance of computer technology: a
comparison of two theoretical models. Management science.
Diamantopoulos, A. (2011). Incorporating formative measures into covariance-based structural
equation models. Mis Quarterly, 335-358.
Diamantopoulos, A., Sarstedt, M., Fuchs, C., Wilczynski, P., & Kaiser, S. (2012). Guidelines for
choosing between multi-item and single-item scales for construct measurement: a predictive
validity perspective. Journal of the academy of marketing science, 40(3), 434-449.
Dillman, D. A., Tortora, R. D., & Bowker, D. (1998, August). Principles for constructing web
surveys. In Joint meetings of the american statistical association.
Donner, J. (2008). Research approaches to mobile use in the developing world: A review of the
literature. The information society, 24(3), 140-159.
Dornas, K. B., de Mesquita, J. M. C., & Patrocinio, R. (2014). The Relationship Between Trust,
Value and Loyalty in the Internet Era. Journal of business and economics, 5(5), 802-812.
Dowell, D., Morrison, M., & Heffernan, T. (2015). The changing importance of affective trust and
cognitive trust across the relationship lifecycle: A study of business-to-business
relationships. Industrial marketing management, 44, 119-130.
Dwyer, F. R., & Oh, S. (1987). Output sector munificence effects on the internal political economy
of marketing channels. Journal of marketing research, 347-358.
Edwards, W. (1954). The theory of decision making. Psychological bulletin, 51(4), 380.
Everett, S. (2016). Food and drink tourism: Principles and practice. Sage.
Excellence, 17(3), 355-372.
Excousseau, J. (2000). La mosaïque des générations. Editions d’Organisation.
Fetters, M. D., Curry, L. A., & Creswell, J. W. (2013). Achieving integration in mixed methods
designs—principles and practices. Health services research, 48(6pt2), 2134-2156.
Fishbein, M., & Ajzen, I. (1975). Belief, attitude, intention, and behavior. Reading, MA: Addison-
Wesley.
Fisk, R. P., Brown, S. W., & Bitner, M. J. (1993). Tracking the evolution of the services marketing
literature. Journal of retailing, 69(1), 61-103.
Flurry Analytics annual mobile applications study, 2016
Fornell, C., & Larcker, D. F. (1981). Evaluating structural equation models with unobservable
variables and measurement error. Journal of marketing research, 39-50.

311
Fornell, C., & Larcker, D. F. (1981). Structural equation models with unobservable variables and
measurement error: Algebra and statistics. Journal of marketing research, 382-388.
Frary, R. B. (1996). Hints for designing effective questionnaires (pp. 28-30). ERIC clearinghouse
on assessment & evaluation, the catholic university of America.
Frost, J. (2014). How to interpret a regression model with low R-squared and low p values. Minitab
Inc.(ed) getting started with minitab, 17.
Gaddis, S. E. (1998). How to design online surveys. Training & Development, 52(6), 67-72.
Garbarino, E., & Johnson, M. S. (1999). The different roles of satisfaction, trust, and commitment
in customer relationships. the Journal of Marketing, 70-87.
Garver, M. S., & Mentzer, J. T. (1999). Logistics research methods: employing structural equation
modeling to test for construct validity. Journal of business logistics, 20(1), 33.
Gefen, D., & Straub, D. W. (2004). Consumer trust in B2C e-Commerce and the importance of
social presence: experiments in e-Products and e-Services. Omega, 32(6), 407-424.
Geisser, S. (1974). A predictive approach to the random effect model. Biometrika, 101-107.
GNSS market report, issue 4, 2015, European global navigation satellite systems agency (GSA)
Godelier, É. (2005). Les élites managériales entre logiques nationales endogènes et globalisation
exogène. Entreprises et histoire, (4), 6-14.
Godin, G., & Kok, G. (1996). The theory of planned behavior: a review of its applications to health-
related behaviors. American journal of health promotion, 11(2), 87-98.
Goodhue, D. L., Lewis, W., & Thompson, R. (2012). Does PLS have advantages for small sample
size or non-normal data?. Mis Quarterly, 36(3), 891-1001.
Goodwin, N. C. (1987). Functionality and usability. Communications of the ACM, 30(3), 229-233.
Google travel report, 2014
Gorokhov, A. (2012). The idea of unity of Russian culture in the 19th century. Vestnik.
GOST 31985-2013 « Услуги общественного питания. Термины и определения » 2015
Gould, J. D., Boies, S. J., & Lewis, C. (1991). Making usable, useful, productivity-enhancing
computer applications. Communications of the ACM, 34(1), 74-85.
Gouldner, A. W. (1960). The norm of reciprocity: A preliminary statement. American sociological
review, 161-178.
Green, R. T., & White, P. D. (1976). Methodological considerations in cross-national consumer
research. Journal of international business studies, 81-87.

312
Gremler, D. D., & Brown, S. W. (1996). Service loyalty: its nature, importance, and
implications. Advancing service quality: A global perspective, 5, 171-181.
Grönroos, C. (1994). From marketing mix to relationship marketing: towards a paradigm shift in
marketing. Management decision, 32(2), 4-20.
Grönroos, C. (1997). Value‐driven relational marketing: from products to resources and
competencies. Journal of marketing management, 13(5), 407-419.
Grönroos, C. (2004). The relationship marketing process: communication, interaction, dialogue,
value. Journal of business & industrial marketing, 19(2), 99-113.
Grönroos, C. (2011). A service perspective on business relationships: The value creation,
interaction and marketing interface. Industrial marketing management, 40(2), 240-247.
Guba, E. G., & Lincoln, Y. S. (1994). Competing paradigms in qualitative research. Handbook of
qualitative research, 2(163-194), 105.
Guerin, A.-J. (2004). The French initiative for innovation in tourism: how to rejuvenate supply and
increase the productivity of the tourism sector. Paris: Organization for Economic Cooperation and
Development.
Gummesson, E. (2011). Total relationship marketing. Routledge.
Gunn, H. (2002). Web-based surveys: Changing the survey process. First Monday, 7(12).
Gupta, P., & Harris, J. (2010). How e-WOM recommendations influence product consideration and
quality of choice: A motivation to process information perspective. Journal of Business
Research, 63(9), 1041-1049.
Gyr, U. (2010). The history of tourism: Structures on the path to modernity.EGO european history
online, URL: http://ieg-ego.eu/en/threads/europe-on-the-road/the-history-of-tourism
Haenlein, M., & Kaplan, A. M. (2004). A beginner's guide to partial least squares
analysis. Understanding statistics, 3(4), 283-297.
Hair, J. F., Ringle, C. M., & Sarstedt, M. (2011). PLS-SEM: Indeed a silver bullet. Journal of
marketing theory and practice, 19(2), 139-152.
Hair, J. F., Sarstedt, M., Pieper, T. M., & Ringle, C. M. (2012). The use of partial least squares
structural equation modeling in strategic management research: a review of past practices and
recommendations for future applications. Long range planning, 45(5), 320-340.
Hair, J. F., Sarstedt, M., Ringle, C. M., & Mena, J. A. (2012). An assessment of the use of partial
least squares structural equation modeling in marketing research. Journal of the academy of
marketing science, 40(3), 414-433.
Hale, J. L., Householder, B. J., & Greene, K. L. (2002). The theory of reasoned action. The
persuasion handbook: Developments in theory and practice, 259286.

313
Halinen, A. (2012). Relationship marketing in professional services: a study of agency-client
dynamics in the advertising sector. Routledge.
Hall, C. M., Sharples, L., & Smith, A. (2003). The experience of consumption or the consumption
of experiences? Challenges and issues in food tourism. Food tourism around the world:
Development, management and markets, 314-331.
Hall, C. M., Timothy, D. J., & Duval, D. T. (2012). Safety and security in tourism: relationships,
management, and marketing. Routledge.
Hamill, L., & Lasen, A. (2005). Mobile world: Past, present and future. Springer Science &
Business Media.
Hamilton, D. L., & Sherman, S. J. (1996). Perceiving persons and groups. Psychological
review, 103(2), 336.
Han, S. (2003). Individual adoption of information systems in organizations: A literature review of
technology acceptance model. Turku Centre for Computer Science (TUCS).
Hantrais, L. (1999). Contextualization in cross-national comparative research. International Journal
of Social Research Methodology, 2(2), 93-108.
Hantrais, L., & Mangen, S. P. (Eds.). (1996). Cross national research methods. A&C Black.
Harkness, J. A., Van de Vijver, F. J., & Mohler, P. P. (2003). Cross-cultural survey methods (Vol.
325). Hoboken, NJ: Wiley-Interscience.
Harwell, M. R. (2011). ReseaRch Design in Qualitative/Quantitative. The Sage handbook for
research in education: Pursuing ideas as the keystone of exemplary inquiry, 147.
Hastie, R., & Dawes, R. M. (2010). Rational choice in an uncertain world: The psychology of
judgment and decision making. Sage.
Hellriegel, D. & J. W. Slocum (2003). Organizational Behavior. Mason, OH: South-Western
College Publishers.
Hennig-Thurau, T. (2004). Customer orientation of service employees: Its impact on customer
satisfaction, commitment, and retention. International Journal of Service Industry
Management, 15(5), 460-478.
Hennig-Thurau, T., Gwinner, K. P., Walsh, G., & Gremler, D. D. (2004). Electronic word-of-mouth
via consumer-opinion platforms: what motivates consumers to articulate themselves on the
internet?. Journal of interactive marketing, 18(1), 38-52.
Henseler, J., Ringle, C. M., & Sinkovics, R. R. (2009). The use of partial least squares path
modeling in international marketing. In New challenges to international marketing (pp. 277-319).
Emerald Group Publishing Limited.
Hilbert, M. (2013). Big Data for Development: A Systematic Review of Promises and
Challenges. United Nations Economic Commission for Latin America and the Caribbean (UN
ECLAC), 1(1), 1-36.

314
Hill, T., Smith, N. D., & Mann, M. F. (1987). Role of efficacy expectations in predicting the
decision to use advanced technologies: The case of computers. Journal of applied psychology,
72(2), 307-313.
Hills, M. D. (2002). Kluckhohn and Strodtbeck's values orientation theory. Online readings in
psychology and culture, 4(4), 3.
Hitlin, S., & Piliavin, J. A. (2004). Values: Reviving a dormant concept. Annu. Rev. Sociol., 30,
359-393.
Hoe, S. L. (2008). Issues and procedures in adopting structural equation modeling technique.
Journal of applied quantitative methods, 3(1), 76-83.
Hoehle, H., & Venkatesh, V. (2015). Mobile Application Usability: Conceptualization and
Instrument Development. Mis Quarterly, 39(2), 435-472.
Hofstede, G. (1995). Multilevel research of human systems: Flowers, bouquets and gardens. Human
Systems Management, 14(3), 207-217.
Hofstede, G. (2010). The GLOBE debate: Back to relevance. Journal of International Business
Studies, 41(8), 1339-1346.
Hofstede, G. (2011). Dimensionalizing cultures: The Hofstede model in context. Online readings in
psychology and culture, 2(1), 8.
Hofstede, G. J. (2001). Adoption of communication technologies and national culture. Systèmes
d’information et management, 6(3), 55-74.
Hofstede, G., & Bond, M. H. (1984). Hofstede's culture dimensions an independent validation using
Rokeach's value survey. Journal of cross-cultural psychology, 15(4), 417-433.
Hofstede, G., & Bond, M. H. (1988). The Confucius connection: From cultural roots to economic
growth. Organizational dynamics, 16(4), 5-21.
Hofstede, G., & Minkov, M. (2010). Long-versus short-term orientation: new perspectives. Asia
Pacific Business Review, 16(4), 493-504.
Hojman, P., Ortuzar, J. D. D., & Rizzi, L. (2004). Internet-based surveys to elicit the value of risk
reductions. In 7th International Conference on Survey Methods in Transport, Costa Rica.
Holzer, A., & Ondrus, J. (2011). Mobile application market: A developer’s perspective. Telematics
and informatics, 28(1), 22-31.
Horn, J. L. (1965). A rationale and test for the number of factors in factor analysis. Psychometrika,
30(2), 179-185.
Hox, J. J., & Bechger, T. M. (1998). An introduction to structural equation modeling. Family
Science Review, 11, 354-373.
Hsu, S. H., Chen, W. H., & Hsieh, M. J. (2006). Robustness testing of PLS, LISREL, EQS and
ANN-based SEM for measuring customer satisfaction. Total Quality Management & Business

315
Hwang, G. J., & Tsai, C. C. (2011). Research trends in mobile and ubiquitous learning: A review of
publications in selected journals from 2001 to 2010. British Journal of Educational Technology,
42(4).
Igbaria, M. (1990). End-user computing effectiveness: A structural equation model. Omega, 18(6),
637-652.
Im, I., Hong, S., & Kang, M. S. (2011). An international comparison of technology adoption:
Testing the UTAUT model. Information & management, 48(1), 1-8.
IMF Economic Review, 2015
IMP Group. (1990). Understanding business markets: Interaction, relationships and networks. D.
Ford (Ed.). London: Academic Press.
INSEE (2014) La reprise différée, Note de Conjoncture (Business Survey), Paris.
James, L. R., & Brett, J. M. (1984). Mediators, moderators, and tests for mediation. Journal of
applied psychology, 69(2), 307.
Jarvenpaa, S. L., Tractinsky, N., & Saarinen, L. (1999). Consumer trust in an internet store: a cross
cultural validation. Journal of computer mediated communication, 5(2), 0-0.
Jick, T.D. (1979). Mixing qualitative and quantative methods: triangulation in action.
Administrative science quarterly.
Johnson, M. S., & Garbarino, E. (2001). Customers of performing arts organisations: are
subscribers different from nonsubscribers?. International Journal of Nonprofit and Voluntary
Sector Marketing, 6(1), 61-77.
Jöreskog, K. G. (1970). A general method for estimating a linear structural equation system. ETS
Research Report Series, 1970(2).
Jöreskog, K. G. (1970). Estimation and testing of simplex models. ETS Research Report Series,
1970(2).
Jöreskog, K. G., & Sörbom, D. (1982). Recent developments in structural equation modeling.
Journal of marketing research, 404-416.
Joshi, K. (1992). A causal path model of the overall user attitudes toward the MIS function: the case
of user information satisfaction. Information & Management, 22(2), 77-88.
Jovanović, V., & Njeguš, A. (2008). The application of GIS and its components in
tourism. Yugoslav Journal of Operations Research, 18(2), 261-272.
Kaiser, H. F. (1960). The application of electronic computers to factor analysis. Educational and
psychological measurement, 20(1), 141-151.
Kang, M., Liew, B. Y. T., Lim, H., Jang, J., & Lee, S. (2015). Investigating the determinants of
mobile learning acceptance in Korea using UTAUT2. In Emerging issues in smart learning (pp.
209-216). Springer, Berlin, Heidelberg.

316
Karahanna, E., Straub, D. W., & Chervany, N. L. (1999). Information technology adoption across
time: a cross-sectional comparison of pre-adoption and post-adoption beliefs. MIS quarterly, 183-
213.
Kelley, S. W., & Davis, M. A. (1994). Antecedents to customer expectations for service
recovery. Journal of the Academy of Marketing Science, 22(1), 52-61.
Kemmis, S., & Wilkinson, M. (1998). Participatory action research and the study of practice. Action
research in practice: Partnerships for social justice in education, 1, 21-36.
Khalid, K., Hilman, H., & Kumar, D. (2012). Get along with quantitative research process.
International Journal of Research in Management, 2(2), 15-29.
Kim, S. S., & Malhotra, N. K. (2005). A longitudinal model of continued IS use: An integrative
view of four mechanisms underlying postadoption phenomena. Management science, 51(5), 741-
755.
Kim, S. S., Malhotra, N. K., & Narasimhan, S. (2005). Research note—two competing perspectives
on automatic use: A theoretical and empirical comparison. Information Systems Research, 16(4),
418-432.
Kim, Y., Kim, D., & Wachter, K. (2012). Smartphones: User engagement motivations effect on
their value, satisfaction, and future engagement intention. AIS electronic library, URL:
http://aisel.aisnet.org/amcis2012/proceedings/HCIStudies/21/
King, W. R., & He, J. (2006). A meta-analysis of the technology acceptance model. Information &
management, 43(6), 740-755.
Kippax, S., & Crawford, J. (1993). Flaws in the theory of reasoned action. The theory of reasoned
action: Its application to AIDS-preventive behavior, 253-269.
Kitayama, S., Mesquita, B., & Karasawa, M. (2006). Cultural affordances and emotional
experience: socially engaging and disengaging emotions in Japan and the United States. Journal of
personality and social psychology, 91(5), 890.
Kline, R. B. (2015). Principles and practice of structural equation modeling. Guilford publications.
Kluckhohn, F. R., & Strodtbeck, F. L. (1961). Variations in value orientations. Evantson, IL: Row,
Peterson.
Kollat, D. T., Engel, J. F., & Blackwell, R. D. (1970). Current problems in consumer behavior
research. Journal of Marketing Research, 327-332.
Kotlarova, V. (2010). Traditional values in contemporary culture. Gramota.
Kroeber, A. L., & Kluckhohn, C. (1952). Culture: A critical review of concepts and definitions.
Papers. Peabody Museum of Archaeology & Ethnology, Harvard University.
Kulta, H. P., & Karjaluoto, H. (2016, October). Conceptualizing engagement in the mobile context:
a systematic literature review. In Proceedings of the 20th International Academic Mindtrek
Conference (pp. 169-176). ACM.

317
Kumar, N., Scheer, L. K., & Steenkamp, J. B. E. (1995). The effects of supplier fairness on
vulnerable resellers. Journal of marketing research, 54-65.
Lai, W. T., & Chen, C. F. (2011). Behavioral intentions of public transit passengers—The roles of
service quality, perceived value, satisfaction and involvement. Transport Policy, 18(2), 318-325.
Lally, P., Van Jaarsveld, C. H., Potts, H. W., & Wardle, J. (2010). How are habits formed:
Modelling habit formation in the real world. European journal of social psychology, 40(6), 998-
1009.
Lamb, C. W., Hair, J. F., & McDaniel, C. (2011). Essentials of marketing. Cengage Learning.
Le Tourisme à Paris Chiffres clés, 2015
Lee, A. S. (1991). Integrating positivist and interpretive approaches to organizational research.
Organization science, 2(4), 342-365.
Lee, D., Moon, J., Kim, Y. J., & Mun, Y. Y. (2015). Antecedents and consequences of mobile
phone usability: Linking simplicity and interactivity to satisfaction, trust, and brand loyalty.
Information & Management, 52(3), 295-304.
Lee, S. G., Trimi, S., & Kim, C. (2013). The impact of cultural differences on technology adoption.
Journal of world business, 48(1), 20-29.
Lee, Y., Kozar, K. A., & Larsen, K. R. (2003). The technology acceptance model: Past, present, and
future. Communications of the Association for information systems, 12(1), 50.
Lee, Y., Kozar, K. A., & Larsen, K. R. (2003). The technology acceptance model: Past, present, and
future. Communications of the Association for information systems, 12(1), 50.
Leedy, P. D., & Ormrod, J. E. (2001). Practical research: Planning and design. New Jersey, Pearson
Merill Prentice hall.
Legris, P., Ingham, J., & Collerette, P. (2003). Why do people use information technology? A
critical review of the technology acceptance model. Information & management, 40(3), 191-204.
Legris, P., Ingham, J., Collerette, P. (2003) Why do people use information technology? A critical
review of the technology acceptance model. Information&Management.
Leidner, D. E., & Kayworth, T. (2006). Review: a review of culture in information systems
research: toward a theory of information technology culture conflict. MIS quarterly, 30(2), 357-399.
Leigh, J. H., & Gabel, T. G. (1992). Symbolic interactionism: its effects on consumer behavior and
implications for marketing strategy. Journal of Services Marketing, 6(3), 5-16.
Leiner, B. M., Cerf, V. G., Clark, D. D., Kahn, R. E., Kleinrock, L., Lynch, D. C., ... & Wolff, S.
(2009). A brief history of the Internet. ACM SIGCOMM Computer Communication Review, 39(5),
22-31.
Li, J. P., & Kishore, R. (2006, April). How robust is the UTAUT instrument?: a multigroup
invariance analysis in the context of acceptance and use of online community weblog systems. In
Proceedings of the 2006 ACM SIGMIS CPR conference on computer personnel research: Forty
318
four years of computer personnel research: achievements, challenges & the future (pp. 183-189).
ACM.
Liao, C., Chen, J.-L., Yen, D.C. (2007) Theory of planning behavior (TPB) and customer
satisfaction in the continued use of e-service: an integrated model. Computers in human behavior.
Lickel, B., Hamilton, D. L., & Sherman, S. J. (2001). Elements of a lay theory of groups: Types of
groups, relational styles, and the perception of group entitativity. Personality and Social Psychology
Review, 5(2), 129-140.
Light, J., & McNaughton, D. (2014). Communicative competence for individuals who require
augmentative and alternative communication: A new definition for a new era of communication?
Augmentative and alternative communication.
Limayem, M., Hirt, S. G., & Cheung, C. M. (2007). How habit limits the predictive power of
intention: The case of information systems continuance. MIS quarterly, 705-737.
Limayem, M., Hirt, S. G., & Cheung, C. M. (2007). How habit limits the predictive power of
intention: The case of information systems continuance. MIS quarterly, 705-737.
Lin, H. H., & Wang, Y. S. (2006). An examination of the determinants of customer loyalty in
mobile commerce contexts. Information & management, 43(3), 271-282.
Lin, P. J., Kao, C. C., Lam, K. H., & Tsai, I. C. (2014). Design and implementation of a tourism
system using mobile augmented reality and gis technologies. In Proceedings of the 2nd
International Conference on Intelligent Technologies and Engineering Systems (ICITES2013) (pp.
1093-1099). Springer International Publishing.
Lincoln, Y. S., & Guba, E. G. (1994). RSVP: We are pleased to accept your invitation. Evaluation
Practice, 15(2), 179-192.
Little, T. D., Lindenberger, U., & Nesselroade, J. R. (1999). On selecting indicators for multivariate
measurement and modeling with latent variables: When" good" indicators are bad and" bad"
indicators are good. Psychological Methods, 4(2), 192.
Litvin, S. W., Crotts, J. C., & Hefner, F. L. (2004). Cross‐cultural tourist behaviour: a replication
and extension involving Hofstede's uncertainty avoidance dimension. International Journal of
Tourism Research, 6(1), 29-37.
Lohr, S. (2012). The age of big data. New York Times, 11(2012).
Long, L. M. (Ed.). (2004). Culinary tourism. Lexington: University Press of Kentucky.
Lovelock, C. H., & Wirtz, J. (2001). Services marketing: people, technology, strategy. Pearson
Prentice Hall.
Lyon, D. (2013). The information society: Issues and illusions. John Wiley & Sons.
MacKenzie, I. S., & Soukoreff, R. W. (2002). Text entry for mobile computing: Models and
methods, theory and practice. Human–Computer Interaction, 17(2-3), 147-198.

319
MacKenzie, S. B., Podsakoff, P. M., & Podsakoff, N. P. (2011). Construct measurement and
validation procedures in MIS and behavioral research: Integrating new and existing techniques. MIS
quarterly, 35(2), 293-334.
Makarenko S.N., Saak A. E. Tourism history. URL:
http://tourlib.net/books_history/makarenko5.htm
Malinowski, B. (2001). A scientific theory of culture and other essays (Vol. 9). Psychology Press.
Marangunic, N., & Granic, A. (2015). Technology acceptance model: a literature review from 1986
to 2013. Universal Access in the Information Society, 14(1), 81.
Marcus, C. (1998). A practical yet meaningful approach to customer segmentation. Journal of
consumer marketing, 15(5), 494-504.
MarketLine Industry Profile Mobile Phones in Russia, 2015
MarketLine Industry Profile : Mobile Phones in France, 2015
MarketLine, Industry Profile: Global Restaurants, 2015
Martin, W. J. (1996). Global information society. Ashgate Publishing Company.
Marwell, G., & Schmitt, D. R. (2013). Cooperation: An experimental analysis. Academic Press.
Mastorakis, G., Trihas, N., Perakakis, E., & Kopanakis, I. (2015). E-CRM in tourism exploiting
emerging information and communication technologies. Anatolia, 26(1), 32-44.
Mathieson, K. (1991). Predicting user intentions: comparing the technology acceptance model with
the theory of planned behavior. Information systems research, 2(3), 173-191.
Mathieson, K., & Doane, D. (2005). Using Fine-Grained Likert Scales in Web Surveys. Alliance
Journal of Business Research, 1(1), 27-34.
Mathieson, K., Peacock, E., & Chin, W. W. (2001). Extending the technology acceptance model:
the influence of perceived user resources. ACM SigMIS Database, 32(3), 86-112.
Mayer-Schönberger, V., & Cukier, K. (2013). Big data: A revolution that will transform how we
live, work, and think. Houghton Mifflin Harcourt.
McDonald, G. (2000). Cross-cultural methodological issues in ethical research. In Business
challenging business ethics: New instruments for coping with diversity in international
business (pp. 89-104). Springer Netherlands.
McIntosh, R. W., Goeldner, C. R., & Ritchie, J. R. B. (1986). Tourism. Principles, Practises,
Philosophies. New York: John Willey & Sons.
McIntosh, R. W., Goeldner, C. R., & Ritchie, J. R. B. (1995). Pleasure travel motivation. Tourism:
principles, practices, philosophies., (Ed. 7), 167-190.

320
Mende, M., Bolton, R. N., & Bitner, M. J. (2013). Decoding customer–firm relationships: how
attachment styles help explain customers' preferences for closeness, repurchase intentions, and
changes in relationship breadth. Journal of Marketing Research, 50(1), 125-142.
Mermet, G. (1996). Francoscopie 1997: comment vivent les Français?: faits, analyses, tendances,
comparaisons, 10,000 chiffres. Larousse.
Mermet, G. (2010). Francoscopie: tout sur les Français. Paris: Larousse.
Miller, A, I, (2012). History of the concept of a nation in Russia. Миллер, А. И. (2012). История
понятия нация в России. Отечественные записки, (1), 162-186.
Mingers, J. (2003). A classification of the philosophical assumptions of management science
methods. Journal of the operational research society, 54(6), 559-570.
Minkov, M., & Hofstede, G. (2011). The evolution of Hofstede's doctrine. Cross cultural
management: an international journal, 18(1), 10-20.
Mittal, V., Kumar, P., Tsiros, M. (1999). Attribute-level performance, satisfaction, and behavioral
intention over time: a consumption-system approach. Journal of marketing.
Moeller, K. (2010). Partner selection, partner behavior, and business network performance: An
empirical study on German business networks. Journal of accounting & organizational
change, 6(1), 27-51.
Möller, K. (2013). Theory map of business marketing: Relationships and networks
perspectives. Industrial marketing management, 42(3), 324-335.
Möller, K., & Halinen, A. (2000). Relationship marketing theory: its roots and direction. Journal of
marketing management, 16(1-3), 29-54.
Moore, G. C., & Benbasat, I. (1991). Development of an instrument to measure the perceptions of
adopting an information technology innovation. Information systems research, 2(3), 192-222.
Morgan, D. L. (2007). Paradigms lost and pragmatism regained methodological implications of
combining qualitative and quantitative methods. Journal of mixed methods research, 1(1), 48-76.
Morgan, R. M., & Hunt, S. D. (1994). The commitment-trust theory of relationship marketing. The
journal of marketing, 20-38.
Morishim, M., & Minami, T. (1983). Task Interdependence and Internal Motivation: Application of
Job Characteristic Model to" Collectivist" Cultures. 哲學, 77, 133-147.
Morosan, C., & DeFranco, A. (2016). It's about time: Revisiting UTAUT2 to examine consumers’
intentions to use NFC mobile payments in hotels. International Journal of Hospitality Management,
53, 17-29.
Morrel-Samuels, P. (2003). Web surveys’ hidden hazards. Harvard Business Review, 81(7), 16-17.
Morris, M. G., & Venkatesh, V. (2000). Age differences in technology adoption decisions:
Implications for a changing work force. Personnel psychology, 53(2), 375-403.
321
Morse, J.M., Niehaus, L. (2009). Mixed methods design: Principles and procedures. Routledge.
Myers, M. D., & Tan, F. B. (2003). Beyond models of national culture in information systems
research. Advanced topics in global information management, 2, 14-29.
Nair, P. K., Ali, F., & Leong, L. C. (2015). Factors affecting acceptance & use of ReWIND:
Validating the extended unified theory of acceptance and use of technology. Interactive Technology
and Smart Education, 12(3), 183-201.
Nakata, C. (Ed.). (2009). Beyond Hofstede: Culture frameworks for global marketing and
management. Springer.
Nistor, N. (2014). When technology acceptance models won’t work: Non-significant intention-
behavior effects. Computers in human behavior, (34), 299-300.
Nistor, N., Lerche, T., Weinberger, A., Ceobanu, C., & Heymann, O. (2014). Towards the
integration of culture into the Unified Theory of Acceptance and Use of Technology. British
journal of educational technology, 45(1), 36-55.
Nunnally, J. C. (1967). Psychometric theory. NY: McGraw-Hill.
O’Brien, H. L. (2010). The influence of hedonic and utilitarian motivations on user engagement:
The case of online shopping experiences. Interacting with Computers, 22(5), 344-352.
OECD Tourism Trends and Policies 2015
Oechslein, O., Fleischmann, M., & Hess, T. (2014, January). An application of UTAUT2 on social
recommender systems: Incorporating social information for performance expectancy. In System
Sciences (HICSS), 2014 47th Hawaii International Conference on (pp. 3297-3306). IEEE.
Ovcharov, A. O., Vasiljeva, M. V., & Shirin, S. S. (2015). The Russian tourist industry: Structure,
trends, competitiveness at the world market. Review of European Studies, 7(9), 151.
Palmatier, R. W. (2008). Relationship marketing (pp. 1-140). Cambridge, MA: Marketing Science
Institute.
Palmatier, R. W., Dant, R. P., Grewal, D., & Evans, K. R. (2006). Factors influencing the
effectiveness of relationship marketing: a meta-analysis. Journal of marketing, 70(4), 136-153.
Palmatier, R. W., Gopalakrishna, S., & Houston, M. B. (2006). Returns on business-to-business
relationship marketing investments: Strategies for leveraging profits. Marketing Science, 25(5),
477-493.
Palmatier, R. W., Houston, M. B., Dant, R. P., & Grewal, D. (2013). Relationship velocity: toward
a theory of relationship dynamics. Journal of Marketing, 77(1), 13-30.
Palmatier, R. W., Jarvis, C. B., Bechkoff, J. R., & Kardes, F. R. (2009). The role of customer
gratitude in relationship marketing. Journal of marketing, 73(5), 1-18.
Parasuraman, A., Berry, L. L., & Zeithaml, V. A. (1991). Understanding customer expectations of
service. MIT Sloan Management Review, 32(3), 39.

322
Paris Region Key Figures 2016
Park, J. H., Kim, D. Y., & Kim, S. H. (2011). The Effects of Structural Factors of Administered
Channels on the Retailer's Trust in the Supplier and Long-Term Orientation: Focusing on the
Moderating Effect of Relationship Lifecycle. Journal of distribution research, 16.
Parker, L. (1992). Collecting data the e-mail way. Training & Development, 46(7), 52-55.
Parr, M.G. (1999). Leisure theory and practice: a critical approach. Canadian association of leisure
studies.
Parsons, T., & Shils, E. A. (1951). Values, motives, and systems of action. Toward a general theory
of action. Glencoe, Ill., Free P. 33, 247-275.
Parvatiyar, A., & Sheth, J. N. (2000). The domain and conceptual foundations of relationship
marketing. Handbook of relationship marketing, 1, 3-38.
Perna, A., & Baraldi, E. (2014). CRM, Its Roots in Management Studies and Recent Research
Trends. In CRM Systems in industrial companies (pp. 57-76). Palgrave Macmillan UK.
Perna, A., & Baraldi, E. (2014). CRM Systems in industrial companies: Intra-and inter-
organizational effects. Springer.
Peter, J. P. (1981). Construct validity: A review of basic issues and marketing practices. Journal of
marketing research, 133-145.
Phillips, D. C., & Burbules, N. C. (2000). Postpositivism and educational research. Rowman &
Littlefield.
Philosophies. New York: John Willey & Sons.
Polasky, S., Carpenter, S. R., Folke, C., & Keeler, B. (2011). Decision-making under great
uncertainty: environmental management in an era of global change. Trends in ecology &
evolution, 26(8), 398-404.
Polites, G. L., & Karahanna, E. (2012). Shackled to the status quo: The inhibiting effects of
incumbent system habit, switching costs, and inertia on new system acceptance. MIS
quarterly, 36(1), 21-42.
Porter, M. E., Hills, G., Pfitzer, M., Patscheke, S., & Hawkins, E. (2011). Measuring shared
value. How to Unlock Value by Linking Social and Business Results, 10-11.
Preacher, K. J., & Hayes, A. F. (2008). Asymptotic and resampling strategies for assessing and
comparing indirect effects in multiple mediator models. Behavior research methods, 40(3), 879-
891.
Premkumar, G., & Bhattacherjee, A. (2008). Explaining information technology usage: A test of
competing models. Omega, 36(1), 64-75.
Raaij, W. (1978). Cross-cultural research methodology as a case of construct validity. NA-Advances
in Consumer Research Volume 05.

323
Rahimi, R., Nadda, V. K., & Wang, H. (2015). CRM in Tourism: Customer Relationship
Management (CRM). In Emerging Innovative Marketing Strategies in the Tourism Industry (pp. 16-
43). IGI Global.
Rauyruen, P., & Miller, K. E. (2007). Relationship quality as a predictor of B2B customer
loyalty. Journal of business research, 60(1), 21-31.
Ravald, A., & Grönroos, C. (1996). The value concept and relationship marketing. European
journal of marketing, 30(2), 19-30.
Read, W., Robertson, N., & McQuilken, L. (2011). A novel romance: The Technology Acceptance
Model with emotional attachment. Australasian Marketing Journal (AMJ), 19(4), 223-229.
Recommendations on Tourism Statistics by UNWTO and UNSTAT in 1994.
Reinartz, W., Haenlein, M., & Henseler, J. (2009). An empirical comparison of the efficacy of
covariance-based and variance-based SEM. International Journal of research in Marketing, 26(4),
332-344.
Reisinger, Y., & Turner, L. W. (2003). Cross-cultural behaviour in tourism: Concepts and analysis.
Elsevier.
Ringle, C. M., Sarstedt, M., & Straub, D. (2012). A critical look at the use of PLS-SEM. MIS
quarterly.
Ringle, C. M., Wende, S., & Will, A. (2010). Finite mixture partial least squares analysis:
Methodology and numerical examples. Handbook of partial least squares, 195-218.
Rinne, T., Steel, G. D., & Fairweather, J. (2012). Hofstede and Shane revisited: the role of power
distance and individualism in national-level innovation success. Cross-cultural research, 46(2), 91-
108.
Rogers, E. M. (1976). New product adoption and diffusion. Journal of consumer Research, 2(4),
290-301.
Rogers, E. M. (1994). History of communication study. New York: Free Press.
Rogers, E. M. (2010). Diffusion of innovations. Simon and Schuster.
Rogers, E.M. (2001). New product adoption and diffusion. The journal of consumer research.
Rogers, E.M., Mahler, A. (1999). The diffusion of interactive communication innovations and the
critical mass: the adoption of telecommunications services by German banks. Elsevier science Ltd.
Rokeach, M. (1973). Values list. The nature of human values. Free press.
Rondan-Cataluña, F. J., Arenas-Gaitán, J., & Ramírez-Correa, P. E. (2015). A comparison of the
different versions of popular technology acceptance models: A non-linear perspective. Kybernetes,
44(5), 788-805.

324
Roster, C. A., Rogers, R. D., Albaum, G., & Klein, D. (2004). A comparison of response
characteristics from web and telephone surveys. International journal of marketing research, 46,
359-374.
Rothchild, I. (2006). Induction, deduction, and the scientific method. Soc. study Reprod.
Rudy, I. A. (1996). A critical review of research on electronic mail. European Journal of
Information Systems, 4(4), 198-213.
Ruengaramrut, V., Ribiere, V., & Ammi, C. (2015, November). A component diagram presenting a
gamified environment supporting customer engagement in a service innovation process. In
International Conference on Intellectual Capital and Knowledge Management and Organisational
Learning (p. 401). Academic Conferences International Limited.
RUSSIA` 2015, Statistical pocketbook.
Russian food market, 2015 RBC
Ryu, K., Lee, H. R., & Gon Kim, W. (2012). The influence of the quality of the physical
environment, food, and service on restaurant image, customer perceived value, customer
satisfaction, and behavioral intentions. International Journal of Contemporary Hospitality
Management, 24(2), 200-223.
Sabir, L. B. (2015). Customer Loyalty: Concept, Context and Character. Al-Barkaat Journal of
Finance & Management, 7(2), 103-104.
Sackmary, B. (1998, January). Internet survey research: Practices, problems, and prospects. In
American marketing association. Conference proceedings (Vol. 9, p. 41). American Marketing
Association.
Salovaara, A., & Tamminen, S. (2009). Acceptance or appropriation? A design-oriented critique of
technology acceptance models. In Future interaction design II (pp. 157-173). Springer London.
Salovaara, A., & Tamminen, S. (2009). Acceptance or appropriation? A design-oriented critique of
technology acceptance models. In Future interaction design II (pp. 157-173). Springer London.
Samaha, S. A., Beck, J. T., & Palmatier, R. W. (2014). The role of culture in international
relationship marketing. Journal of Marketing, 78(5), 78-98.
Samaha, S. A., Palmatier, R. W., & Dant, R. P. (2011). Poisoning relationships: Perceived
unfairness in channels of distribution. Journal of Marketing, 75(3), 99-117.
Sanakulov, N., & Karjaluoto, H. (2015). Consumer adoption of mobile technologies: a literature
review. International Journal of Mobile Communications, 13(3), 244-275.
Satorra, A., & Bentler, P. (2011). Scaling corrections for statistics in covariance structure analysis.
Department of Statistics, UCLA.
Schepers, J., & Wetzels, M. (2007). A meta-analysis of the technology acceptance model:
Investigating subjective norm and moderation effects. Information & management, 44(1), 90-103.

325
Schillewaert, N., & Meulemeester, P. (2005). Comparing response distributions of offline and
online data collection methods. International journal of market research, 47(2), 163-178.
Schneider, B. (2001, August). GIS functionality in multimedia atlases: spatial analysis for everyone.
In Proc. of the 20th Int. cartographic conference, Beijing.
Schuldt, B. A., & Totten, J. W. (1994). Electronic mail vs. mail survey response rates. Marketing
Research, 6(1), 3-7.
Schulz, A. (1996). The role of global computer reservation systems in the travel industry today and
in the future. Newsletter competence center electronic markets, 6(2).
Schwartz, S. H. (2012). An overview of the Schwartz theory of basic values. Online readings in
Psychology and Culture, 2(1), 11.
Segars, A. H., & Grover, V. (1993). Re-examining perceived ease of use and usefulness: A
confirmatory factor analysis. MIS quarterly, 517-525.
Sekaran, U. (2006). Research methods for business: A skill building approach. John Wiley & Sons.
Sekaran, U., & Bougie, R. (2013). Research methods for business: A skill-building approach .[e-
book].
Selltiz, C., Wrightsman, L. S., Cook, S. W., Balch, G. I., Hofstetter, R., & Bickman, L. (1976).
Research methods in social relations. New York : Holt, Rinehart and Winston
Sezgin, E. (Ed.). (2016). e-Consumers in the Era of New Tourism. Springer.
Shaiq, H. M. A., Khalid, H. M. S., Akram, A., & Ali, B. (2011). Why not everybody loves
Hofstede? What are the alternative approaches to study of culture. European Journal of Business
and Management, 3(6), 101-111.
Shao, X., & Siponen, M. (2011, January). Consumer acceptance and use of information technology:
Adding consumption theory to UTAUT2. In Proceedings> Proceedings of SIGSVC Workshop.
Sprouts: Working Papers on Information Systems (Vol. 11, No. 157, pp. 11-157).
Sheehan, K. B. (2001). E-mail survey response rates: A review. Journal of computer mediated
communication, 6(2), 0-0.
Sheppard, B. H., Hartwick, J., & Warshaw, P. R. (1988). The theory of reasoned action: A meta-
analysis of past research with recommendations for modifications and future research. Journal of
consumer research, 15(3), 325-343.
Sheppard, B. H., Hartwick, J., & Warshaw, P. R. (1988). The theory of reasoned action: A meta-
analysis of past research with recommendations for modifications and future research. Journal of
consumer research, 15(3), 325-343.
Shin, C., Hong, J. H., & Dey, A. K. (2012, September). Understanding and prediction of mobile
application usage for smart phones. In Proceedings of the 2012 ACM Conference on ubiquitous
computing (pp. 173-182). ACM.

326
Sirdeshmukh, D., Singh, J., & Sabol, B. (2002). Consumer trust, value, and loyalty in relational
exchanges. Journal of marketing, 66(1), 15-37.
Slade, E. L., Dwivedi, Y. K., Piercy, N. C., & Williams, M. D. (2015). Modeling consumers’
adoption intentions of remote mobile payments in the United Kingdom: extending UTAUT with
innovativeness, risk, and trust. Psychology & Marketing, 32(8), 860-873.
Slade, E. L., Williams, M. D., & Dwivedi, Y. (2013, March). Extending UTAUT2 To Explore
Consumer Adoption Of Mobile Payments. In UKAIS (p. 36).
Sniehotta, F. F., Presseau, J., & Araújo-Soares, V. (2014). Time to retire the theory of planned
behaviour.
Spang, R. (2000). The Invention of the Restaurant: Paris and Modern Gastronomic Culture.
Cambridge: Harvard University Press.
Spash, C. L. (2000). Multiple value expression in contingent valuation: economics and ethics.
Environ. Sci. Technol. 2000, 34, 1433-1438
Stanton, J. M. (1998). An empirical assessment of data collection using the Internet. Personnel
psychology, 51(3), 709-725.
Steenkamp, J. B. E. (2001). The role of national culture in international marketing research.
International marketing review, 18(1), 30-44.
Steenkamp, J. B. E., & Baumgartner, H. (2000). On the use of structural equation models for
marketing modeling. International journal of research in marketing, 17(2), 195-202.
Steenkamp, J. B. E., & Van Trijp, H. C. (1991). The use of LISREL in validating marketing
constructs. International journal of research in marketing, 8(4), 283-299.
Steensma, H. K., Marino, L., Weaver, K. M., & Dickson, P. H. (2000). The influence of national
culture on the formation of technology alliances by entrepreneurial firms. Academy of management
journal, 43(5), 951-973.
STINGLER, G. J. (1951). The division of labor is Iimited by the extend of the market. Journal of
Political Economy, (59).
Stone, M. (1974). Cross-validatory choice and assessment of statistical predictions. Journal of the
royal statistical society. Series B (Methodological), 111-147.
Subhani, M. I., Hasan, S. A., & Osman, A. (2011). Research methodologies for management
sciences & interdisciplinary research in contemporary world. European Journal of Scientific
Research, 63(4), 543-547.
Suhr, D. (2006). The basics of structural equation modeling. Presented: Irvine, CA, SAS User group
of the western region of the United States (WUSS).
Sun, H., & Zhang, P. (2006). The role of moderating factors in user technology acceptance.
International journal of human-computer studies, 64(2), 53-78.

327
Szajna, B. (1996). Empirical evaluation of the revised technology acceptance model. Management
science, 42(1), 85-92.
Taiwo, A. A., & DOWNE, A. G. (2013). The theory of user acceptance and use of technology
(UTAUT): A meta-analytic review of empirical findings. Journal of Theoretical & Applied
Information Technology, 49(1).
Takhar-Lail, A., Chorbani, A. (2014). Market research methodologies : multi-method and
qualitative approaches. ISI Global.
Tanaka, J. S. (1993). Multifaceted conceptions of fit in structural equation models. Sage focus
editions, 154, 10-10.
Tang, D., & Chen, L. (2011, May). A review of the evolution of research on information
Technology Acceptance Model. In Business Management and Electronic Information (BMEI), 2011
International Conference on (Vol. 2, pp. 588-591). IEEE.
Tenenhaus, M., Vinzi, V. E., Chatelin, Y. M., & Lauro, C. (2005). PLS path modeling.
Computational statistics & data analysis, 48(1), 159-205.
The Demographic Yearbook of Russia, Federal State statistics service.
Thomas, R., & Skinner, L. (2010). Total trust and trust asymmetry: Does trust need to be equally
distributed in interfirm relationships?. Journal of relationship marketing, 9(1), 43-53.
Thompson, L. F., Surface, E. A., Martin, D. L., & Sanders, M. G. (2003). From paper to pixels:
Moving personnel surveys to the Web. Personnel psychology, 56(1), 197-227.
Thong, J. Y., Hong, S. J., & Tam, K. Y. (2006). The effects of post-adoption beliefs on the
expectation-confirmation model for information technology continuance. International journal of
human-computer studies, 64(9), 799-810.
Throsby, D. (2001). Economics and culture. Cambridge university press.
Tolstrup, M. (2015). Indoor Radio Planning: A Practical Guide for 2G, 3G and 4G. John Wiley &
Sons.
Tourangeau, R., Conrad, F. G., Couper, M., P., (2013). The science of web survey.
Tourism: normative legal acts of Russia: Collection of acts / Comp. NI Voloshin
Triandis, H. C. (1989). The self and social behavior in differing cultural contexts. Psychological
review, 96(3), 506.
Triandis, H. C. (1995). Individualism & collectivism. Westview press.
Trinquecoste, J. F. (2005). Marketing, stratégie et rhétorique. Décisions marketing, 77-80.
Trinquecoste, J. F., & Bidan, M. (2011). Regards croisés sur le processus d'appropriation des
Technologies de l'Information et de la Communication. Management & Avenir, (5), 175-178.
Tsoukas, H. (1989). The validity of idiographic research explanations. Academy of management
review, 14(4), 551-561.

328
Turk, T., & Gumusay, M. U. (2004, July). GIS design and application for tourism. In XXth ISPRS
Congress (pp. 12-23).
Turner, M., Kitchenham, B., Brereton, P., Charters, S., & Budgen, D. (2010). Does the technology
acceptance model predict actual use? A systematic literature review. Information and Software
Technology, 52(5), 463-479.
USDA Foreign Agricultural Service, GAIN Report: Food Service - Hotel Restaurant, Institutional,
Russian Federation. HRI Sector Adapting to Slowing Economy and Ruble. USDA GAIN Reports.
USDA Foreign Agricultural Service, GAIN Report: Food Service - Hotel Restaurant, Institutional,
France. Annual. Report Number: FR9186, 31.12.2015
USDA Foreign Agricultural Service, GAIN Report: Franchise Restaurants Doing Well Despite
Slowing Economy, Russian Federation, Report number: RSATO13, 18.05.2015
USDA Foreign Agricultural Service, GAIN Report: Russian Federation. Report number:
RFATO031, 22.01.2016
van Biljon, J., & Renaud, K. (2008). A qualitative study of the applicability of technology
acceptance models to senior mobile phone users. Advances in conceptual modeling–Challenges and
opportunities, 228-237.
Van der Heijden, H. (2004). User acceptance of hedonic information systems. MIS quarterly, 695-
704.
Vaus, D. de, (2014). Surveys in Social Research
Venkatesh, V. (2000). Determinants of perceived easy of use: integrating control, intrinsic
motivation, and emotion into the technology acceptance model. Information systems research.
Venkatesh, V. (2014). Technology acceptance model and the unified theory of acceptance and use
of technology. Wiley Encyclopedia of Management.
Venkatesh, V., & Bala, H. (2008). Technology acceptance model 3 and a research agenda on
interventions. Decision sciences, 39(2), 273-315.
Venkatesh, V., & Davis, F. D. (2000). A theoretical extension of the technology acceptance model:
Four longitudinal field studies. Management science, 46(2), 186-204.
Venkatesh, V., & Ramesh, V. (2006). Web and wireless site usability: understanding differences
and modeling use. MIS quarterly, 181-206.
Venkatesh, V., Davis, F. D., & Morris, M. G. (2007). Dead or alive? The development, trajectory
and future of technology adoption research. Journal of the association for information
systems, 8(4), 267.
Venkatesh, V., Goyal, S. (2010). Expectation disconfirmation and technology adoption: polynomial
modeling and response surface analysis. MIS quarterly.

329
Venkatesh, V., Morris, M. G., Davis, G. B., & Davis, F. D. (2003). User acceptance of information
technology: Toward a unified view. MIS quarterly, 425-478.
Venkatesh, V., Ramesh, V. (2006). Web and wireless site usability: understanding differences and
modeling use. MIS quarterly.
Venkatesh, V., Thong, J. Y., Chan, F. K., Hu, P. J. H., & Brown, S. A. (2011). Extending the
two‐stage information systems continuance model: Incorporating UTAUT predictors and the role of
context. Information Systems Journal, 21(6), 527-555.
Venkatesh, Viswanath and Thong, James Y.L. and Xu, Xin, (2012). Consumer Acceptance and Use
of Information Technology: Extending the Unified Theory of Acceptance and Use of Technology
MIS Quarterly, Vol. 36, No. 1, pp. 157-178, 2012. Available at
SSRN: https://ssrn.com/abstract=2002388
Vilares, M. J., Almeida, M. H., & Coelho, P. S. (2010). Comparison of likelihood and PLS
estimators for structural equation modeling: a simulation with customer satisfaction data. In
Handbook of partial least squares (pp. 289-305). Springer Berlin Heidelberg.
Vinzi, V. E., Chin, W. W., Henseler, J., & Wang, H. (Eds.). (2010). Handbook of partial least
squares: Concepts, methods and applications. Springer science & Business media.
Vivek, S. D., Beatty, S. E., & Morgan, R. M. (2012). Customer engagement: Exploring customer
relationships beyond purchase. Journal of marketing theory and practice, 20(2), 122-146.
Von Wieser, F. (2013). Social economics. Routledge.
Wall, G. and Mathieson, A. (2006). Tourism. Change, impacts and opportunities. Pearson.
Wang, L., Law, R., Hung, K., & Guillet, B. D. (2014). Consumer trust in tourism and hospitality: A
review of the literature. Journal of Hospitality and Tourism Management, 21, 1-9.
Wang, Y. S., Li, H. T., Li, C. R., & Zhang, D. Z. (2016). Factors affecting hotels' adoption of
mobile reservation systems: A technology-organization-environment framework. Tourism
management, 53, 163-172.
Webster, F. (2014). Theories of the information society. Routledge.
Werthner, H., Ricci, F. (2004). E-commerce and tourism. Communications of the ACM.
Williams, C. (2011). Research methods. Journal of business & Economics research (JBER), 5(3).
Williams, J. D., Han, S. L., & Qualls, W. J. (1998). A conceptual model and study of cross-cultural
business relationships. Journal of business research, 42(2), 135-143.
Williamson, O. E. (1975). Markets and hierarchies. New York, 26-30.
Williamson, O. E. (1996). Economic organization: The case for candor. Academy of management
review, 21(1), 48-57.

330
Wilson, A., Zeithaml, V. A., Bitner, M. J., & Gremler, D. D. (2012). Services marketing:
Integrating customer focus across the firm. McGraw Hill.
Wilson, D. T. (1995). An integrated model of buyer-seller relationships. Journal of the academy of
marketing science, 23(4), 335-345.
Wirtz, J., & Chew, P. (2002). The effects of incentives, deal proneness, satisfaction and tie strength
on word-of-mouth behaviour. International journal of service industry management, 13(2), 141-
162.
Wold, H. (1975). Path models with latent variables: The NIPALS approach. Acad. Press, (pp. 307-
357).
Wold, H. (1985). Partial least squares. Encyclopedia of statistical sciences.
Wong, K. K. K. (2013). Partial least squares structural equation modeling (PLS-SEM) techniques
using SmartPLS. Marketing bulletin, 24(1), 1-32.
World Development Report, 2015
World Economic Outlook Report (2016)
World Travel and Tourism Council. Travel and Tourism, economic impact 2015, France
Wu, J. H., & Wang, S. C. (2005). What drives mobile commerce?: An empirical evaluation of the
revised technology acceptance model. Information & management, 42(5), 719-729.
Wulf, K. D., Odekerken-Schröder, G., & Iacobucci, D. (2001). Investments in consumer
relationships: A cross-country and cross-industry exploration. Journal of marketing, 65(4), 33-50.
Yong, A. G., & Pearce, S. (2013). A beginner’s guide to factor analysis: Focusing on exploratory
factor analysis. Tutorials in Quantitative methods for psychology, 9(2), 79-94.
Yousafzai, S. Y., Foxall, G. R., & Pallister, J. G. (2007). Technology acceptance: a meta-analysis of
the TAM: Part 2. Journal of Modelling in Management, 2(3), 281-304.
Zeithaml, V. A. (1988). Consumer perceptions of price, quality, and value: a means-end model and
synthesis of evidence. The journal of marketing, 2-22.
Zeithaml, V. A., Berry, L. L., & Parasuraman, A. (1993). The nature and determinants of customer
expectations of service. Journal of the academy of marketing science, 21(1), 1-12.
Zhang, D., & Adipat, B. (2005). Challenges, methodologies, and issues in the usability testing of
mobile applications. International journal of human-computer interaction, 18(3), 293-308.
Zikmund, W. G., & Babin, B. J., Carr, JC, & Griffin, M.(2009). Business research methods.

331
Sites consulted
http://geert-hofstede.com/
http://habrahabr.ru/
http://innospace.ru/mobilnyie-marketingovyie-kommunikatsi/
http://worldfoodtravel.org
http://www.distimo.com/about
http://www.economie.gouv.fr/
http://www.euromonitor.com/
http://www.flurry.com/
http://www.gartner.com/technology/home.jsp
http://www.gks.ru/
http://www.jiwire.com/news-updates/press-releases/
http://www.russiatourism.ru/
http://www.softpressrelease.com/
http://www.worldbank.org/
http://www.wttc.org/
http://www2.unwto.org/
https://www.cen.eu/
http://www.imf.org/
http://www.girafoodservice.com/
http://worldfoodtravel.org/
http://web.json.ru/en/json_partners/
http://www.criteo.com/
https://www2.deloitte.com/
https://www.opentable.com/
http://en.unesco.org/
https://wapstart.ru/en/
https://www.mos.ru/en/
https://www.insee.fr/
http://www.oecd.org/
http://www.economie.gouv.fr/les-ministeres/directions-ministere-economie-industrie-et-
numerique
http://atout-france.fr/
http://www.parisinfo.com/
http://www.cci-paris-idf.fr/

332
https://2gis.ru/
https://www.tripadvisor.com/
http://allcafe.ru/
https://msk.resto.ru/
http://stoliki.ru/
https://www.lafourchette.com/
https://restaurant.michelin.fr/
http://statistica.io/resources/
http://www.rostourunion.ru
https://www.apple.com/pr/

333
Annexes

334
Annex 1: Homepage of the website resto.ru
Annex 2-4: Examples of cooperation with tripadvisor
List of the restaurants on tripadvisor The application form for booking Logo of ZON, booking project of
Resto.ru

335
Annex 5: Choice of the city
Annex 6: Choice of the restaurant: by name, by location
Annex 7: Bottle of champagne as a gift for booking

336
Annex 8: Homepage of the website Lafourchette
Annex 9-11: Mobile application’s functionality
Choice of the city Search for the restaurant Tripadvisor rating

337
Annex 12-14: Loyalty program
Yums score Special offer by restaurant
establishment
Annex 15: Mobile application for the restaurants’ managers

338
Annex 16: The first version of survey before the experts’ validation.
Please mark one answer in each line Several
times per
week
Once a
week
Several
times per
month
Less than
once a month
Never
1 How often do You go out for lunch/dinner?
2 Please choose your usage frequency for
each of the following by choosing the
restaurant:
a) Mobile application N
b) Website of N
c) other website
d) other mobile application
3 How long are You using the mobile
application N in years? (If your answer on
the previous question a) was other than
never)
4 How long are You using any mobile
application for choosing a restaurant in
years? (If your answer on the previous
question d) was other than never)
5 How long are You using smart phone (in
years)?
Please mark one answer in each line
across
Strongly
Agree
Agree Neither
agree nor
disagree
disagree Strongly
disagree
6 I have resources (IOS, Android, Wi-Fi)
necessary to use mobile application.
7 I have the knowledge necessary to use the
mobile application
8 The use of mobile applications has become
a habit for me.
9 The mobile application N is free for
downloading.
10 Application design:
Overall, I think the mobile application N is
designed well
11 I am very satisfied with the overall design
of the mobile application N.
12 User interface structure:
Overall, I think the mobile application N
structures information effectively
13 I am very satisfied with the way the mobile
application N is structured
14 I use geolocation on mobile application N
when reserving the restaurant
15 I can get help from mobile application
provider when I have difficulties using
mobile application N.
16 Mobile application N gives me a feeling of
trust.

339
17 The information provided by mobile
application N is always honest.
18 Mobile application N is trustworthy
19 I intend to continue using mobile
application in the future.
20 I will always try to use mobile application
in my daily life.
21 I plan to continue to use mobile application
frequently.
22 I intend to continue using mobile
application rather than discontinue its use.
23 My intentions are to continue using mobile
application than use any alternative means
24 If I could, I would like to discontinue my
use of mobile application.
25 I encourage friends and relatives to be the
customers of the mobile application N
26 I will use more services offered by the
mobile application N in the next few
months/years
27 I consider the mobile application N to be
my first choice
Please mark one answer in each line very likely likely undecided unlikely very
unlikely
28
How likely are you to:
make more than in 50 % of reservation in
restaurants using mobile application N?
29 use mobile application N the very next time
you choose the restaurant?
Please mark one answer in each line Several
times per
week
Once a
week
Several
times per
month
Less than
once a month
Never
30 How often You go out for lunch/dinner
because of promotion on the mobile
application N
Please circle one answer in each line Strongly
Agree
Agree Neither
agree nor
disagree
disagree Strongly
disagree
31 The bonuses and promotions provided by
mobile application N are reasonable.
32 I use mobile application N to enjoy
promotions
33 I check the promotions on mobile
application N in the restaurant before
entering it
34 I prefer to go to the restaurant next to me
even there are no promotions
35 I prefer to go to the long-run restaurant
because of promotions on the mobile
application
36 I keep time free for leisure
37 Other people or circumstances can not
change my intention

340
38 I like to live in Moscow / Paris
39 Your year of birth?
40 Your gender?
41 Your professional occupation?


Titre : Utilisation des applications mobiles dans les secteurs du tourisme et de la restauration: étude
comparative entre la France et la Russie
Mots clés : marketing mobile, application mobile, technologie, comportement des consommateurs,
tourisme, restaurants
Résumé : Les smartphones avec leurs
différentes applications ont créé une nouvelle
base de clients. Les données de l'utilisateur des
smartphones, obtenues en grande quantité,
permettent aux entreprises de développer leurs
stratégies marketing et d'augmenter également
le nombre de biens et de services achetés. Les
marchés du tourisme et de la restauration offrent
de nouvelles possibilités grâce à l'utilisation
d'applications mobiles dans le but d'améliorer la
qualité des services offerts.
L'objectif de cette recherche est d'étudier
l'utilisation des applications mobiles dans les
industries du tourisme et de la restauration et
d'effectuer une comparaison interculturelle entre
la Russie et la France. Pour atteindre cet objectif
tant théorique qu’empirique, nous avons
appliqué une approche hypothético-déductive.
Dans notre recherche, deux applications
mobiles sont analysées: Lafourchette en France
et Resto en Russie. L'utilisation de l'application
mobile est examinée à partir de trois points de
vue théorique: l'utilisation de la technologie, le
marketing relationnel et la théorie culturelle. Le
modèle TUAUT2 est le modèle central de notre
recherche; modèle qui a fait l'objet de
nombreuses études. Nous avons considéré ce
modèle en relation avec le marketing relationnel
et les dimensions culturelles.
Les résultats de notre étude sur l'utilisation des
applications mobiles ont confirmé nos
hypothèses. La comparaison interculturelle a
démontré des différences liées aux problèmes
économiques, culturels et technologiques.
Nos résultats sont discutés à partir des
perspectives théoriques et managériales.
Title : Mobile application use in the tourism and restaurant industries : comparative study between
France and Russia
Keywords: mobile marketing, mobile application, technology, consumer behavior, tourism,
restaurant
Abstract: The smartphones with application
stores have created a new customer base. The
smartphone user's data, obtained in huge
amount every second, enables companies to
build their marketing strategies, and to increase
the number of goods and services purchased.
The tourism and restaurant markets offer new
possibilities with the use of mobile applications
in order to improve the quality of the provided
services.
The objective of this research is to study
mobile application use in the tourism and
restaurant industries and to accomplish cross-
cultural comparison between Russia and
France. Applying a hypothetico-deductive
approach both theoretical and empirical
investigations are serving this objective.
In the research two mobile applications are
analyzed: Lafourchette in France and Resto in
Russia. The mobile application use is regarded
from three theoretical points of view:
technology’s use, relationship marketing and
cultural theory. UTAUT2 model is the central
model of the research; this model has been a
subject of numerous studies. We regarded this
model in relation to relationship marketing and
cultural dimensions.
The results of the survey about mobile
application use confirmed the hypotheses.
Cross-cultural comparison demonstrated
differences related to the economical, cultural
and technology’s issues.
Our findings are discussed from theoretical and
managerial perspectives.