THESE DOCTEUR
291
N° d’ordre : IMT LILLE DOUAI UNIVERSITE DE LILLE THESE présentée en vue d’obtenir le grade de DOCTEUR en Discipline : Chimie théorique, physique, analytique Spécialité : Optique et Lasers, Physico-chimie, Atmosphère par Darya URUPINA DOCTORAT DE L’UNIVERSITE DE LILLE DELIVRE PAR IMT LILLE DOUAI Titre de la thèse : Uptake and reactivity of sulfur dioxide gas onto Icelandic volcanic dusts Soutenue le 15 décembre 2020 devant le jury d’examen : Rapportrice Paola FORMENTI DR CNRS, LISA, CNRS / Université Paris Est Créteil Rapporteur Yuri BEDJANIAN DR CNRS, ICARE, CNRS / Université d’Orléans Membre Karine DEBOUDT Professeure, LPCA, Université du Littoral Côte d’Opale Membre Denis PETITPREZ Professeur, PC2A, Université de Lille Membre Antoine ROUSSEAU DR CNRS, LPP, CNRS / Ecole Polytechnique Encadrant de thèse Emmanouil ROMANIAS Maitre Assistant, SAGE, IMT Lille Douai Directeur de thèse Frédéric THEVENET Professeur, SAGE, IMT Lille Douai Laboratoire d’accueil : CERI-EE, Unité de Recherche SAGE, IMT Lille Douai Ecole Doctorale SMRE 104 (ULille, UPHF, Centrale Lille, Chimie Lille, IMT Lille Douai)
-
Upload
khangminh22 -
Category
Documents
-
view
2 -
download
0
Transcript of THESE DOCTEUR

N° d’ordre :
IMT LILLE DOUAI
UNIVERSITE DE LILLE
THESE
présentée en vue d’obtenir le grade de
DOCTEUR en
Discipline : Chimie théorique, physique, analytique
Spécialité : Optique et Lasers, Physico-chimie, Atmosphère
par
Darya URUPINA
DOCTORAT DE L’UNIVERSITE DE LILLE DELIVRE PAR IMT LILLE DOUAI
Titre de la thèse :
Uptake and reactivity of sulfur dioxide gas onto Icelandic volcanic dusts
Soutenue le 15 décembre 2020 devant le jury d’examen :
Rapportrice Paola FORMENTI DR CNRS, LISA, CNRS / Université Paris Est Créteil Rapporteur Yuri BEDJANIAN DR CNRS, ICARE, CNRS / Université d’Orléans Membre Karine DEBOUDT Professeure, LPCA, Université du Littoral Côte d’Opale Membre Denis PETITPREZ Professeur, PC2A, Université de Lille Membre Antoine ROUSSEAU DR CNRS, LPP, CNRS / Ecole Polytechnique
Encadrant de thèse Emmanouil ROMANIAS Maitre Assistant, SAGE, IMT Lille Douai Directeur de thèse Frédéric THEVENET Professeur, SAGE, IMT Lille Douai
Laboratoire d’accueil : CERI-EE, Unité de Recherche SAGE, IMT Lille Douai
Ecole Doctorale SMRE 104 (ULille, UPHF, Centrale Lille, Chimie Lille, IMT Lille Douai)


Acknowledgements

4 Acknowledgements

5 Acknowledgements
“Learning never exhausts the mind.”
Leonardo da Vinci
I would like to dedicate this work to the wonderful teachers that guided the journey to this thesis.
Especially, I’m thankful to Dr Sargon Albazi for his help and precious advice. Many thanks go to my first
chemistry teacher Valentina Nikolaevna Fomenko and my Triton College professor Dr Preet Saluja. I’m
especially grateful to my supervisors Dr Frederic Thevenet and Dr Emmanouil Romanias for making me a
part of the team and letting me explore the subject in the way that was fulfilling and challenging, but never
overpowering and suffocating. I would like to acknowledge my colleague Dr Jerome Lasne for his help with
both practical aspects of this thesis and administrative challenges of doing a PhD in France.
Pursuing a doctoral degree in France was also about discovery of a new country and in this context
I’m grateful to my French teacher Ioana Thiery and my colleagues, especially Raphael Brun, for helping me
overcome the language barrier and for being supportive in my cultural quest.
I am also very thankful to my friends here in France and in other parts of the world for their support
and for always believing in me. Finally, I am forever grateful to my family for never stopping me in my
adventures. Even though far away, I know that I can count on you.

Thesis Outline

2 Thesis outline
General Introduction…………………………………………………………………………….....3
Chapter I. Context, state of the art, objectives and strategy.......…………………………………..9
Chapter II. Materials and methods…………………………………………………………...……73
Chapter III. Investigation of the uptake of SO2 on natural v-dust: gas-phase approach……….…103
Chapter IV. In-situ monitoring of SO2 uptake on natural v-dust by DRIFT spectroscopy: toward
surface reaction pathways…………………………………………………………………….…135
Chapter V. HPLC method development and validation for the quantification of sulfites and sulfates
on the surface of natural dusts………………………………………………………………...…155
Chapter VI. How atmospherically relevant is to use mineral proxies to mimic the reactivity of
natural dust samples? A reactivity study using SO2 as probe molecule………………………….187
Chapter VII. Investigating the distributions of sulfites and sulfates on the surface of natural
volcanic dusts……………………………………………………………………………………205
Chapter VIII. Connections between the three experimental approaches: coated wall flow-tube,
DRIFT optical cell, and HPLC…………………………………………………………………..231
General conclusions and perspectives…………………………………………………….……..243
Valorization……………………………………………………………………………………..259
Annex 1………………………………………………………………………………………….251
Annex 2………………………………………………………………………………………….254

General Introduction

4 General Introduction

5 General Introduction
Environmental context
The heterogeneous interactions of gas-phase species with solid surfaces is a crucial research field
to understand the chemical evolution of the atmosphere of Earth. Explosive volcanic eruptions are powerful
events that have a capacity to alter Earth’s climate. They provide an ample environment for heterogeneous
interactions. The development of volcanic plumes and the subsequent transport of volcanic dusts and gasses
in the atmosphere are widely addressed. However, these atmospheric systems are not studied from a
heterogeneous physical chemistry point of view, while the budget of volcanic gasses, especially SO2 can be
considerably influenced by reactive uptake processes on atmospheric aerosols, especially volcanic dusts.
Thus, one area that could particularly benefit from understanding heterogeneous interactions is climate
modelling. But, most importantly, this research contributes to the understanding of heterogeneous chemistry
occurring in the Earth’s atmosphere.
Volcanic dust is a highly variable source of natural particles in the atmosphere, and during the
period of high volcanic activity it can provide a large surface for heterogeneous interactions with other
atmospheric compounds. Emissions from volcanic eruptions range from 33 million tons (Mt) on an average
year to over 100,000 Mt of ash after a major volcanic eruption, as was the case for the eruption of Mount
Tambora in 1815. With respect to atmospheric chemistry the most significant impact would be expected to
come from smaller particles as they can be carried over thousands of kilometers before eventually being
deposited onto the land or the ocean.
Iceland is considered to be one of the most volcanically active areas on the planet. There are about
30 active volcanic systems and volcanic eruptions occurring every 3-5 years on average. Frequent dust
events in Iceland transport dust over long distances, often exceeding 2,500 km, towards High Arctic (>80°
N) and Europe. Located only 1000 km from mainland Europe, it makes a particularly interesting case study
due to its proximity to densely populated European countries.
In this research a greater understanding of the role of interactions of SO2 gas with volcanic particles
is pursued through focused laboratory studies in order to better understand fundamental processes involved.
This thesis has a multifaceted approach to address specifically the interactions of SO2 gas with
Icelandic volcanic dust. A brief description of the content of each chapter of the manuscript is given below.
This work was achieved in the frame of Labex CaPPA, funded by ANR through the PIA under
contract ANR-11-LABX-0005-01, and CPER CLIMIBIO project, both funded by the Hauts-de-France
Regional Council and the European Regional Development Fund (ERDF). The author acknowledges IMT
Lille Douai for funding this PhD.

6 General Introduction
Structure of this Ph.D. thesis
In Chapter 1, an overview of the volcanism in relation to atmospheric chemistry is discussed. Next,
fundamentals of heterogeneous chemistry are introduced. Finally, the objectives of the thesis and the
structure of the manuscript are defined.
In Chapter 2, the origins and the characterization of five volcanic Icelandic dusts and other samples
of interest used during that work are detailed. A second part of this chapter is dedicated to the experimental
strategy and experimental methods employed to investigate the heterogeneous interactions of the volcanic
dust with SO2 gas.
In Chapter 3, the uptake of 75 ppb SO2 gas by five Icelandic volcanic dusts is investigated under
atmospherically relevant conditions using a coated-wall flow-tube reactor. More specifically, steady state
uptake coefficients and the transient number of molecules initially taken up are experimentally determined.
In addition, the influence of humidity and UV light on the uptake of SO2 gas are thoroughly studied. Finally,
atmospheric implications are addressed and discussed.
In Chapter 4, the formation of the surface sulfur species is monitored by DRIFTS using Hagavatn
as a representative volcanic dust sample and employing 175 ppm SO2. As a result of these investigations
and based on the literature, a mechanism for the formation of surface sulfur-based species is proposed. The
role of humidity on the uptake process is assessed by performing the DRIFTS experiments under dry
conditions and 30% RH.
In Chapter 5, to quantify the amount of sulfur-based products formed on the surface of volcanic
dusts and to study the kinetics of the transformation, a simple, accurate and precise reversed-phase liquid
chromatography method is developed and validated. The developed method can be used both for laboratory
studies and for field measurements.
In Chapter 6, the question of how atmospherically relevant is the use of proxies to mimic the
reactivity of natural dust samples is addressed. For this matter, the sample pool is enlarged by introducing
in addition to the five volcanic dusts, three desert dusts and a number of mineral oxides and clays commonly
used as proxies. The samples are aged for one hour with 175 ppm SO2 under ambient conditions.
In Chapter 7, the influence of humidity and elemental composition on the formation of sulfur species
on the surface of five volcanic dusts and three desert dusts after ageing the samples with 175 ppm SO2 are
investigated using the developed HPLC method. Next, the time profiles of sulfur species obtained for up to
24 hours are constructed and the stability of the formed species is discussed. Finally, the validity of ageing

7 General Introduction
at elevated concentrations of 175 ppm SO2 is addressed by performing a long-term 5-day ageing of a selected
Myrdalssandur dust at 75 ppb.
In Chapter 8, the consistency of the different results obtained with contrasted instrumental
techniques during this work, such as flow tube, DRIFTS, and HPLC, is discussed. This final part aims at
taking a step back to evaluate the relevant techniques or groups of techniques to address accurately a
heterogeneous atmospheric system.

8 General Introduction

Chapter I. Context, state of the art, objectives and strategy

10 Chapter I. Context, state of the art, objectives and strategy
Table of content of Chapter 1
1 Volcanic eruptions................................................................................................................................... 16
1.1 Volcanoes ....................................................................................................................................... 16
1.2 Volcanic Conduits and Plumes ....................................................................................................... 20
2 Volcanic ash ............................................................................................................................................ 22
2.1 Properties of volcanic ash ............................................................................................................... 22
2.1.1 Composition ............................................................................................................................ 22
2.1.2 Size distribution ...................................................................................................................... 23
2.2 Impact of volcanic ash on global processes .................................................................................... 24
2.2.1 Impact on stratospheric and tropospheric chemistry............................................................... 24
2.2.2 Impact on climate .................................................................................................................... 25
2.2.3 Other impacts .......................................................................................................................... 26
3 Gasses emitted after volcanic eruptions: focus on SO2 ........................................................................... 26
3.1 Impact of volcanic gasses on global processes ............................................................................... 28
3.1.1 Impact of volcanic gasses on stratospheric and tropospheric chemistry ................................. 28
3.1.2 Impact of volcanic gasses on climate ...................................................................................... 29
3.1.3 Impact of volcanic gasses on health ........................................................................................ 29
4 Iceland: a study-case? .............................................................................................................................. 29
5 Fundamentals of heterogeneous reactions ............................................................................................... 31
5.1 Physical chemistry approach .......................................................................................................... 31
5.1.1 Models for adsorption description .......................................................................................... 33
5.1.2 Experimentally determined kinetic parameters ....................................................................... 35
5.2 Laboratory techniques for studying heterogeneous reactions......................................................... 36
5.2.1 Coated wall flow-tube reactor ................................................................................................. 36
5.2.2 Knudsen cell ........................................................................................................................... 38
5.2.3 Diffuse reflectance infrared Fourier transform spectroscopy ................................................. 40
5.2.4 Reactors using suspended aerosol and typical instrumentation .............................................. 42

11 Chapter I. Context, state of the art, objectives and strategy
5.3 Laboratory techniques for surface characterization ........................................................................ 45
5.3.1 Scanning electron microscopy (SEM) .................................................................................... 46
5.3.2 BET ......................................................................................................................................... 46
5.3.3 Inductively coupled plasma mass spectrometry...................................................................... 46
5.3.4 X-ray photoelectron spectroscopy .......................................................................................... 46
5.3.5 X-ray powder diffraction spectroscopy .................................................................................. 47
6 Groundwork for investigation of the interactions of volcanic dust with SO2 volcanic gas ..................... 48
6.1 Review of SO2 interactions with single metal oxides, CaCO3 and natural dust samples ............... 48
6.1.1 γ- Al2O3 ................................................................................................................................... 49
6.1.2 α-Al2O3 and MgO ................................................................................................................... 51
6.1.3 Fe2O3 ....................................................................................................................................... 52
6.1.4 TiO2 ......................................................................................................................................... 52
6.1.5 CaCO3 ..................................................................................................................................... 52
6.2 Oxidation of sulfites to sulfates ...................................................................................................... 52
6.3 Role of humidity ............................................................................................................................. 54
6.4 Role of the UV light ....................................................................................................................... 56
6.4.1 Photocatalysis ......................................................................................................................... 56
6.4.2 Photochemistry ....................................................................................................................... 57
6.5 Influence of SO2-covered particles on other species ...................................................................... 58
6.6 Atmospheric implications ............................................................................................................... 58
6.7 Limitations of the present research and directions for further work ............................................... 59
7 Thesis objectives and strategy ................................................................................................................. 64
References .................................................................................................................................................... 66

12 Chapter I. Context, state of the art, objectives and strategy
List of Tables of Chapter 1
Table 1 The seven types of volcanoes (McCall, 2004) ................................................................................................ 17
Table 2 Criteria for Estimation of the Volcanic Explosivity Index (VEI) (“The volcanic explosivity index (VEI) an
estimate of explosive magnitude for historical volcanism,” 1982) ................................................................ 18
Table 3 Major types of magma (Langmann, 2013) ...................................................................................................... 19
Table 4 Surface composition of volcanic ash analyzed by XPS. Adapted from Maters et al. (Maters et al., 2016) .... 22
Table 5 Average High-Temperature Volcanic gas Composition in Mole%. Adapted from Hoshyaripour et al.
(Hoshyaripour et al., 2012) ............................................................................................................................ 27
Table 6 Reactive surface sites on the volcanic ash. Adapted from E.C. Maters (Maters et al., 2016) ......................... 48
Table 7 Possible nature of adsorbed species. Adapted from Datta et al., 1985 and Lo et al., 2010 ............................. 50
Table 8 IR vibration modes of water using FT-IR. Adapted from Grassian et al., 2003.............................................. 54
Table 9 Methods and preferred uptake values for reactions of SO2 with mineral dust and various mineral oxides .... 61

13 Chapter I. Context, state of the art, objectives and strategy
List of Figures of Chapter 1
Figure 1: The earliest known record of a volcanic eruption. Çatalhöyük mural in central Turkey is thought to represent
a volcanic eruption of Hasan Dağ Volcano dating around 6,200 BC. Adapted from “Mountains of fire: the
nature of volcanoes” (Decker and Decker, 1991). ...................................................................................... 14
Figure 2: Illustration of the various processes involved in a Plinian eruption. Adapted from “Expansion and quenching
of vesicular magma fragments in Plinian eruptions” (Kaminski and Jaupart, 1997). ................................. 20
Figure 3: Model of the Plinian volcanic eruption after 30 min. Temperature distribution in degrees Celsius. Adapted
from “Injection of gases into the stratosphere by explosive volcanic eruptions” (Textor et al., n.d.). ........ 21
Figure 4: Ash particle size distribution. Adapted from (Langmann, 2013) .................................................................. 23
Figure 5: Ash plume from Iceland’s Eyjafjallajökull Volcano, April 15 2010 (“Ash Plume across the North Atlantic,”
2010) ........................................................................................................................................................... 30
Figure 6: Potential energy of chemisorption and physisorption vs. distance from surface. Adapted from “How does
adsorption work?” (“How does adsorption work?,” n.d.). ......................................................................... 32
Figure 7: Langmuir adsorption isotherm, adapted from “Langmuir adsorption model” (“Langmuir adsorption model,”
2018) ........................................................................................................................................................... 34
Figure 8: Schematic drawing of a coated wall flow tube reactor. ................................................................................ 36
Figure 9: Schematic drawing of a Knudsen Cell. ......................................................................................................... 38
Figure 10: Schematic drawing of a DRIFTS apparatus. ............................................................................................... 40
Figure 11: Absorption difference spectra recorded during the reaction of mineral dust with 20 ppm of SO2. Product
spectra (a) after addition of SO2, (b) after pumping sample for 10 min without SO2, (c) after pumping sample
overnight and (d) after heating of sample to 373 K. Adapted from “The kinetics and mechanism of SO2
oxidation by O3 on mineral dust” (Ullerstam et al., 2002). ......................................................................... 42
Figure 12: Components of an HPLC system. Adapted from “HPLC Troubleshooting Guide” (“HPLC Troubleshooting
Guide,” n.d.). ............................................................................................................................................... 44
Figure 13: Schematic of the Aerodyne aerosol mass spectrometer (AMS). Adapted from “Aerosol mass spectrometry”
(“Aerosol mass spectrometry,” 2020). ........................................................................................................ 45
Figure 14: Mechanism of adsorption of SO2, NO and NH3 on the surface of Fe(0.1)-Mn(0.4)/TiO2 catalytic surface.
Adapted from “DRIFT Study of the SO2 Effect on Low-Temperature SCR Reaction over Fe−Mn/TiO2”
(Jiang et al., 2010). ...................................................................................................................................... 58

14 Chapter I. Context, state of the art, objectives and strategy
Figure 1: The earliest known record of a volcanic eruption. Çatalhöyük mural in central Turkey is thought to represent a volcanic
eruption of Hasan Dağ Volcano dating around 6,200 BC. Adapted from “Mountains of fire: the nature of volcanoes” (Decker and
Decker, 1991).
Volcanic eruptions have always fascinated and intrigued humankind. Countless myths, based on the
volcanic events witnesses by many cultures, provide meaning, explanation and soothing for the observed
catastrophic events (Palmer, n.d.). Through centuries volcanoes are feared, respected and venerated. Hence,
an African volcano Oldonyo-Lengai, literally meaning “Mountain of God” is cherished by Maasai tribe as
the giver of all good things (“Volcano Myths and Rituals,” 2017). In Hawaii, volcanic eruptions are seen as
beneficial and viewed as an act of creation (“Volcano Myths and Rituals,” 2017). In this respect, Hawaiians
might not be too far away from the reality. As unhospitable as volcanic environment might seem, it was
recently suggested that it contains the very ingredients necessary for the emergence of the first organic
molecules - a fundamental step in the prebiotic assembly of life. According to this theory, volcanic lightning
can serve as an energy source, porous volcanic particles can provide a large reactive surface, while volcanic
plumes themselves are rich in gases necessary for the abiotic synthesis (Springsklee, 2020). In a more widely
accepted scenario for the origin of life, hydrothermal environments (e.g. the presence of fresh mafic
minerals, such as olivine, in contact with liquid water) are the most likely conditions to promote synthesis
of organic molecules (Camprubí et al., 2019).
Volcanic eruptions vividly demonstrate how fragile humans are when forced to face the power of
Nature. Large volcanic eruptions of the past have significantly influenced Earth’s climate by injecting vast
amounts of particulate matter and volcanic gases into the atmosphere. Volcanic emissions can cause both
regional and global changes to climate by affecting monsoon circulation, causing either excess or limited
rainfall thus leading to floods and droughts (Stevenson et al., 2003), (Highwood and Stevenson, 2003),
(“Tambora and the ‘Year Without a Summer’ of 1816,” 2016). Failed crops often result in famine and civil
unrest. At times, in the aftermath the volcanic eruptions, whole cultures vanish or people are forced to
migrate (Highwood and Stevenson, 2003). Volcanic eruptions comprise one of the most significant natural

15 Chapter I. Context, state of the art, objectives and strategy
hazards threatening people living in the proximity, as well as effecting livelihoods of the humankind on the
global scale. Significant volcanic eruptions of the past vividly demonstrate how closely Earth and human
systems are connected to each other.
The oldest known record of a volcanic eruption is a wall painting at Çatalhöyük, a village in central
Turkey. It is thought to represent a volcanic eruption of Hasan Dağ Volcano dating around 6,200 BC (Figure
1) (Decker and Decker, 1991). One of the first written records of meteorological data is preserved in
Babylonian astronomical diaries written on cuneiform tablets spanning from 652 to 61 BC and now housed
in the British Museum. These records, unparalleled in resolution and scope until early modern period
(weather observations are given in sub-daily resolution for all seasons), provide information about wind
directions, atmospheric clarity, temperature, and precipitation, etc. together with socio-economic data, such
as agricultural prices and major societal stresses (Ludlow et al., 2020). In the view of recently available and
much-improved ice-core chronologies of explosive volcanism for the first millennium BC, scientists were
able to link extreme weather anomalies and climatic shocks described in these diaries to major ice-core
volcanic signals (Ludlow et al., 2020). Here is a representative excerpt from Astronomical diary dating 173
BC: “The 24th, the north wind blew, the cold became severe… around noon, the disk of the sun looked like
that of the moon…” (Ludlow et al., 2020). According to Sigl et al. the majority of such observations were
found to occur closely in time with volcanic deposition on the revised ice-core timescale (Sigl et al., 2015).
Volcanic eruptions were implicated as catalysts in the major 6th century pandemics, famines, and
socioeconomic disruptions in Eurasia and Mesoamerica (Sigl et al., 2015). Overall, after investigating
volcanic records for the past 2,500 years, cooling was proportional to the magnitude of volcanic forcing and
persisted for up to ten years after some of the largest eruptive episodes (Sigl et al., 2015).
On June 8, 1783, a 27-kilometer-long fissure tore through the highlands in southeastern Iceland
marking the beginning of one of the major eruptive events in human history. The 8-month long Laki fissure
eruption in Iceland in 1783-1784 released approximately 15 km2 of balsatic magma and 122 million tons of
sulfur dioxide, 60 v% of which got emitted in the first six weeks of the eruption (Stevenson et al., 2003),
(Highwood and Stevenson, 2003). Dry fog and haze covered much of the Northern Hemisphere and reached
as far as Asia (Highwood and Stevenson, 2003). Rise in the concentration of SO2 caused respiratory
difficulties and troublesome headaches (Schmidt et al., 2011). Crop failure and livestock loss lead to famine
in Iceland, where about 21 % of the population died (Schmidt et al., 2011). Famine and plague pandemics
ravaged across the Middle East (Stothers, 1999). One study linked this powerful volcanic eruption in
Iceland to the dying out of the entire Inuit population in Northwest Alaska (Highwood and Stevenson, 2003).
On April 10, 1815 the Indonesian Iceland of Sumbawa became the epicenter of the largest volcanic
eruption in the last millennium – eruption of Mount Tambora. The 1815 eruption of Mount Tambora in

16 Chapter I. Context, state of the art, objectives and strategy
Indonesia produced a staggering 100,000 million tons of primary aerosol in a single eruption killing around
100,000 people in Indonesia and as many as 200,000 worldwide (Andreae, 1995), (“Tambora and the ‘Year
Without a Summer’ of 1816,” 2016). The eruption lowered the global temperature by 1 to 1.5 °C (Savarino,
2020). The year of the eruption in the Northern Hemisphere was known as a year without summer, snow
storms were witnessed in New England as late as June (“Tambora and the ‘Year Without a Summer’ of
1816,” 2016). Climate anomalies brought crop failure leading to the worst famine in Europe in the 19th
century followed by epidemics of cholera and typhus (“Tambora and the ‘Year Without a Summer’ of
1816,” 2016).
A number of eruptions marked 20th century. Eruption of Mount Pinatubo on June 15, 1991 injected
20 millions of tons of sulfur dioxide into the stratosphere lowering the average global temperature by 0.5
°C, an effect that lasted for 2 years (Andreae, 1995), (Durant et al., 2010). More recently, Eyjafjallajökull
released 8 ± 4 million tons of volcanic ash and 0.39 million tons of SO2 in the upper troposphere and lower
stratosphere, which led to prolonged disruptions of aviation and billions of dollars in economic loss by the
transportation industry (Thorsteinsson et al., 2012), (Schmidt et al., 2014), (Gislason et al., 2011). Concerns
about health risks were particularly high due to contamination of drinking water with fluoride (Gislason et
al., 2011).
At this point I would like to invite the reader to take a closer look at what is happening during
volcanic eruption. In the following sections, I’ll investigate the lifecycle of the volcanic emissions in both
particular and gaseous phase, paying closer attention to the interaction of volcanic ash particles with sulfur
dioxide, one of the most abundant gases found in the plume of the volcano.
1 Volcanic eruptions
All the matter present on Earth can be viewed as a collection of 94 individual elements that in their
original form or in the form of various molecules migrate continuously from one reservoir to another in the
process known as geochemical cycling. Reservoirs include atmosphere, hydrosphere, biosphere, soil, and
lithosphere. Most of the mass of the planet is concentrated in the Deep Earth part of the lithosphere which
has a very limited exchange with the other reservoirs. Volcanic eruptions provide a main way for such
exchange (Daniel J. Jacob, 1999).
Volcanoes are major components of the Earth’s surface geology. They do not occur everywhere on
Earth, but are most often situated along the edges of the rigid lithospheric plates that move along the Earth’s
surface at the speed of few centimeters per year (McCall, 2004). In relationship to each other, lithospheric

17 Chapter I. Context, state of the art, objectives and strategy
plates can either move away from each other and thus diverge or converge and collide. When a continental
plate collides with an oceanic plate, it forces the latter underneath itself creating subduction zone. Where
two continental plates collide with each other they are forced upwards creating fold mountains, such as
Himalayas. Most volcanoes on Earth are found in subduction zones. Yet, another type of volcanoes found
on our planet is related to neither converging nor diverging plates and is a result of a hot spot, which is a
hot narrow plume of molten material in the Earth’s mantle (McCall, 2004).
At any given moment as many as 20 volcanoes around the globe might be erupting (Langmann,
2013). Eruption can be defined as a sudden occurrence of a violent discharge of gases and volcanic materials.
There are two major types of volcanic eruptions: fissure eruption and central eruption. In fissure eruptions,
lava flows through long linear volcanic vents. This type of eruption is usually not explosive. In fissure
eruptions, fluid balsatic lava forms extensive plateaus. The Laki eruption in 1783 was of this type. More
commonly though, volcanoes form a crater with a central vent through which volcanic material is emitted.
There are seven types of volcanoes classified according to the type of the eruption in Table 1. One must
keep in mind though that most volcanoes show some deviation from the classical definition (McCall, 2004).
Table 1: The seven types of volcanoes (McCall, 2004)
Type Characteristics
Icelandic Fissure eruptions, releasing free-flowing basaltic magma; quiet, gas-poor; great volumes of lava flowing as sheets
over large areas to build plateaus
Hawaiian Fissure, caldera, and pit-crater eruptions; mobile lavas with some gas; quiet to moderately active eruptions,
occasional rapid emissions of gas ; mainly balsatic; minor amounts of ash, builds up lava domes
Strombolian Stratocones with summit craters; moderate, rhythmic to nearly continuous explosions, resulting from spasmodic
gas escape, light colored clouds, mostly steam reach to moderate heights
Vulcanian Stratocones with central vents; associated lavas more viscous; lavas form crust over vents between eruptions,
trapping the gas below its surface; explosive eruptions; dark ash-laden clouds, convoluted and cauliflower-
shaped raise vertically to moderate heights, depositing ash along the flanks of the volcano
Vesuvian Stratocones; extremely violent expulsion of gas-charged magma; vent tends to be emptied to a considerable
depth; repeated cauliflower clouds that reach great heights and deposit ash
Plinian More violent than Vesuvian eruption; last major phase is uprush of gas that carries cloud vertically upward in a
column for kilometers; narrow at the base but expands outwards at upper elevations; clouds generally low in ash
Peléan Results from high viscosity lava and delayed explosiveness; conduit of stratovolcano is usually blocked by dome
or plug; gas and lava escape from lateral openings or by destruction of upper plug; ash, gas and blocks move
with high velocity downslope in one or more blasts
A useful way to evaluate volcanic explosion was proposed by Chris Newhall of the US Geological
Society and Stephen Self at the University of Hawaii who devised a Volcanic Explosivity Index in 1982,
summarized in Table 2 (“The volcanic explosivity index (VEI) an estimate of explosive magnitude for
historical volcanism,” 1982).

18 Chapter I. Context, state of the art, objectives and strategy
Table 2: Criteria for Estimation of the Volcanic Explosivity Index (VEI) (“The volcanic explosivity index (VEI) an estimate of
explosive magnitude for historical volcanism,” 1982)
General
description
Non-
explosive
Small Moderate Moderate-
large
Large Very 1arge
0 1 2 3 4 5 6 7 8
Volume of
tephra
<104 104-106 106-107 107-108 108-109 109-1010 1010-1011 1011-1012 >1012
Cloud column
height (km)*
<0.1 0.1-1 1-5 3-15 10-25 >25
Qualitative
description
Gentle, effusive Explosive Cataclysmic, paroxysmal, colossal
Classification Hawaiian Vulcanian Ultra-Plinian
Strombolian Plinian
Tropospheric
injection
minor minor moderate substantial
Stratospheric
injection
none none none possible definite significant
Maximum
explosivity
lava flows explosion or nuée ardente
phreatic
dome or mudflow
Total historic
eruptions
487 623 3176 733 119 19 5 2 0
* For VEI 0-2 data are in km above crater; for VEI 3-8 data are in km above the sea level.
The explosiveness of the volcano can be linked to the explosivity of magma (Geishi, 2004).
Explosive eruptions occur when magma containing dissolved gases raises rapidly through the conduit. As
pressure rapidly decreases the magma-gas mixture accelerates through the vent till it leaves it in explosive
manner (Langmann, 2013). Lava is usually a product of a non-explosive moderate eruption. By contrast,
volcanic ash is produced as a result of explosive eruption. Explosive magma depends on many factors, such
as viscosity, decompression speed, and gas content (Geishi, 2004). Viscous magma contains a higher
amount of silica that is able to form chain-like structures (Geishi, 2004). Elements such as magnesium can
disrupt those chains, so that magma becomes less viscous. Water has a similar effect on the magma viscosity
(Geishi, 2004). Viscosity is also controlled by the temperature making the magma of higher temperature
more fluid. There are three major types of magma: basaltic, andesitic, and rhyolitic. They differ in viscosity,
melting temperature and amount of volatile gases content (Table 3) (Langmann, 2013). The most viscous
magma is rhyolite, which is similar in composition to granite (McCall, 2004). Higher fragmentation of
magma and surrounding rock during eruption is observed with magma of rhyolitic composition as it contains

19 Chapter I. Context, state of the art, objectives and strategy
the highest amount of silica and dissolved gas (Kaminski and Jaupart, 1997). As a result, it produces the
most explosive eruptions and thus the highest amount of fine volcanic ash. Having said that, highly
explosive Plinian basaltic eruptions do occur and can be induced by rapid crystallization due to high
undercooling and high decompression rates of the ascending magma (Arzilli, 2020). This implies that all
types of volcanic systems on Earth have the potential to produce powerful explosive eruptions.
Table 3: Major types of magma (Langmann, 2013)
Magma type SiO2 (wt %) (°C) Viscosity and gas
content
Amount of
volcanic ash
Basaltic 45–55 1000-1200 Low Low
Andesitic 55–65 800–1000 Intermediate Intermediate
Rhyolitic 65–75 650–1000 High High
In addition to explosive eruptions a significant amount of volcanic ash can be created as a result of
phreatomagmatic eruptions and pyroclastic flows. A phreatomagmatic eruption is a result of magma
interaction with external water, such as a glacier or a crater lake. Initially, water chills the magma interface,
which shatters as a result. Water then penetrates though the shattered glass and turns into superheated steam
that further shatters the magma. The process ends in a violent explosive eruption that creates particularly
fine-grained ash. Pyroclastic flows are a result of the collapse of the part of the volcano leading to high-
speed tephra flows that contribute to fragmentation through collision and milling processes (Langmann,
2013).

20 Chapter I. Context, state of the art, objectives and strategy
Figure 2: Illustration of the various processes involved in a Plinian eruption. Adapted from “Expansion and quenching of
vesicular magma fragments in Plinian eruptions” (Kaminski and Jaupart, 1997).
Figure 2 illustrates various processes involved in an explosive eruption. Gas-tephra mixture is
generated by fragmentation at some depth in the conduit. Fragmentation depth varies from several hundred
meters to almost 4000 meters (Ayris et al., 2013). Above the fragmentation level in subterranean conduit
gas-tephra mixture undergoes pressure release and small amounts of cooling due to adiabatic expansion.
After leaving the conduit the mixture is subjected to large amounts of cooling because of mixing with cold
atmospheric air (Kaminski and Jaupart, 1997). Thus, the first stage in the existence of ash can be
characterized by the conditions of constant high temperature of 650-1200 °C and a high decompression rate
of 0.7 to 10 MPa/s, while the second stage is characterized by variable temperature (1200 to -70°C) and
pressure (Langmann, 2013), (Kaminski and Jaupart, 1997).
While magma makes its way to the surface through the volcanic conduit, different processes happen:
fragmentation, quenching of glass material contained in volcanic ash, as well as homogeneous and
heterogeneous modifications of the ash surface. Volcanic ash interacts with the volatiles that are released
during fragmentation. Ayris et al. estimate that, for a voluminous explosive eruption (>10 km3 of magma),
SO2 scavenging efficiency varies from less than 1 % to 73 %, depending mostly on the depth of the magma
chamber, but also tephra crystallinity and water content (Ayris et al., 2013). Further modifications are
expected to take place on the surface of the volcanic particles as they are transported in the atmosphere.

21 Chapter I. Context, state of the art, objectives and strategy
Volcanic plume formed during explosive eruptions expands vertically from the vent of the volcano
to the level of neutral buoyancy, which is defined as the height at which a rising parcel of air is at the same
temperature as its environment. While ascending through the volcanic plume volcanic ash undergoes an
extreme temperature gradient from 1000°C to 0°C in a matter of just a few minutes (Ayris et al., 2013). As
can be deduced from the model of the explosive Plinian eruption in the plume itself, the exposure of ash to
the gases is brief and temperatures in excess of 500 cannot be sustained for more than 10 seconds (Figure
3) (Textor et al., 2003). Nevertheless, it is assumed that in the process volcanic ash scavenging accounts for
about 30 - 40 % of sulfur and 10 – 20 % of chlorine emitted during eruption (Langmann, 2013).
Figure 3: Model of the Plinian volcanic eruption after 30 min. Temperature distribution in degrees Celsius. Adapted from “Injection
of gases into the stratosphere by explosive volcanic eruptions” (Textor et al., 2003). The volcanic conditions at the base of the
volcanic plume: height - 600 m above sea level, diameter - 750 m, vertical velocity - 400 m/s, and temperature - 1100 K.
Volcanic plumes can be far-reaching. They can carry volcanic ash to a distance of thousands of
kilometers before eventually being deposited onto land or into the ocean by gravitational settling and wet
deposition (Langmann et al., 2010). For example, several volcanic dust plumes originating from Iceland
were observed to exceed 1000 km traveling distance spreading towards Europe, North America and Arctic
(Dagsson-Waldhauserova et al., 2014). Once settled, volcanic dust can then be once again remobilized by
the wind and entrained into the atmosphere. Nevertheless, the physico-chemical processes that govern
modifications in the plume and in the cloud are poorly understood and need further investigation.
In the following sections I would like to explore what happens to the volcanic ash after its emission
in the atmosphere. I will concentrate on its interactions with the most important gas emitted during eruption:
sulfur dioxide. First, characterization of volcanic ash and sulfur dioxide as well as their impact on the
atmosphere will be introduced (Section 2 and Section 3). Second, the system of study will be chosen (Section
4). Third, the fundamentals of heterogeneous reactivity and laboratory techniques used will be presented
(Section 5). Forth, literature concerning heterogeneous reactivity between volcanic dust, mineral dust, and

22 Chapter I. Context, state of the art, objectives and strategy
individual oxides with SO2 will be reviewed (Section 6). Finally, the thesis objectives will be defined
(Section 7).
2 Volcanic ash
Volcanic eruptions are a highly variable source of solid particles in the atmosphere. At 33 to 256
million tons a year, volcanic emissions are the fourth major contributor to the flux of primary solid particles
of natural origin (Andreae, 1995) (Durant et al., 2010). However, during the years of high volcanic activity
explosive volcanic eruptions can inject much higher amounts of particular matter, dwarfing all other sources
of solid particles in the atmosphere. For example, the eruption of Mount Tambora produced 100,000 million
tons of ash (Andreae, 1995).
All fragmental magmatic material issued from a volcano is called tephra and is often classified by
size, the smallest kind being ash and dust. Most of the literature on volcanology refers to volcanic dust as
smaller kind of volcanic ash (less than 0.25 mm in diameter for volcanic dust vs 0.25-4 mm for the volcanic
ash) (McCall, 2004). Some literary sources distinguish between volcanic dust, being a material which
was re-suspended from old tephra deposits, and “fresh unaltered volcanic ash” (Dagsson-
Waldhauserova et al., 2015). In this manuscript the terms volcanic dust and volcanic ash are
interchangeable. When unaltered volcanic dust is discussed it will be clearly stated.
2.1.1 Composition
Just as with mineral dust, the main components of volcanic ash are oxygen and silicon (Langmann,
2013). Other elements found in volcanic ash include iron, aluminum, magnesium, calcium, and titanium
(Maters et al., 2016). Surface composition of volcanic ash from Eyjafjallajökull, Tungurahua, Pinatubo and
Chaitén volcanoes using XPS is reflected in Table 4.
Table 4: Surface composition of volcanic ash analyzed by XPS. Adapted from “Controls on the surface chemical reactivity of
volcanic ash investigated with probe gases” (Maters et al., 2016).
Ash Source O Si Al Fe Mg Ca Na K Ti Cl F
Eyjafjallajökull 56.4 25.5 7.2 3.0 3.4 1.5 1.4 0.5 0.5 0.3 0.3
Tungurahua 56.7 30.7 7.2 0.8 0.8 1.3 1.3 0.5 0.2 0.2 0.3
Pinatubo 54.8 31.2 8.4 0.7 2.0 0.8 1.0 0.9 n.d.a 0.1 0.2
Chaitén 60.2 29.8 7.0 0.3 0.4 0.8 1.2 0.2 n.d. 0.1 n.d.
n.d.: not determined

23 Chapter I. Context, state of the art, objectives and strategy
The mineral composition of the volcanic ash reflects the composition of magma from which it was
generated (Langmann, 2013). These minerals are formed in magma through the process of crystallization,
cooling and decompressing as magma raises to the surface (Langmann, 2013). Silicate is the main
component of minerals found in volcanic ash, such as feldspar, olivine, pyroxene, hornblende, and biotite
(Langmann, 2013). The individual mineral grains and crystals are imbedded in the glass (Dagsson-
Waldhauserova et al., 2015).
2.1.2 Size distribution
Volcanic ash consists of fragments of 4 mm or smaller in diameter (McCall, 2004). The particle
size controls the fraction that is transported to large distances with the coarser particles being deposited
much faster (Langmann, 2013).
Volcanic ash particles are hard and sharp, and remain so, even after days of interaction with each
other and with water in clouds (Gislason et al., 2011). The morphology of volcanic dust particles is assumed
to be spherical with a density from 2000 to 3000 kg/m3. Density depends on the composition (balsatic,
rhyolitic, etc.), amount of crystallization, and porosity of the particles. The specific surface area (SSA)
reported varies from under 2 to 10 m2/g (Langmann, 2013). These values are comparable to those measured
for desert dusts, where a value of 10.5 m2/g was reported for Gobi dust and 14.5 m2/g for M’Bour dust (Joshi
et al., 2017). As for other airborne materials, such as soot (SSA=98-122 m2/g) and montmorillonite clays
(SSA=225 m2/g) the specific surface area of volcanic ash is smaller in comparison (Romanías et al., 2015),
(Lasne et al., 2018).
Figure 4: Ash particle size distribution. Adapted from (Langmann, 2013)
The size distribution of the volcanic particles varies greatly depending on the formation process
(Figure 4). Statistically, the ash particles that are smaller than 1 mm compose 55 to 97 % of total ash content

24 Chapter I. Context, state of the art, objectives and strategy
(Langmann, 2013). Particles smaller than 30 µm contribute to 30 to 50 % of total ash content of rhyolitic
eruptions, but only a few percent of basaltic eruptions (Langmann, 2013). The size of ash particles emitted
varies during eruption. For example, during the early hydromagmatic explosive phase of the 2010 eruption
of Eyjafjallajökull volcano PM10 particles accounted for about 20% of all explosive ash, while the later
magmatic ash produced less than 2% of the PM10 particles (Gislason et al., 2011). It is important to
emphasize that it is mainly the smaller particles of the diameter of less than 10 µm that can be carried for
hundreds of kilometers (Langmann, 2013). Indeed, volcanic particles smaller than 0.3 µm can persist in the
atmosphere 3 months after eruption as observed by Vernier et al. after the eruption of Kelud volcano in
Indonesia in 2014 (Vernier et al., 2016). Volcanic ash produced during explosive volcanic eruptions forms
aggregates of various types that speed up sedimentation rate. Interestingly, it was also suggested that
aggregation of particles does not always result in a premature sedimentation of their constitute particles, but
that it can also result in a delayed sedimentation due to so-called rafting effect (Rossi, 2020). The decrease
in sedimentation rate is explained by the fact that bulk density of ash aggregates can be much lower than
that of a solid ash particles of comparable size enabling clusters of 500 µm or more in size to be carried by
the wind far greater distances than ash particles of similar size (Sorem, 1982). As an example, rafting can
potentially explain the sedimentation of 90 µm particles at about 1300 km from the vent during the 2010
Eyjafjallajökull eruption, which is double the sedimentation distance expected for this particle size (Bagheri
et al., 2016). The latitude of the eruption can further influence the lifetime of ash in the air. For example,
in the tropics a longer lifetime of volcanic ash is observed due to the upward motion associated with Brewer-
Dobson circulation (Vernier et al., 2016). Brewer-Dobson circulation is characterized by tropospheric air
rising into the stratosphere in the tropics, moving poleward before descending in the middle and high
latitudes (“The Brewer‐Dobson circulation - Butchart - 2014 - Reviews of Geophysics - Wiley Online
Library,” n.d.).
The impact of a volcanic eruption depends on its magnitude, intensity, and geographical location.
2.2.1 Impact on stratospheric and tropospheric chemistry
Volcanic ash produced as a result of volcanic eruption, depending on the strength and the type of
the eruption, can be released into the troposphere and/or stratosphere (Table 1). With respect to atmospheric
chemistry the biggest impact comes from the particles with the diameter smaller than 10 µm as they can be
carried over larger distances (Finlayson-Pitts and Jr, 1999).

25 Chapter I. Context, state of the art, objectives and strategy
In the stratosphere, emissions of volcanic ash can be responsible for ozone reduction recorded after
major volcanic eruptions (Brasseur et al., 1990). The observation was attested by computer modelling that
was able to account for perturbations following El Chichón eruption in Mexico in 1982 and Mount Pinatubo
eruption in Philippines in 1991 (Usher et al., 2003). Using data about dispersion of the ash cloud and
efficiency of heterogeneous conversions on the surface of the ash particles, the model successfully predicted
at the end of the winter following the eruption of Mount Pinatubo a reduction of ozone column abundance
much like the one observed over Antarctica in early spring (Granier and Brasseur, 1992). This example
demonstrates that heterogeneous processes included in modeling can vastly improve the predictions, even
though more work is needed to better define the above mentioned processes.
The effect of the volcanic ash in the troposphere is not yet evaluated. It is very likely though that
ash particles can serve as a long-range transporting carrier for many species adsorbed on its surface (Li et
al., 2006). While transferring these species it might participate in different heterogeneous reactions that can
potentially influence the balance of atmospheric species. As a result of heterogeneous interactions the optical
and thermodynamic properties of the particle themselves will change as well (Usher et al., 2003). Therefore,
we expect volcanic ash to have a significant impact on the atmospheric processes both on the short-term
and long-term range.
2.2.2 Impact on climate
Volcanic particles have an ability to affect the climate by scattering solar radiation and thus
changing the amount of heat that reaches the Earth’s surface (Langmann, 2013). Besides, volcanic ash,
having optical and thermal properties similar to those of the black carbon, can also absorb solar radiation
(Arnalds et al., 2016). Thus, volcanic ash influences the energy of the atmosphere. Vernier et al. highlighted
the significance of the radiative impact of ash, in particular in the tropical latitudes due to the Brewer-
Dobson circulation that sustains ash in the stratosphere for longer than was generally assumed (Vernier et
al., 2016). Volcanic ash particles can also affect the climate through influencing cloud formation processes
and acting as ice-nucleation sites during plume rise (Durant et al., 2008). In addition, volcanic ash fallouts
form rich soils for agriculture (McCall, 2004). They also provide a source of nutrients to the oceans in the
form of bioavailable iron, which in turn stimulates biological activity (Durant et al., 2010). It happens so
that for marine phytoplankton separated from the iron-rich sediment of the ocean floor by a considerable
depth, iron supply becomes a limiting factor affecting its growth. Thus, additional influx of iron from
volcanic emissions influences its overall productivity. Increase in iron supply allows more efficient use of
macronutrients and hence enhances CO2 uptake by phytoplankton (Jickells et al., 2005). In addition,
increased productivity of phytoplankton leads to increased dimethyl sulfide (DMS) emissions. DMS

26 Chapter I. Context, state of the art, objectives and strategy
oxidizes in the atmosphere to form sulfuric acid aerosol, that effectively scatters solar radiation (Jickells et
al., 2005).
2.2.3 Other impacts
Ash particles from the volcano fallout can present a health hazard to the human population. The
concern is especially high for the presence of crystalline silica (cristobalite) that forms nanofibers
(Langmann, 2013). Exposure to volcanic ash for a long time is associated with chronic bronchitis and
respiratory infections; skin abrasions and eye irritation have also been reported (Thorsteinsson et al., 2012).
In the long run ash ingestion and inhalation can lead to silicosis, a chronic and often fatal condition caused
by inhalation of particles smaller than 10 µm (Gislason et al., 2011). High PM10 levels in Iceland were linked
to a 4.8 - 7.3 % increase in emergency hospital visits (Arnalds et al., 2016). In Iceland a health limit for
particle matter smaller than 10 µm (PM10) is set at 50 µg/m3 (Thorsteinsson et al., 2012). Additional health
risk can be associated with contamination of surface of waters and terrestrial ecosystems by condensed salts
and trace elements that are carried by the ash particles and can be released in the surrounding (Gislason et
al., 2011). For example, fluoride released during Laki eruption was associated with the most significant loss
of life due to fluoride poisoning (Gislason et al., 2011). About 0.5 % of the explosive ash by mass released
during the eruption of Eyjafjallajökull volcano in 2010 was found to be soluble, corresponding to a mass of
around 40±20 thousand tons of soluble material (Gislason et al., 2011), (Thorsteinsson et al., 2012).
Volcanic eruptions pose particularly severe threat to airplanes as volcanic ash can clog the jet
turbines and abrade the outside corpus of the aircraft (Durant et al., 2010). The ash particles are much harder
than exposed parts of the airplane and can easily turn pilot window completely opaque due to glass abrasion
(Gislason et al., 2011). Melting temperature of the volcanic ash is lower than the operating temperature of
the high-performance engines, which is around 1400°C, so molten ash can get deposited on the cooler parts
of the engine and cause flame-outs (Langmann, 2013). The smaller the particles the easier they melt
(Gislason et al., 2011). During the eruption of Eyjafjallajokull volcano maximum concentration of 4000
µg/m3 was reported in the volcanic ash cloud that was spreading over Europe, twice exceeding the threshold
for safe aviation (Langmann, 2013). In the last 60 years about 129 flights were affected by volcanic ash
(Langmann, 2013).
3 Gasses emitted after volcanic eruptions: focus on SO2
During an eruption, magma releases a diverse range of gases, including water vapor, carbon dioxide,
and sulfur dioxide along with smaller amounts of hydrogen sulfide, hydrogen, helium, carbon monoxide,
hydrogen chloride, hydrogen fluoride, nitrogen, and argon (Durant et al., 2010). Average volcanic gas

27 Chapter I. Context, state of the art, objectives and strategy
composition of the volcanic gas is reflected in Table 5 (Hoshyaripour et al., 2012). As can be seen from
Table 5, the composition of the gas emitted during an explosive eruption varies depending on differences in
tectonic settings: converging plates, diverging plates or a hot spot (Hoshyaripour et al., 2012). It happens so
that the highest amount of SO2 (ca. 20 %) is emitted by the volcanoes that are linked to the hot spot
(Hoshyaripour et al., 2012). The divergent plates contribute 7.84 % of the SO2 emissions, followed by 1.44
% by convergent plates (Hoshyaripour et al., 2012). The most significant climate impact from the volcanic
emissions comes from SO2 even though CO2 and H2O are the most abundant gases emitted during a volcanic
eruption. It is because their concentrations in the atmosphere are already so high (around 400 ppm for CO2
and 25,000 ppm for H2O) that contributions from volcanic eruptions are more or less negligible
(“Atmospheric Composition — OSS Foundation,” n.d.). The background concentration of SO2, however, is
small, concentrations of SO2 in remote areas range from 10 to 50 ppt, in rural areas around 1 - 20 ppb, in
urban areas – up to several hundred ppb, so additional amounts easily become significant (Finlayson-Pitts
and Jr, 1999). Bluth et al. estimate the annual flux of total volcanic SO2 gas at 13 million tons per year with
the contribution from the explosive eruptions at 4 million tons per year (Bluth et al., 1993).
Table 5: Average High-Temperature Volcanic gas Composition in Mole%. Adapted from “How does the hot core of a volcanic
plume control the sulfur speciation in volcanic emission?” (Hoshyaripour et al., 2012).
Convergent Plate Divergent Plate Hot Spot
H2O 91.9 75.1 75.7
CO2 4.6 13.1 3.2
H2 0.5 1.59 0.95
SO2 1.44 7.84 19.4
H2S 0.67 1.01 0.16
HCl 0.76 0.42 0.17
HF 0.061 0.42 0.18
CO 0.03 0.6 0.09
Stevenson et al. estimate that sulfur dioxide (SO2) gas emitted in the atmosphere as a result of
volcanic activity accounts for 8.8 million tons of sulfur per year, due to anthropogenic activity for 71.2
million tons of sulfur per year, and by biomass burning for 1.4 million tons of sulfur per year (Stevenson et
al., 2003). Thus, volcanic emissions are responsible for about 11 % of all the sulfur emitted in the
atmosphere.

28 Chapter I. Context, state of the art, objectives and strategy
3.1.1 Impact of volcanic gasses on stratospheric and tropospheric chemistry
Gas phase processes
Sulfur dioxide is a noticeable component in the atmosphere, where release of SO2 is associated with
the decrease in the levels of atmospheric oxidants, such as H2O2, OH, and O3 as they are involved in the
reactions that convert gaseous and dissolved SO2 to sulfates (Stevenson et al., 2003). For example, in the
troposphere, gas-phase SO2 reacts to produce sulfur trioxide, which is then converted to sulfuric acid
according to Reaction 1- Reaction 3 (Daniel J. Jacob, 1999):
Reaction 1 SO2 + •OH + M → •HSO
3 + M (1-2 weeks)
Reaction 2 •HSO3 + O
2 → SO
3 + •HO
2 (fast)
Reaction 3 SO3 + H
2O + M → H
2SO
4 + M (fast)
Multiphase processes
SO2 is a notorious precursor to acid rain. It was long known that SO2 gets oxidized by the ●OH
radical to form H2SO4 (Reaction 1-Reaction 3). In the atmosphere the lifetime of SO2 against reaction with
●OH is 1-2 weeks. While reconciling this relatively long lifetime with the observation that SO42-
concentration in rain is maximum over SO2 source regions it was realized that there must be an additional
pathway to the homogeneous path for the oxidation of SO2. Indeed, most of the atmospheric oxidation of
SO2 actually takes place in cloud and rain droplets, where SO2 is transformed to HSO3- which is then rapidly
oxidized in the liquid phase by H2O2 (Reaction 4 - Reaction 7) (Daniel J. Jacob, 1999). This last reaction is
now thought to be the dominant pathway for oxidation of SO2 to H2SO4 (Daniel J. Jacob, 1999).
Reaction 4 SO2 (aq) ↔ SO2·H2O
Reaction 5 SO2 + H2O ↔ HSO3- + H+
Reaction 6 H2O2 (g) ↔ H2O2 (aq)
Reaction 7 HSO3-+H2O2 (aq) +H+ → SO4
2-+2H++H2O (fast)
Besides participating in gas-liquid heterogeneous reactions, SO2 also participates in heterogeneous
reactions with solids. In the marine boundary layer SO3 is oxidized to sulfate by O3 and H2O2 on sea salt
aerosol (Goodman et al., 2001). It was proposed that SO2 can also be oxidized to sulfuric acid on the surface
of mineral dust by ozone, but the mechanism of this reaction is not completely understood so laboratory
studies are under way in order to better understand these interactions (Ullerstam et al., 2002).
SO2 shows heterogeneous reactivity towards many mineral oxides such as MgO, Al2O3, Fe2O3, TiO2

29 Chapter I. Context, state of the art, objectives and strategy
(Usher et al., 2002). Gas-phase SO2 reacts with surface oxygen atoms and/or hydroxyl groups of the metal
oxides mentioned above, as shown in Reaction 8 and Reaction 9 (Usher et al., 2002).
Reaction 8 SO2 (ads) + O2- (lattice) → SO3
2-(ads)
Reaction 9 SO2 (ads) + OH- (ads) → HSO3
-(ads)
SO2 is a weakly acidic gas. It was recently evidenced by Maters et al. that volcanic ash is reactive
to SO2 uptake with the reactivity that is proportional to the abundance of strongly basic sites (Maters et al.,
2017).
3.1.2 Impact of volcanic gasses on climate
The quantity of sulfur dioxide released during eruptions is a crucial factor in determining its climate
impact. Conversion of SO2 to H2SO4 and formation of fine sulfur aerosol in the stratosphere, which can
persist for 1 or 2 years in the mid-stratosphere, is known to affect the climate by increasing the reflection of
radiation from the Sun back into space, thus efficiently cooling the Earth’s troposphere (Stevenson et al.,
2003), (Highwood and Stevenson, 2003). In case of the release of SO2 gas in the troposphere the impact of
the eruption is not as strong since the formation of sulfur aerosol competes with SO2 gas deposition and
since the sulfur aerosol formed is deposited within days or weeks (Stevenson et al., 2003).
3.1.3 Impact of volcanic gasses on health
Significant emissions of SO2 gas poses considerable health hazard to the population. Analysis of
historical records about 1783-1784 Laki eruption clearly links elevated levels of SO2 to respiratory disorders
and increased mortality rates (Schmidt et al., 2011). If a Laki style eruption was to happen today it is
estimated that additional 142,000 deaths due to cardiopulmonary failure would occur in Europe (Schmidt et
al., 2011).
4 Iceland: a study-case?
To study the interactions of volcanic ash with SO2 gas one would search for a place that is
volcanically active, has a favorable composition of volcanic emissions and is geographically relevant,
making Iceland a perfect place to study such interactions. Iceland is a volcanic island with an area of 103,000
km2, south of the Arctic Circle and about 1000 km from mainland Europe (Arnalds et al., 2016). It is one of
the most volcanically active places in the world. There are about 30 active volcanic systems and volcanic
eruptions occurring every 3-5 years on average (Thordarson and Larsen, 2007), (Schmidt et al., 2014).
Iceland is situated on the Mid-Atlantic ridge, which is a deep rift or crack that marks the actual boundary
between adjacent tectonic Eurasian and North-American plates. As the plates are slowly being pulled apart

30 Chapter I. Context, state of the art, objectives and strategy
at the rate of a growing human fingernail magma from the mantle erupts as lava producing new crustal
material for the plates. In addition to its position on the ridge, Iceland also lies on top of a hot spot. Iceland’s
hot plume has been active for the past 65 million years (Thordarson and Larsen, 2007). The presence of the
hot spot enhances the volcanism already caused by plate separation (Hoshyaripour et al., 2012).
Consequently, Iceland’s volcanoes display a wide spectrum of forms, ranging from a crack in the ground to
majestic stratovolcanoes (Thordarson and Larsen, 2007).
Iceland’s volcanoes are either the result of a hot spot or divergent plates or both. Therefore,
explosive eruptions in Iceland are likely to contain high amounts of SO2 (Hoshyaripour et al., 2012).
Geographical proximity of Iceland to Europe makes the studies especially relevant. Its eruptions in the past
have already influenced densely populated European nations. The location of Iceland is the critical factor
because it directly affects air travel across Europe (Thordarson and Larsen, 2007).
Figure 5: Ash plume from Iceland’s Eyjafjallajökull Volcano, April 15 2010 (“Ash Plume across the North Atlantic,” 2010). Image
Credit: NASA
Figure 5 demonstrates the immensity of the plume of the volcanic ash coming from Iceland’s
Eyjafjallajökull Volcano as it sends a plume of ash and steam across the North Atlantic Ocean in mid-April
2010, prompting authorities in the United Kingdom, Ireland, France, and Scandinavia to close airspace over
their countries (“Ash Plume across the North Atlantic,” 2010). During the last eruption of Eyjafjallajökull
8±4 million tons of ash and 0.39 million tons of SO2 were emitted in the atmosphere (Thorsteinsson et al.,
2012), (Schmidt et al., 2014). Based on the record of eruptions in Iceland in the last 1150 years this eruption
is representative of medium size explosive volcanic eruption in Iceland making it a relative model (Schmidt

31 Chapter I. Context, state of the art, objectives and strategy
et al., 2014). Ash from Eyjafjallajökull volcano was shown to be particularly reactive to SO2 uptake (Maters
et al., 2017).
As the global temperatures are increasing, the frequency of volcanic eruptions in Iceland are
expected to increase. It happens due to the fact that the glaciers that are covering much of the Iceland’s
territory are receding at the unprecedented rate exposing the volcanoes that were buried under heavy shields
of glaciers. The combination of erosion and melting ice caps decreases the pressure on the Earth’s mantle,
leading to an increase in both magma production (increase of ~1% for 1 kbar of pressure decrease) and
volcanic eruptions (Sternai et al., 2016).
5 Fundamentals of heterogeneous reactions
This section provides a closer look at the interactions between gases and solid surfaces. These
interactions can be reversible or irreversible (Crowley et al., 2010). Heterogeneous interactions start with
transport of the gas to the surface, its accommodation on it, followed by a number of competitive processes
such as desorption back into the gas phase, reaction with the solid substrate or with other trace gases on the
surface and photochemistry on the surface. The rate and efficiency of each step is controlled by surface rate
coefficients, reactant concentrations, diffusion coefficients in the gas and condensed phase and solubility
(Crowley et al., 2010). Each of these factors is further influenced by environmental factors, such as
temperature and relative humidity. Besides, a molecule can get adsorbed on the surface with or without
subsequent dissociation, thus the nature of the adsorption process can be either dissociative or not (Attard
and Barnes, 1998). Atmospheric heterogeneous processes are highly complex and only rarely sufficient
information is provided to understand each individual step of the reaction. This section will try to describe
some key ideas related to the interactions between gases and solids.
Upon collision with a surface a molecule can undergo elastic or inelastic scattering resulting in its
reflection back into the gas phase or it can undergo adsorption. Adsorption is the term that refers to the
process in which a molecule interacts with a surface. These interactions are often typified by hydrogen
bonds, Van Der Waal interactions, charge transfer, or covalent bonding (Crowley et al., 2010), (Attard and
Barnes, 1998). Adsorption of a given species, the adsorbate, can be described in terms of fractional coverage
of the solid surface: θ as reported in Equation 1.
Equation 1 𝜽 =𝑵𝒔
𝑵

32 Chapter I. Context, state of the art, objectives and strategy
In Equation 1, fractional coverage θ is the number of surface sites occupied by adsorbate Ns divided
by the total number of substrate adsorption sites N. The latter is often estimated through the number of
surface atoms of the substrate (Attard and Barnes, 1998), but this approach remains an approximation and
more accurate determinations can be retrieved from experimental determinations of adsorption isotherms.
Two types of adsorption can be distinguished:
Physical adsorption, physisorption, is the weak interaction formed via hydrogen bonding,
charge transfer or Van Der Waal interactions. Bonding is characterized by redistribution of electron
density within the adsorbate and adsorbent separately. There is a negligible exchange of electrons
and -∆H°physisorption < 35 kJ/mol. No products are formed as a result of this interaction in that the
adsorbate does not react and is not irreversibly modified (Attard and Barnes, 1998).
Chemisorption involves breaking and forming of chemical bonds or significant distortion
of electronic structure of adsorbate or substrate (Crowley et al., 2010). Therefore chemisorption is
seen as a chemical reaction on the surface. Spectroscopic methods can be used to confirm the nature
of the bonding. The magnitude of enthalpy of chemisorption is higher: -∆H°chemisorption > 35 kJ/mol
(Attard and Barnes, 1998).
Figure 6 illustrates what happens to the diatomic molecule M2 as it approaches the surface. Provided
that the energy gets released to the surface faster than the molecule can desorb back into the gas phase the
molecule gets trapped in a weak physisorbed state. To reach the chemisorbed state, a larger barrier needs to
be breached. In the way the sketch is drawn activation energy is required to move from physisorbed to
chemosorbed state. However, it is quite possible for the barrier to chemisorption to be below zero, in this
case the rate constant towards chemisorption will be faster than separation from the surface. As before, the
energy released on chemisorption is taken up by the surface states (Attard and Barnes, 1998).
Figure 6: Potential energy of chemisorption and physisorption vs. distance from surface. Adapted from “How does adsorption
work?” (“How does adsorption work?,” n.d.).

33 Chapter I. Context, state of the art, objectives and strategy
5.1.1 Models for adsorption description
Several models were developed to describe the equilibrium between adsorbed and gaseous states.
The number of surface sites occupied by adsorbate molecules at equilibrium at a particular pressure depends
on the partial pressure P of the molecule. Adsorption isotherm reflects this dependence of fractional
coverage θ on partial gas pressure P of the molecule.
The Langmuir adsorption isotherm
One of the simplest and most widely used models is Langmuir adsorption isotherm. To derive this
model the following approximations were made.
(i) The solid surface is uniform and all adsorption sites are equivalent
(ii) Gas phase molecules and adsorbed layer are in the dynamic equilibrium
(iii) Only one monolayer of molecules is formed on the solid surface
(iv) No adsorbate-adsorbate interactions
(v) Once adsorbed the molecules are localized
The model was derived assuming that molecules in gas phase are in a dynamic equilibrium with the
adsorbed layer. For non-dissociative adsorption:
Reaction 10 M (g) + S (surface site) 𝒌(𝒂𝒅𝒔𝒐𝒓𝒑𝒕𝒊𝒐𝒏) 𝒌(𝒅𝒆𝒔𝒐𝒓𝒑𝒕𝒊𝒐𝒏)↔ M-S
where ka (molecules s-1 Pa-1) and kd (molecules s-1) are the rate constants for adsorption and
desorption respectively.
Equation 2 Rate of adsorption = ka P (1-θ)
Equation 3 Rate of desorption = kd θ
where θ is the fractional surface coverage, (1-θ) is the fractional monolayer coverage not occupied
by molecules, P (Pa) is the partial pressure of M. Equation 2 implies that the rate (molecules s-1) will be fast
if the pressure and adsorption constants are high, and surface coverage θ is low. Rate of desorption
(molecules s-1) is not dependent on pressure (Equation 3). At equilibrium the rate of adsorption is equal to
the rate of desorption (Equation 4).
Equation 4 ka P (1-θ) = kd θ
Thus, from Equations 1 and 4, Equation 5 is obtained:
Equation 5 𝜽 =𝑵𝒔
𝑵=
𝑲𝑷
𝟏+𝑲𝑷 , where 𝑲 =
𝒌(𝒂𝒅𝒔𝒐𝒓𝒑𝒕𝒊𝒐𝒏)
𝒌(𝒅𝒆𝒔𝒐𝒓𝒑𝒕𝒊𝒐𝒏)

34 Chapter I. Context, state of the art, objectives and strategy
K (Pa-1) is the adsorption equilibrium constant. When a gaseous species tends to be massively
transferred onto the surface K is large, in the opposite case K value is small. Langmuir adsorption isotherm
describes how the fractional monolayer coverage θ changes with the partial pressure of the compound in the
gas phase (Figure 7). When the partial pressure of the gas is very low, θ=KP, and as the pressure increases
θ is approaching saturation, i.e. θ=1, corresponding to the formation of a complete monolayer. For
dissociative adsorption there are two sites that are required, therefore the reaction rate is a second order
process.
Figure 7: Langmuir adsorption isotherm, adapted from “Langmuir adsorption model” (“Langmuir adsorption model,” 2018)
Multiplying out Equation 5 and rearranging it gives a plot of (P/Ns) versus P as a straight line with
gradient 1/N and intercept at 1/NK (Equation 6).
Equation 6 (𝑷
𝑵𝒔) =
𝟏
𝑵𝑲+ 𝑷(
𝟏
𝑵)
The BET isotherm
Langmuir isotherm gives a good general overview of the adsorption process, but fails to account
for the adsorbate/adsorbate interactions and for the interactions between monolayers. Brunauer, Emmett and
Teller (BET) model attempts to account for multilayer formation. The BET model is based on the following
assumptions:
(i) Adsorption of the first layer takes place on the surface sites of the same energy
(ii) Multilayer adsorption is possible.
(iii) At equilibrium the rates of condensation and evaporation are the same for each layer.

35 Chapter I. Context, state of the art, objectives and strategy
Summation of the amount adsorbed in all layers gives the BET equation (Equation 7).
Equation 7 𝑷
𝑵𝒔(𝑷𝟎−𝑷)=
𝟏
𝑵𝑪+(𝑪−𝟏)
𝑵𝑪×
𝑷
𝑷𝟎
where P (Pa) is the pressure of gas at equilibrium with adsorbed phase, P0 (Pa) is the saturated vapor
pressure of the adsorbate, 𝐶 ≈ 𝑒(∆𝐻°𝐷−∆𝐻°𝑉𝐴𝑃)/𝑅𝑇, ∆𝐻°𝐷 (kJ/mol) is enthalpy of desorption, ∆𝐻°𝑉𝐴𝑃
(kJ/mol) is enthalpy of vaporization, R (kJ K-1 mol-1) is the ideal gas constant and T (K) is temperature.
The BET isotherm model is very often used in surface science for the determination of the specific
surface area (m2/g) of a solid material. In particular, a plot of 𝑃
𝑁𝑠(𝑃0−𝑃)vs
𝑃
𝑃0 (Equation 7), gives a straight
line with the intercept at 1
𝑁𝐶 and a slope of
(𝐶−1)
𝑁𝐶. Note that the range of linearity for BET plot is usually
restricted 0.05 < P/P0 < 0.3.
Knowing the total number of adsorbate molecules, N, and the area (or cross section) of the molecule
Am (m2) it is possible to determine the total surface SA (m2) (Equation 8).
Equation 8 𝑆𝐴 = 𝑁 × 𝐴𝑚
Total surface SA divided by the mass of the substrate allows the determination of the specific surface
area (Equation 9), that provides a comparison of the surfaces available for interaction between different
solids.
Equation 9 𝒔𝒑𝒆𝒄𝒊𝒇𝒊𝒄 𝒔𝒖𝒓𝒇𝒂𝒄𝒆 𝒂𝒓𝒆𝒂 =𝑺𝑨
𝒎𝒂𝒔𝒔 𝒐𝒇 𝒕𝒉𝒆 𝒔𝒖𝒃𝒔𝒕𝒓𝒂𝒕𝒆
5.1.2 Experimentally determined kinetic parameters
The reaction rate constants and uptake coefficients are the variables that can be experimentally
determined in the laboratory.
Uptake kinetics to a solid material is normally described in terms of the uptake coefficient 𝛾, which
represents the probability that a molecule X is removed from the gas upon collision with the surface
(Equation 10).
Equation 10 𝜸 =#𝒏𝒖𝒎𝒃𝒆𝒓 𝒐𝒇 𝒄𝒐𝒍𝒍𝒊𝒔𝒊𝒐𝒏𝒔 𝒍𝒆𝒂𝒅𝒊𝒏𝒈 𝒕𝒐 𝒓𝒆𝒎𝒐𝒗𝒂𝒍 𝒐𝒇 𝒕𝒉𝒆 𝒎𝒐𝒍𝒆𝒄𝒖𝒍𝒆 𝒇𝒓𝒐𝒎 𝒕𝒉𝒆 𝒈𝒂𝒔 𝒑𝒉𝒂𝒔𝒆
#𝒏𝒖𝒎𝒃𝒆𝒓 𝒐𝒇 𝒈𝒂𝒔−𝒔𝒖𝒓𝒇𝒂𝒄𝒆 𝒄𝒐𝒍𝒍𝒊𝒔𝒊𝒐𝒏𝒔
Heterogeneous processes/losses are usually treated as first order loss of X from the gas phase
(Equation 11).
Equation 11 𝒅[𝑿]𝒈
𝒅𝒕= −𝒌𝒌𝒊𝒏[𝑿]𝒈 = −𝜸
𝒄
𝟒[𝑺𝑺][𝑿]𝒈

36 Chapter I. Context, state of the art, objectives and strategy
where [𝑋]𝑔 is the concentration of gas molecule X (molecules/cm3), [𝑆𝑆] is the surface area of the
solid phase per volume of gas (cm-1), 𝑘𝑘𝑖𝑛 (s-1) is the first order rate coefficient for loss, 𝑐 is the mean
thermal velocity of X (cm/s) and 𝛾 is the uptake coefficient. It is important to note that the uptake coefficient
is not a constant. It may depend on time, due to the limitations imposed by adsorption equilibrium on the
surface, by solubility, or by a limited number of reactants on the surface or in the bulk of the substrate. It
can also depend on the concentration of gas molecules X. The rate of change of 𝛾 depends on the type of
interaction between the solid and the gas. For a reversible process the uptake coefficient depends on surface
capacity and concentration of gas phase species. For a reactive process it depends on the number of sites
available for the reaction or the rate of delivery of the reactive sites to the surface and the gas phase
concentration of the gas. Uptake coefficient may decline rapidly from nearly unity to almost zero in a matter
of minutes or the process can take hours, or it can be completely independent of time and equal to the initial
uptake, such as in the case of catalytic reactive uptake with no consumption, i.e. regeneration of reactive
surface sites (Crowley et al., 2010).
Using Equation 11 one can calculate the uptake coefficient by experimentally obtaining kinetic gas
loss rate constant kkin from the observed change of gas concentration after its exposure to the surface. There
are two types of uptake coefficients that are determined in the lab – the initial uptake coefficient 𝛾0 and the
steady state uptake coefficient 𝛾𝑠𝑠. The former reflects the interaction between a solid surface and a gas
molecule in the first instants after the surface has been exposed, the latter is more concerned with adsorption
at equilibrium when a steady state is reached. In atmospheric studies 𝛾𝑠𝑠 might bare more significance due
to its long term effect.
This section briefly covers the typical laboratory techniques used to determine kinetic parameters
that characterize heterogeneous processes in the atmosphere.
5.2.1 Coated wall flow-tube reactor
Figure 8: Schematic drawing of a coated wall flow tube reactor.

37 Chapter I. Context, state of the art, objectives and strategy
Coated-wall flow tube (CWFT) reactors have long been used for investigation of uptake and
reaction kinetics of gases with solid surfaces. They can be operated either under low pressure (of a few Torr)
or under atmospheric pressure. Traditionally low pressure flow tubes are used for the measurement of fast
adsorptive/reactive processes related to uptake coefficients in the order of 10-1 to 10-6, while atmospheric
pressure flow tubes, for slower processes, where uptake coefficients are in the order of 10-5 to 10-9. A
schematic diagram of a typical CWFT reactor is shown in Figure 8. The flow reactor itself consists of a
cylindrical double-wall thermostated tube and a movable sliding injector. The walls of the flow tube are
covered with the solid phase (e.g. dust) under investigation and a movable injector supplies the gaseous
reactant. At the downstream end, the reactor is connected to a gas analyzer or to a mass spectrometer, for
the detection of the gas phase species. Initially, the injector is placed at the downstream end of the reactor
to avoid premature exposure of the surface. Subsequently, the injector is moved back to expose the surface
to the gas. As the gas interacts with the condensed phase the pseudo-first-order rate constant for the removal
of the gas kobs (s-1) is measured from the change of the concentration of the gas that reaches the detector
(Equation 12). The evaluation of uptake coefficient is done under several assumptions: that the loss of the
gas at the walls occurs through a first-order process (see Equation 12) and that the gas flow is a well-
developed laminar flow. Laminar flow can be expected when the dimensionless Reynolds number Re is less
than 2000 (Li et al., 2018).
Equation 12 𝒌𝒐𝒃𝒔 =𝒗
𝑳× 𝒍𝒏(
𝑰𝟎
𝑰𝒓)
where 𝐼0 (molecules/cm3) and 𝐼𝑟 (molecules/cm3) is the initial and final concentrations of the gas
recorded by the analyzer, 𝑣 is the flow in the reactor (cm/s), L is the length of the tube covered with the
condensed phase (cm).
The rate of loss of the gas is often limited by diffusion, therefore the measured constant 𝑘𝑜𝑏𝑠 (s-1)
obtained in a typical experiment has to be corrected for diffusion. The corrected rate constant is referred to
as 𝑘𝑘𝑖𝑛 (s-1) (Equation 13).
Equation 13 𝟏
𝒌𝒐𝒃𝒔=
𝟏
𝒌𝒌𝒊𝒏+
𝟏
𝒌𝒅𝒊𝒇
where 𝑘𝑑𝑖𝑓 (s-1) is the diffusion rate coefficient obtained via Equation 14.
Equation 14 𝟏
𝒌𝒅𝒊𝒇= (
𝒓𝟐
𝟑.𝟔𝟔𝑫) × 𝑷
where r is the radius of the tube in cm, D is diffusion coefficient in Torr×cm2/s, and P is pressure
in Torr.

38 Chapter I. Context, state of the art, objectives and strategy
Diffusion coefficients for different gases have been compiled and can be found in the literature
(Massman, 1998), (Tang et al., 2014), (Tang et al., 2015). Diffusion at a temperature other than 296 K can
be obtained from Equation 15.
Equation 15 𝑫(𝑻) = 𝑫(𝟐𝟗𝟔𝑲) × (𝑻
𝟐𝟗𝟔)𝟏.𝟕𝟓
Thus, knowing the rate constant 𝑘𝑘𝑖𝑛 the geometric steady state uptake coefficient can be calculated
(Equation 16):
Equation 16 𝜸𝒔𝒔 𝒈𝒆𝒐𝒎 =𝟒𝒌𝒌𝒊𝒏𝑽
𝒄𝑺𝒈𝒆𝒐𝒎
where V (cm3) and Sgeom (cm2) are the volume and geometric surface of the region where the
reaction takes place, respectively, and c (cm/s) is the average molecular speed.
Lastly, if necessary, the geometric uptake coefficient 𝛾 𝑠𝑠 𝑔𝑒𝑜𝑚 can be corrected for BET surface
area to obtain 𝛾𝑠𝑠 𝐵𝐸𝑇, which, once again, describes the reactive uptake kinetics (Equation 17).
Equation 17 𝜸𝒔𝒔 𝑩𝑬𝑻 = 𝜸𝒔𝒔 𝒈𝒆𝒐𝒎 ×𝑺𝒈𝒆𝒐𝒎
𝑺𝑩𝑬𝑻
where 𝑆𝑔𝑒𝑜𝑚 (m2) is the geometric surface of the exposed solid of interest and 𝑆𝐵𝐸𝑇 (m2) is the total
BET surface area (the product of specific surface area and the mass of the sample) as obtained using
Equation 7-Equation 9.
A great advantage of flow-tube reactors for investigation of heterogeneous reactivity is the ability
to investigate reactions under atmospherically relevant levels of relative humidity and atmospheric pressure
(if it is operated under these conditions), which is not the case for other techniques, such as Knudsen Cell
reactors, that we introduce in the next section.
5.2.2 Knudsen cell
Figure 9: Schematic drawing of a Knudsen Cell.

39 Chapter I. Context, state of the art, objectives and strategy
Knudsen cells have been used as flow reactors for many years to measure kinetic rate constants for
heterogeneous gas-solid and gas-liquid reactions (Finlayson-Pitts and Jr, 1999). The Knudsen cell is
schematically illustrated in Figure 9. Gas of interest enters the cell through a gas inlet and exits the cell
through an escape orifice of a known size. The escaped gas is detected and measured, usually by mass
spectrometry. Inside the cell is a sample holder that is initially isolated from the flowing gas by a lid.
Knudsen cells are operated under low pressure of less than 10 mTorr to insure that the flow of the gas
molecules in the reactor is in the molecular flow regime. Mean free path is defined as the average distance
a molecule travels before encountering another molecule. Molecular flow in Knudsen cells is characterized
by a long free path (Goodman et al., 2001), (Finlayson-Pitts and Jr, 1999). The long free path insures that
the gas molecules collide with the walls of the reactor more than they collide with other gas molecules. This
ensures transferability of kinetic results, such as uptake coefficients, to other experimental setups
characterized by different surface to volume ratios (Caloz et al., 1997) (Finlayson-Pitts and Jr, 1999). But
above all, the long mean free path suppress any limitations related to the gas diffusion of molecules (there
are no diffusion corrections in Knudsen cells) and secondary or side reactions that can complicate the
chemistry occurring in the reactor.
Quantitative kinetic measurements in Knudsen cells are based on the competition between loss of
the gas through the escape orifice and its loss due to heterogeneous interactions with the solid sample. In a
typical experiment, initially, the sample of interest is isolated from the gas flow. Under conditions of stable
supply of the gas molecules and their constant escape from the Knudsen cell, a steady state flow is
established in the reactor. The substrate is then exposed to the gas by lifting the lid. In case there is a net
loss of the gas due to its uptake on the reactive surface a decrease in detection signal is observed. From the
change in relative concentrations and knowing the area of the escape orifice and the area of the reactive
surface, uptake coefficient can be calculated using Equation 18.
Equation 18 𝜸 =𝑨𝒉
𝑨𝒔×𝑵𝟎−𝑵𝒓
𝑵𝒓
where 𝐴ℎ (m2) is the area of the escape orifice, 𝐴𝑠 (m2) is the geometric area of the reactive surface,
𝑁0 is the number of molecules in the reactor in the absence of reactive surface and 𝑁𝑟 is the number of
molecules in the presence of the reactive surface (Finlayson-Pitts and Jr, 1999).
Knudsen cell is an extremely valuable tool extensively used to investigate heterogeneous
interactions. The limitations of this technique lay in its inability to mimic relative atmospheric conditions
due to the low pressure and dry conditions required for the experiment.

40 Chapter I. Context, state of the art, objectives and strategy
5.2.3 Diffuse reflectance infrared Fourier transform spectroscopy
While most of the techniques for studying heterogeneous reactions monitor changes in the gas-
phase concentration, some focus on changes on the surface of the solid phase. One of such techniques is
diffuse reflectance infrared Fourier transform spectroscopy (DRIFTS). It is used to study the surface of fine
particles and powders, and can be used to investigate adsorption of molecules on solid surfaces. Sampling
is fast and easy because little or no sample preparation is required. The sample is added to a sample cup and
the data is collected on the bulk sample. When the IR beam enters the sample, it can either be reflected off
the surface of a particle or be transmitted through a particle. The IR energy reflecting off the surface is
typically lost. The IR beam that passes through a particle can either reflect off the next particle or be
transmitted through the next particle. The IR radiation interacts with the particles and then reflects off their
surfaces, causing the light to diffuse, or scatter, as it moves throughout the sample. This transmission
reflectance event can occur many times in the sample, which increases the path length. The detected IR light
is partially absorbed by the surface of the particles of the sample, bringing the surface sample information.
Shape, compactness, refractive index, reflectivity and absorption of the particles are all characteristics of
the material being analyzed. Finally, the diffuse reflection that is produced by the sample surface reflection
of the light in all directions is collected by use of an ellipsoid or paraboloid mirror. The output mirror then
directs this scattered energy to the detector in the spectrometer. The detector is a semiconductor, usually
mercury cadmium telluride (MCT), and the electrons present in it absorb IR light and move from valence
band to conduction band. These electrons in the conduction band generate an electrical current proportional
to the IR intensity (Subramanian and Rodriguez-Saona, 2009). The detector records the altered IR beam as
an interferogram, which can then be used to generate a spectrum. The spectra are plotted in units of log
inverse reflectance (log 1/R) versus wavenumber (Finlayson-Pitts and Jr, 1999), (“Volatile Organic
Compounds in the Atmosphere,” n.d.), (“FTIR Sample Techniques - Diffuse Reflectance (DRIFTS),” n.d.).
The final differential spectra is often calculated by Kubelka-Munk function (“DRIFT Study of the SO2
Effect on Low-Temperature SCR Reaction over Fe−Mn/TiO2 - The Journal of Physical Chemistry C (ACS
Publications),” n.d.).
Figure 10: Schematic drawing of a DRIFTS apparatus.

41 Chapter I. Context, state of the art, objectives and strategy
Figure 10 is a schematic diagram of a DRIFTS instrument. DRIFTS can be used to characterize
surface reactions. In this case spectra are collected as difference spectra with the unexposed solid as
background. The signal is recorded at the regular time intervals in order to observe changes on the surface
of the solid phase. If the reaction occurs on the surface, the increase of the products of the reaction can be
readily followed and used to describe the reaction kinetics. As the reaction proceeds, growing or decreasing
peaks can be attributed to the species formed or consumed on the surface. Infrared spectroscopy provides
information about the molecular properties of a sample. In the infrared, bonds that are more active exhibit
a large change in dipole moment as they undergo their vibration. The vibrational modes associated with
stretching, bending, and rocking motions are analyzed. From this information reaction mechanism can be
deduced. Thus, DRIFTS is one of the techniques used to understand heterogeneous processes on the
molecular level (Ullerstam et al., 2003) (“Raman + FTIR - A perfect match,” n.d.).
As with other IR spectra DRIFTS peaks reflect quantized adsorptions on the order from 8 to 40
kJ/mol that correspond to the stretching and bending vibrational frequencies of the molecular bonds. In
order to be absorbed the radiation frequency should match exactly the natural vibrational frequency of the
molecular bond. In addition, a molecule should possess a dipole moment. In general, asymmetric stretching
occurs at higher frequencies than symmetric stretching and stretching vibrations occur at higher frequencies
than bending vibrations. Another trend is that stronger bonds vibrate at higher frequencies than weaker
bonds, and bonds between atoms of higher mass vibrate at lower frequencies than bonds between atoms of
lower mass. Since every type of bond has a different frequency of vibration and since the environment of
each bond is slightly different for different compounds, the pattern of adsorption is unique for each species.
Infrared spectrum provides an important structural information about a molecule (Pavia et al., 2011).
Figure 11 demonstrates a typical DRIFTS spectrum of a mineral dust exposed to SO2 with
assignment of principal bands investigated. A typical peak at 3700 cm-1 corresponds to the vibration motion
of the free surface OH groups. A peak at 3200 cm-1 is assigned to the stretching of water, while peak at 1650
cm-1 is due to the bending of water. Peak at 1330 cm-1 is attributed to the asymmetric stretching vibration of
weakly bonded SO2 species. The expected symmetric stretch vibration of SO2 at 1140 cm-1 is not observed.
Peaks at 1240 and 2450 cm-1 are attributed to the formation of SO4 (Ullerstam et al., 2002). Formation and
loss of species as well as the nature of adsorption can be deduced using DRIFTS.

42 Chapter I. Context, state of the art, objectives and strategy
Figure 11: Absorption difference spectra recorded during the reaction of mineral dust with 20 ppm of SO2. Product spectra (a)
after addition of SO2, (b) after pumping sample for 10 min without SO2, (c) after pumping sample overnight and (d) after heating
of sample to 373 K. Adapted from “The kinetics and mechanism of SO2 oxidation by O3 on mineral dust” (Ullerstam et al., 2002).
5.2.4 Reactors using suspended aerosol and typical instrumentation
In the past 10 to 15 years, aerosol flow tubes and atmospheric simulation chambers have been
widely used to study heterogeneous processes. The objective of these techniques is to provide a more
realistic approach to atmospheric particle processing by the gas environment. For that reason, suspended
aerosols are introduced using only the finest fraction of particles (in general below 10 μm, < PM10). In case
of aerosol flow tubes, the design and the operational conditions are similar to the atmospheric pressure flow
tubes (as described above) with the difference related to the fact that particles are present in suspension (and
not deposited) and are continuously introduced in the reactor with the gas mixture. Nevertheless, the volume
of aerosol flow tubes is significantly higher than CWFT, ranging in the order of a few liters. As for
atmospheric simulation chambers, they are big photochemical reactors (with a volume of a few cubic
meters), where a long-lasting aerosol ageing can be carried out under static or dynamic conditions. More
information about the simulation chambers can be found on the EUROCHAMP community website
(“Eurochamp > Eurochamp 2020,” n.d.).
Although the use of suspended aerosol represents a more realistic approach to the processes
occurring in the atmosphere, the major disadvantage is that the concentration of the particles introduced in
these reactors, i.e. the actual or real surface area of the aerosol particles for reaction, is very low compared
to the surface area of the reactor/chamber walls, and thus, the determination of kinetic parameters (such as
uptake coefficients) is very challenging. Apart from this, and especially concerning simulation chambers,

43 Chapter I. Context, state of the art, objectives and strategy
the introduction of suspended aerosols, and particularly mineral dust, is not a trivial procedure. The coarse
fraction of the dust, being quickly removed through dry deposition, makes the determination of the real
surface area of aerosol introduced in the chamber and encountered by gaseous pollutant really problematic.
At this point it should be mentioned, that for aerosol flow tubes these limitations are less problematic, since
their lower volume allows to achieve higher aerosol concentrations. Besides, dry deposition in aerosol flow
tubes can be better controlled, since they are operated under dynamic conditions. To sum up, both aerosol
flow tubes and atmospheric simulation chambers are important tools for the study of heterogeneous
processes. Actually, they are ideal tools (especially simulation chambers) to evaluate the impact of
long-lasting ageing of aerosols on their physical and chemical properties, but are less adapted to
provide kinetic data, such as uptake coefficients.
To control and monitor the temporal evolution of the physical or chemical properties of the particles,
aerosol flow tubes and simulation chambers can be coupled with a wide variety of instrumentation to
monitor both the gas and the adsorbed phases. Instruments, such as scanning mobility particle sizer (SMPS)
and humidified tandem differential mobility analyzer (HTDMA), are used during a heterogeneous reaction
to monitor the evolution of the size fraction and the hygroscopic properties of the aerosol respectively.
Other instrumentation such as aerosol mass spectrometry (AMS), is used to evaluate the chemical
transformation of the particles during the reaction. Sampling of particles in filters and post analysis can also
provide useful information about the chemical transformation of the particles. Common techniques are Ion
chromatography (IC), or high performance liquid chromatography (HPLC). Next, we provide a short
description of HPLC and AMS techniques that can be used for off-line analysis of aerosol particles and are
available and frequently used in our laboratory.
High performance liquid chromatography
High performance liquid chromatography (HPLC) is a technique in analytical chemistry used to
separate, identify and quantify components of a mixture. It is the most powerful and applicable separation
method. In column chromatography, components of a mixture are carried through stationary phase by the
flow of liquid mobile phase causing separation of the components based on differences in migration rates.
The stationary phase is held in a narrow tube and mobile phase is forced through the tube under pressure.
Stationary phase requires very small particles and thus high pressure of several hundred atmospheres is
indispensable for forcing the liquid phase through the column. It wasn’t until the late 60-s that technology
for producing the sophisticated instrumentation able to use columns with particles of 5 to 10 µm in diameter
was developed and commercialized. Mobile phase is usually a combination of solvents, such as a buffered

44 Chapter I. Context, state of the art, objectives and strategy
aqueous solution, acetonitrile, methanol, etc. The interactions between solvent, adsorbent and a sample are
physical in nature, such as hydrophobic, dipole-dipole and ionic interactions. Figure 12 shows a diagram
of a typical high-pressure chromatographic instrument and includes a solvent reservoir, a degasser, a pump,
a sample injector, a column, a detector and data acquisition device. Detectors used in HPLC include UV-
VIS, photodiode array, reflective index, fluorescence, inductivity detectors and mass spectrometers (Skoog
et al., 1995).
Figure 12: Components of an HPLC system. Adapted from “HPLC Troubleshooting Guide” (“HPLC Troubleshooting Guide,”
n.d.).
Besides separation, HPLC provides both quantitative and qualitative information for individual components
of a mixture whose identities are known. The retention time of an individual component under identical
chromatographic conditions is constant. Thus, by comparing the elution time of the unknown to that of the
standard, an unknown component can be identified. Besides, the area of the peak is proportional to the
amount of the injected compound. Thus, a calibration curve can be derived from peak areas of precisely
known concentrations and the peak size of the unknown component can be used to determine its
concentration (Meyer, 2004).
Building an HPLC method is a time-consuming and laborious process as it requires testing of many
parameters: column type and dimensions, stationary phase, composition and preparation of the mobile
phase, temperature, volume, flow rate, and detection and integration parameters of the instrument itself.
Once built, the method has to be validated to ensure the consistency of the results and to demonstrate its
applicability to the intended use.

45 Chapter I. Context, state of the art, objectives and strategy
Aerosol mass spectrometry
Aerosol mass spectrometry (AMS) is a valuable method of aerosol characterization applicable to
particle sizes in the range of 10 nm to 10 µm in diameter (Nash et al., 2006). A great advantage of using
AMS is its compatibility with on-line analysis and consequently the mobility of the instrumentation. AMS
is often used on ships, planes other types of mobile laboratory platforms. Instrumental technique can be
divided into the methods aiming at bulk characterization and those that focus on single particle
characterization (Froyd et al., 2019). In the first case, all aerosol within a defined size range is collected and
characterized. This type of mass spectrometry is well adopted to the analysis of non-refractory compounds,
which are defined as species that rapidly evaporate at around 600°C under vacuum conditions (e.g. organic
molecules, sulfates and nitrates). The most popular AMS instrument that is used for bulk measurements is
Aerodyne aerosol mass spectrometer depicted at Figure 13. It consists of three sections: the aerosol inlet,
the particle sizing chamber and the particle detection chamber. In the particle detection chamber the particles
are flash vaporized and ionized before being analyzed by mass analyzer. Conversely, single-particle aerosol
mass spectrometer (SPMS) employs a pulsed laser to desorb particles one at a time (Froyd et al., 2019). The
advantage of the second technique is that both refractory and non-refractory particles, such as mineral dust
and soot can be analyzed. In general, the limitation of AMS technique lies in the range of sizes and types of
particles one instrument can analyze (Nash et al., 2006). In addition, although highly portable, the use of the
instrumentation in the immediate vicinity of an active volcano is still very limited, if not entirely impossible.
Figure 13: Schematic of the Aerodyne aerosol mass spectrometer (AMS). Adapted from “Aerosol mass spectrometry” (“Aerosol
mass spectrometry,” 2020).
In order to understand heterogeneous reactivity of solids with a defined gas it is important to
investigate the properties of the solid phase in question. Laboratory techniques for bulk and surface

46 Chapter I. Context, state of the art, objectives and strategy
characterizations of solids include scanning electron microscopy, BET analysis, inductively coupled plasma
mass spectrometry, X-ray photoelectron spectroscopy, and X-ray powder diffraction spectroscopy.
Technically, DRIFTS is also a surface characterization technique, but since in this work it was only used to
study adsorbed species and not a solid itself, it was discussed earlier in section 5.2.
5.3.1 Scanning electron microscopy (SEM)
SEM is a type of microscopy that uses a focused high-energy beam of electrons to create an image.
Electrons from the beam interact with the surface atoms producing secondary electrons, backscatter
electrons and characteristic X-rays. Signals obtained due to these interactions are used to obtain surface
topography. Typical resolution obtained vary from 1 to 20 nm, but resolution below 1 nm can be achieved
by some SEM instruments (“Scanning Electron Microscopy,” n.d.).
5.3.2 BET
BET method measures surface area based predominantly on nitrogen gas adsorption. Knowing the
size of the probe gas molecule, the amount of the adsorbed gas is correlated to the total surface area of the
solid. Measurements are usually done at nitrogen boiling point (-196°C). Principles of Brunauer, Emmett
and Teller method for determination of specific surface area were discussed earlier in Section 5.1.1 and the
details on the in-house built system is provided in Chapter 2.
5.3.3 Inductively coupled plasma mass spectrometry
ICP-MS is a type of mass spectrometry where inductively coupled plasma is used to generate ions
from the solid of interest. By definition, a plasma is a conducting gaseous mixture containing a high
concentration of cations and anions. ICP-MS uses argon ions as the principle conducting species. Once
formed, argon ions can sustain plasma temperatures as high as 10,000 K by absorbing power from an
external source. In particular, inductively coupled plasma uses powerful radio-frequency generators as a
power source. ICP atomizes the sample and creates atomic ions that are then directed to the mass
spectrometer, where they are counted and separated on the basis of their mass-to-charge ratio. The signal
received by the detector is proportional to the concentration. ICP-MS is known for its speed, precision and
sensitivity. ICP-MS enables detection of elements on levels as low as ppb and ppt (Skoog et al., 1995). It is
efficiently used to determine the elemental composition of a solid.
5.3.4 X-ray photoelectron spectroscopy
XPS is a technique that studies surface composition and oxidation states of surface atoms. The
typical depth of the analyzed sample is about 5 nm. The analysis is done by exciting the sample surface with

47 Chapter I. Context, state of the art, objectives and strategy
mono-energetic Al Kα X-rays causing photoelectrons to be emitted from the surface elements. The energy
of the emitted photoelectrons is measured by electron energy analyzer. From the binding energy and
intensity of a photoelectron peak, the elemental identity, chemical state, and quantity of a detected element
can be determined (“X-Ray Photoelectron Spectroscopy (XPS) Surface Analysis Technique,” n.d.).
5.3.5 X-ray powder diffraction spectroscopy
XRD is a powerful and rapid technique used for identification of an unknown crystalline material.
The basis of the technique is the constructive interference of monochromatic X-rays with the crystalline
structure of the sample, which happens when conditions satisfy Bragg's Law:
Equation 19 𝒏𝝀 = 𝟐𝒅𝒔𝒊𝒏𝜽
where n is a positive integer, λ (m) is the wavelength of the incident wave, d (m) is the interplanar
distance between the lattice planes and θ is the glancing angle between the incident beam and the surface.
Thus, Bragg’s Law relates the wavelength of electromagnetic radiation to the diffraction angle and the lattice
spacing in a crystalline sample. By scanning the sample through a range of 2θ angles all possible diffraction
directions of the crystalline lattice are obtained. The diffraction peaks are then converted to d-spacings that
are unique to each mineral. By comparing the d-spacing of the unknown to that of the reference material the
phase is identified. Identification of homogeneous and single-phase material is best for identification of
unknown minerals (“X-ray Powder Diffraction (XRD),” n.d.).
Even though multiple techniques are available today to study heterogeneous reactivity,
heterogeneous reactions that happen in the atmosphere continue to represent a great challenge to the
scientific community (Finlayson-Pitts and Jr, 1999). The main problem comes from limited understanding
of how the surface of real atmospheric particles look like on the molecular level. In other words, the
environment encountered by a gas molecule in the atmosphere is not well-characterized. In addition, surface
changes during reaction, affecting both the reaction mechanism and reactivity. Yet, the consequences of
surface “ageing” are also poorly understood. Furthermore, many of the techniques used to describe the
surface, such as XPS, are incompatible with atmospheric conditions as they require high vacuum.
Nevertheless, great progress has been made in recent years, often using simplified systems, establishing a
groundwork for further investigations of heterogeneous interactions. Heterogeneous interactions of SO2 gas
with various solid surfaces are described in the next section (Section 6) laying a groundwork for studying
interactions between volcanic SO2 gas and volcanic ash.
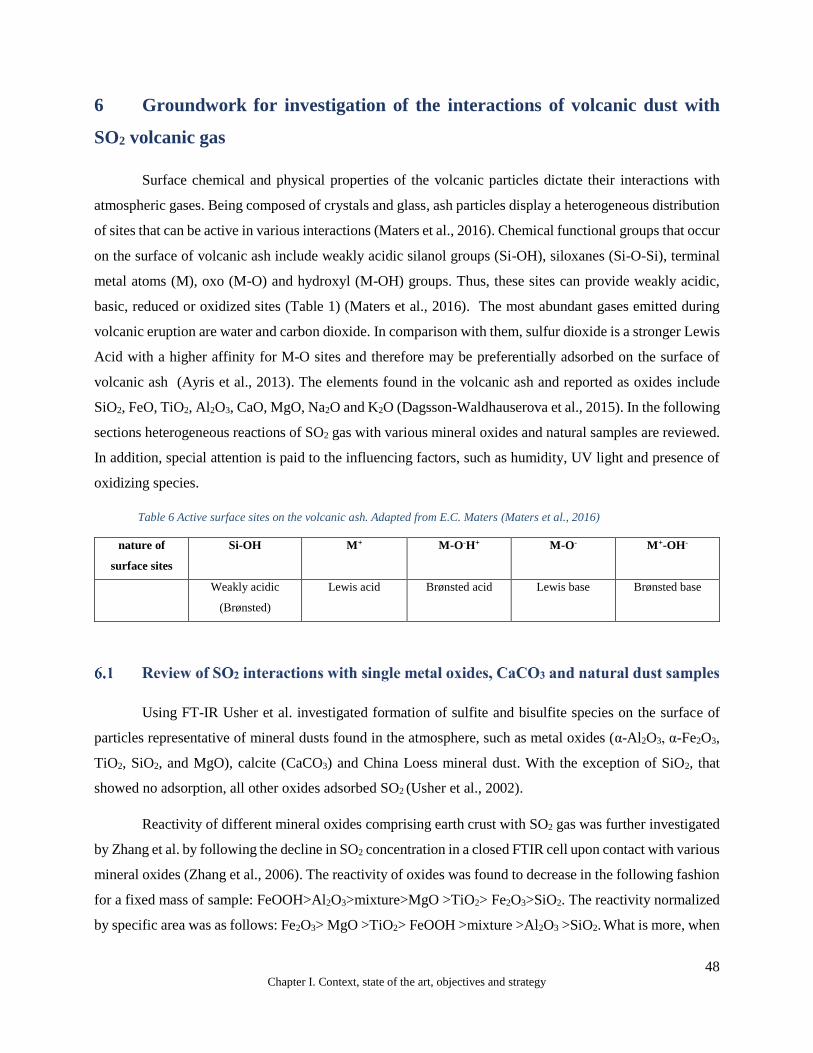
48 Chapter I. Context, state of the art, objectives and strategy
6 Groundwork for investigation of the interactions of volcanic dust with
SO2 volcanic gas
Surface chemical and physical properties of the volcanic particles dictate their interactions with
atmospheric gases. Being composed of crystals and glass, ash particles display a heterogeneous distribution
of sites that can be active in various interactions (Maters et al., 2016). Chemical functional groups that occur
on the surface of volcanic ash include weakly acidic silanol groups (Si-OH), siloxanes (Si-O-Si), terminal
metal atoms (M), oxo (M-O) and hydroxyl (M-OH) groups. Thus, these sites can provide weakly acidic,
basic, reduced or oxidized sites (Table 1) (Maters et al., 2016). The most abundant gases emitted during
volcanic eruption are water and carbon dioxide. In comparison with them, sulfur dioxide is a stronger Lewis
Acid with a higher affinity for M-O sites and therefore may be preferentially adsorbed on the surface of
volcanic ash (Ayris et al., 2013). The elements found in the volcanic ash and reported as oxides include
SiO2, FeO, TiO2, Al2O3, CaO, MgO, Na2O and K2O (Dagsson-Waldhauserova et al., 2015). In the following
sections heterogeneous reactions of SO2 gas with various mineral oxides and natural samples are reviewed.
In addition, special attention is paid to the influencing factors, such as humidity, UV light and presence of
oxidizing species.
Table 6 Active surface sites on the volcanic ash. Adapted from E.C. Maters (Maters et al., 2016)
nature of
surface sites
Si-OH M+ M-O-H+ M-O- M+-OH-
Weakly acidic
(Brønsted)
Lewis acid Brønsted acid Lewis base Brønsted base
Using FT-IR Usher et al. investigated formation of sulfite and bisulfite species on the surface of
particles representative of mineral dusts found in the atmosphere, such as metal oxides (α-Al2O3, α-Fe2O3,
TiO2, SiO2, and MgO), calcite (CaCO3) and China Loess mineral dust. With the exception of SiO2, that
showed no adsorption, all other oxides adsorbed SO2 (Usher et al., 2002).
Reactivity of different mineral oxides comprising earth crust with SO2 gas was further investigated
by Zhang et al. by following the decline in SO2 concentration in a closed FTIR cell upon contact with various
mineral oxides (Zhang et al., 2006). The reactivity of oxides was found to decrease in the following fashion
for a fixed mass of sample: FeOOH>Al2O3>mixture>MgO >TiO2> Fe2O3>SiO2. The reactivity normalized
by specific area was as follows: Fe2O3> MgO >TiO2> FeOOH >mixture >Al2O3 >SiO2. What is more, when

49 Chapter I. Context, state of the art, objectives and strategy
mixed based on the abundance of above oxides in the continental crust
(SiO2:Al2O3:Fe2O3:CaO:MgO:TiO2:MnO2 =61.5:15.1:6.28:5.5:3.7:0.68:0.1), the conversion of SO2 was
higher than expected due to the synergetic effect of the mixture. Also, more basic type of alumina containing
more hydroxyl groups showed higher apparent rate constant for reaction with SO2 gas than neutral or acidic
aluminum implying that hydroxyls on the surface contribute to the heterogeneous oxidation of SO2. Authors
concluded by proposing that metal oxides that have empty or half-empty d atomic orbitals, such as Al2O3,
show excellent performance in the reactions with SO2 while metal oxides with full d orbits, such as MgO,
show weaker reactivity (Zhang et al., 2006).
Numerous other laboratory studies were undertaken to improve understanding of the interactions of
sulfur dioxide with mineral dusts by using various metal oxides as proxies for natural samples. This section
of the manuscript covers the literature data on the reactions of various individual mineral oxides and calcite
with SO2 gas.
6.1.1 γ- Al2O3
Early studies of Datta et al. in 1985 investigated adsorption of SO2 on thermally activated γ-alumina.
The authors came to the conclusion that five distinct SO2-like species can be observed by FTIR (Fourier
Transform Infrared) spectroscopy (Table 7). The most strongly held one was assigned to the SO32- bonded
in a unidentate mode to the metal atom with characteristic absorption at 1135 and 1065 cm-1. The most
weakly attached species showed absorbance at 1334 and 1148 cm-1 and were labeled as physically adsorbed
SO2 species weakly bonded to the surface of hydroxyl groups. The other three types of SO2-like species
were attached through sulfur atom to either an acidic aluminum metal center or anionic oxygen center and
adsorbed at 1140, 1255,1322, and 1189 cm-1 (Datta et al., 1985). In recent studies Lo et al. performed
theoretical calculations for the adsorption of SO2 on γ-alumina where they confirmed Datta’s assignment of
absorption frequencies to type I and II species (see Table 7), but assigned 1255 and 1189 cm-1 bands to SO2
that forms strong bonds with surface oxygen atom through sulfur (Lo et al., 2010). As for the HSO3- bisulfite
species the SH stretch vibration was only found in the literature as a theoretical value calculated by Zhang
et al. for aqueous solution and reported to be in the range of 2450 to 2620 cm-1 (Zhang and Ewing, 2002).

50 Chapter I. Context, state of the art, objectives and strategy
Table 7: Possible nature of adsorbed species. Adapted from Datta et al., 1985 and Lo et al., 2010 and Goodman et al., 2001
Bands (cm-1)
FTIR
1334, 1148 1322, 1140
1255
1189
1135, 1065 (1050)
Type and
nature of
adsorption on
γ-Al2O3 as
assigned by
Datta et al.,
1985 using
FTIR
type I
physisorption,
weak
type II
chemisorption on
basic O site
type III
chemisorption on
acidic Al site
type VI
chemisorption on
acidic Al
type V
chemisorption on
basic O site (see
type II) followed
by rearrangement
leading to
formation of
sulfite-like species
that gets attached
to Al atom in a
unidentate fashion
nature of
adsorption on
γ-Al2O3
as assigned by
Lo et al., 2010
by theoretical
calculations
physisorption,
weak
chemisorption on
basic O site
SO2 forms strong bonds with surface
oxygen atom through sulfur
sulfite/bisulfite
species in
monodentate and
bidentate modes
nature of
adsorption on
α-Al2O3
as assigned by
Goodman et
al., 2001 using
FTIR
physisorption,
weak
sulfite/bisulfite
species
2-
2-
2-

51 Chapter I. Context, state of the art, objectives and strategy
6.1.2 α-Al2O3 and MgO
Goodman et al. studied formation of sulfate particles on the surface of mineral dust using FTIR
(Goodman et al., 2001). In the study they used α-Al2O3 and MgO, that are characterized as acidic and basic
oxides respectively, as models for mineral aerosol found in the atmosphere. They found that SO2 weakly
adsorbs on the surface of α-Al2O3 and MgO and assigned a band at 1149 cm-1 as physisorbed v1 symmetric
stretch of SO2 and band at 1330 cm-1 as physisorbed v3 asymmetric stretch of SO2. Both bands disappeared
upon evacuation of SO2 gas. Broad bands between 900 and 1200 cm-1 on α-Al2O3 and 800-1125 cm-1 on
MgO surface were assigned to sulfite SO32- and bisulfite HSO3
- species. Upon evacuation of SO2 gas
sulfite/bisulfite bands stayed in the spectra. As for the mechanism of adsorption on α-Al2O3 surface, contrary
to the conclusions of Datta et al. (see Table 7), it was proposed that weakly adsorbed SO2 forms on acidic
sites (coordinately unsaturated aluminum atoms) and surface-coordinated sulfite forms when SO2 interacts
with basic oxide anions (exposed oxygen atoms) or hydroxides on the surface of α-Al2O3 (Goodman et al.,
2001). Moreover, it was suggested that O2 with low coordination number such as present at kinks and steps
of the surface is much more reactive to SO2 uptake than O2 found on terrace planes (Goodman et al., 2001).
Several reactions leading to the formation of surface coordinated sulfite/bisulfite species were proposed
(Goodman et al., 2001).
Reaction 11 O2-(lattice) + SO2 (gas) → SO3
2-(surface)
Reaction 12 OH-(surface) + SO2 (gas) → HSO3
-(surface)
Reaction 13 2OH- (surface) + SO2 (gas) → SO3
2-(surface) + H2O
Growth of peaks around 3524 and 3296 cm-1 were attributed to the formation of either surface water
or OH stretch in the adsorbed bisulfite (Goodman et al., 2001).
A mechanism for the formation of weakly adsorbed SO2 species and surface coordinated sulfite on
MgO surface was very similar to that postulated for α-Al2O3: weakly adsorbed SO2 forms on acidic
magnesium sites, while surface coordinated sulfite forms on basic oxide anions (Reaction 14) (Goodman et
al., 2001).
Reaction 14 MgO + SO2 (gas) → MgSO3
Assignment of vibrational peaks of Goodman et al. on α-Al2O3 and MgO was confirmed by
numerous authors on various mineral oxide substrates, such as Wang et al. on Fe2O3 and Nanayakkara on
TiO2 (Wang et al., 2018a), (Nanayakkara et al., 2012). More details on the peak assignments for different
individual vibrations on different surfaces can be found in Table 9.

52 Chapter I. Context, state of the art, objectives and strategy
6.1.3 Fe2O3
Wang et al. studied heterogeneous reactions of sulfur dioxide on hematite (Fe2O3) nanoparticles
(Wang et al., 2018a). Just as Goodman et al. earlier, he came to the conclusion that when SO2 gas interacts
with the surface it forms weak physical bonds with Lewis acid sites (metal sites) and strong chemical bonds
with Lewis base sites (exposed oxygen sites) (Reaction 11). In agreement with Reaction 12 and Reaction
13 they admitted that hydroxyl groups provide additional pathways for the reaction with SO2.
6.1.4 TiO2
Nanayaykkara et al. further demonstrated the importance of OH groups by studying adsorption of
SO2 gas on both hydroxylated and dehydroxylated isotopically labeled TiO2 particles and showed that
dehydroxylated particles show less reactivity with little product formation (Nanayakkara et al., 2012). Thus,
he concluded that OH groups play a very important role in the conversion of SO2 gas into surface sulfites
and bisulfites (Reaction 12 and Reaction 13). Furthermore he concluded that SO2 prefers reacting with
isolated OH groups followed by bridged hydroxyl groups.
6.1.5 CaCO3
On the surface of CaCO3 a slightly different mechanism is observed. Wu et al. suggested that after
adsorption to the surface physisorbed SO2 directly reacts with CaCO3 surface to yield sulfite ion and CO2
gas. This reaction is thermodynamically favorable (Reaction 15) (Wu et al., 2011).
Reaction 15 CaCO3 (surface) + SO2 (adsorbed) → CaSO3 (adsorbed) + CO2 (gas)
Conversion of chemisorbed sulfites to sulfates has been reported in the literature for reactions of
SO2 with α-Al2O3 and MgO oxide surfaces in the presence of molecular oxygen at elevated temperatures
(Goodman et al., 2001).
Wang et al. noticed oxidation of sulfites to sulfates on the surface of Fe2O3 in the presence of air
and suggested either a one-step process of oxidation of sulfites to sulfates by active oxygen (Reaction 16)
or a two-step process of oxidation of bisulfites to bisulfates by active oxygen followed by reaction with
hydroxyl group to produce SO42- ion (Reaction 17, Reaction 18). He suggested that active oxygen O- can be
derived from molecular oxygen upon reaction with the vacant oxygen sites present on the surface. In
addition, it was proposed that iron atoms can contribute to the formation of sulfate species from bisulfites
as per Reaction 19 (Wang et al., 2018a). Oxidation of sulfites to sulfates by molecular oxygen catalyzed by

53 Chapter I. Context, state of the art, objectives and strategy
iron-containing species in aqueous medium was first proposed by Faust et al. (Reaction 20) (Faust et al.,
1989).
Reaction 16 SO32-
(surface) + O- (ads) →SO4
2-(surface) + e-
Reaction 17 HSO3-(surface) + O-
(ads) →HSO4- (surface) + e-
Reaction 18 HSO4- (surface) + OH- (surface) →SO4
2- (surface) + H2O
Reaction 19 HSO3-(surface) + OH-
(surface)
𝑭𝒆𝟑+ →𝑭𝒆𝟐+
→ SO42-
(surface) + 2H++2e-
Reaction 20 HSO3- (aqueous) + 0.5O2
𝒄𝒐𝒍𝒍𝒐𝒊𝒅𝒂𝒍 𝜶−𝑭𝒆𝟐𝑶𝟑, 𝒉𝝊≥𝟑𝟎𝟎𝒏𝒎→ SO4
2- (aqueous) + H+
On the surface of TiO2 mechanism identical to that on Fe2O3 was proposed by Nanayaykkara et al.
(Reaction 16 - Reaction 18) (Nanayakkara et al., 2012).
Li et al. investigated the oxidation mechanism of sulfur dioxide by ozone on the surface of calcium
carbonate. The results demonstrated that SO2 can be adsorbed on the surface of CaCO3 to form sulfites that
can be rapidly oxidized into sulfates by O3. In a step–exposure experiment when SO2 was introduced a band
at 1000-900 cm-1 was immediately observed, corresponding to the v3 stretching vibration of sulfite. Upon
introduction of O3 into the reaction system a band at 980 cm-1 disappeared within minutes and a band at 1130
cm-1 appeared, corresponding to the v3 stretching vibration of sulfate. In the simultaneous exposure of SO2
and O3 experiment the main product detected by DRIFTS was a sulfate band at 1130 cm-1. Ion
chromatography analysis further confirmed that the main product detected was sulfate species. The reaction
rate was calculated to be first order for SO2 and zero order in respect to O3 (Li et al., 2006). The reaction of
CaSO3 with O3 is irreversible and very fast (Reaction 21) (Wu et al., 2011).
Reaction 21 CaSO3 (adsorbed) + O3 (gas) → CaSO4 (adsorbed) + O2 (gas)
Usher et al. investigated oxidation of sulfites in the presence of ozone. Upon reaction with ozone,
the conversion of chemisorbed sulfite-bisulfite to sulfate/bisulfate species was observed as new peaks
around 1000 and 1100 cm-1 for MgO and α-Al2O3 respectively (Usher et al., 2002). No conversion was
observed in the presence of only air and oxygen (Usher et al., 2002).
Ullerstam et al. further investigated oxidation of sulfites to sulfates by ozone on the surface of
Saharah desert dust samples from Cape Verde islands using DRIFTS technique. Formation of sulfate peak
was observed at 1240 cm-1. In comparison to free sulfate ion that shows a v3 vibration at 1105 cm-1 the peak
was shifted to lower frequency due to the lowering the symmetry of the sulfate as it bonds to the surface via
the oxygen atom. Addition of water was shown to increase the total amount of sulfate formed on the surface.
Authors conclude that the mechanism for oxidation of SO2 to sulfate ion proceeds via two-step mechanism.

54 Chapter I. Context, state of the art, objectives and strategy
First, SO2 gets reversibly adsorbed to the surface (Reaction 22). This step is indicated by the formation of
an absorption band at 1330 cm-1 and the loss of free OH- around 3700 cm-1. Second, adsorbed SO2 is oxidized
to sulfate by ozone (Reaction 23). The permanent loss of OH groups may indicate that sulfuric acid or
hydrogen sulfite can be the primary products of this reaction. The reaction order for the first step is close to
first order and for the second step to zero order indicating that the first reaction is a rate-determining step.
Thus, as soon as SO2 gets adsorbed on the surface it gets oxidized by ozone (Ullerstam et al., 2002).
Reaction 22 {MOOH} + SO2 ↔ {MOOH---SO2}
where OH are free surface OH groups, M is a metal, and brackets denote surface species.
Reaction 23 {MOOH--- SO2} + O3 ↔ {MO---HSO4} + O2
Similar mechanism was proposed for oxidation of adsorbed SO2 by NO2 gas on the surface of Saharah
dust (Reaction 24) (Ullerstam et al., 2003). Just as Usher et al., no significant sulfate formation was
observed by Ullerstam et al. without presence of the oxidant (Usher et al., 2002) , (Ullerstam et al., 2002),
(Ullerstam et al., 2003).
Reaction 24 {MOOH--- SO2} + NO2 ↔ {MO---HSO4} + NO
Grassian et al. studied adsorption of water on alumina powders and identified adsorption at 3420
cm-1 on α-Al2O3 and 3444 cm- on γ-Al2O3 as OH stretching vibrations of adsorbed water. They also pointed
out that the first few layers of water are ordered even at room temperature. Table 8 shows characteristic
water IR adsorption wavelengths for different vibrations in gas, liquid and solid phase (Al-Abadleh and
Grassian, 2003). In general, distorted molecular environment contributes to broadening of the bands (Al-
Abadleh and Grassian, 2003). Formation of water monolayer on the natural dust samples originated from
North and West Africa, Saudi Arabia and Gobi desert regions was observed at RH ranging from 15 to 25%,
while additional water layers were formed at higher RH levels (Joshi et al., 2017).
Table 8: IR vibration modes of water using FT-IR. Adapted from “FT-IR Study of Water Adsorption on Aluminum Oxide Surfaces”
(Al-Abadleh and Grassian, 2003).
Vibration Mode Gas Water Solid
Stretching v1 at 3656 cm-1
v3 at 3755 cm-1
3319 cm-1
3411 cm-1
Bending 1594 cm-1 1642 cm-1 1641 cm-1
Association band 2138 cm-1
Overtone band 2243 cm-1

55 Chapter I. Context, state of the art, objectives and strategy
In the experiments investigating the role of water on the adsorption of SO2 gas on the surface of α-
Al2O3 and MgO it was observed that water does not affect strongly adsorbed SO2 on α-Al2O3, but contributes
to the creation of sulfate species on the surface of MgO particles (new bands at 957 and 1110 cm-1 appear
in the spectrum) (Goodman et al., 2001). In line with Datta et al. the peak for water adsorption was identified
through H2O bending mode at 1640 cm-1 (Goodman et al., 2001), (Al-Abadleh and Grassian, 2003).
While investigating the oxidation mechanism of sulfur dioxide by ozone on the surface of calcium
carbonate Li et al. showed that the initial rate of sulfate formation is independent of humidity, but the steady-
state generation of sulfate is increased with increased humidity. It was concluded that water can regenerate
the reactivity of CaCO3 particles and enhance their capability of sulfate formation (Li et al., 2006). Water
on the surface permits more SO2 into aqueous layer (Li et al., 2006). In its turn, surface containing sulfates
adsorbs more water than unprocessed particles (Li et al., 2006). Thus, formation of sulfates on the surface
of the particles changes their physical properties and might have important impact on atmospheric
chemistry.
In contrast to the above-mentioned results, on the surface of hematite (α-Fe2O3) and goethite (α-
FeOOH) particles equivalent saturation coverages and product ratios were observed at RH ranging from 28
to 85% leading to the conclusion that water vapor has no effect on the uptake of SO2 (Baltrusaitis et al.,
2007).
Then again, Shang et al. demonstrated a steady increase in sulfate production on the surface of TiO2
from dry to 80% followed by a slight decrease at 90% (Shang et al., 2010). The authors suggested that water
molecules, besides participating in the reaction as a reactor might also form a film layer that promoted
product diffusion and surface refreshment. As for the reduction of sulfate formation at RH higher than 80%,
hindering of active sights on the surface by water molecules was offered as a possible cause (Shang et al.,
2010).
On the surface of natural samples the role of humidity on SO2 uptake is rather controversial. Thus,
using DRIFTS, the role of water was highlighted in its ability to regenerate the surface of the natural Saharah
desert dust from the Cape Verde Islands located off the coast of west Africa and thus enhance its capacity
for sulfate formation (Ullerstam et al., 2002). Meanwhile, no dependency on humidity was found for the
initial uptake coefficient of SO2 gas on the same-origin Saharan dust collected from the Cape Verde Islands
using coated wall-tube reactor (Adams et al., 2005). Likewise, no such dependence was observed for Adobe
clay soil taken from Los Angeles area (Judeikis and Stewart, 1976). Huang et al. noticed that when three
authentic dusts were subjected to SO2 at RH ranging from 0 to 90% an increase in uptake coefficient was
observed for Tengger Desert dust (i.e. γ BET (dry) ≈ 3.8 × 10⁻⁵ and γ BET (90% RH) ≈ 5.5 × 10⁻⁵) and for

56 Chapter I. Context, state of the art, objectives and strategy
Arizona test dust (i.e. γ BET (dry) ≈ 1.3 × 10⁻⁵ and γ BET (90% RH) ≈ 2.76 × 10⁻⁵), but a decrease was observed
for Asian mineral dust (i.e. γ BET (dry) ≈ 3.2 × 10⁻⁵ and γ BET (90% RH) ≈ 1.9 × 10⁻⁵) (Huang et al., 2015).
Inhibition of the SO2 uptake by water-soluble inorganic coating present on Asian mineral dust was suggested
as a possible cause. Upon removal of the coating by washing, the uptake trend got reversed (i.e. γ BET (dry)
≈ 0.85 × 10⁻⁵ and γ BET (90% RH) ≈ 1.32 × 10⁻⁵) (Huang et al., 2015). Difference in minerology could be
responsible for the difference in the observed trends (Zhou et al., 2014).
While travelling through the air dust particles are likely to be illuminated by UV light. UV light seems
to increase the formation of sulfates on the surface. Two mechanisms were proposed to explain this
phenomena: photocatalysis and photochemistry.
6.4.1 Photocatalysis
Dupart et al. studied the reactions of SO2 with two proxies for mineral dust, Arizona Test Dust and
Fe2O3, and suggested that metal oxide groups present on the surface of mineral dust when irradiated with
UV light and upon contact with water are able to produce OH radicals, which in turn, initiate conversion of
SO2 to sulfuric acid in the vicinity of the dust particle (Dupart et al., 2012). The authors propose that metal
oxides in the dust can act as atmospheric photocatalysts by absorbing UV photons and forming electron-
hole (e–-h+) pairs according to Reaction 25, but this approach needs deeper investigation and confirmation:
Reaction 25 M + hν → M + h+ + e–
Water molecules could react with holes and split, releasing reactive protons and •OH radicals in the
vicinity of the surface (Reaction 26), as shown with SO2 uptake by Arizona Test Dust (Dupart et al., 2012),
(George et al., 2015):
Reaction 26 H2O + h+ → H+ + OH•
•OH radicals could further react with SO2 and form HSO3• (Reaction 27), which reacts with O2 to
form SO3 (Reaction 28). Finally, H2SO4 would be formed by reaction of SO3 with H2O (Reaction 29)
(Dupart et al., 2012), (Park and Jang, 2016), (Park et al., 2017)
Reaction 27 SO2 + •OH → HSO3•
Reaction 28 HSO3• + O2 → SO3 + HO2•
Reaction 29 SO3 + 2H2O → H2SO4 + H2O

57 Chapter I. Context, state of the art, objectives and strategy
In the presence of water H2SO4 would readily ionize and successively release two protons, to form
HSO4– and SO4
2– as described by Reaction 30 (Wang et al., 2018b) .
Reaction 30 H2SO4 → HSO4– + H+ → SO4
2– + H+
H2SO4 plays an important role as aerosol precursor as it is implied in nucleation events (Dupart et
al., 2012). This reaction network relies mostly on the fact that, in presence of both H2O and a source of UV
radiation, •OH radicals are formed. Huang et al. also observed that, in presence of a source of •OH radicals
(H2O2 in their study), SO2 uptake by mineral dust was largely increased (Huang et al., 2015).
6.4.2 Photochemistry
Alternatively, or in addition to possible surface activation by photons, it was suggested by Martins-
Costa et al. that photochemistry could take place at the surface of v-dust covered with a water layer. In the
presence of H2O vapor, SO2 photochemistry can lead to the formation of •OH and HOSO• radicals (Reaction
31) (Martins-Costa et al., 2018):
Reaction 31 SO2 + H2O → •OH + HOSO•
HOSO• dissociates spontaneously and completely in water, releasing SO2– and a proton (Reaction
32). SO2– finally reacts with •OH to form HSO3
– (Reaction 33) (Ruiz-López et al., 2019).
Reaction 32 HOSO• → SO2– + H+
Reaction 33 SO2– + •OH → HSO3
–
Bisulfite then reacts following Reaction 17, Reaction 18, Reaction 19 to form sulfate ions, or
following Reaction 34 to form sulfite ions (Wang et al., 2018a), (Wang et al., 2018b). The reactivity of
sulfite ions with radicals has been reviewed by (Neta and Huie, 1985); the reactions involving SO32– and
relevant for atmospheric chemistry are (Reaction 35) with •OH radicals, and (Reaction 36) with a photon,
both leading to the formation of •SO3–.
Reaction 34 HSO3- ⥨ SO3
2– + H+
Reaction 35 SO32– + •OH → OH– + •SO3
–
Reaction 36 SO32– + hν → •SO3
– + e–
Although the absorption of SO32– is low in the 350 - 410 nm range, it is not zero (Dogliotti and
Hayon, 1968), making Reaction 36 a possible pathway. More reactions can be found in (Neta and Huie,
1985), and show the formation of oxidant species very reactive toward organics, such as •SO5–, •SO4
–, HSO5–
, HSO4– and S2O8
–. An •SO3– radical reacts with H2O and forms H2SO4 and an electron (Reaction 37).

58 Chapter I. Context, state of the art, objectives and strategy
Reaction 37 •SO3– + H2O → H2SO4 + e–
Finally, H2SO4 produces bisulfate and sulfate ions following Reaction 30. Overall, photo-activation
of the surface and photochemistry of adsorbed species lead to the same final products, but via different
pathways, and therefore with different intermediates and kinetics.
An interesting aspect of SO2 interaction with the surface is the way it might influence formation of
other surface species. Jiang et al. investigated adsorption of SO2 on Fe(0.1)-Mn(0.4)/TiO2 catalytic surface
and came to the conclusion that SO2 was adsorbed on the surface as the bidentate mononuclear sulfate. This
kind of surface could produce new Lewis acid sites on the surface, which upon addition of water would be
transferred into Brønsted acid sites. It was also noticed that formation of surface complex of sulfate was in
competition with that of nitrate but did not have an effect on the adsorption of NH3 (Figure 14) (Jiang et al.,
2010).
Figure 14: Mechanism of adsorption of SO2, NO and NH3 on the surface of Fe(0.1)-Mn(0.4)/TiO2 catalytic surface. Adapted from
“DRIFT Study of the SO2 Effect on Low-Temperature SCR Reaction over Fe−Mn/TiO2” (Jiang et al., 2010).
The importance of heterogeneous reactions of SO2 with different particles can be evaluated against
its loss in the gas phase. According to Li et al. the lifetime of SO2 reacting on CaCO3 is 20-30 hours in dust
conditions, 5-10 hours in dust storms, and 3-5 hours in extreme dust storms (Li et al., 2006). Ullerstam et
al. calculated the lifetime of SO2 reacting on Saharan dust to be 3-6 hours in dust conditions, 1-2 hours in
dust storms, and 0.5-1 hours in extreme dust storms (Ullerstam et al., 2002). The average lifetime of SO2 in
the atmosphere is about 5 days due to cloud processing (Li et al., 2006). Thus, heterogeneous reactions of
SO2 on the surface of mineral dust and volcanic ash particles might be an important sink for the SO2 species.

59 Chapter I. Context, state of the art, objectives and strategy
However, large uncertainties remain due to the lack of detailed information about surface properties (Li et
al., 2006).
The majority of literature sources point out to the adsorption of SO2 gas on the surface of mineral
oxides in the form of sulfites and sulfates, with sulfates being the final and stable product of surface
oxidation processes. Hydroxyl groups are suggested to play an important role in the process. Oxidation is
reported to be most likely triggered by ozone, NO2, or oxygen in the presence of iron-containing species.
The role of water in the formation of sulfites and sulfates remains rather controversial, with either increase,
decrease or even no effect reported in the literature. UV light seems to increase the formation of sulfates on
the surface of mineral dust proxies as well as water-covered particles, but scarce data are available on natural
samples. The assignment of vibrational bonds corresponding to different sulfur species is still sometimes
contradictory (see Table 7). Various mineral oxides are used as models or surrogates for natural mineral
dust aerosols found in the troposphere, even though such approach undermines the complexity of their
minerology and definitively questions the representativeness of proxies. As for the natural mineral dust
samples, limited information is available on the components responsible for the uptake and the
transformations of SO2 on natural desert dust. Almost none of the studies deal with complex natural volcanic
samples.
To sum up, after carefully reviewing the extensive published work, the following deficiencies can be
established:
(i) simplified proxies are often used instead of real natural samples (Goodman et al., 2001),
(Usher et al., 2002), (Wang et al., 2018b),
(ii) many experiments are performed under atmospherically irrelevant conditions such as 0%
RH or/and low pressure (Goodman et al., 2001), (Maters et al., 2016),
(iii) high SO2 concentrations starting from 2.5 ppm (Li et al., 2006), but usually much higher,
such as 50 ppm (Shang et al., 2010) are employed for DRIFTS investigations,
(iv) initial uptakes, as opposed to steady-state uptakes, are used to describe long-lasting
atmospheric processes of interaction of SO2 gas with atmospheric particles (Maters et al.,
2017), (Ullerstam et al., 2003),
(v) (iv) very limited information is available on the reactions of SO2 with natural volcanic
dusts.
In the following chapters I will attempt to bridge these gaps in knowledge by:

60 Chapter I. Context, state of the art, objectives and strategy
(i) using natural volcanic dust samples,
(ii) running the experiments under atmospherically relevant conditions of RH and pressure,
(iii) measuring steady-state uptake coefficients, and
(iv) using whenever possible atmospherically relevant concentrations of SO2 gas.

Table 9: Methods and preferred uptake values for reactions of SO2 with mineral dust and various mineral oxides.
Adsorbent T Technique RH Concentration
of gas
Surface area
cm2/mg
Results Uptake coefficients and
reaction rate constants
Reference
wavelength cm-1
assigned species
γ Al2O3 673 K
973 K
FTIR
ABET=2960 1148
1334
1335
1165
1255
1189
v1 symmetric stretch of SO2, hydroxyl
bonded v3 asymmetric stretch SO2, hydroxyl
bonded
sulfite-like species
sulfite-like species
SO2 bonded to aluminum
SO2 bonded to aluminum
Datta et al. 1985
α-Al2O3
296 K FT-IR 4 ppm-
468 ppm
ABET=140 900-1200
960 1015
1098
1149
1330
3296 3524
3707
3748
broad, chemisorbed, sulfite SO32- and
bisulfite HSO32-
v1 symmetric stretch of weakly, physisorbed SO2 (disappears upon
evacuation of SO2)
v3 asymmetric stretch of weakly, physisorbed SO2 (disappears upon
evacuation of SO2)
positive, Hydroxyl region positive, Hydroxyl region
negative, surface OH loss or OH involved
in hydrogen bonding negative, surface OH loss or OH involved
in hydrogen bonding
Goodman et al., 2001
296 K Knudsen cell γi Al2O3 = 9.5±0.3×10⁻⁵ Goodman et al., 2001
MgO 296 K FT-IR 4 ppm- 6990 ppm
ABET=150 800-1125
896
948 1064
1149
1330
broad, chemisorbed, sulfite SO32- and
bisulfite HSO32-
v1 symmetric stretch of weakly,
physisorbed SO2 (disappears upon evacuation of SO2)
v3 asymmetric stretch of weakly,
physisorbed SO2 (disappears upon evacuation of SO2)
Goodman et al., 2001
296 K Knudsen cell γi MgO = 2.6±0.2×10⁻⁴ Goodman et al., 2001
α-Al2O3 Room
temp.
Knudsen cell ~ 0% ABET=140 γi Al2O3 = 1.6±0.5×10⁻⁴ Usher et al., 2002
Room
temp.
FT-IR 1018, broad stretching motion of adsorbed sulfite SO32-
and/or bisulfite HSO32-
Usher et al., 2002

62 Chapter I. Context, state of the art, objectives and strategy
α-Fe2O3 Room
temp.
Knudsen cell ~ 0% ABET=23 γi α-Fe2O3 = 7.0±2×10⁻⁵
Usher et al., 2002
Room
temp.
FT-IR 850-1100 stretching motion of adsorbed sulfite SO32-
and/or bisulfite HSO32-
Usher et al., 2002
CaCO3 Room
temp.
Knudsen cell ~ 0% ABET=4.6 CaCO3 γi CaCO3 = 1.4±0.7×10⁻⁴
Usher et al., 2002
Room
temp.
FT-IR 850-1100 stretching motion of adsorbed sulfite SO32-
and/or bisulfite HSO32-
Usher et al., 2002
TiO2 Room
temp.
Knudsen cell ~ 0% ABET=500 TiO2 γi TiO2 = 1.0±0.2×10⁻⁴
Usher et al., 2002
Room
temp.
FT-IR 850-1100 stretching motion of adsorbed sulfite SO32-
and/or bisulfite HSO32-
Usher et al., 2002
SiO2 Room
temp.
Knudsen cell ~ 0% ABET=2500 γi SiO2<1×10⁻⁷
Usher et al., 2002
Room
temp.
FT-IR SiO2 exhibits virtually no reactivity toward
SO2 gas
Usher et al., 2002
MgO Room
temp.
Knudsen cell ~ 0% ABET=150 MgO γi MgO = 5.1±0.5×10⁻⁴
Usher et al., 2002
Room
temp.
FT-IR 960, broad
923, broad
stretching motion of adsorbed sulfite SO32-
and/or bisulfite HSO32-
Usher et al., 2002
China Loess Room
temp.
Knudsen cell ~ 0% ABET=110 γi China Loess = 3±1×10⁻⁵
Usher et al., 2002
Room
temp.
FT-IR 850-1100 stretching motion of adsorbed sulfite SO32-
and/or bisulfite HSO32-
Usher et al., 2002
Mineral dust
from Cape Verde islands
Room
temp.
DRIFTS ~ 0% 20 ppm 1330
1240
2450 1650
3200
3700
physisorbed SO2, v3 stretch, sharp,
disappears when pumped in the absence of SO2
sulfate formed upon oxidation with O3, weak, stable to pumping and heating
broad
negative, loss of surface water negative, loss of surface water
negative, loss of surface OH groups
Ullerstam et al. 2002
Room temp
DRIFTS ~ 0% 0.089 ppm to 0.813 ppm
ABET=500 γ mineral dust = 5±1×10⁻⁷ in the presence of 0.227 ppm of
O3
Ullerstam et al. 2002
Mineral dust from Cape
Verde islands
Room temp.
DRIFTS ~ 0% 0.382 ppm ABET=500 1330 1240
1280
2450
3700
physisorbed SO2
sulfate formed upon oxidation with NO2
sulfate formed upon oxidation with NO2
hydrogen sulfite
negative, loss of surface OH groups
Ullerstam et al. 2003
Room temp.
Knudsen cell ~ 0% ABET=500 γ mineral dust = 1.6±0.1×10⁻⁵ Ullerstam et al. 2003
CaCO3 Room
temp.
DRIFTS 40% 2.44 ppm -40
ppm
ABET=19.5 1000-900
1130
sulfite stretching v3 vibration
sulfate v3 stretching vibration after explosion to 20 ppm of O3, peak remain
after heating to 300°C under vacuum
Li et al. 2006

63 Chapter I. Context, state of the art, objectives and strategy
CaCO3 296 K DRIFTS 1%-
90%
19 ppm 923-985
1090-1197
sulfite
sulfate
Zhang et al. 2018
Fe(0.1)-
Mn(0.4)/TiO2
423 K DRIFTS 500 ppm 976
1050
1149 1278
1344
1428
sulfate or bisulfate stretching, v1
sulfate or bisulfate stretching, v3
sulfate or bisulfate stretching, v3 sulfate or bisulfate stretching, v3
surface sulfate vibration
SO3
Jiang et al. 2010
CoII3[CoIII(C
N)6]2
298 K DRIFTS 67585 ppm 1146
1332
2466 1623
v1 symmetric stretch of SO2
v3 asymmetric stretch SO2
v1+v3 combination SO2 band water
Windisch et al. 2010
Al2O3 Room
temp.
DRIFTS ABET=124.6 850-1100
1100-1300
stretching motion of adsorbed sulfite SO32-
and/or bisulfite HSO32-
stretching motion of adsorbed sulfate
Zhang et al. 2006
Room
temp.
FTIR 119 ppm rate constant k=1.35×10⁻² Zhang et al. 2006
MgO Room temp.
DRIFTS ABET=65.52 880-1100
1100-1300
stretching motion of adsorbed sulfite SO32-
and/or bisulfite HSO32-
stretching motion of adsorbed sulfate
Zhang et al. 2006
Room
temp.
FTIR 119 ppm rate constant k=9.4×10⁻³ Zhang et al. 2006
Fe2O3
(hematite
nanoparticles)
298 K
DRIFTS
~ 0%
4.686 ppm ABET=262.3
1045
1153-1223
1260
sulfite
sulfate
bidentate sulfate
γBET Fe2O3 = (9.00±0.7)×10-11 Wang et al. 2018a
Al2O3 298 K
DRIFTS
~ 0%
4.686 ppm ABET=469.7 960
1106
sulfite
sulfate
γBET Al2O3 = (7.37±2.7)×10-13 Wang et al. 2018a
TiO2
nanoparticles
296 K FTIR 0.6%
-76%
132 ppm 1139, 1325
1077, 3648 1033, 971, 923
1006, 886
1361, 1297, 1172, 1116,
10150, 1000
1050 1168, 1129
3498, 3211
SO2
HSO3-
Monodentate SO32-
Bidentate SO32-
SO42-
Solvated SO32-/ HSO3
- Solvated SO4
2-
OH region of SO2·H2O complex
Nanayakkara et al.
2012
TiO2
298 K
DRIFTS 0%-90%
50 ppm 1080 1300-1100
3463-2605
1654 3666, 3628
sulfite and/or bisulfite sulfate
surface water
water bending vibration hydroxyl groups
Shang et al. 2010

7 Thesis objectives and strategy
Very little is known about molecular interactions of natural volcanic dusts with SO2 gas, especially
under relevant atmospheric conditions of RH, pressure and SO2 concentrations. Most often, natural samples
are substituted for mineral oxides to simplify the system of interest. This approach though neglects and
undermines the complexity of natural samples and questions their representativeness as models for mineral
aerosols found in the troposphere.
This work aims at explaining what happens when SO2 gas and volcanic dust interact in the real
atmospheric conditions. Thus, the objectives of this thesis are twofold: (i) to provide an accurate
description of the fate of SO2 gas on the surface of natural volcanic particles under atmospheric
relevant conditions and (ii) to evaluate the impact of SO2 interaction on natural volcanic dust on
tropospheric chemistry.
First step on the way to reach these objectives is to characterize in detail the surface of volcanic
dust to understand its heterogeneous interactions with volcanic SO2. We are going to obtain surface
topography using Scanning Electron Spectroscopy (SEM). Specific surface area is determined using
Brunauer, Emmett and Teller (BET) technique. Bulk and surface elemental composition is obtained using
inductively coupled plasma mass spectrometry (ICP-MS) and X-ray photoelectron spectroscopy (XPS)
respectfully.
Second step is to study kinetics and potential mechanisms of formation of different species on the
surface of dust. Both processes that occur in the gas phase and in the adsorbed phase need to be investigated.
We start by evaluating the uptake of atmospheric SO2 on the surface of five selected relevant
volcanic dusts. To that end, flow-tube reactors coupled with SO2 analyzer for the gas phase monitoring of
species involved, allow us to determine the temporal profiles of SO2 uptake and more precisely the steady
state uptake coefficients, which are very important kinetic parameters to be implemented in models. These
experiments are performed under different atmospheric conditions, such as SO2 concentrations, RH, and
UV light. A great advantage of this approach is its ability to employ atmospherically relevant concentration
of SO2 gas, as well as realistic humidity and atmospheric pressure.
Second, in-situ monitoring of adsorbed phase species using DRIFT spectroscopy allows us to
identify the surface species formed and to propose a surface reaction pathway. The influence of RH on
surface mechanism is also investigated. The concentrations usually employed in DRIFTS studies of
adsorption of SO2 gas on various oxides and natural dusts range from 2.5 to 50 ppm (Li et al., 2006), (Shang
et al., 2010), exposing a limitation of the technique to employ atmospherically relevant concentrations of

65 Chapter I. Context, state of the art, objectives and strategy
SO2. In case of inability to use atmospherically relevant concentrations, a problem of relevancy of high
concentrations needs to be addressed. Particularly, whether the use of high concentrations for a shorter time
can mimic longer processes in the atmosphere that employ lower concentrations. This point is questioned
and discussed.
Finally, quantification of the species observed using DRIFT spectroscopy is achieved using a new
developed and validated HPLC method. Once again, we pay special attention to the role RH plays in surface
species formation. Unlike the experimental methods exposed earlier, HPLC investigation requires
developing and validating a method to separate and quantify surface species. Besides enabling further
investigations of the sulfate species kinetics in laboratory settings, the developed method can also be
potentially used to quantify sulfur-containing products on the surface of natural environmental samples,
such as recently erupted volcanic ash, or dust passing through polluted areas. In addition, as a result of this
investigation a protocol to achieve a controlled aging of volcanic ash with SO2 gas is proposed.
The possibility of surface species quantification using HPLC allows comparing the behaviors of a
large number of natural dust samples, of desert and volcanic origins, as well as mineral proxies. First, this
experimental approach provides a relevant overview on the effective representativeness of dust proxies.
Second, it allows a better understanding of the impact of the dust surface composition on its surface
properties.

66 Chapter I. Context, state of the art, objectives and strategy
References of Chapter 1
Adams, J.W., Rodriguez, D., Cox, R.A., 2005. The uptake of SO2 on Saharan dust: a flow tube study.
Atmospheric Chemistry and Physics 5, 2679–2689. https://doi.org/10.5194/acp-5-2679-2005
Aerosol mass spectrometry, 2020. . Wikipedia.
Al-Abadleh, H.A., Grassian, V.H., 2003. FT-IR Study of Water Adsorption on Aluminum Oxide Surfaces.
Langmuir 19, 341–347. https://doi.org/10.1021/la026208a
Andreae, M., 1995. Climate Effects of Changing Atmospheric Aerosol. World Survey of Climatology. Vol.
16: Future Climates of the World, 341-392 (1995).
Arnalds, O., Dagsson-Waldhauserova, P., Olafsson, H., 2016. The Icelandic volcanic aeolian environment:
Processes and impacts — A review. Aeolian Research 20, 176–195.
https://doi.org/10.1016/j.aeolia.2016.01.004
Arzilli, F., 2020. Highly explosive basaltic eruptions: magma fragmentation induced by rapid crystallisation.
Ash Plume across the North Atlantic : Image of the Day [WWW Document], 2010. URL
https://earthobservatory.nasa.gov/IOTD/view.php?id=43670&src=eoa-iotd (accessed 5.25.18).
Atmospheric Composition — OSS Foundation [WWW Document], n.d. URL
http://ossfoundation.us/projects/environment/global-warming/atmospheric-composition (accessed
6.8.18).
Attard, G., Barnes, C., 1998. Surfaces, Oxford Chemistry Primers. Oxford University Press, Oxford, New
York.
Ayris, P.M., Lee, A.F., Wilson, K., Kueppers, U., Dingwell, D.B., Delmelle, P., 2013. SO2 sequestration in
large volcanic eruptions: High-temperature scavenging by tephra. Geochimica et Cosmochimica
Acta 110, 58–69. https://doi.org/10.1016/j.gca.2013.02.018
Bagheri, G., Rossi, E., Biass, S., Bonadonna, C., 2016. Timing and nature of volcanic particle clusters based
on field and numerical investigations. Journal of Volcanology and Geothermal Research 327, 520–
530. https://doi.org/10.1016/j.jvolgeores.2016.09.009
Baltrusaitis, J., Cwiertny, D.M., Grassian, V.H., 2007. Adsorption of sulfur dioxide on hematite and goethite
particle surfaces. Phys. Chem. Chem. Phys. 9, 5542–5554. https://doi.org/10.1039/B709167B
Bluth, G.J.S., SCHNETZLER, C.C., KRUEGER, A.J., WALTER, L.S., 1993. The contribution of explosive
volcanism to global atmospheric sulphur dioxide concentrations. Nature 327–329.
Brasseur, G.P., Granier, C., Walters, S., 1990. Future changes in stratospheric ozone and the role of
heterogeneous chemistry. Nature 348, 626–628. https://doi.org/10.1038/348626a0
Caloz, F., Fenter, F.F., Tabor, K.D., Rossi, M.J., 1997. Paper I: Design and construction of a Knudsen-cell
reactor for the study of heterogeneous reactions over the temperature range 130–750 K:
Performances and limitations. Review of Scientific Instruments 68, 3172–3179.
https://doi.org/10.1063/1.1148263
Camprubí, E., de Leeuw, J.W., House, C.H., Raulin, F., Russell, M.J., Spang, A., Tirumalai, M.R., Westall,
F., 2019. The Emergence of Life. Space Sci Rev 215, 56. https://doi.org/10.1007/s11214-019-0624-
8
Crowley, J.N., Ammann, M., Cox, R.A., Hynes, R.G., Jenkin, M.E., Mellouki, A., Rossi, M.J., Troe, J.,
Wallington, T.J., 2010. Evaluated kinetic and photochemical data for atmospheric chemistry:
Volume V – heterogeneous reactions on solid substrates. Atmos. Chem. Phys. 10, 9059–9223.
https://doi.org/10.5194/acp-10-9059-2010
Dagsson-Waldhauserova, P., Arnalds, O., Olafsson, H., 2014. Long-term variability of dust events in
Iceland (1949–2011). Atmos. Chem. Phys. 14, 13411–13422. https://doi.org/10.5194/acp-14-
13411-2014
Dagsson-Waldhauserova, P., Arnalds, O., Olafsson, H., Hladil, J., Skala, R., Navratil, T., Chadimova, L.,
Meinander, O., 2015. Snow–Dust Storm: Unique case study from Iceland, March 6–7, 2013.
Aeolian Research 16, 69–74. https://doi.org/10.1016/j.aeolia.2014.11.001

67 Chapter I. Context, state of the art, objectives and strategy
Daniel J. Jacob, 1999. Introduction to Atmospheric Chemistry. Princeton University Press, Princeton, New
Jersey.
Datta, A., Cavell, R.G., Tower, R.W., George, Z.M., 1985. Claus catalysis. 1. Adsorption of SO/sub 2/ on
the alumina catalyst studed by FTIR and EPR spectroscopy. J. Phys. Chem.; (United States) 89:3.
https://doi.org/10.1021/j100249a014
Decker, R., Decker, B., 1991. Mountains of fire: the nature of volcanoes, First. ed. Cambridge University
Press, Cambridge New York.
Dogliotti, L., Hayon, E., 1968. Flash photolysis study of sulfite, thiocyanate, and thiosulfate ions in solution.
J. Phys. Chem. 72, 1800–1807. https://doi.org/10.1021/j100851a073
DRIFT Study of the SO2 Effect on Low-Temperature SCR Reaction over Fe−Mn/TiO2 - The Journal of
Physical Chemistry C (ACS Publications) [WWW Document], n.d. URL
https://pubs.acs.org/doi/abs/10.1021/jp907783g (accessed 4.24.18).
Dupart, Y., King, S.M., Nekat, B., Nowak, A., Wiedensohler, A., Herrmann, H., David, G., Thomas, B.,
Miffre, A., Rairoux, P., D’Anna, B., George, C., 2012. Mineral dust photochemistry induces
nucleation events in the presence of SO2. Proc. Natl. Acad. Sci. U.S.A. 109, 20842–20847.
https://doi.org/10.1073/pnas.1212297109
Durant, A.J., Bonadonna, C., Horwell, C.J., 2010. Atmospheric and Environmental Impacts of Volcanic
Particulates. Elements 6, 235–240.
Durant, A.J., Shaw, R.A., Rose, W.I., Mi, Y., Ernst, G.G.J., 2008. Ice nucleation and overseeding of ice in
volcanic clouds. Journal of Geophysical Research: Atmospheres 113.
https://doi.org/10.1029/2007JD009064
Eurochamp > Eurochamp 2020 [WWW Document], n.d. URL https://www.eurochamp.org/ (accessed
10.21.20).
Faust, B.C., Hoffmann, M.R., Bahnemann, D.W., 1989. Photocatalytic oxidation of sulfur dioxide in
aqueous suspensions of .alpha.-iron oxide (Fe2O3). J. Phys. Chem. 93, 6371–6381.
https://doi.org/10.1021/j100354a021
Finlayson-Pitts, B.J., Jr, J.N.P., 1999. Chemistry of the Upper and Lower Atmosphere: Theory,
Experiments, and Applications. Elsevier.
Froyd, K.D., Murphy, D.M., Brock, C.A., Campuzano-Jost, P., Dibb, J.E., Jimenez, J.-L., Kupc, A.,
Middlebrook, A.M., Schill, G.P., Thornhill, K.L., Williamson, C.J., Wilson, J.C., Ziemba, L.D.,
2019. A new method to quantify mineral dust and other aerosol species from aircraft platforms
using single-particle mass spectrometry. Atmospheric Measurement Techniques 12, 6209–6239.
https://doi.org/10.5194/amt-12-6209-2019
FTIR Sample Techniques - Diffuse Reflectance (DRIFTS) [WWW Document], n.d. URL
https://www.thermofisher.com/fr/en/home/industrial/spectroscopy-elemental-isotope-
analysis/spectroscopy-elemental-isotope-analysis-learning-center/molecular-spectroscopy-
information/ftir-information/ftir-sample-handling-techniques/ftir-sample-handling-techniques-
diffuse-reflectance-drifts.html (accessed 3.19.18).
Geishi, N., 2004. Lavas. Encyclopedia of Geology.
George, C., Ammann, M., D’Anna, B., Donaldson, D.J., Nizkorodov, S.A., 2015. Heterogeneous
Photochemistry in the Atmosphere. Chem. Rev. 115, 4218–4258.
https://doi.org/10.1021/cr500648z
Gislason, S.R., Hassenkam, T., Nedel, S., Bovet, N., Eiriksdottir, E.S., Alfredsson, H.A., Hem, C.P., Balogh,
Z.I., Dideriksen, K., Oskarsson, N., Sigfusson, B., Larsen, G., Stipp, S.L.S., 2011. Characterization
of Eyjafjallajökull volcanic ash particles and a protocol for rapid risk assessment. PNAS 108, 7307–
7312. https://doi.org/10.1073/pnas.1015053108
Goodman, A.L., Li, P., Usher, C.R., Grassian, V.H., 2001. Heterogeneous Uptake of Sulfur Dioxide On
Aluminum and Magnesium Oxide Particles. J. Phys. Chem. A 105, 6109–6120.
https://doi.org/10.1021/jp004423z
Granier, C., Brasseur, G., 1992. Impact of heterogeneous chemistry on model predictions of ozone changes.
J. Geophys. Res. 97, 18015–18033. https://doi.org/10.1029/92JD02021

68 Chapter I. Context, state of the art, objectives and strategy
Highwood, E.-J., Stevenson, D.S., 2003. Atmospheric impact of the 1783-1784 Laki Eruption: Part II
Climatic effect of sulphate aerosol. Atmospheric Chemistry and Physics 3, 1177–1189.
Hoshyaripour, G., Hort, M., Langmann, B., 2012. How does the hot core of a volcanic plume control the
sulfur speciation in volcanic emission? Geochem. Geophys. Geosyst. 13, Q07004.
https://doi.org/10.1029/2011GC004020
How does adsorption work? [WWW Document], n.d. . Chemistry Stack Exchange. URL
https://chemistry.stackexchange.com/questions/57329/how-does-adsorption-work (accessed
6.12.18).
HPLC Troubleshooting Guide [WWW Document], n.d. . Sigma-Aldrich. URL
https://www.sigmaaldrich.com/technical-documents/articles/analytical/hplc-troubleshooting-
guide.html (accessed 5.19.20).
Huang, L., Zhao, Y., Li, H., Chen, Z., 2015. Kinetics of Heterogeneous Reaction of Sulfur Dioxide on
Authentic Mineral Dust: Effects of Relative Humidity and Hydrogen Peroxide. Environ. Sci.
Technol. 49, 10797–10805. https://doi.org/10.1021/acs.est.5b03930
Jiang, B.Q., Wu, Z.B., Liu, Y., Lee, S.C., Ho, W.K., 2010. DRIFT Study of the SO2 Effect on Low-
Temperature SCR Reaction over Fe−Mn/TiO2. J. Phys. Chem. C 114, 4961–4965.
https://doi.org/10.1021/jp907783g
Jickells, T.D., An, Z.S., Andersen, K.K., Baker, A.R., Bergametti, G., Brooks, N., Cao, J.J., Boyd, P.W.,
Duce, R.A., Hunter, K.A., Kawahata, H., Kubilay, N., laRoche, J., Liss, P.S., Mahowald, N.,
Prospero, J.M., Ridgwell, A.J., Tegen, I., Torres, R., 2005. Global Iron Connections Between Desert
Dust, Ocean Biogeochemistry, and Climate. Science 308, 67–71.
https://doi.org/10.1126/science.1105959
Joshi, N., Romanias, M.N., Riffault, V., Thevenet, F., 2017. Investigating water adsorption onto natural
mineral dust particles: Linking DRIFTS experiments and BET theory. Aeolian Research 27, 35–45.
https://doi.org/10.1016/j.aeolia.2017.06.001
Judeikis, H.S., Stewart, T.B., 1976. Laboratory measurement of SO2 deposition velocities on selected
building materials and soils. Atmospheric Environment (1967) 10, 769–776.
https://doi.org/10.1016/0004-6981(76)90078-0
Kaminski, E., Jaupart, C., 1997. Expansion and quenching of vesicular magma fragments in Plinian
eruptions. JOURNAL OF GEOPHYSICAL RESEARCH 102, 12187–12203.
Langmann, B., 2013. Volcanic Ash versus Mineral Dust: Atmospheric Processing and Environmental and
Climate Impacts [WWW Document]. International Scholarly Research Notices.
https://doi.org/10.1155/2013/245076
Langmann, B., Zakšek, K., Hort, M., 2010. Atmospheric distribution and removal of volcanic ash after the
eruption of Kasatochi volcano: A regional model study. Journal of Geophysical Research:
Atmospheres 115. https://doi.org/10.1029/2009JD013298
Langmuir adsorption model, 2018. . Wikipedia.
Lasne, J., Romanias, M.N., Thevenet, F., 2018. Ozone Uptake by Clay Dusts under Environmental
Conditions. ACS Earth Space Chem. 2, 904–914.
https://doi.org/10.1021/acsearthspacechem.8b00057
Li, G., Su, H., Kuhn, U., Meusel, H., Ammann, M., Shao, M., Pöschl, U., Cheng, Y., 2018. Technical note:
Influence of surface roughness and local turbulence on coated-wall flow tube experiments for gas
uptake and kinetic studies. Atmos. Chem. Phys. 18, 2669–2686. https://doi.org/10.5194/acp-18-
2669-2018
Li, L., Chen, Z.M., Zhang, Y.H., Zhu, T., Li, J.L., Ding, J., 2006. Kinetics and mechanism of heterogeneous
oxidation of sulfur dioxide by ozone on surface of calcium carbonate. Atmospheric Chemistry and
Physics Discussions 6, 579–613. https://doi.org/10.5194/acpd-6-579-2006
Lo, J.M.H., Ziegler, T., Clark, P.D., 2010. SO2 Adsorption and Transformations on γ-Al2O3 Surfaces: A
Density Functional Theory Study. J. Phys. Chem. C 114, 10444–10454.
https://doi.org/10.1021/jp910895g

69 Chapter I. Context, state of the art, objectives and strategy
Ludlow, F., Kostick, C., Rhonda McGovern, Farrelly, L., 2020. Volcanic Impacts on Climate and Society
in First Millennium BCE Babylonia.
Martins-Costa, M.T.C., Anglada, J.M., Francisco, J.S., Ruiz-López, M.F., 2018. Photochemistry of SO2 at
the Air-Water Interface: A Source of OH and HOSO Radicals. Journal of the American Chemical
Society. https://doi.org/10.1021/jacs.8b07845
Massman, W.J., 1998. A review of the molecular diffusivities of H2O, CO2, CH4, CO, O3, SO2, NH3,
N2O, NO, and NO2 in air O2 and N2 near STP [WWW Document]. Atmospheric Environment.
URL https://eurekamag.com/research/008/072/008072627.php (accessed 11.5.18).
Maters, E.C., Delmelle, P., Rossi, M.J., Ayris, P.M., 2017. Reactive Uptake of Sulfur Dioxide and Ozone
on Volcanic Glass and Ash at Ambient Temperature. J. Geophys. Res.-Atmos. 122, 10077–10088.
https://doi.org/10.1002/2017JD026993
Maters, E.C., Delmelle, P., Rossi, M.J., Ayris, P.M., Bernard, A., 2016. Controls on the surface chemical
reactivity of volcanic ash investigated with probe gases. Earth Planet. Sci. Lett. 450, 254–262.
https://doi.org/10.1016/j.epsl.2016.06.044
McCall, G.J.H., 2004. Volcanoes. Encyclopedia of Geology.
Meyer, V.R., 2004. Practical High-Performance Liquid Chromatography. John Wiley & Sons.
Nanayakkara, C.E., Pettibone, J., Grassian, V.H., 2012. Sulfur dioxide adsorption and photooxidation on
isotopically-labeled titanium dioxide nanoparticle surfaces: roles of surface hydroxyl groups and
adsorbed water in the formation and stability of adsorbed sulfite and sulfate. Phys. Chem. Chem.
Phys. 14, 6957–6966. https://doi.org/10.1039/C2CP23684B
Nash, D.G., Baer, T., Johnston, M.V., 2006. Aerosol mass spectrometry: An introductory review.
International Journal of Mass Spectrometry, Aerosols/Microparticles Special Issue 258, 2–12.
https://doi.org/10.1016/j.ijms.2006.09.017
Neta, P., Huie, R.E., 1985. Free-radical chemistry of sulfite. Environ. Health Perspect. 64, 209–217.
https://doi.org/10.1289/ehp.8564209
Palmer, J., n.d. Why ancient myths about volcanoes are often true [WWW Document]. URL
http://www.bbc.com/earth/story/20150318-why-volcano-myths-are-true (accessed 5.28.20).
Park, J., Jang, M., Yu, Z., 2017. Heterogeneous Photo-oxidation of SO2 in the Presence of Two Different
Mineral Dust Particles: Gobi and Arizona Dust [WWW Document].
https://doi.org/10.1021/acs.est.7b00588
Park, J.Y., Jang, M., 2016. Heterogeneous photooxidation of sulfur dioxide in the presence of airborne
mineral dust particles. RSC Adv. 6, 58617–58627. https://doi.org/10.1039/C6RA09601H
Pavia, D., Lampman, G., Kriz, G., 2011. Introduction to Spectroscopy, 3rd ed. Thomson learning.
Raman + FTIR - A perfect match [WWW Document], n.d. URL http://info1.thermofisher.com/raman-ftir-
perfect-match-interest-4206 (accessed 4.24.18).
Romanías, M.N., Dagaut, P., Bedjanian, Y., Andrade-Eiroa, A., Shahla, R., Emmanouil, K.S.,
Papadimitriou, V.C., Spyros, A., 2015. Investigation of the Photochemical Reactivity of Soot
Particles Derived from Biofuels Toward NO2. A Kinetic and Product Study. J. Phys. Chem. A 119,
2006–2015. https://doi.org/10.1021/jp511468t
Rossi, E., 2020. The fate of volcanic ash aggregates: premature or delayed sedimentation?
Ruiz-López, M.F., Martins-Costa, M.T.C., Anglada, J.M., Francisco, J.S., 2019. A New Mechanism of Acid
Rain Generation from HOSO at the Air–Water Interface. J. Am. Chem. Soc. 141, 16564–16568.
https://doi.org/10.1021/jacs.9b07912
Savarino, J., 2020. Where is the Toba eruption in the Vostok ice core? Clues from tephra, O and S isotopes.
Scanning Electron Microscopy, n.d. . Nanoscience Instruments. URL
https://www.nanoscience.com/techniques/scanning-electron-microscopy/ (accessed 5.25.20).
Schmidt, A., Ostro, B., Carslaw, K.S., Wilson, M., Thordarson, T., Mann, G.W., Simmons, A.J., 2011.
Excess mortality in Europe following a future Laki-style Icelandic eruption. PNAS 108, 15710–
15715. https://doi.org/10.1073/pnas.1108569108
Schmidt, A., Witham, C.S., Theys, N., Richards, N.A.D., Thordarson, T., Szpek, K., Feng, W., Hort, M.C.,
Woolley, A.M., Jones, A.R., Redington, A.L., Johnson, B.T., Hayward, C.L., Carslaw, K.S., 2014.

70 Chapter I. Context, state of the art, objectives and strategy
Assessing hazards to aviation from sulfur dioxide emitted by explosive Icelandic eruptions. J.
Geophys. Res. Atmos. 119, 2014JD022070. https://doi.org/10.1002/2014JD022070
Shang, J., Li, J., Zhu, T., 2010. Heterogeneous reaction of SO2 on TiO2 particles. Sci. China Chem. 53,
2637–2643. https://doi.org/10.1007/s11426-010-4160-3
Sigl, M., Winstrup, M., McConnell, J.R., Welten, K.C., Plunkett, G., Ludlow, F., Büntgen, U., Caffee, M.,
Chellman, N., Dahl-Jensen, D., Fischer, H., Kipfstuhl, S., Kostick, C., Maselli, O.J., Mekhaldi, F.,
Mulvaney, R., Muscheler, R., Pasteris, D.R., Pilcher, J.R., Salzer, M., Schüpbach, S., Steffensen,
J.P., Vinther, B.M., Woodruff, T.E., 2015. Timing and climate forcing of volcanic eruptions for the
past 2,500 years. Nature 523, 543–549. https://doi.org/10.1038/nature14565
Skoog, D., Donald West, Holler, J., 1995. Fundamentals of analytical chemistry, 7th ed. Harcourt Brace
College Publishers, Orlando, Florida.
Sorem, R.K., 1982. Volcanic ash clusters: Tephra rafts and scavengers. Journal of Volcanology and
Geothermal Research 13, 63–71. https://doi.org/10.1016/0377-0273(82)90019-1
Springsklee, C., 2020. Prebiotic synthesis in volcanic discharges: lightning, porous ash and volcanic gas
atmospheres.
Sternai, P., Caricchi, L., Castelltort, S., Champagnac, J.-D., 2016. Deglaciation and glacial erosion: A joint
control on magma productivity by continental unloading. Geophysical Research Letters 43, 1632–
1641. https://doi.org/10.1002/2015GL067285
Stevenson, D.S., Johnson, C.E., Highwood, E.J., Gauci, V., Collins, W.J., Derwent, R.G., 2003.
Atmospheric impact of the 1783–1784 Laki eruption: Part I Chemistry modelling. Atmos. Chem.
Phys. 3, 487–507. https://doi.org/10.5194/acp-3-487-2003
Stothers, R.B., 1999. Volcanic Dry Fogs, Climate Cooling, and Plague Pandemics in Europe and the Middle
East. Climatic Change 42, 713–723. https://doi.org/10.1023/A:1005480105370
Subramanian, A., Rodriguez-Saona, L., 2009. Chapter 7 - Fourier Transform Infrared (FTIR) Spectroscopy,
in: Sun, D.-W. (Ed.), Infrared Spectroscopy for Food Quality Analysis and Control. Academic
Press, San Diego, pp. 145–178. https://doi.org/10.1016/B978-0-12-374136-3.00007-9
Tambora and the “Year Without a Summer” of 1816 [WWW Document], 2016. . Institute of Geography.
URL
http://www.geography.unibe.ch/services/geographica_bernensia/online/gb2016g9001/index_eng.h
tml (accessed 5.17.18).
Tang, M.J., Cox, R.A., Kalberer, M., 2014. Compilation and evaluation of gas phase diffusion coefficients
of reactive trace gases in the atmosphere: volume 1. Inorganic compounds. Atmospheric Chemistry
and Physics 14, 9233–9247. https://doi.org/10.5194/acp-14-9233-2014
Tang, M.J., Shiraiwa, M., Pöschl, U., Cox, R.A., Kalberer, M., 2015. Compilation and evaluation of gas
phase diffusion coefficients of reactive trace gases in the atmosphere: Volume 2. Diffusivities of
organic compounds, pressure-normalised mean free paths, and average Knudsen numbers for gas
uptake calculations. Atmospheric Chemistry and Physics 15, 5585–5598.
https://doi.org/10.5194/acp-15-5585-2015
Textor, C., Graf, H.-F., Herzog, M., Oberhuber, J.M., 2003. Injection of gases into the stratosphere by
explosive volcanic eruptions. Journal of Geophysical Research: Atmospheres 108.
https://doi.org/10.1029/2002JD002987
The Brewer‐Dobson circulation - Butchart - 2014 - Reviews of Geophysics - Wiley Online Library [WWW
Document], n.d. URL https://agupubs.onlinelibrary.wiley.com/doi/abs/10.1002/2013RG000448
(accessed 6.6.18).
The volcanic explosivity index (VEI) an estimate of explosive magnitude for historical volcanism, 1982. .
Journal of Geophysical Research: Oceans 87, 1231–1238.
https://doi.org/10.1029/JC087iC02p01231
Thordarson, T., Larsen, G., 2007. Volcanism in Iceland in historical time: Volcano types, eruption styles
and eruptive history. Journal of Geodynamics - J GEODYNAMICS 43, 118–152.
https://doi.org/10.1016/j.jog.2006.09.005

71 Chapter I. Context, state of the art, objectives and strategy
Thorsteinsson, T., Jóhannsson, T., Stohl, A., Kristiansen, N.I., 2012. High levels of particulate matter in
Iceland due to direct ash emissions by the Eyjafjallajökull eruption and resuspension of deposited
ash. J. Geophys. Res. 117, B00C05. https://doi.org/10.1029/2011JB008756
Ullerstam, M., Johnson, M.S., Vogt, R., Ljungstrom, E., 2003. DRIFTS and Knudsen cell study of the
heterogeneous reactivity of SO2 and NO2 on mineral dust. Atmos. Chem. Phys. 3, 2043–2051.
https://doi.org/10.5194/acp-3-2043-2003
Ullerstam, M., Vogt, R., Langer, S., Ljungstrom, E., 2002. The kinetics and mechanism of SO2 oxidation
by O-3 on mineral dust. Phys. Chem. Chem. Phys. 4, 4694–4699. https://doi.org/10.1039/b203529b
Usher, C.R., Al-Hosney, H., Carlos-Cuellar, S., Grassian, V.H., 2002. A laboratory study of the
heterogeneous uptake and oxidation of sulfur dioxide on mineral dust particles. J.-Geophys.-Res.
107, 4713. https://doi.org/10.1029/2002JD002051
Usher, C.R., Michel, A.E., Grassian, V.H., 2003. Reactions on Mineral Dust. Chem. Rev. 103, 4883–4940.
https://doi.org/10.1021/cr020657y
Vernier, J.-P., Fairlie, T.D., Deshler, T., Natarajan, M., Knepp, T., Foster, K., Wienhold, F.G., Bedka, K.M.,
Thomason, L., Trepte, C., 2016. In situ and space-based observations of the Kelud volcanic plume:
The persistence of ash in the lower stratosphere. Journal of Geophysical Research: Atmospheres
121, 11,104-11,118. https://doi.org/10.1002/2016JD025344
Volatile Organic Compounds in the Atmosphere [WWW Document], n.d. . Wiley.com. URL
https://www.wiley.com/en-fr/Volatile+Organic+Compounds+in+the+Atmosphere-p-
9781405131155 (accessed 4.12.18).
Volcano Myths and Rituals [WWW Document], 2017. . American Scientist. URL
https://www.americanscientist.org/article/volcano-myths-and-rituals (accessed 5.28.20).
Wang, T., Liu, Y., Deng, Y., Fu, H., Zhang, L., Chen, J., 2018a. Emerging investigator series: heterogeneous
reactions of sulfur dioxide on mineral dust nanoparticles: from single component to mixed
components. Environ. Sci.: Nano 5, 1821–1833. https://doi.org/10.1039/C8EN00376A
Wang, T., Liu, Y., Deng, Y., Fu, H., Zhang, L., Chen, J.-M., 2018b. Adsorption of SO 2 on mineral dust
particles influenced by atmospheric moisture. Atmospheric Environment 191.
https://doi.org/10.1016/j.atmosenv.2018.08.008
Wu, L.Y., Tong, S.R., Wang, W.G., Ge, M.F., 2011. Effects of temperature on the heterogeneous oxidation
of sulfur dioxide by ozone on calcium carbonate. Atmospheric Chemistry and Physics 11, 6593–
6605. https://doi.org/10.5194/acp-11-6593-2011
X-Ray Photoelectron Spectroscopy (XPS) Surface Analysis Technique [WWW Document], n.d. URL
https://www.phi.com/surface-analysis-techniques/xps-esca.html (accessed 5.25.20).
X-ray Powder Diffraction (XRD) [WWW Document], n.d. . Techniques. URL
https://serc.carleton.edu/research_education/geochemsheets/techniques/XRD.html (accessed
5.25.20).
Zhang, X., Zhuang, G., Chen, J., Wang, Y., Wang, X., An, Z., Zhang, P., 2006. Heterogeneous Reactions
of Sulfur Dioxide on Typical Mineral Particles. J. Phys. Chem. B 110, 12588–12596.
https://doi.org/10.1021/jp0617773
Zhang, Z., Ewing, G.E., 2002. Infrared spectroscopy of SO2 aqueous solutions. Spectrochim Acta A Mol
Biomol Spectrosc 58, 2105–2113.
Zhou, L., Wang, W., Gai, Y., Ge, M., 2014. Knudsen cell and smog chamber study of the heterogeneous
uptake of sulfur dioxide on Chinese mineral dust. Journal of Environmental Sciences 26, 2423–
2433. https://doi.org/10.1016/j.jes.2014.04.005

72 Chapter I. Context, state of the art, objectives and strategy

Chapter II. Materials and methods

74 Chapter II. Materials and methods
Table of content of Chapter 2
1 Materials .............................................................................................................................................. 78
1.1 Origin of the samples ................................................................................................................... 78
1.1.1 Volcanic dusts ...................................................................................................................... 78
1.1.2 Desert dusts .......................................................................................................................... 78
1.1.3 Clay samples ........................................................................................................................ 79
1.1.4 Mineral oxide samples ......................................................................................................... 79
1.2 Physical and chemical characterization of the natural volcanic and selected desert dust samples
…………………………………………………………………………………………………...80
1.2.1 Specific surface area measurements of the selected volcanic and desert dust samples, clays
and mineral oxides .......................................................................................................................... 80
1.2.2 Scanning Electron Microscopy of the selected volcanic and desert dusts ........................... 81
1.2.3 ICP-MS for chemical bulk elemental composition of the selected volcanic and desert dusts
……………………………………………………………………………………………...83
1.2.4 X-ray photoelectron spectroscopy for surface characterization of the selected v-dust and
desert dust samples ......................................................................................................................... 84
1.3 Gases used for experiments ......................................................................................................... 85
1.4 Other chemicals and reagents used for investigations ................................................................. 86
2 Experimental strategy and methods ..................................................................................................... 86
2.1 Introduction to the experimental strategy .................................................................................... 86
2.2 Experimental setup of flow-tube experiments ............................................................................. 87
2.2.1 Typical flow-tube experiment .............................................................................................. 87
2.2.2 Flow-tube experiments involving UV light. Calibration and characterization of the light
source .............................................................................................................................................. 89
2.2.3 Sample preparation for flow-tube experiments .................................................................... 90
2.2.4 Protocol for a typical flow-tube experiment: dark conditions .............................................. 91
2.2.5 Protocol for a typical flow-tube experiment: UV-light conditions ...................................... 92
2.2.6 Determination of the uptake coefficients from flow-tube experiments ................................ 93

75 Chapter II. Materials and methods
2.2.7 Determination of the transient number of SO2 molecules taken up by dust ......................... 95
2.3 Experimental setup and protocol for DRIFTS experiments ......................................................... 95
2.4 Experimental setup and protocol for ageing and HPLC analysis ................................................ 97
3 Conclusions ......................................................................................................................................... 98
References ............................................................................................................................................... 100

76 Chapter II. Materials and methods
List of Tables of Chapter 2
Table 1: BET specific surface area (m2 g-1) of various natural v-dust and desert samples, selected clays and mineral
oxides used in the study. SSA of the studied samples was determined using the 2-parameter BET method.
At least three nitrogen adsorption experiments were conducted for each sample using a homemade gas
sorption analyzer. The values presented are the average of the measurements and the quoted errors
correspond to one standard deviation. ......................................................................................................... 81
Table 2: % Bulk elemental composition of the v-dust samples used in this study and of mineral dust samples adopted
from (Joshi et al., 2017), as determined by ICP-MS experiments. .............................................................. 84
Table 3: % Surface elemental composition of the v-dust and desert dust samples used in this study as determined by
XPS (surf stands for surface) compared to % bulk composition as determined by ICP-MS (bulk). Both
expressed as % by weight. Bulk compositions of mineral dust samples marked with asterisk were adopted
from (Joshi et al., 2017). Error on the XPS measurements < 10%. ............................................................. 85
Table 4: The three main techniques used for investigation of interactions of SO2 gas with Icelandic v-dusts.
Parameters investigated. Conditions. Advantages and limitations. ............................................................. 87

77 Chapter II. Materials and methods
List of Figures of Chapter 2
Figure 1: SEM images of eight dusts: (a) Mýrdalssandur, (b) Dyngjusandur, (c) Hagavatn, (d) Maelifellsandur, (e)
Eyjafjallajökull, (f) M’Bour, (g) Arizona, (h) Gobi. ................................................................................ 82
Figure 2: Schematic representation of the coated wall flow-tube (CWFT) reactor used in this study. The space filled
with the coolant in between the two walls is shaded in blue. The dust sample coating the inner surface of
the Pyrex tube is shown in orange. ........................................................................................................... 88
Figure 3: JNO2 as a function of the number of lamps switched on along flow-tube experiments. .............................. 90
Figure 4: Theoretical SO2 concentration profile during a typical flow-tube experiment with v-dust exposed to SO2.
At the beginning of the experiment where surface is isolated from the gas mixture the initial SO2
concentration is [SO2]0, then the dust is exposed to the gas and the concentration of SO2 falls to its
minimum, after which it recovers till a steady-state is reached. Note that the steady-state concentration
[SO2]ss is different from the initial state concentration [SO2]0. Initial concentration is controlled when the
injector is pushed in and the SO2 gas in no longer in contact with the dust. Shaded area corresponds to the
integrated area that is used to obtain the number of molecules during the transient initial uptake of SO2 on
v-dusts ns (molecules cm-2). 300 min was chosen as integration limits for the determination of Ns. ....... 92
Figure 5: Theoretical SO2 concentration profile during a typical flow-tube experiment with v-dust under 30% of RH
and 296 K. At the beginning of the experiment, the dust is isolated from the gas mixture, in which an
initial SO2 concentration, [SO2]0, is set. The dust is then exposed to SO2 in the dark (gray area), and [SO2]
decreases initially strongly, before recovering to a steady-state value [SO2]ss,dark within typically 12 hours.
Thereafter, the surface is irradiated with simulated sunlight (yellow area), and a second large consumption
of SO2 is observed, before recovering to a steady-state value [SO2]ss,light within typically 36 hours. Lights
are turned off (second gray area) and [SO2] returns to its steady-state value in the dark. SO2 concentration
is then controlled by pushing the injector in, and the dust is no longer exposed to the gas. Black-shaded
and red-shaded areas are the integrated areas corresponding to the number of SO2 molecules taken up (in
molecules cm-2) during the initial transient uptake by v-dust, respectively in the dark and under UV, Ns,dark
and Ns,light. The moment at which the steady-state is reached (see text) is chosen as integration limit for the
determination of ns. the [SO2]ss,dark and [SO2]ss,light were used to measure the steady state uptake
coefficients γss,dark and γss,light. .................................................................................................................... 93
Figure 8: Scheme of the DRIFT experimental setup. MFC: Mass Flow Controllers are used to supply the optical cell
with a defined mixing ratio of dry air, humid air, and SO2. ..................................................................... 96
Figure 9: Left: schematic representation of the setup used to age samples of dust with SO2 gas. Right: reactor 1 and
2 with deposited dust, zoomed for clarity................................................................................................. 98

78 Chapter II. Materials and methods
This chapter details the materials used during the research and introduces the reader to the methods
employed to characterize and analyze the samples. A special attention is given to the methods employed
and the experimental protocol followed to investigate the interactions of SO2 gas with v-dust.
1 Materials
1.1.1 Volcanic dusts
All five samples of v-dust come from different dust hot spots of Iceland. The geomorphic
properties of Hagavatn (64°28´6,12"N 20°16´55,81"W), Mýrdalssandur (63°26'50.1"N 18°48'52.8"W),
Maelifellssandur (63°48'48.7"N 19°07'42.5"W) and Dyngjusandur (64°50'41,885"N 16°59'40,78"W) v-
dusts are described by Arnalds et al. (Arnalds et al., 2016). Overall, these areas are subjected to extremely
large aeolian erosion due to frequent dust storms, and have extensive areas (from 10 to 140 km2), hence
providing a large supply (from 30 to 40 million tons annually) of v-dust to the atmosphere (Arnalds et al.,
2016). Samples were collected from the top surface layer of each dust hot spot. The samples were dry and
did not come in contact with soil or other organics. The fifth sample, the Eyjafjallajökull (63°33'50.4"N
19°27'28.8"W) volcanic ash, was collected and stored dry during the second phase of the explosive-
effusive volcanic eruption on April 27, 2010. It is a typical volcanic ash sample as characterized by
Gislason et al. (Gislason et al., 2011).
1.1.2 Desert dusts
In order to enrich the discussion and to put the findings about v-dusts in a more global context of
aeolian research it was decided to add to the v-dust samples several desert dusts. Three desert mineral dust
samples of contrasting elemental compositions come from various regions of the Earth: M’Bour (Senegal),
Gobi desert (China), and commercially available Arizona Test Dust (USA). M’Bour natural mineral dust
was collected close to the city of M’Bour in Senegal, West Africa (14°25'22.08"N 16°57'55.44"W). It
comes from the Sahara and Sahel regions, characterized as the largest sources of atmospheric mineral dust.
With annual median emissions of around 1,000 million tons a year, they contribute to about 62 % of the
total global dust emissions in the atmosphere (Prospero et al., 2002), (Marticorena et al., 2017). The sample
was mechanically sieved after collection and the fraction below 100 𝜇m was used for the investigations.
The Gobi mineral desert dust sample comes from Gobi Desert, Ningxia Province, China (36°29'14.39"N
107°28'30.75"E). This area represents another major source of atmospheric mineral dust (Prospero et al.,
2002). This is an aeolian sample that was sieved and the fraction below 100 𝜇m was used for further

79 Chapter II. Materials and methods
studies. In addition, the commercially available nominal 0-3 µm Arizona Test Dust (ID 12332M), (ATD,
Powder Technology Inc.) collected in October 17, 2014 was used for the research.
1.1.3 Clay samples
A number of clays were used for comparison purposes while searching for the origin of specific
behaviors observed in desert dusts. Atmospheric loadings of clay dusts are among the largest (i.e., ca. 9
million tons), accounting for more than a half of total dust loading estimated at 19.2 million tons (Tang et
al., 2016). The emission fluxes of clay dusts are also the largest, accounting for almost half of the total
dust flux (i.e., ca. 800 million tons per year) and providing a large and continuous supply of fresh clay
dusts to the atmosphere (Tang et al., 2016). Two commercially available clay samples, Kaolinite (CAS:
1318-74-7, Lot# BCBS7473V) and Montmorillonite K-10 (CAS: 1318-93-0, Lot# 14772-106) natural
clays, were purchased from Sigma-Aldrich , St Louis, Mo. The third clay sample illite (85-90% purity)
(CAS# 12173-60-3) was obtained from Clay Mineral Society, Aurora, USA and contains 10-15% of
quartz. All three minerals are phyllosilicates composed of plate-like structures characterized by varying
arrangements of alumina and silica sheets stacked in repeating layers (Hatch et al., 2012). Kaolinite
(Al2Si2O5(OH)4) is a 1:1 type clay in which each layer contains one silica and one alumina sheet held
together by shared oxygen atoms, while montmorillonite ((Na,Ca)0.33(Al,Mg)2Si4O10(OH)2·nH2O) and
illite (K,H3O)(Al,Mg,Fe)2(Si,Al)4O10[(OH)2,(H2O)] are 2:1 clays, where alumina sheet is sandwiched
between two silica sheets. Kaolinite is unique relative to illite and montmorionite because the external
surface of its alumina sheet contains structural hydroxyl groups (Hatch et al., 2012). Kaolinite and illite
have a very low ability to adsorb water, while montmorillonite has a high adsorption capacity (Hatch et
al., 2012).
1.1.4 Mineral oxide samples
A number of metal oxides were used during research. Pure mineral oxides included silica (SiO2,
98% purity) (Merck , Darmstadt, Germany, Lot# TA565954 912), quartz (SiO2) (Sigma-Aldrich , St Louis,
Mo, CAS 14808-60-7, Lot# BCBZ9191), iron oxide (Fe3O4, 99.99% purity) (Sigma-Aldrich , St Louis,
Mo, CAS 1317-61-9, Lot# MKBC3159V), goethite (FeOOH, 30-63% Fe) (Sigma-Aldrich , St Louis, Mo,
CAS 20344-49-4, Lot# BCCB4398), calcium oxide (CaO, 99.9% purity) (Merck , Darmstadt, Germany,
CAS 1306-78-8, Lot# MKBW2071V), aluminum oxide (Al2O3) (Sigma-Aldrich , St Louis, Mo, CAS
1344-28-1, Lot# STBC4668V), titanium oxide (Ti2O3, 99.5% purity) (Evonik industries, Essen,
Germany), calcium carbonate (CaCO3, 98% purity) (Sigma-Aldrich , St Louis, Mo, CAS 471-34-1, Lot#
MKBV0812V), and magnesium oxide (MgO, 98-100.5% purity) (Sigma-Aldrich , St Louis, Mo, CAS
1309-48-4, Lot# SZBF2170V).

80 Chapter II. Materials and methods
Physical and chemical characterization of the natural volcanic dust samples was undertaken to
enable understanding of their interactions with SO2 gas and to help quantifying these interactions. Desert
dust samples were often investigated alongside the v-dusts in order to compare the trends. Specific surface
area (SSA) measurements were performed by the author or by the immediate members of the “Reactivity
and Air Treatment” research group at IMT Lille Douai, SAGE department. ICP-MS analysis was
performed by Dr. L. Alleman at IMT Lille Douai, SAGE department. SEM analysis was done by Dr. V.
Thiery, at IMT Lille Douai, GCE department in the presence of the author. XPS measurements were
externalized to University of Louvain, Louvain-la-Neuve, Belgium, and were performed by Dr. Elena
Maters from the School of Earth and Environment, University of Leeds, UK.
1.2.1 Specific surface area measurements of the selected volcanic and desert dust samples, clays and
mineral oxides
The SSA is a physical property of solids, which represents the total surface area of a material per
mass unit (m2 g−1), and is used for the determination of the kinetic and sorption parameters (Chapter 1,
Section 5.1.1). To determine SSA, the Brunauer–Emmett–Teller (BET) method was employed. Nitrogen
(N2) adsorption measurements were performed with a laboratory gas sorption analysis system (Joshi et al.,
2017), (Ibrahim et al., 2018) within 0.05 to 0.3 relative pressure range (P/P0) of N2. To determine the range
of uncertainty, three adsorption measurements were conducted for each sample. The results of the BET
specific surface area (SSABET) of the 5 v-dust samples, 3 mineral dust samples, 2 clays and a number of
mineral oxides are displayed in Table 1. Specific surface area is necessary to determine the uptake
coefficient and surface coverage of a pollutant (Crowley et al., 2010).

81 Chapter II. Materials and methods
Table 1: BET Specific Surface Area (m2 g-1) of various natural v-dust and desert samples, selected clays and mineral oxides used
in the study. SSA of the studied samples was determined using the 2-parameter BET method. At least three nitrogen adsorption
experiments were conducted for each sample using a homemade gas sorption analyzer. The values presented are the average of
the measurements and the quoted errors correspond to one standard deviation. FeOOH data is retrieved from (Xi and Zhang,
2017).
Origin of the Icelandic v-dust sample BET Specific Surface Area
(m2 g-1)
Mýrdalssandur 1.5 ± 0.38
Dyngjusandur 7.0 ± 1.8
Hagavatn 4.5 ± 1.1
Maelifellssandur 8.2 ± 2.0
Eyjafjallajökull 0.75 ± 0.19
Origin of the natural mineral dust sample
M’Bour 14.5 ± 1.0
Gobi 10.5 ± 2.0
ATD 67.2 ± 1.8
Selected clays
Kaolinite 9.2 ± 2.8
Montmorillonite 225 ± 68
Illite 22.2 ± 6.7
Selected mineral oxides
SiO2 Silica 402 ± 40
SiO2 Quartz 1.49 ± 0.12
Al2O3 118 ± 22
CaO 66.01 ± 0.54
CaCO3 0.6 ± 0.1
Fe3O4 3.4 ± 0.4
FeOOH 15.8
TiO2 52 ± 6.4
MgO 49.26 ± 0.23
1.2.2 Scanning Electron Microscopy of the selected volcanic and desert dusts
Morphology of the v-dust samples was analyzed by Scanning Electron Microscopy (SEM) carried
out on a Hitachi S-4300SE/N SEM in high vacuum mode. The images of different v-dust particles together
with desert dusts are presented in Figure 1. V-dusts are small particles with rough edges. Dust from
Eyjafjallajökull has larger particle size with many particles reaching 500 µm in diameter, while the other
four v-dusts have a much finer structure and range from 10 to 50 µm in diameter due to glaciofluvial
processes leading to their generation. As for desert dusts, they range from less than 3 µm for Arizona Test
Dust to 100 µm for Gobi and M’Bour.
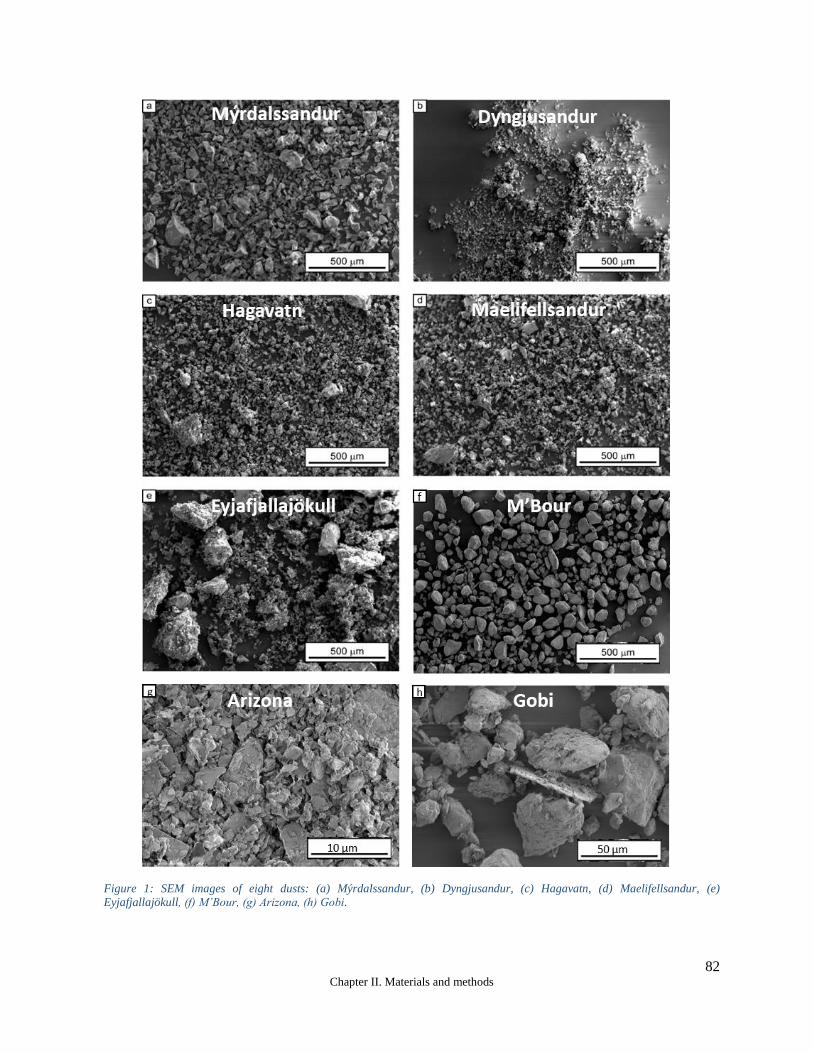
82 Chapter II. Materials and methods
Figure 1: SEM images of eight dusts: (a) Mýrdalssandur, (b) Dyngjusandur, (c) Hagavatn, (d) Maelifellsandur, (e)
Eyjafjallajökull, (f) M’Bour, (g) Arizona, (h) Gobi.

83 Chapter II. Materials and methods
1.2.3 ICP-MS for chemical bulk elemental composition of the selected volcanic and desert dusts
The bulk elemental composition of the samples of Icelandic v-dust used in this study was
determined by ICP-MS using a Perkin Elmer NeXion 300x spectrometer, the results are presented in Table
2. Prior to the analysis, from 2 to 7 mg of each sample were treated in a mixture of acids and peroxide
(HF/HNO3/H2O2) in a microwave oven (Milestone Ultrawave) at 500 K and 35 bar for 15 min (Alleman
et al., 2010). Six measurements per sample were performed to evaluate their chemical heterogeneity.
Repeated measurements were carried out on acid blanks, quality control standard solutions and standard
reference material (NIST SRM 1648a and SRM 2584) to evaluate detection limits, accuracy and to validate
the whole procedure.
As can be seen from Table 2 silicon is the most abundant element of the v-dusts, followed by iron,
calcium, and aluminum. Within the five selected v-dust samples the elemental composition seems to differ
only slightly, except for Eyjafjallajökull v-dust which exhibits a higher amount of silicon than other
samples and a lower amount of calcium, iron and magnesium. The results of ICP-MS analysis for
Eyjafjallajökull v-dust agrees well with the literature (Gislason et al., 2011). The difference in the
composition of Eyjafjallajökull v-dust in comparison with other v-dust samples used in this study is most
probably due to the difference in the composition of magma that produced it. Indeed, the volcanic systems
that supply Dyngjusandur dust hotspot (Bárðarbunga and Kverkfjöll volcanic systems) and Mýrdalssandur
and Maelifellssandur dust hotspots (Katla volcanic system) have magmas of a predominantly basaltic
composition, while magma of Eyjafjallajökull is andesitic, meaning that it is higher in silicon (“Icelandic
Volcanoes,” n.d.), (Vogel et al., 2017). The decrease of calcium, iron and magnesium with increasing
silicon content is in accordance with the expected variation of the composition of magma (Vogel et al.,
2017). Other processes that can influence the composition of magma during a particular eruption include
crystallization (Clague and Denlinger, 1994), melting of the crustal rocks (Deegan, 2010) and mixing of
original magma with another magma that evolved separately (“Icelandic Volcanoes,” n.d.). Since
composition of magma can change within the same eruption, one might expect to see different
compositions of v-dust both on the time scale and on the location scale. Transported dust can also have a
different composition further away from the source. Globally, when compared to other types of mineral
dusts, such as Saharan dusts, Gobi dust or Arizona test dust (Joshi et al., 2017), the amount of silicon in
all five v-dust samples is considerably lower while the amount of iron, magnesium, and titanium is higher
(Romanias et al., 2016), (Langmann, 2013).

84 Chapter II. Materials and methods
Table 2: % bulk elemental composition of the v-dust samples used in this study and of mineral dust samples adopted from (Joshi
et al., 2017), as determined by ICP-MS experiments.
Element Mýrdalssandur Dyngjusandur Hagavatn
Maelifellssandur Eyjafjallajökull M’Bour
Saharan
dust
(Joshi et
al., 2017)
Gobi
dust
(Joshi
et al.,
2017)
ATD
dust
(Joshi
et al.,
2017)
Si 31.3 ± 2.2 32.7 ± 2.0 27.5 ± 2.8 28.3 ± 2.4 49.5 ± 0.9 94.4 57.6 74.6
Fe 23.0 ± 1.5 19.7 ± 0.2 19.6 ± 0.7 23.8 ± 0.8 13.0 ± 0.5 1.3 5.5 3.1
Ca 13.9 ± 1.3 16.3 ± 0.3 19.5 ± 1.1 14.0 ± 0.3 7.3 ± 0.1 1.0 16.1 4.4
Al 12.3 ± 3.1 15.8 ± 0.2 16.7 ± 3.2 15.5 ± 0.1 13.6 ± 0.9 1.8 11 9.5
Mg 5.1 ± 1.2 7.3 ± 0.1 10.4 ± 1.8 5.7 ± 0.4 3.3 ± 0.2 0.1 2.3 1.0
Ti 7.6 ± 0.7 3.3 ± 0.4 2.4 ± 0.1 6.1 ± 0.4 2.4 ± 0.1 0.7 0.8 0.5
Na 4.8 ± 0.2 3.9 ± 0.1 3.1 ± 0.1 4.6 ± 0.1 7.3 ± 0.3 0.2 2.5 2.5
K 1.3 ± 0.2 0.6 ± 0.1 0.2 ± 0.1 1.5 ± 0.1 3.1 ± 0.1 0.1 3.5 4.0
other 0.7 0.4 0.6 0.5 0.5 0.1 0.7 0.1
1.2.4 X-ray photoelectron spectroscopy for surface characterization of the selected v-dust and desert
dust samples
The composition of the samples in the topmost two to ten nanometers of the surface in terms of
relative concentrations (in at.%) of O, Si, Fe, Ca, Al, Mg, Ti, Na, K, and Mn, was analyzed by X-ray
photoelectron spectroscopy using a Kratos Axis Ultra instrument. High resolution scans at a pass energy
of 40 eV were acquired for C1s, O1s, Si2p, Al2p, Fe2p, Mg2p, Ca2p, Na1s, K2p, Ti2p, and Mn2p using
a monochromatic Al X-ray beam centered at 1486.6 eV. Data treatment was performed using the CasaXPS
software program. The binding energy scale was calibrated by assigning a value of 284.8eV to the C1s
peak for adventitious carbon. The obtained results are presented in Table 3.
From Table 3 we can see that, in comparison with bulk composition, surface composition for v-
dust samples is considerably lower in Fe, Ca, Mg, Ti, and, with exception of Eyjafjallajökull, in Na and
K. A completely opposite trend (%Sisurface > %Sibulk, %Alsurface > %Albulk) is observed for Si and, with
exception of Eyjafjallajökull, for Al. The fact that a higher amount of Si and Al is observed on the surface
v-dust particles could be due to the fact that minerals in ash are overlain by thin glass coating consisting
of random three-dimensional network of tetrahedral units made up of Si4+, Al3+ and bridging oxygen atoms
(Delmelle et al., 2018). As for the desert dusts, they show lower % surface Si and Ti composition and
higher % Al composition on the surface than in the bulk (%Sisurface < %Sibulk, %Alsurface > %Albulk). The
trends for other elements on the surface of desert dusts are less clear. A sharp difference in surface vs bulk
composition raises a question of which one would be more important while studying interactions of SO2
gas with the v-dust. It was highlighted that surface of the ash can be modified during eruption (Maters et
al., 2016), (Langmann, 2013). Due to potential modifications of v-dust particles during eruption and to

85 Chapter II. Materials and methods
the fact that SO2 gas is unlikely to penetrate into the hard dust particle, surface composition is expected to
define the interfacial interactions.
Table 3: % surface elemental composition of the v-dust and desert dust samples used in this study as determined by XPS (surf
stands for surface) compared to % bulk composition as determined by ICP-MS (bulk). Both expressed as % by weight. Bulk
compositions of mineral dust samples marked with asterisk were adopted from (Joshi et al., 2017). Error on the XPS
measurements < 10%.
Element Mýrdalssandur Dyngjusandur Hagavatn
Maelifellssandur Eyjafjallajökull M’Bour
Saharan dust
Gobi dust ATD dust
surf bulk surf bulk surf bulk surf bulk surf bulk surf bulk* surf bulk* surf bulk*
Si 47.1 31.3 49.0 32.7 42.8 27.5 43.7 28.3 60.0 49.5 57.0 94.4 54.7 57.6 57.5 74.6
Fe 20.0 23.0 15.9 19.7 10.5 19.6 22.0 23.8 7.7 13.0 6.1 1.3 6.7 5.5 8.2 3.1
Ca 8.1 13.9 9.7 16.3 9.0 19.5 6.3 14.0 5.5 7.3 2.4 1.0 7.7 16.1 5.5 4.4
Al 14.5 12.3 16.8 15.8 31.8 16.7 18.2 15.5 13.4 13.6 32.1 1.8 18.5 11 18.0 9.5
Mg 3.3 5.1 4.8 7.3 2.4 10.4 3.0 5.7 1.5 3.3 0 0.1 6.1 2.3 3.9 1.0
Ti 3.8 7.6 2.0 3.3 1.8 2.4 4.3 6.1 1.0 2.4 0.2 0.7 0 0.8 0.5 0.5
Na 2.3 4.8 1.0 3.9 1.4 3.1 1.3 4.6 7.5 7.3 0.3 0.2 0.8 2.5 1.3 2.5
K 0.9 1.3 0 0.6 0 0.2 0.4 1.5 3.3 3.1 1.9 0.1 4.7 3.5 4.4 4.0
other 0 0.7 0.8 0.4 0.3 0.6 0.8 0.5 0.1 0.5 0 0.1 0 0.7 0.7 0.1
Experiments are carried out using zero air; it is generated by a classical air compressor, and then
passed through a catalytic zero air generator (Claind ZeroAir 2020, Lenno, Italy) coupled to a swing
adsorption (PSA) device. The remaining impurity levels in the air stream before entering the reactor are
lower than the analytical system detection limits: VOCs < 0.1 ppb, CO2 < 10 ppb, and CO < 80 ppb.
Moisture level is ca. 2 ppm. In experiments requiring humid air, a second flow of zero air going through
a bubbler of ultrapure water (milli-Q, resistivity 18.2 MΩ cm) is mixed with the dry air flow, in proportions
necessary to reach the relative humidity (RH) targeted. Certified gas cylinders are used as SO2 sources.
For low concentration experiments aiming to determine uptake coefficients in the flow-tube and for
intercomparison studies an SO2 cylinder of 8.96 ppm in air (20.7 % O2, 79.3 % N2) provided by “Air
Liquide” is used. Regarding the mechanistic investigation employing DRIFT spectroscopy and
quantification using HPLC, higher concentrations are used and a certified cylinder of 250 ppm (Messer,
France) diluted in synthetic air (nearly 80% N2 and 20% O2) is the SO2 source.
Throughout the manuscript, gas concentrations are given in ppmv and ppbv (parts per million and
parts per billion by volume, respectively). Under usual experimental conditions (T = 296 K, P = 1 atm),
the conversion to a concentration is given by 1 ppbv (SO2) ≈ 2.5 × 10¹⁰ molecules cm-3, 1 ppmv (SO2) ≈
2.5 × 10¹³ molecules cm-3. Note that this conversion factor takes a different value when the temperature or
total pressure changes.

86 Chapter II. Materials and methods
HPLC grade acetonitrile (ACN), 99.95% and methanol (MeOH), 99.9% were obtained from
Biosolve Chimie, Dieuze, France. Potassium hydrogen phthalate and triethanolamine, 99% of analytical
grade were purchased from Acros Organics, Geel, Belgium. Cetylpyridinium chloride, 98% was purchased
from Alfa Aesar, Kander, Germany. Sodium sulfate, 99% purity was purchased from Merck, Darmstadt,
Germany. Sodium sulfite, >95 % purity was purchased from Fischer Chemical, Loughborough, UK.
Formalin (37% formaldehyde solution by weight containing 10-15 % MeOH as stabilizer) was obtained
from Sigma-Aldrich. Other chemicals and solvents of analytical grade were used during research.
Deionized water (DI) was used throughout the investigations.
2 Experimental strategy and methods
The following experimental setups and protocols constitute the pillar of this thesis, as the author
primarily used the following three types of experimental procedures in order to fulfill the scientific
objectives: flow-tubes, diffuse reflectance infrared Fourier transform spectroscopy (DRIFTS) and high
performance liquid chromatography (HPLC). Parameters investigated by each technique together with
experimental conditions, advantages and limitations are summarized in Table 4.
The decision to start investigations of the interactions of SO2 with v-dust using flow-tube reactor
was motivated by the fact that it is better adapted to study processes under atmospherically relevant
conditions of low SO2 concentration (ppb range), atmospheric pressure, relevant humidity and
temperature. By using flow-tubes, such information as uptake coefficients and number of molecules
adsorbed on surface can be obtained. Note that the latter is calculated from the number of molecules lost
from the gas phase. In this way molecules reaching the detector are serving as messengers for the observed
phenomena. Thus, flow-tube experiments are limited to the gas phase and do not provide information on
the fate of the molecules taken up on the surface.
To obtain a direct view on the processes that happen on the surface of v-dust when subjected to
SO2 gas DRIFTS was employed. Once again, atmospherically relevant conditions were sought for and
relevant pressure, temperature and relative humidity were employed. The concentration of SO2 gas though
was high (ppm range) due to the low sensitivity of the technique. Note that large difference in SO2
concentrations used for flow-tube versus DRIFTS experiments comes from different technical constrains.
DRIFT spectroscopy is used for the in situ characterization of surface adsorbed species but is characterized

87 Chapter II. Materials and methods
by a relatively low sensitivity, depending on the gas-surface interactions. In this work two different
reactors serve two different purposes: flow-tube is used to study kinetics by providing uptake coefficients
under atmospherically relevant conditions while DRIFTS is used to study surface reaction mechanism. It
is important to keep in mind that while the kinetics is changed by the concentration because the surface
coverage is changed by the concentration, the reaction mechanism is not likely to be changed as a function
of gas phase concentration. Thus, both techniques bring complimentary and valuable information.
Finally, HPLC was considered necessary to quantify the species observed by DRIFTS, as DRIFTS
is a qualitative technique and doesn’t provide quantitative information. In addition, not constrained by
reflectance of samples, all samples could be investigated using HPLC and thus the samples could be easily
compared between each other. In the absence of a suitable HPLC method able to separate and quantify
surface species encountered in this work, a new method was developed and validated for the intended use
(see Chapter 5). The conditions employed were similar to those employed by DRIFTS.
Table 4: The three main techniques used for investigation of interactions of SO2 gas with Icelandic v-dusts. Parameters
investigated. Conditions. Advantages and limitations.
Instrumental
technique
Purposes Conditions Advantages Limitations
Flow-tube
reactor
Determination
of the steady
state uptake
coefficient (γss)
Number of
molecules
transiently
adsorbed (Ns)
[SO2]: 75 ppb
RH: 0-70%
light: dark and
simulated sunlight
Temperature: 23°C
Pressure: 760 Torr
Time: 12hr -80 hr
Atmospherically relevant
conditions of SO2
concentrations, RH,
pressure, temperature and
light exposure
Only relevant for the investigation
of the gas phase, provides no
information on the surface fate of
the lost gas-phase molecules
DRIFTS In-situ
monitoring of
surface species
and processes.
Kinetics
[SO2]: 175 ppm
RH: 0, 30%
light: dark
Temperature:23°C
Pressure: 760 Torr
Time: 72 hr
Able to distinguish between
different species present on
the surface, possible to
monitor temporal evolutions
of surface species
Low reflectance for dark samples
generates weak signals
Larger that atmospherically
relevant concentrations of SO2 gas
Not quantitative
Challenging to run continuous and
long term experiments
HPLC Quantifications
of sulfates and
sulfites present
on the surface
[SO2]: 175 ppm
RH: 0-82%
light: dark
Temperature:23°C
Pressure: 760 Torr
Time: 5 min-120 hr
Quantification of sulfites and
sulfates present on the
surface of various samples
Larger that atmospherically
relevant concentrations
2.2.1 Typical flow-tube experiment
The heterogeneous interactions of SO2 with v-dust were investigated in a horizontal double wall
flow-tube reactor represented schematically in Figure 2. The experiments were conducted under relevant
atmospheric conditions, i.e. SO2 concentration in the ppb range, atmospheric pressure, room temperature,

88 Chapter II. Materials and methods
various % RH, in the dark and under UV light. The objective of this series of experiments was to determine
the uptake coefficients of SO2 on the various Icelandic v-dusts.
Figure 2: Schematic representation of the Coated Wall Flow Tube (CWFT) reactor used in this study. The space filled with the
coolant in between the two walls is shaded in blue. The dust sample coating the inner surface of the Pyrex tube is shown in orange.
Lasne et al described the setup in details in recent publications. It mainly consists of three parts;
(i) the gas mixing line, (ii) the reactor and (iii) the analytical device (Romanias et al., 2016), (Lasne et al.,
2018). The gas preparation line is used for the mixing of zero dry/humid air with SO2 resulting in a flow
with the desired proportion of RH and SO2 concentration. Dry air, humid air and SO2 flows are controlled
with MKS mass-flow controllers (100 to 1000 sccm) connected to a 4-channel MKS type 247 readout unit;
they are mixed at the entrance of the injector. The reactor is made of a double wall Pyrex glass and is
thermostated by circulating water in between the double wall surrounding the flow-tube. Inside and along
the axis of the reactor, a Pyrex tube covered on its inner wall with the v-dust is introduced. Two Viton O-
rings are placed around the Pyrex tube to fix its position inside of the reactor. The gas mixture is flowed
through a movable injector (internal diameter of 0.3 cm) with a flow rate ranging between 250 and 500
sccm, ensuring laminar flow conditions with a Reynolds number, Re < 140. The role of the moveable
injector is to either isolate (placed at the downstream end of the flow tube) or to expose the dust surface
to the gas environment (upstream end of the reactor). A thermoregulation unit (Huber, Ministat 230)
regulates the reactor temperature by circulating water in between the double-wall of the flow-tube. The
outgoing flow is then directed to the SO2 analyzer (Model 43C, Thermo Environmental Instruments Inc.)
for the real time gas phase monitoring of SO2, with a time resolution of 10 seconds. SO2 is detected via its
fluorescence signal after absorption of UV photons. The limit of detection is 2.0 ppb. The precision of the
measurement given by the supplier is 1.0 ppb or 1% of reading, whichever is greater. Before an experiment
is conducted, the setup is flushed with a high concentration of SO2 to passivate all the surfaces accessible
to the gas flow.

89 Chapter II. Materials and methods
2.2.2 Flow-tube experiments involving UV light. Calibration and characterization of the light source
For the experiments involving UV light the UVA Philips PL-L 18W lamps were placed evenly
around the flow-tube at a distance of 12 cm. The dust samples were irradiated with 3 UVA lamps. The
spectrum of the light emitted by the UVA lamps is in the wavelength range 315-400 nm, with maximum
emission at 352 nm.
Light source characterization experiments were carried out with high NO2 concentrations (≈ 1015
molecule cm−3, i.e. ≈50 ppmV) using dry N2 as bath gas. NO2 concentrations were recorded with a
chemical ionization mass spectrometer (SIFT-MS) (Romanias et al., 2016), (Zeineddine et al., 2017). The
total flow rate in the reactor was set at 50 sccm and the kinetics of NO2 was followed as a function of its
residence time (4 - 14 s). Under such experimental conditions, the loss of NO2 is due to two processes:
NO2 photolysis (Reaction 1) and a secondary reaction with oxygen atoms (Reaction 2):
Reaction 1 NO2 + hν → NO + O
Reaction 2 O + NO2 → NO+O2
Therefore, the global rate of NO2 loss is:
Equation 1 d[NO2]/dt = −2 JNO2 [NO2]
The values of JNO2 (s-1), determined from the exponential decay of NO2 concentration for different
numbers of lamps switched on, are in the 1.5 × 10⁻³ – 4.5 × 10⁻³ s−1 range (Figure 3). These values are
similar to those of JNO2 measured in the atmosphere of Earth under cloudy and clear sky conditions
(Barnard et al., 2004), (Bohn et al., 2005), (Topaloglou et al., 2005). Since the JNO2 values measured in
the lab are close to those measured in the real atmosphere, the experiments performed under UV light are
referred to as experiments performed under simulated sunlight radiation.

90 Chapter II. Materials and methods
Figure 3: JNO2 as a function of the number of lamps switched on during flow-tube experiments.
2.2.3 Sample preparation for flow-tube experiments
To coat the inner surface of a Pyrex tube with v-dust (orange color in Figure 2), a defined mass of
dust is first inserted in a tube. A small amount of water is added to form a slurry and the tube is shaken to
deposit an even coating on the Pyrex surface. This way the water/dust suspension is homogeneously spread
on the inner wall of the tube, ensuring that no excess suspension has to be removed after the deposition.
Then, the tube is heated slightly above 380 K for 10 minutes to evaporate excess water, placed in the
reactor and flushed overnight with dry air. Before each experiment, the dust deposited in the tube is left
for at least 1 hour under a zero air flow containing the level of relative humidity that will be used during
the experiment planned next. This prevents any interplay between H2O and SO2 on the surface of v-dust
that may disturb the process of interest, here the interaction of SO2 with the surface of v-dust.
Potential modifications of the volcanic dust upon its dissolution in water in the process of slurry
preparation and subsequent drying process include displacement of soluble salts that might be found on
the surface of v-dust particles as well as leaching of alkali and alkaline earth metals from the
aluminosilicate network at ash surfaces (Witham et al., 2005). In the case of Hagavatn, Mýrdalssandur,
Maelifellssandur and Dyngjusandur natural v-dust samples that were most likely previously exposed to
water, the abovementioned phenomena do not seem to effect the results because the soluble salts would
be expected to be leached out by the time of the experiment. In the case of fresh Eyjafjallajökull dust,

91 Chapter II. Materials and methods
leaching of the soluble salts formed during ash-gas interaction in the plume presents a valid concern. In
order to minimize removal of soluble salts the amount of water added to prepare a slurry was as small as
necessary to spread the dust evenly, i.e. 1:3 ash (g) to water (mL) ratio was used, which is much smaller
than the 1:25 ash-to-water ratio recommended for preparation of ash leachates (Witham et al., 2005). In
addition, contact time with water was minimized to around 10 seconds shaking followed by rapidly drying
the slurry, which is also much faster than 90 min agitation procedure recommended by Witham et al.
(Witham et al., 2005). One could also expect that drying the slurry would lead to redisposition of the
displaced salts, even though some of it could be redeposited on the surface of the glass tube and not the v-
particles.
We didn’t notice any loss of dust during the uptake experiments. Note that the tubes with the
deposited dust are weighed before and after the experiments and the variations noticed were in the range
of the mass scale uncertainty (< 1 %). In addition, considering that (i) the flow rate during the experiments
is relative slow and (ii) the experiments are carried out under atmospheric pressure and no pressure
variation takes place between the reactor and the analyzer, it is highly improbable to experience any loss
of dust during our measurements. Furthermore, we have not observed (at least visually) any large particles
to fail to adhere to the Pyrex tube. However, even if this was the case, in the horizontal flow-tube, these
particles would still be subjected to the flow of gas and thus remain accessible to the gas. To conclude, the
total mass of the dust inside the reactor is maintained during the entire experiment.
2.2.4 Protocol for a typical flow-tube experiment: dark conditions
Theoretical SO2 concentration profile is represented in Figure 4. During a typical flow-tube
experiment SO2 is flowed through the reactor, the dust being left unexposed initially. After a stable SO2
concentration, [SO2]0, is set, the injector is pulled out and the dust is exposed to SO2; the change in SO2
concentration related to its uptake by dust is recorded by the SO2 analyzer. After a steady-state is reached,
the injector is pushed back in to control the [SO2]0. What is obtained as a result of the flow-tube experiment
is a time evolution of the trace gas concentration at the tube exit, the so-called breakthrough curve, that is
used to determine the steady state uptake coefficient (Huthwelker et al., 2006). In the case of SO2 a long-
lasting tailing of the breakthrough curve is observed, similar to the one described for the uptake of nitric
acid (HNO3) on ice (Huthwelker et al., 2006). This phenomenon leads to the following question: at which
point can we say that a steady state is reached? In the absence of the generally accepted understanding of
the nature of tailing and for the practical reasons the following pragmatic approach was adopted. Steady
state is considered to be reached when the variation of the signal falls within 1.5% of its value for at least
three hours. On average it takes about 12 hours to reach the steady state under 30% humidity. Most studies
that use Knudsen cells measure the initial uptakes as opposed to steady state uptakes and thus the time

92 Chapter II. Materials and methods
exposure of the gas to the surface is much shorter, often in the range of several minutes (Ullerstam et al.,
2003), (Maters et al., 2017), (Adams et al., 2005), (Zhou et al., 2014). Thus, determination of steady state
uptake at 12 hours allows characterization of long-term processes that are rarely studied (Crowley et al.,
2010).
Figure 4: Theoretical SO2 concentration profile during a typical flow-tube experiment with v-dust exposed to SO2. At the
beginning of the experiment where surface is isolated from the gas mixture the initial SO2 concentration is [SO2]0, then the dust
is exposed to the gas and the concentration of SO2 falls to its minimum, after which it recovers till a steady-state is reached. Note
that the steady-state concentration [SO2]SS is different from the initial state concentration [SO2]0. Initial concentration is
controlled when the injector is pushed in and the SO2 gas in no longer in contact with the dust. Shaded area corresponds to the
integrated area that is used to obtain the number of molecules during the transient initial uptake of SO2 on v-dusts Ns (molecules
cm-2). 300 min was chosen as integration limits for the determination of Ns.
Preliminary experiments were conducted to determine a possible contribution of the Pyrex
surfaces to the uptake of SO2. They showed negligible contribution to the parameters determined in the
current study. As a consequence, no contribution of the Pyrex glass needs to be subtracted from the steady-
state uptake of SO2 nor from the transient number of SO2 molecules taken up.
2.2.5 Protocol for a typical flow-tube experiment: UV-light conditions
Experiments involving UV light are conducted the following fashion. SO2 is flowed through the
reactor, the dust being left unexposed initially. After a stable initial SO2 concentration, [SO2]0, is set, the
injector is pulled and the dust surface is exposed to SO2 in the dark; the change in SO2 concentration,
[SO2], related to the uptake by dust is recorded by the SO2 analyzer downstream of the reactor. After a
steady-state is reached in the dark, the UV lamps are turned on, and further modifications of the signal are
observed. The UV lamps are turned off after a steady-state under UV is reached and, last, the injector is

93 Chapter II. Materials and methods
pushed back in the reactor to control the level of [SO2]0. A theoretical SO2 concentration profile is
represented in Figure 5.
Figure 5: Theoretical SO2 concentration profile during a typical flow-tube experiment with v-dust under 30% of RH and 296 K.
At the beginning of the experiment, the dust is isolated from the gas mixture, in which an initial SO2 concentration, [SO2]0, is set.
The dust is then exposed to SO2 in the dark (gray area), and [SO2] decreases initially strongly, before recovering to a steady-
state value [SO2]SS,dark within typically 12 hours. Thereafter, the surface is irradiated with simulated sunlight (yellow area), and
a second large consumption of SO2 is observed, before recovering to a steady-state value [SO2]SS,light within typically 36 hours.
Lights are turned off (second gray area) and [SO2] returns to its steady-state value in the dark. SO2 concentration is then
controlled by pushing the injector in, and the dust is no longer exposed to the gas. Black-shaded and red-shaded areas are the
integrated areas corresponding to the number of SO2 molecules taken up (in molecules cm-2) during the initial transient uptake
by v-dust, respectively in the dark and under UV, NS,dark and NS,light. The moment at which the steady-state is reached (see text) is
chosen as integration limit for the determination of NS. The [SO2]SS,dark and [SO2]SS,light were used to measure the steady state
uptake coefficients γss,dark and γss,light.
2.2.6 Determination of the uptake coefficients from flow-tube experiments
The measurements of SO2 concentration at steady-state, [SO2]SS, and at the initial level, [SO2]0,
together with the knowledge of the parameters defining our setup are necessary to conduct the analysis
leading to the determination of the uptake coefficients under equilibrium conditions, 𝛾𝑠𝑠 (Lasne et al.,
2018). Assuming first order kinetics for the uptake of SO2 by v-dust surfaces, the observed constant of
reaction, kobs (in s-1), is determined by Equation 2:
Equation 2
𝒌𝒐𝒃𝒔 =𝒗
𝑳× 𝒍𝒏(
[𝑺𝑶𝟐]𝟎[𝑺𝑶𝟐]𝑺𝑺
⁄ )
where v is the flow in the reactor (in cm s-1) and L is the length of the dust coating (in cm). The
value of kobs (in s-1) is corrected for diffusion of SO2 with a constant kdiff (in s-1) to give the diffusion-

94 Chapter II. Materials and methods
corrected constant kkin (in s-1). In this work, a diffusion coefficient of SO2 in the air derived from (Massman,
1998) is used, D(296 K) = 95.28 Torr cm2 s-1. This value is in excellent agreement with D = 94 ± 13 Torr
cm2 s-1 suggested by Tang et al. (Tang et al., 2014). The diffusion-corrected constant, kkin, is then used to
determine γss, (Equation 3):
Equation 3
𝜸𝒔𝒔 =𝟒𝒌𝒌𝒊𝒏𝑽
𝒄𝑺𝒈𝒆𝒐𝒎
where V and Sgeom are the volume (in cm3) and geometric surface (in cm2) of the region where the
reaction takes place, respectively, and c is the average molecular speed (in cm s-1). The diffusion-correction
accounts for ca. 5 % of the measured uptake coefficients.
Determination of the geometric uptake coefficient represents an upper limit to γ since it does not
take into account the interaction of the gas with all adsorption sites. Another approach is to use the BET
surface area to calculate the uptake coefficient. This approach is especially valid when there is a long
processing of the surface and thus there is enough time for the gas to interact with the maximum available
surface area (Crowley et al., 2010). A series of experiments were carried out as a function of
Mýrdalssandur v-dust mass deposited that showed a linear increase in the 0 - 250 mg range. The linear
increase of the uptake with mass and the lack of saturation reflect the fact that the entire surface of the dust
is accessible to SO2 molecules from the gas and thus the specific surface area SSABET is used for the
calculation of the uptake coefficient, γss,BET,
Equation 4
𝜸𝒔𝒔,𝑩𝑬𝑻 = 𝜸𝒔𝒔 ×𝑺𝒈𝒆𝒐𝒎
𝑨𝒔
where As, is the effective surface area of the dust, obtained from multiplying SSABET (m2 g-1) by
the mass of the sample (g).
The error on the uptake coefficients is the root-mean-square deviation of the values measured. It
was calculated with the precision of the signal (0.5% of the measured concentration) and its propagation
to kobs measurement, the SSA determination (~ 25%) and all relevant uncertainties, i.e. on the gas flow
measurement, temperature, mass weighing, and length of the exposed dust coating (~8%). The total error
calculated for the γ values was estimated to be ca 35% in all experiments and a safe limit of 40% is given.
Although the quoted uncertainty is significant, it reflects the real error accounted for the measurement of
slow uptake processes (uptakes on the order of 10-9) in the flow-tube.

95 Chapter II. Materials and methods
2.2.7 Determination of the transient number of SO2 molecules taken up by dust
Besides uptake coefficients, the transient initial number of SO2 molecules taken up per surface
area of v-dusts Ns (molecules cm-2) is determined at 0 and 30% of RH, both in the dark and under UV
irradiation (3 UV lamps on, JNO2 = 1.5 × 10⁻² s-1); by integrating the area of the initial uptake process in a
typical uptake experiment (Figure 4, Figure 5) divided by the effective surface area of the dust, As,
according to Equation 5:
Equation 5
𝑵𝒔 = ∫𝑭𝒕
𝑨𝒔
𝝉=𝒕
𝝉=𝟎
𝒅𝝉
where Ft is the flow rate (molecules min−1) of SO2 molecules through the reactor. The total error
in Ns determination is estimated to be ca. 30% and includes all systematic uncertainties and the error in
SSA determination.
It should be noted that since the SO2 concentration recorded at the steady-state was lower than its
pre-exposure concentration, for the determination of Ns solely the transient initial uptake removal of SO2
is considered (dashed areas in Figure 4 and Figure 5). The long tailing of the breakthrough curve observed
points to additional physico-chemical processes besides the adsorption/desorption. Therefore for the
determination of integration parameter a similar to two-third criterion approach was adopted as
recommended by Huthwelker et al., where “the surface uptake is considered finished once the
breakthrough curve rises to two-thirds of its initial value” (Huthwelker et al., 2006). The integration limits
for the determination of the number of molecules Ns were chosen from the time of the exposure of SO2 to
the dust to 300 min after the exposure to make sure that the change in the breakthrough curve towards
steady state has occurred for all the dusts. This criterion was adopted in order to be able to compare the
uptake capacity of the v-dusts at the initial stage of the interaction with SO2. On longer scale, samples can
be compared based on the γss,ΒΕΤ values.
The heterogeneous interaction between SO2 gas and v-dusts was studied in-situ inside of the
optical DRIFTS cell operated at atmospheric pressure and room temperature under dry and 30% RH
conditions. The objective of this series of experiments was to monitor the adsorbed species formed on the
surface of v-dusts, aiming to elucidate the mechanism of the interaction under both dry and humid
conditions.

96 Chapter II. Materials and methods
The DRIFT experimental setup consists of three parts: (i) the gas supply line, (ii) the optical
reactor, and (iii) the analytical device as described previously by Romanias et al. (Romanías et al., 2016).
A representation of the system is given in Figure 6. The heterogeneous reactions between SO2 and different
v-dust samples are monitored in situ inside of the optical DRIFTS cell (Praying Mantis Kit, Harrick
Scientific Corp.) fitted with zinc selenium (ZnSe) windows. DRIFT spectra are recorded by a Nicolet 6700
FTIR spectrometer equipped with a mercury cadmium telluride (MCT) detector cooled with liquid
nitrogen.
The temperature of the sample is measured using a thermocouple placed right below of the sample
holder and is monitored/controlled with a Harrick temperature controller (Pleasantville, USA).
Figure 6: Scheme of the DRIFT experimental setup. MFC: Mass Flow Controllers are used to supply the optical cell with a
defined mixing ratio of dry air, humid air, and SO2.
At the beginning of the experiment the crucible sample holder inside the DRIFTS cell is filled
with about 80-110 mg of v-dust. The cell is then tightly closed and the infrared beam is focused on the
surface of the dust. The gas flowed through the DRIFTS cell is made up of different proportions of dry
air, humid air and SO2 gas. Prior to the introduction of the SO2 gas volcanic samples are heated to 423 K
for 1.5 hours to remove any pre-adsorbed species. Samples are then allowed to cool down to room
temperature and are purged overnight with either dry or humid air depending on the experimental

97 Chapter II. Materials and methods
conditions in order to equilibrate the system. A background spectrum is recorded right before introduction
of SO2 gas. DRIFT spectra of the v-dust in the presence of SO2 gas are recorded from 650 to 4000 cm-1
using Omnic software with 100 scans per spectrum, a spectral resolution of 4 cm-1, and a time resolution
ranging from 3 minutes to 1 hour depending on the stage of the experiment. The formation and loss of
surface species are observed as positive and negative absorption bands respectively. Thus, a typical
experiment lasts about 4 days and consists of thermal pre-treatment (1.5 hr), system equilibration (16 hr),
SO2 adsorption phase (72 hr) and desorption upon flushing phase (6 hr). The SO2 concentration in the
mixed gas is 175 ppm. Note that this is over three orders of magnitude higher than the atmospherically
relevant SO2 concentration of ~75 ppb used in the flow-tube reactor experiments.
Quantitative analysis of surface species is an important parameter that makes it possible to
compare different dusts in their ability to form and store various surface species. In this way the technique
is complimentary to DRIFTS as it gives mass values to the peaks observed in the DRIFTS spectra. It is
also helpful to deduce reaction kinetics in case of limitations of other instrumental techniques. Such as,
heterogeneous nature and low absorbance of dark volcanic samples might prevent using DRIFTS in certain
cases due to the low signal obtained from the instrument (Urupina et al., 2019). Unlike the protocols for
flow-tube experiments and DRIFTS investigations discussed earlier, employing HPLC for quantification
of surface species required developing a novel method. This method had to be validated to demonstrate its
suitability for the intended use. An article “Method development and validation for the determination of
sulfites and sulfates on the surface of mineral atmospheric samples using reverse-phase liquid
chromatography” was published in Talanta and is presented in Chapter 5. It goes in detail through every
step of the method optimization, validation and application. A short summary of the method is provided
below.
The setup for ageing samples consists of two parts: (i) the gas mixing line and (ii) the ageing
reactor. A schematic representation of the setup is provided in Figure 7. A dust weighing from 100 to 200
mg is spread on a 47 mm Whatman filter paper and is placed in a tightly closed reactor. The gas mixture
containing 175 ppm SO2 entering the reactor is forced through the filter containing the dust at 100 sccm.
The ageing of environmental samples is carried out using zero air.

98 Chapter II. Materials and methods
Figure 7: Left: schematic representation of the setup used to age samples of dust with SO2 gas. Right: reactor 1 and 2 with
deposited dust, zoomed for clarity.
Chromatography equipment consisted of Thermo Scientific Dionex UltiMate 3000 UHPLC
System with UV/VIS Detector (Thermo Scientific, Waltham, MA). Chromeleon 7 .0 Data Acquisition
System for LC (Thermo Scientific, Waltham, MA) was used to analyze the data. Analysis was performed
using Restek Ultra Column C18, 5 µm, Length 250 mm, I.D. 4.60 mm dynamically coated with 1.0 mM
Cetylpyridinium Chloride in 7% acetonitrile solution to produce a charged surface as recommended by
Zuo et al. (Zuo and Chen, 2003). The HPLC instrument was operated isocratically at 23 C° using a solution
of Potassium Hydrogen Phthalate 1.0 mM, adjusted to pH 6.5 with a dilute solution of Potassium
Hydroxide mobile phase and run at a flow rate of 1.0 mL/min with negative UV-Vis detection at 255 nm
for 15 min. The injection volume was 10 µL. Columns were cleaned at 1 mL/min for 30 minutes with
ACN/water (50:50, v/v), 30 minutes with ACN/water (75:25, v/v), and 1 hour with 100% ACN before
being coated with 1.0 mM cetylpyridinium chloride in ACN/water (7:93, v/v) at 0.5 mL/min for 3 hours.
A developed reversed-phase HPLC method was validated for specificity, LOD and LOQ, linearity and
range, robustness, injection repeatability and reproducibility for sample preparation and extraction.
3 Conclusions
Chapter 2 introduced the samples used for the investigation including their physico-chemical
characterization. Following the discussion about the materials used, experimental strategy and methods
were detailed. As a result, three main axes of research were defined, each prioritizing a specific instrument:
flow-tube reactor to determine the uptake of SO2 gas on the v-dust, DRIFTS to monitor surface species
and processes, and HPLC to quantify surface species.

99 Chapter II. Materials and methods
Naturally, the following thesis chapters were structured to reflect each of these axes. Chapter 3
describes the SO2 uptake using flow-tube reactor, and Chapter 4 focuses on surface processes investigation
using DRIFTS. Chapter 5 is entirely dedicated to the development and validation of HPLC method for
determination of sulfites and sulfates on the surface of mineral atmospheric samples. Chapter 6 and 7
unravel the results of HPLC analysis. Finally, Chapter 8 combines the findings with a purpose of
evaluating the results and the instrumental methods used to see them in a more global context.

100 Chapter II. Materials and methods
References of Chapter 2
Adams, J.W., Rodriguez, D., Cox, R.A., 2005. The uptake of SO2 on Saharan dust: a flow tube study.
Atmospheric Chemistry and Physics 5, 2679–2689. https://doi.org/10.5194/acp-5-2679-2005
Alleman, L.Y., Lamaison, L., Perdrix, E., Robache, A., Galloo, J.-C., 2010. PM10 metal concentrations and
source identification using positive matrix factorization and wind sectoring in a French industrial
zone. Atmospheric Research 96, 612–625. https://doi.org/10.1016/j.atmosres.2010.02.008
Arnalds, O., Dagsson-Waldhauserova, P., Olafsson, H., 2016. The Icelandic volcanic aeolian environment:
Processes and impacts — A review. Aeolian Research 20, 176–195.
https://doi.org/10.1016/j.aeolia.2016.01.004
Barnard, J.C., Chapman, E.G., Fast, J.D., Schmelzer, J.R., Slusser, J.R., Shetter, R.E., 2004. An evaluation
of the FAST-J photolysis algorithm for predicting nitrogen dioxide photolysis rates under clear and
cloudy sky conditions. Atmospheric Environment 38, 3393–3403.
https://doi.org/10.1016/j.atmosenv.2004.03.034
Bohn, B., Rohrer, F., Brauers, T., Wahner, A., 2005. Actinometric measurements of NO2 photolysis
frequencies in the atmosphere simulation chamber SAPHIR. Atmospheric Chemistry and Physics
5, 493–503. https://doi.org/10.5194/acp-5-493-2005
Clague, D.A., Denlinger, R.P., 1994. Role of olivine cumulates in destabilizing the flanks of Hawaiian
volcanoes. Bull Volcanol 56, 425–434. https://doi.org/10.1007/BF00302824
Crowley, J.N., Ammann, M., Cox, R.A., Hynes, R.G., Jenkin, M.E., Mellouki, A., Rossi, M.J., Troe, J.,
Wallington, T.J., 2010. Evaluated kinetic and photochemical data for atmospheric chemistry:
Volume V – heterogeneous reactions on solid substrates. Atmos. Chem. Phys. 10, 9059–9223.
https://doi.org/10.5194/acp-10-9059-2010
Deegan, F.M., 2010. Processes of Magma-crust Interaction Insights from Geochemistry and Experimental
Petrology. Acta Universitatis Upsaliensis, Uppsala.
Delmelle, P., Wadsworth, F.B., Maters, E.C., Ayris, P.M., 2018. High Temperature Reactions Between
Gases and Ash Particles in Volcanic Eruption Plumes. Reviews in Mineralogy and Geochemistry
84, 285–308. https://doi.org/10.2138/rmg.2018.84.8
Gislason, S.R., Hassenkam, T., Nedel, S., Bovet, N., Eiriksdottir, E.S., Alfredsson, H.A., Hem, C.P., Balogh,
Z.I., Dideriksen, K., Oskarsson, N., Sigfusson, B., Larsen, G., Stipp, S.L.S., 2011. Characterization
of Eyjafjallajökull volcanic ash particles and a protocol for rapid risk assessment. PNAS 108, 7307–
7312. https://doi.org/10.1073/pnas.1015053108
Hatch, C.D., Wiese, J.S., Crane, C.C., Harris, K.J., Kloss, H.G., Baltrusaitis, J., 2012. Water Adsorption on
Clay Minerals As a Function of Relative Humidity: Application of BET and Freundlich Adsorption
Models. Langmuir 28, 1790–1803. https://doi.org/10.1021/la2042873
Huthwelker, T., Ammann, M., Peter, T., 2006. The Uptake of Acidic Gases on Ice. Chemical Reviews 106,
1375–1444. https://doi.org/10.1021/cr020506v
Ibrahim, S., Romanias, M.N., Alleman, L.Y., Zeineddine, M.N., Angeli, G.K., Trikalitis, P.N., Thevenet,
F., 2018. Water Interaction with Mineral Dust Aerosol: Particle Size and Hygroscopic Properties of
Dust. ACS Earth Space Chem. 2, 376–386. https://doi.org/10.1021/acsearthspacechem.7b00152
Icelandic Volcanoes [WWW Document], n.d. URL http://icelandicvolcanos.is/?volcano=EYJ# (accessed
2.20.19).
Joshi, N., Romanias, M.N., Riffault, V., Thevenet, F., 2017. Investigating water adsorption onto natural
mineral dust particles: Linking DRIFTS experiments and BET theory. Aeolian Research 27, 35–45.
https://doi.org/10.1016/j.aeolia.2017.06.001
Langmann, B., 2013. Volcanic Ash versus Mineral Dust: Atmospheric Processing and Environmental and
Climate Impacts [WWW Document]. International Scholarly Research Notices.
https://doi.org/10.1155/2013/245076

101 Chapter II. Materials and methods
Lasne, J., Romanias, M.N., Thevenet, F., 2018. Ozone Uptake by Clay Dusts under Environmental
Conditions. ACS Earth Space Chem. 2, 904–914.
https://doi.org/10.1021/acsearthspacechem.8b00057
Marticorena, B., Chatenet, B., Rajot, J.L., Bergametti, G., Deroubaix, A., Vincent, J., Kouoi, A.,
Schmechtig, C., Coulibaly, M., Diallo, A., Koné, I., Maman, A., NDiaye, T., Zakou, A., 2017.
Mineral dust over west and central Sahel: Seasonal patterns of dry and wet deposition fluxes from
a pluriannual sampling (2006–2012). Journal of Geophysical Research: Atmospheres 122, 1338–
1364. https://doi.org/10.1002/2016JD025995
Massman, W.J., 1998. A review of the molecular diffusivities of H2O, CO2, CH4, CO, O3, SO2, NH3,
N2O, NO, and NO2 in air O2 and N2 near STP [WWW Document]. Atmospheric Environment.
URL https://eurekamag.com/research/008/072/008072627.php (accessed 11.5.18).
Maters, E.C., Delmelle, P., Rossi, M.J., Ayris, P.M., 2017. Reactive Uptake of Sulfur Dioxide and Ozone
on Volcanic Glass and Ash at Ambient Temperature. J. Geophys. Res.-Atmos. 122, 10077–10088.
https://doi.org/10.1002/2017JD026993
Maters, E.C., Delmelle, P., Rossi, M.J., Ayris, P.M., Bernard, A., 2016. Controls on the surface chemical
reactivity of volcanic ash investigated with probe gases. Earth Planet. Sci. Lett. 450, 254–262.
https://doi.org/10.1016/j.epsl.2016.06.044
Prospero, J.M., Ginoux, P., Torres, O., Nicholson, S.E., Gill, T.E., 2002. Environmental Characterization
of Global Sources of Atmospheric Soil Dust Identified with the Nimbus 7 Total Ozone Mapping
Spectrometer (toms) Absorbing Aerosol Product. Reviews of Geophysics 40, 2-1-2–31.
https://doi.org/10.1029/2000RG000095
Romanías, M.N., Ourrad, H., Thévenet, F., Riffault, V., 2016. Investigating the Heterogeneous Interaction
of VOCs with Natural Atmospheric Particles: Adsorption of Limonene and Toluene on Saharan
Mineral Dusts. J. Phys. Chem. A 120, 1197–1212. https://doi.org/10.1021/acs.jpca.5b10323
Romanias, M.N., Zeineddine, M.N., Gaudion, V., Lun, X., Thevenet, F., Riffault, V., 2016. Heterogeneous
Interaction of Isopropanol with Natural Gobi Dust. Environ. Sci. Technol. 50, 11714–11722.
https://doi.org/10.1021/acs.est.6b03708
Tang, M., Cziczo, D.J., Grassian, V.H., 2016. Interactions of Water with Mineral Dust Aerosol: Water
Adsorption, Hygroscopicity, Cloud Condensation, and Ice Nucleation. Chem. Rev. 116, 4205–
4259. https://doi.org/10.1021/acs.chemrev.5b00529
Tang, M.J., Cox, R.A., Kalberer, M., 2014. Compilation and evaluation of gas phase diffusion coefficients
of reactive trace gases in the atmosphere: volume 1. Inorganic compounds. Atmospheric Chemistry
and Physics 14, 9233–9247. https://doi.org/10.5194/acp-14-9233-2014
Topaloglou, C., Kazadzis, S., Bais, A.F., Blumthaler, M., Schallhart, B., Balis, D., 2005. NO2 and HCHO
photolysis frequencies from irradiance measurements in Thessaloniki, Greece. Atmospheric
Chemistry and Physics 5, 1645–1653. https://doi.org/10.5194/acp-5-1645-2005
Ullerstam, M., Johnson, M.S., Vogt, R., Ljungstrom, E., 2003. DRIFTS and Knudsen cell study of the
heterogeneous reactivity of SO2 and NO2 on mineral dust. Atmos. Chem. Phys. 3, 2043–2051.
https://doi.org/10.5194/acp-3-2043-2003
Urupina, D., Lasne, J., Romanias, M.N., Thiery, V., Dagsson-Waldhauserova, P., Thevenet, F., 2019.
Uptake and surface chemistry of SO2 on natural volcanic dusts. Atmospheric Environment 217,
116942. https://doi.org/10.1016/j.atmosenv.2019.116942
Vogel, A., Diplas, S., Durant, A.J., Azar, A.S., Sunding, M.F., Rose, W.I., Sytchkova, A., Bonadonna, C.,
Krüger, K., Stohl, A., 2017. Reference data set of volcanic ash physicochemical and optical
properties. Journal of Geophysical Research: Atmospheres 122, 9485–9514.
https://doi.org/10.1002/2016JD026328
Witham, C.S., Oppenheimer, C., Horwell, C.J., 2005. Volcanic ash-leachates: a review and
recommendations for sampling methods. Journal of Volcanology and Geothermal Research 141,
299–326. https://doi.org/10.1016/j.jvolgeores.2004.11.010
Xi, J., Zhang, S., 2017. Adsorption and desorption of Sb(III) on goethite. IOP Conf. Ser.: Earth Environ.
Sci. 100, 012145. https://doi.org/10.1088/1755-1315/100/1/012145

102 Chapter II. Materials and methods
Zeineddine, M.N., Romanias, M.N., Gaudion, V., Riffault, V., Thévenet, F., 2017. Heterogeneous
Interaction of Isoprene with Natural Gobi Dust. ACS Earth Space Chem. 1, 236–243.
https://doi.org/10.1021/acsearthspacechem.7b00050
Zhou, L., Wang, W., Gai, Y., Ge, M., 2014. Knudsen cell and smog chamber study of the heterogeneous
uptake of sulfur dioxide on Chinese mineral dust. Journal of Environmental Sciences 26, 2423–
2433. https://doi.org/10.1016/j.jes.2014.04.005
Zuo, Y., Chen, H., 2003. Simultaneous determination of sulfite, sulfate, and hydroxymethanesulfonate in
atmospheric waters by ion-pair HPLC technique. Talanta 59, 875–881.
https://doi.org/10.1016/S0039-9140(02)00647-1

Chapter III. Investigation of the uptake of SO2 on natural v-dust:
gas-phase approach

104 Chapter III. Investigation of the uptake of SO2 on natural v-dust: gas-phase approach
Table of content of Chapter 3
1 Investigation of the steady state uptake of so2 gas on natural v-dusts under ambient conditions ......... 109
1.1 First insight on the steady state uptake coefficients of SO2 on the five selected volcanic dusts .. 109
1.2 Impact of relative humidity on SO2 steady state uptake on Hagavatn and Myrdalssandur samples
……………………………………………………………………………………………………112
1.3 Dependence of SO2 steady state uptake on Myrdalssandur sample on RH .................................. 114
1.4 Impact of UV radiation on SO2 steady state uptake on v-dust samples ....................................... 115
1.5 Dependence of steady state uptake of SO2 on Myrdalssandur under UV on RH ......................... 117
2 Investigation of the transient uptake of SO2 gas on natural v-dusts under ambient conditions ............ 117
2.1 First insight on the transient uptake of SO2 on the five selected v-dusts ...................................... 117
2.2 Impact of relative humidity on SO2 transient uptake on Hagavatn and Myrdalssandur samples . 119
2.3 Dependence of SO2 transient uptake on Myrdalssandur sample on RH....................................... 120
2.4 Impact of UV radiation on SO2 transient uptake on v-dust samples ............................................ 121
2.5 Dependence of transient uptake of SO2 on Myrdalssandur under UV on RH .............................. 123
2.6 Dependence of transient uptake of SO2 on UV photon flux ......................................................... 124
3 Atmospheric implications of SO2 uptake on v-dusts ............................................................................. 126
3.1 Atmospheric lifetime of SO2 with respect to v-dust ..................................................................... 126
3.2 Surface coverage of v-dust by SO2 molecules .............................................................................. 127
3.3 Parametrization of SO2 uptake on v-dusts. ................................................................................... 127
4 Conclusions ........................................................................................................................................... 129
References .................................................................................................................................................. 131

105 Chapter III. Investigation of the uptake of SO2 on natural v-dust: gas-phase approach
List of Tables of Chapter 3
Table 1: Steady-state BET uptake coefficients of [SO2]0 = 75 ppb by the 5 Icelandic v-dust samples at RH = 30% and
T = 296 K under dark conditions and UV-irradiation (JNO2 = 4.5 × 10⁻³ s-1). ............................................... 117
Table 2: Steady-state BET uptake coefficients measured as a function of RH after exposure of Mýrdalssandur v-dust
to 75 ppb of SO2 under dark and in presence of light (JNO2 = 4.5 × 10⁻³ s-1). The uncertainties quoted on γSS,BET
correspond to the systematic uncertainties and do not include the errors on the BET surface area determination.
..................................................................................................................................................................... 117
Table 3: Transient number of SO2 molecules initially taken up, NS, at [SO2]0 = 75 ppb by the 5 Icelandic v-dust samples
at RH = 30% and T = 296 K under dark conditions and UV-irradiation (JNO2 = 4.5 × 10⁻³ s-1). .................. 122

106 Chapter III. Investigation of the uptake of SO2 on natural v-dust: gas-phase approach
List of Figures of Chapter 3
Figure 1: SO2 concentration recorded by the analyzer during exposure of Mýrdalssandur v-dust at T = 296 K, RH = 30
%. Initial concentration of SO2 gas: (75 ± 2) ppb. .................................................................................... 110
Figure 2: Steady-state uptake coefficients of the Icelandic v-dust samples at [SO2]0 ≈ 75 ppb, RH = 30 %, T = 296 K,
under dark conditions. The errors quoted reflects the total error for the steady state uptake coefficient
determination. ........................................................................................................................................... 110
Figure 3: Steady-state uptake coefficients of the Mýrdalssandur and Hagavatn v-dust samples at RH = 30 % (blue bars)
and RH=0% (beige bars), [SO2]0 ≈ 75 ppb, T = 296 K, under dark conditions. The errors quoted reflects the
total error for the steady state uptake coefficient determination. .............................................................. 113
Figure 4: BET steady-state uptake of 75 ppb of SO2 by Mýrdalssandur v-dust as a function of RH at T = 296 K under
dark conditions. ......................................................................................................................................... 115
Figure 5: Bar graph showing the BET uptake coefficient at steady-state of [SO2]0 = 75 ppb at RH = 30% and T = 296
K on the 5 types of Icelandic v-dust investigated under dark conditions (grey) and UV-irradiation (JNO2 =
4.5 × 10⁻³ s-1; yellow). ............................................................................................................................... 116
Figure 6: Number of SO2 molecules taken up on the surface of different v-dusts during the transient initial uptake
process when exposed to [SO2]0 ≈ 75 ppb, T=296K, RH=30%, dark conditions. The errors quoted reflect the
total error for the Ns determinations. ......................................................................................................... 119
Figure 7: Number of SO2 molecules taken up on the surface of Mýrdalssandur and Hagavatn v-dust samples at RH =
30 % (blue bars) and RH=0% (yellow bars), [SO2]0 ≈ 75 ppb, T = 296 K, under dark conditions. The errors
quoted reflect the total error for the Ns determinations. ............................................................................ 120
Figure 8: Number of SO2 molecules taken up on the surface of Mýrdalssandur v-dust (Ns,dark) as a function of RH.
Mýrdalssandur v-dust samples exposed to 75 ppb at T = 296 K under dark conditions. The errors quoted
reflect the total error for the Ns determinations. ........................................................................................ 121
Figure 9: Bar graph showing the transient number of SO2 molecules initially taken up, NS, at [SO2]0 = 75 ppb at RH =
30% and T = 296 K on the 5 types of Icelandic v-dust investigated under dark conditions (grey) and UV-
irradiation (JNO2 = 4.5 × 10⁻³ s-1; yellow). .................................................................................................. 122
Figure 10: Amplification by light of the transient number of SO2 molecules taken up with respect to dark conditions,
NS,light/NS,dark, as a function of: a) the Ti surface concentration of the v-dust samples and, b) the Ti/Si surface
concentration ratio. Experimental conditions: [SO2]0 = 75 ppb, RH = 30% and T = 296 K, under dark and
JNO2 4.5×10⁻³ s-1. The solid lines are the linear fit of experimental results with a correlation coefficient R2
>0.95 in case of Ti surface concentration and R2 >0.97 for Ti/Si ratio. .................................................... 123
Figure 11: A) The transient number of SO2 molecules taken up in the dark, NS,dark (black symbols), and under light
(JNO2 = 4.5 × 10⁻³ s-1), NS,light (colored symbols), are plotted as a function of RH for Mýrdalssandur v-dust
samples exposed to 75 ppb of SO2 at T = 296 K. The errors quoted on Ns values reflects the precision of the
measurements and the estimated systematic uncertainties related with the Ns determination, and they do not
include the error on the specific surface area measurement. The black line is the fit of experimental results
with an empirical function to demonstrate the saturation of Ns noticed under dark conditions. The yellow

107 Chapter III. Investigation of the uptake of SO2 on natural v-dust: gas-phase approach
line is the linear fit of results measured under surface irradiation. B) The amplification factors, Ns,light/Ns,dark,
are plotted versus RH. The solid line reflects the linear correlation between the amplification factors and
RH. The uncertainties quoted (5%) corresponds to the 2σ precision of the fit and does not include other
systematic uncertainties............................................................................................................................. 124
Figure 12: NS, as a function of photon flux (JNO2 = 0-4.5 × 10⁻³ s-1) for Mýrdalssandur v-dust samples exposed to 75
ppb of SO2 at RH = 30% and T = 296 K. for comparison, the amplification factors are also plotted as a
function of JNO2 (right axis). The errors quoted on Ns values reflects the precision of the measurements and
the estimated systematic uncertainties related with the Ns determination, and they do not include the error
on the specific surface area measurement. The solid line is the linear fit of the amplification factors with the
corresponding JNO2 values. ........................................................................................................................ 125

108 Chapter III. Investigation of the uptake of SO2 on natural v-dust: gas-phase approach
During an episode of volcanic eruption volcanic dust reacts with SO2 gas both in subvolcanic and
atmospheric environments (Renggli et al., 2019), (Schmauss and Keppler, 2014). Initially, at near-magmatic
high temperatures, over 800 °C, there is a compelling evidence that the adsorption of SO2 gas is driven by
diffusion of Ca2+ cations from the interior of the glass to its surface followed by precipitation of CaSO4
(Delmelle et al., 2018). This initial stage is characterized by high concentration of gases and high density of
ash particles, but is very short in duration lasting only a couple of minutes, even in the case of Earth’s largest
explosive eruptions (Delmelle et al., 2018). The pathway is of limited importance in small and medium size
eruptions and/or eruptions of volcanoes lacking a deep-seated magma chamber (Ayris et al., 2013).
Subsequent cooling rapidly brings the system to the subzero temperatures (Textor et al., 2003). At ambient
and low temperatures, where effective diffusion of cations to the ash surface is no longer possible, the
driving force of SO2 uptake is its physisorption on the surface of ash followed by chemical reaction with
active sites that are available on the surface. Previous research under these conditions points out that the
rate of sulfate formation is higher at low temperatures compared to room or elevated temperatures of up to
150 °C (Wu et al., 2011), (Schmauss and Keppler, 2014). Interestingly, uptake of SO2 remains very strong
at very low partial pressures, which confirms that adsorption is likely to happen in diluted and cold parts of
the plume (Schmauss and Keppler, 2014). Furthermore, an increase in sulfur load on ash surfaces was
positively correlated with the distance from the vent during 2010 Eyjafjallajökull eruption (Bagnato et al.,
2013). Thus, one can expect that most of the uptake of SO2 gas during a medium-size volcanic eruption
would happen in the horizontal umbrella part of the volcanic ash cloud. In this case it is important to use the
steady state uptake coefficient to evaluate the uptake as it should better fit to describe the phenomena of the
continuous process.
The impact of v-dust on Earth’s atmosphere is governed by the physical and chemical surface
properties of the particles. However, the physico-chemical processes that govern the modifications of the
particle surface in the plume and in the cloud when ash is in contact with volcanic gases remain poorly
investigated. Although some literature studies evaluated the reactivity of SO2 with different individual
mineral oxides, data available on the interactions of the natural volcanic ash and dust particles with SO2 is
rather limited and not descriptive of the processes occurring in the atmosphere. In this chapter, we focus on
the kinetics and pathway of the reaction of sulfur dioxide with natural volcanic dust samples under
atmospheric conditions using coated wall flow-tube reactor. Important kinetic parameters, such as steady
state uptake coefficients, γss, and number of molecules taken up, Ns, for different dusts were obtained and
compared. As a reminder, γss, reflects the long-term interaction between a solid surface and a gas molecule
once the equilibrium between the two has been established; thus, this variable is particularly valuable for
atmospheric studies. Initial behavior of the system can be described in terms of the number of molecules
per specific area of dust taken up, Ns. For additional information about physical meaning and determination

109 Chapter III. Investigation of the uptake of SO2 on natural v-dust: gas-phase approach
these variables see Chapter 1 Section 5.1.2 and Chapter 2, Sections 2.2. In addition to experimentally
measuring γss and Ns, the impact of two most important atmospheric variables, (i) relative humidity, RH,
and (ii) simulated solar radiation, on the uptake of SO2 gas on the surface of v-dust was investigated and
analyzed. Atmospheric implications of the experimental results were discussed.
1 Investigation of the steady state uptake of SO2 gas on natural v-dusts
under ambient conditions
The uptake of atmospherically relevant concentration of SO2 (i.e. (75 ± 2) ppb) by the surface of
five selected volcanic samples under typical atmospheric conditions of ambient temperature, pressure and
30% RH was investigated using the flow-tube reactor (Lasne et al., 2018). A typical uptake profile depicted
in Figure 1 shows the [SO2] uptake of Mýrdalssandur dust in humid (RH = 30%) conditions. It is clearly
observed from the profile that after the initial uptake of the gas upon exposure of the v-dust the system
reaches a steady-state [SO2] that is distinct from the initial state [SO2]0, evidencing continuous consumption
of the title molecule for the duration of the experiment. All the samples under investigation demonstrated
both an initial uptake and a steady state uptake, alike the profile reported on Figure 1. The latter is worth
investigating as it suggests the ability of the v-dusts to exhibit a long-term effect on the atmosphere. The
steady state coefficients are in the order of 10-9 to 10-8 (Figure 2). These values are much lower than the
values obtained by Maters et al., who reported initial uptakes of SO2 on volcanic ash and glass powders in
the 10-3 to 10-2 range (Maters et al., 2017). Large differences in values are not surprising though for a number
of reasons. First, the initial uptake describes an uptake on the fresh surface at the first instances of its
interaction with gas, while the steady state uptake is an ongoing phenomenon reflecting the ability of the
surface to uptake gas continuously. Second, while determining initial uptakes, geometric surface area was
used by Maters et al. in order to calculate uptake coefficient (Maters et al., 2017), while the specific surface
area was used in this study in order to account for all the surface accessible to the SO2 molecules on longer
time scale. Using geometric vs specific surface area gives an upper value for the uptake coefficient (Crowley
et al., 2010). Thus, in this study, depending on the dust, using geometric surface area to determine steady
state coefficient gives values 20 to 100 times larger than using BET surface area. Finally, in the study of
Maters et al. experiments were performed under low-pressure, 0% humidity of Knudsen cell reactor contrary
to atmospherically relevant 760 Torr, 30% RH used in this study (Maters et al., 2017). Moreover, in the
adsorption/desorption experiments on the volcanic glasses performed by Schmauss and Keppler it was

110 Chapter III. Investigation of the uptake of SO2 on natural v-dust: gas-phase approach
observed that the first layer of SO2 molecules was adsorbed on the surface of volcanic glass irreversibly and
could not be removed (Schmauss and Keppler, 2014).
Figure 1: SO2 concentration recorded by the analyzer during exposure of Mýrdalssandur v-dust at T = 296 K, RH = 30 %. Initial
concentration of SO2 gas: (75 ± 2) ppb.
Figure 2: Steady-state uptake coefficients of the Icelandic v-dust samples at [SO2]0 ≈ 75 ppb, RH = 30 %, T = 296 K, under dark
conditions. The errors quoted reflect the total error for the steady state uptake coefficient determination.
Interestingly, the obtained results show somewhat contrasted behaviors from one sample to another.
In the literature the differences in the uptake of SO2 on solid material are commonly linked to the differences
in elemental composition or minerology (Maters et al., 2017), (Maters et al., 2016), (Usher et al., 2002),
(Zhang et al., 2006), (Harris et al., 2012). Using synthetic and natural silicate glasses as proxies for fresh
unweathered volcanic ash is commonly done due to the fact that glass often represents a major component

111 Chapter III. Investigation of the uptake of SO2 on natural v-dust: gas-phase approach
of v-dust. Besides, a thin layer of glass covering the crystalline components of ash surfaces was observed
(Delmelle et al., 2018). Several studies indicate that sulfates are more likely to get adsorbed on the glass
fraction of volcanic dust (Schmauss and Keppler, 2014), (Farges et al., 2009). While investigating trends in
adsorption of SO2 on glass, surface and bulk elemental composition is commonly investigated (Maters et
al., 2017). This approach though ignores the crystalline phase of the volcanic dust. Maters et al. emphasized
that the influence of crystallinity on the adsorption of SO2 gas is not yet understood (Maters et al., 2017).
On the other hand, authors working with natural mineral dust samples, such as desert dusts, often
approximate composition of dusts using simple mineral oxides and look for trends in uptake in relationship
with the mineral phase composition. In our study v-dusts differ significantly in their crystalline fraction.
Volcanic samples used in this study contain from 20% (Hagavatn) to 80-90% (Mýrdalssandur,
Maelifellssandur and Dyngjusandur) of amorphous material (Baratoux et al., 2011), (Moroni et al., 2018).
The remaining part is crystalline. Eyjafjallajokull is also dominated by glass (Gislason et al., 2011).
Plagioclase, pyroxene, and olivine are the mineral phases reported in all five samples, while magnetite was
only found in Mýrdalssandur and Maelifellsandur (Moroni et al., 2018), (Baratoux et al., 2011) (Gislason
et al., 2011). A very small amount of crystalline silica was found in Eyjafjallajokull and none was reported
for other samples (Gislason et al., 2011).
Since amorphous fraction dominates the morphology of v-dusts, an attempt to find trends in the
uptake vs elemental composition was undertaken. Among the authors linking the differences in uptake
coefficient to the surface elemental composition Maters et al. observed increase of the initial uptake of SO2
on the surface of synthetic volcanic glasses with decrease of their silica (Si) content and increase of the sum
of their sodium (Na), potassium (K), magnesium (Mg) and calcium (Ca) content (Maters et al., 2017). As
for the natural volcanic samples the relationship was not as straightforward, even though a dependence of
the initial uptake on the total surface content of the sum of Na, K, Mg and Ca was suggested (Maters et al.,
2017). In our studies no clear correlation between the bulk elemental composition of a v-dust and its uptake
of SO2 was established (for bulk and surface elemental composition see Chapter 2 Sections 1.2.3-1.2.4). It
can be due to the fact that the elemental concentration in the bulk sample may not represent the availability
of the elements on the surface. We therefore searched for dependency of uptake coefficient on the surface
composition but none was clearly established. One should keep in mind that a given element when
incorporated in glass versus crystalline mineral might behave differently. Farges et al. observed that
crystalline quartz does not adsorb any sulfur species while amorphous silica does (Farges et al., 2009). The
heterogeneous nature of the sample might further complicate finding the trends as elements forming
different mineral phases will behave differently depending on the nature of mineral phase. For example, Fe
is incorporated in both ilmenite (FeTiO3) and fayalite (Fe2SiO4), yet the SO2 uptake is significantly higher
for the former mineral (Harris et al., 2012).

112 Chapter III. Investigation of the uptake of SO2 on natural v-dust: gas-phase approach
Earlier studies can be used to understand potential contribution of crystalline fraction of the volcanic
ash to the uptake of SO2. Both quartz (SiO2) and magnetite (Fe3O4) can be found in volcanic ash. Comparison
of the uptakes of SO2 on individual mineral oxides, such as CaO, Al2O3, CaCO3, Fe3O4 and Fe2O3 showed
that the uptake of SO2 depends on the nature of the mineral oxide with higher uptakes observed when SO2
interacted with iron-containing compounds (Usher et al., 2002). These observations were further tested by
Zhang et al. who compared reactivity of different oxides together with their mixture (based on the abundance
of the corresponding elements in continental crust) taking into consideration their specific area and ranked
them in the following order: Fe2O3>MgO>TiO2>FeOOH>mixture>Al2O3>SiO2 (Zhang et al., 2006). Both
studies indicate that conversion of SO2 per unit surface of Fe2O3 is the highest, suggesting that particles with
the highest amount of iron might be the most reactive with SO2. Furthermore, the reactivity of the mixture,
that was obtained by mixing the different oxides based on their abundance in the continental crust, was
measured to be twice its theoretical value, which demonstrates its synergistic effect (Zhang et al., 2006).
Even though most studies use simple mineral oxides and synthetic dust as a substitution for natural samples,
such approach is questionable, as it undermines the importance of more complex mineralogy in the uptake
of SO2. While studying the uptake of SO2 on Saharan dust Harris et al. distinguished ilmenite (FeTiO3),
rutile (TiO2) and iron oxides (Fe2O3, Fe3O4, FeOOH) (γ BET(mixture of ilmenite and rutile)=3×10⁻⁵) as major phases of
dust responsible for uptake and oxidation of SO2 (Harris et al., 2012). Uptake on feldspar minerals such as
KAlSi3O8, NaAlSi3O8 or CaAl2Si2O8 and quartz (SiO2) was found to be slow (γ BET(feldspar)=9×10⁻⁷, γ (quartz with
basic components)=4×10⁻⁸) (Harris et al., 2012). To identify the elements associated with adsorption of SO2 by
crystalline material, Harris et al. analyzed individual Saharan dust grains that were relatively rich in S
content after their exposure to SO2 and studied their elemental profile using single-particle SEM–EDX
analysis (Harris et al., 2012). Ti, Fe and Ca were identified as the most important reactive elements, while
Na, Mg, Al, Si showed no relationship to oxidizing capacity of dust (Harris et al., 2012). While studying
the uptake of SO2 on v-dusts it would be informative to investigate the uptake of SO2 on other complex
mineral phases present in v-dust such as pyroxene, plagioclase, amphibole, biotite, and olivine even though
higher uptakes of SO2 are linked to the presence of minerals lacking silicates, such as ilmenite (FeTiO3) and
magnetite (Fe3O4) (Harris et al., 2012).
Several studies have highlighted the role of RH on SO2 uptake (Li et al., 2006), (Zhou et al., 2014),
(Huang et al., 2015). In order to investigate the role that RH plays in the steady state uptake of SO2 on v-
dust samples the relationship was investigated for two contrasted samples based on their steady-state uptake
values – Mýrdalssandur and Hagavatn (Figure 3). For Mýrdalssandur we observed that the steady state

113 Chapter III. Investigation of the uptake of SO2 on natural v-dust: gas-phase approach
uptake coefficient of SO2 at 30% of RH was significantly higher than under dry conditions (i.e. γss, BET (30%
RH) = 6.2 × 10⁻⁸ and γss, BET (dry) = 2.0 × 10⁻⁸). For the Hagavatn v-dust a similar trend was observed (i.e.
γss, BET (30% RH) = 6.6 × 10⁻⁹ and γss, BET (dry) = 1.0 × 10⁻⁹). The enhanced uptake trends observed in the
presence of water indicate that water plays an important role promoting the partitioning of SO2 to the
adsorbed phase. There might be various reasons for the observed increased uptake of SO2 in the presence
of water vapor. Adsorbed water molecules can (i) participate in the reactions as reactants, (ii) serve as a
medium for the reaction to take place or (iii) change the physical properties of the particle shifting the
equilibrium towards higher SO2 uptake. Water molecules can also form water layers that can help the
product of the reaction to diffuse along the surface and thus promote the renewal, i.e. the turnover, of surface
sites (Shang et al., 2010). The intrinsic ability of metal oxides to adsorb water molecules and form surface
hydroxyls was linked to higher reactivity in the heterogeneous interaction with SO2 (Zhang et al., 2006).
Figure 3: Steady-state uptake coefficients of the Mýrdalssandur and Hagavatn v-dust samples at RH = 30 % (blue bars) and
RH=0% (beige bars), [SO2]0 ≈ 75 ppb, T = 296 K, under dark conditions. The errors quoted reflect the total error for the steady
state uptake coefficient determination.
In the literature the analysis of the influence of RH on the uptake of SO2 on natural mineral dusts
shows complex trends. An influence of water vapor on the interaction of SO2 with Saharan dust at 258 K
showed no effect on initial uptake within statistical error (i.e. γ BET (27% RH) = (6.0 ± 1.0) × 10-5 and γ BET
(dry) = (6.4 ± 0.7) × 10-5). Likewise, no dependency of the initial uptake coefficient on humidity was found
for Adobe clay soil taken from Los Angeles area (Judeikis and Stewart, 1976). Alternatively, when Huang
et al. subjected three authentic dusts to SO2 at RH ranging from 0 to 90% an increase in uptake coefficient
was observed for Tengger Desert dust (i.e. γ BET (dry) ≈ 3.8 × 10⁻⁵ and γ BET (90% RH) ≈ 5.5 × 10⁻⁵) and for
Arizona test dust (i.e. γ BET (dry) ≈ 1.3 × 10⁻⁵ and γ BET (90% RH) ≈ 2.76 × 10⁻⁵), but a decrease was observed

114 Chapter III. Investigation of the uptake of SO2 on natural v-dust: gas-phase approach
for Asian mineral dust (i.e. γ BET (dry) ≈ 3.2 × 10⁻⁵ and γ BET (90% RH) ≈ 1.9 × 10⁻⁵) (Huang et al., 2015). The
negative dependence of humidity on SO2 uptake in the case of Asian mineral dust was explained by the
presence of water-soluble inorganic coating, which made surface more acidic and inhibited uptake of SO2
(Huang et al., 2015). When the Asian mineral dust was washed and coating was removed, the uptake trend
got reversed and showed positive correlation (i.e. γ BET (dry) ≈ 0.85 × 10⁻⁵ and γ BET (90% RH) ≈ 1.32 × 10⁻⁵)
(Huang et al., 2015). Then again, while the samples from Inner Mongolian desert, characterized by high
carbonate contents, demonstrated considerably increased uptakes at higher humidity (i.e. γss, BET (40% RH)
= 1.0 × 10⁻⁶ and γss, BET (dry) = 1.7 × 10⁻⁷), Xinjiang sierozem natural mineral dust showed only a modest
increase in steady-state uptake (i.e. γss, BET (40% RH) ≈ 2.4 × 10⁻⁷ and γss, BET (dry) ≈ 2.2 × 10⁻⁷) (Adams et al.,
2005). The authors suggest that difference in the minerology could be responsible for the difference in the
observed trends (Zhou et al., 2014). Higher carbonate component of the Inner Mongolian desert dust can
promote the SO2 uptake. Indeed, while investigating carbonate particles Zhang et al. observed that the value
of the steady state uptake γss, BET drastically increases from γss, BET (1% RH) = 0.32× 10⁻⁸ to γss, BET (85% RH)
= 13.9 × 10⁻⁸), at 85% RH reaching 43 times its value at 1% (Zhang et al., 2018). In our study volcanic dusts,
void of carbonates, cannot be directly compared to carbonate-rich samples, but the observed trend follows
the one of Tengger Desert dust and Arizona test dust discussed earlier. More information about influence
of humidity on the steady state uptake of SO2 on the surface of volcanic glass and ash is necessary to obtain
a more comprehensive picture.
While the increase in the SO2 uptake with the increase of relative humidity is observed for a number
of samples, it is not at all the case for the uptakes of other species, such as nonpolar volatile organic
compounds (Romanias et al., 2016), hydrogen peroxide (H2O2) (Romanias et al., 2012a) or ozone (O3)
(Lasne et al., 2018). In fact, the uptake coefficient can decrease with increased humidity, such as the case
for the steady state uptake of O3 on montmorillonite clay dust reflecting the tendency for the molecules in
question and molecules of water to compete with each other for the sorptive sites on the clay surface (Lasne
et al., 2018).
To further investigate the influence of gas-phase water on the uptake of SO2 a series of experiments
were conducted under different relative humidity conditions. Mýrdalssandur v-dust that displayed the
highest steady state uptake among the Icelandic v-dusts was chosen as a representative dust.
The experiments were run at 296 K, with [SO2]0 = 75 ppb (1.88 × 10¹² molecules cm-3). Figure 4
shows the variation of γss,BET on Mýrdalssandur v-dust for RH ranging from 0.1 to 70%.

115 Chapter III. Investigation of the uptake of SO2 on natural v-dust: gas-phase approach
Figure 4: BET steady-state uptake of 75 ppb of SO2 by Mýrdalssandur v-dust as a function of RH at T = 296 K under dark conditions.
An increase of SO2 uptake by Mýrdalssandur v-dust is observed as RH increases from 0.1 to 30%.
Above this value, γss,BET remains constant within the uncertainty values. This variation might be related to
the formation of an H2O monolayer at the surface of Mýrdalssandur v-dust at around 30% RH. Thus, from
0 to 30% additional water molecules assist removal of SO2 from the gas phase while still keeping surface
sites available for interactions with the gas. At values higher than 30% RH, when the monolayer is formed,
the surface environment encountered by a gas molecule does not change much and thus steady state uptake
remains constant.
Consistently, Joshi et al. observed the formation of the H2O monolayer at 23% RH on Icelandic
volcanic ash, and Lathem et al. at 0.05-20% RH on volcanic ash samples (Joshi et al., 2017), (Lathem et al.,
2011). Likewise, formation of the water monolayer is observed at 28±2% RH on ATD dust (Ibrahim et al.,
2018). The exposure of a surface to water vapor has been shown to generate new reaction sites, and to
enhance the formation of sulfate ions (Ullerstam et al., 2002).
The effect of UV radiation was investigated in order to evaluate its impact on the removal of SO2
from the gas phase. Sulfur dioxide uptake by five Icelandic v-dusts was studied at RH = 30%, T = 296 K
and [SO2]0 = 75 ppb, in the dark and under light irradiation (JNO2 = 4.5 × 10⁻³ s-1). For the typical profile
under simulated sunlight and for more information on experimental setup and protocol involving UV light
refer to Chapter 2 Sections 2.2.2, 2.2.5. The experimentally obtained γss,BET values fall in the range of 10-8

116 Chapter III. Investigation of the uptake of SO2 on natural v-dust: gas-phase approach
promoted by a factor of 1.1 to 4.6 under light irradiation compared to dark conditions. (Table 1, Figure 5).
In particular, the increasing trend is observed for all five v-dust samples, even though for 3 dust
(Eyjafjallajökull, Maelifellsandur and Mýrdalssandur) it falls within the relative error bar. For the other two
v-dusts, Hagavatn and Dyngjusandur, the steady-state uptake of SO2 is noticeably higher under UV-
irradiation than in the dark. The photo-enhanced removal of SO2 in the presence of light could be attributed
to photo-induced reactions occurring on the surface of v-dust particles. It is well established in literature
that reactive species (i.e. hydroxyl radicals, •OH, hydroperoxyl radicals, •O2H, or superoxide radicals, O2•–
etc.) can be formed on the surface of mineral samples containing Ti and Fe elements under UV/visible light
irradiation (Herrmann, 2005), (Chen et al., 2012), (George et al., 2015). However, at this level of the work,
only a photo-enhancement can be pointed out, but we cannot conclude at all on the photocatalytic or surface
photochemical nature of the process we observe.
Under dark conditions, the most reactive sample towards SO2 uptake is Mýrdalssandur v-dust.
Indeed, the value of γss,BET measured on this sample is the highest among all the v-dusts tested. Under light
irradiation, Mýrdalssandur v-dust is again, within the experimental uncertainties, among the most reactive
samples. However, the light amplification of its steady state uptake (γss,BET,dark/γss BET.UV) is only 1.1, the
lowest value registered for dusts (see Table 1, Figure 5). The most intense UV light amplification for γss,BET
is reported for Dyngjusandur sample (factor of 4.6). We investigated whether the amplification factors (i.e.
γss,BET,dark/γss BET.UV) are correlated with the surface or bulk elemental composition of the dusts but found no
such correlation. Thus, what exactly causes the difference in light amplification is unclear.
Figure 5: Bar graph showing the BET uptake coefficient at steady-state of [SO2]0 = 75 ppb at RH = 30% and T = 296 K on the 5
types of Icelandic v-dust investigated under dark conditions (grey) and UV-irradiation (JNO2 = 4.5 × 10⁻³ s-1; yellow).

117 Chapter III. Investigation of the uptake of SO2 on natural v-dust: gas-phase approach
Table 1: Steady-state BET uptake coefficients of [SO2]0 = 75 ppb by the 5 Icelandic v-dust samples at RH = 30% and T = 296 K
under dark conditions and UV-irradiation (JNO2 = 4.5 × 10⁻³ s-1).
Dust sample 𝛾ss BET, dark 𝛾ss BET, UV 𝛾ss BET, dark/ 𝛾ss BET, UV
Hagavatn (6.6 ± 2.6) × 10-9 (2.6 ± 1.0) × 10-8 3.9
Dyngjusandur (1.6 ± 0.6) × 10-8 (7.3 ± 2.3) × 10-8 4.6
Maelifellssandur (3.2 ± 1.3) × 10-8 (6.6 ± 2.6) × 10-8 2.0
Eyjafjallajökull (3.3 ± 1.3) × 10-8 (3.9 ± 1.6) × 10-8 1.2
Mýrdalssandur (6.2 ± 2.5) × 10-8 (7.1 ± 2.8) × 10-8 1.1
To investigate the influence of RH on the steady-state uptake of SO2 under UV light (γss,BET,UV),
controlled experiments were conducted using Mýrdalssandur v-dust at 296 K, with [SO2]0 = 75 ppb (1.88 ×
1012 molecules cm-3), in the presence of light (JNO2 = 4.5 × 10⁻³ s-1) and varying the RH in the range of 0.1
to 70%. The results obtained under light irradiation conditions (JNO2 = 4.5 × 10⁻³ s-1) were compared to dark
conditions. Table 2 clearly demonstrates that the γSS,BET of SO2 by Mýrdalssandur v-dust is, within
experimental uncertainty, the same in the dark and under light for all values of RH investigated (0.1 - 70%).
Table 2: Steady-state BET uptake coefficients measured as a function of RH after exposure of Mýrdalssandur v-dust to 75 ppb of
SO2 under dark and in presence of light (JNO2 = 4.5 × 10⁻³ s-1). The uncertainties quoted on γSS,BET correspond to the systematic
uncertainties and do not include the errors on the BET surface area determination.
RH (%) Steady state uptake coefficients, γSS,BET
𝛾ss BET, dark 𝛾ss BET,UV
0.1 (1.96±0.3) × 10-8 -
11 (2.6±0.4) × 10-8 (2.4±0.4) × 10-8
30 (6.2±0.9) × 10-8 (7.1±1.1) × 10-8
50 (4.5±0.7) × 10-8 (4.4±0.7) × 10-8
70 (4.4±0.7) × 10-8 (4.4±0.7) × 10-8
2 Investigation of the transient uptake of SO2 gas on natural v-dusts under
ambient conditions
Apart from the measurement of steady state uptake coefficients that characterizes long-term
interactions between v-particles and SO2 gas, important information can be extracted by characterizing the
total transient uptake of SO2 gas before reaching equilibrium conditions (i.e. steady state). Thus, the number
118 Chapter III. Investigation of the uptake of SO2 on natural v-dust: gas-phase approach
of SO2 molecules removed during the transient uptake process per surface area, Ns, was investigated for the
five v-dusts and determined in the order of 1013 molecules cm-2 (Figure 6). These values are comparable to
the values obtained by Maters et al., who reported the total uptake capacity of SO2 on volcanic ash and glass
powders under dry conditions at 1011 to 1013 range (Maters et al., 2017). As with initial uptakes, total uptake
capacity of SO2 on the surface of synthetic volcanic glasses increased with decrease of their Si content and
increase of their total Na, K, Mg, Ca content (Maters et al., 2017). As for the natural volcanic ash samples
the relationship was less clear and the dependence on total surface Na, K, Mg, Ca content was suggested
(Maters et al., 2017). Furthermore, as displayed in Figure 2 and Figure 6, the transient numbers of molecules
adsorbed, Ns, at the initial stage of the exposure, and the steady state uptake coefficients, γss,BET, do not follow
the same trend. On one hand, Mýrdalssandur seems to adsorb the highest amount of molecules and it has
the highest uptake coefficient. On the other hand, Hagavatn that has the smallest uptake coefficient adsorbs
almost the same amount of molecules as Eyjafjallajökull and more than Maelifellssandur even though the
latter two have an uptake coefficient that is twice as high as uptake coefficient of Hagavatn. Possibly, the
absence of correlation between Ns and γss,BET suggest that the surface is modified upon its initial exposure
to SO2. Indeed, one should keep in mind that uptake behavior of SO2 on each volcanic dust was characterized
by measuring steady state uptake coefficients after 12 hours of exposure, i.e. after long processing. While a
transient uptake was observed at the initial stage of the experiment where the number of molecules taken up
was measured from 0 to 5 hours of interactions. Differences in the observed trends could indicate that at the
initial stage of the experiment the surface of the dust is modified due to SO2 uptake and the corresponding
formation of sulfites and sulfates, and these modifications affect the surface reactivity at longer time scale
when the γss,BET values are determined. The surface modifications could explain why no correlation was
noticed between the γss,BET and Ns with the elemental composition of the v-dusts. Finally, the discrepancies
could be due to the fact that the nature of the governing processes behind the initial fast uptake and thus the
high amount of molecules adsorbed in the initial stage and those dominating the steady state uptake are
fundamentally different (Huthwelker et al., 2006).

119 Chapter III. Investigation of the uptake of SO2 on natural v-dust: gas-phase approach
Figure 6: Number of SO2 molecules taken up on the surface of different v-dusts during the transient initial uptake process when
exposed to [SO2]0 ≈ 75 ppb, T=296K, RH=30%, dark conditions. The errors quoted reflect the total error for the Ns determinations.
The RH is an important atmospheric parameter that can impact the interactions of pollutants on the
surface of mineral dusts and aerosols. Water molecules can (i) block active sites, suppressing the
consumption of pollutants (Zeineddine et al., 2017), (Zeineddine et al., 2018); (ii) serve as a medium for the
reaction to take place and form water layers on the surface of particles promoting the product of the reaction
to diffuse along the surface (Shang et al., 2010); and (iii) act as a source of radical species, especially under
light conditions, and enhance the removal of pollutants, etc., (Herrmann, 2005), (Chen et al., 2012), (George
et al., 2015), (Tang et al., 2017), (Romanias et al., 2017).
In order to investigate the influence of RH on the number of SO2 molecules transiently taken up by
v-dusts, the relationship was investigated for two specific samples – Mýrdalssandur, that adsorbed the
highest number of molecules on its surface, and Hagavatn, that showed average adsorption (Figure 7). For
Mýrdalssandur we observed that the number of molecules taken up, Ns, at 30% of RH was significantly
higher than under dry conditions (i.e. Ns (30% RH) = 2.48 × 10¹³ and Ns (dry) = 3.1 × 10¹²). For the Hagavatn
v-dust a similar trend was observed (i.e. Ns (30% RH) = 1.15 × 10¹³ and Ns (dry) = 7.2 × 10¹²). In line with
the effect of RH on the steady state uptake coefficient, the enhancement in the number of molecules

120 Chapter III. Investigation of the uptake of SO2 on natural v-dust: gas-phase approach
transiently taken up by the surface of dust in the presence of water once again points out to the important
role water plays in promoting adsorption of SO2 molecules.
Figure 7: Number of SO2 molecules taken up on the surface of Mýrdalssandur and Hagavatn v-dust samples at RH = 30 % (blue
bars) and RH=0% (yellow bars), [SO2]0 ≈ 75 ppb, T = 296 K, under dark conditions. The errors quoted reflect the total error for
the Ns determinations.
To further investigate the influence of gas-phase water on the ability of dust to take up SO2 gas in
the initial stage of the experiment, number of molecules taken up by Mýrdalssandur v-dust were evaluated
under different relative humidity conditions ranging from 0.1 to 70% (Figure 8). The experiments were run
at 296 K, with [SO2]0 = 75 ppb (1.88 × 10¹² molecules cm-3). From Figure 8 it can be observed that Ns,dark
increases until RH = 30%, and then saturates. The same threshold value for RH was observed for the steady-
state uptake, which behavior changes at RH = 30%. As it has been previously discussed, the molecularly
adsorbed water monolayer on mineral dust particles is formed above the threshold of 30% of RH (Joshi et
al., 2017), (Tang et al., 2016). Characteristic change of behavior at 30% points out to the twofold role that
water molecules play in the removal of SO2. As RH increases from dry to 30% the removal of SO2 is
enhanced due to the formation of OH groups on the surface of v-dust. The surface OH groups assist in the
transformation of SO2 to sulfites and sulfates. Above 30% of RH there is probably a competition between
two processes; the formation of OH groups promoting the removal of SO2 and the blocking of active surface
sites by molecularly adsorbed water. The competitive nature of these processes probably leads to the
saturation of Ns,dark.

121 Chapter III. Investigation of the uptake of SO2 on natural v-dust: gas-phase approach
Figure 8: Number of SO2 molecules taken up on the surface of Mýrdalssandur v-dust (Ns,dark) as a function of RH. Mýrdalssandur
v-dust samples exposed to 75 ppb at T = 296 K under dark conditions. The errors quoted reflect the total error for the Ns
determinations.
The transient number of molecules taken up by the five v-dusts, Ns, was measured at RH = 30%, T
= 296 K and [SO2]0 = 75 ppb, both in the dark and under UV irradiation (JNO2 = 4.5 × 10⁻³ s-1). Ns,dark and
Ns,UV are given in Table 3 and displayed in Figure 9; they range from roughly 1012 to 1014 molecules cm-2.
The number of SO2 molecules initially taken up by v-dust under UV is markedly larger for Maelifellssandur
and Mýrdalssandur v-dusts, falls within relative error bar for Hagavatn and Dyngjusandur v-dusts, and is
smaller for Eyjafjallajokull, making it difficult to evaluate. Nevertheless, for four out of five dust samples,
Hagavatn, Dyngjusandur, Maelifellssandur and Mýrdalssandur, the Ns values show an increasing trend
between dark and UV irradiation conditions; being larger by a factor of 1.7 to around 3.8 under light
irradiation than in the dark. Interestingly, Dyngjusandur sample that exhibited the most intense light
amplification for γSS,BET (factor of 4.6) had the lowest amplification for Ns (1.7), further suggesting that the
processes occurring on the surface of the dust are contrasted on different uptake time scale. As with steady
state uptake coefficient, photo-induced reactions occurring on the surface of v-dust particles might be
responsible for the enhanced removal of SO2 in the presence of light. Nevertheless, at this point we cannot
state the precise reasons for impact of UV on the number of molecules taken up, it is discussed later based
on further experiments.

122 Chapter III. Investigation of the uptake of SO2 on natural v-dust: gas-phase approach
Figure 9: Bar graph showing the transient number of SO2 molecules initially taken up, NS, at [SO2]0 = 75 ppb at RH = 30% and T
= 296 K on the 5 types of Icelandic v-dust investigated under dark conditions (grey) and UV-irradiation (JNO2 = 4.5 × 10⁻³ s-1;
yellow).
Table 3: Transient number of SO2 molecules initially taken up, NS, at [SO2]0 = 75 ppb by the 5 Icelandic v-dust samples at RH =
30% and T = 296 K under dark conditions and UV-irradiation (JNO2 = 4.5 × 10⁻³ s-1).
Dust sample NS,dark (molecules cm-2) NS,UV (molecules cm-2) NS,UV/NS,dark
Hagavatn (1.2 ± 0.4) × 1013 (2.0 ± 0.6) × 1013 1.7
Dyngjusandur (2.1 ± 0.6) × 1013 (3.6 ± 1.0) × 1013 1.7
Maelifellssandur (9.6 ± 2.9) × 1012 (3.7 ± 1.1) × 1013 3.8
Eyjafjallajökull (1.2 ± 0.4) × 1013 (4.4 ± 1.3) × 1012 0.2
Mýrdalssandur (2.5 ± 0.8) × 1013 (7.8 ± 2.5) × 1013 3.1
Next step was to investigate whether the amplification factors (i.e. Ns,light/Ns,dark) are correlated with
the surface elemental composition of the dusts in respect to these elements. Interestingly, as presented in
Figure 10 there is a linear increase of the Ns,light/Ns,dark as a function of the Ti surface concentration (Figure
10a), and the Ti/Si ratio (Figure 10b) as determined by XPS. Trends with elemental Fe were not
straightforward and thus they are not further discussed. The photo-enhanced removal of SO2 on the surface
of v-dusts is related to the presence of elemental surface Ti. To parametrize the results of the current study
(see also Section 2.3) we consider the Ti/Si ratio as more representative since it indicates the relative
abundance of the element of interest versus the most abundant element of the v-dusts. Therefore, according
to the linear fit of results in Figure 10b and under the defined experimental conditions the amplification
factor is given by the following expression (Equation 1):

123 Chapter III. Investigation of the uptake of SO2 on natural v-dust: gas-phase approach
Equation 1 Ns,light/Ns,dark= 39.4× (Ti/Si)
Figure 10: Amplification by light of the transient number of SO2 molecules taken up with respect to dark conditions, NS,light/NS,dark,
as a function of: a) the Ti surface concentration of the v-dust samples and, b) the Ti/Si surface concentration ratio. Experimental
conditions: [SO2]0 = 75 ppb, RH = 30% and T = 296 K, under dark and JNO2 4.5×10⁻³ s-1. The solid lines are the linear fit of
experimental results with a correlation coefficient R2 >0.95 in case of Ti surface concentration and R2 >0.97 for Ti/Si ratio.
In the following of the chapter, aiming to evaluate the impact of atmospheric relevant parameters
(i.e. photon flux, and RH) to the photo-induced removal of SO2, Mýrdalssandur v-dust was chosen as a
model sample. Two basic criteria were set for this selection. The first one was the precision of the
measurements and the second one the photo-enhanced removal of SO2. Mýrdalssandur v-dust showed the
highest Ns values both under dark and light conditions which ensures a higher accuracy of measurements
and a significant photo-induced uptake of SO2.
To evaluate the dependence of Ns,UV on RH a series of controlled experiments were carried out
exposing Mýrdalssandur v-dust to a fixed concentration of SO2, at 296 K under light conditions (JNO2 4.5
×10-3 s-1) and varying the RH in the range of 0.1% - 70%. The results were compared to the dark conditions
and are displayed in Figure 11. When the surface is irradiated with simulated sunlight, a linear increase of
Ns was noticed as a function of RH, without showing any saturation (from 4 × 10¹³ molecules cm-2 at RH =
11% to 2.3 × 10¹⁴ molecules cm-2 at RH = 70%). The trends observed are consistent with Park et al. and
Jang et al. who studied SO2 uptake by ATD in a photo-irradiation chamber (Park and Jang, 2016), (Yu et
al., 2017). In the dark, they observed an almost constant uptake with RH, whereas under UV, it increased
exponentially. Remember, that NS,dark determined earlier for Mýrdalssandur dust was found to increase from
dry to 30% of RH, and then reach a saturation regime remaining constant. Clearly, as opposed to dark
conditions, the photo-induced processes that occur on the surface of v-dust are promoted as RH increases.
The latter could be either attributed to induced photochemical processes, supposedly on Ti-surface sites,

124 Chapter III. Investigation of the uptake of SO2 on natural v-dust: gas-phase approach
leading to the formation of reactive species on the surface of the dust •OH, •O2H, O2•–, etc., or to the
photolysis of some reactive surface species (Herrmann, 2005), (Chen et al., 2012). Both processes would
accelerate the transformation of SO2 to reaction products (e.g. sulfites and/or sulfates) (George et al., 2015),
(Park et al., 2017), (Dupart et al., 2012). To quantify the enhancement of Ns in presence of light, the
amplification factors were plotted as a function of RH (Figure 11). The results were linearly fitted according
the following Equation 2:
Equation 2 Ns,light/Ns,dark= 1+(7.76 × 10⁻²)× (%RH)
Figure 11: A) The transient number of SO2 molecules taken up in the dark, NS,dark (black symbols), and under light (JNO2 = 4.5 ×
10-3 s-1), NS,light (colored symbols), are plotted as a function of RH for Mýrdalssandur v-dust samples exposed to 75 ppb of SO2 at T
= 296 K. The errors quoted on Ns values reflect the precision of the measurements and the estimated systematic uncertainties
related with the Ns determination, and they do not include the error on the specific surface area measurement. The black line is the
fit of experimental results with an empirical function to demonstrate the saturation of Ns noticed under dark conditions. The yellow
line is the linear fit of results measured under surface irradiation. B) The amplification factors, Ns,light/Ns,dark, are plotted versus
RH. The solid line reflects the linear correlation between the amplification factors and RH. The uncertainties quoted (5%)
correspond to the 2σ precision of the fit and do not include other systematic uncertainties.
Further experiments are needed to elucidate the processes at play in the heterogeneous interaction
of SO2 with the surface of v-dust.
To evaluate the impact of irradiance intensity on the transient uptake of SO2 (Ns,UV), a series of
experiments was performed under controlled experimental conditions, i.e. 30% RH, 296 K and 75 ppb of
SO2, and varying photon flux, i.e. the JNO2 inside the reactor using Mýrdalssandur v-dust. The results are
presented in Figure 12 where the values of Ns are plotted as a function of JNO2 together with the amplification
factor calculated as a ratio of the Ns values measured under the corresponding intensity of light and in dark

125 Chapter III. Investigation of the uptake of SO2 on natural v-dust: gas-phase approach
conditions. Ns increases linearly with the photon flux indicating that the removal of SO2 molecules from the
gas phase is proportional to the photons absorbed by the surface (Herrmann, 2005). An amplification by a
factor of three was noticed for the highest irradiance intensity (JNO2 = 4.5×10⁻³ s-1) compared to dark
conditions. Similar trends have been also noticed in literature for the degradation of pollutants on the surface
of mineral dust proxies (Romanias et al., 2012a), (Zein et al., 2014), (Romanias et al., 2012b), and on
volcanic dusts (Romanias et al., 2020). The following expression (Equation 3) is proposed to describe the
photo-enhanced uptake of SO2 under the current experimental conditions:
Equation 3 Ns,light/Ns,dark= 1+480.5 × JNO2
Figure 12: NS, as a function of photon flux (JNO2 = 0-4.5 × 10⁻³ s-1) for Mýrdalssandur v-dust samples exposed to 75 ppb of SO2 at
RH = 30% and T = 296 K. For comparison, the amplification factors are also plotted as a function of JNO2 (right axis). The errors
quoted on Ns values reflect the precision of the measurements and the estimated systematic uncertainties related with the Ns
determination, and they do not include the error on the specific surface area measurement. The solid line is the linear fit of the
amplification factors with the corresponding JNO2 values.
This series of experiments lead to the conclusion that the number of SO2 molecules transiently
taken up by the selected v-dust per surface area unit, Ns,UV, is linearly and positively influenced by
both (i) the UV photon flux and (ii) RH, i.e. the number (or density) of H2O molecules in the air flow
when the dust is irradiated with UV light, but not in the dark. In contrast, the γss,BET of SO2 by
Mýrdalssandur v-dust was demonstrated to be the same in the dark and under light for all values of
RH investigated (0.1 - 70%). This observation once again points to the existence of one or several
transient surface reaction mechanisms increasing the uptake of SO2 at the early times of the
experiment (measured as Ns,UV ); these mechanisms are quenched at later stages of the exposure,
leading to similar steady-state uptake observed in the dark and under light. The observed

126 Chapter III. Investigation of the uptake of SO2 on natural v-dust: gas-phase approach
phenomenon may be due to the surface of dust being modified during the light irradiation process
(light-induced ageing effect). Initially, the modification or activation of the surface increases
transiently the uptake of SO2; then, surface species that do not absorb or weakly absorb light
radiation form, leading to a smaller consumption of SO2 at steady-state.
3 Atmospheric implications of SO2 uptake on v-dusts
In order to evaluate potential impact of SO2 uptake on v-dust on the atmosphere, its atmospheric
lifetime was calculated using Equation 4.
Equation 4 𝝉𝒉𝒆𝒕 =𝟒
𝜸𝒄𝑫
where γ is the uptake coefficient, c is the mean molecular velocity (m s-1), and D is the volcanic dust
surface area density (m2 m-3). Considering (i) concentrations of volcanic ash in a vertical column of the
volcanic cloud passing over Faroe Islands located about 650 km from the Eyjafjallajökull volcano measured
during its eruption on April 15 2010 ranging from 200 to 6000 µg m-3 (Gudmundsson et al., 2012) and (ii)
the SSA of Eyjafjallajökull dust sample of 0.75 m2 g-1, D can be calculated by direct multiplication of the
dust concentration and the SSA of the v-dust and was found to be in the range from 1.5×10⁻⁴ m2 m-3 to 4.5×10-
3 m2 m-3 for the lower and higher ash load respectively. This leads to the calculation of lifetime of SO2
molecule as a result of its heterogeneous loss on Eyjafjallajökull v-dust particle to 81 to 2.7 years. If we
consider a higher 7.5 m2 g-1 SSA values for Eyjafjallajökull dust obtained by Maters et al. the atmospheric
lifetime falls to 8.1 years to 99 days (Maters et al., 2016). For comparison, the lifetime of SO2 in the
atmosphere as measured over the Eastern United States in the absence of volcanic activity ranges from 15
h in summer to 65 hours in winter (Lee et al., 2011). On the base of these calculations it may appear that the
lifetime of SO2 molecule in the atmosphere is mainly determined by the gas phase oxidation by aqueous
(i.e., H2O2) and gas‐phase (i.e., OH) processes.
However, in case of higher volcanic ash concentrations in the plume, for example 2.0×10⁶ µg m-3
estimated during 1991 Pinatubo eruption (SSA 1.5 m2 g-1 (Maters et al., 2016)) at the direct proximity to the
vent (Witham et al., 2012), and considering the same uptake coefficient measured in this study for
Eyjafjallajökull, calculations lead to a radically shorter lifetime of 36 hr and make heterogeneous uptake of
SO2 on volcanic dust particles equally important. Furthermore, the lifetime of SO2 could be further
decreased for volcanic particles with higher specific surface area. These calculations point out that
127 Chapter III. Investigation of the uptake of SO2 on natural v-dust: gas-phase approach
adsorption of SO2 on the surface of volcanic ash is most likely to happen in the part of volcanic cloud closest
to the vent where ash concentration is the highest. The process of SO2 loss due to heterogeneous reactions
with v-dust particles could be further enhanced in the presence of oxidizing species (i.e., O3, OH) and needs
to be quantitatively evaluated.
Following the calculation of Romanias et al. the fully-stacked SO2 monolayer is composed of NSO2
= 4.3 × 10¹⁴ molecules cm-2 (Romanias et al., 2016). In the literature, the surface coverage of reversibly
adsorbed SO2 has been determined as (1.5±0.3) × 1014 molecules cm-2 on α-Al2O3 and (3.5±0.6) × 1014
molecules cm-2 on MgO (Goodman et al., 2001), (Usher et al., 2002). They represent 1/3 and 2/3 of the
calculated monolayer, respectively. During SO2 uptake by Saharan dust, flow-tube experiments suggest a
maximum surface coverage of (2±1) × 1013 molecules cm-2, an order of magnitude lower than the coverage
on α-Al2O3 and MgO and the theoretical monolayer (Adams et al., 2005). Addition of H2O to the carrier gas
did not affect the measured SO2 surface coverage, in agreement with our observation of a constant value of
Ns,dark for RH > 30% (Adams et al., 2005).
Assuming that all of the molecules lost from the gas phase are adsorbed by the surface, number of
molecules transiently taken up, Ns, is roughly equivalent to the surface coverage. In the dark, our
experiments show a saturation of Ns,dark at roughly 3 × 10¹³ molecules cm-2 for RH = 30%, a value consistent
with that found on Saharan dust by Adams et al., representing almost 1/10 of the full surface coverage
(Adams et al., 2005). This value is also consistent with Maters et al., who reported values of Ns,dark in the
1011 - 1013 molecules cm-2 range for SO2 uptake by volcanic ash and glass powder (Maters et al., 2017).
Under UV, however, a strong transient process takes place on a number of dusts, which can be further
enhanced by increase in RH. Thus, on the surface of Mýrdalssandur v-dust Ns,UV increases linearly both
with RH and with the flux of UV photons. Ns,UV increases from 4 × 10¹³ molecules cm-2 at RH = 11% to 2.3
× 1014 molecules cm-2 at RH = 70%. The latter value represents 1/2 of a fully-compact monolayer, suggesting
that some sites may still remain available for SO2 uptake.
Based on the experimental strategy followed, which includes (i) the screening of v-dusts towards
their capacity to uptake SO2 (ii) the control set of experiments carried out by tuning only one atmospheric
parameter and evaluating its impact on the removal of SO2 under dark and light conditions, it was feasible
to parametrize the experimental results applying linear expressions (expressions 1 to 3). The objective of
fitting the results was to elucidate the impact of the experimental conditions on the photo-enhanced removal

128 Chapter III. Investigation of the uptake of SO2 on natural v-dust: gas-phase approach
of SO2. Using Mýrdalssandur v-dust as a model sample, we propose a general equation that describes the
correlation between the amplification factor with the chemical composition of the sample, the photon flux
and relative humidity according to the following Equation 5:
Equation 5 Ns,light/Ns,dark= 3.68 × [(1+7.76 × 10⁻² × (%RH)] × (1+480 × JNO2) × (Ti/Si)
Despite the fact that we did not performed a detailed RH study for all the v-dusts, Equation 5 seems
to describe (within 10%) the expected amplification factors for all the other volcanic dusts and to
overestimate by 50 % the amplification on Eyjafjallajokull volcanic ash. It should be noted that this type of
expressions can be useful in modelling, since different atmospheric parameters are combined to describe
the photo-enhanced removal of SO2.

129 Chapter III. Investigation of the uptake of SO2 on natural v-dust: gas-phase approach
4 Conclusions
In this chapter the uptake of SO2 gas by Icelandic v-dust has been investigated inside a coated wall
flow-tube reactor. These values are of interest as they can be used for the modelling of atmospheric processes
to better evaluate the effect of SO2 volcanic emissions. Uptake of SO2 by v-dusts was observed even though
all of them have already been exposed to SO2 in the volcanic conduit and plume owing to their
production/emission mode. Upon exposure of the v-dust to SO2 the system reaches a steady state clearly
distinct from the initial state indicating continuous consumption of SO2 molecules. The steady state uptake
coefficients for v-dusts at 30% RH range from (6.6 ± 2.6) × 10-9 for Hagavatn to (6.2 ± 2.5) × 10-8 for
Mýrdalssandur. Moreover, increased uptake of the SO2 gas at 30% RH as compared to dry conditions
suggests that water plays an important role in the above-mentioned processes (for Mýrdalssandur γss, BET
(30% RH) = 6.2 × 10⁻⁸ and γss, BET (dry) = 2.0 × 10⁻⁸); for Hagavatn γss, BET (30% RH) = 6.6 × 10⁻⁹ and γss, BET
(dry) = 1.0) × 10-9). After 30% RH steady state uptake coefficient stabilizes and no further increase is noted.
It can be suggested that increase in concentration of water molecules enhances steady state uptake
coefficient up till the formation of water monolayer at 30% RH, after which the molecule can encounter the
same water-covered surface and thus the γss does not change. As for the effect of UV on the steady state
uptake coefficient, an increase was observed for two out of five dusts (Dyngjusandur and Hagavatn) while
no effect within the uncertainty could be noted for the other three samples (Eyjafjallajökull, Maelifellsandur
and Mýrdalssandur). In addition, the uptake coefficient for Mýrdalssandur v-dust in the dark and under
simulated sunlight was the same for levels of humidity up to 70%. However, more extensive sampling is
necessary to verify the latter trend under simulated sunlight, as a Mýrdalssandur sample, used for this study,
exhibited the lowest light amplification factor.
The initial capacity of the selected dusts to uptake SO2 molecules was also investigated by calculating
the transient number of molecules initially taken up. The transient number of molecules initially taken up
for v-dusts at 30% RH range from (9.6 ± 2.9) × 1012 for Maelifellsandur to (2.5 ± 0.8) × 1013 for
Mýrdalssandur. Just as steady state uptake, the number of molecules transiently taken up in the dark
increases as RH is increased form 0% to 30% and then remains stable at higher values (for Mýrdalssandur:
Ns (30% RH) = 2.48 × 10¹³ and Ns (dry) = 3.1 × 10¹²; for Hagavatn: Ns (30% RH) = 1.15 × 10¹³ and Ns (dry)
= 7.2 × 10¹²). For four out of five dust samples, Hagavatn, Dyngjusandur, Maelifellssandur and
Mýrdalssandur, the Ns values show an increasing trend between dark and UV irradiation conditions, even
though for the first two dusts the increase is within the relative error. On Mýrdalssandur Ns scales linearly
both with the photon flux and with RH. Thus, for the dusts that exhibit light amplification effect on Ns, such
as Mýrdalssandur, the initial number of uptaken molecules Ns is greatly affected by a combination of
humidity and simulated sunlight.

130 Chapter III. Investigation of the uptake of SO2 on natural v-dust: gas-phase approach
Processes leading to the uptake of SO2 on the surface of dust under simulated sunlight at the initial
period of exposure versus steady state are rather different. Thus, Maelifellsandur and Mýrdalssandur exhibit
the highest amplification factor for SO2 uptake at the beginning, but some of the lowest amplification factors
for steady state, while Dyngjusandur and Hagavatn show the opposite trend. Surface ageing might be a
reasonable explanation for this behavior. To further explain the trends in uptake on dust one would need to
take a closer look at the formation of surface species.
In the framework of the current study, we have investigated the uptake of SO2 by natural samples
of Icelandic v-dusts under atmospherically relevant conditions of humidity, in the absence and in presence
of simulated solar irradiation. We found that the uptake of SO2 gas on the surface of v-dust with respect to
reactions occurring in the atmosphere could be important, especially in the denser part of the plume/cloud
and when the emitted particles have a high specific surface area. After passing through the plume rich in
SO2 gas, v-particles are expected to be only partially covered with sulfur species. If the interactions are
happening in the part of the plume/cloud exposed to sunlight and in high levels of RH up to 50% of the
particle surface could be covered with sulfur species. The photo-enhanced removal of SO2, Ns,light/ Ns,dark
was found to be correlated with the Ti surface elemental composition and the Ti/Si ratio of the dusts. In
addition, performing experiments under controlled experimental conditions we managed to correlate the
photo-induced removal of SO2 with each of the atmospheric parameter tuned and to propose a generic
expression of the photo-enhanced removal of SO2 on v-dusts. This type of expressions could be useful for
the implementation of the results in models. Above all, we showed a strategy that needs to be followed to
investigate the heterogeneous reaction of a gas species with a surface and to provide kinetic data that can be
parametrized.

131 Chapter III. Investigation of the uptake of SO2 on natural v-dust: gas-phase approach
References of Chapter 3
Adams, J.W., Rodriguez, D., Cox, R.A., 2005. The uptake of SO2 on Saharan dust: a flow tube study.
Atmospheric Chemistry and Physics 5, 2679–2689. https://doi.org/10.5194/acp-5-2679-2005
Ayris, P.M., Lee, A.F., Wilson, K., Kueppers, U., Dingwell, D.B., Delmelle, P., 2013. SO2 sequestration in
large volcanic eruptions: High-temperature scavenging by tephra. Geochimica et Cosmochimica
Acta 110, 58–69. https://doi.org/10.1016/j.gca.2013.02.018
Bagnato, E., Aiuppa, A., Bertagnini, A., Bonadonna, C., Cioni, R., Pistolesi, M., Pedone, M., Hoskuldsson,
A., 2013. Scavenging of sulphur, halogens and trace metals by volcanic ash: The 2010
Eyjafjallajökull eruption. Geochimica et Cosmochimica Acta 103, 138–160.
https://doi.org/10.1016/j.gca.2012.10.048
Baratoux, D., Mangold, N., Arnalds, O., Bardintzeff, J.-M., Platevoet, B., Grégoire, M., Pinet, P., 2011.
Volcanic Sand in Iceland: Diverse origins of aeolian sand deposits revealed at Dyngjusandur and
Lambahraun, Iceland. Earth Surface Processes and Landforms 36, 1789–1808.
https://doi.org/10.1002/esp.2201
Chen, H., Nanayakkara, C.E., Grassian, V.H., 2012. Titanium Dioxide Photocatalysis in Atmospheric
Chemistry. Chem. Rev. 112, 5919–5948. https://doi.org/10.1021/cr3002092
Crowley, J.N., Ammann, M., Cox, R.A., Hynes, R.G., Jenkin, M.E., Mellouki, A., Rossi, M.J., Troe, J.,
Wallington, T.J., 2010. Evaluated kinetic and photochemical data for atmospheric chemistry:
Volume V – heterogeneous reactions on solid substrates. Atmos. Chem. Phys. 10, 9059–9223.
https://doi.org/10.5194/acp-10-9059-2010
Delmelle, P., Wadsworth, F.B., Maters, E.C., Ayris, P.M., 2018. High Temperature Reactions Between
Gases and Ash Particles in Volcanic Eruption Plumes. Reviews in Mineralogy and Geochemistry
84, 285–308. https://doi.org/10.2138/rmg.2018.84.8
Dupart, Y., King, S.M., Nekat, B., Nowak, A., Wiedensohler, A., Herrmann, H., David, G., Thomas, B.,
Miffre, A., Rairoux, P., D’Anna, B., George, C., 2012. Mineral dust photochemistry induces
nucleation events in the presence of SO2. Proc. Natl. Acad. Sci. U.S.A. 109, 20842–20847.
https://doi.org/10.1073/pnas.1212297109
Farges, F., Keppler, H., Flank, A.M., Lagarde, P., 2009. Sulfur K-edge XANES study of S sorbed onto
volcanic ashes. Journal of Physics: Conference Series 190, 012177. https://doi.org/10.1088/1742-
6596/190/1/012177
George, C., Ammann, M., D’Anna, B., Donaldson, D.J., Nizkorodov, S.A., 2015. Heterogeneous
Photochemistry in the Atmosphere. Chem. Rev. 115, 4218–4258.
https://doi.org/10.1021/cr500648z
Gislason, S.R., Hassenkam, T., Nedel, S., Bovet, N., Eiriksdottir, E.S., Alfredsson, H.A., Hem, C.P., Balogh,
Z.I., Dideriksen, K., Oskarsson, N., Sigfusson, B., Larsen, G., Stipp, S.L.S., 2011. Characterization
of Eyjafjallajökull volcanic ash particles and a protocol for rapid risk assessment. PNAS 108, 7307–
7312. https://doi.org/10.1073/pnas.1015053108
Goodman, A.L., Li, P., Usher, C.R., Grassian, V.H., 2001. Heterogeneous Uptake of Sulfur Dioxide On
Aluminum and Magnesium Oxide Particles. J. Phys. Chem. A 105, 6109–6120.
https://doi.org/10.1021/jp004423z
Gudmundsson, M.T., Thordarson, T., Höskuldsson, Á., Larsen, G., Björnsson, H., Prata, F.J., Oddsson, B.,
Magnússon, E., Högnadóttir, T., Petersen, G.N., Hayward, C.L., Stevenson, J.A., Jónsdóttir, I.,
2012. Ash generation and distribution from the April-May 2010 eruption of Eyjafjallajökull,
Iceland. Scientific Reports 2, 572. https://doi.org/10.1038/srep00572
Harris, E., Sinha, B., Foley, S., Crowley, J.N., Borrmann, S., Hoppe, P., 2012. Sulfur isotope fractionation
during heterogeneous oxidation of SO<sub>2</sub> on mineral dust. Atmospheric
Chemistry and Physics 12, 4867–4884. https://doi.org/10.5194/acp-12-4867-2012

132 Chapter III. Investigation of the uptake of SO2 on natural v-dust: gas-phase approach
Herrmann, J.-M., 2005. Heterogeneous photocatalysis: state of the art and present applications In honor of
Pr. R.L. Burwell Jr. (1912–2003), Former Head of Ipatieff Laboratories, Northwestern University,
Evanston (Ill). Top Catal 34, 49–65. https://doi.org/10.1007/s11244-005-3788-2
Huang, L., Zhao, Y., Li, H., Chen, Z., 2015. Kinetics of Heterogeneous Reaction of Sulfur Dioxide on
Authentic Mineral Dust: Effects of Relative Humidity and Hydrogen Peroxide. Environ. Sci.
Technol. 49, 10797–10805. https://doi.org/10.1021/acs.est.5b03930
Huthwelker, T., Ammann, M., Peter, T., 2006. The Uptake of Acidic Gases on Ice. Chemical Reviews 106,
1375–1444. https://doi.org/10.1021/cr020506v
Ibrahim, S., Romanias, M.N., Alleman, L.Y., Zeineddine, M.N., Angeli, G.K., Trikalitis, P.N., Thevenet,
F., 2018. Water Interaction with Mineral Dust Aerosol: Particle Size and Hygroscopic Properties of
Dust. ACS Earth Space Chem. 2, 376–386. https://doi.org/10.1021/acsearthspacechem.7b00152
Joshi, N., Romanias, M.N., Riffault, V., Thevenet, F., 2017. Investigating water adsorption onto natural
mineral dust particles: Linking DRIFTS experiments and BET theory. Aeolian Research 27, 35–45.
https://doi.org/10.1016/j.aeolia.2017.06.001
Judeikis, H.S., Stewart, T.B., 1976. Laboratory measurement of SO2 deposition velocities on selected
building materials and soils. Atmospheric Environment (1967) 10, 769–776.
https://doi.org/10.1016/0004-6981(76)90078-0
Lasne, J., Romanias, M.N., Thevenet, F., 2018. Ozone Uptake by Clay Dusts under Environmental
Conditions. ACS Earth Space Chem. 2, 904–914.
https://doi.org/10.1021/acsearthspacechem.8b00057
Lathem, T.L., Kumar, P., Nenes, A., Dufek, J., Sokolik, I.N., Trail, M., Russell, A., 2011. Hygroscopic
properties of volcanic ash. Geophysical Research Letters 38.
https://doi.org/10.1029/2011GL047298
Lee, C., Martin, R.V., Donkelaar, A. van, Lee, H., Dickerson, R.R., Hains, J.C., Krotkov, N., Richter, A.,
Vinnikov, K., Schwab, J.J., 2011. SO2 emissions and lifetimes: Estimates from inverse modeling
using in situ and global, space-based (SCIAMACHY and OMI) observations. Journal of
Geophysical Research: Atmospheres 116. https://doi.org/10.1029/2010JD014758
Li, L., Chen, Z.M., Zhang, Y.H., Zhu, T., Li, J.L., Ding, J., 2006. Kinetics and mechanism of heterogeneous
oxidation of sulfur dioxide by ozone on surface of calcium carbonate. Atmospheric Chemistry and
Physics Discussions 6, 579–613. https://doi.org/10.5194/acpd-6-579-2006
Maters, E.C., Delmelle, P., Rossi, M.J., Ayris, P.M., 2017. Reactive Uptake of Sulfur Dioxide and Ozone
on Volcanic Glass and Ash at Ambient Temperature. J. Geophys. Res.-Atmos. 122, 10077–10088.
https://doi.org/10.1002/2017JD026993
Maters, E.C., Delmelle, P., Rossi, M.J., Ayris, P.M., Bernard, A., 2016. Controls on the surface chemical
reactivity of volcanic ash investigated with probe gases. Earth Planet. Sci. Lett. 450, 254–262.
https://doi.org/10.1016/j.epsl.2016.06.044
Moroni, B., Arnalds, O., Dagsson-Waldhauserová, P., Crocchianti, S., Vivani, R., Cappelletti, D., 2018.
Mineralogical and Chemical Records of Icelandic Dust Sources Upon Ny-Ålesund (Svalbard
Islands). Front. Earth Sci. 6. https://doi.org/10.3389/feart.2018.00187
Park, J., Jang, M., Yu, Z., 2017. Heterogeneous Photo-oxidation of SO2 in the Presence of Two Different
Mineral Dust Particles: Gobi and Arizona Dust [WWW Document].
https://doi.org/10.1021/acs.est.7b00588
Park, J.Y., Jang, M., 2016. Heterogeneous photooxidation of sulfur dioxide in the presence of airborne
mineral dust particles. RSC Adv. 6, 58617–58627. https://doi.org/10.1039/C6RA09601H
Renggli, C., King, P., W. Henley, R., Guagliardo, P., McMorrow, L., Middleton, J., Turner, M., 2019. An
experimental study of SO2 reactions with silicate glasses and supercooled melts in the system
anorthite–diopside–albite at high temperature. Contributions to Mineralogy and Petrology 174.
https://doi.org/10.1007/s00410-018-1538-2
Romanias, M.N., El Zein, A., Bedjanian, Y., 2012a. Heterogeneous Interaction of H2O2 with TiO2 Surface
under Dark and UV Light Irradiation Conditions. J. Phys. Chem. A 116, 8191–8200.
https://doi.org/10.1021/jp305366v

133 Chapter III. Investigation of the uptake of SO2 on natural v-dust: gas-phase approach
Romanias, M.N., El Zein, A., Bedjanian, Y., 2012b. Reactive uptake of HONO on aluminium oxide surface.
Journal of Photochemistry and Photobiology A: Chemistry 250, 50–57.
https://doi.org/10.1016/j.jphotochem.2012.09.018
Romanias, M.N., Ren, Y., Grosselin, B., Daële, V., Mellouki, A., Dagsson-Waldhauserova, P., Thevenet,
F., 2020. Reactive uptake of NO2 on volcanic particles: A possible source of HONO in the
atmosphere. Journal of Environmental Sciences. https://doi.org/10.1016/j.jes.2020.03.042
Romanias, M.N., Zeineddine, M.N., Gaudion, V., Lun, X., Thevenet, F., Riffault, V., 2016. Heterogeneous
Interaction of Isopropanol with Natural Gobi Dust. Environ. Sci. Technol. 50, 11714–11722.
https://doi.org/10.1021/acs.est.6b03708
Romanias, M.N., Zeineddine, M.N., Riffault, V., Thevenet, F., 2017. Isoprene Heterogeneous Uptake and
Reactivity on TiO2: A Kinetic and Product Study. International Journal of Chemical Kinetics 49,
773–788. https://doi.org/10.1002/kin.21114
Schmauss, D., Keppler, H., 2014. Adsorption of sulfur dioxide on volcanic ashes. American Mineralogist
99, 1085–1094. https://doi.org/10.2138/am.2014.4656
Shang, J., Li, J., Zhu, T., 2010. Heterogeneous reaction of SO2 on TiO2 particles. Sci. China Chem. 53,
2637–2643. https://doi.org/10.1007/s11426-010-4160-3
Tang, M., Cziczo, D.J., Grassian, V.H., 2016. Interactions of Water with Mineral Dust Aerosol: Water
Adsorption, Hygroscopicity, Cloud Condensation, and Ice Nucleation. Chem. Rev. 116, 4205–
4259. https://doi.org/10.1021/acs.chemrev.5b00529
Tang, M., Huang, X., Lu, K., Ge, M., Li, Y., Cheng, P., Zhu, T., Ding, A., Zhang, Y., Gligorovski, S., Song,
W., Ding, X., Bi, X., Wang, X., 2017. Heterogeneous reactions of mineral dust aerosol: implications
for tropospheric oxidation capacity. Atmos. Chem. Phys. 17, 11727–11777.
https://doi.org/10.5194/acp-17-11727-2017
Textor, C., Graf, H.-F., Herzog, M., Oberhuber, J.M., 2003. Injection of gases into the stratosphere by
explosive volcanic eruptions. Journal of Geophysical Research: Atmospheres 108.
https://doi.org/10.1029/2002JD002987
Ullerstam, M., Vogt, R., Langer, S., Ljungstrom, E., 2002. The kinetics and mechanism of SO2 oxidation
by O-3 on mineral dust. Phys. Chem. Chem. Phys. 4, 4694–4699. https://doi.org/10.1039/b203529b
Usher, C.R., Al-Hosney, H., Carlos-Cuellar, S., Grassian, V.H., 2002. A laboratory study of the
heterogeneous uptake and oxidation of sulfur dioxide on mineral dust particles. J.-Geophys.-Res.
107, 4713. https://doi.org/10.1029/2002JD002051
Witham, C., Webster, H., Hort, M., Jones, A., Thomson, D., 2012. Modelling concentrations of volcanic
ash encountered by aircraft in past eruptions. Atmospheric Environment, Volcanic ash over Europe
during the eruption of Eyjafjallajöekull on Iceland, April-May 2010 48, 219–229.
https://doi.org/10.1016/j.atmosenv.2011.06.073
Wu, L.Y., Tong, S.R., Wang, W.G., Ge, M.F., 2011. Effects of temperature on the heterogeneous oxidation
of sulfur dioxide by ozone on calcium carbonate. Atmospheric Chemistry and Physics 11, 6593–
6605. https://doi.org/10.5194/acp-11-6593-2011
Yu, Z., Jang, M., Park, J., 2017. Modeling atmospheric mineral aerosol chemistry to predict heterogeneous
photooxidation of SO2. Atmospheric Chemistry and Physics 17, 10001–10017.
https://doi.org/10.5194/acp-17-10001-2017
Zein, A.E., Romanias, M.N., Bedjanian, Y., 2014. Heterogeneous Interaction of H2O2 with Arizona Test
Dust. J. Phys. Chem. A 118, 441–448. https://doi.org/10.1021/jp409946j
Zeineddine, M.N., Romanias, M.N., Gaudion, V., Riffault, V., Thévenet, F., 2017. Heterogeneous
Interaction of Isoprene with Natural Gobi Dust. ACS Earth Space Chem. 1, 236–243.
https://doi.org/10.1021/acsearthspacechem.7b00050
Zeineddine, M.N., Romanias, M.N., Riffault, V., Thévenet, F., 2018. Heterogeneous Interaction of Various
Natural Dust Samples with Isopropyl Alcohol as a Probe VOC. The Journal of Physical Chemistry
A. https://doi.org/10.1021/acs.jpca.8b02034

134 Chapter III. Investigation of the uptake of SO2 on natural v-dust: gas-phase approach
Zhang, X., Zhuang, G., Chen, J., Wang, Y., Wang, X., An, Z., Zhang, P., 2006. Heterogeneous Reactions
of Sulfur Dioxide on Typical Mineral Particles. J. Phys. Chem. B 110, 12588–12596.
https://doi.org/10.1021/jp0617773
Zhang, Y., Tong, S., Ge, M., Jing, B., Hou, S., Tan, F., Chen, Y., Guo, Y., Wu, L., 2018. The influence of
relative humidity on the heterogeneous oxidation of sulfur dioxide by ozone on calcium carbonate
particles. Sci. Total Environ. 633, 1253–1262. https://doi.org/10.1016/j.scitotenv.2018.03.288
Zhou, L., Wang, W., Gai, Y., Ge, M., 2014. Knudsen cell and smog chamber study of the heterogeneous
uptake of sulfur dioxide on Chinese mineral dust. Journal of Environmental Sciences 26, 2423–
2433. https://doi.org/10.1016/j.jes.2014.04.005

Chapter IV. In-situ monitoring of SO2 uptake on natural v-dust by
DRIFT spectroscopy: toward surface reaction pathways

136 Chapter IV. In-situ monitoring of SO2 uptake on natural v-dust by DRIFT spectroscopy: toward surface reaction pathways
Table of content of Chapter 4
1 Exploration of DRIFT spectra during SO2 interaction with v-dust .................................................... 139
2 From DRIFT spectra to surface reaction pathways ............................................................................ 145
2.1 Uptake and reaction of SO2 on Hagavatn under DRY conditions using DRIFT ........................ 145
2.2 Uptake and reaction of SO2 on Hagavatn under WET conditions using DRIFT ........................ 148
2.3 Comparison of surface processes between dry and humid conditions ........................................ 150
3 Conclusions and atmospheric implications based on DRIFT approach ............................................. 152
References ................................................................................................................................................ 153

137 Chapter IV. In-situ monitoring of SO2 uptake on natural v-dust by DRIFT spectroscopy: toward surface reaction pathways
List of Tables of Chapter 4
Table 1: Vibrational wavenumbers (cm-1) of sulfur-containing species adsorbed on v-dust and metal oxide ........ 144

138 Chapter IV. In-situ monitoring of SO2 uptake on natural v-dust by DRIFT spectroscopy: toward surface reaction pathways
List of Figures of Chapter 4
Figure 1: DRIFTS spectra of SO2 uptake by Hagavatn v-dust at 0% RH and 296 K depicting evolution of bands for
free surface OH groups (4000-3500 cm-1), adsorbed water (3500-2600 cm-1), physisorbed SO2 (1385-1320
cm-1), sulfates/bisulfates (1320-975 cm-1), sulfites/bisulfites (975-716 cm-1) as a function of time: black
line – before introduction of SO2, red line- after 1.5 h of exposure to SO2, blue line- after 2.5 h of exposure
to SO2, green line- after 22 h of exposure to SO2, yellow line- after 71 h of exposure to SO2. .............. 140
Figure 2: DRIFTS spectra of SO2 uptake on Hagavatn v-dust at 30% RH and 296 K depicting evolution of bands for
free surface OH groups (4000-3500 cm-1), adsorbed water (3500-2600 cm-1), SH groups (2600-2400 cm-
1), physisorbed SO2 (1367-1320), sulfates/bisulfates (1302-1050 cm-1), sulfites/bisulfites (1053-700 cm-1)
as a function of time: black line – before introduction of SO2, red line- after 1.5 h of exposure to SO2, blue
line- after 2.5 h of exposure to SO2, green line- after 22 h of exposure to SO2, yellow line- after 71 h of
exposure to SO2. ..................................................................................................................................... 141
Figure 3: Integrated absorbance for (a) sulfites/bisulfites, (b) sulfates/bisulfates as a function of time under 0% RH
and 296K. Upper graph: sulfites/bisulfites are stabilized after 22 hours of exposure. The solid line is an
exponential fitting of experimental results to better display the observed trends. Lower graph: A linear
growth of sulfates/bisulfates with time is noticed; note that the peak is stable for the first couple of hours
and then keeps increasing in a linear fashion. The solid line is the linear fit of experimental results. ... 148
Figure 4: Integrated absorbance for (a) free hydroxyl groups, (b) physisorbed SO2, (c) sulfites/bisulfites, (d)
sulfates/bisulfates as a function of time under 30% RH and 296 K. a) The free OH groups get consumed
very fast at the beginning of the experiment and reach a minimum at 1.5 hours, then the consumption of
OH groups decreases and reaches a stable level at 2.5 hr. The solid line is an empirical fitting of
experimental results to better display the observed trends. b) The peak for physisorbed SO2 is quite noisy
but increases slowly and remains weak for the duration of the experiment. c) Sulfites/bisulfites grow
rapidly and almost linearly for the first 1.5 hr and then stabilize. The solid line is an exponential fitting of
experimental results to better display the observed trends. d) The peak for sulfates/bisulfates is stable at
low values for the first 2.5 hr, increases in the linear fashion from 2.5 to about 40 hr, and then starts
fluctuating. The solid line is the linear fit of experimental results. ........................................................ 150
Figure 5: Schematic representation of SO2 reaction pathways at the surface of v-dust. Reactions occurring under dark
and dry conditions are shown in black; reactions promoted under humid conditions are shown in blue.
................................................................................................................................................................ 152

139 Chapter IV. In-situ monitoring of SO2 uptake on natural v-dust by DRIFT spectroscopy: toward surface reaction pathways
While flow-tube reactor monitors changes in the gas-phase concentration, DRIFTS focuses on
changes on the solid phase. It is commonly used to study fine particles and powders, and can be used to
investigate adsorption of molecules on solid surfaces. In this case spectra are collected as difference spectra
with the unexposed solid as background. As the reaction proceeds, growing or decreasing infrared
absorption peaks can be attributed to the species formed or consumed on the surface. Infrared spectroscopy
based on light diffuse reflectance offers information about the vibrational modes associated with
stretching, bending, and rocking motions of the adsorbed molecules. However, in order to monitor these
vibrations the sample has to have high enough reflectance to insure an adequate signal in response to
changes in the adsorbed phase. Moreover, the surface concentration needs to be high enough due to the
moderate sensitivity of the technique. If the sample highly absorbs incident light, which is the case of v-
dust samples, it is usually diluted in a non-absorbent matrix, such as KBr. In our case, however, this type
of matrix could not be used because of the interactions of KBr with SO2 and thus the use of pure v-dust
was required. The background obtained for each v-dust under dry conditions showed that all of them
absorb light strongly and, as a result, a weak diffused IR signal was recorded in response to changes in the
adsorbed phase. To study the adsorption of SO2 on v-dust, backgrounds of five samples were taken to
choose the least absorbent varieties. In comparison with other v-dusts the backgrounds for Hagavatn and
Eyjafjallajökull show higher reflectances in the wavenumber range from 800 to 1350 cm-1 where sulfite
and sulfate species usually absorb. Because of its higher reflectance and higher specific surface area,
Hagavatn v-dust was selected as the most appropriate sample for DRIFTS experiments. Besides, results
obtained from the flow-tube studies showed similar trends in SO2 adsorption by the selected v-dusts based
on gas-phase monitoring of SO2, i.e. rapid consumption of SO2 gas at the initial stage of surface exposure
followed by a steady state removal of the probe molecule. Furthermore, in the flow-tube experiments both
steady state uptake coefficients (γss) and initial amounts of molecules taken up (Ns) were demonstrated to
increase as a function of RH and, with the exception of Eyjafjallajökull, UV light. Therefore, it appeared
justified to choose one dust as a representative sample to study the mechanism of product formation on
the surface of aerosols. Aiming to further investigate the results obtained from the flow-tube study
and to deeper assess the role of humidity on the uptake process, the DRIFTS experiments were
performed under dry conditions and 30% RH using Hagavatn as a representative v-dust sample.
1 Exploration of DRIFT spectra during SO2 interaction with v-dust
Figure 1 and Figure 2 show DRIFT typical spectra of Hagavatn v-dust at increasing SO2 exposure
time intervals at room temperature under 0% and 30% RH respectively. In order to provide a detailed

140 Chapter IV. In-situ monitoring of SO2 uptake on natural v-dust by DRIFT spectroscopy: toward surface reaction pathways
understanding of the spectra recorded during SO2 interaction with Hagavatn sample, Table 1 introduces
the assignment of peaks of different adsorbed sulfur-containing species as well as water and hydroxyl
groups on the surface of v-dust investigated, and different metal oxides found in the literature. The
construction of this table results from a detailed literature survey of the IR signature of the species of
interest.
Figure 1: DRIFTS spectra of SO2 uptake by Hagavatn v-dust at 0% RH and 296 K depicting evolution of bands for free surface
OH groups (4000-3500 cm-1), adsorbed water (3500-2600 cm-1), physisorbed SO2 (1385-1320 cm-1), sulfates/bisulfates (1320-
975 cm-1), sulfites/bisulfites (975-716 cm-1) as a function of time: black line – before introduction of SO2, red line- after 1.5 h of
exposure to SO2, blue line- after 2.5 h of exposure to SO2, green line- after 22 h of exposure to SO2, yellow line- after 71 h of
exposure to SO2.

141 Chapter IV. In-situ monitoring of SO2 uptake on natural v-dust by DRIFT spectroscopy: toward surface reaction pathways
Figure 2: DRIFTS spectra of SO2 uptake on Hagavatn v-dust at 30% RH and 296 K depicting evolution of bands for free surface
OH groups (4000-3500 cm-1), adsorbed water (3500-2600 cm-1), SH groups (2600-2400 cm-1), physisorbed SO2 (1367-1320),
sulfates/bisulfates (1302-1050 cm-1), sulfites/bisulfites (1053-700 cm-1) as a function of time: black line – before introduction of
SO2, red line- after 1.5 h of exposure to SO2, blue line- after 2.5 h of exposure to SO2, green line- after 22 h of exposure to SO2,
yellow line- after 71 h of exposure to SO2.
Negative and positive absorption peaks in the area from 4000 to 3500 cm-1 are visible in both
Figure 1 and Figure 2, i.e. irrespectively of the RH level. They correspond to the free OH groups that are
naturally present on the surface of v-dust (Hair, 1975). These groups are attached to the surface atoms,
such as Si for example, and can be either completely isolated or hydrogen-bonded to each other (Hair,
1975). Adsorption of molecules containing a lone-pair of electrons is often associated with isolated surface
OH groups, while neighboring hydrogen-bonded surface OH groups are involved in the adsorption of
water (Hair, 1975), (Nanayakkara et al., 2012). The exact assignment of each individual peak is not
possible due to the complex response reflecting slightly different vibrational energies of OH groups
bonded to different minerals composing the v-dust. A peak from 3500 to 2600 cm-1 and another peak from
1800 to 1400 cm-1 centered at 1620 cm-1 (not displayed) are attributed to vibration modes in molecular
water (Hair, 1975).
A weak broad peak from 2600 to 2400 cm-1, visible under humid conditions, could be assigned to
the S-H stretch vibration of the HSO3- bisulfite species that is only found in the literature as a theoretical
value calculated by Zhang et al. for aqueous solution and reported to be in the range of 2620 to 2450 cm-
1 (Zhang and Ewing, 2002). This peak is not visible under dry condition. Sulfur-containing products appear
in the area from 1385 to 700 cm-1 under humid conditions and from 1367 to 716 cm-1 under dry conditions.

142 Chapter IV. In-situ monitoring of SO2 uptake on natural v-dust by DRIFT spectroscopy: toward surface reaction pathways
Spectra under humid conditions are better resolved and several peaks can be distinguished: 3040,
2500, 1364, 1220, 1135, 930 and 872 cm-1. Peaks under dry conditions are much noisier, nevertheless the
following peaks are observed: 3242, 1340, 1230 and 1150 cm-1. A double peak centered at 1364 cm-1 under
humid conditions and at 1340 cm-1 under dry conditions appears rapidly upon exposure of the surface to
SO2 gas and disappears right away from the spectra after ceasing the SO2 flow. It was therefore assigned
to the weakly, reversibly physisorbed SO2 species. The peak corresponds well to the literature values for
SO2 adsorption under dry conditions on the surfaces of aluminum, magnesium or titanium oxides identified
in previous studies at 1330 cm-1 and its gas-phase value of 1362 cm-1 (Nanayakkara et al., 2012), (Goodman
et al., 2001). Another band appears rapidly upon exposure of SO2 to the surface between 1053 and 700
cm-1 under humid conditions. A corresponding band between 975 and 716 cm-1 under dry conditions takes
more time to develop and is hard to interpret since its intensity is almost at the limit of detection of the
DRIFTS instrument. The attribution of this band is based on the previous assignments of SO2 adsorption
on the surface of different metal oxides found in the literature and corresponds to the stretching motion of
sulfite and bisulfite species that are bonded to the surface in a monodentate or bidentate mode. Different
coordination environments as well as heterogeneous nature of v-dust contribute to the broadening of the
band (Usher et al., 2002). In particular, Goodman et al (Goodman et al., 2001)., Usher et al. (Usher et al.,
2002) and Zhang et al. (Zhang et al., 2006) assigned the band between 1100 to 850 cm-1 to adsorbed sulfite
and bisulfite on α-Al2O3 and MgO. Li et al. (Li et al., 2006) and Wu et al. (Wu et al., 2011) assigned a
1000-900 cm-1 band on CaCO3 to a stretching vibration of sulfite.
A peak from 1200 to 800 cm-1 on TiO2 was assigned to sulfite and bisulfite species by
Nanayakkara et al. (Wu et al., 2011). On hematite particles Wang et al. assigned to sulfites a peak between
950 and 800 cm-1 under dry conditions and a series of peaks from 1050 to 900 cm-1 under humid conditions
(Wang et al., 2018b).
Finally, a band from 1320 to 975 cm-1 with features at 1230 and 1150 cm-1 in dry conditions and
from 1302 to 1055 cm-1 with features at 1220 and 1135 cm-1 under humid conditions was attributed to
sulfate and bisulfate species. The assignment agrees well with the results published previously, where
sulfates/bisulfates were found around 1300-1100 cm-1 on α-Al2O3 and MgO (Usher et al., 2002), (Zhang
et al., 2006); between 1240 and 1012 cm-1 on CaCO3 with features at 1198, 1127, and 1090 cm-1(Wu et
al., 2011), (Li et al., 2006). Sulfates were reported between 1300 and 1100 cm-1 on TiO2 (Nanayakkara et
al., 2012), (Shang et al., 2010); and at 1220 cm-1 on Fe2O3 (Wang et al., 2018b).
Just as sulfites, sulfates can be bonded to the surface in bidentate or monodentate modes (Jiang et
al., 2010). A peak centered at 1220 cm-1 under humid conditions and at 1230 cm-1 under dry conditions

143 Chapter IV. In-situ monitoring of SO2 uptake on natural v-dust by DRIFT spectroscopy: toward surface reaction pathways
could be attributed to the formation of bisulfate species (Wang et al., 2018a). The process of sulfate/sulfite
formation is explained later in the reaction mechanism section.

144 Chapter IV. In-situ monitoring of SO2 uptake on natural v-dust by DRIFT spectroscopy: toward surface reaction pathways
Molecular species
(wavenumbers are
expressed in cm-1)
V-dust (this
work)
Si2O3
Al2O3 MgO TiO2 CaCO3 Fe2O3 Theoretical
calculations
SH stretch of HSO3- 2600-2400 2600-2400 (Hair,
1975)
2620 to 2450 (Zhang
and Ewing, 2002)
SO2 1364, 1340 1330, 1149
(Goodman et al.,
2001)
1330, 1149
(Goodman et al.,
2001)
1139, 1325 (Nanayakkara et
al., 2012)
1400 (Nanayakkara et al.,
2012)
HSO3-/SO3
2- 1053-700
975-716
1200-900 (Goodman
et al., 2001)
1100-850 (Zhang et
al., 2006)
1200-800 (Nanayakkara et
al., 2012)
1080 (Shang et al., 2010)
Dry:
950-800
Humid:
1050-900 (Wang et al.,
2018b)
SO32- 1125-800
(Goodman et al.,
2001)
Monodentate:
1033, 971, 923
(Nanayakkara et al., 2012)
Bidentate:
1006, 886(Nanayakkara et
al., 2012)
1000-900 (Li
et al., 2006)
1000-885
(Wu et al.,
2011)
Dry:891 (Wang et al.,
2018b)
Humid: 981 (Wang et al.,
2018b)
HSO3- 1077 (Nanayakkara et al.,
2012)
1054, 1154, 1219
(Zhang and Ewing,
2002)
HSO4-/SO4
2- 1320-975
1302-1055
1245, 1170 (Usher et
al., 2002)
1150, 1050
(Usher et al.,
2002)
1240-1012
(Wu et al.,
2011)
HSO4- 1220, 1230 1219 (Wang et al., 2018a)
SO4- 1300-1100(Zhang et
al., 2006)
1300-1100
(Zhang et al.,
2006)
1361, 1297, 1172, 1116,
1050, 1000 (Nanayakkara et
al., 2012)
1300-1100 (Shang et al.,
2010)
1130 (Li et
al., 2006)
Dry:
1339-1014
Humid:
1208-1222(Wang et al.,
2018b)
free OH groups 4000-3500 4000-3500
(Hair, 1975)
3748, 3707
(Goodman et al.,
2001)
3800-3600 (Nanayakkara et
al., 2012)
1666, 3628 (Shang et al.,
2010)
3704 (Wang et al., 2018b)
OH groups of acids 3447, 3548 (Wang et al.,
2018b)
3622 (Zhang and
Ewing, 2002)
molecular water 3500-2600
1400-1800
3450, 1630
(Hair, 1975)
3524, 3296
(Goodman et al.,
2001)
3160, 1654 (Shang et al.,
2010)
3208, 1642 (Wang et al.,
2018b)
Table 1: Vibrational wavenumbers (cm-1) of sulfur-containing species adsorbed on v-dust and metal oxide

145 Chapter IV. In-situ monitoring of SO2 uptake on natural v-dust by DRIFT spectroscopy: toward surface reaction pathways
2 From DRIFT spectra to surface reaction pathways
Changes in the DRIFT spectra of the surface of Hagavatn v-dust are clearly seen upon introduction
of SO2 (Figure 1 and 2). In comparison with the studies of the interaction of SO2 with high reflectance pure
metal oxides reported earlier by different authors, it appears that DRIFT peaks are weaker, most probably
due to low sensitivity when dealing with dark natural v-dusts where the reflectance of the infrared light is
limited (Zhang et al., 2006), (Usher et al., 2002), (Goodman et al., 2001), (Li et al., 2006), (Wu et al., 2011),
(Nanayakkara et al., 2012), (Shang et al., 2010), (Wang et al., 2018b). Nonetheless, the time evolution of
five selected peaks corresponding to different key species, such as free OH groups, molecular water,
physisorbed SO2, sulfites/bisulfites and sulfates/bisulfates are followed.
From our flow-tube experiments presented in Chapter 3 it is evidenced that SO2 gas is massively
lost from the gas phase upon its exposure to the v-dust surface. Interestingly, the first peaks that appear in
the DRIFT spectra after introduction of SO2 gas are positive peaks for physisorbed SO2 gas and negative
peaks for free OH groups (Figure 1). Note that although the sample has been thermally pretreated and the
experiment is performed under dry conditions, surface OH groups are present on the surface of the sample.
The complete dehydroxylation of the surface would have required stronger thermal pretreatment. The loss
of surface free OH groups reaches its local minimum at around 1.5 hr of exposure to SO2 before returning
to its initial pre-exposed level where it starts fluctuating around zero. The peak for SO2 gas is stable, but
hard to interpret due to its small size and overlap with a much more pronounced peak for bulk water. Bulk
water peak is highly unstable. The disappearance of free OH groups and appearance of physisorbed SO2
suggest that in the first instants of the reaction, SO2 gas gets weakly bonded to hydroxyl groups of the surface
as first proposed by Datta et al. and later proved by theoretical calculations by Lo et al. for γ-alumina (Datta
et al., 1985), (Lo et al., 2010). Maters et al. suggested that due to the weakly acidic nature of SO2 gas, its
uptake is likely to happen on strongly basic sites affiliated with alkaline and alkaline earth metals on the
surface of the volcanic glass (-K-OH, -Mg-OH, -Ca-OH, Mg-OH) (Maters et al., 2017). At the same time it
is also possible for the SO2 gas to get adsorbed on metallic Lewis acid sites of mineral phase as proposed
by Wang et al. (Wang et al., 2018a). Hence, the first interaction of SO2 gas with the surface under dry
conditions is its distribution on different sites of the v-dust leading to a reversible physisorption of SO2, as
indicated by subscript (ads) (Reaction 1). Throughout the manuscript the chemisorbed species or chemical
groups that form a chemical bond with the surface are indicated as (surface).
Reaction 1 SO2(g) ↔ SO2(ads)

146 Chapter IV. In-situ monitoring of SO2 uptake on natural v-dust by DRIFT spectroscopy: toward surface reaction pathways
Physisorbed SO2 can then participate in reactions leading to chemisorbed species. Sulfites and
sulfates, under dry conditions first appear after several hours of exposure probably due to a lack of sensitivity
of our DRIFT setup to address the dark system of interest. Sulfites can be formed on the lattice oxygen sites
that can be viewed as Lewis basic sites (Wang et al., 2018a) as in Reaction 2.
Reaction 2 SO2(ads) + O2- (lattice) →SO3
2-(surface)
Alternatively, sulfites can be formed in the presence of hydroxyl groups as SO2 can react with either
one hydroxyl group to form bisulfite (Reaction 3) or two neighboring hydroxyl groups to form sulfite and
water (Reaction 4) (Wang et al., 2018a). Surface hydroxyl groups themselves can be bonded to a single
metal atom or bridge two, creating different environments for interactions with SO2 (Ullerstam et al., 2002).
Reaction 3 SO2(ads) + OH-(surface) →HSO3
-(surface)
Reaction 4 SO2(ads) + 2OH- (surface) →SO3
2-(surface) + H2O
Chemisorption of SO2 gas on oxide anions (O2-) and hydroxyl groups of volcanic ash and glass
leading to the formation of sulfites and bisulfites was suggested earlier by Maters et al. and detection of
sulfites in the leachates confirmed the conversion (Maters et al., 2017).
From Figure 3, that shows time evolutions of sulfites and sulfates, it can be observed that, under
dry conditions, sulfites (SO32-) get completely stabilized after 22 hours of exposure, but sulfates (SO4
2-) keep
growing linearly, suggesting that sulfites are the intermediate species in the oxidation of SO2 to sulfates.
Oxidation of sulfites to sulfates on the surface of volcanic glass was observed by Farges et al. (Farges et al.,
2009). Sulfites can be oxidized to sulfates via several pathways. Active oxygen derived from molecular
oxygen adsorbed on the active sites (Reaction 7) can oxidize sulfites to sulfates and bisulfites to bisulfates
as in Reaction 5 and Reaction 6 (Wang et al., 2018a).
Reaction 5 SO32-
(surface) + O- (ads) →SO4
2-(surface) + e-
Reaction 6 HSO3-(surface) + O-
(ads) →HSO4- (surface) + e-
Contrary to our observations and to results reported by Shang et al. (Shang et al., 2010), who also
noticed a stable rate of sulfate production on the surface of titanium dioxide particles in the presence of
oxygen, Usher et al. (Usher et al., 2002) noted complete saturation of mineral oxide surfaces with SO2 gas
and observed no sulfate formation even upon exposure of SO2-treated surface to air and oxygen. It could be
due to the fact that the minerals under investigation were not able to convert molecular oxygen into active
oxygen under the specific experimental conditions of these measurements.

147 Chapter IV. In-situ monitoring of SO2 uptake on natural v-dust by DRIFT spectroscopy: toward surface reaction pathways
Reaction 7 was reported to enable the conversion of sulfites to sulfates on the surface of mineral
phase by converting molecular oxygen into active oxygen, but a similar process can be expected to happen
on the amorphous fraction of the volcanic ash due to the high defect population on silicate glasses (A Leed
and Pantano, 2003), (Farges et al., 2009). Noticeably, reaction proceeds in the absence of light (Baltrusaitis
et al., 2007).
Reaction 7 O(vacancy) + e- + O2 →O2-(ads) + e- →2O-
(ads)
where e- is a conductive electron trapped in the vacant oxygen site on the surface of some oxides
that are prone to having defect sites, such as on the surface of Fe2O3, for example (Wang et al., 2018b),
(Baltrusaitis et al., 2007).
Additionally, certain metal centers that can be readily reduced, such as Fe3+ to Fe2+, contribute to
the formation of sulfates from bisulfites as per Reaction 8 (Wang et al., 2018a).
Reaction 8 HSO3-(surface) + OH-
(surface)
𝑭𝒆𝟑+ →𝑭𝒆𝟐+
→ SO42-
(surface) + 2H++2e-
Finally, bisulfates can be oxidized to sulfates by hydroxyl groups as per Reaction 9 (Wang et al.,
2018a).
Reaction 9 HSO4- (surface) + OH- (surface) →SO4
2- (surface) + H2O
On ceasing the gas flow and flushing the system for 6 hours, the peak for sulfites decreases due to
its oxidation as per Reaction 5, Reaction 6 and Reaction 8, while the peak for sulfates increases for a couple
of hours before getting stable, at the same time slightly changing its shape. The peak centered at 1230 cm-1
gets smaller in comparison with the peak at 1135 cm-1 suggesting indeed further conversion of bisulfates to
sulfates. A decrease in sulfite peak with simultaneous increase in the sulfate peak upon cutting off SO2
supply and addition of O3 was observed by Li et al. (Li et al., 2006). Thus, sulfates appear to be the final
product of oxidation of SO2 gas and they keep being formed on the surface as long as there are sulfites
available for oxidation. Sulfates were also reported as a final irreversible product of the interaction of SO2
gas with volcanic glass by Farges et al. and by Maters et al. (Farges et al., 2009), (Maters et al., 2017).

148 Chapter IV. In-situ monitoring of SO2 uptake on natural v-dust by DRIFT spectroscopy: toward surface reaction pathways
Figure 3: Integrated absorbance for (a) sulfites/bisulfites, (b) sulfates/bisulfates as a function of time under 0% RH and 296K.
Upper graph: sulfites/bisulfites are stabilized after 22 hours of exposure. The solid line is an exponential fitting of experimental
results to better display the observed trends. Lower graph: A linear growth of sulfates/bisulfates with time is noticed; note that the
peak is stable for the first couple of hours and then keeps increasing in a linear fashion. The solid line is the linear fit of experimental
results.
After exposure of v-dust to SO2 gas under humid conditions the following changes are observed in
the analysis of DRIFT spectra as seen in Figure 2 and Figure 4. At the very beginning of the experiment,
the free OH groups get consumed and reach a minimum after 1.5 hours exposure to SO2, at the same time
sulfites form rapidly and at an almost linear rate. The peak for physisorbed SO2 increases much slower and
the peak remains small for the duration of the experiment. The initial time period corresponds well with the
reaction mechanism proposed by Wang et al. in Reaction 3 and Reaction 4 both of which require
consumption of free OH groups to produce sulfites and bisulfites. From 1.5 to 2.5 hours consumption of OH
groups slows down and finally reaches a stable level. It is important to stress out that, when working under

149 Chapter IV. In-situ monitoring of SO2 uptake on natural v-dust by DRIFT spectroscopy: toward surface reaction pathways
humid conditions, surface OH groups are continuously regenerated. The mechanism for metal oxide surface
hydroxylation proposed by Tamura et al. assumes that an exposed oxygen center of the metal oxide lattice
acts as Lewis base with water to form a surface terminal hydroxyl group and a hydroxide ion as shown in
Reaction 10 (Tamura et al., 2001). In other words, a surface oxide ion gets neutralized by water to become
OH- (surface), while water itself loses a proton to become hydroxide ion OH-
(ads).
Reaction 10 O2- (lattice) + H2O → OH-
(surface) + OH-(ads)
Sulfates/bisulfates are first observed in the DRIFT spectra at 2.5 hours exposure to SO2.
Sulfites/bisulfites are transformed to sulfates/bisulfates by three different pathways shown in Reaction 5,
Reaction 6, and Reaction 8 (Wang et al., 2018a). In addition, bisulfates react with hydroxyl groups to form
sulfates (Reaction 9). Unlike sulfites that reach a stable level within 2.5 hours, a peak for sulfates linearly
increases for about 40 hours and then starts fluctuating, making it difficult to evaluate whether the amount
of sulfates on the surface keeps growing or reaches a stable level. A peak for molecular water is hard to
evaluate at 30% RH as water is being constantly supplied in large excess. Initially, the peak for water seems
to decrease, which could be due to the competition with SO2 gas molecules for active sites on the surface
(Figure 4). At 14 hours the water peak stabilizes at a positive value, indicating that the surface is now storing
more H2O molecules than before introduction of SO2 gas (Figure 4). Formation of sulfite and sulfate species
could have changed equilibrium for adsorption of water on the dust surface (e.g. due to chemical changes
of the mineral structure that increase the hygroscopicity of the samples). Particularly, it was argued that
adsorption of bidentate sulfate on the surface of Fe-Mn/TiO2 catalyst increases the Lewis acid character of
the metal ion to which it is attached, thus potentially favoring the adsorption of water on the metal center
(Jiang et al., 2010). Finally, when the flow of SO2 is stopped, the peak for sulfite gradually decreases while
the peak for sulfate increases for a couple of hours, stabilizes and stays in the spectra for at least six hours.
Like under dry conditions the peak for bisulfates/sulfates changes its shape by decreasing the peak
associated with bisulfates (at 1220 cm-1) suggesting its conversion to sulfates.

150 Chapter IV. In-situ monitoring of SO2 uptake on natural v-dust by DRIFT spectroscopy: toward surface reaction pathways
Figure 4: Integrated absorbance for (a) free hydroxyl groups, (b) physisorbed SO2, (c) sulfites/bisulfites, (d) sulfates/bisulfates as
a function of time under 30% RH and 296 K. a) The free OH groups get consumed very fast at the beginning of the experiment and
reach a minimum at 1.5 hours, then the consumption of OH groups decreases and reaches a stable level at 2.5 hr. The solid line is
an empirical fitting of experimental results to better display the observed trends. b) The peak for physisorbed SO2 is quite noisy but
increases slowly and remains weak for the duration of the experiment. c) Sulfites/bisulfites grow rapidly and almost linearly for the
first 1.5 hr and then stabilize. The solid line is an exponential fitting of experimental results to better display the observed trends.
d) The peak for sulfates/bisulfates is stable at low values for the first 2.5 hr, increases in the linear fashion from 2.5 to about 40 hr,
and then starts fluctuating. The solid line is the linear fit of experimental results.
Although DRIFTS is a semi-quantitative technique, it is feasible to compare the results obtained
under dry and humid conditions. Thus, in comparison with the reaction under dry conditions, the reaction
under humid conditions is much more pronounced, resulting in both faster reaction rates and higher
integration values obtained for all sulfur containing species involved. This observation is in line with the
results obtained from the flow-tube experiments, where significantly higher steady state uptakes and initial
number of molecules taken up were determined for SO2 under humid compared to dry conditions.
Faster sulfite formation is most likely related to the dramatic increase in the amount of hydroxyl
groups covering the surface under humid conditions, driving the sulfite and bisulfite formation through

151 Chapter IV. In-situ monitoring of SO2 uptake on natural v-dust by DRIFT spectroscopy: toward surface reaction pathways
Reaction 3 and Reaction 4. Indeed, under humid conditions the amount of hydroxyl groups lost in the first
minutes is much larger than under dry conditions, thus adsorbed SO2 molecules convert rapidly to form
sulfites (Figure 1 and Figure 2). Huang et al. reported that the rate of sulfate formation on the surface of
Arizona test dust increased with RH and reached its maximum at 70% RH (Huang et al., 2015). The
importance of surface OH groups in the heterogeneous oxidation of SO2 gas was discussed by Zhang et al.
who compared basic, neutral and acidic Al2O3 in their ability to oxidize SO2 and noted that basic Al2O3 was
much more efficient due to its higher concentration of hydroxyl groups on the surface (Zhang et al., 2006).
It was also suggested that reactivity of different oxides to SO2 uptake could be predicted by evaluating their
intrinsic ability to form surface hydroxyl groups. Thus, metal oxides that have empty or half-empty d atomic
orbitals, such as Al2O3, easily adsorb molecular oxygen and gaseous water and show excellent performance
in the reactions with SO2 while metals with full d orbitals, such as MnO2, show weak reactivity (Zhang et
al., 2006). Reaction of SO2 gas with the lattice oxygen as in Reaction 2 seems to proceed much slower. The
observation is in line with the results of experiments on dehydroxylated surfaces that show very little
reactivity towards product formation, suggesting low reactivity of lattice oxygen groups (Nanayakkara et
al., 2012). Absence of S-H stretch from the spectra of the v-dust under dry conditions could be due to the
fact that bisulfites and bisulfates are formed in much lower quantities than in humid conditions.

152 Chapter IV. In-situ monitoring of SO2 uptake on natural v-dust by DRIFT spectroscopy: toward surface reaction pathways
3 Conclusions and atmospheric implications based on DRIFT approach
DRIFTS analysis enabled us to propose a mechanistic scheme of SO2 uptake on the volcanic
dust. The DRIFTS data indicate the presence of sulfite and sulfate ions on the surface and addresses
their temporal dynamics. Hydroxyl groups play a major role in the uptake and conversion of SO2 gas
to sulfites, while oxidizing agents in the form of active oxygen, metal centers and/or hydroxyl groups
are involved in their conversion to sulfates. Furthermore, sulfates formed on the surface of v-dust are
stable chemisorbed species, not desorbed even after flushing for several hours in the absence of SO2
gas. Figure 5 overviews the reactional pathways proposed under dry and humid conditions.
Figure 5: Schematic representation of SO2 reaction pathways at the surface of v-dust. Reactions occurring under dark and dry
conditions are shown in black; reactions promoted under humid conditions are shown in blue.
Having identified the species formed on the surface and the important role RH plays in the
transformation of SO2 gas to sulfites and sulfates it was imperative to (i) quantify the amount of sulfites and
sulfates formed on the surface and (ii) clarify the trend of sulfate formation under humid conditions in order
to find out when sulfates reach a stable level and if they actually reach it. In order to reach these objectives
it was decided to investigate the potentialities of HPLC method. In the light of the fact that no suitable
method was identified in the literature to accomplish this goal, a new method was developed and validated.
Development and validation of an HPLC method for determination of sulfites and sulfates on the surface of
mineral atmospheric samples is described in Chapter 5 together with its application to natural samples.

153 Chapter IV. In-situ monitoring of SO2 uptake on natural v-dust by DRIFT spectroscopy: toward surface reaction pathways
References of Chapter 4
A Leed, E., Pantano, C., 2003. Computer Modeling of Water Adsorption on Silica and Silicate Glass
Fracture Surfaces. Journal of Non-Crystalline Solids 325, 48–60. https://doi.org/10.1016/S0022-
3093(03)00361-2
Baltrusaitis, J., Cwiertny, D.M., Grassian, V.H., 2007. Adsorption of sulfur dioxide on hematite and goethite
particle surfaces. Phys. Chem. Chem. Phys. 9, 5542–5554. https://doi.org/10.1039/B709167B
Datta, A., Cavell, R.G., Tower, R.W., George, Z.M., 1985. Claus catalysis. 1. Adsorption of SO/sub 2/ on
the alumina catalyst studed by FTIR and EPR spectroscopy. J. Phys. Chem.; (United States) 89:3.
https://doi.org/10.1021/j100249a014
Farges, F., Keppler, H., Flank, A.M., Lagarde, P., 2009. Sulfur K-edge XANES study of S sorbed onto
volcanic ashes. Journal of Physics: Conference Series 190, 012177. https://doi.org/10.1088/1742-
6596/190/1/012177
Goodman, A.L., Li, P., Usher, C.R., Grassian, V.H., 2001. Heterogeneous Uptake of Sulfur Dioxide On
Aluminum and Magnesium Oxide Particles. J. Phys. Chem. A 105, 6109–6120.
https://doi.org/10.1021/jp004423z
Hair, M.L., 1975. Hydroxyl groups on silica surface. Journal of Non-Crystalline Solids, Glass Surfaces 19,
299–309. https://doi.org/10.1016/0022-3093(75)90095-2
Huang, L., Zhao, Y., Li, H., Chen, Z., 2015. Kinetics of Heterogeneous Reaction of Sulfur Dioxide on
Authentic Mineral Dust: Effects of Relative Humidity and Hydrogen Peroxide. Environ. Sci.
Technol. 49, 10797–10805. https://doi.org/10.1021/acs.est.5b03930
Jiang, B.Q., Wu, Z.B., Liu, Y., Lee, S.C., Ho, W.K., 2010. DRIFT Study of the SO2 Effect on Low-
Temperature SCR Reaction over Fe−Mn/TiO2. J. Phys. Chem. C 114, 4961–4965.
https://doi.org/10.1021/jp907783g
Li, L., Chen, Z.M., Zhang, Y.H., Zhu, T., Li, J.L., Ding, J., 2006. Kinetics and mechanism of heterogeneous
oxidation of sulfur dioxide by ozone on surface of calcium carbonate. Atmospheric Chemistry and
Physics Discussions 6, 579–613. https://doi.org/10.5194/acpd-6-579-2006
Lo, J.M.H., Ziegler, T., Clark, P.D., 2010. SO2 Adsorption and Transformations on γ-Al2O3 Surfaces: A
Density Functional Theory Study. J. Phys. Chem. C 114, 10444–10454.
https://doi.org/10.1021/jp910895g
Maters, E.C., Delmelle, P., Rossi, M.J., Ayris, P.M., 2017. Reactive Uptake of Sulfur Dioxide and Ozone
on Volcanic Glass and Ash at Ambient Temperature. J. Geophys. Res.-Atmos. 122, 10077–10088.
https://doi.org/10.1002/2017JD026993
Nanayakkara, C.E., Pettibone, J., Grassian, V.H., 2012. Sulfur dioxide adsorption and photooxidation on
isotopically-labeled titanium dioxide nanoparticle surfaces: roles of surface hydroxyl groups and
adsorbed water in the formation and stability of adsorbed sulfite and sulfate. Phys. Chem. Chem.
Phys. 14, 6957–6966. https://doi.org/10.1039/C2CP23684B
Shang, J., Li, J., Zhu, T., 2010. Heterogeneous reaction of SO2 on TiO2 particles. Sci. China Chem. 53,
2637–2643. https://doi.org/10.1007/s11426-010-4160-3
Tamura, H., Mita, K., Tanaka, A., Ito, M., 2001. Mechanism of Hydroxylation of Metal Oxide Surfaces.
Journal of Colloid and Interface Science 243, 202–207. https://doi.org/10.1006/jcis.2001.7864
Ullerstam, M., Vogt, R., Langer, S., Ljungstrom, E., 2002. The kinetics and mechanism of SO2 oxidation
by O-3 on mineral dust. Phys. Chem. Chem. Phys. 4, 4694–4699. https://doi.org/10.1039/b203529b
Usher, C.R., Al-Hosney, H., Carlos-Cuellar, S., Grassian, V.H., 2002. A laboratory study of the
heterogeneous uptake and oxidation of sulfur dioxide on mineral dust particles. J.-Geophys.-Res.
107, 4713. https://doi.org/10.1029/2002JD002051
Wang, T., Liu, Y., Deng, Y., Fu, H., Zhang, L., Chen, J., 2018a. Emerging investigator series: heterogeneous
reactions of sulfur dioxide on mineral dust nanoparticles: from single component to mixed
components. Environ. Sci.: Nano 5, 1821–1833. https://doi.org/10.1039/C8EN00376A

154 Chapter IV. In-situ monitoring of SO2 uptake on natural v-dust by DRIFT spectroscopy: toward surface reaction pathways
Wang, T., Liu, Y., Deng, Y., Fu, H., Zhang, L., Chen, J.-M., 2018b. Adsorption of SO 2 on mineral dust
particles influenced by atmospheric moisture. Atmospheric Environment 191.
https://doi.org/10.1016/j.atmosenv.2018.08.008
Wu, L.Y., Tong, S.R., Wang, W.G., Ge, M.F., 2011. Effects of temperature on the heterogeneous oxidation
of sulfur dioxide by ozone on calcium carbonate. Atmospheric Chemistry and Physics 11, 6593–
6605. https://doi.org/10.5194/acp-11-6593-2011
Zhang, X., Zhuang, G., Chen, J., Wang, Y., Wang, X., An, Z., Zhang, P., 2006. Heterogeneous Reactions
of Sulfur Dioxide on Typical Mineral Particles. J. Phys. Chem. B 110, 12588–12596.
https://doi.org/10.1021/jp0617773
Zhang, Z., Ewing, G.E., 2002. Infrared spectroscopy of SO2 aqueous solutions. Spectrochim Acta A Mol
Biomol Spectrosc 58, 2105–2113.

Chapter V. HPLC method development and validation for the
quantification of sulfites and sulfates on the surface of natural dusts

156 Chapter V. HPLC method development and validation for the quantification of sulfites and sulfates on the surface of natural dusts
Table of content of Chapter 5
1 Introduction .......................................................................................................................................... 160
2 Specific experimental consideration for HPLC method development ................................................. 161
2.1 Samples and Standards for HPLC method development ............................................................. 161
2.1.1 Dust samples ......................................................................................................................... 161
2.1.2 Chemicals and reagents ........................................................................................................ 161
2.1.3 Standards .............................................................................................................................. 162
2.2 Experimental Set-Up and Procedure for HPLC method development ......................................... 162
2.2.1 General Outline .................................................................................................................... 162
2.2.2 Dust ageing by SO2 gas ........................................................................................................ 163
2.2.3 Extraction and stabilization of surface sulfites and sulfates ................................................. 163
2.2.4 HPLC analysis. Instrumentation and chromatographic conditions ...................................... 163
3 Results and discussion of the HPLC method development ................................................................. 164
3.1 Optimization of the HPLC Analytical Method ............................................................................ 164
3.2 Optimization of sulfite and sulfate extraction from dust surface ................................................. 167
3.2.1 Dissolution............................................................................................................................ 167
3.2.2 Recovery ............................................................................................................................... 168
3.2.3 Solution stability ................................................................................................................... 169
3.3 Validation of Analytical Performance of the HPLC Method ....................................................... 170
3.3.1 Specificity ............................................................................................................................. 170
3.3.2 Limit of detection (LOD) and limit of quantitation (LOQ) .................................................. 171
3.3.3 Linearity and range ............................................................................................................... 171
3.3.4 Injection repeatability ........................................................................................................... 173
3.3.5 Robustness ............................................................................................................................ 173
3.4 Evaluation of Method Reproducibility: Sample Preparation and Extraction Performance. ........ 174
3.5 Summary of the HPLC Method Developed ................................................................................. 176
3.6 Application of the HPLC Method developed ............................................................................... 177

157 Chapter V. HPLC method development and validation for the quantification of sulfites and sulfates on the surface of natural dusts
3.6.1 Application of the method to natural samples ...................................................................... 177
3.6.2 Application of the method to aged samples.......................................................................... 179
4 Conclusions on HPLC method development and validation ............................................................... 182
References ................................................................................................................................................. 184
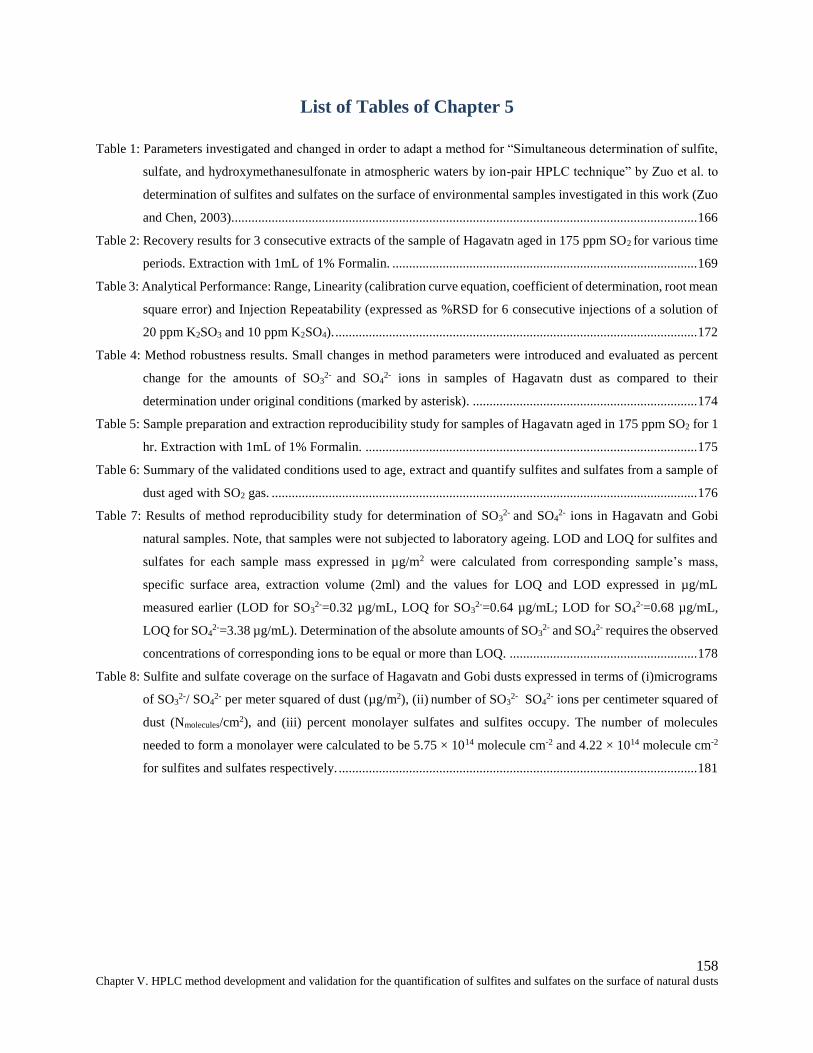
158 Chapter V. HPLC method development and validation for the quantification of sulfites and sulfates on the surface of natural dusts
List of Tables of Chapter 5
Table 1: Parameters investigated and changed in order to adapt a method for “Simultaneous determination of sulfite,
sulfate, and hydroxymethanesulfonate in atmospheric waters by ion-pair HPLC technique” by Zuo et al. to
determination of sulfites and sulfates on the surface of environmental samples investigated in this work (Zuo
and Chen, 2003). .......................................................................................................................................... 166
Table 2: Recovery results for 3 consecutive extracts of the sample of Hagavatn aged in 175 ppm SO2 for various time
periods. Extraction with 1mL of 1% Formalin. ........................................................................................... 169
Table 3: Analytical Performance: Range, Linearity (calibration curve equation, coefficient of determination, root mean
square error) and Injection Repeatability (expressed as %RSD for 6 consecutive injections of a solution of
20 ppm K2SO3 and 10 ppm K2SO4). ............................................................................................................ 172
Table 4: Method robustness results. Small changes in method parameters were introduced and evaluated as percent
change for the amounts of SO32- and SO4
2- ions in samples of Hagavatn dust as compared to their
determination under original conditions (marked by asterisk). ................................................................... 174
Table 5: Sample preparation and extraction reproducibility study for samples of Hagavatn aged in 175 ppm SO2 for 1
hr. Extraction with 1mL of 1% Formalin. ................................................................................................... 175
Table 6: Summary of the validated conditions used to age, extract and quantify sulfites and sulfates from a sample of
dust aged with SO2 gas. ............................................................................................................................... 176
Table 7: Results of method reproducibility study for determination of SO32- and SO4
2- ions in Hagavatn and Gobi
natural samples. Note, that samples were not subjected to laboratory ageing. LOD and LOQ for sulfites and
sulfates for each sample mass expressed in µg/m2 were calculated from corresponding sample’s mass,
specific surface area, extraction volume (2ml) and the values for LOQ and LOD expressed in µg/mL
measured earlier (LOD for SO32-=0.32 µg/mL, LOQ for SO3
2-=0.64 µg/mL; LOD for SO42-=0.68 µg/mL,
LOQ for SO42-=3.38 µg/mL). Determination of the absolute amounts of SO3
2- and SO42- requires the observed
concentrations of corresponding ions to be equal or more than LOQ. ........................................................ 178
Table 8: Sulfite and sulfate coverage on the surface of Hagavatn and Gobi dusts expressed in terms of (i)micrograms
of SO32-/ SO4
2- per meter squared of dust (µg/m2), (ii) number of SO32- SO4
2- ions per centimeter squared of
dust (Nmolecules/cm2), and (iii) percent monolayer sulfates and sulfites occupy. The number of molecules
needed to form a monolayer were calculated to be 5.75 × 10¹⁴ molecule cm-2 and 4.22 × 10¹⁴ molecule cm-2
for sulfites and sulfates respectively. ........................................................................................................... 181

159 Chapter V. HPLC method development and validation for the quantification of sulfites and sulfates on the surface of natural dusts
List of Figures of Chapter 5
Figure 1: Diagram representing two protocols: (A) “environmental sampling” that includes (i) sample collection, (ii)
extraction and stabilization of sulfites and sulfates and (iii) HPLC analysis and (B)“kinetics study” that
includes (i) sample collection, (ii) dust ageing, (iii) extraction and stabilization of sulfites and sulfates and
(iv) HPLC analysis. Dark blue arrows lead through “environmental sampling” protocol, while orange arrows
lead through “kinetics study” protocol. ....................................................................................................... 163
Figure 2: Representative chromatograms of: green) Formalin, offset 45 units for clarity; red) 10 ppm K2SO4 in 1%
Formalin, offset 30 units for clarity; blue) 20 ppm K2SO3 in 1% Formalin, offset 15 units for clarity ; black)
Hagavatn dust aged in 175 ppm SO2 for 1 hr and extracted in 1% Formalin. ............................................. 167
Figure 3: Dissolution studies for Hagavatn dust aged in 175 ppm SO2 for 1 hr and extracted in 1% Formalin. % RSD
for sulfites and sulfates is equal to 12.1 % and 23.6 % respectfully (see section 3.4). ................................ 168
Figure 4: Stability study results for 158.2 mg sample of Hagavatn aged in 175 ppm SO2 for 10 min. Extraction with
1ml of 1% Formalin. Samples are stored at 4°C. % RSD for sulfites and sulfates is equal to 4.7% and 8.7%
respectfully (see 3.3.4). ................................................................................................................................ 170
Figure 5: The typical plot of peak area versus concentration for a) sulfite (blue solid line) and b) sulfate (red dashed
line) ions. The linearity plot was created daily before conducting experiments and each time the mobile phase
solution was changed. .................................................................................................................................. 172
Figure 6: Amount of sulfites and sulfates quantified on the surfaces of Hagavatn volcanic dust and Gobi desert dust
formed after 1 hr ageing with 175 ppm SO2 gas. ......................................................................................... 180

160 Chapter V. HPLC method development and validation for the quantification of sulfites and sulfates on the surface of natural dusts
1 Introduction
Chemical characterization plays a vital role in scientific representation of any process. Defined as
a set of techniques that allows an analyst to know qualitatively and/or quantitatively the composition of the
material, a method is created to reach this goal. The following Chapter V guides the reader through the
development of the method for quantitative determination of sulfites and sulfates on the surface of mineral
dust. As such, we have started by building an analytical HPLC method for analysis of a mixture of sulfites
and sulfates. We then optimized extraction procedure to ensure optimal extraction of sulfites and sulfates
from a dust sample. Finally, we assessed the validity of the method by going through validation studies
using, when possible, SO2-laboratory-aged dust samples in order to have a sufficient amount of sulfites on
the surface, indeed as evidenced in Chapter IV, unless immediately stabilized, adsorbed sulfites get oxidized
to adsorbed sulfates.
The global objective of validation of the method is to demonstrate its suitability for the intended
use (“ICH Official web site : ICH,” n.d.). In the case of this study the method is expected to be used for
research purposes. More specifically, method validation is a process that uses a defined set of experiments
to establish the performance criteria that should be achieved by an analyst using the method and that
provides a means to assess the reliability of results obtained. Method validation is commonly used to check
compliance with certain established criteria. In the case of this study though, method validation is primarily
used to establish performance criteria, as, to the best of our knowledge, no regulatory body is concerned
with determination of sulfites and sulfates on the surface of natural mineral samples and no reference
method exists for extraction, stabilization, and determination of both sulfites and sulfates on the surface of
mineral dusts.
The ion-chromatography methods available in the literature and employed to quantify the amount
of SO2 adsorbed on the surface of volcanic ash are almost solely concerned with quantification of sulfates
as the final oxidation product completely ignoring sulfite quantification (Witham et al., 2005). Indeed, it is
widely accepted that SO2 gas reacts at the surface of the volcanic dust and forms sulfites or bisulfites, which
are then converted to sulfates (T. Wang et al., 2018). However, quantification of sulfites along with the
sulfates could provide a more comprehensive description of the SO2 uptake processes. Simultaneous
determination of sulfites and sulfates by reversed-phase ion-pair HPLC technique in atmospheric waters
was proposed by Zuo et al. (Zuo and Chen, 2003). When applied to environmental samples though, the
method failed to determine sulfites due to their fast conversion to sulfates (Zuo and Chen, 2003).
Nevertheless, ion-pairing technique is a good tool to separate polar compounds by means of user-friendly
widely-used HPLC technique.

161 Chapter V. HPLC method development and validation for the quantification of sulfites and sulfates on the surface of natural dusts
The goal of this study is to develop a method that would (i) extract both sulfites and sulfates
from the surface of minerals, (ii) stop the conversion of sulfites to sulfates and (iii) successfully
quantify both species individually. The method can then be used for two distinctive purposes: to quantify
sulfites and sulfates on the surface of natural environmental samples, such as recently erupted volcanic ash
or dust passing through polluted areas, and to study the kinetics of the sulfite to sulfate transformation in
laboratory settings. The challenge in separating sulfites from sulfates in the solution containing mineral
dust comes from the nature of these dust particles, as they contain various oxidizing elements, such as iron,
that contribute to the oxidation of sulfites into sulfates (Zuo and Hoigné, 1993), (Zuo et al., 2005),
(Michigami and Ueda, 1994). This method proposes (i) a controlled ageing of mineral samples by SO2 gas
in laboratory settings, (ii) extraction and stabilization of sulfites and sulfates with a subsequent use of (iii)
HPLC for quantitative analysis as a technique that can be used to study the conversion of sulfites to sulfates
on the surface of natural samples. While in the case of taking field measurements artificial ageing is not
required, it is important to be able to age samples in reproducible fashion in order to study kinetics of the
sulfite to sulfate transformation as a part of laboratory experimental work.
2 Specific experimental consideration for HPLC method development
2.1 Samples and Standards for HPLC method development
2.1.1 Dust samples
Two representative natural samples, Hagavatn v-dust and Gobi desert dusts, were chosen for this
study. Details on these samples, including their physical and chemical characterization can be found in
Chapter 2 Sections 1 and 2. Hagavatn sample was chosen over other v-dust samples due to the fact that it
was extensively studied with DRIFTS technique (Chapter 4). Gobi dust was chosen as a representative
desert dust due to its major contribution to the global dust loading (Prospero et al., 2002). It was also
highlighted as a reactive natural sample (X. Wang et al., 2018).
2.1.2 Chemicals and reagents
HPLC grade acetonitrile (ACN), 99.95% and methanol (MeOH), 99.9% were obtained from
Biosolve Chimie, Dieuze, France. Potassium hydrogen phthalate and triethanolamine, 99% of analytical
grade were purchased from Acros Organics, Geel, Belgium. Cetylpyridinium chloride, 98% was purchased
from Alfa Aesar, Kander, Germany. Sodium sulfate was purchased from Merck, Darmstadt, Germany.
Sodium sulfite was purchased from Fischer Chemical, Loughborough, UK. Formalin (37% formaldehyde
solution by weight containing 10-15 % MeOH as stabilizer) was obtained from Sigma-Aldrich. Other

162 Chapter V. HPLC method development and validation for the quantification of sulfites and sulfates on the surface of natural dusts
chemicals and solvents of analytical grade were used during research. Deionized water (DI) was used
throughout the investigation. A certified SO2 cylinder, 250 ppm diluted in synthetic air (nearly 80% N2 and
20% O2) was purchased from Messer, France.
2.1.3 Standards
The solution of 1% Formalin was used to prepare a 1000 ppm stock solution of potassium sulfite
(K2SO3) and a 1000 ppm stock solution of potassium sulfate (K2SO4). Other concentrations of K2SO3 and
K2SO4 standards were prepared from their stock solutions through serial dilution with 1% Formalin. Stock
solution of 1% Formalin was prepared by adding 10 ml of Formalin in a 1000 mL volumetric flask and
diluting to the volume with 10% methanol/water to prevent polymerization.
2.2 Experimental Set-Up and Procedure for HPLC method development
2.2.1 General Outline
This work serves two distinctive purposes: (i) to analyze sulfites and sulfates on the surface of
environmental dust samples during field campaign measurements (referred to as “environmental
sampling”) and (ii) to study kinetics of sulfite and sulfate formation on the surface of different dusts in the
laboratory environment by subjecting them to SO2 ageing and analyzing the product formation (referred to
as “kinetics study”).
The developed method for “environmental sampling” protocol consists of three parts: (i) sample
collection, (ii) extraction and stabilization of sulfites and sulfates and (iii) HPLC analysis (Figure 1); the
developed method for “kinetics study” protocol includes four steps: (i) sample collection, (ii) dust ageing,
(iii) extraction and stabilization of sulfites and sulfates and (iv) HPLC analysis (Figure 1). Thus, the
difference between the two protocols is an additional step of controlled SO2 ageing required for the “kinetics
study”. Sample analysis step that includes extraction and HPLC analysis is exactly the same in both cases.
Method for HPLC analysis was validated for specificity, limit of detection and quantitation,
linearity and range, injection repeatability, and robustness. Sample preparation and extraction
reproducibility was validated for the entire “kinetics study” protocol. Note that reproducibility for
“environmental sampling” is expected to be superior to reproducibility for “kinetics study” due to the lack
of ageing that introduces additional uncertainties.

163 Chapter V. HPLC method development and validation for the quantification of sulfites and sulfates on the surface of natural dusts
Figure 1: Diagram representing two protocols: (A) “environmental sampling” that includes (i) sample collection, (ii) extraction
and stabilization of sulfites and sulfates and (iii) HPLC analysis and (B)“kinetics study” that includes (i) sample collection, (ii)
dust ageing, (iii) extraction and stabilization of sulfites and sulfates and (iv) HPLC analysis. Dark blue arrows lead through “environmental sampling” protocol, while orange arrows lead through “kinetics study” protocol.
2.2.2 Dust ageing by SO2 gas
The setup and protocol for ageing samples was described in detail in Chapter 2 Section 2.4.
2.2.3 Extraction and stabilization of surface sulfites and sulfates
After a defined period of ageing in the laboratory or in the absence of controlled ageing, such as in
the case of samples collected in the environment, a sample weighing from 100 to 200 mg was transferred
to a 10 mL glass container and stabilized with 1 mL of 1% Formalin. This step was followed by 10 min
sonication in the ultrasound bath. The solution was then filtered through a 0.45 µm pore size 30 mm
diameter filter using a syringe. The remaining dust was washed with 1 mL of 1% Formalin and filtered
through the same filter that was used to filter the first solution. The combined final solution was analyzed
by HPLC system.
2.2.4 HPLC analysis. Instrumentation and chromatographic conditions
Chromatography equipment used to develop an HPLC method consisted of Thermo Scientific
Dionex UltiMate 3000 UHPLC System with UV/VIS Detector (Thermo Scientific, Waltham, MA).
Chromeleon 7.0 Data Acquisition System for LC (Thermo Scientific, Waltham, MA) was used to analyze
the data. Analysis was performed using Restek Ultra Column C18, 5 µm, Length 250 mm, I.D. 4.60 mm
dynamically coated with cetylpyridinium chloride to produce a charged surface as recommended by Zuo et
al. (Zuo and Chen, 2003). More specifically, columns were cleaned at 1 mL/min for 1.5 hour with 100%
ACN before being coated with 1.0 mM cetylpyridinium chloride in ACN/water (7:93, v/v) at 0.5 mL/min

164 Chapter V. HPLC method development and validation for the quantification of sulfites and sulfates on the surface of natural dusts
for 3 hours (Zuo and Chen, 2003). The HPLC instrument was operated isocratically at 23 C° at a flow rate
of 1 mL/min for 15 min. Potassium hydrogen phthalate solution, 1.0 mM was adjusted to pH 6.5 with a
dilute solution of potassium hydroxide (KOH), vacuum filtered and used as a mobile phase. The injection
volume was 10 µL. An indirect photometric detection was used for quantification of sulfates and sulfites.
Detector was set at 255 nm as the mobile phase showed the highest absorbance at this wavelength. A 6-
point linear calibration curve was established daily for SO32- and SO4
2- ions in the range of 6 µg/mL to 191
µg/mL and 3 µg/mL to 101 µg/mL respectively. Concentration of sulfites and sulfates in the extracts of
natural samples was determined using the slope of the calibration curve and converted to micrograms per
gram (µg/g) of dust using the mass of the sample.
3 Results and discussion of the HPLC method development
3.1 Optimization of the HPLC Analytical Method
The method for determination of sulfites, sulfates and hydroxymethanesulfonate (HMS) in natural
and atmospheric water samples developed by Zuo et al. was used as a base for development of the method
for determination of sulfites and sulfates on the surface of natural mineral samples discussed in this paper
(Zuo and Chen, 2003). The main drawback of the method was the lack of sulfite-stabilizing agent during
sample preparation and, as a consequence, inability to detect sulfites in environmental samples. The authors
acknowledged the problem in the “quantitative analysis” part of their study and recommended to use
methanol in order to stabilize sulfites. Following the suggestion, a 50/50 ppm solution of K2SO3/ K2SO4
was dissolved in 10% methanol used as stabilizing agent. Unfortunately, in our experiments, methanol
solution either did not stabilize sulfites and they were converted into sulfates, or sulfites co-eluted with
sulfates, as only one peak was observed. Besides, methanol would be a poor choice for the extraction of
sulfites in the presence of reactive ions, such as Mn or Fe, which are both known to be present in volcanic
dust (Michigami and Ueda, 1994). Formalin was reported to prevent the conversion of sulfites to sulfates
by converting it to hydroxymethanesulfonate (HMS) and was tested as an extracting solvent (Michigami
and Ueda, 1994). A number of reactions and reaction rate constants were proposed by Kovacs et al. to
demonstrate interactions of sulfites/bisulfates with formaldehyde and its hydrate (Kovacs et al., 2005).
Reaction rate constants suggest that formation of HMS is a favorable process and it is expected that in
access of formaldehyde all of the sulfite/bisulfite will be converted to HMS.
Two concentrations of a mixture of sulfites and sulfates of 50/50 ppm and 5/5 ppm were prepared
using Formalin of the following concentrations: 0.5%, 1% and 5%. A solvent peak for 5% Formalin
overlapped with a sulfite peak, and 5% Formalin concentration was rejected for further studies. Solvent
peaks of both 0.5 and 1% Formalin were well separated from sulfite peak. Besides, less than 5% change

165 Chapter V. HPLC method development and validation for the quantification of sulfites and sulfates on the surface of natural dusts
was observed for sulfites and sulfates in the corresponding solutions when left at ambient temperature for
2 days. Between 0.5% and 1% concentrations of Formalin, a solution of 1% Formalin was chosen as an
extracting solvent for further studies.
A second concern about the method of Zuo et al. was the high pH value of the mobile phase. The
diluted 1.0 mM phthalate mobile phase suggested by the author could not be adjusted to pH 7.9 as pH
became unstable and decreased with time. Addition of triethanolamine drastically increased the pH of the
mobile phase. Taking into consideration that pH higher than 8.0 is detrimental for the column and can easily
dissolve the stationary phase, it was decided to work at pH 6.5, which was stable and easy to maintain.
Addition of methanol to mobile phase did not make any difference on formaldehyde/sulfite pair, but
broadened and pushed the sulfate peak further. It was therefore decided to work with 1.0 mM Potassium
phthalate solution pH 6.5 as a mobile phase. Several other parameters, such as column type, injection
volume and detection wavelength were varied to find the optimum conditions for getting a sharp peak and
a good separation of sulfites and sulfates from formaldehyde peak present in the solvent. Parameters
investigated are listed in Table 1.

166 Chapter V. HPLC method development and validation for the quantification of sulfites and sulfates on the surface of natural dusts
Table 1: Parameters investigated and changed in order to adapt a method for “Simultaneous determination of sulfite, sulfate, and
hydroxymethanesulfonate in atmospheric waters by ion-pair HPLC technique” by Zuo et al. to determination of sulfites and sulfates on the surface of environmental samples investigated in this work (Zuo and Chen, 2003).
Method by Zuo et al. Parameters investigated Parameters chosen
Column 150 mm C18 Column, Particle
size: 5 µm, I.D. 4.60 mm
250 mm Restek Ultra Column
C18, Particle size: 5 µm, I.D.
4.60 mm
250 mm Acclaim 120 Column
C18, Particle size: 3 µm, I.D. 3
mm
250 mm Restek Ultra Column
C18, Particle size: 5 µm, I.D.
4.60 mm
Column coating 1.0 mM cetylpyridinium
chloride in 7% ACN solution
1.0 mM cetylpyridinium
chloride in 7% ACN solution
Mobile phase potassium hydrogen phthalate
0.5 mM-0.015%
triethanolamine-3% methanol
triethanolamine: 0%, 0.015%
potassium hydrogen phthalate:
0.5 mM, 1mM, 10 mM
% Methanol: 0%, 1%, 3% 5%
1 mM potassium hydrogen
phthalate
pH 7.9
6.0, 6.5, 7.0, 7.5, 8.0, 8.5 6.5
Flow rate 1.0 ml/min
0.5 ml/min, 1 ml/min 1.0 ml/min
Detection negative UV-Vis detection at
265 nm
negative UV-Vis detection at
265nm, 255 nm
negative UV-Vis detection at
255 nm
Time 15 min
10 min, 15 min 15 min
HPLC mode isocratic elution
isocratic elution
Temperature 23 °C
20 °C, 23 °C, 26 °C, 30°C, 35°C 23 °C
Injection volume 10 µL
10, 15, 20 µL 10 µL
Sulfite-stabilizing
reagent
none methanol 10 %
Formalin: 0.5%, 1%, 5%
1% Formalin
Finally, the following chromatographic conditions were determined as optimum: 25 mm
Restek Ultra Column C18, Particle size: 5 µm, I.D. 4.60 mm column which was dynamically coated
with 1.0 mM cetylpyridinium chloride in 7% acetonitrile solution to produce a charged surface as
recommended by Zuo et al. (Zuo and Chen, 2003). Mobile phase used: 1 mM potassium hydrogen
phthalate at pH 6.5 at a flow rate of 1.0 ml/min with negative UV-Vis detection at 255 nm in 15 min.
Figure 2 displays four chromatograms offset for clarity: 1% Formalin, 20 ppm K2SO3, 10 ppm
K2SO4, and Hagavatn extract obtained after ageing the dust for 1 hr in 175 ppm SO2. The peak for SO32- is
observed at 2.7 minutes and SO42- peak is observed at 7.2 min. Both peaks demonstrate a high number of
theoretical plates: for Hagavatn extract they are equal to 2235 for SO32- and 884 for SO4
2-. Two small peaks

167 Chapter V. HPLC method development and validation for the quantification of sulfites and sulfates on the surface of natural dusts
around 2.2 and 3.0 min belong to formaldehyde and are separated from the peak for SO32- at 2.7 min. The
sulfite peak present in the form of HMS eluted rather closely to the formaldehyde peak. Therefore, in order
to preserve separation, it was decided to stay with a 250 mm long column.
Figure 2: Representative chromatograms of: green) Formalin, offset 45 units for clarity; red) 10 ppm K2SO4 in 1% Formalin,
offset 30 units for clarity; blue) 20 ppm K2SO3 in 1% Formalin, offset 15 units for clarity ; black) Hagavatn dust aged in 175 ppm
SO2 for 1 hr and extracted in 1% Formalin.
3.2 Optimization of sulfite and sulfate extraction from dust surface
Different parameters, such as extraction time and extraction techniques (shaking vs sonication), as
well as volume of the extracting solution, were studied to insure maximum extraction of sulfites and
sulfates. Solution stability was investigated to assess the time window during which the analysis can be
performed.
3.2.1 Dissolution
The dissolution time of up to 40 min of Hagavatn extract was investigated using sonication.
Sulfites and sulfates immediately dissolved as shown in Figure 3. Similar results were obtained with

168 Chapter V. HPLC method development and validation for the quantification of sulfites and sulfates on the surface of natural dusts
mechanical shaking, and 10 minutes sonication was found to be an appropriate dissolution technique.
Figure 3: Dissolution studies for Hagavatn dust aged in 175 ppm SO2 for 1 hr and extracted in 1% Formalin. % RSD for sulfites and sulfates is equal to 12.1 % and 23.6 % respectfully (see section 3.4).
3.2.2 Recovery
Recovery studies were intended to prove that maximum amount of the sulfites and sulfates are
extracted. Three consecutive extractions with 1 mL of 1 % Formalin were evaluated for the amount of
sulfites and sulfates after the sample was aged by 175 ppm SO2 for 10 min, 30 min, 1 hr, and 2hr. The
criteria is less than 5 % of the product can be left unaccounted. As can be observed from Table 2, all of the
sulfates are extracted from the surface of Hagavatn dust after the first extraction with 1 mL of 1% Formalin.
As for the sulfites, two extractions with 1ml of 1% Formalin are necessary. The third extraction represents
from 0 to 3.9 % of the total amount of SO32- extracted and therefore is not required based on the established
criteria. Method demonstrates efficient recovery after only two extractions. As a result, it was decided to
extract sulfites and sulfates with 1 mL of 1% Formalin, wash the remaining dust with another 1 mL of 1%
Formalin and, using the same syringe, filter and combine the solution.

169 Chapter V. HPLC method development and validation for the quantification of sulfites and sulfates on the surface of natural dusts
Table 2: Recovery results for 3 consecutive extracts of the sample of Hagavatn aged in 175 ppm SO2 for various time periods. Extraction with 1mL of 1% Formalin.
Sample Hagavatn aged with 175 ppm SO2
Time 10 min 30 min 1hr 2hr
Extract 1
SO32- (ppm)
64.1
69.3
71.7
78.4
Extract 2
SO32- (ppm)
14.9
11.9
19.9
16.6
Extract 3
SO32- (ppm)
0.1
3.3
0
1.6
% SO32- in the 3rd extract 0.1 3.9 0.00 1.2
% recovery after 3 extract 99.9 96.1 100.00 98.0
Extract 1
SO42- (ppm)
3.4
3.7
3.7
8.5
Extract 2
SO42- (ppm)
0
0
0
0
% recovery 100.00 100.00 100.00 100.00
3.2.3 Solution stability
In order to observe how analytes of interest change over time, Hagavatn extract was prepared and
injected into the HPLC system. The same solution was injected after 3, 5, 7, and 10 days. Solution stability
results obtained from injecting a sample of 158.2 mg of Hagavatn aged for 10 min are shown in Figure 4.
Solution stability studies indicate that both sulfites and sulfates remain stable up to 10 days, which means
that a sample can be easily collected and extracted to be kept for later analysis, which is indispensable
during geological sampling when the analyzing facility might be far away from the sampling location.
Moreover, in separate experiments a 165 mg sample of Hagavatn aged with SO2 for 1hr was checked for
stability after 10 days and 3 months. Percent change in ppm concentration for sulfites was established at
4.5% after 10 days and 3.2% in 3 months; as for sulfates 5.4 % change was observed after both 10 days and
3 months. Thus, the results indicate that dust samples aged with SO2 and stabilized with 1% Formalin are
stable for long periods (at least up to 3 months). Exceptional stability of solutions is very important in field
campaigns as it makes it possible to collect and stabilize a sample on the go, but analyze it later in the
laboratory.

170 Chapter V. HPLC method development and validation for the quantification of sulfites and sulfates on the surface of natural dusts
Figure 4: Stability study results for 158.2 mg sample of Hagavatn aged in 175 ppm SO2 for 10 min. Extraction with 1ml of 1% Formalin. Samples are stored at 4°C. % RSD for sulfites and sulfates is equal to 4.7% and 8.7% respectfully (see 3.3.4).
3.3 Validation of Analytical Performance of the HPLC Method
The developed method was validated for specificity, limit of detection and limit of quantitation,
linearity and range, injection repeatability, and robustness.
3.3.1 Specificity
To ensure that the peak response is due to only one component and no co-elution occurs, a solution
of Hagavatn dust aged in 175 ppm SO2 for 10 min and extracted in 1% Formalin was analyzed by Waters
2695 HPLC system equipped with Diode Array Detector using Empower software. Thus, specificity was
evaluated as spectral purity. In peak purity testing the software compares the spectrum from each data point
within the peak against the peak apex spectrum. Two parameters are evaluated: purity threshold, which
accounts for the presence of non-ideal and solvent-induced spectral changes, and purity angle. When the
purity angle exceeds purity threshold, a detectable impurity is present within a single chromatographic peak.
A solution of 165 mg of Hagavatn dust aged in 175 ppm SO2 for 10 min and extracted in 1%
Formalin showed no interfering peaks. All peaks were well separated from the analyte peaks. Peak purity
was proved by purity threshold exceeding the purity angle for both sulfite and sulfate peaks.

171 Chapter V. HPLC method development and validation for the quantification of sulfites and sulfates on the surface of natural dusts
3.3.2 Limit of detection (LOD) and limit of quantitation (LOQ)
Limits of detection for sulfites and sulfates were investigated to determine the lowest concentration
of sulfites and sulfates that can be detected but not quantified. It was based on a signal-to-noise ratio S/N ≥
3. Limits of quantitation were studied to determine the lowest levels of the analyte concentrations that can
be quantified and were determined by the concentrations corresponding to signal-to-noise ratio S/N ≥ 10.
The LOD for determination of sulfites was found to be 0.5 µg/mL of K2SO3 (0.32 µg/mL of SO32-
ion). This value is 5 times lower than the 1.52 µg/mL of SO32- ion reported as LOD by Zuo et al.
(corresponding to 19 µM of SO32- ion), but in a good agreement with the limit of detection of
hydroxymethylsulfonate (HMS) reported at 0.42 µg/mL (corresponding to 3.8 µM of HMS ion). This is to
be expected, as the SO32- in our case elutes as a HMS complex. The reason for improved detection limit is
earlier elution of SO32- in the form of HMS at around 3 min instead of 7.5 min as a free sulfite ion using the
original method (Zuo and Chen, 2003). Earlier elution prevents peak broadening and improves LOD and
LOQ. LOQ for determination of SO32- ion was found to be 1 µg/mL of K2SO3 (0.64 µg/mL of SO3
2- ion).
LOD for determination of sulfates was found to be 1 µg/mL of K2SO4 (0.68 µg/mL of SO42- ion).
This value is in excellent agreement with the limit of detection for SO4 ion reported by Zuo et al. and
established at 6.7 µM SO42- ion which is 0.64 µg/mL of SO4
2-. LOQ for determination of sulfates was found
to be 5 µg/mL of K2SO4 (3.38 µg/mL of SO42- ion).
3.3.3 Linearity and range
Linearity proves that the detector response is directly proportional to the concentrations of the
analyte in the sample, and range provides an interval for which the procedure is linear. Calibration ranges
were defined as to include possible concentrations of sulfites and sulfates that can be found on the surface
of mineral dust. This approach was based on preliminary results used to frame the order of magnitude of
typical SO32- and SO4
2- surface concentrations. To investigate linearity for extracted sulfites, six different
concentrations of K2SO3 were prepared from 1000 µg/mL stock solution of K2SO3 in the range 10 – 300
µg/mL (corresponding to 6 µg/mL to 191 µg/mL of SO32- ion). To explore linearity for sulfates, six different
concentrations of K2SO4 were prepared from 1000 µg/mL stock solution of K2SO4 in the range 5-150 µg/mL
and injected into the HPLC system (corresponding to 3 µg/mL to 101 µg/mL of SO42- ion).
Calibration plots were constructed every day in order to insure accurate identification of sulfates
and sulfites in dust. Moreover, since the detection is achieved in negative mode (i.e. the mobile phase
absorbs UV light and the peaks are “observed” when a compound lacking chromophore is passing through
the column) the absorbance of the mobile phase depends on the concentration of the UV absorbing solution.

172 Chapter V. HPLC method development and validation for the quantification of sulfites and sulfates on the surface of natural dusts
Even slightest variations in phthalate concentration can change the slope of the calibration plot. Therefore,
it is crucial to construct a new calibration curve every time a freshly-made mobile phase is introduced into
the system. Nevertheless, it is important to keep in mind that even though the slope of the calibration curve
may change the curve remains linear within the range. Therefore, the daily-constructed curve can be used
for quantitation purposes as long as the same batch of phthalate solution is used. Calibration curves from a
typical experimental day are represented in Figure 5; calibration curve equations, coefficients of
determination (R2) and root mean square errors are provided in Table 3. While R2 shows how close the data
are to the fitted regression line, root mean square error can be interpreted as the average distance of a data
point from the fitted line, measured along a vertical line.
Figure 5: The typical plot of peak area versus concentration for a) sulfite (blue solid line) and b) sulfate (red dashed line) ions. The linearity plot was created daily before conducting experiments and each time the mobile phase solution was changed.
Table 3: Analytical Performance: Range, Linearity (calibration curve equation, coefficient of determination, root mean square
error) and Injection Repeatability (expressed as %RSD for 6 consecutive injections of a solution of 20 ppm K2SO3 and 10 ppm K2SO4).
Test range
(µg/mL)
Calibration curve
R2 Root Mean
Square Error
% RSD
n=6
Sulfites 6-191 y = 0,06x + 0,0489 1.0000 0.024 4.7
Sulfates 3-101 y = 0,1217x - 0,0036 0.9998 0.079 8.7

173 Chapter V. HPLC method development and validation for the quantification of sulfites and sulfates on the surface of natural dusts
3.3.4 Injection repeatability
Injection repeatability was tested to measure the sensitivity of the method towards errors coming
from the instrument itself: the column, the detector, the injector, the integration device. To evaluate
injection repeatability a solution of a mixture of 20 ppm K2SO3 and 10 ppm K2SO4 were injected into the
HPLC system 6 times and evaluated for area % relative standard deviation (%RSD). Injection repeatability
for a solution of 20 ppm K2SO3 and 10 ppm K2SO4 was calculated to be 4.7 % for sulfites and 8.7% for
sulfates (Table 3).
3.3.5 Robustness
Robustness of an analytical procedure is a measure of its capacity to remain unaffected by small
but deliberate variations in parameters listed in the procedure. In this study “remain unaffected” was defined
as no change of the detected amount of the analyte in a sample in spite of the variation of the method
parameter. Stability of the method was evaluated with respect to variations of the internal factors of the
method such as pH of the mobile phase pH (6.5±0.5), column temperature (23±3), different column lots
(Lot #160210E and Lot #130505R) and 1 month old vs 4 months column. Changes in temperature, pH,
column age (up to 4 months) and lot number (Lot #160210E and Lot #130505R) did not affect the amounts
of SO32- and SO4
2- ions determined in the solutions, as they fell within injection variations, where 4.7 %
RSD and 8.7 % RSD were reported for sulfites and sulfates respectively (Table 4). This is important, as it
means that small fluctuations in pH that can come from mobile phase preparation will not affect
quantification. Stability towards temperature changes suggests that method could be used in instruments
not equipped with temperature control function. Stability of the column for at least 4 months and robustness
towards change of column (different batches) assures normal use of the method.

174 Chapter V. HPLC method development and validation for the quantification of sulfites and sulfates on the surface of natural dusts
Table 4: Method robustness results. Small changes in method parameters were introduced and evaluated as percent change for
the amounts of SO32- and SO4
2- ions in samples of Hagavatn dust as compared to their determination under original conditions (marked by asterisk).
Sample T
(C°)
pH Column
Lot#
Column
age
(months)
Amount
for
SO32-
(ppm)
%
Change
Amount
for
SO42-
(ppm)
%
Change
Hagavatn 194 mg aged for 1hr* 23 6.5 160210E 1 27.5 10.45
Hagavatn 194 mg aged for 1hr 20 6.5 160210E 1 26.7 -2.9 10.82 3.5
Hagavatn 194 mg aged for 1hr 26 6.5 160210E 1 27.2 -1.1 10.45 0.0
Hagavatn 158 mg aged for 10 min* 23 6.5 160210E 1 22.7 3.6
Hagavatn 158 mg aged for 10 min 23 7.0 160210E 1 23.09 1.7 3.7 2.8
Hagavatn 158 mg aged for 10 min 23 6.0 160210E 1 21.7 -4.4 3.4 -5.6
Hagavatn 165 mg aged for 1hr* 23 6.5 160210E 1 27.8 8.2
Hagavatn 165 mg aged for 1hr 23 6.5 130505R 1 26.6 -4.5 8.6 5.4
Hagavatn 165 mg aged for 1hr* 23 6.5 160210E 1 27.8 8.2
Hagavatn 165 mg aged for 1hr 23 6.5 160210E 4 26.9 -3.2 8.6 5.4
3.4 Evaluation of Method Reproducibility: Sample Preparation and Extraction
Performance.
The developed method was further validated for sample preparation and extraction reproducibility.
It was decided to use the protocol for “kinetics study” to evaluate reproducibility because, in comparison
with “environmental sampling” protocol, it has a supplementary step of dust ageing that can introduce
additional errors.
Sample preparation and extraction reproducibility studies were conducted to evaluate the sensitivity
of the method towards errors that may result from the combination of steps starting from ageing, extraction
and preparation of the samples to their subsequent analysis by HPLC instrument. To evaluate sample
preparation and extraction reproducibility for the “kinetics study” protocol, seven samples of Hagavatn
volcanic dust were aged with 175 ppm SO2 for 1 hr and extracted in 1% Formalin. The solutions were
injected into HPLC system and %RSD for mass of sulfites/sulfates per square meter of dust was calculated.

175 Chapter V. HPLC method development and validation for the quantification of sulfites and sulfates on the surface of natural dusts
The %RSD for reproducibility (that includes ageing and extraction of sulfites/sulfates) as reported in Table
5 was found to be 12.1% for sulfites and 23.6% for sulfates. It is important to stress that reproducibility for
ageing and extraction of sulfites/sulfates in a dust sample depends on heterogeneity of the sample. Like
most of the natural mineral dusts, Hagavatn volcanic dust represents a highly heterogeneous sample and
variations in adsorption/transformation of SO2 gas by its different components are expected. Many studies
use a combination of different oxides as proxies for natural samples. In this case %RSD for reproducibility
would be expected to be lower as the sample composition is well-defined and ageing process more
reproducible. Nevertheless, the importance of using natural samples cannot be overstated, as they often
demonstrate different adsorption patterns when compared to the mixture of mineral oxides used as proxies
(Zeineddine et al., 2018), (Lasne et al., 2018), (X. Wang et al., 2018). For example, when studying
adsorption of SO2 on individual oxides and comparing them to their mixture Zhang et al. observed that the
reactivity of the mixture is twice as high as the reactivity of individual components (Zhang et al., 2006). In
addition, substituting natural samples characterized by complex mineralogy by simple mineral oxides risks
oversimplification of the observed trends.
Table 5: Sample preparation and extraction reproducibility study for samples of Hagavatn aged in 175 ppm SO2 for 1 hr. Extraction with 1mL of 1% Formalin.
Preparation Date of sample
preparation
Sample mass
(mg)
Concentration
SO32-
(µg/m2)
Concentration
SO42-
(µg/m2)
1 April 8 134.0 59.3 25.2
2 April 12 89.0 66.4 28.7
3 April 12 194.0 67.1 20.5
4 April 15 137.3 69.6 22.7
5 April 15 138.6 56.2 39.1
6 April 16 158.0 75.7 26.1
7 April 16 165.4 79.3 22.5
Average 67.7 26.5
Standard Deviation 8.2 6.2
%RSD 12.1 23.6

176 Chapter V. HPLC method development and validation for the quantification of sulfites and sulfates on the surface of natural dusts
3.5 Summary of the HPLC Method Developed
The validated method is summarized in Table 6. If “environmental sampling” is the desired purpose
of the method, ageing is not required and one can start the protocol from the extraction section. For “kinetics
study”, ageing is followed by extraction and HPLC analysis. Mass of the sample introduced into the reactor
will depend on the specific surface area of the dust. In case of high specific surface area a higher SO2
adsorption might be expected and therefore a smaller sample mass can be used for extraction. Likewise, if
the specific surface area of the dust is low an increased mass might be necessary in order to detect
sulfites/sulfates on the surface. Thus, the method can be easily adapted to different dust samples.
Table 6: Summary of the validated conditions used to age, extract and quantify sulfites and sulfates from a sample of dust aged with SO2 gas.
Ageing Extraction Chromatographic conditions
Dust sample
mass
100.0-200.0 mg Extracting
solution
1% Formalin in
10%
MeOH/water
Column 250 mm Restek
Ultra Column
C18, Particle size:
5 µm, I.D. 4.60
mm
SO2
concentration
175 ppm Mode of
dissolution
sonication Column
modification
coated with 1.0
mM
cetylpyridinium
chloride in 7%
ACN solution
SO2 flow 100 cm3/min Time of
dissolution
10 min Mobile phase 1 mM potassium
hydrogen
phthalate at pH
6.5
RH 30% Filter 0.45 µm pore size
30 mm diameter
Whatman filter
Flow rate 1.0 ml/min
Time 10 min - 1 hr Total volume
of extracting
solution
2 mL Detection negative UV-Vis
detection at 255
nm
Time 15 min

177 Chapter V. HPLC method development and validation for the quantification of sulfites and sulfates on the surface of natural dusts
3.6 Application of the HPLC Method developed
3.6.1 Application of the method to natural samples
Natural samples of Hagavatn volcanic dust and Gobi desert dust were tested for sulfites and sulfates
using the “environmental sampling” method for extraction and quantification described above. Samples
were not aged in the laboratory, but could have been previously subjected to SO2 gas. In case of Hagavatn,
the samples were certainly exposed to SO2 gas during volcanic eruption. As for aeolian samples of Gobi
dust, it is also likely that during its long-range transfer the dust encountered industrially polluted areas of
China known to contain high levels of SO2 (Zhang et al., 2006). Six samples of natural desert dust ranging
from 124.2 to 144.5 mg and seven Hagavatn volcanic dust samples ranging from 110.6 to 505.4 mg were
tested to determine their intrinsic SO32- and SO4
2- ion surface concentrations.
As can be seen from Table 7, the extraction of both Gobi and Hagavatn surface dust did not reveal
sulfites above the limit of detection of 0.32 µg/mL for SO32- ion. Note, that the absolute amount of sulfites
and sulfates are directly dependent on the sample mass since this parameter drives the effective surface area
of the considered sample.
As for the sulfates, although the amounts on the surface of Hagavatn samples were above the LOD
level of 0.68 µg/mL of SO42- for five out of seven samples, they remained under the LOQ level of 3.38
µg/mL of SO42- ion even when the mass of the sample was increased to 505.4 mg. Furthermore, in terms of
absolute amounts of sulfates detected on Hagavatn dust, increasing the mass of the dust sample to 505.4
mg increases its total surface area and therefore decreases the minimum amount of SO42- ion per meter
square that could be detected on the surface. The fact that the amount of sulfates in µg/mL recorded after
extraction of 113.5 mg sample (1.95 µg/mL) is the same as on the 505.4 mg sample (1.86 µg/mL) suggests
that sulfates are not coming from Hagavatn sample. A small amount of sulfates determined in Hagavatn
and Gobi dust samples could have also come from 1% Formalin extracting solution that contains traces of
sulfate impurities. The amount of sulfates in 1% Formalin solution was measured at 1 µg/mL, which is
under LOQ limit.
The low density of sulfates on the surface of Hagavatn volcanic dust might be explained by the fact
that sulfates were dissolved from the surface of the natural sample by rain or surface water, as the sample
is coming from the lava field formed about 4,000 years ago and is subjected to fluctuating water levels
(Baratoux et al., 2011), (Arnalds et al., 2016). As for Gobi dust, it displayed a considerable amount of
sulfates averaging at 15.4±1.3 µg/m2. Interestingly, method reproducibility for extraction and quantification
of sulfates on the surface of Gobi dust was evaluated at 8.4 %RSD for 6 samples, which is three times lower
than 23.6% RSD for sample preparation and extraction reproducibility determined earlier for seven

178 Chapter V. HPLC method development and validation for the quantification of sulfites and sulfates on the surface of natural dusts
Hagavatn samples used for validation of “kinetics study” protocol (see section 3.4, Table 5). In addition,
one should keep in mind that 8.4% RSD for Gobi samples was calculated based on average amount of SO42-
of 15.4 µg/m2, while higher average of 29.0 µg/m2 was used for calculation of 23.6% RSD for Hagavatn
samples. Thus, the developed method for environmental sampling demonstrates good reproducibility and
can be used in field measurements to evaluate the amount of sulfites and sulfates on the surface of natural
dusts.
Table 7: Results of method reproducibility study for determination of SO32- and SO4
2- ions in Hagavatn and Gobi natural samples.
Note, that samples were not subjected to laboratory ageing. LOD and LOQ for sulfites and sulfates for each sample mass expressed
in µg/m2 were calculated from corresponding sample’s mass, specific surface area, extraction volume (2ml) and the values for
LOQ and LOD expressed in µg/mL measured earlier (LOD for SO32-=0.32 µg/mL, LOQ for SO3
2-=0.64 µg/mL; LOD for SO42-
=0.68 µg/mL, LOQ for SO42-=3.38 µg/mL). Determination of the absolute amounts of SO3
2- and SO42- requires the observed
concentrations of corresponding ions to be equal or more than LOQ.
Sample mass
(mg)
SSABET
(m2/g)
LOD for
SO32-
(µg/m2)
LOQ for
SO32-
(µg/m2)
Amount of
SO32-
(µg/m2)
LOD for
SO42-
(µg/m2)
LOQ for
SO42-
(µg/m2)
Amount of
SO42-
(µg/m2)
Gobi 136.2 10.5 ± 2.0 0.45 0.90 < LOD 0.95 4.73 14.1
Gobi 138.5 10.5 ± 2.0 0.44 0.88 < LOD 0.94 4.65 14.8
Gobi 139.5 10.5 ± 2.0 0.44 0.87 < LOD 0.93 4.62 16.5
Gobi 126.2 10.5 ± 2.0 0.48 0.97 < LOD 1.03 5.10 14.4
Gobi 144.5 10.5 ± 2.0 0.42 0.84 < LOD 0.90 4.46 15.5
Gobi 124.2 10.5 ± 2.0 0.49 0.98 < LOD 1.04 5.18 17.2
Average 15.4
STD 1.3
%RSD 8.4
Hagavatn 116.8 4.5 ± 1.1 1.22 2.44 < LOD 2.59 12.86 < LOD
Hagavatn 113.0 4.5 ± 1.1 1.26 2.52 < LOD 2.67 13.26 6.1< LOQ
Hagavatn 125.4 4.5 ± 1.1 1.13 2.27 < LOD 2.41 11.98 4.6< LOQ
Hagavatn 113.5 4.5 ± 1.1 1.25 2.51 < LOD 2.66 13.24 7.6< LOQ
Hagavatn 190.0 4.5 ± 1.1 0.75 1.50 < LOD 1.59 7.91 < LOD
Hagavatn 110.6 4.5 ± 1.1 1.29 2.57 < LOD 2.73 13.58 5.9< LOQ
Hagavatn 505.4 4.5 ± 1.1 0.28 0.56 < LOD 0.60 2.97 1.6< LOQ
Average NA
STD NA
%RSD NA

179 Chapter V. HPLC method development and validation for the quantification of sulfites and sulfates on the surface of natural dusts
3.6.2 Application of the method to aged samples
Following “kinetics study” protocol, samples of 134.0 mg of Hagavatn and 115.0 mg of Gobi dusts
were exposed to 175 ppm of gaseous SO2 for 1 hour at room temperature and under 30 % RH. After
extraction, the amount of sulfites formed on the surface was calculated at 54.4±6.5µg/m2 (µg of sulfites per
m² specific surface area) for Hagavatn and 27.0±3.2 µg/m2 for Gobi desert dust (Figure 6). In the study of
Maters et al. the amount of sulfites measured by ion-chromatography on the surface of laboratory-generated
volcanic glass samples exposed to 60 ppb SO2 for a couple of minutes varied from 10 µg/m2 for the glass
of rhyolitic composition to 63 µg/m2 on the surface of glass of trachybasaltic composition (Maters et al.,
2017). In this respect the amount of sulfites on the surface of Hagavatn basaltic volcanic dust agrees well
with that measured on the surface of laboratory-generated glass samples of trachybasaltic composition.
However, the direct comparison of the results is difficult due to fact that the above-mentioned studies were
performed under low-pressure, 0% humidity, in Knudsen cell reactor (Maters et al., 2017).
The amount of sulfates formed after 1 hr ageing was estimated at 25.2±6.1µg/m2 (µg of sulfate per
m² specific surface area) for Hagavatn and 53.4±12.8 µg/m2 for Gobi desert dust. Note, that blank
subtraction of 15.4±1.3 µg/m2 (µg of sulfates per m² specific surface area) was applied to quantify the
amount of sulfates formed on Gobi dust during laboratory ageing. From this experiment, it appears that
after 1 hr of SO2 exposure volcanic dust accumulates a higher amount of sulfites than desert dust and a
lower amount of sulfates. From earlier studies it was proposed that SO2 gas reacts on the surface of the
volcanic dust and forms sulfites or bisulfites, which are then converted to sulfates (T. Wang et al., 2018),
(Urupina et al., 2019). It is possible that certain mineralogical compounds on the surface of Gobi desert
dust are contributing to a more efficient conversion of sulfites to sulfates. Sulfite conversion to sulfates on
Hagavatn is suggested to be a more limiting kinetic step than on Gobi sample. A larger sample distribution
would be required to confirm the trend and elucidate how the surface chemical composition may influence
the respective kinetics of sulfites and sulfates.

180 Chapter V. HPLC method development and validation for the quantification of sulfites and sulfates on the surface of natural dusts
Figure 6: Amount of sulfites and sulfates quantified on the surfaces of Hagavatn volcanic dust and Gobi desert dust formed after 1 hr ageing with 175 ppm SO2 gas.
The amounts of SO32- and SO4
2- ions expressed in (µg/m2) were also expressed in terms of the
number of SO32- and SO4
2- ions per centimeter squared of dust and percent monolayer they form (see Table
8). The number of molecules needed to form a monolayer were calculated to be 5.75 × 10¹⁴ molecule cm-2
for sulfites and 4.22 × 10¹⁴ molecule cm-2 for sulfates. These values are consistent with the values reported
for surface density of sorptive sites on mineral oxides, ca. 3 x 10¹³ - 5 x 10¹⁴ sites cm-2 (Kulkarni and Wachs,
2002). It should be noted that the experimental monolayer coverage should be assumed to be lower than
the theoretical because the molecules are not expected to pack together perfectly and because the degree of
their interactions with various surface sites is not the same (Hudson et al., 2002), (Diaz et al., 2005). The
shape of the molecules and hindering interactions would render some of the active sites on the surface
inaccessible. Knowing the number of molecules needed to form a monolayer and the amount present on the
surface, percent monolayer coverage was calculated. Accordingly, in terms of a molecular coverage the
sulfites occupy about 7% of the available area on the surface of Hagavatn and 3.8% on the surface of Gobi
dust, while sulfates occupy 3.5% of the calculated monolayer on Hagavatn and 7.8% on the Gobi dust.
Based on this approximation, we can thus calculate that ca. 90% of surface sites are still free and available
for the formation of sulfites/sulfates and the reactive uptake process can continue. Considering that not all
surface sites are available for interactions with SO2 the available surface fraction most probably represents
less than 90%.

181 Chapter V. HPLC method development and validation for the quantification of sulfites and sulfates on the surface of natural dusts
Table 8: Sulfite and sulfate coverage on the surface of Hagavatn and Gobi dusts expressed in terms of (i)micrograms of SO32-/
SO42- per meter squared of dust (µg/m2), (ii) number of SO3
2- SO42- ions per centimeter squared of dust (Nmolecules/cm2), and (iii)
percent monolayer sulfates and sulfites occupy. The number of molecules needed to form a monolayer were calculated to be 5.75
× 1014 molecule cm-2 and 4.22 × 10¹⁴ molecule cm-2 for sulfites and sulfates respectively.
Dust SO32-
(µg/m2)
SO32-
(Nmolecules/cm2)
% monolayer
Sulfite Surface
Coverage
(lower limit)
SO42-
(µg/m2)
SO42-
(Nmolecules/cm2)
% monolayer
Sulfate Surface
Coverage
(lower limit)
Hagavatn 54.4±6.5 (4.1±0.5)×1013 7% 25.2±6.1 (1.6±0.4)×1013 3.8%
Gobi 27.0±3.2 (2.0±0.2)×1013 3.5% 53.4±12.8 (3.3±0.8)×1013 7.8%
To evaluate how relevant the artificial ageing is to the processes encountered in real atmosphere,
results obtained after a one-hour laboratory ageing of Gobi dust with 175 ppm SO2 were compared to the
field measurements of sulfates performed during a severe dust storm in China. Similarly, results from
Hagavatn ageing were compared to leachate measurements of ashes coming from Stromboli volcano in
Italy and Soufriere Hills Volcano, Montserrat.
In spring of 2002 a dust storm originating from Gobi desert in Mongolia and Taklimakan desert in
western China spread over China, Korea and Japan (Sun et al., 2005). On March 20 2002, the dust peak
concentrations over Beijing reached 10.9 mg/m3 (mg of dust per m3 of air) (Sun et al., 2005). Using the
same particle matter concentrations as the ones reported over Beijing and the specific surface area of Gobi
dust determined in the current study (10.5 m2/g), our results of 53.4±12.8 µg/m2 of sulfates on the surface
of Gobi dust correspond to 6.07±1.43 µg/m3 (µg of sulfates present in 1 m3 of gas), considering a dust
density of 10.9 mg/m3 as reported by Sun et al. (Sun et al., 2005). This result is on the same order of
magnitude than the volume concentration of sulfates determined from Ion Chromatography analysis of
airborne samples: from 18 to 19 µg/m3 (Sun et al., 2005). As for the samples of volcanic origin, Bagnato et
al. measured the amount of sulfates on the surface of ash coming from Stromboli volcano, Italy. The results
showed a vast variability from 7 to 55,000 µg/g (µg of sulfates per g of volcanic sample) (Bagnato et al.,
2011). High variability in the amount of sulfates in ash leachates was noted by Edmonds et al. (from 34 to
9,280 µg/g) at Soufriere Hills Volcano, Montserrat (Edmonds et al., 2003). The amount of sulfate per
specific surface determined on Hagavtn volcanic dust (25.2±6.1 µg/m2), after 1 hr ageing, corresponds to
115±27 µg/g (µg of sulfates per g of dust). Results retrieved from our study fall within the range of
concentrations determined by Bagnato et al. and Edmonds et al (Bagnato et al., 2011), (Edmonds et al.,
2003). Note that for elevated concentrations of sulfates on the surface of volcanic dust, samples can be
easily diluted in higher volumes of extraction solution, in our case 1% Formalin.

182 Chapter V. HPLC method development and validation for the quantification of sulfites and sulfates on the surface of natural dusts
4 Conclusions on HPLC method development and validation
A reversed-phase HPLC method was successfully developed for the assay of sulfites and sulfates
on the surface of dust. This method was developed on a 25 mm Restek Ultra Column C18, Particle size: 5
µm, I.D. 4.60 mm column which was dynamically coated with 1.0 mM cetylpyridinium chloride in 7%
acetonitrile solution to produce a charged surface as recommended by Zuo et al (Zuo and Chen, 2003).
Mobile phase used: 1 mM potassium hydrogen phthalate at pH 6.5 at a flow rate of 1.0 ml/min with negative
UV-Vis detection at 255 nm in 15 min.
The developed method was validated for the specificity, LOD and LOQ, linearity and range,
robustness, injection repeatability and reproducibility for sample preparation and extraction. In addition,
the sampling method is easy and fast, and does not require expensive or particularly dangerous solvents.
Besides, the extracted solution displays excellent stability, which is very important in remote sampling
during geological expeditions. Samples can be extracted on site and analyzed days after sampling, provided
they are kept in cool temperature conditions.
We would like to stress out that in case of “environmental sampling” the method should only be
applied if the sample is believed to be recently subjected to SO2 gas and if quantification of sulfites is
desired. Due to the conversion of sulfites to sulfates, the former are not expected to stay on the surface of
dust for a long time (Michigami and Ueda, 1994). Examples of missions that could use the method
developed could be: identification of sulfites and sulfates on fresh volcanic ash samples following an
eruption, identification of sulfites and sulfates in desert dust samples that pass through industrially polluted
areas, as well as laboratory investigation of sulfite and sulfate formation on the surface of natural dusts of
different origins.
Validity of ageing procedure in the reference to natural gas-particle interactions was discussed. The
developed method was successfully applied to assay the amount of sulfites and sulfates formed on the
surface of Hagavatn and Gobi dusts both in natural environmental settings and after artificial ageing.
Sulfates in the amount of 15.4±1.3 µg/m2 were detected on the surface of unexposed Gobi dust. As for the
laboratory-aged samples, both sulfites and sulfates were detected on the surface of the two dusts. Sulfites
were found to be formed in higher quantities on the surface of Hagavatn volcanic dust in comparison with
Gobi desert dust sample (54.4±6.5 µg/m2 of SO32- ion for Hagavatn versus 27.0±3.2 µg/m2 of SO3
2- ion for
Gobi desert dust), while the opposite trend was observed for sulfates (25.2±6.1 µg/m2 of SO42- for Hagavatn
and 53.4±12.8 µg/m2 of SO42- for Gobi desert dust).
Having a method to quantify sulfites and sulfates on the surface of dust paves a pathway to in-depth
investigation of the sulfite/sulfate formation on the surface. In Chapter 6 we will study five volcanic dusts,

183 Chapter V. HPLC method development and validation for the quantification of sulfites and sulfates on the surface of natural dusts
three desert dusts, 3 clays and a number of mineral oxides in their ability to form sulfites and sulfates on
their surfaces. In this way we will be able to (i) compare different samples between each other and (ii) test
the validity of using simple oxide proxies to study complex natural dusts.

184 Chapter V. HPLC method development and validation for the quantification of sulfites and sulfates on the surface of natural dusts
References of Chapter 5
Arnalds, O., Dagsson-Waldhauserova, P., Olafsson, H., 2016. The Icelandic volcanic aeolian environment:
Processes and impacts — A review. Aeolian Research 20, 176–195.
https://doi.org/10.1016/j.aeolia.2016.01.004
Bagnato, E., Aiuppa, A., Andronico, D., Cristaldi, A., Liotta, M., Brusca, L., Miraglia, L., 2011. Leachate
analyses of volcanic ashes from Stromboli volcano: A proxy for the volcanic gas plume
composition? Journal of Geophysical Research: Atmospheres 116.
https://doi.org/10.1029/2010JD015512
Baratoux, D., Mangold, N., Arnalds, O., Bardintzeff, J.-M., Platevoet, B., Grégoire, M., Pinet, P., 2011.
Volcanic Sand in Iceland: Diverse origins of aeolian sand deposits revealed at Dyngjusandur and
Lambahraun, Iceland. Earth Surface Processes and Landforms 36, 1789–1808.
https://doi.org/10.1002/esp.2201
Diaz, L., Liauw, C.M., Edge, M., Allen, N.S., McMahon, A., Rhodes, N., 2005. Investigation of factors
affecting the adsorption of functional molecules onto gel silicas. 1. Flow microcalorimetry and
infrared spectroscopy. J Colloid Interface Sci 287, 379–387.
https://doi.org/10.1016/j.jcis.2004.09.039
Edmonds, M., Oppenheimer, C., Pyle, D., Herd, R., 2003. Rainwater and ash leachate analysis as proxies
for plume chemistry at Soufriere Hills Volcano, Montserrat. Geological Society Special Publication
213, 203–218. https://doi.org/10.1144/GSL.SP.2003.213.01.12
Hudson, P.K., Zondlo, M.A., Tolbert, M.A., 2002. The Interaction of Methanol, Acetone, and Acetaldehyde
with Ice and Nitric Acid-Doped Ice: Implications for Cirrus Clouds. J. Phys. Chem. A 106, 2882–
2888. https://doi.org/10.1021/jp012718m
ICH Official web site : ICH [WWW Document], n.d. URL https://www.ich.org/page/quality-guidelines
(accessed 3.6.20).
Kovacs, K., McIlwaine, R., Gannon, K., Taylor, A.F., Scott, S.K., 2005. Complex Behavior in the
Formaldehyde−Sulfite Reaction. J. Phys. Chem. A 109, 283–288.
https://doi.org/10.1021/jp0464324
Kulkarni, D., Wachs, I.E., 2002. Isopropanol oxidation by pure metal oxide catalysts: number of active
surface sites and turnover frequencies. Applied Catalysis A: General 237, 121–137.
https://doi.org/10.1016/S0926-860X(02)00325-3
Lasne, J., Romanias, M.N., Thevenet, F., 2018. Ozone Uptake by Clay Dusts under Environmental
Conditions. ACS Earth Space Chem. 2, 904–914.
https://doi.org/10.1021/acsearthspacechem.8b00057
Maters, E.C., Delmelle, P., Rossi, M.J., Ayris, P.M., 2017. Reactive Uptake of Sulfur Dioxide and Ozone
on Volcanic Glass and Ash at Ambient Temperature. J. Geophys. Res.-Atmos. 122, 10077–10088.
https://doi.org/10.1002/2017JD026993
Michigami, Y., Ueda, K., 1994. Sulphite stabilizer in ion chromatography. Journal of Chromatography A
663, 255–258. https://doi.org/10.1016/0021-9673(94)85252-9
Prospero, J.M., Ginoux, P., Torres, O., Nicholson, S.E., Gill, T.E., 2002. Environmental Characterization
of Global Sources of Atmospheric Soil Dust Identified with the Nimbus 7 Total Ozone Mapping
Spectrometer (toms) Absorbing Aerosol Product. Reviews of Geophysics 40, 2-1-2–31.
https://doi.org/10.1029/2000RG000095
Sun, Y., Zhuang, G., Wang, Y., Zhao, X., Li, J., Wang, Z., An, Z., 2005. Chemical composition of dust
storms in Beijing and implications for the mixing of mineral aerosol with pollution aerosol on the
pathway. Journal of Geophysical Research: Atmospheres 110.
https://doi.org/10.1029/2005JD006054
Urupina, D., Lasne, J., Romanias, M.N., Thiery, V., Dagsson-Waldhauserova, P., Thevenet, F., 2019.
Uptake and surface chemistry of SO2 on natural volcanic dusts. Atmospheric Environment 217,
116942. https://doi.org/10.1016/j.atmosenv.2019.116942

185 Chapter V. HPLC method development and validation for the quantification of sulfites and sulfates on the surface of natural dusts
Wang, T., Liu, Y., Deng, Y., Fu, H., Zhang, L., Chen, J., 2018. Emerging investigator series: heterogeneous
reactions of sulfur dioxide on mineral dust nanoparticles: from single component to mixed
components. Environ. Sci.: Nano 5, 1821–1833. https://doi.org/10.1039/C8EN00376A
Wang, X., Romanias, M.N., Thévenet, F., Rousseau, A., 2018. Geocatalytic Uptake of Ozone onto Natural
Mineral Dust. Catalysts 8, 263. https://doi.org/10.3390/catal8070263
Witham, C.S., Oppenheimer, C., Horwell, C.J., 2005. Volcanic ash-leachates: a review and
recommendations for sampling methods. Journal of Volcanology and Geothermal Research 141,
299–326. https://doi.org/10.1016/j.jvolgeores.2004.11.010
Zeineddine, M.N., Romanias, M.N., Riffault, V., Thévenet, F., 2018. Heterogeneous Interaction of Various
Natural Dust Samples with Isopropyl Alcohol as a Probe VOC. The Journal of Physical Chemistry
A. https://doi.org/10.1021/acs.jpca.8b02034
Zhang, X., Zhuang, G., Chen, J., Wang, Y., Wang, X., An, Z., Zhang, P., 2006. Heterogeneous Reactions
of Sulfur Dioxide on Typical Mineral Particles. J. Phys. Chem. B 110, 12588–12596.
https://doi.org/10.1021/jp0617773
Zuo, Y., Chen, H., 2003. Simultaneous determination of sulfite, sulfate, and hydroxymethanesulfonate in
atmospheric waters by ion-pair HPLC technique. Talanta 59, 875–881.
https://doi.org/10.1016/S0039-9140(02)00647-1
Zuo, Y., Hoigné, J., 1993. Evidence for Photochemical Formation of H2O2 and Oxidation of SO2 in
Authentic Fog Water. Science 260, 71–73. https://doi.org/10.1126/science.260.5104.71
Zuo, Y., Zhan, J., Wu, T., 2005. Effects of Monochromatic UV-Visible Light and Sunlight on Fe(III)-
Catalyzed Oxidation of Dissolved Sulfur Dioxide. J Atmos Chem 50, 195–210.
https://doi.org/10.1007/s10874-005-2813-y

186 Chapter V. HPLC method development and validation for the quantification of sulfites and sulfates on the surface of natural dusts

Chapter VI. How atmospherically relevant is to use mineral proxies
to mimic the reactivity of natural dust samples? A reactivity study
using SO2 as probe molecule

188 Chapter VI. How atmospherically relevant is to use mineral proxies to mimic the reactivity of natural dust samples? A reactivity
study using SO2 as probe molecule
Table of content of Chapter 6
Introduction .......................................................................................................................................... 191
Specific experimental considerations to address mineral dusts and their surrogates regarding SO2 uptake.
………………………………………………………………………………………………………...192
Results and discussion .......................................................................................................................... 194
3.1 First insights on SO2 uptake on mineral samples ......................................................................... 194
3.2 Classification of mineral samples based on their efficiency to form sulfites and/or sulfates. Can a
natural dust be represented by one chosen individual component? ..................................................... 195
3.3 Can a natural dust be characterized by a sum of “representative” simple mineral proxies? ........ 196
Conclusions .......................................................................................................................................... 200
References ................................................................................................................................................. 201

189 Chapter VI. How atmospherically relevant is to use mineral proxies to mimic the reactivity of natural dust samples? A reactivity
study using SO2 as probe molecule
List of Tables of Chapter 6
Table 1: % surface elemental composition of the v-dust and desert dust samples used in this study as determined by
XPS (surf stands for surface) compared to % bulk composition as determined by ICP-MS (bulk). Both
expressed as % by weight. Bulk compositions of mineral dust samples marked with asterisk were adopted
from (Joshi et al., 2017). Error on the XPS measurements < 10% and for ICP-MS < 10% for major elements.
..................................................................................................................................................................... 193
Table 2: Classification of mineral samples based on their ability to form sulfites and/or sulfates on their surfaces. 196
Table 3: Quantitative comparison for the amount of sulfites and sulfates on the surface of natural dusts (i) calculated
from the addition of the contributions of individual pure oxides and (ii) experimentally measured on the
surface of dust. Elemental composition for dusts expressed as % oxide (by weight) was calculated from %
elemental composition (by weight) measured with XPS and discussed earlier (see Section 2.2, Table 1). . 198

190 Chapter VI. How atmospherically relevant is to use mineral proxies to mimic the reactivity of natural dust samples? A reactivity
study using SO2 as probe molecule
List of Figures of Chapter 6
Figure 1: Amounts of sulfites and sulfates quantified on the surface of desert and volcanic dust samples as compared
to the amounts of sulfites and sulfates formed on various pure metal oxides, calcium carbonate, goethite and
clays. All samples were exposed to 175 ppm SO2 for 1 hr at 30% RH. Sulfites and sulfates were extracted
with 2 mL of 1% Formalin, sonicated for 10 min and analyzed by HPLC. ................................................. 194

191 Chapter VI. How atmospherically relevant is to use mineral proxies to mimic the reactivity of natural dust samples? A reactivity
study using SO2 as probe molecule
Introduction
Since mineral dust originates from the soil it has a similar elemental composition. The major
components of mineral dust are relatively uniform and, expressed as oxides, consist of around 60% SiO2
and 10-15 % of Al2O3 followed by Fe2O3 (6%), MgO (6%) and CaO (3%) (Usher et al., 2003). Note that
the convention of reporting elemental composition in the percent oxide form dates back to when minerals
and rocks were analyzed using wet-chemical methods to precipitate an element. The precipitate was
oxidized under high temperature and the results were weighed as the oxide. However, it should be noted
that, although customary, representation of soil composition in the form of oxides is largely artificial and
contrary to the actual mineralogy of soils (Vodyanitskii, 2018).
Airborne desert dust has a complex composition and consists of quartz, feldspars, micas, chlorite,
kaolinite, illite, smectite, palygorskyte, calcite, dolomite, gypsum, halite, opal, and mixed-layer clays (Usher
et al., 2003). The mineral composition of the volcanic dust reflects the composition of magma from which
it was generated and consists mostly of aluminosilicate glass (Langmann, 2013), (Delmelle et al., 2018).
The individual mineral grains and crystals of volcanic dust are imbedded in the glass (Dagsson-
Waldhauserova et al., 2015). From the crystalline phases, silicates are the main components found in
volcanic ash, such as feldspar, olivine, pyroxene, hornblende, and biotite (Langmann, 2013).
Low abundance of crystalline mineral phases makes their determination and quantification difficult.
Thus, two major differences can be highlighted between desert and volcanic dusts. First, v-dust contains
high share of amorphous material (40-100%), while desert dust is mostly crystalline (Delmelle et al., 2018).
Second, the composition of desert dust, as opposed to volcanic dust, results from chemical weathering of
desert dust on geological timescales (Langmann, 2013). As an example, feldspars present in desert dusts
weather to clays, while iron-bearing materials, such as amphiboles and pyroxenes, weather to hematite and
goethite (Earle, 2015), (Langmann, 2013). Primary iron-bearing phases of v-dust, such as amphiboles and
pyroxenes, are not identified in desert dust (Langmann, 2013).
Due to the crystalline nature of desert dusts authors investigating their behavior often substitute
natural samples for simple metal oxides in order to mimic the behavior of complex minerals. In the most
recent IUPAC review of kinetic data on heterogeneous reactions on dust surfaces, only 30% of the studies
were carried out using natural desert dusts and none dealt with volcanic samples (Crowley et al., 2010).
Thus, kinetic and mechanistic data on natural mineral samples are very limited and their reactivity is often
studied by using mainly “reactive components”, typically hydroxides, and carbonates: Fe2O3, FeOOH,
Al2O3, MgO, CaO, TiO2, MnO2, SiO2, CaCO3 (Crowley et al., 2010), (Goodman et al., 2001), (Zhang et al.,

192 Chapter VI. How atmospherically relevant is to use mineral proxies to mimic the reactivity of natural dust samples? A reactivity
study using SO2 as probe molecule
2006), (Wang et al., 2018a), (Wang et al., 2018b), (Nanayakkara et al., 2012), (Wu et al., 2011), (Usher et
al., 2002), (Zhang et al., 2018), (Huang et al., 2016), (Li et al., 2006). The investigations of volcanic dust
are more commonly carried out using aluminosilicate amorphous material (Delmelle et al., 2018).
Oftentimes a single component or a mixture of several components are used to approximate behavior of
dusts. The kinetic or mechanistic results of the studies using surrogates are then used to estimate the
atmospheric implication of the reactions studied and to elucidate their atmospheric impact. However, is it
really appropriate to use simplified surrogates in order to mimic the behavior of a complex mineral
mixtures? And do the values obtained by using proxies correctly describe atmospheric processes?
To respond to the above questions in the framework of the current study, SO2 was used as a probe
molecule to investigate its interactions with a wide variety of mineral samples (including surrogates, clays,
and natural samples). The choice of using SO2 is twofold. First, it is an important widely-studied
atmospheric molecule (Bluth et al., 1993), (Highwood and Stevenson, 2003), (Daniel J. Jacob, 1999),
(Finlayson-Pitts and Jr, 1999), (Schmidt et al., 2011), (US EPA, 2016), (Stevenson et al., 2003), (Li et al.,
2006). Second, multiple, sometimes conflicting trends in uptake of SO2 and evaluation of influence of
difference variables, such as RH, have been reported in the literature while using different proxies for
atmospheric dust (Crowley et al., 2010), (Baltrusaitis et al., 2007), (Goodman et al., 2001), (Zhang et al.,
2006), (Wang et al., 2018a), (Wang et al., 2018b), (Nanayakkara et al., 2012), (Wu et al., 2011), (Usher et
al., 2002), (Zhang et al., 2018), (Huang et al., 2016), (Li et al., 2006). For instance, for a mixture of two
pure metal oxides, alumina and hematite, two opposite effects on sulfate yields in respect to each individual
component are observed: synergistic effect for hematite (higher sulfate yields for hematite-rich mixtures
compared to theoretical calculation based on its contribution) and antagonistic effect for alumina (lower
sulfate yields for alumina-rich mixtures compared to theoretical calculation based on its contribution)
(Wang et al., 2018a). In order to further examine relevance of using proxies, heterogeneous interactions of
SO2 gas with 20 different mineral samples, such as commonly used proxies, clays, and a number of natural
desert and volcanic dusts were investigated. In particular, the mineral samples were aged for 1 hour with
175 ppm of SO2, 30% of RH. The sulfites and sulfates formed on the surface were identified and quantified
using a recently developed method based on HPLC analysis (Urupina et al., 2020).
Specific experimental considerations to address mineral dusts and their
surrogates regarding SO2 uptake.
To compare the behavior of natural samples when subjected to SO2 gas to the behavior of common
proxies, the following samples were investigated. Natural samples include five v-dusts: (i) Hagavatn,
Mýrdalssandur, Maelifellssandur, Dyngjusandur and Eyjafjallajökull, (ii) three desert dusts: Gobi, M’Bour

193 Chapter VI. How atmospherically relevant is to use mineral proxies to mimic the reactivity of natural dust samples? A reactivity
study using SO2 as probe molecule
and Arizona Test Dust (ATD), (iii) three clays: kaolinite, montmorillonite, illite. The metal oxides include
silica (SiO2), quartz (SiO2), iron oxide (Fe3O4,), goethite (FeOOH), calcium oxide (CaO, 99.9% purity),
aluminum oxide (Al2O3), titanium oxide (Ti2O3,), calcium carbonate (CaCO3), and magnesium oxide
(MgO).
Details on the origins of the samples are provided in Chapter 2, Section 1.1. Physical and chemical
characterization of volcanic and desert dusts, ICP-MS bulk elemental composition and XRD surface
elemental composition analysis, was discussed in Chapter 2 Section 1.2 and is once more provided below
in Table 1 to ease the comprehension of the current chapter. As one can see, bulk and surface compositions
are rather different. For further investigations surface composition (expressed in % element by
weight) was preferred to bulk composition as it is considered to be more relevant in representation of
the physical and chemical properties of dust surfaces (Chapter 2 Section 1.2.4).
Table 1: % surface elemental composition of the v-dust and desert dust samples used in this study as determined by XPS (surf stands
for surface) compared to % bulk composition as determined by ICP-MS (bulk). Both expressed as % by weight. Bulk compositions
of mineral dust samples marked with asterisk were adopted from (Joshi et al., 2017). Error on the XPS measurements < 10% and
for ICP-MS < 10% for major elements.
Element Mýrdalssandur Dyngjusandur Hagavatn
Maelifellssandur Eyjafjallajökull M’Bour
Saharan dust
Gobi dust ATD dust
surf bulk surf bulk surf bulk surf bulk surf bulk surf bulk* surf bulk* surf bulk*
Si 47.1 31.3 49.0 32.7 42.8 27.5 43.7 28.3 60.0 49.5 57.0 94.4 54.7 57.6 57.5 74.6
Fe 20.0 23.0 15.9 19.7 10.5 19.6 22.0 23.8 7.7 13.0 6.1 1.3 6.7 5.5 8.2 3.1
Ca 8.1 13.9 9.7 16.3 9.0 19.5 6.3 14.0 5.5 7.3 2.4 1.0 7.7 16.1 5.5 4.4
Al 14.5 12.3 16.8 15.8 31.8 16.7 18.2 15.5 13.4 13.6 32.1 1.8 18.5 11 18.0 9.5
Mg 3.3 5.1 4.8 7.3 2.4 10.4 3.0 5.7 1.5 3.3 0 0.1 6.1 2.3 3.9 1.0
Ti 3.8 7.6 2.0 3.3 1.8 2.4 4.3 6.1 1.0 2.4 0.2 0.7 0 0.8 0.5 0.5
Na 2.3 4.8 1.0 3.9 1.4 3.1 1.3 4.6 7.5 7.3 0.3 0.2 0.8 2.5 1.3 2.5
K 0.9 1.3 0 0.6 0 0.2 0.4 1.5 3.3 3.1 1.9 0.1 4.7 3.5 4.4 4.0
other 0 0.7 0.8 0.4 0.3 0.6 0.8 0.5 0.1 0.5 0 0.1 0 0.7 0.7 0.1
As can be seen from Table 1, surface composition of desert and volcanic dusts is dominated by
silicon (Si), aluminum (Al) and, in the case of volcanic dusts, iron (Fe), followed by other elements, such
as calcium (Ca), magnesium (Mg) and Ti (titanium). With exception of Si that demonstrated low reactivity,
oxides of Fe, Ca, Al, Mg and Ti and relatively simple minerals, such as calcite (CaCO3) and goethite
(FeOOH) were used in the literature as proxies to study behavior of natural dusts based on the fact that they
are seen as “reactive components” (Usher et al., 2002).
In this study all samples were aged for 1 hr using 175 ppm SO2, at 30% RH, ambient temperature
and atmospheric pressure using the system described in Chapter 2 Section 2.4. They were analyzed for
surface sulfites and sulfates using the method and chromatographic equipment developed in Chapter 5.
Additional details on chemicals and reagents and are available in Chapter 2 Section 1.3-1.4.

194 Chapter VI. How atmospherically relevant is to use mineral proxies to mimic the reactivity of natural dust samples? A reactivity
study using SO2 as probe molecule
Results and discussion
Several authors investigating desert dust samples use mineral oxides and so-called “reactive
components” as proxies for natural samples. In the following study it was decided to directly compare the
amount of sulfites/sulfates present on the surface of natural volcanic and desert dusts after 1 hr ageing with
175 ppm of SO2 gas versus sulfites/sulfates present on commonly used surrogates in order to evaluate this
approach.
3.1 First insights on SO2 uptake on mineral samples
Figure 1 shows the amounts of sulfites and sulfates quantified on: (i) different metal oxides based
on Al, Fe, Ti, Mg, Ca and Si content identified on the surface of desert and volcanic dusts (Table 1), (ii)
volcanic dusts, (iii) desert dusts, (iv) clays, (v) goethite and (vi) calcium carbonate. Note, that clays, calcium
carbonate and goethite are not observed in volcanic ash but they are found in desert dusts and discussed in
the literature, thus they were also included to better explain the behavior of natural samples (Ayris and
Delmelle, 2012). All sample were aged for 1hr under the same experimental conditions using 175 ppm SO2.
Figure 1: Amounts of sulfites and sulfates quantified on the surface of desert and volcanic dust samples as compared to the amounts
of sulfites and sulfates formed on various pure metal oxides, calcium carbonate, goethite and clays. All samples were exposed to
175 ppm SO2 for 1 hr at 30% RH. Sulfites and sulfates were extracted with 2 mL of 1% Formalin, sonicated for 10 min and analyzed
by HPLC.
From Figure 1 we can see that on the surface of pure single mineral oxides, with the exception of
MgO (contains both sulfites and sulfates) and SiO2 (sulfites/sulfates are below the detection limits), only
one type of sulfur species is observed: either sulfites or sulfates. In particular, on the surface of Al2O3, Fe2O3,
TiO2, sulfites are solely formed, while on the surface of CaO, CaCO3, only sulfates are observed.
0
20
40
60
80
100
120
140
160
Mas
s o
f su
lfit
es/s
ulf
ates
per
sp
ecif
ic s
urf
ace
un
it (
µg/
m²)
sulfites sulfates

195 Chapter VI. How atmospherically relevant is to use mineral proxies to mimic the reactivity of natural dust samples? A reactivity
study using SO2 as probe molecule
Meanwhile, both sulfites and sulfates are detected on the surface of most desert and volcanic dusts, except
for Eyjafjallajökull and Arizona dusts that exhibit only sulfates. As a general trend, on the surface of v-
dusts, with exception of Eyjafjallajökull, we observe a higher amount of sulfites and a lower amount of
sulfates than on the surface of desert dusts. In addition, goethite contains both sulfites and sulfates. Three
clays show contrasting behavior: sulfites are only observed on the surface of illite, while sulfates are
observed for kaolinite and illite, but not for montmorionite. Apparently, different minerals have different
behaviors towards SO2 gas and its further conversion from sulfites to sulfates.
Different distribution of sulfites and sulfates on the surface can be investigated from the “rate of
conversion” point of view. Since sulfite formation necessarily precedes sulfate formation, the fact that we
observe different sulfite to sulfate ratios on different dusts means that conversion of sulfites to sulfates
follows different timeframe (Wang et al., 2018a). Apparently, the rate of sulfate formation is higher for
desert dusts in comparison with volcanic dusts. It suggests that at least a part of the surface of desert dusts
has a high sulfite-to-sulfate conversion rate and that at least a part of the surface of v-dusts has a lower
reaction rate. The fact that no sulfites are observed on the surface of certain mineral oxides and natural
samples by no means implies that they are not formed. If the sulfates are observed it follows that sulfites
are formed as well but that their rate of consumption is too fast to be observed by our method (Urupina et
al., 2019). On the other hand, absence of sulfates on the surface means that they were not formed (or they
are formed in concentrations below the detection limit) due to extremely slow rate of sulfite to sulfate
conversion on the corresponding surface.
3.2 Classification of mineral samples based on their efficiency to form sulfites and/or sulfates.
Can a natural dust be represented by one chosen individual component?
Based on Figure 1 mineral dusts and metal oxides can be grouped in the following way (Table 2).
Group 1 forms neither sulfites nor sulfates on the surface: silica (SiO2), quartz (SiO2) and Montmorionite.
Group 2 has only sulfites and fails to convert them to sulfates: Al2O3, Fe3O4, and TiO2. Group 3 exhibits
both sulfites and sulfates: FeOOH, MgO, Illite, Dyngjusandur, Hagavatn, Mýrdalssandur, Maelifellssandur,
Gobi and M’Bour. Finally, Group 4 converts sulfites to sulfates so fast, that no sulfites are observed: CaO,
CaCO3, Eyjafjallajökull, and Arizona Test Dust.

196 Chapter VI. How atmospherically relevant is to use mineral proxies to mimic the reactivity of natural dust samples? A reactivity
study using SO2 as probe molecule
Table 2: Classification of mineral samples based on their ability to form sulfites and/or sulfates on their surfaces.
Group Samples Comments
1 silica (SiO2) quartz (SiO2), Montmorionite Neither formation nor detection of sulfites and sulfates.
2 Al2O3, Fe3O4, and TiO2 Formation and detection of sulfites only.
3 FeOOH, MgO, Illite, Dyngjusandur, Hagavatn,
Mýrdalssandur, Maelifellssandur, Gobi and
M’Bour
Formation and detection of sulfites and sulfates.
4 CaO, CaCO3, Eyjafjallajökull, and Arizona Test
Dust
Detection of sulfates only. Fast conversion of sulfites to
sulfates prevents their detection.
As we can see, not one surrogate is able to completely represent formation of sulfites and sulfates
on the surface of all the dusts, as dusts themselves differ in the amount and distribution of sulfur species.
Especially bad candidates for proxies would be Group 1 and 2 oxides, as they either form no sulfur species
or demonstrate an extremely low rate of sulfite to sulfate conversion. Moreover, we can clearly see that
Al2O3 and CaCO3 that are often chosen as proxies based on the assumption that each represents “the most
important reactive component of mineral dust” show highly contrasted behaviors: only sulfites are formed
on Al2O3 while only sulfates are observed on CaCO3 (Zhang et al., 2018), (Huang et al., 2016). Likewise,
Huang et al. saw a 10 times decrease in the total amount of sulfur species formed on the surface of alumina
vs Asian Mineral Dust particles collected in Beijing (Huang et al., 2016). Those discrepancies could be at
least in part be explained by using alumina as a proxy. In addition, with exception of SiO2, all other proxy
candidates exhibit significant reactivity towards formation of sulfites/sulfates, and thus choosing only one
component while ignoring all the others does not seem justified (Figure 1). A conclusion can be made that
no individual oxide can relevantly represent the reactivity of a complex heterogeneous mixture. But can
reactivity of a mixture be investigated as a sum of reactivities of individual contributors, keeping in mind
that these individual contributors are not necessarily present in the natural mixture in the assigned oxide
form? Next, we will try to deduce individual contribution of pure oxides, goethite and calcium carbonate
surrogates in the formation of sulfites/sulfates on natural samples.
3.3 Can a natural dust be characterized by a sum of “representative” simple mineral proxies?
Zhang et al. compared the reactivities of different oxides together with their mixture (based on the
abundance of the corresponding elements in continental crust) taking into consideration their specific area
and placed them in the following order: Fe2O3>MgO>TiO2>FeOOH>mixture>Al2O3>SiO2 (Zhang et al.,
2006). These authors came to the conclusion that the reactivity of the mixture, that was obtained by mixing
the different oxides based on their abundances in the continental crust, was measured to be twice its
theoretical value, which demonstrates a synergistic effect (Zhang et al., 2006). Contrary to the results
obtained by Zhang et al., reactivity of China Loess was successfully predicted from the reactivity of its
single component oxides and carbonates (Usher et al., 2002). Following the same logic we decided to test

197 Chapter VI. How atmospherically relevant is to use mineral proxies to mimic the reactivity of natural dust samples? A reactivity
study using SO2 as probe molecule
whether the amount of sulfites and sulfates formed on the surface of a natural dust can be predicted from
the sum of relative contributions of its individual oxides without accounting for K and Na component. Note
that, to take into account the well-known discrepancies between bulk and surface composition, the
surface composition for dusts expressed as % oxide (by weight) was calculated from % surface
elemental composition (by weight) measured with XPS. This approach was tested by calculating the
theoretical amount of sulfites/sulfates expected on the surface of dust Sdusttheoretical (µg/m2) based on our
experimental results for simple oxides using Equation 1. The calculated amount of sulfites and sulfates was
then compared to the experimentally measured results on natural volcanic/desert dusts.
Equation 1 𝑆𝑑𝑢𝑠𝑡𝑡ℎ𝑒𝑜𝑟𝑒𝑡𝑖𝑐𝑎𝑙 = ∑ 𝑓𝑖𝑆𝑖𝑖
Where fi is the fraction of ith component and Si (µg/m2) is the amount of sulfur species measured on
the surface of ith component.

198 Chapter VI. How atmospherically relevant is to use mineral proxies to mimic the reactivity of natural dust samples? A reactivity
study using SO2 as probe molecule
Table 3: Quantitative comparison for the amount of sulfites and sulfates on the surface of natural dusts (i) calculated from the
addition of the contributions of individual pure oxides and (ii) experimentally measured on the surface of dust. Elemental
composition for dusts expressed as % oxide (by weight) was calculated from % elemental composition (by weight) measured with XPS and discussed earlier (see Section 2.2, Table 1).
Dust
sample SiO2 Al2O3 CaO Na2O MgO TiO2 K2O Fe2O3 MnO
Calculated
from
individual
contributions
of pure oxides
(Sdusttheoretical)
Experimentally
measured
(𝑆𝑑𝑢𝑠𝑡experimental
)
Myrdalssandur
% 59,96 17,61 4,89 2,36 3,86 2,27 0,47 8,59 0
Sulfites
(µg/m2) 0 23 0 144 61 111 20,5 95
Sulfates
(µg/m2) 1 0 12 38 0 0 2,7 34
Dyngjusandur
% 60,14 19,67 5,68 0,95 5,56 1,18 0,00 6,59 0,23
Sulfites
(µg/m2) 0 23 0 144 61 111 20,6 56
Sulfates
(µg/m2) 1 0 12 38 0 0 3,4 4
Hagavatn
% 50,24 35,50 5,03 1,35 2,65 1,00 0,00 4,14 0,08
Sulfites
(µg/m2) 0 23 0 144 61 111 17,2 54
Sulfates
(µg/m2) 1 0 12 38 0 0 2,1 25
Maelifellsandur
% 56,23 22,34 3,86 1,33 3,59 2,63 0,24 9,53 0,25
Sulfites
(µg/m2) 0 23 0 144 61 111 22,5 101
Sulfates
(µg/m2) 1 0 12 38 0 0 2,4 24
Eyjafjallajokull
% 68,76 14,63 3,00 6,88 1,64 0,55 1,59 2,96 0,00
Sulfites
(µg/m2) 0 23 0 144 61 111 9,3 0
Sulfates
(µg/m2) 1 0 12 38 0 0 1,7 39
Gobi
% 63,03 20,30 4,22 0,76 6,56 0,00 2,27 2,60 0,24
Sulfites
(µg/m2) 0 23 0 144 61 111 17,0 27
Sulfates
(µg/m2) 1 0 12 38 0 0 3,6 53
M'Bour
% 62,01 33,27 1,26 0,24 0,00 0,12 0,87 2,24 0,00
Sulfites
(µg/m2) 0 23 0 144 61 111 10,2 8
Sulfates
(µg/m2) 1 0 12 38 0 0 0,8 53
ATD
% 66,10 19,77 2,98 1,20 4,12 0,30 2,14 3,19 0,23
Sulfites
(µg/m2) 0 23 0 144 61 111 14,2 0
Sulfates
(µg/m2) 1 0 12 38 0 0 2,6 102

199 Chapter VI. How atmospherically relevant is to use mineral proxies to mimic the reactivity of natural dust samples? A reactivity
study using SO2 as probe molecule
From Table 3 it is can be observed that the calculated and measured values are very different.
Theoretical amounts of sulfates are up to 50 times lower than the experimentally measured ones. Indeed,
for sulfates, theoretical values range from 1 to 4 µg/m2 while the experimental values range from 4 to 100
µg/m2. As for sulfites, the theoretical values range from 2 to 20 µg/m2 while the experimental values range
from 0 to 100 µg/m2. The reason of the mismatch is most probably related to the fact that : (i) mineralogical
surface composition of proxies is not the same as the one of real natural samples and (ii) there is a synergetic
effect of the mixture of components of natural samples on the transformation of SO2 to sulfites/sulfates,
which cannot be reproduced by using proxies. Thus, substituting a complex mineral for a collection of
simple oxides does not seem to be appropriate for SO2 transformation. For example, silicate enstatite with
molecular formula MgSiO3, reported as 60% SiO2 and 40% MgO cannot be investigated as a mixture of
these two simple oxides. If that is the case it explains why kaolinite clay which formula in terms of oxides
is sometimes represented as Al2O3 · 2SiO· 2H2O does not at all behaves as Al2O3 (no sulfites observed on
kaolinite, while only sulfites are observed on Al2O3) nor as quartz (a negligible amount of sulfate is observed
on quartz, while a high amount is present on kaolinite) (Figure 1).
A better approach to approximate the behavior of a complex mixture is to identify and quantify the
amount of minerals present in a selected dust and directly compare individual mineral phases to the behavior
of the heterogeneous mixture. Thus, sulfites on the surface of desert dusts can be compared to those detected
on pure hematite (Fe2O3), goethite (FeOOH), magnesium oxide (MgO), rutile (TiO2), aluminum oxide
(Al2O3), carbonates (CaCO3), plagioclase (NaAlSi3O8), muscovite (KAl3Si3O10(OH)2), kaolinite
(Al2Si2O5(OH)4), pyrope (Mg3Al2(SiO4)3), talc (Mg3Si4O10(OH)2), etc., while plagioclase (NaAlSi3O8 -
CaAl2Si2O8), pyroxene ((Ca,Na)(Mg,Fe,Al,Ti)(Si,Al)2O6), olivine ((Mg,Fe)2[SiO4]), magnetite (Fe3O4),
ilmenite (FeTiO3) and aluminosilicate glasses would be more appropriate minerals to consider in the case
of v-dust. As for sulfates, presence of kaolinite (Al2Si2O5(OH)4) and calcium carbonite (CaCO3) can explain
higher amount of sulfates on the surface of Gobi and M’Bour dusts. The exact quantities of minerals are
necessary in order to evaluate trends in formation. But mineralogical analysis of dusts and its accurate
quantification is laborious and expensive. In addition, certain mineral phases are present in dusts in very
small amounts and are not readily obtained in their pure form. Thus, an optimum approach would be to use
natural samples of dusts to study their heterogeneous interactions with gases to provide the most accurate
description of heterogeneous processes on their surfaces.

200 Chapter VI. How atmospherically relevant is to use mineral proxies to mimic the reactivity of natural dust samples? A reactivity
study using SO2 as probe molecule
Conclusions
In this study, three desert and five volcanic dusts were compared to a number of commonly used
mineral surrogates in their ability to form sulfites and sulfates in order to see if metal oxides, calcium
carbonates and goethite could be used as proxies to investigate reactivity of natural samples. We can
conclude that no proxy mimics the behavior of natural dust. Due to the complex crystalline structure
of different mineral phases, approximation of natural samples using a mixture of simple proxies also
does not satisfyingly reflect the behavior of natural samples.
The fact that oxides do not depict the behaviors of natural samples definitely questions the
representativeness of proxies to predict the behavior of natural samples in the atmosphere. For example, the
degradation of SO2 on the surface of Al2O3, Fe3O4 or TiO2 is not the same as on the surface of desert dusts
while metals of these oxides are present in the dusts. Desert dusts effectively convert SO2 into sulfates,
while Al2O3, Fe3O4 and TiO2 have an extremely slow rate of conversion. In the complex atmospheric reaction
pathways, stabilizing a molecule in sulfite form could offer reactivity towards compounds in respect to
which sulfates are immune. Since the dusts behave differently in respect to the pollutants, approximations
done on the lifetime of pollutants using proxies might be questionable. To sum up, trying to evaluate the
impact of natural dusts on the climate using surrogates is problematic as this approach assumes that a proxy
and a real heterogeneous mixture have similar properties, such as particle size, chemical composition,
morphology, hygroscopicity, photo activity, electrical conductivity and other characteristics when they
clearly don’t. Therefore, we propose that the best approach to evaluate the influence of natural dust on
atmospheric processes is to work directly with the natural samples to address the real effects of desert and
volcanic dusts.

201 Chapter VI. How atmospherically relevant is to use mineral proxies to mimic the reactivity of natural dust samples? A reactivity
study using SO2 as probe molecule
References of Chapter 6
Alleman, L.Y., Lamaison, L., Perdrix, E., Robache, A., Galloo, J.-C., 2010. PM10 metal concentrations and
source identification using positive matrix factorization and wind sectoring in a French industrial
zone. Atmospheric Research 96, 612–625. https://doi.org/10.1016/j.atmosres.2010.02.008
Andreae, M., 1995. Climate Effects of Changing Atmospheric Aerosol. World Survey of Climatology. Vol.
16: Future Climates of the World, 341-392 (1995).
Arnalds, O., Dagsson-Waldhauserova, P., Olafsson, H., 2016. The Icelandic volcanic aeolian environment:
Processes and impacts — A review. Aeolian Research 20, 176–195.
https://doi.org/10.1016/j.aeolia.2016.01.004
Ayris, P., Delmelle, P., 2012. Volcanic and atmospheric controls on ash iron solubility: A review. Physics
and Chemistry of the Earth 45, 103–112. https://doi.org/10.1016/j.pce.2011.04.013
Bagheri, G., Rossi, E., Biass, S., Bonadonna, C., 2016. Timing and nature of volcanic particle clusters based
on field and numerical investigations. Journal of Volcanology and Geothermal Research 327, 520–
530. https://doi.org/10.1016/j.jvolgeores.2016.09.009
Baltrusaitis, J., Cwiertny, D.M., Grassian, V.H., 2007. Adsorption of sulfur dioxide on hematite and goethite
particle surfaces. Phys. Chem. Chem. Phys. 9, 5542–5554. https://doi.org/10.1039/B709167B
Baratoux, D., Mangold, N., Arnalds, O., Bardintzeff, J.-M., Platevoet, B., Grégoire, M., Pinet, P., 2011.
Volcanic Sand in Iceland: Diverse origins of aeolian sand deposits revealed at Dyngjusandur and
Lambahraun, Iceland. Earth Surface Processes and Landforms 36, 1789–1808.
https://doi.org/10.1002/esp.2201
Bluth, G.J.S., Schnetzler, C.C., Krueger, A.J., Walter, L.S., 1993. The contribution of explosive volcanism
to global atmospheric sulphur dioxide concentrations. Nature 327–329.
Bristow, C.S., Hudson‐Edwards, K.A., Chappell, A., 2010. Fertilizing the Amazon and equatorial Atlantic
with West African dust. Geophysical Research Letters 37. https://doi.org/10.1029/2010GL043486
Crowley, J.N., Ammann, M., Cox, R.A., Hynes, R.G., Jenkin, M.E., Mellouki, A., Rossi, M.J., Troe, J.,
Wallington, T.J., 2010. Evaluated kinetic and photochemical data for atmospheric chemistry:
Volume V – heterogeneous reactions on solid substrates. Atmos. Chem. Phys. 10, 9059–9223.
https://doi.org/10.5194/acp-10-9059-2010
Dagsson-Waldhauserova, P., Arnalds, O., Olafsson, H., Hladil, J., Skala, R., Navratil, T., Chadimova, L.,
Meinander, O., 2015. Snow–Dust Storm: Unique case study from Iceland, March 6–7, 2013.
Aeolian Research 16, 69–74. https://doi.org/10.1016/j.aeolia.2014.11.001
Daniel J. Jacob, 1999. Introduction to Atmospheric Chemistry. Princeton University Press, Princeton, New
Jersey.
Delmelle, P., Wadsworth, F.B., Maters, E.C., Ayris, P.M., 2018. High Temperature Reactions Between
Gases and Ash Particles in Volcanic Eruption Plumes. Reviews in Mineralogy and Geochemistry
84, 285–308. https://doi.org/10.2138/rmg.2018.84.8
Durant, A.J., Bonadonna, C., Horwell, C.J., 2010. Atmospheric and Environmental Impacts of Volcanic
Particulates. Elements 6, 235–240.
Earle, S., 2015. 5.2 Chemical Weathering, in: Physical Geology. BCcampus.
Finlayson-Pitts, B.J., Jr, J.N.P., 1999. Chemistry of the Upper and Lower Atmosphere: Theory,
Experiments, and Applications. Elsevier.
Gislason, S.R., Hassenkam, T., Nedel, S., Bovet, N., Eiriksdottir, E.S., Alfredsson, H.A., Hem, C.P., Balogh,
Z.I., Dideriksen, K., Oskarsson, N., Sigfusson, B., Larsen, G., Stipp, S.L.S., 2011. Characterization
of Eyjafjallajökull volcanic ash particles and a protocol for rapid risk assessment. PNAS 108, 7307–
7312. https://doi.org/10.1073/pnas.1015053108
Goodman, A.L., Li, P., Usher, C.R., Grassian, V.H., 2001. Heterogeneous Uptake of Sulfur Dioxide On
Aluminum and Magnesium Oxide Particles. J. Phys. Chem. A 105, 6109–6120.
https://doi.org/10.1021/jp004423z

202 Chapter VI. How atmospherically relevant is to use mineral proxies to mimic the reactivity of natural dust samples? A reactivity
study using SO2 as probe molecule
Hatch, C.D., Wiese, J.S., Crane, C.C., Harris, K.J., Kloss, H.G., Baltrusaitis, J., 2012. Water Adsorption on
Clay Minerals As a Function of Relative Humidity: Application of BET and Freundlich Adsorption
Models. Langmuir 28, 1790–1803. https://doi.org/10.1021/la2042873
Highwood, E.-J., Stevenson, D.S., 2003. Atmospheric impact of the 1783-1784 Laki Eruption: Part II
Climatic effect of sulphate aerosol. Atmospheric Chemistry and Physics 3, 1177–1189.
Huang, L., Zhao, Y., Li, H., Chen, Z., 2016. Hydrogen peroxide maintains the heterogeneous reaction of
sulfur dioxide on mineral dust proxy particles. Atmospheric Environment 141, 552–559.
https://doi.org/10.1016/j.atmosenv.2016.07.035
Ibrahim, S., Romanias, M.N., Alleman, L.Y., Zeineddine, M.N., Angeli, G.K., Trikalitis, P.N., Thevenet,
F., 2018. Water Interaction with Mineral Dust Aerosol: Particle Size and Hygroscopic Properties of
Dust. ACS Earth Space Chem. 2, 376–386. https://doi.org/10.1021/acsearthspacechem.7b00152
Joshi, N., Romanias, M.N., Riffault, V., Thevenet, F., 2017. Investigating water adsorption onto natural
mineral dust particles: Linking DRIFTS experiments and BET theory. Aeolian Research 27, 35–45.
https://doi.org/10.1016/j.aeolia.2017.06.001
Langmann, B., 2013. Volcanic Ash versus Mineral Dust: Atmospheric Processing and Environmental and
Climate Impacts [WWW Document]. International Scholarly Research Notices.
https://doi.org/10.1155/2013/245076
Li, L., Chen, Z.M., Zhang, Y.H., Zhu, T., Li, J.L., Ding, J., 2006. Kinetics and mechanism of heterogeneous
oxidation of sulfur dioxide by ozone on surface of calcium carbonate. Atmospheric Chemistry and
Physics Discussions 6, 579–613. https://doi.org/10.5194/acpd-6-579-2006
Marticorena, B., Chatenet, B., Rajot, J.L., Bergametti, G., Deroubaix, A., Vincent, J., Kouoi, A.,
Schmechtig, C., Coulibaly, M., Diallo, A., Koné, I., Maman, A., NDiaye, T., Zakou, A., 2017.
Mineral dust over west and central Sahel: Seasonal patterns of dry and wet deposition fluxes from
a pluriannual sampling (2006–2012). Journal of Geophysical Research: Atmospheres 122, 1338–
1364. https://doi.org/10.1002/2016JD025995
Maters, E.C., Delmelle, P., Rossi, M.J., Ayris, P.M., Bernard, A., 2016. Controls on the surface chemical
reactivity of volcanic ash investigated with probe gases. Earth Planet. Sci. Lett. 450, 254–262.
https://doi.org/10.1016/j.epsl.2016.06.044
Moroni, B., Arnalds, O., Dagsson-Waldhauserová, P., Crocchianti, S., Vivani, R., Cappelletti, D., 2018.
Mineralogical and Chemical Records of Icelandic Dust Sources Upon Ny-Ålesund (Svalbard
Islands). Front. Earth Sci. 6. https://doi.org/10.3389/feart.2018.00187
Nanayakkara, C.E., Pettibone, J., Grassian, V.H., 2012. Sulfur dioxide adsorption and photooxidation on
isotopically-labeled titanium dioxide nanoparticle surfaces: roles of surface hydroxyl groups and
adsorbed water in the formation and stability of adsorbed sulfite and sulfate. Phys. Chem. Chem.
Phys. 14, 6957–6966. https://doi.org/10.1039/C2CP23684B
Prospero, J.M., Ginoux, P., Torres, O., Nicholson, S.E., Gill, T.E., 2002. Environmental Characterization
of Global Sources of Atmospheric Soil Dust Identified with the Nimbus 7 Total Ozone Mapping
Spectrometer (toms) Absorbing Aerosol Product. Reviews of Geophysics 40, 2-1-2–31.
https://doi.org/10.1029/2000RG000095
Schepanski, K., 2018. Transport of Mineral Dust and Its Impact on Climate. Geosciences 8, 151.
https://doi.org/10.3390/geosciences8050151
Schmidt, A., Ostro, B., Carslaw, K.S., Wilson, M., Thordarson, T., Mann, G.W., Simmons, A.J., 2011.
Excess mortality in Europe following a future Laki-style Icelandic eruption. PNAS 108, 15710–
15715. https://doi.org/10.1073/pnas.1108569108
Stevenson, D.S., Johnson, C.E., Highwood, E.J., Gauci, V., Collins, W.J., Derwent, R.G., 2003.
Atmospheric impact of the 1783–1784 Laki eruption: Part I Chemistry modelling. Atmos. Chem.
Phys. 3, 487–507. https://doi.org/10.5194/acp-3-487-2003
Tang, M., Cziczo, D.J., Grassian, V.H., 2016. Interactions of Water with Mineral Dust Aerosol: Water
Adsorption, Hygroscopicity, Cloud Condensation, and Ice Nucleation. Chem. Rev. 116, 4205–
4259. https://doi.org/10.1021/acs.chemrev.5b00529

203 Chapter VI. How atmospherically relevant is to use mineral proxies to mimic the reactivity of natural dust samples? A reactivity
study using SO2 as probe molecule
Urupina, D., Gaudion, V., Romanias, M.N., Verriele, M., Thevenet, F., 2020. Method development and
validation for the determination of sulfites and sulfates on the surface of mineral atmospheric
samples using reverse-phase liquid chromatography. Talanta 219, 121318.
https://doi.org/10.1016/j.talanta.2020.121318
Urupina, D., Lasne, J., Romanias, M.N., Thiery, V., Dagsson-Waldhauserova, P., Thevenet, F., 2019.
Uptake and surface chemistry of SO2 on natural volcanic dusts. Atmospheric Environment 217,
116942. https://doi.org/10.1016/j.atmosenv.2019.116942
US EPA, O., 2016. Sulfur Dioxide Basics [WWW Document]. US EPA. URL https://www.epa.gov/so2-
pollution/sulfur-dioxide-basics (accessed 8.14.20).
Usher, C.R., Al-Hosney, H., Carlos-Cuellar, S., Grassian, V.H., 2002. A laboratory study of the
heterogeneous uptake and oxidation of sulfur dioxide on mineral dust particles. J.-Geophys.-Res.
107, 4713. https://doi.org/10.1029/2002JD002051
Usher, C.R., Michel, A.E., Grassian, V.H., 2003. Reactions on Mineral Dust. Chem. Rev. 103, 4883–4940.
https://doi.org/10.1021/cr020657y
Vodyanitskii, Yu.N., 2018. Elements oxides as a source of errors in the gross chemical composition of soil
and ways to eliminate the errors. Annals of Agrarian Science 16, 90–93.
https://doi.org/10.1016/j.aasci.2017.09.003
Wang, T., Liu, Y., Deng, Y., Fu, H., Zhang, L., Chen, J., 2018a. Emerging investigator series: heterogeneous
reactions of sulfur dioxide on mineral dust nanoparticles: from single component to mixed
components. Environ. Sci.: Nano 5, 1821–1833. https://doi.org/10.1039/C8EN00376A
Wang, T., Liu, Y., Deng, Y., Fu, H., Zhang, L., Chen, J.-M., 2018b. Adsorption of SO 2 on mineral dust
particles influenced by atmospheric moisture. Atmospheric Environment 191.
https://doi.org/10.1016/j.atmosenv.2018.08.008
Wang, X., Romanias, M.N., Pei, Z., Rousseau, A., Thévenet, F., 2020. Uptake Mechanism of Acetic Acid
onto Natural Gobi Dust. ACS Earth Space Chem. 4, 1650–1662.
https://doi.org/10.1021/acsearthspacechem.0c00168
Wu, L.Y., Tong, S.R., Wang, W.G., Ge, M.F., 2011. Effects of temperature on the heterogeneous oxidation
of sulfur dioxide by ozone on calcium carbonate. Atmospheric Chemistry and Physics 11, 6593–
6605. https://doi.org/10.5194/acp-11-6593-2011
Zhang, X., Zhuang, G., Chen, J., Wang, Y., Wang, X., An, Z., Zhang, P., 2006. Heterogeneous Reactions
of Sulfur Dioxide on Typical Mineral Particles. J. Phys. Chem. B 110, 12588–12596.
https://doi.org/10.1021/jp0617773
Zhang, Y., Tong, S., Ge, M., Jing, B., Hou, S., Tan, F., Chen, Y., Guo, Y., Wu, L., 2018. The influence of
relative humidity on the heterogeneous oxidation of sulfur dioxide by ozone on calcium carbonate
particles. Sci. Total Environ. 633, 1253–1262. https://doi.org/10.1016/j.scitotenv.2018.03.288
Zuo, Y., Chen, H., 2003. Simultaneous determination of sulfite, sulfate, and hydroxymethanesulfonate in
atmospheric waters by ion-pair HPLC technique. Talanta 59, 875–881.
https://doi.org/10.1016/S0039-9140(02)00647-1

204 Chapter VI. How atmospherically relevant is to use mineral proxies to mimic the reactivity of natural dust samples? A reactivity
study using SO2 as probe molecule

Chapter VII. Investigating the distributions of sulfites and sulfates
on the surface of natural volcanic dusts

206 Chapter VII. Investigating the distributions of sulfites and sulfates on the surface of natural volcanic dusts
Table of content of Chapter 7
1 Introduction .......................................................................................................................................... 210
2 Specific experimental considerations for the investigation of sulfite and sulfate distribution ............ 211
3 Results and discussion ......................................................................................................................... 211
3.1 Investigating the influence of RH on the formation of sulfites and sulfates on the surface of natural
dusts ..................................................................................................................................................... 211
3.2 Investigating the influence of the surface elemental composition on the formation of sulfites and
sulfates at different values of RH ........................................................................................................ 217
3.3 Sulfite and sulfate formation as a function of time. Stability of surface species. ........................ 220
3.3.1 What happens on the surface of a natural dust particle subjected to SO2? ........................... 220
3.3.2 What happens on the surface of a natural dust particle previously subjected to SO2 when the
gas is no longer available? .............................................................................................................. 225
3.3.3 What happens on the surface of a natural dust particle when ageing with SO2 on ppb level?
227
4 Conclusions .......................................................................................................................................... 228
References ................................................................................................................................................. 230

207 Chapter VII. Investigating the distributions of sulfites and sulfates on the surface of natural volcanic dusts
List of Tables of Chapter 7
Table 1: Relationship between elemental surface composition and the amount of sulfites and sulfates formed on the
surface. ........................................................................................................................................................ 218

208 Chapter VII. Investigating the distributions of sulfites and sulfates on the surface of natural volcanic dusts
List of Figures of Chapter 7
Figure 1: HPLC analysis of mineral and volcanic dust samples 30 mg-180 mg, 175 ppm of SO2, extracted with 2 ml
of 1% Formalin, sonicated for 10 min. (a) Amount of sulfites and sulfates formed on the sulface of volcanic
and desert dusts while aging with 175 ppm SO2 for 1 hr at different values of relative humidity: 0, 30, and
60 and 83 % RH. (b) Total amount sulfur formed on the sulface of volcanic and desert dusts while aging
with 175 ppm SO2 for 1 hr at different values of relative humidity: 0, 30, and 60 and 83 % RH. ........... 213
Figure 2: Various scenarios leading to the formation of sulfites and sulfates as observed on the Hagavatn v-dust when
detected with HPLC. Remember that only sulfites (blue circles) and sulfates (red circles) are detected by
HPLC technique. SO2 gas (yellow circles) is not detected by HPLC. The total sulfur content of the adsorbed
sulfites and sulfates as a function of RH is kept constant as was evidenced for Hagavatn dust earlier. ... 215
Figure 3: Various scenarios leading to the formation of sulfites and sulfates as observed on the Gobi dust when detected
with HPLC. Remember that only sulfites (blue circles) and sulfates (red circles) are detected by HPLC
technique. SO2 gas (yellow circles) is not detected by HPLC. The total sulfur content of the adsorbed
sulfites and sulfates is increasing as a function of RH. ............................................................................. 216
Figure 4: Dependence of the amount of sulfites quantified on the surface of eight natural dusts on the samples’ surface
ratio of (Ti+Fe) over Si. Surface elemental composition expressed in % element by weight was obtained
from XRD measurements (See Chapter 2 Section 1.2.4). Ageing conditions: 1 hr, 175 ppm SO2, 30% RH.
.................................................................................................................................................................. 219
Figure 5: Dependence of the amount of sulfates quantified on the surface of eight natural dusts on the samples’ surface
ratio of Na over Si. Surface elemental composition expressed in % element by weight was obtained from
XRD measurements (See Chapter 2 Section 1.2.4). Ageing conditions: 1 hr, 175 ppm SO2, 0% RH. ..... 219
Figure 6: HPLC analysis of desert and volcanic dust samples 0,089-0,194 g, aged for up to 1400 min, 175 ppm of
SO2, 30 % RH extracted with 2 ml of 1% Formalin, sonicated for 10 min (a) Formation of sulfites on the
surface of volcanic and desert dusts as a function time, (b) Formation of sulfates on the surface on the
surface of volcanic and desert dusts as a function time, (c) Total sulfur content of various volcanic and
desert dusts at 1 hr and 24 hr. ................................................................................................................... 223
Figure 7: Ageing profiles of Hagavatn volcanic dust sample exposed to 175 ppm SO2 for up to 4320 min (72 hours)
HPLC analysis 0,086-0,192 g, 30 % RH extracted with 2 ml of 1% Formalin, sonicated for 10 min. (a)
Profiles of sulfites and sulfates formed on the surface of Hagavatn v-dust as a function of time while ageing
with 175 ppm SO2, (b) Total amount of sulfur formed of the surface of Hagavatn v-dust as a function of
time while ageing with 175 ppm SO2. ...................................................................................................... 224
Figure 8: HPLC analysis of the volcanic and mineral dusts aged with 175 ppm SO2 for 1 hr and then kept for 20 or 30
hr in a closed container. 30 % RH was maintained during experiments. HPLC analysis 0,082-0,189 g,
extracted with 2 ml of 1% Formalin, sonicated for 10 min. (a) Amount of sulfites and sulfates formed on
the surface of dusts while aging with 175 ppm SO2 for 1 hr and then keeping them in a closed container,

209 Chapter VII. Investigating the distributions of sulfites and sulfates on the surface of natural volcanic dusts
(b) Total amount of sulfur formed on the surface of dusts while aging with 175 ppm SO2 for 1hr and then
keeping them for in a closed container. .................................................................................................... 226
Figure 9: Ageing profiles of Mýrdalssandur volcanic dust sample exposed to 175 ppm SO2 for up to 24 and 75 ppb
for up to 120 hr. ........................................................................................................................................ 228

210 Chapter VII. Investigating the distributions of sulfites and sulfates on the surface of natural volcanic dusts
1 Introduction
In this chapter, the influence of humidity and elemental composition on the formation of sulfites
and sulfates on the surface of v-dust was investigated using the HPLC method introduced and developed in
Chapter 5. Desert dusts were likewise studied to put the findings in a more global context. In Chapter 3 we
already evidenced an increase of the uptake of SO2 molecules on the surface of two natural v-dusts,
Hagavatn and Myrdalssandur, as a function of RH, using flow-tube reactor. This trend was confirmed in
Chapter 4 by following the formation of surface sulfate species on Hagavatn v-dust using DRIFTS optical
cell (Urupina et al., 2019). In the literature, various studies report an increase of sulfate formation with the
increase of RH. For instance, Huang et al. observed the phenomena on the surface of Arizona Test Dust
and Tengger Desert Dust and explained it by an accelerated hydration of SO2 in the presence of adsorbed
water (Huang et al., 2015). Most of the studies, though, limit themselves to the investigation of sulfates as
the final oxidation product and ignore the sulfite intermediate while this compounds can be meaningful
regarding the surface reactivity of the dust sample (Wang et al., 2018). Indeed, quantification of sulfites
along with sulfates could provide a more comprehensive description of the SO2 adsorption and
transformation. To the best of our knowledge this is the first study aiming to simultaneously quantitatively
evaluate both sulfites and sulfates formed on the surface of natural dusts at different levels of humidity. The
method developed earlier enabled the individual investigation of both surface species, providing a full
picture of the conversion of SO2 gas to sulfates (Urupina et al., 2020).
Due to the wide range of temperatures (1100 to 230K) and levels of RH (few percent to 100%) in
the volcanic plumes, no fixed experimental conditions are able to fully represent heterogeneous interactions
during volcanic eruptions (Textor et al., 2003). This chapter is more relevant to the investigations of the
processes that happen in the plume as opposed to the processes at high temperatures that happen in the
volcanic vent. Experiments were run at atmospherically relevant conditions: various RH values,
atmospheric pressure of 760 Torr, room temperature, 293 K. The concentration of SO2 is kept at elevated
level of 175 ppm in order to speed up a relatively long ageing process. The validity of this approximation
is addressed at the end of this chapter (Section 3.3.3) in order to estimate how atmospherically relevant is
the one-hour ageing performed at 175 ppm SO2 to processes that happen on the scale of days or weeks, but
with much lower concentrations. Additionally, a search for the elements that might influence the formation
of sulfites and sulfates on the surface of dust was undertaken. Next, long-time ageing profiles (for at least
24 hours) for sulfites and sulfates were conducted to quantitatively evaluate the capacity of dusts to store
sulfur species. Stability of the adsorbed species was likewise addressed. This information will hopefully
enable us to better evaluate the impact of dust on atmospheric processes, such as ability of dusts to remove

211 Chapter VII. Investigating the distributions of sulfites and sulfates on the surface of natural volcanic dusts
SO2, potential change of reactivity of the dusts followed by the formation of surface sulfur species, and the
hygroscopic and optical properties of the dust aged with SO2.
Finally, we evaluated whether ageing the dusts with high SO2 concentration of 175 ppm is justified
for atmospheric investigations. For this matter we performed long term ageing of dusts for up to 5 days
with atmospherically relevant concentration of 75 ppb SO2. We then compared the results obtained
employing one-hour ageing with 175 ppm SO2 to the results obtained using 75 ppb SO2 in order to find
how the concentration of SO2 influences the formation of sulfur surface species.
2 Specific experimental considerations for the investigation of sulfite and
sulfate distribution
To evaluate the influence of humidity on sulfite and sulfate formation on the surface, five volcanic
dusts and three desert dusts described and characterized earlier (Chapter II Section 1.1 and Section 1.2 )
were investigated under various conditions of humidity: 0%, 30%, 60%, and 83 %. A detailed description
of the setup, as well as the method for dust ageing and sulfite/sulfate quantification is provided in Chapter
2 and Chapter 5. Ageing profiles for up to 24 hr using 175 ppm SO2 were obtained for all the samples at
30% RH. The Hagavatn sample was additionally aged at 175 ppm SO2 for 38 hr, 45 hr, 54 hr and 72 hr.
Further transformation of the surface species in the absence of SO2 was investigated by (i) ageing the
samples for 1 hr with 175 ppm SO2 followed by flushing with air (ii) ageing a dust for 1hr with 175 ppm
SO2, transferring it in a 7 ml vial and keeping it closed for a 20 to 30 hr before HPLC analysis. To evaluate
whether ageing the dusts with high SO2 concentrations of 175 ppm is justified for atmospheric
investigations a Mýrdalssandur dust was aged at atmospherically relevant 75 ppb SO2 for 5 hr, 20 hr and
120 hr (5 days). This dust was chosen due to the fact that it demonstrated a particularly high amount of
sulfites and sulfates on the surface (Chapter 6).
3 Results and discussion
3.1 Investigating the influence of RH on the formation of sulfites and sulfates on the surface of
natural dusts
The first step in the investigation of the behavior of dusts of volcanic and desert origin was to
subject them to 1 hr ageing with SO2 gas, 175 ppm, at different levels of relative humidity, such as 0%,
30%, 60%, and 83%. One hour ageing was selected based on the fact that within this time period sulfites
already reach a stable level, while sulfates are formed in detectable amounts and keep increasing. Formation
of both species is necessary to study the reaction mechanism. Longer ageing would be beneficial for the

212 Chapter VII. Investigating the distributions of sulfites and sulfates on the surface of natural volcanic dusts
detection of sulfates. At the same time the longer is the experiment the more the surface is modified. It is
probable that intensive surface modifications at long ageing times could obscure information of the
“pristine” chemical composition with the sulfites/sulfates formation. Thus, one hour ageing is a compromise
between relevant shorter time of ageing and ability to observe sulfites and sulfates.
From Figure 1A it can be observed that with increase of humidity from 0 to 83 % the amount of
sulfites on the surface is decreasing for all samples. Meanwhile, the amount of sulfates is increasing from
0 to 60% RH, after which level the amount of sulfates formed either stabilizes within the relative error or
keeps increasing to a lower extent. Arizona test dust seems to be an exception to the rule as its sulfate
content is slightly decreasing from 60 to 83 % RH. For the majority of samples the increase in the sulfate
formation is visibly higher than the decrease in sulfite formation. In addition, most of v-dusts form higher
amount of sulfites than desert dusts. This difference could be related to the surface composition of the dusts
and is addressed later in Section 3.2. Figure 1B evaluates the total amount of sulfur-based species formed
on the surface as a function of humidity. As a general rule, with exception of Hagavatn, the total amount of
sulfur-based species increases as a function of RH.
0,0
100,0
200,0
300,0
400,0
500,0
600,0
700,0
800,0
Hag
avat
n 0
%H
agav
atn
30
%H
agav
atn
60
%H
agav
atn
83
%
Mae
lifel
lsan
du
r 0
%M
aelif
ells
and
ur
30
%M
aelif
ells
and
ur
60
%M
aelif
ells
and
ur
83
%
Myr
dal
ssan
du
r 0
%M
yrd
alss
and
ur
30
%M
yrd
alss
and
ur
60
%M
yrd
alss
and
ur
83
%
Dyn
gju
san
du
r 0
%D
yngj
usa
nd
ur
30
%D
yngj
usa
nd
ur
60
%D
yngj
usa
nd
ur
83
%
Eyja
fjal
lajo
kull
0%
Eyja
fjal
lajo
kull
30
%Ey
jafj
alla
joku
ll 6
0%
Eyja
fjal
lajo
kull
83
%
M B
ou
r 0
%M
Bo
ur
30
%M
Bo
ur
60
%M
Bo
ur
83
%
Go
bi
0%
Go
bi
30
%G
ob
i 6
0%
Go
bi
83
%
ATD
0%
ATD
30
%A
TD 6
0%
ATD
83
%
Mas
s o
f su
lfit
es/s
ulf
ates
per
sp
ecif
ic s
urf
ace
un
it (
µg/
m²)
a)
sulfites sulfates

213 Chapter VII. Investigating the distributions of sulfites and sulfates on the surface of natural volcanic dusts
Figure 1: HPLC analysis of mineral and volcanic dust samples 30 mg-180 mg, 175 ppm of SO2, extracted with 2 mL of 1%
Formalin, sonicated for 10 min. (a) Amount of sulfites and sulfates formed on the sulface of volcanic and desert dusts while aging
with 175 ppm SO2 for 1 hr at different values of relative humidity: 0, 30, and 60 and 83 % RH. (b) Total amount sulfur formed on
the sulface of volcanic and desert dusts while aging with 175 ppm SO2 for 1 hr at different values of relative humidity: 0, 30, and 60 and 83 % RH.
Based on Figure 1A and Figure 1 B the influence of humidity on the uptake and transformation of
SO2 can be interpreted and evaluated. Figure 1 provides information about (i) the influence of RH on the
transformation of adsorbed SO2 to sulfites, and sulfites to sulfates and (ii) the influence of RH on total sulfur
uptake. Note that the influence of humidity on the transformation of gas phase SO2 to adsorbed phase SO2
cannot be deduced from Figure 1, as we are unable to monitor and quantify molecularly adsorbed SO2 on
the surface with HPLC technique. Nevertheless, as discussed in chapter 4, DRIFTS experiments evidenced
the presence of physisorbed SO2 on the surface of v-dusts. Furthermore, as a reminder, flow-tube
experiments revealed an increase in the total number of molecules of SO2 lost from the gas phase as a
function of RH (Chapter 3), which, while not directly related to the increase of physisorbed SO2, signifies
that the transformation of SO2 to surface species seems to be enhanced in presence of water.
The reactions of SO2 with the surface can be simplified in the following way based on the reactions
discussed earlier (Chapter 4):
Reaction A SO2(g) ↔ SO2(ads)
Reaction B SO2(ads) 𝑶𝑯 𝒈𝒓𝒐𝒖𝒑 𝒐𝒓 𝒍𝒂𝒕𝒕𝒊𝒄𝒆 𝑶𝒙𝒚𝒈𝒆𝒏→ SO3
2-
0
50
100
150
200
250H
agav
atn
0%
Hag
avat
n 3
0%
Hag
avat
n 6
0%
Hag
avat
n 8
3%
Mae
lifel
lsan
du
r 0
%M
aelif
ells
and
ur
30
%M
aelif
ells
and
ur
60
%M
aelif
ells
and
ur
83
%
Myr
dal
ssan
du
r 0
%M
yrd
alss
and
ur
30
%M
yrd
alss
and
ur
60
%M
yrd
alss
and
ur
83
%
Dyn
gju
san
du
r 0
%D
yngj
usa
nd
ur
30
%D
yngj
usa
nd
ur
60
%D
yngj
usa
nd
ur
83
%
Eyja
fjal
lajo
kull
0%
Eyja
fjal
lajo
kull
30
%Ey
jafj
alla
joku
ll 6
0%
Eyja
fjal
lajo
kull
83
%
M B
ou
r 0
%M
Bo
ur
30
%M
Bo
ur
60
%M
Bo
ur
83
%
Go
bi
0%
Go
bi
30
%G
ob
i 6
0%
Go
bi
83
%
ATD
0%
ATD
30
%A
TD 6
0%
ATD
83
%
Mas
s o
f to
tal s
ulf
ur
per
sp
ecif
ic s
urf
ace
un
it (
µg/
m²)
b)
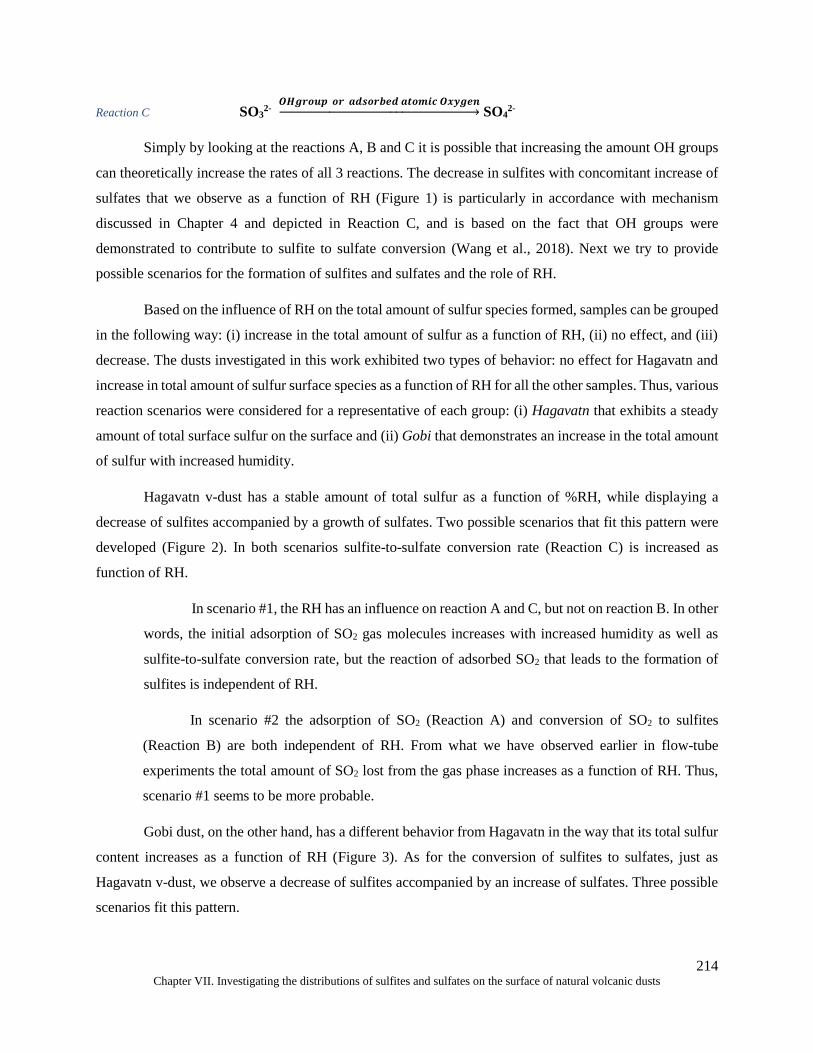
214 Chapter VII. Investigating the distributions of sulfites and sulfates on the surface of natural volcanic dusts
Reaction C SO32- 𝑶𝑯𝒈𝒓𝒐𝒖𝒑 𝒐𝒓 𝒂𝒅𝒔𝒐𝒓𝒃𝒆𝒅 𝒂𝒕𝒐𝒎𝒊𝒄 𝑶𝒙𝒚𝒈𝒆𝒏→ SO4
2-
Simply by looking at the reactions A, B and C it is possible that increasing the amount OH groups
can theoretically increase the rates of all 3 reactions. The decrease in sulfites with concomitant increase of
sulfates that we observe as a function of RH (Figure 1) is particularly in accordance with mechanism
discussed in Chapter 4 and depicted in Reaction C, and is based on the fact that OH groups were
demonstrated to contribute to sulfite to sulfate conversion (Wang et al., 2018). Next we try to provide
possible scenarios for the formation of sulfites and sulfates and the role of RH.
Based on the influence of RH on the total amount of sulfur species formed, samples can be grouped
in the following way: (i) increase in the total amount of sulfur as a function of RH, (ii) no effect, and (iii)
decrease. The dusts investigated in this work exhibited two types of behavior: no effect for Hagavatn and
increase in total amount of sulfur surface species as a function of RH for all the other samples. Thus, various
reaction scenarios were considered for a representative of each group: (i) Hagavatn that exhibits a steady
amount of total surface sulfur on the surface and (ii) Gobi that demonstrates an increase in the total amount
of sulfur with increased humidity.
Hagavatn v-dust has a stable amount of total sulfur as a function of %RH, while displaying a
decrease of sulfites accompanied by a growth of sulfates. Two possible scenarios that fit this pattern were
developed (Figure 2). In both scenarios sulfite-to-sulfate conversion rate (Reaction C) is increased as
function of RH.
In scenario #1, the RH has an influence on reaction A and C, but not on reaction B. In other
words, the initial adsorption of SO2 gas molecules increases with increased humidity as well as
sulfite-to-sulfate conversion rate, but the reaction of adsorbed SO2 that leads to the formation of
sulfites is independent of RH.
In scenario #2 the adsorption of SO2 (Reaction A) and conversion of SO2 to sulfites
(Reaction B) are both independent of RH. From what we have observed earlier in flow-tube
experiments the total amount of SO2 lost from the gas phase increases as a function of RH. Thus,
scenario #1 seems to be more probable.
Gobi dust, on the other hand, has a different behavior from Hagavatn in the way that its total sulfur
content increases as a function of RH (Figure 3). As for the conversion of sulfites to sulfates, just as
Hagavatn v-dust, we observe a decrease of sulfites accompanied by an increase of sulfates. Three possible
scenarios fit this pattern.

215 Chapter VII. Investigating the distributions of sulfites and sulfates on the surface of natural volcanic dusts
Figure 2: Various scenarios leading to the formation of sulfites and sulfates as observed on the Hagavatn v-dust when detected
with HPLC. Remember that only sulfites (blue circles) and sulfates (red circles) are detected by HPLC technique. SO2 gas (yellow
circles) is not detected by HPLC. The total sulfur content of the adsorbed sulfites and sulfates as a function of RH is kept constant as was evidenced for Hagavatn dust earlier.
In scenario #1 all three steps are increased as a function of RH: adsorption of SO2 molecules
on the surface (Reaction A), conversion of SO2 ads to SO32- (Reaction B), and, finally SO3
2- to SO42-
(Reaction C). This scenario reflects well the increase of the total number of SO2 lost from the gas
phase as a function of RH observed in reactions with flow-tubes using v-dusts.
In scenario #2 Reaction A and C are dependent on RH, while Reaction B is not. This
scenario reflects the possibility that conversion of SO2 ads to SO32- is not reliant on RH. In this case
all SO2 molecules adsorbed on the surface are converted to sulfites.
In scenario #3 the number of SO2 molecules physisorbed on the surface does not depend
on RH (Reaction A), but both the conversion of SO2 ads to SO32- (Reaction B) and SO3
2- to SO42- do
(Reaction C). This scenario though does not explain increased amount of SO2 lost from the gas
phase as a function of RH.
Thus, scenarios is #1 and #2 are more likely, as both fit the increase in the total SO2 lost from the
gas phase observed in flow-tube experiments. Note, that effectively scenario #2 for Gobi is the same as
scenario #1 for Hagavatn: in both cases Reaction A and Reaction C depend on RH while Reaction B does
not.

216 Chapter VII. Investigating the distributions of sulfites and sulfates on the surface of natural volcanic dusts
Figure 3: Various scenarios leading to the formation of sulfites and sulfates as observed on the Gobi dust when detected with
HPLC. Remember that only sulfites (blue circles) and sulfates (red circles) are detected by HPLC technique. SO2 gas (yellow circles) is not detected by HPLC. The total sulfur content of the adsorbed sulfites and sulfates is increasing as a function of RH.
To sum up, the most likely scenarios in case of both Hagavatn and Gobi dusts include
dependence of the Reaction A and Reaction C on relative humidity. The presence of water molecules
creates new active sites where SO2 can be taken up more efficiently (Reaction A) as well as supplies
OH groups for sulfite to sulfate conversion (Reaction C).

217 Chapter VII. Investigating the distributions of sulfites and sulfates on the surface of natural volcanic dusts
Nevertheless, these theoretical scenarios aim to demonstrate the impact of RH on the distribution
of sulfites and sulfates. Dusts can potentially exhibit a range of behaviors: it is possible to observe a very
low amount of sulfates at high RH levels and a very low amount of sulfites at low levels RH. The latter
seems to be the case for Eyjafjallajökull v-dust and Arizona desert dusts that convert sulfites to sulfates so
fast that we are only able to witness sulfites at 0% RH.
Another way of evaluating the influence of RH on the formation of surface sulfur species is
evaluating % coverage of the species in question. Formation of total sulfur species on the surface of v-dust
increases as a function of humidity for 7 out of 8 samples, the exception being Hagavatn v-dust, where the
total amount of sulfur species remains relatively stable. Following the calculations of Romanias et al. a
fully-stacked monolayer for sulfurous or sulfuric acid is composed of NH2SO3 = 5.75 × 10¹⁴ molecules cm-2
and N H2SO4 = 4.22 × 10¹⁴ molecules cm-2 respectively (Romanias et al., 2016). Thus, the amount of sulfur
species measured on the surface of dust at different RH levels was converted in molecules cm-2 and using
a total number of molecules necessary to form a monolayer, %coverage of sulfites and sulfates was
calculated. It ranges from 5% total sulfur species coverage at 0% RH to about 60% total sulfur species
coverage at 83% RH. Considering the fact that not all surface sites are involved in adsorption of SO2
molecules, as was demonstrated in case of quartz and silica in Chapter 6 (neither sulfites, nor sulfates
observed), it is possible that the dusts in question reach a monolayer of sulfur species at elevated levels of
RH.
3.2 Investigating the influence of the surface elemental composition on the formation of sulfites
and sulfates at different values of RH
To investigate the influence of the surface composition on the formation of sulfites and sulfates
five mineral dusts and three desert dusts were aged for 1 hr under 4 levels of relative humidity: 0%, 30%,
60% and 83 %. Percent surface composition of Si, Al, Fe, Ti, K, Ca, Na, Mg and Mn for five mineral dusts
and three desert dusts was plotted as a function of the amount of sulfites and sulfates measured on the
surface. The selected results that suggested a correlation are displayed in Table 1.
Interactions of SO2 gas with volcanic dust can be studied from two different angles. At 0% RH
information on interactions with pure mineral surfaces is revealed, while at higher % humidity the
importance of the presence of water on these processes can be evaluated. In the former case we can elucidate
which element is associated with the formation of which surface species. In the latter case information about
complex influence of water on the adsorption processes is highlighted.

218 Chapter VII. Investigating the distributions of sulfites and sulfates on the surface of natural volcanic dusts
An increase in sulfite surface concentration was observed as a function of Ti and Fe content.
Formation of sulfites on the surface of pure oxides of titanium and iron was observed earlier (Chapter 6).
While studying natural samples it is logical to try to look for the trends including the highest amount of
elements as they are a better fit to represent a complex mixture. The best correlation trends were found for
(Fe+Ti)/Si (Table 1, Figure 4). Elemental Si was included based on the fact that it represents the most
abundant element on the surface of dust. When moving from 0 to 30% RH the slope of the fit doesn’t
change which means that the dependence of the amount of the sulfites formed on the % composition stays
the same. The intercept of the graph decreases due to the decreased amount of sulfites quantified on the
surface at 30 % as opposed to 0% due to their increased transformation to sulfates. At 60 and 83 % the
trends are completely lost (the correlation coefficient is below 0.6) most probably due to the fact that water
dominates transformation of SO2. Hence, elemental composition seems to play an important role in the
range from 0 to 30% humidity. It can be hypothesed that the formation of a water monolayer observed
around 30% RH minimizes the direct influence of surface elements on the formation sulfites (Joshi et al.,
2017), (Lathem et al., 2011), (Ibrahim et al., 2018).
As for sulfates, the only trend found is the increase in the amount of sulfates as a function % Na
observed under dry conditions (Figure 5). The lack of the correlation at higher %RH is most probably due
to the fact that OH groups play a dominant role in sulfate formation and therefore in the presence of
humidity a direct correlation of surface sulfates with Na or any other element is not observed.
Table 1: Relationship between elemental surface composition and the amount of sulfites and sulfates formed on the surface.
Ion RH (%) Element Linear regression
equation
R2 Slope
Sulfite (SO32-) 0 (Ti+Fe)/Si y = 188,83x + 9,2685 R² = 0,7108 188,8
30 (Ti+Fe)/Si y = 187,5x – 12,954 R² = 0,8796 187,5
Sulfate (SO42-) 0 Na y = 4,8263x + 1,1151 R² = 0,9369 4,8

219 Chapter VII. Investigating the distributions of sulfites and sulfates on the surface of natural volcanic dusts
Figure 4: Dependence of the amount of sulfites quantified on the surface of eight natural dusts on the samples’ surface ratio of
(Ti+Fe) over Si. Surface elemental composition expressed in % element by weight was obtained from XRD measurements (See
Chapter 2 Section 1.2.4). Ageing conditions: 1 hr, 175 ppm SO2, 30% RH.
Figure 5: Dependence of the amount of sulfates quantified on the surface of eight natural dusts on the samples’ surface ratio of Na
over Si. Surface elemental composition expressed in % element by weight was obtained from XRD measurements (See Chapter 2 Section 1.2.4). Ageing conditions: 1 hr, 175 ppm SO2, 0% RH.
Surface composition plays an important role in sulfite/sulfate formation. Else, we would not
observe a vast variety of trends in their formation on the surface of mineral dusts. Finding the trends though
is complicated by the heterogeneous nature of samples, where the same element can be found as a
constituent of different mineral phases. In addition, surface composition could influence the uptake of
water, which plays a key role by participating in the formation of sulfites and sulfates, further complicating
finding the trends with elemental composition. Nevertheless, higher amounts of sulfites are observed as a

220 Chapter VII. Investigating the distributions of sulfites and sulfates on the surface of natural volcanic dusts
function of Ti and Fe surface composition at 0 and 30% RH, while Na is positively associated with the
amount of sulfates formed on the surface at 0% RH. A great approach would be to evaluate the influence
of surface water uptake as a function of elemental composition, as it actually might be the water that controls
the amount of sulfites and sulfates formed.
3.3 Sulfite and sulfate formation as a function of time. Stability of surface species.
3.3.1 What happens on the surface of a natural dust particle subjected to SO2?
In order to study the temporal evolution of sulfur species on the surface, volcanic and desert dust
samples were exposed to 175 ppm SO2 at room temperature at 30 % RH for increasing time intervals (from
a few minutes up to 24 hr). The choice of 30% RH was based on two criteria: (i) both sulfites and sulfates
were observed for most samples (as opposed to mostly sulfites at 0% RH and mostly sulfates at 83% RH),
(ii) both surface sites and water molecules influence adsorption at this RH, as was demonstrated in previous
section. Blanks of each dust were run and subtracted from the investigated samples. Figure 6 shows the
ageing profiles of sulfites and sulfates on the surface of five volcanic dusts and three desert mineral dusts.
Mineral desert dusts showed a lower amount of sulfites but a higher amount of sulfates per specific
surface unit of dust in comparison with v-dusts. Another trend for both desert and volcanic dusts is that
sulfite formation reaches a plateau fast, around 30 min, while sulfates keep increasing for most of the
samples. Sulfate formation rate gradually decreases for all samples. For v-dust it slows down considerably
at around 6 hours, for desert mineral dust - after 16 hr. In the case of Arizona dust and Eyjafjallajokull v-
dust no sulfites were observed at 30% RH, indicating an ability of the surface to convert sulfites to sulfates
very quickly. It was suggested in the literature that the fact that fresh v-ash has been recently exposed to
acids in the plume would make it less likely to adsorb SO2 gas due to pH-dependent solubility of acid
dissolution (Ayris and Delmelle, 2012). In the case of Eyjafjallajokull it is definitely not the case. Even
though it is a fresh dust that has a much higher amount of sulfates determined in the blanks (167 µg/m2 for
Eyjafjallajokull vs 0-36 µg/m2 for other samples), it is still active in accumulation of sulfates. At 24 hours,
the total sulfur species coverage roughly ranges from 20% to 60% of the total surface coverage. As it was
noted earlier, lower limit of 60% could indicate formation of sulfur species monolayer, as some parts of the
particles, notably quartz, are not expected to form sulfur species.

221 Chapter VII. Investigating the distributions of sulfites and sulfates on the surface of natural volcanic dusts
0
20
40
60
80
100
120
140
160
0,00 5,00 10,00 15,00 20,00 25,00
Mas
s o
f su
lfit
es p
er s
pec
ific
su
rfac
e u
nit
(µ
g/m
²)
Time (hr)
a)
Dyngjussandur Hagavatn Maellidellsandur Myrdalssandur M'Bour Gobi

222 Chapter VII. Investigating the distributions of sulfites and sulfates on the surface of natural volcanic dusts
0
50
100
150
200
250
300
350
400
450
500
0,00 5,00 10,00 15,00 20,00 25,00
Mas
s o
f su
lfat
es p
er s
pec
ific
su
rfac
e u
nit
(µ
g/m
²)
Time (hr)
b)
Eyjafjallajokull Dyngjussandur Hagavatn Maellifelssandur
Myrdalssandur M Bour Gobi Arizona

223 Chapter VII. Investigating the distributions of sulfites and sulfates on the surface of natural volcanic dusts
Figure 6: HPLC analysis of desert and volcanic dust samples 0,089-0,194 g, aged for up to 1400 min, 175 ppm of SO2, 30 % RH
extracted with 2 mL of 1% Formalin, sonicated for 10 min (a) Formation of sulfites on the surface of volcanic and desert dusts as
a function time, (b) Formation of sulfates on the surface on the surface of volcanic and desert dusts as a function time, (c) Total sulfur content of various volcanic and desert dusts at 1 hr and 24 hr.
To further investigate the formation of sulfites and sulfates at longer time scales, a sample of
Hagavatn dust was aged for 72 hours. Figure 7 shows the profile sulfur based surface species of this dust
with time.
An increase in the amount of sulfates is observed till 38 hours after which a stable amount of
sulfates is monitored from 38 to 72 hours. Remember that previously, in Chapter 4, while interpreting the
results of ageing of Hagavatn dust under similar experimental conditions (SO2 concentration, RH,
temperature) but using DRIFTS technique, we were not able to interpret the sulfate trend after 40 hours of
ageing due to high signal fluctuation. Further comparison of sulfite and sulfate trends by using HPLC and
DRIFTS techniques is provided in Chapter 8.
As for the sulfites, a slight decrease is observed at 38 hours and the amount is constant from 38 to
72 hours. In addition, if we look at the total number of sulfur adsorbed on the surface it stabilizes even
earlier at around 16 hours. It could mean that at 16 hours the surface approached its saturation limit. The
fact that finally not all sulfites are converted to sulfates at this RH level (30%) could be due to the fact that
a certain phase of the surface (most probably an Fe or Ti bearing mineral phase associated with the detection
0
20
40
60
80
100
120
140
160M
ass
of
tota
l su
rfu
r p
er s
pec
ific
su
rfac
e u
nit
(µg/
m²)
c)

224 Chapter VII. Investigating the distributions of sulfites and sulfates on the surface of natural volcanic dusts
of sulfites on the surface) is responsible for a very slow oxidation of sulfites to sulfates, thus effectively
hindering the conversion.
Figure 7: Ageing profiles of Hagavatn volcanic dust sample exposed to 175 ppm SO2 for up to 4320 min (72 hours)
HPLC analysis 0,086-0,192 g, 30 % RH extracted with 2 mL of 1% Formalin, sonicated for 10 min. (a) Profiles of sulfites and
sulfates formed on the surface of Hagavatn v-dust as a function of time while ageing with 175 ppm SO2, (b) Total amount of sulfur
formed of the surface of Hagavatn v-dust as a function of time while ageing with 175 ppm SO2.
0
20
40
60
80
100
120
140
160
180
0,00 10,00 20,00 30,00 40,00 50,00 60,00 70,00 80,00Mas
s o
f su
lfit
es/s
ulf
ates
per
sp
ecif
ic s
urf
ace
un
it
(µg/
m²)
Time (hr)
a)
sulfites sulfates
0
10
20
30
40
50
60
70
80
0,00 10,00 20,00 30,00 40,00 50,00 60,00 70,00 80,00
Mas
s o
f to
tal s
ulf
ur
per
sp
ecif
ic s
urf
ace
un
it
(µg/
m²)
Time (hr)
b)

225 Chapter VII. Investigating the distributions of sulfites and sulfates on the surface of natural volcanic dusts
3.3.2 What happens on the surface of a natural dust particle previously subjected to SO2 when the
gas is no longer available?
To evaluate what happens on the surface of v-dust that was previously exposed to volcanic SO2 gas
when the gas is no longer present in the volcanic plume or its concentration falls dramatically, it was decided
to age different v-dust and desert dust samples in the presence of 175 ppm SO2 for one hour and then flush
the samples with pure air. For comparison, desert mineral dust samples were subjected to the same
procedure. Under this protocol, we observed a slight decreasing trend for sulfites and a slight increasing
trend for sulfates.
Two different processes could explain the decreasing trend for sulfites: (i) desorption of sulfites
from the surface or (ii) their conversion to sulfates. In order to check whether sulfites can be easily detached
from the surface and partition to the gas phase, it was decided to bubble the airflow exiting the reactor
through two consecutive beakers containing 4 mL of 1% formalin each after turning off SO2 supply. One
and six hour ageing of Mýrdalssandur and M’Bour dusts with 175 SO2 was followed by one hour flushing.
In the blanks (after flowing SO2 gas through the system for 1 hr in the absence of dust and then passing
pure air through the setup including the beaker filled with 1% formalin for 1 hour) sulfites were identified
only in the first beaker suggesting effective reaction. Sulfites in excess of the blanks were not found in 1%
formalin upon bubbling the gas exiting the reactor containing aged dust. Therefore, the drop for sulfites can
only be explained as the conversion into sulfates. Note that sulfates do not react with 1% formalin, so
absence of sulfates in excess of the blanks in the exit beakers does not prove that they are not found in the
flow exiting the reactor.
The sulfite to sulfate conversion was further investigated in a closed system; where after exposure
of a v-dust or desert mineral dust sample to 175 ppm of SO2 gas for 1 hr, the dust was transferred to a closed
7 mL clear vial, where it remained for 20 or 30 hours before being analyzed. The conversion of sulfites to
sulfates in a closed system is illustrated in Figure 8. It is clearly observed that the amount of sulfites decrease
while the amount of sulfates increase for all dust samples which exhibited sulfites on the surface after 1 hr
exposure to SO2 gas. The dusts that exhibited the smallest amount of sulfites, such as M’Bour, and no
sulfites, such as Arizona desert dust, demonstrated a negligible increase in sulfates (that can be interpreted
as no increase in sulfates within statistical error). Sulfur balance is maintained within the error when cutting
the SO2 supply. Interestingly, even Eyjafjallajokull, for which determination of sulfites was not possible
(bellow detection limit), exhibited increase in sulfates. The reason could be related to the ability of this
particular dust to store high amounts of physisorbed SO2 on the surface. As the supply of SO2 is stopped
the stock of SO2 on the surface continues to feed the reaction (Reaction A). In this case transformation of
physisorbed SO2 to sulfites is a rate-limiting step (Reaction B). The conversion of sulfites to sulfates

226 Chapter VII. Investigating the distributions of sulfites and sulfates on the surface of natural volcanic dusts
(Reaction C) is fast, as was noted earlier, and explains reasonably well, why we observe no sulfites on the
surface of dust.
Figure 8: HPLC analysis of the volcanic and mineral dusts aged with 175 ppm SO2 for 1 hr and then kept for 20 or 30 hr in a
closed container. 30 % RH was maintained during experiments. HPLC analysis 0,082-0,189 g, extracted with 2 mL of 1% Formalin,
sonicated for 10 min. (a) Amount of sulfites and sulfates formed on the surface of dusts while aging with 175 ppm SO2 for 1 hr and
then keeping them in a closed container, (b) Total amount of sulfur formed on the surface of dusts while aging with 175 ppm SO2
for 1hr and then keeping them for in a closed container.
0,0
50,0
100,0
150,0
200,0
250,0
Mas
s o
f su
lfit
es/s
ulf
ates
per
sp
ecif
ic s
urf
ace
un
it
(µg/
m²)
a)
sulfites sulfates
0
10
20
30
40
50
60
70
80
Mas
s o
f to
tal s
ulf
ur
per
sp
ecif
ic s
urf
ace
un
it
(µg/
m²)
b)

227 Chapter VII. Investigating the distributions of sulfites and sulfates on the surface of natural volcanic dusts
To conclude, a v-dust particle in the presence of 175 ppm of SO2 gas exhibits both sulfite and
sulfate species on the surface for at least 24 hours (with the exception of Eyjafjallajökull and Arizona dusts
that at 30% RH display only sulfates). The surface of desert dust is able to convert sulfites to sulfates faster
than volcanic dusts. Upon cutting SO2 supply sulfite share will gradually go down and the amount of
sulfates on the surface will increase. Eventually, with time and in the absence of SO2 supply, all sulfites are
expected to be converted to sulfates.
3.3.3 What happens on the surface of a natural dust particle when ageing with SO2 on ppb level?
It is important to estimate how atmospherically relevant is the one hour ageing performed at 175
ppm to processes that happen on the scale of days or weeks, but with much lower concentrations.
To justify employing elevated concentrations of SO2 gas for ageing experiments that are meant to
describe atmospheric phenomena, we compared the amount of total sulfur species measured on the surface
of Mýrdalssandur v-dust while using high concentration of SO2 equal to 175 ppm to those obtained at low
atmospherically relevant concentration of 75 ppb. Note that only sulfate species are observed on the surface
of Mýrdalssandur v-dust when using 75 ppb SO2, while both sulfites and sulfates are observed when using
175 ppm SO2. This is most probably due the fact that more active sites for sulfite-to-sulfate conversion are
available per SO2 molecule thus leaving no sulfites behind. To compare the amounts of the sulfur species
formed on the surface of Mýrdalssandur v-dust while using two different concentration, the obtained sulfites
and sulfates at each concentration were expressed as total sulfur.
From Figure 9 we can see that for Mýrdalssandur dust 1 hour ageing with 175 ppm SO2 corresponds
roughly to 3 days ageing with 75 ppb. Thus, ageing with higher concentrations to speed up the formation
of surface species seems valid and justified. Note, that increasing SO2 concentration by 2333 times leads to
72 times shorter ageing to obtain the same amount of surface product. It follows that at lower concentrations
the uptake of SO2 is higher, which is expected.

228 Chapter VII. Investigating the distributions of sulfites and sulfates on the surface of natural volcanic dusts
Figure 9: Ageing profiles of Mýrdalssandur volcanic dust sample exposed to 175 ppm SO2 for up to 24 and 75 ppb for up to 120
hr.
4 Conclusions
The reversed-phase HPLC method, developed in that work, was successfully applied to assay the
amount of sulfites and sulfates formed on the surface of dust at different levels of RH: 0%, 30%, 60%, and
83%. For the majority of samples it was clearly observed that the amount of sulfites on the surface of dust
decreases as a function of RH while a sharp increase is observed for sulfates. Water therefore exhibits
the highest level of control on the distribution of sulfites and sulfates on the surface of dusts by
changing the rate on their transformation. The surface elemental composition also plays a direct role
on sulfite formation, especially at levels of humidity ranging from 0 to 30%. Thus, higher amounts of
sulfites are correlated with (Fe+Ti)/Si parameter. As for sulfates, the amount of Na on the surface of dust
was positively correlated to the ability of samples to form sulfates at 0%. At higher RH, water plays a
dominant role and no such correlation is observed. The role of elemental composition on the water uptake
could provide us with additional information on the formation of sulfites and sulfates on the surface of
natural dusts.
As for the time profiles, the ageing of dust is a long term process. Sulfites reach a steady level
rather fast, but sulfates increase continuously on the dust surface. At high 175 ppm concentration of SO2 it
takes about 38 hours for Hagavatn v-dust to saturate, at which point total surface coverage by sulfites and
sulfates corresponds roughly to the lower limit of 6% and 17% of the available surface respectively. The
amount of sulfates on the surface of other dusts keeps increasing for as long as the experiment is run, i.e.
up to 24 hr. At lower atmospherically relevant concentrations of SO2 the time to achieve saturation is
-10
10
30
50
70
90
110
0 20 40 60 80 100 120 140
Mas
s o
f to
tal s
ulf
ur
per
sp
ecif
ic s
urf
ace
un
it (
µg/
m²)
Time (hr)
75 ppb 175 ppm

229 Chapter VII. Investigating the distributions of sulfites and sulfates on the surface of natural volcanic dusts
expected to be even longer. Thus, ageing a Mýrdalssandur sample at 175 ppm SO2 for 1 hr roughly
corresponds to ageing at atmospherically relevant 75 ppb for 3 days. When the dust particle is no longer in
contact with the SO2 gas the amount of sulfites detected on the surface goes down while the transformation
to sulfates continues. Thus, a particle travelling through the air contains two types of species: sulfites
and sulfates, but their distribution is a function of time, humidity and SO2 concentration. This
information can be used in atmospheric modelling to better evaluate the impact of dust on various
atmospheric processes such as the ability of dusts to remove SO2 gas and thus better evaluate air quality.
The results suggest that it is imperative to evaluate hygroscopic and optical properties of the dust aged with
SO2 because sulfates form a stable layer. This work open perspective toward the investigation of the
potential reactivity of the surface sulfur compounds with reactive species, such as O3, H2O2 and NOx.
In the next chapter we objectively evaluate the trends that we have obtained using different
instruments and approaches.

230 Chapter VII. Investigating the distributions of sulfites and sulfates on the surface of natural volcanic dusts
References of Chapter 7
Ayris, P., Delmelle, P., 2012. Volcanic and atmospheric controls on ash iron solubility: A review. Physics
and Chemistry of the Earth 45, 103–112. https://doi.org/10.1016/j.pce.2011.04.013
Huang, L., Zhao, Y., Li, H., Chen, Z., 2015. Kinetics of Heterogeneous Reaction of Sulfur Dioxide on
Authentic Mineral Dust: Effects of Relative Humidity and Hydrogen Peroxide. Environ. Sci.
Technol. 49, 10797–10805. https://doi.org/10.1021/acs.est.5b03930
Ibrahim, S., Romanias, M.N., Alleman, L.Y., Zeineddine, M.N., Angeli, G.K., Trikalitis, P.N., Thevenet,
F., 2018. Water Interaction with Mineral Dust Aerosol: Particle Size and Hygroscopic Properties
of Dust. ACS Earth Space Chem. 2, 376–386. https://doi.org/10.1021/acsearthspacechem.7b00152
Joshi, N., Romanias, M.N., Riffault, V., Thevenet, F., 2017. Investigating water adsorption onto natural
mineral dust particles: Linking DRIFTS experiments and BET theory. Aeolian Research 27, 35–
45. https://doi.org/10.1016/j.aeolia.2017.06.001
Lathem, T.L., Kumar, P., Nenes, A., Dufek, J., Sokolik, I.N., Trail, M., Russell, A., 2011. Hygroscopic
properties of volcanic ash. Geophysical Research Letters 38.
https://doi.org/10.1029/2011GL047298
Romanias, M.N., Zeineddine, M.N., Gaudion, V., Lun, X., Thevenet, F., Riffault, V., 2016. Heterogeneous
Interaction of Isopropanol with Natural Gobi Dust. Environ. Sci. Technol. 50, 11714–11722.
https://doi.org/10.1021/acs.est.6b03708
Textor, C., Graf, H.-F., Herzog, M., Oberhuber, J.M., 2003. Injection of gases into the stratosphere by
explosive volcanic eruptions. Journal of Geophysical Research: Atmospheres 108.
https://doi.org/10.1029/2002JD002987
Urupina, D., Gaudion, V., Romanias, M.N., Verriele, M., Thevenet, F., 2020. Method development and
validation for the determination of sulfites and sulfates on the surface of mineral atmospheric
samples using reverse-phase liquid chromatography. Talanta 219, 121318.
https://doi.org/10.1016/j.talanta.2020.121318
Urupina, D., Lasne, J., Romanias, M.N., Thiery, V., Dagsson-Waldhauserova, P., Thevenet, F., 2019.
Uptake and surface chemistry of SO2 on natural volcanic dusts. Atmospheric Environment 217,
116942. https://doi.org/10.1016/j.atmosenv.2019.116942
Wang, T., Liu, Y., Deng, Y., Fu, H., Zhang, L., Chen, J., 2018. Emerging investigator series: heterogeneous
reactions of sulfur dioxide on mineral dust nanoparticles: from single component to mixed
components. Environ. Sci.: Nano 5, 1821–1833. https://doi.org/10.1039/C8EN00376A

Chapter VIII. Connections between the three experimental
approaches: coated wall flow-tube, DRIFT optical cell, and HPLC

232 Chapter VIII. Connections between the three experimental approaches: coated wall flow-tube, DRIFT optical cell, and HPLC
Table of content of Chapter 8
1 Introduction .......................................................................................................................................... 235
2 Connecting results of flow-tube experiments with results obtained from HPLC: a sulfur balance
determination. ....................................................................................................................................... 236
3 Connecting results of DRIFTS with results obtained from HPLC. ...................................................... 238
4 Conclusions .......................................................................................................................................... 240
References……………………………………………………………………………………...…………241

233 Chapter VIII. Connections between the three experimental approaches: coated wall flow-tube, DRIFT optical cell, and HPLC
List of Tables of Chapter 8
Table 1: Uptake coefficients for Mýrdalssandur and Maelifellsandur dusts at different times. Time values marked with
asterisk are extrapolated from the fitting of the breakthrough curve obtained in a typical flow-tube experiment
(see Chapter 2 Section 2.2.4). ...................................................................................................................... 236

234 Chapter VIII. Connections between the three experimental approaches: coated wall flow-tube, DRIFT optical cell, and HPLC
List of Figures of Chapter 8
Figure 1: The amount of sulfur on the surface of (a) Mýrdalssandur and (b) Maelifellsandur dusts after ageing with 75
ppb of SO2 as measured with HPLC (blue line, circles) and the amount of sulfur lost from the gas phase as
calculated from flow-tube experiments (green line, squares). ................................................................... 237
Figure 2: Overlaid results of two studies: (i) in blue triangles is the amount of sulfites (µg/m2) from HPLC studies and
(ii) in black squares is an integrated area for sulfite peak obtained from DRIFTS experiment. ............... 239
Figure 3: Overlaid results of two studies: (i) in blue triangles is the amount of sulfates (µg/m2) from HPLC studies and
(ii) in black squares is an integrated area for sulfate peak obtained from DRIFTS experiment. Purple squares
refer to the part of the DRIFTS experiment that exhibited high signal fluctuation. .................................. 240

235 Chapter VIII. Connections between the three experimental approaches: coated wall flow-tube, DRIFT optical cell, and HPLC
1 Introduction
Studying heterogeneous reactivity is challenging because of the lack of sufficient understanding of
how the surface appears on the molecular level. Indeed, it is unclear, what is the exact environment a gas
molecule encounters, when it interacts with the surface. In addition, in case of surface chemical reactions,
surface modifications might occurs, and the comprehensive understanding of how these changes affect
mechanism or reactivity remains to be explored. Adding to the challenge the fact that techniques commonly
used to study the structure of surfaces require high vacuum conditions while atmospherically relevant
reactions require a significant level of moisture and pressures, up to 1 atm, it becomes clear that evaluating
heterogeneous processes is not a trivial experimental task (Finlayson-Pitts and Jr, 1999).
The biggest challenge comes from the fact that the different techniques used to obtain kinetic
measurements require highly contrasted experimental conditions. For instance, results obtained using a
Knudsen cell that requires low pressure and dry conditions with a time resolution in the millisecond range,
are different from the results obtained under atmospherically relevant conditions of a flow-tube reactor
(Chapter 1), where time resolution is in the range of seconds, while the system addressed can be same. In
addition, sample preparation and introduction may contribute to the poor agreement of the results.
Considering mineral dust as an example, it is well known in literature that the chemical composition is
dependent on the size fraction. Therefore, the reactivity of an aerosolized dust sample studied in a simulation
chamber could be different from the reactivity of a sample of the same origin studied in a coated wall flow-
tube where much bigger particles are left to react (Ibrahim et al., 2018). As a result, the agreement between
measurements of heterogeneous reactions is often poor. In the recent IUPAC evaluation the errors associated
with measuring uptake coefficients on the surface of dust are commonly well over a factor of 10 (Crowley
et al., 2010). In comparison, gas phase reactions nowadays demonstrate solid agreement within only ca 15%
(“JPL Data Evaluation,” n.d.). In this Chapter, in order to face the experimental difficulty in the frame of
this work, we compare the measurements obtained by the various techniques used and evaluate their
consistency.
The objective of this chapter is to attempt to make a comparison and a connection between
the results obtained during the course of this thesis with the three distinct experimental techniques
used: the coated wall flow-tube, the DRIFT optical cell, and the HPLC. First, using different selected
dust samples, the quantitative losses of gaseous SO2 measured during flow-tube experiments are compared
to the amounts of sulfur species determined with HPLC. Thereafter, we attempt to correlate the trends
observed for the formation of sulfites and sulfates using (i) DRIFTS and (ii) HPLC. This approach is

236 Chapter VIII. Connections between the three experimental approaches: coated wall flow-tube, DRIFT optical cell, and HPLC
especially useful to evaluate the performance of the DRIFTS instrument that tends to exhibit considerable
signal fluctuations after 45 hours of continuous use.
2 Connecting results of flow-tube experiments with results obtained from
HPLC: a sulfur balance determination.
Two volcanic dusts Mýrdalssandur and Maelifellsandur were chosen for sulfur balance
investigations as they formed the highest number of sulfur species on the surface, as was demonstrated by
long-time ageing experiments with HPLC (Chapter 7). To calculate the amount of sulfites and sulfates
formed on the surface of v-dusts, Mýrdalssandur and Maelifellsandur v-dust samples ranging from 0.120 to
0.250 g were aged for 5 hr, 20 hr and 120 hr with 75 ppb SO2, 30% RH, at ambient temperature and analyzed
by the HPLC method described in Chapter 5. The long-term ageing was necessary in order to largely exceed
the limit of detection of the HPLC method and permit a precise quantification of sulfur species on the surface
of dust. Interestingly, only sulfate species were observed on the surface when using 75 ppb concentration.
This is most probably due to the fast conversion of sulfites to sulfates. The mass of sulfur in SO42- ion was
calculated from the mass of sulfates experimentally obtained with HPLC. To evaluate gas-phase loss of SO2
at 5 hours, the uptake coefficient was extracted using the breakthrough curve from the corresponding uptake
experiment (Chapter 3). To obtain the uptake coefficients at 20 and 120 hours the results obtained during
the 10 hr flow-tube experiments (see Chapter 3) were extrapolated from the fitting of the breakthrough
curve. The results are displayed in Table 1.
Table 1: Uptake coefficients for Mýrdalssandur and Maelifellsandur dusts at different times. Time values marked with asterisk are extrapolated from the fitting of the breakthrough curve obtained in a typical flow-tube experiment (Chapter 2 Section 2.2.4).
γ at 5 hr γ 20 hr* γ 120 hr*
Mýrdalssandur 9.32×10⁻⁸ 6.20×10⁻⁸ 1.94×10⁻⁸
Maelifellsandur 3.71×10⁻⁸ 2.76×10⁻⁸ 1.62×10⁻⁸
As can be seen from Table 1, the uptake coefficients diminish with time. This behavior could be
explained by the fact that the surface gets gradually saturated with sulfur species and, since sulfates are
unlikely to leave the surface, the surface is permanently modified and its capacity to accommodate SO2
molecules changes. Uptake coefficients were then used to calculate the total amount of sulfur lost from the
gas phase expressed in grams by using Equation 1.
Equation 1: 𝑻𝒐𝒕𝒂𝒍 𝒎𝒂𝒔𝒔 𝒐𝒇 𝑺 𝒓𝒆𝒎𝒐𝒗𝒆𝒅 =𝜸 𝒗(𝑺𝑶𝟐) 𝑪(𝑺𝑶𝟐) 𝑴(𝒔) 𝒕
𝟒𝑨

237 Chapter VIII. Connections between the three experimental approaches: coated wall flow-tube, DRIFT optical cell, and HPLC
where γ is the uptake coefficient at time t, t is time in s, v(SO2) is the molecular speed of SO2 molecule, i.e.
312 m/s, C(SO2) is the concentration of SO2 molecules in the reactor (in our case 1.18×10¹⁸ molecules/m3),
M(S) is the molar mass of sulfur in g/mole and A is Avagadro’s number (6.43×10²³ molecules/mole). The
amount of sulfur lost from the gas phase was calculated and compared to the amounts obtained with HPLC.
The results are displayed in Figure 1.
Figure 1: The amount of sulfur on the surface of (a) Mýrdalssandur and (b) Maelifellsandur dusts after ageing with 75 ppb of SO2
as measured with HPLC (blue line, circles) and the amount of sulfur lost from the gas phase as calculated from flow-tube
experiments (green line, squares).
From the graphs displayed in Figure 1, it is clear that the amounts of sulfur lost form the gas phase
(flow-tube) and formed on the surface (HPLC) at 5, 20 and 120 hours are in excellent agreement for
Mýrdalssandur dust. The latter implies that it is possible to make a direct and quantitative correlation of the
two different experimental approaches when experiments are carried out under the same experimental
conditions. In addition, it also signifies that the SO2 removed from the gas phase is entirely transformed to
sulfates, leading to a complete sulfur balance.
0
20
40
60
80
100
0 20 40 60 80 100 120 140
Mas
s o
f su
rfu
r p
er s
pec
ific
su
rfac
eu
nit
(µ
g/m
²)
Time (hr)
a)
HPLC: total amount of S fromsulfites and sulfates on the surface
Flow tube: amount of S removedfrom the gas phase
0
20
40
60
80
100
0 20 40 60 80 100 120 140
Mas
s o
f su
rfu
r p
er s
pec
ific
su
rfac
eu
nit
(µ
g/m
²)
Time (hr)
b)
HPLC: total amount of S fromsulfites and sulfates on the surface
Flow tube: amount of S removedfrom the gas phase

238 Chapter VIII. Connections between the three experimental approaches: coated wall flow-tube, DRIFT optical cell, and HPLC
As for Maelifellsandur, the results show that the sulfur detected on the surface of the sample is
lower than that lost from the gas phase. This observation does not necessary imply that the experimental
approaches are not consistent. Indeed, two different scenarios could explain this discrepancy. Either
Maelifellsandur dust stores a lot of sulfur on the surface in the form of physisorbed SO2, preventing its
quantification with HPLC and/or the uptake coefficient extrapolated from flow-tube experiments is
overestimated from the fitting of the flow-tube uptake experiment at longer timescales.
To conclude, the flow tube and the HPLC experimental approaches seem to be consistent when
compared from the sulfur mass balance point of view. Moreover, coupling flow-tube experiments with
HPLC method for sulfite and sulfate determination provides a complementary quantitative information on
the process of SO2 adsorption on the surface of volcanic dusts.
3 Connecting results of DRIFTS with results obtained from HPLC.
To compare the trends obtained in Chapter 4 with DRIFTS instrument using Hagavatn volcanic
dust to the profiles of the same dust obtained with HPLC in Chapter 7, the DRIFTS profiles were overlaid
with those obtained with HPLC. This comparison does not intend to provide a calibration of the DRIFTS
instrument, but aims to address the consistency of the temporal dynamics provided by two experimental
approaches. First, the surface concentrations of sulfites as a function of time measured on Hagavatn volcanic
dust using HPLC are compared to the DRIFTS sulfite profile for the same dust. Second, a profile of
Hagavatn surface sulfates determined with HPLC is compared to that determined with DRIFTS.
Looking at the HPLC profile (Figure 2), one can see that the amount of sulfites goes sharply up and
reaches a level of (61±7) µg/m2 in just 10 minutes. It stays around this maximum level for 24 hours before
decreasing and establishing, beyond 38 hours, a new level of (42±5) µg/m2. With DRIFTS, the first sulfite
measurement, of (0.03±0.004) AU, is done only after 30 min.; at around 3 hours the system seems to reach
a plateau at (0.04±0.006), but due to the fluctuations of the signal we are unable to make clear conclusions
about the trends. Figure 2 shows a noticeable correlation of sulfite profiles using DRIFTS and HPLC
techniques. The main difference in trends comes from the fact that with HPLC two stable periods in the
sulfite concentrations can be noted: from 10 minutes to 24 hours and from 38 to 72 hours, while with
DRIFTS only one global stable period can be observed: from 3 hours up to 72 hours. Globally, the behavior
of sulfites determined by two techniques is consistent. The reason for this mismatch is probably due to lower
detection limit and higher instrumental uncertainty of DRIFTS technique when applied to dark volcanic
dusts.

239 Chapter VIII. Connections between the three experimental approaches: coated wall flow-tube, DRIFT optical cell, and HPLC
Figure 2: Overlaid results of two studies: (i) in blue triangles is the amount of sulfites (µg/m2) from HPLC studies and (ii) in black
squares is an integrated area for sulfite peak obtained from DRIFTS experiment.
As for the sulfates, examining the HPLC profile in Figure 3 we observe a fast increase in sulfates
during the first 3 hours, reaching (46±6) µg/m2. Then, a slower increase, from 3 hours to 38 hours, reaching
(115±14) µg/m2, is noticed, after which level the attained surface concentration of sulfates remains stable
for the duration of the experiment, i.e. 72 hours. When DRIFTS profile is examined, sulfates remain below
the detection limits of the instrument along the first 3 hours. Then, the signal of sulfates increase linearly up
to 14 hours reaching 0.01 AU. From 14 to 32 hours the data on the DRIFTS signal is not available. From
35 to 54 hours DRIFTS signal for sulfates reaches a relatively stable level of around (0.04±0.005) AU. After
54 hours due to high fluctuations of the DRIFTS signal, the determination of the trend is not possible. The
common trend observed from HPLC and DRIFTS techniques is the increase in the amount of surface
sulfates from 3 to about 35 hours followed by a rather stable amount recorded from 35 to 54 hours. The
discrepancies are observed at the very beginning and at the end of the experiment. At the beginning of the
experiment the amount of sulfates recorded on the surface with DRIFTS is much smaller than that registered
with HPLC. It has to do with the low sensitivity of the DRIFTS instrument towards detection of sulfates on
dark v-dust surfaces as discussed earlier in Chapter 4. Thus, at this point we are operating at the limit of
detection of sulfates by DRIFTS. After 54 hours we have to rely solely on HPLC results because of the high
fluctuation in the DRIFTS signal that is related to instabilities of the MCT detector of the instrument after
long utilization and consecutive refilling of the liquid nitrogen chamber. For that reason, DRIFTS data points
beyond 54 hr are reported in purple to display the sulfate trend provided by DRIFTS experiment, and to
underline the fact that it should not be exploited with the same level of reliability as the HPLC
measurements.

240 Chapter VIII. Connections between the three experimental approaches: coated wall flow-tube, DRIFT optical cell, and HPLC
Figure 3: Overlaid results of two studies: (i) in blue triangles is the amount of sulfates (µg/m2) from HPLC studies and (ii) in black
squares is an integrated area for sulfate peak obtained from DRIFTS experiment. Purple squares refer to the part of the DRIFTS
experiment that exhibited high signal fluctuation.
In conclusion, a global agreement in trends can be established for DRIFTS and HPLC measurements
for the determination of sulfites for the duration of the 72 hour experiment. As for sulfates, once the amount
detected by DRIFTS is above 0.001 AU, i.e. around 3 hours, the trends for DRIFTS and HPLC can correlate
till 54 hours. If DRIFTS provides specific signals for surface species with high temporal resolution, it is
limited by its limit of detection and by long term operation of the system, which may induce signal
fluctuations hindering any accurate interpretation. The HPLC approach, is far more compliant with extra
long-term ageing experiments as well as for early sulfate determination on mineral surfaces regardless of
their reflectance.
4 Conclusions
In this chapter we evaluated the experimental consistency of the measurements obtained with
different techniques: flow-tube, DRIFTS, and HPLC. Flow-tubes and HPLC were proven to be consistent
and complementary quantitative techniques that enriched the understanding of the transformation of SO2
gas on the surface of volcanic dust. As for DRIFTS and HPLC techniques, they showed a noticeable
correlation as long as DRIFTS measurements are above 0.001 AU. In addition, using DRIFTS for
monitoring longer than 54 hours is not recommended based on the instrumental constrains. Thus, the added
value of HPLC technique is unquestionable as it helps to clarify the trends observed on the surface of v-dust
with DRIFTS and enriches the discussion provided by the flow-tube experiments by enabling determination
of the sulfur balance.

241 Chapter VIII. Connections between the three experimental approaches: coated wall flow-tube, DRIFT optical cell, and HPLC
References of Chapter 8
Crowley, J.N., Ammann, M., Cox, R.A., Hynes, R.G., Jenkin, M.E., Mellouki, A., Rossi, M.J., Troe, J.,
Wallington, T.J., 2010. Evaluated kinetic and photochemical data for atmospheric chemistry:
Volume V – heterogeneous reactions on solid substrates. Atmos. Chem. Phys. 10, 9059–9223.
https://doi.org/10.5194/acp-10-9059-2010
Finlayson-Pitts, B.J., Jr, J.N.P., 1999. Chemistry of the Upper and Lower Atmosphere: Theory,
Experiments, and Applications. Elsevier.
Ibrahim, S., Romanias, M.N., Alleman, L.Y., Zeineddine, M.N., Angeli, G.K., Trikalitis, P.N., Thevenet,
F., 2018. Water Interaction with Mineral Dust Aerosol: Particle Size and Hygroscopic Properties of
Dust. ACS Earth Space Chem. 2, 376–386. https://doi.org/10.1021/acsearthspacechem.7b00152
JPL Data Evaluation [WWW Document], n.d. URL https://jpldataeval.jpl.nasa.gov/ (accessed 10.15.20).

242 Chapter VIII. Connections between the three experimental approaches: coated wall flow-tube, DRIFT optical cell, and HPLC

General conclusions and perspectives

244 General conclusions and perspectives
This PhD thesis is driven by a multifaceted approach to investigate the uptake of SO2 on Icelandic
volcanic dusts. This experimental work has been based on existing protocols and it allowed new
methodological developments to provide an accurate insight into an atmospheric heterogeneous system of
interest under realistic environmental conditions. The main outcomes of this work can be categorized in
three complementary sections.
Outcomes regarding experimental protocols and methods
Three distinct techniques have been combined, confronted and questioned: flow tube reactor,
DRIFTS and HPLC. Considering their advantages and limitations, these techniques have been proved
consistent and complementary. When relevantly associated, they can shed light on the fate of volcanic SO2
in relation to the volcanic dust surface. Combining these approaches allowed us to examine various
heterogeneous interactions of the SO2 molecule with the surface from two different angles (i) by
quantitatively examining the loss of the SO2 molecules from the gas phase using flow-tube reactor and (ii)
by qualitatively and quantitatively following the formation of surface species using respectively DRIFTS
and HPLC. When possible, we worked under real atmospheric conditions of relevant SO2 concentrations,
RH, temperature and pressure. For DRIFTS and HPLC studies, we had to increase SO2 concentration in
order to obtain sufficient amounts of surface species, but the validity of this experimental approach has been
questioned and assessed.
To increase the scope of our experimental instrumentation, a new HPLC method has been fully
developed and validated. The new method includes a detailed protocol for controlled SO2 ageing of volcanic
dusts that enabled us to obtain time profiles and to examine the influence of humidity and composition on
the formation of surface species on various dust samples. This method is unique in the sense that it
simultaneously quantifies both sulfites and sulfates while preventing conversion of sulfites to sulfates. The
method can be used on other environmental samples, such as desert dusts, and can be applied to field studies
due to the ease of the sampling technique and stability of the final solution.
In addition, during this work we addressed a question of validity of using surrogates to substitute
for natural samples. This work highlighted the importance of using natural samples in the investigations of
atmospheric heterogeneous systems. Meanwhile, it also pointed at the necessity of innovative experimental
developments to face the diversity and the complexity of natural samples.
New possibilities that stem from the developed methodology include the production of control-aged
natural dust samples for the exploration of their surface properties. The capacity of preparing control-aged
natural samples opens new perspective to address the behavior of mineral aerosols at various steps of their
atmospheric transport. As such, a research project can be envisioned in collaboration with colleagues from

245 General conclusions and perspectives
aerosol physics. Another interesting area for further research is the investigation of iron solubility of
volcanic particles aged with SO2 that could provide a new understanding of cycling of this important
micronutrient.
Outcomes regarding surface processes on mineral aerosols
Likewise, new insights were brought by this PhD regarding heterogeneous processes on mineral
aerosols. The reaction scheme for the formation of surface species was proposed in detail. It includes (i)
physisorption of SO2 molecules on the surface of v-dust, followed by (ii) reaction with the surface to form
sulfites and (iii) oxidation of sulfites to sulfates.
Figure 1: Schematic representation of SO2 reaction pathways at the surface of v-dust. Reactions occurring under dark and dry
conditions are shown using black arrows; reactions occurring in the dark and are promoted under humid conditions are shown in
black-blue colored arrows; reactions occurring in presence of light are shown in orange.
The influential parameters on v-dust surface processes have been identified and explored. They
include: RH, elemental composition and UV light. We have demonstrated that UV light enhances the uptake
of SO2 molecules by the volcanic dust. Elemental composition influences sulfite and sulfate formation,
especially under dry conditions. Above all, it is clear that water plays a major role both in the adsorption of
SO2 and in the distribution of sulfites and sulfates on the surface of dusts. At high levels of humidity a
monolayer of sulfates might be formed, confirming that the surface properties of the aged aerosol are
modified. Besides, sulfates formed on the surface of v-dust are stable chemisorbed species, not desorbed

246 General conclusions and perspectives
even after flushing for several hours in the absence of SO2 gas. This extensive stable sulfate coverage of a
v-dust particle changes the way we see the volcanic particles travelling through the air as it changes the way
their surface looks and reacts.
An interesting direction in the area of heterogeneous atmospheric chemistry would be to explore
the stability of the sulfate coverage on dust, including possible further transformations, such as potential to
form sulfuric acid. Investigating the role of elemental composition of the volcanic dusts on the water uptake
is another area that might be especially important to understanding how the surface composition influences
SO2 uptake at high humidity.
Outcomes regarding atmospheric chemistry
With respect to atmospheric chemistry, we can state that the uptake of SO2 gas on the surface of v-
dust with respect to reactions occurring in the atmosphere is significant, especially in the denser part of the
plume/cloud and when the emitted particles have a high specific surface area. Moreover, the kinetic data on
the uptake of SO2 obtained by our group has already enabled scientific inquiries in climate simulations.
Thus, the data on saturation coverage of SO2 contributed to the re-estimation of SO2 lifetime following 2014
Mt. Kelut eruption that agrees better with real-life observations, as reported in recent “Nature
Communications” (Zhu et al., 2020). In particular, about 43% more volcanic sulfur is removed in 3 months
following the eruption when considering SO2 heterogeneous chemistry (Zhu et al., 2020).
In addition, we demonstrated that ageing a v-dust particle in the presence of SO2 gas is a long-term
process, and we now better understand how it changes its surface. Interestingly, in comparison with desert
dust, the surface of volcanic dusts converts sulfites to sulfates slower, most probably due to the difference
in surface composition. Contrary to former estimations based on other heterogeneous atmospheric systems,
in the presence of SO2 gas, the uptake on the v-dust surface continues for days and weeks. Upon cutting SO2
supply sulfite share gradually goes down because of the continuous surface reaction process and the amount
of sulfates on the surface increases. Eventually, with time and in the absence of SO2 supply, all sulfites are
expected to be converted to sulfates. Thus, a particle exposed to high levels of humidity and SO2 gas in the
volcanic plume clearly acts as an SO2 sink and can be expected to be covered with a sulfate layer which can
definitely alter the particle hygroscopic and optical properties. The quantitative experimental data gained
through this work can be used in atmospheric modelling to better evaluate the impact of dust on various
atmospheric processes such as ability of dusts to remove SO2 gas and thus better evaluate air quality. The
perspectives for future atmospheric studies include investigations of how modifications of dust reactivity
due to ageing changes its behavior towards important atmospheric oxidants, such as O3 and NOx. Beyond
the evaluation of optical and hygroscopic properties of dust at various SO2 ageing levels, it is also imperative

247 General conclusions and perspectives
to see how ageing the dust affects its ice nucleation and cloud nucleation properties. Besides, incorporating
the long-term steady state uptake coefficients of SO2 on v-dust in climate simulations provides a way to
correct the current models, especially if the effect of UV radiation is included.
References
Zhu, Y., Toon, O.B., Jensen, E.J., Bardeen, C.G., Mills, M.J., Tolbert, M.A., Yu, P., Woods, S., 2020.
Persisting volcanic ash particles impact stratospheric SO 2 lifetime and aerosol optical properties.
Nature Communications 11, 4526. https://doi.org/10.1038/s41467-020-18352-5

248 General conclusions and perspectives

Valorization

250 Valorization
List of journal publications related to this thesis
1) D. URUPINA, J. LASNE, M. ROMANIAS, V. THIERY, P. DAGSSON-WALDHAUSEROVA,
F. THEVENET, Uptake and surface chemistry of SO2 on natural volcanic dusts, Atmospheric
Environment, Vol 217, pp 116942, 2019. DOI: 10.1016/j.atmosenv.2019.116942
2) D. URUPINA, V. GAUDION, M. ROMANIAS, M. VERRIELE, F. THEVENET, Method
development and validation for the determination of sulfites and sulfates on the surface of mineral
atmospheric samples using reverse-phase liquid chromatography, Talanta, Vol 219, 2020. DOI:
10.1016/j.talanta.2020.121318
List of international communications related to this thesis
1) J. LASNE, M. ROMANIAS, D. URUPINA, F. THEVENET, Influence of humidity and UV-
irradiation on SO2 uptake by volcanic dust, 3rd International Conference on Atmospheric Dust,
Villa Romanazzi Carducci, Bari, Italy , May 29-31, 2018
2) D. URUPINA, F. THEVENET, M. ROMANIAS, J. LASNE Uptake and surface chemistry of SO2
on natural Icelandic volcanic dusts under simulated atmospheric conditions, EGU General Assembly
2020, Online, 4-8 May, 2020
List of national communications related to this thesis
1) D. URUPINA, J. LASNE, M. ROMANIAS, F. THEVENET, Impact of SO2 uptake by Icelandic
volcanic dust on tropospheric chemistry, Conseil Scientifique du Labex CaPPA, Villeneuve d’Ascq,
1 juillet 2019
2) D. URUPINA, J. LASNE, M. ROMANIAS, F. THEVENET, Impact of SO2 uptake by Icelandic
volcanic dust on tropospheric chemistry, 5ème Journée Scientifique Labex Cappa, Villeneuve
d'Ascq, 6 mars 2019

Annex 1

252 Annex 1

Contents lists available at ScienceDirect
Atmospheric Environment
journal homepage: www.elsevier.com/locate/atmosenv
Uptake and surface chemistry of SO2 on natural volcanic dusts
D. Urupinaa,∗, J. Lasnea, M.N. Romaniasa, V. Thieryb, P. Dagsson-Waldhauserovac,d, F. Theveneta
a IMT Lille Douai, Univ. Lille, SAGE, 59000, Lille, Franceb IMT Lille Douai, Univ. Lille, GCE, 59000, Lille, Francec Agricultural University of Iceland, Keldnaholt, Reykjavik, 112, Icelandd Faculty of Environmental Sciences, Czech University of Life Sciences, Prague, 165 21, Czech Republic
G R A P H I C A L A B S T R A C T
A R T I C L E I N F O
Keywords:V-dustHeterogeneous reactionsSulfur dioxideSulfate formationUptake coefficientDRIFTS
A B S T R A C T
V-dust (v-dust) is a highly variable source of natural particles in the atmosphere, and during the period of highvolcanic activity it can provide a large surface for heterogeneous interactions with other atmospheric com-pounds. Icelandic v-dust was chosen as a case study due to frequency of volcanic eruptions and high aeolianactivity in the area. In this study, we focus on the kinetics and mechanism of the reaction of sulfur dioxide (SO2)with natural v-dust samples under atmospheric conditions using coated wall flow tube reactor and diffuse re-flectance infrared Fourier transform spectroscopy (DRIFTS). Steady state uptake coefficients determined are inthe range of 10−9 to 10−8 depending on the considered v-dust. Concomitantly with SO2 uptake, both sulfites andsulfates are monitored on the surface of v-dust, with sulfates being the final oxidation product, attesting of SO2
surface reaction. Surface hydroxyl groups play a crucial role in the conversion of SO2 to sulfites as evidencedfrom both flow tube and DRIFTS experiments. Based on these experimental results, a mechanism for SO2 in-teraction with different surface sites of v-dust is proposed and discussed. This study provides original insights inthe kinetics of SO2 uptake under simulated atmospheric conditions and its mechanism and transformation onvolcanic material. To that regards, it brings an accurate perspective on SO2 heterogeneous sinks in the atmo-sphere.
1. Introduction
Volcanic eruptions comprise one of the most significant naturalhazards directly threatening people living in the proximity, and, in the
extreme case, can affect livelihoods of the humankind on the globalscale. Large volcanic eruptions of the past have significantly influencedEarth's climate by injecting vast amounts of volcanic gases and aerosolsinto the atmosphere (Stevenson et al., 2003). Volcanic emissions can
https://doi.org/10.1016/j.atmosenv.2019.116942Received 23 April 2019; Received in revised form 26 August 2019; Accepted 28 August 2019
∗ Corresponding author.E-mail address: [email protected] (D. Urupina).
Atmospheric Environment 217 (2019) 116942
Available online 03 September 20191352-2310/ © 2019 Elsevier Ltd. All rights reserved.
T

cause both regional and global changes to climate by affecting monsooncirculation, causing either excessive or limited rainfall thus leading tofloods and droughts (Stevenson et al., 2003), (Highwood andStevenson, 2003), (“Tambora and the ‘Year Without a Summer’ of1816,” 2016). Volcanic particles have an ability to affect the climate byscattering solar radiation and thus changing the Earth radiation budget(Langmann, 2013). Besides, volcanic ash, having optical and thermalproperties similar to those of the black carbon, can absorb solar ra-diation (Arnalds et al., 2016). Vernier et al. highlighted the significanceof the radiative impact of ash, in particular in the tropical latitudes dueto the Brewer-Dobson circulation that sustains ash in the stratospherefor longer than was generally assumed (Vernier et al., n.d.). Finally,volcanic ash particles can affect the climate through influencing cloudformation processes and acting as ice nucleation sites during plume rise(Durant et al., 2008). The impact of v-dust on Earth's atmosphere isgoverned by the physical and chemical surface properties of the parti-cles. However, the physico-chemical processes that govern the mod-ifications of the particle surface in the plume and in the cloud when ashis in contact with volcanic gases remain poorly investigated.
Volcanic eruptions are a highly variable sources of solid particlesranging from 33 million tons (Mt) on an average year to over100,000Mt of ash after a major volcanic eruption, as was the case forthe eruption of Mount Tambora in 1815 (Andreae, 1995). With respectto atmospheric chemistry the most significant impact would be ex-pected to come from the particles that are in the 0.002–10 μm range asthey can be carried over thousands of kilometers before eventuallybeing deposited onto land or into the ocean by gravitational settlingand wet deposition (Finlayson-Pitts and Jr, 1999), (Langmann et al.,2010), (Dagsson-Waldhauserova et al., 2014). When settled on land, v-dust (v-dust) can then be once again remobilized by the wind and en-trained into the atmosphere. Some places on Earth are particularlyprone to high aeolian activity. Such is, for example, the case for Iceland,that experiences on average about 135 dust days per year, partly due tofrequent volcanic eruptions and re-suspension of volcanic materials(Dagsson-Waldhauserova et al., 2014). In fact, this volcanic island ofNorth Atlantic with an area of 103,000 km2 lying south of the ArcticCircle is one of the dustiest areas of the world as well as the largestdesert in Europe and the Arctic (Dagsson-Waldhauserova et al., 2014).It is also one of the most volcanically active areas. There are about 30active volcanic systems and volcanic eruptions occurring every 3–5years on average (Thordarson and Larsen, 2007), (Schmidt et al., 2014).Frequent dust events in Iceland transport dust over long distances, oftenexceeding 2500 km, towards High Arctic (> 80° N) and Europe(Ovadnevaite et al., 2009), (Groot Zwaaftink et al., 2017), (Moroniet al., 2018), (Dordevic et al., 2019). Located only 1000 km frommainland Europe, it makes a particularly interesting case study due toits proximity to densely populated European countries.
In the stratosphere, emissions of volcanic ash were linked to ozonereduction recorded after major volcanic eruptions, such as El Chichóneruption in Mexico in 1982 and Mount Pinatubo eruption in Philippinesin 1991 (Brasseur et al., 1990), (“Reactions on Mineral Dust - ChemicalReviews (ACS Publications),” n.d.). Even if the effect of volcanic ash inthe chemistry of the troposphere has not yet been evaluated, it is sug-gested that ash particles act as a long-range transporting carrier forvarious species adsorbed on their surface and as a solid support for theirreactions with atmospheric trace gases (Li et al., 2006), (Maters et al.,2017). Some of these species are formed during eruption, when avariety of gases are released along with volcanic ash. Sulfur dioxide(SO2) is typically the third most emitted volcanic gas after water andcarbon dioxide (Durant et al., 2010). SO2 is known to contribute to theformation of sulfuric acid aerosol, which, when injected in the strato-sphere, stays there for up to 2 years effectively cooling the tropospherebelow (Stevenson et al., 2003), (Highwood and Stevenson, 2003).
Volcanic ash and SO2 are likely to participate in a variety of het-erogeneous reactions that could potentially influence the balance ofother atmospheric species. SO2 has already been shown to exhibit
heterogeneous reactivity towards many mineral oxides such as MgO,Al2O3, Fe2O3 and TiO2 (Usher et al., 2002). Along SO2 uptake on thesematerials, sulfite and sulfate formation was detected on the surface ofmost mineral oxides and synthetic mineral dust and it was proposedthat hydroxyl groups and surface-active oxygen are responsible foroxidation of sulfites to sulfates (Zhang et al., 2006). Nevertheless,limited data exist on the mechanism of the interaction of SO2 gas withnatural multi-component samples, such as volcanic ash as well as on thestability of the surface species formed during reaction.
It was recently evidenced by Maters et al. that volcanic ash is re-active to the uptake of weakly acidic SO2 gas with a reactivity that isproportional to the abundance of strongly basic sites, such as thoseaffiliated with alkaline and alkaline earth metals (Maters et al., 2017).Although very informative of the processes occurring on the short scale,the initial uptake and the total uptake capacity measured by the authorshave limited ability to explain the interactions on the longer time scale.Besides, the above-mentioned experiments were performed in aKnudsen cell under very low pressure and dry conditions that are notcompliant with the atmospheric processes (Maters et al., 2017). It wastherefore decided to undertake a comprehensive study of the interac-tions of SO2 with v-dust under atmospheric conditions. Iceland waschosen as a location of interest for sample collection required to studyheterogeneous reactivity of volcanic ash and SO2 gas. The scope of thisstudy is threefold. First, different natural volcanic and Icelandic sam-ples were collected and characterized using various techniques, such asSEM (Scanning Electron Microscopy) and ICP-MS (Inductively CoupledPlasma-Mass Spectrometry). Second, the uptake of atmospheric SO2 bythe surface of selected v-dusts was investigated using a flow tube re-actor. Finally, Diffuse Reflectance Fourier Transformed Spectroscopy(DRIFTS) employed for the in-situ monitoring of adsorbed phase wasused to identify the surface species formed and to clarify the surfacereaction mechanisms. The in-situ spectroscopic approach has beencomplemented by HPLC (High-Performance Liquid Chromatography)technique employed for quantification of the surface products.
2. Experimental section
2.1. Materials
2.1.1. Origin of the dust samplesAll five samples of v-dust come from different dust hot spots of
Iceland. The properties of Hagavatn (64°28′6,12″N 20°16′55,81″W),Mýrdalssandur (63°26′50.1″N 18°48′52.8″W), Maelifellssandur(63°48′48.7″N 19°07′42.5″W) and Dyngjusandur (64°50′41,885″N16°59′40,78″W) v-dusts are described by Arnalds et al. (2016). Overall,these areas are subjected to extremely large aeolian erosion due tofrequent dust storms, and have extensive areas (10–140 km2), henceproviding a large supply (31–40 million tons annually) of v-dust to theatmosphere. Samples were collected from the top surface layer of eachdust hot spot. The samples were dry and did not come in contact withsoil or other organics. The fifth sample of Eyjafjallajökull (63°33′50.4″N19°27′28.8″W) volcanic ash was collected and stored dry during thesecond phase of the explosive-effusive volcanic eruption on April 27. Itis a typical volcanic ash sample as characterized by Gislason et al.(2011).
2.1.2. Characterization of the samplesScanning Electron Microscopy/Morphology of the samples was
analyzed by SEM carried out on a Hitachi S-4300SE/N SEM in highvacuum mode. The images of different v-dust particles are presented inFig. 1. These are small particles with rough edges. Dust from Ey-jafjallajökull (Fig. 1e) has larger particle size with many particlesreaching 500 μm in diameter, while the other four dusts (Fig. 1a–d)have a much finer structure and range from 10 to 50 μm in diameterdue to glaciofluvial processes leading to their generation.
Specific surface area measurements/To avoid any overestimation
D. Urupina, et al. Atmospheric Environment 217 (2019) 116942
2

of the uptake coefficients by the use of the geometric surface of thesample bed, it was decided to use the specific surface area (SSA) in theuptake calculations as discussed in the latest IUPAC evaluation(Crowley et al., 2010). In brief, the determination of the uptake coef-ficient using the geometric surface - i.e. the geometric area of the tubecovered with the volcanic dust as noted in equation (2) (see section2.2.1) of the manuscript-overestimates the uptake since it does notconsider all the surface of the dust as accessible to gaseous SO2. How-ever, in a series of experiments it was evidenced that the entire surfacearea of the sample is accessible to the gas environment and thus thetotal surface area of the dust deposited in the tube should be used todetermine the real uptake coefficient. The SSA is a physical property ofsolids, which represents the total surface area of a material per massunit (m2 g−1), and is used for the determination of the kinetic andsorption parameters (see section 2.2.1). To determine SSA, the Bru-nauer–Emmett–Teller (BET) method was employed. Nitrogen (N2) ad-sorption measurements were performed with a laboratory gas sorptionanalysis system (Joshi et al., 2017), (Ibrahim et al., 2018) within0.05–0.3 relative pressure range (P/P0) of N2. To determine the range ofuncertainty, three adsorption measurements were conducted for eachsample. The results of the BET specific surface area (SSABET) of the 5samples are displayed in Table 1.
Chemical composition/The bulk elemental composition of thesamples of Icelandic v-dust used in this study was determined by ICP-MS using a Perkin Elmer NeXion 300x spectrometer, the results are
presented in Table 2. Prior to the analysis, from 2 to 7mg of eachsample were treated in a mixture of acids (HF/HNO3/H2O2) in a mi-crowave oven (Milestone Ultrawave) at 500 K and 35 bar for 15min(Alleman et al., 2010). Six measurements per sample were performed toevaluate their chemical heterogeneity. Repeated measurements werecarried out on acid blanks, quality control standard solutions andstandard reference material (NIST SRM 1648a and SRM 2584) toevaluate detection limits, accuracy and to validate the whole proce-dure. As can be seen from Table 2 silicon is the most abundant elementof the v-dust, followed by iron, calcium, and aluminum. Within the fiveselected v-dust samples the elemental composition seems to differ onlyslightly, except for Eyjafjallajökull v-dust which exhibits a higheramount of silicon than other samples and a lower amount of calcium,iron and magnesium. The results of ICP-MS analysis for Eyjafjallajökullv-dust agrees well with the literature (Gislason et al., 2011). The
Fig. 1. SEM images of five v-dusts: (a) Mýrdalssandur, (b) Dyngjusandur, (c) Hagavatn, (d) Maelifellsandur, (e) Eyjafjallajökull.
Table 1BET Specific Surface Area of the v-dust samples used in this study.
Origin of the Icelandic v-dust sample BET Specific Surface Area (m2 g−1)
Mýrdalssandur 1.5 ± 0.38Dyngjusandur 7.0 ± 1.8Hagavatn 4.5 ± 1.1Maelifellssandur 8.2 ± 2.0Eyjafjallajökull 0.75 ± 0.19
D. Urupina, et al. Atmospheric Environment 217 (2019) 116942
3

difference in the composition of Eyjafjallajökull v-dust in comparisonwith other samples is most probably due to the difference in the com-position of magma that produced it. Indeed, the volcanic systems thatsupply Dyngjusandur dust hotspot (Bárðarbunga and Kverkfjöll vol-canic systems) and Mýrdalssandur and Maelifellssandur dust hotspots(Katla volcanic system) have magmas of a predominantly basalticcomposition, while magma of Eyjafjallajökull is andesitic, meaning thatit is higher in silicon (“Icelandic Volcanoes,” n.d.), (Vogel et al., 2017).The decrease of calcium, iron and magnesium with increasing siliconcontent is in accordance with the expected variation of the compositionof magma (Vogel et al., 2017). Other processes that can influence thecomposition of magma during a particular eruption include crystal-lization (Clague and Denlinger, 1994), melting of the crustal rocks(Deegan, 2010) and mixing of original magma with another magmathat evolved separately (“Icelandic Volcanoes,” n.d.). Since compositionof magma can change within the same eruption, one might expect to seedifferent compositions of v-dust both on the time scale and on the lo-cation scale. Transported dust can also have a different compositionfurther away from the source. Globally, when compared to other typesof mineral dusts, such as Saharan dusts or Gobi dust (Joshi et al., 2017),the amount of silicon in all five v-dust samples is considerably lowerwhile the amount of iron, magnesium, and titanium is higher(Romanias et al., 2016), (Langmann, 2013).
2.1.3. GasesExperiments are carried out using zero air; it is generated by a
classical air compressor, and then passed through a catalytic zero airgenerator (Claind ZeroAir, 2020, Lenno, Italy) coupled to a swing ad-sorption (PSA) device. The remaining impurity levels in the air streambefore entering the reactor are lower than the analytical system de-tection limits: VOCs<0.1 ppb, CO2 < 10 ppb, and CO < 80 ppb.Moisture level is ca. 2 ppm. In experiments requiring humid air, asecond flow of zero air going through a bubbler of ultrapure water(milli-Q, resistivity 18.2 MΩ cm) is mixed with the dry air flow, inproportions necessary to reach the relative humidity (RH) targeted.Certified gas cylinders are used as SO2 source. For low concentration
experiments aiming to determine uptake coefficients in the flow tube,an SO2 cylinder of 8.96 ppm in air (20.7% O2, 79.3% N2) provided by“Air Liquide” is used. Regarding the mechanistic investigation em-ploying DRIFT spectroscopy, higher concentrations are used and acertified cylinder of 250 ppm (Messer, France) diluted in synthetic air(nearly 80% N2 and 20% O2) is the SO2 source.
Throughout the manuscript, gas concentrations are given in ppmvand ppbv (parts per million and parts per billion by volume, respec-tively). Under usual experimental conditions (T=296 K, P=1 atm),the conversion to a concentration is given by 1 ppbv(SO2)≈ 2.5×10¹⁰ molecules cm−3. Note that this conversion factortakes a different value when the temperature or total pressure changes.
2.2. Experimental set ups
2.2.1. Coated wall flow tube reactorThe heterogeneous interaction of SO2 with v-dust was investigated
in a horizontal double wall flow tube reactor represented schematicallyin Fig. 2. The experiments were conducted under relevant atmosphericconditions, i.e. SO2 concentration in the ppb range, atmospheric pres-sure, room temperature, under dry conditions and 30% RH. The ob-jective of this series of experiments was to determine the uptake coef-ficients of SO2 on the various Icelandic v-dusts.
The setup was described in detail in a previous paper (Lasne et al.,2018) it mainly consists of three parts; (i) the gas mixing line, (ii) thereactor and (iii) the analytical device. The gas preparation line is usedfor the mixing of zero dry/humid air with SO2 resulting in a flow withthe desired proportion of RH and SO2 concentration. The reactor ismade of a double wall Pyrex glass and is thermostated by circulatingwater in between the double wall surrounding the flow tube. Inside andalong the axis of the reactor, a Pyrex tube covered on its inner wall withthe v-dust is introduced. To coat the inner surface of a Pyrex tube withv-dust (orange color in Fig. 2), a defined mass of dust is first inserted ina tube. A small amount of water is added to form a slurry and the tube isshaken to deposit an even coating on the Pyrex surface. Then, the tubeis heated slightly above 380 K for 10min to evaporate excess water,
Table 2% Elemental composition of the v-dust samples used in this study and of mineral dust samples adopted from (Joshi et al., 2017), as determined by ICP-MSexperiments.
Element Mýrdalssandur Dyngjusandur Hagavatn Maelifellssandur Eyjafjallajökull BordjSaharan dust (Joshi et al., 2017)
Gobi dust (Joshi et al., 2017)
Si 31.3 ± 2.2 32.7 ± 2.0 27.5 ± 2.8 28.3 ± 2.4 49.5 ± 0.9 94.4 57.6Fe 23.0 ± 1.5 19.7 ± 0.2 19.6 ± 0.7 23.8 ± 0.8 13.0 ± 0.5 1.3 5.5Ca 13.9 ± 1.3 16.3 ± 0.3 19.5 ± 1.1 14.0 ± 0.3 7.3 ± 0.1 1.0 16.1Al 12.3 ± 3.1 15.8 ± 0.2 16.7 ± 3.2 15.5 ± 0.1 13.6 ± 0.9 1.8 11Mg 5.1 ± 1.2 7.3 ± 0.1 10.4 ± 1.8 5.7 ± 0.4 3.3 ± 0.2 0.1 2.3Ti 7.6 ± 0.7 3.3 ± 0.4 2.4 ± 0.1 6.1 ± 0.4 2.4 ± 0.1 0.7 0.8Na 4.8 ± 0.2 3.9 ± 0.1 3.1 ± 0.1 4.6 ± 0.1 7.3 ± 0.3 0.2 2.5K 1.3 ± 0.2 0.6 ± 0.1 0.2 ± 0.1 1.5 ± 0.1 3.1 ± 0.1 0.1 3.5other 0.7 0.4 0.6 0.5 0.5 0.1 0.7
Fig. 2. Schematic representation of the Coated wall Flow Tube (CWFT) reactor used in this study. The space filled with the coolant in between the two walls is shadedin blue. The dust sample coating the inner surface of the Pyrex tube is shown in orange. (For interpretation of the references to color in this figure legend, the reader isreferred to the Web version of this article.)
D. Urupina, et al. Atmospheric Environment 217 (2019) 116942
4

placed in the reactor and flushed overnight with dry air. Potentialmodifications of the volcanic dust upon its dissolution in water in theprocess of slurry preparation and subsequent drying process includedisplacement of soluble salts that might be found on the surface of v-dust particles as well as leaching of alkali and alkaline earth metalsfrom the aluminosilicate network at ash surfaces (Witham et al., 2005).In the case of Hagavatn, Mýrdalssandur, Maelifellssandur and Dyngju-sandur natural v-dust samples, that were likely previously exposed towater the above mentioned phenomena does not seem to effect theresults because the soluble salts would be expected to leach out by thetime of the experiment. In the case of fresh Eyjafjallajökull dustleaching of the soluble salts formed during ash-gas interaction in theplume presents a valid concern. In order to minimize removal of solublesalts the amount of water added to prepare a slurry was as small asnecessary to spread the dust evenly, i.e. in the case of Eyjafjallajökull1:3 ash (g) to water (mL) ratio was used, which is much smaller thanthe 1:25 ash-to-water ratio recommended for preparation of ash lea-chates (Witham et al., 2005). In addition, contact time with water wasminimized to around 10 s shaking followed by rapidly drying the slurry,which is also much faster than 90min agitation procedure re-commended by Witham et al. (2005). One could also expect that dryingthe slurry would lead to redisposition of the displaced salts, eventhough some of it could be redeposited on the surface of the glass tubeand not the v-particles. Two Viton O-rings are placed around the Pyrextube to fix its position inside of the reactor. The gas mixture is flowedthrough a movable injector (internal diameter of 0.3 cm) with a flowrate ranging between 250 and 500 sccm, ensuring laminar flow con-ditions with a Reynolds number, Re < 50. The role of the moveableinjector is to either isolate (placed at the downstream end of the flowtube) or to expose the dust surface to the gas environment (upstreamend of the reactor). The outgoing flow is then directed to the SO2
analyzer (Model 43C, Thermo Environmental Instruments Inc.) for thereal time gas phase monitoring of SO2, with a time resolution of 10 s.We didn't noticed any loss of dust during the uptake experiments. Notethat the tubes with the deposited dust are weighted before and after theexperiments and the variations noticed were in the range of the massscale uncertainty (< 1%). In addition, considering that the flow rateduring the experiments is relative slow, the experiments are carried outunder atmospheric pressure and no pressure variation takes place be-tween the reactor and the analyzer, it is highly improbable to experi-ence any loss of dust during our measurements. Furthermore, we havenot observed (at least visually) any large particles to fail to adhere tothe Pyrex tube. However, even if this was the case, in the horizontalflow tube, these particles would still be subjected to the flow of gas andthus remain accessible to the gas. To conclude, the total mass of thedust inside the reactor is maintained during the entire experiment andis accessible to the gas environment and hence the total surface areadoes not change and no correction is required to determine the uptakecoefficients. The uptake of SO2 by v-dust is studied under dark condi-tions at T=296 K, [SO2]≈ 75 ppb (1.88×10¹² molecules cm−3) inair, and a relative humidity of either 30% or under dry conditions (i.e.RH<0.1%). Regarding RH, studying the uptake under dry conditionsprovides an evaluation of the interaction of the probe gas with the di-rect surface of volcanic material, while increasing RH to 30% con-tributes to the understanding of the impact of the water coverage on themineral aerosol (Joshi et al., 2017).
Theoretical SO2 concentration profile is represented in Fig. 3.During a typical flow tube experiment SO2 is flowed through the re-actor, the dust being left unexposed initially. After a stable SO2 con-centration, [SO2]0, is set, the injector is pulled out and the dust is ex-posed to SO2; the change in SO2 concentration related to its uptake bydust is recorded by the SO2 analyzer. After a steady-state is reached, theinjector is pushed back in to control the [SO2]0. What is obtained as aresult of the flow tube experiment is a time evolution of the trace gasconcentration at the tube exit, the so-called breakthrough curve, that isused to calculate the steady state uptake coefficient (Huthwelker et al.,
2006). In the case of SO2 a long-lasting tailing of the breakthroughcurve is observed, similar to the one described for the uptake of nitricacid (HNO3) on ice (Huthwelker et al., 2006). This phenomena leads tothe following question: at which point can we say that a steady state isreached? In the absence of the generally accepted understanding of thenature of tailing and for the practical reasons the following pragmaticapproach was adopted. Steady state is considered to be reached whenthe variation of the signal falls within 1.5% of its value for at least 3 h.On average it takes about 12 h to reach the steady state under 30%humidity, which is much longer than 1 h needed to achieve a steady-state for the uptake of ozone by clay dust (Lasne et al., 2018).
Preliminary experiments were conducted to determine a possiblecontribution of the Pyrex surfaces to the uptake of SO2. They showednegligible contribution to the parameters determined in the currentstudy.
The measurements of [SO2] at steady-state and at the initial level,[SO2]0, together with the knowledge of the parameters defining oursetup are necessary to conduct the analysis leading to the determinationof the uptake coefficients under equilibrium conditions, γss (Lasne et al.,2018). Assuming first order kinetics for the uptake of SO2 by v-dustsurfaces, the observed constant of reaction, kobs (in s−1), is determinedby (1):
= × ⎛⎝
⎞⎠
k vL
SOSOln [ ]
[ ]obs 2 02 (1)
where v is the flow in the reactor (in cm s−1) and L is the length of thedust coating (in cm). The value of kobs (in s−1) is corrected for diffusionof SO2 with a constant kdiff (in s−1) to give the diffusion-correctedconstant kkin (in s−1). In this work, a diffusion coefficient of SO2 in theair derived from (Massman, 1998) is used, D(296 K)= 95.28 Torr cm2
s−1. This value is in excellent agreement with D=94 ± 13 Torr cm2
s−1 suggested by Tang et al. (2014). The diffusion-corrected constant,kkin, is then used to determine γss, (2):
=γ k VcS4
sskin
geom (2)
where V and Sgeom are the volume (in cm3) and geometric surface (incm2) of the region where the reaction takes place, respectively, and c isthe average molecular speed (in cm s−1). The diffusion-correction ac-counts for ca. 5% of the measured uptake coefficients.
A series of experiments were carried out as a function ofMýrdalssandur v-dust mass deposited that showed a linear increase inthe 0–250mg range. The linear increase of the uptake with mass andthe lack of saturation reflect the fact that the entire surface of the dust isaccessible to SO2 molecules from the gas and thus the specific surfacearea SSABET is used for the calculation of the uptake coefficient, γss,BET,(3):
= ×γ γS
Ass BET ssgeom
s, (3)
where As, is the effective surface area of the dust, obtained from mul-tiplying SSABET (m2 g−1) by the mass of the sample (g).
The error on the uptake coefficients is the root-mean-square de-viation of the values measured. It was calculated with the precision ofthe signal (0.5% of the measured concentration) and its propagation tokobs measurement, the SSA determination (~25%) and all relevantuncertainties, i.e. on the gas flow measurement, temperature, massweighting, and length of the exposed dust coating (~8%). The totalerror calculated for the γ values was estimated to be ca 35% in all ex-periments and a safe limit of 40% is given. Although the quoted un-certainty is significant, it reflects the real error accounted for themeasurement of slow uptake processes (uptakes on the order of 10−9)in the flow tube.
Besides uptake coefficients, the transient initial number of SO2
molecules taken up per surface area of v-dusts Ns (molecules cm−2) isdetermined at 30% of RH; by integrating the area of the initial uptake
D. Urupina, et al. Atmospheric Environment 217 (2019) 116942
5

process in a typical uptake experiment (Fig. 3) divided by the effectivesurface area of the dust, As, according to (4):
∫==
=
N FA
dτsτ
τ tt
s0 (4)
where Ft is the flow rate (molecules min−1) of SO2 molecules throughthe reactor. The total error in Ns determination is estimated to be ca.30% and includes all systematic uncertainties and the error in SSAdetermination.
It should be noted that since the SO2 concentration recorded at thesteady-state was lower than its pre-exposure concentration, for thedetermination of Ns solely the transient initial uptake removal of SO2 isconsidered (dashed area in Fig. 3). The long tailing of the breakthroughcurve observed points to additional physico-chemical processes besidesthe absorption/desorption. Therefore for the determination of integra-tion parameter a similar to two-third criterion approach was adopted asrecommended by Huthwelker et al., where “the surface uptake is con-sidered finished once the breakthrough curve rises to two-thirds of itsinitial value” (Huthwelker et al., 2006). The integration limits for thedetermination of the number of molecules Ns were chosen from the timeof the exposure of SO2 to the dust to 300min after the exposure to makesure that the change in the breakthrough curve towards steady state hasoccurred for all the dusts. This criterion was adopted in order to be ableto compare the uptake capacity of the v-dusts at the initial stage of theinteraction with SO2. On longer scale, samples can be compared basedon the γss,ΒΕΤ values.
2.2.2. DRIFTS experimentsThe heterogeneous interaction between SO2 gas and v-dusts was
studied in-situ inside of the optical DRIFTS cell operated at atmosphericpressure and room temperature under dry and 30% RH conditions. Theobjective of this series of experiments was to monitor the adsorbedspecies formed on the surface of v-dusts, aiming to elucidate the me-chanism of the interaction under both dry and humid conditions.
The DRIFT experimental setup consists of three parts: (i) the gassupply line, (ii) the optical reactor, and (iii) the analytical device asdescribed previously by Romanias et al. (Romanías et al., 2016). Arepresentation of the system is given in Fig. 4. The heterogeneous re-actions between SO2 and different v-dust samples are monitored in situ
inside of the optical DRIFTS cell (Praying Mantis Kit, Harrick ScientificCorp.) fitted with zinc selenium (ZnSe) windows. DRIFT spectra arerecorded by a Nicolet 6700 FTIR spectrometer equipped with a mercurycadmium telluride (MCT) detector cooled with liquid nitrogen.
The temperature of the sample is measured using a thermocoupleplaced right below of the sample holder and is monitored/controlledwith a Harrick temperature controller (Pleasantville, USA).
At the beginning of the experiment the crucible sample holder in-side the DRIFTS cell is filled with about 80–110mg of v-dust. The cell isthen tightly closed and the infrared beam is focused on the surface ofthe dust. The gas flowed through the DRIFTS cell is made up of differentproportions of dry air, humid air and SO2 gas. Prior to the introductionof the SO2 gas volcanic samples are heated to 423 K for 1.5 h to removeany pre-adsorbed species. Samples are then allowed to cool down toroom temperature and are purged overnight with either dry or humidair depending on the experimental conditions in order to equilibratesystem. A background spectrum is recorded right before introduction ofSO2 gas. DRIFT spectra of the v-dust in the presence of SO2 gas arerecorded from 650 to 4000 cm−1 using Omnic software with 100 scansper spectrum, a spectral resolution of 4 cm−1, and a time resolutionranging from 3min to 1 h depending on the stage of the experiment.The formation and loss of surface species are observed as positive andnegative absorption bands respectively. Thus, a typical experiment lastsabout 4 days and consists of thermal pre-treatment (1.5 h), systemequilibration (16 h), SO2 adsorption phase (72 h) and desorption uponflushing phase (6 h). The SO2 concentration in the mixed gas is175 ppm. Note that this is over three orders of magnitude higher thanthe atmospherically relevant SO2 concentration of ~75 ppb used in theflow-tube reactor experiments. Large difference in SO2 concentrationsused for flow tube versus DRIFTS experiments comes from differenttechnical constrains. For instance, DRIFT spectroscopy is used for the insitu characterization of surface adsorbed species but is characterized bya relatively low sensitivity, depending on the gas-surface interactions.Likewise, the observation of the steady state in flow tubes, when theflowing gas is in ppm level, is not possible. In this work two differentreactors serve two different purposes: flow tube is used to study kineticsby providing uptake coefficients under atmospherically relevant con-ditions while DRIFTS is used to study surface reaction mechanism. It isimportant to keep in mind that while the kinetics is changed by the
Fig. 3. Theoretical SO2 concentration profile during atypical flow tube experiment with v-dust exposed to SO2.At the beginning of the experiment where surface isisolated from the gas mixture the initial SO2 concentra-tion is [SO2]0, then the dust is exposed to the gas and theconcentration of SO2 falls to its minimum, after which itrecovers till a steady-state is reached. Note that thesteady-state concentration [SO2] is different from theinitial state concentration [SO2]0. Initial concentrationis controlled when the injector is pushed in and the SO2
gas in no longer in contact with the dust. Shaded areacorresponds to the integrated area that is used to obtainthe number of molecules during the transient initial up-take of SO2 on v-dusts Ns (molecules cm−2). 300 minwas chosen as integration limits for the determination ofNs.
D. Urupina, et al. Atmospheric Environment 217 (2019) 116942
6

concentration because the surface coverage is changed by the con-centration, the reaction mechanism is not likely to be changed as afunction of gas phase concentration. Thus, both techniques bringcomplimentary and valuable information.
2.2.3. Ion analysisA reverse-phase HPLC method with indirect photometric detection
for the simultaneous determination of sulfates and sulfites was used forquantification of sulfates and sulfites formed following experimentswith DRIFTS. To prevent oxidation of sulfites to sulfates, 1.0 mL of 1%formalin in pure water is used as an extracting solvent as recommendedby Michigami (Michigami and Ueda, 1994). After 20min of mechanicalshaking the extracted solution is passed through a 0.2 μm PTFE mem-brane and a filtered leaching solution is analyzed by Waters HPLCsystem. Chromatography equipment consists of Waters 2695 SeriesHPLC System equipped with 2487 UV/VIS Dual wavelength absorbancedetector, (Waters Corporation, Milford, MA). Empower 2 Data Acqui-sition System for LC (Copyright, 2005, Waters Corporation, Milford,MA) is used to analyze the data. Analysis is performed using RestekUltra Column C18, 5 μm, Length 250mm, I.D. 4.60mm column dyna-mically coated with 1.0mM cetylpyridinium chloride in 7% acetonitrilesolution to produce a charged surface as recommended by Zuo et al.(Zuo and Chen, 2003) The HPLC instrument is operated isocratically atambient temperature using Methanol-Potassium Hydrogen PhthalateBuffer 1.0 mM, adjusted to pH 6.5 with dilute potassium hydroxide(1:99, v/v) mobile phase and run at a flow rate of 1mL/min for 15min.The injection volume is 10 μL. Detector is set at 255 nm. All chemicalsand solvents used for HPLC analysis are of analytical grade.
3. Results and discussion
3.1. Exploring SO2 uptake on v-dust from the gas phase: flow tube study
3.1.1. First insight on SO2 uptake on various natural v-dusts under ambientconditions
The uptake of atmospheric relevant concentration of SO2
(i.e.≈ 75 ppb) by the surface of five selected v-dusts under typical at-mospheric conditions of ambient temperature, pressure and 30% RHwas investigated using the flow tube reactor (Lasne et al., 2018). Atypical uptake profile depicted in Fig. 5 shows the [SO2] uptake ofMýrdalssandur dust in humid (RH=30%) conditions. It is clearly ob-served from the profile that after the initial uptake of the gas uponexposure of the v-dust the system reaches a steady-state [SO2] that is
distinct from the initial state [SO2]0, evidencing continuous consump-tion of the title molecule at least for the duration of the experiment. Allthe samples under investigation demonstrated both an initial uptakeand a steady state uptake (similar to Fig. 5). The latter is worth in-vestigating as it suggests the ability of the v-dusts to exhibit a long-termeffect on the equilibrium composition of the atmosphere. The steadystate coefficients are in the order of 10−9 to 10−8 (Fig. 6, Table 3).These values are much lower than the values obtained by Maters et al.,who reported the initial uptakes of SO2 on volcanic ash and glasspowders at 10−3 to 10−2 range (Maters et al., 2017). Large differencein values is not surprising though for a number of reasons. First, theinitial uptake describes an uptake on the fresh surface at the first in-stances of its interaction with gas, while the steady state uptake is anongoing phenomenon reflecting the ability of the surface to adsorb gascontinuously. Second, while determining initial uptakes geometricsurface area was used by Maters et al. in order to calculate uptakecoefficient (Maters et al., 2017), while specific surface area was used inthis study in order to account for all the surface accessible to the SO2
molecules on longer time scales. Using geometric vs specific surfacearea gives an upper value for the uptake coefficient (Crowley et al.,2010). Finally, in the study of Maters et al. experiments were performedunder dry conditions contrary to 30% RH used in this study. Moreover,in the adsorption/desorption experiments on the volcanic glasses per-formed by Schmauss and Keppler it was observed that the first layer of
Fig. 4. Scheme of the DRIFT experimental setup. MFC: Mass Flow Controllers are used to supply the optical cell with a defined mixing ratio of dry air, humid air, andSO2.
Fig. 5. SO2 concentration recorded by the analyzer during exposure ofMýrdalssandur v-dust at T= 296 K, RH=30%.
D. Urupina, et al. Atmospheric Environment 217 (2019) 116942
7

SO2 molecules was adsorbed on the surface of volcanic glass irrever-sibly and could not be removed (Schmauss and Keppler, 2014).
Interestingly, the obtained results show somewhat contrasted be-haviors from one sample to another. In the literature the differences inthe uptake of SO2 on solid material are commonly linked to the dif-ferences in elemental composition or minerology (Maters et al., 2017),(Maters et al., 2016), (Usher et al., 2002), (Zhang et al., 2006), (Harriset al., 2012). Using synthetic and natural silicate glasses as proxies forfresh unweathered volcanic ash is commonly done due to the fact thatglass often represents a major component of v-dust. Besides, a thin layerof glass covering the crystalline components of ash surfaces was ob-served (Delmelle et al., 2018). Several studies indicated that sulfates aremore likely to get adsorbed on the glass fraction of volcanic dust(Schmauss and Keppler, 2014), (Farges et al., 2009). While in-vestigating trends in adsorption of SO2 on glass, elemental compositionis commonly investigated (Maters et al., 2017). This approach thoughignores the crystalline phase of the volcanic dust. Maters et al. em-phasized that the influence of crystallinity on the adsorption of SO2 gasis not yet understood (Maters et al., 2017). On the other hand authorworking with natural mineral dust samples, such as desert dusts oftenapproximate composition of dusts using simple mineral oxides and lookfor trends in adsorption in relationship with the mineral phase com-position. In our study v-dusts differ significantly in their crystallinefraction. Volcanic samples used in this study contain from 20% (Ha-gavatn) to 80–90% (Mýrdalssandur, Maelifellssandur and Dyngju-sandur) of amorphous material (Baratoux et al., 2011), (Moroni et al.,2018). The remaining part is crystalline. Eyjafjallajokull is also domi-nated by glass (Gislason et al., 2011). Plagioclase, pyroxene, and olivineare the mineral phases reported in all five samples, while magnetite wasonly found in Myrdalssandur and Maelifellsandur (Moroni et al., 2018),(Baratoux et al., 2011) (Gislason et al., 2011). A very small amount ofcrystalline silica was found in Eyjafjallajokull and none was reportedfor other samples (Gislason et al., 2011).
Since amorphous fraction dominates composition of v-dusts, an at-tempt to find trends in the uptake vs elemental composition was un-dertaken. Among the authors linking the differences in uptake coeffi-cient to the elemental composition Maters et al. observed increase ofthe initial uptake of SO2 on the surface of synthetic volcanic glasseswith decrease of their silica (Si) content and increase of the sum of theirsodium (Na), potassium (K), magnesium (Mg) and calcium (Ca) content(Maters et al., 2017). As for the natural volcanic samples the relation-ship was not as straightforward, even though a dependence of the initialuptake on the total surface content of the sum of Na, K, Mg and Ca wassuggested (Maters et al., 2017). In our studies no clear correlation be-tween the bulk elemental composition of a v-dust and its uptake of SO2
was established. It can be due to the fact that the elemental con-centration in the bulk sample may not represent the availability of theelements on the surface. Therefore, one might expect the informationderived from elemental surface composition to be more accurate, yetcare must be taken in interpreting such results. One should keep inmind that a given element when incorporated in glass versus crystallinemineral might behave differently. Farges et al. observed that crystallinequartz does not adsorb any sulfur species while amorphous silica does(Farges et al., 2009). The heterogeneous nature of the sample mightfurther complicate finding the trends as elements forming differentmineral phases will behave differently depending on the nature of mi-neral phase. For example, Fe is incorporated in both ilmenite (FeTiO3)and fayalite (Fe2SiO4), yet the SO2 uptake is significantly higher for theformer mineral (Harris et al., 2012).
Earlier studies can be used to understand potential contribution ofcrystalline fraction of the volcanic ash to the uptake of SO2. Both quartz(SiO2) and magnetite (Fe3O4) can be found in volcanic ash. Comparisonof the uptakes of SO2 on individual mineral oxides, such as CaO, Al2O3,CaCO3, Fe3O4 and Fe2O3 showed that the uptake of SO2 depends on thenature of the mineral oxide with higher uptakes observed when SO2
interacted with iron-containing compounds (Usher et al., 2002). Theseobservations were further tested by Zhang et al. who compared re-activity of different oxides taking into consideration their specific areaand placed them in the following order:Fe2O3>MgO > TiO2> FeOOH > mixture > Al2O3> SiO2 (Zhanget al., 2006). Both studies indicate that conversion of SO2 per unitsurface of Fe2O3 is the highest, suggesting that particles with thehighest amount of iron might be the most reactive in reactions withSO2. Furthermore, the reactivity of the mixture, that was obtained bymixing the different oxides based on their abundance in the continentalcrust, was measured to be twice its theoretical value, which demon-strates its synergistic effect (Zhang et al., 2006). Even though moststudies use simple mineral oxides and synthetic dust as a substitutionfor natural samples, such approach is problematic, as it undermines theimportance of more complex mineralogy in the uptake of SO2. Whilestudying the uptake of SO2 on Saharan dust Harris et al. distinguishedilmenite (FeTiO3), rutile (TiO2) and iron oxides (Fe2O3, Fe3O4, FeOOH)(γ BET(mixture of ilmenite and rutile) = 3×10⁻⁵) as major phases of dustresponsible for uptake and oxidation of SO2 (Harris et al., 2012). Up-take on feldspar minerals such as KAlSi3O8, NaAlSi3O8 or CaAl2Si2O8
and quartz (SiO2) was found to be slow (γ BET(feldspar) = 9×10⁻⁷, γ(quartz with basic components) = 4×10⁻⁸) (Harris et al., 2012). To identifythe elements associated with adsorption of SO2 by crystalline materialHarris et al. analyzed individual Saharan dust grains that were rela-tively rich in S content after their exposure to SO2 and studied theirelemental profile using single-particle SEM–EDX analysis (Harris et al.,2012). Ti, Fe and Ca were identified as the most important reactiveelements, while Na, Mg, Al, Si showed no relationship to oxidizingcapacity of dust (Harris et al., 2012). While studying the uptake of SO2
on v-dusts it would be informative to investigate the uptake of SO2 onother complex mineral phases present in v-dust such as pyroxene,plagioclase, amphibole, biotite, and olivine even though higher uptakesof SO2 are linked to the presence of minerals lacking silicates, such asilmenite (FeTiO3) and magnetite (Fe3O4) (Harris et al., 2012).
Fig. 6. Steady-state uptake coefficients of the Icelandic v-dust samples at[SO2]0≈ 75 ppb, RH=30%, T=296 K, under dark conditions. The errorsquoted reflects the total error for the steady state uptake coefficient determi-nation.
Table 3SO2 steady-state uptake coefficients (γSS,BET) and transient initial number ofmolecules adsorbed (Ns) on the surface of v-dusts. Experimental conditions:[SO2]0≈ 75 ppb, RH=30%, T= 296 K, under dark conditions.
Origin of the Icelandic v-dust γSS,BET Ns (molecules cm−2)
Mýrdalssandur (6.2 ± 2.5)×10−8 (2.5 ± 0.8)× 1013
Dyngjusandur (1.6 ± 0.6)×10−8 (2.1 ± 0.6)× 1013
Hagavatn (6.6 ± 2.6)×10−9 (1.2 ± 0.4)× 1013
Maelifellssandur (3.2 ± 1.3)×10−8 (9.6 ± 2.9)× 1012
Eyjafjallajökull (3.3 ± 1.3)×10−8 (1.2 ± 0.4)× 1013
D. Urupina, et al. Atmospheric Environment 217 (2019) 116942
8

The number of SO2 (Ns) molecules removed during the transientinitial uptake process per surface area was also investigated and wascalculated to be in the order of 1013 molecules cm−2 (Table 3). Thesevalues are comparable to the values obtained by Maters et al., whoreported the total uptake capacity of SO2 on volcanic ash and glasspowders under dry conditions at 1011 to 1013 range (Maters et al.,2017). As with initial uptakes, total uptake capacity of SO2 on thesurface of synthetic volcanic glasses increased with decrease of their Sicontent and increase of their total Na, K, Mg, Ca content (Maters et al.,2017). As for the natural volcanic ash samples the relationship was lessclear and the dependence on total surface Na, K, Mg, Ca content wassuggested (Maters et al., 2017). Furthermore, as displayed in Fig. 7, thetransient number of molecules adsorbed Ns at the initial stage of theexposure, and the steady state uptake coefficients do not follow thesame trend. On one hand, Mýrdalssandur seems to adsorb the highestamount of molecules and it has the highest uptake coefficient. On theother hand, Hagavatn that has the smallest uptake coefficient adsorbsalmost the same amount of molecules as Eyjafjallajökull and more thanMaelifellssandur even though the latter two have an uptake coefficientthat is twice as high as uptake coefficient of Hagavatn. The dis-crepancies between Ns and γss,BET suggest that the surface is modifiedupon its initial exposure to SO2. Indeed, one should keep in mind that
adsorption behavior of SO2 on each volcanic dust was characterized bymeasuring the steady state uptake coefficients after 12 h of exposure,i.e. after long processing, while the number of molecules taken up wasmeasured after the first 5 h of the interaction where a transient uptakewas observed at the initial stage of the experiment. Differences in theobserved trends could indicate that at the initial stage of the experimentthe surface of the dusts is modified due to SO2 uptake and the corre-sponding formation of sulfites and sulfates, and these modificationsaffect the surface reactivity at longer time scale when the γss,BET valuesare determined. The modifications could explain why no correlationwas noticed between the γss,BET and Ns with the elemental compositionof the v-dusts. Finally, the discrepancies could be due to the fact thatthe nature of the governing processes behind the initial fast uptake andthus the high amount of molecules adsorbed in the initial stage andthose dominating the steady state uptake are fundamentally different(Huthwelker et al., 2006).
3.1.2. The role of relative humidity on the uptake of SO2 on v-dustsSeveral studies have highlighted the role of RH on SO2 uptake (Li
et al., 2006), (Zhou et al., 2014), (Huang et al., 2015). In order to in-vestigate the role that RH plays in the steady state uptake of SO2 on v-dust samples the relationship was investigated for two contrastedsamples based on their steady-state uptakes – Mýrdalssandur and Ha-gavatn (Fig. 8). For Mýrdalssandur we observed that the steady stateuptake coefficient of SO2 at 30% of RH was significantly higher thanunder dry conditions (i.e. γss, BET (30% RH)= 6.2×10⁻⁸ and γss, BET
(dry)= 2.0× 10⁻⁸). For the Hagavatn v-dust a similar trend was ob-served (i.e. γss, BET (30% RH)= 6.6× 10⁻⁹ and γss, BET
(dry)= 1.0× 10⁻⁹). The enhanced uptake trends observed in thepresence of water indicate that water plays an important role pro-moting the partitioning of SO2 to the adsorbed phase. There might benumerous reasons for the observed increased uptake of SO2 in thepresence of water vapor. Adsorbed water molecules can (i) participatein the reactions as reactants, (ii) serve as a medium for the reaction totake place or (iii) change the physical properties of the particle shiftingthe equilibrium towards higher SO2 uptake. Water molecules can alsoform water layers that can help the product of the reaction to diffusealong the surface and thus promote the renewal, i.e. the turnover, ofsurface sites (Shang et al., 2010). The intrinsic ability of metal oxides toadsorb water molecules and form surface hydroxyls was linked tohigher reactivity in the heterogeneous reaction with SO2 (Zhang et al.,2006).
In the literature the analysis of the influence of RH on the uptake of
Fig. 7. Number of SO2 molecules taken up on the surface of different v-dustsduring the transient initial uptake process when exposed to [SO2]0≈ 75 ppb,T= 296K, RH=30%, dark conditions. The errors quoted reflect the total errorfor the Ns determinations.
Fig. 8. Steady-state uptake coefficients of theMýrdalssandur and Hagavatn v-dust samples atRH=30% (blue bars) and RH=0% (red bars),[SO2]0≈ 75 ppb, T= 296 K, under dark condi-tions. The errors quoted reflects the total errorfor the steady state uptake coefficient determi-nation. (For interpretation of the references tocolor in this figure legend, the reader is referredto the Web version of this article.)
D. Urupina, et al. Atmospheric Environment 217 (2019) 116942
9

SO2 on natural mineral dusts shows complex trends. An influence ofwater vapor on the interaction of SO2 with Saharah dust at 258 Kshowed no effect on initial uptake within statistical error (i.e. γ BET
(27% RH) = (6.0 ± 1.0)× 10−5 and γ BET (dry) =(6.4 ± 0.7)× 10−5). Likewise, no dependency of the initial uptakecoefficient on humidity was found for Adobe clay soil taken from LosAngeles area (Judeikis and Stewart, 1976). Alternatively, when Huanget al. subjected three authentic dusts to SO2 at RH ranging from 0 to90% an increase in uptake coefficient was observed for Tengger Desertdust (i.e. γ BET (dry)≈ 3.8×10⁻⁵ and γ BET (90% RH)≈ 5.5× 10⁻⁵)and for Arizona test dust (i.e. γ BET (dry)≈ 1.3× 10⁻⁵ and γ BET (90%RH)≈ 2.76× 10⁻⁵), but a decrease was observed for Asian mineraldust (i.e. γ BET (dry)≈ 3.2×10⁻⁵ and γ BET (90% RH)≈ 1.9× 10⁻⁵)(Huang et al., 2015). The negative dependence of humidity on SO2
uptake in the case of Asian mineral dust was explained by the presenceof water-soluble inorganic coating, which made surface more acidic andinhibited uptake of SO2(Huang et al., 2015). When the Asian mineraldust was washed and coating was removed, the uptake trend got re-versed and showed positive correlation (i.e. γ BET (dry)≈ 0.85× 10⁻⁵
and γ BET (90% RH)≈ 1.32×10⁻⁵)(Huang et al., 2015). Then again,while the samples from Inner Mongolian desert, characterized by highcarbonate contents, demonstrated considerably increased uptakes athigher humidity (i.e. γss, BET (40% RH)= 1.0× 10⁻⁶ and γss, BET
(dry)= 1.7×10⁻⁷), Xinjiang sierozem natural mineral dust showedonly a modest increase in steady-state uptake (i.e. γss, BET (40%RH)≈ 2.4×10⁻⁷ and γss, BET (dry)≈ 2.2× 10⁻⁷) (Adams et al.,2005). The authors suggest that difference in the minerology could beresponsible for the difference in the observed trends (Zhou et al., 2014).Higher carbonate component of the Inner Mongolian desert dust canpromote the SO2 uptake. Indeed, while investigating carbonate particlesZhang et al. observed that the value of the steady state uptake γss, BETdrastically increases from γss, BET (1%)= 0.32× 10⁻⁸ to γss, BET (85%RH)= 13.9× 10⁻⁸), at 85% RH reaching 43 times its value at 1%(Zhang et al., 2018). In our study volcanic dusts, void of carbonates,cannot be directly compared to carbonate-rich samples, but the ob-served trend follows the one of Tengger Desert dust and Arizona testdust discussed earlier. More information about influence of humidity onthe steady state uptake of SO2 on the surface of volcanic glass and ash isnecessary to obtain a more comprehensive picture.
While the increase in the SO2 uptake with the increase of relativehumidity is observed for a number of samples, it is not at all the case forthe uptakes of other species, such as nonpolar volatile organic com-pounds (Romanias et al., 2016), hydrogen peroxide (H2O2) (Romaniaset al., 2012) or ozone (O3)(Lasne et al., 2018). In fact, the uptakecoefficient can decrease with increased humidity, such as the case forthe steady state uptake of O3 on montmorillonite clay dust reflectingthe tendency for the molecules in question and molecules of water tocompete with each other for the sorptive sites on the clay surface (Lasneet al., 2018).
The observation of the steady state nature of the uptakes points outthat there are important and maybe cyclic processes occurring on thesurface of the v-dust. The gas phase monitoring limits us to the de-termination of kinetic parameters; in order to investigate the me-chanism of the SO2 uptake surface monitoring is necessary. IncreasedSO2 uptake at higher RH suggests that humidity plays a particularlyimportant role in the adsorption of SO2 to the surface. To monitor theadsorbed phase, determine the functional groups that are involved inthe adsorption of SO2 and to further evaluate the role of water to thereaction system, a series of experiments were carried out employingDRIFT spectroscopy.
3.2. Exploring SO2 uptake on v-dust from the adsorbed phase: DRIFTSstudy
While flow tube reactor monitors changes in the gas-phase con-centration, DRIFTS focuses on changes on the solid phase. It is
commonly used to study fine particles and powders, and can be used toinvestigate adsorption of molecules on solid surfaces. In this casespectra are collected as difference spectra with the unexposed solid asbackground. As the reaction proceeds, growing or decreasing peaks canbe attributed to the species formed or consumed on the surface. Infraredspectroscopy based on light diffuse reflectance offers information aboutthe vibrational modes associated with stretching, bending, and rockingmotions of the adsorbed molecules. However, in order to monitor thesevibrations the sample has to have high enough reflectance to insure anadequate signal in response to changes in the adsorbed phase, and thesurface concentration needs to be high enough due to the low sensi-tivity of the technique. If the sample is highly absorbent, which is thecase of v-dust samples, it is usually diluted in a non-absorbent matrix,such as KBr. In our case, however, this type of matrix could not be usedbecause of the interactions of KBr with SO2 and thus the use of pure v-dust was required. The background obtained for each v-dust under dryconditions showed that all of them absorb light strongly and, as a result,a weak IR signal was recorded in response to changes in the adsorbedphase. To study the adsorption of SO2 on v-dust, backgrounds of fivesamples were taken to choose the least absorbent varieties. In com-parison with other v-dusts the background for Hagavatn andEyjafjallajökull shows higher reflectance in the area from 800 to1350 cm−1 where sulfite and sulfate species usually absorb. Because ofits higher reflectance and higher specific surface area, Hagavatn v-dustwas selected as the most appropriate sample for DRIFTS experiments.Besides, results obtained from the flow tube studies showed similartrends in SO2 adsorption by the v-dusts based on gas-phase monitoringof SO2, i.e. rapid consumption of SO2 gas at the initial stage of surfaceexposure followed by a steady state removal of the probe molecule.Therefore, it appeared justified to choose one dust as a representativesample to study the mechanism of product formation on the surface ofaerosols. Aiming to further investigate the observations from the flowtube study and to further assess the role of humidity on the reactionmechanism, the DRIFTS experiments were performed under dry con-ditions and 30% RH using Hagavatn as a sample material.
3.2.1. Typical DRIFT spectra of SO2 interaction on v-dustFig. 9 and Fig. 10 show DRIFT spectra of Hagavatn v-dust at in-
creasing SO2 exposure time intervals at room temperature under 0%and 30% RH respectively. Table 4 introduces the assignment of peaks ofdifferent adsorbed sulfur-containing species as well as water and hy-droxyl groups on the surface of v-dust investigated and different metaloxides found in the literature.
In Particular, the negative and positive absorption peaks in the areafrom 4000 to 3500 cm−1 correspond to the free OH groups that arenaturally present on the surface of v-dust (Hair, 1975). These groupsare attached to the surface atoms, such as Si for example, and can beeither completely isolated or hydrogen-bonded to each other (Hair,1975). Adsorption of molecules containing a lone-pair of electrons isoften associated with isolated surface OH groups, while neighboringhydrogen-bonded surface OH groups are involved in the adsorption ofwater (Hair, 1975), (Nanayakkara et al., 2012). The exact assignment ofeach individual peak is not possible due to the complex response re-flecting slightly different vibrational energies of OH groups bonded todifferent minerals composing the v-dust. A peak from 3500 to2600 cm−1 and another peak from 1800 to 1400 cm−1 centered at1620 cm−1 (not displayed) are attributed to vibration modes in mole-cular water (Hair, 1975).
A weak broad peak from 2600 to 2400 cm−1, visible under humidconditions, could be assigned to the S–H stretch vibration of the HSO3
−
bisulfite species that is only found in the literature as a theoretical valuecalculated by Zhang et al. for aqueous solution and reported to be in therange of 2620 to 2450 cm−1 (Zhang and Ewing, 2002). This peak is notvisible under dry condition. Sulfur-containing products appear in thearea from 1385 to 700 cm−1 under humid conditions and from 1367 to716 cm−1 under dry conditions. Spectra under humid conditions are
D. Urupina, et al. Atmospheric Environment 217 (2019) 116942
10

better resolved and several peaks can be distinguished: 3040, 2500,1364, 1220, 1135, 930 and 872 cm−1. Peaks under dry conditions aremuch noisier, nevertheless the following peaks are observed: 3242,1340, 1230 and 1150 cm−1. A double peak centered at 1364 cm−1
under humid conditions and at 1340 cm−1 under dry conditions ap-pears rapidly upon exposure of the surface to SO2 gas and disappears
right away from the spectra after ceasing the SO2 flow. It was thereforeassigned to the weakly, reversibly physisorbed SO2 species. The peakcorresponds well to the literature values for SO2 adsorption under dryconditions on the surfaces of aluminum, magnesium or titanium oxidesidentified in the previous studies at 1330 cm−1 and its gas-phase valueof 1362 cm−1 (Nanayakkara et al., 2012), (Goodman et al., 2001).Another band appears rapidly upon exposure of SO2 to the surfacebetween 1053 and 700 cm−1 under humid conditions. A correspondingband between 975 and 716 cm−1 under dry conditions takes more timeto develop and is hard to interpret since its intensity is almost at thelimit of detection of the DRIFTS instrument. The assignment of thisband is based on the previous assignments of SO2 adsorption on thesurface of different metal oxides found in the literature and correspondsto the stretching motion of sulfite and bisulfite species that are bondedto the surface in a monodentate or bidentate mode. Different co-ordination environments as well as heterogeneous nature of v-dustcontribute to the broadening of the band (Usher et al., 2002). In par-ticular, Goodman et al. (2001)., Usher et al. (2002) and Zhang et al.(2006) assigned the band between 1100 and 850 cm−1 to adsorbedsulfite and bisulfite on α-Al2O3 and MgO. Li et al. (2006) and Wu et al.(2011) assigned a 1000-900 cm−1 band on CaCO3 to a stretching vi-bration of sulfite. A peak from 1200 to 800 cm−1 on TiO2 was assignedto sulfite and bisulfite species by Nanayakkara et al. (2012). On he-matite particles Wang et al. assigned to sulfites a peak between 950 and800 cm−1 under dry conditions and a series of peaks from 1050 to900 cm−1 under humid conditions (Wang et al., 2018b). Finally, a bandfrom 1320 to 975 cm−1 with features at 1230 and 1150 cm−1 in dryconditions and from 1302 to 1055 cm−1 with features at 1220 and1135 cm−1 under humid conditions was attributed to sulfate and bi-sulfate species. The assignment agrees well with the results publishedpreviously, where sulfates/bisulfates were found around 1300-1100 cm−1 on α-Al2O3 and MgO (Usher et al., 2002), (Zhang et al.,2006); between 1240 and 1012 cm−1 on CaCO3 with features at 1198,1127, and 1090 cm−1(Wu et al., 2011), (Li et al., 2006). Sulfates werereported between 1300 and 1100 cm−1 on TiO2 (Nanayakkara et al.,2012), (Shang et al., 2010); and at 1220 cm−1 on Fe2O3 (Wang et al.,2018b). Just as sulfites, sulfates can be bonded to the surface in bi-dentate or monodentate modes (Jiang et al., 2010). A peak centered at1220 cm−1 under humid conditions and at 1230 cm−1 under dry con-ditions could be attributed to the formation of bisulfate species (Wanget al., 2018a). The process of sulfate/sulfite formation is explained laterin the reaction mechanism section.
3.2.2. Surface reaction mechanismChanges in the DRIFT spectra of the surface of Hagavatn v-dust are
clearly seen upon introduction of SO2 (Figs. 9 and 10). In comparisonwith the studies of the interaction of SO2 with pure metal oxides re-ported earlier by different researchers, it is evident that the peaks forsulfur-containing species appear much slower, most probably due tolow sensitivity when dealing with dark v-dusts where the reflectance ofthe infrared light is limited (Zhang et al., 2006), (Usher et al., 2002),(Goodman et al., 2001), (Li et al., 2006), (Wu et al., 2011),(Nanayakkara et al., 2012), (Shang et al., 2010), (Wang et al., 2018b).The time evolution of five peaks corresponding to different species,such as free OH groups, molecular water, physisorbed SO2, sulfites/bisulfites and sulfates/bisulfates is followed.
3.2.2.1. Dry conditions. From our flow tube experiments presentedearlier it is apparent that SO2 gas is massively lost from the gas phaseupon its exposure to the v-dust surface. Interestingly, the first peaks thatappear in the DRIFT spectra after introduction of SO2 gas are positivepeaks for physisorbed SO2 gas and negative peaks for free OH groups(Fig. 9). Note that although the sample has been thermally pretreatedand the experiment is performed under dry conditions, surface OHgroups are present on the surface of the sample. The completedehydroxylation of the surface would have required stronger thermal
Fig. 9. DRIFTS spectra of SO2 uptake by Hagavatn v-dust at 0% RH and 296 Kdepicting evolution of bands for free surface OH groups (4000-3500 cm−1),adsorbed water (3500-2600 cm−1), physisorbed SO2 (1385-1320 cm−1), sul-fates/bisulfates (1320-975 cm−1), sulfites/bisulfites (975-716 cm−1) as afunction of time: black line – before introduction of SO2, red line-after 1.5 h ofexposure to SO2, blue line-after 2.5 h of exposure to SO2, green line-after 22 h ofexposure to SO2, yellow line-after 71 h of exposure to SO2. (For interpretation ofthe references to color in this figure legend, the reader is referred to the Webversion of this article.)
Fig. 10. DRIFTS spectra of SO2 uptake on Hagavatn v-dust at 30% RH and296 K depicting evolution of bands for free surface OH groups (4000-3500 cm−1), adsorbed water (3500-2600 cm−1), SH groups (2600-2400 cm−1),physisorbed SO2 (1367–1320), sulfates/bisulfates (1302-1050 cm−1), sulfites/bisulfites (1053-700 cm−1) as a function of time: black line – before introduc-tion of SO2, red line-after 1.5 h of exposure to SO2, blue line-after 2.5 h of ex-posure to SO2, green line-after 22 h of exposure to SO2, yellow line-after 71 h ofexposure to SO2. (For interpretation of the references to color in this figurelegend, the reader is referred to the Web version of this article.)
D. Urupina, et al. Atmospheric Environment 217 (2019) 116942
11

Table4
Vibration
alwav
enum
bers
(cm
−1)of
sulfur-con
tainingspeciesad
sorbed
onv-du
stan
dmetal
oxides.
Molecular
species
(wav
enum
bers
areexpressedin
cm−
1)
V-dust(this
work)
Si2O3
Al 2O3
MgO
TiO2
CaC
O3
Fe2O3
Theo
reticalcalculations
SHstretchof
HSO
3−
2600
–240
026
00-240
0(H
air,
1975
)26
20to
2450
(Zha
ngan
dEw
ing,
2002
)SO
213
64,13
4013
30,1
149(G
oodm
anet
al.,20
01)
1330
,114
9(G
oodm
anet
al.,20
01)
1139
,13
25(N
anay
akka
raet
al.,20
12)
1400
(Nan
ayak
kara
etal.,
2012
)HSO
3−/S
O32-
1053
–700
975–
716
1200
-900
(Goo
dman
etal.,20
01)
1100
-850
(Zha
nget
al.,
2006
)
1200
-800
(Nan
ayak
kara
etal.,20
12)
1080
(Sha
nget
al.,20
10)
Dry:
950–
800
Hum
id:
1050
-900
(Wan
get
al.,
2018
b)SO
32-
1125
-800
(Goo
dman
etal.,20
01)
Mon
oden
tate:
1033
,97
1,92
3(N
anay
akka
raet
al.,
2012
)Bide
ntate:
1006
,88
6(Nan
ayak
kara
etal.,20
12)
1000
-900
(Li
etal.,20
06)
1000
-885
(Wu
etal.,20
11)
Dry:891
(Wan
get
al.,
2018
b)Hum
id:9
81(W
anget
al.,
2018
b)
HSO
3−
1077
(Nan
ayak
kara
etal.,20
12)
1054
,115
4,12
19(Zha
ngan
dEw
ing,
2002
)HSO
4−/S
O42-
1320
–975
1302
–105
512
45,1
170(U
sher
etal.,
2002
)11
50,1
050(U
sher
etal.,20
02)
1240
-101
2(W
uet
al.,20
11)
HSO
4−
1220
,12
3012
19(W
anget
al.,
2018
a)SO
4−
1300
-110
0(Zh
anget
al.,
2006
)13
00-110
0(Zha
nget
al.,20
06)
1361
,12
97,1
172,
1116
,105
0,10
00(N
anay
akka
raet
al.,20
12)
1300
-110
0(Sha
nget
al.,20
10)
1130
(Liet
al.,
2006
)Dry:
1339
–101
4Hum
id:
1208
-122
2(Wan
get
al.,
2018
b)free
OH
grou
ps40
00–3
500
4000
-350
0(H
air,
1975
)37
48,3
707(G
oodm
anet
al.,20
01)
3800
-360
0(N
anay
akka
raet
al.,20
12)
1666
,36
28(Sha
nget
al.,20
10)
3704
(Wan
get
al.,
2018
b)OH
grou
psof
acids
3447
,354
8(W
anget
al.,
2018
b)36
22(Zha
ngan
dEw
ing,
2002
)molecular
water
3500
–260
014
00–1
800
3450
,163
0(H
air,
1975
)35
24,3
296(G
oodm
anet
al.,20
01)
3160
,16
54(Sha
nget
al.,20
10)
3208
,164
2(W
anget
al.,
2018
b)
D. Urupina, et al. Atmospheric Environment 217 (2019) 116942
12

pretreatment. The loss of surface free OH groups reaches its localminimum at around 1.5 h exposure to SO2 before returning to its initialpre-exposed level where it starts fluctuating around zero. The peak forSO2 gas is stable, but hard to integrate due to its small size and overlapwith a much more pronounced peak for bulk water. Bulk water peak ishighly unstable. The disappearance of free OH groups and appearanceof physisorbed SO2 suggest that in the first instants of the reaction, SO2
gas gets weakly bonded to hydroxyl groups of the surface as firstproposed by Datta et al. and later proved by theoretical calculations byLo et al. for γ-alumina (Datta et al., 1985), (Lo et al., 2010). Materset al. suggested that due to the weakly acidic nature of SO2 gas itsuptake is likely to happen on strongly basic sites affiliated with alkalineand alkaline earth metals on the surface of the volcanic glass (-K-OH,-Mg-OH, -Ca-OH, Mg–OH)(Maters et al., 2017). At the same time it isalso possible for the SO2 gas to get adsorbed on metallic Lewis acid sitesof mineral phase as proposed by Wang et al. (2018a). Hence, the firstinteraction of SO2 gas with the surface under dry conditions is itsdistribution on different sites of the v-dust leading to a reversiblephysisorption of SO2, as indicated by subscript (ads) (Reaction 1).Throughout the manuscript the chemisorbed species or chemical groupsthat form a chemical bond with the surface are indicated as (surface).
SO2(g) ↔ SO2(ads) Reaction 1
Physisorbed SO2 can then participate in reactions leading to che-misorbed species. Sulfites and sulfates, under dry conditions first ap-pear after several hours of exposure probably due to the low sensitivityof our DRIFT setup, as abovementioned. Sulfites can be formed on thelattice oxygen sites that can be viewed as Lewis basic sites (Wang et al.,2018a) as in Reaction 2.
SO2(ads) + O2−(lattice) →SO3
2−(surface) Reaction 2
Alternatively, sulfites can be formed in the presence of hydroxylgroups as SO2 can react with either one hydroxyl group to form bisulfite(Reaction 3) or two neighboring hydroxyl groups to form sulfite andwater (Reaction 4) (Wang et al., 2018a). Surface hydroxyl groupsthemselves can be bonded to a single metal atom or bridge two,creating different environments for interactions with SO2 (Ullerstamet al., 2002).
SO2(ads) + OH−(surface) →HSO3
−(surface) Reaction 3
SO2(ads) + 2OH−(surface) →SO3
2−(surface) + H2O Reaction4
Chemisorption of SO2 gas on oxide anions (O2−) and hydroxylgroups of volcanic ash and glass leading to the formation of sulfites andbisulfites was suggested earlier by Maters et al. and detection of sulfitesin the leachates confirmed the conversion (Maters et al., 2017).
From Fig. 11 that shows time evolutions of sulfites and sulfates, itcan be observed that, under dry conditions, sulfites (SO3
2−) get com-pletely stabilized after 22 h of exposure, but sulfates (SO4
2−) keepgrowing linearly, suggesting that sulfites are the intermediate species inthe oxidation of SO2 to sulfates. Oxidation of sulfites to sulfates on thesurface of volcanic glass was observed by Farges et al. (2009). Sulfitescan be oxidized to sulfates via several pathways. Active oxygen derivedfrom molecular oxygen adsorbed on the active sites (Reaction 7) canoxidize sulfites to sulfates and bisulfites to bisulfates as in Reaction 5and Reaction 6 (Wang et al., 2018a).
SO32−(surface) + O−
(ads) →SO42−(surface) + e− Reaction 5
HSO3−(surface) + O−
(ads) →HSO4−
(surface) + e− Reaction6
Contrary to our observations and to results reported by Shang et al.(2010), who also noticed a stable rate of sulfate production on thesurface of titanium dioxide particles in the presence of oxygen, Usheret al. (2002) noted complete saturation of mineral oxide surfaces withSO2 gas and observed no sulfate formation even upon exposure of SO2-treated surface to air and oxygen. It could be due to the fact that the
minerals under investigation were not able to convert molecular oxygeninto active oxygen under the specific experimental conditions of thesemeasurements.
O(vacancy) + e− + O2 →O2−(ads) Reaction7
O2−(ads)+ e− →2O−
(ads)
where e- is a conductive electron trapped in the vacant oxygen siteon the surface of some oxides that are prone to having defect sites, suchas on the surface of Fe2O3, for example (Wang et al., 2018b),(Baltrusaitis et al., 2007). Noticeably, reaction proceeds in the absenceof light (Baltrusaitis et al., 2007). Reaction 7 was reported to enable theconversion of sulfites to sulfates on the surface of mineral phase, but asimilar process can be expected to happen on the amorphous fraction ofthe volcanic ash due to the high defect population on silicate glasses (ALeed and Pantano, 2003), (Farges et al., 2009).
Additionally, certain metal centers that can be readily reduced, suchas Fe3+ to Fe2+, contribute to the formation of sulfates from bisulfitesas per Reaction 8 (Wang et al., 2018a).
Fig. 11. Integrated absorbance for (a) sulfites/bisulfites, (b) sulfates/bisulfatesas a function of time under 0% RH and 296K. Upper graph: sulfites/bisulfitesare stabilized after 22 h of exposure. The solid line is an exponential fitting ofexperimental results to better display the observed trends. Lower graph: Alinear growth of sulfates/bisulfates with time is noticed; note that the peak isstable for the first couple of hours and then keeps increasing in a linear fashion.The solid line is the linear fit of experimental results.
D. Urupina, et al. Atmospheric Environment 217 (2019) 116942
13

+ →→ + +− −+ +
− + −Fe FeHSO OH SO 2H 2e3 (surface) (surface)3 2
4 (surface)2
Reaction 8
Finally, bisulfates can be oxidized to sulfates by hydroxyl groups asper Reaction 9 (Wang et al., 2018a).
HSO4−
(surface) + OH−(surface) →SO4
2−(surface) + H2O Reaction9
On ceasing the gas flow and flushing the system for 6 h, the peak forsulfites decreases due to its oxidation as per Reaction 5, Reaction 6 andReaction 8, while the peak for sulfates increases for a couple of hoursbefore getting stable, at the same time slightly changing its shape. Thepeak centered at 1230 cm−1 gets smaller in comparison with the peakat 1135 cm−1 suggesting indeed further conversion of bisulfates tosulfates. A decrease in sulfite peak with simultaneous increase in thesulfate peak upon cutting off SO2 supply and addition of O3 was ob-served by Li et al. (2006). Thus, sulfates appear to be the final productof oxidation of SO2 gas and they keep being formed on the surface aslong as there are sulfites available for oxidation. Sulfates were alsoreported as a final irreversible product of the interaction of SO2 gaswith volcanic glass by Farges et al. and by Maters et al. (Farges et al.,2009), (Maters et al., 2017).
3.2.2.2. Humid conditions. After exposure of v-dust to SO2 gas underhumid conditions the following changes are observed in the analysis of
DRIFT spectra as seen in Figs. 10 and 12. At the very beginning of theexperiment, the free OH groups get consumed and reach a minimumafter 1.5 h exposure to SO2, at the same time sulfites form rapidly and atan almost linear rate. The peak for physisorbed SO2 increases muchslower and the peak remains small for the duration of the experiment.The initial time period corresponds well with the reaction mechanismproposed by Wang et al. in Reaction 3 and Reaction 4 both of whichrequire consumption of free OH groups to produce sulfites andbisulfites. From 1.5 to 2.5 h consumption of OH groups slows downand finally reaches a stable level. It is important to stress out that, whenworking under humid conditions, surface OH groups are continuouslyregenerated. The mechanism for metal oxide surface hydroxylationproposed by Tamura et al. assumes that an exposed oxygen center of themetal oxide lattice acts as Lewis base with water to form a surfaceterminal hydroxyl group and a hydroxide ion as shown in Reaction 10(Tamura et al., 2001). In other words, a surface oxide ion getsneutralized by water to become OH−
(surface), while water itself losesa proton to become hydroxide ion OH−
(ads).
O2−(lattice) + H2O → OH−
(surface) + OH−(ads) Reaction 10
Sulfates are first observed in the DRIFT spectra at 2.5 h exposure toSO2. Sulfates can be formed by three different pathways shown inReaction 5, Reaction 6, and Reaction 8 (Wang et al., 2018a). Unlikesulfites, the peak for sulfates keeps growing linearly with time once
Fig. 12. Integrated absorbance for (a) free hydroxyl groups, (b) physisorbed SO2, (c) sulfites/bisulfites, (d) sulfates/bisulfates as a function of time under 30% RH and296 K. The free OH groups get consumed very fast at the beginning of the experiment and reach a minimum at 1.5 h, then the consumption of OH groups decreasesand reaches a stable level at 2.5 h. The solid line is an empirical fitting of experimental results to better display the observed trends. The peak for physisorbed SO2 isquite nosiy but increases slowly and remains weak for the duration of the experiment. The solid line is an empirical fitting of experimental data points. Sulfites/bisulfites grow rapidly and almost linearly for the first 1.5 h and then stabilize. The solid line is an exponential fitting of experimental results to better display theobserved trends. The peak for sulfates/bisulfates is stable at low values for the first 2.5 h and then increases in the linear fashion. The solid line is the linear fit ofexperimental results.
D. Urupina, et al. Atmospheric Environment 217 (2019) 116942
14

again suggesting that sulfate is the final product of SO2 oxidation andthat the surface does not get saturated within the duration of the ex-periment. A peak for molecular water is hard to evaluate at 30% RH aswater is being constantly supplied in large excess. Initially, the peak forwater seems to decrease, which could be due to the competition withSO2 gas molecules for active sites on the surface (Fig. 10). At 14 h thewater peak stabilizes at a positive value, indicating that the surface isnow storing more H2O molecules than before introduction of SO2 gas(Fig. 10). Formation of sulfite and sulfate species could have changedequilibrium for adsorption of water on the dust surface (e.g. due tochemical changes of the mineral structure that increase the hygro-scopicity of the samples). Particularly, it was argued that adsorption ofbidentate sulfate on the surface of Fe–Mn/TiO2 catalyst increases theLewis acid character of the metal ion to which it is attached, thus po-tentially favoring the adsorption of water on the metal center (Jianget al., 2010). Finally, when the flow of SO2 is stopped, the peak forsulfite gradually decreases while the peak for sulfate increases for acouple of hours, stabilizes and stays in the spectra for at least 6 h. Likeunder dry conditions the peak for bisulfates/sulfates changes its shapeby decreasing the peak associated with bisulfates (at 1220 cm−1) sug-gesting its conversion to sulfates.
3.2.2.3. Comparison between dry and humid conditions. AlthoughDRIFTS is a semi-quantitative technique, it is feasible to compare theresults obtained under dry and humid conditions. Thus, in comparisonwith the reaction under dry conditions the reaction under humidconditions is much more pronounced, resulting in both faster reactionrates and higher integration values obtained for all sulfur containingspecies involved. This observation is in line with the results obtainedfrom the flow tube experiments, where significantly higher steady stateuptakes were determined for SO2 under humid compared to dryconditions. Faster sulfite formation is most likely related to thedramatic increase in the amount of hydroxyl groups covering thesurface under humid conditions, driving the sulfite and bisulfiteformation through Reaction 3 and Reaction 4. Indeed, under humidconditions the amount of hydroxyl groups lost in the first minutes ismuch larger than under dry conditions, thus adsorbed SO2 moleculesconvert rapidly to form sulfites (Figs. 9 and 10). Huang et al. reportedthat the rate of sulfate formation on the surface of Arizona test dustincreased with RH and reached its maximum at 70% RH (Huang et al.,2015). Importance of surface OH groups in the heterogeneous oxidationof SO2 gas was discussed by Zhang et al. who compared basic, neutraland acidic Al2O3 in their ability to oxidize SO2 and noted that basicAl2O3 was much more efficient due to its higher concentration ofhydroxyl groups on the surface (Zhang et al., 2006). It was alsosuggested that reactivity of different oxides to SO2 uptake could bepredicted by evaluating their intrinsic ability to form surface hydroxylgroups. Thus, metal oxides that have empty or half-empty d atomicorbitals, such as Al2O3, easily adsorb molecular oxygen and gaseouswater and show excellent performance in the reactions with SO2 whilemetal with full d orbitals, such as MnO2, show weak reactivity (Zhanget al., 2006). Reaction of SO2 gas with the lattice oxygen as in Reaction2 seems to proceed much slower. The observation is in line with theresults of experiments on dehydroxylated surfaces that show very littlereactivity towards product formation, suggesting low reactivity oflattice oxygen groups (Nanayakkara et al., 2012). Absence of S–Hstretch from the spectra of the v-dust under dry conditions could be dueto the fact that bisulfites and bisulfates are formed in much lowerquantities than in humid conditions.
3.2.2.4. Surface coverage of v-dust with SO42− ions. The uptake of SO2
gas on the surface of the v-dust proved to be very long and the processof conversion to H2SO4 was not declining for as long as the SO2 gas wassupplied, at least for the duration of the experiments. At the same timeno product leaving the surface was identified. This is puzzling sincethere seems to be no reason for continuous uptake in the absence of
some kind of catalytic process leading to regeneration of active sites. Inthis case it only makes sense that sooner or later the process shouldcome to an end. In order to evaluate a potential for further uptake andconversion of SO2 to H2SO4 it was decided to evaluate the surfacecoverage of SO4
2− at the end of the experiment. The amount of theproduct formed on the surface was quantified using HPLC. A 109mgsample of Hagavatn dust was exposed to 175 ppm of SO2 gas for 24 h at23 °C and 30% RH and then flushed for 6 h to allow complete oxidationof sulfites into sulfates. The dust was then extracted in 1mL of 1%formalin. A calibration curve was constructed using Na2SO4 as astandard solution. The amount of SO4
2− recovered was calculated at62.79 μg corresponding to 0.57mg of SO4
2− ion per 1g of Hagavatndust. The number of molecules formed after 24 h of continuousexposure was calculated as 7.95×10¹³ molecules cm−2. Consideringthe linear trend that we observed in DRIFTS experiments, the coverageof SO4
2− ions after 72 h of exposure was estimated at ca. 2.3×10¹⁴
molecules cm−2. To approximate whether the monolayer coverage wasreached it was decided to compare the amount of molecules formed onthe surface to its theoretical monolayer coverage.
The calculated value for the amount of sulfuric acid molecules ne-cessary to form a monolayer was calculated to be 4.22× 10¹⁴ moleculecm−2. This value is consistent with the usually reported surface densityof sorptive sites on mineral oxides, ca. 3× 10¹³–5×10¹⁴ sites cm−2
(Kulkarni and Wachs, 2002). The coverage of SO42− ions after 72 h of
exposure was estimated to be almost by a factor of 2 lower than thetheoretical monolayer coverage of the sample by H2SO4 molecules. Atthis point it should be noted that experimentally, the molecules are notexpected to pack together perfectly since the shape of the molecules andhindering interactions would render some of the active sites on thesurface inaccessible. Thus, the experimental monolayer coverage wouldbe assumed to be lower than the theoretical one (Hudson et al., 2002),(Diaz et al., 2005).
The rough approximation points to the fact that the surface cov-erage θ after 72 h of exposure is approximately θ=0.5. Therefore, itcan be concluded that there are still available sites on the surface of v-dust for the conversion of SO2 to occur and the subsequent sorption ofsulfates. Moreover, the process does not seem to slow down. Longerexposure times are necessary to determine how the sulfate formationwill behave at θ=1 when a monolayer of sulfate ions forms. Furtheron, what happens after the formation of monolayer? Will the processstop, and if it continues what are the driving forces behind it?
4. Conclusions and atmospheric implications
In this study the uptake of SO2 gas by Icelandic v-dust was in-vestigated. Uptake of SO2 by v-dusts was observed even though all ofthem have already been exposed to SO2 in the volcanic conduit andplume owing to their production/emission mode. Upon exposure of thev-dust to SO2 the system reaches a steady state clearly distinct from theinitial state indicating continuous consumption of SO2 molecules. Thesteady state uptake coefficients for v-dusts at 30% RH range from(6.6 ± 2.6)× 10−9 for Hagavatn to (6.2 ± 2.5)× 10−8 forMýrdalssandur. Moreover, increased uptake of the SO2 gas in humidconditions suggests that water plays an important role in the above-mentioned processes. The DRIFTS data indicate the presence of sulfiteand sulfate ions on the surface. Presence of sulfates was further detectedby HPLC analysis and it was also noted that after 3 days of exposure ofv-dust to 175 ppm SO2 the surface coverage by SO4
2− ions is ca.θ=0.5, i.e. lower than the monolayer coverage suggesting that thesurface of the v-dust is still active in uptake processes that are occurringon the surface. It is most likely that SO2 gas reacts at the surface of thev-dust and forms sulfites or bisulfites, which are then converted tosulfates. Hydroxyl groups play a major role in the conversion of SO2 gasto sulfites, while oxidizing agents in the form of active oxygen or metalcenters are necessary to their conversion to sulfates. Furthermore, sul-fates formed on the surface of v-dust are a stable chemisorbed species
D. Urupina, et al. Atmospheric Environment 217 (2019) 116942
15

not easily desorbed even after flushing for hours in the absence of SO2
gas.During an episode of volcanic eruption volcanic dust will react with
SO2 gas both in subvolcanic and atmospheric environments (Renggliet al., 2019), (Schmauss and Keppler, 2014). Initially, at near-magmatichigh temperatures of over 800 °C there is a compelling evidence that theadsorption of SO2 gas is driven by diffusion of Ca2+ cations from theinterior of the glass to its surface followed by precipitation of CaSO4
(Delmelle et al., 2018). This initial stage is characterized by high con-centration of gases and high density of ash particles, but is very short induration lasting only a couple of minutes even in the case of Earth'slargest explosive eruptions (Delmelle et al., 2018). The pathway is oflimited importance in small and medium size eruptions and/or erup-tions of volcanoes lacking a deep-seated magma chamber (Ayris et al.,2013). Subsequent cooling rapidly brings the system to the subzerotemperatures (Textor et al., n.d.). At ambient and low temperatureswhere effective diffusion of cations to the ash surface is no longerpossible the driving force of SO2 adsorption is its physisorption on thesurface of ash followed by chemical reaction with active sites that areavailable on the surface. Previous research under these conditionspoints out that the rate of sulfate formation is higher at low tempera-tures compared to room or elevated temperatures of up to 150 °C (Wuet al., 2011),(Schmauss and Keppler, 2014). Interestingly, adsorption ofSO2 remains very strong at very low partial pressures, which confirmsthat adsorption is likely to happen in diluted cold parts of the plume(Schmauss and Keppler, 2014). Furthermore, an increase in sulfur loadon ash surfaces was observed to increase with increase of distance fromthe vent during 2010 Eyjafjallajökull eruption (Bagnato et al., 2013).Thus, one can expect that most of the adsorption of SO2 gas during amedium-size volcanic eruption would happen in the horizontal um-brella part of the volcanic ash cloud. In this case it is important to usethe steady state uptake coefficient to evaluate the uptake as it is betterfit to describe the phenomena of the continuous process. In this re-search it was demonstrated that even after 3 days of exposure of naturalv-dust to the SO2 gas there are still active sites available for the reactionto take place. Therefore one can expect a v-dust particle travellingthrough the air to remain active to the adsorption of SO2 gas.
In order to evaluate potential impact of SO2 adsorption on v-dust onatmosphere its atmospheric lifetime was calculated using equation (5).
=τγcD
4het
(5)
where γ is the uptake coefficient, c is the mean molecular velocity (ms−1), and D is the volcanic dust surface area density (m2 m−3). Con-sidering (i) concentrations of volcanic ash in a vertical column of thevolcanic cloud passing over Faroe Islands located about 650 km fromthe Eyjafjallajökull volcano measured during its eruption on April 152010 ranging from 200 to 6000 μgm−3 (Gudmundsson et al., 2012)and (ii) the SSA of Eyjafjallajökull dust sample of 0.75m2 g−1, D can becalculated by direct multiplication of the dust concentration and theSSA of the v-dust and was found to be in the range from1.5×10−4 m2m−3 to 4.5× 10⁻³ m2m−3 for the lower and higher ashload respectively. This leads to the calculation of lifetime of SO2 mo-lecule as a result of its heterogeneous loss on Eyjafjallajökull v-dustparticle to 81 to 2.7 years. If we consider a higher 7.5 m2 g−1 SSA va-lues for Eyjafjallajökull dust obtained by Maters et al. the atmosphericlifetime falls to 8.1 years to 99 days (Maters et al., 2016). For com-parison, the lifetime of SO2 in the atmosphere as measured over theEastern United States in the absence of volcanic activity ranges from15 h in summer to 65 h in winter (Lee et al., 2011). On the base of thesecalculations it appears that the heterogeneous uptake of SO2 moleculeon the surface of v-dust particle is a negligible process in comparisonwith the gas phase oxidation by aqueous (i.e., H2O2) and gas-phase (i.e.,OH) processes. However, in case of higher volcanic ash concentrationsin the plume, for example 2.0× 10⁶ μgm−3 estimated during 1991Pinatubo eruption (SSA 1.5 m2 g−1 (Maters et al., 2016)) at the direct
proximity to the vent (Witham et al., 2012), and considering the sameuptake coefficient measured in this study for Eyjafjallajökull, calcula-tions lead to a radically shorter lifetime of 36 h and make hetero-geneous uptake of SO2 on volcanic dust particles equally important.Furthermore, the lifetime of SO2 could be further decreased for volcanicparticles with higher specific surface area. These calculations point outthat adsorption of SO2 on the surface of volcanic ash is most likely tohappen in the part of volcanic cloud closest to the vent where ashconcentration is the highest. The process of SO2 loss due to hetero-geneous reactions with v-dust particles could be further enhanced in thepresence of oxidizing species (i.e., O3, OH) and sunlight, and needs tobe quantitatively evaluated.
Declaration of competing interest
The authors declare that they have no known competing financialinterests or personal relationships that could have appeared to influ-ence the work reported in this paper.
Acknowledgments
The authors acknowledge Mr Vincent Gaudion and Dr MohamadZeineddine (SAGE, IMT Lille Douai) for their assistance in the lab. Weare grateful to Mr Bruno Malet and Dr Laurent Alleman (SAGE, IMTLille Douai) for conducting the ICP-MS experiments. This work wasachieved in the frame of Labex CaPPA, funded by ANR through the PIAunder contract ANR-11-LABX-0005-01, and CPER CLIMIBIO project,both funded by the Hauts-de-France Regional Council and the EuropeanRegional Development Fund (ERDF). J. Lasne acknowledges supportfrom the Labex CaPPA and CPER CLIMIBIO projects and the Hauts-de-France Regional Council for his post-doctoral fellowship.
Appendix A. Supplementary data
Supplementary data to this article can be found online at https://doi.org/10.1016/j.atmosenv.2019.116942.
References
Harris, E., Sinha, B., Foley, S., Crowley, J.N., Borrmann, S., Hoppe, P., 2012. Sulfur iso-tope fractionation during heterogeneous oxidation of SO2 on mineral dust. Atmos.Chem. Phys. 12, 4867–4884. https://doi.org/10.5194/acp-12-4867-2012.
A Leed, E., Pantano, C., 2003. Computer modeling of water adsorption on silica andsilicate glass fracture surfaces. J. Non-Cryst. Solids 325, 48–60. https://doi.org/10.1016/S0022-3093(03)00361-2.
Adams, J.W., Rodriguez, D., Cox, R.A., 2005. The uptake of SO2 on Saharan dust: a flowtube study. Atmos. Chem. Phys. 5, 2679–2689. https://doi.org/10.5194/acp-5-2679-2005.
Alleman, L.Y., Lamaison, L., Perdrix, E., Robache, A., Galloo, J.-C., 2010. PM10 metalconcentrations and source identification using positive matrix factorization and windsectoring in a French industrial zone. Atmos. Res. 96, 612–625. https://doi.org/10.1016/j.atmosres.2010.02.008.
Andreae, M., 1995. Climate Effects of Changing Atmospheric Aerosol. World Survey ofClimatology, vol. 16. Future Climates of the World, pp. 341–392 1995.
Arnalds, O., Dagsson-Waldhauserova, P., Olafsson, H., 2016. The Icelandic volcanicaeolian environment: processes and impacts — a review. Aeolian Res. 20, 176–195.https://doi.org/10.1016/j.aeolia.2016.01.004.
Ayris, P.M., Lee, A.F., Wilson, K., Kueppers, U., Dingwell, D.B., Delmelle, P., 2013. SO2sequestration in large volcanic eruptions: high-temperature scavenging by tephra.Geochem. Cosmochim. Acta 110, 58–69. https://doi.org/10.1016/j.gca.2013.02.018.
Bagnato, E., Aiuppa, A., Bertagnini, A., Bonadonna, C., Cioni, R., Pistolesi, M., Pedone,M., Hoskuldsson, A., 2013. Scavenging of sulphur, halogens and trace metals byvolcanic ash: the 2010 Eyjafjallajökull eruption. Geochem. Cosmochim. Acta 103,138–160. https://doi.org/10.1016/j.gca.2012.10.048.
Baltrusaitis, J., Cwiertny, D.M., Grassian, V.H., 2007. Adsorption of sulfur dioxide onhematite and goethite particle surfaces. Phys. Chem. Chem. Phys. 9, 5542–5554.https://doi.org/10.1039/B709167B.
Baratoux, D., Mangold, N., Arnalds, O., Bardintzeff, J.-M., Platevoet, B., Grégoire, M.,Pinet, P., 2011. Volcanic Sand in Iceland: diverse origins of aeolian sand depositsrevealed at Dyngjusandur and Lambahraun, Iceland. Earth Surf. Process. Landforms36, 1789–1808. https://doi.org/10.1002/esp.2201.
Brasseur, G.P., Granier, C., Walters, S., 1990. Future changes in stratospheric ozone andthe role of heterogeneous chemistry. Nature 348, 626–628. https://doi.org/10.1038/348626a0.
D. Urupina, et al. Atmospheric Environment 217 (2019) 116942
16

Clague, D.A., Denlinger, R.P., 1994. Role of olivine cumulates in destabilizing the flanksof Hawaiian volcanoes. Bull. Volcanol. 56, 425–434. https://doi.org/10.1007/BF00302824.
Crowley, J.N., Ammann, M., Cox, R.A., Hynes, R.G., Jenkin, M.E., Mellouki, A., Rossi,M.J., Troe, J., Wallington, T.J., 2010. Evaluated kinetic and photochemical data foratmospheric chemistry: volume V – heterogeneous reactions on solid substrates.Atmos. Chem. Phys. 10, 9059–9223. https://doi.org/10.5194/acp-10-9059-2010.
Dagsson-Waldhauserova, P., Arnalds, O., Olafsson, H., 2014. Long-term variability of dustevents in Iceland (1949–2011). Atmos. Chem. Phys. 14, 13411–13422. https://doi.org/10.5194/acp-14-13411-2014.
Datta, A., Cavell, R.G., Tower, R.W., George, Z.M., 1985. Claus catalysis. 1. Adsorption ofSO/sub 2/on the alumina catalyst studed by FTIR and EPR spectroscopy. J. Phys.Chem. 89, 3. https://doi.org/10.1021/j100249a014.
Deegan, F.M., 2010. Processes of Magma-Crust Interaction Insights from Geochemistryand Experimental Petrology. Acta Universitatis Upsaliensis, Uppsala.
Delmelle, P., Wadsworth, F.B., Maters, E.C., Ayris, P.M., 2018. High temperature reac-tions between gases and ash particles in volcanic eruption plumes. Rev. Mineral.Geochem. 84, 285–308. https://doi.org/10.2138/rmg.2018.84.8.
Diaz, L., Liauw, C.M., Edge, M., Allen, N.S., McMahon, A., Rhodes, N., 2005. Investigationof factors affecting the adsorption of functional molecules onto gel silicas. 1. Flowmicrocalorimetry and infrared spectroscopy. J. Colloid Interface Sci. 287, 379–387.https://doi.org/10.1016/j.jcis.2004.09.039.
Dordevic, D., Tošić, I., Sakan, S., Petrovic, S., Đuričić-Milanković, J., Finger, D.,Waldhauserova, P., 2019. Can volcanic dust suspended from surface soil and desertsof Iceland Be transferred to central Balkan similarly to African dust (Sahara)? Front.Earth Sci. 7, 142. https://doi.org/10.3389/feart.2019.00142.
Durant, A.J., Shaw, R.A., Rose, W.I., Mi, Y., Ernst, G.G.J., 2008. Ice nucleation andoverseeding of ice in volcanic clouds. J. Geophys. Res.: Atmosphere 113. https://doi.org/10.1029/2007JD009064.
Durant, A.J., Bonadonna, C., Horwell, C.J., 2010. Atmospheric and environmental im-pacts of volcanic particulates. Elements 6, 235–240.
Farges, F., Keppler, H., Flank, A.M., Lagarde, P., 2009. Sulfur K-edge XANES study of Ssorbed onto volcanic ashes. J. Phys. Conf. Ser. 190, 012177. https://doi.org/10.1088/1742-6596/190/1/012177.
Finlayson-Pitts Jr., B.J., J.N.P, 1999. Chemistry of the Upper and Lower Atmosphere:Theory, Experiments, and Applications. Elsevier.
Gislason, S.R., Hassenkam, T., Nedel, S., Bovet, N., Eiriksdottir, E.S., Alfredsson, H.A.,Hem, C.P., Balogh, Z.I., Dideriksen, K., Oskarsson, N., Sigfusson, B., Larsen, G., Stipp,S.L.S., 2011. Characterization of Eyjafjallajökull volcanic ash particles and a protocolfor rapid risk assessment. Proc. Natl. Acad. Sci. 108, 7307–7312. https://doi.org/10.1073/pnas.1015053108.
Goodman, A.L., Li, P., Usher, C.R., Grassian, V.H., 2001. Heterogeneous uptake of sulfurdioxide on aluminum and magnesium oxide particles. J. Phys. Chem. A 105,6109–6120. https://doi.org/10.1021/jp004423z.
Groot Zwaaftink, C.D., Arnalds, Ó., Dagsson-Waldhauserova, P., Eckhardt, S., Prospero,J.M., Stohl, A., 2017. Temporal and spatial variability of Icelandic dust emissions andatmospheric transport. Atmos. Chem. Phys. 17, 10865–10878. https://doi.org/10.5194/acp-17-10865-2017.
Gudmundsson, M.T., Thordarson, T., Höskuldsson, Á., Larsen, G., Björnsson, H., Prata,F.J., Oddsson, B., Magnússon, E., Högnadóttir, T., Petersen, G.N., Hayward, C.L.,Stevenson, J.A., Jónsdóttir, I., 2012. Ash generation and distribution from the April-May 2010 eruption of Eyjafjallajökull, Iceland. Sci. Rep. 2, 572. https://doi.org/10.1038/srep00572.
Hair, M.L., 1975. Hydroxyl groups on silica surface. J. Non-Cryst. Solids Glass Surf. 19,299–309. https://doi.org/10.1016/0022-3093(75)90095-2.
Highwood, E.-J., Stevenson, D.S., 2003. Atmospheric impact of the 1783-1784 LakiEruption: Part II Climatic effect of sulphate aerosol. Atmos. Chem. Phys. 3,1177–1189.
Huang, L., Zhao, Y., Li, H., Chen, Z., 2015. Kinetics of heterogeneous reaction of sulfurdioxide on authentic mineral dust: effects of relative humidity and hydrogen per-oxide. Environ. Sci. Technol. 49, 10797–10805. https://doi.org/10.1021/acs.est.5b03930.
Hudson, P.K., Zondlo, M.A., Tolbert, M.A., 2002. The interaction of Methanol, acetone,and acetaldehyde with ice and nitric acid-doped Ice: implications for cirrus clouds. J.Phys. Chem. A 106, 2882–2888. https://doi.org/10.1021/jp012718m.
Huthwelker, T., Ammann, M., Peter, T., 2006. The uptake of acidic gases on ice. Chem.Rev. 106, 1375–1444. https://doi.org/10.1021/cr020506v.
Ibrahim, S., Romanias, M.N., Alleman, L.Y., Zeineddine, M.N., Angeli, G.K., Trikalitis,P.N., Thevenet, F., 2018. Water interaction with mineral dust aerosol: particle sizeand hygroscopic properties of dust. ACS Earth Space Chem. 2, 376–386. https://doi.org/10.1021/acsearthspacechem.7b00152.
Icelandic Volcanoes [WWW Document], n.d. URL http://icelandicvolcanos.is/?volcano=EYJ# (accessed 2.20.2019).
Jiang, B.Q., Wu, Z.B., Liu, Y., Lee, S.C., Ho, W.K., 2010. DRIFT study of the SO2 effect onlow-temperature SCR reaction over Fe−Mn/TiO2. J. Phys. Chem. C 114, 4961–4965.https://doi.org/10.1021/jp907783g.
Joshi, N., Romanias, M.N., Riffault, V., Thevenet, F., 2017. Investigating water adsorptiononto natural mineral dust particles: linking DRIFTS experiments and BET theory.Aeolian Res. 27, 35–45. https://doi.org/10.1016/j.aeolia.2017.06.001.
Judeikis, H.S., Stewart, T.B., 1976. Laboratory measurement of SO2 deposition velocitieson selected building materials and soils. Atmos. Environ. 10, 769–776. 1967. https://doi.org/10.1016/0004-6981(76)90078-0.
Kulkarni, D., Wachs, I.E., 2002. Isopropanol oxidation by pure metal oxide catalysts:number of active surface sites and turnover frequencies. Appl. Catal. Gen. 237,121–137. https://doi.org/10.1016/S0926-860X(02)00325-3.
Langmann, B., 2013. Volcanic ash versus mineral dust: atmospheric processing and
environmental and climate impacts. [WWW Document]. International ScholarlyResearch Notices. https://doi.org/10.1155/2013/245076.
Langmann, B., Zakšek, K., Hort, M., 2010. Atmospheric distribution and removal ofvolcanic ash after the eruption of Kasatochi volcano: a regional model study. J.Geophys. Res.: Atmosphere 115. https://doi.org/10.1029/2009JD013298.
Lasne, J., Romanias, M.N., Thevenet, F., 2018. Ozone uptake by clay dusts under en-vironmental conditions. ACS Earth Space Chem. 2, 904–914. https://doi.org/10.1021/acsearthspacechem.8b00057.
Lee, C., Martin, R.V., Donkelaar, A. van, Lee, H., Dickerson, R.R., Hains, J.C., Krotkov, N.,Richter, A., Vinnikov, K., Schwab, J.J., 2011. SO2 emissions and lifetimes: estimatesfrom inverse modeling using in situ and global, space-based (SCIAMACHY and OMI)observations. J. Geophys. Res.: Atmosphere 116. https://doi.org/10.1029/2010JD014758.
Li, L., Chen, Z.M., Zhang, Y.H., Zhu, T., Li, J.L., Ding, J., 2006. Kinetics and mechanism ofheterogeneous oxidation of sulfur dioxide by ozone on surface of calcium carbonate.Atmos. Chem. Phys. Discuss. 6, 579–613. https://doi.org/10.5194/acpd-6-579-2006.
Lo, J.M.H., Ziegler, T., Clark, P.D., 2010. SO2 adsorption and transformations on γ-Al2O3surfaces: a density functional theory study. J. Phys. Chem. C 114, 10444–10454.https://doi.org/10.1021/jp910895g.
Massman, W.J., 1998. A review of the molecular diffusivities of H2O, CO2, CH4, CO, O3,SO2, NH3, N2O, NO, and NO2 in air O2 and N2 near STP. [WWW Document].Atmospheric Environment. URL https://eurekamag.com/research/008/072/008072627.php , Accessed date: 11 May 2018.
Maters, E.C., Delmelle, P., Rossi, M.J., Ayris, P.M., Bernard, A., 2016. Controls on thesurface chemical reactivity of volcanic ash investigated with probe gases. EarthPlanet. Sci. Lett. 450, 254–262. https://doi.org/10.1016/j.epsl.2016.06.044.
Maters, E.C., Delmelle, P., Rossi, M.J., Ayris, P.M., 2017. Reactive uptake of sulfur dioxideand ozone on volcanic glass and ash at ambient temperature. J. Geophys. Res. Atmos.122, 10077–10088. https://doi.org/10.1002/2017JD026993.
Michigami, Y., Ueda, K., 1994. Sulphite stabilizer in ion chromatography. J. Chromatogr.A 663, 255–258. https://doi.org/10.1016/0021-9673(94)85252-9.
Moroni, B., Arnalds, O., Dagsson-Waldhauserová, P., Crocchianti, S., Vivani, R.,Cappelletti, D., 2018. Mineralogical and chemical records of Icelandic dust sourcesupon Ny-Ålesund (Svalbard islands). Front. Earth Sci. 6. https://doi.org/10.3389/feart.2018.00187.
Nanayakkara, C.E., Pettibone, J., Grassian, V.H., 2012. Sulfur dioxide adsorption andphotooxidation on isotopically-labeled titanium dioxide nanoparticle surfaces: rolesof surface hydroxyl groups and adsorbed water in the formation and stability ofadsorbed sulfite and sulfate. Phys. Chem. Chem. Phys. 14, 6957–6966. https://doi.org/10.1039/C2CP23684B.
Ovadnevaite, J., Ceburnis, D., Plauskaite-Sukiene, K., Modini, R., Dupuy, R., Rimselyte, I.,Ramonet, M., Kvietkus, K., Ristovski, Z., Berresheim, H., O'Dowd, C.D., 2009.Volcanic sulphate and arctic dust plumes over the North Atlantic Ocean. Atmos.Environ. 43, 4968–4974. https://doi.org/10.1016/j.atmosenv.2009.07.007.
Reactions on Mineral Dust - Chemical Reviews (ACS Publications) [WWW Document], n.d. URL https://pubs.acs.org/doi/abs/10.1021/cr020657y (accessed 2.8.2018).
Renggli, C., King, P., Henley, W.R., Guagliardo, P., McMorrow, L., Middleton, J., Turner,M., 2019. An experimental study of SO2 reactions with silicate glasses and super-cooled melts in the system anorthite–diopside–albite at high temperature. Contrib.Mineral. Petrol. 174. https://doi.org/10.1007/s00410-018-1538-2.
Romanias, M.N., El Zein, A., Bedjanian, Y., 2012. Heterogeneous interaction of H2O2with TiO2 surface under dark and UV light irradiation conditions. J. Phys. Chem. A116, 8191–8200. https://doi.org/10.1021/jp305366v.
Romanías, M.N., Ourrad, H., Thévenet, F., Riffault, V., 2016. Investigating the hetero-geneous interaction of VOCs with natural atmospheric particles: adsorption of li-monene and toluene on saharan mineral dusts. J. Phys. Chem. A 120, 1197–1212.https://doi.org/10.1021/acs.jpca.5b10323.
Romanias, M.N., Zeineddine, M.N., Gaudion, V., Lun, X., Thevenet, F., Riffault, V., 2016.Heterogeneous interaction of isopropanol with natural Gobi dust. Environ. Sci.Technol. 50, 11714–11722. https://doi.org/10.1021/acs.est.6b03708.
Schmauss, D., Keppler, H., 2014. Adsorption of sulfur dioxide on volcanic ashes. Am.Mineral. 99, 1085–1094. https://doi.org/10.2138/am.2014.4656.
Schmidt, A., Witham, C.S., Theys, N., Richards, N.A.D., Thordarson, T., Szpek, K., Feng,W., Hort, M.C., Woolley, A.M., Jones, A.R., Redington, A.L., Johnson, B.T., Hayward,C.L., Carslaw, K.S., 2014. Assessing hazards to aviation from sulfur dioxide emittedby explosive Icelandic eruptions. J. Geophys. Res. Atmos. 119 2014JD022070.https://doi.org/10.1002/2014JD022070.
Shang, J., Li, J., Zhu, T., 2010. Heterogeneous reaction of SO2 on TiO2 particles. Sci.China Chem. 53, 2637–2643. https://doi.org/10.1007/s11426-010-4160-3.
Stevenson, D.S., Johnson, C.E., Highwood, E.J., Gauci, V., Collins, W.J., Derwent, R.G.,2003. Atmospheric impact of the 1783–1784 Laki eruption: Part I Chemistry mod-elling. Atmos. Chem. Phys. 3, 487–507. https://doi.org/10.5194/acp-3-487-2003.
Tambora and the “Year Without a Summer” of 1816, 2016. Institute of geography. WWWDocument, URL. http://www.geography.unibe.ch/services/geographica_bernensia/online/gb2016g9001/index_eng.html , Accessed date: 17 May 2018.
Tamura, H., Mita, K., Tanaka, A., Ito, M., 2001. Mechanism of hydroxylation of metaloxide surfaces. J. Colloid Interface Sci. 243, 202–207. https://doi.org/10.1006/jcis.2001.7864.
Tang, M.J., Cox, R.A., Kalberer, M., 2014. Compilation and evaluation of gas phase dif-fusion coefficients of reactive trace gases in the atmosphere: volume 1. Inorganiccompounds. Atmos. Chem. Phys. 14, 9233–9247. https://doi.org/10.5194/acp-14-9233-2014.
Textor, C., Graf, H.-F., Herzog, M., Oberhuber, J.M., n.d. Injection of gases into thestratosphere by explosive volcanic eruptions. Journal of Geophysical Research:Atmospheres 108. https://doi.org/10.1029/2002JD002987.
Thordarson, T., Larsen, G., 2007. Volcanism in Iceland in historical time: volcano types,
D. Urupina, et al. Atmospheric Environment 217 (2019) 116942
17

eruption styles and eruptive history. J. Geodyn. 43, 118–152. https://doi.org/10.1016/j.jog.2006.09.005.
Ullerstam, M., Vogt, R., Langer, S., Ljungstrom, E., 2002. The kinetics and mechanism ofSO2 oxidation by O-3 on mineral dust. Phys. Chem. Chem. Phys. 4, 4694–4699.https://doi.org/10.1039/b203529b.
Usher, C.R., Al-Hosney, H., Carlos-Cuellar, S., Grassian, V.H., 2002. A laboratory study ofthe heterogeneous uptake and oxidation of sulfur dioxide on mineral dust particles. J.Geophys. Res. 107, 4713. https://doi.org/10.1029/2002JD002051.
Vernier, J.-P., Fairlie, T.D., Deshler, T., Natarajan, M., Knepp, T., Foster, K., Wienhold, F.G., Bedka, K.M., Thomason, L., Trepte, C., n.d. In situ and space-based observations ofthe Kelud volcanic plume: The persistence of ash in the lower stratosphere. J.Geophys. Res.: Atmosphere 121, 11,104-11,118. https://doi.org/10.1002/2016JD025344.
Vogel, A., Diplas, S., Durant, A.J., Azar, A.S., Sunding, M.F., Rose, W.I., Sytchkova, A.,Bonadonna, C., Krüger, K., Stohl, A., 2017. Reference data set of volcanic ash phy-sicochemical and optical properties. J. Geophys. Res.: Atmosphere 122, 9485–9514.https://doi.org/10.1002/2016JD026328.
Wang, T., Liu, Y., Deng, Y., Fu, H., Zhang, L., Chen, J., 2018a. Emerging investigatorseries: heterogeneous reactions of sulfur dioxide on mineral dust nanoparticles: fromsingle component to mixed components. Environ. Sci.: Nano 5, 1821–1833. https://doi.org/10.1039/C8EN00376A.
Wang, T., Liu, Y., Deng, Y., Fu, H., Zhang, L., Chen, J.-M., 2018b. Adsorption of SO 2 onmineral dust particles influenced by atmospheric moisture. Atmos. Environ. 191.https://doi.org/10.1016/j.atmosenv.2018.08.008.
Witham, C.S., Oppenheimer, C., Horwell, C.J., 2005. Volcanic ash-leachates: a review and
recommendations for sampling methods. J. Volcanol. Geotherm. Res. 141, 299–326.https://doi.org/10.1016/j.jvolgeores.2004.11.010.
Witham, C., Webster, H., Hort, M., Jones, A., Thomson, D., 2012. Modelling concentra-tions of volcanic ash encountered by aircraft in past eruptions. AtmosphericEnvironment, Volcanic ash over Europe during the eruption of Eyjafjallajöekull onIceland. April-May 2010 48, 219–229. https://doi.org/10.1016/j.atmosenv.2011.06.073.
Wu, L.Y., Tong, S.R., Wang, W.G., Ge, M.F., 2011. Effects of temperature on the het-erogeneous oxidation of sulfur dioxide by ozone on calcium carbonate. Atmos. Chem.Phys. 11, 6593–6605. https://doi.org/10.5194/acp-11-6593-2011.
Zhang, Z., Ewing, G.E., 2002. Infrared spectroscopy of SO2 aqueous solutions.Spectrochim. Acta A Mol. Biomol. Spectrosc. 58, 2105–2113.
Zhang, X., Zhuang, G., Chen, J., Wang, Y., Wang, X., An, Z., Zhang, P., 2006.Heterogeneous reactions of sulfur dioxide on typical mineral particles. J. Phys. Chem.B 110, 12588–12596. https://doi.org/10.1021/jp0617773.
Zhang, Y., Tong, S., Ge, M., Jing, B., Hou, S., Tan, F., Chen, Y., Guo, Y., Wu, L., 2018. Theinfluence of relative humidity on the heterogeneous oxidation of sulfur dioxide byozone on calcium carbonate particles. Sci. Total Environ. 633, 1253–1262. https://doi.org/10.1016/j.scitotenv.2018.03.288.
Zhou, L., Wang, W., Gai, Y., Ge, M., 2014. Knudsen cell and smog chamber study of theheterogeneous uptake of sulfur dioxide on Chinese mineral dust. J. Environ. Sci. 26,2423–2433. https://doi.org/10.1016/j.jes.2014.04.005.
Zuo, Y., Chen, H., 2003. Simultaneous determination of sulfite, sulfate, and hydro-xymethanesulfonate in atmospheric waters by ion-pair HPLC technique. Talanta 59,875–881. https://doi.org/10.1016/S0039-9140(02)00647-1.
D. Urupina, et al. Atmospheric Environment 217 (2019) 116942
18

Annex 2

255 Annex 2

Method development and validation for the determination of sulfites and sulfates on the surface of mineral atmospheric samples using reverse-phase liquid chromatography
Darya Urupina *, Vincent Gaudion, Manolis N. Romanias, Marie Verriele **, Frederic Thevenet IMT Lille Douai, Univ. Lille, SAGE, 59000, Lille, France
A R T I C L E I N F O
Keywords: Sulfite Sulfate Mineral dust Surface analysis HPLC
A B S T R A C T
Earlier studies suggest that SO2 gas reacts at the surface of mineral dust and forms sulfites or bisulfites, which are then converted to sulfates. In order to monitor and quantify the amounts of both sulfites and sulfates formed on the surface of mineral dusts of volcanic and desert origins an accurate and precise reversed-phase liquid chro-matography method was developed and validated to extract, stabilize and individually analyze sulfites and sulfates initially present on the surface of dusts exposed to SO2. The method was developed on a 25 mm Restek Ultra Column C18, Particle size: 5 μm, I.D. 4.60 mm column which was dynamically coated with 1.0 mM cetylpyridinium chloride in 7% acetonitrile solution to produce a charged surface as recommended in the literature. Mobile phase used: 1 mM Potassium Hydrogen Phthalate at pH 6.5 at a flow rate of 1.0 ml/min with negative UV–Vis detection at 255 nm in 15 min. The method was validated for specificity, linearity and range, injection repeatability, stability, robustness, limit of detection and limit of quantitation, and sample preparation and extraction reproducibility. The method was adapted for straight sulfite and sulfate quantification: (i) of environmental samples, and (ii) natural samples additionally exposed to SO2 gas in a dedicated laboratory setup. The method was then successfully applied to quantify sulfites and sulfates on natural volcanic and a desert dust samples both collected in the environment and additionally exposed to SO2 gas in the laboratory. The method can be efficiently used to identify sulfites and sulfates on fresh volcanic ash following an eruption, on aeolian desert dust exposed to industrial pollutants, as well as for laboratory investigations of sulfite and sulfate for-mation on the surface of minerals and natural dusts of different origins.
1. Introduction
Sulfur dioxide (SO2) is a noticeable component in the atmosphere, where release of SO2 is associated with the decrease in the levels of at-mospheric oxidants, such as H2O2, OH, and O3 as they are involved in the reactions that convert gaseous and dissolved SO2 to sulfates [1,2]. Stevenson et al. estimate that, on average, emissions of SO2 gas in the atmosphere due to anthropogenic activity account for the 71.2 Tg/yr, while volcanic eruptions contribute 8.8 Tg/yr, and 1.4 Tg/yr is due to the biomass burning [2]. Needless to say, volcanic eruptions are a highly variable source of SO2 gas. The 2014–2015 Holuhraun eruption in Ice-land, emitted ca. 11 Tg of SO2 into the troposphere over a 6 month period, and caused one of the most intense and widespread volcanogenic air pollution events in centuries [3]. It was an effusive eruption with
very little volcanic ash produced, yet with the amount of SO2 that exceeded all of the anthropological flux in Europe for the year 2011 [3]. That is not to undermine the significance of the anthropogenic contri-bution. The “Great smog” of 1952 in London was caused by SO2 emitted from coal burning and reached levels as high as 1.34 ppm [4]. From the industrial point of view removal of SO2 gas from the exhaust fumes is an area of ongoing active research [5–7].
Explosive volcanic eruptions have a potential to inject vast amounts of SO2 gas into the stratosphere, where conversion of SO2 to H2SO4 leads to the formation of fine sulfur aerosol that can persist in the mid- stratosphere for up to 2 years [2]. Sulfate aerosols are known to affect the climate by increasing the reflection of radiation from the Sun back into space, thus efficiently cooling the Earth’s troposphere [2]. In the troposphere itself, formation of sulfur aerosols due to anthropogenic and
* Corresponding author. ** Corresponding author.
E-mail addresses: [email protected] (D. Urupina), [email protected] (M. Verriele).
Contents lists available at ScienceDirect
Talanta
journal homepage: www.elsevier.com/locate/talanta
https://doi.org/10.1016/j.talanta.2020.121318 Received 8 April 2020; Received in revised form 17 June 2020; Accepted 22 June 2020

natural emissions competes with SO2 gas deposition, and therefore sulfur aerosols formed are deposited within days or weeks [2]. Impor-tant reactions of SO2 gas in the troposphere include oxidation of SO2 in cloud and rain droplets, leading to the formation of acid rain, and oxidation to sulfate on the surface of atmospheric particles [1,6,8–11]. Adsorption of sulfur dioxide SO2 gas on the surface of atmospheric samples leads to the formation of sulfate coating that can affect both the dust properties and the sulfur cycle [12]. Volcanic dusts acquire the sulfate coating while passing through the volcanic conduit [13], as well as further away from the crater, in the colder parts of the plume, higher in the atmosphere [14,15]. Desert dusts as well are known to accumulate hygroscopic sulfate coating during their long-range transport [16]. Thus, a negative correlation was observed between atmospheric con-centrations of SO2 and both Saharan and Chinese desert dust loadings [17]. Once coated, these particles can act as large cloud condensation nuclei (CCN) and affect cloud formation [18]. They may also affect climate forcing by forming cirrus ice clouds, ice nuclei (IN), at relatively warm temperatures and low supersaturation [18].
The physico-chemical processes that govern transformation of SO2 gas on the surface of dusts are poorly understood and need further investigation. SO2 shows heterogeneous reactivity towards many min-eral oxides such as MgO, Al2O3, Fe2O3, TiO2, as well as volcanic ash and mineral dust [9,10,19,20]. Reactivity of the dusts towards the uptake of SO2 as well as influence of different atmospheric conditions and various oxidants is often evaluated in terms of uptake coefficient using Knudsen cell and flow-tube reactors [10,19,20]. Quantifications of the amounts of products formed on the surface of dust could provide additional in-formation and might clarify reaction pathways.
While summarizing previous work on volcanic ash analysis, Witham et al. cited about 55 articles reporting original volcanic ash-leaching data [21]. The ion-chromatography methods available in the literature and employed to quantify the amount of SO2 adsorbed on the surface of volcanic ash are almost solely concerned with quantification of sulfates as the final oxidation product completely ignoring sulfite quantification [21]. Indeed, it is widely accepted that SO2 gas reacts at the surface of the volcanic dust and forms sulfites or bisulfites, which are then con-verted to sulfates [22]. However, quantification of sulfites along with the sulfates could provide a more comprehensive description of the SO2 adsorption processes. The ability of transitional metal such as iron ions to catalytically oxidize SO2 in fog was first suggested by Zuo et al. [1]. The reaction order of Fe (III)-catalyzed thermal chemical and photo-chemical oxidation of dissolved sulfur dioxide in atmospheric liquids was found to be first order in respect to sulfite ion concentration [23]. Sulfite to sulfate conversion on synthetic mineral dust aerosol (using α-Al2O3, CaO, ZnO, TiO2, MgO, and Fe2O3 oxides) was recently studied by He et al. using DRIFTS in order to better explain haze formation mechanism in China [4]. The need to explore the effect of minerology on SO2 adsorption using authentic dust samples of various compositions in laboratory studies was expressed by Sullivan et al. [24]. However, employment of DRIFTS is limited on natural heterogeneous samples that are dark in color, such as volcanic dust or ash. In addition, DRIFTS is a qualitative technique and does not provide quantitative data. Simulta-neous determination of sulfites and sulfates by reversed-phase ion-pair HPLC technique in atmospheric waters was proposed by Zuo et al. [25]. When applied to environmental samples though, the method failed to determine sulfites due to their fast conversion to sulfates [25]. Never-theless, ion-pairing technique is a good tool to separate polar com-pounds by means of user-friendly widely-used HPLC technique.
The goal of this study is to develop a method that would (i) extract both sulfites and sulfates, (ii) stop the conversion of sulfites to sulfates and (iii) successfully quantify both species. The method can then be used for two distinctive purposes: to quantify sulfites and sulfates on the surface of natural environmental samples, such as recently erupted volcanic ash or dust passing through polluted areas, and to study the kinetics of the sulfite to sulfate transformation in laboratory settings. The challenge in separating sulfites from sulfates in the solution
containing mineral dust comes from the nature of these dust particles, as they contain various oxidizing elements, such as iron, that contribute to the oxidation of sulfites into sulfates [1,23,26]. This article proposes (i) a controlled ageing of mineral samples by SO2 gas in laboratory settings, (ii) extraction and stabilization of sulfites and sulfates with a subsequent use of (iii) HPLC for quantitative analysis as a technique that can be used to study the conversion of sulfites to sulfates on the surface of natural samples. While in the case of taking field measurements artificial ageing is not required, it is important to be able to age samples in reproducible fashion in order to study kinetics of the sulfite to sulfate transformation as a part of laboratory experimental work.
2. Experimental
2.1. Samples and standards
2.1.1. Dust samples A sample of volcanic dust of basaltic origin, used for method devel-
opment and method application, comes from Hagavatn - an active desert area of Iceland. It was collected dry from the top surface layer. Particles are small, ranging from 10 to 50 μm in diameter due to glaciofluvial processes leading to their generation. Modal composition of Hagavatn dust (referred as Lambahraun sand by Baratoux et al.) and, in particular, the amount of crystalline material versus glassy material, was deter-mined by Baratoux et al. using optical and scanning mode microscope [27]. Hagavatn sample contains about 80% of minerals and 20% of glassy material [27]. Mineral phases typical of basaltic rocks include olivine, pyroxene and plagioclase [27].
The mineral desert dust sample, used for method application only, comes from Gobi Desert, Ningxia Province, China. This area represents the second most important source of atmospheric mineral dusts after Sahara desert [28]. This is an aeolian sample that was sieved and only the fraction below 100 was used for further studies. The morphology of the sieved fraction of the natural Gobi dust sample was evaluated using scanning electron microscopy (SEM) carried out on a Hitachi S-4300SE/N SEM in high vacuum mode. Gobi dust particles are chunky, irregular in shape, with mean diameter ranging from a few to 50 μm. Flat particles are also observed, suggesting the presence of distinct crystal-line phase structures. The relative abundance of mineral phases for Gobi dust was determined using X-ray diffraction (XRD; Bruker D2 phaser 2 theta analyzer). Gobi dust shows a low silica content typical for Asian desert dusts (33.0%). Other minerals include calcite (8.7%), albite (8.6%), muscovite (25.8%), kaolinite (8.9%), rutile (4.4%), hedenber-gite (6.2%), chromian pyrope (4.1%) and beaconite (0.3%).
Elemental compositions of Hagavatn and Gobi dusts as determined by ICP-MS are presented in Table 1 [20,29].
Specific surface area (SSA) for Hagavatn and Gobi dusts was deter-mined in previous studies using the Brunauer–Emmett–Teller (BET) method, and the values obtained are as follows: 4.5 ± 1.1 m2/g for Hagavatn and 10.5 ± 2.0 m2/g for Gobi dust [20,30].
2.1.2. Chemicals and reagents HPLC grade acetonitrile (ACN), 99.95% and methanol (MeOH),
99.9% were obtained from Biosolve Chimie, Dieuze, France. Potassium hydrogen phthalate and triethanolamine, 99% of analytical grade were purchased from Acros Organics, Geel, Belgium. Cetylpyridinium chlo-ride, 98% was purchased from Alfa Aesar, Kander, Germany. Sodium sulfate was purchased from Merck, Darmstadt, Germany. Sodium sulfite was purchased from Fischer Chemical, Loughborough, UK. Formalin (37% formaldehyde solution by weight containing 10–15% MeOH as stabilizer) was obtained from Sigma-Aldrich. Other chemicals and sol-vents of analytical grade were used during research. Deionized water (DI) was used throughout the investigation. A certified SO2 cylinder, 250 ppm diluted in synthetic air (nearly 80% N2 and 20% O2) was purchased from Messer, France.
D. Urupina et al.

2.1.3. Standards The solution of 1% Formalin was used to prepare a 1000 ppm stock
solution of potassium sulfite (K2SO3) and a 1000 ppm stock solution of potassium sulfate (K2SO4). Other concentrations of K2SO3 and K2SO4 standards were prepared from their stock solutions through serial dilu-tion with 1% Formalin. Stock solution of 1% Formalin was prepared by adding 10 ml of Formalin in a 1000 mL volumetric flask and diluting to the volume with 10% methanol/water to prevent polymerization.
2.2. Experimental set-up and procedure
2.2.1. General outline This work serves two distinctive purposes: (i) analyze sulfites and
sulfates on the surface of environmental dust samples during field campaign measurements (referred to as “environmental sampling”) and (ii) study kinetics of sulfite and sulfate formation on the surface of different dusts in the laboratory environment by subjecting them to SO2 ageing and analyzing the product formation (referred to as “kinetics study”).
The developed method for “environmental sampling” protocol con-sists of three parts: (i) sample collection, (ii) extraction and stabilization of sulfites and sulfates and (iii) HPLC analysis (Fig. 1); the developed method for “kinetics study” protocol includes four steps: (i) sample collection, (ii) dust ageing, (iii) extraction and stabilization of sulfites and sulfates and (iv) HPLC analysis (Fig. 1). Thus, the difference be-tween the two protocols is an additional step of controlled SO2 ageing required for the “kinetics study”. Sample analysis step that includes extraction and HPLC analysis is exactly the same in both cases.
Method for HPLC analysis was validated for specificity, limit of detection and quantitation, linearity and range, injection repeatability, and robustness. Sample preparation and extraction reproducibility was validated for the entire “kinetics study” protocol. Note that reproduc-ibility for “environmental sampling” is expected to be superior to
reproducibility for “kinetics study” due to the lack of ageing that in-troduces additional uncertainties.
2.2.2. Dust ageing by SO2 gas The setup for ageing samples consists of two parts: (i) the gas mixing
line and (ii) the ageing reactor. A schematic representation of the setup is provided in Fig. 2. A dust weighing from 100 to 200 mg is spread on a 47 mm Whatman filter paper and is placed in a tightly closed reactor. The gas mixture containing 175 ppm SO2 entering the reactor is forced through the filter containing the dust at 100 cm3/min. The ageing of environmental samples is carried out using zero air; it is generated by a classical air compressor, and then passed through a catalytic zero air generator (Claind ZeroAir 2020, Lenno, Italy) coupled to a pressure swing adsorption (PSA) device. The remaining impurity levels in the air stream before entering the reactor are lower than the analytical system detection limits: VOCs <0.1 ppb, CO2 < 10 ppb, and CO < 80 ppb. Moisture level is ca. 2 ppm. In experiments requiring humid air, a second flow of zero air going through a bubbler of ultrapure water (Milli-Q, resistivity 18.2 MΩ cm) is mixed with the dry air flow, in proportions necessary to reach the relative humidity (RH) targeted.
2.2.3. Extraction and stabilization of surface sulfites and sulfates After a defined period of ageing in the laboratory or in the absence of
controlled ageing, such as in the case of samples collected in the envi-ronment, a sample weighing from 100 to 200 mg was transferred to a 10 mL glass container and stabilized with 1 mL of 1% Formalin. This step was followed by 10 min sonication in the ultrasound bath. The solution was then filtered through a 0.45 μm pore size 30 mm diameter filter using a syringe. The remaining dust was washed with 1 mL of 1% Formalin and filtered through the same filter that was used to filter the first solution. The combined final solution was analyzed by HPLC system.
Table 1 % elemental composition of mineral dust samples used in this study adapted from Ref. [20,29] as determined by ICP-MS experiments.
Si Al Ca Na Mg Ti K Fe other
Hagavatn 27.5 16.7 19.5 3.1 10.4 2.4 0.2 19.6 0.6 Gobi 57.6 11.0 16.1 2.5 2.3 0.8 3.5 5.5 0.7
Fig. 1. Diagram representing two protocols: (A) “environmental sampling” that includes (i) sample collection, (ii) extraction and stabilization of sulfites and sulfates and (iii) HPLC analysis and (B)“kinetics study” that includes (i) sample collection, (ii) dust ageing, (iii) extraction and stabilization of sulfites and sulfates and (iv) HPLC analysis. Dark blue arrows lead through “environmental sampling” protocol, while orange arrows lead through “kinetics study” protocol. (For interpretation of the references to color in this figure legend, the reader is referred to the Web version of this article.)
D. Urupina et al.

2.2.4. HPLC analysis. Instrumentation and chromatographic conditions Chromatography equipment used to develop an HPLC method con-
sisted of Thermo Scientific Dionex UltiMate 3000 UHPLC System with UV/VIS Detector (Thermo Scientific, Waltham, MA). Chromeleon 7.0 Data Acquisition System for LC (Thermo Scientific, Waltham, MA) was used to analyze the data. Analysis was performed using Restek Ultra Column C18, 5 μm, Length 250 mm, I.D. 4.60 mm dynamically coated with cetylpyridinium chloride to produce a charged surface as recom-mended by Zuo et al. [25]. More specifically, columns were cleaned at 1 mL/min for 1.5 h with 100% ACN before being coated with 1.0 mM cetylpyridinium chloride in ACN/water (7:93, v/v) at 0.5 mL/min for 3 h [25]. The HPLC instrument was operated isocratically at 23 C◦ at a flow rate of 1 mL/min for 15 min. Potassium hydrogen phthalate solu-tion, 1.0 mM was adjusted to pH 6.5 with a dilute solution of potassium hydroxide (KOH), vacuum filtered and used as a mobile phase. The in-jection volume was 10 μL. An indirect photometric detection was used for quantification of sulfates and sulfites. Detector was set at 255 nm as the mobile phase showed the highest absorbance at this wavelength. A 6-point linear calibration curve was established daily for SO3
2− and SO42−
ions in the range of 6 μg/mL to 191 μg/mL and 3 μg/mL to 101 μg/mL respectively. Concentration of sulfites and sulfates in the extracts of natural samples was determined using the slope of the calibration curve and converted to micrograms per gram (μg/g) of dust using the mass of the sample.
3. Results and discussion
3.1. HPLC analytical method optimization
The method for determination of sulfites, sulfates and hydrox-ymethanesulfonate (HMS) in natural and atmospheric water samples developed by Zuo et al. was used as a base for development of the method for determination of sulfites and sulfates on the surface of nat-ural mineral samples discussed in this paper [25]. The main drawback of the method was the lack of sulfite-stabilizing agent during sample preparation and, as a consequence, inability to detect sulfites in envi-ronmental samples. The authors acknowledged the problem in the “quantitative analysis” part of their study and recommended to use methanol in order to stabilize sulfites. Following the suggestion, a 50/50 ppm solution of K2SO3/K2SO4 was dissolved in 10% methanol used as stabilizing agent. Unfortunately, in our experiments, methanol
solution either did not stabilize sulfites and they were converted into sulfates, or sulfites co-eluted with sulfates, as only one peak was observed. Besides, methanol would be a poor choice for the extraction of sulfites in the presence of reactive ions, such as Mn or Fe, which are both known to be present in volcanic dust [26]. Formalin was reported to prevent the conversion of sulfites to sulfates by converting it to hydroxymethanesulfonate (HMS) and was tested as an extracting sol-vent [26]. A number of reactions and reaction rate constants were proposed by Kovacs et al. to demonstrate interactions of sulfites/bi-sulfates with formaldehyde and its hydrate [31]. Reaction rate constants suggest that formation of HMS is a favorable process and it is expected that in access of formaldehyde all of the sulfite/bisulfite will be con-verted to HMS.
Two concentrations of a mixture of sulfites and sulfates of 50/50 ppm and 5/5 ppm were prepared using Formalin of the following concen-trations: 0.5%, 1% and 5%. A solvent peak for 5% Formalin overlapped with a sulfite peak, and 5% Formalin concentration was rejected for further studies. Solvent peaks of both 0.5 and 1% Formalin were well separated from sulfite peak. Besides, less than 5% change was observed for sulfites and sulfates in the corresponding solutions when left at ambient temperature for 2 days. Between 0.5% and 1% concentrations of Formalin, a solution of 1% Formalin was chosen as an extracting solvent for further studies.
A second concern about the method of Zuo et al. was the high pH value of the mobile phase. The diluted 1.0 mM phthalate mobile phase suggested by the author could not be adjusted to pH 7.9 as pH became unstable and decreased with time. Addition of triethanolamine drasti-cally increased the pH of the mobile phase. Taking into consideration that pH higher than 8.0 is detrimental for the column and can easily dissolve the stationary phase, it was decided to work at pH 6.5, which was stable and easy to maintain. Addition of methanol to mobile phase didn’t make any difference on formaldehyde/sulfite pair, but broadened and pushed the sulfate peak further. It was therefore decided to work with 1.0 mM Potassium phthalate solution pH 6.5 as a mobile phase. Several other parameters, such as column type, injection volume and detection wavelength were varied to find the optimum conditions for getting a sharp peak and a good separation of sulfites and sulfates from formaldehyde peak present in the solvent. Parameters investigated are listed in Table 2.
Finally, the following chromatographic conditions were determined as optimum: 25 mm Restek Ultra Column C18, Particle size: 5 μm, I.D.
Fig. 2. Left: schematic representation of the setup used to age samples of dust with SO2 gas. Right: reactor 1 and 2 with deposited dust, zoomed for clarity.
D. Urupina et al.

4.60 mm column which was dynamically coated with 1.0 mM cetyl-pyridinium chloride in 7% acetonitrile solution to produce a charged surface as recommended by Zuo et al. [25]. Mobile phase used: 1 mM potassium hydrogen phthalate at pH 6.5 at a flow rate of 1.0 ml/min with negative UV–Vis detection at 255 nm in 15 min.
Fig. 3 displays four chromatograms offset for clarity: 1% Formalin, 20 ppm K2SO3, 10 ppm K2SO4, and Hagavatn extract obtained after ageing the dust for 1 h in 175 ppm SO2. The peak for SO3
2− is observed at 2.7 min and SO4
2− peak is observed at 7.2 min. Both peaks demonstrate a high number of theoretical plates: for Hagavatn extract they are equal to 2235 for SO3
2− and 884 for SO42− . Two small peaks around 2.2 and 3.0
min belong to formaldehyde and are separated from the peak for SO32− at
2.7 min. The sulfite peak present in the form of HMS eluted rather closely to the formaldehyde peak. Therefore, in order to preserve sep-aration, it was decided to stay with a 250 mm long column.
3.2. Extraction optimization
Different parameters, such as extraction time and extraction tech-niques (shaking vs sonication), as well as volume of the extracting so-lution, were studied to insure maximum extraction of sulfites and sulfates. Solution stability was investigated to assess the time window during which the analysis can be performed.
3.2.1. Dissolution The dissolution time of up to 40 min of Hagavatn extract was
investigated using sonication. Sulfites and sulfates immediately dis-solved as shown in Fig. 4. Similar results were obtained with mechanical shaking, and 10 min sonication was found to be an appropriate disso-lution technique.
3.2.2. Recovery Recovery studies were intended to prove that maximum amount of
the sulfites and sulfates are extracted. Three consecutive extractions with 1 mL of 1% Formalin were evaluated for the amount of sulfites and sulfates after the sample was aged by 175 ppm SO2 for 10 min, 30 min, 1 h, and 2hr. The criteria is less than 5% of the product can be left
Table 2 Parameters investigated and changed in order to adapt a method for “Simultaneous determination of sulfite, sulfate, and hydroxymethanesulfonate in atmospheric waters by ion-pair HPLC technique” by Zuo et al. to determination of sulfites and sulfates on the surface of environmental samples investigated in this work [25].
Method by Zuo et al. Parameters investigated Parameters chosen
Column 150 mm C18 Column, Particle size: 5 μm, I.D. 4.60 mm
250 mm Restek Ultra Column C18, Particle size: 5 μm, I.D. 4.60 mm 250 mm Acclaim 120 Column C18, Particle size: 3 μm, I.D. 3 mm
250 mm Restek Ultra Column C18, Particle size: 5 μm, I.D. 4.60 mm
Column coating 1.0 mM cetylpyridinium chloride in 7% ACN solution
1.0 mM cetylpyridinium chloride in 7% ACN solution
Mobile phase potassium hydrogen phthalate 0.5 mM-0.015% triethanolamine-3% methanol
triethanolamine: 0%, 0.015% potassium hydrogen phthalate: 0.5 mM, 1 mM, 10 mM % Methanol: 0%, 1%, 3% 5%
1 mM potassium hydrogen phthalate
pH 7.9 6.0, 6.5, 7.0, 7.5, 8.0, 8.5 6.5 Flow rate 1.0 ml/min 0.5 ml/min, 1 ml/min 1.0 ml/min Detection negative UV–Vis detection at 265 nm negative UV–Vis detection at 265 nm, 255
nm negative UV–Vis detection at 255 nm
Time 15 min 10 min, 15 min 15 min HPLC mode isocratic elution isocratic elution Temperature 23 ◦C 20 ◦C, 23 ◦C, 26 ◦C, 30 ◦C,
35 ◦C 23 ◦C
Injection volume 10 μL 10, 15, 20 μL 10 μL Sulfite-stabilizing
reagent None methanol 10%
Formalin: 0.5%, 1%, 5% 1% Formalin
Fig. 3. Representative chromatograms of: green) Formalin, offset 45 units for clarity; red) 10 ppm K2SO4 in 1% Formalin, offset 30 units for clarity; blue) 20 ppm K2SO3 in 1% Formalin, offset 15 units for clarity; black) Hagavatn dust aged in 175 ppm SO2 for 1 h and extracted in 1% Formalin. (For interpretation of the references to color in this figure legend, the reader is referred to the Web version of this article.)
Fig. 4. Dissolution studies for Hagavatn dust aged in 175 ppm SO2 for 1 h and extracted in 1% Formalin. % RSD for sulfites and sulfates is equal to 12.1% and 23.6% respectfully (see section 3.4).
D. Urupina et al.

unaccounted. As can be observed from Table 3, all of the sulfates are extracted from the surface of Hagavatn dust after the first extraction with 1 mL of 1% Formalin. As for the sulfites, two extractions with 1 ml of 1% Formalin are necessary. The third extraction represents from 0 to 3.9% of the total amount of SO3
2− extracted and therefore is not required based on the established criteria. Method demonstrates efficient recov-ery after only two extractions. As a result, it was decided to extract sulfites and sulfates with 1 mL of 1% Formalin, wash the remaining dust with another 1 mL of 1% Formalin and, using the same syringe, filter and combine the solution.
3.2.3. Solution stability In order to observe how analytes of interest change over time,
Hagavatn extract was prepared and injected into the HPLC system. The same solution was injected after 3, 5, 7, and 10 days. Solution stability results obtained from injecting a sample of 158.2 mg of Hagavatn aged for 10 min are shown in Fig. 5. Solution stability studies indicate that both sulfites and sulfates remain stable up to 10 days, which means that a sample can be easily collected and extracted to be kept for later analysis, which is indispensable during geological sampling when the analyzing facility might be far away from the sampling location. Moreover, in separate experiments a 165 mg sample of Hagavatn aged with SO2 for 1hr was checked for stability after 10 days and 3 months. Percent change in ppm concentration for sulfites was established at 4.5% after 10 days and 3.2% in 3 months; as for sulfates 5.4% change was observed after both 10 days and 3 months. Thus, the results indicate that dust samples aged with SO2 and stabilized with 1% Formalin are stable
for long periods (at least up to 3 months). Exceptional stability of so-lutions is very important in field campaigns as it makes it possible to collect and stabilize a sample on the go, but analyze it later in the laboratory.
3.3. Validation of analytical performance
The developed method was validated for specificity, limit of detec-tion and limit of quantitation, linearity and range, injection repeat-ability, and robustness.
3.3.1. Specificity To ensure that the peak response is due to only one component and
no co-elution occurs, a solution of Hagavatn dust aged in 175 ppm SO2 for 10 min and extracted in 1% Formalin was analyzed by Waters 2695 HPLC system equipped with Diode Array Detector using Empower software. Thus, specificity was evaluated as spectral purity. In peak purity testing the software compares the spectrum from each data point within the peak against the peak apex spectrum. Two parameters are evaluated: purity threshold, which accounts for the presence of non- ideal and solvent-induced spectral changes, and purity angle. When the purity angle exceeds purity threshold, a detectable impurity is pre-sent within a single chromatographic peak.
A solution of 165 mg of Hagavatn dust aged in 175 ppm SO2 for 10 min and extracted in 1% Formalin showed no interfering peaks. All peaks were well separated from the analyte peaks. Peak purity was proved by purity threshold exceeding the purity angle for both sulfite and sulfate peaks.
3.3.2. Limit of detection (LOD) and limit of quantitation (LOQ) Limits of detection for sulfites and sulfates were investigated to
determine the lowest concentration of sulfites and sulfates that can be detected but not quantified. It was based on a signal-to-noise ratio S/N ≥ 3. Limits of quantitation were studied to determine the lowest levels of the analyte concentrations that can be quantified and were determined by the concentrations corresponding to signal-to-noise ratio S/N ≥ 10.
The LOD for determination of sulfites was found to be 0.5 μg/mL of K2SO3 (0.32 μg/mL of SO3
2− ion). This value is 5 times lower than the 1.52 μg/mL of SO3
2− ion reported as LOD by Zuo et al. (corresponding to 19 μM of SO3
2− ion), but in a good agreement with the limit of detection of hydroxymethylsulfonate (HMS) reported at 0.42 μg/mL (corre-sponding to 3.8 μM of HMS ion). This is to be expected, as the SO3
2− in our case elutes as a HMS complex. The reason for improved detection limit is earlier elution of SO3
2− in the form of HMS at around 3 min instead of 7.5 min as a free sulfite ion using the original method [25]. Earlier elution prevents peak broadening and improves LOD and LOQ. LOQ for determination of SO3
2− ion was found to be 1 μg/mL of K2SO3 (0.64 μg/mL of SO3
2− ion). LOD for determination of sulfates was found to be 1 μg/mL of K2SO4
(0.68 μg/mL of SO42− ion). This value is in excellent agreement with the
limit of detection for SO4 ion reported by Zuo et al. and established at 6.7 μM SO4
2− ion which is 0.64 μg/mL of SO42− . LOQ for determination of
sulfates was found to be 5 μg/mL of K2SO4 (3.38 μg/mL of SO42− ion).
3.3.3. Linearity and range Linearity proves that the detector response is directly proportional to
the concentrations of the analyte in the sample, and range provides an interval for which the procedure is linear. Calibration ranges were defined as to include possible concentrations of sulfites and sulfates that can be found on the surface of mineral dust. This approach was based on preliminary results used to frame the order of magnitude of typical SO3
2−
and SO42− surface concentrations. To investigate linearity for extracted
sulfites, six different concentrations of K2SO3 were prepared from 1000 μg/mL stock solution of K2SO3 in the range 10–300 μg/mL (corre-sponding to 6 μg/mL to 191 μg/mL of SO3
2− ion). To explore linearity for sulfates, six different concentrations of K2SO4 were prepared from 1000
Table 3 Recovery results for 3 consecutive extracts of the sample of Hagavatn aged in 175 ppm SO2 for various time periods. Extraction with 1 mL of 1% Formalin.
Sample Hagavatn aged with 175 ppm SO2
Time 10 min 30 min 1hr 2hr
Extract 1 SO3
2− (ppm) 64.1 69.3 71.7 78.4
Extract 2 SO3
2− (ppm) 14.9 11.9 19.9 16.6
Extract 3 SO3
2− (ppm) 0.1 3.3 0 1.6
% SO32− in the 3rd extract 0.1 3.9 0.00 1.2
% recovery after 3 extract 99.9 96.1 100.00 98.0 Extract 1
SO42− (ppm)
3.4 3.7 3.7 8.5
Extract 2 SO4
2− (ppm) 0 0 0 0
% recovery 100.00 100.00 100.00 100.00
Fig. 5. Stability study results for 158.2 mg sample of Hagavatn aged in 175 ppm SO2 for 10 min. Extraction with 1 ml of 1% Formalin. Samples are stored at 4 ◦C. % RSD for sulfites and sulfates is equal to 4.7% and 8.7% respectfully (see 3.3.4).
D. Urupina et al.

μg/mL stock solution of K2SO4 in the range 5–150 μg/mL and injected into the HPLC system (corresponding to 3 μg/mL to 101 μg/mL of SO4
2−
ion). Calibration plots were constructed every day in order to insure ac-
curate identification of sulfates and sulfites in dust. Moreover, since the detection is achieved in negative mode (i.e. the mobile phase absorbs UV light and the peaks are “observed” when a compound lacking chromo-phore is passing through the column) the absorbance of the mobile phase depends on the concentration of the UV absorbing solution. Even slightest variations in phthalate concentration can change the slope of the calibration plot. Therefore, it is crucial to construct a new calibration curve every time a freshly-made mobile phase is introduced into the system. Nevertheless, it is important to keep in mind that even though the slope of the calibration curve may change the curve remains linear within the range. Therefore, the daily-constructed curve can be used for quantitation purposes as long as the same batch of phthalate solution is used. Calibration curves from a typical experimental day are represented in Fig. 6; calibration curve equations, coefficients of determination (R2) and root mean square errors are provided in Table 4. While R2 shows how close the data are to the fitted regression line, root mean square error can be interpreted as the average distance of a data point from the fitted line, measured along a vertical line.
3.3.4. Injection repeatability Injection repeatability was tested to measure the sensitivity of the
method towards errors coming from the instrument itself: the column, the detector, the injector, the integration device. To evaluate injection repeatability a solution of a mixture of 20 ppm K2SO3 and 10 ppm K2SO4 were injected into the HPLC system 6 times and evaluated for area % relative standard deviation (%RSD). Injection repeatability for a solu-tion of 20 ppm K2SO3 and 10 ppm K2SO4 was calculated to be 4.7% for sulfites and 8.7% for sulfates (Table 4).
3.3.5. Robustness Robustness of an analytical procedure is a measure of its capacity to
remain unaffected by small but deliberate variations in parameters listed in the procedure. In this study “remain unaffected” was defined as no change of the detected amount of the analyte in a sample in spite of the variation of the method parameter. Stability of the method was evalu-ated with respect to variations of the internal factors of the method such as pH of the mobile phase pH (6.5 ± 0.5), column temperature (23 ± 3), different column lots (Lot #160210E and Lot #130505R) and 1 month old vs 4 months column. Changes in temperature, pH, column age (up to 4 months) and lot number (Lot #160210E and Lot #130505R) did not affect the amounts of SO3
2− and SO42− ions determined in the solutions, as
they fell within injection variations, where 4.7% RSD and 8.7% RSD were reported for sulfites and sulfates respectively (Table 5). This is important, as it means that small fluctuations in pH that can come from mobile phase preparation will not affect quantification. Stability to-wards temperature changes suggests that method could be used in in-struments not equipped with temperature control function. Stability of the column for at least 4 months and robustness towards change of column (different batches) assures normal use of the method.
3.4. Validation of the sample preparation and extraction performance. Method reproducibility
The developed method was further validated for sample preparation and extraction reproducibility. It was decided to use the protocol for “kinetics study” to evaluate reproducibility because in comparison with “environmental sampling” protocol it has a supplementary step of dust ageing that can introduce additional errors.
Sample preparation and extraction reproducibility studies were conducted to evaluate the sensitivity of the method towards errors that may result from the combination of steps starting from ageing, extrac-tion and preparation of the samples to their subsequent analysis by HPLC instrument. To evaluate sample preparation and extraction reproducibility for the “kinetics study” protocol, seven samples of Hagavatn volcanic dust were aged with 175 ppm SO2 for 1 h and extracted in 1% Formalin. The solutions were injected into HPLC system and %RSD for mass of sulfites/sulfates per square meter of dust was calculated. The %RSD for reproducibility (that includes ageing and extraction of sulfites/sulfates) as reported in Table 6 was found to be 12.1% for sulfites and 23.6% for sulfates. It is important to stress that reproducibility for ageing and extraction of sulfites/sulfates in a dust sample depends on heterogeneity of the sample. Like most of the natural mineral dusts, Hagavatn volcanic dust represents a highly heteroge-neous sample and variations in adsorption/transformation of SO2 gas by its different components are expected. Many studies use a combination of different oxides as proxies for natural samples. In this case %RSD for reproducibility would be expected to be lower as the sample composi-tion is well-defined and ageing process more reproducible. Nevertheless, the importance of using natural samples cannot be overstated, as they often demonstrate different adsorption patterns when compared to the mixture of mineral oxides used as proxies [28,32,33]. For example, when studying adsorption of SO2 on individual oxides and comparing them to their mixture Zhang et al. observed that the reactivity of the mixture is twice as high as the reactivity of individual components [3]. In addition, substituting natural samples characterized by complex
Fig. 6. The typical plot of peak area versus concentration for a) sulfite (blue solid line) and b) sulfate (red dashed line) ions. The linearity plot was created daily before conducting experiments and each time the mobile phase solution was changed. (For interpretation of the references to color in this figure legend, the reader is referred to the Web version of this article.)
Table 4 Analytical Performance: Range, Linearity (calibration curve equation, coefficient of determination, root mean square error) and Injection Repeatability (expressed as %RSD for 6 consecutive injections of a solution of 20 ppm K2SO3 and 10 ppm K2SO4).
Test range (μg/mL) Calibration curve R2 Root Mean Square Error % RSD n = 6
Sulfites 6–191 y = 0,06x + 0,0489 1.0000 0.024 4.7 Sulfates 3–101 y = 0,1217x - 0,0036 0.9998 0.079 8.7
D. Urupina et al.

mineralogy by simple mineral oxides risks oversimplification of the observed trends.
3.5. Method summary
The validated method is summarized in Table 7. If “environmental sampling” is the desired purpose of the method, ageing is not required and one can start the protocol from the extraction section. For “kinetics study”, ageing is followed by extraction and HPLC analysis. Mass of the sample introduced into the reactor will depend on the specific surface area of the dust. In case of high specific surface area a higher SO2 adsorption might be expected and therefore a smaller sample mass can be used for extraction. Likewise, if the specific surface area of the dust is low an increased mass might be necessary in order to detect sulfites/
sulfates on the surface. Thus, the method can be easily adapted to different dust samples.
3.6. Method application
3.6.1. Application of the method to natural samples Samples of Hagavatn volcanic dust and Gobi desert dust were tested
for sulfites and sulfates using the “environmental sampling” method for extraction and quantification described above. Samples were not aged in the laboratory, but could have been previously subjected to SO2 gas. In case of Hagavatn, the samples were certainly exposed to SO2 gas during volcanic eruption. As for aeolian samples of Gobi dust, it is also likely that during its long-range transfer the dust encountered industrially polluted areas of China known to contain high levels of SO2 [16]. Six samples of natural desert dust ranging from 124.2 to 144.5 mg and seven Hagavatn volcanic dusts ranging from 110.6 to 505.4 mg were tested to determine their SO3
2− and SO42− ion surface concentrations. As can be
seen from Table 8, the extraction of both Gobi and Hagavatn surface dust did not reveal sulfites above the limit of detection of 0.32 μg/mL for SO3
2− ion. Note, that the absolute amounts of sulfites and sulfates are directly dependent on the sample mass since this parameter drives the effective surface area of the considered sample. As for the sulfates, although the amounts on the surface of Hagavatn samples were above the LOD level of 0.68 μg/mL of SO4
2− for five out of seven samples, they remained under the LOQ level of 3.38 μg/mL of SO4
2− ion even when the mass of the sample was increased to 505.4 mg. Furthermore, in terms of absolute amounts of sulfates detected on Hagavatn dust, increasing the mass of the dust sample to 505.4 mg increases its total surface area and therefore decreases the minimum amount of SO4
2− ion per meter square that could be detected on the surface. The fact that the amount of
Table 5 Method robustness results. Small changes in method parameters were introduced and evaluated as percent change for the amounts of SO3
2− and SO42− ions in samples of
Hagavatn dust as compared to their determination under original conditions (marked by asterisk).
Sample T (C◦) pH Column Lot#
Column age (months) Amount for SO32− (ppm) % Change Amount for SO4
2− (ppm) % Change
Hagavatn 194 mg aged for 1hr* 23 6.5 160210E 1 27.5 10.45 Hagavatn 194 mg aged for 1hr 20 6.5 160210E 1 26.7 − 2.9 10.82 3.5 Hagavatn 194 mg aged for 1hr 26 6.5 160210E 1 27.2 − 1.1 10.45 0.0
Hagavatn 158 mg aged for 10 min* 23 6.5 160210E 1 22.7 3.6 Hagavatn 158 mg aged for 10 min 23 7.0 160210E 1 23.09 1.7 3.7 2.8 Hagavatn 158 mg aged for 10 min 23 6.0 160210E 1 21.7 − 4.4 3.4 − 5.6
Hagavatn 165 mg aged for 1hr* 23 6.5 160210E 1 27.8 8.2 Hagavatn 165 mg aged for 1hr 23 6.5 130505R 1 26.6 − 4.5 8.6 5.4
Hagavatn 165 mg aged for 1hr* 23 6.5 160210E 1 27.8 8.2 Hagavatn 165 mg aged for 1hr 23 6.5 160210E 4 26.9 − 3.2 8.6 5.4
Table 6 Sample preparation and extraction reproducibility study for samples of Haga-vatn aged in 175 ppm SO2 for 1 h. Extraction with 1 mL of 1% Formalin.
Preparation Date of sample preparation
Sample mass (mg)
Concentration SO3
2− (μg/m2) Concentration SO4
2− (μg/m2)
1 April 8 134.0 59.3 25.2 2 April 12 89.0 66.4 28.7 3 April 12 194.0 67.1 20.5 4 April 15 137.3 69.6 22.7 5 April 15 138.6 56.2 39.1 6 April 16 158.0 75.7 26.1 7 April 16 165.4 79.3 22.5 Average 67.7 26.5 Standard Deviation 8.2 6.2 %RSD 12.1 23.6
Table 7 Summary of the validated conditions used to age, extract and quantify sulfites and sulfates in the sample of dust aged with SO2 gas.
Ageing Extraction Chromatographic conditions
Dust sample mass 100.0–200.0 mg
Extracting solution 1% Formalin in 10% MeOH/ water
Column 250 mm Restek Ultra Column C18, Particle size: 5 μm, I.D. 4.60 mm
SO2
concentration 175 ppm Mode of dissolution sonication Column
modification coated with 1.0 mM cetylpyridinium chloride in 7% ACN solution
SO2 flow 100 cm3/min Time of dissolution 10 min Mobile phase 1 mM potassium hydrogen phthalate at pH 6.5
RH 30% Filter 0.45 μm pore size 30 mm diameter Whatman filter
Flow rate 1.0 ml/min
Time 10 min - 1 h Total volume of extracting solution
2 mL Detection negative UV–Vis detection at 255 nm
Time 15 min
D. Urupina et al.

sulfates in μg/mL recorded after extraction of 113.5 mg sample (1.95 μg/mL) is the same as on the 505.4 mg sample (1.86 μg/mL) suggests that sulfates are not coming from Hagavatn sample. A small amount of sulfates determined in Hagavatn and Gobi dust samples could have also come from 1% Formalin extracting solution that contains traces of sul-fate impurities. The amount of sulfates in 1% Formalin solution was measured at 1 μg/mL, which is under LOQ limit. The lack of sulfates on the surface of Hagavatn volcanic dust might be explained by the fact that sulfates were dissolved from the surface of the natural sample by rain or surface water, as the sample is coming from the lava field formed about 4000 years ago and is subjected to fluctuating water levels [27,34]. As for Gobi dust, it displayed a considerable amount of sulfates averaging at 15.4 ± 1.3 μg/m2. Interestingly, method reproducibility for extraction and quantification of sulfates on the surface of Gobi dust was evaluated at 8.4 %RSD for 6 samples, which is three times lower than 23.6% RSD for sample preparation and extraction reproducibility determined earlier for seven Hagavatn samples used for validation of “kinetics study” protocol (see section 3.4, Table 6). In addition, one should keep in mind that 8.4% RSD for Gobi samples was calculated based on average amount of SO4
2− of 15.4 μg/m2, while higher average of 29.0 μg/m2 was used for calculation of 23.6% RSD for Hagavatn samples. The improvement in method reproducibility for “environmental sampling”
most certainly comes from the fact that no artificial ageing was performed.
3.6.2. Application of the method to aged samples In the next step, following “kinetics study” protocol samples of 134.0
mg of Hagavatn and 115.0 mg of Gobi dusts were exposed to 175 ppm of gaseous SO2 for 1 h at room temperature and under 30% RH. After extraction, the amount of sulfites formed on the surface was calculated at 54.4 ± 6.5 μg/m2 (μg of sulfites per m2 specific surface area) for Hagavatn and 27.0 ± 3.2 μg/m2 for Gobi desert dust (Fig. 7). In the study of Maters et al. the amount of sulfites measured by ion-chromatography on the surface of laboratory-generated volcanic glass samples exposed to 60 ppb SO2 for a couple of minutes varied from 10 μg/m2 for the glass of rhyolitic composition to 63 μg/m2 on the surface of glass of trachyba-saltic composition [9]. In this respect the amount of sulfites on the surface of Hagavatn basaltic volcanic dust agrees well with that measured on the surface of laboratory-generated glass samples of tra-chybasaltic composition. However, the direct comparison of the results is difficult due to fact that the above-mentioned studies were performed under low-pressure, 0% humidity of Knudsen cell reactor [9].
The amount of sulfates formed after 1 h ageing was estimated at 25.2 ± 6.1μg/m2 (μg of sulfate per m2 specific surface area) for Hagavatn and 53.4 ± 12.8 μg/m2 for Gobi desert dust. Note, that blank subtraction of 15.4 ± 1.3 μg/m2 (μg of sulfates per m2 specific surface area) was applied to quantify the amount of sulfates formed on Gobi dust during laboratory ageing. From this experiment it is evident that after 1 h of SO2 exposure volcanic dust accumulates a higher amount of sulfites than desert dust and a lower amount of sulfates. From earlier studies it was proposed that SO2 gas reacts on the surface of the volcanic dust and forms sulfites or bisulfites, which are then converted to sulfates [20,22]. It is possible that certain mineralogical compounds on the surface of Gobi desert dust are contributing to a more efficient conversion of sul-fites to sulfates. A larger sample distribution would be required to confirm the trend and elucidate how the surface chemical composition may influence the respective kinetics of sulfites and sulfates.
The amounts of SO32− and SO4
2− ions expressed in (μg/m2) were also expressed in terms of the number of SO3
2− and SO42− ions per centimeter
squared of dust and percent monolayer they form (see Table 9). The number of molecules needed to form a monolayer were calculated to be 5.75 × 10¹⁴ molecule cm− 2 for sulfites and 4.22 × 10¹⁴ molecule cm− 2
Table 8 Results of method reproducibility study for determination of SO3
2− and SO42− ions in Hagavatn and Gobi natural samples. Note, that samples were not subjected to
laboratory ageing. LOD and LOQ for sulfites and sulfates for each sample mass expressed in μg/m2 were calculated from corresponding sample’s mass, specific surface area, extraction volume (2 ml) and the values for LOQ and LOD expressed in μg/mL measured earlier (LOD for SO3
2− = 0.32 μg/mL, LOQ for SO32− = 0.64 μg/mL; LOD
for SO42− = 0.68 μg/mL, LOQ for SO4
2− = 3.38 μg/mL). Determination of the absolute amounts of SO32− and SO4
2− requires the observed concentrations of corresponding ions to be equal or more than LOQ.
Sample mass (mg) SSABET
(m2/g) LOD for SO3
2− (μg/m2) LOQ for SO32−
(μg/m2) Amount of SO3
2−
(μg/m2) LOD for SO4
2−
(μg/m2) LOQ for SO4
2−
(μg/m2) Amount of SO4
2−
(μg/m2)
Gobi 136.2 10.5 ± 2.0 0.45 0.90 < LOD 0.95 4.73 14.1 Gobi 138.5 10.5 ± 2.0 0.44 0.88 < LOD 0.94 4.65 14.8 Gobi 139.5 10.5 ± 2.0 0.44 0.87 < LOD 0.93 4.62 16.5 Gobi 126.2 10.5 ± 2.0 0.48 0.97 < LOD 1.03 5.10 14.4 Gobi 144.5 10.5 ± 2.0 0.42 0.84 < LOD 0.90 4.46 15.5 Gobi 124.2 10.5 ± 2.0 0.49 0.98 < LOD 1.04 5.18 17.2 Average 15.4 STD 1.3 %RSD 8.4
Hagavatn 116.8 4.5 ± 1.1 1.22 2.44 < LOD 2.59 12.86 < LOD Hagavatn 113.0 4.5 ± 1.1 1.26 2.52 < LOD 2.67 13.26 6.1< LOQ Hagavatn 125.4 4.5 ± 1.1 1.13 2.27 < LOD 2.41 11.98 4.6< LOQ Hagavatn 113.5 4.5 ± 1.1 1.25 2.51 < LOD 2.66 13.24 7.6< LOQ Hagavatn 190.0 4.5 ± 1.1 0.75 1.50 < LOD 1.59 7.91 < LOD Hagavatn 110.6 4.5 ± 1.1 1.29 2.57 < LOD 2.73 13.58 5.9< LOQ Hagavatn 505.4 4.5 ± 1.1 0.28 0.56 < LOD 0.60 2.97 1.6< LOQ Average NA STD NA %RSD NA
Fig. 7. Amount of sulfites and sulfates on the surface of Hagavatn volcanic dust and Gobi desert dust formed after ageing with 175 ppm SO2 gas.
D. Urupina et al.

for sulfates. These values are consistent with the values reported for surface density of sorptive sites on mineral oxides, ca. 3 × 10¹³ - 5 × 10¹⁴
sites cm− 2 [35]. It should be noted that the experimental monolayer coverage should be assumed to be lower than the theoretical because the molecules are not expected to pack together perfectly and because the degree of their interactions with various surface sites is not the same [36, 37]. The shape of the molecules and hindering interactions would render some of the active sites on the surface inaccessible. Knowing the number of molecules needed to form a monolayer and the amount present on the surface, percent monolayer coverage was calculated. Accordingly, in terms of a molecular coverage the sulfites occupy about 7% of the available area on the surface of Hagavatn and 2.8% on the surface of Gobi dust, while sulfates occupy 3.5% of the calculated monolayer on Hagavatn and 7.8% on the Gobi dust. We can thus calculate that about 90% of space is still free and available for the formation of sulfi-tes/sulfates and the reaction can continue. Note that this is a very rough approximation. Considering that not all surface sites are available for interactions with SO2 the percent space available most probably repre-sents less than 90%.
To evaluate how relevant the artificial ageing is to the processes encountered in real atmosphere, results obtained after a 1-h laboratory ageing of Gobi dust with 175 ppm SO2 were compared to the field measurements of sulfates performed during a severe dust storm in China. Similarly, results from Hagavatn ageing were compared to leachate measurements of ashes coming from Stromboli volcano in Italy and Soufriere Hills Volcano, Montserrat.
In spring of 2002 a dust storm originating from Gobi desert in Mongolia and Taklimakan desert in western China spread over China, Korea and Japan [38]. On March 20 2002, the dust peak concentrations over Beijing reached 10.9 mg/m3 (mg of dust per m3 of air) [38]. Using the same particle matter concentrations as the ones reported over Bei-jing and the specific surface area of Gobi dust determined in the current study (10.5 m2/g), our results of 53.4 ± 12.8 μg/m2 of sulfates on the surface of Gobi dust correspond to 6.07 ± 1.43 μg/m3 (μg of sulfates present in 1 m3 of gas), considering a dust density of 10.9 mg/m3 as reported by Sun et al. [38]. This result is on the same order of magnitude than the volume concentration of sulfates determined from Ion Chro-matography analysis of airborne samples: from 18 to 19 μg/m3 [38]. As for the samples of volcanic origin, Bagnato et al. measured the amount of sulfates on the surface of ash coming from Stromboli volcano, Italy. The results showed a vast variability from 7 to 55,000 μg/g (μg of sulfates per g of volcanic sample) [39]. High variability in the amount of sulfates in ash leachates was noted by Edmonds et al. (from 34 to 9280 μg/g) at Soufriere Hills Volcano, Montserrat [40]. The amount of sulfate per specific surface determined on Hagavtn volcanic dust (25.2 ± 6.1 μg/m2), after 1 h ageing, corresponds to 115 ± 27 μg/g. (μg of sulfates per g of dust). Results retrieved from our study fall within the range of concentrations determined by Bagnato et al. and Edmonds et al. [39,40]. Note that for elevated concentrations of sulfates on the surface of vol-canic dust, samples can be easily diluted in higher volumes of extraction solution, in our case 1% Formalin.
4. Conclusions
A reversed-phase HPLC method was successfully developed for the assay of sulfites and sulfates on the surface of dust. A method was developed on a 25 mm Restek Ultra Column C18, Particle size: 5 μm, I.D. 4.60 mm column which was dynamically coated with 1.0 mM cetyl-pyridinium chloride in 7% acetonitrile solution to produce a charged surface as recommended by Zuo et al. [25]. Mobile phase used: 1 mM potassium hydrogen phthalate at pH 6.5 at a flow rate of 1.0 ml/min with negative UV–Vis detection at 255 nm in 15 min. The developed method was validated for the specificity, LOD and LOQ, linearity and range, robustness, injection repeatability and reproducibility for sample preparation and extraction. In addition, the sampling method is easy and fast, and does not require expensive or particularly dangerous solvents. Besides, the extracted solution displays excellent stability, which is very important in remote sampling during geological expeditions. Samples can be extracted on site and analyzed days after sampling, provided they are kept in cool temperature conditions. We would like to stress out that in case of “environmental sampling” the method should only be applied if the sample is believed to be recently subjected to SO2 gas and if quantification of sulfites is desired. Due to the conversion of sulfites to sulfates, the former are not expected to stay on the surface of dust for a long time [26]. Examples of missions that could use the method devel-oped could be: identification of sulfites and sulfates on fresh volcanic ash samples following an eruption, identification of sulfites and sulfates in desert dust samples that pass through industrially polluted areas, as well as laboratory investigation of sulfite and sulfate formation on the surface of natural dusts of different origins. Validity of ageing procedure in the reference to natural gas-particle interactions was discussed. The devel-oped method was successfully applied to assay the amount of sulfites and sulfates formed on the surface of Hagavatn and Gobi dusts both in natural environmental settings and after artificial ageing. Sulfates in the amount of 15.4 ± 1.3 μg/m2 were detected on the surface of unexposed Gobi dust. As for the laboratory-aged samples, both sulfites and sulfates were detected on the surface of the two dusts. Sulfites were found to be formed in higher quantities on the surface of Hagavatn volcanic dust in comparison with Gobi desert dust sample (54.4 ± 6.5 μg/m2 of SO3
2− ion for Hagavatn versus 27.0 ± 3.2 μg/m2 of SO3
2− ion for Gobi desert dust), while the opposite trend was observed for sulfates (25.2 ± 6.1 μg/m2 of SO4
2− for Hagavatn and 53.4 ± 12.8 μg/m2 of SO42− for Gobi desert dust).
Author contribution
Darya Urupina: conceptualization, methodology, validation, anal-ysis, investigation, writing - original draft, writing - review and editing; Vincent Gaudion: resourses; Manolis N. Romanias: conceptualization, review and editing, supervision, funding acquisition; Marie Verriele: review and editing; Frederic Thevenet: review and editing, supervision, funding acquisition, visualization.
Table 9 Sulfite and sulfate coverage on the surface of Hagavatn and Gobi dusts expressed in terms of (i)micrograms of SO3
2− /SO42− per meter squared of dust (μg/m2), (ii)
number of SO32− /SO4
2− ions per centimeter squared of dust (Nmolecules/cm2), and (iii) percent monolayer sulfates and sulfites occupy. The number of molecules needed to form a monolayer were calculated to be 5.75 × 10¹⁴ molecule cm− 2 and 4.22 × 10¹⁴ molecule cm− 2 for sulfites and sulfates respectively.
Dust SO32−
(μg/m2) SO3
2− (Nmolecules/cm2) % monolayer Sulfite Surface Coverage (lower limit)
SO42−
(μg/m2) SO4
2− (Nmolecules/cm2) % monolayer Sulfate Surface Coverage (lower limit)
Hagavatn 54.4 ± 6.5 (4.1 ± 0.5) × 1013 7% 25.2 ± 6.1 (1.6 ± 0.4) × 1013 2.8% Gobi 27.0 ± 3.2 (2.0 ± 0.2) × 1013 3.5% 53.4 ± 12.8 (3.3 ± 0.8) × 1013 7.8%
D. Urupina et al.

Declaration of competing interest
The authors declare that they have no known competing financial interests or personal relationships that could have appeared to influence the work reported in this paper.
Acknowledgments
This work was achieved in the frame of Labex CaPPA, funded by ANR through the PIA under contract ANR-11-LABX-0005-01, and CPER CLIMIBIO project, both funded by the Hauts-de-France Regional Council and the European Regional Development Fund (ERDF). This work was supported by the French national program LEFE/INSU within the framework of INVOC-dust project. Darya Urupina acknowledges IMT Lille Douai for funding her PhD.
References
[1] Y. Zuo, J. Hoigne, Evidence for photochemical formation of H2O2 and oxidation of SO2 in authentic fog water, Science 260 (1993) 71–73, https://doi.org/10.1126/ science.260.5104.71.
[2] D.S. Stevenson, C.E. Johnson, E.J. Highwood, V. Gauci, W.J. Collins, R.G. Derwent, Atmospheric impact of the 1783–1784 Laki eruption: Part I Chemistry modelling, Atmos. Chem. Phys. 3 (2003) 487–507, https://doi.org/10.5194/acp-3-487-2003.
[3] E. Ilyinskaya, A. Schmidt, T.A. Mather, F.D. Pope, C. Witham, P. Baxter, T. Johannsson, M. Pfeffer, S. Barsotti, A. Singh, P. Sanderson, B. Bergsson, B. McCormick Kilbride, A. Donovan, N. Peters, C. Oppenheimer, M. Edmonds, Understanding the environmental impacts of large fissure eruptions: aerosol and gas emissions from the 2014–2015 Holuhraun eruption (Iceland), Earth Planet Sci. Lett. 472 (2017) 309–322, https://doi.org/10.1016/j.epsl.2017.05.025.
[4] H. He, Y. Wang, Q. Ma, J. Ma, B. Chu, D. Ji, G. Tang, C. Liu, H. Zhang, J. Hao, Mineral dust and NOx promote the conversion of SO2 to sulfate in heavy pollution days, Sci. Rep. 4 (2014) 4172, https://doi.org/10.1038/srep04172.
[5] A. Sardar, SO2 emission control and finding a way out to produce sulphuric acid from industrial SO2 emission, J. Chem. Eng. Process Technol. (2015), https://doi. org/10.4172/2157-7048.1000230, 06.
[6] H.T, A/S HQ, Sulfuric acid | H2SO4 | Haldor Topsoe (n.d.) (accessed June 3, 2020), https://www.topsoe.com/processes/sulfuric-acid.
[7] A. Jawad, A. Al-Dallal, Simulation of a wet sulfuric acid process (WSA) for utilization of acid gas separated from Omani natural gas, Al-Khawarizmi Eng. J. 9 (2013) 58–69.
[8] Y. Zuo, Light-induced formation of hydroxyl radicals in fog waters determined by an authentic fog constituent, hydroxymethanesulfonate, Chemosphere 51 (2003) 175–179, https://doi.org/10.1016/S0045-6535(02)00803-2.
[9] E.C. Maters, P. Delmelle, M.J. Rossi, P.M. Ayris, Reactive uptake of sulfur dioxide and ozone on volcanic glass and ash at ambient temperature, J. Geophys. Res. Atmos. 122 (2017) 10077–10088, https://doi.org/10.1002/2017JD026993.
[10] M. Ullerstam, R. Vogt, S. Langer, E. Ljungstrom, The kinetics and mechanism of SO2 oxidation by O-3 on mineral dust, Phys. Chem. Chem. Phys. 4 (2002) 4694–4699, https://doi.org/10.1039/b203529b.
[11] A.L. Goodman, P. Li, C.R. Usher, V.H. Grassian, Heterogeneous uptake of sulfur dioxide on aluminum and magnesium oxide particles, J. Phys. Chem. A 105 (2001) 6109–6120, https://doi.org/10.1021/jp004423z.
[12] E. Harris, B. Sinha, S. Foley, J.N. Crowley, S. Borrmann, P. Hoppe, Sulfur isotope fractionation during heterogeneous oxidation of SO2 on mineral dust, Atmos. Chem. Phys. 12 (2012) 4867–4884, https://doi.org/10.5194/acp-12-4867-2012.
[13] P.M. Ayris, A.F. Lee, K. Wilson, U. Kueppers, D.B. Dingwell, P. Delmelle, SO2 sequestration in large volcanic eruptions: high-temperature scavenging by tephra, Geochimica et Cosmochimica Acta. https://doi.org/10.1016/j.gca.2013.02.018, 2013, 110 58–69.
[14] D. Schmauss, H. Keppler, Adsorption of sulfur dioxide on volcanic ashes, Am. Mineral. 99 (2014) 1085–1094, https://doi.org/10.2138/am.2014.4656.
[15] E. Bagnato, A. Aiuppa, A. Bertagnini, C. Bonadonna, R. Cioni, M. Pistolesi, M. Pedone, A. Hoskuldsson, Scavenging of sulphur, halogens and trace metals by volcanic ash: the 2010 Eyjafjallajokull eruption, Geochem. Cosmochim. Acta 103 (2013) 138–160, https://doi.org/10.1016/j.gca.2012.10.048.
[16] X. Zhang, G. Zhuang, J. Chen, Y. Wang, X. Wang, Z. An, P. Zhang, Heterogeneous reactions of sulfur dioxide on typical mineral particles, J. Phys. Chem. B 110 (2006) 12588–12596, https://doi.org/10.1021/jp0617773.
[17] J.W. Adams, D. Rodriguez, R.A. Cox, The uptake of SO2 on Saharan dust: a flow tube study, Atmos. Chem. Phys. 5 (2005) 2679–2689, https://doi.org/10.5194/ acp-5-2679-2005.
[18] T. Kojima, P.R. Buseck, Y. Iwasaka, A. Matsuki, D. Trochkine, Sulfate-coated dust particles in the free troposphere over Japan, Atmos. Res. 82 (2006) 698–708, https://doi.org/10.1016/j.atmosres.2006.02.024.
[19] C.R. Usher, H. Al-Hosney, S. Carlos-Cuellar, V.H. Grassian, A laboratory study of the heterogeneous uptake and oxidation of sulfur dioxide on mineral dust particles, J. Geophys. Res. 107 (2002) 4713, https://doi.org/10.1029/2002JD002051.
[20] D. Urupina, J. Lasne, M.N. Romanias, V. Thiery, P. Dagsson-Waldhauserova, F. Thevenet, Uptake and surface chemistry of SO2 on natural volcanic dusts, Atmos. Environ. 217 (2019) 116942, https://doi.org/10.1016/j.atmosenv.2019.116942.
[21] C.S. Witham, C. Oppenheimer, C.J. Horwell, Volcanic ash-leachates: a review and recommendations for sampling methods, J. Volcanol. Geoth. Res. 141 (2005) 299–326, https://doi.org/10.1016/j.jvolgeores.2004.11.010.
[22] T. Wang, Y. Liu, Y. Deng, H. Fu, L. Zhang, J. Chen, Emerging investigator series: heterogeneous reactions of sulfur dioxide on mineral dust nanoparticles: from single component to mixed components, Environ. Sci.: Nano 5 (2018) 1821–1833, https://doi.org/10.1039/C8EN00376A.
[23] Y. Zuo, J. Zhan, T. Wu, Effects of monochromatic UV-visible light and sunlight on Fe(III)-Catalyzed oxidation of dissolved sulfur dioxide, J. Atmos. Chem. 50 (2005) 195–210, https://doi.org/10.1007/s10874-005-2813-y.
[24] R.C. Sullivan, S.A. Guazzotti, D.A. Sodeman, K.A. Prather, Direct observations of the atmospheric processing of Asian mineral dust, Atmos. Chem. Phys. 7 (2007) 1213–1236, https://doi.org/10.5194/acp-7-1213-2007.
[25] Y. Zuo, H. Chen, Simultaneous determination of sulfite, sulfate, and hydroxymethanesulfonate in atmospheric waters by ion-pair HPLC technique, Talanta 59 (2003) 875–881, https://doi.org/10.1016/S0039-9140(02)00647-1.
[26] Y. Michigami, K. Ueda, Sulphite stabilizer in ion chromatography, J. Chromatogr. A 663 (1994) 255–258, https://doi.org/10.1016/0021-9673(94)85252-9.
[27] D. Baratoux, N. Mangold, O. Arnalds, J.-M. Bardintzeff, B. Platevoet, M. Gregoire, P. Pinet, Volcanic Sand in Iceland: diverse origins of aeolian sand deposits revealed at Dyngjusandur and Lambahraun, Iceland, Earth Surf. Process. Landforms 36 (2011) 1789–1808, https://doi.org/10.1002/esp.2201.
[28] X. Wang, M.N. Romanias, F. Thevenet, A. Rousseau, Geocatalytic uptake of ozone onto natural mineral dust, Catalysts 8 (2018) 263, https://doi.org/10.3390/ catal8070263.
[29] N. Joshi, M.N. Romanias, V. Riffault, F. Thevenet, Investigating water adsorption onto natural mineral dust particles: linking DRIFTS experiments and BET theory, Aeolian Res. 27 (2017) 35–45, https://doi.org/10.1016/j.aeolia.2017.06.001.
[30] M.N. Zeineddine, M.N. Romanias, V. Gaudion, V. Riffault, F. Thevenet, Heterogeneous interaction of isoprene with natural Gobi dust, ACS Earth Space Chem 1 (2017) 236–243, https://doi.org/10.1021/acsearthspacechem.7b00050.
[31] K. Kovacs, R. McIlwaine, K. Gannon, A.F. Taylor, S.K. Scott, Complex behavior in the Formaldehyde− Sulfite reaction, J. Phys. Chem. A 109 (2005) 283–288, https://doi.org/10.1021/jp0464324.
[32] M.N. Zeineddine, M.N. Romanias, V. Riffault, F. Thevenet, Heterogeneous interaction of various natural dust samples with isopropyl alcohol as a probe VOC, J. Phys. Chem. (2018), https://doi.org/10.1021/acs.jpca.8b02034.
[33] J. Lasne, M.N. Romanias, F. Thevenet, Ozone uptake by clay dusts under environmental conditions, ACS Earth Space Chem 2 (2018) 904–914, https://doi. org/10.1021/acsearthspacechem.8b00057.
[34] O. Arnalds, P. Dagsson-Waldhauserova, H. Olafsson, The Icelandic volcanic aeolian environment: processes and impacts — a review, Aeolian Res. 20 (2016) 176–195, https://doi.org/10.1016/j.aeolia.2016.01.004.
[35] D. Kulkarni, I.E. Wachs, Isopropanol oxidation by pure metal oxide catalysts: number of active surface sites and turnover frequencies, Appl. Catal. Gen. 237 (2002) 121–137, https://doi.org/10.1016/S0926-860X(02)00325-3.
[36] P.K. Hudson, M.A. Zondlo, M.A. Tolbert, The interaction of methanol, acetone, and acetaldehyde with ice and nitric acid-doped Ice: implications for cirrus clouds, J. Phys. Chem. A 106 (2002) 2882–2888, https://doi.org/10.1021/jp012718m.
[37] L. Diaz, C.M. Liauw, M. Edge, N.S. Allen, A. McMahon, N. Rhodes, Investigation of factors affecting the adsorption of functional molecules onto gel silicas. 1. Flow microcalorimetry and infrared spectroscopy, J. Colloid Interface Sci. 287 (2005) 379–387, https://doi.org/10.1016/j.jcis.2004.09.039.
[38] Y. Sun, G. Zhuang, Y. Wang, X. Zhao, J. Li, Z. Wang, Z. An, Chemical composition of dust storms in Beijing and implications for the mixing of mineral aerosol with pollution aerosol on the pathway, J. Geophys. Res.: Atmosphere 110 (2005), https://doi.org/10.1029/2005JD006054.
[39] E. Bagnato, A. Aiuppa, D. Andronico, A. Cristaldi, M. Liotta, L. Brusca, L. Miraglia, Leachate analyses of volcanic ashes from Stromboli volcano: a proxy for the volcanic gas plume composition? J. Geophys. Res.: Atmosphere 116 (2011) https://doi.org/10.1029/2010JD015512.
[40] M. Edmonds, C. Oppenheimer, D. Pyle, R. Herd, Rainwater and Ash Leachate Analysis as Proxies for Plume Chemistry at Soufriere Hills Volcano, Montserrat, vol. 213, Geological Society Special Publication, 2003, pp. 203–218, https://doi. org/10.1144/GSL.SP.2003.213.01.12.
D. Urupina et al.


Summary
This thesis investigates the interactions of sulfur dioxide (SO2) gas with Icelandic Volcanic Dusts.
Five natural volcanic dust samples were used for the study: Hagavatn, Mýrdalssandur, Maelifellssandur,
Dyngjusandur and Eyjafjallajökull.
The heterogeneous interactions of gas-phase SO2 with volcanic dusts are investigated using a
number of complimentary techniques. Temporal profiles of SO2 uptake and, more precisely, the steady state
uptake coefficients have been determined experimentally. These are important kinetic parameters that can
be implemented in models. Mechanisms of formation of various surface species resulting from the
interactions of SO2 with the surface of dusts are proposed. A new method for quantification of surface
sulphur species has been developed and validated. This method can now be used both for further laboratory
investigations and in field measurements.
It is evidenced that the interactions of SO2 gas with the volcanic dust is a long continuous process.
The products formed on the surface are stable and definitely influence the mineral particle properties. It is
evidenced that the interactions of SO2 gas and volcanic particles are highly influenced by humidity and by
UV light. The influence of surface composition also plays an important role especially at levels of humidity
equal or lower than 30% RH. This work emphasizes the importance of using relevant natural dust samples
in order to study the heterogeneous atmospheric phenomena involving natural solid particles.
Résumé
Ces travaux de thèse portent sur l’étude des interactions du dioxyde de soufre (SO2) gazeux avec des
poussières volcaniques islandaises. Ils intègrent cinq échantillons naturels de poussières volcaniques:
Hagavatn, Mýrdalssandur, Maelifellssandur, Dyngjusandur and Eyjafjallajökull.
Les interactions hétérogènes entre SO2 et les poussières volcaniques sont abordées avec plusieurs techniques
expérimentales complémentaires. Les profils temporels associés à la capture de SO2, caractérisés par les
coefficients de capture en régime stationnaire ont été renseignés expérimentalement. Ces paramètres sont
des données d’importance pour les modèles atmosphériques. Des mécanismes réactionnels décrivant la
formation des espèces de surface résultant de l’interaction de SO2 avec la surface des poussières sont
proposés. Une nouvelle méthode analytique permettant l’extraction et la quantification d’espèces soufrées
de surface a été développée et validée. Cette méthode est à présent disponible tant pour l’étude de processus
hétérogènes en laboratoire que pour la caractérisation d’échantillons de terrain.
Il a été mis en évidence que l’interaction de SO2 avec les poussières volcaniques est un processus de long
terme. Les produits formés en surface sont stables et influencent les propriétés des particules minérales. Il a
été démontré expérimentalement que l’humidité relative présente une influence marquée sur la capture et la
transformation de SO2. La composition de surface des particules minérales est aussi un élément clé,
particulièrement pour des humidités relatives inférieures à 30%. Enfin, ces travaux montrent l’importance
d’avoir recours à des échantillons minéraux naturels pour assurer une bonne représentativité des études
portant sur les processus atmosphériques hétérogènes impliquant des particules minérales.