THESE DE DOCTORAT Xuan ZHAO
278
T L’U L Electrica Spécialité de doctorat : Elect Conception and fabrication biological phenomena: app migr Thèse présentée et soutenue au C Composition du Jury : M. Bruno LE PIOUFLE Profes M. Vincent STUDER DR CN Mme Marie-Caroline JULLIEN DR CN M. Pierre-Henri PUECH CR IN M. Charlie GOSSE CR CN NNT : 2017SACLS226 THESE DE DOCTORAT DE UNIVERSITE PARIS-SACLAY PREPAREE A L’UNIVERSITE PARIS-SUD ECOLE DOCTORALE N° 575 al, optical, bio-physics and engineering tronique et Optoélectronique, Nano- et Par Xuan ZHAO n of reusable microfluidic tools to study plication to antibiotic influx/efflux in ba ration during mouse development C2N Orsay, le 7 Septembre 2017 : sseur ENS Cachan, Laboratoire SATIE NRS, Institut Interdisciplinaire de Neurosciences NRS, Laboratoire Gulliver ESPCI NSERM, Laboratoire Adhésion et Inflammation NRS, Centre de Nanosciences et de Nanotechnologies Microtechnologies y the dynamics of acteria and to cell Président Rapporteur Rapporteur Examinateur Directeur de thèse
-
Upload
khangminh22 -
Category
Documents
-
view
3 -
download
0
Transcript of THESE DE DOCTORAT Xuan ZHAO
T
L’U
L
Electrical, o Spécialité de doctorat : Electronique
Conception and fabrication of reusable microfluidic tools to study the dynamics of biological phenomena: application to
migration during
Thèse présentée et soutenue au C2N Orsay, Composition du Jury : M. Bruno LE PIOUFLE Professeur ENS Cachan, M. Vincent STUDER DR CNRSMme Marie-Caroline JULLIEN DR CNRS,M. Pierre-Henri PUECH CR INSERMM. Charlie GOSSE CR CNRS
NNT : 2017SACLS226
THESE DE DOCTORAT DE
L’U NIVERSITE PARIS-SACLAY PREPAREE A
L’UNIVERSITE PARIS-SUD
ECOLE DOCTORALE N° 575 Electrical, optical, bio-physics and engineering
lectronique et Optoélectronique, Nano- et
Par
Xuan ZHAO
Conception and fabrication of reusable microfluidic tools to study the dynamics of biological phenomena: application to antibiotic influx/efflux in bacteria and to cell
migration during mouse development
C2N Orsay, le 7 Septembre 2017 :
Professeur ENS Cachan, Laboratoire SATIE CNRS, Institut Interdisciplinaire de Neurosciences
R CNRS, Laboratoire Gulliver ESPCI INSERM, Laboratoire Adhésion et Inflammation CNRS, Centre de Nanosciences et de Nanotechnologies
et Microtechnologies
Conception and fabrication of reusable microfluidic tools to study the dynamics of influx/efflux in bacteria and to cell
Président Rapporteur
Rapporteur Examinateur
Directeur de thèse

Université Paris-Saclay
Espace Technologique / Immeuble Discovery
Route de l’Orme aux Merisiers RD 128 / 91190 Saint
Espace Technologique / Immeuble Discovery
Route de l’Orme aux Merisiers RD 128 / 91190 Saint-Aubin, France
Acknowledgements
My first thanks will be given to Bruno Le Pioufle, Vincent Studer, Marie-Caroline Jullien,
and Pierre-Henri Puech, members of the committee who have accepted to read my PhD
manuscript and judge my work.
Secondly, I would like to express my sincere gratitude to my thesis advisor, Charlie Gosse
(C2N Marcoussis, CNRS), for his kind encouragement, clear guidance, great patience, and
continuous support throughout the whole research project. His comprehension and
knowledge of microfluidics, microfabrication, and numerical simulations were extremely
valuable for improving the quality of my thesis and of the publications that have been
written. His insightful comments and suggestions helped me to make progresses in my
microfluidic studies, in the redaction of the dissertation as well as in the capture of my future
career.
I am also extremely grateful to Matthieu Réfrégiers (DISCO beamline, SOLEIL
Synchrotron) for his invitation and for the permission to conduct my research on the
TELECOM microscope. My integration in the beamline team and the financial support I have
benefited for my work were much valuable. I also appreciated all the members of the Biology
Laboratory and of the Chemistry Laboratory of the SOLEIL Synchrotron for their help and
assistance during my experimentals.
I am grateful to my collaborators, Aitana Perea-Gomez, Isabelle Migeotte, Diana
Suárez-Boomgaard, Joni Frederick, Julia Vergalli, and Anne-Marie Tran, for their help and for
the harmonious cooperation during my thesis period.
I want to express my deep appreciation to my friends and colleagues for their support:
Elsa Mazari, Anne-Claire Loüer, Hugo Salmon, Antoine Barbot, and Qiongdi Zhang, who were
Ph.D students in the same laboratory than me. All the members of the C2N clean room are
also deeply acknowledged for their kind guidance on the use of the machines and for the
constructive exchanges and discussions we had all these years.
Finally, I would like to express my great respect to my family for their warmly
encouragement and continuous support.

1 / 192
Table of content
Part I. A reusable microdevice
for dynamic studies of antibiotics
uptake in immobilized individual
bacterium
Chapter I. Various view points on antibiotherapy ___________________________ 11
I. Historical perspective on drug discovery and development _____________________ 11
I.1. Early findings _______________________________________________________________ 11
I.2. The discovery of antagonism between microorganisms _____________________________ 12
I.3. The discovery of penicillin _____________________________________________________ 12
I.4. The golden era ______________________________________________________________ 14
I.4.1. Natural compounds in the 1940s-1950s ______________________________________ 14
I.4.2. Semi-synthetic drugs in the 1960s ___________________________________________ 14
I.4.3. Synthetic quinolones in the 1980s ___________________________________________ 15
I.5. The discovery void ___________________________________________________________ 15
II. Public health issues related to drug resistance ______________________________ 16
II.1. Emergence of the phenomena and anticipated consequences _______________________ 16
II.2. Reported causes ____________________________________________________________ 17
II.2.1. Endopathic factors _______________________________________________________ 17
II.2.2. Exopathic factors ________________________________________________________ 19
II.3. Possible solutions ___________________________________________________________ 20
II.3.1. Rational use of antibiotics by doctors and patients _____________________________ 20
II.3.2. Increase supervision and support by policy makers _____________________________ 20
III. Cellular and molecular aspects __________________________________________ 21
III.1. Classification of bacteria according to their structure ______________________________ 21
III.1.1. Appearance and shape ___________________________________________________ 21
III.1.2. Result of Gram staining __________________________________________________ 22
III.2. Classification of antibiotics according to their target _______________________________ 23
III.2.1. Inhibition of cell wall synthesis ____________________________________________ 24
III.2.2. Disruption of the cytoplasmic membrane ____________________________________ 25

2 / 192
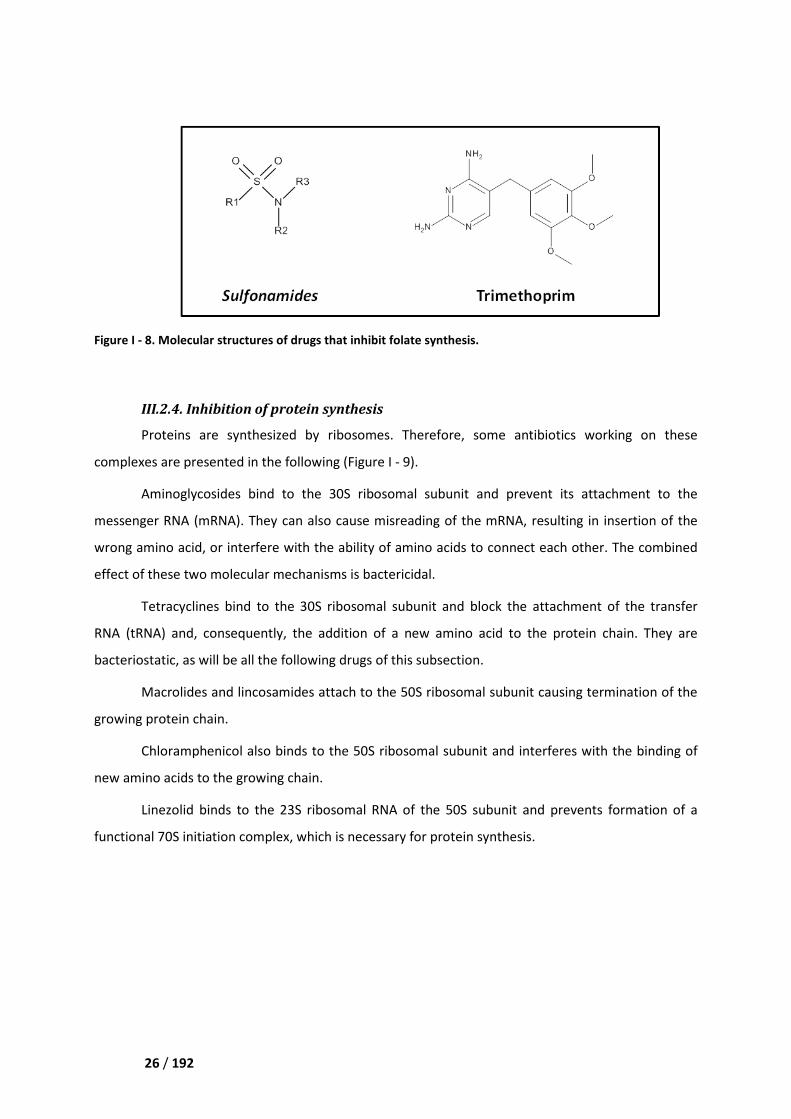
III.2.3. Inhibition of folate synthesis ______________________________________________ 25
III.2.4. Inhibition of protein synthesis _____________________________________________ 26
III.2.5. Inhibition of nucleic acids synthesis _________________________________________ 27
III.3. Classification of resistances according to their mechanism __________________________ 28
III.3.1. Drug inactivation by an enzyme ____________________________________________ 29
III.3.2. Alteration of the target site _______________________________________________ 29
III.3.3. Changes of membrane permeability ________________________________________ 30
III.3.4. Active expulsion of the drug from the bacteria ________________________________ 30
III.4. Description of the biomolecules involved in drug influx/efflux _______________________ 30
III.4.1. The cell wall of the Gram-negative bacteria __________________________________ 30
III.4.2. The OmpC and OmpF porins ______________________________________________ 31
III.4.3. The multi drug efflux pumps ______________________________________________ 32
Chapter II Strategies used for influx/efflux measurements ___________________ 35
I. A review of the literature ________________________________________________ 35
I.1. Bulk studies_________________________________________________________________ 36
I.1.1 Natural systems __________________________________________________________ 36
I.1.2 Artificial systems _________________________________________________________ 37
I.2. Single cell studies ____________________________________________________________ 38
I.2.1. Natural systems _________________________________________________________ 38
I.2.2 Artificial systems _________________________________________________________ 39
I.3 Single protein studies _________________________________________________________ 40
II. Our biological system __________________________________________________ 41
II.1. Escherichia coli, a typical Gram-negative bacteria __________________________________ 42
II.1.1. Main characteristics______________________________________________________ 42
II.1.2. Relevance for public health ________________________________________________ 43
II.1.3. Use as a model organism __________________________________________________ 43
II.2. Quinolones, a family of fluorescent antibiotics ____________________________________ 44
II.2.1. Structural properties _____________________________________________________ 44
II.2.2. Mechanism of action _____________________________________________________ 45
II.2.3. Relevance for public health ________________________________________________ 46
II.2.4. Spectroscopic properties __________________________________________________ 47
III. The experiments performed at SOLEIL ____________________________________ 47
III.1. Intrinsic fluorescence imaging of antibiotic concentration __________________________ 48
III.1.1. Necessity of a real-time label-free technique _________________________________ 48
III.1.2. Description of the Telemos epifluorescence microscope ________________________ 49
III.1.3. Specific issues related to UV fluorescence observation _________________________ 51

3 / 192
III.2. Previous protocol ___________________________________________________________ 52
III.2.1. Description ____________________________________________________________ 52
III.2.2. Limitations ____________________________________________________________ 54
III.3. Proposed protocol __________________________________________________________ 54
Chapter III. Design and fabrication of the microdevice _______________________ 55
I. Criteria to be fulfilled ___________________________________________________ 55
I.1. Complete cell immobilization __________________________________________________ 55
I.2. Parallel monitoring of individual bacteria _________________________________________ 56
I.3. Quick change of the chemical environment _______________________________________ 56
I.4. Practicity ___________________________________________________________________ 57
II. Existing technologies ___________________________________________________ 57
II.1. Electromagnetic trapping _____________________________________________________ 57
II.1.1. Dielectrophoresis ________________________________________________________ 57
II.1.2. Optical tweezers ________________________________________________________ 59
II.2. Physico-chemical traps _______________________________________________________ 61
II.2.1. Surface coating _________________________________________________________ 61
II.2.2. Gel matrix ______________________________________________________________ 61
II.3. Steric traps _________________________________________________________________ 63
II.3.1. Microfluidic growth chamber and growth track ________________________________ 63
II.3.2. Elastomeric ring valve ____________________________________________________ 66
II.3.3. Semi-permeable membrane onto a growth chamber ___________________________ 67
II.4. Comparison and conclusion ___________________________________________________ 67
III. Tentative implementations _____________________________________________ 68
III.1. Dielectrophoresis ___________________________________________________________ 69
III.2. Elastomeric button valve _____________________________________________________ 69
IV. Final solution ________________________________________________________ 71
IV.1. Reflection around the static chamber ___________________________________________ 71
IV.2. Design of the flow device ____________________________________________________ 72
IV.3. Compliance with the requirements _____________________________________________ 73
IV.4. Fabrication protocols ________________________________________________________ 74
Chapter IV. Description of an experiment step by step _______________________ 77
I. Bacteria culture ________________________________________________________ 77
I.1. Experiments on the BL21 (DE3) strain ____________________________________________ 77
I.2. Experiments on the AG100/AG100A/AG102 strains ________________________________ 77

4 / 192
II. Reagent preparation ___________________________________________________ 78
II.1. NaPi Buffer_________________________________________________________________ 78
II.2. Antibiotic solution ___________________________________________________________ 78
III. Microfluidic actuation _________________________________________________ 79
III.1. Immobilization of the bacteria ________________________________________________ 79
III.2. Installation of the fluidic system _______________________________________________ 79
III.3. Selection of an appropriate field of view ________________________________________ 80
III.4. Modulation of the antibiotic concentration ______________________________________ 81
IV. Image acquisition and data analysis ______________________________________ 83
IV.1. Optical set up ______________________________________________________________ 83
IV.2. Experiments on the BL21 (DE3) strain ___________________________________________ 84
IV.3. Experiments on the AG100/AG100A/AG102 strains _______________________________ 86
Chapter V. Microdevice characterization__________________________________ 87
I. Finite element method simulations ________________________________________ 87
I.1. Generalities ________________________________________________________________ 87
I.2. Hydrodynamics ______________________________________________________________ 87
I.3. Solute transport _____________________________________________________________ 89
II. Numerical and experimental results _______________________________________ 90
II.1. Hydrodynamics _____________________________________________________________ 91
II.2. Solute transport ____________________________________________________________ 92
III. Discussion ___________________________________________________________ 95
III.1. Selection of the field of view __________________________________________________ 95
III.2. Variability and stability ______________________________________________________ 97
IV. Comparison of our microdevice with the existing solutions ___________________ 98
IV.1. Steric immobilization in microfluidic growth chambers _____________________________ 98
IV.2. Physico-chemical trapping at the surface of a microfluidic channel __________________ 101
Chapter VI. Experiments on bacteria ____________________________________ 103
I. Influx/efflux studies ___________________________________________________ 103
I.1. Device validation on the uptake of ciprofloxacin by the BL21 (DE3) strain ______________ 103
I.2. Preliminary results on the uptake of fleroxacin by the AG100/AG100A/AG102 strains ____ 105
I.3. Perspectives on the use of efflux modulators and/or other bacterial species ___________ 105
II. Cell growth studies ___________________________________________________ 106

5 / 192
Part II. Reusable microdevices to
study the dynamics of cell migration
during mouse development
Chapter I. Technical context ___________________________________________ 111
I. Electroporation for transgenesis _________________________________________ 111
I.1. Pore opening upon electric field application _____________________________________ 112
I.2. Entry of nucleic acids into the cytoplasm ________________________________________ 115
II. Electroporation in embryology __________________________________________ 116
II.1 Goal of the transfection experiments ___________________________________________ 116
II.1.1. Cell fate mapping _______________________________________________________ 116
II.1.2. Gene function study ____________________________________________________ 116
II.2. Localization strategies _______________________________________________________ 117
II.2.1. Orientation of the embryo _______________________________________________ 117
II.2.2. Containment of the nucleic acids solution ___________________________________ 117
II.2.3. Generation of an electric field gradient _____________________________________ 118
II.2.4. Combination of both molecular localization and electric field focusing ____________ 119
III. Electroporation and microsystems ______________________________________ 119
III.1 Microelectrodes ___________________________________________________________ 119
III.2 Dielectric guides ___________________________________________________________ 120
IV. Electroporation at the LPN _____________________________________________ 121
IV.1. Biological insights __________________________________________________________ 121
IV.2. The project and the collaboration _____________________________________________ 122
IV.3. The dielectric guide devices__________________________________________________ 123
IV.3.1. General architecture ___________________________________________________ 123
IV.3.2 List of the various demonstrators and prototypes _____________________________ 124
Chapter II. Microdevice design and processing ____________________________ 129
I. Choice of materials and microfabrication technologies _______________________ 129
I.1 The laboratory demonstrators so far realized _____________________________________ 130
I.1.1 Soft lithography (EM5) ___________________________________________________ 130
I.1.2 Mix “craft” technologies (EM6) _____________________________________________ 131
I.1.3. Achievements and limitations _____________________________________________ 131
I.2. The industrial prototypes _____________________________________________________ 132

6 / 192
I.2.1 Thermoplastic manufacturing ______________________________________________ 132
I.2.2 MEMS-type manufacturing ________________________________________________ 134
I.2.3 Strategy selection _______________________________________________________ 134
II. Overview of the different processes available to make a glass micro chip ________ 135
II.1. Etching ___________________________________________________________________ 135
II.1.1 Dry etching ____________________________________________________________ 135
II.1.2 Wet etching ____________________________________________________________ 137
II.2. Electrochemical discharged machining _________________________________________ 138
II.3. Sand blasting ______________________________________________________________ 140
II.4. Femtosecond laser ablation __________________________________________________ 141
II.5. Selective laser-induced Etching (SLE) ___________________________________________ 143
II.6 Bonding ___________________________________________________________________ 144
II.6.1. Direct bonding _________________________________________________________ 145
II.6.2. Anodic bonding ________________________________________________________ 145
II.6.3. Adhesive bonding ______________________________________________________ 147
II.6.4. Eutectic bonding _______________________________________________________ 147
II.6.5. Sol-gel bonding ________________________________________________________ 148
II.7. Summary of the possibilities offered by the various techniques _____________________ 149
III. Comparative experiments on individual technological steps __________________ 150
III.1 Through hole manufacturing _________________________________________________ 150
III.2 Wafer bonding _____________________________________________________________ 151
IV. Validation of the two protocols selected to produce an all-in-glass device ______ 152
IV.1 Design update between the EM6 and EM7 devices _______________________________ 152
IV.2 Workflow selection and evaluation ____________________________________________ 154
IV.2.1. Microfabrication process by wet etching, laser ablation and bonding ____________ 154
IV.2.2. Microfabrication process by SLE __________________________________________ 156
Chapter III. Microfabrication protocols __________________________________ 159
I. The SU-8/parafilm single-use device (EM6) _________________________________ 159
II. The reusable all-in-glass device series (EM7) _______________________________ 161
II.1. EM7-01 __________________________________________________________________ 161
II.2. EM7-02 and EM7-11 ________________________________________________________ 163
III. The use of protection layers during glass micromachinging ___________________ 164
III.1. Wet etching ______________________________________________________________ 164
III.2. Laser ablation _____________________________________________________________ 166
Chapter IV Results and discussion ______________________________________ 167

7 / 192
I. Simulations __________________________________________________________ 167
I.1 Description of the models _____________________________________________________ 167
I.2 Determination of the permeation threshold ______________________________________ 169
II. Electroporation experiments ___________________________________________ 170
Chapter V. Perspectives ______________________________________________ 173
I. Post-electroporation culture ____________________________________________ 173
II. Measurement of temperature and pH jumps _______________________________ 174
References _________________________________________________________ 177

8 / 192
9 / 192
Part I. A reusable microdevice for
dynamic studies of antibiotics
uptake in immobilized individual
bacterium

10 / 192
Chapter I Various view points on antibiotherapy
11 / 192
Chapter I. Various view points on
antibiotherapy
I. Historical perspective on drug discovery and development
Antibiotics are one of the greatest achievements in the history of medicine, without which
many diseases could not have been fought. We do not need to emphasize on how many lives have
been saved and how significantly these drugs contributed to the control of infectious diseases. The
history of antibiotic development is also instructive. Similarly to what can be observed for many
other inventions, after accumulation of many years of experience, phenomena have been
interpreted along with the progresses made in other basic sciences, and finally fundamental studies
have been transformed into industrial production, so as to better serve mankind.
One of the contributions of the founder of microbiology, Louis Pasteur, was to point out that
many diseases were caused by microbial infection. Several microorganisms can induce human
diseases: bacteria (such as Escherichia coli), viruses (such as coronaviruses), fungi (such as lichen
planus), and protozoa (such as plasmodia). Among them, bacteria, fungi, and protozoa can effectively
be killed by antibiotics.
I.1. Early findings
In many ancient cultural records, people around the world have been known to utilize fungi,
molds as well as some plants to treat infections. Moldy bread and soil have been employed to treat
ulcers, intestinal infections, and wounds. So the use of bacterial products in the treatment of disease
is very old, but people did not know terms like “bacteria” and “antibiotic”. Indeed, it was not until
the second half of the 19th century that the development of antibiotics was really initiated.
Chapter I Various view points on antibiotherapy
12 / 192
I.2. The discovery of antagonism between microorganisms
With the development of microbiology, from the 1870s onwards, the essence of the concept
of antibiosis was discovered and reported by various scholars. John Burdon Sanderson and William
Roberts independently observed that fungi were capable of inhibiting bacterial growth in certain
culture media. In 1874 the latter scientist named this phenomenon “antagonism” (Roberts 1874). In
1876, John Tyndall did a similar observation, concluding that fungi consumed the oxygen necessary
to bacteria multiplication and pointing out that, in the competition for survival between molds and
bacteria, molds were usually the winner (Tyndall 1876). In 1877, Louis Pasteur and Jules François
Joubert evidenced the antagonistic role of microorganisms present in the air while trying to culture
Bacillus anthracis in urine. They even sometimes succeeded in preventing the anthrax infection of an
animal by inoculating these aerial microorganisms at the same time than Bacillus anthracis (Pasteur
and Vallery-Radot 1933). In 1899 Rudolph Emmerich and Oscar Löw isolated germs from the infected
bandages that caused green infections in open wounds. This microorganism was Pseudomonas
aeruginosa. They noticed that this bacterium, as well as the extracts from its cultures, was active
against a number of other pathogenic bacteria, like Vibrio cholerae, Corynebacterium diphtheriae,
and Bacillus anthracis (Hays, Wells et al. 1945) (Aminov 2010).
Thus, by the beginning of the 20th century, antagonistic phenomena involving
microorganisms had been discovered and proved to be numerous. Various strains of Penicillium and
Pseudomonas had been studied, and their potential for the treatment of diseases had been
evaluated.
I.3. The discovery of penicillin
In the first decades of the 20th century, antibiotic research was only a continuation of the one
of the former century, without any new development. In 1910, the German doctor Paul Ehrlich
synthesized arsphenamine (salvarsan, Figure I - 1), which was effective to treat syphilis without being
too harmful to the human body. The 1920s were characterized by the sole isolation of kojic acid (in
1912, from Aspergillus oryzae colonies growing on rice) and penicillic acid (in 1913, from a mold
growing on maize). From 1920 to 1929, the only discovered molecules were actinomycin (isolated
from a soil actinomycete by Gratia and Dath (Hogg 2013) and pyocyanin (chemically synthesized by
Wrede and Strack (MacDonald 1967). However, the effects of the two latter substances were not
high or the drugs were toxic: without great practical value, these findings did not have much impact.
In 1928 Fleming fortuitously discovered penicillin (Figure I - 1). While studying the
morphology of colonies of Staphylococcus aureus, a colony of Penicillium notatum accidentally
contaminated his Petri dish. Under a magnifying glass he found that the colonies of Staphylococci
around the Penicillium colony were apparently dissolved. It was later confirmed that Penicillium had
Chapter I Various view points on antibiotherapy
13 / 192
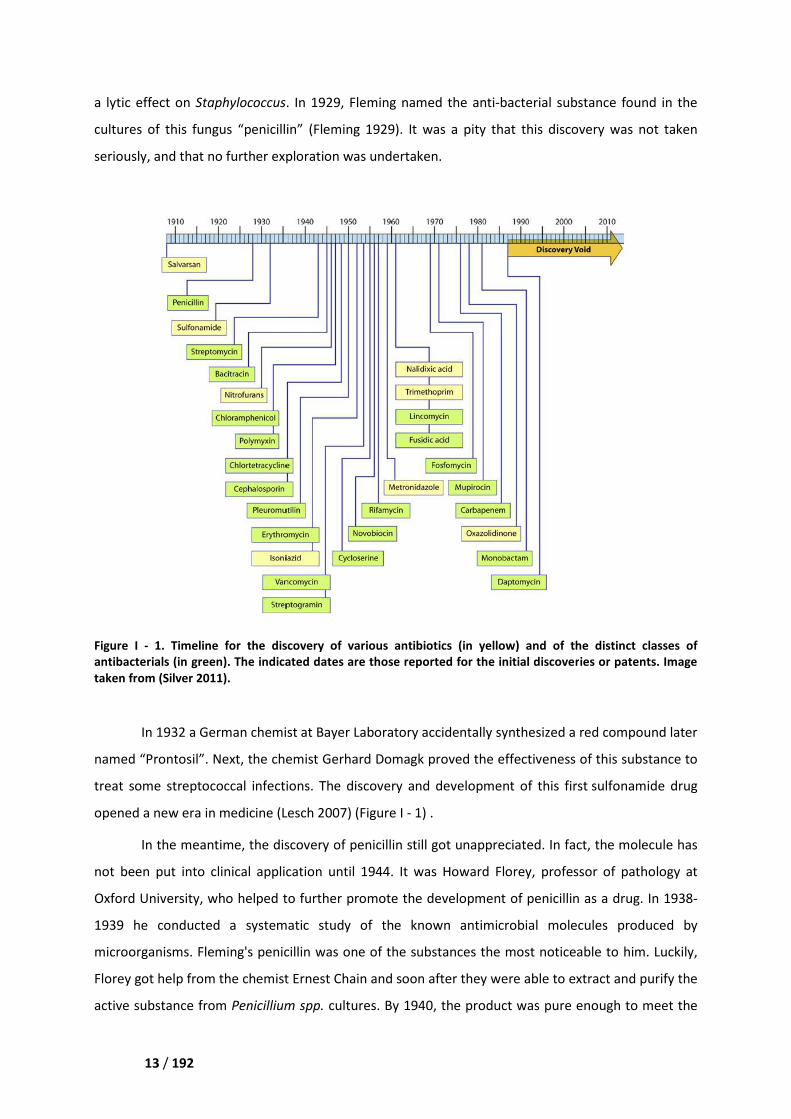
a lytic effect on Staphylococcus. In 1929, Fleming
cultures of this fungus “penicillin”
seriously, and that no further exploration
Figure I - 1. Timeline for the discovery of
antibacterials (in green). The indicated date
taken from (Silver 2011).
In 1932 a German chemist
named “Prontosil”. Next, the chemist Gerhard Domagk
treat some streptococcal infection
opened a new era in medicine (Lesch 2007)
In the meantime, the discovery of penicillin still got unappreciated. In
not been put into clinical application
Oxford University, who helped to
1939 he conducted a systematic stud
microorganisms. Fleming's penicillin
Florey got help from the chemist Ernest Chain and soon
active substance from Penicillium
Various view points on antibiotherapy
. In 1929, Fleming named the anti-bacterial substance
“penicillin” (Fleming 1929). It was a pity that this discovery
no further exploration was undertaken.
discovery of various antibiotics (in yellow) and of the
The indicated dates are those reported for the initial discover
German chemist at Bayer Laboratory accidentally synthesized a red
hemist Gerhard Domagk proved the effectiveness of this
streptococcal infections. The discovery and development of this first
(Lesch 2007) (Figure I - 1) .
In the meantime, the discovery of penicillin still got unappreciated. In fact, the molecule
not been put into clinical application until 1944. It was Howard Florey, professor
who helped to further promote the development of penicillin as a drug
1939 he conducted a systematic study of the known antimicrobial molecules
rganisms. Fleming's penicillin was one of the substances the most noticeable to him.
chemist Ernest Chain and soon after they were able to extract and purify
enicillium spp. cultures. By 1940, the product was pure enough to
bacterial substance found in the
this discovery was not taken
various antibiotics (in yellow) and of the distinct classes of
initial discoveries or patents. Image
y synthesized a red compound later
effectiveness of this substance to
The discovery and development of this first sulfonamide drug
fact, the molecule has
professor of pathology at
of penicillin as a drug. In 1938-
molecules produced by
most noticeable to him. Luckily,
extract and purify the
pure enough to meet the
Chapter I Various view points on antibiotherapy
14 / 192
requirements for human intramuscular injection. In the first clinical trial, the therapeutic effect was
obvious, even with a little amount of drug (Macfarlane and Taylor 1979). From these days, the
treatment of infectious diseases hugely changed. During the Second World War, mass production of
penicillin saved thousands of death-threatened lives.
I.4. The golden era
In the 1940s, the history of antibiotics turned a new page. With the development of new
concept in microbiology, biochemistry, and organic chemistry, as well as with the advancement of
molecular biology, the method for discovering new antibiotics has gradually improved and become
more rational.
I.4.1. Natural compounds in the 1940s-1950s
Selman Waksman is another important figure in the history of antibiotics. He and his
colleagues screened consciously and purposefully thousands different soil microbes before they
isolated streptomycin in 1943 (Figure I - 1), which could cure tuberculosis (Schatz and Waksman
1944).
The works of Waksman inspired other researchers in the world, a large-scale screening of
antibiotics produced by soil microorganisms began. Aureomycin (1945), chloramphenicol (1947),
oxytetracycline (1950), nystatin (1950), erythromycin (1952), and kanamycin (1957) were all
discovered in the following two decades. While researches for antibiotics have entered in a
purposeful, planned and systematic stage, production methods were industrialized with the
establishment of large antibiotic pharmaceutical companies. In 1956, Eli Lilly and Company isolated
Amycolatopsis orientalis from soil collected in Indonesia. After purification, a compound was found
to kill various Staphylococci and most Gram-positive bacteria: vancomycin was born (Levine 2006).
I.4.2. Semi-synthetic drugs in the 1960s
However, the discovery of new antibiotics from microbes significantly slowed down at the
end of the 1950s and semi-synthetic antibiotics were developed. Semi-synthesis uses compounds
isolated from natural sources (e.g. plant material or bacterial or cell cultures) as starting materials,
the chosen raw materials usually have the basic skeleton of the final product and most of its
functional groups, and even have the desired configuration for the final product.
In 1958 John C. Sheehan opened up the road to semi-synthetic penicillins through the
synthesis of 6-aminopenicillanic acid (Sheehan 1967). In the next few years, scientists developed this
big family of semi-synthetic drugs with, for instance, phenoxyethylpenicillin (Penicillin V), methicillin,
and ampicillin. In 1961, Edward Abraham found cephalosporin C in the metabolites of
Cephalosporium (Loder, Newton et al. 1961) (Figure I - 1). It is an important antibiotic in the
Chapter I Various view points on antibiotherapy
15 / 192
cephalosporin family, from which
1971).
I.4.3. Synthetic quinolones in
In 1962 Lesher et al. reported
as an impurity during the manufacture of quinine
compound had only shown a weak activity against several Gram
discovery facilitated the design and synthesis of new analogues: it can be called the ancestor of the
quinolone family. The synthetic quin
because of their considerable clinical and scientific interest.
in contemporary anti-infective therapy
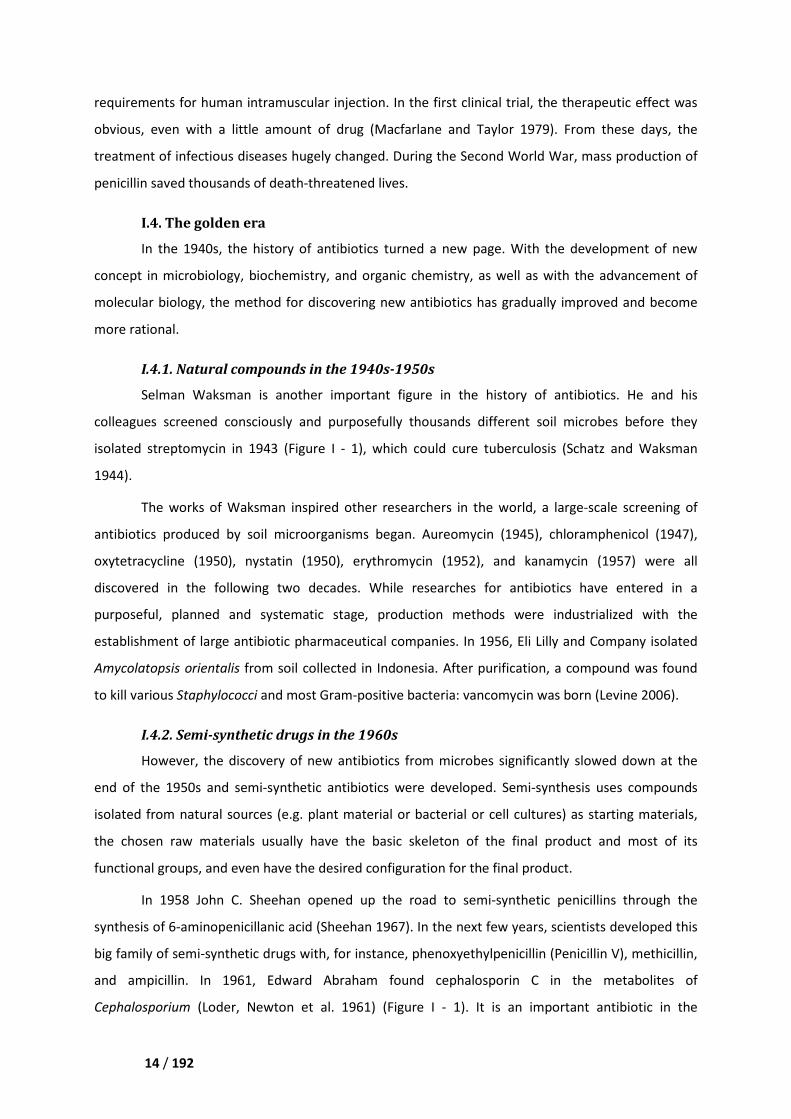
I.5. The discovery void
At this point, the history of a
have become less effective and resistance has
It is also important to note that since
introduced on the market has declined steadily
antibiotics were developed up to clinic
century. In 2003 only a single new product
2004 was even blank. Over the past decade,
What is even more worrying is that
1987, and the drugs that are entered on the ma
discoveries.
Figure I - 2. (a) Increase in antibiotic resista
1990 to2002. (b) Number of novel antibiotics
taken from (Livermore 2004) and (Cain 2012)
Various view points on antibiotherapy
which the other semi-synthetic cephalosporins could
inolones in the 1980s
reported the nalidixic acid (Figure I - 1). In fact, this molecule
ing the manufacture of quinine (Lesher, Froelich et al. 1962)
a weak activity against several Gram-negative bacteria
and synthesis of new analogues: it can be called the ancestor of the
he synthetic quinolones obtained in the 1980s were developed very rapidly
considerable clinical and scientific interest. These antibiotics, which are widely used
infective therapy, are broad spectrum and highly effective.
void
At this point, the history of antibiotics can be drawn a comma. In recent years, antibiotics
resistance has suddenly increased (Figure I - 2 a).
note that since the 1980s the annual number of novel antibiotics being
declined steadily (Figure I - 2 b). From 1996 to 2000, only six new
up to clinic. This trend became more obvious while entering the new
century. In 2003 only a single new product - daptomycin was on the list of the approved drugs and
2004 was even blank. Over the past decade, only tenth of drugs have been developed and
is that there have been no successful discoveries of novel agents since
1987, and the drugs that are entered on the market of recent years are issued from the old
ncrease in antibiotic resistant strains of E. coli, Enterobacter spp., and
umber of novel antibiotics approved and entering clinic use from 1983 to 2012. Image
(Cain 2012).
could be derived (Eykyn
. In fact, this molecule appeared
. 1962). Although this
negative bacteria in vitro, its
and synthesis of new analogues: it can be called the ancestor of the
developed very rapidly
which are widely used
.
. In recent years, antibiotics
).
1980s the annual number of novel antibiotics being
From 1996 to 2000, only six new
re obvious while entering the new
of the approved drugs and
developed and approved.
there have been no successful discoveries of novel agents since
are issued from the old
, and Klebsiella spp. from
ntering clinic use from 1983 to 2012. Image
Chapter I Various view points on antibiotherapy
16 / 192
II. Public health issues related to drug resistance
In order to win the fight against bacteria, microbiologists and pharmaceutical chemists have
been constantly moving forward on the road of searching new antibiotics. However, bacteria are
evolving and mutant strains resistant to commonly used antibiotics have appeared. More
problematically, today the pace of development of new antibiotics is falling far behind the speed of
bacterial resistance.
II.1. Emergence of the phenomena and anticipated consequences
Antimicrobial resistance is said to occur when the targeted microorganisms change in ways
that render the medication used to cure the infections they cause ineffective (WHO Drug Resistance).
On the World Health Day of 2011, the World Health Organization devised the slogan
“Antimicrobial resistance: No action today, no cure tomorrow”, thus calling for the halt of drug abuse.
(WHO World Health Day 2011). The first report on antibiotic resistance based on global data
collected from 114 countries was published in April 2014 (Organization 2014).
In the early 20th century, one third of all deaths of the world were due to infectious diseases
like pneumonia, tuberculosis, enteritis, and diarrhea. Today, heart diseases and cancer are the
leading killers, with fewer than 4.5 % of deaths by pneumonia and influenza. This important result
was achieved through the use of antibiotics (CDC 1999). However, humans have now reached
another extreme: abuse of antibiotics leads to the rapid emergence of drug resistant bacteria.
Drug resistance is a serious problem in modern medicine. Once dozens of units of penicillin
were able to save lives, which is not the case anymore. In 2014, there were about 480 000 new drug
resistance tuberculosis cases, and the current extensively drug resistance tuberculosis has been
reported in 92 countries and regions. These patients have to endure longer courses and worse
treatment effects (WHO Antimicrobial Resistance 2014). A world-wide metagenomic study has
shown that drug resistant microorganisms are now ubiquitous in nature (Nesme, Cecillon et al. 2014).
This means that humans are about to return to an era without antibiotics. A large number of
infectious diseases, which had once been conquered or totally eradicated, become again incurable
diseases, with which minor bacterial infection could result in fatal consequences. More dramatically,
bacteria that we have to face are enhanced versions of those of hundred years ago.
It is of urgent need to develop new targets, or even new mechanisms, as countermeasures.
Some bacteria are even listed as “crucial priority” for which new antibiotics are urgently needed (e.g.
Chapter I Various view points on antibiotherapy
17 / 192
Acinetobacter baumannii carbapenem-resistant, Pseudomonas aeruginosa carbapenem-resistant,
and Enterobacteriaceae carbapenem-resistant) (WHO 2017 FEB media). The additional cost
associated with resistant pathogen infections was estimated at 5 billion USD in 2004 (America 2004)
and they cost trillions USD to address in 2016 (UN 2016 SEP media). The development of new drugs,
after all, is a giant project. It is difficult to catch the speed of bacterial mutation. Meanwhile,
mankinds, who are already heavily dependent on antibiotics, are now more in need of new drugs
than ever. If we cannot control the drug resistance, the economic burden will be heavy of the whole
society.
II.2. Reported causes
Basically, antibiotic resistance is a consequence of evolution via natural selection. Bacterial
resistance needs to be considered from two aspects, endopathically and exopathically. More
precisely, endopathic causes are the genetic factors that provide of bacteria almost innumerable
possibilities of evolutionary directions whereas exopathic causes include the misuse of antibiotics in
the medical process and the abuse of antibiotics in livestock, both providing an environmental
selective pressure giving selection an orientation (Figure I - 3).
II.2.1. Endopathic factors
Intrinsic resistance. It is the innate ability of a bacterial species to resist a particular drug
through its inherent structural or functional characteristics, which allow tolerance to a particular
drug or a class of antibiotics. For example, many Gram-negative bacteria (e.g. Pseudomonas
aeruginosa) are insensitive to penicillins and vancomycin because they lack the main target of the
drug, i.e. a thick cell wall composed of peptidoglycans.
Acquired resistance. It occurs when a bacterium becomes resistant to a particular drug to
which it was initially susceptible. Two mechanisms may be involved: either the mutation of a given
gene that helps the bacterium to survive or the acquisition of genetic material from a bacterium that
is already resistant, mainly through the transfer of genetic elements such as plasmids, transposons,
or integrons.
Genetic mutation is the fundamental cause of drug-resistance in bacteria. Bacteria can be
traced back to three billion years ago. Therefore, uninterrupted evolution conferred them an
extraordinary ability to adapt to the environment. Spontaneous random mutations occur accidentally
in all bacterial populations, at every moment. Most of mutations are harmful or useless; only a few
are both harmless and useful, for instance because they provide a weak drug resistance. However, it
is almost impossible to confer a bacterium a perfect resistance through only one single mutation. In
Chapter I Various view points on antibiotherapy
18 / 192
the reality, there is no sudden emergence
gradually accumulated mutation
Figure I - 3. Diagram illustrating the reason why
2013)
Besides spontaneous mutations, resistance can be due to a gene that is coming from some
other bacteria. For instance, plasmids are circular extra chromo
one bacterium to another by conjugation, i.e. through cell
typically harbor some plasmids in various sizes:
Various view points on antibiotherapy
emergence of drug-resistance, this phenomena is a consequence of
accumulated mutations.
llustrating the reason why antibiotic resistance happens and how it
Besides spontaneous mutations, resistance can be due to a gene that is coming from some
other bacteria. For instance, plasmids are circular extra chromosome that can be
to another by conjugation, i.e. through cell-cell contact. Natural isolates of
plasmids in various sizes: one to five small plasmids and one to two
this phenomena is a consequence of
how it spreads (Prevention
Besides spontaneous mutations, resistance can be due to a gene that is coming from some
some that can be transferred from
Natural isolates of E. coli
one to five small plasmids and one to two large
Chapter I Various view points on antibiotherapy
19 / 192
plasmids (Hartl, Medhora et al. 1986) (Selander, Caugant et al. 1987). The small plasmids are usually
smaller than 7.5 kb, and the large ones range from 40 to 200 kb. A given plasmid can carry several
drug-resistant genes. The R plasmid, also known as the resistance plasmid, is commonly found in
clinical studies. It is also known that plasmids can encode a variety of enzymes, in order to passivate
antibiotics by biochemical modification (Bennett 2008) (Hawkey 1998).
Another process involved in horizontal gene transfer relies on transposon. They are DNA
sequences that can change their positions within the genome, sometimes creating or reversing
mutations. In bacteria, transposons can also jump from chromosomal DNA to plasmid DNA and back,
allowing for the transfer and/or permanent addition or removal of genes (Pray 2008).
Finally, integrons are mobile genetic elements with the ability to capture and mobilize genes
that are contained in mobile elements called gene cassette. Notably they can work on the gene
encoding antibiotic resistance by site-specific recombination. An integron provides a promoter for an
expression of the genes of the cassette, and thus acts both as a natural cloning system and as
expression vector (Hall and Collis 1995).
II.2.2. Exopathic factors
Misuse of antibiotics in human medicine. The fact that bacteria develop resistance to a
drug enters in the framework of the theory of the evolution. However, the way drugs are used, or we
could say misuse, affects how quickly and how widely drug resistance occurs.
A study published at 2003 reported that 30 % of the antibiotics received by hospitalized adult
patients were unnecessary (Hecker, Aron et al. 2003). Ten years after, the Center for Disease Control
and Prevention of USA (CDC) estimated that up to 50 % of antibiotics were unnecessary or
inappropriately prescribed (Health and Services 2013).
We have discussed above that, even before antibiotics were applied in the medicine on a
large scale, there was already a very small quantity of bacteria with accidentally acquired resistance
genes. Nevertheless, it was almost of no significance for the bacterial population since the resistance
could not spread because of the lack of selective pressure. Later antibiotics appeared, bacteria
without this gene (i.e. sensitive strains) were killed one after another, whereas those having this
gene were able to survive and benefited from the available space to reproduce. Thus, the resistance
is not triggered by the application of antibiotics, the evolution of resistant strains is a natural
phenomenon associated with the survival of the fittest. Certainly, genetic mutations and transfers
are happening in nature at all times, but to make those low occurrence phenomena to become
meaningful and influential, it needs a strong fecundity. Of course, for simple organisms like bacteria,
it is not too difficult.
Chapter I Various view points on antibiotherapy
20 / 192
Use of antibiotics in agriculture. The amount of antibiotics used for human is negligible
compared with the one used for livestock. According to the CDC, more than 70 % of the antibiotics
sold in the US market in 2013 are used in agriculture (Kennedy 2013). In most other countries, this
figure is also more than 50 %. The use of antibiotics in agriculture is primarily intended to prevent the
infection of animals, but another aim, more controversial, is to accelerate growth in order to make
more profits. The British economist Jim O'Neill, commissioned by the British government, estimated
the global annual consumption of antibiotics to be between 63 000 and 240 000 tonnes. By 2030
global agricultural consumption of antibiotics is expected to increase by 67 % with respect to its 2010
level (O’Neill 2015).
II.3. Possible solutions
II.3.1. Rational use of antibiotics by doctors and patients
When normally used, antibiotics can kill almost all of the targeted bacteria − even if some
survive they are usually eliminated by the immune system. However, if the correct dose of antibiotics
is not respected, bacteria are not killed completely at once. The less-sensitive strains survive to
establish new populations or continue to mutate on this resistance basis. Therefore, the effects of
the prescription are compromised by inappropriate drug choices, inadequate doses, uncompleted
treatments, and/or too frequent change of antibiotics. Consequently, acute infection turns into
chronic one, giving resistant bacteria a chance. Those bacteria that have escaped from
antibiotherapy not only have grown with a tenacious survivability but are now also able to transfer
resistance gene to other bacteria.
Besides, at any time, we should not forget the basic good way to eliminate bacteria:
disinfection and isolation.
II.3.2. Increase supervision and support by policy makers
In the area of public health there is a need to ensure strong national or even supra-national
actions, to address antibiotic resistance. For instance, one must improve surveillance of drug
resistant infections, strengthen programs dedicated to the prevention and control of diseases, and
finally regulate and promote the appropriate use of medicines. In addition, the development of new
antibiotics, vaccines, and diagnostic methods should be supported at the government level. To be
more precise, societies can hardly rely on big pharmaceutical companies to face the emergence of
drug-resistant bacteria. Indeed, the latter actors have turned attention to the treatments of chronic
diseases, a more lucrative activity than the painstaking development of new antibiotics.
Chapter I Various view points on antibiotherapy
21 / 192
III. Cellular and molecular aspects
Macroscopic phenomena
briefly review and explain the interaction bet
III.1. Classification of b
Bacteria can be classified in many ways,
type (autotrophic or heterotrophic
facultative anaerobe, microaerophile, ae
preference (psychrophiles, psychrotrophs,
their cell structure. We will introduce
meaningful for guiding the present doctoral
III.1.1. Appearance and shape
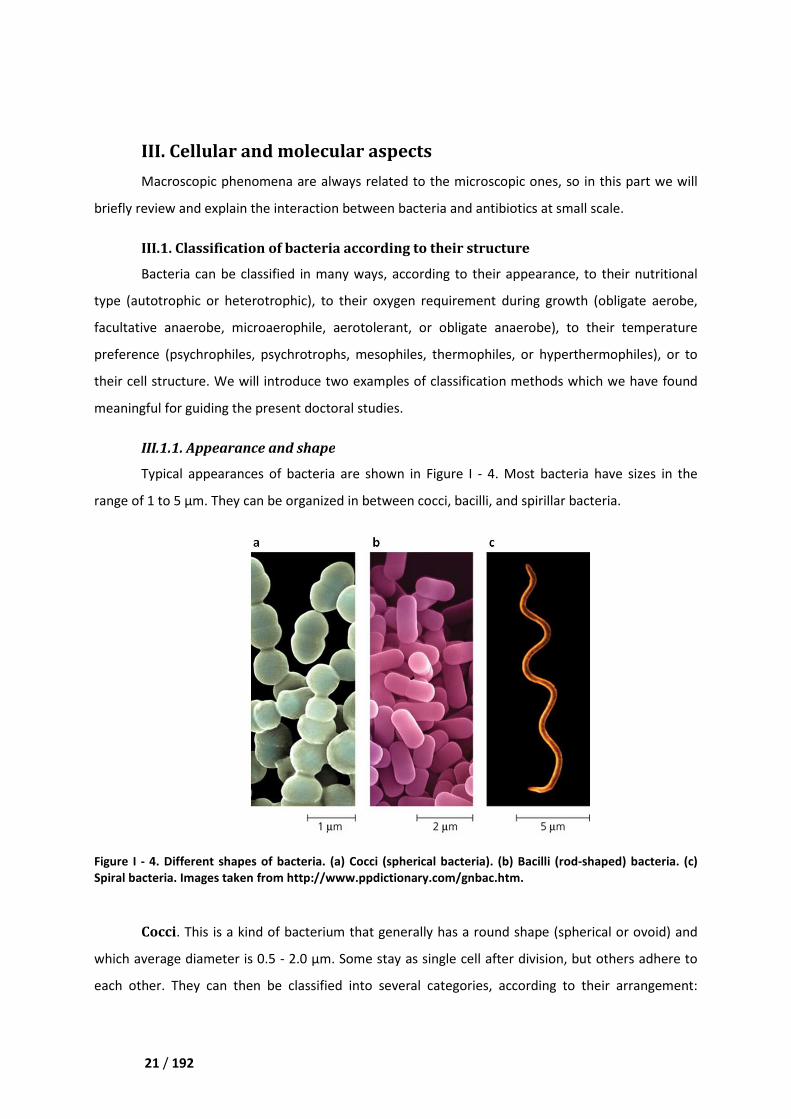
Typical appearances of bacteria are shown in
range of 1 to 5 µm. They can be organized in between cocci,
Figure I - 4. Different shapes of bacteria. (a) C
Spiral bacteria. Images taken from
Cocci. This is a kind of bacterium that
which average diameter is 0.5 -
each other. They can then be classified into several categorie
Various view points on antibiotherapy
III. Cellular and molecular aspects
a are always related to the microscopic ones, so in this part
ly review and explain the interaction between bacteria and antibiotics at small
bacteria according to their structure
classified in many ways, according to their appearance,
or heterotrophic), to their oxygen requirement during growt
e, microaerophile, aerotolerant, or obligate anaerobe), to their temperature
psychrotrophs, mesophiles, thermophiles, or hyperthermophiles
their cell structure. We will introduce two examples of classification methods which we
guiding the present doctoral studies.
ppearance and shape
of bacteria are shown in Figure I - 4. Most bacteria have sizes in the
. They can be organized in between cocci, bacilli, and spirillar bacteria.
Different shapes of bacteria. (a) Cocci (spherical bacteria). (b) Bacilli (rod
from http://www.ppdictionary.com/gnbac.htm.
bacterium that generally has a round shape (spherical or ovoid) and
2.0 µm. Some stay as single cell after division, but others
can then be classified into several categories, according to
ones, so in this part we will
small scale.
appearance, to their nutritional
growth (obligate aerobe,
, to their temperature
hyperthermophiles), or to
which we have found
. Most bacteria have sizes in the
bacilli, and spirillar bacteria.
rod-shaped) bacteria. (c)
(spherical or ovoid) and
but others adhere to
s, according to their arrangement:

Chapter I Various view points on antibiotherapy
22 / 192
diplococci are paired; tetrads are in clusters of four arranged in the same plane; sarcina are in cube
of eight; streptococci are organized in chains; and staphylococci are organized like grapes.
Bacilli. They are rods of various size, length, curvature, and thickness. The majority of them
are straight rods of medium length 2 - 5 µm and width 1 µm. For most bacilli both ends of the cell are
round. However, a few have flattened ends (such as Bacillus anthracis), tapered ends (such as
Fusobacterium), or expanded rod-shaped ends (such as Corynebacterium diphtheria). Generally,
bacilli are found as single cells, but sometimes they are in pairs or in chains.
Spiral bacteria. They are rods displaying a significant bending. Vibrio presents only one
curve, like a comma, whereas spirillum is larger, elongate, and spiral shaped.
In this doctoral thesis, studies on a typical bacillus will be performed at the single cell scale.
Fortunately, E. coli stays in a dispersed state after reproduction. The immobilization method will be
relatively simpler than what would have been necessary for bacteria that stay aggregated like
streptococci or for those that present a complex three dimensional structure like spiral bacteria.
III.1.2. Result of Gram staining
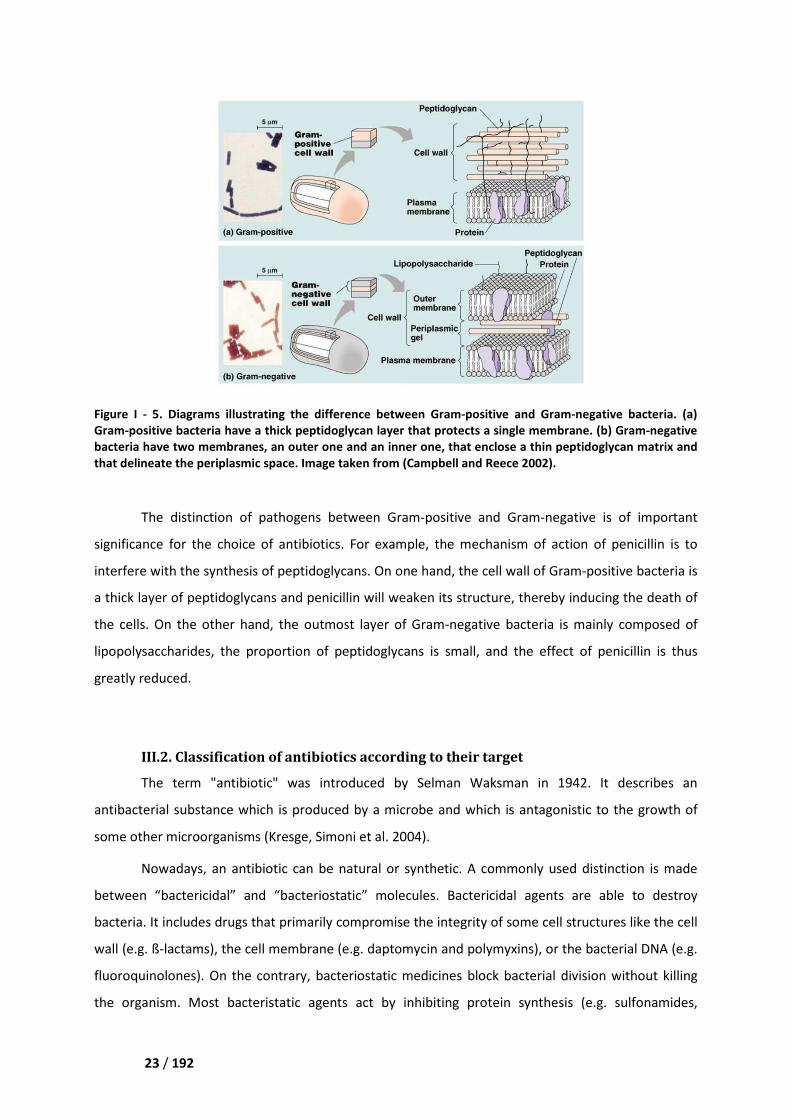
The Gram test enables to classify bacteria into two large groups, based on the structure of
the cell wall (Figure I - 5). The process includes staining by crystal violet, mordant incubation with
Gram’s iodine, decoloring with alcohol, and counterstaining with safranin. Gram-positive bacteria
appear dark violet and Gram-negative ones red. We will concentrate on the Gram-negative bacteria,
since this category is the one that includes most of the resistant strain − the structure of these
microorganisms will be described in more details in Chapter I, Section III.4.1.
Chapter I Various view points on antibiotherapy
23 / 192
Figure I - 5. Diagrams illustrating the difference between
Gram-positive bacteria have a thick peptidoglycan layer t
bacteria have two membranes, an o
that delineate the periplasmic space. Image taken from
The distinction of pathogens between
significance for the choice of antibiotics. For example, the
interfere with the synthesis of peptidoglycan
a thick layer of peptidoglycans and
the cells. On the other hand, the
lipopolysaccharides, the proportion of
greatly reduced.
III.2. Classification of antibiotics according to their target
The term "antibiotic" was introduced
antibacterial substance which is
some other microorganisms (Kresge, Simoni et al. 2004)
Nowadays, an antibiotic can be
between “bactericidal” and “b
bacteria. It includes drugs that primarily compromise the integrity of
wall (e.g. ß-lactams), the cell membrane (e
fluoroquinolones). On the contrary, b
the organism. Most bacteristatic
Various view points on antibiotherapy
Diagrams illustrating the difference between Gram-positive and Gram-
a thick peptidoglycan layer that protects a single membrane
an outer one and an inner one, that enclose a thin peptidoglycan
that delineate the periplasmic space. Image taken from (Campbell and Reece 2002).
pathogens between Gram-positive and Gram-negative
antibiotics. For example, the mechanism of action of penicillin is to
peptidoglycans. On one hand, the cell wall of Gram
s and penicillin will weaken its structure, thereby inducing the death of
he outmost layer of Gram-negative bacteria is
the proportion of peptidoglycans is small, and the effect of penicillin is thus
III.2. Classification of antibiotics according to their target
ntibiotic" was introduced by Selman Waksman in 1942.
which is produced by a microbe and which is antagonistic
(Kresge, Simoni et al. 2004).
Nowadays, an antibiotic can be natural or synthetic. A commonly used distinction
bacteriostatic” molecules. Bactericidal agents are able to
es drugs that primarily compromise the integrity of some cell structures like the cell
cell membrane (e.g. daptomycin and polymyxins), or the
On the contrary, bacteriostatic medicines block bacterial division
static agents act by inhibiting protein synthesis
-negative bacteria. (a)
s a single membrane. (b) Gram-negative
a thin peptidoglycan matrix and
negative is of important
action of penicillin is to
Gram-positive bacteria is
inducing the death of
is mainly composed of
is small, and the effect of penicillin is thus
in 1942. It describes an
antagonistic to the growth of
A commonly used distinction is made
” molecules. Bactericidal agents are able to destroy
structures like the cell
the bacterial DNA (e.g.
division without killing
act by inhibiting protein synthesis (e.g. sulfonamides,
Chapter I Various view points on antibiotherapy
24 / 192
tetracyclines, and macrolides). The dist
and bactericidal; it depends on the
et al. 2011).
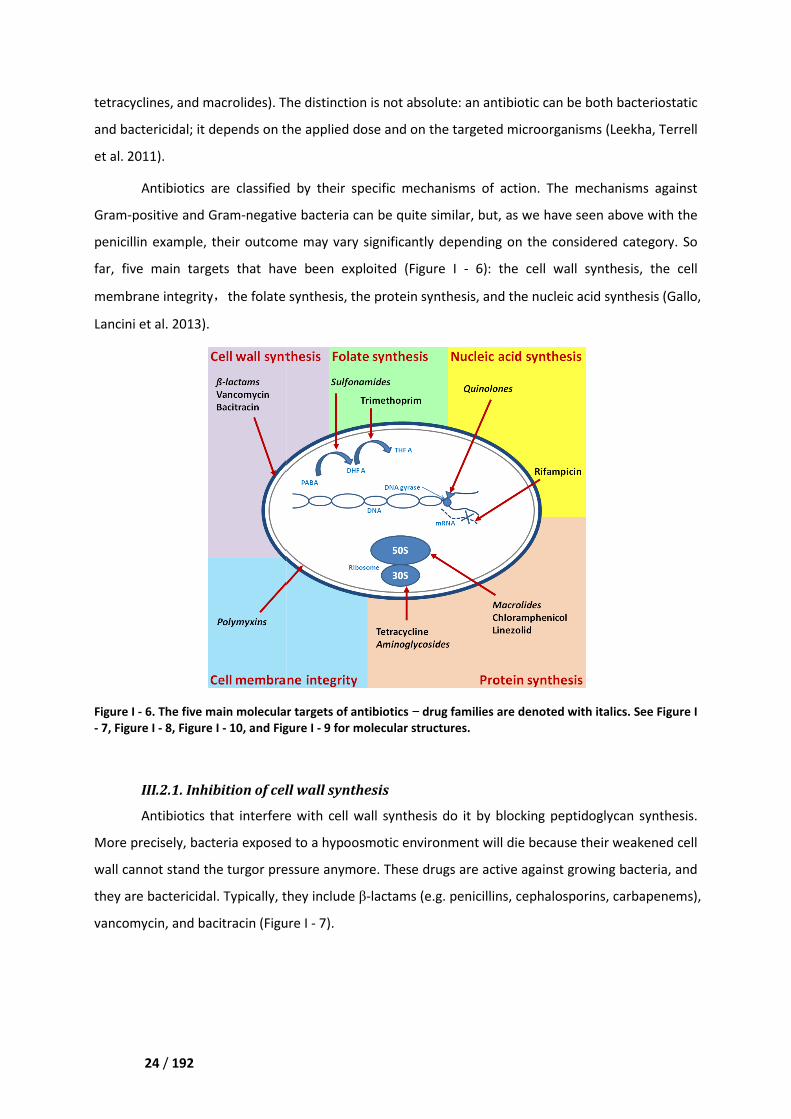
Antibiotics are classified by their specific m
Gram-positive and Gram-negative
penicillin example, their outcome may vary significantly depending on the considered category
far, five main targets that have b
membrane integrity,the folate synthesis
Lancini et al. 2013).
Figure I - 6. The five main molecula
- 7, Figure I - 8, Figure I - 10, and Figure I
III.2.1. Inhibition of cell wall synthesis
Antibiotics that interfere with cell wall synthesis
More precisely, bacteria exposed to a hypo
wall cannot stand the turgor pressur
they are bactericidal. Typically, the
vancomycin, and bacitracin (Figure I
Various view points on antibiotherapy
The distinction is not absolute: an antibiotic can be both
and bactericidal; it depends on the applied dose and on the targeted microorganisms
are classified by their specific mechanisms of action. The mechanisms
gative bacteria can be quite similar, but, as we have seen above with the
penicillin example, their outcome may vary significantly depending on the considered category
have been exploited (Figure I - 6): the cell wall synthesis,
folate synthesis, the protein synthesis, and the nucleic acid synthesis
main molecular targets of antibiotics − drug families are denoted with italics. See
Figure I - 9 for molecular structures.
on of cell wall synthesis
s that interfere with cell wall synthesis do it by blocking peptidoglycan synthesis.
exposed to a hypoosmotic environment will die because their weakened cell
wall cannot stand the turgor pressure anymore. These drugs are active against growing bacteria
Typically, they include β-lactams (e.g. penicillins, cephalosporins
Figure I - 7).
n antibiotic can be both bacteriostatic
organisms (Leekha, Terrell
The mechanisms against
bacteria can be quite similar, but, as we have seen above with the
penicillin example, their outcome may vary significantly depending on the considered category. So
cell wall synthesis, the cell
and the nucleic acid synthesis (Gallo,
families are denoted with italics. See Figure I
peptidoglycan synthesis.
environment will die because their weakened cell
growing bacteria, and
ephalosporins, carbapenems),
Chapter I Various view points on antibiotherapy
25 / 192
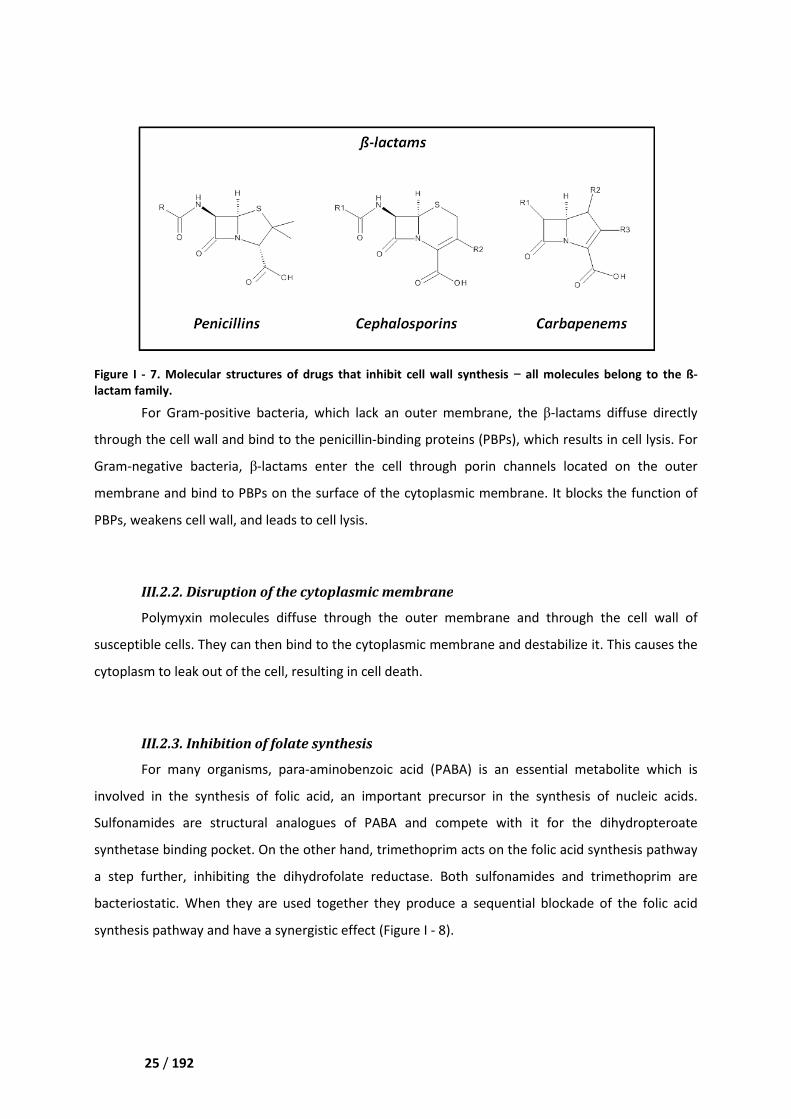
Figure I - 7. Molecular structures
lactam family.
For Gram-positive bacteria
through the cell wall and bind to the
Gram-negative bacteria, β-lacta
membrane and bind to PBPs on the surfac
PBPs, weakens cell wall, and leads
III.2.2. Disruption of the cytoplasmic membrane
Polymyxin molecules diffuse through the outer membrane and
susceptible cells. They can then bind to the cytoplasmic membrane and destabilize it. This causes the
cytoplasm to leak out of the cell,
III.2.3. Inhibition of folate synthesis
For many organisms, para
involved in the synthesis of foli
Sulfonamides are structural analogues
synthetase binding pocket. On the other hand, t
a step further, inhibiting the dihydrofolate
bacteriostatic. When they are used together they produce a sequential blockade of the folic acid
synthesis pathway and have a synergistic effect (
Various view points on antibiotherapy
Molecular structures of drugs that inhibit cell wall synthesis − all molecules be
bacteria, which lack an outer membrane, the β-lactams
through the cell wall and bind to the penicillin-binding proteins (PBPs), which results in
lactams enter the cell through porin channels located
PBPs on the surface of the cytoplasmic membrane. It blocks the function
and leads to cell lysis.
Disruption of the cytoplasmic membrane
Polymyxin molecules diffuse through the outer membrane and through the
bind to the cytoplasmic membrane and destabilize it. This causes the
, resulting in cell death.
nhibition of folate synthesis
para-aminobenzoic acid (PABA) is an essential metabolite which is
involved in the synthesis of folic acid, an important precursor in the synthesis of nucleic acid
Sulfonamides are structural analogues of PABA and compete with it for the
binding pocket. On the other hand, trimethoprim acts on the folic acid synthesis pathway
dihydrofolate reductase. Both sulfonamides and
tatic. When they are used together they produce a sequential blockade of the folic acid
y and have a synergistic effect (Figure I - 8).
all molecules belong to the ß-
lactams diffuse directly
(PBPs), which results in cell lysis. For
ls located on the outer
blocks the function of
through the cell wall of
bind to the cytoplasmic membrane and destabilize it. This causes the
(PABA) is an essential metabolite which is
the synthesis of nucleic acids.
it for the dihydropteroate
rimethoprim acts on the folic acid synthesis pathway
and trimethoprim are
tatic. When they are used together they produce a sequential blockade of the folic acid
Chapter I Various view points on antibiotherapy
26 / 192
Figure I - 8. Molecular structures of
III.2.4. Inhibition of protein synthesis
Proteins are synthesized by
complexes are presented in the following
Aminoglycosides bind to the 30
messenger RNA (mRNA). They can also cause misreading of the mRNA
wrong amino acid, or interfere with
effect of these two molecular mechanisms is bactericidal
Tetracyclines bind to the 30
RNA (tRNA) and, consequently, the
bacteriostatic, as will be all the following drugs of this subsection.
Macrolides and lincosamides attach to the 50
growing protein chain.
Chloramphenicol also binds to the 50
new amino acids to the growing chain.
Linezolid binds to the 23
functional 70S initiation complex
Various view points on antibiotherapy
of drugs that inhibit folate synthesis.
nhibition of protein synthesis
Proteins are synthesized by ribosomes. Therefore, some antibiotics working on the
complexes are presented in the following (Figure I - 9).
bind to the 30S ribosomal subunit and prevent its attachment to
(mRNA). They can also cause misreading of the mRNA, resulting in insertion of t
wrong amino acid, or interfere with the ability of amino acids to connect each other.
mechanisms is bactericidal.
Tetracyclines bind to the 30S ribosomal subunit and block the attachment of
, consequently, the addition of a new amino acid to the protein chain
, as will be all the following drugs of this subsection.
Macrolides and lincosamides attach to the 50S ribosomal subunit causing termination of the
Chloramphenicol also binds to the 50S ribosomal subunit and interferes
the growing chain.
zolid binds to the 23S ribosomal RNA of the 50S subunit and prevent
initiation complex, which is necessary for protein synthesis.
some antibiotics working on these
prevent its attachment to the
resulting in insertion of the
to connect each other. The combined
attachment of the transfer
amino acid to the protein chain. They are
ribosomal subunit causing termination of the
s with the binding of
subunit and prevents formation of a

Chapter I Various view points on antibiotherapy
27 / 192
Figure I - 9. Molecular structures of drugs that inhibit protein synthesis.
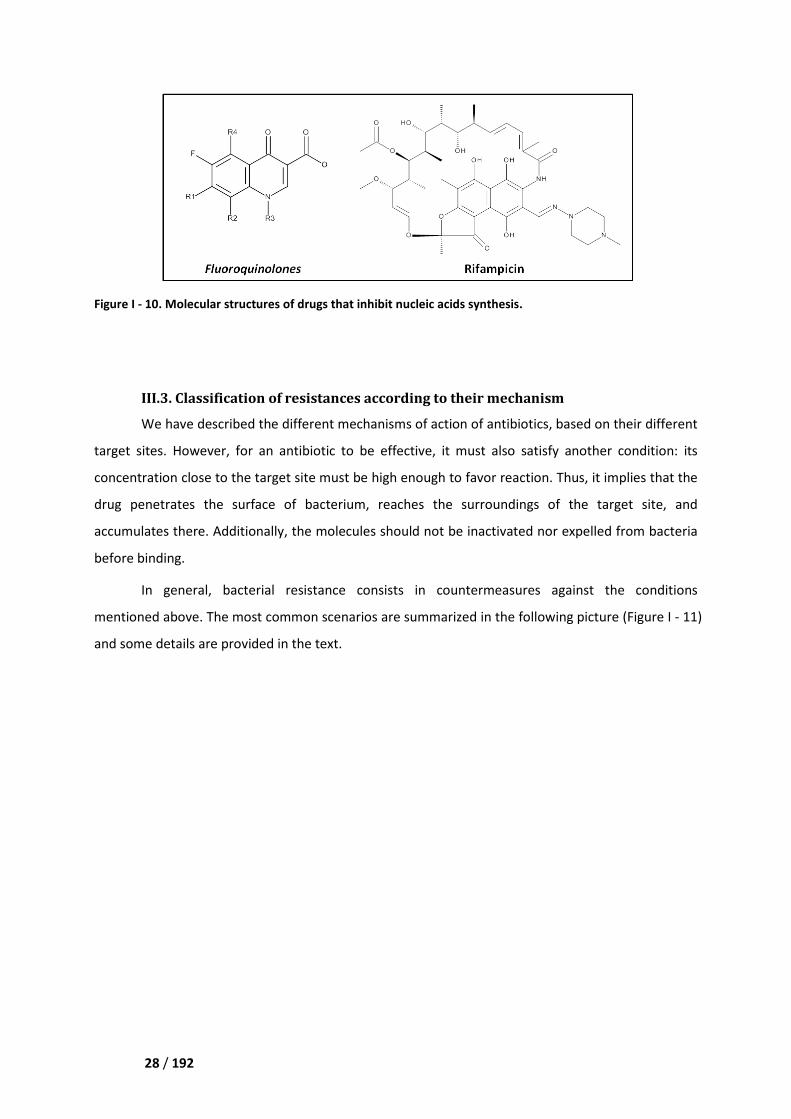
III.2.5. Inhibition of nucleic
Fluoroquinolones interfere wi
topoisomerase. These enzymes
the DNA to unwind, and thus maintain a normal topological state during chromosome replication
Fluoroquinolones trap these enzymes
prevented to rejoin and be repaired
extensively later in Chapter II, Section II.2 (
Rifampicin binds to the DNA
and yields cell death (Calvori, Frontali et al. 1965)
Various view points on antibiotherapy
Molecular structures of drugs that inhibit protein synthesis.
nhibition of nucleic acids synthesis
quinolones interfere with DNA synthesis by blocking enzyme
first bind to DNA and introduce double-stranded br
, and thus maintain a normal topological state during chromosome replication
trap these enzymes at the DNA cleavage stage so that the DNA
and be repaired, resulting in cell death. This family of drug will be described
extensively later in Chapter II, Section II.2 (Figure I - 10).
DNA-dependent RNA polymerase, it thus blocks
(Calvori, Frontali et al. 1965).
enzymes called DNA
stranded breaks that allow
, and thus maintain a normal topological state during chromosome replication.
so that the DNA strands are
This family of drug will be described
blocks the synthesis of RNA
Chapter I Various view points on antibiotherapy
28 / 192
Figure I - 10. Molecular structures of
III.3. Classification of resistances
We have described the different mechanisms of action of antibiotics, based on their different
target sites. However, for an antibiotic
concentration close to the target site must be high enough to favor reaction. Thus
drug penetrates the surface of bacterium,
accumulates there. Additionally, the molecules should not be
before binding.
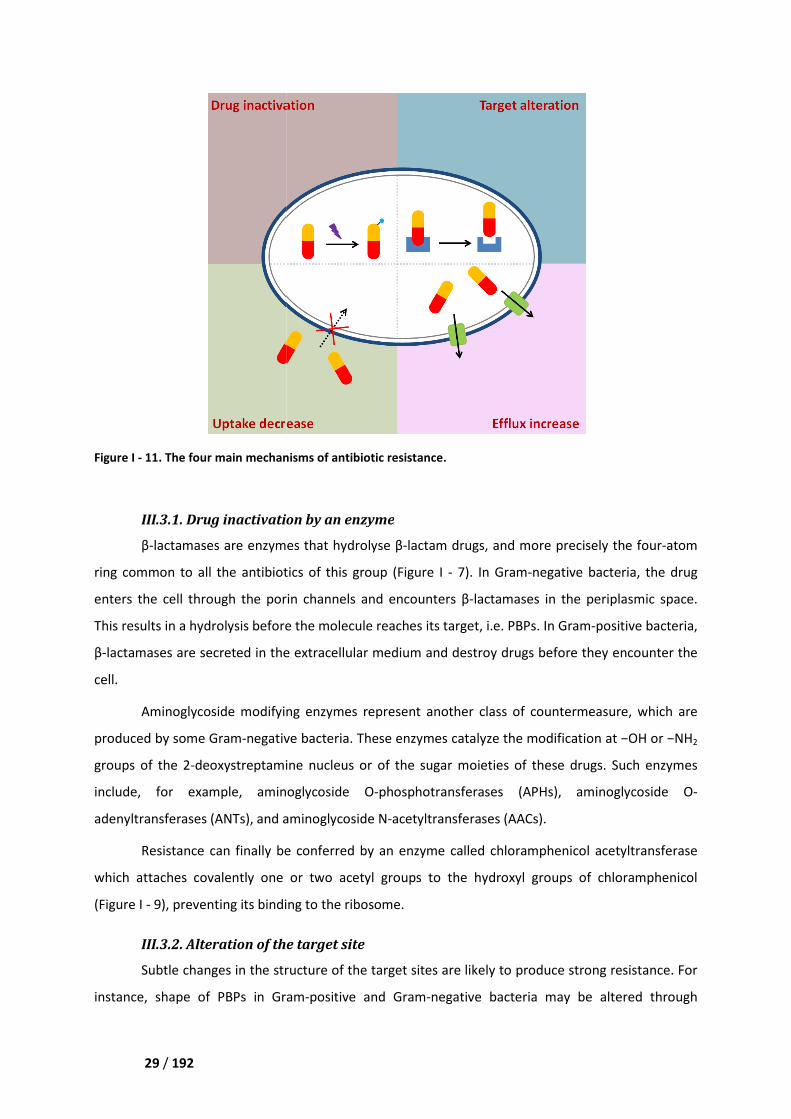
In general, bacterial resistance consists in countermeasures
mentioned above. The most common scenarios are summarized in
and some details are provided in the text.
Various view points on antibiotherapy
of drugs that inhibit nucleic acids synthesis.
resistances according to their mechanism
described the different mechanisms of action of antibiotics, based on their different
n antibiotic to be effective, it must also satisfy another condition
get site must be high enough to favor reaction. Thus
netrates the surface of bacterium, reaches the surroundings of the target site, and
accumulates there. Additionally, the molecules should not be inactivated nor expell
resistance consists in countermeasures against
The most common scenarios are summarized in the following picture
rovided in the text.
described the different mechanisms of action of antibiotics, based on their different
another condition: its
get site must be high enough to favor reaction. Thus, it implies that the
reaches the surroundings of the target site, and
expelled from bacteria
against the conditions
the following picture (Figure I - 11)
Chapter I Various view points on antibiotherapy
29 / 192
Figure I - 11. The four main mechanisms of antibiotic resistance.
III.3.1. Drug inactivation by an enzyme
β-lactamases are enzymes that hydrolyse
ring common to all the antibiotics of this group (
enters the cell through the porin channels and encounters
This results in a hydrolysis before the molecule reaches its target, i.e. PBPs. In Gram
β-lactamases are secreted in the extracellular medium and destroy drugs before they encounter the
cell.
Aminoglycoside modifying enzymes represent another class of counte
produced by some Gram-negative bacteria
groups of the 2-deoxystreptamine nucleus or
include, for example, aminoglycoside O
adenyltransferases (ANTs), and a
Resistance can finally be conferred by
which attaches covalently one or two
(Figure I - 9), preventing its binding to the
III.3.2. Alteration of the
Subtle changes in the structure of
instance, shape of PBPs in Gram
Various view points on antibiotherapy
main mechanisms of antibiotic resistance.
activation by an enzyme
lactamases are enzymes that hydrolyse β-lactam drugs, and more precisely the four
common to all the antibiotics of this group (Figure I - 7). In Gram-negative bacteria, the drug
enters the cell through the porin channels and encounters β-lactamases in the periplasmic space.
rolysis before the molecule reaches its target, i.e. PBPs. In Gram
lactamases are secreted in the extracellular medium and destroy drugs before they encounter the
Aminoglycoside modifying enzymes represent another class of countermeasure, which are
negative bacteria. These enzymes catalyze the modification at
deoxystreptamine nucleus or of the sugar moieties of these drugs. Such enzymes
aminoglycoside O-phosphotransferases (APHs),
), and aminoglycoside N-acetyltransferases (AACs).
be conferred by an enzyme called chloramphenicol acetyltransferase
covalently one or two acetyl groups to the hydroxyl groups
), preventing its binding to the ribosome.
the target site
Subtle changes in the structure of the target sites are likely to produce strong resistance.
PBPs in Gram-positive and Gram-negative bacteria may be altered through
lactam drugs, and more precisely the four-atom
negative bacteria, the drug
lactamases in the periplasmic space.
rolysis before the molecule reaches its target, i.e. PBPs. In Gram-positive bacteria,
lactamases are secreted in the extracellular medium and destroy drugs before they encounter the
rmeasure, which are
enzymes catalyze the modification at −OH or −NH2
of these drugs. Such enzymes
, aminoglycoside O-
chloramphenicol acetyltransferase
groups of chloramphenicol
target sites are likely to produce strong resistance. For
bacteria may be altered through
Chapter I Various view points on antibiotherapy
30 / 192
mutations, so that β-lactams can no longer recognize them. Methylation of ribosomal RNA confers
bacteria some resistance against macrolides, lincosamides, and streptograms. Mutations in the genes
of topoisomerase II − also called DNA gynase − and topoisomerase IV bring quinolone resistance
(Willmott and Maxwell 1993).
III.3.3. Changes of membrane permeability
Outer membrane proteins like OmpC and OmpF form non-specific transmembrane channels
called porins, that allow drugs to enter the cell. When bacteria are put into contact with antibiotics
too many times, the strain mutates, resulting in the inactivation of the translocation through
OmpC/OmpF. As a result, the entrance of molecules like β-lactams or quinolones is reduced (see
Chapter I, Section III.4.2 for more details). In most cases, the loss of translocation through porins is
not the sole mechanism of resistance at play, but it can work synergistically with other mechanisms
to significantly increase resistance.
III.3.4. Active expulsion of the drug from the bacteria
A wide variety of efflux pumps are related to antibiotic resistance in both Gram-positive and
Gram-negative bacteria. These transmembrane proteins form channels that actively expel an
antibiotic out of the cell, nearly as fast as it enters (see Chapter I, Section III.4.3 of for more details).
III.4. Description of the biomolecules involved in drug influx/efflux
Among the resistance mechanisms discussed above, we are more interested in the influx /
efflux ones. The movement of ions, or molecules, between the intracellular space and the
extracellular one is achieved through specific channels. We will here describe in detail the structure
of the envelope of Gram-negative bacteria, E. coli being taken as a representative example.
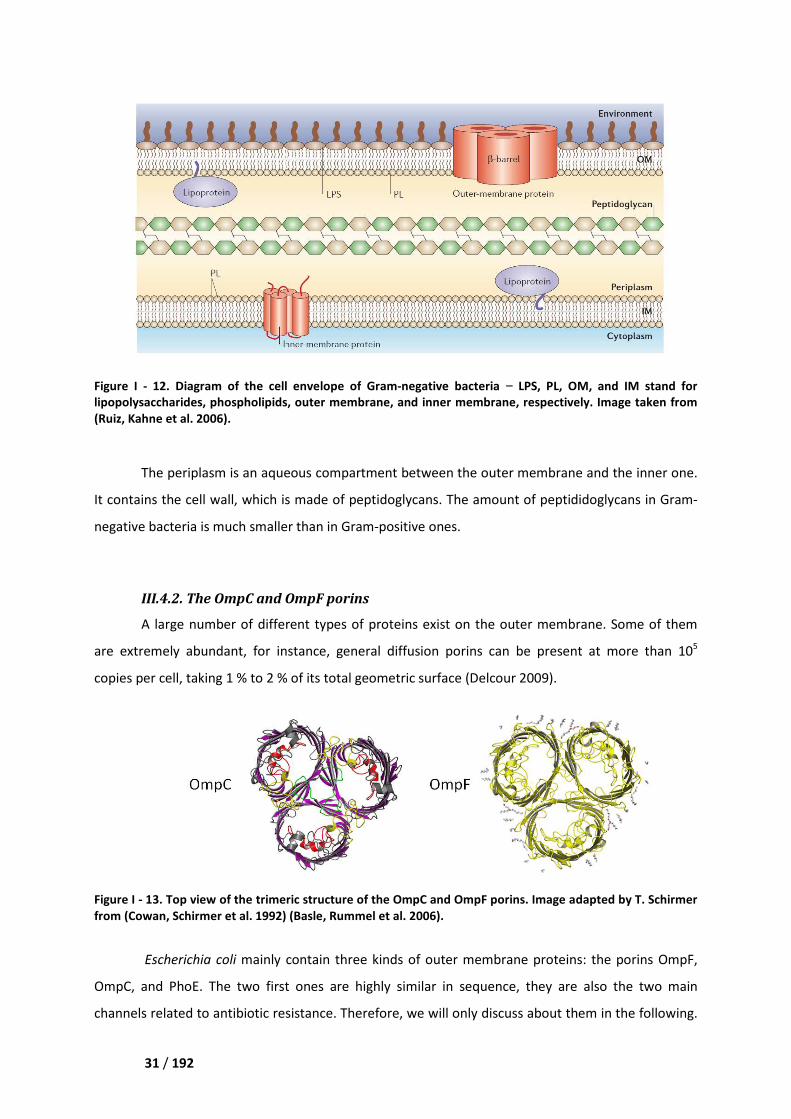
III.4.1. The cell wall of the Gram-negative bacteria
The structure of the cell wall of Gram-negative bacteria is presented in Figure I - 12. It is
characterized by the presence of two membranes, which constitute two hydrophobic barriers that a
molecule must cross to enter the cytoplasm. The outer membrane is an asymmetric bilayer located
outmost of the bacteria. It contains phospholipids on its inner leaflet and lipopolysaccharides (LPS)
on its outer one (Delcour 2009). Moreover, the outer membrane includes integral proteins which
serve as entry ports for various molecules, the porins. The inner membrane is a phospholipid bilayer
which also contains various integral membrane proteins.
Chapter I Various view points on antibiotherapy
31 / 192
Figure I - 12. Diagram of the cell envelope of
lipopolysaccharides, phospholipids, outer membrane, and inner membrane, respectively. Image taken from
(Ruiz, Kahne et al. 2006).
The periplasm is an aqueou
It contains the cell wall, which is made of
negative bacteria is much smaller
III.4.2. The OmpC and OmpF
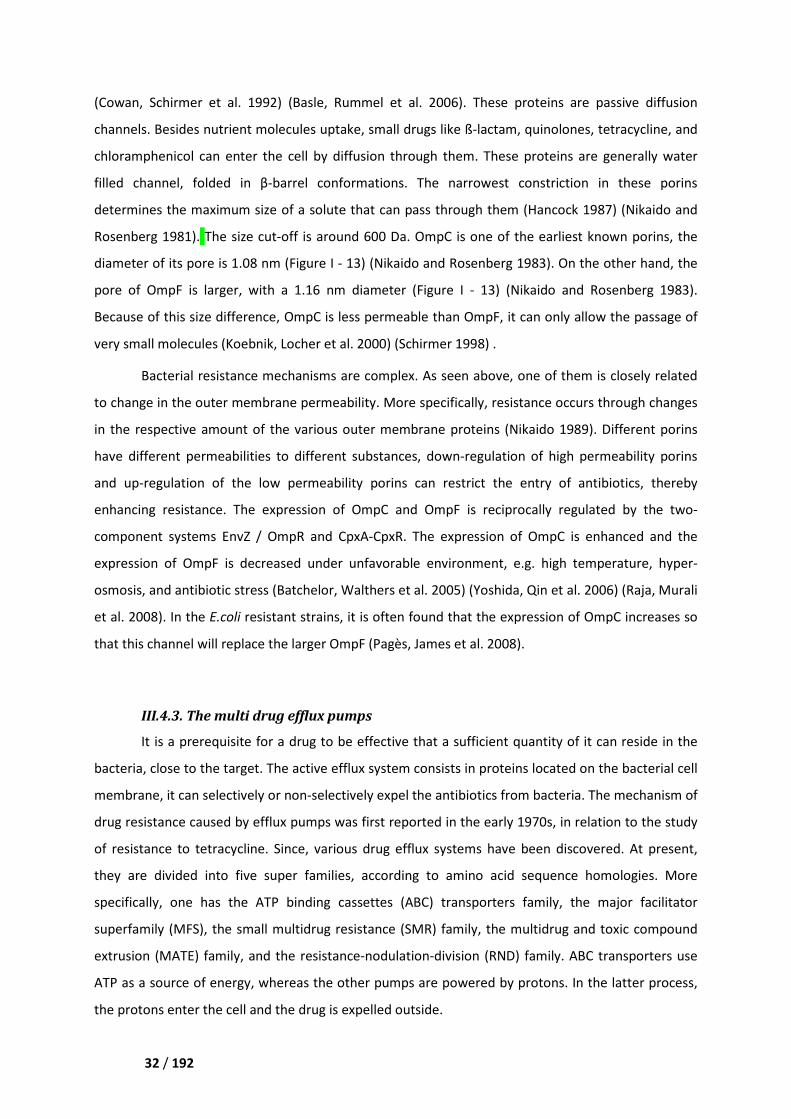
A large number of different types of proteins exist
are extremely abundant, for instance,
copies per cell, taking 1 % to 2 % of its total geometric surface
Figure I - 13. Top view of the trimeric structure of the OmpC and OmpF porins.
from (Cowan, Schirmer et al. 1992)
Escherichia coli mainly contain t
OmpC, and PhoE. The two first ones are
channels related to antibiotic resistance. Therefore, we will only discuss about them in the following.
Various view points on antibiotherapy
Diagram of the cell envelope of Gram-negative bacteria − LPS, PL, OM, and IM stand for
s, outer membrane, and inner membrane, respectively. Image taken from
The periplasm is an aqueous compartment between the outer membrane and
, which is made of peptidoglycans. The amount of peptididoglycan
negative bacteria is much smaller than in Gram-positive ones.
OmpC and OmpF porins
A large number of different types of proteins exist on the outer membrane
for instance, general diffusion porins can be present at more than
, taking 1 % to 2 % of its total geometric surface (Delcour 2009).
Top view of the trimeric structure of the OmpC and OmpF porins. Image a
(Cowan, Schirmer et al. 1992) (Basle, Rummel et al. 2006).
mainly contain three kinds of outer membrane proteins:
two first ones are highly similar in sequence, they are also the two main
channels related to antibiotic resistance. Therefore, we will only discuss about them in the following.
LPS, PL, OM, and IM stand for
s, outer membrane, and inner membrane, respectively. Image taken from
s compartment between the outer membrane and the inner one.
of peptididoglycans in Gram-
outer membrane. Some of them
present at more than 105
Image adapted by T. Schirmer
embrane proteins: the porins OmpF,
ly similar in sequence, they are also the two main
channels related to antibiotic resistance. Therefore, we will only discuss about them in the following.
Chapter I Various view points on antibiotherapy
32 / 192
(Cowan, Schirmer et al. 1992) (Basle, Rummel et al. 2006). These proteins are passive diffusion
channels. Besides nutrient molecules uptake, small drugs like ß-lactam, quinolones, tetracycline, and
chloramphenicol can enter the cell by diffusion through them. These proteins are generally water
filled channel, folded in β-barrel conformations. The narrowest constriction in these porins
determines the maximum size of a solute that can pass through them (Hancock 1987) (Nikaido and
Rosenberg 1981). The size cut-off is around 600 Da. OmpC is one of the earliest known porins, the
diameter of its pore is 1.08 nm (Figure I - 13) (Nikaido and Rosenberg 1983). On the other hand, the
pore of OmpF is larger, with a 1.16 nm diameter (Figure I - 13) (Nikaido and Rosenberg 1983).
Because of this size difference, OmpC is less permeable than OmpF, it can only allow the passage of
very small molecules (Koebnik, Locher et al. 2000) (Schirmer 1998) .
Bacterial resistance mechanisms are complex. As seen above, one of them is closely related
to change in the outer membrane permeability. More specifically, resistance occurs through changes
in the respective amount of the various outer membrane proteins (Nikaido 1989). Different porins
have different permeabilities to different substances, down-regulation of high permeability porins
and up-regulation of the low permeability porins can restrict the entry of antibiotics, thereby
enhancing resistance. The expression of OmpC and OmpF is reciprocally regulated by the two-
component systems EnvZ / OmpR and CpxA-CpxR. The expression of OmpC is enhanced and the
expression of OmpF is decreased under unfavorable environment, e.g. high temperature, hyper-
osmosis, and antibiotic stress (Batchelor, Walthers et al. 2005) (Yoshida, Qin et al. 2006) (Raja, Murali
et al. 2008). In the E.coli resistant strains, it is often found that the expression of OmpC increases so
that this channel will replace the larger OmpF (Pagès, James et al. 2008).
III.4.3. The multi drug efflux pumps
It is a prerequisite for a drug to be effective that a sufficient quantity of it can reside in the
bacteria, close to the target. The active efflux system consists in proteins located on the bacterial cell
membrane, it can selectively or non-selectively expel the antibiotics from bacteria. The mechanism of
drug resistance caused by efflux pumps was first reported in the early 1970s, in relation to the study
of resistance to tetracycline. Since, various drug efflux systems have been discovered. At present,
they are divided into five super families, according to amino acid sequence homologies. More
specifically, one has the ATP binding cassettes (ABC) transporters family, the major facilitator
superfamily (MFS), the small multidrug resistance (SMR) family, the multidrug and toxic compound
extrusion (MATE) family, and the resistance-nodulation-division (RND) family. ABC transporters use
ATP as a source of energy, whereas the other pumps are powered by protons. In the latter process,
the protons enter the cell and the drug is expelled outside.
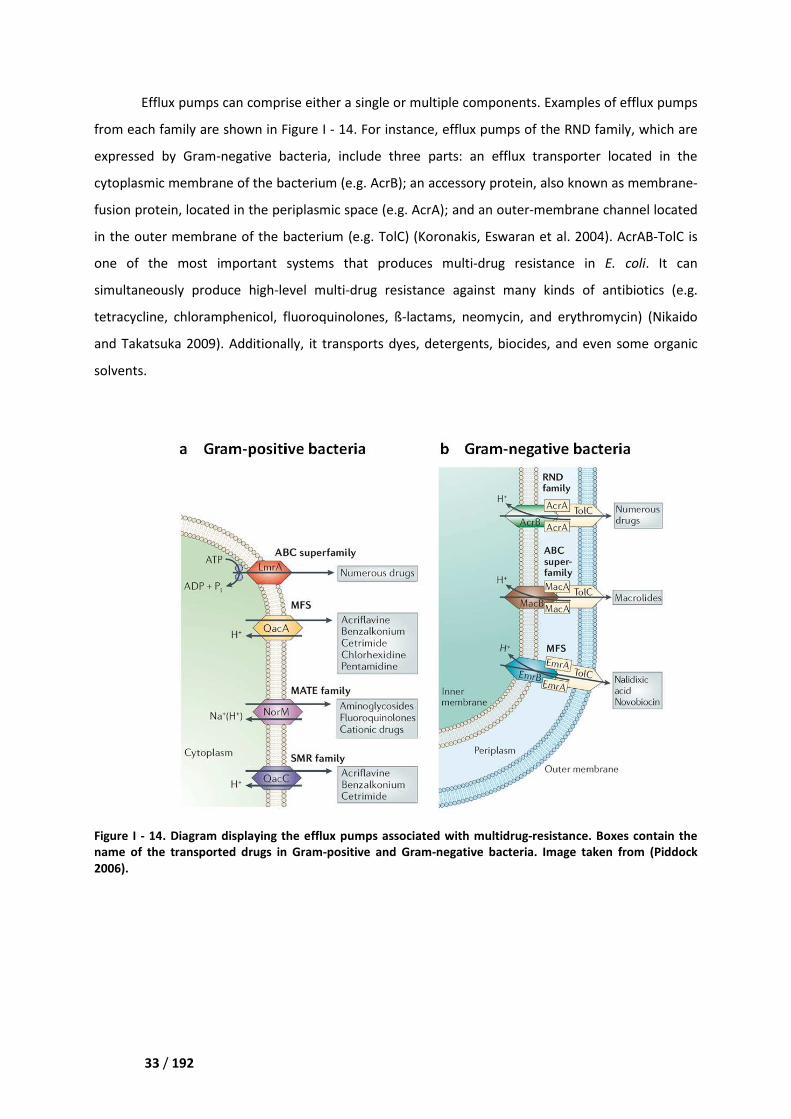
Chapter I Various view points on antibiotherapy
33 / 192
Efflux pumps can comprise either a single or multiple components. Examples of efflux pumps
from each family are shown in Figure I
expressed by Gram-negative bacteria
cytoplasmic membrane of the bacterium
fusion protein, located in the periplasmic space
in the outer membrane of the bacter
one of the most important systems
simultaneously produce high-level multi
tetracycline, chloramphenicol, fluoroquinolones, ß
and Takatsuka 2009). Additionally, it transports
solvents.
Figure I - 14. Diagram displaying the
name of the transported drugs in Gram
2006).
Various view points on antibiotherapy
Efflux pumps can comprise either a single or multiple components. Examples of efflux pumps
Figure I - 14. For instance, efflux pumps of the RND family
negative bacteria, include three parts: an efflux transporter located in the
cytoplasmic membrane of the bacterium (e.g. AcrB); an accessory protein, also know
located in the periplasmic space (e.g. AcrA); and an outer-membrane channel
in the outer membrane of the bacterium (e.g. TolC) (Koronakis, Eswaran et al. 2004)
ne of the most important systems that produces multi-drug resistance
level multi-drug resistance against many kinds of antibiotics
tetracycline, chloramphenicol, fluoroquinolones, ß-lactams, neomycin, and erythromycin)
. Additionally, it transports dyes, detergents, biocides, and even some
Diagram displaying the efflux pumps associated with multidrug-resistance.
name of the transported drugs in Gram-positive and Gram-negative bacteria. Image taken from
Efflux pumps can comprise either a single or multiple components. Examples of efflux pumps
fflux pumps of the RND family, which are
three parts: an efflux transporter located in the
also known as membrane-
membrane channel located
(Koronakis, Eswaran et al. 2004). AcrAB-TolC is
drug resistance in E. coli. It can
drug resistance against many kinds of antibiotics (e.g.
erythromycin) (Nikaido
and even some organic
resistance. Boxes contain the
negative bacteria. Image taken from (Piddock

Chapter I Various view points on antibiotherapy
34 / 192
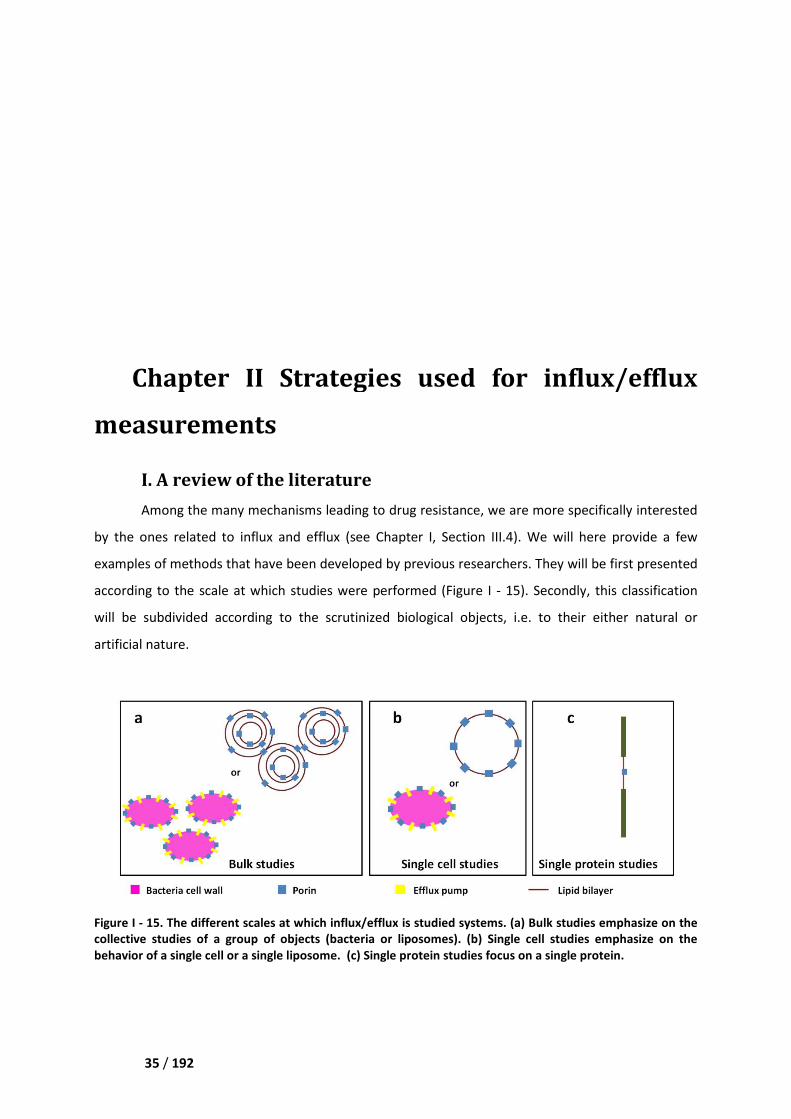
Chapter II Strategies used for influx/efflux measurements
35 / 192
Chapter II Strategies used for influx/efflux
measurements
I. A review of the literature
Among the many mechanisms
by the ones related to influx and
examples of methods that have been
according to the scale at which studies
will be subdivided according to
artificial nature.
Figure I - 15. The different scales at which influx/efflux is studied
collective studies of a group of object
behavior of a single cell or a single
I Strategies used for influx/efflux measurements
Chapter II Strategies used for influx/efflux
view of the literature
mechanisms leading to drug resistance, we are more specifically
and efflux (see Chapter I, Section III.4). We will
have been developed by previous researchers. They will
to the scale at which studies were performed (Figure I - 15). Secondly
according to the scrutinized biological objects, i.e. to their
at which influx/efflux is studied systems. (a) Bulk studies emphasize on the
of a group of objects (bacteria or liposomes). (b) Single cell studies emphasize on the
liposome. (c) Single protein studies focus on a single protein.
Chapter II Strategies used for influx/efflux
drug resistance, we are more specifically interested
will here provide a few
will be first presented
. Secondly, this classification
their either natural or
ulk studies emphasize on the
ingle cell studies emphasize on the
single protein.
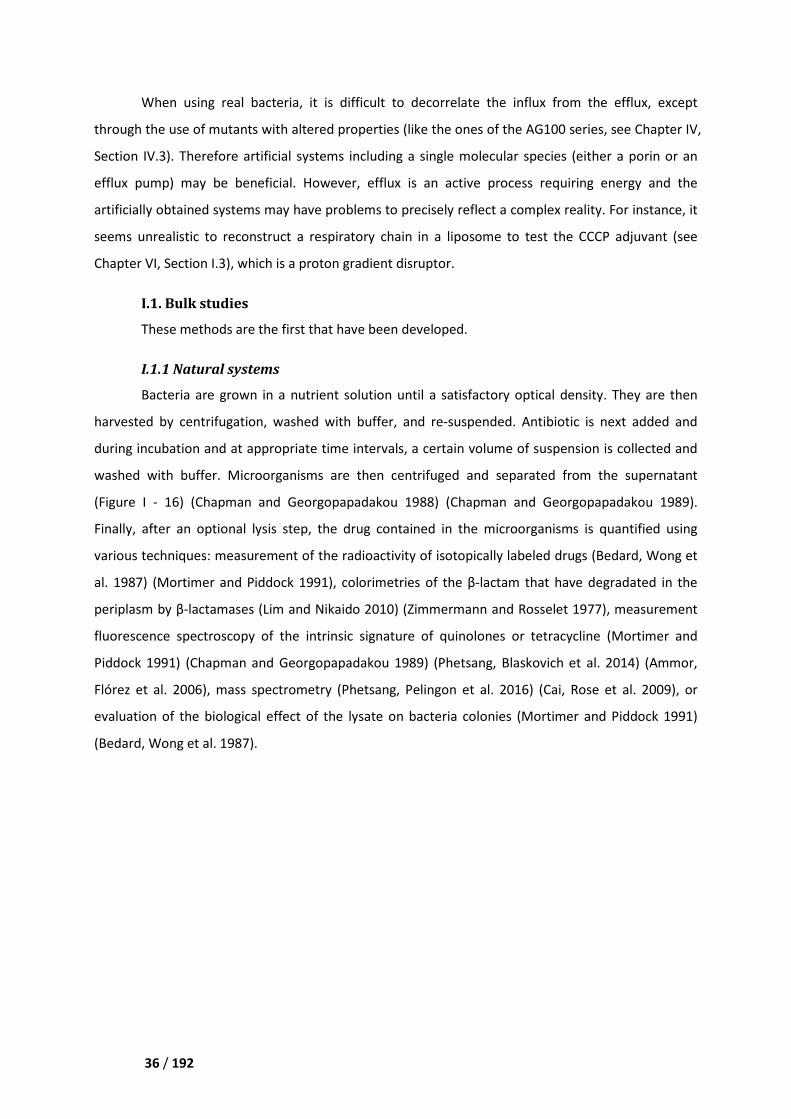
Chapter II Strategies used for influx/efflux measurements
36 / 192
When using real bacteria, it is difficult to decorrelate the influx from the efflux, except
through the use of mutants with altered properties (like the ones of the AG100 series, see Chapter IV,
Section IV.3). Therefore artificial systems including a single molecular species (either a porin or an
efflux pump) may be beneficial. However, efflux is an active process requiring energy and the
artificially obtained systems may have problems to precisely reflect a complex reality. For instance, it
seems unrealistic to reconstruct a respiratory chain in a liposome to test the CCCP adjuvant (see
Chapter VI, Section I.3), which is a proton gradient disruptor.
I.1. Bulk studies
These methods are the first that have been developed.
I.1.1 Natural systems
Bacteria are grown in a nutrient solution until a satisfactory optical density. They are then
harvested by centrifugation, washed with buffer, and re-suspended. Antibiotic is next added and
during incubation and at appropriate time intervals, a certain volume of suspension is collected and
washed with buffer. Microorganisms are then centrifuged and separated from the supernatant
(Figure I - 16) (Chapman and Georgopapadakou 1988) (Chapman and Georgopapadakou 1989).
Finally, after an optional lysis step, the drug contained in the microorganisms is quantified using
various techniques: measurement of the radioactivity of isotopically labeled drugs (Bedard, Wong et
al. 1987) (Mortimer and Piddock 1991), colorimetries of the β-lactam that have degradated in the
periplasm by β-lactamases (Lim and Nikaido 2010) (Zimmermann and Rosselet 1977), measurement
fluorescence spectroscopy of the intrinsic signature of quinolones or tetracycline (Mortimer and
Piddock 1991) (Chapman and Georgopapadakou 1989) (Phetsang, Blaskovich et al. 2014) (Ammor,
Flórez et al. 2006), mass spectrometry (Phetsang, Pelingon et al. 2016) (Cai, Rose et al. 2009), or
evaluation of the biological effect of the lysate on bacteria colonies (Mortimer and Piddock 1991)
(Bedard, Wong et al. 1987).
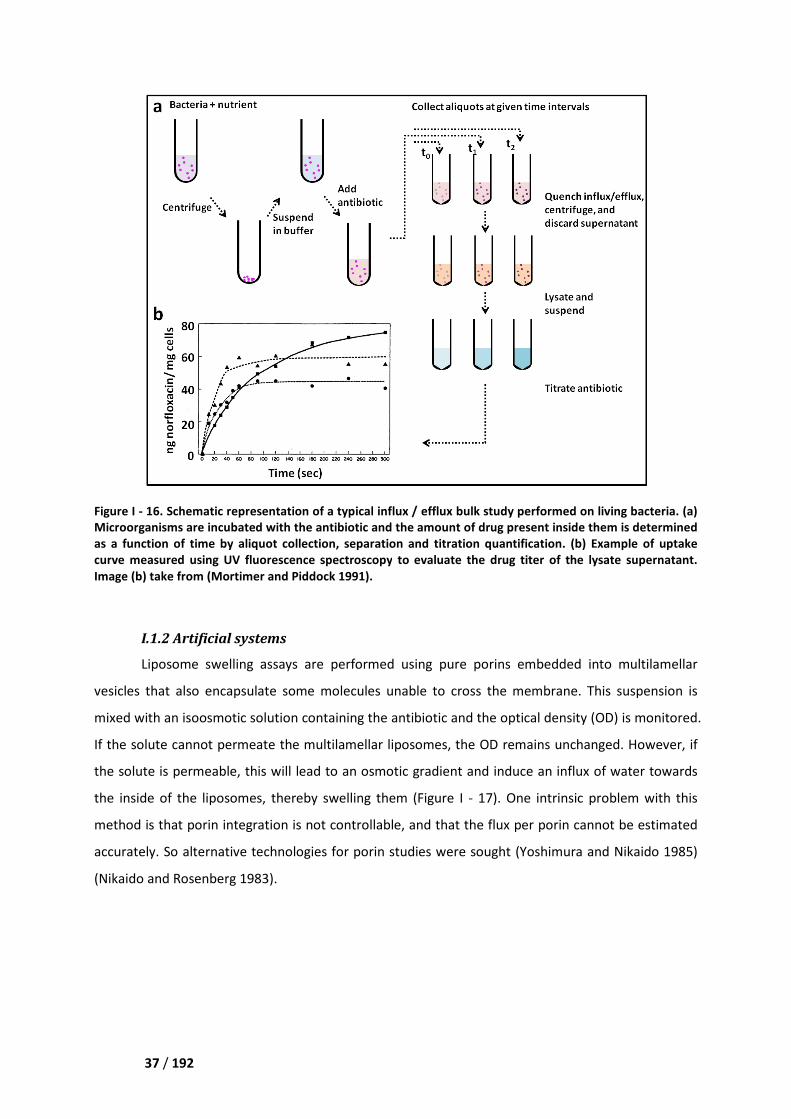
Chapter II Strategies used for influx/efflux measurements
37 / 192
Figure I - 16. Schematic representation of a typical influx / efflux bulk study
Microorganisms are incubated with
as a function of time by aliquot collection
curve measured using UV fluorescence spectroscopy
Image (b) take from (Mortimer and Piddock 1991)
I.1.2 Artificial systems
Liposome swelling assays are performed using pure porins embedded into multilamellar
vesicles that also encapsulate some molecules un
mixed with an isoosmotic solution containing the antibioti
If the solute cannot permeate the multilamellar liposome
the solute is permeable, this will lead to an osmotic gradient and induce an influx of water towards
the inside of the liposomes, thereby swell
method is that porin integration is not controllable, and
accurately. So alternative technologies for porin studies were so
(Nikaido and Rosenberg 1983).
I Strategies used for influx/efflux measurements
Schematic representation of a typical influx / efflux bulk study performed
incubated with the antibiotic and the amount of drug present inside
as a function of time by aliquot collection, separation and titration quantification. (b) Example of uptake
UV fluorescence spectroscopy to evaluate the drug titer of the lysate superna
(Mortimer and Piddock 1991).
s
ys are performed using pure porins embedded into multilamellar
encapsulate some molecules unable to cross the membrane. This
with an isoosmotic solution containing the antibiotic and the optical density
If the solute cannot permeate the multilamellar liposomes, the OD remains unchanged. However, if
the solute is permeable, this will lead to an osmotic gradient and induce an influx of water towards
, thereby swelling them (Figure I - 17). One intrinsic problem
porin integration is not controllable, and that the flux per porin
alternative technologies for porin studies were sought (Yoshimura and Nikaido 1985)
performed on living bacteria. (a)
amount of drug present inside them is determined
(b) Example of uptake
of the lysate supernatant.
ys are performed using pure porins embedded into multilamellar
able to cross the membrane. This suspension is
the optical density (OD) is monitored.
, the OD remains unchanged. However, if
the solute is permeable, this will lead to an osmotic gradient and induce an influx of water towards
). One intrinsic problem with this
the flux per porin cannot be estimated
(Yoshimura and Nikaido 1985)
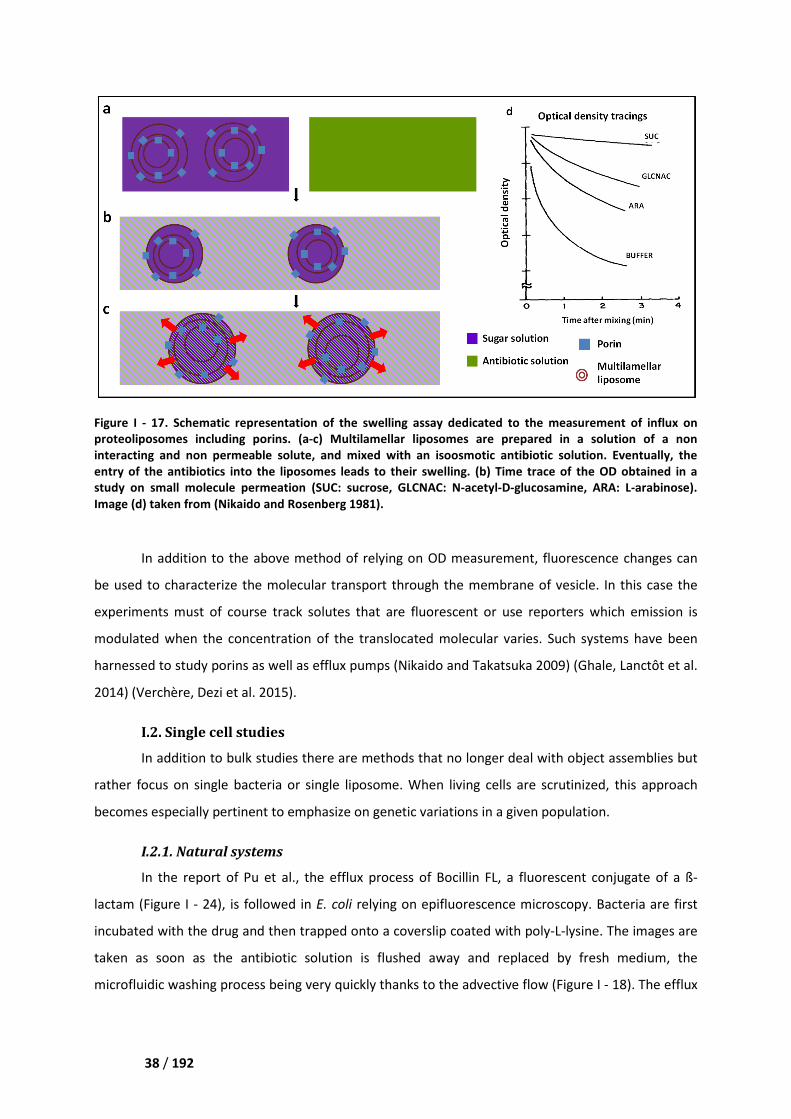
Chapter II Strategies used for influx/efflux measurements
38 / 192
Figure I - 17. Schematic representation of the swelling assay dedicated to
proteoliposomes including porins.
interacting and non permeable solute
entry of the antibiotics into the liposomes leads to the
study on small molecule permeation (
Image (d) taken from (Nikaido and Rosenberg 1981)
In addition to the above
be used to characterize the molecul
experiments must of course track solutes that are fluorescent or use reporters which emission is
modulated when the concentration of the translocated molecular varies. Such systems have been
harnessed to study porins as well as efflux pumps
2014) (Verchère, Dezi et al. 2015)
I.2. Single cell studies
In addition to bulk studies
rather focus on single bacteria or
becomes especially pertinent to emphasize on genetic variations in a given
I.2.1. Natural systems
In the report of Pu et al., the efflux process of Bocillin
lactam (Figure I - 24), is followed in
incubated with the drug and then trapped on
taken as soon as the antibiotic solution is
microfluidic washing process being
I Strategies used for influx/efflux measurements
Schematic representation of the swelling assay dedicated to the measurement
proteoliposomes including porins. (a-c) Multilamellar liposomes are prepared in
ing and non permeable solute, and mixed with an isoosmotic antibiotic solution
liposomes leads to their swelling. (b) Time trace of the
cule permeation (SUC: sucrose, GLCNAC: N-acetyl-D-glucosamine, ARA: L
(Nikaido and Rosenberg 1981).
above method of relying on OD measurement, fluorescence
molecular transport through the membrane of vesicle. In this case the
experiments must of course track solutes that are fluorescent or use reporters which emission is
modulated when the concentration of the translocated molecular varies. Such systems have been
d to study porins as well as efflux pumps (Nikaido and Takatsuka 2009)
e, Dezi et al. 2015).
cell studies
ies there are methods that no longer deal with object assemblies
cteria or single liposome. When living cells are scrutinized
ially pertinent to emphasize on genetic variations in a given population
In the report of Pu et al., the efflux process of Bocillin FL, a fluorescent conjugate of a ß
is followed in E. coli relying on epifluorescence microscop
incubated with the drug and then trapped onto a coverslip coated with poly-L-lysine.
as the antibiotic solution is flushed away and replaced by fresh
process being very quickly thanks to the advective flow (Figure I
measurement of influx on
in a solution of a non
an isoosmotic antibiotic solution. Eventually, the
of the OD obtained in a
glucosamine, ARA: L-arabinose).
fluorescence changes can
membrane of vesicle. In this case the
experiments must of course track solutes that are fluorescent or use reporters which emission is
modulated when the concentration of the translocated molecular varies. Such systems have been
(Ghale, Lanctôt et al.
deal with object assemblies but
living cells are scrutinized, this approach
population.
fluorescent conjugate of a ß-
relying on epifluorescence microscopy. Bacteria are first
lysine. The images are
and replaced by fresh medium, the
Figure I - 18). The efflux
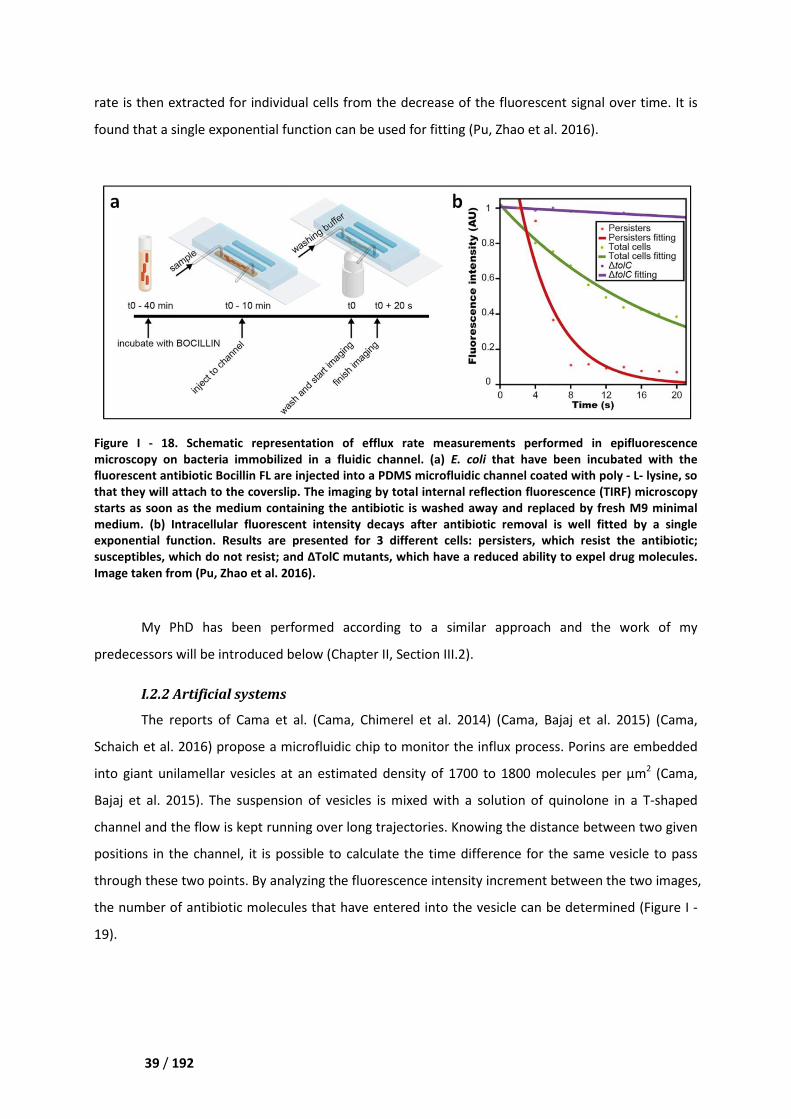
Chapter II Strategies used for influx/efflux measurements
39 / 192
rate is then extracted for individual cells f
found that a single exponential function
Figure I - 18. Schematic representation of
microscopy on bacteria immobilized in a fluidic channel
fluorescent antibiotic Bocillin FL are injected into
that they will attach to the coverslip.
starts as soon as the medium containing
medium. (b) Intracellular fluorescent intensity deca
exponential function. Results are presented for 3 different cells: persisters
susceptibles, which do not resist; and ΔTolC mutant
Image taken from (Pu, Zhao et al. 2016)
My PhD has been performed according to
predecessors will be introduced below
I.2.2 Artificial systems
The reports of Cama et al.
Schaich et al. 2016) propose a microfluidic chip
into giant unilamellar vesicles at an esti
Bajaj et al. 2015). The suspension
channel and the flow is kept running
positions in the channel, it is possible to
through these two points. By analyzing the fluorescence intensity increment
the number of antibiotic molecules that
19).
I Strategies used for influx/efflux measurements
extracted for individual cells from the decrease of the fluorescent signal over time
exponential function can be used for fitting (Pu, Zhao et al. 2016)
Schematic representation of efflux rate measurements performed in epifluorescence
bacteria immobilized in a fluidic channel. (a) E. coli that have been
FL are injected into a PDMS microfluidic channel coated with poly
that they will attach to the coverslip. The imaging by total internal reflection fluorescence
as soon as the medium containing the antibiotic is washed away and replaced by fresh M9 minimal
Intracellular fluorescent intensity decays after antibiotic removal is well fit
Results are presented for 3 different cells: persisters, which resist
and ΔTolC mutants, which have a reduced ability to expel drug molecules.
(Pu, Zhao et al. 2016).
My PhD has been performed according to a similar approach and the work of my
will be introduced below (Chapter II, Section III.2).
s
et al. (Cama, Chimerel et al. 2014) (Cama, Bajaj et al. 2015)
microfluidic chip to monitor the influx process. Po
at an estimated density of 1700 to 1800 molecules
suspension of vesicles is mixed with a solution of quinolone in a T
kept running over long trajectories. Knowing the distance between
in the channel, it is possible to calculate the time difference for the same vesicle
analyzing the fluorescence intensity increment between
antibiotic molecules that have entered into the vesicle can be determined
fluorescent signal over time. It is
(Pu, Zhao et al. 2016).
measurements performed in epifluorescence
that have been incubated with the
PDMS microfluidic channel coated with poly - L- lysine, so
by total internal reflection fluorescence (TIRF) microscopy
antibiotic is washed away and replaced by fresh M9 minimal
is well fitted by a single
which resist the antibiotic;
ability to expel drug molecules.
a similar approach and the work of my
(Cama, Bajaj et al. 2015) (Cama,
Porins are embedded
molecules per µm2 (Cama,
of quinolone in a T-shaped
Knowing the distance between two given
the same vesicle to pass
between the two images,
can be determined (Figure I -
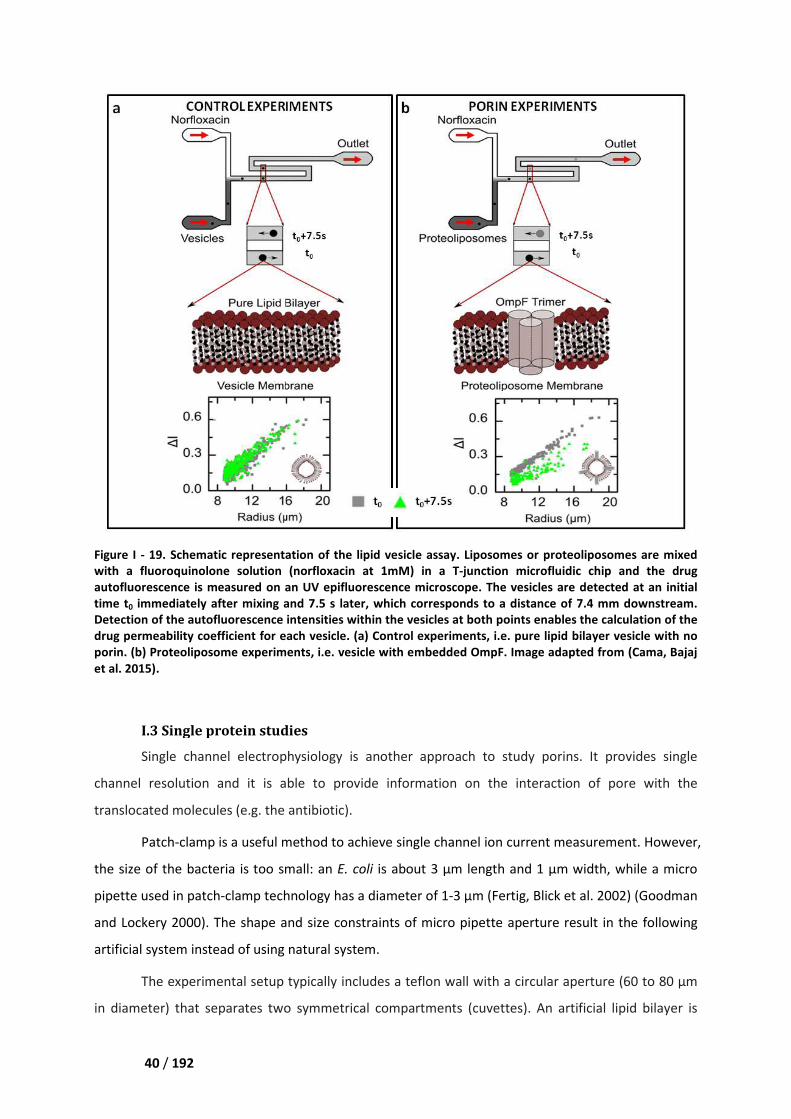
Chapter II Strategies used for influx/efflux measurements
40 / 192
Figure I - 19. Schematic representation
with a fluoroquinolone solution (
autofluorescence is measured on an
time t0 immediately after mixing and 7.5
Detection of the autofluorescence intensities within the vesicles at both points enables the calculation of the
drug permeability coefficient for each vesicle.
porin. (b) Proteoliposome experiments
et al. 2015).
I.3 Single protein studies
Single channel electrophysiology is another
channel resolution and it is able to provide information on the inte
translocated molecules (e.g. the antibiotic).
Patch-clamp is a useful method to achieve
the size of the bacteria is too small: an
pipette used in patch-clamp technology has a diameter of
and Lockery 2000). The shape and size constraints
artificial system instead of using natural system.
The experimental setup typicall
in diameter) that separates two symmetrical compartments (cuvettes). An artificial lipid bilay
I Strategies used for influx/efflux measurements
representation of the lipid vesicle assay. Liposomes or proteoliposomes are mixed
a fluoroquinolone solution (norfloxacin at 1mM) in a T-junction microfluidic chip
measured on an UV epifluorescence microscope. The vesicles are detected
mixing and 7.5 s later, which corresponds to a distance of 7.4 mm downstream.
Detection of the autofluorescence intensities within the vesicles at both points enables the calculation of the
drug permeability coefficient for each vesicle. (a) Control experiments, i.e. pure lipid bilayer vesicle with no
roteoliposome experiments, i.e. vesicle with embedded OmpF. Image adapted from
I.3 Single protein studies
Single channel electrophysiology is another approach to study porins. It provides single
channel resolution and it is able to provide information on the interaction of pore with the
ted molecules (e.g. the antibiotic).
method to achieve single channel ion current me
the size of the bacteria is too small: an E. coli is about 3 µm length and 1 µm
clamp technology has a diameter of 1-3 µm (Fertig, Blick et al. 2002)
. The shape and size constraints of micro pipette aperture result
artificial system instead of using natural system.
The experimental setup typically includes a teflon wall with a circular aperture (60 to 80 µm
in diameter) that separates two symmetrical compartments (cuvettes). An artificial lipid bilay
proteoliposomes are mixed
junction microfluidic chip and the drug
UV epifluorescence microscope. The vesicles are detected at an initial
a distance of 7.4 mm downstream.
Detection of the autofluorescence intensities within the vesicles at both points enables the calculation of the
bilayer vesicle with no
Image adapted from (Cama, Bajaj
approach to study porins. It provides single
raction of pore with the
single channel ion current measurement. However,
width, while a micro
(Fertig, Blick et al. 2002) (Goodman
result in the following
circular aperture (60 to 80 µm
in diameter) that separates two symmetrical compartments (cuvettes). An artificial lipid bilayer is
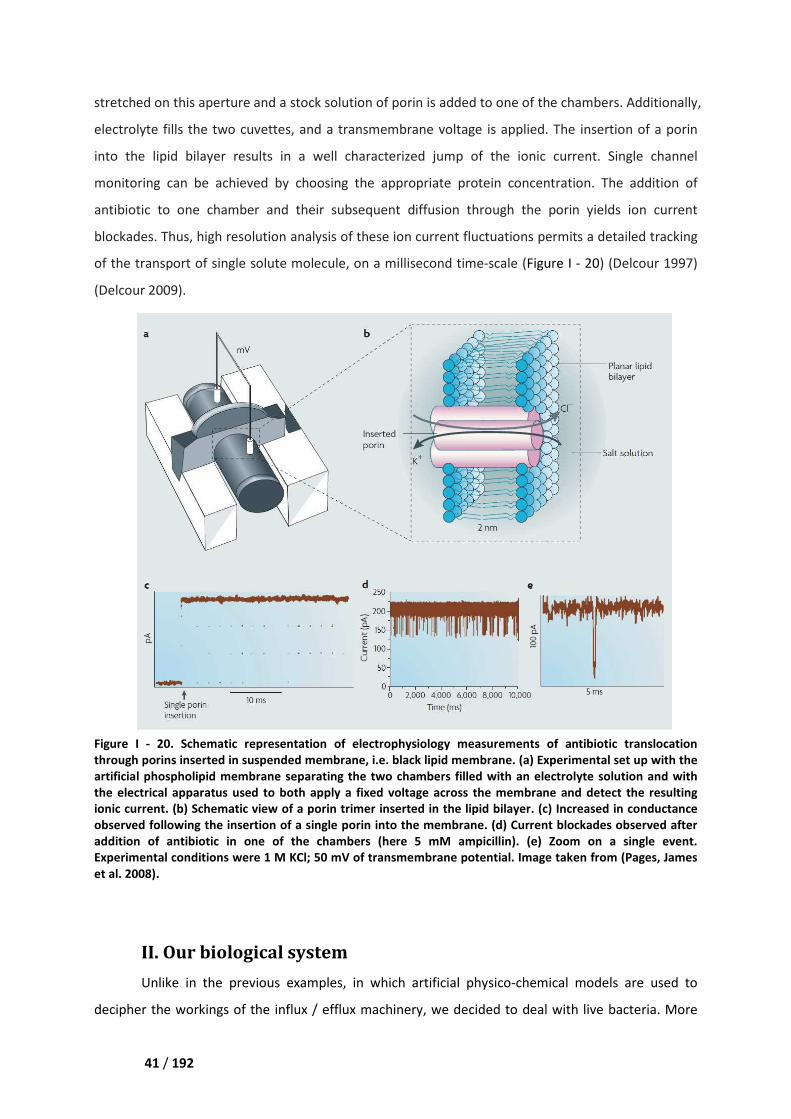
Chapter II Strategies used for influx/efflux measurements
41 / 192
stretched on this aperture and a stock solution of porin is added to one of the chambers. Additionally,
electrolyte fills the two cuvettes, and a transmembrane voltage is applied. The insertion of a porin
into the lipid bilayer results in a well characterized jump of the ionic current. Single channel
monitoring can be achieved by choosing the appropriate protein concentration. The addition of
antibiotic to one chamber and their subsequent diffusion through the porin yields ion current
blockades. Thus, high resolution analysis of these ion current fluctuations permits a detailed tracking
of the transport of single solute molecule, on a millisecond time-scale (Figure I - 20) (Delcour 1997)
(Delcour 2009).
Figure I - 20. Schematic representation of electrophysiology measurements of antibiotic translocation
through porins inserted in suspended membrane, i.e. black lipid membrane. (a) Experimental set up with the
artificial phospholipid membrane separating the two chambers filled with an electrolyte solution and with
the electrical apparatus used to both apply a fixed voltage across the membrane and detect the resulting
ionic current. (b) Schematic view of a porin trimer inserted in the lipid bilayer. (c) Increased in conductance
observed following the insertion of a single porin into the membrane. (d) Current blockades observed after
addition of antibiotic in one of the chambers (here 5 mM ampicillin). (e) Zoom on a single event.
Experimental conditions were 1 M KCl; 50 mV of transmembrane potential. Image taken from (Pages, James
et al. 2008).
II. Our biological system
Unlike in the previous examples, in which artificial physico-chemical models are used to
decipher the workings of the influx / efflux machinery, we decided to deal with live bacteria. More
Chapter II Strategies used for influx/efflux measurements
42 / 192
precisely, we chose to study the interaction between E. coli and ciprofloxacin, which are respectively
a representative Gram-negative bacteria and a representative fluoroquinolone molecule. This choice
is in the line with the previous research conducted by the DISCO beamline of SOLEIL synchrotron, in
collaboration with the UMR-MD1 team in Marseille.
II.1. Escherichia coli, a typical Gram-negative bacteria
In addition to the proteins related to drug resistance that have been introduced in the
previous section, we here present E. coli’s main characteristics, the relationship of this
microorganism with human being and the associated public health issues, as well as the reasons why
it has been chosen as a model organism.
II.1.1. Main characteristics
The Enterobacteriaceae are a large family of Gram-negative bacteria that includes, along with
many harmless symbionts, some familiar pathogens such as Salmonella, Escherichia, Klebsiella,
Serratia, and Shigella.
Escherichia coli was described for the first time in 1885 by the German pediatrician Theodore
Escherich, who found this microbe associated with infant enteritis (Nomenclature 1958) . E. coli is the
representative species of the genus Escherichia. DNA-DNA hybridization studies have led to the
identification of five other species within this genus: E. hermannii, E. vulneris, E. fergusonii, E. albertii,
and the recently described E. marmotae (Brenner, Davis et al. 1982) (Brenner, McWhorter et al. 1982)
(Farmer III, Fanning et al. 1985) (Huys, Cnockaert et al. 2003) (Liu, Jin et al. 2015). All these species
are generally related to human pathology and each has its own biochemical characteristics ─ that
make it possible to identify them.
E. coli are rod-shape bacilli measuring 0.3 to 1 μm in diameter and 1 to 3 μm in length. These
dimensions can vary considerably depending on the strain and on the growth conditions. E. coli has
flagella throughout its body, used for movement around its environment. Its type of metabolism is
chemo-heterotrophic. Nosporulating, facultative anaerobes, E. coli possess both a respiratory chain
and a fermentative metabolism. More precisely, it is able to produce ATP by aerobic
respiration if oxygen is present or to switch to sugar fermentation to produce lactic acid and gas if
oxygen is absent. E. coli cannot grow at extreme temperatures or pH, nor can it perform
photosynthesis. It is a prokaryote, containing only a simple organelle ribosome, no nucleus, but a
nuclear region. Its genome is a circular molecule of about 4 700 kbp, coding for more than 4 200
proteins. E. coli cytoplasm can also harbor multiple circular plasmids DNA (Chapter I, Section II. 2.1).
Chapter II Strategies used for influx/efflux measurements
43 / 192
II.1.2. Relevance for public health
Escherichia coli is a bacterium that is commonly found in the gut of humans, and of some
other warm-blooded animals (mammals and birds) (Kaper, Nataro et al. 2004) (Greatorex and Thorne
1994). It colonizes the human digestive tract asymptomatically in the first few hours after birth and it
is therefore the dominant bacterial species of the facultative anaerobic flora of the human colon
(Freter, Brickner et al. 1983) (Berg 1996). Its ecological niche is located in the layer of mucus secreted
by the epithelium of the colon; along with the other components of the microflora. This bacteria thus
provides a protective barrier for the mucosa (Poulsen, Lan et al. 1994). The concentration of E. coli
per gram of faeces varies from individual to individual but is around 107 to 109 colony forming units
(CFU), which is higher than in other mammals (Tenaillon, Skurnik et al. 2010).
For a very long period of time, E. coli has been regarded as a non-pathogenic bacterium,
being part of the normal intestinal flora. However, some strains can cause severe foodborne diseases.
By the middle of 20th century some serotypes were already known to be pathogenic to humans and
animals. The infection is usually transmitted through consumption of contaminated water or food,
such as undercooked meat products and raw milk. The Foodborne Disease Burden Epidemiology
Reference Group (FERG) of the WHO estimated that, from 2010 to 2015, there were ~ 582 million
cases of foodborne enteric diseases and 351 000 associated deaths, of which 37 000 were due to the
enteropathogenic E. coli (WHO World Health Day 2015). For example, the O157: H7 serotype, which
was first discovered in 1982 in the United States, is enterohaemorrhagic. An infection with this type
of pathogenic bacteria may lead to hemorrhagic diarrhea, sepsis, and sometimes kidney failure.
Therefore, such pathogen is particularly dangerous, especially for children and elderly (Karch, Tarr et
al. 2005). As pointed out in a report of 2002, this serotype caused 73 000 illnesses in the United
States annually in the few years preceding the study and 52 % of the transmission routes were
foodborne.
II.1.3. Use as a model organism
A model organism is a non-human species that is widely studied, usually due to its short
generation cycle, simple nutritional requirements, well established genetic background, and also
ease of breeding and reproducing in laboratory conditions. It additionally has particular experimental
values so that research results can help to understand a representative phenomenon, also found in
other species.
E. coli has many attributes that make it an ideal candidate for being a model organism
(Watson 1992) (Blount 2015):
- It is able to grow and reproduce very rapidly. Its population can double in about 20 minutes,
facilitating the experiments on evolution thanks to its adaptative faculties.
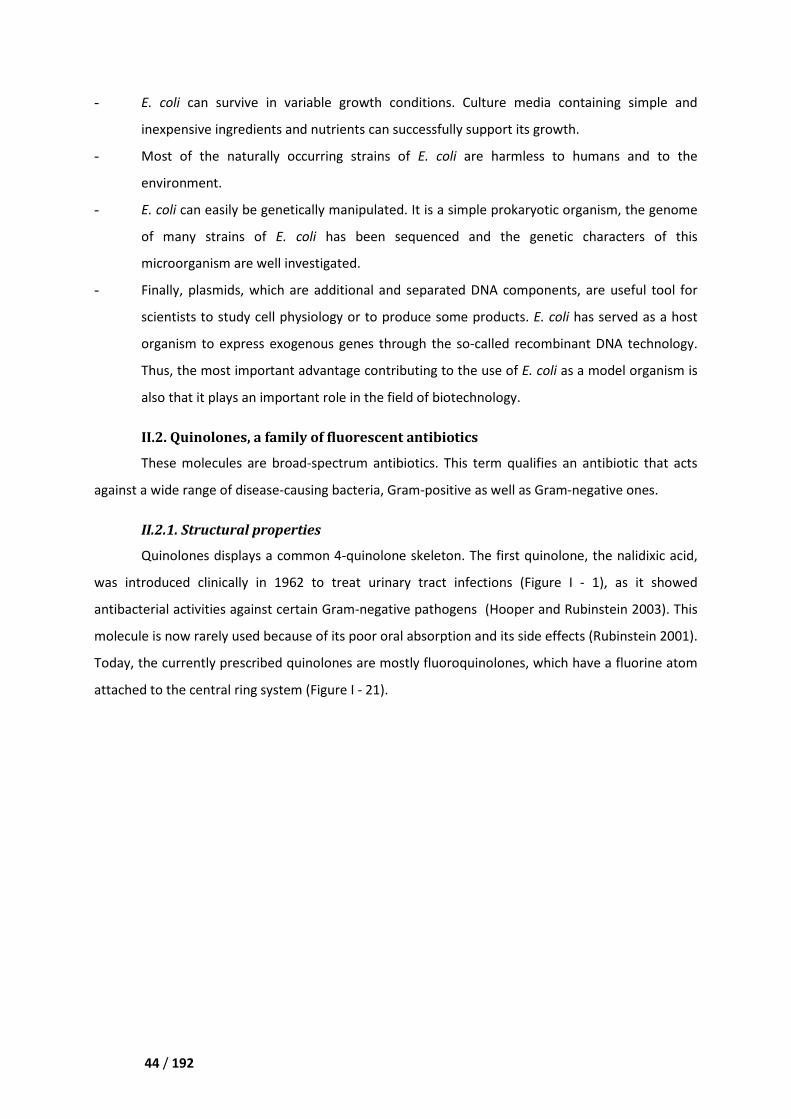
Chapter II Strategies used for influx/efflux measurements
44 / 192
- E. coli can survive in variable growth conditions. Culture media containing simple and
inexpensive ingredients and nutrients can successfully support its growth.
- Most of the naturally occurring strains of E. coli are harmless to humans and to the
environment.
- E. coli can easily be genetically manipulated. It is a simple prokaryotic organism, the genome
of many strains of E. coli has been sequenced and the genetic characters of this
microorganism are well investigated.
- Finally, plasmids, which are additional and separated DNA components, are useful tool for
scientists to study cell physiology or to produce some products. E. coli has served as a host
organism to express exogenous genes through the so-called recombinant DNA technology.
Thus, the most important advantage contributing to the use of E. coli as a model organism is
also that it plays an important role in the field of biotechnology.
II.2. Quinolones, a family of fluorescent antibiotics
These molecules are broad-spectrum antibiotics. This term qualifies an antibiotic that acts
against a wide range of disease-causing bacteria, Gram-positive as well as Gram-negative ones.
II.2.1. Structural properties
Quinolones displays a common 4-quinolone skeleton. The first quinolone, the nalidixic acid,
was introduced clinically in 1962 to treat urinary tract infections (Figure I - 1), as it showed
antibacterial activities against certain Gram-negative pathogens (Hooper and Rubinstein 2003). This
molecule is now rarely used because of its poor oral absorption and its side effects (Rubinstein 2001).
Today, the currently prescribed quinolones are mostly fluoroquinolones, which have a fluorine atom
attached to the central ring system (Figure I - 21).
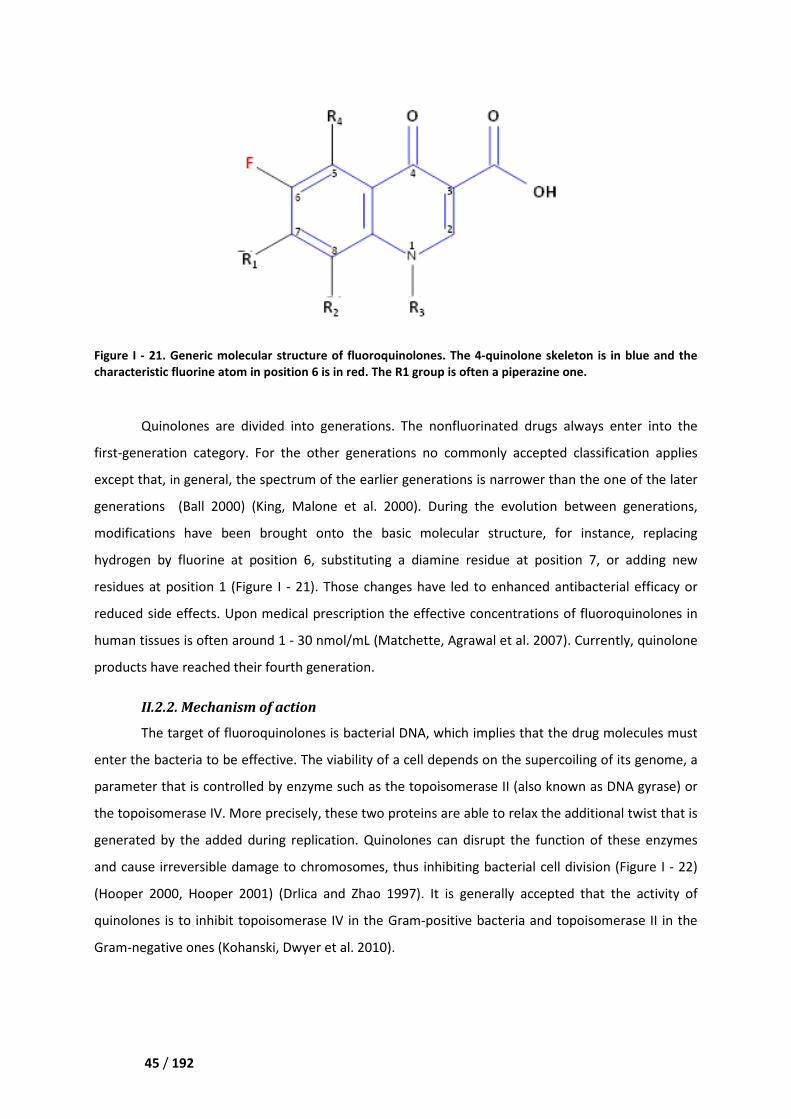
Chapter II Strategies used for influx/efflux measurements
45 / 192
Figure I - 21. Generic molecular structure of
characteristic fluorine atom in position 6
Quinolones are divided into generations. T
first-generation category. For the other generations no commonly accepted classification applies
except that, in general, the spectrum of the earlier
generations (Ball 2000) (King, Malone et al. 2000)
modifications have been brought onto
hydrogen by fluorine at position 6, substituting a diamine residue at position 7
residues at position 1 (Figure I
reduced side effects. Upon medical prescription t
human tissues is often around 1
products have reached their fourth generation.
II.2.2. Mechanism of action
The target of fluoroquinolones is
enter the bacteria to be effective
parameter that is controlled by enzyme such as the topoisomerase II
the topoisomerase IV. More precisely, these two
generated by the added during replication.
and cause irreversible damage to chromosomes,
(Hooper 2000, Hooper 2001) (Drlica and Zhao 1997)
quinolones is to inhibit topoisomerase IV
Gram-negative ones (Kohanski, Dwyer e
I Strategies used for influx/efflux measurements
structure of fluoroquinolones. The 4-quinolone skeleton is in blue and the
characteristic fluorine atom in position 6 is in red. The R1 group is often a piperazine one.
es are divided into generations. The nonfluorinated drugs always
category. For the other generations no commonly accepted classification applies
general, the spectrum of the earlier generations is narrower than the
(King, Malone et al. 2000). During the evolution between generatio
s have been brought onto the basic molecular structure, for instance,
hydrogen by fluorine at position 6, substituting a diamine residue at position 7
- 21). Those changes have led to enhanced antibacterial efficacy
Upon medical prescription the effective concentrations of fluoroquinolones in
- 30 nmol/mL (Matchette, Agrawal et al. 2007).
have reached their fourth generation.
II.2.2. Mechanism of action
of fluoroquinolones is bacterial DNA, which implies that the drug molecules
to be effective. The viability of a cell depends on the supercoiling of its genome, a
parameter that is controlled by enzyme such as the topoisomerase II (also known as
the topoisomerase IV. More precisely, these two proteins are able to relax the additional twist that is
added during replication. Quinolones can disrupt the function of the
cause irreversible damage to chromosomes, thus inhibiting bacterial cell division
(Drlica and Zhao 1997). It is generally accepted that the activity of
topoisomerase IV in the Gram-positive bacteria and topoisomerase II in the
(Kohanski, Dwyer et al. 2010).
quinolone skeleton is in blue and the
often a piperazine one.
always enter into the
category. For the other generations no commonly accepted classification applies
than the one of the later
between generations,
for instance, replacing
hydrogen by fluorine at position 6, substituting a diamine residue at position 7, or adding new
have led to enhanced antibacterial efficacy or
he effective concentrations of fluoroquinolones in
. Currently, quinolone
that the drug molecules must
The viability of a cell depends on the supercoiling of its genome, a
also known as DNA gyrase) or
proteins are able to relax the additional twist that is
can disrupt the function of these enzymes
inhibiting bacterial cell division (Figure I - 22)
It is generally accepted that the activity of
topoisomerase II in the
Chapter II Strategies used for influx/efflux measurements
46 / 192
Figure I - 22. Structure of the bacterial
ciprofloxacin molecules (in green). Image taken from
II.2.3. Relevance for pu
Fluoroquinolones are broad
today are Avelox (moxifloxacin), Cipro (ciproflo
several tenth of the global antibiotic prescription. T
infections, respiratory infections,
uses bring many hazards on the long
- The extensive application of broad
number of resistant strains, at the patient
- Long-term prescription increases the occurrence of adverse effects.
gastrointestinal reactions (
reactions (e.g. dizziness, insomnia
- During the long-term and high
neutral, as well as beneficial bacteria are indis
only survive, but also gain
flora and of the related disappearance of antagonists. Flora imbalance can
secondary infection.
I Strategies used for influx/efflux measurements
bacterial topoisomerase II (in blue) with DNA (in orange)
. Image taken from (Wikipedia quionolone).
Relevance for public health
Fluoroquinolones are broad-spectrum antibiotics. The most frequently prescribed
Avelox (moxifloxacin), Cipro (ciprofloxacin), and Levaquin (levofloxacin). They represent
several tenth of the global antibiotic prescription. Their coverage is indeed wide
, respiratory infections, and intestinal infections to typhia. However, extensive
long term:
The extensive application of broad-spectrum antibiotics favors the emergence of
number of resistant strains, at the patient level as well as at the population
term prescription increases the occurrence of adverse effects.
gastrointestinal reactions (e.g. nausea, dyspepsia, vomiting), central nervous system
dizziness, insomnia, headache), as well as hepatotoxicity have been reported.
term and high-dose application of broad spectrum antibiotic
beneficial bacteria are indiscriminately attacked. Resistant strains can not
only survive, but also gain some opportunity to multiply because of the loss of the normal
flora and of the related disappearance of antagonists. Flora imbalance can
in orange) and two complexed
prescribed molecules
xacin), and Levaquin (levofloxacin). They represent
wide, from genitourinary
. However, extensive and broad
the emergence of a large
at the population one.
term prescription increases the occurrence of adverse effects. For instance,
entral nervous system
hepatotoxicity have been reported.
on of broad spectrum antibiotic, pathological,
esistant strains can not
opportunity to multiply because of the loss of the normal
flora and of the related disappearance of antagonists. Flora imbalance can finally lead to a
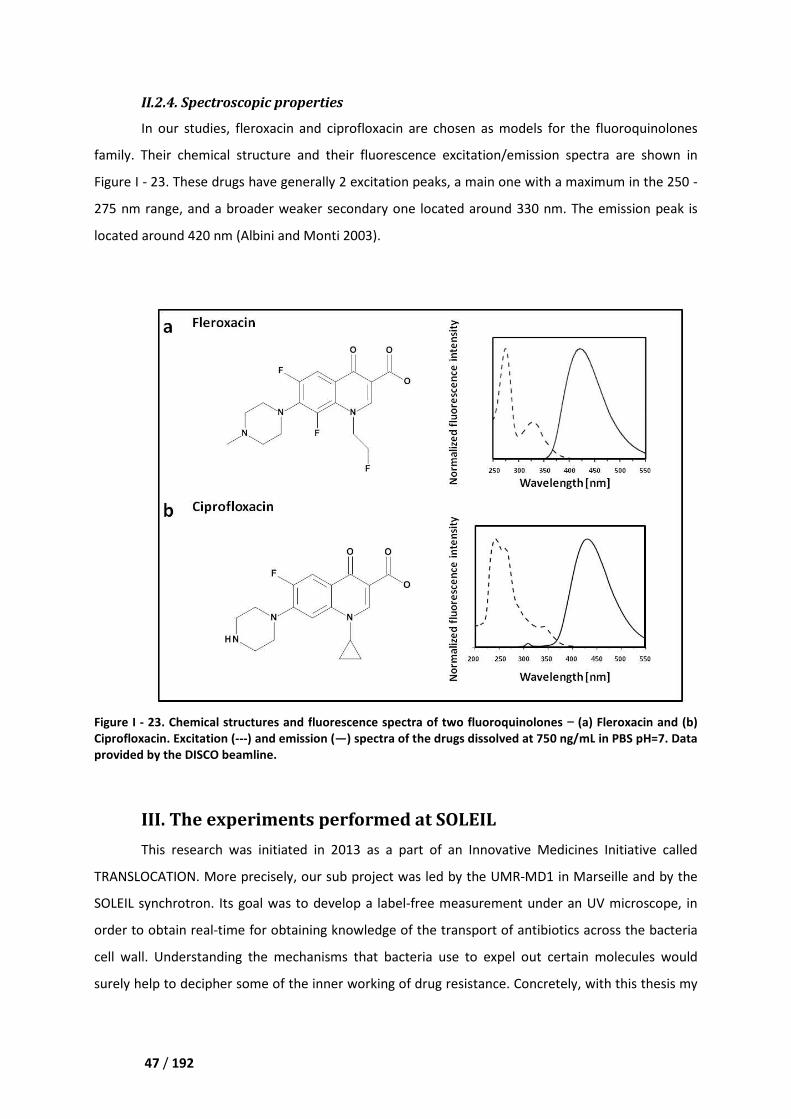
Chapter II Strategies used for influx/efflux measurements
47 / 192
II.2.4. Spectroscopic properties
In our studies, fleroxacin and c
family. Their chemical structure and their fluorescence excitation/emission spectra are show
Figure I - 23. These drugs have generally 2 excitation peaks, a main one
275 nm range, and a broader weaker
located around 420 nm (Albini and Monti 2003)
Figure I - 23. Chemical structures and f
Ciprofloxacin. Excitation (---) and emission (
provided by the DISCO beamline.
III. The experiments performed at SOLEIL
This research was initiated
TRANSLOCATION. More precisely, o
SOLEIL synchrotron. Its goal was to develop
order to obtain real-time for obtaining knowledge
cell wall. Understanding the mechanisms that bacteria use to
surely help to decipher some of the inner working of
I Strategies used for influx/efflux measurements
Spectroscopic properties
In our studies, fleroxacin and ciprofloxacin are chosen as models for the fluoroquinolones
family. Their chemical structure and their fluorescence excitation/emission spectra are show
. These drugs have generally 2 excitation peaks, a main one with a maximum in the 250
weaker secondary one located around 330 nm. The emission peak is
(Albini and Monti 2003).
and fluorescence spectra of two fluoroquinolones −) and emission (—) spectra of the drugs dissolved at 750 ng/mL
experiments performed at SOLEIL
initiated in 2013 as a part of an Innovative Medicines Initiati
. More precisely, our sub project was led by the UMR-MD1 in Marseille
s to develop a label-free measurement under an
for obtaining knowledge of the transport of antibiotics
the mechanisms that bacteria use to expel out certain molecul
surely help to decipher some of the inner working of drug resistance. Concretely
are chosen as models for the fluoroquinolones
family. Their chemical structure and their fluorescence excitation/emission spectra are shown in
with a maximum in the 250 -
. The emission peak is
− (a) Fleroxacin and (b)
) spectra of the drugs dissolved at 750 ng/mL in PBS pH=7. Data
n Innovative Medicines Initiative called
in Marseille and by the
an UV microscope, in
antibiotics across the bacteria
out certain molecules would
drug resistance. Concretely, with this thesis my
Chapter II Strategies used for influx/efflux measurements
48 / 192
task was to conceive and fabricate a microfluidic device with the help of which the temporal and
spatial resolution of the influx/efflux measurements could be improved.
III.1. Intrinsic fluorescence imaging of antibiotic concentration
III.1.1. Necessity of a real-time label-free technique
Studying the dynamics of transport of molecules or atoms in biological systems, or the
dynamics of chemical reactions, often require to label the compound of interest. Generally, this can
be achieved by isotopic labelling or by conjugation to a fluorophore.
At the atomic level, isotopic labelling was developed by George de Hevesy (George de Hevesy,
1943). Specific atoms in the reactant are substituted by their isotope. Then, the molecule is allowed
to be transported in the living object and to enter the metabolic pathway. Through the tracking of
the spatial position of the isotope, as well as through the determination of the molecular species it
now belongs to, the fate of the original reactant can be hypothesized. In this technique, the physical
and chemical properties of the labelled compounds are not very different from the one of the
unlabelled one, which prevents artifacts. However, the labelling process is not an easy nor a cheap
one, and the detection has a poor temporal and spatial resolution. Nevertheless, the influx/efflux
of many antibiotics has been studied in this way. For instance, reports exist on quinolones (Diver,
Piddock et al. 1990), tetracycline (Shales, Chopra et al. 1980), and chloramphenicol (Mortimer and
Piddok 1993).
Conjugating the compound of interest to a fluorescent dye is an alternative strategy. Small
fluorophores such as fluorescein, bodipy, and rhodamine have molecular weights that vary from
several hundreds to a thousand Daltons. Although small, those fluorescent groups thus have a size
similar or larger than the molecule to be marked (Figure I - 24). As a consequence, it likely changes its
transport properties and reactivity. However, compared with isotopic labelling, this method is less
expensive and more convenient. In addition, the spatial and temporal resolutions are better: single
cell and sub-second of observations are possible (Pu, Zhao et al. 2016).
As an example of transition between the two previously described labelling techniques, we
can cite studies on the binding mechanism of ß-lactams (Figure I - 7) onto Penicillin Binding Proteins
(PBP). First, isotope labelling was used in 1972 by Suginaka et al. who reported the structure and
function of PBP as a necessary element for bacteria to maintain normal morphology (Suginaka,
Blumberg et al. 1972) (Spratt 1977) (Noguchi, Matsuhashi et al. 1979). They could indeed detect the
presence of this protein on the surface of the bacteria relying on radioactive penicillin. Then, in a
subsequent study, a fluorescent derivative of penicillin V was synthesized, called Bocillin FL (Zhao,
Meier et al. 1999). More precisely, a bodipy group was grafted on the R position of the general ß-
Chapter II Strategies used for influx/efflux measurements
49 / 192
lactam structure (Figure I - 24). This molecule could be tracked, with an excitation set at 488 nm and
an emission band pass filter 530 ± 15 nm are used (Pu, Zhao et al. 2016).
Figure I - 24. Structure of Bocillin FL. Image taken from (Pu, Zhao et al. 2016).
Fortunately, labelling is not always necessary. Drugs like quinolones and tetracyclines (Figure
I - 10, Figure I - 9) present conjugated structures that can indeed be excited and emit fluorescence in
the UV range (Albini and Monti 2003) (Jamme, Villette et al. 2010) (Ammor, Flórez et al. 2006). This
fluorescence is intrinsic to the antibiotic, and the drug now can be detected without necessiting the
introduction of a foreign label that could modify its biolocalization or any of its properties. Hence,
besides mass spectrometry (Phetsang, Pelingon et al. 2016) (Cai, Rose et al. 2009), fluorescence
spectrometry can also be a label-free technique. However, until very recently it was not able to
provide real-time monitoring ─ compare the methods in Section I.1.1 to the ones in Section I.2.1
and I.2.2 of current chapter.
III.1.2. Description of the Telemos epifluorescence microscope
Synchrotron SOLEIL is a third generation machine. The work carried out during my PhD was
performed on the Telemos imaging endstation of the DISCO beamline (see Chapter IV, Section IV.1
for details).
Synchrotron radiation. It is an electromagnetic radiation emitted when charged particles
are accelerated radially, that is, when they are subjected to an acceleration perpendicular to their
velocity vector. The acceleration can be produced by bending magnets, undulators, and/or wigglers.
Such technology usually provides a broad continuous spectrum from far infrared to hard X-rays.
These photons can then be used directly or filtered at a desired wavelength through an optical
element, such as a grating or a crystal monochromator. In general, the following characteristics are
found:
Chapter II Strategies used for influx/efflux measurements
50 / 192
- Synchrotron radiation light is generated in ultra-high vacuum, no pollution is caused by
impurities.
- A synchrotron is a high intensity light source, with high radiated power density. X-rays issued
from a third-generation machine are 108 to 1010 times brighter than the ones coming from a
conventional X-ray machine.
- Light drawn from the bending magnet is almost completely linearly polarized on the electron
orbital plane. In addition, any polarization state can be obtained from a specially designed
element. Such a light source can thus be used to study the orientation of particular
parameters in a sample.
- Synchrotron radiation light is concentrated in a very narrow cone centered around the
direction of the electron movement. It is almost as parallel as in a laser. With such
collimation it is possible to undertake studies on trace elements in very small samples.
- Synchrotron radiation is pulsed. The pulse duration is narrow, being tunable between 10-11
and 10-8 s with a spacing between 10-5 and 10-3 s. Such a feature is very useful to study the
dynamics of physical, chemical, or biological phenomena.
- The electron beam inside the storage ring can live up to about 10 h, leading to a stable beam
position and a good reproducibility.
UV fluorescence microscopy. UV microscopes were first developed by August Köhler and
Moritz von Rohr (Swingle and Briggs 1907). It is known that the resolution of optics is inversely
proportional to the wavelength of light, so when short wavelengths UV are used, the resolution is
improved. As for standard epifluorescence microscope, the light source is generally a mercury-vapor
lamp and the optical path makes use of an excitation filter, a dichroic mirror, and an emission filter.
An important issue encountered in UV microscopy is the transparency of the optical components (e.g.
coverslips and lenses). Most of ordinary glasses absorb a large amount of light under 340 nm, so we
have to use materials such as quartz, which can transmit UV down to 190 nm.
The DISCO beamline uses light ranging from the Vacuum Ultra Violet (VUV) range to the
visible one, i.e. from 180 nm to 700 nm. It performs researches in biochemistry, chemistry, and cell
biology (Jamme, Villette et al. 2010) (Jamme, Kascakova et al. 2013).
When using synchrotron radiation coupled with an epifluorescence microscope, the
excitation wavelength is precisely selected by the line monochromator; therefore, no excitation filter
is required and the wavelength of the excitation photons is very accurately defined. Additionally, the
greatest benefit that we have is the high photon flux. For instance, at the wavelength of 280 nm, the
Chapter II Strategies used for influx/efflux measurements
51 / 192
photon flux reaches 1.6 × 10¹²
beamline).
III.1.3. Specific issues related to UV fluores
Label-free fluorescence microscopy is a powerful tool; however, when applied to our project
two issues have to be discussed.
Autofluorescence. The objects
UV illumination. On one hand,
tyrosine residues, as well as small molecules such as
flavin adenine dinucleotide (FAD
The problem is that there are considerable overlap
25), suggesting that the autofluorescen
quantitative determination of the
channel.
Figure I - 25. (a) Fluorescence emission spectra of
Fluorescence emission spectra of NADH
(b) Fluorescence emission spectra of
excitation wavelengths, from 310 to 390 nm
Toxicity. In the 260 to
absorption. For instance, nucleic
(Cantor and Schimmel 1981).
destruction of the chromosome and thus
of UV sterilization. (Meulemans 1987)
I Strategies used for influx/efflux measurements
12 s-1, this corresponds to 10-5 W power (Data provided by DISCO
Specific issues related to UV fluorescence observation
free fluorescence microscopy is a powerful tool; however, when applied to our project
he objects that we are studying all display natural
, bacteria include autofluorescent proteins having
as well as small molecules such as nicotinamide adenine ainucleotide
FAD); on the other hand, the antibiotic molecules are
considerable overlaps of the excitation and emission
autofluorescence signal issued from the bacteria will perturb the
the fluoroquinolone concentration in the 420
Fluorescence emission spectra of autofluorescent molecules that can be found in bacteria.
NADH excited at 340 nm, FAD at 450 nm, and protoporphyrin IX
mission spectra of ciprofloxacin recorded in phosphate-buffered saline
from 310 to 390 nm. Images taken from (Matchette, Agrawal et al. 2007)
to 320 nm range, some biological substances show a strong s
nucleic bases display strong absorption peaks in the 260 to
This property can be used for detection as well as for specific
destruction of the chromosome and thus alteration of the genetic transcription: this is the prin
(Meulemans 1987).
(Data provided by DISCO
free fluorescence microscopy is a powerful tool; however, when applied to our project
that we are studying all display natural fluorescence under
having tryptophan and
inucleotide (NADH), and
antibiotic molecules are also fluorescent.
and emission peaks (Figure I -
bacteria will perturb the
concentration in the 420 – 480 nm collection
escent molecules that can be found in bacteria.
protoporphyrin IX at 408 nm.
buffered saline using different
(Matchette, Agrawal et al. 2007).
biological substances show a strong specific
260 to 280 nm region
as well as for specific
ation of the genetic transcription: this is the principle
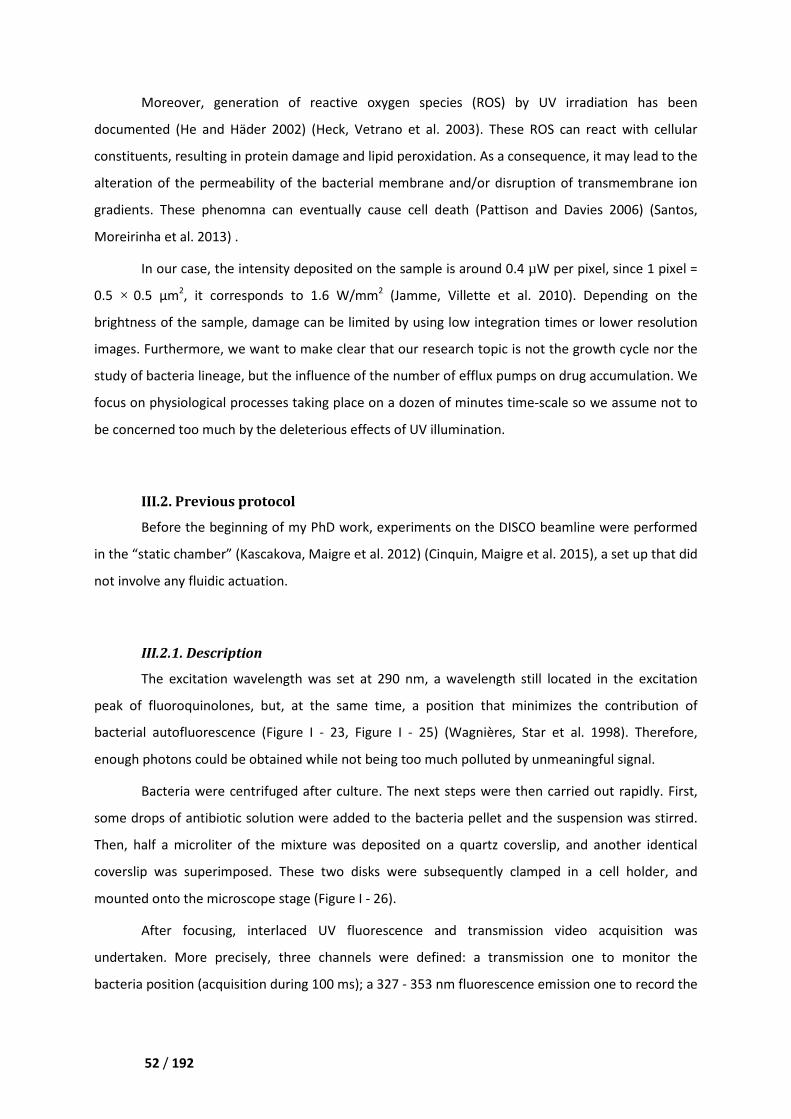
Chapter II Strategies used for influx/efflux measurements
52 / 192
Moreover, generation of reactive oxygen species (ROS) by UV irradiation has been
documented (He and Häder 2002) (Heck, Vetrano et al. 2003). These ROS can react with cellular
constituents, resulting in protein damage and lipid peroxidation. As a consequence, it may lead to the
alteration of the permeability of the bacterial membrane and/or disruption of transmembrane ion
gradients. These phenomna can eventually cause cell death (Pattison and Davies 2006) (Santos,
Moreirinha et al. 2013) .
In our case, the intensity deposited on the sample is around 0.4 µW per pixel, since 1 pixel =
0.5 × 0.5 µm2, it corresponds to 1.6 W/mm2 (Jamme, Villette et al. 2010). Depending on the
brightness of the sample, damage can be limited by using low integration times or lower resolution
images. Furthermore, we want to make clear that our research topic is not the growth cycle nor the
study of bacteria lineage, but the influence of the number of efflux pumps on drug accumulation. We
focus on physiological processes taking place on a dozen of minutes time-scale so we assume not to
be concerned too much by the deleterious effects of UV illumination.
III.2. Previous protocol
Before the beginning of my PhD work, experiments on the DISCO beamline were performed
in the “static chamber” (Kascakova, Maigre et al. 2012) (Cinquin, Maigre et al. 2015), a set up that did
not involve any fluidic actuation.
III.2.1. Description
The excitation wavelength was set at 290 nm, a wavelength still located in the excitation
peak of fluoroquinolones, but, at the same time, a position that minimizes the contribution of
bacterial autofluorescence (Figure I - 23, Figure I - 25) (Wagnières, Star et al. 1998). Therefore,
enough photons could be obtained while not being too much polluted by unmeaningful signal.
Bacteria were centrifuged after culture. The next steps were then carried out rapidly. First,
some drops of antibiotic solution were added to the bacteria pellet and the suspension was stirred.
Then, half a microliter of the mixture was deposited on a quartz coverslip, and another identical
coverslip was superimposed. These two disks were subsequently clamped in a cell holder, and
mounted onto the microscope stage (Figure I - 26).
After focusing, interlaced UV fluorescence and transmission video acquisition was
undertaken. More precisely, three channels were defined: a transmission one to monitor the
bacteria position (acquisition during 100 ms); a 327 - 353 nm fluorescence emission one to record the
Chapter II Strategies used for influx/efflux measurements
53 / 192
autofluorescence (acquisition during
the antibiotic uptake (acquisition
When analyzing the data,
fluorescence signal is an important
deconvolution, thanks to crosstalk coefficient that had previously been measured with a
spectrofluorometry. Importantly, these coefficients have been found to vary during acquisition
because of the induced photochemical reactions. Therefore, data acquired in cu
use and one had to rely on calibration performed by microfluorospectrometry on the microscope
itself. As a conclusion, one can say that crosstalk and bleaching correction was not an easy process.
Figure I - 26. Schematic representation of the previous
time-lapse movies of influx/efflux.
A drop of bacteria mixed with the ant
clamped in the holder, resulting in the so
epifluorescence microscope for monitoring. (
bacteria are acquired in UV fluorescence
(Cinquin, Maigre et al. 2015).
I Strategies used for influx/efflux measurements
during 30 s); and a 420 - 480 nm fluorescence emission one
acquisition during 30 s).
the data, separation the bacterial autofluorescence signal from the
is an important operation. Two spectral channels were to enable this
volution, thanks to crosstalk coefficient that had previously been measured with a
spectrofluorometry. Importantly, these coefficients have been found to vary during acquisition
because of the induced photochemical reactions. Therefore, data acquired in cuvette were of limited
use and one had to rely on calibration performed by microfluorospectrometry on the microscope
itself. As a conclusion, one can say that crosstalk and bleaching correction was not an easy process.
Schematic representation of the previous protocol used at SOLEIL to record UV fluoresce
(a) Antibiotic solution is added to the centrifuged bacteria
the antibiotic is mounted between two coverslips. (c
, resulting in the so-called “static chamber”. (d) The holder is mounted onto the
epifluorescence microscope for monitoring. (e) Images of bacteria are acquired in fluore
acquired in UV fluorescence and analyzed to yield antibiotic uptake curves
emission one to record
signal from the drug
Two spectral channels were to enable this
volution, thanks to crosstalk coefficient that had previously been measured with a
spectrofluorometry. Importantly, these coefficients have been found to vary during acquisition
vette were of limited
use and one had to rely on calibration performed by microfluorospectrometry on the microscope
itself. As a conclusion, one can say that crosstalk and bleaching correction was not an easy process.
used at SOLEIL to record UV fluorescence
bacteria after culture. (b)
s. (c) The two disks are
) The holder is mounted onto the
fluorescence. (e) Images of
curves. Image taken from
Chapter II Strategies used for influx/efflux measurements
54 / 192
III.2.2. Limitations
We found that, although this protocol gave access to some information on antibiotic uptake,
it presented several drawbacks:
- The first minutes of the phenomena were missed because of sample preparation and focus
adjustment. Therefore, the curve reporting on fluorescence intensity versus time was not
complete;
- Bacteria were completely isolated from the external environment, i.e. the one accessible to
the experimentalist. There was no possibility to supply a different antibiotic solution nor to
replace it by buffer. Besides, if the imaging process ran for too long the observation chamber
could eventually dry;
- It was difficult to acquire the background signal, i.e. without antibiotic, because the first
image was taken after uptake had already begun and because the chamber was already filled
with antibiotic. Therefore, if this information was needed another sample had to be prepared.
However, even though bacteria were from the same culture batch, their autofluorescence
could vary because of incertitudes on dilution or on cell mounting.
- The leakage of the bacteria autofluorescence signal into the drug channel, as well as the
different bleaching time between the proteins and the drug, complicated a lot the extraction
of quantitative data.
III.3. Proposed protocol
As a result, we thought of using a microfluidic device, by which the above issues could be
solved one by one:
- Bacteria suspended in buffer are first immobilized in the chamber and the experimentalist
can wait until all parameters are well adjusted before starting the introduction of the
antibiotic;
- Fluid actuation brings the possibility of connecting the observation chamber with the
environment. In such a way, we can control the onset of drug injection but also change the
type of injected solution during the course of an experiment. It thus opens opportunities to
test the response of the same bacteria to different antibiotic concentrations or different
drug/adjuvant mixtures;
- Enough time to get the background information is available between bacteria immobilization
and antibiotic injection;
- Bacteria can be irradiated before the antibiotic solution is introduced, so as to photobleach
their autofluorescence. The latter signal is then no longer mixed into the one of the drug.
Chapter III Design and fabrication of the microdevice
55 / 192
Chapter III. Design and fabrication of the
microdevice
I. Criteria to be fulfilled
An important prerequisite that has to be satisfied before implementing a microfluidic
technology is a clear understanding of the user’s needs, in order to be able to devise microdevices
with the appropriate properties. More specifically, we will address below four technical criteria:
complete cell immobilization, parallel monitoring, quick change of the chemical environment, and
practicity.
I.1. Complete cell immobilization
Even though they can be collectively called “trapping”, motion restriction and complete
immobilization refer to two different notions. More precisely, motion restriction emphasizes on the
fact that bacteria are identifiable and traceable. For instance, when nDEP force is used, one
bacterium is held at the center of an electrode cage, but it can still move and tumble (Fritzsch,
Rosenthal et al. 2013). This trapping method allows bacteria to be identified, to be distinguished
from another one, but the remaining degrees of freedom result in different orientations on each
captured image, or worst in a halo when long-exposure time are used. The first strategy to analyze
data is then to choose a ROI larger than the microorganism, so that automatic analysis of the
fluorescent intensity can be performed. However, too much background signal will be included,
which will degrade the signal-to-noise ratio. The second strategy is to manually select the outlines of
the bacteria on every image to obtain the fluorescence intensity corresponding to this sole in this
Chapter III Design and fabrication of the microdevice
56 / 192
region. However, the size of the selected ROI will vary. Both methods result in imprecise analysis, so
that complete immobilization is the only acceptable way of working for us.
I.2. Parallel monitoring of individual bacteria
We would like to have enough number cells in the same image so that it can permit to collect
as much information as possible. We have adopted time-lapse video acquisition, so it is possible to
analyze independently region-of-interest for each cell by defining appropriate ROI (see Chapter IV,
Section IV.2). However, for this strategy to be effective, we need a microdevice that guarantees an
arrangement of bacteria in monolayer in order to have positioned in the same focal plane.
We must also provide to each cell a similar environment in term of exposure to antibiotics.
Fortunately, E.coli cells are generally well dispersed, especially after stirring, and the NaPi buffer is in
which the cells stay alive, halt the growth and division: those two features prevent bacteria from
gathering into clusters.
I.3. Quick change of the chemical environment
We want to rapidly apply, in series, different compounds (e.g. antibiotics, adjuvants, efflux
pump inhibitors) to bacteria. Thus, we need a clear understanding of the mass transfer regimes.
There are two ways by which a solute can reach bacteria: diffusion and advection. Diffusion is
always present, it is associated with thermal motion. On the contrary, advection can be present or
absent, depending on the experimental conditions. Indeed it is associated with the transport of
matter on a large-scale, for instance by a flowing fluid, it is not always present.
If the characteristic length of the system is denoted l and the diffusion coefficient of the
solute �, the characteristic time associated with diffusion is �� = ��/�. If the characteristic flow
velocity is denoted �, the characteristic time of advection is � = �/�. The ratio of these two times
forms the Péclet number: � = ��/� = ��/� . If � < 1 , diffusive effects are predominant;
conversely, if � > 1, advective transport takes a higher importance.
Our goal is to design a device and the corresponding experimental protocol. By playing on
the different geometrical structures we can manipulate the flow rates and the hydrodynamic
resistances for each compartment. Similarly, we have a direct control on the overall applied flow rate.
Therefore, we can define the respective importance of advection and diffusion, with the limitation
that thermal motion is always the ultimate phenomenon ensuring mixing.
Chapter III Design and fabrication of the microdevice
57 / 192
I.4. Practicity
Most microfluidic chips are usually disposable because they are fabricated by bonding a
PDMS stamp with a SiO2 substrate, which makes them difficult to clean and recycle. We mentioned
that all optical components for UV microscope are in quartz to minimize absorption, one of the
limitations faced while conceiving the device was that the fragile 170 µm thick quartz coverslips are
ordered from a supplier located in the USA, and that the delivery cycle is very long (2 months for 200
pieces). In addition, the cost of quartz is high. As a consequence, these two constrains are hardly
compatible with the daily consumption of the laboratory, and requirements for a reusable device
were strong.
Reusability infers that the production of this device should be easy to assemble and
disassemble. Indeed, microbiology laboratories lack clean room facilities.
II. Existing technologies
Microfluidic chips have become an attractive tool for biology over the past 20 years, for
reviews on early developments, see (Tabeling 2006), (Whitesides 2006), (Janasek, Franzke et al.
2006), (Psaltis, Quake et al. 2006), (Craighead 2006), (deMello 2006), (El-Ali, Sorger et al. 2006), and
(Yager, Edwards et al. 2006). With the help of advanced microfabrication techniques (Xia and
Whitesides 1998), (Voldman, Gray et al. 1999), researchers have developed many platforms and
devices to capture, manipulate, monitor, and analyze different types of cells. Depending on the
object being studied, devices are designed at different scales. More precisely, for eukaryotic cells,
which are from ten to several tens of microns large, channels and chambers have a size ranging from
a few microns to hundreds of microns. Conversely, the development of chips is a considerable
challenge for smaller cells such as bacteria, which are motile and difficult to trap. In the following
part, I will analyze the articles that have been published on the latter topic and analyze the features
of the reported techniques with respect to the criteria introduced in the preceding section.
II.1. Electromagnetic trapping
II.1.1. Dielectrophoresis
Dielectrophoresis (DEP) is a phenomenon in which a force is exerted on a dielectric particle
when it is subjected to a non-uniform electric field (Pohl 1978). This force does not require the
particle to be charged, it just needs to have a dielectric constant different from the one of the
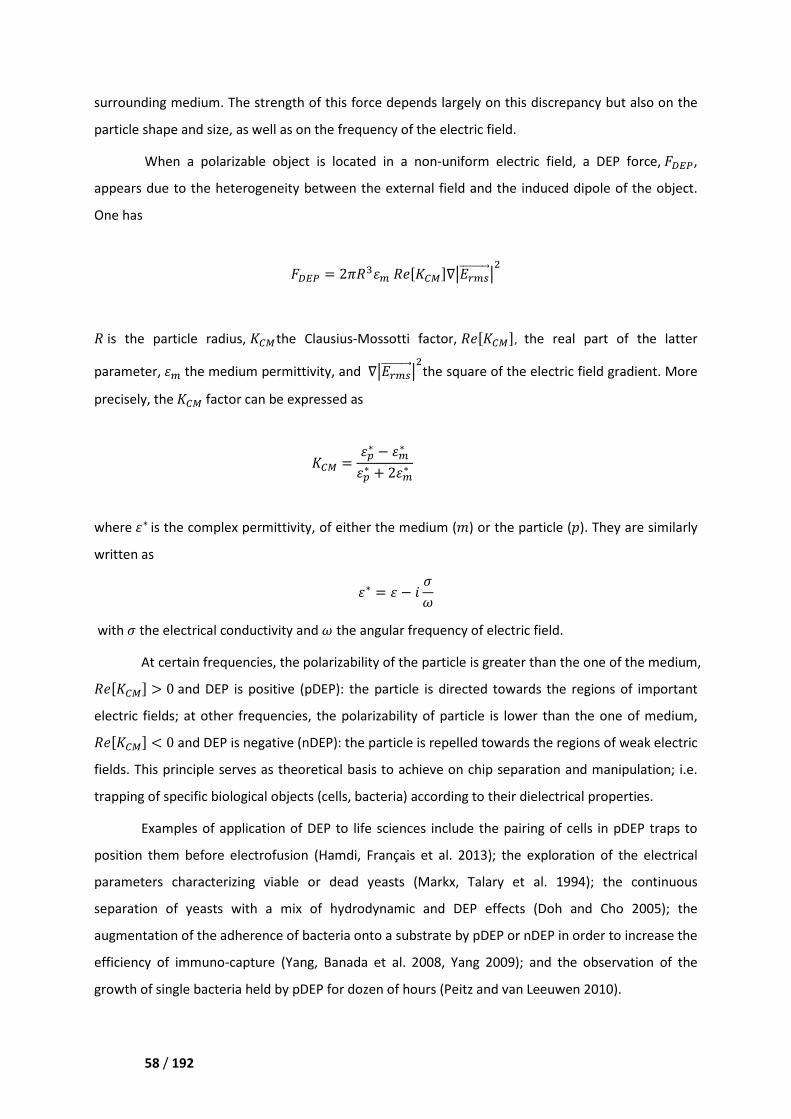
Chapter III Design and fabrication of the microdevice
58 / 192
surrounding medium. The strength of this force depends largely on this discrepancy but also on the
particle shape and size, as well as on the frequency of the electric field.
When a polarizable object is located in a non-uniform electric field, a DEP force, ����,
appears due to the heterogeneity between the external field and the induced dipole of the object.
One has
���� = 2����� �������∇� !�"#########$��
� is the particle radius, ���the Clausius-Mossotti factor, �������, the real part of the latter
parameter, �� the medium permittivity, and ∇� !�"#########$��the square of the electric field gradient. More
precisely, the ��� factor can be expressed as
��� = �%∗ − ��∗�%∗ + 2��∗
where �∗ is the complex permittivity, of either the medium ()) or the particle (*). They are similarly
written as
�∗ = � − + ,-
with , the electrical conductivity and - the angular frequency of electric field.
At certain frequencies, the polarizability of the particle is greater than the one of the medium,
������� > 0 and DEP is positive (pDEP): the particle is directed towards the regions of important
electric fields; at other frequencies, the polarizability of particle is lower than the one of medium,
������� < 0 and DEP is negative (nDEP): the particle is repelled towards the regions of weak electric
fields. This principle serves as theoretical basis to achieve on chip separation and manipulation; i.e.
trapping of specific biological objects (cells, bacteria) according to their dielectrical properties.
Examples of application of DEP to life sciences include the pairing of cells in pDEP traps to
position them before electrofusion (Hamdi, Français et al. 2013); the exploration of the electrical
parameters characterizing viable or dead yeasts (Markx, Talary et al. 1994); the continuous
separation of yeasts with a mix of hydrodynamic and DEP effects (Doh and Cho 2005); the
augmentation of the adherence of bacteria onto a substrate by pDEP or nDEP in order to increase the
efficiency of immuno-capture (Yang, Banada et al. 2008, Yang 2009); and the observation of the
growth of single bacteria held by pDEP for dozen of hours (Peitz and van Leeuwen 2010).
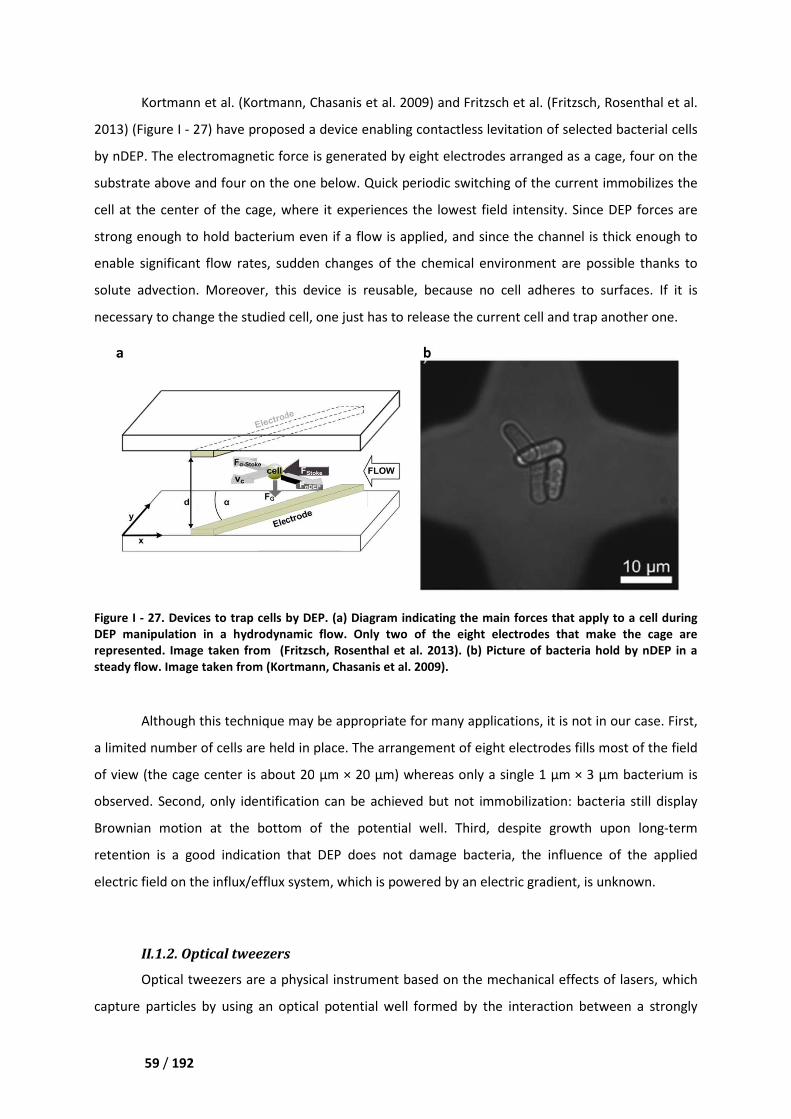
Chapter III Design and fabrication of the microdevice
59 / 192
Kortmann et al. (Kortmann, Chasanis et al. 2009)
2013) (Figure I - 27) have proposed a device enabling contactless levitation of
by nDEP. The electromagnetic force is generated by eight electrodes arranged
substrate above and four on the one
cell at the center of the cage, where it experiences the lowest field intensity. Sin
strong enough to hold bacterium
enable significant flow rates, sudden change
solute advection. Moreover, this device
necessary to change the studied
Figure I - 27. Devices to trap cells by DEP
DEP manipulation in a hydrodynamic flow.
represented. Image taken from (Fritzsch, Rosenthal et al. 2013)
steady flow. Image taken from (Kortmann, Chasanis et al. 2009)
Although this technique may be appropriate for many application
a limited number of cells are held in place
of view (the cage center is about 20
observed. Second, only identification
Brownian motion at the bottom of the potential
retention is a good indication that DEP
electric field on the influx/efflux system, which is powered by an electric gradient, is unknown.
II.1.2. Optical tweezers
Optical tweezers are a physical instrument based on the mechanical effects of lasers, which
capture particles by using an optical potential well
II Design and fabrication of the microdevice
(Kortmann, Chasanis et al. 2009) and Fritzsch et al. (Fritzsch, Rosenthal et al.
proposed a device enabling contactless levitation of selected
force is generated by eight electrodes arranged as a
on the one below. Quick periodic switching of the current
center of the cage, where it experiences the lowest field intensity. Sin
to hold bacterium even if a flow is applied, and since the channel is thick enough to
sudden changes of the chemical environment are possible thanks to
Moreover, this device is reusable, because no cell adheres
the studied cell, one just has to release the current cell and
to trap cells by DEP. (a) Diagram indicating the main forces that apply to a cell during
DEP manipulation in a hydrodynamic flow. Only two of the eight electrodes that
(Fritzsch, Rosenthal et al. 2013). (b) Picture of bacteria
(Kortmann, Chasanis et al. 2009).
Although this technique may be appropriate for many applications, it is not in our case. First
s are held in place. The arrangement of eight electrodes
of view (the cage center is about 20 µm × 20 µm) whereas only a single 1 µm
nly identification can be achieved but not immobilization:
at the bottom of the potential well. Third, despite growth
s a good indication that DEP does not damage bacteria, the influence of the applied
electric field on the influx/efflux system, which is powered by an electric gradient, is unknown.
eezers
are a physical instrument based on the mechanical effects of lasers, which
ing an optical potential well formed by the interaction between
(Fritzsch, Rosenthal et al.
selected bacterial cells
as a cage, four on the
current immobilizes the
center of the cage, where it experiences the lowest field intensity. Since DEP forces are
the channel is thick enough to
the chemical environment are possible thanks to
res to surfaces. If it is
cell and trap another one.
ng the main forces that apply to a cell during
electrodes that make the cage are
bacteria hold by nDEP in a
, it is not in our case. First,
. The arrangement of eight electrodes fills most of the field
× 3 µm bacterium is
bacteria still display
Third, despite growth upon long-term
, the influence of the applied
electric field on the influx/efflux system, which is powered by an electric gradient, is unknown.
are a physical instrument based on the mechanical effects of lasers, which
formed by the interaction between a strongly
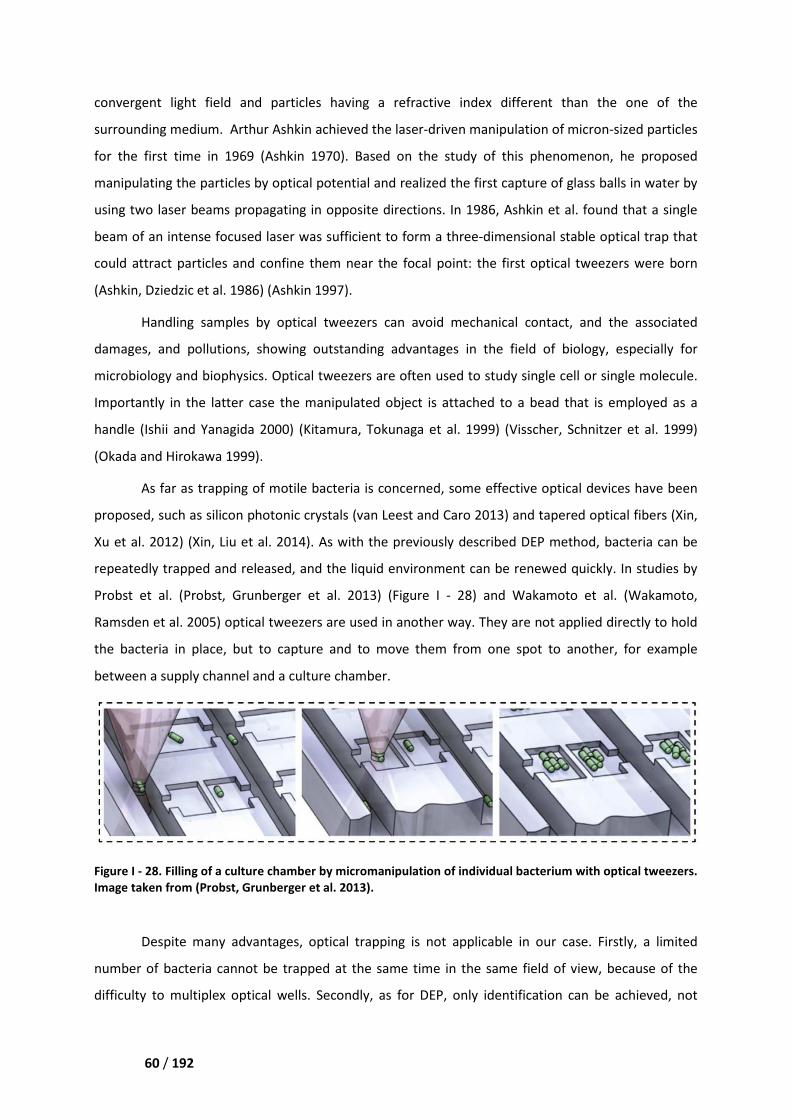
Chapter III Design and fabrication of the microdevice
60 / 192
convergent light field and particles having a refractive index different than the one of the
surrounding medium. Arthur Ashkin achieved the laser-driven manipulation of micron-sized particles
for the first time in 1969 (Ashkin 1970). Based on the study of this phenomenon, he proposed
manipulating the particles by optical potential and realized the first capture of glass balls in water by
using two laser beams propagating in opposite directions. In 1986, Ashkin et al. found that a single
beam of an intense focused laser was sufficient to form a three-dimensional stable optical trap that
could attract particles and confine them near the focal point: the first optical tweezers were born
(Ashkin, Dziedzic et al. 1986) (Ashkin 1997).
Handling samples by optical tweezers can avoid mechanical contact, and the associated
damages, and pollutions, showing outstanding advantages in the field of biology, especially for
microbiology and biophysics. Optical tweezers are often used to study single cell or single molecule.
Importantly in the latter case the manipulated object is attached to a bead that is employed as a
handle (Ishii and Yanagida 2000) (Kitamura, Tokunaga et al. 1999) (Visscher, Schnitzer et al. 1999)
(Okada and Hirokawa 1999).
As far as trapping of motile bacteria is concerned, some effective optical devices have been
proposed, such as silicon photonic crystals (van Leest and Caro 2013) and tapered optical fibers (Xin,
Xu et al. 2012) (Xin, Liu et al. 2014). As with the previously described DEP method, bacteria can be
repeatedly trapped and released, and the liquid environment can be renewed quickly. In studies by
Probst et al. (Probst, Grunberger et al. 2013) (Figure I - 28) and Wakamoto et al. (Wakamoto,
Ramsden et al. 2005) optical tweezers are used in another way. They are not applied directly to hold
the bacteria in place, but to capture and to move them from one spot to another, for example
between a supply channel and a culture chamber.
Figure I - 28. Filling of a culture chamber by micromanipulation of individual bacterium with optical tweezers.
Image taken from (Probst, Grunberger et al. 2013).
Despite many advantages, optical trapping is not applicable in our case. Firstly, a limited
number of bacteria cannot be trapped at the same time in the same field of view, because of the
difficulty to multiplex optical wells. Secondly, as for DEP, only identification can be achieved, not
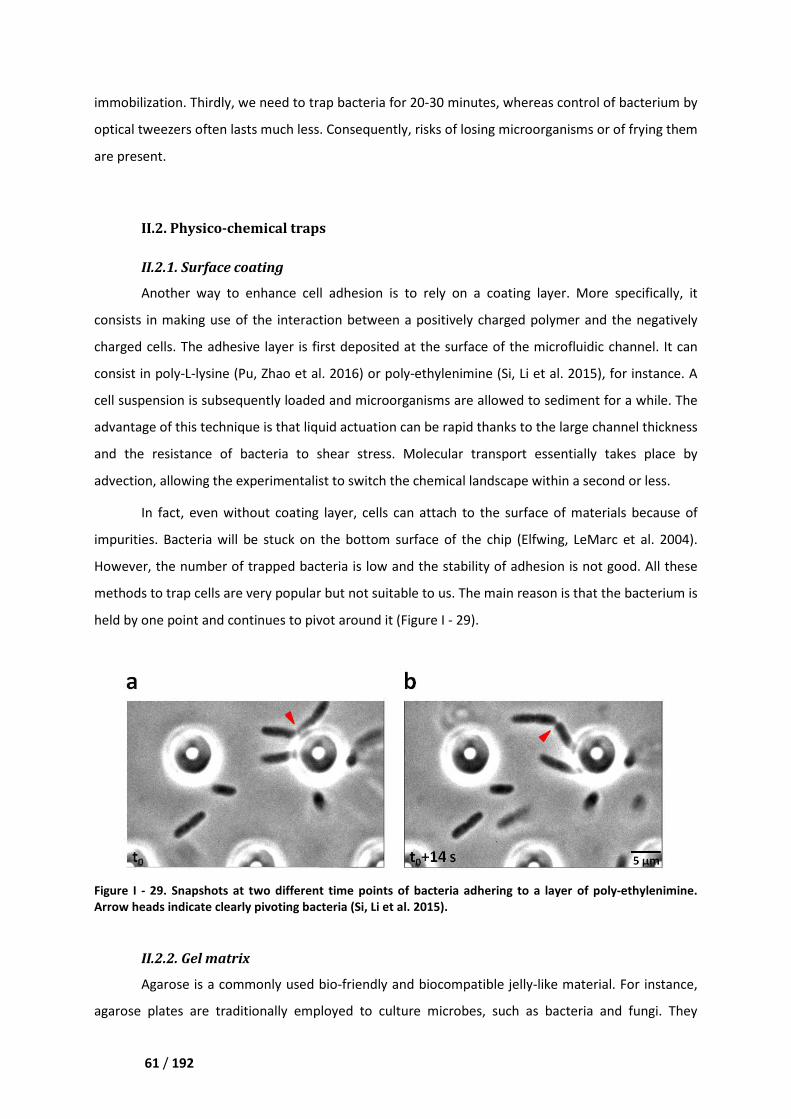
Chapter III Design and fabrication of the microdevice
61 / 192
immobilization. Thirdly, we need to trap
optical tweezers often lasts much
are present.
II.2. Physico-chemical
II.2.1. Surface coating
Another way to enhance cell adhesion is t
consists in making use of the interaction between
charged cells. The adhesive layer
consist in poly-L-lysine (Pu, Zhao et al. 2016)
cell suspension is subsequently loaded
advantage of this technique is th
and the resistance of bacteria
advection, allowing the experiment
In fact, even without coating layer, cell
impurities. Bacteria will be stuck on the bottom surface of the
However, the number of trapped
methods to trap cells are very popular
held by one point and continues to pivot around
Figure I - 29. Snapshots at two different
Arrow heads indicate clearly pivoting bacteria
II.2.2. Gel matrix
Agarose is a commonly used bio
agarose plates are traditionally
II Design and fabrication of the microdevice
ed to trap bacteria for 20-30 minutes, whereas control
much less. Consequently, risks of losing microorganisms or of frying the
hemical traps
enhance cell adhesion is to rely on a coating layer.
the interaction between a positively charged polymer and
layer is first deposited at the surface of the microflu
(Pu, Zhao et al. 2016) or poly-ethylenimine (Si, Li et al. 2015)
loaded and microorganisms are allowed to sediment
is that liquid actuation can be rapid thanks to the large channel thickness
bacteria to shear stress. Molecular transport essentially takes place by
rimentalist to switch the chemical landscape within a second or less.
In fact, even without coating layer, cells can attach to the surface of material
Bacteria will be stuck on the bottom surface of the chip (Elfwing, LeMarc et al. 2004)
trapped bacteria is low and the stability of adhesion is
very popular but not suitable to us. The main reason is that the bacterium is
int and continues to pivot around it (Figure I - 29).
different time points of bacteria adhering to a layer
ng bacteria (Si, Li et al. 2015).
used bio-friendly and biocompatible jelly-like m
traditionally employed to culture microbes, such as bacteria and fungi.
control of bacterium by
microorganisms or of frying them
More specifically, it
positively charged polymer and the negatively
the microfluidic channel. It can
(Si, Li et al. 2015), for instance. A
diment for a while. The
thanks to the large channel thickness
Molecular transport essentially takes place by
in a second or less.
attach to the surface of materials because of
(Elfwing, LeMarc et al. 2004).
is not good. All these
but not suitable to us. The main reason is that the bacterium is
of bacteria adhering to a layer of poly-ethylenimine.
like material. For instance,
culture microbes, such as bacteria and fungi. They
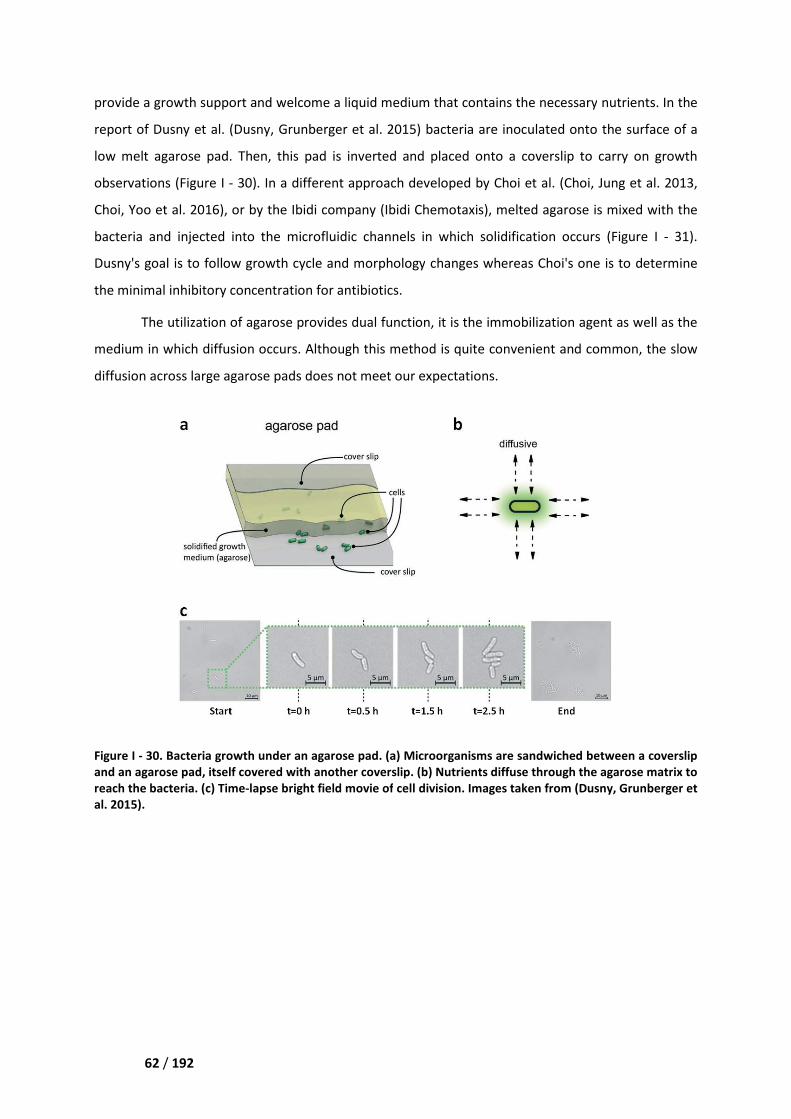
Chapter III Design and fabrication of the microdevice
62 / 192
provide a growth support and welcome
report of Dusny et al. (Dusny, Grunberger et al. 2015)
low melt agarose pad. Then, this
observations (Figure I - 30). In a different approach
Choi, Yoo et al. 2016), or by the Ibidi com
bacteria and injected into the
Dusny's goal is to follow growth cycle and morphology
the minimal inhibitory concentration
The utilization of agarose provides dual function, it
medium in which diffusion occurs.
diffusion across large agarose pads
Figure I - 30. Bacteria growth under an agarose pad. (a)
and an agarose pad, itself covered with a
reach the bacteria. (c) Time-lapse bright field movie of
al. 2015).
II Design and fabrication of the microdevice
welcome a liquid medium that contains the necessary
(Dusny, Grunberger et al. 2015) bacteria are inoculated onto the surface of
this pad is inverted and placed onto a coverslip to carry on growth
In a different approach developed by Choi et al. (Choi, Jung et al. 2013,
by the Ibidi company (Ibidi Chemotaxis), melted agarose
microfluidic channels in which solidification occurs
growth cycle and morphology changes whereas Choi's
oncentration for antibiotics.
he utilization of agarose provides dual function, it is the immobilization agent as well as the
medium in which diffusion occurs. Although this method is quite convenient and co
pads does not meet our expectations.
under an agarose pad. (a) Microorganisms are sandwiched between
with another coverslip. (b) Nutrients diffuse through the agarose matrix to
lapse bright field movie of cell division. Images taken from
necessary nutrients. In the
acteria are inoculated onto the surface of a
p to carry on growth
(Choi, Jung et al. 2013,
agarose is mixed with the
occurs (Figure I - 31).
Choi's one is to determine
immobilization agent as well as the
nvenient and common, the slow
andwiched between a coverslip
(b) Nutrients diffuse through the agarose matrix to
taken from (Dusny, Grunberger et
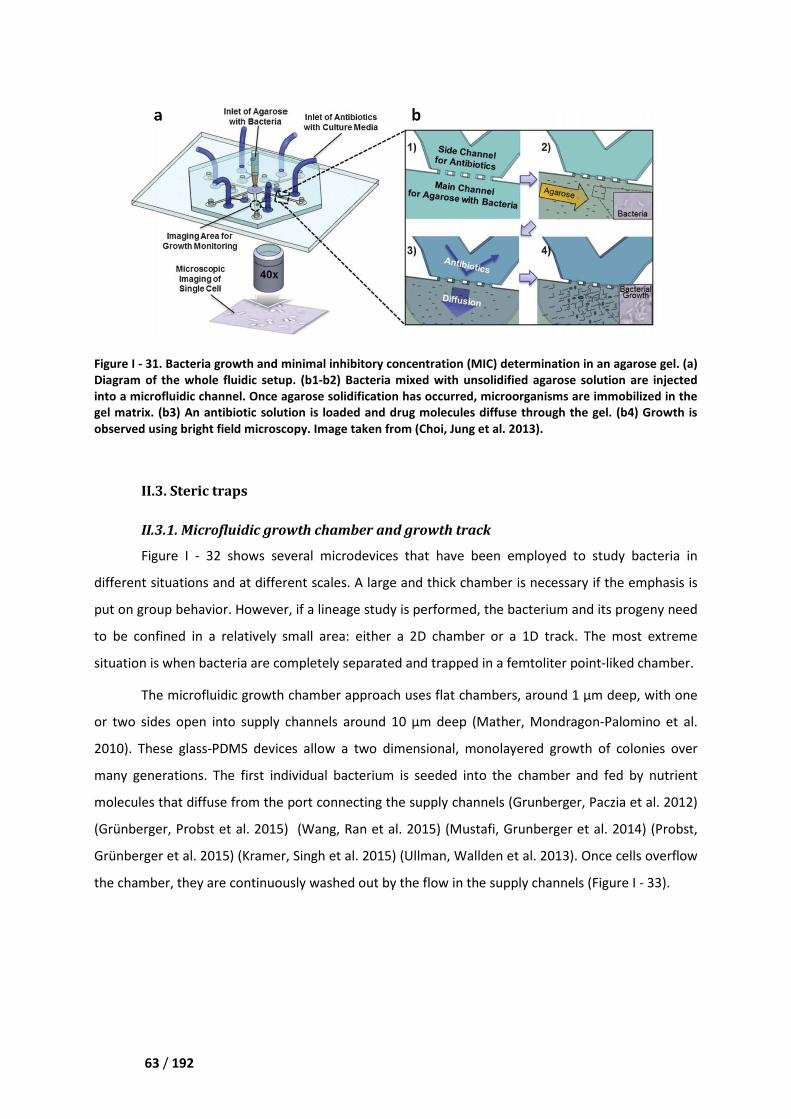
Chapter III Design and fabrication of the microdevice
63 / 192
Figure I - 31. Bacteria growth and minimal inhibitory concentration (MIC)
Diagram of the whole fluidic setup. (b1
into a microfluidic channel. Once agarose solidification has occurred, microorganisms are immobilized in the
gel matrix. (b3) An antibiotic solution is loaded and
observed using bright field microscopy
II.3. Steric traps
II.3.1. Microfluidic growth chamber
Figure I - 32 shows several microdevices that
different situations and at different scales. A large
put on group behavior. However,
to be confined in a relatively small area:
situation is when bacteria are completely separate
The microfluidic growth chamber
or two sides open into supply channels
2010). These glass-PDMS device
many generations. The first individual bacterium is seeded into the chamber and fed by nutrient
molecules that diffuse from the
(Grünberger, Probst et al. 2015)
Grünberger et al. 2015) (Kramer, Singh et al. 2015)
the chamber, they are continuously
II Design and fabrication of the microdevice
. Bacteria growth and minimal inhibitory concentration (MIC) determination
up. (b1-b2) Bacteria mixed with unsolidified agarose solution are injected
microfluidic channel. Once agarose solidification has occurred, microorganisms are immobilized in the
solution is loaded and drug molecules diffuse through th
observed using bright field microscopy. Image taken from (Choi, Jung et al. 2013).
icrofluidic growth chamber and growth track
shows several microdevices that have been employed
at different scales. A large and thick chamber is necessary if the emphasis is
However, if a lineage study is performed, the bacterium and its progeny need
to be confined in a relatively small area: either a 2D chamber or a 1D track. The most extreme
completely separated and trapped in a femtoliter point
icrofluidic growth chamber approach uses flat chambers, around 1
y channels around 10 µm deep (Mather, Mondragon
PDMS devices allow a two dimensional, monolayered grow
many generations. The first individual bacterium is seeded into the chamber and fed by nutrient
the port connecting the supply channels (Grunberger, Paczia et al. 2012)
(Grünberger, Probst et al. 2015) (Wang, Ran et al. 2015) (Mustafi, Grunberger et al
(Kramer, Singh et al. 2015) (Ullman, Wallden et al. 2013)
are continuously washed out by the flow in the supply channels (
determination in an agarose gel. (a)
fied agarose solution are injected
microfluidic channel. Once agarose solidification has occurred, microorganisms are immobilized in the
iffuse through the gel. (b4) Growth is
to study bacteria in
chamber is necessary if the emphasis is
bacterium and its progeny need
1D track. The most extreme
r point-liked chamber.
around 1 µm deep, with one
ndragon-Palomino et al.
growth of colonies over
many generations. The first individual bacterium is seeded into the chamber and fed by nutrient
(Grunberger, Paczia et al. 2012)
(Mustafi, Grunberger et al. 2014) (Probst,
(Ullman, Wallden et al. 2013). Once cells overflow
in the supply channels (Figure I - 33).
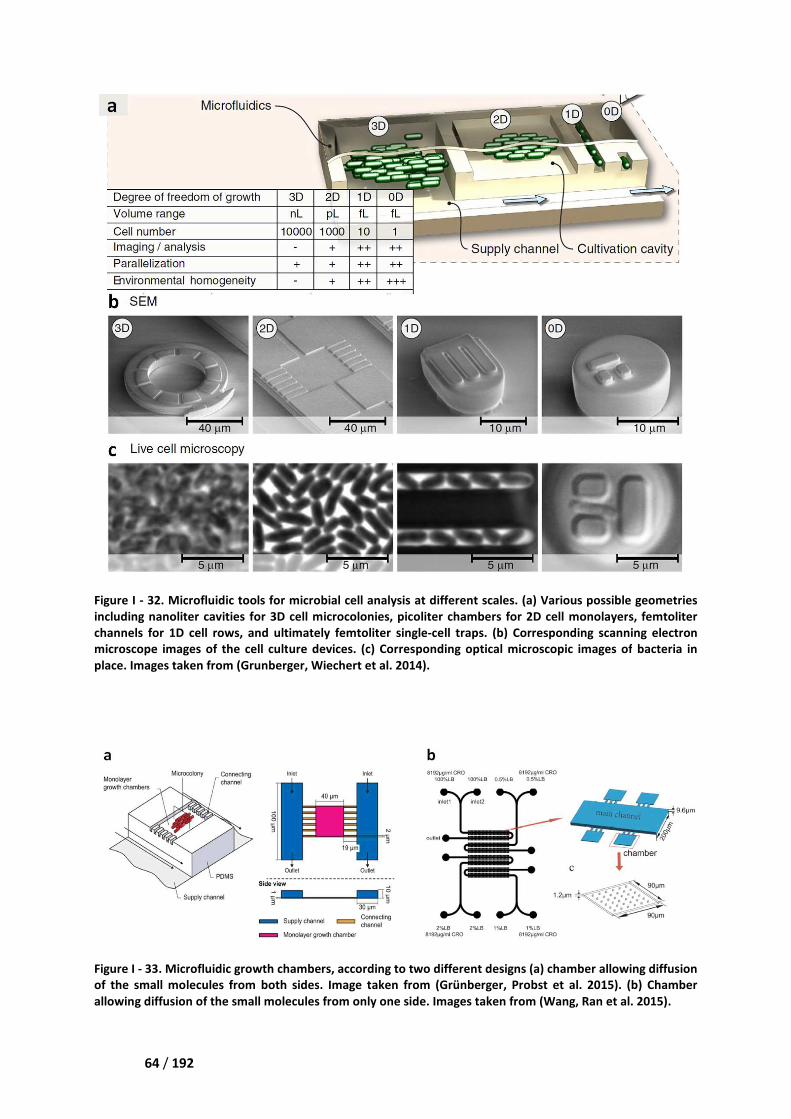
Chapter III Design and fabrication of the microdevice
64 / 192
Figure I - 32. Microfluidic tools for microbial cell analysis
including nanoliter cavities for 3D
channels for 1D cell rows, and ultimately femtolit
microscope images of the cell cult
place. Images taken from (Grunberger, Wiechert et al. 2014)
Figure I - 33. Microfluidic growth chamber
of the small molecules from both sides
allowing diffusion of the small molecules from only one s
II Design and fabrication of the microdevice
for microbial cell analysis at different scales. (a) Various
nanoliter cavities for 3D cell microcolonies, picoliter chambers for 2D cell monolayer
and ultimately femtoliter single-cell traps. (b) Corresponding
cell culture devices. (c) Corresponding optical microscopic images of
(Grunberger, Wiechert et al. 2014).
Microfluidic growth chambers, according to two different designs (a) chamber allowing
from both sides. Image taken from (Grünberger, Probst et al. 2015)
molecules from only one side. Images taken from (Wang, Ran et al. 2015)
arious possible geometries
monolayers, femtoliter
Corresponding scanning electron
ptical microscopic images of bacteria in
chamber allowing diffusion
(Grünberger, Probst et al. 2015). (b) Chamber
(Wang, Ran et al. 2015).
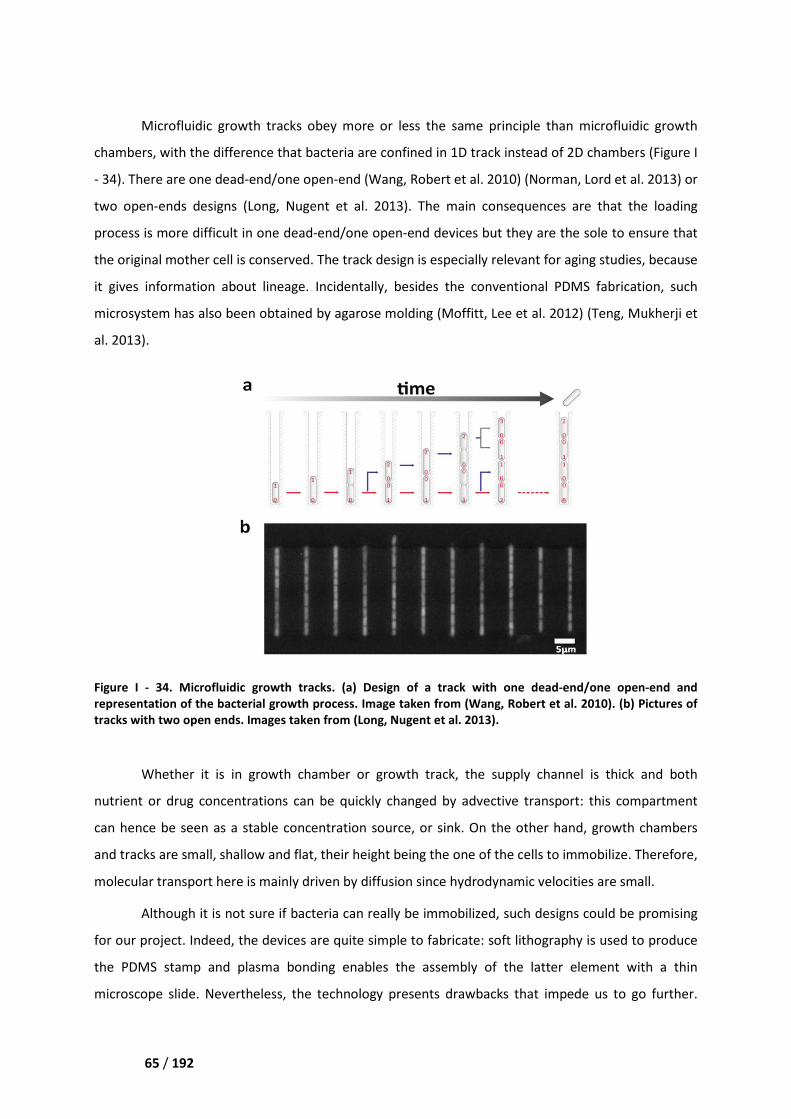
Chapter III Design and fabrication of the microdevice
65 / 192
Microfluidic growth tracks obey
chambers, with the difference that
- 34). There are one dead-end/one open
two open-ends designs (Long, Nugent et al. 2013)
process is more difficult in one dead
the original mother cell is conserved
it gives information about lineage.
microsystem has also been obtained by
al. 2013).
Figure I - 34. Microfluidic growth tracks
representation of the bacterial growth process
tracks with two open ends. Images taken from
Whether it is in growth chamber
nutrient or drug concentrations
can hence be seen as a stable concentration source
and tracks are small, shallow and flat
molecular transport here is mainly
Although it is not sure if bacteria can really be immobilized, such design
for our project. Indeed, the devices are quite simple
the PDMS stamp and plasma
microscope slide. Nevertheless, the technology presents drawbacks
II Design and fabrication of the microdevice
Microfluidic growth tracks obey more or less the same principle than microfluidic growth
chambers, with the difference that bacteria are confined in 1D track instead of 2D chamber
one open-end (Wang, Robert et al. 2010) (Norman, Lord et al. 2013)
(Long, Nugent et al. 2013). The main consequences are
one dead-end/one open-end devices but they are the sole to ensure that
conserved. The track design is especially relevant for aging stud
information about lineage. Incidentally, besides the conventional PDMS fabrication
been obtained by agarose molding (Moffitt, Lee et al. 2012)
Microfluidic growth tracks. (a) Design of a track with one dead-end
the bacterial growth process. Image taken from (Wang, Robert et al. 2010)
ages taken from (Long, Nugent et al. 2013).
growth chamber or growth track, the supply channel
s can be quickly changed by advective transport
concentration source, or sink. On the other hand, g
small, shallow and flat, their height being the one of the cells to immobilize.
mainly driven by diffusion since hydrodynamic velocities
it is not sure if bacteria can really be immobilized, such design
devices are quite simple to fabricate: soft lithography
bonding enables the assembly of the latter element
less, the technology presents drawbacks that impede us to go
than microfluidic growth
of 2D chambers (Figure I
(Norman, Lord et al. 2013) or
are that the loading
devices but they are the sole to ensure that
aging studies, because
esides the conventional PDMS fabrication, such
(Moffitt, Lee et al. 2012) (Teng, Mukherji et
end/one open-end and
(Wang, Robert et al. 2010). (b) Pictures of
upply channel is thick and both
advective transport: this compartment
or sink. On the other hand, growth chambers
to immobilize. Therefore,
velocities are small.
it is not sure if bacteria can really be immobilized, such designs could be promising
soft lithography is used to produce
enables the assembly of the latter element with a thin
that impede us to go further.
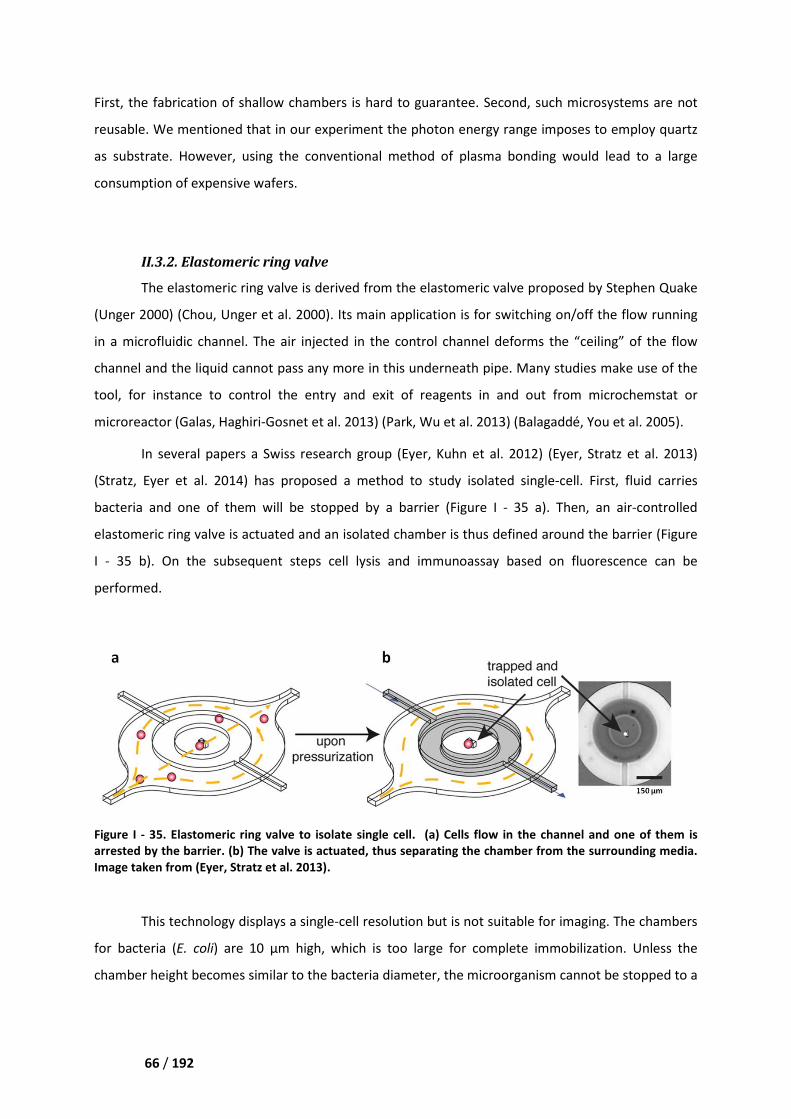
Chapter III Design and fabrication of the microdevice
66 / 192
First, the fabrication of shallow chamber
reusable. We mentioned that in o
as substrate. However, using the
consumption of expensive wafers
II.3.2. Elastomeric ring valve
The elastomeric ring valve i
(Unger 2000) (Chou, Unger et al. 2000)
in a microfluidic channel. The air inject
channel and the liquid cannot pass
tool, for instance to control the
microreactor (Galas, Haghiri-Gosnet et al. 2013)
In several papers a Swiss research group
(Stratz, Eyer et al. 2014) has propose
bacteria and one of them will be stopped by a barrier (
elastomeric ring valve is actuated
I - 35 b). On the subsequent
performed.
Figure I - 35. Elastomeric ring valve to isolate single cell
arrested by the barrier. (b) The valve is actuated, thus
Image taken from (Eyer, Stratz et al. 2013)
This technology displays a
for bacteria (E. coli) are 10 µm
chamber height becomes similar to the bacteria
II Design and fabrication of the microdevice
fabrication of shallow chambers is hard to guarantee. Second, such microsystems are
that in our experiment the photon energy range imposes t
the conventional method of plasma bonding would
expensive wafers.
lastomeric ring valve
The elastomeric ring valve is derived from the elastomeric valve proposed by Steph
(Chou, Unger et al. 2000). Its main application is for switching on/off
air injected in the control channel deforms the
pass any more in this underneath pipe. Many studies
the entry and exit of reagents in and out from
Gosnet et al. 2013) (Park, Wu et al. 2013) (Balagaddé, You et al. 2005)
a Swiss research group (Eyer, Kuhn et al. 2012) (Eyer, Stratz et al. 2013)
proposed a method to study isolated single-cell.
will be stopped by a barrier (Figure I - 35 a). Then
ed and an isolated chamber is thus defined around the barrier
steps cell lysis and immunoassay based on fluore
Elastomeric ring valve to isolate single cell. (a) Cells flow in the channel
valve is actuated, thus separating the chamber from the surrounding
(Eyer, Stratz et al. 2013).
s a single-cell resolution but is not suitable for imagi
µm high, which is too large for complete immobiliz
ecomes similar to the bacteria diameter, the microorganism cannot be
cond, such microsystems are not
energy range imposes to employ quartz
would lead to a large
roposed by Stephen Quake
on/off the flow running
deforms the “ceiling” of the flow
Many studies make use of the
and out from microchemstat or
(Balagaddé, You et al. 2005).
(Eyer, Stratz et al. 2013)
cell. First, fluid carries
). Then, an air-controlled
an isolated chamber is thus defined around the barrier (Figure
based on fluorescence can be
channel and one of them is
the surrounding media.
not suitable for imaging. The chambers
immobilization. Unless the
cannot be stopped to a
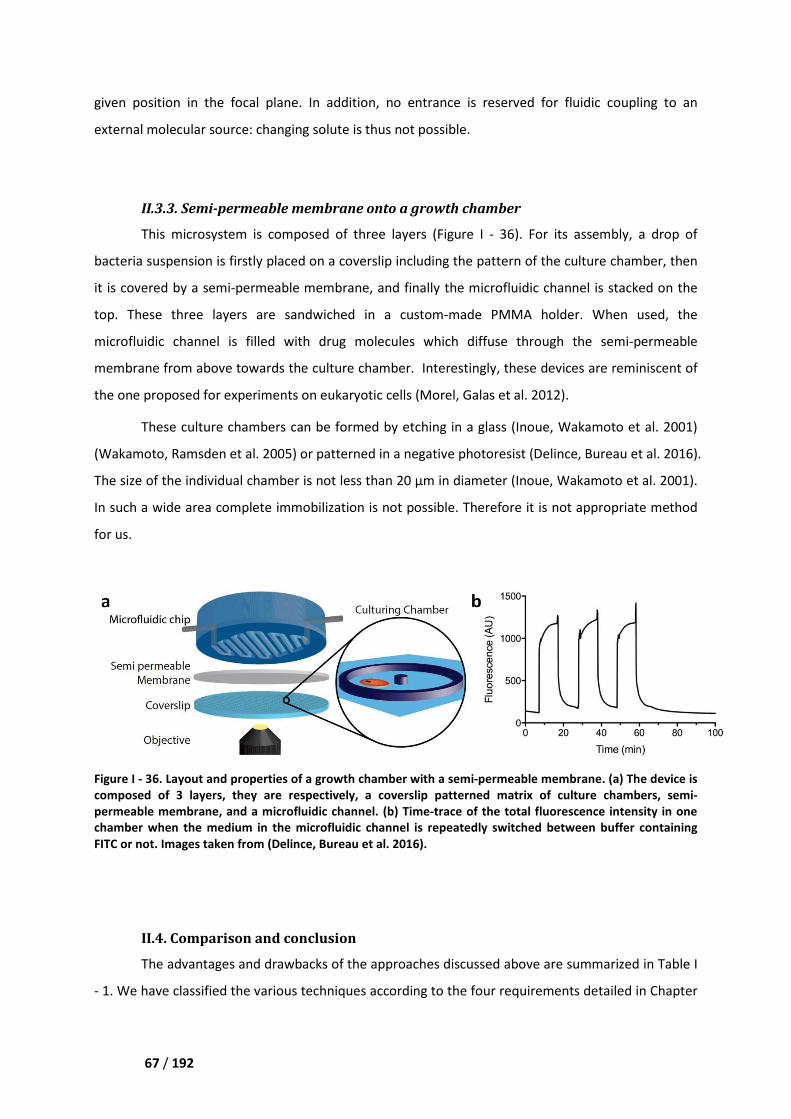
Chapter III Design and fabrication of the microdevice
67 / 192
given position in the focal plane.
external molecular source: changing
II.3.3. Semi-permeable
This microsystem is composed
bacteria suspension is firstly placed on
it is covered by a semi-permeable membrane, and finally th
top. These three layers are sandwiched in a custom
microfluidic channel is filled with drug molecules
membrane from above towards
the one proposed for experiments on eukaryotic cells
These culture chambers c
(Wakamoto, Ramsden et al. 2005)
The size of the individual chamber is not less than 20
In such a wide area complete immobilization
for us.
Figure I - 36. Layout and properties of a growth chamber with a semi
composed of 3 layers, they are respectively
permeable membrane, and a microfluidic channel
chamber when the medium in the microfluidic channel
FITC or not. Images taken from (Delince, Bureau et al. 2016)
II.4. Comparison and conclusion
The advantages and drawbacks of
- 1. We have classified the various techniques a
II Design and fabrication of the microdevice
plane. In addition, no entrance is reserved for fluidic
changing solute is thus not possible.
permeable membrane onto a growth chamber
mposed of three layers (Figure I - 36). For its assembl
bacteria suspension is firstly placed on a coverslip including the pattern of the culture chamber, then
permeable membrane, and finally the microfluidic channel is
layers are sandwiched in a custom-made PMMA holder.
l is filled with drug molecules which diffuse through the semi
the culture chamber. Interestingly, these devices are
the one proposed for experiments on eukaryotic cells (Morel, Galas et al. 2012).
ulture chambers can be formed by etching in a glass (Inoue, Wakamoto et al. 2001)
(Wakamoto, Ramsden et al. 2005) or patterned in a negative photoresist (Delince, Bureau et al. 2016)
individual chamber is not less than 20 µm in diameter (Inoue, Wakamoto et al. 2001)
immobilization is not possible. Therefore it is not appropriate method
and properties of a growth chamber with a semi-permeable membrane
3 layers, they are respectively, a coverslip patterned matrix of culture chambers
microfluidic channel. (b) Time-trace of the total fluorescence
in the microfluidic channel is repeatedly switched between
(Delince, Bureau et al. 2016).
Comparison and conclusion
advantages and drawbacks of the approaches discussed above are summarized
e various techniques according to the four requirements
fluidic coupling to an
ts assembly, a drop of
culture chamber, then
e microfluidic channel is stacked on the
made PMMA holder. When used, the
diffuse through the semi-permeable
Interestingly, these devices are reminiscent of
(Inoue, Wakamoto et al. 2001)
(Delince, Bureau et al. 2016).
(Inoue, Wakamoto et al. 2001).
Therefore it is not appropriate method
permeable membrane. (a) The device is
a coverslip patterned matrix of culture chambers, semi-
e total fluorescence intensity in one
between buffer containing
are summarized in Table I
four requirements detailed in Chapter
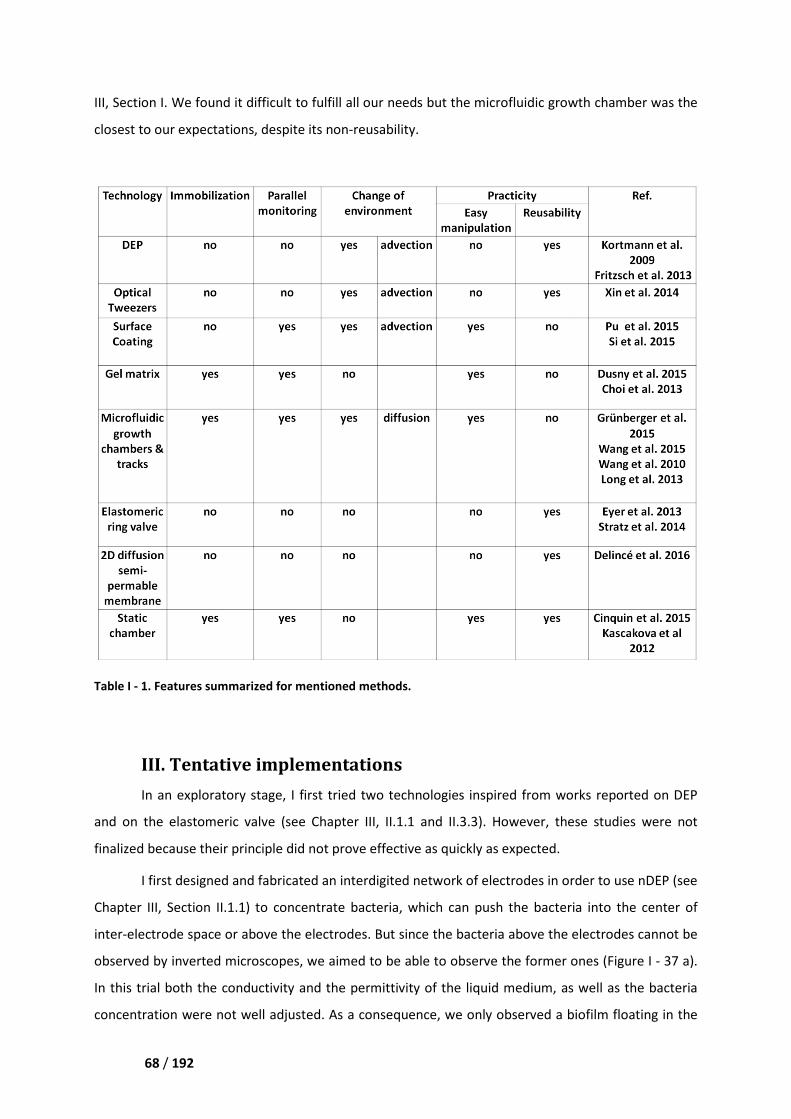
Chapter III Design and fabrication of the microdevice
68 / 192
III, Section I. We found it difficult to
closest to our expectations, despite its
Table I - 1. Features summarized for mentioned methods.
III. Tentative implementations
In an exploratory stage, I first tried tw
and on the elastomeric valve (see
finalized because their principle did not prove effective as quickly as expected.
I first designed and fabricated
Chapter III, Section II.1.1) to concentrate bacteria, which can
inter-electrode space or above the electrodes
observed by inverted microscopes, we aimed to
In this trial both the conductivity and
concentration were not well adjusted. As a consequence,
II Design and fabrication of the microdevice
We found it difficult to fulfill all our needs but the microfluidic growth chamber
despite its non-reusability.
summarized for mentioned methods.
III. Tentative implementations
exploratory stage, I first tried two technologies inspired from works
see Chapter III, II.1.1 and II.3.3). However, these studies
because their principle did not prove effective as quickly as expected.
bricated an interdigited network of electrodes in order to use
concentrate bacteria, which can push the bacteria into the
or above the electrodes. But since the bacteria above the el
observed by inverted microscopes, we aimed to be able to observe the former ones
both the conductivity and the permittivity of the liquid medium, as well as the
not well adjusted. As a consequence, we only observed a biofilm
icrofluidic growth chamber was the
echnologies inspired from works reported on DEP
However, these studies were not
s in order to use nDEP (see
push the bacteria into the center of
But since the bacteria above the electrodes cannot be
former ones (Figure I - 37 a).
as well as the bacteria
biofilm floating in the
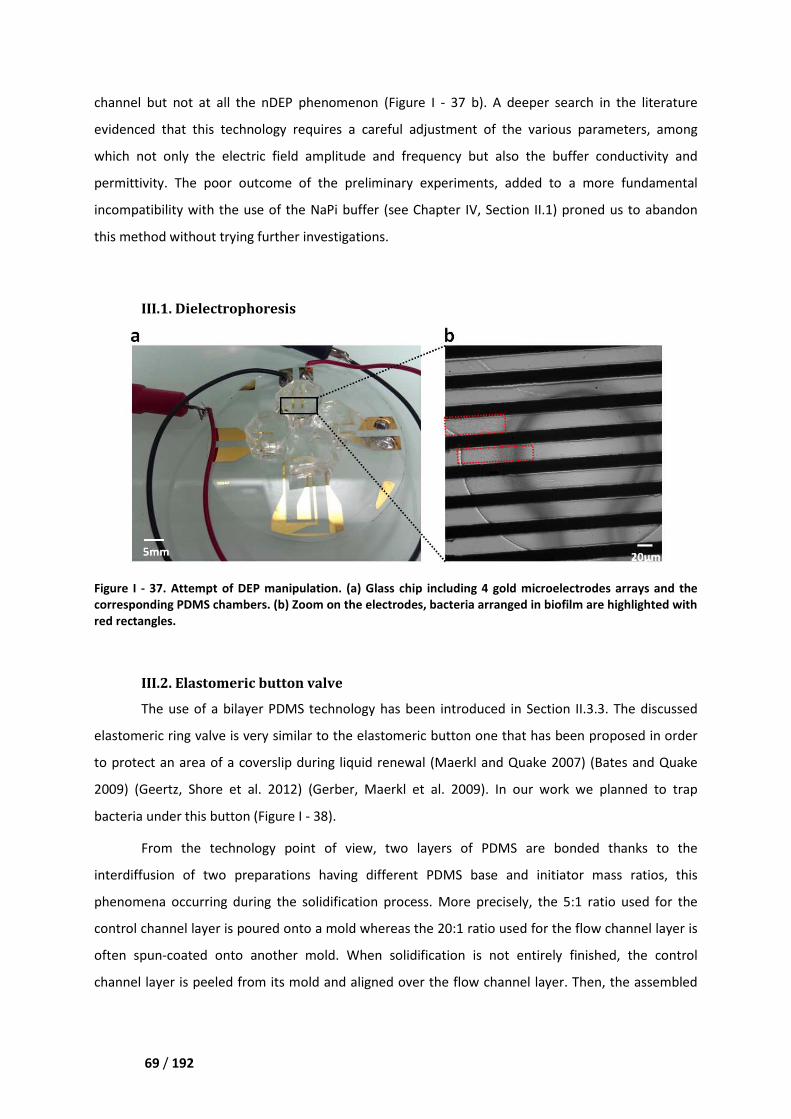
Chapter III Design and fabrication of the microdevice
69 / 192
channel but not at all the nDEP
evidenced that this technology
which not only the electric field
permittivity. The poor outcome of the preliminary experiment
incompatibility with the use of the NaPi buffer (see Chapter IV,
this method without trying further investigations.
III.1. Dielectrophoresis
Figure I - 37. Attempt of DEP manipulation. (a) Glass chip includ
corresponding PDMS chambers. (b) Zoom on the electrodes, bacteria arranged in biofilm are highlighted with
red rectangles.
III.2. Elastomeric button valve
The use of a bilayer PDMS technology
elastomeric ring valve is very similar to
to protect an area of a coverslip
2009) (Geertz, Shore et al. 2012)
bacteria under this button (Figure I
From the technology point of view, t
interdiffusion of two preparation
phenomena occurring during the solidifi
control channel layer is poured onto a mold whereas th
often spun-coated onto another
channel layer is peeled from its
II Design and fabrication of the microdevice
nDEP phenomenon (Figure I - 37 b). A deeper search in the literature
evidenced that this technology requires a careful adjustment of the various
electric field amplitude and frequency but also the buffer conductivity and
permittivity. The poor outcome of the preliminary experiments, added to a more fundamental
h the use of the NaPi buffer (see Chapter IV, Section II.1) proned us to abandon
this method without trying further investigations.
Dielectrophoresis
EP manipulation. (a) Glass chip including 4 gold microelectrodes arrays and
mbers. (b) Zoom on the electrodes, bacteria arranged in biofilm are highlighted with
Elastomeric button valve
layer PDMS technology has been introduced in Section II.3.3
very similar to the elastomeric button one that has been proposed in order
an area of a coverslip during liquid renewal (Maerkl and Quake 2007)
(Geertz, Shore et al. 2012) (Gerber, Maerkl et al. 2009). In our work we planned to trap
Figure I - 38).
From the technology point of view, two layers of PDMS are bonded
interdiffusion of two preparations having different PDMS base and initiator mass ratios, this
during the solidification process. More precisely, the 5:
oured onto a mold whereas the 20:1 ratio used for the
another mold. When solidification is not entirely finished,
mold and aligned over the flow channel layer. T
b). A deeper search in the literature
areful adjustment of the various parameters, among
amplitude and frequency but also the buffer conductivity and
, added to a more fundamental
II.1) proned us to abandon
ing 4 gold microelectrodes arrays and the
mbers. (b) Zoom on the electrodes, bacteria arranged in biofilm are highlighted with
Section II.3.3. The discussed
that has been proposed in order
(Maerkl and Quake 2007) (Bates and Quake
In our work we planned to trap
wo layers of PDMS are bonded thanks to the
itiator mass ratios, this
5:1 ratio used for the
the flow channel layer is
s not entirely finished, the control
Then, the assembled
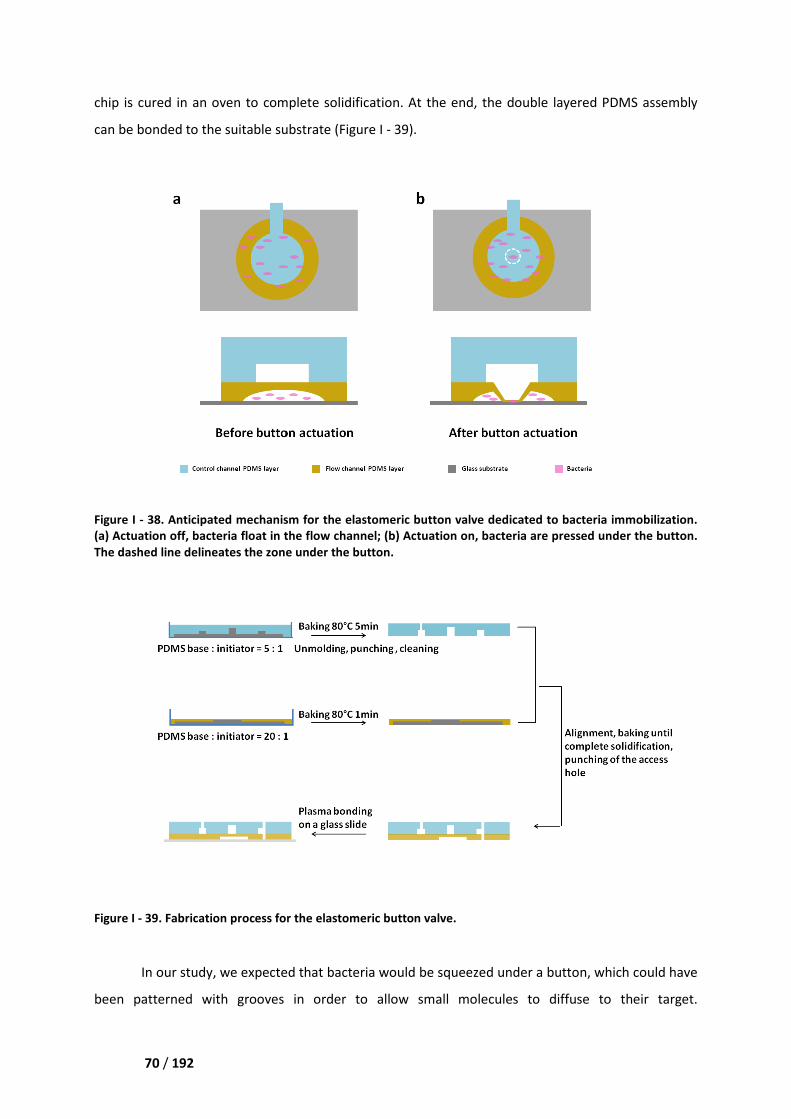
Chapter III Design and fabrication of the microdevice
70 / 192
chip is cured in an oven to complete solidification.
can be bonded to the suitable substrate (
Figure I - 38. Anticipated mechanism for the elastomeric button valve dedicated to bacteria immobilization
(a) Actuation off, bacteria float in the flow channel; (b) Actuation on, bacteria are pressed under the button.
The dashed line delineates the zone under the
Figure I - 39. Fabrication process for the elastomeric button
In our study, we expected
been patterned with grooves in order to allow small molecules to diffuse to their target.
II Design and fabrication of the microdevice
oven to complete solidification. At the end, the double layered PDMS ass
bonded to the suitable substrate (Figure I - 39).
Anticipated mechanism for the elastomeric button valve dedicated to bacteria immobilization
a float in the flow channel; (b) Actuation on, bacteria are pressed under the button.
delineates the zone under the button.
Fabrication process for the elastomeric button valve.
ed that bacteria would be squeezed under a button, which could have
been patterned with grooves in order to allow small molecules to diffuse to their target.
he double layered PDMS assembly
Anticipated mechanism for the elastomeric button valve dedicated to bacteria immobilization.
a float in the flow channel; (b) Actuation on, bacteria are pressed under the button.
button, which could have
been patterned with grooves in order to allow small molecules to diffuse to their target.
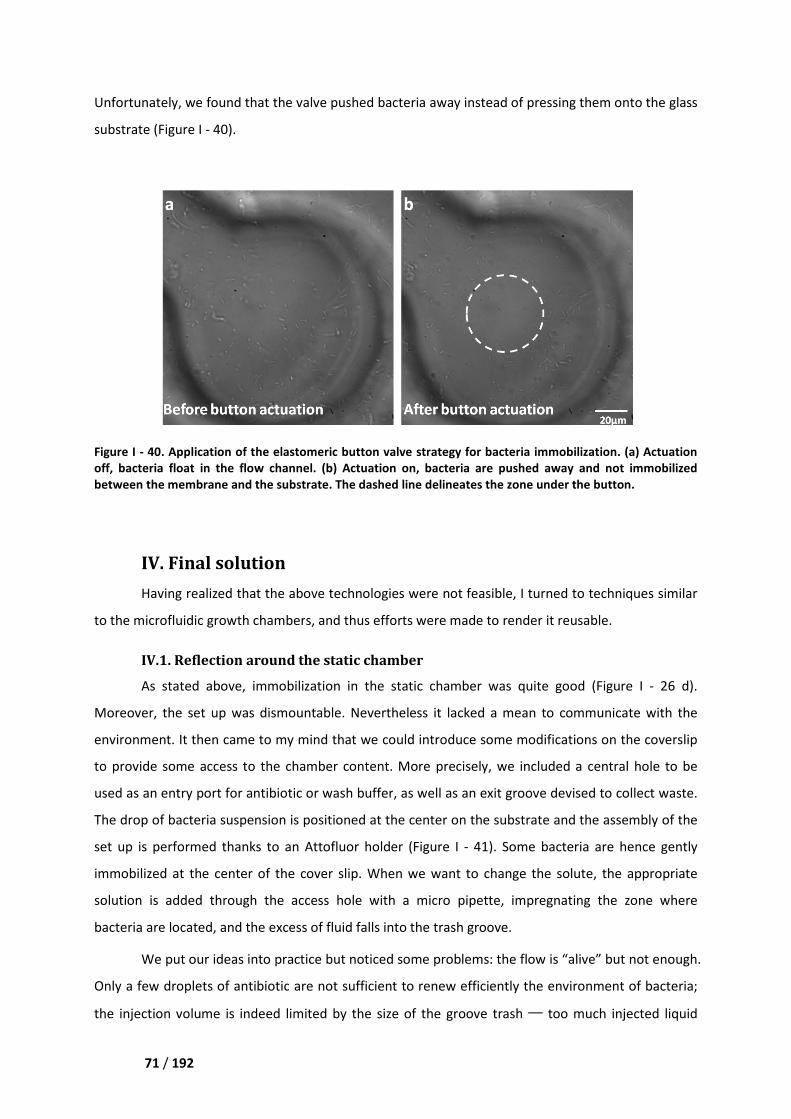
Chapter III Design and fabrication of the microdevice
71 / 192
Unfortunately, we found that the
substrate (Figure I - 40).
Figure I - 40. Application of the elastomeric button valve strategy for bacteria immobilization. (a) Actuation
off, bacteria float in the flow channel. (b)
between the membrane and the substrate. The dashed line
IV. Final solution
Having realized that the above technolog
to the microfluidic growth chamber
IV.1. Reflection around the static chamber
As stated above, immobilization
Moreover, the set up was dismountable
environment. It then came to my mind
to provide some access to the chamber conte
used as an entry port for antibiotic or wash buffer
The drop of bacteria suspension
set up is performed thanks to an
immobilized at the center of the
solution is added through the access hole
bacteria are located, and the excess
We put our ideas into practice
Only a few droplets of antibiotic
the injection volume is indeed limit
II Design and fabrication of the microdevice
the valve pushed bacteria away instead of pressing
Application of the elastomeric button valve strategy for bacteria immobilization. (a) Actuation
off, bacteria float in the flow channel. (b) Actuation on, bacteria are pushed away and not immobilized
between the membrane and the substrate. The dashed line delineates the zone under the button
alized that the above technologies were not feasible, I turned to
microfluidic growth chambers, and thus efforts were made to render it reusable
Reflection around the static chamber
immobilization in the static chamber was quite good
dismountable. Nevertheless it lacked a mean to communicate with
my mind that we could introduce some modifications on
to the chamber content. More precisely, we included
used as an entry port for antibiotic or wash buffer, as well as an exit groove devised to collect waste.
of bacteria suspension is positioned at the center on the substrate and
an Attofluor holder (Figure I - 41). Some bacteria are
the cover slip. When we want to change the solute, the
the access hole with a micro pipette, impregnating
excess of fluid falls into the trash groove.
practice but noticed some problems: the flow is “a
of antibiotic are not sufficient to renew efficiently the environment of bacteria
limited by the size of the groove trash ─ too much
instead of pressing them onto the glass
Application of the elastomeric button valve strategy for bacteria immobilization. (a) Actuation
Actuation on, bacteria are pushed away and not immobilized
delineates the zone under the button.
turned to techniques similar
reusable.
was quite good (Figure I - 26 d).
to communicate with the
some modifications on the coverslip
a central hole to be
groove devised to collect waste.
and the assembly of the
bacteria are hence gently
solute, the appropriate
impregnating the zone where
“alive” but not enough.
the environment of bacteria;
oo much injected liquid
Chapter III Design and fabrication of the microdevice
72 / 192
injection results in backflow. In addition,
touching the setup might cause one to lose focus.
Figure I - 41. Diagram for the “improve
substrate. (b) Addition of the antibiotic
dashed line in (a).
IV.2. Design of the flow device
Inspired from the former
flow device is consistent with the
II.3.1): imposing a constant external
the bacteria trapped in a thin observation chamber, both component being connected to each other
(Figure I - 42 a, b)(Westerwalbesloh, Grünberger et al. 2015)
height is not defined by features in the
42 a, b). The immobilization process is thus similar to the one
II Design and fabrication of the microdevice
In addition, the solution change has to be done
setup might cause one to lose focus.
“improved static chamber”. (a) Immobilization of bacteria
Addition of the antibiotic solution through the entry port. (c) Zoomed cross
flow device
Inspired from the former attempt, I have designed a new microsystem.
consistent with the one of the microfluidic growth chamber (see Chapter III,
a constant external concentration source in thick supply channel
trapped in a thin observation chamber, both component being connected to each other
(Westerwalbesloh, Grünberger et al. 2015). However, in our case,
features in the PDMS stamp, but by the bacteria that act as spacers
. The immobilization process is thus similar to the one used in the previous static
ne with a pipette and
of bacteria at the center of the
. (c) Zoomed cross-section along the
. The concept of this
(see Chapter III, Section
in thick supply channels and maintaining
trapped in a thin observation chamber, both component being connected to each other
However, in our case, the chamber
act as spacers (Figure I -
the previous static chamber.
Chapter III Design and fabrication of the microdevice
73 / 192
Figure I - 42. Diagrams for the flow device. (
thickness of the supply channels and the one of the bacteria cha
channels, it quickly renews their conte
bacteria chamber. (c) The four parts of this d
chamber lid, and the bottom substrate. The buffer droplet containi
to be deposited on the bottom substrate before assembl
There are 4 parts in the
170 µm called the “bottom substrate”; a little
“observation chamber lid”; another
channel lid”, and finally a piece of PDMS
watertight “top gasket”.
IV.3. Compliance with the requirements
The flow device, i.e. the final solution
requirements:
- Immobilization: In the
“observation chamber lid” were two 1
II Design and fabrication of the microdevice
the flow device. (a) Cross-section emphasizing on the contrast between the
and the one of the bacteria chamber. (b) Once the liquid enters the supply
ir contents, providing an external concentration source
our parts of this device, i.e. the gasket, the supply channel lid,
ottom substrate. The buffer droplet containing the bacteria is also represented
to be deposited on the bottom substrate before assembling.
device (Figure I - 42 c): conventional 1 inch quartz wafer of thickness
ottom substrate”; a little 3 mm × 2 mm piece of 350 µm thick quartz called the
ervation chamber lid”; another 7 mm × 4 mm piece of 350 µm thick quartz that
and finally a piece of PDMS with a cavity of 7 mm × 4 mm × 0.68
IV.3. Compliance with the requirements
the final solution we propose, can meet the 4 aforementioned
the static chamber, the equivalents of the “botto
“observation chamber lid” were two 1 inch quartz wafers. We know that, the larger the
section emphasizing on the contrast between the
) Once the liquid enters the supply
source for diffusion into the
supply channel lid, the observation
bacteria is also represented: it has
quartz wafer of thickness
350 µm thick quartz called the
that serves as “supply
mm that serves as a
can meet the 4 aforementioned
er, the equivalents of the “bottom substrate” and
quartz wafers. We know that, the larger the
Chapter III Design and fabrication of the microdevice
74 / 192
surface of the coverslip is
to stress and curvature, resulting in
43). As a consequence bacteria are not well immobilized
the coverslips is reduced, there is more possibility to form a
homogeneous height in
observation chamber lid is reduced to 3 mm × 2 mm.
that case it would also be
- Parallel monitoring: As stated before,
was satisfactory (Figure I
individual bacteria to achieve parallel monitoring is
controlled than flow seeding
tweezers seeding (Probst, Grunberger et al. 2013)
obtain easily cells that are well
positioned.
Figure I - 43. Influence of the quartz pieces
Bacteria chamber used in the flow device.
- Change of the solute in the chamber
easily wetted by water and thus
bubble.
- Practicity: No complicated pattern design
involved. The assembly of the
without any bonding. Hence,
IV.4. Fabrication protocols
Figure I - 44 introduces all the
II Design and fabrication of the microdevice
is, the more likely we have to face incomplete planarity
, resulting in an interspace which height is superior to
bacteria are not well immobilized. Conversely, if t
is reduced, there is more possibility to form a thin chamber with a
homogeneous height in which bacteria are immobilized tightly. Here the size of
observation chamber lid is reduced to 3 mm × 2 mm. Of course it could be still smaller, but
it would also be more difficulty to fabricate and manipulate.
s stated before, the distribution of cells in the previous static chamber
Figure I - 26 d). With the use of an appropriate
individual bacteria to achieve parallel monitoring is thus feasible. O
flow seeding (Grünberger, Probst et al. 2015) and simpler than
(Probst, Grunberger et al. 2013) (Wakamoto, Ramsden et al. 2005)
that are well dispersed and isolated when the observation chamber lid is
Influence of the quartz pieces curvature on the immobilization. (a) Previous static
hamber used in the flow device.
Change of the solute in the chamber: Quartz is used for the supply channels.
easily wetted by water and thus fluid filling and exchange is achieved without observing any
mplicated pattern design nor tedious fabrication process
of the different parts is realized by screwing of the POCmini
ng. Hence, a convenient and reusable device has been developed.
Fabrication protocols
introduces all the parts needed to produce the flow device.
planarity matching due
is superior to 1 µm (Figure I -
if the surface of one of
thin chamber with a
Here the size of the present
be still smaller, but in
e previous static chamber
appropriate density, isolation of
Our strategy is more
simpler than optical
(Wakamoto, Ramsden et al. 2005); we
dispersed and isolated when the observation chamber lid is
revious static chamber. (b)
the supply channels. This material is
e is achieved without observing any
nor tedious fabrication process (see Section IV.4) is
by screwing of the POCmini-2 holder,
reusable device has been developed.
Chapter III Design and fabrication of the microdevice
75 / 192
Figure I - 44. Device micromachining
lithography and of the 4 different parts which assembly yields the final microsystem: the PDMS top gasket
and the 3 quartz parts. (b) Temporary asse
wafer to ensure the total cutting of the quartz wafer.
Top gasket molding. The PDMS
without any micro-size pattern.
methacrylate) sheet by a milling using a
mm in diameter drill (Performance Micro Tool, USA).
soap bath with ultra-sound.
PDMS base and initiator
degassed, put in oven of 70 °C
diameter, are manually punched at both ends of
Supply channel and observation
sawn in a 350 µm thick substrate,
saw (model 8003; ESEC, Switzerland)
noteworthy that, prior to sawing, the
and not installed directly onto the
Cleaning. After dicing, the
bath at 90 °C. The quartz pieces
isopropanol bath with ultra-soun
II Design and fabrication of the microdevice
hining. (a) Picture of the PMMA mold used to fabricate the top gasket by soft
lithography and of the 4 different parts which assembly yields the final microsystem: the PDMS top gasket
Temporary assembly used during quartz dicing. The blade must enter in the silicon
wafer to ensure the total cutting of the quartz wafer.
he PDMS gasket is a simple rectangular cavity. It is
pattern. The corresponding mold is fabricated on a PMMA (
a milling using a Mini-Mill/GX (Minitech Machinery Corporation, USA) and a
(Performance Micro Tool, USA). The machined PMMA mold
initiator are mixed with a 10:1 mass ratio and poured onto the mold,
C, and incubated for 2 h. The access hole and exit hole
nually punched at both ends of the cavity.
Supply channel and observation chamber lids dicing. Small dimension quartz
substrate, which is of the same material than the bottom substrate
ESEC, Switzerland) is used, with a resin blade running at 25 000 rpm. It is
sawing, the 350 μm quartz wafer is stuck onto a silicon
directly onto the holder which ensures a total vertical cut (Figure I
the intermediate sticky wax layer is removed in a
quartz pieces released from the silicon wafer are then gathered and
nd, and finally dried under a nitrogen gas flow.
to fabricate the top gasket by soft
lithography and of the 4 different parts which assembly yields the final microsystem: the PDMS top gasket
must enter in the silicon
. It is large and deep,
a PMMA (poly-methyl
ech Machinery Corporation, USA) and a 1
The machined PMMA mold is then cleaned in
poured onto the mold,
access hole and exit hole, 4 mm in
mall dimension quartz pieces are
bottom substrate. A dicing
resin blade running at 25 000 rpm. It is
silicon one with sticky wax
Figure I - 44 b).
moved in a trichloroethylene
gathered and cleaned in an

Chapter III Design and fabrication of the microdevice
76 / 192
All quartz parts are reusable. After use in a microbiology experiment, their surface is
scrubbed in a 2 % Hellmanex III detergent solution and rinse with deionized water. The substrate
and lids are next soaked in an ethanol bath, and finally dried with precision Kimtech Science wipes.
Chapter IV Description of an experiment step by step
77 / 192
Chapter IV. Description of an experiment step
by step
I. Bacteria culture
I.1. Experiments on the BL21 (DE3) strain
For the sake of accessibility and practicity, the commercial and non-pathogenic E. coli strain
BL21 (DE3) (cat. C2527H, New England BioLabs, USA) is used to characterize the microfluidic device.
As received 50 µL tubes are stored at -80 °C. They correspond to competent cells but this detail is
assumed to have no incidence on our results. The culture is initiated by inoculating 4 mL of Luria-
Bertani broth (LB, Sigma-Aldrich, USA) contained in a plastic cultivation tube with 25 µL of stock
bacteria. Growth takes place at 37 °C for about 3 h on a rotary shaker at 180 rpm, until reaching an
optical density of ~ 0.6 at 600 nm, which roughly corresponds to the mid-exponential phase. Then,
this bacteria solution is centrifuged in 2 tubes at 3000 g, 20 °C, for 15 min and the supernatant is
discarded. Both aliquots are then kept on ice.
I.2. Experiments on the AG100/AG100A/AG102 strains
The E. coli AG100, AG100A, and AG102 laboratory strain (Viveiros, Jesus et al. 2005) (Okusu,
Ma et al. 1996) are provided by our collaborators from the UMR-MD1 laboratory in Marseille and the
culture is performed using their protocol.
A pre-culture is initiated the night before the experiment: a colony being picked up from the
agar pad with an oese and used to inoculate 2-3 mL of LB broth contained in a 15 mL culture tube. A
rotary shaker keeps aerating the medium at 37°C, 160 rpm, overnight (about 8 h). The next day, 20
µL of pre-culture are transferred in 20 mL of LB broth contained in a 100 mL Erlenmeyer flask, and
Chapter IV Description of an experiment step by step
78 / 192
shaking is performed at 37°C, 160 rpm for about 3 h. When OD600 ~ 0.6 the culture is stopped and
bacteria are centrifuged at 3000 g, 20 °C for 15 min. The supernatant is discarded and the
microorganisms are re-suspended in 10 times less (i.e. usually 1.9 mL) NaPi buffer (see below).
Subsequently, 100 µL of the new mixture are diluted into 1 mL of buffer to measure the OD600 value,
at this time, it should equal to 0.06. The remaining 1.8 mL is divided in 120 µL aliquots which are
centrifuged at 3000 g, 20 °C, for 15 min. After removal of the supernatant, these tubes are kept on
ice until needed.
II. Reagent preparation
II.1. NaPi Buffer
NaPi is the buffer used to suspend bacteria, to dilute drug, and to wash bacteria from drug. It
is actually a phosphate buffer supplemented with MgCl2. In such buffer bacteria growth is halted but
microorganisms remain alive. Furthermore, the components in this buffer are simple, under our
imaging conditions these chemicals do not add fluorescence.
Preparing NaPi 50mM pH 7 necessitates to first prepare the following 3 solutions:
(A) NaH2PO4 (Sigma-Aldrich) dissolved at 50 mM (1.1998 g in 200 mL H2O)
(B) Na2HPO4 ∙12H2O (Sigma-Aldrich) dissolved at 50 mM (3.58 g in 200 mL H2O)
(C) MgCl2∙ 6H2O (Sigma-Aldrich) dissolved at 2 mM (406.62 mg in 1 mL H2O)
For 250 mL of NaPi, 110.5 mL of (A), 139.5 mL of (B), and 625 µL of (C) are mixed. After pH
have been adjusted to pH 7, the solution is sterilized by filtration on a membrane (0.22 µm Millipore
syringe filter, Millex-GP, Sigma-Aldrich) and it is stored at 4 °C in the refrigerator.
II.2. Antibiotic solution
Two fluoroquinolone molecules are used in the experiments: ciprofloxacin (Sigma-Aldrich)
and fleroxacin (Sigma-Aldrich). The former drug is dissolved at 16 µg/mL (48.3 µM) in NaPi buffer.
This concentration, relatively important with respect to clinical standards (Matchette, Agrawal et al.
2007), is selected in order to obtain a good signal-to-noise ratio when imaging the device during the
fluidic characterization phase. The latter drug is dissolved at 1 µg/mL (2.7µM) in NaPi buffer, which
enables to acquire clinically relevant data, in continuity with the ongoing work of our Marseille
collaborators.
Chapter IV Description of an experiment step by step
79 / 192
III. Microfluidic actuation
.
III.1. Immobilization of the bacteria
Centrifuged bacteria are re-suspended in 0.03 mL of NaPi buffer, a volume that will ensure an
optimal density of bacteria in the field of view. Next, 0.2 µL of the suspension are deposited at center
of the bottom substrate. Thereafter, the observation chamber lid is positioned and pressed onto the
droplet gently, in order to yield a thin layer of liquid that sticks the two glass pieces together by
capillarity. The exceeding liquid is simply squeezed out by pressing and left as it is. Then, the already
integrated top gasket and supply channel lid are added, their positioning with respect to the
observation chamber lid being achieved by hand. Therefore, the lateral dimensions of the supply
channels may vary within a few percents. Nevertheless, the natural affinity between the clean quartz
surfaces and the PDMS yields reversible seals so that further adjustment is always possible.
It is worth noting that the experimentalist should not let dry the extra volume of bacteria
suspension which is located around the observation chamber lid. Indeed, the microorganisms may
stick to the surface and act like an obstacle (Figure I - 47). In order to prevent this phenomenon, 10
µL of buffer are injected by the access ports after the assembly of the top gasket, to prevent any
drying and to facilitate the evacuation of the exceeding bacteria during the “control” phase (see
Section III.4).
The parts making the device are finally screwed tightly in a POC mini-2 holder (PeCon GmbH,
Germany) and the assembly is mounted onto the microscope.
III.2. Installation of the fluidic system
Since no permanent sealing is performed between the various parts of the microdevice,
classical insertion of metal ports into a reduced-size punched hole cannot be employed.
Consequently, tubing for fluidic actuation is installed using plasticine. Two bent needles (Venofix®
25G, 0.5×15 mm; B. Braun, Germany) for buffer and drug solutions are fixed above the input port. A
larger diameter needle (18G, 1.5” 1.2×40 mm; Terumo, Japan) is fixed above the exit port and kept
perpendicular to the bottom substrate to eliminate waste.
Three syringe pumps (Aladdin-1000; World Precision Instruments, USA) are used: one for the
drug, one for the buffer, and one for the waste elimination. Liquid coming from the input port
spreads and flows quickly in the supply channel thanks to the hydrophilicity of quartz. At the other
side of the supply channels, liquid is eliminated by aspiration to prevent overflowing (Figure I - 45).
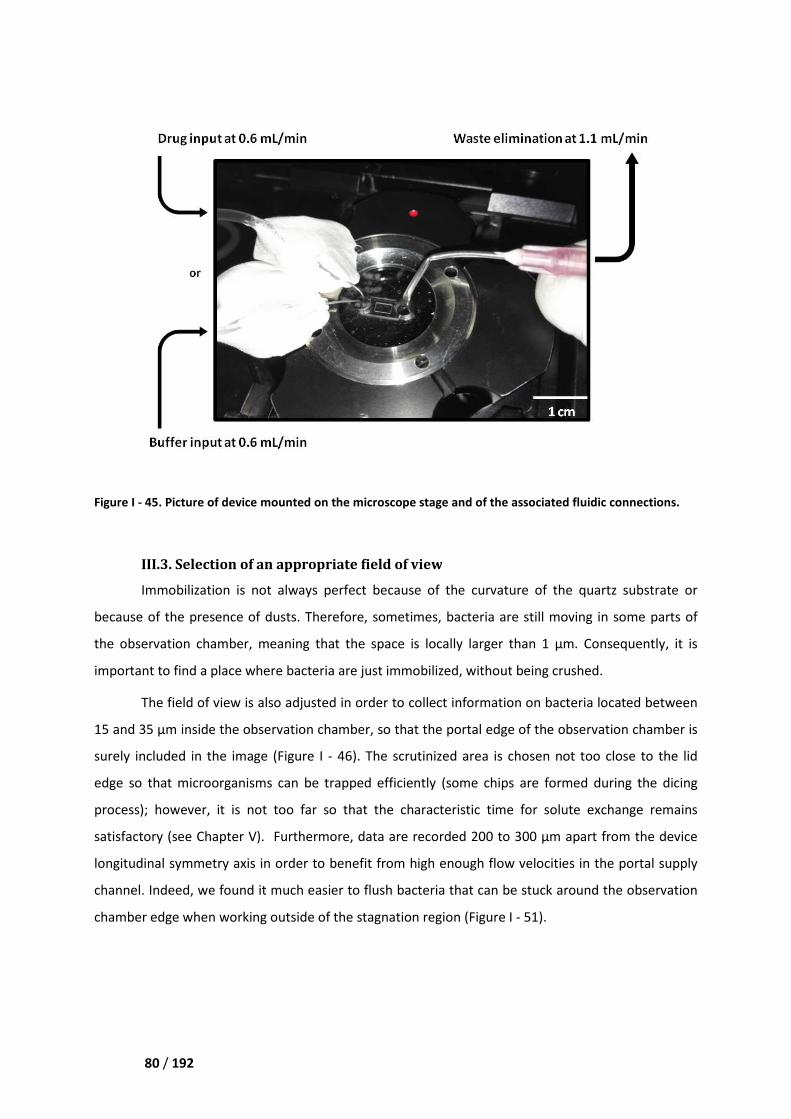
Chapter IV Description of an experiment step by step
80 / 192
Figure I - 45. Picture of device mounted on the microscope stage and of the
III.3. Selection of an appropriate field of view
Immobilization is not always perfect
because of the presence of dust
the observation chamber, meaning that the
important to find a place where bacteria are just im
The field of view is also adjusted in order to collect in
15 and 35 µm inside the observation chamber, so
surely included in the image (Figure I
edge so that microorganisms can be trapped efficiently
process); however, it is not too far so that the characteristic time for solute exchange remains
satisfactory (see Chapter V). Furthermore,
longitudinal symmetry axis in order t
channel. Indeed, we found it much easier to flush
chamber edge when working outside
V Description of an experiment step by step
Picture of device mounted on the microscope stage and of the associated fluidic connections
III.3. Selection of an appropriate field of view
not always perfect because of the curvature of the
because of the presence of dusts. Therefore, sometimes, bacteria are still moving in
, meaning that the space is locally larger than 1 µm.
to find a place where bacteria are just immobilized, without being crushed.
adjusted in order to collect information on bacteria located between
15 and 35 µm inside the observation chamber, so that the portal edge of the observation chamber is
Figure I - 46). The scrutinized area is chosen not too close to
edge so that microorganisms can be trapped efficiently (some chips are formed during the
; however, it is not too far so that the characteristic time for solute exchange remains
Furthermore, data are recorded 200 to 300 µm apart
in order to benefit from high enough flow velocities in the portal supply
und it much easier to flush bacteria that can be stuck around the observation
e when working outside of the stagnation region (Figure I - 51).
associated fluidic connections.
the quartz substrate or
moving in some parts of
µm. Consequently, it is
without being crushed.
formation on bacteria located between
of the observation chamber is
not too close to the lid
me chips are formed during the dicing
; however, it is not too far so that the characteristic time for solute exchange remains
apart from the device
benefit from high enough flow velocities in the portal supply
bacteria that can be stuck around the observation
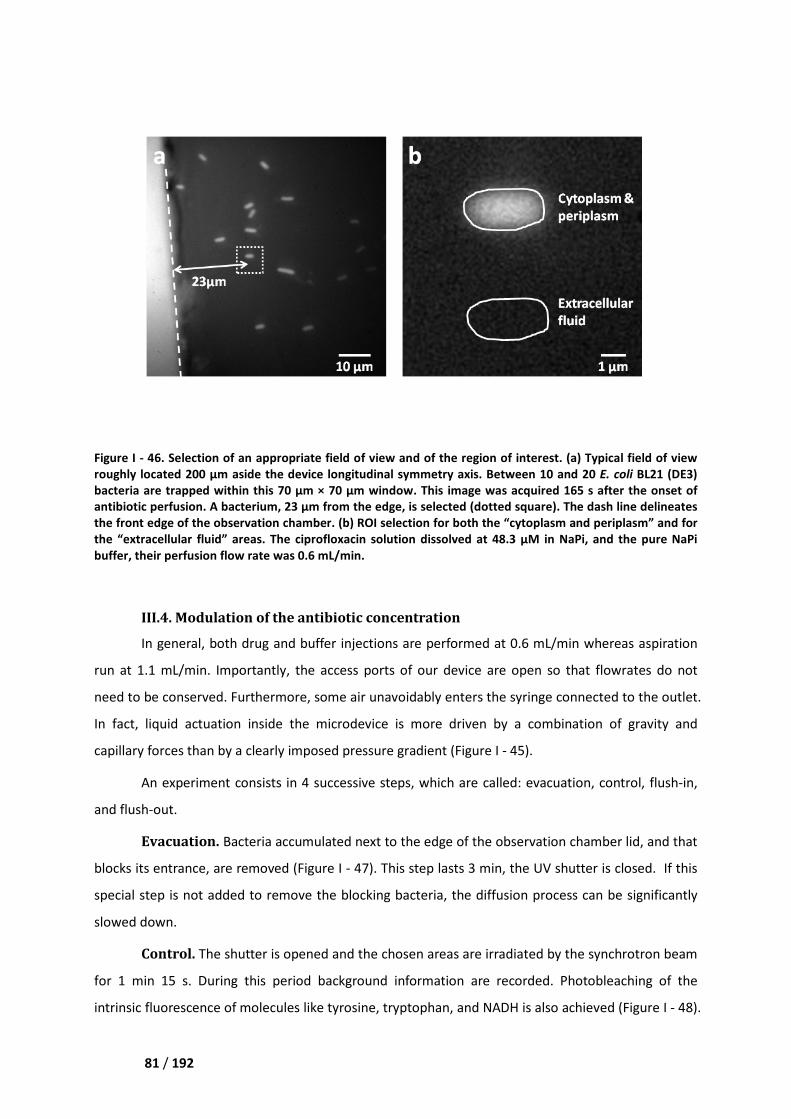
Chapter IV Description of an experiment step by step
81 / 192
Figure I - 46. Selection of an appropriate field of view
roughly located 200 µm aside the device longitudinal symmetry axis. Between 10 and 20
bacteria are trapped within this 70 µm × 70
antibiotic perfusion. A bacterium, 23
the front edge of the observation chamber. (b) ROI
the “extracellular fluid” areas. The ciprofloxacin solution
buffer, their perfusion flow rate was 0.6 mL/min.
III.4. Modulation of the antibiotic concentration
In general, both drug and buffer
run at 1.1 mL/min. Importantly, the access ports of our dev
need to be conserved. Furthermore, some air unavoidably enters the syringe connected to the outlet.
In fact, liquid actuation inside the microdevice
capillary forces than by a clearly imposed pressure gradien
An experiment consists in 4 successive steps, which are called:
and flush-out.
Evacuation. Bacteria accumulated next to the edge of
blocks its entrance, are removed
special step is not added to remove
slowed down.
Control. The shutter is opened and the chosen
for 1 min 15 s. During this period background
intrinsic fluorescence of molecul
V Description of an experiment step by step
an appropriate field of view and of the region of interest. (a
0 µm aside the device longitudinal symmetry axis. Between 10 and 20
bacteria are trapped within this 70 µm × 70 µm window. This image was acquired 165 s after the onset of
23 µm from the edge, is selected (dotted square). The dash line delineates
he observation chamber. (b) ROI selection for both the “cytoplasm and periplasm”
he ciprofloxacin solution dissolved at 48.3 µM in NaPi, and the pure
perfusion flow rate was 0.6 mL/min.
Modulation of the antibiotic concentration
drug and buffer injections are performed at 0.6 mL/min whereas aspiration
mL/min. Importantly, the access ports of our device are open so that
need to be conserved. Furthermore, some air unavoidably enters the syringe connected to the outlet.
nside the microdevice is more driven by a combination of gravity and
by a clearly imposed pressure gradient (Figure I - 45).
consists in 4 successive steps, which are called: evacuation
ria accumulated next to the edge of the observation chamber lid
are removed (Figure I - 47). This step lasts 3 min, the UV shutter is closed
special step is not added to remove the blocking bacteria, the diffusion process
The shutter is opened and the chosen areas are irradiated by the
this period background information are recorded. Photobleaching of
molecules like tyrosine, tryptophan, and NADH is also achieved
. (a) Typical field of view
0 µm aside the device longitudinal symmetry axis. Between 10 and 20 E. coli BL21 (DE3)
image was acquired 165 s after the onset of
. The dash line delineates
selection for both the “cytoplasm and periplasm” and for
dissolved at 48.3 µM in NaPi, and the pure NaPi
mL/min whereas aspiration
that flowrates do not
need to be conserved. Furthermore, some air unavoidably enters the syringe connected to the outlet.
is more driven by a combination of gravity and
evacuation, control, flush-in,
ation chamber lid, and that
the UV shutter is closed. If this
cteria, the diffusion process can be significantly
the synchrotron beam
hotobleaching of the
is also achieved (Figure I - 48).
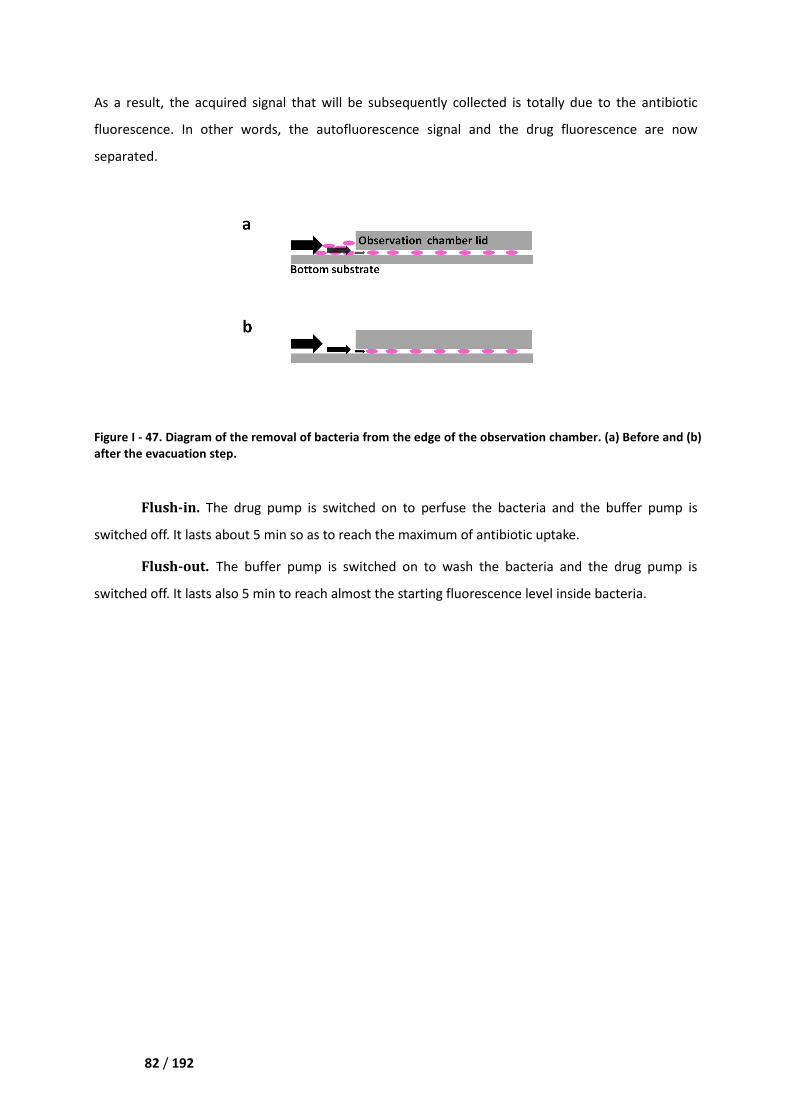
Chapter IV Description of an experiment step by step
82 / 192
As a result, the acquired signal that will be subsequently collected i
fluorescence. In other words,
separated.
Figure I - 47. Diagram of the removal
after the evacuation step.
Flush-in. The drug pump is switched
switched off. It lasts about 5 min
Flush-out. The buffer
switched off. It lasts also 5 min to reach almost
V Description of an experiment step by step
signal that will be subsequently collected is totally due to the antibiotic
. In other words, the autofluorescence signal and the drug fluorescence
emoval of bacteria from the edge of the observation chamber. (a)
pump is switched on to perfuse the bacteria and the
min so as to reach the maximum of antibiotic uptake
buffer pump is switched on to wash the bacteria and the drug
min to reach almost the starting fluorescence level inside bacteria
s totally due to the antibiotic
luorescence are now
from the edge of the observation chamber. (a) Before and (b)
and the buffer pump is
antibiotic uptake.
and the drug pump is
inside bacteria.
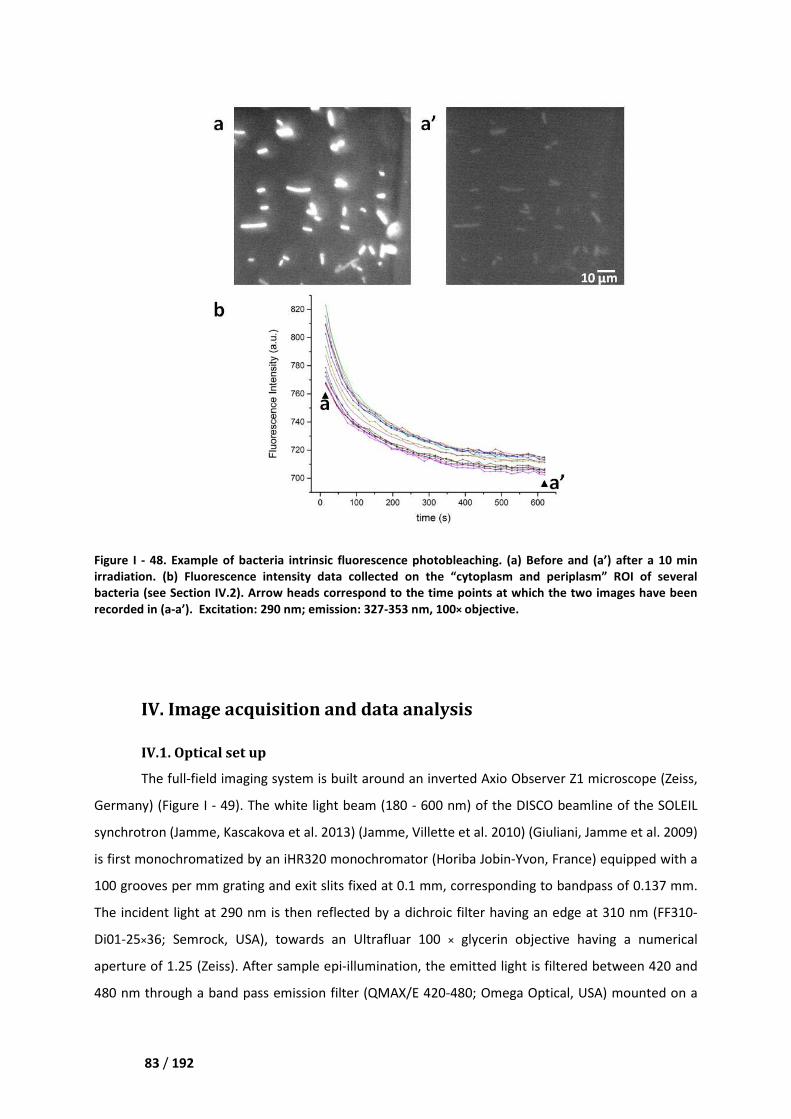
Chapter IV Description of an experiment step by step
83 / 192
Figure I - 48. Example of bacteria
irradiation. (b) Fluorescence intensity
bacteria (see Section IV.2). Arrow heads correspond to the time point
recorded in (a-a’). Excitation: 290 nm; emission:
IV. Image acquisition and data an
IV.1. Optical set up
The full-field imaging system is built around an inverted Axio Observer Z1 microscope
Germany) (Figure I - 49). The white
synchrotron (Jamme, Kascakova et al. 2013)
is first monochromatized by an iHR320
100 grooves per mm grating and exit slits fixed at 0.1 mm, corresponding to bandpass of 0.137 mm.
The incident light at 290 nm is then reflected
Di01-25×36; Semrock, USA), towards
aperture of 1.25 (Zeiss). After sample
480 nm through a band pass emission filter
V Description of an experiment step by step
Example of bacteria intrinsic fluorescence photobleaching. (a) Before and (a
luorescence intensity data collected on the “cytoplasm and periplasm
rrow heads correspond to the time points at which the two
Excitation: 290 nm; emission: 327-353 nm, 100× objective.
IV. Image acquisition and data analysis
field imaging system is built around an inverted Axio Observer Z1 microscope
. The white light beam (180 - 600 nm) of the DISCO beamline of
(Jamme, Kascakova et al. 2013) (Jamme, Villette et al. 2010) (Giuliani, Jamme et al. 2009)
iHR320 monochromator (Horiba Jobin-Yvon, France)
grating and exit slits fixed at 0.1 mm, corresponding to bandpass of 0.137 mm.
s then reflected by a dichroic filter having an edge at 31
towards an Ultrafluar 100 × glycerin objective
sample epi-illumination, the emitted light is filtered
emission filter (QMAX/E 420-480; Omega Optical, USA) mounted on a
efore and (a’) after a 10 min
asm and periplasm” ROI of several
the two images have been
field imaging system is built around an inverted Axio Observer Z1 microscope (Zeiss,
DISCO beamline of the SOLEIL
(Giuliani, Jamme et al. 2009)
Yvon, France) equipped with a
grating and exit slits fixed at 0.1 mm, corresponding to bandpass of 0.137 mm.
n edge at 310 nm (FF310-
lycerin objective having a numerical
s filtered between 420 and
Omega Optical, USA) mounted on a
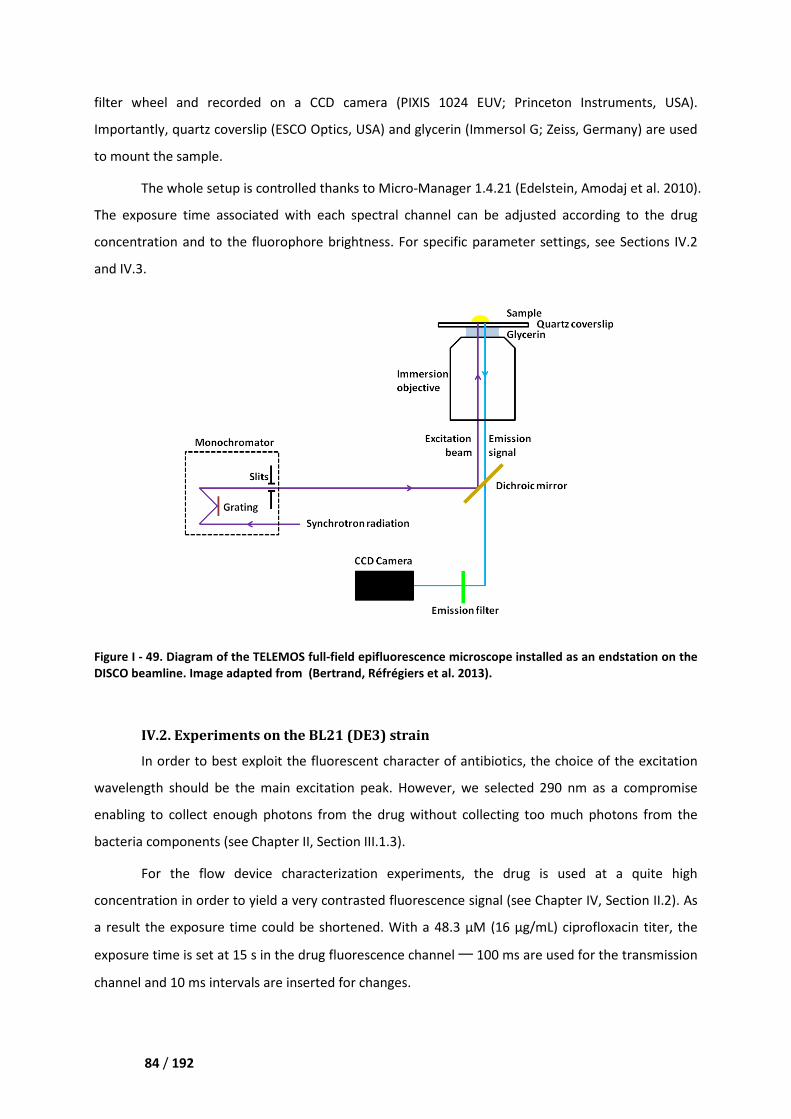
Chapter IV Description of an experiment step by step
84 / 192
filter wheel and recorded on a CCD camera
Importantly, quartz coverslip (ESCO Optics, USA
to mount the sample.
The whole setup is control
The exposure time associated with e
concentration and to the fluorophore brightness.
and IV.3.
Figure I - 49. Diagram of the TELEMOS full
DISCO beamline. Image adapted from
IV.2. Experiments on the BL21 (DE3) strain
In order to best exploit
wavelength should be the main
enabling to collect enough photons fr
bacteria components (see Chapter II,
For the flow device characterization
concentration in order to yield a
a result the exposure time could be shorte
exposure time is set at 15 s in the drug
channel and 10 ms intervals are inserted for changes.
V Description of an experiment step by step
on a CCD camera (PIXIS 1024 EUV; Princeton Instruments
(ESCO Optics, USA) and glycerin (Immersol G; Zeiss,
controlled thanks to Micro-Manager 1.4.21 (Edelstein, Amodaj et al. 2010)
associated with each spectral channel can be adjusted according
the fluorophore brightness. For specific parameter settings, see
TELEMOS full-field epifluorescence microscope installed as an endstation on the
adapted from (Bertrand, Réfrégiers et al. 2013).
Experiments on the BL21 (DE3) strain
it the fluorescent character of antibiotics, the choice
be the main excitation peak. However, we selected 290 nm as a compromise
enabling to collect enough photons from the drug without collecting too much photon
Chapter II, Section III.1.3).
characterization experiments, the drug is used
ion in order to yield a very contrasted fluorescence signal (see Chapter IV,
a result the exposure time could be shortened. With a 48.3 µM (16 µg/mL) ciproflox
s in the drug fluorescence channel ─ 100 ms are used for
are inserted for changes.
Princeton Instruments, USA).
Zeiss, Germany) are used
(Edelstein, Amodaj et al. 2010).
be adjusted according to the drug
For specific parameter settings, see Sections IV.2
microscope installed as an endstation on the
the choice of the excitation
we selected 290 nm as a compromise
too much photons from the
, the drug is used at a quite high
(see Chapter IV, Section II.2). As
µg/mL) ciprofloxacin titer, the
are used for the transmission
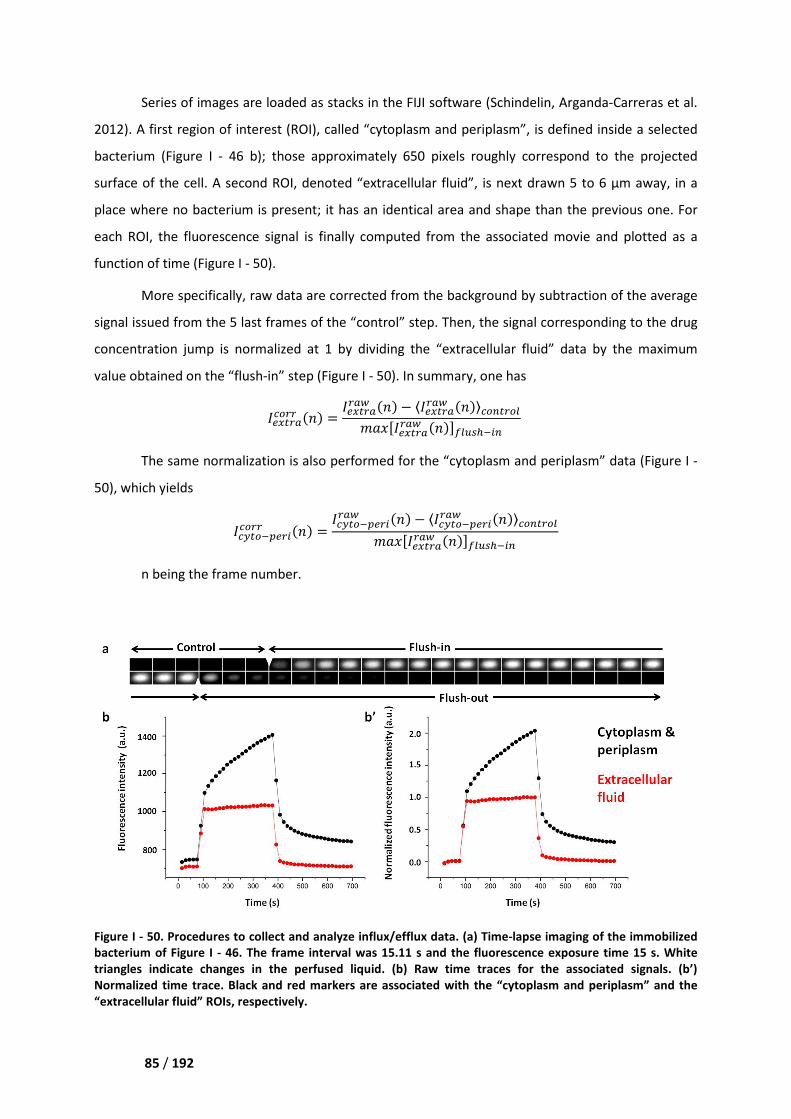
Chapter IV Description of an experiment step by step
85 / 192
Series of images are loade
2012). A first region of interest (ROI), ca
bacterium (Figure I - 46 b); those
surface of the cell. A second ROI, d
place where no bacterium is present; it ha
each ROI, the fluorescence signal
function of time (Figure I - 50).
More specifically, raw data are corrected from the background by
signal issued from the 5 last frames of
concentration jump is normalized at 1
value obtained on the “flush-in”
/012!345!!
The same normalization is
50), which yields
/46257%0!845!!
n being the frame number.
Figure I - 50. Procedures to collect
bacterium of Figure I - 46. The frame interval was 15.11 s and the
triangles indicate changes in the perfused liquid.
Normalized time trace. Black and red markers
“extracellular fluid” ROIs, respectivel
V Description of an experiment step by step
re loaded as stacks in the FIJI software (Schindelin, Arganda
A first region of interest (ROI), called “cytoplasm and periplasm”, is defined ins
); those approximately 650 pixels roughly correspond to the projected
surface of the cell. A second ROI, denoted “extracellular fluid”, is next drawn 5
place where no bacterium is present; it has an identical area and shape than the previous one
e fluorescence signal is finally computed from the associated movie and plotted as a
More specifically, raw data are corrected from the background by subtraction
signal issued from the 5 last frames of the “control” step. Then, the signal corresponding to the drug
jump is normalized at 1 by dividing the “extracellular fluid” data
step (Figure I - 50). In summary, one has
012!345!! 9:; = /012!3!3< 9:; − ⟨/012!3!3< 9:;⟩45?2!5@)AB�/012!3!3< 9:;�C@"D78? The same normalization is also performed for the “cytoplasm and periplasm
%0!89:; = /46257%0!8!3< 9:; − ⟨/46257%0!8!3< 9:;⟩45?2!5@)AB�/012!3!3< 9:;�C@"D78?
being the frame number.
to collect and analyze influx/efflux data. (a) Time-lapse imaging of
The frame interval was 15.11 s and the fluorescence exposure time 15
triangles indicate changes in the perfused liquid. (b) Raw time traces for the associated
Black and red markers are associated with the “cytoplasm and periplasm” and the
“extracellular fluid” ROIs, respectively.
(Schindelin, Arganda-Carreras et al.
s defined inside a selected
spond to the projected
s next drawn 5 to 6 µm away, in a
than the previous one. For
s finally computed from the associated movie and plotted as a
subtraction of the average
signal corresponding to the drug
data by the maximum
cytoplasm and periplasm” data (Figure I -
lapse imaging of the immobilized
exposure time 15 s. White
associated signals. (b’)
the “cytoplasm and periplasm” and the
Chapter IV Description of an experiment step by step
86 / 192
IV.3. Experiments on the AG100/AG100A/AG102 strains
For the AG 100 series of E. coli, the same excitation wavelength 290 nm is used. However,
the choice of very important concentration of drug is not suitable any more, 2.7 µM (1 µg/mL)
fleroxacin is thus used here. Because of the lowered concentration, the exposure time should be set
longer to collect more efficient photons: 30 s exposure time in the drug fluorescence channel, 30 s
pause without irradiation, and 0.1 s interval. The protocol concentrates first mainly on the “control”
and “flush-in” periods, which are extended: control for 4 min and flush-in for 25 min. The
disadvantage is that it results in losing the temporal resolution ─ the information during 30 sec is
only summed up into one image.
The choice of the ROI is the same than in the experiments on BL21 (DE3), but MATLAB is used
to treat and extract signals. As it is taken in charge specifically by another member in the team, the
process is presented here in short. It is figured out that the darkfield of camera should be first
subtracted from the raw data (average value equals to 700). Then the value of the 4th point of control
phase is normalized to be 1, meaning that every signal has value 1 just before the flush-in process),
then the values on the curve are proportionally reduced. The points on the curve correspond to the
average intensity of the available E.coli in the field of view.
/46257%0!845!! 9:; = /46257%0!8!3< 9:; − 700/46257%0!8!3< 9: = 4; − 700
Chapter V Microdevice characterization
87 / 192
Chapter V. Microdevice characterization
The three first Sections of this Chapter are mainly issued from the text of an article in
preparation (Zhao & Gosse 2017).
I. Finite element method simulations
I.1. Generalities
Both buffer flow and antibiotic transport were analyzed using the finite element method
(FEM) software COMSOL Multiphysics 5.2 (R2015b release; COMSOL, USA). Computations were
realized on a PowerEdge R720 workstation (Dell, USA) equipped with a 48 Go RAM and two E5-2650
0 processors running at 2.0 GHz. For those numerical evaluations we considered a single domain
corresponding to the cavity in between the bottom substrate and the two lids, i.e. the cavity that
includes the observation chamber and the four supply channels (Figure I - 51 a). Otherwise specified,
the quality of the “physics-controlled mesh” was set at “fine”.
I.2. Hydrodynamics
The liquid flow was first computed as a “stationary” study with the “ laminar flow” physics.
The buffer was given the water properties, i.e. a density G = 103 kg/m3 and a dynamic viscosity H = 10-
3 Pa.s, and the flow was considered as incompressible. Both inlet and outlet were characterized by
constant pressures (the “normal flow” and “suppress backflow” settings being selected). More
precisely, the value of the pressure difference, ∆, was adjusted to 9.72 Pa in order to obtain a value
of the flow rate, J, equal to 0.6 mL/min. A “no slip” condition was enforced on all the other
boundaries since they correspond to quartz or PDMS surfaces.
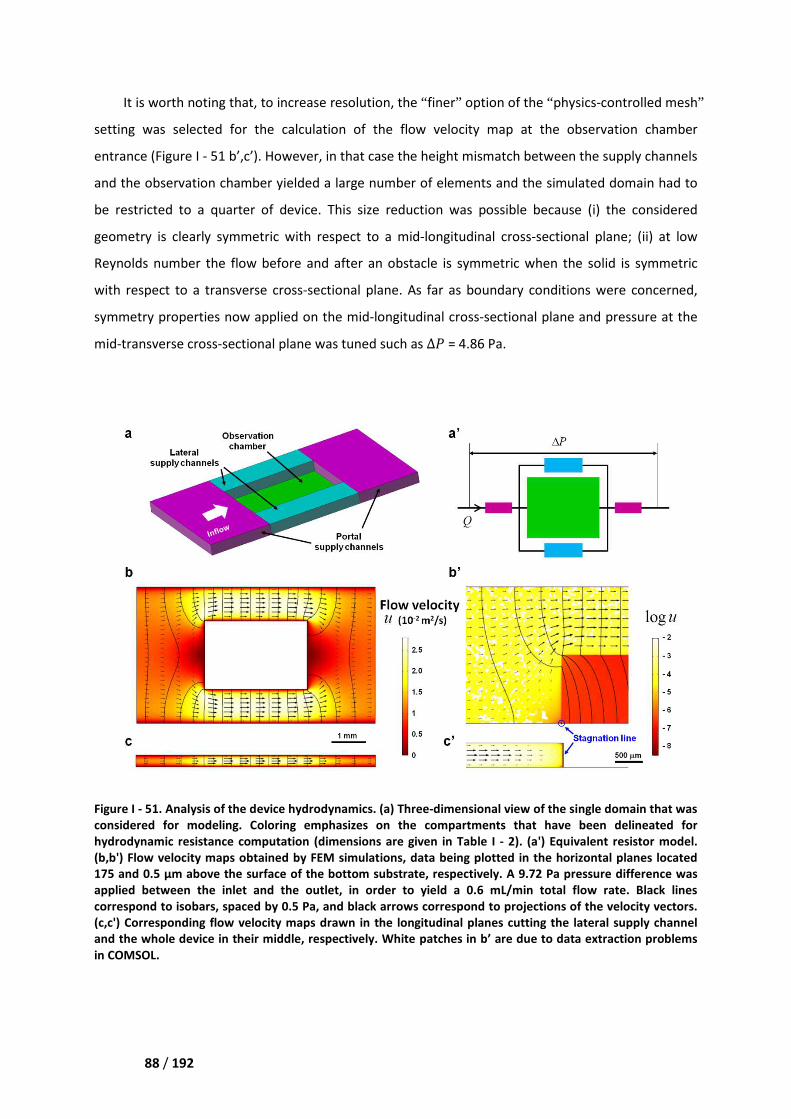
Chapter V Microdevice character
88 / 192
It is worth noting that, to increase resolution,
setting was selected for the calculation of the flow velocity map at the observation chamber
entrance (Figure I - 51 b’,c’). However, in that case the height mismatch between the supply channels
and the observation chamber yielded a large number of elements and the simulated domain had to
be restricted to a quarter of device.
geometry is clearly symmetric with respect to a mid
Reynolds number the flow before and after an obstacle is symmetric when the solid is symmetric
with respect to a transverse cross
symmetry properties now applied
mid-transverse cross-sectional plane was tuned such as
Figure I - 51. Analysis of the device hydrodynamics. (a) Three
considered for modeling. Coloring emphasizes on the compartments that have been delineated for
hydrodynamic resistance computation (dimensions are given in
(b,b') Flow velocity maps obtained by FEM simulations, data being plotted in the horizontal planes located
175 and 0.5 µm above the surface of the bottom substrate, respectively. A 9.72 Pa pressure difference was
applied between the inlet and the outlet, in order to yield a 0.6 mL/min total flow rate. Black lines
correspond to isobars, spaced by 0.5 Pa, and black arrows correspon
(c,c') Corresponding flow velocity maps drawn in the longitudinal planes cutting the lateral supply channel
and the whole device in their middle, respectively.
in COMSOL.
V Microdevice characterization
increase resolution, the “ finer” option of the “physics
setting was selected for the calculation of the flow velocity map at the observation chamber
. However, in that case the height mismatch between the supply channels
and the observation chamber yielded a large number of elements and the simulated domain had to
be restricted to a quarter of device. This size reduction was possible because (i) the co
geometry is clearly symmetric with respect to a mid-longitudinal cross-sectional plane; (ii) at low
Reynolds number the flow before and after an obstacle is symmetric when the solid is symmetric
with respect to a transverse cross-sectional plane. As far as boundary conditions were concerned,
symmetry properties now applied on the mid-longitudinal cross-sectional plane and pressure at the
sectional plane was tuned such as ∆ = 4.86 Pa.
Analysis of the device hydrodynamics. (a) Three-dimensional view of the single domain that was
Coloring emphasizes on the compartments that have been delineated for
rodynamic resistance computation (dimensions are given in Table I - 2). (a') Equivalent resistor model.
(b,b') Flow velocity maps obtained by FEM simulations, data being plotted in the horizontal planes located
e the surface of the bottom substrate, respectively. A 9.72 Pa pressure difference was
applied between the inlet and the outlet, in order to yield a 0.6 mL/min total flow rate. Black lines
correspond to isobars, spaced by 0.5 Pa, and black arrows correspond to projections of the velocity vectors.
(c,c') Corresponding flow velocity maps drawn in the longitudinal planes cutting the lateral supply channel
and the whole device in their middle, respectively. White patches in b’ are due to data extraction problem
physics-controlled mesh”
setting was selected for the calculation of the flow velocity map at the observation chamber
. However, in that case the height mismatch between the supply channels
and the observation chamber yielded a large number of elements and the simulated domain had to
This size reduction was possible because (i) the considered
sectional plane; (ii) at low
Reynolds number the flow before and after an obstacle is symmetric when the solid is symmetric
As far as boundary conditions were concerned,
sectional plane and pressure at the
dimensional view of the single domain that was
Coloring emphasizes on the compartments that have been delineated for
(a') Equivalent resistor model.
(b,b') Flow velocity maps obtained by FEM simulations, data being plotted in the horizontal planes located
e the surface of the bottom substrate, respectively. A 9.72 Pa pressure difference was
applied between the inlet and the outlet, in order to yield a 0.6 mL/min total flow rate. Black lines
d to projections of the velocity vectors.
(c,c') Corresponding flow velocity maps drawn in the longitudinal planes cutting the lateral supply channel
White patches in b’ are due to data extraction problems
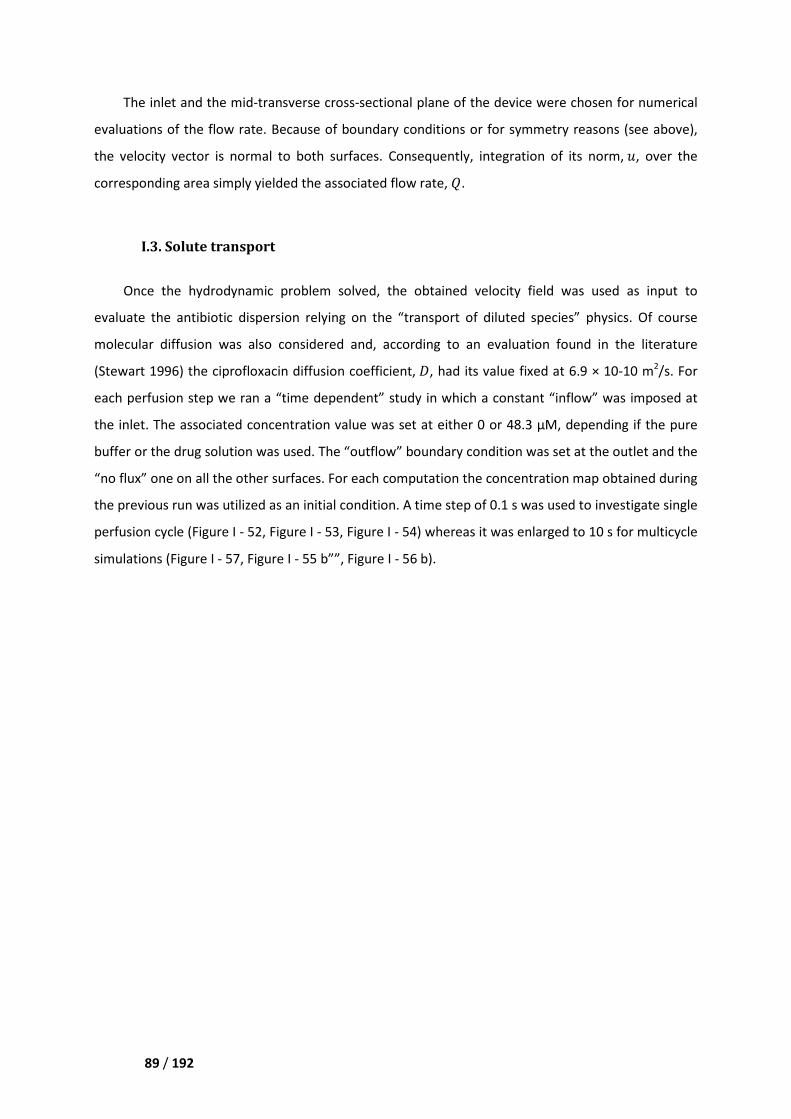
Chapter V Microdevice characterization
89 / 192
The inlet and the mid-transverse cross-sectional plane of the device were chosen for numerical
evaluations of the flow rate. Because of boundary conditions or for symmetry reasons (see above),
the velocity vector is normal to both surfaces. Consequently, integration of its norm, �, over the
corresponding area simply yielded the associated flow rate, J.
I.3. Solute transport
Once the hydrodynamic problem solved, the obtained velocity field was used as input to
evaluate the antibiotic dispersion relying on the “transport of diluted species” physics. Of course
molecular diffusion was also considered and, according to an evaluation found in the literature
(Stewart 1996) the ciprofloxacin diffusion coefficient, �, had its value fixed at 6.9 × 10⁻¹⁰ m2/s. For
each perfusion step we ran a “time dependent” study in which a constant “inflow” was imposed at
the inlet. The associated concentration value was set at either 0 or 48.3 µM, depending if the pure
buffer or the drug solution was used. The “outflow” boundary condition was set at the outlet and the
“no flux” one on all the other surfaces. For each computation the concentration map obtained during
the previous run was utilized as an initial condition. A time step of 0.1 s was used to investigate single
perfusion cycle (Figure I - 52, Figure I - 53, Figure I - 54) whereas it was enlarged to 10 s for multicycle
simulations (Figure I - 57, Figure I - 55 b””, Figure I - 56 b).
Chapter V Microdevice character
90 / 192
Figure I - 52. Antibiotic concentration maps obtained at various times after the o
9.72 Pa pressure difference was applied between the inlet and the outlet, in order to yield a 0.6 mL/min total
flow rate. A 48.3µM ciprofloxacin concentration was imposed at the inlet.
to FEM results collected at the surface of the simulation domain.
surface. (b) Trimetric view including the top, front, and lateral surface
Time traces of the antibiotic concentration were extracted by averaging this parameter
small surface elements that were parallel to the bottom substrate, located 0.5
having a few µm2 area. Furthermore, the obtained data points were also averaged in time when
numerical results had to be compared with experimental ones
window was selected in order to mimic at best video integration; however, the lack of
synchronization between fluidic actuation and camera shutter operation prevented us to accurately
define the origin of the movie with respect to solute exchange.
II. Numerical and experimental results
V Microdevice characterization
. Antibiotic concentration maps obtained at various times after the onset of drug perfusion. A
9.72 Pa pressure difference was applied between the inlet and the outlet, in order to yield a 0.6 mL/min total
M ciprofloxacin concentration was imposed at the inlet. The displayed values correspond
s collected at the surface of the simulation domain. (a) Vertical view emphasizing on the top
including the top, front, and lateral surface.
Time traces of the antibiotic concentration were extracted by averaging this parameter
small surface elements that were parallel to the bottom substrate, located 0.5
area. Furthermore, the obtained data points were also averaged in time when
numerical results had to be compared with experimental ones (Figure I - 54). In that case a 15 s
window was selected in order to mimic at best video integration; however, the lack of
synchronization between fluidic actuation and camera shutter operation prevented us to accurately
origin of the movie with respect to solute exchange.
II. Numerical and experimental results
nset of drug perfusion. A
9.72 Pa pressure difference was applied between the inlet and the outlet, in order to yield a 0.6 mL/min total
The displayed values correspond
emphasizing on the top
Time traces of the antibiotic concentration were extracted by averaging this parameter over
small surface elements that were parallel to the bottom substrate, located 0.5 µm above it and
area. Furthermore, the obtained data points were also averaged in time when
. In that case a 15 s
window was selected in order to mimic at best video integration; however, the lack of
synchronization between fluidic actuation and camera shutter operation prevented us to accurately
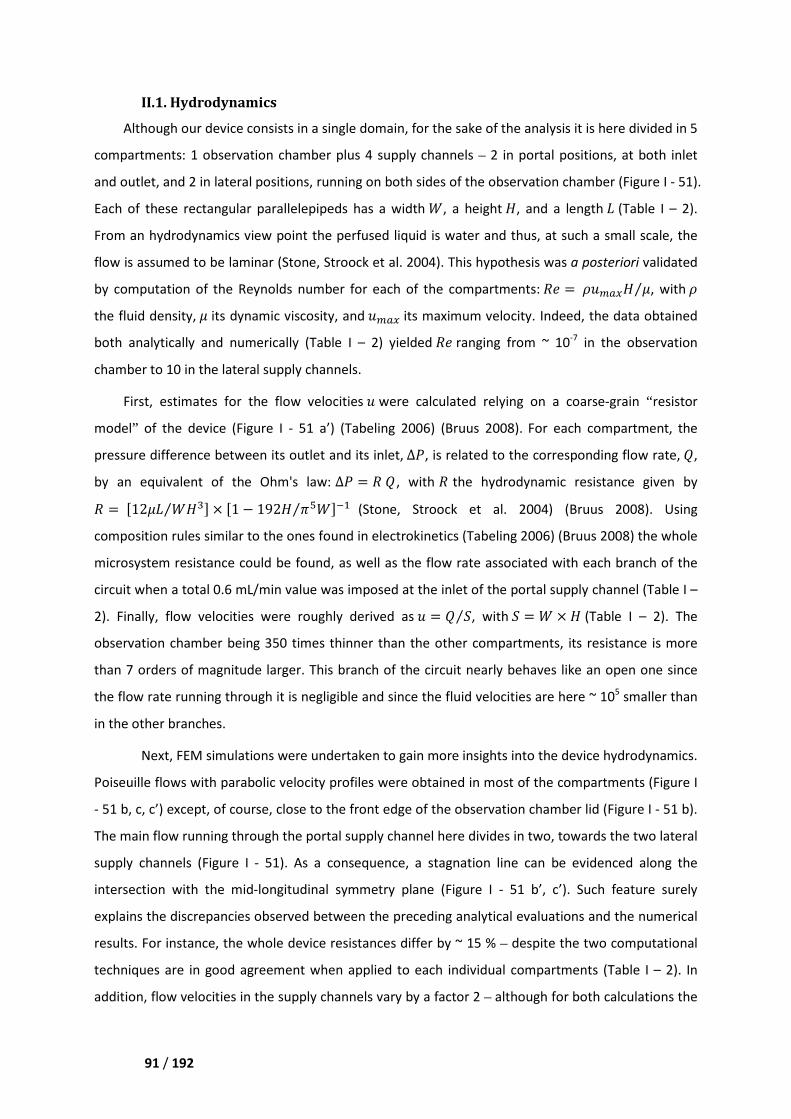
Chapter V Microdevice characterization
91 / 192
II.1. Hydrodynamics
Although our device consists in a single domain, for the sake of the analysis it is here divided in 5
compartments: 1 observation chamber plus 4 supply channels – 2 in portal positions, at both inlet
and outlet, and 2 in lateral positions, running on both sides of the observation chamber (Figure I - 51).
Each of these rectangular parallelepipeds has a width K, a height L, and a length M (Table I – 2).
From an hydrodynamics view point the perfused liquid is water and thus, at such a small scale, the
flow is assumed to be laminar (Stone, Stroock et al. 2004). This hypothesis was a posteriori validated
by computation of the Reynolds number for each of the compartments: �� = G��31L H⁄ , with G
the fluid density, H its dynamic viscosity, and ��31 its maximum velocity. Indeed, the data obtained
both analytically and numerically (Table I – 2) yielded �� ranging from ~ 10-7 in the observation
chamber to 10 in the lateral supply channels.
First, estimates for the flow velocities � were calculated relying on a coarse-grain “ resistor
model” of the device (Figure I - 51 a’) (Tabeling 2006) (Bruus 2008). For each compartment, the
pressure difference between its outlet and its inlet, ∆, is related to the corresponding flow rate, J,
by an equivalent of the Ohm's law: ∆ = � J, with � the hydrodynamic resistance given by
� = �12HM KL�⁄ � × �1 − 192L �QK⁄ �7R (Stone, Stroock et al. 2004) (Bruus 2008). Using
composition rules similar to the ones found in electrokinetics (Tabeling 2006) (Bruus 2008) the whole
microsystem resistance could be found, as well as the flow rate associated with each branch of the
circuit when a total 0.6 mL/min value was imposed at the inlet of the portal supply channel (Table I –
2). Finally, flow velocities were roughly derived as � = J S⁄ , with S = K × L (Table I – 2). The
observation chamber being 350 times thinner than the other compartments, its resistance is more
than 7 orders of magnitude larger. This branch of the circuit nearly behaves like an open one since
the flow rate running through it is negligible and since the fluid velocities are here ~ 105 smaller than
in the other branches.
Next, FEM simulations were undertaken to gain more insights into the device hydrodynamics.
Poiseuille flows with parabolic velocity profiles were obtained in most of the compartments (Figure I
- 51 b, c, c’) except, of course, close to the front edge of the observation chamber lid (Figure I - 51 b).
The main flow running through the portal supply channel here divides in two, towards the two lateral
supply channels (Figure I - 51). As a consequence, a stagnation line can be evidenced along the
intersection with the mid-longitudinal symmetry plane (Figure I - 51 b’, c’). Such feature surely
explains the discrepancies observed between the preceding analytical evaluations and the numerical
results. For instance, the whole device resistances differ by ~ 15 % – despite the two computational
techniques are in good agreement when applied to each individual compartments (Table I – 2). In
addition, flow velocities in the supply channels vary by a factor 2 – although for both calculations the
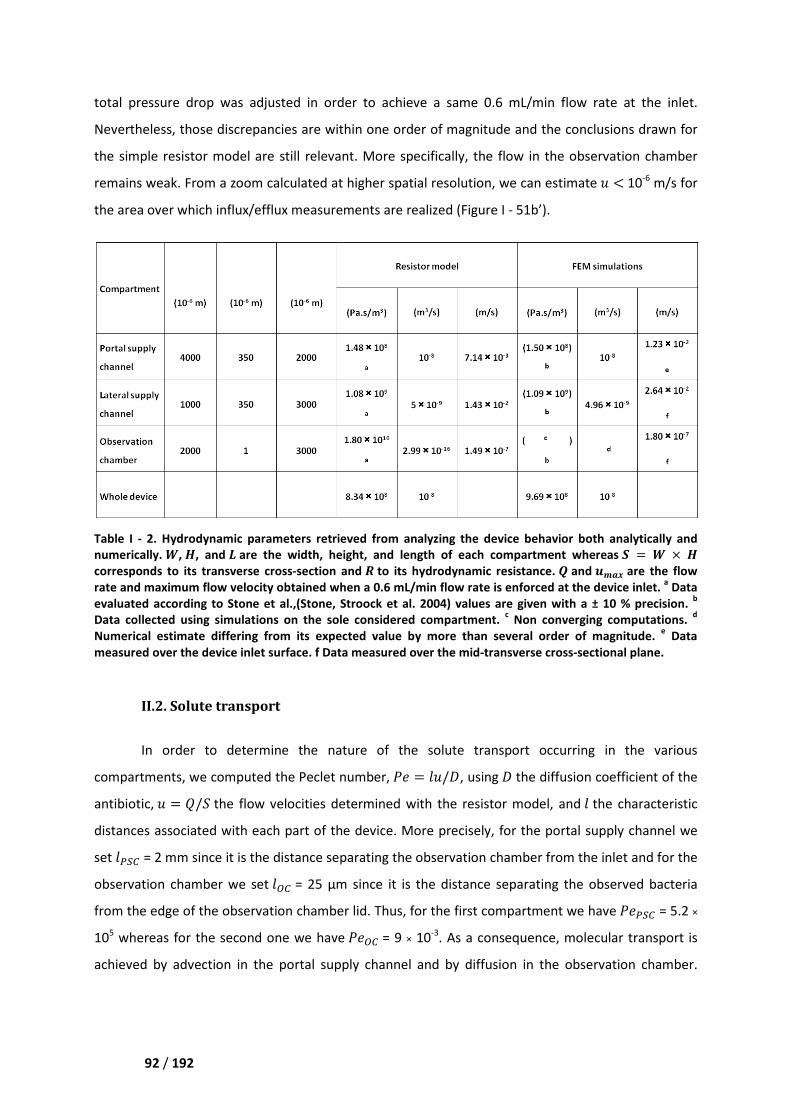
Chapter V Microdevice character
92 / 192
total pressure drop was adjusted in order to achieve a same 0.6 mL/min flow rate at the inlet.
Nevertheless, those discrepancies are within
the simple resistor model are still relevant. More specifically,
remains weak. From a zoom calculated at higher spatial resolution, we can estimate
the area over which influx/efflux measurements are realized (
Table I - 2. Hydrodynamic parameters retrieved from analyzing the device behavior both analytically and
numerically. T, U, and V are the width, height, and length of each compartment whereas
corresponds to its transverse cross
rate and maximum flow velocity obtained when a 0.6 mL/min flow rate is enforced at the device inlet.
evaluated according to Stone et al.,
Data collected using simulations on the sole considered compartment.
Numerical estimate differing from its expected value by more than several order of magnitude.
measured over the device inlet surface. f Data measured over the mid
II.2. Solute transport
In order to determine the nature o
compartments, we computed the Peclet number,
antibiotic, � = J/S the flow velocities determined with the resistor model, and
distances associated with each part of the device. More precisely, for the portal supply channel
set ��W� = 2 mm since it is the distance separating the observation chamber from the inlet and for the
observation chamber we set �X�from the edge of the observation chamber
105 whereas for the second one we have
achieved by advection in the portal supply channel and by diffusion in the observati
V Microdevice characterization
tal pressure drop was adjusted in order to achieve a same 0.6 mL/min flow rate at the inlet.
those discrepancies are within one order of magnitude and the conclusions drawn for
the simple resistor model are still relevant. More specifically, the flow in the observation chamber
remains weak. From a zoom calculated at higher spatial resolution, we can estimate
the area over which influx/efflux measurements are realized (Figure I - 51b’).
Hydrodynamic parameters retrieved from analyzing the device behavior both analytically and
are the width, height, and length of each compartment whereas
transverse cross-section and Y to its hydrodynamic resistance. Z and
rate and maximum flow velocity obtained when a 0.6 mL/min flow rate is enforced at the device inlet.
evaluated according to Stone et al.,(Stone, Stroock et al. 2004) values are given with a ± 10 % precision.
Data collected using simulations on the sole considered compartment. c Non converging computations.
l estimate differing from its expected value by more than several order of magnitude.
measured over the device inlet surface. f Data measured over the mid-transverse cross
In order to determine the nature of the solute transport occurring in the various
compartments, we computed the Peclet number, � = ��/�, using � the diffusion coefficient of the
the flow velocities determined with the resistor model, and
distances associated with each part of the device. More precisely, for the portal supply channel
= 2 mm since it is the distance separating the observation chamber from the inlet and for the
X� = 25 µm since it is the distance separating the observed bacteria
from the edge of the observation chamber lid. Thus, for the first compartment we have
whereas for the second one we have �X� = 9 × 10⁻³. As a consequence, molecular transport is
achieved by advection in the portal supply channel and by diffusion in the observati
tal pressure drop was adjusted in order to achieve a same 0.6 mL/min flow rate at the inlet.
order of magnitude and the conclusions drawn for
the flow in the observation chamber
remains weak. From a zoom calculated at higher spatial resolution, we can estimate � < 10-6 m/s for
Hydrodynamic parameters retrieved from analyzing the device behavior both analytically and
are the width, height, and length of each compartment whereas [ = T × U
and \]^_ are the flow
rate and maximum flow velocity obtained when a 0.6 mL/min flow rate is enforced at the device inlet. a Data
values are given with a ± 10 % precision. b
Non converging computations. d
l estimate differing from its expected value by more than several order of magnitude. e Data
transverse cross-sectional plane.
f the solute transport occurring in the various
the diffusion coefficient of the
the flow velocities determined with the resistor model, and � the characteristic
distances associated with each part of the device. More precisely, for the portal supply channel we
= 2 mm since it is the distance separating the observation chamber from the inlet and for the
ce it is the distance separating the observed bacteria
lid. Thus, for the first compartment we have ��W� = 5.2 ×
. As a consequence, molecular transport is
achieved by advection in the portal supply channel and by diffusion in the observation chamber.
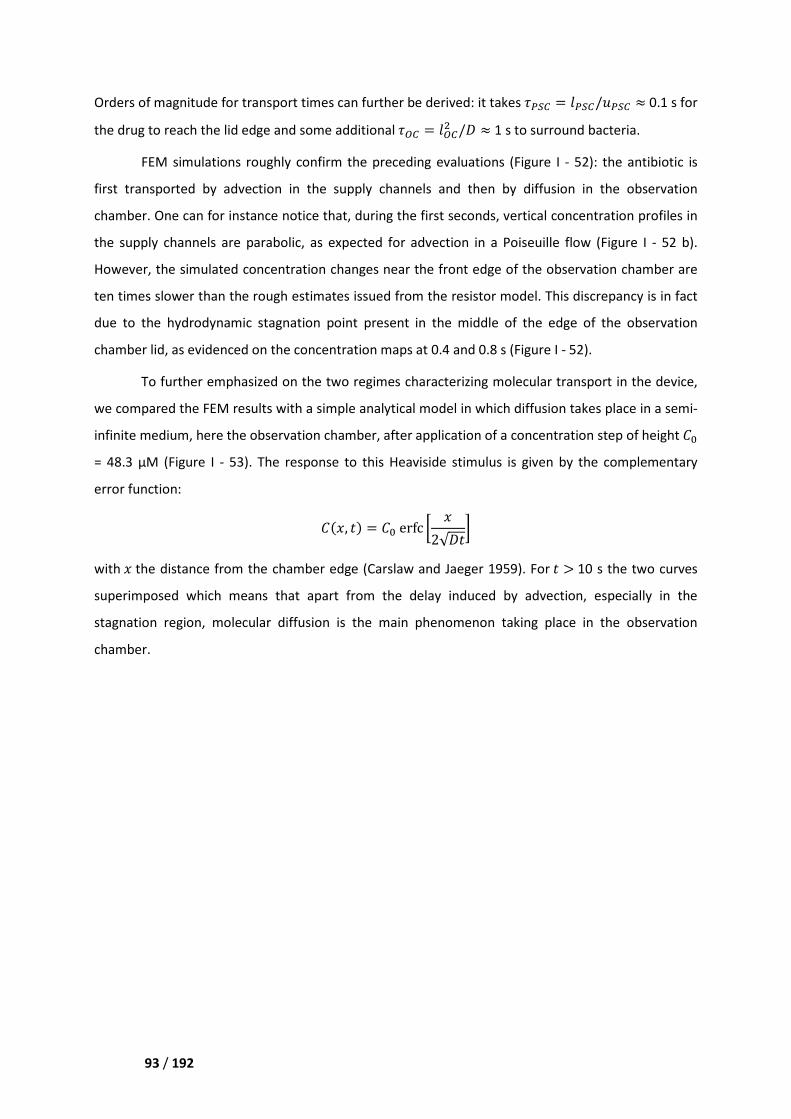
Chapter V Microdevice characterization
93 / 192
Orders of magnitude for transport times can further be derived: it takes ��W� = ��W�/��W� ≈ 0.1 s for
the drug to reach the lid edge and some additional �X� = �X�� /� ≈ 1 s to surround bacteria.
FEM simulations roughly confirm the preceding evaluations (Figure I - 52): the antibiotic is
first transported by advection in the supply channels and then by diffusion in the observation
chamber. One can for instance notice that, during the first seconds, vertical concentration profiles in
the supply channels are parabolic, as expected for advection in a Poiseuille flow (Figure I - 52 b).
However, the simulated concentration changes near the front edge of the observation chamber are
ten times slower than the rough estimates issued from the resistor model. This discrepancy is in fact
due to the hydrodynamic stagnation point present in the middle of the edge of the observation
chamber lid, as evidenced on the concentration maps at 0.4 and 0.8 s (Figure I - 52).
To further emphasized on the two regimes characterizing molecular transport in the device,
we compared the FEM results with a simple analytical model in which diffusion takes place in a semi-
infinite medium, here the observation chamber, after application of a concentration step of height ab
= 48.3 µM (Figure I - 53). The response to this Heaviside stimulus is given by the complementary
error function:
a9B, d; = ab erfc i B2√�dk
with B the distance from the chamber edge (Carslaw and Jaeger 1959). For d > 10 s the two curves
superimposed which means that apart from the delay induced by advection, especially in the
stagnation region, molecular diffusion is the main phenomenon taking place in the observation
chamber.
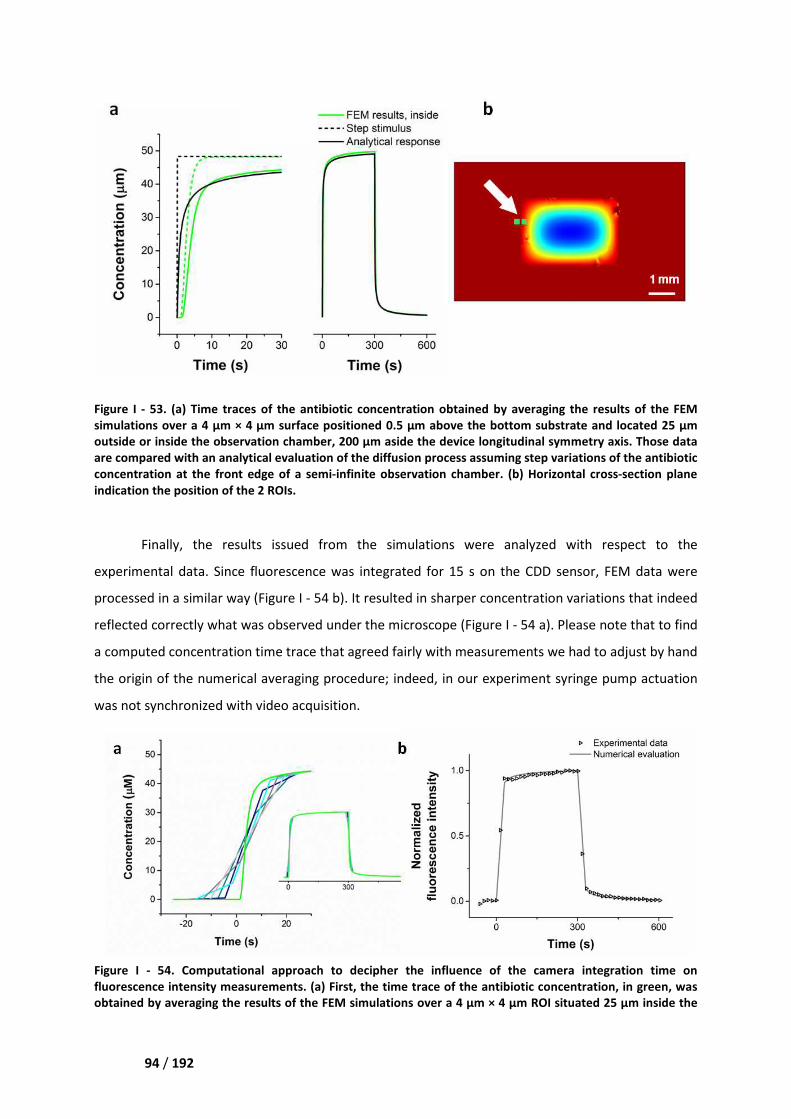
Chapter V Microdevice character
94 / 192
Figure I - 53. (a) Time traces of the antibiotic concentration obtained by averaging the results of the FEM
simulations over a 4 µm × 4 µm surface positioned 0.5
outside or inside the observation chamber, 200
are compared with an analytical evaluation of the diffusion process assuming step variations of the antibiotic
concentration at the front edge of a semi
indication the position of the 2 ROIs.
Finally, the results issued from
experimental data. Since fluorescence was integrated for 15 s on the CDD sensor, FEM data were
processed in a similar way (Figure I
reflected correctly what was observed under the microsc
a computed concentration time trace that agreed fairly with measurements we had
the origin of the numerical averaging procedure; indeed, in our experiment syringe p
was not synchronized with video acquisition.
Figure I - 54. Computational approach to decipher the influence of the camera integration time on
fluorescence intensity measurements.
obtained by averaging the results of the FEM simulations over a 4
V Microdevice characterization
. (a) Time traces of the antibiotic concentration obtained by averaging the results of the FEM
m surface positioned 0.5 µm above the bottom substrate and located 25
outside or inside the observation chamber, 200 µm aside the device longitudinal symmetry axis. Those data
are compared with an analytical evaluation of the diffusion process assuming step variations of the antibiotic
concentration at the front edge of a semi-infinite observation chamber. (b) Horizontal cross
indication the position of the 2 ROIs.
Finally, the results issued from the simulations were analyzed with respect to the
luorescence was integrated for 15 s on the CDD sensor, FEM data were
Figure I - 54 b). It resulted in sharper concentration variations that indeed
reflected correctly what was observed under the microscope (Figure I - 54 a). Please note that to find
a computed concentration time trace that agreed fairly with measurements we had
the origin of the numerical averaging procedure; indeed, in our experiment syringe p
was not synchronized with video acquisition.
Computational approach to decipher the influence of the camera integration time on
fluorescence intensity measurements. (a) First, the time trace of the antibiotic concentration, in green, was
obtained by averaging the results of the FEM simulations over a 4 µm × 4 µm ROI situated 25
. (a) Time traces of the antibiotic concentration obtained by averaging the results of the FEM
the bottom substrate and located 25 µm
m aside the device longitudinal symmetry axis. Those data
are compared with an analytical evaluation of the diffusion process assuming step variations of the antibiotic
(b) Horizontal cross-section plane
simulations were analyzed with respect to the
luorescence was integrated for 15 s on the CDD sensor, FEM data were
. It resulted in sharper concentration variations that indeed
. Please note that to find
a computed concentration time trace that agreed fairly with measurements we had to adjust by hand
the origin of the numerical averaging procedure; indeed, in our experiment syringe pump actuation
Computational approach to decipher the influence of the camera integration time on
he antibiotic concentration, in green, was
m ROI situated 25 µm inside the
Chapter V Microdevice characterization
95 / 192
observation chamber, 0.5 µm above the bottom substrate and 200 µm aside the device longitudinal
symmetry axis. For both the drug solution and the pure buffer a 9.72 Pa pressure difference was applied
between the inlet and the outlet, in order to yield a 0.6 mL/min total flow rate. The ciprofloxacin
concentration imposed at the inlet was changed from 0 to 48.3 µM at l = 0 s, and switched back to 0 at t =
300 s. The time step for these simulations was 0.1 s. Next, data were averaged over 15 s windows: it resulted
in the 5 blue-gray curves, which only differ by the origin of the latter integration process. More precisely, the
various starting positions are separated by 3 s increments in order to account for several possible
synchronization delays between the acquisition sequence and the fluid exchange one. (b) Comparison
between the real signals extracted from the experiment shown in Figure I - 62 and the best fitting data
obtained in (a).
III. Discussion
III.1. Selection of the field of view
Numerical simulations were further used to validate the choice of the scrutinized area. As
evidenced in Figure I - 55, at the scale of the CDD camera integration time, solute exchange takes
place with the same dynamics along both the front edge of the observation chamber and the lateral
ones. However, when looking at the phenomena at a higher resolution we can notice that drug
reaches more quickly the bacteria located close to the lateral supply channel than the ones in portal
position. Once more this observation can simply be explained by the presence of the hydrodynamic
stagnation point. Diffusion is indeed similar all around the edges of the chamber but this molecular
step starts earlier where the lid edge is parallel to the main direction of the flow, although this place
may be farther from the inlet.
We also try to set the region of interest at different locations inside the observation chamber
(Figure I - 56). Without any surprise the larger the distance from the edge, the longer it takes to reach
a given drug concentration. Additionally, on a larger time-scale, the response to a square-wave signal
in antibiotic concentration displayed the damping in amplitude and the delay in phase that are
associated with the propagation of diffusion waves in a semi-infinite medium. More precisely, for a
cosine stimulus the response writes
a9B, d; = ab exp o−Bp -
2�q cos o-d − Bp -2�q − 2ab
√� t cos o- ud − B�4�H�vq �7w
1�√�2
bxH
Where the second member of the equation corresponds to the transient (Carslaw and Jaeger 1959).
One can thus evidence the characteristic length scale Lz = {2D/ω above which the initial signal will
be significantly modified. Here Lz~ 350 µm.
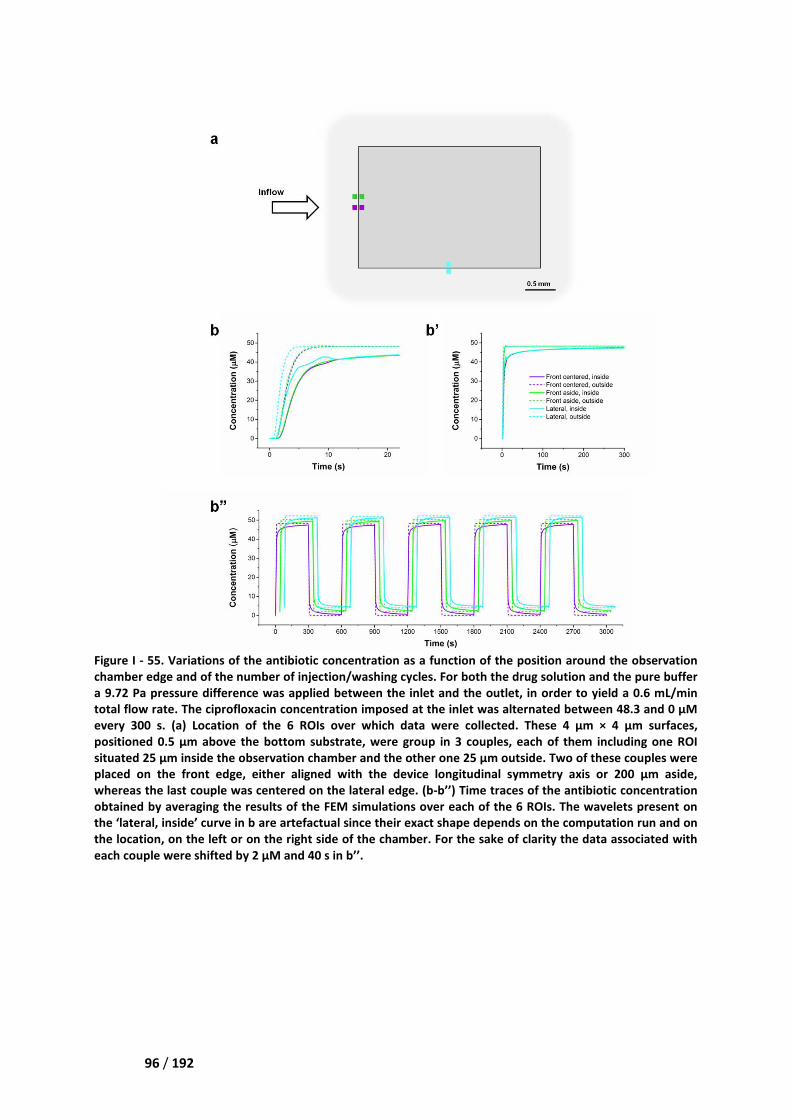
Chapter V Microdevice character
96 / 192
Figure I - 55. Variations of the antibiotic concentration as a function of the position around the observation
chamber edge and of the number of injection/washing cycles.
a 9.72 Pa pressure difference was applied between the inlet and the outlet, in order to yield a 0.6 mL/min
total flow rate. The ciprofloxacin concentration imposed at the
every 300 s. (a) Location of the 6 ROIs over which data were collected. These 4
positioned 0.5 µm above the bottom substrate, were group in 3 couples, each of them including one ROI
situated 25 µm inside the observation chamber and the other one 25
placed on the front edge, either aligned with the device longitudinal symmetry axis or 200
whereas the last couple was centered on the lateral edge. (b
obtained by averaging the results of the FEM simulations over each of the 6 ROIs. The wavelets present on
the ‘lateral, inside’ curve in b are artefactual since their exact shape depends on the computation
the location, on the left or on the right side of the chamber. For the sake of clarity the data associated with
each couple were shifted by 2 µM and 40 s in
V Microdevice characterization
Variations of the antibiotic concentration as a function of the position around the observation
he number of injection/washing cycles. For both the drug solution and the pure buffer
a 9.72 Pa pressure difference was applied between the inlet and the outlet, in order to yield a 0.6 mL/min
total flow rate. The ciprofloxacin concentration imposed at the inlet was alternated between 48.3 and 0
) Location of the 6 ROIs over which data were collected. These 4
m above the bottom substrate, were group in 3 couples, each of them including one ROI
m inside the observation chamber and the other one 25 µm outside. Two of these couples were
placed on the front edge, either aligned with the device longitudinal symmetry axis or 200
centered on the lateral edge. (b-b’’) Time traces of the antibiotic concentration
obtained by averaging the results of the FEM simulations over each of the 6 ROIs. The wavelets present on
are artefactual since their exact shape depends on the computation
the location, on the left or on the right side of the chamber. For the sake of clarity the data associated with
M and 40 s in b’’.
Variations of the antibiotic concentration as a function of the position around the observation
For both the drug solution and the pure buffer
a 9.72 Pa pressure difference was applied between the inlet and the outlet, in order to yield a 0.6 mL/min
inlet was alternated between 48.3 and 0 µM
) Location of the 6 ROIs over which data were collected. These 4 µm × 4 µm surfaces,
m above the bottom substrate, were group in 3 couples, each of them including one ROI
m outside. Two of these couples were
placed on the front edge, either aligned with the device longitudinal symmetry axis or 200 µm aside,
’’) Time traces of the antibiotic concentration
obtained by averaging the results of the FEM simulations over each of the 6 ROIs. The wavelets present on
are artefactual since their exact shape depends on the computation run and on
the location, on the left or on the right side of the chamber. For the sake of clarity the data associated with
Chapter V Microdevice character
97 / 192
Figure I - 56. Variations of the antibiotic concent
chamber edge and of the number of injection/washing cycles.
a 9.72 Pa pressure difference was applied between the inlet and the outlet, in order to yield
total flow rate. The ciprofloxacin concentration imposed at the inlet was alternated between 48.3 and 0
every 300 s. (a) Location of the 5 ROIs over which data were collected. The center of these 4
surfaces, positioned 0.5 µm above the bottom substrate, was situated 25, 50, 75, 375, or 1500
observation chamber, 200 µm aside the device longitudinal symmetry axis. The light green and red ROIs are
similar to the ones of Fig. 5, the position of former being similar to th
bacteria. The distance separating the pink ROI from the edge of the chamber roughly corresponds to the
characteristic diffusion length associated with the present concentration modulation:
traces of the antibiotic concentration obtained by averaging the results of the FEM simulations over each of
the 5 ROIs.
III.2. Variability and stability
Finally, we experimentally evaluated the robustness of the applied solute exchange
57). First, wherever bacteria are observed within 50
concentration modulation is similar at the time
discrepancies in signal intensity can be attributed to the Gaussian illumination profile, an issue that
we straightforwardly solved by renormalizing our data
On the other hand, multiple drug solution / washing buffer commutations are possible over
several periods. Fluidic actuation displays a fairly good stability over more than 50 min.
V Microdevice characterization
Variations of the antibiotic concentration as a function of the distance to the observation
chamber edge and of the number of injection/washing cycles. For both the drug solution and the pure buffer
a 9.72 Pa pressure difference was applied between the inlet and the outlet, in order to yield
total flow rate. The ciprofloxacin concentration imposed at the inlet was alternated between 48.3 and 0
) Location of the 5 ROIs over which data were collected. The center of these 4
ve the bottom substrate, was situated 25, 50, 75, 375, or 1500
m aside the device longitudinal symmetry axis. The light green and red ROIs are
similar to the ones of Fig. 5, the position of former being similar to the usual position of the analyzed
bacteria. The distance separating the pink ROI from the edge of the chamber roughly corresponds to the
characteristic diffusion length associated with the present concentration modulation:
of the antibiotic concentration obtained by averaging the results of the FEM simulations over each of
III.2. Variability and stability
Finally, we experimentally evaluated the robustness of the applied solute exchange
. First, wherever bacteria are observed within 50 µm from the chamber edge, the
concentration modulation is similar at the time-scale of the video exposure time
discrepancies in signal intensity can be attributed to the Gaussian illumination profile, an issue that
rdly solved by renormalizing our data (Chapter IV, Section IV.2).
On the other hand, multiple drug solution / washing buffer commutations are possible over
several periods. Fluidic actuation displays a fairly good stability over more than 50 min.
ration as a function of the distance to the observation
For both the drug solution and the pure buffer
a 9.72 Pa pressure difference was applied between the inlet and the outlet, in order to yield a 0.6 mL/min
total flow rate. The ciprofloxacin concentration imposed at the inlet was alternated between 48.3 and 0 µM
) Location of the 5 ROIs over which data were collected. The center of these 4 µm × 4 µm
ve the bottom substrate, was situated 25, 50, 75, 375, or 1500 µm inside the
m aside the device longitudinal symmetry axis. The light green and red ROIs are
e usual position of the analyzed
bacteria. The distance separating the pink ROI from the edge of the chamber roughly corresponds to the
characteristic diffusion length associated with the present concentration modulation: �� = 363 µm. (b) Time
of the antibiotic concentration obtained by averaging the results of the FEM simulations over each of
Finally, we experimentally evaluated the robustness of the applied solute exchange (Figure I -
m from the chamber edge, the dynamics of the
exposure time. Second,
discrepancies in signal intensity can be attributed to the Gaussian illumination profile, an issue that
.
On the other hand, multiple drug solution / washing buffer commutations are possible over
several periods. Fluidic actuation displays a fairly good stability over more than 50 min.
Chapter V Microdevice character
98 / 192
Figure I - 57. Variations of the fluorescence signal as a function of the position inside the observation
chamber and of the number of injection/washing cycles.
perfusion flow rate was 0.6 mL/min. The
between 48.3 and 0 µM every 300 s
was 4 µm × 4 µm in size and was situated either 25 or 50
µm aside the device longitudinal symmetry axis. The displayed image was acquired 150 s after the onset of
antibiotic perfusion. (a') Intensity map obtained for the Gaussian illumination beam
fluorescence intensity collected over each of the previous ROI and corrected by subtraction of the
background (i.e. the signal averaged on the 5 images preceding drug injection). (
antibiotic concentration obtained by averaging the results o
IV. Comparison of our microdevice with the existing solutions
IV.1. Steric immobilization in microfluidic growth chambers
Three designs of bacteria
have our own contribution (Grünberger, Probst et al. 2015)
et al. 2015), and (Zhao & Gosse
existence of connecting channel
connect the supply channels (Table I
We have performed FEM simulations in order to evaluate the performances of these 4
devices with respect to the rapidity of solute transport. More specifically, a step concentration
stimulus was imposed, at the bo
allowed to proceed by diffusion in the shallow chamber and concentrations were monitored at 3
different distances from the chamber edge: 10, 20,
V Microdevice characterization
Variations of the fluorescence signal as a function of the position inside the observation
chamber and of the number of injection/washing cycles. For both the drug solution and the pure buffer the
as 0.6 mL/min. The ciprofloxacin concentration in the perfused liquid was alternated
M every 300 s. (a) Location of the 3 square ROIs which were analyzed. Each of them
m in size and was situated either 25 or 50 µm inside the observation chamber, roughly 200
m aside the device longitudinal symmetry axis. The displayed image was acquired 150 s after the onset of
') Intensity map obtained for the Gaussian illumination beam. (b
scence intensity collected over each of the previous ROI and corrected by subtraction of the
background (i.e. the signal averaged on the 5 images preceding drug injection). (
antibiotic concentration obtained by averaging the results of the FEM simulations over each of the 3 ROIs.
IV. Comparison of our microdevice with the existing solutions
IV.1. Steric immobilization in microfluidic growth chambers
bacteria chambers can be found in the literature, a set to which we
(Grünberger, Probst et al. 2015) (Ullman, Wallden et al. 2013)
Zhao & Gosse 2017). Designs can be distinguished according to
ing channels, the size of culture chamber, and the number of sides used to
Table I - 3, Figure I - 58).
We have performed FEM simulations in order to evaluate the performances of these 4
devices with respect to the rapidity of solute transport. More specifically, a step concentration
stimulus was imposed, at the border with the deep supply channel and different of the antibiotic was
allowed to proceed by diffusion in the shallow chamber and concentrations were monitored at 3
different distances from the chamber edge: 10, 20, and 30 µm (Figure I - 58, Figure I
Variations of the fluorescence signal as a function of the position inside the observation
For both the drug solution and the pure buffer the
ciprofloxacin concentration in the perfused liquid was alternated
) Location of the 3 square ROIs which were analyzed. Each of them
he observation chamber, roughly 200
m aside the device longitudinal symmetry axis. The displayed image was acquired 150 s after the onset of
. (b) Time trace of the
scence intensity collected over each of the previous ROI and corrected by subtraction of the
background (i.e. the signal averaged on the 5 images preceding drug injection). (b') Time trace of the
f the FEM simulations over each of the 3 ROIs.
IV. Comparison of our microdevice with the existing solutions
can be found in the literature, a set to which we have to
(Ullman, Wallden et al. 2013) (Wang, Ran
according to three points: the
the number of sides used to
We have performed FEM simulations in order to evaluate the performances of these 4
devices with respect to the rapidity of solute transport. More specifically, a step concentration
rder with the deep supply channel and different of the antibiotic was
allowed to proceed by diffusion in the shallow chamber and concentrations were monitored at 3
Figure I - 59).
Chapter V Microdevice character
99 / 192
Table I - 3. Comparison of the parameters
chambers.
Figure I - 58. Model of the bacteria chamber
et al. (c) Ullman et al. (d) Zhao & Gosse. Symbols
observed (see Figure I - 59). The olive green lin
the chamber edge.
V Microdevice characterization
he parameters characterizing the designs of the existing microfluidic growth
bacteria chambers used for the simulation studies. (a) Grünberger et a
Zhao & Gosse. Symbols represent the positions where concentration
live green lines are the supply channel borders and m
existing microfluidic growth
Grünberger et al. (b) Wang
represent the positions where concentration changes were
magenta lines delineate
Chapter V Microdevice character
100 / 192
Figure I - 59. Concentration variations obtained by numerical simulations after applying a step stimulus of
48.3 µM at the supply channel of the
(indications in micron, for the chamber edge.)
According to the above presentations and simulations,
exchange is the fastest thanks to
channel exists. However, in Wang's design, the molecular exchange rate is the slowest because
only with 1 side of opening, but also
need to cross them to reach the growth chamber.
Grünberger’s design has still the connecting
only from one side (in the field of view).
Another question that can be
exchange with respect to a single side one.
Grünberger's design, with a small
exact center of the chamber,
concentration plateau faster.
V Microdevice characterization
variations obtained by numerical simulations after applying a step stimulus of
channel of the Figure I - 58. Symbols correspond to the locations on
(indications in micron, for the chamber edge.)
According to the above presentations and simulations, in Ullman’s design
fastest thanks to 2 reasons: 2 sides opening to the supply channel
n Wang's design, the molecular exchange rate is the slowest because
only with 1 side of opening, but also diffusion begins from the connecting channel and the molecules
need to cross them to reach the growth chamber. In the rest 2 designs, they can only meet one point:
design has still the connecting channel, and Zhao’s design expects molecules
only from one side (in the field of view).
Another question that can be addressed is whether or not a 2-side entry spreads up solute
exchange with respect to a single side one. Figure I - 60 displays simulation
with a small chamber surface (40 µm × 40 µm). From the examination of
exact center of the chamber, it can be clearly seen that 2-side opening enables to reach
variations obtained by numerical simulations after applying a step stimulus of
. Symbols correspond to the locations on Figure I - 58
’s design, the molecular
opening to the supply channel and no connecting
n Wang's design, the molecular exchange rate is the slowest because not
fusion begins from the connecting channel and the molecules
the rest 2 designs, they can only meet one point:
s design expects molecules coming
side entry spreads up solute
simulations are based on
From the examination of the
pening enables to reach
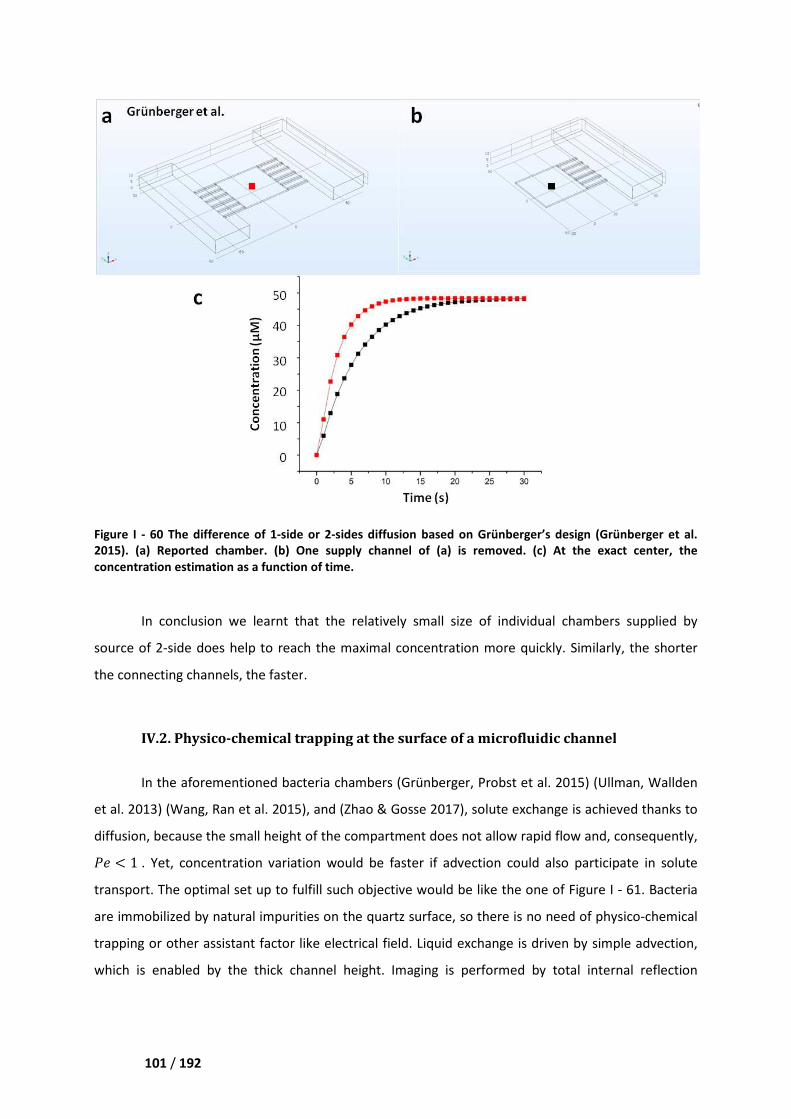
Chapter V Microdevice character
101 / 192
Figure I - 60 The difference of 1-side or 2
2015). (a) Reported chamber. (b)
concentration estimation as a function of time
In conclusion we learnt
source of 2-side does help to reach the maximal concentration
the connecting channels, the faster
IV.2. Physico-chemical trapping at th
In the aforementioned bacteria
et al. 2013) (Wang, Ran et al. 2015)
diffusion, because the small height
� < 1 . Yet, concentration variation would
transport. The optimal set up to fulfill such
are immobilized by natural impurities on the quartz surface
trapping or other assistant factor like electrical field
which is enabled by the thick channel height. I
V Microdevice characterization
side or 2-sides diffusion based on Grünberger’s design
) One supply channel of (a) is removed. (c) At the exact center
estimation as a function of time.
t that the relatively small size of individual ch
side does help to reach the maximal concentration more quickly. Similarly
faster.
chemical trapping at the surface of a microfluidic channel
bacteria chambers (Grünberger, Probst et al. 2015)
(Wang, Ran et al. 2015), and (Zhao & Gosse 2017), solute exchange is achieved thanks to
small height of the compartment does not allow rapid flow and, consequently,
Yet, concentration variation would be faster if advection could also p
optimal set up to fulfill such objective would be like the one of Figure I
l impurities on the quartz surface, so there is no need of
factor like electrical field. Liquid exchange is driven
led by the thick channel height. Imaging is performed by total internal reflection
rünberger’s design (Grünberger et al.
) At the exact center, the
that the relatively small size of individual chambers supplied by
more quickly. Similarly, the shorter
e surface of a microfluidic channel
(Grünberger, Probst et al. 2015) (Ullman, Wallden
exchange is achieved thanks to
of the compartment does not allow rapid flow and, consequently,
could also participate in solute
Figure I - 61. Bacteria
no need of physico-chemical
by simple advection,
total internal reflection
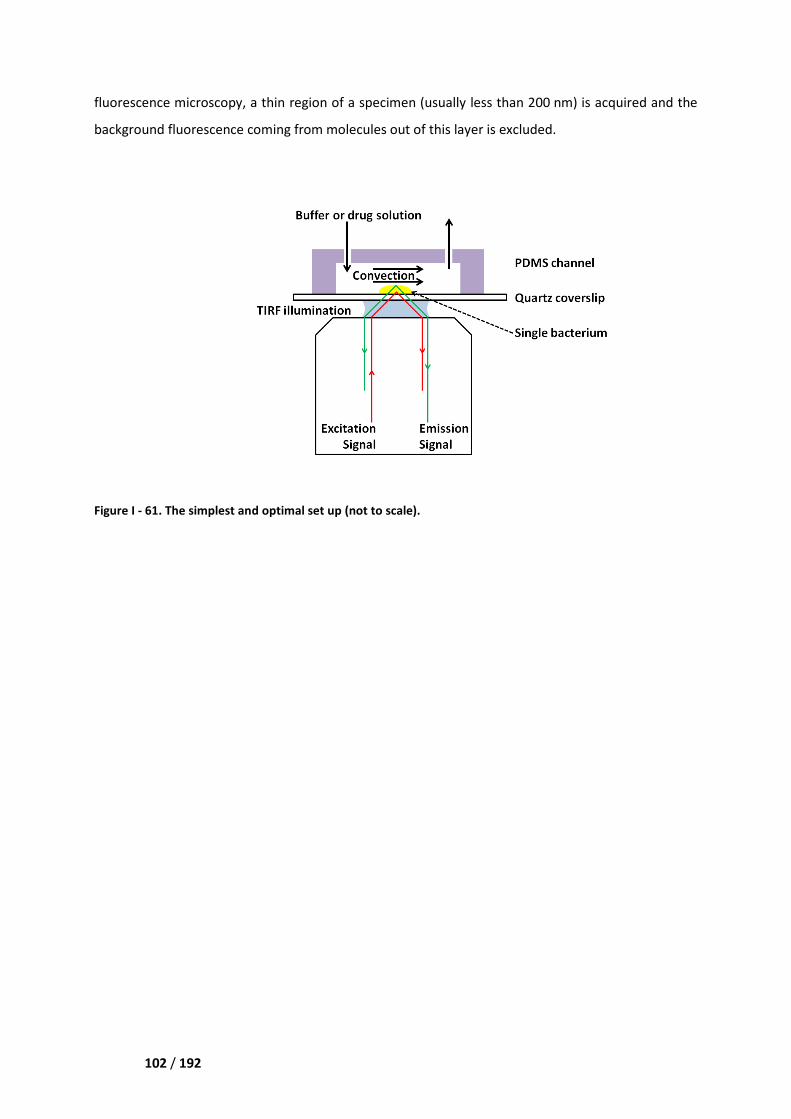
Chapter V Microdevice character
102 / 192
fluorescence microscopy, a thin region of a specimen
background fluorescence coming fro
Figure I - 61. The simplest and optimal set up (not to scale).
V Microdevice characterization
a thin region of a specimen (usually less than 200 nm
coming from molecules out of this layer is excluded.
The simplest and optimal set up (not to scale).
nm) is acquired and the
Chapter VI Experiments on bacteria
103 / 192
Chapter VI. Experiments on bacteria
After the development of the flow device, we so far have made two application attempts:
one concerned influx/efflux studies, in line with the main topic of this PhD work, and the other deals
with microorganism culture.
I. Influx/efflux studies
I.1. Device validation on the uptake of ciprofloxacin by the BL21 (DE3) strain
During the device development, a commercial microbiological product, i.e. the BL21 (DE3) E.
coli strain from New England Biolabs, was used for convenience. More precisely, this material was
easily accessible, its quality was controlled and constant; thus, microdevice characterization was
eased and freed from a number of experiment biases.
In order to have a general concept, we discuss from two ways the analysis.
As can be seen in the “extracellular fluid” time trace of Figure I - 62, the introduction of the
antibiotic molecules is achieved within 2 video frames, i.e. 30 s. Indeed, the signal corresponding to
the first point has not yet reached the highest value, but the one associated with the second point is
on the plateau. After, the signal stays almost constant. Conversely, the fluorescence intensity inside
bacteria keeps on increasing over the next 5 min. In the efflux phase, it is basically the reverse
process that is observed. Therefore, one can conclude that solute exchange is fast enough to be
employed with the present acquisition system, which is limited to a 15 s exposure time.
From the simulation point of view, it is confirmed by the concentration estimation. On one
hand we can have a concept that each porin monomer can let pass about 10 - 100 fluoroquinolone
molecules (e.g. norfloxacin) per second when the external concentration gradient equals to 1 mM
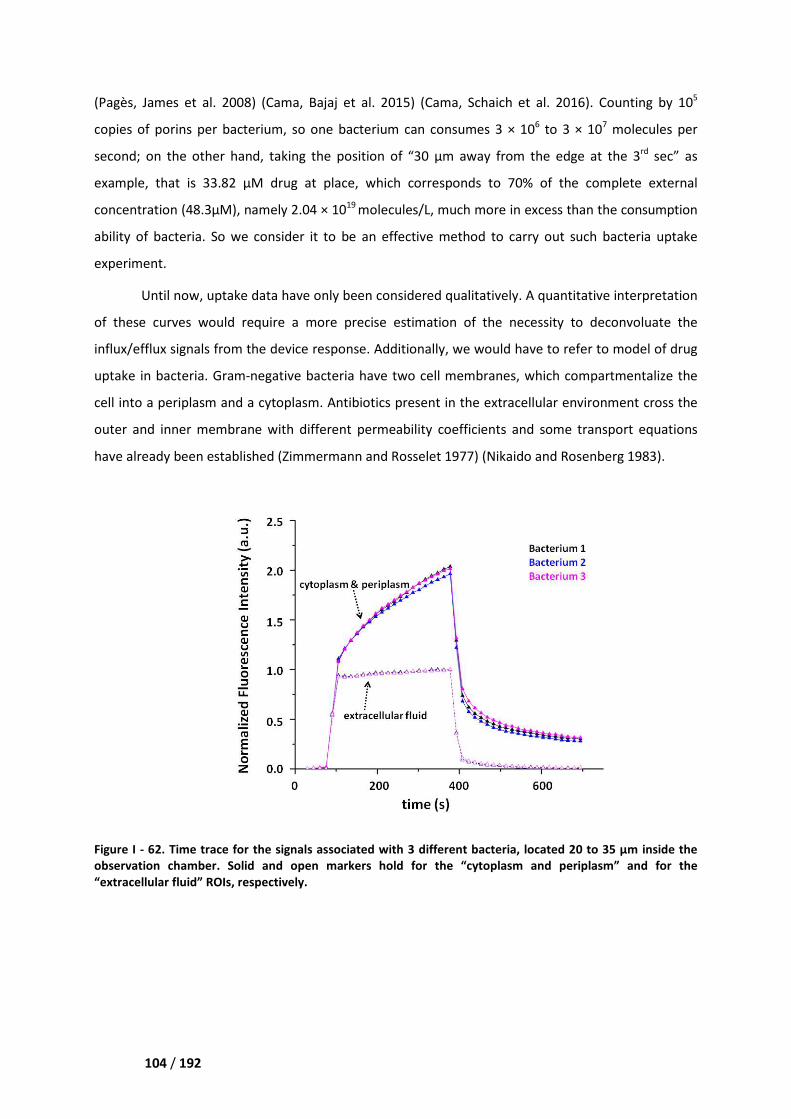
Chapter VI Experiments on bacteria
104 / 192
(Pagès, James et al. 2008) (Cama, Bajaj et al. 2015)
copies of porins per bacterium,
second; on the other hand, taking the
example, that is 33.82 µM drug
concentration (48.3µM), namely 2.04
ability of bacteria. So we consider it to be an effective method to carry out such b
experiment.
Until now, uptake data have only been considered qualitatively.
of these curves would require a more precise estimation of the necessity to deconvoluate the
influx/efflux signals from the device resp
uptake in bacteria. Gram-negative bacteria have two cell membrane
cell into a periplasm and a cytoplasm
outer and inner membrane with different permeability coefficients and some transport equation
have already been established (Zimmermann and Rosselet 1977)
Figure I - 62. Time trace for the signals associated with 3 different bacteria, located 20 to 35 µm inside the
observation chamber. Solid and open
“extracellular fluid” ROIs, respectively.
Chapter VI Experiments on bacteria
(Cama, Bajaj et al. 2015) (Cama, Schaich et al. 2016)
copies of porins per bacterium, so one bacterium can consumes 3 × 10⁶ to 3
hand, taking the position of “30 µm away from the edge
µM drug at place, which corresponds to 70% of the complete external
3µM), namely 2.04 × 10¹⁹ molecules/L, much more in excess than the consumption
So we consider it to be an effective method to carry out such b
Until now, uptake data have only been considered qualitatively. A quantitative interpretation
would require a more precise estimation of the necessity to deconvoluate the
influx/efflux signals from the device response. Additionally, we would have to refer to
negative bacteria have two cell membranes, which compartmentalize
cytoplasm. Antibiotics present in the extracellular environment
outer and inner membrane with different permeability coefficients and some transport equation
(Zimmermann and Rosselet 1977) (Nikaido and Rosenberg 1983)
or the signals associated with 3 different bacteria, located 20 to 35 µm inside the
observation chamber. Solid and open markers hold for the “cytoplasm and periplasm” and for the
“extracellular fluid” ROIs, respectively.
(Cama, Schaich et al. 2016). Counting by 105
× 107 molecules per
µm away from the edge at the 3rd sec” as
, which corresponds to 70% of the complete external
in excess than the consumption
So we consider it to be an effective method to carry out such bacteria uptake
A quantitative interpretation
would require a more precise estimation of the necessity to deconvoluate the
, we would have to refer to model of drug
, which compartmentalize the
ular environment cross the
outer and inner membrane with different permeability coefficients and some transport equations
(Nikaido and Rosenberg 1983).
or the signals associated with 3 different bacteria, located 20 to 35 µm inside the
markers hold for the “cytoplasm and periplasm” and for the
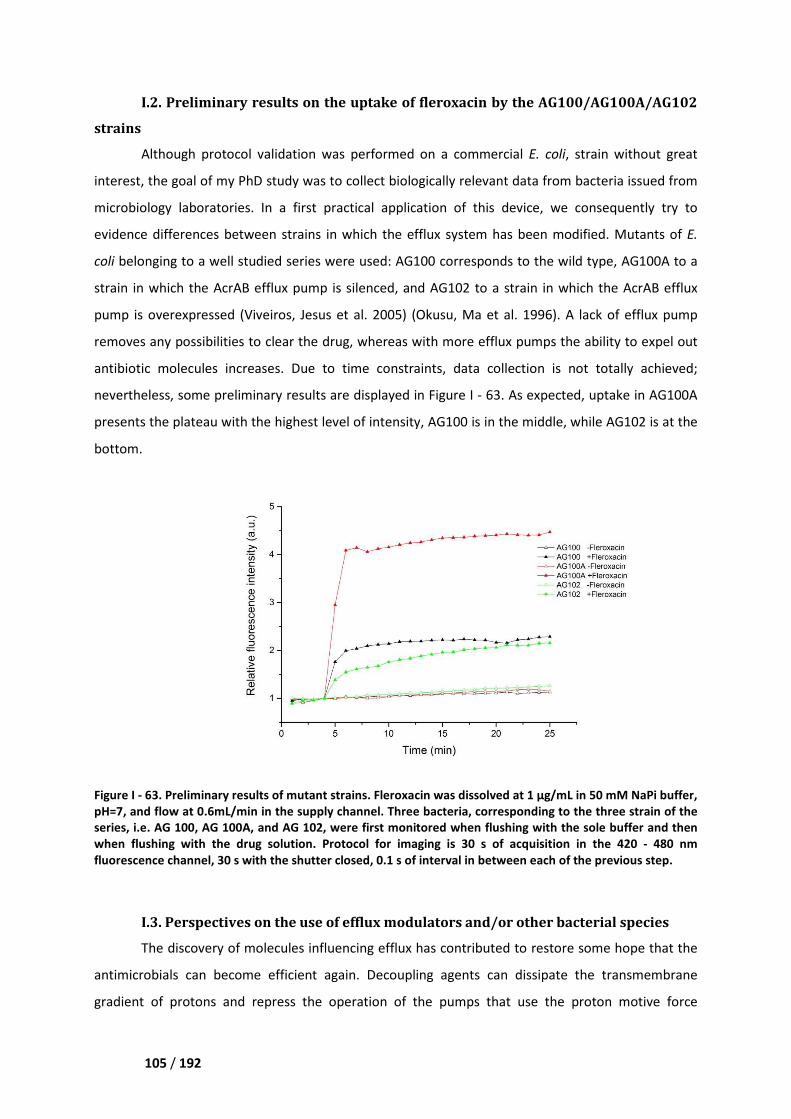
Chapter VI Experiments on bacteria
105 / 192
I.2. Preliminary results on the uptake of fleroxacin by the AG100/AG100A/AG102
strains
Although protocol validation was performed on a commercial E. coli, strain without great
interest, the goal of my PhD study was to collect biologically relevant data from bacteria issued from
microbiology laboratories. In a first practical application of this device, we consequently try to
evidence differences between strains in which the efflux system has been modified. Mutants of E.
coli belonging to a well studied series were used: AG100 corresponds to the wild type, AG100A to a
strain in which the AcrAB efflux pump is silenced, and AG102 to a strain in which the AcrAB efflux
pump is overexpressed (Viveiros, Jesus et al. 2005) (Okusu, Ma et al. 1996). A lack of efflux pump
removes any possibilities to clear the drug, whereas with more efflux pumps the ability to expel out
antibiotic molecules increases. Due to time constraints, data collection is not totally achieved;
nevertheless, some preliminary results are displayed in Figure I - 63. As expected, uptake in AG100A
presents the plateau with the highest level of intensity, AG100 is in the middle, while AG102 is at the
bottom.
Figure I - 63. Preliminary results of mutant strains. Fleroxacin was dissolved at 1 µg/mL in 50 mM NaPi buffer,
pH=7, and flow at 0.6mL/min in the supply channel. Three bacteria, corresponding to the three strain of the
series, i.e. AG 100, AG 100A, and AG 102, were first monitored when flushing with the sole buffer and then
when flushing with the drug solution. Protocol for imaging is 30 s of acquisition in the 420 - 480 nm
fluorescence channel, 30 s with the shutter closed, 0.1 s of interval in between each of the previous step.
I.3. Perspectives on the use of efflux modulators and/or other bacterial species
The discovery of molecules influencing efflux has contributed to restore some hope that the
antimicrobials can become efficient again. Decoupling agents can dissipate the transmembrane
gradient of protons and repress the operation of the pumps that use the proton motive force
Chapter VI Experiments on bacteria
106 / 192
(Piddock 2006). For instance, these molecules include carbonyl cyanide 3-chlorophenyl hydrazone
(CCCP) and dinitrophenol (DNP). Another family of compounds is capable of inhibiting RND pumps by
competition with the substrate (Lomovskaya, Warren et al. 2001). A representant of this family is
phenylalanine arginine-β-naphthylamide (PAβN), whose activity has been demonstrated on the
AcrAB pump of Enterobacteriaceae (Pagès and Amaral 2009). However, the therapeutic use of PAβN
in combination with an antibiotic is impossible because of its toxicity. More interestingly, efflux pump
inhibitory properties have also been demonstrated for classes of drugs already used in humans. For
instance, artesunate, a derivative of artemisinin (used against malaria) is able to potentiate β-lactam
activities against E. coli and increased cell accumulation of daunorubicin, possibly through the
inhibition of AcrAB-TolC expression (Li, Yao et al. 2011). Independently, quinoline and
pyridoquinoline derivatives are investigated as inhibitors of AcrAB in E. aerogenes (Chevalier, Bredin
et al. 2004) (Chevalier, Atifi et al. 2001).
The work planed on efflux modulators is still under design. To realize meaningful
experiments, we will change the drug solution used the in flush-in phase into a drug plus adjuvant
one (e.g. fleroxacin + CCCP) and then replace or not the buffer used in the flush-out phase by buffer
supplemented with adjuvant. Doing so we expect to observe different levels of accumulation in cells
and also to better understand the dynamics of inhibition.
In parallel, other bacterial species will be included in experiments, for example Enterobacter
aerogenes and its mutants, which are of importance in medicine are studied by our collaborators
from Marseille.
II. Cell growth studies
From the simulations we learn that mass transfer in the observation chamber is mainly
driven by diffusion and that there is always a moment when the concentration there will equal the
one of the external source. As long as the external supply flow is steady, the concentration in
nutrients around bacteria can reach its maximum and remains stable.
Furthermore, even if the large upper wafer of the static chamber has been changed into a
much smaller rectangular lid, in order to reduce the mismatch of curvature between the two pieces,
eventual dust or particle may increase the interspace to a value larger than 1 µm. Therefore bacteria
can gain space to grow and divide.
In one attempt, I tried to cultivate bacteria inside the device. An area 300 µm away from the
edge was chosen, where several bacteria were isolated and almost trapped (according to the criteria,
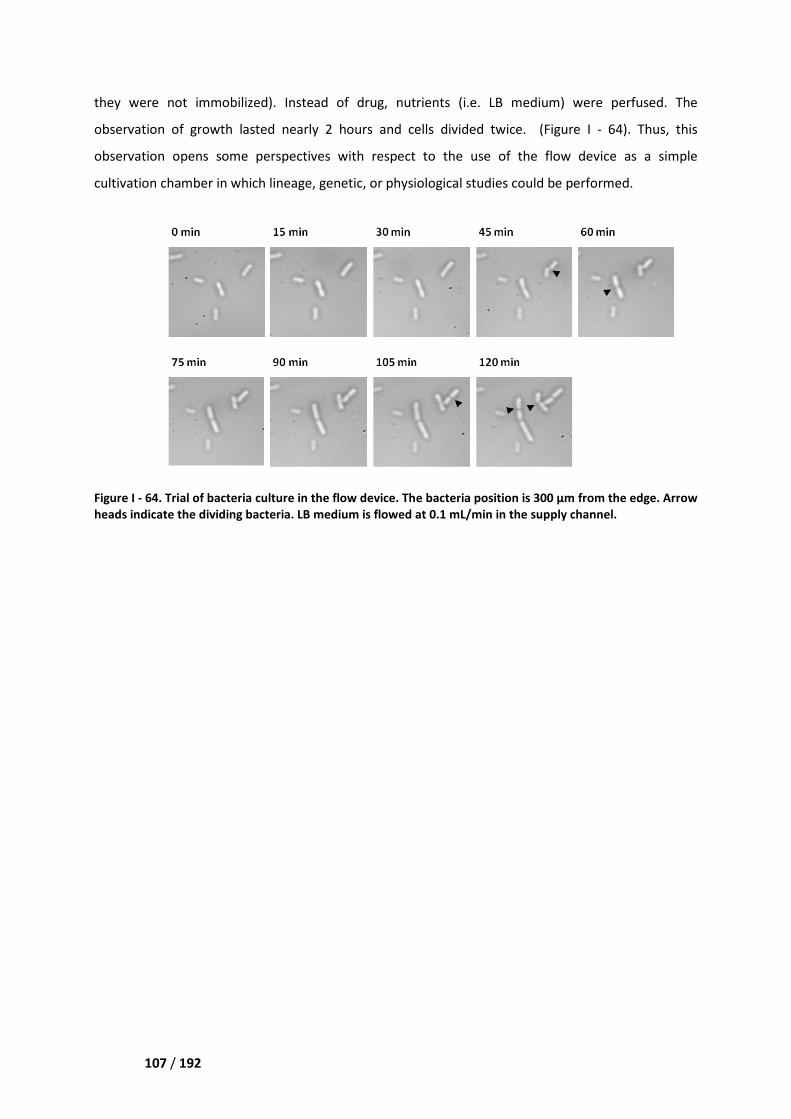
Chapter VI Experiments on bacteria
107 / 192
they were not immobilized). Instead of drug, nutrient
observation of growth lasted nearl
observation opens some perspectives with respect to the use of the flow device as a simple
cultivation chamber in which lineage, genetic, or physiological studies could be performed.
Figure I - 64. Trial of bacteria culture
heads indicate the dividing bacteria. LB medium is flowed at 0.1
Chapter VI Experiments on bacteria
they were not immobilized). Instead of drug, nutrients (i.e. LB medium) w
observation of growth lasted nearly 2 hours and cells divided twice. (Figure
observation opens some perspectives with respect to the use of the flow device as a simple
cultivation chamber in which lineage, genetic, or physiological studies could be performed.
Trial of bacteria culture in the flow device. The bacteria position is 300 µm from the edge. Arrow
heads indicate the dividing bacteria. LB medium is flowed at 0.1 mL/min in the supply channel
LB medium) were perfused. The
Figure I - 64). Thus, this
observation opens some perspectives with respect to the use of the flow device as a simple
cultivation chamber in which lineage, genetic, or physiological studies could be performed.
µm from the edge. Arrow
in the supply channel.

Chapter VI Experiments on bacteria
108 / 192
109 / 192
Part II. Reusable microdevices to
study the dynamics of cell
migration during mouse
development

110 / 192
111 / 192
Chapter I. Technical context
Transfection is a specialized technique for delivering exogenous genes into cells. With the
development of research on gene and protein functions, it has become a basic laboratory method.
Transfection protocols can be classified in three kinds: the physical, the chemical, and the biological
ones. In the Section "2.4 Competing transfection techniques" of the handbook chapter reproduced
below (Gosse et al. 2017, see the articles in Annexes), we introduced several of them. To make it
short, an ideal transfection technique must be characterized by a high efficiency, a high reducibility,
and a low cytotoxicity.
This thesis is part of the applied physics domain dealing with microdevices dedicated to
biomedical applications, and more particularly we here focus on a transfection technique called
electroporation. In this Chapter we will first recall the mechanisms of electroporation. Then, we will
introduce the various implementations that have been performed in developmental biology. Finally,
we will present some typical electroporation strategies that make use of the lab-on-a-chip concept.
I. Electroporation for transgenesis
Electroporation belongs to the category of the physical transfection method. It appeared in
the 1980s (Neumann, Schaefer-Ridder et al. 1982). This technique can easily deliver DNA, RNA,
proteins, or many other biologically active molecules into bacterial, yeast, animal, and plant cells. It is
a convenient gene transfer method, which main advantages are the simplicity of implementation, the
facility associated with the development of reproducible and efficient protocols, and the ease of
adjustment and control of the electrical parameters. This is the reason why, for many researchers,
electroporation is a promising technique. In order to understand its mechanism, we first discuss the
effect of the electrical field on cells.

112 / 192
I.1. Pore opening upon electric field
The first studies describing the
the late 1960s (Sale and Hamilton 1968)
application of an electrical pulse, cell membranes were destr
during the dielectric break-down
(Zimmermann, Pilwat et al. 1974)
resulting from the application of an intense electric field
pores formed in the membrane could allow
al. 1988) (Rols, Delteil et al. 1998)
Figure II - 1. Composition of the plasma
membrane).
To understand the above phenomena, it
membrane. The latter separation
(Figure II - 1). The specific molecular
aggregation in a two-plane assembly
the hydrophobic tails on the inside
are generally carried out through various proteins, or by diffusion through the phospholipids in the
case of lipophilic molecules.
When a cell is placed between electrodes
when the applied electric field is sufficiently strong,
I.1. Pore opening upon electric field application
The first studies describing the in vitro effect of a pulsed field on a biological cell
Sale and Hamilton 1968) (Coster 1965). It was observed that, following th
ulse, cell membranes were destroyed in a way similar to what happen
down of a capacity submitted to a too large voltage drop
(Zimmermann, Pilwat et al. 1974). A few years later, it was demonstrated that th
the application of an intense electric field was not necessarily irreversible
pores formed in the membrane could allow some molecules to enter the cytoplasm
(Rols, Delteil et al. 1998).
plasma membrane of the eukaryotic cells. Image taken from
o understand the above phenomena, it is necessary to first discuss the
separation consists in a phospholipid bilayer into which proteins are inserted
molecular structure of the phospholipids allows the
plane assembly, with the hydrophilic heads oriented towards
on the inside. The exchanges between the interior and the exterior of the cell
are generally carried out through various proteins, or by diffusion through the phospholipids in the
When a cell is placed between electrodes that are connected to a voltage generato
electric field is sufficiently strong, the arising potential difference between the
on a biological cell date from
. It was observed that, following the
similar to what happen
of a capacity submitted to a too large voltage drop (Crowley 1973)
emonstrated that the perturbations
irreversible and that the
enter the cytoplasm (Mir, Banoun et
Image taken from (Wikipedia Cell
e anatomy of the cell
into which proteins are inserted
allows their spontaneous
wards the solution and
the exterior of the cell
are generally carried out through various proteins, or by diffusion through the phospholipids in the
that are connected to a voltage generator, and
potential difference between the
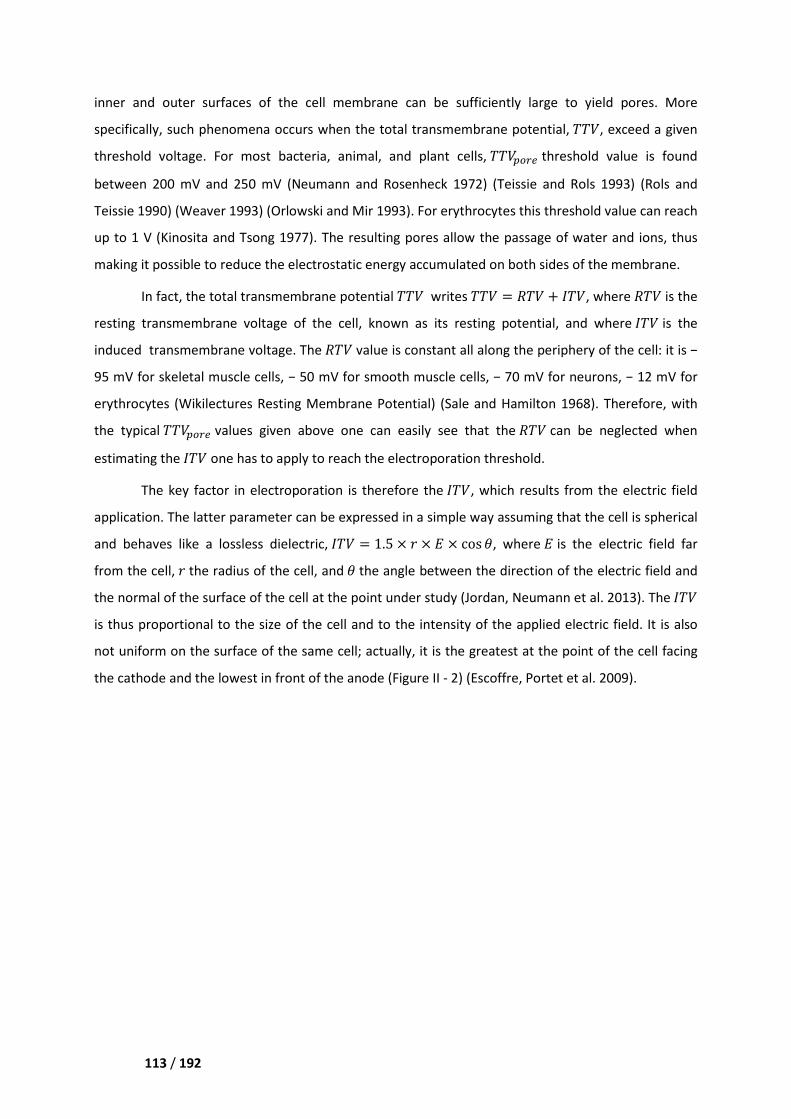
113 / 192
inner and outer surfaces of the cell membrane can be sufficiently large to yield pores. More
specifically, such phenomena occurs when the total transmembrane potential, ���, exceed a given
threshold voltage. For most bacteria, animal, and plant cells, ���%5!0 threshold value is found
between 200 mV and 250 mV (Neumann and Rosenheck 1972) (Teissie and Rols 1993) (Rols and
Teissie 1990) (Weaver 1993) (Orlowski and Mir 1993). For erythrocytes this threshold value can reach
up to 1 V (Kinosita and Tsong 1977). The resulting pores allow the passage of water and ions, thus
making it possible to reduce the electrostatic energy accumulated on both sides of the membrane.
In fact, the total transmembrane potential ��� writes ��� = ��� + /��, where ��� is the
resting transmembrane voltage of the cell, known as its resting potential, and where /�� is the
induced transmembrane voltage. The ��� value is constant all along the periphery of the cell: it is −
95 mV for skeletal muscle cells, − 50 mV for smooth muscle cells, − 70 mV for neurons, − 12 mV for
erythrocytes (Wikilectures Resting Membrane Potential) (Sale and Hamilton 1968). Therefore, with
the typical ���%5!0 values given above one can easily see that the ��� can be neglected when
estimating the /�� one has to apply to reach the electroporation threshold.
The key factor in electroporation is therefore the /��, which results from the electric field
application. The latter parameter can be expressed in a simple way assuming that the cell is spherical
and behaves like a lossless dielectric, /�� = 1.5 × � × × cos �, where is the electric field far
from the cell, � the radius of the cell, and � the angle between the direction of the electric field and
the normal of the surface of the cell at the point under study (Jordan, Neumann et al. 2013). The /��
is thus proportional to the size of the cell and to the intensity of the applied electric field. It is also
not uniform on the surface of the same cell; actually, it is the greatest at the point of the cell facing
the cathode and the lowest in front of the anode (Figure II - 2) (Escoffre, Portet et al. 2009).
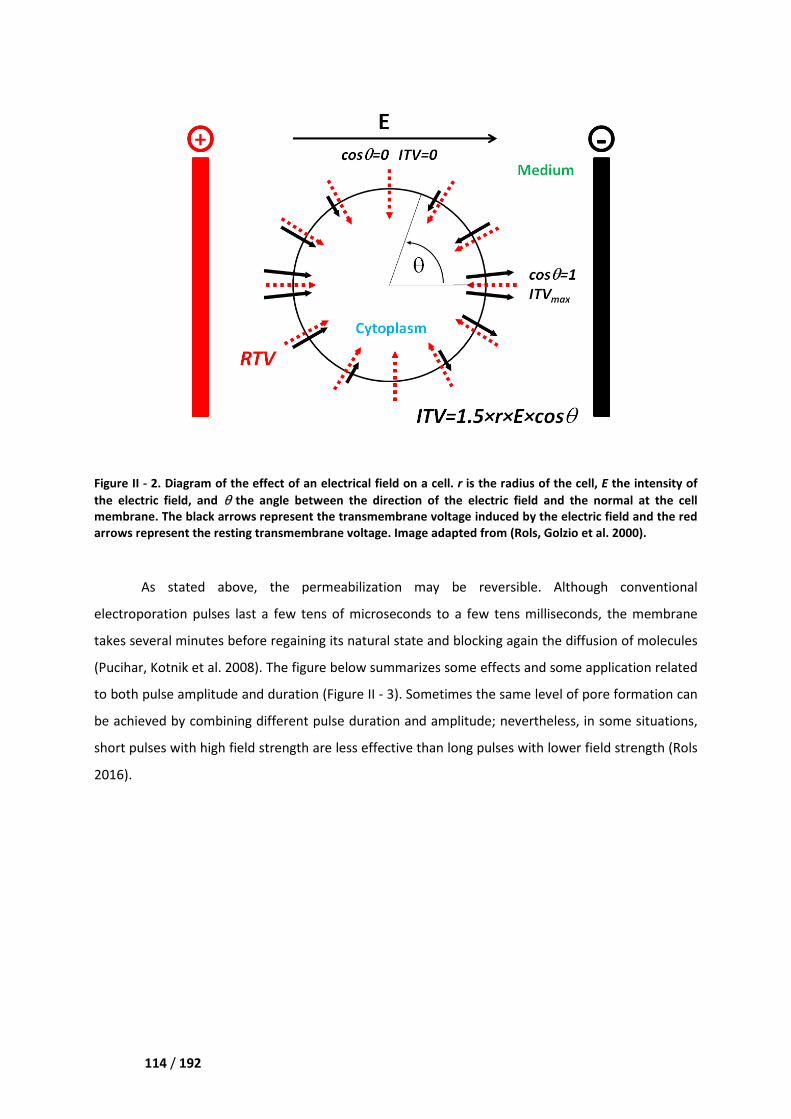
114 / 192
Figure II - 2. Diagram of the effect
the electric field, and θ the angle between the direction of the electric field and the normal
membrane. The black arrows represent the t
arrows represent the resting transmembrane voltage
As stated above, the permeabiliz
electroporation pulses last a few tens of microseconds
takes several minutes before regaining its natural state and blocking
(Pucihar, Kotnik et al. 2008). The figure below summarizes some effects and some application related
to both pulse amplitude and duration (
be achieved by combining different
short pulses with high field strength are less effective than long pulses with lower field
2016).
of an electrical field on a cell. r is the radius of the cell,
he angle between the direction of the electric field and the normal
The black arrows represent the transmembrane voltage induced by the electric field and the red
transmembrane voltage. Image adapted from (Rols, Golzio et al. 2000)
he permeabilization may be reversible. Although
electroporation pulses last a few tens of microseconds to a few tens milliseconds
takes several minutes before regaining its natural state and blocking again the diffusion
The figure below summarizes some effects and some application related
e and duration (Figure II - 3). Sometimes the same level of pore formation
different pulse duration and amplitude; nevertheless, in some situations,
hort pulses with high field strength are less effective than long pulses with lower field
the radius of the cell, E the intensity of
he angle between the direction of the electric field and the normal at the cell
ransmembrane voltage induced by the electric field and the red
(Rols, Golzio et al. 2000).
though conventional
a few tens milliseconds, the membrane
diffusion of molecules
The figure below summarizes some effects and some application related
the same level of pore formation can
nevertheless, in some situations,
hort pulses with high field strength are less effective than long pulses with lower field strength (Rols
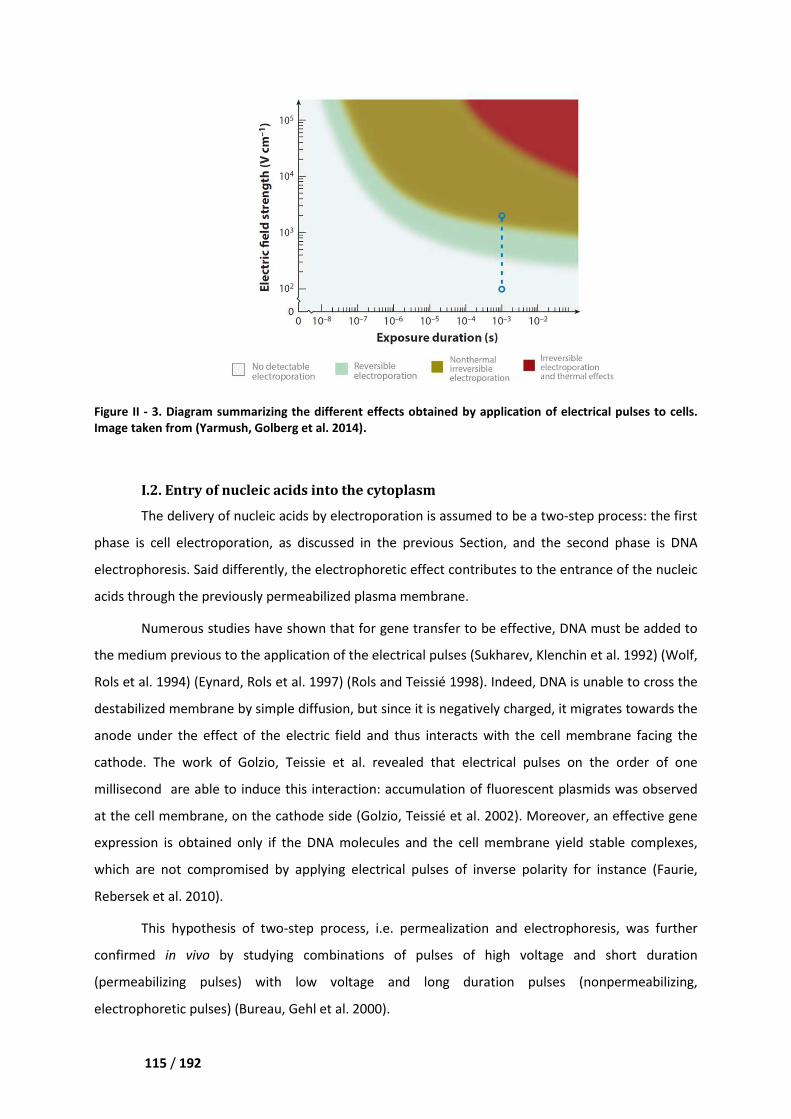
115 / 192
Figure II - 3. Diagram summarizing the different effects obtained by application of el
Image taken from (Yarmush, Golberg et al. 2014)
I.2. Entry of nucleic acid
The delivery of nucleic acid
phase is cell electroporation, as
electrophoresis. Said differently,
acids through the previously permeabilized plasma membrane.
Numerous studies have
the medium previous to the applic
Rols et al. 1994) (Eynard, Rols et al. 1997)
destabilized membrane by simple diffusion
anode under the effect of the electric f
cathode. The work of Golzio, Teissie et al. revealed that electrical pulses on the order of one
millisecond are able to induce this
at the cell membrane, on the cathode side
expression is obtained only if the DNA molecules and the cell membrane yield
which are not compromised by applying electrical pulses of inverse polarity
Rebersek et al. 2010).
This hypothesis of two-
confirmed in vivo by studying
(permeabilizing pulses) with low voltage and long duration pulses
electrophoretic pulses) (Bureau, Gehl et al. 2000)
Diagram summarizing the different effects obtained by application of electrical pulses
armush, Golberg et al. 2014).
I.2. Entry of nucleic acids into the cytoplasm
nucleic acids by electroporation is assumed to be a two-step
as discussed in the previous Section, and the sec
Said differently, the electrophoretic effect contributes to the entrance of the nucleic
the previously permeabilized plasma membrane.
have shown that for gene transfer to be effective, DNA m
the medium previous to the application of the electrical pulses (Sukharev, Klenchin et al. 1992)
(Eynard, Rols et al. 1997) (Rols and Teissié 1998). Indeed, DNA is unable to cross the
ed membrane by simple diffusion, but since it is negatively charged, it migrates towards the
anode under the effect of the electric field and thus interacts with the cell membrane facing the
cathode. The work of Golzio, Teissie et al. revealed that electrical pulses on the order of one
this interaction: accumulation of fluorescent plasmids was observed
on the cathode side (Golzio, Teissié et al. 2002). Moreover,
the DNA molecules and the cell membrane yield
y applying electrical pulses of inverse polarity
-step process, i.e. permealization and electrophoresis
ing combinations of pulses of high voltage and short durat
(permeabilizing pulses) with low voltage and long duration pulses
(Bureau, Gehl et al. 2000).
ectrical pulses to cells.
step process: the first
the second phase is DNA
to the entrance of the nucleic
that for gene transfer to be effective, DNA must be added to
(Sukharev, Klenchin et al. 1992) (Wolf,
DNA is unable to cross the
is negatively charged, it migrates towards the
ield and thus interacts with the cell membrane facing the
cathode. The work of Golzio, Teissie et al. revealed that electrical pulses on the order of one
ccumulation of fluorescent plasmids was observed
Moreover, an effective gene
the DNA molecules and the cell membrane yield stable complexes,
for instance (Faurie,
permealization and electrophoresis, was further
ombinations of pulses of high voltage and short duration
(permeabilizing pulses) with low voltage and long duration pulses (nonpermeabilizing,
116 / 192
II. Electroporation in embryology
In the developmental biology studies of the last century, two methods were employed to
follow cell development and differentiation: transplantation and staining. Spemann made use of the
naturally different color of two newt species to track the developmental fate of transplanted cells in
a host embryo (1924); Le Douarin created quail-chicken chimera to visualize the differentiation and
migration of embryonic cells (1969). On the other hand, Vogt, from the beginning of the 1920s, used
dyes to track the fate of cells in embryo (1923). After decades of development, we can now use
electroporation easily to mark cells of interest. This achievement is discussed in both the book of
Nakamura (Nakamura 2009) and in our handbook chapter (Gosse et al. 2017, see the articles in
Annexes).
II.1 Goal of the transfection experiments
This section is more detailed in Section "2. Typical experiments" of the handbook chapter.
(Gosse et al. 2017, see the articles in Annexes).
II.1.1. Cell fate mapping
To understand developmental processes, the origin and the dynamics of given cell
populations need to be precisely determined. Indeed, in the process of forming complex organisms,
cells divide, die, migrate, and differentiate. Fate maps are then drawn by tracing the descendants of
a particular cell population (cell lineage analysis) or even of a single cell (clonal analysis). Transfection
can serve to mark cells, in order to be able to track their position. One can achieve cell labelling by
modifying their gene expression to produce specific proteins like the enzyme ß-galactosidase, which
produces a colored compound that can be detected in fixed tissues, or fluorescent proteins, which
allow live imaging experiments.
II.1.2. Gene function study
Modification of gene expression is commonly used to change the characteristics of the
targeted cells, making them gaining or losing some functions. The activity of a protein of interest can
be up- or down-regulated by modulating its synthesis or by interfering with its normal molecular
behavior. Thus, in embryology, molecular signals can for instance be switched on and off to perturb
regulatory pathways.
117 / 192
II.2. Localization strategies
Many researchers use some commercially available devices such as electroporation cuvettes
to electroporate fertilized eggs (Buono and Linser 1991) (Zeller 2004). This method makes use of
large electrodes and the molecules that need to be transfected are also present in great amount:
neither the field nor the transgene is localized.
When electroporation is applied to a more complex biological structure like an embryo, it is
often required to target precisely one given tissue or cell population. From an engineering point of
view, we thus need some means to achieve the localization of the transfection. Since the
implementation of electroporation needs two partners, an electric field to open pores and a DNA
solution to obtain a biological effect, we can play on one or the other, or even both, to reach our
objectives. Four corresponding strategies are summarized below; for more precise information
please see the Section “3. Strategies to spatially restrict transfection” of the handbook chapter
(Gosse et al. 2017, see the articles in Annexes).
II.2.1. Orientation of the embryo
The embryo is placed between parallel plates electrodes and the electroporation is achieved
by controlling its orientation. Even if the molecules to be transfected are present everywhere, they
will not cross the plasma membrane if pores are not opened, which will occur only for cells facing the
electrodes. However, with this implementation localization is not very precise, especially when the
targeted tissue is very flat.
II.2.2. Containment of the nucleic acids solution
This strategy also uses parallel plates as electrodes but it additionally relies on the
microinjection of the DNA solution. Said differently, it involves disposing the transgene solution close
to the targeted tissue by micro injection and applying a non-focalized electric field to transfect it.
With such a technique the plasmid can be used in limited amount and its concentration can be quite
well controlled (Figure II - 4).
118 / 192
Figure II - 4. Electroporation strategy relying on both macroelectrodes and microinjection of the DNA
solution.
II.2.3. Generation of an electric field gradient
Instead of controlling the place where nucleic acids are ap
restrain the area over which cells are porate
pointing towards the targeted tissue
by electrolysis in the vicinity of the electrode, which
Figure II - 5. Electroporation strategy relying on a micro
So there is another reported method
is filled with electrolyte, which allow
embryo (Figure II - 6). Metal electrodes are
the generated harmful species cannot reach it.
. Electroporation strategy relying on both macroelectrodes and microinjection of the DNA
Generation of an electric field gradient
Instead of controlling the place where nucleic acids are applied, this strategy chooses to
restrain the area over which cells are porated. It can be achieved by a metal needle
tissue (Figure II - 5). However, harmful chemical species
by electrolysis in the vicinity of the electrode, which by necessity must be very close to the embryo.
Electroporation strategy relying on a micro-needle electrode and a homogeneous DNA solution.
is another reported method which makes use of liquid electrode.
, which allows shaping and focusing the electric field at the surface of the
). Metal electrodes are deported far from the biological object and
the generated harmful species cannot reach it.
. Electroporation strategy relying on both macroelectrodes and microinjection of the DNA
plied, this strategy chooses to
needle-type electrode
chemical species are produced
by necessity must be very close to the embryo.
needle electrode and a homogeneous DNA solution.
liquid electrode. A dielectric guide
at the surface of the
deported far from the biological object and, therefore,
119 / 192
Figure II - 6. Electroporation strategy relying on a micropipette and on a homogeneous DNA solution.
II.2.4. Combination of both molecular localization and electric field focusing
In this strategy, microinjection and
to further control the area over which
III. Electroporation and
Here we will present some
microelectrodes or dielectric guides
their designs.
III.1 Microelectrodes
Such microdevices work sometimes as well as
related to fluidic systems. Indeed
cuvette, while allowing simultaneous observation and control of the movement of
cells under a microscope. Basically, such
the floor and ceiling of a straight microchannel
metalized on a glass substrate
metallization and electroplating
decrease the interspace between electrodes
2006), so in such chips it is possible to reach a high enough el
It is important to note that the material used for the electrodes must be carefull
Indeed, upon electric field application
the interface between the electrodes and the s
It is therefore necessary to avoid materials
Electroporation strategy relying on a micropipette and on a homogeneous DNA solution.
n of both molecular localization and electric field focusing
In this strategy, microinjection and focalized electric field are used simultaneously,
over which of transfection is achieved.
III. Electroporation and microsystems
some microdevices used for electroporation, which
guides. Although they deal with single cells, we can
k sometimes as well as bulk strategies, but with
. Indeed, they make it possible to treat a larger number of cells
while allowing simultaneous observation and control of the movement of
cells under a microscope. Basically, such chips can be composed of parallel plate electrodes on both
the floor and ceiling of a straight microchannel (Lin, Jen et al. 2001); coplanar metal electrode pads
metalized on a glass substrate (Adamo, Arione et al. 2013); or 3D electrodes fabricated by
metallization and electroplating (Lu, Schmidt et al. 2005) (Figure II - 7). Miniaturization
he interspace between electrodes, typically between 5 and 500 µm
it is possible to reach a high enough electric field with less important voltage.
It is important to note that the material used for the electrodes must be carefull
upon electric field application it is common to observe a release of metal ions or particles,
the interface between the electrodes and the solution (Tomov and Tsoneva 2000)
It is therefore necessary to avoid materials such as copper or aluminum because they produce
Electroporation strategy relying on a micropipette and on a homogeneous DNA solution.
n of both molecular localization and electric field focusing
ocalized electric field are used simultaneously, in order
, which they make use of
we can be inspired from
strategies, but with some advantages
they make it possible to treat a larger number of cells, as in
while allowing simultaneous observation and control of the movement of the suspended
parallel plate electrodes on both
coplanar metal electrode pads
or 3D electrodes fabricated by
Miniaturization enables to
µm (Fox, Esveld et al.
ectric field with less important voltage.
It is important to note that the material used for the electrodes must be carefully chosen.
metal ions or particles, at
(Tomov and Tsoneva 2000) (Stapulionis 1999).
because they produce Cu2+
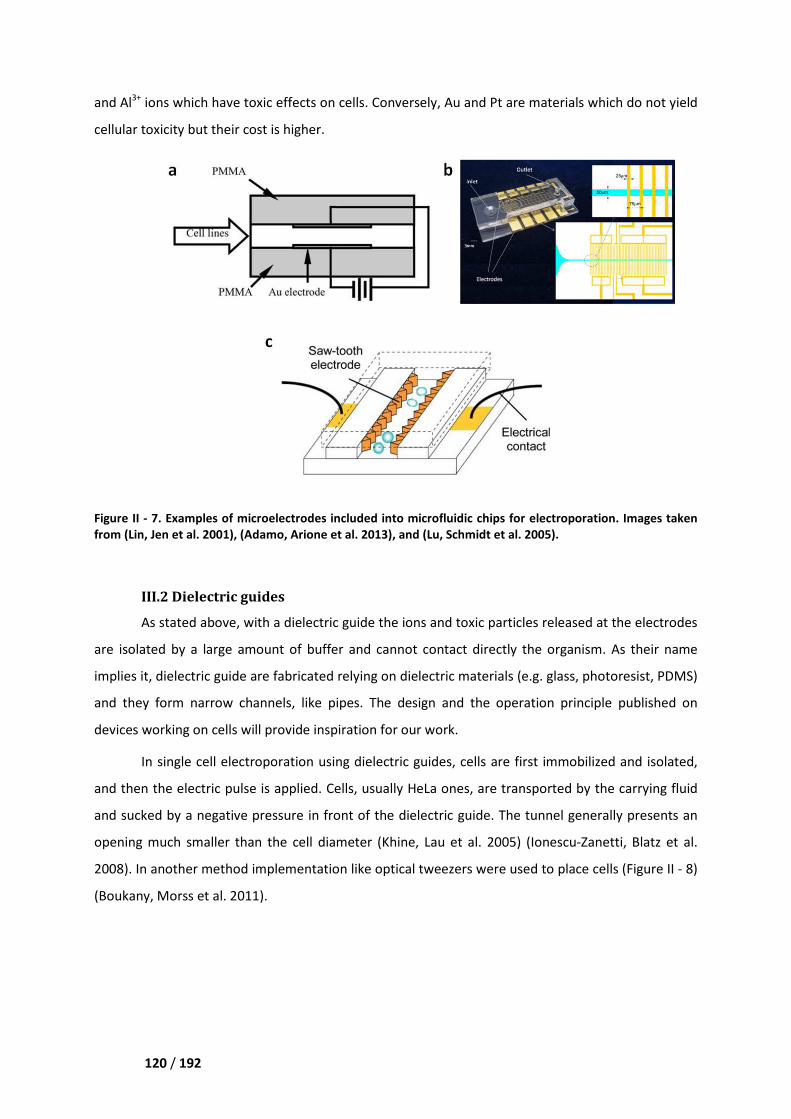
120 / 192
and Al3+ ions which have toxic effects on cells
cellular toxicity but their cost is higher
Figure II - 7. Examples of microelectrodes
from (Lin, Jen et al. 2001), (Adamo, Arione et al. 2013)
III.2 Dielectric guides
As stated above, with a dielectric guide
are isolated by a large amount of buffer and cannot
implies it, dielectric guide are fabricated relying on
and they form narrow channels
devices working on cells will provide
In single cell electroporation
and then the electric pulse is applied. Cells, usually HeLa ones, are trans
and sucked by a negative pressure
opening much smaller than the cell di
2008). In another method implementation
(Boukany, Morss et al. 2011).
ave toxic effects on cells. Conversely, Au and Pt are materials which
but their cost is higher.
microelectrodes included into microfluidic chips for electroporation.
(Adamo, Arione et al. 2013), and (Lu, Schmidt et al. 2005).
dielectric guide the ions and toxic particles released
ount of buffer and cannot contact directly the organism.
are fabricated relying on dielectric materials (e.g. glass, photoresist, PDMS)
channels, like pipes. The design and the operation princ
will provide inspiration for our work.
single cell electroporation using dielectric guides, cells are first immobilized and isolated,
e electric pulse is applied. Cells, usually HeLa ones, are transported by the carrying fluid
negative pressure in front of the dielectric guide. The tunnel generally
smaller than the cell diameter (Khine, Lau et al. 2005) (Ionescu
implementation like optical tweezers were used to place cells
Pt are materials which do not yield
chips for electroporation. Images taken
toxic particles released at the electrodes
contact directly the organism. As their name
glass, photoresist, PDMS)
principle published on
cells are first immobilized and isolated,
ported by the carrying fluid
in front of the dielectric guide. The tunnel generally presents an
(Ionescu-Zanetti, Blatz et al.
to place cells (Figure II - 8)
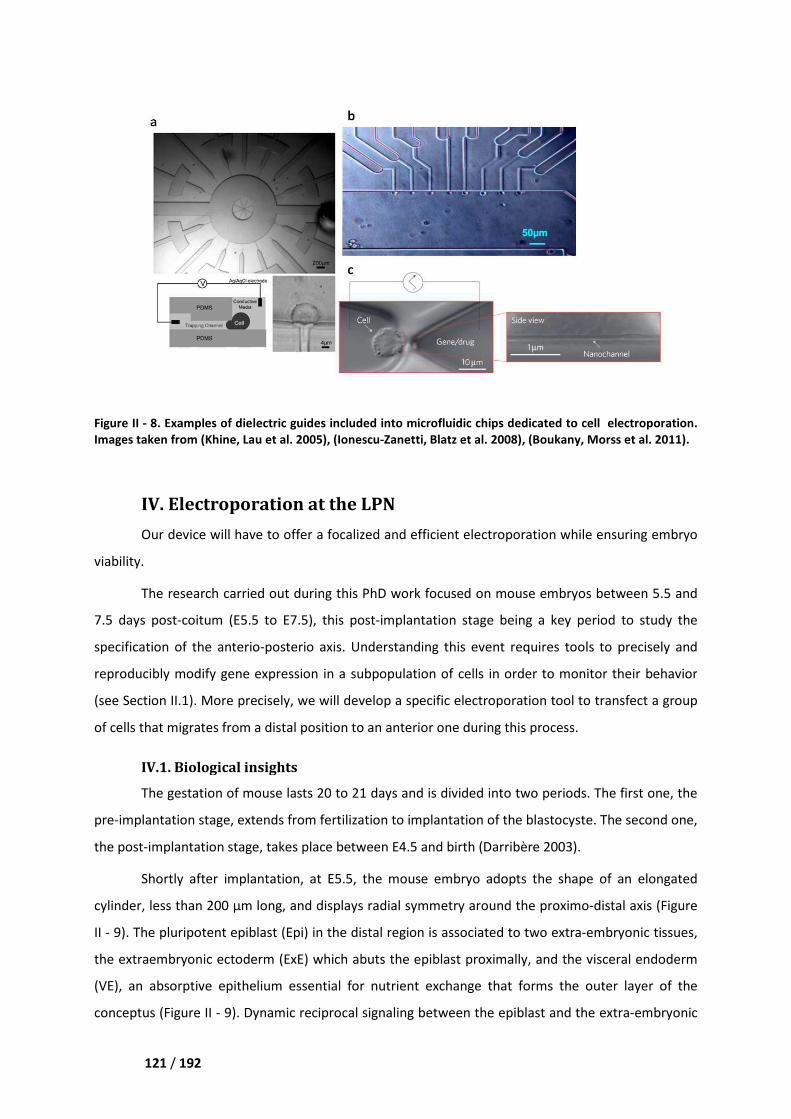
121 / 192
Figure II - 8. Examples of dielectric guides include
Images taken from (Khine, Lau et al. 2005)
IV. Electroporation at the LPN
Our device will have to offer a f
viability.
The research carried out during this
7.5 days post-coitum (E5.5 to E7.5), t
specification of the anterio-posterio axis.
reproducibly modify gene expression
(see Section II.1). More precisely,
of cells that migrates from a distal
IV.1. Biological insights
The gestation of mouse lasts 20 to 21 days and is divided into two peri
pre-implantation stage, extends from fertilization to implantation
the post-implantation stage, takes place
Shortly after implantation, at E5.5, the mouse embryo adopts the shape of an elongated
cylinder, less than 200 µm long, and displays radial symmetry around the proximo
II - 9). The pluripotent epiblast (Epi) in the distal region is associated to two ex
the extraembryonic ectoderm (ExE) which abuts the epiblast proximally, and the visceral endoderm
(VE), an absorptive epithelium essential fo
conceptus (Figure II - 9). Dynamic
dielectric guides included into microfluidic chips dedicated to cell electroporation.
(Khine, Lau et al. 2005), (Ionescu-Zanetti, Blatz et al. 2008), (Boukany, Morss et al. 2011)
IV. Electroporation at the LPN
will have to offer a focalized and efficient electroporation while
The research carried out during this PhD work focused on mouse embryos between
m (E5.5 to E7.5), this post-implantation stage being a key period to study
posterio axis. Understanding this event requires tools
gene expression in a subpopulation of cells in order to monitor their behavior
y, we will develop a specific electroporation tool
from a distal position to an anterior one during this process.
Biological insights
mouse lasts 20 to 21 days and is divided into two periods. The first one,
extends from fertilization to implantation of the blastocyste. The second one,
takes place between E4.5 and birth (Darribère 2003)
Shortly after implantation, at E5.5, the mouse embryo adopts the shape of an elongated
cylinder, less than 200 µm long, and displays radial symmetry around the proximo
. The pluripotent epiblast (Epi) in the distal region is associated to two extra
the extraembryonic ectoderm (ExE) which abuts the epiblast proximally, and the visceral endoderm
(VE), an absorptive epithelium essential for nutrient exchange that forms the outer layer of the
). Dynamic reciprocal signaling between the epiblast and the extra
chips dedicated to cell electroporation.
(Boukany, Morss et al. 2011).
while ensuring embryo
embryos between 5.5 and
ey period to study the
tools to precisely and
a subpopulation of cells in order to monitor their behavior
tool to transfect a group
during this process.
ods. The first one, the
of the blastocyste. The second one,
(Darribère 2003).
Shortly after implantation, at E5.5, the mouse embryo adopts the shape of an elongated
cylinder, less than 200 µm long, and displays radial symmetry around the proximo-distal axis (Figure
tra-embryonic tissues,
the extraembryonic ectoderm (ExE) which abuts the epiblast proximally, and the visceral endoderm
r nutrient exchange that forms the outer layer of the
reciprocal signaling between the epiblast and the extra-embryonic
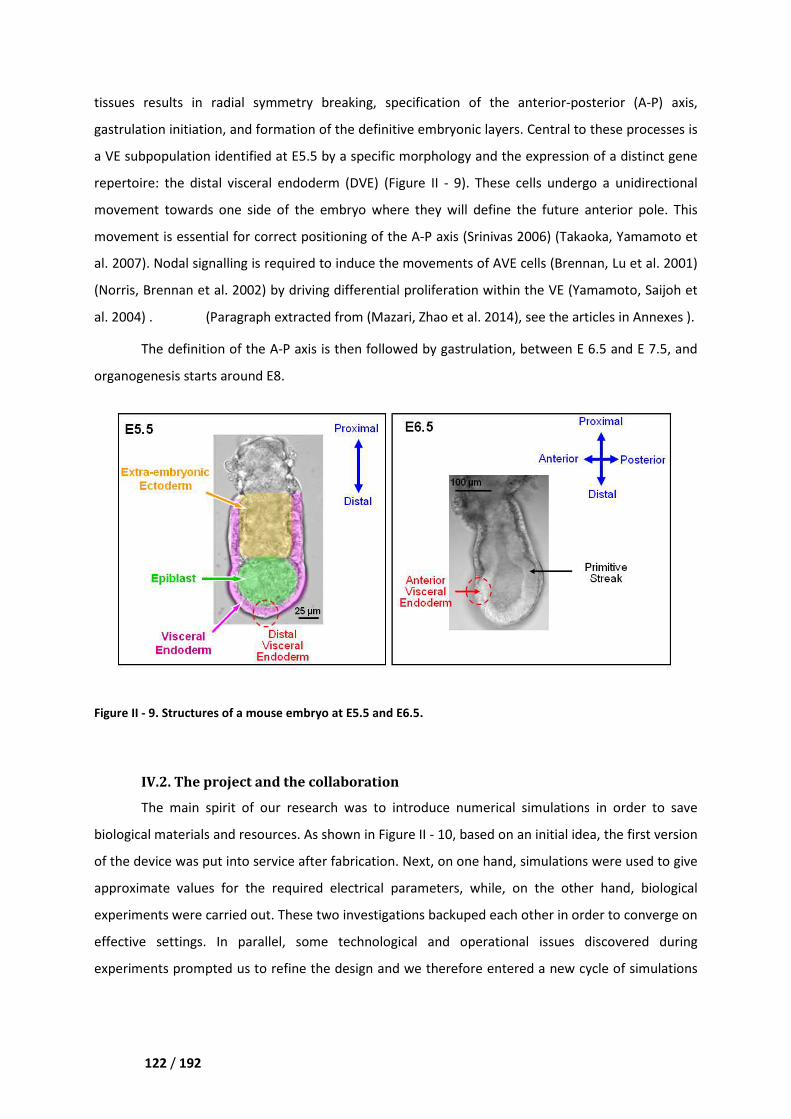
122 / 192
tissues results in radial symmetry breaking, specification of the anterior
gastrulation initiation, and formation of the definitive embryonic layers. Central to these processes is
a VE subpopulation identified at E5.5 by a specific morphology and the expression of a distinct gene
repertoire: the distal visceral endoderm (DVE)
movement towards one side of the embryo where they will define the future anterior pole. This
movement is essential for correct positioning of the A
al. 2007). Nodal signalling is required to indu
(Norris, Brennan et al. 2002) by driving differential p
al. 2004) . (Paragraph extracted
The definition of the A-P axis is then followed by gastrulation, between E 6.5 and E 7.5, and
organogenesis starts around E8.
Figure II - 9. Structures of a mouse embryo at
IV.2. The project and the collaboration
The main spirit of our research wa
biological materials and resources. As shown in
of the device was put into service aft
approximate values for the required electrical
experiments were carried out. These two
effective settings. In parallel, s
experiments prompted us to refine the
tissues results in radial symmetry breaking, specification of the anterior-posterior (A
gastrulation initiation, and formation of the definitive embryonic layers. Central to these processes is
a VE subpopulation identified at E5.5 by a specific morphology and the expression of a distinct gene
ral endoderm (DVE) (Figure II - 9). These cells undergo a unidirectional
movement towards one side of the embryo where they will define the future anterior pole. This
ct positioning of the A-P axis (Srinivas 2006) (Takaoka, Yamamoto et
. Nodal signalling is required to induce the movements of AVE cells (Brennan, Lu et al. 2001)
by driving differential proliferation within the VE (Yamamoto, Saijoh et
extracted from (Mazari, Zhao et al. 2014), see the articles in
P axis is then followed by gastrulation, between E 6.5 and E 7.5, and
tructures of a mouse embryo at E5.5 and E6.5.
and the collaboration
of our research was to introduce numerical simulations
esources. As shown in Figure II - 10, based on an initial idea,
into service after fabrication. Next, on one hand, simulation
the required electrical parameters, while, on the other hand
hese two investigations backuped each other in order to
settings. In parallel, some technological and operational issues
refine the design and we therefore entered a new
posterior (A-P) axis,
gastrulation initiation, and formation of the definitive embryonic layers. Central to these processes is
a VE subpopulation identified at E5.5 by a specific morphology and the expression of a distinct gene
. These cells undergo a unidirectional
movement towards one side of the embryo where they will define the future anterior pole. This
(Takaoka, Yamamoto et
(Brennan, Lu et al. 2001)
(Yamamoto, Saijoh et
articles in Annexes ).
P axis is then followed by gastrulation, between E 6.5 and E 7.5, and
numerical simulations in order to save
initial idea, the first version
on one hand, simulations were used to give
on the other hand, biological
each other in order to converge on
ome technological and operational issues discovered during
a new cycle of simulations
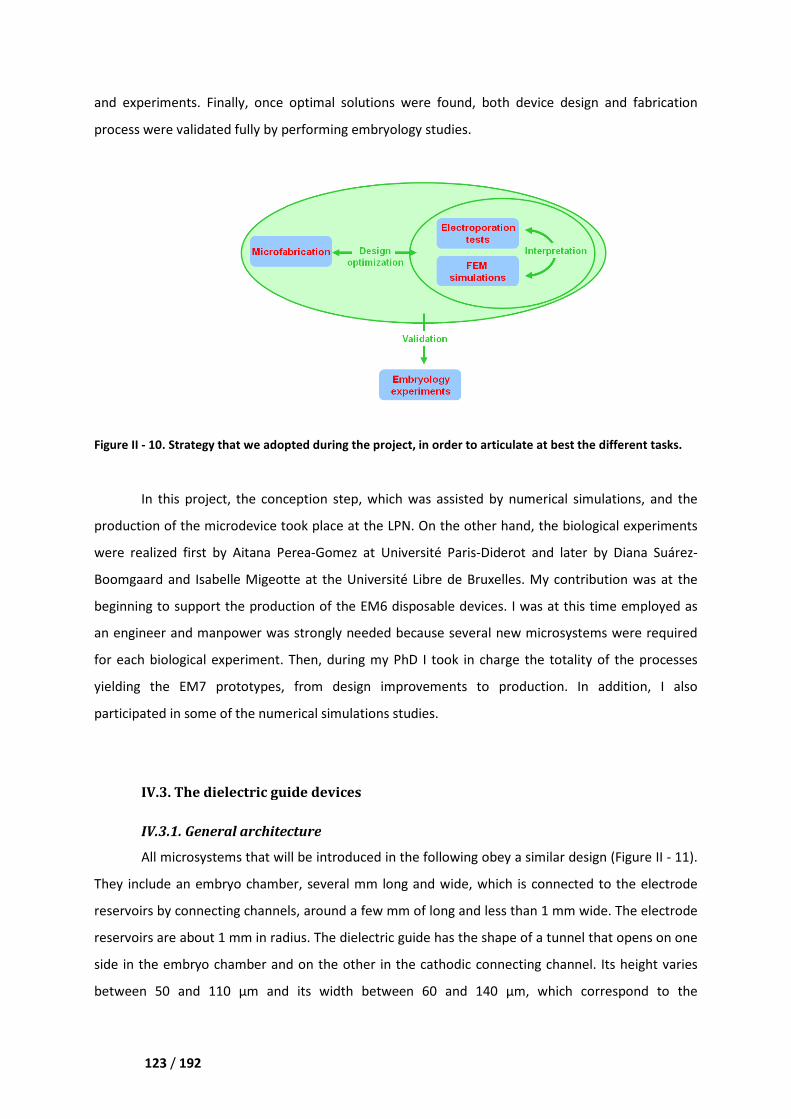
123 / 192
and experiments. Finally, once optimal solutions we
process were validated fully by performing embryology studies.
Figure II - 10. Strategy that we adopted during the project, in order to
In this project, the conception step
production of the microdevice took place
were realized first by Aitana Perea
Boomgaard and Isabelle Migeotte
beginning to support the production
an engineer and manpower was strongly needed
for each biological experiment. Then,
yielding the EM7 prototypes,
participated in some of the numerical
IV.3. The dielectric guide devices
IV.3.1. General architecture
All microsystems that will
They include an embryo chamber
reservoirs by connecting channels
reservoirs are about 1 mm in radius
side in the embryo chamber and on the other in the cathodic
between 50 and 110 µm and its width between 60 and 140
experiments. Finally, once optimal solutions were found, both device design and fabrication
were validated fully by performing embryology studies.
Strategy that we adopted during the project, in order to articulate at best the different tasks.
conception step, which was assisted by numerical simulation
production of the microdevice took place at the LPN. On the other hand, the biological experiments
by Aitana Perea-Gomez at Université Paris-Diderot and later
Boomgaard and Isabelle Migeotte at the Université Libre de Bruxelles. My contribution
support the production of the EM6 disposable devices. I was at this time employed as
power was strongly needed because several new microsystems were required
for each biological experiment. Then, during my PhD I took in charge the totality of the processes
from design improvements to production. In addition, I
of the numerical simulations studies.
ielectric guide devices
General architecture
All microsystems that will be introduced in the following obey a similar design
mber, several mm long and wide, which is connected to the electrode
reservoirs by connecting channels, around a few mm of long and less than 1 mm
radius. The dielectric guide has the shape of a tunnel
in the embryo chamber and on the other in the cathodic connecting channel
and its width between 60 and 140 µm, which correspond to the
device design and fabrication
at best the different tasks.
assisted by numerical simulations, and the
biological experiments
later by Diana Suárez-
. My contribution was at the
of the EM6 disposable devices. I was at this time employed as
because several new microsystems were required
I took in charge the totality of the processes
from design improvements to production. In addition, I also
be introduced in the following obey a similar design (Figure II - 11).
connected to the electrode
less than 1 mm wide. The electrode
tunnel that opens on one
connecting channel. Its height varies
, which correspond to the
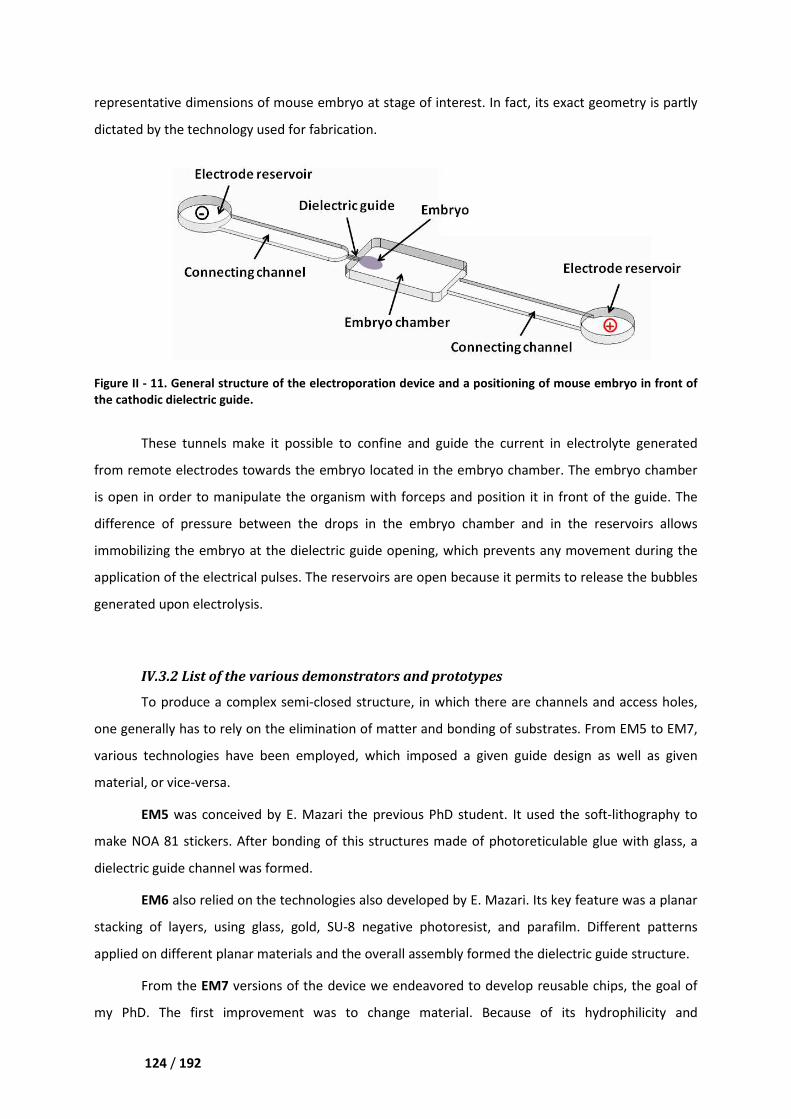
124 / 192
representative dimensions of mouse embryo at stage of interest
dictated by the technology used for fabrication.
Figure II - 11. General structure of the electroporation device and a positioning of mouse embryo in front of
the cathodic dielectric guide.
These tunnels make it possible to confine and guide the
from remote electrodes towards the embryo
is open in order to manipulate the
difference of pressure between the drops
immobilizing the embryo at the dielectric guide opening,
application of the electrical pulses
generated upon electrolysis.
IV.3.2 List of the various demonstrat
To produce a complex semi
one generally has to rely on the elimination
various technologies have been employed, which imposed a given guide design as well as given
material, or vice-versa.
EM5 was conceived by E. Mazari the previous PhD stud
make NOA 81 stickers. After bonding
dielectric guide channel was formed.
EM6 also relied on the technologies
stacking of layers, using glass, gold
applied on different planar materials and the
From the EM7 versions of
my PhD. The first improvement
representative dimensions of mouse embryo at stage of interest. In fact, its exact
dictated by the technology used for fabrication.
. General structure of the electroporation device and a positioning of mouse embryo in front of
These tunnels make it possible to confine and guide the current in electrolyte
remote electrodes towards the embryo located in the embryo chamber. The embryo chamber
is open in order to manipulate the organism with forceps and position it in front of the guide.
difference of pressure between the drops in the embryo chamber and in the reservoirs
at the dielectric guide opening, which prevents any movement during the
application of the electrical pulses. The reservoirs are open because it permits to
List of the various demonstrators and prototypes
To produce a complex semi-closed structure, in which there are channels and access holes,
the elimination of matter and bonding of substrates
various technologies have been employed, which imposed a given guide design as well as given
was conceived by E. Mazari the previous PhD student. It used the soft
fter bonding of this structures made of photoreticulable glue
dielectric guide channel was formed.
the technologies also developed by E. Mazari. Its key feature
of layers, using glass, gold, SU-8 negative photoresist, and parafilm. Different
erent planar materials and the overall assembly formed the dielectric guide structure
versions of the device we endeavored to develop reusable
my PhD. The first improvement was to change material. Because of its hydrophilicity
its exact geometry is partly
. General structure of the electroporation device and a positioning of mouse embryo in front of
in electrolyte generated
The embryo chamber
it in front of the guide. The
the reservoirs allows
any movement during the
permits to release the bubbles
are channels and access holes,
s. From EM5 to EM7,
various technologies have been employed, which imposed a given guide design as well as given
used the soft-lithography to
of this structures made of photoreticulable glue with glass, a
ts key feature was a planar
and parafilm. Different patterns
dielectric guide structure.
reusable chips, the goal of
material. Because of its hydrophilicity and
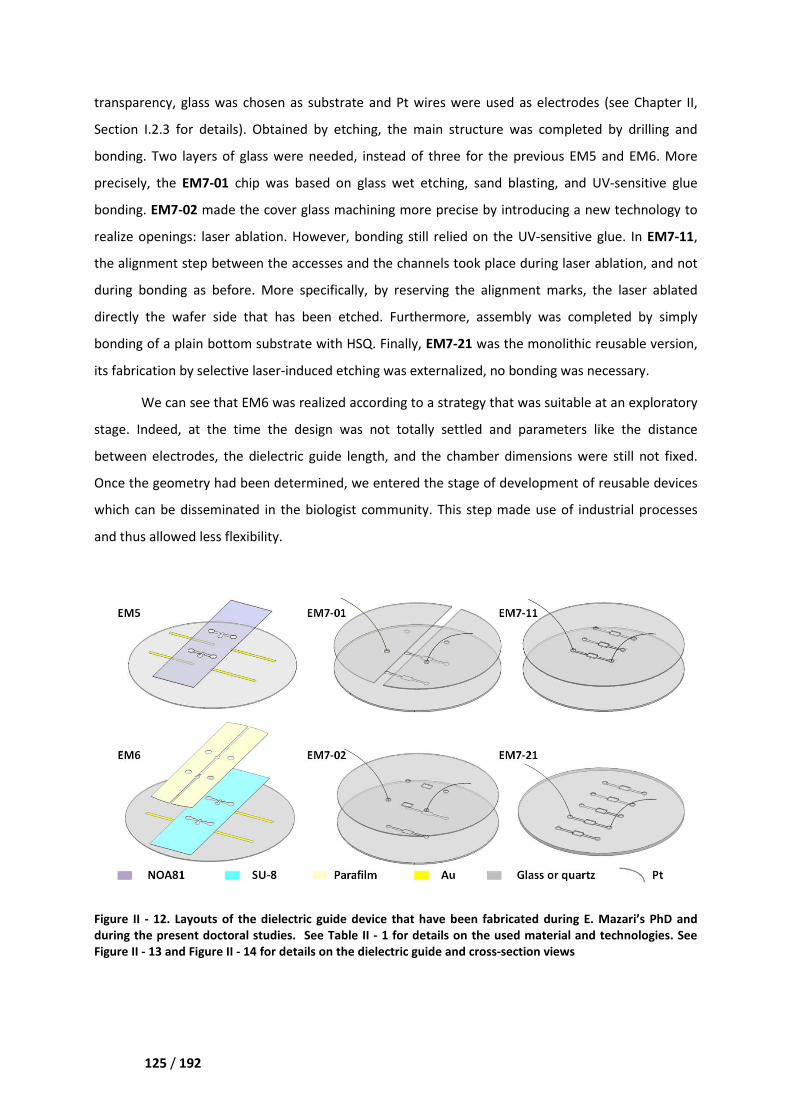
125 / 192
transparency, glass was chosen as substrate
Section I.2.3 for details). Obtained by etching
bonding. Two layers of glass were needed,
precisely, the EM7-01 chip was
bonding. EM7-02 made the cover glass machining more precise
realize openings: laser ablation.
the alignment step between the accesses
during bonding as before. More specifically, b
directly the wafer side that has been etched. Furthermore, assembly
bonding of a plain bottom substrate with HSQ.
its fabrication by selective laser-induced etching
We can see that EM6 was realized according to
stage. Indeed, at the time the
between electrodes, the dielectric guide length, and
Once the geometry had been determined, we entered th
which can be disseminated in the biologist community. This step made use of industrial process
and thus allowed less flexibility.
Figure II - 12. Layouts of the dielectric guide
during the present doctoral studies. See
Figure II - 13 and Figure II - 14 for details on the dielectric guide and cross
s chosen as substrate and Pt wires were used as electrodes (see Chapter II,
Obtained by etching, the main structure was completed by
were needed, instead of three for the previous EM5 and EM6
chip was based on glass wet etching, sand blasting, and
the cover glass machining more precise by introducing a
. However, bonding still relied on the UV-sensitive glue
etween the accesses and the channels took place during laser
More specifically, by reserving the alignment marks, the laser
side that has been etched. Furthermore, assembly was completed by simpl
ottom substrate with HSQ. Finally, EM7-21 was the monolithic
induced etching was externalized, no bonding was necessary.
was realized according to a strategy that was suitable at
the design was not totally settled and parameters
dielectric guide length, and the chamber dimensions were
been determined, we entered the stage of development of
in the biologist community. This step made use of industrial process
Layouts of the dielectric guide device that have been fabricated during E. Mazari’s PhD and
during the present doctoral studies. See Table II - 1 for details on the used material and
for details on the dielectric guide and cross-section views
electrodes (see Chapter II,
was completed by drilling and
EM5 and EM6. More
and UV-sensitive glue
by introducing a new technology to
sensitive glue. In EM7-11,
laser ablation, and not
y reserving the alignment marks, the laser ablated
s completed by simply
monolithic reusable version,
bonding was necessary.
a strategy that was suitable at an exploratory
parameters like the distance
chamber dimensions were still not fixed.
development of reusable devices
in the biologist community. This step made use of industrial processes
that have been fabricated during E. Mazari’s PhD and
material and technologies. See
section views
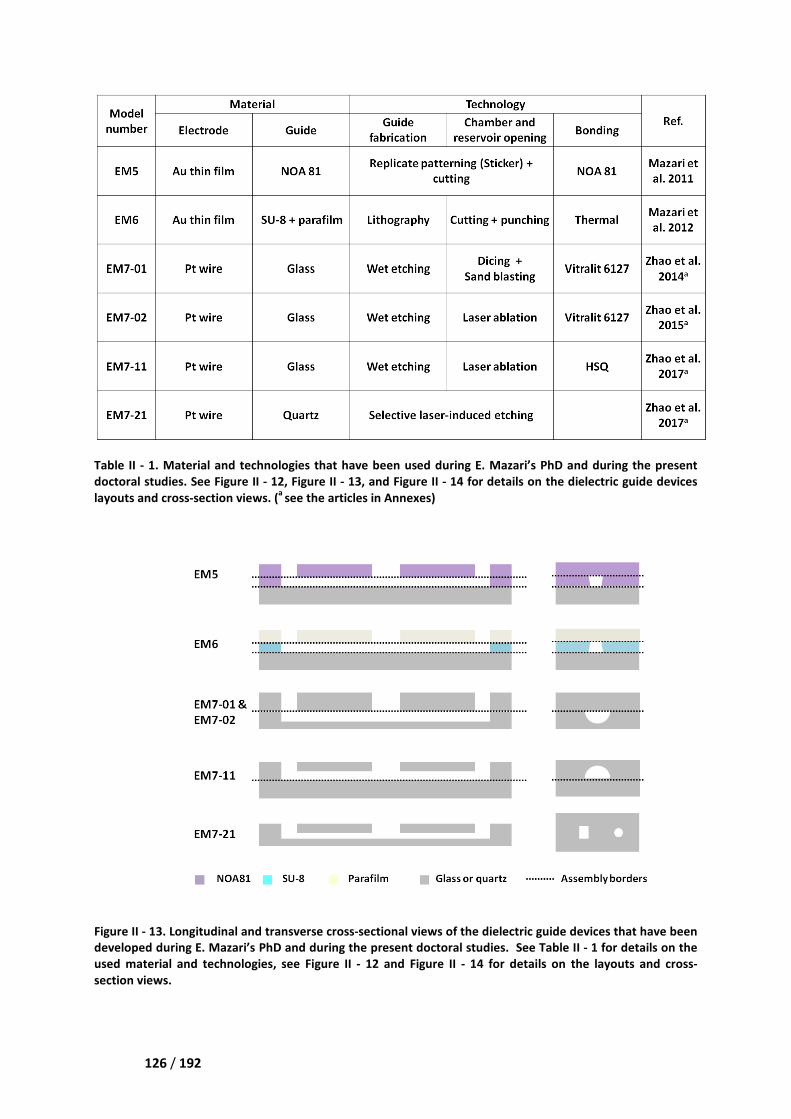
126 / 192
Table II - 1. Material and technologies that have been used
doctoral studies. See Figure II - 12,
layouts and cross-section views. (a
see the
Figure II - 13. Longitudinal and transverse cross
developed during E. Mazari’s PhD and during the present doctoral studies. See
used material and technologies, s
section views.
Material and technologies that have been used during E. Mazari’s PhD and during the present
, Figure II - 13, and Figure II - 14 for details on the dielectric guide devices
see the articles in Annexes) (Mazari, Zhao et al.)
Longitudinal and transverse cross-sectional views of the dielectric guide devices
during E. Mazari’s PhD and during the present doctoral studies. See Table II
technologies, see Figure II - 12 and Figure II - 14 for details on the
during E. Mazari’s PhD and during the present
for details on the dielectric guide devices
ectional views of the dielectric guide devices that have been
Table II - 1 for details on the
for details on the layouts and cross-
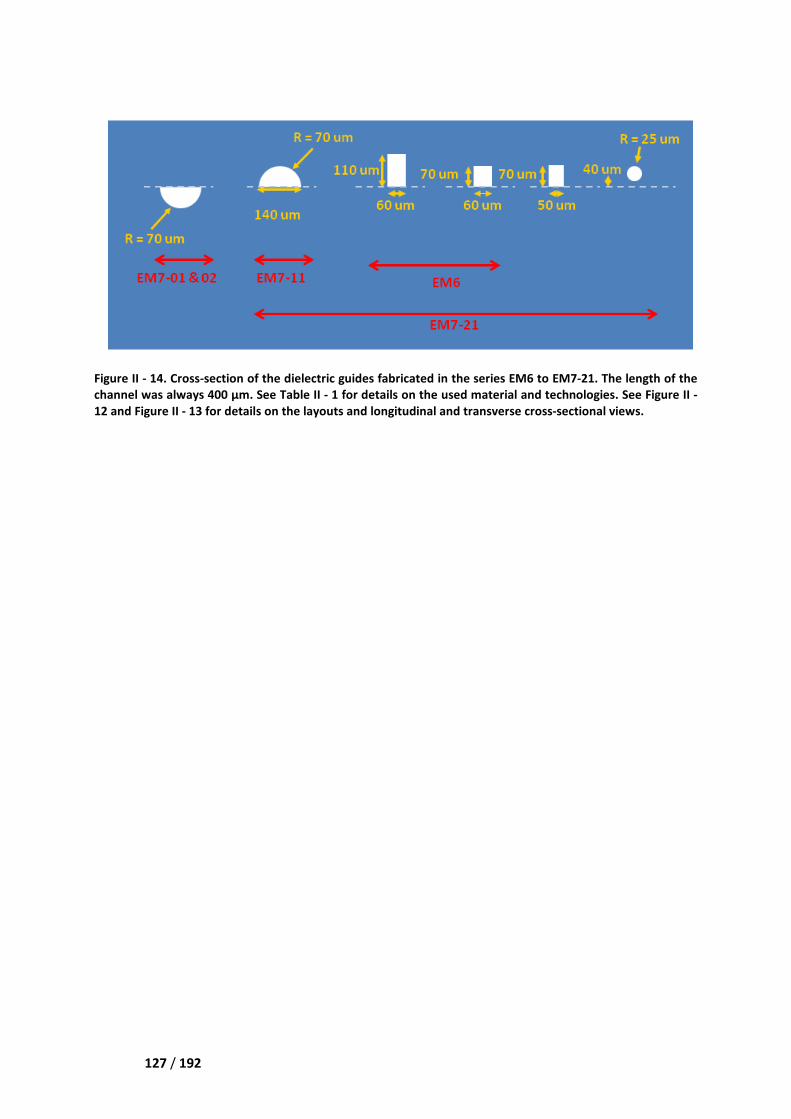
127 / 192
Figure II - 14. Cross-section of the dielectric guide
channel was always 400 μm. See Table II
12 and Figure II - 13 for details on the
dielectric guides fabricated in the series EM6 to EM7
Table II - 1 for details on the used material and technologies.
for details on the layouts and longitudinal and transverse cross-sectional views
EM6 to EM7-21. The length of the
technologies. See Figure II -
ectional views.

128 / 192
129 / 192
Chapter II. Microdevice design and processing
I. Choice of materials and microfabrication technologies
Historically, the development of microfluidic tools for analytical and life sciences has
benefited from technologies issued from the mature semiconductor industry. The used materials
were then silicon and glass, as in the case of the first microfluidic device fabricated in 1979 by the
Electronic Laboratory of Stanford University: a miniature gas chromatograph (Terry, Jerman et al.
1979).
Nowadays, many different materials can be chosen to fabricate microfluidic chips. For
instance, in soft lithography, it is just necessary to pour liquid oligomers and initiators onto a rigid
mold, reticulate the mixture, and peel off the soft replica. This process can be repeated many times
on the same mold, which is a relatively low-cost technology from the equipment point of view. At the
beginning the material used for this technology was a type of organic silicone: polydimethylsiloxane
(PDMS). Later on, other polymers were included, like photosensitive adhesive (Bartolo, Degré et al.
2008), which are liquid before polymerization. From the mold point of view, there are also many
materials: structures can be obtained by etching in silicon or glass, patterns can be created by
photolithography, or mold can be processed by micromilling.
In parallel, polymer manufacturing techniques were introduced to produce microfluidic chips
industrially. For instance, use was made of hot bossing and injection molding, processes already
utilized to fabricate disposable plastic petri dish and culture flask. In order for this technique to be
available for microfluidic tool production, it is necessary to make sure that the metal master can
faithfully keep the feature size of every fine component, and that the required accuracy could be
obtained over thousands of replication cycles.
130 / 192
I.1 The laboratory demonstrators so far realized
First, we relied on some of the accessible techniques in laboratory conditions to make
demonstrators, in order to verify
quickly and efficiently applied to
the former PhD student to realize
demonstrator, also used some common clean room academic techniques.
I.1.1 Soft lithography (EM5)
Soft lithography is a technique
pouring fluids such as PDMS base or NOA (
the initial material is often liquid, it lays on the mold with a perfect
polymerization is triggered, the shape of the mold is perfectly copied.
The EM5 demonstrator was made of NOA 81, insp
(Bartolo, Degré et al. 2008). The workflow is summarized in
Figure II - 15. Device fabrication by so
glass substrate and then closed by a stencil which has been prepared on a flat
The laboratory demonstrators so far realized
some of the accessible techniques in laboratory conditions to make
er to verify the rationality of our design. Because soft lithography can be
quickly and efficiently applied to transform patterns into a demonstrator, it was used in the work of
the former PhD student to realize EM5 the first dielectric guide device
, also used some common clean room academic techniques.
lithography (EM5)
Soft lithography is a technique used to transfer a fine three-dimensional structure
base or NOA (Norland optical adhesive) onto a mold and curing it.
the initial material is often liquid, it lays on the mold with a perfect conformability
polymerization is triggered, the shape of the mold is perfectly copied.
The EM5 demonstrator was made of NOA 81, inspired from the work of Vincent Studer
The workflow is summarized in Figure II - 15.
Device fabrication by soft UV imprint. (a) Process flow − the guides are first patterned on a
then closed by a stencil which has been prepared on a flat PDMS wafer. (b) SEM picture
some of the accessible techniques in laboratory conditions to make
Because soft lithography can be
demonstrator, it was used in the work of
the first dielectric guide device. EM6, the second
dimensional structures by
nto a mold and curing it. Since
conformability. Once the
ired from the work of Vincent Studer
are first patterned on a
PDMS wafer. (b) SEM picture
131 / 192
of the SU-8 template used to obtain a PDMS mold #1. (c) View of the complete
from (Mazari, Mantelet et al. 2011)
I.1.2 Mix “craft” technologies (EM6)
In the mix “craft” version
standard microfabrication, the SU
parafilm was used to close the assembly,
metal pads. This layer stacking strategy is clearly shown
without embryo, are displayed in
Figure II - 16. Summary of the workflow used to
Image adapted from (Mazari, Zhao et al. 2014)
I.1.3. Achievements and limitations
Proof-of-concept experiments were successful
dielectric guide concept. Results w
there were still many limitations.
First, the microfabrication procedure
they were not industrializable for mass production.
experimental schedule was busy and dense, tedious
consummation rate in the biology laboratory.
Second, materials were poorly suitable. The dielectric materials (
these demonstrators were not easily accepted by biologists
deleteriousness of the photoresist
obtain a PDMS mold #1. (c) View of the complete micro
(Mazari, Mantelet et al. 2011).
I.1.2 Mix “craft” technologies (EM6)
version that we denoted EM6, electrodes were
standard microfabrication, the SU-8 epoxy photoresist was adopted to make
close the assembly, and electrical connectors were welde
cking strategy is clearly shown in Figure II - 16 and device pictures, with or
without embryo, are displayed in Figure II - 17.
the workflow used to fabricate the EM6 single-use SU-8/Parafilm microdevice.
(Mazari, Zhao et al. 2014).
I.1.3. Achievements and limitations
concept experiments were successful. The EM5 and EM6 devices validated the
dielectric guide concept. Results were reproducible and the success rate was guaranteed
itations.
icrofabrication procedure was complicated. Technologies used we
re not industrializable for mass production. The device was designed for single
busy and dense, tedious production was unable to meet the
consummation rate in the biology laboratory.
Second, materials were poorly suitable. The dielectric materials (i.e. NOA81 and SU
these demonstrators were not easily accepted by biologists. Especially, the harmfulness
photoresist solvent resulted in biocompatibility and biosafety
crodevice. Image taken
produces thanks to
epoxy photoresist was adopted to make the guide walls,
re welded at the ends of the
and device pictures, with or
8/Parafilm microdevice.
The EM5 and EM6 devices validated the
guaranteed. However,
used were quite specific,
for single-use, when the
production was unable to meet the
NOA81 and SU-8) used in
the harmfulness and
iocompatibility and biosafety issues (Mazari,
132 / 192
Mantelet et al. 2011). Moreover, h
materials are here basically hydrophobic.
surface treatment was time-consuming and its
Therefore the diffusion of this device in the biological community was not easy,
technologies had been finally abandoned
Figure II - 17. Layout and use of the
the fluidic networks being filled with a Bromophenol Blue soluti
showing a pair of electrodes with the corresponding connecting channels, dielectric guides
chamber. (c) Scanning electron microscopy micrograph of a dielectric guide of height H
W = 60 μm, as observed from the embryo
the electrodes. An E5.5 embryo (white arrow) is positioned so as to target its DVE, this
dielectric guide connected to the cathode. (e) Zoom on the E5.5 embryo. (f
embryo positioned so as to target its AVE.
I.2. The industrial prototypes
Because of the above limitations, we
use and well accepted by biologists. Furthermore, the involved processes had to be available from
various companies, in order for
academic or industrial.
I.2.1 Thermoplastic manufacturing
Amorphous thermoplastic polymers have a lot of advantages: low density, low cost
to manufacture. Nowadays, thermoplastic polymers are widely used in microstructure replic
when they reach a temperature above the glass transition they
reover, hydrophilicity is a prerequisite for the use of this device,
basically hydrophobic. A step of hydrophilization by plasma was necessary but this
consuming and its effects decay in the following 48 h.
n of this device in the biological community was not easy,
been finally abandoned.
Layout and use of the EM6 electroporation device. (a) Global view of the microsystem, one of
the fluidic networks being filled with a Bromophenol Blue solution to highlight connectivity. (b
ectrodes with the corresponding connecting channels, dielectric guides
) Scanning electron microscopy micrograph of a dielectric guide of height H
m, as observed from the embryo chamber. (d) View of the whole fluidic system included between
the electrodes. An E5.5 embryo (white arrow) is positioned so as to target its DVE, this
cathode. (e) Zoom on the E5.5 embryo. (f) Similar enlarged view of an E6.5
its AVE. Images taken from (Mazari, Zhao et al. 2014)
I.2. The industrial prototypes
Because of the above limitations, we looked for other ways to realize the prototypes easy to
ted by biologists. Furthermore, the involved processes had to be available from
various companies, in order for life scientist not to be dependent on a single provider, either
I.2.1 Thermoplastic manufacturing
tic polymers have a lot of advantages: low density, low cost
thermoplastic polymers are widely used in microstructure replic
a temperature above the glass transition they can be molded
site for the use of this device, but
by plasma was necessary but this
h.
n of this device in the biological community was not easy, these
) Global view of the microsystem, one of
on to highlight connectivity. (b) Diagram
ectrodes with the corresponding connecting channels, dielectric guides, and embryo
) Scanning electron microscopy micrograph of a dielectric guide of height H = 110 μm and width
) View of the whole fluidic system included between
the electrodes. An E5.5 embryo (white arrow) is positioned so as to target its DVE, this tissue facing the
) Similar enlarged view of an E6.5
(Mazari, Zhao et al. 2014).
the prototypes easy to
ted by biologists. Furthermore, the involved processes had to be available from
ife scientist not to be dependent on a single provider, either
tic polymers have a lot of advantages: low density, low cost, and ease
thermoplastic polymers are widely used in microstructure replication:
can be molded and they keep the
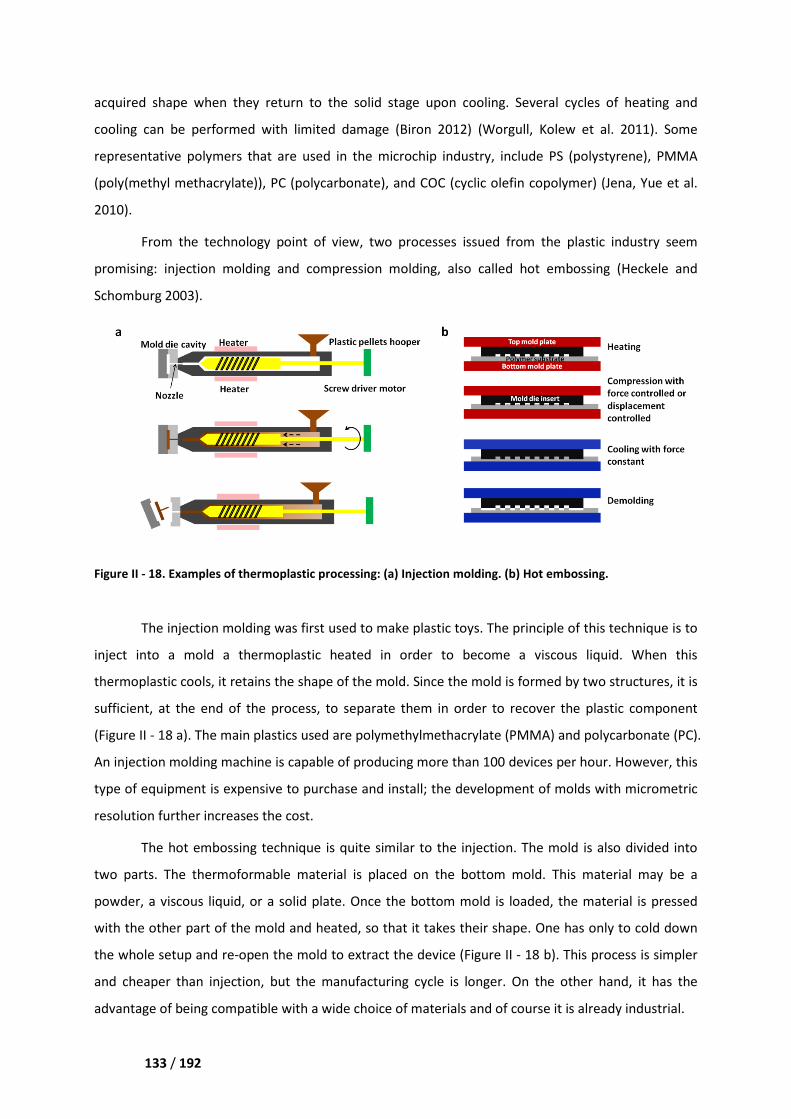
133 / 192
acquired shape when they return to
cooling can be performed with limited damage
representative polymers that are used
(poly(methyl methacrylate)), PC (polycarbonate), and
2010).
From the technology point of view,
promising: injection molding and
Schomburg 2003).
Figure II - 18. Examples of thermoplastic processing
The injection molding wa
inject into a mold a thermoplastic heated
thermoplastic cools, it retains the shape of the mold. Since the mold is formed by two structures, it is
sufficient, at the end of the process
(Figure II - 18 a). The main plastics used are polymethylmethacrylate (PMMA) and polycarbonate (PC).
An injection molding machine is capable of producing
type of equipment is expensive to purchase
resolution further increases the cost.
The hot embossing technique is quite similar to the injection. The mold
two parts. The thermoformable material is p
powder, a viscous liquid, or a solid
with the other part of the mold
the whole setup and re-open the mold to extract the
and cheaper than injection, but the manufacturing cycle is longer.
advantage of being compatible with a wide choice of materials and of course it is already industrial.
return to the solid stage upon cooling. Several cycles of heating and
cooling can be performed with limited damage (Biron 2012) (Worgull, Kolew et al. 2011)
are used in the microchip industry, include PS (polystyre
(poly(methyl methacrylate)), PC (polycarbonate), and COC (cyclic olefin copolymer)
From the technology point of view, two processes issued from the plastic industry seem
: injection molding and compression molding, also called hot embossing
of thermoplastic processing: (a) Injection molding. (b) Hot embossing.
was first used to make plastic toys. The principle of
thermoplastic heated in order to become a viscous
thermoplastic cools, it retains the shape of the mold. Since the mold is formed by two structures, it is
of the process, to separate them in order to recover the plastic component
. The main plastics used are polymethylmethacrylate (PMMA) and polycarbonate (PC).
An injection molding machine is capable of producing more than 100 devices per hour. However, this
type of equipment is expensive to purchase and install; the development of molds with micrometric
cost.
technique is quite similar to the injection. The mold
he thermoformable material is placed on the bottom mold. This material may be a
or a solid plate. Once the bottom mold is loaded, the material is pressed
and heated, so that it takes their shape. One has only to
open the mold to extract the device (Figure II - 18 b). This process is simpler
than injection, but the manufacturing cycle is longer. On the other hand, it has the
advantage of being compatible with a wide choice of materials and of course it is already industrial.
solid stage upon cooling. Several cycles of heating and
(Worgull, Kolew et al. 2011). Some
PS (polystyrene), PMMA
cyclic olefin copolymer) (Jena, Yue et al.
issued from the plastic industry seem
, also called hot embossing (Heckele and
ot embossing.
of this technique is to
viscous liquid. When this
thermoplastic cools, it retains the shape of the mold. Since the mold is formed by two structures, it is
to separate them in order to recover the plastic component
. The main plastics used are polymethylmethacrylate (PMMA) and polycarbonate (PC).
more than 100 devices per hour. However, this
the development of molds with micrometric
technique is quite similar to the injection. The mold is also divided into
n the bottom mold. This material may be a
. Once the bottom mold is loaded, the material is pressed
One has only to cold down
. This process is simpler
the other hand, it has the
advantage of being compatible with a wide choice of materials and of course it is already industrial.
134 / 192
I.2.2 MEMS-type manufacturing
Silicon and glass are materials commonly used in the MEMS industry, mainly because they
are widely available and not too expensive, but also because their processing technology benefit
from the experience accumulated in the integrated circuit industry − for instance, lithography,
etching, metallization, dielectric deposition can all be adapted.
Although silicon is a good material for MEMS and semiconductor industries, its application to
the field of biology had suffered from several drawbacks. For instance, its surface is naturally
hydrophobic whereas many biological studies are performed in an aqueous environment. It is also
opaque whereas transparency is most of the time required to follow phenomena in optical
microscopy.
Besides silicon, various types of glass are widely used in microfluidic technologies, including
borosilicates and fused silica. They are amorphous solids which displays several advantageous
properties: natural hydrophilicity, good mechanical strength, bio-friendliness, chemical inertia,
optical transparency, low autofluorescence, electrical insulation, and thermal stability.
I.2.3 Strategy selection
The two types of processes mentioned in the two preceding Sections significantly differ.
Microfluidic Petri dishes are single-use and disposable, but they are also very cheap. Microfluidic
glass beakers are expensive but they can be cleaned repeatedly. All in all the cost per experiment
would thus be quite similar.
However, our design is still at an exploratory stage, and our design can still be modified.
Certainly the single-use plastic devices can finally be cheap, but fabrication is constraining when one
considers the uncertainties associated with the surface modification as well as the cost of an
expensive mold insert. If during the development process we find that some pattern is inappropriate,
we will need to change the material or the mold, which is an expensive and long cycle. Hence,
thermoplastic technologies do not permit device evolution while carrying out experiments. While a
single glass device is expensive, recycling is possible as long as cleaning is efficient. Its fabrication is
flexible, whether it is manufactured in our laboratory or externalized to a company. Furthermore, the
process for production is quite fast, which allows design improvement at any time.
Therefore, we choose to continue on the way of the reusable all-in-glass device.
135 / 192
II. Overview of the different processes available to make a glass
micro chip
In the last section we have determined that glass will be the material selected for further
elaboration. Now we will review the available technologies for its processing, from through holes and
channels machining to wafer bonding.
II.1. Etching
Etching refers to a chemical, physical, or physico-chemical method that selectively removes
the unprotected part of a film (such as SiO2, Si3N4, αSi, or Al) or of a substrate. The final goal is to
transfer the pattern from the mask to the film or substrate. An ideal etching technology must have
the following characteristics: it must be anisotropic since the vertical etching guarantees accurate
geometric transfer of the pattern from the mask to the substrate. It must be selective, with an
etching rate of the mask slower than that of material to be etched, in order to ensure the
effectiveness of the mask during etching process. It will be better if it is suitable for industrial
production. That means the process should be easy to control for large quantities, of low cost, less
environmental pollution.
Etching methods can be generally divided into two categories: dry etching and wet etching.
II.1.1 Dry etching
Dry etching is a process of micromachining which relies on reactive species in gaseous phase.
The interaction between the gas etchants and the targeted materials (e.g. metals, semiconductors,
insulators) may be dominated by three regimes:
- Physical process. Ion beam of high energy bombards onto the surface of target material to
eject its particles, that is very similar to the sputtering process. This highly directional etching
method is able to achieve anisotropic features.
- Chemical process. Reactive radicals in plasma chemically erode the targeted material. Its
effects are similar to that of wet etching, the anisotropy is poor.
- A mixture of physical and chemical processes. The physical bombardment of reactive
particles on the substrate plus the chemical reactions of ions have both the advantages of
anisotropy and selectivity.
In my thesis, the research and development object is the devices suitable for biological study
above micrometer level, the use of RIE can satisfy our requirements.
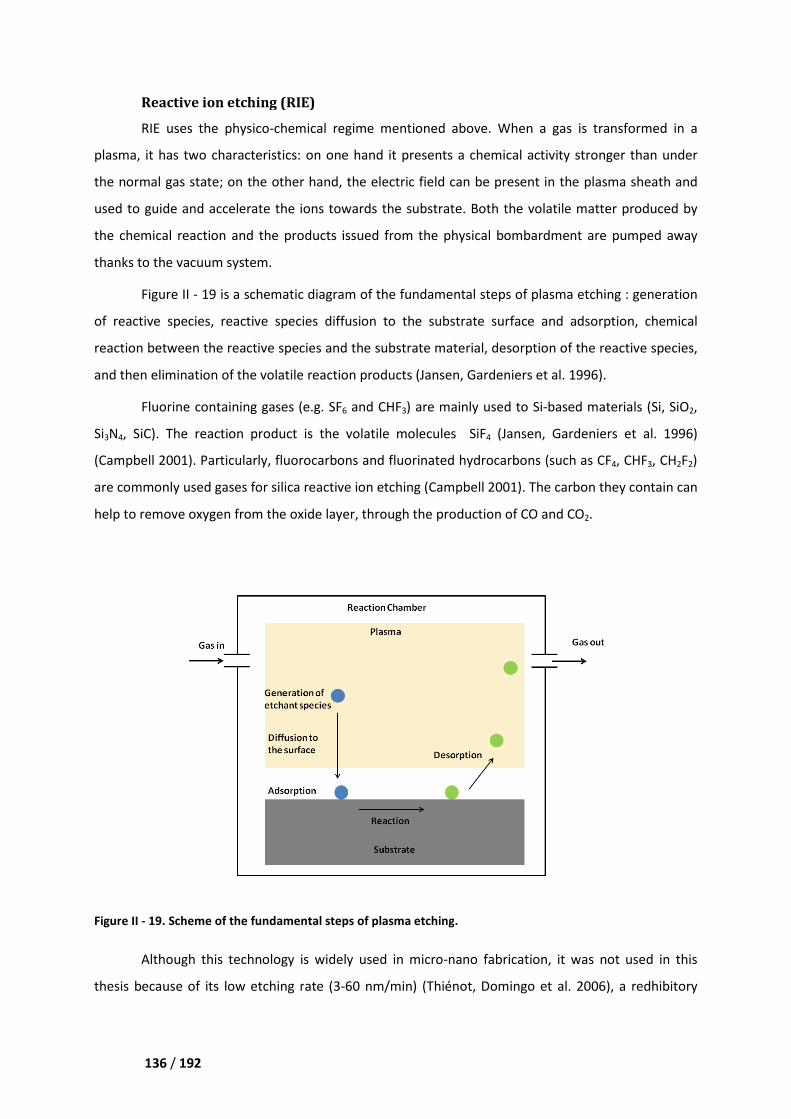
136 / 192
Reactive ion etching (RIE)
RIE uses the physico-chemical regime
plasma, it has two characteristics: on one hand it presents
the normal gas state; on the other hand, the electri
used to guide and accelerate the ions
the chemical reaction and the products
thanks to the vacuum system.
Figure II - 19 is a schematic diagram of the fundamental steps of plasma etching : generation
of reactive species, reactive species diffus
reaction between the reactive species and
and then elimination of the volatile reaction products
Fluorine containing gases
Si3N4, SiC). The reaction product is
(Campbell 2001). Particularly, fluorocarbons and fluorinated hydrocarbons (such as CF
are commonly used gases for silica reactive ion etching
help to remove oxygen from the oxide layer
Figure II - 19. Scheme of the fundamental steps of plasma etching
Although this technology is widely used in micro
thesis because of its low etching r
tching (RIE)
chemical regime mentioned above. When a gas
plasma, it has two characteristics: on one hand it presents a chemical activity stronger than under
on the other hand, the electric field can be present in the plasma sheath
used to guide and accelerate the ions towards the substrate. Both the volatile matter
the chemical reaction and the products issued from the physical bombardment are pumped away
is a schematic diagram of the fundamental steps of plasma etching : generation
of reactive species, reactive species diffusion to the substrate surface and adsorption
ve species and the substrate material, desorption of
volatile reaction products (Jansen, Gardeniers et al. 1996)
luorine containing gases (e.g. SF6 and CHF3) are mainly used to Si-based materials (Si, SiO
product is the volatile molecules SiF4 (Jansen, Gardeniers et al. 1
luorocarbons and fluorinated hydrocarbons (such as CF
for silica reactive ion etching (Campbell 2001). The carbon
help to remove oxygen from the oxide layer, through the production of CO and CO
of the fundamental steps of plasma etching.
Although this technology is widely used in micro-nano fabrication, it was
because of its low etching rate (3-60 nm/min) (Thiénot, Domingo et al. 2006)
gas is transformed in a
chemical activity stronger than under
can be present in the plasma sheath and
Both the volatile matter produced by
al bombardment are pumped away
is a schematic diagram of the fundamental steps of plasma etching : generation
ubstrate surface and adsorption, chemical
substrate material, desorption of the reactive species,
(Jansen, Gardeniers et al. 1996).
based materials (Si, SiO2,
(Jansen, Gardeniers et al. 1996)
luorocarbons and fluorinated hydrocarbons (such as CF4, CHF3, CH2F2)
. The carbon they contain can
CO and CO2.
it was not used in this
(Thiénot, Domingo et al. 2006), a redhibitory
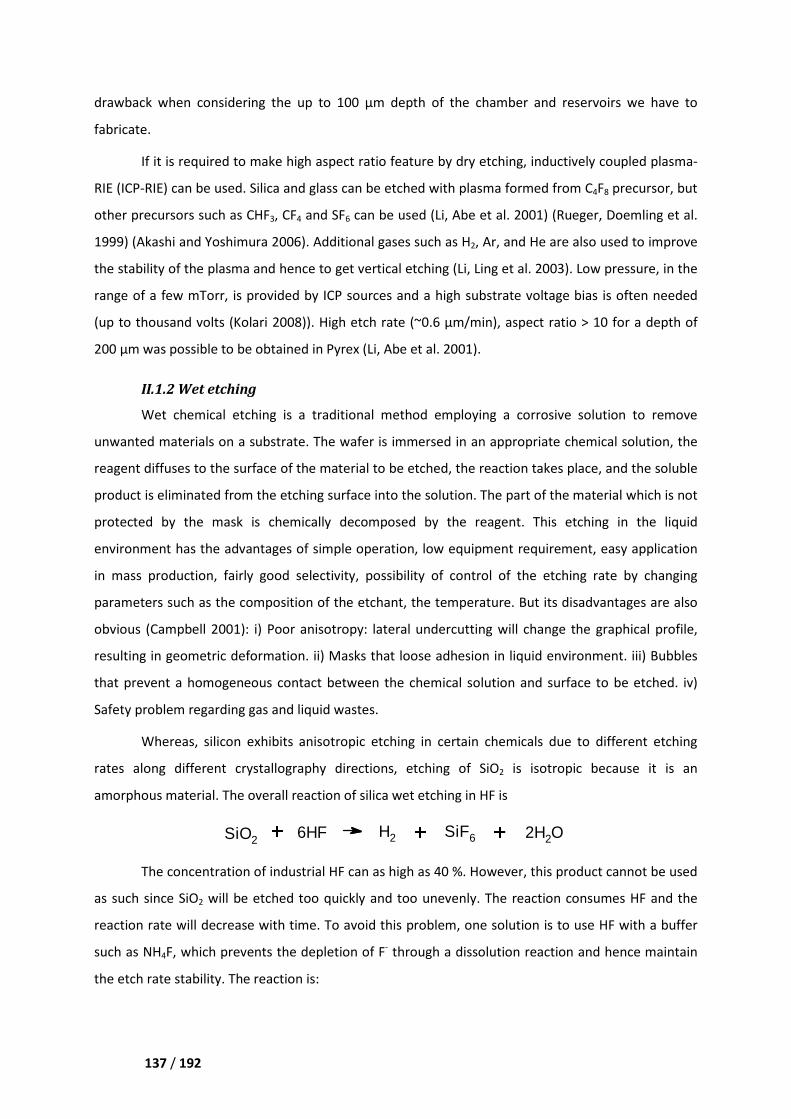
137 / 192
drawback when considering the up to 100 µm depth of the chamber and reservoirs we have to
fabricate.
If it is required to make high aspect ratio feature by dry etching, inductively coupled plasma-
RIE (ICP-RIE) can be used. Silica and glass can be etched with plasma formed from C4F8 precursor, but
other precursors such as CHF3, CF4 and SF6 can be used (Li, Abe et al. 2001) (Rueger, Doemling et al.
1999) (Akashi and Yoshimura 2006). Additional gases such as H2, Ar, and He are also used to improve
the stability of the plasma and hence to get vertical etching (Li, Ling et al. 2003). Low pressure, in the
range of a few mTorr, is provided by ICP sources and a high substrate voltage bias is often needed
(up to thousand volts (Kolari 2008)). High etch rate (~0.6 µm/min), aspect ratio > 10 for a depth of
200 µm was possible to be obtained in Pyrex (Li, Abe et al. 2001).
II.1.2 Wet etching
Wet chemical etching is a traditional method employing a corrosive solution to remove
unwanted materials on a substrate. The wafer is immersed in an appropriate chemical solution, the
reagent diffuses to the surface of the material to be etched, the reaction takes place, and the soluble
product is eliminated from the etching surface into the solution. The part of the material which is not
protected by the mask is chemically decomposed by the reagent. This etching in the liquid
environment has the advantages of simple operation, low equipment requirement, easy application
in mass production, fairly good selectivity, possibility of control of the etching rate by changing
parameters such as the composition of the etchant, the temperature. But its disadvantages are also
obvious (Campbell 2001): i) Poor anisotropy: lateral undercutting will change the graphical profile,
resulting in geometric deformation. ii) Masks that loose adhesion in liquid environment. iii) Bubbles
that prevent a homogeneous contact between the chemical solution and surface to be etched. iv)
Safety problem regarding gas and liquid wastes.
Whereas, silicon exhibits anisotropic etching in certain chemicals due to different etching
rates along different crystallography directions, etching of SiO2 is isotropic because it is an
amorphous material. The overall reaction of silica wet etching in HF is
SiO2 6HF H2 SiF6 2H2O
The concentration of industrial HF can as high as 40 %. However, this product cannot be used
as such since SiO2 will be etched too quickly and too unevenly. The reaction consumes HF and the
reaction rate will decrease with time. To avoid this problem, one solution is to use HF with a buffer
such as NH4F, which prevents the depletion of F- through a dissolution reaction and hence maintain
the etch rate stability. The reaction is:
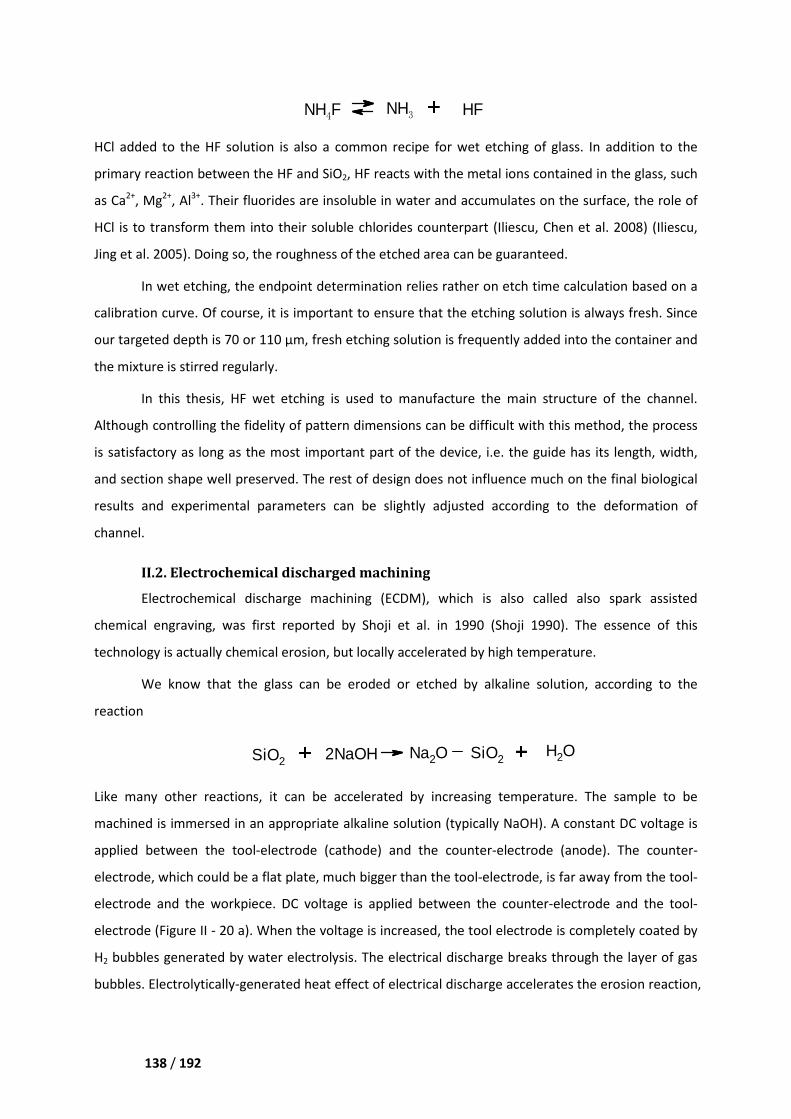
138 / 192
NH4
F NH3
HF
HCl added to the HF solution is also a common recipe for wet etching of glass. In addition to the
primary reaction between the HF and SiO2, HF reacts with the metal ions contained in the glass, such
as Ca2+, Mg2+, Al3+. Their fluorides are insoluble in water and accumulates on the surface, the role of
HCl is to transform them into their soluble chlorides counterpart (Iliescu, Chen et al. 2008) (Iliescu,
Jing et al. 2005). Doing so, the roughness of the etched area can be guaranteed.
In wet etching, the endpoint determination relies rather on etch time calculation based on a
calibration curve. Of course, it is important to ensure that the etching solution is always fresh. Since
our targeted depth is 70 or 110 µm, fresh etching solution is frequently added into the container and
the mixture is stirred regularly.
In this thesis, HF wet etching is used to manufacture the main structure of the channel.
Although controlling the fidelity of pattern dimensions can be difficult with this method, the process
is satisfactory as long as the most important part of the device, i.e. the guide has its length, width,
and section shape well preserved. The rest of design does not influence much on the final biological
results and experimental parameters can be slightly adjusted according to the deformation of
channel.
II.2. Electrochemical discharged machining
Electrochemical discharge machining (ECDM), which is also called also spark assisted
chemical engraving, was first reported by Shoji et al. in 1990 (Shoji 1990). The essence of this
technology is actually chemical erosion, but locally accelerated by high temperature.
We know that the glass can be eroded or etched by alkaline solution, according to the
reaction
SiO2 2NaOH Na2O SiO2H2O
Like many other reactions, it can be accelerated by increasing temperature. The sample to be
machined is immersed in an appropriate alkaline solution (typically NaOH). A constant DC voltage is
applied between the tool-electrode (cathode) and the counter-electrode (anode). The counter-
electrode, which could be a flat plate, much bigger than the tool-electrode, is far away from the tool-
electrode and the workpiece. DC voltage is applied between the counter-electrode and the tool-
electrode (Figure II - 20 a). When the voltage is increased, the tool electrode is completely coated by
H2 bubbles generated by water electrolysis. The electrical discharge breaks through the layer of gas
bubbles. Electrolytically-generated heat effect of electrical discharge accelerates the erosion reaction,
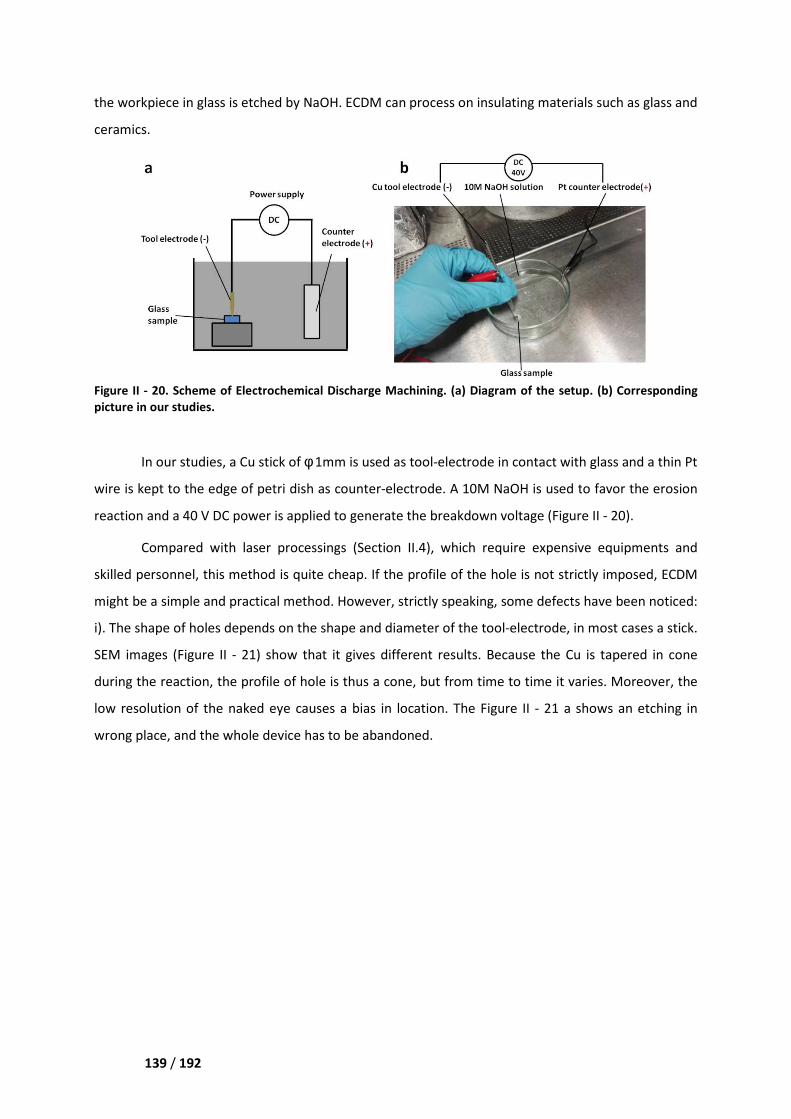
139 / 192
the workpiece in glass is etched by NaOH. ECDM can process on insulating materials such as glass and
ceramics.
Figure II - 20. Scheme of Electrochem
picture in our studies.
In our studies, a Cu stick of
wire is kept to the edge of petri dish as counter
reaction and a 40 V DC power is applied to gener
Compared with laser processing
skilled personnel, this method is quite cheap. If the profile of the hole is not strictly
might be a simple and practical method. However, strictly speaking, some defects have been
i). The shape of holes depends on the shape and diameter of
SEM images (Figure II - 21) show that it gives different results. Because the Cu is tapered
during the reaction, the profile of hole is
low resolution of the naked eye causes a bias in location. The
wrong place, and the whole device
the workpiece in glass is etched by NaOH. ECDM can process on insulating materials such as glass and
trochemical Discharge Machining. (a) Diagram of the setup
Cu stick of φ 1mm is used as tool-electrode in contact with glass
e edge of petri dish as counter-electrode. A 10M NaOH is used t
is applied to generate the breakdown voltage (Figure II
laser processings (Section II.4), which require expensive equipments and
personnel, this method is quite cheap. If the profile of the hole is not strictly
might be a simple and practical method. However, strictly speaking, some defects have been
depends on the shape and diameter of the tool-electrode, in most
) show that it gives different results. Because the Cu is tapered
, the profile of hole is thus a cone, but from time to time it vari
esolution of the naked eye causes a bias in location. The Figure II - 21 a
device has to be abandoned.
the workpiece in glass is etched by NaOH. ECDM can process on insulating materials such as glass and
Diagram of the setup. (b) Corresponding
contact with glass and a thin Pt
NaOH is used to favor the erosion
Figure II - 20).
which require expensive equipments and
personnel, this method is quite cheap. If the profile of the hole is not strictly imposed, ECDM
might be a simple and practical method. However, strictly speaking, some defects have been noticed:
electrode, in most cases a stick.
) show that it gives different results. Because the Cu is tapered in cone
varies. Moreover, the
shows an etching in
140 / 192
Figure II - 21. Scanning electron micro
method (see text for experimental details).
II.3. Sand blasting
Sand blasting refers to the
material under high pressure, usually relying on the
the abrasive particles ablate the surface of
aspect is significantly altered (Smil 2005)
In practice, a thick metal mask i
locations. The glass substrate is
mask and substrate are brought in the sand chamber
allows some exposure (Figure II -
It has to be admitted that
we do not deny that if particles are miniaturized, the mask protection is refined, and the alignment is
precised, this will be a way to achieve accurate processing
utilize powders with fine particles (
with lateral dimensions as small as 10
about 5 - 15°, which limits the aspect ratio of
2000) (Angelescu 2011).
We use sand blasting to open
another piece in order to yield fully functional microdevice. The technique yields holes indeed
generally displaying a positive taper
repeatedly defined and controlled
electron micrographs of two holes made by electrochemical discharge m
(see text for experimental details).
the processing of a surface by the delivery of a stream of abrasive
usually relying on the compressed air. It is a pure physical process. As
ablate the surface of the processed substrate by shocking and cutting
(Smil 2005).
a thick metal mask is first fabricated, some holes being drilled
he glass substrate is then roughly and intimely fixed on the metal mask with
rought in the sand chamber and the material is ablated only
- 22 b).
that this method is a rough one because of its macroscopic
we do not deny that if particles are miniaturized, the mask protection is refined, and the alignment is
be a way to achieve accurate processing. Modern sand blasting equipment can
ilize powders with fine particles (3 – 30 µm), which allows the fabrication of well
with lateral dimensions as small as 10 µm. The lateral walls present slightly taper
imits the aspect ratio of the structure below 10 (Wensink, Berenschot et al.
use sand blasting to open through holes in the glass cover, before assembling
in order to yield fully functional microdevice. The technique yields holes indeed
a positive taper shape, but the angle of the cone (Figure II
controlled. Similarly, the diameter of the holes cannot be faithful
electrochemical discharge machining
a stream of abrasive
compressed air. It is a pure physical process. As
by shocking and cutting it, its
drilled at the appropriate
ly and intimely fixed on the metal mask with tape. The
he material is ablated only where opening
macroscopic nature ─
we do not deny that if particles are miniaturized, the mask protection is refined, and the alignment is
blasting equipment can
), which allows the fabrication of well-defined features
htly taper shape typically of
(Wensink, Berenschot et al.
before assembling it with
in order to yield fully functional microdevice. The technique yields holes indeed
Figure II - 22 c) cannot be
cannot be faithful reproduced.
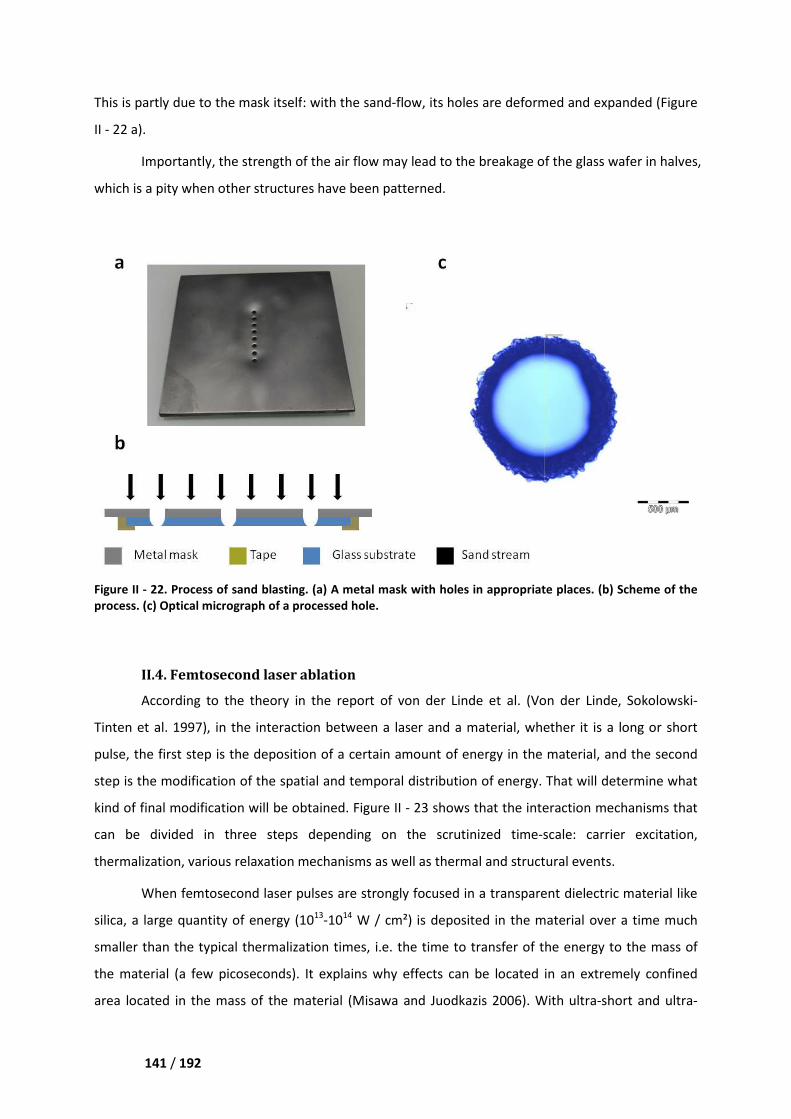
141 / 192
This is partly due to the mask itself
II - 22 a).
Importantly, the strength
which is a pity when other structures
Figure II - 22. Process of sand blasting.
process. (c) Optical micrograph of a processed hole.
II.4. Femtosecond laser
According to the theory in the report of von der
Tinten et al. 1997), in the interacti
pulse, the first step is the deposition of a certain amount of energy in the material, and the second
step is the modification of the spatial and temporal distribution of energy
kind of final modification will be obtained.
can be divided in three steps
thermalization, various relaxation mechanisms as well as
When femtosecond laser pulses are strongly focused in a transparent dielectric material like
silica, a large quantity of energy (10
smaller than the typical thermalization times, i.e.
the material (a few picoseconds)
area located in the mass of the material
the mask itself: with the sand-flow, its holes are deformed and expanded
strength of the air flow may lead to the breakage of the glass
other structures have been patterned.
Process of sand blasting. (a) A metal mask with holes in appropriate places. (b) Scheme of the
process. (c) Optical micrograph of a processed hole.
aser ablation
According to the theory in the report of von der Linde et al. (Von der Linde, Sokolowski
, in the interaction between a laser and a material, whether it is
the deposition of a certain amount of energy in the material, and the second
spatial and temporal distribution of energy. That will determine what
kind of final modification will be obtained. Figure II - 23 shows that the interaction mechanisms that
in three steps depending on the scrutinized time-scale
laxation mechanisms as well as thermal and structural event
cond laser pulses are strongly focused in a transparent dielectric material like
silica, a large quantity of energy (1013-1014 W / cm²) is deposited in the material over a time much
than the typical thermalization times, i.e. the time to transfer of the energy to the mass of
he material (a few picoseconds). It explains why effects can be located in an extremely confined
ted in the mass of the material (Misawa and Juodkazis 2006). With ultra
deformed and expanded (Figure
the glass wafer in halves,
laces. (b) Scheme of the
(Von der Linde, Sokolowski-
material, whether it is a long or short
the deposition of a certain amount of energy in the material, and the second
hat will determine what
raction mechanisms that
: carrier excitation,
thermal and structural events.
cond laser pulses are strongly focused in a transparent dielectric material like
W / cm²) is deposited in the material over a time much
nergy to the mass of
can be located in an extremely confined
. With ultra-short and ultra-
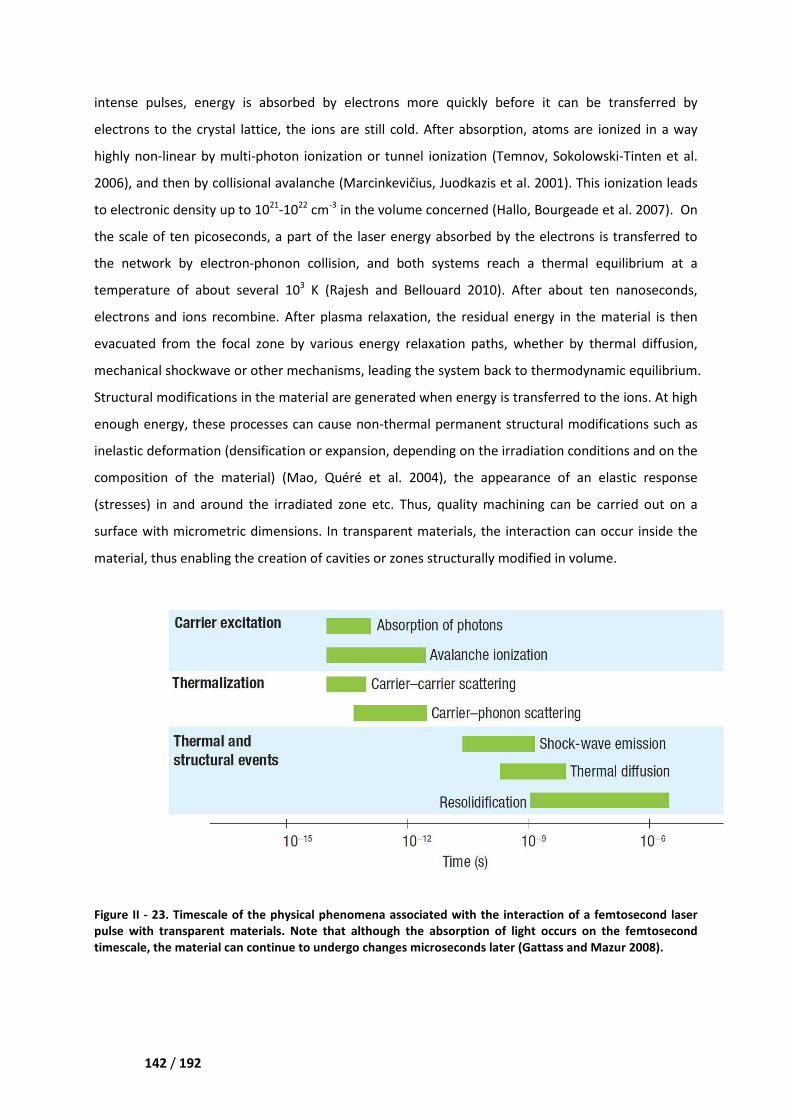
142 / 192
intense pulses, energy is absorbed by electrons more quickly before it can be transferred by
electrons to the crystal lattice, the ions are still cold. After absorption, atoms are ionized in a way
highly non-linear by multi-photon ionization or tunnel ionization (Temnov, Sokolowski-Tinten et al.
2006), and then by collisional avalanche (Marcinkevičius, Juodkazis et al. 2001). This ionization leads
to electronic density up to 1021-1022 cm-3 in the volume concerned (Hallo, Bourgeade et al. 2007). On
the scale of ten picoseconds, a part of the laser energy absorbed by the electrons is transferred to
the network by electron-phonon collision, and both systems reach a thermal equilibrium at a
temperature of about several 103 K (Rajesh and Bellouard 2010). After about ten nanoseconds,
electrons and ions recombine. After plasma relaxation, the residual energy in the material is then
evacuated from the focal zone by various energy relaxation paths, whether by thermal diffusion,
mechanical shockwave or other mechanisms, leading the system back to thermodynamic equilibrium.
Structural modifications in the material are generated when energy is transferred to the ions. At high
enough energy, these processes can cause non-thermal permanent structural modifications such as
inelastic deformation (densification or expansion, depending on the irradiation conditions and on the
composition of the material) (Mao, Quéré et al. 2004), the appearance of an elastic response
(stresses) in and around the irradiated zone etc. Thus, quality machining can be carried out on a
surface with micrometric dimensions. In transparent materials, the interaction can occur inside the
material, thus enabling the creation of cavities or zones structurally modified in volume.
Figure II - 23. Timescale of the physical phenomena associated with the interaction of a femtosecond laser
pulse with transparent materials. Note that although the absorption of light occurs on the femtosecond
timescale, the material can continue to undergo changes microseconds later (Gattass and Mazur 2008).
143 / 192
In our studies, femtosecond laser processing was entrusted to the FEMTO ST at Besançon.
Holes corresponding to the electrode reservoirs and to the embryo chamber were subsequently
opened by femtosecond laser ablation. A Tangerine ytterbium femtosecond fiber laser (Amplitude
Systèmes) operating at a nominal wavelength of 1030 nm was used. The beam at the exit of the laser
head had approximately a Gaussian profile, with a M² factor of 1.23 and a full diameter of 3.5 mm at
1/e². Specific optics were then added to obtain a non-diffracting Bessel beam with a 3 µm diameter
and a 130 µm length (Bhuyan, Courvoisier et al. 2010). The repetition rate and the pulse duration
were tuned around 5 kHz and 220 fs, respectively, and the laser power at the sample was adjusted to
~ 100 mW by combining a half-wave plate and a linear polarizer. Focusing on the sample was
performed with achromatic lenses, the wet etched side of the wafer being the one exposed to the
laser beam. The material was ablated along a predefined contour thanks to a 3-axis translation stage,
alignment onto the gold marks being achieved with a better than 10 µm accuracy. Each hole was
realized relying on 3 successive infeeds, which took between 2 and 5 min.
II.5. Selective laser-induced Etching (SLE)
The principle of selective laser-induced etching is femtosecond laser processing combined
with chemical etching. This technology was first reported by Marcinkevicius et al. for fused silica
(Marcinkevičius, Juodkazis et al. 2001). The main difference with femtosecond laser processing is that
SLE uses relative low energy femtosecond laser irradiation, in fact just enough to induce structural
modifications in order to improve wet etching selectivity. The pulse energy levels are set weak (≤ 1 µJ)
so no material is removed but structural modifications of the material takes place at the laser focal
zone, the irradiated areas thus acquire an increased solubility to etchant such as hydrofluoric acid
(HF). There is no direct ablation. Secondly, preferential chemical etching of the laser processed
region is performed by immersing the substrate in an etching agent. Low concentration HF (typically
less than 10%) is generally used, and heated KOH is also developed to be an etchant, increasing the
aspect ratio up to 1:200 (Kiyama, Matsuo et al. 2009) (Figure II - 24).
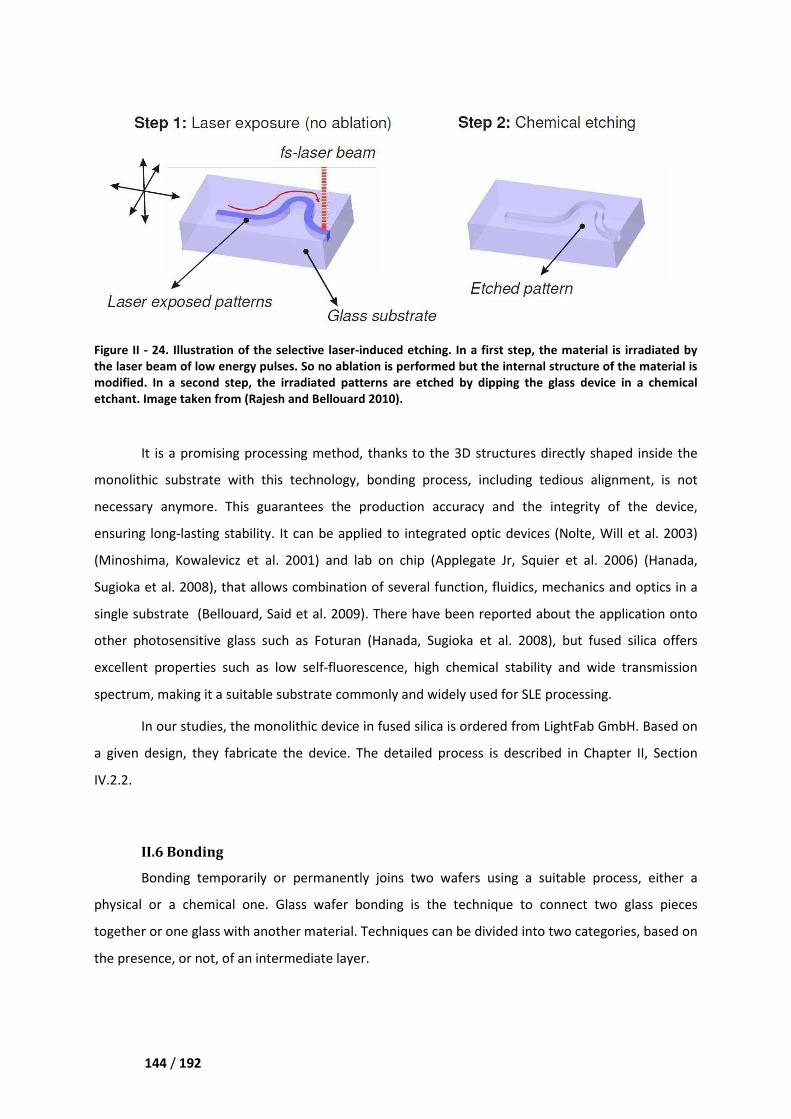
144 / 192
Figure II - 24. Illustration of the selective laser-induced etching. In a first step, the material is irradiated by
the laser beam of low energy pulses. So no ablation is performed but the internal structure of the material is
modified. In a second step, the irradiated patterns are etched by dipping the glass device in a chemical
etchant. Image taken from (Rajesh and Bellouard 2010).
It is a promising processing method, thanks to the 3D structures directly shaped inside the
monolithic substrate with this technology, bonding process, including tedious alignment, is not
necessary anymore. This guarantees the production accuracy and the integrity of the device,
ensuring long-lasting stability. It can be applied to integrated optic devices (Nolte, Will et al. 2003)
(Minoshima, Kowalevicz et al. 2001) and lab on chip (Applegate Jr, Squier et al. 2006) (Hanada,
Sugioka et al. 2008), that allows combination of several function, fluidics, mechanics and optics in a
single substrate (Bellouard, Said et al. 2009). There have been reported about the application onto
other photosensitive glass such as Foturan (Hanada, Sugioka et al. 2008), but fused silica offers
excellent properties such as low self-fluorescence, high chemical stability and wide transmission
spectrum, making it a suitable substrate commonly and widely used for SLE processing.
In our studies, the monolithic device in fused silica is ordered from LightFab GmbH. Based on
a given design, they fabricate the device. The detailed process is described in Chapter II, Section
IV.2.2.
II.6 Bonding
Bonding temporarily or permanently joins two wafers using a suitable process, either a
physical or a chemical one. Glass wafer bonding is the technique to connect two glass pieces
together or one glass with another material. Techniques can be divided into two categories, based on
the presence, or not, of an intermediate layer.
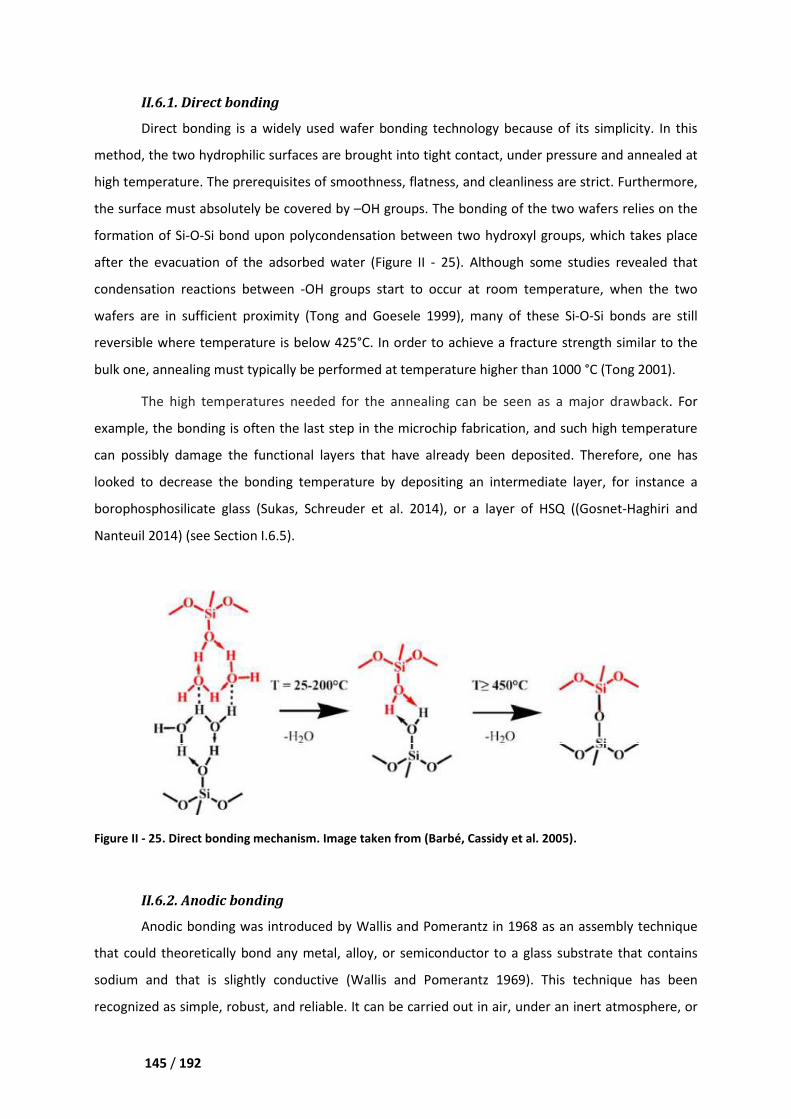
145 / 192
II.6.1. Direct bonding
Direct bonding is a widely used wafer bonding technology because of its simplicity. In this
method, the two hydrophilic surfaces are brought into tight contact, under pressure and annealed at
high temperature. The prerequisites of smoothness, flatness, and cleanliness are strict. Furthermore,
the surface must absolutely be covered by –OH groups. The bonding of the two wafers relies on the
formation of Si-O-Si bond upon polycondensation between two hydroxyl groups, which takes place
after the evacuation of the adsorbed water (Figure II - 25). Although some studies revealed that
condensation reactions between -OH groups start to occur at room temperature, when the two
wafers are in sufficient proximity (Tong and Goesele 1999), many of these Si-O-Si bonds are still
reversible where temperature is below 425°C. In order to achieve a fracture strength similar to the
bulk one, annealing must typically be performed at temperature higher than 1000 °C (Tong 2001).
The high temperatures needed for the annealing can be seen as a major drawback. For
example, the bonding is often the last step in the microchip fabrication, and such high temperature
can possibly damage the functional layers that have already been deposited. Therefore, one has
looked to decrease the bonding temperature by depositing an intermediate layer, for instance a
borophosphosilicate glass (Sukas, Schreuder et al. 2014), or a layer of HSQ ((Gosnet-Haghiri and
Nanteuil 2014) (see Section I.6.5).
Figure II - 25. Direct bonding mechanism. Image taken from (Barbé, Cassidy et al. 2005).
II.6.2. Anodic bonding
Anodic bonding was introduced by Wallis and Pomerantz in 1968 as an assembly technique
that could theoretically bond any metal, alloy, or semiconductor to a glass substrate that contains
sodium and that is slightly conductive (Wallis and Pomerantz 1969). This technique has been
recognized as simple, robust, and reliable. It can be carried out in air, under an inert atmosphere, or
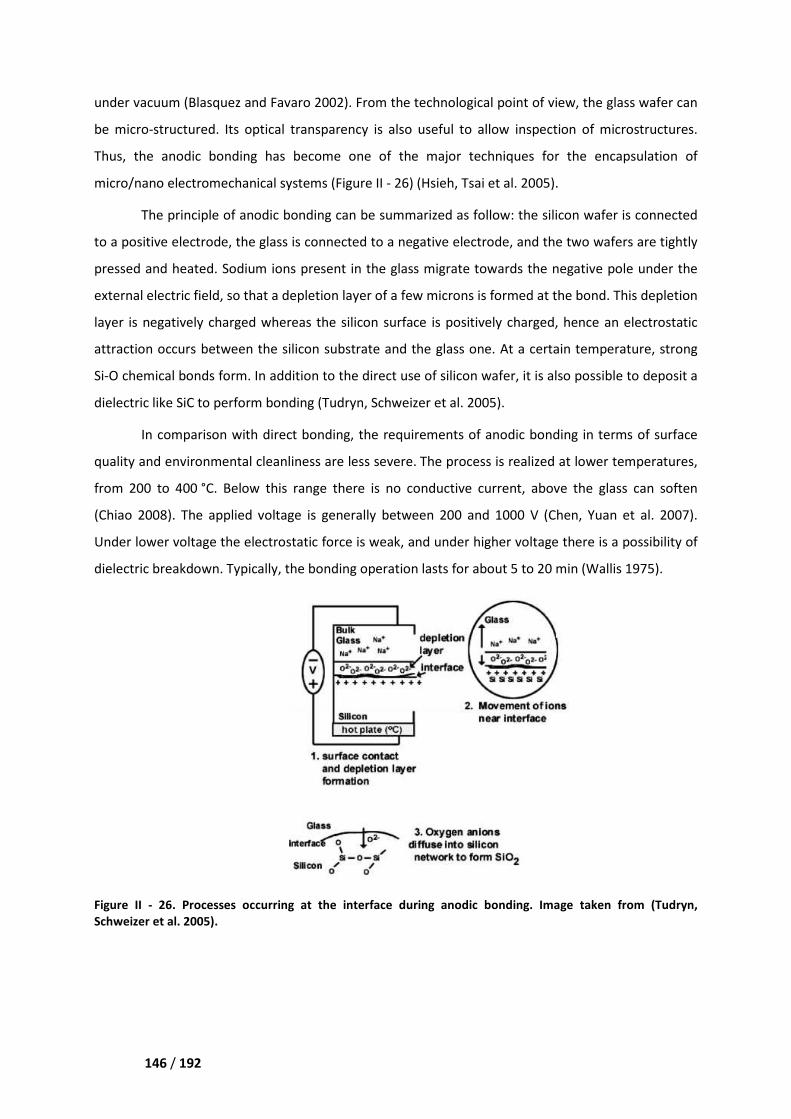
146 / 192
under vacuum (Blasquez and Favaro 2002). From the technological point of view, the glass wafer can
be micro-structured. Its optical transparency is also useful to allow inspection of microstructures.
Thus, the anodic bonding has become one of the major techniques for the encapsulation of
micro/nano electromechanical systems (Figure II - 26) (Hsieh, Tsai et al. 2005).
The principle of anodic bonding can be summarized as follow: the silicon wafer is connected
to a positive electrode, the glass is connected to a negative electrode, and the two wafers are tightly
pressed and heated. Sodium ions present in the glass migrate towards the negative pole under the
external electric field, so that a depletion layer of a few microns is formed at the bond. This depletion
layer is negatively charged whereas the silicon surface is positively charged, hence an electrostatic
attraction occurs between the silicon substrate and the glass one. At a certain temperature, strong
Si-O chemical bonds form. In addition to the direct use of silicon wafer, it is also possible to deposit a
dielectric like SiC to perform bonding (Tudryn, Schweizer et al. 2005).
In comparison with direct bonding, the requirements of anodic bonding in terms of surface
quality and environmental cleanliness are less severe. The process is realized at lower temperatures,
from 200 to 400 °C. Below this range there is no conductive current, above the glass can soften
(Chiao 2008). The applied voltage is generally between 200 and 1000 V (Chen, Yuan et al. 2007).
Under lower voltage the electrostatic force is weak, and under higher voltage there is a possibility of
dielectric breakdown. Typically, the bonding operation lasts for about 5 to 20 min (Wallis 1975).
Figure II - 26. Processes occurring at the interface during anodic bonding. Image taken from (Tudryn,
Schweizer et al. 2005).
147 / 192
II.6.3. Adhesive bonding
The method is cost-effective since it relies on inexpensive polymeric adhesives. During
polymerization, the organic monomers will form long polymer chains. The polymerization reaction
can be initiated by a thermal treatment (e.g. for benzocyclobutene) (Niklaus, Enoksson et al. 2001) or
by ultraviolet irradiation (e.g. for Vitralit 6127 in current thesis). After cross-linking, the adhesive
becomes a solid layer of polymer, which forms the basis of adhesive bonding.
The polymer adhesive is used as an intermediate layer which is deposited on one or both of
the surfaces to be bonded. Pressure should be applied to ensure some intimate contact. The bonding
temperature depends on the type of adhesive, it can vary from 1000 °C down to room temperature.
Besides its advantages, adhesive bonding has some drawbacks. The coefficient of thermal expansion
of adhesives is often different from the one of the substrates; therefore, the temperature stability is
limited and the mechanical reliability cannot be guaranteed. For a microfluidic chip, which is often
used in aqueous phase and undergoes pressure by liquid injection, the hermeticity of the whole
device cannot be guaranteed if the adhesive layer is not solid. In our case, some version of the chip is
achieved by the adhesive bonding, but due to the instability of the adhesive layer, the device cannot
be completely cleaned which was a problem.
II.6.4. Eutectic bonding
Eutectic bonding relies on an intermediate metal layer that can form an eutectic with the
wafer material. It makes use of the fact that the eutectic temperature can be much lower than the
melting temperature of each of the component. An alloy can thus be formed at the intersurface upon
moderate heating.
In industry, the Au-Si (e.g. 19% Si, 81% Au with a melting temperature of 363°C)
(Wolffenbuttel 1997) and the Al-Ge ( e.g. 72% Al, 28% Ge with a melting temperature of 420°C) (Sood,
Farrens et al. 2010) combinations are the most commonly used. Metallization is several hundreds of
nanometers to micrometer thick. As the temperature of the compressed material stack is raised and
passes the eutectic point, interdiffusion of atoms occurs, leading to the eutectic alloy formation.
When the temperature decreases, the eutectic alloy solidifies, serving as a solid bonding layer
between the substrates.
This approach does not meet our requirements, since metal layers must be deposited
between two wafers that may block the optical pathway of biological experiment. Furthermore, a
conductive intermediate layer would be a problem for electroporation.
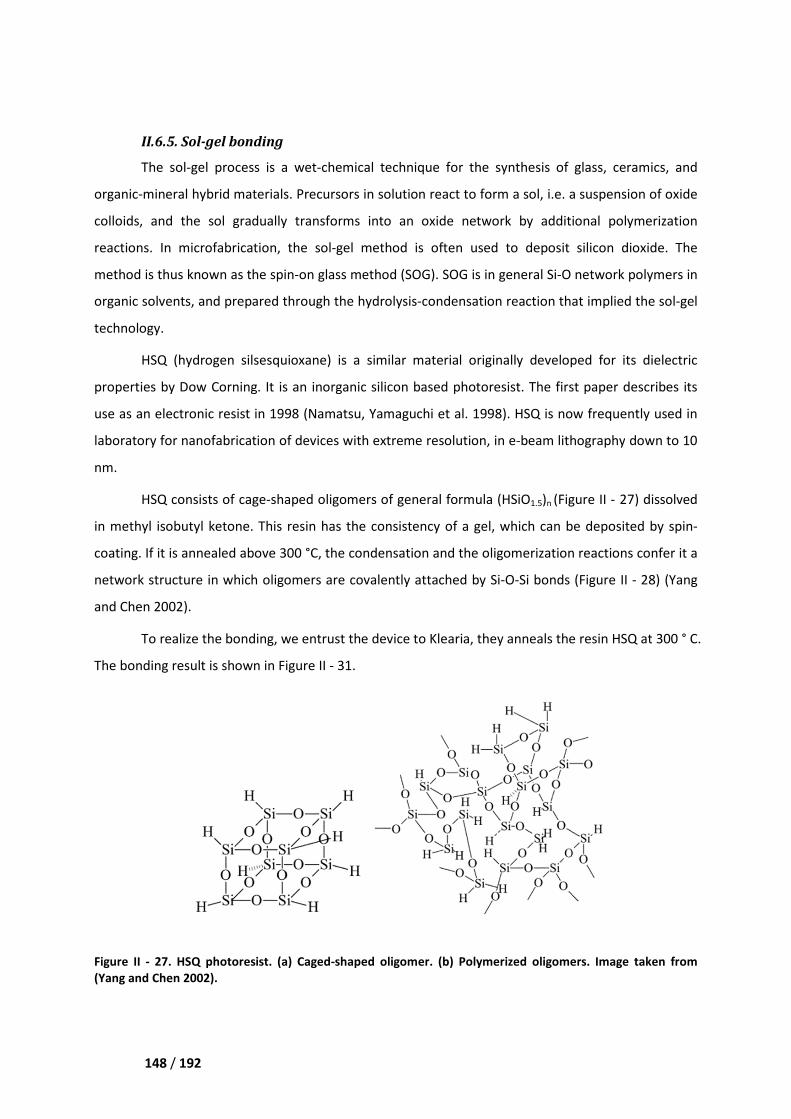
148 / 192
II.6.5. Sol-gel bonding
The sol-gel process is a
organic-mineral hybrid materials
colloids, and the sol gradually transforms
reactions. In microfabrication,
method is thus known as the spin
organic solvents, and prepared through
technology.
HSQ (hydrogen silsesquioxane) is a
properties by Dow Corning. It is an inorganic silicon based
use as an electronic resist in 1998
laboratory for nanofabrication of devices with extreme resolution
nm.
HSQ consists of cage-shaped oligomers of general formula (HSiO
in methyl isobutyl ketone. This resin has the consistency of a gel, which can be deposited by spin
coating. If it is annealed above 300 °C, the condensation and
network structure in which oligomers
and Chen 2002).
To realize the bonding, we entrust the device to
The bonding result is shown in Figure
Figure II - 27. HSQ photoresist. (a)
(Yang and Chen 2002).
gel process is a wet-chemical technique for the synthesis of glass, ceramics
mineral hybrid materials. Precursors in solution react to form a sol, i.e. a suspension of oxide
gradually transforms into an oxide network by additional
the sol-gel method is often used to deposit silicon
pin-on glass method (SOG). SOG is in general Si-O network polymers in
ents, and prepared through the hydrolysis-condensation reaction that implied the sol
HSQ (hydrogen silsesquioxane) is a similar material originally developed for its dielectric
properties by Dow Corning. It is an inorganic silicon based photoresist. The first paper describes its
in 1998 (Namatsu, Yamaguchi et al. 1998). HSQ is now frequently used in
laboratory for nanofabrication of devices with extreme resolution, in e-beam lithography
shaped oligomers of general formula (HSiO1.5)n (Figure II
his resin has the consistency of a gel, which can be deposited by spin
300 °C, the condensation and the oligomerization reactions confer
oligomers are covalently attached by Si-O-Si bonds (
, we entrust the device to Klearia, they anneals the resin HSQ at
Figure II - 31.
a) Caged-shaped oligomer. (b) Polymerized oligomers
for the synthesis of glass, ceramics, and
to form a sol, i.e. a suspension of oxide
additional polymerization
gel method is often used to deposit silicon dioxide. The
O network polymers in
condensation reaction that implied the sol-gel
material originally developed for its dielectric
first paper describes its
HSQ is now frequently used in
beam lithography down to 10
Figure II - 27) dissolved
his resin has the consistency of a gel, which can be deposited by spin-
oligomerization reactions confer it a
bonds (Figure II - 28) (Yang
anneals the resin HSQ at 300 ° C.
ized oligomers. Image taken from
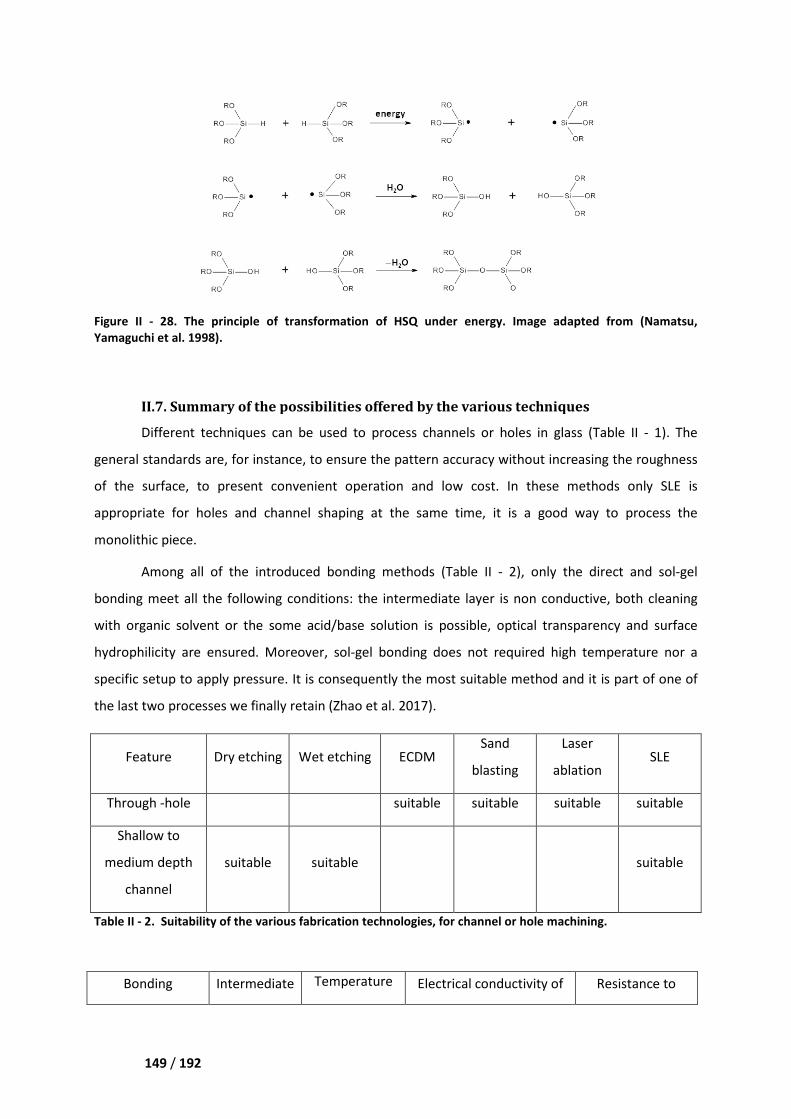
149 / 192
Figure II - 28. The principle of transformation of HSQ under energy.
Yamaguchi et al. 1998).
II.7. Summary of the p
Different techniques can be
general standards are, for instance,
of the surface, to present convenient
appropriate for holes and channel
monolithic piece.
Among all of the introduced
bonding meet all the following conditions:
with organic solvent or the some
hydrophilicity are ensured. Moreover
specific setup to apply pressure. It
the last two processes we finally retain (
Table II - 2. Suitability of the various
Feature Dry etching
Through -hole
Shallow to
medium depth
channel
suitable
Bonding Intermediate
The principle of transformation of HSQ under energy. Image adapted fr
II.7. Summary of the possibilities offered by the various techniques
can be used to process channels or holes in glass (
are, for instance, to ensure the pattern accuracy without increasing the roughness
to present convenient operation and low cost. In these methods only SLE
for holes and channel shaping at the same time, it is a good way to process
introduced bonding methods (Table II - 2), only the direct and sol
meet all the following conditions: the intermediate layer is non conductive
some acid/base solution is possible, optical transparenc
hydrophilicity are ensured. Moreover, sol-gel bonding does not required high temperature nor a
specific setup to apply pressure. It is consequently the most suitable method and it is part of one of
processes we finally retain (Zhao et al. 2017).
various fabrication technologies, for channel or hole machining
Wet etching ECDM Sand
blasting
Laser
ablati
suitable suitable suitable
suitable
Intermediate Temperature Electrical conductivity of
Image adapted from (Namatsu,
ossibilities offered by the various techniques
s in glass (Table II - 1). The
without increasing the roughness
hese methods only SLE is
good way to process the
only the direct and sol-gel
n conductive, both cleaning
optical transparency and surface
uired high temperature nor a
and it is part of one of
machining.
Laser
ablation SLE
uitable suitable
suitable
Resistance to

150 / 192
Table II - 3. Comparison of the various bonding methods.
III. Comparative experiments on individual technological steps
III.1 Through hole manufacturing
In this thesis, five methods to realize holes have be tried (Figure II - 29). Their suitability
depends on the scale and on the required accuracy. Sand blasting, ECDM, and wet etching are
practical and easy techniques, but results are rough, and dimensions cannot be guaranteed at all. If
one only needs a fluidic entry and if its dimensions are not important, then these methods can be
adopted. Nevertheless, laser technologies are more precise. They can yield vertical and precisely
positioned walls.
techniques layer the intermediate layer organic solvents
or acid/base
solution
Direct no > 1000 °C no yes
Anodic yes/no 200-400 °C yes yes
Adhesive yes < 1000 °C no no
Eutectic yes 300-400 °c yes yes
Sol-gel yes ~300 °C no yes
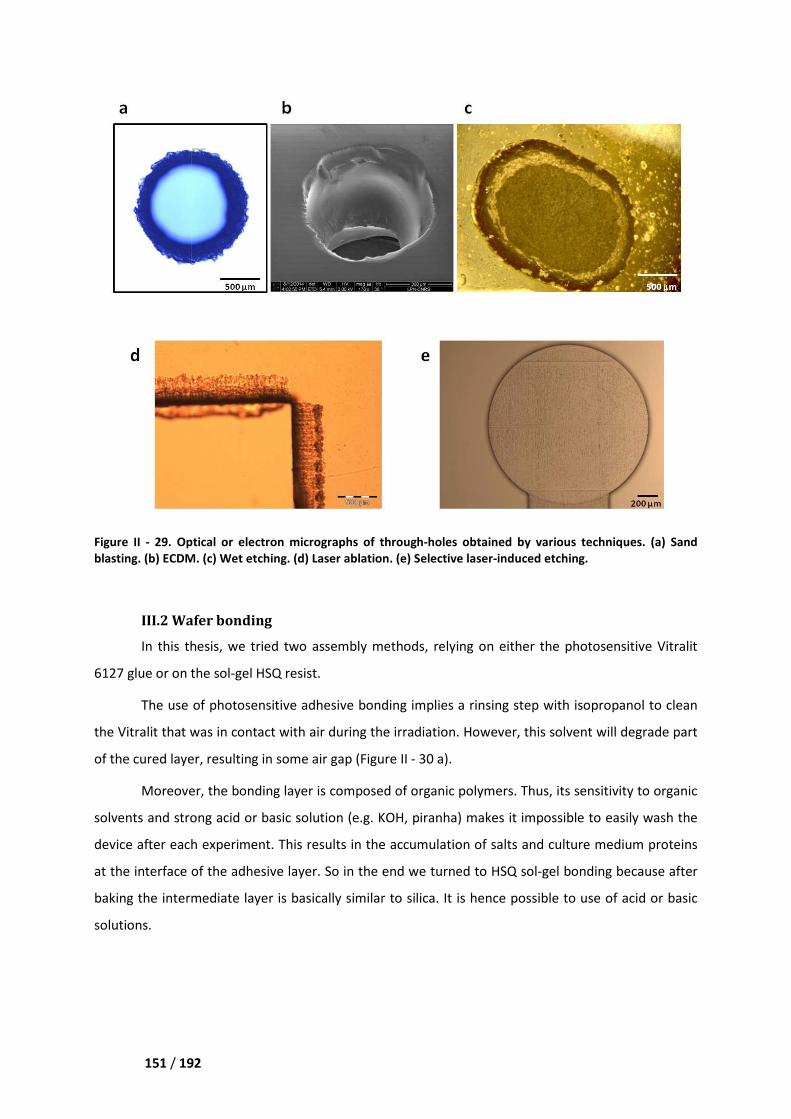
151 / 192
Figure II - 29. Optical or electron micrographs of through
blasting. (b) ECDM. (c) Wet etching
III.2 Wafer bonding
In this thesis, we tried two
6127 glue or on the sol-gel HSQ resist.
The use of photosensitive adhesive bonding
the Vitralit that was in contact with air
of the cured layer, resulting in some air gap (
Moreover, the bonding layer is composed of organic
solvents and strong acid or basic solution (e.g. KOH, piranha)
device after each experiment. This
at the interface of the adhesive layer
baking the intermediate layer is basically similar to silica. It is hence possible to
solutions.
Optical or electron micrographs of through-holes obtained by various techniques.
et etching. (d) Laser ablation. (e) Selective laser-induced etching
tried two assembly methods, relying on either the photosensitive
resist.
photosensitive adhesive bonding implies a rinsing step with isopropanol to
the Vitralit that was in contact with air during the irradiation. However, this solvent
some air gap (Figure II - 30 a).
he bonding layer is composed of organic polymers. Thus, its
and strong acid or basic solution (e.g. KOH, piranha) makes it impossible to easily w
. This results in the accumulation of salts and culture medium proteins
of the adhesive layer. So in the end we turned to HSQ sol-gel bonding
baking the intermediate layer is basically similar to silica. It is hence possible to
holes obtained by various techniques. (a) Sand
induced etching.
photosensitive Vitralit
ing step with isopropanol to clean
solvent will degrade part
sensitivity to organic
it impossible to easily wash the
results in the accumulation of salts and culture medium proteins
gel bonding because after
baking the intermediate layer is basically similar to silica. It is hence possible to use of acid or basic
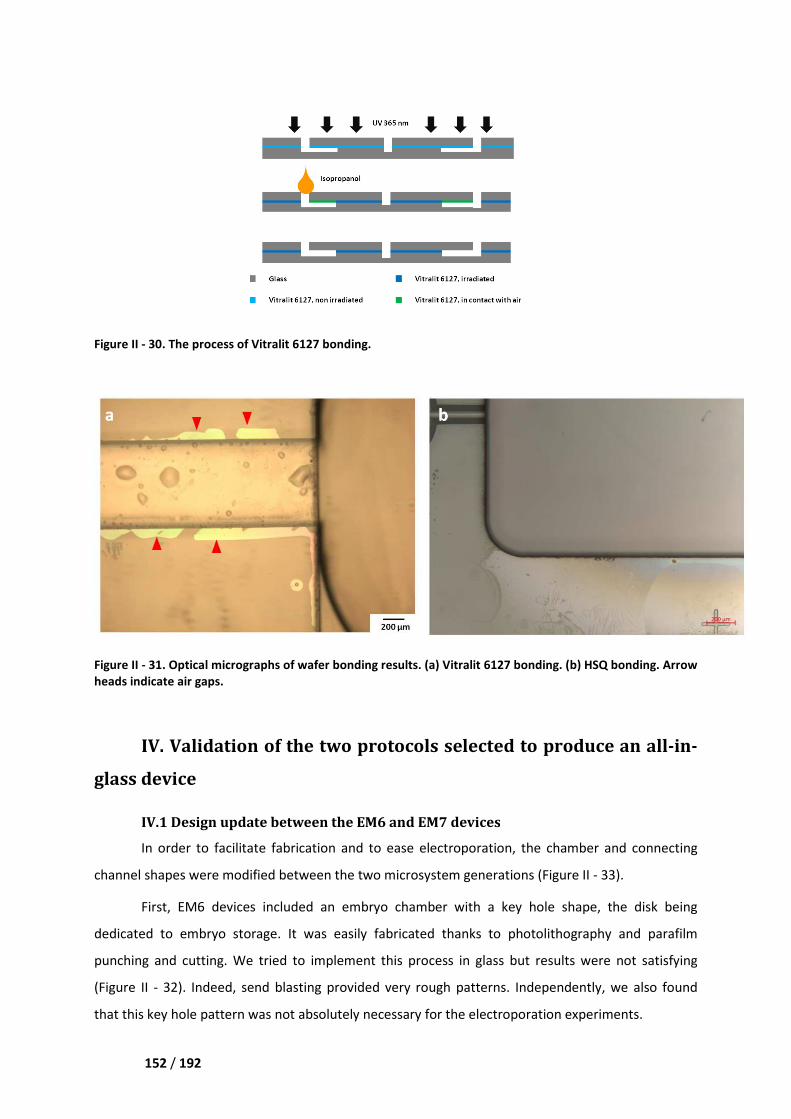
152 / 192
Figure II - 30. The process of Vitralit
Figure II - 31. Optical micrographs of
heads indicate air gaps.
IV. Validation of
glass device
IV.1 Design update between the EM6 and EM7 devices
In order to facilitate fabrication
channel shapes were modified between the two m
First, EM6 devices included an embryo cham
dedicated to embryo storage. It was easily fabricated thanks to photolithography and parafilm
punching and cutting. We tried to implement this process in glass but results were not satisfying
(Figure II - 32). Indeed, send blasting
that this key hole pattern was not absolutely
The process of Vitralit 6127 bonding.
of wafer bonding results. (a) Vitralit 6127 bonding. (b) HSQ bonding. Arrow
the two protocols selected to produce
e between the EM6 and EM7 devices
fabrication and to ease electroporation, the chamber
modified between the two microsystem generations (Figure II
First, EM6 devices included an embryo chamber with a key hole shape, the disk being
dedicated to embryo storage. It was easily fabricated thanks to photolithography and parafilm
ied to implement this process in glass but results were not satisfying
. Indeed, send blasting provided very rough patterns. Independently, we also found
that this key hole pattern was not absolutely necessary for the electroporation experiments.
(b) HSQ bonding. Arrow
the two protocols selected to produce an all-in-
chamber and connecting
generations (Figure II - 33).
ber with a key hole shape, the disk being
dedicated to embryo storage. It was easily fabricated thanks to photolithography and parafilm
ied to implement this process in glass but results were not satisfying
. Independently, we also found
for the electroporation experiments.
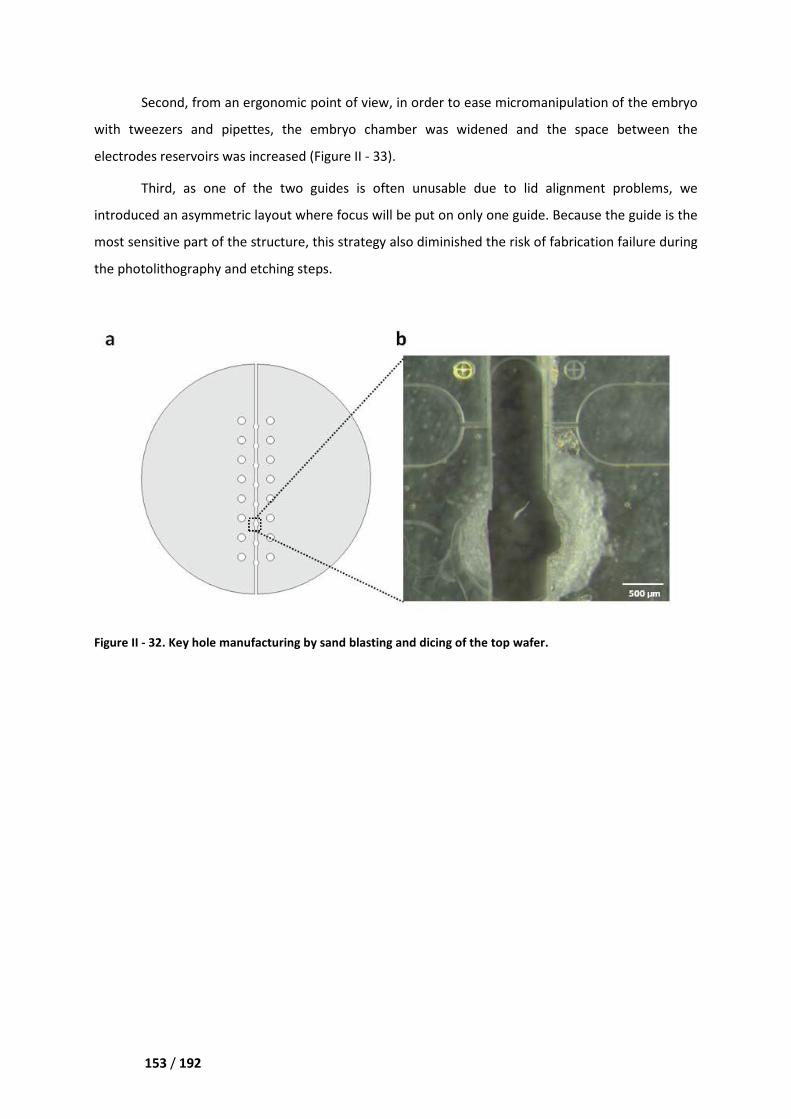
153 / 192
Second, from an ergonomic poin
with tweezers and pipettes, the embryo chamber was
electrodes reservoirs was increased
Third, as one of the two gu
introduced an asymmetric layout
most sensitive part of the structure
the photolithography and etching
Figure II - 32. Key hole manufacturing by sand blasting and dicing of the top wafer.
nomic point of view, in order to ease micromanipulation
the embryo chamber was widened and the space between the
increased (Figure II - 33).
, as one of the two guides is often unusable due to lid alignment problems, we
an asymmetric layout where focus will be put on only one guide. Because the guide is the
most sensitive part of the structure, this strategy also diminished the risk of fabrication failure
and etching steps.
Key hole manufacturing by sand blasting and dicing of the top wafer.
to ease micromanipulation of the embryo
he space between the
ides is often unusable due to lid alignment problems, we
ecause the guide is the
the risk of fabrication failure during
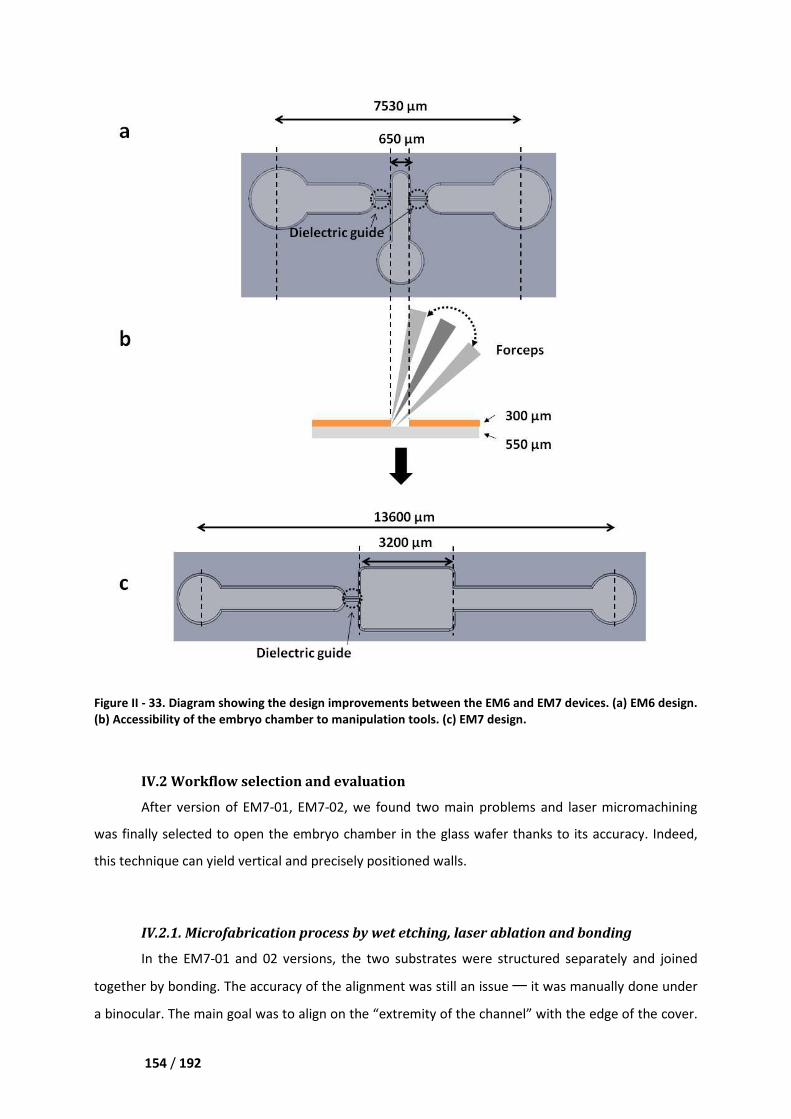
154 / 192
Figure II - 33. Diagram showing the design improvements
(b) Accessibility of the embryo chamber to manipulation tools. (c) EM7 design.
IV.2 Workflow selection and evaluation
After version of EM7-01, EM7
was finally selected to open the embryo chamber in the glass wafer
this technique can yield vertical and precisely positioned walls.
IV.2.1. Microfabrication process
In the EM7-01 and 02 version
together by bonding. The accuracy of the alignment
a binocular. The main goal was to align on the
the design improvements between the EM6 and EM7 devices.
Accessibility of the embryo chamber to manipulation tools. (c) EM7 design.
IV.2 Workflow selection and evaluation
01, EM7-02, we found two main problems and laser micromachining
selected to open the embryo chamber in the glass wafer thanks to its accuracy
this technique can yield vertical and precisely positioned walls.
Microfabrication process by wet etching, laser ablation and bonding
versions, the two substrates were structured separately
he accuracy of the alignment was still an issue ─ it was manually done un
s to align on the “extremity of the channel” with the edge of the cover.
between the EM6 and EM7 devices. (a) EM6 design.
aser micromachining
thanks to its accuracy. Indeed,
by wet etching, laser ablation and bonding
separately and joined
t was manually done under
ith the edge of the cover.
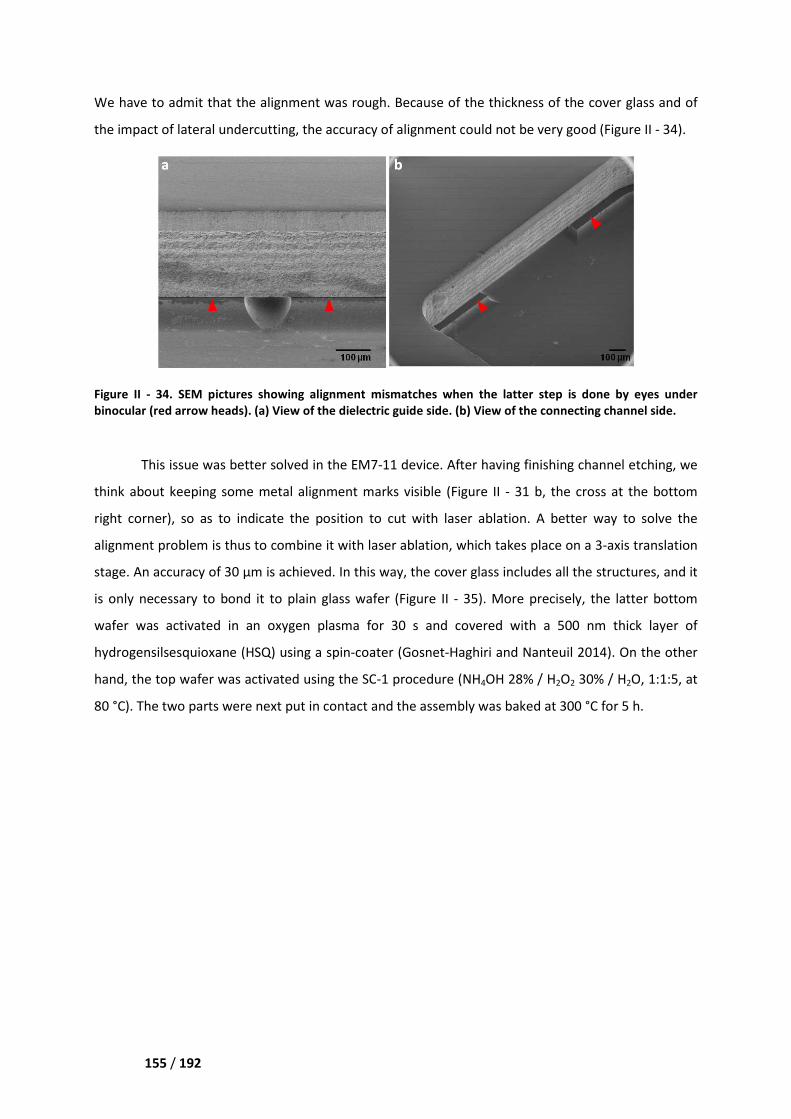
155 / 192
We have to admit that the alignment
the impact of lateral undercutting, the accuracy of alignment c
Figure II - 34. SEM pictures showing alignment mismatches when the latter step is done by eyes under
binocular (red arrow heads). (a) View of the dielectric guide side.
This issue was better solved
think about keeping some metal alignment m
right corner), so as to indicate
alignment problem is thus to combine
stage. An accuracy of 30 µm is achieved
is only necessary to bond it to
wafer was activated in an oxygen plasma for 30 s and covered with a 500 nm thick layer of
hydrogensilsesquioxane (HSQ) using a spin
hand, the top wafer was activated using the SC
80 °C). The two parts were next put in contact and the
We have to admit that the alignment was rough. Because of the thickness of the cover glass
ng, the accuracy of alignment could not be very good
owing alignment mismatches when the latter step is done by eyes under
ocular (red arrow heads). (a) View of the dielectric guide side. (b) View of the connecting channel side.
solved in the EM7-11 device. After having finishing
etal alignment marks visible (Figure II - 31 b, the cross
the position to cut with laser ablation. A better
to combine it with laser ablation, which takes place on
achieved. In this way, the cover glass includes all the structures
is only necessary to bond it to plain glass wafer (Figure II - 35). More precisely, t
was activated in an oxygen plasma for 30 s and covered with a 500 nm thick layer of
hydrogensilsesquioxane (HSQ) using a spin-coater (Gosnet-Haghiri and Nanteuil 2014)
hand, the top wafer was activated using the SC-1 procedure (NH4OH 28% / H2O2
80 °C). The two parts were next put in contact and the assembly was baked at 300 °C for 5 h.
he thickness of the cover glass and of
not be very good (Figure II - 34).
owing alignment mismatches when the latter step is done by eyes under
(b) View of the connecting channel side.
fter having finishing channel etching, we
he cross at the bottom
better way to solve the
which takes place on a 3-axis translation
all the structures, and it
More precisely, the latter bottom
was activated in an oxygen plasma for 30 s and covered with a 500 nm thick layer of
Haghiri and Nanteuil 2014). On the other
2 30% / H2O, 1:1:5, at
assembly was baked at 300 °C for 5 h.
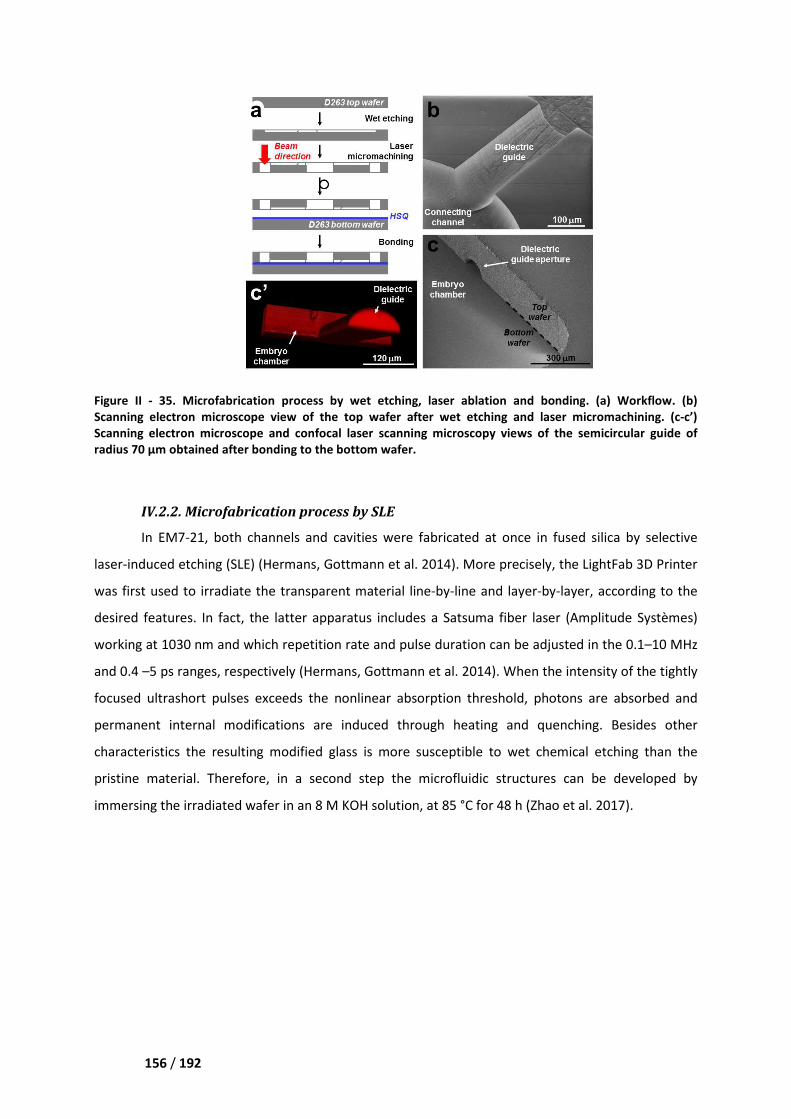
156 / 192
Figure II - 35. Microfabrication process
Scanning electron microscope view of the top wafer after wet etching and laser mic
Scanning electron microscope and
radius 70 µm obtained after bonding to the bottom wafer.
IV.2.2. Microfabrication process
In EM7-21, both channels and cavit
laser-induced etching (SLE) (Hermans, Gottmann et al. 2014
was first used to irradiate the transparent material line
desired features. In fact, the latter apparatus includes a Satsuma fiber laser (Amplitude Systèmes)
working at 1030 nm and which repetition rate and pulse duration can be adjusted in the 0.1
and 0.4 –5 ps ranges, respectively
focused ultrashort pulses exceeds the nonlinear absorption threshold
permanent internal modifications are induced through heating and quenching. Besides
characteristics the resulting modified glass is more susceptible to wet chemical etching than the
pristine material. Therefore, in a second step the microfluidic structures can be developed by
immersing the irradiated wafer in an 8
. Microfabrication process by wet etching, laser ablation and bonding
view of the top wafer after wet etching and laser mic
and confocal laser scanning microscopy views of the semicircular guide of
radius 70 µm obtained after bonding to the bottom wafer.
Microfabrication process by SLE
21, both channels and cavities were fabricated at once in fused silica by select
(Hermans, Gottmann et al. 2014). More precisely, the LightFab 3D Printer
was first used to irradiate the transparent material line-by-line and layer-by-layer, according to the
desired features. In fact, the latter apparatus includes a Satsuma fiber laser (Amplitude Systèmes)
nm and which repetition rate and pulse duration can be adjusted in the 0.1
5 ps ranges, respectively (Hermans, Gottmann et al. 2014). When the intensity of the tightly
focused ultrashort pulses exceeds the nonlinear absorption threshold, photons are absorbed and
permanent internal modifications are induced through heating and quenching. Besides
characteristics the resulting modified glass is more susceptible to wet chemical etching than the
pristine material. Therefore, in a second step the microfluidic structures can be developed by
immersing the irradiated wafer in an 8 M KOH solution, at 85 °C for 48 h (Zhao et al. 2017).
wet etching, laser ablation and bonding. (a) Workflow. (b)
view of the top wafer after wet etching and laser micromachining. (c-c’)
views of the semicircular guide of
ies were fabricated at once in fused silica by selective
More precisely, the LightFab 3D Printer
layer, according to the
desired features. In fact, the latter apparatus includes a Satsuma fiber laser (Amplitude Systèmes)
nm and which repetition rate and pulse duration can be adjusted in the 0.1–10 MHz
. When the intensity of the tightly
photons are absorbed and
permanent internal modifications are induced through heating and quenching. Besides other
characteristics the resulting modified glass is more susceptible to wet chemical etching than the
pristine material. Therefore, in a second step the microfluidic structures can be developed by
Zhao et al. 2017).
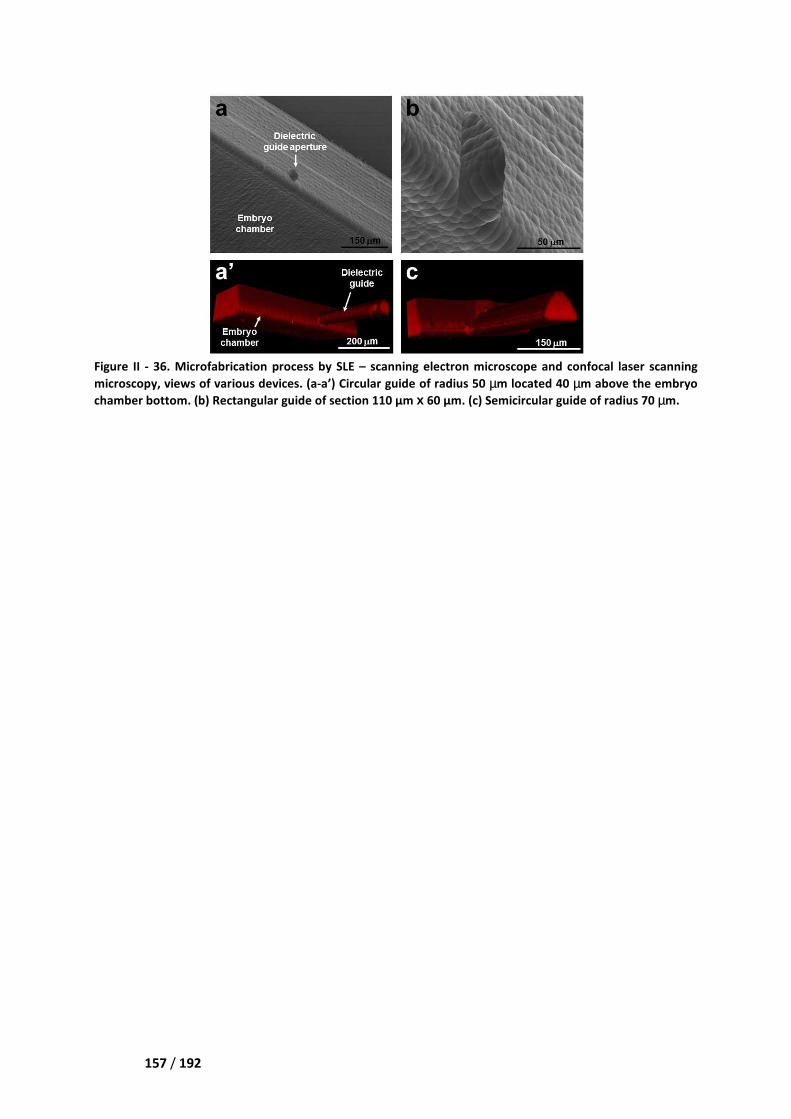
157 / 192
Figure II - 36. Microfabrication process by SLE
microscopy, views of various devices. (a
chamber bottom. (b) Rectangular guide of section 110
ion process by SLE – scanning electron microscope and c
views of various devices. (a-a’) Circular guide of radius 50 µm located 40
chamber bottom. (b) Rectangular guide of section 110 µm x 60 µm. (c) Semicircular guide of radius 70
confocal laser scanning
m located 40 µm above the embryo
(c) Semicircular guide of radius 70 µm.

158 / 192
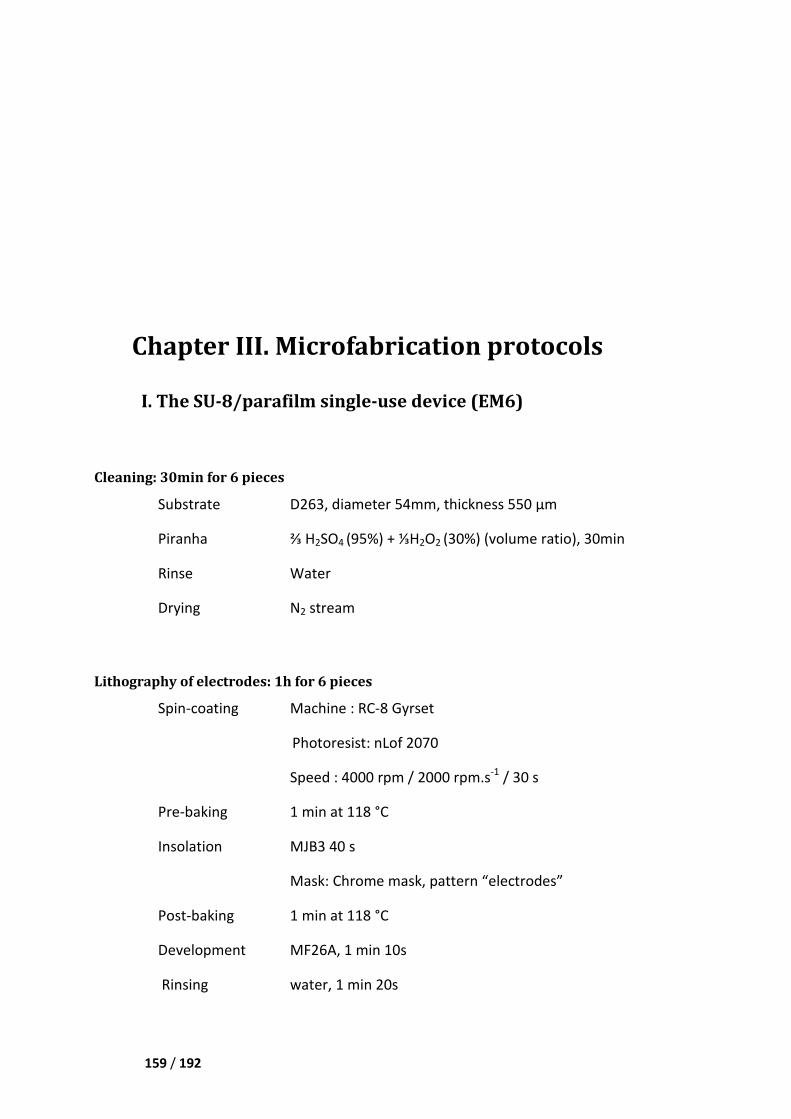
159 / 192
Chapter III. Microfabrication protocols
I. The SU-8/parafilm single-use device (EM6)
Cleaning: 30min for 6 pieces
Substrate D263, diameter 54mm, thickness 550 µm
Piranha ⅔ H2SO4 (95%) + ⅓H2O2 (30%) (volume ratio), 30min
Rinse Water
Drying N2 stream
Lithography of electrodes: 1h for 6 pieces
Spin-coating Machine : RC-8 Gyrset
Photoresist: nLof 2070
Speed : 4000 rpm / 2000 rpm.s-1 / 30 s
Pre-baking 1 min at 118 °C
Insolation MJB3 40 s
Mask: Chrome mask, pattern “electrodes”
Post-baking 1 min at 118 °C
Development MF26A, 1 min 10s
Rinsing water, 1 min 20s
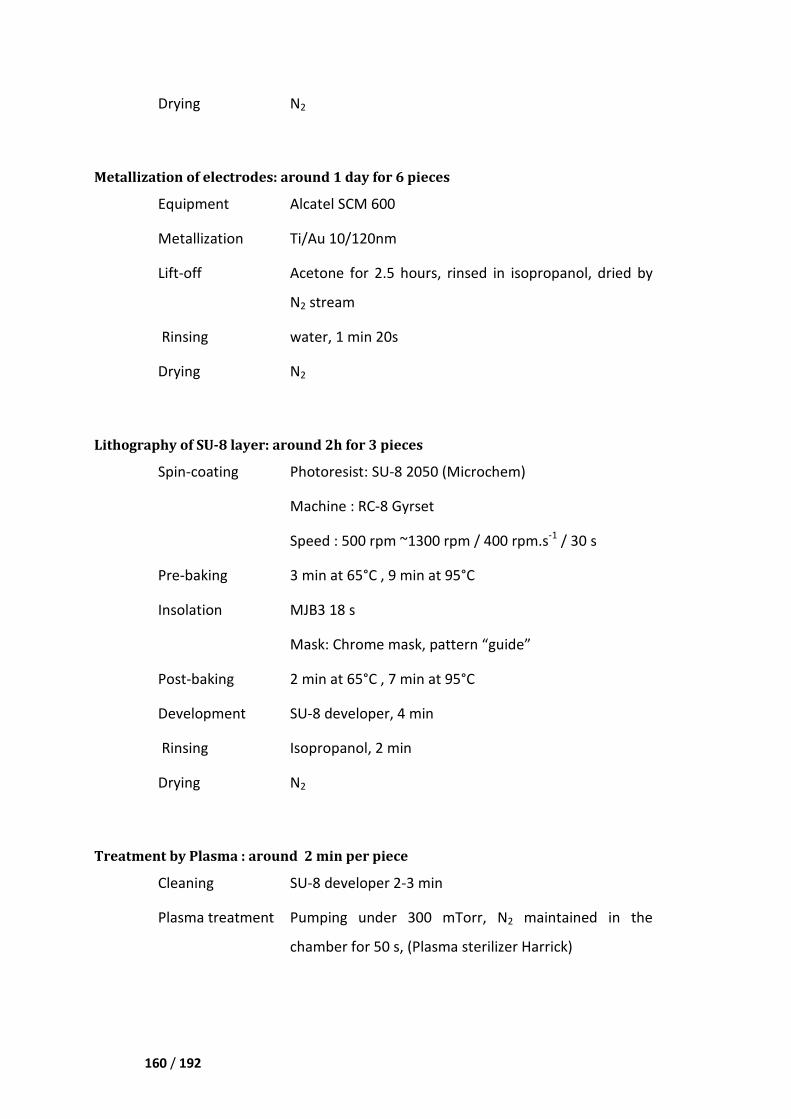
160 / 192
Drying N2
Metallization of electrodes: around 1 day for 6 pieces
Equipment Alcatel SCM 600
Metallization Ti/Au 10/120nm
Lift-off Acetone for 2.5 hours, rinsed in isopropanol, dried by
N2 stream
Rinsing water, 1 min 20s
Drying N2
Lithography of SU-8 layer: around 2h for 3 pieces
Spin-coating Photoresist: SU-8 2050 (Microchem)
Machine : RC-8 Gyrset
Speed : 500 rpm ~1300 rpm / 400 rpm.s-1 / 30 s
Pre-baking 3 min at 65°C , 9 min at 95°C
Insolation MJB3 18 s
Mask: Chrome mask, pattern “guide”
Post-baking 2 min at 65°C , 7 min at 95°C
Development SU-8 developer, 4 min
Rinsing Isopropanol, 2 min
Drying N2
Treatment by Plasma : around 2 min per piece
Cleaning SU-8 developer 2-3 min
Plasma treatment Pumping under 300 mTorr, N2 maintained in the
chamber for 50 s, (Plasma sterilizer Harrick)
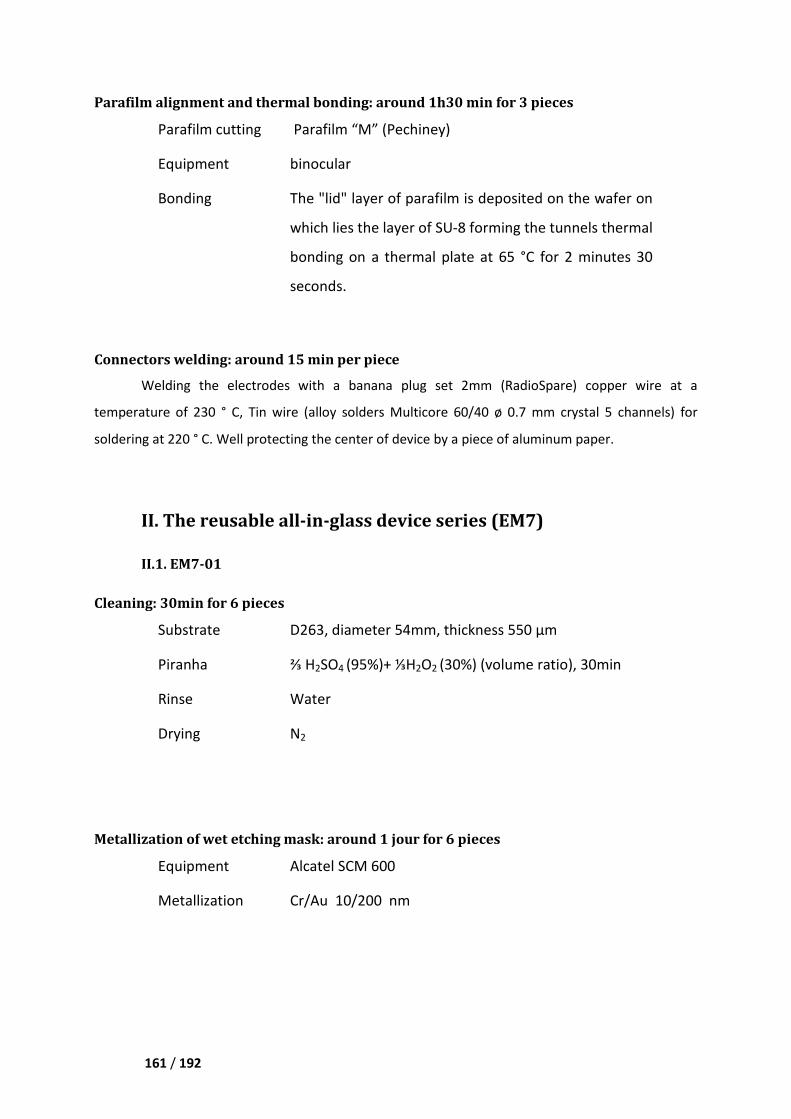
161 / 192
Parafilm alignment and thermal bonding: around 1h30 min for 3 pieces
Parafilm cutting Parafilm “M” (Pechiney)
Equipment binocular
Bonding The "lid" layer of parafilm is deposited on the wafer on
which lies the layer of SU-8 forming the tunnels thermal
bonding on a thermal plate at 65 °C for 2 minutes 30
seconds.
Connectors welding: around 15 min per piece
Welding the electrodes with a banana plug set 2mm (RadioSpare) copper wire at a
temperature of 230 ° C, Tin wire (alloy solders Multicore 60/40 ø 0.7 mm crystal 5 channels) for
soldering at 220 ° C. Well protecting the center of device by a piece of aluminum paper.
II. The reusable all-in-glass device series (EM7)
II.1. EM7-01
Cleaning: 30min for 6 pieces
Substrate D263, diameter 54mm, thickness 550 µm
Piranha ⅔ H2SO4 (95%)+ ⅓H2O2 (30%) (volume ratio), 30min
Rinse Water
Drying N2
Metallization of wet etching mask: around 1 jour for 6 pieces
Equipment Alcatel SCM 600
Metallization Cr/Au 10/200 nm
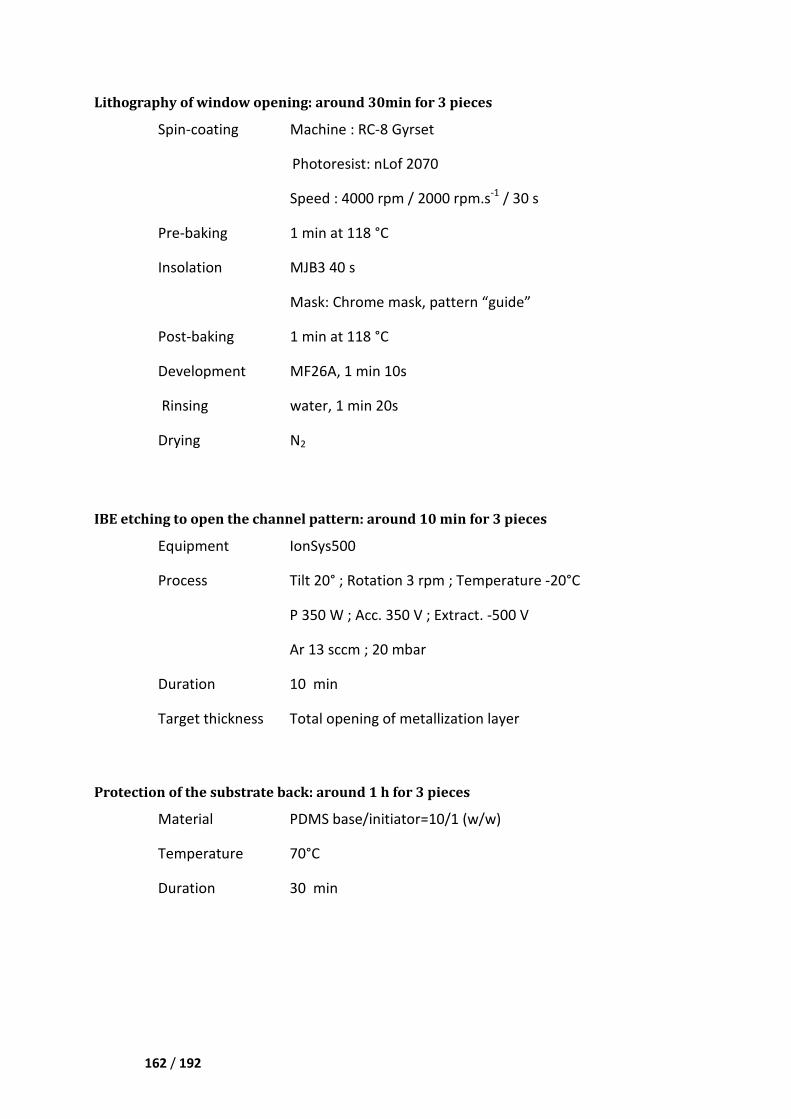
162 / 192
Lithography of window opening: around 30min for 3 pieces
Spin-coating Machine : RC-8 Gyrset
Photoresist: nLof 2070
Speed : 4000 rpm / 2000 rpm.s-1 / 30 s
Pre-baking 1 min at 118 °C
Insolation MJB3 40 s
Mask: Chrome mask, pattern “guide”
Post-baking 1 min at 118 °C
Development MF26A, 1 min 10s
Rinsing water, 1 min 20s
Drying N2
IBE etching to open the channel pattern: around 10 min for 3 pieces
Equipment IonSys500
Process Tilt 20° ; Rotation 3 rpm ; Temperature -20°C
P 350 W ; Acc. 350 V ; Extract. -500 V
Ar 13 sccm ; 20 mbar
Duration 10 min
Target thickness Total opening of metallization layer
Protection of the substrate back: around 1 h for 3 pieces
Material PDMS base/initiator=10/1 (w/w)
Temperature 70°C
Duration 30 min

163 / 192
Wet etching in HF: around 50 min for 3 pieces
Solution 100 mL HF (40%)/200 mL deionized H2O/30 mL
HCl (37%)
Duration 35-40 min
Cleaning 10 min deionized water bath
Etched substrate cleaning: around 30 min for 3 pieces
PDMS Peel-off
nLOF2070 Piranha solution 5 min
Au Regia aqua 10 min
Cr Cr etchant solution 5 min
Rinse Deionized water
Sand blasting for piecing cover: around 15 min per piece
The same D263 substrates are first diced into half-disk. Then they are stuck on the back side
of the “sand blasting holes” mask. The assembly is put in the sand blasting chamber and the latter
one is performed (for about 10 min).
Alignment and binding: around 30 min per piece
Vitralit 6127 is spun-coated onto the half-disk covers (4000 rpm/2000 rpm∙s-1/30 s), the cover
is flipped and aligned with the edge of the guide. They are exposed under the Hamamatsu LC5 UV
light for 2 min to solidify the adhesive.
II.2. EM7-02 and EM7-11
From “substrate cleaning” to “wet etching in HF”, steps are the same as for EM7-01. At the
step of “etched substrate cleaning”, the markers are protected by drops of photoresist, the
remaining part of metallization is removed.
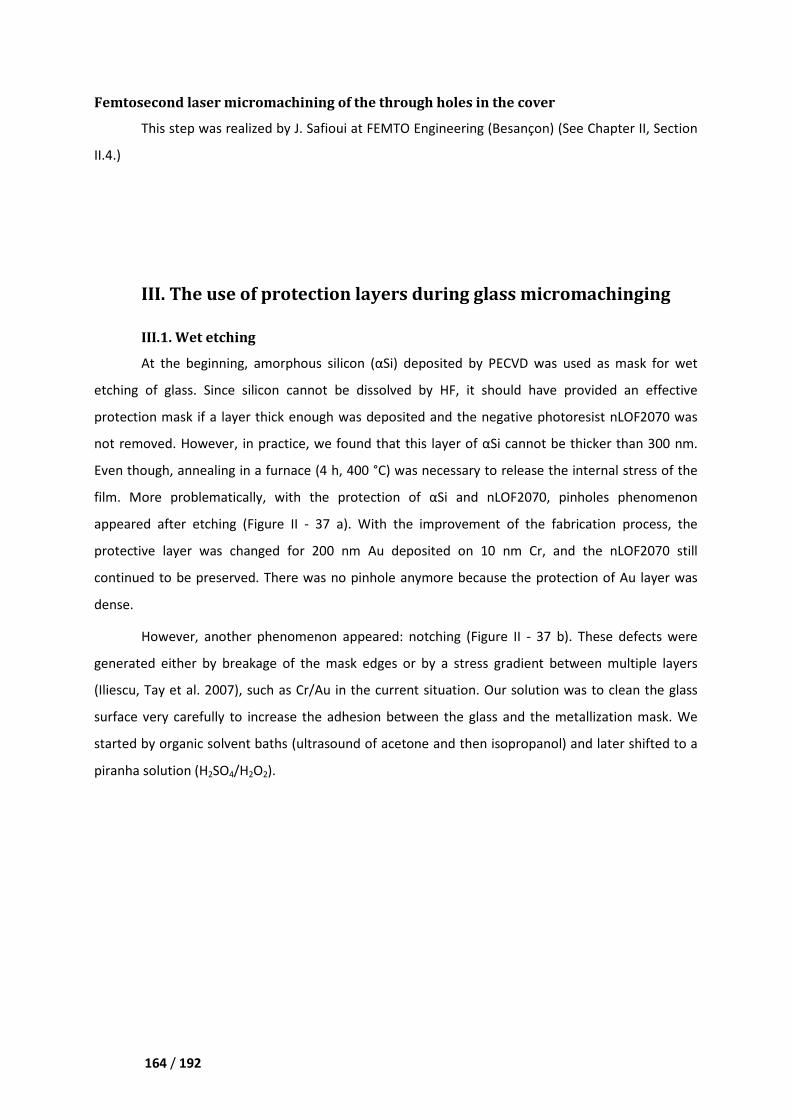
164 / 192
Femtosecond laser micromachining of the through holes in the cover
This step was realized by J. Safioui at FEMTO Engineering (Besançon) (See Chapter II, Section
II.4.)
III. The use of protection layers during glass micromachinging
III.1. Wet etching
At the beginning, amorphous silicon (αSi) deposited by PECVD was used as mask for wet
etching of glass. Since silicon cannot be dissolved by HF, it should have provided an effective
protection mask if a layer thick enough was deposited and the negative photoresist nLOF2070 was
not removed. However, in practice, we found that this layer of αSi cannot be thicker than 300 nm.
Even though, annealing in a furnace (4 h, 400 °C) was necessary to release the internal stress of the
film. More problematically, with the protection of αSi and nLOF2070, pinholes phenomenon
appeared after etching (Figure II - 37 a). With the improvement of the fabrication process, the
protective layer was changed for 200 nm Au deposited on 10 nm Cr, and the nLOF2070 still
continued to be preserved. There was no pinhole anymore because the protection of Au layer was
dense.
However, another phenomenon appeared: notching (Figure II - 37 b). These defects were
generated either by breakage of the mask edges or by a stress gradient between multiple layers
(Iliescu, Tay et al. 2007), such as Cr/Au in the current situation. Our solution was to clean the glass
surface very carefully to increase the adhesion between the glass and the metallization mask. We
started by organic solvent baths (ultrasound of acetone and then isopropanol) and later shifted to a
piranha solution (H2SO4/H2O2).
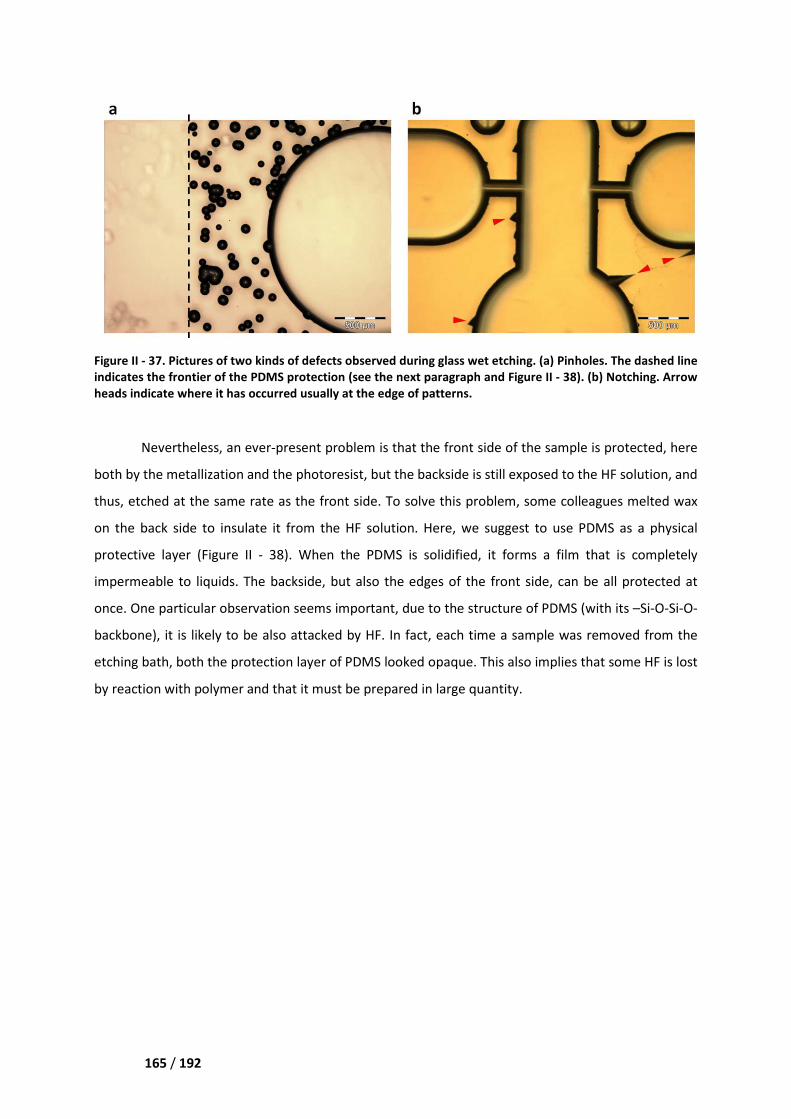
165 / 192
Figure II - 37. Pictures of two kinds of defects
indicates the frontier of the PDMS protection (see the next paragraph and
heads indicate where it has occurred
Nevertheless, an ever-present problem is that the front side of the sample is protected,
both by the metallization and the
thus, etched at the same rate as the front side
on the back side to insulate it from
protective layer (Figure II - 38)
impermeable to liquids. The back
once. One particular observation
backbone), it is likely to be also
etching bath, both the protection layer of PDMS
by reaction with polymer and that it must be prepared in large quantity.
two kinds of defects observed during glass wet etching. (a) Pinhole
PDMS protection (see the next paragraph and Figure II - 38
occurred usually at the edge of patterns.
present problem is that the front side of the sample is protected,
and the photoresist, but the backside is still exposed to the HF solution,
he same rate as the front side. To solve this problem, some colleagues
from the HF solution. Here, we suggest to use PDMS as a
). When the PDMS is solidified, it forms a film that is completely
impermeable to liquids. The backside, but also the edges of the front side, can be all protected
. One particular observation seems important, due to the structure of PDMS (
also attacked by HF. In fact, each time a sample was removed from the
e protection layer of PDMS looked opaque. This also implies that some
mer and that it must be prepared in large quantity.
inholes. The dashed line
38). (b) Notching. Arrow
present problem is that the front side of the sample is protected, here
o the HF solution, and
this problem, some colleagues melted wax
use PDMS as a physical
. When the PDMS is solidified, it forms a film that is completely
can be all protected at
re of PDMS (with its –Si-O-Si-O-
was removed from the
also implies that some HF is lost
166 / 192
Figure II - 38. Use of a PDMS protection layer during glass wet
to be processed. (b) Corresponding cross
III.2. Laser ablation
We found that around the
deposit of ablated matter (Figur
protective layers before laser processing: photoresist and ITO.
coated on both sides of the glass
of the laser. After laser ablation,
The photoresist was removed using
solution. However, neither of these methods
protective material was not comple
exposure to the high energy flux of the laser beam.
Use of a PDMS protection layer during glass wet-etching in HF. (a) Picture of a substrate ready
to be processed. (b) Corresponding cross-section diagram.
e found that around the edge of the opened holes, some defects were present, such as
Figure II - 29 d). Therefore, we have tried to apply to
before laser processing: photoresist and ITO. More precisely, AZ 9260 was
of the glass and baked at 120 °C. ITO was deposited only on the side of entrance
After laser ablation, the method for removing the protective layer
The photoresist was removed using a piranha solution whereas ITO was removed
solution. However, neither of these methods yielded satisfactory result since removal of the
protective material was not complete, surely because its structure had been modified by the
exposure to the high energy flux of the laser beam.
etching in HF. (a) Picture of a substrate ready
were present, such as
to apply to two kinds of
More precisely, AZ 9260 was spun-
was deposited only on the side of entrance
ctive layer was also different.
removed with an ITO etching
result since removal of the
its structure had been modified by the
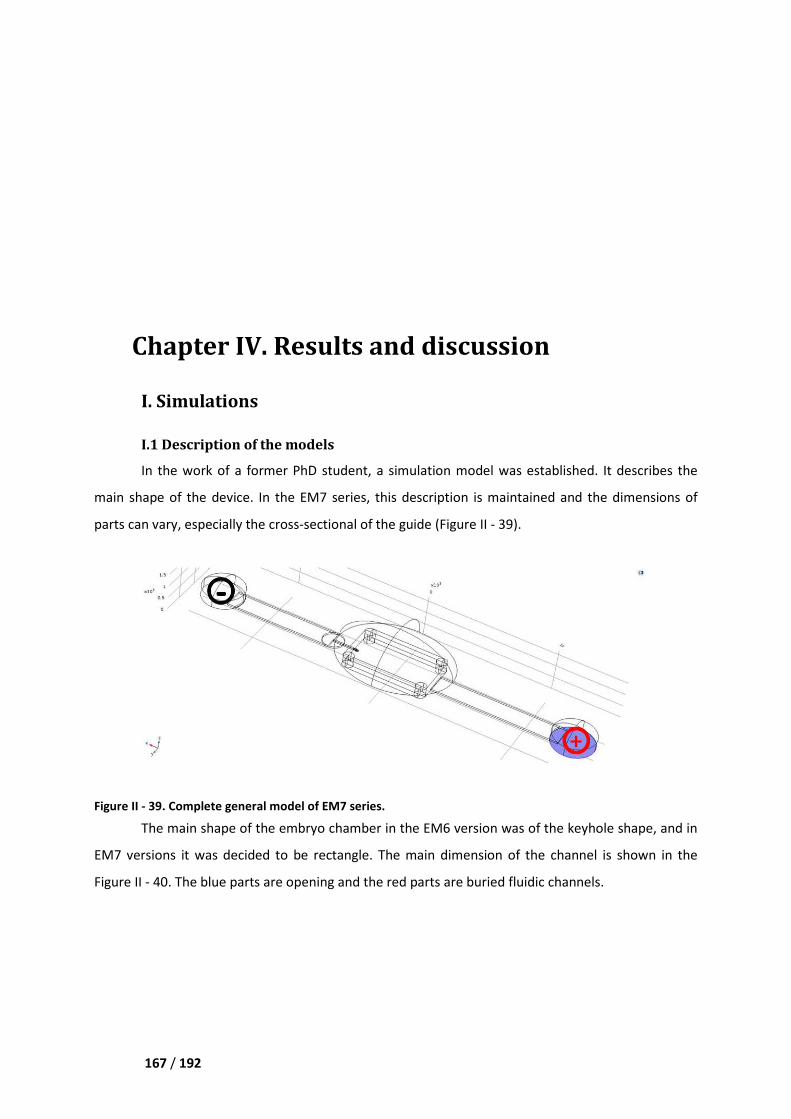
167 / 192
Chapter IV. Results and discussion
I. Simulations
I.1 Description of the m
In the work of a former
main shape of the device. In the EM7 series, this description is maintained and the dimensions
parts can vary, especially the cross
Figure II - 39. Complete general model
The main shape of the embryo chamber
EM7 versions it was decided to be rectangle. The main dimension of the channel is shown in the
Figure II - 40. The blue parts are opening and the red parts are
Results and discussion
the models
In the work of a former PhD student, a simulation model was established. It describes the
the EM7 series, this description is maintained and the dimensions
parts can vary, especially the cross-sectional of the guide (Figure II - 39).
model of EM7 series.
embryo chamber in the EM6 version was of the keyhole shape, and in
decided to be rectangle. The main dimension of the channel is shown in the
. The blue parts are opening and the red parts are buried fluidic channels
stablished. It describes the
the EM7 series, this description is maintained and the dimensions of
in the EM6 version was of the keyhole shape, and in
decided to be rectangle. The main dimension of the channel is shown in the
channels.
168 / 192
Figure II - 40. The plan of the channel. The concrete dimension of dielectric guide is shown in
Early post-implantation embryos were modelled as two concentric prolate
- 41), the outer one representing the organism external boundary and
the proamniotic cavity. The outer one, 200 by 100
the inner one, 140 by 40 µm large,
interfaces, whereas dashed lines represent tissue/tissue junctions not
Cells were not considered individually, as they are
Miklavcic et al. 2009), present in all
Niu et al. 2012). No data being available for the electrical properties of mouse
reported for various cell types were used
(Pucihar, Kotnik et al. 2006) (Sudsiri, Wachner et al. 2007)
The plan of the channel. The concrete dimension of dielectric guide is shown in
implantation embryos were modelled as two concentric prolate
, the outer one representing the organism external boundary and the inner one the periphery of
The outer one, 200 by 100 µm large, represents the buffer/VE interface
m large, is for the PAC/Epi+ExE. Solid lines depict those two liquid/tissue
whereas dashed lines represent tissue/tissue junctions not considered in computations.
Cells were not considered individually, as they are electrically connected by GAP junctions
, present in all tissues at these developmental stages (Kalimi and Lo 1988)
. No data being available for the electrical properties of mouse
reported for various cell types were used (Gowrishankar and Weaver 2003) (Hibino,
(Sudsiri, Wachner et al. 2007).
The plan of the channel. The concrete dimension of dielectric guide is shown in Figure II - 14.
implantation embryos were modelled as two concentric prolate ellipsoids (Figure II
the inner one the periphery of
buffer/VE interface and
Solid lines depict those two liquid/tissue
onsidered in computations.
electrically connected by GAP junctions (Pucihar,
(Kalimi and Lo 1988) (Viotti,
. No data being available for the electrical properties of mouse embryos, values
(Hibino, Itoh et al. 1993)
169 / 192
Figure II - 41. Electrical model of an E5.5, as used in FEM simulatons.
concentric prolate ellipsoids of respectiv
140 and 40 µm for the PAC/Epi+ExE one
The channel is filled by the
S/m, using a CDM210 conductimeter (Rad
resistive membranes having 3 ×
proamniotic fluid was assumed identical to that of the cytoplasm and fixed at
polymer, and air boundaries were insulating. The cathode surface was grounded and the
had its potential corresponding to the pulse amplitude.
Comsol Multiphysics was run in the “Stationary” “Electric Currents” mode
al. 2006). Simple time-independent modeling was here relevant because pulses were longer than the
characteristic charging time associated with phospholipidic membranes
I.2 Determination of the permeation threshold
As the guide has always
obtained, which restricts the area over which the induced transmembrane voltage (ITV) exceeds the
poration threshold. In order to evaluate
stimulation studies. The premise is that p
threshold (Escoffre, Portet et al. 2009)
In an experiment using the
marked by FITC-Dextran after electroporation
f an E5.5, as used in FEM simulatons. The embryo is approximated by two
lipsoids of respective length and width 200 and 100 µm for the buff
m for the PAC/Epi+ExE one.
annel is filled by the electroporation buffer which conductivity was
a CDM210 conductimeter (Radiometer analytical). The two ellipsoids were described
× 10-7 S/m conductivity and 5 nm thickness. The conductivity of the
proamniotic fluid was assumed identical to that of the cytoplasm and fixed at
air boundaries were insulating. The cathode surface was grounded and the
had its potential corresponding to the pulse amplitude.
Comsol Multiphysics was run in the “Stationary” “Electric Currents” mode
independent modeling was here relevant because pulses were longer than the
characteristic charging time associated with phospholipidic membranes (Valič, Golzio et al. 2003)
Determination of the permeation threshold
always a slightly smaller diameter than the embryo, a focusing effect is
estricts the area over which the induced transmembrane voltage (ITV) exceeds the
In order to evaluate this threshold, experimental results
stimulation studies. The premise is that pores are assumed to form each time the
(Escoffre, Portet et al. 2009) (Rols and Teissié 1998).
the EM6 device, which guide is 110 µm × 60 µm
after electroporation was determined and the ratio with respect to the total
The embryo is approximated by two
m for the buffer/VE interface and
which conductivity was measured at 1.5
iometer analytical). The two ellipsoids were described as
5 nm thickness. The conductivity of the
proamniotic fluid was assumed identical to that of the cytoplasm and fixed at 0.3 S/m. The glass,
air boundaries were insulating. The cathode surface was grounded and the anode one
Comsol Multiphysics was run in the “Stationary” “Electric Currents” mode (Pucihar, Kotnik et
independent modeling was here relevant because pulses were longer than the
(Valič, Golzio et al. 2003).
slightly smaller diameter than the embryo, a focusing effect is
estricts the area over which the induced transmembrane voltage (ITV) exceeds the
al results were compared to
the ITV exceeds a given
µm, the length of tissue
determined and the ratio with respect to the total
170 / 192
length of embryo was calculated. T
lowest ITV in this delineated area
our studies (Figure II - 42), which agreed with publish
Portet et al. 2009) (Hibino, Itoh et al. 1993)
reached in the electroporated zone was 0.72
applications.
Figure II - 42. Determination of the permeation threshold
inform us on the relationship between the applied voltage and the length of tissue being marked. (b)
same voltage is applied in simulation
lowest voltage in this area.
In the subsequent experiments, we fully applied simulation
and to set the electrical parameters. After each design change, it is necessary to determine the
of the voltage to apply. Giving the premise that on the exposed area t
endured should not exceed 0.72V, the
II. Electroporation experiments
From the EM7-01 prototype
Bruxelles for biological validation.
determined by simulations.
In general, there are three work
simulation gives roughly the range
length of embryo was calculated. This proportion was next applied in the simulation model, and the
area was determined. This /��%5!0 value was confirmed to be 0.65
which agreed with published data (Valič, Golzio et al. 2003)
(Hibino, Itoh et al. 1993). At the same time it was found that the maxim
in the electroporated zone was 0.72 V. These two values are important for our following
. Determination of the permeation threshold by comparison. (a) Result
the relationship between the applied voltage and the length of tissue being marked. (b)
same voltage is applied in simulations in order to determine the same area electroporated and further the
quent experiments, we fully applied simulations to assist the design of
electrical parameters. After each design change, it is necessary to determine the
of the voltage to apply. Giving the premise that on the exposed area to the guide opening the ITV
endured should not exceed 0.72V, then the voltage applied at anode can be estimated.
II. Electroporation experiments
prototype, devices were sent to the IRIBHM at the
validation. We also communicated to our collaborators
, there are three works involved in determining the electrical parameters. First, the
gives roughly the range, as explained in the previous section.
applied in the simulation model, and the
was confirmed to be 0.65 V in
(Valič, Golzio et al. 2003) (Escoffre,
t the same time it was found that the maximal /��
These two values are important for our following
esults of electroporation
the relationship between the applied voltage and the length of tissue being marked. (b) The
n order to determine the same area electroporated and further the
to assist the design of the device
electrical parameters. After each design change, it is necessary to determine the range
o the guide opening the ITV
voltage applied at anode can be estimated.
the Université Libre de
We also communicated to our collaborators the parameters
involved in determining the electrical parameters. First, the
Second, before real
171 / 192
experiment, the use of dyes to characterize the opening of
Third, propidium iodide (PI) is used
information on the maximal value
It is necessary to determine the localization of the zones where the transmembrane potential
is greater than the electroporation threshold, fluorescein labeled Dextrans solutions were used.
Indeed, the latter make it possible to reveal the ex
the electroporated cells (Sukharev, Klenchin et al. 1992)
predictiability of our models.
When addressing cell death, embryos were electroporated in HBS, allowed to recover for 30
minutes in culture, and stained for 20 minutes a
propidium iodide. Control embryos submitted to the whole protocol with the exception of the pulse
application did not show any PI incorporation.
conventional approaches, in full field epifluorescence and in particular by video microscopy.
Figure II - 43. Expression of various proteins observed in both bright field and confocal laser scanning
microcopies after electroporation of E5.5 embryo with the corresponding plasmid
used to label histones in the nuclei
used to label actin filaments in the cytoskeleton
which DVE is constitutively labeled in green. (
junction. (a-b’) Electroporation are performed using
23 V high, separated by 1 s. (c-f’)
guide of radius 70 µm and applying 3 pulses, 50 ms long
Thanks to these devices
collaborators at the Université L
shown in Figure II - 43 , they are pCMV
pCMV-YFP-actin, mApple-actin, and FusionRed
and GFP-α-catenin for labelling cell
and validity of our device concept and
simulations. Of course, it can also be
characterize the opening of pores delimits the minimal volatge value;
s used to mark the eventual dead cells by electroporation
aximal value.
t is necessary to determine the localization of the zones where the transmembrane potential
is greater than the electroporation threshold, fluorescein labeled Dextrans solutions were used.
Indeed, the latter make it possible to reveal the existence of the pores by dyeing the cytoplasm of
(Sukharev, Klenchin et al. 1992). They provide information about the
When addressing cell death, embryos were electroporated in HBS, allowed to recover for 30
minutes in culture, and stained for 20 minutes at 37 °C in dissection medium containing 25 µg/mL of
propidium iodide. Control embryos submitted to the whole protocol with the exception of the pulse
application did not show any PI incorporation. The analysis of the electroporated embryos is done by
ntional approaches, in full field epifluorescence and in particular by video microscopy.
Expression of various proteins observed in both bright field and confocal laser scanning
on of E5.5 embryo with the corresponding plasmid. (a
nuclei. (b-b’) pCMV-YFP-actin, (c-c’) mApple-actin, (e-f’) FusionRed
used to label actin filaments in the cytoskeleton – in the two latter cases embryos are Hex
which DVE is constitutively labeled in green. (d-d’) GFP-α-catenin is used to label the cell
are performed using the EM7-02 device and applying 3 pulses, 50 ms long and
Electroporation are performed using the EM7-21 device
and applying 3 pulses, 50 ms long and 20 V high, separated by 1 s.
s and to the parameters obtained from numerical
Université Libre de Bruxelles have led successfully some eletroporation
, they are pCMV-H2B-CFPnes which is used for labelling histones
actin, and FusionRed-Lifact for labelling actin filaments in the cytoskeleton,
cell-cell junction. These successful examples demonstrate
concept and the procedure in which design is assisted by
. Of course, it can also be extended for the electroporation of other plasmids.
pores delimits the minimal volatge value;
electroporation, it gives the
t is necessary to determine the localization of the zones where the transmembrane potential
is greater than the electroporation threshold, fluorescein labeled Dextrans solutions were used.
istence of the pores by dyeing the cytoplasm of
They provide information about the
When addressing cell death, embryos were electroporated in HBS, allowed to recover for 30
°C in dissection medium containing 25 µg/mL of
propidium iodide. Control embryos submitted to the whole protocol with the exception of the pulse
The analysis of the electroporated embryos is done by
ntional approaches, in full field epifluorescence and in particular by video microscopy.
Expression of various proteins observed in both bright field and confocal laser scanning
(a-a’) pCMV-H2B-CFP is
’) FusionRed-Lifact are
ses embryos are Hex-GFP transgenics
the cell-cell adherence
02 device and applying 3 pulses, 50 ms long and
device the semicircular
, separated by 1 s.
umerical simulations, our
some eletroporations. As
histones in the nuclei,
aments in the cytoskeleton,
demonstrate the efficacy
n which design is assisted by numerical
ther plasmids.

172 / 192
173 / 192
Chapter V. Perspectives
I. Post-electroporation culture
It has been demonstrated that external mechanical cues exerted by maternal tissues on the
embryo are crucial for the specification of the anterior-posterior axis, between E5 and E6.5
(Hiramatsu, Matsuoka et al. 2013). In the body of the mouse, this external cue is provided by the
uterine wall which, thanks to the pressure it applies, enables the embryo to elongate (Figure II - 44 a).
In turn, this elongation yields a well-defined distribution of internal molecular signals and indirectly
results in the differentiation of the DVE cell (Figure II - 44 b). If embryos are cultured in vitro, the
elongation process does not take place and cells at the distal tip do not migrate in anterior position.
Following Hiramatsu et al., we propose to use elastomeric pit to mimic the uterine wall (Figure II - 44
a). Accordingly, we will be able to electroporate the DVE at a very early stage while still having
embryos that elongate normally and in which the DVE migration occurs as expected.
Hiramatsu et al. adopted SU-8 lithography to fabricate the molds that were used to cast the
PDMS pits. We propose to rely on PMMA micromilling, which can manufacture different sizes of
pattern simply, provided features not too small. The molds contain a positive cylinder of diameter 70
µm to 150 µm located in a negative cylinder of diameter 1.2 mm; the depth reaches 300 µm (Figure II
- 44 c).
After electroporation, the embryo is put into the pit vertically, and culture lasts for 8 h at
37 °C. When harvested, the embryo adopts an elongated shape like in Figure II - 44 d.
174 / 192
Figure II - 44. Biomimetic devices used to trigger embryo
on embryos by the uterine wall, this mechanism will be imitated by installing the embryo in elastomeric pits.
(b) Scheme explaining the coupling between elongation and DVE migration. (c) Scheme and photo showing
the micromilled molds fabricated in PMMA
pit.
II. Measurement of temperature and pH
As discussed in Chapter I
It may then result in the production of highly reactive chemical species
release of metal ions (Friedrich, Stachowicz et al. 1998)
depends on the chemical nature of the electrodes (
composition of the medium, and the
anode always becomes acid and the
adverse consequences on embryo
microsystem (Loste, Eynard et al. 1998)
imetic devices used to trigger embryo elongation. (a) Scheme explaining the force exerted
on embryos by the uterine wall, this mechanism will be imitated by installing the embryo in elastomeric pits.
coupling between elongation and DVE migration. (c) Scheme and photo showing
the micromilled molds fabricated in PMMA as well as the PDMS pits. (d) Picture of an embryo cultured in
II. Measurement of temperature and pH jumps
in Chapter I, Section III.1, oxido-reduction reactions take place at the electrodes.
production of highly reactive chemical species, such as free radical
(Friedrich, Stachowicz et al. 1998). The nature of the e
on the chemical nature of the electrodes (e.g. steel, stainless steel, aluminum), the
and the applied electrical parameters. However, the solution at the
acid and the one at the cathode basic. Since these pH variations may
embryos, it would be of interest to evaluate their amplitude in our
(Loste, Eynard et al. 1998). Of course our device has been especially
on. (a) Scheme explaining the force exerted
on embryos by the uterine wall, this mechanism will be imitated by installing the embryo in elastomeric pits.
coupling between elongation and DVE migration. (c) Scheme and photo showing
Picture of an embryo cultured in a
reactions take place at the electrodes.
such as free radicals, or the
nature of the electrolytic reactions
steel, aluminum), the
However, the solution at the
pH variations may have
of interest to evaluate their amplitude in our
especially devised to avoid
175 / 192
such effect, so these measurements will surely emphasize on the benefits of using a dielectric guide.
More specifically, we propose to make pH measurements relying on the ratiometric fluorescent
probes that have been conceived by the group of L. Jullien (Charier, Ruel et al. 2004). In addition,
these data could be backuped by FEM simulations taking into account the generation of chemical
species at the electrodes as well as their molecular diffusion in the connecting channel and in the
dielectric guide.
Another physical parameter needing to be monitored is temperature. As the entire channel is
filled and connected by electrolyte solution, when the voltage is applied, Joule effect results in a
temperature increase. For the biological object soaked in the chamber it is not a favorable condition.
To measure this temperature changes in microfluidic devices, the use of molecular probes seems
appropriate (Gosse, Bergaud et al. 2009).
More precisely, we plan to use the molecular beacons that we have developed in
collaboration with L. Jullien at the ENS. Such molecule has two different fluorescent groups, one is
fluorescein, and the other texas red; they are attached to the ends of a DNA strand which can fold in
a hairpin thanks to base pairing. These fluorophores can undergo Foster resonance energy transfer
(FRET) and thus the luminescent state of the beacon characterizes the state of the DNA: in the open
configuration − at relative high temperature − the excited fluorescein emits light; in the closed
configuration − at relative low temperature − the excited fluorescein transfers its energy by FRET to
the texas red group which emits light (Barilero, Le Saux et al. 2009). The quotient between the
fluorescein and the texas red emission is monotonic as a function of temperature. In this way, the
fluorescence emission spectrum of the molecular beacon is able to report on temperature. Once
more, experimental data will be correlated with the results issued from FEM simulations.

176 / 192
177 / 192
References
Adamo, A., Arione, A., Sharei, A., and Jensen, K. F. (2013). "Flow-through comb electroporation
device for delivery of macromolecules." Analytical chemistry 85(3): 1637-1641. Akashi, T., and Yoshimura, Y. (2006). "Deep reactive ion etching of borosilicate glass using an
anodically bonded silicon wafer as an etching mask." Journal of Micromechanics and Microengineering 16(5): 1051.
Albini, A., and Monti, S. (2003). "Photophysics and photochemistry of fluoroquinolones." Chemical Society Reviews 32(4): 238.
America, I. D. S. o. (2004). "Bad bugs, no drugs: As antibiotic discovery stagnates." A public health crisis brews.
Aminov, R. I. (2010). "A brief history of the antibiotic era: lessons learned and challenges for the future." Frontiers in microbiology 1: 134.
Ammor, M. S., Flórez, A. B., Margolles, A., and Mayo, B. (2006). "Fluorescence spectroscopy: a rapid tool for assessing tetracycline resistance in Bifidobacterium longum." Canadian Journal of Microbiology 52(8): 740-746.
Angelescu, D. E. (2011). Highly integrated microfluidics design, Artech House. Applegate Jr, R. W., Squier, J., Vestad, T., Oakey, J., Marr, D. W., Bado, P., Dugan, M. A., and Said, A. A.
(2006). "Microfluidic sorting system based on optical waveguide integration and diode laser bar trapping." Lab on a Chip 6(3): 422-426.
Ashkin, A. (1970). "Acceleration and trapping of particles by radiation pressure." Physical Review Letters 24(4): 156-159.
Ashkin, A. (1997). "Optical trapping and manipulation of neutral particles using lasers." Proceedings of the National Academy of Sciences 94(10): 4853-4860.
Ashkin, A., Dziedzic, J. M., Bjorkholm, J. E., and Chu, S. (1986). "Observation of a single-beam gradient force optical trap for dielectric particles." Optics letters 11(5): 288-290.
Balagaddé, F. K., You, L., Hansen, C. L., Arnold, F. H., and Quake, S. R. (2005). "Long-term monitoring of bacteria undergoing programmed population control in a microchemostat." Science 309(5731): 137-140.
Ball, P. (2000). "Quinolone generations: natural history or natural selection?" Journal of Antimicrobial Chemotherapy 46(Suppl 3): 17-24.
Barbé, C., Cassidy, D., Triani, G., Latella, B., Mitchell, D., Finnie, K., Short, K., Bartlett, J., Woolfrey, J., and Collins, G. (2005). "Sol–gel bonding of silicon wafers: Part 1: Influence of the processing temperature on final bond morphology and interfacial energy." Thin Solid Films 488(1): 153-159.
Barilero, T., Le Saux, T., Gosse, C., and Jullien, L. (2009). "Fluorescent thermometers for dual-emission-wavelength measurements: Molecular engineering and application to thermal imaging in a microsystem." Analytical chemistry 81(19): 7988-8000.
Bartolo, D., Degré, G., Nghe, P., and Studer, V. (2008). "Microfluidic stickers." Lab on a Chip 8(2): 274-279.
Basle, A., Rummel, G., Storici, P., Rosenbusch, J. P., and Schirmer, T. (2006). "Crystal structure of osmoporin OmpC from E. coli at 2.0 A." Journal of Molecular Biology 362(5): 933-942.
Batchelor, E., Walthers, D., Kenney, L. J., and Goulian, M. (2005). "The Escherichia coli CpxA-CpxR envelope stress response system regulates expression of the porins ompF and ompC." Journal of Bacteriology 187(16): 5723-5731.
Bates, S. R., and Quake, S. R. (2009). "Highly parallel measurements of interaction kinetic constants with a microfabricated optomechanical device." Applied Physics Letters 95(7): 73705.
Bedard, J., Wong, S., and Bryan, L. E. (1987). "Accumulation of enoxacin by Escherichia coli and Bacillus subtilis." Antimicrobial Agents and Chemotherapy 31(9): 1348-1354.
178 / 192
Bellouard, Y., Said, A. A., Dugan, M., and Bado, P. (2009). Monolithic integration in fused silica: When fluidics, mechanics and optics meet in a single substrate. Optomechatronic Technologies, 2009. ISOT 2009. International Symposium on, IEEE.
Bennett, P. M. (2008). "Plasmid encoded antibiotic resistance: acquisition and transfer of antibiotic resistance genes in bacteria." British Journal of Pharmacology 153 Suppl 1: S347-357.
Berg, R. D. (1996). "The indigenous gastrointestinal microflora." Trends in Microbiology 4(11): 430-435.
Bertrand, L., Réfrégiers, M., Berrie, B., Échard, J.-P., and Thoury, M. (2013). "A multiscalar photoluminescence approach to discriminate among semiconducting historical zinc white pigments." Analyst 138(16): 4463-4469.
Bhuyan, M. K., Courvoisier, F., Lacourt, P.-A., Jacquot, M., Furfaro, L., Withford, M., and Dudley, J. (2010). "High aspect ratio taper-free microchannel fabrication using femtosecond Bessel beams." Optics express 18(2): 566-574.
Biron, M. (2012). Thermoplastics and thermoplastic composites, William Andrew. Blasquez, G., and Favaro, P. (2002). "Silicon glass anodic bonding under partial vacuum conditions:
problems and solutions." Sensors and Actuators A: Physical 101(1): 156-159. Blount, Z. D. (2015). "The unexhausted potential of E. coli." eLife 4. Boukany, P. E., Morss, A., Liao, W.-c., Henslee, B., Jung, H., Zhang, X., Yu, B., Wang, X., Wu, Y., and Li,
L. (2011). "Nanochannel electroporation delivers precise amounts of biomolecules into living cells." Nature nanotechnology 6(11): 747-754.
Brennan, J., Lu, C. C., Norris, D. P., Rodriguez, T. A., Beddington, R. S., and Robertson, E. J. (2001). "Nodal signalling in the epiblast patterns the early mouse embryo." Nature 411(6840): 965-969.
Brenner, D. J., Davis, B. R., Steigerwalt, A. G., Riddle, C. F., McWhorter, A. C., Allen, S. D., Farmer III, J. J., Saitoh, Y., and Fanning, G. R. (1982). "Atypical biogroups of Escherichia coli found in clinical specimens and description of Escherichia hermannii sp. nov." Journal of Clinical Microbiology 15(4): 703-713.
Brenner, D. J., McWhorter, A. C., Leete Knutson, J. K., and Steigerwalt, A. G. (1982). "Escherichia vulneris: a new species of Enterobacteriaceae associated with human wounds." Journal of Clinical Microbiology 15(6): 1133-1140.
Bruus, H. (2008). Theoretical microfluidics. Oxford master series in condensed matter physics, Oxford University Press Oxford.
Buono, R., and Linser, P. (1991). "Transient expression of RSVCAT in transgenic zebrafish made by electroporation." Molecular marine biology and biotechnology 1(4-5): 271-275.
Bureau, M., Gehl, J., Deleuze, V., Mir, L., and Scherman, D. (2000). "Importance of association between permeabilization and electrophoretic forces for intramuscular DNA electrotransfer." Biochimica et Biophysica Acta (BBA)-General Subjects 1474(3): 353-359.
Cai, H., Rose, K., Liang, L.-H., Dunham, S., and Stover, C. (2009). "Development of a liquid chromatography/mass spectrometry-based drug accumulation assay in Pseudomonas aeruginosa." Analytical Biochemistry 385(2): 321-325.
Cain, C. (2012). "Rediscovering antibiotics." SciBX: Science-Business eXchange 5(46). Calvori, C., Frontali, L., Leoni, L., and Tecce, G. (1965). "Effect of rifamycin on protein synthesis."
Nature 207: 417-418. Cama, J., Bajaj, H., Pagliara, S., Maier, T., Braun, Y., Winterhalter, M., and Keyser, U. F. (2015).
"Quantification of Fluoroquinolone Uptake through the Outer Membrane Channel OmpF of Escherichia coli." Journal of American Chemical Society 137(43): 13836-13843.
Cama, J., Chimerel, C., Pagliara, S., Javer, A., and Keyser, U. F. (2014). "A label-free microfluidic assay to quantitatively study antibiotic diffusion through lipid membranes." Lab on a Chip 14(13): 2303-2308.
Cama, J., Schaich, M., Al Nahas, K., Hernandez-Ainsa, S., Pagliara, S., and Keyser, U. F. (2016). "Direct Optofluidic Measurement of the Lipid Permeability of Fluoroquinolones." Scientific Reports 6: 32824.
179 / 192
Cama, J., Schaich, M., Al Nahas, K., Hernández-Ainsa, S., Pagliara, S., and Keyser, U. F. (2016). "Direct Optofluidic Measurement of the Lipid Permeability of Fluoroquinolones." Scientific Reports 6.
Campbell, N. A., and Reece, J. B. (2002). Biology. 6th, Menlo Park, California: Benjamin/Cummings Publishing Company, Inc.
Campbell, S. A. (2001). The science and engineering of microelectronic fabrication, Oxford university press.
Cantor, C. R., and Schimmel, P. R. (1981). "Biophysical Chemistry: Part II "Techniques for the study of Biological Structure and Function"." Biochemical Education 9: 4.
Carslaw, H. S., and Jaeger, J. C. (1959). "Conduction of heat in solids." Oxford: Clarendon Press, 1959, 2nd ed.
Chapman, J. S., and Georgopapadakou, N. H. (1988). "Routes of quinolone permeation in Escherichia
coli." Antimicrobial Agents and Chemotherapy 32(4): 438-442. Chapman, J. S., and Georgopapadakou, N. H. (1989). "Fluorometric assay for fleroxacin uptake by
bacterial cells." Antimicrobial Agents and Chemotherapy 33(1): 27-29. Charier, S., Ruel, O., Baudin, J. B., Alcor, D., Allemand, J. F., Meglio, A., and Jullien, L. (2004). "An
efficient fluorescent probe for ratiometric pH measurements in aqueous solutions." Angewandte Chemie International Edition 43(36): 4785-4788.
Chen, M., Yuan, L., and Liu, S. (2007). "Research on low-temperature anodic bonding using induction heating." Sensors and Actuators A: Physical 133(1): 266-269.
Chevalier, J., Atifi, S., Eyraud, A., Mahamoud, A., Barbe, J., and Pagès, J.-M. (2001). "New Pyridoquinoline Derivatives as Potential Inhibitors of the Fluoroquinolone Efflux Pump in Resistant Enterobacter a erogenes Strains." Journal of Medicinal Chemistry 44(23): 4023-4026.
Chevalier, J., Bredin, J., Mahamoud, A., Mallea, M., Barbe, J., and Pages, J. M. (2004). "Inhibitors of Antibiotic Efflux in Resistant Enterobacter aerogenes and Klebsiella pneumoniae Strains." Antimicrobial Agents and Chemotherapy 48(3): 1043-1046.
Chiao, M. (2008). Packaging (and Wire Bonding). Encyclopedia of Microfluidics and Nanofluidics. Li, D., SpringerUS.
Choi, J., Jung, Y.-G., Kim, J., Kim, S., Jung, Y., Na, H., and Kwon, S. (2013). "Rapid antibiotic susceptibility testing by tracking single cell growth in a microfluidic agarose channel system." Lab on a Chip 13(2): 280-287.
Choi, J., Yoo, J., Kim, K.-j., Kim, E.-G., Park, K. O., Kim, H., Kim, H., Jung, H., Kim, T., and Choi, M. (2016). "Rapid drug susceptibility test of Mycobacterium tuberculosis using microscopic time-lapse imaging in an agarose matrix." Applied Microbiology and Biotechnology 100(5): 2355-2365.
Chou, H.-P., Unger, M. A., Scherer, A., and Quake, S. R. (2000). Integrated Elastomer Fluidic Lab-On-A-Chip-Surface Patterning and DNA Diagnostics. Proceedings of the Solid State Actuator and Sensor Workshop, Hilton Head, South Carolina, Citeseer.
Cinquin, B., Maigre, L., Pinet, E., Chevalier, J., Stavenger, R. A., Mills, S., Réfrégiers, M., and Pagès, J.-M. (2015). "Microspectrometric insights on the uptake of antibiotics at the single bacterial cell level." Scientific Reports 5: 17968.
Coster, H. (1965). "A quantitative analysis of the voltage-current relationships of fixed charge membranes and the associated property of “punch-through”." Biophysical journal 5(5): 669-686.
Cowan, S. W., Schirmer, T., Rummel, G., Steiert, M., Ghosh, R., Pauptit, R. A., Jansonius, J. N., and Rosenbusch, J. P. (1992). "Crystal structures explain functional properties of two E. coli porins." Nature 358(6389): 727-733.
Craighead, H. (2006). "Future lab-on-a-chip technologies for interrogating individual molecules." Nature 442(7101): 387-393.
Crowley, J. M. (1973). "Electrical breakdown of bimolecular lipid membranes as an electromechanical instability." Biophysical journal 13(7): 711-724.
Darribère, T. (2003). Le développement d'un mammifère: la souris, Belin. Delcour, A. H. (1997). "Function and modulation of bacterial porins: insights from electrophysiology."
FEMS Microbiology Letters 151(2): 115-123.
180 / 192
Delcour, A. H. (2009). "Outer membrane permeability and antibiotic resistance." Biochim Biophys Acta 1794(5): 808-816.
Delince, M. J., Bureau, J.-B., Lopez-Jiménez, A. T., Cosson, P., Soldati, T., and McKinney, J. D. (2016). "A microfluidic cell-trapping device for single-cell tracking of host-microbe interactions." Lab on a Chip 16(17): 3276-3285.
deMello, A. J. (2006). "Control and detection of chemical reactions in microfluidic systems." Nature 442(7101): 394-402.
Diver, J. M., Piddock, L. J. V., and Wise, R. (1990). "The accumulation of five quinolone antibacterial agents by Escherichia coli." Journal of Antimicrobial Chemotherapy 25(3): 319-333.
Doh, I., and Cho, Y.-H. (2005). "A continuous cell separation chip using hydrodynamic dielectrophoresis (DEP) process." Sensors and Actuators A: Physical 121(1): 59-65.
Drlica, K., and Zhao, X. (1997). "DNA gyrase, topoisomerase IV, and the 4-quinolones." Microbiology and Molecular Biology Reviews 61(3): 377-392.
Dusny, C., Grunberger, A., Probst, C., Wiechert, W., Kohlheyer, D., and Schmid, A. (2015). "Technical bias of microcultivation environments on single-cell physiology." Lab on a Chip 15(8): 1822-1834.
Edelstein, A., Amodaj, N., Hoover, K., Vale, R., and Stuurman, N. (2010). "Computer control of microscopes using microManager." Curr Protoc Mol Biol Chapter 14: Unit14 20.
El-Ali, J., Sorger, P. K., and Jensen, K. F. (2006). "Cells on chips." Nature 442(7101): 403. Elfwing, A., LeMarc, Y., Baranyi, J., and Ballagi, A. (2004). "Observing Growth and Division of Large
Numbers of Individual Bacteria by Image Analysis." Applied and Environmental Microbiology 70(2): 675-678.
Escoffre, J.-M., Portet, T., Wasungu, L., Teissié, J., Dean, D., and Rols, M.-P. (2009). "What is (still not) known of the mechanism by which electroporation mediates gene transfer and expression in cells and tissues." Molecular biotechnology 41(3): 286-295.
Eyer, K., Kuhn, P., Hanke, C., and Dittrich, P. S. (2012). "A microchamber array for single cell isolation and analysis of intracellular biomolecules." Lab on a Chip 12(4): 765-772.
Eyer, K., Stratz, S., Kuhn, P., Kuster, S. K., and Dittrich, P. S. (2013). "Implementing enzyme-linked immunosorbent assays on a microfluidic chip to quantify intracellular molecules in single cells." Analytical Chemistry 85(6): 3280-3287.
Eykyn, S. (1971). "Use and control of cephalosporins." Journal of Clinical Pathology 24(5): 419. Eynard, N., Rols, M., Ganeva, V., Galutzov, B., Sabri, N., and Teissié, J. (1997). "Electrotransformation
pathways of procaryotic and eucaryotic cells: recent developments." Bioelectrochemistry and Bioenergetics 44(1): 103-110.
Farmer III, J. J., Fanning, G. R., Davis, B. R., O'hara, C. M., Riddle, C., Hickman-Brenner, F. W., Asbury, M. A., Lowery, V. A., and Brenner, D. J. (1985). "Escherichia fergusonii and Enterobacter
taylorae, two new species of Enterobacteriaceae isolated from clinical specimens." Journal of Clinical Microbiology 21(1): 77-81.
Faurie, C., Rebersek, M., Golzio, M., Kanduser, M., Escoffre, J. M., Pavlin, M., Teissie, J., Miklavcic, D.,
and Rols, M. P. (2010). "Electro‐mediated gene transfer and expression are controlled by the
life‐time of DNA/membrane complex formation." The journal of gene medicine 12(1): 117-125.
Fertig, N., Blick, R. H., and Behrends, J. C. (2002). "Whole cell patch clamp recording performed on a planar glass chip." Biophysical Journal 82(6): 3056-3062.
Fleming, A. (1929). "On the antibacterial action of cultures of a penicillium, with special reference to their use in the isolation of B. influenzae." British Journal of Experimental Pathology 10(3): 226.
Fox, M., Esveld, D., Valero, A., Luttge, R., Mastwijk, H., Bartels, P., Van Den Berg, A., and Boom, R. (2006). "Electroporation of cells in microfluidic devices: a review." Analytical and bioanalytical chemistry 385(3): 474.
Freter, R., Brickner, H., Fekete, J., Vickerman, M. M., and Carey, K. E. (1983). "Survival and implantation of Escherichia coli in the intestinal tract." Infection and Immunity 39(2): 686-703.
181 / 192
Friedrich, U., Stachowicz, N., Simm, A., Fuhr, G., Lucas, K., and Zimmermann, U. (1998). "High efficiency electrotransfection with aluminum electrodes using microsecond controlled pulses." Bioelectrochemistry and bioenergetics 47(1): 103-111.
Fritzsch, F. S., Rosenthal, K., Kampert, A., Howitz, S., Dusny, C., Blank, L. M., and Schmid, A. (2013). "Picoliter nDEP traps enable time-resolved contactless single bacterial cell analysis in controlled microenvironments." Lab on a Chip 13(3): 397-408.
Galas, J. C., Haghiri-Gosnet, A. M., and Estevez-Torres, A. (2013). "A nanoliter-scale open chemical reactor." Lab on a Chip 13(3): 415-423.
Gallo, G. G., Lancini, G., and Parenti, F. (2013). Antibiotics: a multidisciplinary approach, Springer Science & Business Media.
Gattass, R. R., and Mazur, E. (2008). "Femtosecond laser micromachining in transparent materials." Nature photonics 2(4): 219-225.
Geertz, M., Shore, D., and Maerkl, S. J. (2012). "Massively parallel measurements of molecular interaction kinetics on a microfluidic platform." Proceedings of the National Academy of Sciences 109(41): 16540-16545.
Gerber, D., Maerkl, S. J., and Quake, S. R. (2009). "An in vitro microfluidic approach to generating protein-interaction networks." Nature Methods 6(1): 71-74.
Ghale, G., Lanctôt, A. G., Kreissl, H. T., Jacob, M. H., Weingart, H., Winterhalter, M., and Nau, W. M. (2014). "Chemosensing ensembles for monitoring biomembrane transport in real time." Angewandte Chemie International Edition 53(10): 2762-2765.
Giuliani, A., Jamme, F., Rouam, V., Wien, F., Giorgetta, J. L., Lagarde, B., Chubar, O., Bac, S., Yao, I., Rey, S., Herbeaux, C., Marlats, J. L., Zerbib, D., Polack, F., and Refregiers, M. (2009). "DISCO: a low-energy multipurpose beamline at synchrotron SOLEIL." J Synchrotron Radiat 16(Pt 6): 835-841.
Golzio, M., Teissié, J., and Rols, M.-P. (2002). "Direct visualization at the single-cell level of electrically mediated gene delivery." Proceedings of the National Academy of Sciences 99(3): 1292-1297.
Goodman, M. B., and Lockery, S. R. (2000). "Pressure polishing: a method for re-shaping patch pipettes during fire polishing." Journal of Neuroscience Methods 100(1): 13-15.
Gosnet-Haghiri, A.-M., and Nanteuil, C. (2014). Method for manufacturing a microfluidic chip, and related chip and plate, Google Patents.
Gosse, C., Bergaud, C., and Löw, P. (2009). Molecular probes for thermometry in microfluidic devices. Thermal Nanosystems and Nanomaterials, Springer: 301-341.
Gowrishankar, T. R., and Weaver, J. C. (2003). "An approach to electrical modeling of single and multiple cells." Proceedings of the National Academy of Sciences 100(6): 3203-3208.
Greatorex, J. S., and Thorne, G. M. (1994). "Humoral immune responses to Shiga-like toxins and Escherichia coli O157 lipopolysaccharide in hemolytic-uremic syndrome patients and healthy subjects." Journal of Clinical Microbiology 32(5): 1172-1178.
Grunberger, A., Paczia, N., Probst, C., Schendzielorz, G., Eggeling, L., Noack, S., Wiechert, W., and Kohlheyer, D. (2012). "A disposable picolitre bioreactor for cultivation and investigation of industrially relevant bacteria on the single cell level." Lab on a Chip 12(11): 2060-2068.
Grünberger, A., Probst, C., Helfrich, S., Nanda, A., Stute, B., Wiechert, W., von Lieres, E., Nöh, K.,
Frunzke, J., and Kohlheyer, D. (2015). "Spatiotemporal microbial single‐cell analysis using a
high‐throughput microfluidics cultivation platform." Cytometry Part A 87(12): 1101-1115. Grunberger, A., Wiechert, W., and Kohlheyer, D. (2014). "Single-cell microfluidics: opportunity for
bioprocess development." Current Opinion of Biotechnology 29: 15-23. Hall, R. M., and Collis, C. M. (1995). "Mobile gene cassettes and integrons: capture and spread of
genes by site‐specific recombination." Molecular Microbiology 15(4): 593-600. Hallo, L., Bourgeade, A., Tikhonchuk, V. T., Mezel, C., and Breil, J. (2007). "Model and numerical
simulations of the propagation and absorption of a short laser pulse in a transparent dielectric material: Blast-wave launch and cavity formation." Physical Review B 76(2): 024101.
182 / 192
Hamdi, F. S., Français, O., Subra, F., Dufour-Gergam, E., and Le Pioufle, B. (2013). "Microarray of non-connected gold pads used as high density electric traps for parallelized pairing and fusion of cells." Biomicrofluidics 7(4): 044101.
Hanada, Y., Sugioka, K., Kawano, H., Ishikawa, I. S., Miyawaki, A., and Midorikawa, K. (2008). "Nano-aquarium for dynamic observation of living cells fabricated by femtosecond laser direct writing of photostructurable glass." Biomedical Microdevices 10(3): 403-410.
Hancock, R. E. W. (1987). "Role of porins in outer membrane permeability." Journal of Bacteriology 169(3): 929.
Hartl, D., Medhora, M., Green, L., and Dykhuizen, D. (1986). "The evolution of DNA sequences in Escherichia coli." Philosophical Transactions of the Royal Society of London B: Biological Sciences 312(1154): 191-204.
Hawkey, P. M. (1998). "The origins and molecular basis of antibiotic resistance." British Medical Journal 317(7159): 657.
Hays, E. E., Wells, I. C., Katzman, P. A., Cain, C. K., Jacobs, F. A., Thayer, S. A., Doisy, E. A., Gaby, W. L., Roberts, E. C., Muir, R. D., Caroll, C. J., and Jones, L. R. (1945). "Antibiotic Substances produced by Pseu-domonas aeruginosa." Biological Chemistry 159(3): 725-750.
He, Y.-Y., and Häder, D. P. (2002). "UV-B-induced formation of reactive oxygen species and oxidative damage of the cyanobacterium Anabaena sp.: protective effects of ascorbic acid and N-acetyl-
L-cysteine." Journal of Photochemistry and Photobiology B: Biology 66(2): 115-124. Health, U. D. o., and Services, H. (2013). "Antibiotic resistance threats in the United States, 2013."
Atlanta: CDC. Heck, D. E., Vetrano, A. M., Mariano, T. M., and Laskin, J. D. (2003). "UVB light stimulates production
of reactive oxygen species: unexpected role for catalase." Journal of Biological Chemistry 278(25): 22432-22436.
Heckele, M., and Schomburg, W. (2003). "Review on micro molding of thermoplastic polymers." Journal of Micromechanics and Microengineering 14(3): R1.
Hecker, M. T., Aron, D. C., Patel, N. P., Lehmann, M. K., and Donskey, C. J. (2003). "Unnecessary use of antimicrobials in hospitalized patients: current patterns of misuse with an emphasis on the antianaerobic spectrum of activity." Archives of Internal Medicine 163(8): 972-978.
Hermans, M., Gottmann, J., and Riedel, F. (2014). "Selective, laser-induced etching of fused silica at high scan-speeds using KOH." Journal of Laser Micro Nanoengineering 9(2): 126.
Hibino, M., Itoh, H., and Kinosita, K. (1993). "Time courses of cell electroporation as revealed by submicrosecond imaging of transmembrane potential." Biophysical journal 64(6): 1789-1800.
Hiramatsu, R., Matsuoka, T., Kimura-Yoshida, C., Han, S.-W., Mochida, K., Adachi, T., Takayama, S., and Matsuo, I. (2013). "External mechanical cues trigger the establishment of the anterior-posterior axis in early mouse embryos." Developmental cell 27(2): 131-144.
Hogg, S. (2013). Essential microbiology, John Wiley & Sons. Hooper, D., and Rubinstein, E. (2003). "Quinolone antimicrobial agents, ASM Press." Washington, DC. Hooper, D. C. (2000). "Mechanisms of action and resistance of older and newer fluoroquinolones."
Clinical infectious diseases 31(Supplement 2): S24-S28. Hooper, D. C. (2001). "Mechanisms of action of antimicrobials: focus on fluoroquinolones." Clinical
infectious diseases 32(Supplement 1): S9-S15. Hsieh, G.-W., Tsai, C.-H., and Lin, W.-C. (2005). "Anodic bonding of glass and silicon wafers with an
intermediate silicon nitride film and its application to batch fabrication of SPM tip arrays." Microelectronics journal 36(7): 678-682.
Huys, G., Cnockaert, M., Janda, J. M., and Swings, J. (2003). "Escherichia albertii sp. nov., a diarrhoeagenic species isolated from stool specimens of Bangladeshi children." International Journal of Systematic and Evolutionary Microbiology 53: 807-810.
Iliescu, C., Chen, B., and Miao, J. (2008). "On the wet etching of Pyrex glass." Sensors and actuators A: Physical 143(1): 154-161.
183 / 192
Iliescu, C., Jing, J., Tay, F. E., Miao, J., and Sun, T. (2005). "Characterization of masking layers for deep wet etching of glass in an improved HF/HCl solution." Surface and Coatings Technology 198(1): 314-318.
Iliescu, C., Tay, F. E., and Miao, J. (2007). "Strategies in deep wet etching of Pyrex glass." Sensors and Actuators A: Physical 133(2): 395-400.
Inoue, I., Wakamoto, Y., Moriguchi, H., Okano, K., and Yasuda, K. (2001). "On-chip culture system for observation of isolated individual cells." Lab on a Chip 1(1): 50-55.
Ionescu-Zanetti, C., Blatz, A., and Khine, M. (2008). "Electrophoresis-assisted single-cell electroporation for efficient intracellular delivery." Biomedical microdevices 10(1): 113-116.
Ishii, Y., and Yanagida, T. (2000). "Single molecule detection in life sciences." Single Molecules 1(1): 5-16.
Jamme, F., Kascakova, S., Villette, S., Allouche, F., Pallu, S., Rouam, V., and Réfrégiers, M. (2013). "Deep UV autofluorescence microscopy for cell biology and tissue histology." Biologu of the Cell 105(7): 277-288.
Jamme, F., Villette, S., Giuliani, A., Rouam, V., Wien, F., Lagarde, B., and Réfrégiers, M. (2010). "Synchrotron UV fluorescence microscopy uncovers new probes in cells and tissues." Microscopy and Microanalysis 16(5): 507-514.
Janasek, D., Franzke, J., and Manz, A. (2006). "Scaling and the design of miniaturized chemical-analysis systems." Nature 442(7101): 374.
Jansen, H., Gardeniers, H., de Boer, M., Elwenspoek, M., and Fluitman, J. (1996). "A survey on the reactive ion etching of silicon in microtechnology." Journal of micromechanics and microengineering 6(1): 14.
Jena, R. K., Yue, C., Lam, Y., and Wang, Z. (2010). "High fidelity hot-embossing of COC microdevices using a one-step process without pre-annealing of polymer substrate." Sensors and Actuators B: Chemical 150(2): 692-699.
Jordan, C. A., Neumann, E., and Sowers, A. E. (2013). Electroporation and electrofusion in cell biology, Springer Science & Business Media.
Kalimi, G. H., and Lo, C. W. (1988). "Communication compartments in the gastrulating mouse embryo." J Cell Biol 107(1): 241-255.
Kaper, J. B., Nataro, J. P., and Mobley, H. L. (2004). "Pathogenic Escherichia coli." Nature Reviews Microbiology 2(2): 123-140.
Karch, H., Tarr, P. I., and Bielaszewska, M. (2005). "Enterohaemorrhagic Escherichia coli in human medicine." International Journal of Medical Microbiology 295(6-7): 405-418.
Kascakova, S., Maigre, L., Chevalier, J., Réfrégiers, M., and Pagès, J.-M. (2012). "Antibiotic transport in resistant bacteria: synchrotron UV fluorescence microscopy to determine antibiotic accumulation with single cell resolution." PLoS One 7(6): e38624.
Kennedy, D. (2013). "Time to deal with antibiotics." Science 342(6160): 777-777. Khine, M., Lau, A., Ionescu-Zanetti, C., Seo, J., and Lee, L. P. (2005). "A single cell electroporation
chip." Lab on a Chip 5(1): 38-43. King, D. E., Malone, R., and Lilley, S. H. (2000). "New classification and update on the quinolone
antibiotics." American Family Physician 61(9): 2741-2748. Kinosita, K., and Tsong, T. (1977). "Hemolysis of human erythrocytes by transient electric field."
Proceedings of the National Academy of Sciences 74(5): 1923-1927. Kitamura, K., Tokunaga, M., Iwane, A. H., and Yanagida, T. (1999). "A single myosin head moves along
an actin filament with regular steps of 5.3 nanometres." Nature 397(6715): 129-134. Kiyama, S., Matsuo, S., Hashimoto, S., and Morihira, Y. (2009). "Examination of etching agent and
etching mechanism on femotosecond laser microfabrication of channels inside vitreous silica substrates." The Journal of Physical Chemistry C 113(27): 11560-11566.
Koebnik, R., Locher, K. P., and Van Gelder, P. (2000). "Structure and function of bacterial outer membrane proteins: barrels in a nutshell." Molecular Microbiology 37(2): 239-253.
Kohanski, M. A., Dwyer, D. J., and Collins, J. J. (2010). "How antibiotics kill bacteria: from targets to networks." Nature Reviews Microbiology 8(6): 423-435.
184 / 192
Kolari, K. (2008). "Deep plasma etching of glass with a silicon shadow mask." Sensors and Actuators A: Physical 141(2): 677-684.
Koronakis, V., Eswaran, J., and Hughes, C. (2004). "Structure and function of TolC: the bacterial exit duct for proteins and drugs." Annual Review of Biochemistry 73: 467-489.
Kortmann, H., Chasanis, P., Blank, L. M., Franzke, J., Kenig, E. Y., and Schmid, A. (2009). "The Envirostat - a new bioreactor concept." Lab on a Chip 9(4): 576-585.
Kramer, C. E., Singh, A., Helfrich, S., Grunberger, A., Wiechert, W., Noh, K., and Kohlheyer, D. (2015). "Non-Invasive Microbial Metabolic Activity Sensing at Single Cell Level by Perfusion of Calcein Acetoxymethyl Ester." PLoS One 10(10): e0141768.
Kresge, N., Simoni, R. D., and Hill, R. L. (2004). "Selman Waksman: the father of antibiotics." Journal of Biological Chemistry 279(48): e7-e7.
Leekha, S., Terrell, C. L., and Edson, R. S. (2011). "General principles of antimicrobial therapy." Mayo Clin Proc 86(2): 156-167.
Lesch, J. E. (2007). The first miracle drugs: how the sulfa drugs transformed medicine, Oxford University Press, USA.
Lesher, G. Y., Froelich, E. J., Gruett, M. D., Bailey, J. H., and Brundage, R. P. (1962). "1, 8-Naphthyridine derivatives. A new class of chemotherapeutic agents." Journal of Medicinal Chemistry 5(5): 1063-1065.
Levine, D. P. (2006). "Vancomycin: a history." Clinical Infectious Diseases 42(Supplement 1): S5-S12. Li, B., Yao, Q., Pan, X. C., Wang, N., Zhang, R., Li, J., Ding, G., Liu, X., Wu, C., Ran, D., Zheng, J., and
Zhou, H. (2011). "Artesunate enhances the antibacterial effect of {beta}-lactam antibiotics against Escherichia coli by increasing antibiotic accumulation via inhibition of the multidrug efflux pump system AcrAB-TolC." Journal of Antimicrobial Chemotherapy 66(4): 769-777.
Li, X., Abe, T., and Esashi, M. (2001). "Deep reactive ion etching of Pyrex glass using SF 6 plasma." Sensors and actuators A: Physical 87(3): 139-145.
Li, X., Ling, L., Hua, X., Fukasawa, M., Oehrlein, G. S., Barela, M., and Anderson, H. M. (2003). "Effects of Ar and O 2 additives on SiO 2 etching in C 4 F 8-based plasmas." Journal of Vacuum Science & Technology A: Vacuum, Surfaces, and Films 21(1): 284-293.
Lim, S. P., and Nikaido, H. (2010). "Kinetic parameters of efflux of penicillins by the multidrug efflux transporter AcrAB-TolC of Escherichia coli." Antimicrobial Agents and Chemotherapy 54(5): 1800-1806.
Lin, Y.-C., Jen, C.-M., Huang, M.-Y., Wu, C.-Y., and Lin, X.-Z. (2001). "Electroporation microchips for continuous gene transfection." Sensors and Actuators B: Chemical 79(2): 137-143.
Liu, S., Jin, D., Lan, R., Wang, Y., Meng, Q., Dai, H., Lu, S., Hu, S., and Xu, J. (2015). "Escherichia
marmotae sp. nov., isolated from faeces of Marmota himalayana in Qinghai-Tibet Plateau China." International Journal of Systematic and Evolutionary Microbiology 65(7): 2130-2134.
Livermore, D. (2004). "The need for new antibiotics." Clinical Microbiology and Infection 10(s4): 1-9. Loder, B., Newton, G. G. F., and Abraham, E. P. (1961). "The cephalosporin C nucleus (7-
aminocephalosporanic acid) and some of its derivatives." Biochemical Journal 79(2): 408. Lomovskaya, O., Warren, M. S., Lee, A., Galazzo, J., Fronko, R., Lee, M., Blais, J., Cho, D., Chamberland,
S., Renau, T., Leger, R., Hecker, S., Watkins, W., Hoshino, K., Ishida, H., and Lee, V. J. (2001). "Identification and characterization of inhibitors of multidrug resistance efflux pumps in Pseudomonas aeruginosa: novel agents for combination therapy." Antimicrob Agents and Chemotherapy 45(1): 105-116.
Long, Z., Nugent, E., Javer, A., Cicuta, P., Sclavi, B., Lagomarsino, M. C., and Dorfman, K. D. (2013). "Microfluidic chemostat for measuring single cell dynamics in bacteria." Lab on a Chip 13(5): 947-954.
Loste, F., Eynard, N., and Teissie, J. (1998). "Direct monitoring of the field strength during electropulsation." Bioelectrochemistry and bioenergetics 47(1): 119-127.
Lu, H., Schmidt, M. A., and Jensen, K. F. (2005). "A microfluidic electroporation device for cell lysis." Lab on a Chip 5(1): 23-29.
MacDonald, J. (1967). Pyocyanine. Biosynthesis, Springer: 52-65.
185 / 192
Macfarlane, G., and Taylor, F. (1979). Howard Florey: the making of a great scientist, Oxford University Press Oxford.
Maerkl, S. J., and Quake, S. R. (2007). "A systems approach to measuring the binding energy landscapes of transcription factors." Science 315(5809): 233-237.
Mao, S., Quéré, F., Guizard, S., Mao, X., Russo, R., Petite, G., and Martin, P. (2004). "Dynamics of femtosecond laser interactions with dielectrics." Applied Physics A: Materials Science & Processing 79(7): 1695-1709.
Marcinkevičius, A., Juodkazis, S., Watanabe, M., Miwa, M., Matsuo, S., Misawa, H., and Nishii, J. (2001). "Femtosecond laser-assisted three-dimensional microfabrication in silica." Optics Letters 26(5): 277-279.
Markx, G. H., Talary, M. S., and Pethig, R. (1994). "Separation of viable and non-viable yeast using dielectrophoresis." Journal of Biotechnology 32(1): 29-37.
Matchette, L. S., Agrawal, A., and Pfefer, T. J. (2007). "Fluoroquinolone Antibiotics Having the Potential to Interfere with Fluorescence-Based Diagnosis." Photochemistry and Photobiology 83(6): 1386-1393.
Mather, W., Mondragon-Palomino, O., Danino, T., Hasty, J., and Tsimring, L. S. (2010). "Streaming instability in growing cell populations." Physical Review Letters 104(20): 208101.
Mazari, E., Mantelet, M., Iranzo, J., Perea-Gomez, A., and Gosse, C. (2011). Localized electroporation of mouse embryo using dielectric guides. Solid-State Sensors, Actuators and Microsystems Conference (TRANSDUCERS), 2011 16th International, IEEE.
Mazari, E., Zhao, X., Collignon, J., Perea-Gomez, A., and Gosse, C. "ON CHIP SPATIOTEMPORAL ELECTRIC FIELD SHAPING TO LOCALLY ELECTROPORATE CELL MARKERS INTO MOUSE EMBRYONIC TISSUES."
Mazari, E., Zhao, X., Migeotte, I., Collignon, J., Gosse, C., and Perea-Gomez, A. (2014). "A microdevice to locally electroporate embryos with high efficiency and reduced cell damage." Development 141(11): 2349-2359.
Meulemans, C. C. E. (1987). "The Basic Principles of UV–Disinfection of Water." Ozone: Science & Engineering 9(4): 299-313.
Minoshima, K., Kowalevicz, A. M., Hartl, I., Ippen, E. P., and Fujimoto, J. G. (2001). "Photonic device fabrication in glass by use of nonlinear materials processing with a femtosecond laser oscillator." Optics Letters 26(19): 1516-1518.
Mir, L. M., Banoun, H., and Paoletti, C. (1988). "Introduction of definite amounts of nonpermeant molecules into living cells after electropermeabilization: direct access to the cytosol." Experimental cell research 175(1): 15-25.
Misawa, H., and Juodkazis, S. (2006). 3D laser microfabrication: principles and applications, John Wiley & Sons.
Moffitt, J. R., Lee, J. B., and Cluzel, P. (2012). "The single-cell chemostat: an agarose-based, microfluidic device for high-throughput, single-cell studies of bacteria and bacterial communities." Lab on a Chip 12(8): 1487-1494.
Morel, M., Galas, J.-C., Dahan, M., and Studer, V. (2012). "Concentration landscape generators for shear free dynamic chemical stimulation." Lab on a Chip 12(7): 1340-1346.
Mortimer, P. G., and Piddok, L. J. (1993). "The accumulation of five antibacterial agents in porin-deficient mutants of Escherichia coli." Journal of Antimicrobial Chemotherapy 32(2): 195-213.
Mortimer, P. G. S., and Piddock, L. J. V. (1991). "A comparison of methods used for measuring the accumulation of quinolones by Enterobacteriaceae, Pseudomonas aeruginosa and Staphylococcus aureus." Journal of Antimicrobial Chemotherapy 28(5): 639-653.
Mustafi, N., Grunberger, A., Mahr, R., Helfrich, S., Noh, K., Blombach, B., Kohlheyer, D., and Frunzke, J. (2014). "Application of a genetically encoded biosensor for live cell imaging of L-valine production in pyruvate dehydrogenase complex-deficient Corynebacterium glutamicum strains." PLoS One 9(1): e85731.
Nakamura, H. (2009). Electroporation and sonoporation in developmental biology, Springer Science & Business Media.
186 / 192
Namatsu, H., Yamaguchi, T., Nagase, M., Yamazaki, K., and Kurihara, K. (1998). "Nano-patterning of a hydrogen silsesquioxane resist with reduced linewidth fluctuations." Microelectronic Engineering 41: 331-334.
Nesme, J., Cecillon, S., Delmont, T. O., Monier, J.-M., Vogel, T. M., and Simonet, P. (2014). "Large-scale metagenomic-based study of antibiotic resistance in the environment." Current Biology 24(10): 1096-1100.
Neumann, E., and Rosenheck, K. (1972). "Permeability changes induced by electric impulses in vesicular membranes." Journal of Membrane Biology 10(1): 279-290.
Neumann, E., Schaefer-Ridder, M., Wang, Y., and Hofschneider, P. (1982). "Gene transfer into mouse lyoma cells by electroporation in high electric fields." The EMBO journal 1(7): 841.
Nikaido, H. (1989). "Outer membrane barrier as a mechanism of antimicrobial resistance." Antimicrobial Agents and Chemotherapy 33(11): 1831.
Nikaido, H., and Rosenberg, E. Y. (1981). "Effect on solute size on diffusion rates through the transmembrane pores of the outer membrane of Escherichia coli." Journal of General Physiology 77(2): 121-135.
Nikaido, H., and Rosenberg, E. Y. (1983). "Porin channels in Escherichia coli: studies with beta-lactams in intact cells." Journal of Bacteriology 153(1): 232-240.
Nikaido, H., and Rosenberg, E. Y. (1983). "Porin channels in Escherichia coli: studies with liposomes reconstituted from purified proteins." Journal of Bacteriology 153(1): 241-252.
Nikaido, H., and Takatsuka, Y. (2009). "Mechanisms of RND multidrug efflux pumps." Biochim Biophys Acta 1794(5): 769-781.
Nikaido, H., and Takatsuka, Y. (2009). "Mechanisms of RND multidrug efflux pumps." Biochimica et Biophysica Acta 1794(5): 769-781.
Niklaus, F., Enoksson, P., Griss, P., Kalvesten, E., and Stemme, G. (2001). "Low-temperature wafer-level transfer bonding." Journal of microelectromechanical systems 10(4): 525-531.
Noguchi, H., Matsuhashi, M., and Mitsuhashi, S. (1979). "Comparative Studies of Penicillin‐Binding Proteins in Pseudomonas aeruginosa and Escherichia coli." The FEBS Journal 100(1): 41-49.
Nolte, S., Will, M., Burghoff, J., and Tuennermann, A. (2003). "Femtosecond waveguide writing: a new avenue to three-dimensional integrated optics." Applied Physics A: Materials Science & Processing 77(1): 109-111.
Nomenclature, J. C. o. t. I. C. o. B. (1958). "Conservation of the family name Enterobacteriaceae, of the name of the type genus, and designation of the type species, Opinion No. 15." International Bulletin of Bacteriolcgical Nomenclature and Taxonomy 8: 73-74.
Norman, T. M., Lord, N. D., Paulsson, J., and Losick, R. (2013). "Memory and modularity in cell-fate decision making." Nature 503(7477): 481-486.
Norris, D. P., Brennan, J., Bikoff, E. K., and Robertson, E. J. (2002). "The Foxh1-dependent autoregulatory enhancer controls the level of Nodal signals in the mouse embryo." Development 129(14): 3455-3468.
O’Neill, J. (2015). "Antimicrobials in agriculture and the environment: reducing unnecessary use and waste." The review on antimicrobial resistance.
Okada, Y., and Hirokawa, N. (1999). "A processive single-headed motor: kinesin superfamily protein KIF1A." Science 283(5405): 1152-1157.
Okusu, H., Ma, D., and Nikaido, H. (1996). "AcrAB efflux pump plays a major role in the antibiotic resistance phenotype of Escherichia coli multiple-antibiotic-resistance (Mar) mutants." Journal of bacteriology 178(1): 306-308.
Organization, W. H. (2014). Antimicrobial resistance: global report on surveillance, World Health Organization.
Orlowski, S., and Mir, L. M. (1993). "Cell electropermeabilization: a new tool for biochemical and pharmacological studies." Biochimica et Biophysica Acta (BBA)-Reviews on Biomembranes 1154(1): 51-63.
187 / 192
Pages, J.-M., James, C. E., and Winterhalter, M. (2008). "The porin and the permeating antibiotic: a selective diffusion barrier in Gram-negative bacteria." Nature Reviews Microbiology 6(12): 893-903.
Pagès, J.-M., James, C. E., and Winterhalter, M. (2008). "The porin and the permeating antibiotic: a selective diffusion barrier in Gram-negative bacteria." Nature Reviews Microbiology 6(12): 893-903.
Pagès, J. M., and Amaral, L. (2009). "Mechanisms of drug efflux and strategies to combat them: challenging the efflux pump of Gram-negative bacteria." Biochim Biophys Acta 1794(5): 826-833.
Park, J., Wu, J., Polymenis, M., and Han, A. (2013). "Microchemostat array with small-volume fraction replenishment for steady-state microbial culture." Lab on a Chip 13(21): 4217-4224.
Pasteur, L., and Vallery-Radot, P. (1933). Oeuvres de Pasteur: Maladies virulentes, virus-vaccins et prophylaxie de la rage, Masson et Cie.
Pattison, D. I., and Davies, M. J. (2006). Actions of ultraviolet light on cellular structures. Cancer: cell structures, carcinogens and genomic instability. Bignold, L. P., Springer: 131-157.
Peitz, I., and van Leeuwen, R. (2010). "Single-cell bacteria growth monitoring by automated DEP-facilitated image analysis." Lab on a Chip 10(21): 2944-2951.
Phetsang, W., Blaskovich, M. A., Butler, M. S., Huang, J. X., Zuegg, J., Mamidyala, S. K., Ramu, S., Kavanagh, A. M., and Cooper, M. A. (2014). "An azido-oxazolidinone antibiotic for live bacterial cell imaging and generation of antibiotic variants." Bioorganic and Medicinal Chemistry 22(16): 4490-4498.
Phetsang, W., Pelingon, R., Butler, M. S., KC, S., Pitt, M., Kaeslin, G., Cooper, M. A., and Blaskovich, M. A. T. (2016). "Fluorescent Trimethoprim Conjugate Probes To Assess Drug Accumulation in Wild Type and Mutant Escherichia coli." ACS Infectious Diseases 2(10): 688-701.
Piddock, L. J. (2006). "Clinically relevant chromosomally encoded multidrug resistance efflux pumps in bacteria." Clinical Microbiology Reviews 19(2): 382-402.
Piddock, L. J. V. (2006). "Multidrug-resistance efflux pumps? not just for resistance." Nature Reviews Microbiology 4(8): 629-636.
Pohl, H. A. (1978). Dielectrophoresis: the behavior of neutral matter in nonuniform electric fields, Cambridge university press Cambridge.
Poulsen, L. K., Lan, F., Kristensen, C. S., Hobolth, P., Molin, S., and Krogfelt, K. A. (1994). "Spatial distribution of Escherichia coli in the mouse large intestine inferred from rRNA in situ hybridization." Infection and Immunity 62(11): 5191-5194.
Pray, L. A. (2008). "Transposons: The jumping genes." Nature Education 1(1): 204. Prevention, C. f. D. C. (2013). Antibiotic resistance threats in the United States, 2013, Centres for
Disease Control and Prevention, US Department of Health and Human Services. Probst, C., Grünberger, A., Braun, N., Helfrich, S., Nöh, K., Wiechert, W., and Kohlheyer, D. (2015).
"Rapid inoculation of single bacteria into parallel picoliter fermentation chambers." Analytical Methods 7(1): 91-98.
Probst, C., Grunberger, A., Wiechert, W., and Kohlheyer, D. (2013). "Microfluidic growth chambers with optical tweezers for full spatial single-cell control and analysis of evolving microbes." Journal of Microbiological Methods 95(3): 470-476.
Psaltis, D., Quake, S. R., and Yang, C. (2006). "Developing optofluidic technology through the fusion of microfluidics and optics." nature 442(7101): 381.
Pu, Y., Zhao, Z., Li, Y., Zou, J., Ma, Q., Zhao, Y., Ke, Y., Zhu, Y., Chen, H., and Baker, M. A. B. (2016). "Enhanced efflux activity facilitates drug tolerance in dormant bacterial cells." Molecular cell 62(2): 284-294.
Pu, Y., Zhao, Z., Li, Y., Zou, J., Ma, Q., Zhao, Y., Ke, Y., Zhu, Y., Chen, H., Baker, M. A. B., Ge, H., Sun, Y., Xie, X. S., and Bai, F. (2016). "Enhanced Efflux Activity Facilitates Drug Tolerance in Dormant Bacterial Cells." Molecular Cell 62(2): 284-294.
Pucihar, G., Kotnik, T., Miklavčič, D., and Teissié, J. (2008). "Kinetics of transmembrane transport of small molecules into electropermeabilized cells." Biophysical journal 95(6): 2837-2848.
188 / 192
Pucihar, G., Kotnik, T., Valič, B., and Miklavčič, D. (2006). "Numerical determination of transmembrane voltage induced on irregularly shaped cells." Annals of biomedical engineering 34(4): 642.
Pucihar, G., Miklavcic, D., and Kotnik, T. (2009). "A time-dependent numerical model of transmembrane voltage inducement and electroporation of irregularly shaped cells." IEEE Transactions on Biomedical Engineering 56(5): 1491-1501.
Raja, S. B., Murali, M. R., and Devaraj, S. N. (2008). "Differential expression of ompC and ompF in multidrug-resistant Shigella dysenteriae and Shigella flexneri by aqueous extract of Aegle marmelos, altering its susceptibility toward beta-lactam antibiotics." Diagnostic Microbiology and Infectious Disease 61(3): 321-328.
Rajesh, S., and Bellouard, Y. (2010). "Towards fast femtosecond laser micromachining of fused silica: The effect of deposited energy." Optics express 18(20): 21490-21497.
Roberts, W. (1874). "Studies on biogenesis." Philosophical Transactions of the Royal Society of London 164: 457-477.
Rols, M.-P. (2016). Gene Delivery by Electroporation In Vitro: Mechanisms, Springer International Publishing.
Rols, M.-P., Delteil, C., Golzio, M., Dumond, P., Cros, S., and Teissie, J. (1998). "In vivo electrically mediated protein and gene transfer in murine melanoma." Nature biotechnology 16(2): 168-171.
Rols, M.-P., Golzio, M., Delteil, C., and Teissié, J. (2000). "In vitro delivery of drugs and other molecules to cells." Electrochemotherapy, Electrogenetherapy, and Transdermal Drug Delivery: Electrically Mediated Delivery of Molecules to Cells: 83-97.
Rols, M.-P., and Teissie, J. (1990). "Electropermeabilization of mammalian cells. Quantitative analysis of the phenomenon." Biophysical journal 58(5): 1089-1098.
Rols, M.-P., and Teissié, J. (1998). "Electropermeabilization of mammalian cells to macromolecules: control by pulse duration." Biophysical journal 75(3): 1415-1423.
Rubinstein, E. (2001). "History of quinolones and their side effects." Chemotherapy 47(Suppl 3): 3-8. Rueger, N., Doemling, M., Schaepkens, M., Beulens, J., Standaert, T., and Oehrlein, G. (1999).
"Selective etching of SiO 2 over polycrystalline silicon using CHF 3 in an inductively coupled plasma reactor." Journal of Vacuum Science & Technology A: Vacuum, Surfaces, and Films 17(5): 2492-2502.
Ruiz, N., Kahne, D., and Silhavy, T. J. (2006). "Advances in understanding bacterial outer-membrane biogenesis." Nature Reviews Microbiology 4(1): 57-66.
Sale, A., and Hamilton, W. (1968). "Effects of high electric fields on micro-organisms: III. Lysis of erythrocytes and protoplasts." Biochimica et Biophysica Acta (BBA)-Biomembranes 163(1): 37-43.
Santos, A. L., Moreirinha, C., Lopes, D., Esteves, A. C., Henriques, I., Almeida, A., Domingues, M. R. r. M., Delgadillo, I., Correia, A. n., and Cunha, A. n. (2013). "Effects of UV radiation on the lipids and proteins of bacteria studied by mid-infrared spectroscopy." Environmental Science and Technology 47(12): 6306-6315.
Schatz, A., and Waksman, S. A. (1944). "Effect of Streptomycin and Other Antibiotic Substances upon Mycobacterium tuberculosis and Related Organisms." Experimental Biology and Medicine 57(2): 244-248.
Schindelin, J., Arganda-Carreras, I., Frise, E., Kaynig, V., Longair, M., Pietzsch, T., Preibisch, S., Rueden, C., Saalfeld, S., Schmid, B., Tinevez, J. Y., White, D. J., Hartenstein, V., Eliceiri, K., Tomancak, P., and Cardona, A. (2012). "Fiji: an open-source platform for biological-image analysis." Nat Methods 9(7): 676-682.
Schirmer, T. (1998). "General and specific porins from bacterial outer membranes." Journal of Structural Biology 121(2): 101-109.
Selander, R. K., Caugant, D. A., and Whittam, T. S. (1987). Genetic structure and variation in natural populations of Escherichia coli.
189 / 192
Shales, S. W., Chopra, I., and Ball, P. R. (1980). "Evidence for more than one mechanism of plasmid-determined tetracycline resistance in Escherichia coli." Journal of General Microbiology 121(1): 221-229.
Sheehan, J. C. (1967). "The chemistry of synthetic and semisynthetic penicillins." Annals of the New York Academy of Sciences 145(1): 216-223.
Shoji, S. (1990). Photoetching and electrochemical discharge drilling of Pyrex glass. Technical Digest of the 9th Sensor Symposium.
Si, F., Li, B., Margolin, W., and Sun, S. X. (2015). "Bacterial growth and form under mechanical compression." Scientific Reports 5: 11367.
Silver, L. L. (2011). "Challenges of antibacterial discovery." Clinical Microbiology Reviews 24(1): 71-109.
Smil, V. (2005). Creating the twentieth century: Technical innovations of 1867-1914 and their lasting impact, Oxford University Press.
Sood, S., Farrens, S., Pinker, R., Xie, J., and Cataby, W. (2010). "Al-Ge eutectic wafer bonding and bond characterization for CMOS compatible wafer packaging." ECS Transactions 33(4): 93-101.
Spratt, B. G. (1977). "Properties of the Penicillin‐Binding Proteins of Escherichia coli K12." European Journal of Biochemistry 72(2): 341-352.
Srinivas, S. (2006). "The anterior visceral endoderm—turning heads." Genesis 44(11): 565-572. Stapulionis, R. (1999). "Electric pulse-induced precipitation of biological macromolecules in
electroporation." Bioelectrochemistry and bioenergetics 48(1): 249-254. Stewart, P. S. (1996). "Theoretical aspects of antibiotic diffusion into microbial biofilms."
Antimicrobial Agents and Chemotherapy 40(11): 2517-2522. Stone, H. A., Stroock, A. D., and Ajdari, A. (2004). "Engineering flows in small devices: microfluidics
toward a lab-on-a-chip." Annu. Rev. Fluid Mech. 36: 381-411. Stratz, S., Eyer, K., Kurth, F., and Dittrich, P. S. (2014). "On-chip enzyme quantification of single
Escherichia coli bacteria by immunoassay-based analysis." Analytical Chemistry 86(24): 12375-12381.
Sudsiri, J., Wachner, D., and Gimsa, J. (2007). "On the temperature dependence of the dielectric membrane properties of human red blood cells." Bioelectrochemistry 70(1): 134-140.
Suginaka, H., Blumberg, P. M., and Strominger, J. L. (1972). "Multiple penicillin-binding components in Bacillus subtilis, Bacillus cereus, Staphylococcus aureus, and Escherichia coli." Journal of Biological Chemistry 247(17): 5279-5288.
Sukas, S., Schreuder, E., de Wagenaar, B., Swennenhuis, J., van den Berg, A., Terstappen, L., and Le Gac, S. (2014). "A novel side electrode configuration integrated in fused silica microsystems for synchronous optical and electrical spectroscopy." Lab on a Chip 14(11): 1821-1825.
Sukharev, S., Klenchin, V., Serov, S., Chernomordik, L., and YuA, C. (1992). "Electroporation and electrophoretic DNA transfer into cells. The effect of DNA interaction with electropores." Biophysical journal 63(5): 1320-1327.
Swingle, W. T., and Briggs, L. J. (1907). "Improvements in the Ultra-Violet Microscope." Science: 180-183.
Tabeling, P. (2006). Introduction to Microfluidics Oxford University Press, Oxford, England ISBN. Takaoka, K., Yamamoto, M., and Hamada, H. (2007). "Origin of body axes in the mouse embryo."
Current opinion in genetics & development 17(4): 344-350. Teissie, J., and Rols, M.-P. (1993). "An experimental evaluation of the critical potential difference
inducing cell membrane electropermeabilization." Biophysical journal 65(1): 409-413. Temnov, V., Sokolowski-Tinten, K., Zhou, P., El-Khamhawy, A., and Von Der Linde, D. (2006).
"Multiphoton ionization in dielectrics: comparison of circular and linear polarization." Physical review letters 97(23): 237403.
Tenaillon, O., Skurnik, D., Picard, B., and Denamur, E. (2010). "The population genetics of commensal Escherichia coli." Nature Reviews Microbiology 8(3): 207-217.
190 / 192
Teng, S.-W., Mukherji, S., Moffitt, J. R., De Buyl, S., and O’shea, E. K. (2013). "Robust circadian oscillations in growing cyanobacteria require transcriptional feedback." Science 340(6133): 737-740.
Terry, S. C., Jerman, J. H., and Angell, J. B. (1979). "A gas chromatographic air analyzer fabricated on a silicon wafer." IEEE Transactions on Electron Devices 26(12): 1880-1886.
Thiénot, E., Domingo, F., Cambril, E., and Gosse, C. (2006). "Reactive ion etching of glass for biochip applications: Composition effects and surface damages." Microelectronic engineering 83(4): 1155-1158.
Tomov, T., and Tsoneva, I. (2000). "Are the stainless steel electrodes inert?" Bioelectrochemistry 51(2): 207-209.
Tong, Q.-Y. (2001). "Wafer bonding for integrated materials." Materials Science and Engineering: B 87(3): 323-328.
Tong, Q.-Y., and Goesele, U. (1999). Semiconductor wafer bonding: science and technology, John Wiley.
Tudryn, C., Schweizer, S., Hopkins, R., Hobbs, L., and Garratt-Reed, A. J. (2005). "Characterization of Si and CVD SiC to glass anodic bonding using TEM and STEM analysis." Journal of the Electrochemical Society 152(4): E131-E134.
Tyndall, J. (1876). "The optical deportment of the atmosphere in relation to the phenomena of putrefaction and infection." Philosophical Transactions of the Royal Society of London 166: 27-74.
Ullman, G., Wallden, M., Marklund, E. G., Mahmutovic, A., Razinkov, I., and Elf, J. (2013). "High-throughput gene expression analysis at the level of single proteins using a microfluidic turbidostat and automated cell tracking." Philosophical Transactions of the Royal Society of London B: Biological Sciences 368(1611): 20120025.
Ullman, G., Wallden, M., Marklund, E. G., Mahmutovic, A., Razinkov, I., and Elf, J. (2013). "High-throughput gene expression analysis at the level of single proteins using a microfluidic turbidostat and automated cell tracking." Philosophical Transactions of the Royal Society B: Biological 368(1611): 20120025.
Unger, M. A. (2000). "Monolithic Microfabricated Valves and Pumps by Multilayer Soft Lithography." Science 288(5463): 113-116.
Valič, B., Golzio, M., Pavlin, M., Schatz, A., Faurie, C., Gabriel, B., Teissié, J., Rols, M.-P., and Miklavčič, D. (2003). "Effect of electric field induced transmembrane potential on spheroidal cells: theory and experiment." European Biophysics Journal 32(6): 519-528.
van Leest, T., and Caro, J. (2013). "Cavity-enhanced optical trapping of bacteria using a silicon photonic crystal." Lab on a Chip 13(22): 4358-4365.
Verchère, A., Dezi, M., Adrien, V., Broutin, I., and Picard, M. (2015). "In vitro transport activity of the fully assembled MexAB-OprM efflux pump from Pseudomonas aeruginosa." Nature Communications 6.
Viotti, M., Niu, L., Shi, S.-H., and Hadjantonakis, A.-K. (2012). "Role of the gut endoderm in relaying left-right patterning in mice." PLoS Biol 10(3): e1001276.
Visscher, K., Schnitzer, M. J., and Block, S. M. (1999). "Single kinesin molecules studied with a molecular force clamp." Nature 400(6740): 184-189.
Viveiros, M., Jesus, A., Brito, M., Leandro, C., Martins, M., Ordway, D., Molnar, A. M., Molnar, J., and Amaral, L. (2005). "Inducement and reversal of tetracycline resistance in Escherichia coli K-12 and expression of proton gradient-dependent multidrug efflux pump genes." Antimicrobial Agents and Chemotherapy 49(8): 3578-3582.
Viveiros, M., Jesus, A., Brito, M., Leandro, C., Martins, M., Ordway, D., Molnar, A. M., Molnar, J., and Amaral, L. (2005). "Inducement and reversal of tetracycline resistance in Escherichia coli K-12 and expression of proton gradient-dependent multidrug efflux pump genes." Antimicrob Agents Chemother 49(8): 3578-3582.
Voldman, J., Gray, M. L., and Schmidt, M. A. (1999). "Microfabrication in biology and medicine." Annual review of biomedical engineering 1(1): 401-425.
191 / 192
Von der Linde, D., Sokolowski-Tinten, K., and Bialkowski, J. (1997). "Laser–solid interaction in the femtosecond time regime." Applied Surface Science 109: 1-10.
Wagnières, G. A., Star, W. M., and Wilson, B. C. (1998). "In vivo fluorescence spectroscopy and imaging for oncological applications." Photochemistry and Photobiology 68(5): 603-632.
Wakamoto, Y., Ramsden, J., and Yasuda, K. (2005). "Single-cell growth and division dynamics showing epigenetic correlations." Analyst 130(3): 311-317.
Wallis, G. (1975). "Field assisted glass sealing." Active and Passive Electronic Components 2(1): 45-53.
Wallis, G., and Pomerantz, D. I. (1969). "Field assisted glass‐metal sealing." Journal of applied physics 40(10): 3946-3949.
Wang, P., Robert, L., Pelletier, J., Dang, W. L., Taddei, F., Wright, A., and Jun, S. (2010). "Robust growth of Escherichia coli." Current Biology 20(12): 1099-1103.
Wang, Y., Ran, M., Wang, J., Ouyang, Q., and Luo, C. (2015). "Studies of Antibiotic Resistance of Beta-Lactamase Bacteria under Different Nutrition Limitations at the Single-Cell Level." PLoS One 10(5): e0127115.
Watson, J. D. (1992). Recombinant Dna, Macmillan. Weaver, J. C. (1993). "Electroporation: a general phenomenon for manipulating cells and tissues."
Journal of cellular biochemistry 51(4): 426-435. Wensink, H., Berenschot, J., Jansen, H. V., and Elwenspoek, M. C. (2000). High resolution powder
blast micromachining. Micro Electro Mechanical Systems, 2000. MEMS 2000. The Thirteenth Annual International Conference on, IEEE.
Westerwalbesloh, C., Grünberger, A., Stute, B., Weber, S., Wiechert, W., Kohlheyer, D., and von Lieres, E. (2015). "Modeling and CFD simulation of nutrient distribution in picoliter bioreactors for bacterial growth studies on single-cell level." Lab on a Chip 15(21): 4177-4186.
Whitesides, G. M. (2006). "The origins and the future of microfluidics." Nature 442(7101): 368. Willmott, C. J. R., and Maxwell, A. (1993). "A single point mutation in the DNA gyrase A protein
greatly reduces binding of fluoroquinolones to the gyrase-DNA complex." Antimicrobial Agents and Chemotherapy 37(1): 126-127.
Wolf, H., Rols, M., Boldt, E., Neumann, E., and Teissie, J. (1994). "Control by pulse parameters of electric field-mediated gene transfer in mammalian cells." Biophysical journal 66(2): 524-531.
Wolffenbuttel, R. (1997). "Low-temperature intermediate Au-Si wafer bonding; eutectic or silicide bond." Sensors and Actuators A: Physical 62(1-3): 680-686.
Worgull, M., Kolew, A., Heilig, M., Schneider, M., Dinglreiter, H., and Rapp, B. (2011). "Hot embossing of high performance polymers." Microsystem technologies 17(4): 585-592.
Xia, Y., and Whitesides, G. M. (1998). "Soft lithography." Annual review of materials science 28(1): 153-184.
Xin, H., Liu, Q., and Li, B. (2014). "Non-contact fiber-optical trapping of motile bacteria: dynamics observation and energy estimation." Scientific Reports 4: 6576.
Xin, H., Xu, R., and Li, B. (2012). "Optical trapping, driving, and arrangement of particles using a tapered fibre probe." Scientific Reports 2: 818.
Yager, P., Edwards, T., Fu, E., Helton, K., Nelson, K., Tam, M. R., and Weigl, B. H. (2006). "Microfluidic diagnostic technologies for global public health." Nature 442(7101): 412.
Yamamoto, M., Saijoh, Y., Perea-Gomez, A., Shawlot, W., Behringer, R. R., Ang, S.-L., Hamada, H., and Meno, C. (2004). "Nodal antagonists regulate formation of the anteroposterior axis of the mouse embryo." Nature 428(6981): 387-392.
Yang, C.-C., and Chen, W.-C. (2002). "The structures and properties of hydrogen silsesquioxane (HSQ) films produced by thermal curing." Journal of Materials Chemistry 12(4): 1138-1141.
Yang, L. (2009). "Dielectrophoresis assisted immuno-capture and detection of foodborne pathogenic bacteria in biochips." Talanta 80(2): 551-558.
Yang, L., Banada, P. P., Bhunia, A. K., and Bashir, R. (2008). "Effects of Dielectrophoresis on Growth, Viability and Immuno-reactivity of Listeria monocytogenes." Journal of Biological Engineering 2: 6.
192 / 192
Yarmush, M. L., Golberg, A., Serša, G., Kotnik, T., and Miklavčič, D. (2014). "Electroporation-based technologies for medicine: principles, applications, and challenges." Annual review of biomedical engineering 16: 295-320.
Yoshida, T., Qin, L., Egger, L. A., and Inouye, M. (2006). "Transcription regulation of ompF and ompC by a single transcription factor, OmpR." Journal of Biological Chemistry 281(25): 17114-17123.
Yoshimura, F., and Nikaido, H. (1985). "Diffusion of beta-lactam antibiotics through the porin channels of Escherichia coli K-12." Antimicrobial Agents and Chemotherapy 27(1): 84-92.
Zeller, R. W. (2004). "Generation and use of transgenic ascidian embryos." Methods in cell biology 74: 713-730.
Zhao, G., Meier, T. I., Kahl, S. D., Gee, K. R., and Blaszczak, L. C. (1999). "BOCILLIN FL, a sensitive and commercially available reagent for detection of Penicillin-Binding Proteins." Antimicrobial Agents and Chemotherapy 43(5): 1124-1128.
Zimmermann, U., Pilwat, G., and Riemann, F. (1974). "Dielectric breakdown of cell membranes." Biophysical journal 14(11): 881-899.
Zimmermann, W., and Rosselet, A. (1977). "Function of the Outer Membrane of Escherichia Coli as a Permeability Barrier to Beta-Lactam Antibiotics." Antimicrobial Agents and Chemotherapy 12(3): 368-372.
Zhao X., Suárez-Boomgaard D., Saykali B., Safioui J., Hermans M., Louër A.-C., Migeotte I., and Gosse
C. ‘LASER MICROMACHINING OF REUSABLE GLASS DEVICES DEDICATED TO THE TARGETED ELE
CTROPORATION OF CELL ASSEMBLIES’, Transducer 2017.
George de Hevesy, 1943: http://www.su.se/english/about/prizes-awards/nobel-prize/george-de-
hevesy
Ibidi chemotaxis: http://ibidi.com/applications/chemotaxis/u-slide-chemotaxis/
UN 2016 SEP media: https://www.un.org/press/en/2016/ga11825.doc.htm
WHO Antimicrobial Resistance 2014: World Health Organization, April 2014.
http://www.who.int/mediacentre/factsheets/fs194/en/.
WHO Drug Resistance: World Health Organization. http://www.who.int/topics/drug_resistance/en/
WHO World Health Day 2011: antimicrobial resistance: no action today, no cure tomorrow.
http://www.who.int/world-health-day/2011/en/
WHO World Health Day 2015: From farm to plate, make food safe.
http://www.who.int/mediacentre/news/releases/2015/food-safety/en/
WHO 2017 FEB media: http://www.who.int/mediacentre/news/releases/2017/bacteria-antibiotics-n
eeded/en/
Wikilectures Resting Membrane Potential: http://www.wikilectures.eu/index.php/Resting_Membran
e_Potential
RESEARCH ARTICLE TECHNIQUES AND RESOURCES
Amicrodevice to locally electroporate embryos with high efficiencyand reduced cell damageElsa Mazari1, Xuan Zhao1, Isabelle Migeotte2, Jerome Collignon3, Charlie Gosse1,* and Aitana Perea-Gomez3,*
ABSTRACTThe ability to follow and modify cell behaviour with accuratespatiotemporal resolution is a prerequisite to study morphogenesis indeveloping organisms. Electroporation, the delivery of exogenousmolecules into targeted cell populations through electric permeation ofthe plasma membrane, has been used with this aim in different modelsystems. However, current localised electroporation strategies sufferfrom insufficient reproducibility and mediocre survival when applied tosmall and delicate organisms such as early post-implantation mouseembryos. We introduce here a microdevice to achieve localisedelectroporation with high efficiency and reduced cell damage. In silicosimulationsusingasimpleelectricalmodel ofmouseembryos indicatedthat a dielectric guide-based design would improve on existingalternatives. Such a device was microfabricated and its capacitiestested by targeting the distal visceral endoderm (DVE), a migratingcell population essential for anterior-posterior axis establishment.Transfection was efficiently and reproducibly restricted to fewer thanfour visceral endoderm cells without compromising cell behaviour andembryo survival. Combining targetedmosaic expression of fluorescentmarkers with live imaging in transgenic embryos revealed that, likeleading DVE cells, non-leading ones send long basal projections andintercalate during their migration. Finally, we show that the use of ourmicrosystem can be extended to a variety of embryological contexts,from preimplantation stages to organ explants. Hence, we haveexperimentally validated an approach delivering a tailor-made tool forthe study of morphogenesis in the mouse embryo. Furthermore, wehave delineated a comprehensive strategy for the development of adhoc electroporation devices.
KEY WORDS: Localised electroporation, Mouse embryo,Microsystem, Visceral endoderm, Migration, Organ explant,Finite element model simulations
INTRODUCTIONDuring embryonic development, morphogenesis is the result ofdynamic and complex cellular events controlled by signallingnetworks finely regulated in space and time. Understanding theseprocesses requires the ability to label discrete cell populations inorder to characterise their lineage and fate and to modify geneexpression with precise spatiotemporal resolution.Electroporation consists in delivering exogenous molecules into
cells via the electric permeabilisation of the plasma membrane. It
has been widely used to introduce nucleic acids in model organisms(Calegari et al., 2004; Escoffre et al., 2009; Nakamura andFunahashi, 2012; Swartz et al., 2001). Unlike viral infection andlipofection, electroporation does not require specific samplepreparation. Moreover, spatial and temporal control of geneexpression is achieved without the obligatory identification oftissue-specific regulatory sequences, nor the time- and resource-consuming production of genetically modified animals.
Targeting electroporation to specific tissues often involves localapplication of the exogenous molecule and generation of an electricfield with large electrodes, either commercially available or home-made. This approach has been implemented most successfully whenthe tissue of interest surrounds a natural body cavity in whichmicroinjection is possible, for example the neural tube lumen or theproamniotic cavity of vertebrate embryos (Itasaki et al., 1999;Soares et al., 2008). In other situations, such as experimentsinvolving epithelial tissues lying at the periphery of embryos ororgans, the geometry and the position of the targeted area do notallow local concentration of the exogenous molecule. The lattercompound is then homogeneously distributed, and localisedelectroporation can only be achieved if the electric field isspatially restricted, for instance by using needle-shaped electrodesplaced close to the targeted area (Davidson et al., 2003; Momoseet al., 1999). The main limitation of this strategy is that electrolysisat the surface of the needles leads to pH variations and gas bubblegeneration that can be detrimental to the adjacent cells (Kim et al.,2008;Wang et al., 2010;Wang and Lee, 2013). This problem can becircumvented by relying on electrodes placed at a distance from theorganism while channelling the electric field through narrowdielectric guides filled with an electrolyte, a technique notablyapplied to label single neurons with electroporation micropipettes(Haas et al., 2001; Nolkrantz et al., 2001; Wang et al., 2010).Recently, dielectric guide-based electroporation has also beenadapted to the on-chip format, with microfabricated electrodes andfluidic channels (Fox et al., 2006; Wang et al., 2010; Wang and Lee,2013). Although the use of such devices has so far been restricted tosingle cells in culture, one could in principle devise similarmicrosystems to target small embryos or organ explants that facepoor survival in traditional electroporation experiments. This is thecase for mouse embryos at early post-implantation stages, a crucialtime-window for anterior-posterior axis formation (Rossant andTam, 2009; Takaoka and Hamada, 2012).
Shortly after implantation, at embryonic day5ofdevelopment (E5),the mouse embryo has the shape of an elongated cylinder, less than200 µm long, and displays radial symmetry around the proximo-distalaxis. The pluripotent epiblast (Epi) in the distal region is associated totwo extra-embryonic tissues, the extra-embryonic ectoderm (ExE),which abuts the epiblast proximally, and the visceral endoderm (VE),an absorptive epitheliumessential for nutrient exchange that forms theouter layer of the conceptus. Dynamic reciprocal signalling betweenthe epiblast and the extra-embryonic tissues results in radial symmetryReceived 2 December 2013; Accepted 8 April 2014
1Laboratoire de Photonique et de Nanostructures, LPN-CNRS, route de Nozay,91460 Marcoussis, France. 2Institut de Recherche Interdisciplinaire en BiologieHumaine et Moleculaire, Universite Libre de Bruxelles, Brussels 1070, Belgium.3Institut Jacques Monod, CNRS, UMR7592, Univ Paris Diderot, Sorbonne ParisCite, F-75205 Paris, France.
*Authors for correspondence ([email protected]; [email protected])
2349
© 2014. Published by The Company of Biologists Ltd | Development (2014) 141, 2349-2359 doi:10.1242/dev.106633
DEVELO
PM
ENT
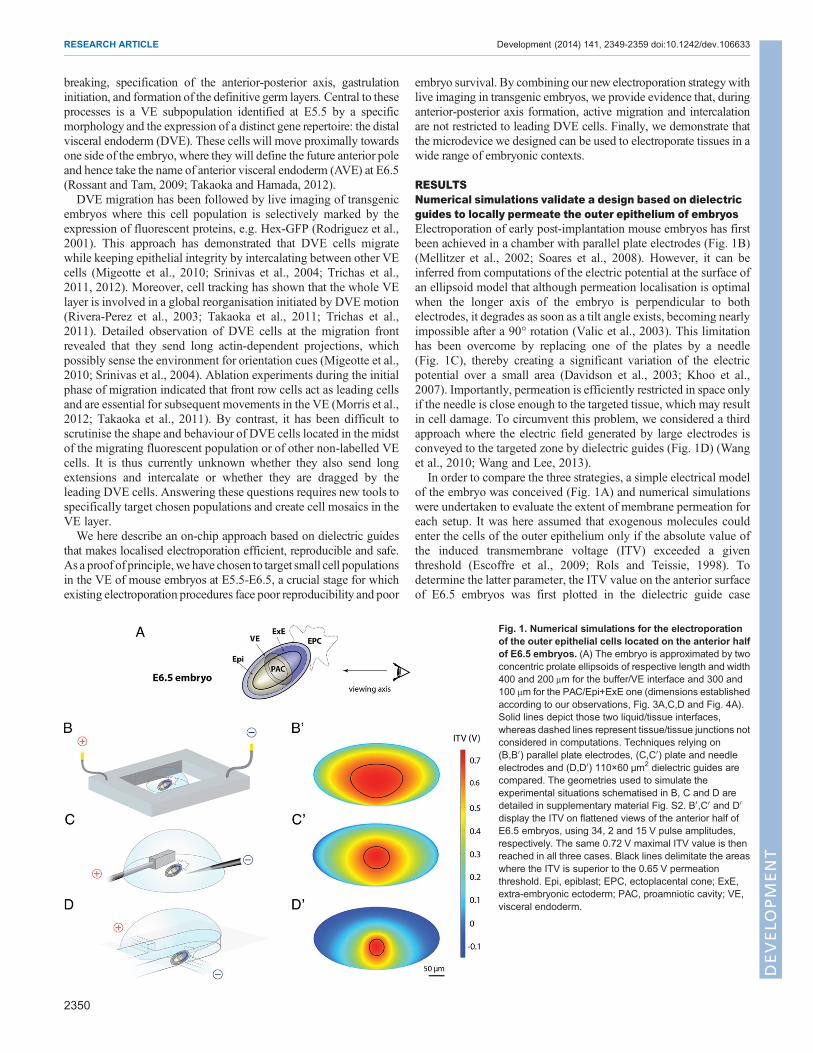
breaking, specification of the anterior-posterior axis, gastrulationinitiation, and formation of the definitive germ layers.Central to theseprocesses is a VE subpopulation identified at E5.5 by a specificmorphology and the expression of a distinct gene repertoire: the distalvisceral endoderm (DVE). These cells will move proximally towardsone side of the embryo, where they will define the future anterior poleand hence take the name of anterior visceral endoderm (AVE) at E6.5(Rossant and Tam, 2009; Takaoka and Hamada, 2012).DVE migration has been followed by live imaging of transgenic
embryos where this cell population is selectively marked by theexpression of fluorescent proteins, e.g. Hex-GFP (Rodriguez et al.,2001). This approach has demonstrated that DVE cells migratewhile keeping epithelial integrity by intercalating between other VEcells (Migeotte et al., 2010; Srinivas et al., 2004; Trichas et al.,2011, 2012). Moreover, cell tracking has shown that the whole VElayer is involved in a global reorganisation initiated by DVE motion(Rivera-Perez et al., 2003; Takaoka et al., 2011; Trichas et al.,2011). Detailed observation of DVE cells at the migration frontrevealed that they send long actin-dependent projections, whichpossibly sense the environment for orientation cues (Migeotte et al.,2010; Srinivas et al., 2004). Ablation experiments during the initialphase of migration indicated that front row cells act as leading cellsand are essential for subsequent movements in the VE (Morris et al.,2012; Takaoka et al., 2011). By contrast, it has been difficult toscrutinise the shape and behaviour of DVE cells located in the midstof the migrating fluorescent population or of other non-labelled VEcells. It is thus currently unknown whether they also send longextensions and intercalate or whether they are dragged by theleading DVE cells. Answering these questions requires new tools tospecifically target chosen populations and create cell mosaics in theVE layer.We here describe an on-chip approach based on dielectric guides
that makes localised electroporation efficient, reproducible and safe.As a proof of principle,we have chosen to target small cell populationsin the VE of mouse embryos at E5.5-E6.5, a crucial stage for whichexisting electroporation procedures face poor reproducibility and poor
embryo survival. By combining our new electroporation strategywithlive imaging in transgenic embryos, we provide evidence that, duringanterior-posterior axis formation, active migration and intercalationare not restricted to leading DVE cells. Finally, we demonstrate thatthe microdevice we designed can be used to electroporate tissues in awide range of embryonic contexts.
RESULTSNumerical simulations validate a design based on dielectricguides to locally permeate the outer epithelium of embryosElectroporation of early post-implantation mouse embryos has firstbeen achieved in a chamber with parallel plate electrodes (Fig. 1B)(Mellitzer et al., 2002; Soares et al., 2008). However, it can beinferred from computations of the electric potential at the surface ofan ellipsoid model that although permeation localisation is optimalwhen the longer axis of the embryo is perpendicular to bothelectrodes, it degrades as soon as a tilt angle exists, becoming nearlyimpossible after a 90° rotation (Valic et al., 2003). This limitationhas been overcome by replacing one of the plates by a needle(Fig. 1C), thereby creating a significant variation of the electricpotential over a small area (Davidson et al., 2003; Khoo et al.,2007). Importantly, permeation is efficiently restricted in space onlyif the needle is close enough to the targeted tissue, which may resultin cell damage. To circumvent this problem, we considered a thirdapproach where the electric field generated by large electrodes isconveyed to the targeted zone by dielectric guides (Fig. 1D) (Wanget al., 2010; Wang and Lee, 2013).
In order to compare the three strategies, a simple electrical modelof the embryo was conceived (Fig. 1A) and numerical simulationswere undertaken to evaluate the extent of membrane permeation foreach setup. It was here assumed that exogenous molecules couldenter the cells of the outer epithelium only if the absolute value ofthe induced transmembrane voltage (ITV) exceeded a giventhreshold (Escoffre et al., 2009; Rols and Teissie, 1998). Todetermine the latter parameter, the ITV value on the anterior surfaceof E6.5 embryos was first plotted in the dielectric guide case
Fig. 1. Numerical simulations for the electroporationof the outer epithelial cells located on the anterior halfof E6.5 embryos. (A) The embryo is approximated by twoconcentric prolate ellipsoids of respective length and width400 and 200 μm for the buffer/VE interface and 300 and100 μm for the PAC/Epi+ExE one (dimensions establishedaccording to our observations, Fig. 3A,C,D and Fig. 4A).Solid lines depict those two liquid/tissue interfaces,whereas dashed lines represent tissue/tissue junctions notconsidered in computations. Techniques relying on(B,B0) parallel plate electrodes, (C,C0) plate and needleelectrodes and (D,D0) 110×60 µm2 dielectric guides arecompared. The geometries used to simulate theexperimental situations schematised in B, C and D aredetailed in supplementary material Fig. S2. B0,C0 and D0
display the ITV on flattened views of the anterior half ofE6.5 embryos, using 34, 2 and 15 V pulse amplitudes,respectively. The same 0.72 V maximal ITV value is thenreached in all three cases. Black lines delimitate the areaswhere the ITV is superior to the 0.65 V permeationthreshold. Epi, epiblast; EPC, ectoplacental cone; ExE,extra-embryonic ectoderm; PAC, proamniotic cavity; VE,visceral endoderm.
2350
RESEARCH ARTICLE Development (2014) 141, 2349-2359 doi:10.1242/dev.106633
DEVELO
PM
ENT
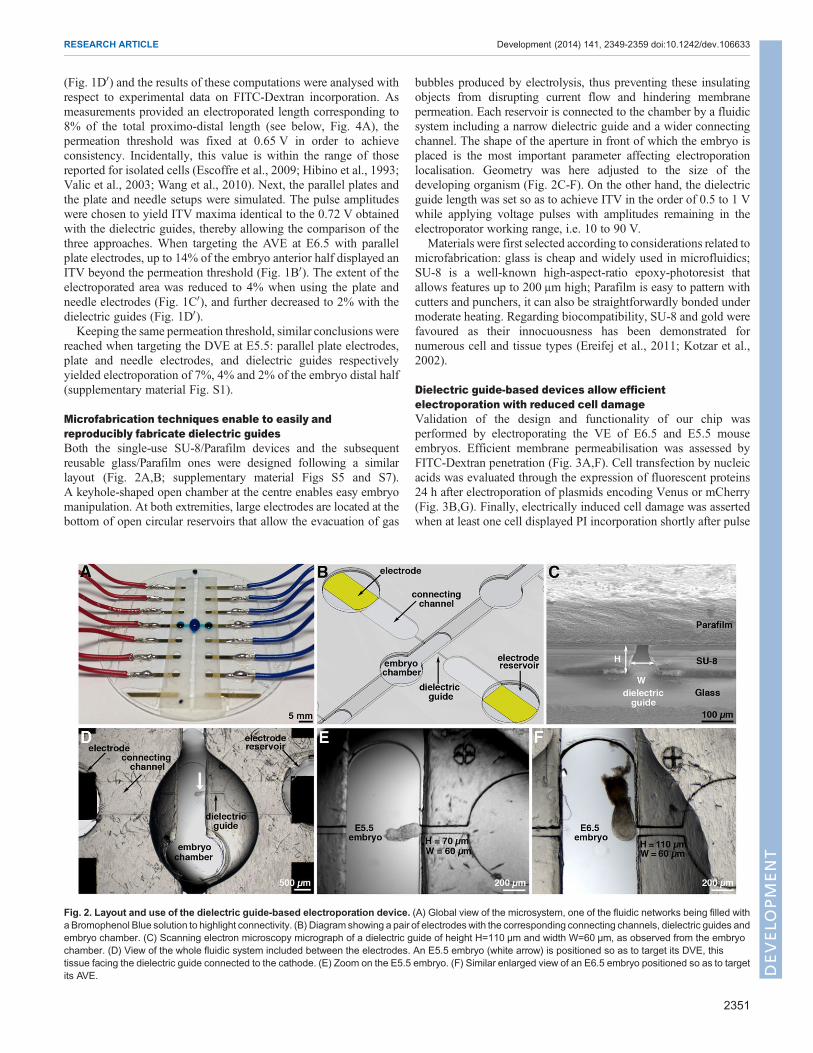
(Fig. 1D0) and the results of these computations were analysed withrespect to experimental data on FITC-Dextran incorporation. Asmeasurements provided an electroporated length corresponding to8% of the total proximo-distal length (see below, Fig. 4A), thepermeation threshold was fixed at 0.65 V in order to achieveconsistency. Incidentally, this value is within the range of thosereported for isolated cells (Escoffre et al., 2009; Hibino et al., 1993;Valic et al., 2003; Wang et al., 2010). Next, the parallel plates andthe plate and needle setups were simulated. The pulse amplitudeswere chosen to yield ITV maxima identical to the 0.72 V obtainedwith the dielectric guides, thereby allowing the comparison of thethree approaches. When targeting the AVE at E6.5 with parallelplate electrodes, up to 14% of the embryo anterior half displayed anITV beyond the permeation threshold (Fig. 1B0). The extent of theelectroporated area was reduced to 4% when using the plate andneedle electrodes (Fig. 1C0), and further decreased to 2% with thedielectric guides (Fig. 1D0).Keeping the same permeation threshold, similar conclusions were
reached when targeting the DVE at E5.5: parallel plate electrodes,plate and needle electrodes, and dielectric guides respectivelyyielded electroporation of 7%, 4% and 2% of the embryo distal half(supplementary material Fig. S1).
Microfabrication techniques enable to easily andreproducibly fabricate dielectric guidesBoth the single-use SU-8/Parafilm devices and the subsequentreusable glass/Parafilm ones were designed following a similarlayout (Fig. 2A,B; supplementary material Figs S5 and S7).A keyhole-shaped open chamber at the centre enables easy embryomanipulation. At both extremities, large electrodes are located at thebottom of open circular reservoirs that allow the evacuation of gas
bubbles produced by electrolysis, thus preventing these insulatingobjects from disrupting current flow and hindering membranepermeation. Each reservoir is connected to the chamber by a fluidicsystem including a narrow dielectric guide and a wider connectingchannel. The shape of the aperture in front of which the embryo isplaced is the most important parameter affecting electroporationlocalisation. Geometry was here adjusted to the size of thedeveloping organism (Fig. 2C-F). On the other hand, the dielectricguide length was set so as to achieve ITV in the order of 0.5 to 1 Vwhile applying voltage pulses with amplitudes remaining in theelectroporator working range, i.e. 10 to 90 V.
Materials were first selected according to considerations related tomicrofabrication: glass is cheap and widely used in microfluidics;SU-8 is a well-known high-aspect-ratio epoxy-photoresist thatallows features up to 200 μm high; Parafilm is easy to pattern withcutters and punchers, it can also be straightforwardly bonded undermoderate heating. Regarding biocompatibility, SU-8 and gold werefavoured as their innocuousness has been demonstrated fornumerous cell and tissue types (Ereifej et al., 2011; Kotzar et al.,2002).
Dielectric guide-based devices allow efficientelectroporation with reduced cell damageValidation of the design and functionality of our chip wasperformed by electroporating the VE of E6.5 and E5.5 mouseembryos. Efficient membrane permeabilisation was assessed byFITC-Dextran penetration (Fig. 3A,F). Cell transfection by nucleicacids was evaluated through the expression of fluorescent proteins24 h after electroporation of plasmids encoding Venus or mCherry(Fig. 3B,G). Finally, electrically induced cell damage was assertedwhen at least one cell displayed PI incorporation shortly after pulse
Fig. 2. Layout and use of the dielectric guide-based electroporation device. (A) Global view of the microsystem, one of the fluidic networks being filled witha Bromophenol Blue solution to highlight connectivity. (B) Diagram showing a pair of electrodeswith the corresponding connecting channels, dielectric guides andembryo chamber. (C) Scanning electron microscopy micrograph of a dielectric guide of height H=110 µm and width W=60 µm, as observed from the embryochamber. (D) View of the whole fluidic system included between the electrodes. An E5.5 embryo (white arrow) is positioned so as to target its DVE, thistissue facing the dielectric guide connected to the cathode. (E) Zoom on the E5.5 embryo. (F) Similar enlarged view of an E6.5 embryo positioned so as to targetits AVE.
2351
RESEARCH ARTICLE Development (2014) 141, 2349-2359 doi:10.1242/dev.106633
DEVELO
PM
ENT
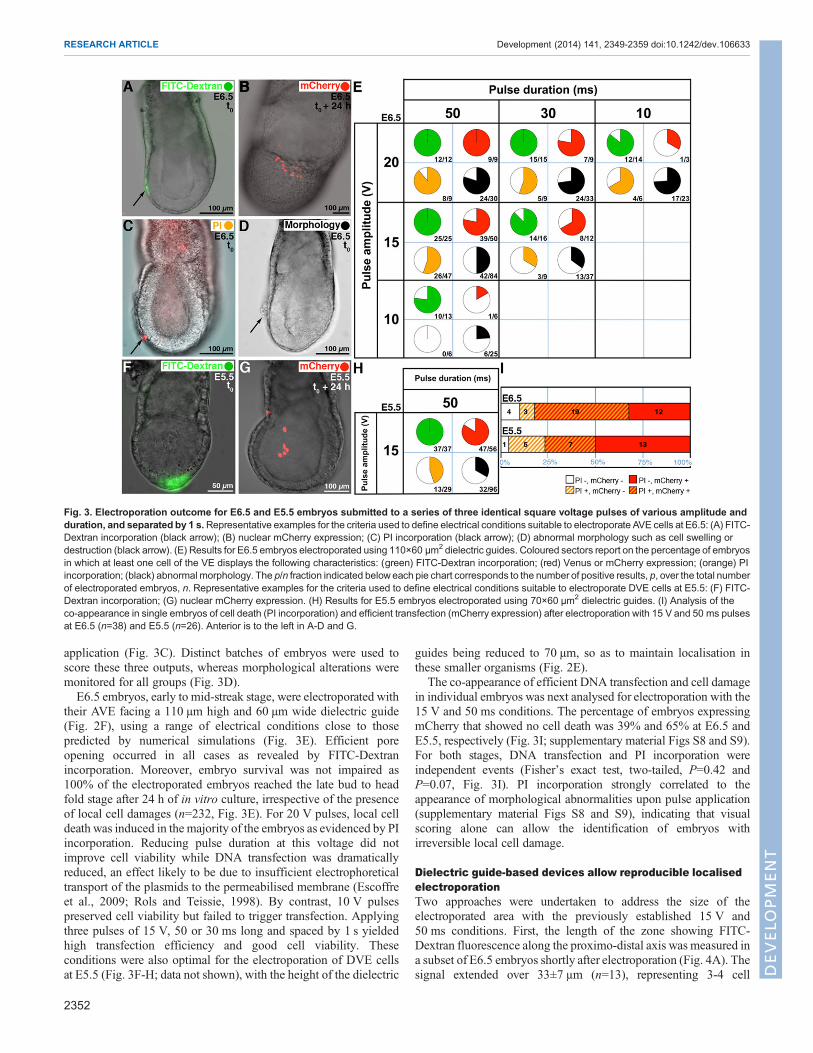
application (Fig. 3C). Distinct batches of embryos were used toscore these three outputs, whereas morphological alterations weremonitored for all groups (Fig. 3D).E6.5 embryos, early to mid-streak stage, were electroporated with
their AVE facing a 110 µm high and 60 µm wide dielectric guide(Fig. 2F), using a range of electrical conditions close to thosepredicted by numerical simulations (Fig. 3E). Efficient poreopening occurred in all cases as revealed by FITC-Dextranincorporation. Moreover, embryo survival was not impaired as100% of the electroporated embryos reached the late bud to headfold stage after 24 h of in vitro culture, irrespective of the presenceof local cell damages (n=232, Fig. 3E). For 20 V pulses, local celldeath was induced in the majority of the embryos as evidenced by PIincorporation. Reducing pulse duration at this voltage did notimprove cell viability while DNA transfection was dramaticallyreduced, an effect likely to be due to insufficient electrophoreticaltransport of the plasmids to the permeabilised membrane (Escoffreet al., 2009; Rols and Teissie, 1998). By contrast, 10 V pulsespreserved cell viability but failed to trigger transfection. Applyingthree pulses of 15 V, 50 or 30 ms long and spaced by 1 s yieldedhigh transfection efficiency and good cell viability. Theseconditions were also optimal for the electroporation of DVE cellsat E5.5 (Fig. 3F-H; data not shown), with the height of the dielectric
guides being reduced to 70 µm, so as to maintain localisation inthese smaller organisms (Fig. 2E).
The co-appearance of efficient DNA transfection and cell damagein individual embryos was next analysed for electroporation with the15 V and 50 ms conditions. The percentage of embryos expressingmCherry that showed no cell death was 39% and 65% at E6.5 andE5.5, respectively (Fig. 3I; supplementary material Figs S8 and S9).For both stages, DNA transfection and PI incorporation wereindependent events (Fisher’s exact test, two-tailed, P=0.42 andP=0.07, Fig. 3I). PI incorporation strongly correlated to theappearance of morphological abnormalities upon pulse application(supplementary material Figs S8 and S9), indicating that visualscoring alone can allow the identification of embryos withirreversible local cell damage.
Dielectric guide-based devices allow reproducible localisedelectroporationTwo approaches were undertaken to address the size of theelectroporated area with the previously established 15 V and50 ms conditions. First, the length of the zone showing FITC-Dextran fluorescence along the proximo-distal axis was measured ina subset of E6.5 embryos shortly after electroporation (Fig. 4A). Thesignal extended over 33±7 μm (n=13), representing 3-4 cell
Fig. 3. Electroporation outcome for E6.5 and E5.5 embryos submitted to a series of three identical square voltage pulses of various amplitude andduration, and separated by 1 s.Representative examples for the criteria used to define electrical conditions suitable to electroporate AVE cells at E6.5: (A) FITC-Dextran incorporation (black arrow); (B) nuclear mCherry expression; (C) PI incorporation (black arrow); (D) abnormal morphology such as cell swelling ordestruction (black arrow). (E) Results for E6.5 embryos electroporated using 110×60 µm2 dielectric guides. Coloured sectors report on the percentage of embryosin which at least one cell of the VE displays the following characteristics: (green) FITC-Dextran incorporation; (red) Venus or mCherry expression; (orange) PIincorporation; (black) abnormal morphology. The p/n fraction indicated beloweach pie chart corresponds to the number of positive results, p, over the total numberof electroporated embryos, n. Representative examples for the criteria used to define electrical conditions suitable to electroporate DVE cells at E5.5: (F) FITC-Dextran incorporation; (G) nuclear mCherry expression. (H) Results for E5.5 embryos electroporated using 70×60 µm2 dielectric guides. (I) Analysis of theco-appearance in single embryos of cell death (PI incorporation) and efficient transfection (mCherry expression) after electroporation with 15 V and 50 ms pulsesat E6.5 (n=38) and E5.5 (n=26). Anterior is to the left in A-D and G.
2352
RESEARCH ARTICLE Development (2014) 141, 2349-2359 doi:10.1242/dev.106633
DEVELO
PM
ENT
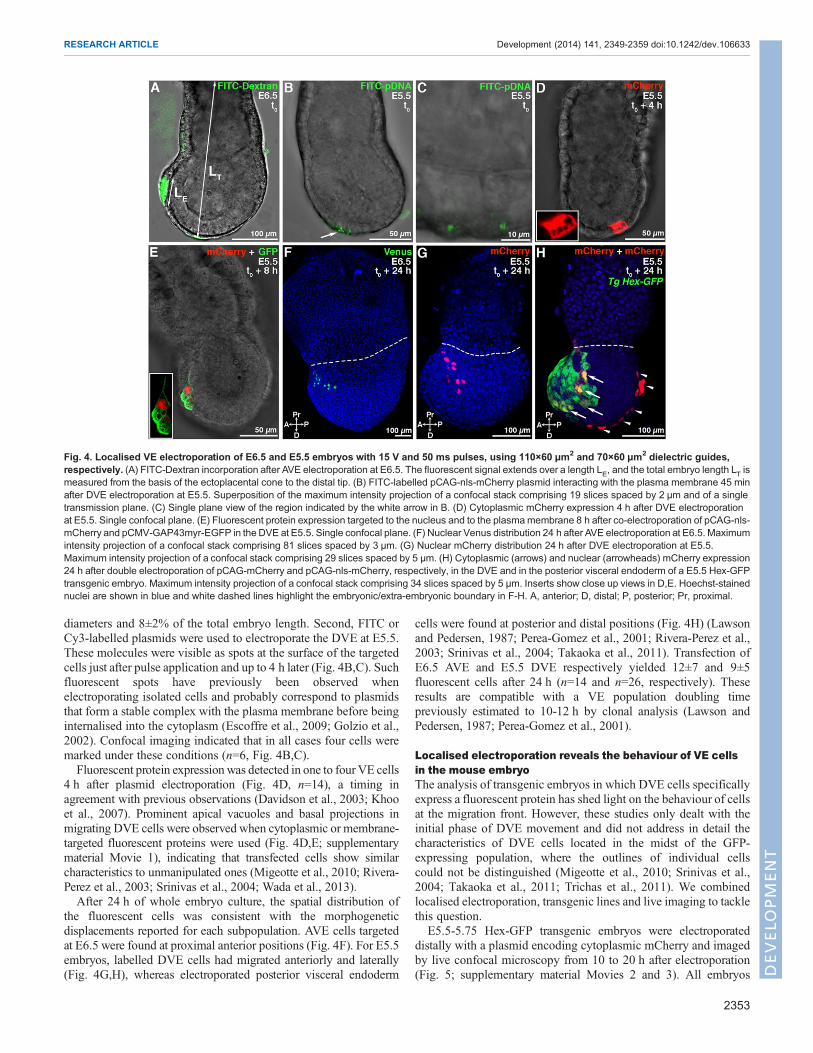
diameters and 8±2% of the total embryo length. Second, FITC orCy3-labelled plasmids were used to electroporate the DVE at E5.5.These molecules were visible as spots at the surface of the targetedcells just after pulse application and up to 4 h later (Fig. 4B,C). Suchfluorescent spots have previously been observed whenelectroporating isolated cells and probably correspond to plasmidsthat form a stable complex with the plasma membrane before beinginternalised into the cytoplasm (Escoffre et al., 2009; Golzio et al.,2002). Confocal imaging indicated that in all cases four cells weremarked under these conditions (n=6, Fig. 4B,C).Fluorescent protein expression was detected in one to four VE cells
4 h after plasmid electroporation (Fig. 4D, n=14), a timing inagreement with previous observations (Davidson et al., 2003; Khooet al., 2007). Prominent apical vacuoles and basal projections inmigrating DVE cells were observed when cytoplasmic or membrane-targeted fluorescent proteins were used (Fig. 4D,E; supplementarymaterial Movie 1), indicating that transfected cells show similarcharacteristics to unmanipulated ones (Migeotte et al., 2010; Rivera-Perez et al., 2003; Srinivas et al., 2004; Wada et al., 2013).After 24 h of whole embryo culture, the spatial distribution of
the fluorescent cells was consistent with the morphogeneticdisplacements reported for each subpopulation. AVE cells targetedat E6.5 were found at proximal anterior positions (Fig. 4F). For E5.5embryos, labelled DVE cells had migrated anteriorly and laterally(Fig. 4G,H), whereas electroporated posterior visceral endoderm
cells were found at posterior and distal positions (Fig. 4H) (Lawsonand Pedersen, 1987; Perea-Gomez et al., 2001; Rivera-Perez et al.,2003; Srinivas et al., 2004; Takaoka et al., 2011). Transfection ofE6.5 AVE and E5.5 DVE respectively yielded 12±7 and 9±5fluorescent cells after 24 h (n=14 and n=26, respectively). Theseresults are compatible with a VE population doubling timepreviously estimated to 10-12 h by clonal analysis (Lawson andPedersen, 1987; Perea-Gomez et al., 2001).
Localised electroporation reveals the behaviour of VE cellsin the mouse embryoThe analysis of transgenic embryos in which DVE cells specificallyexpress a fluorescent protein has shed light on the behaviour of cellsat the migration front. However, these studies only dealt with theinitial phase of DVE movement and did not address in detail thecharacteristics of DVE cells located in the midst of the GFP-expressing population, where the outlines of individual cellscould not be distinguished (Migeotte et al., 2010; Srinivas et al.,2004; Takaoka et al., 2011; Trichas et al., 2011). We combinedlocalised electroporation, transgenic lines and live imaging to tacklethis question.
E5.5-5.75 Hex-GFP transgenic embryos were electroporateddistally with a plasmid encoding cytoplasmic mCherry and imagedby live confocal microscopy from 10 to 20 h after electroporation(Fig. 5; supplementary material Movies 2 and 3). All embryos
Fig. 4. Localised VE electroporation of E6.5 and E5.5 embryos with 15 V and 50 ms pulses, using 110×60 µm2 and 70×60 µm2 dielectric guides,respectively. (A) FITC-Dextran incorporation after AVE electroporation at E6.5. The fluorescent signal extends over a length LE, and the total embryo length LT ismeasured from the basis of the ectoplacental cone to the distal tip. (B) FITC-labelled pCAG-nls-mCherry plasmid interacting with the plasma membrane 45 minafter DVE electroporation at E5.5. Superposition of the maximum intensity projection of a confocal stack comprising 19 slices spaced by 2 µm and of a singletransmission plane. (C) Single plane view of the region indicated by the white arrow in B. (D) Cytoplasmic mCherry expression 4 h after DVE electroporationat E5.5. Single confocal plane. (E) Fluorescent protein expression targeted to the nucleus and to the plasmamembrane 8 h after co-electroporation of pCAG-nls-mCherry and pCMV-GAP43myr-EGFP in the DVE at E5.5. Single confocal plane. (F) Nuclear Venus distribution 24 h after AVE electroporation at E6.5. Maximumintensity projection of a confocal stack comprising 81 slices spaced by 3 µm. (G) Nuclear mCherry distribution 24 h after DVE electroporation at E5.5.Maximum intensity projection of a confocal stack comprising 29 slices spaced by 5 µm. (H) Cytoplasmic (arrows) and nuclear (arrowheads) mCherry expression24 h after double electroporation of pCAG-mCherry and pCAG-nls-mCherry, respectively, in the DVE and in the posterior visceral endoderm of a E5.5 Hex-GFPtransgenic embryo. Maximum intensity projection of a confocal stack comprising 34 slices spaced by 5 µm. Inserts show close up views in D,E. Hoechst-stainednuclei are shown in blue and white dashed lines highlight the embryonic/extra-embryonic boundary in F-H. A, anterior; D, distal; P, posterior; Pr, proximal.
2353
RESEARCH ARTICLE Development (2014) 141, 2349-2359 doi:10.1242/dev.106633
DEVELO
PM
ENT
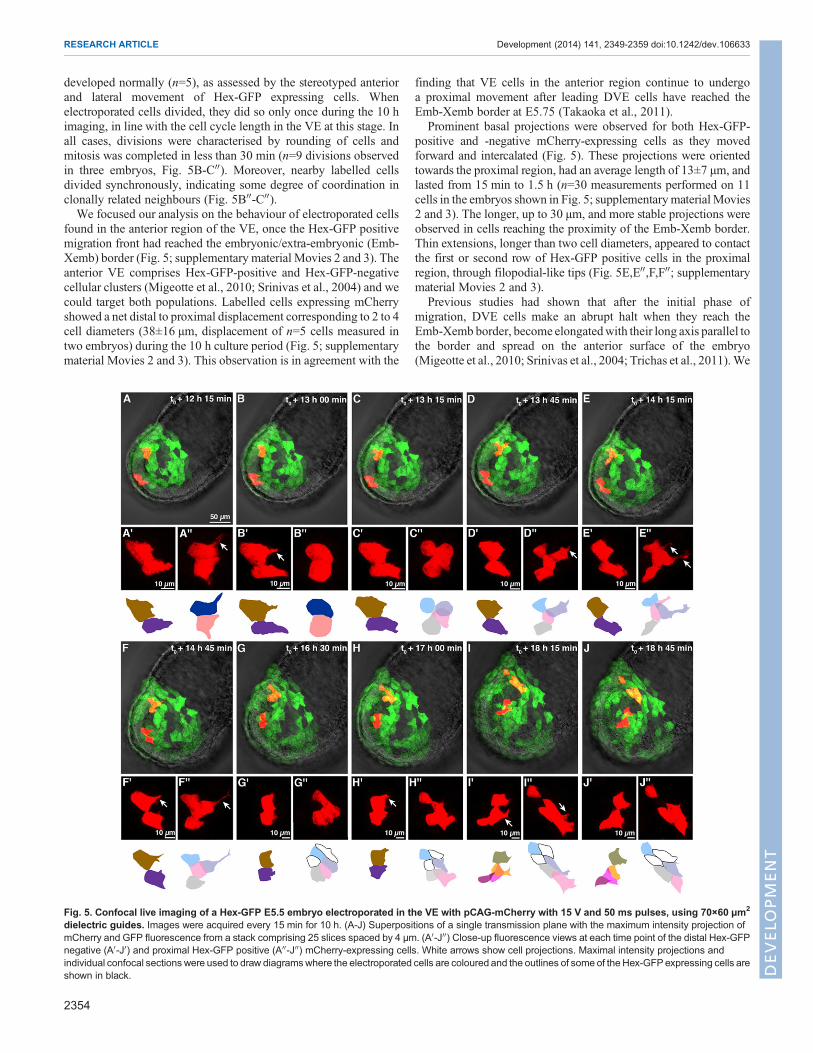
developed normally (n=5), as assessed by the stereotyped anteriorand lateral movement of Hex-GFP expressing cells. Whenelectroporated cells divided, they did so only once during the 10 himaging, in line with the cell cycle length in the VE at this stage. Inall cases, divisions were characterised by rounding of cells andmitosis was completed in less than 30 min (n=9 divisions observedin three embryos, Fig. 5B-C00). Moreover, nearby labelled cellsdivided synchronously, indicating some degree of coordination inclonally related neighbours (Fig. 5B00-C00).We focused our analysis on the behaviour of electroporated cells
found in the anterior region of the VE, once the Hex-GFP positivemigration front had reached the embryonic/extra-embryonic (Emb-Xemb) border (Fig. 5; supplementary material Movies 2 and 3). Theanterior VE comprises Hex-GFP-positive and Hex-GFP-negativecellular clusters (Migeotte et al., 2010; Srinivas et al., 2004) and wecould target both populations. Labelled cells expressing mCherryshowed a net distal to proximal displacement corresponding to 2 to 4cell diameters (38±16 µm, displacement of n=5 cells measured intwo embryos) during the 10 h culture period (Fig. 5; supplementarymaterial Movies 2 and 3). This observation is in agreement with the
finding that VE cells in the anterior region continue to undergoa proximal movement after leading DVE cells have reached theEmb-Xemb border at E5.75 (Takaoka et al., 2011).
Prominent basal projections were observed for both Hex-GFP-positive and -negative mCherry-expressing cells as they movedforward and intercalated (Fig. 5). These projections were orientedtowards the proximal region, had an average length of 13±7 µm, andlasted from 15 min to 1.5 h (n=30 measurements performed on 11cells in the embryos shown in Fig. 5; supplementarymaterialMovies2 and 3). The longer, up to 30 µm, and more stable projections wereobserved in cells reaching the proximity of the Emb-Xemb border.Thin extensions, longer than two cell diameters, appeared to contactthe first or second row of Hex-GFP positive cells in the proximalregion, through filopodial-like tips (Fig. 5E,E00,F,F00; supplementarymaterial Movies 2 and 3).
Previous studies had shown that after the initial phase ofmigration, DVE cells make an abrupt halt when they reach theEmb-Xemb border, become elongatedwith their long axis parallel tothe border and spread on the anterior surface of the embryo(Migeotte et al., 2010; Srinivas et al., 2004; Trichas et al., 2011).We
Fig. 5. Confocal live imaging of a Hex-GFP E5.5 embryo electroporated in the VE with pCAG-mCherry with 15 V and 50 ms pulses, using 70×60 µm2
dielectric guides. Images were acquired every 15 min for 10 h. (A-J) Superpositions of a single transmission plane with the maximum intensity projection ofmCherry and GFP fluorescence from a stack comprising 25 slices spaced by 4 µm. (A0-J00) Close-up fluorescence views at each time point of the distal Hex-GFPnegative (A0-J0) and proximal Hex-GFP positive (A00-J00) mCherry-expressing cells. White arrows show cell projections. Maximal intensity projections andindividual confocal sections were used to draw diagramswhere the electroporated cells are coloured and the outlines of some of the Hex-GFPexpressing cells areshown in black.
2354
RESEARCH ARTICLE Development (2014) 141, 2349-2359 doi:10.1242/dev.106633
DEVELO
PM
ENT
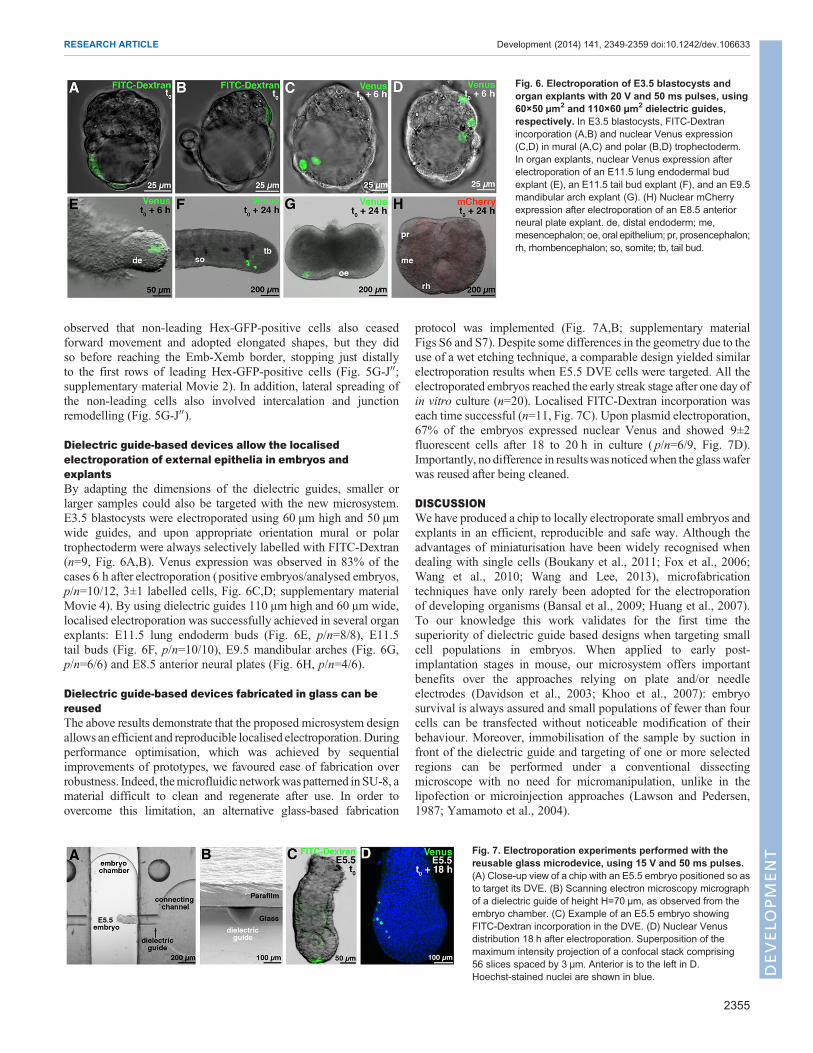
observed that non-leading Hex-GFP-positive cells also ceasedforward movement and adopted elongated shapes, but they didso before reaching the Emb-Xemb border, stopping just distallyto the first rows of leading Hex-GFP-positive cells (Fig. 5G-J00;supplementary material Movie 2). In addition, lateral spreading ofthe non-leading cells also involved intercalation and junctionremodelling (Fig. 5G-J00).
Dielectric guide-based devices allow the localisedelectroporation of external epithelia in embryos andexplantsBy adapting the dimensions of the dielectric guides, smaller orlarger samples could also be targeted with the new microsystem.E3.5 blastocysts were electroporated using 60 µm high and 50 µmwide guides, and upon appropriate orientation mural or polartrophectoderm were always selectively labelled with FITC-Dextran(n=9, Fig. 6A,B). Venus expression was observed in 83% of thecases 6 h after electroporation (positive embryos/analysed embryos,p/n=10/12, 3±1 labelled cells, Fig. 6C,D; supplementary materialMovie 4). By using dielectric guides 110 μm high and 60 μm wide,localised electroporation was successfully achieved in several organexplants: E11.5 lung endoderm buds (Fig. 6E, p/n=8/8), E11.5tail buds (Fig. 6F, p/n=10/10), E9.5 mandibular arches (Fig. 6G,p/n=6/6) and E8.5 anterior neural plates (Fig. 6H, p/n=4/6).
Dielectric guide-based devices fabricated in glass can bereusedThe above results demonstrate that the proposed microsystem designallows an efficient and reproducible localised electroporation.Duringperformance optimisation, which was achieved by sequentialimprovements of prototypes, we favoured ease of fabrication overrobustness. Indeed, themicrofluidic networkwas patterned in SU-8, amaterial difficult to clean and regenerate after use. In order toovercome this limitation, an alternative glass-based fabrication
protocol was implemented (Fig. 7A,B; supplementary materialFigs S6 and S7). Despite some differences in the geometry due to theuse of a wet etching technique, a comparable design yielded similarelectroporation results when E5.5 DVE cells were targeted. All theelectroporated embryos reached the early streak stage after one day ofin vitro culture (n=20). Localised FITC-Dextran incorporation waseach time successful (n=11, Fig. 7C). Upon plasmid electroporation,67% of the embryos expressed nuclear Venus and showed 9±2fluorescent cells after 18 to 20 h in culture ( p/n=6/9, Fig. 7D).Importantly, no difference in resultswas noticedwhen the glasswaferwas reused after being cleaned.
DISCUSSIONWe have produced a chip to locally electroporate small embryos andexplants in an efficient, reproducible and safe way. Although theadvantages of miniaturisation have been widely recognised whendealing with single cells (Boukany et al., 2011; Fox et al., 2006;Wang et al., 2010; Wang and Lee, 2013), microfabricationtechniques have only rarely been adopted for the electroporationof developing organisms (Bansal et al., 2009; Huang et al., 2007).To our knowledge this work validates for the first time thesuperiority of dielectric guide based designs when targeting smallcell populations in embryos. When applied to early post-implantation stages in mouse, our microsystem offers importantbenefits over the approaches relying on plate and/or needleelectrodes (Davidson et al., 2003; Khoo et al., 2007): embryosurvival is always assured and small populations of fewer than fourcells can be transfected without noticeable modification of theirbehaviour. Moreover, immobilisation of the sample by suction infront of the dielectric guide and targeting of one or more selectedregions can be performed under a conventional dissectingmicroscope with no need for micromanipulation, unlike in thelipofection or microinjection approaches (Lawson and Pedersen,1987; Yamamoto et al., 2004).
Fig. 7. Electroporation experiments performed with thereusable glass microdevice, using 15 V and 50 ms pulses.(A) Close-up view of a chip with an E5.5 embryo positioned so asto target its DVE. (B) Scanning electron microscopy micrographof a dielectric guide of height H=70 µm, as observed from theembryo chamber. (C) Example of an E5.5 embryo showingFITC-Dextran incorporation in the DVE. (D) Nuclear Venusdistribution 18 h after electroporation. Superposition of themaximum intensity projection of a confocal stack comprising56 slices spaced by 3 µm. Anterior is to the left in D.Hoechst-stained nuclei are shown in blue.
Fig. 6. Electroporation of E3.5 blastocysts andorgan explants with 20 V and 50 ms pulses, using60×50 µm2 and 110×60 µm2 dielectric guides,respectively. In E3.5 blastocysts, FITC-Dextranincorporation (A,B) and nuclear Venus expression(C,D) in mural (A,C) and polar (B,D) trophectoderm.In organ explants, nuclear Venus expression afterelectroporation of an E11.5 lung endodermal budexplant (E), an E11.5 tail bud explant (F), and an E9.5mandibular arch explant (G). (H) Nuclear mCherryexpression after electroporation of an E8.5 anteriorneural plate explant. de, distal endoderm; me,mesencephalon; oe, oral epithelium; pr, prosencephalon;rh, rhombencephalon; so, somite; tb, tail bud.
2355
RESEARCH ARTICLE Development (2014) 141, 2349-2359 doi:10.1242/dev.106633
DEVELO
PM
ENT
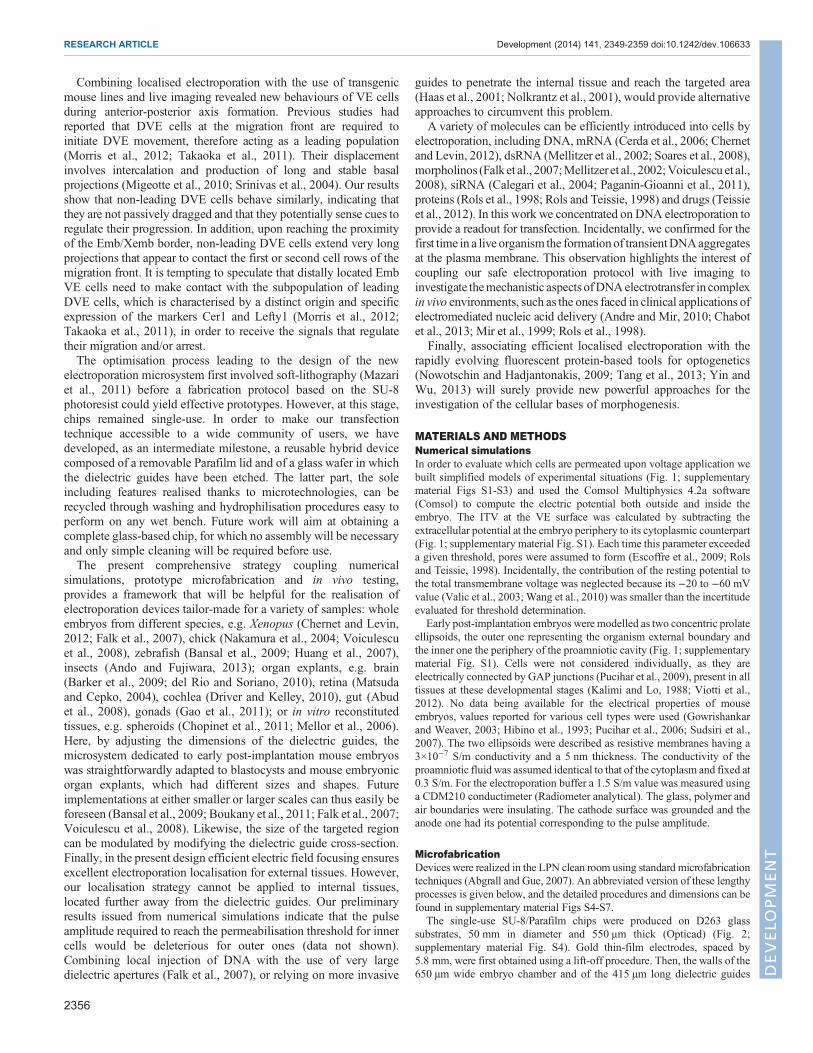
Combining localised electroporation with the use of transgenicmouse lines and live imaging revealed new behaviours of VE cellsduring anterior-posterior axis formation. Previous studies hadreported that DVE cells at the migration front are required toinitiate DVE movement, therefore acting as a leading population(Morris et al., 2012; Takaoka et al., 2011). Their displacementinvolves intercalation and production of long and stable basalprojections (Migeotte et al., 2010; Srinivas et al., 2004). Our resultsshow that non-leading DVE cells behave similarly, indicating thatthey are not passively dragged and that they potentially sense cues toregulate their progression. In addition, upon reaching the proximityof the Emb/Xemb border, non-leading DVE cells extend very longprojections that appear to contact the first or second cell rows of themigration front. It is tempting to speculate that distally located EmbVE cells need to make contact with the subpopulation of leadingDVE cells, which is characterised by a distinct origin and specificexpression of the markers Cer1 and Lefty1 (Morris et al., 2012;Takaoka et al., 2011), in order to receive the signals that regulatetheir migration and/or arrest.The optimisation process leading to the design of the new
electroporation microsystem first involved soft-lithography (Mazariet al., 2011) before a fabrication protocol based on the SU-8photoresist could yield effective prototypes. However, at this stage,chips remained single-use. In order to make our transfectiontechnique accessible to a wide community of users, we havedeveloped, as an intermediate milestone, a reusable hybrid devicecomposed of a removable Parafilm lid and of a glass wafer in whichthe dielectric guides have been etched. The latter part, the soleincluding features realised thanks to microtechnologies, can berecycled through washing and hydrophilisation procedures easy toperform on any wet bench. Future work will aim at obtaining acomplete glass-based chip, for which no assembly will be necessaryand only simple cleaning will be required before use.The present comprehensive strategy coupling numerical
simulations, prototype microfabrication and in vivo testing,provides a framework that will be helpful for the realisation ofelectroporation devices tailor-made for a variety of samples: wholeembryos from different species, e.g. Xenopus (Chernet and Levin,2012; Falk et al., 2007), chick (Nakamura et al., 2004; Voiculescuet al., 2008), zebrafish (Bansal et al., 2009; Huang et al., 2007),insects (Ando and Fujiwara, 2013); organ explants, e.g. brain(Barker et al., 2009; del Rio and Soriano, 2010), retina (Matsudaand Cepko, 2004), cochlea (Driver and Kelley, 2010), gut (Abudet al., 2008), gonads (Gao et al., 2011); or in vitro reconstitutedtissues, e.g. spheroids (Chopinet et al., 2011; Mellor et al., 2006).Here, by adjusting the dimensions of the dielectric guides, themicrosystem dedicated to early post-implantation mouse embryoswas straightforwardly adapted to blastocysts and mouse embryonicorgan explants, which had different sizes and shapes. Futureimplementations at either smaller or larger scales can thus easily beforeseen (Bansal et al., 2009; Boukany et al., 2011; Falk et al., 2007;Voiculescu et al., 2008). Likewise, the size of the targeted regioncan be modulated by modifying the dielectric guide cross-section.Finally, in the present design efficient electric field focusing ensuresexcellent electroporation localisation for external tissues. However,our localisation strategy cannot be applied to internal tissues,located further away from the dielectric guides. Our preliminaryresults issued from numerical simulations indicate that the pulseamplitude required to reach the permeabilisation threshold for innercells would be deleterious for outer ones (data not shown).Combining local injection of DNA with the use of very largedielectric apertures (Falk et al., 2007), or relying on more invasive
guides to penetrate the internal tissue and reach the targeted area(Haas et al., 2001; Nolkrantz et al., 2001), would provide alternativeapproaches to circumvent this problem.
A variety of molecules can be efficiently introduced into cells byelectroporation, including DNA, mRNA (Cerda et al., 2006; Chernetand Levin, 2012), dsRNA (Mellitzer et al., 2002; Soares et al., 2008),morpholinos (Falket al., 2007;Mellitzeret al., 2002;Voiculescu et al.,2008), siRNA (Calegari et al., 2004; Paganin-Gioanni et al., 2011),proteins (Rols et al., 1998; Rols and Teissie, 1998) and drugs (Teissieet al., 2012). In this work we concentrated on DNA electroporation toprovide a readout for transfection. Incidentally, we confirmed for thefirst time in a live organism the formationof transientDNAaggregatesat the plasma membrane. This observation highlights the interest ofcoupling our safe electroporation protocol with live imaging toinvestigate themechanistic aspects ofDNAelectrotransfer in complexin vivo environments, such as the ones faced in clinical applications ofelectromediated nucleic acid delivery (Andre and Mir, 2010; Chabotet al., 2013; Mir et al., 1999; Rols et al., 1998).
Finally, associating efficient localised electroporation with therapidly evolving fluorescent protein-based tools for optogenetics(Nowotschin and Hadjantonakis, 2009; Tang et al., 2013; Yin andWu, 2013) will surely provide new powerful approaches for theinvestigation of the cellular bases of morphogenesis.
MATERIALS AND METHODSNumerical simulationsIn order to evaluate which cells are permeated upon voltage application webuilt simplified models of experimental situations (Fig. 1; supplementarymaterial Figs S1-S3) and used the Comsol Multiphysics 4.2a software(Comsol) to compute the electric potential both outside and inside theembryo. The ITV at the VE surface was calculated by subtracting theextracellular potential at the embryo periphery to its cytoplasmic counterpart(Fig. 1; supplementary material Fig. S1). Each time this parameter exceededa given threshold, pores were assumed to form (Escoffre et al., 2009; Rolsand Teissie, 1998). Incidentally, the contribution of the resting potential tothe total transmembrane voltage was neglected because its −20 to −60 mVvalue (Valic et al., 2003; Wang et al., 2010) was smaller than the incertitudeevaluated for threshold determination.
Early post-implantation embryos were modelled as two concentric prolateellipsoids, the outer one representing the organism external boundary andthe inner one the periphery of the proamniotic cavity (Fig. 1; supplementarymaterial Fig. S1). Cells were not considered individually, as they areelectrically connected by GAP junctions (Pucihar et al., 2009), present in alltissues at these developmental stages (Kalimi and Lo, 1988; Viotti et al.,2012). No data being available for the electrical properties of mouseembryos, values reported for various cell types were used (Gowrishankarand Weaver, 2003; Hibino et al., 1993; Pucihar et al., 2006; Sudsiri et al.,2007). The two ellipsoids were described as resistive membranes having a3×10−7 S/m conductivity and a 5 nm thickness. The conductivity of theproamniotic fluid was assumed identical to that of the cytoplasm and fixed at0.3 S/m. For the electroporation buffer a 1.5 S/m value was measured usinga CDM210 conductimeter (Radiometer analytical). The glass, polymer andair boundaries were insulating. The cathode surface was grounded and theanode one had its potential corresponding to the pulse amplitude.
MicrofabricationDevices were realized in the LPN clean room using standard microfabricationtechniques (Abgrall and Gue, 2007). An abbreviated version of these lengthyprocesses is given below, and the detailed procedures and dimensions can befound in supplementary material Figs S4-S7.
The single-use SU-8/Parafilm chips were produced on D263 glasssubstrates, 50 mm in diameter and 550 μm thick (Opticad) (Fig. 2;supplementary material Fig. S4). Gold thin-film electrodes, spaced by5.8 mm, were first obtained using a lift-off procedure. Then, the walls of the650 µm wide embryo chamber and of the 415 µm long dielectric guides
2356
RESEARCH ARTICLE Development (2014) 141, 2349-2359 doi:10.1242/dev.106633
DEVELO
PM
ENT
were patterned in SU-8 2050 (MicroChem). The thickness H of the epoxy-resist layer and the width Wof the dielectric guides were adjusted to the sizeof the electroporated organism, varying from 60 to 110 μm and from 50 to60 μm, respectively (supplementary material Fig. S5). Next, the polymersurface was hydrophilised by plasma treatment. Finally, the fluidic systemwas closed by thermal bonding of a 130 μm thick ceiling made of Parafilm‘M’ (Pechiney) including the necessary access holes.
For fabrication of the reusable glass/Parafilm device (Fig. 7;supplementary material Figs S6 and S7) a chromium mask was firstpatterned on the D263 substrate by optical lithography followed by ion beametching. Hydrofluoric acid was subsequently used to selectively etch thefluidic network in the wafer bulk up to H=70 μm, which resulted in guideswith a rounder profile. After electrodes were deposited, the glass surface washydrophilised in a basic solution. Finally, the Parafilm lid was assembled.Following electroporation, glass substrate recycling was performed bypeeling off the Parafilm, cleaning the organic traces in trichloroethylene andthe mineral ones in a caustic soda solution. A new surface activation and thebonding of a new lid could then be undertaken.
Mouse strains, embryo collection, in vitro culture of wholeembryos and explantsEmbryos were obtained from natural matings of wild-type Swiss females witheither Swiss males or transgenic Hex-GFP males maintained on a mixedC57Bl/6 CBA/J and Swiss background (embryos obtained from males of theC57Bl/6 CBA/J background alone were less resistant to the electroporationprocedure, data not shown). E5.5 and E6.5 embryos were dissected in DMEM,10% fetal calf serum, 25 mM Hepes buffer pH 7.0 (Gibco) and cultured at37°C and 5% CO2 in, respectively, 50% or 75% heat-inactivated rat serum inDMEM/F12, 100 μg/ml streptomycin, 100 U/ml penicillin, by groups of threein 200 µl or individually in 30 µl. E3.5 blastocysts were flushed from uterinehorns in M2 medium (Sigma), depellucidated in acid Tyrode’s solution, andcultured in 10 μl ofG2medium (Vitrolife) coveredwithmineral oil. E11.5 lungendodermal bud explants, obtained after removal of mesenchyme withpancreatin/trypsin treatment, were cultured in Matrigel (Becton Dickinson)(Weaver et al., 2000). E11.5 tail buds, E9.5 mandibular arches, and E8.5anterior neural plate explants were cultured on Millicell organotypic inserts(Millipore) (Chai et al., 1998; Shimamura andRubenstein, 1997). Experimentswere performed in accordancewith FrenchAgriculturalMinistry andEuropeanguidelines for the care and use of laboratory animals (certificate CEB-35-2012delivered by ethical committee CEEA-40).
Markers for electroporationFluorescein-labelled dextran (FITC-Dextran, 4 kDa, Sigma) was dissolvedat 2 mg/ml in HBS (150 mM NaCl, 20 mM Hepes buffer pH 7.0).pCAG-mCherry, pCAG-nls-mCherry, pCMV-GAP43myr-EGFP (themyristoylation sequence of GAP43 targets EGFP to the plasmamembrane), and pCAG-nls-Venus endotoxin-free plasmids were dilutedat 1 to 1.5 µg/µl in HBS. Concentrations were selected according to literature(Davidson et al., 2003; Khoo et al., 2007; Rols and Teissie, 1998). Forimmediate visualisation of DNA electroporation, plasmids were labelledwith either Cy3 or fluorescein using the Label IT Tracker kit (Mirus)(Boukany et al., 2011). Incubating the embryos in FITC-Dextran or influorescently labelled plasmid solutions for 5 min did not result in anyfluorescence above background (data not shown), ruling out any significantendocytic uptake of these markers by VE cells during the procedure.Furthermore, marker molecular weights above 1 kDa precluded diffusionfrom cell to cell through GAP junctions (Kalimi and Lo, 1988).
Electroporation protocolsFor each electroporation, 15 μl of solution containing the exogenous moleculewere applied to the device, starting with the electrode reservoirs to easilyachieve dielectric guide filling. Individual embryos or explants were brieflyrinsed in HBS and transferred to the central chamber, with the targeted areafacing the cathodic channel (Fig. 2D-F). A small residual flow, probably due topressure differences between droplets of different volumes in the electrodereservoirs and the embryo chamber, kept the organism steady in front of theguide opening during the procedure (2 to 3 min per sample). A train of three
square pulses of duration 10 to 50 ms and amplitude 10 to 20 V, spaced by 1 s,was immediately applied using a TSS20 Ovodyne electroporator (Intracel).
When addressing cell death, electroporated embryos were cultured for30 min and stained for 20 min at 37°C in dissection medium containing25 µg/ml of propidium iodide (PI, Sigma). PI staining did not modify theefficiency of transfection with plasmid DNA. Control embryos submitted tothe whole protocol with the exception of pulse application did not show anyPI incorporation (data not shown).
Wide-field and confocal microscopyTo document FITC-Dextran and PI incorporation, embryos were imaged 1 to3 h after electroporation using a DMI6000B inverted microscope (Leica)equipped with 20×/0.7NA and 10×/0.4NA lenses. For detailed investigationson the position and number of electroporated cells, embryos were fixed inPBS/paraformaldehyde 4% at 4°C for 1 h and stained with 10 µg/ml Hoechst33342 (Molecular Probes). Confocal images were obtained using a LSM 710confocalmicroscope (Zeiss) equippedwith 25×/0.8NAand40×/1.3NA lenses.
Time-lapse microscopyIndividual E5.5 electroporated embryos were transferred into wells ofangiogenesis µ-slides (Ibidi) containing 30 µl of culture medium andimaged for up to 16 h on an inverted LSM 710 confocal microscope (Zeiss)equipped with a 40×/1.3NA lens. Cell projections were measured on 3Dimages by manually selecting their tip and basis and using the ‘Filamenttracer’ function of Imaris 7.6.4 (Bitplane).
AcknowledgementsWe are indebted to the staff of the LPN clean room, the ImagoSeine platform, andthe IJM animal facility for excellent technical assistance. We thank L. Couraud,C. Dupuis and L. Leroy for performing metallization and electron microscopy,A.-C. Louer and W. Supatto for useful discussions, C. Papanayotou and S. Meilhacfor gifts of plasmids, G. Duval for help with embryo culture, G. Dubois, J. Laniel,M. Mantelet and J. Iranzo for participating in initial experiments, A. Camus,H. Berthoumieux, C. Papanayotou, P.-H. Puech and D. Saberan-Djoneidi for criticalreading of the manuscript.
Competing interestsThe authors declare no competing financial interests.
Author contributionsA.P.-G. and C.G. conceived and coordinated the project; E.M. and C.G. performednumerical simulations; C.G., E.M. and X.Z. designed and fabricated electroporationdevices; A.P.-G. and E.M. carried out electroporations and analysed data withcontributions of I.M.; A.P.-G. and C.G. wrote the manuscript with contributions ofE.M., I.M., X.Z. and J.C.
FundingThis work was supported by ElectroMice, Biomodulator and ElectroTagMan grantsfrom the Centre National de la Recherche Scientifique (CNRS) PI 2008, AgenceNationale de la Recherche (ANR) PNANO 2009, and C’nano IdF 2011 calls,respectively. E.M. was the recipient of PhD scholarships from the Fondation pour laRecherche Medicale (FRM) and from the Reseau Thematique de RechercheAvancee (RTRA) ‘Triangle de la Physique’ (ElectroMagSign project). I.M. is aresearch associate of the Fonds National de la Recherche Scientifique (FNRS).
Supplementary materialSupplementary material available online athttp://dev.biologists.org/lookup/suppl/doi:10.1242/dev.106633/-/DC1
ReferencesAbgrall, P. and Gue, A.-M. (2007). Lab-on-chip technologies: making a microfluidic
network and coupling it into a complete microsystem – a review. J. Micromech.Microeng. 17, R15-R49.
Abud, H. E., Young, H. M. and Newgreen, D. F. (2008). Analysing tissue and genefunction in intestinal organ culture. Methods Mol. Biol. 468, 275-286.
Ando, T. and Fujiwara, H. (2013). Electroporation-mediated somatic transgenesisfor rapid functional analysis in insects. Development 140, 454-458.
Andre, F. M. and Mir, L. M. (2010). Nucleic acids electrotransfer in vivo:mechanisms and practical aspects. Curr. Gene Ther. 10, 267-280.
Bansal, T., Lenhart, J., Kim, T., Duan, C. and Maharbiz, M. M. (2009). Patterneddelivery and expression of gene constructs into zebrafish embryos usingmicrofabricated interfaces. Biomed. Microdevices 11, 633-641.
2357
RESEARCH ARTICLE Development (2014) 141, 2349-2359 doi:10.1242/dev.106633
DEVELO
PM
ENT
Barker, M., Billups, B. and Hamann, M. (2009). Focal macromolecule delivery inneuronal tissue using simultaneous pressure ejection and local electroporation.J. Neurosci. Methods 177, 273-284.
Boukany, P. E., Morss, A., Liao, W.-C., Henslee, B., Jung, H., Zhang, X., Yu, B.,Wang, X., Wu, Y., Li, L. et al. (2011). Nanochannel electroporation deliversprecise amounts of biomolecules into living cells. Nat. Nanotechnol. 6, 747-754.
Calegari, F., Marzesco, A.-M., Kittler, R., Buchholz, F. and Huttner, W. B. (2004).Tissue-specific RNA interference in post-implantation mouse embryos usingdirectional electroporation and whole embryo culture. Differentiation 72, 92-102.
Cerda, G. A., Thomas, J. E., Allende, M. L., Karlstrom, R. O. and Palma, V.(2006). Electroporation of DNA, RNA, and morpholinos into zebrafish embryos.Methods 39, 207-211.
Chabot, S., Rosazza, C., Golzio, M., Zumbusch, A., Teissie, J. and Rols, M.-P.(2013). Nucleic acids electro-transfer: from bench to bedside. Curr. Drug Metab.14, 300-308.
Chai,Y.,Bringas, P., Jr, Shuler, C., Devaney,E.,Grosschedl,R. andSlavkin,H.C.(1998). A mouse mandibular culture model permits the study of neural crest cellmigration and tooth development. Int. J. Dev. Biol. 42, 87-94.
Chernet, B. T. and Levin, M. (2012). A versatile protocol for mRNA electroporationof Xenopus laevis embryos. Cold Spring Harb. Protoc. 2012, 447-452.
Chopinet, L., Wasungu, L. and Rols, M.-P. (2011). First explanations fordifferences in electrotransfection efficiency in vitro and in vivo using spheroidmodel. Int. J. Pharm. 423, 7-15.
Davidson, B. P., Tsang, T. E., Khoo, P.-L., Gad, J. M. and Tam, P. P. L. (2003).Introduction of cell markers into germ layer tissues of themouse gastrula by wholeembryo electroporation. Genesis 35, 57-62.
del Rıo, J. A. and Soriano, E. (2010). Regenerating cortical connections ina dish: the entorhino-hippocampal organotypic slice co-culture as tool forpharmacological screening of molecules promoting axon regeneration. Nat.Protoc. 5, 217-226.
Driver, E. C. and Kelley, M. W. (2010). Transfection of mouse cochlear explants byelectroporation. Curr. Protoc. Neurosci. Chapter 4, Unit 4 34 1-10.
Ereifej, E. S., Khan, S., Newaz, G., Zhang, J., Auner, G. W. and VandeVord, P. J.(2011). Characterization of astrocyte reactivity and gene expression onbiomaterials for neural electrodes. J. Biomed. Mater. Res. A 99A, 141-150.
Escoffre, J.-M., Portet, T., Wasungu, L., Teissie, J., Dean, D. and Rols, M.-P.(2009). What is (still not) known of the mechanism by which electroporationmediates gene transfer and expression in cells and tissues. Mol. Biotechnol. 41,286-295.
Falk, J., Drinjakovic, J., Leung, K. M., Dwivedy, A., Regan, A. G., Piper, M. andHolt, C. E. (2007). Electroporation of cDNA/Morpholinos to targeted areas ofembryonic CNS in Xenopus. BMC Dev. Biol. 7, 107.
Fox, M. B., Esveld, D. C., Valero, A., Luttge, R., Mastwijk, H. C., Bartels, P. V.,van den Berg, A. and Boom, R. M. (2006). Electroporation of cells in microfluidicdevices: a review. Anal. Bioanal. Chem. 385, 474-485.
Gao, L., Kim, Y., Kim, B., Lofgren, S. M., Schultz-Norton, J. R., Nardulli, A. M.,Heckert, L. L. and Jorgensen, J. S. (2011). Two regions within the proximalsteroidogenic factor 1 promoter drive somatic cell-specific activity in developinggonads of the female mouse. Biol. Reprod. 84, 422-434.
Golzio, M., Teissie, J. and Rols, M.-P. (2002). Direct visualization at the single-celllevel of electrically mediated gene delivery. Proc. Natl. Acad. Sci. U.S.A. 99,1292-1297.
Gowrishankar, T. R. and Weaver, J. C. (2003). An approach to electrical modelingof single and multiple cells. Proc. Natl. Acad. Sci. U.S.A. 100, 3203-3208.
Haas, K., Sin, W.-C., Javaherian, A., Li, Z. and Cline, H. T. (2001). Single-cellelectroporation for gene transfer in vivo. Neuron 29, 583-591.
Hibino, M., Itoh, H. and Kinosita, K., Jr. (1993). Time courses of cellelectroporation as revealed by submicrosecond imaging of transmembranepotential. Biophys. J. 64, 1789-1800.
Huang, K.-S., Lin, Y.-C., Su, K.-C. and Chen, H.-Y. (2007). An electroporationmicrochip system for the transfection of zebrafish embryos using quantum dotsand GFP genes for evaluation. Biomed. Microdevices 9, 761-768.
Itasaki, N., Bel-Vialar, S. and Krumlauf, R. (1999). ‘Shocking’ developments inchick embryology: electroporation and in ovo gene expression. Nat. Cell Biol. 1,E203-E207.
Kalimi, G. H. and Lo, C. W. (1988). Communication compartments in thegastrulating mouse embryo. J. Cell Biol. 107, 241-255.
Khoo, P. L., Franklin, V. J. and Tam, P. P. (2007). Fate-mapping technique:targeted whole-embryo electroporation of DNA constructs into the germ layers ofmouse embryos 7-7.5 days post-coitum. CSH Protoc. 2007, pdb prot4893.
Kim, J. A., Cho, K., Shin, M. S., Lee, W. G., Jung, N., Chung, C. and Chang, J. K.(2008). A novel electroporation method using a capillary and wire-type electrode.Biosens. Bioelectron. 23, 1353-1360.
Kotzar, G., Freas, M., Abel, P., Fleischman, A., Roy, S., Zorman, C., Moran, J. M.and Melzak, J. (2002). Evaluation of MEMS materials of construction forimplantable medical devices. Biomaterials 23, 2737-2750.
Lawson, K. A. and Pedersen, R. A. (1987). Cell fate, morphogenetic movementand population kinetics of embryonic endoderm at the time of germ layer formationin the mouse. Development 101, 627-652.
Matsuda, T. and Cepko, C. L. (2004). Electroporation and RNA interference in therodent retina in vivo and in vitro. Proc. Natl. Acad. Sci. U.S.A. 101, 16-22.
Mazari, E., Mantelet, M., Iranzo, J., Perea-Gomez, A. and Gosse, C. (2011).Localized electroporation of mouse embryo using dielectric guides. Transducers2011, Digest of the Technical Papers of the 16th International Conference onSolid-State Sensors, Actuators, and Microsystems, 1172-1175.
Mellitzer, G., Hallonet, M., Chen, L. and Ang, S.-L. (2002). Spatial and temporal‘knock down’ of gene expression by electroporation of double-stranded RNA andmorpholinos into early postimplantation mouse embryos.Mech. Dev. 118, 57-63.
Mellor, H. R., Davies, L. A., Caspar, H., Pringle, C. R., Hyde, S. C., Gill, D. R. andCallaghan, R. (2006). Optimising non-viral gene delivery in a tumour spheroidmodel. J. Gene Med. 8, 1160-1170.
Migeotte, I., Omelchenko, T., Hall, A. and Anderson, K. V. (2010). Rac1-dependent collective cell migration is required for specification of the anterior-posterior body axis of the mouse. PLoS Biol. 8, e1000442.
Mir,L.M.,Bureau,M.F.,Gehl, J.,Rangara,R.,Rouy,D.,Caillaud, J.-M.,Delaere,P.,Branellec, D., Schwartz, B. and Scherman, D. (1999). High-efficiency genetransfer into skeletal muscle mediated by electric pulses. Proc. Natl. Acad. Sci.U.S.A. 96, 4262-4267.
Momose,T., Tonegawa,A., Takeuchi, J.,Ogawa,H.,Umesono,K.andYasuda,K.(1999). Efficient targeting of gene expression in chick embryos bymicroelectroporation. Dev. Growth Differ. 41, 335-344.
Morris, S. A., Grewal, S., Barrios, F., Patankar, S. N., Strauss, B., Buttery, L.,Alexander, M., Shakesheff, K. M. and Zernicka-Goetz, M. (2012). Dynamics ofanterior-posterior axis formation in the developing mouse embryo. Nat. Commun.3, 673.
Nakamura, H. and Funahashi, J. (2012). Electroporation: past, present and future.Dev. Growth Differ. 55, 15-19.
Nakamura, H., Katahira, T., Sato, T., Watanabe, Y. and Funahashi, J. (2004).Gain- and loss-of-function in chick embryos by electroporation. Mech. Dev. 121,1137-1143.
Nolkrantz, K., Farre, C., Brederlau, A., Karlsson, R. I. D., Brennan, C.,Eriksson, P. S., Weber, S. G., Sandberg, M. and Orwar, O. (2001).Electroporation of single cells and tissues with an electrolyte-filled capillary.Anal. Chem. 73, 4469-4477.
Nowotschin, S. and Hadjantonakis, A.-K. (2009). Photomodulatable fluorescentproteins for imaging cell dynamics and cell fate. Organogenesis 5, 217-226.
Paganin-Gioanni, A., Bellard, E., Escoffre, J. M., Rols, M. P., Teissie, J. andGolzio, M. (2011). Direct visualization at the single-cell level of siRNAelectrotransfer into cancer cells. Proc. Natl. Acad. Sci. U.S.A. 108, 10443-10447.
Perea-Gomez, A., Lawson, K. A., Rhinn, M., Zakin, L., Brulet, P., Mazan, S. andAng, S. L. (2001). Otx2 is required for visceral endoderm movement and for therestriction of posterior signals in the epiblast of the mouse embryo. Development128, 753-765.
Pucihar, G., Kotnik, T., Valic, B. and Miklavcic, D. (2006). Numericaldetermination of transmembrane voltage induced on irregularly shaped cells.Ann. Biomed. Eng. 34, 642-652.
Pucihar, G., Miklavcic, D. and Kotnik, T. (2009). A time-dependent numericalmodel of transmembrane voltage inducement and electroporation of irregularlyshaped cells. IEEE Trans. Biomed. Eng. 56, 1491-1501.
Rivera-Perez, J. A., Mager, J. and Magnuson, T. (2003). Dynamic morphogeneticevents characterize the mouse visceral endoderm. Dev. Biol. 261, 470-487.
Rodriguez, T. A., Casey, E. S., Harland, R. M., Smith, J. C. and Beddington,R. S. P. (2001). Distinct enhancer elements control Hex expression duringgastrulation and early organogenesis. Dev. Biol. 234, 304-316.
Rols, M.-P. and Teissie, J. (1998). Electropermeabilization of mammalian cells tomacromolecules: control by pulse duration. Biophys. J. 75, 1415-1423.
Rols, M.-P., Delteil, C., Golzio, M., Dumond, P., Cros, S. and Teissie, J. (1998). Invivo electrically mediated protein and gene transfer in murine melanoma. Nat.Biotechnol. 16, 168-171.
Rossant, J. and Tam, P. P. L. (2009). Blastocyst lineage formation, early embryonicasymmetries and axis patterning in the mouse. Development 136, 701-713.
Shimamura, K. and Rubenstein, J. L. (1997). Inductive interactions direct earlyregionalization of the mouse forebrain. Development 124, 2709-2718.
Soares, M. L., Torres-Padilla, M.-E. and Zernicka-Goetz, M. (2008). Bonemorphogenetic protein 4 signaling regulates development of the anterior visceralendoderm in the mouse embryo. Dev. Growth Differ. 50, 615-621.
Srinivas, S., Rodriguez, T., Clements, M., Smith, J. C. and Beddington, R. S. P.(2004). Active cell migration drives the unilateral movements of the anteriorvisceral endoderm. Development 131, 1157-1164.
Sudsiri, J., Wachner, D. and Gimsa, J. (2007). On the temperature dependence ofthe dielectric membrane properties of human red blood cells. Bioelectrochemistry70, 134-140.
Swartz, M., Eberhart, J., Mastick, G. S. and Krull, C. E. (2001). Sparking newfrontiers: using in vivo electroporation for genetic manipulations. Dev. Biol. 233,13-21.
Takaoka, K. and Hamada, H. (2012). Cell fate decisions and axis determination inthe early mouse embryo. Development 139, 3-14.
2358
RESEARCH ARTICLE Development (2014) 141, 2349-2359 doi:10.1242/dev.106633
DEVELO
PM
ENT
Takaoka, K., Yamamoto, M. and Hamada, H. (2011). Origin and role of distalvisceral endoderm, a group of cells that determines anterior-posterior polarity ofthe mouse embryo. Nat. Cell Biol. 13, 743-752.
Tang, J. C., Szikra, T., Kozorovitskiy, Y., Teixiera, M., Sabatini, B. L., Roska, B.andCepko,C. L. (2013). A nanobody-based system using fluorescent proteins asscaffolds for cell-specific gene manipulation. Cell 154, 928-939.
Teissie, J., Escoffre, J. M., Paganin, A., Chabot, S., Bellard, E., Wasungu, L.,Rols, M. P. and Golzio, M. (2012). Drug delivery by electropulsation: recentdevelopments in oncology. Int. J. Pharm. 423, 3-6.
Trichas, G., Joyce, B., Crompton, L. A., Wilkins, V., Clements, M., Tada, M.,Rodriguez, T. A. and Srinivas, S. (2011). Nodal dependent differentiallocalisation of dishevelled-2 demarcates regions of differing cell behaviour inthe visceral endoderm. PLoS Biol. 9, e1001019.
Trichas,G.,Smith,A.M.,White,N.,Wilkins,V.,Watanabe,T.,Moore,A., Joyce,B.,Sugnaseelan, J., Rodriguez, T. A., Kay, D. et al. (2012). Multi-cellular rosettes inthe mouse visceral endoderm facilitate the ordered migration of anterior visceralendoderm cells. PLoS Biol. 10, e1001256.
Valic, B., Golzio, M., Pavlin, M., Schatz, A., Faurie, C., Gabriel, B., Teissie, J.,Rols, M.-P. and Miklavcic, D. (2003). Effect of electric field induced
transmembrane potential on spheroidal cells: theory and experiment. Eur.Biophys. J. 32, 519-528.
Viotti, M., Niu, L., Shi, S.-H. and Hadjantonakis, A.-K. (2012). Role of the gutendoderm in relaying left-right patterning in mice. PLoS Biol. 10, e1001276.
Voiculescu, O., Papanayotou, C. and Stern, C. D. (2008). Spatially and temporallycontrolled electroporation of early chick embryos. Nat. Protoc. 3, 419-426.
Wada, Y., Sun-Wada, G.-H. and Kawamura, N. (2013). Microautophagy in thevisceral endoderm is essential for mouse early development. Autophagy 9,252-254.
Wang, S. and Lee, L. J. (2013). Micro-/nanofluidics based cell electroporation.Biomicrofluidics 7, 11301.
Wang, M., Orwar, O., Olofsson, J. and Weber, S. G. (2010). Single-cellelectroporation. Anal. Bioanal. Chem. 397, 3235-3248.
Weaver, M., Dunn, N. R. and Hogan, B. L. (2000). Bmp4 and Fgf10 play opposingroles during lung bud morphogenesis. Development 127, 2695-2704.
Yamamoto, M., Saijoh, Y., Perea-Gomez, A., Shawlot, W., Behringer, R. R.,Ang, S.-L., Hamada, H. and Meno, C. (2004). Nodal antagonists regulateformation of the anteroposterior axis of the mouse embryo. Nature 428, 387-392.
Yin, T. and Wu, Y. I. (2013). Guiding lights: recent developments in optogeneticcontrol of biochemical signals. Pflugers Arch. 465, 397-408.
2359
RESEARCH ARTICLE Development (2014) 141, 2349-2359 doi:10.1242/dev.106633
DEVELO
PM
ENT
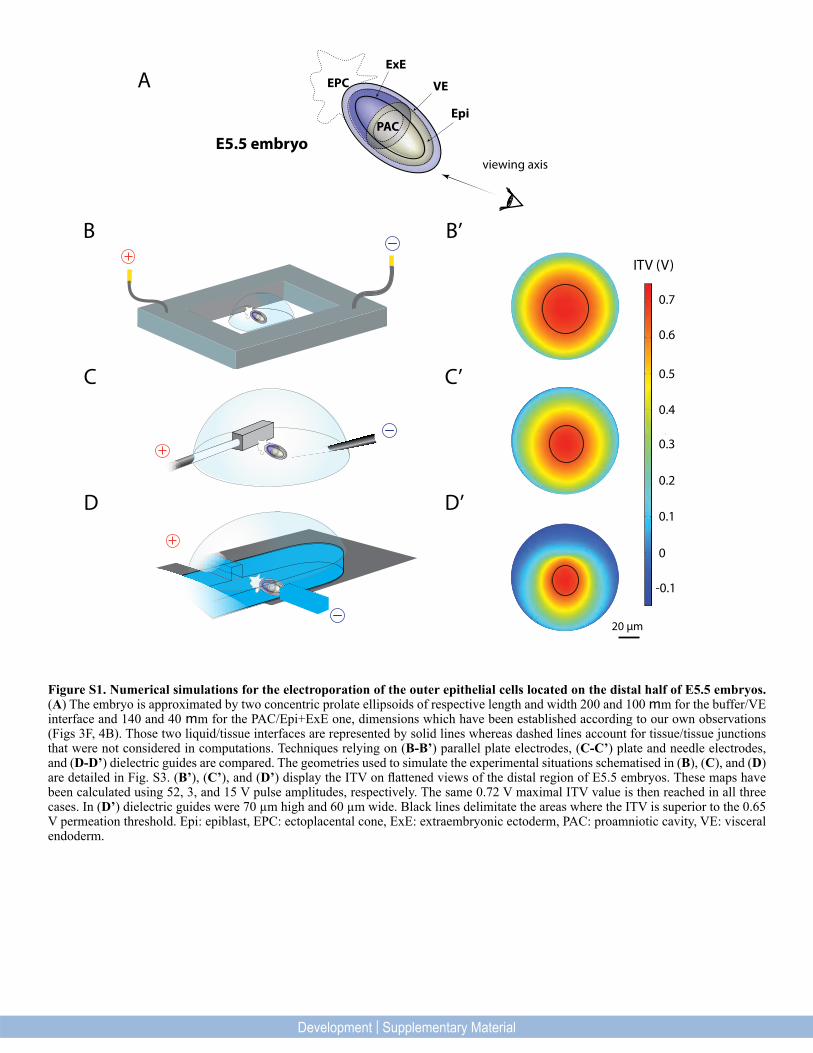
Figure S1. Numerical simulations for the electroporation of the outer epithelial cells located on the distal half of E5.5 embryos. (A) The embryo is approximated by two concentric prolate ellipsoids of respective length and width 200 and 100 mm for the buffer/VE interface and 140 and 40 mm for the PAC/Epi+ExE one, dimensions which have been established according to our own observations (Figs 3F, 4B). Those two liquid/tissue interfaces are represented by solid lines whereas dashed lines account for tissue/tissue junctions that were not considered in computations. Techniques relying on (B-B’) parallel plate electrodes, (C-C’) plate and needle electrodes, and (D-D’) dielectric guides are compared. The geometries used to simulate the experimental situations schematised in (B), (C), and (D) are detailed in Fig. S3. (B’), (C’), and (D’) display the ITV on flattened views of the distal region of E5.5 embryos. These maps have been calculated using 52, 3, and 15 V pulse amplitudes, respectively. The same 0.72 V maximal ITV value is then reached in all three cases. In (D’) dielectric guides were 70 µm high and 60 µm wide. Black lines delimitate the areas where the ITV is superior to the 0.65 V permeation threshold. Epi: epiblast, EPC: ectoplacental cone, ExE: extraembryonic ectoderm, PAC: proamniotic cavity, VE: visceral endoderm.
B
C
D
C’
D’
A
PAC
EPC
Epi
VE
ExE
E5.5 embryoviewing axis
20 µm
0.7
0.6
0.5
0.4
0.3
0.2
0.1
0
-0.1
ITV (V)
Figure S1
B’
Development | Supplementary Material
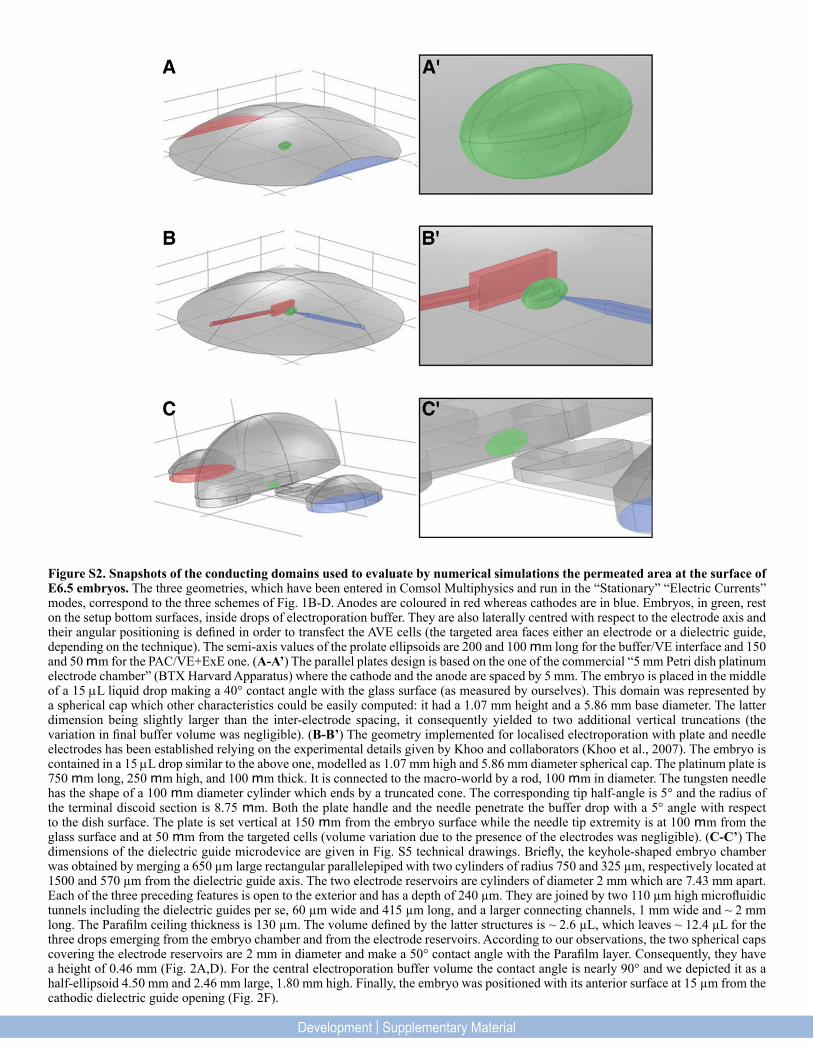
Figure S2. Snapshots of the conducting domains used to evaluate by numerical simulations the permeated area at the surface of E6.5 embryos. The three geometries, which have been entered in Comsol Multiphysics and run in the “Stationary” “Electric Currents” modes, correspond to the three schemes of Fig. 1B-D. Anodes are coloured in red whereas cathodes are in blue. Embryos, in green, rest on the setup bottom surfaces, inside drops of electroporation buffer. They are also laterally centred with respect to the electrode axis and their angular positioning is defined in order to transfect the AVE cells (the targeted area faces either an electrode or a dielectric guide, depending on the technique). The semi-axis values of the prolate ellipsoids are 200 and 100 mm long for the buffer/VE interface and 150 and 50 mm for the PAC/VE+ExE one. (A-A’) The parallel plates design is based on the one of the commercial “5 mm Petri dish platinum electrode chamber” (BTX Harvard Apparatus) where the cathode and the anode are spaced by 5 mm. The embryo is placed in the middle of a 15 µL liquid drop making a 40° contact angle with the glass surface (as measured by ourselves). This domain was represented by a spherical cap which other characteristics could be easily computed: it had a 1.07 mm height and a 5.86 mm base diameter. The latter dimension being slightly larger than the inter-electrode spacing, it consequently yielded to two additional vertical truncations (the variation in final buffer volume was negligible). (B-B’) The geometry implemented for localised electroporation with plate and needle electrodes has been established relying on the experimental details given by Khoo and collaborators (Khoo et al., 2007). The embryo is contained in a 15 µL drop similar to the above one, modelled as 1.07 mm high and 5.86 mm diameter spherical cap. The platinum plate is 750 mm long, 250 mm high, and 100 mm thick. It is connected to the macro-world by a rod, 100 mm in diameter. The tungsten needle has the shape of a 100 mm diameter cylinder which ends by a truncated cone. The corresponding tip half-angle is 5° and the radius of the terminal discoid section is 8.75 mm. Both the plate handle and the needle penetrate the buffer drop with a 5° angle with respect to the dish surface. The plate is set vertical at 150 mm from the embryo surface while the needle tip extremity is at 100 mm from the glass surface and at 50 mm from the targeted cells (volume variation due to the presence of the electrodes was negligible). (C-C’) The dimensions of the dielectric guide microdevice are given in Fig. S5 technical drawings. Briefly, the keyhole-shaped embryo chamber was obtained by merging a 650 µm large rectangular parallelepiped with two cylinders of radius 750 and 325 µm, respectively located at 1500 and 570 µm from the dielectric guide axis. The two electrode reservoirs are cylinders of diameter 2 mm which are 7.43 mm apart. Each of the three preceding features is open to the exterior and has a depth of 240 µm. They are joined by two 110 µm high microfluidic tunnels including the dielectric guides per se, 60 µm wide and 415 µm long, and a larger connecting channels, 1 mm wide and ~ 2 mm long. The Parafilm ceiling thickness is 130 µm. The volume defined by the latter structures is ~ 2.6 µL, which leaves ~ 12.4 µL for the three drops emerging from the embryo chamber and from the electrode reservoirs. According to our observations, the two spherical caps covering the electrode reservoirs are 2 mm in diameter and make a 50° contact angle with the Parafilm layer. Consequently, they have a height of 0.46 mm (Fig. 2A,D). For the central electroporation buffer volume the contact angle is nearly 90° and we depicted it as a half-ellipsoid 4.50 mm and 2.46 mm large, 1.80 mm high. Finally, the embryo was positioned with its anterior surface at 15 µm from the cathodic dielectric guide opening (Fig. 2F).
Development | Supplementary Material
Figure S3. Snapshots of the conducting domains used to evaluate by numerical simulations the permeated area at the surface of E5.5 embryos. The three configurations, which have been entered in Comsol Multiphysics and run in the “Stationary” “Electric Currents” modes, correspond to the three schemes of Fig. S1B-D. The red and blue surfaces correspond respectively to anodes and cathodes. The embryo is in green and its angular positioning is set in order to target the DVE cells. The semi-axis values of the prolate ellipsoids are 100 and 50 mm long for the buffer/VE interface and 70 and 20 mm for the PAC/VE+ExE one. (A-A’) The device with parallel plate electrodes is identical to the one used at E6.5 and the embryo is resting halfway from the cathode and from the anode. (B-B’) The plate and the needle electrodes have the same dimension than at E6.5. They have not been displaced in order to maintain the same 150 mm and 50 mm respective spacing with the embryo surface. (C-C’) Although the dielectric guide width has been kept at 60 mm, its height has been adjusted to 70 mm. Consequently, the embryo chamber and the electrode reservoir depths are 200 mm, as displayed in Fig. S5 technical drawings. Moreover, the distal tip of the developing organism is now entering by 8 mm inside the guide opening (Fig. 2E).
Development | Supplementary Material
Figure S4. Fabrication of single-use SU-8/Parafilm microdevices such as the ones displayed in Fig. 2. Wafers of D263 glass (Opticad), 50 mm in diameter and 550 mm thick, are first cleaned by soaking in a fresh piranha mixture (H2SO4 95% / H2O2 30%, 2:1) for 3 hours followed by thorough rinsing with water. Then, a four-step protocol begins: (A) The electrodes are obtained by patterning a nLOF 2070 (MicroChemicals) layer by optical lithography, depositing by e-beam evaporation a metal film composed of 10 nm Ti / 120 nm Au, and dissolving the resist in acetone. The resulting features consist in paired stripes, 1 mm large and 12 mm long, that are separated by a 5.8 mm gap; (B) The dielectric guides (415 µm long for their narrowest section), the embryo chamber (650 µm wide), and the electrode reservoirs (2 mm in diameter) are photolithographed in SU-8 2050 (MicroChem), the thickness of the epoxy-resist and the width of the dielectric guides being respectively adjusted to 60 and 50 µm for E3.5 blastocysts, 70 and 60 µm for E5.5 embryos, and 110 and 60 µm for E6.5 embryos and explants; (C) The polymer surface is rendered hydrophilic using an ambient air plasma treatment for 50 s, at 300 mTorr in the Expanded Plasma Cleaner (Harrick); (D) The fluidic channels and guides are closed by thermal bonding of a thin film ceiling made of Parafilm “M” (Pechiney) in which appropriate access holes have been punched. The lid is assembled on a hot plate set at 60°C, and its final thickness is 130 µm. Finally, electrical connectors are welded to the electrodes.
Spin-coating Insolation &Development
Insolation &Development
Metalization
Plasma hydrophilisation
Para�lm lidassembly
Thermalbonding
Electrical connectorswelding
Glass
Gold
nLOF photoresist
SU-8 photoresist
Para�lmHydrophilised SU-8 photoresist
Spin-coating
Lift-o�A
B C D
Figure S4
Development | Supplementary Material
Figure S5. Technical drawing of the SU-8/Parafilm microdevice including 70 µm high and 60 µm wide dielectric guides, such as the one displayed in Fig. 2D,E. Detail A corresponds to a top view of the fluidic network whereas detail D emphasizes on the shape of the aperture in front of which the embryo is placed. The parent chip of Fig. 2F, which comprises 110 µm high and 60 µm wide dielectric guides, is obtained by simply changing the thickness of the SU-8 layer from 70 to 110 µm.
Development | Supplementary Material
Figure S6. Fabrication and recycling procedure for reusable glass/Parafilm microdevices such as the one displayed in Fig. 7A,B. The starting glass wafers are the same than for the single-use chips, they are cleaned similarly in the piranha mixture. Then, a five-step protocol begins: (A) A mask is prepared by depositing by e-beam evaporation a 200 nm thin Cr film, patterning a nLOF 2070 layer by optical lithography, and attacking by ion beam etching the metal where it is unprotected. Patterns here obtained are identical to the previous SU-8 ones, except that the open trenches that will yield the dielectric guide are only 15 mm large. (B) Glass is next etched in a hydrofluoric acid solution (HF 40% / HCl 37% / H2O, 10:3:20) for 40 minutes before thorough rinsing with water. Features are now 70 mm deep and they have significantly widened since wet etching is isotropic. The resist is next dissolved in acetone and the metal mask is removed in Chrome-Etch 3144 (Honeywell); (C) After a new piranha clean, metal electrodes are obtained thanks to a lift-off procedure identical to the one used for the SU-8/Parafilm devices; (D) The glass surface is then hydrophilised by dipping in a RCA1 mixture (NH4OH 28% / H2O2 30% / H2O, 1:1:1) for 5 minutes and rinsing with water; (E) The Parafilm with all the necessary openings is finally thermally bonded, the connectors are welded, and the channels are filled with water within 5 minutes. Once the electroporation experiments performed, the glass part of the microsystem can be recycled according to the following four-step procedure: (F) The Parafilm is peeled off and the connectors are dismounted; (G) The wafer is soaked in trichloroethylene for 2 hours at 95°C, rinsed with acetone and isopropanol, dried under nitrogen, wiped in a 1 M NaOH solution, rinsed with water; Steps (D) and (E) are realized once more.
Glass
nLOF photoresist Parafilm
Hydrophilised glass
Gold
Chrome
Water
Photolithography
Wet hydrophilisation
Metalization
Parafilm lid assembly
Thermal bonding &
C Resist &Chrome removal
Electrodes deposition
A
D BE
Electrical connectors welding
FChannels filling & Electroporation
GParafilm peeling& Connectors removal
Ion beam etching Glass etching
Wafer cleaning
Figure S6
Development | Supplementary Material
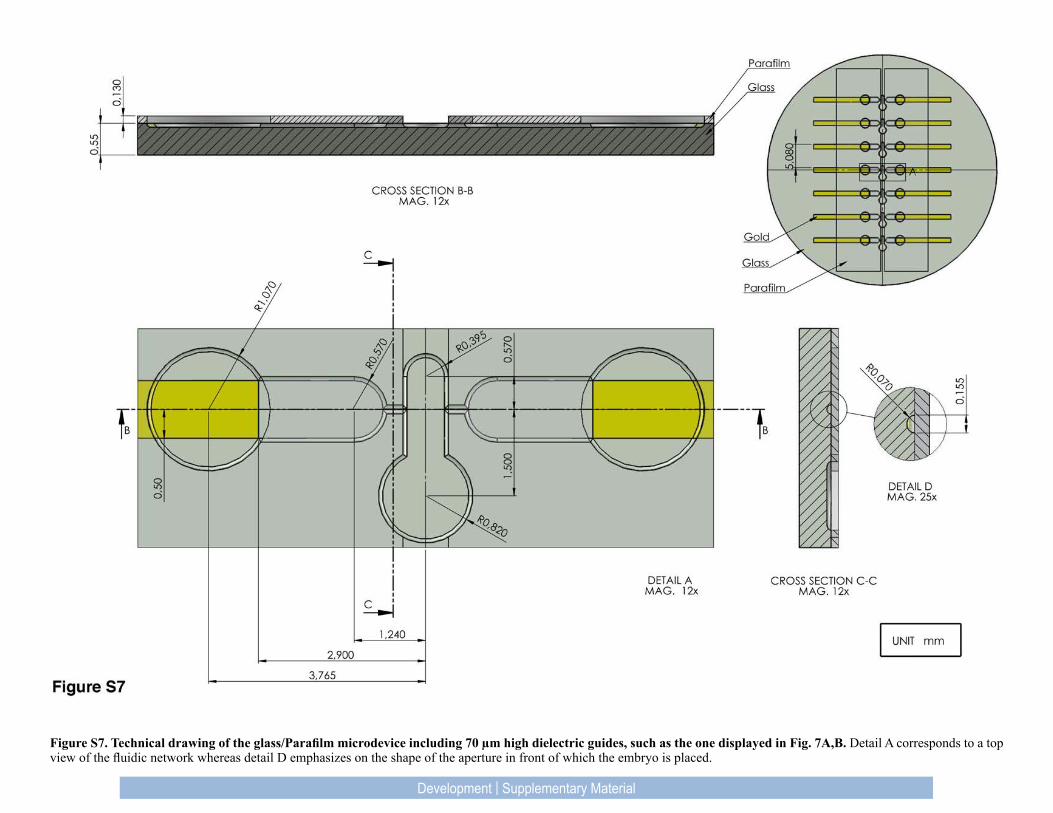
Figure S7. Technical drawing of the glass/Parafilm microdevice including 70 µm high dielectric guides, such as the one displayed in Fig. 7A,B. Detail A corresponds to a top view of the fluidic network whereas detail D emphasizes on the shape of the aperture in front of which the embryo is placed.
Development | Supplementary Material
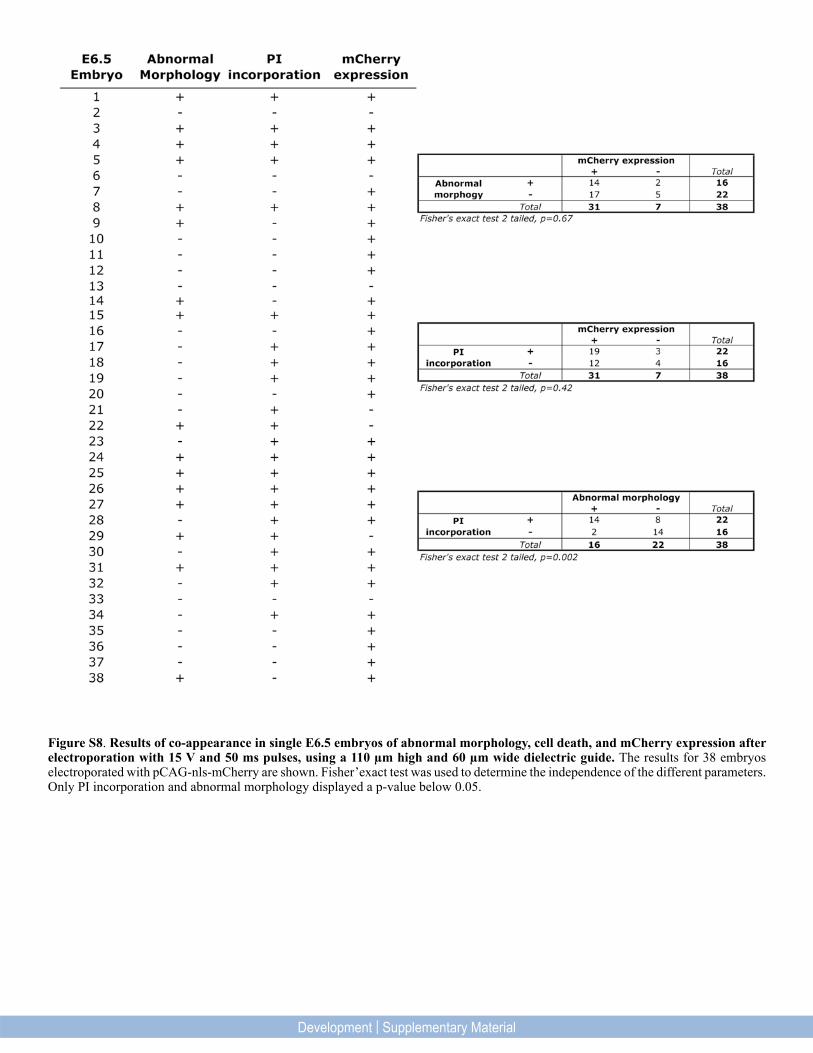
Figure S8. Results of co-appearance in single E6.5 embryos of abnormal morphology, cell death, and mCherry expression after electroporation with 15 V and 50 ms pulses, using a 110 µm high and 60 µm wide dielectric guide. The results for 38 embryos electroporated with pCAG-nls-mCherry are shown. Fisher’exact test was used to determine the independence of the different parameters. Only PI incorporation and abnormal morphology displayed a p-value below 0.05.
Development | Supplementary Material
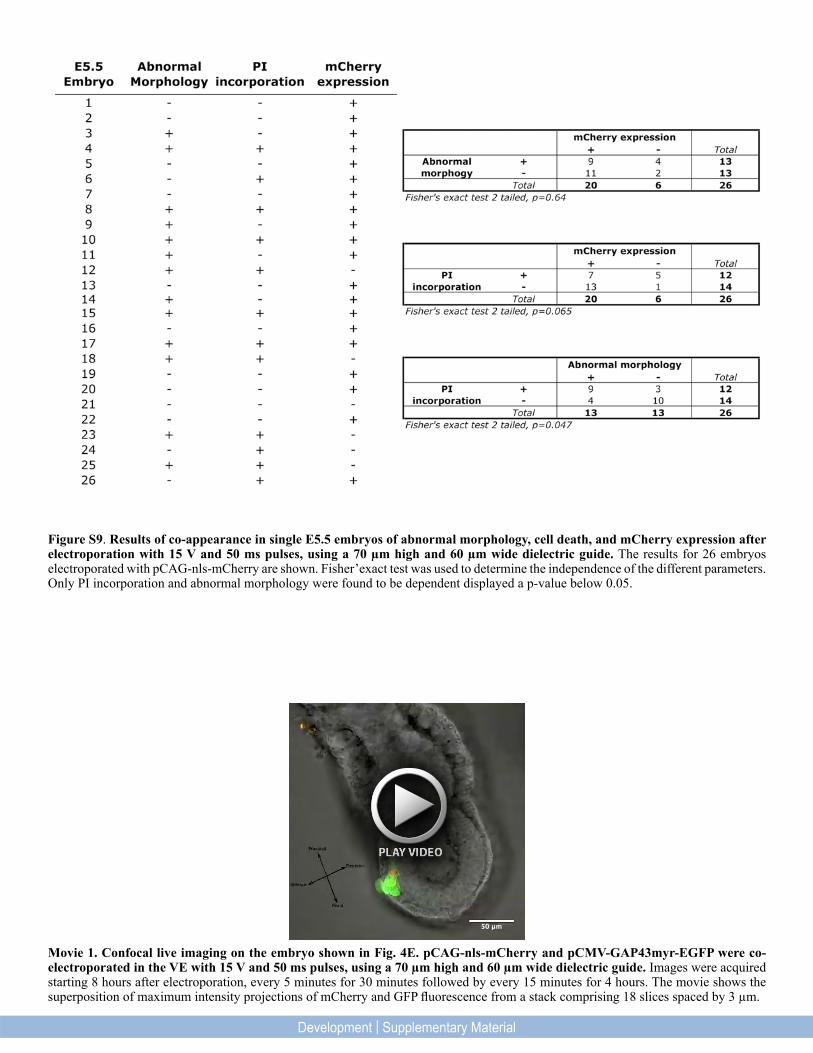
Figure S9. Results of co-appearance in single E5.5 embryos of abnormal morphology, cell death, and mCherry expression after electroporation with 15 V and 50 ms pulses, using a 70 µm high and 60 µm wide dielectric guide. The results for 26 embryos electroporated with pCAG-nls-mCherry are shown. Fisher’exact test was used to determine the independence of the different parameters. Only PI incorporation and abnormal morphology were found to be dependent displayed a p-value below 0.05.
Movie 1. Confocal live imaging on the embryo shown in Fig. 4E. pCAG-nls-mCherry and pCMV-GAP43myr-EGFP were co-electroporated in the VE with 15 V and 50 ms pulses, using a 70 µm high and 60 µm wide dielectric guide. Images were acquired starting 8 hours after electroporation, every 5 minutes for 30 minutes followed by every 15 minutes for 4 hours. The movie shows the superposition of maximum intensity projections of mCherry and GFP fluorescence from a stack comprising 18 slices spaced by 3 µm.
Development | Supplementary Material
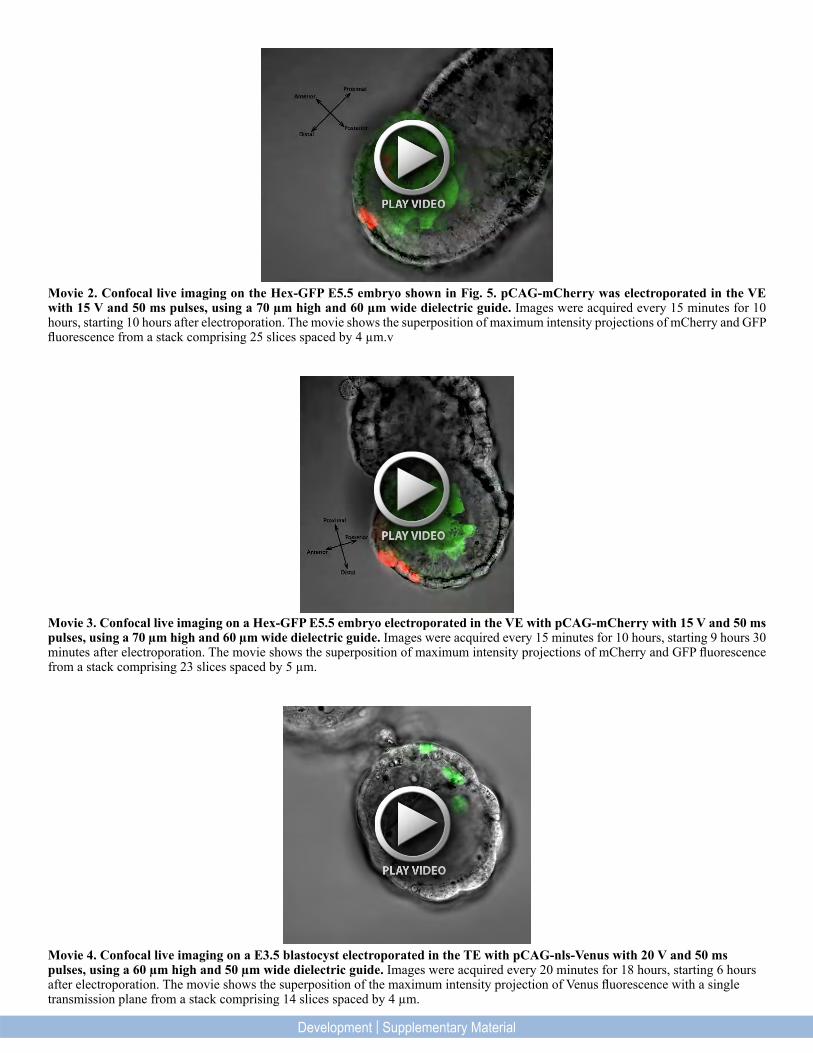
Movie 4. Confocal live imaging on a E3.5 blastocyst electroporated in the TE with pCAG-nls-Venus with 20 V and 50 ms pulses, using a 60 µm high and 50 µm wide dielectric guide. Images were acquired every 20 minutes for 18 hours, starting 6 hours after electroporation. The movie shows the superposition of the maximum intensity projection of Venus fluorescence with a single transmission plane from a stack comprising 14 slices spaced by 4 µm.
Movie 2. Confocal live imaging on the Hex-GFP E5.5 embryo shown in Fig. 5. pCAG-mCherry was electroporated in the VE with 15 V and 50 ms pulses, using a 70 µm high and 60 µm wide dielectric guide. Images were acquired every 15 minutes for 10 hours, starting 10 hours after electroporation. The movie shows the superposition of maximum intensity projections of mCherry and GFP fluorescence from a stack comprising 25 slices spaced by 4 µm.v
Movie 3. Confocal live imaging on a Hex-GFP E5.5 embryo electroporated in the VE with pCAG-mCherry with 15 V and 50 ms pulses, using a 70 µm high and 60 µm wide dielectric guide. Images were acquired every 15 minutes for 10 hours, starting 9 hours 30 minutes after electroporation. The movie shows the superposition of maximum intensity projections of mCherry and GFP fluorescence from a stack comprising 23 slices spaced by 5 µm.
Development | Supplementary Material

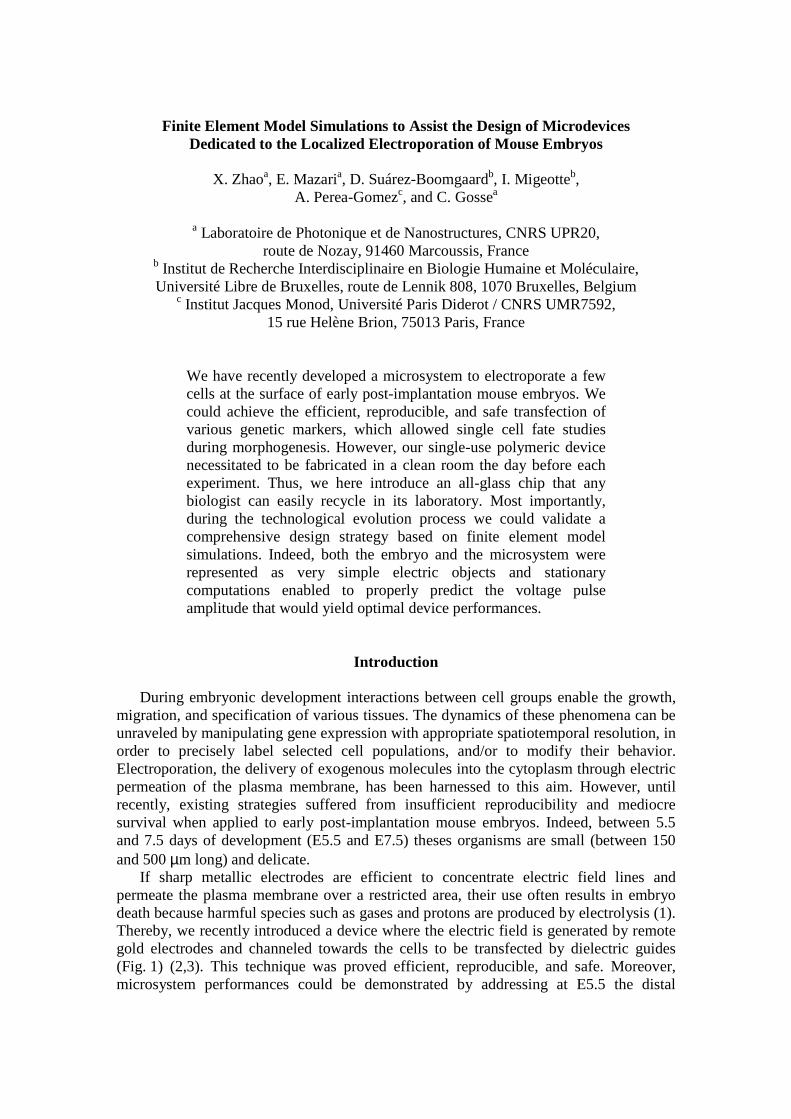
Finite Element Model Simulations to Assist the Design of Microdevices Dedicated to the Localized Electroporation of Mouse Embryos
X. Zhaoa, E. Mazaria, D. Suárez-Boomgaardb, I. Migeotteb,
A. Perea-Gomezc, and C. Gossea
a Laboratoire de Photonique et de Nanostructures, CNRS UPR20, route de Nozay, 91460 Marcoussis, France
b Institut de Recherche Interdisciplinaire en Biologie Humaine et Moléculaire, Université Libre de Bruxelles, route de Lennik 808, 1070 Bruxelles, Belgium
c Institut Jacques Monod, Université Paris Diderot / CNRS UMR7592, 15 rue Helène Brion, 75013 Paris, France
We have recently developed a microsystem to electroporate a few cells at the surface of early post-implantation mouse embryos. We could achieve the efficient, reproducible, and safe transfection of various genetic markers, which allowed single cell fate studies during morphogenesis. However, our single-use polymeric device necessitated to be fabricated in a clean room the day before each experiment. Thus, we here introduce an all-glass chip that any biologist can easily recycle in its laboratory. Most importantly, during the technological evolution process we could validate a comprehensive design strategy based on finite element model simulations. Indeed, both the embryo and the microsystem were represented as very simple electric objects and stationary computations enabled to properly predict the voltage pulse amplitude that would yield optimal device performances.
Introduction
During embryonic development interactions between cell groups enable the growth, migration, and specification of various tissues. The dynamics of these phenomena can be unraveled by manipulating gene expression with appropriate spatiotemporal resolution, in order to precisely label selected cell populations, and/or to modify their behavior. Electroporation, the delivery of exogenous molecules into the cytoplasm through electric permeation of the plasma membrane, has been harnessed to this aim. However, until recently, existing strategies suffered from insufficient reproducibility and mediocre survival when applied to early post-implantation mouse embryos. Indeed, between 5.5 and 7.5 days of development (E5.5 and E7.5) theses organisms are small (between 150 and 500 µm long) and delicate.
If sharp metallic electrodes are efficient to concentrate electric field lines and permeate the plasma membrane over a restricted area, their use often results in embryo death because harmful species such as gases and protons are produced by electrolysis (1). Thereby, we recently introduced a device where the electric field is generated by remote gold electrodes and channeled towards the cells to be transfected by dielectric guides (Fig. 1) (2,3). This technique was proved efficient, reproducible, and safe. Moreover, microsystem performances could be demonstrated by addressing at E5.5 the distal
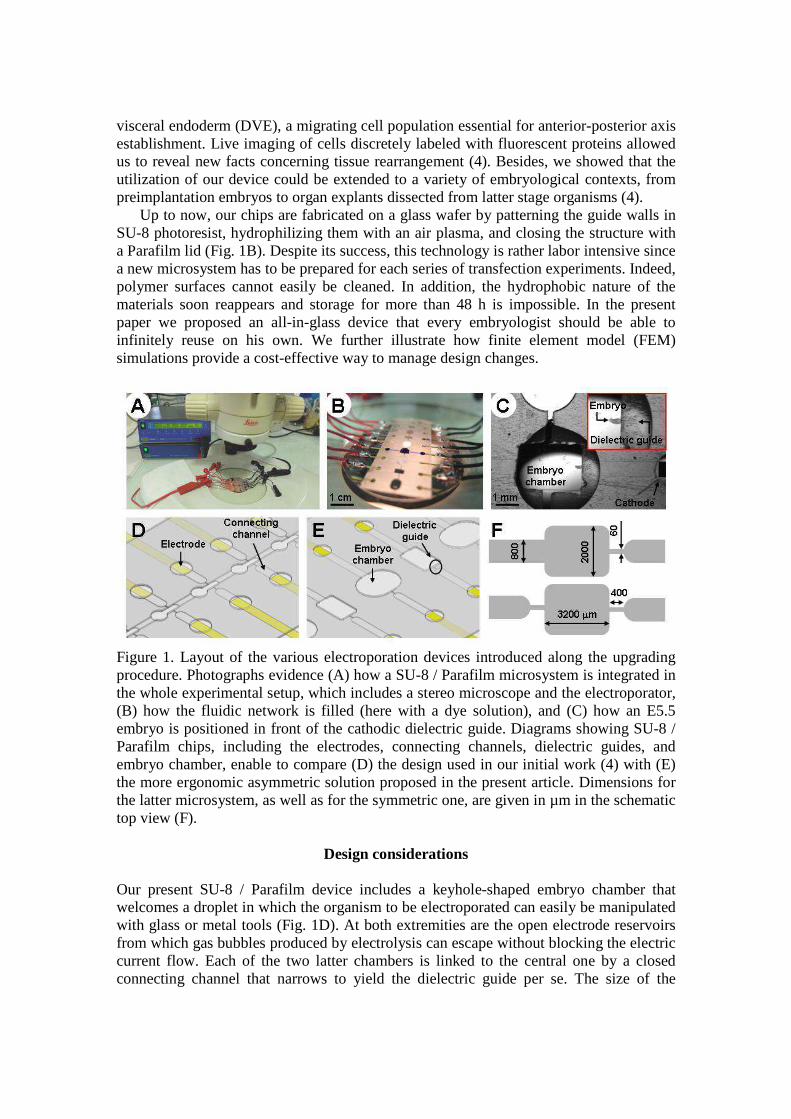
visceral endoderm (DVE), a migrating cell population essential for anterior-posterior axis establishment. Live imaging of cells discretely labeled with fluorescent proteins allowed us to reveal new facts concerning tissue rearrangement (4). Besides, we showed that the utilization of our device could be extended to a variety of embryological contexts, from preimplantation embryos to organ explants dissected from latter stage organisms (4).
Up to now, our chips are fabricated on a glass wafer by patterning the guide walls in SU-8 photoresist, hydrophilizing them with an air plasma, and closing the structure with a Parafilm lid (Fig. 1B). Despite its success, this technology is rather labor intensive since a new microsystem has to be prepared for each series of transfection experiments. Indeed, polymer surfaces cannot easily be cleaned. In addition, the hydrophobic nature of the materials soon reappears and storage for more than 48 h is impossible. In the present paper we proposed an all-in-glass device that every embryologist should be able to infinitely reuse on his own. We further illustrate how finite element model (FEM) simulations provide a cost-effective way to manage design changes.
Figure 1. Layout of the various electroporation devices introduced along the upgrading procedure. Photographs evidence (A) how a SU-8 / Parafilm microsystem is integrated in the whole experimental setup, which includes a stereo microscope and the electroporator, (B) how the fluidic network is filled (here with a dye solution), and (C) how an E5.5 embryo is positioned in front of the cathodic dielectric guide. Diagrams showing SU-8 / Parafilm chips, including the electrodes, connecting channels, dielectric guides, and embryo chamber, enable to compare (D) the design used in our initial work (4) with (E) the more ergonomic asymmetric solution proposed in the present article. Dimensions for the latter microsystem, as well as for the symmetric one, are given in µm in the schematic top view (F).
Design considerations Our present SU-8 / Parafilm device includes a keyhole-shaped embryo chamber that welcomes a droplet in which the organism to be electroporated can easily be manipulated with glass or metal tools (Fig. 1D). At both extremities are the open electrode reservoirs from which gas bubbles produced by electrolysis can escape without blocking the electric current flow. Each of the two latter chambers is linked to the central one by a closed connecting channel that narrows to yield the dielectric guide per se. The size of the
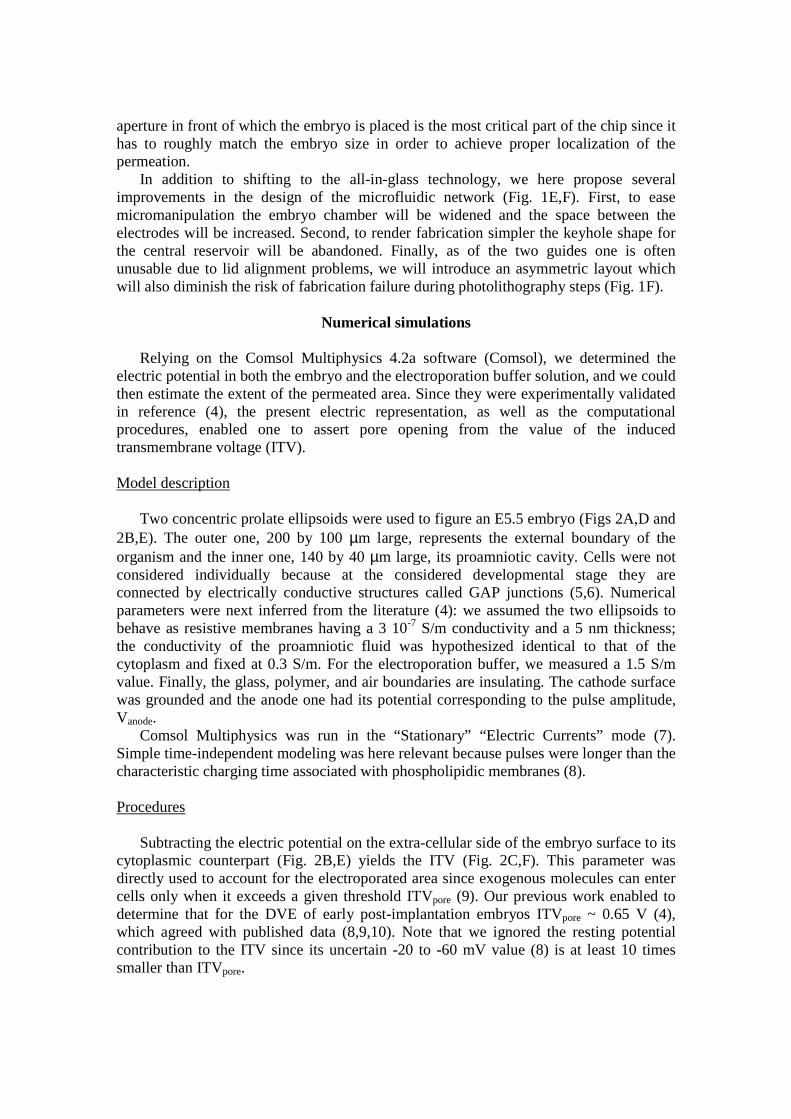
aperture in front of which the embryo is placed is the most critical part of the chip since it has to roughly match the embryo size in order to achieve proper localization of the permeation.
In addition to shifting to the all-in-glass technology, we here propose several improvements in the design of the microfluidic network (Fig. 1E,F). First, to ease micromanipulation the embryo chamber will be widened and the space between the electrodes will be increased. Second, to render fabrication simpler the keyhole shape for the central reservoir will be abandoned. Finally, as of the two guides one is often unusable due to lid alignment problems, we will introduce an asymmetric layout which will also diminish the risk of fabrication failure during photolithography steps (Fig. 1F).
Numerical simulations
Relying on the Comsol Multiphysics 4.2a software (Comsol), we determined the electric potential in both the embryo and the electroporation buffer solution, and we could then estimate the extent of the permeated area. Since they were experimentally validated in reference (4), the present electric representation, as well as the computational procedures, enabled one to assert pore opening from the value of the induced transmembrane voltage (ITV). Model description
Two concentric prolate ellipsoids were used to figure an E5.5 embryo (Figs 2A,D and
2B,E). The outer one, 200 by 100 µm large, represents the external boundary of the organism and the inner one, 140 by 40 µm large, its proamniotic cavity. Cells were not considered individually because at the considered developmental stage they are connected by electrically conductive structures called GAP junctions (5,6). Numerical parameters were next inferred from the literature (4): we assumed the two ellipsoids to behave as resistive membranes having a 3 10-7 S/m conductivity and a 5 nm thickness; the conductivity of the proamniotic fluid was hypothesized identical to that of the cytoplasm and fixed at 0.3 S/m. For the electroporation buffer, we measured a 1.5 S/m value. Finally, the glass, polymer, and air boundaries are insulating. The cathode surface was grounded and the anode one had its potential corresponding to the pulse amplitude, Vanode.
Comsol Multiphysics was run in the “Stationary” “Electric Currents” mode (7). Simple time-independent modeling was here relevant because pulses were longer than the characteristic charging time associated with phospholipidic membranes (8). Procedures
Subtracting the electric potential on the extra-cellular side of the embryo surface to its
cytoplasmic counterpart (Fig. 2B,E) yields the ITV (Fig. 2C,F). This parameter was directly used to account for the electroporated area since exogenous molecules can enter cells only when it exceeds a given threshold ITVpore (9). Our previous work enabled to determine that for the DVE of early post-implantation embryos ITVpore ~ 0.65 V (4), which agreed with published data (8,9,10). Note that we ignored the resting potential contribution to the ITV since its uncertain -20 to -60 mV value (8) is at least 10 times smaller than ITVpore.
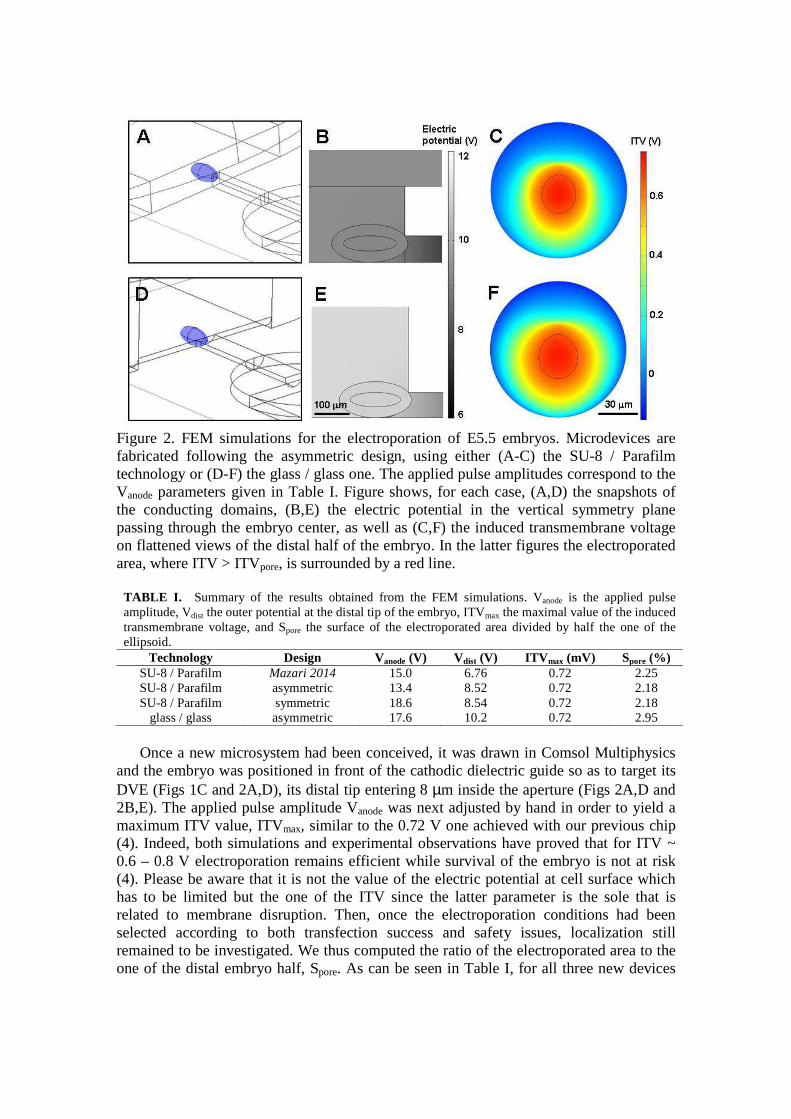
Figure 2. FEM simulations for the electroporation of E5.5 embryos. Microdevices are fabricated following the asymmetric design, using either (A-C) the SU-8 / Parafilm technology or (D-F) the glass / glass one. The applied pulse amplitudes correspond to the Vanode parameters given in Table I. Figure shows, for each case, (A,D) the snapshots of the conducting domains, (B,E) the electric potential in the vertical symmetry plane passing through the embryo center, as well as (C,F) the induced transmembrane voltage on flattened views of the distal half of the embryo. In the latter figures the electroporated area, where ITV > ITVpore, is surrounded by a red line.
TABLE I. Summary of the results obtained from the FEM simulations. Vanode is the applied pulse amplitude, Vdist the outer potential at the distal tip of the embryo, ITVmax the maximal value of the induced transmembrane voltage, and Spore the surface of the electroporated area divided by half the one of the ellipsoid.
Technology Design Vanode (V) Vdist (V) ITVmax (mV) Spore (%) SU-8 / Parafilm Mazari 2014 15.0 6.76 0.72 2.25 SU-8 / Parafilm asymmetric 13.4 8.52 0.72 2.18 SU-8 / Parafilm symmetric 18.6 8.54 0.72 2.18
glass / glass asymmetric 17.6 10.2 0.72 2.95
Once a new microsystem had been conceived, it was drawn in Comsol Multiphysics
and the embryo was positioned in front of the cathodic dielectric guide so as to target its DVE (Figs 1C and 2A,D), its distal tip entering 8 µm inside the aperture (Figs 2A,D and 2B,E). The applied pulse amplitude Vanode was next adjusted by hand in order to yield a maximum ITV value, ITVmax, similar to the 0.72 V one achieved with our previous chip (4). Indeed, both simulations and experimental observations have proved that for ITV ~ 0.6 – 0.8 V electroporation remains efficient while survival of the embryo is not at risk (4). Please be aware that it is not the value of the electric potential at cell surface which has to be limited but the one of the ITV since the latter parameter is the sole that is related to membrane disruption. Then, once the electroporation conditions had been selected according to both transfection success and safety issues, localization still remained to be investigated. We thus computed the ratio of the electroporated area to the one of the distal embryo half, Spore. As can be seen in Table I, for all three new devices
we could find appropriate pulse amplitudes Vanode that yielded ITVmax and Spore values similar to the ones characterizing the former SU-8 / Parafilm chip.
Device fabrication
Most of the procedures given below are fully described in reference (4), with the exception of the glass / glass bonding one which is mentioned here for the first time. SU-8 / Parafilm technology
Microsystems were realized on D263 glass substrates, 550 µm thick and 2 inches in
diameter (Fig. 1B,C). An identical four-step process was followed for both asymmetric and symmetric designs: (i) the electrodes were obtained by patterning a nLOF2070 layer (AZ Electronic Materials) by optical lithography, successively evaporating 10 nm of Ti and 120 nm Au, and dissolving the resist in acetone. The resulting features consisted in pairs of 0.8 mm large aligned stripes which will serve as electrodes; (ii) the 60 µm large dielectric guides, as well as the connecting channels, the electroporation chamber, and the electrode reservoirs were photolithographed in a 70 µm thick layer of SU8-2050 (MicroChem); (iii) the polymer surface was rendered hydrophilic using a 300 mTorr air plasma treatment for 50 s in a plasma cleaner reactor (Harrick); (iv) the fluidic network was closed by thermal bonding, at 60 °C, of a 130 µm thick Parafilm ‘M’ lid (Pechiney) in which appropriate access holes had been cut out with a CE6000-40 cutting plotter (Graphtec). Glass / glass technology
Starting with similar glass wafers than above, a two-step protocol yielded the lower
part of the device: (i) a 200 nm Cr thin film was deposited by e-beam evaporation, the fluidic system was patterned in a nLOF 2070 layer by optical lithography, and the metal coating was opened by ion beam etching; (ii) glass was attacked in a HF 40% / HCl 37% / H2O, 10:3:20 mixture for 40 minutes before thorough rinsing with water. The resist was next dissolved in acetone and the metal removed in Chrome-Etch 3144 (Honeywell). The lithography mask was here conceived in order to account for the widening inherent to isotropic etching. Thus, it resulted in rounded features having the same dimensions than the SU-8 ones, except for the dielectric guide which had the shape of a half-pipe with a 70 µm radius (Fig. 2D).
The upper lid was also made of 550 µm thick D263 glass. After dicing a wafer along its diameter, the ~ 1.5 mm diameter access holes for the electrode reservoirs were sand blasted. A thin layer of Vitralit 6127 (Eleco) was then spin-coated onto these parts before their assembly onto the lower wafer using a MJB3 aligner (SUSS MicroTec). Insolation of the UV-curable glue for 1 min was followed by baking at 100 °C for 3 h in order to complete the evaporation of any toxic solvents.
Experimental validation
The goal of the present section was to certify the relevance of the electroporation
conditions predicted by FEM simulations (Table I), for the three devices that had been fabricated.
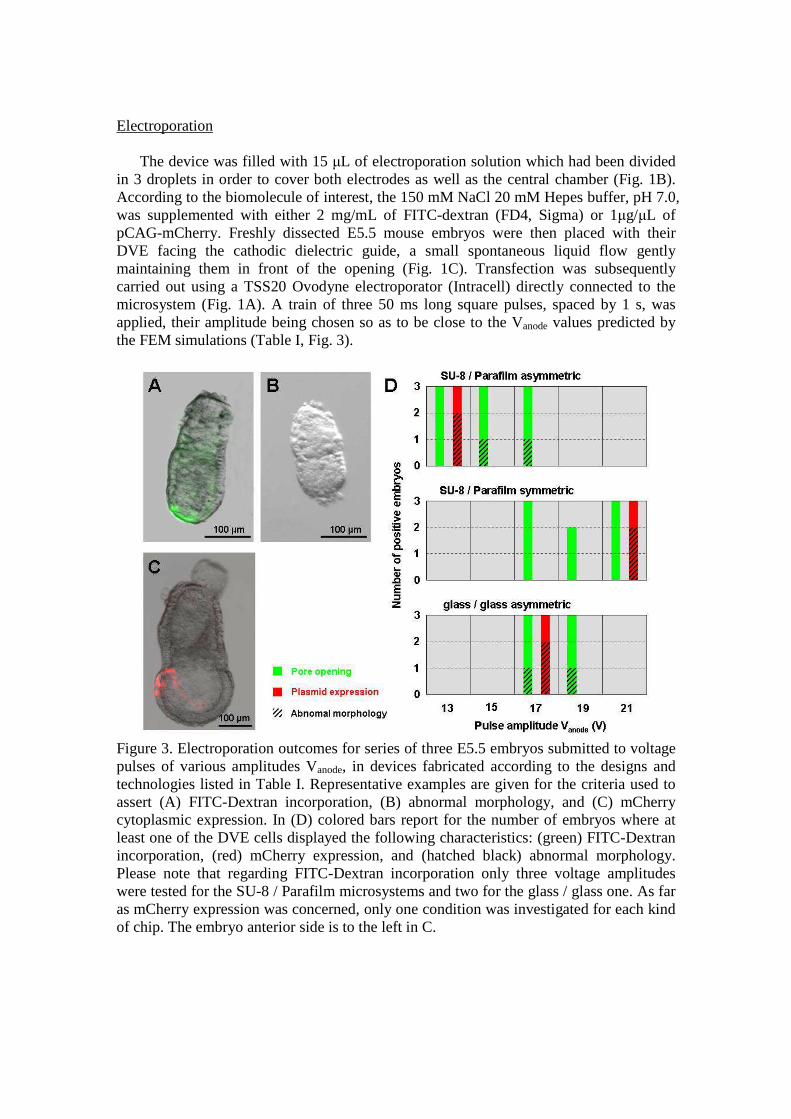
Electroporation The device was filled with 15 µL of electroporation solution which had been divided
in 3 droplets in order to cover both electrodes as well as the central chamber (Fig. 1B). According to the biomolecule of interest, the 150 mM NaCl 20 mM Hepes buffer, pH 7.0, was supplemented with either 2 mg/mL of FITC-dextran (FD4, Sigma) or 1µg/µL of pCAG-mCherry. Freshly dissected E5.5 mouse embryos were then placed with their DVE facing the cathodic dielectric guide, a small spontaneous liquid flow gently maintaining them in front of the opening (Fig. 1C). Transfection was subsequently carried out using a TSS20 Ovodyne electroporator (Intracell) directly connected to the microsystem (Fig. 1A). A train of three 50 ms long square pulses, spaced by 1 s, was applied, their amplitude being chosen so as to be close to the Vanode values predicted by the FEM simulations (Table I, Fig. 3).
Figure 3. Electroporation outcomes for series of three E5.5 embryos submitted to voltage pulses of various amplitudes Vanode, in devices fabricated according to the designs and technologies listed in Table I. Representative examples are given for the criteria used to assert (A) FITC-Dextran incorporation, (B) abnormal morphology, and (C) mCherry cytoplasmic expression. In (D) colored bars report for the number of embryos where at least one of the DVE cells displayed the following characteristics: (green) FITC-Dextran incorporation, (red) mCherry expression, and (hatched black) abnormal morphology. Please note that regarding FITC-Dextran incorporation only three voltage amplitudes were tested for the SU-8 / Parafilm microsystems and two for the glass / glass one. As far as mCherry expression was concerned, only one condition was investigated for each kind of chip. The embryo anterior side is to the left in C.
Observations
After electroporation completion, embryos were rinsed in the dissection solution (DMEM-GlutaMAX, 4.5 g/L glucose – Invitrogen – supplemented with 25 mM Hepes and 10 % inactivated fetal calf serum). If relevant, observation of FITC-Dextran penetration was here performed to assert pore opening (Fig. 3A). Furthermore irrespectively of the electroporated molecule, cells of the outer periphery of the organism were always scrutinized for morphological abnormalities such as swelling or destruction (Fig. 3B). Subsequently, each group of 3 embryos was placed into 200 µL of culture medium (DMEM-GlutaMAX, 4.5 g/L glucose, 100 µg/ml streptomycin, 100 U/ml penicillin, supplemented with 50 % inactivated rat serum) and incubated in a 8-wells chambers slide (NUNC) under standard cell culture conditions (37 °C, 5% CO2). In the case a plasmid was transfected, the expression of the red fluorescent protein was checked after 24 h (Fig. 3C).
Both bright field and fluorescence visualization were achieved on a M165FC stereomicroscope (Leica) equipped with GFP and Cy3 filters and connected to an Orca-R2 camera (Hamamatsu).
Discussion
The transition from the single-use polymeric device introduced in references (3,4) towards a simply recyclable microsystem was two-step. First, we changed the chip design while stacking to the effective SU-8 / Parafilm technology (Fig. 1B,C). It allowed us to notice that both asymmetric and symmetric configurations worked equally well (Figs 1F and 3D). As usually only a single dielectric guide is used in an experiment and as the fabrication of asymmetric device is less constrained during lid alignment, we consequently selected the latter design to implement the glass / glass technology. Up to now, the bottom wafer containing the fluidic system and the upper one with the access holes were assembled relying on an original gluing procedure. Although not completely optimal as far as microfabrication is concerned, our strategy has enabled to prove that the rounded shape of dielectric guides wet etched in glass is as efficient as the squared one that characterized our initial polymeric chips. Future work will include the development of glass drilling for access hole opening as well as fusion bonding for wafer assembly.
Regarding FEM simulations, we have confirmed that they represent a very helpful tool to assist device conception. Indeed, before performing any test on embryos we could devise microsystems which operating range will match the electroporator one. Later on we successfully predicted the pulse amplitude to apply for each of the fabricated chips. Indeed, conditions distant by less than 2 V from the Vanode parameters recommended in Table I yielded very satisfactory outcomes with respect to electroporation efficiency and safety (Fig. 3D). Although relying on a limited number of samples, our results indicate that in a large majority of cases a restricted cell population integrates the exogeneous molecules, either FITC-Dextran or plasmid DNA, while deleterious effects remain limited to 30 – 50 % of the processed embryos. These data are similar to the one associated with the best conditions used to run our original SU-8 / Parafilm chip (4). However, thanks to the simulations the present optimal parameters were obtained after a very limited number of tests, ~ 12 per device, whereas in our initial screening work on the first design we performed more than 200 electroporations (4). Finally, it is worth noting that permeation localization also stayed satisfactory since the shape of the dielectric guides was roughly kept constant during the technological evolution process.
Acknowledgments
This work was supported by the grants BioModulator (ANR Pnano 2008), ElectroMice (CNRS PI: Physique Chimie Biologie 2008), ElectroTagMam (Cnano IdF 2011), ElectroMagSign (RTRA Triangle de la Physique 2012), and ElectroDev (PHC Tournesol 2013). E.M. was recipient of a PhD scholarship from the FRM, I.M. is a research associate of the FNRS, and D.S.B is supported by the FNRS under grant n° MIS F.4525.14. We thank J.-C. Galas for technical assistance with the cutting plotter.
References
1. B. P. Davidson, T. E. Tsang, P.-L. Khoo, J. M. Gad, and P. P. L. Tam, Genesis,
35, 57 (2003). 2. E. Mazari, M. Mantelet, J. Iranzo, A. Perea-Gomez, and C. Gosse, Transducers
2011, Digest of the Technical Papers of the 16th International Conference on Solid-State Sensors, Actuators, and Microsystems, 1172 (2011).
3. E. Mazari, X. Zhao, J. Collignon, A. Perea-Gomez, and C. Gosse, MicroTAS 2012, Proceedings of the 16th International Conference on Miniaturized Systems for Chemistry and Life Sciences, 1729 (2012).
4. E. Mazari, X. Zhao, I. Migeotte, J. Collignon, C. Gosse, and A. Perea-Gomez, Development, 141, 2349 (2014).
5. G. H. Kalimi and C. W. Lo, J. Cell Biol., 107, 241 (1988). 6. G. Pucihar, D. Miklavcic, and T. Kotnik, IEEE Trans. Biomed. Eng., 56, 1491
(2009). 7. G. Pucihar, T. Kotnik, B. Valic, and D. Miklavcic, Ann. Biomed. Eng., 34, 642
(2006). 8. B. Valic, M. Golzio, M. Pavlin, A. Schatz, C. Faurie, B. Gabriel, J. Teissié, M.-P.
Rols, and D. Miklavcic, Eur. Biophys. J., 32, 519 (2003). 9. J.-M. Escoffre, T. Portet, L. Wasungu, J. Teissié, D. Dean, and M.-P. Rols, Mol.
Biotechnol., 41, 286 (2009). 10. M. Hibino, H. Itoh, and K. Kinosita Jr, Biophys. J., 64, 1789 (1993).
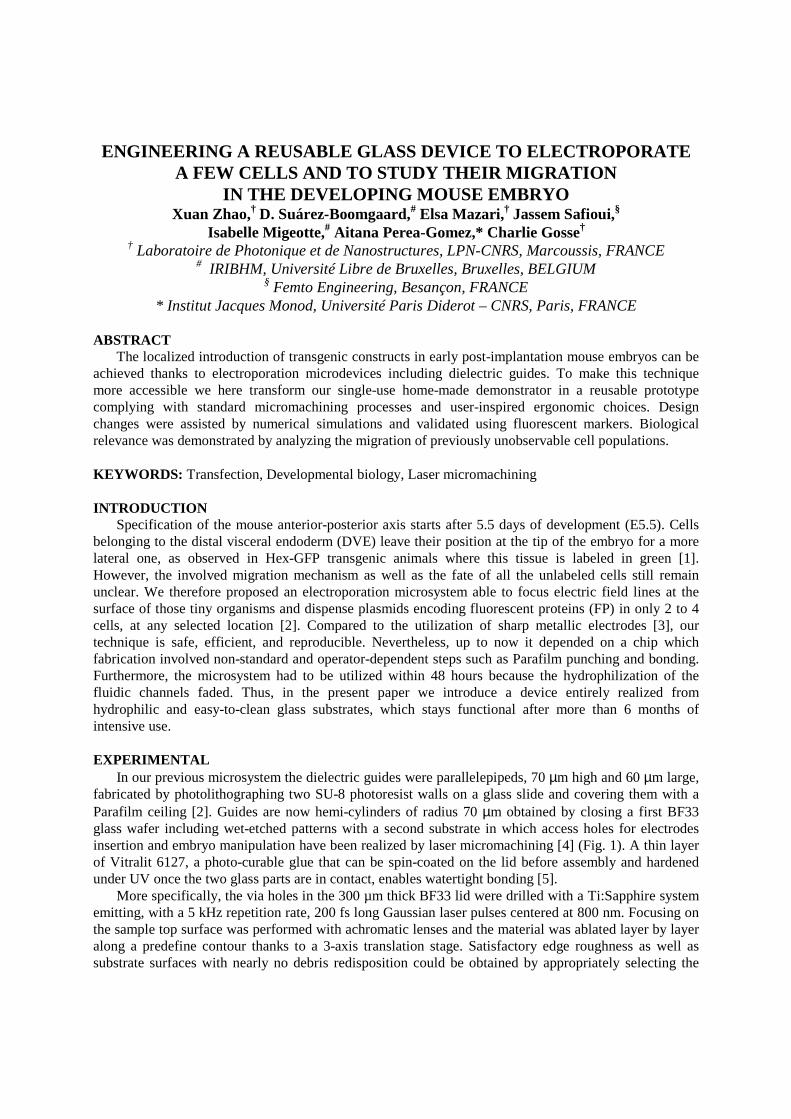
ENGINEERING A REUSABLE GLASS DEVICE TO ELECTROPORAT E A FEW CELLS AND TO STUDY THEIR MIGRATION
IN THE DEVELOPING MOUSE EMBRYO Xuan Zhao,† D. Suárez-Boomgaard,# Elsa Mazari,† Jassem Safioui,§
Isabelle Migeotte,# Aitana Perea-Gomez,* Charlie Gosse†
† Laboratoire de Photonique et de Nanostructures, LPN-CNRS, Marcoussis, FRANCE # IRIBHM, Université Libre de Bruxelles, Bruxelles, BELGIUM
§ Femto Engineering, Besançon, FRANCE * Institut Jacques Monod, Université Paris Diderot – CNRS, Paris, FRANCE
ABSTRACT
The localized introduction of transgenic constructs in early post-implantation mouse embryos can be achieved thanks to electroporation microdevices including dielectric guides. To make this technique more accessible we here transform our single-use home-made demonstrator in a reusable prototype complying with standard micromachining processes and user-inspired ergonomic choices. Design changes were assisted by numerical simulations and validated using fluorescent markers. Biological relevance was demonstrated by analyzing the migration of previously unobservable cell populations. KEYWORDS: Transfection, Developmental biology, Laser micromachining
INTRODUCTION
Specification of the mouse anterior-posterior axis starts after 5.5 days of development (E5.5). Cells belonging to the distal visceral endoderm (DVE) leave their position at the tip of the embryo for a more lateral one, as observed in Hex-GFP transgenic animals where this tissue is labeled in green [1]. However, the involved migration mechanism as well as the fate of all the unlabeled cells still remain unclear. We therefore proposed an electroporation microsystem able to focus electric field lines at the surface of those tiny organisms and dispense plasmids encoding fluorescent proteins (FP) in only 2 to 4 cells, at any selected location [2]. Compared to the utilization of sharp metallic electrodes [3], our technique is safe, efficient, and reproducible. Nevertheless, up to now it depended on a chip which fabrication involved non-standard and operator-dependent steps such as Parafilm punching and bonding. Furthermore, the microsystem had to be utilized within 48 hours because the hydrophilization of the fluidic channels faded. Thus, in the present paper we introduce a device entirely realized from hydrophilic and easy-to-clean glass substrates, which stays functional after more than 6 months of intensive use. EXPERIMENTAL
In our previous microsystem the dielectric guides were parallelepipeds, 70 µm high and 60 µm large, fabricated by photolithographing two SU-8 photoresist walls on a glass slide and covering them with a Parafilm ceiling [2]. Guides are now hemi-cylinders of radius 70 µm obtained by closing a first BF33 glass wafer including wet-etched patterns with a second substrate in which access holes for electrodes insertion and embryo manipulation have been realized by laser micromachining [4] (Fig. 1). A thin layer of Vitralit 6127, a photo-curable glue that can be spin-coated on the lid before assembly and hardened under UV once the two glass parts are in contact, enables watertight bonding [5].
More specifically, the via holes in the 300 µm thick BF33 lid were drilled with a Ti:Sapphire system emitting, with a 5 kHz repetition rate, 200 fs long Gaussian laser pulses centered at 800 nm. Focusing on the sample top surface was performed with achromatic lenses and the material was ablated layer by layer along a predefine contour thanks to a 3-axis translation stage. Satisfactory edge roughness as well as substrate surfaces with nearly no debris redisposition could be obtained by appropriately selecting the
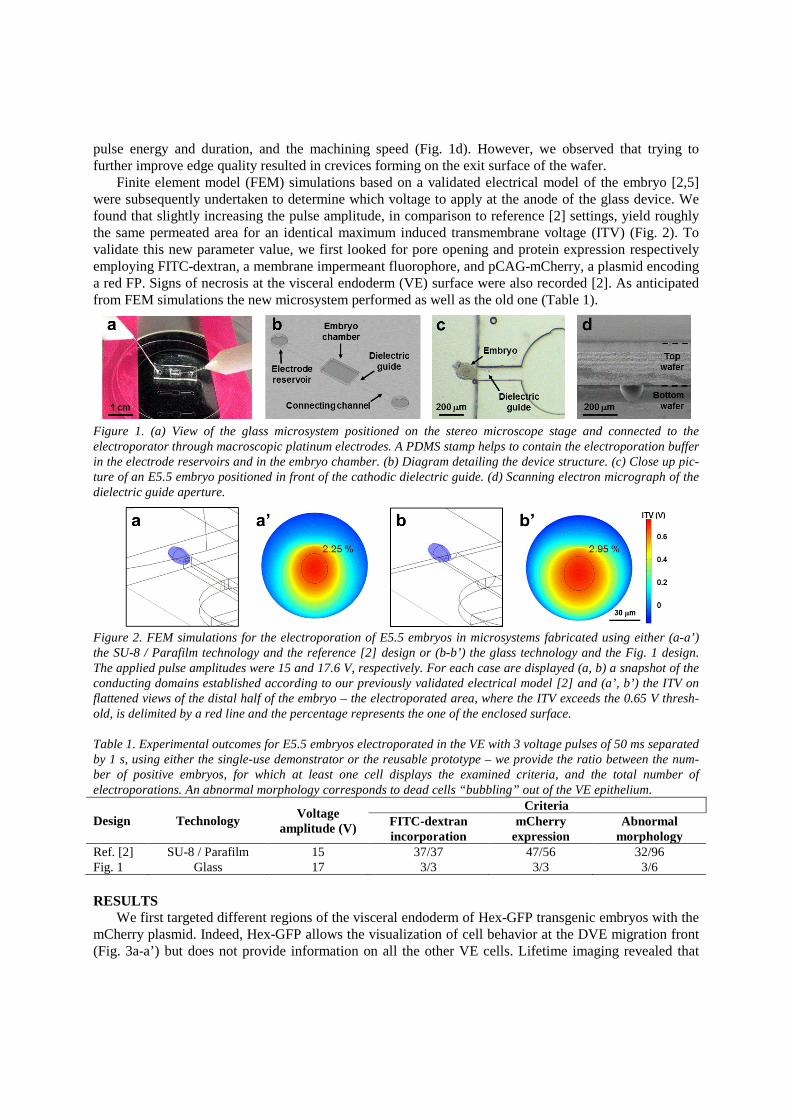
pulse energy and duration, and the machining speed (Fig. 1d). However, we observed that trying to further improve edge quality resulted in crevices forming on the exit surface of the wafer.
Finite element model (FEM) simulations based on a validated electrical model of the embryo [2,5] were subsequently undertaken to determine which voltage to apply at the anode of the glass device. We found that slightly increasing the pulse amplitude, in comparison to reference [2] settings, yield roughly the same permeated area for an identical maximum induced transmembrane voltage (ITV) (Fig. 2). To validate this new parameter value, we first looked for pore opening and protein expression respectively employing FITC-dextran, a membrane impermeant fluorophore, and pCAG-mCherry, a plasmid encoding a red FP. Signs of necrosis at the visceral endoderm (VE) surface were also recorded [2]. As anticipated from FEM simulations the new microsystem performed as well as the old one (Table 1).
Figure 1. (a) View of the glass microsystem positioned on the stereo microscope stage and connected to the electroporator through macroscopic platinum electrodes. A PDMS stamp helps to contain the electroporation buffer in the electrode reservoirs and in the embryo chamber. (b) Diagram detailing the device structure. (c) Close up pic-ture of an E5.5 embryo positioned in front of the cathodic dielectric guide. (d) Scanning electron micrograph of the dielectric guide aperture.
Figure 2. FEM simulations for the electroporation of E5.5 embryos in microsystems fabricated using either (a-a’) the SU-8 / Parafilm technology and the reference [2] design or (b-b’) the glass technology and the Fig. 1 design. The applied pulse amplitudes were 15 and 17.6 V, respectively. For each case are displayed (a, b) a snapshot of the conducting domains established according to our previously validated electrical model [2] and (a’, b’) the ITV on flattened views of the distal half of the embryo – the electroporated area, where the ITV exceeds the 0.65 V thresh-old, is delimited by a red line and the percentage represents the one of the enclosed surface.
Table 1. Experimental outcomes for E5.5 embryos electroporated in the VE with 3 voltage pulses of 50 ms separated by 1 s, using either the single-use demonstrator or the reusable prototype – we provide the ratio between the num-ber of positive embryos, for which at least one cell displays the examined criteria, and the total number of electroporations. An abnormal morphology corresponds to dead cells “bubbling” out of the VE epithelium.
Design Technology Voltage
amplitude (V)
Criteria FITC-dextran incorporation
mCherry expression
Abnormal morphology
Ref. [2] SU-8 / Parafilm 15 37/37 47/56 32/96 Fig. 1 Glass 17 3/3 3/3 3/6 RESULTS
We first targeted different regions of the visceral endoderm of Hex-GFP transgenic embryos with the mCherry plasmid. Indeed, Hex-GFP allows the visualization of cell behavior at the DVE migration front (Fig. 3a-a’) but does not provide information on all the other VE cells. Lifetime imaging revealed that
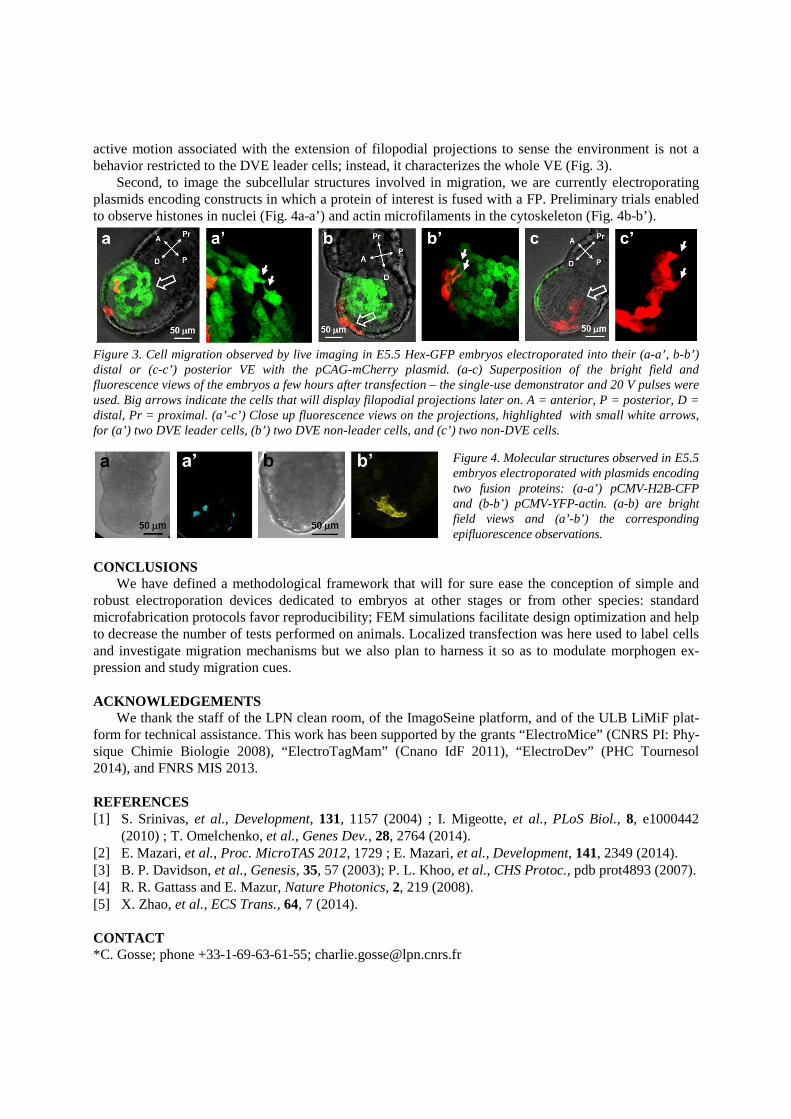
active motion associated with the extension of filopodial projections to sense the environment is not a behavior restricted to the DVE leader cells; instead, it characterizes the whole VE (Fig. 3).
Second, to image the subcellular structures involved in migration, we are currently electroporating plasmids encoding constructs in which a protein of interest is fused with a FP. Preliminary trials enabled to observe histones in nuclei (Fig. 4a-a’) and actin microfilaments in the cytoskeleton (Fig. 4b-b’).
Figure 3. Cell migration observed by live imaging in E5.5 Hex-GFP embryos electroporated into their (a-a’, b-b’) distal or (c-c’) posterior VE with the pCAG-mCherry plasmid. (a-c) Superposition of the bright field and fluorescence views of the embryos a few hours after transfection – the single-use demonstrator and 20 V pulses were used. Big arrows indicate the cells that will display filopodial projections later on. A = anterior, P = posterior, D = distal, Pr = proximal. (a’-c’) Close up fluorescence views on the projections, highlighted with small white arrows, for (a’) two DVE leader cells, (b’) two DVE non-leader cells, and (c’) two non-DVE cells.
Figure 4. Molecular structures observed in E5.5 embryos electroporated with plasmids encoding two fusion proteins: (a-a’) pCMV-H2B-CFP and (b-b’) pCMV-YFP-actin. (a-b) are bright field views and (a’-b’) the corresponding epifluorescence observations.
CONCLUSIONS
We have defined a methodological framework that will for sure ease the conception of simple and robust electroporation devices dedicated to embryos at other stages or from other species: standard microfabrication protocols favor reproducibility; FEM simulations facilitate design optimization and help to decrease the number of tests performed on animals. Localized transfection was here used to label cells and investigate migration mechanisms but we also plan to harness it so as to modulate morphogen ex-pression and study migration cues. ACKNOWLEDGEMENTS
We thank the staff of the LPN clean room, of the ImagoSeine platform, and of the ULB LiMiF plat-form for technical assistance. This work has been supported by the grants “ElectroMice” (CNRS PI: Phy-sique Chimie Biologie 2008), “ElectroTagMam” (Cnano IdF 2011), “ElectroDev” (PHC Tournesol 2014), and FNRS MIS 2013.
REFERENCES [1] S. Srinivas, et al., Development, 131, 1157 (2004) ; I. Migeotte, et al., PLoS Biol., 8, e1000442
(2010) ; T. Omelchenko, et al., Genes Dev., 28, 2764 (2014). [2] E. Mazari, et al., Proc. MicroTAS 2012, 1729 ; E. Mazari, et al., Development, 141, 2349 (2014). [3] B. P. Davidson, et al., Genesis, 35, 57 (2003); P. L. Khoo, et al., CHS Protoc., pdb prot4893 (2007). [4] R. R. Gattass and E. Mazur, Nature Photonics, 2, 219 (2008). [5] X. Zhao, et al., ECS Trans., 64, 7 (2014). CONTACT *C. Gosse; phone +33-1-69-63-61-55; [email protected]

LASER MICROMACHINING OF REUSABLE GLASS DEVICES DEDICATED TO THE TARGETED ELECTROPORATION OF CELL ASSEMBLIES
Xuan Zhao1, Diana Suárez-BoomgaardAnne-Claire Louër
1Laboratoire de Photonique et de Nanostructures2IRIBHM, Université Libre de Bruxelles, Bruxelles
3Femto Engineering, Besançon,4LightFab GmbH, Aachen
5Klearia SAS
ABSTRACT We demonstrate that the localized introduction of cell
markers by electroporation can be efficiently and safely achieved with reusable glass chips complying with industrial micromachining techniques. Consequently, any biologist can now rely on contract manufacturing implement this transfection approach at moderate cost KEYWORDS
Femtosecond laser ablation, selective laseretching, hydrogensilsesquioxane, dielectric guide,transfection, embryology. INTRODUCTION
Following and/or modifying the fate of specific cell populations are key issues in developmental biology.Therefore, life scientists aim at techniques able to locally introduce transgenic constructs into tissues organisms [1]. As an example, we focus labeling with fluorescent proteins of the distal visceral endoderm (DVE) of 5.5 days old (E5.5) mouse embryos. The 12 hours long collective migration of this group of cells is of importance since it is specification of the anterior-posterior axis
Electroporation depends on voltage pulses and eventually permeabilize the plasma membraneenabling DNA to enter the cytoplasm. electrodes have traditionally been used to induce strong transmembrane potential variations at the (Fig. 1a) [1,2]. However, harmful chemical species (e.g. gas, protons) generated by electrolysis compromise the survival of the cells located close to the tipelectrodes. Therefore, using dielectric guides electric field created by remote metal wiresEfficient and reproducible results have been obtained with both glass micropipettes (Fig. 1b) [channels [1,4,5]. We recently microfabrication allows one to better control the shape and size of the guide aperture, as well as compatible with easy and fast embryo manipulationYet, specialized equipment and know-how to produce chips that were only singleprototype dielectric guides were parallelepipeds,high and 60 µm large, fabricated by photolithographtwo SU-8 walls on a glass slide, plasma of the photoresist, and thermal bonding of[5]. The surface activation lasted only 24hfilling was thus impossible after this delay.
LASER MICROMACHINING OF REUSABLE GLASS DEVICES DEDICATED TO THE TARGETED ELECTROPORATION OF CELL ASSEMBLIES
Boomgaard2, Bechara Saykali2, Jassem Safioui3
Claire Louër5, Isabelle Migeotte2, and Charlie GosseLaboratoire de Photonique et de Nanostructures, LPN-CNRS, Marcoussis
IRIBHM, Université Libre de Bruxelles, Bruxelles, BELGIUMFemto Engineering, Besançon, FRANCE LightFab GmbH, Aachen, GERMANY
Klearia SAS, Marcoussis, FRANCE
We demonstrate that the localized introduction of cell markers by electroporation can be efficiently and safely
chips complying with Consequently, any
on contract manufacturing to easily implement this transfection approach at moderate cost.
selective laser-induced , dielectric guide,
or modifying the fate of specific cell populations are key issues in developmental biology. Therefore, life scientists aim at techniques able to locally introduce transgenic constructs into tissues of model
xample, we focus here on the labeling with fluorescent proteins of the distal visceral
old (E5.5) mouse embryos. migration of this group of
cells is of importance since it is required for the posterior axis.
voltage pulses that charge the plasma membrane,
to enter the cytoplasm. Sharp metallic electrodes have traditionally been used to induce strong
variations at the tissue surface . However, harmful chemical species (e.g.
gas, protons) generated by electrolysis compromise the lose to the tip of the
using dielectric guides to focus the metal wires appears safer.
Efficient and reproducible results have been obtained with (Fig. 1b) [1,3] and fluidic
We recently showed that better control the shape
and size of the guide aperture, as well as to create a design manipulation [4,5].
how were necessary single-use. In our
dielectric guides were parallelepipeds, 70 µm , fabricated by photolithography of
plasma hydrophilization thermal bonding of a Parafilm lid
surface activation lasted only 24h, and channel impossible after this delay.
Figure 1: Previous strategies employed to lelectroporate the DVE of early postembryos. The electric field is focumetallic microneedle or (b) a micropipette. solution is represented in clear green and the encoded protein in dark green.
In this paper we rely on gdisseminate the dielectric guide scientists agree on glass biocompatibilitychips can be easily cleaned and reusedcompensates for the ~ 200 $ cost per 2a-b). Finally, many companies propose singlecontract manufacturing, henceengage in a rapid prototyping cycle.
EXPERIMENTAL SECTIONGeneral considerations
The device consists in a buried fluidic network and large open cavities; the connecting channels and the dielectric guide bring the electric field from the ereservoirs to the chamber where the embryo is positioned(Fig. 2a-d). As the guide has than the embryo, a focusing efrestricts the area over which the induced transmembrane voltage (ITV) exceeds the poration threshold. the success of localized electroporationdependent on the shape of the aperture,by finite element method (FEM) [6]. Therefore, laser micromachining was selected to the embryo chamber in the glass wafer. Indeed, this technique can yield vertical and precisely positioned walls. Furthermore, to demonstrate the variety of the technological offer, we herefabrication processes.
LASER MICROMACHINING OF REUSABLE GLASS DEVICES DEDICATED TO THE TARGETED ELECTROPORATION OF CELL ASSEMBLIES
3, Martin Hermans4, Gosse1
CNRS, Marcoussis, FRANCE BELGIUM
Previous strategies employed to locally
of early post-implantation mouse is focused with either (a) a
metallic microneedle or (b) a micropipette. The plasmid solution is represented in clear green and the encoded
In this paper we rely on glass micromachining to dielectric guide approach. Indeed, all life
biocompatibility. Moreover, easily cleaned and reused, which
for the ~ 200 $ cost per functional unit (Fig. ly, many companies propose single-piece
hence enabling biologists to engage in a rapid prototyping cycle.
EXPERIMENTAL SECTION
device consists in a buried fluidic network and in he connecting channels and the
bring the electric field from the electrode reservoirs to the chamber where the embryo is positioned
has a slightly smaller diameter than the embryo, a focusing effect is obtained, which
the area over which the induced transmembrane voltage (ITV) exceeds the poration threshold. However, the success of localized electroporation is highly
the shape of the aperture, as demonstrated (FEM) simulations (Fig. 2e-e’)
laser micromachining was selected to open in the glass wafer. Indeed, this vertical and precisely positioned o demonstrate the variety of the we here explore two different
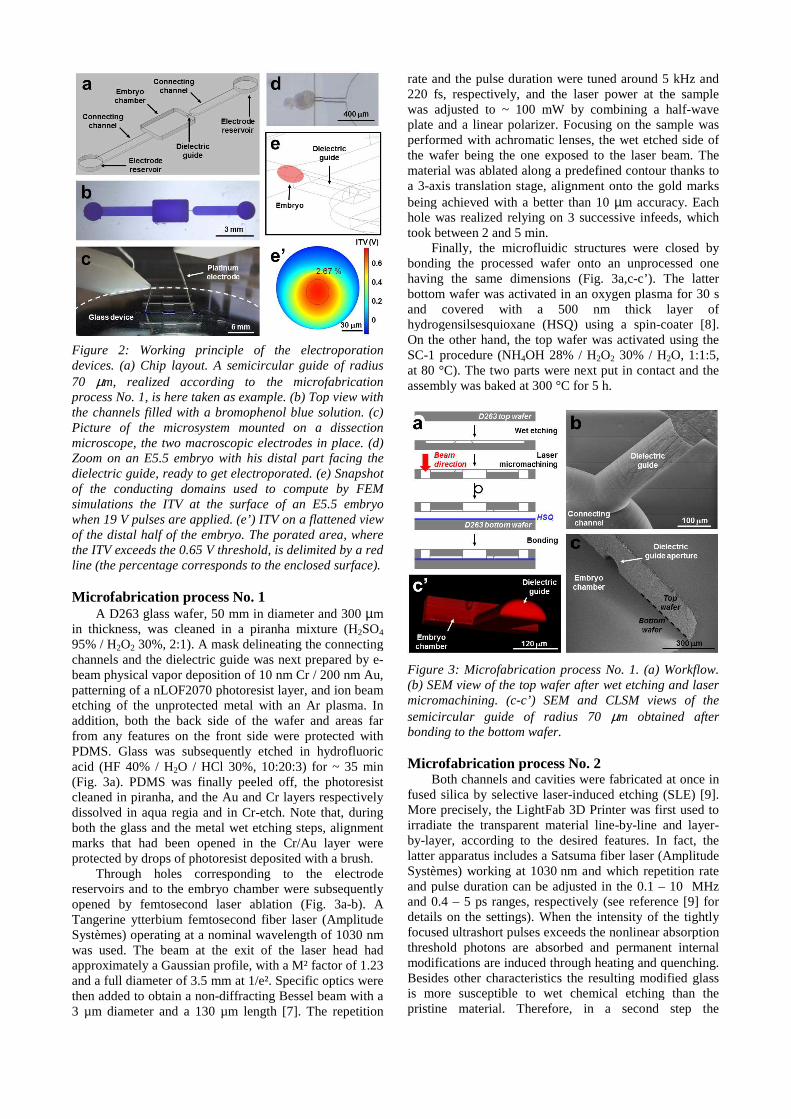
Figure 2: Working principle of thedevices. (a) Chip layout. A semicircular guide of radius 70 µm, realized according to the microfabrication process No. 1, is here taken as example.the channels filled with a bromophenol blue solution. (c) Picture of the microsystem mounted on a dissection microscope, the two macroscopic electrodes in place. (d) Zoom on an E5.5 embryo with his distal part facing the dielectric guide, ready to get electroporated. (e) Snapshot of the conducting domains used to compute by simulations the ITV at the surface of awhen 19 V pulses are applied. (e’) ITV on a flattened view of the distal half of the embryo. The porated area,the ITV exceeds the 0.65 V threshold, is delimited by a red line (the percentage corresponds to the enclosed surface Microfabrication process No. 1
A D263 glass wafer, 50 mm in diameter and 300 in thickness, was cleaned in a piranha95% / H2O2 30%, 2:1). A mask delineating the connecting channels and the dielectric guide was next beam physical vapor deposition of 10 nm patterning of a nLOF2070 photoresist layeretching of the unprotected metal with anaddition, both the back side of the wafer and areas far from any features on the front side were PDMS. Glass was subsequently etched in acid (HF 40% / H2O / HCl 30%, 10:20:3(Fig. 3a). PDMS was finally peeled off, the photoresist cleaned in piranha, and the Au and Cr layers respectively dissolved in aqua regia and in Cr-etch. both the glass and the metal wet etching stepsmarks that had been opened in the Cr/Au layer were protected by drops of photoresist deposited with a brush.
Through holes corresponding to the reservoirs and to the embryo chamber were opened by femtosecond laser ablation Tangerine ytterbium femtosecond fiber laser Systèmes) operating at a nominal wavelength of 1030was used. The beam at the exit of the laser head approximately a Gaussian profile, with a and a full diameter of 3.5 mm at 1/e². Specific opticsthen added to obtain a non-diffracting Bessel 3 µm diameter and a 130 µm length [
the electroporation
semicircular guide of radius the microfabrication
. (b) Top view with the channels filled with a bromophenol blue solution. (c)
of the microsystem mounted on a dissection microscope, the two macroscopic electrodes in place. (d)
embryo with his distal part facing the , ready to get electroporated. (e) Snapshot
of the conducting domains used to compute by FEM at the surface of an E5.5 embryo
. (e’) ITV on a flattened view of the distal half of the embryo. The porated area, where the ITV exceeds the 0.65 V threshold, is delimited by a red
the percentage corresponds to the enclosed surface).
mm in diameter and 300 µm piranha mixture (H2SO4
mask delineating the connecting next prepared by e-
tion of 10 nm Cr / 200 nm Au, photoresist layer, and ion beam
with an Ar plasma. In of the wafer and areas far
from any features on the front side were protected with etched in hydrofluoric
O / HCl 30%, 10:20:3) for ~ 35 min peeled off, the photoresist and Cr layers respectively
Note that, during wet etching steps, alignment d in the Cr/Au layer were
protected by drops of photoresist deposited with a brush. corresponding to the electrode
were subsequently opened by femtosecond laser ablation (Fig. 3a-b). A
femtosecond fiber laser (Amplitude operating at a nominal wavelength of 1030 nm
at the exit of the laser head had a M² factor of 1.23
Specific optics were diffracting Bessel beam with a
[7]. The repetition
rate and the pulse duration were 220 fs, respectively, and the laser power was adjusted to ~ 100 mW bplate and a linear polarizer. Focusing on the sample was performed with achromatic lensesthe wafer being the one exposed to the laser beam.material was ablated along a predefinea 3-axis translation stage, alignment onto the gold marks being achieved with a better than 10 hole was realized relying on 3took between 2 and 5 min.
Finally, the microfluidic bonding the processed wafer onto an unprocessed one having the same dimensions (Fig. 3a,bottom wafer was activated in an oxygen plasma for 30 sand covered with a 500 nm thick layer ofhydrogensilsesquioxane (HSQ)On the other hand, the top wafer was activated using the SC-1 procedure (NH4OH 28% / Hat 80 °C). The two parts were assembly was baked at 300 °C for
Figure 3: Microfabrication process (b) SEM view of the top wafer aftermicromachining. (c-c’) SEM and CLSM semicircular guide of radius 70 bonding to the bottom wafer.
Microfabrication process No. 2
Both channels and cavities were fabricated at once fused silica by selective laser-More precisely, the LightFab 3D Printer was first used to irradiate the transparent material lineby-layer, according to the desired features.latter apparatus includes a Satsuma fiber laser Systèmes) working at 1030 nm and pulse duration can be adjusted in the 0.1 and 0.4 – 5 ps ranges, respectivelydetails on the settings). When the intensityfocused ultrashort pulses exceeds thethreshold photons are absorbed modifications are induced through hBesides other characteristics the resulting modified glass is more susceptible to wet chemical etching than thepristine material. Therefore, in a second step
were tuned around 5 kHz and he laser power at the sample
by combining a half-wave plate and a linear polarizer. Focusing on the sample was performed with achromatic lenses, the wet etched side of the wafer being the one exposed to the laser beam. The material was ablated along a predefined contour thanks to
, alignment onto the gold marks being achieved with a better than 10 µm accuracy. Each
3 successive infeeds, which
structures were closed by the processed wafer onto an unprocessed one
having the same dimensions (Fig. 3a,c-c’). The latter activated in an oxygen plasma for 30 s
ed with a 500 nm thick layer of hydrogensilsesquioxane (HSQ) using a spin-coater [8].
he top wafer was activated using the OH 28% / H2O2 30% / H2O, 1:1:5,
The two parts were next put in contact and the °C for 5 h.
Microfabrication process No. 1. (a) Workflow.
wafer after wet etching and laser c’) SEM and CLSM views of the
semicircular guide of radius 70 µm obtained after
Microfabrication process No. 2 oth channels and cavities were fabricated at once in
induced etching (SLE) [9]. he LightFab 3D Printer was first used to
irradiate the transparent material line-by-line and layer-esired features. In fact, the
a Satsuma fiber laser (Amplitude nm and which repetition rate
and pulse duration can be adjusted in the 0.1 – 10 MHz 5 ps ranges, respectively (see reference [9] for
details on the settings). When the intensity of the tightly focused ultrashort pulses exceeds the nonlinear absorption
absorbed and permanent internal s are induced through heating and quenching.
istics the resulting modified glass chemical etching than the
pristine material. Therefore, in a second step the
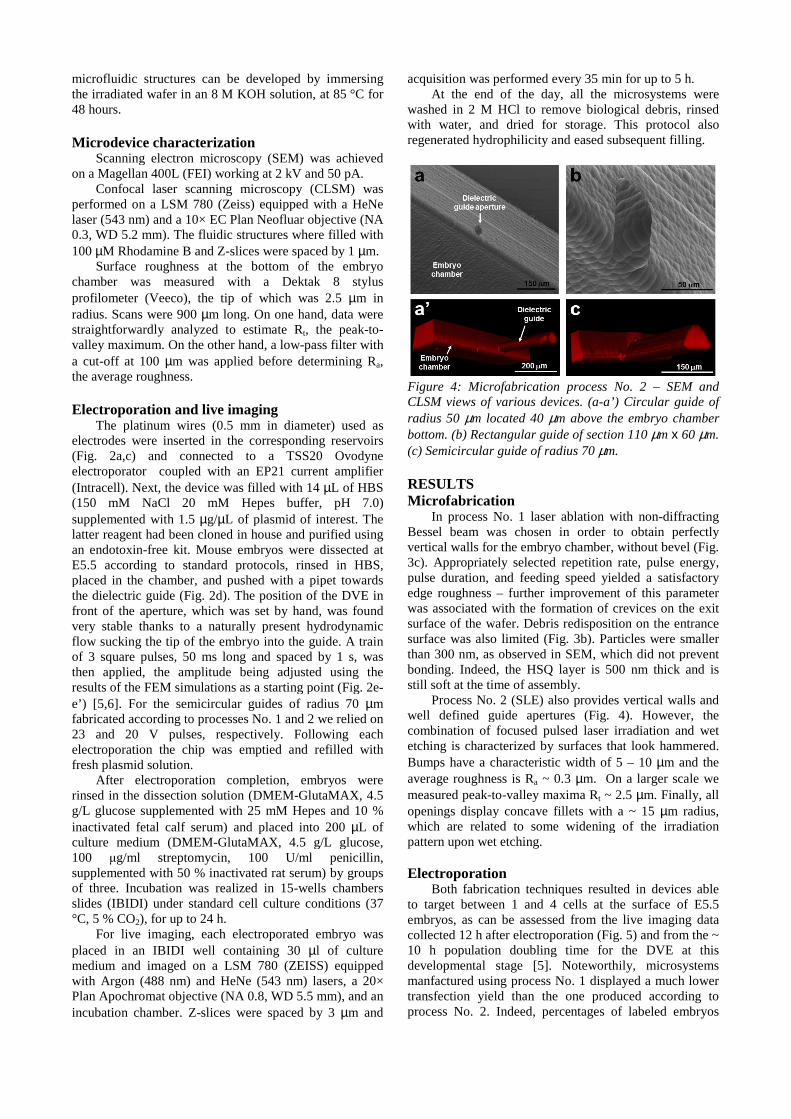
microfluidic structures can be developed by immersing the irradiated wafer in an 8 M KOH solution48 hours. Microdevice characterization
Scanning electron microscopy (SEM) was achieved on a Magellan 400L (FEI) working at 2 kV and 50 pA.
Confocal laser scanning microscopy (CLSM) was performed on a LSM 780 (Zeiss) equipped withlaser (543 nm) and a 10× EC Plan Neofluar 0.3, WD 5.2 mm). The fluidic structures where filled with 100 µM Rhodamine B and Z-slices were
Surface roughness at the bottom of the embryo chamber was measured with a Dektak 8 stylusprofilometer (Veeco), the tip of which radius. Scans were 900 µm long. On one hand, straightforwardly analyzed to estimate Rvalley maximum. On the other hand, a lowa cut-off at 100 µm was applied before determinthe average roughness. Electroporation and live imaging
The platinum wires (0.5 mm in diameter) used as electrodes were inserted in the corresponding reservoirs(Fig. 2a,c) and connected to a electroporator coupled with an EP21 (Intracell). Next, the device was filled with 14 (150 mM NaCl 20 mM Hepes buffer, pH 7.0) supplemented with 1.5 µg/µL of plasmid of interest. The latter reagent had been cloned in house and purified using an endotoxin-free kit. Mouse embryos were E5.5 according to standard protocols, placed in the chamber, and pushed with a pipet the dielectric guide (Fig. 2d). The position of the DVE in front of the aperture, which was set by handvery stable thanks to a naturally presentflow sucking the tip of the embryo into the of 3 square pulses, 50 ms long and spacedthen applied, the amplitude being adjustresults of the FEM simulations as a starting point (Fig. 2ee’) [5,6]. For the semicircular guides of radius 70 fabricated according to processes No. 1 and 2 23 and 20 V pulses, respectively. electroporation the chip was emptied and refilled with fresh plasmid solution.
After electroporation completion, embryos were rinsed in the dissection solution (DMEMg/L glucose supplemented with 25 mM Hepes and 10 % inactivated fetal calf serum) and placed into 200 culture medium (DMEM-GlutaMAX, 4.5 g/L glucose, 100 µg/ml streptomycin, 100 U/ml penicillin, supplemented with 50 % inactivated rat serum)of three. Incubation was realized in 15slides (IBIDI) under standard cell culture conditions °C, 5 % CO2), for up to 24 h.
For live imaging, each electroporated embryo was placed in an IBIDI well containing 30 medium and imaged on a LSM 780 (ZEISS) equipped with Argon (488 nm) and HeNe (543 nm) lasers, a 20Plan Apochromat objective (NA 0.8, WD 5.5 mm), aincubation chamber. Z-slices were spaced by 3
microfluidic structures can be developed by immersing solution, at 85 °C for
Scanning electron microscopy (SEM) was achieved 2 kV and 50 pA.
Confocal laser scanning microscopy (CLSM) was equipped with a HeNe
EC Plan Neofluar objective (NA . The fluidic structures where filled with
were spaced by 1 µm. at the bottom of the embryo
Dektak 8 stylus ), the tip of which was 2.5 µm in
ong. On one hand, data were straightforwardly analyzed to estimate Rt, the peak-to-
a low-pass filter with m was applied before determining Ra,
mm in diameter) used as in the corresponding reservoirs
a TSS20 Ovodyne EP21 current amplifier
Next, the device was filled with 14 µL of HBS 150 mM NaCl 20 mM Hepes buffer, pH 7.0)
plasmid of interest. The cloned in house and purified using
ouse embryos were dissected at E5.5 according to standard protocols, rinsed in HBS, placed in the chamber, and pushed with a pipet towards
he position of the DVE in by hand, was found
naturally present hydrodynamic into the guide. A train
square pulses, 50 ms long and spaced by 1 s, was adjusted using the
starting point (Fig. 2e-semicircular guides of radius 70 µm
fabricated according to processes No. 1 and 2 we relied on Following each
electroporation the chip was emptied and refilled with
electroporation completion, embryos were rinsed in the dissection solution (DMEM-GlutaMAX, 4.5 g/L glucose supplemented with 25 mM Hepes and 10 %
placed into 200 µL of , 4.5 g/L glucose,
g/ml streptomycin, 100 U/ml penicillin, % inactivated rat serum) by groups
15-wells chambers ) under standard cell culture conditions (37
For live imaging, each electroporated embryo was placed in an IBIDI well containing 30 µl of culture
LSM 780 (ZEISS) equipped with Argon (488 nm) and HeNe (543 nm) lasers, a 20×
(NA 0.8, WD 5.5 mm), and an slices were spaced by 3 µm and
acquisition was performed every 35 min forAt the end of the day, all
washed in 2 M HCl to remove biological debris, rinsed with water, and dried for storage. This regenerated hydrophilicity and ease
Figure 4: Microfabrication process No. 2 CLSM views of various devicesradius 50 µm located 40 µm above the bottom. (b) Rectangular guide of (c) Semicircular guide of radius RESULTS Microfabrication
In process No. 1 laser ablation with nonBessel beam was chosen in order to obtain vertical walls for the embryo chamber, 3c). Appropriately selected repetition rate, pulse duration, and feeding speededge roughness – further improvement of this parameter was associated with the formation ofsurface of the wafer. Debris redisposition on the entrance surface was also limited (Fig. 3than 300 nm, as observed in SEM, bonding. Indeed, the HSQ layer is 500 nm thick and still soft at the time of assembly.
Process No. 2 (SLE) also providwell defined guide aperturescombination of focused pulsed etching is characterized by surfaceBumps have a characteristic width of average roughness is Ra ~ 0.3 measured peak-to-valley maximopenings display concave fillets with a ~which are related to some widening of thepattern upon wet etching.
Electroporation
Both fabrication techniques to target between 1 and 4 cells at the surface of embryos, as can be assessed from collected 12 h after electroporation10 h population doubling time for the DVE at this developmental stage [5]. Noteworthily, mmanfactured using process No. 1transfection yield than the one process No. 2. Indeed, percentages of labeled embryos
acquisition was performed every 35 min for up to 5 h. At the end of the day, all the microsystems were
washed in 2 M HCl to remove biological debris, rinsed with water, and dried for storage. This protocol also
hydrophilicity and eased subsequent filling.
Microfabrication process No. 2 – SEM and
devices. (a-a’) Circular guide of m above the embryo chamber
Rectangular guide of section 110 µm x 60 µm. of radius 70 µm.
1 laser ablation with non-diffracting in order to obtain perfectly
s for the embryo chamber, without bevel (Fig. repetition rate, pulse energy, speed yielded a satisfactory
improvement of this parameter associated with the formation of crevices on the exit
Debris redisposition on the entrance (Fig. 3b). Particles were smaller
as observed in SEM, which did not prevent bonding. Indeed, the HSQ layer is 500 nm thick and is
at the time of assembly. also provides vertical walls and
well defined guide apertures (Fig. 4). However, the pulsed laser irradiation and wet
surfaces that look hammered. e a characteristic width of 5 – 10 µm and the
~ 0.3 µm. On a larger scale we valley maxima Rt ~ 2.5 µm. Finally, all
display concave fillets with a ~ 15 µm radius, which are related to some widening of the irradiation
Both fabrication techniques resulted in devices able to target between 1 and 4 cells at the surface of E5.5
, as can be assessed from the live imaging data collected 12 h after electroporation (Fig. 5) and from the ~ 10 h population doubling time for the DVE at this
Noteworthily, microsystems process No. 1 displayed a much lower than the one produced according to
percentages of labeled embryos
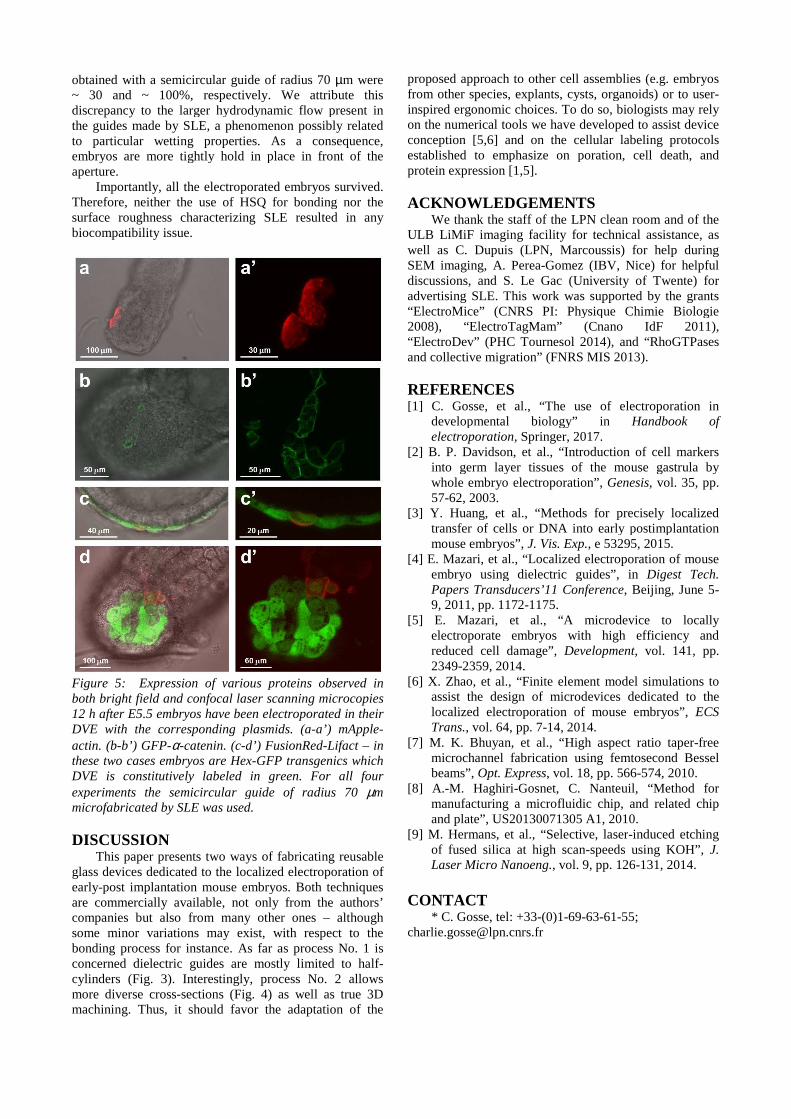
obtained with a semicircular guide of radius 70 ~ 30 and ~ 100%, respectively. We attribute thisdiscrepancy to the larger hydrodynamic flow present in the guides made by SLE, a phenomenon possibly related to particular wetting properties. As a consequence, embryos are more tightly hold in place in front of the aperture.
Importantly, all the electroporated embryos survived. Therefore, neither the use of HSQ for bonding surface roughness characterizing SLE rebiocompatibility issue.
Figure 5: Expression of various proteins both bright field and confocal laser scanning 12 h after E5.5 embryos have been electroporated DVE with the corresponding plasmidsactin. (b-b’) GFP-α-catenin. (c-d’) Fusionthese two cases embryos are Hex-GFP DVE is constitutively labeled in green. For all four experiments the semicircular guide of radius 70microfabricated by SLE was used. DISCUSSION
This paper presents two ways of fabricatiglass devices dedicated to the localized electroporation of early-post implantation mouse embryosare commercially available, not only from the authors’ companies but also from many other onessome minor variations may exist, with respect to the bonding process for instance. As far asconcerned dielectric guides are mostly limited to halfcylinders (Fig. 3). Interestingly, process No. 2 allows more diverse cross-sections (Fig. 4) as well as true 3D machining. Thus, it should favor the
obtained with a semicircular guide of radius 70 µm were We attribute this
to the larger hydrodynamic flow present in the guides made by SLE, a phenomenon possibly related
cular wetting properties. As a consequence, more tightly hold in place in front of the
Importantly, all the electroporated embryos survived. HSQ for bonding nor the
SLE resulted in any
of various proteins observed in laser scanning microcopies
5.5 embryos have been electroporated in their s. (a-a’) mApple-
d’) FusionRed-Lifact – in GFP transgenics which
DVE is constitutively labeled in green. For all four experiments the semicircular guide of radius 70 µm
fabricating reusable devices dedicated to the localized electroporation of post implantation mouse embryos. Both techniques
are commercially available, not only from the authors’ rom many other ones – although
some minor variations may exist, with respect to the As far as process No. 1 is
mostly limited to half-process No. 2 allows
as well as true 3D it should favor the adaptation of the
proposed approach to other cell assemblies (e.g. embryos from other species, explants, cysts, organoids)inspired ergonomic choices. To doon the numerical tools we have developed to assist device conception [5,6] and on the cellular labeling protocols established to emphasize on poration, cell death, and protein expression [1,5].
ACKNOWLEDGEMENTS
We thank the staff of the LPN clean room and ULB LiMiF imaging facility for technical assistancewell as C. Dupuis (LPN, Marcoussis)SEM imaging, A. Perea-Gomez discussions, and S. Le Gac (advertising SLE. This work was supported by the grants “ElectroMice” (CNRS PI: Physique Chimie Biologie 2008), “ElectroTagMam” “ElectroDev” (PHC Tournesol 2014), and and collective migration” (FNRS MIS 2013).
REFERENCES [1] C. Gosse, et al., “The use of electroporation in
developmental biology” in electroporation, Springer, 2017.
[2] B. P. Davidson, et al., “Introduction of cell markers into germ layer tissues of the mouse gastrula by whole embryo electroporation57-62, 2003.
[3] Y. Huang, et al., “Methods for precisely localized transfer of cells or DNA into early postimplantation mouse embryos”, J. Vis. Exp.
[4] E. Mazari, et al., “Localized electroporationembryo using dielectric guides”, in Papers Transducers’11 Conference9, 2011, pp. 1172-1175.
[5] E. Mazari, et al., “Aelectroporate embryos with high efficiency and reduced cell damage”, Devel2349-2359, 2014.
[6] X. Zhao, et al., “Finite element model simulations to assist the design of microdevices dedicated to the localized electroporation of mouse embryos”, Trans., vol. 64, pp. 7-14, 2014.
[7] M. K. Bhuyan, et al., “High aspect ratio tapermicrochannel fabrication using femtosecond Bessel beams”, Opt. Express, vol. 18, pp. 566
[8] A.-M. Haghiri-Gosnet, C. Nanteuil, “manufacturing a microfluidic chip, and related chip and plate”, US20130071305 A1, 2010.
[9] M. Hermans, et al., “Selective, laserof fused silica at high scanLaser Micro Nanoeng., vol. 9, pp. 126
CONTACT
* C. Gosse, tel: +33-(0)[email protected]
cell assemblies (e.g. embryos cysts, organoids) or to user-
To do so, biologists may rely on the numerical tools we have developed to assist device
] and on the cellular labeling protocols established to emphasize on poration, cell death, and
ACKNOWLEDGEMENTS LPN clean room and of the for technical assistance, as
C. Dupuis (LPN, Marcoussis) for help during Gomez (IBV, Nice) for helpful
S. Le Gac (University of Twente) for . This work was supported by the grants (CNRS PI: Physique Chimie Biologie
(Cnano IdF 2011), (PHC Tournesol 2014), and “RhoGTPases
(FNRS MIS 2013).
] C. Gosse, et al., “The use of electroporation in developmental biology” in Handbook of
, Springer, 2017. Introduction of cell markers
into germ layer tissues of the mouse gastrula by electroporation”, Genesis, vol. 35, pp.
] Y. Huang, et al., “Methods for precisely localized transfer of cells or DNA into early postimplantation
J. Vis. Exp., e 53295, 2015. E. Mazari, et al., “Localized electroporation of mouse embryo using dielectric guides”, in Digest Tech.
Transducers’11 Conference, Beijing, June 5-
et al., “A microdevice to locally electroporate embryos with high efficiency and
Development, vol. 141, pp.
[6] X. Zhao, et al., “Finite element model simulations to assist the design of microdevices dedicated to the localized electroporation of mouse embryos”, ECS
14, 2014. , et al., “High aspect ratio taper-free
microchannel fabrication using femtosecond Bessel , vol. 18, pp. 566-574, 2010.
Gosnet, C. Nanteuil, “Method for manufacturing a microfluidic chip, and related chip
S20130071305 A1, 2010. ] M. Hermans, et al., “Selective, laser-induced etching
of fused silica at high scan-speeds using KOH”, J. , vol. 9, pp. 126-131, 2014.
69-63-61-55;
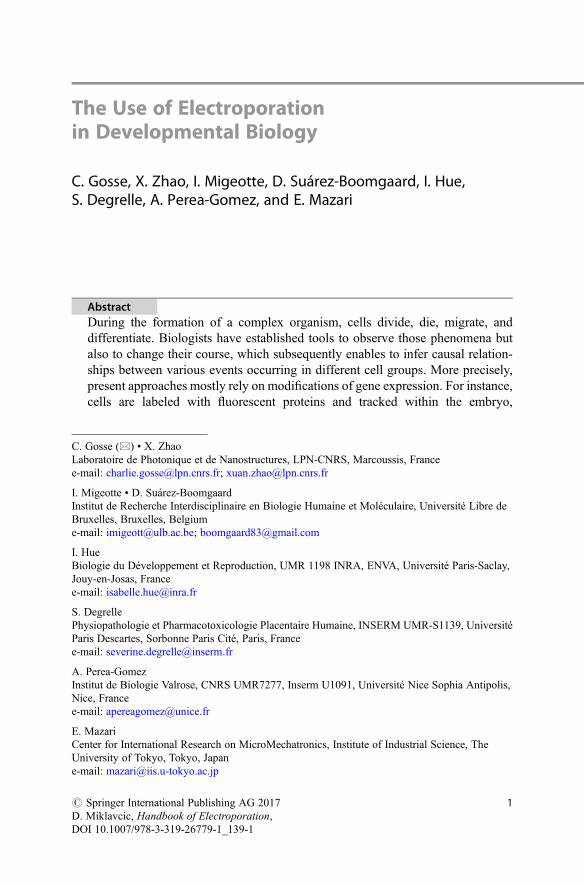
The Use of Electroporationin Developmental Biology
C. Gosse, X. Zhao, I. Migeotte, D. Suárez-Boomgaard, I. Hue,S. Degrelle, A. Perea-Gomez, and E. Mazari
AbstractDuring the formation of a complex organism, cells divide, die, migrate, anddifferentiate. Biologists have established tools to observe those phenomena butalso to change their course, which subsequently enables to infer causal relation-ships between various events occurring in different cell groups. More precisely,present approaches mostly rely on modifications of gene expression. For instance,cells are labeled with fluorescent proteins and tracked within the embryo,
C. Gosse (*) • X. ZhaoLaboratoire de Photonique et de Nanostructures, LPN-CNRS, Marcoussis, Francee-mail: [email protected]; [email protected]
I. Migeotte • D. Suárez-BoomgaardInstitut de Recherche Interdisciplinaire en Biologie Humaine et Moléculaire, Université Libre deBruxelles, Bruxelles, Belgiume-mail: [email protected]; [email protected]
I. HueBiologie du Développement et Reproduction, UMR 1198 INRA, ENVA, Université Paris-Saclay,Jouy-en-Josas, Francee-mail: [email protected]
S. DegrellePhysiopathologie et Pharmacotoxicologie Placentaire Humaine, INSERM UMR-S1139, UniversitéParis Descartes, Sorbonne Paris Cité, Paris, Francee-mail: [email protected]
A. Perea-GomezInstitut de Biologie Valrose, CNRS UMR7277, Inserm U1091, Université Nice Sophia Antipolis,Nice, Francee-mail: [email protected]
E. MazariCenter for International Research on MicroMechatronics, Institute of Industrial Science, TheUniversity of Tokyo, Tokyo, Japane-mail: [email protected]
# Springer International Publishing AG 2017D. Miklavcic, Handbook of Electroporation,DOI 10.1007/978-3-319-26779-1_139-1
1
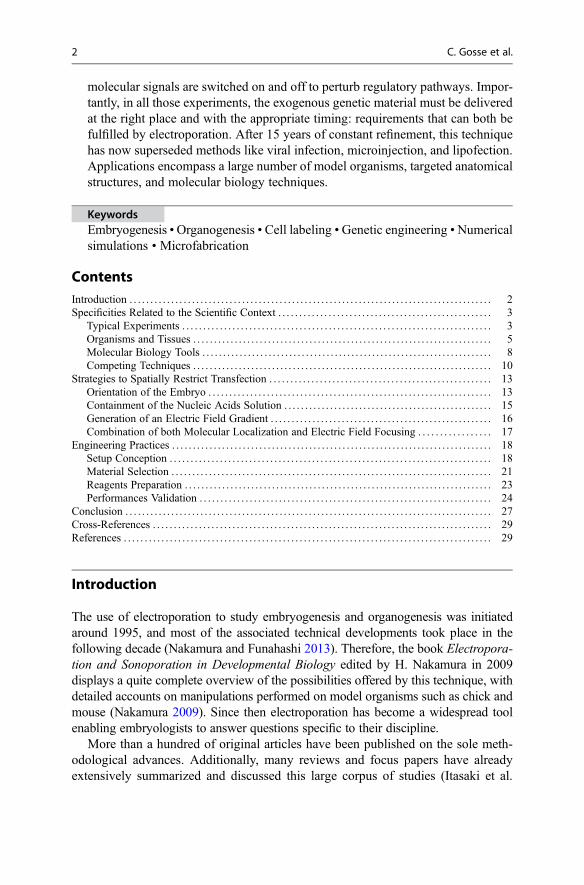
molecular signals are switched on and off to perturb regulatory pathways. Impor-tantly, in all those experiments, the exogenous genetic material must be deliveredat the right place and with the appropriate timing: requirements that can both befulfilled by electroporation. After 15 years of constant refinement, this techniquehas now superseded methods like viral infection, microinjection, and lipofection.Applications encompass a large number of model organisms, targeted anatomicalstructures, and molecular biology techniques.
KeywordsEmbryogenesis •Organogenesis • Cell labeling •Genetic engineering •Numericalsimulations • Microfabrication
ContentsIntroduction . . . . . . . . . . . . . . . . . . . . . . . . . . . . . . . . . . . . . . . . . . . . . . . . . . . . . . . . . . . . . . . . . . . . . . . . . . . . . . . . . . . . . . . 2Specificities Related to the Scientific Context . . . . . . . . . . . . . . . . . . . . . . . . . . . . . . . . . . . . . . . . . . . . . . . . . . . 3
Typical Experiments . . . . . . . . . . . . . . . . . . . . . . . . . . . . . . . . . . . . . . . . . . . . . . . . . . . . . . . . . . . . . . . . . . . . . . . . . . 3Organisms and Tissues . . . . . . . . . . . . . . . . . . . . . . . . . . . . . . . . . . . . . . . . . . . . . . . . . . . . . . . . . . . . . . . . . . . . . . . . 5Molecular Biology Tools . . . . . . . . . . . . . . . . . . . . . . . . . . . . . . . . . . . . . . . . . . . . . . . . . . . . . . . . . . . . . . . . . . . . . . 8Competing Techniques . . . . . . . . . . . . . . . . . . . . . . . . . . . . . . . . . . . . . . . . . . . . . . . . . . . . . . . . . . . . . . . . . . . . . . . . 10
Strategies to Spatially Restrict Transfection . . . . . . . . . . . . . . . . . . . . . . . . . . . . . . . . . . . . . . . . . . . . . . . . . . . . . 13Orientation of the Embryo . . . . . . . . . . . . . . . . . . . . . . . . . . . . . . . . . . . . . . . . . . . . . . . . . . . . . . . . . . . . . . . . . . . . 13Containment of the Nucleic Acids Solution . . . . . . . . . . . . . . . . . . . . . . . . . . . . . . . . . . . . . . . . . . . . . . . . . . 15Generation of an Electric Field Gradient . . . . . . . . . . . . . . . . . . . . . . . . . . . . . . . . . . . . . . . . . . . . . . . . . . . . . 16Combination of both Molecular Localization and Electric Field Focusing . . . . . . . . . . . . . . . . . 17
Engineering Practices . . . . . . . . . . . . . . . . . . . . . . . . . . . . . . . . . . . . . . . . . . . . . . . . . . . . . . . . . . . . . . . . . . . . . . . . . . . . . 18Setup Conception . . . . . . . . . . . . . . . . . . . . . . . . . . . . . . . . . . . . . . . . . . . . . . . . . . . . . . . . . . . . . . . . . . . . . . . . . . . . . 18Material Selection . . . . . . . . . . . . . . . . . . . . . . . . . . . . . . . . . . . . . . . . . . . . . . . . . . . . . . . . . . . . . . . . . . . . . . . . . . . . . 21Reagents Preparation . . . . . . . . . . . . . . . . . . . . . . . . . . . . . . . . . . . . . . . . . . . . . . . . . . . . . . . . . . . . . . . . . . . . . . . . . . 23Performances Validation . . . . . . . . . . . . . . . . . . . . . . . . . . . . . . . . . . . . . . . . . . . . . . . . . . . . . . . . . . . . . . . . . . . . . . 24
Conclusion . . . . . . . . . . . . . . . . . . . . . . . . . . . . . . . . . . . . . . . . . . . . . . . . . . . . . . . . . . . . . . . . . . . . . . . . . . . . . . . . . . . . . . . . 27Cross-References . . . . . . . . . . . . . . . . . . . . . . . . . . . . . . . . . . . . . . . . . . . . . . . . . . . . . . . . . . . . . . . . . . . . . . . . . . . . . . . . . 29References . . . . . . . . . . . . . . . . . . . . . . . . . . . . . . . . . . . . . . . . . . . . . . . . . . . . . . . . . . . . . . . . . . . . . . . . . . . . . . . . . . . . . . . . 29
Introduction
The use of electroporation to study embryogenesis and organogenesis was initiatedaround 1995, and most of the associated technical developments took place in thefollowing decade (Nakamura and Funahashi 2013). Therefore, the book Electropora-tion and Sonoporation in Developmental Biology edited by H. Nakamura in 2009displays a quite complete overview of the possibilities offered by this technique, withdetailed accounts on manipulations performed on model organisms such as chick andmouse (Nakamura 2009). Since then electroporation has become a widespread toolenabling embryologists to answer questions specific to their discipline.
More than a hundred of original articles have been published on the sole meth-odological advances. Additionally, many reviews and focus papers have alreadyextensively summarized and discussed this large corpus of studies (Itasaki et al.
2 C. Gosse et al.
1999; Swartz et al. 2001; Ogura 2002; Krull 2004; Odani et al. 2008; Sauka-Spengler and Barembaum 2008; Takahashi et al. 2008a; Tanaka et al. 2014). Thus,the present chapter has been conceived along somewhat different lines: it aims to be aprimer that presents the utilization of electroporation in developmental biology froman engineering point of view. To start with, the fundamental objectives pursued byembryologists will be described, as well as the typical experiments they carry out.How electroporation can fulfill some of the corresponding technical needs will also beexplained. Next, a comprehensive summary of the realizations so far published will beprovided, using the strategy devised to localize transfection as an organizing principlefor the redaction. Finally, some of the practical issues related to the implementation ofelectroporation in this particular field of life sciences will be discussed.
The bibliography will be more illustrative than exhaustive. It will mainly focus onseminal publications and on well-detailed technical papers, leaving aside reports onbiological questions in which electroporation is marginally employed. Furthermore,references for many reviews will be included, to be used as introductions to morespecific parts of the literature. We will also try to discuss as much as possible theadvances posterior to the 2009 publication of Nakamura’s book. Noteworthily, in thelast 10 years both Nature Protocols and the Journal of Visualized Experiments havereleased a few dozens of detailed protocols, old and new. In the case of the latterjournal, each article is associated with videos that really bring a plus, because skilledmanual experimentation is often a prerequisite in embryology. Finally, for comple-mentary technical and bibliographical information, one can profitably check thewebsites of some of the main providers of electroporation apparatus (e.g., BTXHarvard Apparatus, NepaGene).
Specificities Related to the Scientific Context
Typical Experiments
The formation of a multicellular organism from a single cell, the fertilized egg(or zygote), involves fundamental processes like differentiation, which producesdiverse cell types such as neurons or insulin producing cells, and morphogenesis,which allows their spatial and functional organization into organs such as the brainor the pancreas. During embryonic development, a tight regulation of cell division,cell death, and cell migration is also at play to control the global growth (Slack 2006;Gilbert 2013). Importantly, developmental processes are not restricted to the time ofthe embryonic life. Indeed, in human for instance, some organs like the skin or thesurface of the intestine are constantly renewed. Moreover, in animals with highregenerative capacities like amphibians, an entire adult limb or a tail can be replacedafter injury.
Understanding the development of a complex organism requires acquiring aprecise knowledge of the origins and of the dynamics of the cell populations thatform the different tissues of the embryo. So-called fate maps are then drawn bytracing the descendants of a particular cell population (cell lineage analysis) or even
The Use of Electroporation in Developmental Biology 3
of a single cell (clonal analysis) (Stern and Fraser 2001; Kretzschmar and Watt2012). Classically, marking selected cell populations relied on the injection oforganic dyes (Bhattacharyya et al. 2008) or the grafting of cells possessing specificcharacters such as a pigmentation or a specific nuclear organization (Le Douarinet al. 2008 – Fig. 1a). In modern developmental biology, cells are labeled bymodifying their gene expression so that they produce specific proteins like theenzyme β-galactosidase, which product can be detected in fixed tissues or fluores-cent proteins, that allow live imaging experiments (Fig. 2a).
Another important experimental paradigm in developmental biology is to modifythe behavior of a given cell population in order to understand its role in the formationof a given tissue. In classic embryology it was achieved by the grafting or theablation of specific cell groups. This approach is best illustrated by the Spemannand Mangold experiment, demonstrating that grafting some specific dorsal cellpopulation of an amphibian embryo, the organizer, is sufficient to modify the
Fig. 1 Examples, in developmental biology, of seminal experiments relying on tissue transplan-tation. (A1–2) Lineage tracing performed on avian embryos to decipher the origin of the skullcomponents (Adapted from Couly et al. 1993). (A1) A piece of the anterior part of the neural fold isdissected from a quail embryo at the three-somite stage and grafted in a chick one. (A2) The fate ofthe tissues issued from this isotopic and isochronic substitution is analyzed by inspection of headsections at later stages. Quail cells can indeed be distinguished from chick ones thanks to differ-ences in the structure of their interphase nuclei. The xenograft is here at the origin of the upper partof the skull. (B1–2) Induction experiment evidencing the presence of the organizer in newt embryos(Adapted from Kretzschmar and Watt 2012) and inspired from the work presented in (Spemann andMangold 1924). (B1) A piece of tissue from above the dorsal blastopore lip is collected on a Tritoncristatus gastrula and ectopically transplanted in the ventral marginal zone of a Triton taeniatus one(the two species differ by their pigmentation). (B2) The signals produced by the graft subsequentlylead to the apparition of a secondary body axis
4 C. Gosse et al.
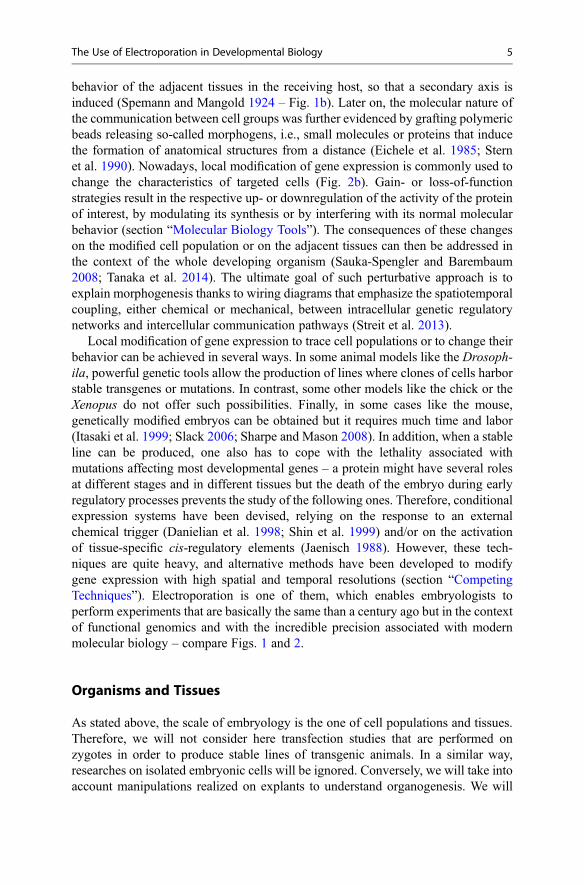
behavior of the adjacent tissues in the receiving host, so that a secondary axis isinduced (Spemann and Mangold 1924 – Fig. 1b). Later on, the molecular nature ofthe communication between cell groups was further evidenced by grafting polymericbeads releasing so-called morphogens, i.e., small molecules or proteins that inducethe formation of anatomical structures from a distance (Eichele et al. 1985; Sternet al. 1990). Nowadays, local modification of gene expression is commonly used tochange the characteristics of targeted cells (Fig. 2b). Gain- or loss-of-functionstrategies result in the respective up- or downregulation of the activity of the proteinof interest, by modulating its synthesis or by interfering with its normal molecularbehavior (section “Molecular Biology Tools”). The consequences of these changeson the modified cell population or on the adjacent tissues can then be addressed inthe context of the whole developing organism (Sauka-Spengler and Barembaum2008; Tanaka et al. 2014). The ultimate goal of such perturbative approach is toexplain morphogenesis thanks to wiring diagrams that emphasize the spatiotemporalcoupling, either chemical or mechanical, between intracellular genetic regulatorynetworks and intercellular communication pathways (Streit et al. 2013).
Local modification of gene expression to trace cell populations or to change theirbehavior can be achieved in several ways. In some animal models like the Drosoph-ila, powerful genetic tools allow the production of lines where clones of cells harborstable transgenes or mutations. In contrast, some other models like the chick or theXenopus do not offer such possibilities. Finally, in some cases like the mouse,genetically modified embryos can be obtained but it requires much time and labor(Itasaki et al. 1999; Slack 2006; Sharpe and Mason 2008). In addition, when a stableline can be produced, one also has to cope with the lethality associated withmutations affecting most developmental genes – a protein might have several rolesat different stages and in different tissues but the death of the embryo during earlyregulatory processes prevents the study of the following ones. Therefore, conditionalexpression systems have been devised, relying on the response to an externalchemical trigger (Danielian et al. 1998; Shin et al. 1999) and/or on the activationof tissue-specific cis-regulatory elements (Jaenisch 1988). However, these tech-niques are quite heavy, and alternative methods have been developed to modifygene expression with high spatial and temporal resolutions (section “CompetingTechniques”). Electroporation is one of them, which enables embryologists toperform experiments that are basically the same than a century ago but in the contextof functional genomics and with the incredible precision associated with modernmolecular biology – compare Figs. 1 and 2.
Organisms and Tissues
As stated above, the scale of embryology is the one of cell populations and tissues.Therefore, we will not consider here transfection studies that are performed onzygotes in order to produce stable lines of transgenic animals. In a similar way,researches on isolated embryonic cells will be ignored. Conversely, we will take intoaccount manipulations realized on explants to understand organogenesis. We will
The Use of Electroporation in Developmental Biology 5
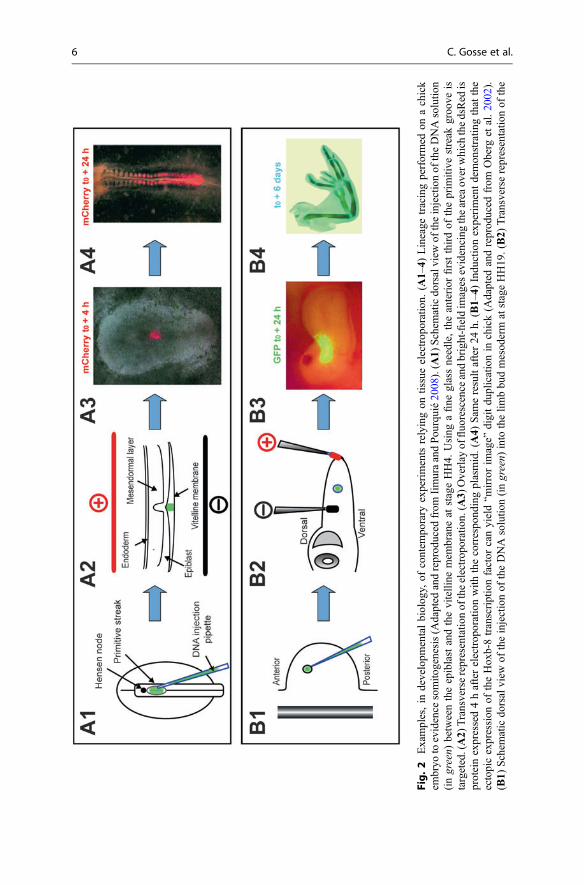
Fig.2
Examples,in
developm
entalbiolog
y,of
contem
porary
experiments
relyingon
tissueelectrop
oration.
(A1–
4)Lineage
tracingperformed
onachick
embryo
toevidence
somito
genesis(A
dapted
andreprod
uced
from
IimuraandPou
rquié20
08).(A
1)Schem
aticdo
rsalview
oftheinjectionof
theDNAsolutio
n(ingreen)
betweentheepiblastandthevitelline
mem
braneat
stageHH4.
Using
afine
glassneedle,theanterior
firstthirdof
theprim
itive
streak
groo
veis
targeted.(A2)
Transverserepresentatio
nof
theelectrop
oration.(A
3)Overlay
offluo
rescence
andbright-fieldim
ages
evidencing
thearea
overwhich
thedsRed
isproteinexpressed4hafterelectrop
orationwith
thecorrespo
ndingplasmid.(A
4)Sam
eresultafter24
h.(B1–
4)Indu
ctionexperimentdemon
stratin
gthat
the
ectopicexpression
oftheHox
b-8transcriptionfactor
canyield“m
irrorim
age”
digitdu
plicationin
chick(A
dapted
andreprod
uced
from
Oberg
etal.20
02).
(B1)
Schem
aticdo
rsalview
oftheinjectionof
theDNAsolutio
n(ingreen)
into
thelim
bbu
dmesod
erm
atstageHH19
.(B2)
Transverserepresentatio
nof
the
6 C. Gosse et al.
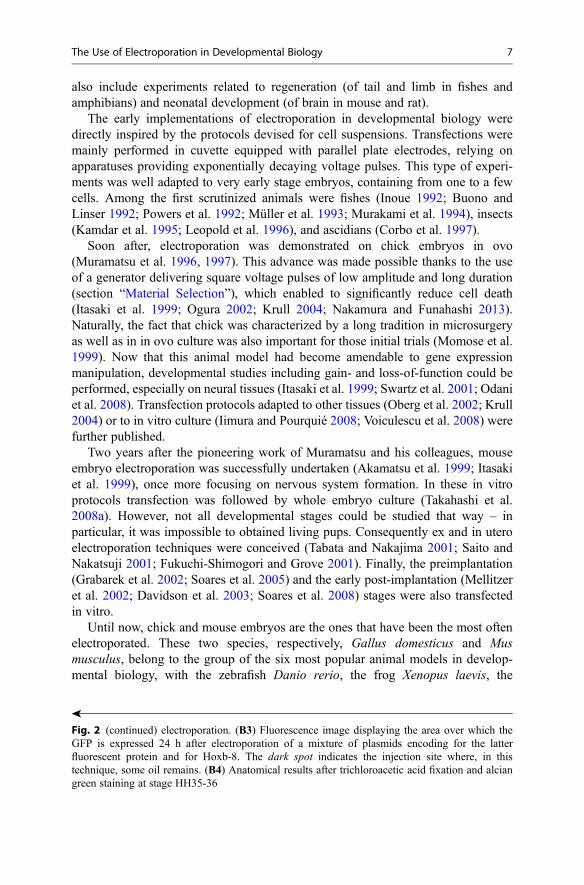
also include experiments related to regeneration (of tail and limb in fishes andamphibians) and neonatal development (of brain in mouse and rat).
The early implementations of electroporation in developmental biology weredirectly inspired by the protocols devised for cell suspensions. Transfections weremainly performed in cuvette equipped with parallel plate electrodes, relying onapparatuses providing exponentially decaying voltage pulses. This type of experi-ments was well adapted to very early stage embryos, containing from one to a fewcells. Among the first scrutinized animals were fishes (Inoue 1992; Buono andLinser 1992; Powers et al. 1992; Müller et al. 1993; Murakami et al. 1994), insects(Kamdar et al. 1995; Leopold et al. 1996), and ascidians (Corbo et al. 1997).
Soon after, electroporation was demonstrated on chick embryos in ovo(Muramatsu et al. 1996, 1997). This advance was made possible thanks to the useof a generator delivering square voltage pulses of low amplitude and long duration(section “Material Selection”), which enabled to significantly reduce cell death(Itasaki et al. 1999; Ogura 2002; Krull 2004; Nakamura and Funahashi 2013).Naturally, the fact that chick was characterized by a long tradition in microsurgeryas well as in in ovo culture was also important for those initial trials (Momose et al.1999). Now that this animal model had become amendable to gene expressionmanipulation, developmental studies including gain- and loss-of-function could beperformed, especially on neural tissues (Itasaki et al. 1999; Swartz et al. 2001; Odaniet al. 2008). Transfection protocols adapted to other tissues (Oberg et al. 2002; Krull2004) or to in vitro culture (Iimura and Pourquié 2008; Voiculescu et al. 2008) werefurther published.
Two years after the pioneering work of Muramatsu and his colleagues, mouseembryo electroporation was successfully undertaken (Akamatsu et al. 1999; Itasakiet al. 1999), once more focusing on nervous system formation. In these in vitroprotocols transfection was followed by whole embryo culture (Takahashi et al.2008a). However, not all developmental stages could be studied that way – inparticular, it was impossible to obtained living pups. Consequently ex and in uteroelectroporation techniques were conceived (Tabata and Nakajima 2001; Saito andNakatsuji 2001; Fukuchi-Shimogori and Grove 2001). Finally, the preimplantation(Grabarek et al. 2002; Soares et al. 2005) and the early post-implantation (Mellitzeret al. 2002; Davidson et al. 2003; Soares et al. 2008) stages were also transfectedin vitro.
Until now, chick and mouse embryos are the ones that have been the most oftenelectroporated. These two species, respectively, Gallus domesticus and Musmusculus, belong to the group of the six most popular animal models in develop-mental biology, with the zebrafish Danio rerio, the frog Xenopus laevis, the
�
Fig. 2 (continued) electroporation. (B3) Fluorescence image displaying the area over which theGFP is expressed 24 h after electroporation of a mixture of plasmids encoding for the latterfluorescent protein and for Hoxb-8. The dark spot indicates the injection site where, in thistechnique, some oil remains. (B4) Anatomical results after trichloroacetic acid fixation and alciangreen staining at stage HH35-36
The Use of Electroporation in Developmental Biology 7
nematode worm Caenorhabditis elegans, and the fruit fly Drosophila melanogaster(Slack 2006; Sharpe and Mason 2008). Reports on electroporation of the two latterorganisms can hardly be found in the literature because genetic tools have beenavailable for long, and establishing a new technique was unnecessary (section“Typical Experiments”). Conversely, methods to control gene expression were alsoeagerly required for the two remaining species, and therefore electroporation wasreadily transferred to zebrafish (Tawk et al. 2002; Teh et al. 2003; Cerda et al. 2006;Hendricks and Jesuthasan 2007; Tawk et al. 2009; Kera et al. 2010) and Xenopus (Eideet al. 2000; Haas et al. 2001, 2002; Sasagawa et al. 2002; Falk et al. 2007; Lin et al.2007; Chernet and Levin 2012) after it had been established in chick and mouse.
Subsequently, more confidential animal models could also be transfected byelectroporation. It includes the silkworm Bombyx mori (Moto et al. 1999; Thomas2003; Ando and Fujiwara 2013), the sea squirt Ciona intestinalis (Corbo et al. 1997),the freshwater polyps Hydra vulgaris and Hydra magnipapillata (Smith et al. 2000;Bosch et al. 2002), the axolotl Ambystoma mexicanum (Echeverri and Tanaka 2003,2005), and the newt Notophthalmus viridescens (Kumar et al. 2007).
As far as in vitro organ electroporation is concerned, the proof of concept wasrealized on chick retinal explants (Pu and Young 1990) – in fact it was the first use ofthe technique in a developing tissue. Then, the transfection of a whole heart(Harrison et al. 1998) as well as pieces of gut (Fukuda et al. 2000) and slices ofbrain (Hashimoto-Torii et al. 2003) followed. To study organogenesis in mouse,protocols are now available for the intestine (Abud et al. 2004), retina (Donovan andDyer 2006), kidney (Alie et al. 2007), palate (Lee et al. 2008), cochlear (Driver andKelley 2010), genital ridge (Tanaka et al. 2014), mandibular arch, tail bud, neuralplate, and lung endodermal bud (Mazari et al. 2014).
Finally, in regenerative biology, electroporation has enabled to better understandthe regrowth of tentacle in Hydra (Smith et al. 2000), spinal cord in Xenopus tadpole(Lin et al. 2007) and axolotl (Echeverri and Tanaka 2003), limb in newt (Kumar et al.2007) and axolotl (Echeverri and Tanaka 2005), as well as fin in zebrafish (Tawket al. 2002).
Molecular Biology Tools
From the physicochemical point of view, there are only four kinds of molecules thatare electroporated in embryos to perform gain- and loss-of-function experiments: theplasmids (pDNA) which are double-stranded circular DNA polymers (up to 14,000base pairs long), the messenger RNA (mRNA) which are single-stranded RNApolymers (up to 1,500 nucleotides long), the small interfering RNA (siRNA)which are double-stranded RNA molecules (20–24 base pairs long), and themorpholinos (MO) which are oligomeric single-stranded analogues of DNA (around25 morpholino units long). For the sake of simplicity, all these chemical species willbe denoted as nucleic acids in the following, although morpholinos do not have aphosphate backbone. In fact, the latter oligomers are neutral, and to favor theirdelivery to the targeted cells by electrophoresis, they are often conjugated to a
8 C. Gosse et al.
charged dye (section “Performances Validation”). The difference in size character-izing those four reagents is also noteworthy when one considers the transfectionmechanism: siRNA are small enough to first enter through the pores opened by theelectric pulses and then diffuse freely in the cytoplasm before reaching their biolog-ical target (Paganin-Gioanni et al. 2011); in contrast, large plasmids form aggregatesat the cell surface (Golzio et al. 2002; Mazari et al. 2014) before being activelytransported to the nucleus (chapters “▶Gene Delivery by Electroporation In Vitro:Mechanisms” and “▶Nucleic Acid Electrotransfer in Mammalian Cells: Mechanis-tic Description”). Information on mRNA and MO are scarce (Chabot et al. 2013),although processes should be similar to the ones occurring in the siRNA case.
From the biological point of view, the nature of the obtained biological pertur-bation, i.e., either an up- or a downregulation, is not unambiguously related to thenature of transfected molecules, as reviewed for chick (Krull 2004; Sauka-Spenglerand Barembaum 2008; Streit et al. 2013) and for mouse (Takahashi et al. 2008a;Tanaka et al. 2014).
Gain-of-function experiments consist in the overexpression of the gene of inter-est, either in its wild-type form or in a constitutively activated one. This is commonlyachieved through the electroporation of a plasmid encoding for the correspondingprotein; relying on mRNA is more expensive and thus rarer (Sasagawa et al. 2002;Cerda et al. 2006; Bansal et al. 2009; Chernet and Levin 2012).
On the other hand, the ways to realize loss-of-function experiments are morediverse. First, one can use a plasmid that encodes for a dominant-negative form ofthe targeted protein, e.g., a transcription factor with an inactive transactivationdomain or a receptor without transmembrane domain. Consequently, the lattermolecule will act as a competitive inhibitor of the wild-type form and perturb theassociated regulatory pathway (Akamatsu et al. 1999; Bartkowska et al. 2007,Barembaum and Bronner-Fraser 2007). Another common strategy consists inblocking the transcription of the gene of interest, which is classically achievedthrough morpholino electroporation (Mellitzer et al. 2002; Kos et al. 2003). Thesenucleic acids are in fact antisense oligonucleotides which are either directed againstthe proximal region of the translation initiation site, to sterically inhibit the initiationcomplex, or designed to encompass the intron/exon boundaries and thus interferewith RNA splicing. The last well-established loss-of-function approach involvessiRNA. These nucleic acids operate within the RNA interference pathway, a suc-cession of several enzymatic reactions catalyzed by various protein complexes, thefinal result being that the sequence complementarity between one of the RNA strandand a given mRNA drives the degradation of the latter molecule and therebyprevents protein synthesis. siRNA molecules can be introduced as such in thecytoplasm by electroporation (Mellitzer et al. 2002; Calegari et al. 2002; Pekariket al. 2003) or one may have them produced by the cell from a transfected plasmid(Katahira and Nakamura 2003; Peng et al. 2012). In this case, a promoter for RNApolymerase III is used, and the sequences are chosen to yield small hairpin RNA(shRNA) that are then processed as siRNA.
To conclude, we would like to mention that up to now, the CRISPR/Cas9 genomeediting technology has only been scarcely used in embryos in conjunction with
The Use of Electroporation in Developmental Biology 9
electroporation, except for transgenic line production (Sato et al. 2016). Concerningdevelopmental biology, knockout experiments have so far been realized in ascidia(Stolfi et al. 2014; Sasaki et al. 2014), chick (Véron et al. 2015), and mouse(Tsunekawa et al. 2016).
The differences in mechanism of action outlined above come with differences intiming of perturbation. In experiments using plasmids encoding fluorescent proteins,expression is detectable 2–4 h after electroporation, it then reaches a maximum4–7 days later, and finally it fades within 1–2 weeks (Momose et al. 1999; Teh et al.2003; Echeverri and Tanaka 2003; Oberg et al. 2002; Davidson et al. 2003; Falket al. 2007; Takahashi et al. 2008a; Kera et al. 2010; Sauka-Spengler andBarembaum 2008; Simkin et al. 2014). However, these numbers may stronglyvary with the cell type: for instance, a signal still measured after 4 months inpostmitotic neurons (Saito 2006). Such an observation thereby indicates thatpDNA displays a fair chemical stability and that the loss of expression is likelydue to the dilution of the vector in the dividing cells. To tackle the latter issue, Tol2transposon-mediated gene transfer has been devised, which provides a stable inte-gration into the host genome (Takahashi et al. 2008b; Simkin et al. 2014).
With mRNA, expression can be observed as early as 1 h after electroporation(Sasagawa et al. 2002). Yet, this technique is more costly and more challenging dueto the poor stability of mRNA and its degradation by cell nucleases. As far as siRNAare concerned, things are even worst since the dicer enzyme cut them into pieces.Therefore, to sustain the knockout activity, plasmids permanently enabling shRNAproduction are utilized (Katahira and Nakamura 2003; Peng et al. 2012). Finally,MO are stable but their antisense effect tends to disappear due to the dilutionassociated with cell division.
Competing Techniques
Different methods have been developed to introduce nucleic acids into cells, so as toproduce genetically modified animals or to cure hereditary diseases (Kaestner et al.2015; Sato et al. 2016). Among the ones listed in the first column of Table 1, four aretoday routinely used in embryology laboratories: viral infection, lipofection, micro-injection, and electroporation. Incidentally, a few articles report on sonoporation(Ohta et al. 2003; Skachkov et al. 2014) on biolistics (Muramatsu et al. 1997;Thomas et al. 2001; Lee et al. 2005). On the other hand, the Table 1 header givessome of the parameters that have to be taken into account when selecting a tech-nique. It is here worth noting that protocols are not exclusive. For instance,lipofection has been coupled to sonoporation (Lee et al. 2005) or to magnetofection(Svingen et al. 2009); grafting experiments, as described in Fig. 1, have beenperformed after transfection of the donor tissues (Iba 2000; Iimura and Pourquié2008).
Gene transfer by viral infection has been important in chick embryology, as a wayto cope with the lack of genetic tools characterizing this model (Iba 2000; Sauka-Spengler and Barembaum 2008). With retrovirus, the transgene is integrated in the
10 C. Gosse et al.

Table
1Com
parisonof
thevariou
smetho
dsutilizedto
introd
ucenu
cleicacidsin
embryo
sor
inem
bryo
nictissues,in
orderto
achievegene
expression
mod
ulation.Thissynthesisispartlybasedon
theresults
anddiscussion
spresentedinthefollo
wingcomparativ
esstud
iesandreview
s:forchick
(Muram
atsu
etal.
1997
;Fuk
udaetal.200
0;Oberg
etal.200
2;Ohtaetal.200
3;Scaaletal.200
4;Sauka-Speng
lerandBarem
baum
2008
),formou
se(G
irou
xetal.200
7;Sakaiand
Trainor
2014
;Tanakaetal.2
014),and
forbo
th(O
gura
2002
;deCastroetal.2
006;
Geetha-Log
anathanetal.2
011)
Techn
ique
Efficacy
Possiblerisk
forthetissue
Drawback
for
the
researcher
Transfected
molecules
Spatialresolutio
nLocalization
strategy
Tim
ingfor
overexpression
experiments
Problem
atic
celltype
Biologicaltransfectio
n
Retroviral
infection
High
Biological
toxicity;
mutagenic
Labor;cost;
bioh
azard
Insert
<5kb
pInitially
100um
m;
Ulterior
spreading
Injection
Startafter12
–24h;
Stable
Postm
itotic
cells
Lentiv
iral
infection
High
Biological
toxicity;
mutagenic
Labor;cost;
bioh
azard
Insert
<8kb
pStable
Adeno
viral
infection
Variable
Labor;cost
Insert
<8kb
pTransient
Chemicaltransfectio
n
Lipofectio
nChemical
toxicity
pDNA;
siRNA
100μm
Injection
Startafter2–3h;
Stopwith
indays
Phy
sicaltransfectio
n
Genebiolistics
Mechanical
damage
pDNA
500μm
Focusing
Startafter2–3h;
Stopwith
indays
Buriedcells
Microinjection
Goo
dMechanical
damage
Labor
All
Singlecell
Injection
Smallcells
Electropo
ratio
nHigh
Electrical
damage
All
Singlecell
Injection;
focusing
Mesenchym
e
Son
oporation
Goo
dMechanical
damage
pDNA;dy
e50
0μm
Injection;
focusing
The Use of Electroporation in Developmental Biology 11
host genome, which leads to a stable expression. However, such initial process isonly possible when cells are dividing. It also significantly delays the onset ofexpression. Furthermore, the infectious nature of the method results in spreadingoutside the initially targeted area and limits the possibility of subsequent genetransfer (through a phenomenon called interference). The latter issue becomesproblematic when associated with the reduced space available for the inserts. Theuse of other types of viruses has enabled to overcome numbers of the precedingshortcomings: lentivirus can carry two genes (Semple-Rowland and Berry 2014) andreplication-defective vectors cannot infect neighboring cells (Iba 2000). Despite allthese progresses, the viral infection technique is getting superseded. Indeed, virusproduction remains too demanding in time, money, and expertise. Additionally,stable gene integration can now also be achieved with the other transfection tech-niques, relying for instance on the Tol2 transposon-mediated gene transfer(Takahashi et al. 2008b; Simkin et al. 2014).
Chemical and physical transfection protocols are in fact much easier to imple-ment, from both an economical and a practical point of view: only basic embryologylaboratory equipment is necessary, plus a machine costing less than 15,000 € forelectroporation and sonoporation. These methods are also more polyvalent sincethey are not restricted to any organism, or even cell type, for biological reasons.Similarly, the variety of molecules they can deal with is larger (Table 1). Forlipofection all negatively charged nucleic acids can be used since they all assemblewith cationic lipids to form transfection complexes that will cross the cell membrane(deCastro et al. 2006). In comparison, electroporation suffers even less limitationssince many molecular species are actually able to diffuse through the electropores(chapters “▶ Fluorescent Indicators of Membrane Permeabilization Due to Electro-poration” “▶Nucleic Acid Electrotransfer in Mammalian Cells: MechanisticDescription”). Finally, microinjection is adapted to any kind of marker since theapertures created in plasma membranes by micropipettes are larger than a micron.Accordingly, fluorescently labeled polymers like dextrans, proteins like the horse-radish peroxidase, and small cyanine dyes like DiI have all been microinjected intoembryonic tissues to establish fate maps (Bhattacharyya et al. 2008). Nevertheless,this technique is quite time consuming and is better suited to target large cells, as inthe classical manipulations on early Xenopus embryos, that involved mRNA injec-tion (Slack 2006).
To end, the different methods can be compared with respect to their temporal andspatial targeting abilities (Table 1). In fact, the former property mostly depends onmolecular biology as modern constructs allow the sustained or the conditionalproduction of both proteins and interfering RNA, independently of the utilizedtransfection technique (sections “Molecular Biology Tools” and “Conclusion”).Concerning the spatial resolution, because some intimate contact between thenucleic acids and the cells is necessary, locally injecting the reagent always offersan opportunity to restrict the transfected area to a given tissue. However, moleculardiffusion prevents the precision to be better than 100 μm, as observed for viralinfection and for lipofection. Electroporation further permits to focus the electricfield and to approach the single cell resolution. Interestingly, this limit is more surely
12 C. Gosse et al.
reached when the DNA solution fills a patch-clamp pipette and when the tip of thelatter is in close contact with the plasma membrane: microinjection driven byiontophoresis and focal electroporation then become surprisingly similar.
Strategies to Spatially Restrict Transfection
Orientation of the Embryo
Whereas electroporation provides a straightforward control of the timing of geneexpression (section “Molecular Biology Tools”), managing the spatial extent overwhich transfection is achieved is more complicated. In the following, the case of a6.5-day-old (E6.5) mouse embryo placed between parallel plate electrodes will beconsidered as an illustration (Fig. 3a, b). The latter organism roughly consists of aclosed double-layered epithelium and can be modeled by two concentric prolatespheroids (section “Setup Conception”): the first one corresponds to the interface ofthe embryonic tissues with the buffer and the second one with the proamniotic cavitycontent (Mazari et al. 2014; Zhao et al. 2014). Pores will open at the surface of cellsonly if the induced transmembrane voltage (ITV) generated upon electric fieldapplication exceeds a given threshold, ITVpore (chapters “▶Transmembrane VoltageInduced by Applied Electric Fields” and “▶Critical Electric Field and Transmem-brane Voltage for Lipid Pore Formation in Experiments”). Since the ITV is maximalfor plasma membrane regions facing the electrodes, it is possible to selectivelytransfect a given area by adjusting the orientation of the biological object(Fig. 3c). However, controlling the extent of the porated zone additionally requiresto tune the amplitude of the voltage pulses, Vanode (Fig. 3d). Unfortunately, thisadjustment may not be easy to achieve because, in comparison with what occurs onclearly bumped tissues, ITV variations are gentle on flat surfaces. As a consequence,to significantly restrict poration, the ITVpore threshold should not be exceeded bymuch, which in turn may result in suboptimal transfection efficiency.
The former example shows how problematic localized transfection may becomewhen the embryo, or the explant, is simply soaked in the solution of nucleic acidsand when a homogeneous electric field is applied. Therefore, cuvettes with parallelplate electrodes is mainly used to electroporate early embryos, from zygotes tocleaving stages and blastocysts (Powers et al. 1992; Buono and Linser 1992;Corbo et al. 1997; Grabarek et al. 2002; Soares et al. 2005; Peng et al. 2012). Dataanalysis is here often performed while taking into account the mosaic nature of thetransfection, and a precise localization of the expression at the surface of thosespherical objects is not a prerequisite. Moreover, cuvette protocols can deal with tensto hundreds of organisms in parallel and thus are well suited to the better embryoavailability at those stages – it compares favorably with microinjection in terms ofthroughput. Despite this general trend of using parallel plate electrodes only forsimple biological objects, studies on larger and more complex organisms or tissueshave to be mentioned. It concerns whole Xenopus tadpole (Eide et al. 2000),silkworm brain (Moto et al. 1999), and mouse cochlea explant (Driver and Kelley
The Use of Electroporation in Developmental Biology 13
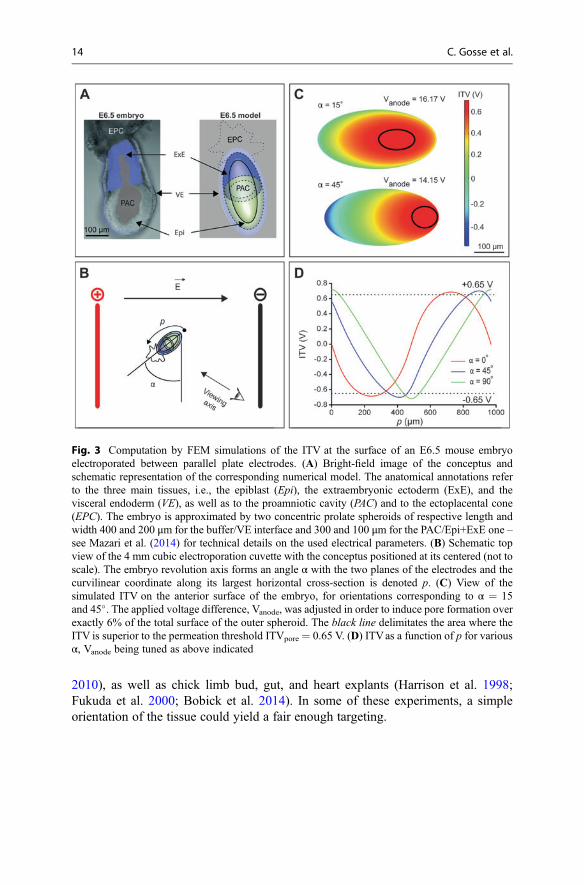
2010), as well as chick limb bud, gut, and heart explants (Harrison et al. 1998;Fukuda et al. 2000; Bobick et al. 2014). In some of these experiments, a simpleorientation of the tissue could yield a fair enough targeting.
Fig. 3 Computation by FEM simulations of the ITV at the surface of an E6.5 mouse embryoelectroporated between parallel plate electrodes. (A) Bright-field image of the conceptus andschematic representation of the corresponding numerical model. The anatomical annotations referto the three main tissues, i.e., the epiblast (Epi), the extraembryonic ectoderm (ExE), and thevisceral endoderm (VE), as well as to the proamniotic cavity (PAC) and to the ectoplacental cone(EPC). The embryo is approximated by two concentric prolate spheroids of respective length andwidth 400 and 200 μm for the buffer/VE interface and 300 and 100 μm for the PAC/Epi+ExE one –see Mazari et al. (2014) for technical details on the used electrical parameters. (B) Schematic topview of the 4 mm cubic electroporation cuvette with the conceptus positioned at its centered (not toscale). The embryo revolution axis forms an angle α with the two planes of the electrodes and thecurvilinear coordinate along its largest horizontal cross-section is denoted p. (C) View of thesimulated ITV on the anterior surface of the embryo, for orientations corresponding to α = 15and 45�. The applied voltage difference, Vanode, was adjusted in order to induce pore formation overexactly 6% of the total surface of the outer spheroid. The black line delimitates the area where theITV is superior to the permeation threshold ITVpore = 0.65 V. (D) ITVas a function of p for variousα, Vanode being tuned as above indicated
14 C. Gosse et al.
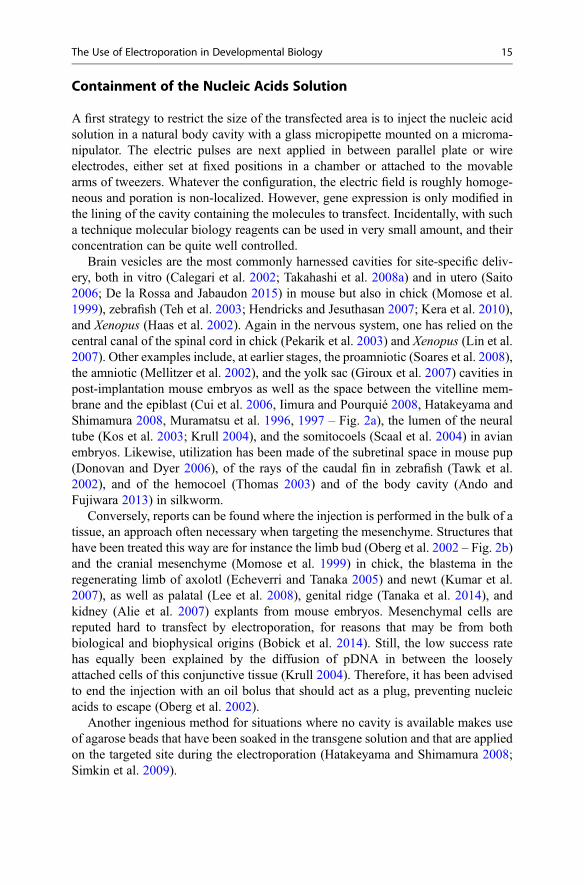
Containment of the Nucleic Acids Solution
A first strategy to restrict the size of the transfected area is to inject the nucleic acidsolution in a natural body cavity with a glass micropipette mounted on a microma-nipulator. The electric pulses are next applied in between parallel plate or wireelectrodes, either set at fixed positions in a chamber or attached to the movablearms of tweezers. Whatever the configuration, the electric field is roughly homoge-neous and poration is non-localized. However, gene expression is only modified inthe lining of the cavity containing the molecules to transfect. Incidentally, with sucha technique molecular biology reagents can be used in very small amount, and theirconcentration can be quite well controlled.
Brain vesicles are the most commonly harnessed cavities for site-specific deliv-ery, both in vitro (Calegari et al. 2002; Takahashi et al. 2008a) and in utero (Saito2006; De la Rossa and Jabaudon 2015) in mouse but also in chick (Momose et al.1999), zebrafish (Teh et al. 2003; Hendricks and Jesuthasan 2007; Kera et al. 2010),and Xenopus (Haas et al. 2002). Again in the nervous system, one has relied on thecentral canal of the spinal cord in chick (Pekarik et al. 2003) and Xenopus (Lin et al.2007). Other examples include, at earlier stages, the proamniotic (Soares et al. 2008),the amniotic (Mellitzer et al. 2002), and the yolk sac (Giroux et al. 2007) cavities inpost-implantation mouse embryos as well as the space between the vitelline mem-brane and the epiblast (Cui et al. 2006, Iimura and Pourquié 2008, Hatakeyama andShimamura 2008, Muramatsu et al. 1996, 1997 – Fig. 2a), the lumen of the neuraltube (Kos et al. 2003; Krull 2004), and the somitocoels (Scaal et al. 2004) in avianembryos. Likewise, utilization has been made of the subretinal space in mouse pup(Donovan and Dyer 2006), of the rays of the caudal fin in zebrafish (Tawk et al.2002), and of the hemocoel (Thomas 2003) and of the body cavity (Ando andFujiwara 2013) in silkworm.
Conversely, reports can be found where the injection is performed in the bulk of atissue, an approach often necessary when targeting the mesenchyme. Structures thathave been treated this way are for instance the limb bud (Oberg et al. 2002 – Fig. 2b)and the cranial mesenchyme (Momose et al. 1999) in chick, the blastema in theregenerating limb of axolotl (Echeverri and Tanaka 2005) and newt (Kumar et al.2007), as well as palatal (Lee et al. 2008), genital ridge (Tanaka et al. 2014), andkidney (Alie et al. 2007) explants from mouse embryos. Mesenchymal cells arereputed hard to transfect by electroporation, for reasons that may be from bothbiological and biophysical origins (Bobick et al. 2014). Still, the low success ratehas equally been explained by the diffusion of pDNA in between the looselyattached cells of this conjunctive tissue (Krull 2004). Therefore, it has been advisedto end the injection with an oil bolus that should act as a plug, preventing nucleicacids to escape (Oberg et al. 2002).
Another ingenious method for situations where no cavity is available makes useof agarose beads that have been soaked in the transgene solution and that are appliedon the targeted site during the electroporation (Hatakeyama and Shimamura 2008;Simkin et al. 2009).
The Use of Electroporation in Developmental Biology 15
Generation of an Electric Field Gradient
Instead of controlling the place where the nucleic acids are applied, restraining thearea over which cells are porated constitutes an alternative strategy to spatially limitgene overexpression or knockdown. More explicitly, the molecules to transfect cannow be present everywhere since they will not cross the plasma membrane if the ITVis lower than the ITVpore threshold.
Such localization effect can only be obtained if the electric potential varies a lot inclose proximity to the targeted tissue. Laying the embryo in between much smallerelectrodes that have been microfabricated on a flat substrate is an option (Murakamiet al. 1994). Nevertheless, the most popular implementation of electric field focusingrelies on tungsten microneedles (Fig. 4a): strong electric potential gradients are heregenerated around the highly curved conductors upon charging (Olofsson et al. 2003).Applications to chick (Momose et al. 1999; Brown et al. 2012) and mouse (Davidsonet al. 2003; Quinlan et al. 2008) embryos have for instance been reported.
To achieve an optimum reduction of the porated area size, the metal tip must bevery close to the tissue. However, chemical species are produced by electrolysis atthe surface of both the anode and the cathode during pulses, which is problematic(chapters “▶Electrode Erosion and Metal Release Under Electroporation Condi-tions,” “Electrolysis During Pulse Electric Field Treatment,” and “▶CombiningElectrolysis and Electroporation for Tissue Ablation”; Wang and Lee 2013). Indeed,metal ions are directly toxic for cells, whereas protons and hydroxide ions yielddangerous pH changes. Furthermore, gas like H2, O2, and Cl2 are also released.Thus, bubbles may form (Cerda et al. 2006 – Fig. 4b), which can be detrimental tothe plasma membrane integrity and which alter the geometry of the electric fieldlines. Away to reduce harmful species production is to limit the current, by loweringthe buffer conductivity for instance (chapter “▶ Parameters Affecting Cell ViabilityFollowing Electroporation”). Incidentally, it will also prevent excessive temperatureincrease due to Joule heating.
In order to bypass the lethality issues associated with metal microneedles, one canemploy “liquid electrodes,” as it has been done for single cell electroporation(Olofsson et al. 2003, 2007). More precisely, the electric field is channeled by adielectric hollow structure which opening has a size close to the one of the targetedarea. Therefore, the ITVpore threshold is exceeded only locally, before electricpotential gradients weaken in the container welcoming the embryo or the explant(Fig. 5a). Such dielectric guides result in a focusing effect similar to the oneassociated with microelectrodes (Mazari et al. 2014), with the advantage thatharmful species are not generated in proximity to the studied tissue but aroundmetal electrodes located afar. Applications involving microsystems have beenreported for mouse (Mazari et al. 2014; Zhao et al. 2014) and zebrafish (Bansalet al. 2009) embryos. Interestingly, the latter article demonstrates that it is possible toelectroporate the surface of a blastula with various arbitrary patterns.
16 C. Gosse et al.
Combination of both Molecular Localization and Electric FieldFocusing
In order to more robustly restrict the spatial extent over which transfection isachieved, researchers have simultaneously enforced the two previous approaches
Fig. 4 Examples of strategies used to restrict the number of electroporated cells and to control theirlocation. (A) Electroporation of the distal tip of an E7 mouse embryo with a tungsten needle. Aplatinum plate is used as a counter-electrode, and the conceptus is fully immerged in the DNAsolution (Reproduced from Quinlan et al. 2008). (B) Electroporation of the midbrain of a zebrafishembryo with tungsten needle electrodes, after microinjection of the molecular biology reagent in thetargeted brain vesicle (Reproduced from Cerda et al. 2006). The white arrow head indicates abubble that has formed by electrolysis. (C1–2) Electroporation of a few cells in the distal epiblast ofan E7.5 mouse embryo (Adapted and reproduced from Huang et al. 2015). (C1) The amniotic cavityis microinjected with the DNA solution (in green), and the electric field is focused at the tip of aglass micropipette, which is 20 μm in diameter. (C2) Overlay of confocal and bright-field imagesdisplaying the nuclear distribution of the GFP 2 h after electroporation with the correspondingplasmid. (D1–2) Single neuron electroporation in the Xenopus tadpole brain (Reproduced fromHaas et al. 2001, Haas et al. 2002). (D1) A micropipette filled with the DNA solution (in green) isintroduced into the brain of an anesthetized animal, and electrical pulses are delivered between themetal wire inserted in the pipette and the external counter-electrode. (D2) Confocal image of anoptic tectal neuron expressing the EGFP 48 h after electroporation with the corresponding plasmid
The Use of Electroporation in Developmental Biology 17
(sections “Containment of the Nucleic Acids Solution” and “Generation of anElectric Field Gradient”). For instance, the nucleic acid solution can be micro-injected into a cavity (Momose et al. 1999, Cerda et al. 2006, Falk et al. 2007,Quinlan et al. 2008 – Fig. 4b), or in the bulk of a tissue (Momose et al. 1999; Chernetand Levin 2012), and strong electric potential gradients generated by a microneedleelectrode.
Likewise, the use of a pipette acting as a dielectric guide can be coupled with theinjection in a body cavity to further improve localization (Huang et al. 2015 – Fig. 4c). Yet,the most common strategy consists in backfilling the hollow glass needle itself with thesolution containing themolecule to transfect (Fig. 4d). The equipment is here similar to theone used in patch-clamp and applications mainly concern neural tissues, in Xenopus (Haaset al. 2001, 2002), axolotl (Echeverri and Tanaka 2003), zebrafish (Tawk et al. 2009), andchick (Hashimoto-Torii et al. 2003), for instance. Although the formation of a seal doesnot seem to be required, the single cell resolution is often reached. Of course with largerpipette openings more cells are transfected, as demonstrated inHydra (Smith et al. 2000),chick (Atkins et al. 2000), and rat (Barker et al. 2009).
Finally, an original approach based on three electrodes has been devised to allowmore flexibility in electric field lines engineering during in utero rat embryo elec-troporation (dal Maschio et al. 2012). After plasmid injection it then became possibleto target, at the surface of brain vesicles, areas that were poorly addressed in previousstudies (Fig. 5b).
Engineering Practices
Setup Conception
Computation of the ITV is valuable to interpret electroporation experiments whendealing with isolated cells. Although analytical calculations provide satisfactoryresults for simple geometries, finite element method (FEM) simulations are requiredfor more complicated situations, like the one involving plated cells with irregularshapes (chapter “▶Transmembrane Voltage Induced by Applied Electric Fields”).Similarly, numerical tools soon become necessary when departing from the case ofthe homogenous electric field generated in between parallel plate electrodes, forinstance, when a metallic needle or a dielectric guide is used to yield a strong voltagegradient (Olofsson et al. 2003, 2007). For more than 15 years now, programs such asComsol Multiphysics are thus harnessed to assist engineers in the design of instru-ments and microdevices dedicated to cell electroporation – see the large majority ofthe references reviewed in (Fox et al. 2006, Wang and Lee 2013, Geng and Lu 2013;chapter “▶Description by Electroporation in Microfluidic Devices”). Surprisingly,the use of FEM simulations have little pervaded in developmental biology, even ifthe structural complexity of embryos would make this practice pertinent (Murakamiet al. 1994; Huang et al. 2007; dal Maschio et al. 2012; Mazari et al. 2014; Zhao et al.2014). Two examples detailed in the following will illustrate such an opportunity.
18 C. Gosse et al.
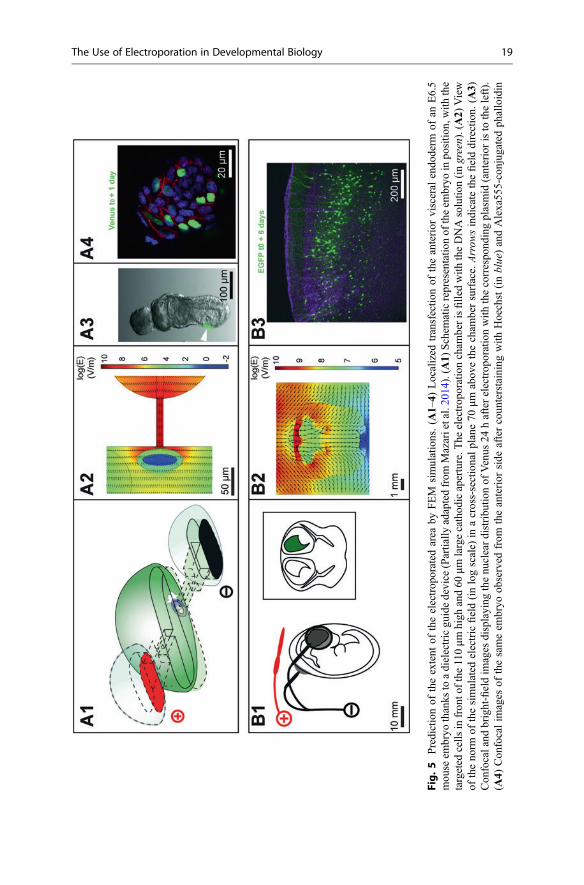
Fig.5
Predictionof
theextent
oftheelectrop
orated
area
byFEM
simulations.(A
1–4)
Localized
transfectio
nof
theanterior
visceral
endo
derm
ofan
E6.5
mou
seem
bryo
thanks
toadielectricgu
idedevice
(Partially
adaptedfrom
Mazarietal.20
14).(A
1)Schem
aticrepresentatio
nof
theem
bryo
inpo
sitio
n,with
the
targeted
cells
infronto
fthe110μm
high
and60
μmlargecathod
icaperture.T
heelectrop
orationcham
berisfilledwith
theDNAsolutio
n(ingreen).(A2)
View
oftheno
rmof
thesimulated
electricfield(inlogscale)
inacross-sectionalplane70
μmabov
ethecham
bersurface.Arrow
sindicatethefielddirection.
(A3)
Con
focaland
bright-fieldim
ages
displaying
thenu
cleardistribu
tionof
Venus
24hafterelectrop
orationwith
thecorrespo
ndingplasmid
(anterioristo
theleft).
(A4)
Con
focalim
ages
ofthesameem
bryo
observed
from
theanterior
side
aftercoun
terstainingwith
Hoechst(inblue)andAlexa55
5-conjug
ated
phalloidin
The Use of Electroporation in Developmental Biology 19
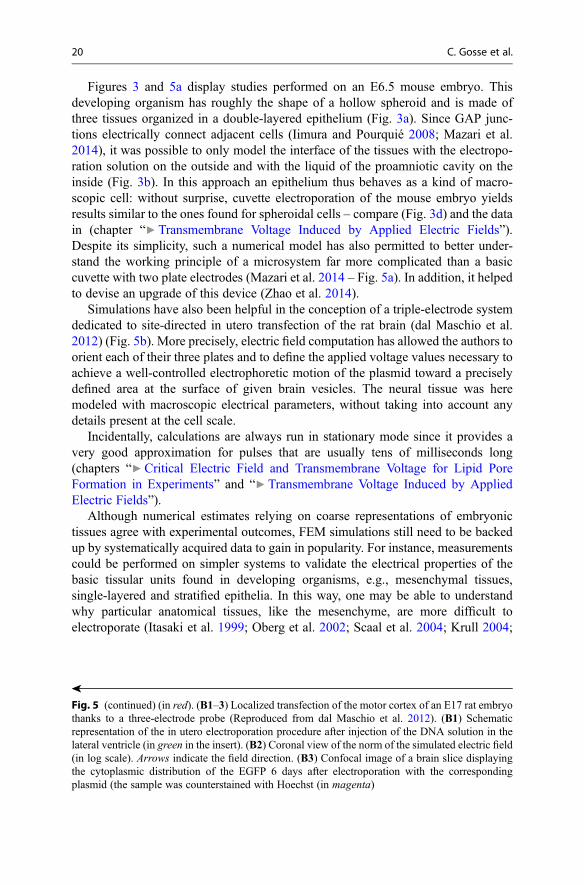
Figures 3 and 5a display studies performed on an E6.5 mouse embryo. Thisdeveloping organism has roughly the shape of a hollow spheroid and is made ofthree tissues organized in a double-layered epithelium (Fig. 3a). Since GAP junc-tions electrically connect adjacent cells (Iimura and Pourquié 2008; Mazari et al.2014), it was possible to only model the interface of the tissues with the electropo-ration solution on the outside and with the liquid of the proamniotic cavity on theinside (Fig. 3b). In this approach an epithelium thus behaves as a kind of macro-scopic cell: without surprise, cuvette electroporation of the mouse embryo yieldsresults similar to the ones found for spheroidal cells – compare (Fig. 3d) and the datain (chapter “▶Transmembrane Voltage Induced by Applied Electric Fields”).Despite its simplicity, such a numerical model has also permitted to better under-stand the working principle of a microsystem far more complicated than a basiccuvette with two plate electrodes (Mazari et al. 2014 – Fig. 5a). In addition, it helpedto devise an upgrade of this device (Zhao et al. 2014).
Simulations have also been helpful in the conception of a triple-electrode systemdedicated to site-directed in utero transfection of the rat brain (dal Maschio et al.2012) (Fig. 5b). More precisely, electric field computation has allowed the authors toorient each of their three plates and to define the applied voltage values necessary toachieve a well-controlled electrophoretic motion of the plasmid toward a preciselydefined area at the surface of given brain vesicles. The neural tissue was heremodeled with macroscopic electrical parameters, without taking into account anydetails present at the cell scale.
Incidentally, calculations are always run in stationary mode since it provides avery good approximation for pulses that are usually tens of milliseconds long(chapters “▶Critical Electric Field and Transmembrane Voltage for Lipid PoreFormation in Experiments” and “▶Transmembrane Voltage Induced by AppliedElectric Fields”).
Although numerical estimates relying on coarse representations of embryonictissues agree with experimental outcomes, FEM simulations still need to be backedup by systematically acquired data to gain in popularity. For instance, measurementscould be performed on simpler systems to validate the electrical properties of thebasic tissular units found in developing organisms, e.g., mesenchymal tissues,single-layered and stratified epithelia. In this way, one may be able to understandwhy particular anatomical tissues, like the mesenchyme, are more difficult toelectroporate (Itasaki et al. 1999; Oberg et al. 2002; Scaal et al. 2004; Krull 2004;
�
Fig. 5 (continued) (in red). (B1–3) Localized transfection of the motor cortex of an E17 rat embryothanks to a three-electrode probe (Reproduced from dal Maschio et al. 2012). (B1) Schematicrepresentation of the in utero electroporation procedure after injection of the DNA solution in thelateral ventricle (in green in the insert). (B2) Coronal view of the norm of the simulated electric field(in log scale). Arrows indicate the field direction. (B3) Confocal image of a brain slice displayingthe cytoplasmic distribution of the EGFP 6 days after electroporation with the correspondingplasmid (the sample was counterstained with Hoechst (in magenta)
20 C. Gosse et al.
Iimura and Pourquié 2008) and why complex organs, like kidney explants, havebeen reported to respond to electrical pulses differently (Alie et al. 2007). Thus, adeeper knowledge of the biophysics at work would certainly favor the rationaldesign of more efficient transfection protocols (chapters “▶ 3D Culture Models toAssess Tissue Responses to Electroporation,” “▶ 3D Tissue Models to Bridge theGap Between Cell Culture and Tissue in Assessing Electroporation,” and “▶Effectsof Electroporation of Mammalian Cells on Cytoskeleton and IntercellularConnections”).
Material Selection
Electroporation of embryos and embryonic tissues is mainly performed relying ontrains of square voltage pulses (section “Organisms and Tissues”). The most com-monly used machines are the CUY21 and the NEPA21 from NepaGene (Ishikawa,Japan), the TSS20 Ovodyne from Intracel (St Ives, UK), and the ECM830 and theECM2001 from BTX Harvard Apparatus (Holliston, USA) – see the provider’swebpage for detailed specifications; Echeverri and Tanaka (2003), Krull (2004), andCerda et al. (2006) for comparative analyses; and Ando and Fujiwara (2013) andBullmann et al. (2015) for instructions on the homemade assembly of cheaperapparatuses (costing less than 200 €).
Relatively low pulse amplitudes are selected to limit cell death, whereas longdurations allow nucleic acids to reach the targeted area upon electrophoresis (chapter“▶Gene Delivery by Electroporation In Vitro: Mechanisms”). More precisely, aseries of three to six pulses is generally applied. Their amplitude of course dependson the electrodes geometry and spacing as well as on the tissue shape and nature(section “Setup Conception”) (Krull 2004; Chernet and Levin 2012); however, itusually falls within the 10–100 V range. Concerning the length of the pulses and thedwell time between them, the respective 50 ms and 1 s values established duringearly studies seem today consensual (Itasaki et al. 1999); they consequently repre-sent a good starting point for any optimization in a new biological system. Largeramplitudes and longer durations will be associated with higher poration efficiencybut also with lower cell, or even embryo, viability (Muramatsu et al. 1997; Momoseet al. 1999; Eide et al. 2000; Echeverri and Tanaka 2003; Teh et al. 2003; Abud et al.2004; Hendricks and Jesuthasan 2007; Kera et al. 2010; Mazari et al. 2014; Simkinet al. 2014; chapters “▶Gene Delivery by Electroporation In Vitro: Mechanisms”and “▶Parameters Affecting Cell Viability Following Electroporation”). Note alsothat more specific adjustments may be required in the case of organs with a morecomplicated structure (Alie et al. 2007).
Despite the success of square-wave electroporation, some experiments are basedon other electrical sequences: exponentially decaying voltage pulses are extensivelyused on zygotes and on embryos including only a small number of cells (Buono andLinser 1992; Kamdar et al. 1995; Leopold et al. 1996; Corbo et al. 1997; Bosch et al.2002); rapid trains of pulses produced with neurophysiological simulators look more
The Use of Electroporation in Developmental Biology 21
appropriate when utilizing a patch-clamp pipette (Atkins et al. 2000; Haas et al.2001; Echeverri and Tanaka 2003; Tawk et al. 2009).
Concerning the electroporation setup per se, platinum is the material of choice forelectrode fabrication. Although expensive this noble metal is inert and thus resistantto corrosion. Furthermore, it is quite soft, which enables one to easily shape foils andwires in house (Haas et al. 2002; Krull 2004; Scaal et al. 2004; Quinlan et al. 2008).This latter property obviously becomes a drawback when penetration in a tissue isnecessary. In this case one will favor tungsten, which is harder and which can beelectrochemically sharpened to yield microneedles (Momose et al. 1999; Quinlanet al. 2008). Options cheaper than platinum include stainless steel and aluminum(Leopold et al. 1996; Thomas 2003) but these two materials are prone to fastelectrochemical degradation (chapter “▶Electrode Erosion and Metal ReleaseUnder Electroporation Conditions”; Wang and Lee 2013). Other noble metals canequally be considered: silver is utilized to build bulk electrode, whereas gold is onlyplated. Finally, standard procedures exist in microelectronics to deposit thin film ofplatinum or gold; therefore, those two materials are often used to apply voltagepulses in miniaturized electroporation devices (Murakami et al. 1994; Huang et al.2007; Bansal et al. 2009; Mazari et al. 2010).
Dielectric guides usually consist in a glass micropipette in which a tungsten,silver, or platinum wire has been inserted (Haas et al. 2002; Echeverri and Tanaka2003; Tawk et al. 2009; Huang et al. 2015). The former part of the setup can simplybe pulled out from a glass capillary thanks to a microforge (Huang et al. 2015) – formore complex injection scheme, one can even rely on double-barreled microtubes(Atkins et al. 2000; Barker et al. 2009). When the structure that focused the electricfield is integrated in a microsystem, as reviewed in Fox et al. (2006), Geng and Lu(2013), Wang and Lee (2013) (chapters “▶Description by Electroporation in Micro-fluidic Devices” and “▶Nanochannel Electroporation: Delivery of Precise Amountsof Biomolecules into Living Cells”), options in terms of material are more diverse.Glass is often used, alone (Zhao et al. 2014) or in association with polymers likephotoresists (Mazari et al. 2014), photocurable glues (Mazari et al. 2011), plastics(Huang et al. 2007), elastomers (Falk et al. 2007; Bansal et al. 2009), and/or paraffins(Mazari et al. 2014). In fact, the choice of a given material is first related to themicrofabrication procedure, itself selected in terms of laboratory know-how as wellas of desired spatial resolution and planed functionality. Eventually, it is compulsoryto consider the compatibility between the foreseen experiment and the properties ofthe material, such as its biological innocuity (Mazari et al. 2010, 2014) and itswettability (Mazari et al. 2014; Zhao et al. 2014).
To conclude this instrumentation section, it is interesting to discuss the electro-poration protocol itself. Targeting a given area can be achieved by simple orientationof the tissue with respect to plate electrodes or thanks to a setup enabling electricfield focusing, e.g., a microelectrode or a dielectric guide (section “Strategies toSpatially Restrict Transfection”). Whatever the selected option, two main strategiesare available: in the first one the electrodes and their appendages are set in placearound the embryonic tissue; in the second one the position of the biological object isadjusted within a fixed device. Naturally, some situations enforce a procedure:
22 C. Gosse et al.
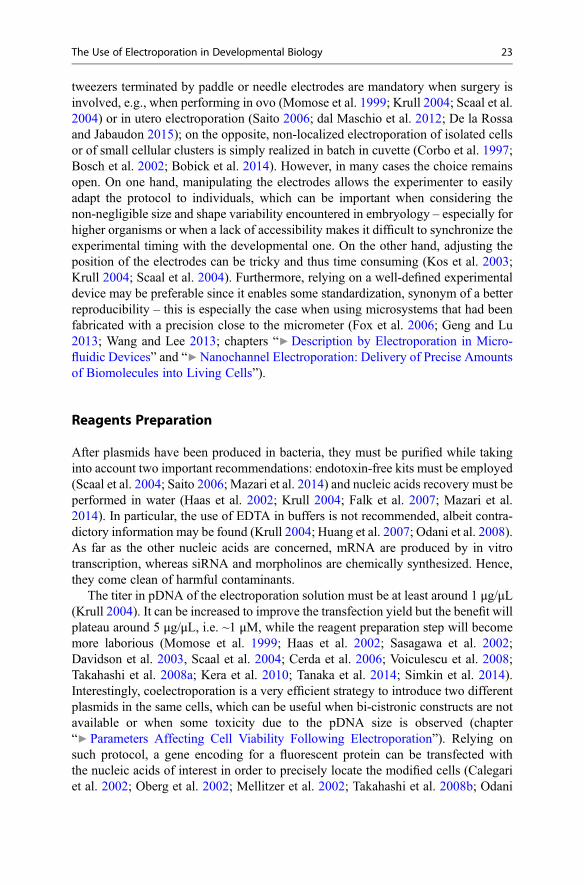
tweezers terminated by paddle or needle electrodes are mandatory when surgery isinvolved, e.g., when performing in ovo (Momose et al. 1999; Krull 2004; Scaal et al.2004) or in utero electroporation (Saito 2006; dal Maschio et al. 2012; De la Rossaand Jabaudon 2015); on the opposite, non-localized electroporation of isolated cellsor of small cellular clusters is simply realized in batch in cuvette (Corbo et al. 1997;Bosch et al. 2002; Bobick et al. 2014). However, in many cases the choice remainsopen. On one hand, manipulating the electrodes allows the experimenter to easilyadapt the protocol to individuals, which can be important when considering thenon-negligible size and shape variability encountered in embryology – especially forhigher organisms or when a lack of accessibility makes it difficult to synchronize theexperimental timing with the developmental one. On the other hand, adjusting theposition of the electrodes can be tricky and thus time consuming (Kos et al. 2003;Krull 2004; Scaal et al. 2004). Furthermore, relying on a well-defined experimentaldevice may be preferable since it enables some standardization, synonym of a betterreproducibility – this is especially the case when using microsystems that had beenfabricated with a precision close to the micrometer (Fox et al. 2006; Geng and Lu2013; Wang and Lee 2013; chapters “▶Description by Electroporation in Micro-fluidic Devices” and “▶Nanochannel Electroporation: Delivery of Precise Amountsof Biomolecules into Living Cells”).
Reagents Preparation
After plasmids have been produced in bacteria, they must be purified while takinginto account two important recommendations: endotoxin-free kits must be employed(Scaal et al. 2004; Saito 2006; Mazari et al. 2014) and nucleic acids recovery must beperformed in water (Haas et al. 2002; Krull 2004; Falk et al. 2007; Mazari et al.2014). In particular, the use of EDTA in buffers is not recommended, albeit contra-dictory information may be found (Krull 2004; Huang et al. 2007; Odani et al. 2008).As far as the other nucleic acids are concerned, mRNA are produced by in vitrotranscription, whereas siRNA and morpholinos are chemically synthesized. Hence,they come clean of harmful contaminants.
The titer in pDNA of the electroporation solution must be at least around 1 μg/μL(Krull 2004). It can be increased to improve the transfection yield but the benefit willplateau around 5 μg/μL, i.e. ~1 μM, while the reagent preparation step will becomemore laborious (Momose et al. 1999; Haas et al. 2002; Sasagawa et al. 2002;Davidson et al. 2003, Scaal et al. 2004; Cerda et al. 2006; Voiculescu et al. 2008;Takahashi et al. 2008a; Kera et al. 2010; Tanaka et al. 2014; Simkin et al. 2014).Interestingly, coelectroporation is a very efficient strategy to introduce two differentplasmids in the same cells, which can be useful when bi-cistronic constructs are notavailable or when some toxicity due to the pDNA size is observed (chapter“▶ Parameters Affecting Cell Viability Following Electroporation”). Relying onsuch protocol, a gene encoding for a fluorescent protein can be transfected withthe nucleic acids of interest in order to precisely locate the modified cells (Calegariet al. 2002; Oberg et al. 2002; Mellitzer et al. 2002; Takahashi et al. 2008b; Odani
The Use of Electroporation in Developmental Biology 23
et al. 2008; Streit et al. 2013). This approach is also necessary when working with theCRISPR/Cas9 system, the many components of which are scattered over severalplasmids (Sasaki et al. 2014; Véron et al. 2015; Tsunekawa et al. 2016). As far asmRNA is concerned, its typical concentration in the electroporation buffer is0.5–2 μg/μL, i.e., ~1 μM (Sasagawa et al. 2002; Cerda et al. 2006; Bansal et al.2009; Chernet and Levin 2012). For siRNA the recommended titer varies between0.05 and 5 μg/μL, i.e., 3 and 300 μM (Mellitzer et al. 2002; Grabarek et al. 2002;Pekarik et al. 2003; Soares et al. 2005, 2008; Tanaka et al. 2014), whereas formorpholinos a consensus exists with values around 0.5–1 mM (Kos et al. 2003;Cerda et al. 2006; Voiculescu et al. 2008; Tawk et al. 2009; Peng et al. 2012).
Whereas in developmental biology most of the ex vivo cultures are carried out inmedia rich in salts, growth factors, and nutriments, electroporation is usuallyperformed in dilute buffers (e.g., phosphate buffer saline, HEPES buffer saline)(chapter “▶ Parameters Affecting Cell Viability Following Electroporation”). What-ever the selected components, relying on low salinity solutions enables to reduceJoule heating and thus tissue degradation. In the particular case of sea waterorganism, such as ascidians, mannitol is used to replace some of the dissolvedions while keeping the osmolarity constant (Corbo et al. 1997).
The nucleic acid solution may be supplemented with various adjuvants. Forinstance, a dye is often employed to facilitate delivery by microinjection close to thecells to be transfected. Fast green is the far most popular molecule (Haas et al. 2002;Krull 2004; Saito 2006; Huang et al. 2015; De la Rossa and Jabaudon 2015) but theuse of methyl green (Momose et al. 1999), trypan blue (Pekarik et al. 2003), andphenol red (Krull 2004; Cui et al. 2006) has also sporadically been reported –interestingly, some authors have pointed out that fast green may inhibit genetic controlby morpholinos (Kos et al. 2003) or be toxic to embryos (Krull 2004). Other additivesmay include carboxymethyl cellulose which, by making the injected mixture moreviscous, prevents its spreading outside of the targeted tissue or cavity (Scaal et al.2004; Falk et al. 2007). Trans-cyclohexane-1,2-diol has also been mentioned, its rolebeing to disrupt the selectivity of the nuclear pores and thus to favor the passivediffusion of plasmids into the nucleus (De la Rossa and Jabaudon 2015).
Performances Validation
In test experiments, transfection success, both in terms of efficiency and localization,is assessed thanks to plasmids that encode readily detectable proteins. Early on,enzymes such as the β-galactosidase (Muramatsu et al. 1997, Momose et al. 1999,Itasaki et al. 1999, Swartz et al. 2001, Oberg et al. 2002 – Fig. 6a) or the luciferase(Murakami et al. 1994; Muramatsu et al. 1996; Harrison et al. 1998; Sasagawa et al.2002) were used, the first one producing a colored product and the second onereleasing photons upon reaction with its substrate. Nowadays, most technicaldevelopments are undertaken relying on constructs driving the expression of afluorescent protein, like the GFP or the mCherry (Fig. 6b). Those markers are notonly more sensitive and more practical; they also enable live imaging (Fig. 6c). The
24 C. Gosse et al.
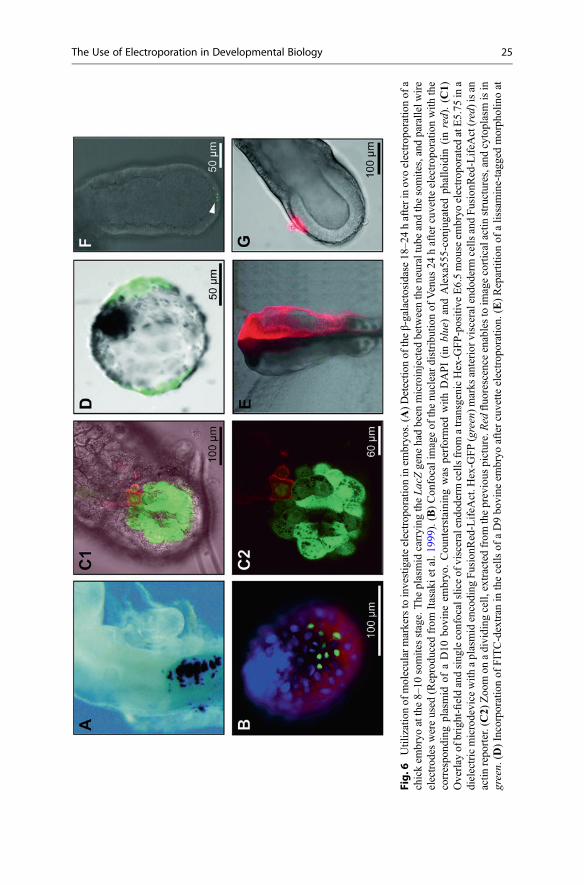
Fig.6
Utilizationof
molecularmarkerstoinvestigateelectrop
orationinem
bryo
s.(A
)Detectio
nof
theβ-galactosidase18
–24hafterinov
oelectrop
orationof
achickem
bryo
atthe8–
10somitesstage.The
plasmid
carrying
theLacZgene
hadbeen
microinjected
betweentheneuraltube
andthesomites,andparallelw
ire
electrod
eswereused
(Reprodu
cedfrom
Itasakietal.19
99).(B)Con
focalimageof
thenu
cleardistribu
tionof
Venus
24haftercuvette
electrop
orationwith
the
correspo
ndingplasmid
ofaD10
bovine
embryo
.Cou
nterstaining
was
performed
with
DAPI(inblue)andAlexa55
5-conjug
ated
phalloidin
(inred).(C
1)Overlay
ofbright-fieldandsing
leconfocalsliceof
visceralendo
derm
cells
from
atransgenicHex-G
FP-positive
E6.5mou
seem
bryo
electrop
orated
atE5.75
ina
dielectricmicrodevice
with
aplasmidencoding
FusionR
ed-LifeA
ct.H
ex-G
FP(green)m
arks
anterior
visceralendo
derm
cells
andFusionR
ed-LifeA
ct(red)isan
actin
repo
rter.(C2)
Zoo
mon
adividing
cell,
extractedfrom
theprevious
picture.Red
fluo
rescence
enablestoim
agecorticalactin
structures,and
cytoplasmisin
green.
(D)Incorporationof
FITC-dextran
inthecells
ofaD9bo
vine
embryo
aftercuvette
electrop
oration.
(E)Repartitionof
alissamine-tagg
edmorph
olinoat
The Use of Electroporation in Developmental Biology 25
onset of expression can even be determined quite precisely provided one utilizes afast maturating protein (Shaner et al. 2004; Chudakov et al. 2010). Fluorescencestarts to be detected 2–4 h after electroporation, as reported in zebrafish (Teh et al.2003; Kera et al. 2010), Xenopus (Haas et al. 2002; Falk et al. 2007), chick (Oberget al. 2002; Sauka-Spengler and Barembaum 2008), quail (Cui et al. 2006), axolotl(Echeverri and Tanaka 2003), and mouse (Abud et al. 2004).
Nevertheless, one may fail to observe any modification in gene expression uponelectroporation. Several reasons may then be invoked, among which pores that donot open in the plasma membrane, nucleic acids that do not enter through them, ortransfected cells that die. Each of these issues can in fact be systematically addressedwith the help of appropriate fluorescent probes.
The technique to detect pore formation is the same than the one working forisolated cells (chapter “▶ Fluorescent Indicators of Membrane Permeabilization Dueto Electroporation”). It consists in applying the voltage pulses in presence of amolecule that normally does not enter into the cytoplasm. Dextrans labeled withdyes such as fluorescein, tetra-methyl-rhodamine, or Texas Red are the most popularmarkers (Haas et al. 2002, Bosch et al. 2002, Grabarek et al. 2002, Barker et al. 2009,Hendricks and Jesuthasan 2007, Bansal et al. 2009, Tawk et al. 2009, Mazari et al.2014, Zhao et al. 2014 – Fig. 6d). Their molecular weight is usually ~ 4 kDa.Interestingly, such size also prevents the molecule to diffuse from cell to cell throughGAP junction, thereby allowing one to trace lineage (Stern and Fraser 2001;Bhattacharyya et al. 2008; Kretzschmar and Watt 2012). Other reporters of porationinclude propidium iodide (Harrison et al. 1998; Eide et al. 2000; Barker et al. 2009),trypan blue (Huang et al. 2007; Bansal et al. 2009), and even quantum dot (Huanget al. 2007).
Evaluating if nucleic acids enter the targeted cells is the next step in developing anefficient transfection protocol. The neutral morpholinos are most often tagged with afluorescent dye that provides them a charge and consequently enables their transportby electrophoresis to the tissue to be transfected. As a result they can be trackedthanks to labels like lissamine (Cerda et al. 2006; Falk et al. 2007; Sauka-Spenglerand Barembaum 2008 – Fig. 6e), fluorescein (Kos et al. 2003; Falk et al. 2007;Voiculescu et al. 2008; Tawk et al. 2009), or carboxyfluorescein (Kos et al. 2003).Although it is not necessary to favor their electroporation, siRNA have also beenconjugated to fluorophores, and their presence in embryos could then be monitored(Soares et al. 2005). Concerning plasmid labeling, the strategy involvingnon-covalent ligands of the double helix, such as TOTO-1, is very popular toinvestigate electroporation at the cell level (Golzio et al. 2002; chapter “▶Gene
�
Fig. 6 (continued) staged HH10 after unilateral electroporation of neural crest and neural pro-genitors a chick embryo at stage HH4 (Reproduced from Sauka-Spengler and Barembaum 2008).(F) Formation of nucleic acids aggregates at the surface of an E5.5 mouse embryo after electropo-ration in a dielectric guide device with a plasmid that had been previously chemically conjugated toFITC. (G) Detection of dead cells using propidium iodine uptake and morphological analysis afterelectroporation of an E6.5 mouse embryo in a dielectric guide device
26 C. Gosse et al.
Delivery by Electroporation In Vitro: Mechanisms”). However, it has never beenexperimented in embryos. Instead, utilization has been made of reacting dyes able tocovalently bind to pDNA (Mazari et al. 2014 – Fig. 6f).
The third issue to be studied is whether the cells that have been exposed to thevoltage pulses are still healthy or not. Immediate death by plasma membranedisruption is suspected when darker areas appear (Huang et al. 2015) or whencellular morphology is abnormal (Mazari et al. 2014 – Fig. 6g). However, to securethe diagnosis, a post-electroporation staining procedure can be performed (chapter“▶Different Cell Viability Assays Following Electroporation In Vitro”), whichinvolves dyes that do not cross intact phospholipidic bilayers and that also staingenomic DNA inside the nucleus, e.g., propidium iodide (Haas et al. 2002, Barkeret al. 2009, Mazari et al. 2014 – Fig. 6g), Sytox Green (Barker et al. 2009), andRedDot1 (Huang et al. 2015). More complex assays can further be realized to detectcells entering apoptosis: TUNEL reports on DNA fragmentation (Krull 2004; Falket al. 2007; Peng et al. 2012), propidium iodide staining informs on nuclei structure(Eide et al. 2000), and immunohistochemistry is used to evidence the activation ofthe caspase3 signaling pathway (Brown et al. 2012). Yet, the ultimate test isfunctional: one has to check if the electroporated cells behave as expected, withrespect to their division rate, their migration route, and their differentiation pathwayfor instance (Echeverri and Tanaka 2003; Mazari et al. 2014). Indeed, electropora-tion is known to alter both the cytoskeleton and the intercellular connections, whichmay result in subtle and/or delayed effects on the tissue structure and/or on itsfunction (chapter “▶Effects of Electroporation of Mammalian Cells on Cytoskele-ton and Intercellular Connections”).
Conclusion
The successful implementation of electroporation in developmental biology may beattributed to the following characters: the protocols are quite straightforward to setup, time-saving, low cost, and relatively harmless for the manipulated organisms(Table 1). It took roughly 15 years of methodological research to be able to introducenucleic acids in embryonic tissues in a save and efficient way (section “Organismsand Tissues”). Meanwhile, molecular biology tools were conceived in order toperform loss-of-function experiments more easily, consequently adding to thealready existing constructs allowing gain-of-function experiments (section “Molec-ular Biology Tools”). As a result, electroporation is now a mature technique rou-tinely employed to decipher the workings of the genetic networks involved in thetransformation of a unicellular fertilized egg in an autonomous multicellularorganism.
Although the previous assertion holds for the most popular animal models (e.g.,mouse, chick, frog, zebrafish), the situation is rather different for numerous specieswhich embryology and functional genomics are less advanced, despite their eco-nomic importance (e.g., silkworm, cow, sheep, pig, horse). This situation is para-doxical since electroporation represents an effective methodology to tackle the lack
The Use of Electroporation in Developmental Biology 27
of genetic tools. However, things should change soon thanks to the large corpus ofstudies now available: numerous instruments have been invented that can be inspir-ing to design more specific devices (sections “Strategies to Spatially Restrict Trans-fection” and “Material Selection”), and clear procedures have been published thatdescribe how to validate an electroporation protocol or at least how to understandwhat is going wrong with it (section “Performances Validation”).
Besides those applied issues, a few challenges remain in the field of biophysics.For example, through the literature it has been reported that mesenchymal tissues aredifficult to transfect (Itasaki et al. 1999; Oberg et al. 2002; Scaal et al. 2004; Krull2004; Sakai and Trainor 2014). However, the invoked reasons have not been so farstrongly backed up by experimental facts. Although some have raised concernsabout the leaking of the nucleic acids solution out of the injection site, deeper causesrelated to the structure of the mesenchyme have been proposed. Indeed, dealing withcells dispersed into a conjunctive matrix (Itasaki et al. 1999; Krull 2004), or with atissue far less electrically coupled than the surrounding epithelia, may be problem-atic (Oberg et al. 2002). Therefore, more fundamental studies are needed that wouldanalyze results acquired on massive tissues and on small cellular systems likespheroids, cysts, and organoids (chapters “▶ 3D Culture Models to Assess TissueResponses to Electroporation” and “▶ 3D Tissue Models to Bridge the Gap BetweenCell Culture and Tissue in Assessing Electroporation”). These data would alsobenefit the conception of more accurate numerical models (section “SetupConception”).
Finally, one of the last frontiers that may present opportunities for technologicaldevelopment is the one of resolution, both in space and in time. As a matter of fact,the physical tools that have been devised so far have reached their intrinsic limita-tions. The patch-clamp pipette technique is already able to transfect a single cell.Similarly, each molecular biology tool has its own response time (Table 1), whichcan hardly be reduced because it depends on how long it for the nucleic acids reachthe concerned cellular machinery and interact with it. Thus, a paradigm shift appearsnecessary. For example, controlling the protein synthesis or functionality can beachieved well after electroporation relying on some external trigger. The latter signalcan be molecular, like in the activation by the 4-hydroxytamoxifen of a Cre/lox-mediated inducible expression system (Matsuda and Cepko 2007) and by thedoxycycline of Tet-On or Tet-Off ones (Takahashi et al. 2008b). Alternatively,light proves useful when it drives photoactivation of fluorescent proteins (Starkand Kulesa 2007; Bhattacharyya et al. 2008). Noteworthily, using photons alsoallows one to act deep inside organisms, in places that are normally reluctant togenetic modulation by methods requiring some kind of physical intimacy betweenthe targeted cells and the nucleic acids (e.g., microinjection, viral infection, andelectroporation). A last approach to manage both the timing and the location ofexpression involves the use of tissue-specific cis-regulatory elements; in this case theprotein is only produced when cells engage into a given developmental pathway(Itasaki et al. 1999; Matsuda and Cepko 2007).
28 C. Gosse et al.
Acknowledgments This book chapter was written in the context of collaborative research projectsfunded by the grants “ElectroMice” (CNRS PI: Physique Chimie Biologie 2008), “Electro-TagMam” (Cnano IdF 2011), “ElectroDev” (PHC Tournesol 2014), and “RhoGTPases and collec-tive migration” (FNRS MIS 2013).
Cross-References
▶ 3D Culture Models to Assess Tissue Responses to Electroporation▶ 3D Tissue Models to Bridge the Gap Between Cell Culture and Tissue inAssessing Electroporation
▶Combining Electrolysis and Electroporation for Tissue Ablation▶Critical Electric Field and Transmembrane Voltage for Lipid Pore Formation inExperiments
▶Description by Electroporation in Microfluidic Devices▶Different Cell Viability Assays Following Electroporation In Vitro▶Effects of Electroporation of Mammalian Cells on Cytoskeleton and IntercellularConnections
▶Electrode Erosion and Metal Release Under Electroporation Conditions▶Electrolysis During Pulse Electric Field Treatment▶ Fluorescent Indicators of Membrane Permeabilization Due to Electroporation▶Gene Delivery by Electroporation In Vitro: Mechanisms▶Nanochannel Electroporation: Delivery of Precise Amounts of Biomolecules intoLiving Cells
▶Nucleic Acid Electrotransfer in Mammalian Cells: Mechanistic Description▶ Parameters Affecting Cell Viability Following Electroporation▶Transmembrane Voltage Induced by Applied Electric Fields
References
Abud HE, Lock P, Heath JK (2004) Efficient gene transfer into the epithelial cell layer of embryonicmouse intestine using low-voltage electroporation. Gastroenterology 126:1779–1787
Akamatsu W, Okano HJ, Osumi N, Inoue T, Nakamura S, Sakakibara SI, Miura M, Matsuo N,Darnell RB, Okano H (1999) Mammalian ELAV-like neuronal RNA-binding proteins HuB andHuC promote neuronal development in both the central and the peripheral nervous systems.Proc Natl Acad Sci U S A 96:9885–9890
Alie TM, Vrljicak PJ, Myburgh DB, Gupta IR (2007) Microinjection and electroporation ofembryonic kidney explants: an improved method. Kidney Int 72:121–125
Ando T, Fujiwara H (2013) Electroporation-mediated somatic transgenesis for rapid functionalanalysis in insects. Development 140:454–458
Atkins RL, Wang D, Burke RD (2000) Localized electroporation: a method for targeting expressionof genes in avian embryos. BioTechniques 28:94–100
Bansal T, Lenhart J, Kim T, Duan C, Maharbiz MM (2009) Patterned delivery and expression ofgene constructs into zebrafish embryos using microfabricated interfaces. Biomed Microdevices11:633–641
Barembaum M, Bronner-Fraser M (2007) Spalt4 mediates invagination and otic placode geneexpression in cranial ectoderm. Development 134:3805–3814
The Use of Electroporation in Developmental Biology 29
Barker M, Billups B, Hamann M (2009) Focal macromolecule delivery in neuronal tissue usingsimultaneous pressure ejection and local electroporation. J Neurosci Methods 177:273–284
Bartkowska K, Paquin A, Gauthier AS, Kaplan DR, Miller FD (2007) Trk signaling regulates neuralprecursor cell proliferation and differentiation during cortical development. Development134:4369–4380
Bhattacharyya S, Kulesa PM, Fraser SE (2008) Vital labeling of embryonic cells using fluorescentdyes and proteins. In: Bronner-Fraser M (ed) Avian embryology, 2nd edn. Academic, London,pp 187–210
Bobick BE, Alexander PG, Tuan RS (2014) High efficiency transfection of embryonic limbmesenchyme with plasmid DNA using square wave pulse electroporation and sucrose buffer.BioTechniques 56:85–89
Bosch TCG, Augustin R, Gellner K, Khalturin K, Lohmann JU (2002) In vivo electroporation forgenetic manipulations of whole hydra polyps. Differentiation 70:140–147
Brown CY, Eom DS, Amarnath S, Agarwala S (2012) A simple technique for early in vivoelectroporation of E1 chick embryos. Dev Dyn 241:545–552
Bullmann T, Arendt T, Frey U, Hanashima C (2015) A transportable, inexpensive electroporator forin utero electroporation. Develop Growth Differ 57:369–377
Buono RJ, Linser PJ (1992) Transient expression of RSVCAT in transgenic zebrafish made byelectroporation. Mol Mar Biol Biotechnol 1:271–275
Calegari F, Haubensak W, Yang D, Huttner WB, Buchholz F (2002) Tissue-specific RNA interfer-ence in postimplantation mouse embryos with endoribonuclease-prepared short interferingRNA. Proc Natl Acad Sci U S A 99:14236–14240
Cerda GA, Thomas JE, Allende ML, Karlstrom RO, Palma V (2006) Electroporation of DNA,RNA, and morpholinos into zebrafish embryos. Methods 39:207–211
Chabot S, Rosazza C, Golzio M, Zumbusch A, Teissié J, Rols MP (2013) Nucleic acids electro-transfer: from bench to bedside. Curr Drug Metab 14:300–308
Chernet BT, Levin M (2012) A versatile protocol for mRNA electroporation of Xenopus laevisembryos. Cold Spring Harb Protocol:447–452
Chudakov DM, Matz MV, Lukyanov S, Lukyanov KA (2010) Fluorescent proteins and theirapplications in imaging living cells and tissues. Physiol Rev 90:1103–1163
Corbo JC, Levine M, Zeller RW (1997) Characterization of a notochord-specific enhancer from theBrachyury promoter region of the ascidian, Ciona intestinalis. Development 124:589–602
Couly GF, Coltey PM, Le Douarin NM (1993) The triple origin of skull in higher vertebrates: astudy in quail-chick chimeras. Development 117:409–429
Cui C, Lansford R, Filla MB, Little CD, Cheuvront TJ, Rongish BJ (2006) Electroporation andEGFP labeling of gastrulating quail embryos. Dev Dyn 235:2802–2810
dal Maschio M, Ghezzi D, Bony G, Alabastri A, Deidda G, Brondi M, Sato SS, Zaccaria RP,Fabrizio ED, Ratto GM, Cancedda L (2012) High-performance and site-directed in uteroelectroporation by a triple-electrode probe. Nat Commun 3:960
Danielian PS, Muccino D, Rowitch DH, Michael SK, McMahon AP (1998) Modification of geneactivity in mouse embryos in utero by a tamoxifen-inducible form of Cre recombinase. Curr Biol8:1323–1326
Davidson BP, Tsang TE, Khoo PL, Gad JM, Tam PPL (2003) Introduction of cell markers into germlayer tissues of the mouse gastrula by whole embryo electroporation. Genesis 35:57–62
De la Rossa A, Jabaudon D (2015) In vivo rapid gene delivery into postmitotic neocortical neuronsusing iontoporation. Nat Protoc 10:25–32
deCastro M, Saijoh Y, Schoenwolf JC (2006) Optimized cationic lipid-based gene delivery reagentsfor use in developing vertebrate embryos. Dev Dyn 235:2210–2219
Donovan SL, Dyer MA (2006) Preparation and square wave electroporation of retinal explantcultures. Nat Protoc 1:2710–2718
Driver EC, Kelley MW (2010) Transfection of mouse cochlear explants by electroporation. CurrProtocol Neurosci. Chapter 4:Unit 4.34.1–10
30 C. Gosse et al.
Echeverri K, Tanaka EM (2003) Electroporation as a tool to study in vivo spinal cord regeneration.Dev Dyn 226:418–425
Echeverri K, Tanaka EM (2005) Proximodistal patterning during limb regeneration. Dev Biol279:391–401
Eichele G, Tickle C, Alberts BM (1985) Studies on mechanism of retinoid-induced patternduplications in the early chick limb bud: temporal and spatial aspects. J Cell Biol101:1913–1920
Eide FF, Eisenberg SR, Sanders TA (2000) Electroporation-mediated gene transfer in free-swimming embryonic Xenopus laevis. FEBS Lett 496:29–32
Falk J, Drinjakovic J, Leung KM, Dwivedy A, Regan AG, Piper M, Holt CE (2007) Electroporationof cDNA/morpholinos to targeted areas of embryonic CNS in Xenopus. BMC Dev Biol 7:107
Fox MB, Esveld DC, Valero A, Luttge R, Mastwijk HC, Bartels PV, van den Berg A, Boom RM(2006) Electroporation of cells in microfluidic device: a review. Anal Bioanal Chem385:474–485
Fukuchi-Shimogori T, Grove EA (2001) Neocortex patterning by the secreted signaling moleculeFGF8. Science 294:1071–1074
Fukuda K, Sakamoto N, Narita T, Saitoh K, Kameda T, Iba H, Yasugi S (2000) Application ofefficient and specific gene transfer systems and organ culture techniques for the elucidation ofmechanisms of epithelial-mesenchymal interaction in the developing gut. Develop GrowthDiffer 42:207–211
Geetha-Loganathan P, Nimmagadda S, Hafez I, Fu K, Cullis PR, Richman JM (2011) Developmentof high-concentration lipoplexes for in vivo gene function studies in vertebrate embryos. DevDyn 240:2108–2119
Geng T, Lu C (2013) Microfluidic electroporation for cellular analysis and delivery. Lab Chip13:3830–3821
Gilbert SF (2013) Developmental biology, 10th edn. Sinauer, SunderlandGiroux SJD, Alves-Leiva C, Lécluse Y, Martin P, Albagl O, Godin I (2007) Gene transfer to
pre-hematopoietic and committed hematopoietic precursors in the early mouse yolk sac: acomparative study between in situ electroporation and retroviral transduction. BMC Dev Biol7:79
Golzio M, Teissie J, Rols MP (2002) Direct visualization at the single-cell level of electricallymediated gene delivery. Proc Natl Acad Sci U S A 99:1292–1297
Grabarek JB, Plusa B, Glover DM, Zernicka-Goetz M (2002) Efficient delivery of dsRNA intozona-enclosed mouse oocytes and preimplantation embryos by electroporation. Genesis32:269–276
Haas K, Sin WC, Javaherian A, Li Z, Cline HT (2001) Single-cell electroporation for gene transferin vivo. Neuron 29:583–591
Haas K, Jensen K, Sin WC, Foa L, Cline HT (2002) Targeted electroporation in Xenopus tadpolesin vivo-from single cells to the entire brain. Differentiation 70:148–154
Harrison RL, Byrne BJ, Tung L (1998) Electroporation-mediated gene transfer in cardiac tissue.FEBS Lett 435:1–5
Hashimoto-Torii K, Motoyama J, Hui CC, Kuroiwa A, Nakafuku M, Shimamura K (2003)Differential activities of sonic hedgehog mediated by Gli transcription factors define distinctneuronal subtypes in the dorsal thalamus. Mech Dev 120:1097–1111
Hatakeyama J, Shimamura K (2008) Method for electroporation for the early chick embryo.Develop Growth Differ 5:449–452
Hendricks M, Jesuthasan S (2007) Electroporation-based methods for in vivo, whole mount andprimary culture analysis of zebrafish brain development. Neural Dev 2:6
Huang KS, Lin YC, Su KC, Chen HY (2007) An electroporation microchip system for thetransfection of zebrafish embryos using quantum dots and GFP genes for evaluation. BiomedMicrodevices 9:761–768
Huang Y, Wilkie R, Wilson V (2015) Methods for precisely localized transfer of cells or DNA intoearly postimplantation mouse embryos. J Vis Exp 106:53295
The Use of Electroporation in Developmental Biology 31
Iba H (2000) Gene transfer into chicken embryos by retrovirus vectors. Develop Growth Differ42:213–218
Iimura T, Pourquié O (2008) Manipulation and electroporation of the avian segmental plate andsomites in vitro. In: Bronner-Fraser M (ed) Avian embryology, 2nd edn. Academic, London, pp257–270
Inoue K (1992) Expression of reporter genes introduced by microinjection and electroporation infish embryos and fry. Mol Mar Biol Biotechnol 1:266–270
Itasaki N, Bel-Vialar S, Krumlauf R (1999) ‘Shocking’ developments in chick embryology:electroporation and in ovo gene expression. Nat Cell Biol 1:E203–E207
Jaenisch R (1988) Transgenic animals. Science 240:1468–1474Kaestner L, Scholz A, Lipp P (2015) Conceptual and technical aspects of transfection and gene
delivery. Bioorg Med Chem Lett 25:1171–1176Kamdar KP, Wagner TN, Finnerly V (1995) Electroporation of Drosophila embryos. In: Nickoloff
JA (ed) Animal cell electroporation and electrofusion protocols. Humana Press, Totowa, pp239–243
Katahira T, Nakamura H (2003) Gene silencing in chick embryos with a vector-based smallinterfering RNA system. Develop Growth Differ 45:361–367
Kera SA, Agerwala SM, Horne JH (2010) The temporal resolution of in vivo electroporation inzebrafish: a method for time-resolved loss of function. Zebrafish 7:97–108
Kos R, Tucker RP, Hall R, Duong TD, Erickson CA (2003) Methods for introducing morpholinosinto the chicken embryo. Dev Dyn 226:470–477
Kretzschmar K, Watt FM (2012) Lineage tracing. Cell 148:33–45Krull CE (2004) A primer on using in ovo electroporation to analyze gene function. Dev Dyn
229:433–439Kumar A, Godwin JW, Gates PB, Garza-Garcia AA, Brockes JP (2007) Molecular basis for the
nerve dependence of limb regeneration in an adult vertebrate. Science 318:772–777Le Douarin N, Dieterlen-Lièvre F, Creuzet S, Teillet MA (2008) Quail–chick transplantations. In:
Bronner-Fraser M (ed) Avian embryology, 2nd edn. Academic, London, pp 19–58Lee JM, Takahashi M, Mon H, Koga K, Kawaguchi Y, Kusakabe T (2005) Efficient gene transfer
into silkworm larval tissues by a combination of sonoporation and lipofection. Cell Biol Int29:976–979
Lee JM, Kim JY, Cho KW, Lee MJ, Cho SW, Kwak S, Cai J, Jung HS (2008) Wnt11/Fgfr1b cross-talk modulates the fate of cells in palate development. Dev Biol 314:341–350
Leopold RA, Hughes KJ, DeVault JD (1996) Using electroporation and a slot cuvette to deliverplasmid DNA to insect embryos. Genet Anal: Biomol Eng 12:197–200
Lin G, Chen Y, Slack JMW (2007) Regeneration of neural crest derivatives in the Xenopus tadpoletail. BMC Dev Biol 7:56
Matsuda T, Cepko CL (2007) Controlled expression of transgenes introduced by in vivo electro-poration. Proc Natl Acad Sci U S A 104:1027–1032
Mazari E, Laniel J, Dubois G, Griffon S, Marty F, Perea-Gomez A, Gosse C (2010) Mouse embryoelectroporation and culture in devices made by soft lithography. In: Verpoorte S, Andersson-Svahn H, Emnéus J, Pamme N (eds) Proceedings of the 14th international conference onminiaturized systems for chemistry and life sciences. CBMS, San Diego, pp 312–314
Mazari E, Mantelet M, Iranzo J, Perea-Gomez A, Gosse C (2011) Localized electroporation ofmouse embryo using dielectric guides. In: Digest of the technical papers of the 16th internationalconference on solid-state sensors, actuators, and microsystems. IEEE, Piscataway, pp1172–1175
Mazari E, Zhao X, Migeotte I, Collignon J, Gosse C, Perea-Gomez A (2014) A microdevice tolocally electroporate embryos with high efficiency and reduced cell damage. Development141:1–11
Mellitzer G, Hallonet M, Chen L, Ang SL (2002) Spatial and temporal ‘knock down’ of geneexpression by electroporation of double-stranded RNA and morpholinos into early post-implantation mouse embryos. Mech Dev 118:57–63
32 C. Gosse et al.
Momose T, Tonegawa A, Takeuchi J, Ogawa H, Umesono K, Yasuda K (1999) Efficient targeting ofgene expression in chick embryos by microelectroporation. Develop Growth Differ 41:335–344
Moto K, Salam SEA, Sakurai S, Iwami M (1999) Gene transfer into insect brain and cell-specificexpression of Bombyxin gene. Dev Genes Evol 209:447–450
Müller F, Lele Z, Varadi L, Menczel L, Orban L (1993) Efficient transient expression system basedon square pulse electroporation and in vivo luciferase assay of fertilized fish eggs. FEBS Lett324:27–32
Murakami Y, Motohashi K, Yano K, Ikebukuro K, Yokoyama K, Tamiya E, Karube I (1994)Micromachined electroporation system for transgenic fish. J Biotechnol 34:35–42
Muramatsu T, Mizutani Y, Okumura J (1996) Live detection of the firefly luciferase gene expressionby bioluminescence in incubating chicken embryos. Amin Sci Technol (Jpn) 67:906–909
Muramatsu T, Mizutani Y, Ohmori Y, Okumura J (1997) Comparison of three nonviral transfectionmethods for foreign gene expression in early chicken embryos in ovo. Biochem Biophys ResCommun 230:376–380
Nakamura H (2009) Electroporation and sonoporation in developmental biology. Springer, TokyoNakamura H, Funahashi J (2013) Electroporation: past, present and future. Develop Growth Differ
55:15–19Oberg KC, Pira CU, Revelli JP, Ratz B, Aguilar-Cordova E, Eichele G (2002) Efficient ectopic gene
expression targeting chick mesoderm. Dev Dyn 224:291–302Odani N, Ito K, Nakamura H (2008) Electroporation as an efficient method of gene transfer.
Develop Growth Differ 50:443–448Ogura T (2002) In vivo electroporation: a new frontier for gene delivery and embryology. Differ-
entiation 70:163–171Ohta S, Suzuki K, Tachibana K, Yamada G (2003) Microbubble-enhanced sonoporation: efficient
gene transduction technique for chick embryos. Genesis 37:91–101Olofsson J, Nolkrantz K, Ryttsén F, Lambie BA, Weber SG, Orwar O (2003) Single-cell electro-
poration. Curr Opin Biotechnol 14:29–34Olofsson J, Levin M, Strömberg A, Weber SG, Ryttsén F, Orwar O (2007) Scanning electroporation
of selected areas of adherent cell cultures. Anal Chem 79:4410–4418Paganin-Gioanni A, Bellard E, Escoffre JM, Rols MP, Teissié J, Golzio M (2011) Direct visuali-
zation at the single-cell level of siRNA electrotransfer into cancer cells. Proc Natl Acad Sci U SA 108:10443–10447
Pekarik V, Bourikas D, Miglino N, Joset P, Preiswerk S, Stoeckli ET (2003) Screening for genefunction in chicken embryo using RNAi and electroporation. Nat Biotechnol 21:93–96
Peng H, Wu Y, Zhang Y (2012) Efficient delivery of DNA and morpholinos into mouse preim-plantation embryos by electroporation. PLoS One 7:e43748
Powers DA, Hereford L, Cole T, Chen TT, Lin CM, Kight K, Creech K, Dunham R (1992)Electroporation: a method for transferring genes into the gametes of zebrafish (Brachydaniorerio), channel catfish (Ictalurus punctatus), and common carp (Cyprinus carpio). Mol Mar BiolBiotechnol 1:301–308
Pu H, Young AP (1990) Glucocorticoid-inducible expression of a glutamine synthetase-CAT-encoding fusion plasmid after transfection of intact chicken retinal explant cultures. Gene89:259–263
Quinlan GA, Khoo PL, Wong N, Trainor PA, Tam PPL (2008) Cell grafting and labeling inpostimplantation mouse embryos. In: Sharpe P, Mason I (eds) Molecular embryology: methodsand protocols, 2nd edn. Humana Press, New-York, pp 47–70
Saito T (2006) In vivo electroporation in the embryonic mouse central nervous system. Nat Protoc1:1552–1558
Saito T, Nakatsuji N (2001) Efficient gene transfer into the embryonic mouse brain using in vivoelectroporation. Dev Biol 240:237–246
Sakai D, Trainor PA (2014) Gene transfer techniques in whole embryo cultured post-implantationmouse embryos. In: Lewandoski M (ed) Mouse molecular embryology. Humana Press,New-York, pp 227–234
The Use of Electroporation in Developmental Biology 33
Sasagawa S, Takabatake T, Takabatake Y, Muramatsu T, Takeshima K (2002) Improved mRNAelectroporation method for Xenopus neurula embryos. Genesis 33:81–85
Sasaki H, Yoshida K, Hozumi A, Sasakura Y (2014) CRISPR/Cas9-mediated gene knockout in theascidian Ciona intestinalis. Develop Growth Differ 56:499–510
Sato M, Ohtsuka M, Watanabe S, Gurumurthy CB (2016) Nucleic acids delivery methods forgenome editing in zygotes and embryos: the old, the new, and the old-new. Biol Direct 11:16
Sauka-Spengler T, Barembaum M (2008) Gain- and loss-of-function approaches in the chickembryo. In: Bronner-Fraser M (ed) Avian embryology, 2nd edn. Academic, London, pp237–256
Scaal M, Gros J, Lesbros C, Marcelle C (2004) In ovo electroporation of avian somites. Dev Dyn229:643–650
Semple-Rowland SL, Berry J (2014) Use of lentiviral vectors to deliver and express bicistronictransgenes in developing chicken embryos. Methods 66:466–473
Shaner NC, Campbell RE, Steinbach PA, Giepmans BNG, Palmer AE, Tsien RY (2004) Improvedmonomeric red, orange and yellow fluorescent proteins derived from Discosoma sp red fluo-rescent protein. Nat Biotechnol 22:1567–1572
Sharpe P, Mason I (2008) Molecular embryology: methods and protocols, 2nd edn. Humana Press,New-York
Shin MK, Levorse JM, Ingram RS, Tilghman SM (1999) The temporal requirement for endothelinreceptor-B signalling during neural crest development. Nature 402:496–501
Simkin JE, McKeown SJ, Newgreen DF (2009) Focal electroporation in ovo. Dev Dyn238:3152–3155
Simkin JE, Zhang D, Ighaniyan S, Newgreen DF (2014) Parameters affecting efficiency of in ovoelectroporation of the avian neural tube and crest. Dev Dyn 243:1440–1447
Skachkov I, Luan Y, van der Steen AFW, de Jong N, Kooiman K (2014) Targeted microbubblemediated sonoporation of endothelial cells in vivo. IEEE Trans Ultrason Ferroelectr FreqControl 61:1661–1667
Slack JMW (2006) Essential developmental biology, 2nd edn. Blackwell, MaldenSmith KM, Gee L, Bode HR (2000) HyAlx, an aristaless-related gene, is involved in tentacle
formation in hydra. Development 127:4743–4752Soares ML, Haraguchi S, Torres-Padilla ME, Kalmar T, Carpenter L, Bell G, Morrison A, Ring
CJA, Clarke NJ, Glover DM, Zernicka-Goetz M (2005) Functional studies of signaling path-ways in peri-implantation development of the mouse embryo by RNAi. BMC Dev Biol 5:28
Soares ML, Torres-Padilla ME, Zernicka-Goetz M (2008) Bone morphogenetic protein 4 signalingregulates development of the anterior visceral endoderm in the mouse embryo. Develop GrowthDiffer 50:615–621
Spemann H, Mangold H (1924) Über die Induktion von Embryonalanlagen durch Implantationartfremder Organisatoren. W Roux’ Arch f Entw d Organis u mikrosk Anat 100:599–638.Translated and reprinted as: Spemann H, Mangold H (2001) Induction of embryonic primordiaby implantation of organizers from different species. Int J Dev Biol 45:13–38
Stark DA, Kulesa PM (2007) An in vivo comparison of photoactivatable fluorescent proteins in anavian embryo model. Dev Dyn 236:1583–1594
Stern CD, Fraser SE (2001) Tracing the lineage of tracing cell lineages. Nat Cell Biol 3:E216–E218Stern CD, Ireland GW, Herrick SE, Gherardi E, Gray J, Perryman M, Stoker M (1990) Epithelial
scatter factor and development of the chick embryonic axis. Development 110:1271–1284Stolfi A, Gandhi S, Salek F, Christiaen L (2014) Tissue-specific genome editing in Ciona embryos
by CRISPR/Cas9. Development 141:4115–4120Streit A, Tambalo M, Chen J, Grocott T, Anwar M, Sosinsky A, Stern CD (2013) Experimental
approaches for gene regulatory network construction: the chick as a model system. Genesis51:296–310
Svingen T, Wilhelm D, Combes AN, Hosking B, Harley VR, Sinclair AH, Koopman P (2009) Exvivo magnetofection: a novel strategy for the study of gene function in mouse organogenesis.Dev Dyn 238:956–964
34 C. Gosse et al.
Swartz M, Eberhart J, Mastick GS, Krull CE (2001) Sparking new frontiers: using in vivoelectroporation for genetic manipulations. Dev Biol 233:13–21
Tabata H, Nakajima K (2001) Efficient in utero gene transfer system to the developing mouse brainusing electroporation: visualization of neuronal migration in the developing cortex. Neurosci-ence 103:865–872
Takahashi M, Nomura T, Osumi N (2008a) Transferring genes into cultured mammalian embryosby electroporation. Develop Growth Differ 50:485–497
Takahashi Y, Watanabe T, Nakagawa S, Kawakami K, Sato Y (2008b) Transposon-mediated stableintegration and tetracycline-inducible expression of electroporated transgenes in chickenembryos. In: Bronner-Fraser M (ed) Avian embryology, 2nd edn. Academic, London, pp271–280
Tanaka SS, Yamaguchi YL, Jones VJ, Tam PPL (2014) Analyzing gene function in whole mouseembryo and fetal organ in vitro. In: Lewandoski M (ed) Mouse molecular embryology. HumanaPress, New-York, pp 367–393
Tawk M, Tuil D, Torrente Y, Vriz S, Paulin D (2002) High-efficiency gene transfer into adult fish: anew tool to study fin regeneration. Genesis 32:27–31
Tawk M, Bianco IS, Clarke JDW (2009) Focal electroporation in zebrafish embryos and larvae. In:Lieschke GJ, Oates AC, Kawakami K (eds) Zebrafish: methods and protocols. Humana Press,Dordrecht, pp 145–151
Teh C, Chong SW, Korzh V (2003) DNA delivery into anterior neural tube of zebrafish embryos byelectroporation. BioTechniques 35:950–954
Thomas JL (2003) Electroporation, an alternative to biolistics for transfection of Bombyx moriembryos and larval tissues. J Insect Sci 3:17
Thomas JL, Bardou J, L’hoste S, Mauchamp B, Chavancy G (2001) A helium burst biolistic deviceadapted to penetrate fragile insect tissues. J Insect Sci 1:9
Tsunekawa Y, Terhune RK, Fujita I, Shitamukai A, Suetsugu T, Matsuzaki F (2016) Developing ade novo targeted knock-in method based on in utero electroporation into the mammalian brain.Development 143:3216–3222
Véron N, Qu Z, Kipen PAS, Hirst CE, Marcelle C (2015) CRISPR mediated somatic cell genomeengineering in the chicken. Dev Biol 407:68–74
Voiculescu O, Papanayotou C, Stern CD (2008) Spatially and temporally controlled electroporationof early chick embryos. Nat Protoc 3:419–426
Wang S, Lee LJ (2013) Micro-/nanofluidics cell electroporation. Biomicrofluidics 7:011301Zhao X, Mazari E, Suárez-Boomgaard D, Migeotte I, Perea-Gomez A, Gosse C (2014) Finite
element model simulations to assist the design of microdevices dedicated to the localizedelectroporation of mouse embryos. ECS Trans 64:7–14
The Use of Electroporation in Developmental Biology 35

Conception et fabrication d'outils microfluidiques réutilisables pour
étudier la dynamique de phénomènes biologiques: application à
l'influx / efflux d'antibiotiques dans les bactéries et à la migration des
cellules pendant le développement de la souris
Résumé en français
Au cours de cette thèse, nous avons développé des outils microfluidiques
réutilisables et leur protocoles expérimentaux afin de mettre en place l’utilisation d’
instrumentations miniaturisées dédiées à l’étude des objets biologiques à différentes
échelles. Ce développement permet à l’émergence de stratégies innovantes ainsi que de
répondre à d’importantes questions en sciences de la vie. Cette thèse est divisée en deux
sous-parties : l’application dans le domaine microbiologie et l’application dans le domaine
embryologie.
Part I :
La recherche sur les antibiotiques a commencé il y a plus d'un siècle. A partir du
premier rapport au sujet du phénomène de l’antagonisme, à la découverte fortuite de la
pénicilline, ensuite les recherches des antibiotiques dans l’habitat naturel, et enfin la
synthèse/semi-synthèse artificielle des antibiotiques, des antibiotiques ont joué un grand
rôle dans la médicine moderne.
Cependant, actuellement l‘être-humain fait face à un problème plus sévère : à cause
de l’abus des antibiotiques, de plus en plus de bactéries résistantes apparaissent, donc l’être-
humain dispose de moins en moins de médicaments, mais en même temps, la recherche et
le développement de nouveaux médicaments stagnent.
Autour de ce grand thème, cette première partie de thèse se focalise sur l'influx et
l’efflux de la molécule d’antibiotique à travers l’enveloppe bactérienne, en combinaison avec
l’application d’un nouveau dispositif microfluidique, pour offrir un autre angle de vision dans
la première période où les bactéries entrent en contact avec les antibiotiques, dans une
petite échelle de temps.
Les bactéries peuvent être classifiées de différentes façons, en fonction de leur
apparence, de leur type nutritionnel, de leurs besoins en oxygène pendant la croissance, de
leur préférence de température ou de leur structure cellulaire. Notre étude utilise un
organisme de modèle bien étudié, Escherichia coli, qui est bacilli et bactérie Gram-négative.
Les antibiotiques peuvent être classifiés par leurs mécanismes d'action spécifiques.
Cinq cibles principales sont identifiées: la synthèse de la paroi cellulaire, l'intégrité de la
membrane cellulaire, la synthèse des protéines, la synthèse des acides nucléiques et la
synthèse du folate.
Quant à ce qui concerne l'interaction entre les bactéries et les antibiotiques, il faut
parler de la résistance aux antibiotiques. Le mécanisme de résistance peut être
généralement divisé en quatre catégories : l'inactivation de l’antibiotique par enzyme,
l'altération du site de cible, les changements de la perméabilité de la membrane et
l'expulsion active de l’antibiotique par les bactéries. Les deux derniers forment une paire de
mécanismes de multiples résistance, et c'est aussi le point focal du travail actuel : influx /
efflux.
Dans les recherches sur l'influx / efflux rapportées, on voit en général la méthode à
trois échelles : études sur le comportement du groupe ; études sur le comportement de
cellules individuelles, et études sur le comportement des protéines du canal individuel. Dans
chaque échelle, deux genres de systèmes sont trouvés, le système naturel ou la construction
artificielle. Ces études utilisent diverses technologies de détection, e.g. la microscopie de
fluorescence, la spectrométrie de masse, la mesure électrophysiologique. Récemment, les
outils microfluidiques sont intégrés pour traiter ces petits objects.
Notre recherche est menée dans le cadre de l'IMI (INNOVATIVE MEDICINES
INITIATIVE) en collaboration avec Soleil synchrotron et UMR-MD1 à Marseille. Cette
recherche vise à utiliser les antibiotiques naturellement fluorescents, fluoroquinolones, par
l'imagerie sous irradiation UV, à observer l’accumulation de l’antibiotique dans le corps des
bactéries en fonction du temps. Selon de differents espèces mutantes, de differents
antibiotiques, voire même de differentes adjuvants ajoutés, ce niveau d’accumulation doit
varier. Ceci est une technique sans marquage permettant la détection en temps réel aux
études du système réel biologique, il offre de certaines significations cliniques.
Étant donné que la méthode employée par le passé a des défauts, elle ne peut être
appelée que « méthode statique ». Par exemple, il n'y a aucun moyen de changer le liquide
environnemental extérieur, il n'y a aucun moyen d'obtenir des informations de fond. Nous
avons donc décidé de mettre en œuvre un moyen plus flexible en introduisant l'outil
microfluidique.
Il s’agit de se focaliser sur une petite gamme de bacteries immobilizées et isolées.
Dans les recherches rapportées, nous avons résumé que trois catégories de méthodes
peuvent être trouvées par rapport à l’application du dispositif microfluidique à l’échelle de
cellule unique : électromagnétiques (diélectrophorès ou pinces optiques), adhésions
chimiques ou physiques (revêtement de surface ou matrice de gel), et des pièges stériques
(chambre microfluidique, vanne annulaire élastomère ou membrane semi-perméable). En
même temps, notre dispositif microfluidique doit pouvoir répondre aux demandes : une
immobilisation complète des bactéries, une isolation des bactéries jusqu’à single-cell pour
permettre l’imagerie parallèle, une necessité d’entrée et de sortie du fluidie, et une
préférence d’être réutilisable.
Après avoir testé le diélectrophorèse et la vanne bouton élastomère sans succès,
nous avons décidé de concevoir un dispositif qui peut remplir les quatre demandes ci-dessus.
Il est basé sur la méthode statique précédente, une des deux lamelles a été reduite, un
timbre de PDMS a été assemblé de la manière réversible avec le substrat, et des pousse-
seringues vont réaliser de l’input et l’élimination du liquide.
Ensuite, à travers une analyse grossière de « circuit résistif » et une simulation
numérique précise, le comportement de fluide dans le dispositif est clarifié: dans le « canal
d’approvisionnement » le fluide est renouvelé par advection pour offrir une source stable
alors que dans le « canal de bactérie », en raison de la résistance hydrodynamique très
importante, le transfert de masse est conduit principalement par diffusion. ROI (region of
interest) est sélectionnée dans la zone de 15~35 µm à la frontière de « couvercle de la
chambre d’observation », donc le changement de l’environnement liquide est plus rapide
que la vitesse à laquelle les bactéries absorbent les molécules de l’antibiotique de
l’environnement. C’est une méthode qui peut refléter l’interaction véritable entre les
bacteries et les molécules antibiotiques.
Le focus du travail suivant est concentré essentiellement sur 2 points : 1. Pour les

bactéries de différentes mutations, est-ce que elles présentent de différents niveaux
d’accumulation par rapport aux même médicaments ? 2. Pour les mêmes bactéries, à
l'utilisation de différents adjuvants, est-ce qu’elles présentent de différentes réponses ? Cela
guidera le développement des futurs antibiotiques. Nous démontrons également les
possibilités de ce dispositif en terme de plate-forme d'observation pour la culture des
bactéries.
Part II:
Dans cette 2ème partie de thèse, nous avons pour but d’étudier un processus de vie
d’un organisme de modèle qui est un embryon de souris de stade précoce de 5.5 jours : son
endoderme viscéral distal déplace vers un côté de l’embryon pour définir le futur endoderme
viscéral anterieur et donc l’axe et le plan du corps. Pour révéler ce processus, la technique de
marquage-traçage est utilisée.
La transfection est une technique spécialisée pour la délivrance de gènes exogènes
dans les cellules. Avec le développement de la recherche sur les fonctions des gènes et des
protéines, elle est devenue une méthode de laboratoire de base. Les protocoles de
transfection peuvent être classés en trois types : physique (e.g. sonoporation ou
électroporation), chimique (e.g. lipofection) et biologique (e.g. infection lentivirale ou
infection retrovirale). Parmi lesquels, l’électroporation est une des méthodes physiques,
effice et non toxique. L’électroporation utilise l’effet de chocs électriques pour déstabiliser la
membrane cellulaire pendant de courtes périodes, permettant ainsi la pénétration de
molécules ou de principes actifs peu perméables. Ce phénomène peut être réversible si les
paramètres électriques sont bien contrôlés. A travers ces trous, des ADN ou d’autres
macromolécules déjà présents dans la solution peuvent translocater dans les cellules.
L'ancienne doctorante a développé la conception d’un dispositif basé sur « guide
diélectrique ». Grâce à cette conception, d'une part la possibilité de contact direct entre
l’embryon et les électrodes est évitée ; d'autre part, la focalisation des lignes de champ
électrique est mise en place afin de réaliser une électroporation ciblée précise. Par EM5 et
EM6, les deux versions de dispositifs à usage unique, le design du guide diélectrique a été
validé. EM5 a utilisé la méthode de «lithographie molle » pour la moitié supérieure de la
structure, puis elle est collée avec un substrat en verre ordinaire pour fermer le canal; EM6 a
utilisé de la métallisation, une résine négative de photolithographie, et un collage thermique
pour former la structure du canal. Cependant, en raison de la mauvaise bio-compatibilié des
matériaux et la complexité de technologies, ces deux versions ne sont pas applicables à la
propagation dans la communauté biologique. Par conséquence, nous voulons que ces
dispositifs soient practique à utiliser pour que les biologistes puissent se dispenser de la
dépendance d’une salle blanche.
Pour la réutilisabilité, deux options s’offernt à nous : premièrement, la micro puce
par moulage thermoplastique comme les « petri dish » à usage unique : ils sont jetables, et
peuvent être produits en masse. Deuxièmement, la micro puce répétivement nettoyable et
recyclable, comme un bécher en verre. Etant donné deux prémisses importantes, nous avons
finalement choisi le développement et la fabrication en verre : d'abord, la conception de la
nature particulière du dispositif et la diversité des tailles des embryons de souris exigent que
les dimensions du dispositif soient flexibles ; et le second, ce dispositif nécessite que la
surface de dispositif soit hydrophile.
Dans mon travail, nous nous sommes efforcés de développer des puces réutilisables
en verre qui sont nommées EM7. La version EM7-01 était basée sur la gravure humide pour
la structure de substrat, le microsablage pour le couvercle et la colle photo sensible aux UV
pour l’assemlage. EM7-02 a rendu l'usinage du verre de couvercle plus précis en introduisant
l’ablation au laser. Cependant, l’assemblage reposait toujours sur la colle photo sensible aux
UV et l’alignement entre ces deux couches était toujours un problème. Dans EM7-11, l'étape
d'alignement a eu lieu pendant l'ablation au laser en réservant les marques d'alignement
pour augmenter la précision et non plus pendant l’assemblage comme précédemment. En
outre, l'assemblage a été complété par simple collage d'un substrat neuf par HSQ. En
parallèle, EM7-21, une puce réutilisable monolithique était faite pas externalisation, par une
entreprise experte en « selective laser-induced etching ».
Ce dispositif a été envoyé à l'Université Libre de Bruxelles pour participer aux essais
biologiques. Combiné avec les paramètres électrique fournis à partir des simulations
numériques, nos collaborateurs ont mené avec succès plusieurs électroporations et observé
des expressions de différentes protéines correspondants aux plasmides électroporés dans
des embryons.
En développant ce dispositif, nous proposons une stratégie d’électroporation à haute
précision, haute reproductibilité, et faible toxicité. En plus de la méthode marquage-traçage,
il peut, bien sûr, être appliqué sur la modification de la fonction cellulaire localement. Grâce
au choix des matériaux et technologies, ce dispositif est réutilisable et facile à propager dans
les laboratoires de biologie.

Université Paris-Saclay
Espace Technologique / Immeuble Discovery
Route de l’Orme aux Merisiers RD 128 / 91190 Saint
Espace Technologique / Immeuble Discovery
Route de l’Orme aux Merisiers RD 128 / 91190 Saint-Aubin, France
Université Paris-Saclay
Espace Technologique / Immeuble Discovery
Route de l’Orme aux Merisiers RD 128 / 91190 Saint
Titre : Conception et fabrication d'outils microfluidiques réutilisables pour étudier la dynamique de
phénomènes biologiques: application à l'influx / efflux d'antibiotiques dans les bactéries et à la
migration des cellules pendant le développement de la souris
Mots clés : microfluidique, imagerie de fluorescence, multirésistance, embryologie, microfabrication
Nous voulons mettre en évidence et analyser la réponse de systèmes biologiques à l’introduction de perturbations spatio
temporelles. Plus précisément, afin de développer des stratégies innovantes pour l’étude des systèmes biologiques, nous
proposons d’utiliser des outils microfluidiques. Nous concevons des microsystèmes adaptés qui permettent influer
localement sur les comportements biologiques, ceci afin
l’environnement externe d’objects biologiques dont l’échelle est microscopique.
Cette stratégie d’ingénierie est générique et multidisciplinaire. Au cours de cette thèse, elle a été mise en œuvre dans
cadre de deux projets collaboratifs, d’une part à l’échelle de la bactérie E. coli, et d’autre part à celle de l’embryon de s
à un stade post-implantation précoce. Les objets d’étude choisis sont caractéristiques à bien des égards des champs
biologiques concernés : taille, représentativité, complexité. Nous avons mis nos compétences de spécialistes en conception
et en fabrication de dispositifs fluidiques au service de la ligne DISCO du synchrotron SOLEIL et de l’équipe d’embryologie d
la souris de l’IRIBHM. Le nœud de mon travail a été de concevoir et fabriquer des outils microfluidiques recyclable peuvent
être utilisés de façon simple dans des laboratoires de biologie générique ne possédant pas de salle blanche. Au cours de
cette thèse, nous avons développé non seulement des microdispositifs réutilisables mais aussi des protocoles expérimentaux
adaptés à l’utilisation de ces instruments miniaturisés.
Plus précisément, le projet de microbiologie à SOLEIL avait pour object l’étude de l’influx et l
antibiotiques dans des bactéries. Pour ce faire, nous avons developpé un dispositif réutilisable pour immobiliser les
microorganismes et changer leur environnement chimique pendant l’imagerie en microscopie d’épifluorescence dans l’UV.
Cette étude s’effectue en utilisant deux partenaires typiques : la bactérie E. coli et un médicament de la famille des
fluoroquinolones. Le projet d’embryologie a reposé sur l’électroporation localisée d’acides nucléiques des embryons de
souris et le suivi des migrations cellulaires.
Title: Conception and fabrication of reusable microfluidic tools to study the dynamics of biological
phenomena: application to antibiotic influx/efflux in bacteria and to cell migration during mouse
development
Key words: microfluidics, fluorescence microscopy, multidrug resistance, embryology,
microfabrication
We want to analyze the response of biological systems to the introduction of spatio
specifically, in order to develop innovative strateg
tools. We design dedicated microsystems that can locally influence biological behaviors, so that a macroscopic experimenter
can control the external environment of biological objects w
This engineering strategy is generic and multidisciplinary. In this thesis, it has been implemented in two collaborative
projects, on one hand, at the scale of the
early stage post-implantation. These objects are selected since they are, in many aspects, characteristic of the concerned
biological fields: size, representativeness, complexity. We provided our expertise in fluidic device design and manufac
to the DISCO beamline of the SOLEIL synchrotron and to the IRIBHM mouse embryology team. The key point of my work has
been to produce recyclable microfluidic tools that can be used simply in generic biological laboratories that do not possess
clean room. In this thesis, we have developed not only reusable microdevices but also experimental protocols adapted to the
use of these miniaturized instruments.
More precisely, the microbiology project at SOLEIL focused on the influx and the efflux of antibi
We have developed a reusable device for immobilizing those microorganisms and changing their chemical environment
during UV imaging on an epifluorescence microscopy. This study was carried out using two typical partners: the
bacterium and a drug from the fluoroquinolone family. The embryology project relied on the localized electroporation of
nucleic acids into mouse embryos and the monitoring of cell migrations.
Espace Technologique / Immeuble Discovery
Route de l’Orme aux Merisiers RD 128 / 91190 Saint-Aubin, France
: Conception et fabrication d'outils microfluidiques réutilisables pour étudier la dynamique de
phénomènes biologiques: application à l'influx / efflux d'antibiotiques dans les bactéries et à la
migration des cellules pendant le développement de la souris
: microfluidique, imagerie de fluorescence, multirésistance, embryologie, microfabrication
Nous voulons mettre en évidence et analyser la réponse de systèmes biologiques à l’introduction de perturbations spatio
fin de développer des stratégies innovantes pour l’étude des systèmes biologiques, nous
proposons d’utiliser des outils microfluidiques. Nous concevons des microsystèmes adaptés qui permettent influer
localement sur les comportements biologiques, ceci afin qu’un experimentateur macroscopique puisse contrôler
l’environnement externe d’objects biologiques dont l’échelle est microscopique.
Cette stratégie d’ingénierie est générique et multidisciplinaire. Au cours de cette thèse, elle a été mise en œuvre dans
cadre de deux projets collaboratifs, d’une part à l’échelle de la bactérie E. coli, et d’autre part à celle de l’embryon de s
implantation précoce. Les objets d’étude choisis sont caractéristiques à bien des égards des champs
giques concernés : taille, représentativité, complexité. Nous avons mis nos compétences de spécialistes en conception
et en fabrication de dispositifs fluidiques au service de la ligne DISCO du synchrotron SOLEIL et de l’équipe d’embryologie d
e l’IRIBHM. Le nœud de mon travail a été de concevoir et fabriquer des outils microfluidiques recyclable peuvent
être utilisés de façon simple dans des laboratoires de biologie générique ne possédant pas de salle blanche. Au cours de
ns développé non seulement des microdispositifs réutilisables mais aussi des protocoles expérimentaux
adaptés à l’utilisation de ces instruments miniaturisés.
Plus précisément, le projet de microbiologie à SOLEIL avait pour object l’étude de l’influx et l
antibiotiques dans des bactéries. Pour ce faire, nous avons developpé un dispositif réutilisable pour immobiliser les
microorganismes et changer leur environnement chimique pendant l’imagerie en microscopie d’épifluorescence dans l’UV.
Cette étude s’effectue en utilisant deux partenaires typiques : la bactérie E. coli et un médicament de la famille des
fluoroquinolones. Le projet d’embryologie a reposé sur l’électroporation localisée d’acides nucléiques des embryons de
i des migrations cellulaires.
Conception and fabrication of reusable microfluidic tools to study the dynamics of biological
phenomena: application to antibiotic influx/efflux in bacteria and to cell migration during mouse
microfluidics, fluorescence microscopy, multidrug resistance, embryology,
We want to analyze the response of biological systems to the introduction of spatio-temporal modulations. More
specifically, in order to develop innovative strategies for the study of biological systems, we propose to use microfluidic
tools. We design dedicated microsystems that can locally influence biological behaviors, so that a macroscopic experimenter
can control the external environment of biological objects which scale is microscopic.
This engineering strategy is generic and multidisciplinary. In this thesis, it has been implemented in two collaborative
projects, on one hand, at the scale of the E.coli bacterium and on the other hand at the scale of the mouse
implantation. These objects are selected since they are, in many aspects, characteristic of the concerned
biological fields: size, representativeness, complexity. We provided our expertise in fluidic device design and manufac
to the DISCO beamline of the SOLEIL synchrotron and to the IRIBHM mouse embryology team. The key point of my work has
been to produce recyclable microfluidic tools that can be used simply in generic biological laboratories that do not possess
room. In this thesis, we have developed not only reusable microdevices but also experimental protocols adapted to the
More precisely, the microbiology project at SOLEIL focused on the influx and the efflux of antibiotic molecules in bacteria.
We have developed a reusable device for immobilizing those microorganisms and changing their chemical environment
during UV imaging on an epifluorescence microscopy. This study was carried out using two typical partners: the
bacterium and a drug from the fluoroquinolone family. The embryology project relied on the localized electroporation of
nucleic acids into mouse embryos and the monitoring of cell migrations.
: Conception et fabrication d'outils microfluidiques réutilisables pour étudier la dynamique de
phénomènes biologiques: application à l'influx / efflux d'antibiotiques dans les bactéries et à la
: microfluidique, imagerie de fluorescence, multirésistance, embryologie, microfabrication
Nous voulons mettre en évidence et analyser la réponse de systèmes biologiques à l’introduction de perturbations spatio-
fin de développer des stratégies innovantes pour l’étude des systèmes biologiques, nous
proposons d’utiliser des outils microfluidiques. Nous concevons des microsystèmes adaptés qui permettent influer
qu’un experimentateur macroscopique puisse contrôler
Cette stratégie d’ingénierie est générique et multidisciplinaire. Au cours de cette thèse, elle a été mise en œuvre dans le
cadre de deux projets collaboratifs, d’une part à l’échelle de la bactérie E. coli, et d’autre part à celle de l’embryon de souris
implantation précoce. Les objets d’étude choisis sont caractéristiques à bien des égards des champs
giques concernés : taille, représentativité, complexité. Nous avons mis nos compétences de spécialistes en conception
et en fabrication de dispositifs fluidiques au service de la ligne DISCO du synchrotron SOLEIL et de l’équipe d’embryologie de
e l’IRIBHM. Le nœud de mon travail a été de concevoir et fabriquer des outils microfluidiques recyclable peuvent
être utilisés de façon simple dans des laboratoires de biologie générique ne possédant pas de salle blanche. Au cours de
ns développé non seulement des microdispositifs réutilisables mais aussi des protocoles expérimentaux
Plus précisément, le projet de microbiologie à SOLEIL avait pour object l’étude de l’influx et l’efflux de molécules
antibiotiques dans des bactéries. Pour ce faire, nous avons developpé un dispositif réutilisable pour immobiliser les
microorganismes et changer leur environnement chimique pendant l’imagerie en microscopie d’épifluorescence dans l’UV.
Cette étude s’effectue en utilisant deux partenaires typiques : la bactérie E. coli et un médicament de la famille des
fluoroquinolones. Le projet d’embryologie a reposé sur l’électroporation localisée d’acides nucléiques des embryons de
Conception and fabrication of reusable microfluidic tools to study the dynamics of biological
phenomena: application to antibiotic influx/efflux in bacteria and to cell migration during mouse
microfluidics, fluorescence microscopy, multidrug resistance, embryology,
temporal modulations. More
ies for the study of biological systems, we propose to use microfluidic
tools. We design dedicated microsystems that can locally influence biological behaviors, so that a macroscopic experimenter
This engineering strategy is generic and multidisciplinary. In this thesis, it has been implemented in two collaborative
bacterium and on the other hand at the scale of the mouse embryo at an
implantation. These objects are selected since they are, in many aspects, characteristic of the concerned
biological fields: size, representativeness, complexity. We provided our expertise in fluidic device design and manufacturing
to the DISCO beamline of the SOLEIL synchrotron and to the IRIBHM mouse embryology team. The key point of my work has
been to produce recyclable microfluidic tools that can be used simply in generic biological laboratories that do not possess
room. In this thesis, we have developed not only reusable microdevices but also experimental protocols adapted to the
otic molecules in bacteria.
We have developed a reusable device for immobilizing those microorganisms and changing their chemical environment
during UV imaging on an epifluorescence microscopy. This study was carried out using two typical partners: the E. coli
bacterium and a drug from the fluoroquinolone family. The embryology project relied on the localized electroporation of