DOCTORAT DE L'UNIVERSITE DE TOULOUSE
430
Université Fédérale Toulouse Midi-Pyrenees En vue de l’obtention du DOCTORAT DE L’UNIVERSITE DE TOULOUSE IMT - Ecole Nationale Supérieure des Mines d’AIbi-Carmaux Cotutelle internationale avec INCQS/FIOCRUZ, Brésil Présentée et soutenue par: Janine BONIATTI Ie 30 juin 2021 Titre: Développement et caractérisation de dispersions solides amorphes de Praziquantel à usage pédiatrique par extrusion à chaud et impression 3D Ecole doctorale et discipline ou spécialité : ED MEGEP : Génie des procédés et de l’Environnement Unité de recherche : Centre RAPSODEE, UMR CNRS 5302, IMT Mines Albi Directeurs de Thése : Maria-Inês RÉ, Directrice de Recherche, IMT Mines Albi Fabio Coelho AMENDOEIRA, Professeur, INCQS/FIOCRUZ Jose Carlos Costa da Silva PINTO, Professeur, UFRJ/Brésil, Rapporteur Eric BEYSSAC, Professeur, Université Clermont Auvergne /France, Rapporteur Ana Cristina Martins de Almeida NOGUEIRA, Professeure, INCQS/FIOCRUZ, Examinatrice Gabriel Lima Barros de ARAUJO, Professeur, USP/Brésil, Examinateur Délivré par:
-
Upload
khangminh22 -
Category
Documents
-
view
0 -
download
0
Transcript of DOCTORAT DE L'UNIVERSITE DE TOULOUSE

Université Fédérale
Toulouse Midi-Pyrenees
En vue de l’obtention du
DOCTORAT DE L’UNIVERSITE DE TOULOUSE
IMT - Ecole Nationale Supérieure des Mines d’AIbi-Carmaux
Cotutelle internationale avec INCQS/FIOCRUZ, Brésil
Présentée et soutenue par:
Janine BONIATTI
Ie 30 juin 2021
Titre:
Développement et caractérisation de dispersions solides amorphes de Praziquantel à usage pédiatrique par extrusion à
chaud et impression 3D
Ecole doctorale et discipline ou spécialité :
ED MEGEP : Génie des procédés et de l’Environnement
Unité de recherche :
Centre RAPSODEE, UMR CNRS 5302, IMT Mines Albi
Directeurs de Thése :
Maria-Inês RÉ, Directrice de Recherche, IMT Mines Albi
Fabio Coelho AMENDOEIRA, Professeur, INCQS/FIOCRUZ
Jose Carlos Costa da Silva PINTO, Professeur, UFRJ/Brésil, Rapporteur
Eric BEYSSAC, Professeur, Université Clermont Auvergne /France, Rapporteur
Ana Cristina Martins de Almeida NOGUEIRA, Professeure, INCQS/FIOCRUZ, Examinatrice
Gabriel Lima Barros de ARAUJO, Professeur, USP/Brésil, Examinateur
Délivré par:

POS GRADUATION PROGRAM IN SANITARY SURVEILLANCE
NATIONAL INSTITUTE FOR HEALTH QUALITY CONTROL
OSWALDO CRUZ FOUNDATION
&
UNIVERSITÉ FÉDÉRALE TOULOUSE MIDI-PYRÉNÉES
ÉCOLE DOCTORALE MÉCANIQUE, ENERGÉTIQUE, GÉNIE CIVIL & PROCÉDÉS
IMT MINES ALBI – ÉCOLE NATIONALE SUPÉRIEURE DES MINES D’ALBI-
CARMAUX
Janine Boniatti
DEVELOPMENT AND CHARACTERIZATION OF PRAZIQUANTEL
AMORPHOUS SOLID DISPERSIONS FOR PAEDIATRIC USE BY HOT MELT
EXTRUSION AND 3D PRINTING
Supervisor in Brazil: Prof. Fábio Coelho Amendoeira
Supervisor in France: Prof. Maria Inês Ré
Rio de Janeiro
2021

JANINE BONIATTI
DEVELOPMENT AND CHARACTERIZATION OF PRAZIQUANTEL AMORPHOUS SOLID
DISPERSIONS FOR PAEDIATRIC USE BY HOT MELT EXTRUSION AND 3D PRINTING
Thesis in international joint supervision submitted in partial
fulfilment of the requirements for the degree of Doctor in
Sciences (National Institute for Quality Control in Health
(INCQS)/Oswaldo Cruz Foundation-FIOCRUZ, Brazil)
and degree of Doctor in Environment and Process
Engineering (IMT MINES ALBI – ÉCOLE NATIONALE
SUPÉRIEURE DES MINES D’ALBI-CARMAUX,
Federal University of Toulouse, France).
Supervisor in Brazil: Prof. Fábio Coelho Amendoeira
Co-Supervisor in Brazil: Laís Bastos da Fonseca
Alessandra Lifsitch Viçosa
Supervisor in France: Prof. Maria Inês Ré
Co-Supervisor in France: Ass. Prof. Martial Sauceau
Rio de Janeiro
2021

Janine Boniatti
DEVELOPMENT AND CHARACTERIZATION OF PRAZIQUANTEL AMORPHOUS SOLID
DISPERSIONS FOR PAEDIATRIC USE BY HOT MELT EXTRUSION AND 3D PRINTING
Thesis in international joint supervision submitted in partial
fulfilment of the requirements for the degree of Doctor in
Sciences (National Institute for Quality Control in Health
(INCQS)/Oswaldo Cruz Foundation (FIOCRUZ), Brazil)
and degree of Environment and Process Engineering (IMT
MINES ALBI – ÉCOLE NATIONALE SUPÉRIEURE
DES MINES D’ALBI-CARMAUX, Federal University of
Toulouse, France).
Approved: _____/_____/_____
EXAMINATION BOARD
Ana Cristina Martins de Almeida Nogueira/INCQS - Fiocruz
José Carlos Costa da Silva Pinto/UFRJ
Eric Beyssac/UCA
Fábio Coelho Amendoeira/INCQS – Fiocruz (Brazil)
Maria Inês-Ré/IMT Mines Albi (France)

With all my love, to my daughter Helena,
companion of every adventure in this journey.

ACKNOWLEDGEMENTS
I am extremely happy to write these thanks. It is gratifying to get here, and many people
are co-responsible for this, which makes it even more challenging to mention so much in so
little space. Here is what I consider to be one of my “results”: nobody achieves anything alone.
I wanted to start by thanking Katia Miriam Peixoto, she was one of the first people who
encouraged, and supported me. Thank you for the conversations and the friendship.
Thanks to the LEES team (Ana, Lucas, Andreça, Sabrina, and Marcos) for being so
supportive and loyal, and for replacing me as a great team when I needed to leave. To Rafael
Seiceira, my eternal gratitude for the partnership, friendship, teachings and for making happy
even the worst days, when challenges seemed insurmountable.
The LabFE team (Ana, Thiago, Deise, Augusto, Italo, Tamires, Marcia and Caroline),
thank you for your help with the experiments and for understanding my absence during the
period in France.
I thank the direction of Farmanguinhos, Jorge Mendonça and Nubia Boechat, for
agreeing with my period abroad and for authorizing my departure to France.
I am grateful to the graduate program of INCQS and Katia Leandro for helping me in
the whole process so that this joint thesis was possible.
To my advisor Fabio Amendoeira for the moments of teaching, conversation, support
and encouragement.
Thank you, Alessandra Viçosa, for your co-tutorship, friendship, and all the efforts
made so that I could complete the stage of my Ph.D. in France. I will always be grateful to you,
as you always believed that it would be possible.
Many thanks to my co-advisor, Lais Bastos da Fonseca. I have no words to describe the
role she played in this process. Thank you, Lais, for being the first person to welcome me as a
student and believe in me ever since. With you, I learned beyond the technician, and you are a
model of professionalism and person to me.
Thanks to my advisor Maria Ines for having me in Albi and for allowing me to have
wonderful life experiences. I appreciate your patience, encouragement, guidance, teachings,
and the precious time you dedicated to me. Thanks for the intense learning, the opportunities,
and especially for the support in all "scientific adventures" (be it a new test, or a stay in London
for 3D printing). I am so grateful also for the friendship we developed and for the affection you
have for my family.

To my co-advisors Martial Sauceau and Romain Sescousse for the moments of teaching,
conversation and support.
I thank Clélia Christina Mello-Silva and Érica Tex Paulino for all the exchange of
experience and for their help with pharmacokinetic experiments.
I am very grateful to Leticia Vallim and the entire LabSEFAR team for their help with
animals and pharmacokinetic experiments.
I thank the entire IMT Mines Albi team (Christine Rolland, Laurent Devriendt, Rachel
Calvet, Phillipe Accart, Véronique Nallet, Séverine Patry, Céline Boachon, Manolita Boval,
Dolores Liret, Noemie, Thèrese, and Fabienne Espitalier) for welcoming me and always being
willing to teach.
J'aimerais également remercier Sylvie Deconfeto pour son aide, sa gentillesse,
disponibilité, ainsi que son amabilité avec moi e ma familie.
Thanks to the Gala Platform team (Antoine, Laurene, Katia, Marine, and Angelique),
with whom I had the honor and privilege to spend a good part of my days producing more than
30 HME batches and countless pleasant moments. “Un grand merci”!
To Alvaro Goyanes for accepting my ideas and making an effort to have me at FabRx
in the middle of a pandemic. Thank you so much for the many conversations, discussions, and
your help with all the 3D printing experiments.
I thank Professor Catherine Tuleu for having kindly received me at UCL - School of
Pharmacy. Thank you for the teachings, the warm welcome, and the discussions we had.
I am grateful to the friends I built along this journey, especially to Magno, Sibele, Akhil,
Maria Theresa, Marine, Bahaa, Felipe, Roger, Barath, Hayfa, Carla, Jennifer. I will always
remember our exchange of experiences and our laid-back funny moments.
An enormous thank you to Suenia de Paiva Lacerda, who, from the first day in Albi, has
spared no effort to help and encourage me. My eternal gratitude to you for all that was this
period and for the great friendship built. I am sure that I have won a friendship for life! I extend
my gratitude to Rafaelle for all the moments shared.
To Anne Marie Fontes and Eric for her kindness and all the wonderful moments we
shared. J’exprime tous mes remerciements et mon affection à vous.
To Jean-Paul for the kindness with us since day 1 in French lands. Thank you for
receiving my family so lovingly and for all the help during this period. Je vous remercie et
j'espère que nous pourrons nous rencontrer bientôt !
To my brother Vinícius for the constant encouragement and the help with the figures
and projects. Te amo!

To Cassia for being tireless and always willing to help me. Te amo!
My deepest and most sincere thanks to my parents Altair and Jaquelina. Thank you for
giving up on your dreams so that I could fulfill mine. Thank you for being Helena's mom and
dad when I was gone. Obrigada, amo vocês infinitamente!
Lovely thanks to my husband for his love, affection, patience and, mainly, for facing all
the adventures of this life in a joyful way, even when the challenges arose. Love you!
Finally, I thank my greatest encourager, my greatest love, Helena. Thank you, my
daughter, for being by my side on this walk. It is true that with you, the challenge was bigger,
but it was also immensely more joyful, fun, and pleasurable. Please forgive me for the moments
when I was absent for the realization of this thesis. I love you with all my heart.
Cette thèse a été faite avec beaucoup de dévouement et d'amour. Mais si cela aide et
encourage tous ces gens, ce ne serait certainement pas possible. Mes plus sincères
remerciements!

If you’re going to try, go all the
way.
Otherwise, don’t even start.
If you’re going to try, go all the
way.
This could mean losing girlfriends,
wives, relatives, jobs and
maybe your mind.
Go all the way.
it could mean not eating for 3 or 4 days.
It could mean freezing on a
park bench.
It could mean jail,
it could mean derision,
mockery,
isolation.
Isolation is the gift,
all the others are a test of your
endurance, of
how much you really want to
do it.
And you’ll do it
despite rejection and the worst odds
and it will be better than
anything else
you can imagine.
If you’re going to try,
go all the way.
There is no other feeling like
that.
You will be alone with the gods
and the nights will flame with
fire.
Roll the dice - Charles Bukowski

ABSTRACT
Janine Boniatti. Development and characterization of praziquantel amorphous solid dispersions for paediatric use
by hot melt extrusion and 3d printing. Rio de Janeiro, 2021. Thesis (Doctor in Sciences), National Institute for
Quality Control in Health (INCQS)/Oswaldo Cruz Foundation (FIOCRUZ), Brazil; (Doctor in Process
Engineering and Environment), IMT Mines Albi, University of Toulouse, France, 2021.
For the past 40 years, praziquantel (PZQ) has been the standard treatment for schistosomiasis,
the neglected parasitic disease that affects more than 250 million people worldwide. However,
there is no adequate paediatric formulation on the market, leading to off-label use and the
division of commercial tablets for adults. This thesis focused on the development of a PZQ
formulation based on solid amorphous dispersion (ASD) to solve physicochemical (low water
solubility) and sensory (bitter taste) of PZQ active pharmaceutical ingredient (API)
disadvantages. ASD with 35 to 50 w/w% API (binary and ternary systems) were produced by
hot-melt extrusion (HME) using vinylpyrrolidone-vinyl acetate copolymer (Kollidon® VA 64)
as a polymeric carrier. The binary systems consisted of PZQ and Kollidon® VA 64. To
rationally develop ASD highly loaded with PZQ, the first study of this thesis focused on the
construction of a PZQ- Kollidon® VA 64 phase diagram, constructed from a thermal study of
the recrystallization of a supersaturated ASD (50 % PZQ), generated by spray drying. The
ternary systems were formulated with a surfactant as an additional component (5 w/w%), using
two different types (Span ™ 20 and Kolliphor® SLS). Several techniques were used to
characterize the produced ASD (PZQ content, thermal properties, particle morphology,
apparent solubility, dissolution profile, and physical stability). All binary and ternary ASD
increased the PZQ apparent solubility, more specifically, 70 % to 90 % more than the
equilibrium concentration in water at 37°C. The dissolution kinetics was also improved, for
example, 90 % of drug release in one hour for the ternary ASD containing SPAN 20 as a
surfactant and 35 wt% of API. The second challenge is to mask the bitter taste of PZQ. Taste
masking assessments (in vivo and in vitro) and pharmacokinetics studies were performed with
selected formulations. Positive results related to masking the bitter taste for both PZQ load (50
and 35 wt%) could be demonstrated. The third challenge for paediatric PZQ is the need of
accurate dose adjustment. As an alternative to overcome the challenge of adjusting the doses of
a paediatric medicine based on PZQ for children, the use of 3D printing technology (FDM) with
direct feeding of powdered amorphous solid dispersions was proposed. We could demonstrate
the feasibility of obtaining printlets with two different doses of PZQ (100 and 150 mg) using
ternary ASD. The printlets containing 35 wt% of API load and SPAN 20 showed the best
dissolution performance. This work demonstrated the interest of ternary ASD containing PZQ
in the form of pellets or powder for compressed 3D printing. The main obstacles in the
formulation of PZQ, such as low drug solubility, inappropriate taste, and high and variable
dosage requirements, can be overcome using the combination of different technologies
(production of ASD by HME and FDM as SD printing technology).
Key words: amorphous solid dispersions, hot-melt extrusion, solubility enhancement, phase
diagram, praziquantel, direct powder extrusion 3D printing, printing pharmaceuticals,
paediatric treatment.

RÉSUMÉ
Janine Boniatti. Développement et caractérisation de dispersions solides amorphes de Praziquantel à usage
pédiatrique par extrusion à chaud et impression 3D. Rio de Janeiro, 2021. Thèse (Doctorat Sciences), Institut
National de Contrôle de Qualité en Santé (INCQS)/Fondation Osvaldo Cruz (FIOCRUZ), Brésil ; (Doctorat en
Génie des Procédés et de l'Environnement), IMT Mines Albi, Université de Toulouse, France, 2021.
Depuis 40 ans, le praziquantel (PZQ) est le traitement standard de la schistosomiase, une
maladie parasitaire négligée qui touche plus de 250 millions de personnes dans le monde.
Cependant, il n'existe pas de formulation pédiatrique adéquate sur le marché, ce qui conduit à
une utilisation hors indication et à la division des comprimés commerciaux pour les adultes.
Cette thèse s’articule autour du développement d'une dispersion amorphe solide (ASD) pour le
PZQ afin d’améliorer certaines caractéristiques physico-chimiques (faible solubilité dans l'eau)
et sensoriels (goût amer) de cet API. Des ASD contenant 35 à 50 % en masse d'API (systèmes
binaires et ternaires) ont été produites par extrusion à chaud (HME) en utilisant un copolymère
vinylpyrrolidone-acétate de vinyle (Kollidon® VA 64) comme support polymère. Les systèmes
binaires sont constitués de PZQ et de Kollidon® VA 64. Afin de développer rationnellement
des ASD hautement chargées en PZQ, la première étude de cette thèse porte sur la construction
d'un diagramme de phase PZQ- Kollidon® VA 64, construit à partir d'une étude thermique de
la recristallisation d'une ASD sursaturé (50 % PZQ), générée par séchage par pulvérisation. Les
systèmes ternaires ont été formulés avec un tensioactif comme composant supplémentaire (5 %
en masse), en utilisant deux types différents (Span ™ 20 et Kolliphor® SLS). Plusieurs
techniques ont été utilisées pour caractériser les ASD produites (teneur en PZQ, propriétés
thermiques, morphologie des particules, solubilité apparente, profil de dissolution et stabilité
physique). Les ASD binaires et ternaires augmentent la solubilité apparente de la PZQ, plus
précisément de 70 % à 90 % par rapport à la concentration d'équilibre dans l'eau à 37 °C. La
cinétique de dissolution a également été améliorée, par exemple, 90 % de libération du
médicament en une heure pour l’ASD ternaire contenant du SPAN 20 comme surfactant et 35
% en masse d'API. Le deuxième défi consiste à masquer le goût amer du PZQ. Des évaluations
du masquage du goût (in vivo et in vitro) et des études pharmacocinétiques ont été réalisées
avec des formulations sélectionnées. Des résultats positifs liés au masquage du goût amer pour
les deux charges de PZQ (50 et 35 % en masse) ont pu être démontrés. Le troisième défi pour
le PZQ à usage pédiatrique est le besoin d'un ajustement précis de la dose. Comme alternative
pour surmonter le défi de l'ajustement des doses d'un médicament pédiatrique à base de PZQ
pour les enfants, l'utilisation de la technologie d'impression 3D (FDM) avec alimentation directe
de dispersions solides amorphes en poudre a été proposée. Nous avons pu démontrer la
faisabilité d'obtenir des imprimés (printlets) avec deux doses différentes de PZQ (100 et 150
mg) en utilisant la technologie de FDM. Les printlets avec 35 % en masse de PZQ et SPAN 20
ont montré la meilleure performance de dissolution. Ce travail a démontré l'intérêt d’une
dispersion solide amorphe ternaire contenant du PZQ sous forme de pellets ou de poudre pour
l'impression 3D directe (FDM). Les principaux obstacles à la formulation du PZQ, tels qu'une
faible solubilité du médicament, un goût inapproprié et des exigences de dosage élevées et
variables, peuvent être surmontés en utilisant la combinaison de différents technologies
(production d'ASD par HME et FDM comme technologie d'impression 3D).
Mots clés : dispersions solides amorphes, extrusion à chaud, amélioration de la solubilité,
diagramme de phase, praziquantel, impression 3D par extrusion directe de poudre, impression
de produits pharmaceutiques, traitement pédiatrique.

RESUMO
Janine Boniatti. Desenvolvimento e caracterização de dispersões sólidas amorfas de praziquantel para uso
pediátrico por hot melt extrusion e impressão 3D. Rio de Janeiro, 2021. Tese (Doutorado em Ciências), Instituto
Nacional de Controle de Qualidade em Saúde (NCQS)/Fundação Osvaldo Cruz (FIOCRUZ), Brasil; (Doutorado
em Engenharia de Processo e Meio Ambiente), IMT Mines Albi, Universidade de Toulouse, France, 2021.
Nos últimos 40 anos, o praziquantel (PZQ) tem sido o tratamento padrão para a
esquistossomose, uma doença parasitária negligenciada que afeta mais de 250 milhões de
pessoas em todo o mundo. No entanto, não existe uma formulação pediátrica adequada no
mercado, levando ao uso off-label e à divisão de comprimidos comerciais para adultos. Esta
tese se concentrou no desenvolvimento de uma formulação de PZQ baseada em dispersão sólida
amorfa (ASD) para resolver as desvantagens físico-químicas (baixa solubilidade em água) e
sensoriais (sabor amargo) do PZQ – insumo farmacêutico ativo (IFA). ASD com 35 a 50 % p/p
de IFA (sistemas binários e ternários) foram produzidos por extrusão de fusão a quente (HME)
usando o copolímero de vinilpirrolidona-acetato de vinila (Kollidon® VA 64) como um
carreador polimérico. Os sistemas binários consistiram em PZQ e Kollidon® VA 64. Para
desenvolver racionalmente ASD com altas cargas de PZQ, o primeiro estudo desta tese focou
na construção de um diagrama de fases PZQ- Kollidon® VA 64, obtido a partir de um estudo
térmico de recristalização de uma ASD supersaturada (50 % PZQ), gerado por spray drying.
Os sistemas ternários foram formulados com um surfactante como componente adicional (5 %
p/p) e, utilizou-se dois tipos diferentes (Span ™ 20 e Kolliphor® SLS). Diversas técnicas foram
empregadas para caracterizar a ASD produzida (teor de PZQ, propriedades térmicas,
morfologia das partículas, solubilidade aparente, perfil de dissolução e estabilidade física).
Todas as ASD binárias e ternárias aumentaram a solubilidade aparente do PZQ, mais
especificamente, 70 % a 90 % a mais do que a concentração de equilíbrio em água a 37 °C. A
cinética de dissolução também foi melhorada, por exemplo, 90 % da liberação do IFA em uma
hora para a ASD ternária contendo SPAN 20 como surfactante e 35 % em peso do IFA. O
segundo desafio é mascarar o sabor amargo do PZQ. Avaliações de mascaramento de sabor (in
vivo e in vitro) e estudos farmacocinéticos foram realizados com formulações selecionadas.
Resultados positivos relacionados ao mascaramento do sabor amargo para ambas as cargas de
PZQ (50 e 35 % em peso) puderam ser demonstradas. O terceiro desafio para o PZQ pediátrico
é a necessidade de um ajuste preciso da dose. Como alternativa para superar a barreira do ajuste
de doses de um medicamento pediátrico a base de PZQ para crianças, foi proposta a utilização
da tecnologia de impressão 3D (FDM) com alimentação direta dispersões sólidas amorfas em
pó. Pudemos demonstrar a viabilidade de obter printlets (comprimidos obtidos por impressão
3D) com duas doses diferentes de PZQ (100 e 150 mg) usando ASD ternária. Os printlets
contendo 35 % em peso do IFA e SPAN 20 apresentaram o melhor desempenho de dissolução.
Este trabalho demonstrou o interesse de ASD ternária na forma de pellets ou pó para impressão
3D de comprimidos contendo PZQ. Os principais obstáculos para formulação do PZQ, como
baixa solubilidade do fármaco, sabor inadequado e requisitos de dosagem alta e variável,
puderam ser superados usando a combinação de diferentes tecnologias (produção de ASD por
HME e FDM como tecnologia de impressão SD).
Palavras-chave: dispersões sólidas amorfas, extrusao à quente, incremento de solubilidade,
diagrama de fase, praziquantel, impressão 3D por alimentão extrusão direta de pó, impressão
farmacêutica, tratamento pediátrico.

LIST OF EQUATIONS
Equation 1 ................................................................................................................................. 96
Equation 2 ................................................................................................................................. 96
Equation 3 ............................................................................................................................... 104
Equation 4 ............................................................................................................................... 105
Equation 5 ............................................................................................................................... 177
Equation 6 ............................................................................................................................... 246
Equation 7 ............................................................................................................................... 246
Equation 8 ............................................................................................................................... 246
Equation 9 ............................................................................................................................... 263

LIST OF TABLES
Table 1. Summary of physicochemical characteristics of Praziquantel. .................................. 58
Table 2. Summary of the main diffraction peaks on powder diffractograms for different PZQ
solid forms. ............................................................................................................................... 61
Table 3. Literature reporting improved solubility and/or dissolution obtained through different
PZQ formulation approaches. ................................................................................................... 78
Tabela 4. Pharmaceutical features of crystalline and amorphous compounds. Source: Author
and adapted from [249]............................................................................................................. 90
Table 5. Summary of the surfactants generally used in amorphous solid dispersions [217]–
[220]. ........................................................................................................................................ 94
Table 6. Currently marketed HME products. Source: Author and adapted from [225], [267].
................................................................................................................................................ 115
Table 7. Summary of the polymers generally used in HME. Source: Author and adapted from
[184], [199], [225], [268]........................................................................................................ 118
Table 8. Main materials used in this thesis to produce binary and ternary ASD systems. ..... 128
Table 9. Acceptance criteria for PZQ related compounds [53]. ............................................. 130
Table 10. Composition of the different media used to evaluate the PZQ solubility. ............. 134
Table 11. Stability study conditions. ...................................................................................... 136
Table 12. PZQ dosage and organic impurities determined by HPLC measurements. ........... 137
Table 13. Mass variation from TG analysis for pure compounds. ......................................... 138
Table 14. PZQ fusion enthalpy (ΔHfusion) and fusion temperature (T onset and T peak) under
different storage conditions. ................................................................................................... 140
Table 15. Summary of the results obtained to validate the process for the PZQ PSD method by
laser light diffraction. ............................................................................................................. 149
Table 16. PSD of pure PZQ used in this thesis ...................................................................... 149
Table 17. Raw PZQ solubility in different aqueous media at 37 °C ± 0.5 ºC. ....................... 151
Table 18. Raw PZQ water solubility at 37 °C ± 0.5 ºC. ......................................................... 151

Table 19. Composition, process parameters to produce PZQ spray-dried powders and effective
drug content. ........................................................................................................................... 158
Table 20. PZQ content in the samples produced by spray drying. ......................................... 161
Table 21. Glass transitions of SD samples obtained by reverse heat flow signal during the DSC
analysis. .................................................................................................................................. 163
Table 22. PZQ water solubility (37 °C) for SD samples, in comparison to physical mixtures of
corresponding compositions and raw API. ............................................................................. 171
Table 23. mDSC methods used to determine the experimental glass transitions of each physical
mixture (Tgmix) and the API-polymer solubility curve by recrystallization ......................... 179
Table 24. Experimental glass transitions of physical mixtures (API:Polymer). .................... 180
Table 25. Calculated equilibrium concentrations ( WPA) from PZQ recrystallisation in spray-
dried SD 50 % PZQ. ............................................................................................................... 182
Table 26.Screw elements used in this study. .......................................................................... 194
Table 27. Temperature and screw profile for screening tests with PZQ and PVPVA (1:1). . 194
Table 28. Process operating conditions to produce PZQ: PVPVA systems. .......................... 197
Table 29. Summary of HME process conditions, thermal properties, and visual aspect for all
HME extrudates generated from a binary PZQ: PVPVA 1:1. ................................................ 206
Table 30. Summary of selected HME parameters. ................................................................. 207
Table 31. Summary of results obtained for the selected HME parameters. ........................... 207
Table 32. Solubility data (water at 37 °C) for all HME samples ........................................... 208
Table 33. Composition used for manufacturing ternary system by HME. ............................. 217
Table 34. Extrusion process parameters. ................................................................................ 218
Table 35. Identification test of PZQ. ...................................................................................... 223
Table 36. PZQ content (extrudate samples and physical mixtures). ...................................... 224
Table 37 Impurities of FEXT 1 and 2 samples. ...................................................................... 224
Table 38. Loss mass by drying method (50 ºC). .................................................................... 225
Table 39. Mass moisture variation after different storage conditions. ................................... 226
Table 40. Water solubility of FEXT 1 and 2. ......................................................................... 239
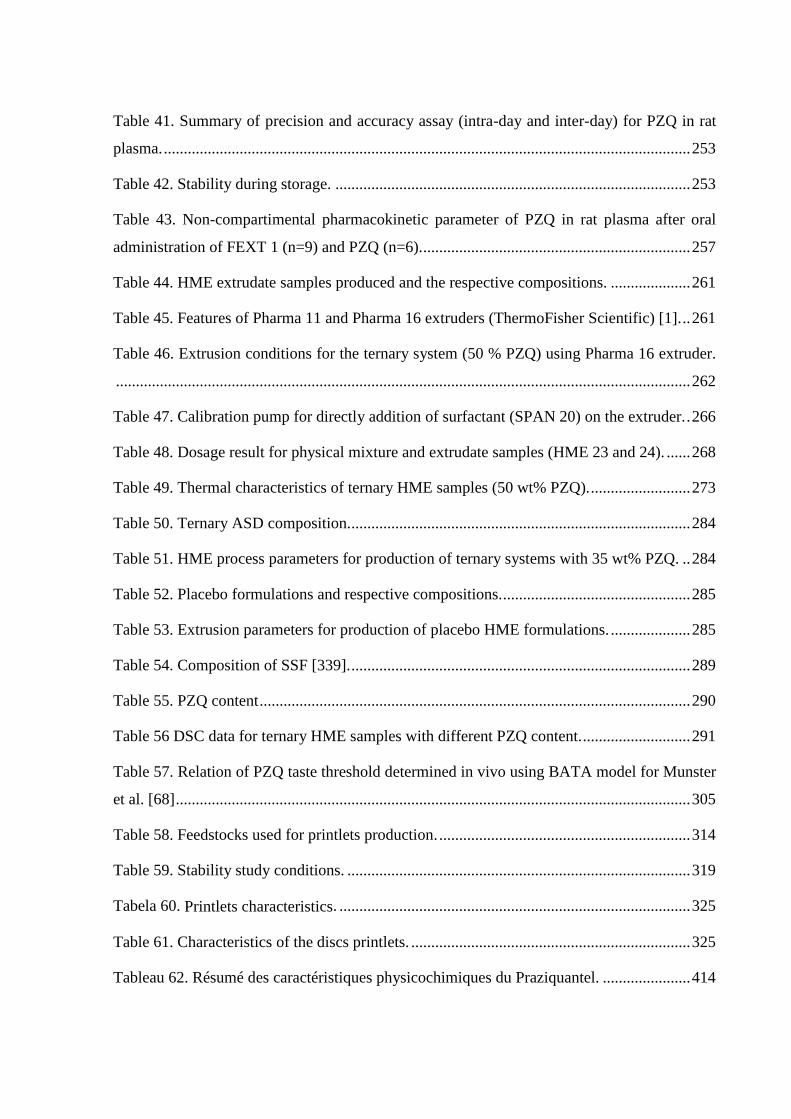
Table 41. Summary of precision and accuracy assay (intra-day and inter-day) for PZQ in rat
plasma. .................................................................................................................................... 253
Table 42. Stability during storage. ......................................................................................... 253
Table 43. Non-compartimental pharmacokinetic parameter of PZQ in rat plasma after oral
administration of FEXT 1 (n=9) and PZQ (n=6). ................................................................... 257
Table 44. HME extrudate samples produced and the respective compositions. .................... 261
Table 45. Features of Pharma 11 and Pharma 16 extruders (ThermoFisher Scientific) [1]. .. 261
Table 46. Extrusion conditions for the ternary system (50 % PZQ) using Pharma 16 extruder.
................................................................................................................................................ 262
Table 47. Calibration pump for directly addition of surfactant (SPAN 20) on the extruder. . 266
Table 48. Dosage result for physical mixture and extrudate samples (HME 23 and 24). ...... 268
Table 49. Thermal characteristics of ternary HME samples (50 wt% PZQ). ......................... 273
Table 50. Ternary ASD composition. ..................................................................................... 284
Table 51. HME process parameters for production of ternary systems with 35 wt% PZQ. .. 284
Table 52. Placebo formulations and respective compositions. ............................................... 285
Table 53. Extrusion parameters for production of placebo HME formulations. .................... 285
Table 54. Composition of SSF [339]. ..................................................................................... 289
Table 55. PZQ content ............................................................................................................ 290
Table 56 DSC data for ternary HME samples with different PZQ content. ........................... 291
Table 57. Relation of PZQ taste threshold determined in vivo using BATA model for Munster
et al. [68] ................................................................................................................................. 305
Table 58. Feedstocks used for printlets production. ............................................................... 314
Table 59. Stability study conditions. ...................................................................................... 319
Tabela 60. Printlets characteristics. ........................................................................................ 325
Table 61. Characteristics of the discs printlets. ...................................................................... 325
Tableau 62. Résumé des caractéristiques physicochimiques du Praziquantel. ...................... 414

LIST OF FIGURES
Figure 1. Schematic representation of this thesis. .................................................................... 46
Figure 2. Biological cycle of S. mansoni. Source: author. ....................................................... 49
Figure 3. International reference drug (Biltricide®) produced by the German company Bayer
Healthcare Pharmaceutics – praziquantel 600 mg dose. Source: [4] (with permission). ......... 55
Figure 4. a) Primary package e; b) Tablet produced by Farmanguinhos/FIOCRUZ –
Praziquantel, 600 mg dose. Source: Author. ............................................................................ 56
Figure 5. Chemical structure of praziquantel a) (R,S)-praziquantel (racemic), b) (S)-
praziquantel and, c) (R)-praziquantel (Reuse from [5] with permission)................................. 58
Figure 6. Unit cell of crystal structure of anhydrous PZQ a) commercial racemic compound
(TELCEU) and b) praziquantel form B (TELCEU01) (Reuse from [10], [33] CCDC 896767
and 1557658 ). ......................................................................................................................... 59
Figure 7. Crystal structure of the hemihydrate of (R)-Praziquantel (SIGBUG01) (Reuse from
CCSD 710418 [42]. .................................................................................................................. 59
Figure 8. Praziquantel patterns XRPD. a) racemic form - TELCEU [33], b) form B TELCEU01
[30] and, the enantiomer form C – SIBUG and, SIBUG01 [42], [71] (Reuse from CCSD
710418, 896767 and 1557658 ). .............................................................................................. 60
Figure 9. Similarity of the three PZQ polymorphic forms by FT-IR spectra (Reuse from [73]
with permission). ...................................................................................................................... 62
Figure 10. The Biopharmaceutical Classification System (BCS) (Source: Author). ............... 63
Figure 11. Process of taste perception in the mouth (Source: Author)..................................... 68
Figure 12. Dose-response curve for BATA model. Source: Author. ....................................... 71
Figure 13. Stages of growth. Source: Author. .......................................................................... 74
Figure 14. Schematic representation of 3D printing using the FDM technique with filament
feed. Source: Author. ................................................................................................................ 76
Figure 15. Representation of the chemical structure and the molecular shape of α, β, and γ
cyclodextrins. Source: from [91] (with permission). ................................................................ 82
Figure 16. Schematic depiction of the variation of enthalpy (or volume) as a function of
temperature for crystalline, amorphous (glassy). Source: Author and adapted from [78]. ...... 91

Figure 17. Representation of the "spring" and "parachute" model: high supersaturation (stable
form of the API) achieved by the amorphous phase (the spring), while desupersaturation is
retarded (the parachute) by the action of recrystallisation inhibitors. Adapted from [196]. .... 92
Figure 18. Amorphous API versus ASD in terms of activation energy barrier. Adapted from
[186], [207]. Diagram is not scale. ........................................................................................... 93
Figure 19. Plot of enthalpy, entropy, or free volume in function of temperature for molecular
substances. Adapted from [192], [231]. ................................................................................... 95
Figure 20. Diagram showing the change in equilibrium concentrations as a function of
temperature (in pink) and the change in glass transition temperatures of the mixture (in purple).
The intersection of these two curves delimits zones of stability I, II, III and IV. .................. 100
Figure 21. Schematic time and process evolution of the glass transition temperature of an
API/polymer mixture when reaching its equilibrium solubility upon annealing. Adapted from
[246]. ...................................................................................................................................... 102
Figure 22. Schematic representation of kinetic solubility for amorphous and crystalline
materials. Adapted from [184]. .............................................................................................. 103
Figure 23. Schematic demonstration of solubility, dissolution, and oral absorption. The drug
must be in solution to be absorbed. Dissolution will drive the initial solubilization of the API,
and solubility in the gastrointestinal media will drive potential precipitation events. At the same
time, there is intrinsic permeability of the compound and absorption. Source: adapted from
[251]. ...................................................................................................................................... 104
Figure 24. Illustration of the disruption of the crystal lattice by mechanical activation. Source:
Author. .................................................................................................................................... 107
Figure 25. Illustration of the formation of an amorphous solid dispersion by spray drying.
Source: Author. ....................................................................................................................... 109
Figure 26. Schematic representation of a hot melt extrusion process. Source: Author based on
[184], [188]. ............................................................................................................................ 110
Figure 27. Representation of HME process. Source: Author. ................................................ 112
Figure 28. Input and dependent variables in the HME process. ............................................. 112
Figure 29. Publications present in the Scopus® database with search using the terms: hot melt
extrusion and hot melt extrusion & APIs from 2000 to 2020. ............................................... 113

Figure 30. Graphic structure of chapter 4 (Source: Author)................................................... 124
Figure 31 a) Schematic representation of a stub; b) a top view representation of a stub with the
presence of the carbon-coated double-sided tape; c) representation of the top view of a stub
with the sample already added to the tape surface; d) (imaginary) stub for the purpose of
representative images from different parts of the stub. Source: Author. ................................ 132
Figure 32. Experimental apparatus for PZQ solubility studies at 37°C ± 0.5°C. Source: Author.
................................................................................................................................................ 135
Figure 33. a) Petri dish and paper - recipient to put samples on stability; b) sample ready to
climatic chamber for the stability study. Source: Author. ...................................................... 136
Figure 34. DSC curves of pure compounds: PZQ, PVPVA and SLS. ................................... 139
Figure 35. DSC curves of PZQ under different conditions of stability study. ....................... 139
Figure 36. Diffractogram pattern of the pure compounds (PZQ, PVPVA, and SLS) and
indication of the characteristic diffraction angles for racemic PZQ. ...................................... 141
Figure 37. PXRD diffractogram obtained for the PZQ exposed to different environment
conditions (RT, LT, and AS) for 30 days. .............................................................................. 142
Figure 38. PXRD diffractograms for SLS samples exposed to different environment conditions
(RT, LT, and AS) for 30 days. ................................................................................................ 142
Figure 39. XRD diffractograms for PVPVA samples exposed to room conditions RT for 30
days. ........................................................................................................................................ 143
Figure 40. SEM images of the raw PZQ particles. ................................................................. 144
Figure 41. SEM images of raw PVPVA particles. ................................................................. 144
Figure 42. SEM images of raw SLS particles. ....................................................................... 145
Figure 43. Stereomicroscopy images of PVPVA: a) RT t0; b) RT t15; c) RT t30; d) LT t15; e)
AS t15; f) LT t30; AS t30. ...................................................................................................... 146
Figure 44. Stereomicroscopy images of SLS: a) RT t0; b) RT t15; c) RT t30; d) LT t15; e) AS
t15; f) LT t30; AS t30. ............................................................................................................ 147
Figure 45. Stereomicroscopy images of PZQ: a) RT t0; b) RT t15; c) RT t30; d) LT t15; e) AS
t15; f) LT t30; AS t30. ............................................................................................................ 148
Figure 46. Cumulative and incremental PSD curve of PZQ. ................................................. 150

Figure 47. PZQ in vitro dissolution profile in acidic medium added (or not) of 0.2 wt% SLS.
................................................................................................................................................ 153
Figure 48. Spray drying used for samples production. a) Buchi B-290 mini spray dryer; b) liquid
feed; ........................................................................................................................................ 158
Figure 49. PXRD diffractograms for raw materials (PZQ and PVPVA) and spray-dried samples
(SD 1, SD 2, SD 3, and SD 4). ............................................................................................... 162
Figure 50. DSC curve for samples with 50 wt% PZQ (n = 3) generated at different drying
temperatures: a) 80 °C, and b) 110 °C. .................................................................................. 164
Figure 51 DSC curve for samples with 70 wt% PZQ (n = 3) generated at different drying
temperatures: a) 80 °C, and b) 110 °C. .................................................................................. 165
Figure 52. Magnification of DSC curves for SD 2 and SD 4 samples showing the endothermic
events. ..................................................................................................................................... 166
Figure 53. a) DSC curves and, b) TG curves of pure components - PZQ and PVPVA. ........ 167
Figure 54. SEM images of raw materials and physical mixtures: a) PZQ; b) PVPVA; c) PM 50;
d) PM 70.8 .............................................................................................................................. 168
Figure 55. SEM images of SD samples: a) SD 1 with magnification 7000x; b) SD 2 with
magnification 5000x; c) SD 3 with magnification 1200x and, d) SD 4 with magnification 1200x.
................................................................................................................................................ 169
Figure 56. Solubility in water at 37 °C of raw praziquantel, physical mixtures (PM 50 and PM
70) and SD 1, SD 2, SD 3, and SD 4. Data are presented as the mean ± standard deviation (n=3).
................................................................................................................................................ 172
Figure 57. Monitoring the glass transition (Tg) of spray-dried binary systems (SD 1, SD 2, SD
3, and SD 4) at different times. ............................................................................................... 173
Figure 58. DSC thermograms for SD samples after 3 months of production (25 °C and 60
%RH). ..................................................................................................................................... 174
Figure 59. XRPD diffractograms for SD 1, SD 2, SD 3 and SD 4 after 3 months of production,
stored at 25 °C and 60 % RH. ................................................................................................. 175
Figure 60. Recrystallization method by DSC where Run 1 - supersaturation heating (reveals the
𝑇𝑔𝑚𝑖𝑥 𝟏 of supersaturation system), Run 2 - isotherm, Run 3 - cooling and, Run 4 - saturation
heating (reveals the 𝑇𝑔𝑚𝑖𝑥 𝟐 of saturation system). ............................................................. 178

Figure 61. The Gordon Taylor equation adjusted from measured Tgmix ................................ 181
Figure 62. Composition-temperature phase diagram for the binary PZQ-PVPVA ................ 183
Figure 63. General view of the structure of chapter 5. ........................................................... 189
Figure 64. Schematic representation of extruder with 8-shaped cross-section heating zones.
Source: Author. ....................................................................................................................... 191
Figure 65. General view of the extruder (Thermo-Fisher pharma 16) and complementary
equipment. Source: Author. .................................................................................................... 192
Figure 66. a) General screw view with element reverse, b) conveying element, c) Mixing area
with kneading elements following the conveying element reverse and d) different angles with
the kneading elements. Source: Author. ................................................................................. 193
Figure 67. Turbula® T2F mixer (Willy A. Bachofen AG Switzerland). Source: [312] with
permission. .............................................................................................................................. 195
Figure 68. a) Gravimetric feeder; b) extruder feed hopper and, c) top view - mixing input into
the extruder. Source: Author. ................................................................................................. 196
Figure 69. Air cooling conveyor belt (ThermoFisher Scientific). ......................................... 196
Figure 70. Pelletizer (ThermoFisher Scientific). .................................................................... 197
Figure 71. a) Capsules containing amorphous solid dispersions (pellets form) being inserted in
the sinker and b) capsule inserted in the sinker, ready for addition to the dissolution vessel.
................................................................................................................................................ 198
Figure 72. Opaque extrudate after interrupted feeding; b) extrudate after die temperature
increase (change on visual aspect to semi-opaque) ................................................................ 199
Figure 73. SEM images. a); b) physical mixture PZQ: PVPVA; c) and d) HME 1; e) and f)
HME 2; g) and h) HME 3; i) and j) HME 4; l) HME 5; m) HME 6 and n) HME 7. ............. 201
Figure 74. PXRD for samples produced for screening process parameters (arrow shows the
very small signal diffraction for HME 1 and HME3 samples). ............................................. 203
Figure 75. DSC curves. a) samples with amorphous characteristic; b) samples with crystalline
diffraction peaks ..................................................................................................................... 204
Figure 76. PZQ concentration measured in water (37 °C) from HME extrudates of PZQ and
PVPVA (50%PZQ). Time points :1, 24 and 48h. .................................................................. 209

Figure 77 Dissolution profile for HME 10 and HME 11 samples. ........................................ 211
Figure 78. Extrusion system using Pharma 11 extruder. ........................................................ 216
Figure 79. Conical mill (Quadro® Comil® U3 0125) with the respective sieve size used. .. 219
Figure 80. Slow addition of the surfactant SPAN 20 during granulation of PZQ by an ethanolic
solution of PVPVA in a fluidized bed. ................................................................................... 220
Figure 81. Fluidized bed (Bosh®) for drying the FEXT 1 formulation after granulation. .... 221
Figure 82. Schematic division of the characterizations carried out in this chapter according to
the samples produced.............................................................................................................. 222
Figure 83. DSC curves for FEXT 1 under different storage conditions. ................................ 227
Figure 84. DSC curves for FEXT 2 under different storage conditions. ................................ 228
Figure 85. PXRD of the physical mixture corresponding to the composition of FEXT 1. .... 229
Figure 86. PXRD for FEXT 1, freshly produced and during stability monitoring. ............... 230
Figure 87. PXRD pattern of FEXT 1 placebo. ...................................................................... 230
Figure 88. PXRD for FEXT 2 physical mixture. .................................................................... 231
Figure 89. PXRD pattern for FEXT 2, freshly produced and under stability monitoring ...... 231
Figure 90. PXRD for placebo FEXT 2. .................................................................................. 232
Figure 91. SEM images of FEXT 1 extrudate. a) RT; b) RT t15; c) RT t30, and d) LT t15; e)
and f) AS t15. ......................................................................................................................... 233
Figure 92. SEM imagen of FEXT 2 extrudate. a) RT; b) RT t15; c) RT t30, and d) LT t15; e)
and f) AS t15. ......................................................................................................................... 234
Figure 93. Comparison between solid dispersion obtained in this study by HME (PZQ: PVPVA
- 1: 1) and solid dispersion obtained by solvent evaporation [14]. a) particle surface after RT
t30- PZQ: PVPVA by HME and, b and c) PZQ: PVP (3: 1) - solvent evaporation (ethanol).
Source: reprinted from [65] with permission. ........................................................................ 235
Figure 94. SEM imagens of Placebo FEXT 1. ....................................................................... 236
Figure 95. SEM imagens of Placebo FEXT 2. ....................................................................... 236
Figure 96. Images obtained by stereomicroscopy for extrudate FEXT 1. a) RT; b) RT t15; c)
RT t30, and d) LT t15; e) and f) AS t15. ................................................................................ 237

Figure 97. FEXT 1 milled. a) after extrusion. a) RT; b) RT t15; c) RT t30, and d) LT t15; e) and
f) AS t15. ................................................................................................................................ 237
Figure 98. Images obtained by stereomicroscopy for extrudate FEXT 2. a) after extrusion; b)
15 days at RT; c) 30 days at RT; d) 15 days at 30ºC/75%RU; e) 15 days at 40ºC/75%RU. . 238
Figure 99. FEXT 2 milled. a) after extrusion; b) 15 days at RT; c) 30 days at RT; d) 15 days at
30ºC/75%RU and 15 days at 40ºC/75%RU. .......................................................................... 238
Figure 100. Dissolution profile for extrudate samples, FEXT 1 and FEXT 2. ...................... 240
Figure 101. Schematic setup for in vitro taste experiment. An array of five sensing units were
modified with (PEI/NiTsPc) 5, (PANI/PSS) 5, (PEI/PEDOT:PSS)5, (PEI/PPY) 5, and
(Chit/PSS) 5 films. .................................................................................................................. 242
Figure 102. Representation of a rat exposed with a recirculation system. ............................. 243
Figure 103. Representation of keeping animals in a bioterium during the acclimatization period.
................................................................................................................................................ 244
Figure 104. Animal groups for the study of pharmacokinetics. ............................................. 245
Figure 105. Gaving and taking plasma samples for the pharmacokinetics study................... 247
Figure 106. IDMAP plot for FEXT 1, 2, commercial PZQ tablet and their respective placebos
(n=3). ...................................................................................................................................... 250
Figure 107. In vivo palatability test. (A) ANOVA (single factor 95%) for the samples. ...... 251
Figure 108. Observation of rat’s behaviour. a and b) drinking with neutral mouth movements
(similar behaviour for water, placebos and FEXT 2); c and d) after taste FEXT 1 and
commercial PZQ solutions, the rat tries to get it out of his mouth - oral grooming/paw wipe and
retreating during the entire exposure time. ............................................................................. 252
Figure 109. Comparative profile of mean plasma concentrations of PZQ as a function of time
for each preparation administered (arithmetic mean + standard deviation). After removing the
outlier animals. ....................................................................................................................... 256
Figure 110. Schematic representation of the batches produced and presented in this sub-chapter.
................................................................................................................................................ 260
Figure 111. a) Cryomilling equipment; b) sample holder loaded; c) open equipment ready for
insertion of the sample holder and d) sample holder after cryomilling in a specific accessory to
perform the opening. Source: Author. .................................................................................... 264

Figure 112. General view of production process described in this chapter. ........................... 265
Figure 113. Addition of the liquid surfactant directly in the extruder after the first mixing zone.
a) Adhesion of the powder to the surfactant drop; b) Formation of an ‘agglomerate’ that begins
to be lost and, c) large amount of product lost after a few minutes of extrusion. .................. 267
Figure 114. Schematic view of the point to addition the liquid surfactant (after the second
mixing zone). .......................................................................................................................... 267
Figure 115. Surfactant addition zone (after the second mixing zone). a) without orifice reduction
accessory and, b) with accessory - entry restricted to the surfactant drop. ............................ 268
Figure 116. SEM images of HME ternary extrudate filaments shaped as pellets. a) HME 14, b)
HME 23, c) HME 16, and d) HME 24 samples. .................................................................... 269
Figure 117. SEM images of HME ternary extrudate filaments shaped as pellets and then
cryomilled. a - c) HME 23; d- f) HME 24 samples. ............................................................... 270
Figure 118. SEM image of PZQ form B. Reuse from [30] with permission.......................... 271
Figure 119. DSC curves of HME ternary extrudates and their respective physical mixtures. a)
samples containing SPAN 20 surfactant (HME 14 and HME 23), and b) samples containing
SLS surfactant (HME 16 and HME 24). ................................................................................ 272
Figure 120. PXRD diffractograms. a) raw materials (PZQ, SLS, and PVPVA), binary and
ternary physical mixture (PZQ: PVPVA and PZQ: PVPVA: SLS), and extrudate HME 23 and
HME 24 (PZQ:SPAN 20:PVPVA and PZQ:SLS:PVPVA) cryomilled. ................................ 275
Figure 121. Variation of the PZQ concentration in water at 37°C from different samples: HME
23 and HME 24 pellets, its respective physical mixture and raw PZQ. ................................. 276
Figure 122. Comparison between binary (HME 10) and ternary systems (HME 23, HME 24).
Raw PZQ is the reference. ...................................................................................................... 277
Figure 123. Optical microscopy for HME 23 (before mill) a) part of an extrudate and pellets,
and b) pellets. Both microphotographs have a scale that refers to 2 mm. .............................. 278
Figure 124. Dissolution curves for all HME ternary systems (HME23 and HME 24), as pellets
and powder (cryomilled). Experiments conducted in 37 ºC ± 0.5 ºC and HCl 0.1N with 0.2% of
SLS in the medium. ................................................................................................................ 279
Figure 125. Visual aspects of HME 23 and HME 24 residual after dissolution test. ............. 279
Figure 126. Schematic procedure of chapter 5.4. Source: Author. ........................................ 283

Figure 127. a) General view of Quadro® Comill with HE High energy Mill, b) material feed,
c) feed screw, d) grinder, e, and f) different view of particle grinding, and g) collector. Source:
Author and from [349]. ........................................................................................................... 286
Figure 128. Schematic view of the process to obtain pellet shape and powder for the samples
produced in this step. Source: Author. ................................................................................... 287
Figure 129. Flow diagram representing the biorelevant buccal dissolution test to evaluate taste
masking. (*calculated internal volume of the column). Source: Author. ............................... 289
Figure 130. DSC curves for pellets a) HME 25 and HME 27 (with SPAN 20), and for milled
powders b) HME 26 and HME 28 (with SLS). ...................................................................... 291
Figure 131. PXRD diffractograms for a) HME 25 and HME 27 (with SPAN 20) and the
corresponding placebos, and b) HME 26 and HME 28 (with SLS), and corresponding physical
mixture and placebo. Crystalline raw materials as given as references. ................................ 293
Figure 132. SEM images obtained for pellets: HME 25 (a-c) and HME 26 (d-f). ................. 294
Figure 133. SEM images obtained for powders: HME 27 (a-c) and HME 28 (d-f). .............. 295
Figure 134. Optical microscopy images for HME 27 (a-b) and HME 28 (c-d). Scale: 2 mm (b
and d) and 0.5 mm (a and c). .................................................................................................. 296
Figure 135. Optical microphotography showing the color difference between the two HME
ternary studied (left side HME 28/26 (with SLS) and right side HME 25/27 (with SPAN). Scale
0.5 mm. ................................................................................................................................... 297
Figure 136. Optical microscopy images for a) HME 2, and b) and HME 28 milled. Scale: 2 mm.
................................................................................................................................................ 297
Figure 137. Photomicrographs for HME placebo samples. a and c) unmilled, HME SPAN 20
and HME SLS, respectively and, b and d) milled HME SPAN 20 and HME SLS, respectively.
All images refer to a 2 mm scale. ........................................................................................... 298
Figure 138. Optical microphotography showing the color difference between the two HME
placebo (left and yellow – HME 28 and right and transparent HME 27). Scale 2 mm.......... 298
Figure 139. PZQ Concentration in water at 37°C released from different pellets: a) HME 27
and b) HME 28 Raw PZQ is the reference. ............................................................................ 299
Figure 140. Comparative dynamic solubility study, grouping HME ternary samples developed
in chapters 5.3 and 5.4. For 30 min: HME 27 (0.328 mg/mL), HME 28 (0.305 mg/mL), and

API (0.185 mg/mL and 0.174 mg/mL). For 60 min: HME 23 (0.325 mg/mL), HME 24 (0.315
mg/mL, and API (0.190 mg/mL and 0.180 mg/mL). ............................................................. 300
Figure 141. DSC scan for the remaining solid in suspension after the water solubility
experiment (37°C) for sample HME 27. ................................................................................ 301
Figure 142. Dissolution profile for sample HME 27 (powder and pellets) on a) pharmacopeial
medium (with SLS 0.2%) and b) without SLS in the medium. For both the medium was HCl
0.1N at 37 ºC ± 1ºC. ............................................................................................................... 303
Figure 143. Dissolution profile for sample HME 28 (powder and pellet) on a) pharmacopeial
medium (with SLS 0.2%) and b) without SLS in the medium. For both the medium was HCl
0.1N at 37 ºC ± 1ºC. ............................................................................................................... 304
Figure 144. PZQ release as a function of both type of shape (powder and pellet) for extrudate
samples a) HME 27 and b) HME 28. The taste thresholds are represented as black and pink
dashed lines. ........................................................................................................................... 306
Figure 145. Residual sample of HME pellet and HME powder after in vitro buccal dissolution
taste to predict palatability. ..................................................................................................... 307
Figure 146. PZQ release as a function of both API load for extrudate samples a) HME 27 and
HME 23 (Sub-chapter 5.3), and b) HME 28 and HME 24 (Sub-chapter 5.3). The taste thresholds
are represented as black and pink dashed lines. ..................................................................... 308
Figure 147. Printlets production as part of this thesis. Source: Author .................................. 313
Figure 148. Design of the single-screw powder extruder FabRX 3D printer used in this thesis.
................................................................................................................................................ 316
Figure 149. Schematic representation of the printlet samples used for DSC analysis. .......... 318
Figure 150. Flasks used for packaging printlets during the stability study. ........................... 320
Figure 151. Flasks used for packaging printed discs during the stability study. .................... 320
Figure 152. Aspect of the PZQ printlets obtained by directly feeding the physical mixture of
praziquantel and PVPVA (1: 1) into the hopper of the 3D printer extruder. ......................... 321
Figure 153. Top and bottom image of printlets obtained with: a - b) PM 50, c - d) M 35 Span,
e – f) M ASD 35 SLS, g- h) M Placebo Span and, i – j) M Placebo SLS. ........................... 323
Figure 154. SEM images of printlets: a – c) obtained with M 35 Span and, d – f) obtained with
M 35 SLS. ............................................................................................................................... 324

Figure 155. Visual aspect of disc, on left printlet M 35 Span and right side printlet M 35 SLS.
................................................................................................................................................ 326
Figure 156. DSC thermograms for P 50 and M 50 printlets, performed in two different parts of
each unit (core and bord). ....................................................................................................... 327
Figure 157. DSC thermograms for M 35 Span and M 35 SLS powdered materials (before print)
and their respective printlets performed with freshly samples and after 3 months at 25 °C/60 %
RH. .......................................................................................................................................... 328
Figure 158. XRD diffractograms for raw materials (PZQ, KOL and SLS), ASDs (M 50, M 35
SLS and M 35 Span) and their respective 3D disc. ................................................................ 329
Figure 159. Raman mapping for raw materials (PZQ, KOL and SLS) and printlets (M 50, M 35
Span and M Placebo Span). .................................................................................................... 330
Figure 160. Raman mapping 3D for: a) M 50 printlet with area 10x10 microns, and b) M 35
Span printlet with area 15x15 microns. .................................................................................. 331
Figure 161. In vitro dissolution profile of PZQ (raw material) and printlets (M 50, M 35 Span
and M 35 SLS) using HCl 0.1N medium with 0.2 % w/w of SLS at 37°C............................ 332
Figure 162. a) PZQ release (mean ± SD) for M 35 Span and M 35 SLS materials (before print)
and their respective printlets and, b) detail of the 3D printed formulations. The taste thresholds
are represented as pink and purple dotted line. ...................................................................... 334

ABBREVIATIONS
3D Three-Dimensional
AC Compressed Air
ANVISA Agência Nacional de Vigilância Sanitária
API Active Pharmaceutical Ingredient
ASD Amorphous Solid Dispersion
ATR-FTIR Attenuated Total Reflectance with Fourier Transform Infrared
AUC Area Under The Curve
BATA Brief-Access Taste
BCS Biopharmaceutical Classification System
C-1816 Sucrose stearate
CCDC Cambridge Crystallographic Data Centre
CD Cyclodextrins
Cequilibrium Equilibrium concentration
CEUA Animal Use Ethics Committee
CG-MS Gas Chromatography–Mass Spectrometry
Chit chitosan
CK Couchman-Karasz
Cmax Maximum concentration
CROSP Crospovidone
CV Coefficient of Variation
DoE Design of Experiments
DPE Direct Powder Extruder
DSC Differential Scanning Calorimetry
EFZ Efavirenz
EMA European Medicines Agency
Eudragit® Polymethacrylate-based copolymers
EVA Ethylene Vinyl Acetate
F-127 Poloxamer
FDA Food And Drug Administration
FDM Fused Deposition Modeling
FIOCRUZ Fundação Oswaldo Cruz
FT-IR Fourier Transform Infrared
GIT Gastrointestinal Tract
GMS Glyceryl monostearate
GT Gordon-Taylor
HF Heat Flow
HME Hot Melt Extrusion
HPC Hydroxypropylcellulose
HPH High-pressure homogenization
HPLC High Performance Liquid Chromatography
HPMC Hydroxypropyl methylcellulose
HPMCAS Hydroxypropyl Methylcellulose Acetate Succinate
ICH International Council for Harmonisation

IDPMA Interactive Document Mapping plot
INM Indomethacin
IOC Oswaldo Cruz Institute
ISO International Organization for Standardization
IUPAC Pure and Applied Chemistry Union
LDH Layered Double Hydroxide
LN Liquid Nitrogen
MC Methyl Cellulose
mDSC Modulated Differential Scanning Calorimetry
MDX Maltodextrin
MeCD Methyl--cyclodextrin
MMCS Make Medicines Child Size
MS/MG Ministério Da Saúde/Minas Gerais
MW Molecular Weight
NiTsPc tetrasulphonated nickel (II) phthalocyanine
NMR Nuclear Magnetic Resonance
NMT Not more than
P 188 Ploxamer 188
PAM Pressure-Assisted Microsyringe
PANI poly(aniline)
PCE Schistosomiasis Control Program
PDCO Paediatric Committee
PECE Programa Especial de Controle da Esquistossomose
PEDOT:PSS poly(3,4-ethylene dioxythiophene): poly(styrene sulfonate)
PEG Polietilenoglicol
PHB poly (3-hydroxybutyrate)
PEI poly(ethyleneimine)
PICU Paediatric Intensive Care Unit
PIPs Paediatric Investigation Plans
PLGA Poly(Lactic-Co-Glycolic Acid)
PM Physical Mixture
PMMA Polymethacrylates
PPy poly(pyrrole)
PSD Particle Size Distribution
PSPs Paediatric Study Plans
PSS poly(styrene sulfonate)
PTFE Polytetrafluoroethylene
PVA Polyvinyl Alcohol
PVP Polyvinylpyrrolidone
PVPVA Polyvinylpyrrolidone/Vinyl Acetate
PXRD Powder X-Ray Diffraction
PZQ Praziquantel
PZQ Praziquantel
RAC-PZQ Racemic praziquantel
RBM Rebamipide

RDC Resolução da Diretoria Colegiada
RENAME Relação Nacional De Medicamentos Essenciais
Rebamipide RBM
RH Relative Humidity
RT Room Temperature
SANAR Programa de Enfrentamento às Doenças Negligenciadas do Estado de
Pernambuco
SD Standard Deviation
SEM Scanning Electron Microscope
SGF Simulated Gastric Fluid
SI Sink index
SLN Solid Lipid Nanoparticles
SLS Sodium Lauril Sulfate
SPAN 20 Span™ 20
SSE Semi-Solid Extrusion
SSF Simulated Salivar Fluid
SSG Sodium Starch Glycolate
SUS Sistema Único De Saúde (Brazilian National Health Service)
Tg Glass transition
TGA Thermogravimetric Analysis
Tgmix Glass transition of mixture
Tm Melting Temperature
Tmax Maximum Time
Tonset Onset Temperature
Tpeak Peak Temperature
Trecrystallization Recristalization Temperature
UFF Universidade Federal Fluminense
UPLC-MS Ultraperformance Liquid Chromatography-Mass
USP United States Pharmacopeia
USP/IFSC Universidade de São Paulo/Instituto de Física de São Carlos
UV Ultraviolet
WHO World Health Organization

CONTENTS
CHAPTER 1 - GENERAL INTRODUCTION AND THESIS OBJECTIVES ........... - 38 -
1. GENERAL INTRODUCTION ....................................................................................... 39
2. THESIS OBJECTIVES ................................................................................................... 43
3. THESIS OUTLINE .......................................................................................................... 44
CHAPTER 2 - THEORICAL SECTION ............................................................................. 47
1. INTRODUCTION ........................................................................................................... 48
2. SCHISTOSSOMIASIS .................................................................................................... 48
1.1 Epidemiological evidence .................................................................................................................... 50
1.2 Treatment ............................................................................................................................................. 51
1.3 Health Policies ..................................................................................................................................... 52
3. PRAZIQUANTEL ........................................................................................................... 53
1.4 Mechanism of action ............................................................................................................................ 54
1.5 Pharmacokinetics of praziquantel ........................................................................................................ 54
1.6 Commercial medicines of praziquantel ................................................................................................ 55
1.7 Resistance to praziquantel .................................................................................................................... 57
1.8 Physical and chemical properties of Praziquantel ................................................................................ 57
4. PHARMACEUTICAL DEVELOPMENT WITH EMPHASIS ON PAEDIATRIC
MEDICINES ........................................................................................................................... 64
4.1 Acceptability ........................................................................................................................................ 66
4.2 Palatability ........................................................................................................................................... 67
4.2.1 Taste ............................................................................................................................................ 68
4.1.4.1 Taste assessment ..................................................................................................................... 69
4.1.4.1.1 In vivo test assessment ....................................................................................................... 70
4.2.1.1.1.1 Brief-access taste aversion (BATA) ............................................................................. 70
4.2.1.1.1.2 Aversion evaluation by volume consumed ................................................................... 71
4.1.4.1.2 In vitro test assessment ....................................................................................................... 71
4.2.1.1.1.3 Electronic taste sensors ................................................................................................ 72
4.2.1.1.1.4 In vitro dissolution and drug release for palatability evaluation .................................. 72
STRATEGIES IN THE DEVELOPMENT OF PAEDIATRIC FORMULATIONS 73
5.1 Traditional and emerging forms ........................................................................................................... 73
5.2 3D printed forms .................................................................................................................................. 75
6. PHARMACEUTICAL DEVELOPMENT WITH EMPHASIS ON PZQ MEDICINES
77

7. AMORPHOUS SOLID DISPERSIONS ........................................................................ 89
7.1 The amorphous state ............................................................................................................................ 89
7.1.1 Characteristics of amorphous solid dispersions........................................................................... 91
7.1.1.1 Parachute effect....................................................................................................................... 91
7.1.1.2 Physical stability ..................................................................................................................... 92
7.1.2 Evaluation of amorphous solid dispersion properties .................................................................. 94
7.1.2.1 Glass Transition ...................................................................................................................... 94
7.1.2.1.1 Additional factors influencing glass transition ................................................................... 97
7.1.2.1.1.1 Correlation of solid dispersion stability and Tg ........................................................... 98
7.1.2.2 Solubility of the API in the polymer matrix............................................................................ 99
7.1.2.3 Considerations about solubility and dissolution of amorphous solid dispersions ................. 102
7.2 Manufacturing processes of amorphous solid dispersions ................................................................. 106
7.2.1 Crystal lattice disruption ........................................................................................................... 106
7.2.2 Co-solubilisation and rapid solvent evaporation ....................................................................... 108
7.2.3 Melting processes ...................................................................................................................... 109
7.2.3.1 Hot melt extrusion ................................................................................................................ 110
7.2.3.1.1 Carriers for HME .............................................................................................................. 117
8. 3D PRINTING TECHNOLOGY FOR MEDICINES ................................................ 119
8.1 Brief approach on regulatory 3D printing aspects ............................................................................. 120
9. Chapter synthesis ........................................................................................................... 121
CHAPTER 3 - CHARACTERIZATION OF RAW MATERIALS ................................. 123
1. INTRODUCTION ......................................................................................................... 124
2. MATERIALS ................................................................................................................. 125
2.1 Active Pharmaceutical Ingredient (API) ............................................................................................ 125
2.2 Polymer .............................................................................................................................................. 125
2.3 Surfactants ......................................................................................................................................... 125
2.4 Solvents and reagents ......................................................................................................................... 126
2.5 Reference standard ............................................................................................................................. 126
2.6 Active materials ................................................................................................................................. 127
3. CHARACTERIZATION OF FORMULATIONS RAW MATERIALS .................. 129
3.1 Methods ............................................................................................................................................. 129
3.1.1 Dosage of PZQ and related compounds by High-Performance Liquid Chromatography (HPLC)
129
3.1.2 Thermogravimetric Analysis (TGA) ......................................................................................... 130
3.1.3 Differential Scanning Calorimetry (DSC) ................................................................................. 130
3.1.4 Powder X-Ray Diffraction (PXRD) .......................................................................................... 131
3.1.5 Scanning Electronic Microscopy (SEM) ................................................................................... 131
3.1.6 Particle Size Distribution by Laser Diffraction ......................................................................... 132

3.1.7 Stereomicroscopy ...................................................................................................................... 133
3.1.8 Solubility studies of raw PZQ ................................................................................................... 133
3.1.9 Dissolution Profile .................................................................................................................... 135
3.1.10 Stability studies ......................................................................................................................... 135
4. RESULTS ....................................................................................................................... 136
4.1 Dosage of PZQ and related compounds ............................................................................................. 136
4.2 Thermogravimetric Analysis (TGA) .................................................................................................. 137
4.3 Differential Scanning Calorimetry (DSC) ......................................................................................... 138
4.4 Powder X-Ray Diffraction (PXRD) ................................................................................................... 140
4.5 Scanning Electronic Microscopy (SEM) ........................................................................................... 143
4.6 Stereomicroscopy ............................................................................................................................... 145
4.7 Particle size distribution (PSD) by laser light diffraction .................................................................. 148
4.8 PZQ solubility in aqueous media ....................................................................................................... 150
4.9 Dissolution profile ............................................................................................................................. 152
5. CONCLUSIONS ............................................................................................................ 154
CHAPTER 4 - DETERMINATION OF PZQ SOLUBILITY IN PVPVA BY
RECRYSTALLIZATION FROM SUPERSATURATED SOLID SOLUTION ............ 155
1. INTRODUCTION ......................................................................................................... 156
PART 1 - GENERATION AND CHARACTERIZATION OF SUPERSATURATED PZQ
SOLUTIONS BY SPRAY DRYING ................................................................................... 157
1. METHODS ..................................................................................................................... 157
1.1. Generation of supersaturated PZQ solutions by spray drying .................................. 157
1.2 Characterization of supersaturated PZQ solutions ......................................................................................... 159
1.2.1 Determination of drug loading............................................................................................................ 159
1.2.2 Differential Scanning Calorimetry (DSC) .......................................................................................... 159
1.2.3 X-ray diffraction (PXRD) ................................................................................................................... 159
1.2.4 Scanning Electronic Microscopy (SEM) ............................................................................................ 160
1.2.5 Apparent solubility ............................................................................................................................. 160
1.2.6 Stability monitoring ............................................................................................................................ 160
2. RESULTS ....................................................................................................................... 161
2.1 Characterization of the spray-dried powders ................................................................................................. 161
2.1.1. Determination of effective composition .................................................................................... 161
2.1.2. Powder X-Ray Diffraction (PXRD) .......................................................................................... 161
2.1.3. Thermal analysis ....................................................................................................................... 162
2.1.4 Scattering Electronic Microscopy (SEM) ................................................................................. 167
2.1.5 PZQ Water Solubility ................................................................................................................ 170
2.1.6 Physical stability of the amorphous state .................................................................................. 172

PART 2 - DETERMINATION OF A TEMPERATURE-COMPOSITION PHASE
DIAGRAM FOR THE BINARY PZQ-PVPVA ................................................................ 176
1. METHODS ..................................................................................................................... 176
1.1 Temperature-composition PZQ: PVPVA phase diagram .................................................................. 176
2. RESULTS ....................................................................................................................... 179
2.1. API-polymer solubility determination by recrystallization ................................................................ 179
3. CONCLUSIONS ............................................................................................................ 184
CHAPTER 5 - BINARY AND TERNARY SYSTEMS of PRAZIQUANTEL
AMORPHOUS SOLID DISPERSIONS MANUFACTURED BY HOT MELT
EXTRUSION ........................................................................................................................ 186
1. INTRODUCTION ......................................................................................................... 187
SUB-CHAPTER 5.1 - PRAZIQUANTEL AMORPHOUS SOLID DISPERSIONS
MANUFACTURED BY HME - BINARY SYSTEM (50 wt% PZQ) PHARMA 16
EXTRUDER .......................................................................................................................... 190
1. INTRODUCTION ......................................................................................................... 191
2. METHODS ..................................................................................................................... 191
2.1 Binary ASD system prepared by HME (50 wt% PZQ)...................................................................... 191
2.2 Characterization of HME extrudates .................................................................................................. 198
2.2.1 Dissolution profile ..................................................................................................................... 198
3. RESULTS ....................................................................................................................... 198
3.1 Extruder configuration ....................................................................................................................... 198
3.2 Scattering Electronic Microscopy (SEM) .......................................................................................... 200
3.3 Powder X-ray diffraction (PXRD) ..................................................................................................... 202
3.4 Differential scanning calorimetry (DSC) ........................................................................................... 203
3.5 Water solubility .................................................................................................................................. 207
3.6 Dissolution Profile ............................................................................................................................. 210
4. CONCLUSIONS ............................................................................................................ 212
SUB-CHAPTER 5.2 - PRAZIQUANTEL AMORPHOUS SOLID DISPERSIONS
MANUFACTURED BY HME - TERNARY SYSTEM (40 and 50 wt% PZQ) - PHARMA
11 EXTRUDER ..................................................................................................................... 214
1. INTRODUCTION ......................................................................................................... 215

PART 1 - Generation and physicochemical characterization of the extrudate ternary
systems ................................................................................................................................... 216
1. METHODS ..................................................................................................................... 216
1.1 Ternary ASD system prepared by HME (40 and 50 wt% PZQ) ........................................................ 216
1.2 Preparation of the feeding material .................................................................................................... 219
1.3 Characterization of samples ............................................................................................................... 221
1.3.1 Determination of mass loss on drying ....................................................................................... 222
1.3.2 Determination of water - Titration by Karl Fischer ................................................................... 222
2. RESULTS ....................................................................................................................... 223
2.1 API content and organic impurities.................................................................................................... 223
2.2 Determination of mass loss on drying ................................................................................................ 225
2.3 Thermogravimetric analysis (TGA) ................................................................................................... 225
2.4 Differential scanning calorimetry (standard DSC) ............................................................................. 226
2.5 Powder X-Ray Diffraction (PXRD) ................................................................................................... 228
2.6 Scanning Electron Microscopy (SEM) .............................................................................................. 232
2.7 Stereomicroscopy ............................................................................................................................... 236
2.8 PZQ-HME solubility in aqueous media ............................................................................................. 238
2.9 Dissolution Profile ............................................................................................................................. 239
PART 2 - TASTE MASKING AND PHARMACOKINETICS STUDY ........................ 241
1. METHODS ........................................................................................................................ 241
1.1 In vitro taste masking test by electronic tongue (e-tongue) ............................................................... 241
1.2 In vivo taste masking by volume consumed ...................................................................................... 242
1.3 Pharmacokinetic study ....................................................................................................................... 244
1.3.1 Animals ..................................................................................................................................... 244
1.3.2 Design of pharmacokinetic experiments ................................................................................... 244
1.3.2.1 Theorical considerations for the determination of AED ....................................................... 245
1.3.2.2 Bioanalytical method ............................................................................................................ 247
1.3.2.3 Pharmacokinetic data analysis .............................................................................................. 248
2. RESULTS ....................................................................................................................... 249
2.1 Taste masking .................................................................................................................................... 249
2.1.1 In vitro taste masking (e-tongue) ............................................................................................... 249
2.1.2 In vivo taste masking by volume consumed .............................................................................. 251
2.2 Pharmacokinetic study (PK) .............................................................................................................. 252
2.2.1 Bioanalytical validation method ................................................................................................ 252
2.2.2 Pharmacokinetic profile ............................................................................................................ 254
3. CONCLUSIONS ............................................................................................................ 258

SUB-CHAPTER 5.3 - PRAZIQUANTEL AMORPHOUS SOLID DISPERSIONS
MANUFACTURED BY HME - TERNARY SYSTEM (50 wt% PZQ) PHARMA 16
EXTRUDER .......................................................................................................................... 259
1. INRTODUCTION ......................................................................................................... 260
2. METHODS ..................................................................................................................... 261
2.1 Ternary ASD system prepared by HME (50 wt% PZQ) .................................................................... 261
2.1.1 Addition of a liquid surfactant................................................................................................... 262
2.2 Cryomilling process ........................................................................................................................... 263
2.3 Characterization of PZQ-ASD ........................................................................................................... 265
2.3.1 Optical microscopy ................................................................................................................... 265
3. RESULTS ....................................................................................................................... 266
3.1 Ternary ASD system prepared by HME (50 wt% PZQ) .................................................................... 266
3.1.1 Addition and determination of the liquid surfactant feeding zone ............................................ 266
3.2 Characterization of PZQ - ternary ASDs ........................................................................................... 268
3.2.1 PZQ dosage in the HME extrudates .......................................................................................... 268
3.2.2 Scattering Electronic Microscopy (SEM) ................................................................................. 269
3.2.3 Differential scanning calorimetry (DSC) .................................................................................. 271
3.2.4 Powder X-ray diffraction (PXRD) ............................................................................................ 274
3.2.5 Water solubility ......................................................................................................................... 276
3.2.6 Dissolution profile ..................................................................................................................... 278
4. CONCLUSIONS ............................................................................................................ 280
SUB-CHAPTER 5.4 - PRAZIQUANTEL AMORPHOUS SOLID DISPERSIONS
MANUFACTURED BY HME - TERNARY SYSTEM (35 wt% PZQ) - PHARMA 16
EXTRUDER .......................................................................................................................... 281
1. INTRODUCTION ......................................................................................................... 282
2. METHODS ..................................................................................................................... 284
2.1 Ternary ASD systems prepared by HME (35 wt% PZQ) .................................................................. 284
2.2 Generation of a placebo formulation (without PZQ) ......................................................................... 285
2.3 Extrudate milling process................................................................................................................... 285
2.4 Characterization of ASDs .................................................................................................................. 288
2.4.1 In vitro taste masking by buccal dissolution evaluation ............................................................ 288
3. RESULTS ....................................................................................................................... 290
3.1 Characterization of ternary ASD system produced by HME (35 wt% PZQ) ..................................... 290
3.1.1 PZQ dosage in the HME extrudates .......................................................................................... 290
3.1.2 Differential scanning calorimetry (DSC) .................................................................................. 290
1.1.1 Powder X-ray diffraction (PXRD) ............................................................................................ 292

1.1.2 Scanning Electron Microscopy (SEM) ...................................................................................... 294
3.1.3 Optical Microscopy ................................................................................................................... 295
3.1.4 Water solubility ......................................................................................................................... 299
3.1.5 Dissolution studies .................................................................................................................... 301
3.1.6 In vitro buccal dissolution test to predict the palatability .......................................................... 304
4. CONCLUSIONS ............................................................................................................ 309
CHAPTER 6 - 3D PRINTING TO OVERCOME PRAZIQUANTEL PAEDIATRIC
FORMULATION CHALLENGES .................................................................................... 311
1. INTRODUCTION ......................................................................................................... 312
2. METHODS ..................................................................................................................... 314
2.1 Preparation of the powdered materials ............................................................................................... 314
2.2 3D Printing ......................................................................................................................................... 315
2.3 Printlet characterisation ..................................................................................................................... 317
2.3.1 Dimensions ................................................................................................................................ 317
2.3.2 X-ray diffraction (XRD) ............................................................................................................ 317
2.3.3 Differential Scanning Calorimetry (DSC) ................................................................................. 317
2.3.4 Raman Microscopy ................................................................................................................... 318
2.3.5 Determination of drug loading .................................................................................................. 318
2.3.6 Dissolution test .......................................................................................................................... 318
2.3.7 Assessment of Taste Masking Efficiency Using a Novel Biorelevant Buccal Dissolution ....... 318
2.3.8 Stability study............................................................................................................................ 319
3. RESULTS ....................................................................................................................... 321
3.1 Physical characteristics of printlets .................................................................................................... 321
3.1.1 From physical mixtures ............................................................................................................. 321
3.1.2 From pellets and powders produced from HME-filaments ....................................................... 321
3.2 Physicochemical characterizations..................................................................................................... 326
3.3 Dissolution profiles ............................................................................................................................ 331
3.4 In vitro taste masking test .................................................................................................................. 332
4. CONCLUSIONS ............................................................................................................ 335
CHAPTER 7 - GENERAL CONCLUSION AND PERSPECTIVES ............................. 336
1. GENERAL CONCLUSION AND PERSPECTIVES ................................................. 337
CHAPTER 8 - BIBLIOGRAPHY ....................................................................................... 342
CHAPTER 9 - RESUME ETENDU EN FRANÇAIS ....................................................... 412
CHAPTER 10 - PUBLISHED WORK ............................................................................... 424
CHAPTER 11 - APPENDIX ................................................................................................ 426

CHAPTER 1 - GENERAL INTRODUCTION AND
THESIS OBJECTIVES

39
1. GENERAL INTRODUCTION
Neglected tropical diseases (NTDs) affect more than 1.4 billion people worldwide, with
children making a significant proportion [1]–[3]. The second most frequent is schistosomiasis
disease and affects around 28 million preschool-age children (5 to 14 years old) [1]–[6].
Schistosomiasis, also known as bilharzia, is considered one of the NTDs. It is a disease
caused by parasitic worm, corresponding to helminths of class Trematoda, family
Schistossomatidae and genus Schistosoma [1]. The six schistosomes species infecting humans
are S. guineensis, S. hermatobium, S, intercalatum, S. japonicum, S. mansoni, and S. mekongi,
and the three majors are S. mansoni, S. haematobium and S. japonicum [1], [6].
The parasites that cause schistosomiasis live in certain types of freshwater snails. The
infectious form of the parasite, known as cercariae, emerge from the snail into the water. People
can become infected when its skin meets contaminated freshwater. In Brazil, it is estimated that
8 to 10 million people are infected by S. mansoni, and 30 million live in areas with a high risk
of contamination.
Schistosomiasis is second only to malaria as the most devastating parasitic disease, and
the major cause of morbidity in the world. Globally, it is estimated that it affects over 250
million people in 78 countries of the world and is responsible for some 280,000 deaths each
year [6].
Basic sanitation, potable water access, education for hygiene and snail control are
means of schistosomiasis prevention. Besides sanitary measures for disease control, the
treatment of schistosomiasis is also a necessary measure to decrease, and eradication of this
disease generally linked to poverty [1], [7], [8]. However, this significant public health problem
must be monitored and taken care of in the guidelines, such as establishing large-scale
preventive treatment programs. These measures may have important consequences for public
health due to the change in the biology and immunoepidemiology of S. mansoni [7].
Praziquantel (PZQ) is the reference drug in the treatment of schistosomiasis according
to World Health Organization (WHO), by reasons like high efficiency, low toxicity, and low
costs. All those factors make praziquantel the only commercial drug for the treatment of
schistosomiasis, for which, there is no vaccine available.
Still regarding PZQ, there is no appropriate paediatric medicine available in the market.
Currently, children’s treatment is realized with the adaptation of the adult medicine, by splitting
or smashing tablets [9]. For children, the dosage is adjusted to the child bodyweight by

40
administering in sets of 150 mg (1/4 tablet) [9], [10]. That practice clearly leads to a low
adherence to treatment since it highlights the bad taste of the medicine. Also, factors as high
corporal variability and tablet splitting into homogeneous parts hamper the drug efficacy [11].
The difficulty in developing a pharmaceutical form based on praziquantel suitable for
children lies in three main factors:
a. it is an API class II of the BCS, that means low water solubility, which need to be
increased for the sake of good oral bioavailability.
b. there is a need to mask the bitter taste of the API to allow paediatric patients to accept
PZQ medicine and adhere to the schistosomiasis treatment.
c. another challenge is the production of formulations with different dosages to allow
administration of the accurate dose due to the children's weight contributing to the
efficacy of the treatment.
The first challenge is to improve water solubility.
Different technical approaches have already been employed to improve bioavailability
for praziquantel, the focus being in improving its water solubility or dissolution rate. Among
them, modification of crystal form (polymorphs, hydrates, cocrystal) or physical characteristics
(reduction of crystal particle size), complexation with cyclodextrins, association of praziquantel
with lipids or polymers in a particulate form (nano or microparticles) or as solid dispersions, in
which other excipients might also be added such as surfactants.
Techniques that have been used to generate solid forms and increase the solubility of
PZQ are milling or co-milling with excipients; preparation of an organic solution or suspension
containing praziquantel and excipients, with subsequent evaporation of the solvent; dispersion
(or melting) of praziquantel in molten carriers followed by solidification. Among all technical
approaches, solid dispersions are highly effective for enhancing the dissolution, absorption, and
therapeutic efficacy of different poorly water-soluble drugs. Regarding praziquantel, solid
dispersions with a wide variety of excipients have been investigated. For that purpose,
preparation methods using a solvent evaporation step are the most used.
Even if a crystalline state provides a highly solid-stable form, the amorphous state of a drug
could be preferred due to enhanced apparent solubility, dissolution, and oral bioavailability that
they are able to offer. However, maintaining the drug in its amorphous state is one of the great
challenges in formulation development. Amorphous solid dispersion (ASD) is one promising
approach to increase the physical stability of an amorphous drug. ASD are generally generated

41
by modifying the crystalline structure (amorphization) of the drug during dispersion in a
polymeric matrix.
ASD can be produced by different technologies, among them, melt processes. Hot melt
extrusion (HME) is a continuous manufacturing process for which the interest in as a
pharmaceutical process continues to grow. Some ASD-based products produced by HME
process are already available on the market, for example, Kaletra® (ritonavir/lopinavir),
Onmel™ (intraconazole), Norvir® (ritonavir), and NuvaRing® (etonogestrel/ethinylestriol/
ethinyladiol).
An ASD containing praziquantel could represent a promising way to accomplish a
paediatric formulation containing the high drug load (50 wt%) required for designing an API
dose close to 150 mg. In fact, there are already several studies to obtain ASDs using associations
of PZQ with polymeric carriers by techniques such as melting, solvent, or co-grinding. Some
of them have demonstrated promising results with solubility enhancement up to 4.6-fold greater
than the raw praziquantel, however all have employed a manufacturing process that has been
proven to be possible at lab scale, but the step up to industrial-scale production is still rather
large.
The use of HME process to produce ASD involves a challenging study from a scientific
and technological perspective as there are still gaps that need to be further explored. The first
understanding is the maximum concentration of an API capable to be solubilized in the
polymer. The praziquantel load in these solid structures is a critical factor, since paediatric
formulations will require large API amounts on ASDs to reduce the physical dimension of the
final pharmaceutical dosage forms (mini tablets or others).
Still with high drug loads, processability will be the new challenge for achieving optimal
parameters such as assessing screw configuration, temperature profile during extrusion, and
feed and flow ratios. The extent of API's amorphization, water-solubility, dissolution kinetics
and physical stability may provide a photograph of the correlation between process parameters
and these ASD product characteristics.
High API load in ASDs can also correspond to supersaturated formulations whose
physical stability need to be controlled. One of the biggest challenges to produce ASDs is the
physical stability of these systems highly dependent on their composition (API load, polymer
carrier) and the environmental conditions.
The second challenge is to mask the bitter taste of praziquantel.

42
Praziquantel has a bitter taste for children and is also very noticeable for oral
administration of the adult tablet. Due to crushing, the taste becomes even more pronounced
for paediatric treatment. As a result, incomplete treatment, and effectiveness. Currently, some
technological strategies are described in the literature to overcome this problem with a focus on
liquid and solid oral pharmaceutical forms. For liquids, the API complexation technique in
solution is widely explored. The interactions of the molecule with the taste buds are prevented.
Cyclodextrins and maltodextrins were explored for paediatric use. Regarding solids, mini-
tablets and orodispersible mini-tablets have been proposed, seeking to combine two advantages:
dose flexibility and taste masking with the help of different excipients for direct compression
and with masking capacity.
Amorphous solid dispersion (ASD) might have an important role in taste masking. The
dispersion of the API in the polymer can provide a physical barrier that masks the drug's bitter
taste. However, with the amorphous form, it would expect an increase in solubility and,
therefore, the evaluation of ASDs in terms of taste is challenging.
Although each of the strategies has barriers to be overcome (e.g., excipients suitable for
children), taste assessment represents yet another challenge. The literature is extensive on this
subject, as the gold standard for evaluating taste would be the human panel. However, for
paediatric products, these experiments with children are very restrictive. The use of adults does
not always provide consistent results due to physiological differences in terms of perception
and taste preferences. Thus, in vivo (animal) and in vitro (electronic tongue) methods have been
increasingly used and discussed to evaluate paediatric products.
The third challenge for paediatric PZQ is the possibility of accurate dose adjustment.
The possibility of precise dose adjustment could bring enormous benefits to the efficacy
of the schistosomiasis with praziquantel treatment since the children's dosage is based on the
dose-to-weight ratio.
3D printing technologies are gaining more and more strength in the pharmaceutical area
due to the possibilities that they represent. Currently, the most applied 3D printing technique is
Fused Deposition Modeling (FDM). Most of the studies dealing with HME - FDM 3D
combination shows the approach of a continuous process starting from feeding the 3D printer
with HME filaments. Several APIs have already been described in the literature as a model for
printing printlets1 using this approach. Specifically, 3D printing to paediatric pharmaceutical
1 Printlets: 3D printed tablets

43
forms has been presented with benefits that researchers must carefully evaluate and conduct.
The possibility of printing any shape makes the childish appeal viable using forms like "bear"
viable. Even colour printing to make it attractive for pharmaceuticals medicines should also be
evaluated with attention, especially in children.
One of the disadvantages of the HME filaments for 3DP is finding the right combination
of excipients to provide appropriate mechanical and physical characteristics for 3DP. The
filaments production has been the stage of the highest intellectual dedication of the researchers
requires for the API incorporation. Recently, a technology that does not necessarily require the
preparation of filaments using HME and could potentially allow the direct extrusion of mixtures
of raw API and carriers as powders was proposed. It is known as a direct powder extrusion 3D
printing. This technology allows the production of printlets in a single step, adding particulate
material to the feeder. It could represent an alternative for accurate dose adjustment and
personalized medicines.
However, one of the greatest difficulties today is to achieve success in solving
simultaneously the three limitations: low solubility (oral bioavailability), bad sensory (bitter
taste) and need to personalize paediatric medicines (children’s dosage based on the dose-to-
weight ratio).
2. THESIS OBJECTIVES
In Brazil, the Oswaldo Cruz Foundation (Fiocruz) is the most prominent Institution of
Science and Technology in Health in Latin America. One of its main missions is manufacturing
strategic products for the Brazilian Unified Public Health System (SUS) through its Complexo
Tecnológico de Medicamentos2 (Farmanguinhos). Fiocruz is the main institution for research
on schistosomiasis in Brazil.
This doctoral thesis was undertaken under the framework of an international joint
supervision between Instituto Nacional de Controle de Qualidade em Saúde3 (INCQS)/Fiocruz
in Brazil (Rio de Janeiro) and l’École Nationale Supérieure des Mines d’Albi-
Carmaux/Institut Mines Telecom (IMT Mines Albi) in France (Albi). It aimed to contribute
with alternatives to assist in a significant public health problem that is schistosomiasis.
2 N.T.: Technological Medicines Complex (loose translation). 3 N.T.: National Institute for Quality Control in Health (loose translation).

44
The work was firstly focused on developing a praziquantel formulation based on ASDs
to solve both physicochemical (low solubility) and sensory (bitter) API problems. Secondly,
since the children's dosage is based on the dose-to-weight ratio, it aimed to check the possibility
of personalizing dosage by using 3D printing technologies.
A previous study conducted by Fiocruz team has identified the polymer of their choice
to produce ASDs containing praziquantel. The polymer is polyvidone-vinylacetate 64
(Kollidon® VA 64/PVPVA 64) and it was a fixed formulation parameter in this thesis. It will
be called ‘PVPVA’ in this manuscript.
The work covered the following studies:
o Experimental determination of praziquantel solubility in the polymer (PVPVA)
(temperature-composition phase diagram). The phase diagram was considered an early-
stage development tool to assist in predicting the stability of PZQ-PVPVA ASDs at
different API loadings and under different thermal conditions.
o Experimental studies of ASDs with PZQ load from 35 to 50 wt% produced by hot melt
extrusion (HME) process. Binary systems were constituted of PZQ and PVPVA.
Ternary systems were formulated with one surfactant as an additional component (5
wt%), and two types were used (Span™ 20 and Kolliphor® SLS Fine). The ternary
systems were studied in two different twin-screw extruders (pharma 11, at BASF/BR,
and pharma 16, at IMT MINES ALBI/FR). The ASDs generated in these different
studies were characterized using a wide range de techniques: API content, thermal
properties, morphology, apparent solubility, dissolution profile, and physical stability,
taste masking tests (in vivo and in vitro) and pharmacokinetic study (the two later, for
selected formulations).
o Use of a recent 3D printing technology based on the direct feed of powdered material
for shaping personalized paediatric medicines from selected ASD formulations. The
prototypes generated were characterized with respect to their thermal properties,
morphology, dissolution profile, physical stability, and taste masking tests (in vitro).
3. THESIS OUTLINE
The manuscript is made up of seven Chapters.

45
Chapter 1 is an introductory Chapter.
Chapter 2 provides background and is divided into four sections. Firstly, section 1
presents an overview of schistosomiasis disease and treatment. Section 2 is focused on PZQ
(characteristics, benefits in treating the disease, formulation challenges). Section 3 introduces
some challenges and strategies on the pharmaceutical development of paediatric drugs,
focusing on acceptance and palatability. The last section covers amorphous solid dispersions
and concludes with the presentation of opportunities that 3D printing technology can offer to
develop medicines, especially paediatric ones.
Chapter 3 is dedicated to characterization of the raw materials used in this thesis.
Chapter 4 presents the study carried out to evaluate the solubility of API (PZQ) in the
polymer (PVPVA) from the recrystallization of a supersaturated solid form produced by spray
drying. Unexpected results obtained during the production of supersaturated systems by spray
drying are also discussed.
Chapter 5 focuses on the development of binary and ternary ASDs. The Chapter is then
divided into four Sub-chapters that address the different studies performed with binary (Sub-
Chapter 5.1) or ternary systems produced on different equipment (pharma 11 extruder – Sub-
Chapter 5.2 and pharma 16 extruder – Sub-Chapters 5.3 and 5.4).
Chapter 6 presents the 3D printing step to obtain the PZQ prototype units.
Chapter 7 provides an overall summary, conclusions and perspectives of the work
presented in this thesis.
The graphic abstract of this thesis is presented in Figure 1.

46
Figure 1. Schematic representation of this thesis.

CHAPTER 2 - THEORICAL SECTION

48
1. INTRODUCTION
Chapter 2 provides background and is divided into four sections.
Firstly, section 1 presents an overview of schistosomiasis disease and treatment. It
shows statistical data and public health impacts in Brazil and the world.
Section 2 is dedicated to the schistosomiasis treatment reference drug praziquantel. The
mechanism of action, pharmacokinetics, physicochemical properties, and the commercial
medicines are presented.
The following important topic treated in Section 3 deals with the challenges
surrounding the lack of appropriate medication for paediatric patients. The target population of
the praziquantel-based formulation is intended to be explored in this thesis. The main aspects
addressed here are acceptance and palatability. This section also presents the formulation
strategies in developing paediatric medicines covering traditional and emerging forms such as
tablets, mini-tablets, orodispersible forms, chewable tablets, and 3D printed forms (named
printlets). It finalized the section with a special focus on the different approaches that have been
proposed for praziquantel medicines, aiming to improve some properties like water solubility,
dissolution kinetics, and then oral bioavailability.
The next section focuses on the formulation approach explored in this thesis, the
amorphous solid dispersions. Some fundamental aspects are introduced (amorphous state,
advantages, and limitations of this category of solid forms, the solubility of the drug in the
polymer, manufacturing processes) to conclude with a review of the previous studies employing
the same praziquantel formulations approach. Finally, opportunities that 3D printing
technology could offer to develop medicines, especially paediatric ones, including regulatory
aspects for pharmaceutical use, are addressed.
2. SCHISTOSSOMIASIS
Schistosomiasis is caused by helminths of class Trematoda, family Schistossomatidae
and genus Schistosoma [12]. Six species belonging to that genus are capable to infect humans:
S. guineensis, S. hermatobium, S. intercalatum, S. japonicum, S. mansoni, and S. mekongi, from
which S. haematobium and S. mansoni predominate [1].
In Brazil, the species with major prevalence is S. mansoni, which was set due to the
Atlantic slave trade. Its establishment was caused by both the presence of susceptible

49
intermediate hosts (snails of genus Biomphalaria) and environment conditions in the country,
similar to those found on the species’ region of origin [12].
The disease transmission begins when human feces contaminated with parasite eggs
enter the water. Those eggs liberate a caterpillar named miracidium, that in turn penetrates
snails that belong to genus Biomphalaria - the intermediate host in which another type of the
parasite grows: the cercariae. That new parasite can penetrate human skin or mucosa of exposed
members, such as feet and legs when touching contaminated water. Later, the parasite feeds on
and grows in the human’s intrahepatic portal system, migrating already mated to the inferior
mesenteric vein area, where the oviposition happens. The first eggs may be found in the feces
of the infected person around forty-two days after the cercariae’s penetration (Figure 2) [1], [2],
[12], [13].
The disease - schistosomiasis - may be classified as acute or chronic. Its acute phase is
characterized by mild symptoms of diarrhea, low-grade fever, headache, sweating, asthenia,
anorexia, and weight loss. On the other hand, during the chronic phase, the patient’s condition
varies from the absence of hemodynamic alterations to several clinical pictures corresponding
to portal hypertension, pulmonary hypertension, cyanosis, and glomerulopathies. Different
Adult worms in
hepatic veins
Eggs eliminated
in the water
Miracide
Development
of the miracide
in the snail
Cercaria leaves
the snail
Active penetration
of cercariae
Sick man
Figure 2. Biological cycle of S. mansoni. Source: author.

50
presentations of the disease may be observed, as pseudotumoral, neural and panvisceral, and
schistosomiasis is sometimes associated with chronic septicemic salmonellosis and other
morbid conditions. However, the main complication of schistosomiasis is portal hypertension,
whose advanced stage causes bleeding, ascites, edema, and severe hepatic insufficiency. It
nearly always leads to death despite the treatment, due to the irreversibility of the fibrosis and
cirrhosis around the granuloma [14], [15].
Schistosomiasis morbidity rate is related, amongst other factors, with the intensity and
length of the infection, as well as with the host’s immune response to parasite antigens. Also,
the parasite load depends on the intensity of contact with contaminated water, more common
where sanitary conditions are precarious. A great part of the affected population lives in
poverty, with dreadful sanitary conditions and low economic development [14]–[16].
All these factors are interrelated and responsible for determining the transmission
intensity, which varies from place to place. That complex scenario surrounding the transmission
of schistosomiasis, disease control depends on several preventive actions, such as early
diagnosis and appropriate treatment, surveillance and control of intermediate hosts, health
education and sanitation actions, as well as improvements on housing conditions. Those
measures also aim to reduce the geographic expansion of schistosomiasis [14] and, according
to the Brazilian Health Surveillance Secretariat (2014), should be implemented in an integrated
manner, as part of a regular control program. The Federal Ministry of Health determines as well
that it is up to municipalities to regularly carry out active search and treatment of carriers, over
the long term, on average in biennial cycles, to keep the prevalence low and reduce the onset
of the disease.
1.1 Epidemiological evidence
In Brazil, it is estimated that 8 to 10 million people are infected by schistosomiasis and
the other 30 million live in areas with a high risk of contamination [17], [18]. Recent data
released by SANAR – Programa de Enfrentamento às Doenças Negligenciadas do Estado de
Pernambuco [19] show that this state has the highest level of endemicity for schistosomiasis
and presents a historical series of mortality, almost five times higher than the national one. In
2010, 358 deaths were registered, mainly from prioritized municipalities [19].
Worldwide, schistosomiasis affects almost every continent, but Africa is still
responsible for the great majority of cases (around 90 %). In Asia, there are close to 900
thousand people infected with the parasite, most of them living in China [1], [18]. According

51
to information from World Health Organization (WHO) [1], in 2013 the total number of people
in need of treatment for schistosomiasis in the world was approximately 260 million, of whom
46 % was school-age children (5 to 14 years old). It is known that younger children are a
vulnerable population, but data for that year range are still limited. Moreover, around 779
million people live in endemic areas, which makes schistosomiasis the second on the ranking
of neglected tropical diseases in terms of socioeconomic resources and the second most
problematic disease for public health in underdeveloped nations. From those, Brazil is the most
affected country in South America [1], [2], [20], [21]. Schistosomiasis infects more than 230 to
250 million people annually [2].
The mortality rate for schistosomiasis is close to 280,000 people per year, with the
highest percentage of deaths on the African continent [2], [20]. In Brazil, the extensive
geographical distribution of schistosomiasis alone scales the magnitude of this public health
problem. In addition, the occurrence of severe forms and deaths makes schistosomiasis one of
the most transcendent parasites. The morbidity of schistosomiasis represents great damage to
the population's health, quality of life, and economic losses [14].
With regard once more to Brazil, according to official statistics published in 2014, S.
mansoni is present in the states of Ceará, Piauí, and Maranhão, all in the Northeast; Pará, in the
northern region; Goiás and Federal District, in the Midwest; Espírito Santo, Sao Paulo, Rio de
Janeiro and Minas Gerais in the Southeast; and Paraná, Santa Catarina and Rio Grande do Sul,
in the Southern Region. In total, there are 19 Federated Units where transmission is active [14].
1.2 Treatment
Basic sanitation, potable water access, education for hygiene and snail control are means
of achieving lasting benefits and prevention for the population, not only related to the problem
of schistosomiasis, but also of every disease delivered by polluted water, as salmonellosis,
hepatitis, giardiasis, etc. [1], [8], [12].
Nonetheless, given the data discussed above, in addition to sanitary measures, which are
efficient for disease control, the treatment of schistosomiasis must be brought to attention to
contribute to its decrease and eradication. Concerning that, chemotherapy is sometimes needed.
The chemotherapy treatment for schistosomiasis has a history of limitations, due to the reduced
number of efficient, safe, and well-tolerated medicines available [15], [20], [22].
The drugs that are being widely used to treat schistosomiasis are oxamniquine and
praziquantel. Nevertheless, oxamniquine acts only against schistosomiasis and causes side

52
effects on the central nervous system, besides having carcinogenic effects [12], [20]. Also,
oxamniquine is described as having a complex and high-cost production, which led Pfizer to
suspend its offering [23]. Praziquantel, on the other hand, is a very effective drug in the
treatment of schistosomiasis and of other diseases caused by genus Schistosoma; it has milder
and few side effects, as well as superior pharmacological activity in comparison to
oxamniquine. It also has high efficiency, low toxicity and costs less [21], [24], [25]. All those
factors make praziquantel the only commercial drug for the treatment of Schistosoma sp., for
which, besides, there is no vaccine available [25]–[27].
In Brazil, praziquantel was introduced in the Schistosomiasis Control Program (PCE in
the Portuguese acronym) back in 1996, and remains the drug of choice for schistosomiasis, both
in public and clinical campaigns. According to the WHO – Model List Essential Medicines
[28], praziquantel is recognized as the primary drug in the treatment of all kinds of Schistosoma,
besides being indicated for the treatment of taeniasis, cysticercosis [23], [29].
The treatment of schistosomiasis consists of 20 mg/Kg three times a day at intervals of
four to six hours; this therapeutic regimen shall then be repeated after four to six weeks [9],
[10]. Another option of treatment is a single dose of 40 mg/Kg for just one day (depending on
the parasite), usually used as preventive chemotherapy [30]. For children, the dosage is adjusted
to the child bodyweight by administering in sets of 150 mg (1/4 tablet) [9], [10]. The efficacy
of that treatment can be measured by parasite egg excretion on feces; results showed that 60 -
90 of the cases are cured (no more eggs in feces) and 80 – 95 of noncured patients have
an average reduction in the number on excreted eggs, depending on the level of infection [23],
[31].
1.3 Health Policies
In Brazil, campaign initiatives for fighting schistosomiasis began in 1953 by the Federal
Government. In 1956 it was created the Departamento de Endemias Rurais4 of the Brazilian
Ministry of Health, which was composed of various centers and research cores focusing on
treating diseases like schistosomiasis. Only in 1970, it was implemented the Programa Especial
de Controle da Esquistossomose (PECE)5, which was renamed Programa de Controle da
Esquistossomose (PCE) five years later. In 1990, the PCE6 was placed under the direct
4 N.T.: Department of Rural Endemic Diseases (loose translation). 5 N.T.: Special Program for Control of Schistosomiasis (loose translation) 6 N.T.: Program for Control of Schistosomiasis (loose translation)

53
responsibility of the Fundação Nacional de Saúde and, since 1993, a decentralization of the
actions aimed at controlling the disease has been implemented, by putting the control of
schistosomiasis in charge of the municipal offices in each territory [16].
Currently, the federal administration is working on encouraging national industrial
development, especially in the drugs and medicines field. In this context, the decree MS/GM n.
3.916/1998 approved a National Policy for Medicines, following the prescriptions of the
National Health Surveillance System, whose objective is to promote better health conditions
for the population through actions as (i) sanitary regulation for medicines; (ii) scientific and
technologic development, focusing on the pharmaceutical industry; (iii) promotion of drug
manufacturing, first and foremost by official pharmaceutical labs.
Praziquantel is one of the drugs listed on the National Relation of Medicines
(RENAME), part of the strategic component on pharmaceutical assistance, destined to
guarantee access to medicines and other supplies that prevent, diagnose and treat diseases and
their specific complications, covered by strategic health policies from the Brazilian National
Health Service (Sistema Único de Saúde – SUS) [32]. Now, considering schistosomiasis is a
serious public health problem, praziquantel must be improved so that paediatric drugs can
respond to children with efficiency, security and quality under the standards and guidelines
recommended by the National Health Surveillance System.
3. PRAZIQUANTEL
Praziquantel is the result of a collaborative work by two pharmaceutical companies in
Germany, Bayer A.G. and E. Merck [33], [34]. The anti-helminthic activity was discovered in
1972 by Bayer and its action against a broad spectrum of pathogenic platyhelminths was
confirmed in partnership with Merck (WHO, 1998). Praziquantel was patented in Germany in
1973 and in the United States in 1977. It became available in the European market in 1978 and
worldwide in the ’80s. Initially, it was restricted to veterinary use and the registry for its use by
humans was granted by the Food and Drug Administration (FDA) in 1982 [35].
Currently, praziquantel is the first-choice drug for the treatment of diseases caused by
different species of genus Schistosoma and it is also indicated to treat infections by other
helminths of the class Trematoda [36]. It is present on the WHO Model List of Essential Drug,
with a posology of 150 mg or 600 mg capsules to treat helminthic intestinal infections and of

54
600 mg capsules to treat schistosomiasis infections and other pathologies caused by trematodes
[28].
Furthermore, in regions where schistosomiasis treatment is massive, as in Africa,
praziquantel is also used for chemoprophylaxis since 2006. This means that where there are
high levels of schistosomiasis endemicity and precariousness of health services, the treatment
is administered regardless of previous diagnosis [8], [21].
Additionally, there are studies already showing that praziquantel may increase
paclitaxel's anticancer activity, which demonstrates how therapeutic indications of praziquantel
may increase over the next few years [37].
1.4 Mechanism of action
Praziquantel mechanism of action is not totally elucidated. It is known, however, that
the anthelminthic action of the drug is probably due to the inhibition of schistosome Na+K+
pump, increasing the permeability of the helminth membrane to certain monovalent and
divalent cations, mostly calcium, which causes muscles activity intensification, followed by
contraction and spastic paralysis. As a consequence, helminths separate from the host’s tissues
and are quickly dislocated from the mesenteric veins to the liver, whereas intestinal helminths
are expelled [24], [38]. Is known that praziquantel can act on various stages of Schistosoma
and affect adult parasites, miracidia and cercariae, but has little or no effect on the parasite eggs,
sporocysts or schistosomula [39].
1.5 Pharmacokinetics of praziquantel
The drug currently available for the treatment of schistosomiasis is praziquantel in the
form of tablets, as will be further detailed in this section. This product is manufactured with
racemic API and, for this, absorption is carried out quickly by the gastrointestinal tract, and the
plasma peak is reached about 1 to 3 hours after its oral administration [20], [40].
It is a drug that has an extensive first-pass effect on the liver, broad binding to plasma
proteins (about 85 %), half-life around 60 to 90 minutes, and its excretion occurs through urine
[41].
Recent studies have confirmed that the (R) - Praziquantel enantiomer is responsible for the
pharmacological activity, and (S) - Praziquantel, although it has no anti-schistosomiasis

55
activity, plays some role in contributing to the extent of the activity performed by (R) –
Praziquantel [41]–[46].
In 2018, the Zanolla et al. research group reported the formation of the polymorphic form
B of praziquantel by milling [30]. The following year, a study on pharmacokinetics of that new
polymorphic form in mouses was published. Although the new crystalline structure has shown
an increase in properties such as solubility, dissolution rate, and chemical stability, the general
level bloods were lower when compared to the praziquantel formulation based on the racemic
form [40].
1.6 Commercial medicines of praziquantel
Currently, praziquantel is commercialized at doses of 500 mg and, most commonly, 600
mg worldwide. The reference medicine is produced by Bayer at 600 mg strength, in the form
of coated tablets with 22 mm length (Figure 3) commercialized under the name of Biltricide®.
Cisticid® 600 mg and Cisticid® 500 mg are commercialized by Merck KGaA for human use
[9]. Praziquantel posology is based with the patient’s weight, hence one of the existing
difficulties for treating children is the administration of the appropriate dosage, to which cutting
the tablet is widely used (the reference medicine is commercialized with 3 grooves and can be
divided into up to 4 parts). The splitting/smashing practice tablets cause dosage impacts and
improve the unpleasant taste by eliminating the product coating. [9].
Another issue of praziquantel is that the medicines are produced from the racemic
mixture of the API, one being active against the helminth and the other inactive. As the
separation of both isomers is a very expensive technique, it is usually not applied, keeping one
of the structures with a null effect. That makes a need for increasing the concentration of the
drug for each dose, which in turn results in tablets that are quite big and difficult to swallow,
mainly for children that represents a high number of infected patients [11].
Figure 3. International reference drug (Biltricide®) produced by the German company Bayer Healthcare
Pharmaceutics – praziquantel 600 mg dose. Source: [4] (with permission).

56
In Brazil, there is just one praziquantel-based product available (Praziquantel 600 mg),
from a public company (Farmanguinhos/Fiocruz) linked to the Ministry of Health (Figure 4)
[47].
According to the Cisticid® leaflet, the tablet must be swallowed entirely, with potable
water and during meals. Otherwise, when needed, it may be dissolved and administered via
nasogastric tube. As for Cestox®, the leaflet indicates that tablets must be swallowed entirely,
without chewing [48]. About the medicine produced by Farmanguinhos, the guidance is not to
chew tablets, but to split them into two or four parts to permit the administration of individual
doses. Due to the bitter taste, according to Farmanguinhos, they should also be swallowed
immediately with enough liquid to avoid vomiting [49].
The cure rate using praziquantel is known to approach 80 % for adults and 70 % for
children [14]. In a document of Technical Guidelines for Surveillance of Schistosoma mansoni
published by the Brazilian Ministry of Health [14], it is highlighted the need for attention to
patients who have been treated several times and who have not healed, which must be notified
to the PCE. Those guidelines are indicative of concern about the resistance of strains to the use
of praziquantel. This may be due to the difficulty of administering the drug with a more accurate
dosage for the patient (mainly paediatric) and the lack of adherence to treatment due to
palatability.
There are some reports of a commercial praziquantel medicine for children in
suspension form, Epiquantel® 120 mg/mL produced by the Egyptian company (Egyptian
Pharmaceutical Industries Co). It is known, though, that there is no information regarding the
a)
b)
Figure 4. a) Primary package e; b) Tablet produced by Farmanguinhos/FIOCRUZ – Praziquantel, 600 mg dose.
Source: Author.

57
acceptance of that product by children in the literature and, even though that would be the only
paediatric drug available, it was not adopted by WHO [50], [51]. Moreover, when consulting
the company's website, there is no description of its availability. The only product categorized
as “antiparasitic & schistosomicide” is Distocid® 600 mg in tablet form.
Against this background, the need for a formulation for praziquantel that can be
administered to children and overcome the barriers of bioavailability, bitter taste and dosage is
clear.
1.7 Resistance to praziquantel
In 2017, 100 million people (80 million school-age children) received free preventive
treatment (praziquantel) for schistosomiasis [27] and, it is known that the control of
schistosomiasis is predominantly dependent on this therapy for millions of people around the
world [46].
However, it is important to mention that some studies are being undertaken to verify the
heterogeneity in the cure rates with this medication. Currently, there is great concern about the
variations in the drug efficacy found in diverse populations, raised by the possibility of
praziquantel resistance among parasites. For this reason, different studies are conducted to
assess the factors that can result in praziquantel levels in the systemic circulation that potentially
contribute to these low and variable cure rates [46], [52].
The main variables that are discussed in this regard are the different formulations and
brands, the patient's liver health, medications administered concomitantly and genetic factors
[43], [44], [46].
1.8 Physical and chemical properties of Praziquantel
Praziquantel (PZQ) is an imidazole derivative, chemically known as: (+)-
2cyclohexylcarbonyl-1,2,3,6,7,11b-hexahydro-4H-pyrazine[2,1-a]isoquilonin-4-one [29],
[53]. Its molecule weights 312.4 g/mol and contains an oxo group in position 4, which is an
important characteristic, since it cannot be modified without suppressing drug activity [34].
PZQ is described as a white to nearly white crystalline powder, it has a low solubility in
water and it is soluble in ethanol and in other solvents organics [35], [54]. Other
physicochemical characteristics of PZQ are presented in Table 1.

58
Table 1. Summary of physicochemical characteristics of Praziquantel.
PZQ - Physicochemical characteristics References
Molecular weight 312.4 g/mol [53]–[57]
Melting point 136-144 ºC [53]–[58]
Glass Transition temperature 35.9 -37.7 ºC [56], [59]
Water solubility
0.14 mg/mL (20 ºC)
0.22 mg/mL (25 ºC)
0.40 mg/mL (25 ºC)
[30], [60]
[61]
[4], [57], [62]–[66]
0.28 mg/mL (37 ºC) [67]
Ethanol solubility 63 - 97 mg/mL [57]
pKa 19.38 [57]
LogP 2.42 [57]
Taste threshold 0.03 mg/mL [68]
Chemically, it is known that PZQ is hydrophobic and a chiral substance (position 11b),
obtained mainly from a racemic mixture (1:1 mixture of enantiomers) (Figure 5Erro! Fonte de
referência não encontrada.). The optical resolution proved that the anthelminthic activity is
principally due to the R-(-)-enantiomer (L‐PZQ or (-)-PZQ or R-PZQ) while the S-(+)-
enantiomer (D‐PZQ or (+)-PZQ or S-PZQ) is inactive, presenting higher toxicity and being the
main responsible for praziquantel bitter taste [20], [34], [60], [69]. The isomers also have
different physicochemical characteristics such as solubility (R-PZQ 1.91 mmol/L, S-PZQ 1.64
mmol/L and Rac-PZQ 0.92 mmol/L) and melting temperature (R-PZQ 𝑇𝑜𝑛𝑠𝑒𝑡 109.4 ºC, 𝑇𝑝𝑒𝑎𝑘
122.3 ºC and, 𝛥𝐻 77.3 J/g; S-PZQ 𝑇𝑜𝑛𝑠𝑒𝑡 109.7, 𝑇𝑝𝑒𝑎𝑘 112.6 ºC and 𝛥𝐻 78.2 J/g) [70].
There are currently two anhydrous crystalline structures of PZQ described in The
Cambridge Crystallographic Data Center (CCDC), which are the commercial racemic
compound (TELCEU) [33] and the second crystalline structure (TELCEU01), described in the
literature as PZQ polymorph B [10] (Figure 6). Like the commercial crystal structure, form B
Figure 5. Chemical structure of praziquantel a) (R,S)-praziquantel (racemic), b) (S)-praziquantel and, c) (R)-
praziquantel (Reuse from [5] with permission).

59
is described as a mixture of enantiomers. In addition to these structures, enantiomers
hemihydrates (SIBUG and SIBUG01) [42], [71], the enantiomer (R)-praziquantel hydrate
(LIVED), and some acid derivate were also observed [72].
Some disorders in the position of the atoms can be visualized on the crystalline structure
of anhydrous PZQ (Figure 7). In contrast, the crystalline structure of the hemihydrate of the
enantiomer R of PZQ (SIGBUG01) [42] is well defined, presenting four praziquantel molecules
and three water molecules.
Figure 8 shows the diffraction patterns published in the CCDC for the racemic form of
PZQ, and the enantiomers, respectively.
a
b
Figure 6. Unit cell of crystal structure of anhydrous PZQ a) commercial racemic compound (TELCEU) and b)
praziquantel form B (TELCEU01) (Reuse from [10], [33] CCDC 896767 and
1557658 ).
Figure 7. Crystal structure of the hemihydrate of (R)-Praziquantel (SIGBUG01) (Reuse from CCSD 710418 [42].

60
Figure 8. Praziquantel patterns XRPD. a) racemic form - TELCEU [33], b) form B TELCEU01 [30] and, the
enantiomer form C – SIBUG and, SIBUG01 [42], [71] (Reuse from CCSD 710418, 896767 and
1557658 ).

61
The polymorphic form C of PZQ was recently described. It was characterized during a
study that used the design of experiments (DoE) approach to evaluate milling conditions of
PZQ Form B [73]. This crystalline structure was elucidated thanks to its production from API
grinding alone and the association of different solid-state characterization techniques such as
Differential Scanning Calorimetry (DSC), Thermogravimetric Analysis (TGA), Synchrotron
X-Ray powder diffraction, Nuclear Magnetic Resonance (NMR) measurements and, Fourier-
transform infrared spectroscopy (FT-IR). It was verified that forms B and C have very close
characteristics. For example, through X-ray diffraction (XRD) results, it was possible to
visualize the diffraction patterns' differences between the racemic form, form B and form C
(Table 2), while through FT-IR, it was not possible to identify differences between B and C
forms (Figure 9) [73].
Table 2. Summary of the main diffraction peaks on powder diffractograms for different PZQ solid forms.
PZQ form Angles of 2Ө References
Commercial
PZQ
7.08, 8.42, 12.1, 13.2, 14.7, 13.3, 16.3, 17.5, 18.5, 18.8, 19.2, 20.0,
21.1, 21.7, 22.5, 22.9, 24.3, 25.4, 26.5, 28.8, 29.1, 30.1, 31.4 [74]
Form B
6.83, 8.48, 9.08, 12.35, 13.64, 15.74, 16.28, 16.55, 17.6, 18.23,
19.61, 19.94, 20.39, 20.45, 21.68, 22.34, 23.45, 25.31, 25.58, 26.3,
27.59, 27.95, 28.64, 28.97, 30.53, 31.4, 33.38
[73]
Form C
6.95, 8.54, 12.68, 13.94, 15.38, 16.1, 16.49, 17.66, 18.05, 18.71,
19.43, 19.76, 20.54, 21.56, 22.13, 22.16, 22.55, 24.29, 25.19, 26.12,
27.59, 28.76, 29.0, 30.92, 31.16, 34.64
[73]
Monohydrate 12.0, 13.0, 16.2, 17.2, 18.5, 19.1, 20.2, 21.0, 22.7, 24.7, 24.9 26.6,
28.0, 30.7 [74]
Hemihydrate 6.28, 16.14, 16.50, 17.18, 18.67, 19.12, 20.05, 20.41 and 24.37 [63]

62
The same study [73] has identified the melting points for forms B and C, respectively:
106.84 ºC (𝛥𝐻 = 71.06 J/g) and 110.28 ºC (𝛥𝐻 = 69.03 J/g), lower than the melting point of
the racemic mixture (144 ºC and 𝛥𝐻 = 104.13 J/g) [74]. It was also demonstrated that Form C
provided lower physical stability after two months of storage in a desiccator at 25 ºC protected
from light, unlike the one-year stability reported for polymorph B [73]. This stability result was
confirmed by the appearance of an endothermic signal in the fusion region of the commercial
racemic PZQ. No other parameters have been evaluated for monitoring stability.
It is estimated that one-third of the pharmaceutical molecules can exist as a hydrate [75].
For PZQ, the obtention of the monohydrate and hemihydrate forms was reported in the literature
[74], [75].
The hemihydrate form of PZQ was prepared by Zanolla and collaborators [75]. by three
different methods: a) starting from the commercial PZQ, b) starting from the PZQ form B, or
c) starting from preformed seeds of the hemihydrate form of the PZQ and commercial PZQ
[75]. The first option involved three stages: the grinding of the commercial PZQ, adding water,
and new grinding. In the second and third methods, water was added to the materials, and the
grinding process was done in a single step. The procedure to obtain form B was also carried out
with the specific grinding conditions of the pure commercial API [10], [75]. The hemihydrate
form of PZQ generated in this work presented a completely different PXRD pattern (shown in
Table 2) from the previous structures of PZQ already discussed here (racemic form, forms B
and C). DSC analysis revealed a first endothermic event in the region of 68 ºC (61.38 J/g)
related to dehydration. TGA confirmed it with a 2.19 % loss of mass - a good correlation with
the expected 2.73 % theoretical value for the hemihydrate form. Other characterizations were
Figure 9. Similarity of the three PZQ polymorphic forms by FT-IR spectra (Reuse from [73] with permission).

63
carried out like FT-IR, Scanning Electron Microscope (SEM), and Crystal Structure Solution,
to complete the characterization of the hemihydrate PZQ solid form. About its physical
stability, after three months under room temperature conditions, it started to show diffraction
peaks corresponding to form B, until complete transformation to form B at the end of 12
months. The grinding and exposure of the hemihydrate sample at 50 °C for a few hours also
resulted in form B. However, none of the cases studied evidenced the transition of the
hemihydrate sample to the more stable racemic form and no evidence of form C. The hypothesis
is that the preference for migration to form B is like packing arrangement (anti-conformation),
unlike commercial PZQ (syn conformation). It is believed that to reach this rotation and reach
racemic form (commercial) much more energy is needed than the dehydration process [75].
The Biopharmaceutical Classification System (BCS) was established in 1995 [76] to
determine water solubility and intestinal permeability characteristics of a drug molecule.
Characteristics are divided into four different classes and predict the in vivo/in vitro relationship
of the molecule [77] (Figure 10). A drug is considered highly soluble if its highest dosage is
capable of solubilizing in a volume less than or equal to 250 mL, with pH between 1.0 and 6.8
and at a temperature of 37 ºC ± 1 ºC. To be considered highly permeable, its higher dose must
present an absorption equal to or greater than 85 % (mass balance determination) or comparable
to the intravenous reference dose [20], [77]–[79].
Figure 10. The Biopharmaceutical Classification System (BCS) (Source: Author).

64
PZQ is a drug in class II according to the BCS classification, which means that it has
low water solubility (Table 1) and high permeability. The dissolution rate is a decisive factor
to determine the effective concentration of the drug able to reach the parasite tissue, and this is
one of the main reasons for high doses [20]. Likewise, permeability is of essential relevance as
it is directly related to the processes of absorption, distribution, metabolism, and excretion.
4. PHARMACEUTICAL DEVELOPMENT WITH EMPHASIS ON PAEDIATRIC
MEDICINES
Increasing efforts have been developed by the European Medicines Agency (EMA) and
the Food and Drug Administration (FDA) to encourage responses to the needs of child patients
[80]. In 2007, WHO launched the 'make medicines child size' (MMCS) campaign so that
specific attention was given to the need for children to receive the correct medicine at the correct
dose [81]. In that same year, data indicated that there was still an alarming gap in the number
of paediatric drugs officially licensed for paediatric use [82]. About 50 % of the drugs available
for use in children are still considered off-license and/or off-label [82], [83]. This panorama is
also evident for 90 % of the drugs administered to babies and neonates in the Paediatric
Intensive Care Unit (PICU) of the European Union [84]. This means that paediatricians
prescribe drugs authorized for adults by only adjusting the dose and format [83]. To satisfy the
need for suitable dosage forms for the paediatric group, some practices are usually employed
in the administration routine to overcome drug suitability problems, such as mixing the drug
with food additives, and crushing/dissolving pills. However, all those practices may bring on
technical and clinical risks such as drug degradation, microbial contamination, dosage
calculation errors, and the formulation's therapeutic inefficiency [83], [85]. Besides that, the
adaptation of pharmaceutical forms for administration to children has a history of even more
drastic results as occurred in Ethiopia during a deworming campaign [9]: children under 36
months died from asphyxiation following albendazole administration [9], [84].
In the same year of 2007, the EMA established paediatric regulation, which triggered
the development of guidelines for manufacture and prescription of children’s drugs, through
the Paediatric Committee (PDCO) [83]. All this work resulted in recognition of paediatric drug
development as a specific department within companies. One of the results that came from that
initiative was the requirement imposed to EMA and FDA agencies in need to submit paediatric
development strategies through Paediatric Investigation Plans (PIPs) and Paediatric Study Plans

65
(PSPs) of presenting product development strategies [86]. In 10 years of paediatric regulation
in the European Union, 260 new medicines for paediatric use (new indications and new market
authorizations) have been authorized.
Pharmaceutical technologies, research, and business models have been evolving rapidly
in recent years, which favor improving the paediatric medication scenario. However, even after
ten years of incentives, guidelines, committees, and, especially, regulations for paediatric drugs,
there is still a great need to develop products suitable for this group of patients [87].
Currently, pharmaceutical development is a big challenge: in recent years, about 70%
of new drug candidates are classified as poorly water-soluble, which is the factor mostly
responsible for their low bioavailability and low therapeutic efficacy [88].
In an attempt to overcome this barrier, numerous formulation strategies have been
devised, such as micro and nanoparticles, inclusion complexes, salt formation, cocrystals,
polymorphic modification, eutectic mixtures, among others [10], [79], [89]–[92]. However, in
the case of paediatric medications, improving the solubility of a drug may not be the solution
to all barriers encountered. Besides, the development of these drugs poses the challenge of
encompassing a large age group meeting their specific needs with respect to the pharmaceutical
forms available for administration [93].
About 80 % of adult medicines are not necessarily suitable for paediatric populations,
so they have not yet been developed directly for paediatric patients [85]. This group of patients
presents a great diversity in terms of anatomy, physiological and psychological response when
compared to adults and, as a result, the therapeutic response is varied. Furthermore, the
development of paediatric formulations also has specific challenges related to physicochemical
properties such as solubility, permeability, stability, and organoleptic properties of active
pharmaceutical ingredients. All those factors may likely be connected to safety, tolerability and
efficacy in the developed drug [85].
The issue of palatability is not considered a key problem in developing oral forms for
adults, as the coating can disguise unpleasant tastes, and adults have another clarification on
the subject. In the child population, dysphagia is a problem, which leads to a significant
preference for liquid, orodispersible, or chewable formulae in drugs of choice. Consequently,
developing pharmaceutical solutions that beat the challenge of unpleasant taste masking
becomes even more complex [94].
This problem has been widely discussed in the last ten years, and the most widely used
techniques to mask drug taste are: bitter receptor blockers, sweetening and flavouring systems,
modification of API solubility, complexation and coating systems [94]. Although the criteria

66
for acceptance and quality of a drug for adults may undergo evaluation of parameters such as
high dose flexibility, swallowability, palatability, and safety of excipients, the same cannot
happen for paediatric formulae, as all these factors are crucial for their acceptance and the
efficiency of treatment.
Against this background, WHO strongly recommends that anthelmintic manufacturers
responsible for public health programs for preschool children develop appropriate formulations
[95]–[97]. The WHO [98] presents a classification in 5 bands for the paediatric patient group:
a) new born, premature, lactating; b) new-borns from zero to 28 days; c) babies and children
over 28 days to 23 months; d) children from 2 to 12 years old and; e) adolescents from 12 to
16/18 years.
Obtaining a paediatric PZQ formulation should then address three main issues:
a) increasing PZQ solubility and dissolution, which is expected to allow de reduction of the
dose of the drug to be administered, increasing the absorption efficiency, and reducing side
effects and the costs involved in the production process and,
b) masking the bitter taste of the PZQ molecule to allow paediatric patients to accept PZQ
medicine and adhere to the schistosomiasis treatment.
c) optimize formulations with different dosages to allow correct administration of the dose due
to the children's weight contributing to the efficacy of the treatment.
4.1 Acceptability
According to EMA, the acceptability of a drug is defined by the patient's or caregiver's
ability to use the product according to the proposed purpose. This acceptability is determined
through the relationship between the patient's characteristics (age, ability, type of disease,
social/cultural backgrounds and settings (e.g., home, hospital, or school) and those of the
product (palatability, swallowability (size and shape, dosage form), appearance (colour, shape),
ease of administration (necessity of modification before administration), required dose (dosing
volume, number of tablets, break marks), dose frequency, administration device and packaging
[86], [99], [100].
Acceptability must be addressed in full during pharmaceutical development so that all
the patients' needs for which the drug is intended can be met. Currently, some drugs for
paediatric use on the market are only the reduction of the dosage available for adult patients.
Examples of this practice are benznidazole and the artesunate association of mefloquine
publicly available in Brazil to treat Chagas disease and Malaria, respectively. The lower dosage

67
naturally reduced tablet sizes, but other specific criteria for better acceptance of paediatric
patients were not considered. Although efforts and support in developing specific and
appropriate formulations for children with neglected diseases are challenging, this group of
patients cannot be considered small adults [87], [101]. On the other hand, another group of
drugs representing more than 80 % of the drugs prescribed and intended for children is
classified as off-label. These drugs have not been formally tested in this population and are
therefore not labelled for use in neonates, infants, and children [102]. Currently, the use of
praziquantel in children is off-label, and its administration requires breaking the pill to fit the
body weight [9], [103]–[105].
4.2 Palatability
Although palatability is not the only fact that affects drug acceptance, it is still
considered the first cause of non-adherence to treatment, especially in children [99], [100],
[106]. However, it is important to mention that other patients who do not fall under the category
of "standard patient" [107] are equal beneficiaries of an approach considering the importance
of it. Although geriatric patients have different characteristics to be considered,
pharmacokinetics cannot be framed only by physiological variations in age, as in paediatric
patients (neonates, children, infants, and adolescents). The elderly have their pharmacokinetics
strongly affected by morbidity, co-morbidity, multiple drug use, or reduced organ function
[107]. Given this scenario, paediatric and geriatric patients are groups in which the palatability
of a drug can determine treatment adherence and, consequently, therapeutic efficacy.
According to EMA, palatability is defined by an overall appreciation of an (oral)
medicine by organoleptic properties such as vision (appearance), smell, taste, aftertaste, and
mouthfeel set of organoleptic perceptions (taste, smell, residual taste, dose, volume or size and
texture (mouth feel) emitted by a patient and which directly affect his acceptance [86], [99],
[101]. The notion that taste is related to the perception of aroma, mouthfeel, and texture is
important, while the taste is directly related to the sensations perceived through the taste buds
in the tongue epithelium and the oral cavity [86], [101], [108]. All this palatability response
will be directly dependent on the excipients, actives and the pharmaceutical form used in the
development of the product [109].
For paediatric formulations, palatability is one of the main important features that affect
acceptability [99]. The overall appreciation of a drug for organoleptic properties such as smell,
taste, texture (mouthfeel) and possibly sight and sound may be crucial for a child to accept the

68
treatment. That is, palatability is linked to the acceptability of the drug to the indicated patients
and is likely to have a significant impact on patient compliance and, consequently, on product
safety and efficacy [99], [109].
4.2.1 Taste
Taste is one of the senses in which humans and other animals can develop perceptions
about the environment in which they live [110]. Taste modalities are basically described as
sweetness, sourness, saltiness, bitterness, and umami [111], [112]. When introducing
medication into the mouth, the first perceptions of taste come from the taste buds, which are
structures composed of about 50 to 100 neuroepithelial cells arranged in groups, resembling the
shape of an onion (Figure 11). The main function of taste buds is to transmit a molecule's taste
that comes in contact with the tongue to the nervous system [113]. These cells can be classified
according to their morphology, protein expression, and signalling characteristics. Each cell type
is responsible for transmitting one of the following tastes: type I - probably, salty taste, type II
- sweet, umami and bitter, type III - sour, and type IV - basal cells.
The function of taste buds is to transmit information on the taste of the molecule to the
central nervous system.
Figure 11. Process of taste perception in the mouth (Source: Author).

69
When it comes to medicines' taste, this is a key factor in achieving the desired
treatment's success, especially when the patient is a child [68], [114]. In a study conducted by
Ascent Paediatrics, Inc. (Wilmington, Massachusetts) with 500 parents, 75 % of the unfinished
treatments were due to the drug's bad taste [115]. Besides, 90 % of paediatricians report that
the taste of the medication and palatability are the major barriers to be overcome for the
treatment's adequate conclusion [110].
4.1.4.1 Taste assessment
Since most APIs have a bitter taste or poor organoleptic properties, the development and
validation of methods for taste evaluation is a fundamental requirement for obtaining palatable
pharmaceutical formulations, especially for paediatric patients [114], [116], [117]. The sooner
the taste screening of the API or formulation is carried out, the greater the chance of
development adequacy and the lesser the cost of the tests stage [68], [118].
The test considered the gold standard for assessing the taste of medicines is the human
panel. This tool faces ethical and safety difficulties though, especially when it comes to products
with limited toxicity data [114], [119]. This scenario becomes even more restrictive with
medicines for paediatric use due to technical, practical, regulatory factors, questionnaire design,
and reliability of paediatric responses depending on the ability of children to distinguish and
express variations in taste and sensations in the mouth [118], [120].
To circumvent this problem, other tools can be used to assess taste. The measures can
be classified as direct (when the response is due to the taste itself) and indirect (when the
measure is due to the dissolution and/or release of the API and the quantification is related to
the taste response) [114]. For the first, in vivo (animal behaviour assessment) and in vitro
(electronic tongue) methods can be used. [114].
In a literature review on non-human techniques for the evaluation of taste in pure drugs,
evaluation of taste masking and commercial formulations showed that among the most used in
vivo techniques, the BATA model stands out and, for the in vitro evaluation, commercial
electronic language (Astree and Insent) [114].
As for the latter, the results showed a good correlation with the human panel, but
electronic language responses still have some limitations because it is necessary to calibrate the
equipment with taste standards or validate the result with the human panel. Nonetheless, it is
undeniable that the technique can be a very useful tool in the Early screening of taste of pure
APIs and evaluate formulations that have gone through the taste masking stage. Likewise, in

70
vitro experiments for dissolving or evaluating drug release have shown promising results, even
if these experiments depend on previous data determining the API taste threshold (in vivo). In
vitro experiments are all relatively simple and can be easily accessed and executed, both for
API alone and formulated products, but they must be associated with other assessment tools,
such as supporting the interpretation of data obtained through the electronic language.
On the other hand, in vivo methods showed a good correlation with the taste response
in humans. The most described method is BATA, and different drugs and products have already
been evaluated. It is important to mention that, in addition to BATA, other in vivo experiments
are described and are based on the consumption of the solution for the relationship with the
taste of the sample. It is important to note, however, that in most in vivo taste assessment
methods, rodent liquid deprivation is used before the test experiment. This means that the
evaluation of the solutions will report the palatability and not the taste quality of the product
under test since deprivation can influence the licks' baseline profile [114].
4.1.4.1.1 In vivo test assessment
4.2.1.1.1.1 Brief-access taste aversion (BATA)
The rodent brief-access taste aversion model (BATA) is one of the most in vivo
assessment tools described in studies that analyse APIs, formulated and commercial products
in the literature.
The experiment is based on the brief exposure (from around 06 to 10 seconds) of animals
kept in water deprivation (to encourage them to drink) to the taste solution to be evaluated. The
apparatus used to provide the solution has a system for computing the number of times animals
lick, called licking [114]. The result is based on the change in the number of licks; that is, high
numbers are interpreted as a pleasant taste, and, conversely, a minimum number of licks reflects
the aversion [114]. This type of test can be used to determine a taste threshold for pure APIs,
and this theory assumes that taste sensations are dependent on the intensity of the stimuli [121].
Different concentrations are made available to the animals, and a dose-response curve (number
of licks) can be drawn, and the tolerability determined (Figure 12). Besides, it is possible to
predict a formulation or drug's tolerability by correlating the number of licks obtained with
water (a neutral solution).

71
4.2.1.1.1.2 Aversion evaluation by volume consumed
The aversion assessment test by measuring the volume consumed is quite like BATA.
However, it does not have a sensor for accurate counting of the number of licks; but exposure
to the test solution is described in about 30 minutes [107], based on the difference in volume
between the initial moment and the final exposure time.
That test is also preferably carried out on rodents that go through the same period of
deprivation and water supply. It is assumed that the volume difference is the amount consumed
by the animal. Moreover, following the same assessment, the higher the value consumed, the
greater the animal's tolerability and acceptance of the test solution.
This type of model was used to evaluate the taste masking of the caffeine from a
formulation produced by hot melt extrusion process (HME) and presented promising results
because it was possible to discriminate the differences in taste and clearly capture the animals'
different expressions [116]. This characteristic of the in vivo experiment is extremely important
for evaluations of formulations with a paediatric purpose since the human panel with adults
generates questionable results if transposed to children. Still, studies show a good correlation
in the pattern of behaviour between rats and primates with human babies, especially in the
evaluation of palatability through characteristic expressions such as facial expression (bitter)
and protrusion of the tongue (pleasant taste) [116], [122].
4.1.4.1.2 In vitro test assessment
Nu
mb
er o
f li
cks
Concentration
IC50
Figure 12. Dose-response curve for BATA model. Source: Author.

72
In vitro tests for evaluating medicines' taste have been widely disseminated in the
literature, especially for the initial stages of developing medicine where the taste of API and
taste masking for formulations in preclinical stages are initially evaluated [114].
4.2.1.1.1.3 Electronic taste sensors
Currently, there are two main commercial equipment for taste evaluation using
electronic sensors, which are commonly called electronic tongues. The Japanese model is based
on the use of lipid membrane sensors (SA401, SA402/TS-5000z - Insent Inc., Atsugi-chi,
Japan), while the French one (α-Astree sensor - Alpha MOS) performs measurements based on
the chemical modification of structures [114]. In addition to these, several other electronic
languages are characterized by differentiation in the type of receiver, selectivity, necessary
sample properties, and operating characteristics [123].
The literature is vast in the publication of evaluations using these electronic sensors for
taste evaluation, or taste masking of drugs and formulations [124]–[133] and the results of the
majority have reported a good relationship with the human panel [114]. However, a study that
evaluated the taste masking of PZQ after the use of cyclodextrins concluded that the use of
electronic language (Insent Inc., Atsugi-chi, Japan) did not provide coherent results for none of
the tested sensors [68], due to the characteristics of the molecule (non-ionic and poorly water-
soluble). Later, another study that used the microencapsulation technique of PZQ in a polymeric
matrix also evaluated taste masking through coated sensors, and the principle of detection used
was electrical impedance spectroscopy. Then, the electrical response was used to evaluate the
taste-masking properties of the formulations. The results were evaluated by interactive
document mapping (IDPMA) plot and show the efficiency of taste masking across the different
regions where the samples are positioned [134].
Although the results obtained with the electronic language are promising, especially for
the early development stages, there are still barriers to be overcome. Unlike in vivo
experiments, in electronic language tests, it is necessary to calibrate the equipment to
understand the bitter taste. Hence, the use is still somewhat limited and requires the association
of the result with other techniques, especially when the molecule has an unknown taste
characteristic [114].
4.2.1.1.1.4 In vitro dissolution and drug release for palatability evaluation

73
This evaluation method can initially be presented in a simple way, but its stages and
applications must be evaluated carefully.
To carry out this method, regardless of the analytical detection technique, three main
factors must be analysed: the dissolution of the drug (medium, pH characteristics), sample
withdrawal, and analytical evaluation. As a calibration, the dissolution of the pure API must be
performed, and this step is hardly found in the literature [135].
The UV spectroscopy is one of the most employed tools to determine taste masking by
the dissolution method. It can be used in-line with an optical fiber, and several studies have
already shown positive results or offline analysis with a spectrophotometer or HPLC with a UV
detector.
It is assumed that a drug needs to be dissolved to cause an unpleasant taste and, likewise,
the evaluation of the influence of excipients needs to be considered. In these methods, the most
critical action is to assume an absolute correlation of the concentration released with the taste
of the drug [135].
Other important factors are related to the specifications of the methods, such as adjusting
the temperature of the oral cavity, volume of medium, pH, physiological variations depending
on age [135], [136]. Many studies have reported the use of 900 ml of dissolution medium, and
criticism is related to the correlation to the volume of saliva in the oral cavity (about 1 to 2 ml)
[137]. Recently, a study published by Keeley et al. [80], presented a column to assess
palatability by the dissolution method where the internal volume mimics 1 or 2 mL. In this
work, it was possible to quantify the taste masking of formulations developed with different
coating types, unlike the conventional dissolution technique from The United States
Pharmacopeia (USP), which provided only the distinction between coating technologies and
thicknesses.
STRATEGIES IN THE DEVELOPMENT OF PAEDIATRIC FORMULATIONS
5.1 Traditional and emerging forms
As an initial stage in developing a paediatric pharmaceutical formulation, characteristics
such as pharmacokinetics and pharmacodynamics, potential routes of administration, toxicity
relationship, and taste preferences should be evaluated due to the children's age [84].
In general, it can be said that from birth to around 16 or 18 years old, individuals are
considered paediatric patients [94]. However, when analysing this age group, it is easy to see

74
big differences in the physiological development of the body and the need for personalized
development for different stages of childhood [84].
According to the International Conference of Harmonization (ICH), childhood is
divided into 5 age groups related to the development stage (pharmacokinetic and
pharmacological). Also, the European Committee for Medicinal Products for Human Use
further subdivides the age group “children” into “preschool children”, and “school children” to
more precisely reflect the children's ability to accept and use different dosage forms (Figure 13)
[84].
Although liquid pharmaceutical forms come to mind as paediatric patients' choice, solid
forms have been preferred due to characteristics such as greater stability, longer and easier
storage, and ease of transport [84], [101].
Traditional solid dosage forms are associated with pills that are difficult to administer
to children due to their size, taste, and acceptability. The lack of choice makes it necessary to
manipulate these dosage forms, such as cracking or breaking the tablet for administration. This
type of practice, as previously mentioned, portrays the worst scenario for paediatric patients as
it results in variation in dosage, problems with adherence to treatment, and, consequently, lack
of therapeutic efficacy [87].
New approaches in developing solid paediatric formulations have been discussed
according to age and need [101]. One of the most discussed dosage forms considered promising
for developing drugs suitable for children is the mini-tablet. Mini-tablets are characterized by
Figure 13. Stages of growth. Source: Author.

75
a size ranging from 2 to 3 mm [138]. Their acceptability and swallowing are already described
by several studies [138]–[141], moreover, the flexibility of dosage and the traditional process
production (compression) make the technology a good alternative for the traditional
pharmaceutical industry [139].
Orodispersible dosage forms (films, tablets, mini-tablets, lyophilized powder forms)
are another pharmaceutical form widely discussed for paediatric patients as they can quickly
disperse or dissolve in the oral cavity [129].
In addition, as a multiparticulate dosage form, we can mention the use of pellets with
good acceptability and dosing flexibility [142], [143], which can cover a wide age range,
depending on the adaptability of the formulation. Pellets can be administered by mixing them
with food, which also provides another advantage to this form [143]. The most widely used
technique for the production of this type of formulation is extrusion-spheronization, which
offers numerous technological advantages such as a high-throughput process, ease of operation,
high drug loading capacity, and particle size with a small variation range [142].
Another pharmaceutical form that has gained visibility is chewable tablets. They are
dosage forms that have good acceptability due to characteristics such as disintegration in the
mouth through chewing, smooth texture, and not requiring water for administration. The biggest
challenge in developing this type of formulation lies in the choice of excipients [144], that must
be assertive to guarantee the good disintegration characteristics in the mouth. Also, excipients
intended to mask the taste of the API cannot be enough to this end, requiring the combination
of different sweeteners or excipients to circumventing this barrier.
5.2 3D printed forms
More recently, 3D medicine printing technology has been described as a tool capable of
bringing countless benefits, and personalization is one of the most important. The main
advantages of the technology are the ability of producing units with specific and precise doses
and high reproducibility, and it also allows production on demand, the development of polypill7
formulation and the modulation of drug release [145]–[147].
Although all these advantages are exciting to developers, the possibility of personalizing
the therapy has been one of the factors widely discussed and increasingly sought after. This
means saying, for example, that it is possible to make a specific dose adjustment for a patient
7 Polypill: range of pills that combine many medicines to provide a single solid dosage form that allows the patients
to self-administer easily [347].

76
with specific characteristics (children have different pharmacokinetics and
pharmacodynamics), making the treatment more assertive, greater patient compliance with the
treatment [146], [148]. Besides, the rationalization of medications is also an important factor as
waste is reduced. With these characteristics, the 3D printing of medicines aimed at paediatric
patients can add even more advantages, such as the possibility of more palatable and better-
accepted drugs with different types of shapes [149].
Several 3D drug printing technologies are available, among them, FDM (Fused
Deposition Modeling), which is the most studied to produce pharmaceutical forms [27], [150],
[151].
FDM principle is based on the deposition of layer-by-layer from the extrusion of a
molten/softened formulation through a nozzle tip and the deposition of the extrudate filament
onto a colder substrate (printing table), leaving behind a 3D object when the material has
solidified. The printing nozzle moves horizontally and vertically after each layer (Figure 14).
One of the first works that demonstrated the ability to print filaments in the
pharmaceutical area used Fluorescein sodium salt and PVA as a carrier polymer. Tablets of 10
mm diameter and 3.6 mm height were printed and the different possibilities of infill and the
impact on the drug release profile were evaluated [152].
Recently, a work was published describing a technique for the production of double-
layer tablets containing rifampicin and isoniazid [153]. The type of polymer, drug loading,
filling density, and layers were investigated for drug release in an acid medium, rapid
(immediate) for isoniazid, and delayed for rifampicin. The percentage of filling and the number
of layers for the adequate drug release rate were seen as crucial steps.
Figure 14. Schematic representation of 3D printing using the FDM technique with filament feed. Source: Author.

77
Formulated filaments can be produced by hot melt extrusion process, and then be later
printed by FDM [154], [155]. In this case, the first step of HME filament production with
optimal printing conditions and adequate API loading is one of the biggest challenges faced by
the pharmaceutical industry [156].
6. PHARMACEUTICAL DEVELOPMENT WITH EMPHASIS ON PZQ MEDICINES
Different approaches have already been described in the literature to improve
bioavailability for praziquantel.
In Table 3, the technical approaches were regrouped by category. The main categories
are isomers separation, modification of the crystal form (polymorphs, hydrates, cocrystal) or
their physical characteristics (reduction of crystal particle size), complexation with
cyclodextrins, lipid-based nano and microparticles, polymeric nano and microparticles and
solid dispersions (crystalline and amorphous).

78
Table 3. Literature reporting improved solubility and/or dissolution obtained through different PZQ formulation approaches.
Technical approach API concentration or proportion
(wt %, mg or p/p) PZQ final form Carrier/Surfactant Reference
Isomers separation - (+)-PZQ and (-)-PZQ - [70]
Modification of the
crystal form
- PZQ B fom - [10]
- PZQ C form - [73]
- PZQ Monohydrate form - [74]
- PZQ Hemyhydrate form - [75]
1:1 (PZQ:coformer) Cocrystals Coformers (citric, malic, salicilic and tartaric acids) [37]
Modification of
physical
characteristics of
crystals
1:1 and 1:0.5 Nanosized particles
Poloxamer 188 (P 188), P-188/Sodium lauril sulfate
(SLS), P-188/Maltodextrin (MDX), P-
188/polivinilpirrolidona (PVP)
[157]
Cyclodextrin (CD)
complexation
1:1 PZQ-CD complex Methyl--cyclodextrin (MeCD) [158]
75, 100 and 75 mg PZQ-CD complex CDs (α-, - and ɤ-) [159]
Lipid-based particles
1:1 Nanosuspension PEG-60 - castor oil hydrogenated [160]
20 mg Nanoparticles Cetyl palmitate [161]
1:1 Microparticles Gelucire® 50/13 and PVP K30 [60]
3:1, 1:1 and 1:3 Microparticles Mannitol, Gelurice® 50/13 and, Gelurice® 50/13 +
Mannitol [63]
10 % Microparticles Gelurice® 50/13 [58]
200 mg Microspheres poly (3-hydroxybutyrate) and Eudragit® E [162]
Polymer-based
particles
10, 20 and, 30 % Nanoparticles
Poly(D,L-lactide-coglycolide)
(PLGA), DL-lactide glycolide and poly(vinyl
alcohol) (PVA)
[163]
20 % Nanoparticles poly (methyl methacrylate) (PMMA) [164]–[166]
PZQ:EPO - 1:1 ; 1:2
PZQ:EPO:GMS -
1:1:0.3 ; 1:2:0.6
Microparticles Eudragit® E PO(EPO) and Glyceryl monostearate
(GMS) [61]
1:1 and 1:2:1 Microcapsules e microspheres Eudragit® E100 and Eudragit® L30D55 [134]

79
20:1, 10:1, 10:2, 10:3 Microparticles Poloxamer 407 (F-127), Sucrose stearate [69]
Solid Dispersion (SD)
10 to 100 % SD/ASD PVP K30 [67]
1:1, 1:2.4, 1:5, 1:9 ASD PVP K12, PVP K17, PVP K25 [167]
1:0.25; 1:0.5 and 1:1 SD Sodium alginate and Carboxymethylcellulose [29]
1:5 SD Calcium carbonate [168]
1:1, 1:1:1 and 2:1:1 SD Poloxamer 237 and PVP K30 [169]
1:1, 2:1 and 3:1 SD PVP K30 [65]
1:1, 1:2, 1:3 (each) SD/shaped as tablets Mannitol, Urea, PEG 6000 [170]
1:1 SD PVP K30 and Crospovidone (CROS) [59]
1:1 and 1:2 ASD PVP, PVP VA, CROSPVP and, SSG [66]
1:1, 1:2 and 2:1 SD PEG-60 - castor oil hydrogenated [171]
Eudragit® E 100 = cationic polymethacrylate polymer (granules); Eudragit® E PO = the same as Eudragit® E 100 (powder) and Gelurice® 50/13 = stearoyl polyoxyl-
32 glycerides (non-ionic water-dispersible surfactant) [60], [61].

80
Isomer’s separation. PZQ medicines currently used are produced from the
racemic mixture of the API, R‐ and D‐PZQ in different proportions, in which levo-
praziquantel (L‐PZQ or (-)-PZQ or R-PZQ) is the active principle, while the dextro-
praziquantel (D‐PZQ or (+)-PZQ or S-PZQ) is not and, furthermore, the latter is bitter
than the former. The bitterness difference is one of the driving characteristics of the
development of a formulation with only one of the isomers [42]. As the separation of both
isomers is a very expensive technique, it is usually not applied [42]. A technical route of
interest is the separation of PZQ racemic mixture and several research groups have been
working in the isomers separation to obtain L‐PZQ and D‐PZQ with high purities (higher
than 97 %) and larger scales of production (higher than 253 g kgads−1 day−1) using
chromatographic processes [172]. Unfortunately, current chemical routes are not
effective to attend large scale production.
Modification of the crystal form. The solid state directly influences properties like
solubility and dissolution kinetics of an API [48]. As already discussed, PZQ presents
different solid forms, the more used being the racemic mixture, also identified in the
literature as commercial form (crystalline) A. New polymorphic forms have been
identified more recently, named B and C [30], [73]. They are characterized by different
properties among them, the water solubility. Forms B and C appear to be more water-
soluble than the racemic form (form C with 2.7-fold > form B 1.4-fold greater of the
racemic praziquantel) [23], [56]. Despite a better solubility or dissolution kinetics, the
use of new polymorphic forms requires attention because they can be physically less
stable, as experimentally demonstrated with Forms B and C [56].
Hydrate forms of PZQ also exists. The generation of hemihydrate PZQ form was
demonstrated from two stages of grinding, starting from the racemic mixture (form A).
PZQ form A was first milled (30 min at 25 Hz), then secondly milled in the presence of
an equimolar amount of water (1 h at 25 Hz) [75]. Like the new PZQ polymorphs recently
identified (forms B and C), the resulting hemihydrate form named PZQ-HH appears to
be more soluble (1.4-fold greater) than the PZQ racemic form. A monohydrate form of
PZQ was produced by Salazar-Rojas et al. from PZQ (form A) [ 67] and characterized
with respect to the intrinsic dissolution (2.2 mg cm− 2h − 1), which was also slightly higher
than the intrinsic dissolution of the form A (1.6 mg cm− 2 h− 1).

81
Cocrystals. Cocrystals are very interesting and useful product for improving
different properties such as dissolution rate, melting point, solubility, and chemical
stability of an API during the solid-state synthesis. They are solid substances, which
consist of molecular complexes of the API with one or more solid components [173].
Pharmaceutical cocrystals are typically composed of an API and a nontoxic guest
molecule (cocrystal former) in a stoichiometric ratio. For purposes of comparison, salt
formation can improve the solubility sometimes 100- or even 1000-fold, while cocrystals
can improve it 4- to 160-fold [174]. To our knowledge, the first cocrystals of PZQ were
identified via liquid-assisted grinding of PZQ crystals and coformers. A total of nine 1:1
and 2:1 cocrystals with oxalic acid, malonic acid, succinic acid maleic acid, fumaric acid,
glutaric acid, adipic acid, and pimelic acid [33]. Among them, the cocrystals obtained
from PZQ and malic acid (1:1) showed the better solubility performance (2.1-fold greater)
than the racemic PZQ [37].
Modification of physical characteristics of crystals. It is well-established that one
of the possible approaches for overcoming dissolution rate and even low water solubility
issue is to reduce the drug particle size, leading to the enhancement of the specific surface
area, the saturation solubility (below the micrometric range), and, thus, the dissolution
rate [175]. The effect of the particle size reduction was another approach used, to improve
PZQ dissolution rate. PZQ dispersions have been developed by high-pressure
homogenization (HPH), in which PZQ crystals were brought by cavitation, high-shear
forces and collision of the particles against each other. The PZQ dispersions were
developed using different stabilizers, selected upon PZQ saturation solubility after
screening (Poloxamer 188, Poloxamer 188/Sodium lauril sulfate, Poloxamer
188/Maltodextrin, Poloxamer 188/ Polyvinylpyrrolidone PVP). After 60 cycles of HPH,
all formulations exhibited a particle size distribution below 2 μm, with highly significant
reduction with respect to PZQ raw material (d10 8.24 ± 0.3 µm, d50 18.63 ± 0.8 µm and
d90 102.31 ± 29.9 µm). Characterization studies including particle size distribution,
crystallinity, morphology, drug content, and in vitro dissolution profiles, were performed
over selected formulations. The formulation with the smallest particle size distribution
(d10 830.3 ± 131.4 nm, d50 1063.3 ± 193.5 nm and d90 1132.7 ± 205.4 nm) was produced
in presence of Poloxamer 188/PVP as stabilizer, corresponding to the better improvement
on the dissolution kinetics. In this study, PZQ crystallinity was partially preserved during
the HPH process. It is well established in the literature [175], [176] that crystal structure

82
change or even amorphization can occur during particle size reduction by milling
processes.
Complexation of PZQ and cyclodextrins. Cyclodextrins (CDs) have been widely
investigated as a unique pharmaceutical excipient for past few decades and is still
explored for new applications [91]. CDs can be defined as cyclic oligosaccharides
assembled of D-(+) glucopyranose units connected by α- (1,4) glucosidic bonds to form
torus-like macro rings. Naturally occurring α, β, and γ CDs consist of 6, 7, and 8
glucopyranose units, respectively, and differ in their molecular weight, cavity size, and
solubility (Figure 15) [91].
PZQ has already been formulated with and ɤ - cyclodextrins [159]. Using high-
resolution solid-state NMR spectroscopy, the interaction between PZQ and the
cyclodextrins and derivatives were deeply investigated. The PZQ presented a tendency to
stay in an anti-conformation in the complex, especially in the molar ratio 1: 2 PZQ:CD
[177]. Other PZQ:CD complexes were also developed, for example, with methyl--
cyclodextrin (modified CD with a methoxy group instead of primary hydroxyls) (1:1
stoichiometry), in which PZQ was found to be completely amorphous, with 5.5-fold water
solubility increase, suggesting that this PZQ:CD complex may be more bioavailable than
the racemic PZQ alone [177].
Figure 15. Representation of the chemical structure and the molecular shape of α, β, and γ cyclodextrins.
Source: from [91] (with permission).

83
Hydroxypropyl--cyclodextrin was also used to form complex with PZQ
cocrystals (PZQ: malic acid coformer) previously described in this section [37]. The
cyclodextrin complex formed with the PZQ: malic acid cocrystals (1:1) resulted in 2.2-
times the solubility of the racemic raw PZQ crystals, comparable to that of the PZQ
cocrystals before complexation (2.1 times the solubility of the racemic raw PZQ crystals).
Furthermore, it appears that all tested systems (cocrystals and cyclodextrins)
showed photostability problems, causing degradation of about 7.9 % and 6.8 %,
respectively.
Lipid-based particles. Micro and nanoparticulate forms constituted by racemic
PZQ and lipids are another formulation approach that has been investigated. In this
category, it can be found solid lipid nanoparticles (SLN) of PZQ with different lipids, for
example, cetyl palmitate [161], and hydrogenated castor oil [160].
Different methods have been employed for this end. The first method consists in
elaborating a mixture of PZQ and lipid to produce a clear melting solution, to which an
aqueous surfactant solution is added under mechanical agitation (or sonication) to form a
hot nanoemulsion. The hot nanoemulsion is then cooled down to obtain a nanoparticle
suspension. This method was employed to produce SLN nanosuspension of PZQ and
hydrogenated castor oil [160].
Another method is called hot homogenization technique. Here, PZQ is
incorporated into the melted lipid. The drug loaded lipidic phase is dispersed in a hot
aqueous phase containing surfactants under continuous stirring to form a coarse o/w
emulsion. It is then homogenized at the temperature above the melting point of the lipid
using high pressure homogenization with piston-gap homogenizers to form o/w
nanoemulsion, which is then cooled to room temperature for solidification and formation
of solid lipid nanoparticles. The hot homogenization method was employed to produce
SLN nanosuspension of PZQ and cetyl palmitate, using Tween® 80 in the aqueous phase
[161].
The mentioned PZQ-SLN formulations presented some similar physical
characteristics, for example, a nanometric size and low polydispersity index (in the range
of 260-300nm for PZQ- hydrogenated castor oil and PZQ-cetyl palmitate SLN, with a
polydispersity index less than 0.3). Regarding PZQ-cetyl palmitate SLN, an improved
dissolution profile and great parasiticidal properties was demonstrated. For PZQ-
hydrogenated castor oil SLN, the pharmacokinetics and therapeutic efficacy of the

84
suspension were studied in dogs (subcutaneous administration of the suspension). The
results demonstrated that SLNs increased the bioavailability of PZQ 5.67-fold and
extended the mean residence time of the drug from 56.71 to 280.38 hours.
PZQ nanoparticles with hydrogenated castor oil solid lipid (1:1) were also tested
later [178] to other administration routes (oral, intramuscular, and subcutaneous) in rats.
The different routes of administration tested (intramuscular, and subcutaneous) were
expected to represent alternative ways to overcome the extensive first-pass effect
evidenced by the oral route. In this way, the dose reduction for the formulated products
could be expected.
PZQ has also been formulated with lipids at the microscopic size scale, with
several excipients and by different methods, among them, co-milling or melt granulation.
Spray congealing is frequently used as the cooling step. In this process, the molten
material is sprayed through nozzles into a chamber containing cool air t produce spherical
uniform shaped particles (microspheres).
Gelucire® 50/13 is the lipid most used in the lipid based PZQ microspheres. For
Gelucire® 50/13 was used to produce microspheres with different PZQ loads (5, 10, 20,
and 30 wt%) by using an ultrasonic spray congealing process [58]. Microspheres with
different sizes (75-150 µm, 150-250 µm, and 250-355 µm) were generated. Unlike the
microspheres size, the dissolution rate was impacted by the PZQ load in the microspheres,
being lowered for loads higher than 15 % PZQ. The PZQ solubility was increased 3-times
compared to the solubility of raw PZQ crystals.
Gelucire® 50/13 was also used with other additives such as polyvinylpyrrolidone
(PVP) [60] or Mannitol [63] or misture of both [63]. In all cases, PZQ solubility was
improved, for example, 2 times for microspheres composed by PZQ and Gelucire® 50/13
(1:1), and 4.6 times when PZQ was firstly co-milled with crospovidone (1:1) [60], [179].
Formulations based on lipids as excipients presents advantages such as solvent-
free, rapid, and low expensive manufacturing methods able to increase the dissolution
rate of PZQ. Their use presents the challenge for evaluating controlled release of the
loaded drug and the long-term physical stability due to polymorphic transformations of
lipids than can take place during aging.
Polymer-based particles. Another way to improve the dissolution and solubility
of poorly water-soluble APIs is by producing microparticles or nanoparticles with
polymers.

85
In general they are produced by an emulsion–solvent evaporation process [163]
aiming a controlled PZQ release. Typically, a solution of the polymer in an organic
solvent is produced to which PZQ is added. The resulting organic solution containing
PZQ and the polymer is poured in an aqueous phase generally containing a surfactant like
poly(vinyl alcohol), PVA. The emulsion is then subjected to constant stirring, followed
by evaporation of the solvent (by vacuum generally), leading to the entrapment of PZQ
into the polymeric micro or nanoparticles formed. The micro or nanoparticles formed can
be washed to remove additives, such as surfactants, filtered and dried under appropriate
conditions [4].
The technique was used for example to encapsulate PZQ in PLGA nanoparticles
containing 10 to 30 wt% PZQ. In all nanoparticles produced, PZQ was found to be
amorphous. Throughout characterisation studies, no molecular interactions between PZQ
and PLGA have been identified and the physical stability of nanoparticles was confirmed
after four months of storage at room temperature [163]. The same process was used to
produce PZQ microspheres using poly (3-hydroxybutyrate) (PHB) and mixtures between
this biodegradable polymer and Eudragit® E, a cationic copolymer based on
dimethylaminoethyl methacrylate, butyl methacrylate, and methyl methacrylate. [162]. It
was found, during in vitro dissolution tests, that the mass composition 75:25 (Eudragit®
E: PHB) significantly improved the PZQ release compared to the microspheres
containing PZQ and PHB alone. The increase in the dissolution kinetics of the drug was
related to the high proportion of Eudragit® E present in the formulation that gave them
characteristics of greater porosity. In summary, with polymer-based particles the PZQ
release kinetics may be modulated by the type of polymer and its content in the particles.
Miniemulsion polymerization has also been used to manufacture of polymer
nanoparticles containing PZQ [165], [180]. This technique presents many advantages,
including the non-use of toxic solvents and the possibility to perform the encapsulation
of chemicals in-situ. Two phases comprise a typical formulation: the aqueous dispersant
phase and the emulsified organic phase, which contains monomers and co-stabilizers. The
monomer droplets are stabilized by surfactants added to the aqueous phase (which
prevents particle coalescence). At least one co-stabilizer is added to the organic phase
(which prevents the diffusional degradation of the droplets). Ionic surfactants can be
anionic or cationic and form electrical layers around the particles that reduce particle
collision rates and coalescence efficiency. Nanoparticles loaded with PZQ were prepared
through in situ miniemulsion copolymerization of methyl methacrylate (MMA) with

86
diethylaminoethyl methacrylate (DEAEMA) or dimethylaminoethyl methacrylate
(DMAEMA) as comonomers. Due to the cationic nature of the water-soluble
comonomers, the use of different ionic surfactants was also investigated (cetyl trimethyl
ammonium bromide (CTAB) as a cationic surfactant or sodium dodecylsufate (SDS) as
an anionic surfactant in deionized water). The organic phase was prepared with 0–20 wt%
of PZQ, mineral oil, and one wt% of Aazobisisobutyronitrile (AIBN, used as free-radical
initiator) MMA. Nanoparticles with narrow particle size distributions, characteristic
average diameters ranging from 50 nm to 110 nm, and loaded with 20 wt% of PZQ were
manufactured successfully [180]. However, it was possible to observe that PZQ
significantly impacted the course of the polymerization and stability of obtained
nanoparticles.
Polymer-based particles containing PZQ can also be produced by other techniques
like hot-melt extrusion and spray drying [61]. For example, the development of a
paediatric PZQ formulation containing Eudragit® and glyceryl monostearate was
performed testing the two mentioned techniques. Glyceryl monostearate was added to
provide better flow in the physical mixture and as taste masking agent. The final mass
proportions studied for PZQ: Eudragit®: glycerol monostearate were: 1:1:0.3 and 1:2:0.6.
The mixtures were extruded, and the resulting HME-filaments were ground after the
process (particle size - 3 to 400 μm). On the other hand, the same formulations were
processed by spray drying. For that, the mixtures were dissolved in absolute ethanol to
give a solution that was then spray-dried. Spray-dried powders are smaller (1–16 μm)
than those produced by milling of the HME-extrudate. Both systems showed an increase
in dissolution (PZQ8; 0.2 mg/mL; spray-dryed powders PZQ: E: GMS 27.8 % 0.6 mg/mL,
and extrudates5 PZQ: PEG 27.8 % (70-100 °C) 0.4 mg/mL). Taste masking was more
effective for the particles obtained by HME process. However, this result was obtained
from in vitro test9, and an in vivo evaluation would be necessary (PZQ 0.17 mg/mL;
physical mixtures with 43.5 % PZQ 1.1 mg/mL; spray-dried powders with 43.5 % PZQ
0.3 mg/mL; ground extrudates with 43.5 % PZQ 0.03 mg/mL; physical mixtures with
27.8 % PZQ 1.3 mg/mL, spray-dried powders with 27.8 % PZQ 0.9 mg/mL, and ground
extrudates with 27.8 % 0.03 mg/mL).
8 non-sink dissolution profiles in Simulated gastric fluid sine pepsin (spSGF) 9 no sink dissolution in simulated salivary fluid (SSF)

87
Solid dispersions. One promising approach for solubility enhancement is solid
dispersion, which has also been investigated for PZQ [92]. A solid dispersion consists of
one or more hydrophobic API dispersed in a hydrophilic inert carrier or a mixture of
carriers [181], [182]. The classification of solid dispersions as eutectic mixtures, solid
solutions and vitreous solutions is based on the physical state of the API and its carrier
[183]. Solid dispersions are divided in four generations: the first used crystalline carriers
and the API can be crystalline or amorphous; the second generation used amorphous
polymeric carriers with crystalline or amorphous APIs, the third used carriers with surface
activity or emulsifying properties, which can improve the dissolution properties and
finally, the fourth can be referred as controlled release solid dispersions, for which the
release kinetics are modulated with soluble or insoluble-water carriers [92], [181], [184],
[185].
Perissuti et al [179] shows different types of solid dispersion that have been
proposed for PZQ improvement of properties such as water solubility, dissolution kinetics
and palatability. Different processes (milling, solvent evaporation) have been employed
to produce solid dispersions with PZQ and excipients. A variety of them can be seen in
Table 1: water-soluble polymers such as polyvinylpyrrolidone (PVP), polyethylene
glycol (PEG) and alginate, insoluble form of polyvinylpyrrolidone (crospovidone,
CROS), sugar alcohol (mannitol), cellulose derivatives (carboxymethylcellulose) and
other organic (urea) and inorganic (calcium carbonate) compounds.
Solvent evaporation method is the most applied to produce solid dispersions
containing praziquantel. In most studies, PZQ and the polymer carrier are dissolved in a
common solvent, for example, ethanol [167]. Afterward, the resulting organic solution is
subjected to drying, and different drying techniques can be used for this step, such as
drying oven under reduced pressure [29], [169] or rotary evaporation [167].
Most studies discuss the types of polymers or surfactants used, the mass
proportion between components in a mixture, or the solvent composition on the final solid
properties such as physical characteristics and solubility and dissolution performances.
Some examples of partially amorphous solid dispersions of PZQ produced by
solvent evaporation are given in Table 1. A first example can be given, in which the final
state of PZQ depended on the solvent composition [65]. In this case the polymer was
PVPK 30, and different solvents (water, ethanol, and water/ethanol) were used to produce
the liquid formulations of PZQ and PVPK 30. Solid dispersions produced from solvents
containing water led to the presence of crystalline PZQ in the solid form, whereas an

88
amorphous form was obtained with pure ethanol. These differences in the solid state of
PZQ resulted in differences in the solubility too. SDs prepared with a mixture of water
and ethanol presented lower solubility when compared to those obtained only with
ethanol.
Another example is related to solid dispersions produced with sodium starch
glycolate (SSG) [66]. SSG is an excipient commonly used in oral pharmaceuticals as a
disintegrant to promote rapid disintegration and dissolution of immediate release solid
dosage forms. PZQ solid dispersion was prepared using co-solubilisation (in ethanol) and
solvent evaporation consecutive step. The mass proportions between PZQ and SSG were
2:1, 1:1, 1:2 or 1:3. Traces of crystalline PZQ were found in these solid dispersions,
although an amorphous form of PZQ was expected. Despite that, the partially amorphous
solid dispersion PZQ:SSG 1:3 could increase the dissolution10 rate compared to the
equivalent physical mixture of constituents, as well PZQ alone (PZQ: SSG 90 %, PM 70
%, and PZQ 60 % dissolved in 120 min) [66].
Solid dispersions of PZQ and three different carriers (mannitol, urea, and PEG
6000) in the mass proportions PZQ: carrier of 1: 1, 1: 2, and 1: 3 were also obtained by
solvent (chloroform) evaporation [170]. The better results on dissolution enhancement
were obtained with the composition PZQ: PEG 6000 1: 2, which was attributed to the
hydrophilic characteristics of PEG 6000 (better wettability and dispersibility abilities).
The solid dispersions were used to produce tablets by direct compression. The in vitro
PZQ controlled release reached about 82 % in 12 h.
Another parameter affecting solid dispersion properties is the characteristics of
the polymer, like its molecular weight. As an example, amorphous solid dispersions of
PZQ were prepared in a rotatory evaporator using different types of polyvinylpyrrolidone
with molecular weights of 3000 (PVP K12), 11000 (PVP K17), and 34000 PVP K25
g/mol [167]. The best solubility performance (10 times greater than PZQ alone) was
obtained with the lower molecular weight polymer, PVP K12, demonstrating the effect
of this parameter, which may influence other polymer properties including glass transition
temperature, solution, and melt viscosity.
Amorphous solid dispersion is the formulation approach employed in this thesis
and will be focused on the next section.
10 The dissolution test was performed in 900 mL of 0.1 M HCl with 0.2 %w/v of sodium lauryl sulphate, at
37 ± 0.5 °C, rotating at 50 rpm, and for 120 min. PZQ (USP method).

89
7. AMORPHOUS SOLID DISPERSIONS
Amorphous solid dispersions (ASDs) are widely known for their definition: an
amorphous API dispersed in an amorphous phase which comprises a polymer, a mixture
of polymers, or a mixture of polymers and surfactants [186]. Amorphous solid dispersions
are an increasingly important formulation approach to improve the dissolution rate ant
the apparent solubility of poorly-water soluble compounds such as PZQ and will be
focused on this section.
7.1 The amorphous state
Solids can be either amorphous or crystalline. Pharmaceutical companies have
focused, in a historic way, on developing crystalline forms of molecules of
pharmacological interest and much effort has gone toward discovering and developing
the most stable crystalline form of an API. Developing the most stable form will prevent
changes in the formulation after manufacture and helps to ensure a reliable API product.
Some main pharmaceutical features of crystalline and amorphous compounds are
grouped in Table 4. In the crystalline state the molecules are structured regularly in a
lattice formation, while amorphous solids are disordered at the molecular level, with some
short-range packing order but lacking the long-range order of a crystalline form.
Van der Waals forces, hydrogen bonding and other intermolecular interactions
hold the molecules within the crystal lattice, resulting in lower molecular mobility.
Because the molecular interactions in the crystalline state are strong, the compound is
usually more stable, but the dissolution rate is slower.
As illustrated in Table 4, amorphous solids have higher dissolution rates than the
crystal forms and, when they are dissolved, API concentrations in solution can be higher
than the saturated solution of the crystalline form (i.e., they can form a supersaturated
solution for which the highest concentration is known as 𝐶𝑚𝑎𝑥). The super-saturated state
is temporary because the API recrystallises back (𝑇𝑟𝑒𝑐𝑟𝑦𝑠𝑡𝑎𝑙𝑙𝑖𝑠𝑎𝑡𝑖𝑜𝑛) to the saturation
concentration equal to that of the crystal form, 𝐶𝑒𝑞𝑢𝑖𝑙𝑖𝑏𝑟𝑖𝑢𝑚. The temporarily
supersaturated API solution creates a time window for enhanced in-vivo absorption.
Therefore, maintaining the compound in its amorphous state is one of the great challenges
in formulation development.

90
Figure 16 represents a schematic depiction of the variation of enthalpy (or volume)
as a function of temperature for crystalline and amorphous states of a pure compound
[78], [187], [188]. When a crystalline compound is heated, it undergoes melting at
temperature 𝑇𝑚. Then when the molten compound is slowly cooled, the molecules have
sufficient time to move from their current location to a thermodynamically stable point
on the crystal lattice, regenerating a crystalline structure. If, however, the molten
compound is cooled suddenly, it can reach a super-cooled liquid state. If it is cooled
further below its 𝑇𝑚, the system remains in equilibrium until the glass transition
temperature (𝑇𝑔) is reached, below which it enters a nonequilibrium (rubbery) state and
converts into the amorphous (glassy) state of the compound.
= one API molecule, = crystal bond
Stability physical structure
Feature Crystalline Amorphous
Schematic structure of one
powder particle
C max = highest apparent solubility
C equilibrium = intrinsic solubility of the API
T recrystallization = time at wich API starts to recristallize after having reached its highest apparent solubility
Molecular orientation Regular Irregular
Strong Weak
Dissolution
Tabela 4. Pharmaceutical features of crystalline and amorphous compounds. Source: Author and adapted
from [249].

91
The glass transition is a second order thermodynamic transition characterized by
a step change in the heat capacity which is also associated with changes in other
thermodynamic properties such as volume, enthalpy, and entropy [187]. The amorphous
state has a higher free energy than the crystalline state and molecules or atoms can convert
gradually into the highly ordered crystalline state if they are maintained at a specific
temperature for a long time [148], [151]- [156].
7.1.1 Characteristics of amorphous solid dispersions
7.1.1.1 Parachute effect
The challenge is in creating concentrations of the API that are many times higher
than the thermodynamic solubility concentration and maintaining these high
concentrations for an adequate time for the absorption process to take place.
The benefit of supersaturation as a strategy for improving the intestinal absorption
and bioavailability of ASDs depends on two essential steps: the generation (the ‘spring’)
Figure 16. Schematic depiction of the variation of enthalpy (or volume) as a function of temperature for
crystalline, amorphous (glassy). Source: Author and adapted from [78].

92
and maintenance (the ‘parachute’) of the metastable supersaturated state, as largely
described in the literature [193]–[196] and depicted in Figure 17.
The ‘spring’ effect is due to the higher energy form of the amorphous solid form
(compared to the crystalline form) and has already been demonstrated for different APIs
(e.g.: felodipine, indomethacin, carbamazepine, glibenclamide, hydrochlorotiazide)
[197]–[200]. Once supersaturation has been induced, recrystallisation of API molecules
will occur through kinetically or thermodynamically controlled processes.
The ‘parachute’ is the temporary inhibition of recrystallisation by interfering with
nucleation and/or crystal growth, achieved by the use of other components such as
polymers and surfactants [195], [201] [195], [202].
7.1.1.2 Physical stability
Besides the parachute effect on the dissolution of the amorphous API, the presence
of excipients such as polymers, surfactants, or mixtures of both will also contribute to a
better physical stability of the formulation, by decreasing the activation energy for API
recrystallization (Figure 18) [186], [203].
Figure 17. Representation of the "spring" and "parachute" model: high supersaturation (stable form of the
API) achieved by the amorphous phase (the spring), while desupersaturation is retarded (the parachute) by
the action of recrystallisation inhibitors. Adapted from [196].

93
Amorphous materials are very sensitive to their environmental conditions and
temperature and humidity can directly affect their stability [204]. Polymer carriers can
improve the physical stability of the amorphous compounds by increasing the glass
transition temperature (𝑇𝑔) [205] (see more details in 7.1.2.1 Glass transition). However,
polymer carriers not only stabilize the dispersed amorphous API but can also increase
wettability and, prevent API recrystallisation in the gastrointestinal tract (GIT), as
reported in the literature [202], [206] and already said before.
Currently, carriers are categorized as synthetic and natural, and they are selected
based on several factors, such as toxicity, cost, physical and chemical properties and
processability (melting, solubilization in solvents).
Natural product-based polymers are mainly composed of cellulose derivatives
such as hydroxypropyl methylcellulose (HPMC), hydroxypropyl cellulose (HPC),
hydroxypropyl methylcellulose acetate succinate (HPMC-AS), hydroxypropyl methyl
cellulose phthalate (HPMCP) and ethylcellulose [78], [205], [207].
Polyvinyl pyrrolidone (PVP), polyethylene glycols (PEG), polymethacrylates
(PMMA) and, poly-(vinylpyrrolidone-co-vinyl acetate) [78], [206]–[209] are some
examples of carries in the group of synthetic polymers.
It has been demonstrated in the literature that the presence of surfactants has the
potential to reduce recrystallization by inhibiting nucleation and crystal growth [210]–
[213], which depends on factors like the chemical structure of the API and the surfactant,
the temperature, and the pH [201]. [214], [215]. For example, different formulations of
Fre
e en
erg
y
Figure 18. Amorphous API versus ASD in terms of activation energy barrier. Adapted from [186], [207].
Diagram is not scale.

94
efavirenz (API) containing a polymer carrier (HPMC HP 50 and HP 55) and a mixture of
two surfactants (sucrose palmitate and polysorbate 80) in different concentrations were
used to produce ASD by the hot melt extrusion process [216]. The presence of surfactants
in the formulation accelerated the dissolution (probably increasing wettability), without
impact on 𝐶𝑚𝑎𝑥 measured during dissolution. The surfactants currently used in the
production of solid amorphous dispersions are shown in Table 5.
Table 5. Summary of the surfactants generally used in amorphous solid dispersions [217]–[220].
Class Surfactants Trade name Tm (ºC)
Non ionic
Poloxamer 188 Kolliphor® P188 52-57
Poloxamer 237 Kolliphor® P237 49
Poloxamer 338 Kolliphor® P338 57
P407 Kolliphor® P407 55
Polysorbate 20 Tween™ 20 -
Polysorbate 80 Tween™ 80 -
Sorbitan monolaurate Span™ 20 -
d-α-tocopheryl polyethylene
glycol 1000 succinate TPGS 1000® 37-41
Anionic Docusate sodium 153 -157
Sodium lauryl sulfate Kolliphor® SLS
7.1.2 Evaluation of amorphous solid dispersion properties
As already introduced, amorphous solid dispersions appear to be a suitable
formulation for increasing the dissolution and absorption rates of poorly soluble APIs.
Key parameters of interest that can influence product performance include the glass
transition temperature (𝑇𝑔), miscibility between the API and carrier/excipients and the
rate and extent of API recristallisation.
7.1.2.1 Glass Transition
The first thermal event associated with an amorphous system is the glass transition
temperature (𝑇𝑔) which is the temperature at which an amorphous “glass” turns into a
metastable “supercooled liquid” [192], as illustrated in Figure 18.

95
The molecular level mixing of an amorphous API with an amorphous polymer can
lead to a binary system considered miscible when only one 𝑇𝑔 is observed as also
represented in Figure 19 (𝑇𝑔𝑚𝑖𝑥). More than one 𝑇𝑔 indicates more than one amorphous
phase.
Assuming that the glass transition temperature of an amorphous solid dispersion
is between the temperature of the pure API and that of the pure polymer, the increase of
𝑇𝑔 to 𝑇𝑔𝑚𝑖𝑥 might increase physical stability by reducing molecular mobility [221]
(Figure 19). The use of polymers with high glass transition temperatures are preferred as
they act as anti-plasticizers leading to higher 𝑇𝑔𝑚𝑖𝑥 [222].
The relation between the physical stability of ASDs and their composition was
demonstrated for example with sildenafil ASDs and two different polymer carriers,
PVPVA and PVA [221]. The 𝑇𝑔 of the individual constituents were 57.85 ºC, 102.85 ºC
and 40.85 ºC for the API, PVPVA and PVA, respectively. The increase on PVPVA
concentration resulted in increased 𝑇𝑔𝑚𝑖𝑥 (51.85 ºC with 25 % PVA to 92.85 ºC with 75
Figure 19. Plot of enthalpy, entropy, or free volume in function of temperature for molecular substances.
Adapted from [192], [231].

96
% PVPVA), whereas an opposite effect was observed with PVA (68.85 ºC with 25 %
PVPVA to 42.85 ºC with 75 % PVA), negatively impacting the physical stability of the
resulting PVA- sildenafil ASDs.
Although its low 𝑇𝑔, PVA has been successfully used as carrier in other amorphous
formulations (ASD) with APIs such as rebamipide (RBM) with a high 𝑇𝑔 of 215.4 ºC.
For this binary, a formulation with 30 % PVA and a lowered 𝑇𝑔𝑚𝑖𝑥 of 178.4 ºC did not
show signs of physical evolution when exposed to stress conditions of humidity (75 %
RH) during a stability test performed for 11 days.
Several equations are described to predict the Tg of solid mixtures such as Fox or
Couchman-Karasz (CK) or Gordon-Taylor (GT) [222]–[224]. The later has been widely
used and reported in scientific publications [78], [88], [188], [225] to predict the 𝑇𝑔𝑚𝑖𝑥 of
amorphous mixtures from 𝑇𝑔 temperatures of the individual components (API and
polymer) assuming an ideal mixture:
Equation 1
𝑇𝑔𝑚𝑖𝑥 = 𝑊1𝑇𝑔1 +𝐾𝑔𝑊2𝑇𝑔2
𝑊1+ 𝐾𝑔𝑊2
This equation assumes that 𝑇𝑔𝑚𝑖𝑥, 𝑇𝑔1, and 𝑇𝑔2 are glass transition temperature of
the mixture (API-polymer), amorphous API, and polymer. 𝑊1 and 𝑊2 are the weight
fraction of API and polymer, respectively, and k is a constant that depends on the level of
interaction between the API and the polymer [51], [67], [154]. This constant can be
determined using the Equation 2.
Equation 2
𝐾 = ∆𝐶𝑝
𝑃𝑍𝑄
∆𝐶𝑝𝐾𝑜𝑙
Where ∆𝐶𝑝𝑃𝑍𝑄
and ∆𝐶𝑝𝐾𝑜𝑙 correspond to the heat capacity step of 𝑇𝑔 for the API
and polymer, respectively.
Differences between experimental 𝑇𝑔𝑚𝑖𝑥 and theoretical 𝑇𝑔𝑚𝑖𝑥 calculated by the
Gordon-Taylor equation (ideal mixture, without interactions) have been attributed to
intermolecular interactions between constituents or self-associations [192], [226].

97
Negative 𝑇𝑔𝑚𝑖𝑥 deviations can occur if molecular forces between API and polymer are
weaker than self-associating interactive API-API or polymer-polymer forces [224].
Negative 𝑇𝑔𝑚𝑖𝑥 deviations may also be related to unidentified phase separation, when two
amorphous phases are formed by only one of them is detected [192], [226].
Unlike, interactions between components can also result in lower free volume and
higher 𝑇𝑔 values [224], [227]. The work of Liu and collaborators [228] is mentioned
here to illustrate one study case in which higher experimental 𝑇𝑔𝑚𝑖𝑥 was measured for co-
amorphous systems. Different co-amorphous (API-API) samples (cimetidine/naproxen,
cimetidine/indomethacin, naproxen/indomethacin) were analysed by the association of
different analytical techniques (DSC, Raman and terahertz spectroscopies and 13C solid
state NMR). All co-amorphous mixtures showed a single 𝑇𝑔𝑚𝑖𝑥 (42.3, 59.7 and 22.3 °C)
higher than the GT calculated values (9.2, 44.7 and 10.7 °C) and the positive deviation
was explained by the authors by interactions de type π – π, salt formation and hydrogen
bonds between the respective components.
7.1.2.1.1 Additional factors influencing glass transition
The glass transition is a kinetic event influenced by the presence of additives, the
production process (thermal history) but also by the measurement method (heating or
cooling rate) [229], [230].
The addition of a plasticizer to the polymer carrier causes the polymer chains to
separate and an increase in the free volume [231], [232]. As a result, polymer chains can
move more easily, and the more easily this occurs, the lower the temperature required for
the polymer to leave the glassy rigid state to enter the rubberized soft. 𝑇𝑔 will change
according to how easily the polymer chains move. Other factors can influence the
movement of the chains, such as the pending groups.
The experimental procedure can also influence the 𝑇𝑔 value by changing the
cooling rate or the experimental measurement protocol used [231], [233], [234]. As an
example, a study performed with sucrose (70 % and 30 wt%) solution [235], evaluating
the impact of two cooling rates during DSC analysis (150 ºC/min and 1 ºC/min), is cited.
For the more concentrated sucrose solution (70 wt%), a lower 𝑇𝑔 (-66.7 ºC) was
measured from the rapid cooling compared to the slow one (𝑇𝑔 -64.6 ºC).

98
For the more diluted sucrose solution (30 wt%), also a lower 𝑇𝑔 (-34.6 ºC) was
measured from the rapid cooling compared to the slow one (𝑇𝑔 33.3 ºC).
These results were related to the amount of frozen water. More water could be
frozen in a slower cooling, so higher 𝑇𝑔 were obtained [235].
Other factors can also affect 𝑇𝑔 as the amorphous sample preparation process. For
example, amorphous solid dispersions of nisoldipine (API) and PVP K25 as polymer,
containing 30 wt% of nisoldipine were prepared by two different methods involving
solubilisation of API and polymer in a common solvent (methanol), which was then
evaporated in a subsequent step. The processes used were spray drying and rotary
evaporation. The resulting ASDs presented different 𝑇𝑔 85 °C (from spray drying) against
103.5 °C (from rotary evaporation). The lowering of 𝑇𝑔 on the sample obtained from
spray drying may be due to an incomplete drying of the product during the process, via
the plasticization effect of water.
Finally, concerning the impact of the cooling rate during ASDs production, it has
been demonstrated that ASDs produced using slower cooling rates have lower 𝑇𝑔𝑚𝑖𝑥 than
those quickly cooled [236]. As last example, three different cooling systems were
evaluated: a) compressed air (AC) 25 ºC, b) room temperature (RT) and, c) liquid nitrogen
(LN) in the production of solid dispersions of indomethacin (INM/30 wt%) with a
surfactant (P407/15 wt%) and a mixture of polymers (PVPVA 64 (27.5 wt%) and PL-
360 (27.5 wt%) [219]. The 𝑇𝑔𝑚𝑖𝑥 was higher for the rapidly cooled sample (LN/70.19 ºC,
RT/69.24 ºC, AC/67.42 ºC). This means that the cooling speed can impact the rate of
amorphization and/or recrystallization.
7.1.2.1.1.1 Correlation of solid dispersion stability and 𝑇𝑔
The main factors that influence the stability of supersaturated solid amorphous
dispersions characterized by an inherent recrystallization tendency are the temperature
and moisture because they can dramatically impact the molecular mobility of the system.
If a sample is stored below its 𝑇𝑔, the risk of devitrification is considerably reduced.
Although it is often not feasible for the product, the literature describes the storage
temperature rule “50 °C below 𝑇𝑔” to reduce molecular mobility [224], [237], [238].
Amorphous solid dispersions can be supersaturated at room temperatures
commonly applied for material storage (20 °C to 40 °C) and their physical stability will

99
be strongly dependent on their demixing kinetics under these temperature conditions
[237].
Similarly, the presence of moisture leads to an increase in the free volume due to
the formation of hydrogen bonds with polymeric chains increasing the distance between
them. This increase in volume leads to a decrease in 𝑇𝑔 [236], [239]. This phenomenon
has been widely described in the literature. A decrease in 𝑇𝑔 with increasing relative
humidity is illustrated here for starch materials as an example: wheat starch (𝑇𝑔 90 ºC at
0.151 % RH; 𝑇𝑔 67 ºC at 0.164 % RH) and pregelatinized wheat starch (𝑇𝑔 127 ºC at
0.078 % RH; 92 ºC at 0.122 % RH) [231].
7.1.2.2 Solubility of the API in the polymer matrix
The solubility of an API in a polymer matrix is a very important parameter that
must be considered during polymer selection for an ASD [206].
A phase diagram is very useful to predict the stability of a binary ASD under
different temperature conditions. A simplified phase diagram of API/polymer binary
mixture is given in Figure 20. Here, the solubility line describes the amount of API that
can be dissolved into a polymer without re(crystallization). For a given temperature, the
ASD is thermodynamically stable if its composition is left of the solubility line. Below
the solubility line, the API tends to recrystallize, which might compromise the
bioavailability-improving effect of an ASD.
The curve of API solubility in the polymer (solid curve) is particularly important
not only to select the lower limit of the processing temperature to obtain a molecular
dispersion by a thermal process like as hot melt extrusion, but also to understand the
supersaturation level of such dispersions when they are cooled down (e.g., to the storage
temperature).

100
The glass-transition temperature (𝑇𝑔𝑚𝑖𝑥) depicts the transition temperature from
the super-cooled, glassy state of the formulation to its liquid state. The glass transition
temperature 𝑇𝑔 curve can be correlated from using empirical approaches, e.g., the
Gordon-Taylor-Equation or can be measured experimentally from fused physical
mixtures by thermal (DSC) analysis (dotted curve). The glass-transition temperature
indicates a change in mobility and viscosity which usually dramatically decreases the rate
of crystallization and/or phase separation, a knowledge of which is essential for predicting
the storage stability of an ASD [184], [240], [241], mainly when it is supersaturated.
For example, Figure 19 shows two kinetically unstable regions (III and IV – pink
region). In region III, above the 𝑇𝑔𝑚𝑖𝑥 dotted curve, API recrystallization has a high
probability to occur due to the higher molecular mobility in the supersaturated state. In
region IV, below the 𝑇𝑔𝑚𝑖𝑥 dotted curve, there is a reduction in mobility and viscosity
which reduces the rate of demixing (phase separation) and API crystallization [184],
Figure 20. Diagram showing the change in equilibrium concentrations as a function of temperature (in pink)
and the change in glass transition temperatures of the mixture (in purple). The intersection of these two
curves delimits zones of stability I, II, III and IV.

101
[240], [241]. In contrast, in regions I and II (blue region), the binary mixture is
undersaturated [240], [241].
Generally, 𝑇𝑔𝑚𝑖𝑥 decreases continuously from that of the pure polymer to that of
pure API [242]. Ideally, a molecular dispersion should be kinetically stable at its storage
temperature as this is important for its dissolution profile. The potential risks with
unstable systems are phase separation or recrystallisation (short-term or long-term) and a
negative impact on apparent solubility and dissolution kinetic profiles [242]. Such
stability can be achieved by carefully selecting the composition of the binary mixture.
Although the knowledge of the thermodynamic phase behavior is very important,
experimental results for these systems are rather limited in the literature. Measuring the
API solubility in polymers is still a challenge due to the high polymers viscosity that
hampers the solubility equilibrium achievement (equilibrium between a crystalline solute
and its solution) and makes difficult the experimental construction of solubility curves in
a low time consuming [184]. For this reason, different methods have been developed to
determine the solubility of APIs in polymeric carriers, among them, methods based on
thermal analysis such as the melting point depression method [243], [244], the dissolution
end point [244] and recrystallization methods [223], [245].
Figure 21 shows the schematic time evolutions of 𝑇𝑔𝑚𝑖𝑥 of an API/polymer
mixture when reaching its equilibrium solubility upon annealing [246]. The top curve
corresponds to a dissolution process (melting point depression, dissolution end point
methods) while the bottom curve corresponds to a demixing process (recrystallisation
methods). The dissolution process follows the dissolution kinetics of APIs into polymers
at under saturated concentration solutions. The demixing process characterizes the
recrystallization of the API in excess in a supersaturated homogeneous API-polymer solid
solution.

102
Methods such as melting point depression and dissolution endpoints [243] have
some limitations, such as the long process, standardization, and particle size, affecting the
results [247]. The demixing kinetics of APIs from supersaturated systems is expected to
be much faster than the dissolution kinetics of APIs into undersaturated systems. This
difference arises directly from the molecular mobility in the polymer matrix, which is
higher in supersaturated API-polymer solutions than in undersaturated ones.
For the experimental determination of phase diagrams of an API/polymer mixture,
the supersaturation of the API into the polymer can be obtained from a physical mixture
of crystalline API and polymer carrier by different techniques such as film casting method
[243] and comilling [246], [248] that forces the miscibility of the two compounds to reach
supersaturation. The supersaturated glass solution is then loaded in a DSC analyser and
annealed above its 𝑇𝑔 during a sufficient time to complete the demixing process: release
the excess of API in the mixture and reach the equilibrium solution concentration at the
annealing temperature. The use of spray drying was recently proposed [244] as an
alternative to determine API-carrier solubility from demixing, because it is a fast process
(some seconds) compared to solvent casting or comilling which are very time-consuming
(hours). The binary mixture used for the authors [244] to demonstrate the feasibility of
the method was Efavirenz-Soluplus®11.
In this work the composition-temperature phase diagram for the binary
praziquantel and the chosen polymer (that will be presented later) will be determined by
following the recrystallization of PZQ from a supersaturated API-polymer solid solution
generated by spray drying. The method will be detailed in the experimental section of the
Chapter 4.
7.1.2.3 Considerations about solubility and dissolution of amorphous solid dispersions
According to Pure and Applied Chemistry Union (IUPAC), solubility is defined
as the solute concentration in the saturated solution, expressed as the portion of the
designated solute in the designated solvent [249]. It is a thermodynamic parameter and
usually measured according to techniques developed by Higuchi and Connors in which
an excessive amount of solute is suspended in a solvent and stirred or rotated for an
11 Soluplus® is a polyvinylcaprolactam-polyvinyl acetate-polyethylene glycol graft co-polymer [348].
Figure 21. Schematic time and process evolution of the glass transition temperature of an API/polymer
mixture when reaching its equilibrium solubility upon annealing. Adapted from [246].

103
extended period of time (typically 24, 48 or 72 hours) to achieve the concentration
equilibrium [250]. When equilibrium is reached, the suspension is filtered and the
concentration of the solute in the filtrate is measured using ultraviolet light absorption
spectroscopy (UV) or high-performance liquid chromatography (HPLC) and compared
to a standard UV or HPLC. Because it is a thermodynamic parameter, the solubility is
dependent on the solute (for example, 𝑝𝐾𝑎, lipophilicity, and intermolecular forces in the
solid state) and solvent properties (for example, pH, polarity, and solvent interactions)
[251].
During solubility measurements, a crystalline material solubilizes over time,
which leads to increasing solute concentration in the filtrate up to reach the maximum
concentration which is the equilibrium concentration (solubility of the solute in the
solvent at specific conditions of temperature). For amorphous materials, as discussed
before, the solubilization profile is different. Higher solute concentrations are reached
earlier (spring effect) increasing up to a maximum value (𝐶𝑚𝑎𝑥), represented in Figure
22. Considering a possible recrystallisation of the high solute concentration in the
medium, the solute concentration in the filtrate will decrease after the peak of
solubilization (𝐶𝑚𝑎𝑥). The API concentration from ASDs at the peak of the solubilization
could be used for the determination of apparent (kinetic) solubility (𝐶𝑚𝑎𝑥) as represented
in Figure 22.
Figure 22. Schematic representation of kinetic solubility for amorphous and crystalline materials. Adapted
from [184].

104
For the increase in solubility to be effectively bioavailable, it is important to
determine the longevity of this supersaturation in the amorphous state. The rate at which
an API goes into solution (dissolution rate) is then an essential pre-requisite for the
absorption process and an important aspect of formulation development of ASDs.
Essentially, the apparent solubility advantage of ASDs determines the probability
of success of improving bioavailability in vivo. Typically, the apparent solubility
behaviours of ASDs are evaluated by dissolution studies. Not only the point of maximum
concentration achieved (𝐶𝑚𝑎𝑥) but also the extent of supersaturation is biorelevant.
The term “dissolution” describes the mixing of the two phases, resulting in a new
homogeneous phase: the “solution” [251], [252]. Generally, the solute (API in this thesis
context) goes into solution and the rate of its dissolution is a determining step towards
absorption. Moreover, a fraction of the dissolved API may recrystallise before absorption
as represented in Figure 23 if the available concentration exceeds the API's
thermodynamic solubility [251], [252]. In this case, bioavailability may be affected.
The rate of dissolution of a solid can be expressed by using Noyes-Whitney
equation:
Equation 3
𝑑𝑋
𝑑𝑡=
𝐷𝐴
ℎ (𝑪𝒔 −
𝑋
𝑉 )
where, 𝒅𝑿
𝒅𝒕 is the dissolution rate, A is the surface area available for dissolution, D
is the diffusion coefficient of the API particle, h is the thickness of the diffusion layer
Recrystallization
Dissolution
Dissolution
Figure 23. Schematic demonstration of solubility, dissolution, and oral absorption. The drug must be in
solution to be absorbed. Dissolution will drive the initial solubilization of the API, and solubility in the
gastrointestinal media will drive potential precipitation events. At the same time, there is intrinsic
permeability of the compound and absorption. Source: adapted from [251].

105
adjacent to the dissolving API particle surface, 𝑪𝒔 is the saturation solubility of the API
particle in diffusion layer, X is the amount of the API particle dissolved at time t and V
is the volume of dissolution medium [251].
As ASD disintegrates, the increased apparent solubility of the amorphous form
will yield a higher dissolution rate relative to the corresponding stable (crystalline) form,
as well the increased surface area (A) resulting from size reduction of the API particles
during solid dispersion process to the molecular or nearly molecular scale.
The dissolution behaviour of ASDs is governed by the degree of supersaturation
(C > Cs) [201], [251], [253]. Then, crystallization can take place under supersaturated
conditions and the rate of this transformation is affected by the degree of supersaturation
besides factors like API physicochemical properties and API-carrier interactions.
The dissolution method during the development of an ASD formulation is usually,
if not always, different from a quality control dissolution test that is mainly designed to
verify the consistency of a API product as well as the process robustness and long-term
stability [201], [251], [252]. Therefore, variations in methodologies can be found, such
as the composition of the dissolution medium, presence of surfactant, pH, and agitation
[253], [254].
Tests can be performed in sink or non-sink conditions for super-saturating
formulation. The sink index (SI) is defined as follows [253]:
Equation 4
𝑺𝑰 = 𝐶𝑠
𝐷𝑜𝑠𝑒𝑉𝑜𝑙𝑢𝑚𝑒⁄
Where 𝑪𝒔 is the solubility of crystalline API, V the volume of dissolution medium and
Dose is the total amount of API in the test sample to achieve specific SI. is maintained at
a constant value, by adjusting the amount of ASD sample in accordance to the measured
𝑪𝒔 of API in the dissolution medium. In other words, sink condition is the volume of
medium, at least three times greater than necessary to obtain a saturated solution of the
drug, so that the concentration gradient is maintained without interfering with the
dissolution rate [220], [251]–[253]. The API (dose) will be completely dissolved
according to this condition. The dissolution behaviour of amorphous APIs is governed by
the degree of supersaturation. Thus, it is natural for dissolution studies to be conducted
initially in non-sink conditions when a API load relevant to dose can be more

106
discriminating since the ability for a formulation to maintain supersaturation can only be
tested under this condition [251]–[253], [255].
The sink/non-sink condition is a critical factor for the dissolution method.
However, a recent study showed that about 86% of the works do not specify the condition
used [251].
7.2 Manufacturing processes of amorphous solid dispersions
The choice of a manufacturing technique is dependent upon API and polymer
properties and might have an impact on the stability and pharmaceutical performance of
amorphous solid dispersions.
Crystal lattice disruption (also called mechanical activation), co-solubilization
followed by rapid solvent removal and melting are the most common basic principles
involved in the production of ASDs.
7.2.1 Crystal lattice disruption
The disruption of the crystal lattice of an API (Figure 24) , also called mechanical
activation may be performed by high-intensity milling and has a wide range of
applications [256]. Especially for the pharmaceutical industry, with a large part of the
APIs with crystalline characteristics and low solubility, this technique can considerably
alter the structure of these molecules [239]. As a result, there are changes in API
properties such as solubility, dissolution, and hygroscopicity [256], [257].
The use of this technique has been shown to be effective in amorphization of APIs,
for example, budesonide [256], indomethacin [256], [257], crystalline anhydrous α-
lactose [258], praziquantel [59], naproxen [259], and sulindac [260]. This method has
been successful in the creation of co-amorphous systems [245], [260] and more recently,
in the creation of amorphous solid dispersions [259]. Some benefits of using milling for
the creation of solid dispersions include the non-use of possibly toxic or destabilizing
solvents (green synthesis), and its potential for thermolabile compounds [256].

107
Regarding PZQ, a number of papers [33], [37], [59], [69], [75] have demonstrated
that the mechanochemical activation of PZQ, via neat grinding or comilling with different
polymers (Povidone, Copovidone, Crospovidone and Sodium Starch Glycolate) enabled
the transformation of the original PZQ polymorphic form into a new polymorphic variety
of racemic PZQ [10], [73] or into a drug amorphous state [75].
In these studies, different parameters have influenced the PZQ solubility, the PZQ
structure (degradation) during co-milling and the physical stability of the solid forms
obtained. For example, co-milling of crystals of racemic PZQ and polymers (poly
(vinylpyrrolidone) (PVP) and crospovidone (CROS)) in a vibrational mill [59] revealed
some negative feature related to the degradation of the PZQ. In fact, the use of PVP and
CROS led to different levels of API degradation depending on the milling parameters
used and the proportion of excipients.
Another example of mechanical activation to modify PZQ bioavailability
involved the use of surfactants such as poloxamers and sucrose esters as carriers. As with
polymeric systems, it has been demonstrated that grinding and formulation parameters
impacted solubility (double for proportions F-127 - 10: 3 and C-1816 - 10:2), dissolution,
and content. Unlike the polymer mixture, there was no degradation of the PZQ in the
presence of poloxamer (F-127) and sucrose stearate (C-1816) [69] during co-milling. This
difference related to degradation may be linked to the different materials (oxide-based
zirconium and stainless steel) of the grinding jars and balls used in those studies. Although
stainless steel does not offer such a chemically inert environment for the
mechanochemical activation as the zirconium oxide does, it did not lead to significant
PZQ degradation [69], which was explained by its higher thermal conductivity, thus
providing a more efficient distribution of the generated heat.
In summary, the milling process can be a valid alternative to produce amorphous,
stable systems with increased solubility of the PZQ when associated with a
High-intensity milling
Figure 24. Illustration of the disruption of the crystal lattice by mechanical activation. Source: Author.

108
recrystallization inhibitor. However, according to the studies carried out, it is verified that
it is a methodology dependent on the ideal adjustment of different parameters to guarantee
the obtainment of a quality product (frequency, time, and temperature of the grinding
process, excipients, grinding ball material). In addition, these are generally lengthy
procedures (for example, obtaining the polymorphic form B of the PZQ requires 4 hours
of uninterrupted milling [10].
7.2.2 Co-solubilisation and rapid solvent evaporation
In this method, API and polymer are dissolved in an organic solvent to give a
solution, and the solvent is subsequently removed by evaporation. A well-established
technique in this category is spray drying (Figure 25), in which a API-polymer solution
is fed through a nozzle and mixed with pressurized gas to form fine droplets (atomization)
[261]–[263]. Other nozzle types, employing centrifugal, pressure, kinetic or vibration
energy for atomization are available as well. These droplets are further transported and
dried along a heated gas flow through a drying chamber and a cyclone, where particles
within a desirable size range fall out of the gas stream in a collector [261].
The formulation of solid dispersions through spray drying has been received
considerable attention and has already been used in several APIs BCS class II to improve
solubility, dissolution, and consequently bioavailability, such as meloxicam [264],
curcumin [265], itraconazole [266], indomethacin [261]. The subsequently formed
powder can be processed in a wide array of API delivery systems (capsules, tablets,
dispersible powders). Spray drying is a suitable method for thermally degradable
compounds since the temperature during spray drying reaches lower values compared to
that in the melt processes. The presence of residual solvent, which can act as a plasticizer
or is potentially toxic, is seen as one of the disadvantages of this technique.
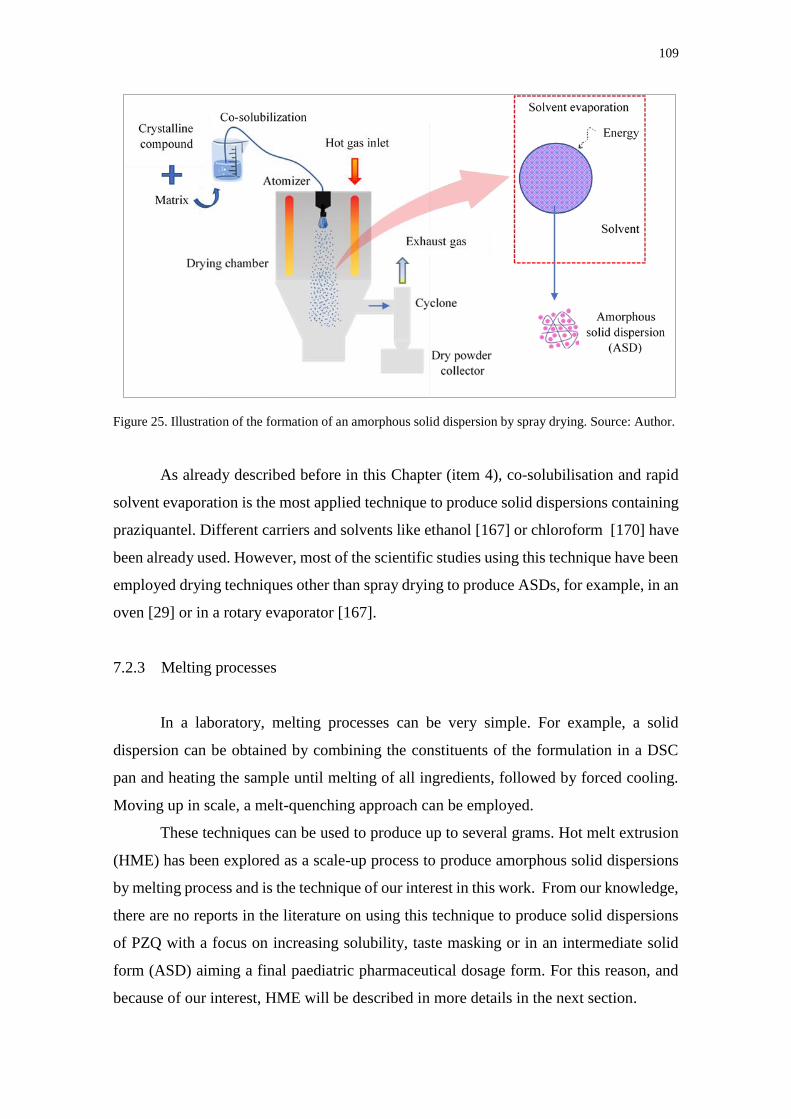
109
As already described before in this Chapter (item 4), co-solubilisation and rapid
solvent evaporation is the most applied technique to produce solid dispersions containing
praziquantel. Different carriers and solvents like ethanol [167] or chloroform [170] have
been already used. However, most of the scientific studies using this technique have been
employed drying techniques other than spray drying to produce ASDs, for example, in an
oven [29] or in a rotary evaporator [167].
7.2.3 Melting processes
In a laboratory, melting processes can be very simple. For example, a solid
dispersion can be obtained by combining the constituents of the formulation in a DSC
pan and heating the sample until melting of all ingredients, followed by forced cooling.
Moving up in scale, a melt-quenching approach can be employed.
These techniques can be used to produce up to several grams. Hot melt extrusion
(HME) has been explored as a scale-up process to produce amorphous solid dispersions
by melting process and is the technique of our interest in this work. From our knowledge,
there are no reports in the literature on using this technique to produce solid dispersions
of PZQ with a focus on increasing solubility, taste masking or in an intermediate solid
form (ASD) aiming a final paediatric pharmaceutical dosage form. For this reason, and
because of our interest, HME will be described in more details in the next section.
Figure 25. Illustration of the formation of an amorphous solid dispersion by spray drying. Source: Author.

110
7.2.3.1 Hot melt extrusion
The HME technique was first invented by Joseph Brama in the late 18th century
for the manufacture of lead pipes and has since been widely spread as a production
process for different areas such as rubber, food and plastic [188], [267], [268].
In general, the HME process can be divided into three stages: feeding, conveying,
melting, mixing and shaping, and down streaming (Figure 26). Basically, the technology
itself involves the application of heat, pressure, and agitation through an extrusion
channel to mix materials together, and subsequently forcing them out through a die, which
allows to produce extrudates of different shapes and diameters.
The temperature decrease out of the dye allows for solidification. During the melt
extrusion process, the dissolution of APIs into the polymer matrix is accelerated under
the influence of shear and heat. The barrel temperature, screw speed, screw design and
feed rate are process parameters which can influence the quality of the end product [269].
The HME process can be conducted using a single-screw or twin-screws.
Although their operation follows the same principle, generally, in the plastics industry,
single-screw is used because it is a simpler process [268]. In the pharmaceutical area, the
twin-screw is preferred because it has advantages such as higher kneading and dispersing
capacities, less tendency to over-heat, and shorter residence times, which prevents
degradation of heat-sensitive components [184]. Also, for pharmaceutical processes, the
Figure 26. Schematic representation of a hot melt extrusion process. Source: Author based on [184], [188].

111
equipment must meet specific regulatory compliance. For example, all metallurgy parts
of the extruder must be inert (physically and chemically), not appear to have any erosion,
absorption, or adsorption during the process. It is also necessary to plan quality
inspections and to provide cleaning validation protocols according the main regulatory
guides [268].
Figure 27 illustrates the representation of the HME process with a twin-screw
extruder. Typically, the equipment consists of the feeder (allowing volumetric or
gravimetric feeding), the barrel in which the twin-screw is inside, a control unit, torque
sensors, heating/cooling device, and die. The process starts by feeding the material, which
is then transported along with the two screws through co-rotation using thermal and
mechanical energy. These forces will be defined through the following parameters: barrel
temperature, feed rate, screw configuration, screw speed, and torque [268], [270], [271].
The heating zones are present along the entire length of the barrel and can be
individually controlled according to the physical-chemical characteristics of the product
being processed. [271].
The screw configuration can be defined in several different ways using conveying,
mixing and distributive flow elements and discharge feed screws [184], [271]. The
transport elements have the function of pushing the material forward along the length of
the barrel passing from zone to zone and have no capacity to mix the material. In contrast,
the mixing elements can be positioned at 0, 30, 60, and 90. The greater the angle used,
the lower the transport capacity and the greater the shear [271].
After the material passes through the entire barrel and is extruded, its output is
usually made in the form of filament with a diameter adjusted according to a die.
Commonly, the filament is cooled and then shaped according to the desired final physical
form (pellets, powder, granules).

112
The formation of ASD by the HME process is the result of the combination of
mixing and melting. For this to be possible, it is necessary to add energy to the system,
and this energy comes from two important parameters: the heating of the barrel and the
rotation and configuration of the screw. The first will influence the softening and melting
of the material along the path, and the second will increase heating as a result of the shear
forces [259], [272], [273].
The main input and dependent variables can be seen in Figure 28.
Figure 27. Representation of HME process. Source: Author.
Figure 28. Input and dependent variables in the HME process.

113
The interest of HME process in the pharmaceutical area has grown rapidly in
recent years, as confirmed by the number of scientific publications in the period 2000-
2020 (Figure 29) [187], [225].
Besides the increasing number of scientific publications, the growth of patents is
also verified for granules [274], [275], pellets [276], controlled-release tablets [272],
transdermal controlled-release patches, implants, taste-masked oral fast dissolving
systems [277]–[279] and other pharmaceutical API delivery systems [225], [280].
Currently, the pharmaceutical market has several products available that make use
of HME technology in their production (Table 6) [225], [267], [280].
The reason for the abrupt growth of scientific and technological production in the
area is due to some advantages over other methods. It is a process that does not require
the presence of solvents, is fast and continuous, has an excellent mixing capacity, high
productivity (on a commercial scale it is possible to make more than 500 Kg/h), and has
a wide applicability [281].
Regarding ASDs, the FDA approved 19 ASD-based products [282] in the period
2007-2017. This growing interest in the pharmaceutical industry is closely linked to the
fact that currently, about 70 % of developing APIs are water-insoluble which makes the
ASD approach an increasingly accepted strategy to get around this problem [283].
Figure 29. Publications present in the Scopus® database with search using the terms: hot melt extrusion
and hot melt extrusion & APIs from 2000 to 2020.

114
Despite the advantages mentioned, the HME technique also has some
disadvantages. The stability of the API/polymer mixture may be a limiting factor due to
the high energy provided in processing by both temperatures rise and shear. The limited
number of polymers available with adequate flowability, thermal stability and
pharmaceutical properties suitable for their use may make it impossible to achieve a
desired quality formulation using HME [125]. The complexity of the influence of process
parameters such as temperature, thread design, thread speed, residence time, cooling rate,
polymer rheology and the influence of API concentration on the rheological behavior of
the polymer are challenges for the more large of the technique for ASDs production
[284].

115
Table 6. Currently marketed HME products. Source: Author and adapted from [225], [267].
Trade name Owner API Polymer Terapeutic indication Pharmaceutical
form HME pouporse
Lacrisert® Valeant without API - implant
acts as wetting agent HPC Dry eye syndrome
ocular Shaped (rod) system
Ozurdex® Allergan dexamethasone PLGA Macular edema Shaped system
Depot-profact® Sanofi
AventisBuserelim Buserelin acetate PLGA Prostate cancer
subcutaneous
Shaped (rod) system
Probuphine® Titan
Pharmaceuticals Buprenorphine EVA Opioid dependence Shaped (rod) system
Zoladex® AstraZeneca Gosserelin acetate PLGA Prostate cancer Shaped (rod) system
(different size)
Implanon® Merck Etonogestrel EVA Contraceptive Shaped (rod) system
Annovera® Therapeutics MD Ethinylestradiol/
segesterone acetate Silicone Contraceptive
intravaginal
Shaped (ring) and
multilayer system
NuvaRing® Merck Etonogestrel/
Etinilestradiol EVA Contraceptive Shaped ring
Isoptin® SER Abbott Verapamil HPC/HPMC Hypertension
oral
Shaped system (oral)
Rezulin® Parker-Davis Troglitazone PVP Diabetes Amorphous dispersion
Cesamet® Meda
Pharmaceuticals Nabilone PVP Aniemetic Solid dispersion
Adalat SL® Bayer Nifedipine HPMC/PEO Antianginal agent Controlled realease
Fenoglide® Life Cycle Pharma Fenofibrate PEG 6000 Dyslipdemia Solid dispersion
Noxafil® Merck Posaconazole HPMCAS Antifungal Amorphous dispersion

116
Onmel® Merz Itraconazole HPMC Onychomycosis
Oral
Amorphous dispersion
Gris-PEG® Pedinol griseofulvine PEG Onychomycosis Crystalline dispersion
Covera-HS® Pfizer verapamil hydrochloride HPC Hyperversion and
angina pectoris Melt granulation
Eucreas® Norvartis vildagliptin / metformina HPC Diabets - type II Melt granulation
Zithromax® Pfizer azithromycin-coated enteric
multiparticulate Pregelatinized starch Bacterial infection Melt granulation
Trade name Owner API Polymer Terapeutic indication Pharmaceutical
form HME pouporse
Belsomra® Merck Suvorexant Copovidone Insomnia
Oral
Amorphous dispersion
Technivie® Abbvie Ombitasvir Copovidone / vitamin E / polyethilene
glycol succinate Hepatitis C virus
Amorphous dispersion
(3 separate ASDs)
Venclyxto® Abbvie Venetoclax Copovidone / polysorbate 80 / colloidal
silicon dioxide
Chronic lymphocitic
leukemia Amorphous dispersion
Viekira pak® Abbvie Ombitasvir/paritaprevir
/ritonavir/dasabuvir Copovidone
Hepatitis C virus
Amorphous dispersion
(3 separate ASDs)
Mavyret Abbvie Glecaprevir/pibrentasvir Copovidone / vitamin E / polyethilene
glycol succinate Amorphous dispersion
Norvir® Abbott ritonavir PEG-glyceride Viral infection Amorphous dispersion
Kaletra® Abbott lopinavir / ritonavir Copovidone Viral infection Amorphous dispersion

117
7.2.3.1.1 Carriers for HME
There is an extensive list of polymers being widely used for HME, and some are
listed in Table 7 [268], [272], [285]. Polymers can be amorphous (polyacrylic acid),
semicrystalline (poly L-lactic acid), or crystalline (polyethylene glycol). Although
amorphous polymers are the most used, the use of semi-crystalline crystals (such as
Poloxamer 407) has been used with a strategy to overcome the disadvantages of HME
due to its high processing temperatures. In this way, the association with this type of
polymer can be interesting for thermosensitive APIs [219]. In addition, some more
plasticizers can be added to the system, which contains a semi-crystalline polymer so that
less energy is needed for the process and, consequently, lower temperature and lower
torque [286]. Their physicochemical properties provide opportunities to overcome
processability challenges in HME and make it possible to obtain new pharmaceutical
materials [268].
Polymers are the main excipients used for the production of ASDs [184]. Table 8
gives a list of amorphous polymers available for this use. The success of ASD production
depends largely on the correct choice of carrier, and it must be based on its main
properties such as glass transition temperature, degradation temperature, solubilization
capacity, and mechanical characteristics [268]. A prerequisite of the polymer to be used
in HME is appropriate thermoplastic behavior. However, the number of such polymers
approved for pharmaceutical use is still limited.

118
Table 7. Summary of the polymers generally used in HME. Source: Author and adapted from [184], [199], [225], [268].
Structure Polymer chemical name* Trade name Tg (°C) Td (°C)
Amorphous
PVP (MW 2000–3000) Kollidon® 12 PF 72 196
PVP (MW 7000–11,000) Kollidon® 17 PF 140 217
PVP (MW 28,000–34,000) Kollidon® 25 153 166
PVP (MW 44,000–54,000) Kollidon® 30 160 171
PVP (MW 1,000,000–1,500,000) Kollidon® 90F 177 194
Vinyl pyrrolidone: vinyl acetate 6:4 (MW 45,000–
70,000) Kollidon® VA64 105 270
Poly(vinyl caprolactam-covinylacetateethylene
glycol) graft polymer( MW 90,000–140,000) Soluplus® 72 278
Methyl Cellulose (MC) (MW 14,000) Methocel™A 200 247
Hydroxypropyl cellulose (HPC) (MW 95000) Klucel® LF 111 227
Hydroxypropyl methyl cellulose acetate succinate
(HPMCAS)
AFFINISOL™ HPMC
HME ~115 >250
Butyl methacrylate:Dimethylamino ethyl
methacrylate:Methyl methacrylate (1:2:1) (MW –
47,000 Da)
Eudragit® E PO 52 250
*MW: molecular weight

119
8. 3D PRINTING TECHNOLOGY FOR MEDICINES
FDM is the most discussed technology for pharmaceuticals medicines, and the related
main way is using filaments from HME to direct feed the printer. However, with this approach,
researchers have spent most of the time because the material into printable filament and passing
the filament through a heated nozzle [287]. It means that filaments must have rheological
properties and mechanical strength adequate to ensure proper processability in FDM 3D
printing [287]. The high dependency of physical and mechanical properties of the filaments for
printing feasibility [156], [288] becomes more critical especially when high-drug loads are
required.
One way to get round this problem is to work with the direct powder extruder 3D printer
(DPE). This concept was applied for the first time to print itraconazole tablets and different
types of HPC as a polymer [156]. Binary physical mixtures were prepared in the mass
proportion 35:65 (API: Polymer) to obtain a final dose of 100 mg. Tablets of 10 mm diameter
and 3.6 mm height were printed with each of the prepared mixtures. The dissolution rate was
found to be dependent on the type of HPC polymer used, which was related to the solid state of
ASDs (amorphous or partially amorphous). The faster dissolution kinetics was obtained from
the only completely amorphous ASD, formed with the polymer named HPC-UL.
The possibility of directly feeding powdered material into the extruder printer may
become a great advance for the pharmaceutical area. Most publications that aim to obtain a
pharmaceutical form by 3D FDM printing investigate the critical process and formulation
parameters for the obtention of HME filaments with adequate mechanical characteristics for
printing (not too soft, not too hard) like the drug load and the type of polymer. So, the possibility
of excluding the previous stage of production of HME filament to feed the printer is attractive.
However, for 3D printer (DPE), in some cases where a completely amorphous material is
desired like an amorphous solid dispersion, caution is necessary, because it may be not
completely amorphized during the printing process, as observed with print itraconazole-HPC
tablets [156].
In turn, the SSE 3D printing technology is based on the deposition of a material in the
form of gel or paste in sequential layers to form the desired 3D object. The printing process is
exactly as described for the FDM process, however, the most important difference is in the use
of molten filaments for printing, while SSE uses soft materials.

120
Goyanes et al. [289] made available a list of names to identify SSE 3D printing
technology in the pharmaceutical field:
pressure-assisted microsyringe (PAM) printing
robocasting or robotic material extrusion
cold extrusion-based printing
hydrogel-forming extrusion
melting extrusion
thermal extrusion
soft-material extrusion
melting solidification printing process
direct ink writing
hot melt ram extrusion
pneumatic extrusion hot melt
micro-extrusion.
The feeding of this type of printer usually occurs through a syringe, which represents an
advantage technique when compared to the others. This characteristic provides greater
precision and quality to the product, what is crucial to the pharmaceutical industry [289].
In addition to the already mentioned characteristics of other types of 3D technologies
such as medication customization, production on demand, design variability, the possibility of
different release profiles, speed, and ease of the process, SSE also relies on low temperatures
for print.
For paediatric use, this technology can be even more attractive due to the possibility of
printing chewable medicines. In a recent study, chewable printlets of isoleucine in various
colours and tastes were prepared to treat a rare metabolic disease that mainly affects children
[290]. These drugs were administered to paediatric hospitalized patients that could choose the
colour and taste of their preference. The results were very promising, showing no difference in
plasma levels of 3D drugs compared to conventional treatment.
8.1 Brief approach on regulatory 3D printing aspects
In August 2015, the first drug obtained by 3D printing was approved by the FDA, and
this ends up being a milestone for innovation in the pharmaceutical industry's drug production
area. Spritam® (levetiracetam) is a drug for seizures that disintegrate in the mouth with a small

121
amount of water [31]. It is an innovation for patients, including those with difficulties
swallowing solid oral dosage forms [31–33].
However, the great appeal of 3D printing in the pharmaceutical area is the personalization of
medicines. A topic that has been treated since the nineties with new therapies to meet each
patient's characteristics.
Currently, the pharmaceutical industry is accustomed to producing large quantities and
“one size fits all” drugs, that is, without flexibilities specific doses for specific individuals.
Then, regulatory requirements are defined to assess the quality of this type of approach [32].
Changing production to something personalized requires new regulatory discussions, and the
area is under increasing discussion.
Regulation has already been approved to produce medical devices obtained by 3D
printing [32]. The specifications of medicine produced by 3D printing must follow the
guidelines described in ICH Q6 (for bulk products). However, if 3D production is a
conventional dosage form, the current pharmacopeial requirements must be followed. Also, if
necessary, specific quality attributes for any product generated by 3D printing can be added.
For example, suppose a tablet is produced by 3D printing with its internal porosity increased to
obtain a quick release of the drug. In that case, the measure of porosity can be considered as an
additional attribute [32]. It is important to be clear that production on-demand or specific
characteristics of patients may require specific quality attributes.
Although “Technical Considerations for Additive Manufacturing of Medical Devices”
was published in 2017, there are no specific requirements for pharmaceutical drug
requirements. To date, there is no clear and specific regulation to differentiate the way of
producing personalized medicines obtained by 3D printing in any country [32]. Currently, the
European Medicines Agency (EMA) has defined some measures for the approval of medicines
using 3D printing as the complete certification of electronic components and a specific master
file for submission. Japan also had some similarities [33]. Agencia Nacional de Vigilância
Sanitária (ANVISA12) is developing new regulatory frameworks to facilitate the development
of innovative products [33].
9. CHAPTER SYNTHESIS
Chapter 2 reviewed the literature about topics of interest for our work: an overview of
schistosomiasis disease and treatment, characteristics of the API studied in this thesis (PZQ),
12 Brazilian Health Regulatory Agency

122
challenges and strategies on the pharmaceutical development of paediatric medicines and, ways
that will be investigated here to propose new directions to formulate praziquantel for paediatric
use. Emphasis was given to amorphous solid dispersions and 3D printing technology.
An overview of the literature on amorphous solid dispersions to praziquantel
summarized the main results of previous works. The main points to be highlighted are:
o Until now, several solid dispersions have been proposed using different carriers, and only
one suggests the partial use of the amorphous dispersion approach, making the correlation
between increased solubility and, consequently, increased unpleasant taste perception.
None intends to study the increase of solubility by the amorphization of API in a polymer
and evaluation of taste perceptions with the paediatric pharmaceutical formulation.
o Hot-melt extrusion can be a promising continuous production method for amorphous solid
dispersions of praziquantel. However, it is crucial to select correct excipients and
compositions to produce amorphous and stabilized formulations of PZQ.
o Finally, could 3D printing be an adequate technology to produce printed tablets with a
suitable dosage for children, from formulated amorphous solid dispersions powders of
PZQ?
This thesis will try to answer these questions and technological needs.

CHAPTER 3 - CHARACTERIZATION OF RAW
MATERIALS

124
1. INTRODUCTION
Three formulations were studied in this thesis, constituted of two or three
constituents. For the binary system, API (Praziquantel) and polymer (PVPVA, Kollidon®
VA 64) were used. For the ternary, a surfactant was added as the third constituent: SPAN
20 and Kolliphor® SLS Fine.
In this Chapter, all active materials, excipients, solvents, reagents, reference
standards used are firstly introduced.
Secondly, the characterisation of some properties of the main pure components, of
interest for this work, are presented. They are:
- Physical characteristics of the primary particles (morphology, particle size);
- PZQ composition (dosage and determination of impurities);
- PZQ solubility and dissolution profile in different media;
- Thermal properties (glass transition, melting and degradation temperatures);
- Physical stability evaluation of PZQ and the polymer under three controlled
conditions (15 to 30 ºC/max 60 % RH, 30 ºC/75 % RH and 40 ºC/7 5% RH).
Figure 30 present the graphic structure of the Chapter 3.
Figure 30. Graphic structure of chapter 4 (Source: Author).

125
2. MATERIALS
The production of the main formulations developed was based on three
compositions:
- API: Polymer
- API: Polymer: Solid Surfactant
- API: Polymer: Liquid Surfactant
The materials used for these formulations are shown in Table 8.
The quantitative compositions will be detailed in each of the following Chapters
as well as the respective methods of preparation, characterisation results, and assessments
of physicochemical sensory, and pharmacokinetic characteristics.
2.1 Active Pharmaceutical Ingredient (API)
Racemic praziquantel (C19H24N202), was kindly provided by Farmanguinhos,
Fiocruz, Brazil.
2.2 Polymer
A vinyl pyrrolidone-vinyl acetate copolymer (C6H9NO)n x (C4H6O2)m) (PVP-VA),
Kollidon® VA 64, was provided by BASF corporation (Jacareí, Brazil; Burgbernheim,
Germany).
2.3 Surfactants
Two surfactants were used as the third component in ternary amorphous solid
dispersions produced by hot melt extrusion (HME).
Sorbitan monolaurate (C18H34O6), Span™ 20, was purchased from Croda
International Pcl (UK).
Sodium lauryl sulfate, Kolliphor® SLS Fine, was donated by BASF corporation
(Jacareí, Brazil; Burgbernheim, Germany).

126
Polietilenoglicol 4000 (PEG 4000) was purchased from Sigma-Aldrich
(Germany) to prepare sample suspensions for animal gavage procedures during
pharmacokinetics studies.
2.4 Solvents and reagents
Ethanol (99 %) was used as common solvent for racemic praziquantel and the
polymer PVPVA to produce spray-dried samples. It was purchased from Carlo ERBA
Reagent (Italy).
Acetonitrile and methanol HPLC/Spectro for the HPLC experiments were
purchased from Merck (Germany) and Tedia Company (Fairfield, USA).
Distilled and purified water (conductivity of 18.2 MΩ.cm at 23 °C) was produced
by the purification system Milli-Q (Purelab DI, MK2, E3lga, UK).
Hydrochloric acid fuming 37 % (Merck KGaA, Darmstadt, Germany), Acetic acid
(glacial) (Merck KGaA, Darmstadt, Germany), Sodium Hydroxide 97.0 % PA (Bio Scie,
Anápolis/GO, Brazil), Sodium Dodecyl Sulfate 95 % (J. T. Baker, Pennsylvania, EUA),
Potassium dihydrogen phosphate (Merck KGaA, Darmstadt, Germany), Sodium acetate
trihydrate (Scharlab S.L., Sentmenat, Spain) were used to prepare the aqueous media for
the solubility tests.
Sodium Dodecyl Sulfate 95 % (J. T. Baker, Pennsylvania, EUA) was used for
dissolution profiles tests.
Formic acid and tert-butyl methyl ether from Scharlau (Spain) and methanol from
Tedia (Fairfield, OH, USA) were used for bioanalytical and pharmacokinetic analysis.
Heparin sodium 5.000 IU /mL from B. Braum (Germany) was applied on blood
samples during the pharmacokinetic experiments with animals.
Sodium chloride and Potassium phosphate monobasic (Merck®, Germany) and,
Sodium phosphate dibasic (Sigma-Aldrich®, St. Louis, USA) was used for in vitro taste
masking test evaluation.
2.5 Reference standard
The praziquantel reference standard was purchased from USP® (Rockville, MD,
USA) for drug content analysis and validation of the bioanalytical and pharmacokinetic
methods.

127
Praziquantel reference compound-related (A, B, and C) standard was purchased
from USP® (Rockville, MD, USA) for impurities analysis.
Diazepam reference standard was donated by INCQS (Rio de Janeiro, RJ, Brazil),
and caffeine was purchased from USP® (Rockville, MD, USA). They are used with
nicotine bitartrate dihydrate as internal standard (IS) to validate the bioanalytical and
pharmacokinetic methods.
2.6 Active materials
Ketamine and xylazine from USP (USA) were used as a combination of
anaesthetics for animals’ euthanasia procedures after pharmacokinetic study.
Praziquantel commercial tablets (Farmanguinhos/Fiocruz) were used for the taste
masking tests.

128
Table 8. Main materials used in this thesis to produce binary and ternary ASD systems.
Substance Physical form Code for this thesis Molecule Reference
Praziquantel powder PZQ
[291]
Vinyl pyrrolidone-vinyl acetate
copolymer powder PVPVA
[292]
Sorbitan monolaurate liquid SPAN
[217]
Sodium lauryl sulfate powder SLS
[217], [293]

129
3. CHARACTERIZATION OF FORMULATIONS RAW MATERIALS
3.1 Methods
3.1.1 Dosage of PZQ and related compounds by High-Performance Liquid
Chromatography (HPLC)
High-performance liquid chromatography (HPLC) is a technique used to separate
molecules based on size and surface charge, among other properties. The incorporation
of ultra-violet (UV) spectroscopy with HPLC allows the concentration of molecules to be
determined following separation. HPLC-UV was used to quantify PZQ according to the
pharmacopeia method [3]. The HPLC system used consisted of two mobile phase delivery
pumps (LC-10 ADVP, Shimadzu, Japan), a UV–Vis detector (SPD-10Avp, Shimadzu,
Japan), an autosampler (SIL-20A, Shimadzu, Japan), an interface (SCL-10Avp,
Shimadzu, Japan) for the acquisition of data through a software Ez-Star and a column
Kinetex® C18 100 Å (150×4.60 mm – 5 µm). The mobile phase comprised methanol and
water (60:40 V/V), the flow rate was 1.5 ml/min, injection volume was 10 µL, and
conducted absorbance readings at a fixed wavelength of 210 nm. The retention time of
PZQ was about 1 min and set the run time at 10 min. Quantification was carried out using
a fresh stock PZQ standard (Brazilian Pharmacopoeia – batch 1069) solution prepared
each time before starting the analysis dissolving 9 mg of PZQ in the mobile phase for a
final concentration of 0.18 mg/mL. For each sample, an equivalent of 37.5 mg of PZQ
was weighed in duplicate in 25 ml volumetric flasks and added to the mobile phase. The
solutions were subjected to ultrasound for 5 minutes. The sample was filtered with a PTFE
0.22 µm filter and diluted to 0.18 mg/mL. After homogenization, a fresh aliquot was
filtered (same type of filter) and transferred to a vial. HPLC analysis took place
immediately after sample preparation. The results were expressed in the percentage of
PZQ recovery.
The quantification of the related compounds in the PZQ sample (namely A, B, and
C), was based on recommendations from the American Pharmacopoeia [53].

130
Initially, individual solutions were prepared with the respective PZQ standard
related compounds (USP) (A, B, and C13 - batches: R01600, R079Q0 and R032B0,
respectively). A solution for each impurity standard was prepared in a mobile phase to a
final concentration of 0.04 mg/mL). The PZQ sample was also dissolved in the mobile
phase to a final concentration of 20 mg/mL.
The solutions were injected in duplicate on the HPLC, and the calculation of each
related compound of PZQ was performed by normalization in the function of the relative
retention time (RRT) (Table 9).
Table 9. Acceptance criteria for PZQ related compounds [53].
Compound Relative Retention
Time (RRT)
Acceptance criteria
NMT* (%)
PZQ 1.0 0.2
Praziquantel related compound A 0.8 -
Praziquantel related compound B** 1.8 0.2
Praziquantel related compound C** 2.1 0.2
*NMT = no more than; ** Stored in a refrigerator (2 to 8 ºC).
3.1.2 Thermogravimetric Analysis (TGA)
Thermogravimetric analysis or thermal gravimetric analysis (TGA) is a method
of thermal analysis in which the mass of a sample is measured over time as the
temperature changes. This measurement provides information for example about physical
phenomena, such as phase transitions, absorption, adsorption, and desorption. For TGA
analysis, the sample (9.5 – 10.5 mg) was carefully weighed in aluminium crucibles. The
tests were performed in a Mettler Toledo Thermogravimetric Analyser, model
DSC/TGA3+, under a dynamic nitrogen atmosphere with a 50 mL/min flow rate and a
heating rate of 10 ºC/min, in the temperature range from 25 to 300 °C. The TGA
equipment was previously calibrated with metallic indium and aluminium standards.
3.1.3 Differential Scanning Calorimetry (DSC)
13 Related compound A = 2-Benzoyl-1,2,3,6,7,11b-hexahydro-4H-pyrazino [2,1-a]isoquinolin-4-one;
Related compound B = 2-(Cyclohexylcarbonyl)-2,3,6,7-tetrahydro-4H-pyrazino [2,1-a]isoquinolin-4-one,
and Related compound C = 2-(N-Formylhexahydrohippuroyl-1,2,3,4-tetrahydroisoquinolin-1-one [53].

131
Differential Scanning Calorimetry (DSC) is an analytical technique which
measures the heat flow into or out of a sample as a function of time and/or temperature.
Plots showing differences in heat flow between a sample and reference, as a function of
time or temperature, yield information on thermal transitions in a sample due to melting,
crystallization, chemical reactions, glass transitions, and other exothermic (heat
evolving) and endothermic (heat absorbing) transitions. For DSC analysis, samples with
a mass between 3.0 and 3.5 mg were carefully weighed in aluminium crucibles, sealed
with aluminium caps. The tests were carried out in a Mettler Toledo model DSC/TGA3+
differential exploratory calorimeter, under a dynamic nitrogen atmosphere with a flow
rate of 80 mL/min and a heating rate of 10 °C/min, in the temperature range from 25 to
250 °C. The DSC equipment was previously calibrated with metallic zinc and indium.
3.1.4 Powder X-Ray Diffraction (PXRD)
PXRD or Powder X-Ray Diffraction is a method for measuring the X-Rays
scattered by a crystalline sample as a function of the scattering angle. Analysis of this
distribution gives a lot of information about the microstructure and properties of the
sample. X-ray sample diffraction patterns were obtained on a Bruker diffractometer
model D8-Advance (at UFF - Universidade Federal Fluminense), using CuKα radiation
(λ for Kα1 = 1.54060 Å; λ for Kα2 = 1.54438 Å), 40 KV and 40 mA current, with scanning
speed of 0.2 °/second in the 2θ range of 3-50 º.
3.1.5 Scanning Electronic Microscopy (SEM)
SEM is a class of electron microscopy that uses a high-energy electron beam to
scan the samples and provide a high magnification and resolution image. The electron
beam from the electron gun interacts with the electrons on the sample surface and
produces specific signals about the topography [294]. The SEM images are obtained by
analyzing the signals from the secondary and backscattered electrons. Non-conductive
samples need to be coated by a layer of a conductive element such as gold or platinum.
The SEM analyses were performed at the Rudolph Barth Electron Microscopy
Platform (IOC/Fiocruz), using an electronic microscope Jeol, model JSM6390LV and a
sputter coated (Deton Vaccum Desck IV) to apply an ultra-thin coating of platinum (Pt)
on the non-conducting samples before analyses.

132
A small piece of double-sided tape was added over the stub. Then, an aliquot from
the vial containing the sample by random selection with the aid of a spatula. It added to
the tape attached to the stub. Light strokes were made on the stub to disperse the particles
into the tape, and the stub was subjected to 10 mA plating for about 3 minutes and
continuous argon flow.
The SEM analysis were performed on the Pt-coated samples. During the analysis,
images were obtained from the four representative quadrants of the stub. For this, we used
the methodology of dividing the stub into four quadrants, thus contemplating several
microphotographs that provide a representative analysis. Schematically, Figure 31 shows
the preparation of the stub and its division for the capture of images in different regions
to guarantee good sampling.
3.1.6 Particle Size Distribution by Laser Diffraction
The laser light diffraction technique used for the determination of particle-size
distribution is based on the analysis of the diffraction pattern produced when particles are
exposed to a beam of laser light. Sample dispersed at an adequate concentration in a
suitable liquid or gas, passed through a laser. The light scattered by the particles at various
angles is measured by a multi-element detector. These scattering pattern values are then
transformed, using an appropriate optical model and mathematical procedure, to yield the
proportion of total volume to a discrete number of size classes, forming a volumetric
particle-size distribution. This is one of the most common techniques for particle size
analysis on the pharmaceutical industries and a good practice is to develop and validate
this method according to official and specifics guidelines such as American pharmacopeia
[1] and International Organization for Standardization (ISO) [2].
a)
b)
c)
d)
Figure 31 a) Schematic representation of a stub; b) a top view representation of a stub with the presence of
the carbon-coated double-sided tape; c) representation of the top view of a stub with the sample already
added to the tape surface; d) (imaginary) stub for the purpose of representative images from different parts
of the stub. Source: Author.

133
In this thesis the procedure developed for PSD measurement was based on the
assumptions described in ISO 13320 [295] and USP [296]. For the analysis of particle
size distribution of the API used in this work, initially, the dispersion medium to be used
in the well of the analysis equipment was prepared. About 2 g of praziquantel was added
in three liters of purified water and subjected to magnetic stirring for four hours. The
saturated solution was filtrated in a 0.45 µm cellulose membrane with a vacuum system.
At the same time, 42 mg of surfactant (polysorbate 80) weighed in a glass beaker.
Approximately 30 ml of the saturated filtered solution was transferred, and the aid of a
spatula stirred vigorously until the complete solubilization of the surfactant. This solution
was transferred to the beaker containing all the saturated and previously filtered solutions.
The final solution was submitted to magnetic stirring for 5 minutes for complete
homogenization.
The mass in the range of 27.5 ± 2.5 mg weighted and then transferred to a plastic
test tube with a cap and conical bottom. 10 mL of surfactant-containing saturated
praziquantel solution was added and stirred manually (up and down) about five times.
The sample was vortexed for 5 minutes (speed 1, continuous mode) and inserted in the
ultrasound for 01 min. At the end of the ultrasound time, the prepared suspension was
immediately added to the equipment for reading. The saturated solution was also used as
a sample dispersion medium and rinsed solution between each measurement. Finally, it
was added for further sample addition.
3.1.7 Stereomicroscopy
Stereomicroscope is a type of optical microscope that offer lower resolution power
where the magnification typically ranges between 6x and 50x while optical microscope
have around 40x to 1,000x [294].
An Olympus SZX9 stereomicroscope (Olympus) was used, coupled to a camera
of the same brand model Oly-220 to capture the images. The magnification was adjusted
according to the characteristics of each sample and the purpose of the analysis.
3.1.8 Solubility studies of raw PZQ

134
Solubility studies of raw PZQ were performed following the standard shake flask
method (Incubator Shaker SL 222, Solab) (Figure 32). Table 10 shows the different
solvents in which the PZQ solubility will be experimentally determined.
Table 10. Composition of the different media used to evaluate the PZQ solubility.
Medium pH Concentration of
SLS (wt%)
Purified water 7.2 -
HCl 0,1 N 1.2
0; 0.05; 0.1 and 0.2 Acetate buffer 4.5
Phosphate buffer 6.8
Preparation of the dissolution media: HCl 0.1 N medium was prepared according
to USP 43 (2020) [3] by diluting HCL 0.1 N with purified water. Likewise, sodium acetate
trihydrate was solubilized in purified water and acetic acid (2 N) was added to the solution
and the pH was adjusted to 4.5. The third buffer medium, potassium phosphate
monobasic, was solubilized in purified water and the pH was adjusted to 6.8 with 0.2 M
sodium hydroxide. For the preparation of the respective media containing surfactant, the
preparation procedure was the same as described above with the addition of sodium lauryl
sulphate in various concentrations: 0.05 %, 0.1 %, and 0.2 % (wt).
Solubility measurements (Figure 32)Erro! Fonte de referência não
encontrada.: For that purpose, an excess amount of samples powder was added into 50
mL of each tested medium under magnetic agitation at 37 ± 0.5 °C. The samples of 2 mL
were filtered (cellulose acetate filter, 0.22 µm) and collected to the vial at pre-determined
time points (0.5 h, 1 h, 24 h or 48 h). The concentration of PZQ in water was measured
by an HPLC system equipped with a UV-visible detector (with the same method
described before). The experiments were carried out in triplicate and for all samples the
final pH of the medium was recorded.

135
3.1.9 Dissolution Profile
Dissolution tests were performed to investigate the PZQ release profile according
the dissolution method described in USP for PZQ tablets [297]. Dissolution tests were
executed using an USP apparatus 2 (Dissolutor VK7010, Varian) at 50 rpm with 900 mL
of dissolution medium (0.1 N HCl with and without 0.2 % by weight of SLS14). Samples
with the equivalent dose of 150 mg of PZQ was added directly to the dissolution medium
at 37 °C. At predetermined time points (5, 10, 15, 30, 60, and 120 min), 5 ml of aliquots
were withdrawn and immediately filtered (0.45 µm - PTFE) to the respective vial.
The collected samples were assayed by HPLC-UV, as previously described. All
dissolution experiments were conducted at least in triplicate, and the SD (%) was
calculated at each time point. Dissolution profile curve (amount of drug dissolved over
time) was calculated using a calibration curve.
3.1.10 Stability studies
The solid raw materials (PZQ, PVPVA and SLS) were conditioned in glass plates
and covered with parchment paper to avoid falling particles or dirt (Figure 33). The
14 The dissolution profile of the PZQ was evaluated under two different conditions of dissolution medium:
with and without the addition of SLS.
Figure 32. Experimental apparatus for PZQ solubility studies at 37°C ± 0.5°C. Source: Author.

136
samples were stored during 30 days at three different conditions given in Table 11, to
evaluate the physical stability of the samples.
The samples were analysed at pre-determined time points (starting point – t0, 15
and 30 days – t10 and t15, respectively). DSC, PXRD, SEM, and stereomicroscopy were
performed according to the methodologies described in sections 2.1.3, 2.1.4, 2.1.5, and
2.1.7.
Table 11. Stability study conditions.
Condition name Storage condition
Temperature (°C) Relative humidity (%)
Room temperature (RT)1 between 15 and 30 60
Long-term stability (LT)2
30 ± 2 75 ± 5
Accelerated stability (AS)3 40 ± 2 75 ± 5 1 in the laboratory; 2,3 in a climatic chamber (Weis Technok /WK13’)
4. RESULTS
4.1 Dosage of PZQ and related compounds
a) b)
Figure 33. a) Petri dish and paper - recipient to put samples on stability; b) sample ready to climatic chamber
for the stability study. Source: Author.

137
The PZQ used is approved according to the specifications of the American
Pharmacopoeia [53], an official compendium recognized by the ANVISA in Brazil and
by other regulatory agencies in the world, such as the FDA. It was subjected to dosage
(PZQ content and content of organic impurities) by HPLC analysis, according to the
experimental procedure described in 3.1.1 section.
Table 12 presents the API content for the raw PZQ sample and the concentration
of each related compound. According to the references peak obtained by standards related
compounds, it was possible to calculate the correspondent each one for the PZQ sample
thanks to the relative retention time. No PZQ related compounds identified were higher
than 0.06 wt%, indicating that the sample meets the requirements established by official
compendiums for this API (NMT 0.2 % for each one). Also, PZQ was according to the
specifications for drug content (100.6 ± 0.8 wt%).
Table 12. PZQ dosage and organic impurities determined by HPLC measurements.
Measured dosage
(wt%)*
Specification [53]
PZQ (raw material) 100.60 ± 0.8 98.5 – 101.0%
Related compound A 0.004 ± 0.0001
Max 0.2% Related compound B 0.047 ± 0.0005
Related compound C 0.002 ± 0.0003
*Values represent the standard deviation, n = 2
4.2 Thermogravimetric Analysis (TGA)
TG analysis can provide a fingerprint of the sample's thermal behaviour and is
used as a basis for determining the initial stages of the development of the DSC method
such as endpoint run temperature. All percentage results regarding the mass variations of
pure compounds are presented in Table 13.

138
Table 13. Mass variation from TG analysis for pure compounds.
Pure compounds
Δm (%)
RT* 30 °C / 75 % 40 °C / 75 %
t0 t15 t30 t15 t30 t15 t30
PZQ 0.036 0.099 0.084 0.209 0.099 0.223 0.105
0.053 0.110 0.089 0.217 0.101 0.216 0.117
PVPVA 4.545 5.383 7.047 10.857 12.140 10.887 11.228
4.276 5.572 7.070 10.767 11.950 10.527 10.948
SLS 1.323 0.853 0.945 2.138 1.233 1.523 0.774
1.329 0.843 1.033 2.113 0.535 1.532 0.786
*RT = room temperature
The results show that praziquantel is anhydrous with a mass loss of less than 0.1
%. The polymer (PVPVA) is hygroscopic and absorbs water over time, depending on the
storage condition, unlike surfactant (powder), which does not vary by more than 0.5 wt%
at room temperature and about 1 wt% under stress conditions.
4.3 Differential Scanning Calorimetry (DSC)
The heat flow (HF) is plotted as a function of temperature and shows the DSC
curves obtained for the pure compound, PZQ, PVPVA, and the surfactant SLS which will
be used as the third component in some ASD formulations (Figure 34).
The DSC curve for PZQ shows an endothermic signal at 140.77 °C (𝑇 𝑝𝑒𝑎𝑘 -
mean, n = 2), according to the literature 𝑇𝑚 data for the racemic form [298][74][161].
The DSC analysis of the polymer demonstrated a variation at approximately 110 ºC,
probably related to the loss of mass that was confirmed by the TG analysis (4.4 %) (4.2
section) [299].
For the surfactant SLS, Figure 34 shows an endothermic event starting at around
90 ºC, followed by the melting of the material around 190 ºC and then degradation from
200°C.

139
As explained, all materials were exposed to different environmental conditions for
30 days and they were monitored by different techniques, among them, DSC analysis.
Figure 35 shows the DSC curves obtained during the stability study of PZQ at the three
pre-fixed analysis points (t0, t15 and t30).
A single endothermic event, characteristic of the praziquantel fusion, was
observed for all the studied conditions. Table 14 shows the values of fusion enthalpy
(𝛥𝐻𝑓𝑢𝑠𝑖𝑜𝑛) and fusion temperature (𝑇 𝑜𝑛𝑠𝑒𝑡 and 𝑇 𝑝𝑒𝑎𝑘), respectively.
Figure 34. DSC curves of pure compounds: PZQ, PVPVA and SLS.
Figure 35. DSC curves of PZQ under different conditions of stability study.

140
Table 14. PZQ fusion enthalpy (𝛥𝐻𝑓𝑢𝑠𝑖𝑜𝑛) and fusion temperature (𝑇 𝑜𝑛𝑠𝑒𝑡 and 𝑇 𝑝𝑒𝑎𝑘) under different
storage conditions.
Thermal behaviour of PZQ - Stability study for 30 days
𝛥𝐻𝑓𝑢𝑠𝑖𝑜𝑛 (J/g)
RT LT (30°C/75%) AS (40°C/75%)
t0 t15 t30 t15 t30 t15 t30
PZQ 101.47 99.29 104.93 103.49 106.67 100.40 107.67
99.37 101.36 103.85 103.54 109.67 100.43 109.99
Average 100.4 100.3 104.4 103.5 108.2 100.4 108.8
SD 1.48 1.46 0.76 0.04 2.12 0.02 0.14
𝑇 𝑜𝑛𝑠𝑒𝑡 (°C)
RT LT (30°C/75%) AS (40°C/75%)
t0 t15 t30 t15 t30 t15 t30
PZQ 139.24 139.31 139.28 139.34 139.28 139.29 139.21
139.18 139.25 139.30 139.19 139.29 139.89 139.34
Average 139.2 139.3 139.3 139.3 139.3 139.6 139.3
SD 0.04 0.04 0.01 0.11 0.01 0.42 0.09
𝑇 𝑝𝑒𝑎𝑘 (°C)
RT LT (30°C/75%) AS (40°C/75%)
t0 t15 t30 t15 t30 t15 t30
PZQ 140.66 140.42 140.79 140.53 140.89 140.64 141.10
140.87 140.63 140.83 140.69 140.70 141.43 140.95
Average 140.8 140.5 140.8 140.6 140.8 141.0 141.0
SD 0.15 0.15 0.03 0.11 0.13 0.56 0.11
The physical stability of raw PZQ at 30 ºC/40 ºC and 75 % RH in a period of 30
days was confirmed by DSC and TG results:
- any thermal change was detected in the DSC curves, keeping the single
endothermic fusion event at around 140 ºC for all storage conditions.
- very small mass loss of approximately 0.1 % detected by TG analysis (Table
14).
This physical stability was expected since a similar behaviour was reported [37] for
PZQ exposed to close environment conditions (40 °C/75 % RH) for 90 days.
4.4 Powder X-Ray Diffraction (PXRD)
Figure 36 shows the PXRD diffractogram for PZQ, PVPVA and SLS samples,
revealing the crystalline nature of PZQ and SLS and the amorphous nature of the polymer.

141
To complete the analysis of these results, a previous study published by LARA et
al. (2013) performed with PZQ cocrystals is mentioned here. During this work, it was
necessary to characterize the crystal structure of PZQ using monocrystal X-ray
diffraction. As one of the results, the crystalline phase of PZQ (racemate) was elucidated
and published in The Cambridge Crystallographic Data Centre (CCSD) (see Table 2 -
Chapter 2) [10], [33], [73] . Comparing the diffraction pattern of raw PZQ with that in
the Chapter 2 (item 3.5), the racemate form of our raw PZQ is confirmed with similar
angles of diffraction signals (2θ - 6.3, 6.7, 8.0, 8.18, 15.4, 16.3, 17.5 and 20.1, indicated
by blue arrow on Figure 36). The difference in signal intensity is probable related, on one
side, to differences in method sensibility (PXRD and monocrystal XRD) and, on the
other, to differences on the degree of crystallinity between samples.
Figure 37 shows the diffraction patterns for raw PZQ during the stability test,
confirming its unchanged solid state after exposition to the different environment
conditions. This result corroborates with the data obtained with DSC analysis.
Figure 36. Diffractogram pattern of the pure compounds (PZQ, PVPVA, and SLS) and indication of the
characteristic diffraction angles for racemic PZQ.

142
Similarly, the polymer SLS and the solid surfactant PVPVA exposed to the same
stability test were analysed and the PXRD diffractograms obtained are presented in Figure
38 and Figure 39, respectively.
Figure 37. PXRD diffractogram obtained for the PZQ exposed to different environment conditions (RT,
LT, and AS) for 30 days.
Figure 38. PXRD diffractograms for SLS samples exposed to different environment conditions (RT, LT,
and AS) for 30 days.

143
The surfactant SLS showed all characteristics diffraction signals and others two
small diffraction peaks (angles at 5.4 and 7.2) for the samples after 15 and 30 days of
stability study under AS condition (40 ºC and 75% RH).
The PVPVA polymer samples were analysed only under ambient temperature
conditions and remained unchanged (amorphous). At t15, the samples were physically
modified (fine powder to agglomerates) when exposed to the humid environment, as will
be evidenced by stereomicroscopy in item 3.1.7.
4.5 Scanning Electronic Microscopy (SEM)
The SEM microphotographs of the commercial PZQ particles are shown in Figure
40. According to the American pharmacopoeia [300], SEM images show that the
predominant morphology in the PZQ sample is columnar. The columnar microstructure
resulted from an oriented attachment growth mechanism, in which nuclei precipitating
from solution attached along preferred crystallographic facets to form highly oriented,
size-quantized columnar grains [301].
Still, with the dimensions of the primary particles, it is possible to say that the
material has characteristics of a micronized (milled) sample. This material was probably
ground after synthesis. Generally, this type of procedure is adopted to improve the
dissolution of pharmaceutical ingredients that are poorly soluble in water.
Figure 39. XRD diffractograms for PVPVA samples exposed to room conditions RT for 30 days.

144
Figure 40. SEM images of the raw PZQ particles.
The SEM images of polymer (PVPVA) and the surfactant (SLS) are shown in
Figure 41 and 42. The polymer's primary particles are predominantly spherical in shape,
and the surfactant used has a rounded morphology of agglomerated primary particles and
are in accordance with that described by the respective technical documents [292], [293].
Figure 41. SEM images of raw PVPVA particles.

145
4.6 Stereomicroscopy
Stereomicroscopic images of the raw materials were obtained to verify their
physical aspect behaviour under different storage conditions. Figure 43, 44 and 45
represent the images at different times and conditions of temperature and relative
humidity for PVPVA, SLS, and PZQ, respectively.
Figure 42. SEM images of raw SLS particles.

146
a)
a)
b)
b)
c)
c)
d)
d)
e)
e)
f)
f)
g)
g)
Figure 43. Stereomicroscopy images of PVPVA: a) RT t0; b) RT t15; c) RT t30; d) LT t15; e) AS t15; f)
LT t30; AS t30.

147
a)
a)
b)
b)
c)
c)
d)
d)
e)
e)
f)
f)
g)
g)
Figure 44. Stereomicroscopy images of SLS: a) RT t0; b) RT t15; c) RT t30; d) LT t15; e) AS t15; f) LT
t30; AS t30.

148
The images of the commercial polymer (PVPVA) after insertion in the climatic
chamber present structures in the form of “splinters”. However, this appearance resulted
from scraping with a spatula to remove the sample that adhered to the glass plate. The
polymer was influenced by environmental conditions, changing its initial physical state
(fine powder to agglomerate).
The SLS and PZQ remained similar to the original state and showed no physical
changes like the polymer.
4.7 Particle size distribution (PSD) by laser light diffraction
The method used to analyse the particle size distribution of PZQ was previously
developed and validated. The data were recorded in an official notebook of
Farmanguinhos/Fiocruz, and a validation report was generated (08/2017) with all detailed
results.
f)
f)
g)
g)
a)
a)
b)
b)
c)
c)
d)
d)
e)
e)
Figure 45. Stereomicroscopy images of PZQ: a) RT t0; b) RT t15; c) RT t30; d) LT t15; e) AS t15; f) LT
t30; AS t30.

149
The method validation was carried according to the parameters indicated in the
American Pharmacopoeia [296] and ISO 13320-1 [295]. Three PZQ samples were used
from different manufacturers15 to address the variability of characteristics related to
dimension during the validation process. The summarized results of the validation are
given in Table 15.
Table 15. Summary of the results obtained to validate the process for the PZQ PSD method by laser light
diffraction.
PZQ PSD - Validation
Sample dx*
System
repeatability
(CV%)
Methodology
repetibility
(CV%)
Intermediated
precision
(CV%)
PZQ Nº 6
𝑑10 0.96 5.94 4.87
𝑑50 2.75 11.93 9.91
𝑑90 1.66 8.97 7.17
PZQ Nº 7
𝑑10 2.93 3.82 10.02
𝑑50 4.13 3.62 6.37
𝑑90 4.46 6.31 5.02
PZQ Nº 8
𝑑10 2.02 0.47 3.19
𝑑50 4.58 0.86 4.82
𝑑90 6.66 5.39 4.65
∗ 𝑑𝑥 = particle diameter corresponding to x % of the cumulative undersize
distribution (here by volume)
The PSD analysis of the PZQ used in this work was performed using the
developed and validated method. Table 16 shows the results of particle size distribution
by scattering laser light obtained for the three samples of the PZQ.
Table 16. PSD of pure PZQ used in this thesis
PSD (µm)*
𝒅𝟏𝟎 𝒅𝟓𝟎 𝒅𝟗𝟎 𝒅𝟒.𝟑 Span
PZQ 1.04 ± 0.01 3.14 ± 0.06 8.59 ± 0.35 4.35 ± 0.21 2.40 ± 0.09
* Values represent the standard deviation, n = 3
15 More details about this samples on the official notebook.

150
Figure 46 shows the cumulative and incremental distribution curves for the mean
(n = 3) of PZQ.
PZQ is in accordance with the nomenclature identification being categorized as
micronized. Most of its particles (90 %) have dimensions less than 9 µm. This analysis
uses as a premise the approximation of the measurement performed to an equivalent
sphere. In contrast, microscopy is a direct analysis and is used to validate the result
obtained, especially for PSD by scattering laser light [296]. SEM images obtained for the
PZQ corroborate the PSD results obtained by laser diffraction analysis.
4.8 PZQ solubility in aqueous media
HCl 0.1 M and, phosphate buffer pH 6.8 are commonly proposed in the literature
[37][63] for the evaluation of PZQ solubility in pH 1.2 and pH 6.8, respectively. Here,
raw PZQ solubility was evaluated in three media (HCl 0.1 M, acetate buffer pH 4.5 and
phosphate buffer pH 6.8) in absence or presence of different concentrations of surfactant
(SLS).
The results are grouped in Table 17. From these data, the presence of SLS did not
cause a significant variation on the solubility in HCL 0.1M pH 1.2, contrarily to the other
two media were the PZQ solubility increased significantly (p <0.05) as the SLS
concentration was increased.
Figure 46. Cumulative and incremental PSD curve of PZQ.

151
Table 17. Raw PZQ solubility in different aqueous media at 37 °C ± 0.5 ºC.
Medium Inicial pH Final pH Solubility
(mg/mL)
HCl 0.1 M 1.09 ± 0.01 1.11 ± 0.01 0.19 ± 0.05
HCl 0.1 M with 0.05 % SLS 1.17 ± 0.01 1.15 ± 0.01 0.23 ± 0.04
HCl 0.1 M with 0.1 % SLS 1.15 ± 0.01 1.20 ± 0.03 0.21 ± 0.02
HCl 0.1 M with 0.2 % SLS 1.17 ± 0.01 1.15 ± 0.01 0.18 ± 0.02
Acetate buffer pH 4.5 4.52 ± 0.01 4.52 ± 0.02 0.20 ± 0.04
Acetate buffer pH 4.5 with 0.05 % SLS 4.53 ± 0.01 4.54 ± 0.02 0.29 ± 0.01
Acetate buffer pH 4.5 with 0.1 % SLS 4.52 ± 0.01 4.52 ± 0.01 0.35 ± 0.02
Acetate buffer pH 4.5 with 0.2 % SLS 4.53 ± 0.00 4.53 ± 0.01 0.37 ± 0.01
Phosphate buffer pH 6.8 6.73 ± 0.00 6.75 ± 0.00 0.20 ± 0.02
Phosphate buffer pH 6.8 with 0.0 5% SLS 6.83 ± 0.00 6.83 ± 0.01 0.32 ± 0.02
Phosphate buffer pH 6.8 with 0.1 % SLS 6.83 ± 0.01 6.82 ± 0.01 0.36 ± 0.07
Phosphate buffer pH 6.8 with 0.2 % SLS 6.82 ± 0.02 6.81 ± 0.01 0.42 ± 0.03
According to Resolution-RDC No. 37/201 [302], a drug is considered highly
soluble when its highest dose administered orally (maximum dose per administration
described in package insert) is completely solubilized in a volume up to 250 mL of each
of the solutions tested within the range of physiological pH at 37 ± 1 ⁰C. According to the
package insert for the PZQ reference drug, Cisticid® 500 mg [48], the highest dose
administered is 600 mg of Praziquantel. The measured solubility data confirmed that the
API used in this study does not meet the recommended criteria to be considered highly
water-soluble, which was expected considering its classification as class II drug,
according to the biopharmaceutical classification system [303].
In addition to these data, the water solubility of the PZQ was analysed. For this
experiment, measurements were made up to 48 hours, and the results are shown in Table
18.
Table 18. Raw PZQ water solubility at 37 °C ± 0.5 ºC.
Time (h) Solubility (mg/mL)*
0.5 0.174 ± 0.02
1 0.181 ± 0.15
24 0.184 ± 0.03
48 0.195 ± 0.01
* Average value, n = 2

152
As mentioned before, several studies in the literature explore different tools to
improve the solubility of the PZQ and solubility in water. The evaluation method is
generally based on the excess addition of API in water and agitation of the suspension for
24 to 72 hours. The difference between the studies is in the temperature used to
experiment. Most studies make a physical-chemical assessment using 20 ºC or 25 ºC to
conduct the analysis and the results are around 0.14 mg/mL [18], [33], [53], [60], [304].
However, when a biopharmaceutical evaluation is desired, a temperature of 37 ºC is used
and our results are similar for the common values reported at lower bath temperature.
4.9 Dissolution profile
Some preliminary experiments were carried out by powder dispersion according
to the pharmacopeia method proposed for PZQ tablets in acid medium (HCl 0.1 N).
However, the presence of surfactant in the medium might have an impact on the powder
dispersion, modifying the powder wettability and then the initial dissolution time. For this
reason, we have decided to perform dissolution tests without the addition of surfactant
too. The difference on the dissolution kinetics obtained under these two different
conditions was clearly demonstrated (Figure 47).
The dissolution results in the medium without surfactant revealed a slow and
incomplete dissolution profile [24]. A study evaluating how PZQ was mixed with a
surfactant to increase dissolution found that PZQ alone had a similar dissolution profile
(about 26 % in 90 minutes) [24]. In the same vein, a recent study that evaluated the use
of smart excipients, such as layered double hydroxide (LDH) to promote an appropriate
delivery system, showed a similar result for pure PZQ [25]. Although the use of surfactant
(0.2 wt% SLS) is described in the pharmacopeial method for evaluating praziquantel
tablets, its use in the development of new formulations or intermediates may not be
favourable to discriminate the differences between samples. We have then concluded that
the acid medium without surfactant was the discriminating medium to be used throughout
that thesis.

153
The dissolution results in the medium without surfactant reveals a slow and
incomplete dissolution profile [24]. A study evaluating how PZQ was mixed with a
surfactant to increase dissolution found that the unprocessed material has a similar
dissolution profile (about 26 % in 90 minutes) [24]. In the same vein, a recent study that
evaluated the use of smart excipients, such as layered double hydroxide (LDH) to promote
an appropriate delivery system, showed a similar result for pure PZQ [25]. Although the
use of surfactant (0.2 wt% SLS) is described in the pharmacopeial method for evaluating
praziquantel tablets, its use in the development of new formulations or intermediates may
not be favourable to discriminate the differences between samples.
Figure 47. PZQ in vitro dissolution profile in acidic medium added (or not) of 0.2 wt% SLS.

154
5. CONCLUSIONS
The most important pure materials were characterized.
The raw API (PZQ) refers to the racemic crystal structure described as commercial
in the literature, confirmed by DSC, PXRD and image analysis.
Both, the raw PZQ and the polymer carrier (PVPVA) of interest in this thesis, are
physically stable after exposition to different environment conditions for 30 days.
The low PZQ solubility at 37 °C ± 1 ºC. was demonstrated:
- in purified water, in accordance with literature data (0.18 - 0.2 mg/mL),
- in acidic medium (HCl 0.1 N), around 0.2 mg/mL, not influenced by the
addition of surfactant (0.2 wt% SLS),
- in phosphate and acetate buffers (pH 4.5 and 6.8, respectively), equivalent to
that in acidic medium, but in these media, the addition of 0.2 wt% SLS led to
an increase of PZQ solubility (0.37 mg/mL in acetate buffer pH 4.5 and 0.42
mg/mL in phosphate buffer pH 6.8).
The dissolution profile of the raw PZQ was evaluated according to the
pharmacopeial method described for praziquantel tablets, evidencing the low dissolution
rate (15 wt% in 2h) which was strongly affected by the addition of 0.2 wt% SLS in the
medium (60 wt% in 2h). This background can be decisive for the discrimination of the
dissolution profiles between different formulations and allowed us to decide not to use
surfactant in the dissolution tests in the subsequent studies.

CHAPTER 4 - DETERMINATION OF PZQ
SOLUBILITY IN PVPVA BY
RECRYSTALLIZATION FROM
SUPERSATURATED SOLID SOLUTION

156
1. INTRODUCTION
It is widely discussed in the literature that, although ASDs have been a
technological alternative for poorly water-soluble drugs, a critical point of these systems
is their physical stability.
One of the main parameters affecting the physical stability of an ASD is the drug
solubility in the carrier, because this value determines the maximal drug load without a
risk of phase separation and recrystallization. Phase-diagrams have been experimentally
obtained by following the recrystallization of the drug from a supersaturated
homogeneous drug-polymer solid solution, commonly produced by processes as solvent
casting, comilling or, more recently, spray drying.
In the thesis, a composition-temperature phase diagram Praziquantel (PZQ) -
Kollidon® VA 64 (PVPVA) was established and is one of the main subjects treated in
this Chapter.
The first part is dedicated to the generation and characterisation of supersaturated
solid solutions containing PZQ and the polymer Kollidon® VA 64 (PVPVA) by spray
drying process.
Unexpectedly, in some batches of spray-dried powders produced in this study,
traces of crystalline forms of PZQ were found, which are different from the initial racemic
form. As mentioned before, two polymorphic forms (B and C) of praziquantel have been
recently described by researchers. They present different physical and chemical
characteristics compared to the racemic PZQ. It will be shown in the end of this part that
the traces of crystallinity found in some of the supersaturated solid solutions could
correspond to one of these polymorphic forms of PZQ recently reported.
The second part of the Chapter deals with the construction of the temperature-
composition PZQ - PVPVA phase diagram, by means of a thermal study of
recrystallization with one of the spray-dried supersaturated solid solutions presented in
the first part of the Chapter.
For the sake of clarity, the two parts will be presented separately.

157
PART 1 - GENERATION AND CHARACTERIZATION OF
SUPERSATURATED PZQ SOLUTIONS BY SPRAY DRYING
1. METHODS
1.1. Generation of supersaturated PZQ solutions by spray drying
Spray drying was the process used to generate supersaturated solutions of PZQ in
Kollidon® VA 64 (PVPVA) with 50 wt% and 70 wt% of theoretical loads of PZQ.
A Buchi B-290 mini spray dryer (Buchi Labortechnik AG, Flawil, Switzerland)
equipped with Inert Loop B-295 and an integrated two-fluid 0.7 mm nozzle was used
(Figure 48). The feeding solution was prepared by dissolving PZQ in a 10 wt% solution
of PVPVA in absolute ethanol 99.9 %. The inlet air temperature was set to 80 ± 2°C (dry
method 1) or 110 ± 2 °C (dry method 2), aspiration rate of 100 % (i.e., 35 m3/h),
compressed nitrogen atomization flow rate set at 600 L/h and liquid feed rate of 2.8 to 7.2
mL/min. The dry powder was recovered in a cyclone. Ethanol in the outlet gas flow was
continuously condensed for further disposal.
The formulation and operating conditions used are summarized in Table 19.
Different compositions of the binary PZQ: PVPVA system were prepared by spray
drying. It aimed to obtain an amorphous solid solution of PZQ to use on the determination
of the API-polymer solubility curve by the recrystallization method (DSC).
For purposes of comparison, physical mixtures (PM) of PZQ in PVPVA with 50
w%t and 70 wt% of PZQ were produced by manual mixing (coded PM 50 and PM 70,
respectively).
All samples were stored in a glass flask protected from light and inside a
desiccator stored at 20°C.

158
Table 19. Composition, process parameters to produce PZQ spray-dried powders and effective drug
content.
Samples (n = 3)
Composition PZQ : PVPVA
(wt%)
Inlet gas
temperature (°C)
Dry
Method
code
Outlet gas
temperature (°C)
SD 1 50:50 80 ± 2 °C 1 48 ± 2 °C
SD 2 70:30
SD 3 50:50 110 ± 2 °C 2 68 ± 2 °C
SD 4 70:30
a) b) c)
d)
Figure 48. Spray drying used for samples production. a) Buchi B-290 mini spray dryer; b) liquid feed;
c) sample spraying; d) cyclone and sample colector.

159
1.2 Characterization of supersaturated PZQ solutions
1.2.1 Determination of drug loading
HPLC-UV method [297] was used for PZQ dosage in the spray-dried samples.
The HPLC system used consisted of two mobile phase delivery pumps (LC-10
ADVP, Shimadzu, Japan), a UV–Vis detector (SPD-10Avp, Shimadzu, Japan), an
autosampler (SIL-20A, Shimadzu, Japan), an interface (SCL-10Avp, Simadzu, Japan) for
the acquisition of data through a software Ez-Star and a column Protosil C18 100 Å
(150×4.60 mm - 5 μm, Phenomenex, Bologna, Italy). The mobile phase comprised
methanol and water (60:40 V/V), the flow rate was 1.5 ml/min, injection volume was
10µL and absorbance readings were conducted at a fixed wavelength of 210 nm. The
retention time of PZQ was about 3 min and the run time was set at 10 min. Quantification
was carried out using a fresh stock solution prepared each time before starting the
analysis. The standard solution of PZQ was prepared by dissolving 9 mg of PZQ in the
mobile phase to obtain a final concentration of 0.18 mg/mL. For each sample, an
equivalent of 37.5 mg of PZQ was weighed in duplicate, in 25 ml volumetric flasks, and
added to the mobile phase. The solutions were subjected to ultrasound for 5 minutes. The
sample was filtered with a PTFE 0.22 µm filter and diluted to 0.18 mg/mL. The flask was
homogenized, and a fresh aliquot was filtered (same type of filter) and transferred directly
to a vial. HPLC analysis took place immediately after the sample preparation. The results
were expressed in the percentage of PZQ recovery.
1.2.2 Differential Scanning Calorimetry (DSC)
The analyses were performed by using a DSC Q200 with the base module and
mDSC (TA instruments, USA). Nitrogen was used as the purging gas at 50 mL/min, the
analysis was made in non-hermetic aluminium pans, indium standards were used for
enthalpy and temperature calibration and an empty aluminium pan was used as a blank.
As for mDSC, sapphire was used to calibrate in CP. Samples were heated at 2 °C/min.
from 10 to 160 °C, with a modulation period of 40 s and an amplitude of 0.2 °C.
1.2.3 X-ray diffraction (PXRD)

160
Powder X-ray diffraction patterns were obtained by X’Pert Panalytical X-ray
diffractometer (Philips, USA) using CuKα radiation, putting 40 mA of current and 45 kV
of voltage. The recording spectral range was set at 5–50° with a measuring step (angular
deviation between 2 consecutive points) of 0.0167° and an acquisition time of 100 s per
point. In addition, the powder was rotated in its sample holder (1 s/revolution) during the
acquisition of the results.
1.2.4 Scanning Electronic Microscopy (SEM)
SEM images were obtained using a scanning electron microscope HITACHI
TM3030 Plus (HITACHI) with an acceleration voltage of 15 kV. Samples were fixed on
support using a double-sided adhesive and covered with platinum using a high-resolution
SEM coated spray Polaron SC7640 (Quorom Technologies, England).
1.2.5 Apparent solubility
Solubility measurements were performed following the standard shake flask
method (Incubator Shaker SL 222, Solab). An excess mass of samples was added into 50
mL of purified water under magnetic agitation with 100 rpm at 37 ± 0.5 °C. Two mL of
each sample was withdrawn, filtered through 0.22 μm cellulose acetate filter and
immediately transferred to vial, at different time points: 30 min, 1h, 24h and 48 h. The
concentration of PZQ in water was measured by HPLC system (Agilent 1100 Series)
equipped with a UV-visible detector (with the same method described before). The
experiments were carried out in duplicate.
1.2.6 Stability monitoring
To monitor the physical stability of the solid state of PZQ in the spray-dried
powders, the samples were kept in glass vials protected from light and kept in a desiccator,
which was stored under laboratory conditions (25 °C ± 2 °C and 60 % RH) during 5
months after production. DSC and PXRD analyses were undertaken over the storage
period to check the solid state of the analysed samples.

161
2. RESULTS
2.1 Characterization of the spray-dried powders
2.1.1. Determination of effective composition
HPLC measurements allowed to quantify the PZQ on the spray-dried samples,
which were close to the theoretical values (Table 20).
To characterize the residual solvent content, the weight loss of SD samples at the
end of the thermal analysis was measured, considering that the weight loss corresponded
to solvent evaporation in the range 20 °C – 100 °C. The higher residual solvent in the
samples SD 1 and SD 2 dried under milder conditions (dry method 1) was lower than 0.8
wt%.
Table 20. PZQ content in the samples produced by spray drying.
Samples (n = 3)
Theoretical
PZQ
(wt%)
Real PZQ
(wt%)
(n = 2)
SD 1 50 50.8/51.8
SD 2 70 69.8/69.3
SD 3 50 50.9/49.6
SD 4 70 70.2/67.1
2.1.2. Powder X-Ray Diffraction (PXRD)
The X-ray diffraction pattern of the raw PZQ in Figure 49 shows well defined
Bragg peaks, as already seen in the literature [10], [73], [74]. The most intense peaks were
found at 2θ degrees of 6.2, 7.7, 11.5, 12, 12.5, 13.6, 14.6, 15.6, 15.8, 18.6. In the same
figure, the diffraction pattern of the raw polymer (PVPVA) represents a single broad halo,
characteristics of an amorphous material.
Still in Figure 49, PXRD patterns for the SD samples confirmed the
transformation of the raw PZQ from crystalline to amorphous. In fact, for all produced

162
samples (SD 1, SD 2, SD 3 and SD 4), a broad halo with no diffraction signs is observed.
Samples were produced in triplicate and all replicates presented the same PXRD patterns
represented in Figure 52.
2.1.3. Thermal analysis
Figures 50 and 51 show the DSC scans for the three replicates of all SD samples.
The data from DSC curves are grouped in Table 21.
For the samples with 50 wt% PZQ: two values of 𝑇𝑔 were found for two of three
replicates of the SD1 sample. Differently, the third replicate shows a single 𝑇𝑔 on 44.5
°C. For the SD3 sample, a single 𝑇𝑔 was detected for all replicates, with values in the
range 45.6 to 59.9 °C.
For the samples with 70 wt% PZQ: A single 𝑇𝑔 of 37 °C was found for SD 2
sample, whereas for SD 4 sample, the 𝑇𝑔 failed in the range 29.7 to 34.1 °C.
Figure 49. PXRD diffractograms for raw materials (PZQ and PVPVA) and spray-dried samples (SD 1, SD
2, SD 3, and SD 4).

163
Table 21. Glass transitions of SD samples obtained by reverse heat flow signal during the DSC analysis.
Time Batch
SD 1 SD 2 SD 3 SD 4
Tg (°C) ΔCP
(J/g.°C) Tg (°C)
ΔCP
(J/g.°C) Tg (°C)
ΔCP
(J/g.°C) Tg (°C)
ΔCP
(J/g.°C)
t0 -
freshly
produced
a 56.58 0.30
41.88 0.35 45.55 0.30 34.12 0.38 108.23 0.87
b 56.17 0.47
41.15 0.30 53.43 0.54 29.68 0.40 113.56 0.11
c 44.49 0.45 37.01 0.37 59.88 0.88 33.76 0.36
The effect of the inlet drying temperature (referred as drying method) on the
thermal profile of samples with 50 wt% PZQ can be analysed comparing Figures 50a (dry
method 1) and Figure 50b (dry method 2). For samples with 70wt% PZQ, Figures 51a
and 51b allow a similar analysis.

164
Figure 50. DSC curve for samples with 50 wt% PZQ (n = 3) generated at different drying
temperatures: a) 80 °C, and b) 110 °C.
a)
b)

165
In some DSC curves of Figure 51, it can be observed the presence of endothermic
events, which could correspond to melting transformations. The characteristic values are
shown in Figure 52.
Considering that two of the replicates of SD 2 and SD 4 samples are amorphous
without endothermic events, the differences in the solid state, detected in one of their
triplicates, have evidenced that the final state of the spray-dried solid may undergo
modifications during or immediately after the solid formation. It is important to remember
that these samples contain around 70 wt% of PZQ which, if rendered amorphous during
a)
b)
Figure 51 DSC curve for samples with 70 wt% PZQ (n = 3) generated at different drying temperatures: a)
80 °C, and b) 110 °C.

166
the solid formation, need to stay amorphous within the polymeric matrix. Therefore,
recrystallisation may take place if they are highly supersaturated. The higher PZQ
concentration (70 wt%) in both samples (SD 2 and SD 4) could be the reason for the lack
of repeatability of amorphous characteristics for the batches produced.
The endothermic events detected in these replicates did not correspond to the
melting of the initial racemic molecule (around 137 °C). In fact, they could correspond to
new polymorphic forms of PZQ recently described in the literature [30], [73] like the
form B (melting temperature of 110 °C – 112 °C) or the form C (melting temperature of
106 °C). However, the broadness of the peaks prevents the clear identification of the
polymorph form in the samples freshly produced. As these replicates (batch ‘c’ – Figure
51) were monitored for 3 and 5 months after production, this discussion will be continued
later in the section dedicated to stability.
For purpose of comparison, the DSC scan of unprocessed PZQ reveals a first
endotherm at peak at 137.78 °C, attributed to the melting of racemic form, in according
with previous DSC measurements shown in Chapter 3 (item 4.3). Also, no dehydration
event was observed in the TG curve, confirming its anhydrous nature. Regarding the
polymer, the DSC thermogram confirms the absence of endothermic peaks due to
melting, in according with describe in Chapter 3 (item 4.3). A variation of the baseline
Figure 52. Magnification of DSC curves for SD 2 and SD 4 samples showing the endothermic events.

167
starting 30 °C to ~110 °C is observed for PVPVA. This variation corresponds to the loss
weight of the material and was confirmed by the TG analysis, as displayed in Figure 53b.
Indeed, TG curves give information’s related to the high degradation temperatures for
PZQ and PVPVA (> 240 ºC and > 270 ºC, respectively). These results corroborate those
reported in the literature [299][305].
2.1.4 Scattering Electronic Microscopy (SEM)
SEM images of SD samples are presented in Figure 55. For comparison, the SEM
images of the raw materials (PZQ and PVPVA) and their physical mixtures prepared in
the same mass proportion of the SD samples are shown in Figure 54.
a)
b)
Figure 53. a) DSC curves and, b) TG curves of pure components - PZQ and PVPVA.

168
The raw PZQ is constituted of needle-shaped crystals (Figure 54a), while raw
PVPVA particles are predominantly spherical (Figure 54b) and larger than those of raw
PZQ. In the SEM images of PZQ and PVPVA physical mixtures with different mass
proportions (Figures 54c and 54d), PZQ particles covered the PVPVA particle surfaces,
which was not the case for SD spray-dried particles (Figures 58a to 58d). Figures 58a to
58d revealed the effect of two parameters on the microstructure morphologies of the SD
powders, PZQ load and drying temperature.
The SD 1 powder (50 wt% PZQ, drying temperature of 80 °C) is constituted by
spherical particles (Figure 55a). The SD 3 powder, that has a similar mass composition
but is produced at higher drying temperature (100 °C), shows spherical particles partially
sintered together (Figure 55c).
SD 2 and SD 4 spray-dried powders in Figures 55(b) and (d) correspond
respectively to formulations dried at 80 °C and 100 °C. Their PZQ mass load is around
70 wt%. In both powders, particles with a less perfect spherical shape partially (also
sintered together) were observed. Moreover, very fine needle-like particles are found at
their surface and their presence became more apparent for SD 4 powder.
a b
c d
Figure 54. SEM images of raw materials and physical mixtures: a) PZQ; b) PVPVA; c) PM 50; d) PM 70.8

169
a
d
b
c
Figure 55. SEM images of SD samples: a) SD 1 with magnification 7000x; b) SD 2 with magnification 5000x; c) SD 3 with magnification 1200x and, d) SD 4 with magnification
1200x.

170
The differences in microstructure morphologies between SD samples are due to
the combination of two different effects, the increase of the PZQ load in the formulation
and the increase of the inlet gas drying temperature which affected the outlet drying
temperature (see Table 1). As discussed before, SD powders are mostly amorphous, and
their glass transition temperature is dependent on their PZQ load. The temperature
reached by the solid powder during the spray drying process will strongly affect their
physical stability and tendency for sintering and stuck, mainly if it is close to its glass
transition temperature.
The physical characteristics of the powders were influenced by the process outlet
temperature (48 ºC and 68 ºC) that was close to or even exceed the respective 𝑇𝑔, leading
to the softening state and sintering effect between the particles.
The increase of PZQ concentration from 50 to 70 wt% is expected to lower 𝑇𝑔 on
the amorphous mixture, increasing the tendency for sintering and stuck as observed in
Figures 55(b) and 55(d). Another interesting characteristic evidenced in the same figures
is the presence of needle-like particles on the surface of the larger partially sintered more
spherical particles in SD 2 and SD 4 powders. They might correspond to PZQ particles,
suggesting that there was a change in the morphology of the primary particles of PZQ
initially used. As the raw PZQ was completely dissolved in ethanol before drying, these
new particles were formed during drying or just after drying (recrystallization) considered
the very high drug load (70 wt%) in the solid sample. They may correspond to the
crystalline form identified in two replicates, as discussed before (item 2.1.3).
2.1.5 PZQ Water Solubility
In order to learn more about the SD samples, other properties were measured as
the effect of the new solid state (amorphous or predominantly amorphous solid solutions)
on the PZQ water solubility. For that, the solubilization of the SD samples in water at
37°C was investigated, in comparison to their corresponding compositions but as physical
mixtures (PM 50, PM 70) and with raw PZQ as reference for solubility enhancement.
The solubilization process was monitored over time, at 0.5 h, 1 h, 24 h and 48 h,
when the equilibrium concentration of PZQ in solution was reached. Data are given in
Table 22 and represented in Figure 56 for the first point (0.5 h) and at the end of the
experiment (48 h).

171
Table 22. PZQ water solubility (37 °C) for SD samples, in comparison to physical mixtures of
corresponding compositions and raw API.
Sample
code PZQ concentration (mg/mL)*
0.5 h 1h 24h 48h
PZQ 0.181 ± 0.02 0.189 ± 0.16 0.192 ± 0.03 0.204 ± 0.01
PM 50 0.217 ± 0.03 0.246 ± 0.00 0.206 ± 0.03 0.213 ± 0.01
SD 1 0.259 ± 0.10 0.252 ± 0.10 0.267 ± 0.04 0.263 ± 0.01
SD 3 0.312 ± 0.08 0.293 ± 0.05 0.284 ± 0.02 0.300 ± 0.03
PM 70 0.211 ± 0.01 0.215 ± 0.00 0.179 ± 0.01 0.210 ± 0.02
SD 2 0.283 ± 0.01 0.273 ± 0.03 0.274 ± 0.02 0.286 ± 0.00
SD 4 0.360 ± 0.01 0.331 ± 0.00 0.313 ± 0.01 0.269 ± 0.03
* Values represent the average and standard deviation, n = 2
From data, the concentration of PZQ16 in solution was 0.181 ± 0.02 mg/mL in the
first 30 minutes, reaching the equilibrium of 0.204 ± 0.01 mg/mL in 48 hours, a value
that is in line with the literature data (Table 23) [157], [161], [304]. The same tendency
of increased solubilization was verified for the physical mixtures of raw PZQ and the
polymer (PM 50 and PM 70). The wetting agent effect of polymer, which favours PZQ
solubilization in the first 30 min was observed, and it was directly proportional to the
concentration of the polymer in the mixture. However, the equilibrium solubility reached
from the physical mixtures is similar to the one obtained for raw PZQ, suggesting that the
polymer in this formulation form exerts little or no solubility enhancing effect.
In contrast to raw PZQ and physical mixtures, Figure 56 shows that the SD
samples improved the apparent solubility of PZQ. The maximum concentration of PZQ
in solution was reached in the first 30 min for all SD samples, the highest being 0.360 ±
0.01 mg/mL for SD 4, which represents an increase of 47 %.
16 This experiment was independent of Chapter 3. It means that the water solubility test for PZQ raw
material was conducted simultaneously with the other samples presented here. The values of both
experiments are comparable.

172
SD 3 and SD 4 samples showed fast kinetics solubilization in 30 minutes
compared to the other samples. However, SD 4 is also responsible for a higher decrease
to 48 h. The ‘spring effect’ initially observed is related to the change from the crystalline
form to the predominantly amorphous form of the drug in the SD samples. In fact, as
already discussed in Chapter 2, a high-energy form of the drug in its amorphous state (the
spring) provides the driving force to its solubilisation at a concentration greater than its
equilibrium solubility level [306]. Nonetheless, amorphous forms are metastable
structures and tend to migrate to their more stable form under conditions that can increase
molecular mobility, for example, in the presence of water or temperature [186], [190],
[192], which explains the tendency of reduction in the PZQ concentration in the medium
measured at 48h. Still, although the decay, the apparent solubility is improved at least of
31% for SD4 sample. A ‘parachute’ effect (inhibition of the recrystallization expected
with amorphous solid dispersions) in 48 h was observed for SD 1 and SD 2 samples,
resulting in an improvement of 28 % and 41%, respectively, in the apparent solubility of
PZQ.
2.1.6 Physical stability of the amorphous state
Figure 56. Solubility in water at 37 °C of raw praziquantel, physical mixtures (PM 50 and PM 70) and SD
1, SD 2, SD 3, and SD 4. Data are presented as the mean ± standard deviation (n=3).

173
Finally, we have decided to verify the physical stability of the SD samples. For
this purpose, they were stored in glass vials protected from light and kept in a desiccator
at 25 °C and 60 % RH and reanalysed by DSC at 3 months and 5 months after production.
Also, PXRD was performed after 3 months of aging under storage.
For all replicates, 𝑇𝑔 values initially detected by DSC in the samples freshly
produced (t0) barely changed over time. As the evolution was quite similar, Figure 57
represents the 𝑇𝑔 data for one replicate of each SD sample at t0, t3 (after 3 months) and
t5 (at the end of the experiment at 5 months). It should be noted that the only modification
was seen for SD 1 sample for which two 𝑇𝑔 were identified in two replicates at t0. After
3 months of storage, only a single 𝑇𝑔 (54.35 °C) was identified in the sample near the
first one detected before (56.58 °C). A reduction of this value was observed at t5 (43.76
°C). For SD 1 and SD 3, there was a greater decay of 𝑇𝑔 after 5 months when compared
to samples SD 2 and SD 4.
We consider that some values of 𝑇𝑔 are not high enough to guarantee the product's
stability at room temperature, and, in these cases, small variations are sufficient to
increase the molecular mobility of the system and cause drug recrystallization. This
sensibility to temperature could explain the new endothermic event around 106.5 °C
followed by 133 – 134 °C observed in the samples at t3 for samples with 50 wt% PZQ as
Figure 57. Monitoring the glass transition (Tg) of spray-dried binary systems (SD 1, SD 2, SD 3, and SD 4)
at different times.

174
shown in Figure 58. It could be attributed to the recrystallization of the polymorphic form
into racemic form.
Based on the recent literature on forms B and C of PZQ [75], we can hypothesize
to interpret the observed transformations. Initially, there is a variation of the baseline
related to residual ethanol evaporation, followed by the possible melting of form C (106
°C) and the recrystallization to the racemic commercial form (around 137 °C).
XRPD analyses (Figure 59) confirmed the appearance of crystalline peaks during
aging,
Figure 58. DSC thermograms for SD samples after 3 months of production (25 °C and 60 %RH).

175
The main results from this part 1 are summarized now.
The spray drying technique is advantageous for obtaining amorphous systems as
it is a fast procedure based on the drying of two compounds molecularly dispersed in a
solution. It was demonstrated in this part of the Chapter that spray-dried amorphous
binary mixtures of PZQ and PVPVA containing 50 and 70 wt% of PZQ could be
generated by spray drying. Different techniques were applied to their characterization:
DSC, PXRD, SEM, HPLC (for solubility and API content), besides monitoring of
physical stability for 5 months.
The results from these analyses confirmed the predominantly amorphous state of
the samples and, in some cases, a mixture of amorphous and a new polymorph (Form C
or form B) recently identified in the literature and never reported for PZQ solid
dispersions. For these samples, the confirmation of the PZQ polymorphic form (B or C)
requires additional characterization to evaluate small amounts of crystalline material
dispersed in a polymeric matrix such as X-ray pair distribution function (PDF), which has
not been done here.
The physical evolution detected mainly after 3 to 5 months of aging under mild
conditions, even if still not significant, reflects the behavior of an amorphous mixture
supersaturated in the drug presenting a kinetic (and not thermodynamic) stability.
Figure 59. XRPD diffractograms for SD 1, SD 2, SD 3 and SD 4 after 3 months of production, stored at 25
°C and 60 % RH.
b)

176
This study was undertaken to verify the feasibility for generating supersaturated
solid solutions with PZQ. This material is required for the determination of the solubility
of PZQ in PVPVA by means of a recrystallization method. Four samples were produced
and after characterization, the SD1 sample was chosen for the recrystallization study that
will detailed in the next part of this Chapter.
PART 2 - DETERMINATION OF A TEMPERATURE-
COMPOSITION PHASE DIAGRAM FOR THE BINARY PZQ-
PVPVA
1. METHODS
1.1 Temperature-composition PZQ: PVPVA phase diagram
First step – determination of the relation between 𝑇𝑔𝑚𝑖𝑥 and the binary composition
The first step in determining the PZQ-PVPVA solubility curve was to determine
𝑇𝑔𝑚𝑖𝑥 for the binary mixture.
For PZQ-PVPVA mixture, 𝑇𝑔𝑚𝑖𝑥 was determined experimentally from mixtures
prepared directly on the crucible, with different mass compositions. For DSC
measurements, the experimental protocol is given in Table 217.
The analyses were performed by using a DSC Q200 with the base module and
mDSC (TA instruments, USA). Nitrogen was used as the purging gas at 50 mL/min, the
analysis was made in non-hermetic aluminium pans, indium standards were used for
enthalpy and temperature calibration and an empty aluminium pan was used as a blank.
As for mDSC, sapphire was used to calibrate in CP.
17 Table 2 also regroups other DSC protocols employed in this study like that to reanalyse the raw materials
(the first analysis presented in Chapter 2 was performed in another laboratory employing another DSC
ecquipment) and the protocol used for the API-polymer solubility curve which is explained just after.

177
As already introduced in Chapter 2 (Section 6.1.2.1), one of the most popular
equations for predicting glass transition temperatures of amorphous mixtures is the
Gordon-Taylor (GT) equation [78], [88], [225]:
Equation 5
𝑇𝑔𝑚𝑖𝑥 = 𝑊1𝑇𝑔1 + 𝐾 𝑊2𝑇𝑔2/𝑊1 + 𝐾 𝑊2
where 𝑇𝑔𝑚𝑖𝑥 and 𝑇𝑔 𝑖 are respectively the glass transition temperature of the
mixture and of the components, Wi is the mass fraction of component i and K is an
adjustable fitting parameter. By plotting experimental 𝑇𝑔 values as a function of the glass
composition, one can usually apply the GT equation to determine the slope K, which
subsequently can be used in 𝑇𝑔 predictions.
Second step – determination of the solubility of PZQ in PVPVA (in the range 100-130°C)
The second step was to determine the PZQ-PVPVA solubility from a
supersaturated solid solution. To this end, one of the spray-dried powders generated in
the first part of this study, with 50 wt% PZQ, was used. The sample was SD 1, batch “c”
(method 1) with amorphous characteristic (𝑇𝑔 44.49 °C and ∆𝐶𝑝 0.45 J/g.°C) described in
“Part 1” of this Chapter and here named as SD 50% PZQ.
Figure 60 shows a typical DSC scan for the API-polymer solubility measured by
recrystallization, which comprises four cycles of thermal analysis.

178
The first cycle refers to the first heating step revealing the 𝑇𝑔𝑚𝑖𝑥 𝟏 of the
supersaturated binary system, followed by an exothermic phenomenon (recrystallization)
(run 1).
The second cycle (referring to the isotherm) aims to reach the equilibrium state
for the sample at a given annealing temperature (run 2).
In the third cycle, the sample is cooled down (run 3).
Finally, the fourth and last cycle corresponds to a second heat cycle that gives a
new 𝑇𝑔𝑚𝑖𝑥 𝟐 , corresponding to the API amount that still remains dispersed in the polymer
at the annealing temperature (run 4).
For the recrystallization method, two factors are essential: annealing temperature
and annealing time. The key relationship between annealing time and temperature is that
a longer time is required to reach the equilibrium state for lower temperatures. This
phenomenon is probably related to a slower demixing kinetics due to an insufficient
molecular mobility, leading consequently to slower API diffusion in the polymer matrix
[244].
Figure 60. Recrystallization method by DSC where Run 1 - supersaturation heating (reveals the 𝑇𝑔𝑚𝑖𝑥 𝟏
of supersaturation system), Run 2 - isotherm, Run 3 - cooling and, Run 4 - saturation heating (reveals the
𝑇𝑔𝑚𝑖𝑥 𝟐 of saturation system).
𝑇𝑔𝑚𝑖𝑥 𝟏 𝑇𝑔𝑚𝑖𝑥 𝟐

179
Completing the DSC analysis, the new equilibrium concentration of API
remaining dispersed in the polymer is calculated using the GT equation.
The experimental protocol used in this study was then the following:
The SD 50 % PZQ sample was loaded into the DSC analyser and heated at a rate
of 2 °C/min up to the annealing temperature. The sample was annealed at different
temperatures (100 °C to 130 °C) below the 𝑇𝑚 (melting point) of PZQ for 6 – 30 h, aiming
to recrystallize the excess of PZQ in the mixture and to reach the equilibrium solubility
(Table 23, method 2).
After annealing, the sample was cooled to 0 °C with a rate of 30 °C/min.
Immediately after cooling, the second heating ramp was performed at a rate of 2 °C/min
from 0 °C to 160 °C to obtain the value of 𝑇𝑔𝑚𝑖𝑥 𝟐 (glass transition temperature) of the
annealed material.
To determine the PZQ concentration corresponding to the new 𝑇𝑔𝑚𝑖𝑥 𝟐 (annealed
material), the GT equation was used.
Table 23. mDSC methods used to determine the experimental glass transitions of each physical mixture
(𝑇𝑔𝑚𝑖𝑥) and the API-polymer solubility curve by recrystallization
2. RESULTS
2.1. API-polymer solubility determination by recrystallization
First step - determination of 𝑇𝑔𝑚𝑖𝑥 for PZQ-PVPVA amorphous binary mixtures
From physical binary mixtures (prepared directly inside the DSC crucibles) it was
possible to measure the glass transition temperatures 𝑇𝑔𝑚𝑖𝑥 with the reversing heat flow
(RHF) mDSC data (second cycle of heating) (see Table 24 – method 1).
By plotting experimentally 𝑇𝑔𝑚𝑖𝑥 values as a function of the binary composition,
the GT equation was used to determine the slope, k, which was subsequently used to
identify, from the GT equation, the SD 50 % PZQ equilibrium composition associated to
𝑇𝑔𝑚𝑖𝑥 2 .
The experimental values used for k determination are done in Table 24. The best
fitting was found for k equal to 0.2225. The GT curve is represented on Figure 61.

180
Table 24. Experimental glass transitions of physical mixtures (API:Polymer).
WPA Experimental Tgmix (ºC)
Molten physical mixtures and raw material
0 110.3
0.249 72.7
0.330 62.4
0.400 56.1
0.500 43.0
0.580 41.5
0.600 41.2
0.730 40.9
0.750 39.1
1 38.4
Method/samples
analized
T initial
(°C)
T end
(°C)
Heating
rate
(°C/min)
Modulation
temperature
amplitude
(°C)
Modulat.
Period
(s)
T
isotherm
(°C)
Time
isotherm
(h)
Cycle
reference
(Raw materials
and physical
mixtures)
0 180 2 0.2 40 NA NA Heating 1
180 180 0 NA NA 170 0.017 Isotherm
180 0 30 NA NA NA NA Cooling
0 180 2 0.2 40 NA NA Heating 2
(Amorphous
solid solution -
sample named
SD 50 % PZQ
0 120 2 0.2 40 NA NA Heating 1
120 120 0 NA NA
100
110
120
130*
6
10
20
30*
Isotherm
120 0 30 NA NA NA NA Cooling
0 180 2 0.2 40 NA NA Heating 2
1
2

181
Second step – determination of the solubility of PZQ in PVPVA in the range 100-130°C
The second step was to determine the PZQ-PVPVA solubility from the SD 50 t%
PZQ.
The glass transition temperatures of ASD sample were determined by DSC (Table
24). A single and distinctive mixture glass transition temperature (𝑇𝑔𝑚𝑖𝑥 ) in the reversing
heat flow signals, indicated the formation of one-phase in the solid structure produced by
spray-drying. PXRD also confirmed the results from DSC.
This sample was then annealed from 100 °C until 130 °C to promote the
recrystallization of excess PZQ amount. In order to use a reasonable annealing time, the
lower limit of temperature range (100°C) was chosen far enough above the glass
transition (≈109 °C for pure polymer, 60.3°C for the binary mixture), the molecular
mobility reducing strongly as we approach 𝑇𝑔𝑚𝑖𝑥 . The upper value of this range was
chosen under the melting point of pure API (𝑇𝑓 𝑃𝑍𝑄 = 138 °C).
One example of the experimental recrystallization method is given here. When the
SD 50 % PZQ sample undergoes an annealing from 10 h to 120 ºC, the 𝑇𝑔𝑚𝑖𝑥 goes from
44 ºC (run 1) followed by a recrystallization which starts at about 90 °C and is stopped at
*Variation of temperature and annealing time to evaluate SD 50% PZQ system.
Figure 61. The Gordon Taylor equation adjusted from measured Tgmix

182
the annealing temperature of 120 °C. In Run 2 (isotherm), the sample is kept at 120°C
during 10 h. Here it is possible to understand why this step is considered crucial for the
good execution of the method. At this point, when the recrystallization finishes, PZQ has
the opportunity to reach equilibrium with the remaining excess of API into the sample.
After reaching equilibrium, the cooling step occurs, and then the second heating
in the same conditions as the first (see Table 24, method 2). During this second heating,
the 𝑇𝑔𝑚𝑖𝑥 was obtained at 60 ºC (run 4). After, the endothermic signal, related to the
melting of the recrystallized material, can be visualized (𝛥𝐻𝑓𝑢𝑠𝑖𝑜𝑛 8.03 J / g) with heat
flow signal.
After each annealing step (see method on Figure 60), the 𝑇𝑔𝑚𝑖𝑥 𝟐 detected in run
4 was associated to a new equilibrium concentration from the Gordon Taylor curve.
Table 25 regroups the PZQ concentrations at equilibrium obtained for all annealing
temperatures.
Table 25. Calculated equilibrium concentrations ( 𝑾𝑷𝑨) from PZQ recrystallisation in spray-dried SD 50
% PZQ.
Annealing
temperature (ºC)
Annealing
time (h)
𝑻𝒎𝒊𝒙𝟐 𝒈
(ºC)
(run 4)
W PZQ
100 10 77.6 0.16
100 20 75.9 0.17
110 10 70.1 0.22
110 20 73.4 0.19
110 30 72.6 0.20
120 10 60.3 0.34
130 6 59.3 0.50
A polynomial model gives the solubility curve of PZQ in PVPVA (Figure 62).
Thanks to these plots, it is possible to identify regions of kinetic and thermodynamic
stability. Praziquantel is practically insoluble in PVPVA at room temperature (25 °C). It
means that a thermodynamic stability should be achieved at room temperature for API
loads lower than ~ 2 %. In contrast, a high PZQ load SD with 50 % of PZQ might be
phase separate and probably recrystallize at 25 °C.

183
Comparison with PZQ-PVPVA solubility data obtained from a dissolution method
Recently we have identified another study carried out in 2018 presenting a similar
phase diagram for the binary PZQ-PVPVA (Kollidon® VA 64), constructed from a DSC
method [56].This method was based on the dissolution of the API in the polymer
following a DSC protocol developed in a previous work of the same authors [307]. The
dissolution process was detected through DSC as an endothermic event. The melting
temperature of the API/polymer solid mixture was determined as the temperature at which
the dissolution of the API in the polymer was completed. Since this method is dynamic,
the obtained temperature depends on the heating rate. A correlation between melting
temperature and applied heating rate is necessary for the use of this method. From this
correlation (found to be linear by the authors), the melting temperature for a API-polymer
binary mixture of known composition was extrapolated to a heating rate of zero to obtain
the equilibrium value (API solubility in the polymer).
This method was applied by Bochmann et al. [56] to determine the solubility of
PZQ in the same polymer used in this thesis. The mentioned work has used the PZQ-
PVPVA system as one of four systems evaluated (three other APIs) to correlate API
solubility to the melt viscosity of amorphous solid dispersions. The aim was to propose a
model-based melt viscosity in hot-melt extrusion numerical simulation.
Figure 62. Composition-temperature phase diagram for the binary PZQ-PVPVA
0 0.1 0.2 0.3 0.4 0.5 0.6 0.7 0.8 0.9 1

184
The method we have employed is the recrystallization of a supersaturated solid
solution. In this way, 𝑇𝑔𝑚𝑖𝑥 𝟐 is obtained from the residual crystalline material after
annealing. Different annealing temperatures can provide specific 𝑇𝑔𝑚𝑖𝑥 𝟐 that, with a
deviation fit model, the solubility curve can be established. Comparatively, the method
used in this thesis presents a higher execution speed because regardless of the deviation
adjustment model used, the process of obtaining the 𝑇𝑔𝑚𝑖𝑥 𝟐 is more practical, with only
two heating cycles and one cooling.
Independently of the method used, the results described in the literature (plotted
as orange points on Figure 62) have a good correlation with our data, which represent a
greater number of points, thus generating a better relationship for solubility predictions
with the mass fractions of the system at a given temperature.
3. CONCLUSIONS
API-polymer solubility and the glass transition temperature are the main factors
that influence physical stability and performance behaviour. An API-polymer
temperature-composition phase diagram is useful to predict the stability of amorphous
binary-mixtures of different compositions under different temperature conditions.
The development of such phase diagram for the PZQ-PVPVA binary was one of
the first objectives of this thesis to evaluate the risks of physical stability for amorphous
solid dispersions with high content of PZQ (50wt% as primary ambition).
A demixing process characterizes the recrystallization of the API in a
supersaturated API-Polymer solution up to reach the equilibrium concentration of the API
at a given (annealing) temperature. Supersaturated amorphous systems could be
generated by spray-drying and be widely characterized. The use of spray drying was
proposed by our group in a previous PhD thesis as an alternative to determine API-
polymer solubility from demixing, because it is a fast process (some seconds for sample
production) compared to solvent casting or comilling which are very time-consuling
(hours). We employed this preparation process for a second time. Its interest is confirmed
from the comparison to the method used by other authors for the same binary (PZQ-
PVPVA).

185
From our diagram, we could confirm that their physical stability against phase
separation and recrystallization will be a great challenge. However, before stability risks,
the previous question is related to the feasibility of producing amorphous solid
dispersions containing 50 wt% PZQ by hot-melt extrusion technology.
We look at these questions in Chapter 5.

CHAPTER 5 - BINARY AND TERNARY SYSTEMS
OF PRAZIQUANTEL AMORPHOUS SOLID
DISPERSIONS MANUFACTURED BY HOT MELT
EXTRUSION

187
1. INTRODUCTION
This Chapter is dedicated to the development of amorphous solid dispersions of
praziquantel, comprising binary (API and polymer) and ternary (API-polymer-
surfactant) systems.
The binary and ternary systems were produced by hot-melt extrusion (HME) process.
The choice of HME as the manufacturing process was based on some of its advantages
over other techniques: it is a continuous manufacturing process, does not require the use
of solvents and can be transposed from the bench-scale to an industrial scale of
production.
The Chapter is divided into four Sub-chapters:
Sub-chapter 5.1 - has the main objective to present a binary PVPVA and PZQ
amorphous solid dispersion. The theoretical PZQ load in the formulations was fixed at 50
wt%. The selected process parameters and the characteristics of the products obtained
(solid state, apparent solubility, dissolution performance, stability) are presented and
discussed.
Sub-chapter 5.2 - is focused on the ternary amorphous solid dispersions (PVPVA,
API, surfactant). Two surfactants, one liquid (monolaurate de sorbitan) and another in a
powder form (sodium lauryl sulfate) were used, generating two different categories of
ternary formulations. The main motivation for studying ternary formulations was to
improve dissolution and solubility PZQ properties. The theoretical PZQ load in the
formulations was also fixed at 50 wt%. The study described in this Sub-chapter was
performed in a Pharma 11 Extruder (Thermo Scientific). The preparation method, the
characteristics of the samples generated (solid state, apparent solubility, dissolution
performance, stability) are presented and discussed. Batches of placebo formulations
(without PZQ) were also produced and characterized.
Sub-chapter 5.3 – is dedicated to the development of the same ternary systems of Sub-
chapter 5.2 (theoretical PZQ load of 50 wt%), however, the samples were generated in
another equipment, a Pharma 16 extruder (Thermo Scientific). Changing of HME
extruder requested modifications in the preparation of the ternary mixture fed to the

188
extruder. Like for ternary ASDs generated before in Sub-chapter II, the preparation
method, the characteristics of the samples generated are presented and discussed.
Sub-chapter 5.4 - this last Sub-chapter is dedicated to new compositions of the
ternary
formulations, in which the theoretical PZQ load was reduced to 35 wt%. The reasons for
the load reduction will be presented and discussed. These new formulations are the ones
that will be used in the production and evaluation of printlets (tablets obtained by 3D
printing) explored in the Chapter 6.
To facilitate the lecture of the Chapter 5, Figure 63 gives a schematic
representation of its Sub-chapters.

189
Figure 63. General view of the structure of chapter 5.
Ternary system study API (50 wt%), Polymer (45 wt%), and
Surfactant (5 wt%)
Pharma 11 extruder (Thermo Scientific)
Sub-chapter 2
Sub-chapter 3
Hot Melt Extrusion
Hot Melt Extrusion
Hot Melt Extrusion
Hot Melt Extrusion
Binary system study – API (50 wt%), and Polymer (50 wt%)
Pharma 11 extruder (Thermo Scientific)
Sub-chapter 1
Ternary system study – API (50 wt%), Polymer (45
wt%), and Surfactant (5 wt%)
Pharma 16 extruder (Thermo Scientific)
Sub-chapter 4
Ternary system study – API (35 %wt), Polymer (60
wt%), and Surfactant (5 wt%)
Pharma 16 extruder (Thermo Scientific)

SUB-CHAPTER 5.1 - PRAZIQUANTEL
AMORPHOUS SOLID DISPERSIONS
MANUFACTURED BY HME - BINARY SYSTEM
(50 WT% PZQ) PHARMA 16 EXTRUDER

191
1. INTRODUCTION
This Sub-Chapter is dedicated to the binary amorphous solid dispersions (ASD)
produced by hot-melt-extrusion (HME). The composition of these binary systems was
fixed at the mass proportion of 1:1 for PZQ and PVPVA.
A co-rotating twin-screw extruder (pharma 16, Thermo-Fisher) was used for the
HME process. The HME process parameters (speed and screw design, and feed rate) were
adjusted in a first series of tests. Second, PZQ-PVPVA systems were produced at selected
HME process conditions and the resulting HME extrudates were characterized with
respect to their solid state (DSC, DRX, SEM) and performance behaviour (solubility, in-
vitro dissolution).
The methodology used and the results obtained are presented and discussed in this
Sub-Chapter.
2. METHODS
2.1 Binary ASD system prepared by HME (50 wt% PZQ)
The production of amorphous solid dispersions (ASD) containing praziquantel
was performed using a twin-screw extruder (pharma 16, Thermo scientific™, Germany).
The twin-screw extruder comprises a pair of parallel screws, rotating inside a
barrel with an 8-shaped cross-section (eight heating zones), two mixing zones and a screw
diameter (D) of 16 mm and L/D ratio equal to 40 (L being the length of barrel) (Figure
64).
Z1 Z2
Z3 Z4
Z5 Z6
Z7 Z8
Figure 64. Schematic representation of extruder with 8-shaped cross-section heating zones. Source: Author.

192
Four auxiliary equipment was used in the production according to the needs of
each formulation. They are: gravimetric feeder, peristaltic pump, and stirrer with heating,
air cooling conveyor, and pelletizer. A general view of the equipment is shown in Figure
65. The adjustment of the equipment's settings was made on the control panel (touch
screen).
As introduced before (Chapter 2), the choice of the process parameters such as the
temperature profile of the different zones, the screw speed, the thread configuration, and
the material feed rate will impact the process feasibility and the quality of the extruded
material [308][268][309].
The determination of the screw configuration is then an important step. In general,
the three main types of elements are: conveying, kneading, or mixing, and reverse
conveying (Table 26).
The main function of the conveying element is to flow the material along the screw
[310]. However, different designs of these elements can change their characteristics. For
example, the width of the step in conveying elements increases in the distributive and
dispersed mixture per unit of mixing length, increasing conveying speed [311]. On the
other hand, reverse conveying elements can be used. Usually, this strategy is applied to
cause the backpressure and leaving the areas filled with API: Polymer, favouring the
mixture [310]. Typically, the position of the reverse conveying elements is after the block
Control painel
Gravimetric feeder
Die Barrel
Peristaltic pump
and magnetic
stirrer with heating
air cooling
conveyor
Figure 65. General view of the extruder (Thermo-Fisher pharma 16) and complementary equipment.
Source: Author.

193
of kneading or mixing elements creating the resistance of the flow forward, causing an
increase of the mixing efficiency, residence time, and shear (Figure 66) [272].
The kneading or mixing elements are designed with different offset angles
between adjacent discs (Table 26). They are usually 30, 45, 60, and 90 º. The smaller
displacement angles provide greater flow capacity (push the material), acting almost as a
flow element. In this way, the kneading elements have the characteristic of controlling
the residence time and pressure [310].
In this study, the rationale adopted to determine the screw design was:
a) a profile in which it had two mixing zones with a variation of the offset angles
for conveying (smaller) and mixing (larger angles) (Table 27 - blue);
b) a profile with two points of conveying reverse elements positioned after the
kneading zone (effective mixing) to extend the time of intense contact of
constituents in the molten material (Table 27 - pink) [311].
Conveying
element
reverse
Mixing area
a)
b)
d) Kneading
element
Conveying
element
c)
Figure 66. a) General screw view with element reverse, b) conveying element, c) Mixing area with kneading
elements following the conveying element reverse and d) different angles with the kneading elements.
Source: Author.

194
Table 26.Screw elements used in this study.
Screw elements name Screw elements Symbol Dimension Application
Conveying
C or ½ C
C: 16 mm width element Material conveying in feed,
conveying, or mixing area
1½ C: 8 mm width element Presence only in mixing area to
disperse or distribute the material
Kneading or Mixing
0 or 90 º
(depending on the
desired angle of
inclination)
1 element:
4 mm width
In mixing, dispersion and/or
distribution area
Table 27. Temperature and screw profile for screening tests with PZQ and PVPVA (1:1).
Parameter
condition Code
Temperature (°C)
Zone 2 Zone 3 Zone 4 Zone
5 Zone 6
Zone
7 Zone 8 Die
Temperature
profile
T 1 50 70 100 140 140 140 100 90
T 2 50 70 100 140 140 140 100 100
Screw profile
RE 5 C 5 C 0/90/0/90/0 ½ C
½ C 1 C 5 C 0/90/0/90/0 ½ C
½ C 3 C 5 C 3 C ½ C
30° Reverse 30° Reverse Fixe
NRE 5 C 5 C 0/90/0 0/0/0 0/90/0/90
2 C 5 C 0/90/0 0/0/0 0/90/0/90
1 C 5 C 3 C 1/5 C
90° 60° 30° 90° 60° 30° Fixe

195
The extruder is connected to a central control, allowing the control of process
parameters such as screw speed and temperature, and therefore pressure [272]. The
process has to be conducted above the glass transition temperature (𝑇𝑔) of the constituents
but below its degradation temperature (𝑇𝑑𝑒𝑔). The API can be processed below or above
its melting temperature (𝑇𝑚) depending on the solubility capacity of the polymer [272].
In our studies, the temperature profile was established from the knowledge of the
melting temperature of the crystalline component (PZQ). Process temperatures close to
the PZQ melting temperature are expected to allow its miscibility with the polymer in the
molten state. Table 27 presents the selected temperature profiles.
To produce the physical mixtures, a powder mixer (Turbula® T2F mixer) was
used (Figure 67). This equipment is a reversible mixer whose operation is based on the
combination of three movements: a translation, a rotation, and an inversion [312]. This
combination leads to a three-dimensional movement. The device consists of a tank
inserted and fixed in a mixing basket connected by two brackets with two axes of rotation.
One of the two axes is a motor and drives the system at the chosen speed (Figure 67).
The polymer PVPVA was dried overnight before use. Physical mixtures of PZQ
and the polymer were premixed for 08 min (Turbula® T2F - 48 rpm) before feeding the
twin-screw extruder as illustrated in Figure 68. A gravimetric feeder with a small dosing
unit was used for feeding.
Figure 67. Turbula® T2F mixer (Willy A. Bachofen AG Switzerland). Source: [312] with permission.

196
The extrudate comes out through the "die" and pass by the other two components
in downstream processes: an air-cooling conveyor and a pelletizer (Figure 69). The first
has the purpose of quickly cooling the freshly prepared extrudate, and the conveyor
carries it to the second, the pelletizer.
Die – extrudate exit
Conveyor belt (cool air)
Feeding
Twin-screw extruder
a)
b) c)
Figure 68. a) Gravimetric feeder; b) extruder feed hopper and, c) top view - mixing input into the extruder.
Source: Author.
Figure 69. Air cooling conveyor belt (ThermoFisher Scientific).

197
At this point, the extrudate is broken up into small pieces and the pellet size can
be adjusted according to the distance from the cutter (in the range 1.0 to 2.5 mm) (Figure
70).
The batches composed of PZQ and PVPVA in the mass proportion 1:1 prepared
in this study are described in Table 28.
Table 28. Process operating conditions to produce PZQ: PVPVA systems.
Sample
code
Process operating conditions
Rate Flow
(kg/h)
Screw speed
(rpm)
Temperature
profile +
Screw
profile + Objective
HME 1 0.15 150
T1 NRE*
Parameter
effect
analysis
HME 2 0.15 300
HME 3 0.30 150
HME 4 0.15 150
T1 RE**
HME 5 0.15 300
HME 6 0.30 150
HME 7 0.30 300
HME 8 0.50 300
HME 9 0.15 200 T2
HME 10 0.15 300 T 1 RE**
Repeatability
test HME 11 0.30 300
* NRE = no reverse element, and *ER = reverse element. + See details in Table 2.
Pellet cut point Pellet collection
Cut adjustment
Figure 70. Pelletizer (ThermoFisher Scientific).

198
2.2 Characterization of HME extrudates
HME extrudates were characterized by the techniques described previously in
Chapter 5.1, that are powder X-ray diffraction (PXRD), scanning electron microscopy
(SEM), differential scanning calorimetry (DSC), and water solubility.
The equipment and measurements protocols used for these analyses are the same
described in Chapter 4 sections 1.2.2, 1.2.3, 1.2.4, and 1.2.5.
2.2.1 Dissolution profile
The experiments were carried out following the method described in Chapter 3
(item 3.1.9) to analyse praziquantel tablets from the American pharmacopeia [297].
For the HME extrudates produced here, an amount equivalent to 150 mg of PZQ
was weighed in gelatine capsules (size 0). They were packed in a sinker to avoid the
floating and adherence of the particulate materials in the dissolution medium. (Figure 71).
The sinkers were added to the vats in the same way as adding tablets.
3. RESULTS
3.1 Extruder configuration
a) b)
Figure 71. a) Capsules containing amorphous solid dispersions (pellets form) being inserted in the sinker
and b) capsule inserted in the sinker, ready for addition to the dissolution vessel.

199
One of the factors that influence the efficiency of the extrusion process is the
screw design [183] [313] [280].
Aiming to define the better screw design for the extrusion of a binary mixture with
fixed composition (PZQ: PVPVA - 1:1), the first HME trials evidenced problems related
to the powder flowability into the feeder.
Even with a gravimetric feeder, it was possible to visualize variations in the feed
rate over the extrusion time. If the powder feed varied for a short time, and even within
the limit set by the extruder, the result was a white and opaque product (Figure 72a),
evidencing a non-homogeneous mixture. In some cases, the modification of operating
conditions as the increase of the temperature in the zone of the barrel close to the exit
orifice (die) shown in Figure 72b or the increase of the screw speed could improve the
processability of the binary system.
However, the adequate selection of the screw elements should help reduce
processability problems. To that purpose, different HME process configurations were
investigated on the processability of the binary mixture (see Table 29). They are screw
configuration (with and without the use of reverse elements), feed rate, and die
temperature. Each of these parameters has a specific function during the extrusion
process. At the same time, they all interact with each other to control the process as a
whole [269]. The configuration with conveying and reverse elements was chosen because
they generally result in better processability and production of homogeneous mixtures
(transparent filaments). It is known that reverse elements may increase shear forces within
the barrel in the mixing section and the residence time of the molten material in the
a)
b)
Figure 72. Opaque extrudate after interrupted feeding; b) extrudate after die temperature increase (change
on visual aspect to semi-opaque)

200
extruder [6]. Reverse elements were used in our screening configuration to generate back
pressure and thus enhance the dispersive mixing by resisting forward flow as expected.
As shown in Table 29, the feed rate was also a parameter investigated in these
trials. By impacting the residence time into the extruder, the feed rate may influence the
quality of the mixture (homogeneity) and of its constituents (degradation). The lower the
feed rate, the longer the residence time [269], [270].
From all HME trials performed with the extruder configurations presented in
Table 29, 11 HME extrudates were produced and characterized with respect to their solid
state (PDRX, DSC), physical aspect (SEM images) and product performance (PZQ
solubility enhancement, dissolution behaviour). The analysis of these characteristics that
are presented right after allowed us to select the better screw configuration for hot-melt
extrusion of a binary system PZQ-PVPVA with 50 wt% PZQ.
3.2 Scattering Electronic Microscopy (SEM)
SEM images referring to six extruded samples (HME1 to HME7), and the powder
mixed (before extrusion), are shown in Figure 73.

201
a) b) c) d) e)
f) g) h) i) j)
l) m) n)
Figure 73. SEM images. a); b) physical mixture PZQ: PVPVA; c) and d) HME 1; e) and f) HME 2; g) and h) HME 3; i) and j) HME 4; l) HME 5; m) HME 6 and n) HME 7.

202
The SEM images of the physical mixtures were taken just after the mixing process
in the Turbula® T2F mixer. The images on Figures 10a and 10b clearly show primary
PZQ particles adhered to the spherical particles of the PVPVA polymer. No
morphological change was identified between the components after the physical mixing
procedure.
Regarding the HME extrudate samples, five different physical shapes can be
observed in Figures 73c to 73n:
• HME 1 and HME 4: the presence of structures in the form of extremely fine needles
(Figures 73c, 73d, 73i and 73j, respectively);
• HME2: the presence of thin structures, as agglomerated threads (Figure 73e and 73f);
• HME 3: the presence of thin structures, positioned vertically in the extrudates (Figure
73g and 73h);
• HME 5: absence of particles but presence of ripples in the spherical shape, that are
probably related to the presence of bubbles in the extruded material (Figure 73l);
• HME 6 and HME7: absence of particles on the surface/core of the extrudates/pellets
with evidence of irregular surface or structures arising from the pelletization (Figure 73m
and 73n);
3.3 Powder X-ray diffraction (PXRD)
The results of PXRD are shown in Figure 74. All samples presented a broad halo
characteristic of amorphous material. However, some diffractograms (HME1 and HME3
samples) exhibited very small diffraction peaks which are rather characteristics of
crystalline than amorphous materials.
Here, it is important to note that the HME extrudates produced in the form of
pellets were ground manually in a mortar with pistil to perform the PXRD analysis. The
need to crush the HME pellets might have resulted in some crystallinity confirmed by the
not-well-defined crystalline peaks observed in HME1 and HME 3 samples. As
demonstrated in Chapter 3, a binary amorphous solid dispersion with 50 % PZQ in
PVPVA is supersaturated at room conditions and a recrystallization could also be caused
by milling in this way. On the other hand, the opposite is also true. Some crystalline
structures can change their state under grinding. For this reason, techniques such as DSC
are generally associated to PXRD for a more comprehensive analysis of amorphous solid
dispersions.

203
3.4 Differential scanning calorimetry (DSC)
The results obtained by DSC analysis for nine samples produced by HME are
shown in Figure 75.
Six HME samples did not show endothermic events, corresponding to an
amorphous state (Figure 75a). One of the extrudate samples (HME 4) showed two glass
transitions (Tg1 = 48.24 ºC and Tg2 = 110.59 ºC), characteristic of a system constituted by
two amorphous phases. Contrarily, three of them (HME1, HME3 and HM6) presented
endothermic events related to melting transformations (Figure 75b), confirming for two
of them (HM1 and HME3) the traces of crystallinity detected by PXRD.
Figure 74. PXRD for samples produced for screening process parameters (arrow shows the very small
signal diffraction for HME 1 and HME3 samples).

204
Table 30 also presents the thermal characteristics from DSC analysis (𝑇𝑔 and 𝑇𝑚).
A single 𝑇𝑔 was detected in eight samples, between 43.49 °C (HME 2) and 49.62
°C (HME 9). From the GT equation developed in Chap 4, for a binary system PZQ:
PVPVA with 50 wt% PZQ, the estimated 𝑇𝑔𝑚𝑖𝑥 is 4 3°C. The 𝑇𝑔 values measured for
the HME samples were found to be dependent on the HME process conditions and screw
profile. For some samples, the 𝑇𝑔 measured was very close to the GT value, but for others
not so much. The variations could be related to mixture homogeneity or repeatability.
The visual aspect of the extrudates obtained for each of the nine conditions tested
can be observed in Table 30. Differences are probably linked to the homogeneity of the
a)
b)
Figure 75. DSC curves. a) samples with amorphous characteristic; b) samples with crystalline diffraction
peaks

205
molten mixture that might have impacted the properties of the final solid dispersion as
𝑇𝑔.
For example, the higher 𝑇𝑔 (~ 57 °C) was found for the HME 5 sample, which
was produced with only reverse elements (RE), and the lowest feed rate. The objective
was to promote mixing with the use of “RE” and the longer residence time.
In contrast, the lowest 𝑇𝑔 (~ 45 °C) was found for the HME 8 sample, which was
produced with the same RE, but with the highest feed rate (shorter residence time). Both
HME 5 and HME 8 samples were produced with the same temperature profile (T1, see
Table 29) in the extruder. These results evidenced, for a same screw elements design and
temperature profile in the extruder, the effect of the residence time on the characteristics
of the amorphous solid dispersion (𝑇𝑔 in this case).
The screw design is another factor that influences the mixing efficiency of the
extrusion process and a parameter commonly studied. For example, a study using
nifedipine and hydroxypropylmethyl cellulose, demonstrated that the kneading elements
impacted the alteration of the crystalline structure and the properties related to the
dissolution of the produced solid dispersion [314]. Another study demonstrated that the
position of the zones containing the kneading elements and the number of these elements
does not influence the homogeneity and the drug release rate on the final extrudate
product. However, one of these zones was essential to guarantee homogenous distribution
[315]. From our first HME trials, the presence of reverse elements (RE) on the screw
profile has been found to be essential for good mixing of the binary system under study.

206
Table 29. Summary of HME process conditions, thermal properties, and visual aspect for all HME extrudates generated from a binary PZQ: PVPVA 1:1.
Sample
name
Condition DSC result
Visual aspect Visual aspect and observations did during the
production Rate
Flow
(kg/h)
Screw
speed
(rpm)
Temperature
profile
Screw
profile Tg (°C)
Tonset
(°C)
Tpeak
(°C)
ΔHm
(J/g)
HME 1 0.15 150 T1
Zone 4 and
6 without
RE
45.59 125.32 128.82 2.916
The flow was too slow for production. The filament
thickness was not uniform, and it was smooth,
brittle, and transparent with opacity points.
HME 2 0.15 300 T1
Zone 4 and
6 without
RE
43.49 - - -
similar to HME 1 and quite brittle
HME 3 0.3 150 T1
Zone 4 and
6 without
RE
48.41 123.51 128.3 5.426
similar to HME 1 and 2
HME 4 0.15 150 T1 Zone 4 and
6 with RE
Tg1 48.24
Tg2 110.59 - - -
The flow was too slow for production. The filament
was very thin and transparent. If the thickness, and
the opacity increased
HME 5 0.15 300 T1 Zone 4 and
6 with RE 57.12 - - -
It started with an opaque aspect and became more
transparent over time.
HME 6 0.3 150 T1 Zone 4 and
6 with RE 45.97 120.91 126.8 0.358
Opaque and formed a large volume of material at the
"die" making it difficult to obtain and maintain the
filament
HME 7 0.3 300 T1 Zone 4 and
6 with RE 49.34 - - -
It formed a "pear" at the exit of the filament. It was
difficult to maintain the continuous filament shape.
Always transparent.
HME 8 0.5 300 T1 Zone 4 and
6 with RE 45.22 - - -
Similar to HME 7 but with the white material as a
coating at the "die"
HME 9 0.15 200 T2 Zone 4 and
6 with RE 49.62 - - -
Formation of "pear" at the exit. Transparent, but it
was necessary to increase the temperature of the last
zone to 100 °C after indication of "die" blocking.
RE = reverse element on the screw profile

207
Finally, to verify the batch repeatability, two samples (HME 5 and HME 7) were
reproduced. Table 30 presents the conditions of the two chosen samples.
Table 30. Summary of selected HME parameters.
Test/Sample
name
Condition
Rate Flow
(kg/h)
Screw speed
(rpm) Temperature profile
Screw profile
HME 5 0.15 300 (Z2) 50 °,70 °,100 °,
140° 140°,140°, 100
° and 90 ° (die)
Zone 4 and 6 with
RE HME 7 0.30 300
Table 31 presents a comparison between replicates. The batches were successfully
repeated, and the results were similar between them. Although the production of the
extrudate with a 50 % drug load has a sensitivity to the process parameters, especially the
feed rate, it was possible to obtain reproducible batches. However, the homogeneity of
the mixture can influence the 𝑇𝑔 values.
Table 31. Summary of results obtained for the selected HME parameters.
Step Sample
name
DSC result
PXRD Tg
(°C)
ΔCp
(J/g.°C)
Tonset
(°C)
Tpeak
(°C)
ΔHm
(J/g)
Parameter selection study HME 5 57.12 0.62 - - - Amorphous
HME 7 49.34 0.40 - - - Amorphous
Batch repeatability study HME 10 51.16 0.32 - - - Amorphous
HME 11 44.23 0.32 - - - Amorphous
PZQ (raw material) 39 0.36 131 138 95.72 Crystalline
3.5 Water solubility
Table 32 shows the evolution of the values of PZQ concentration in water (37°C)
over 48 h.

208
Table 32. Solubility data (water at 37 °C) for all HME samples
Samples Solubility (mg/mL)*
1h 24h 48h
Raw PZQ 0.138 ± 0.04 0.149 ± 0.02 0.136 ± 0.03
Physical Mixture (1:1) 0.190 ± 0.02 0.177 ± 0.03 0.146 ± 0.04
HME 1 0.286 ± 0.02 0.221 ± 0.03 0.198 ± 0.04
HME 2 0.291 ± 0.02 0.189 ± 0.01 0.191 ± 0.05
HME 3 0.057 ± 0.01 0.222 ± 0.04 0.173 ± 0.06
HME 4 0.142 ± 0.003 0.228 ± 0.04 0.161 ± 0.05
HME 5 0.296 ± 0.02 0.215 ± 0.03 0.157 ± 0.07
HME 6 0.307 ± 0.03 0.215 ± 0.05 0.191 ± 0.05
HME 7 0.304 ± 0.03 0.266 ± 0.05 0.187 ± 0.05
HME 8 0.154 ± 0.01 0.215 ± 0.04 0.172 ± 0.06
HME 9 0.287 ± 0.03 0.189 ± 0.04 0.169 ± 0.05
HME 101 0.257 ± 0.04 0.202 ± 0.05 0.197 ± 0.05
HME 112 0.272 ± 0.02 0.203 ± 0.02 0.183 ± 0.04
* Values represent the mean of n =2 and SD. 1 replicate of HME5; 2 replicate of HME7
First, it can be seen from Table 33, that most HME extrudates showed a positive
effect, increasing PZQ water solubility (37 °C) in comparison with raw PZQ, during a
given period. The positive effect is lessened over time, as expected for amorphous solid
dispersions. Except for HME samples 3, 4, and 8, all showed similar performance in
increasing PZQ concentration in water in the first hour and subsequent decrease in the
subsequent ones, sometimes an oscillatory variation (increase and decrease on measured
concentration, corresponding to dissolution-recrystallization-dissolution events). Figure
76 represents graphically the same data grouped in Table 33 for better visualization of the
mentioned solubilization behavior.
This kind of variation is typically found with amorphous solid dispersions for as
efavirenz [184] and ritonavir [184], [316]. For example, with efavirenz (API) solid
dispersion produced by spray drying, for which, an oscillatory variation in drug
concentration was measured in the first two hours.
From our results, when comparing the ‘spring’ effect (the maximum measured
concentration reached at 1h is taken for analysis here), we can see that the improvement
in PZQ concentration reached more than 2-fold the equilibrium concentration (raw PZQ)
for samples HME 5 and HME 7.
The HME 6 sample also presents a 2-fold increase in the PZQ concentration in the
first hour compared to the API alone. However, the HME 6 sample presented an
endothermic event, probably related to the fusion of the crystalline part of the system. We

209
can propose two hypotheses for this result: first, the crystalline phase is a polymorph of
the PZQ that presents greater solubility in water than the racemic form; or the fraction
used for the solubility experiments, although conducted in triplicate, did not have
crystalline material (heterogeneity of the sample).
The HME 10 and HME 11 samples (replicates of HME 5 and HME7 respectively),
showed similar performance in the solubility tests, confirming the reproducibility of HME
samples’ properties.
To briefly put things into context, different results obtained with PZQ amorphous
solid dispersions already reported in the literature are discussed here.
Different studies that evaluated the increase in solubility for solid dispersions
containing PZQ report success in reaching this objective, but none report monitoring over
time and this phenomenon of solubility decay. For example, samples of PZQ and
crospovidone produced by cryomilling (1: 1) showed about 3 times more solubility in
water (at 20 °C, after 48 h) compared to the respective physical mixture and more than 4
times compared to raw API [179]. Another study evaluated the increase in solubility of
solid dispersions obtained by the solvent evaporation method. The binary samples were
prepared with different concentrations of PVP. It was concluded that the solubility
Figure 76. PZQ concentration measured in water (37 °C) from HME extrudates of PZQ and PVPVA
(50%PZQ). Time points :1, 24 and 48h.

210
increased with the increasing proportion of PVP (better results for PZQ:PVP (3:1)
prepared with water/ethanol show a solubility of 1.15 mg/mL, and PZQ: PVP prepared
with ethanol show a solubility of 1.29 mg/mL, measured at 25°C after 72h) [65]. Another
useful information from these studies concerned the maximum time for solubility studies,
that should not exceed 48h due to the chemical degradation of PZQ at 72 h or more [10],
[179].
Solid dispersions of praziquantel with starch glycolate [66] also showed an
improvement on PZQ water solubility (25 °C, after 48 h) compared to their respective
physical mixtures and raw API. The best results obtained with the highest proportion of
starch glycolate (API: Polymer 1: 3) was around 1.2 mg/mL.
In our case, the experiments were conducted at 37 °C in water while most of the
experiments described in the literature use 20 or 25 °C. At this time, the solubility
maintenance effect was not achieved and we obtained an increase in solubility of 117 %
and 111 % HME 7 and 5, respectively) when compared to the API in the first hour (spring
effect).
3.6 Dissolution Profile
HME 10 and HME11 samples were the chosen extrudate products for dissolution
tests that were carried in – HCl 0.1N with 0.2 wt% of SLS at 37 °C.
Figure 77 shows the dissolution curves obtained for both samples, taking the raw
API as reference.

211
Starting the analysis with the raw API, a dissolution of 65.4 % was reached at the
end of the experiment (2 h). A similar dissolution profile was reported by Orlandi and
collaborators [169] with about 57 wt% of racemic PZQ dissolved in 2 h, with the same
conditions (medium HCl 0.1 with 0.2 wt% SLS).
Figure 77 shows that the dissolution profile from the physical mixture between
PZQ and PVPVA revealed a retard effect of the polymer in the initial PZQ dissolution,
but the final amount released remained almost the same. The same tendency is observed
with the HME samples, however, with them, the drug dissolution was effectively retarded
up the end of the experiment.
The interpretation of these data needs to consider some analytical factors that may
have influenced the results. Initially, it could be seen some agglomeration between the
pellets inside the capsule. That agglomeration was probably a limiting factor in the
dissolution process because the free pellets would have a larger surface area in contact
with the medium.
Still, the difference between the two samples (HME 10 and HME11) may be
influenced by different particle sizes between the two amorphous solid dispersions.
Although the pellets were produced by the same ‘pelletizing’ (to shape HME filaments
into pellet form) process, after that, they are not sieved to guarantee a narrow range of
particle sizes in the analysed samples. In the further studies on this thesis, samples with
Figure 77 Dissolution profile for HME 10 and HME 11 samples.

212
different formats (powder and pellets) were evaluated as well the composition of the
dissolution medium in view to identify the best discriminative conditions to compare
dissolution profiles from different HME samples.
4. CONCLUSIONS
The study presented in the Part I of this Chapter aimed to verify the feasibility for
producing binary amorphous solid of PZQ (50 wt%) and PVPVA (50 wt%) by hot-melt
extrusion process.
A first series of HME trials was performed. It was soon realized that the high
concentration of PZQ in the binary mixture make difficult the feed of the extruder and is
a weak point for the processability of this composition. From the trials, it was
demonstrated that the processability of this binary system was dependent on the
adjustment of parameter as the residence time and the homogeneity of the molten mixture
into the extruder. They can be varied by the adequate choice of operating parameters such
as the feed rate, the screw design (conveying and mixing elements) and configuration
(number and placement of screw elements).
Different HME extrudate samples were produced from these different extruder
configurations and the characterization of these samples showed differences like:
- Thermal properties: they were predominantly amorphous, but the extruder
configuration impacted their 𝑇𝑔, and even the presence of some crystallinity in
some of them. This is an interesting finding because, as already seen in Chapter
4, a binary system with 50 wt% PZQ is falling in the region IV of the PZQ-
PVPVA phase diagram at room conditions. Be or not partially amorphous can be
the consequence of the sensitivity of the supersaturated samples to undergo
recrystallization, depending on the homogeneity of the dispersed amorphous PZQ
in the amorphous polymer, which could be influenced by the process conditions
of their preparation.
- Desired characteristics of improved water solubility and dissolution: the typical
behaviour of an amorphous product (spring effect) was evidenced during the
solubilization in water. The parachute effect was not evaluated at this time.
However, the dissolution kinetics was remarkably delayed, which needs to be
improved. The dissolution methods were modified for the subsequent studies. The

213
other parameter studied was the composition of the amorphous solid dispersion,
focused on the next Sub-chapters.

SUB-CHAPTER 5.2 - PRAZIQUANTEL
AMORPHOUS SOLID DISPERSIONS
MANUFACTURED BY HME - TERNARY SYSTEM
(40 AND 50 WT% PZQ) - PHARMA 11 EXTRUDER

215
1. INTRODUCTION
This subchapter presents the methodologies employed for preparing,
manufacturing, and characterizing ternary solid dispersions containing PZQ by HME
using a Pharma 11 extruder (Thermo Scientific).
Two formulations were prepared, both containing API, polymer, and surfactant.
For one of them, a liquid surfactant (SPAN 20) was used, and for the other, a solid
surfactant (SLS). Thus, two different ways of preparing the physical mixture to be used
in the extruder feed were evaluated.
The main objectives of the study presented here are:
• Processability study of extruding physical mixtures with different
characteristics.
• Characterization of solid-state, water solubility, in-vitro dissolution and physical
stability.
• Evaluation of the in vitro and in vivo palatability
• In vivo pharmacokinetic profile of the ternary systems obtained.
For sake of clarity and to help the evaluation of results, the chapter 5.2 is divided
in two parts:
Part 1. Generation and physicochemical characterization of the extrudate ternary
systems,
Part 2. Taste masking and pharmacokinetics study.

216
1. METHODS
1.1 Ternary ASD system prepared by HME (40 and 50 wt% PZQ)
The production of solid amorphous dispersions containing praziquantel was
performed using a Thermo-Fisher pharma 11 Extruder (Thermo scientific™, Germany)
(Figure 78).
The extruder was configured with a co-rotating twin-screw parallel with eight
heating zones, two mixing zones and a screw diameter (D) of 11 mm. As in chapter 5.1,
a gravimetric feeder, air cooling conveyor, and pelletizer were also used.
The composition of the formulations studied are shown in the Table 33.
The temperature profile and the twin-screw extruder profile used for each of the
formulations produced is shown in Table 34.
PART 1 - GENERATION AND PHYSICOCHEMICAL
CHARACTERIZATION OF THE EXTRUDATE TERNARY SYSTEMS
Feeding
Control Panel Pelletization Cooling Extrusion
Figure 78. Extrusion system using Pharma 11 extruder.

217
Table 33. Composition used for manufacturing ternary system by HME.
Ingredients Formulation composition (wt%)
FEXT1 FEXT2
Praziquantel (PZQ) 50 40
Kollidon® VA64 (PVPVA) 45 55
Span (SPAN) 5 -
Kolliphor® SLS Fine (SLS) - 5

218
Table 34. Extrusion process parameters.
Parameter
condition Code
Temperature (°C)
Zone
2
Zone
3 Zone 4
Zone
5 Zone 6
Zone
7 Zone 8 Die
Temperature
profile
T 1
FEXT 1 50 80 120 160 180 160 120 110
T 2
FEXT 2 50 80 120 160 180 160 122 110
T3
Placebo 50 80 120 160 180 160 120 110
Screw profile NRE 5 C 5 C 0/90/0 0/0/0 0/90/0/90
2 C 5 C 0/90/0 0/0/0 0/90/0/90
1 C 5 C 3 C
1/5
C
90° 60° 30° 90° 60° 30° Fixe

219
1.2 Preparation of the feeding material
Considering that the ternary systems had different surfactants in their
composition, one solid (SLS) and the other liquid (SPAN 20), the preparation of the
powdered mixtures for feeding the twin-screw extruder was specific por each ternary,
depending on the type of surfactant used.
The FEXT 2 formulation, with the solid surfactant (SLS), correspond to a mixture
of solid ingredients (PZQ, PVPVA, SLS). The preparation of the physical ternary mixture
was quite simple and realized in plastic bags with manual homogenisation by the same
operator for 3 minutes. A laboratory scale conical mill (Comil®) by Quadro® (Model
U3 0125) shown in (Figure 79) was used to grind the ternary mixture. The material
entered the mill through the hopper and a rotating impeller reduced the size of the material
in the milling chamber. The rotational speed of the mill was set at 2200 rpm, and the
sieve size used was 1575 mesh (1.5 mm). The milling operation was carried out for 5 min.
The main objective of this procedure was to improve and standardize the homogeneity of
the powder mixture since the constituents have different particle sizes.
A similar milling equipment was used in other subsequent studies in this thesis, at
Rapsodee laboratory in France, where a part of the experimental work of this thesis was
carried out. A similar equipment was more detailed in the Sub-chapter 5.4.
Figure 79. Conical mill (Quadro® Comil® U3 0125) with the respective sieve size used.

220
The preparation of the FEXT 1 formulation required additional steps on the
preparation of the ternary mixture for feeding the twin-screw Pharma 11 extruder. As
SPAN 20 is a liquid surfactant, the solution proposed was a wet granulation step followed
by the drying of the granules.
First, PZQ was granulated with an ethanolic solution of PVPVA and the liquid
surfactant was incorporated to the binary mixture during the granulation process.
For that, a high-speed granulator (Micromix Huttlin - Bosch®) was used. The
equipment based on a mechanical impeller moves the powder while a liquid binder is
applied into a moving powder bed. The addition of the liquid binder starts the formation
of granules. The granulator also has a chopper that works to break larger agglomerates
and facilitate uniform mixing [317], [318]. The following operating conditions were
adjusted after preliminary tests: torque of 1.4 Nm, 10 % pump flow, chopper 1500 rpm,
and impeller 100 rpm. The ‘binder’ solution was an alcoholic solution of PVPVA at 20
wt%. This solution was prepared by dissolving 30 grams of PVPVA in 120 mL of ethanol
under mechanical stirring (625 rpm) for 20 minutes. The surfactant SPAN 20 (previously
warm in a water bath at 70°C) was then slowly poured during the granulation process
(Figure 80).
Figure 80. Slow addition of the surfactant SPAN 20 during granulation of PZQ by an ethanolic solution of
PVPVA in a fluidized bed.

221
The granulated material was then transferred to the fluidized bed dryer
(SOLIDLAB 1 – BOSCH®) (Figure 81). This equipment is used to reduce the moisture
content of pharmaceutical powder and granules. It is works on a principle of fluidization
of the feed materials. In fluidization process, hot air is introduced at high pressure through
a perforated bed of moist solid particulate. The wet solids are lifted from the bottom and
suspended in a stream of air (fluidized state). Heat transfer is accomplished by direct
contact between the wet solid and hot gases. The vaporized liquid is carried away by the
drying gasses.
During this step the material was kept fluidized by an air flow rate of 20 m3/h at
22°C for 35 minutes. The air temperature was raised and kept at 40°C for 5 minutes,
finalizing the drying operation for the granules.
Two batches were prepared using the same methodologies described above for
each of the respective formulations, however, without the API. They corresponded to
‘placebo’ samples.
To produce the placebo samples for the mixture PVPVA and SPAN 20 (liquid
surfactant), some adjustments on the operating conditions were made for the wet
granulation. In fact, it was necessary to adjust the chopper to 3000 rpm and the impeller
to 150 rpm. Likewise, the temperature profile for the placebo also needed to be adapted
and is shown in Table 35.
The placebo referring to the FEXT 2 formulation was prepared as described before
but without the API in the mixture.
1.3 Characterization of samples
Figure 81. Fluidized bed (Bosh®) for drying the FEXT 1 formulation after granulation.

222
Extruded were characterized as previously performed and described in Chapter 3
(powder X-ray Scattering diffraction (PXRD), differential scanning calorimetry (DSC),
scanning electron microscopy (SEM), dissolution profile, and drug content). Other
methods of physicochemical characterization (mass loss on drying, water content, taste
masking and pharmacokinetic) were performed and are described in this section.
Placebo formulations were evaluated by TGA, DSC, PXRD and, SEM techniques.
The physical stability of the extrudate materials was investigated using the same
procedure also described on Chapter 3 (section 3.1.10) and monitored with samples’
characterization by DSC, TGA, PXRD, Stereomicroscopy, SEM.
A graphical summary of the techniques used for each ternary system is shown in
Figure 82.
2.1.1 Determination of drying loss - Gravimetric method
1.3.1 Determination of mass loss on drying
This analysis is used mainly in pharmaceutical laboratories to determine the total
amount of volatiles on solid materials (i.e., water and residual solvents vaporized under
the experimental conditions) [319]. It was carried out according to the method described
in the Brazilian Pharmacopoeia [291]. In brief, 1 to 2 g of sample to be analysed were
dried in a vacuum oven (5 mmHg) at 50 ºC to a constant weight.
1.3.2 Determination of water - Titration by Karl Fischer
Figure 82. Schematic division of the characterizations carried out in this chapter according to the samples
produced.

223
Unlike loss on drying, the Karl Fischer titration titration is a moisture
determination method specific for water [319]. It allows the quantification of the total
water content on the sample (i.e., free moisture and water of crystallization). This test was
carried out with both extrudate samples, FEXT 1 and FEXT 2, according to the Brazilian
Pharmacopoeia [291]. Initially, enough methanol was transferred to the titration vessel,
ensuring that the volume was sufficient to cover the electrodes (approximately 30 to 40
mL) and titrated with Karl Fisher's previously standardized solution up to the
electrometric endpoint. This procedure was carried out so that all the moisture presents
could be eliminated. The sample (about 200 mg) was then added to the titration vessel,
mixed, and titrated with the Karl Fischer reagent to the end point.
2. RESULTS
2.1 API content and organic impurities
An initial identification test with a PZQ reference compound (SQR)18 was performed
by evaluating the peak retention time of the API (Table 35). After, the drug content for
each formulation and the respective physical mixture (feeding the extruder) were
analysed (Table 36).
Table 35. Identification test of PZQ.
Sample Retention time of principal
peak (min)
SQR (for FEXT 1 analysis) 2.74
FEXT 1 2.75
SQR (for FEXT 2 analysis) 2.86
FEXT 2 2.88
18 An SQR sample was prepared for each formulation to make the injection and preparation as close as
possible.

224
Table 36. PZQ content (extrudate samples and physical mixtures).
Sample Measured
drug content (wt%)
Theorical drug
content (wt%)
FEXT 1 Physical Mixture 51.04 ± 0.87 50
FEXT 1 46.52 ± 0.31
FEXT 2 Physical Mixture 38.83 ± 0.88 40
FEXT 2 34.03 ± 0.09
Table 36 shows that the formulations FEXT 1 and FEXT 2 are characterized by a
reduction in the PZQ content, in comparison to their respective physical mixtures (before
HME processing). It is important remember that these materials were processed by HME
and then ground.
Regarding the impurities, Table 37 gives information about the concentration of
organic impurities for each extruded formulation (FEXT 1 and FEXT 2).
Table 37 Impurities of FEXT 1 and 2 samples.
Sample Impurity Impurity content (wt%)
FEXT 1 Physical Mixture A 0.0040 ± 0.0001
B 0.0476 ± 0.0009
C 0.0038 ± 0.0009
FEXT 2 Physical Mixture A 0.0036 ± 0.0001
B 0.0494 ± 0.0023
C 0.0078 ± 0.0034
FEXT 1 A 0.3202 ± 0.0018
B 0.0532 ± 0.0017
C 0.0700 ± 0,0049
FEXT 2 A 0.2962 ± 0.0152
B 1.9827 ± 0.1370
C 0.3470 ± 0.0116
First, by comparing the content of impurities associated to PZQ (impurities A, B
and C) between the physical mixtures and the HME extrudates shown in Table 6, the
impact, on the amount of these impurities, of the HME processing and the downstream
step of milling, can be analysed.
What emerges from this analysis is an increase in impurities A and C in FEXT 1
and an increase of all impurities (A, B and C) in FEXT 2.
According to the American pharmacopoeia, the limit for each impurity of
praziquantel (A, B and C) must be less than 0.2 wt %. However, this limitation is

225
described in the praziquantel monograph (API). The extrudate sample is not more a
powder like API or a final product. It is considered an intermediate product.
2.2 Determination of mass loss on drying
The percentage of mass loss in drying is related to all volatile materials or
decomposition products that may be present in the sample. The mass loss on drying from
both studied formulations FEXT 1 FEXT 2 are very close, 0.7 and 0.6% (Table 38),
respectively.
The American and Brazilian pharmacopoeia [53], [291], [297] determines that the
acceptance criterion for weight loss trial is 0.5 %, however this value is related to the
sample of the praziquantel tablet and API. Specific conditions for this type of
"intermediate" material as the extrudate solid dispersions developed in this work are not
established, and, even if used in a final formulation of PZQ, the results need to be re-
evaluated according to the final dosage form and its storage conditions.
Table 38. Loss mass by drying method (50 ºC).
Sample Mass loss (mg) Loss (%)
FEXT 1 0.00948 0.7
FEXT 2 0.00912 0.6
2.3 Thermogravimetric analysis (TGA)
Following the sample procedure used for raw materials alone and already
described (Chapter 3, item 3.1.2), these samples were stored at different environment
conditions (RT19 = room temperature; LT = long time stability, and AS = accelerate
stability) for 15 days and reanalysed by TGA. Table 39 shows un up-take of moisture,
dependent of the storage conditions and higher for FEXT 2 than FEXT 1.
19 RT = between 15 and 30 ºC and max 60% RH, LT = 30 ± 2 ºC and 75 % RH, and AS = 40 ± 2 ºC and
75 % RH.

226
Table 39. Mass moisture variation after different storage conditions.
Sample
Δm (%) *
RT t0 RT t15 LT t15 AS t15
FEXT 1 2.29 ± 0.02 3.20 ± 0,00 4,15 ± 0,00 4.76 ± 0,05
FEXT 2 2.29 ± 0.01 4.42 ± 0,12 8.40 ± 0,10 9.71 ± 0,07
*SD = standard deviation (n=2)
2.4 Differential scanning calorimetry (standard DSC)
With standard DSC, temperature is always changed linearly, and the operator must
specify the rate in degrees per minute (ºC/min). With a single heating rate, a single heat
flow rate signal is produced, which is the sum of all heat flows occurring at any point in
temperature or time. The operating principle of MDSC differs from standard DSC in that
MDSC uses two simultaneous heating rates - a linear heating rate that provides
information similar to standard DSC, and a sinusoidal or modulated heating rate that
permits the simultaneous measurement of the sample's heat capacity. Creation of the
sinusoidal temperature change requires the operator to select a modulation period
(seconds) and modulation temperature amplitude (± ºC). Applying simultaneous heating
rates (linear and modulated) provides further information on sample heat capacity or
structure. MDSC is superior to standard DSC since it can separate kinetic events (e.g., a
cold crystallization) from changes in heat capacity (e.g., a 𝑇𝑔).
MDSC was applied in the subsequent HME extrudates in this thesis, however, the
thermal analyses performed for FEXT 1 and FEXT 2 were conducted with a standard
DSC, which rendered difficult the identification of 𝑇𝑔 on these samples.
FEXT 1 and FEXT 2 were analysed just after production and after storage for 30
days under two different conditions: 30 °C/75 % RH and 40 °C/75 % RH. Their DSC
curves are also shown in Figures 83 and 84, respectively.
Once freshly produced, both formulations did not show signs of presence of
crystalline material (no melting point on the curves). Both remained unchanged for 30
days storage at room temperature.

227
During storage under the other conditions (30 °C/75 % RH and 40 °C/75 % RH),
an endothermic signal has appeared between 106 - 109 ºC followed by an exotherm and
a second endothermic event in the range of 125 - 130 ºC. The recrystallisation process on
the samples is evidenced. The first endothermic peak (106 - 109 ºC) could be associated
with the recently published C form of the PZQ [4]. However, the second sign does not
refer to PZQ forms B or commercial [5] [6].
For FEXT 2, during storage at 30 °C/75 % RH and 40 °C/75 % RH, an
endothermic signal has appeared in the region of 125 ºC (Figure 84). The recrystallisation
process is also observed, however the phase crystalline was not identified.
Figure 83. DSC curves for FEXT 1 under different storage conditions.

228
2.5 Powder X-Ray Diffraction (PXRD)
PXRD analyses were performed to help elucidate the solid state of PZQ in the
HME extrudates. For that, the physical mixtures were also analysed.
Initially, PXRD was performed for the physical mixing of FEXT 1 sample after
staying in the most stressful condition (AS t30) and immediately after the extrusion
process (RT t0) (Figure 85). Naturally, the results report only the characteristic signs of
pure PZQ and a slight change in the baseline due to the presence of the polymer
(amorphous).
Figure 84. DSC curves for FEXT 2 under different storage conditions.

229
Figure 86 regroups all PXRD data for FEXT 1, freshly produced and during
stability monitoring. The diffractograms corroborate the results obtained by DSC. The
samples that were kept at room conditions did not present signs of crystallinity (no
melting points), while those submitted to a climatic chamber already show signs of
diffraction, confirming the presence of crystalline material resulted from a
recrystallisation process on the samples during storage
Figure 85. PXRD of the physical mixture corresponding to the composition of FEXT 1.

230
However, the crystalline signals appeared in FEXT 1 cannot be attributed to the
polymorphic forms of praziquantel reported in the literature. One explanation could be
the low amount of crystalline material (low intensity of peaks) in presence of other
materials, rendering difficult the data analysis.
To finish with FEXT 1, the placebo sample (extrudate) showed an amorphous
characteristic, as expected by the presence of only PVPVA and SPAN (Figure 87).
For the FEXT 2 sample, the same characterization was performed and, initially,
the physical mixture presented the melting characteristic signs of the PZQ and the
surfactant (SLS), also crystalline, and the same profile was observed for the physical
mixture storage at 40°C/75%RH. (Figure 88).
Figure 86. PXRD for FEXT 1, freshly produced and during stability monitoring.
Figure 87. PXRD pattern of FEXT 1 placebo.

231
Figure 89 regroups all PXRD data for FEXT 2, freshly produced and during
stability monitoring. Contrarily to FEXT 1, the FEXT 2 samples that were kept at room
conditions started to present signs of crystallinity after 15 days stored at room conditions.
The DSC analysis did not detect the presence of crystalline material. Differently, for the
FEXT 1 sample, the results of DSC and PXRD corroborate, and recrystallization was
evidenced after 15 days, but only under stress conditions.
Also, it is interesting to note that even after the extrusion process, the sample is
characterized by small crystalline signals at 2θ 32 and 34 º, respectively. However, the
Figure 89. PXRD pattern for FEXT 2, freshly produced and under stability monitoring
Figure 88. PXRD for FEXT 2 physical mixture.

232
same diffractions can be seen for the placebo extrudate (Figure 90). Still, when these signs
are compared to the physical mixture of the pure ingredients, they are not found. This
means that, probably, something might happen in the physical structure between the
materials (PVPVA and SLS) during the extrusion process.
2.6 Scanning Electron Microscopy (SEM)
The milled extruded samples were evaluated right after processing and when
storage under the different conditions of stability already presented (RT, LT, and AS).
Figures 91 and 92 show the SEM images obtained for the FEXT 1 and FEXT 2
extrudates obtained by samples submitted to the stability study.
Figure 90. PXRD for placebo FEXT 2.

233
Figure 91. SEM images of FEXT 1 extrudate. a) RT; b) RT t15; c) RT t30, and d) LT t15; e) and f) AS t15.
a) b)
c)
d)
e) f)

234
For both extrudate formulations, fine needle-shaped particles can be seen on the
surface of samples maintained at room temperature (Figures 91a and 92a). For higher
temperature/RH conditions, it is possible to evidence particles with a columnar format
similar to those identified for the raw API [300] (91d and 91d). Particles with a similar
shape were found in a study that produced solid dispersions containing PZQ and PVP
[65]. Different morphologies were identified depending on the variation in the
composition of the solvent (ethanol and water) used to produce them. Samples produced
a) b)
c)
d)
e) f)
Figure 92. SEM imagen of FEXT 2 extrudate. a) RT; b) RT t15; c) RT t30, and d) LT t15; e) and f) AS
t15.

235
with PZQ and PVP (2: 1) using only ethanol for evaporation showed structures in the
form of needles on the surface, like those obtained here (Figure 93).
Figure 93. Comparison between solid dispersion obtained in this study by HME (PZQ: PVPVA - 1: 1) and
solid dispersion obtained by solvent evaporation [14]. a) particle surface after RT t30- PZQ: PVPVA by
HME and, b and c) PZQ: PVP (3: 1) - solvent evaporation (ethanol). Source: reprinted from [65] with
permission.
As temperature and humidity increased during storage, the “growth” of the
needles was clearly evidenced, and the FEXT 1 particles became agglomerate (Figures
15f and 15e). Although FEXT 2 also showed agglomeration of extruded material, the
needles are found horizontally on the surface (Figures 11b, d, and f). Also, some “cracks”
were identified in the extruded material (Figures 92c and 92d).
Samples of the placebo extrudate were not included in the stability study due to
the absence of API. In this way, Figures 94 and 95 present the respective formulations
after production. As expected, the surface of the material is smooth without the presence
of particulate material. Only particles and deformations resulting from the pelletizing
process are evident.
a

236
2.7 Stereomicroscopy
Like SEM analysis, stereomicroscopy was applied to the materials after extrusion
and during the stability studies to monitor morphological changes. Unlike SEM, this
analysis aims to obtain macro information related to the aspect of extruded materials.
Samples in pellet shape (before grinding) and milled were evaluated.
The images obtained by stereomicroscopy for the extruded material FEXT 1
(pellet), and its respective ground are presented in Figures 96 and 97. Changes on physical
aspect were seen during stability monitoring.
Figure 94. SEM imagens of Placebo FEXT 1.
Figure 95. SEM imagens of Placebo FEXT 2.

237
After 30 days at room temperature, it can see that the ground material has a more
whitish colour when compared to the extruded material. This factor is probably related to
the fact that the ground material has a larger surface area, favouring the uptake or water
from the environment. For both cases, under higher humidity and temperature conditions,
the material was completely opaque and brittle. This transformation was shown
simultaneously, but to a lesser extent, in the material at the ambient condition.
a) b) c)
d) e)
a) b) c)
d) e)
Figure 96. Images obtained by stereomicroscopy for extrudate FEXT 1. a) RT; b) RT t15; c) RT t30, and
d) LT t15; e) and f) AS t15.
Figure 97. FEXT 1 milled. a) after extrusion. a) RT; b) RT t15; c) RT t30, and d) LT t15; e) and f) AS t15.

238
As previously discussed, the FEXT 2 formulation exhibited the same aspect
(Figures 98 and 99), and the colour change of the ground material was even more evident
after 30 days on RT (Figure 98c) when compared to its respective extrudate (Figure 99c).
2.8 PZQ-HME solubility in aqueous media
Figure 99. FEXT 2 milled. a) after extrusion; b) 15 days at RT; c) 30 days at RT; d) 15 days at 30ºC/75%RU
and 15 days at 40ºC/75%RU.
a) b) c)
d) e)
a) b) c)
d) e)
Figure 98. Images obtained by stereomicroscopy for extrudate FEXT 2. a) after extrusion; b) 15 days at
RT; c) 30 days at RT; d) 15 days at 30ºC/75%RU; e) 15 days at 40ºC/75%RU.

239
Measurements were carried out with both extrudate formulations to evaluate their
capacity to improve the water solubility of the PZQ at 37°C (Table 40).
Table 40. Water solubility of FEXT 1 and 2.
Solubility (mg/mL) at 37ºC
1h 24h 48h
API 0.138 ± 0.03 0.15 ± 0.01 0.136 ± 0.01
FEXT 1 0.298 ± 0.03 0.228 ± 0.07 0.110 ± 0.01
FEXT 2 0.479 ± 0.14 0.167 ± 0.003 0.219 ± 0.04
Both formulations showed an increase in the PZQ concentration in water (after 1
hour) compared to pure PZQ and FEXT 2 by more than two hundred percent. The
measured solubility of pure PZQ is in accordance with the literature, as already presented
in Chapter 4 (Section 4.2.2) [10]. For both samples, the apparent solubility decreases at
the subsequent points, presenting a profile similar to that found for binary extrudates and
solid dispersions of praziquantel produced by spray drying (Sub-chapters 5.2 and Chapter
4).The experiment should be performed again with more collect points for a better
understanding of the evolution of the PZQ concentration in water during solubilization
from the extrudate samples (these values can indicate recrystallization or degradation, for
example).
2.9 Dissolution Profile
The dissolution profile was also evaluated and presented in Figure 100. Both
(ground) FEXT 1 and 2 samples were analysed, reaching respectively 79 % and 90 % of
PZQ release at the end of 2 hours.
Although both formulations present promising results for “intermediates”
materials a difference can be evidenced between the dissolution profile of FEXT 1 and
FEXT 2. The dissolution medium used followed the guidelines described in the American
pharmacopeia [297] for the evaluation of PZQ tablets, and the composition is HCl 0.1N
and 0.2 % (wt) of the surfactant (SLS). FEXT 2 has the same surfactant in its composition,
and an assumption to elucidate the difference in the dissolution profile is related to this
factor. LSS is an anionic surfactant, and molecule hydrophilic (with the sulfate group)
that makes, soluble in water. Span™ 20 is a non-ionic surfactant, having no miscibility
in water, causing the formulation containing it to dissolve more slowly.

240
Figure 100. Dissolution profile for extrudate samples, FEXT 1 and FEXT 2.
Another factor influencing the dissolution rate is the granulometric size
distribution of the extruded material added (by dispersion) in the dissolution tank.
Although a precise evaluation of this characteristic has not been carried out, the samples
used in this test have undergone a selection through the sieving tests, and both had a
particle size in the range 210 to 300 µm. In addition, although FEXT 2 has a 10% less
drug than FEXT 1, the mass used for the dissolution profile was based on the paediatric
dose of PZQ (150 mg). Thus, the dissolution profile difference is related to the extrudate
characteristics and not the different concentrations of the API in each formulation (FEXT
1 50 wt% and FEXT 2 40 wt%).

241
1. METHODS
1.1 In vitro taste masking test by electronic tongue (e-tongue)
These analyses were carried out in collaboration with a Brazilian laboratory from
USP – University of Sao Paulo in Brazil (Instituto de Física de São Carlos - IFSC),
equipped with an e-tongue. Electronic tongue is a device simulating human sense of taste,
that allows for the identification and classification of liquid samples regarding palatability
[320].
The in vitro taste assessment was performed with an impedimetric electronic
tongue comprised of an array with several units modified with nanostructured films. In
this study, we used an array with 5 sensing units made with interdigitated gold electrodes
coated layer-by-layer by alternating immersion of the electrodes into cationic and anionic
layering solutions. The materials used to produce the multi-layer films were
poly(ethyleneimine) (PEI), poly(styrene sulfonate) (PSS), poly(3,4-ethylene
dioxythiophene): poly(styrene sulfonate) (PEDOT:PSS), poly(pyrrole) (PPy),
poly(aniline) (PANI), chitosan (Chit) and tetrasulphonated nickel (II) phthalocyanine
(NiTsPc). They were dissolved in ultrapure water from a Millipore Direct-Q5 system with
a concentration of 0.5 g/l at pH 3 adjusted with HCl solution.
The architectures of the five sensing units were as follows: i) (PEI/NiTsPc) 5, ii)
(PANI/PSS) 5, iii) (PEI/PEDOT:PSS)5, iv) (PEI/PPY) 5 and v) (Chit/PSS) 5, where the
number ‘5’ means that all films had 5 bilayers (10). The capacitance data were collected
with an impedance analyser (Solartron) in the frequency range from 1 Hz to 1 MHz,
applying an a.c. voltage of 25 mV at room temperature. The electrical response of an
array of 5 sensing units modified with conducting organic films was used to evaluate the
taste characteristics of the formulations. The capacitance data were projected using the
multidimensional projection technique referred to as Interactive Document Map
(IDMAP), in the PEx-Sensors software [321]. The whole procedure is illustrated in Figure
101.
PART 2 - TASTE MASKING AND PHARMACOKINETICS STUDY

242
The extrudate formulations FEXT 1 and FEXT 2 were analysed in the same
concentration as the therapeutic dosage recommendation for paediatrics patients (150
mg). For each commercial tablet and the prepared dispersions were analysed in replicate
(n = 3). For all analyses, 10 mL of water were used to disperse the samples.
1.2 In vivo taste masking by volume consumed
This method applied here is based on the evaluation of the palatability of a given
sample according to the difference in the volume consumption of the sample by animals
[116].
The animal's exposure is made under a controlled time. It is possible to predict
taste palatability or hedonic impact (pleasant taste) because it was already described in
the literature the similar behavioural pattern of human infants and rats and facial
expression and certain taste-related behaviours (e.g., tongue protrusion) [116]. In this
way, when exposing an animal to the test, the volume difference is measured, which is
directly linked to the taste (the more consumed, the more palatable).
The in vivo taste assessment was performed on 42 adults female Wistar rats
weighing between 300 - 350 g. All procedures were approved by the Animal Use Ethics
Committee (CEUA) at Fluminense Federal University (UFF) Rio de Janeiro, Brazil
(protocol number CEUA 4119060418 – Appendix I). They were housed alone in standard
cages at 25± 2 C and 50 % ± 10 % humidity under 12 light/12 h dark cycle. All training
and testing occurred during the light phase of the cycle. Animals had free access to chow
and water except for training and testing periods where a water-restriction schedule
occurred. The experimental design consisted of two training and one testing days. Each
Figure 101. Schematic setup for in vitro taste experiment. An array of five sensing units were modified with
(PEI/NiTsPc) 5, (PANI/PSS) 5, (PEI/PEDOT:PSS)5, (PEI/PPY) 5, and (Chit/PSS) 5 films.

243
rat was water-deprived for 22 h before each session (training and testing) of 30 min to
motivate the licking behaviour (response to thirst) but had access to food ad libitum. This
method was adapted from the literature [68].
A system for recirculation of the solution/suspension samples was developed by
our group for this study. The procedure adopted aims to maintain homogeneity of the
dispersion taste during all experiments. The system was assembled using silicone tubes
(8 mm ) and a recirculation pump (DC20C model, 4,5 W and flow rate 240 L/h) (Figure
102).
The two initial days of the protocol were dedicated to training with water drinking
bottle presenting 100 mL of purified water, and the system of recirculation was active all
the time of the experiment. After each testing period, they received drinking water for
one hour for rehydration.
At the third day, the animals were separated into 5 groups (n = 6) for receiving
our FEXT 1, FEXT 2 formulations, their respective placebos, and water. The animals in
each group were kept in separate cages. For each sample, the mass equivalent to the
paediatric dose (150 mg) was dispersed in the bottle. The position of the silicone tubes
was the same for all drinking bottles. Each dispersion was prepared immediately before
the start of each experiment and the recirculation was kept active throughout the
experiment. The taste of each sample was assessed by volumes of basal water
consumption, commercial tablets and their placebos were measured and compared by
statistical analysis to verify what there was a difference in the ingestion. Behavior visual
responses, such as jaw smacking, oral grooming/paw wipe, retreating, and tail erection,
were also observed and registered by taking pictures. Results of volume consumption
Figure 102. Representation of a rat exposed with a recirculation system.

244
were analyzed by single factor ANOVA using JMP Statistical Discovery Software
version 8.
1.3 Pharmacokinetic study
1.3.1 Animals
To carry out the efficacy tests, an animal study model was developed. 31 male and
adult Wistar rats were selected, weighing between 350 and 500 g. The animals were
supplied by the Oswaldo Cruz Foundation's Institute of Science and Technology in
Biomodels (ICTB).
Animal experimentation and all its manipulation followed the Ethical
Commission's principles on the Use of Animals (CEUA), under protocol L-009/2019
CEUA/IOC - Fiocruz (30/05/2019) (Appendix II).
The animals were kept animal house of the Oswaldo Cruz Institute (IOC), with
free access for water and feed, being kept in a climate-controlled environment with a
controlled temperature (Figure 103).
On the experiment day, the rats were deprived of water and food for two hours
before administering the test formulations.
1.3.2 Design of pharmacokinetic experiments
Figure 103. Representation of keeping animals in a bioterium during the acclimatization period.

245
As it was a preliminary evaluation and considering the rational use of animals, it
was decided to perform the experiment just with FEXT 1. This sample was selected based
on the better palatability performance, higher API load, and less dissolution in the first
minutes of analysis (which may favor the taste masking).
Four groups of formulations were then studied: Extruded placebo (vehicle); Blank
(vehicle); Extruded FEXT 1 (extruded containing PZQ), and API (PZQ). All formulations
were dispersed in the vehicle (solution of polyethylene glycol 400 (PEG 400) 60 wt% in
water), except blank, which was the vehicle itself.
The number of animals for each group was defined through a sample space from
a statistical calculation, where they were distributed, as shown in Figure 104.
The administration of the samples occurred orally using the gavage technique.
To determine the animal equivalent dose (AED), the bodyweight of the animal
model and human and their body surface (m²) were considered. For that, it is necessary
to convert the dose from mg/kg to mg/m² using a constant, Km. This constant varies not
only between species but also increases proportionally within each species [322], [323].
1.3.2.1 Theorical considerations for the determination of AED
Determination of Km in animals [322]:
Rats and mice have K = 9 and humans weighing 70 kg, Km = 39.
Figure 104. Animal groups for the study of pharmacokinetics.

246
Equation 6
𝑲𝒎 = 102 ∗ (𝑝𝑒𝑠𝑜)1 3⁄
𝑘
For rats, with an average weight of 300 grams: Km = 7.9
Determination of Animal Equivalent Dose (AED):
The human dose to be used in the calculations is 50 mg/kg
Equation 7
𝑨𝑬𝑫(𝒎𝒈 𝒌𝒈)⁄ = ℎ𝑢𝑚𝑎𝑛 𝑑𝑜𝑠𝑒 (𝑚𝑔 𝑘𝑔)⁄ ∗ 𝐾𝑚 ℎ𝑢𝑚𝑎𝑛
𝐾𝑚 𝑎𝑛𝑖𝑚𝑎𝑙
For the conversion of the human dose to RATS with an average weight of 300
grams: ≈ 262 𝑚𝑔 𝑘𝑔⁄ .
The equivalent animal dose refers only to the praziquantel API, it means that for
the extruded formulation (50% PZQ API):
Equation 8
𝑨𝑬𝑫𝑭𝑬𝑿𝑻 𝟏 (𝒎𝒈 𝒌𝒈)⁄ = 𝑨𝑬𝑫𝑷𝒁𝑸 𝑨𝑷𝑰 (𝒎𝒈 𝒌𝒈)⁄ ∗ 2
According to this, the AED is around 524 𝑚𝑔 𝑘𝑔⁄ .
All rats were weighed in order to adjust the dose schedule for each animal. 12
blood samples were collected from each animal at the intervals: 00:00 (pre-dose), 00:05
min; 00:10, 00:20 min, 00:30 min, 00:40 min, 00:50 min, 01:00 h, 01h:30 min, 02h:00 h,
04:00 h, 06:00 h. The blood samples were centrifuged (15000 rpm for 5 min at 10 ºC) to
obtain the plasma fraction, and it was stored in a freezer at -70 °C.
The collected material was sent to SEFAR/FIOCRUZ, the laboratory responsible
for plasma quantification and PZQ determination using the high-performance liquid
chromatography technique coupled to mass spectrometry (HPLC-MS/MS) by
electrospray ionization.
The methodology used for this step is represented in Figure 105.

247
To guarantee the reliability of the results obtained from animal samples, it was
essential to develop and optimize a validated bioanalytical method according to the
guidelines recommended by ANVISA, present in Brazilian resolution RDC n. 27 [324].
Tests of stability, precision and accuracy, matrix, and residual effect were performed.
1.3.2.2 Bioanalytical method
Analyses were performed with Nexera XRTM HPLC (Shimadzu, Kyoto, Japan)
coupled to a Qtrap 4500 linear ion trap quadrupole mass spectrometer (Ab Sciex,
Franingham, MA, USA). Chromatographic separation was carried out using a Zorbax
C18 column (4.6 × 150 mm, 5 µm) (Merck KGaA, Darmstadt, Germany), using the
isocratic method. The mobile phase used was a mixture of methanol (and an aqueous
solution containing 0.1 wt% of formic acid (70:30, v/v) at a flow rate of 0.800 mL/min.
The autosampler and column oven temperatures were equal to 10 ºC and 40 ºC,
respectively. Sample injection volumes of 10 µL were used.
Figure 105. Gaving and taking plasma samples for the pharmacokinetics study.

248
The mass spectrometer was operated with electrospray ionization (ESI) in the
positive mode. Nitrogen was used as the nebulizer and auxiliary gas. Important operation
parameters were: (i) source temperature of 650 ºC, (ii) curtain gas at 30 psi, (iii) nebulizer
gas (GS1) at 65 psi and (iv) heater gas (GS2) at 50 psi. Collision-activated dissociation
(CAD) gas was high. The ion spray voltage was equal to 5500 V, while the entrance
potential (EP) was equal to 10 V. Quantification was carried out using multiple reaction
monitoring (MRM). The MRM transitions selected were m/z 312.89 > 203.10 for PZQ
and m/z 284.68 > 193.20 for Diazepam (DZP).
Four standards were used in this work, PZQ reference standard, Diazepam internal
standard (IS), as well caffeine and Nicotine Bitartrate Dihydrate as possible interfering.
The stock solution of PZQ (1 mg/mL) and DZP (IS) (1 mg/mL) were prepared by
dissolving the accurately weighed in methanol/ water (50:50, v/v). The calibration
standards and quality controls solutions were prepared from the stock solution in
methanol/ water (50:50, v/v) at the concentrations: 100.00, 300.00, 600.00, 1200.00,
3000.00, 6000.00, 12000.00 and 15000.00 ng/mL. Low, medium, high and dilution
quality controls were prepared at 300.00, 6000.00, 12000.00 and 120000.00 ng/ mL,
respectively. For the analysis, spiked plasma at dilution quality control (120000.00 ng/
mL) was 10-fold diluted with blank plasma to 12000.00 ng/ mL. The IS working solution
was prepared in methanol/ water (50:50, v/v) at 5000.00 ng/ mL.
An aliquot of 25 µL of rat plasma was dispensed into a microtube. Then, 25 µL
of IS working solution was added and the extraction was 1.50 mL of tertmethy buthyl
ether. After mixing in automatic shakers for 5 minutes, samples were submitted to
centrifugation at 19.90 g at 10 ºC at 5 minutes. The organic phase was transferred to a
clean microtube (300 μL) and evaporated under nitrogen flow. The sample was
reconstituted in 1.50 mL of the mobile phase (methanol/ 0.1% formic acid in water –
70:30 v/v). The sample was transferred to a vial and 10 μL were injected into the HPLC-
MS/MS system for analysis.
1.3.2.3 Pharmacokinetic data analysis
Non-compartmental analyses were performed with the Phoenix WinNonlin
software (version 6.3, Pharsight, St. Louis, MO, USA). The pharmacokinetic (PK)
parameters determined were the maximum concentration (𝐶𝑚𝑎𝑥), time to achieve
maximum concentration (𝑇𝑚𝑎𝑥), area under the curve (AUC0-t and AUC 0−∞), the

249
terminal elimination rate constant (Ke) and the terminal elimination halflife (T½).
Parameters 𝐶𝑚𝑎𝑥 and Tmax were extracted directly from the plasma concentration (Cp)
versus time curve, AUC 0−t was calculated with a linear trapezoidal method, AUC0−∞
was calculated by combining AUC0−tlast with Ctlast/Ke, Ke was obtained by calculating
the slope of the decay phase from the graph of ln (Cp) versus time and T½ was calculated
using the equation: T½ = 0.693/ Ke. Outliers were detected with the Dixon and Chauvente
tests.
2. RESULTS
2.1 Taste masking
2.1.1 In vitro taste masking (e-tongue)
A positive effect on taste masking for PZQ is expected with the extrudate solid
dispersions studied in this thesis. It is true that the literature has already reported
promising results on HME solid dispersions with different APIs such as efavirenz [325],
griseofulvin [326], caffeine [326], verapamil hydrochloride [327], ibuprofen [281], and
paracetamol [328]. One of these works [329] is cited as example. It appears be the first
that demonstrated the use HME solid dispersions of verapamil HCl for taste masking
using two polymers, Eudragit L100 and L100 55. The results were very promising
confirming a good taste masking for extrudates with high drug loads (neutral taste for 50
wt% of API and slightly bitter taste for 70 wt% API). However, the taste-masking ability
might be dependent on the right combination of the excipients (polymers and others), the
API load and the extrusion parameters.
Starting the palatability studies of our extrudate samples produced in this time of
the thesis, in-vitro taste masking data of FEXT 1 and FEXT 2 samples and their respective
placebos, PZQ commercial tablet as well the correspondent placebo were obtained by
using an electronic tongue with impedance analyser.
The results are shown in Figure 106, coded by different colours. The number of
balls represents the replicates for each sample. The distance between replicate can
indicate variability of sample homogeneity. Finally, the palatability can be predicted by
the distance between the group of balls from the water. The water taste is considered

250
neutral. If a sample is situated next to water, a good palatability could be expected from
it.
In summary, from the in-vitro palatability test performed with an e-tongue, the
better palatability was found for FEXT 1. For remembering FEXT 1 is composed by (PZQ
50 wt%: PVPVA 45 wt%: SPAN 20 5 wt%).
Regarding the e-tongue test, a French electronic language (α Astree) is one of
the two types of equipment available on the market for this purpose [121]. The sensors
respond in the form of an electric potential (measured by an ion-selective field-effect-
transistor, ISFET) that is generated across the membrane of individual sensors due to the
taste quality of the formulation or test sample [134]. However, a limitation for this type
of sensor is non-ionic molecules that generate very low conductivity signals such as
praziquantel, ibuprofen, and caffeine [68]. This barrier was overcame using an electronic
language developed by partners of the research group where our samples were analysed.
The sensitivity improvement of the technique was obtained thanks to changes in the
surface of the electrodes using nanomaterials [121]. This alteration permitted analysing
Figure 106. IDMAP plot for FEXT 1, 2, commercial PZQ tablet and their respective placebos (n=3).

251
molecules like praziquantel. Machado et al. [134] has already successfully been
demonstrated the evaluation of the taste mask of PZQ with microencapsulated products.
2.1.2 In vivo taste masking by volume consumed
In a study published in 2017, PZQ was encapsulated with maltodextrin and
cyclodextrins. The palatability was evaluated by in vivo (aversion test in rats) and in vitro
(electronic language TS-5000Z - Insent - Japan). The in vivo method used in the
mentioned study, although using animals, is considered the gold standard for assessing
taste masking of drugs in development. The researchers established a very important data
through this experiment, that is the taste threshold for praziquantel (0.03 mg / mL) in
vivo. From this data, in vitro methods can estimate a correlation with the perception of
taste in vivo.
The results are shown in Figure 107 that displays the difference on volume
consumption for each ‘treatment’ (sample tested). These data indicated a tendency
towards aversion of the commercial PZQ tablet and the FEXT 2 extrudate (below the zero
lines). This result agrees with the animal's behaviour observed, since they lie in the water
trough and remain retracted at the bottom of the cage for the rest of the experiment (Figure
108). For placebo samples, the animals behaved normally, indicating that the perception
of taste was acceptable. Likewise, the results for FEXT 1 were statistically similar to
those for water and placebos. The bitterness profile detected by the e-tongue (in vitro
palatability tests) are in accordance with those found here in the in vivo tests.
Figure 107. In vivo palatability test. (A) ANOVA (single factor 95%) for the samples.

252
2.2 Pharmacokinetic study (PK)
2.2.1 Bioanalytical validation method
Bioanalytical methods refer to the identification and quantification of analytes in
various biological matrices (e.g., blood, plasma, urine, and saliva) [323]. The high quality
of bioanalytical methods is critical because it confers reliability, traceability,
standardization of steps (e.g., sample collection, storage, and preparation) [302], [330].
All of these factors contribute to decision-making in pharmacokinetic studies that can
result in an impact on the patient's health [330].
The results obtained in the validation of the methodology are presented in
summary form in Table 41. The intra-day and inter-day precision RSD % did not exceed
8.48 % at any QC concentration levels. Since both intra-day and inter-day precision were
below 15 % and accuracy was within ± 15%, the stability studies were also satisfactory,
thus the proposed bioanalytical method could be regarded as precise and accurate
according the current Brazilian guide for bioanalytical validation [324].
Figure 108. Observation of rat’s behaviour. a and b) drinking with neutral mouth movements (similar
behaviour for water, placebos and FEXT 2); c and d) after taste FEXT 1 and commercial PZQ solutions,
the rat tries to get it out of his mouth - oral grooming/paw wipe and retreating during the entire exposure
time.

253
Table 41. Summary of precision and accuracy assay (intra-day and inter-day) for PZQ in rat plasma.
Precision accuracy of control
Intra-day Inter-day
Nominal
concetration (n=8) Day 1 Day 2 Day 3 Overall
Mean RSD
(%)
Accuracy
(%) Mean
RSD
(%)
Accuracy
(%) Mean
RSD
(%)
Accuracy
(%) Mean
RSD
(%)
Accuracy
(%)
100 ng/mL 103.71 4.69 103.71 88.64 5.79 88.64 82.22 5.67 82.22 91.52 8.48 91.52
300 ng/mL 299.33 2.57 99.78 266.33 3.48 88.78 277.44 2.29 92.48 281.03 6.32 93.68
6000 ng/mL 6207.41 3.43 103.46 5905.64 1.80 98.43 6056.05 3.86 100.93 6056.37 -0.94 100.94
12000 ng/mL 12554.33 4.89 104.62 12207.59 2.56 101.73 12125.17 0.80 101.04 12295.70 -2.46 102.46
12000 ng/mL 11798.45 1.91 98.32 12579.25 3.42 104.83 12015.84 1.53 100.13 12131.18 -1.09 101.09
Table 42. Stability during storage.
Stability during storage in different conditions (n=8)
Nominal concentration
(n=8) Stability at room temperature
Stability at 10 °C in the
autosampler Stability of three freeze-thaw
05h:02min 26h:45min 08 cycles
Mean CV (%) RSD (%) Mean CV (%) RSD (%) Mean CV (%) RSD (%)
300 ng/mL 308.11 2.04 2.70 323.79 3.61 7.93 283.56 1.90 -5.48
12000 ng/mL 12227.46 1.16 1.90 13062.56 2.97 8.85 11104.02 4.85 -7.47

254
The results of the long-term stability of the sample into a biological matrix are shown
in Table 42. For all determined conditions, the results are within limits established by legislation
(CV% <15%) [324]. In addition, the long-term stability test demonstrated that the sample
showed no signs of degradation of the analyte after 237 days. Thus, all samples analysed in this
study (140 days) are within the stability time evaluated in the method validation protocol.
2.2.2 Pharmacokinetic profile
Pharmacokinetic studies were performed to determine the absorption, bioavailability
and elimination profile of praziquantel administered in milled extrudate (FEXT 1) after single
oral doses (50 mg/Kg) and to compare with the raw PZQ profile. After outlier detection, one
animal from the FEXT 1 group and three animals from the PZQ group were excluded, according
to criteria established by the Grubbs test. Then, the pharmacokinetic parameters were calculated
with six placebo animals (extrudate placebo without PZQ) (n = 6), five animals in control group
(n = 5), nine animals in FEXT 1 group (n = 9) and seven animals in API group (n = 7). PZQ in
rat plasma was observed from 5 mins until 6 h after oral administration in FEXT 1 and PZQ
groups. In the control group, PZQ was not detected in any of the analysed times, demonstrating
that the vehicle used (water with 60 % PEG 400) was free of the drug, PEG 400 did not interfere
with the analytical setup and there was no cross-contamination during sample preparation and
analysis.
The absorption speed of FEXT 1 was 4.5 times higher (Tmax: p = 0.006) than the API
(mean 𝑇𝑚𝑎𝑥 was 13 min and 59 min, respectively). The API guarantees a good characterization
of the absorption phase over time with 4 quantifiable points before 𝐶𝑚𝑎𝑥. Unlike the FEXT 1
formulation, which has only one point up to its 𝐶𝑚𝑎𝑥. This reveals an improvement point for
the protocol design. According to this fast speed of the extruded material (spring effect), more
collection points must be performed (1 point) in this initial phase of absorption (before 10 min).
Although the statistical results do not allow a difference between the 𝐶𝑚𝑎𝑥 of FEXT 1 and API
(p = 0.053), the average values of this parameter indicate that FEXT 1 has twice the maximum
API concentration. In the literature, this 𝐶𝑚𝑎𝑥 value for praziquantel is variable, mainly
depending on the composition of the formulation used, the experimental model, and the dosage.
For example, poly (methyl methacrylate) (PMMA) nanoparticles loaded with PZQ (PZQ-NP)
and obtained by sintering showed 𝐶𝑚𝑎𝑥 and AUC 3 times less than the API raw material (60
mg/Kg) in rats [180]. Another study that evaluated the pharmacokinetics of lipid nanoparticles
loaded with PZQ demonstrated that it significantly increases bioavailability compared to the

255
praziquantel tablet [331]. However, this previous study evaluated intramuscular administration
(5 mg/kg) in dogs.
The phase of elimination of the PZQ was significantly greater than the FEXT 1 (p <<
0.05), where the T1/2 was approximately three times greater with the time of 196.21 min and
64.33 min, respectively. If we consider that both samples (FEXT 1 and API) were prepared
with the same vehicle and same concentration, a hypothesis that could explain the slow
elimination of the API is the crystalline state. Differently of the extrudate in supersaturated
amorphous form (or mostly amorphous) that has a spring absorption effect demonstrated by
𝐶𝑚𝑎𝑥. This profile has already been described for solid amorphous PZQ dispersions using a
mixture of two surfactants (PZQ: PEG 4000: Poloxamer 188; 1: 3.75: 1.25) [332]. 𝐶𝑚𝑎𝑥 (173
± 34 µg/L) was obtained in 1h. However, it should be noted that the experiment was carried out
in dogs, and the number of animals was very limited (n = 3). The absence of parachute effect
from FEXT 1 may be related to the recrystallization of the PZQ in the lumen. And the next
question could be: why does FEXT 1, supposedly recrystallized, not maintain the same
absorption level as PZQ? Three main assumptions could be made:
a) the amount of recrystallized material is too small to maintain the same level;
b) it is unknown if the recrystallization process would be associated with the same
crystalline form as the raw material;
c) the recrystallized material is still in a polymeric system, resulting in a solubilization
disadvantage compared to API in its free form. Another question that could be asked is: why is
the FEXT 1 elimination time much longer than the API? The assumption that could explain this
phenomenon is related to the first hypothesis described above. The recrystallized material is in
small amount. So, first the PZQ was quickly absorbed due to the amorphous structure, but as
the system is supersaturated, a small amount recrystallizes. The elimination is proportional to
the absorption.
The results of ASC0-t showed no statistical difference between FEXT 1 and PZQ,
indicating that the extent of absorption can be considered similar for both. The flattening of the
concentration curve as a function of the time observed for API compared to the FEXT 1 and
the possible similarity between the observed absorption extension values (ASC0-t) seem to
reinforce the discussion above.
It is important to say that although the mean ASC0-inf values showed a statistically
significant difference between the groups (p = 0.005; 95% CI [-6.65 x 10⁵; -1.43 x 10⁵]), this
data can be considered fragile in the function of another possibility to improve the experimental
protocol. An adequate collection schedule should include a period of not less than three half-

256
lives of the substance to be dosed (this interval should be between 3-5 T1/2) [302], [323]. The
maximum interval for collecting blood samples for the PZQ dosage adopted in the present study
was 360 min (6 hours). Therefore, five and a half times the calculated half-life for the PZQ after
administration of the preparation FEXT 1 (mean T1/2 of 64.33 min). However, only
approximately twice the half-life was calculated for the PZQ after administering the preparation
“PZQ” (mean T1/2 of 196.21 min). An extended schedule for this case with a minimum of 10
hours should be necessary. The values presented must be corrected by the bioavailability factor
(F) provided by the preparations, which is unknown for this study. The bioavailability factor
must be calculated in a comparative test with an intravenous administration.
Figure 109 shows the profiles of the average concentration of PZQ as a function of time
after removing outlier animals. Table 43 presents the descriptive statistics of the
pharmacokinetics parameters observed for FEXT 1 and the API, respectively, after removing
the outlier animals.
Figure 109. Comparative profile of mean plasma concentrations of PZQ as a function of time for each preparation
administered (arithmetic mean + standard deviation). After removing the outlier animals.
Placebo
Placebo FEXT 1
PZQ
FEXT 1

257
Table 43. Non-compartimental pharmacokinetic parameter of PZQ in rat plasma after oral administration of FEXT
1 (n=9) and PZQ (n=6).
Group Pharmacokinetic parameters
Cmax (ng/mL) Tmax
(min) ASC0-t (min*ng/mL) Ke (1/min) T1/2 (min)
FEXT 1 5407.43 ± 3515.07 13 ± 8 292876.47 ± 249299.25 0.0149 ± 0.0085 64.33 ± 44.15
PZQ 2574.97 ± 284.08 59 ± 42 490022.03 ± 56502.12 0.0038 ± 0.0010 196.21 ± 58.07
Although the extruded material has achieved increased solubility, the PZQ efficacy does
not depend on the maximum API concentration but rather on the extension ratio over time when
the parasites are exposed to the limit concentration of the drug [178], [333], [334]. Some authors
have already shown that dividing the total dose administered in 3 times almost doubled the
effectiveness compared to administering a single oral dose [333]. Thus, the improvement in the
controlled release of the API in the extruded system is necessary.
Analysing the data obtained for the API raw material, it is possible to see a considerable
variation in main pharmacokinetic parameters compared with similar protocols in the literature
(e.g., 𝐶𝑚𝑎𝑥 554.23 µg/L, whereas in our study, it was 2754 µg/L). For example, Malhado et al.
[180] used the same animal model, administration method (gavage), and PZQ (commercial
form) raw material. The main differences were in the dispersion vehicle used (aqueous solution
containing 2 % of Cremophor E), in the administered dose (60 mg/Kg), and the calculation of
the administered mass (simple human dose/Kg relation for the animal's weight). Even though
the authors administered a 10 mg higher dose, the 𝐶𝑚𝑎𝑥 value is almost 5 times higher.
This evidence may be related to the fact that, as described in item 1.3.2.1 of this Chapter,
the calculation of mass administered to animals took into account critical physiological
parameters described in the literature (e.g., body area, metabolism, animal model) for the
correlation of human dose versus animal [322], [323].

258
3. CONCLUSIONS
The knowledge developed in this chapter was fundamental because:
- It was possible to check the stability of the ternary systems looking for and, through
them, the importance of determining the solubility of the API in the polymer during the early-
stage development.
- It was possible to evaluate for the first time the in vitro (and tongue) and in vivo
(volume consumed) palatability of solid amorphous dispersions produced by HME containing
50 wt% PZQ. The promising results of taste masking corroborate with literature on the
application of the HME technique to overcome the bitterness of drugs.
- Although the information is still not ideal, it was possible to verify the increase in
bioavailability found by the production of the amorphous solid dispersion with the ternary
composition: PZQ (50 wt%), PVPVA (45 wt%) and SPAN 20 (5 wt%).
- It was possible to identify two potential improvement points for pharmacokinetic
protocols to evaluate the bioavailability of ASD, which are first the increase in the number of
collection points before 10 minutes to prove the initial phase of PZQ ASD absorption and
second the extension of the PK study to at least 10 hours to meet the requirements considered
for drugs with API-like half-life.
The subsequent steps of the work turned toward improvements on the studied
formulations, FEXT 1 and FEXT 2, more specifically on the quality of the extruded
formulations and knowledge of their characteristics.
It was possible to identify the most suitable HME process conditions for obtaining solid
amorphous dispersions that resulted in a significant increase in kinetic solubility when
compared to the starting API. However, through the screening of the HME process parameters
initiated in this phase of the work, it could be verified that a load of 50 wt% PZQ in the ternary
system is challenging in balancing the processability and the necessary characteristics of the
solid dispersion.

SUB-CHAPTER 5.3 - PRAZIQUANTEL
AMORPHOUS SOLID DISPERSIONS
MANUFACTURED BY HME - TERNARY SYSTEM
(50 WT% PZQ) PHARMA 16 EXTRUDER

260
1. INRTODUCTION
This Sub-chapter presents new results for ternary solid dispersions of same composition
that those described in the previous Sub-chapter. This time the production was performed in an
extruder with larger capacity (Pharma 16, Thermofisher), the same used to produce the binary
amorphous solid dispersions (Chapter 5.1).
Contrarily to the procedure described in Chapter 5.2, for the ternary systems containing the
liquid surfactant (span20), it was directly fed into the extruder. This modification aimed to
simplify the production process by eliminating the granulation step previously described. It
required some preliminary investigations on the liquid feed realized by a peristaltic pump (feed
rate, insertion zone in the barrel). Then, two batches were produced for each of the two
formulations, as schematically illustrated in Figure 110.
The HME extrudate samples obtained were shaped in two different physical forms: first as
pellets (size around 1mm), and secondly, the pellets were milled to produce a powdered sample.
Both forms were characterized, and the methods used and the results obtained are presented in
this Sub-chapter.
Figure 110. Schematic representation of the batches produced and presented in this sub-chapter.

261
2. METHODS
2.1 Ternary ASD system prepared by HME (50 wt% PZQ)
Two formulations were produced, with the same qualitative composition described in the
previous Sub-chapter. The concentration of 50 wt% PZQ was maintained for both formulations,
regardless of the surfactant.
The formulations were made in duplicate in a different period. Table 44 shows the
formulations produced and the respective compositions.
Table 44. HME extrudate samples produced and the respective compositions.
Samples Composition (wt%)
PZQ PVPVA SLS SPAN20
HME 14 and HME 23 50 45
5
HME 16 and HME 24 5
Two formulations were produced in an extruder from the same manufacturer (Thermo
Scientific) but with a larger model (Pharma 16). Pharma 11 extruder used in the previous study
presented in Chapter 5.2 is a bench-scale equipment, while Pharma 16 is a pilot one [1]. The
difference between the extruders lies mainly in the size and production capacity (Table 45).
Table 45. Features of Pharma 11 and Pharma 16 extruders (ThermoFisher Scientific) [1].
Equipment
Barrel
Diameter
(mm)
Barrel
Lenght (mm)
Screw lenght
(mm)
Achievable
output (kg/h)
Pharma 11 11 40 440 0.02 - 2.5
Pharma 16 16 40 640 0.2 - 5
The temperature profile of the formulation containing SPAN 20 was kept the same20
used for the binary mixture and described in Chapter 5.1. In contrast, for the formulation
containing the SLS surfactant (powder), the temperature profile was adjusted according to the
SLS melting characteristics (around 200 °C).
20 The extruder was fed with the binary mixture and the SPAN 20 was added into the barrel during extrusion.

262
The best screw profile selected from the hot-melt extrusion of the binary formulations
(Chapter 5.1) was used for this study.
The powder flow rate and the screw speed were adjusted according to the characteristics
of the mixture to ensure good processability.
The extrusion parameters can be seen in Table 46.
Table 46. Extrusion conditions for the ternary system (50 % PZQ) using Pharma 16 extruder.
Sample
Code Composition
Conditions
Observation Powder
Rate
Flow
(kg/h)
Screw
speed
(rpm)
Liquid
Rate Flow
(mL/min)
Temperature profile Screw
profile
HME 14
50 % API /
45 % KOL /
SPAN 5 %
0.25 300 0.23
(Z1) 50°, 70°,100°,
140°, 140°,140°, 100°
and 90° (die)
Zone 4
and 6
without RE
-
HME 16
50 % API /
45 % KOL /
SLS 5 %
0.15 300 NA*
(Z1) 50°, 100°,140°,
180°, 180°,180°, 130°
and 105° (die)
-
HME 23
50 % API /
45 % KOL /
SPAN 5 %
0.3 150 0.23
(Z1) 50°, 70°,100°,
140°, 140°,140°, 100°
and 90° (die) samples were
cryomilled
after
extrusion HME 24
50% API /
45% KOL /
SLS 5%
0.15 150 NA*
(Z1) 50°, 100°,140°,
180°, 180°,180°, 130°
and 105° (die)
* NA = not applicable
For formulations (HME 14 and HME 23), in which the surfactant was a powder (SLS),
preparation was carried out by physical mixing the components in the Turbula® T2F mixer (08
min, 46 tr/min rotation speed).
For formulations (HME 16 and HME 24), where the surfactant was liquid (SPAN 20),
it was added using a peristaltic pump directly in the extruder. Unlike what was previously
presented, there was no need to carry out the wet granulation step to incorporate the surfactant
into the powder mixture of PZQ and VPVA. This step is discussed in detail in this Sub-chapter.
2.1.1 Addition of a liquid surfactant
The first steps were to calibrate the peristaltic pump for liquid feeding and define the
zone in the extruder for addition of the surfactant into the molten material during extrusion.
263
The calibration was based on the flow rate of the peristaltic pump as a function of the
feed flow rate of the powder mixture and the desired final surfactant concentration in the
formulation. To this end, the following relationship was used (Equation 6):
Equation 9
𝐹𝑅𝑝𝑢𝑚𝑝𝑔/ℎ = ([%𝑆𝑢𝑟𝑓] 𝑥 [𝐹𝑅𝑚𝑖𝑥 𝑔/ℎ]) / [%𝐴𝑃𝐼] 𝑥 [%𝑃𝑜𝑙]
Where 𝐹𝑅𝑝𝑢𝑚𝑝 is the pump flow rate and (𝐹𝑅𝑚𝑖𝑥) is the flow rate of the molten material
on the extruder with a respective composition of API (%𝐴𝑃𝐼), polymer (%𝑃𝑜𝑙), and surfactant
(%𝑆𝑢𝑟𝑓).
2.2 Cryomilling process
As one of our objectives was to produce an amorphous solid dispersion by HME aiming
its use in a pharmaceutical formulation, we decided to reduce the granulometry of the pellets
produced. For that, and considering the amorphous nature of the extruded material, the milling
of the pellets was performed by cryomilling. In short, cryomilling is a process to reduce the
particle size mainly used for thermolabile materials. It can be carried out first by freezing the
materials to be ground in liquid nitrogen or milling under cryogenic conditions (in the presence
of liquid nitrogen) [335].
The equipment available in the laboratory (6775 Freezer/Mill® (SPEX SamplePre,
LLC) and used in this work is shown in Figure 111. The pellets were added up to half of the
sample holder (Figure 82Figure 111b) and inserted into the equipment that already contained the
appropriate liquid nitrogen level for the procedure (Figure 82c). At the end of the experiment,
the sample holder was accommodated on the support (Figure 82d) for removing the lid and
removing the sample. The method parameters were previously adjusted, and the sample was
pre-cooled for 4 minutes, rate 5, 2 cycles of 1 minute and 30 seconds each (minimum equipment
time). After cryomilling, the samples were placed in plastic test tubes with a screw cap,
parafilm, and aluminium for light protection and kept in a desiccator under laboratory
conditions (25 °C and 60 % RH).

264
Samples HME 23 and HME 24 were cryomilled, while HME 14 and HME 16 samples
were kept in the form of pellets (Figure 112).
b)
c)
d)
a)
Figure 111. a) Cryomilling equipment; b) sample holder loaded; c) open equipment ready for insertion of the
sample holder and d) sample holder after cryomilling in a specific accessory to perform the opening. Source:
Author.

265
Pellet samples were placed in opaque plastic flasks with a screw cap, parafilm and kept
in a desiccator under laboratory conditions (25 °C and 60 % RH).
2.3 Characterization of PZQ-ASD
DSC, PXRD, Optical microscopy, and SEM were used to characterize the solid state of the
HME samples produced. Likewise, other characteristics were also evaluated (water solubility,
drug content, and in vitro dissolution profile).
All the characterization methods (except optical microscopy) used in this Sub-chapter have
been described previously (see Chapter 5.1).
2.3.1 Optical microscopy
Images were obtained using a Leca EZ4 HD ® microscope with an integrated high-
definition digital camera, set to 8x magnification. These images were then edited with the Leica
LAS EZ software program. For calibration purposes, an image (obtained under the same
conditions) of a standard slide containing a straight 1cm segment, with 100 divisions, was
employed.
Figure 112. General view of production process described in this chapter.

266
3. RESULTS
3.1 Ternary ASD system prepared by HME (50 wt% PZQ)
3.1.1 Addition and determination of the liquid surfactant feeding zone
For a HME extrudate with the desired composition (50 wt% PZQ, 45 wt% PVPVA and
5 wt% SPAN20), the following mass flow rates had to be adjusted (Equation 6):
For 250 g/h of powdered mixture PZQ-PVPVA, the mass flow rate for SPAN 20 was
13.16 g/h (0.24 mL/min), whereas
For 300 g/h of powdered mixture PZQ-PVPVA, the mass flow rate for SPAN 20 was
15.79 g/h (0.27 mL/min).
The calibration results for the peristaltic pump are shown in Table 47.
Table 47. Calibration pump for directly addition of surfactant (SPAN 20) on the extruder.
Tube
diameter
(mm)
Theorical
flow rate
(mL/min)
Calibration
time (sec)
Recovered
mass (g)
Density of
surfactant
(g/ml)
Recovered
volume
(ml)
Real
Flow rate
(ml/min)
24 FRmax 1,37mL/min
16 FRmax 0,19mL/min
16 0.20 600 2.5 1.032 2.42 0.24
16 0.23 300 1.4 1.032 1.36 0.27
The surfactant was initially fed int the extruder after the first mixing zone. However, in
this region, as the powder mixture has not yet been fully melted, the introduction of a liquid
caused adherence of the powder to the surface of the surfactant droplet. Consequently, in that
open region of the extruder, it was formed an ‘agglomerate’ that no longer had the same
temperature as the internal part (close to the screw), making it difficult to maintain a continuous
liquid (surfactant) feeding (Figure 113Figure 113).

267
The change in the liquid surfactant feeding point to the back of the second mixing zone
(Figure 114) caused the liquid to be completely incorporated into the melted mixture that passes
through the thread in this region. This ensured the homogeneity of the surfactant concentration
in the extruded material obtained.
Also, a specific extruder accessory was finally necessary for feeding liquids during the
process in order to reduce the opening and to decrease the variation of temperature and humidity
in the product (Figure 115).
a)
c)
b)
Figure 113. Addition of the liquid surfactant directly in the extruder after the first mixing zone. a) Adhesion of the
powder to the surfactant drop; b) Formation of an ‘agglomerate’ that begins to be lost and, c) large amount of
product lost after a few minutes of extrusion.
After first mixture
zone (failed) After second mixture
zone
Figure 114. Schematic view of the point to addition the liquid surfactant (after the second mixing zone).
Source: Author.

268
After developing the conditions for continuous processing of the two ternary systems in
Pharma 16 extruder, with the adequate addition of the surfactant regardless of its solid or liquid
nature, four HME extrudate samples were produced.
3.2 Characterization of PZQ - ternary ASDs
3.2.1 PZQ dosage in the HME extrudates
The real content of PZQ in the HME samples, measured by HPLC (method described
in Chapter 3, item 3.1.1) is given in Table 48.
Table 48. Dosage result for physical mixture and extrudate samples (HME 23 and 24).
Samples
Theoretical
drug content
(wt%)
Measured drug
content (wt%)
PM HME 23 50% NM*
HME 23 50% 51.74 % ± 0.2
PM HME 24 50% 47.38 % ± 0.1
HME 24 50% 43.15 % ± 0.2
API 100% 100.58 % ± 0.2
*NM = not measured; PM = physical mixture
Comparing with the theoretical load (50 wt%), the PZQ content in the HME sample is
in according to the theoretical value, while lower values were found for the other samples, even
the physical mixtures.
a)
b)
Figure 115. Surfactant addition zone (after the second mixing zone). a) without orifice reduction accessory and, b)
with accessory - entry restricted to the surfactant drop.

269
3.2.2 Scattering Electronic Microscopy (SEM)
SEM images of HME extrudates can be visualized in Figure 116 (pellets) and 117
(cryomilled pellets).
In Figure 116, the images show the dense structure of the extrudates, and it is possible
to observe the presence of thin filaments on the surface of some of them.
After cryomilling, Figure 117 allowed us to find the physical characteristics of a milled
powder, with a particle size distribution in the micrometric range. Small particles appear to be
adhered to the larger ones. The thin filaments observed in the surface of some pellets can be
seen in some milled particles too, as shown in Figure 117c and 117f.
Figure 116. SEM images of HME ternary extrudate filaments shaped as pellets. a) HME 14, b) HME 23, c) HME
16, and d) HME 24 samples.
a)
b)
c)
d)

270
a) b) c)
d) e) f)
Figure 117. SEM images of HME ternary extrudate filaments shaped as pellets and then cryomilled. a - c) HME 23; d- f) HME 24 samples.

271
In an attempt to understand to what could correspond the thin filaments, observed
in some pellets and even in cryomilled HME powders, a SEM image published by
Zanolla and collaborators [30] is shown in Figure 118. It corresponds to the polymorph
B of PZQ, produced by milling in a vibrational mill in that work, and described by them
as "agglomerates of long and very thin whiskers”. DCS analysis could perhaps identify
the presence of form B in our HME extrudates, and this is discussed later in this Chapter.
Figure 118. SEM image of PZQ form B. Reuse from [30] with permission.
3.2.3 Differential scanning calorimetry (DSC)
Figure 119 displays the DSC curves obtained for the ternary systems produced
with both surfactants, SLS and SPAN 20. Surprisingly, they did not correspond to typical
DSC thermograms for completely amorphous materials. In all DSC curves, endothermic
events can be observed, probably due to melting transformations. For formulations
containing SLS (Figure 119b), an exothermic signal is visualized before the endotherm.
The thermal data corresponding to these curves are grouped in Table 49.

272
a)
b)
Figure 119. DSC curves of HME ternary extrudates and their respective physical mixtures. a) samples
containing SPAN 20 surfactant (HME 14 and HME 23), and b) samples containing SLS surfactant (HME
16 and HME 24).

273
Table 49. Thermal characteristics of ternary HME samples (50 wt% PZQ).
In comparison to the binary system (PZQ and PVPVA), the reduction of 𝑇𝑔 due
to the presence of SLS or SPAN 20 was evidenced (Table 5). On the other hand, the
cryomillling did not result in changes on 𝑇𝑔 for both HME ternary samples. In addition,
samples with SPAN 20 presented lower 𝑇𝑔 than those formulated with SLS.
The other values of temperature in Table 50, corresponding to the endothermic
signals in the DSC curves (Figure 119a and 119b), are probably related to the fusion of
the API. The crystalline racemic PZQ used in this thesis has a characteristic melting point
of 𝑇𝑜𝑛𝑠𝑒𝑡 138 ºC and 𝑇𝑝𝑒𝑎𝑘139.4 ºC (presented in Chapter 3). The physical mixtures of
both formulations also showed a corresponding racemic PZQ melting 𝑇𝑝𝑒𝑎𝑘 around 137
ºC.
However, the values in Table 49 are lower (118°C for HME 14 and HME 16 and
115 °C for HME 23 and HME 24). The melting point of an API can be reduced in presence
of a miscible polymer [336]. For PZQ, a lowering from 140 °C to 133 °C was already
reported during hot-melt extrusion of PZQ (PZQ –33 wt%)with Eudragit EPO [118]. The
lower 𝑇𝑚 found here could rather correspond to the melting of the form B of PZQ recently
described and characterized by melting at 110 °C.
The melting temperatures (115 °C-118 °C) closer to the melting of the polymorph
B (110 °C), the morphology of the thin filaments detected in the surface of samples
presented in section (3.2.2) that was very similar to the morphology attributed to form B
in the literature [10], let us suppose that the HME ternary samples presented here are
characterized by an amorphous and a crystalline fraction (polymorph B?) which could be
formed by recrystallization during or after hot-melt extrusion.
Sample 𝑻𝒎𝒐𝒏𝒔𝒆𝒕
(°C)
Tpeak
(°C)
ΔHm
(J/g) 𝑻𝒈 (°C)
ΔCp
J/g.°C Observations
PM (SPAN 20)* 135.93 138.63 51.18 110.49 0.06 Powder
HME 14 118.13 125.74 11.13 25.13 0.32 Pellets
HME 16 117.92 121.57 2.165 13.18 0.34
PM (SLS) 128.69 136.82 41.49 106.9 0.14 Powder
HME 23 115.31 126.6 11.87 26.17 0.42 Cryomilled
HME 24 115.91 122.2 2.435 13.80 0.35
* PM (SPAN 20) corresponds to a mixture made without the surfactant (added directly to the
extruder).

274
The low values of 𝑇𝑔 showed in Table 50 could perhaps explain the presence of
crystallinity in the samples. Once freshly extruded, they were cooled to the room
temperature, that is close (or higher) their 𝑇𝑔. As we already know, a binary mixture with
PVPVA and 50 wt% PZQ is supersaturated in PZQ and kinetically (and not
thermodynamically) stable at room conditions. The lowering of 𝑇𝑔 with the presence of
5 wt% of surfactant can contribute to their physical evolution to more stable (crystalline)
API forms.
3.2.4 Powder X-ray diffraction (PXRD)
As mentioned earlier, PXRD analyses were performed only for cryomilled HME
samples, for two main reasons: the final material of interest is in the powder form. The
PXRD analysis of pellets would be carried out with grinding (manual with mortar and
pistil), adding another variable (potential amorphization on surface) that could influence
the data interpretation.
The PXRD diffractograms are shown in Figure 1200. The differences between the
diffractograms of HME ternary extrudates (predominantly amorphous) and their
respective physical mixtures (crystalline materials) are clear. However, small crystalline
peaks are also observed in the broad halo for the sample HME 24 cryomilled. Some of
these diffraction signals (around 32°) have also been observed in HME placebo extrudates
containing only SLS and PVPVA presented in the Sub-chapter 5.2. These diffraction
signals might be related to the structural organization of the excipients during the
extrusion process.

275
No signs of crystallinity or residual crystallinity were detected on the X-ray
diffraction pattern for HME ternary with SPAN 20, contrarily to that found on DSC
thermograms.
A published work [337] studying a HME binary amorphous solid dispersion with
another API (felodipine, 30 wt%) and the same polymer used here (PVPVA) can be
mentioned as example of similar findings. The x-ray diffraction pattern revealed an
amorphous characteristic for the sample, while DSC analysis showed an endothermic
event in the API melting region, demonstrating the presence of an API crystalline form
Figure 120. PXRD diffractograms. a) raw materials (PZQ, SLS, and PVPVA), binary and ternary physical
mixture (PZQ: PVPVA and PZQ: PVPVA: SLS), and extrudate HME 23 and HME 24 (PZQ:SPAN
20:PVPVA and PZQ:SLS:PVPVA) cryomilled.

276
in the solid dispersion. In fact, by transmission electron microscopy, the crystalline phase
was found to correspond to felodipine nanocrystals. The analysis of PXDR with powders
was considered limiting to demonstrate the difference between a completely amorphous
material and an amorphous material with small and fine crystals (<10 nm). The imitation
of PXRD technique as exemplified by this example might explain the differences between
DSC and PXRD results.
3.2.5 Water solubility
The solubility experiments in water were conducted according to the method
described in Chapter 3 (item 3.1.8).
However, the physical mixture corresponding to the HME 23 pellets, using a
liquid surfactant (SPAN 20), was not produced due to the technical difficulties in the
preparation of a homogeneous mixture. Only the physical mixture of HME 24 pellets was
thus used in these experiments.
Figure 121 regroups all values of PZQ concentration measured in water at 37°C
at 1h, 24h and 48h for HME 23 and HM24 ternary extrudate samples in the form of
pellets.
Figure 121. Variation of the PZQ concentration in water at 37°C from different samples: HME 23 and HME
24 pellets, its respective physical mixture and raw PZQ.

277
For HME 24 pellets (ternary system 50% PZQ and with SLS as surfactant):
- The highest PZQ concentration (0.335 mg/mL) was reached in 30 min, decaying
over time up to 0.255 mg/mL at 24h, after what it remained practically constant up to the
end of the experiment (0.250 mg/mL at 48h).
- The corresponding physical mixtures PM also increased the water solubility of
PZQ to a constant value of approximately 0.233 mg/mL, that remained lesser than the
PZQ concentration reached with the corresponding HME ternary pellets.
For HME 23 pellets (ternary system 50% PZQ with Span 20 as surfactant):
- The highest PZQ concentration was reached in 60 min (0.325 mg/mL), decaying
later up to the same level of concentration maintained with HME 24 pellets.
Comparing HME 23 and HM24 pellets regarding their capacity to improve the apparent
solubility of PZQ in water, HME24 pellets can lead faster to an equivalent supersaturation
in water.
Figure 122 regroups the apparent solubility data obtained with the two ternary
systems which were just presented, and the data obtained with the binary system (without
surfactant) presented before in the Sub-chapter 5.1. All samples have the same physical
characteristics (pellets) and similar dimensions (1mm in size), as illustrated in Figure 123
for HME 23.
Figure 122. Comparison between binary (HME 10) and ternary systems (HME 23, HME 24). Raw PZQ is
the reference.

278
Although the PZQ concentration in water was not measured at 30 min for the
binary system, at 60 min the concentration reached with the binary was lesser than those
reached with both ternary ones. Until the end of the experiment the beneficial effect of
the ternary systems was observed.
3.2.6 Dissolution profile
Although the main interest is the extruded powder material, the respective pellets
were also evaluated for the dissolution profile.
Figure 124 displays the dissolution curves obtained for all ternary systems (HME
23 and HME 24), as pellets and powder (cryomilled). An unexpected very slow
dissolution was demonstrated in all cases.
Figure 123. Optical microscopy for HME 23 (before mill) a) part of an extrudate and pellets, and b) pellets.
Both microphotographs have a scale that refers to 2 mm.

279
The dissolution test was thus considered unsuccessful owing to a lack of adequate
dispersion of the pellets and powders from the capsules that resulted in the formation of
insoluble agglomerates remaining undissolved until the end of the experiment. They can
be visualized in Figure 125. Although the cryomilling process was not efficient (also in
terms of operation), additional particle size distribution analyses could be performed to
better understand the phenomenon visualized in this dissolution test.
Figure 124. Dissolution curves for all HME ternary systems (HME23 and HME 24), as pellets and powder
(cryomilled). Experiments conducted in 37 ºC ± 0.5 ºC and HCl 0.1N with 0.2% of SLS in the medium.
Figure 125. Visual aspects of HME 23 and HME 24 residual after dissolution test.

280
4. CONCLUSIONS
After the generation of binary systems constituted by PZQ and PVPVA with 50
wt% PZQ (Sub-chapter 5.1), the feasibility to generate ternary systems (adding a
surfactant to the binary) was also demonstrated in the large model of extruder used in this
thesis, the Pharma 16. The use of two different surfactants was validate in the process,
one solid (SLS) and directly incorporated into the solid mixture of PZQ and PVPVA
before feeding to the extruder, the other liquid (span 20) added to the molten mixture
during extrusion. For the later, The HME operating conditions were modified to allow
the continuous manufacturing with the addition of the liquid surfactant.
Two new samples were generated (HME 23 and HME 24), which were used as
pellets and as powder (obtained from cryomilling of the pellets).
According to DRX and DSC analysis, these ternary samples were predominantly
amorphous, however all they presented some crystallinity.
Their capability to improve the apparent PZQ water solubility was demonstrated,
representing an increase of 71 % for HME 23 (SPAN 20) and 66 % for HME 24 (SLS) in
the first hour when compared to the API alone at the same time. HME 24 reached higher
value faster (81% increase in 30 min when compared to the API).
Finally, the better capacity of the ternary systems to increase the apparent
solubility of PZQ in water could be demonstrated in comparison to that of the binary
system (without surfactant in the solid product).
Although the apparent solubility has increased with the use of the surfactant, the
decrease in 𝑇𝑔 might be one of the major causes contributing to a partial solid state
transformation of the amorphous API (recrystallisation to form B?) in the solid
dispersions. Aiming to improve the physical stability of the ternary systems, a
reformulation was proposed concerning a reduction of the PZQ load in these systems.
New samples were produced with the following composition: 35 wt% PZQ, 45 wt%
PVPVA and 5 wt% surfactant (SPAN 20 or SLS). They are the subject of the next Sub-
chapter 5.4.

SUB-CHAPTER 5.4 - PRAZIQUANTEL
AMORPHOUS SOLID DISPERSIONS
MANUFACTURED BY HME - TERNARY SYSTEM
(35 WT% PZQ) - PHARMA 16 EXTRUDER

282
1. INTRODUCTION
One of the main objectives of this thesis is to develop an amorphous solid
dispersion of praziquantel with a high drug concentration to be used in the formulation of
paediatric medicines. For children, the dosage is adjustable to the child body weight by
administering in sets of 150 mg. As already explained, an ASD containing 50 wt% PZQ
could be adequate for designing a PZQ dose close to 150 mg to children. This load was
the target in the PZQ-ASD formulations studied so far.
As outlined earlier in the Chapter 4, a phase diagram was constructed from
experimental data related to the solubility of PZQ in the polymer of our choice, PVPVA,
and on another side, from the glass transition temperature variation of the binary mixtures
as a function of composition and temperature. From this pre-formulation tool, it was
evident that the challenge to produce an amorphous solid dispersion with acceptable
physical stability was substantial. Even if the feasibility for producing binary and ternary
solid dispersions containing 50 wt% of PZQ by HME process was proved by the studies
presented until this point of the manuscript, it appeared interesting to investigate a new
formulation with a lower PZQ load (35 wt%) in the ternary configuration (PZQ-PVPVA-
surfactant), aiming to create a more favourable condition to preserve its physical stability.
This Sub-chapter is focused on the development of a new formulation of ASD.
The composition was fixed at 35 wt% PZQ, 60 wt% PVPVA and 5 wt% Surfactant (SLS
or SPAN 20).
Two formulations (differencing on the type of surfactant used) were produced in
duplicate (on different days). As a powdered material is the preferential physical form for
a subsequent development of a pharmaceutical product from PZQ-ASD, samples of the
two formulations were ground, this time not by cryomilling as performed before (chap
5.3) but by using a milling process industrially applicable.
The new HME samples generated were characterized as the last ones presented in
Chapter 5.3. However, a new evaluation method was introduced regarding the taste
masking capacity of the formulations. For this purpose, a collaboration has been
established with a laboratory in England (School of Pharmacy - SoP, UCL - University
College London) where these experiments were performed. The method used was
developed by this laboratory. The principle is to simulate an oral cavity with an evaluation
of API release in the function of time.

283
The different activities of this part of the thesis are presented in the Sub-chapter
following the schematic procedure shown in Figure 126.
Figure 126. Schematic procedure of chapter 5.4. Source: Author.

284
2. METHODS
2.1 Ternary ASD systems prepared by HME (35 wt% PZQ)
Pharma 16 (Thermo Fisher), the twin-screw extruder used in a previous
investigation (binary system, see Chapter 5.1), was used in the study presented here. This
equipment was described earlier in chap 5.1 (item 2.1).
The composition of the new formulations studied here are given in Table 51.
Table 50. Ternary ASD composition.
Sample code Composition (wt%)
PZQ PVPVA SLS SPAN 20
HME 25* and HME 27 35 60
5 -
HME 26* and HME 28 - 5
*Produced in replicate (n=2), at different periods
The HME process parameters used to produce the samples coded HME 25 an
HME 26 are grouped in Table 51.
Table 51. HME process parameters for production of ternary systems with 35 wt% PZQ.
Samples
Extrusion parameters
Powder
Rate Flow
(kg/h)
Screw
speed
(rpm)
Liquid
Rate Flow
(mL/min)
Temperature profile Screw profile
HME 25 and
HME 27 0.25 300 0,23
(Z1) 50°, 70°,100°,
140°, 140°,140°, 110°
and 100° (die) Zone 4 and 6 with RE**
HME 26 and
HME 28 0.3 300 NA*
(Z1) 50°, 100°,140°,
180°, 180°,180°, 130°
and 105° (die)
* NA = not aplicable ** RE = reverse element
Regarding the surfactant addition, the same methodology developed in Chapter
5.3 (item 2.1.1) to produce ternary systems with 50 wt% PZQ was also applied. In brief,
the solid surfactant (SLS) was directly incorporated into the solid mixture of PZQ and

285
PVPVA before feeding to the extruder, while the other surfactant, which is a liquid
(SPAN 20), was added to the molten mixture during extrusion.
2.2 Generation of a placebo formulation (without PZQ)
To get more information about the thermal properties of a homogeneous
(amorphous) mixture between PVPVA and the surfactants, we have decided to prepare
placebo samples, whose compositions are shown in Table 52. The same HME process
conditions used to produce the samples are given in Table 53. They are essentially
identical to those used in the generation of ASD ternary systems with PZQ, with some
adjustments.
Table 52. Placebo formulations and respective compositions.
Samples Composition (wt%)
PZQ PVPVA SLS SPAN 20
Placebo HME 25 - 95
5 -
Placebo HME 26 - 5
Table 53. Extrusion parameters for production of placebo HME formulations.
Formulation
Flow rate -
Peristaltic
pump (mL/min)
Flow Rate
powder/mixture
(kg/h)
Screw
speed
Temperatur
profile
Visual
aspect
PVPVA and
SPAN 20 0.48 0.27 300
(Z1) 30°,
50°,110°,
130°, 150°,150°,
150° and 150°
(die)
PVPVA and
SLS NA 0.3 300
(Z1) 50°,
100°,140°,
180°, 180°,180°,
130° and 105°
(die)
* NA = not applicable
2.3 Extrudate milling process
The powder form can be the most appropriate for subsequent steps of use in
pharmaceutical paediatric formulations. For this reason, the HME extrudates are
produced and characterized in both forms: as pellets, and as powders (after milling).

286
This procedure is commonly adopted for HME materials to reduce the largest
pellets and, subsequently, obtain greater homogeneity in the granulometry of the powder
[338].
In the previous study with HME ASD ternary systems with 50 wt% PZQ, powder
was produced from a cryomilling of pellets. It was performed in a bench laboratory
equipment. In this point of the work, another milling process, industrially applicable, was
used. The mill used is a Quadro® Comil H5 High Energy Mill (Figure 127). The
equipment operates by impeller rotates and it forces the material through the holes in the
screen, reducing the size of the particles. The important step is the choice of the size of
the role screen.
Figure 127. a) General view of Quadro® Comill with HE High energy Mill, b) material feed, c) feed screw,
d) grinder, e, and f) different view of particle grinding, and g) collector. Source: Author and from [349].

287
Figure 128. Schematic view of the process to obtain pellet shape and powder for the samples produced in
this step. Source: Author.

288
2.4 Characterization of ASDs
As described in the previous Chapter 5.3, solid-state characterizations of ternary
ASDs with 35 wt% PZQ were performed by DSC, XRD, SEM, and optical microscopy.
The same methods used previously to evaluate water solubility and drug content were
applied. Additionally, the extruded material was evaluated for taste masking using a
method described by Keeley et al. [80].
The dissolution method used to evaluate the ASD ternary with higher drug load
(50 wt%) in Chapter 5.3 was modified here, because it was found unsatisfactory for
dissolution kinetics evaluation.
The main modifications were:
- Evaluation of the dissolution medium composition with the remotion of the
surfactant.
It should be remembered that the pharmacopeial method [297] contain 0.2 wt% of
SLS.
- Addition of the sample (power or pellet) directly into the dissolution vessel.
The previous studies have been carried out with the samples into a capsule. This
method caused an incomplete dissolution of the extrudate by retaining the sample
and forming a unique mass.
Regardless of these changes, the procedure of collecting samples, HPLC,
calibration curve, and the mass amount (equivalent to 150 mg of PZQ) were maintained.
2.4.1 In vitro taste masking by buccal dissolution evaluation
Taste masking prediction of the ternary systems produced by HME with 35 wt%
PZQ were analysed by an in vitro method using a system consisting of a magnetic stirrer
and heating monitoring, a peristaltic pump and the oral dissolution column (Figure 129)
[80].

289
The simulated salivary fluid (SSF) (Table 54) [339] was kept in agitation and
constant temperature of 37 °C ± 1 ºC and pumped to the buccal dissolution column using
a peristaltic pump at the rate of 1 mL.min – 1.
Table 54. Composition of SSF [339].
Composition of SSF
Compound Concentration g/L
Sodium chloride 8.00
Potassium phosphate monobasic 0.19
Sodium phosphate dibasic 2.38
pH 6.8
The sample (precisely weighed to give 150 mg PZQ) was added to the centre and
top of the column. The other two adjacent parts are threaded. A system composed of wire
mesh discs was placed either side of the column for particles retention. After inserting the
material to be analyse in the column lumen (where the medium SSF constantly flows at
1 mL.min-1), sampling was taken at 60, 120, 180, 240, 300, 360, 420, 480, 540 and 600
seconds and filtered through a 0.22 µm membrane (cellulose acetate). The final solution
was immediately analyzed by HPLC (Agilent Technologies 1200 series) with an
ultraviolet (UV) detector a column Kinetex 5 μm C18 100 Å (150×4.60 mm). The mobile
phase was comprised of methanol and water (60:40 V/V), the flow rate was 1.5 mL/min,
injection volume was 10 µL and absorbance readings were conducted at fixed wavelength
of 210 nm. The HPLC method was the sample described to USP for PZQ [53].
Quantification was carried out using a fresh stock solution prepared each time before
Figure 129. Flow diagram representing the biorelevant buccal dissolution test to evaluate taste masking.
(*calculated internal volume of the column). Source: Author.

290
starting the analysis. PZQ standard solution was prepared with the same method described
for dissolution test for PZQ tablets by USP [297], with adaptation (change of the
dissolution medium). For this test, SSF was used. A calibration curve was prepared using
9 points in the range 0.01 mg/mL to 1 mg/mL. Each point on the calibration curve was
prepared in duplicate.
3. RESULTS
3.1 Characterization of ternary ASD system produced by HME (35 wt% PZQ)
3.1.1 PZQ dosage in the HME extrudates
The drug content in the HME extrudates and respective physical mixtures are
given in Table 55. They are close to the theoretical values, confirming that no drug loss
occurred during the extrusion process.
Table 55. PZQ content
Samples Theoretical drug
content (wt%)
Measured drug
content (wt %)
PM - PVPVA/SLS/PZQ 35 34.35 ± 3.13
PM - PVPVA/SPAN/PZQ 35 35.15 ± 2.51
HME 28 35 34.84 ± 1.01
HME 27 35 33.25 ± 1.75
API 100 100.58 ± 0.2
3.1.2 Differential scanning calorimetry (DSC)
The DSC curves for the four new HME samples are shown in Figure 130.
Firstly, in all DSC curves, variations in the baseline are displayed up to
approximately 100 °C. They are probably related to the loss of water from the samples.
The DSC curves for HME 25 (pellet) and HME 27 (powder) as well as those for
HME 26 (pellet) and HME 28 (powder) did not show endothermic peak characteristic of
the fusion of crystalline PZQ. However, for the latter, an exothermic variation in the

291
baseline between 112 and 114 ºC was observed (Figure 130b), that cannot yet be
explained.
Only the samples HME 27 and HME 28 could be analyzed by mDSC. The mDSC
data are grouped on Table 56 with other ones taken from Chapter 5.3. A comparison
between 𝑇𝑔𝑚𝑖𝑥 of equivalent ternary systems (same surfactant) and different API content
is thus possible:
As expected, the decrease of PZQ load from 43% to 32% led to an increase in 𝑇𝑔
from 13.80 °C to 29.67 °C, in formulations with SPAN 20 as third component. The
decrease of PZQ load from 51 % to 33.8 % had the same effect on 𝑇𝑔,which was 26.2 °C
and 27.6 °C in formulations with SLS.
Table 56 DSC data for ternary HME samples with different PZQ content.
a
)
b
)
Figure 130. DSC curves for pellets a) HME 25 and HME 27 (with SPAN 20), and for milled powders b)
HME 26 and HME 28 (with SLS).

292
1.1.1 Powder X-ray diffraction (PXRD)
Similarly, as presented previously, XRD diffractograms are shown in Figure 131a
and Figure 131b for HME 25 and HME 27 (with SPAN 20) in the first and HME 26 and
HME 28 (with SLS) in the second. Still, the results obtained for placebos and raw
crystalline materials are presented in both figures.
Sample 𝑻𝒎𝒐𝒏𝒔𝒆𝒕
(°C)
ΔHm
(J/g) 𝑻𝒈
(°C) ΔCp
J/g.°C Observations
Measured PZQ
load (wt%)
HME 17 - - 49.34 0.40 binary NM
HME 23 117.92 2.165 13.18 0.34 ternary with
SPAN 20 51.74% ± 0.2
HME 24 115.91 2.435 13.80 0.35 ternary with SLS 43.15% ± 0.2
HME 27 - - 29.67 0.27 ternary with
SPAN 20 34.84 ± 1.01
HME 28 - - 27.60 0.38 ternary with SLS 33.25 ± 1.75
NM = not measured

293
The PXRD results for batches HME 25 and HME27 (with SPAN 20) show a
characteristic halo of amorphous material. Likewise, the respective placebo shows the
same profile.
In contrast, the XRD diffraction patterns for batches HME 27 and HME 28 show
small diffraction peaks. However, the same peaks are also observed in the absence of
PZQ (in the placebos). Comparatively, they were not found in raw PZQ and SLS. These
peaks were already observed in similar HME placebo extrudates presented in Chapter 5.2,
as well as in HME 24 (cryomilled) discussed in Chapter 5.3. Considering that they were
Figure 131. PXRD diffractograms for a) HME 25 and HME 27 (with SPAN 20) and the corresponding
placebos, and b) HME 26 and HME 28 (with SLS), and corresponding physical mixture and placebo.
Crystalline raw materials as given as references.

294
not present in the raw materials (PVPVA and SLS) and have appeared in the HME
extrudates, they might be related to some structural change on the excipients during the
extrusion process.
1.1.2 Scanning Electron Microscopy (SEM)
As previously mentioned, HME 27 and 28 samples were ground after extrusion,
while HME 25 and 26 samples were kept as pellets.
The images deal with pellets and powders (batches are duplicated). Thus, Figure
132 shows the images obtained for samples HME 25 and HME 26 as pellets, while Figure
133 shows the images of samples HME 27 and HME 28 as powders (after pellet grinding).
a)
b)
c)
d)
e)
f)
Figure 132. SEM images obtained for pellets: HME 25 (a-c) and HME 26 (d-f).

295
Similarly, as previously presented, both pellets and primary particles generated by
milling have very fine structures on the surface resembling to ‘needles’. They are found
in very low amount on the surface of the samples. As discussed in Sub-chapter 5.3, similar
morphology has been attributed to the polymorph B of praziquantel [10]. However, no
signs of crystallinity were detected in the samples.
3.1.3 Optical Microscopy
This analysis was carried out in order to evaluate the physical aspect and
transparency characteristics of the extrudates produced. The images obtained by optical
microscopy, for both formulations in pellet shape, are shown in Figure 134.
Figure 133. SEM images obtained for powders: HME 27 (a-c) and HME 28 (d-f).

296
The images obtained by this technique are interesting because they allow
visualizing in detail the physical aspect of the HME filaments and final shaped forms.
Both formulations were translucent and included air bubbles are visible. A difference in
colour between the two ternary systems is also evident (Figure 135). It can be due to the
difference in composition between them (type of surfactant). Although yellow, the
formulation containing SLS has a translucent aspect, characteristic of amorphous
homogeneous mixture (to be confirmed by other techniques as DSC and PXRD analysis).
Figure 134. Optical microscopy images for HME 27 (a-b) and HME 28 (c-d). Scale: 2 mm (b and d) and 0.5
mm (a and c).

297
Similarly, the analysis of the ground HME ternary samples was carried out, and,
although qualitatively, a micrometric size range of the particles was confirmed. The
images are shown in Figure 136.
Figure 135. Optical microphotography showing the color difference between the two HME ternary studied
(left side HME 28/26 (with SLS) and right side HME 25/27 (with SPAN). Scale 0.5 mm.
Figure 136. Optical microscopy images for a) HME 2, and b) and HME 28 milled. Scale: 2 mm.

298
Figure 137 displays the microphotographs for the HME placebo samples.
Figure 138 represents the difference in colour shown for the placebo samples
(HME 27 and HME 28). Both follow the same colour trend for extrudates containing PZQ
(yellowish to HME 28 and transparent to HME 27).
Figure 138. Optical microphotography showing the color difference between the two HME placebo (left
and yellow – HME 28 and right and transparent HME 27). Scale 2 mm.
Figure 137. Photomicrographs for HME placebo samples. a and c) unmilled, HME SPAN 20 and HME
SLS, respectively and, b and d) milled HME SPAN 20 and HME SLS, respectively. All images refer to a
2 mm scale.

299
Unfortunately, it was not possible to perform particle size distribution analysis of
the samples produced.
3.1.4 Water solubility
The water solubility experiments were performed for a sample of each formulation
HME 27 (with SPAN 20) and HME 28 (with SLS). Although HME 27 and HME 28
samples referred as ‘powders’ were used, this experiment was carried out using them as
pellets because the grinding process had not yet been carried out at this time of the study.
The raw API was also analysed as reference.
The comparative variation of the PZQ concentration in water through time for
both samples can be visualized in Figure 139.
For HME 27 pellets (ternary system 50% PZQ, SPAN 20 as surfactant):
- The highest PZQ concentration (0.343 mg/mL) was reached in 60 min,
decaying over time up to 0.278 mg/mL at 24h, after what it is remained
practically constant up to the end of the experiment (0.275 mg/mL at 48h,
representing a 25% drop when compared to the value obtained in 1 hour).
For HME 28 pellets (ternary system 50% PZQ, SLS as surfactant):
- The highest PZQ concentration was reached also in 60 min (0.319 mg/mL),
decaying after up to 0.252 mg/mL (26% less than the value obtained in one
hour).
Figure 139. PZQ Concentration in water at 37°C released from different pellets: a) HME 27 and b) HME
28 Raw PZQ is the reference.

300
Figure 140 gives a comparative view on the capacity of the different ternary
systems studied to improve the apparent solubility of PZQ in water at 37 °C. The
parameters investigated were the composition (type of surfactant used as third
component) and the PZQ load (two levels).
In summary, with ~35 wt% PZQ in the ternary systems, the two surfactants
presented similar performance in terms of water solubility improvement), the best ones
always in the first hour due to solubilization of a supersaturated solid state of the drug.
With increased PZQ load (~50 wt%), the higher concentration was reached 30 min later
when for 35 wt% it was reached in 30 min. Otherwise, the water solubility improvement
is not the discriminating factor between them.
Figure 140. Comparative dynamic solubility study, grouping HME ternary samples developed in chapters
5.3 and 5.4. For 30 min: HME 27 (0.328 mg/mL), HME 28 (0.305 mg/mL), and API (0.185 mg/mL and
0.174 mg/mL). For 60 min: HME 23 (0.325 mg/mL), HME 24 (0.315 mg/mL, and API (0.190 mg/mL and
0.180 mg/mL).

301
Turning back to the analysis of the graphic represented in Figure 139, the decrease
of the PZQ concentration in the medium corresponds well to the diminution of the spring
effect of amorphous solids during dissolution. We have tried to analyse the solid phase
remaining in the medium at the end of the experiment (48h) with the HME 27 sample.
The final suspension was filtered and analysed by DSC. The DSC thermogram is
represented in Figure 141. Interestingly, a sequence of endothermic events occurs,
indicating that the remaining solid phase might be the product of dissolution-
recrystallization steps which could explain the different endothermic events. Some values
could correspond perhaps to metastable polymorphs (form C, Tm at 106.8 ºC [73], form
B 110.3 ºC [10]). However, this subject had not always been sufficiently investigated.
3.1.5 Dissolution studies
The dissolution profile was evaluated for the HME 27 and HME 28 samples in
two physical forms: pellet and powder. As described above, particle size distribution
analyses should be further explored to understand the dissolution profile results better.
However, for comparative purposes, the results are evaluated in this chapter in the form
of pellets (about 1 mm) and powder (less than 500 µm) with approximate dimensions
obtained by optical microscopy (see 3.1.5).
Figure 141. DSC scan for the remaining solid in suspension after the water solubility experiment (37°C)
for sample HME 27.

302
The dissolution profile method described in Chapter 5.3 was slightly modified
regarding the addition of the sample in the medium (by adding the equivalent to the dose
studied directly in the dissolution vessel).
Usually, the experiments reveal dissolution dependence on the surfactant
concentration, that influences solid’s wettability. Aiming to eliminate the wettability (and
perhaps solubilizing effect) of the surfactant, the dissolution kinetics were studied in two
different media:
- 0.1N HCl with 0.2 wt% of SLS (described in the Sub-chapter 5.3), which
corresponds to the pharmacopeial method [297];
- 0.1N HCl without surfactant.
The dissolution profiles for the HME 27 sample in the medium with and without
surfactant are shown respectively in Figure 142a and 142b. The remarkable effect of the
presence of SLS in the medium is observed comparing the release profile for the raw PZQ
in Figures 113a and 113b, for which wettability is important for dissolution. The presence
of the surfactant has less impact on the PZQ release from the ternary amorphous solid
dispersion.

303
Likewise, Figure 143a and 143b show the dissolution profiles for the HME 28
sample, for purpose of comparison in this case also the effect of the physical form (pellets
and powder). The powder form of HME 28 showed a reduced dissolution compared to
the pellets in the medium with surfactant, but the performance remained comparable.
Figure 142. Dissolution profile for sample HME 27 (powder and pellets) on a) pharmacopeial medium
(with SLS 0.2%) and b) without SLS in the medium. For both the medium was HCl 0.1N at 37 ºC ± 1ºC.

304
3.1.6 In vitro buccal dissolution test to predict the palatability
The taste masking test was applied to samples containing 35 wt% PZQ load, as
powder and pellets. As mentioned before, a recent study, that sought to achieve taste
masking of PZQ, evaluated the production of solid dispersions of PZQ and Eudragit®
EPO: Glyceryl monostearate (1:0.3 w/w) containing 27.8 % and 43.5 % PZQ (provided
a delayed release of the API below 0.01 mg/ml after 1 min) [118]. On this occasion, the
author aimed to generate a product partially crystalline to minimize the increase in
dissolution caused by the amorphous state and, consequently, the amount of PZQ in the
oral cavity in the first contact with the taste buds. Thus, the idea was to increase
solubility/dissolution, even if not as much as possible, and to achieve the masking of the
bitter taste of PZQ. The results showed that one of their samples had masking capacity,
and this characteristic was proportional to the API concentration. This example showed
that a major cause for the worst performance of another tested sample was the smaller
Figure 143. Dissolution profile for sample HME 28 (powder and pellet) on a) pharmacopeial medium (with
SLS 0.2%) and b) without SLS in the medium. For both the medium was HCl 0.1N at 37 ºC ± 1ºC.

305
particle size resulting in greater dissolution and taste perception. The masking
experiments were carried out in an animal model using the BATA method [117].
Additionally, the acceptability limits of the rat for PZQ were evaluated by different
concentrations. Solutions with different concentrations of PZQ were prepared and offered
to the animals in a very short and predetermined time. The taste evaluation is measured
according to the number of licks. That means that the lower the number of licks, the less
acceptable the product is. In this way, it is possible to estimate the concentrations:
completely tolerable, well tolerable, tolerable, not tolerable/aversive and, highly
aversive/highly not tolerable. The limits found for the PZQ are shown in Table 57.
Table 57. Relation of PZQ taste threshold determined in vivo using BATA model for Munster et al. [68]
Classification PZQ concentration (mg/mL)
Fully tolerated 0.005 to 0.01
Well tolerated 0.03
Tolerated 0.05
Aversive/untolerated 0.1 and 0.2
The BATA evaluation model was previously tested with nine different APIs with
different degrees of aversiveness and its result compared to the respective data obtained
from the human panel (gold standard) [80], [119], [125]. The results demonstrated an
extensive correlation between animals (rats) and humans for 8 of the tested API models.
The data from this correlation indicate that the BATA model can be used as a screening
tool for medicines in the early development stage, helpful in predicting the human taste
response.
With these data, predicting an in vivo taste evaluation with the extrudate samples
produced in this thesis is possible. Using the dissolution method that mimics the oral
cavity (2 mL of SSF), the concentrations released from the API as a function of time were
obtained. In this way, HME 27 and HME 28 were evaluated as well as the relation of taste
with their physical form (pellets or powder).
The results are shown in Figure 144. For both formulations, the pellets are
considered very tolerable/tolerable in the first minute. The taste perception with the
powders can be explained as did in the example we have just described, that is the fast
dissolution of smaller particles [118]. Figure 145 shows the remaining solids in the in

306
vitro buccal dissolution apparatus, where the physical differences between samples can
be visualized.
Figure 144. PZQ release as a function of both type of shape (powder and pellet) for extrudate samples a)
HME 27 and b) HME 28. The taste thresholds are represented as black and pink dashed lines.

307
Still, to better understand the taste masking profile of the samples produced, the
pellets made by extrusion and described in Sub-chapter 5.3 containing 50% drug load
were evaluated. In a comparative way between the concentrations of API in the
extrudates, the results are presented in Figure 146.
Figure 145. Residual sample of HME pellet and HME powder after in vitro buccal dissolution taste to
predict palatability.

308
Surprisingly, the results for HME containing 50 wt% drug showed a better profile
in terms of release and taste. However, it is necessary to make some considerations in the
interpretation of this result. As discussed in Sub-chapter 5.3, samples with 50 wt% are
highly supersaturated and already presented traces of crystallinity just after production.
Also, they were previously produced and oldest at the time of this analysis. An
aging/recrystallization effect would contribute to a lower release.
Although the results are promising, these evaluation results of taste masking need
to be confirmed in vivo.
Figure 146. PZQ release as a function of both API load for extrudate samples a) HME 27 and HME 23
(Sub-chapter 5.3), and b) HME 28 and HME 24 (Sub-chapter 5.3). The taste thresholds are represented as
black and pink dashed lines.

309
4. CONCLUSIONS
Aiming to develop amorphous solid dispersions of praziquantel with a high drug
concentration, we have started with 50 wt% PZQ and studied their production first in
Brazil (FIOCRUZ) with a twin-screw extruder Pharma 11 and then in France (Centre
Rapsodee) with a twin-screw extruder Pharma 16 with large production capacity.
The ternary systems of our interest (PZQ-PVPVA-surfactant) loaded with
50%PZQ produced in the Pharma 16 showed confirmed capacity to improve PZQ
concentration in water (apparent solubility) during an appropriate period (1h). However,
they are highly supersaturated and evidenced traces of crystallinity and instability.
This sub-chapter thus focused on the production of new ternary with 35 wt%
PZQ, 60 wt% PVPVA and 5 wt% Surfactant (SLS or SPAN 20).
The reduction of the PZQ load in the ternary extrudates resulted in a complete
amorphization of the mixture and elimination of crystallinity.
Unlike the samples presented in the Chapter 5.3, HME 27 (with SPAN 20) and
HME 28 (with SLS) were produced using a conical mill (Quadro® Comil®). Changing
the grinding methodology represented an advance in the process because it is most
common on the industrial scale. Also, the dissolution method, considered inadequate for
analysis of our extrudates, was improved by changing the operating procedure (addition
of samples in the dissolution vessels; identification of a more discriminating medium for
comparative study, without surfactant).
Both studied new ternary showed the typical behaviour of amorphous solid
dispersion during solubilization characterized by an initial spring effect followed by the
decay of the API concentration in solution. Both have proved their capacity to increase
the apparent solubility of PZQ in the first one hour (90 % and 76 % higher than the
equilibrium solubility of PZQ for HME 27 and HME 28, respectively). The reached
concentrations are higher than those from the ternary samples with similar composition
(API-polymer-surfactant) and higher PZQ load (50 %) presented in chapter 5.3.
As expected, pellet extruded products showed better performance in taste masking
(in vitro method) compared to the respective milled ones. Both formulations (HME 27
and 28) were considered "well-tolerated" up to one minute in contact with the SSF
medium. This result is promising for two main reasons: a) the formulations evaluated did
not contain the addition of excipients with a function of taste improvement as sweeteners.

310
Also, the final formulation can still be improved (with excipients like edulcorates), and
b) One minute time is reasonable time for the medication to remain in the oral cavity.
Although we still need to deepen the characterization of the formulations
presented in this chapter (such as particle size distribution by other analysis methods such
as laser granulometry), they it could be promising to develop prototypes of paediatric
drugs based on praziquantel. The formulations presented here showed positive prospects
for overcoming two of the three main formulation challenges with this API.

311
CHAPTER 6 - 3D PRINTING TO OVERCOME
PRAZIQUANTEL PAEDIATRIC FORMULATION
CHALLENGES

312
1. INTRODUCTION
As discussed in Chapter 2, the use of 3D printing in the production of medicines
has some interesting advantages over the techniques commonly used in the
pharmaceutical industry.
The first advantage concerns the possibility of customizing the dose and
composition of drugs produced by 3D printing. The second advantage is related to the
fact that 3D printers, given their characteristics (ease of transport, installation, and
operation), can be used in places of difficult access and inadequate structure that are the
focus of neglected diseases. In this sense, it is possible to imagine 3D printers in field
hospitals or primary care clinics in more remote regions.
These exciting advantages had motivated the study presented in this Chapter
which was focused on the investigation of the use of innovative 3D printing technology
to overcome the main challenges to formulate PZQ for paediatric patients widely
discussed in the previous Chapters (low drug solubility, bad taste, need of high and
variable drug doses).
In this study, direct powder extrusion 3D printing was used to prepare PZQ-ASD
as paediatric printlets (3D printed tablets). The suitability of different powdered materials
to directly feed the 3D printer was investigated. The powdered materials tested were
physical mixtures of crystalline drug and polymer and pellets and powder forms obtained
from ASD-HME filaments. The characteristics of the resulting 3D printlets were
evaluated with special focus on drug dissolution profiles, effectiveness of taste masking
and physical stability and are presented and discussed in this Chapter.
The study presented in the Chapter 6 was carried out in collaboration with:
- Professor Alvaro Goyanes, School of Pharmacy, University College of London
(UCL) and FabRX, London.
- Professor Catherine Tuleu, School of Pharmacy, University College of London
(UCL).
Figure 147 show the schematic of the HME and FDM 3D printing process used in
this Chapter.

313
Figure 147. Printlets production as part of this thesis. Source: Author

2. METHODS
2.1 Preparation of the powdered materials
As already said, direct powder extrusion 3D printing (DPE 3D printing) was used
to prepare 3D printed tablets from powdered materials.
Different powdered materials were tested in the DPE 3D printing: physical
mixture of crystalline PZQ and polymer (PM), pellets produced by HME in a twin-screw
extruder (Pharma 16, Thermofisher) and powder obtained by milling the HME-pellets.
The mass composition of the powdered materials is given in Table 58.
Table 58. Feedstocks used for printlets production.
The physical mixtures (PM 50, PM 35, and PM 35 SLS) were prepared in a
Turbula® T2F mixer (96 rpm, 8 min). The equipment used and the experimental protocol
were described before (Sub-chapter 5.2).
As already described in Sub-chapters 5.3 and 5.4, HME filaments were generated
using the Thermo-Fisher pharma 16 Extruder (Thermo scientific ™, Germany) presented
in Sub-chapter 5.2 (1.1). The heating extrusion zones were determined for each of the
formulations according to their specific characteristics. The HME filaments were cut in
pellets of 1 mm size. Part of the binary formulation was used as pellets (P 50), and part
was milled (M 50). The two ternary formulations (M 35 Span, M 35 SLS) were milled
(M 35 Span and M 35 SLS). The milling process was carried out using Quadro Comil H5
Formulation
code
Composition (% w/w) Print Parameters
PZQ PVPVA SLS Span
Extruder
temperature
(°C)
Flow rate*
(%)
Feed rate
* (%)
Physical mixtures (PM)
PM 50 50 50 - - 145 - 170 100 - 140 100
PM 35 35 65 - - 145 - 170 100 - 140 100
PM 35 SLS 35 60 5 - 140 - 200 100 - 140 100
Pellet (P) and milled powder (M) obtained by HME filaments produced in a twin-screw
extruder
P 50 50 50 - - 140 90 100
M 50 50 50 - - 135 75 100
M 35 Span 35 60 - 5 130 75 100
M 35 SLS 35 60 5 - 130 75 100
*The flow rate is given as a percentage relative to the calibrated value of its full scale

High Energy Mill (Fitzpatrick® Quadro®) with 8000 rpm for speed mill and a sieve with
610 µm of size. The samples were protected from light and kept in a desiccator for
conservation.
The three formulations of PZQ processed by hot-melt extrusion (HME) contained
50 or 35 wt% PZQ, in the presence (or not) of surfactants. As already explained in Sub-
chapter 5.4, the addition of the surfactants (Span or SLS) in the formulations had as main
objective to increase the dissolution of the solid dispersions (SD) produced by HME. This
investigation was conducted with the formulations containing 35 wt% of PZQ. The
respective placebo formulations were produced (M Placebo Span and M Placebo SLS) to
check the printer's cleanliness by contaminating the batches with PZQ.
2.2 3D Printing
The prepared mixtures, pellets or milled extrudates were added to the hopper of a
M3DIMAKER™ pharmaceutical 3D printer (FabRx, London, UK) with a direct powder
extruder nozzle [156]. AutoCAD 2014 (Autodesk Inc., USA) was used to design the
templates of the printlets, which were then exported as a stereolithography (.stl) file into
the 3D printer software (Repetier host Version 2.1.3, Germany). The selected 3D
geometry was a cylindrical printlet (10 mm diameter × 3.6 mm height). The printer
settings in the Repetier Host software were as follows: Feed 2100 steps/mm, infill 100%,
high resolution with brim, without raft, extruding (20 mm/s), speed while travelling (90
mm/s), number of shells (2) and layer height (0.20 mm). The flow rate, extruder
temperature and feed rate were determined according to each formulation (Table 1).
The 3D printer used (FabRx, UK) is specifically designed with a direct single-
screw powder extruder and a nozzle diameter of 0.8 mm. Its design is based on a single-
screw HME with rotation speed (and hence extrusion) controlled by the 3D printer
software (Repetier-Host V 2.1.3, Germany). Furthermore, the extruder nozzle moves in
three dimensions to create the objects in a layer-by-layer fashion (Figure 148).

Figure 148. Design of the single-screw powder extruder FabRX 3D printer used in this thesis.

After printing each formulation, the extruder was removed from the printing
platform and the screw was dismounted and washed to avoid cross-contamination
between different formulations.
2.3 Printlet characterisation
Microphotographs were obtained by SEM and optical microscopy. The methods used
were described in Sub-chapters 5.3, item 2.3.1.
2.3.1 Dimensions
The physical dimensions of the printlets were measured using a digital Vernier
caliper and a Sartorius Entris 124-1S analytical balance to determine the mass of each
printlet.
2.3.2 X-ray diffraction (XRD)
Discs of 20 mm diameter × 2 mm height made from the same formulations of the
printlets were 3D printed and analysed. X’Pert Panalytical X-ray diffractometer (Philips,
USA) using CuKα radiation, putting 40 mA of current and 45 kV of voltage was used.
The recording spectral range was set at 7-50° with a measuring step (angular deviation
between 2 consecutive points) of 0.0167° and an acquisition time of 100 s per point. Also,
the disc was rotated in its sample holder (1 revolution/s) during the results acquisition.
Disc printing was performed only for feeding with HME-extrudate powder. X-ray powder
diffraction (PXRD) was performed for the raw and extruded materials ground using the
same method.
2.3.3 Differential Scanning Calorimetry (DSC)
The analysis was performed by using a DSC Q200 with the base module and mDSC
(TA instruments, USA) and the conditions were the same that described before (Chapter
4 item 1.2.2).
For analysis, the printlets were broken with a spatula and two analyzes of each unit
were performed: one with part of the edge and another with the interior part (Figure 149).

2.3.4 Raman Microscopy
Raman mapping was performed using a Raman confocal microscope 300R Alpha
(Witec, Germany), equipped with a laser at a wavelength of 532 nm and the analyses were
conducted at room temperature. Samples were analysed by a 50x objective on the surface
and deep mapping (8x8 μm PVPVA, 5x5 PZQ and 10x10 and 10x20 P and M printlets)
was applied to predict drug and polymer distribution.
2.3.5 Determination of drug loading
A printlet of each formulation was placed in a volumetric flask phase mobile
(50 mL) under ultrasound for 5 minutes until complete dissolution (n = 2). Samples of the
solutions were then filtered through 0.22 μm PTFE filter (Millipore Ltd., Ireland) and the
concentration of drug was determined with HPLC system (Agilent 1100 Series) equipped
with a UV-visible detector, by the same method detailed before (item 3.1.1, Chapter 3).
2.3.6 Dissolution test
Dissolution of printlets was monitored using a dissolution rate test type II
apparatus (DT 60 ERWEKA, Germany). The method was described before on the
Chapter 3 (3.1.9).
Three printlets of each formulation were analyzed with manually addition to the
cube.
2.3.7 Assessment of Taste Masking Efficiency Using a Novel Biorelevant Buccal
Dissolution
Figure 149. Schematic representation of the printlet samples used for DSC analysis.

The in vitro method described by Keeley et al. [80] was used to predict the taste
of PZQ released from the milled extrudates and printlets in a simulated buccal
environment.
The simulated salivary fluid (SSF) (Sodium chloride—8 g/L; Potassium phosphate
monobasic—0.19 g/L; Sodium phosphate dibasic—2.38 g/L; pH 7.4) [339] kept under
magnetic stirring at 37 °C ± 1 °C, was pumped through the ‘buccal dissolution
column’using a peristaltic pump at a rate of 1 mL/min, corresponding to an average
adult normal total simulated saliva flow range. The other two adjacent parts were
composed of wire mesh discs, placed either side of the column. After inserting the sample
in the centre of the column lumen, from the top, aliquots were collected at 60, 120, 180,
240, 300, 360, 420, 480, 540, and 600 s, filtered through a 0.22 um membrane, and PZQ
analysed by HPLC. Tests were conducted in triplicate. Data are reported throughout as
mean ± standard deviation using Microsoft Excel (Microsoft Corp., Redmond, WA,
USA) software (version 2016 MSO).
The PZQ taste-concentration profile was previously determined with the rat brief
access taste aversion (BATA) model [114]. It was found that the half maximal inhibitory
concentration (IC50) was 0.06 mg/mL, and the taste threshold was 0.03 mg/mL. The
classification proposed by Mohamed-Ahmed et al. [114] was used to classify levels of
PZQ released at different time points as fully tolerated, well tolerated, tolerated,
aversive/untolerated, or highly aversive/highly untolerated, and predict taste masking
efficiency of the different formulations.
2.3.8 Stability study
The stability study was performed with a Memmert HPP260eco (Germany) and
the conditions are described in Table 59.
Table 59. Stability study conditions.
Stability study conditions
Temperature (°C) 25
Humidity (%) 60
Points of analysis 1 and 3 month

The stability study was designed to monitor only physical changes in the printlets
produced. Therefore, the formulations submitted to the study were analyzed by DSC and
XRDP.
The printlets were packaged in amber glass bottles with a plastic screw cap and
seal for DSC analysis. For each point of the stability study, a single bottle, containing one
printlet inside, was prepared. The bottles ready for the study are shown in Figure 150.
For XRD analysis, discs were used instead of printlets, and they were subjected
to the same conditions of humidity, temperature, and storage time. However, due to the
lack of sufficient quantity, the same disk was analyzed during all successive time points.
Another necessary adjustment was the use of transparent glass bottles with a plastic screw
cap. It was made according to the diameter of the bottle opening. Aluminium was used to
protect the bottle and reduce the difference between light from the amber bottles used for
printlets. The prepared bottles are shown in Figure 151.
Figure 150. Flasks used for packaging printlets during the stability study.
Figure 151. Flasks used for packaging printed discs during the stability study.

3. RESULTS
3.1 Physical characteristics of printlets
3.1.1 From physical mixtures
The physical mixture of PZQ and KOL (PM 50) was directly added to the hopper
of the 3D printer extruder, the feeding material hampered the printing process and led to
unsatisfactory final products (Figure 152). Different mass feed rates and screw speed
parameters were tested, but none produced printlets with satisfactory visual quality or
enough material. The poor flow of the mixture and electrostatic forces caused high
variation in the feeding during printing, making it impossible a continuous and
homogeneous flow of material through the screw.
A similar and unsatisfactory behaviour was verified when another physical
mixture of PZQ (PM 35 SLS) was directly added to the hopper of the 3D printer extruder.
These results showed that, for 3D printing with direct powdered material feeding, powder
characteristics capable of providing fluidity and homogeneity are essential to a regular
flow through the extruder. Without adding additional excipients to improve the flow
properties of physical mixtures, it was not possible to obtain printlets with good quality
from both PZQ formulations.
For the third tested formulation (PM 35 Span), printing experiments were not
possible since the mixture could not be prepared with the same conditions used for HME
extrusion (addition of the liquid surfactant directly in the extruder).
3.1.2 From pellets and powders produced from HME-filaments
Figure 152. Aspect of the PZQ printlets obtained by directly feeding the physical mixture of praziquantel
and PVPVA (1: 1) into the hopper of the 3D printer extruder.

The main objective of printing using HME-filaments cut into pellets was to
improve powdered properties like mixing homogeneity and flowability compared to a
physical mixture of same composition being directly fed to the extruder of the printer.
Although it was possible to print with this type of material, the pellets' flow into the printer
has not improved significantly. This barrier is probably related to the size of these
particles (around 1 mm) and the lack of homogeneity in these particulate materials'
morphology. The printing of the printlets using the sample P 50 was possible, however,
with a limited number of printlets since the cleaning of the screw was necessary
practically to each unit produced. For this reason, only DSC analysis was performed for
this sample to verify the thermal properties after printing and during the stability period.
In contrast, milled materials provided a continuous flow, and the printing process
took place more easily. However, it was evidenced that the feed rate was impacted for the
drug load in the system. The samples in the powder form with a load of 35% PZQ (M 35)
showed greater ease of continuous printing than the sample containing 50% load of PZQ
(M 50). For this reason, even the powder formulation containing 50% drug load (M 50)
presented limitations in the quantity of units produced. Because of this, SEM and
palatability analyses were not performed. Even with these limitations, the
characterizations present in this work are an important step as they demonstrate the
possibility to print with material containing high drug load from HME.
The images obtained by optical microscopy of PZQ printlets are shown in Figure
153). The difference between the printlets colours is related to the composition of each
one. The HME-filaments containing surfactant (M 35 Span and M 35 SLS) have a yellow
appearance, with the most intense coloration for M 35 SLS. This characteristic was
maintained for the respective printlets produced with the M 35 Span and M 35 SLS
formulations. Another aspect that can be identified in optical microscopy is the greater
opacity of the printlet containing 50 wt% PZQ load (M 50) compared to the others having
35 wt% drug load. When comparing the M 35 Span and M 35 SLS printlets to the
respective placebos, it was evidenced that the presence of PZQ resulted in less
transparency. However, all printlets presented good physical aspect, quite smooth and
with a shiny appearance.

SEM cross-section images of some PZQ printlets (M 35 Span and M 35 SLS) are
shown in Figure 154. They show a dense and homogeneous inner matrix, in which some
small holes can be observed. They are probably formed from air bubbles entrapped during
the printing process. The images also provide a clear view of the layers formed by the
layer-by-layer deposition of material during printing.
Figure 153. Top and bottom image of printlets obtained with: a - b) PM 50, c - d) M 35 Span, e – f) M
ASD 35 SLS, g- h) M Placebo Span and, i – j) M Placebo SLS.

All printlets were designed for the following dimensions: 10 mm diameter and 3.6
mm height. The measured printlet dimension, weight and PZQ load is given in Table 3.
M 50 and P 50 printlets showed higher mass variation (0.298 and 0.270,
respectively), probably due to differences in feed flow. PZQ content was determined only
for M 50 printlet according to the number of units available and was close to the
theoretical content value (48.4 %), showing that the dose is around 150 mg.
The formulations M 35 with surfactants (Span and SLS) showed a homogeneous
flow during feeding in the printer and good uniformity in the physical dimensions (Table
60). Before print, the milled HME-filaments, M 35 Span and M 35 SLS, contained 34.84
wt% and 33.25 wt% of PZQ, respectively. After printing, the values remained similar for
both formulations (35.02 % and 33.54 %, respectively), corresponding to a dosage of the
tablet of approximately 100 mg.
One of the most discussed approaches for applying 3D printing of medicines is
adjusting the dose using the manipulation of the sizes, structure, or format of the tablets.
As an initial stage in developing a paediatric pharmaceutical formulation,
characteristics such as pharmacokinetics and pharmacodynamics, potential routes of
administration, toxicity relationship, and taste preferences should be evaluated due to the
children's age [66]. In general, it can be said that from birth to around 16 or 18 years old,
individuals are considered paediatric patients [75]. However, let's analyse this age group.
Figure 154. SEM images of printlets: a – c) obtained with M 35 Span and, d – f) obtained with M 35 SLS.

It is easy to see significant differences in the physiological development of the body and
the need for personalized development for different stages of childhood [66]. The 3D
printing approach can promote different designs for new dosage forms with specific
pharmacokinetic characteristics.
Tabela 60. Printlets characteristics.
Printlets
Formulation
Measured characteristics of printlets
Weight (mg) Diameter (mm) Height (mm)
P 50* 0.270 ± 0.02 9.720 ± 0.22 3.579 ± 0.05
M 50* 0.298 ± 0.01 9.810 ± 0.16 3.554 ± 0.14
M 35 Span** 0.297 ± 0.02 9.982 ± 0.25 3.507 ± 0.09
M 35 SLS** 0.290 ± 0,04 9.841 ± 0.22 3.591 ± 0.11 * Values represent the standard deviation, n = 8 and ** n= 18.
Placebo printlets were also analyzed for drug dosage to check for the possibility
of contamination of printer parts. For all placebo printlets, the presence of PZQ was not
identified, thus indicating that cleaning the printer between one batch and another was
effective, and there was no contamination.
The printed discs for XRD analysis also showed good uniformity of dimensional
characteristics, and the results are shown in Table 61.
Table 61. Characteristics of the discs printlets.
Formulation
Measured characteristics*
Weight (mg) Diameter (mm) Height (mm)
Disc M 35 Span 0.621 ± 0.04 20.01 ± 0.25 1.79 ± 0.01
Disc M 35 SLS 0.596 ± 0.01 19.85 ± 0.07 1.79 ± 0.01
Printlet M 50 0.656 ± 0.04 20.05 ± 0.07 1.85 ± 0.02
* Values represent the standard deviation, n = 2
The visual aspect of the obtained printlets is shown in Figure 155.

3.2 Physicochemical characterizations
DSC, XRD, and Raman mapping were used to characterize the solid state of
printlets.
DSC thermograms confirms the crystalline nature of the raw drug (melting point
at 137.78 °C and enthalpy of 95.72 J/g), and the amorphous state of the polymer PVPVA
(Figure 157), as reported in the literature [73], [75], [340], [341] and already discussed in
the previous Chapters. Although an endothermic event was observed in the HME
powdered material and mainly after milling (data not shown), its low intensity allows us
to conclude that P 50 and M 50 powdered materials were predominantly amorphous
before printing.
These physical characteristics are maintained after printing for both formulations
where the P 50 remained amorphous while the DSC thermogram of M 50 printlet shows
an endothermic signal visualized in the range of 120 - 122 °C with ΔHfusion 2.15 J/g,
indicating that M 50 printlet became slightly crystalline. However, the crystallinity is
similar to that evidenced in the material before printing and cannot be attributed to the
presence of the started PZQ (𝑇𝑚 ~ 136 ºC) or one of the polymorphs of PZQ, B or C, for
which the melting temperatures described in the literature are different (around 106 ºC
and 112 ºC, respectively) [30], [73], [75]. The endothermic event shown in Figure 10
would be, rather, related to the effect of the polymer on lowering the melting temperature
of the drug in the mixture. Figure 156 also shows the homogeneity of the printlets without
differences on their thermal characteristics measured on the core and on the bord.
Figure 155. Visual aspect of disc, on left printlet M 35 Span and right side printlet M 35 SLS.

Although M 50 printlets presented a mixture of crystalline and amorphous
material, it was verified that, over 3 months of storage under controlled conditions (25
°C, 60 % RH), the endothermic melting event detected after production remained
unchanged (data no show), indicating no evolution of the solid structure exposed to the
mentioned environmental conditions.
Figure 157 displays DSC thermograms for printlets containing 35 wt% of PZQ,
formulated with surfactants (Span or SLS). The amorphous nature of M 35 Span and M
35 SLS materials before printing was confirmed, with no evidence of crystalline PZQ due
to the absence of melting event and the presence of a single glass transition (𝑇𝑔 𝑀 35 𝑆𝑃𝐴𝑁
33 °C and ∆𝐶𝑝 0.37 J/g.°C; 𝑇𝑔 𝑀 35 𝑆𝐿𝑆 25 °C and ∆𝐶𝑝 0.36 J/g.°C, respectively). The
amorphous pattern after printing (M 35 Span and M 35 SLS printlets) remained
unchanged and no evolution was detected by DSC analysis after 3 months of storage at
25 °C, 60 % RH.
Figure 156. DSC thermograms for P 50 and M 50 printlets, performed in two different parts of each unit
(core and bord).
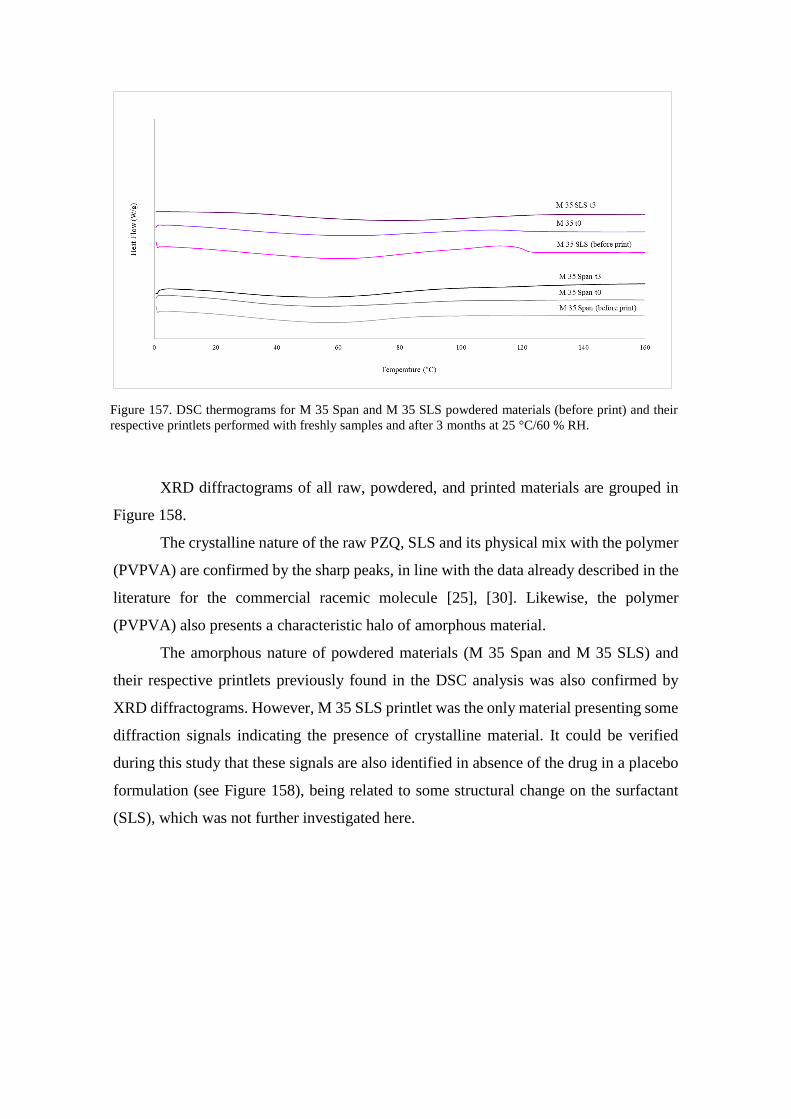
XRD diffractograms of all raw, powdered, and printed materials are grouped in
Figure 158.
The crystalline nature of the raw PZQ, SLS and its physical mix with the polymer
(PVPVA) are confirmed by the sharp peaks, in line with the data already described in the
literature for the commercial racemic molecule [25], [30]. Likewise, the polymer
(PVPVA) also presents a characteristic halo of amorphous material.
The amorphous nature of powdered materials (M 35 Span and M 35 SLS) and
their respective printlets previously found in the DSC analysis was also confirmed by
XRD diffractograms. However, M 35 SLS printlet was the only material presenting some
diffraction signals indicating the presence of crystalline material. It could be verified
during this study that these signals are also identified in absence of the drug in a placebo
formulation (see Figure 158), being related to some structural change on the surfactant
(SLS), which was not further investigated here.
Figure 157. DSC thermograms for M 35 Span and M 35 SLS powdered materials (before print) and their
respective printlets performed with freshly samples and after 3 months at 25 °C/60 % RH.

Raman microscopy was performed to provide information about the distribution
of PZQ in the printlets. Figure 159 shows Raman spectra for PZQ and KOL and their
respective characteristic signs (1054, 1451, 2866, 3061 cm-1 and 749, 862, 1740, 2940
cm-1, respectively).
The results showed the presence of PZQ in M 35 SLS and M 50 printlets (2879,
2873 and 3068, 3071 cm-1), but it is not possible to detect Raman characteristic peaks of
the surfactant (SLS), probably due to the small proportion used (5 wt%) (Figure 159).
Figure 158. XRD diffractograms for raw materials (PZQ, KOL and SLS), ASDs (M 50, M 35 SLS and M 35
Span) and their respective 3D disc.

3D images (Figure 161) obtained from the integration of PZQ and PVPVA peaks
revealed each material's distribution in the analysis area (Figure 160a and 160b). It is
possible to visualize the graphs with different colour intensities that reflect the
distribution of PZQ concentration. Areas that appear in light yellow indicate high
absorbance (high concentration of drug). The darker the colour is (black), the lower
concentration of drug it represents [342]. Thus, these colour variations can map the
homogeneity and the concentration of the dispersed drug on the screened printlet area
showing that for all printed samples there is a good distribution of PZQ in the polymer.
Figure 159. Raman mapping for raw materials (PZQ, KOL and SLS) and printlets (M 50, M 35 Span and
M Placebo Span).

For the M 35 SLS printlet, several analyses were performed, with two lasers (532
and 785 nm), different integration times and laser intensities. In all these analyses, the
fluorescence phenomena remain important for the perimeter of Raman images. Therefore,
it was impossible to obtain a spectrum on this sample, certainly, because of the printlet
colour.
3.3 Dissolution profiles
The dissolution profiles of M 50, M 35 Span, and M 35 SLS printlets show a
greater than four-fold increase in drug release after 2 h compared to PZQ alone (Figure
161). It is important to mention that all printlets were printed directly with powdered
materials obtained from HME extrudates without the addition of other excipients that
could improve properties such as flowability, dissolution, disintegration, and taste
masking. This proves that 3DP can be a highly valuable technology for producing
personalised pharmaceutical dosage forms to improve physical and sensory properties
necessary for a large variety of medicines. The combination of HME and 3DP techniques
could be useful to overcome challenges in the formulation development of BCS class II
drugs with low solubility, which represent more than 70% of new drug candidates in the
pipeline [88].
a)
b)
Figure 160. Raman mapping 3D for: a) M 50 printlet with area 10x10 microns, and b) M 35 Span printlet
with area 15x15 microns.

3.4 In vitro taste masking test
Considering that the highest concentration of 50 wt% would be more sensitive to
recrystallization, M 35 Span and M 35 SLS printlets were chosen to be evaluated for
palatability using an in vitro method described by Keeley et al. [80]. This method
evaluates the drug release profile in a spine system that mimics the oral cavity with
artificial saliva.
M 35 Span and M 35 SLS powdered materials (before print) present about 0.2 to
0.3 mg/mL PZQ in the medium in the first minute of the experiment (Figure 162a). The
dashed lines indicate the tolerability thresholds about the taste of the PZQ previously
determined in a study that evaluated different concentrations of the raw drug in an in vivo
model (BATA) [68]. This means that when ingesting a particulate material produced, for
example, being a powder formulation for dispersion, probably the bitter taste of the PZQ
would quickly be noticeable in the mouth.
Also, according to Münster and collaborators [68], the IC50 determined for PZQ
during BATA was 0.06 mg/ml. Figure 162b presents the results obtained for the printlets.
It is possible to better visualize the difference when comparing to the extrudates
previously produced by HME. Both printlets (M 35 Span and M 35 SLS) are below the
Figure 161. In vitro dissolution profile of PZQ (raw material) and printlets (M 50, M 35 Span and M 35
SLS) using HCl 0.1N medium with 0.2 % w/w of SLS at 37°C.

threshold of good PZQ tolerability, suggesting that the formulations are also promising
in taste masking and palatability.
The bespoke flowthrough oral dissolution apparatus was used in a previous study
to evaluate chlorphenamine maleate incorporated in sugar spheres coated with different
technologies and components [80]. In this study, the apparatus showed real results on
different formulations' taste masking capacity, showing a good correlation with the
BATA (rodent model) and human panel methods.
In the case of PZQ, this in vitro taste assessment is a very useful tool to screen
formulations and evaluate printlets in early-stage formulation development. The method
is simple to execute, relatively inexpensive, and can guide development decisions so that
animal experimentation can be reduced as only one taste profiling of the drug is needed.
However, although the preliminary results of the printlets are encouraging, there is still
the possibility of improving the final formulation with additional excipients to further
favour taste masking.

Figure 162. a) PZQ release (mean ± SD) for M 35 Span and M 35 SLS materials (before print) and their
respective printlets and, b) detail of the 3D printed formulations. The taste thresholds are represented as
pink and purple dotted line.

4. CONCLUSIONS
For the first time, 3D printed tablets containing 35 and 50 wt% praziquantel (PZQ)
were successfully produced by direct powder extrusion (DPE) 3DP from HME extrudates
(in pellet and powder form), reducing the dependence on the strict mechanical properties
of HME filaments for FDM 3DP.
Printlets with adequate dimensional characteristics and two different doses (~150 and
100 mg) were produced. In vitro dissolution studies showed a greater than four-fold
increase in PZQ from the printlets when compared to pure PZQ, most likely due to the
predominantly amorphous solid state of PZQ after printing. In addition to the improved
performance in the dissolution studies, in vitro taste masking results revealed that the
formulations would be within acceptable taste thresholds (tolerated and well tolerated),
with enhanced features for paediatric patients.
Most of the paediatric users of PZQ are found in developing countries, with a large
variation in the children’s weight due to the poor dietary conditions, showing a wide range
of physiological and pharmacokinetic characteristics within a heterogeneous age group.
Due to the absence of an appropriate paediatric formulation, treatment of schistosomiasis
patients involves the breaking or crushing of a standard adult tablet to achieve the required
dose of 40 mg/kg [343]–[345] .
The printlets in this work were developed with a focus on paediatric patients, and
although the drug loading still requires optimisation, promising results with amorphous
systems have been obtained in taste masking and possible dose reduction compared to
what is currently available [68], [346]. The results from this work demonstrate the unique
potential of 3DP in customising PZQ medicines from amorphous systems, specifically
for paediatric patients.

CHAPTER 7 - GENERAL CONCLUSION AND
PERSPECTIVES

337
1. GENERAL CONCLUSION AND PERSPECTIVES
Neglected tropical diseases affect more than 1.4 billion people worldwide, with
children making a significant proportion. The second most frequent is schistosomiasis
disease and affects around 28 million preschool-age children.
Praziquantel is the reference medicine for schistosomiasis treatment according to
WHO, but there is no appropriate paediatric formulation available in the market.
This thesis aimed to contribute with alternatives to address an important public
health problem that is schistosomiasis, through the development of a praziquantel
formulation based on ASDs to improve both physicochemical (low solubility) and
sensory (bitter) API characteristics, and personalizing dosage for children.
The first challenge is to improve the water solubility of praziquantel.
New formulations were proposed here, associating praziquantel to Poly (Vinyl
Pyrrolidone/Vinyl Acetate) (PVP/VA) in a binary mixture, or both with a surfactant to
compose a ternary mixture.
Hot-melt extrusion (HME) was the process used. Amorphous solid dispersion
could be generated from binary and ternary mixtures in different twin-screw extruders
(Pharma 11 and Pharma 16, Thermo Fisher).
The ternary formulations varied on the type of the surfactant used and API load
(35%, 40% and 50 wt%). The two surfactants used were: 1. SLS, a solid surfactant used
directly in the physical mixture prepared for extrusion; 2. SPAN 20, a liquid surfactant
added to the solid mixture of PZQ and PVPVA in two ways: wet granulation before
extrusion and direct addition to the molten material during extrusion).
Regarding the praziquantel solubility in water:
All ternary and binary extrudate forms proved to increase the apparent solubility,
evidencing the solubilization behaviour of amorphous solid dispersions (produced totally
or predominantly amorphous) with a spring effect on drug concentration observed mainly
between the initial 30 and 60 min of the experiments in water at 37 °C.
More specifically, the apparent solubility could be increased 70 % to 90 % more
than the equilibrium concentration in this medium.
Regarding the dissolution kinetics, it was also improved by these new ASDs, for
example, 90 % of drug release in 1 h for the ternary formulation containing SPAN 20 as

338
a surfactant and 35 wt% of API (pharma 16), compared with the (crystalline) API alone.
However, it is essential to mention that the characterization regarding particle sizes of the
studied formulations needs to be improved to allow a better comparative analysis of their
dissolution profiles and the effect of this parameter (particle size) on this kinetics.
This same formulation was used to carry out pharmacokinetic experiments on
animals. Although the ASD pharmacokinetic assessment protocol will require some
improvements, the results are promising and demonstrate that ASD approach (and the
composition proposed) might be an alternative to overcoming the PZQ solubility
challenge.
This issue was addressed, it remained another challenge that is the physical
stability of these systems requiring high drug loads as those of interest here.
One of the main parameters affecting the physical stability of an ASD is the drug
solubility in the carrier, because this value determines the maximal drug load without a
risk of phase separation and recrystallization. In the thesis, a composition-temperature
phase diagram Praziquantel - PVPVA was established. The determination of API-
polymer solubility was performed from a supersaturated solid solution produced by spray
drying. A recrystallization (thermal) method based on demixing was then applied. The
diagram was built and through these data, it is possible to know if the binary system is
above or below its saturation at a given temperature. With the valuable assistance of this
diagram, new compositions that could make the system more stable could be tested.
Unexpectedly, in some batches of spray-dried powders produced in this study,
traces of crystalline forms of PZQ were found, which are different from the initial racemic
form. They might correspond to one of these polymorphic forms of PZQ recently
reported. It is an interesting finding because, to the best of our knowledge, it was the first
time that the new polymorphic forms of praziquantel are supposed to be formed from the
recrystallization of an amorphous form.
The second challenge is to mask the bitter taste of praziquantel.
The unpleasant taste of praziquantel is also a problem when administering adult
medicine to children. Unpleasant taste is crucial for adherence to paediatric treatment and,
consequently, for effectiveness.
Extruded formulations (pellets) and printlets obtained positive results in all three
forms of tests performed (in vivo, oral cavity dissolution, and electronic tongue), related
to masking the bitter taste of praziquantel for both API load (50 and 35 wt%).

339
In vivo taste masking showed that a ternary formulation (FEXT 1) was better
acceptable for rats than the commercial praziquantel tablets. This result was according to
the in vitro test performed with electronic tongue.
Electronic tongue tested two extrudate formulations: FEXT 1 and FEXT 2. The
first one showed better results indicating that the taste was better than the commercial
PZQ tablets and FEXT 2. From the in vivo experiment, it was possible to demonstrate
that the adaptation of the methodology using solution recirculation pumps is feasible and
makes sure that the animal is always exposed to a homogeneous solution/suspension of
the sample tested.
It is important to highlight that the electronic tongue sensors were adapted to
determine the impedance, overcoming the limiting factor presented by currently
commercialized equipment that does not allow the identification of taste for molecules
with low conductivity characteristics such as praziquantel.
Oral cavity dissolution showed that the printlets obtained from two ternary
formulations (both with 35 wt% of praziquantel) are considered well tolerable until the
end of the experiment (600 seconds). The two formulations tested (pellets), and from
which printlets were generated, have demonstrated better taste masking capacity in 1
minute of contact with artificial saliva, remaining below the well tolerable limit.
Surprisingly, this same result was observed for pellets of different concentrations (35 and
50 wt%).
It is important to highlight that all taste masking tests in this thesis were performed
with intermediate materials (extruded) and printlets as testing materials. There was no
addition of excipients with taste-enhancing functionality (e.g., sweeteners, flavours). In
this way, increments on pharmaceutical formulation can still be explored to optimize a
medicine specifically designed for children.
The third challenge for paediatric praziquantel is the need of accurate dose
adjustment.
As an alternative to overcome the challenge of adjusting the doses of a paediatric
medicine based on PZQ for children, the use of 3D printing technology (FDM) with direct
feeding of particulate material was proposed.
The prototypes produced at this stage of the study showed that 3D printing can be
a viable tool for customizing doses since the design of the drug can be precisely adjusted.

340
In this thesis, we could demonstrate the possibility of obtaining two different
doses (100 and 150 mg) using the ternary formulations obtained by HME. The printlets
containing 35 wt% of API load and SPAN 20 as surfactant showed the best dissolution
performance (81 % in 2 h). However, as previously mentioned, printlets were produced
only with the extruded material, without the addition of taste masking or disintegrating
agents. For the next steps, these formulations can be further improved both, in taste
masking, and in increasing dissolution.
A major result was also obtained concerning the printability of particulate
materials using this 3D printing technology that has a direct feed. It was not possible to
directly print the physical mixtures containing 50% or 35% of API (with or without
surfactant in the formulation), contrary to the previously existing literature. For this
specific API, the use of previously processed materials represented better processability
due to the change in physical characteristics such as less electrostatic charges and better
flow. However, for PZQ, in addition to these characteristics, the amorphization obtained
by HME is essential to address the first challenge described above, increasing solubility.
Still, it was demonstrated that the use of pellets of extruded materials resulted in printlets,
but the printing process showed little processability (need for constant cleaning of the
printer). Amorphous solid dispersions produced by HME and shaped as powders seems
to be the better technical solution for production of printlets of praziquantel for paediatric
medicines by 3D printing technology (FDM) with direct feeding of solid material.
Nowadays, 3D printing technology is beginning to be seen as promising for
developing pharmaceutical products, and legislation, especially regarding the quality
assessment of this type of product, needs to accompany this evolution. In this thesis,
routine tests were presented to assess the quality of printlets, such as dissolution and
content. However, it is essential to determine the need for specific tests and procedures
to monitor the quality of these new products emerging on the market from 3D printing.
Although 3D printing has been presented as a strategy and with promising results,
other paths can be followed to obtain a final pharmaceutical form suitable for paediatric
patients. According to our results and the outcome of the discussions on the theme, there
is still a need to optimize the amorphous solid dispersions produced here by hot melt
extrusion, especially to achieve stability characteristics. The coating could be an
additional step to test for improving their physical stability against exposition to
environmental conditions. In this sense, a few experiments were performed during this
thesis (not presented in the manuscript) from which the interest of this technical

341
improvement was demonstrated. Coated amorphous solid dispersions could create an
opening for another pharmaceutical form that is their use in the form of a sachet.
.

342
CHAPTER 8 - BIBLIOGRAPHY

343
[1] O. MONDIALE and D. LA SANTÉ, “Schistosomiasis : number of people treated
worldwide in 2014 Schistosomiase : nombre de personnes traitées dans le monde
en 2014,” Wkly. Epidemiol. Rec., vol. 30, no. 5, pp. 25–31, 2015.
[2] M. L. Nelwan, “Schistosomiasis: Life Cycle, Diagnosis, and Control,” Curr. Ther.
Res. - Clin. Exp., vol. 91, no. 24, pp. 5–9, 2019, doi:
10.1016/j.curtheres.2019.06.001.
[3] E. Y. Li, D. Gurarie, N. C. Lo, X. Zhu, and C. H. King, “Improving public health
control of schistosomiasis with a modified WHO strategy : a model-based
comparison study,” Lancet Glob. Heal., vol. 7, no. 10, pp. e1414–e1422, 2019,
doi: 10.1016/S2214-109X(19)30346-8.
[4] L. B. da Fonseca, “DESENVOLVIMENTO DE NANOPARTÍCULAS
POLIMÉRICAS CONTENDO PRAZIQUANTEL PARA O TRATAMENTO DA
ESQUISTOSSOMOSE,” Universidade Federal do Rio de Janeiro, 2012.
[5] H. Wang et al., “Metabolic profiling of praziquantel enantiomers,” vol. 90, pp.
166–178, 2014.
[6] P. T. Loverde, “Digenetic Trematodes,” in Schistosomiasis, R. T. Fried, Ed.
Springer, 2019.
[7] D. P. Mcmanus, D. W. Dunne, M. Sacko, N. Zhou, and B. J. Vennervald,
“Schistosomiasis,” Nat. Rev. Dis. Prim., pp. 1–19, 2018, doi: 10.1038/s41572-018-
0013-8.
[8] J. P. Soldati, “Dose maior é sinônimo de eficácia ?,” Inf. IOC. Inst. Oswaldo
Cruz/Fiocruz -, p. 2012, 2011.
[9] R. Trastullo, L. S. Dolci, N. Passerini, and B. Albertini, “Development of flexible
and dispersible oral formulations containing praziquantel for potential
schistosomiasis treatment of pre-school age children,” Int. J. Pharm., vol. 495, no.
1, pp. 536–550, 2015, doi: 10.1016/j.ijpharm.2015.09.019.
[10] D. Zanolla et al., “A new soluble and bioactive polymorph of praziquantel,” Eur.
J. Pharm. Biopharm., vol. 127, no. January, pp. 19–28, 2018, doi:
10.1016/j.ejpb.2018.01.018.
[11] A. A. L. Carvalho, A. C. Mafud, P. L. S. Pinto, Y. P. Mascarenhas, and J. De

344
Moraes, “Schistosomicidal effect of the anti-inflammatory drug diclofenac and its
structural correlation with praziquantel,” Int. J. Antimicrob. Agents, vol. 44, no. 4,
pp. 372–374, 2014, doi: 10.1016/j.ijantimicag.2014.06.018.
[12] Alan Lane de Melo and P. M. Z. Coelho, Parasitologia Humana - Leishmaniose
Visceral Americana. 2007.
[13] Ministério da Saúde, Guide to Health Surveillance. 2019.
[14] M. da S. BRASIL, “MANSONI Diretrizes Técnicas Diretrizes técnicas,” 2014.
[15] K. E. R. Silva, R. M. F. Silva, S. P. M. Costa, L. A. Rolim, M. do C. A. Lima, and
P. J. Rolim-Neto, “Alternativas terapêuticas no combate à Esquistossomose
Mansônica,” Rev. Ciencias Farm. Basica e Apl., vol. 33, no. 1, pp. 9–16, 2012.
[16] C. V. V. Rollemberg et al., “Aspectos epidemiológicos e distribuição geográfica
da esquistossomose e geo-helmintos, no Estado de Sergipe, de acordo com os
dados do Programa de Controle da Esquistossomose,” Rev. Soc. Bras. Med. Trop.,
vol. 44, no. 1, pp. 91–96, 2011, doi: 10.1590/s0037-86822011000100020.
[17] M. L. A. Ferrari, P. M. Z. Coelho, C. M. F. Antunes, C. A. P. Tavares, and A. S.
Da Cunha, “Efficacy of oxamniquine and praziquantel in the treatment of
Schistosoma mansoni infection: A controlled trial,” Bull. World Health Organ.,
vol. 81, no. 3, pp. 190–196, 2003, doi: 10.1590/S0042-96862003000300009.
[18] R. E. Zaparoli, “2011 Sorocaba / SP,” 2011.
[19] 2013. Pernambuco. Secretaria Estadual de Saúde. Secretaria Executiva de
Vigilância em Saúde. Programa de Enfretamento das Doenças Negligenciadas no
Estado de Pernambuco SANAR – 2011 / 2014 / Secretaria Estadual de Saúde.
Secretaria Executiva de Vigilância em Sa, “SANAR. Programa de enfrentamento
às doenças negligenciadas.”
[20] L. B. Da Fonseca et al., “Desenvolvimento de um medicamento brasileiro
nanoencapsulado para o tratamento da esquistossomose,” Vigilância Sanitária em
Debate, vol. 1, no. 4, pp. 85–91, 2013, doi: 10.3395/vd.v1i4.111pt.
[21] J. Zwang and P. L. Olliaro, “Clinical Efficacy and Tolerability of Praziquantel for
Intestinal and Urinary Schistosomiasis—A Meta-analysis of Comparative and
Non-comparative Clinical Trials,” PLoS Negl. Trop. Dis., vol. 8, no. 11, 2014, doi:
10.1371/journal.pntd.0003286.

345
[22] N. Katz and P. M. Z. Coelho, “Clinical therapy of schistosomiasis mansoni: The
Brazilian contribution,” Acta Trop., vol. 108, no. 2–3, pp. 72–78, 2008, doi:
10.1016/j.actatropica.2008.05.006.
[23] V. B. R. da Silva, B. R. K. L. Campos, J. F. de Oliveira, J. L. Decout, and M. do
Carmo Alves de Lima, “Medicinal chemistry of antischistosomal drugs:
Praziquantel and oxamniquine,” Bioorganic Med. Chem., vol. 25, no. 13, pp.
3259–3277, 2017, doi: 10.1016/j.bmc.2017.04.031.
[24] M. R. Carvalho Garbi Novaes, J. P. de Souza, and H. Clemente de Araújo,
“Anthelmintic praziquantel synthesis from glycine,” Quim. Nova, no. 1, pp. 5–10,
1999.
[25] A. Borrego-Sánchez et al., “Conformational polymorphic changes in the crystal
structure of the chiral antiparasitic drug praziquantel and interactions with calcium
carbonate,” Eur. J. Pharm. Biopharm., vol. 132, no. July, pp. 180–191, 2018, doi:
10.1016/j.ejpb.2018.09.028.
[26] F. C. Lombardo, V. Pasche, G. Panic, Y. Endriss, and J. Keiser, “Life cycle
maintenance and drug-sensitivity assays for early drug discovery in Schistosoma
mansoni,” Nat. Protoc., vol. 14, no. 2, pp. 461–481, 2019, doi: 10.1038/s41596-
018-0101-y.
[27] S. K. Park et al., “The anthelmintic drug praziquantel activates a schistosome
transient receptor potential channel,” J. Biol. Chem., vol. 294, no. 49, pp. 18873–
18880, 2019, doi: 10.1074/jbc.AC119.011093.
[28] WHO, “WHO Model Lists of Essential Medicines - Praziquantel,” 2021.
[29] C. S. Ferreira Marques et al., “Solid dispersion of praziquantel enhanced solubility
and improve the efficacy of the schistosomiasis treatment,” J. Drug Deliv. Sci.
Technol., vol. 45, no. December 2017, pp. 124–134, 2018, doi:
10.1016/j.jddst.2018.03.009.
[30] D. Zanolla et al., “A new soluble and bioactive polymorph of praziquantel,” Eur.
J. Pharm. Biopharm., vol. 127, no. August 2017, pp. 19–28, 2018, doi:
10.1016/j.ejpb.2018.01.018.
[31] D. Cioli, L. Pica-mattoccia, A. Basso, and A. Guidi, “Schistosomiasis control :
praziquantel forever ?,” Mol. Biochem. Parasitol., vol. 195, no. 1, pp. 23–29, 2014,

346
doi: 10.1016/j.molbiopara.2014.06.002.
[32] A. M. de L. A. B. E. de A. B. E. de O. L. S. de C. Barros, Re lação Na cional de
Me dicamentos Essenciais Re lação Na cional de Me dicamentos Essenciais. 2020.
[33] J. C. Espinosa-Lara et al., “Cocrystals of active pharmaceutical ingredients -
Praziquantel in combination with oxalic, malonic, succinic, maleic, fumaric,
glutaric, adipic, and pimelic acids,” Cryst. Growth Des., vol. 13, no. 1, pp. 169–
185, 2013, doi: 10.1021/cg301314w.
[34] A. Borrego-Sánchez, C. Viseras, C. Aguzzi, and C. I. Sainz-Díaz, “Molecular and
crystal structure of praziquantel. Spectroscopic properties and crystal
polymorphism,” Eur. J. Pharm. Sci., vol. 92, pp. 266–275, 2016, doi:
10.1016/j.ejps.2016.04.023.
[35] WHO, “International strategies for tropical disease treatments - Experiences with
praziquantel,” 1998.
[36] WHO, “Schistosomiasis in children_ a major public health problem,” pp. 1–3,
2017, [Online]. Available:
https://www.pediatricpraziquantelconsortium.org/schistosomiasis.
[37] M. Cugovčan, J. Jablan, J. Lovrić, D. Cinčić, N. Galić, and M. Jug,
“Biopharmaceutical characterization of praziquantel cocrystals and cyclodextrin
complexes prepared by grinding,” J. Pharm. Biomed. Anal., vol. 137, pp. 42–53,
2017, doi: 10.1016/j.jpba.2017.01.025.
[38] M. J. Doenhoff, D. Cioli, and J. Utzinger, “Praziquantel: Mechanisms of action,
resistance and new derivatives for schistosomiasis,” Curr. Opin. Infect. Dis., vol.
21, no. 6, pp. 659–667, 2008, doi: 10.1097/QCO.0b013e328318978f.
[39] W. Wu, W. Wang, and Y. X. Huang, “New insight into praziquantel against
various developmental stages of schistosomes,” Parasitol. Res., vol. 109, no. 6, pp.
1501–1507, 2011, doi: 10.1007/s00436-011-2670-3.
[40] F. C. Lombardo, B. Perissutti, and J. Keiser, “Activity and pharmacokinetics of a
praziquantel crystalline polymorph in the Schistosoma mansoni mouse model,”
Eur. J. Pharm. Biopharm., vol. 142, no. June, pp. 240–246, 2019, doi:
10.1016/j.ejpb.2019.06.029.
[41] J. Kovač, M. Vargas, and J. Keiser, “In vitro and in vivo activity of R- and S-

347
praziquantel enantiomers and the main human metabolite trans-4-hydroxy-
praziquantel against Schistosoma haematobium,” Parasites and Vectors, vol. 10,
no. 1, pp. 3–7, 2017, doi: 10.1186/s13071-017-2293-3.
[42] T. Meyer, H. Sekljic, S. Fuchs, H. Bothe, D. Schollmeyer, and C. Miculka, “Taste,
a new incentive to switch to (R)-praziquantel in schistosomiasis treatment,” PLoS
Negl. Trop. Dis., vol. 3, no. 1, pp. 3–7, 2009, doi: 10.1371/journal.pntd.0000357.
[43] D. Zhang, H. Wang, J. Ji, L. Nie, and D. Sun, “A quantification method for
determination of racemate praziquantel and R-enantiomer in rat plasma for
comparison of their pharmacokinetics,” J. Chromatogr. B, vol. 1048, pp. 64–69,
2017, doi: 10.1016/j.jchromb.2017.02.013.
[44] I. Meister et al., “Activity of praziquantel enantiomers and main metabolites
against Schistosoma mansoni,” Antimicrob. Agents Chemother., vol. 58, no. 9, pp.
5466–5472, 2014, doi: 10.1128/AAC.02741-14.
[45] W. M. Bagchus, D. Bezuidenhout, E. Harrison-moench, E. Kourany-lefoll, and P.
Wolna, “Relative Bioavailability of Orally Dispersible Tablet Formulations of
Levo- and Racemic Praziquantel : Two Phase I Studies,” no. December 2018, pp.
66–76, 2019, doi: 10.1111/cts.12601.
[46] G. Z. Id and F. Mutapi, “Drug metabolism and pharmacokinetics of praziquantel :
A review of variable drug exposure during schistosomiasis treatment in human
hosts and experimental models,” pp. 1–26, 2020, doi:
10.1371/journal.pntd.0008649.
[47] ANVISA, “Consulta Medicamentos ANVISA - Praziquantel,” 2020.
[48] Merck, “Bula Cisticid 500mg Merck.”
[49] F.- Fiocruz, “Praziquantel - DMG-FAR-PRO-PRZ-001-2017,” in Memento
Terapeutico, 2017, pp. 1–9.
[50] A. Garba et al., “Acta Tropica Schistosomiasis in infants and preschool-aged
children : Infection in a single Schistosoma haematobium and a mixed S .
haematobium – S . mansoni foci of Niger,” vol. 115, no. May 2001, pp. 212–219,
2010, doi: 10.1016/j.actatropica.2010.03.005.
[51] M. Woelfle, J. Seerden, J. De Gooijer, K. Pouwer, P. Olliaro, and H. Matthew,
“Resolution of Praziquantel,” vol. 5, no. 9, pp. 1–7, 2013, doi:

348
10.1371/journal.pntd.0001260.
[52] S. Botros, N. El-lakkany, S. H. Seif, A. Sabra, and M. Ibrahim, “Experimental
Parasitology Comparative efficacy and bioavailability of different praziquantel
brands,” Exp. Parasitol., vol. 127, no. 2, pp. 515–521, 2011, doi:
10.1016/j.exppara.2010.10.019.
[53] The United States Pharmaceutical Convention., “USP43 Praziquantel API,” p.
3649, 2020.
[54] ANVISA, “Farmacopeia Brasileira Volume II – Monografias Insumos
Farmacêuticos e Especialidades,” Farm. Bras., vol. 2, pp. 1–1504, 2019.
[55] U. S. N. L. of Medicine, “ChemIDplus Advanced - Chemical information -
Praziquantel,” 2021.
[56] E. S. Bochmann, A. Gryczke, and K. G. Wagner, “Validation of Model-Based Melt
Viscosity in Hot-Melt Extrusion Numerical Simulation,” pp. 9–12, 2018, doi:
10.3390/pharmaceutics10030132.
[57] U. S. P. Convention, “Promoting the Quality of Medicines (PQM). Product
Information Report: Praziquantel,” Rockville, Maryland., 2019.
[58] N. Passerini, B. Albertini, B. Perissutti, and L. Rodriguez, “Evaluation of melt
granulation and ultrasonic spray congealing as techniques to enhance the
dissolution of praziquantel,” Int. J. Pharm., vol. 318, no. 1–2, pp. 92–102, 2006,
doi: 10.1016/j.ijpharm.2006.03.028.
[59] D. Zanolla et al., “Milling and comilling Praziquantel at cryogenic and room
temperatures: Assessment of the process-induced effects on drug properties,” J.
Pharm. Biomed. Anal., vol. 153, pp. 82–89, 2018, doi: 10.1016/j.jpba.2018.02.018.
[60] B. Albertini et al., “Combining mechanochemistry and spray congealing for new
praziquantel pediatric formulations in schistosomiasis treatment,” Int. J. Mol. Sci.,
vol. 20, no. 5, 2019, doi: 10.3390/ijms20051233.
[61] M. Münster, C. Schoch, C. Schmidt, and J. Breitkreutz, “Multiparticulate system
combining taste masking and immediate release properties for the aversive
compound praziquantel,” Eur. J. Pharm. Sci., vol. 109, no. August, pp. 446–454,
2017, doi: 10.1016/j.ejps.2017.08.034.

349
[62] P. Olliaro, P. Delgado-romero, and J. Keiser, “The little we know about the
pharmacokinetics and pharmacodynamics of praziquantel ( racemate and R -
enantiomer ),” no. January, pp. 863–870, 2014, doi: 10.1093/jac/dkt491.
[63] P. R. Dametto, A. C. Dametto, L. Polese, C. A. Ribeiro, M. Chorilli, and O. de
Freitas, “Development and physicochemical characterization of solid dispersions
containing praziquantel for the treatment of schistosomiasis,” J. Therm. Anal.
Calorim., vol. 127, no. 2, pp. 1693–1706, 2017, doi: 10.1007/s10973-016-5759-1.
[64] PUBCHEM, “Praziquantel - Chemical and Physical Properties,” 2019.
[65] E. D. Costa et al., “Unexpected solvent impact in the crystallinity of
praziquantel/poly(vinylpyrrolidone) formulations. A solubility, DSC and solid-
state NMR study,” Int. J. Pharm., vol. 511, no. 2, pp. 983–993, 2016, doi:
10.1016/j.ijpharm.2016.08.009.
[66] M. V. Chaud et al., “Development and evaluation of praziquantel solid dispersions
in sodium starch glycolate,” Trop. J. Pharm. Res., vol. 12, no. 2, pp. 163–168,
2013, doi: 10.4314/tjpr.v12i2.5.
[67] S. K. El-arini and H. Leuenberger, “Dissolution properties of praziquantel – PVP
systems,” pp. 89–94, 1998.
[68] M. Münster et al., “Comparative in vitro and in vivo taste assessment of liquid
praziquantel formulations,” Int. J. Pharm., vol. 529, no. 1–2, pp. 310–318, 2017,
doi: 10.1016/j.ijpharm.2017.06.084.
[69] A. Gaggero et al., “Co-grinding with surfactants as a new approach to enhance in
vitro dissolution of praziquantel,” J. Pharm. Biomed. Anal., vol. 189, 2020, doi:
10.1016/j.jpba.2020.113494.
[70] S. K. El-Arini, D. Giron, and H. Leuenberger, “Solubility properties of racemic
praziquantel and its enantiomers,” Pharm. Dev. Technol., vol. 3, no. 4, pp. 557–
564, 1998, doi: 10.3109/10837459809028638.
[71] K.-K. and C. B. C. Yue Liu, Xin Wang, “Investigation of the phase diagrams of
chiral praziquantel,” Chirality, vol. 18, pp. 259–264, 2006, doi: 10.1002/chir.
[72] A. Cedillo-Cruz, M. I. Aguilar, M. Flores-Alamo, F. Palomares-Alonso, and H.
Jung-Cook, “A straightforward and efficient synthesis of praziquantel enantiomers
and their 4′-hydroxy derivatives,” Tetrahedron Asymmetry, vol. 25, no. 2, pp. 133–

350
140, 2014, doi: 10.1016/j.tetasy.2013.11.004.
[73] D. Zanolla et al., “Exploring mechanochemical parameters using a DoE approach:
Crystal structure solution from synchrotron XRPD and characterization of a new
praziquantel polymorph,” Eur. J. Pharm. Sci., vol. 140, no. October, p. 105084,
2019, doi: 10.1016/j.ejps.2019.105084.
[74] D. Salazar-Rojas, R. M. Maggio, and T. S. Kaufman, “Preparation and
characterization of a new solid form of praziquantel, an essential anthelmintic
drug. Praziquantel racemic monohydrate,” Eur. J. Pharm. Sci., vol. 146, no.
December 2019, p. 105267, 2020, doi: 10.1016/j.ejps.2020.105267.
[75] D. Zanolla et al., “Mechanochemical formation of racemic praziquantel
hemihydrate with improved biopharmaceutical properties,” Pharmaceutics, vol.
12, no. 3, pp. 1–22, 2020.
[76] G. L. Amidon, H. Lennernäs, V. P. Shah, and J. R. Crison, “A Theoretical Basis
for a Biopharmaceutic Drug Classification: The Correlation of in Vitro Drug
Product Dissolution and in Vivo Bioavailability,” Pharmaceutical Research: An
Official Journal of the American Association of Pharmaceutical Scientists, vol. 12,
no. 3. pp. 413–420, 1995, doi: 10.1023/A:1016212804288.
[77] A. Charalabidis, M. Sfouni, C. Bergström, and P. Macheras, “The
Biopharmaceutics Classification System (BCS) and the Biopharmaceutics Drug
Disposition Classification System (BDDCS): Beyond guidelines,” Int. J. Pharm.,
vol. 566, no. April, pp. 264–281, 2019, doi: 10.1016/j.ijpharm.2019.05.041.
[78] S. Baghel, H. Cathcart, and N. J. O. Reilly, “Polymeric Amorphous Solid
Dispersions : A Review of Amorphization , Crystallization , Stabilization , Solid-
State Characterization , and Aqueous Solubilization of Biopharmaceutical Classi
fi cation System Class II Drugs,” J. Pharm. Sci., 2016, doi:
10.1016/j.xphs.2015.10.008.
[79] K. Göke et al., “European Journal of Pharmaceutics and Biopharmaceutics Novel
strategies for the formulation and processing of poorly water- soluble drugs,” Eur.
J. Pharm. Biopharm., vol. 126, pp. 40–56, 2018, doi: 10.1016/j.ejpb.2017.05.008.
[80] A. Keeley et al., “In Vitro Dissolution Model Can Predict the in Vivo Taste
Masking Performance of Coated Multiparticulates,” Mol. Pharm., vol. 16, no. 5,

351
pp. 2095–2105, 2019, doi: 10.1021/acs.molpharmaceut.9b00060.
[81] X. Nsabagasani et al., “The ‘child size medicines’ concept: Policy provisions in
Uganda,” J. Pharm. Policy Pract., vol. 8, no. 1, pp. 1–9, 2015, doi:
10.1186/s40545-015-0025-7.
[82] V. Klingmann et al., “Acceptability of an orodispersible film compared to syrup
in neonates and infants: A randomized controlled trial,” Eur. J. Pharm. Biopharm.,
vol. 151, no. December 2019, pp. 239–245, 2020, doi: 10.1016/j.ejpb.2020.03.018.
[83] European Commission, “State of Paediatric Medicines in the EU: 10 years of the
EU Paediatric Regulation,” DG Heal. Consum., pp. 1–17, 2017.
[84] V. Ivanovska, C. M. A. Rademaker, L. Van Dijk, and A. K. Mantel-Teeuwisse,
“Pediatric drug formulations: A review of challenges and progress,” Pediatrics,
vol. 134, no. 2, pp. 361–372, 2014, doi: 10.1542/peds.2013-3225.
[85] K. Vithani and D. Douroumis, “Hot-melt extruded lipidic pellets for pediatric
applications : An investigation of the e ff ects and stability on drug dissolution,” J.
Drug Deliv. Sci. Technol., vol. 49, no. August 2018, pp. 43–49, 2019, doi:
10.1016/j.jddst.2018.10.033.
[86] R. Ternik et al., “Assessment of swallowability and palatability of oral dosage
forms in children: Report from an M-CERSI pediatric formulation workshop,” Int.
J. Pharm., vol. 536, no. 2, pp. 570–581, 2018, doi: 10.1016/j.ijpharm.2017.08.088.
[87] L. Freerks, J. Sommerfeldt, P. C. Löper, and S. Klein, “Safe, swallowable and
palatable paediatric mini-tablet formulations for a WHO model list of essential
medicines for children compound – A promising starting point for future PUMA
applications,” Eur. J. Pharm. Biopharm., vol. 156, no. August, pp. 11–19, 2020,
doi: 10.1016/j.ejpb.2020.08.014.
[88] N. Mendonsa et al., “Manufacturing strategies to develop amorphous solid
dispersions: An overview,” J. Drug Deliv. Sci. Technol., vol. 55, no. December
2019, p. 101459, 2020, doi: 10.1016/j.jddst.2019.101459.
[89] G. C. Bazzo, B. R. Pezzini, and H. K. Stulzer, “Eutectic mixtures as an approach
to enhance solubility , dissolution rate and oral bioavailability of poorly water-
soluble drugs,” Int. J. Pharm., vol. 588, no. May, p. 119741, 2020, doi:
10.1016/j.ijpharm.2020.119741.

352
[90] A. Batra, D. Desai, and A. T. M. Serajuddin, “Conversion of α-lactose
monohydrate to anhydrous form with superior tabletability by twin-screw
extrusion at elevated temperature,” Int. J. Pharm., vol. 588, no. July, p. 119790,
2020, doi: 10.1016/j.ijpharm.2020.119790.
[91] S. Jacob and A. B. Nair, “Cyclodextrin complexes : Perspective from drug delivery
and formulation,” no. May, pp. 201–217, 2018, doi: 10.1002/ddr.21452.
[92] A. Ramrao, T. Id, and J. N. Yadav, “A Review on Solid Dispersion and Carriers
Used Therein for Solubility Enhancement of Poorly Water Soluble Drugs,” Tabriz
Univ. Med. Sci., vol. 10, no. 3, pp. 359–369, 2020, doi: 10.34172/apb.2020.044.
[93] J. Keiser, H. Sayed, M. El-ghanam, H. Sabry, S. Anani, and A. El-wakeel,
“Efficacy and Safety of Artemether in the Treatment of Chronic Fascioliasis in
Egypt : Exploratory Phase-2 Trials,” vol. 5, no. 9, 2011, doi:
10.1371/journal.pntd.0001285.
[94] S. E. Gerrard, J. Walsh, N. Bowers, S. Salunke, and S. Hershenson, “Innovations
in Pediatric Drug Formulations and Administration Technologies for Low
Resource Settings,” 2019.
[95] W. H. O. E. Committee, W. H. O. M. List, E. Medicines, W. H. O. M. List, and E.
Medicines, “THE SELECTION AND USE OF ESSENTIAL MEDICINES Report
of the WHO Expert Committee , 2009 ( including the 16th WHO Model List of
Essential Medicines and the 2nd WHO Model List of Essential Medicines for
Children ),” 2009.
[96] W. H. O. E. Committee, W. H. O. M. List, E. Medicines, M. List, and E. Medicines,
“The Selection and Use of Essential Medicines,” 2017.
[97] B. Group, “BNF for Children. The essencial resource for clinical use of medicines
in children,” UK.
[98] V. Anand, M. Kataria, V. Kukkar, V. Saharan, and P. K. Choudhury, “The latest
trends in the taste assessment of pharmaceuticals,” Drug Discov. Today, vol. 12,
no. 5–6, pp. 257–265, 2007, doi: 10.1016/j.drudis.2007.01.010.
[99] P. Kozarewicz, “Regulatory perspectives on acceptability testing of dosage forms
in children,” Int. J. Pharm., vol. 469, no. 2, pp. 245–248, 2014, doi:
10.1016/j.ijpharm.2014.03.057.

353
[100] European Medicines Agency (EMA), “Guideline on pharmaceutical development
of medicines for paediatric use,” European Medicines Agency, vol. rev 2. London,
UK, pp. 1–24, 2013, [Online]. Available:
https://www.ema.europa.eu/en/documents/scientific-guideline/guideline-
pharmaceutical-development-medicines-paediatric-use_en.pdf.
[101] M. Moreira and M. Sarraguça, “How can oral paediatric formulations be
improved? A challenge for the XXI century,” Int. J. Pharm., vol. 590, no. July, p.
119905, 2020, doi: 10.1016/j.ijpharm.2020.119905.
[102] F. Rodieux, M. Wilbaux, J. N. Van Den Anker, and M. Pfister, “Effect of Kidney
Function on Drug Kinetics and Dosing in Neonates , Infants , and Children,” Clin.
Pharmacokinet., 2015, doi: 10.1007/s40262-015-0298-7.
[103] J. T. Coulibaly, G. Panic, K. D. Silué, J. Kovač, J. Hattendorf, and J. Keiser,
“Efficacy and safety of praziquantel in preschool-aged and school-aged children
infected with Schistosoma mansoni: a randomised controlled, parallel-group, dose-
ranging, phase 2 trial,” Lancet Glob. Heal., vol. 5, no. 7, pp. e688–e698, 2017, doi:
10.1016/S2214-109X(17)30187-0.
[104] M. K. Freeman, W. White, and M. Iranikhah, “Tablet Splitting: A Review of
Weight and Content Uniformity,” Consult. Pharm. may, vol. 27, no. 5, pp. 341–
352, 2012.
[105] J.-P. R. & M. P. Charlotte Verrue, Els Mehuys, Koen Boussery, “Tablet-splitting :
a common yet not so innocent practice,” J. Adv. Nurs., vol. 67, no. 1, pp. 26–32,
2010, doi: 10.1111/j.1365-2648.2010.05477.x.
[106] H. R. Devantier et al., “Quantitative assessment of TRPM5-dependent oral
aversiveness of pharmaceuticals using a mouse brief-access taste aversion assay,”
Behav. Pharmacol., vol. 19, no. 7, pp. 673–682, 2008, doi:
10.1097/FBP.0b013e3283123cd6.
[107] S. M. Hanning, F. L. Lopez, I. C. K. Wong, T. B. Ernest, C. Tuleu, and M. Orlu
Gul, “Patient centric formulations for paediatrics and geriatrics: Similarities and
differences,” Int. J. Pharm., vol. 512, no. 2, pp. 355–359, 2016, doi:
10.1016/j.ijpharm.2016.03.017.
[108] E. Grossi, F. Pace, and R. Stockbrugger, “Human nutrition from the

354
gastroenterologist’s perspective: Lessons from expo milano 2015,” Hum. Nutr.
From Gastroenterol. Perspect. Lessons From Expo Milano 2015, pp. 1–213, 2016,
doi: 10.1007/978-3-319-30361-1.
[109] J. Walsh et al., “Playing hide and seek with poorly tasting paediatric medicines :
Do not forget the excipients ☆,” Adv. Drug Deliv. Rev., vol. 73, pp. 14–33, 2014,
doi: 10.1016/j.addr.2014.02.012.
[110] C. S. Mennella JA, Spector AC, Reed DR, “Bad taste of medicines,” Clin Ther,
vol. 35, no. 8, pp. 1225–1246, 2013, doi: 10.1016/j.clinthera.2013.06.007.The.
[111] R. Ternik et al., “Assessment of swallowability and palatability of oral dosage
forms in children: Report from an M-CERSI pediatric formulation workshop,” Int.
J. Pharm., vol. 536, no. 2, pp. 570–581, 2018, doi: 10.1016/j.ijpharm.2017.08.088.
[112] A. A. Lee and C. Owyang, Sugars, sweet taste receptors, and brain responses.
Elsevier Inc., 2019.
[113] R. Bala, S. badjatya, and R. Madaan, “Strategies practiced to perk up oral
palatability and acceptance of bitter drugs,” J. Drug Deliv. Sci. Technol., vol. 56,
no. February, p. 101580, 2020, doi: 10.1016/j.jddst.2020.101580.
[114] A. H. A. Mohamed-Ahmed, J. Soto, T. Ernest, and C. Tuleu, “Non-human tools
for the evaluation of bitter taste in the design and development of medicines: A
systematic review,” Drug Discov. Today, vol. 21, no. 7, pp. 1170–1180, 2016, doi:
10.1016/j.drudis.2016.05.014.
[115] C. P. Milne and J. B. Bruss, “The economics of pediatric formulation development
for off-patent drugs,” Clin. Ther., vol. 30, no. 11, pp. 2133–2145, 2008, doi:
10.1016/j.clinthera.2008.11.019.
[116] R. V. Tiwari, A. N. Polk, H. Patil, X. Ye, M. B. Pimparade, and M. A. Repka, “Rat
Palatability Study for Taste Assessment of Caffeine Citrate Formulation Prepared
via Hot-Melt Extrusion Technology,” AAPS PharmSciTech, vol. 18, no. 2, pp.
341–348, 2017, doi: 10.1208/s12249-015-0447-1.
[117] A. V Keating, J. Soto, C. Tuleu, C. Forbes, M. Zhao, and D. Q. M. Craig, “Solid
state characterisation and taste masking ef fi ciency evaluation of polymer based
extrudates of isoniazid for paediatric administration,” Int. J. Pharm., vol. 536, no.
2, pp. 536–546, 2018, doi: 10.1016/j.ijpharm.2017.07.008.

355
[118] M. Münster, “Paediatric drug development for praziquantel,” 2018.
[119] J. Soto et al., “Rats can predict aversiveness of Active Pharmaceutical
Ingredients,” Eur. J. Pharm. Biopharm., vol. 133, no. August, pp. 77–84, 2018,
doi: 10.1016/j.ejpb.2018.09.027.
[120] S. D.-B. Gesine Winzenburg∗, “Industry perspective on palatability testing in
children—Two case studies,” Tech. Res. Dev. Novartis Pharma AG, Basel CH
4056, Switz., vol. 2012, no. 435, pp. 131–151, 2012.
[121] A. Riul, C. A. R. Dantas, C. M. Miyazaki, and O. N. Oliveira, “Recent advances
in electronic tongues,” Analyst, vol. 135, no. 10, pp. 2481–2495, 2010, doi:
10.1039/c0an00292e.
[122] K. C. Berridge, “Measuring hedonic impact in animals and infants: Microstructure
of affective taste reactivity patterns,” Neurosci. Biobehav. Rev., vol. 24, no. 2, pp.
173–198, 2000, doi: 10.1016/S0149-7634(99)00072-X.
[123] S. Gittings, N. Turnbull, C. J. Roberts, and P. Gershkovich, “Dissolution
methodology for taste masked oral dosage forms,” J. Control. Release, vol. 173,
no. 1, pp. 32–42, 2014, doi: 10.1016/j.jconrel.2013.10.030.
[124] D. H. Choi, N. A. Kim, T. S. Nam, S. Lee, and S. H. Jeong, “Evaluation of taste-
masking effects of pharmaceutical sweeteners with an electronic tongue system,”
Drug Dev. Ind. Pharm., vol. 40, no. 3, pp. 308–317, 2014, doi:
10.3109/03639045.2012.758636.
[125] M. Maniruzzaman, J. S. Boateng, M. Bonnefille, A. Aranyos, J. C. Mitchell, and
D. Douroumis, “Taste masking of paracetamol by hot-melt extrusion: An in vitro
and in vivo evaluation,” Eur. J. Pharm. Biopharm., vol. 80, no. 2, pp. 433–442,
2012, doi: 10.1016/j.ejpb.2011.10.019.
[126] M. Guhmann, M. Preis, F. Gerber, N. Pöllinger, J. Breitkreutz, and W. Weitschies,
“Development of oral taste masked diclofenac formulations using a taste sensing
system,” Int. J. Pharm., vol. 438, no. 1–2, pp. 81–90, 2012, doi:
10.1016/j.ijpharm.2012.08.047.
[127] G. A. Campbell et al., “Evaluating the taste masking effectiveness of various
flavors in a stable formulated pediatric suspension and solution using the Astree
trade; electronic tongue,” Powder Technol., vol. 224, pp. 109–123, 2012, doi:

356
10.1016/j.powtec.2012.02.038.
[128] H. Nakamura, S. Uchida, T. Sugiura, and N. Namiki, “The prediction of the
palatability of orally disintegrating tablets by an electronic gustatory system,” Int.
J. Pharm., vol. 493, no. 1–2, pp. 305–312, 2015, doi:
10.1016/j.ijpharm.2015.07.056.
[129] Y. Deng, L. Shen, Y. Yang, and J. Shen, “Development of nanoparticle-based
orodispersible palatable pediatric formulations,” Int. J. Pharm., vol. 596, no.
January, p. 120206, 2021, doi: 10.1016/j.ijpharm.2021.120206.
[130] M. Wesoły, M. Zabadaj, A. Amelian, K. Winnicka, W. Wróblewski, and P. Ciosek,
“Tasting cetirizine-based microspheres with an electronic tongue,” Sensors
Actuators, B Chem., vol. 238, pp. 1190–1198, 2017, doi:
10.1016/j.snb.2016.06.147.
[131] K. Woertz, C. Tissen, P. Kleinebudde, and J. Breitkreutz, “A comparative study
on two electronic tongues for pharmaceutical formulation development,” J. Pharm.
Biomed. Anal., vol. 55, no. 2, pp. 272–281, 2011, doi: 10.1016/j.jpba.2011.02.002.
[132] J. B. KATHARINA WOERTZ, CORINNA TISSEN, PETER KLEINEBUDDE,
“Development of a Taste-Masked Generic Ibuprofen Suspension: Top-Down
Approach Guided by Electronic Tongue Measurements,” J. Pharm. Sci., vol. 100,
no. 10, pp. 4460–4470, 2011, doi: DOI 10.1002/jps.22629.
[133] L. I. Immohr et al., “Early pediatric formulation development with new chemical
entities: Opportunities of e-tongue besides human taste assessment,” Int. J.
Pharm., vol. 530, no. 1–2, pp. 201–212, 2017, doi: 10.1016/j.ijpharm.2017.07.069.
[134] J. C. Machado et al., “Efficient praziquantel encapsulation into polymer
microcapsules and taste masking evaluation using an electronic tongue,” Bull.
Chem. Soc. Jpn., vol. 91, no. 6, pp. 865–874, 2018, doi: 10.1246/bcsj.20180005.
[135] M. Pein, M. Preis, C. Eckert, and F. E. Kiene, “Taste-masking assessment of solid
oral dosage forms – A critical review,” Int. J. Pharm., vol. 465, no. 1–2, pp. 239–
254, 2014, doi: 10.1016/j.ijpharm.2014.01.036.
[136] M. W. J. Dodds, D. A. Johnson, and C. Yeh, “Health benefits of saliva : a review,”
pp. 223–233, 2005, doi: 10.1016/j.jdent.2004.10.009.
[137] S. T. Prajapati, P. B. Patel, and C. N. Patel, “Formulation and evaluation of

357
sublingual tablets containing Sumatriptan succinate,” vol. 2, no. 3, 2012, doi:
10.4103/2230-973X.104400.
[138] A. Lura, G. Tardy, and P. Kleinebudde, “Tableting of mini-tablets in comparison
with conventionally sized tablets : A comparison of tableting properties and tablet
dimensions,” vol. 2, no. November, 2020, doi: 10.1016/j.ijpx.2020.100061.
[139] V. Tumuluri, Pharmaceutical mini - tablets : a. Elsevier Inc., 2020.
[140] V. Klingmann et al., “Favorable Acceptance of Mini-Tablets Compared with
Syrup: A Randomized Controlled Trial in Infants and Preschool Children,” pp.
1728–1733, 2013, doi: 10.1016/j.jpeds.2013.07.014.
[141] A. Tsiligiannis, M. Sfouni, R. Nalda-molina, and A. Dokoumetzidis, “European
Journal of Pharmaceutical Sciences Optimization of a paediatric fixed dose
combination mini-tablet and dosing regimen for the first line treatment of
tuberculosis,” Eur. J. Pharm. Sci., vol. 138, no. June, p. 105016, 2019, doi:
10.1016/j.ejps.2019.105016.
[142] T. Huong, H. Thi, S. Lha, S. Pinto, and M. Flament, “Feasability of a new process
to produce fast disintegrating pellets as novel multiparticulate dosage form for
pediatric use,” vol. 496, pp. 842–849, 2015.
[143] S. Kayuni et al., “A systematic review with epidemiological update of male genital
schistosomiasis (MGS): A call for integrated case management across the health
system in sub-Saharan Africa,” Parasite Epidemiol. Control, vol. 4, p. e00077,
2019, doi: 10.1016/j.parepi.2018.e00077.
[144] T. Sangnim and K. Huanbutta, “Journal of Drug Delivery Science and Technology
Development and evaluation of taste-masked paracetamol chewable tablets using
a polymer and / or wax dispersion technique,” J. Drug Deliv. Sci. Technol., vol.
54, no. August, p. 101361, 2019, doi: 10.1016/j.jddst.2019.101361.
[145] G. G. Pereira, S. Figueiredo, and A. I. Fernandes, “Polymer Selection for Hot-Melt
Extrusion Coupled to Fused Deposition Modelling in Pharmaceutics,” 2020.
[146] T. Tagami, E. Ito, R. Kida, K. Hirose, T. Noda, and T. Ozeki, “3D printing of
gummy drug formulations composed of gelatin and an HPMC-based hydrogel for
pediatric use,” Int. J. Pharm., vol. 594, no. September 2020, p. 120118, 2021, doi:
10.1016/j.ijpharm.2020.120118.

358
[147] M. Elbadawi, B. Muñiz, F. K. H. Gavins, J. Jie, and S. Gaisford, “M3DISEEN : A
novel machine learning approach for predicting the 3D printability of medicines,”
Int. J. Pharm., vol. 590, no. September, p. 119837, 2020, doi:
10.1016/j.ijpharm.2020.119837.
[148] G. Chen, Y. Xu, P. Chi, L. Kwok, and L. Kang, “Pharmaceutical Applications of
3D Printing,” Addit. Manuf., vol. 34, no. November 2019, p. 101209, 2020, doi:
10.1016/j.addma.2020.101209.
[149] G. Chen, Y. Xu, P. Chi, L. Kwok, and L. Kang, “Pharmaceutical Applications of
3D Printing,” Addit. Manuf., vol. 34, no. April, p. 101209, 2020, doi:
10.1016/j.addma.2020.101209.
[150] B. Shaqour, A. Samaro, B. Verleije, K. Beyers, and C. Vervaet, “Production of
Drug Delivery Systems Using Fused Filament Fabrication : A Systematic
Review,” pp. 1–16, 2020.
[151] A. Melocchi et al., “A Graphical Review on the Escalation of Fused Deposition
Modeling ( FDM ) 3D Printing in the Pharmaceutical Field,” J. Pharm. Sci., vol.
109, no. 10, pp. 2943–2957, 2020, doi: 10.1016/j.xphs.2020.07.011.
[152] A. Goyanes, A. B. M. Buanz, A. W. Basit, and S. Gaisford, “Fused- fi lament 3D
printing ( 3DP ) for fabrication of tablets,” vol. 476, pp. 88–92, 2014, doi:
10.1016/j.ijpharm.2014.09.044.
[153] A. Ghanizadeh Tabriz et al., “3D printed bilayer tablet with dual controlled drug
release for tuberculosis treatment,” Int. J. Pharm., vol. 593, no. November 2020,
p. 120147, 2021, doi: 10.1016/j.ijpharm.2020.120147.
[154] A. Goyanes, P. Robles, A. Buanz, A. W. Basit, and S. Gaisford, “Effect of
geometry on drug release from 3D printed tablets,” Int. J. Pharm., vol. 494, no. 2,
pp. 657–663, 2015, doi: 10.1016/j.ijpharm.2015.04.069.
[155] K. Shi, J. P. Salvage, M. Maniruzzaman, and A. Nokhodchi, “Role of release
modifiers to modulate drug release from fused deposition modelling ( FDM ) 3D
printed tablets,” Int. J. Pharm., vol. 597, no. January, p. 120315, 2021, doi:
10.1016/j.ijpharm.2021.120315.
[156] A. Goyanes, N. Allahham, S. J. Trenfield, E. Stoyanov, S. Gaisford, and A. W.
Basit, “Direct powder extrusion 3D printing: Fabrication of drug products using a

359
novel single-step process,” Int. J. Pharm., vol. 567, no. May, 2019, doi:
10.1016/j.ijpharm.2019.118471.
[157] M. A. Gonzalez, M. V. Ramírez Rigo, and N. L. Gonzalez Vidal, “Praziquantel
systems with improved dissolution rate obtained by high pressure
homogenization,” Mater. Sci. Eng. C, vol. 93, no. September 2017, pp. 28–35,
2018, doi: 10.1016/j.msec.2018.07.050.
[158] S. G. Rodrigues, I. Chaves, N. Ferreira, S. De Melo, and M. B. De Jesus,
“Computational analysis and physico-chemical characterization of an inclusion
compound between praziquantel and methyl- β -cyclodextrin for use as an
alternative in the treatment of s ... Computational analysis and physico-chemical
characterization of an i,” J. Incl. Phenom., no. May, 2011, doi: 10.1007/s10847-
010-9852-y.
[159] G. Becket, L. J. Schep, and M. Yee, “Improvement of the in vitro dissolution of
praziquantel by complexation with a - , b - and g -cyclodextrins,” vol. 179, pp. 65–
71, 1999.
[160] W. W. Shuyu Xie, Baoliang Pan, Zhou, Baoxin shi, Zhuangzhi Zhang Xu, Zhang
Ming, “Solid lipid nanoparticle suspension enhanced the therapeutic efficacy of
praziquantel against tapeworm,” Int. J. Nanomedicine, pp. 2367–2374, 2011.
[161] L. N. Andrade et al., “Praziquantel-loaded solid lipid nanoparticles: Production,
physicochemical characterization, release profile, cytotoxicity and in vitro activity
against Schistosoma mansoni,” J. Drug Deliv. Sci. Technol., vol. 58, no. June 2019,
p. 101784, 2020, doi: 10.1016/j.jddst.2020.101784.
[162] G. C. Bazzo, G. Tambosi, E. C. Brüske, and M. Zétola, “Evaluation of enhanced
aqueous solubility of praziquantel incorporated in poly (3- hydroxybutyrate) and
Eudragit® E microspheres,” Acta Sci., pp. 91–96, 2013, doi:
10.4025/actascihealthsci.v35i1.10673.
[163] R. M. Mainardes, M. Palmira, D. Gremião, and R. C. Evangelista,
“Thermoanalytical study of praziquantel-loaded PLGA nanoparticles,” vol. 42,
2006.
[164] L. B. Da Fonseca et al., “Development of a brazilian nanoencapsulated drug for
schistosomiasis treatment,” Vigilância Sanitária em Debate, vol. 1, no. 4, pp. 4–

360
10, 2013, doi: 10.3395/vd.v1i4.111en.
[165] Lorena Menezes Vieira, “ENCAPSULAMENTO IN SITU DE PRAZIQUANTEL
NA POLIMERIZAÇÃO EM SUSPENSÃO DO METACRILATO DE METILA
PARA A PRODUÇÃO DE SISTEMAS DE LIBERAÇÃO CONTROLADA,”
UNIVERSIDADE FEDERAL DO RIO DE JANEIRO COMO, 2014.
[166] J. B. Alves, T. Franckini Paiva, V. M. Salim, H. Conceição Ferraz, and J. C. Pinto,
“ In situ encapsulation of praziquantel through methyl
methacrylate/diethylaminoethyl methacrylate and MMA / DMAEMA
miniemulsion copolymerizations in presence of distinct ionic surfactants ,” SPE
Polym., vol. 2, no. 2, pp. 110–121, 2021, doi: 10.1002/pls2.10037.
[167] S. T. and S. T. Paloma de la Torre, “Preparation, dissolution and characterization
of praziquantel solid dispersions,” Chem. Pharm. Bull, vol. 47, no. 11, pp. 1629–
1633, 1999, [Online]. Available: http://www.mendeley.com/research/geology-
volcanic-history-eruptive-style-yakedake-volcano-group-central-japan/.
[168] A. Borrego-s et al., “Ground Calcium Carbonate as a Low Cost and Biosafety
Excipient for Solubility and Dissolution Improvement of Praziquantel,” 2019.
[169] S. Orlandi, J. Priotti, H. P. Diogo, D. Leonardi, C. J. Salomon, and T. G. Nunes,
“Structural Elucidation of Poloxamer 237 and Poloxamer 237 / Praziquantel Solid
Dispersions : Impact of Poly ( Vinylpyrrolidone ) over Drug Recrystallization and
Dissolution Research Article Structural Elucidation of Poloxamer 237 and
Poloxamer 237 / Prazi,” no. January, 2018, doi: 10.1208/s12249-017-0946-3.
[170] B. Om, S. Amruta, D. Shashikant, P. Rohini, R. Vinita, and K. Priyanka, “Design
and statistical optimisation of praziquantel tablets by using solid dispersion
approach,” no. June, pp. 83–92, 2015, doi: 10.4103/0973-8398.154689.
[171] M. V. Chaud et al., “Solid dispersions with hydrogenated castor oil increase
solubility , dissolution rate and intestinal absorption of praziquantel,” vol. 46,
2010.
[172] F. C. Cunha, “Separation of praziquantel enantiomers using simulated moving bed
chromatographic unit with performance designed for semipreparative
applications,” no. March, pp. 9–13, 2019, doi: 10.1002/chir.23084.
[173] X. Wang, S. Du, R. Zhang, X. Jia, T. Yang, and X. Zhang, “Drug-drug cocrystals :

361
Opportunities and challenges,” Asian J. Pharm. Sci., no. xxxx, 2020, doi:
10.1016/j.ajps.2020.06.004.
[174] R. Thakuria, A. Delori, W. Jones, M. P. Lipert, L. Roy, and N. Rodríguez-hornedo,
“Pharmaceutical cocrystals and poorly soluble drugs,” Int. J. Pharm., vol. 453, no.
1, pp. 101–125, 2013, doi: 10.1016/j.ijpharm.2012.10.043.
[175] C. Jacobs, O. Kayser, and R. H. Muller, “Nanosuspensions as particulate drug
formulations in therapy Rationale for development and what we can expect for the
future,” vol. 47, pp. 3–19, 2001.
[176] V. Chikhalia et al., “The effect of crystal morphology and mill type on milling
induced crystal disorder,” vol. 7, pp. 19–26, 2005, doi: 10.1016/j.ejps.2005.08.013.
[177] E. C. Arrúa, M. J. G. Ferreira, C. J. Salomon, and T. G. Nunes, “Elucidating the
guest-host interactions and complex formation of praziquantel and cyclodextrin
derivatives by 13 C and 15 N solid-state NMR spectroscopy,” Int. J. Pharm., vol.
496, no. 2, pp. 812–821, 2015, doi: 10.1016/j.ijpharm.2015.11.026.
[178] S. Xie et al., “Formulation, characterization and pharmacokinetics of praziquantel-
loaded hydrogenated castor oil solid lipid nanoparticles,” Nanomedicine, vol. 5,
pp. 693–701, 2010.
[179] B. Perissutti et al., “An explorative analysis of process and formulation variables
affecting comilling in a vibrational mill : The case of praziquantel,” Int. J. Pharm.,
vol. 533, no. 2, pp. 402–412, 2017, doi: 10.1016/j.ijpharm.2017.05.053.
[180] M. Malhado et al., “Journal of Pharmaceutical and Biomedical Analysis
Preclinical pharmacokinetic evaluation of praziquantel loaded in poly ( methyl
methacrylate ) nanoparticle using a HPLC – MS / MS,” vol. 117, pp. 405–412,
2016, doi: 10.1016/j.jpba.2015.09.023.
[181] B. Kumari and H. Bishnoi, “Review Article SOLID DISPERSION : ITS TYPES
AND MECHANISM OF J ournal of P harma R esearch,” no. March, 2019, doi:
10.5281/zenodo.2594669.
[182] A. Kapourani, E. Vardaka, K. Katopodis, and K. Kachrimanis, “Crystallization
tendency of APIs possessing di ff erent thermal and glass related properties in
amorphous solid dispersions,” Int. J. Pharm., vol. 579, no. February, p. 119149,
2020, doi: 10.1016/j.ijpharm.2020.119149.

362
[183] S. Shah, S. Maddineni, J. Lu, and M. A. Repka, “Melt extrusion with poorly soluble
drugs,” Int. J. Pharm., vol. 453, no. 1, pp. 233–252, 2013, doi:
10.1016/j.ijpharm.2012.11.001.
[184] B. L. de A. Costa, “Generation of high drug loading amorphous solid dispersions
by different manufacturing processes,” 2017.
[185] H. Veith, F. Wiechert, C. Luebbert, and G. Sadowski, “Combining crystalline and
polymeric excipients in API solid dispersions – Opportunity or risk ?,” Eur. J.
Pharm. Biopharm., vol. 158, no. September 2020, pp. 323–335, 2021, doi:
10.1016/j.ejpb.2020.11.025.
[186] A. Newman, Rational Design for Amorphous Solid Dispersions. Elsevier Inc.,
2017.
[187] P. Pandi, R. Bulusu, N. Kommineni, W. Khan, and M. Singh, “Amorphous solid
dispersions: An update for preparation, characterization, mechanism on
bioavailability, stability, regulatory considerations and marketed products,” Int. J.
Pharm., vol. 586, no. June, p. 119560, 2020, doi: 10.1016/j.ijpharm.2020.119560.
[188] P. Kanaujia, P. Poovizhi, W. K. Ng, and R. B. H. Tan, “Amorphous formulations
for dissolution and bioavailability enhancement of poorly soluble APIs,” Powder
Technol., vol. 285, pp. 2–15, 2015, doi: 10.1016/j.powtec.2015.05.012.
[189] K. Kogermann et al., “Dissolution testing of amorphous solid dispersions,” Int. J.
Pharm., vol. 444, no. 1–2, pp. 40–46, 2013, doi: 10.1016/j.ijpharm.2013.01.042.
[190] M. Tobyn et al., “Amorphous Drug – PVP Dispersions : Application of Theoretical
, Thermal and Spectroscopic Analytical Techniques to the Study of a Molecule
With Intermolecular Bonds in Both the Crystalline and Pure Amorphous State,” J.
Am. Pharm. Assoc., vol. 98, no. 9, pp. 3456–3468, 2009, doi: 10.1002/jps.21738.
[191] M. Savolainen et al., “Better understanding of dissolution behaviour of amorphous
drugs by in situ solid-state analysis using Raman spectroscopy,” Eur. J. Pharm.
Biopharm., vol. 71, no. 1, pp. 71–79, 2009, doi: 10.1016/j.ejpb.2008.06.001.
[192] P. J. Skrdla, P. D. Floyd, and P. C. D. Orco, “The amorphous state : first-principles
derivation of the Gordon – Taylor equation for direct prediction of the glass
transition temperature of mixtures ; glass formers ; physical basis of the ‘“ Rule of
2 / 3 ,”’” Phys. Chem. Chem. Phys., vol. 19, pp. 20523–20532, 2017, doi:

363
10.1039/C7CP04124A.
[193] O. Jennotte, N. Koch, A. Lechanteur, and B. Evrard, “Three-dimensional printing
technology as a promising tool in bioavailability enhancement of poorly water-
soluble molecules : A review,” Int. J. Pharm., vol. 580, no. December 2019, p.
119200, 2020, doi: 10.1016/j.ijpharm.2020.119200.
[194] M. Hanada, S. V Jermain, X. Lu, Y. Su, and R. O. Williams, “Predicting physical
stability of ternary amorphous solid dispersions using speci fi c mechanical energy
in a hot melt extrusion process ☆,” Int. J. Pharm., vol. 548, no. 1, pp. 571–585,
2018, doi: 10.1016/j.ijpharm.2018.07.029.
[195] S. Xu and W. Dai, “Drug precipitation inhibitors in supersaturable formulations,”
Int. J. Pharm., vol. 453, no. 1, pp. 36–43, 2013, doi:
10.1016/j.ijpharm.2013.05.013.
[196] K. Kachrimanis and I. Nikolakakis, “Polymers as Formulation Excipients for Hot-
Melt Extrusion Processing of Pharmaceuticals,” in Handbook of Polymers for
Pharmaceutical Technologies, vol. 2, 2015, pp. 121–149.
[197] P. J. Skrdla, P. D. Floyd, and P. C. D. Orco, “Predicting the solubility enhancement
of amorphous drugs and related phenomena using basic thermodynamic principles
and semi-empirical kinetic models,” Int. J. Pharm., vol. 567, no. July, p. 118465,
2019, doi: 10.1016/j.ijpharm.2019.118465.
[198] B. C. Hancock and M. Parks, “What is the True Solubility Advantage for
Amorphous Pharmaceuticals ?,” vol. 17, no. 4, 2000.
[199] R. Han et al., “Insight into the Dissolution Molecular Mechanism of Ternary Solid
Dispersions by Combined Experiments and Molecular Simulations,” AAPS
PharmSciTech, vol. 20, no. 7, pp. 10–20, 2019, doi: 10.1208/s12249-019-1486-9.
[200] S. Huang, C. Mao, R. O. W. Iii, and C. Yang, “Solubility Advantage ( and
Disadvantage ) of Pharmaceutical Amorphous Solid Dispersions,” J. Pharm. Sci.,
pp. 1–13, 2016, doi: 10.1016/j.xphs.2016.08.017.
[201] A. Alhayali, “In Vitro Solubility and Supersaturation Behavior of Supersaturating
Drug Delivery Systems,” Luleå University of Technology May.
[202] A. Schittny, “Mechanisms of increased bioavailability through amorphous solid
dispersions : a review,” vol. 27, no. 1, pp. 110–127, 2020, doi:

364
10.1080/10717544.2019.1704940.
[203] G. Zogra and A. Newman, “Interrelationships Between Structure and the
Properties of Amorphous Solids of Pharmaceutical Interest,” vol. 106, pp. 5–27,
2017, doi: 10.1016/j.xphs.2016.05.001.
[204] T. Pas, S. Verbert, B. Appeltans, and G. Van Den Mooter, “The influence of
crushing amorphous solid dispersion dosage forms on the in-vitro dissolution
kinetics,” Int. J. Pharm., vol. 573, no. November 2019, p. 118884, 2020, doi:
10.1016/j.ijpharm.2019.118884.
[205] R. B. Chavan, S. Rathi, V. G. S. S. Jyothi, and N. R. Shastri, “Cellulose based
polymers in development of amorphous solid dispersions,” Asian J. Pharm. Sci.,
vol. 14, no. 3, pp. 248–264, 2019, doi: 10.1016/j.ajps.2018.09.003.
[206] A. R. Nair et al., “Review Article Overview of Extensively Employed Polymeric
Carriers in Solid Dispersion Technology,” 2020, doi: 10.1208/s12249-020-01849-
z.
[207] T. D. Vaibhav Sihorkara, The role of polymers and excipients in developing
amorphous solid dispersions: An industrial perspective. Elsevier Inc., 2020.
[208] S. B. Teja, S. P. Patil, G. Shete, S. Patel, and A. K. Bansal, “Drug-excipient
behavior in polymeric amorphous solid dispersions .,” vol. 4, no. September, pp.
70–94, 2013.
[209] K. Lehmkemper, S. O. Kyeremateng, O. Heinzerling, M. Degenhardt, and G.
Sadowski, “Long-Term Physical Stability of PVP- and PVPVA-Amorphous Solid
Dispersions,” 2017, doi: 10.1021/acs.molpharmaceut.6b00763.
[210] D. Feng et al., “Polymer – Surfactant System Based Amorphous Solid Dispersion :
Precipitation Inhibition and Bioavailability Enhancement of Itraconazole,” no. 1,
pp. 1–15, 2018, doi: 10.3390/pharmaceutics10020053.
[211] H. J. Jung et al., “Improved oral absorption of tacrolimus by a solid dispersion with
hypromellose and sodium lauryl sulfate,” Int. J. Biol. Macromol., vol. 83, pp. 282–
287, 2016, doi: 10.1016/j.ijbiomac.2015.11.063.
[212] J. Chen, J. D. Ormes, J. D. Higgins, and L. S. Taylor, “Impact of Surfactants on
the Crystallization of Aqueous Suspensions of Celecoxib Amorphous Solid
Dispersion Spray Dried Particles,” 2015, doi: 10.1021/mp5006245.

365
[213] D. Hoon et al., “Improved oral absorption of dutasteride via Soluplus 1 -based
supersaturable self-emulsifying drug delivery system ( S-SEDDS ),” vol. 478, pp.
341–347, 2015.
[214] S. P. Chaudhari and R. P. Dugar, “Application of surfactants in solid dispersion
technology for improving solubility of poorly water soluble drugs Journal of Drug
Delivery Science and Technology Application of surfactants in solid dispersion
technology for improving solubility of poorly w,” J. Drug Deliv. Sci. Technol., vol.
41, no. February 2018, pp. 68–77, 2017, doi: 10.1016/j.jddst.2017.06.010.
[215] W. Zhang, S. S. Hate, D. J. Russell, H. H. Hou, and K. Nagapudi, “Impact of
Surfactant and Surfactant-Polymer Interaction on Desupersaturation of
Clotrimazole,” J. Pharm. Sci., vol. 108, no. 10, pp. 3262–3271, 2019, doi:
10.1016/j.xphs.2019.05.035.
[216] A. Schittny, S. Philipp-bauer, P. Detampel, J. Huwyler, and M. Puchkov,
“Mechanistic insights into e ff ect of surfactants on oral bioavailability of
amorphous solid dispersions,” J. Control. Release, vol. 320, no. August 2019, pp.
214–225, 2020, doi: 10.1016/j.jconrel.2020.01.031.
[217] R. C. Rowe, P. J. Sheskey, and S. C. Owen, Handbook of Pharmaceutical
Excipients, 5th ed. London: Pharmaceutical Pres, 2006.
[218] C. Viet and P. C. Cho, “Application of D -α-tocopheryl polyethylene glycol 1000
succinate ( TPGS ) in transdermal and topical drug delivery systems ( TDDS ),” J.
Pharm. Investig., vol. 0, no. 0, p. 0, 2017, doi: 10.1007/s40005-016-0300-x.
[219] D. Hurley, M. Davis, G. M. Walker, J. G. Lyons, and C. L. Higginbotham, “The E
ff ect of Cooling on the Degree of Crystallinity , Solid-State Properties , and
Dissolution Rate of Multi-Component Hot-Melt Extruded Solid Dispersions,” no.
2004, 2020.
[220] Y. A. and M. S. François Hallouarda, Lyes Mehennic, Malika Lahiani-Skibaa,
“Solid Dispersions for Oral Administration : An Overview of the Methods for their
Preparation Solid Dispersions for Oral Administration : An Overview of the
Methods for their Preparation,” Curr. Pharm. Des., vol. 22, no. August, pp. 1–17,
2016, doi: 10.2174/138161282266616072.
[221] J. Knapik-kowalczuk, K. Chmiel, J. Pacułt, and K. Bialek, “Enhancement of the

366
Physical Stability of Amorphous Sildenafil in a Binary Mixture , with either a
Plasticizing or Antiplasticizing Compound,” pp. 23–28, 2020.
[222] A. Prudic, T. Kleetz, M. Korf, Y. Ji, and G. Sadowski, “In fl uence of Copolymer
Composition on the Phase Behavior of Solid Dispersions,” 2014.
[223] K. Deboyace and P. L. D. Wildfong, “The Application of Modeling and Prediction
to the Formation and Stability of Amorphous Solid Dispersions,” J. Pharm. Sci.,
vol. 107, no. 1, pp. 57–74, 2018, doi: 10.1016/j.xphs.2017.03.029.
[224] J. L. Calahan and F. Alvarez-nunez, “Characterization of Amorphous Solid
Dispersions of AMG 517 in HPMC-AS and Crystallization using Isothermal
Microcalorimetry By,” 2011.
[225] M. F. Simões, R. M. A. Pinto, and S. Simões, “Hot-melt extrusion in the
pharmaceutical industry : toward filing a new drug application,” Drug Discov.
Today, vol. 00, no. 00, 2019, doi: 10.1016/j.drudis.2019.05.013.
[226] F. C. Campbell, “Thermodynamics and Phase Diagrams,” pp. 41–72, 2012.
[227] D. Jeli, “Thermal Stability of Amorphous Solid Dispersions,” 2021.
[228] W. F. WEI LIU, , YU LIU, JIAOQI HUANG, ZHONGQUAN LIN,
XUANCHENG PAN, XIAOJUN ZENG, MARC LAMY DE LA CHAPELLE,
YANG ZHANG, “Identification and investigation of the vibrational properties of
crystalline and co- amorphous drugs with Raman and terahertz spectroscopy,” vol.
10, no. 8, pp. 4290–4304, 2019, doi: 10.1364/BOE.10.004290.
[229] D. G. Dastidar and G. Chakrabarti, Thermoresponsive Drug Delivery Systems,
Characterization and Application. Elsevier Inc., 2019.
[230] Y. Peng, D. D. Dussan, and R. Narain, Thermal, mechanical, and electrical
properties. 2020.
[231] N. R. Jadhav, V. L. Gaikwad, K. J. Nair, and H. M. Kadam, “Glass transition
temperature : Basics and application in pharmaceutical sector,” no. June, 2009, doi:
10.4103/0973-8398.55043.
[232] C. Wu and J. W. Mcginity, “Influence of Ibuprofen as a Solid-State Plasticizer in
Eudragit ® RS 30 D on the Physicochemical Properties of Coated Beads,” vol. 2,
no. 4, 2001.

367
[233] J. A. Baird and L. S. Taylor, “Evaluation of amorphous solid dispersion properties
using thermal analysis techniques ☆,” vol. 64, pp. 396–421, 2012, doi:
10.1016/j.addr.2011.07.009.
[234] V. Corrtelius T. Moynihan,” Allan J. Easteal, James Wilder, “Dependence of the
glass transition temperature on heating and cooling rate,” vol. 7, no. 26, 1974, doi:
10.1021/j100619a008.
[235] A. H. L. K. C.-L. HSU, D.R. HELDMAN, T.A. TAYLOR and ABSTRACT:,
“Influence of Cooling Rate on Glass Transition Temperature of Sucrose Solutions
and Rice Starch Gel,” vol. 68, no. 6, pp. 1–6, 2003.
[236] A. Newman and G. Zografi, “Commentary Commentary : Considerations in the
Measurement of Glass Transition Temperatures of Pharmaceutical Amorphous
Solids,” pp. 1–13, 2020, doi: 10.1208/s12249-019-1562-1.
[237] S. Janssens and G. Van Den Mooter, “Review : physical chemistry of solid
dispersions,” pp. 1571–1586, 2009, doi: 10.1211/jpp/61.12.0001.
[238] P. G. Royall, D. Q. M. Craig, and C. Doherty, “Characterisation of moisture uptake
effects on the glass transitional behaviour of an amorphous drug using modulated
temperature DSC,” vol. 192, pp. 39–46, 1999.
[239] R. Tanaka, Y. Hattori, Y. Horie, H. Kamada, and T. Nagato, “Characterization of
Amorphous Solid Dispersion of Pharmaceutical Compound with pH-Dependent
Solubility Prepared by Continuous-Spray Granulator,” doi:
10.3390/pharmaceutics11040159.
[240] M. Latreche, “Maîtrise de la stabilité physique des alliages moléculaires amorphes
pour optimiser l’efficacité des médicaments,” L’Université de Lille, 2019.
[241] S. Dedroog, T. Pas, B. Vergauwen, C. Huygens, and G. Van Den Mooter,
“Analysis Solid-state analysis of amorphous solid dispersions : Why DSC and
XRPD may not be regarded as stand-alone techniques,” J. Pharm. Biomed. Anal.,
vol. 178, p. 112937, 2020, doi: 10.1016/j.jpba.2019.112937.
[242] H. A. Schneider, “The Gordon-Taylor equation . Additivity and interaction in
compatible polymer blends,” vol. 1955, pp. 1941–1955, 1988.
[243] M. M. Knopp et al., “A Promising New Method to Estimate Drug-Polymer
Solubility at Room Temperature,” vol. 105, pp. 2621–2624, 2016, doi:

368
10.1016/j.xphs.2016.02.017.
[244] B. L. A. Costa, M. Sauceau, S. Del Confetto, R. Sescousse, and M. I. Ré,
“Determination of drug-polymer solubility from supersaturated spray-dried
amorphous solid dispersions : A case study with Efavirenz and Soluplus ®,” Eur.
J. Pharm. Biopharm., vol. 142, no. July 2018, pp. 300–306, 2019, doi:
10.1016/j.ejpb.2019.06.028.
[245] A. Karagianni, “Co-Amorphous Solid Dispersions for Solubility and Absorption
Improvement of Drugs : Composition , Preparation , Characterization and
Formulations for Oral Delivery,” 2018, doi: 10.3390/pharmaceutics10030098.
[246] and M. D. Aurélien Mahieu, JeanFrançois Willart,* Emeline Dudognon, Florence
Danede, “A New Protocol To Determine the Solubility of Drugs into Polymer
Matrixes,” Mol. Pharm., 2013.
[247] Y. E. Sun, J. Tao, G. G. Z. Zhang, and L. Yu, “Solubilities of Crystalline Drugs in
Polymers : An Improved Analytical Method and Comparison of Solubilities of
Indomethacin and Nifedipine in PVP , PVP / VA , and PVAc,” J. Pharm. Sci., vol.
99, no. 9, pp. 4023–4031, 2010, doi: 10.1002/jps.22251.
[248] Z. Yang, K. Nollenberger, J. Albers, and S. Qi, “Molecular Implications of Drug
− Polymer Solubility in Understanding the Destabilization of Solid Dispersions by
Milling,” 2014.
[249] E. Sawicki, “Solid dispersions in oncology : a solution to solubility-limited oral
drug absorption,” Universiteit Utrecht, 2017.
[250] N. Boersen, T. Lee, and H. Hui, Toxicology Studies. Elsevier Inc., 2013.
[251] A. Newman, Pharmaceutical amorphous solid dispersion. New Jersey, 2015.
[252] A. W. M. Navnit Shah, Harpreet Sandhu, Duk Soon Choi Hitesh Chokshi,
Amorphous Solid Dispersions Theory and Practice. London: Springer NewYork
Heidelberg Dordrecht London, 2014.
[253] D. D. Sun, H. Wen, and L. S. Taylor, “Non-Sink Dissolution Conditions for
Predicting Product Quality and In Vivo Performance of Supersaturating Drug
Delivery Systems,” J. Pharm. Sci., vol. 105, no. 9, pp. 2477–2488, 2016, doi:
10.1016/j.xphs.2016.03.024.

369
[254] K. Sugita and N. Takata, “Dose-Dependent Solubility – Permeability Interplay for
Poorly Soluble Drugs under Non-Sink Conditions,” pp. 297–307, 2021.
[255] S. Petralito et al., “Apparent Solubility and Dissolution Profile at Non-Sink
Conditions as Quality Improvement Tools,” 2010.
[256] M. Descamps and J. F. Willart, “Perspectives on the amorphisation / milling
relationship in pharmaceutical materials ☆,” Adv. Drug Deliv. Rev., vol. 100, pp.
51–66, 2016, doi: 10.1016/j.addr.2016.01.011.
[257] M. Descamps, A. Aumelas, S. Desprez, and J. F. Willart, “The amorphous state of
pharmaceuticals obtained or transformed by milling : Sub-Tg features and
rejuvenation,” vol. 407, pp. 72–80, 2015, doi: 10.1016/j.jnoncrysol.2014.08.055.
[258] M. Descamps, J. F. Willart, E. Dudognon, and V. Caron, “Transformation of
Pharmaceutical Compounds upon Milling and Comilling : The Role of T g,” vol.
96, no. 5, pp. 1398–1407, 2007, doi: 10.1002/jps.
[259] S. Dedroog, C. Huygens, and G. Van Den Mooter, “Chemically identical but
physically different : A comparison of spray drying , hot melt extrusion and cryo-
milling for the formulation of high drug loaded amorphous solid dispersions of
naproxen,” Eur. J. Pharm. Biopharm., vol. 135, no. November 2018, pp. 1–12,
2019, doi: 10.1016/j.ejpb.2018.12.002.
[260] M. Latreche, J. Willart, M. Guerain, H. Alain, and F. Dan, “Using Milling to
Explore Physical States : The Amorphous and Polymorphic Forms of Sulindac,”
vol. 108, pp. 2635–2642, 2019, doi: 10.1016/j.xphs.2019.03.017.
[261] B. Wang et al., “A critical review of spray-dried amorphous pharmaceuticals :
Synthesis , analysis and application,” Int. J. Pharm., vol. 594, no. October 2020,
p. 120165, 2021, doi: 10.1016/j.ijpharm.2020.120165.
[262] M. Ré, “Formulating Drug Delivery Systems by Spray Drying,” Dry. Technol. An
Int. J., vol. 24, no. 4, pp. 433–446, 2007, doi: 10.1080/07373930600611877.
[263] A. Paudel, Z. A. Worku, J. Meeus, S. Guns, and G. Van Den Mooter,
“Manufacturing of solid dispersions of poorly water soluble drugs by spray drying :
Formulation and process considerations,” Int. J. Pharm., vol. 453, no. 1, pp. 253–
284, 2013, doi: 10.1016/j.ijpharm.2012.07.015.
[264] D. S. / M. Y. / D. Isadiartuti1, “Ternary solid dispersion to improve solubility and

370
dissolution of meloxicam Abstract :,” J. Basic Clin. Physiol. Pharmacol. 2019;
20190244, pp. 1–8, 2019, doi: 10.1515/jbcpp-2019-0244.
[265] C. C. C. Teixeira et al., “Microparticles Containing Curcumin Solid Dispersion :
Stability , Bioavailability and Anti-Inflammatory Activity,” vol. 17, no. 2, pp. 252–
261, 2016, doi: 10.1208/s12249-015-0337-6.
[266] K. Wlodarski and F. Zhang, “Synergistic Effect of Polyvinyl Alcohol and
Copovidone in Itraconazole Amorphous Solid Dispersions,” no. 1, 2018.
[267] M. Maniruzzaman, D. Douroumis, J. S., and M. J., “Hot-Melt Extrusion (HME):
From Process to Pharmaceutical Applications,” Recent Adv. Nov. Drug Carr. Syst.,
pp. 3–16, 2012, doi: 10.5772/51582.
[268] R. Thakkar, R. Thakkar, A. Pillai, E. A. Ashour, and M. A. Repka, “Systematic
screening of pharmaceutical polymers for hot melt extrusion processing: a
comprehensive review,” Int. J. Pharm., vol. 576, no. October 2019, p. 118989,
2020, doi: 10.1016/j.ijpharm.2019.118989.
[269] A. Alshetaili, S. M. Alshahrani, B. K. Almutairy, and M. A. Repka, “Hot Melt
Extrusion Processing Parameters Optimization,” pp. 1–14, 2020.
[270] H. Patil, R. V Tiwari, and M. A. Repka, “Hot-Melt Extrusion : from Theory to
Application in Pharmaceutical Formulation,” 2015, doi: 10.1208/s12249-015-
0360-7.
[271] S. Narala, D. Nyavanandi, P. Srinivasan, P. Mandati, and S. Bandari,
“Pharmaceutical Co-crystals , Salts , and Co-amorphous Systems : A novel
opportunity of hot-melt extrusion,” J. Drug Deliv. Sci. Technol., vol. 61, no.
November 2020, p. 102209, 2021, doi: 10.1016/j.jddst.2020.102209.
[272] J. Thiry, F. Krier, and B. Evrard, “A review of pharmaceutical extrusion : Critical
process parameters and,” Int. J. Pharm., vol. 479, no. 1, pp. 227–240, 2015, doi:
10.1016/j.ijpharm.2014.12.036.
[273] L. Saerens et al., “In-line NIR spectroscopy for the understanding of polymer –
drug interaction during pharmaceutical hot-melt extrusion,” Eur. J. Pharm.
Biopharm., vol. 81, no. 1, pp. 230–237, 2012, doi: 10.1016/j.ejpb.2012.01.001.
[274] N. Follonier, E. Doelker, and E. T. Cole, “controlled release Various ways of
modulating the release of diltiazem hydrochloride from hot-melt extruded

371
sustained release pellets prepared using polymeric materials,” vol. 36, pp. 243–
250, 1995.
[275] A. Gryczke, S. Schminke, M. Maniruzzaman, J. Beck, and D. Douroumis,
“Colloids and Surfaces B : Biointerfaces Development and evaluation of orally
disintegrating tablets ( ODTs ) containing Ibuprofen granules prepared by hot melt
extrusion,” Colloids Surfaces B Biointerfaces, vol. 86, no. 2, pp. 275–284, 2011,
doi: 10.1016/j.colsurfb.2011.04.007.
[276] V. W. Yeung and I. C. K. Wong, “R ESEARCH ARTICLE,” pp. 399–402, 2005.
[277] A. S. Alshetaili, J. Morott, S. Shah, and V. Kulkarni, “Mefenamic acid taste-
masked oral disintegrating tablets with enhanced solubility via molecular
interaction produced by hot melt extrusion technology,” pp. 18–27, 2016, doi:
10.1016/j.jddst.2015.03.003.Mefenamic.
[278] L. F. B. Malaquias et al., “Hot Melt Extrudates Formulated Using Design Space:
One Simple Process for Both Palatability and Dissolution Rate Improvement,” J.
Pharm. Sci., vol. 107, no. 1, pp. 286–296, 2018, doi: 10.1016/j.xphs.2017.08.014.
[279] R. Censi and M. R. Gigliobianco, “Hot Melt Extrusion : Highlighting
Physicochemical Factors to Be Investigated While Designing and Optimizing a
Hot Melt Extrusion Process,” 2018, doi: 10.3390/pharmaceutics10030089.
[280] A. Butreddy, S. Bandari, and M. A. Repka, “Quality-by-design in hot melt
extrusion based amorphous solid dispersions: An industrial perspective on product
development,” Eur. J. Pharm. Sci., vol. 158, no. November 2020, p. 105655, 2020,
doi: 10.1016/j.ejps.2020.105655.
[281] M. Maniruzzaman, J. S. Boateng, M. J. Snowden, and D. Douroumis, “A Review
of Hot-Melt Extrusion : Process Technology to Pharmaceutical Products,” vol.
2012, 2012, doi: 10.5402/2012/436763.
[282] S. V Jermain, C. Brough, and R. O. Williams, “Amorphous solid dispersions and
nanocrystal technologies for poorly water- soluble drug delivery – An update,” Int.
J. Pharm., vol. 535, no. 1–2, pp. 379–392, 2018, doi:
10.1016/j.ijpharm.2017.10.051.
[283] X. Ma and R. O. W. Iii, “Characterization of amorphous solid dispersions : An
update,” J. Drug Deliv. Sci. Technol., vol. 50, no. November 2018, pp. 113–124,

372
2019, doi: 10.1016/j.jddst.2019.01.017.
[284] Y. L. N. T. R. L. J. Q. W. Wu, “Understanding the Relationship between
Wettability and Dissolution of Solid Dispersion,” 2014, doi:
10.1016/j.ijpharm.2014.02.004.
[285] J. Thiry et al., “Continuous production of itraconazole-based solid dispersions by
hot melt extrusion : Preformulation , optimization and design space
determination,” Int. J. Pharm., vol. 515, no. 1–2, pp. 114–124, 2016, doi:
10.1016/j.ijpharm.2016.10.003.
[286] M. M. Crowley et al., “Pharmaceutical Applications of Hot-Melt Extrusion : Part
I Pharmaceutical Applications of Hot-Melt Extrusion : Part I,” vol. 9045, 2008,
doi: 10.1080/03639040701498759.
[287] M. A. Azad, D. Olawuni, G. Kimbell, A. Z. Badruddoza, S. Hossain, and T.
Sultana, Polymers for Extrusion-Based 3D Printing of Pharmaceuticals : A
Holistic Materials – Process Perspective. .
[288] A. Goyanes, U. Det-Amornrat, J. Wang, A. W. Basit, and S. Gaisford, “3D
scanning and 3D printing as innovative technologies for fabricating personalized
topical drug delivery systems,” J. Control. Release, vol. 234, pp. 41–48, 2016, doi:
10.1016/j.jconrel.2016.05.034.
[289] A. G. Iria Seoane-Viaño, Patricija Januskaite, Carmen Alvarez-Lorenzo, Abdul W.
Basit, “Semi-solid extrusion 3D printing in drug delivery and biomedicine:
Personalised solutions for healthcare challenges,” J. Control. Release, 2021, doi:
10.1016/j.jconrel.2021.02.027.
[290] A. Goyanes et al., “Automated therapy preparation of isoleucine formulations
using 3D printing for the treatment of MSUD : First single-centre , prospective ,
crossover study in patients,” Int. J. Pharm., vol. 567, no. June, p. 118497, 2019,
doi: 10.1016/j.ijpharm.2019.118497.
[291] Brasil and Agência Nacional de Vigilância Sanitária, “Farmacopeia Brasileira,”
Farm. Bras., vol. 1, p. 874, 2019.
[292] BASF, “kOLLIDON VA 64 Technical Informations,” no. June 2008, pp. 1–16,
2011.
[293] BASF, “Kolliphor ® SLS Kolliphor ® SLS Fine,” no. 119863, pp. 1–6, 2012.

373
[294] A. Venkateshaiah, V. V. T. Padil, and M. Nagalakshmaiah, “Microscopic
Techniques for the Analysis of Micro and Nanostructures of Biopolymers and
Their Derivatives.”
[295] International Organization for Standardization, “International Organization for
Standardization. 13320 2009,” 2009.
[296] The United States Pharmaceutical Convention., “<429> Light diffraction
measurement of particle size,” Suppl. to USP 43, vol. 43, no. 4, p. 6697, 2020.
[297] The United States Pharmaceutical Convention., “USP43 Praziquantel Tablets,”
vol. 43, p. 3650, 2020.
[298] J. Sha et al., “Solid-liquid phase equilibrium of praziquantel in eleven pure
solvents: Determination, model correlation, solvent effect, molecular simulation
and thermodynamic analysis,” J. Chem. Thermodyn., no. xxxx, 2020, doi:
10.1016/j.jct.2020.106327.
[299] S. S. Gupta, N. Solanki, and A. T. M. Serajuddin, “Investigation of Thermal and
Viscoelastic Properties of Polymers Relevant to Hot Melt Extrusion, IV:
AffinisolTM HPMC HME Polymers,” AAPS PharmSciTech, vol. 17, no. 1, pp. 148–
157, 2016, doi: 10.1208/s12249-015-0426-6.
[300] The United States Pharmaceutical Convention., “⟨ 776 ⟩ optical microscopy,”
Suppl. to USP 43, vol. 43, p. 6998, 2020.
[301] T. Templeman, S. Sengupta, N. Maman, E. Bar-or, and M. Shandalov, “Oriented
Attachment: A Path to Columnar Morphology in Chemical Bath Deposited PbSe
Thin Films,” 2018, doi: 10.1021/acs.cgd.7b01771.
[302] D. Colegiada et al., “Ministério da Saúde RESOLUÇÃO - RDC No 37, DE 3 DE
AGOSTO DE 2011,” 2011.
[303] U. S. D. of H. and H. Services and F. and D. Administration, “Waiver of In Vivo
Bioavailability and Bioequivalence Studies for Immediate-Release Solid Oral
Dosage Forms Based on a Biopharmaceutics Classification System Guidance for
Industry,” 2017.
[304] K. Yamasaki, K. Taguchi, K. Nishi, M. Otagiri, and H. Seo, “Enhanced dissolution
and oral bioavailability of praziquantel by emulsification with human serum
albumin followed by spray drying,” Eur. J. Pharm. Sci., vol. 139, no. September,

374
p. 105064, 2019, doi: 10.1016/j.ejps.2019.105064.
[305] M. Karl and K. Kolter, “Suitability of Plasticized Polymers for Hot Melt
Extrusion,” Excipients Act. Pharma, vol. 24, no. Table 1, pp. 2–6, 2010.
[306] Y. Chen et al., “Initial Drug Dissolution from Amorphous Solid Dispersions
Controlled by Polymer Dissolution and Drug-Polymer Interaction,” Pharm. Res.,
2016, doi: 10.1007/s11095-016-1969-2.
[307] A. Prudic, Y. Ji, and G. Sadowski, “Thermodynamic Phase Behavior of
API/Polymer Solid Dispersions,” 2014.
[308] T. R. Hörmann et al., “Sensitivity of a continuous hot-melt extrusion and strand
pelletization line to control actions and composition variation,” Int. J. Pharm., vol.
566, no. February, pp. 239–253, 2019, doi: 10.1016/j.ijpharm.2019.05.046.
[309] H. G. Moradiya, M. T. Islam, N. Scoutaris, S. A. Halsey, B. Z. Chowdhry, and D.
Douroumis, “Continuous Manufacturing of High Quality Pharmaceutical
Cocrystals Integrated with Process Analytical Tools for In-Line Process Control,”
Cryst. Growth Des., vol. 16, no. 6, pp. 3425–3434, 2016, doi:
10.1021/acs.cgd.6b00402.
[310] F. Z. Tongzhou Liu, Nada Kittikunakorn, Yi Zhang, “Mechanisms of twin screw
melt granulation Tongzhou,” J. Drug Deliv. Sci. Technol., vol. 61, no. August
2020, p. 102150, 2021, doi: 10.1016/j.jddst.2020.102150.
[311] B. Mayoral, G. Garrett, and T. McNally, “Influence of screw profile employed
during melt mixing on the micro-scale dispersion of MWCNTs in
poly(propylene),” Macromol. Mater. Eng., vol. 299, no. 6, pp. 748–756, 2014, doi:
10.1002/mame.201300172.
[312] M. Marigo, D. L. Cairns, M. Davies, A. Ingram, and E. H. Stitt, “Developing
mechanistic understanding of granular behaviour in complex moving geometry
using the Discrete Element Method Part B : Investigation of fl ow and mixing in
the Turbula ® mixer,” Powder Technol., vol. 212, no. 1, pp. 17–24, 2011, doi:
10.1016/j.powtec.2011.04.009.
[313] C. S. Yee, “The Development of PVP-based Solid Dispersions using Hot Melt
Extrusion for the Preparation of Immediate Release Formulations,” vol. 9, no.
November, 2014.

375
[314] K. Nakamichi, T. Nakano, H. Yasuura, S. Izumi, and Y. Kawashima, “The role of
the kneading paddle and the effects of screw revolution speed and water content
on the preparation of solid dispersions using a twin-screw extruder,” Int. J. Pharm.,
vol. 241, no. 2, pp. 203–211, 2002, doi: 10.1016/S0378-5173(02)00134-5.
[315] E. Verhoeven, T. R. M. De Beer, G. Van den Mooter, J. P. Remon, and C. Vervaet,
“Influence of formulation and process parameters on the release characteristics of
ethylcellulose sustained-release mini-matrices produced by hot-melt extrusion,”
Eur. J. Pharm. Biopharm., vol. 69, no. 1, pp. 312–319, 2008, doi:
10.1016/j.ejpb.2007.10.007.
[316] N. Siriwannakij, T. Heimbach, and A. T. M. Serajuddin, “Aqueous Dissolution and
Dispersion Behavior of Polyvinylpyrrolidone Vinyl Acetate-based Amorphous
Solid Dispersion of Ritonavir Prepared by Hot-Melt Extrusion with and without
Added Surfactants,” J. Pharm. Sci., pp. 1–15, 2020, doi:
10.1016/j.xphs.2020.08.007.
[317] L. Briens and R. Logan, “The Effect of the Chopper on Granules from Wet High-
Shear Granulation Using a PMA-1 Granulator,” vol. 12, no. 4, pp. 1358–1365,
2011, doi: 10.1208/s12249-011-9703-1.
[318] J. Dun and C. C. Sun, Structures and Properties of Granules Prepared By High
Shear Wet Granulation. Elsevier Inc., 2019.
[319] R. Nogueira et al., “Determination of Volatiles in Pharmaceutical Certified
Reference Materials,” vol. 23, no. 9, pp. 1636–1646, 2012.
[320] M. Ja, A. Kuty, K. Sollohub, H. Wosicka, K. Cal, and P. Ciosek,
“Bioelectrochemistry Electronic tongue for the detection of taste-masking
microencapsulation of active pharmaceutical substances,” vol. 80, pp. 94–98,
2010, doi: 10.1016/j.bioelechem.2010.08.006.
[321] F. V. Paulovich, M. L. Moraes, R. M. Maki, M. Ferreira, O. N. Oliveira, and M.
C. F. De Oliveira, “Information visualization techniques for sensing and
biosensing,” Analyst, vol. 136, no. 7, pp. 1344–1350, Mar. 2011, doi:
10.1039/c0an00822b.
[322] S. J. Anroop B. Nair, “A simple practice guide for dose conversion between
animals and human,” J. Basic Clin. Pharm. |, vol. 7, pp. 27–31, 2016, doi:

376
10.4103/0976-0105.177703.
[323] FDA, “Bioanalytical Method Validation Guidance for Industry Bioanalytical
Method Validation Guidance for Industry,” no. May, 2018.
[324] ANVISA, RESOLUÇÃO - RDC No 27 , DE 17 DE MAIO DE 2012. 2012.
[325] A. Noorjahan, B. Amrita, and S. Kavita, “In vivo evaluation of taste masking for
developed chewable and orodispersible tablets in humans and rats,” Pharm. Dev.
Technol., vol. 19, no. 3, pp. 290–295, 2014, doi: 10.3109/10837450.2013.778870.
[326] A. Juluri et al., “Taste Masking of Griseofulvin and Caffeine Anhydrous Using
Kleptose Linecaps DE17 by Hot Melt Extrusion,” vol. 17, no. 1, 2016, doi:
10.1208/s12249-015-0374-1.
[327] D. K. Tan, D. A. Davisjr, D. A. Miller, R. O. Williamsiii, and A. Nokhodchi,
“Innovations in Thermal Processing : Hot-Melt Extrusion and KinetiSol ®
Dispersing,” 2020, doi: 10.1208/s12249-020-01854-2.
[328] X. Zheng, F. Wu, Y. Hong, L. Shen, X. Lin, and Y. Feng, “Developments in Taste-
Masking Techniques for Traditional Chinese Medicines,” pp. 1–22, 2018, doi:
10.3390/pharmaceutics10030157.
[329] M. Maniruzzaman, J. S. Boateng, B. Z. Chowdhry, M. J. Snowden, and D.
Douroumis, “A review on the taste masking of bitter APIs: hot-melt extrusion
(HME) evaluation,” vol. 9045, pp. 1–12, 2013, doi:
10.3109/03639045.2013.804833.
[330] M. Kaza, M. Kara, K. Kosicka, A. Siemi, and P. J. Rudzki, “Journal of
Pharmaceutical and Biomedical Analysis Bioanalytical method validation : new
FDA guidance vs . EMA guideline . Better or worse ?,” vol. 165, pp. 381–385,
2019, doi: 10.1016/j.jpba.2018.12.030.
[331] L. Yang, Y. Geng, H. Li, Y. Zhang, J. You, and Y. Chang, “Enhancement the oral
bioavailability of praziquantel by incorporation into solid lipid nanoparticles,” vol.
64, pp. 3–6, 2009, doi: 10.1691/ph.2009.8140.
[332] Y. Liu et al., “Dissolution and oral bioavailability enhancement of praziquantel by
solid dispersions,” 2018.
[333] H. Jung, R. Medina, N. Castro, T. Corona, I. Nacional, and D. Neurologia,

377
“Pharmacokinetic Study of Praziquantel Administered Alone and in Combination
with Cimetidine in a Single-Day Therapeutic Regimen,” vol. 41, no. 6, pp. 1256–
1259, 1997.
[334] R. G. and P. Andrews, “Praziquantel, a New Broad-spectrum Antischistosomal
Agent,” Parasitenkunde, vol. 150, pp. 129–150, 1977.
[335] Z. Hui, A. Kumar, P. Wan, and S. Heng, “ScienceDirect Overview of milling
techniques for improving the solubility of poorly water-soluble drugs,” Asian J.
Pharm. Sci., vol. 10, no. 4, pp. 255–274, 2015, doi: 10.1016/j.ajps.2014.12.006.
[336] M. M. Knopp et al., “Comparative Study of Di ff erent Methods for the Prediction
of Drug − Polymer Solubility,” 2015, doi: 10.1021/acs.molpharmaceut.5b00423.
[337] S. Mark et al., “Characterization of Amorphous Solid Dispersions and Identi fi
cation of Low Levels of Crystallinity by Transmission Electron Microscopy,”
2021, doi: 10.1021/acs.molpharmaceut.0c00918.
[338] A. Agrawal et al., “Development of Tablet Formulation of Amorphous Solid
Dispersions Prepared by Hot Melt Extrusion Using Quality by Design Approach,”
vol. 17, no. 1, pp. 214–232, 2016, doi: 10.1208/s12249-015-0472-0.
[339] M. R. C. Marques and M. Almukainzi, “Simulated Biological Fluids with Possible
Application in Dissolution Testing,” no. March 2015, pp. 14–28, 2011, doi:
10.14227/DT180311P15.
[340] J. N. Pawar et al., “Development of amorphous dispersions of artemether with
hydrophilic polymers via spray drying: Physicochemical and in silico studies,”
Asian J. Pharm. Sci., vol. 11, no. 3, pp. 385–395, 2016, doi:
10.1016/j.ajps.2015.08.012.
[341] S. S. Gupta, A. Meena, T. Parikh, and A. T. M. Serajuddin, “Investigation of
thermal and viscoelastic properties of polymers relevant to hot melt extrusion - I:
Polyvinylpyrrolidone and related polymers,” J. Excipients Food Chem., vol. 5, no.
1, pp. 32–45, 2014.
[342] Á. A. N. de Lima, “Avaliação dos aspectos físico-químicos do antichagásico
Benznidazol, diferentes sistemas carreadores e formas farmacêuticas, através de
técnicas analíticas e de imagens,” Universidade Federal de Pernambuco, 2012.
[343] World Health Organization, “Report of a meeting to review the results of studies

378
on the treatment of schistosomiasis in preschool-age children,” GENEVA,
SWITZERLAND, 2010. [Online]. Available:
https://apps.who.int/iris/bitstream/handle/10665/44639/9789241501880_eng.pdf?
sequence=1.
[344] P. L. Olliaro et al., “Efficacy and safety of single 40 mg/kg oral praziquantel in the
treatment of schistosomiasis in preschool-age versus school-age children: An
individual participant data meta-analysis,” PLoS Negl. Trop. Dis., vol. 14, no. 6,
pp. 1–23, 2020, doi: 10.1371/journal.pntd.0008277.
[345] J. T. Coulibaly et al., “Efficacy and safety of ascending doses of praziquantel
against Schistosoma haematobium infection in preschool-aged and school-aged
children: A single-blind randomised controlled trial,” BMC Med., vol. 16, no. 1,
pp. 1–10, 2018, doi: 10.1186/s12916-018-1066-y.
[346] J. Boniatti et al., “Taste evaluation of three different commercial tablets for
paediatric patients for neglected tropical diseases,” in Poster presented on
European Paediatric Formulation initiative (EUPFI), 2019, vol. 5, p. 2019.
[347] S. Qi, J. Nasereddin, and F. Alqahtani, “Personalized Polypills Produced by Fused
Deposition Modeling 3D Printing,” 2019.
[348] T. Information, “Technical Information Soluplus ®,” no. September 2015, pp. 1–
14, 2019.
[349] F. H. M. La, “Quadro Comil Scalable Lab System TM.” p. 10, 2020.
[1] O. MONDIALE and D. LA SANTÉ, “Schistosomiasis : number of people treated
worldwide in 2014 Schistosomiase : nombre de personnes traitées dans le monde
en 2014,” Wkly. Epidemiol. Rec., vol. 30, no. 5, pp. 25–31, 2015.
[2] M. L. Nelwan, “Schistosomiasis: Life Cycle, Diagnosis, and Control,” Curr. Ther.
Res. - Clin. Exp., vol. 91, no. 24, pp. 5–9, 2019, doi:
10.1016/j.curtheres.2019.06.001.
[3] E. Y. Li, D. Gurarie, N. C. Lo, X. Zhu, and C. H. King, “Improving public health
control of schistosomiasis with a modified WHO strategy : a model-based
comparison study,” Lancet Glob. Heal., vol. 7, no. 10, pp. e1414–e1422, 2019,
doi: 10.1016/S2214-109X(19)30346-8.

379
[4] L. B. da Fonseca, “DESENVOLVIMENTO DE NANOPARTÍCULAS
POLIMÉRICAS CONTENDO PRAZIQUANTEL PARA O TRATAMENTO DA
ESQUISTOSSOMOSE,” Universidade Federal do Rio de Janeiro, 2012.
[5] H. Wang et al., “Metabolic profiling of praziquantel enantiomers,” vol. 90, pp.
166–178, 2014.
[6] P. T. Loverde, “Digenetic Trematodes,” in Schistosomiasis, R. T. Fried, Ed.
Springer, 2019.
[7] D. P. Mcmanus, D. W. Dunne, M. Sacko, N. Zhou, and B. J. Vennervald,
“Schistosomiasis,” Nat. Rev. Dis. Prim., pp. 1–19, 2018, doi: 10.1038/s41572-018-
0013-8.
[8] J. P. Soldati, “Dose maior é sinônimo de eficácia ?,” Inf. IOC. Inst. Oswaldo
Cruz/Fiocruz -, p. 2012, 2011.
[9] R. Trastullo, L. S. Dolci, N. Passerini, and B. Albertini, “Development of flexible
and dispersible oral formulations containing praziquantel for potential
schistosomiasis treatment of pre-school age children,” Int. J. Pharm., vol. 495, no.
1, pp. 536–550, 2015, doi: 10.1016/j.ijpharm.2015.09.019.
[10] D. Zanolla et al., “A new soluble and bioactive polymorph of praziquantel,” Eur.
J. Pharm. Biopharm., vol. 127, no. January, pp. 19–28, 2018, doi:
10.1016/j.ejpb.2018.01.018.
[11] A. A. L. Carvalho, A. C. Mafud, P. L. S. Pinto, Y. P. Mascarenhas, and J. De
Moraes, “Schistosomicidal effect of the anti-inflammatory drug diclofenac and its
structural correlation with praziquantel,” Int. J. Antimicrob. Agents, vol. 44, no. 4,
pp. 372–374, 2014, doi: 10.1016/j.ijantimicag.2014.06.018.
[12] Alan Lane de Melo and P. M. Z. Coelho, Parasitologia Humana - Leishmaniose
Visceral Americana. 2007.
[13] Ministério da Saúde, Guide to Health Surveillance. 2019.
[14] M. da S. BRASIL, “MANSONI Diretrizes Técnicas Diretrizes técnicas,” 2014.
[15] K. E. R. Silva, R. M. F. Silva, S. P. M. Costa, L. A. Rolim, M. do C. A. Lima, and
P. J. Rolim-Neto, “Alternativas terapêuticas no combate à Esquistossomose
Mansônica,” Rev. Ciencias Farm. Basica e Apl., vol. 33, no. 1, pp. 9–16, 2012.
[16] C. V. V. Rollemberg et al., “Aspectos epidemiológicos e distribuição geográfica
da esquistossomose e geo-helmintos, no Estado de Sergipe, de acordo com os
dados do Programa de Controle da Esquistossomose,” Rev. Soc. Bras. Med. Trop.,
vol. 44, no. 1, pp. 91–96, 2011, doi: 10.1590/s0037-86822011000100020.

380
[17] M. L. A. Ferrari, P. M. Z. Coelho, C. M. F. Antunes, C. A. P. Tavares, and A. S.
Da Cunha, “Efficacy of oxamniquine and praziquantel in the treatment of
Schistosoma mansoni infection: A controlled trial,” Bull. World Health Organ.,
vol. 81, no. 3, pp. 190–196, 2003, doi: 10.1590/S0042-96862003000300009.
[18] R. E. Zaparoli, “2011 Sorocaba / SP,” 2011.
[19] 2013. Pernambuco. Secretaria Estadual de Saúde. Secretaria Executiva de
Vigilância em Saúde. Programa de Enfretamento das Doenças Negligenciadas no
Estado de Pernambuco SANAR – 2011 / 2014 / Secretaria Estadual de Saúde.
Secretaria Executiva de Vigilância em Sa, “SANAR. Programa de enfrentamento
às doenças negligenciadas.”
[20] L. B. Da Fonseca et al., “Desenvolvimento de um medicamento brasileiro
nanoencapsulado para o tratamento da esquistossomose,” Vigilância Sanitária em
Debate, vol. 1, no. 4, pp. 85–91, 2013, doi: 10.3395/vd.v1i4.111pt.
[21] J. Zwang and P. L. Olliaro, “Clinical Efficacy and Tolerability of Praziquantel for
Intestinal and Urinary Schistosomiasis—A Meta-analysis of Comparative and
Non-comparative Clinical Trials,” PLoS Negl. Trop. Dis., vol. 8, no. 11, 2014, doi:
10.1371/journal.pntd.0003286.
[22] N. Katz and P. M. Z. Coelho, “Clinical therapy of schistosomiasis mansoni: The
Brazilian contribution,” Acta Trop., vol. 108, no. 2–3, pp. 72–78, 2008, doi:
10.1016/j.actatropica.2008.05.006.
[23] V. B. R. da Silva, B. R. K. L. Campos, J. F. de Oliveira, J. L. Decout, and M. do
Carmo Alves de Lima, “Medicinal chemistry of antischistosomal drugs:
Praziquantel and oxamniquine,” Bioorganic Med. Chem., vol. 25, no. 13, pp.
3259–3277, 2017, doi: 10.1016/j.bmc.2017.04.031.
[24] M. R. Carvalho Garbi Novaes, J. P. de Souza, and H. Clemente de Araújo,
“Anthelmintic praziquantel synthesis from glycine,” Quim. Nova, no. 1, pp. 5–10,
1999.
[25] A. Borrego-Sánchez et al., “Conformational polymorphic changes in the crystal
structure of the chiral antiparasitic drug praziquantel and interactions with calcium
carbonate,” Eur. J. Pharm. Biopharm., vol. 132, no. July, pp. 180–191, 2018, doi:
10.1016/j.ejpb.2018.09.028.
[26] F. C. Lombardo, V. Pasche, G. Panic, Y. Endriss, and J. Keiser, “Life cycle
maintenance and drug-sensitivity assays for early drug discovery in Schistosoma
mansoni,” Nat. Protoc., vol. 14, no. 2, pp. 461–481, 2019, doi: 10.1038/s41596-

381
018-0101-y.
[27] S. K. Park et al., “The anthelmintic drug praziquantel activates a schistosome
transient receptor potential channel,” J. Biol. Chem., vol. 294, no. 49, pp. 18873–
18880, 2019, doi: 10.1074/jbc.AC119.011093.
[28] WHO, “WHO Model Lists of Essential Medicines - Praziquantel,” 2021.
[29] C. S. Ferreira Marques et al., “Solid dispersion of praziquantel enhanced solubility
and improve the efficacy of the schistosomiasis treatment,” J. Drug Deliv. Sci.
Technol., vol. 45, no. December 2017, pp. 124–134, 2018, doi:
10.1016/j.jddst.2018.03.009.
[30] D. Zanolla et al., “A new soluble and bioactive polymorph of praziquantel,” Eur.
J. Pharm. Biopharm., vol. 127, no. August 2017, pp. 19–28, 2018, doi:
10.1016/j.ejpb.2018.01.018.
[31] D. Cioli, L. Pica-mattoccia, A. Basso, and A. Guidi, “Schistosomiasis control :
praziquantel forever ?,” Mol. Biochem. Parasitol., vol. 195, no. 1, pp. 23–29, 2014,
doi: 10.1016/j.molbiopara.2014.06.002.
[32] A. M. de L. A. B. E. de A. B. E. de O. L. S. de C. Barros, Re lação Na cional de
Me dicamentos Essenciais Re lação Na cional de Me dicamentos Essenciais. 2020.
[33] J. C. Espinosa-Lara et al., “Cocrystals of active pharmaceutical ingredients -
Praziquantel in combination with oxalic, malonic, succinic, maleic, fumaric,
glutaric, adipic, and pimelic acids,” Cryst. Growth Des., vol. 13, no. 1, pp. 169–
185, 2013, doi: 10.1021/cg301314w.
[34] A. Borrego-Sánchez, C. Viseras, C. Aguzzi, and C. I. Sainz-Díaz, “Molecular and
crystal structure of praziquantel. Spectroscopic properties and crystal
polymorphism,” Eur. J. Pharm. Sci., vol. 92, pp. 266–275, 2016, doi:
10.1016/j.ejps.2016.04.023.
[35] WHO, “International strategies for tropical disease treatments - Experiences with
praziquantel,” 1998.
[36] WHO, “Schistosomiasis in children_ a major public health problem,” pp. 1–3,
2017, [Online]. Available:
https://www.pediatricpraziquantelconsortium.org/schistosomiasis.
[37] M. Cugovčan, J. Jablan, J. Lovrić, D. Cinčić, N. Galić, and M. Jug,
“Biopharmaceutical characterization of praziquantel cocrystals and cyclodextrin
complexes prepared by grinding,” J. Pharm. Biomed. Anal., vol. 137, pp. 42–53,
2017, doi: 10.1016/j.jpba.2017.01.025.

382
[38] M. J. Doenhoff, D. Cioli, and J. Utzinger, “Praziquantel: Mechanisms of action,
resistance and new derivatives for schistosomiasis,” Curr. Opin. Infect. Dis., vol.
21, no. 6, pp. 659–667, 2008, doi: 10.1097/QCO.0b013e328318978f.
[39] W. Wu, W. Wang, and Y. X. Huang, “New insight into praziquantel against
various developmental stages of schistosomes,” Parasitol. Res., vol. 109, no. 6, pp.
1501–1507, 2011, doi: 10.1007/s00436-011-2670-3.
[40] F. C. Lombardo, B. Perissutti, and J. Keiser, “Activity and pharmacokinetics of a
praziquantel crystalline polymorph in the Schistosoma mansoni mouse model,”
Eur. J. Pharm. Biopharm., vol. 142, no. June, pp. 240–246, 2019, doi:
10.1016/j.ejpb.2019.06.029.
[41] J. Kovač, M. Vargas, and J. Keiser, “In vitro and in vivo activity of R- and S-
praziquantel enantiomers and the main human metabolite trans-4-hydroxy-
praziquantel against Schistosoma haematobium,” Parasites and Vectors, vol. 10,
no. 1, pp. 3–7, 2017, doi: 10.1186/s13071-017-2293-3.
[42] T. Meyer, H. Sekljic, S. Fuchs, H. Bothe, D. Schollmeyer, and C. Miculka, “Taste,
a new incentive to switch to (R)-praziquantel in schistosomiasis treatment,” PLoS
Negl. Trop. Dis., vol. 3, no. 1, pp. 3–7, 2009, doi: 10.1371/journal.pntd.0000357.
[43] D. Zhang, H. Wang, J. Ji, L. Nie, and D. Sun, “A quantification method for
determination of racemate praziquantel and R-enantiomer in rat plasma for
comparison of their pharmacokinetics,” J. Chromatogr. B, vol. 1048, pp. 64–69,
2017, doi: 10.1016/j.jchromb.2017.02.013.
[44] I. Meister et al., “Activity of praziquantel enantiomers and main metabolites
against Schistosoma mansoni,” Antimicrob. Agents Chemother., vol. 58, no. 9, pp.
5466–5472, 2014, doi: 10.1128/AAC.02741-14.
[45] W. M. Bagchus, D. Bezuidenhout, E. Harrison-moench, E. Kourany-lefoll, and P.
Wolna, “Relative Bioavailability of Orally Dispersible Tablet Formulations of
Levo- and Racemic Praziquantel : Two Phase I Studies,” no. December 2018, pp.
66–76, 2019, doi: 10.1111/cts.12601.
[46] G. Z. Id and F. Mutapi, “Drug metabolism and pharmacokinetics of praziquantel :
A review of variable drug exposure during schistosomiasis treatment in human
hosts and experimental models,” pp. 1–26, 2020, doi:
10.1371/journal.pntd.0008649.
[47] ANVISA, “Consulta Medicamentos ANVISA - Praziquantel,” 2020.
[48] Merck, “Bula Cisticid 500mg Merck.”

383
[49] F.- Fiocruz, “Praziquantel - DMG-FAR-PRO-PRZ-001-2017,” in Memento
Terapeutico, 2017, pp. 1–9.
[50] A. Garba et al., “Acta Tropica Schistosomiasis in infants and preschool-aged
children : Infection in a single Schistosoma haematobium and a mixed S .
haematobium – S . mansoni foci of Niger,” vol. 115, no. May 2001, pp. 212–219,
2010, doi: 10.1016/j.actatropica.2010.03.005.
[51] M. Woelfle, J. Seerden, J. De Gooijer, K. Pouwer, P. Olliaro, and H. Matthew,
“Resolution of Praziquantel,” vol. 5, no. 9, pp. 1–7, 2013, doi:
10.1371/journal.pntd.0001260.
[52] S. Botros, N. El-lakkany, S. H. Seif, A. Sabra, and M. Ibrahim, “Experimental
Parasitology Comparative efficacy and bioavailability of different praziquantel
brands,” Exp. Parasitol., vol. 127, no. 2, pp. 515–521, 2011, doi:
10.1016/j.exppara.2010.10.019.
[53] The United States Pharmaceutical Convention., “USP43 Praziquantel API,” p.
3649, 2020.
[54] ANVISA, “Farmacopeia Brasileira Volume II – Monografias Insumos
Farmacêuticos e Especialidades,” Farm. Bras., vol. 2, pp. 1–1504, 2019.
[55] U. S. N. L. of Medicine, “ChemIDplus Advanced - Chemical information -
Praziquantel,” 2021.
[56] E. S. Bochmann, A. Gryczke, and K. G. Wagner, “Validation of Model-Based Melt
Viscosity in Hot-Melt Extrusion Numerical Simulation,” pp. 9–12, 2018, doi:
10.3390/pharmaceutics10030132.
[57] U. S. P. Convention, “Promoting the Quality of Medicines (PQM). Product
Information Report: Praziquantel,” Rockville, Maryland., 2019.
[58] N. Passerini, B. Albertini, B. Perissutti, and L. Rodriguez, “Evaluation of melt
granulation and ultrasonic spray congealing as techniques to enhance the
dissolution of praziquantel,” Int. J. Pharm., vol. 318, no. 1–2, pp. 92–102, 2006,
doi: 10.1016/j.ijpharm.2006.03.028.
[59] D. Zanolla et al., “Milling and comilling Praziquantel at cryogenic and room
temperatures: Assessment of the process-induced effects on drug properties,” J.
Pharm. Biomed. Anal., vol. 153, pp. 82–89, 2018, doi: 10.1016/j.jpba.2018.02.018.
[60] B. Albertini et al., “Combining mechanochemistry and spray congealing for new
praziquantel pediatric formulations in schistosomiasis treatment,” Int. J. Mol. Sci.,
vol. 20, no. 5, 2019, doi: 10.3390/ijms20051233.

384
[61] M. Münster, C. Schoch, C. Schmidt, and J. Breitkreutz, “Multiparticulate system
combining taste masking and immediate release properties for the aversive
compound praziquantel,” Eur. J. Pharm. Sci., vol. 109, no. August, pp. 446–454,
2017, doi: 10.1016/j.ejps.2017.08.034.
[62] P. Olliaro, P. Delgado-romero, and J. Keiser, “The little we know about the
pharmacokinetics and pharmacodynamics of praziquantel ( racemate and R -
enantiomer ),” no. January, pp. 863–870, 2014, doi: 10.1093/jac/dkt491.
[63] P. R. Dametto, A. C. Dametto, L. Polese, C. A. Ribeiro, M. Chorilli, and O. de
Freitas, “Development and physicochemical characterization of solid dispersions
containing praziquantel for the treatment of schistosomiasis,” J. Therm. Anal.
Calorim., vol. 127, no. 2, pp. 1693–1706, 2017, doi: 10.1007/s10973-016-5759-1.
[64] PUBCHEM, “Praziquantel - Chemical and Physical Properties,” 2019.
[65] E. D. Costa et al., “Unexpected solvent impact in the crystallinity of
praziquantel/poly(vinylpyrrolidone) formulations. A solubility, DSC and solid-
state NMR study,” Int. J. Pharm., vol. 511, no. 2, pp. 983–993, 2016, doi:
10.1016/j.ijpharm.2016.08.009.
[66] M. V. Chaud et al., “Development and evaluation of praziquantel solid dispersions
in sodium starch glycolate,” Trop. J. Pharm. Res., vol. 12, no. 2, pp. 163–168,
2013, doi: 10.4314/tjpr.v12i2.5.
[67] S. K. El-arini and H. Leuenberger, “Dissolution properties of praziquantel – PVP
systems,” pp. 89–94, 1998.
[68] M. Münster et al., “Comparative in vitro and in vivo taste assessment of liquid
praziquantel formulations,” Int. J. Pharm., vol. 529, no. 1–2, pp. 310–318, 2017,
doi: 10.1016/j.ijpharm.2017.06.084.
[69] A. Gaggero et al., “Co-grinding with surfactants as a new approach to enhance in
vitro dissolution of praziquantel,” J. Pharm. Biomed. Anal., vol. 189, 2020, doi:
10.1016/j.jpba.2020.113494.
[70] S. K. El-Arini, D. Giron, and H. Leuenberger, “Solubility properties of racemic
praziquantel and its enantiomers,” Pharm. Dev. Technol., vol. 3, no. 4, pp. 557–
564, 1998, doi: 10.3109/10837459809028638.
[71] K.-K. and C. B. C. Yue Liu, Xin Wang, “Investigation of the phase diagrams of
chiral praziquantel,” Chirality, vol. 18, pp. 259–264, 2006, doi: 10.1002/chir.
[72] A. Cedillo-Cruz, M. I. Aguilar, M. Flores-Alamo, F. Palomares-Alonso, and H.
Jung-Cook, “A straightforward and efficient synthesis of praziquantel enantiomers

385
and their 4′-hydroxy derivatives,” Tetrahedron Asymmetry, vol. 25, no. 2, pp. 133–
140, 2014, doi: 10.1016/j.tetasy.2013.11.004.
[73] D. Zanolla et al., “Exploring mechanochemical parameters using a DoE approach:
Crystal structure solution from synchrotron XRPD and characterization of a new
praziquantel polymorph,” Eur. J. Pharm. Sci., vol. 140, no. October, p. 105084,
2019, doi: 10.1016/j.ejps.2019.105084.
[74] D. Salazar-Rojas, R. M. Maggio, and T. S. Kaufman, “Preparation and
characterization of a new solid form of praziquantel, an essential anthelmintic
drug. Praziquantel racemic monohydrate,” Eur. J. Pharm. Sci., vol. 146, no.
December 2019, p. 105267, 2020, doi: 10.1016/j.ejps.2020.105267.
[75] D. Zanolla et al., “Mechanochemical formation of racemic praziquantel
hemihydrate with improved biopharmaceutical properties,” Pharmaceutics, vol.
12, no. 3, pp. 1–22, 2020.
[76] G. L. Amidon, H. Lennernäs, V. P. Shah, and J. R. Crison, “A Theoretical Basis
for a Biopharmaceutic Drug Classification: The Correlation of in Vitro Drug
Product Dissolution and in Vivo Bioavailability,” Pharmaceutical Research: An
Official Journal of the American Association of Pharmaceutical Scientists, vol. 12,
no. 3. pp. 413–420, 1995, doi: 10.1023/A:1016212804288.
[77] A. Charalabidis, M. Sfouni, C. Bergström, and P. Macheras, “The
Biopharmaceutics Classification System (BCS) and the Biopharmaceutics Drug
Disposition Classification System (BDDCS): Beyond guidelines,” Int. J. Pharm.,
vol. 566, no. April, pp. 264–281, 2019, doi: 10.1016/j.ijpharm.2019.05.041.
[78] S. Baghel, H. Cathcart, and N. J. O. Reilly, “Polymeric Amorphous Solid
Dispersions : A Review of Amorphization , Crystallization , Stabilization , Solid-
State Characterization , and Aqueous Solubilization of Biopharmaceutical Classi
fi cation System Class II Drugs,” J. Pharm. Sci., 2016, doi:
10.1016/j.xphs.2015.10.008.
[79] K. Göke et al., “European Journal of Pharmaceutics and Biopharmaceutics Novel
strategies for the formulation and processing of poorly water- soluble drugs,” Eur.
J. Pharm. Biopharm., vol. 126, pp. 40–56, 2018, doi: 10.1016/j.ejpb.2017.05.008.
[80] A. Keeley et al., “In Vitro Dissolution Model Can Predict the in Vivo Taste
Masking Performance of Coated Multiparticulates,” Mol. Pharm., vol. 16, no. 5,
pp. 2095–2105, 2019, doi: 10.1021/acs.molpharmaceut.9b00060.
[81] X. Nsabagasani et al., “The ‘child size medicines’ concept: Policy provisions in

386
Uganda,” J. Pharm. Policy Pract., vol. 8, no. 1, pp. 1–9, 2015, doi:
10.1186/s40545-015-0025-7.
[82] V. Klingmann et al., “Acceptability of an orodispersible film compared to syrup
in neonates and infants: A randomized controlled trial,” Eur. J. Pharm. Biopharm.,
vol. 151, no. December 2019, pp. 239–245, 2020, doi: 10.1016/j.ejpb.2020.03.018.
[83] European Commission, “State of Paediatric Medicines in the EU: 10 years of the
EU Paediatric Regulation,” DG Heal. Consum., pp. 1–17, 2017.
[84] V. Ivanovska, C. M. A. Rademaker, L. Van Dijk, and A. K. Mantel-Teeuwisse,
“Pediatric drug formulations: A review of challenges and progress,” Pediatrics,
vol. 134, no. 2, pp. 361–372, 2014, doi: 10.1542/peds.2013-3225.
[85] K. Vithani and D. Douroumis, “Hot-melt extruded lipidic pellets for pediatric
applications : An investigation of the e ff ects and stability on drug dissolution,” J.
Drug Deliv. Sci. Technol., vol. 49, no. August 2018, pp. 43–49, 2019, doi:
10.1016/j.jddst.2018.10.033.
[86] R. Ternik et al., “Assessment of swallowability and palatability of oral dosage
forms in children: Report from an M-CERSI pediatric formulation workshop,” Int.
J. Pharm., vol. 536, no. 2, pp. 570–581, 2018, doi: 10.1016/j.ijpharm.2017.08.088.
[87] L. Freerks, J. Sommerfeldt, P. C. Löper, and S. Klein, “Safe, swallowable and
palatable paediatric mini-tablet formulations for a WHO model list of essential
medicines for children compound – A promising starting point for future PUMA
applications,” Eur. J. Pharm. Biopharm., vol. 156, no. August, pp. 11–19, 2020,
doi: 10.1016/j.ejpb.2020.08.014.
[88] N. Mendonsa et al., “Manufacturing strategies to develop amorphous solid
dispersions: An overview,” J. Drug Deliv. Sci. Technol., vol. 55, no. December
2019, p. 101459, 2020, doi: 10.1016/j.jddst.2019.101459.
[89] G. C. Bazzo, B. R. Pezzini, and H. K. Stulzer, “Eutectic mixtures as an approach
to enhance solubility , dissolution rate and oral bioavailability of poorly water-
soluble drugs,” Int. J. Pharm., vol. 588, no. May, p. 119741, 2020, doi:
10.1016/j.ijpharm.2020.119741.
[90] A. Batra, D. Desai, and A. T. M. Serajuddin, “Conversion of α-lactose
monohydrate to anhydrous form with superior tabletability by twin-screw
extrusion at elevated temperature,” Int. J. Pharm., vol. 588, no. July, p. 119790,
2020, doi: 10.1016/j.ijpharm.2020.119790.
[91] S. Jacob and A. B. Nair, “Cyclodextrin complexes : Perspective from drug delivery

387
and formulation,” no. May, pp. 201–217, 2018, doi: 10.1002/ddr.21452.
[92] A. Ramrao, T. Id, and J. N. Yadav, “A Review on Solid Dispersion and Carriers
Used Therein for Solubility Enhancement of Poorly Water Soluble Drugs,” Tabriz
Univ. Med. Sci., vol. 10, no. 3, pp. 359–369, 2020, doi: 10.34172/apb.2020.044.
[93] J. Keiser, H. Sayed, M. El-ghanam, H. Sabry, S. Anani, and A. El-wakeel,
“Efficacy and Safety of Artemether in the Treatment of Chronic Fascioliasis in
Egypt : Exploratory Phase-2 Trials,” vol. 5, no. 9, 2011, doi:
10.1371/journal.pntd.0001285.
[94] S. E. Gerrard, J. Walsh, N. Bowers, S. Salunke, and S. Hershenson, “Innovations
in Pediatric Drug Formulations and Administration Technologies for Low
Resource Settings,” 2019.
[95] W. H. O. E. Committee, W. H. O. M. List, E. Medicines, W. H. O. M. List, and E.
Medicines, “THE SELECTION AND USE OF ESSENTIAL MEDICINES Report
of the WHO Expert Committee , 2009 ( including the 16th WHO Model List of
Essential Medicines and the 2nd WHO Model List of Essential Medicines for
Children ),” 2009.
[96] W. H. O. E. Committee, W. H. O. M. List, E. Medicines, M. List, and E. Medicines,
“The Selection and Use of Essential Medicines,” 2017.
[97] B. Group, “BNF for Children. The essencial resource for clinical use of medicines
in children,” UK.
[98] V. Anand, M. Kataria, V. Kukkar, V. Saharan, and P. K. Choudhury, “The latest
trends in the taste assessment of pharmaceuticals,” Drug Discov. Today, vol. 12,
no. 5–6, pp. 257–265, 2007, doi: 10.1016/j.drudis.2007.01.010.
[99] P. Kozarewicz, “Regulatory perspectives on acceptability testing of dosage forms
in children,” Int. J. Pharm., vol. 469, no. 2, pp. 245–248, 2014, doi:
10.1016/j.ijpharm.2014.03.057.
[100] European Medicines Agency (EMA), “Guideline on pharmaceutical development
of medicines for paediatric use,” European Medicines Agency, vol. rev 2. London,
UK, pp. 1–24, 2013, [Online]. Available:
https://www.ema.europa.eu/en/documents/scientific-guideline/guideline-
pharmaceutical-development-medicines-paediatric-use_en.pdf.
[101] M. Moreira and M. Sarraguça, “How can oral paediatric formulations be
improved? A challenge for the XXI century,” Int. J. Pharm., vol. 590, no. July, p.
119905, 2020, doi: 10.1016/j.ijpharm.2020.119905.

388
[102] F. Rodieux, M. Wilbaux, J. N. Van Den Anker, and M. Pfister, “Effect of Kidney
Function on Drug Kinetics and Dosing in Neonates , Infants , and Children,” Clin.
Pharmacokinet., 2015, doi: 10.1007/s40262-015-0298-7.
[103] J. T. Coulibaly, G. Panic, K. D. Silué, J. Kovač, J. Hattendorf, and J. Keiser,
“Efficacy and safety of praziquantel in preschool-aged and school-aged children
infected with Schistosoma mansoni: a randomised controlled, parallel-group, dose-
ranging, phase 2 trial,” Lancet Glob. Heal., vol. 5, no. 7, pp. e688–e698, 2017, doi:
10.1016/S2214-109X(17)30187-0.
[104] M. K. Freeman, W. White, and M. Iranikhah, “Tablet Splitting: A Review of
Weight and Content Uniformity,” Consult. Pharm. may, vol. 27, no. 5, pp. 341–
352, 2012.
[105] J.-P. R. & M. P. Charlotte Verrue, Els Mehuys, Koen Boussery, “Tablet-splitting :
a common yet not so innocent practice,” J. Adv. Nurs., vol. 67, no. 1, pp. 26–32,
2010, doi: 10.1111/j.1365-2648.2010.05477.x.
[106] H. R. Devantier et al., “Quantitative assessment of TRPM5-dependent oral
aversiveness of pharmaceuticals using a mouse brief-access taste aversion assay,”
Behav. Pharmacol., vol. 19, no. 7, pp. 673–682, 2008, doi:
10.1097/FBP.0b013e3283123cd6.
[107] S. M. Hanning, F. L. Lopez, I. C. K. Wong, T. B. Ernest, C. Tuleu, and M. Orlu
Gul, “Patient centric formulations for paediatrics and geriatrics: Similarities and
differences,” Int. J. Pharm., vol. 512, no. 2, pp. 355–359, 2016, doi:
10.1016/j.ijpharm.2016.03.017.
[108] E. Grossi, F. Pace, and R. Stockbrugger, “Human nutrition from the
gastroenterologist’s perspective: Lessons from expo milano 2015,” Hum. Nutr.
From Gastroenterol. Perspect. Lessons From Expo Milano 2015, pp. 1–213, 2016,
doi: 10.1007/978-3-319-30361-1.
[109] J. Walsh et al., “Playing hide and seek with poorly tasting paediatric medicines :
Do not forget the excipients ☆,” Adv. Drug Deliv. Rev., vol. 73, pp. 14–33, 2014,
doi: 10.1016/j.addr.2014.02.012.
[110] C. S. Mennella JA, Spector AC, Reed DR, “Bad taste of medicines,” Clin Ther,
vol. 35, no. 8, pp. 1225–1246, 2013, doi: 10.1016/j.clinthera.2013.06.007.The.
[111] R. Ternik et al., “Assessment of swallowability and palatability of oral dosage
forms in children: Report from an M-CERSI pediatric formulation workshop,” Int.
J. Pharm., vol. 536, no. 2, pp. 570–581, 2018, doi: 10.1016/j.ijpharm.2017.08.088.

389
[112] A. A. Lee and C. Owyang, Sugars, sweet taste receptors, and brain responses.
Elsevier Inc., 2019.
[113] R. Bala, S. badjatya, and R. Madaan, “Strategies practiced to perk up oral
palatability and acceptance of bitter drugs,” J. Drug Deliv. Sci. Technol., vol. 56,
no. February, p. 101580, 2020, doi: 10.1016/j.jddst.2020.101580.
[114] A. H. A. Mohamed-Ahmed, J. Soto, T. Ernest, and C. Tuleu, “Non-human tools
for the evaluation of bitter taste in the design and development of medicines: A
systematic review,” Drug Discov. Today, vol. 21, no. 7, pp. 1170–1180, 2016, doi:
10.1016/j.drudis.2016.05.014.
[115] C. P. Milne and J. B. Bruss, “The economics of pediatric formulation development
for off-patent drugs,” Clin. Ther., vol. 30, no. 11, pp. 2133–2145, 2008, doi:
10.1016/j.clinthera.2008.11.019.
[116] R. V. Tiwari, A. N. Polk, H. Patil, X. Ye, M. B. Pimparade, and M. A. Repka, “Rat
Palatability Study for Taste Assessment of Caffeine Citrate Formulation Prepared
via Hot-Melt Extrusion Technology,” AAPS PharmSciTech, vol. 18, no. 2, pp.
341–348, 2017, doi: 10.1208/s12249-015-0447-1.
[117] A. V Keating, J. Soto, C. Tuleu, C. Forbes, M. Zhao, and D. Q. M. Craig, “Solid
state characterisation and taste masking ef fi ciency evaluation of polymer based
extrudates of isoniazid for paediatric administration,” Int. J. Pharm., vol. 536, no.
2, pp. 536–546, 2018, doi: 10.1016/j.ijpharm.2017.07.008.
[118] M. Münster, “Paediatric drug development for praziquantel,” 2018.
[119] J. Soto et al., “Rats can predict aversiveness of Active Pharmaceutical
Ingredients,” Eur. J. Pharm. Biopharm., vol. 133, no. August, pp. 77–84, 2018,
doi: 10.1016/j.ejpb.2018.09.027.
[120] S. D.-B. Gesine Winzenburg∗, “Industry perspective on palatability testing in
children—Two case studies,” Tech. Res. Dev. Novartis Pharma AG, Basel CH
4056, Switz., vol. 2012, no. 435, pp. 131–151, 2012.
[121] A. Riul, C. A. R. Dantas, C. M. Miyazaki, and O. N. Oliveira, “Recent advances
in electronic tongues,” Analyst, vol. 135, no. 10, pp. 2481–2495, 2010, doi:
10.1039/c0an00292e.
[122] K. C. Berridge, “Measuring hedonic impact in animals and infants: Microstructure
of affective taste reactivity patterns,” Neurosci. Biobehav. Rev., vol. 24, no. 2, pp.
173–198, 2000, doi: 10.1016/S0149-7634(99)00072-X.
[123] S. Gittings, N. Turnbull, C. J. Roberts, and P. Gershkovich, “Dissolution

390
methodology for taste masked oral dosage forms,” J. Control. Release, vol. 173,
no. 1, pp. 32–42, 2014, doi: 10.1016/j.jconrel.2013.10.030.
[124] D. H. Choi, N. A. Kim, T. S. Nam, S. Lee, and S. H. Jeong, “Evaluation of taste-
masking effects of pharmaceutical sweeteners with an electronic tongue system,”
Drug Dev. Ind. Pharm., vol. 40, no. 3, pp. 308–317, 2014, doi:
10.3109/03639045.2012.758636.
[125] M. Maniruzzaman, J. S. Boateng, M. Bonnefille, A. Aranyos, J. C. Mitchell, and
D. Douroumis, “Taste masking of paracetamol by hot-melt extrusion: An in vitro
and in vivo evaluation,” Eur. J. Pharm. Biopharm., vol. 80, no. 2, pp. 433–442,
2012, doi: 10.1016/j.ejpb.2011.10.019.
[126] M. Guhmann, M. Preis, F. Gerber, N. Pöllinger, J. Breitkreutz, and W. Weitschies,
“Development of oral taste masked diclofenac formulations using a taste sensing
system,” Int. J. Pharm., vol. 438, no. 1–2, pp. 81–90, 2012, doi:
10.1016/j.ijpharm.2012.08.047.
[127] G. A. Campbell et al., “Evaluating the taste masking effectiveness of various
flavors in a stable formulated pediatric suspension and solution using the Astree
trade; electronic tongue,” Powder Technol., vol. 224, pp. 109–123, 2012, doi:
10.1016/j.powtec.2012.02.038.
[128] H. Nakamura, S. Uchida, T. Sugiura, and N. Namiki, “The prediction of the
palatability of orally disintegrating tablets by an electronic gustatory system,” Int.
J. Pharm., vol. 493, no. 1–2, pp. 305–312, 2015, doi:
10.1016/j.ijpharm.2015.07.056.
[129] Y. Deng, L. Shen, Y. Yang, and J. Shen, “Development of nanoparticle-based
orodispersible palatable pediatric formulations,” Int. J. Pharm., vol. 596, no.
January, p. 120206, 2021, doi: 10.1016/j.ijpharm.2021.120206.
[130] M. Wesoły, M. Zabadaj, A. Amelian, K. Winnicka, W. Wróblewski, and P. Ciosek,
“Tasting cetirizine-based microspheres with an electronic tongue,” Sensors
Actuators, B Chem., vol. 238, pp. 1190–1198, 2017, doi:
10.1016/j.snb.2016.06.147.
[131] K. Woertz, C. Tissen, P. Kleinebudde, and J. Breitkreutz, “A comparative study
on two electronic tongues for pharmaceutical formulation development,” J. Pharm.
Biomed. Anal., vol. 55, no. 2, pp. 272–281, 2011, doi: 10.1016/j.jpba.2011.02.002.
[132] J. B. KATHARINA WOERTZ, CORINNA TISSEN, PETER KLEINEBUDDE,
“Development of a Taste-Masked Generic Ibuprofen Suspension: Top-Down

391
Approach Guided by Electronic Tongue Measurements,” J. Pharm. Sci., vol. 100,
no. 10, pp. 4460–4470, 2011, doi: DOI 10.1002/jps.22629.
[133] L. I. Immohr et al., “Early pediatric formulation development with new chemical
entities: Opportunities of e-tongue besides human taste assessment,” Int. J.
Pharm., vol. 530, no. 1–2, pp. 201–212, 2017, doi: 10.1016/j.ijpharm.2017.07.069.
[134] J. C. Machado et al., “Efficient praziquantel encapsulation into polymer
microcapsules and taste masking evaluation using an electronic tongue,” Bull.
Chem. Soc. Jpn., vol. 91, no. 6, pp. 865–874, 2018, doi: 10.1246/bcsj.20180005.
[135] M. Pein, M. Preis, C. Eckert, and F. E. Kiene, “Taste-masking assessment of solid
oral dosage forms – A critical review,” Int. J. Pharm., vol. 465, no. 1–2, pp. 239–
254, 2014, doi: 10.1016/j.ijpharm.2014.01.036.
[136] M. W. J. Dodds, D. A. Johnson, and C. Yeh, “Health benefits of saliva : a review,”
pp. 223–233, 2005, doi: 10.1016/j.jdent.2004.10.009.
[137] S. T. Prajapati, P. B. Patel, and C. N. Patel, “Formulation and evaluation of
sublingual tablets containing Sumatriptan succinate,” vol. 2, no. 3, 2012, doi:
10.4103/2230-973X.104400.
[138] A. Lura, G. Tardy, and P. Kleinebudde, “Tableting of mini-tablets in comparison
with conventionally sized tablets : A comparison of tableting properties and tablet
dimensions,” vol. 2, no. November, 2020, doi: 10.1016/j.ijpx.2020.100061.
[139] V. Tumuluri, Pharmaceutical mini - tablets : a. Elsevier Inc., 2020.
[140] V. Klingmann et al., “Favorable Acceptance of Mini-Tablets Compared with
Syrup: A Randomized Controlled Trial in Infants and Preschool Children,” pp.
1728–1733, 2013, doi: 10.1016/j.jpeds.2013.07.014.
[141] A. Tsiligiannis, M. Sfouni, R. Nalda-molina, and A. Dokoumetzidis, “European
Journal of Pharmaceutical Sciences Optimization of a paediatric fixed dose
combination mini-tablet and dosing regimen for the first line treatment of
tuberculosis,” Eur. J. Pharm. Sci., vol. 138, no. June, p. 105016, 2019, doi:
10.1016/j.ejps.2019.105016.
[142] T. Huong, H. Thi, S. Lha, S. Pinto, and M. Flament, “Feasability of a new process
to produce fast disintegrating pellets as novel multiparticulate dosage form for
pediatric use,” vol. 496, pp. 842–849, 2015.
[143] S. Kayuni et al., “A systematic review with epidemiological update of male genital
schistosomiasis (MGS): A call for integrated case management across the health
system in sub-Saharan Africa,” Parasite Epidemiol. Control, vol. 4, p. e00077,

392
2019, doi: 10.1016/j.parepi.2018.e00077.
[144] T. Sangnim and K. Huanbutta, “Journal of Drug Delivery Science and Technology
Development and evaluation of taste-masked paracetamol chewable tablets using
a polymer and / or wax dispersion technique,” J. Drug Deliv. Sci. Technol., vol.
54, no. August, p. 101361, 2019, doi: 10.1016/j.jddst.2019.101361.
[145] G. G. Pereira, S. Figueiredo, and A. I. Fernandes, “Polymer Selection for Hot-Melt
Extrusion Coupled to Fused Deposition Modelling in Pharmaceutics,” 2020.
[146] T. Tagami, E. Ito, R. Kida, K. Hirose, T. Noda, and T. Ozeki, “3D printing of
gummy drug formulations composed of gelatin and an HPMC-based hydrogel for
pediatric use,” Int. J. Pharm., vol. 594, no. September 2020, p. 120118, 2021, doi:
10.1016/j.ijpharm.2020.120118.
[147] M. Elbadawi, B. Muñiz, F. K. H. Gavins, J. Jie, and S. Gaisford, “M3DISEEN : A
novel machine learning approach for predicting the 3D printability of medicines,”
Int. J. Pharm., vol. 590, no. September, p. 119837, 2020, doi:
10.1016/j.ijpharm.2020.119837.
[148] G. Chen, Y. Xu, P. Chi, L. Kwok, and L. Kang, “Pharmaceutical Applications of
3D Printing,” Addit. Manuf., vol. 34, no. November 2019, p. 101209, 2020, doi:
10.1016/j.addma.2020.101209.
[149] G. Chen, Y. Xu, P. Chi, L. Kwok, and L. Kang, “Pharmaceutical Applications of
3D Printing,” Addit. Manuf., vol. 34, no. April, p. 101209, 2020, doi:
10.1016/j.addma.2020.101209.
[150] B. Shaqour, A. Samaro, B. Verleije, K. Beyers, and C. Vervaet, “Production of
Drug Delivery Systems Using Fused Filament Fabrication : A Systematic
Review,” pp. 1–16, 2020.
[151] A. Melocchi et al., “A Graphical Review on the Escalation of Fused Deposition
Modeling ( FDM ) 3D Printing in the Pharmaceutical Field,” J. Pharm. Sci., vol.
109, no. 10, pp. 2943–2957, 2020, doi: 10.1016/j.xphs.2020.07.011.
[152] A. Goyanes, A. B. M. Buanz, A. W. Basit, and S. Gaisford, “Fused- fi lament 3D
printing ( 3DP ) for fabrication of tablets,” vol. 476, pp. 88–92, 2014, doi:
10.1016/j.ijpharm.2014.09.044.
[153] A. Ghanizadeh Tabriz et al., “3D printed bilayer tablet with dual controlled drug
release for tuberculosis treatment,” Int. J. Pharm., vol. 593, no. November 2020,
p. 120147, 2021, doi: 10.1016/j.ijpharm.2020.120147.
[154] A. Goyanes, P. Robles, A. Buanz, A. W. Basit, and S. Gaisford, “Effect of

393
geometry on drug release from 3D printed tablets,” Int. J. Pharm., vol. 494, no. 2,
pp. 657–663, 2015, doi: 10.1016/j.ijpharm.2015.04.069.
[155] K. Shi, J. P. Salvage, M. Maniruzzaman, and A. Nokhodchi, “Role of release
modifiers to modulate drug release from fused deposition modelling ( FDM ) 3D
printed tablets,” Int. J. Pharm., vol. 597, no. January, p. 120315, 2021, doi:
10.1016/j.ijpharm.2021.120315.
[156] A. Goyanes, N. Allahham, S. J. Trenfield, E. Stoyanov, S. Gaisford, and A. W.
Basit, “Direct powder extrusion 3D printing: Fabrication of drug products using a
novel single-step process,” Int. J. Pharm., vol. 567, no. May, 2019, doi:
10.1016/j.ijpharm.2019.118471.
[157] M. A. Gonzalez, M. V. Ramírez Rigo, and N. L. Gonzalez Vidal, “Praziquantel
systems with improved dissolution rate obtained by high pressure
homogenization,” Mater. Sci. Eng. C, vol. 93, no. September 2017, pp. 28–35,
2018, doi: 10.1016/j.msec.2018.07.050.
[158] S. G. Rodrigues, I. Chaves, N. Ferreira, S. De Melo, and M. B. De Jesus,
“Computational analysis and physico-chemical characterization of an inclusion
compound between praziquantel and methyl- β -cyclodextrin for use as an
alternative in the treatment of s ... Computational analysis and physico-chemical
characterization of an i,” J. Incl. Phenom., no. May, 2011, doi: 10.1007/s10847-
010-9852-y.
[159] G. Becket, L. J. Schep, and M. Yee, “Improvement of the in vitro dissolution of
praziquantel by complexation with a - , b - and g -cyclodextrins,” vol. 179, pp. 65–
71, 1999.
[160] W. W. Shuyu Xie, Baoliang Pan, Zhou, Baoxin shi, Zhuangzhi Zhang Xu, Zhang
Ming, “Solid lipid nanoparticle suspension enhanced the therapeutic efficacy of
praziquantel against tapeworm,” Int. J. Nanomedicine, pp. 2367–2374, 2011.
[161] L. N. Andrade et al., “Praziquantel-loaded solid lipid nanoparticles: Production,
physicochemical characterization, release profile, cytotoxicity and in vitro activity
against Schistosoma mansoni,” J. Drug Deliv. Sci. Technol., vol. 58, no. June 2019,
p. 101784, 2020, doi: 10.1016/j.jddst.2020.101784.
[162] G. C. Bazzo, G. Tambosi, E. C. Brüske, and M. Zétola, “Evaluation of enhanced
aqueous solubility of praziquantel incorporated in poly (3- hydroxybutyrate) and
Eudragit® E microspheres,” Acta Sci., pp. 91–96, 2013, doi:
10.4025/actascihealthsci.v35i1.10673.

394
[163] R. M. Mainardes, M. Palmira, D. Gremião, and R. C. Evangelista,
“Thermoanalytical study of praziquantel-loaded PLGA nanoparticles,” vol. 42,
2006.
[164] L. B. Da Fonseca et al., “Development of a brazilian nanoencapsulated drug for
schistosomiasis treatment,” Vigilância Sanitária em Debate, vol. 1, no. 4, pp. 4–
10, 2013, doi: 10.3395/vd.v1i4.111en.
[165] Lorena Menezes Vieira, “ENCAPSULAMENTO IN SITU DE PRAZIQUANTEL
NA POLIMERIZAÇÃO EM SUSPENSÃO DO METACRILATO DE METILA
PARA A PRODUÇÃO DE SISTEMAS DE LIBERAÇÃO CONTROLADA,”
UNIVERSIDADE FEDERAL DO RIO DE JANEIRO COMO, 2014.
[166] J. B. Alves, T. Franckini Paiva, V. M. Salim, H. Conceição Ferraz, and J. C. Pinto,
“ In situ encapsulation of praziquantel through methyl
methacrylate/diethylaminoethyl methacrylate and MMA / DMAEMA
miniemulsion copolymerizations in presence of distinct ionic surfactants ,” SPE
Polym., vol. 2, no. 2, pp. 110–121, 2021, doi: 10.1002/pls2.10037.
[167] S. T. and S. T. Paloma de la Torre, “Preparation, dissolution and characterization
of praziquantel solid dispersions,” Chem. Pharm. Bull, vol. 47, no. 11, pp. 1629–
1633, 1999, [Online]. Available: http://www.mendeley.com/research/geology-
volcanic-history-eruptive-style-yakedake-volcano-group-central-japan/.
[168] A. Borrego-s et al., “Ground Calcium Carbonate as a Low Cost and Biosafety
Excipient for Solubility and Dissolution Improvement of Praziquantel,” 2019.
[169] S. Orlandi, J. Priotti, H. P. Diogo, D. Leonardi, C. J. Salomon, and T. G. Nunes,
“Structural Elucidation of Poloxamer 237 and Poloxamer 237 / Praziquantel Solid
Dispersions : Impact of Poly ( Vinylpyrrolidone ) over Drug Recrystallization and
Dissolution Research Article Structural Elucidation of Poloxamer 237 and
Poloxamer 237 / Prazi,” no. January, 2018, doi: 10.1208/s12249-017-0946-3.
[170] B. Om, S. Amruta, D. Shashikant, P. Rohini, R. Vinita, and K. Priyanka, “Design
and statistical optimisation of praziquantel tablets by using solid dispersion
approach,” no. June, pp. 83–92, 2015, doi: 10.4103/0973-8398.154689.
[171] M. V. Chaud et al., “Solid dispersions with hydrogenated castor oil increase
solubility , dissolution rate and intestinal absorption of praziquantel,” vol. 46,
2010.
[172] F. C. Cunha, “Separation of praziquantel enantiomers using simulated moving bed
chromatographic unit with performance designed for semipreparative

395
applications,” no. March, pp. 9–13, 2019, doi: 10.1002/chir.23084.
[173] X. Wang, S. Du, R. Zhang, X. Jia, T. Yang, and X. Zhang, “Drug-drug cocrystals :
Opportunities and challenges,” Asian J. Pharm. Sci., no. xxxx, 2020, doi:
10.1016/j.ajps.2020.06.004.
[174] R. Thakuria, A. Delori, W. Jones, M. P. Lipert, L. Roy, and N. Rodríguez-hornedo,
“Pharmaceutical cocrystals and poorly soluble drugs,” Int. J. Pharm., vol. 453, no.
1, pp. 101–125, 2013, doi: 10.1016/j.ijpharm.2012.10.043.
[175] C. Jacobs, O. Kayser, and R. H. Muller, “Nanosuspensions as particulate drug
formulations in therapy Rationale for development and what we can expect for the
future,” vol. 47, pp. 3–19, 2001.
[176] V. Chikhalia et al., “The effect of crystal morphology and mill type on milling
induced crystal disorder,” vol. 7, pp. 19–26, 2005, doi: 10.1016/j.ejps.2005.08.013.
[177] E. C. Arrúa, M. J. G. Ferreira, C. J. Salomon, and T. G. Nunes, “Elucidating the
guest-host interactions and complex formation of praziquantel and cyclodextrin
derivatives by 13 C and 15 N solid-state NMR spectroscopy,” Int. J. Pharm., vol.
496, no. 2, pp. 812–821, 2015, doi: 10.1016/j.ijpharm.2015.11.026.
[178] S. Xie et al., “Formulation, characterization and pharmacokinetics of praziquantel-
loaded hydrogenated castor oil solid lipid nanoparticles,” Nanomedicine, vol. 5,
pp. 693–701, 2010.
[179] B. Perissutti et al., “An explorative analysis of process and formulation variables
affecting comilling in a vibrational mill : The case of praziquantel,” Int. J. Pharm.,
vol. 533, no. 2, pp. 402–412, 2017, doi: 10.1016/j.ijpharm.2017.05.053.
[180] M. Malhado et al., “Journal of Pharmaceutical and Biomedical Analysis
Preclinical pharmacokinetic evaluation of praziquantel loaded in poly ( methyl
methacrylate ) nanoparticle using a HPLC – MS / MS,” vol. 117, pp. 405–412,
2016, doi: 10.1016/j.jpba.2015.09.023.
[181] B. Kumari and H. Bishnoi, “Review Article SOLID DISPERSION : ITS TYPES
AND MECHANISM OF J ournal of P harma R esearch,” no. March, 2019, doi:
10.5281/zenodo.2594669.
[182] A. Kapourani, E. Vardaka, K. Katopodis, and K. Kachrimanis, “Crystallization
tendency of APIs possessing di ff erent thermal and glass related properties in
amorphous solid dispersions,” Int. J. Pharm., vol. 579, no. February, p. 119149,
2020, doi: 10.1016/j.ijpharm.2020.119149.
[183] S. Shah, S. Maddineni, J. Lu, and M. A. Repka, “Melt extrusion with poorly soluble

396
drugs,” Int. J. Pharm., vol. 453, no. 1, pp. 233–252, 2013, doi:
10.1016/j.ijpharm.2012.11.001.
[184] B. L. de A. Costa, “Generation of high drug loading amorphous solid dispersions
by different manufacturing processes,” 2017.
[185] H. Veith, F. Wiechert, C. Luebbert, and G. Sadowski, “Combining crystalline and
polymeric excipients in API solid dispersions – Opportunity or risk ?,” Eur. J.
Pharm. Biopharm., vol. 158, no. September 2020, pp. 323–335, 2021, doi:
10.1016/j.ejpb.2020.11.025.
[186] A. Newman, Rational Design for Amorphous Solid Dispersions. Elsevier Inc.,
2017.
[187] P. Pandi, R. Bulusu, N. Kommineni, W. Khan, and M. Singh, “Amorphous solid
dispersions: An update for preparation, characterization, mechanism on
bioavailability, stability, regulatory considerations and marketed products,” Int. J.
Pharm., vol. 586, no. June, p. 119560, 2020, doi: 10.1016/j.ijpharm.2020.119560.
[188] P. Kanaujia, P. Poovizhi, W. K. Ng, and R. B. H. Tan, “Amorphous formulations
for dissolution and bioavailability enhancement of poorly soluble APIs,” Powder
Technol., vol. 285, pp. 2–15, 2015, doi: 10.1016/j.powtec.2015.05.012.
[189] K. Kogermann et al., “Dissolution testing of amorphous solid dispersions,” Int. J.
Pharm., vol. 444, no. 1–2, pp. 40–46, 2013, doi: 10.1016/j.ijpharm.2013.01.042.
[190] M. Tobyn et al., “Amorphous Drug – PVP Dispersions : Application of Theoretical
, Thermal and Spectroscopic Analytical Techniques to the Study of a Molecule
With Intermolecular Bonds in Both the Crystalline and Pure Amorphous State,” J.
Am. Pharm. Assoc., vol. 98, no. 9, pp. 3456–3468, 2009, doi: 10.1002/jps.21738.
[191] M. Savolainen et al., “Better understanding of dissolution behaviour of amorphous
drugs by in situ solid-state analysis using Raman spectroscopy,” Eur. J. Pharm.
Biopharm., vol. 71, no. 1, pp. 71–79, 2009, doi: 10.1016/j.ejpb.2008.06.001.
[192] P. J. Skrdla, P. D. Floyd, and P. C. D. Orco, “The amorphous state : first-principles
derivation of the Gordon – Taylor equation for direct prediction of the glass
transition temperature of mixtures ; glass formers ; physical basis of the ‘“ Rule of
2 / 3 ,”’” Phys. Chem. Chem. Phys., vol. 19, pp. 20523–20532, 2017, doi:
10.1039/C7CP04124A.
[193] O. Jennotte, N. Koch, A. Lechanteur, and B. Evrard, “Three-dimensional printing
technology as a promising tool in bioavailability enhancement of poorly water-
soluble molecules : A review,” Int. J. Pharm., vol. 580, no. December 2019, p.

397
119200, 2020, doi: 10.1016/j.ijpharm.2020.119200.
[194] M. Hanada, S. V Jermain, X. Lu, Y. Su, and R. O. Williams, “Predicting physical
stability of ternary amorphous solid dispersions using speci fi c mechanical energy
in a hot melt extrusion process ☆,” Int. J. Pharm., vol. 548, no. 1, pp. 571–585,
2018, doi: 10.1016/j.ijpharm.2018.07.029.
[195] S. Xu and W. Dai, “Drug precipitation inhibitors in supersaturable formulations,”
Int. J. Pharm., vol. 453, no. 1, pp. 36–43, 2013, doi:
10.1016/j.ijpharm.2013.05.013.
[196] K. Kachrimanis and I. Nikolakakis, “Polymers as Formulation Excipients for Hot-
Melt Extrusion Processing of Pharmaceuticals,” in Handbook of Polymers for
Pharmaceutical Technologies, vol. 2, 2015, pp. 121–149.
[197] P. J. Skrdla, P. D. Floyd, and P. C. D. Orco, “Predicting the solubility enhancement
of amorphous drugs and related phenomena using basic thermodynamic principles
and semi-empirical kinetic models,” Int. J. Pharm., vol. 567, no. July, p. 118465,
2019, doi: 10.1016/j.ijpharm.2019.118465.
[198] B. C. Hancock and M. Parks, “What is the True Solubility Advantage for
Amorphous Pharmaceuticals ?,” vol. 17, no. 4, 2000.
[199] R. Han et al., “Insight into the Dissolution Molecular Mechanism of Ternary Solid
Dispersions by Combined Experiments and Molecular Simulations,” AAPS
PharmSciTech, vol. 20, no. 7, pp. 10–20, 2019, doi: 10.1208/s12249-019-1486-9.
[200] S. Huang, C. Mao, R. O. W. Iii, and C. Yang, “Solubility Advantage ( and
Disadvantage ) of Pharmaceutical Amorphous Solid Dispersions,” J. Pharm. Sci.,
pp. 1–13, 2016, doi: 10.1016/j.xphs.2016.08.017.
[201] A. Alhayali, “In Vitro Solubility and Supersaturation Behavior of Supersaturating
Drug Delivery Systems,” Luleå University of Technology May.
[202] A. Schittny, “Mechanisms of increased bioavailability through amorphous solid
dispersions : a review,” vol. 27, no. 1, pp. 110–127, 2020, doi:
10.1080/10717544.2019.1704940.
[203] G. Zogra and A. Newman, “Interrelationships Between Structure and the
Properties of Amorphous Solids of Pharmaceutical Interest,” vol. 106, pp. 5–27,
2017, doi: 10.1016/j.xphs.2016.05.001.
[204] T. Pas, S. Verbert, B. Appeltans, and G. Van Den Mooter, “The influence of
crushing amorphous solid dispersion dosage forms on the in-vitro dissolution
kinetics,” Int. J. Pharm., vol. 573, no. November 2019, p. 118884, 2020, doi:

398
10.1016/j.ijpharm.2019.118884.
[205] R. B. Chavan, S. Rathi, V. G. S. S. Jyothi, and N. R. Shastri, “Cellulose based
polymers in development of amorphous solid dispersions,” Asian J. Pharm. Sci.,
vol. 14, no. 3, pp. 248–264, 2019, doi: 10.1016/j.ajps.2018.09.003.
[206] A. R. Nair et al., “Review Article Overview of Extensively Employed Polymeric
Carriers in Solid Dispersion Technology,” 2020, doi: 10.1208/s12249-020-01849-
z.
[207] T. D. Vaibhav Sihorkara, The role of polymers and excipients in developing
amorphous solid dispersions: An industrial perspective. Elsevier Inc., 2020.
[208] S. B. Teja, S. P. Patil, G. Shete, S. Patel, and A. K. Bansal, “Drug-excipient
behavior in polymeric amorphous solid dispersions .,” vol. 4, no. September, pp.
70–94, 2013.
[209] K. Lehmkemper, S. O. Kyeremateng, O. Heinzerling, M. Degenhardt, and G.
Sadowski, “Long-Term Physical Stability of PVP- and PVPVA-Amorphous Solid
Dispersions,” 2017, doi: 10.1021/acs.molpharmaceut.6b00763.
[210] D. Feng et al., “Polymer – Surfactant System Based Amorphous Solid Dispersion :
Precipitation Inhibition and Bioavailability Enhancement of Itraconazole,” no. 1,
pp. 1–15, 2018, doi: 10.3390/pharmaceutics10020053.
[211] H. J. Jung et al., “Improved oral absorption of tacrolimus by a solid dispersion with
hypromellose and sodium lauryl sulfate,” Int. J. Biol. Macromol., vol. 83, pp. 282–
287, 2016, doi: 10.1016/j.ijbiomac.2015.11.063.
[212] J. Chen, J. D. Ormes, J. D. Higgins, and L. S. Taylor, “Impact of Surfactants on
the Crystallization of Aqueous Suspensions of Celecoxib Amorphous Solid
Dispersion Spray Dried Particles,” 2015, doi: 10.1021/mp5006245.
[213] D. Hoon et al., “Improved oral absorption of dutasteride via Soluplus 1 -based
supersaturable self-emulsifying drug delivery system ( S-SEDDS ),” vol. 478, pp.
341–347, 2015.
[214] S. P. Chaudhari and R. P. Dugar, “Application of surfactants in solid dispersion
technology for improving solubility of poorly water soluble drugs Journal of Drug
Delivery Science and Technology Application of surfactants in solid dispersion
technology for improving solubility of poorly w,” J. Drug Deliv. Sci. Technol., vol.
41, no. February 2018, pp. 68–77, 2017, doi: 10.1016/j.jddst.2017.06.010.
[215] W. Zhang, S. S. Hate, D. J. Russell, H. H. Hou, and K. Nagapudi, “Impact of
Surfactant and Surfactant-Polymer Interaction on Desupersaturation of

399
Clotrimazole,” J. Pharm. Sci., vol. 108, no. 10, pp. 3262–3271, 2019, doi:
10.1016/j.xphs.2019.05.035.
[216] A. Schittny, S. Philipp-bauer, P. Detampel, J. Huwyler, and M. Puchkov,
“Mechanistic insights into e ff ect of surfactants on oral bioavailability of
amorphous solid dispersions,” J. Control. Release, vol. 320, no. August 2019, pp.
214–225, 2020, doi: 10.1016/j.jconrel.2020.01.031.
[217] R. C. Rowe, P. J. Sheskey, and S. C. Owen, Handbook of Pharmaceutical
Excipients, 5th ed. London: Pharmaceutical Pres, 2006.
[218] C. Viet and P. C. Cho, “Application of D -α-tocopheryl polyethylene glycol 1000
succinate ( TPGS ) in transdermal and topical drug delivery systems ( TDDS ),” J.
Pharm. Investig., vol. 0, no. 0, p. 0, 2017, doi: 10.1007/s40005-016-0300-x.
[219] D. Hurley, M. Davis, G. M. Walker, J. G. Lyons, and C. L. Higginbotham, “The E
ff ect of Cooling on the Degree of Crystallinity , Solid-State Properties , and
Dissolution Rate of Multi-Component Hot-Melt Extruded Solid Dispersions,” no.
2004, 2020.
[220] Y. A. and M. S. François Hallouarda, Lyes Mehennic, Malika Lahiani-Skibaa,
“Solid Dispersions for Oral Administration : An Overview of the Methods for their
Preparation Solid Dispersions for Oral Administration : An Overview of the
Methods for their Preparation,” Curr. Pharm. Des., vol. 22, no. August, pp. 1–17,
2016, doi: 10.2174/138161282266616072.
[221] J. Knapik-kowalczuk, K. Chmiel, J. Pacułt, and K. Bialek, “Enhancement of the
Physical Stability of Amorphous Sildenafil in a Binary Mixture , with either a
Plasticizing or Antiplasticizing Compound,” pp. 23–28, 2020.
[222] A. Prudic, T. Kleetz, M. Korf, Y. Ji, and G. Sadowski, “In fl uence of Copolymer
Composition on the Phase Behavior of Solid Dispersions,” 2014.
[223] K. Deboyace and P. L. D. Wildfong, “The Application of Modeling and Prediction
to the Formation and Stability of Amorphous Solid Dispersions,” J. Pharm. Sci.,
vol. 107, no. 1, pp. 57–74, 2018, doi: 10.1016/j.xphs.2017.03.029.
[224] J. L. Calahan and F. Alvarez-nunez, “Characterization of Amorphous Solid
Dispersions of AMG 517 in HPMC-AS and Crystallization using Isothermal
Microcalorimetry By,” 2011.
[225] M. F. Simões, R. M. A. Pinto, and S. Simões, “Hot-melt extrusion in the
pharmaceutical industry : toward filing a new drug application,” Drug Discov.
Today, vol. 00, no. 00, 2019, doi: 10.1016/j.drudis.2019.05.013.

400
[226] F. C. Campbell, “Thermodynamics and Phase Diagrams,” pp. 41–72, 2012.
[227] D. Jeli, “Thermal Stability of Amorphous Solid Dispersions,” 2021.
[228] W. F. WEI LIU, , YU LIU, JIAOQI HUANG, ZHONGQUAN LIN,
XUANCHENG PAN, XIAOJUN ZENG, MARC LAMY DE LA CHAPELLE,
YANG ZHANG, “Identification and investigation of the vibrational properties of
crystalline and co- amorphous drugs with Raman and terahertz spectroscopy,” vol.
10, no. 8, pp. 4290–4304, 2019, doi: 10.1364/BOE.10.004290.
[229] D. G. Dastidar and G. Chakrabarti, Thermoresponsive Drug Delivery Systems,
Characterization and Application. Elsevier Inc., 2019.
[230] Y. Peng, D. D. Dussan, and R. Narain, Thermal, mechanical, and electrical
properties. 2020.
[231] N. R. Jadhav, V. L. Gaikwad, K. J. Nair, and H. M. Kadam, “Glass transition
temperature : Basics and application in pharmaceutical sector,” no. June, 2009, doi:
10.4103/0973-8398.55043.
[232] C. Wu and J. W. Mcginity, “Influence of Ibuprofen as a Solid-State Plasticizer in
Eudragit ® RS 30 D on the Physicochemical Properties of Coated Beads,” vol. 2,
no. 4, 2001.
[233] J. A. Baird and L. S. Taylor, “Evaluation of amorphous solid dispersion properties
using thermal analysis techniques ☆,” vol. 64, pp. 396–421, 2012, doi:
10.1016/j.addr.2011.07.009.
[234] V. Corrtelius T. Moynihan,” Allan J. Easteal, James Wilder, “Dependence of the
glass transition temperature on heating and cooling rate,” vol. 7, no. 26, 1974, doi:
10.1021/j100619a008.
[235] A. H. L. K. C.-L. HSU, D.R. HELDMAN, T.A. TAYLOR and ABSTRACT:,
“Influence of Cooling Rate on Glass Transition Temperature of Sucrose Solutions
and Rice Starch Gel,” vol. 68, no. 6, pp. 1–6, 2003.
[236] A. Newman and G. Zografi, “Commentary Commentary : Considerations in the
Measurement of Glass Transition Temperatures of Pharmaceutical Amorphous
Solids,” pp. 1–13, 2020, doi: 10.1208/s12249-019-1562-1.
[237] S. Janssens and G. Van Den Mooter, “Review : physical chemistry of solid
dispersions,” pp. 1571–1586, 2009, doi: 10.1211/jpp/61.12.0001.
[238] P. G. Royall, D. Q. M. Craig, and C. Doherty, “Characterisation of moisture uptake
effects on the glass transitional behaviour of an amorphous drug using modulated
temperature DSC,” vol. 192, pp. 39–46, 1999.

401
[239] R. Tanaka, Y. Hattori, Y. Horie, H. Kamada, and T. Nagato, “Characterization of
Amorphous Solid Dispersion of Pharmaceutical Compound with pH-Dependent
Solubility Prepared by Continuous-Spray Granulator,” doi:
10.3390/pharmaceutics11040159.
[240] M. Latreche, “Maîtrise de la stabilité physique des alliages moléculaires amorphes
pour optimiser l’efficacité des médicaments,” L’Université de Lille, 2019.
[241] S. Dedroog, T. Pas, B. Vergauwen, C. Huygens, and G. Van Den Mooter,
“Analysis Solid-state analysis of amorphous solid dispersions : Why DSC and
XRPD may not be regarded as stand-alone techniques,” J. Pharm. Biomed. Anal.,
vol. 178, p. 112937, 2020, doi: 10.1016/j.jpba.2019.112937.
[242] H. A. Schneider, “The Gordon-Taylor equation . Additivity and interaction in
compatible polymer blends,” vol. 1955, pp. 1941–1955, 1988.
[243] M. M. Knopp et al., “A Promising New Method to Estimate Drug-Polymer
Solubility at Room Temperature,” vol. 105, pp. 2621–2624, 2016, doi:
10.1016/j.xphs.2016.02.017.
[244] B. L. A. Costa, M. Sauceau, S. Del Confetto, R. Sescousse, and M. I. Ré,
“Determination of drug-polymer solubility from supersaturated spray-dried
amorphous solid dispersions : A case study with Efavirenz and Soluplus ®,” Eur.
J. Pharm. Biopharm., vol. 142, no. July 2018, pp. 300–306, 2019, doi:
10.1016/j.ejpb.2019.06.028.
[245] A. Karagianni, “Co-Amorphous Solid Dispersions for Solubility and Absorption
Improvement of Drugs : Composition , Preparation , Characterization and
Formulations for Oral Delivery,” 2018, doi: 10.3390/pharmaceutics10030098.
[246] and M. D. Aurélien Mahieu, JeanFrançois Willart,* Emeline Dudognon, Florence
Danede, “A New Protocol To Determine the Solubility of Drugs into Polymer
Matrixes,” Mol. Pharm., 2013.
[247] Y. E. Sun, J. Tao, G. G. Z. Zhang, and L. Yu, “Solubilities of Crystalline Drugs in
Polymers : An Improved Analytical Method and Comparison of Solubilities of
Indomethacin and Nifedipine in PVP , PVP / VA , and PVAc,” J. Pharm. Sci., vol.
99, no. 9, pp. 4023–4031, 2010, doi: 10.1002/jps.22251.
[248] Z. Yang, K. Nollenberger, J. Albers, and S. Qi, “Molecular Implications of Drug
− Polymer Solubility in Understanding the Destabilization of Solid Dispersions by
Milling,” 2014.
[249] E. Sawicki, “Solid dispersions in oncology : a solution to solubility-limited oral

402
drug absorption,” Universiteit Utrecht, 2017.
[250] N. Boersen, T. Lee, and H. Hui, Toxicology Studies. Elsevier Inc., 2013.
[251] A. Newman, Pharmaceutical amorphous solid dispersion. New Jersey, 2015.
[252] A. W. M. Navnit Shah, Harpreet Sandhu, Duk Soon Choi Hitesh Chokshi,
Amorphous Solid Dispersions Theory and Practice. London: Springer NewYork
Heidelberg Dordrecht London, 2014.
[253] D. D. Sun, H. Wen, and L. S. Taylor, “Non-Sink Dissolution Conditions for
Predicting Product Quality and In Vivo Performance of Supersaturating Drug
Delivery Systems,” J. Pharm. Sci., vol. 105, no. 9, pp. 2477–2488, 2016, doi:
10.1016/j.xphs.2016.03.024.
[254] K. Sugita and N. Takata, “Dose-Dependent Solubility – Permeability Interplay for
Poorly Soluble Drugs under Non-Sink Conditions,” pp. 297–307, 2021.
[255] S. Petralito et al., “Apparent Solubility and Dissolution Profile at Non-Sink
Conditions as Quality Improvement Tools,” 2010.
[256] M. Descamps and J. F. Willart, “Perspectives on the amorphisation / milling
relationship in pharmaceutical materials ☆,” Adv. Drug Deliv. Rev., vol. 100, pp.
51–66, 2016, doi: 10.1016/j.addr.2016.01.011.
[257] M. Descamps, A. Aumelas, S. Desprez, and J. F. Willart, “The amorphous state of
pharmaceuticals obtained or transformed by milling : Sub-Tg features and
rejuvenation,” vol. 407, pp. 72–80, 2015, doi: 10.1016/j.jnoncrysol.2014.08.055.
[258] M. Descamps, J. F. Willart, E. Dudognon, and V. Caron, “Transformation of
Pharmaceutical Compounds upon Milling and Comilling : The Role of T g,” vol.
96, no. 5, pp. 1398–1407, 2007, doi: 10.1002/jps.
[259] S. Dedroog, C. Huygens, and G. Van Den Mooter, “Chemically identical but
physically different : A comparison of spray drying , hot melt extrusion and cryo-
milling for the formulation of high drug loaded amorphous solid dispersions of
naproxen,” Eur. J. Pharm. Biopharm., vol. 135, no. November 2018, pp. 1–12,
2019, doi: 10.1016/j.ejpb.2018.12.002.
[260] M. Latreche, J. Willart, M. Guerain, H. Alain, and F. Dan, “Using Milling to
Explore Physical States : The Amorphous and Polymorphic Forms of Sulindac,”
vol. 108, pp. 2635–2642, 2019, doi: 10.1016/j.xphs.2019.03.017.
[261] B. Wang et al., “A critical review of spray-dried amorphous pharmaceuticals :
Synthesis , analysis and application,” Int. J. Pharm., vol. 594, no. October 2020,
p. 120165, 2021, doi: 10.1016/j.ijpharm.2020.120165.

403
[262] M. Ré, “Formulating Drug Delivery Systems by Spray Drying,” Dry. Technol. An
Int. J., vol. 24, no. 4, pp. 433–446, 2007, doi: 10.1080/07373930600611877.
[263] A. Paudel, Z. A. Worku, J. Meeus, S. Guns, and G. Van Den Mooter,
“Manufacturing of solid dispersions of poorly water soluble drugs by spray drying :
Formulation and process considerations,” Int. J. Pharm., vol. 453, no. 1, pp. 253–
284, 2013, doi: 10.1016/j.ijpharm.2012.07.015.
[264] D. S. / M. Y. / D. Isadiartuti1, “Ternary solid dispersion to improve solubility and
dissolution of meloxicam Abstract :,” J. Basic Clin. Physiol. Pharmacol. 2019;
20190244, pp. 1–8, 2019, doi: 10.1515/jbcpp-2019-0244.
[265] C. C. C. Teixeira et al., “Microparticles Containing Curcumin Solid Dispersion :
Stability , Bioavailability and Anti-Inflammatory Activity,” vol. 17, no. 2, pp. 252–
261, 2016, doi: 10.1208/s12249-015-0337-6.
[266] K. Wlodarski and F. Zhang, “Synergistic Effect of Polyvinyl Alcohol and
Copovidone in Itraconazole Amorphous Solid Dispersions,” no. 1, 2018.
[267] M. Maniruzzaman, D. Douroumis, J. S., and M. J., “Hot-Melt Extrusion (HME):
From Process to Pharmaceutical Applications,” Recent Adv. Nov. Drug Carr. Syst.,
pp. 3–16, 2012, doi: 10.5772/51582.
[268] R. Thakkar, R. Thakkar, A. Pillai, E. A. Ashour, and M. A. Repka, “Systematic
screening of pharmaceutical polymers for hot melt extrusion processing: a
comprehensive review,” Int. J. Pharm., vol. 576, no. October 2019, p. 118989,
2020, doi: 10.1016/j.ijpharm.2019.118989.
[269] A. Alshetaili, S. M. Alshahrani, B. K. Almutairy, and M. A. Repka, “Hot Melt
Extrusion Processing Parameters Optimization,” pp. 1–14, 2020.
[270] H. Patil, R. V Tiwari, and M. A. Repka, “Hot-Melt Extrusion : from Theory to
Application in Pharmaceutical Formulation,” 2015, doi: 10.1208/s12249-015-
0360-7.
[271] S. Narala, D. Nyavanandi, P. Srinivasan, P. Mandati, and S. Bandari,
“Pharmaceutical Co-crystals , Salts , and Co-amorphous Systems : A novel
opportunity of hot-melt extrusion,” J. Drug Deliv. Sci. Technol., vol. 61, no.
November 2020, p. 102209, 2021, doi: 10.1016/j.jddst.2020.102209.
[272] J. Thiry, F. Krier, and B. Evrard, “A review of pharmaceutical extrusion : Critical
process parameters and,” Int. J. Pharm., vol. 479, no. 1, pp. 227–240, 2015, doi:
10.1016/j.ijpharm.2014.12.036.
[273] L. Saerens et al., “In-line NIR spectroscopy for the understanding of polymer –

404
drug interaction during pharmaceutical hot-melt extrusion,” Eur. J. Pharm.
Biopharm., vol. 81, no. 1, pp. 230–237, 2012, doi: 10.1016/j.ejpb.2012.01.001.
[274] N. Follonier, E. Doelker, and E. T. Cole, “controlled release Various ways of
modulating the release of diltiazem hydrochloride from hot-melt extruded
sustained release pellets prepared using polymeric materials,” vol. 36, pp. 243–
250, 1995.
[275] A. Gryczke, S. Schminke, M. Maniruzzaman, J. Beck, and D. Douroumis,
“Colloids and Surfaces B : Biointerfaces Development and evaluation of orally
disintegrating tablets ( ODTs ) containing Ibuprofen granules prepared by hot melt
extrusion,” Colloids Surfaces B Biointerfaces, vol. 86, no. 2, pp. 275–284, 2011,
doi: 10.1016/j.colsurfb.2011.04.007.
[276] V. W. Yeung and I. C. K. Wong, “R ESEARCH ARTICLE,” pp. 399–402, 2005.
[277] A. S. Alshetaili, J. Morott, S. Shah, and V. Kulkarni, “Mefenamic acid taste-
masked oral disintegrating tablets with enhanced solubility via molecular
interaction produced by hot melt extrusion technology,” pp. 18–27, 2016, doi:
10.1016/j.jddst.2015.03.003.Mefenamic.
[278] L. F. B. Malaquias et al., “Hot Melt Extrudates Formulated Using Design Space:
One Simple Process for Both Palatability and Dissolution Rate Improvement,” J.
Pharm. Sci., vol. 107, no. 1, pp. 286–296, 2018, doi: 10.1016/j.xphs.2017.08.014.
[279] R. Censi and M. R. Gigliobianco, “Hot Melt Extrusion : Highlighting
Physicochemical Factors to Be Investigated While Designing and Optimizing a
Hot Melt Extrusion Process,” 2018, doi: 10.3390/pharmaceutics10030089.
[280] A. Butreddy, S. Bandari, and M. A. Repka, “Quality-by-design in hot melt
extrusion based amorphous solid dispersions: An industrial perspective on product
development,” Eur. J. Pharm. Sci., vol. 158, no. November 2020, p. 105655, 2020,
doi: 10.1016/j.ejps.2020.105655.
[281] M. Maniruzzaman, J. S. Boateng, M. J. Snowden, and D. Douroumis, “A Review
of Hot-Melt Extrusion : Process Technology to Pharmaceutical Products,” vol.
2012, 2012, doi: 10.5402/2012/436763.
[282] S. V Jermain, C. Brough, and R. O. Williams, “Amorphous solid dispersions and
nanocrystal technologies for poorly water- soluble drug delivery – An update,” Int.
J. Pharm., vol. 535, no. 1–2, pp. 379–392, 2018, doi:
10.1016/j.ijpharm.2017.10.051.
[283] X. Ma and R. O. W. Iii, “Characterization of amorphous solid dispersions : An

405
update,” J. Drug Deliv. Sci. Technol., vol. 50, no. November 2018, pp. 113–124,
2019, doi: 10.1016/j.jddst.2019.01.017.
[284] Y. L. N. T. R. L. J. Q. W. Wu, “Understanding the Relationship between
Wettability and Dissolution of Solid Dispersion,” 2014, doi:
10.1016/j.ijpharm.2014.02.004.
[285] J. Thiry et al., “Continuous production of itraconazole-based solid dispersions by
hot melt extrusion : Preformulation , optimization and design space
determination,” Int. J. Pharm., vol. 515, no. 1–2, pp. 114–124, 2016, doi:
10.1016/j.ijpharm.2016.10.003.
[286] M. M. Crowley et al., “Pharmaceutical Applications of Hot-Melt Extrusion : Part
I Pharmaceutical Applications of Hot-Melt Extrusion : Part I,” vol. 9045, 2008,
doi: 10.1080/03639040701498759.
[287] M. A. Azad, D. Olawuni, G. Kimbell, A. Z. Badruddoza, S. Hossain, and T.
Sultana, Polymers for Extrusion-Based 3D Printing of Pharmaceuticals : A
Holistic Materials – Process Perspective. .
[288] A. Goyanes, U. Det-Amornrat, J. Wang, A. W. Basit, and S. Gaisford, “3D
scanning and 3D printing as innovative technologies for fabricating personalized
topical drug delivery systems,” J. Control. Release, vol. 234, pp. 41–48, 2016, doi:
10.1016/j.jconrel.2016.05.034.
[289] A. G. Iria Seoane-Viaño, Patricija Januskaite, Carmen Alvarez-Lorenzo, Abdul W.
Basit, “Semi-solid extrusion 3D printing in drug delivery and biomedicine:
Personalised solutions for healthcare challenges,” J. Control. Release, 2021, doi:
10.1016/j.jconrel.2021.02.027.
[290] A. Goyanes et al., “Automated therapy preparation of isoleucine formulations
using 3D printing for the treatment of MSUD : First single-centre , prospective ,
crossover study in patients,” Int. J. Pharm., vol. 567, no. June, p. 118497, 2019,
doi: 10.1016/j.ijpharm.2019.118497.
[291] Brasil and Agência Nacional de Vigilância Sanitária, “Farmacopeia Brasileira,”
Farm. Bras., vol. 1, p. 874, 2019.
[292] BASF, “kOLLIDON VA 64 Technical Informations,” no. June 2008, pp. 1–16,
2011.
[293] BASF, “Kolliphor ® SLS Kolliphor ® SLS Fine,” no. 119863, pp. 1–6, 2012.
[294] A. Venkateshaiah, V. V. T. Padil, and M. Nagalakshmaiah, “Microscopic
Techniques for the Analysis of Micro and Nanostructures of Biopolymers and

406
Their Derivatives.”
[295] International Organization for Standardization, “International Organization for
Standardization. 13320 2009,” 2009.
[296] The United States Pharmaceutical Convention., “<429> Light diffraction
measurement of particle size,” Suppl. to USP 43, vol. 43, no. 4, p. 6697, 2020.
[297] The United States Pharmaceutical Convention., “USP43 Praziquantel Tablets,”
vol. 43, p. 3650, 2020.
[298] J. Sha et al., “Solid-liquid phase equilibrium of praziquantel in eleven pure
solvents: Determination, model correlation, solvent effect, molecular simulation
and thermodynamic analysis,” J. Chem. Thermodyn., no. xxxx, 2020, doi:
10.1016/j.jct.2020.106327.
[299] S. S. Gupta, N. Solanki, and A. T. M. Serajuddin, “Investigation of Thermal and
Viscoelastic Properties of Polymers Relevant to Hot Melt Extrusion, IV:
AffinisolTM HPMC HME Polymers,” AAPS PharmSciTech, vol. 17, no. 1, pp. 148–
157, 2016, doi: 10.1208/s12249-015-0426-6.
[300] The United States Pharmaceutical Convention., “⟨ 776 ⟩ optical microscopy,”
Suppl. to USP 43, vol. 43, p. 6998, 2020.
[301] T. Templeman, S. Sengupta, N. Maman, E. Bar-or, and M. Shandalov, “Oriented
Attachment: A Path to Columnar Morphology in Chemical Bath Deposited PbSe
Thin Films,” 2018, doi: 10.1021/acs.cgd.7b01771.
[302] D. Colegiada et al., “Ministério da Saúde RESOLUÇÃO - RDC No 37, DE 3 DE
AGOSTO DE 2011,” 2011.
[303] U. S. D. of H. and H. Services and F. and D. Administration, “Waiver of In Vivo
Bioavailability and Bioequivalence Studies for Immediate-Release Solid Oral
Dosage Forms Based on a Biopharmaceutics Classification System Guidance for
Industry,” 2017.
[304] K. Yamasaki, K. Taguchi, K. Nishi, M. Otagiri, and H. Seo, “Enhanced dissolution
and oral bioavailability of praziquantel by emulsification with human serum
albumin followed by spray drying,” Eur. J. Pharm. Sci., vol. 139, no. September,
p. 105064, 2019, doi: 10.1016/j.ejps.2019.105064.
[305] M. Karl and K. Kolter, “Suitability of Plasticized Polymers for Hot Melt
Extrusion,” Excipients Act. Pharma, vol. 24, no. Table 1, pp. 2–6, 2010.
[306] Y. Chen et al., “Initial Drug Dissolution from Amorphous Solid Dispersions
Controlled by Polymer Dissolution and Drug-Polymer Interaction,” Pharm. Res.,

407
2016, doi: 10.1007/s11095-016-1969-2.
[307] A. Prudic, Y. Ji, and G. Sadowski, “Thermodynamic Phase Behavior of
API/Polymer Solid Dispersions,” 2014.
[308] T. R. Hörmann et al., “Sensitivity of a continuous hot-melt extrusion and strand
pelletization line to control actions and composition variation,” Int. J. Pharm., vol.
566, no. February, pp. 239–253, 2019, doi: 10.1016/j.ijpharm.2019.05.046.
[309] H. G. Moradiya, M. T. Islam, N. Scoutaris, S. A. Halsey, B. Z. Chowdhry, and D.
Douroumis, “Continuous Manufacturing of High Quality Pharmaceutical
Cocrystals Integrated with Process Analytical Tools for In-Line Process Control,”
Cryst. Growth Des., vol. 16, no. 6, pp. 3425–3434, 2016, doi:
10.1021/acs.cgd.6b00402.
[310] F. Z. Tongzhou Liu, Nada Kittikunakorn, Yi Zhang, “Mechanisms of twin screw
melt granulation Tongzhou,” J. Drug Deliv. Sci. Technol., vol. 61, no. August
2020, p. 102150, 2021, doi: 10.1016/j.jddst.2020.102150.
[311] B. Mayoral, G. Garrett, and T. McNally, “Influence of screw profile employed
during melt mixing on the micro-scale dispersion of MWCNTs in
poly(propylene),” Macromol. Mater. Eng., vol. 299, no. 6, pp. 748–756, 2014, doi:
10.1002/mame.201300172.
[312] M. Marigo, D. L. Cairns, M. Davies, A. Ingram, and E. H. Stitt, “Developing
mechanistic understanding of granular behaviour in complex moving geometry
using the Discrete Element Method Part B : Investigation of fl ow and mixing in
the Turbula ® mixer,” Powder Technol., vol. 212, no. 1, pp. 17–24, 2011, doi:
10.1016/j.powtec.2011.04.009.
[313] C. S. Yee, “The Development of PVP-based Solid Dispersions using Hot Melt
Extrusion for the Preparation of Immediate Release Formulations,” vol. 9, no.
November, 2014.
[314] K. Nakamichi, T. Nakano, H. Yasuura, S. Izumi, and Y. Kawashima, “The role of
the kneading paddle and the effects of screw revolution speed and water content
on the preparation of solid dispersions using a twin-screw extruder,” Int. J. Pharm.,
vol. 241, no. 2, pp. 203–211, 2002, doi: 10.1016/S0378-5173(02)00134-5.
[315] E. Verhoeven, T. R. M. De Beer, G. Van den Mooter, J. P. Remon, and C. Vervaet,
“Influence of formulation and process parameters on the release characteristics of
ethylcellulose sustained-release mini-matrices produced by hot-melt extrusion,”
Eur. J. Pharm. Biopharm., vol. 69, no. 1, pp. 312–319, 2008, doi:

408
10.1016/j.ejpb.2007.10.007.
[316] N. Siriwannakij, T. Heimbach, and A. T. M. Serajuddin, “Aqueous Dissolution and
Dispersion Behavior of Polyvinylpyrrolidone Vinyl Acetate-based Amorphous
Solid Dispersion of Ritonavir Prepared by Hot-Melt Extrusion with and without
Added Surfactants,” J. Pharm. Sci., pp. 1–15, 2020, doi:
10.1016/j.xphs.2020.08.007.
[317] L. Briens and R. Logan, “The Effect of the Chopper on Granules from Wet High-
Shear Granulation Using a PMA-1 Granulator,” vol. 12, no. 4, pp. 1358–1365,
2011, doi: 10.1208/s12249-011-9703-1.
[318] J. Dun and C. C. Sun, Structures and Properties of Granules Prepared By High
Shear Wet Granulation. Elsevier Inc., 2019.
[319] R. Nogueira et al., “Determination of Volatiles in Pharmaceutical Certified
Reference Materials,” vol. 23, no. 9, pp. 1636–1646, 2012.
[320] M. Ja, A. Kuty, K. Sollohub, H. Wosicka, K. Cal, and P. Ciosek,
“Bioelectrochemistry Electronic tongue for the detection of taste-masking
microencapsulation of active pharmaceutical substances,” vol. 80, pp. 94–98,
2010, doi: 10.1016/j.bioelechem.2010.08.006.
[321] F. V. Paulovich, M. L. Moraes, R. M. Maki, M. Ferreira, O. N. Oliveira, and M.
C. F. De Oliveira, “Information visualization techniques for sensing and
biosensing,” Analyst, vol. 136, no. 7, pp. 1344–1350, Mar. 2011, doi:
10.1039/c0an00822b.
[322] S. J. Anroop B. Nair, “A simple practice guide for dose conversion between
animals and human,” J. Basic Clin. Pharm. |, vol. 7, pp. 27–31, 2016, doi:
10.4103/0976-0105.177703.
[323] FDA, “Bioanalytical Method Validation Guidance for Industry Bioanalytical
Method Validation Guidance for Industry,” no. May, 2018.
[324] ANVISA, RESOLUÇÃO - RDC No 27 , DE 17 DE MAIO DE 2012. 2012.
[325] A. Noorjahan, B. Amrita, and S. Kavita, “In vivo evaluation of taste masking for
developed chewable and orodispersible tablets in humans and rats,” Pharm. Dev.
Technol., vol. 19, no. 3, pp. 290–295, 2014, doi: 10.3109/10837450.2013.778870.
[326] A. Juluri et al., “Taste Masking of Griseofulvin and Caffeine Anhydrous Using
Kleptose Linecaps DE17 by Hot Melt Extrusion,” vol. 17, no. 1, 2016, doi:
10.1208/s12249-015-0374-1.
[327] D. K. Tan, D. A. Davisjr, D. A. Miller, R. O. Williamsiii, and A. Nokhodchi,

409
“Innovations in Thermal Processing : Hot-Melt Extrusion and KinetiSol ®
Dispersing,” 2020, doi: 10.1208/s12249-020-01854-2.
[328] X. Zheng, F. Wu, Y. Hong, L. Shen, X. Lin, and Y. Feng, “Developments in Taste-
Masking Techniques for Traditional Chinese Medicines,” pp. 1–22, 2018, doi:
10.3390/pharmaceutics10030157.
[329] M. Maniruzzaman, J. S. Boateng, B. Z. Chowdhry, M. J. Snowden, and D.
Douroumis, “A review on the taste masking of bitter APIs: hot-melt extrusion
(HME) evaluation,” vol. 9045, pp. 1–12, 2013, doi:
10.3109/03639045.2013.804833.
[330] M. Kaza, M. Kara, K. Kosicka, A. Siemi, and P. J. Rudzki, “Journal of
Pharmaceutical and Biomedical Analysis Bioanalytical method validation : new
FDA guidance vs . EMA guideline . Better or worse ?,” vol. 165, pp. 381–385,
2019, doi: 10.1016/j.jpba.2018.12.030.
[331] L. Yang, Y. Geng, H. Li, Y. Zhang, J. You, and Y. Chang, “Enhancement the oral
bioavailability of praziquantel by incorporation into solid lipid nanoparticles,” vol.
64, pp. 3–6, 2009, doi: 10.1691/ph.2009.8140.
[332] Y. Liu et al., “Dissolution and oral bioavailability enhancement of praziquantel by
solid dispersions,” 2018.
[333] H. Jung, R. Medina, N. Castro, T. Corona, I. Nacional, and D. Neurologia,
“Pharmacokinetic Study of Praziquantel Administered Alone and in Combination
with Cimetidine in a Single-Day Therapeutic Regimen,” vol. 41, no. 6, pp. 1256–
1259, 1997.
[334] R. G. and P. Andrews, “Praziquantel, a New Broad-spectrum Antischistosomal
Agent,” Parasitenkunde, vol. 150, pp. 129–150, 1977.
[335] Z. Hui, A. Kumar, P. Wan, and S. Heng, “ScienceDirect Overview of milling
techniques for improving the solubility of poorly water-soluble drugs,” Asian J.
Pharm. Sci., vol. 10, no. 4, pp. 255–274, 2015, doi: 10.1016/j.ajps.2014.12.006.
[336] M. M. Knopp et al., “Comparative Study of Di ff erent Methods for the Prediction
of Drug − Polymer Solubility,” 2015, doi: 10.1021/acs.molpharmaceut.5b00423.
[337] S. Mark et al., “Characterization of Amorphous Solid Dispersions and Identi fi
cation of Low Levels of Crystallinity by Transmission Electron Microscopy,”
2021, doi: 10.1021/acs.molpharmaceut.0c00918.
[338] A. Agrawal et al., “Development of Tablet Formulation of Amorphous Solid
Dispersions Prepared by Hot Melt Extrusion Using Quality by Design Approach,”

410
vol. 17, no. 1, pp. 214–232, 2016, doi: 10.1208/s12249-015-0472-0.
[339] M. R. C. Marques and M. Almukainzi, “Simulated Biological Fluids with Possible
Application in Dissolution Testing,” no. March 2015, pp. 14–28, 2011, doi:
10.14227/DT180311P15.
[340] J. N. Pawar et al., “Development of amorphous dispersions of artemether with
hydrophilic polymers via spray drying: Physicochemical and in silico studies,”
Asian J. Pharm. Sci., vol. 11, no. 3, pp. 385–395, 2016, doi:
10.1016/j.ajps.2015.08.012.
[341] S. S. Gupta, A. Meena, T. Parikh, and A. T. M. Serajuddin, “Investigation of
thermal and viscoelastic properties of polymers relevant to hot melt extrusion - I:
Polyvinylpyrrolidone and related polymers,” J. Excipients Food Chem., vol. 5, no.
1, pp. 32–45, 2014.
[342] Á. A. N. de Lima, “Avaliação dos aspectos físico-químicos do antichagásico
Benznidazol, diferentes sistemas carreadores e formas farmacêuticas, através de
técnicas analíticas e de imagens,” Universidade Federal de Pernambuco, 2012.
[343] World Health Organization, “Report of a meeting to review the results of studies
on the treatment of schistosomiasis in preschool-age children,” GENEVA,
SWITZERLAND, 2010. [Online]. Available:
https://apps.who.int/iris/bitstream/handle/10665/44639/9789241501880_eng.pdf?
sequence=1.
[344] P. L. Olliaro et al., “Efficacy and safety of single 40 mg/kg oral praziquantel in the
treatment of schistosomiasis in preschool-age versus school-age children: An
individual participant data meta-analysis,” PLoS Negl. Trop. Dis., vol. 14, no. 6,
pp. 1–23, 2020, doi: 10.1371/journal.pntd.0008277.
[345] J. T. Coulibaly et al., “Efficacy and safety of ascending doses of praziquantel
against Schistosoma haematobium infection in preschool-aged and school-aged
children: A single-blind randomised controlled trial,” BMC Med., vol. 16, no. 1,
pp. 1–10, 2018, doi: 10.1186/s12916-018-1066-y.
[346] J. Boniatti et al., “Taste evaluation of three different commercial tablets for
paediatric patients for neglected tropical diseases,” in Poster presented on
European Paediatric Formulation initiative (EUPFI), 2019, vol. 5, p. 2019.
[347] S. Qi, J. Nasereddin, and F. Alqahtani, “Personalized Polypills Produced by Fused
Deposition Modeling 3D Printing,” 2019.
[348] T. Information, “Technical Information Soluplus ®,” no. September 2015, pp. 1–

411
14, 2019.
[349] F. H. M. La, “Quadro Comil Scalable Lab System TM.” p. 10, 2020.

CHAPTER 9 - RESUME ETENDU EN FRANÇAIS

413
Les maladies tropicales négligées (MTN) touchent plus de 1,4 milliard de
personnes dans le monde, dont une proportion importante d'enfants [1]-[3]. La deuxième
maladie la plus fréquente est la schistosomiase et touche environ 28 millions d'enfants en
âge préscolaire (5 à 14 ans) [1]-[6]. Il s'agit d'une maladie causée par des vers parasites,
correspondant à des helminthes de la classe Trematoda, de la famille Schistossomatidae
et du genre Schistosoma [1]. Les parasites à l'origine de la schistosomiase vivent dans
certains types d'escargots d'eau douce. La forme infectieuse du parasite, appelée cercaire,
émerge de l'escargot dans l'eau. Les personnes peuvent être infectées lorsque leur peau
entre en contact avec de l'eau douce contaminée. À l'échelle mondiale, on estime qu'elle
touche plus de 250 millions de personnes dans 78 pays du monde et qu'elle est responsable
de quelque 280 000 décès chaque année [6]. Le praziquantel (PZQ) est le médicament
de référence dans le traitement de la schistosomiase selon l'Organisation Mondiale de la
Santé (OMS), pour des raisons telles que sa grande efficacité, sa faible toxicité et son
faible coût. Tous ces facteurs font du praziquantel le seul médicament commercialisé pour
le traitement de la schistosomiase, pour laquelle il n'existe aucun vaccin.
En ce qui concerne le PZQ, il n'y a toujours pas de médicament pédiatrique
approprié disponible sur le marché. Actuellement, le traitement des enfants est réalisé en
adaptant le médicament pour adultes, en divisant ou en écrasant les comprimés [9]. Pour
les enfants, la posologie est adaptée au poids corporel de l'enfant en administrant des
doses de 150 mg (1/4 de comprimé) [9], [10]. Cette pratique conduit clairement à une
faible adhésion au traitement car elle met en évidence le mauvais goût du médicament.
De plus, des facteurs tels que la grande variabilité corporelle et la division des comprimés
en parties homogènes nuisent à l'efficacité du médicament [11].
L'OMS recommande vivement aux fabricants d'anthelminthiques responsables
des programmes de santé publique destinés aux enfants d'âge préscolaire de développer
des formulations appropriées [95]-[97]. L'OMS [98] présente une classification en 5
bandes pour le groupe de patients pédiatriques : a) nouveau-nés, prématurés, allaitants ;
b) nouveau-nés de zéro à 28 jours ; c) bébés et enfants de 28 jours à 23 mois ; d) enfants
de 2 à 12 ans et ; e) adolescents de 12 à 16/18 ans.
L'obtention d'une formulation de PZQ pédiatrique devrait alors répondre à trois
questions principales :
a) augmenter la solubilité et la dissolution de la PZQ, ce qui devrait permettre de
réduire la dose de médicament à administrer, d'augmenter l'efficacité de l'absorption et de
réduire les effets secondaires et les coûts liés au processus de production,

414
b) optimiser les formulations avec différents dosages pour permettre une
administration correcte de la dose en fonction du poids des enfants, ce qui contribue à
l'efficacité du traitement,
c) masquer le goût amer de la molécule PZQ pour permettre aux patients
pédiatriques d'accepter le médicament PZQ et d'adhérer au traitement de la
schistosomiase.
Dans ce contexte, cette these a eu pour objectif le développement d’une
formulation de PZQ (l’IPA) à usage pédiatrique pour répondre aux trois questions ci-
dessus.
Le premier défi était d'améliorer la solubilité du praziquantel dans l'eau.
Le praziquantel (PZQ) est un dérivé de l'imidazole, chimiquement connu sous le
nom de (+)-2cyclohexylcarbonyl-1,2,3,6,7,11b-hexahydro-4H-pyrazine[2,1
a]isoquilonin-4-one. Certaines caractéristiques physicochimiques du PZQ sont présentées
dans le Tableau 1.
Tableau 62. Résumé des caractéristiques physicochimiques du Praziquantel.
PZQ – caractéristiques physicochimiques Références
Poids moléculaire 312.4 g/mol [53]–[57]
Point de fusion 136-144 ºC [53]–[58]
Température de transition vitreuse 35.9 -37.7 ºC [56], [59]
Solubilité dans l'eau
0.14 mg/mL (20 ºC)
0.22 mg/mL (25 ºC)
0.40 mg/mL (25 ºC)
[30], [60]
[61]
[4], [57], [62]–[66]
0.28 mg/mL (37 ºC) [67]
Solubilité dans l'eau 63 - 97 mg/mL [57]
pKa 19.38 [57]
LogP 2.42 [57]
Seuil de perception du goût 0.03 mg/mL [68]
Chimiquement, le PZQ est une substance hydrophobe et chirale (position 11b),
obtenue principalement à partir d'un mélange racémique (mélange 1:1 d'énantiomères)
(Figure 5). La résolution optique a prouvé que l'activité anthelminthique est
principalement due à l'énantiomère R-(-) (L-PZQ ou (-)-PZQ ou R-PZQ) tandis que
l'énantiomère S-(+) (D-PZQ ou (+)-PZQ ou S-PZQ) est inactif, présentant une toxicité
plus élevée et étant le principal responsable du goût amer du praziquantel. Les isomères
ont également des caractéristiques physico-chimiques différentes, telles que la solubilité

415
(R-PZQ 1,91 mmol/L, S-PZQ 1,64 mmol/L et Rac-PZQ 0. 92 mmol/L) et la température
de fusion (R-PZQ T_onset 109,4 ºC, T_peak 122,3 ºC et, ΔH 77,3 J/g ; S-PZQ T_onset
109,7, T_peak 112,6 ºC et ΔH 78,2 J/g) [70].
Les travaux de cette thèse ont porté sur le développement de dispersions solides
amorphes de (R,S)-praziquantel (racémique) pour améliorer les caractéristiques physico-
chimiques (faible solubilité dans l'eau) et sensorielles (goût amer) de ce principe actif
pharmaceutique.
Les dispersions solides amorphes (DSA, ASD en anglais) sont une approche de
formulation de plus en plus importante pour améliorer la vitesse de dissolution et la
solubilité apparente de composés peu solubles dans l'eau comme le PZQ. Les DSA sont
largement connues pour leur définition : une molécule d’intérêt pharmaceutique amorphe
dispersée dans une phase amorphe qui comprend un polymère, un mélange de polymères
ou un mélange de polymères et de tensioactifs.
Le procédé utilisé est l'extrusion à chaud (HME). Il s’agit d’un procédé de
fabrication (thermo)mécanique par lequel un matériau fondu est contraint de traverser une
filière au travers de laquelle il est poussé. Dans les extrudeuses à vis, le matériau fondu
(mélange de matières premières) est acheminé dans le fourreau de la machine par une
(mono) ou deux (bi) vis sans fin jusqu’à la filiere au travers de laquelle il est poussé. Un
extrudat est formé en continu sous la forme de jonc qui peut être alors mis en forme
(pellets ou poudre de différentes granulométries) en fonction de l’opération de post-
traitement utilisée, notamment le broyage. Pendant le processus d'extrusion à l'état fondu,
la dissolution des molécules actives dans la matrice polymère est accélérée sous l'effet du
cisaillement et de la chaleur. Les différents paramètres du procédé comme la
configuration (profil) et la vitesse de la vis, le débit d’alimentation et le profil de
température sont généralement variés lors d’une étude afin d’influencer sur l’extrudabilité
et la stabilité du produit extrudé.
Figure 163. Structure chimique du praziquantel a) (R,S)-praziquantel (racémique), b) (S)-praziquantel et,
c) (R)-praziquantel (réutilisation de [5] avec permission).

416
La figure 27 illustre la représentation du processus HME avec les extrudeuses à
double vis utilisées dans cette thèse.
De nouvelles formulations de DSA ont été proposées associant le PZQ au poly
(vinyl pyrrolidone/vinyl acetate) (PVP/VA) dans un mélange binaire, ou les deux avec un
tensioactif pour composer un mélange ternaire. Elles ont pu être générées à l'aide de deux
extrudeuses à double vis (Pharma 11 et Pharma 16, Thermo Fisher).
Les systèmes ternaires varient en fonction du type de tensioactif utilisé et de la
teneur en PZQ (35 %, 40 % et 50 % en masse). Les deux tensioactifs utilisés sont les
suivants : a) SLS, un tensioactif solide utilisé directement dans le mélange physique
préparé pour l’extrusion ; b) SPAN 20, un tensioactif liquide introduit dans le mélange
PZQ/PVPVA de deux façons (granulation humide avant l'extrusion ou ajout direct au
matériau fondu pendant l'extrusion).
En ce qui concerne la solubilité du praziquantel dans l'eau :
Toutes les formes d'extrudat ternaires et binaires se sont avérées capables
d’améliorer la solubilité apparente, mettant en évidence le comportement de
solubilisation des dispersions solides (amorphes ou majoritairement amorphes) avec un
effet de ressort (spring en anglais) sur la concentration du PZQ dans l'eau à 37 °C
principalement dans les premiers 60 min (Figure 147). Plus précisément, la solubilité
apparente a pu être augmentée de 70 % à 90 % de plus que la concentration à l'équilibre
dans ce milieu.
Figure 27. Représentation du processus HME. Source : Auteur.

417
En ce qui concerne la cinétique de dissolution, elle a également été améliorée par
ces nouveaux DSA, par exemple, 90 % de libération du PZQ en 1 h pour la formulation
ternaire contenant SPAN 20 comme agent tensioactif et 35 % en masse de PZQ
(extrudeuse bi-vis pharma 16, Thermofisher), par rapport à la molécule (cristalline) de
départ. Cette même formulation a été utilisée pour réaliser des expériences
pharmacocinétiques sur des animaux. Bien que le protocole d'évaluation
pharmacocinétique des DSA nécessite quelques améliorations, les résultats sont
prometteurs et démontrent que l'approche DSA (et la composition proposée) pourrait être
une alternative pour surmonter le défi de la solubilité du PZQ (Figure 109).
Figure 164. Concentration de PZQ dans l'eau à 37°C libéré de différents extrudats coupés en pellets (~1
mm) : PZQ brut, HME 27 (PZQ:Kollidon® VA 64 : SLS) et, HME 28 (PZQ:Kollidon® VA 64 : SPAN).
Placebo
Placebo FEXT 1
PZQ
FEXT 1
Figure 165. Profil comparatif des concentrations plasmatiques moyennes de PZQ en fonction du temps
pour chaque préparation administrée (moyenne arithmétique + écart-type). Après élimination des animaux
aberrants.

418
Cette question d’amélioration de la pharmacocinétique étant traitée, il restait un
autre défi qui est la stabilité physique de ces systèmes. Afin de développer
rationnellement des DSA fortement chargés en PZQ, une des premières études de cette
thèse s'est concentrée sur la construction d'un diagramme de phases PZQ-PVPVA.
Le diagramme de phases présenté dans la Figure 62 a été construit à partir d'une
étude thermique de la recristallisation d'une DSA sursaturé (50% PZQ en masse) généré
par séchage par pulvérisation. À notre connaissance, il s'agit de la première étude
rapportant un diagramme de phases pour ce système binaire.
De manière inattendue, dans certains lots de poudres séchées par pulvérisation
produits dans cette étude, des traces de formes cristallines de PZQ ont été trouvées, qui
sont différentes de la forme racémique initiale. Elles pourraient correspondre à l'une de
ces formes polymorphes de PZQ récemment rapportées. Il s'agit d'une découverte
intéressante car, à notre connaissance, c'est la première fois que les nouvelles formes
polymorphes du praziquantel sont supposées se former à partir de la recristallisation d'une
forme amorphe.
Le deuxième défi pour le praziquantel pédiatrique est l’ajustement précis des
doses.
Figure 166. Diagramme de phases composition-température pour le binaire PZQ-PVPVA.

419
Comme alternative pour surmonter le défi de l'ajustement des doses d'un
médicament pédiatrique à base de PZQ pour les enfants, l'utilisation de la technologie
d'impression 3D (FDM) avec alimentation directe d’un matériau particulaire a été
proposée. La faisabilité d’impression 3D de comprimés directement à partir de différents
matériaux granulaires (poudres, pellets..) a été étudiée. Les matériaux testés étaient des
mélanges physiques des cristaux de PZQ de départ et de polymère, ainsi que des pellets
et poudres (extrudats broyés) produits a partir de filaments DSA obtenus par extrusion à
chaud (HME en anglais). Les caractéristiques des imprimés 3D résultants ont été
évaluées, surtout les profils de dissolution du médicament, l'efficacité du masquage du
goût et la stabilité physique. Cette étude a été réalisée en collaboration avec le professeur
Alvaro Goyanes, de la faculté de pharmacie de l'University College of London (UCL) et
de FabRX, Londres, et le professeur Catherine Tuleu, de la faculté de pharmacie de
l'University College of London (UCL).
L’imprimante utilisée est une imprimante 3D pharmaceutique M3DIMAKER™
(FabRx, Londres, Royaume-Uni) [156]. Cette imprimante a été conçue par FabRx avec
une extrudeuse à vis unique en amont de l’impression dont la vitesse de rotation (et donc
l'extrusion) est contrôlée par le logiciel de l'imprimante 3D (Repetier-Host V 2.1.3,
Allemagne). L’extrudeuse est alimentée par une trémie qui permet l’alimentation d’un
matériau granulaire (poudre, pellets..). La sortie de l’extrudeuse (une buse de 0,8 mm de
diamètre) se déplace en trois dimensions pour créer les objets couche par couche avec le
matériau fondu. Le débit, la température de l'extrudeuse et la vitesse d'alimentation ont
été déterminés pour chaque matériau utilisé. AutoCAD 2014 (Autodesk Inc., États-Unis)
a été utilisé pour concevoir les gabarits des empreintes, qui ont ensuite été exportés sous
forme de fichier de stéréolithographie (.stl) dans le logiciel de l'imprimante 3D. La
géométrie 3D sélectionnée est une empreinte cylindrique (10 mm de diamètre × 3,6 mm
de hauteur).
Nous avons ainsi pu démontrer la faisabilité de la production des comprimés
imprimés (appelés simplement imprimés) avec une empreinte cylindrique et deux doses
différentes (100 et 150 mg) (Figure 167) en utilisant une DSA ternaire obtenue
préalablement par HME avant impression 3D.

420
Les imprimés contenant 35 % en masse de PZQ et SPAN 20 comme tensioactif
ont montré la meilleure performance de dissolution (81 % en 2 h) (Figure 175).
Un résultat majeur concerne l'imprimabilité des matériaux particulaires en
utilisant une technologie d'impression 3D qui dispose d'une alimentation directe de
poudre. Il n'a pas été possible d'imprimer directement les mélanges physiques contenant
50% ou 35% de PZQ (avec ou sans tensioactif dans la formulation), contrairement à
d’autres matériaux testés par FaBRx (données obtenues avec d’autres principes actifs).
Pour notre principe actif spécifique, l'utilisation des DSA a été une étape indispensable
pour assurer l’amorphisation du PZQ (relever le premier défi décrit ci-dessus, c’est-à-dire
l’amélioration de la solubilité) en plus d’un changement des caractéristiques physiques
de la poudre (diminution des charges électrostatiques et meilleur écoulement).
a
)
b
)
c)
d)
e)
f
)
g)
h)
i
)
j)
Figure 168. Image supérieure et inférieure d'empreintes obtenues avec : a - b) PM 50, c - d) M 35 Span, e
- f) M ASD 35 SLS, g - h) M Placebo Span et, i - j) M Placebo SLS.

421
En conclusion, les prototypes produits dans cette étude ont montré que
l'impression 3D peut être un outil viable pour la personnalisation des doses de
praziquantel pour les médicaments pédiatriques puisque la conception du médicament
peut être ajustée avec précision.
Le troisième défi consiste à masquer le goût amer du praziquantel.
Un goût désagréable est crucial pour l'adhésion au traitement pédiatrique et, par
conséquent, pour l'efficacité. Les formulations extrudées (pellets) et les imprimés ont
montré des résultats positifs dans les trois types de tests réalisés (in vivo, dissolution dans
la cavité buccale et langue électronique), en ce qui concerne le masquage du goût amer
du praziquantel pour les deux charges API (50 et 35 % en masse).
La langue électronique a permis de tester deux formulations de DSA : la première
a donné des meilleurs résultats, indiquant que le goût était meilleur que celui des
comprimés commerciaux de PZQ et de FEXT 2 (Figure 106). Il est important de
souligner que les capteurs électroniques de la langue ont été adaptés pour déterminer
l'impédance, surmontant ainsi le facteur limitant présenté par les équipements
actuellement commercialisés qui ne permettent pas l'identification du goût pour les
molécules ayant des caractéristiques de faible conductivité comme le praziquantel.
Le masquage du goût in vivo a montré qu'une formulation ternaire (FEXT 1) était
mieux acceptée par les rats que les comprimés commerciaux de PZQ (Figure 107). Ce
résultat est conforme au test in vitro réalisé avec la langue électronique. L'expérience in
Figure 169. Profil de dissolution in vitro de PZQ (matière première) et des imprimés (M 50, M 35 Span et
M 35 SLS) en utilisant un milieu HCl 0,1N avec 0.2 % p/p de SLS a 37°C.

422
vivo a permis de démontrer que l'adaptation de la méthodologie en utilisant des pompes
de recirculation de la solution est réalisable et garantit que l'animal est toujours exposé à
une solution/suspension homogène de l'échantillon testé.
La dissolution dans la cavité buccale a montré que les imprimés obtenus a partir
de deux DSA ternaires (tous deux avec 35 % de PZQ) sont considérés comme bien
tolérables jusqu'à la fin de l'expérience (600 secondes). Les deux DSA ternaires testées
(et à partir desquelles les imprimés 3D ont été générés) ont démontré une meilleure
capacité de masquage du goût en 1 minute de contact avec de la salive artificielle, restant
en dessous de la limite bien tolérable (Figure 176),. De manière surprenante, ce même
résultat a été observé pour des pellets de concentrations différentes (35 et 50 % PZQ).
Figure 170. Test de palatabilité in vivo. (A)
ANOVA (facteur unique 95%) pour les
échantillons.
Figure 171. Tracé IDMAP pour FEXT 1, 2, comprimé
commercial PZQ et leurs placebos respectifs (n=3).
Figure 172. a) Profil de libération de PZQ (moyenne ± SD) pour les matériaux M 35 Span et M 35 SLS
(avant impression) et leurs imprimés respectifs et, b) détail des formulations imprimées en 3D. Les seuils
de goût sont représentés par des lignes pointillées roses et violettes.
a)
b)

423
Il est important de souligner que tous les tests de masquage du goût dans cette
thèse ont été réalisés avec des matériaux intermédiaires (extrudés) et des imprimés 3D
comme matériaux d'essai. Il n'y a pas eu d'ajout d'excipients ayant une fonctionnalité
d'amélioration du goût (par exemple, des édulcorants, des arômes). De cette façon, les
incréments sur la formulation pharmaceutique peuvent encore être explorés pour
optimiser un médicament contenant du PZQ spécifiquement conçu pour les enfants.

CHAPTER 10 - PUBLISHED WORK

Publications in international journals
Janine Boniatti1; Marcelo R R Tappin1; Rafaela G da S Teixeira2; Tamires de A V
Gandos1,2; Luis P S Rios2; Izabelle A M Ferreira2; Karina C Oliveira2; Sabrina Calil-
Elias2; Aila K M Santana3, Laís B da Fonseca1; Flavio M Shimizu4,5; Olívia Carr4;
Osvaldo N. Oliveira Jr.4; Fabio M L Dantas6; Fabio C. Amendoeira1; Alessandra L
Viçosa1. In vivo and in vitro taste assessment of drugs for neglected tropical
diseases and paediatric patients. Received: 24 March 2021; accepted: 14 October
2021. AAPS PharmSciTech (2022) 23:22 Vol (0123456789) DOI: 10.1208/s12249-021-
02162-z.
Janine Boniatti, L.B. Fonseca, A.L. Viçosa, F.C. Amendoeira, A. W. Basit, P.
Januskaite, A. Goyanes, M. I. Ré. Direct Powder Extrusion 3D Printing of Praziquantel
to Overcome Neglected Disease Formulation Challenges in Paediatric Populations. Received: 29 June 2021 Accepted: 18 July 2021 Published: 21 July 2021. Pharmaceutics 2021,
13, 1114. https://doi.org/10.3390/pharmaceutics13081114.
Publications in preparation
Janine Boniatti, S.P. Lacerda, L.B. Fonseca, A.L. Viçosa, F.C. Amendoeira, M. I. Ré.
Overcoming solubility challenges for praziquantel with high-drug load solid
dispersions produced by spray drying.
Janine Boniatti, S. Delconfetto, R. Sescousse, M. Sauceau, M. I. Ré. Determination of
praziquantel-PVPVA solubility from a thermal study of recrystallization of a
supersaturated solid solution.
Publications in International Conferences/Seminar
Janine Boniatti, L.B. Fonseca, A.L. Viçosa, F.C. Amendoeira, A. W. Basit, P.
Januskaite, A. Goyanes, M. I. Ré. Direct Powder Extrusion 3D printing for neglected
disease to overcome Praziquantel formulation challenges. EUPFI 2021. Best
poster/oral presentation award.
Janine Boniatti1; Marcelo R R Tappin1; Rafaela G da S Teixeira2; Tamires de A V
Gandos1,2; Luis P S Rios2; Izabelle A M Ferreira2; Karina C Oliveira2; Sabrina Calil-
Elias2; Aila K M Santana3, Laís B da Fonseca1; Flavio M Shimizu4,5; Olívia Carr4;
Osvaldo N. Oliveira Jr.4; Fabio M L Dantas6; Fabio C. Amendoeira1; Alessandra L
Viçosa1. Taste evaluation of three commercial tablets for paediatric patients for
neglected tropical diseases. EUPFI 2019. Best poster presentation award.
Janine Boniatti1; Marcelo R R Tappin1; Rafaela G da S Teixeira2; Sabrina Calil-
Elias2; Laís B da Fonseca1, Thiago F Guimarães1; Flavio M Shimizu3; Osvaldo N
Oliveira Jr4; Fabio M L Dantas5; Alessandra L Viçosa1. Extrudate materials via hot
melt extrusion mask the bitter taste of drugs used for neglected tropical diseases.
12th PBP World Meeting. 2021.
Boniatti, J.; Viçosa, L. A.; Amendoeira, F.; Fonseca, B. L.; Ré, M.-I. Amorphous
Solid Solution by Hot Melt Extrusion: development for a paediatric drug
formulation for neglected diseases. Seminar How to accelerate your pharmaceutical
developments based on the solid dispersion strategy. International Seminar Gala-
Merck.

CHAPTER 11 - APPENDIX

427
APPENDIX 1

428
APPENDIX 2

429
APPENDIX 3
USE LICENSES
License Number Journal Title Authors
5062820970919 Journal of Drug
Delivery Science and
Technology
Solid dispersion of praziquantel enhanced
solubility and improvethe efficacy of the
schistosomiasis treatment
Carine Santana Ferreira Marques,Polyana Rezende,Luciana
N.Andrade,Tiago M.F. Mendes,Silmara M.
Allegretti,CristianeBani,Marco Vinicius Chaud,Mônica Batista
de Almeida,Eliana B.Souto,Luiz Pereira da Costa,Patrícia
Severino
5067790284403
Powder Technology Developing mechanistic understanding of
granular behaviour incomplex moving
geometry using the Discrete Element
MethodPart B: Investigation of flow and
mixing in the Turbula® mixer
M. Marigo,D.L. Cairns,M. Davies,A. Ingram,E.H. Stitt
5062750322927
Biochemical
Pharmacology
Metabolic profiling of praziquantel
enantiomers
Haina Wang,Zhong-Ze Fang,Yang Zheng,Kun
Zhou,ChangyanHu,Kristopher W. Krausz,Dequn Sun,Jeffrey
R. Idle,Frank J.Gonzalez
5062750543004
European Journal of
Pharmaceutics and
Biopharmaceutics
A new soluble and bioactive polymorph of
praziquantel
Debora Zanolla,Beatrice Perissutti,Nadia Passerini,Michele
R.Chierotti,Dritan Hasa,Dario Voinovich,Lara
Gigli,NicolaDemitri,Silvano Geremia,Jennifer Keiser,Paolo
CerreiaVioglio,Beatrice Albertini
5062701319600
European Journal of
Pharmaceutical
Sciences
Exploring mechanochemical parameters
using a DoE approach:Crystal structure
solution from synchrotron XRPD
andcharacterization of a new praziquantel
polymorph
Debora Zanolla,Beatrice Perissutti,Paolo Cerreia
Vioglio,MicheleR. Chierotti,Lara Gigli,Nicola Demitri,Nadia
Passerini,BeatriceAlbertini,Erica Franceschinis,Jennifer
Keiser,Dario Voinovich

430