2014 Volume 46 / Special Issue A - Bulgarian Chemical ...
279
BULGARIAN CHEMICAL COMMUNICATIONS Journal of the Chemical Institutes of the Bulgarian Academy of Sciences and of the Union of Chemists in Bulgaria 2014 Volume 46 / Special Issue A Commemorative Issue in Honor of Acad. Dimiter Ivanov on the occasion of his 120 th birth anniversary
-
Upload
khangminh22 -
Category
Documents
-
view
0 -
download
0
Transcript of 2014 Volume 46 / Special Issue A - Bulgarian Chemical ...

BULGARIAN CHEMICAL
COMMUNICATIONS
Journal of the Chemical Institutes
of the Bulgarian Academy of Sciences
and of the Union of Chemists in Bulgaria
2014 Volume 46 / Special Issue A
Commemorative Issue in Honor of Acad. Dimiter Ivanov on the occasion
of his 120th birth anniversary


5
Bulgarian Chemical Communications, Volume 46, Special Issue A (pp. 5 – 8) 2014
ACADEMICIAN DIMITER IVANOV
120 Years of His Birth
13.10.1894 – 25.10.1975
In the annals of Bulgarian science the name of
Dimiter Ivanov holds a special place. In his fifty
years of work he left ineffaceable and lasting traces
in organic chemistry. His personal qualities and
scientific achievements were on such a high
international level that in him Bulgarian chemistry
has one of its most outstanding representatives. The
120th anniversary of his birth is in October 2014.
Dimiter Ivanov Popov was born in the family of
a clergyman on October 13 (27), 1894 in the village
of Makotzevo in the district of Sofia. He graduated
from the First High School for Boys in Sofia. He
won a competition for a grant awarded by Stefan
Beron from Kotel and in 1914 and 1915 he was
studying chemical engineering in Lyon, France. On
the declaration of mobilization in 1915, he returned
to Bulgaria and took part in the First World War in
Dobrudzha and Macedonia near Chervenata Stena.
During the defeat of the Bulgarian army at Dobro
Pole he was captured along with a Bulgarian army
division near Thessaloniki and kept there up to the
end of 1918.
He graduated in chemistry from Sofia
University in 1920 and was immediately appointed
as an assistant of Professor Zachary Karaoglanov in
inorganic and analytical chemistry. Soon after that
he obtained a grant to study in France again. He
graduated as a chemical engineer in Nancy in 1922
with a Ph.D. degree and stayed for a year in the
same university as a postdoc with G. Vavon, one of
the outstanding stereochemists at that time. His first
scientific paper on steric hindrance in catalytic
hydrogenation dating from that time (1923) was
published in Comptes rendus de l'Académie des
Sciences de Paris.
In 1926 Dimiter Ivanov became an Assistant
Professor at the Chair of Organic Chemistry headed
by Professor Pencho Raykov. The same year he
obtained a Rockefeller Scholarship and went to
work with Victor Grignard, a Nobel Prize winner
who discovered the organomagnesium compounds.
This was, to a great degree, the decisive factor in
determining his further scientific career. Years
afterwards Academician Ivanov would never forget
and would emphasize to his students what he owed
to this great man and scientist. Grignard welcomed
his young Bulgarian colleague by handing over his
own laboratory bench with the words "Here were
discovered the magnesium reagents (known today
as the Grignard reagents, author’s remark) and I
wish you with all my heart to move forward".
In 1931 Dimiter Ivanov, already an associate
professor of organic chemistry in Sofia University,
published a paper entitled "On a Method of
Preparing Phenylmalonic Acid" in the Bulletin de
la Société Chimique de France. Co-author of this
work was his young Ph.D. student, later one of
Bulgaria's great synthetic chemists Professor
Alexander Spassov. Dimiter Ivanov had already
published a dozen or more scientific communica-
tions abroad, but the above-mentioned paper laid
the foundations of what is named today "Ivanov
reagents" or "Ivanov reaction". Ivanov and Spassov
reported that phenylacetic acid reacts with lower
aliphatic Grignard reagents by liberating ca. two
equivalents of hydrocarbon, for example:
© 2014 Bulgarian Academy of Sciences, Union of Chemists in Bulgaria

6
Phenylacetic acid thus behaves simultaneously
as a carboxylic and as a C-H acid, i.e. a hydrogen
atom of the methylene group can be replaced by
metal. The organomagnesium compound so-
obtained has a more complex structure than that of
Grignard reagents but, to a considerable degree,
possesses the reactivity of the latter. Different kinds
of compounds give with the Ivanov reagent
products which are either very hard or impossible
to synthesize by other means. The first reaction of
the newly obtained Ivanov reagent was carried out
by the authors with carbon dioxide to yield
phenylmalonic acid:
Thus a general method of preparing Ivanov
reagents was set: metallation by means of Grignard
reagents of compounds containing labile hydrogen
atoms, called today C-H acids.
The same year D. Ivanov and A. Spassov
discovered the reaction which would later be named
the Ivanov reaction. It involves the interaction of
the Ivanov reagents with aldehydes or ketones
leading to β-hydroxy acids.
As recognition of this achievement next year,
1932, Dimiter Ivanov was awarded the honorary
title of "Laureate of the French Academy of
Sciences".
In the course of more than forty years
Academician Ivanov worked steadfastly and
systematically to develop the chemistry of
organometallic compounds obtained by metalating
C-H acids. After 1950, both in Bulgaria and abroad,
there was a very intensive development of research
along the perspectives outlined by Ivanov. Apart
from magnesium, alkaline metals, zinc and calcium
came into use and, in the case of each one, new
features and fresh possibilities for application were
found. The number of parent compounds which
could be metalated was greatly expanded. The
following are only a few examples:
Dimiter Ivanov called the metal derivatives so-
obtained "polyfunctional organometallic reagents".
Already in the 'fifties outstanding scientists in USA,
France, the USSR and other countries were
introducing, using and substantiating the terms
"Ivanov reagents, "Ivanov-like reagents", "Ivanov
reaction".
Nowadays the concept of Ivanov reagents
implies deprotonated derivatives of C-H acids,
whose organic moiety, independently of the metal,
may be considered as a two-charged anion capable
to interact with one equivalent electrophile.
These reagents provide great synthetic
opportunities because they are readily oxidized,
alkylated, acylated and silylated, added to carbonyl
and azomethine groups and conjugated double
bonds. It was established that the formulas shown
in the figure above, although easy to visualize, do
not correspond to the real structure of Ivanov
reagents. In some cases they are for example en-
diolates, as for the phenylacetic acid:
The reaction with carbonyl compounds named
after Dimiter Ivanov belongs to the class of the so-
called aldol reactions which are among the most
important ones in organic chemistry. Many studies
at home and abroad have clarified its similarities
and differences with other aldol type reactions,
such as Perkin, Reformatsky, Claisen. The kinetic
stereoselectivity shows moderate degrees, threo
diastereoisomer prevails, and depends on the metal
and the solvent used. A mechanism of the reaction
proposed by American scientists Zimmerman and
Traxler, based on a six-membered transition state,
explains the majority of the experimental data.
In experiments to react the Ivanov reagents with
the unsaturated ketone dypnone an unexpected
course occurred. It turned out that the product (no
matter which organometallic regent was used) was
dypnopinacone, a class of ca. 60 compounds
prepared and systematically studied by the great

7
Belgian chemist Maurice Delacre. This was the
beginning of another remarkable line of D. Ivanov's
research. His first publications on this problem at
the end of the ’thirties initiated a revision of the
structure of dypnopinacones. Delacre himself,
greatly impressed by the results obtained by his
Bulgarian colleague with whom he had not been till
then acquainted, sent Dimiter Ivanov his complete
laboratory files. He wished Ivanov to bring to a
successful conclusion the problem which had been
his lifework. An extraordinary example of high
moral behavior in the world of science!
In the 'forties, after having made use of a
remarkable research strategy, Dimiter Ivanov and
his then assistant Professor Tchavdar Ivanov
disproved the structures suggested by Delacre and
unequivocally determined the structure and
mechanism of formation of dypnopinacones - a
class of unsaturated cyclic hydroxy ketones. The
brilliant solution to the dypnopinacone problem
was the reason why dypnopinacone synthesis has
been named "Reaction of Delacre-Ivanov".
The above examples are only a brief illustration
of the impulse given to science by Academician
Ivanov's research in the field of synthetic organic
chemistry. This great scientist was not only a
witness to its further useful development but also
an active participant even in the last years of his
life.
In 1947 D. Ivanov took charge of a team of
scientists who systematically investigated the
composition of Bulgarian essential oils, above all
rose oil, but also lavender, mint, sweet basil,
zdravets (wild geranium) and the oil of other plants.
The papers published became very widely known
and contributed towards raising the international
prestige of the products of the Bulgarian essential
oil industry and the confidence in them.
Academician Ivanov was welcomed everywhere as
the "scientific ambassador" of the Kazanluk
Oleaginous Rose.
The studies on zdravets oil, which is produced
only in Bulgaria, deserve special attention. The
crystal component of the oil, named germacrone,
has a sesquiterpene carbon skeleton unknown in
other natural compounds. In 1957 and 1958 a joint
team of Bulgarian and Czech scientists, headed by
D. Ivanov and Fr. Ṧorm, proved germacrone to be a
ten-membered ring ketone. This was the starting
point for intensive research on various transfor-
mations on this structure, which contributed
significantly to the prestige of the Bulgarian School
of natural products chemistry.
Dimiter Ivanov published over 180 original
scientific papers, some of them in Bulgarian
journals but the greater part in foreign ones. In
1948 he was elected Corresponding Member of the
Bulgarian Academy of Sciences and in 1961
Academician. Up to 1972 he was head of the
"Organic Chemistry" section of the Chemical
Institute of the Bulgarian Academy of Sciences,
from the time of its foundation in 1951 (later this
became "Laboratory of Organic Synthesis" to the
Institute of Organic Chemistry).
The services rendered by Professor Dimiter
Ivanov as a teacher and instructor were exceptional
and indisputable. On the death of Professor Assen
Zlatarov he was appointed (1937) to the Chair of
Organic Chemistry at Sofia University, which he
held up to 1962. His text-book on organic
chemistry, which was excellent for that time, went
through seven editions in the course of twenty five
years. It has been the corner-stone in preparing
many generations of chemists and chemical
engineers. This text-book is now of great
bibliographical value and today is still often used as
a source of reference. Professor Ivanov had a
profound feeling of responsibility and devotion in
fulfilling his teaching duties. Having a marvelous
memory he remembered everyone who had passed
during decades through "his organic chemistry" and
he always called them "our alumni". His lectures
were unforgettable for many generations of
students. Already in 1933 he was the initiator in
introducing diploma works (master theses) which
later became a well-established form for the
instruction of students in most fields of study.
Academician Dimiter Ivanov stood out with his
vivid and unique individuality. People's attitude
towards his personality never was, and never could
be, indifferent or indefinite. But everyone was, and
is, unanimous in respect to his uncompromising
attitude towards mediocre, opportunistic, lazy
people, towards those who instead of serving
science live on its back (these, to some extent,
succeeded in avenging themselves on him when
they provoked and caused his removal from the
university in 1945 for one year, because of his
"anti-people's behavior"). Nothing except personal
qualities mattered to him in his estimation of people
and his attitude towards them in general and
towards his colleagues in particular. Maybe in this

8
lay the secret of his enviable insight in choosing his
assistants and coworkers (never very many in
numbers) and his approach in working with them.
By creating a school in organic chemistry from
which many of Bulgarian chemists started their
career, Dimiter Ivanov raised a monument to
himself already during his own lifetime.
He had a remarkable gift for getting in touch
with people who were on most various professional
and social levels. His inherent interest and curiosity
about ordinary everyday problems made him a
good listener and always good company. He would
talk with equal satisfaction about his experiences
with Nobel Prize winners or with some old
neighbor in his native village of Makotzevo. It is
easy to imagine him in lively conversation with
students, or with the postman, or as the centre of
attention at some scientific congress. This feature
of his personality combined with his scientific and
language culture made Academician Ivanov a
desirable participant or guest at different
international scientific meetings. The last event
which he attended, still showing his youthful
emotion, was the celebration of the centenary of the
birth of Grignard in 1971. The Bulgarian scientist
was invited to take part in it and was given the
honor of delivering the speech on behalf of the
grateful former Grignard students, then scattered
around many countries, whose indisputable doyen
he was.
Academician Ivanov described his long career,
illuminated by the rays of his sunset in his short
"Memoirs", completed several weeks before he
departed from us forever. The publication of these
"Memoirs", unfortunately concealed by ill-wishers,
would have provided not only an interesting, but
also instructive reading matter. He passed away on
October 25, 1975.
The absence of the personality of Dimiter
Ivanov is very strongly felt at a time when the
future of Bulgarian science is at stake! One always
imagines that he would appear at the end of the
corridor with his easy step and lively look, ready to
tell us the next of his stories, to give us hope and
faith in eternal values.
Blagoy Blagoev
Institute of Organic Chemistry with Centre of
Phytochemistry, Bulgarian Academy of Sciences, Acad.
G. Bonchev str., bl. 9, 1113 Sofia, Bulgaria; E-mail:

9
Bulgarian Chemical Communications, Volume 46, Special Issue A (pp. 9 – 15) 2014
Interaction between charged groups. pK-values and conformations of the
diastereomers of 3-amino-2,3-diphenylpropanoic acids and their ester and N-acetyl
derivatives
P. M. Ivanov1, I. G. Pojarlieff
1*, S. D. Simova
1, G. D. Velinov
2
1Institute of Organic Chemistry with Centre of Phytochemistry, Bulgarian Academy of Sciences, Acad. G. Bonchev str.,
bl. 9, 1113 Sofia, Bulgaria 2Faculty of Pharmacy, Medical University of Sofia, 2 Dunav str., 1000 Sofia, Bulgaria
Received July 03, 2014; Revised July 22, 2014
Dedicated to Acad. Dimiter Ivanov on the occasion of his 120th
birth anniversary
The system of 1,2-disubstituted-1,2-diphenylethanes is characterized by the strong preference of the conformation
with antiperiplanar phenyl groups in both diastereomers which positions the other substituents ap in the erythro and
(+)-sc in the threo isomer. This proved true for the isomers of 3-amino-2,3-diphenylpropanoic acid and its N-acetyl and
ester derivatives as evidenced by J2H3H-couplings above 10 Hz found in formamide. Only the zwitterion of erythro
amino acid 1a showed a smaller value of 9 Hz indicating charge attraction overcoming partly the steric interactions.
Molecular mechanics calculations by means of the Scheraga force field corroborated the interpretation. An IR-study of
the equilibrium zwitterion – neutral amino acid showed the latter to be preferred in aprotic solvents ≈ 100% in pure
DMSO for 1a but decreased in the presence of water, until only the zwitterion was detected in 80% DMSO. The J2H3H-
couplings of 1a (10.3 Hz in D2O and 7.7.Hz in pure DMSO) indicated that solvation by water increases steric hindrance
and suggested a strong hydrogen bond CO2H….NH2 in aprotic media. The pK-values of all compounds were
determined potentiometricly in 80% methylcellosolve and in 90% DMSO. The pK1’s of threo zwitterion 1a for COOH
were 0.8 pK units larger than those of the erythro isomer as predicted for anti vs. gauche charged groups. The pK2-
values of the isomers do not differ significantly, the electrostatic effects are apparently offset by steric hindrance from
solvation of NH3+. The pK’s of the ester and N-acetylated derivatives differ from those of the zwitterion by ca. 2 pK
units evidencing strong effects of charge interaction. In organic solvents the acidities of COOH and NH3+
change
strongly in opposite directions leading to appearance of neutral amino acid bands proven by the IR data.
Key words: intramolecular electrostatic interactions, vicinal charged groups in sc and ap conformations, erythro- threo
isomers, pK-values in 80% methylcelosolve and 90% DMSO, zwitterion vs. free amino acid, conformations, molecular
mechanics
INTRODUCTION
D. Ivanov and A. Spassov in 1931 [1,2] disco-
vered the Ivanov reaction by reacting benzaldehyde
with the dimagnesium salt of phenylacetic acid
(known as the Ivanov reagent) opening the road to a
wide range of 1,2-disubstituted-1,2-diphenyl com-
pounds. The two chiral centres give rise to two
diastereomers, the threo isomer being preferred. In
general terms the Ivanov reaction is a base cataly-
sed aldol reaction. Alternately, B. Kurtev and N.
Mollov [3] discovered an acid catalysed version
e.g. in the presence of AlCl3 esters of phenylacetic
acid add to hydrobenzamide yielding the esters of
the title amino acids. The opposite erythro selecti-
vity was observed [4]. Early studies on the confor-
mations of 1,2-disubstituted-1,2-diphenyl compo-
unds revealed from optical rotation studies [5] and
from 1H NMR vicinal coupling constants [6,7] an
intriguing feature: the threo isomer existed mainly
as the conformer with gauche Ph groups ((+)-sc,
Scheme 1) contrary to qualitative conformational
analysis. As shown on the conformational formulae
below when X and Y are medium sized groups then
the preferred conformers with both diastereomers
should be with the large phenyl groups anti.
Actually appreciation of “large” applied to a phenyl
group stems from Eliel’s A-values derived from
equatorial/axial equilibria in cyclohexane systems;
3 kcal for Ph versus 1.8 kcal for Me. In open-chain
systems there emerged from numerous studies re-
viewed in reference [8] that the syn/anti equilibrium
in 1,2-diphenylethane is very similar of the methyl
groups with a ΔG of ca. 0.8 kcal/mol. In 1,2-diphe-
nylethane some attraction between syn phenyl gro-
ups is outweighed by the greater librational entropy
© 2014 Bulgarian Academy of Sciences, Union of Chemists in Bulgaria
* To whom all correspondence should be sent:
E-mail: [email protected]
P. Ivanov et al.: Interaction between charged groups. pK-values and conformations of the diastereomers of 3-amino-2,3-…
10
in the anti position. These preferences have been
confirmed by advanced computational methods [9].
The case of 1,2-disubstituted-1,2-diphenyl compo-
unds has also drawn a great amount of attention and
has been also reviewed in [8] both with respect to
experimental determination of preferred conforma-
tions and their theoretical interpretation. Molecular
mechanics permitted conformational preferences to
be discussed in terms of separate contributions:
steric strain (torsional, angle and bond deforma-
tions), electrostatic interactions, hydrogen bonding.
Among the huge mass of accumulated data on the
diphenylethane system the absence of examples
where X and Y are charged groups is conspicuous.
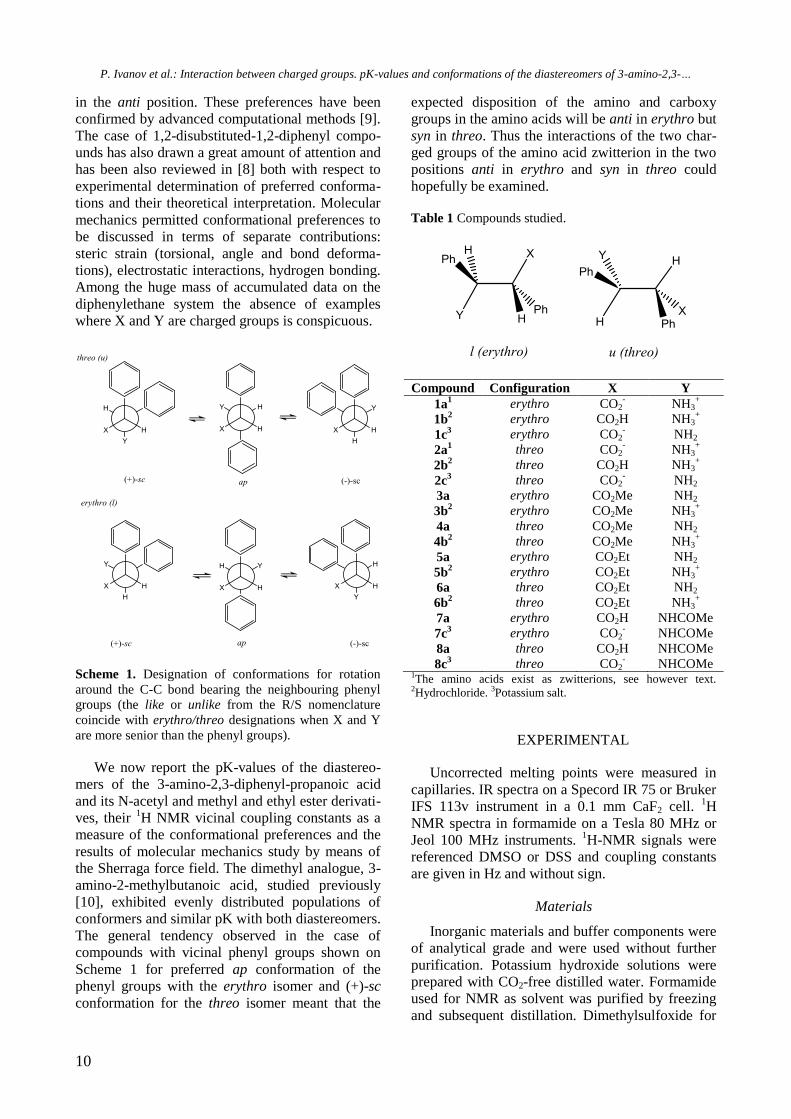
Scheme 1. Designation of conformations for rotation
around the C-C bond bearing the neighbouring phenyl
groups (the like or unlike from the R/S nomenclature
coincide with erythro/threo designations when X and Y
are more senior than the phenyl groups).
We now report the pK-values of the diastereo-
mers of the 3-amino-2,3-diphenyl-propanoic acid
and its N-acetyl and methyl and ethyl ester derivati-
ves, their 1H NMR vicinal coupling constants as a
measure of the conformational preferences and the
results of molecular mechanics study by means of
the Sherraga force field. The dimethyl analogue, 3-
amino-2-methylbutanoic acid, studied previously
[10], exhibited evenly distributed populations of
conformers and similar pK with both diastereomers.
The general tendency observed in the case of
compounds with vicinal phenyl groups shown on
Scheme 1 for preferred ap conformation of the
phenyl groups with the erythro isomer and (+)-sc
conformation for the threo isomer meant that the
expected disposition of the amino and carboxy
groups in the amino acids will be anti in erythro but
syn in threo. Thus the interactions of the two char-
ged groups of the amino acid zwitterion in the two
positions anti in erythro and syn in threo could
hopefully be examined.
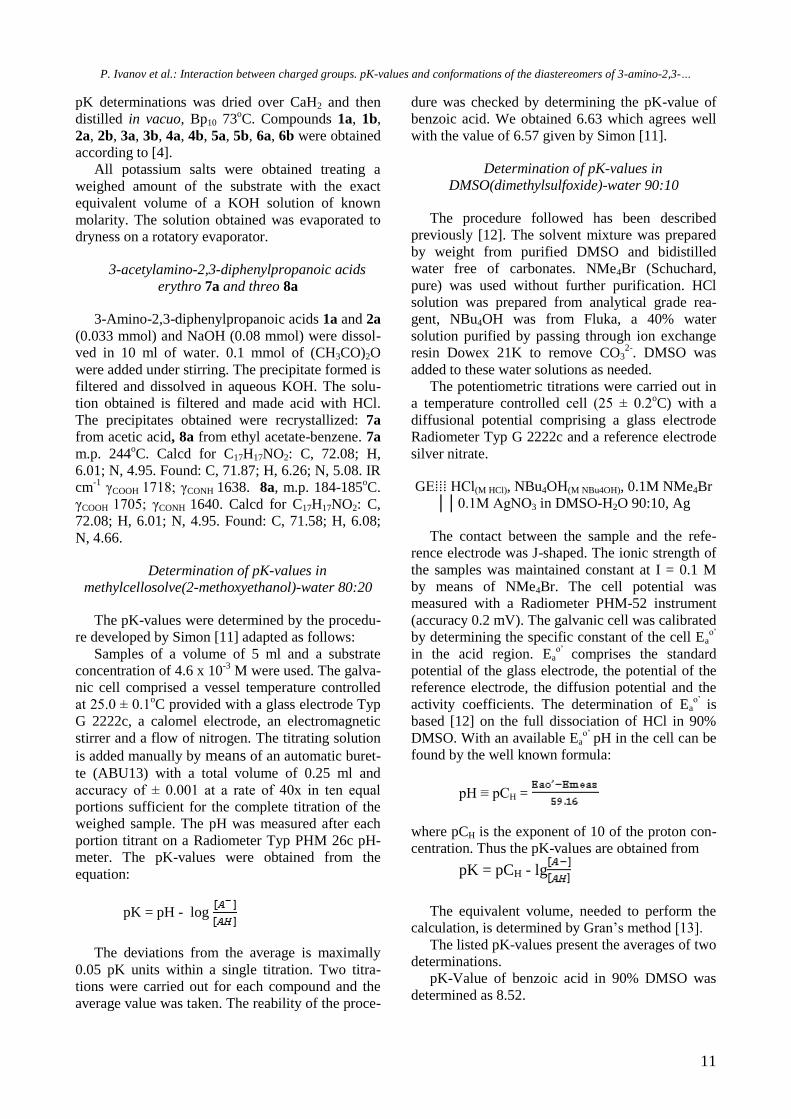
Table 1 Compounds studied.
Compound Configuration X Y 1a
1 erythro CO2- NH3
+ 1b
2 erythro CO2H NH3+
1c3 erythro CO2
- NH2 2a
1 threo CO2- NH3
+ 2b
2 threo CO2H NH3+
2c3 threo CO2
- NH2 3a erythro CO2Me NH2 3b
2 erythro CO2Me NH3+
4a threo CO2Me NH2 4b
2 threo CO2Me NH3+
5a erythro CO2Et NH2 5b
2 erythro CO2Et NH3+
6a threo CO2Et NH2 6b
2 threo CO2Et NH3+
7a erythro CO2H NHCOMe 7c
3 erythro CO2- NHCOMe
8a threo CO2H NHCOMe 8c
3 threo CO2- NHCOMe
1The amino acids exist as zwitterions, see however text. 2Hydrochloride. 3Potassium salt.
EXPERIMENTAL
Uncorrected melting points were measured in
capillaries. IR spectra on a Specord IR 75 or Bruker
IFS 113v instrument in a 0.1 mm CaF2 cell. 1H
NMR spectra in formamide on a Tesla 80 MHz or
Jeol 100 MHz instruments. 1H-NMR signals were
referenced DMSO or DSS and coupling constants
are given in Hz and without sign.
Materials
Inorganic materials and buffer components were
of analytical grade and were used without further
purification. Potassium hydroxide solutions were
prepared with CO2-free distilled water. Formamide
used for NMR as solvent was purified by freezing
and subsequent distillation. Dimethylsulfoxide for
P. Ivanov et al.: Interaction between charged groups. pK-values and conformations of the diastereomers of 3-amino-2,3-…
11
pK determinations was dried over CaH2 and then
distilled in vacuo, Bp10 73oC. Compounds 1a, 1b,
2a, 2b, 3a, 3b, 4a, 4b, 5a, 5b, 6a, 6b were obtained
according to [4].
All potassium salts were obtained treating a
weighed amount of the substrate with the exact
equivalent volume of a KOH solution of known
molarity. The solution obtained was evaporated to
dryness on a rotatory evaporator.
3-acetylamino-2,3-diphenylpropanoic acids
erythro 7a and threo 8a
3-Amino-2,3-diphenylpropanoic acids 1a and 2a
(0.033 mmol) and NaOH (0.08 mmol) were dissol-
ved in 10 ml of water. 0.1 mmol of (CH3CO)2O
were added under stirring. The precipitate formed is
filtered and dissolved in aqueous KOH. The solu-
tion obtained is filtered and made acid with HCl.
The precipitates obtained were recrystallized: 7a
from acetic acid, 8a from ethyl acetate-benzene. 7a
m.p. 244oC. Calcd for C17H17NO2: C, 72.08; H,
6.01; N, 4.95. Found: C, 71.87; H, 6.26; N, 5.08. IR
cm-1
γCOOH 1718; γCONH 1638. 8a, m.p. 184-185oC.
γCOOH 1705; γCONH 1640. Calcd for C17H17NO2: C,
72.08; H, 6.01; N, 4.95. Found: C, 71.58; H, 6.08;
N, 4.66.
Determination of pK-values in
methylcellosolve(2-methoxyethanol)-water 80:20
The pK-values were determined by the procedu-
re developed by Simon [11] adapted as follows:
Samples of a volume of 5 ml and a substrate
concentration of 4.6 x 10⁻³
M were used. The galva-
nic cell comprised a vessel temperature controlled
at 25.0 ± 0.1oC provided with a glass electrode Typ
G 2222c, a calomel electrode, an electromagnetic
stirrer and a flow of nitrogen. The titrating solution
is added manually by means of an automatic buret-
te (ABU13) with a total volume of 0.25 ml and
accuracy of ± 0.001 at a rate of 40x in ten equal
portions sufficient for the complete titration of the
weighed sample. The pH was measured after each
portion titrant on a Radiometer Typ PHM 26c pH-
meter. The pK-values were obtained from the
equation:
pK = pH - log
The deviations from the average is maximally
0.05 pK units within a single titration. Two titra-
tions were carried out for each compound and the
average value was taken. The reability of the proce-
dure was checked by determining the pK-value of
benzoic acid. We obtained 6.63 which agrees well
with the value of 6.57 given by Simon [11].
Determination of pK-values in
DMSO(dimethylsulfoxide)-water 90:10
The procedure followed has been described
previously [12]. The solvent mixture was prepared
by weight from purified DMSO and bidistilled
water free of carbonates. NMe4Br (Schuchard,
pure) was used without further purification. HCl
solution was prepared from analytical grade rea-
gent, NBu4OH was from Fluka, a 40% water
solution purified by passing through ion exchange
resin Dowex 21K to remove CO32-
. DMSO was
added to these water solutions as needed.
The potentiometric titrations were carried out in
a temperature controlled cell (25 ± 0.2oC) with a
diffusional potential comprising a glass electrode
Radiometer Typ G 2222c and a reference electrode
silver nitrate.
GE⁞⁞⁞ HCl(M HCl), NBu4OH(M NBu4OH), 0.1M NMe4Br
││0.1M AgNO3 in DMSO-H2O 90:10, Ag
The contact between the sample and the refe-
rence electrode was J-shaped. The ionic strength of
the samples was maintained constant at I = 0.1 M
by means of NMe4Br. The cell potential was
measured with a Radiometer PHM-52 instrument
(accuracy 0.2 mV). The galvanic cell was calibrated
by determining the specific constant of the cell Eao’
in the acid region. Eao’
comprises the standard
potential of the glass electrode, the potential of the
reference electrode, the diffusion potential and the
activity coefficients. The determination of Eao’
is
based [12] on the full dissociation of HCl in 90%
DMSO. With an available Eao’
pH in the cell can be
found by the well known formula:
pH ≡ pCH =
where pCH is the exponent of 10 of the proton con-
centration. Thus the pK-values are obtained from
pK = pCH - lg
The equivalent volume, needed to perform the
calculation, is determined by Gran’s method [13].
The listed pK-values present the averages of two
determinations.
pK-Value of benzoic acid in 90% DMSO was
determined as 8.52.

P. Ivanov et al.: Interaction between charged groups. pK-values and conformations of the diastereomers of 3-amino-2,3-…
12
IR-spectra in DMSO
In order to assess the tautomeric forms of the
amino acid: zwitterion – uncharged amino acid IR
spectra were taken in 85-100% DMSO in CaF2 0.1
mm cells.
RESULTS AND DISCUSSION
The pK-values obtained concern the following
equilibria:
Amino acids, 1a (erythro) and 2a (threo):
(1)
Esters of amino acids (only Me ester shown),
Me 3a (erythro), 4a (threo); Et 5a (erythro), 6a
(threo):
(2)
N-Acetylamino acids, 7a (erythro) and 8a
(threo):
(3)
Table 2. pK-values of the diastereomeric amino acid and
their N-acetyl and ester derivatives.
Compd 80% methylcellosolve 90% dimethylsulfoxide
KCOOH KNH3+ KCOOH KNH3+
1a 4.96 8.86 6.81 9.54
2a 4.18 8.98 6.08 9.25
3a 6.49 7.29
4a 6.57 7.28
5a 6.56 7.31
6a ≈6.6 7.28
7a 6.82 8.46
8a 6.38 8.03
In the zwitterion of the parent amino acids, 1a
and 2a, Coulomb interactions are expected to
increase KCOOH (decrease pKCOOH) because the
attraction between the positively and negatively
charged groups will shift the first equilibrium of
Eqn. 1 to the right. Alternately the second equilib-
rium will be shifted to the left making the conjuga-
ted acid of the amino group a weaker acid i.e. in-
crease pKNH3+. This effect is nicely demonstrated by
the roughly 2 pK units larger pKCOOH-values in the
N-acetyl derivatives 7a and 8a compared to 1a and
2a in 80% methylcellosolve. The same difference
persists with the data obtained in 90% DMSO only
the ΔpKCOOH-values are slightly smaller (see be-
low). Comparison of the p KNH3+-values of the free
acids with those of the esters in both solvents exhi-
bits the expected effect which noteworthy is very
similar to the one with pKCOOH in magnitude but
opposite in sign. The similarity of the results
obtainned on the pK in the two solvents systems
suggests that the measurments are reliable.
The main reason for carrying out the present
investigation is to establish the importance of the
electrostatic interaction in the syn versus the anti
position of the charged groups in zwitterions of β-
amino acids making use of the unique conforma-
tional preferences in the system with neighbouring
phenyl groups: the erythro isomer providing anti
charged groups and the threo isomer – syn charged
groups (Scheme 1). The closer distance in the threo
isomer 2a than in the erythro isomer 1a predicts the
former to be a stronger carboxylic acid which is
confirmed by pKCOOH of 2a found to be smaller by
0.8 pK units than that of 1a in 80% methyl-
cellosolve. In 90% DMSO ΔpKCOOH is slightly
smalller 0.7 which fits the finding by means of IR-
spectra that in 90% an appreciable amount of the
neutral form of the amino acid is present (≈20%).
However, no significant difference was found
for pKNH3+-values of the two diastereomeric amino
acids. We shall return to this point later.
The gap between pKCOOH and pKNH3+ in 90%
DMSO is smaller ca. 2.5 - 3 pK units compared to
4-5 units in 80% methylcellosolve. This is readily
explained by the well known phenomenon that
aprotic dipolar solvents strongly destabilize anions
and stabilize cations because the negative pole of
the S=O bond is on the surface of the DMSO
molecule. On the other hand, a disturbing fact con-
cerning the assignment of the two pK-values, which
one is due to COOH and which to NH3, is that
pKCOOH of the N-acetylamino acids and pKNH3+ of
the amino esters become the same in values in 80%
methylcellosolve, while in 90% DMSO the order is
even reversed - the amino group becomes a weaker
base that the carboxy anion: pKNH3+ of the esters in
90% DMSO are close in value to pKCOOH of the
amino acids and similarly to pKCOOH of the N-
acetylamino acids are close to pKNH3+ of the amino
esters. This casts doubt on the assignment of first
and second ionization constants of the amino acid.
Another consequence is that if the order of the ioni-
zation constants of monocharged derivatives holds
in amino acids then the neutral amino acid should
be the prevailing tautomer.
This problem was solved by measuring the
tautomeric equilibria utilizing the fact that IR-bands

P. Ivanov et al.: Interaction between charged groups. pK-values and conformations of the diastereomers of 3-amino-2,3-…
13
of COO- and COOH appear at different frequencies.
As reference, the bands in the N-acetylamino deri-
vative 7a and its potassium salt 7c were taken. The
intensities or absorbances, respectively, of these
bands were utilised for a quantitative estimation of
the concentration of the species in the tautomeric
equilibria.
The data on the vicinal coupling constants sum-
marised in Table 4 were collected in order to gain
insight on the preferred conformations of the diaste-
reoisomers 1a and 2a of the amino acids, their
esters and N-acetyl derivatives as well as their salts.
The solubility of the parent amino acids is low
in both water and organic solvents of low polarity,
particularly of the threo isomer whose spectrum
could only be recorded in 1:1 DMSO/H2O. The
spectra of all the remaining compounds were taken
in formamide, a polar solvent with proton donor
capacity. The protons of HCONH2 resonate at low
fields which permits spectra to be taken up to δ 5
ppm with the non deuterated solvent.
Table 3. Data on the tautomeric konstants KT of erythro
amino acid 1a for equilibria in DMSO/ H2O solutions.
Solvent KT=[Zw]/[Neut] Note
pure DMSO ≈0 Only the neutral
form observed 95% DMSO 1.26 90% DMSO 3.5
80% DMSO ≈∞ Only the zwitterionic
form observed
With the exception of 1a, the erythro free amino
acid, all vicinal couplings 2H:3H of the remaining
compounds are greater than 10 Hz as expected
because steric energy is known to determine the
preference of erythro anti and threo (+)-sc confor-
mations of Scheme 1. The lower J-constant of 1a of
Table 4. Coupling constants, J2H,3H Hz, of amino acids, methyl and ethyl esters and N-acetylamino acids and their salts
in HCONH2.1
erythro threo
Compd Form J2H3H Hz Compd Form J2H3H Hz
1a2 Free amino acid 9.0 (7.7
3a, 10.3
3b) 2a
6 Free amino acid 10.9
1b4 HCl salt 10.0 2b
7 HCl salt 10.9
1c5 Potassium salt 10.3 2c
8 Potassium salt 10.5
3a9 Free methyl ester 10.1 4a
11 Free methyl ester 10.8
3b10
HCl salt 11.0 4b12
HCl salt 11.2
5a13
Free ethyl ester 10.5 6a15
Free ethyl ester 10.5
5b14
HCl salt 11.2 6b16
HCl salt ≈11
7a17
Free acetylamino acid 11.8 8a19
Free acetylamino acid 10.3
7c18
Potassium salt 11.5 8c20
Potassium salt 9.6 1Concentration of samples 0.04 g in 0.5 ml HCONH2. Chemical shifts in δ (ppm) are listed in the corresponding footnotes; 2 4.04 (d
1H), ˃5.25; 3aIn DMSOd6; 3bIn D2O 4.10 (d 1H), 4.95 (d 1H), 7.32 (s 10H); 4 4.27 (d 1H), 4.98 (d 1H); 53.72 (d 1H), 4.45 (d 1H); 6In
DMSOd6/ D20 1:1; 3.80 (d 1H), 4.60 (d 1H), 7.04 (s 4H), 7.18 (s 6H); 74.24 (d 1H), 4.90 (d 1H); 83.62 (d 1H), 4.39 (d 1H); 93.20 (s
3H), 3.81 (d 1H), 4.40 (d 1H); 103.30 (s 3H), ≈4.37 (d 1H), 5.50 (d 1H); 113.57 (s 3H), ≈3.85 (d 1H), 4.40 (d 1H); 123.57 (s 3H), ≈4.35
(d 1H), 4.96 (d 1H); 130.70 (t 3H), 3.3 (q 2H), 3.67 (d 1H), 4.39 (d 1H); 140.71 (t 3H), 3.72 (q 2H), 4.34 (d 1H), 4.96 (d 1H); 151.01 (t
3H), 3.8 (d 1 H), ≈ 4 (4H, CH2 + NH2), 4.32 (d 1H); 161.02 (t 3H), 4.2 (q 2H), ≈4.0 (d 1H), 4.92 (d 1H); 171.57 (s 3H), 3.96 (d 1H),
˃5.25; 181.46 (s 3H), 3.93 (d 1H), ˃5.25; 201.83 (s 3H), 3.84 (d 1H), ˃5.25.
Table 5. Local minima of the conformational energy of the zwitterions of the 3-amino-2,3-diphenylpropanoic acid in
kcal/mol and statistical weight at 300oK.
ΔE = Eo - (Eo)g Nonbonded Electrostatical Hydrogen
bonding Normalized stat.
weight threo global minimum (Eo)g = -15.7
(+)-sc 0.0 -3.6 -11.3 -1.0 1.0
ap 11.0 5.0 -11.9 -1.1 0.0 (-)-sc 8.5 1.0 -6.6 0.0 0.0
erythro global minimum (Eo)g = -10.7 (+)-sc 5.3 6.9 -11.9 -1.0 0.0
ap 0.0 -4.5 -6.5 0.0 1.0
(-)-sc 2.2 3.8 -11.8 -1.1 0.0

P. Ivanov et al.: Interaction between charged groups. pK-values and conformations of the diastereomers of 3-amino-2,3-…
14
9 Hz in formamide is also not surprising because
gauche charged groups of opposite sign will lower
the energy of the sc conformations in the erythro
isomer and thus decrease the population of erythro
anti. The same interaction of course stabilizes the
(+)-sc-conformation in the threo isomer 2b.
The still lower value of J2H3H of 7.7 Hz observed
with 1a in pure DMSOd6 shows that an attractive
interaction arises in the neutral amino acid stronger
than that in the zwitterion, where according to the
IR data the neutral form of the amino acid entirely
prevails in practice. This apparently is due to a
hydrogen bond.
In D2O on the contrary a larger J2H3H of 10.3 Hz
is observed. Although the obvious reason appears
the higher dielectric coefficient of water, this is
hardly the whole reason because intramolecular
Coulomb interactions take place mainly through the
hydrocarbon skeleton of low dielectric coefficient.
Actually ε = 2.0 is most commonly used in
molecular mechanics. More likely of importance is
the solvation of the groups: water solvates both
cations and anions thus increasing their steric
demands and thus overriding the attraction of the
charged groups. The better solvation of –NH3+
than
of -NH2 explains the systematically higher J2H3H-
couplings found in the hydrochlorides of the amino
esters compared to the free amino esters (Table 4).
MM deals with empirical force fields which
agree quantitatively with experiments when they
are well calibrated for a class of compounds. The
preferred conformations are properly predicted. The
closer local minima over the global one in the
erythro case correspond to the greater mobility of
the conformational equilibrium. The computed di-
fference in the electrostatic interactions between the
sc and ap positions of the charged groups amounts
to ca. 4.5 kcal/mol. Only a small part of it is
expressed to change pK1 by 0.8 pK units indicating
the complexity of factors determining experimental
pK-values. Noteworthy is that in the case of the
amino acid studied the threo isomer is more stable
which is not common. On Table 5 are listed the
local minima for the conformational energy of the
conformations of the zwitterions of the threo and
erythro isomers of 3-amino-2,3-diphenylpropanoic
acid (Scheme 1), calculated by means of the
Sheraga force field [14].
CONCLUSION
The 1H NMR J2H3H-couplings above 10 Hz
found in formamide for the diastereomers of 3-
amino-2,3-diphenylpropanoic acid, its salts and
ester and N-acetyl derivatives confirmed the
expectation of anti amino and carboxy groups in
the erythro isomers and syn in the threo ones
according to general preferences found in 1,2-
disubstituted-1,2-diphenylethane systems. Coulomb
attraction in the zwitterion only slightly enhances
the gauche conformation in the erythro isomer (J =
9.0 Hz). This conformation is disfavored in water
(10.3 Hz) apparently because of increasing steric
demands due to solvation. An entirely different
phenomenon was observed in DMSO – the low J =
7.7 Hz is actually the result of a strong hydrogen
bond between the NH2 and COOH groups in the
neutral form of amino acid with an abundance of
ca. 100% in pure DMSO according to IR spectral
data. The presence of water rapidly decreases the
percentage of the neutral form: around 20% in 90%
DMSO and ca 0% in 80% DMSO. The traditional
measure of electrostatic effects is ΔpK = pK2 – pK1
for ionizations of the two charged groups. When the
groups are different, as in the case of amino acid,
the effect of charge is exhibited by ΔpK between
the pK’s in the zwitterion and the N-acetyl or ester
derivatives where one of the charges is removed.
These ΔpK-values amounted to ca. 2 pK units
according to our pK-measurements in two solvents:
80% methyl cellosolve and 90% DMSO. The effect
of proximity of the charged groups, syn versus anti
disposition in the zwitterion, is measured by ΔΔpK
between ΔpK of the diastereomers. An early study
of Gentschew and Toleva [15] showed a small
ΔΔpK of 0.3 between 1a and 2a in water (0.1M
KCl). This was interpreted by means of Tanford’s
model [16] that closer proximity in threo (syn) is
compensated by a lower effective dielectric
constant, D, in erythro (anti) because less
interaction is realized through the solvent of large
D [10]. As expected, in solvents with smaller D,
80% methyl cellosolve and 90% DMSO, larger
ΔΔpK of 0.9 and 0.5 were found, respectively.
Molecular mechanics calculations gave an
electrostatic energy difference of 4.5 kcal/mol
between the diastereomeric zwitterions correspond-
ding to 3.2 ΔΔpK at 300 K.

P. Ivanov et al.: Interaction between charged groups. pK-values and conformations of the diastereomers of 3-amino-2,3-…
15
REFERENCES
1. D. Ivanoff, A. Spassoff, Bull. Soc. Chim. France, 49,
19 (1931).
2. D. Ivanoff, A. Spassoff, Bull. Soc. Chim. France, 49,
375 (1931).
3. B. Kurtev, N. M. Mollov, Acta Chim. Acad. Sci.
Hungar., 18, 430 (1959).
4. B. J. Kurtev, N. M. Mollov, M. J. Ljapova, A. S.
Orahovats, Monatsh. Chem., 94, 904 (1963).
5. G. Fodor, J. Stefanovsky, B. Kurtev, Chem. Ber., 98,
705 (1965).
6. G. Fodor, R. F. Reavill, J. Stefanovsky, B. Kurtev, H.
J. Bernstein, Tetrahedron, 22, 235 (1966).
7. S. L. Spassov, Tetrahedron, 25, 3638 (1969).
8. P. M. Ivanov, I. G. Pojarlieff, J. Mol. Struct.
(Theochem), 170, 257 (1988).
9. N. Kurita, P. M. Ivanov, J. Mol. Struct., 554, 183
(2000).
10. M. Gentschev, A. Toleva, I. G. Pojarlieff, Compt. r.
Acad. Bulg. Sci., 23, 799 (1970).
11. W. Simon, Helvetica Chim. Acta, 41, 1835 (1958).
12. J. Tencheva, G. Velinov, O. Budevsky, J.
Electroanal. Chem. Interfacial Elecrochem., 68, 65
(1976).
13. F. J. C. Rossotti, H. Rossotti, J. Chem. Educ., 42, 375
(1965).
14. F. A. Momany, R. F. McGuire, A. W. Burgess, H. A.
Scheraga, J. Phys. Chem., 79, 2361 (1975).
15. M. Gentschew, A. Toleva, Nauchni trud. Ped. I-tut,
Plovdiv, 5, 78 (1967).
16. C. Tanford, J. Am. Chem. Soc., 79, 5348 (1957).
ВЗАИМОДЕЙСТВИЕ НА ЗАРЕДЕНИ ГРУПИ. РК И КОНФОРМАЦИИ НА
ДИАСТЕРЕОМЕРИТЕ НА 3-АМИНО-2,3-ДИФЕНИЛПРОПАНОВАТА КИСЕЛИНА,
МЕТИЛОВИТЕ И ЕТИЛОВИТЕ Й ЕСТЕРИ И N-АЦЕТИЛНИ ПРОИЗВОДНИ
П. М. Иванов1, И. Г. Пожарлиев
1*, С. Д. Симова
1, Г. Д. Велинов
2
1Институт по Органична химия с Център по Фитохимия, Българска Академия на Науките, ул. Акад. Г. Бончев,
бл. 9, 1113 София, България 2Фармацевтичен Факултет, Медицински Университет - София, ул. Дунав 2, 1000 София, България
Постъпила на 03 юли 2014 г.; Коригирана на 22 юли 2014 г.
(Резюме)
Характерно за системата на 1,2-дизаместени-1,2-дифенилетани е силното предпочитание на конформацията
с антиперипланарни фенилни групи, поради което другите заместители застават ap в еритро и (+)-sc в трео
изомера. Същото явление бе установено за изомерите на 3-амино-2,3-дифенилпропановата киселина и нейните
N-ацетилни и естерни производни съгласно J2H3H-константите ˃ 10 Хц, измерени в формамид. Само
цвитерионът на еритро амино киселината 1а даде по-ниска стойност 9.0 Хц, указание, че привличането на
зарядите е преодоляло частично стеричните взаимодействия. Пресмятания с молекулна механика със силовото
поле на Шерага подкрепиха тази интерпретация. ИЧ-спектроскопски изследвания на равновесието цвитерйон -
неутрална амино киселина показаха, че неутралната форма е предпочетена в апротни разтворители, при 1a ≈
100% в чист DMSO, но намалява при добавяне на вода като при 80% DMSO вече се наблюдава само
цвитерйонът. pK-константите бяха определени потенциометрично в 80% метилцелосолв и в 90% DMSO. pK1-
константите за трео цвитерйона 1а са с 0.8 рК единици по-големи от тези на еритро изомера, очаквано
съотношение между анти и гош заредени групи. рК2-константите на изомерите не се различават съществено;
видимо електростатичното взаимодействие частично се компенсира поради стерично пречене породено от
солватиране на NH3+. рК на естерите и на N-ацетилираните производни се различават с около 2 рК единици от
тези на цвитерйона, отразяващо силното влияние на взаимодействието на заредените групи. В органичните
разтворители силно се променят киселиностите на СООН и NH3+ в обратни посоки, което води до поява на
неутралната форма, доказана с ИЧ изследванията.

16
Bulgarian Chemical Communications, Volume 46, Special Issue A (pp. 16 – 20) 2014
Catalytic method for synthesis of Grignard compounds with magnesium attached to
tertiary bridge head C-atom
V. Dimitrov
Institute of Organic Chemistry with Centre of Phytochemistry, Bulgarian Academy of Sciences, Acad. G. Bonchev str.,
bl. 9, 1113 Sofia, Bulgaria
Received June 30, 2014; Revised July 13, 2014
Dedicated to Acad. Dimiter Ivanov on the occasion of his 120th
birth anniversary
The reaction of 1-norbornyl chloride, 1-bicyclooctyl chloride and 1-adamantyl bromide with magnesium was
realized through the catalytic influence of anthracene. The formation of anthracene magnesium species, the so called
“organic dissolved” magnesium, is the highly active form of the metal, responsible for the formation of the
corresponding Grignard compounds in very pure form.
Key words: 1-norbornyl, 1-bicyclooctyl, 1-adamantyl, magnesium
INTRODUCTION
The organomagnesium compounds discovered
by Victor Grignard over 100 years ago are
indispensable for the organic synthetic chemistry
[1,2]. The interest to the synthesis of Grignard-
reagents is steadily growing since the development
of new approaches to obtain functionalized
organomagnesium compounds [3-5] expand the
application area significantly in particularly for the
preparation of pharmaceutically relevant structures.
For the synthesis of Grignard compounds in some
cases it is not easy to bring organic halides into
reaction with metallic magnesium and therefore
several methods for the activation of magnesium
have been developed [6]. Among them the
preparation of highly active magnesium is one of
the very useful tools for synthesis of organo-
magnesium compounds. Highly active magnesium,
the so called “Riecke-magnesium” could be
obtained by reduction of anhydrous MgCl2 with
alkali metals [7-9]. Alternatively, highly active
magnesium is produced during the decomposition
of anthracene magnesium [10]. In the first case the
active magnesium is a component of a highly
heterogeneous mixture containing also metallic
potassium and in the second, organic by-products
are contained. Therefore the Grignard reagents
prepared by using magnesium obtained through
these methods may contain impurities or disturbing
components for further applications.
In this work we were interested to prepare
Grignard reagents with the bridgehead substituted
organic halides 1-norbornyl chloride (1), 1-bicyclo-
octyl chloride (2) and 1-adamantyl bromide (3).
Fig. 1. Bridgehead substituted organic halides.
The chloride 1 forms 1-norbornyl-magnesium
chloride after reaction with “Rieke-magnesium”
[11] and 1-adamathyl-magnesium bromide has been
prepared in the course of prolonged reaction after
activation of magnesium with 1,2-dibromoethane
[12,13]. The synthesis of 1-bicylooctyl-magnesium
has been realized in situ by means of “Rieke-
magnesium” in order to obtain 13
C-labeled
compound for NMR studies [14,15]. In general
there is difficult to prepare Grignard reagents from
organic halides with quaternary substituted C-atom.
Generation of the Grignard reagents with these
bridgehead substituted halides is very useful
alternative to the corresponding organolithium
compounds. The synthesis of organolithium or
organomagnesium compounds with metal attached
to the same organo-group offers excellent
opportunity to use different conditions and to vary
the reactivity within further transformations. Herein
we are presenting very convenient catalytic method
for the synthesis of bridgehead-substituted organo-
magnesium compounds.
© 2014 Bulgarian Academy of Sciences, Union of Chemists in Bulgaria
* To whom all correspondence should be sent:
E-mail: [email protected]

V. Dimitrov: Catalytic method for synthesis of Grignard compounds with magnesium attached to tertiary bridge head C-atom
17
EXPERIMENTAL
General
All reactions were carried out in flame-dried
Schlenk-flasks under argon atmosphere. Hexane
and deuterated solvents were distilled over
Na[Et4Al]. Etheral solvents were distilled from
sodium/benzophenone. Thin layer chromatography
(TLC) was performed on aluminum sheets pre-
coated with silica gel 60 F254 (Merck). Flash
column chromatography was carried out using
silica gel 60 (230-400 mesh, Merck). The NMR
spectra were recorded in THF-d8 or CDCl3 on a
Bruker AM200 (200 MHz for 1H NMR, 50.3 MHz
for 13
C NMR) and DRX 250 (250.13 MHz for 1H
NMR, 62.9 MHz for 13
C NMR) spectrometer with
TMS as the internal standard for chemical shifts (,
ppm). 1H and
13C NMR data are reported as
follows: chemical shift, multiplicity (s = singlet, d =
doublet, t = triplet, q = quartet, br = broad, m =
multiplet), coupling constants (Hz), integration, and
identification. Mass-spectra were recorded on a
Finnigan MAT 8200 and Finnigan MAT SSQ 7000.
Reaction of 1-norbornyl lithium (4) with tetra-
hydrofurane (5) - synthesis of vinyloxy-lithium 7
and norbornane 8
1-Norbornyl lithium (4) (1.09 g, 10.69 mmol)
was placed in a Schlenk-flask and cooled to -50°C.
Tetrahydrofuran (5) (50 ml) precooled to -50°C was
added and the mixture was slowly warmed up by
stirring it constantly. The gas evolution started
slowly between -10 and 0°C and was intensive
between 5°C and room temperature. The gas was
collected and analyzed by mass-spectrometry as
mixture of ethylene (6) and argon. The estimated
quantity of ethylene corresponded to the expected
value (there was deviation because of the argon
content). The tetrahydrofurane (5) was evaporated
in vacuum and the solid residue was treated with 70
ml of n-pentane. After filtration 0.41 g (77%) of 7
was isolated as colorless crystalline substance. The
pentane filtrate was evaporated to dryness and the
residue chromatographed (150 g silica gel;
pentane/diethyl ether = 10:1) to give 0.91 g (88%)
of 8.
Data of 7: 1H NMR (THF-d8, 200 MHz) δ 6.91
(dd, J1-H, 2-H(Z) = 13.3 Hz, J1-H, 2-H(E) = 5.1 Hz, 1H, 1-
H,), 3.54 (dd, J2-H(Z), 2-H(E) = 1.6 Hz, 1H, 2-H(Z),),
3.15 (dd, 1H, 2-H(E)) ppm. 13
C NMR (THF-d8,
50.3 MHz) δ 158.98 (2-C), 81.74 (1-C), 68.22 and
26.30 coordinated THF.
General procedure (GP) for synthesis of 1-
norbolnyl-magnesium chloride (9), 1-bicyclooctyl-
magnesium chloride (10) and 1-adamantyl-
magnesium bromide (11)
Magnesium turnings (fivefold excess related to
the quantity of the corresponding alkyl halide) were
placed in a Schlenk flask and were dried in vacuum
by heating over 100°C. After cooling to rt the
solvent THF was introduced under argon
atmosphere in such quantity to cover the
magnesium turnings. For activation of magnesium
ethyl bromide (5 mol % of the quantity of the
corresponding alkyl halide) was introduces and the
mixture was allowed to stand over the night.
Anthracene (2 mol %) was introduced and after
several seconds green color appeared on the surface
of magnesium, which turned after several minutes
in blue color indicating the good activation. The
blue mixture was stirred for 0.5 h and the
corresponding alkyl halide was introduces drop
wise as THF-solution (approximately 90 ml THF
for 10 mmol of alkyl halide). The reaction mixture
was stirred for the necessary time (see below),
filtered and the volume of the solution was
measured. The content of the corresponding
Grignard compound in the obtained solution was
determined, as follows: Aliquot of the RMgX-
solution was quenched in 0.1N HCl-solution and
the reacted HCl was determined by titration with
0.1N NaOH-solution. Magnesium content was
determined by complexometric titration.
Synthesis of 1-norbornyl-magnesium chloride
(9)
According to GP, after stirring the reaction
mixture at rt for 5 h and standing for 15 days, 250
ml THF-solution of 9 in 85% yield was prepared
from 3.94 g (162.00 mmol) magnesium, activated
with 0.176 g (1.62 mmol) ethyl bromide and 0.115
g (0.65 mmol) anthracene, and 4.23 (32.38 mmol)
of 1. 13
C NMR (THF-d8, 50.3 MHz) δ 47.27 (7-C),
39.09 (2-C, 6-C), 35.66 (4-C), 31.44 (3-C, 5-C),
13.75 (1-C), 68.20 and 26.19 coordinated THF.
Synthesis of 1-bicyclooctyl-magnesium chloride
(10)
According to GP, after stirring the reaction
mixture at rt for 5 h and standing for 15 days, 120
ml THF-solution of 10 in 78% yield was prepared
from 2.02 g (83.09 mmol) magnesium, activated
with 0.090 g (0.83 mmol) ethyl bromide and 0.059
g (0.33 mmol) anthracene, and 2.40 (16.59 mmol)

V. Dimitrov: Catalytic method for synthesis of Grignard compounds with magnesium attached to tertiary bridge head C-atom
18
of 2. 13
C NMR (THF-d8, 50.3 MHz) δ 33.21 (β),
29.00 (δ), 28.89 (γ), 25.13 (α), 68.06 and 25.77
coordinated THF.
Synthesis of 1-adamantyl-magnesium bromide (11)
According to GP, after stirring the reaction
mixture at rt for 5 h and standing for 4 days, 250 ml
THF-solution of 11 in 80% yield was prepared
from 1.70 g (69.93 mmol) magnesium, activated
with 0.076 g (0.70 mmol) ethyl bromide and 0.050
g (0.28 mmol) anthracene, and 3.00 (13.95 mmol)
of 3. 13
C NMR (THF-d8, 50.3 MHz) δ 38.38 (β),
36.05 (δ), 30.13 (γ), 26.36 (α); no coordinated THF
could be observed.
RESULTS AND DISCUSSION
We have long standing interest in the synthesis
of 1-norbornyl transition metal compounds [16-18]
in which 1-norLi 4 is the reagent of choice. Some
of the reactions have to be performed in ethereal
solvents and therefore, it is advantageous to avoid
the possibility of side reactions caused by ether-
cleavage of 1-norLi. Consequently our initial
interest to prepare bridgehead substituted organo-
magnesium compounds arose from the fact that 1-
norbornyl lithium (1-norLi, 4) undergoes rapid
ether-cleavage with ethereal solvents (Scheme 1).
The reaction of 1-norLi (4) with tetrahydrofuran
(THF, 5) occurs even at low temperature with
formation of ethen (6). Between -10 and 0°C the
ether-cleavage reaction is relatively slow; from 5°C
up to room temperature there is intensive gas
evolution. The generated gas was collected and
proved by mass-spectrometry to be ethen (6). After
evaporation of the solvent 5 and treatment the
residue with pentane colorless solid was
precipitated, which was identified as vinyloxy-
lithium (7) (see Experimental). This compound was
in fact the lithium enolate of acetaldehyde and this
was proved through the identification of
acetaldehyde formation generated by hydrolysis of
7. In the pentane filtrate was identified norbornane
8 (by GC-MS experiments). The reaction observed
is supported by published data [19,20].
Scheme 1. Reaction between 1-norbornyl lithium and
tetrahydrofuran.
On these grounds we were interested to develop
valuable pathway to generate 1-norbornyl-
magnesium chloride in ethereal solvent (preferably
THF). The use of the organometallic reagent
anthracene magnesium in stoichiometric reactions
with alkyl halides has been described previously as
method providing in some cases excellent results
[10]. The formation of anthracene in the course of
the corresponding Grignard reagent generation is
disadvantageous if further transformations are
aimed. Catalytic variants of the anthracene
magnesium promoted Grignard reagents formation
have also been tested [21]. The present work has
been inspired by published reports [22,23]
describing that the addition of catalytic quantities of
anthracene to magnesium in tetrahydrofurane
results in the formation of the so called “organic
dissolved” magnesium.
Scheme 2. Synthesis of bridgehead substituted organo-
magnesium compounds 9-11.
The optimization was performed first in the
reaction of 1-norbornyl chloride (1) with
magnesium in THF catalyzed by anthracene
(Scheme 2). The generation of magnesium
anthracene is the decisive step. However, the
reaction of magnesium with anthracene is very
sensitive and can be initiated only if very dry THF
and properly activated magnesium are used. For
this purpose it is important to dry Mg in vacuum by
heating it above 100°C and to use THF freshly
distilled from sodium/benzophenone. To the
mixture of Mg and THF prepared in Schlenk-flask
under argon atmosphere is introduced ethyl

V. Dimitrov: Catalytic method for synthesis of Grignard compounds with magnesium attached to tertiary bridge head C-atom
19
bromide (5% related to the organic halide to be
used for the formation of RMgX) and then the
mixture is kept at room temperature for several
hours (better over night; see Experimental). The
ethyl bromide used forms Grignard reagent
activating thus the Mg-surface. Besides, the
EtMgBr formed contributes on prolonged standing
to additional activation of the metal surface. The
magnesium activated in this manner reacts with
anthracene (2 mol %) rapidly forming yellow-green
mixture turning into blue after stirring for several
minutes. After stirring for 0.5 h 1-norbornyl
chloride (1) was introduced drop wise. The reaction
of the organic halide and the “organic dissolved”
magnesium starts immediately indicated by the
disappearance of the blue color. If no further 1-
norbornyl chloride is introduced the species causing
the blue color are formed within several minutes.
These species are most probably anthracene
magnesium radical anion complexes which nature
has been extensively discussed elsewhere [24]. The
formation of the anthracene magnesium species is
reversible with two consequences, formation of
quasi atomic magnesium in solution and additional
activation of the metal surface [22].
The reaction of 1-norbornyl chloride (1) to form
the Grignard reagent was slow. For the formation of
the reagent in 48% yield reaction time of 24 h was
necessary and acceptable yield (85%) was achieved
only after 14 days (see Table 1). For comparison
the related bridgehead substituted bicyclooctyl
chloride (2) and adamantyl bromide (3) were
applied in the reaction with magnesium. Compound
2 has been synthesize according own published
procedure [25] whereas 3 is commercially
available. The formation of the Grignard reagent
with 2 was slow and good yields could be realized
after 14 days although acceptable conversion has
been observed in the first 24 h. In the case of 3 the
formation of the corresponding magnesium reagent
proceeded in 4 h in good yield (70%). The yield
could be improved slightly up to 80% if the
reaction time is prolonged to 4 days. It should be
pointed out that apart from the prolonged time for
the formation of the reagents the method described
is definitely synthetically valuable. The obtained
Grignard reagents are very pure and could be stored
under argon atmosphere for months.
The structure of the synthesized compounds 9-
11 was confirmed by 13
C NMR spectroscopy (see
Experimental). The samples were prepared by
evaporating the THF to dryness and dissolution of
the remaining solid residue in THF-d8. As expected
the persistent coordinated THF could be observed
in the 13
C spectra, however only for compounds 9
and 10. It was surprising the absence of coordinated
THF in the case of 11 which is probably a result of
the very crowded structure of the adamantyl-Mg-
compound. The 1H NMR spectra do not provide
useful structural information due to the overlapping
multiplets. Compounds 9-11 react with water to
form the corresponding hydrocarbons proved by
mass-spectra. The 1-norbornyl magnesium reagent
was used successfully for reactions with
nickelocene [16,18] to prepare CpNi(1-nor)-olefin
complexes. These results will be reported elsewhere
[26].
Table 1. Reaction time for the formation and yields of
Grignard compounds 9-11.
Compound Reaction time Yield [%]
1-nor-MgCl (9)
24 h
4 days
14 days
48
60
85
1-boc-MgCl (10)
24 h
4 days
14 days
58
65
78
1-ad-MgBr (11) 24 h
4 days
70
80
CONCLUSION
Convenient method for anthracene magnesium
catalyzed preparation of Grignard compounds has
been demonstrated in which the magnesium is
attached to the bridgehead carbon atom of the
norbornyl, bicyclooctyl and adamantyl organic
groups. The magnesium compounds are stable in
form of THF solutions under argon atmosphere and
can be easily stored for further applications.
Acknowledgements: Financial support of
Alexander von Humboldt Foundation is gratefully
acknowledged.
REFERENCES
1. G. S. Silverman, P. E. Rakita, Eds., Handbook of
Grignard Reagents, Marcel Dekker, New York, 1996.
2. B. J. Wakefield, Organomagnesium Methods in
Organic Synthesis, Academic Press, London, 1995.
3. T. Klatt, J. T. Markiewicz, C. Saemann, P. Knochel,
J. Org. Chem., 79, 4253 (2014).
4. P. Knochel, M. A. Schade, S. Bernhardt, G.
Manolikakes, A. Metzger, F. M. Piller, C. J.
Rohbogner, M. Mosrin, Beilstein J. Org. Chem., 7,
1261 (2011).
5. P. Knochel, W. Dohle, N. Gommermann, F. F.
Kneisel, F. Kopp, T. Korn, I. Sapountzis, V. A. Vu,
Angew. Chem. Int. Ed., 42, 4302 (2003).

V. Dimitrov: Catalytic method for synthesis of Grignard compounds with magnesium attached to tertiary bridge head C-atom
20
6. U. Tilstam, H. Weinmann, Org. Proc. Res. Dev., 6,
906 (2002).
7. R. D. Rieke, P. M. Hudnall, J. Am. Chem. Soc., 94,
7178 (1972).
8. R. D. Rieke, S. E. Bales, J. Chem. Soc., Chem.
Commun., 879 (1973).
9. R. D. Rieke, S. E. Bales, J. Am. Chem. Soc., 96, 1775
(1974).
10. B. Bogdanovic, N. Janke, H.-G. Kinzelmann, Chem.
Ber., 123, 1507 (1990).
11. R. D. Rieke, S. E. Bales, P. M. Hudnall, T. P. Burns,
G. S. Poindexter, Org. Synth., 59, 85 (1979); Coll.
Vol. 6, 845 (1988).
12. G. Molle, P. Bauer, J. E. Dubois, J. Org. Chem., 47,
4120 (1982).
13. G. Schäfer, C. Matthey, J. W. Bode, Angew. Chem.
Int. Ed., 51, 9173 (2012).
14. M. Barfield, S. E. Brown, E. D. Canada, Jr., N. D.
Ledford, J. L. Marshall, S. R. Walter, E. Yakali, J.
Am. Chem. Soc., 102, 3355 (1980).
15. E. W. Delia, H. Gangodawila, P. E. Pigou, J. Org.
Chem., 53, 592 (1988).
16. H. Lehmkuhl, V. Dimitrov, J. Organomet. Chem.,
519, 69 (1996).
17. H. Lehmkuhl, V. Dimitrov, J. Organomet. Chem.,
519, 83 (1996).
18. V. Dimitrov, A. Linden, Angew. Chem. Int. Ed., 42,
2631 (2003).
19. P. Stanetty, H. Roller, M. Mihovilovic, J. Org.
Chem., 57, 6833 (1992).
20. A Maercker, Angew. Chem. Int. Ed., 26, 972 (1987).
21. S. Harvey, P. C. Junk, C. L. Raston, G. Salem, J.
Org. Chem., 53, 3134 (1988).
22. H. Bönnemann, B. Bogdanovic, R. Brinkmann, D.-
W. He, B. Spliethoff, Angew. Chem., Int. Ed., 22,
728 (1983).
23. B. Bogdanovic, S.-T. Liao, R. Mynott, K. Schlichte,
U. Westeppe, Chem. Ber., 117, 1378 (1884).
24. B. Bogdanovic, Acc. Chem. Res., 21, 261 (1988).
25. K. Kostova, V. Dimitrov, Synth. Commun., 25, 1575
(1995).
26. V. Dimitrov, Synthesis of CpNi(1-nor)-olefin
complexes, in preparation for publication.
КАТАЛИТИЧЕН МЕТОД ЗА СИНТЕЗ НА ГРИНЯРОВИ СЪЕДИНЕНИЯ С МАГНЕЗИЙ
СВЪРЗАН С ТРЕТИЧЕН МОСТОВИ ВЪГЛЕРОДЕН АТОМ
В. Димитров
Институт по Органична химия с Център по Фитохимия, Българска Академия на Науките, ул. Акад. Г. Бончев,
бл. 9, 1113 София, България
Постъпила на 30 юни 2014 г.; Коригирана на 13 юли 2014 г.
(Резюме)
Реакцията на 1-норборнил хлорид, 1-бициклооктил хлорид и 1-адамантил бромид с магнезий е осъществена
чрез каталитичното влияние на антрацен. Формирането на антрацен магнезиеви интермедиати, така наречения
„органично разтворен“ магнезий, е високо активната форма на метала, отговорна за формирането на
съответните гринярови реагенти в чист вид.

21
Bulgarian Chemical Communications, Volume 46, Special Issue A (pp. 21 – 26) 2014
Phosphino-carboxamide hybrid ligands with a camphane scaffold for Pd-catalyzed
asymmetric allylic alkylation
I. Philipova1, G. Stavrakov
2, V. Dimitrov
1*
1Institute of Organic Chemistry with Centre of Phytochemistry, Bulgarian Academy of Sciences, Acad. G. Bonchev str.,
bl. 9, 1113 Sofia, Bulgaria 2Faculty of Pharmacy, Medical University of Sofia, 2 Dunav str., 1000 Sofia, Bulgaria
Received April 03, 2014; Revised April 29, 2014
Dedicated to Acad. Dimiter Ivanov on the occasion of his 120th
birth anniversary
Condensation of ortho-diphenylphosphino benzoic acid with 3-exo-aminoisoborneol, isobornylamine and
bornylamine afforded three new ligands, which were evaluated in the palladium-catalyzed allylic alkylation of (E)-1,3-
diphenyl-2-propen-1-yl acetate. The catalytic performance strongly depended on the system used to generate the
dimethyl malonate anion. The best enantioselectivity was achieved with the 3-exo-aminoisoborneol derived ligand
when Cs2CO3 was used as a base. The isobornylamine and bornylamine derived ligands gave generally low
enantioselectivities.
Key words: (+)-camphor, phosphino-carboxamides, P,O-ligands, allylic substitution
INTRODUCTION
Palladium-catalyzed asymmetric allylic alkyl-
ation has proven to be a powerful method for the
preparation of a wide variety of chiral compounds
and the rapid assembly of complex molecular
architecture from simple starting materials [1].
While many types of catalyst systems have been
successfully employed with certain systems,
diphenylphosphino benzoic acid (DPPBA) based
ligands have found use over a broad range of
substrate classes [2].
Over the years, there has been a steady interest
in the synthesis and application of simple, hybrid,
hemilabile, P,O-type ligands [3]. Among the latter
compounds, phosphino-carboxamides evolved into
a specific class of structurally diverse molecules,
bearing the combination of weak and strong donor
heteroatom pairs, which enables them to bind to
almost any metal, generating electronic asymmetry
[4]. Another privilege is their stability and the ease
with which they could be accessed. The advantages
presented above and the unambiguous proof that
P,O-mode of coordination with palladium center is
giving catalytically active complex (Fig. 1, I) [5-7]
justify the efforts to the development and appli-
cation of amido-phosphine ligands in asymmetric
allylic alkylation (AAA) [8-17].
A number of simple phosphino-carboxamides
have been studied. For example, Marinho et al. [18,
19] have prepared a series of phosphino-amide
ligands bearing a free hydroxyl function (Fig. 1, II).
Fig. 1. Phosphino-carboxamides as hybrid, hemilabile,
P,O-type ligands.
© 2014 Bulgarian Academy of Sciences, Union of Chemists in Bulgaria
* To whom all correspondence should be sent:
E-mail: [email protected]

I. Philipova et al.: Phosphino-carboxamide hybrid ligands with a camphane scaffold for Pd-catalyzed asymmetric allylic alkylation
22
The application of the ligands in AAA resulted
in moderate enantioselectivities (up to 62% ee) and
the authors hypothesized that the free-OH group
was also coordinating with Pd, resulting in a
deactivation of the latter. Mahadik et al. [20-22]
reported the synthesis and application of nor-
ephedrine and pseudonorephedrine analogues (Fig.
1, III) that furnished slightly better enantio-
selectivities (up to 75% ee). Noteworthy is that in
both cases the ligands are secondary amides.
Recently, we have accomplished practical syn-
thesis of camphane based planar chiral diphenyl-
phosphino-ferrocenecarboxamide (Fig. 1, IV) and
diphenylphosphino-benzenecarboxamide ligands
(Fig. 1, V) [23-25]. Application of these ligands in
the Pd-catalyzed AAA as P,O-chelates proceeded
with promising degree of enantio-selectivity (up to
92%) [25]. The use of camphane based chiral
auxiliary proved to be the major contributor to the
asymmetric induction in the catalytic process.
Encouraged by these results, we dedicated our
efforts toward the synthesis of secondary benzene-
carboxamides. A switch of tertiary to secondary
amides gave us the opportunity to investigate the
influence of the amide hydrogen in the catalytic
process. Furthermore, examination of the effect of
the OH-function on the ligand structure/activity
study, made us interested in the synthesis of
secondary amide analogue of V (Fig 1.), bearing a
free hydroxyl group. Herein, we report a practical
synthesis of new camphor derived phosphino-
benzenecarboxamide ligands and their application
in Pd-catalyzed asymmetric allylic alkylation.
EXPERIMENTAL
Reagents were commercial grade and used
without further purification. CH2Cl2 was distilled
from CaH2. THF and Et2O were distilled over
sodium/benzophenone. Thin layer chromatography
(TLC) was performed on aluminum sheets pre-
coated with Merck Kieselgel 60 F254 0.25 mm
(Merck). Flash column chromatography was carried
out using Silica Gel 60 230-400 mesh (Fluka).
Melting points of the compounds were determined
using “Electrothermal” MEL-TEMP apparatus (un-
corrected). Optical rotations ([α]D20
) were measured
on Perkin–Elmer 241 polarimeter. The NMR
spectra were recorded on a Bruker Avance II+ 600
(600.13 for 1H NMR, 150.92 MHz for
13C NMR
and 242.92 MHz for 31
P NMR) spectrometer with
TMS (85% H3PO4 for 31
P) as internal standard for
chemical shifts (δ, ppm). 1H and
13C NMR data are
reported as follows: chemical shift, multiplicity (s =
singlet, d = doublet, t = triplet, q = quartet, br =
broad, m = multiplet), coupling constants (Hz),
integration and identification. The assignment of
the 1H and
13C NMR spectra was made on the basis
of DEPT, COSY, HSQC, HMBC and NOESY
experiments. Mass spectra (MS) were recorded on a
Thermo Scientific DFS (High Resolution Double
Focusing Magnetic Sector) mass spectrometer
(Bremen, Germany) and are reported as fragmen-
tation in m/z with relative intensities (%) in paren-
theses. The high performance liquid chroma-
tography (HPLC) separations were performed with
an Agilent 1100 System fitted with diode array
detector and manual injector with a 20 µl injection
loop Chiralpak IA, 250x4.6mm particle size 5 μm,
and Chiralpak IC 250x4.6mm, particle size 5 μm
stainless-steel columns from Chiral Technologies
Europe LTD were used. The analyses were perfor-
med at 25°C. Elemental analyses were performed
by Microanalytical Service Laboratory of Faculty
of Chemistry, University of Sofia, using Vario EL3
CHNS(O) and Microanalytical service Laboratory
of the Institute of Organic Chemistry, Bulgarian
Academy of Science.
General Procedure for the preparation of the
amides 2, 4 and 6 (GP)
1-Hydroxybenzotriazole (HOBt) (1.1 equiv) and
2-diphenylphosphinobenzoic acid (1 equiv) were
suspended in dichloromethane, and the mixture was
stirred for 5 min. Then, N-[3-(dimethylamino)
propyl]-N-ethylcarbodiimide (EDC) (1.1 equiv)
was added, followed by the appropriate amine,
diluted with a small amount of dichloromethane
(1.1 equiv). Stirring was continued for 24 h at room
temperature until the starting material was comple-
tely consumed (TLC). Then the mixture was
directly subjected to flash column chromatography.
Synthesis of 2-(diphenylphosphino)-N-
((1S,2R,3S,4R)-3-hydroxy-4,7,7-trimethylbicyclo
[2.2.1]heptan-2-yl)benzamide 2
According to GP, a mixture of 2-diphenyl-phos-
phinobenzoic acid (0.100 g, 0.326 mmol), HOBt
(0.049 g, 0.359 mmol), EDC (0.069 g, 0.359 mmol)
and (1R,2S,3R,4S)-3-amino-1,7,7-trimethyl-bicyc-
lo[2.2.1]heptan-2-ol [26] (0.061 g, 0.359 mmol)
afforded after column chromatography (silica gel,
CH2Cl2/Et2O, 100:1) 0.127 g (85% yield) of 2 as a
white solid; mp >89°C decomp. [α]20
D +16.0 (c
0.53, CHCl3). 1H NMR (CDCl3, 600 MHz) δ 0.76
(s, 3H, 9-H), 0.91 (s, 3H, 10-H), 0.97 (s, 3H, 8-H),
1.01-1.07 (m, 1H, 6-Hendo), 1.12-1.16 (m, 1H, 5-
Hendo), 1.44-1.49 (m, 1H, 6-Hexo), 1.65-1.70 (m, 1H,
5-Hexo), 1.68 (d, J 2.3 Hz, 1H, 4-H), 2.23 (d, J 2.6
Hz, 1H, OH), 3.78 (dd, J 7.2, 3.4 Hz, 1H, 2-H),

I. Philipova et al.: Phosphino-carboxamide hybrid ligands with a camphane scaffold for Pd-catalyzed asymmetric allylic alkylation
23
3.80-3.83 (m, 1H, 3-H), 6.40 (d, J 5.9 Hz, 1H, NH),
6.98 (ddd, J 7.6, 4.0, 1.0 Hz, 1H, arom.), 7.27-7.31
(m, 5H, arom.), 7.32-7.34 (m, 6H, arom.), 7.37 (dt,
J 7.5, 1.3 Hz, 1H, arom.), 7.55 (ddd, J 7.5, 3.8, 1.2
Hz, 1H, arom.) ppm. 13
C NMR (CDCl3, 150.9
MHz) δ 11.32 (10-C), 20.94 (8-C), 21.37 (9-C),
26.23 (5-C), 33.23 (6-C), 46.93 (7-C), 49.10 (1-C),
50.03 (4-C), 58.41 (3-C), 80.09 (2-C), 127.35 (d,
JP,C 5.3 Hz, 1 arom. CH), 128.48 (d, JP,C 7.1 Hz, 2
arom. CH), 128.57 (d, JP,C 7.1 Hz, 2 arom. CH),
128.73 (2 arom. CH), 128.83 (1 arom. CH), 130.00
(1 arom. CH), 133.71 (d, JP,C 19.8 Hz, 2 arom. CH),
133.95 (d, JP,C 20.1 Hz, 2 arom. CH), 134.27 (1
arom.CH), 135.84 (d, JP,C 19.4 Hz, 2 arom. C),
136.92 (d, JP,C 9.8 Hz, 2 arom. C), 137.21 (d, JP,C
11.0 Hz, 2 arom. C), 141.95 (d, JP,C 26.7 Hz, 2
arom. C), 169.14 (CO) ppm. 31
P NMR (CDCl3,
242.92 МHz): δ -10.44 (s) ppm. MS (ESI): m/z 458
(100, [M+1]+). C29H32NO2P (457.54): calcd. C
76.13, H 7.05, N 3.06, found C 76.24, H 7.13, N
3.10.
Synthesis of 2-(diphenylphosphino)-N-
((1R,2R,4R)-1,7,7-trimethylbicyclo[2.2.1]heptan-2-
yl)benzamide 4
According to GP, a mixture of 2-diphenyl-
phosphinobenzoic acid (0.100 g, 0.326 mmol),
HOBt (0.049 g, 0.359 mmol), EDC (0.069 g, 0.359
mmol) and (1R,2R,4R)-1,7,7-trimethyl bicyclo-
[2.2.1]heptan-2-amine [27] (0.055 g, 0.359 mmol)
afforded after column chromatography (silica gel,
CH2Cl2/Et2O, 100:1) 0.142 g (99% yield) of 4 as a
white solid; mp 73-75 °C. [α]20
D -58.1 (c 0.74,
CHCl3). 1H NMR (CDCl3, 600 MHz) δ 0.67 (s, 3H,
9-H), 0.78 (s, 3H, 8-H), 0.82 (s, 3H, 10-H), 1.09-
1.14 (m, 1H, 5-Hendo), 1.27-1.31 (m, 1H, 6-Hendo),
1.39-1.43 (m, 1H, 3-Hexo), 1.50-1.55 (m, 1H, 6-
Hexo), 1.64-1.66 (m, 1H, 5-Hexo), 1.66 (d, J 4.2 Hz,
1H, 4-H), 1.77 (dd, J 13.3, 9.1 Hz, 1H, 3-Hendo),
4.00 (dt, J 9.0, 5.1 Hz, 1H, 2-Hendo), 5.89 (d, J 8.3
Hz, 1H, NH), 6.94 (dd, J 7.0, 4.0 Hz, 1H, arom.),
7.22-7.29 (m, 4H, arom.), 7.31-7.34 (m, 7H, arom.),
7.38 (dt, J 7.5, 1.0 Hz, 1H, arom.), 7.57 (ddd, J 6.6,
3.8, 0.9 Hz, 1H, arom.) ppm. 13
C NMR (CDCl3,
150.9 MHz) δ 11.76 (10-C), 20.05 (9-C), 20.19 (8-
C), 26.94 (5-C), 35.82 (6-C), 38.46 (3-C), 44.77 (4-
C), 47.01 (7-C), 48.63 (1-C), 57.14 (2-C), 127.81
(d, JP,C 5.2 Hz, 1 arom. CH), 128.50 (d, JP,C 7.0 Hz,
2 arom. CH), 128.65 (d, JP,C 7.0 Hz, 2 arom. CH),
128.70 (1 arom. CH), 128.82 (1 arom. CH), 128.86
(1 arom. CH), 129.91 (1 arom. CH), 133.76 (d, JP,C
20.0 Hz, 2 arom. CH), 133.85 (d, JP,C 20.0 Hz, 2
arom. CH), 134.21 (1 arom. CH), 135.15 (d, JP,C
20.0 Hz, 1 arom. C), 136.87 (d, JP,C 11.3 Hz, 1
arom. C), 137.11 (d, JP,C 11.5 Hz, 1 arom. C),
142.31 (d, JP,C 27.0 Hz, 1 arom. C), 168.38 (CO)
ppm. 31
P NMR (CDCl3, 242.92 МHz): δ -11.37 (s)
ppm. MS (ESI): m/z 442 (100, [M+1]+). C29H32NOP
(441.54): calcd. C 78.88, H 7.30, N 3.17, found C
78.99, H 7.42, N 3.19.
Synthesis of 2-(diphenylphosphino)-N-
((1R,2S,4R)-1,7,7-trimethylbicyclo[2.2.1]heptan-2-
yl)benzamide 6
According to GP, a mixture of 2-diphenyl-
phosphinobenzoic acid (0.100 g, 0.326 mmol),
HOBt (0.049 g, 0.359 mmol), EDC (0.069 g, 0.359
mmol) and (1R,2S,4R)-1,7,7-trimethyl bicycle-
[2.2.1]heptan-2-amine [28] (0.055 g, 0.359 mmol)
afforded after column chromatography (silica gel,
CH2Cl2/Et2O 100:1) 0.140 g (97% yield) of 6 as a
white solid; mp 71-72 °C. [α]20
D +10.2 (c 0.47,
CHCl3). 1H NMR (CDCl3, 600 MHz) δ 0.63 (dd,
JH,H = 13.4, 4.6 Hz, 1H, 3-Hendo), 0.77 (s, 3H, 10-
H), 0.82 (s, 3H, 9-H), 0.85-0.89 (m, 1H, 5-Hendo),
0.91 (s, 3H, 8-H), 1.19-1.24 (m, 2H, 6-Hendo, 6-
Hexo), 1.57 (d, J 4.5 Hz, 1H, 4-H), 1.60-1.66 (m,
1H, 5-Hexo), 2.24-2.29 (m, 1H, 3-Hexo), 4.30-4.34
(m, 1H, 2-Hexo), 6.02 (d, J 7.3 Hz, 1H, NH), 6.92
(ddd, J 7.7, 4.1, 1.0 Hz, 1H, arom.), 7.23-7.29 (m,
4H, arom.), 7.30-7.35 (m, 7H, arom.), 7.40 (dt, J
7.5, 1.2 Hz, 1H, arom.), 7.65 (ddd, J 7.6, 3.8, 1.2
Hz, 1H, arom.) ppm. 13
C NMR (CDCl3, 150.9
MHz) δ 13.61 (10-C), 18.66 (8-C), 19.74 (9-C),
28.06 (6-C), 28.12 (5-C), 37.00 (3-C), 44.71 (4-C),
47.99 (7-C), 49.36 (1-C), 54.51 (2-C), 127.30 (d,
JP,C 5.3 Hz, 1 arom. CH), 128.60 (d, JP,C 6.9 Hz, 2
arom. CH), 128.82 (1 arom. CH), 128.90 (1 arom.
CH), 128.92 (1 arom. CH), 129.97 (1 arom. CH),
133.79 (d, JP,C 18.6 Hz, 4 arom. CH), 134.10 (1
arom. CH), 134.43 (d, JP,C 19.6 Hz, 1 arom. C),
136.64 (d, JP,C 11.0 Hz, 1 arom. C), 136.93 (d, JP,C
11.4 Hz, 1 arom. C), 142.52 (d, JP,C 27.3 Hz, 1
arom. C), 169.10 (CO) ppm. 31
P NMR (CDCl3,
242.92 МHz): δ -11.17 (s) ppm. MS (ESI): m/z 442
(100, [M+1]+). C29H32NOP (441.54): calcd. C
78.88, H 7.30, N 3.17, found C 78.96, H 7.25, N
3.21.
General procedure for the palladium-catalyzed
allylic alkylation
A: A mixture of chiral ligand (0.03 mmol),
[Pd(η3-C3H5)Cl]2 (6.0 mg, 0.016 mmol), and LiOAc
(0.05 mmol) in a dry solvent (3 mL) was stirred at
rt in a Schlenk tube for 30 min. Then, rac- (E)-1,3-
diphenylprop-2-en-1-yl acetate (126 mg, 0.5 mmol)
was introduced followed, after stirring for another 5
min, by N,O-bis-(trimethylsilyl)acetamide (BSA;
0.37 mL, 1.5 mmol) and dimethyl malonate (0.17
mL, 1.5 mmol). The mixture was stirred at rt for 24
h, then the reaction mixture was diluted with

I. Philipova et al.: Phosphino-carboxamide hybrid ligands with a camphane scaffold for Pd-catalyzed asymmetric allylic alkylation
24
diethyl ether (10 mL) and washed consecutively
with sat. aq. NH4Cl and water. The organic phase
was dried over anhydrous Na2SO4, filtered and
concentrated in vacuo. The residue was purified by
flash column chromatography (silica gel, hexane:
ethyl acetate, 9:1).
B: A mixture of chiral ligand (0.03 mmol),
[Pd(η3-C3H5)Cl]2 (6.0 mg, 0.016 mmol), in a dry
solvent (3 mL) was stirred at rt in a Schlenk tube
for 30 min. Then, rac- 1,3-diphenylprop-2-en-1-yl
acetate (126 mg, 0.5 mmol) was introduced
followed, after stirring for another 5 min, by
Cs2CO3 (0.326 g, 1.0 mmol) and dimethyl malonate
(0.11 mL, 1.0 mmol). The mixture was stirred at rt
for 24 h. The reaction was quenched with sat. aq.
NH4Cl, extracted with EtOAc (3×20 mL). The
organic phase was washed with saturated aqueous
NaHCO3, water, and brine, dried over Na2SO4, and
concentrated under reduced pressure. The residue
was purified by flash column chromatography
(silica gel, hexane:ethyl acetate, 9:1).
The enantioselectivity was determined by HPLC
analysis with a chiral column (Chiralpak IA;
hexane/i-PrOH, 95:5; flow rate, 0.7 mL/ min; tR,
14.321; tS, 17.871 min). The absolute configura-
tions of the enantiomers were determined by
comparison of the retention times with that of an
authentic sample and by measurement of the optical
rotation of the product.
RESULTS AND DISCUSSION
For the planned condensation reactions, readily
available, 3-exo-aminoisoborneol [26], iso-bornyl-
amine [27] and bornylamine [28] were selected as
key (+)-camphor-derived starting compounds.
First, we synthesized the secondary amide
analogue of V (Fig 1.), bearing a hydroxyl group on
the camphane scaffold. Thus, we had the chance to
exploit whether the presence of the free OH-group
might serve as a third coordination site in the
formation of more rigid chelates of the palladium
catalyst, resulting in enhanced enantioselectivity, or
will lead to a problem of deactivation of the
palladium in the catalytic process [18-22]. One
more aspect of our investigation was modification
of the electronic properties of the amide carbonyl
group as a coordination center. The desired
diphenylphosphino-benzenecarboxamide ligand 2
was easily obtained by condensation of o-DPPBA
with (2S)-(-)-3-exo-aminoisoborneol 1 in dry
CH2Cl2 in the presence of N-[-3-(dimethyl amino)-
propyl]-N’-ethylcarbodiimide (EDC) and 1-hydro-
xybenzotriazole (HOBT) (Scheme 1). The amide 2
was isolated by column chromatography as air
stable white solid in 85% yield. The influence of
the camphane chiral source was further investigated
by the synthesis of diphenylphosphino-benzenecar-
boxamide ligands 4 and 6, starting from isobornyl-
amine or bornylamine, respectively. Thereby, we
had the possibility to investigate how the difference
in the camphor derived fragment influences the
reactivity of the transition metal complexes and the
asymmetric induction in the catalytic process.
Moreover, the ligand structures lacking a hydroxyl
function afforded an opportunity to examine
additionally the effect of the latter. Formation of the
amide linkage was accomplished by applying the
EDC/HOBT/o-DPPBA coupling procedure to exo-
bornylamine 3 and endo-bornylamine 5. The desi-
red products 4 and 6 were isolated in quantitative
yields after purification (Scheme 1).
Scheme 1. Synthesis of diphenylphosphino-benzene-
carboxamide ligands 2, 4 and 6.
In all cases the oxidation of the phosphines to
the corresponding phosphine oxides was minimized
by using a non-aqueous work-up procedure,
subjecting the reaction mixtures directly to flash
column chromatography on silica gel. The struc-
tures of the newly synthesized compounds were
confirmed by 1D and 2D NMR spectra, MS data
and elemental analysis.
The chiral diphenylphosphino-benzene carbox-
amide ligands 2, 4 and 6 were evaluated in the
palladium-catalyzed asymmetric allylic alkylation
of (E)-1,3-diphenyl-2-propen-1-yl acetate with
dimethyl malonate using [Pd(η3-C3H5)Cl]2 as a
palladium source (Scheme 2).

I. Philipova et al.: Phosphino-carboxamide hybrid ligands with a camphane scaffold for Pd-catalyzed asymmetric allylic alkylation
25
Scheme 2. Pd-catalyzed asymmetric allylic alkylation of
(E)-1,3-diphenyl-2-propen-1-yl acetate.
Initially, the reaction was performed with ligand
2 under our previously reported conditions [25].
The nucleophile was generated in situ by Trost’s
procedure [29] using N,O-bis(trimethylsilyl) aceta-
mide (BSA) and a catalytic amount of LiOAc as a
base additive (Table 1). The reaction carried out in
Et2O proceeded with excellent conversion but no
asymmetric induction was observed (Table 1, entry
1). Performing the alkylation in THF instead of
Et2O led to enantioselectivity of 16% ee in favor of
(R)-enantiomer (Table 1, entry 2). The best enantio-
selectivity of 52% ee was achieved when 2 equi-
valents of anhydrous cesium carbonate were
employed as the base, instead of BSA/LiOAc, in
CH2Cl2 (Table 1, entry 3). An interesting compa-
rison can be made with the N,O-disubstituted
analogue of ligand 2. Both the reactions in Et2O and
in THF with ligand V (Fig. 1) proceeded with
excellent enantioselectivity of 91% ee, favoring the
same (R)-enantiomer [25]. Obviously, the presence
of free-OH group greatly influences the catalytic
performance, leading to substantial drop of enantio-
selectivity.
Applying the optimized for ligand 2 reaction
conditions to the isobornylamine derived ligand 4
resulted in excellent conversion but lack of asym-
metric induction (Table 1, entry 4). When a mixture
of BSA and a catalytic amount of LiOAc in THF
was used as the base instead of Cs2CO3, the
enantioselectivity raised to 12% ee, favoring (R)-
configuration of the substitution product (Table 1,
entry 5). Performing the alkylation in Et2O instead
of THF did not influence the catalytic performance
(13% ee, entry 6). In comparison, the N-ethylated
analogue of ligand 4 afforded enantioselectivity of
30% favoring the same (R)-enantiomer [25].
Evidently, the secondary amide performs no better
than the tertiary.
Ligand 6, the endo-diastereoisomer of 4, also
afforded low level of enantioselectivity favoring the
same (R)-enantiomer (12% ee, entry 7). Surpri-
singly, a change of the configuration at the carbon
atom bonded to the amide nitrogen did not
influence the enantioselectivity and the configu-
ration of the products obtained.
Table 1. Palladium-catalyzed AAA of racemic (E)-1,3-
diphenyl-2-propen-1-yl acetate with dimethyl malonatea.
Entry L* Solvent Base/Additive Yield
(%)b
ee (%),
confc
1 2 Et2O BSA/LiOAc 99 1, R
2 2 THF BSA/LiOAc 99 16, R
3 2 CH2Cl2 Cs2CO3 99 52, R
4 4 CH2Cl2 Cs2CO3 99 1, S
5 4 THF BSA/LiOAc 99 12, R
6 4 Et2O BSA/LiOAc 99 13, R
7 6 Et2O BSA/LiOAc 99 12, R aReaction conditions: A 1 equiv. substrate, 0.03 equiv [Pd(η3-
C3H5)Cl]2, 0.06 equiv. ligand, 3 equiv. N,O-bis(trimethylsilyl)
acetamide (BSA), 3 equiv. dimethylmalonate, catalytic amount
of additive salts, 24 h. B 1 equiv. substrate, 0.03 equiv [Pd(η3-
C3H5)Cl]2, 0.06 equiv. ligand, 2 equiv. Cs2CO3 2 equiv.
dimethylmalonate, 24 h; bIsolated pure products after column
chromatography; cEnantiomeric excess determined by HPLC
analysis (Chiralpak IA chiral column). The absolute
configuration was determined by comparison of the specific
rotation to the literature value, see Ref [30].
The low enantio-selectivity made us forsake
further optimizations. Quite controversial was also
the result obtained with its N-ethylated analogue.
No asymmetric induction was detected when
employing the latter in the AAA, under the same
reaction conditions [25]. Obviously, in the case of
the bornylamine derived ligands the secondary
amide is more potential than the tertiary. The oppo-
site result was observed for the isobornylamine
derived ligands.
CONCLUSION
New ligands were synthesized by condensation
reactions of 3-exo-aminoisoborneol, isobornyl
amine and bornylamine with ortho-diphenyl phos-
phino benzoic acid and evaluated in the palladium-
catalyzed asymmetric allylic alkylation. The system
used to generate the dimethyl malonate anion
strongly determined the catalytic perfor-mance of
3-exo-aminoisoborneol derived ligand 2. The best
enantioselectivity of 52% ee was achieved when
Cs2CO3 was used as a base. The combination of
secondary amide with a free-OH group led to a
drop of enantioselectivity compared to tertiary
amide alkoxy analogues. The isobornylamine and
bornylamine derived ligands gave generally low
enantioselectivities of 13% ee and 12% ee, respect-
tively. A comparison with their tertiary amide
analogues revealed that the electronic properties of
the amide carbonyl group greatly influenced the
asymmetric induction.
I. Philipova et al.: Phosphino-carboxamide hybrid ligands with a camphane scaffold for Pd-catalyzed asymmetric allylic alkylation
26
Acknowledgements: Financial support of National
Science Fund, Bulgaria (DID02/33/2009 and
DRNF-02/13/2009) is gratefully acknowledged.
REFERENCES
1. B. M. Trost, C. Lee, Catalytic Asymmetric Synthesis,
In: I. Ojima, editor, 2nd ed, New York: Wiley-VCH,
2000.
2. B. M. Trost, M. R. Machacek, A. Aponick, Acc.
Chem. Res., 39, 747 (2006).
3. P. Braunstein, N. Frederic, Angew. Chem. Int. Ed.,
40, 680 (2001).
4. P. Stepnicka, Chem. Soc. Rev., 41, 4273 (2012).
5. C. P. Butts, E. Filali, G. C. Lloyd-Jones, P.-O.
Norrby, D. A. Sale, Y. Schramm, J. Am. Chem. Soc.,
131, 9945 (2009).
6. C. Amatore, A. Jutand, L. Mansah, L. Ricard, J.
Organomet. Chem., 692, 1457 (2007).
7. C. P. Butts, J. Crosby, G. C. Lloyd-Jones, S. Stephen,
Chem. Commun., 1707 (1999).
8. J. Clayden, P. Johnson, J. H. Pink, M. Helliwell, J.
Org. Chem., 65, 7033 (2000).
9. T. Mino, K. Kashihara, M. Yamashita, Tetrahedron:
Asymmetry, 12, 287 (2001).
10. J. Clayden, L. W. Lai, M. Helliwell, Tetrahedron:
Asymmetry, 12, 695 (2001).
11. W.-M. Dai, K. K. Y. Yeung, J.-T. Liu, Y. Zhang, I.
D. Williams, Org. Lett., 4, 1615 (2002).
12. M. Tollabi, E. Framery, C. Goux-Henry, D. Sinou,
Tetrahedron: Asymmetry, 14, 3329 (2003).
13. Y.-H. Lee, Y. K. Kim, J.-H. Son, K. H. Ahn, Bull.
Korean Chem. Soc., 24, 225 (2003).
14. N. W. Boaz, J. A. Ponasik, Jr., S. E. Large, S. D.
Debenham, Tetrahedron: Asymmetry, 15, 2151
(2004).
15. M. Lamac, J. Tauchman, I. Cisarova, P. Stepnicka,
Organometallics, 26, 5042 (2007).
16. K. Glego1a, E. Framery, C. Goux-Henry, K. M.
Pietrusiewicz, D. Sinou, Tetrahedron, 63, 7133
(2003).
17. V. Benessere, F. Ruffo, Tetrahedron: Asymmetry, 21,
171 (2010).
18. V. R. Marinho, A. I. Rodrigues, A. J. Burke,
Tetrahedron: Asymmetry, 19, 454 (2008).
19. V. R. D. Marinho, J. P. P. Ramalho, A. I. Rodrigues,
A. J. Burke, Chirality, 23, 383 (2011).
20. G. S. Mahadik, S. A. Knott, L. F. Szczepura, S. R.
Hitchcock, Tetrahedron: Asymmetry, 20, 1132
(2009).
21. G. S. Mahadik, S. A. Knott, L. F. Szczepura, S. J.
Peters, J. M. Standard, S. R. Hitchcock, J. Org.
Chem., 74, 8164 (2009).
22. G. S. Mahadik, S. R. Hitchcock, Tetrahedron:
Asymmetry, 21, 33 (2010).
23. G. Stavrakov, I. Philipova, B. Ivanova, V. Dimitrov,
Tetrahedron: Asymmetry, 21, 1845 (2010).
24. I. Philipova, G. Stavrakov, A. Chimov, R. Nikolova,
B. Shivachev, V. Dimitrov, Tetrahedron: Asymmetry,
22, 970 (2011).
25. I. Philipova, G. Stavrakov, V. Dimitrov,
Tetrahedron: Asymmetry, 23, 927 (2012).
26. Y. K. Chen, S. Jeon, P. J. Walsh, W. A. Nugent, Org.
Synth., 82, 87 (2005).
27. J. Ipaktschi, Chem. Ber., 117, 856 (1984).
28. R. M. Carman, K. L. Greenfield, Aust. J. Chem., 37,
1785 (1984).
29. B. M. Trost, D. J. Murphy, Organometallics, 4, 1143
(1985).
30. T. Hayashi, A. Yamamoto, T. Hagihara, Y. Ito,
Tetrahedron Lett., 27, 191 (1986).
ФОСФИН-КАРБОКСАМИДИ С КАМФАНОВ СКЕЛЕТ КАТО ЛИГАНДИ ЗА Pd-
КАТАЛИЗИРАНО АСИМЕТРИЧНО АЛКИЛИРАНЕ
И. Филипова1, Г. Ставраков
2, В. Димитров
1*
1Институт по Органична химия с Център по Фитохимия, Българска Академия на Науките, ул. Акад. Г. Бончев,
бл. 9, 1113 София, България 2Фармацевтичен Факултет, Медицински Университет – София, ул. Дунав 2, 1000 София, България
Постъпила на 03 април 2014 г.; Коригирана на 29 април 2014 г.
(Резюме)
Чрез кондензация на орто-дифенилфосфино бензоена киселина с 3-екзо-аминоизоборнеол, изоборниламин
и борниламин са получени три нови фосфин-карбоксамиди, които са изследвани като лиганди в Pd-
катализирано асиметрично алилово алкилиране на (E)-1,3-дифенил-2-пропен-1-ил ацетат. Каталитичното
действие силно зависи от условията използвани за получаване на диметил малонатния анион. Най-висока
енантиоселективност е постигната с лиганд производен на 3-екзо-аминоизоборнеол и използването на Cs2CO3
като база. Лигандите, производни на изоборниламин и борниламин, индуцират по-ниска енантиоселективност.

27
Bulgarian Chemical Communications, Volume 46, Special Issue A (pp. 27 – 32) 2014
Synthesis and antimycobacterial activity of bornylamine derived amido-alcohols
G. Stavrakov1*, I. Philipova
2, V. Valcheva
3, G. Momekov
1
1Faculty of Pharmacy, Medical University of Sofia, 2 Dunav str., 1000 Sofia, Bulgaria
2Institute of Organic Chemistry with Centre of Phytochemistry, Bulgarian Academy of Sciences, Acad. G. Bonchev str.,
bl. 9, 1113 Sofia, Bulgaria 3Institute of Microbiology, Bulgarian Academy of Sciences, Akad. Bonchev str., bl. 26, 1113 Sofia, Bulgaria
Received April 16, 2014; Revised May 30, 2014
Dedicated to Acad. Dimiter Ivanov on the occasion of his 120th
birth anniversary
Three novel amido-alcohols were synthesized on the base of the camphane scaffold. Natural amino acids were
transformed into their -hydroxy analogues with retention of configuration, and attached to bornylamine. The
compounds were evaluated for their in vitro activity against Mycobacterium tuberculosis H37Rv. The activity shifts
from micromolar to nanomolar inhibitory concentrations depending on the -hydroxy acid moiety. The valine derived
compound demonstrates activity 25 times higher than the referent ethambutol. The amido-alcohols with camphane
scaffolds emerge as promising new class of antimycobacterial agents.
Key words: camphane, -hydroxy acids, M. tuberculosis H37Rv, cytotoxicity
INTRODUCTION
Tuberculosis (TB) still remains a growing
problem in the context of diagnosis and treatment
of multidrug-resistant TB [1]. The unacceptable
large number of TB deaths necessitates the search
for new antimycobacterial agents with novel
structures and mode of action. SQ 109 (Fig. 1. I),
emerged as capable second line drug with
promising antimycobacterial potencies and pharma-
cokinetic properties [2]. It is very likely that its
highly lipophilic adamantane structure helps the
penetration into the bacterial wall and thus is
decisive for the activity [3].
Inspired by the analogy of the camphane
scaffold as compact lipophilic moiety to the
adamantyl fragment in SQ 109, we have previously
studied camphor derived structures as novel
antimycobacterial agents [4,5]. A practical synthe-
sis of a small number of new amido-alcohols and
amido-diols was accomplished on the base of 3-
exo-aminoisoborneol (Fig. 1. II) [4]. These were
screened for antimycobacterial activity against two
MTB strains (H37Rv and MDR strain 43) and some
of the compounds show activity much higher than
the referent ethambutol. Additionally, we expanded
the study towards amido-alcohols derived from
isobornylamine and -hydroxy acids (Fig. 1. III)
[5]. Thereby, we had the opportunity to investigate
how the difference in the camphor derived fragment
influences the activity. The latter shifted from
micromolar to nanomolar inhibitory concentrations
depending on the -hydroxy acid moiety.
Noteworthy, two of the structures possess very high
activity in combination with low levels of
cytotoxicity.
Fig. 1. Structures of SQ109 (I), 3-exo-aminoisoborneol
(II) and isobornylamine (III) based amido-alcohols.
Encouraged by these observations, we expanded
the approach to the synthesis of bornylamine
analogues where the asymmetric center neighboring
the nitrogen in the targeted structures is with the
opposite (S)-configuration compared to the iso-
bornylamine and 3-exo-aminoisoborneol structu-
res. This afforded the chance to investigate the role
of chirality on the structure-activity relationship.
© 2014 Bulgarian Academy of Sciences, Union of Chemists in Bulgaria
* To whom all correspondence should be sent:
E-mail: [email protected]
G. Stavrakov et al.: Synthesis and antimycobacterial activity of bornylamine derived amido-alcohols
28
Thus, we pursue the exploration of the camphane
based structures as novel class of anti-TB
compounds.
EXPERIMENTAL
General
Reagents were commercial grade and used
without further purification. Thin layer chroma-
tography (TLC) was performed on aluminum sheets
pre-coated with Merck Kieselgel 60 F254 0.25 mm
(Merck). Flash column chromatography was carried
out using Silica Gel 60 230-400 mesh (Fluka).
Commercially available solvents for reactions, TLC
and column chromatography were used after
distillation (and were dried when needed). Melting
points of the compounds were determined using
“Electrothermal” MEL-TEMP apparatus (uncorrec-
ted). Optical rotations ([α]D20
) were measured on
Perkin–Elmer 241 polarimeter. The NMR spectra
were recorded on a Bruker Avance II+ 600
spectrometer (600.13 MHz for 1H, 150.92 MHz for
13C NMR) in CDCl3 with TMS as internal standards
for chemical shifts (δ, ppm). 1H and
13C NMR data
are reported as follows: chemical shift, multiplicity
(s = singlet, d = doublet, t = triplet, q = quartet, br =
broad, m = multiplet), coupling constants (Hz),
integration, identification. The assignment of the 1H
and 13
C NMR spectra was made on the basis of
DEPT, COSY, HSQC, HMBC and NOESY
experiments. Elemental analyses were performed
by Microanalytical Service Laboratory of Faculty
of Pharmacy, Medical University of Sofia, using
Vario EL3 CHNS(O). Dimethyl sulfoxide (DMSO)
for testing of bioactivities was commercial
(spectroscopic grade) and was used without
distillation.
General Procedure for the Preparation of the
Amides (4a-c).
1-Hydroxybenzotriazole (HOBt) (1.1 equiv) and
the respective α-hydroxy acid (1 equiv) were
suspended in dichloromethane, and the mixture was
stirred for 5 min. Then, N-[3-(dimethylamino)-
propyl]-N-ethylcarbodiimide (EDC) (1.1 equiv)
was added, followed by bornylamine (1 equiv).
Stirring was continued at room temperature until
the starting material was completely consumed
(TLC). The mixture was quenched with water,
extracted with CH2Cl2, washed with 2M HCl, sat.
aq. NaHCO3 and brine. The organic phase was
dried over Na2SO4, and concentrated under
vacuum. The residue was purified by flash column
chromatography on silica gel.
(S)-2-Hydroxy-2-phenyl-N-((1R,2S,4R)-1,7,7-
trimethylbicyclo[2.2.1]heptan-2-yl)acetamide 4a.
Yield: 54%; waxy solid. [α]20
D = +41.3 (c 0.492,
CHCl3). 1H NMR 7.41-7.38 (m, 4H, arom.), 7.35-
7.33 (m, 1H, arom.), 5.99 (d, JH,H = 8.8 Hz, 1H,
NH), 5.01 (d, JH,H = 2.6 Hz, 1H, CHOH), 4.23-4.18
(m, 1H, 2-Hexo), 3.90 (d, JH,H = 3.2 Hz, 1H, OH),
2.33-2.28 (m, 1H, 3-Hexo), 1.73-1.68 (m, 1H, 5-
Hexo), 1.64 (t, JH,H = 4.5 Hz, 1H, 4-H), 1.27-1.21 (m,
1H, 5-Hendo), 1.10-1.05 (m, 2H, 6-Hexo, 6-Hendo),
0.91 (s, 3H, 8-H), 0.83 (s, 3H, 9-H), 0.76 (dd, JH,H =
13.4, 4.5 Hz, 1H, 3-Hendo), 0.69 (s, 3H, 10-H) ppm. 13
C NMR 172.16 (CO), 139.83 (1 arom. C), 128.87
(2 arom. CH), 128.62 (1 arom. CH), 126.73 (2
arom. CH), 73.98 (CHOH), 53.92 (2-C), 49.64 (1-
C), 48.09 (7-C), 44.77 (4-C), 37.33 (3-C), 28.21 (6-
C), 27.48 (5-C), 19.68 (9-C), 18.55 (8-C), 13.48 (10-
C) ppm. C18H22NO2 (287.40): calcd. C 75.22, H
8.77, N 4.87, found C 75.18, H 8.56, N 5.12.
(2S,3S)-2-Hydroxy-3-methyl-N-((1R,2S,4R)-
1,7,7-trimethylbicyclo[2.2.1]heptan-2-yl)pentan-
amide 4b. Yield: 60%; white crystals; m.p. 97-
101°C. [α]20
D = -20.5 (c 0.538, CHCl3). 1H NMR
6.44 (d, JH,H = 8.8 Hz, 1H, NH), 4.28-4.23 (m, 1H,
2-Hexo), 4.02 (dd, JH,H = 5.2, 3.3 Hz, 1H, CHOH),
2.96 (d, JH,H = 5.3 Hz, 1H, OH), 2.39-2.33 (m, 1H,
3-Hexo), 1.90-1.83 (m, 1H, CH3CH), 1.81-1.75 (m,
1H, 5-Hexo), 1.68 (t, JH,H = 4.5 Hz, 1H, 4-H), 1.46-
1.51 (m, 1H, 6-Hexo), 1.44-1.37 (m, 2H, 6-Hendo,
CH3CH2), 1.24-1.17 (m, 2H, 5-Hendo, CH3CH2),
1.01 (d, JH,H = 7.0 Hz, 3H, CH3CH), 0.96 (s, 3H, 8-
H), 0.90 (t, JH,H = 7.5 Hz, 3H, CH3CH2), 0.88 (s, 3H,
9-H), 0.82 (s, 3H, 10-H), 0.81 (dd, JH,H = 13.3, 4.5
Hz, 1H, 3-Hendo) ppm. 13
C NMR 173.08 (CO),
76.20 (CHOH), 53.42 (2-C), 49.44 (1-C), 48.13 (7-
C), 44.85 (4-C), 39.06 (CH3CH), 37.57 (3-C), 28.32
(5-C), 27.94 (6-C), 23.08 (CH3CH2), 19.78 (9-C),
18.61 (8-C), 15.63 (CH3CH), 13.67 (10-C), 11.91
(CH3CH2) ppm. C16H29NO2 (267.41): calcd. C
71.86, H 10.93, N 5.24, found C 71.93, H 10.64, N
5.58.
(S)-2-Hydroxy-3-methyl-N-((1R,2S,4R)-1,7,7-
trimethylbicyclo[2.2.1]heptan-2-yl)butanamide 4c.
Yield: 48%; white crystals; m.p. 88-91°C. [α]20
D =
-25.2 (c 0.445, CHCl3) 1H NMR 6.44 (d, JH,H = 6.4
Hz, 1H, NH), 4.26-4.22 (m, 1H, 2-Hexo), 3.97 (dd,
JH,H = 5.2, 3.1 Hz, 1H, CHOH), 3.05 (brs, 1H, OH),
2.38-2.35 (m, 1H, 3-Hendo), 2.15-2.10 (m, 1H,
(CH3)2CH), 1.80-1.74 (m, 1H, 5-Hexo), 1.67 (t, JH,H =
4.6 Hz, 1H, 4-H), 1.46-1.50 (m, 1H, 6-Hendo), 1.41-
1.36 (m, 1H, 6-Hexo), 1.20-1.16 (m, 1H, 5-Hendo),
1.03 (d, JH,H = 6.9 Hz, 3H, (CH3)2CH), 0.94 (s, 3H,
8-H), 0.87 (s, 3H, 9-H), 0.86 (d, JH,H = 6.9 Hz, 3H,

G. Stavrakov et al.: Synthesis and antimycobacterial activity of bornylamine derived amido-alcohols
29
(CH3)2CH), 0.81 (s, 3H, 10-H), 0.80 (dd, JH,H =
13.4, 4.6 Hz, 1H, 3-Hendo) ppm. 13
C NMR 173.22
(CO), 76.13 (CHOH), 53.46 (2-C), 49.47 (1-C),
48.18 (7-C), 44.89 (4-C), 37.63 (3-C), 32.18
((CH3)2CH), 28.36 (5-C), 28.00 (6-C), 19.82 (9-C),
19.23 ((CH3)2CH), 18.66 (8-C), 15.44 ((CH3)2CH),
13.72 (10-C) ppm. C15H27NO2 (253.38): calcd. C
71.10, H 10.74, N 5.53, found C 71.44, H 10.97, N
5.63.
Antimycobacterial activity
The antimycobacterial activity was determined
through the proportional method of Canetti towards
reference strain M. Tuberculosis H37Rv and multi-
drug resistant strain 43 (resistant to Rifampin and
Isoniazid), recovered from Bulgarian adult HIV-
negative pulmonary TB patient, who was perma-
nent resident of the country. This method, recom-
mended by the WHO, is the most commonly used
one worldwide for exploration of sensitivity/
resistance of tuberculosis strains towards chemothe-
rapeutics [6-10]. It allows precise determination of
the proportion of resistant mutants to a certain drug.
A sterile suspension/solution of each tested
compound was added to Löwenstein-Jensen egg
based medium before its coagulation (30 min at
85°C). Each compound was tested at five
concentrations – 5 mg/ml, 2 mg/ml, 0.2 mg/ml, 0.1
mg/ml and 0.05 mg/ml in DMSO. Tubes with
Löwenstein-Jensen medium (5 ml) containing
tested compounds and those without them
(controls) were inoculated with 0.2 ml suspension
of M. tuberculosis H37Rv (105 cells/ml) and
incubated for 45 days at 37°C. The ratio between
the number of colonies of M. tuberculosis grown in
medium containing compounds and the number of
colonies in control medium were calculated and
expressed as percentage of inhibition. The MIC is
defined as the minimum concentration of compo-
und required to inhibit bacterial growth completely
(0% growth). The MIC values are calculated and
given as M.
Cytotoxicity
The human embryonal kidney cell line 293T
cells were obtained from the German Collection of
Microorganisms and Cell Cultures. Cells were kept
in controlled environment e RPMI-1640 medium,
supplemented with 10% heat-inactivated fetal calf
serum and 2mM L-glutamine, at 37ºC in a
‘Heraeus’ incubator with 5% CO2 humidified
atmosphere.
The cytotoxicity of the newly synthesized
compounds was assessed using the MTT [3-(4,5-
dimethylthiazol-2-yl)-2,5-diphenyltetrazolium bro-
mide]-dye reduction assay as described by
Mossman with some modifications [11,12]. In
brief, exponentially growing cells were seeded in
96-well microplates (100 µl/well) at a density of
3.5 - 105 cell/ml and allowed to grow for 24 h prior
the exposure to the studied compounds. Stock
solutions of the tested compounds were freshly
prepared in DMSO and thereafter were subset to
serial dilutions with growth medium in order to
obtain the desired final concentrations. At the final
dilutions the solvent concentration never exceeded
0.5%. Cells were exposed to the tested agents for
72 h, whereby for each concentration a set of at
least 8 separate wells was used. After the exposure
period MTT solution (10 mg/ml in phosphate-
buffered saline) aliquots (100 µl/well) were added
to each well. The plates were further incubated for
4 h at 37ºC and the MTT-formazan crystals formed
were dissolved through addition of 110 ml of 5%
HCOOH in 2-propanol. The MTT-formazan ab-
sorption of the samples was measured by a
multimode microplate reader DTX 880 (Beckman
Coulter) at 580 nm. Cell survival fractions were
calculated as percentage of the untreated control.
The experi-mental data were fitted to sigmoidal
concentration-response curves and the correspond-
ding IC50 values (concentrations causing 50%
reduction of cellular survival vs the untreated
control) via non-linear regression (GraphPad Prizm
software for PC).
RESULTS AND DISCUSSION
Chemistry
Since peptides and peptide-related structures
have a wide variety of physiological and pharma-
cological actions, the concept of peptidomimetics
was aimed by the design of -amino acids derived
amido-alcohols. A series of chiral -hydroxy acids
as starting building blocks was prepared from their
corresponding natural amino acid analogues. Ingold
first developed the transformation of L-phenyl-
alanine to its -hydroxy acid analogue with reten-
tion of configuration [13]. The reaction proceeded
via initial deamination followed by nucleophilic
attack of the neighbouring carboxyl group to
heterocyclic intermediate and final nucleophilic
attack of water. The product had the same
configuration due to two consecutive Walden
inversions. Applying the procedure to isoleucine 1a

G. Stavrakov et al.: Synthesis and antimycobacterial activity of bornylamine derived amido-alcohols
30
and valine 1b afforded the corresponding -hyd-
roxy analogues 2a and 2b (Scheme 1).
Scheme 1. Synthesis of -hydroxy acids.
Readily available bornylamine 3 was selected as
the camphane starting compound [14]. The targeted
structures were aimed by simple and effective
synthetic transformations (Scheme 2).
Scheme 2. Synthesis of bornylamine based amido-
alcohols.
The amide linkage between the -hydroxy acids
and bornylamine 3 was accomplished by proce-
dures developed for peptide synthesis. The reaction
was optimized for the commercially available
mandelic acid 5 in the presence of N-(3-dimethyl-
aminopropyl)-N′-ethylcarbodiimide hydrochloride
(EDCI) and 1-hydroxybenzotriazole hydrate
(HOBT) as coupling reagents to yield 4a.
Following the same protocol for -hydroxy acids
2a-b we synthesized the corresponding amido-
alcohols 4b-c (Scheme 2). The products were
obtained in good yields and excellent purity after
flash column chromatography.
All compounds were identified by elementary
analysis, 1H NMR and
13C NMR. The spectral
analyses were in accordance with the assigned
structures.
Antimycobacterial activity
The synthesized compounds were evaluated for
their in vitro activity against M. tuberculosis
H37Rv using the method of Canetti (Table 1). The
mandelic acid derived amido-alcohol 4a exhibited
activity against M. tuberculosis H37Rv with MIC
of 6.96 M, which is comparable with the one of
the reference compound ethambutol. In the case of
the isoleucine derived amido-alcohol 4b the activity
dropped to MIC of 18.70 M. The best result was
observed with the valine derived amido-alcohol 4c,
which exhibited MIC of 0.20 M (Table 1).
Interestingly, a slight variation of the alkyl side
chain, a switch of the isobutyl group to isopropyl,
greatly increased the activity.
No correlation could be assigned between the
configuration of the stereogenic center at the
nitrogen and the activity. In both cases: compounds
with (R)-configuration derived from 3-exo-
aminoisoborneol [4] and isobornylamine [5], and
compounds with (S)-configuration derived from
bornylamine; we detected either nanomolar or
micromolar activities. Therefore, SAR dependence
on the chirality in camphane based structures
should be handled with care.
Cytotoxicity
The cytotoxicity of the presented compounds
was assessed against the human embryonal kidney
cell line 293T in order to examine the selectivity of
the antiproliferative effects. Evident from the IC50
values (Table 1), the compounds were characterized
with low 4a to moderate 4b, 4c cytotoxicity against
the human cells. The results are in favour of
structure 4c. The latter exhibits high antimyco-
bacterial activity and moderate cytotoxicity, which
is represented by its excellent selectivity index:
217.15. Considering that compounds 4b and 4c are
practically equi-toxic against human cells while
displaying prominent selective inhibition of H37RV
it could be concluded that they modulate a distinct
target peculiar for mycobacteria.

G. Stavrakov et al.: Synthesis and antimycobacterial activity of bornylamine derived amido-alcohols
31
Table 1. In vitro screening data for antimycobacterial
activity and cytotoxicity of the synthesized compounds.
Compound Anti-MTB
a
MIC (M)
Cytotoxicityb
IC50 (M)
SIc
IC50/MIC
4a 6.96 124.40 17.87
4b 18.70 43.86 2.34
4c 0.20 43.43 217.15
ETM.2HCld
7.20 - - aAntimycobacterial activity towards reference strain of
Mycobacterium tuberculosis H37Rv; bIn vitro cytotoxicity
towards human embryonal kidney cell line 293T; cSelectivity
index; d
EMB.2HCl – ethambutol dihydrochloride (reference
compound).
The analogy between the bulky lipophilic
camphane fragment and the adamantyl fragment in
the molecule of SQ109, a drug currently in clinical
trials for the treatment of tuberculosis, made us
speculate that they share the same target [3].
Further docking studies are due in a short time.
CONCLUSION
In summary, three new amido-alcohols were
synthesized by condensation of bornylamine with
-hydroxy acids. The compounds were screened
for their antimycobacterial activity against M.
tuberculosis H37Rv. The activity shifts from
micromolar to nanomolar inhibitory concentrations
depending on the -hydroxy acid moiety. The
valine derived compound shows 25 times higher
activity than the classical anti-TB drug ethambutol
and moderate level of cytotoxic activity against a
human embryonal kidney cell line 293T. The
mandelic acid derived amido-alcohol demonstrates
activity comparable with ethambutol and low level
of cytotoxicity. Further evaluation of camphane
based structures as potential anti-TB agents is in
progress and will be reported in due lines.
Acknowledgements: Financial support of National
Science Fund, Bulgaria (DMU 02/3 – 2009) is gra-
tefully acknowledged.
REFERENCES
1. World Health Organization, Global tuberculosis
report 2013, http://www.who.int/tb/publications/
global_ report/en/
2. L. Jia, J. E. Tomaszewski, C. Hanrahan, L. Coward,
P. Noker, G. Gorman, B. Nikonenko, M.
Protopopova, Br. J. Pharmacol., 144, 80 (2005).
3. K. Tahlan, R. Wilson, D. B. Kastrinsky, K. Arora, V.
Nair, E. Fischer, S. W. Barnes, J. R. Walker, D.
Alland, C. E. Barry 3rd, H.I. Boshoff, Antimicrob.
Agents Chemother., 56, 1797 (2012).
4. G. Stavrakov, V. Valcheva, I. Philipova, I.
Doytchinova, Eur. J. Med. Chem., 70, 372 (2013).
5. G. Stavrakov, I. Philipova, V. Valcheva, G.
Momekov, Bioorg. Med. Chem. Lett., 24, 165 (2014).
6. G. Canetti, N. Rist, J. Grosset, Rev. Tuberc.
Pneumol., 27, 217 (1963).
7. G. Canetti, S. Froman, J. Grosset, P. Hauduroy, M.
Langerova, H. T. Mahler, G. Meissner, D. A.
Mitchison, L. Sula, Bull. WHO, 29, 565 (1963).
8. G. Canetti, W. Fox, A. Khomenko, H. T. Mahler, N.
K. Menon, D. A. Mitchinson, N. Rist, N. A. Smelev,
Bull. Org. Mond. Sante, 41, 21 (1969).
9. L. Heifets, Conventional methods for antimicrobial
susceptibility testing of Mycobacterium tuberculosis,
in: I. Bastian, F. Portaels (Eds.), Multidrug-Resistant
Tuberculosis, Kluwer Academic Publishers,
Dordrecht, The Netherlands, 2000.
10. CellTiter 96 Non-Radioactive Cell Proliferation
Assay, Technical Bulletin #TB112, Promega
Corporation USA, Revised 12/99.
11. T. J. Mosmann, Immunol. Meth., 65, 55 (1983).
12. S. M. Konstantinov, H. Eibl, M. R. Berger, Br. J.
Haematol., 107, 365 (1999).
13. P. Brewster, F. Hiron, E. D. Hughes, C. K. Ingold, P.
A. D. S. Rao, Nature, 166, 179 (1950).
14. R. M. Carman, K. L. Greenfield, Aust. J. Chem., 37,
1785 (1984).

G. Stavrakov et al.: Synthesis and antimycobacterial activity of bornylamine derived amido-alcohols
32
СИНТЕЗ И АНТИМИКОБАКТЕРИАЛНА АКТИВНОСТ НА АМИДОАЛКОХОЛИ
ПРОИЗВОДНИ НА БОРНИЛАМИН
Г. Ставраков1*
, И. Филипова2, В. Вълчева
3, Г. Момеков
1
1Фармацевтичен Факултет, Медицински Университет – София, ул. Дунав 2, 1000 София, България
2Институт по Органична химия с Център по Фитохимия, Българска Академия на Науките, ул. Акад. Г. Бончев,
бл. 9, 1113 София, България 3Институт по Микробиология Стефан Ангелов, ул. Акад. Г. Бончев, бл.26, 1113 София, България
Постъпила на 16 април 2014 г.; Коригирана на 30 май 2014 г.
(Резюме)
Синтезирани са три нови амидо-алкохоли с камфанов скелет. Природни амино-киселини бяха
трансформирани в техните α-хидрокси аналози със запазване на конфигурацията и в последствие кондензирани
с борниламин. Веществата бяха изследвани за тяхната in vitro активност срещу щама Mycobacterium tuberculosis
H37Rv. Активността варира от микромоларни до наномоларни инхибиращи концентрации в зависимост от α-
хидрокси киселинния остатък. Валиновото производно показва активност 25 пъти по-висока от референта
етамбутол. Амидоалкохолите с камфанов скелет се проявяват като обещаващ нов клас антимикобактериални
агенти.

33
Bulgarian Chemical Communications, Volume 46, Special Issue A (pp. 33 – 38) 2014
Enantioselective addition of diethylzinc to ferrocene carbaldehyde - reaction outcome
by using natural compound based catalysts
K. Dikova, M. Kamenova-Nacheva, K. Kostova, V. Dimitrov*
Institute of Organic Chemistry with Centre of Phytochemistry, Bulgarian Academy of Sciences, Acad. G. Bonchev str.,
bl. 9, 1113 Sofia, Bulgaria
Received June 19, 2014; Revised July 15, 2014
Dedicated to Acad. Dimiter Ivanov on the occasion of his 120th
birth anniversary
The efficiency of the alkaloids quinine, cinchonine, cinchonidine and ephedrine, the aminoalcohols prolinol, and
alaninol, as well as the aminoacids proline, and phenylalanine as catalysts for the enantioselective addition of
diethylzinc to ferrocene carbaldehyde and benzaldehyde has been studied. The addition reactions proceeded with
acceptable yields and low to moderate enantioselectivities. The side products ferrocenyl methanol and 1-ferrocenyl-1-
propanone, observed during the additions to ferrocene carbaldehyde were isolated and characterized.
Key words: diethylzinc, addition to aldehydes, natural products
INTRODUCTION
The synthesis of chiral aminoalcohols, first
reported by Oguni and Omi [1-3], to catalyze
enantioselectively the addition of diorganozinc
compounds to aldehydes, still attracts considerable
interest due to the utility of the secondary alcohols
formed by this reaction [1-7]. Over the past decades
a large number of aminoalcohols has been
synthesized and tested as ligands [1-9]. One of the
most potent aminoalcohols used as a catalyst is the
dimethylamino-isoborneol investigated by Noyori
[10-16]. For the synthesis of aminoalcohols natural
sources of chirality (e.g. terpenoids, aminoacids,
alkaloids) are generally used. In many cases
catalysts based on naturally occurring amino-
alcohols have been applied as such or amino-
alcohols have been obtained after minor
modifications. The cinchona alkaloids quinine,
quinidine, cinchonine and cinchonidine have been
used directly [17,18] or after simple chemical
transformations [19,20] as efficient catalyst for
enantioselective addition of diethylzinc to aldehy-
des. In similar manner ephedrine and norephedrine
derivatives have been obtained and used in catalytic
diethylzinc addition reactions [21-25]. On the other
hand various strategies have been developed for the
synthesis of structurally diverse aminoalcohols
which are suitable ligands for different catalytic
applications [4-9]. Among them are the 1,2-
substituted ferrocenyl aminoalcohols of type C
(Fig. 1; E = -CH(R1)OH) and other derivatives that
possess chirality plane and have proven to be very
useful for asymmetric catalysis [26-29].
Fig. 1. Synthesis of chiral ferrocene derivatives by using
the enantioselective addition of diethylzinc to ferrocene
carbaldehyde as key transformation step.
Key compounds for synthesis of planar chiral
1,2-disubstituted ferrocenes are the chiral alkyl- (or
aryl-) ferrocenyl methanols obtained either by
asymmetric reduction of alkyl- (or aryl-) ferrocenyl
ketones [26-29] or through enantioselective addi-
tion of dialkylzinc compounds to ferrocene carbal-
dehyde (Fig. 1). After the enantioselective addition
of e.g. diethylzinc (2) to ferrocene carbaldehyde
(1), catalyzed by suitable chiral ligand, the resulting
1-ferrocenyl-1-propanol (3) can be easily trans-
© 2014 Bulgarian Academy of Sciences, Union of Chemists in Bulgaria
* To whom all correspondence should be sent:
E-mail: [email protected]

K. Dikova et al.: Enantioselective addition of diethylzinc to ferrocene carbaldehyde - reaction outcome by using natural compound…
34
formed to dialkylamino derivative A with retention
of the configuration. Compounds of type A undergo
highly diastereoselective ortho-lithiation (up to
96% de) with butyllithium reagents due to the
directed ortho-metallation caused by the dialkyl-
amino group attached to the stereogenic center. The
reaction of the lithiated ferrocene B with suitable
electrophiles (e.g. aldehydes, ketones) leads to the
formation of planar chiral amino-alcohols or other
aminoalkylferrocenyl derivatives of type C bearing
various functionalities [26-29].
The aim of the present work is to evaluate the
ability of some alkaloids (quinine, cinchonine, cin-
chonidine, ephedrine), aminoalcohols obtained
from aminoacids (prolinol, alaninol) and amino-
acids (proline, phenylalanine), (see Fig. 2), to cata-
lyze enantioselectively the addition of diethylzinc
to ferrocene carbaldehyde.
Fig. 2. Chiral natural compounds and derivatives applied
as catalysts for enantioselective addition of diethylzinc
to ferrocene carbaldehyde.
EXPERIMENTAL
General
All reactions were carried out in flame-dried
Schlenk flasks under argon atmosphere. Hexane
was distilled over Na[Et4Al]. Thin layer chroma-
tography (TLC) was performed on aluminum sheets
pre-coated with silica gel 60 F254 (Merck). Flash
column chromatography was carried out using
silica gel 60 (230-400 mesh, Merck). Optical rota-
tions ([α]20
D ) were measured on a Perkin Elmer 241
polarimeter. The NMR spectra were recorded in
CDCl3 on a Bruker DRX 250 (250.13 MHz for 1H
NMR, 62.9 MHz for 13
C NMR) spectrometer with
TMS as the internal standard for chemical shifts (,
ppm). 1H and
13C NMR data are reported as
follows: chemical shift, multiplicity (s = singlet, d =
doublet, t = triplet, q = quartet, br = broad, m =
multiplet), coupling constants (Hz), integration, and
identification. EI-MS (70eV) were recorded on a
Hewlett Packard 6890/5973 and reported as
fragmentation in m/z with relative intensities (%) in
parentheses.
General procedure for enantioselective addition of
diethylzinc to carbaldehydes
To a solution of the corresponding ligand 6-13
(3 mol %) in hexane or toluene (20 ml) Et2Zn (2.1
mmol, 1M solution in hexane) was added dropwise
at 0°C under Ar atmosphere. The mixture was
stirred for 30 min at 0°C and then the corres-
ponding aldehyde (1.40 mmol) was added at -20°C.
The reaction mixture was stirred at 20°C (in 2 cases
at 60°C) and monitored by TLC (petroleum
ether/Et2O = 1:1) until the aldehyde was consumed
or no further consumption was observed. The
mixture was quenched (aq. NH4Cl), extracted with
Et2O, and dried (Na2SO4). After evaporation of the
solvent, the crude product was purified by column
chromatography (petroleum ether/Et2O = 5:1).
General procedure for enantioselective addition
of diethylzinc to carbaldehydes in the presence of
Ti(O-iPr)4
To a suspension of the ligands 6, 10 and 12
(0.57 mmol, 20 mol %) in toluene (8 ml), Ti(O-
iPr)4 (0.58 mmol) was added at 20°C under Ar
atmosphere. The reaction mixture was stirred at
20°C for 1.5 h and then benzaldehyde (14) (2.83
mmol) and Ti(O-iPr)4 (3.40 mmol) were added.
After 1 h the mixture was cooled to -20°C and
Et2Zn (5.66 mmol, 1M solution in hexane) was
added. It was stirred at -20°C until completion of
the reaction (monitored by TLC). The mixture was
quenched (aq. NH4Cl), filtered through a pad of
Celite, extracted with Et2O, and dried (Na2SO4).
After evaporation of the solvent, the crude product
was purified by column chromatography (petro-
leum ether/Et2O = 10:1).
Data of 1-ferrocenylpropan-1-ol (3): 1H NMR:
4.27-4.14 (m, 10H, C5H5, C5H4, CH), 1.99 (br. s,
1H, OH), 1.76-1.61 (m, 2H, CH2), 0.95 (t, J = 7.5

K. Dikova et al.: Enantioselective addition of diethylzinc to ferrocene carbaldehyde - reaction outcome by using natural compound…
35
Hz, 3H, CH3). 13
C NMR: 94.20 (s, C5H4), 71.00 (d,
C5H4), 68.18 (5d, C5H5), 67.78 (d, C5H4), 67.63 (d,
C5H4), 67.22 (d, C5H4), 65.12 (d, CH-OH), 30.95 (t,
CH2), 10.33 (q, CH3). (Data obtained correspond to
the literature [30]).
Data of ferrocenyl methanol (4): 1H NMR: 4.32
(s, 2H, CH2), 4.23 (s, 2H, C5H4), 4.17 (s, 7H, C5H4,
C5H5), 1.74 (br. s, 1H, OH). 13
C NMR: 88.25 (s,
C5H4), 68.22 (7d, C5H4, C5H5), 67.85 (2d, C5H4),
60.69 (t, CH2-OH). MS (EI) m/z (rel. int.) = 216
(74, M+), 138 (100), 121 (10), 73 (19). (Data
obtained correspond to the literature [31-35]).
Data of 1-ferrocenyl-1-propanone (5): 1H NMR:
4.79 (s, 2H, C5H4), 4.49 (s, 2H, C5H4), 4.19 (s, 5H,
C5H5), 2.74 (q, J = 7.4 Hz, 2H, CH2), 1.20 (t, J =
7.4 Hz, 3H, CH3). 13
C NMR: 205.09 (s, C=O),
78.90 (s, C5H4), 72.05 (2d, C5H4), 69.69 (5d, C5H5),
69.24 (2d, C5H4), 32.73 (t, CH2), 8.50 (q, CH3). MS
(EI) m/z (rel. int.) = 242 (23, M+), 213 (100, [M-
CH2CH3]+), 185 (62), 149 (35), 129 (81), 121 (47),
69 (62), 57 (88), 43 (97). (Data obtained correspond
to the literature [36-40]).
Data of 1-phenylpropan-1-ol (15): 1H NMR:
7.33 (m, 5H, C6H5), 4.57 (t, J = 6.6, 1H, CH), 2.22
(br. s, 1H, OH), 1.78 (m, 2H, CH2), 0.91 (t, J = 7.5
Hz, 3H, CH3).
RESULTS AND DISCUSSION
The addition of diethylzinc (2) to ferrocene
carbaldehyde (1) was performed in most cases in
hexane according standard conditions [2,4,10,41-
46] by using 3 mol % of the corresponding chiral
compounds 6-13 as ligands (Scheme 1). In general
prolonged reaction times (up to 190 h) were
necessary for the formation of the desired product
and the conversion of the aldehyde 1 was not
complete in several cases. It was, however, remar-
kable to observe the formation of significant
amounts of ferrocenyl methanol (4) and 1-ferroce-
nyl-1-propanone (5) as side products. The forma-
tion of 4 and 5 could be explained with the
assumption [47] that redox Cannizaro like reaction
between 1 and 3 occurs leading to oxidation of 3 to
the keton 5 and reduction of 1 to the alcohol 4. It is
noteworthy to mention that in a paper of Noyori
[11] the formation of 1-phenyl-1-propanone has
been described beside the 1-phenyl-1-propanol
formation in the course of the addition of diethyl
zinc to benzaldehyde, however without any
discussion. The primary alcohol 4 could also be a
result of reduction of the aldehyde 1 through β-
hydrogen transfer from the ethyl-group of the
diethylzinc reagent.
The addition reactions catalyzed by ligands 6-13
provided acceptable yields of 1-ferrocenylpropan-
1-ol (3). The ratios of unreacted 1, product 3 and
side-products 4, and 5, determined by NMR
experiments and the quantities of isolated products
are introduced in Table 1. Considering the
composition of the compounds observed after
performing the reactions it can be concluded that
the conversion of the starting aldehyde 1 is very
good despite of the prolonged reaction time.
Enhancement of the reaction temperature to 60°C
shortened significantly the reaction time (Table. 1,
entry 1 vs 2 and 7 vs 8), however the enantio-
selectivity was lowered.
The best enantioselectivities were observed with
quinine (6) and prolinol (10), however the values
were significantly lower in comparison with some
literature data [19,20,48,49]. The insufficient
degree of enantioselectivity in case of ligands 7, 8,
9 and 11 was also surprising if compared with
reported results [17,18,50,51]. The enantioselec-
tivity realized with proline (entry 10) was low and
it could not be enhanced attempting to block the
carboxy group through reaction with n-BuLi (entry
11) prior to performing the catalytic addition of
diethylzinc. In the case of phenylalanine (entry 12)
there is no enantioselectivity at all.
For the purpose of comparison ligands 6, 10 and
12 furnishing promising enantioselectivities were
tested in the addition reaction of diethylzinc to
benzaldehyde (Table 2). The reaction catalyzed by
ligand 6 provided very good yields whereas in all
other cases the yields were moderate. The observed
prolonged reaction times could be shortened by
applying titanium tetraisopropoxid (Ti(O-iPr)4)
Scheme 1. Enantioselective addition of diethylzinc to ferrocene carbaldehyde.

K. Dikova et al.: Enantioselective addition of diethylzinc to ferrocene carbaldehyde - reaction outcome by using natural compound…
36
Table 1. Enantioselective addition of Et2Zn to ferrocene carbaldehyde (1) catalyzed by chiral ligands (L*) 6-13.
Entry L* Reaction
Temp.
Reaction
Time [h]
Composition [%] ee [%]
a
1 3 4 5
1 6 20°C 101 28 61 7 1 27 (S)
2 6 60°Cb 7 - 72 9 9 19 (R)
3 7 20°C 164 16 50 7 4 0
4 8 20°C 183 4 72 7 8 9 (S)
5 9 20°C 67 6 66 7 4 1 (R)
6 10 20°C 191 2 53 9 2 34 (R)
7 10 20°Cb 168 8 52 7 traces 50 (R)
8 10 60°Cb 24 7 51 17 7 42 (R)
9 11 20°C 138 14 27 10 5 5 (S)
10 12 20°C 193 10 60 7 2 18 (S)
11 12/n-BuLic 20°C 193 4 67 10 6 11 (S)
12 13 20°C 191 5 8 10 10 0
aDetermined by polarimetry based on the maximum values for the specific rotations of R-(-)-3; [α]20
D = -57.5 (c 1.0, benzene) for
96% ee [30]; bThe reaction is carried out in toluene; cButyllithium was added aiming to block the carboxylate function of ligand 12.
as promoter, however without affecting the
enantioselectivity (Table 2, entry 1 vs. 2). Ligand
10 provided comparable results compared with
those obtained with aldehyde 1.
Table 2. Enantioselective addition of Et2Zn to
benzaldehyde (14) catalyzed by chiral ligands (L*) 6, 10
and 12.
Entry L* Reaction
Time [h]
Yield of
15 [%] ee [%]a
1 6 193 71 40 (R)
2 6/Ti(O-iPr)4 4 77 34 (R)
3 10 193 24 38 (R)
4 10/Ti(O-iPr)4 193 47 0
5 12/Ti(O-iPr)4 114 51 0 aDetermined by polarimetry based on the maximum values for
the specific rotations of (S)-(-)-15 ([α]20
D = -47 (c 2.2, hexane)
for 98% ee [52]).
CONCLUSION
Comparative study has been performed to
evaluate the efficiency of the alkaloids quinine,
cinchonine, cinchonidine, ephedrine, the amino-
alcohols prolinol, and alaninol, and the aminoacids
proline, and phenylalanine as catalysts for the
enantioselective addition of diethylzinc to ferrocene
carbaldehyde. The important intermediate 1-ferro-
cenyl-1-propanol has been obtained in moderate
enantioselectivity besides ferrocenyl methanol and
1-ferrocenyl-1-propanone as side products. The
efficiency of the natural products studied as
enantioselective catalysts was not sufficient for
additions of diethylzinc to ferrocene carbaldehyde
and also to benzaldehyde.
Acknowledgements: Financial support of National
Science Fund, Bulgaria (DID02/33/2009 and
DRNF-02/13/2009) is gratefully acknowledged.
REFERENCES
1. N. Oguni, T. Omi, Tetrahedron Lett., 25, 2823
(1984).
2. R. Noyori, Angew. Chem., Int. Ed., 30, 49 (1991).
3. K. Soai, S. Niwa, Chem. Rev., 92, 833 (1992).
4. L. Pu, H. H. L. Yu, Chem. Rev., 101, 757 (2001).
5. R. Noyori, in: Asymmetric Catalysis in Organic
Chemistry; John Wiley and Sons: New York, 1994.
6. Catalytic Asymmetric Synthesis, I. Ojima (Ed.),
Wiley-VCH: New York, 2000.
7. New Frontiers in Asymmetric Catalysis, K. Mikami,
M. Lautens (Eds.), Wiley-Interscience: Hoboken,
2007.
8. R. G. Arrays, J. Adrio, J. C. Carretero, Angew.
Chem., Int. Ed., 45, 7674 (2006).
9. V. Dimitrov, K. Kostova, Lett. Org. Chem., 3, 176
(2006).
10. M. Kitamura, S. Suga, K. Kawai, R. Noyori, J. Am.
Chem. Soc., 108, 6071 (1986).
11. M. Kitamura, S. Okada, S. Suga, R. Noyori, J. Am.
Chem. Soc., 111, 4028 (1989).
12. R. Noyori, S. Suga, K. Kawai, S. Okada, M.
Kitamura, N. Oguni, M. Hayashi, T. Kaneko, Y.
Matsuda, J. Organomet. Chem., 382, 19 (1990).
13. M. Kitamura, S. Suga, M. Niwa, R. Noyori, J. Am.
Chem. Soc., 117, 4832 (1995).
14. M. Yamakawa, R. Noyori, J. Am. Chem. Soc., 117,
6327 (1995).

K. Dikova et al.: Enantioselective addition of diethylzinc to ferrocene carbaldehyde - reaction outcome by using natural compound…
37
15. M. Yamakawa, R. Noyori, Organometallics, 18, 128
(1999).
16. R. Noyori, Angew. Chem., Int. Ed., 41, 2008 (2002).
17. A. Smaardijk, H. Wynberg, J. Org. Chem., 52, 135
(1987).
18. R. R. Deshmukh, D. H. Ryu, C. E. Song, in:
Cinchona Alkaloids in Synthesis and Catalysis, John
Wiley and Sons, 2009, pp. 73-104.
19. B. Shen, H. Huang, G. Bian, H. Zong, L. Song,
Chirality, 25, 561 (2013).
20. V. Casarotto, Z. Li, J. Boucau, Y. M. Lin,
Tetrahedron Lett., 48, 5561 (2007).
21. S. Bräse, F. Lauterwasser, R. E. Ziegert, Adv. Synth.
Catal., 345, 869 (2003).
22. M. W. Paixao, M. de Godoi, C. R. B. Rhoden, B.
Westermann, L. A. Wessjohann, D. S. Lüdtke, A. L.
Braga, J. Mol. Catal. A - Chem., 261, 120 (2007).
23. A. Mastalir, Z. Király, Catal. Commun., 9, 1404
(2008).
24. S. Abramson, M. Laspéras, D. Brunel, Tetrahedron:
Asymmetry, 13, 357 (2002).
25. M. P. Sibi, L. M. Stanley, Tetrahedron: Asymmetry,
15, 3353 (2004).
26. H.-U. Blaser, W. Chen, F. Camponovo, A. Togni, in:
Ferrocenes, P. Štěpnička (Ed.), John Wiley & Sons
Ltd, UK, 2008, Chapter 6, p. 205.
27. T. Hayashi, in: Ferrocenes, A. Togni, T. Hayashi
(Eds.), VCH, Weinheim, Germany, 1995, p. 105.
28. A. Togni, in: Metallocenes, A. Togni, R. L.
Halterman (Eds.), Wiley-VCH GmbH, Weinheim,
Germany, 1998, p. 685.
29. M. Perseghini, A. Togni, in: Science of Synthesis
(Houben-Weyl), Vol. 1, M. Lautens (Ed.), Thieme,
Stuttgart, Germany, 2001, p. 889.
30. Y. Matsumoto, A. Ohno, S. Lu, T. Hayashi, N.
Oguni, M. Hayashi, Tetrahedron: Asymmetry, 4,
1763 (1993).
31. C. Imrie, L. Cook, D. C. Levendis, J. Organomet.
Chem., 637-639, 266 (2001).
32. W. L. Davis, R. F. Shago, E. H. G. Langner, J. C.
Swarts, Polyhedron, 24, 1611 (2005).
33. D. Kalita, M. Morisue, Y. Kobuke, New J. Chem.,
30, 77 (2006).
34. M. Merabet-Khellasi, L. Aribi-Zouioueche, O. Riant,
Tetrahedron: Asymmetry, 20, 1371 (2009).
35. M. I. Ikhile, M. D. Bala, V. O. Nyamoria, J. C. Ngila,
Appl. Organomet. Chem., 27, 98 (2013).
36. V. A. Darin, A. F. Neto, J. Miller, M. M. de Freitas
Afonso, H. C. Fonsatti, Á. D. L. Borges, J. Prakt.
Chem., 341, 588 (1999).
37. W. G. Jary, A.-K. Mahler, T. Purkathofer, J.
Baumgartner, J. Organomet. Chem., 629, 208 (2001).
38. K. Tappe, P. Knochel, Tetrahedron: Asymmetry, 15,
91 (2004).
39. D. Plażuk and J. Zakrzewski, Synth. Commun., 34, 99
(2004).
40. V. H. Purecha, N. S. Nandurkar, B. M. Bhanage, J.
M. Nagarkar, J. Chem. Res., 426 (2007).
41. M. Genov, V. Dimitrov, V. Ivanova, Tetrahedron:
Asymmetry, 8, 3703 (1997).
42. W. A. Nugent, Chem. Commun., 1369 (1999).
43. I. Philipova, V. Dimitrov, S. Simova, Tetrahedron:
Asymmetry, 10, 1381 (1999).
44. S. Panev, A. Linden, V. Dimitrov, Tetrahedron:
Asymmetry, 12, 1313 (2001).
45. N. Garcia-Delgado, M. Fontes, M. A. Pericas, A.
Riera, X. Verdaguer, Tetrahedron: Asymmetry, 15,
2085 (2004).
46. V. Dimitrov, M. Kamenova-Nacheva, J. Univ. Chem.
Technol. Metall., 44, 317 (2009).
47. L. Bonetto, R. Fornasier, U. Tonellato, Gazz. Chim.
Ital., 125, 63 (1995).
48. P. Hodge, R. J. Kell, J. Ma, H. Morris, Aust. J.
Chem., 52, 1041 (1999).
49. C. L. Gibson, Tetrahedron: Asymmetry, 10, 1551
(1999).
50. E. J. Corey, F. J. Hannon, Tetrahedron Lett., 28,
5233 (1987).
51. P. A. Chaloner, S. A. R. Perera, Tetrahedron Lett.,
28, 3013 (1987).
52. www.sigma-aldrich.com

K. Dikova et al.: Enantioselective addition of diethylzinc to ferrocene carbaldehyde - reaction outcome by using natural compound…
38
ЕНАНТИОСЕЛЕКТИВНО ПРИСЪЕДИНЯВАНЕ НА ДИЕТИЛЦИНК КЪМ
ФЕРОЦЕНКАРБАЛДЕХИД – РЕЗУЛТАТИ OТ ИЗПОЛЗВАНЕ НА ПРИРОДНИ
СЪЕДИНЕНИЯ КАТО КАТАЛИЗАТОРИ
К. Дикова, М. Каменова-Начева, К. Костова, В. Димитров*
Институт по Органична химия с Център по Фитохимия, Българска Академия на Науките, ул. Акад. Г. Бончев,
бл. 9, 1113 София, България
Постъпила на 19 юни 2014 г.; Коригирана на 15 юли 2014 г.
(Резюме)
Изучена е ефективността на алкалоидите хинин, цинхонин, цинхонидин и ефедрин, на аминоалкохолите
пролинол и аланинол, както и на аминокиселините пролин и фенилаланин за енантиоселективно
присъединяване на диетилцинк към фероценкарбалдехид и бензалдехид. Присъединителните реакции протичат
с приемливи добиви и ниски до умерени енантиоселективности. При присъединителните реакции към
фероценкарбалдехид се наблюдават страничните продукти фероценил метанол и 1-фероценил-1-пропанон,
които са изолирани и охарактеризирани.

39
Bulgarian Chemical Communications, Volume 46, Special Issue A (pp. 39– 46) 2014
Bifunctionalized allenes. Part XIV. A convenient and efficient regioselective
synthesis of phosphorylated -hydroxyallenes with protected and unprotected
hydroxy group
I. E. Ismailov, I. K. Ivanov, V. C. Christov*
Department of Organic Chemistry & Technology, Faculty of Natural Sciences, Konstantin Preslavsky University of
Shumen, 115 Universitetska str., 9712 Shumen, Bulgaria
Received May 09, 2014; Revised June 24, 2014
Dedicated to Acad. Dimiter Ivanov on the occasion of his 120th
birth anniversary
A convenient and efficient regioselective synthesis of phosphorylated -hydroxyallenes by an atom economical
[2,3]-sigmatropic rearrangement of the mediated propargyl phosphite or phosphinite which can be readily prepared via
reaction of protected 5-methyl-dec-6-yn-5-ol with dimethyl chlorophosphite or chlorodiphenyl phosphine respectively
in the presence of a base is described.
Key words: synthesis, protection of hydroxy group, [2,3]-sigmatropic rearrangement, phosphorylated -hydroxyallenes
INTRODUCTION
In the past three decades, synthesis and use of
allene derivatives have been expanded in
preparative organic chemistry. The presence of two
electron clouds separated by a single sp
hybridized carbon atom is the identifying structural
characteristic of allenes, and it is this unique
structural and electronic arrangement that is
responsible for the extraordinary reactivity profile
displayed by allenic compounds [1-8].
Functionalized allenes have attracted a growing
attention because of their versatility as key building
blocks for organic synthesis. The synthetic potential
of functionalized allenes has been explored
extensively in recent years, and this has led to the
development of novel methods for the construction
of a variety of functionalized heterocyclic and
carbocyclic systems [9-13].
A plethora of methods exists for the construction
of hydroxyallenes, including prototropic rearrange-
ment of propargylic alcohols [14,15], metal-cataly-
zed nucleophilic addition of propargylic derivatives
to aldehydes [16-22], Cu(I)-catalyzed reaction of
propargylic chlorides with Grignard reagents
[23,24], metal-catalyzed reaction of propargylic
oxiranes with organometallic compounds [25-29]
and ketones [30,31], reduction of alcohols, ethers,
oxiranes etc. with aluminium reagents [32-34],
Pd(0)-catalyzed reaction of cyclic carbonates with
acetylenic compounds [35,36], SN2’[37,38] and AN
[39-41] reactions of metalled alkoxy-allenes with
oxiranes and ketones [5], and by other methods
[42].
There are methods [43-46] for the synthesis of
phosphorus-containing allenes (phosphonates [47-
50], phosphinates [51,52], and phosphine oxides
[53-58]) including reactions of -alkynols with
chloride-containing derivatives of phosphorus acids
followed by [2,3]-sigmatropic rearrangement. Seve-
ral diethylphosphono-substituted -allenic alcohols
were prepared by Brel [59,60] directly from
alcohols by Horner-Mark rearrangement of unstable
propargylic phosphites.
Since its discovery five decades ago [51,52], the
reversible interconversion of propargylic phos-
phites, phosphonites and phosphinites to allenyl
phosphonates, phosphinates and phosphine oxides
has become one of the most studied and synthe-
tically useful [2,3]-sigmatropic rearrangement. Nu-
merous synthetic applications of the rearrangement
have been reported, including its use in the
synthesis of allenic steroids as substrate-induced
inactivation of aromatase [61],
in the efficient
synthesis of (2R)-2-amino-5-phosphonopentanoic
acid (AP5) as a powerful and selective N-methyl-
D-aspartate (NMDA) antagonist [62], in the prepa-
ration of the phosphonate analogues of phospha-
tidyl derivatives [63,64], and in the synthesis of
new acyclic analogues of nucleotides containing a
purine or pyrimidine moiety and an allenic skeleton
[65,66].
© 2014 Bulgarian Academy of Sciences, Union of Chemists in Bulgaria
* To whom all correspondence should be sent:
E-mail: [email protected]

I. E. Ismailov et al.: Bifunctionalized allenes. Part XIV. A convenient and efficient regioselective synthesis of phosphorylated
40
As a part of our research program on the
chemistry of the bifunctionalized allenes, we requi-
red a convenient method to introduce a phosphorus-
containing group such as phosphonate or phosphine
oxide group as well as a -hydroxy-alkyl group in
the first position to the allenic system of double
bonds. The above mentioned groups attract increa-
sing attention as useful functionalities in organic
synthesis. Of particular interest are the applications
of these groups as temporary transformers of
chemical reactivity of the allenic system in the
synthesis of eventually heterocyclic compounds.
In a continuation to our previous reports on the
synthesis [67] and electrophilic cyclization reac-
tions [68] of bifunctionalized allenes, we have
found a convenient and efficient method for regio-
selective synthesis of phosphorylated -hydroxy-
allenes by an atom economical [2,3]-sigmatropic
rearrangement of the mediated 4-(tetrahydro-2H-
pyran-2-yloxy)-propargyl phosphite or phosphinite.
EXPERIMENTAL
General information
All new synthesized compounds were purified
by column chromatography and characterized on
the basis of NMR, IR, and microanalytical data.
NMR spectra were recorded on DRX Brucker
Avance-250 (Bruker BioSpin, Karlsruhe, Germany)
(1H at 250.1 MHz,
13C at 62.9 MHz,
31P at 101.2
MHz) and Brucker Avance II+600 (Bruker BioSpin
GmbH, Karlsruhe, Germany) (1H at 600.1 MHz,
13C at 150.9 MHz,
31P at 242.9 MHz) spectrometers
for solutions in CDCl3. All 1H and
13C NMR
experiments were measured referring to the signal
of internal TMS and 31
P NMR experiments were
measured referring to the signal of external 85%
H3PO4. J values are given in hertz. IR spectra were
recorded with an FT-IRAfinity-1 Shimadzu spec-
trophotometer (Shimadzu, Tokyo, Japan). Elemen-
tal analyses were carried out by the Microanalytical
Service Laboratory of Faculty of Chemistry and
Pharmacy, University of Sofia, Bulgaria, using
Vario EL3 CHNS(O) (Elementar Analysensysteme,
Hanau, Germany). Column chromatography was
performed on Kieselgel F25460 (70-230 mesh
ASTM, 0.063-0.200 nm, Merck). Et2O and THF
were distilled from Na wire/benzophenone, CH2Cl2
was distilled over CaH2, other commercially avai-
lable chemicals were used without additional purifi-
cation unless otherwise noted. Reactions were
carried out in oven dried glassware under an argon
atmosphere and exclusion of moisture. All compo-
unds were checked for purity on TLC plates
Kieselgel F254 60 (Merck).
Procedure [21] for synthesis of 2-(1-methyl-but-3-
yn-1-yloxy)-tetrahydro-2H-pyran 2
A solution of the pent-4-yn-2-ol 1 (60 mmol)
and DHP (3,4-dihydro-2H-pyran) (7.57 g, 90
mmol) in dry methylene chloride (50 ml) contain-
ning PPTS (pyridinium p-toluenesulfonate) (1.50 g,
6 mmol) is stirred for 4 h at room temperature.
Then the reaction was quenched with saturated
NaHCO3 end extracted with methylene chloride.
The organic layer was dried over anhydrous sodium
sulfate. After evaporation of the solvent, the residue
was chromatographed on a column (silica gel,
Kieselgel Merck 60 F254
) with a mixture of ethyl
acetate and hexane (3:1) as an eluent. The pure
product 2 had the following properties:
2-(1-Methyl-but-3-ynyloxy)-tetrahydro-2H-
pyran (2). Colourless oil, yield: 87%. Rf 0.55. IR
(neat, cm−1
): 1125 (C-O-C), 2106 (C≡C), 3292 (≡C-
H). 1H-NMR (250.1 MHz): δ = 1.09-1.25, 3.65-
3.77, 4.74-4.81 (mmm, 9H, OTHP), 1.27 (d, J = 7.2
Hz, 3H, Me-CHO), 2.02 (m, 1H, H-C≡), 2.38, 2.59
(mm, 2H, CH-C≡), 3.80-3.89 (m, 1H, Me-CHO). 13
C-NMR (62.9 MHz) = 20.1 (CH2), 22.7 (CH3),
25.8 (CH2), 26.4 (CH2), 31.9 (CH2), 63.8 (CH2),
67.0 (CH), 75.2 (CH), 81.2 (C), 95.9 (CH). Anal.
Calcd. for C10H16O2 (168.23): C 71.39; H 9.59;
found: C 71.32; H 9.65.
Synthesis of the 5-methyl-9-(tetrahydro-2H-pyran-
2-yloxy)-dec-6-yn-5-ol 5
Ethylmagnesium bromide [prepared from
magnesium (1.22 g, 50 mmol) and ethyl bromide
(5.50 g, 50 mmol) in dry THF (50 ml)] is added
dropwise under stirring to substituted alkynyloxy-
tetrahydro-2H-pyran 2 (50 mmol) and then the
mixture is refluxed for 2 h. The solution of the
prepared pentynyl magnesium bromide 3 is added
dropwise under stirring to the hexan-2-one 4 (100
mmol). The mixture is refluxed for 24 h and after
cooling is hydrolyzed with a saturated aqueous
solution of ammonium chloride. The organic layer
is separated, washed with water, and dried over
anhydrous sodium sulfate. Solvent and the excess
of ketone are removed by distillation. Purification
of the residue is achieved by column chroma-
tography (silica gel, Kieselgel Merck 60 F254) with
ethyl acetate and hexane (5:1). The pure product 5
had the following properties:
5-Methyl-9-(tetrahydro-2H-pyran-2-yloxy)-dec-
6-yn-5-ol (5). Colourless oil, yield: 55%. Rf 0.51.

I. E. Ismailov et al.: Bifunctionalized allenes. Part XIV. A convenient and efficient regioselective synthesis of phosphorylated
41
IR (neat, cm−1
): 1122 (C-O-C), 3408 (OH). 1H-
NMR (250.1 MHz): δ = 0.88 (t, J = 6.5 Hz, 3H,
Me-(CH2)3), 1.15-1.37, 3.60-3.81, 4.73-4.81 (mmm,
9H, OTHP), 1.28 (d, J = 7.1 Hz, 3H, Me-CHO),
1.30-1.58 (m, 2H, Me-(CH2)2), 1.37 (s, 3H, Me-C),
2.54 (s, 1H, OH), 2.57-2.64 (m, 2H, O-CH-CH2-
C≡), 3.83-3.88 (m, 1H, Me-CHO). 13
C-NMR (62.9
MHz) = 14.7 (CH3), 20.1 (CH2), 22.7 (CH3), 24.3
(CH2), 24.7 (CH2), 25.1 (CH2), 25.6 (CH2), 30.0
(CH3), 31.8 (CH2), 45.3 (CH2), 63.9 (CH2), 68.1
(C), 75.7 (CH), 78.4 (C), 82.3 (C), 96.1 (CH). Anal.
Calcd. for C16H28O3 (268.39): C 71.60; H 10.52;
found: C 71.66; H 10.44.
Synthesis of dimethyl 3-methyl-1-[2-(tetrahydro-
2H-pyran-2-yloxy)-propyl]-hepta-1,2-diene-
phosphonate 7
To a solution of phosphorus trichloride (2.75 g,
20 mmol) and triethylamine (2.23 g, 22 mmol) in
dry diethyl ether (60 ml) at -70oC was added
dropwise with stirring a solution of the 5-methyl-9-
(tetrahydro-2H-pyran-2-yloxy)-dec-6-yn-5-ol 5 (20
mmol) in the same solvent (20 ml). After 30 min
stirring at the same conditions a solution of pyri-
dine (3,16 g, 44 mmol) and of methanol (1,28 g, 40
mmol) in dry diethyl ether (50 mL) were added.
The reaction mixture was stirred for an hour at the
same temperature and for 10 hours at room tempe-
rature. The mixture was then washed with water,
2N HCl, extracted with ether, washed with satura-
ted NaCl, and dried over anhydrous sodium sulfate.
After evaporation of the solvent, the residue was
chromatographed on a column (silica gel, Kiesel-
gel Merck 60 F254
) with a mixture of ethyl acetate
and hexane (10:1) as an eluent to give the pure pro-
duct 7 as an oil, which had the following properties:
Dimethyl 3-methyl-1-[2-(tetrahydro-2H-pyran-
2-yloxy)-propyl]-hepta-1,2-dienephosphonate (7).
Orange oil, yield: 71%. Rf 0.45. IR (neat, cm−1
):
1118 (C-O-C), 1258 (P=O), 1955 (C=C=C). 1H-
NMR (600.1 MHz): δ = 0.90 (t, J = 7.3 Hz, 3H,
Me-(CH2)3), 1.17 (d, J = 6.0 Hz, 3H, Me-CHO),
1.20-1.23, 1.24-1.29, 1.42-1.47, 3.84-3.95, 4.90-
4.94 (mmmmm, 9H, OTHP), 1.32-1.38 (m, 2H,
Me-CH2(CH2)2), 1.51-1.57 (m, 2H, Me-
CH2CH2CH2), 1.76 (d, J = 7.0 Hz, 3H, Me-C=),
2.14-2.42 (m, 2H, O-CH-CH2-C=), 2.35-2.42 (m,
2H, Me-(CH2)2CH2), 3.73 (d, J = 11.1 Hz, 3H,
MeO), 4.67-4.71 (m, 1H, Me-CHO). 13
C-NMR
(150.9 MHz) = 13.9 (CH3), 18.8 (J = 5.3 Hz,
CH3), 19.7 (CH2), 20.0 (J = 7.8 Hz, CH3), 20.4
(CH2), 25.3 (CH2), 29.4 (CH2), 32.0 (CH2), 36.1 (J
= 6.7 Hz, CH2), 36.9 (J = 8.9 Hz, CH2), 52.8 (J =
6.4 Hz, CH3), 62.9 (J = 12.1 Hz, CH), 63.7 (CH2),
88.4 (J = 191.8 Hz, C), 96.2 (CH), 102.4 (J = 13.2
Hz, C), 208.3 (J = 5.1 Hz, C). 31
P-NMR (242.9
MHz): δ 21.9. Anal. Calcd. for C18H33O5P (360.43):
C 59.98; H 9.23. Found: C 59.93; H 9.16.
Synthesis of 2-(3-diphenyl-phosphinoyl-1,5-dime-
thyl-nona-3,4-dienyloxy)-tetrahydro-2H-pyran 9
To a solution of the 5-methyl-9-(tetrahydro-2H-
pyran-2-yloxy)-dec-6-yn-5-ol 5 (20 mmol) and
triethylamine (2.23 g, 22 mmol) in dry diethyl ether
(60 ml) at -70oC, a solution of freshly distilled
diphenylchlorophosphine (4.41 g, 20 mmol) in the
same solvent (20 ml) was added dropwise with
stirring. The reaction mixture was stirred for an
hour at the same temperature and for 8 h at room
temperature and then washed with water, 2N HCl,
extracted with diethyl ether, and the extract was
washed with saturated NaCl, and dried over anhyd-
rous sodium sulfate. The solvent was removed
using a rotary evaporator, and the residue was
purified by column chromatography on a silica gel
(Kieselgel Merck 60 F254
) with ethyl acetate-hexane
(10:1) to give the pure product 9 as an oil, which
had the following properties:
2-(3-Diphenylphosphinoyl-1,5-dimethyl-nona-
3,4-dienyloxy)-tetrahydro-2H-pyran (9). Yellow
oil, yield: 79%. Rf 0.43. IR (neat, cm−1
): 1122 (C-
O-C), 1156 (P=O), 1436, 1490 (Ph), 1951
(C=C=C). 1H-NMR (600.1 MHz): δ = 0.81 (t, J =
7.3 Hz, 3H, Me-(CH2)3), 1.11-1.16, 1.23-1.28, 1.44-
1.49, 3.86-3.94, 4.88-4.93 (mmmmm, 9H, OTHP),
1.17 (d, J = 6.1 Hz, 3H, Me-CHO), 1.35-1.39 (m,
2H, Me-CH2(CH2)2), 1.49-1.55 (m, 2H, Me-
CH2CH2CH2), 1.79 (d, J = 7.1 Hz, 3H, Me-C=),
2.04-2.16 (m, 2H, O-CH-CH2-C=), 2.29-2.36 (m,
2H, Me-(CH2)2CH2), 4.66-4.70 (m, 1H, Me-CHO),
7.37-7.88 (m, 10H, 2Ph). 13
C-NMR (150.9 MHz)
= 13.9 (CH3), 19.1 (J = 5.4 Hz, CH3), 19.8 (J = 8.0
Hz, CH3), 21.1 (CH2), 21.3 (CH2), 25.4 (CH2), 29.3
(CH2), 32.1 (CH2), 35.1 (J = 6.2 Hz, CH2), 35.6 (J
= 8.7 Hz, CH2), 62.7 (J = 12.2 Hz, CH), 62.9
(CH2), 93.8 (J = 103.6 Hz, C), 96.2 (CH), 102.9 (J
= 13.2 Hz, C), 127.7-133.2 (2Ph), 207.9 (J = 6.6
Hz, C). 31
P-NMR (242.9 MHz): δ 32.6. Anal.
Calcd. for C28H37O3P (452.57): C 74.31; H 8.24;
found: C 74.39; H 8.20.
Synthesis of dimethyl [1-(2-hydroxypropyl)-3-me-
thyl-hepta-1,2-dienyl]-phosphonate 10 and 4-di-
phenylphosphinoyl-6-methyl-deca-4,5-dien-2-ol 11
A solution of the dimethyl 3-methyl-1-[2-(tetra-
hydro-2H-pyran-2-yloxy)-propyl]-hepta-1,2-diene-
phosphonate 7 or the 2-(3-diphenyl-phosphinoyl-

I. E. Ismailov et al.: Bifunctionalized allenes. Part XIV. A convenient and efficient regioselective synthesis of phosphorylated
42
1,5-dimethyl-nona-3,4-dienyloxy)-tetrahydro-2H-
pyran 9 (5 mmol) and PPTS (0.5 mmol) in ethanol
(10 ml) was stirred at room temperature for 6 h.
The mixture was then washed with water, extracted
with methylene chloride and dried over anhydrous
sodium sulfate. After evaporation of the solvent, the
residue was chromatographed on a column (silica
gel, Kieselgel Merck 60 F254
) with a mixture of
ethyl acetate and hexane (10:1) as an eluent to give
the pure products 10 or 11 as oils, which had the
following properties:
Dimethyl 1-(2-hydroxypropyl)-3-methyl-hepta-
1,2-dienephosphonate (10). Yellow oil, yield: 83%.
Rf 0.59. IR (neat, cm−1
): 1259 (P=O), 1951
(C=C=C), 3420 (OH). 1H-NMR (600.1 MHz): δ =
0.91 (t, J = 7.3 Hz, 3H, Me-(CH2)3), 1.22 (d, J =
6.4 Hz, 3H, Me-CHO), 1.33-1.38 (m, 2H, Me-
CH2(CH2)2), 1.41-1.47 (m, 2H, Me-CH2CH2CH2),
1.78 (d, J = 6.9 Hz, 3H, Me-C=), 2.03-2.06 (m, 2H,
O-CH-CH2-C=), 2.27-2.33 (m, 2H, Me-
(CH2)2CH2), 2.88 (s, 1H, OH), 3.74 (d, J = 11.1 Hz,
3H, MeO), 4.59-4.62 (m, 1H, Me-CHO). 13
C-NMR
(150.9 MHz) = 13.8 (CH3), 18.0 (J = 5.8 Hz,
CH3), 22.2 (CH2), 22.7 (J = 7.9 Hz, CH3), 29.3
(CH2), 33.0 (J = 6.6 Hz, CH2), 39.4 (J = 12.1 Hz,
CH2), 52.9 (J = 6.3 Hz, CH3), 66.9 (J = 9.7 Hz,
CH), 88.6 (J = 190.3 Hz, C), 102.3 (J = 15.9 Hz,
C), 208.1 (J = 5.2 Hz, C). 31
P-NMR (242.9 MHz):
δ 22.6. Anal. Calcd. for C13H25O4P (276.31): C
56.51; H 9.12; found: C 56.43; H 9.19.
4-Diphenylphosphinoyl-6-methyl-deca-4,5-dien-
2-ol (11). Orange oil, yield: 88%. Rf 0.58. IR (neat,
cm−1
): 1167 (P=O), 1436, 1491 (Ph), 1949
(C=C=C), 3401 (OH). 1H-NMR (600.1 MHz): δ =
0.82 (t, J = 7.2 Hz, 3H, Me-(CH2)3), 1.20 (d, J =
6.4 Hz, 3H, Me-CHO), 1.40-1.44 (m, 2H, Me-
CH2(CH2)2), 1.46-1.51 (m, 2H, Me-CH2CH2CH2),
1.80 (d, J = 7.1 Hz, 3H, Me-C=), 2.04-2.10 (m, 2H,
O-CH-CH2-C=), 2.30-2.36 (m, 2H, Me-
(CH2)2CH2), 2.90 (s, 1H, OH), 4.58-4.61 (m, 1H,
Me-CHO), 7.35-7.89 (m, 10H, 2Ph). 13
C-NMR
(150.9 MHz) = 13.9 (CH3), 18.7 (J = 5.9 Hz,
CH3), 21.1 (CH2), 22.9 (J = 8.0 Hz, CH3), 29.2
(CH2), 32.9 (J = 6.4 Hz, CH2), 39.5 (J = 12.4 Hz,
CH2), 67.3 (J = 9.8 Hz, CH), 94.6 (J = 102.4 Hz,
C), 102.2 (J = 15.7 Hz, C), 128.0-132.5 (2Ph),
209.0 (J = 5.4 Hz, C). 31
P-NMR (242.9 MHz): δ
34.5. Anal. Calcd. for C23H29O2P (368.45): C 74.98;
H 7.93; found: C 75.04; H 7.88.
RESULTS AND DISCUSSION
Our strategy for the synthesis of the phos-
phorylated -hydroxyallenes, using our experience
on the preparation of the 4-heteroatom-functiona-
lized allenecarboxylates [67], relies on the well-
precedented [2,3]-sigmatropic shift of propergylic
phosphites to allenephosphonates [47-50] and pro-
pargylic phosphinites to allenyl phosphine oxides
[53-58]. Precedent exists for such an approach to
the synthesis of the diethylphosphono-substituted
-allenic alcohols [59,60] only. However, to the
best of our knowledge, synthesis of phosphorylated
(phosphonates and phosphine oxides) -hydro-
xyallenes with protected or unprotected hydroxy
group has not been reported.
In order to assess this approach towards the
target 1,1-bifunctionalized allenes, a range of the
phosphorylated -hydroxyallenes 7, 9, 10, and 11,
was prepared by the following four-step procedure
including i) protection of hydroxy group in the
pent-4-yn-2-ol 1; ii) subsequent reaction with
Grignard reagent and butylmethyl ketone to give
the 6-methyl-dec-4-yne-2,6-diol 5 with protected
hydroxy group at 2 position; iii) interaction with
chloride of phosphorus acid in the presence of a
base; and finally iv) [2,3]-sigmatropic rearran-
gement of the mediated protected propargyl
phosphite or phosphinite.
As a starting point for our investigation, we first
examined the protection of hydroxy group in the
pent-4-yn-2-ol 1 with DHP in the presence of PPTS
[69-72] (Scheme 1). Thus, the formed 2-(1-methyl-
but-3-ynyloxy)-tetrahydro-2H-pyran 2 was isolated
by column chromatography with excellent yield
(87%). Reaction of the protected pent-4-yn-2-ol 2
with ethyl magnesium bromide and subsequent
dropwise addition of in situ the generated pentynyl
magnesium bromide 3 to the hexan-2-one 4 and
reflux for 24 hours gave the 5-methyl-9-(tetra-
hydro-2H-pyran-2-yloxy)-dec-6-yn-5-ol 5, which
was stable and was isolated by column
chromatography in 55% yield.
With the required dec-4-yne-2,6-diol 5 with
protected hydroxy group at 2 position in hand, we
were then able to investigate the proposed reactions
with the corresponding chlorocontaining phospho-
rus reagents such as dimethyl chlorophosphite and
chlorodiphenyl phosphine in the presence of a base
and subsequent [2,3]-sigmatropic rearrangement of
the mediated 4-(tetrahydro-2H-pyran-2-yloxy)-pro-
pargyl phosphite 6 or phosphinite 8. In the first
instance, the dimethyl 1-(tetrahydro-2H-pyran-2-yl-
oxy)-alka-1,2-dienephosphonates 7 can be readily
prepared via an atom economical 2,3-sigmatropic
rearrangement of the 4-(tetrahydro-2H-pyran-2-
yloxy)-propargyl phosphite 6, intermediate formed
by reaction of the (tetrahydro-2H-pyran-2-yloxy)-
alkynol 5 with dimethyl chlorophosphite, prepared
in situ from phosphorus trichloride and 2 equiv of

I. E. Ismailov et al.: Bifunctionalized allenes. Part XIV. A convenient and efficient regioselective synthesis of phosphorylated
43
MgBr
Me
HO
i) ii) iii)
1 2, 97% 3 5, 55%
OH OTHP OTHP OTHP
Me
Me Me Me Me
Scheme 1. Synthesis of the 5-methyl-9-(tetrahydro-2H-pyran-2-yloxy)-dec-6-yn-5-ol 5. Reagents and Conditions: i)
DHP (1.5 eq), PPTS (0.1 eq), CH2Cl2, rt, 4 h, distillation; ii) EtMgBr (1 eq), THF, reflux, 2 h; iii) dropwise addition of 3
to MeC(O)Bu 4 (2 eq), reflux, 24 h, column chromatography.
•
(MeO)2P
O
MeMe
O
(MeO)2P
iv) v)
•
Ph2P
O
MeMe
O
Ph2P
vi) vii)
6 7, 71%
8 9, 79%
Me
HO
5
OTHP
OTHP
OTHP
Me
Me
Me
Me
Me
Me
Me
Me
OTHP
Me
OTHP
Me
Scheme 2. Synthesis of the dimethyl-3-methyl-1-[2-(tetrahydro-2H-pyran-2-yloxy)-propyl]-hepta-1,2-
dienephosphonate 7 and 2-(3-diphenylphosphinoyl-1,5-dimethyl-nona-3,4-dienyloxy)-tetrahydro-2H-pyran 9. Reagents
and Conditions: iv) PCl3 (1 eq), Et3N (1.1 eq), Et2O, -70oC, 30 min stirring, pyridine (2.2 eq), MeOH (2 eq), Et2O,
-70oC; v) [2,3-]-rearrangement, -70
oC, 1 h, rt, 10 h; vi) Ph2PCl (1 eq), Et3N (1.1 eq), Et2O, -70
oC, 1 h, rt, 10 h,
column chromatography; vii) [2,3-]-rearrangement, -70oC, 1 h, rt, 8 h, column chromatography.
pyridine, according to Scheme 2.
Pleasingly, the reaction of the (tetrahydro-2H-
pyran-2-yloxy)-alkynol 5 with chlorodiphenyl
phosphine in the presence of triethylamine at -70oC
gave the expected 2-(2-(diphenylphosphinoyl-alka-
2,3-dienyloxy)-tetrahydro-2H-pyrans 9 in very
good yield (79%) as a result of [2,3]-sigmatropic
rearrangement of the 4-(tetrahydro-2H-pyran-2-
yloxy)-propargyl phosphinite 8 for 8 hours at room
temperature, according to the reaction sequence
outlined in Scheme 2.
A new family of phosphorylated -hydroxy-
allenes with protected hydroxyl group 7 and 9 was
synthesized via an atom economical and regio-
selective [2,3]-sigmatropic rearrangement of the
intermediate formed propargyl phosphite 6 or
phosphinite 8 in the reaction of protected alkynol 5
with dimethylchloro phosphite or chlorodiphenyl
phosphine in the presence of triethylamine.
Compounds 7 and 9 were stable enough to be
handled at ambient temperature. The hydroxy group
was deprotected by stirring the ethanol solution of
the protected hydroxypropyl-allenephosphonate 7
and hydroxypropyl-allenyl phosphine oxide 9 in the
presence of 0.1 equiv PPTS at room temperature for
6 hours, according to Scheme 3.
After a conventional work-up, all allenic
products 7, 9, 10, and 11 were isolated as stable
yellow or orange oils by column chromatography
and identified by 1H,
13C, and
31P NMR and IR
spectra as well as by elemental analysis. Some
characteristic chemical shifts and coupling
constants in the 13
C and 31
P NMR spectra of the
prepared phosphorylated -hydroxyallenes 7, 9, 10,
and 11 are summarized in Table 1.
10, Y=MeO, 81%11, Y=Ph, 88%
7, 9
viii)•
Y2P
O
Me
•
Y2P
O
Me
MeMe
OH
Me
OTHP
Me
Scheme 3. Synthesis of the dimethyl [1-(2-hydroxy-
propyl)-3-methyl-hepta-1,2-dienyl]-phosphonate 10 and
the 4-(diphenylphosphinoyl)-6-methyl-deca-4,5-dien-2-
ol 11. Reagents and Conditions: viii) PPTS (0.1 eq),
EtOH, rt, 6h, stirring, column chromatography.

I. E. Ismailov et al.: Bifunctionalized allenes. Part XIV. A convenient and efficient regioselective synthesis of phosphorylated
44
Table 1. Some characteristic 13
C and 31
P NMR spectral
data of the prepared phosphorylated -hydroxyallenes 7,
9, 10, and 11.
•
Y2P
O
Me1 2 3
47, Y=MeO, Z=THP
9, Y=Ph, Z=THP
10, Y=MeO, Z=H
11, Y=Ph, Z=H
OZ
Me5
Me
All
ene
C-1
(1JP-C-1)
C-2
(2JP-C-2)
C-3
(2JP-C-4)
C-4
(3JP-C-3)
C-5
(3JP-C-5) P
7 88.4
(191.8)
208.3
(5.1)
102.4
(13.2)
36.9
(8.9)
62.9
(12.1)
21.9
9 93.8
(103.6)
207.9
(6.6)
102.9
(13.2)
35.6
(8.7)
62.7
(12.2)
32.6
10 88.6
(190.3)
208.1
(5.2)
102.3
(15.9)
39.4
(12.1)
66.9
(9.7)
22.6
11 94.6
(102.4)
209.0
(5.4)
102.2
(15.7)
39.5
(12.4)
67.3
(9.8)
34.5
A series of new phosphorylated -hydroxy-
allenes with protected 7 and 9 and unprotected
hydroxy group 10 and 11 were synthesized by a
convenient, efficient, atom economical and regio-
selective method.
CONCLUSION
In conclusion, a convenient and efficient method
for regioselective synthesis of a new family of 1,1-
bifunctionalized allenes has been explored. Phos-
phorylated -hydroxyallenes prepared were derived
from [2,3]-sigmatropic rearrangement of the inter-
mediate propargyl phosphites or phosphinites
formed in the reaction of protected alkynols with
dimethylchloro phosphite or chlorodiphenyl phos-
phine in the presence of a base.
Further investigations on this potentially
important synthetic methodology are currently in
progress. At the same time, the synthetic applica-
tion of the prepared phosphorylated -hydroxy-
allenes with protected or unprotected hydroxy
group for synthesis of different heterocyclic
compounds is now under investigation in our
laboratory as a part of our general synthetic strategy
for investigation of the scope and limitations of the
electrophilic cyclization and cycloisomerization
reactions of bifunctionalized allenes. Results of
these investigations will be reported in due course.
Acknowledgements: Support from the Research
Fund of the Konstantin Preslavsky University of
Shumen (Project No. RD-08-208 / 2014), National
Research Fund of Bulgaria (Project No. DRNF-02-
13/2009) and Human Resources Development
Operational Programme of the European Union
(BG051PO001-3.3.06-0003/2012) is gratefully
acknowledged.
REFERENCES
1. S. Patai (Ed.), The Chemistry of Ketenes, Allenes
and Related Compounds, John Wiley & Sons, New
York, 1980.
2. S. R. Landor (Ed.), The Chemistry of the Allenes,
Academic Press, London, 1982, Vol. 1-3.
3. D. J. Pasto, Tetrahedron, 40, 2805 (1984).
4. H. F. Schuster, G. M. Coppola, Allenes in Organic
Synthesis, John Wiley & Sons, New York, 1988.
5. R. Zimmer, Synthesis, 165 (1993).
6. C. J. Elsevier, Methods of Organic Chemistry
(Houben-Weyl), R. W. Helmchen, J. Mulzer, E.,
Schaumann (Eds.), Vol. E21a, Thieme, Stuttgart,
1995, pp. 537-566.
7. N. Krause, A. S. K. Hashmi (Eds.), Modern Allene
Chemistry, Wiley-VCH, Weinheim, 2004, Vol. 1,2.
8. K. M. Brummond, J. E. DeForrest, Synthesis, 795
(2007).
9. R. W. Bates, V. Satcharoen, Chem. Soc. Rev., 31, 12
(2002).
10. S. Ma, Aldrichimica Acta, 40, 91 (2007).
11. H. H. A. M. Hassan, Curr. Org. Synth., 4, 413
(2007).
12. T. M. V. D. Pinho e Melo, Curr. Org. Chem., 13,
1406 (2009).
13. T. G. Back, K. N. Clary, D. Gao, Chem. Rev., 110,
4498 (2010).
14. M. Enomoto, T. Katsuki, M. Yamaguchi,
Tetrahedron Lett., 27, 4599 (1986).
15. S. Phadtare, J. Zemlicka, J. Am. Chem. Soc., 111,
5925 (1989).
16. S. Ma, H. Hou, S. Zhao, G. Wang, Synthesis, 1643
(2002).
17. J. Ye, S. Li, B. Chen, W. Fan, J. Kuang, J. Liu, Y.
Liu, B. Miao, B. Wan, Y. Wang, X. Xie, Q. Yu, W.
Yuan, S. Ma, Org. Lett., 14, 1346 (2012).
18. G. P. Boldrini, L. Lodi, E. Tagliavini, C. Tarasco, C.
Trombini, A. Umanl-Ronchi, J. Org. Chem., 52,
5447 (1987).
19. R. W. Hoffman, U. Weldmann, Chem. Ber., 118,
3966 (1985).
20. E. J. Corey, R. Imwinkelried, S. Pikul, Y. B. Xiang,
J. Am. Chem. Soc., 111, 5493 (1989).
21. E. J. Corey, C.-M. Yu, D.-H. Lee, J. Am. Chem. Soc.,
112, 878 (1990).
22. E. J. Corey, G. B. Jones, Tetrahedron Lett., 32, 5713
(1991).
23. J. Li, W. Kong, C. Fu, S. Ma, J. Org. Chem., 74,
5104 (2009).
24. J. Li, C. Zhou, C. Fu, S. Ma, Tetrahedron, 65, 3695
(2009).
I. E. Ismailov et al.: Bifunctionalized allenes. Part XIV. A convenient and efficient regioselective synthesis of phosphorylated
45
25. A. Alexakis, I. Marek, P. Mangeney, J. F. Normant,
Tetrahedron Lett., 30, 2387 (1989).
26. A. Alexakis, I. Marek, P. Mangeney, J. F. Normant,
Tetrahedron, 47, 1677 (1991).
27. J. A. Marshall, K. G. Pinney, J. Org. Chem., 58, 7180
(1993).
28. N. Krause, A. Hoffmann-Röder, J. Canisius,
Synthesis, 12, 1759 (2002).
29. N. Krause, A. Hoffmann-Röder, Tetrahedron, 60,
11671 (2004).
30. J. M. Aurrecoechea, M. Solay, Tetrahedron Lett., 36,
2501 (1995).
31. J. M. Aurrecoechea, E. Alonso, M. Solay,
Tetrahedron, 54, 3833 (1998).
32. J. S. Cowie, P. D. Landor, S. R. Landor, J. Chem.
Soc., Chem. Commun., 541 (1969).
33. J. S. Cowie, P. D. Landor, S. R. Landor, J. Chem.
Soc., Perkin Trans. 1, 720 (1973).
34. M. Nakano, N. Furuichi, H. Mori, S. Katsumura,
Tetrahedron Lett., 42, 7307 (2001).
35. C. Darcel, C. Bruneau, P. H. Dixneuf, J. Chem. Soc.,
Chem. Commun., 1845 (1994).
36. C. Darcel, S. Bartsch, C. Bruneau, P. H. Dixneuf,
Synlett, 457 (1994).
37. S. Hoff, L. Brandsma, J. F. Arens, Rec. Trav. Chim.
Pays-Bas, 87, 916 (1968).
38. S. Hoff, L. Brandsma, J. F. Arens, Trav. Chim. Pays-
Bas, 87, 1179 (1968).
39. S. Hormuth, H.-U. Reissig, Synlett, 179 (1991).
40. S. Hormuth, H.-U. Reissig, D. Dorsch, Liebigs Ann.
Chem., 121 (1994).
41. S. Hormuth, H.-U. Reissig, J. Org. Chem., 59, 67
(1994).
42. J. Marshall, Y. Tang, J. Org. Chem., 58, 3233 (1993).
43. V. Mark, The Uncatalyzed Rearrangements of
Tervalent Phosphorus Esters, in: Selective Organic
Transformations, B. S. Thyagarajan (Ed.), John
Wiley & Sons, New York, 1970, pp. 319-437.
44. P. D. Landor, in: The Chemistry of the Allenes, Vol.
1, S. R. Landor (Ed.), Academic Press, New York,
1982, pp. 174-178.
45. R. W. Saalfrank, C.-J. Lurz, in: Methoden der
Organischen Chemie (Houben Weyl), H. Kropf, E.
Scheumann (Eds.), Thieme, Stuttgart, 1993, pp.
2959-3102.
46. A. S. K. Hashmi, Synthesis of Allenes, in: Modern
Allene Chemistry, Vol. 1, N. Krause, A. S. K.
Hashmi (Eds.), Wiley-VCH, Weinheim, 2004, pp. 3-
50.
47. R. S. Macomber, J. Am. Chem. Soc., 99, 3072 (1977).
48. S. E. Denmark, J. E. Marlin, J. Org. Chem., 56, 1003
(1991).
49. B. Cai, G. M. Blackburn, Synth. Commun., 27, 3943
(1997).
50. R. W. Saalfrank, M. Haubner, C. Deutscher, U.
Bauer, Eur. J. Org. Chem., 2367 (1999).
51. A. P. Boiselle, N. A. Meinhardt, J. Org. Chem., 27,
1828 (1962).
52. V. Mark, Tetrahedron Lett., 3, 281 (1962).
53. K. C. Nicolaou, P. Maligres, J. Shin, E. de Leon, D.
Rideout, J. Am. Chem. Soc., 112, 7825 (1990).
54. M. L. Curfin, W. H. Okamura, J. Org. Chem., 55,
5278 (1990).
55. J. W. Grissom, D. Huang, Angew. Chem. Int. Ed., 34,
2037 (1995).
56. C. Darcel, C. Bruneau, P. H. Dixneuf, Synthesis, 711
(1996).
57. O. de Frutos, A. M. Echavarren, Tetrahedron Lett.,
38, 7941 (1997).
58. M. Schmittel, J.-P. Steffen, M. Maywald, B. Engels,
H. Helten, P. Musch, J. Chem. Soc., Perkin Trans. 2,
1331 (2001).
59. V. K. Brel, Synthesis, 463 (1999).
60. V. K. Brel, E. V. Abramkin, Mendeleev Commun.,
12, 64 (2002).
61. B. W. Metcalf, C. L. Wright, J. P. Burkhart, J. O.
Johnston, J. Am. Chem. Soc., 103, 3221 (1981).
62. M. Muller, A. Mann, M. Taddei, Tetrahedron Lett.,
34, 3289 (1993).
63. V. K. Brel, P. J. Stang, Eur. J. Org. Chem., 224
(2003).
64. V. K. Brel, Synthesis, 1539 (2001).
65. V. K. Brel, V. K. Belsky, A. I. Stash, V. E. Zvodnik,
P. J. Stang, Org. Biomol. Chem., 1, 4220 (2003).
66. V. K. Brel, V. K. Belsky, A. I. Stash, V. E. Zvodnik,
P. J. Stang, Eur. J. Org. Chem., 512 (2005).
67. I. K. Ivanov, I. D. Parushev, V. C. Christov,
Heteroatom Chem., 24, 322 (2013).
68. I. K. Ivanov, I. D. Parushev, V. C. Christov,
Heteroatom Chem., 25, 60 (2014).
69. D. N. Robertson, J. Org. Chem., 25, 931 (1960).
70. M. Miyashita, A. Yoshikoshi, P. A. Griecolb, J. Org.
Chem., 42, 3772 (1977).
71. M. C. Joshi, P. Joshi, D. S. Rawat, ARKIVOC, (xvi),
65 (2006).
72. B. Partha, I. Pimkov, US Patent 8378123 B2 (2011).

I. E. Ismailov et al.: Bifunctionalized allenes. Part XIV. A convenient and efficient regioselective synthesis of phosphorylated
46
БИФУНКЦИОНАЛИЗИРАНИ АЛЕНИ. ЧАСТ XIV. УДОБЕН И ЕФИКАСЕН
РЕГИОСЕЛЕКТИВЕН СИНТЕЗ НА ФОСФОРИЛИРАНИ -ХИДРОКСИАЛЕНИ СЪС
ЗАЩИТЕНА И НЕЗАЩИТЕНА ХИДРОКСИ ГРУПА
И. Е. Исмаилов, И. К. Иванов, В. Х. Христов*
Катедра по органична химия и технология, Факултет по природни науки, Шуменски университет „Епископ
Константин Преславски“, ул. Университетска 115, 9712 Шумен, България
Постъпила на 09 май 2014 г.; Коригирана на 24 юни 2014 г.
(Резюме)
Описан e удобен и ефикасен региоселективен синтез на фосфорилирани -хидроксиалени чрез атом-
икономична [2,3]-сигматропна прегрупировка на междинно образуваните пропаргилови фосфити или
фосфонити, които лесно се получават чрез реакция на защитения 5-метил-дец-6-ин-5-ол с диметил
хлорофосфит или хлородифенил фосфин съответно в присъствие на база.

47
Bulgarian Chemical Communications, Volume 46, Special Issue A (pp. 47 – 52) 2014
2,3-Disubstituted imidazo[1,2-a]pyridines from 2-aminopyridines and acetophenones.
Catalyst’s efficiency and solid state NMR study.
V. B. Kurteva*, L. A. Lubenov, S. D. Simova†
Institute of Organic Chemistry with Centre of Phytochemistry, Bulgarian Academy of Sciences, Acad. G. Bonchev str.,
bl. 9, 1113 Sofia, Bulgaria
Received June 16, 2014; Revised June 30, 2014
Dedicated to Acad. Dimiter Ivanov on the occasion of his 120th
birth anniversary
Various sulfonic and carboxylic acids were tested as catalyst in a direct acid catalyzed conversion of 2-
aminopyridines and acetophenones into 2,3-disubstituted imidazo[1,2-a]pyridines in order to improve the reaction yield.
The most effective catalyst, isoquinoline-5-sulfonic acid, was applied in the reaction between substituted
aminopyridines and acetophenones. The efficiency of the catalysts and their influence on the products distribution is
discussed. Several chiral acids were also used but no stereoselectivity was induced. NMR study shows existence of two
different species in the solid state, differentiation between them was not possible based on the available experimental
and theoretical considerations.
Key words: imidazo[1,2-a]pyridines, 2-aryl-3-(1-arylethyl) substituted, 2-aryl-3-(1-arylethenyl) substituted, catalysts,
solid state NMR
INTRODUCTION
Imidazo[1,2-a]pyridines are fused nitrogen-
bridged heterocyclic compounds exhibiting a broad
spectrum of biological activities [1-5]; antimicro-
bial, anti-inflammatory, antiviral, cytotoxicity, se-
dative, and many others. These properties are
critically dependent on the presence and nature of
substituents at positions 2 and 3 of the imidazole
ring [6-8], which is demonstrated by the immense
efficiency of some formulations on the market like
zolpidem, necopidem, saripidem, alpidem, zolimi-
dine, olprinone [9].
The observed pharmacological activities sti-
mulated the development of numerous methods for
the preparation of compounds possessing imi-
dazo[1,2-a]pyridine scaffold [10-14]. 2,3-Disubsti-
tuted products are most commonly obtained by
multicomponent reactions of 2-aminopyridines with
aldehydes and alkynes, nitriles, isocyanides, thio-
cyanates [15-21], including catalytic variants. In the
latter, Lewis acids like Zn(II) [22], Cu(II) [23,24],
Cu(II)/Fe(III) [25], Fe(III) [26], In(III) [27] salts are
found to be highly efficient catalysts. Contrary to
aldehydes, ketones are poorly examined, mainly in
direct reaction with 2-aminopyridine in a bromine
containing ionic liquid [28] or in iodine [29,30] or
iodobenzene [31] catalysed conversions.
Recently, we reported on the direct acid cata-
lyzed conversion of 2-aminopyridines and aceto-
phenones into 2,3-disubstituted imidazo[1,2-a]-py-
ridines [32,33]. Two products were obtained as
easy separable mixtures, 2-aryl-3-(1-arylethyl) and
2-aryl-3-(1-arylethenyl)imidazo[1,2-a]pyridines.
However, the reaction was not complete; the
products were isolated in moderate to high total
yields. The aim of the current work is to improve
the conversion by finding out more efficient cata-
lysts. Additionally, since the main product is ob-
tained as a racemic mixture, attempts to conduct the
reaction stereoselectively have been undertaken.
Moreover, solid state NMR spectra of racemic 2-
phenyl-3-(1-phenylethyl)imidazo[1,2-a]pyridine re-
veal two different forms, pointing out to a possible
alternative explicit method for enantiomeric purity
estimation.
EXPERIMENTAL
Materials, Methods and Apparatus
All reagents were purchased from Aldrich,
Merck and Fluka and were used without any further
purification. Merck Silica gel 60 (0.040-0.063 mm)
was used for flash chromatography purification of
the products. The high performance liquid chroma-
© 2014 Bulgarian Academy of Sciences, Union of Chemists in Bulgaria
* To whom all correspondence should be sent:
E-mail: [email protected] † For NMR study:
E-mail: [email protected]

V. Kurteva et al.: 2,3-Disubstituted imidazo[1,2-a]pyridines from 2-aminopyridines and acetophenones. Catalyst’s efficiency and …
48
tography (HPLC) enantioseparations were perfor-
med on an Agilent 1100 System fitted with diode
array detector and manual injector with a 20 µl
injection loop. A stainless-steel Nucleosil Chiral-2
column (Macherey-Nagel GmbH & Co. KG,
Düren, Germany) was used; 250x4 mm, particle
size 5 μm, pore size 100 Å, chiral selector N-(3,5-
dinitro-benzoyl)-D-phenylglycine. The HPLC gra-
de solvents were purchased from Sigma-Aldrich
and LabScan.
Synthetic Procedure
All reactions were carried out in constant condi-
tions by following a published protocol [32,33].
Shortly, a mixture of 2-aminopyridine (1 mmol),
acetophenone (5 mmol), and catalyst (10 mol %)
was refluxed for 1 h; acetophenone 202°C, 4-
methylacetophenone 226°C, 4-chloroacetophenone
232°C. The products were purified by flash chro-
matography on silica gel by using mobile phase
with a gradient of polarity from CH2Cl2 to
acetone:CH2Cl2 5:95. The results are summarized
on Tables 1 and 2. The characterization of the
compounds is published in ref. 32 and 33.
HPLC Analyses
Resolution of 3a enantiomers by HPLC was
performed at 25°C by using hexane/i-PrOH 80:20
as eluent: the flow rate was varied and similar
separations were achieved: flow rate 0.7 ml/min,
retention times: tR-1 12.18 min, tR-2 12.84 min;
flow rate 1 ml/min, retention times: tR-1 10.75 min,
tR-2 11.38 min.
NMR Spectra
The NMR spectra were recorded on a Bruker
Avance II+ SB 600 spectrometer (Rheinstetten,
Germany) at room temperature using standard
Bruker library pulse programs [34]. 13
C and 15
N
NMR spectra were recorded at 150.91 and 60.81
MHz. The liquid state 15
N chemical shifts were
extracted from the heteronuclear multiple bond
(long range) correlation and quoted as δ-values in
ppm using the unified scale [35]. For the spectra
in solid state -glycine (43.5 ppm for 13
C and 33.4
ppm for 15
N) has been employed as external
reference [36].
Solid state 13
C and 15
N NMR spectra were recor-
ded on a 4 mm double resonance CPMAS probe-
head. The sample was ground softly with a mortar
and pestle and then packed tightly in a 4-mm zirco-
nium oxide rotor. The magic angle was adjusted
using the 79
Br resonance of KBr. Samples were
spun at 6.0 kHz for all experiments. Typical radio-
frequency (RF) field strengths were 30-65 kHz for
13C and
15N. The Hartmann–Hahn polarization
transfer was optimized to a contact time of 2 ms for 13
C and 4 ms for 15
N with a linear ramp starting at
50%. 13
C NMR spectra were obtained using a
combination of CP/MAS and total sideband
suppression (TOSS) methods (CP/MAS/TOSS)
with SPINAL64 proton decoupling. Non Quarter-
nary Suppression (NQS) technique was applied to
distinguish unambiguously the quaternary carbons.
128 transients for 13
C and 3072 for 15
N were
accumulated with a 5 s relaxation delay.
Computational Method
Calculations were done on Spartan 08 program
package v. 1.2.0 [37]. The structures were first
optimized using the MMFF94 field. The geometry
optimization was performed with DFT calculations
using B3LYP/6-31G(d) basis set. Energies and
NMR chemical shifts were calculated from the DFT
derived structures, using the SM8 routine for
solvation with chloroform [38]. 13
C NMR chemical
shifts are corrected from an empirical relationship
in Spartan for the effects of local chemical
environment. Referencing to TMS (0 ppm) and
CH3NO2 (381.7) is done internally in the Spartan
package.
RESULTS AND DISCUSSION
Catalyst’s efficiency
In our previous study [32,33], we achieved a
direct acid catalyzed conversion of 2-aminopyri-
dines and acetophenones into an easy separable
mixtures of 2-aryl-3-(1-arylethyl) (3) and 2-aryl-3-
(1-arylethenyl)imidazo[1,2-a]pyridines (4), shown
on Scheme 1. It was found that acetic and tri-
fluoroacetic acid did not catalyze the transfor-
mation significantly, while p-toluenesulfonic and
sulfuric acid led to considerable conversion of 2-
aminopyridines. The products were isolated in 42-
91% total yields depending on the 2-aminopyridine
and acetophenone substituents [33].
A possible way to improve the reaction yield is
to find more effective catalysts. Various acids were
checked, which can be divided in two general
groups: sulfonic acids and carboxylic acids. Their
efficiency was first studied on a model reaction, the
formation of imidazopyridines 3a and 4a by reflu-
xing (202°C) a mixture of 2-aminopyridine and 5-
fold excess acetophenone in solventless conditions
for 1 h in the presence of 10 mol % catalyst.
As expected, sulfonic acids led to better
conversions than carboxylic. Among the latter, the
aromatic acids 1-naphthoic acid, 5-methylthiophe-

V. Kurteva et al.: 2,3-Disubstituted imidazo[1,2-a]pyridines from 2-aminopyridines and acetophenones. Catalyst’s efficiency and …
49
ne-3-carboxylic acid, and pyridine-3-carboxylic
acid catalyzed poorly the transformation, 5-12%
total yields, while aliphatic mono- and poly-
carboxylic acids were not efficient in general. The
best conversion was achieved with 1,2,3,4-tetra-
hydro-9-acridinecarboxylic acid (A, Scheme 1,
Table 1). Contrary, the sulfonic acids tested, 3,4-
dioxo-3,4-dihydronaphthalene-1-sulfonic acid (B),
2-hydroxy-5-sulfobenzoic acid (C), and isoquino-
line-5-sulfonic acid (D), showed moderate to exce-
llent efficiency. As seen on Table 1, the poly-
functionalized catalyst C showed commensurable
efficacy with p-toluenesulfonic acid, while iso-
quinoline sulfonic acid D led to almost complete
conversion with significant superior of 2-aryl-3-(1-
arylethyl) substituted product 3a.
Scheme 1. Synthesis of imidazo[1,2-a]pyridines 3 and 4.
Table 1. Formation of imidazo[1,2-a]pyridines 3a and
4a in the presence of various catalysts.
Entry Catalyst Reaction yield, %* 3a:4a
ratio Total 3a 4a 1 p-TSA [33] 76 72 4 95:5
2 H2SO4 [33] 61 50 11 82:18
3 A 34 33 1 97:3
4 B 54 47 7 87:13
5 C 77 73 4 95:5
6 D 94 86 8 92:8 *Isolated yields by flash chromatography.
The most effective catalyst, isoquinoline-5-
sulfonic acid D, was further applied in the forma-
tion of imidazopyridines 3b-3i and 4b-4i. The
results are summarized on Table 2. As seen,
significant improvement of the reaction yield was
achieved in all cases compared to p-TSA and
sulfuric acid [33]. This effect is most clearly
demonstrated on the example of 3c/4c mixture
formation (Entry 3), where the products were
isolated in 99% total yield when catalyst D was
used, while p-TSA and sulfuric acid led only to
83% and 81% yield, respectively. Similarly to the
previous results, the lowest yields were obtained
from 5-chloro-2-aminopyridine and 4-methylace-
tophenone; 71% with D (Entry 8), 66% with p-TSA
and 68% with H2SO4.
Table 2. Formation of imidazo[1,2-a]pyridines 3 and 4
in the presence of catalyst D.
Entry Total
yield*
Compound 3 Compound 4 3:4
ratio Prod Yield Prod Yield
1 94 3a 86 4a 8 92:8
2 96 3b 80 4b 16 82:18
3 99 3c 87 4c 12 87:13
4 93 3d 83 4d 10 89:11
5 96 3e 80 4e 16 83:17
6 92 3f 79 4f 13 86:14
7 94 3g 71 4g 23 76:24
8 71 3h 41 4h 30 58:42
9 87 3i 65 4i 22 75:25 *Isolated yields by flash chromatography.
From the other side, isoquinoline sulfonic acid
D accelerated the Ortoleva-King type intermediated
transformation better than p-toluenesulfonic acid
[33], i.e. more like sulfuric acid in terms of 3:4
ratio. The latter was most significant when 4-
methylacetophenone was used. The reaction output
was similar from 2-aminopyridine and 5-methyl-2-
aminopyridine, 94% of 82:18 3a:4a and 96% of
83:17 3e:4e catalyzed by D vs 76% of 95:5 3a:4a
and 86% of 90:10 3e:4e catalyzed by p-TSA vs
61% of 82:18 3a:4a and 80% of 86:14 3e:4e
catalyzed by sulfuric acid, while lower yields with
significant percentage of vinylated product were
observed from 5-chloro-2-aminopyridine, 71% of
58:42 3h:4h with D vs 66% of 70:30 3h:4h with p-
TSA vs 68% of 62:38 3h:4h with H2SO4.
Enantioseparation
The main reaction products, 2-aryl-3-(1-
arylethyl)imidazo[1,2-a]pyridines (3), are racemic
compounds due to the presence of a chiral center in
the substituent at position 3. We were interested to
achieve the transformation enantioselectively des-
pite the relative low prospects because the chiral
center is not sufficiently close to any nitrogen.
Several chiral acids were examined in the formation
of 3a. The carboxylic acids (L)-mandelic, (L)-ma-
lic, N-Z-(D)-norleucine, N-Boc-(L)-glutamic acid
5-benzyl ester, O,O’-dibenzoyl-(L)-tartaric acid led
to insignificant conversion (up to 17%), while
3a/4a were obtained in 85% total yield in 94:6 ratio
with (+)-camphor-10-sulfonic acid. Surprisingly,
(R)-1,1’-binaphthyl-2,2’-diyl hydrogen phosphate
efficiently catalyzed the reaction; the products were
isolated in 89% total yield in 96:4 ratio.

V. Kurteva et al.: 2,3-Disubstituted imidazo[1,2-a]pyridines from 2-aminopyridines and acetophenones. Catalyst’s efficiency and …
50
The products were analyzed by HPLC on chiral
stationary phase. Sufficient separation of the
enantiomers was achieved, as illustrated on Fig. 1,
but no enantioselectivity was induced with all acids
tested. All attempts to separate the enantiomers by
salts formation were also unsuccessful.
Fig. 1. Resolution of 3a enantiomers by HPLC; eluent:
hexane/i-PrOH 80:20; flow rate 1 ml/min; retention
times: tR-1 10.22 min, tR-2 10.83 min.
Solid State NMR Study
Contrary to the liquid state spectra 15
N solid
state NMR experiments of 2-phenyl-3-(1-phenyl-
ethyl)imidazo[1,2-a]pyridine (3a) reveal doubling
of the signals for both nitrogen atoms, indicating
the presence of two species with different structure
(Fig. 2).
Fig. 2. 15
N CPMAS spectrum of 3a.
13C CPMAS spectra for 3a are also compatible
with two different species since most of the carbon
atoms are doubled as revealed in Fig. 3. Using the
unambiguous assignment of the liquid state spectra
[32] and the technique of nonquaternary atom
suppression the quaternary atoms could be un-
ambiguously recognized, along with some rest
signals for the methyl groups. The small difference
between the experimental NMR chemical shifts of
the two species precludes differentiation of the two
species.
Fig. 3. Comparison of liquid state (13
C BB and
DEPT135) with 13
C CPMAS (CPTOSS and CPTOSS-
NQS) spectra of 3a.
Two main alternatives are possible: polymorphic
structures or different chemical shifts for two
enantiomers in the solid state. Two conformational
isomers in the solid state could also not be
excluded. The energy difference between the major
and minor isomers of 3a in chloroform amounts
only 2.4 kcal/mol (Fig. 4), making the minor isomer
also a possible alternative for the solid state. The
major conformer corresponds to the atom arran-
gement in the solid X-ray structure [32].
Theoretical NMR chemical shifts were calculated
for both isomers.
Fig. 4. Theoretical structures of the major and minor
conformers of 3a.
Table 3 and Fig. 5 reveal the close resemblance
of the experimentally determined in the liquid and
the solid state and the theoretically predicted NMR
chemical shifts. This precludes unambiguous deter-
mination of the differences between the two species
in the solids state based on the so far available data.
Further experiments are in progress.

V. Kurteva et al.: 2,3-Disubstituted imidazo[1,2-a]pyridines from 2-aminopyridines and acetophenones. Catalyst’s efficiency and …
51
Table 3. Experimentally determined 13
C and 15
N NMR
chemical shifts in CDCl3 and the two solid state forms
(SS1 and SS2), along with theoretically calculated
values.
No. Experimental Theoretical
CDCl3 SS1 SS2 3a
major 3a
minor
1 - 241.20 237.06 243.14 246.62
2 143.76 144.50 143.67 136.91 136.02
3 122.96 122.61 121.63 124.98 125.31
4 198.66 197.17 199.01 205.74 212.99
5 124.53 125.72 122.61 125.42 121.53
6 111.56 110.15 110.35 111.43 112.80
7 123.74 123.99 123.75 122.54 122.51
8 117.78 119.81 117.76 117.21 117.59
9 144.86 145.85 144.70 144.78 144.33
10 33.78 32.77 33.14 32.42 32.72
11 16.17 12.78 10.68 12.40 13.51
1′ 135.02 136.69 135.27 130.49 129.30
2′ 128.92 130.18 130.18 133.20 132.13
6′ 128.92 129.87 128.18 129.15 131.53
3′ 128.42 127.61 127.08 127.67 126.70
5′ 128.42 127.61 127.08 127.08 126.70
4′ 127.68 131.37 130.95 125.39 125.22
1″ 141.11 141.10 140.61 141.23 144.00
2″ 126.80 130.18 130.18 129.43 128.07
6″ 126.80 129.87 128.18 124.88 124.58
3″ 128.81 127.61 127.08 128.14 127.98
5″ 128.81 127.61 127.08 127.26 127.85
4″ 126.61 131.37 130.95 125.07 127.97
Fig. 5. Comparison of experimental data in CDCl3 with
experimental solid state 13
C NMR shifts and theoretically
predicted shifts for the two possible conformers of 3a.
CONCLUSION
The catalytic efficiency of various sulfonic and
carboxylic acids in the direct acid catalyzed
conversion of 2-aminopyridines and acetophenones
into 2,3-disubstituted imidazo[1,2-a]pyridines was
tested aiming to improve the reaction yields. It was
observed that the carboxylic acids tested catalyzed
the transformation insignificantly, while the
sulfonic acids led to moderate to excellent yields. It
was found that isoquinoline-5-sulfonic acid was the
most efficient catalyst, up to 99% total yield. The
latter was applied in the reaction between
substituted aminopyridines and acetophenones.
Significant improvement of the reaction yield was
achieved in all cases compared to p-TSA and
sulfuric acid [33] but the ratios 2-aryl-3-(1-
arylethyl) to 2-aryl-3-(1-arylethenyl)imidazo[1,2-a]
pyridines were more similar to that obtained with
sulfuric acid, i.e. isoquinoline-5-sulfonic acid ace-
lerated the Ortoleva-King type intermediated
transformation better than p-toluenesulfonic acid.
Several chiral acids were also examined but no
enantioselectivity was induced. It was found that
(R)-1,1’-binaphthyl-2,2’-diyl hydrogen phosphate
was a very effective catalyst in the transformation
studied. Comparison of experimental and theore-
tically predicted NMR chemical shifts does not
allow assignment of the two observed species in the
solid state.
Acknowledgements: The financial support by The
Bulgarian Science Fund, projects UNA-17/2005
and DRNF-02-13/2009, is gratefully acknowledged.
REFERENCES
1. J. A. Joule, K. Mills, Heterocyclic Chemistry, 4th
Edition, Blackwell Publishing, Oxford, 2000,
Chapter 25, p. 489.
2. H. T. Swainston, G. M. Keating, CNS Drugs, 19, 65
(2005).
3. C. Enguehard-Gueiffier, A. Gueiffier, Mini-Rev.
Med. Chem., 7, 888 (2007).
4. D. Damour, C. Nemecek, P. Nemecek, S. Wentzler,
PCT Int. Appl. WO 2010007317, pp. 88 (2010).
5. J. A. Joule, K. Mills, Heterocyclic Chemistry, 5th
Edition, John Wiley & Sons Ltd, UK, 2010, Chapter
28, p. 539.
6. P. A. Bonnet, A. Michel, F. Laurent, C. Sablayrolles,
E. Rechencq, J. C. Mani, M. Boucard, J. P. Chapat, J.
Med. Chem., 35, 3353 (1992).
7. C. Hamdouchi, J. de Blas, M. del Prado, J. Gruber, B.
A. Heinz, L. Vance, J. Med. Chem., 42, 50 (1999).
8. W. M. El-Sayed, W. A. Hussin, Y. S. Al-Faiyz, M.
A. Ismail, Eur. J. Pharmacol., 715, 212 (2013).
9. M. Baumann, I. R. Baxendale, S. V. Ley, N. Nikbin,
Beilstein J. Org. Chem., 7, 442 (2011).
10. W. L. Mosby, Chem. Heterocycl. Compd., 15, 460
(1961).

V. Kurteva et al.: 2,3-Disubstituted imidazo[1,2-a]pyridines from 2-aminopyridines and acetophenones. Catalyst’s efficiency and …
52
11. K. Undheim, in: Comprehensive Heterocyclic
Chemistry I, A. R. Katritzky, C. W. Rees (Eds.), vol.
6, Pergamon, Oxford, 1984, p. 613.
12. A. S. Howard, in: Comprehensive Heterocyclic
Chemistry II, A. R. Katritzky, C. W. Rees (Eds.), vol.
8, Pergamon, Oxford, 1996, p. 249.
13. C. Hulme, Y.-S. Lee, Mol. Divers., 12, 1 (2008).
14. F. Couty, G. Evano, in: Comprehensive Heterocyclic
Chemistry III, A. R. Katritzky, C. W. Ramsden, E. F.
V. Scriven, R. J. K. Taylor (Eds.), vol. 11, chapter
10, Elsevier Ltd., 2008, p. 409.
15. H. Bienayme, K. Bouzid, Angew. Chem. Int. Ed., 37,
2234 (1998).
16. R. Akbarzadeh, G. Imani Shakibaei, A. Bazgir,
Monatsh. Chem., 141, 1077 (2010).
17. E. Kianmehr, M. Ghanbari, M. Nadiri Niri, R.
Faramarzi, J. Comb. Chem., 12, 41 (2010).
18. P. Liu, L.-s. Fang, X. Lei, G.-q. Lin, Tetrahedron
Lett., 51, 4605 (2010).
19. M. Adib, E. Sheikhi, N. Rezaei, Tetrahedron Lett.,
52, 3191 (2011).
20. S. Mishra, R. Ghosh, Synthesis, 3463 (2011).
21. I. R. Siddiqui, P. Rai, Rahila, A. Srivastava, S.
Shamim, Tetrahedron Lett., 55, 1159 (2014).
22. A. L. Rousseau, P. Matlaba, C. J. Parkinson,
Tetrahedron Lett., 48, 4079 (2007).
23. N. Chernyak, V. Gevorgyan, Angew. Chem. Int. Ed.,
49, 2743 (2010).
24. H. Huang, X. Ji, X. Tang, M. Zhang, X. Li, H. Jiang,
Org. Lett., 15, 6254 (2013).
25. J. Zeng, Y. J. Tan, M. L. Leow, X.-W. Liu, Org.
Lett., 14, 4386 (2012).
26. A. Maleki, Helv. Chim. Acta, 97, 587 (2014).
27. B. V. Subba Reddy, P. Sivaramakrishna Reddy, Y.
Jayasudhan Reddy, J. S. Yadav, Tetrahedron Lett.,
52, 5789 (2011).
28. Z.-G. Le, Z.-B. Xie, J.-P. Xu, Molecules, 17, 13368
(2012).
29. A. J. Stasyuk, M. Banasiewicz, M. K. Cyrański, D. T.
Gryko, J. Org. Chem., 77, 5552 (2012).
30. Z. Fei, Y.-p. Zhu, M.-c. Liu, F.-c. Jia, A.-x. Wu,
Tetrahedron Lett., 54, 1222 (2013).
31. Y.-L. Chang, H.-M. Wang, R.-S. Hou, I.-J. Kang, L.-
C. Chen, J. Chinese Chem. Soc., 57, 153 (2010).
32. V. B. Kurteva, L. A. Lubenov, D. V. Nedeltcheva, R.
P. Nikolova, B. L. Shivachev, Arkivoc, viii, 282
(2012).
33. V. B. Kurteva, L. A. Lubenov, D. V. Antonova, RSC
Adv., 4, 175 (2014).
34. Topspin 3.2 pl 5, Solid State NMR, AVANCE Solids
User Manual.
35. R. K. Harris, E. D. Becker, S. M. Cabral de Menezes,
P. Granger, R. E. Hoffman, K. W. Zilm, Pure Appl.
Chem., 80, 59 (2008).
36. P. Bertani, J. Raya, B. Bechinger, Solid State Nucl.
Magn. Reson., 2014, accepted.
37. www.wavefun.com.
38. A. V. Marenich, R. M. Olson, C. P. Kelly, C. J.
Cramer, D. G. Truhlar, J. Chem. Theory Comput., 3,
2011 (2007).
2,3-ДИЗАМЕСТЕНИ ИМИДАЗО[1,2-а]ПИРИДИНИ ОТ 2-АМИНОПИРИДИНИ И
АЦЕТОФЕНОНИ. ЕФЕКТИВНИ КАТАЛИЗАТОРИ И ЯМР ИЗСЛЕДВАНЕ В ТВЪРДО
СЪСТОЯНИЕ.
В. Б. Куртева*, Л. А. Любенов, С. Д. Симова†
Институт по Органична Химия с Център по Фитохимия, Българска Академия на Науките, ул. Акад. Г. Бончев,
бл. 9, 1113 София, България
Постъпила на 16 юни 2014 г.; Коригирана на 30 юни 2014 г.
(Резюме)
Проверена е ефективността на редица сулфо и карбоксилови киселини като катализатори в директно кисело
катализирано превръщане на 2-аминопиридини и ацетофенони в 2,3-дизаместени имидазо[1,2-a]пиридини с цел
подобряване на реакционните добиви. Най-ефективният катализатор е използван и при реакция между
заместени аминопиридини и ацетофенони. Дискутирани са ефективността на катализаторите и влиянието им
върху разпределението на продуктите. Изследвани са и хирални киселини, но стереоселективност не е
индуцирана. ЯМР спектрите показват наличие на две форми в твърдо състояние, чието надеждно отнасяне не е
възможно с наличните експериментални и теоретични данни.

53
Bulgarian Chemical Communications, Volume 46, Special Issue A (pp. 53 – 58) 2014
One-pot synthesis of a chromeno[4,3,2-de]-1,6-naphthyridine derivative from
4-chlorocoumarin-3-carbaldehyde
V. T. Angelova1, W. Frey
2, I. C. Ivanov
1*, N. Vassilev
3, T. N. Glasnov
4
1Faculty of Pharmacy, Medical University of Sofia, 2 Dunav str., 1000 Sofia, Bulgaria
2Institut für Organische Chemie, Universität Stuttgart, Pfaffenwaldring 55, D-70569 Stuttgart, Germany
3Institute of Organic Chemistry with Centre of Phytochemistry, Bulgarian Academy of Sciences, Acad. G. Bonchev str.,
bl. 9, 1113 Sofia, Bulgaria 4Christian Doppler Laboratory for Flow Chemistry and Institute of Chemistry, Karl-Franzens-University Graz,
Heinrichstrasse 28, A-8010 Graz, Austria
Received April 24, 2014; Revised July 16, 2014
Dedicated to Acad. Dimiter Ivanov on the occasion of his 120th
birth anniversary
In the reaction of 4-chlorocoumarin-3-carbaldehyde with malononitrile in the presence of piperidine a crystalline
piperidinium salt of a novel tetracyclic chromeno[4,3,2-de]-1,6-naphthyridine-2-carboxylic acid was isolated instead of
the expected product of the “tert-amino effect”. The structure of this piperidinium salt and its corresponding acidic form
was characterized through spectral methods (IR, NMR, MS) and elemental analysis. In addition, the structure was
established by means of X-ray crystallographic analysis. A theoretical multistep mechanism for this one-pot synthesis is
discussed.
Key words: 4-chlorocoumarin-3-carbaldehyde, chromeno[4,3,2-de]-1,6-naphthyridine, X-ray crystallographic analysis,
malononitrile
INTRODUCTION
In a previous paper we described some new
examples of the so-called “tert-amino effect” reac-
tion [1] starting from 4-chlorocoumarin-3-carbal-
dehyde and ethyl cyanoacetate as a CH-acid in the
presence of piperidine. This reaction occurred via
intermediate Knoevenagel condensation with the
formyl group and led to the formation of 1,2 fused
5H-chromeno[4,3-b]pyridin-5-ones of type 3 (Sche-
me 1). We found that under the same reaction
conditions but employing malononitrile in place of
ethyl cyanoacetate [2] the corresponding aminium
salts of 2-hydroxy-5-oxo-5H-chromeno [3,4-c]pyri-
dine-1-carbonitrile (4a,b) could be obtained. In
continuation of our interest in the development of
new and simple methods for the synthesis of poly-
functionally substituted heterocycles with antici-
pated biological activity [3] we now wish to report
the use of 4-chlorocoumarin-3-carbaldehyde (1) for
the one-pot synthesis of a new chromeno[4,3,2-de]-
1,6-naphthyridine (5a,b -Scheme 2).
Many known methods for the preparation of 5H-
chromeno[4,3-b]pyridine or 5H-chromeno[3,4-c]
pyridine derivatives involve coumarin derivatives
as starting compounds or intermediates, e. g. [4-6].
Further detailed information on the synthesis and
application of various 3,4-fused chromenopyridi-
nes is summarized in two review articles [3,7] and a
recent paper [8]. We have also developed some
synthetic procedures leading to the formation of
substituted 5H-chromeno[4,3-b]pyridines via
Knoevenagel condensation [9], via Wittig reaction
followed by Vilsmeier conditions [10], or even via
the Erlenmeyer-Ploechl reaction [11], all of them
starting from coumarin-3-carbaldehydes. The pre-
paration of some novel 5H-chromeno[3,4-c]pyri-
dines was also reported by us [12,13].
O
Cl
O
CHO
+ CH2(CN)2 +
1 2a n = 1
2b n = 2
HNn
O O
NCN
CN
n
3
NC
O O
N
O
4a n = 1
4b n = 2
NH
H
n
Scheme 1. Reaction of 4-chlorocoumarin-3-carbalde-
hyde (1) with malononitrile, cf. [1,2].
The synthesis of some [1]benzopyrano[4,3-b]
pyrrol-4(1H)-ones from 4-chlorocoumarin-3-carb-
© 2014 Bulgarian Academy of Sciences, Union of Chemists in Bulgaria
* To whom all correspondence should be sent:
E-mail: [email protected]

V. Angelova et al.: One-pot synthesis of a chromeno[4,3,2-de]-1,6-naphthyridine derivative from 4-chlorocoumarin-3-carbaldehyde
54
aldehyde (1) has also been described [14]. An
efficient preparation of novel chromeno-2,6,9-tri-
oxabicyclo-[3.3.1]nonadiene scaffolds was per-
formed by mild base mediated reaction of 4-chloro-
3-formylcoumarin (1) and o-hydroxy-acetopheno-
nes [15]. The synthesis of some novel chromeno
[4,3-b]pyridine-2,5-diones with antimicrobial acti-
vity was reported recently, starting from 4-chloro-
3-formylcoumarin (1) and acetoacetamides in poly-
ethylene glycol as a recoverable solvent [16].
1
4
5
O O
Cl
O
NH
+ +- HCl
O
OOC
N
N
CN
NH2
N
H H
. 2H2OCN
NC
1
5a
2a
HCl / H2O
O
HOOC
N
N
CN
NH2
or
O
OOC
N
N
CN
NH3
5b (H-form)
11
Scheme 2. Synthesis of 5-amino-4-cyanochromeno-
[4,3,2-de]-1,6-naphthyridine-1-carboxylic acid (5) – as
piperidinium salt (5a) and the acidic form (5b).
EXPERIMENTAL
General Remarks
The FTIR spectra were recorded on a Nicolet
iS10 FT-IR Spectrometer from Thermo Scientific
(USA) using ATR technique. The NMR experi-
ments on Bruker Avance II+ 600 MHz NMR spec-
trometer in DMSO-d6 allow the assignment of the
structures. The precise assignment of the 1H and
13C
NMR spectra (resolved signals) was accomplished
by measurement of 2D homonuclear correlation
(COSY), DEPT-135 and 2D inverse detected hete-
ronuclear (C–H) correlations (HMQC and HMBC).
LC-MS: Shimadzu LC-MS 2020 (ESI detector)
equipped with a C18 reversed-phase analytical
column at 37°C using a mobile phase H2O-MeCN
[90:10 (v/v)] + 0.1% HCOOH. Elemental analyses
were performed by the Microanalytical Laboratory,
Institute of Chemistry, University of Vienna,
Austria. TLC: silica gel 60 GF254 Merck pre-coated
aluminum sheets, eluted by hexane-chloroform-
acetone 5:3:2 (vol. parts); the spots were visualized
under UV irradiation ( = 254 nm) and/or by
treatment with I2 (vapor).
Piperidinium 5-amino-4-cyanochromeno[4,3,2-
de]-1,6-naphthyridine-1-carboxylate dihydrate (5a)
Drawn on Scheme 2. To a solution of 1.04 g (5.0
mmol) of 4-chlorocoumarin-3-carbaldehyde (1)
(prepared according to lit. [10,17]) and 0.66 g (10
mmol) of malononitrile in 20 ml of anhydr. ethanol,
1.08 ml (0.93 g; 10.9 mmol) of piperidine (2a) was
added dropwise for 5 min under vigorous stirring at
20-25°C. The reaction mixture turned into a red
solution and after stirring for additional 15 min
orange-yellow crystals of compound 4a separated.
This product was reported elsewhere [2]. The
separated crystals were filtered, recrystallized from
ethanol (2 × 10 ml) and air-dried to yield 0.45 g
(28%) of 4a with m.p. 255-256°C.
After a 12 h stay at room temperature a yellow
solid crystallized from the ethanolic filtrate. It was
filtered, washed with cold ethanol (2 × 10 ml) and
air-dried to yield 0.89 g (41%) of crystalline, TLC
homogeneous product 5a. A small sample for X-ray
analysis was additionally recrystallized from etha-
nol to give yellow crystals of 5a with m.p. 206.5-
207.3°C, insoluble in chloroform. FTIR (ATR):
(cm-1
) = 3460 (OH/NHassoc.), 3056 (Ar-H), 3200-
2400 (NHassoc.), 2210, 2168, 2144 (CN), 1733 (w)
(C=O), 1591, 1557, 1514, 1491, 1444, 1258, etc. 1H
NMR (600 MHz, DMSO-d6): δ (ppm) = 1.62-1.56
(m, 2H, 4’-H), 1.61-1.65 (m, 4H, 3’-H and 5’-H),
3.00-3.02 (m, 4H, 2’-H and 6’-H), 7.42 (dd, J3 =
8.3 Hz, J4 = 1.2 Hz, 1H, 8-H), 7.45 (ddd, J
4 = 1.2
Hz, J3 =7.2 Hz, J
3 =8.3 Hz, 1H, 10-H), 7.70 (ddd, J
4
= 1.3 Hz, J3 =7.2 Hz, J
3 = 8.3 Hz, 1H, 9-H), 8.22
(bs, 2H, NH), 8.84 (s, 1H, 2-H), 8.98 (dd, J3 = 8.3
Hz, J4 = 1.3 Hz, 1H, 11-H).
13C NMR (150 MHz,
DMSO-d6): δ (ppm) = 21.6 (C-4’), 22.3 (C-3’ and
C-5’), 43.8 (C-2’ and C-6’), 83.1 (C-4), 106.0 (C-
11c), 115.4 (C-11a), 117.5 (CN), 118.0 (C-8), 119.1
(C-1), 120.5 (C-11b), 124.5 (C-10), 125.3 (C-11),
133.6 (C-9), 144.0 (C-7a), 152.7 (C-6a), 154.1 (C-
2), 158.6 (C-3a), 166.3 (C=O). Calcd. for
C21H19N5O3 (389.41) (water loss on drying): C
64.77, H 4.92, N 17.98; found C 64.70, H 4.49, N
17.80.
5-Amino-4-cyanochromeno[4,3,2-de]-1,6-
naphthyridine-1-carboxylic acid (5b)
Drawn on Scheme 2. After acidification of the
aqueous solution of 2b (0.15 g in 50 ml of water)
with HCl (to pH ≈ 2) compound 5b was isolated as
yellow powder with m.p. 313°C (dec.), insoluble in
chloroform. FTIR (ATR): (cm-1
) = 3489 and 3415
(NH2), 3086 (Ar-H), 2210, 2190 (CN), 1714 (s,
C=O), 1589 (s), 1570 (m), 1444, 1423 (w), 1261
(s), 1207 (m), etc. H-Form: 1H NMR (600 MHz,
DMSO-d6): δ (ppm) = 7.42 (dd, J3 = 8.3 Hz, J
4 =
1.2 Hz, 1H, 8-H), 7.45 (ddd, J3 = 7.2 Hz, J
3 = 8.3
Hz, J4 = 1.2 Hz, 1H, 10-H), 7.70 (ddd, J
3 =7.2 Hz,
J3 = 8.3 Hz, J
4 = 1.3 Hz, 1H, 9-H), 8.84 (s, 1H, 2-

V. Angelova et al.: One-pot synthesis of a chromeno[4,3,2-de]-1,6-naphthyridine derivative from 4-chlorocoumarin-3-carbaldehyde
55
H), 8.97 (dd, J3 = 8.3 Hz, J
4 = 1.3 Hz, 1H, 11-H).
8.97 (dd, Hz, 1H, 8-H), 8.84 (s, 1H, 2-H), 7.70 (mc,
1H, 9-H), 7.41-7.46 (m, 2H, 10-H and 11-H). 13
C
NMR (150.9 MHz, DMSO-d6): δ (ppm) = 83.2 (C-
4), 106.0 (C-11c), 115.4 (C-11a), 117.5 (CN), 118.0
(CHarom.,C-8), 119.1 (C-1), 120.5 (C-11b), 124.5
(CHarom., C-10), 125.4 (CHarom., C-11), 133.6
(CHarom., C-9), 144.1 (C-7a), 152.7 (C-6a), 154.0
(CHarom.,C-2), 158.6 (C-3a), 166.1 (C=O).
C16H8N4O3 (304.26). LC-MS (ESI, pos. mode): m/z
= 425 [M–CO2 + 4MeCN + H]+, 343 [M–CO2 +
2MeCN + H]+, 327 [M + Na]+.
Crystal structure determination of compound 5a
(Table 1)
Data collection: Bruker APEX II Software Suite,
2008; cell refinement: Bruker APEX II Software
Suite, 2008; data reduction: Bruker APEX II
Software Suite, 2008; program used to solve
structure: SHELXS-97 [18]; program used to refine
structure: SHELXL-97 [19]; molecular graphics:
SHELXTL-Plus, XP [20].
X-ray single-crystal diffraction data were
collected on a Bruker Kappa APEX II Duo
diffractometer (Bruker AXS GmbH, Karlsruhe,
Germany), using graphite monochromatized MoKα
radiation (λ = 0.71073 Å). A single crystal, coated
with perfluorinated oil, was mounted on a teflon
loop. Unit cell parameters, obtained by indexing the
peaks in the first 36 frames, were refined by
employing the whole data set. All frames were
integrated and corrected for Lorentz and polari-
zation effects. The crystal was measured at low
temperature [100 (2) K]. The structure was solved
by direct method using SHELXS-97 [18]. Refine-
ment was evaluated on F2 against all reflections.
The weighted R-factor wR and goodness of fit S are
based on F2, conventional R-factors R are based on
F, with F set to zero for negative F2. The threshold
expression of F2 > 2(F
2) is used only for calcu-
lating R-factors (gt) etc. and is not relevant to the
choice of reflections for refinement. R-factors
based on F2 are statistically about twice as large as
those based on F, and R-factors based on all data
will be even larger. All nonhydrogen atoms were
located and refined anisotropically by full-matrix
least squares using SHELXL-97 [19]. The carbon
bonded hydrogen atoms were placed in idealized
positions. The nitrogen bonded hydrogen atoms
were found in the final difference Fourier map and
were allowed to refine freely with isotropic
displacement para-meters. For the preparation of
the structural images the program SHELXTL-Plus
[20] was used. The deposition number CCDC
992210 contains the supplementary crystallo-
graphic data for this paper. These data can be
obtained free of charge from the CCDC via
www.ccdc.cam.ac.uk/data_request/cif.
Table 1. Crystal data, data collection and structure
refinement details for 5a. Chemical formula C16H7N4O3·C5H12N·2(H2O)
Mr 425.44 Crystal system, space
group Triclinic, Pī
Temperature (K) 110
a, b, c (Å) 8.3890 (5), 10.9439 (7),
11.6018 (8)
, , (°) 98.979 (4), 96.261 (3),
109.626 (3) V (Å
3) 975.93 (11)
Z 2 Radiation type Mo K
(mm-1
) 0.11 Crystal size (mm) 0.16 × 0.13 × 0.10
Data collection
Diffractometer Bruker Kappa APEX II Duo
difractometer Absorption correction Multi-scan Blessing, 1995
Tmin, Tmax 0.717, 0.747 No. of measured,
independent and
observed [I > 2(I)]
reflections
28545, 3992, 3091
Rint 0.035 (sin /)max (Å
-1) 0.628
Refinement R[F
2 > 2(F
2)],
wR(F2), S
0.043, 0.109, 1.05
No. of reflections 3992 No. of parameters 310 No. of restraints 3
H-atom treatment H atoms treated by a mixture
of independent and
constrained refinement Δρmax, Δρmin (e Å
-3) 0.32, -0.23
RESULTS AND DISCUSSION
The IR spectra of 5a displays a split band for
cyano group in the range 2144-2210 cm-1
and a
carbonyl band at 1733 cm-1
. The acidic form 5b
shows absorption at 3489 and 3415 cm-1
for
primary amino group whereas the cyano group
absorbs at 2210 and 2190 cm-1
. In the 1H NMR
spectrum of 5a a typical singlet for 2-H is observed
at = 8.84 ppm (same shift in the H-form 5b) as
are the corresponding multiplets for five methylene
groups due to the piperidinium ion. Both 13
C NMR
spectra of 5a,b contain the same 13
C signals due to
the anionic part of 5a,b, i.e. the only difference

V. Angelova et al.: One-pot synthesis of a chromeno[4,3,2-de]-1,6-naphthyridine derivative from 4-chlorocoumarin-3-carbaldehyde
56
between them is the cationic moiety. The assigned 13
C NMR signals are close to those of compounds
5c,d described by O'Callaghan [21]. The single
crystal X-ray crystallography (Table 1) confirmed
the structure of the product 5a (Fig. 1; crystallo-
graphic numbering) [Cambridge Crystallo-graphic
Data Centre (CCDC): deposit No. 992210].
(a)
(b)
Fig. 1. ORTEP representation of the molecular structure
of 5a in the solid state with displacement ellipsoids at the
50% probability level: (a) whole structure; (b) anion
only.
We suggest the following mechanistic sequence
for the formation of 5a: As an initial step, the base-
catalyzed dimerization of malononitrile [22,23] into
2-amino-1-propene-1,1,3-tricarbonitrile (6) could
be assumed (Scheme 3). This dimer has attracted a
great deal of interest due to its wide applications in
the field of heterocyclic synthesis [24]. The reagent
was used for the synthesis of pyridines, pyrimi-
dines, pyridazines, thiophenes, thiazoles and their
analogs with diverse pharmaceutical activities
including against neurological disorders, as recep-
tor antagonists, as antidiabetics, tubulin inhibitors,
kinase inhibitors and anticancer agents [25,26].
CN
CN2
CN
CNH2N
NCbase
2a
6 Scheme 3. Dimerization of malononitrile.
The next step of the suggested mechanism
(Scheme 4) is the nucleophilic addition of the tri-
nitrile 6 to the chloroaldehyde 1 accompanied by
elimination of HCl. Further, heterocyclisation to the
benzopyrano[4,3-b]pyridine derivative 7 is follo-
wed by lactone ring opening, re-cyclizing to 2-
aminochromene and finally closing of the new py-
ridine ring to give thе stable carboxyllic acid 5b
which readily transforms into the crystallizing
piperidinium salt 5a.
21
4
5
- HCl - H2O
CN
CN
NH2
N
O
HOOC
COOH
N
OH
C(CN) 2
NC
OH2
N
OO
C(CN)2
NC
NC CN
NH2
O
NC
OO
HH
N+
NH2
CN
N
N
-OOC
O
NH
NH2
CN
N
N
HOOC
O
CN
NH2
NC CN
O
Cl
OO
5a
• 2 H2O
1
+
7
6
5b
CN
CN
CN
N
OH
HOOC
/ H2O
Scheme 4. Suggested mechanism for the formation of
compounds 5a,b.
Stable adducts, relevant to 7, were prepared
from salicylaldehyde and malononitrile and were
reported earlier [21,27]. They were used for the
synthesis of the already known [l]benzo-pyrano
[4,3,2-de][1,6]naphthyridine derivatives 5c,d (Fig.
2). The synthetic pathway for these compounds, as
described by O'Callaghan [21], differs substantially
from that of 5a,b reported here. The essential
difference here is that we used 4-chlorocoumarin-3-
carbaldehyde (1) as starting material in the presence
of piperidine. As a result, a 1-carboxylated
compound 5a without any substituent at position 2
and getting stabilized as a piperidinium salt was
formed.
Shaker [28] reported the synthesis of some
benzo[5,6]chromeno[4,3,2-de][1,6]naphthyridines,
related to 5a-d, starting from a 1H-benzo-[f]
chromene trinitrile derivative with CH-acids in
order to obtain a series of polyfunctionally sub-
stituted heterocyclic compounds with expected
biological activity.

V. Angelova et al.: One-pot synthesis of a chromeno[4,3,2-de]-1,6-naphthyridine derivative from 4-chlorocoumarin-3-carbaldehyde
57
O N
N
CN
NH2
X
Y
5 c X = CN, Y = NH2
5 d X = COOCH3, Y = CH3
Fig. 2. Known chromeno[4,3,2-de][1,6]naphthyridine
derivatives 5c,d.
CONCLUSION
We developed a rare example of heterocyclic
synthesis where a multiply substituted tetracyclic
system 5a,b arises directly in one reaction vessel as
a main product. The proposed domino type
mechanism (Scheme 4) is based on several one-step
processes that are already known from the
literature. The possibility the final product to
stabilize as a piperidinium salt is obviously an
important driving force for this complex multi-step
synthetic route to proceed.
Full spectral characterization (IR, NMR and
MS) is presented. In addition, suitable crystals of
compound 5a were successfully prepared in order
crystallographic X-ray analysis to be carried out
(see Table 1 for major X-ray data). Thus, the
molecular structure of the product 5a is unam-
biguously proven. The acidic form (compound 5b)
of the isolated piperidinium salt has also been
characterized.
Acknowledgements: The financial support by the
National Research Fund of Bulgaria (Projects
UNA-17/2005 and DRNF-02/13) is gratefully
acknowledged.
REFERENCES
1. I. C. Ivanov, T. N. Glasnov, F. Belaj, J. Heterocycl.
Chem., 45, 177 (2008).
2. I. C. Ivanov, V. T. Angelova, I. Tiritiris, T. N.
Glasnov, J. Heterocycl. Chem. (2014); doi 10.1002/
jhet.2103.
3. L. J. Núñez-Vergara, J. A. Squella, P. A. Navarrete-
Encina, E. Vicente-García, S. Preciado, R. Lavilla
(Review article), Curr. Med. Chem., 18, 4761 (2011).
4. K. Tabaković, I. Tabaković, N. Ajdini, O. Leci,
Synthesis, 308 (1987).
5. D. Heber, Arch. Pharm. (Weinheim), 320, 577
(1987).
6. G. E. H. Elgemeie, A. H. H. Elghandour, Bull. Chem.
Soc. Jpn., 63, 1230 (1990).
7. M. Darbarwar, V. Sundaramurthy (Review article),
Synthesis, 337 (1982).
8. V. O. Iaroshenko, F. Erben, S. Mkrtchyan, A.
Hakobyan, M. Vilches-Herrera, S. Dudkin, A.
Bunescu, A. Villinger, V. Y. Sosnovskikh, P. Langer,
Tetrahedron, 67, 7946 (2011).
9. I. C. Ivanov, S. K. Karagiosov, M. F. Simeonov,
Liebigs Ann. Chem., 203 (1992).
10. D. Heber, I. C. Ivanov, S. K. Karagiosov, J.
Heterocycl. Chem., 32, 505 (1995).
11. I. C. Ivanov, T. N. Glasnov, D. Heber, J. Heterocycl.
Chem., 42, 857 (2005).
12. I. C. Ivanov, L. D. Raev, Liebigs Ann. Chem., 1107
(1987).
13. L. D. Raev, I. C. Ivanov, W. Frey, H. Astroug, S. G.
Agontseva, in preparation.
14. A. Alberola, L. Calvo, A. González-Ortega, A. P.
Encabo, M. Carmen Sañudo, Synthesis, 1941 (2001).
15. J. S. Reddy, K. A. Solomon, G. Gayatri, M. Shukla,
K. Dorai, G. Gopikrishna, Tetrahedron, 69, 2142
(2013).
16. J. S. Reddy, K. A. Solomon, J. V. Prasad, G. S.
Kumar, G. Munusswamy-Ramanujam, G.
Gopikrishna, J. Chem. Sci., 126, 187 (2014).
17. T. Steinführer, A. Hantschmann, M. Pietsch, M.
Weißenfels, Liebigs Ann. Chem., 23 (1992).
18. G. M. Sheldrick, SHELXS-97, Program for the
Solution of Crystal Structures, University of
Göttingen, Göttingen (Germany) 1997. See also: G.
M. Sheldrick, Acta Crystallogr., A46, 467 (1990).
19. G. M. Sheldrick, SHELXL-97, Program for the
Refinement of Crystal Structures, University of
Göttingen, Göttingen (Germany) 1997. See also: G.
M. Sheldrick, Acta Crystallogr., A64, 112 (2008).
20. G. M. Sheldrick, SHELXTL-Plus. Structure Determi-
nation Software Suite. Release 4.1. Siemens Analyti-
cal Systems Inc., Madison, Wisconsin, USA 1991.
21. C. N. O'Callaghan, T. B. H. McMurry, J. E. O'Brien,
J. Chem. Soc. Perkin Trans. 1, 417 (1995).
22. R. A. Carboni, D. D. Coffman, E. G. Howard, J. Am.
Chem. Soc., 80, 2838 (1958).
23. M. Mittelbach, Monatsh. Chem. / Chem. Monthly,
116, 689 (1985).
24. N. M. Helmy, F. E. M. El-Baih, M. A. Al-Alshaikh,
M. S. Moustafa, Molecules, 16, 298 (2011).
25. R. M. Mohareb, H. E. Moustafa, Acta Pharm., 61, 51
(2011); and the references cited therein.
26. R. M. Mohareb, D. H. Fleita, O. K. Sakka,
Heterocycl. Commun., 17, 25 (2011); and the
references cited therein.
27. R. Ghorbani-Vaghei, Z. Toghraei-Semiromi, R.
Karimi-Nami, J. Braz. Chem. Soc., 22, 905 (2011).
28. R. M. Shaker, ARKIVOC, xiv, 59 (2006).

V. Angelova et al.: One-pot synthesis of a chromeno[4,3,2-de]-1,6-naphthyridine derivative from 4-chlorocoumarin-3-carbaldehyde
58
ЕДНОСТЪПКОВ СИНТЕЗ НА ХРОМЕНО[4,3,2-d,e]-1,6-НАФТИРИДИНОВО
ПРОИЗВОДНО ОТ 4-ХЛОРОКУМАРИН-3-КАРБАЛДЕХИД
В. T. Ангелова1, В. Фрай
2, И. Х. Иванов
1*, Н. Василев
3, Т. Н. Гласнов
4
1 Фармацевтичен факултет, Медицински университет - София, ул. Дунав 2, 1000 София, България
2Институт по органична химия на Университета в Щутгарт, ул. Пфафенвалдринг 55, D-70569 Щутгарт,
Германия 3Институт по Органична химия с Център по Фитохимия, Българска Академия на Науките, ул. Акад. Г. Бончев,
бл. 9, 1113 София, България 4Лаборатория „Кристиан Доплер” за Flow химия и Институт по химия на Университета „Карл Франц” -
Грац, Хайнрихщрасе 28, A-8010 Грац, Австрия
Постъпила на 24 април 2014 г.; Коригирана на 16 юли 2014 г.
(Резюме)
Изолирана е пиперидиниевата сол на едно ново тетрациклично производно на хромено[4,3,2-d,e]-1,6-
нафтиридина вместо очаквания продукт на "трет-амино ефект" при взаимодействие на 4-хлорокумарин-3-
карбалдехид с малононитрил в присъствие на пиперидин. Молекулният строеж на пиперидиниевата сол и на
съответната Н-форма е охарактеризиран чрез спектрални методи (ИЧ, ЯМР, МС) и елементен анализ.
Структурата е допълненително потвърдена и с помощта на рентгеноструктурен кристалографски анализ.

59
Bulgarian Chemical Communications, Volume 46, Special Issue A (pp. 59 – 64) 2014
Rose hip extract synergistically increase antioxidant activity of fruit and herb extracts
M. G. Kratchanova1*
, P. N. Denev1,2
, C. G. Kratchanov2
1Laboratory of biologically active substances, Institute of Organic Chemistry with Centre of Phytochemistry, Bulgarian
Academy of Sciences, 139 Ruski blvd., 4000 Plovdiv, Bulgaria
2ITC – Innovative-Technological Centre Ltd., 20 D-r G.M. Dimitrov str., 4000 Plovdiv, Bulgaria
Received May 20, 2014; Revised June 12, 2014
Dedicated to Acad. Dimiter Ivanov on the occasion of his 120th
birth anniversary
In the current study, we investigated the possibility to use rosehip extract for synergistic elevation of the antioxidant
activity of fruit and herb extracts. The obtained rosehip extract was characteristic with very high antioxidant activity
measured by the ORAC method and the addition of the extract to chokeberry, blackberry, blackcurrants or elderflower
extracts increased significantly their antioxidant activity. Moreover, there was synergistic effect in ORAC antioxidant
activity of the mixed extracts that reached up to 64%. The removal of rosehip polysaccharides inhibited the synergistic
effect, indicating that rosehip pectic polysaccharides are at least partially involved in the observed synergism. This
opens the possibility to develop rosehip based functional beverages with increased antioxidant activity.
Key words: rosehip, synergism, antioxidant activity, ORAC, fruit, herbs
INTRODUCTION
Increasing amount of evidence indicates the role
of reactive oxygen species (ROS) and reactive
nitrogen species (RNS) in the pathophysiology of
ageing and in the development of degenerative
chronic diseases [1,2]. In human body, there is a
protective antioxidant system, which impairs
oxidative damage and keeps balance between pro-
oxidants and antioxidants. However, because of
many factors related to the modern way of life the
balance is often broken which lead to a physio-
logical state known as oxidative stress. In such
cases to maintain the oxidative balance, an external
intake of antioxidant with the diet is required. The
definition for antioxidants depends on their applica-
tion and probably the most widely accepted defini-
tion is “any substance that, when present at low
concentration compared with those of an oxidizable
substrate, significantly delays or prevents oxidation
of that substrate” [3]. In food science, term anti-
oxidant has a broader meaning. From one hand,
antioxidants are substances that prevent rancidity of
foods. On the other hand, these compounds admi-
nistered with the diet decrease the detrimental
effects of ROS and RNS in our bodies [4]. Diet
derived antioxidants include free radical scaven-
gers, metal ion chelators, oxidative enzymes inhibi-
tors, and cofactors of antioxidant enzymes. Stu-
dying antioxidants in foods is an important issue
because of several reasons: Endogenous or added to
foods antioxidants prevent food components from
oxidation; Antioxidants taken with the diet are
absorbed in human body and exert their beneficial
effects in vivo. This undoubtedly was found for
vitamin E and vitamin C [5], but more and more
collected evidence indicates the same for poly-
phenol compounds [6]. It is quite often that
compound with antioxidant activity taken with the
diet reveals other health benefits like antiinflamma-
tory effect, antiischemic effect, etc., besides
antioxidant activity; Since absorption of phenolic
compounds is incomplete, the majority passes
through the gastro-intestinal tract (GIT) and enters
the colon. Their local action may nevertheless be
important because the intestine is particularly
exposed to oxidizing agents and may be affected by
inflammation and numerous diseases such as
cancer. The diet contains various prooxidants,
which may induce oxidative stress in the GIT, to
induce stomach ulcer and develop stomach, colon,
and rectal cancers [7].
The majority of antioxidants taken with the diet
are of plant origin and fruit, vegetables, and herbs
are the richest sources of natural antioxidants. The
most important antioxidants in plants are poly-
phenols including flavonoids, carotenoids, vitamin
C, vitamin E, etc. [1,2,8]. There are numerous
studies in the literature demonstrating the correla-
tion between consumption of fresh fruits and vege-
tables with the prevention of socially significant
diseases including cancer, cardiovascular diseases,
© 2014 Bulgarian Academy of Sciences, Union of Chemists in Bulgaria
* To whom all correspondence should be sent:
E-mail: [email protected]

M. G. Kratchanova et al.: Rose hip extract synergistically increase antioxidant activity of fruit and herb extracts
60
Alzheimer disease, etc. [9,10]. Several epidemio-
logic studies point out that the consumption of
polyphenol-rich foods and beverages is associated
with lower risk of oxidative stress-related diseases
[9,11]. At the laboratory of biologically active sub-
stances, Institute of Organic Chemistry with Centre
of Phytochemistry, we are dedicated to the develop-
ment of functional foods, rich in natural anti-
oxidants. In searching of suitable raw materials for
functional beverages, we previously investigated
the antioxidant activity of 26 Bulgarian fruits [12].
Rosehip appeared to be among the fruits with the
highest antioxidant activity and suitable raw
material for production of functional foods with
antioxidant activity. From the literature, it is known
that often plant extracts consisting of several herbs
or fruits exert synergistic effect in their antioxidant
activity [13]. Synergism is defined as „interaction
between two or more entities, factors, substances,
etc. that produces an effect greater than the sum of
their individual effects”. In the current study, we
decided to further explore the applicability of
rosehip fruits for the production of mixed herb and
fruit extracts with synergistic action in the
antioxidant activity. Therefore, the aim of the
current work was to investigate the synergism in
the antioxidant activity of fruit (chokeberry,
blackberry, blackcurrants) and herb extracts
(elderflowers) mixed with rosehip fruit extract.
EXPERIMENTAL
Plant materials
All fruit and herb samples were collected from
the region of Rhodopi mountain in the stage of full
maturity in 2012. The following fruits were used:
rosehip, chokeberry, blackcurrant and blackberry.
Chokeberries were cultivated, while other fruits
were widely collected in the nature. Fresh fruits
were frozen immediately and freeze dried in a
Cryodos-50 laboratory freeze drier (Telstar
Industrial, Spain). Elderflowers (Sambucus nigra)
were collected from the region of Ravnogor
(Rhodopi mountain) in 2012. Fresh flowers were
dried at room temperature and dry drug was stored
in paper bags at ambient temperature prior to
analysis.
Extraction
Plant materials were subjected to extractions
under the following conditions:
Fruits: 70 g fruits (rosehip, chokeberry, black-
currant or blackberry) were mixed with 200 ml
warm water (60˚С). Mixtures were homogenized at
turbulent conditions and remained at ambient
temperature for overnight. After that mixtures were
centrifuged (6 000 x g) and supernatants were
collected for antioxidant activity determination.
Elderflowers: 1 g of dried elderflowers were
mixed with 100 ml warm water (60˚С) Mixture
was infused at room temperature for 24 hours,
centrifuged (6 000 x g) and supernatant was
collected for antioxidant activity determination.
Removal of rosehip extract polysaccharides
Rosehip extract polysaccharides were removed
via the following procedure: 100 ml extract were
mixed with 300 ml 96% ethanol. The mixture was
left in refrigerator overnight and centrifuged (6000
x g). The clear supernatant without polysaccharides
was collected and investigated for antioxidant
activity. Precipitated polysaccharides were collec-
ted and dried in a laboratory dryer.
Antioxidant activity
Oxygen Radical Absorbance Capacity (ORAC)
assay: ORAC was measured according to the
method of Ou et al. [14] with some modifications
described in details by Denev et al. [15]. The
method measures the antioxidant scavenging
activity against peroxyl radical generated by ther-
mal decomposition of 2,2’-azobis[2-methyl-pro-
pionamidine] dihydrochloride (AAPH) at 37°C.
Fluorescein (FL) was used as the fluorescent probe.
The loss of fluorescence of FL was an indication of
the extent of damage from its reaction with the
peroxyl radical. The protective effect of an anti-
oxidant was measured by assessing the area under
the fluorescence decay curve (AUC) relative to that
of a blank in which no antioxidant has been present.
Solutions of AAPH, fluorescein and trolox were
prepared in a phosphate buffer (75 mmol/l, pH 7.4).
Samples were diluted in the phosphate buffer as
well. Reaction mixture (total volume 200 μl) con-
tained FL - (170 μl, final concentration 5.36x10⁻⁸
mol/l), AAPH - (20 μl, final concentration 51.51
mmol/l), and sample - 10 μl. The FL solution and
sample were incubated at 37°C for 20 min directly
in a microplate reader, and AAPH (dissolved in
buffer at 37°C) was added. The mixture was
incubated for 30 s before the initial fluorescence
was measured. After that, the fluorescence readings
were taken at the end of every cycle (1 min) after
shaking. For the blank, 10 μl of phosphate buffer
were used instead of the extract. The antioxidant
activity was expressed in micromole trolox

M. G. Kratchanova et al.: Rose hip extract synergistically increase antioxidant activity of fruit and herb extracts
61
equivalents (µmol TE) per liter of extract. Trolox
solutions (6.25; 12.5; 25 and 50 μmol/l) were used
for defining the standard curve. ORAC analyses
were carried out using a FLUOstar OPTIMA plate
reader (BMG Labtech, Germany), excitation
wavelength of 485 nm and emission wavelength of
520 nm were used.
Statistics
All antioxidant activity tests were repeated 4
times. The results are expressed as means ±
standard deviation (SD).
RESULTS AND DISCUSSION
The Oxygen Radical Absorbance Capacity
(ORAC) antioxidant activity of the investigated
fruit and herb mixed extracts is presented in Table
1. It is evident from the results that the obtained
rosehip extract and mixed extracts are very rich
source of natural antioxidants, rendering very high
ORAC values. In one of the first attempts to quan-
tify dietary antioxidant needs of the body, Prior et
al. [16] demonstrated that consumption of certain
berries and fruits such as blueberries, mixed grape
and kiwifruit was associated with increased ORAC
plasma antioxidant capacity in the postprandial
state. They estimated that according to the energy
intake of the diet, 5000-15000 μmol TE are
necessary to cover human daily antioxidant needs.
This indicates that the obtained mixed extracts in
our study could serve as functional beverage with
high antioxidant activity. For example, only 100 ml
of rosehip extract will supply the body with more
than 13000 ORAC units. Furthermore, we observed
a synergistic effect in the antioxidant activity of the
fruit and herb extracts, when mixed with rosehip
extract. The effect was concentration-dependent
and was up to 64% in the case of mixed rosehip-
blackberry extract. The observed synergistic effect
opens new possibilities for the production of novel
functional foods with increased antioxidant activity.
The used fruits and elderflower contain various
components with antioxidant activity [7], which
could be one of the reasons for the observed syner-
gistic effect. There are reports in the literature that
compounds with antioxidant exert synergism in
their action when acting together. For example, the-
re was synergism in the common antioxidant acti-
vity of β-carotene and α-tocopherol [17]. In another
study synergistic effect expressed as elevated lipid
peroxidation inhibiting activity was observed for α-
tocopherol and quercetin, and quercetin with rutin
[18]. Significant synergistic effect was found also
between the action of lycopene-lutein, lycopene-β-
carotene, and α-tocopherol-β-carotene [19].
Table1. Synergism between rosehip extract and fruit and herb extracts.
Extracts Ratio, % ORAC, µmolTE/l
(experimental)
ORAC, µmolTE/l
(expected)
synergism,
% Rosehip Chokeberry
100 0 132408.8 ± 4058.2 na na
0 100 15429.2 ± 1405.2 na na
75 25 121429.4 ± 6504.2 103163.9 17.7
50 50 92725.8 ± 6504.2 73919.0 25.4
25 75 51937.2 ± 2987.6 44674.1 16.3
Rosehip Blackberry
100 0 134889.6 ± 5049.6 na na
0 100 12463.0 ± 985.2 na na
75 25 118570.7 ± 5012.3 104283.0 13.7
50 50 91097.9 ± 3456.2 73676.3 23.6
25 75 70614.1 ± 4022.2 43069.6 64.0
Rosehip Blackcurrants
100 0 134889.6 ± 5049.6 na na
0 100 12463.0 ± 1012.8 na na
75 25 125698.3 ± 5069.8 103836.1 21.1
50 50 102088.1 ± 3985.6 72782.7 40.3
25 75 58014.7 ± 3046.7 41729.2 39.0
Rosehip Elderflower
100 0 126953.9 ± 5056.3 na na
0 100 6213.8 ± 456.2 na na
75 25 109138.4 ± 4834.4 96768.8 12.8
50 50 77050.6 ± 3695.8 66583.8 15.7
25 75 43820.8 ± 2865.7 36398.8 20.4 na – not applicable

M. G. Kratchanova et al.: Rose hip extract synergistically increase antioxidant activity of fruit and herb extracts
62
Table2. Synergism between chokeberry extract, elderflower extract and rosehip extract with removed
polysaccharide fraction.
Extracts Ratio, % ORAC, µmolTE/l
(experimental)
ORAC, µmolTE/l
(expected)
synergism,
% Rosehip without
polysaccharide Chokeberry
100 0 68635.6 ± 3089.9 na na
0 100 12815.3 ± 952.1 na na
75 25 51129.4 ± 2054.7 54680.5 -6.5
50 50 39223.3 ± 1114.2 40725.4 -3.7
25 75 26223.5 ± 2005.7 26770.4 -2.0
Rosehip without
polysaccharide Elderflower
100 0 68635.6 ± 3089.9 na na
0 100 6213.8 ± 456.2 na na
75 25 50088.0 ± 3054.2 53030.2 -5.5
50 50 35484.2 ± 1865.2 37424.7 -5.2
25 75 20369.4 ± 1024.5 21819.2 -6.6 na – not applicable
Table3. Synergism between crude polysaccharide isolated from rosehips and chokeberry and elderflower extracts.
Extracts Ratio, %
ORAC, µmolTE/l
(experimental)
ORAC, µmolTE/l
(expected)
synergism,
%
Crude rosehip
polysaccharide
(7mg/ml)
Chokeberry
100 0 24508.6 ± 1256.3 na na
0 100 12815.3 ± 957.2 na na
75 25 23442.1 ± 1002.4 21585.3 8.6
50 50 18268.7 ± 854.2 18662.0 -2.1
25 75 15116.5 ± 802.2 15738.6 -4.0
Crude rosehip
polysaccharide Elderflower
100 0 68635.6 ± 1256.3 na na
0 100 6213.8 ± 456.2 na na
75 25 20466.1 ± 1235.8 19934.9 2.7
50 50 21850.4 ± 1078.9 15361.2 42.2
25 75 12068.5 ± 605.2 10787.5 11.9 na – not applicable
Another example for synergism in antioxidant
activity of pure compo-unds is the ability of rutin
and lycopene, and rutin and luteolin to inhibit
synergistically the oxidation of LDL cholesterol
[20]. Yi et al. [21] found out that α-tocopherol and
ascorbic acid act in synergism in a model of fish oil
oxidation, and Maillard and Berset [22] observed
synergism in the antioxidant activity of p-coumaric
and ferulic acids. Similar effect was observed for
caffeic and ascorbic acids, as well [23]. Meyer et
al. [24] found synergism in mixtures of phenolic
acids and flavonoids. Except for pure compounds,
synergistic antioxidant action was observed after
mixing plant extracts with pure phytochemicals.
For example, Hait Darshan et al. [25] observed
synergistic effect in the antioxidant activity of
polyphenol extract from spinach and ferulic acid,
caffeic acid, and epigallocatechin-3-gallate. Interes-
ting is the synergistic common action of the three
active components in the Chinese formula
ShengMai San, which is one the most prescribed
remedy in the traditional Chinese medicine [26].
Synergistic anti-oxidant effect was observed also
for great burdock mixture with α-tocopherol [27]
and ascorbic acid with grape seed extract [28]. The
polyherbal extracts obtained with green tea also
showed higher antioxidant activity compared to the
separate components [13]. Chu and Hsu [29]
reported 2-3 fold increment of antioxidant activity
of peanut oil when using mixtures of antioxidants.
It is well known that rosehips are rich source of
various classes of biologically active substances.
Besides polyphenols, ascorbic acid and carotenoids
that reveal antioxidant activity, fruits contain
minerals and sustainable amount of pectic poly-
saccharides. In order to check whether rosehip
polysaccharides take part in the synergistic action
we removed the polysaccharide fraction by ethanol

M. G. Kratchanova et al.: Rose hip extract synergistically increase antioxidant activity of fruit and herb extracts
63
precipitation and measured again the antioxidant
activity of the obtained mixed extracts. Results are
shown in Table 2. As it is evident from the results,
after the removal of the pectic fraction, the syner-
gistic effect was lost. Furthermore, to explore this
effect we isolated crude pectic polysaccharide from
rosehip extract and combine it with the tested
chokeberry and elderflower extract (Table 3). The
obtained results show that in the case of elderflower
the synergistic effect was partially due to the
interaction with polysaccharides.
Several authors have already observed the
synergistic effect in the biological activity of
polyphenols and polysaccharides. The health
effects of apples, especially their cholesterol-
lowering properties, were first ascribed to the
content of pectin [30-32]. In more recent studies,
Aprikian et al. [33] found that apple pectin and
polyphenolic fractions lowered plasma, liver
cholesterol and triglycerides, and were more
effective together than were either apple pectin
alone or apple phenolics alone. In the intact fruit,
the fibres and the phenolic compounds are closely
associated; they could reciprocally affect digesti-
bility and possibly exert synergistic effects. The
lyophilized apple diet lowered plasma and LDL
cholesterol in rats and reduced triglyceride accumu-
lation in heart and liver [34]. Many works [31-33]
suggest that there is a beneficial interaction
between fruit fibre and polyphenolic components
and also support the benefits of eating whole fruits
as opposed to dietary supplements.
CONCLUSION
Rosehips are raw material with high antioxidant
activity and from the presented results, it is evident
that they synergistically increase ORAC antioxidant
activity of fruit (chokeberry, blackcurrant and
blackberry) and herb (elderflower) extracts. The
observed synergistic effect is at least partially due
to the presence of pectic polysaccharides in
rosehips. However, future studies are necessary to
fully investigate this phenomenon. The obtained
results indicate that rosehips could be used for the
development of functional beverages with increased
antioxidant activity. From one hand, this will
increase the oxidative stability of the beverages,
and from other, probably will increase the health
benefits from the consumption of these beverages.
Acknowledgements: This work was funded by
project № BG161РО003-1.1.05-0024-С0001
“Development of nutraceuticals with antioxidant
and immune-stimulating action” of Operational
Program “Competitiveness” of the EU.
REFERENCES
1. K. J. Davies, IUBM Life, 50, 279 (2000).
2. T. Fenkel, N. J. Holbrook, Nature, 408, 240 (2000).
3. B. Hаlliwell, J. Gutteridge, Free Radicals in Biology
and Medicine 4th
edition. Oxford Univ. Press, 2007.
4. National Academy of Sciences, Institute of Medicine.
Dietary reference intakes for vitamin C, vitamin E,
selenium, and carotenoids, Washington DC, p. 35
(2000).
5. M. G. Traber, Adv. Pharmacol., 38, 49 (1997).
6. C. Rice-Evans, Wake up to flavonoids. Royal Society
of Medicine, London, 2000.
7. P. Denev, M. Kratchanova, M. Ciz, A. Lojek, O.
Vasicek, P. Nedelcheva, D. Blazheva, R. Toshkova,
E. Gardeva, L. Yossifova, P. Hyrsl, L. Vojtek, Food
Chem., 157, 37 (2014).
8. R. L. Prior, Am. J. Clin. Nutr., 78, 570S (2003).
9. M. G. Hertog, H. B. Bueno de Mesquita, A. M.
Fehily, P. M. Sweetnam, P. C. Elwood, D.
Kromhout, Cancer Epidem. Biomar., 5, 673 (1996).
10. D. Heber, J. Postgrad. Med., 50, 145 (2004).
11. B. N. Ames, M. K. Shigenaga, T. M. Hagen, P. Nat.
Acad. Sci. USA, 90, 7915 (1993).
12. P. Denev, A. Lojek, M. Ciz, M. Kratchanova, Bulg.
J. Agric. Sci., 19, 22 (2013).
13. D. P. Jain, S. S. Pancholi, R. Patel, J. Adv. Pharm.
Technol. Res., 2, 177 (2011).
14. B. Ou, M. Hampsh-Woodill, R. L. Prior, J. Agric.
Food Chem., 49, 4619 (2001).
15. P. Denev, M. Ciz, G. Ambrozova, A. Lojek, I.
Yanakieva, M. Kratchanova, Food Chem., 123, 1055
(2010).
16. R. L. Prior, H. Hoang, L. Gu, X. Wu, R. Jacob, G.
Sotoudeh, A. Kader, R. Cook, J. Am. Coll. Nutr.,
269, 170 (2007).
17. P. Palozza, N. Krinsky, Arch. Biochem. Biophys.,
297, 184 (1992).
18. E. M. Becker, G. Ntouma, L. H. Skibsted. Food
Chem., 103, 1288 (2007).
19. Z. Kotíková, A. Hejtmánková, K. Hejtmánková,
LWT- Food Sci. Technol., 44, 1703 (2011).
20. J. Milde, E. F. Elstner, J. Grassmann, Mol. Nutr.
Food Res., 51, 956 (2007).
21. O. S. Yi, D. Han, H. K. Shin, J. Am. Oil Chem. Soc.,
68, 881 (1991).
22. M. N. Maillard, C. Berset, J. Agr. Food Chem., 43,
1789 (1995).
23. J. J. Cilliers, V. L. Singleton, J. Agr. Food Chem., 38,
1797 (1990).
24. A. S. Meyer, M. Heinonen, E. N. Frankel, Food
Chem., 61, 71 (1998).
25. R. Hait-Darshan, S. Grossman, M. Bergman, M.
Deutsch, N. Zurgil, Food Res. Int., 42, 246 (2009).
26. Y. Li, M. Gong, T. Konishi, J. Health Sci., 53, 692
(2007).

M. G. Kratchanova et al.: Rose hip extract synergistically increase antioxidant activity of fruit and herb extracts
64
27. G. Blekas, D. Boskou, Grasas Aceites, 49, 34 (1998).
28. P.-D. Duh, J. Am. Oil Chem. Soc., 75, 455 (1998).
29. Y.-H. Chu, H.-F. Hsu, Food Chem., 66, 29 (1999).
30. J. Groudeva, M. Kratchanova, I. Panchev, C.
Kratchanov, Z. Lebensm. Untres. F. A., 204, 374
(1997).
31. L. Cara, M. Dubois, N. Armand, M. Mekki, M. Senft,
H. Portugal, D. Lairon, Nutrition, 12, 66 (1993).
32. R. Sable-Amplis, R. Sicart, E. Bluthe, Nutr. Rep.
Int., 27, 881 (1983).
33. O. Aprikian, V.Duclos, S.Guyot, C. Besson, C.
Manach, A. Bernalier, C. Morand, C. Rémésy, C.
Demigné, J. Nutr., 133, 1860 (2003).
34. O. Aprikian, M.-A. Levrat-Verny, C. Besson, J.
Busserolles, C. Rémésy, C. Demigné, Food Chem.,
75, 445 (2001).
ЕКСТРАКТ ОТ ШИПКА СИНЕРГИЧНО ПОВИШАВА АНТИОКСИДАНТНАТА
АКТИВНОСТ НА ПЛОДОВИ И БИЛКОВИ ЕКСТРАКТИ
M. Г. Крачанова1*
, П. Н. Денев1,2
, Х. Г. Крачанов2
1Лаборатория Биологично Активни Вещества, Институт по Органична химия с Център по Фитохимия,
Българска Академия на Науките, бул. Руски 139, 4000 Пловдив, България 2ИТЦ – Иновативно-Технологичен Център ООД, ул. Д-р Г. М. Димитров 20, 4000 Пловдив, България
Постъпила на 20 май 2014 г.; Коригирана на 12 юни 2014 г.
(Резюме)
В настоящата работа е изследвана възможността за използване на екстракт от шипкови плодове за
синергично повишаване на антиоксидантната активност на плодови и билкови екстракти. Екстрактът от шипки
се характеризира с много висока антиоксидантна активност, измерена посредством ORAC метода, а
прибавянето му към екстракти от плодове на арония, къпина, черен касис или цвят от бъз повиши значително
тяхната антиоксидантна активност. Освен това бе наблюдаван и синергичен ефект в антиоксидантната
активност на смесените екстракти, който достигна до 64%. Отстраняването на полизахаридите от шипковите
плодове инхибира синергичния ефект, което е индикатор, че пектиновите полизахариди от шипката играят роля
в синергичното действие. Наблюдаваният синергичен ефект отваря нови възможности за разработване на
функционални напитки с повишена антиоксидантна активност.

65
Bulgarian Chemical Communications, Volume 46, Special Issue A (pp. 65 – 70) 2014
Optimization of the key parameters for extraction of polyphenol compounds from
tomato fruits (Solanum lycopersicum L.). Kinetics of the process.
A. H. Atanasova1, P. N. Denev
2*, I. I. Tringovska
1, S. Y. Grozeva
1, D. G. Ganeva
1, M. G.
Kratchanova2, I. N. Panchev
3
1Maritsa Vegetable Crops Research Institute, 32 Brezovsko Shosse str., 4003 Plovdiv, Bulgaria
2Institute of Organic Chemistry with Centre of Phytochemistry, Bulgarian Academy of Sciences, 4000 Plovdiv, Bulgaria
3University of Food Technologies, 26 Maritsa str., 4000 Plovdiv, Bulgaria
Received May 20, 2014; Revised June 24, 2014
Dedicated to Acad. Dimiter Ivanov on the occasion of his 120th
birth anniversary
The main parameters that affect extraction process of polyphenolic compounds from tomato were investigated. The
most suitable solvent for reaching maximum yield of polyphenols was acetone-water mixture 80:20 (v:v). Using this
extragent the concentration of extracted polyphenols was approximately 17% higher than using ethanol and methanol.
The optimal extraction time, temperature and solid to solvent ratio were 45 min, 60ºC and 1:40, respectively. Using
these extraction parameters the yield of total polyphenols in tomato variety Desperado was 27.80 GAE/100 g fresh
weight. The kinetics of extraction process was investigated and theoretical model describing extraction process was
proposed. This mathematical model provides the theoretical initial amount of polyphenols in tomato fruits which could
be useful for the breeding programs of varieties with high amount of polyphenol compounds.
Key words: tomatoes, polyphenols, extraction, optimization, kinetics
INTRODUCTION
Polyphenols are secondary metabolites that are
synthesized mainly in plants [1,2]. It is known that
these components protect plants from pathogens,
UV-B light and play role as signal molecules in the
interaction between plants and environment [3]. In
the recent years polyphenol compounds gained a lot
of attention because they act as antioxidants and
protect human body from oxidative stress which is
the main reason for different degenerative process-
es. Because of the polyphenol components, the con-
sumption of fruits and vegetables is reversely
correlated with the development of chronic diseases
[4,5]. Therefore, contemporary breeding programs
are directed to the selection of cultivars with
increased content of polyphenols and other anti-
oxidant components.
The accurate determination of polyphenols
depends on the methods of extraction and analysis.
Since the extraction is the main part of sample
preparation, there are many methods for isolation of
phenolic compounds from different plant matrices.
The yield of analytes is influenced by many factors
such as: chemical structure, solvent, pH, tempera-
ture, etc. Optimization of extraction parameters is
critical for precise and reproducible analysis and
there is no protocol, suitable for all classes of
phenolic compounds [6]. Therefore, optimization of
extraction parameters for different plant matrices is
necessary [2].
Tomato is among the most consumed vegetables
in the world. Generally, tomato fruits are not very
rich of polyphenols, but high consumption of toma-
to and tomato products make them an important
source of these compounds [7]. The main part of
the hydrophilic antioxidant capacity of tomatoes is
due to the presence of polyphenols [8]. For exam-
ple, Grozeva et al. (2013) compared the polyphenol
content and antioxidant activity of cherry and small
sized tomatoes and observed that cherry tomato line
1620/10 is distinctive with the highest polyphenol
content and the highest antioxidant activity, mea-
sured by ORAC (11.54 μmol TE/g) and HORAC
(6.69 μmol GAE/g) methods [9]. Similar results
were obtained by Toor et al. (2005) who inves-
tigated antioxidant properties of tomatoes grown in
New Zealand [8].
Predominate phenolic compounds in tomatoes
are chlorogenic acid, rutin, naringenin, naringenin
chalcone, quercetin [10]. All plant phenolics are
conjugated with sugars, rather than free aglycones,
which make them more soluble in water. Therefore,
for extraction of these compounds mixtures of
© 2014 Bulgarian Academy of Sciences, Union of Chemists in Bulgaria
* To whom all correspondence should be sent:
E-mail: [email protected]

A. H. Atanasova et al.: Optimization of the key parameters for extraction of polyphenol compounds from tomato fruits (Solanum…
66
ethanol, methanol and acetone with water are most
commonly used [11-13]. For obtaining better yield
of these compounds optimization of extraction
parameters such as temperature, extraction time,
solid to solvent ratio is also necessary. These para-
meters were already optimized in other plant
materials but to our knowledge the optimization of
these key factors for tomato polyphenols extraction
has not been addressed [14,15]. Therefore, the aim
of this study was to find the optimal parameters for
extraction (temperature, extraction time, solid to
solvent ratio) of phenolic compounds from tomato-
es and to develop mathematical models describing
the process.
EXPERIMENTAL
Reagents, Solvents and Apparatus
Ethanol, methanol and acetone used in expe-
rimental work were pure for analysis. Folin-
Ciocauteu reagent was from Merck, gallic acid was
from Sigma Aldrich. UV/VIS Spectrophotometer
used in this work was from Camspec Ltd.,
Cambridge, UK.
Plant Material
Optimization of extraction parameters was
carried out by using freeze-dried tomato samples,
variety Desperado (Enza Zaden, the Netherlands).
The plants were grown under greenhouse condi-
tions during the period March-July 2012. Randomi-
zed samples of tomato fruits were harvested at red
ripening state.
Sample Preparation
About 700-800 g of tomatoes were washed,
packed in plastic bag and frozen in refrigerator at -
20˚C. After that, samples were freeze-dried, sub-
sequently crushed to powder using laboratory
blender and stored at -20˚C prior analysis.
Optimization of Extraction Parameters
The main factors that affect the extraction such
as type of solvents (methanol, ethanol and acetone)
and their mixtures with water (20%, 40%, 60%,
80% (v:v)), extraction time (15, 30, 45, 60, 75 and
90 min), temperature (room, 40˚C and 60˚C) and
plant material to solvent ratio (1:20, 1:40 and 1:80
(w:v)) were studied. For the extraction two grams
of dry powdered sample were weighted accurately
and mixed with 40 ml of extragent in extraction
tubes with caps. Samples were extracted in shaking
water bath for 1 hour.
Extraction solvent and temperature: Three
solvents (acetone, methanol and ethanol) and their
mixtures with water (20%, 40%, 60%, 80% (v:v)),
as well as three different temperatures of extraction
(room temperature, 40˚C and 60˚C) were studied.
Time of extraction: The influence of time on
extraction process was examined in optimal condi-
tions, found for type of extragent and temperature.
The tested time intervals were 15, 30, 45, 60, 75
and 90 min.
Sample to solvent ratio: The optimal solvent,
temperature and extraction time were used to
determine the optimal sample to solvent ratio (v:v)
of the extraction process. For that aim 1 gram of the
sample were weighted accurately and mixed with
20, 40 or 80 ml of the extragent (80% acetone) to
obtain 1:20, 1:40 and 1:80 sample to solvent ratio,
respectively. All samples were put in shaking water
bath for 45 min at 60˚C. After that, samples were
filtrated and supernatants were collected for deter-
mination of total polyphenol contents.
Determination of Total Polyphenols
The influence of different extraction parameters
on the yield of polyphenols was estimated accor-
ding to the method of Singleton & Rossi (1965)
with Folin-Ciocalteu’s reagent [16]. Briefly, 100 µl
of extract was mixed with 3100 µl water, 200 µl
Folin-Ciocalteu’s reagent and 600 µl 20% Na2CO3.
The mixture (final volume 4 ml) was vortexed,
incubated for 5 min at 50˚C, cooled in ice bath for 5
min and then absorbance was measured spectropho-
tometrically at 750 nm. The amount of polyphenols
was determined by standard curve of seven differ-
rent concentrations of Gallic acid (0.04; 0.06; 0.08;
0.10; 0.20; 0.40 and 0.60 mg/ml) and results were
expressed as mg GAE/100 g fresh weight (FW).
Statistics
Data were subjected to Duncan’s Multiple
Range Test to evaluate the statistical significance
among means. Each sample was measured in
triplicates (or quintuplicates) and variations bet-
ween these technical triplicates in each analysis
were less than 1% (data not shown). Method of
least squares was also used.
Kinetics of Extraction Process
Based on data obtained from the experiments the
rate constants (k1, k2) of the process and the amount

A. H. Atanasova et al.: Optimization of the key parameters for extraction of polyphenol compounds from tomato fruits (Solanum…
67
of polyphenols in matrices (A0) were determined
(equation 1). The principal of Nuton-Rafson For
was used for determination of nonlinear regression
correlation and implementation was performed
using NONLIN program compiled on FORTRAN
IV, with adapted sub program FUNCTN for the
specific mathematical correlation.
RESULTS AND DISCUSSION
We investigated the influence of the main
factors that affect the extraction of polyphenols
from tomato matrix, namely type of solvent, tempe-
rature, solid to liquid ratio (w:v) and extraction
time. In Table 1 the results for the influence of
temperature and type of solvent on yield of total
polyphenols from tomato fruits are presented.
Type of Solvent
From the results in Table 1 it is evident that
ethanol-water mixtures have a better extraction
efficiency compared to methanol-water mixtures at
room temperature and at 40ºC. With increasing of
the temperature, the yield of total polyphenols for
these two solvents has also increased, but diffe-
rences between obtained values are very low and
statistically insignificant (22.79 mg GAE/100 g for
methanol-water and 22.97 mg GAE/100 g for
ethanol-water). Similar results were reported by
Mukhopdhyay et al. in 2006 in different plant mat-
rices [6]. In these cases ethanol is preferable solvent
because of it’s lower toxicity compared to metha-
nol. Among the three solvents used in this inves-
tigation acetone exhibited extraction efficiency
resulting in up to 17% higher yield of total poly-
phenols in all studied temperatures. Our results are
in line with other studies pointing out acetone as
suitable extragent for polyphenol compounds [14].
Acetone has polar index 5.1 which makes it a
solvent with intermediate polarity. Phenols, which
are present in the tomatoes are compounds with
different polarity. Therefore, such types of solvents
are preferable for their extraction from this matrix.
The higher yield of total polyphenols from tomato-
es using acetone extract is probably due to the
presence of high molecular polyphenols as tannins
that are also extracted with acetone [17].
Temperature
Values obtained for total polyphenol content of
tomato extract obtained by methanol-water mixtu-
res at room temperature and 40˚C were very close
(Table 1). Increasing the temperature inten-sified
the extraction process, yielding higher amounts of
extractible polyphenols. The highest yield of poly-
phenolic compounds was achieved at temperature
60˚C. It is known that high temperature promotes
high analite solubility and increases mass transfer.
Viscosity and solvent surface tension are decreased
by high temperature and solvent could easily reach
sample matrices which leads to increased extraction
rate [13].
Table 1. Influence of type solvent, percentage of solvent with water (v:v), and temperature on yield of total polyphenols
from freeze-dried tomato.
Room temperature Temperature 40˚C Temperature 60˚C
Solvent, % Polyphenols,
mgGAE/100g Solvent, %
Polyphenols,
mgGAE/100g Solvent, %
Polyphenols,
mgGAE/100g
Methanol 18.36±0.36 ef
Methanol 18.23±0.15 fg
Methanol 20.91±0.40 f
20 18.07±0.38 g 20 18.20±0.05
fg 20 20.67±0.58
f
40 19.36±0.26 ef 40 18.29±0.47
fg 40 22.79±0.28
de
60 19.18±0.39 e-g
60 18.79±0.39 f 60 22.07±0.06
e
80 19.54±0.36 de
80 19.58±0.45 e 80 22.34±0.33
e
Ethanol 15.87±0.49 h Ethanol 17.39±0.23
h Ethanol 18.39±0.58
g
20 18.56±0.71 e-g
20 19.73±0.40 e 20 22.78±0.75
cd
40 19.08±0.47 e-g
40 21.19±0.11 d 40 22.78±0.06
de
60 22.07±0.80 c 60 22.76±0.66
c 60 22.57±0.40
e
80 22.62±1.06 bc
80 20.95±0.46 d 80 22.97±0.61
de
Acetone 18.13±0.45 i Acetone 17.54±0.31
h Acetone 12.55±0.24
h
20 20.40±0.30 d 20 21.38±0.20
d 20 23.15±0.54
de
40 23.07±0.54 b 40 22.68±0.35
c 40 24.34±0.46
c
60 26.05±0.53 a 60 23.88±0.56
b 60 26.21±0.59
b
80 25.82±0.42 a 80 26.14±0.11
a 80 27.80±0.45
a
Results are expressed as mean value ± standard deviation from three measurements. Differences between values marked with
different superscript letters are statistically significant at P<0.05 based on Duncan’s Multiple Range Test (n = 3).

A. H. Atanasova et al.: Optimization of the key parameters for extraction of polyphenol compounds from tomato fruits (Solanum…
68
Solvent Concentration
Obtained results about the influence of different
concentrations of organic solvents on the extraction
efficiency of polyphenols indicate that pure
solvents have the lowest extraction ability in
comparison to solvent-water mixtures. Mixtures
with water are preferable because water facilitates
the penetration of organic solvent into the plant
cells and increase polyphenols extraction [6]. In our
study, the highest yields were obtained with 60%
and 80% water solution of the used organic
solvents (Table 1). It has been observed that 80%
methanol was better extragent for extraction of
some flavonoids from vegetables compared to 50%
and 90% methanol [14]. Gyenai et al. in 2012 also
reported 80% acetone as better solvent for extrac-
tion of polyphenols from tomato than methanol and
acetonitrile [15].
Extraction Time
The influence of extraction time on polyphenols
extraction is shown on Fig. 1.
15,1d
22,8c
25,8a 25,4a 25,1a24,2b
10,0
12,0
14,0
16,0
18,0
20,0
22,0
24,0
26,0
28,0
15 30 45 60 75 90
time,min
mg
GA
E/1
00g
fw
Fig. 1. Influence of extraction time on the yield of total
polyphenols in freeze-dried sample tomato.
The lowest yield of total polyphenols was
obtained after 15 minutes of extraction at optimum
condition (80% acetone at 60ºC). Accumulation of
polyphenols increased gradually and reached maxi-
mum value at the 45th min. After that the yield
slightly decreased. Phenolic compounds are not
uniformly distributed in plants. Some of them are
strongly linked with cellular walls, while others like
hydroxycinamic acid are linked with various cell
components and more time is required for their
penetration into the solvent. This could explain the
low extraction of polyphenols in the first 15
minutes and their gradual increment [1]. On the
other hand, polyphenols are prone to degradation if
exposed to harsh conditions and long extraction
times, which could lead to reduction of their yield
[17]. The values for total polyphenols yield in the 3
time points between 45 and 75 min were very close
and mathematical modeling was necessary for
prediction of the most effective extraction time.
The influence of solid to solvent ratio (w:v) is
shown in Fig. 2. Among the ratios studied, the
lowest yield of polyphenols was obtained with 1:20
(w:v). The highest concentration of investigated
compounds was achieved with 1:80 (w:v) but the
difference between values obtained with 1:80 and
1:40 was not statistically significant. The extraction
process is characterized with mass transfer process,
where the main driving force is concentration
gradient between the solid and the solvent. The
transition (moving) of components of solid matrix
to the solvents continues until equilibrium of the
system is reached. The equilibrium constant of the
mass transfer process can be affected by increasing
the solid to solvent ratio because the concentration
gradient also increases. On the other hand
increasing the solid to solvent ratio affects the
active coefficient of components and their solu-
bility in the solvent, and thus the yield of analytes is
increased [18].
25,6a25,5a
21,5b
0,0
5,0
10,0
15,0
20,0
25,0
30,0
20 40 80
solid to solvent ratio
mg
GA
E/1
00g
fw
Fig. 2. Influence of ratio sample:solvent (w:v) on the
yield of total polyphenols in freeze-dried tomato sample.
Kinetics of Extraction Process in Case of Solid-
Liquid Extraction
The extraction processes are dynamic and
therefore characterized with their own kinetics. The
kinetics of the process is influenced by many fac-
tors such as plant matrices, shape and size of
participle and especially by temperature and extrac-
tion time [19]. The extraction process starts with
the crossing of the plant phenolic compounds of the
matrix to the extragent. This process is characteri-

A. H. Atanasova et al.: Optimization of the key parameters for extraction of polyphenol compounds from tomato fruits (Solanum…
69
zed by rate constant k1, which includes a diffusion
coefficient. In this case, the extraction of poly-
phenols for a certain time t can be described by the
differential equation 1.
)()(
1 tzkdt
tdz (1)
where z (t) is the amount of polyphenol remaining
in the plant tissue, k1 is the rate constant and t is
time.
The extraction of the polyphenols can also be
described as an accumulation in the extractant, and
the degradation of the components for a given time
t. Degradation is a process which is also characte-
rized by a rate constant k2. These processes can be
described by a differential equation 2.
)()()(
21 tyktzkdt
tdy (2)
where y (t) is the accumulation and at the same time
the decomposition of polyphenols.
Since degradation and accumulation of phenolic
compounds are simultaneous processes, they are
described by the two differential equations (1 and
2). After mathematical processing, the following
equations describing the whole process of extrac-
tion are derived:
tkeAtz 1
0)(
(3)
tktkee
kk
kAty 21
12
10)(
(4)
tktke
kk
ke
kk
kAtq 21
12
2
21
20 1)( (5)
where q (t) is the amount of degraded polyphenols
time t.
21
2
1
max
ln
kk
k
k
t
(6)
1
2
1
2
1
2
10max
k
k
k
k
k
kAy
(7)
The proposed theoretical model describing the
extraction and degradation of polyphenols is practi-
cally verified by the experimental data shown on
Fig. 1. Accumulated experimental data approxi-
mated with equation (4) and equations (6) and (7)
are provided for maximum yields during extraction.
Data are presented on Fig. 3.
10 20 30 40 50 60 70 80 90 100
14
16
18
20
22
24
26
mg
GA
E/1
00
g f
w
t, min
Fig. 3. Theoretical model of the influence of the
extraction time on the yield of total polyphenols from
tomato: R2= 0.98599; A0 = 34.60136 ± 2.68647; K1 =
0.04112 ± 0.00466; K2 = 0.00512 ± 0.0013; t max = 57.87
min; y max = 25.73 mg GAE/100g.
From Fig. 3 it is evident that the established
theoretical model describes well the experimental
data. Statistical processing were performed by the
method of least squares and the correlation
coefficient is R2 = 0.98599, which shows that more
than 98% of the experimental data are described by
the model. The optimal extraction time tmax is 57.87
min (6) and the optimal extraction yield of poly-
phenols ymax is 25.73 mgGAE/100g fresh weight at
the selected primary extraction conditions (tempe-
rature, solid to liquid/solvent ratio and type of
extragent). The coefficient A0, known after solving
equation (1) is a very important indicator of the
model, which theoretically calculates the initial
amount of total polyphenols in the matrix. The
application of the model could provide valuable
information about the theoretical contents of
polyphenols in different varieties of tomatoes, and
thus allow the choice of polyphenol-rich genotypes
for the purposes of tomato breeding.
CONCLUSION
The main extraction parameters that affect
extraction process of polyphenolic compounds in
tomato were investigated. Maximum amounts of
these components were obtained with 80% acetone
at 60˚C and 1:40 solid to solvent ratio. The kinetics
of extraction was also studied. An equation
showing what was the theoretical initial quantity of
polyphenols in raw material was elaborated, which
could be useful for the breeding programs of

A. H. Atanasova et al.: Optimization of the key parameters for extraction of polyphenol compounds from tomato fruits (Solanum…
70
varieties with high amount of polyphenol
compounds.
Acknowledgements: The research leading to these
results has received funding from National Science
Fund under Bulgarian Ministry of Education and
Science (grant № DMU03/76).
REFERENCES
1. M. Naczk, F. Shahidi, J. Chromatogr. A, 1054, 95
(2004).
2. A. Crozier, B. Jaganath, M. Clifford, in: Phenols,
Polyphenols and Tannins: An Overview in Plant
Secondary Metabolites: Occurrence, Structure and
Role in the Human Diet, A. Crozier, M. N Clifford,
H. Ashihara (eds.), 2006.
3. J. H. Makoi, P. A. Ndakidemi, Afr. J. Biotechnol., 6,
1358 (2007).
4. P. G. Pietta, J. Nat. Prod., 63, 1035 (2000).
5. C. Iwamura, K. Shinoda, M. Yoshimura, Y.
Watanabe, A. Obata, T. Nakayama, Cells Allergol.
Int., 59, 1 (2010).
6. S. Mukhopadhyay, D. L. Luthria, R. J. Robbins, J.
Sci. Food Agr., 86, 156 (2006).
7. M. G. Willits, C. M. Kramer, R. T. Prata, V. De
Luca, B. G. Potter, J. C. Steffens, G. Graser, J. Agric.
Food. Chem., 53, 1231 (2005).
8. R. K. Toor, C. E. Lister, G. P. Savage, Int. J. Food
Sci. Nutr., 56, 597 (2005).
9. S. Grozeva, A. Atanasova, P. Denev, D. Ganeva, M.
Krachanova, I. Tingovska, Agrochimica, 57, 337
(2013).
10. I. Martinez-Valverde, M. J. Periago, G. Provan, A.
Chesson, J. Sci. Food Agric., 82, 323 (2002).
11. K. Helmja, M. Vaher, J. Gorbatšova, M. Kaljurand,
Proc. Estonian Acad. Sci. Chem., 56, 172 (2007).
12. E. Sarnchez-Rodrıґguez, M. Rubio-Wilhelmi, L. M.
Cervilla, B. Blasco, J. Rios, M. A. Rosales, L.
Romero, J. M. Ruiz,. Plant Sci., 178, 30 (2010).
13. J. Dai, R. J. Mumper, Molecules, 15, 7313 (2010).
14. B. Druzynska, A. Stepniewska, R. Wołosiak, Acta
Sci. Pol. Technol. Aliment., 6, 27 (2007).
15. K. Gyenai, N. Mikiashvili, H. Ismail, M. Worku, Am.
J. Anim. Vet. Sci., 7, 126 (2012).
16. V. Singleton, J. Rossi, Am. J. Enol. Vitic., 16, 144
(1965).
17. L. Y. Nig, Y. K. Ang, H. E. Khoo, H. S. Yim, J.
Phytochem., 6, 61 (2012).
18. Y. C. Shen, S. Chen, S. Zhuang, C. Wang, J. Food
Sci., 73, 1 (2008).
19. P. W. Tan, C. P. Tan, C. W. Ho, Int. Food Res. J., 18,
557 (2011).
ОПТИМИЗАЦИЯ НА КЛЮЧОВИ ПАРАМЕТРИ НА ЕКСТРАКЦИЯ НА ФЕНОЛНИ
КОМПОНЕНТИ ОТ ДОМАТЕНИ ПЛОДОВЕ (Solanum lycopersicum L.). КИНЕТИКА НА
ПРОЦЕСА.
А. Х. Атанасова1, П. Н. Денев
2*, И. И. Тринговска
1, С. Й. Грозева
1, Д. Г. Ганева
1, М. Г.
Крачанова2, И. Н. Панчев
3
1Институт по зеленчукови култури „Марица“, ул. Брезовско шосе 32, 4003 Пловдив, България
2Институт по Органична химия с Център по Фитохимия, Българска Академия на Науките, 4000 Пловдив,
България 3Университет по хранителни технологии, ул. Марица 26, 4000 Пловдив, България
Постъпила на 20 май 2014 г.; Коригирана на 24 юни 2014 г.
(Резюме)
Проучени бяха основните параметри, оказващи влияние върху процеса на екстракция на полифеноли от
доматени плодове. Най-подходящ разтворител, с който се достигна максимален добив на полифеноли от
плодовете, беше смес от ацетон и вода в съотношение 80:20 (v:v). Използвайки този разтворител, концентра-
цията на търсените компоненти е приблизително 17% по-висока в сравнение с етанол и метанол. Оптималните
време на екстракция, температурата и хидромодул (съотношение проба-екстрагент) бяха съответно 45 мин,
60ºC и 1:40. Използвайки оптималните параметри на екстракция, добивът на полифенолни вещества от
доматени плодове сорт Desperado достигна 27.80 GAE/100g свежо тегло. Кинетиката на екстракционния процес
също беше проучена и бе предложен теоретичен модел, описващ екстракционния процес. Този математически
модел дава сведения за първоначалното съдържание (теоретично изчислено) на търсените компоненти в
доматените плодове, което може да бъде използвано успешно за нуждите на селекцията.

71
Bulgarian Chemical Communications, Volume 46, Special Issue A (pp. 71 – 78) 2014
Purification and biological activity of pectic polysaccharides from leek
M. Nikolova1, M. G. Kratchanova
1*, E. V. Pavlova
1, I. Ianakieva
1, V. Kussovski
2
1Laboratory of Biologically Active Substances, Institute of Organic Chemistry with Centre of Phytochemistry,
Bulgarian Academy of Sciences, 139 Ruski blv., 4000 Plovdiv, Bulgaria 2Institute of Microbiology, Bulgarian Academy of Sciences, Acad. G. Bonchev str., bl. 26, 1113 Sofia, Bulgaria
Received May 20, 2014; Revised July 04, 2014
Dedicated to Acad. Dimiter Ivanov on the occasion of his 120th
birth anniversary
The pectic polysaccharides isolated from leek through consecutive water and acid extractions with 0.5% HCl were
purified by ion-exchange chromatography on DEAE-Sepharose fast flow. As a result four fractions – W1, A1, A2 and A3
were obtained, which were partitioned with gel-chromatography on Sephadex G-200 and other fractions were obtained -
W11, A11, A21 and A31. All fractions differ on their monosaccharide compositions. In the A1 fraction obtained through
chromatography purification of the acid-extractable polysaccharides prevail neutral sugars (> 58%) whereas the other
fractions have higher uronic acid content. It was found that fractions having higher uronic acid content also contain
glucuronic acid. The dominant neutral monosaccharides in the pectic polysaccharides from leek are galactose and
rhamnose. The molecular mass and the polydispersity of the polysaccharide fractions were determined by HPLC. The
purified polysaccharide fractions from leek showed immunomodulating activity, which was determined by the
alternative and classical pathway. The activity of the purified polysaccharides increase compared to the activity of the
initial polysaccharides.
Key words: pectic polysaccharides, purification, biological activity, leek
INTRODUCTION
The effect of pectic polysaccharides on the
physiological processes in the human body, such as
lipid exchange [1-4], carbohydrate exchange [2],
bile acid metabolism [5,6], etc. has been the subject
of a host of experimental and clinical observations.
It has been found by international [1,3,7] and local
[8,9] studies that the intake of pectin significantly
reduces the serum cholesterol levels in the body,
which is especially important in cardiovascular
diseases. Other biological activities of the pectic
polysaccharides, such as immunomodulating, anti-
complementary and anti-inflammatory, have also
been reported in the recent years [10-13].
Two pectic polysaccharides - W0 and A0, were
obtained through sequenced water and acid
extraction with 0.5% HCl in the course of our
previous studies [14]. They were characterised and
identified as polysaccharides of a pectic type with a
pronounced immunomodulating activity. Definite-
ly, the individual structural fragments from the
macromolecule of leek influence on its immuno-
modulating activity after enzymatic hydrolysis.
Obtained hydrolysis products rich in RG-I
participated in the activation process of the immune
system [15]. The purification process played an
important role in determining the relationship
between the structure of the polysaccharides and
their biological properties. The purification of the
active polysaccharides was carried out through
various chromatographic methods depending on the
composition of the crude polysaccharides.
The aim of this work was chromatographic
purification by means of ion-exchange and gel
chromatography of the biologically active pectic
polysaccharides from leek and the comparison of
their immunomodulating activities.
EXPERIMENTAL
The trials were carried out with leek (Allium
porrum L.) purchased on the vegetable market. The
alcohol insoluble substances (AIS) of leek were
obtained by the method described in a previous
article of us [16].
Isolation and purification of polysaccharides from
leek
Two pectic polysaccharides were isolated by
means of a sequenced water and acid extraction
with 0.5% HCl from the AIS of leek. The purify-
cation procedure is presented in Fig. 1.
© 2014 Bulgarian Academy of Sciences, Union of Chemists in Bulgaria
* To whom all correspondence should be sent:
E-mail: [email protected]

M. Nikolova et al.: Purification and biological activity of pectic polysaccharides from leek
72
The two isolated polysaccharides W0 and A0
were subjected to fractionating by means of ion-
exchange chromatography on a DEAE-Sepharose
fast flow using a semipreparative chromatographic
system Pharmacia, Sweden, equipped with a ХК
2.6/40 cm column (Pharmacia, Sweden). The eluent
was a buffer solution of sodium acetate with
рН=4.8 and a linear gradient (0.05-1.0 М). The
elution rate was 1 ml/min. Fractions of 10 ml were
collected and analyzed for content of neutral sugars
and galacturonic acid.
120 mg of polysaccharide В0 were diluted in 15
ml sodium acetate buffer (рН=4.8), and the solution
was centrifuged at 15 000 rpm. 10 ml of the
obtained supernatant containing 66.5 mg of В0 was
applied to a column with DEAE-Sepharose fast
flow. Chromatography on the polysaccharide led to
the emergence of a peak - W1, which was collected,
dialyzed for 48 h against distilled water and lyophi-
lized on a Cryodos 50 system (Telstar, Spain).
120 mg of polysaccharide A0 were dissolved in
15 ml sodium acetate buffer (рН=4.8) and the
solution was centrifuged at 15 000 rpm. 10 ml of
the supernatant containing 71.7 mg of poly-
saccharide A0 were subjected to chromatographic
purification on a DEAE-Sepharose fast flow.
Chromatography on A0 led to the distinction of
three peaks: A1, A2, A3, respectively. The isolated
peaks were collected, dialyzed for 48 h against
distilled water and lyophilized on a Cryodoс 50
system (Telstar, Spain).
The chromatographically purified fractions W1,
A1, A2 and A3 were subjected to gel chromato-
graphic separation on Sephadex G-200, on column
ХК 1.6/100 cm (Pharmacia, Sweden). The eluent
was phosphate buffer (рН=6), and the elution rate
was 0.2 ml/min. Fractions of 10 ml were collected
in the process of elution and were analyzed for
neutral sugars and galacturonic acid.
crude pectic polysaccharides from leek
dissolve
centrifugation
residue residue supernatant supernatant
ion exchange chromatography on
DEAE-Sepharose - fast flow
W1
A2 A1 A3
dialyze
lyophilize
dissolve dialyze
lyophilize
dissolve gel filtration chromatography
on Sephadex G-200
gel filtration chromatography on Sephadex G-200
A11 A21
A31 W11
dialyze
lyophilize dialyze
lyophilize
dialyze
lyophilize
dialyze
lyophilize
dialyze
lyophilize
dissolve
dialyze
lyophilize
dissolve
dissolve
centrifugation
W0 A0
ion exchange chromatography on
DEAE-Sepharose - fast flow
Fig. 1. Purification procedure of anti-complementary pectic polysaccharides from leek.

M. Nikolova et al.: Purification and biological activity of pectic polysaccharides from leek
73
60 mg of each purified fraction (W1, A1, A2 and
A3) were dissolved in 8 ml distilled water. 7 ml of
the solution obtained (containing a sample of 52.2
mg) was applied to a column with Sephadex G-200.
Fractions W11, A11, A21 and A31 were isolated
during the gel chromatography separation. Each
fraction was collected, dialyzed for 48h and
lyophilized.
Major analytical methods
Assessment of the total neutral sugars, uronic
acids, and protein
The total neutral sugars and uronic acids were
assessed by the orcinol [17] and meta-
hydroxybiphenyl methods [18], respectively, using
arabinose and galacturonic acid as a standard. The
separation of galacturonic acid and glucuronic acid
was implemented on a Waters HPLC system with
RI detector – R401. HPLC analysis was conducted
on an Aminex HPX - 87H column with 0.04М
H2SO4 and the elution rate was 0.3 ml/min. Galac-
turonic acid and glucuronic acid were identified by
the retention time.
The protein content was analyzed by the Lowry
method [19] against a standard of bovine serum
albumin.
Determination of neutral sugars
Neutral sugars were measured as alditol acetates
after hydrolysis. The crude extracted pectic
polysaccharides (20 mg) were pretreated with 2M
trifluoroacetic acid (TFA) for 3 h at 120С before
conversion to alditol acetates according to the
method developed by Blakeney at al. [20].
The monosaccharide composition of the pectic
polysaccharides was determined by HP gas
chromatograph 6890 Series Plus coupled with a
5973 mass-selective detector (Helwett–Packard,
Palo Alto, CA), on a column SP-2380 (Supelco).
The oven temperature was programmed to 200°С
for 3 min, then to 250°С with a rate of 5°С/min.
Helium was carrier gas at 1 ml/min. Peak identify-
cation was based on retention times, using myo-
inositole as internal standard.
Determination of molecular mass
The molar masses of the polysaccharides were
assayed through HPSEC on a Waters (Millipore)
system. The assay was made on UltrahydrogelTM
120 and UltrahydrogelTM
500 column (7.8 x 300
mm, Waters) with bidistilled water as eluent at an
eluation rate of 0.8 ml/min. The column was
calibrated using the Shodex standard P-82 (Showa
DENKO, Japan).
Determination of anti-complementary activity
Complement activity was measured using a
microassay method according to Klerx et al.
[21,22]. The test is based on the colorimetric
measurement of hemoglobin released from target
erythrocytes after incubation with normal human
serum. In the classical pathway assay (CP), veronal
buffered saline (25 mM, pH 7.4) containing 0.15
mM CaCl2 and 0.5 mM MgCl2 served as an diluent.
Sheep red blood cells (SRBC) sensitized with rabbit
anti-SRBC antibodies at a concentration of
2x10⁸cells/ml were used as targets. In the alterna-
tive pathway (AP) assay, uncoated (without anti-
RRBC antibodies) rabbit erythrocytes (RRBC) at a
concentration of 1x10⁸cells/ml as targets were used.
Activation of the calcium-dependent classical
pathway is prevented by the addition of calcium
chelator ethyleneglycol-bis(2-aminoethyl) tetra-
acetic acid (EGTA) to the assay veronal buffer
containing 5 mM MgCl2 and 8 mM EGTA.
The effect of polysaccharides on complement
activity was determined after pre-incubation for 45
min at 37C of equal volumes of normal human
serum (dilution giving about 50% lysis of the target
cells) and two-fold dilutions of polysaccharides
(usually starting with 2 mg/ml). After incubation
(1.5h at 37C) of target erythrocytes and treated
sera, hemolysis in cell supernatants was measured
at 541 nm. The anti-complementary activity of the
samples was expressed as the percentage inhibition
of the total complement hemolysis (TCH50) of the
control serum given by the formula:
Inhibition of TCH50 (%) = [(TCH50 of control serum
- TCH50 treated with pectin serum)/ TCH50 of
control] x 100.
RESULTS AND DISCUSSION
The isolated pectic polysaccharides, obtained by
a sequenced extraction with water were name W0
and 0.5% hydrochloric acid were name A0 from
AIS of leek, were purified by the procedure shown
in Fig. 1.
The polysaccharides were applied to a column
with ion-exchange resin DEAE–Sepharose – fast
flow and eluted with sodium acetate buffer at a
linear gradient (0.05-1.0 М). One fraction, W1, was
obtained from the water extractable polysaccharide,
while three fractions, A1, A2, A3 (Fig. 2), were
obtained from the acid extractable polysaccharide.

M. Nikolova et al.: Purification and biological activity of pectic polysaccharides from leek
74
The chemical composition of these fractions is
presented in Table 1.
B1
No fractions
0 2 4 6 8 10 12 14 16 18 20 22 24 26 28 30 32 34 36 38 40 42 44 46 48 50 52 54 56 58 60 62 64 66 68 70 72 74
con
cen
trati
on
g/m
l
0
20
40
60
80
100
120
140
160
180
200
220
240
CH
3C
OO
Na b
uff
er (
M)
0,0
0,5
1,0
galacturonic acid
neutral sugars
buffer molarity
W1
(a)
K1
K2
K3
No fractions
0 2 4 6 8 10 12 14 16 18 20 22 24 26 28 30 32 34 36 38 40 42 44 46 48 50 52 54 56 58 60 62 64 66 68 70 72 74
con
cen
trati
on
s
g/m
l
0
20
40
60
80
100
120
140
160
180
200
220
240
CH
3C
OO
Na b
uff
er (
M)
0,0
0,5
1,0
galacturonic acid
neutral sugar
buffer molarity
A1
A2
A3
(b)
Fig. 2. Elution profile of water extractable (a) and acid
extractable (b) pectic polysaccharides on DEAE-
Sepharose fast flow.
The water extractable purified fraction – W1 had
a high content of uronic acids 66.4% (59.7%
galacturonic acid and 6.7% glucuronic acid). Galac-
tose (21.2%) was the prevailing neutral mono-
saccharide in the composition of W1.
Fraction A1 from the acid extractable
polysaccharide contained mostly neutral mono-
saccarides (59.9%) and 38.8% uronic acids, as it
can be seen from Table 1. No glucuronic acid was
found in this fraction. This polysaccharide had a
high molecular mass and the major neutral mono-
saccharide was galactose (47%). Most probably, it
was a polysaccharide of galactan type.
The other two fractions A2 and A3 were acidic
polysaccharides because they had a higher content
of uronic acids: 50.5% and 61.2%, respectively. In
both polysaccharides (A2 and A3), glucuronic acid
was found in addition to galacturonic acid, as it
occurred in higher amounts in A3. Galactose and
rhamnose accounted for the largest share of the
monosaccharide.
Dialyzed and lyophilized polysaccharide fracti-
ons purified by ion-exchange chromatography (W1,
A1, A2 and A3) were subjected to gel chromatogra-
phy on Sephadex G-200. Each fraction was eluted
with a phosphate buffer at рН=6, where fractions
W11, A11, A21 and A31 were obtained (Fig. 3).
Fraction W11 was characterized by a higher
content of galacturonic acid than W1 and a lower
quantity of glucuronic acid (Table 2). The nonuro-
nide ingredients of W11 were dominated by the
galactose monosaccharide.
In the purified fraction A11 the amount of
galacturonic acid increased from 38.8% in A1, to
50.7%, respectively. Total neutral monosaccharide
in the purified fraction A11 was 48.0% mostly that
of galactose (42.8%). In the other two SEC purified
acidic polysasccharides - A21 and A31, a lower con-
tent of glucuronic acid was obtained as compared
with A2 and A3. As for the nonuronide mono-
saccharide, the rhamnose content in A31 increased to
16.3% in comparison with A3 (10.7%).
The polysaccharide fraction A21 was dominated
by the monosaccharide galactose.
Table 1. Chemical compositions of purified anti-complementary extractable polysaccharides on DEAE-Sepharose fast
flow.
W1 A1 A2 A3
Uronic acid, % 66.4 38.8 50.5 61.2
Total neutral sugar, % 33.1 59.9 48.0 37.8
Protein,% 0.5 1.3 1.5 1.0
Monosaccharides composition,%
Rhamnose 5.8 8.2 16.0 10.7
Arabinose 5.2 4.2 8.0 2.5
Xylose 0.8 - 0.4 0.5
Mannose trace trace trace trace
Galactose 21.2 47.0 19.2 23.6
Glucose trace trace 4.5 trace
Galacturonic acid 59.7 38.8 41.2 43.5
Glucuronic acid 6.7 - 9.3 17.7

M. Nikolova et al.: Purification and biological activity of pectic polysaccharides from leek
75
Table 2. Chemical compositions of purified anti-complementary extractable polysaccharides on Sephadex G-200.
W11 A11 A21 A31
Uronic acid, % 66.2 50.7 60.6 67.1
Total neutral sugar, % 33.4 48.0 38.2 31.9
Protein,% 0.4 1.3 1.2 1.0
Monosaccharides composition,%
Rhamnose 0.6 2.2 5.0 16.3
Arabinose 0.9 1.0 6.2 trace
Xylose 0.8 - 0.4 0.5
Mannose trace trace trace trace
Galactose 27.9 42.8 24.4 15.1
Glucose 3.2 2.4 2.2 trace
Galacturonic acid 61.6 50.7 53.7 58.2
Glucuronic acid 4.6 - 6.9 8.9
No fractions
0 1 2 3 4 5 6 7 8 9 10 11 12 13 14 15 16 17 18 19 20 21 22 23 24 25 26 27 28 29
con
cen
tra
tio
n
g/m
l
0
20
40
60
80
100
120
140
160
180
200
220
240
galacturonic acid
neutral sugar
W11
No fractions
0 1 2 3 4 5 6 7 8 9 10 11 12 13 14 15 16 17 18 19 20 21 22 23 24 25 26 27 28 29 30 31 32 33
con
cen
trati
on
g/m
l
0
20
40
60
80
100
120
140
160
180
200
220
240
galacturonic acid
neutral sugar
A11
No fractions
0 1 2 3 4 5 6 7 8 9 10 11 12 13 14 15 16 17 18 19 20 21 22 23 24 25 26 27 28 29 30 31 32 33
con
cen
trati
on
,
g/m
l
0
20
40
60
80
100
120
140
160
180
200
220
240
galacturonic acid
neutral sugar A21
No fractions
0 1 2 3 4 5 6 7 8 9 10 11 12 13 14 15 16 17 18 19 20 21 22 23 24 25 26 27 28 29 30 31 32 33
con
cen
trati
on
,
g/m
l
0
20
40
60
80
100
120
140
160
180
200
220
240
galacturonic acid
neutral sugar
A31
Fig. 3. Elution profile of purified pectic polysaccharides on Sephadex G-200.
The follow-up analyses of the purified samples
were related to determining their molecular mass
values and their molecular homogeneity (Fig. 4).
Fractions W1 and W11 obtained as a result of the
purification and separation of the water-extractable
pectic polysaccharide had the highest molecular
mass, as well as the highest homogeneity.
Fractions A1 and A11 made up mostly of neutral
monosaccharide showed a high molecular mass and
were considerably more homogeneous than the
other polysaccharide fractions of the acid extrac-
table pectic polysaccharide. Fractions A2 and A21
had a higher molecular mass than A3 and A31.
All polysaccharides tested had some activity in
complement-fixation test (Fig. 5). The fractions W0
and W1 showed the same low activity. W11 was
signifycantly more active than W0 and W1. Neither
the anticomplementary activity values of A0, A1,
and A2 nor those of A3 showed significant differen-
ces. A11, A21 and A31 were the most active fractions.
The obtained results indicate that the activation
of the complement system by these polysaccharides
occurs via both the classical and alternative
pathways.

M. Nikolova et al.: Purification and biological activity of pectic polysaccharides from leek
76
Re
fra
ctic in
de
xW1
7.4e+08
3.1e+06
1.2e+0453 7.4e+08
3.1e+06
1.2e+04
53
Molecular Mass, Da
7.4e+08
3.1e+06
1.2e+04537.4e+08
3.1e+06
1.2e+0453
5 10 15 20 25 30 35 5 10 15 20 25 30 35 5 10 15 20 25 30 35
Retention time, min
5 10 15 20 25 30 35
A1 A2 A3
W11 A11 A21 A31
Fig. 4. HPSEC elution patterns to molecular weight of purified on DEAE-Sepharose fast flow and Sephadex G-200
pectic polysaccharides from leek.
complemen activation on classical pathway
sample
W0 W1 W11 A0 A1 A2 A3 A11 A21 A31
% h
emoly
sis
inhib
itio
n
0
20
40
60
80
100
1000 g/ml
500 g/ml
complement activation on alternative pathway
sample
W0 W1 W11 A0 A1 A2 A3 A11 A21 A31
% h
emoly
sis
inhib
itio
n
0
20
40
60
80
100
500 g/ml
250 g/ml
Fig. 5. Immunomodulating activity of purified pectic polysaccharides from leek.
CONCLUSION
It was found, based on the analysis of the
polysaccharide fractions obtained by ion-exchange
and gel chromatography, that fractions A2 and A3
had a higher uronic acid content. The composition
of those uronic acids included galacturoniuc acid
and glucuronic acid. In the process of ion-exchange
chromatography, a fraction was isolated that had a
high content of neutral monosaccharides, such as
fraction A1 (59.9% neutral sugars). This fraction
contained 47.0% galactose. Most probably, there
was a presence of galactan type of polysaccharide
in the leek.

M. Nikolova et al.: Purification and biological activity of pectic polysaccharides from leek
77
The analyzed polysaccharide fractions that were
by ion-exchange and gel chromatography purified
were characterized by a pronounced biological
activity which increased in comparison with the
source polysaccharides.
Acknowledgements: This work was funded by
project No BG161РО003-1.1.05-0024-С0001
“Development of nutraceuticals with antioxidant
and immune-stimulating action” of Operational
Program “Competitiveness” of the EU.
REFERENCES
1. M. Fernandes, D. M. Sun, M. A. Tosca, D. J.
McNamara, A.m. J. Clin. Nutr., 59, 869 (1994).
2. R. D. Hopewell, R. Yeater, I. Ullrich, Prog. Food.
Nutr. Sci., 17, 159 (1993).
3. M. Thorogood, R. Carter, L. Benfield, Brit. Med. J.,
259, 351 (1987).
4. A. S. Truswell, A. C. Beynen, in: Dietary Fibre, A
component of Food Nutrional Function in Health and
Disease, Schweizer T.F., Edwards C. A. (eds.),
Springer Verlag, 1999.
5. C. Huang, N. Dural, J. Food Process. Eng., 18, 234
(1995).
6. T. Ide, M. Horil, K. Kawasluma, T. Yamamoto, Br.
J. Nutr., 62, 539 (1989).
7. T. D. Hockaday, Scand. J. Gastr. Suppl., 124 (1987).
8. J. Grudeva, M. Kratchanova, I. Panchev, C.
Kratchanov, Z. Lebensm. Unters. F. A., 204, 374
(1997).
9. J. Grudeva-Popova, M. Kratchanova, A. Djurdjev, C.
Kratchanov, Folia Medica, XXXIX, 1 (1997).
10. R. Labadie, in: Bioactive natural products, S. M.
Colegate, R. S. Molyneux (eds.), CRC Press Inc.
London, 1993, p. 297.
11. A. Sendi, N. Mulinacci, F. Vincieri , H. Wagner,
Phytochemistry, 34, 1357 (1993).
12. R. Srivastara, D. K. Kulshrestha, Phytochem., 28,
2877 (1989).
13. H. Yamada, H. Kiohara, T. Matsumoto, in: Advances
in Pectin and Pectinase Reserch, F. Voragen, H.
Schols, R. Visser (eds.), The Netherlands: Kluwer
Academic Publishers, 2003, p. 481.
14. M. Kratchanova, M. Nikolova, E. Pavlova, I.
Yanakieva, V. Kussovski, J. Sci. Food Agr., 90, 2046
(2010).
15. M. Ognyanov, M. Nikolova, I. Yanakieva, V.
Kussovski, M. Kratchanova, J. BioSci. Biotech.
SE/ONLINE, 2, 13 (2013).
16. M. Kratchanova, M. Gocheva, E. Pavlova, I.
Yanakiev, D. Nedelcheva, V. Kussovski, A. Slavov,
Bulg. Chem. Commun., 40, 561 (2008).
17. D. W. F. Shannon, Analyst, 97, 209 (1972).
18. M. Blumenkrantz, G. Asboe-Hansen, Anal.
Biochem., 54, 484 (1973).
19. O. H. Lowry, N. J. Rosenbrough, A. L. Farr, R. L.
Randall, J. Biol. Chem., 193, 265 (1951).
20. A. Blakeney, P. Harris, R. Henry, B. Stony,
Carbohyd. Res., 113, 291 (1983).
21. J. P. A. M. Klerx, C. J. Beukelman, V. H. Dijk, J. M.
N. Willers, J. Immunol. Methods, 63, 215 (1983).
22. J. P. A. M. Klerx, C. J. Beukelman, H. V. Dijk, F. J.
Van Overveld, W. J. Van der Maaden, J. M. N.
Willers, Infect. Immun., 49, 841 (1985).

M. Nikolova et al.: Purification and biological activity of pectic polysaccharides from leek
78
ПРЕЧИСТВАНЕ И БИОЛОГИЧНА АКТИВНОСТ НА ПЕКТИНОВИ ПОЛИЗАХАРИДИ ОТ
ПРАЗ
М. Николова1, М. Крачанова
1*, Е. Павлова
1, И. Янакиева
1, В. Късовски
2
1Лаборатория Биологично Активни Вещества, Институт по Органична химия с Център по Фитохимия,
Българска Академия на Науките, бул. Руски 139, 4000 Пловдив, България 2Институт по микробиология, Българска Академия на Науките, ул. Акад. Г. Бончев, бл. 26, 1113 София,
България
Постъпила на 20 май 2014 г.; Коригирана на 04 юли 2014 г.
(Резюме)
Осъществено е хроматографско пречистване на пектинови полизахариди от праз, изолирани при
последователно екстрахиране с вода и 0,5% солна киселина. Посредством йонообменна хроматография върху
DEAE-Sepharose fast flow от водно и киселинно ексрахируемите полизахариди се получават четири фракции–
W1, A1, A2 и A3, всяка от които е гел храмотографски пречистена на Sephadex G-200, при което са обособени
фракциите W11, A11, A21 и A31. Тези фракции се различават по монозахаридния си състав. Във фракцията К1,
получена при йонообменното пречистване на киселинния екстракт, преобладават неутралните захари (> 58%),
докато останалите фракции са с високо уронидно съдържание. Установено е, че високо уронидните фракции
съдържат и глюкуронова киселина. Доминиращи монозахариди в пектиновите полизахариди от праз са
галактоза и рамноза. Чрез HPLC е определена молекулна маса на полизахаридните фракции и тяхната
дисперсност. Хроматографски пречистените полизахаридни фракции от праз показват имуномодулираща
активност, определена чрез активиране на комплемента по класическия и алтернативния път. В сравнениe с
изходните полизахариди, активността на пречистените се увеличава.

79
Bulgarian Chemical Communications, Volume 46, Special Issue A (pp. 79 – 87) 2014
Chemical composition and anti-complementary activity of enzyme-modified citrus
pectins
M. H. Ognyanov1, Y. N. Georgiev
1, I. Z. Yanakieva
1, V. К. Kussovski
2, M. G. Kratchanova
1*
1Laboratory of Biologically Active Substances, Institute of Organic Chemistry with Centre of Phytochemistry,
Bulgarian Academy of Sciences, 139 Ruski blv., 4000 Plovdiv, Bulgaria 2Department of Infectious Microbiology, Institute of Microbiology, Bulgarian Academy of Sciences, Acad. G. Bonchev
str., bl. 26, 1113 Sofia, Bulgaria
Received July 03, 2014; Revised July 26, 2014
Dedicated to Acad. Dimiter Ivanov on the occasion of his 120th
birth anniversary
A consecutive enzyme modification of citrus pectin series with endo-polygalacturonase (EPG) and combination of
β-galactosidase and endo-β-(1→4)-galactanase was conducted. Alcohol precipitation with two volumes of 96% ethanol
was used for fractionation of the enzyme hydrolyzate, resulting to recover of alcohol-insoluble and alcohol-soluble (AS)
parts. Alcohol-precipitated (AP) rhamnose-enriched fragments were obtained after homogalacturonan (HG) degradation
with EPG. Furthermore, it was found that citrus pectins contained xylogalacturonan fragments liberated after EPG
treatment. After modification with galactan-degrading enzymes galactose content was reduced between 50-89%, which
confirmed predominance of β-(1→4)-linked galactose in ramified hairy regions of citrus pectins. Anti-complementary
activity of investigated pectins was higher through the classical pathway in comparison with alternative ones. Enzyme
modification influenced to different extent on the anti-complementary activity. Аlcohol precipitation approach let to
obtaining of complex mixtures with pectic fragments, hindering the interpretation of biological activity results.
Key words: citrus pectin, enzyme modification, pectinases, monosaccharide composition, immunomodulating
polysaccharides
INTRODUCTION
Citrus peels are very rich in pectic constituents
and are one of the best sources for commercial
pectin production. Pectin is used mainly as a gelling
agent in the food industry for manufacturing of
jams, jellies and marmalades [1]. As well as pectin
has potential uses in many other fields such as
pharmaceutical and healthy supplement. For
example, modified citrus pectin (MCP) obtained by
acid, alkali or enzymatic treatment possesses
considerable therapeutic effects on tumor meta-
stasis and apoptosis in experimental animal models
and in clinical trials with humans [2]. Regarding the
study of anti-complementary activity of citrus
pectins there is no enough investigation. During the
past few years many efforts for MCP preparation
were referred to application of enzymatic and
physicochemical techniques. Alcohol precipitation
is a method used for isolation and fractionation of
polysaccharides from different extracts and at the
same way for purification from low molecular
weight substances. This approach is used also for
isolation of GalA oligomers with different degree
of polymerization after EPG treatment [3,4].
Additionally, alcohol precipitation was used also
for separation of mono- and oligosaccharides from
stepwise acid hydrolyzed pectic polysaccharide
from Siberian fir [5]. In our work alcohol
precipitation was used for separation of enzyme-
modified high molecular weight fragments from
low molecular weight mono- and oligomers. In our
previous publication we described the chemical
composition, molecular weight and complement-
fixing activity of initial water- and acid-extracted
orange and lemon peel pectins. All investigated
pectins were modified by EPG and AP residues
were assessed for their anti-complementary
potential [6]. In other earlier studies, Kratchanova
et al. [7-9] have established a favorable effect of
microwave pre-treatment of fresh citrus peels on
the yield and quality of pectin. Data on the
influence of microwave heating on biological
activity was not published.
The aim of the present study was to further
elucidate the composition and anti-complementary
activity of enzymatic modified by EPG and
galactan-degrading enzymes orange and lemon peel
pectins, obtained through extraction from alcohol-
insoluble solids (AIS) or microwave pretreatment.
© 2014 Bulgarian Academy of Sciences, Union of Chemists in Bulgaria
* To whom all correspondence should be sent:
E-mail: [email protected]

M. Ognyanov et al.: Chemical composition and anti-complementary activity of enzyme-modified citrus pectins
80
EXPERIMENTAL
Preparation of AIS
AIS from orange and lemon peels were prepared
as described previously [6].
Microwave pretreatment of fresh orange peels
Fresh orange peels (200 g) were placed in a
glass vessel and heated in a microwave oven with
duration of exposure 10 min, power 0.63 kW, and
operating frequency 2450 MHz. Microwave
treatment conditions were selected according to
Kratchanova et al. [9].
Sequential extraction
Sequential extraction of AIS from orange and
lemon peels as well as from microwave pretreated
fresh orange peels with hot water and 0.5%
hydrochloric acid was carried out as previously
reported [6]. Water- and acid-extracted orange
(WEOP and AEOP), lemon (WELP and AELP)
pectins as well as microwave pretreated (AEOP
MW) were obtained.
Enzymatic hydrolysis
All enzymes used in these experiments were
commercially prepared and were purchased from
Megazyme International Ireland Ltd. (Bray, Co.
Wicklow, Ireland). They were used without further
purification. EPG modification was carried out as
previously described elsewhere with slight modi-
fication [6]. Briefly: saponified orange or lemon
pectins (5 mg/ml) were dissolved in 50 mM sodium
acetate buffer (pH 5.0) and incubated with 0.042
IU/5 mg pectin at 40ºC for 24 h. Further AP
residues after EPG treatment were modified by
galactan-degrading enzymes. Modification was
performed by combination of endo-β-(1→4)-
galactanase (2.5 IU/5 mg substrate) and β-
galactosidase (0.8 IU/5 mg substrate) at 40ºC for 24
h according to Ognyanov et al. [10]. After this
modification AP residues were obtained. All
enzyme units for applied modifying enzymes were
selected after some pretests at different enzyme
dosages with saponified AEOP. According to the
final kinetic investigation (data not included) the
most significant changes in the saponified AEOP
after EPG modification were until 7 h. For the
subsequent modification with β-(1→4)-D-Gal-
releasing enzymes the most significant changes
were observed until 2 h.
Monosaccharide composition
Determination of neutral monosaccharides and
glucuronic acid content of AP enzyme-modified
pectins were carried out after CF3CO2H acid
hydrolysis by HPLC without derivatization as
previously described else-where [6]. Sugar
composition analysis of alcohol-soluble parts was
done without acid hydrolysis. Anhydrouronic acid
content (AUAC) was assayed by m-hydroxy-
biphenyl method [11]. Galacturonic acid was
calculated on the base of difference between total
anhydrouronic acid content and glucuronic acid.
Size-exclusion chromatography (SEC)
SEC was performed on Pharmacia Biotech
system. Two milliliters of each sample (3 mg/ml)
were centrifuged and loaded on HK 16/100 column
filled with Sephacryl S-300 HR and eluted with
0.05 M NaOAc buffer (pH=5.0) at 1.0 ml/min flow
rate. Fractions (5.0 ml) were collected and analyzed
for uronic acids by a microplate variant of
carbazole-sulfuric acid method, using D-GalA as a
standard [12]. Additionally molecular weight of
separated fractions was determined, using dextran
standards (35-200 kDa).
Anti-complementary activity
Anti-complementary activity of alcohol-
insoluble residues was measured through the
classical and alternative pathway, using a micro-
assay method, according to Klerx et al. [13]. The
anti-complementary activity of the samples was
expressed as a percentage inhibition of the total
complement hemolysis (TCH50) of target rabbit and
sensitized mutton erythrocytes from normal human
serum.
RESULTS AND DISCUSSION
In a previous publication we reported sequential
extraction of water- and acid-soluble pectins from
AIS of orange and lemon peels. Data on the content
and further chemical characterization of the initial
pectins were published elsewhere [6]. Furthermore
in the case of microwave treated peels a higher
yield of pectin (5.18% on the fresh peel base) was
obtained in comparison with both AIS (4.70%) and
control directly dried peels (3.47%). This obser-
vation was in agreement with the results published
by Kratchanova et al. [8,9], and Fishman et al. [14].
Keeping in mind higher yield and anti-comple-
mentary activity of AEOPMW than water extracted
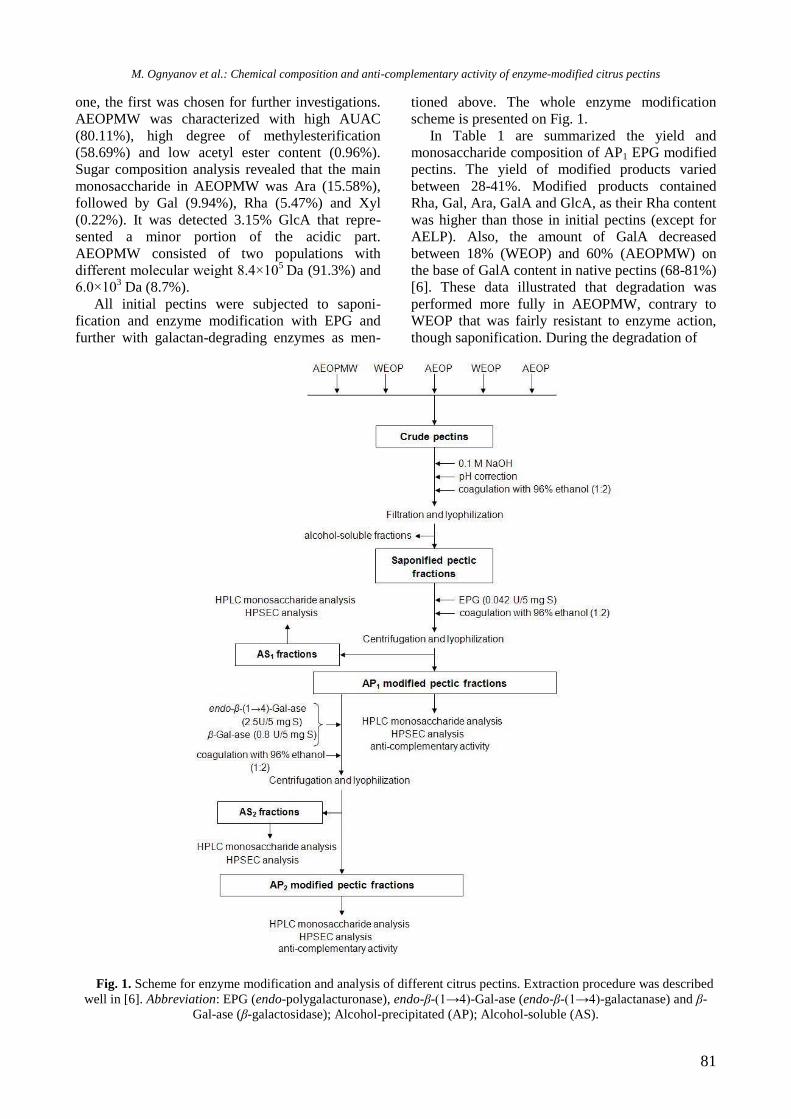
M. Ognyanov et al.: Chemical composition and anti-complementary activity of enzyme-modified citrus pectins
81
one, the first was chosen for further investigations.
AEOPMW was characterized with high AUAC
(80.11%), high degree of methylesterification
(58.69%) and low acetyl ester content (0.96%).
Sugar composition analysis revealed that the main
monosaccharide in AEOPMW was Ara (15.58%),
followed by Gal (9.94%), Rha (5.47%) and Xyl
(0.22%). It was detected 3.15% GlcA that repre-
sented a minor portion of the acidic part.
AEOPMW consisted of two populations with
different molecular weight 8.4×10⁵
Da (91.3%) and
6.0×10³ Da (8.7%).
All initial pectins were subjected to saponi-
fication and enzyme modification with EPG and
further with galactan-degrading enzymes as men-
tioned above. The whole enzyme modification
scheme is presented on Fig. 1.
In Table 1 are summarized the yield and
monosaccharide composition of AP1 EPG modified
pectins. The yield of modified products varied
between 28-41%. Modified products contained
Rha, Gal, Ara, GalA and GlcA, as their Rha content
was higher than those in initial pectins (except for
AELP). Also, the amount of GalA decreased
between 18% (WEOP) and 60% (AEOPMW) on
the base of GalA content in native pectins (68-81%)
[6]. These data illustrated that degradation was
performed more fully in AEOPMW, contrary to
WEOP that was fairly resistant to enzyme action,
though saponification. During the degradation of
Fig. 1. Scheme for enzyme modification and analysis of different citrus pectins. Extraction procedure was described
well in [6]. Abbreviation: EPG (endo-polygalacturonase), endo-β-(1→4)-Gal-ase (endo-β-(1→4)-galactanase) and β-
Gal-ase (β-galactosidase); Alcohol-precipitated (AP); Alcohol-soluble (AS).

M. Ognyanov et al.: Chemical composition and anti-complementary activity of enzyme-modified citrus pectins
82
citrus pectins EPG activity could be hindered by
neutral sugar side chains and resistant to degrada-
tion alcohol-insoluble residue could be isolated.
Rhamnogalacturonan I (RG) fraction that was not
free of the HG components may be accumulated in
AP1 residue. Indication for this was GalA presence
in AP1 fraction after enzyme treatment (Table 1).
Table 1. Yield and sugar composition (% w/w) of the
alcohol-precipitated (AP1) residue after degradation of
citus pectins with EPG. AEOPMW WEOP AEOP WELP AELP
Yield, % 39 28 39 41 29
Monosaccharides*
Rha 9.1 11.2 11.0 10.4 12.5
Ara 2.1 1.4 1.5 4.0 2.2
Gal 20.1 9.5 15.6 7.4 11.5
GalA 31 56.4 44.4 53.1 49.2
GlcA 2.6 2.7 3.5 0.7 3.4 *Values are the average of two replicates.
These results were in good agreement with
mode of EPG action. The enzyme catalyzes
hydrolytic depolymerization of linear HG regions
in pectic polysaccharides to oligomers and mono-
mers, but ramified hairy regions remain non-
degraded [15]. Therefore a high proportion of
pectic RG region is obtained. Surprisingly, after
modification Gal and Ara contents were decreased
(except AEOPMW). Interestingly, Xyl was not
detected in all AP1 residues, contrary to its presence
in AS1 residue (see Table 2) and this showed that
the monosaccharide was in some way released.
Quite possible could be the presence of short EPG
resistant Xyl-substituted galacturonan segments
interspersed with long EPG-degradable HG seg-
ments. Thus, it appears that after digestion intact
xylosilated oligomers could be accumulated in AS1
supernatant. Rather, it would be confirmed the
statement for Xyl-GalA containing units in initial
pectins than for co-extracted hemicelluloses. The
presence of mixed AS oligomers could be seen in
Table 2, where oligomer’s raw data represent the
sum of acidic and neutral oligomers. Schols et al.
[16] and Mort et al. [17] have obtained and well-
explained the phenomenon with Xyl-substituted
HG subunit. Sugar composition was in agreement
with another our previous publication, where we
reported that in AP part after EPG treatment of leek
pectin Rha amount was increased contrary to Gal
and Ara contents that were decreased [10]. Suh et
al. [18] have modified with EPG pectin isolated
from mandarine and they obtained a fraction with
increased Rha, Gal and Ara contents in comparison
with the initial pectin. Inngjerdingen et al. [19]
have observed a considerable Xyl decrease in one
of the chromatographically purified fractions of
EPG treated pectic polysaccharide from Biophytum
petersianum Klotzsch. It could also be observed
that GlcA content after this enzyme modification
was increased for some of the products [19]. It was
expected because it is well-known that GlcA
presents in the RG side chains [20]. Inngjerdingen
et al. [21] have also found increase of GlcA in a
chromatographically purified fraction of pectic
polysaccharide from Glinus oppositifolius after
EPG modification.
Neutral monosaccharides and uronic acids in
AS1 parts after EPG treatment were determined
without further acid hydrolysis to investigate
enzyme-liberated free monomers. The results are
presented in Table 2. Small amounts of free neutral
sugars were quantified in all AS1 products. Data for
GalA content illustrated that EPG modification was
performed. The presence of Ara and Gal in all
samples could be explained with external enzyme
activities mentioned in the certificates of used
enzymes. Glucuronic acid was not detected in most
of the AS1 parts (except WEOP) as was expected.
Table 2. Sugar composition (% w/w) of the alcohol-
soluble (AS1) part after degradation of citrus pectins with
EPG. Monosac-
charides AEOPMW WEOP AEOP WELP AELP
Rha 1.7 3.4 2.5 1.3 1.7
Xyl 1.2 0.9 1.2 1.3 1.2
Ara 0.7 0.4 1.1 0.8 0.7
Gal 0.3 0.3 1.6 0.5 0.3
GalA 46.5 10.2 26.9 27.6 22.1
GlcA - 0.4 - - -
Oligo-
mers* 70.4 67.2 69.3 69.7 68.7
* Data for oligomers are directly extracted from chromato-
grams as % area. Values are the average of two replicates.
For expectation, as many enzymes are involved
in the successive stepwise degradation of pectin as
more substantial is the reduction in molecular
weight and increase of molecular heterogeneity.
Because of this fact lower AP products were reco-
vered. The yield of AP2 products varied in a narrow
range between 49-54% calculated on EPG AP1
residue base (Table 3). Generally, citrus pectins
contain predominatly arabinogalactan type I, which
is a linear chain of β-(1→4)-linked Gal residues
with 20-40% Ara monomers connected mostly to
C3 of Gal units [22]. To study the influence of this
type of galactan chains on anti-complementary
activity of citrus pectins treatment with β-(1→4)-

M. Ognyanov et al.: Chemical composition and anti-complementary activity of enzyme-modified citrus pectins
83
galactan-degrading enzymes was performed. Beta-
Galactosidase (EC 3.2.1.23) catalyzes hydrolytic
decomposition of β-(1→4)-galactosidic bonds in
lactose and different β-D-galactosides towards non-
reducing end. The enzyme acts in a synergistic
manner with endo-β-(1→4)-D-galactanase (EC
3.2.1.89). The latter catalyzes hydrolytic degrada-
tion of different galactans to galactooligo-
saccharides by endo mechanism. These enzymes
play a key role in decomposition of β-(1→4)-D-
galactan side chains in pectic arabinogalactan type I
from RG I [23,24]. The results in Table 3 show that
Gal amount was considerably lower after
synergistic action of endo-β-(1→4)-galactanase and
β-galactosidase. From Table 1 and 3 could be
calculated that Gal content was reduced between
50% (WELP) and 89% (WEOP). The detected Gal
amount after this treatment could be related to non-
degraded β-(1→4) glycosidic bonds and the pre-
sence of highly branched arabinogalactan type II
with chains of galactose residues joint by β-
(1→3,6) linkages. Zhang et al. [25] have found that
after endo-β-(1→4)-galactanase digestion of arabi-
nogalactan from Angelica acutiloba Gal amount
was reduced with 30%. Characteristically, pectic
ramified regions and more specifically galactan
side chains could be substituted with GlcA and/or
4-O-methyl-GlcA, mainly as a non-reducing termi-
nal residue [26]. Therefore digestion with galactan-
degrading enzymes leads to liberation of AS
galactooligomers substituted with GlcA, which is
the reason for its lower quantity in AP2 products
(Table 3). Grønhaug et al. [27] have found that
after modification with endo-β-(1→4)-galactanase
of EPG treated pectic polysaccharide from
Biophytum petersianum Klotzsch Rha, Gal and Ara
contents were increased, but no GlcA was detected.
Raw data expressed as %Area and extracted from
chromatograms, showing the sum of acidic and
neutral AS oligomers are also presented in Table 4.
Additionally a small amount of Rha was detected in
these fractions because most of the released RG
backbone fragments could be AS. Contradictory to
previous results for EPG AP1 residues (Table 1)
Xyl was detected in trace amounts in both products
after galactose-releasing enzymes (Table 3).
The results, as shown in Table 4, confirmed that
the same quality sugar composition was detected as
before modification (Table 2). Galactose was the
most abundant free neutral monosaccharide because
of specificity of conducted enzyme modification.
This simply showed that most of Gal was bound by
β-(1→4) linkages.
It should be noted that the absence of mono-
meric GlcA in AS2 parts (except AEOPMW) could
be explained with direct sugar analysis without
further acid hydrolysis of solubilized GlcA-sub-
stituted (galacto)oligomeric residue. This leads to
underestimation and masking the GlcA amount in
the sample. Detected amounts of GalA in all samp-
les could be related to the mentioned minor external
EPG activity in endo-β-(1→4)-galactanase certifi-
cate. Actually the same could be said for detected
low (trace) amounts of Ara and Xyl.
Table 3. Yield and sugar composition (% w/w) of the
alcohol-precipitated (AP2) residue after degradation of
citrus pectins with galactan-degrading enzymes endo-β-
(1→4)-galactanase and β-galactosidase. AEOPMW WEOP AEOP WELP AELP
Yield, % 49 54 5152 54
Monosaccharides*
Rha 0.7 1.0 1.0 1.2 0.5
Xyl 0.4 0.1 - trace 0.2
Ara 10.6 13.2 10.5 11.9 11.8
Gal 5.3 1.0 4.3 3.7 4.0
GalA 28.6 54.1 24.8 36.3 21.1
GlcA 0.5 0.6 0.3 1.0 - *Values are the average of two replicates.
Generally, comparing molecular heterogeneity
of all citrus pectins after EPG action AP1 residues
contained higher proportion of molecular fragments
with Mw 105 Da and smaller 10
4 Da. Oppositely,
AS1 parts contained mainly 104 Da population. In
result of enzyme hydrolysis with galactose-relea-
sing enzymes AP2 residues contained predomi-
nantly fragments with Mw 104
Da and smaller
proportion with 105 Da.
Table 4. Sugar composition (% w/w) of the alcohol-
soluble (AS2) part after degradation of citrus pectins with
galactan-degrading enzymes endo-β-(1→4)-galactanase
and β-galactosidase. Monosac-
charides AEOPMW WEOP AEOP WELP AELP
Rha 1.3 0.5 0.1 0.8 1.6
Xyl trace 0.1 - 0.2 trace
Ara 0.4 0.7 0.9 1.0 1.1
Gal 11.4 4.9 15.5 1.4 7.5
GalA 2.0 2.3 2.1 2.0 1.0
GlcA 0.4 - - - -
Oligo-
mers* 45.2 80.1 57.6 85 69.7
*Data for oligomers are directly extracted from chromatograms
as % area. Values are the average of two replicates.
To access the molecular weight distribution of
the initial AEOP and its alcohol-insoluble enzyme-
modified products they were analyzed by SEC.
AEOP was selected for fractionation because of its
higher anti-complementary activity. Fig. 2 shows
the elution pattern obtained by fractionation of

M. Ognyanov et al.: Chemical composition and anti-complementary activity of enzyme-modified citrus pectins
84
AEOP sample before and after enzyme treatment.
Also, the found molecular weight value for
different peaks was annotated. It was shown by the
lower molecular mass of the AP1 residue that initial
high molecular weight substrate was degraded with
EPG. In general, initial AEOP consisted of one
distinct population in the high molecular weight
region and was eluted as a broad peak faster than
oligomers.
0.0
0.1
0.2
0.3
0.4
0.5
0.6
0.7
0.8
0.9
1.0
0 50 100 150 200 250Elution volume [ml]
Uro
nic
ac
id d
istr
ibu
tio
n
(Ab
so
rba
nc
e a
t 5
44
nm
) AEOP
AEOP -EPG
AEOP - β-Gal-ases
2.2 × 10⁵ Da
9.8 × 10⁴ Da
4.0 × 10³ Da
4.0 × 10³ Da
8.0 × 10⁴ Da
Fig. 2. Size-exclusion chromatography of AEOP and its
alcohol-insoluble residues after a consecutive
modification with EPG and galactan-degrading enzymes
(β-Gal-ases).
Interestingly, two subfractions were separated
from AP1 residue. The higher molecular weight
fraction was eluted as a rather broad peak between
50 and 110 ml consisted of lower amount of uronic
acids, contrary to the second population that gave a
high absorbance, but was eluted later with higher
elution volume. Presumably, the first peak repre-
sented enzyme-resistant polymeric material and the
second either galacturonic acid oligomers with
higher molecular weight or mixture of lower
molecular weight ramified hairy region fragments
that co-eluted with larger oligogalacturonides. The
molecular weight distribution and pattern of AP1
residue after EPG were comparable with this after
galactan-degrading enzymes, but as can be seen a
small fraction was eluted at elution volume of 250
ml. It could be alcohol co-precipitated acidic
oligomers with lower degree of polymerization.
Schols et al. [28] have shown that by SEC on
Sephacryl S-300 was possible the separation of
apple pectin EPG hydrolizate to rich in neutral
sugar regions and acidic oligogalacturonides.
Authors have determined by HPSEC that molecular
weight of obtained hydrolysis products were in the
range 103
- 105
Da. This was in a good agreement
with our results. Additionally our results and
assumptions were comparative with these of Ros et
al. [29]. It was also seen that after treatment with
galactan-degrading enzymes the peak at elution
volume under 80 ml was retained and absorption
maximum of detected uronic acids was slightly
increased. This was probably a result from change
of uronic acid to neutral sugar ratio in this popu-
lation as a consequence from Gal release.
The complement system is a basic antimicrobial
defense mechanism in humans and normally
present in blood in an inactive form. It can be
activated through three different enzyme cascades -
classical, alternative and lectin pathways by
microbial cell wall carbohydrate structures (lipo-
polysaccharides, mannans, poly-N-acetylglucos-
amine) and by some plant polysaccharides (pectin,
inulin, glucans). It is well-known that the anti-
complementary activity of the most biologically
active pectins is due to the containing arabino-
galactan II side chains in RG I and that pectin could
stimulate both classical and alternative pathway
[30,31]. For investigation of the influence of linear
acidic HG and RG I side chains on the activity was
conducted modification by EPG and a successive
modification with combination of galactan-degra-
ding enzymes. EPG was used for obtaining of
active ramified pectic RGs.
In Table 5 are presented the results from the
complement activation test for different citrus
pectins and their enzyme-modified alcohol-inso-
luble products through the classical and alternative
pathways. All polysaccharides expressed higher
anti-complementary activity through the classical
pathway. Acid-extracted pectins were more active
than water-extracted ones through this pathway. For
example, acid-extracted citrus pectins inhibited
mutton erythrocyte hemolysis over 50% at 2500
µg/ml. Furthermore, AEOP inhibited rabbit eryth-
rocyte hemolysis over 80% at 5000 µg/ml through
alternative pathway. Additionally, polysaccharides
were investigated at 2500 µg/ml, but they did not
show any activity through this pathway. Microwave
pretreatment of orange peels did not negatively
influence on the activity of AEOPMW. Studies
dealing with anti-complementary activity of unmo-
dified pectic polysaccharides from different plant
sources have been published. For example,
Kiyohara et al. [32] have obtained by ion-exchange
chromatography four acidic fractions AR-2IIa-2IId
from A. acutiloba with above 90% AUAC and anti-
complementary activity over 50% at 1000 µg/ml.
Paik et al. [33] have isolated the biologically active
acidic fraction HCAP-0 with hot water from pepper
(Capsicum annuum), which expressed 85% anti-
complementary activity through the classical
pathway at 1000 µg/ml. In comparison with our
results AEOP possessed about 80% activity through
both pathways, but in significantly higher concen-

M. Ognyanov et al.: Chemical composition and anti-complementary activity of enzyme-modified citrus pectins
85
Table 5. Anti-complementary activity of citrus pectins and their alcohol-insoluble (AP1 and AP2) enzyme-modified
products. Mean ± SD.
Inhibition of total complement hemolysis of target animal erythrocytes, %
Classical pathway Alternative
pathway Classical pathway
Alternative
pathway Classical pathway
2500
µg/ml 1250
µg/ml 5000 µg/ml
2500
µg/ml 1250
µg/ml 5000 µg/ml
2500
µg/ml 1250
µg/ml
Pectins Initial EPG modified pectins β-Gal-ases modified
pectins AEOPMW 74.8±13.8 14.2±5.8 20.7±6.4 34.8±6.3 4.2±0.8 35.1±15.9 60.7±6.2 10.6±1.6
WEOP 41.4±10.7 8.7±0.9 22.6±7.6 54.6±6.6 34.4±10.1 27.7±8.4 55.2±21.4 25.2±9.8 AEOP 85.8±7.4 12.6±1.7 81.5±15.1 37.3±4.7 7.7±4.2 22.4±2.2 46.4±15.3 19.1±11.7 WELP 31.5±5.6 5.3±0.6 56.9±16.2 25.5±5.8 14.2±4.1 63.6±14.6 64.3±11.4 35.3±13.2 AELP 57.1±2.5 11.4±2.9 19.1±4.4 28.7±4.1 14.2±5.8 29.2±1.8 44.8±7.3 25.8±4.6
trations. Furthermore, Diallo et al. [34] have inves-
tigated two very potent crude polysaccharide
extracts from the leaves of Trichilia emetica that
showed ICH50 at 35 µg/ml and 45 µg/ml, respect-
tively. After ion-exchange chromatography of both
extracts they isolated the most potent fraction "Te
100 fraction acidic 4" with ICH50 < 15 µg/ml rich in
GalA, Gal and Rha. Investigated citrus pectins were
with considerably lower activity than the mentioned
above because of different plant source and
polysaccharide preparation.
Clear positive influence after modification with
EPG was observed in WEOP through the classical
pathway. Except AEOP modification was not nega-
tive through the alternative pathway. Interestingly,
AEOP was the most potent sample through this
pathway before EPG digestion. In agreement with
our results Kiyohara et al. [32] have observed the
same phenomenon after EPG digestion of AR-2IIa
and AR-2IIb because their anti-complementary
activity decreased from 59.5% to 29.0% and 62.6%
to 42.8% at 1000 µg/ml. But after separation of
oligogalacturonides from enzyme resistant fraction
on Sephadex G-50 the latter showed higher activity
in comparison with the original fraction.
Inngjerdingen et al. [21] have isolated a pectic
polysaccharide GOA2 from G. oppositifolius,
which inhibited hemolysis of sheep sensitized
erythrocytes to about 40% under 1000 µg/ml. After
modification by EPG they obtained chromato-
graphically fractions GOA2-I, II, III, and oligo-
galacturonides as the first one inhibited hemolysis
to 90% and the next two expressed very low
activity. As is shown in Table 5 anti-complemen-
tary activity is either decreased or not substantially
changed. Accumulation of alcohol-insoluble oligo-
galacturonides could not be excluded because of the
mode of action of EPG. The latter may have a nega-
tive masking effect on the activity expression of
arabinogalactans. The best way for elucidation of
this problem could be fractionation of the obtained
products to oligogalacturonides and rich of neutral
sugar fraction by ion-exchange chromatography
and further investigation of their activity.
Also it was interestingly to study the influence
of β-(1→4)-linked Gal on the anti-complementary
activity through the classical pathway. Generally, it
could be concluded that this modification did not
influence negatively on the activity of citrus pectins
(Table 5). For example, WELP (initial) increased
its activity from 31.5±5.6% to 64.3±11.4%. The
higher observed activity for most of the samples
could be interpreted with concentration of biolo-
gically active oligomers with glycosidic bonds
resistant to the catalytic activity of applied enzy-
mes. They should be the active β-(1→3)-galactans
branched with β-(1→6)-galactans and/or biologica-
lly active β-(1→4)-galactooligosaccharides accu-
mulated in AP residue. Ognyanov et al. [10] have
determined for acid-extracted leek pectin that
modification with EPG led to 3 fold increase in
anti-complementary activity of AP residue through
the classical pathway, otherwise digestion with
endo-β-(1→4)-galactanase led to twofold decrease
in activity. Grønhaug et al. [27] have reported for
pectic polysaccharides from B. petersianum that
additionally to (1→3,6)-galactans β-(1→4)-galac-
tans could also contribute to the immunomodula-
ting activity against immunocompetent Peyer’s
patch cells. They have shown this fact by digestion
with endo-β-(1→4)-galactanase and the aforemen-
tioned specific Gal-releasing enzymes and further
chromatographic separation. This was in contra-
diction with our results.

M. Ognyanov et al.: Chemical composition and anti-complementary activity of enzyme-modified citrus pectins
86
CONCLUSION
In the present study an attempt for
characterization of AP enzyme-released pectic oli-
gosaccharides was made. AP1 rhamnose-enriched
fragments were obtained by EPG treatment. It was
indicated that investigated citrus pectins contained
xylogalacturonan fragments. The predominant pre-
sence of β-(1→4)-linked Gal in investigated pectins
using β-(1→4)-Gal-releasing enzymes was confir-
med. Enzyme modification influenced to different
extent anti-complementary activity of investigated
pectins. Alcohol precipitation is a suitable and
relatively prompt strategy for fractionation of
enzyme-digested pectins. Introduced approach led
to obtaining of a complex mixture of mono- and
oligosaccharides that hindered appropriate estima-
tion of influence of enzyme modification on anti-
complementary activity. On the base of our investi-
gations it could be concluded that for obtaining
more clear results alcohol precipitation procedure
should be optimized by applying a stepwise
procedure with different alcohol concentrations.
For elucidation of the relationship between carbo-
hydrate composition and anti-complementary acti-
vity enzymolysis and glycosidic linkage analysis of
chromatographically purified pectic arabinogalac-
tan chains are necessary to be used. Moreover for
better understanding of pectic monosaccharide
composition and structure investigation of more
complex AS oligomers after appropriate acid
hydrolysis by modern analytical tools (HILIC-
ELSD/ESI-MSn, CE-MS/CE-LIF, HPAEC-PAD)
are needed.
Acknowledgements: This work was funded by
project № BG161РО003-1.1.05-0024-С0001
“Development of nutraceuticals with antioxidant
and immune-stimulating action” of Operational
Program “Competitiveness” of the EU.
REFERENCES
1. Z. I. Kertesz, The Pectic Substances, Interscience
Publishers, New York, 1951.
2. P. S. Bhimanagouda, J. S. Brodbelt, E. G. Miller, N.
D. Turner, in: Potential Health Benefits of Citrus,
ACS Sym. Ser., 936, 1 (2006).
3. R. Cameron, G. Luzio, E. Baldwin, J. Narciso, A.
Plotto, Proc. Fla. State Hort. Soc., 118, 406 (2005).
4. R. Cameron, G. Luzio, B. Savary, A. Nuñez, K.
Goodner, Proc. Fla. State Hort. Soc., 122, 295
(2009).
5. E. Makarova, O. Patova, E. Shakhmatov, S.
Kuznetsov, Yu. Ovodov, Carbohydr. Polym., 92,
1817 (2013).
6. Y. Georgiev, M. Ognyanov, I. Yanakieva, V.
Kussovski, M. Kratchanova, J. BioSci. Biotech., 1,
223 (2012).
7. M. Kratchanova, I. Panchev, E. Pavlova, L.
Schtereva, Carbohydr. Polym., 25, 141 (1994).
8. M. Kratchanova, E. Pavlova, I. Panchev, Chr.
Kratchanov, Prog. Biotech., 14, 941 (1996).
9. M. Kratchanova, E. Pavlova, I. Panchev, Carbohydr.
Polym., 56, 181 (2004).
10. M. Ognyanov, M. Nikolova, I. Yanakieva, V.
Kussovski, M. Kratchanova, J. BioSci. Biotech., 2, 13
(2013).
11. N. Blumenkrantz, G. Asboe-Hansen, Anal. Biochem.,
54, 484 (1973).
12. M. Cesaretti, E. Luppi, F. Maccari, N. Volpi,
Carbohydr. Polym., 54, 59 (2003).
13. J. Klerx, C. Beukelman, V. Dijk, J. Willers, J.
Immunol. Methods, 63, 215 (1983).
14. M. Fishman, H. Chau, P. Hoagland, A. Hotchkiss,
Food Hydrocolloids, 20, 1170 (2006).
15. J. A. E. Benen, J. Visser J. 2003. in: Handbook of
Food Enzymology, J. R. Whitaker, A. G. J. Voragen,
D. W. S. Wong (eds.), Marcel Dekker, Inc., 2003, ch.
69.
16. H. A. Schols, E. J. Bakx, D. Schipper, A. G. J.
Voragen, Carbohydr. Res., 279, 265 (1995).
17. A. Mort, Y. Zheng, F. Qui, M. Nimtz, G. Bell-
Eunice, Carbohydr. Res., 343, 1212 (2008).
18. H.-J. Suh, H.-S. Yang, K.-S. Ra, D.-O. Noh, K.-H.
Kwon, J.-H. Hwang, K.-W. Yu, Food Chem., 138,
1079 (2013).
19. M. Inngjerdingen, K. T. Inngjerdingen, T. R. Patel, S.
Allen, X. Chen, B. Rolstad, G. A. Morris, S. E.
Harding, T. E. Michaelsen, D. Diallo, B. S. Paulsen,
Glycobiology, 18, 1074 (2008).
20. J. An, M. A. O'Neill, P. Albersheim, A. G. Darvill,
Carbohydr. Res., 252, 235 (1994).
21. K. T. Inngjerdingen, T. R. Patel, X. Chen, L. Kenne,
S. Allen, G. A. Morris, S. E. Harding, T. Matsumoto,
D. Diallo, H. Yamada, T. E. Michaelsen, M.
Inngjerdingen, B. S. Pausen, Glycobiology, 17, 1299
(2007).
22. G. Beldman, H. A. Schols, S. M. Pitson, M. J. F.
Searle-Van Leeuwen, A. G. J. Voragen, in: Advances
in Macromolecular Carbohydrate Research, R. J.
Sturgeon (ed.), vol. 1, 1997, Jai Press, Inc., London,
1997, p. 1.
23. R. R. Mohoney, in: Handbook of Food Enzymology,
J. R. Whitaker, A. G. J. Voragen, D. W. S. Wong
(eds.), Marcel Dekker, Inc., 2003, ch. 65.
24. R. de Vries, J. Visser, in: Handbook of Food
Enzymology, J. R. Whitaker, A. G. J. Voragen, D.
W. S. Wong (eds.), Marcel Dekker, Inc., 2003, ch.
70.
25. Y. Zhang, H. Kiyohara, M. H. Sakurai, H. Yamada,
Carbohydr. Polym., 31, 149 (1996).
26. M. Haque, T. Kotake, Y. Tsumuraya, Biosci. Biotech.
& Biochem., 69, 2170 (2005).

M. Ognyanov et al.: Chemical composition and anti-complementary activity of enzyme-modified citrus pectins
87
27. T. E. Grønhaug, H. Kiyohara, A. Sveaass, D. Diallo,
H. Yamada, B. S. Paulsen, Phytochem., 72, 2139
(2011).
28. H. A. Schols, E. Vierhuis, E. J. Bakx, A. G. J.
Voragen, Carbohydr. Res., 275, 343 (1995).
29. J. M. Ros, H. A. Schols, A. G. J. Voragen,
Carbohydr. Polym., 37, 159 (1998).
30. H. Yamada, H. Kiyohara, in: Immunomodulatory
agents from plant, H. Wagner (ed.), 1999,
Birkhäuser, Basel, p. 161.
31. H. Yamada, H. Kiyohara, in: Comprehensive
Glycoscience – From Chemistry to Systems Biology,
J. P. Kamerling (ed.), 2007, Elsevier, Oxford, p. 663.
32. H. Kiyohara, J. C. Cyong, H. Yamada, Carbohydr.
Res., 182, 259 (1988).
33. S.-Y. Paik, K. S. Ra, I. S. Chang, Y. C. Park, H. S.
Park, H. S. Baik, J. W. Yun, J. W. Choi, J. Biochem.
Mol. Biol., 36, 230 (2003).
34. D. Diallo, B. S. Pausen, T. H. A. Liljebäck, T. E.
Michaelsen, J. Ethnopharmacol., 84, 279 (2003).
ХИМИЧЕН СЪСТАВ И АНТИКОМПЛЕМЕНТАРНА АКТИВНОСТ НА ЕНЗИМНО-
МОДИФИЦИРАНИ ЦИТРУСОВИ ПЕКТИНИ
М. Х. Огнянов1, Й. Н. Георгиев
1, И. Ж. Янакиева
1, В. К. Късовски
2, М. Г. Крачанова
1*
1Лаборатория Биологично Активни Вещества, Институт по Органична химия с Център по Фитохимия,
Българска Академия на Науките, бул. Руски 139, 4000 Пловдив, България 2 Департамент по Инфекциозна Микробиология, Институт по микробиология, Българска Академия на
Науките, ул. Акад. Г. Бончев, бл. 26, 1113 София, България
Постъпила на 03 юли 2014 г.; Коригирана на 26 юли 2014 г.
(Резюме)
В настоящoто изследване беше проведена последователна ензимна модификация на серия от цитрусови
пектини с ендо-полигалактуроназа и комбинация от β-галактозидаза и ендо-β-(1→4)-галактаназа. За
фракциониране на ензимните хидролизати беше използвано утаяване с двукратен обем 96% етанол, което
доведе до получаването на алкохолно-разтворима и алкохолно-неразтворима част. След действието на ендо-
полигалактуроназа бяха получени алкохолно утаими фракции с повишено съдържание на рамноза и понижено
на галактуронова киселина (между 18-60%). Освен това беше установено, че цитрусовите пектини съдържат
ксилогалактуронанови фрагменти, които се освобождават след третирането с ендо-полигалактуроназа. След
последващата ензимна модификация галактозното съдържание на изследваните пектини беше намалено между
50 и 89%, което потвърждава преимуществото на β-(1→4)-свързаната галактоза в разклонените вериги на
цитрусовите пектини. Антикомплементарната активност на цитрусовите пектини беше по-висока по
класическия път в сравнение с алтернативния път на активиране на комплемента. Използваният подход за
фракциониране с алкохол след ензимната модификация доведе до получаването на комплексни смеси от
пектинови фрагменти, проявяващи различно влияние върху антикомплементарната активност на
модифицирания продукт.

88
Bulgarian Chemical Communications, Volume 46, Special Issue A (pp. 88 – 93) 2014
A new coumarin and total phenolic and flavonoids content of Bulgarian celeriac
M. Popova1, A. Stoyanova
1, N. Valyovska-Popova
2, V. Bankova
1*, D. Peev
2
1Institute of Organic Chemistry with Centre of Phytochemistry, Bulgarian Academy of Sciences, Acad. G. Bonchev str.,
bl. 9, 1113 Sofia, Bulgaria 2Institute of Biodiversity and Ecosystem Research, Bulgarian Academy of Sciences, 2 Gagarin str., 1113 Sofia, Bulgaria
Received June 06, 2014; Revised July 02, 2014
Dedicated to Acad. Dimiter Ivanov on the occasion of his 120th
birth anniversary
Apium graveolens is a popular vegetable and also a well known medicinal plant. Different extracts have
demonstrated diverse useful properties: antioxidant, hipolipidemic, antibacterial, anticancer, etc. In Bulgaria, the most
often consumed parts are the leaves (as spice) and the thickened roots of A. graveolens var. rapaceum, celeriac. We
studied the chemical composition of unpolar extract of Bulgarian celeriac. In petroleum ether fraction of the methanol
root extract we identified by GC-MS several compounds: neocnidilide, isocnidilide, 3-n-butyl phtalide, allyl
phenoxyacetate, fatty acids and hydrocarbons; the coumarins xanthotoxin, isopimpinellin, psoralene. A new natural
compound 6-(3’-methyl-1’-oxobutyl)-7-hydroxy coumarin was isolated and its structure proved by spectral data. Total
phenolic and total flavonoids content of plant material from different locations in Bulgaria was also analyzed spectro-
photmetrically. We studied methanol extract of leaves and roots from 19 different locations in Bulgaria, including some
wild-growing Apium nodiflorum. The total phenolics varied between 15-67.2 mg/g GAE in leaves and 8.2-13.6 mg/g
GAE in roots, ant total flavonoids were between 6-26.5 mg/g in leaves and 1-4.8 mg/g in roots (as quercetin). Our study
demonstrated that the roots and leaves of Bulgarian celery are a rich source of biologically active constituents.
Key words: Apium graveolens var. rapaceum, celеriac, total phenolics, total flavonoids, 6-(3’-methyl-1’-oxobutyl)-7-
hydroxy coumarin
INTRODUCTION
Apium graveolens L., belonging to the Apiaceae
family, is a plant cultivated and consumed world-
wide. In Bulgaria, the most often consumed parts
are the leaves (as spice) and the thickened roots of
A. graveolens var. rapaceum known as celeriac.
There are abundant literature data reporting a wide
spectrum of biological activity of A. graveolens
[1,2]. Different authors reported that its extracts
possessed antimicrobial [3], antifungal [4] and anti-
inflammatory activity [5-7], as well as positive
effects in treatment of rheumatoid arthritis and
osteoarthritis [8]. Further, alcohol extracts of A.
graveolens have demonstrated significant hepato-
protective [9,10], anticancerogenic, antiprolifera-
tive [11], cytotoxic [12] and hypolipidemic action
[13]. Leave and root extracts of A. graveolens have
potential to scavenge free OH and DPPH
radicals
and to inhibit lipid peroxidation [14-16].
Phytochemical studies revealed the presence of
secondary metabolites belonging to different
structural groups: flavonoids (major constituents
glycosides of apigenin, kaempferol and quercetin),
phenolic acids (caffeic, ferulic, and their deriva-
tives), phthalides, tannins, steroids, terpenoids,
saponins, essential oils [16-24]. Among these, the
most important biologically active constituents are
phenolics, mainly flavonoids, phenolic acids, and
coumarins. It is known that natural products rich in
polyphenols are potently effective against dyslipi-
demia, cardiovascular diseases, inflammation, and
underlying mechanisms of other disease processes,
mainly because of their antioxidant activity [25].
The aim of the present work was to study the
content of bioactive constituents of Bulgarian
celeriac roots and leaves from different regions of
the country. The quantification of groups of active
constituents instead of individual compounds is
reasonable because of the well recognized fact that
the activity of medicinal plant extracts is mostly
due to the simultaneous action of many different
constituents [26-29].
EXPERIMENTAL
Extraction of celeriac roots
Commercial Bulgarian celeriac fresh roots (1.4
kg) were cut into small pieces and extracted with
© 2014 Bulgarian Academy of Sciences, Union of Chemists in Bulgaria
* To whom all correspondence should be sent:
E-mail: [email protected]

M. Popova et al.: A new coumarin and total phenolic and flavonoids content of Bulgarian celeriac
89
MeOH three times successively (1.5 l each) at room
temperature for 24h. The extracts were filtered and
the combined extracts after concentration in vacuo
were mixed with water and extracted successively
with petroleum ether (PE) (3x, 1:1 v/v). The extract
obtained was evaporated to give 880 mg dry
residue.
Fractionation of methanol extract of celeriac
roots and GC-MS analysis
A part of the PE fraction (20 mg) was subjected
to PTLC with mobile phase PE:EtOAc (10:1). Two
sub-fractions were gathered and analyzed by GC-
MS. The second, more polar fraction was silylated
prior to the analysis.
The GC-MS analysis was performed with a
Hewlett Packard gas chromatograph 5890 Series II
Plus linked to a Hewlett Packard 5972 mass
spectrometer system, equipped with a 23m long,
0.25mm i.d. and 0.5 mm film thickness HP-5
capillary column. The temperature was prog-
rammed from 100°C to 310°C at a rate of 5°Cmin-1
.
Helium was used as a carrier gas, at flow rate
0.7mLmin-1
, split ratio 1:80, injector temperature
280°C and ionisation voltage 70 eV. For silylation,
about 5 mg of the sample was mixed with 75 mL
bis(trimethylsilyl)trifluoro-acetamide and 50 mL of
dry pyridine, heated at 80°C for 20 min and
analysed by GC-MS.
Isolation of individual compounds
Column chromatography was performed on
silica gel 60 (Merck, 63-200 mm), normal phase.
Analytical TLC was performed on silica gel 60
F254 plates (Merck). Preparative TLC (PTLC) was
performed on silica gel 60 F254 glass plates
(Merck, 20x20 cm and 0.25 mm). Detection of the
spots was achieved under UV light (254 and 366
nm) and by spraying with vanillin-sulphuric acid in
methanol, followed by heating at 100°C.
NMR spectra were recorded on a Bruker AV
600 spectrometer (600MHz for 1H and 150 MHz
for 13
C) in CDCl3.
A part of the PE extract (750 mg) was subjected
to column chromatography on silica gel using a
gradient system of PE-EtOAc (1:0-0:1). Nineteen
fractions were obtained. Fraction 6 (19 mg, eluted
with PE-EtOAc (95:5)) was separated by PTLC
with mobile phase CHCl3-EtOAc (20:1) to yield
mixture of neo- and isocnidilide (3a and 3b, 7 mg).
Fraction 15 (10 mg, eluted with PE-EtOAc (75:25))
was subjected to PTLC with mobile phase CHCl3 to
yield two compounds: xanthotoxin (5, 1 mg) and 6-
(3’-methyl-1’-oxobutyl)-7-hydroxy coumarin (7, 1
mg).
Identification of isolated compounds
Compounds 3a and 3b (mixture of neo- and
isocnidilide) were identified based on comparison
of 1H-NMR spectrum with literature data [30,31].
Xanthotoxin 5 was identified based on compa-
rison of its 1H-NMR and MS spectra with literature
data [32].
6-(3’-methyl-1’-oxobutyl)-7-hydroxy coumarin
7: 1H NMR (CDCl3, 600 MHz) δ: 0.97 (6H, d, J =
6.7 Hz, CH3-4’, CH3-5’), 2.25 (1H, m, H-3’), 2.81
(2H, d, J = 6.9 Hz, H2-2’), 6.23 (1H, d, J = 9.5 Hz,
H-3), 6.79 (1H, s, H-8), 7.57 (1H, d, J = 9.5 Hz, H-
4), 7.83 (1H, s, H-5), 12.81 (1H, s, OH); 13
C NMR
(CDCl3, 150 MHz) δ: 22.7 (q, C-4’, C-5’), 25.5 (d,
C-3’), 47.1 (t, C-2’), 105.6 (d, C-8), 111.6 (s, C-4a),
114.1 (d, C-3), 117.3 (s, C-6), 130.9 (d, C-5), 142.9
(d, C-4), 159.0 (s, C-8a), 159.9 (s, C-2), 165.8 (s,
C-7), 105.5 (s, C-1’). GC/MS (6-(3’-methyl-1’-
oxobutyl)-7-hydroxy coumarin TMS), MS (EI, 70
eV), m/z (relative intensity %): 318 M+ (5), 303
[M–CH3]+ (100), 261 [M–C4H9]
+ (75), 233 [M–
C4H9–CO]+ (15), 73 (20).
Plant material. The plant species, the
geographic origin and the type of plant material are
listed in Table 1.
Extraction of roots and leaves of samples from
different regions in Bulgaria. Fresh plant material
was extracted twice with methanol, 1:3 (w/v) for
leaves and 1:2 (w/v) for roots. The extracts were
evaporated to dryness in vacuo and 400 mg of the
dry extract were dissolved in 70% methanol in a 50
ml volumetric flask (solution a) and subjected to
spectrophotometric analyses. For every extract, the
procedure was performed in triplicate.
Total flavonoids quantification. Methanol
solutions of quercetin (0.0095, 0.019, 0.038, 0.076
m and 0.19 mg/ml) were used to generate the
standard curve. In a volumetruc flask, 20 ml MeOH
and 2 ml of the standard solution were added, and 1
ml 5% AlCl3 solution in MeOH (w/v) and the
volume was made up to 50 ml. The obtained
solution was allowed to stay 30 min. Absorbance
was measured at 425 nm (blank prepared in the
same way, 2 ml of MeOH instead of standard
solution). Every analysis was performed in
triplicate. For analysis of the plant extracts, 2 ml of
solution а was applied in the same procedure.
Every analysis was performed in triplicate.
Total phenolics quantification. Methanol
solutions of gallic acid (0.009; 0.019; 0.037; 0.075
and 0.15 mg/ml) were used to generate the standard

M. Popova et al.: A new coumarin and total phenolic and flavonoids content of Bulgarian celeriac
90
curve. To 1 ml of the standard solution, 10 ml
distilled water were added, after that 4 ml of Folin-
Ciocalteu reagent and 6 ml of 20% Na2CO3 were
added and the volume made up to 50 ml (volu-
metric flask). The solution was allowed to stay for
2 h (±3 min). Absorbance was measured at 760 nm
(blank prepared in the same way, 1 ml of MeOH
instead of standard solution). Every analysis was
performed in triplicate. For analysis of the plant
extracts, 1 ml of solution а was applied in the same
procedure. Every analysis was performed in
triplicate.
RESULTS AND DISCUSSION
The major constituents of the celeriac roots
methanol extract are phenolic compounds,
including predominantly polar flavonoids and their
glycosides, and phenolic acids. However, it con-
tains also other bioactive compounds of lesser
polarity and in order to study their chemical profile
we used GC-MS. We obtained the petroleum ether
fraction of the methanol extracts and divided it into
two sub-fractions by preparative TLC. The less
polar fraction from the PTLC was analyzed by GC-
MS and aliphatic hydrocarbons, fatty acids, allyl
phenoxyacetate 1, and several phtalides were
identified, using computer libraries. The phtalides
detected were n-butyl phtalide 2 and two isomers of
cnidilide (Fig. 1). For complete identification of the
cnidilides, they were isolated by PTLC as an
inseparable mixture and by comparison with litera-
ture NMR data [30,31] they were identified as
neocnidilide 3a and isocnidilide 3b. N-butyl-
phtalide and similar compounds are responsible for
the flavor and aroma of celery and extracts thereof
[32]. A number of phtalides with diverse biological
activity have been found in A. graveolens [18,33].
The second, more polar fraction from the PTLC
of the petroleum ether fraction, was silylated prior
to GC/MS analysis. The data indicated the presence
of fatty acids (major constituents), one diterpenic
acid (dehydoabietic acid) and the furocoumarines
psoralen 4, xanthotoxin 5, and isopimpinellin 6.
Two major compounds of this fraction were
isolated by PTLC and one of them was identified as
xanthotoxin 5 by comparison of its mass and NMR
spectra with literature data [34]. Compound 5 has
been isolated from A. graveolens [35]. The second
compound was identified as 6-(3’-methyl-1’-
oxobutyl)-7-hydroxy coumarin 7 based on different
NMR experiments (1H,
13C, DEPT, HSQC, HMBC)
and GC/MS after silylation.
The 1H NMR spectrum of compound 7 showed
two one proton doublets at δ 7.57 (J = 9.5 Hz) and
6.23 (J = 9.5 Hz), typical for olefin protons H-4 and
H-3 of α-pyrone ring in coumarins. The HMBC
correlation (Fig. 2) between H-4 and quaternary C-
2 (δ 159.9, C=O) and C-8a (δ 159.0), H-3 and C-4a
(δ 111.6) confirm the base structure.
O
O
O
O
O 1 2
O
O
H
O
O
H
3a 3b
O OO O O
OCH3
O
4 5
O O
OCH3
O
OCH3
O O
O
HO
6 7
Fig. 1. Compounds, identified in celeriac roots.
Two singlets for one proton each, at δ 7.83 and
6.79 were assigned to para aromatic protons H-5
and H-8, respectively. In up field part of 1H NMR
spectrum appeared the signals for the side chain:
doublet for two methyl groups at δ 0.97 (J = 6.7
Hz), multiplet for one proton at δ 2.25 and doublet
for two protons at δ 2.81 (J = 6.9 Hz). The
corresponding carbon atoms have resonances at δ
22.7 (CH3-4’, 5’), 25.5 (C-3’) and 47.1 (C-2’),
respectively. The downfield shifted signal for
methylene group at δc 47.1 (C-2’) and HMBC
correlation (Fig. 2) between H2-2’ and carbon
signal at δ 205.5 indicate the side chain as an
oxoisopentyl group. The carbon atom C-1’ (δ
205.5) was bonded to C-6 (δ 117.3) based on
HMBC correlation between H-5 and C-1’, and H-8
and C-6. The singlet for one proton at δ 12.81 was
assigned to the proton from hydroxy group at C-7

M. Popova et al.: A new coumarin and total phenolic and flavonoids content of Bulgarian celeriac
91
using HMBC data. Correlation between H-5 and C-
7 was seen in the same spectrum. Based on these
data, the structure of 7 was concluded to be 6-(3’-
methyl-1’-oxobutyl)-7-hydroxy-coumarin 7. Com-
pound 7 has not yet been isolated from a natural
source, it has been synthesized back in 1955 [36].
Further, in order to characterize Bulgarian
celeriac with respect to the content of potential
antioxidants, total phenolics and total flavonoids
content was measured spectrophotometrically in
methanol extract of leaves and roots of A.
graveolens var. rapaceum from 19 different
locations in Bulgaria. The results are represented in
Table 1.
The total phenolics varied between 15 - 67.2
mg/g GAE in leaves (mean value 29±13) and 8.2-
13.6 mg/g GAE in roots (mean value 11±2), and
total flavonoids were between 6 – 26.5 mg/g in
leaves (mean value 15±6) and 1 - 4.8 mg/g in roots
(as quercetin) (mean value 2±1). The mean values
for both compound groups are higher in leaves, the
differences being statistically significant (p<0.001).
O O
O
HO1
2
3
45
6
7
8
4a
8a
1'
2'3'4'
5'
Fig. 2. HMBC (H C) correlation in 7.
The samples analyzed originated from regions with
different climatic conditions. They demonstrated
more or less similar content of phenolics and
flavonoids; this fact suggests a possible dominance
of genetic rather than ecological factors as deter-
minant for the biosynthesis of these compounds.
Some samples of wild-growing Apium
nodiflorum were also analyzed. The two leave
samples of A. nodiflorum demonstrated total pheno-
lic content and total flavonoids in the range of the
samples of celeriac from the same region (Varna).
Table 1. Total phenolics and total flavonoids in extracts of Bulgarian celeriac.
No. Origin Organ Total Phenolics
(GAEa, mg.g
-1)
Total Flavonoids
(QEb, mg.g
-1)
1 Varna Region, Oborishte A leaves 26.9±0.9 19.3±0.5
2 Varna Region, Oborishte B leaves 15.7±1.1 6.9±0.1
3 Varna Region, Oborishte C leaves 36±3 11.02±0.03
4 Varna Region, Beloslav A leaves 20.2±0.1 15.3±0.3
5 Varna Region, Beloslav B leaves 28.0±1.4 25.6±0.7
6 Varna region, Strashimirovo leaves 67.2±1.9 26.5±1.6
7 Shabla leaves 23.3±0.3 21.46±0.02
8 Balgarevo leaves 38.05±0.05 13.5±1.1
roots 10.7±0.5 1.45±0.02
9 Aitos Region, Bosilkovo leaves 33.4±1.1 18.2±0.7
10 Aitos Region, Devetak leaves 26.9±1.1 16.8±0.3
11 Aitos leaves 45.8±2.5 18.1±0.1
12 Sofia Region, German roots 8.2±0.3 1.15±0.1
13 Petrich Region, Drangovo leaves 18.7±1.3 6.0±0.4
roots 9.3±0.7 1.6±0.1
14 Petrich Region, Mihievo roots 13.6±0.8 2.0±0.2
15 Karnobat Region, Gluche leaves 41.2±0.9 16.9±1.3
16 Karnobat Region, Sokolovo leaves 20.8±1.0 10.3±0.09
roots 13.3±0.8 1.31±0.03
17 Karnobat Region, Tserkovsko leaves 15.0±1.0 8.4±0.1
roots 8.4±0.7 1.00±0.07
18 Karnobat Region, Dobrilovo leaves 23.3±0.8 17.2±1.5
roots 11.1±0.4 1.03±0.05
19 Kardzhali leaves 16.7±0.8 9.3±0.6
20 Sofia leaves 38.7±1.4 10.4±0.5
roots 11.7±0.3 4.8±0.2
21 Bulgaria, commercial sample roots 8.9±1.1 2.3±0.6
22 Varna Region, Devnyac leaves 24±2 8.1±0.5
23 Varna Region, Beloslavc
roots 16.1±0.4 7.4±0.1
leaves 14.9±0.5 10.7±0.2 a GAE – gallic acid equivalents; b QE – quercetin equivalents; c Apium nodiflorum.

M. Popova et al.: A new coumarin and total phenolic and flavonoids content of Bulgarian celeriac
92
The only root sample of A. nodiflorum had total
phenolics and total flavonoids higher than that of
the highest values for A. graveolens var. rapaceum.
CONCLUSION
Our results demonstrate that the roots and leaves
of Bulgarian celeriac are a rich source of
biologically active constituents. Obviously, Fool's-
water-cress roots deserve further, more detailed
studies.
Acknowledgements: Partial support of this work
by the Bulgarian Science Fund, Contract No. DVU
10 0033 is gratefully acknowledged. The authors
wish to thank Dr. D. Antonova for running the GC-
MS analyses.
REFERENCES
1. S. S. Fazal, R. K. Singla, Indo Global J. Pharm. Sci.,
2, 36 (2012).
2. H. B. Sowbhagya, Crit. Rev. Food Sci. Nutr., 54, 389
(2014).
3. A. Sipailiene, P. R. Venskutonis, A. Sarkinas, V.
Cypiene, Acta Hortic. (ISHS), 677, 71 (2005).
4. R. A. Momin, M. G. Nair, J. Agric. Food Chem., 49,
142 (2001).
5. D. A. Lewis, Int. J. Crude Drug Res., 23, 27 (1985).
6. M. Al-Hindawi, I. Al Deen, M. Nabi, M. Ismail, J.
Ethnopharmacol., 26, 163 (1989).
7. A. H. Atta, A. Alkofahi, J. Ethnopharmacol., 60, 117
(1998).
8. J. Kolarovic, M. Popovic, J. Zlinska, S. Trivic, M.
Vojnovic, Molecules, 15, 6193 (2010).
9. A. Singh, S. S. Handa, J. Ethnopharmacol., 4, 119
(1995).
10. A. Bahar, T. Alam, M. Varshney, S. A. Khan, J.
Ethnopharmacol., 79, 313 (2002).
11. S. Sultana, S. Ahmad, T. Jahangir, S. Sharma,
Cancer Lett., 221, 11 (2005).
12. V. Subhadradevi, K. Khairunissa, K. Asokkumar, M.
Umamaheswari, A. Sivashanmugam, P. Jagannath,
Middle-East J. Sci. Res., 9, 90 (2011).
13. D. Tsi, N. P. Das, B. K. Tan, Planta Med., 6, 18
(1995).
14. Y. F. Chu; J. Sun, X. Wu, R. H. Liu, J. Agric. Food
Chem., 50, 6910 (2002).
15. M. Popovic, B. Kaurinovic, S. Trivic, N. N. Mimica-
Dukic, M. Bursac, Phytother. Res., 20, 357 (2006).
16. N. Nikolic, D. Cvetkovic, Z. Todorovic, Italian J.
Food Sci., 23, 214 (2011).
17. L. F. Bjeldanes, I.-S. Kim, J. Org. Chem., 42, 2333
(1977).
18. M. J. M. Gijibels, F. C. Fischer; J. J. C. Scheffer; A.
B. Svendsen, Fitoterapia, 56, 17 (1985).
19. A. E. Ataga, H. A. S. Epton, R. R. Frost, Physiol.
Molecular Plant Pathol., 42, 161 (1993).
20. K. H. Miean, S. Mohamed, J. Agric. Food Chem., 49,
3106 (2001).
21. K. Zhou, F. Zhao, Z. Liu, Y. Zhuang, L. Chen, F.
Qiu, J. Nat. Prod., 72, 1563 (2009).
22. Y. Yao, W. Sang, M. Zhou, G. Ren, J. Food Sci., 75,
9 (2010).
23. A. A. Shad, H. U. Shah, J. Bakht, M. I. Chiudhary,
A. J. Ullah, J. Med. Plants Res., 5, 5160 (2011).
24. A. Kajser, K. Hartmann, D. Kammerer, R. Carle,
Eur. Food Res. Technol, 237, 353 (2013).
25. K. R. Martin, C. L. Appel, Nutr. Diet. Suppl., 2, 1
(2010).
26. T. Efferth, E. Koch, Curr. Drug Targets, 12, 122
(2011).
27. D. Marinova, F. Ribarova, M. Atanassova, J. Univ.
Chem. Technol. Metallurgy, 40, 255 (2005).
28. E. Souri, G. Amin, H. Farsam, T. M. Barazandeh,
DARU, 16, 83 (2008).
29. M. Stankevičius, I. Akuņeca, I. Jãkobsone, A.
Maruška, Maisto Chemija ir Technologija, 44, 85
(2010).
30. F. C. Fischer, M. J. M. Gijbels, Planta Med., 77
(1987).
31. D. Oguro, H. Watanabe, Tetrahedron, 67, 771
(2011).
32. H. J. Gold, C. W. Wilson III, J. Org. Chem., 28, 985
(1963).
33. J. J. Beck, S.-C. Chou, J. Nat. Prod., 70, 891 (2007).
34. J. Intekhab, M. Aslam, FABAD J. Pharm. Sci., 33, 67
(2008).
35. R. C. Beier, G. W. Ivie, E. H. Oertli, D. L. Holt,
Food Chem. Toxicol., 21, 163 (1983).
36. L. G. Shah, J. Sci. Indust. Res., 14B, 670 (1955).

M. Popova et al.: A new coumarin and total phenolic and flavonoids content of Bulgarian celeriac
93
НОВ КУМАРИН И СЪДЪРЖАНИЕ НА ТОТАЛНИ ФЛАВОНОИДИ И
ТОТАЛНИ ФЕНОЛИ В БЪЛГАРСКА ЦЕЛИНА
М. Попова1, А. Стоянова
1, Н. Вальовска-Попова
2, В. Банкова
1*, Д. Пеев
2
1Институт по Органична химия с Център по Фитохимия, Българска Академия на Науките, ул. Акад. Г. Бончев,
бл. 9, 1113 София, България 2Институт по биорацнообразие и екосистемни изследвания, Българска Академия на Науките, ул. Ю. Гагарин
2, 1113 София, България
Постъпила на 06 юни 2014 г.; Коригирана на 04 юли 2014 г.
(Резюме)
Целината Apium graveolens е популярен зеленчук, но също така и добре познато лечебно растение. Различни
екстракти от целина са показали разнообразни ценни свойства: антиоксидантни, антибактериални,
противоракови, и др. В България най-често се използват листата (като подправка) и удебелените корени на A.
graveolens var. rapaceum. Изследван беше химичният състав на неполярни екстракти от българска целина. В
петролевоетерната фракция на метанолния екстракт от корени посредством ГХ-МС идентифицирахме мастни
киселини и въглеводороди, алилфеноксиацетат, фталидите неокнидилид, изокнидилид, 3-n-бутилфталид и
кумарините ксантотоксин, изопимпинелин и псорален. Беше изолирано и едно ново природно съединение, 6-
(3’-метил-1’-оксобутил)-7-хидроксикумарин, като структурата му беше доказана с помощта на спектрални
данни. Съдържанието на тотални феноли и тотални флаваноиди в растителен материал от различни райони на
България беше определено спектрофотометрично. Анализирахме метанолните екстракти от листа и корени от
19 местонаходища в България, както и няколко проби от диворастящ Apium nodiflorum. Тоталните феноли
варираха в границите 15 - 67,2 mg/g еквиваленти галова киселина (ЕГК) в листа и 8.2 - 13.6 ЕГК в корени, а
тоталните флавоноиди – в границите 6 – 26,5 mg/g еквиваленти кверцетин в листа и 1 - 4.8 mg/g еквиваленти
кверцетин в корени. Резултатите показват, че корените на българската целина са ценен източник на биологично
активни компоненти.

94
Bulgarian Chemical Communications, Volume 46, Special Issue A (pp. 94 – 99) 2014
Determination of Benzethonium Chloride in Grapefruit Seed Extracts - a GC/MS
alternative
D. V. Nedeltcheva-Antonova*, K. S. Tsandeva, R. D. Dimitrova
Institute of Organic Chemistry with Centre of Phytochemistry, Bulgarian Academy of Sciences, Acad. G. Bonchev str.,
bl. 9, 1113 Sofia, Bulgaria
Received June 18, 2014; Revised July 03, 2014
Dedicated to Acad. Dimiter Ivanov on the occasion of his 120th
birth anniversary
Commercial grapefruit seed extracts, distributed on the market as food supplements, were analysed by gas
chromatography-mass spectrometry (GC/MS). Presence of benzethonium chloride, a synthetic antimicrobial agent, in
the range of 0.14-22.2% was found in 4 of 5 analysed commercial samples (one of them - especially developed for
children). The presence of benzethonium chloride was additionally confirmed by high-performance liquid
chromatography with diode-array detection (HPLC/DAD) and direct infusion electrospray ionization mass spectrometry
(ESI-MS). This work demonstrates that GC/MS represents a simple, fast, selective and sensitive alternative approach
for identification and quantitation of benzethonium chloride in commercial grapefruit seed extracts.
Key words: benzethonium chloride, Grapefruit seed extract, GC/MS
INTRODUCTION
Nowadays, there is a growing interest toward
alternative medicine and consumption of herbal
drugs and additives. At the same time, many of the
herbal products available on the market have not
been assessed by regulatory authorities and their
chemical composition and pharmacological proper-
ties are not always well described. One of the
products with most controversial fame in the
natural products market is the “grapefruit seed
extract” (GSE), labelled as an extract of the seeds
and pulp of the common grapefruit (Citrus
paradisi, Rutaceae). GSE has been promoted over
the last three decades as a gentle non-toxic natural
product with healing power against a variety of
diseases, with very high antimicrobial efficacy and
has been used as an ingredient for cosmetic and
dermatological formulations, in dietary supple-
ments as well as food/cosmetic preservative.
However, in most of the cases, the compositions of
commercial GSEs are not defined, and the methods
of production being proprietary are not specified.
In 1991 the first analysis of commercial GSE
was published by Nishina et al. [1], where methyl
4-hydroxybenzoate (methyl paraben), a preserva-
tive, and 2,4,4-trichloro-2-hydroxydiphenyl ether
(triclosan), a microbicide and disinfectant were
found by means of preparative HPLC. Using HPLC
and ESI-MS, Sakamoto et al. [2] repeated the
analysis of GSE, and compared the commercial
GSE with ethanolic extracts of grapefruit seeds
prepared by themselves. The presence of methyl
paraben and triclosan in the commercial GSE
(1.66% and 1.97%, respectively) was confirmed
and no trace of these compounds was found in the
ethanolic extract of grapefruit seeds. The anti-
microbial activity as well as the content of presser-
vative agents (methyl paraben and triclosan) in 6
commercially available GSE were examined by von
Woedtke and co-workers [3], who additionally
found N-Benzyl-N,N-dimethyl-2-{2-[4-(2,4,4-tri-
methylpentan-2-yl)phenoxy]ethoxy}ethanaminium
chloride (benzethonium chloride), a synthetic
antimicrobial agent commonly used in cosmetics
and other topical applications, in these products.
The five extracts containing one to three of these
preservative agents showed high antimicrobial
activity. At the same time, the only GSE product
without synthetic preservatives along with the fresh
extracts prepared from grapefruit seeds with
glycerol, water and ethanol, did not exhibit any
antimicrobial activity. The authors concluded that
the antimicrobial activity attributed to GSE is due
to the synthetic preservative agents with benzetho-
nium chloride being responsible for the majority of
activity. Takeoka et al. subsequently published two
analyses of GSE formulations [4,5]. They have
found using HPLC, ESI-MS, nuclear magnetic
resonance (NMR) spectroscopy, and elemental
© 2014 Bulgarian Academy of Sciences, Union of Chemists in Bulgaria
* To whom all correspondence should be sent:
E-mail: [email protected]

D. V. Nedeltcheva-Antonova et al.: Determination of Benzethonium Chloride in Grapefruit Seed Extracts - a GC/MS alternative
95
analysis that benzethonium chloride is the main
constituent in the analysed commercial GSE in
form of a liquid concentrate and a concentrated
powder (as 8% of the mass of the liquid GSE,
higher amounts of benzethonium chloride were
found in powder). Sugimoto et al. [6] carried out
comprehensive research of the commercial GSE
products which are used in Japan as food additives
(13 products from 6 manufactures), dietary supple-
ments (5 products from 4 manufactures), cosmetic
materials (16 products from 10 manufactures) and
disinfectants (7 products from 7 manufactures). By
means of LC/MS and NMR analysis, synthetic
disinfectant agents such as benzethonium or
benzalkonium salts were detected in most of the
commercial GSE products. Simultaneous identifica-
tion and quantification of benzethonium chloride,
methyl paraben and triclosan in 9 commercial GSE
products, one pomegranate (Punica granatum,
Punicaceae) seed extract, and a freshly prepared
methanolic extract of grapefruit seeds, were perfor-
med by Avula et al. using HPLC/UV/MS [7].
Benzethonium chloride was found in 8 of 9 com-
mercial GSE preparations. Only the commercial
pomegranate seed extract (used as a control sample)
and the fresh grapefruit seed extract were free of
synthetic additives. An HPLC/UV/MS method was
developed and validated by Ganzera et al. for
simultaneous determination of 18 possible presser-
vatives, disinfectants, and microbicides in GSE and
tested on 9 commercial products used for eco-
farming [8]. A method for the quantitative analysis
of benzethonium chloride in GSE based on 1H-
NMR is also described in the literature [9].
Evidently, there is a serious problem with the
adulteration of the commercial GSE, which proves
the necessity of development and validation of new
methods for analysis of benzethonium chloride. As
seen, currently most of the methods are based on
high–performance liquid chromatography. In addi-
tion to the above described, benzethonium chloride
was determined by gas-liquid chromatоgraphy as
reduction product obtained by treatment of the
sample with sodium borohydrate and nickel (II)
chloride by Kawase et al. [10].
Benzethonium chloride being quaternary
ammonium salt (QAS) is non-volatile and at first
sight gas chromatography could not be the most
suitable method for its direct determination. How-
ever, the QAS are thermally unstable and decom-
pose at high temperatures by cleavage at the
quarternary nitrogen, forming tertiary amines and
other neutral molecules [11-13]. Gas chromato-
graphy seems to be an ideal analytical technique for
the determination of QAS because the heated inlet
system of the instrument allows in situ decom-
position of the salts. Consequently, thermal
decomposition to neutral molecules, vaporization,
and analysis of the characteristic products can be
performed in a single step. An injection port
pyrolysis method for the analysis of quaternary
ammonium compounds (QAC) is reported by
Lukazewsky et al. [14]. Direct injection GC/MS
was used for the analysis of benzyl diethyl (2,6-
xylylcarbamoylmethyl) ammonium benzoate, a
QAS, in various Canadian denatured alcohol
formulations [15].
Therefore, the aim of the current communication
is to describe a fast, simple and sensitive direct
GC/MS method for simultaneous identification and
quantification of benzethonium chloride, based on
the analysis of N,N-dimethyl-2-{2-[4-(2,4,4-tri-
methylpentan-2-yl)phenoxy]ethoxy}ethanamine as
main pyrolysis product.
EXPERIMENTAL
Materials
Samples of commersial GSE, four of them in
form of a liquid concentrate and one as a kid syrup,
were purchased from drug stores in Bulgaria,
Poland and UK. Benzethonium chloride reference
material (99%) was delivered from Sigma-Aldrich.
Solvents (methanol, chloroform, acetonitrile) of
HPLC gradient grade (Sigma-Aldrich) and de-
ionized water ASTM Type I were used. Solid-phase
extraction columns SOLA SCX, 10 mg/1ml were
purchased from Thermo Scientific.
Sample Preparation
Liquid-liquid extraction. Approximately 2 g of
each GSE sample was mixed with 10 ml of water
and extracted three times with 30 mL of
chloroform. The combined chloroform extracts
were evaporated either in a rotary vacuum evapo-
rator or under stream of nitrogen. The dry residues
were then dissolved in HPLC mobile phase and
filtered through a membrane filter (PTFE, 0.22 m)
before the chromatographic analysis.
Solid Phase Extraction. Approximately 0.1 g of
each sample was dissolved in 10 ml of methanol
and then an aliquot of 0.5 ml was used for solid
phase extraction.
Methods
High-Performance Liquid Chromatography
(HPLC). The analyses were performed on a HPLC
system consisting of an HP1100 liquid chroma-

D. V. Nedeltcheva-Antonova et al.: Determination of Benzethonium Chloride in Grapefruit Seed Extracts - a GC/MS alternative
96
tograph equipped with a manual injector
(Rheodyne, model 7725), fitted with a 20 L
sample loop and a diode–array detector (G1365B
DAD), and controlled by ChemStation software
(Rev. B.04.03, Agilent Technologies). Analytical
column ChromSep SS, Inertsil 5 ODS-2 (250 x 4.6
mm i.d. 5 m) equipped with a ChromSep guard
column (Varian, Palo Alto, CA) was used. The
mobile phase was acetonitrile/water (80:20, v/v)
containing 0.1% formic acid (pH 3) at a flow rate of
1.0 ml/min. The detector signal was monitored at
215 and 275 nm.
Gas Chromatography-Mass Spectrometry (GC/
MS). The GC/MS analysis was performed on a HP
gas chromatograph 6890 Series Plus coupled with a
5973 mass - selective detector (Hewlett–Packard,
Palo Alto, CA). The ultra-inert fused silica capillary
column DB-5ms UI (J&W Scientific, Folsom, CA)
with 30 m column length, 0.25 mm i.d., 0.25 m
film thickness was used. The oven temperature was
programmed from 80 to 300oC at a rate of 5
oC
/min, and a 10 min hold at 300oC was applied.
Helium (99.999%) was used as a carrier gas at a
constant flow rate of 0.8 ml/min. The split ratio was
1:10, the inlet temperature was set to 280oC and the
transfer line temperature was 300oC. Mass -
selective detector operated in electron impact
ionization (EI) mode at 70 eV electron energy, the
ion source temperature was set to 200oC, and the
quadrupole temperature was 150oC.
Electrospray Ionization-Mass Spectrometry
(ESI-MS). ESI-MS spectra were recorded on a DFS
High Resolution magnetic-sector mass spectro-
meter (Thermo Scientific, Bremen, Germany) under
the following operating conditions: positive ion
scan mode, capillary temperature of 260oC and
capillary voltage of 3.5 kV was applied. Direct
infusion mode was used for the introducing of
samples into the mass spectrometer via Harvard 11
Plus syringe pump (Harvard Apparatus, Holliston,
Massachusetts, USA). Acetonitrile/water (30:70%,
v.v) with 0.05% formic acid was used as a mobile
phase at a flow rate of 0.05 ml/min. The instrument
was controlled and the data was processed by
Xcalibur™ software (Rev. 2.0 SR 1, Thermo
Scientific).
Calibration Curves
The absolute calibration method (external
standard method) was used to establish the calib-
ration curve and quantify the analytes. 0.025 g of
benzethonium chloride standard was weight and
diluted in a 25 ml volumetric flask with methanol.
Five working standard solutions with concentra-
tions in the range 0.001-0.200 mg/ml were prepared
from the stock standard solution with concentration
1 mg/ml. Each working standard solution was then
analysed in triplicate by GC/MS, operating in full
scan mode and the results were presented graphi-
cally, plotting peak area (for the peak at tR =20.086
min) versus concentration.
RESULTS AND DISCUSSION
Benzethonium chloride, being quaternary
ammonium salt is non-volatile, but, as seen in Fig.
1, its GC/MS chromatogram exhibits two main
peaks. The first one is benzyl chloride (1), at
retention time tR=5,54 min, and the second one has
been identified as N,N-dimethyl-2-{2-[4-(2,4,4-
trimethylpentan-2-yl)phenoxy]ethoxy}ethanamine
(2), at tR=20.08 min. These peaks are result of the
thermal dissociation of benzethonium chloride
(favored pathway is shown in Scheme 1) in the GC
inlet system, following the fact that QAS are
unstable at high temperatures. In general, the N-
benzyl cleavage is favored over the N-alkyl one in
this process. The main pyrolysis product 2 exhibits
GC/MS behavior, which makes it suitable for
identification and low level quantification of
benzethonium chloride.
Fig. 1. GC/MS total ion current (TIC) chromatogram of
the benzethonium chloride reference material.
Linear calibration curve with regression
coefficient of 0.9997 was established between the
EI-MS response of 2 as a function of the benzetho-
nium chloride standard solutions concentration. The
corresponding equation is given below: 7 4Y 2.46 10 .X 4.74 10 ,
where Y is the total ion current peak area of 2 and
X is the concentration of benzethonium chloride in
mg/ml.
The linearity was studied in concentration range
from 0.001 to 1 mg/ml with limit of quantification

D. V. Nedeltcheva-Antonova et al.: Determination of Benzethonium Chloride in Grapefruit Seed Extracts - a GC/MS alternative
97
(LOQ) of 0.005 mg/ml (S/N=10) and limit of
detection (LOD) of 0.001 mg/ml.
Scheme 1. Thermal dissociation of benzethonium
chloride.
Glycerin, used as carrier in the commercial GSE
formulations, is moderately volatile and need to be
removed from the sample before the GC/MS
analysis. Therefore two methods of extraction of
benzethonium chloride from the commercial
samples have been attempted, namely liquid-liquid
extraction with chloroform and solid phase extrac-
tion (SPE). In the first case it was impossible to
remove glycerin completely and always a white
viscous product, containing sufficient amount of
glycerin was obtained. The glycerin was fully
removed by using only SPE and, therefore, this
extraction method was finally selected for sample
preparation. The recovery of the SPE, determined
by standard addition method, was 0.98.
Using the above discussed procedure, five
commercial GSE formulations, available in phar-
macies as dietary supplements, with declared
ingredients extract of seeds and pulp of grapefruit,
plant glycerin and in some cases vitamin C, have
been analysed. It is worth to underline that one of
these products (sample 1) was introduced as stimu-
lating immune activity syrup, especially designed
for kids, with GSE content of 0.1%, containing in
addition rose hips extract. The GC/MS analysis has
shown availability of benzethonium chloride in four
of the samples in range from 0.14 to 22.2%.The
corresponding results are collected in Table 1.
These results are stunning, because according to
the opinion of the Scientific Committee on
Cosmetic Products and Non-Food Products, the
scientific advisory body to the European
Commission in matters of consumer protection
SCCNFP/0762/03, the use of benzethonium chlori-
de as a preservative in leave-on products is safe up
to a maximum concentration of 0.1% and abso-
lutely prohibited for internal use.
Table 1. Content of benzethonium chloride in the
analysed commercial GSE. Sample Benzethonium chloride [%]
1 0.14 ± 0.01
2 8.96 ± 0.39
3 10.6 ± 0.28
4 22.1 ± 0.02
5 < LOD
Benzethonium chloride was identified in the
commercial samples by using mass spectral
libraries (NIST08, Wiley 275 and MS Search
v.2.0), by the retention time of pyrolysis product 2
of the reference material and its mass spectrum
with characteristic fragment ions (Fig. 2). As an
additional piece of evidence the chromatograms of
the analysed samples are shown in Fig. 3.
Fig. 2. EI-MS (70 eV) spectrum of 2.
Fig. 3. GC/MS TIC chromatograms of commercial GSE
samples.
The identification of benzethonium chloride was
additionally confirmed by means of HPLC/DAD
and ESI-MS. It is worth to underline that in both
cases the samples were analysed at room
temperature, which excludes thermal dissociation.

D. V. Nedeltcheva-Antonova et al.: Determination of Benzethonium Chloride in Grapefruit Seed Extracts - a GC/MS alternative
98
When HPLC/DAD (215 and 275 nm) was used
a single peak at tR = 8.35 min has been detected in
the samples 1-4, which corresponds to the retention
time of the benzethonium chloride standard. The
commercial samples and the standard solution of
benzethonium chloride in suitable concentrations
have been analysed by direct infusion ESI-MS in
full scan positive mode. The ESI-MS spectra of the
reference benzethonium chloride and the samples
1-4, shown in Fig. 4, are identical, which once
again confirms the presence of benzethonium
chloride in the samples.
Fig. 4. Positive mode ESI-MS spectrum of benzethoni-
um chloride as reference material and in the samples 1-4.
CONCLUSION
This work demonstrates that direct GC/MS
represents a simple, fast, selective and sensitive
alternative approach for identification and
quantification of benzethonium chloride in
commercial GSE. The proposed method seems to
be suitable, with small modifications of the sample
preparation procedure, for determination of
benzethonium chloride and/or other synthetic
microbicides based on quaternary ammonium
compounds in various matrices (food additives,
cosmetics, etc.).
Acknowledgements: The technical support from
Ms E. Dimitrova is gratefully acknowledged.
REFERENCES
1. A. Nishina, H. Kihara, T. Uchibori, T. Oi, Bokin
Bobai (J. Antibact. Antifung. Agents), 19, 401 (1991).
2. S. Sakamoto, K. Sato, T. Maitani, T. Yamada, Eisei
Shikenjo Hokoku (Bull. Natl. Inst. Health Sci.), 114,
38 (1996).
3. T. von Woedtke, B. Schlüter, P. Pflegel, U.
Lindequist, D. W. Jülich, Pharmazie, 54, 452 (1999).
4. R. G. Takeoka, D. Lan, Y. R. Wong , R. Lundin, N.
Mahoney, J. Agr. Food Chem., 49, 3316 (2001).
5. R. G. Takeoka, T. L. Dao, Y. R. Wong, A. L.
Harden, J. Agr. Food Chem., 53, 7630 (2005).
6. N. Sugimoto, A. Tada, M. Kuroyanagi, Y. Yoneda,
S. Y. Yun, A. Kunugi, K. Sato, T. Yamazaki, K.
Tanamoto, Shokuhin Eiseigaku Zasshi, 49, 56 (2008).
7. B. Avula, S. Dentali, A. I. Khan, Pharmazie, 62, 593
(2007).
8. M. Ganzera, A. Aberham, H. Stuppner, J. Agr. Food
Chem., 54, 3768 (2006).
9. S. Bekiroglu, O. Myrberg, K. Ostman, M. Ek, T.
Arvidsson, T. Rundlöf, B. Hakkarainen, J. Pharm.
Biomed. Anal., 47, 958 (2008).
10. S. Kawase, S. Kanno, S. Ukai, J. Chromatogr., 247,
273 (1982).
11. L.-K. Ng, M. Hupe´, A. G. Harris, J. Chromatogr.,
351, 554 (1986).
12. B. W. Barry, G. M. Saunders, J. Pharm. Sci., 60, 645
(1971).
13. A. F. Lopez, M. T. Peralta de Ariza, O. A. Orio, J.
High Resolut. Chromatogr., 12, 503 (1989).
14. T. Lukaszewski, J. Anal. Toxicol., 9, 101 (1985).
15. K. L. Ng, M. Hupe, J. Harnois, A. Lawrence, Anal.
Chem., 70, 4389 (1998).

D. V. Nedeltcheva-Antonova et al.: Determination of Benzethonium Chloride in Grapefruit Seed Extracts - a GC/MS alternative
99
ОПРЕДЕЛЯНЕ НА БЕНЗЕТОНИЕВ ХЛОРИД В ЕКСТРАКТИ ОТ СЕМЕНА НА
ГРЕЙПФРУТ – АЛТЕРНАТИВЕН ПОДХОД ЧРЕЗ ИЗПОЛЗВАНЕ НА ГАЗОВА
ХРОМАТОГРАФИЯ С МАССПЕКТРАЛНА ДЕТЕКЦИЯ
Д. В. Неделчева-Антонова*, К. С. Цандева, Р. Д. Димитрова
Институт по Органична химия с Център по Фитохимия, Българска Академия на Науките, ул. Акад. Г. Бончев,
бл. 9, 1113 София, България
Постъпила на 18 юни 2014 г.; Коригирана на 03 юли 2014 г.
(Резюме)
Търговски екстракти от семена на грейпфрут, разпространени в търговската мрежа като хранителни
добавки, бяха анализирани чрез газова хроматография – масспектрометрия (ГХ/МС). В четири от пет
анализирани търговски продукта (един от които специално разработен за деца) беше намерено присъствие на
бензетониев хлорид, синтетичен антимикробен агент, със съдържание от 0.14-22.2%. Наличието на бензетониев
хлорид беше допълнително потвърдено чрез високо ефективна течна хроматография с фотометричен детектор с
диодна матрица и масспектрометрия с електроспрей йонизация. Публикацията демонстрира възможностите на
ГХ/МС като лесен, бърз, селективен и чувствителен алтернативен подход за идентификация и количествено
определяне на бензетониев хлорид в търговски екстракти от семена на грейпфрут.

100
Bulgarian Chemical Communications, Volume 46, Special Issue A (pp. 100 – 105) 2014
Phospholipid composition of Cucurbitaceae seed oils
Z. Y. Petkova*, G. A. Antova
University of Plovdiv ‘Paisii Hilendarski’, Department of Chemical Technology, 24 Tzar Assen str., 4000 Plovdiv, Bulgaria
Received April 17, 2014; Revised May 27, 2014
Dedicated to Acad. Dimiter Ivanov on the occasion of his 120th
birth anniversary
Phospholipid composition of three species of Cucurbitaceae family (Cucurbita moschata, Cucurbita pepo and
Cucurbita maxima) grown in the southern Bulgaria, was investigated. Oil content of Cucurbita moschata, Cucurbita
pepo and Cucurbita maxima seeds was 45.1%, 46.8% and 51.5%, respectively. Phospholipids were determined
spectrophotometrically after separation by two dimensional thin layer chromatography. Total phospholipid content in
Cucurbita moschata, Cucurbita pepo and Cucurbita maxima seed oils was 0.5%, 1.1% and 1.0%, respectively.
Phosphatidylinositol (19.7-29.4%), phosphatidylcholine (34.8-48.6%) and phosphatidylethanolamine (16.0-23.7%)
predominated in phospholipid fraction. The quantity of phosphatidic acids was found to be from 2.1% to 5.5%. Fatty
acid composition of individual phospholipids was determined by gas chromatography. The predominant fatty acids of
phospholipids were palmitic, stearic, oleic and linoleic acids.
Key words: phospholipids, pumpkin seed oil, fatty acids
INTRODUCTION
Phospholipids are the major structural constitu-
ents of all biological membranes. They are also
present in plants, especially in seeds and kernels of
different flora species. Phospholipids are complex
lipids which are amphipathic in nature i.e. each
molecule consists of a hydrophilic and a hydropho-
bic parts, thus tending to form lipid bilayers. They
are present in many natural sources like human and
animal tissues, plants and microbial organisms.
Vegetable materials usually contain only small
amounts of phospholipids, ranging from 0.3 to 2.5
wt% [1]. The major phospholipids present in plant
sources are phosphatidylcholine, phosphatidylino-
sitol and phosphatidylethanolamine. Phospholipids
are removed as by-products during the degumming
process of vegetable oil refining, too. They are used
in food and cosmetic industry [2,3], thence a more
detailed study is necessary. Phospholipids are
present in pumpkin seeds; therefore the latter could
be used as a source of these biologically active
components. Their content in pumpkin seeds range
from 1.09 to 1.27% [1,4-6]. Nevertheless, the phos-
pholipid content and quantities in pumpkin seed
oils have not been investigated in depth.
The most valuable pumpkin species in Bulgaria
are Cucurbita moschata, Cucurbita pepo and
Cucurbita maxima. There is no information about
their phospholipid content and composition, so the
aim of the current study is to present the compa-
rative results of the investigation of phospholipid
content and their individual composition in some
Cucurbitaceae seed oils (three species of pumpkin
seed oils) grown in southern Bulgaria. Fatty acid
composition of the major phospholipids was inves-
tigated, too, and the results were collated to the
respective glyceride oils.
MATERIALS AND METHODS
The investigation was carried out with seeds of
Cucurbita moschata, Cucurbita pepo, Cucurbita
maxima grown in southern Bulgaria, crop 2012. All
investigations were carried out with hulled and air-
dried seeds. All solvents and reagents were of
analytical grade from Merck (Darmstadt, Germany)
and were used without additional purification.
Extraction of lipids
The seeds (50 g sample) were ground to powder
and the oil was extracted with n-hexane in Soxhlet
apparatus for 8 h. After rotation vacuum evapo-
ration of the solvent the extracted oils were dried
and weighed [7].
Analysis of phospholipids
Another part (50 g) of air-dried seeds was
subjected to Folch extraction [8] and polar lipids
were isolated from the total lipids by column
© 2014 Bulgarian Academy of Sciences, Union of Chemists in Bulgaria
* To whom all correspondence should be sent:
E-mail: [email protected]

Z. Y. Petkova, G. A. Antova: Phospholipid composition of Cucurbitaceae seed oils
101
chromatography. The column chromatography was
performed according to the procedure reported by
Angelova-Romova et al. [9]. The sample (about
100 mg oil) was applied into column (2 cm
diameter and 40 cm long) filled with silica gel
(100-200 mesh). The eluting solvents were
chloroform and methanol, respectively. Neutral
lipid classes were eluted in sequence of 50 ml
chloroform and phospholipids were isolated with
75 ml methanol. The purity of the different classes
was verificated with thin-layer chromatography.
The solvents in the different fractions were
evaporated by using N2. The isolated phospholipids
classes were separated by two-dimensional thin-
layer chromatography (TLC) on 20 x 20 cm glass
plates with 0.2 mm silica gel 60 G layer
impregnated with aqueous (NH4)2SO4 (1 g in 100
ml water). In the first direction the plate was
developed with chloroform:methanol:ammonia,
65:25:5 (v/v/v) and in the second - with
chloroform:acetone:methanol:acetic acid:water,
50:20:10:10:5 (v/v/v/v/v). The individual phospho-
lipids were detected and identified by spraying with
specific reagents: Dragendorff test (detection of
choline-containing phospholipids), ninhydrin spray
(for phospholipids with free amino groups) and
Shiff’s reagent (for inositol containing phosphor-
lipids). Additional identification was performed by
comparing the respective Rf values with those of
authentic commercial standards subjected to silica
gel TLC under identical experimental conditions.
The quantification was carried out spectrophoto-
metrically against a standard curve by measuring
the phosphorous content at 700 nm after scraping
the respective phospholipid zone and mineralization
of the substance with a mixture of perchloric acid
and sulphuric acid, 1:1 (v/v) [10].
Determination of fatty acid composition of
phospholipids
The fatty acids of phospholipids were
determined by gas chromatography (GC). The
method is based on isolation of phosphatidylcholine
(PC), phosphatidylinositol (PI), phosphatidyl-etha-
nolamine (PE) from the phospholipid fraction by
preparative TLC. The obtained free fatty acids after
saponification of main phospholipids and acidify-
cation [11] were esterified with 2% H2SO4 in
absolute СН3ОН at 50oC to methyl esters of the
fatty acids (FAME) [12]. FAMEs were purified by
TLC on 20 x 20 cm plates covered with 0.2 mm
silica gel 60 G (Merck, Darmstadt, Germany) layer
with mobile phase n-hexane:diethyl ether, 97:3
(v/v). GC was performed on a HP 5890 gas
chromatograph (Hewlett Packard GmbH, Austria)
equipped with a 60 m x 0.25 mm capillary DB-23
column and a flame ionization detector. The
column temperature was programmed from 130оC
(1 min), at 6.5оC/min to 170
оC, at 3.0
оC/min to
215оC (9 min), at 40.0
оC/min to 230
оC (1 min),
injector and detector temperatures were kept at
270oC and 280
оC. The carrier gas was hydrogen at
a flow rate 0.8 ml/min; split was 1:50. Identifi-
cation of fatty acids was performed by comparison
of retention times with those of a standard mixture
of methyl esters of fatty acids subjected to GC
under identical experimental conditions [13]. The
standard mixture of fatty acid methyl esters was
provided by Sigma-Aldrich Chemical Co. (St.
Louis, MO, USA).
RESULTS AND DISCUSSION
The content of oil, phospholipids in oil and
phospholipids in seeds are presented in Table 1.
Table 1. Oil content, phospholipids in oil and
phospholipids in seeds*.
Source Content, wt %
Oil in the
seeds
Phospholipids
in the oil
Phospholipids
in the seeds
Cucurbita
moschata 45.1±0.5 0.5±0.1 0.2±0.05
Cucurbita
pepo 46.8±0.2 1.1±0.2 0.5±0.1
Cucurbita
maxima 51.5±0.3 1.0±0.1 0.5±0.1
*Means of triplicate analysis ± SD.
Based on the data, it is obvious that Cucurbita
maxima has the highest amount of oil in the seeds
(51.5%), followed by Cucurbita pepo (46.8%) and
Cucurbita moschata (45.1%) seeds. According to
Kim et al. [14], lipid content in Cucurbita
moschata, Cucurbita pepo and Cucurbita maxima
seed oils was 45.7%, 43.9% and 52.4%, respect-
tively. These results were similar to those obtained
in our investigation; according to these authors,
only the oil content of Cucurbita pepo seeds was a
bit lower. On the other hand, according to
Ihediohanma et al. [15] the lipid content of
Cucurbita pepo seed oil was 50.3% which was
higher than in the species grown in Bulgaria. Fokou
et al. and Achu et al. [16,17] presented the oil
content of Cucurbita moschata and Cucurbita
maxima seeds from 48.56 to 52.02% and from
49.05 to 50.81%, respectively.
Cucurbita pepo and Cucurbita maxima seeds
had the highest amount of phospholipids (0.5%)
and phospholipid content in the oil of the same

Z. Y. Petkova, G. A. Antova: Phospholipid composition of Cucurbitaceae seed oils
102
varieties had also higher amount (1.1 and 1.0%,
respectively) than in Cucurbita moschata seed oil
(0.5% in the oil and 0.2% in the seeds). These
values are lower than those in previous publications
by Raharjo et al. and El-Adawy and Taha [4,6] who
report that phospholipid content in Cucurbita
moschata seeds are 1.27% and 1.09%, respectively.
The reasons for the different values of the phospho-
lipids are probably origin and geographic region of
the growing [6]. Phospholipid content of pumpkin
seed oils is similar to that of sunflower, flaxseed,
corn germ, soybean and canola oil (0.7-1.0%) [18-
20].
Individual phospholipid composition of
pumpkin seed oils is shown in Fig. 1.
Fig. 1. Individual phospholipid composition of pumpkin
seed oils. PI - Phosphatidylinositol; PS - Phosphatidyl-
serine; PC - Phosphatidylcholine; SM - Sphingomyelin;
PE - Phosphatidylethanolamine; MGL - Monophosphati-
dylglycerol; DGL - Diphosphatidylglycerol; PA - Phos-
phatidic acid.
All main classes of phospholipids were
presented in pumpkin seed oils. Phosphatidylcho-
line was the predominant constituent in all pumpkin
seed oils (from 34.8% to 48.6%) followed by
phosphatidylinositol (from 19.7% to 29.4%) and
phosphatidylethanolamine (from 16.0% to 23.7%).
Phosphatidylcholine was detected in highest quan-
tity in Cucurbita pepo - 48.6%, while in the other
two species its amount was 42.8% in Cucurbita
maxima and 34.8% in Cucurbita moschata. The
amount of phosphatidylinositol in Cucurbita
moschata and Cucurbita maxima seed oils was
28.3% and 29.4%, respectively, while the quantity
of this class of phospholipids in Cucurbita pepo
seed oil was 19.7%. The quantity of phosphatidyl-
ethanolamine in Cucurbita pepo species was
23.7%, while the other two varieties contained
lower amounts of it - 18.5% in Cucurbita moschata
and 16.0% in Cucurbita maxima seed oil. Phospha-
tidylserine (1.3-5.5%), monophosphatidylglycerol
(1.4-3.1%) and phosphatidic acids (2.1-5.5%) were
presented in small quantities. The amount of sphin-
gomyelin (0.7-2.2%) and diphosphatidylglycerol
(~2.8%) was minimal in all pumpkin seed oils.
Fatty acid composition of the main phospholi-
pids (phosphatidylcholine, phosphatidylinositol and
phosphatidylethanolamine) is shown in Fig. 2. The
most predominant component in all species was
palmitic acid, followed by oleic, stearic and linoleic
acids.
Fig. 2. Fatty acid composition of the main phospholipids
classes. C14:0- Myristic acid; C16:0- Palmitic acid; C18:0-
Stearic acid; C18:1- Oleic acid; C18:2- Linoleic acid; C18:3-
Linolenic acid.
The quantity of palmitic acid in phosphatidyl-
inositol, phosphatidylcholine and phosphatidyl-
ethanolamine in Cucurbita moschata was 47.4%,
40.9% and 49.7%, respectively. The amount of
oleic acid in phosphatidylinositol, phosphatidyl-
choline and phosphatidylethanolamine was 21.1%,
12.6% and 9.8%, respectively, while the quantity of
linoleic acid in the same phospholipids was 10.0%,
11.2% and 16.0%, respectively. The levels of
stearic acid were close - 12.8%, 13.3% and 9.7%.
Linolenic acid was presented in higher quantity in
phosphatidylcholine (13.8%) and in phosphatidyl-
ethanolamine (8.0%), while in phosphatidylinositol
it was significantly lower (2.9%). Myristic acid in
these three phospholipid classes was detected in
similar amounts (2.1-2.6%).
The quantity of palmitic acid in phosphatidyl-
inositol, phosphatidylcholine and phosphatidyl-
ethanolamine in Cucurbita pepo was 50.7%, 49.2%
and 49.5%, respectively followed by stearic acid -
21.6%, 19.8% and 18.8%. The levels of oleic acid
in phosphatidylinositol, phosphatidylcholine and
phosphatidylethanolamine were from 21.6% to
18.8%, respectively. The quantity of linoleic acid in
the same phospholipids was a bit higher - 15.4%,
16.5% and 19.0% in phosphatidylinositol, phos-
phatidylethanolamine and phosphatidylcholine.
Linolenic and myristic acids were presented in
lower quantities (1.9-4.0% and 2.2-2.9%, respec-
tively), in these phospholipids.

Z. Y. Petkova, G. A. Antova: Phospholipid composition of Cucurbitaceae seed oils
103
The quantity of palmitic acid in phosphatidyl-
inositol, phosphatidylcholine and phosphatidyl-
ethanolamine in Cucurbita maxima was 41.7%,
36.8% and 46.1%, respectively, and that of stearic
acid was 18.9%, 8.5% and 7.9%. The amount of
oleic acid was higher in phosphatidylcholine
(20.6%), while in phosphatidylinositol and phos-
phatidylethanolamine it was 12.2% and 14.0%,
respectively. Linoleic acid was presented in a
relatively higher amount (17.1% in phosphatidyl-
inositol, 19.3% in phosphatidylcholine and 16.7%
in phosphatidylethanolamine). The quantity of
linolenic acid was lower - 5.1% in phosphatidyl-
inositol, 9.5% in phosphatidylcholine and 8.4% in
phosphatidylethanolamine. There was also a small
amount of myristic acid (from 1.8% in phospha-
tidylinositol and phosphatidylcholine to 2.6% in
phosphatidylethanolamine).
These results differ from the data obtained by
Vidhute et al. [21] who reported that linoleic acid
predominated in phospholipid fraction (37.1%),
followed by oleic (27.4%) and palmitic acid
(24.0%).
The ratio between saturated (SFA), mono-
unsaturated (MUFA) and polyunsaturated fatty
acids (PUFA) of the main phospholipids was
presented in Fig. 3 and these results were collated
to the respective triacylglycerols (TAG) reported by
Petkova and Antova [22]. Identical fatty acids have
been detected in the TAG and phospholipids, but
they are in different amounts.
Fig. 3. The ratio between saturated (SFA),
monounsaturated (MUFA) and polyunsaturated fatty
acids (PUFA) of the main phospholipids and
triacylglycerols (TAG).
The highest content of SFAs was detected in
Cucurbita pepo (73.4-76.8%), while the amount of
PUFAs was very low (6.3-9.5%). The phospholipid
fraction of Cucurbita maxima had a significantly
higher content of PUFAs (25.1-28.8%) which was
at the expense of the content of SFAs in the same
species (49.3-59.7%). There are considerable
differences in the fatty acid composition of
phospholipid classes in all pumpkin species. The
highest quantity of SFAs was detected in phospha-
tidylinositol (64.6-76.8%), followed by phosphati-
dylethanolamine (59.7-73.4%) and phosphatidyl-
choline (49.3-74.2%). On the other hand, phospha-
tidylcholine contained the highest level of PUFAs
(6.3-28.8%). The differences in the fatty acid
composition can be explained by the different
individual stages of biosynthesis of the separated
phospholipids. Saturated fatty acids were synthe-
sized in the first stage of biosynthesis and were
included in phospholipids when the last were
synthesized, too [23]. On the other hand, phos-
phatidylinositol was synthesized first, thus satura-
ted fatty acids were predominant in this phos-
pholipid. Phosphatidylcholine was synthesized last,
when the biosynthesis of polyunsaturated fatty
acids began. Therefore, polyunsaturated fatty acids
predominate in the phosphatidylcholine.
The fatty acid composition of the phospholipids
and triacylglycerols was very different. The fatty
acid profiles of the phospholipid fraction were
characterized by a significant amount of saturated
acids, while unsaturated acids predominated in the
triacylglycerols [22]. The increase of unsaturated
fatty acids was most significant in Cucurbita pepo
seed oils (from 6.3-9.5% in phospholipids to 51.0%
in triacylglycerols), while the changes of the same
acids in Cucurbita maxima seed oils were only
about 10% (from 22.2-28.8% in phospholipids to
35.8% in triacylglycerols).
CONCLUSION
This study shows that the phospholipid content
and the fatty acid composition of the main
phospholipids classes in pumpkin seed oils do not
differ significantly from those in other seed oils as
sunflower, canola, corn germ oil, etc. The pumpkin
seed oils and seeds have a relatively high content of
biologically active compounds, such as phos-
pholipids (0.5-1.1% in the oils and 0.2-0.5% in the
seeds). Phospholipids have a similar qualitative and
quantitative composition in the studied pumpkin
varieties and are similar to those of other vegetable
oils, such as sunflower, soybean, flaxseed oils, etc.
Palmitic acid is the major component in phos-
pholipids (36.8-50.7%), followed by stearic acid
(7.9-21.6%), oleic acid (9.8-21.1%) and linoleic
acid (3.3-19.3%). Saturated fatty acids predominate

Z. Y. Petkova, G. A. Antova: Phospholipid composition of Cucurbitaceae seed oils
104
in phospholipids, while unsaturated fatty acids are
predominant in triacylglycerols.
This leads to their complete and versatile
examination. The studies about phospholipid con-
tent of pumpkin seed oils also contribute to a full
assessment of their nutritional value.
Acknowledgements: The investigations were
carried out with the partial financial support of
contract SI13FC006/2013 of the University of
Plovdiv “Paisii Hilendarski”.
REFERENCES
1. F. Pasini, Y. Riciputi, V. Verardo, M. Fiorenza
Caboni, Recent Res. Devel. Lipids, 9, 139 (2013).
2. S. Kanoh, K. Maeyama, R. Tanaka, T. Takahashi, M.
Aoyama, M. Watanabe, K. Lida, E. Niwa, Dev. Food
Sci., 42, 179 (2004).
3. M. Schneider, Eur. J. Lipid Sci. Technol., 103, 98
(2001).
4. T. A. El-Adawy, K. M. Taha, Food Chem., 74, 47
(2001).
5. A. Szydlowska-Czerniak, E. Szlyk, Food Chem., 81,
613 (2003).
6. T. J. Raharjo, L. Nurliana, S. Mastjeh, Indo. J.
Chem., 11, 48 (2011).
7. ISO 659:2009. Oilseeds – Determination of oil
content (Reference method), p. 12 (2009).
8. J. Folch, M. Lees, G. H. Sloane-Stanley, J. Biol.
Chem., 226, 498 (1957).
9. M. Angelova-Romova, M. Zlatanov, G. Antova, S.
Momchilova, E. Blagoeva, M. Nikolova, Compt.
rend. Acad. Bulg. Sci., 66, 1689 (2013).
10. ISO 10540-1:2003. Animal and vegetable fats and
oils. Determination of phosphorus content – Part 1:
Colorimetric method, p. 10 (2003).
11. N. S. Arutyunyan, E. P. Kornena, Phospholipids of
vegetable oils, Agropromizdat Press, Moscow, p. 63
(1986).
12. ISO 5509:2000. Animal and vegetable fats and oils.
Preparation of methyl esters of fatty acids, p. 30
(2000).
13. ISO 5508:2004. Animal and vegetable fats and oils.
Analysis by gas chromatography of methyl esters of
fatty acids, p. 9 (2004).
14. M. Y. Kim, E. J. Kim, Y.-N. Kim, C. Choi, B.-H.
Lee, Nutr. Res. Pract., 6, 21 (2012).
15. N. C. Ihediohanma, C. N. Ubbaonu, E. N. T.
Akobundu, E. O. I. Banigo, Niger. Food J., 24, 123
(2006).
16. E. Fokou, M. B. Achu, G. Kansci, R. Ponka, M.
Fotso, C. Tchiegang, F. M. Tchouanguep, Pak. J.
Nutr., 8, 1325 (2009).
17. M. B. Achu, E. Fokou, C. Tchiegang, M. Fotso, F.
M. Tchouanguep, Afr. J. Biotechnol., 4, 1329 (2005).
18. M. Zlatanov, M. Angelova-Romova, G. Antova, E.
Ivanova, B. Damyanova, S. Momchilova, I.
Marekov, Plovdiv University „Paisii Hilendarski“
Bulgaria Scientific Papers-Chemistry, 36, 105
(2008).
19. O. Teneva, M. Zlatanov, G. Antova, M. Angelova-
Romova, R. Dimitrova, M. Marcheva, Discourse J.
Agric. Food Sci., 2, 59 (2014).
20. D. R. O’Brien, W. E. Farr, P. J. Wan, Introduction to
Fats and Oils Technology, 2nd ed. AOCS Press, p.
140 (2000).
21. B. P. Vidhute, D. R. Bhide, V. Y. Karadbhajne, A. S.
Kulkarni, R. R. Khotpal, J. Botanic. Sci., 2, 1 (2013).
22. Z. Y. Petkova, G. A. Antova, J. Food Pack. Sci.
Techn. Technol., 1, 43 (2013).
23. S. K. Munshi, S. P. Sukhija, I. S. Bahatia,
Phytochem., 22, 79 (1982).

Z. Y. Petkova, G. A. Antova: Phospholipid composition of Cucurbitaceae seed oils
105
ФОСФОЛИПИДЕН СЪСТАВ НА МАСЛА ОТ СЕМ. CUCURBITACEAE
Ж. Ю. Петкова*, Г. А. Антова
ПУ „Паисий Хилендарски”, Катедра „Химична технология”, ул. „Цар Асен” 24, 4000 Пловдив, България
Постъпила на 17 април 2014 г.; Коригирана на 27 май 2014 г.
(Резюме)
Изследван е фосфолипидният състав на масла от семена на три сорта тиква от сем. Cucurbitaceae (Cucurbita
moschata, Cucurbita pepo и Cucurbita maxima). Масленото им съдържание е съответно 45.1%, 46.8% и 51.5%.
Фосфолипидите са определени спектрофотометрично, след разделянето им чрез двупосочна тънкослойна
хроматография. Общото съдържание на фосфолипиди в тиквените масла от семена на сортове Cucurbita
moschata, Cucurbita pepo и Cucurbita maxima е съответно 0.5%, 1.1% и 1.0%. Във фосфолипидната фракция
преобладават основно фосфатидилинозитол (19.7-29.4%), фосфатидилхолин (34.8-48.6%) и фосфатидилетанол-
амин (16.0-23.7%). Количеството на фосфатидните киселини е от 2.1% до 5.5%. Мастнокиселинният състав на
индивидуалните фосфолипиди е определен чрез газова хроматография. Установено е, че преобладаващите
мастни киселини във фосфолипидната фракция са палмитиновата, стеариновата, олеиновата и линоловата.

106
Bulgarian Chemical Communications, Volume 46, Special Issue A (pp. 106 – 110) 2014
Sterol and fatty acid composition of grape seed oils
T. N. Ovcharova1, M. D. Zlatanov
1*, A. S. Ivanov
2
1Department of Chemical Technology, University of Plovdiv “Paisii Hilendarski”,24 Tsar Assen str.,4000 Plovdiv,
Bulgaria 2Agricultural University, Faculty of Viticulture and Horticulture, Plovdiv, Bulgaria
Received April 24, 2014; Revised July 01, 2014
Dedicated to Acad. Dimiter Ivanov on the occasion of his 120th
birth anniversary
The content and composition of sterols, sterol esters and fatty acid composition of the triacylglycerol and sterol
esters fractions isolated from the seed oil of four Bulgarian grape varieties - Super ran bolgar, Bolgar, Mavroud and
Shiroka melnishka loza - were investigated. The total sterol content was estimated to be 0.3-0.4% with an amount of
free sterols - 93.4-97.0% and that of sterol esters - 3.0-6.6%. Sterol composition of both sterol fractions was determined
by gas chromatography. -Sitosterol was the main component in both sterol fractions (66.8-73.2%) followed by
campesterol (7.1-24.5%) and stigmasterol (2.7-6.9%). The content of cholesterol and stigmasterol in sterol esters was
found to be several times higher than in the fraction of free sterols (1.3-2.0% vs 0.5-0.7 % and 3.2-6.9% vs 2.7-3.3%
respectively). On the contrary, the percentage of campesterol in the sterol esters (7.1-14.0%) was about two times lower
than in the free sterols fraction (19.1-24.5%). Linoleic acid predominated in all samples of sterol esters followed by
oleic and palmitic acids (40.7-53.8 %, 24.9-35.5% and 13.0-16.7% respectively); the content of these acids in the
triacylglycerols fractions were in the ranges 68.5-72.3%, 16.3-18.7% and 8.8-11.5% respectively.
Key words: grape seed oil, sterols, sterol esters, fatty acids
INTRODUCTION
The fruits of grape (Vitis vinifera L.) are used as
food for raw or dried consumption, as well as a
source for the production of wine. Grape seeds
represent a by-product obtained after winery
exploitation and are a cheap renewable source for
the production of glyceride oil. The content of
glyceride oil in the seeds was found to be about 11-
16% [1,2]. Besides, the seeds contain dietary fiber,
galic acid, catechin, tannins [3,4]. The oil is rich in
essential fatty acids, such as linoleic and linolenic,
and contains some bioactive substances: sterols,
tocopherols, carotenoids, phospholipids, polyphe-
nols which have a significant role for the deter-
mination of its food value [4,5]. The seeds contain
relatively small amounts of oil which is usually
extracted by solvent but can also be obtained by
pressing [6].
Sterols have a beneficial effect for the
prevention of atherosclerosis and coronary heart
diseases by lowering the levels of cholesterol. El-
Shami et al. [7] and Fedeli et al. [8] reported
predomination of -sitosterol (73.8%) in sterol
fraction followed by stigmasterol (13.7%) and
campesterol (10.6%). According to Pironen et al.
[9] the total quantity of sterols in the dry pomace
was found to be 1390 mg/kg-1
, and the main
constituents were -sitosterol, campesterol and
stigmasterol. The recent investigations of
Madawala et al. [10] announced about 0.27% total
sterol content in the oil and the sterol fraction
included 0.5% brasicasterol, 10.3% campesterol,
9.2% stigmasterol, 74.9% -sitosterol, 5.1% 5-
avenasterol. Cholesterol was not detected in the oil.
All these investigations have a bearing on
composition of total sterol fraction. On the other
hand, in glyceride oil, sterols are present in two
forms - free sterols and sterol esters.
Sterol composition is an important indicator of
the quality of vegetable oils due to the requirement
for providing information about the content of
cholesterol in foods. However, the information on
the type and amount of sterols in grape varieties is
rather fragmentary as yet. In addition, separate data
on free sterols and sterol esters have not been
published so far.
Linoleic acid was found to be the main (63.0-
73.1%) constituent in triacylglycerols, followed by
oleic (13.7-20.8%) and palmitic acids (6.2-8.5%)
according to Fernandes et al. [11].
In this connection, the aim of this study was to
investigate the seeds recovered from four Bulgarian
grape varieties for oil content and to present the
© 2014 Bulgarian Academy of Sciences, Union of Chemists in Bulgaria
* To whom all correspondence should be sent:
E-mail: [email protected]

T. N. Ovcharova et al.: Sterol composition of grape seed oils
107
results about the content and composition of free
and esterified sterols separated from the oils as well
as the fatty acid composition of sterol esters and
triacylglycerol fractions.
MATERIALS AND METHODS
Samples
The seeds of the investigated grape varieties
Super ran bolgar, Bolgar, Mavroud and Shiroka
melnishka loza were obtained from the Agricultural
University, Faculty of Viticulture and Horticulture,
Plovdiv, Plovdiv region in South Bulgaria, crop
2013. The study was carried out on air dried seeds
in technical ripeness.
Glyceride oil
The oil was extracted in Soxhlet apparatus with
hexane for 8 h [12]. Then the main part of the
solvent was removed in a rotary evaporator, the
residue of the solvent was evaporated under a
stream of nitrogen and the samples were weighed to
determine the oil content.
Sterols
The total oil sample (sample size about 200 mg,
precisely measured) was applied on a 20 cm x 20
cm glass plate with 0.5 mm thick silica gel 60 G
layer (Merck, Darmstadt, Germany) and developed
with hexane-acetone, 100:8 (by volume) to a front
of 19 cm. Free (Rf=0.4) and esterified (Rf=0.8)
sterols were detected under UV light by spraying
the edges of the plate with 2´,7´-dichlorofluorescein
and then they were scraped, transferred to small
glass columns and eluted with diethyl ether. The
solvent was evaporated under a stream of nitrogen,
the residue was weighed in small glass containers
to a constant weight. Finally, 1% solutions in
chloroform were prepared. Free sterols were
subjected to gas chromatography (GC) without
derivatization.
Sterol esters
Sterol esters were hydrolyzed with ethanolic
KOH [13]; free sterols were extracted with light
petroleum ether and purified by thin layer
chromatography under the above conditions. Sterol
composition of both sterol fractions was determined
without derivatization on HP 5890 gas chroma-
tograph (Hewlett Packard GmbH, Austria)
equipped with 25 m x 0.25 mm HP5 capillary
column (Agilent Technologies, Santa Clara CA,
USA) and flame ionization detector (FID). The
following temperature gradient was applied: from
90oC (held for 2 min) to 290
oC at 15
oC/min then to
310oC at 4
oC/min and held at this temperature for
10 min; the injector temperature was 300oC and the
detector temperature was 320oC. Hydrogen was the
carrier gas at a flow rate of 0.8 mL/min; split 100:1.
Identification was performed by comparison of the
retention times with those of a standard mixture of
sterols [14]. The content of total sterols was deter-
mined by gas chromatography under the same
conditions with betulin as an internal standard [14].
Fatty acids
The fatty acid composition of the triacyl-
glycerols and sterol esters fractions were deter-
mined by GC after transmethylation of the res-
pective sample with 2N methanolic KOH at 50oC
according to Christie [13]. Fatty acid methyl esters
(FAME) were purified by silica gel TLC on 20x20
cm plates covered with 0.2 mm Silica gel 60 G
layer (Merck, Darmstadt, Germany) with mobile
phase n-hexane:acetone, 100:8 (by volume). GC
was performed on a HP 5890 (Hewlett Packard
GmbH, Austria) gas chromatograph equipped with
a 30 m x 0.25 mm capillary DB-23 column
(Hewlett Packard GmbH, Austria) and a FID. The
column temperature was programmed from 130oC
(1 min) to 170oC at 6.5
oC/min; at 3
oC/min to 215
oC
(9 min), at 40oC/min to 230
oC (1 min); injector and
detector temperatures were 270oC and 280
oC
respectively. Hydrogen was the carrier gas at a flow
rate 0.8 mL/min; split was 100:1. Identification was
performed by comparison of retention times with
those of a standard mixture of fatty acids subjected
to GC under identical experimental conditions [15].
All the analyses were made in triplicate. Data
were expressed as mean SD.
RESULTS AND DISCUSSION
The data about oil content in the seeds and sterol
content in the oils are presented in Table 1.
The investigated seeds contain low amount of
glyceride oil. These values are close to data repor-
ted about some varieties of foreign origin [1,16,20].
The sterol content in the oils was found to be
similar to data reported earlier by Piironen et al. [9]
and Madawala et al. [10]. Expectedly, the major
part of sterols (more than 90%) was in a free form.
Since there is no information about free to esteri-
fied sterols ratio in grape seed oil, this profile was
compared with sterol composition of other vege-

T. N. Ovcharova et al.: Sterol composition of grape seed oils
108
table oils. The quantity of free sterols was found to
be rather higher than that in sunflower [17] and
tomato [18] seed oils where this content was about
70-75%.
The qualitative and quantitative composition of
the free and esterified sterols is given in Table 2.
The qualitative and quantitative sterol compo-
sition of the studied oils isolated from all grape
varieties was found to be identical. -Sitosterol
predominated in both sterol fractions and was
present in relatively close quantities. The content of
campesterol in both fractions was relatively high
but in the free sterol fraction its value was about 2
times higher than in sterol esters. On the other
hand, the quantities of stigmasterol were about 2
times lower in the fraction of free sterols. A
substantial difference in cholesterol content of free
and esterified sterols fractions was also found. In
sterol esters the cholesterol amount was signifi-
cantly higher than in the free form. A similar ratio
between the content of cholesterol in the free and
sterol fractions was reported earlier for other
glyceride oils of Asteraceae family [17] and for
tomato seed oil [18]. This picture about ratio
between free sterols and sterol esters is a result of
different stages for biosynthesis of free sterols and
sterol esters and, on the other hand, of different
stages for biosynthesis of cholesterol. The presence
of a higher content of cholesterol in sterols esters is
ascribed to: (i) the fact that sterol esters are the first
to biosynthesize and, (ii) cholesterol is bio-
synthesized firstly in this sterol fraction and is then
used as an intermediate for the synthesis of the
other sterols [19].
The other sterol components - brasicasterol, 7-
campesterol, 5-avenasterol,
7-avenasterol and
7-
stigmasterol - were present in insignificant quanti-
ties or in traces in all investigated varieties of grape
seed oils.
These amounts of sterols are different from the
data reported by El Shami et al. [7] and Madawala
et al. [10], who found the quantities of campesterol
to be considerably lower at the expense of the
higher values of stigmasterol.
The fatty acid composition of the sterol esters
and triacylglycerol fractions are given in Table 3.
Linoleic acid followed by oleic acid predo-
minated in all sterol ester fractions as unsaturated
fatty acids. Saturated fatty acids are presented
mainly by palmitic and stearic acids. The other
constituents are detected in negligible amounts
(lower than 1.0%).
Significant differences were established between
the separate species. The sterol fraction isolated
from Bolgar and Mavroud seed oils contains higher
percentages of oleic acid (32.1% and 35.5%
respectively) at the expense of lower levels of
linoleic acid (44.6% and 40.7% respectively). On
the other hand, the content of oleic acid in the sterol
esters of Shiroka melnishka loza and Super ran
bolgar was found to be lower (28.3% and 24.9%
respectively) while the quantity of linoleic acid was
rather higher (48.6% and 53.8% respectively).
The qualitative and quantitative fatty acid
profile of transmethylated triacylglycerols isolated
from the oil of all four investigated grape species
was similar. Linoleic acid (68.5-72.3%) predomi-
nated, followed by oleic and palmitic acids. The ob-
Table 1. Content of oil in the seeds and sterols in the oils*.
Variety Oil content of seeds,
wt %
Sterol content in oil,
wt %
Sterol fractions, rel. % from total sterols
Free sterols Esterified sterols
1. Bolgar 11.6 ± 0.2 0.4 ± 0.02 94.3 ± 1.9 5.7 ± 0.2
2. Super ran bolgar 16.5 ± 0.5 0.3 ± 0.01 93.4 ± 2.8 6.6 ± 0.2
3. Mavroud 15.7 ± 0.3 0.3 ± 0.01 93.5 ± 1.9 6.5 ± 0.1
4. Shiroka melnishka loza 13.9 ± 0.6 0.3 ± 0.01 97.0 ± 3.9 3.0 ± 0.1 *Mean ± SD of three determinations.
Table 2. Composition of free and esterified sterols* (rel. %).
Sterols
Varieties Bolgar Super ran bolgar Mavroud Shiroka melnishka loza
Free Esterified Free Esterified Free Esterified Free Esterified Cholesterol 0.5 ± 0.01 1.6 ± 0.05 0.6 ± 0.02 2.0 ± 0.1 0.5 ± 0.02 1.3 ± 0.04 0.7 ± 0.01 1.9 ± 0.04
Brasicasterol 2.6 ± 0.1 1.8 ± 0.1 2.6 ± 0.1 1.5 ± 0.1 2.4 ± 0.1 1.4 ± 0.04 1.8 ± 0.1 1.9 ± 0.1 Campesterol 20.5 ± 0.4 11.7 ± 0.2 19.1 ± 0.8 7.1 ± 0.1 20.0 ± 0.4 14.0 ± 0.6 24.5 ± 0.7 12.2 ± 0.5 Stigmasterol 3.2 ± 0.1 6.7 ± 0.3 3.3 ± 0.1 6.0 ± 0.1 3.3 ± 0.2 6.9 ± 0.1 2.7 ± 0.1 3.2 ± 0.1
7-Campesterol 1.3 ± 0.1 2.4 ± 0.05 1.0 ± 0.02 2.9 ± 0.1 1.7 ± 0.1 2.4 ± 0.1 1.8 ± 0.04 2.7 ± 0.1 -Sitosterol 70.2 ± 1.4 72.5 ± 2.9 72.1 ± 1.4 72.8 ± 2.2 70.4 ± 1.4 70.9 ± 2.1 66.8 ± 1.3 73.2 ± 2.2
5-Avenasterol 0.4 ± 0.01 1.5 ± 0.1 0.4 ± 0.02 1.5 ± 0.03 0.5 ± 0.01 1.4 ± 0.1 0.4 ± 0.02 2.0 ± 0.1 7-Avenasterol 0.8 ± 0.02 1.4 ± 0.04 0.5 ± 0.02 2.3 ± 0.1 0.6 ± 0.02 0.8 ± 0.02 0.5 ± 0.02 1.2 ± 0.04 7-Stigmasterol 0.5 ± 0.02 2.4 ± 0.05 0.3 ± 0.01 3.9 ± 0.1 0.6 ± 0.01 0.9 ± 0.02 0.9 ± 0.02 1.7 ± 0.1 *Mean ± SD of three determinations.

T. N. Ovcharova et al.: Sterol composition of grape seed oils
109
Table 3. The fatty acid composition of sterol esters and triacylglycerols* (rel. %).
Fatty acids
Grape varieties
Bolgar Shiroka melnishka loza Mavroud Super ran Bolgar
Sterol
esters
Triacyl-
glycerols
Sterol
esters
Triacyl-
glycerols
Sterol
esters
Triacyl-
glycerols
Sterol
esters
Triacyl-
glycerols
Lauric (С12:0) 0.1 ± 0 0.4 ± 0.02 0.3 ± 0.01 0.1 ± 0 0.3 ± 0.02 0.4 ± 0.02 0.1±0 -
Myristic (С14:0) 0.5 ± 0.02 0.1 ± 0 0.5 ± 0.01 0.1 ± 0 1.3 ± 0.04 0.1 ± 0 0.2 ± 0.01 0.1 ± 0
Pentadecanoic (С15:0) 0.2 ± 0.01 - 0.1 ± 0 - 0.3 ± 0.01 0.1 ± 0 0.1 ± 0 -
Palmitic (С16:0) 16.7 ± 0.3 11.5 ± 0.5 14.4 ± 0.4 10.0 ± 0.4 16.4 ± 0.7 8.8 ± 0.4 13.0 ± 0.3 8.8 ± 0.4
Palmitoleic (С16:1) 0.1 ± 0 0.2 ± 0.01 0.1 ± 0 0.3 ± 0.01 0.2 ± 0.01 0.2 ± 0.01 0.1 ± 0 0.1 ± 0
Margarinic (С17:0) 0.3 ± 0.01 0.1 ± 0.01 0.2 ± 0.01 0.1 ± 0 0.2 ± 0 0.1 ± 0 0.1 ± 0 0.1 ± 0
Stearic (С18:0) 4.2 ± 0.1 1.0 ± 0.03 6.7 ± 0.3 0.7 ± 0.03 3.5 ± 0.1 1.0 ± 0.1 6.1 ± 0.3 0.8 ± 0.03
Оleic (С18:1) 32.1 ± 1.3 17.6 ± 0.4 28.3 ± 1.1 16.3 ± 0.7 35.5 ± 1.1 18.7 ± 0.7 24.9 ± 1.2 17.3 ± 0.7
Linoleic (С18:2) 44.6 ± 0.9 68.5 ± 2.7 48.6 ± 1.9 71.3 ± 2.9 40.7 ± 1.2 70.1 ± 2.1 53.8 ± 2.2 72.3 ± 2.9
Linolenic (С18:3) 0.2 ± 0.01 0.3 ± 0.01 0.1 ± 0 0.5 ± 0.02 0.3 ± 0.01 0.2 ± 0.01 0.1 ± 0 -
Аrahinic (С20:0) 0.6 ± 0.02 0.2 ± 0.01 0.3 ± 0.01 0.2 ± 0.01 0.8 ± 0.03 0.1 ± 0 0.2 ± 0.01 0.1 ± 0
Gadoleic (С20:1) 0.2 ± 0 0.1 ± 0 0.2 ± 0 0.3 ± 0.01 0.3 ± 0.01 0.1 ± 0.01 0.9 ± 0.04 0.1 ± 0
Behenic (С22:0) 0.2 ± 0 - 0.3 ± 0.02 0.1 ± 0.01 0.2 ± 0.01 0.1 ± 0 0.3 ± 0.01 0.3 ± 0.01
*Mean ± SD of three determinations.
tained data are close to results reported earlier by
[20,21].
This fatty acid profile of the transmethylated
triacylglycerol fraction is to a considerable extent
different from this of sterol esters. The amount of
linoleic acid in triacylglycerols of all investigated
varieties was higher at the expense of the lower
level of oleic acid. On the other hand, the content of
palmitic (8.8-11.5%) and stearic acids (0.7-1.0%)
showed decreasing in comparison with fraction of
sterol esters.
CONCLUSION
Sterol composition of the glyceride oils isolated
from seeds of four Bulgarian grape varieties was
found to be similar. The main part of sterol fraction
was in free form. -Sitosterol predominated in both
sterol fractions but the content of campesterol in
free form was higher than in sterol esters at the
expense of the lower quantities of cholesterol and
stigmasterol. The qualitative fatty acid profile of
sterol esters and triacylglycerols was found to be
similar, but higher amounts of saturated and mono-
unsaturated fatty acids were present in sterol esters
than in triacylglycerols.
Acknowledgements: The investigations were
carried out with the partial financial support of
contract SI 13 FC 006/2013 of the University of
Plovdiv “Paisii Hilendarski”.
REFERENCES
1. S. M. Ahmadi, B. A. Siahsar, Cienc. Investig. Agrar.,
38, 291 (2011).
2. A. Akin, A. Altindişli, BIBAD, 4, 13 (2011).
3. T. Maier, A. Schieber, D. R. Kammerer, R. Carle,
Food Chem., 112, 551 (2009).
4. S. Y. Kim, S. M. Jeong, W. P. Park, K. C. Nam, D.
U. Ahn, S. C. Lee, Food Chem., 97, 472 (2006).
5. Codex standard for named vegetable oils, CODEX-
STAN 210 (Amended 2003, 2005).
6. C. Da Porto, E. Porretto, D. Decorti, Ultrason.
Sonochem., 20, 1076 (2013).
7. S. M. El-Shami, M. H. El-Mallah, S. S. Mohamed,
Grasas Aceites, 43, 157 (1992).
8. E. Fedeli, A. Lanzani, P. Capella, G. Jacini, J. Am.
Oil Chem. Soc., 43, 254 (1966).
9. V. Piironen, J. Toivo, R. Puupponen-Pimiä, A.-M.
Lampi, J. Sci. Food Agr. 83, 330 (2003).
10. S. R. P. Madawala, S. P. Kochhar, P. C. Dutta,
Grasas Aceites, 63, 143 (2012).
11. L. Fernandes, S. Casal, R. Cruz, J. A. Pereira, E.
Ramalhosa, Food Res. Int., 50, 161 (2013).
12. Oilseeds – determination of oil content (Reference
method), ISO 659 (2009).
13. W. W. Christie, Lipid Analysis. The Oily Press:
Bridgwater, England, (2003).
14. Animal and vegetable fat and oils – Determination of
individual and total sterols contents (Gas
chromatographic method), ISO 12228 (1999).
15. Animal and vegetable fat and oils – Determination of
methyl esters of fatty acids- Gas chromatographic
method, ISO 5508 (1990).
16. J. M. Luque-Rodríguez, M. D. Luque de Castro, P.
Pérez-Juan, Talanta, 68, 126 (2005).
17. M. D. Zlatanov, M. J. Angelova-Romova, G. A.
Antova, R. D. Dimitrova, S. M. Momchilova, B. M.
Nikolova-Damyanova, J. Am. Oil Chem. Soc., 86,
867 (2009).
18. V. Kiosseoglou, D. Boskou, Oleagineux, 44, 113
(1989).
19. S. K. Munshi, S. Sukhija, J. Bahatia, Phytochemistry,
22, 79 (1982).
20. N. G. Baydar, M. Akkurt, Turk. J. Agric. For., 25,
163 (1999).

T. N. Ovcharova et al.: Sterol composition of grape seed oils
110
21. H. Lutterodt, M. Slavin, M. Whent, E. Turner, L. Yu,
Food Chem., 128, 391 (2011).
СТЕРОЛОВ И МАСТНО-КИСЕЛИНЕН СЪСТАВ НА МАСЛО ОТ ГРОЗДОВИ СЕМКИ
T. Овчаровa1, M. Златанов
1*, A. Иванов
2
1Пловдивски университет “П. Хилендарски”, Катедра Органична Химична Технология, ул. Цар Асен 24, 4000
Пловдив, България 2Аграрен университет, Катедра лозарство и градинарство, Пловдив, България
Постъпила на 24 април 2014 г.; Коригирана на 01 юли 2014 г.
(Резюме)
Изследвано е съдържанието и състава на стеролите, стероловите естери, техния мастно-киселинен състав,
както и този на триацилглицероловите фракции, изолирани от семената на четири български сорта грозде:
Супер ран Болгар, Болгар, Мавруд и Широка мелнишка лоза. Общото съдържание на стероли в маслото е 0.3-
0.4%, като свободните стероли са 93.4-97.0%, а стероловите естери-3.0-6.6%. Индивидуалният състав е
определен чрез газова хроматография. Основният компонент в двете стеролови фракции e β-ситостерол (66.8-
73.2%), следван от кампестерол (7.1-24.5%) и стигмастерол (2.7-6.9%). Съдържанието на холестерол и
стигмастерол в стероловите естери е няколко пъти по-високо, отколкото във фракциите на свободните стероли
(1.3-2.0% срещу 0.5-0.7% и 3.2-6.9% срещу 2.7-3.3%). Обратно, съдържанието на кампестерол в стероловите
естери (7.1-14.0%) е около два пъти по-ниско отколкото в свободната форма (19.1-24.5%). Основните мастни
киселини, които преобладават в стероловите естери са линолова (40.7-53.8%), олеинова (24.9-35.5%) и
палмитинова (13.0-16.7%); съдържанието на тези киселини в триацилглицеролите е съответно 68.5-72.3%, 16.3-
18.7% и 8.8-11.5%).

111
Bulgarian Chemical Communications, Volume 46, Special Issue A (pp. 111 – 116) 2014
SDS-induced phenoloxidase activity of Helix aspersa maxima hemocyanin
Y. Raynova1, S. Todinova
2, D. Yordanov
1, K. Idakieva
1*
1Institute of Organic Chemistry with Centre of Phytochemistry, Bulgarian Academy of Sciences, Acad. G. Bonchev str.,
bl. 9, 1113 Sofia, Bulgaria 2Institute of Biophysics and Biomedical Engineering, Bulgarian Academy of Sciences, Acad. G. Bonchev str., bl. 21,
1113 Sofia, Bulgaria
Received May 13, 2014; Revised June 13, 2014
Dedicated to Acad. Dimiter Ivanov on the occasion of his 120th
birth anniversary
Oxygen-transporting protein of the hemolimph of snails Helix aspersa maxima (HaH) was converted from being an
oxygen carrier to a form which exhibited phenoloxidase activity by incubation with sodium dodecyl sulfate (SDS). On
treatment with 1.73 mM SDS, for 3 min, significant increase of catalytic efficiency of hemocyanin towards substrate
catechol (kcat/Km = 34.56 mM.min-1
versus kcat/Km = 0.093 mM.min-1
for native hemocyanin) was achieved. The highest
o-diPO activity and enzyme efficiency of HaH (kcat/Km = 60.94 mM-1
min-1
), after incubation in 1.73 mM SDS for 3
min, was determined towards substrate dopamine. Structural characterization by means of absorption and fluorescence
spectroscopy and circular dichroism showed that SDS induced optimal conformational changes in the protein. As a
result the active sites become more accessible to the molecules of the substrate and the hemocyanin can function as
phenoloxidase.
Key words: hemocyanin; Helix aspersa maxima; phenoloxidase activity; enzyme activation
INTRODUCTION
Hemocyanins (Hcs) are high molecular mass
copper proteins, freely dissolved in the hemolymph
of invertebrates from the phyla Mollusca and
Arthropoda [1,2]. Molecules of molluscan Hcs are
structured as decamers (cephalopods) or dide-
camers (gastropods) of subunits with molecular
mass of 350-450 kDa [3]. The subunit polypeptide
chains are organized as a linear sequence of seven
or eight globular functional units (FUs) of ~ 50
kDa, each containing a binuclear copper active site
capable of reversibly binding dioxygen. The bi-
nuclear copper active site has two closely spaced
copper atoms each coordinated by 3 histidine
nitrogen atoms. Dioxygen is reversibly bound to the
active site as peroxide in the characteristic side-on
bridging (-2:
2) geometry (Fig. 1) [4-7]. Similar
active site geometry possess the other members of
the type-3 copper protein family enzymes i.e.
tyrosinase (Ty) and catechol oxidase (CO).
Although the binuclear site is highly conserved, as
witnessed by its characteristic spectroscopic proper-
ties and sequence homology, the functionality of
these proteins is different. Namely, Ty catalyzes
both the o-hydroxylation of monophenols to o-di-
phenols (tyrosinase or monophenoloxidase activity)
and subsequent oxidation of o-diphenols to o-
quinones (catecholase or diphenoloxidase activity),
whereas CO catalyzes only the second reaction
(Fig. 2) [7].
Fig. 1. Binuclear copper active site with six conserved
histidine residues, indicative of type-3 copper proteins.
In contrast to these dicopper enzymes, the
function of Hcs is restricted to reversible binding of
O2. The inaccessibility of the type-3 center to
potential substrates has been accepted as one of the
main reasons for the absence or low level of
phenoloxidase (PO) activity in Hcs [8]. After acti-
vation of Hcs, making the active sites more
accessible to the molecules of the substrate, they
can function as POs [9]. Thus, upon treatment of
© 2014 Bulgarian Academy of Sciences, Union of Chemists in Bulgaria
* To whom all correspondence should be sent:
E-mail: [email protected]

Y. Raynova et al.: SDS-induced phenoloxidase activity of Helix aspersa maxima hemocyanin
112
the Hc, isolated from snails Helix aspersa maxima
(gastropod) with proteolytic enzyme, more than
sixty fold increase in its enzymatic efficiency was
achieved [10].
Fig. 2. Hydroxylation step (top) and subsequent
oxidation (bottom) mediated by tyrosinase (Ty). The
later reaction is also catalyzed by catechol oxidase (CO)
and hemocyanin (Hc).
This study presents the SDS-induced phenol-
oxidase activity of Helix aspersa maxima hemo-
cyanin (HaH), as well as an analysis of the accom-
panying conformational changes in the protein,
which gives further insight for the enzymatic
properties of these multifunctional proteins.
EXPERIMENTAL
Reagents
L-Dopa and dopamine hydrochloride were
purchased from Sigma-Aldrich. Catechol was
obtained from Merck. All other chemicals used are
of analytical grade.
HaH was isolated from the hemolymph of the
snails Helix aspersa maxima and purified as
described in [10].
Assay of phenoloxidase activity
In the standard procedure, the PO activity of
HaH was determined at 25C in 25 mM sodium
phosphate buffer, pH 7.2, at a final concentration of
Hc of 0.5 mg/ml. The enzyme reaction was follow-
ed by absorbance measurement of quinone derivati-
ves, formed as a result of substrate oxidation at 400
nm (for substrate catechol) or 475 nm (for substra-
tes L-Dopa and dopamine). The absorbance values
were corrected for the contribution due to the auto-
oxidation of the substrates by running the same
assay in the absence of Hc. The reaction rate was
measured from the initial quasi-linear portion of the
curves (usually 0-3 min). The kinetic parameters
[Km (mM), Vmax (nmol min-1
mg-1
) and kcat (min-1
),
expressed per copper pair] were derived from non-
linear regression data analysis of the dependence of
the initial rates on the substrate concentration
(according to Michaelis-Menten kinetics) using
HYPER software (Hyperbolic Regression Analysis
of Enzyme Kinetic Data, Copyright J. S. Easterby)
[11], taking into account the molar absorption
coefficient of 1417 M-1
cm-1
for o-quinone [12] and
3600 M-1
cm-1
for dopachrome [13], and the
molecular mass of a FU (entity with one active site;
50 kDa). The kinetic parameters were determined
from three experiments and reported as mean ±
standard deviation.
UV-VIS absorption spectroscopy
UV-VIS spectrophotometer model Evolution
300, Thermo Electron Corporation, equipped with a
Peltier temperature control accessory, was used for
the kinetic measurements. Specific absorption co-
efficient a278 nm = 1.413 ml mg-1
cm-1
for HaH [14]
was used for determining the protein concentration.
Steady-state fluorescence measurements
The fluorescence spectra of HaH were recorded
by means of a spectrofluorimeter Perkin Elmer
model LS55, at an excitation wavelength of 295
nm. In order to avoid inner filter effects, the optical
density of protein samples was 0.05.
Circular dichroism
Far-UV circular dichroism (CD) measurements
were performed at 25oC with a Jobin-Yvon CD6
spectropolarimeter in the 190-250 nm region, using
a cell with 0.1 cm pathlength. The protein was
dissolved in 25 mM phosphate buffer, pH 7.2, at a
concentration of 0.1 mg/ml. Spectra in the near-UV
(260-420 nm) were recorded in a rectangular cell of
pathlength 0.5 cm, using a protein concentration of
0.3 mg/ml. In each case, five scans were averaged
and corrected by subtraction of a spectrum of buffer
alone.
RESULTS AND DISCUSSION
Phenoloxidase activation by SDS
Recently, we have established that the native
HaH is able to catalyze the reaction of oxidation of
catechol to o-quinones, i.e. possesses o-diPO [10].
The Vmax value for HaH was obtained to be 22 ±
0.001 nmol min-1
mg-1
, corresponding with a kcat =
1.1 min-1
(expressed per dinuclear copper active
site) (Table 1). The native HaH did not show any o-

Y. Raynova et al.: SDS-induced phenoloxidase activity of Helix aspersa maxima hemocyanin
113
diPO activity with L-Dopa and dopamine as
substrates. Similar results have been reported for
other molluscan Hcs, namely Hcs isolated from
terrestrial snail Helix pomatia (β-HpH) and marine
snail Rapana thomasiana (RtH) [15,16]. Sodium
dodecyl sulphate (SDS) is effective in activating
Hcs. It has been shown that the micellar form of
SDS (present at concentrations > 1 mM in 100 mM
sodium phosphate buffer, pH 7.5) is required to
induce optimal conformational transitions in the
protein, which may result in opening a channel to
the di-copper center allowing bulky phenolic
substrates to access the catalytic site [17]. Different
concentrations of the detergent SDS (0.35-3.81
mM; final concentrations) and incubation times
were used in our study to induce o-diPO activity in
HaH. High degree of increase of the o-diPO activity
of HaH (vi 0.75 μmol min-1
mg-1
) towards
substrate catechol, was achieved after 3 min
incubation in SDS at concentrations from 1.04 mM
to 2.08 mM (Fig. 3).
Fig. 3. o-diPO activity of HaH, after 3 min incubation
with SDS (0.35-3.81 mM; final concentrations). The
assay was carried out with catechol (1 mM) as substrate
in 25 mM phosphate buffer, pH 7.2, at 25oC and Hc
concentration of 0.5 mg/ml.
Higher concentrations of SDS (>2.08 mM SDS)
most probably affect the catalytically active confor-
mation of the binuclear copper active sites, thus the
induced activity again decreases (Fig. 3). Confor-
mational changes in the protein associated with the
addition of SDS have been analyzed by various
biophysical methods.
Effect of SDS on the secondary structure of HaH
The far-UV CD spectrum of native HaH shows
two distinct negative Cotton effects at about 208
nm and 222 nm due to the the α-helix and β-sheet
structures of the protein. CD spectra taken after 3
min of incubation with different concentrations
SDS (1.2-2.6 mM) for 3 min at 25°C show changes
in the secondary structure, as indicated by the shift
of the minimum at 208 nm to lower wavelengths
(Fig. 4). This is in agreement with the observations
by Baird et al. [17] on the Hcs of chelicerates.
Fig. 4. Far-UV CD spectra of HaH in 25 mM phosphate
buffer, pH 7.2, after 3 min incubation in different
concentrations of SDS (1.2-2.6 mM).
Effect of SDS on the tertiary structure
SDS-induced changes in the tertiary structure of
HaH were characterized by recording intrinsic fluo-
rescence intensities and near-UV CD spectra. After
excitation at 295 nm, the fluorescence spectrum of
native HaH has maximum at 3371 nm character-
ristic for tryptophans “buried” in the hydro phobic
interior of the protein molecule. The fluorescence
maxima of HaH, incubated in SDS (0.62-2.6 mM)
for 3 min, were shifted to longer wavelength (Fig.
5). It appears that after treatment with SDS certain
tryptophan side chains turn out to be exposed at the
Table 1. Kinetic parameters of intrinsic and induced o-diphenoloxidase activity of Helix aspersa maxima hemocyanin
towards substrates catechol, L-Dopa and dopamine.
Hemocyanin
Catechol L-Dopa Dopamine
KM
(mM)
kcat
(min-1)
kcat/KM
(mM-1
min-1)
KM
(mM)
kcat
(min-1)
kcat/KM
(mM-1
min-1)
KM
(mM)
kcat
(min-1)
kcat/KM
(mM-1
min-1)
Native 11.8±0.5 1.1 0.093 no activity no activity
SDS-activated 0.91±0.23 31.45 34.56 15.26±0.98 9.58 0.62 0.51±0.17 31.08 60.94
Proteolytically
activated 6.8±0.2 40.15 5.9 17.3±0.5 12.45 0.72

Y. Raynova et al.: SDS-induced phenoloxidase activity of Helix aspersa maxima hemocyanin
114
surface of the protein molecule. The presence of
SDS also led to increase of the intensity of
fluorescence which is indicative for a reduction of
internal quenching.
Fig. 5. Fluorescence spectra of HaH in 25 mM
phosphate buffer, pH 7.2, excited at 295 nm, after 3 min
incubation in different concentrations of SDS (0.62-2.6
mM).
Hcs and POs with bound dioxygen exhibit
unique absorption spectra with a characteristic
absorption peak at ∼345 nm [5]. This absorption
band results from the peroxide, which is present in
a μ−η2:η2 side-on arrangement and acts as a strong
σ-donor ligand to the Cu(II) ions. The di-copper
center of Hcs is also responsible for the
characteristic near UV-CD negative signal at 345
nm [18]. The intensity of the near-UV CD spectra
(in the 260- to 320-nm range) of HaH, incubated in
SDS (1.2-2.6 mM) for 3 min, was found to decrease
substantially (Fig. 6), consistent with conforma-
tional changes that alter the microenvironment of at
least some of the aromatic residues of the protein.
Thus intrinsic fluorescence intensities and near-UV
CD spectra both indicate changes in the tertiary
structure of HaH upon treatment with SDS.
Fig. 6. Near-UV CD spectra of HaH in 25 mM
phosphate buffer, pH 7.2, after 3 min incubation in
different concentrations of SDS (1.2-2.6 mM).
Absorption spectra taken for HaH at increasing
concentration (0.87-3.47 mM) of SDS showed that
the intensity of copper-dioxygen band at 345 nm
slightly decreased as a function of SDS
concentration in the Hc samples (Fig. 7a, b).
Therefore, SDS-induced conformational changes
did not affect the integrity of the copper active sites
in the Hc molecule.
(a)
(b)
Fig. 7. (a) Absorption spectra of HaH in 25 mM
phosphate buffer, pH 7.2, after 3 min incubation in
different concentrations of SDS (0.87-3.47 mM); (b)
Absorbance at 345 nm of HaH in function of time in the
presence of SDS at different concentrations (0.87-3.12
mM).
Assay of phenoloxidase activity
Kinetic analysis of the o-diPO activity of HaH,
activated with SDS, with increasing concentrations
of substrates catechol (from 0.1 to 1.2 mM), L-
Dopa (from 0.5 to 12 mM) and dopamine (from
0.015 to 0.3 mM) was performed. The kinetic para-
meters (according to Michaelis-Menten kinetics),
obtained by fitting the experimental data using the

Y. Raynova et al.: SDS-induced phenoloxidase activity of Helix aspersa maxima hemocyanin
115
software HYPER, are presented in Table 1. High
level of SDS-induced activity was detected for HaH
towards substrate catechol – Vmax increased up to
629 ± 0.002 nmol min-1
mg-1
, corresponding with a
kcat = 31.45 min-1
(Table 1). The enzymatic activity
of HaH, treated with 1.73 mM SDS for 3 min, is
related to that observed with proteolytically activa-
ted Hc (kcat = 40.15 min-1
) [10]. However, the
affinity of SDS-activated HaH towards substrate
catechol is higher (Km = 0.91 ± 0.2 mM) than the
affinity shown by the native HaH (Km = 11.8 ± 0.5
mM) and proteolytically activated HaH (Km = 6.8 ±
0.2 mM) [10]. Moreover, the enzyme efficiency
(kcat/Km = 34.56 mM-1
min-1
) of SDS-activated HaH
towards catechol is considerably higher than that
achieved for proteolytically activated Hc (kcat/Km =
5.9 mM-1
min-1
) [10]. This fact reveals that SDS-
activated HaH possesses even higher potential for
preparation of biosensors and studies are in
progress. Recently, Naresh et al. report for a similar
sensor for detection of phenols using Hc isolated
from a freshwater gastropod Pila globosa [19]. The
o-diPO activity of P. globosa Hc has also been
enhanced by treatment with SDS.
After activation with SDS, HaH showed o-diPO
towards the more bulky substrate L-Dopa and
dopamine. The Vmax value amounted to 192 ± 0.001
nmol min-1
mg-1
, kcat = 9.58 min-1
, Km value of 15.26
± 0.98 mM characterizes the affinity of SDS activa-
ted HaH towards substrate L-Dopa. The highest o-
diPO activity and enzyme efficiency of HaH
(kcat/Km = 60.94 mM-1
min-1
), after incubation in
1.73 mM SDS for 3 min, was determined towards
substrate dopamine (Fig. 8a, b). Dopamine was also
found to be a preferred substrate of SDS-activated
Hcs from arthropods Cancer pagurus [20] and
Eurypelma californicum [21]. The physiological
importance of this observation represents the fact
that dopamine is important metabolite for sclera-
tization and melanization of the cuticle.
By means of electron cryomicroscopy Cong et
al. reveal the structural mechanism of SDS-induced
enzyme activity of Hc from the scorpion Pandinus
imperator [22]. They show that secondary and
tertiary structural alterations not only provide an
increased access of substrates to active sites, but
promote novel bridge formation between Hc linker
subunits. In this way SDS seems to imitate an
allosteric effector.
CONCLUSION
In conclusion, this study demonstrates that
micellar concentration of detergent SDS can indu-
ced phenoloxidase activity in the hemocyanin of
Helix aspersa maxima. The accompanying confor-
mational changes in the protein result in opening a
channel to the di-copper center allowing bulky
phenolic substrates access to the catalytic site. The
high enzyme efficiency of SDS-activated HaH
towards catechol (kcat/Km = 34.56 mM-1
min-1
) and
dopamine (kcat/Km = 60.94 mM-1
min-1
) reveals the
benefit of utilization of PO activity of Hcs for
preparation of Hc-based biosensors.
(a)
(b)
Fig. 8. (a) Kinetic analysis of o-diPO activity of HaH
with increasing concentration of substrate dopamine: (a)
0.015 mM; (b) 0.03 mM; (c) 0.05 mM; (d) 0.08 mM; (e)
0.1 mM; (f) 0.15 mM; (g) 0.2 mM; (h).25 mM; (i) 0.3
mM. The assay was carried out in 25 mM phosphate
buffer, pH 7.2, at 25oC and Hc concentration of 0.5
mg/ml; (b) The corresponding Lineweaver–Burk plot.
The derived KM and kcat values are given in Table 1.
Acknowledgements: Financial support by the
National Science Fund of the Ministry of Education
and Science, Bulgaria (research grant DTK 02/78),
is gratefully acknowledged.
REFERENCES
1. G. Préaux, C. Gielens, Hemocyanins, in: Copper
Proteins and Copper Enzymes, Lontie, R. (Ed.), vol.
II, CRC Press, Boca Raton, 1984, p. 159.

Y. Raynova et al.: SDS-induced phenoloxidase activity of Helix aspersa maxima hemocyanin
116
2. K. E. van Holde, K. I. Miller, Adv. Protein. Chem.,
47, 1 (1995).
3. J. Markl, Biochim. Biophys. Acta, 1834, 1840 (2013).
4. C. J. Coates, J. Nairn, Dev. Comp. Immunol., 45, 43
(2014).
5. E. I. Solomon, U. M. Sundaram, T. E. Machonkin,
Chem. Rev., 96, 2563 (1996).
6. H. Decker, N. Terwilliger, J. Exp. Biol., 203, 1777
(2000).
7. M. Rolff, J. Schottenheim, H. Decker, F. Tuczek,
Chem. Soc. Rev., 40, 4077 (2011).
8. H. Decker, F. Tuczek, Trends Biochem. Sci., 25, 392
(2000).
9. H. Decker, E. Jaenicke, Dev. Comp. Immunol., 28,
673 (2004).
10. Y. Raynova, L. Doumanova, K. Idakieva, Protein J.,
32, 609 (2013).
11. J. S. Easterby, HYPER.EXE, Version 1.1s:
Hyperbolic regression analysis of enzyme kinetic
data (1996). http://homepage.ntlworld.com/john.
easterby/ index.html
12. T. Zlateva, P. Di Muro, B. Salvato, M. Beltramini,
FEBS Lett., 384, 251 (1996).
13. J. L. Muñoz-Muñoz, F. Garcia-Molina, R. Varon, J.
N. Rodriguez-Lopez, F. Garcia-Canovas, L. Tudel,
Anal. Biochem., 351, 128 (2006).
14. C. Gielens, J. De Sadeleer, G. Preaux, R. Lontie,
Comp. Biochem. Physiol., 88B, 181 (1987).
15. N. I. Siddiqui, R. F. Akosung, C. Gielens, Biochim.
Biophys. Res. Commun., 348, 1138 (2006).
16. K. Idakieva, N. I. Siddiqui, F. Meersman, M. De
Maeyer, I. Chakarska, C. Gielens, Int. J. Biol.
Macromol., 45, 181 (2009).
17. S. Baird, S. Kelly, N. Price, E. Jaenicke, Ch.
Meesters, D. Nillius, H. Decker, J. Nairn, Biochim.
Biophys. Acta, 1774, 1380 (2007).
18. A. M Tamburro, B. Salvato, P. Zatta, Comp.
Biochem. Physiol., 55B, 347 (1976).
19. K. N. Naresh, S. Krupanidhi, S. S. Rajan, Protein J.,
32, 327 (2013).
20. K. Idakieva, Y. Raynova, F. Meersman, C. Gielens,
Comp. Biochem. Physiol., 164B, 201 (2013).
21. E. Jaenicke, H. Decker, FEBS J., 275, 1518 (2008).
22. Y. Cong, Q. Zhang, D. Woolford, T. Schweikardt, H.
Khant, M. Dougherty, S. Ludtke, W. Chiu, H.
Decker, Structure, 17, 749 (2009).
SDS-ИНДУЦИРАНА ФЕНОЛОКСИДАЗНА АКТИВНОСТ НА ХЕМОЦИАНИН ОТ HELIX
ASPERSA MAXIMA
Ю. Райнова1, С. Тодинова
2, Д. Йорданов
1, К. Идакиева
1*
1Институт по Органична химия с Център по Фитохимия, Българска Академия на Науките, ул. Акад. Г. Бончев,
бл. 9, 1113 София, България 2 Институт по биофизика и биомедицинско инженерство, Българска Академия на Науките, ул. Акад. Г.
Бончев, бл. 21, 1113 София, България
Постъпила на 13 май 2014 г.; Коригирана на 13 юни 2014 г.
(Резюме)
Кислород-пренасящият протеин, изолиран от хемолимфата на охлюви от вида Helix aspersa maxima (HaH),
беше превърнат във форма, която проявява фенолоксидазна активност. Посредством инкубиране на НаН с 1.73
mM SDS, в продължение на 3 мин, беше постигнато значително повишение на каталитичната ефективност на
хемоцианина при субстрат катехол (kcat/Km = 34.56 mM.min-1
срещу kcat/Km = 0.093 mM.min-1
, определена за
нативен НаН). Най-висока SDS-индуцирана o-дифенолоксидазна активност и ефективност на НаН, след
активиране посредством SDS, беше определена при субстрат допамин (kcat/Km = 60.94 mM-1
min-1
). Структурно
характеризиране с помощта на абсорбционна и флуоресцентна спектроскопия и кръгов дихроизъм показаха, че
мицеларен SDS предизвиква оптимални конформационни промени в протеина, в резултат на което активните
центрове стават по-достъпни за молекулите на субстрата и хемоцианинът може да функционира като
фенолоксидаза.

117
Bulgarian Chemical Communications, Volume 46, Special Issue A (pp. 117 – 122) 2014
Resveratrol loading on mesoporous silica and zeolite carriers by solid state method
M. Popova1, K. Yoncheva
2, A. Szegedi
3, Y. Kalvachev
4, N. Benbassat
2, V. Mavrodinova
1*
1Institute of Organic Chemistry with Centre of Phytochemistry, Bulgarian Academy of Sciences, Acad. G. Bonchev str.,
bl. 9, 1113 Sofia, Bulgaria 2Faculty of Pharmacy, Medical University of Sofia, 2 Dunav str., 1000 Sofia, Bulgaria
3Research Centre for Natural Sciences, Institute of Materials and Environmental Chemistry, Hungarian Academy of
Sciences, Magyar tudósok körútja 2, 1117 Budapest, Hungary 4Institute of Mineralogy and Crystallography, Bulgarian Academy of Sciences, Acad. G. Bonchev str., bl. 107, 1113
Sofia, Bulgaria
Received April 30, 2014; Revised June 18, 2014
Dedicated to Acad. Dimiter Ivanov on the occasion of his 120th
birth anniversary
The feasibility of mesoporous SBA-16 and MCM-41 materials to be used as carriers for the poorly water soluble
compound Resveratrol (RES) was studied and compared with that of zeolite Y. A simple procedure of encapsulation in
solid-state aiming amorphization of the drug which thus enhancing its solubility has been successfully applied.
Investigations using powder XRD, N2 physisorption, ATR FT-IR and TG analysis demonstrated the effective loading of
RES on the surface of the carriers. RES release in buffers with pH=1.2 and pH=6.8 demonstrated faster dissolution of
the loaded drug compared to non-loaded resveratrol.
Key words: resveratrol encapsulation, in vitro release, mesoporous silica, zeolite Y carrier
INTRODUCTION
The research and application of natural
polyphenols have recently attracted great interest
due to their potential in functional food and drug
delivery [1-3]. Among these compounds, resverat-
rol (RES) is recognized mainly as an antioxidant,
but also as antiviral, anticancer, an antiinflamma-
tory, antihypersensitive, cardioprotective agent, etc.
[4-6]. Despite the promising results in preclinical
settings, the extensive use of RES has met only
limited success, largely due to its insta-bility [7],
poor solubility [8], inefficient systemic delivery
and low bioavailability [9]. In this context, the
encapsulation of RES into polymeric or lipid-based
matrices is a major challenge, and nanotechnology
represents a powerful strategy [10]. The develop-
ment of innovative formulation strategies, capable
of overcoming the physicochemical and pharma-
cokinetic limitations of this compound, is mainly
based on discovering suitable carriers able to
provide controlled release and protection for RES.
Mesoporous silica nanomaterials of the MCM-
41 and SBA-series as well as the microporous
zeolites, possess great surface area allowing an
efficient drug loading and stabilization of labile
drugs during storage or physiological administra-
tion. Further, these carriers could improve water
solubility of poorly soluble drugs probably due to
the increased surface and/or transformation of the
crystal form into amorphous one. Ordered meso-
porous silicate MCM-41 and SBA-15 have been
widely evaluated as carriers for different poorly
soluble compounds [11-15]. In contrast, there has
been very limited work dealing with the employ-
ment of the cage-like SBA-16 materials as drug
carriers [16,17].
The advantages of using zeolites for biomedical
applications are their biocompatibility, low toxicity
[18-20] and the ability to tune the zeolite properties
by varying the SiO2/Al2O3 ratio and the surface
functional groups [21,22]. In addition, the smaller
zeolite pore size (relative to mesoporous silica)
more closely matches the drug molecule size and
may better control the drug release kinetics.
The main method applied for loading of active
molecules on these carriers is solvent impregnation.
This method requires long incubation of the drug
and the carrier, usually under heating in appropriate
organic solvent. However, some drugs are thermo-
sensitive or insoluble in solvents. Thus, because of
this limitation, some new approaches should be
developed for the achievement of efficient loading.
The aim of the present study was to evaluate the
capacity of three carriers (MCM-41, SBA-16 and Y
type zeolite) for RES loading by solid state method.
© 2014 Bulgarian Academy of Sciences, Union of Chemists in Bulgaria
* To whom all correspondence should be sent:
E-mail: [email protected]

M. Popova et al.: Resveratrol loading on mesoporous silica and zeolite carriers by solid state method
118
The method was considered advantageous since no
organic solvents or catalysts are required for the
encapsulation process and the procedure could be
easily performed. Furthermore, the solid state
method could be applied as loading method espe-
cially for drugs with poor solubility and stability
problems like resveratrol.
In our previous publication a thorough
examination on the effectiveness of the newly
introduced method for solid-state preparation of
drug formulations composed of the purely soluble
antioxidant resveratrol and nanosized silica materi-
als has been made [23]. In the present contribution
a comparison of the loading efficiency and the
release kinetics of RES delivery systems based on
mesoporous MCM-41 and SBA-16 silicas as well
as on Y type zeolite support with different channel
structures and morphology, formulated at dry
mixing conditions has been made.
EXPERIMENTAL
Synthesis of mesoporous MCM-41 and SBA-16
silica materials. Zeolite Y support
MCM-41 with 100 nm particle size was
prepared according to the procedure of Huh et al.
[24]. This sol-gel procedure is carried out at 80oC
without co-solvent, in water solution and applying
NaOH as a catalyst. The relative molar composition
of the reaction mixture was: 1 TEOS: 0.12
C16TMABr: 0.31 NaOH: 1190 H2O. The formed gel
was aged at 80°C for 2 h, then washed with distilled
water until neutral pH and dried at ambient tempe-
rature. Structure directing agent removal of MCM-
41 materials was carried out in air at 550°C with 1
K/min rate and held at this temperature for 5 h.
SBA-16 has been synthesized according to Zhao
et al. [25]. F127 triblock copolymer (BASF) is used
as template and tetraethylortosilicate (TEOS) as
silica source. The relative molar composition of the
synthesis mixture is the following: 4 g
PEO106PPO70PEO106: 0.24 HCl: 0.04 TEOS: 7.86
H2O. The synthesis mixture was stirred at room
temperature for 20 h, than hydrothermally treated at
80oC for 48 h. Structure directing agent was
removed by calcination in air at 500oC with a
heating rate of 1 K/min.
Zeolite Y in its ammonium form was supplied
by Zeolyst International (UWE Ohlrogge (VF),
CBV 500) as a powder with the following charac-
teristics: Si/Al molar ratio of 2.6, Na2O = 0.2 wt.%,
unit cell size = 24.53. The decomposition of the
NH4+-form was performed by stepwise heating in
dry N2 as follows: heating up to 300oC, hold for
30min and then heating from 300oC to 550
oC, hold
90 min. Heating rate was 8 K/min. The as-obtained
initial material is designated as HY(2.6).
Characterization of the samples
X-ray patterns were recorded by a Philips PW
1810/3710 diffractometer with Bragg-Brentano
para focusing geometry applying monochromatized
CuKα (λ = 0.15418 nm) radiation (40 kV, 35 mA)
and a proportional counter. Philips XPert-MPD
apparatus was used for structure characterization of
SBA-16.
Nitrogen physisorption measurements were
carried out at 77 K using Quantachrome Autosorb
1C apparatus. The specific surface area was
calculated by the BET method in the range of
relative pressures from 0.01 to 0.1. The pore-size
distribution was calculated from desorption branch
of the isotherms with the BJH method. The silica
supports were pre-treated at 350°C, whereas the
drug loaded formulations were heated at 80°C for 5
h before measurements.
Thermogravimetric measurements were perfor-
med with a Setaram TG92 instrument. The samples
(about 20 mg) were treated in situ in air flow up to
600oC (5
oC/min) followed by a hold-up of 1 h. The
detected weight loss corresponds to the amount of
the deposited resveratrol.
Attenuated Total Reflection Infrared (ATR-FT-
IR) spectra were recorded by means of a Varian
Scimitar 2000 FT-IR spectrometer equipped with a
MCT (mercurycadmium-tellur) detector and a
single reflection ATR unit (SPECAC “Golden
Gate”) with diamond ATR element. In general, 128
scans and 4 cm-1
resolution were applied. For all
spectra ATR-correction was performed (Varian
ResPro 4.0 software).
Resveratrol loading and in vitro release studies
For the solid state method of RES loading 1:1
weight ratio of RES to the parent mesoporous
MCM-41 and SBA-16 materials was used. In case
of the zeolite sample 0.8:1.0 ratio was applied. RES
was mixed with the carriers at room temperature in
a DDR-GM 9458 type vibrational ball mill mixer
with stainless holder (ø = 24 mm) and one ball (ø =
9.5 mm), for 3 minutes without adding any additive
for wetting. The as-prepared samples are designated
as R/MCM-41(SS), R/SBA-16(SS) and R/Y(2.6)SS
indicating their solid-state procedure of preparation.
Resveratrol (>99.5%) was provided by Sigma-
Aldrich.

M. Popova et al.: Resveratrol loading on mesoporous silica and zeolite carriers by solid state method
119
For in vitro release studies, 5 mg of the drug
loaded particles were incubated in 200 ml acid or
phosphate buffers (pH=1.2 or pH=6.8, respectively)
at 37°C under stirring (100 rpm). At appropriate
time intervals, 3 ml samples were withdrawn and
replaced by fresh buffer. The withdrawn samples
were centrifuged at 15 000 rpm for 15 min and the
concentration of the released RES into the super-
natant was determined by UV-Vis spectro-
photometry (Hewlett Packard 8452A) at a
wavelength of 308 nm.
RESULTS AND DISCUSSION
Materials characterization
The XRD reflections of the commercial RES
compound and the grinded substance are presented
in Fig. 1a. Decrease in the intensity of the diffract-
tion peaks at 2θ = 17o, 19
o, 22
o, 23
o, and 28.3
o com-
pared to that of the commercial form of the drug is
observed (Fig. 1a). This effect proves that treatment
in the vortex mixer leads to partial amorphization
of the antioxidant, which was the aim of applying
this solid-state preparation procedure. Presence of
crystalline RES phase is clearly visible, however,
on all loaded samples (Fig. 1a-c). This is evidence
that RES is not only introduced in the meso/
micropores, but can be found on the outer surface
of the nanoparticles or in the voids among them.
The low-angle powder XRD patterns of MCM-
41 and SBA-16 show an ordered pore arrangement
with the typical reflections at the low angles at 2θ =
2.4o (Fig. 1a) and 2θ = 1
o (Fig. 1b) for MCM-41
and SBA-16 respectively which are not destroyed
upon RES encapsulation. The X-ray reflections of
RES loaded mesoporous carriers reveal clear
indication for presence of small RES crystallites on
the surface of both MCM-41 and SBA-16
materials.
The X-ray powder diffraction patterns of the
calcined zeolite reveal the characteristic of the
faujasite topology main diffraction peaks assigned
to (1 1 1) and (5 3 3) faces at 2θ = 6.2o and 15.3
o
respectively (Fig. 1c) the intensity of which decree-
ses to some extent compared to the parent HY
zeolite. This effect indicates that the microporous
structure was retained, although, the crystallinity
has decreased, together with that of RES during the
solid-state preparation of the RES containing
zeolite formulation (Fig.1c).
The parent and resveratrol loaded MCM-41,
SBA-16 and Y samples were characterized by the
method of low temperature nitrogen adsorption and
the data are presented in Table 1 and in Fig. 2.
0 10 20 30 40 50
1000
2000
3000
4000
5000
6000
7000
8000
1 2 3 4 5 6 7 8 9 10
4000
6000
8000
10000
12000
Inte
nsity (
co
un
ts)
Bragg angle (°2)
MCM-41
Inte
nsity (
co
un
ts)
Bragg angle (°2)
R/MCM-41(SS)
grinded RES
initial RES
(a)
0 10 20 30 40 50 60 70 80 90-100
0
100
200
300
400
500
600
700
800
900
1000
1 2 3 4 560000
80000
100000
120000
140000
Inte
nsity (
co
un
ts)
Bragg angle (°2)
SBA-16
Inte
nsit
y (
counts
)
Bragg angle (°2)
R/SBA-16(SS)
(b)
20 400
300
600
900
R/HY(2.6)(SS)Inte
nsity (
co
un
ts)
Bragg angle (°2)
HY(2.5)
(c)
Fig. 1. Powder X-ray diffraction patterns of: (a) initial
and grinded RES and RES/MCM-41(SS); (b) RES/SBA-
16(SS); (c) parent and RES loaded, RES/HY(2.6)(SS).
As the results reveal, compared to the parent
carriers, all loaded with resveratrol compositions
exhibit substantial decrease in the surface area and
pore volume, as well as some pore diameter reduc-
tion in case of the mesoporous carriers (Table 1,
Fig. 2). It can be suggested that the pores of the
latter supports are not filled entirely with drug,
however.

M. Popova et al.: Resveratrol loading on mesoporous silica and zeolite carriers by solid state method
120
Table 1. Physicochemical properties of the supports and their formulations with RES and concentration of the released
RES in pH=1.2 and pH=6.8.
Samples BET
(m2/g)
Pore diameter
(nm)
Pore volume
(cm3/g)
TG data for
loaded RES (%)
Released RES* (%)
in pH=1.2 in pH=6.8
MCM-41 1175 2.7 0.97 - - -
R/MCM-41(SS) 306 2.5 0.27 50.6 36.7 31.8
SBA-16 1128 2.5-7.9 0.64 - - -
R/SBA-16(SS) 105 2.5-4.4 0.10 45.5 36.8 33.5
HY(2.6) 758 0.11 0.34 - - -
R/Y(2.6)(SS) 119 n.d. ** 0.04 37.1 27.0 31.7 *Determined by TGA by heating from 180°C to 600°C; **no presence of pores detected.
As the results reveal, compared to the parent
carriers, all loaded with resveratrol compositions
exhibit substantial decrease in the surface area and
pore volume, as well as some pore diameter reduc-
tion in case of the mesoporous carriers (Table 1,
Fig. 2). It can be suggested that the pores of the
latter supports are not filled entirely with drug,
however.
0.0 0.2 0.4 0.6 0.80.0 0.2 0.4 0.6 0.8
0
200
400
600
800
1000
Relative pressure (p/p0)
B
initial carrier resveratrol loaded material
Adsorb
ed v
olu
me/c
m3 (
ST
P)
g-1
Relative pressure (p/p0)
A
Fig. 2. Nitrogen adsorption/desorption isotherms of the
parent materials and resveratrol loaded MCM-41 (a) and
SBA-16 (b) composites, respectively.
The change in the isotherms for the loaded Y
zeolite, compared to the parent carrier is an indica-
tion for total micropore filling or rather plugging.
The microporosity of this material with much
narrower channel system was actually disappeared
and the total pore volume was strongly reduced.
ATR FT-IR method was used to investigate
whether some interaction between the adsorbed
RES molecule and the nanosized porous carriers
(Fig. 3) has occurred upon the drug encapsulation.
As was already observed in our previous study [23]
that the FT-IR spectrum of resveratrol shows three
characteristic strong bands at 1606, 1585 and 1384
cm-1
, belonging to RES double bond C–C
stretchings of olefinic and aromatic groups, and of
ring C–C stretching, respectively. The bands at
1509, 1443 and 1324 cm-1
can be assigned to in
plane and out of plane C–H bending, respectively
[26]. After deposition into silica/zeolitе framework,
a slight blueshift of the resveratrol IR bands
corresponding to vinylidene group and a decrease
in intensity of the vinylidene C–H in plane band
(1324 cm-1
) can be observed. These spectral
features due to perturbation at vinylidene dipole
moments suggest an interaction of resveratrol C=C
with the MCM-41 silica and the zeolite framework.
For all cases, the out of plane C–H bending of
RCH=CHR (965 cm-1
, not shown), diagnostic for
trans-configuration around the di-substituted
double bond [27], remains unchanged, indicating
that the trans-resveratrol configuration is preserved
during encapsulation over all supports used.
1700 1650 1600 1550 1500 1450 1400 1350 1300
-0.1
0.0
0.1
0.2
0.3
0.4
0.5
0.6
Wavenumbers ( cm-1)
R/SBA-16(SS)
R/HY(2.6)(SS)
R/MCM-41(SS)
Abso
rbance
RESVERATROL
13241509
1384
Fig. 3. FT-IR spectra of RES and RES loaded meso-
porous and zeolite supports.
Resveratrol loading
The adsorbed amount of RES on the loaded
preparations was evaluated by thermogravimetric
analysis (TGA) considering the weight loss at
heating the formulations in air up to 600oC (Fig. 4).
The TGA profile of the pure grinded RES reveals
two distinct weight changes starting at 250oC and
400oC which can be attributed to the onset of

M. Popova et al.: Resveratrol loading on mesoporous silica and zeolite carriers by solid state method
121
melting followed by the decomposition of the RES
molecule, respectively. At temperatures below
200oC the drug-host formulations lose the physic-
sorbed water. Above 230oC the onset of a short
temperature interval of melting of the supported
substance follows, and then fast drug decom-
position takes place.
100 200 300 400 500 600-60
-40
-20
0
R/SBA-16(SS)
R/MCM-41(SS)
TG
(%
)
Temperature (oC)
R/Y(2.6)(SS)
200 400 600
-4
-2
0
2
4
R/Y(2.6)(SS)
Resveratrol Resveratrol
503oC
R/SBA-16(SS)
dtg
(%/m
in)
Temperature (oC)
R/MCM-41(SS)
470oC
522oC
Fig. 4. TGA (a) and DTG (b) profiles of the RES loaded
materials.
The calculated from the TGA data values for the
amount of encapsulated RES are obtained by
subtracting the weight loss due to water released
from room temperature to 230oC from the total
weight loss registered after heating for 1 h at 600oC.
Compared to the pure RES the loaded RES is
released, with the exception of R/SBA-16(SS), at
lower temperature, in both regions (Fig. 4). This is
an indication for easier release corresponding to the
enhanced solubility of the loaded compound com-
pared to the non-supported one. Almost complete
adsorption of the deposited RES, corresponding to
the envisaged (1:1 for the mesoporous supports and
0.8:1 for the zeolite) RES: carrier weight ratio is
registered for the three studied formulations. This
result points to the high effectiveness of the simple
solid-state procedure of RES deposition used for
the preparation of such drug delivery systems.
In vitro drug release
The in vitro release process was studied in acid
and phosphate buffer with pH values of 1.2 and 6.8,
respectively. As shown in Fig. 5, the release rate of
RES from the porous carriers was faster than its
solubility in the same media. These results were
probably due to the transformation of RES from
crystal to amorphous state during the loading via
grinding procedure. The slightly faster release in
acid buffer was associated with the protonation of
the carriers that was previously reported [28,29].
0 1 2 3 4 5
0
20
40
60
80
100
0 1 2 3 4 5
Rele
sed
re
sve
ratr
ol (
%)
Time (h)
Resveratrol R/HY(2.6) R/MCM-41 R/SBA-16
A B
pH=6.8
Time(h)
pH=1.2
Fig. 5. In vitro release of resveratrol in pH=1.2 (a) and in
pH=6.8 (b) from the supported samples.
Comparing the profiles of the three carriers,
faster release was observed from both mesoporous
carriers (MCM-41 and SBA-16) compared to the
microporous Y type zeolite. This behavior could be
perhaps explained with the slower diffusion of RES
through the narrower zeolite pores. Thus, it
appeared that the different pore size (mesoporous
for the silica matеrials and microporous for the
zeolite) influenced the release drug kinetics, in
accordance to the previously reported findings of
M. Vallet-Regi et al. [12].
CONCLUSION
Solid, silica-based spherical mesoporous MCM-
41 and SBA-16 as well as microporous zeolite Y
materials differing in morphology and pore size
distribution were used as carriers for the prepa-
ration of resveratrol-loaded delivery systems by dry
mixing of resveratrol and the respective carrier in
solid state. This preparation procedure resulted in
better resveratrol solubility compared to the free
resveratrol, regardless of the carrier structure. The
applied deposition method proved to be effective
for encapsulation and stabilization of the drug as
well as for its enhanced solubility.
Acknowledgements: Support for this work in the
framework of the Hungarian-Bulgarian Inter-
Academic Exchange Agreement is gratefully
acknowledged.
REFERENCES
1. C. Manach, A. Scalbert, C. Morand, C. Rémésy, L.
Jiméne, Am. J. Clin. Nutr., 79, 727 (2004).
2. A. Scalbert, C. Manach, C. Morand, C. Rémésy, L.
Jiménez, Crit. Rev. Food Sci. Nutr., 45, 287 (2005).

M. Popova et al.: Resveratrol loading on mesoporous silica and zeolite carriers by solid state method
122
3. A. Scalbert, I. T. Johnson, M. Saltmarsh, Am. J. Clin.
Nutr., 81, 215S (2005).
4. F. Afaq, V. M. Adhami, N. Ahmad, Toxicol Appl.
Pharmacol., 186, 28 (2003).
5. P. R. van Ginkel, D. Sareen, L. Subramanian, Clin.
Cancer Res., 13, 5162 (2007).
6. E. Wenzel, V. Somoza, Mol. Nutr. Food Res., 49,
472 (2005).
7. P. Signorelli, R. Ghidon, J. Nutr. Biochem., 16, 449
(2005).
8. Z. Lu, B. Cheng, Y. L. Hu, Y. H. Zhang, G. L. Zou,
Food Chem., 113, 17 (2009).
9. M. E. Juan, J. Buenafuente, I. Casals, J. M. Planas,
Food Res. Int., 35, 195 (2002).
10. A. Amri, J. C. Chaumeil, S. Sfar, C. Charrueau, J.
Control Release, 158, 182 (2012).
11. V. Ambrogi, L. Perioli, F. Marmottini, S. Giovagnoli,
M. Esposito, C. Rossi, Eur. J. Pharm. Sci., 32, 216
(2007).
12. M. Vallet-Regi, A. Ramila, R. P. del Real, J. Perez-
Pariente, Chem. Mater., 13, 308 (2001).
13. A. Ramila, B. Munos, J. Perez-Pariente, M. Vallet-
Regi, J. Sol-Gel Sci. Tech., 26, 1199 (2003).
14. S.-C. Shen, W. K. Ng, L. Chia, J. Hu, R. Tan, Int. J.
Pharm., 410, 188 (2011).
15. R. Mellaerts, J. Jammaer, M. van Speybroeck, H.
Chen, J. van Humbeeck, P. Augustijns, G. van den
Mooter, J. Martens, Langmuir, 24, 8651 (2008).
16. S. Shen, W. Ng, L. Chia, Y. Dong, R. Tan, J. Pharm.
Sci., 99, 1997 (2010).
17. Y. Hu, Z. Zhi, Q. Zhao, C. Wu, P. Zhao, H. Jiang, T.
Jiang, Micropor. Mesopor. Mater., 14, 94 (2012).
18. A. Petushkov, N. Ndiege, A. Sale, S. Larsen, Adv.
Mol. Tox., 4, 223 (2010).
19. A. Petushkov, J. Intra, J. B. Graham, S. C. Larsen, A.
K. Salem, Chem. Res. Toxicol., 22, 1359 (2009).
20. I. Fenoglio, A. Croce, F. Di Renzo, R. Tiozzo, B.
Fubini, Chem. Res. Toxicol., 13, 489 (2000).
21. C. H. Cheng, T. H. Bae, B. A. McCool, R. R.
Chance, S. Nair, C. W. Jones, J. Phys. Chem. C, 112,
3543 (2008).
22. S. C. Larsen, J. Phys. Chem. C, 111, 18464 (2007).
23. M. Popova, A. Szegedi, V. Mavrodinova, N. Novak-
Tusar, J. Mihály, S. Klébert, K. Yoncheva, J. Solid
State Chem., (2014) - submitted.
24. S. Huh, J. Wiench, J.-Ch Yoo, M. Pruski, V. S.-Y.
Lin, Chem. Mater., 15, 4247 (2003).
25. D. Zhao, J. Feng, Q. Huo, N. Melosh, G. H.
Fredrickson, B. F. Chmelka, G. D. Stucky, Science,
279, 548 (1998).
26. F. Billes, I. Mohammed-Ziegler, H. Mikosch, E.
Tyihák, Spectrochimica Acta Part A, 68, 669 (2007).
27. V. Bertacche, N. Lorenzi, D. Nava, E. Pini, C.
Sinico, J. Incl. Phenom. Macrocycl. Chem., 55, 279
(2006)
28. C. H. Lee, L. W. Lo, C. W. Mou, C. S. Yang, Adv.
Funct. Mater., 18, 3283 (2008).
29. B. Tzankov, K. Yoncheva, M. Popova, A. Szegedi,
G. Momekov, J. Mihály, N. Lambov, Micropor.
Mesopor. Matter., 171, 131 (2013).
НАТОВАРВАНЕ НА РЕСВЕРАТРОЛ ВЪРХУ МЕЗОПОРЕСТИ СИЛИКАТНИ И
ЗЕОЛИТНИ НОСИТЕЛИ ЧРЕЗ ТВЪРДОФАЗЕН МЕТОД
М. Попова1, К. Йончева
2, А. Сегеди
3, Ю. Кълвачев
4, Н. Бeнбасат
2, В. Мавродинова
1*
1Институт по Органична химия с Център по Фитохимия, Българска Академия на Науките, ул. Акад. Г. Бончев,
бл. 9, 1113 София, България 2Фармацевтичен Факултет, Медицински Университет – София, ул. Дунав 2, 1000 София, България
3Изследователски център за природни науки, Унгарска Академия на Науките, H-1025 Будапеща, Унгария
4Институт по минералогия и кристалография, Българска Академия на Науките, ул. Акад. Г. Бончев, бл. 107,
1113 София, България
Постъпила на 30 април 2014 г.; Коригирана на 18 юни 2014 г.
(Резюме)
Възможността за използване на мезопорестите SBA-16 и MCM-41 силикатни материали като носители за
слабо разтворимия във вода ресвератрол (RES) беше изследвана и съпоставена с тази на зеолит тип Y. Успешно
беше приложена опростена процедура за натоварване в твърда фаза, съпроводена с аморфизиране на
лекарственото вещество и повишаване на разтворимостта му. Изследванията с прахообразна рентгенова
дифракция, азотна физисорбция, инфрачервена спектроскопия при пълно вътрешно отражение и
термогравиметричен анализ показаха ефективно натоварване на ресвератрола върху повърхността на всички
използвани носители. Резултатите от освобождаването в буфери с pH=1.2 и pH=6.8 показаха по-бързо
разтваряне на ресвератрола, натоварен в подбраните носители, в сравнение с изходния ресвератрол.

123
Bulgarian Chemical Communications, Volume 46, Special Issue A (pp. 123 – 128) 2014
Reductive pyrolysis of leonardite humic acids
M. Stefanova1*, L. Gonsalvesh
1, S. P. Marinov
1, J. Czech
2, R. Carleer
2, J. Yperman
2
1Institute of Organic Chemistry with Centre of Phytochemistry, Bulgarian Academy of Sciences, Acad. G. Bonchev str.,
bl. 9, 1113 Sofia, Bulgaria 2 Research group of Applied and Analytical Chemistry, Hasselt University, B-3590 Diepenbeek, Belgium
Received June 16, 2014; Revised July 17, 2014
Dedicated to Acad. Dimiter Ivanov on the occasion of his 120th
birth anniversary
Leonardite humic acids from Kaz Daglari (Turkey) are studied by reductive pyrolysis. Sample is pyrolysed in a H2
flow in the temperature range 250oC÷950
oC. Volatiles are trapped in two ice-cooled Tenax tubes. Atmosphere Pressure-
Temperature Programmed Reduction (AP-TPR) technique coupled “off-line” with thermal desorption gas
chromatography - mass spectrometry (TD-GC/MS) apparatus is used to specify organic compounds in the pyrolysate.
During sample thermal decomposition a broad range of species is produced. Aliphatic compounds, i.e. n-alkenes/n-
alkanes, i.e. nC6÷nC14; aromatic compounds, i.e. benzene, alkylated benzenes, naphthalenes, biphenyls; oxygen
containing compounds, i.e. phenols, methoxy phenols, furans, benzofurans; sulphur containing compounds, i.e.
polysulphides, thiophenes and nitrogen compounds, i.e. benzonitriles, indoles and quinolines. Leonardite organic matter
is rich in oxygen, where phenolic structures are the most abundant. Compounds are quantitatively interpreted.
According to pyrolysis data “average” structural units of leonardite humic acids from Kaz Daglari deposit are mainly
composed by 1-2 aromatic cycles, condensed or coupled. Heteroatom compounds are also admitted. Experimental data
argue for sample low maturity as rests of lignin building blocks, i.e. methoxy phenols, and carbohydrate degradation
products, i.e., 2-methyl-2-cyclopenten-1-one, are still present.
Key words: leonardite, humic acids, pyrolysis, structural study
INTRODUCTION
Leonardite is a concentrated form of humic and
fulvic acids and has appearance of coal but it does
not reach its compactness. Leonardite is rich in
organic matter (50-75%) and its humic acid content
could range between 30-80%. Humic acid and other
humic compounds stimulate root and shoot
development, increase both available plant nutrients
and nutrient uptake from soil, and enhance plants
resistance to biotic and abiotic stress factors.
Effects of humic acid containing fertilizers on plant
yield and nutrient uptake depend on humic acid
source, concentration, application type, plant
species and cultivars. Therefore leonardite humic
acids are of special interest in Turkey and Greece,
where they are abundant and serve as raw materials
for fertilizers industrial production [1-4]. Nowadays
there is a tendency for chemical fertilizers to be
gradually replaced by natural products, i.e.
leonardite and its derivatives. In such circum-
stances they should be properly characterized.
Pyrolysis techniques have proved their useful
application in fossil material study as they supply
detailed information on a molecular level. Janoš [5]
in his review on the separation methods in the
chemistry of humic substances from different origin
stated that pyrolysis –- GC/MS, although not ideal,
remained the best technique for structural analysis.
Different pyrolytic approaches have been used in
our previous studies on coal humic acids, i.e.
pyrolysis in a stream of water vapor [6], thermo-
chemolysis [7] and reductive pyrolysis [8].
Atmosphere Pressure - Temperature Program-
med Reduction (AP-TPR) technique coupled “off-
line” with thermal desorption gas chromatography -
mass spectrometry (TD-GC/MS) apparatus can be
successfully used to specify qualitatively and
quantitatively organic functionalities in coal and its
derivatives. This pyrolytic technique has been
previously developed and successfully applied for
the specification of sulphur species in coals [9].
However, it can be used to track qualitatively and
quantitatively the volatile organic compounds as
well, like hydrocarbons and aromatic species,
released during thermal decomposition of the
humic acids. In this way information for
composition of the non-extractable portion of the
organic matter is obtained.
© 2014 Bulgarian Academy of Sciences, Union of Chemists in Bulgaria
* To whom all correspondence should be sent:
E-mail: [email protected]

M. Stefanova et al.: Reductive Pyrolysis of Leonardite Humic Acids
124
The aim of the present study is to analyze
products of leonardite humic acids reductive
pyrolysis by AP-TPR - TD-GC/MS technique and
to relate registered volatile components to the
sample organic matter composition.
EXPERIMENTAL
Leonardite from Kaz Daglari (Turkey) is a
waxy, brown, shiny, vitreous mineraloid that is
easily soluble in alkaline solutions. Its humic acids
(HA) are under consideration. HA sample is
prepared by 0.1N NaOH extraction and HCl
precipitation [10]. Dried sample is milled and
sieved < 0.06 mm.
Data for proximate analysis, i.e. moisture,
volatile matter (VM), fixed carbon Cfix, ash content,
are acquired by thermo gravimetric analysis using
DuPont 951 instrument. The following programme
is applied: i) heating with 20ºC/min up to 600ºC
under nitrogen atmosphere; ii) at 600ºC isothermal
hold of the temperature for 10 min; iii) the
atmosphere is switched to oxygen; iv) after 5 min
of isothermal period, heating with 20ºC/min up to
800ºC under oxygen atmosphere. From the thermo
gravimetric curves the following information can
be obtained: i) moisture content, from ambient
temperature up to 150ºC; ii) VM content, from
150ºC up to 600ºC; iii) combustion of Cfix in
oxygen atmosphere at temperature > 600ºC; iv) ash
content is the residue at 800ºC.
Elemental analysis is run with a Thermo
Electron Flash EA1113 elemental analyzer. By one
measurement C, H, N and S can be determined. The
instrument is calibrated with 2,5-bis-(5-tert-butyl-
benzoxazol-2-yl)thiophene (Thermo Electron). All
samples are analyzed in duplicate. The oxygen
content is calculated by difference as: O% = 100% -
(C% + H% + N% + S% + ash%).
Pyrolysis is performed in the AP-TPR set-up
described previously [11]. Briefly, 40 mg of sample
and 20 mg of fumed silica are placed in the reactor
under a 100 ml/min flow of pure H2. A linear
temperature program of 5°C min-1
from ambient
temperature up to 950°C is applied. The outlet of
the AP-TPR reactor is connected to a set of two ice-
cooled tubes containing Tenax (Sigma-Aldrich), a
porous polymer of 2,6-diphenyl-p-phenylene oxide,
as adsorbent. The volatiles are additionally diluted
by adding inert gas to the H2 flow in ratio 5:1 (v/v)
in order to prevent the saturation of the adsorption
tube. Volatiles are trapped in two separated
temperature ranges: i) 250oC÷550
oC for the first
tube; ii) 550oC-950
oC for the second one.
Adsorption tubes are separately desorbed and
analyzed by thermal desorption-gas chromatogra-
phy/mass spectrometry (TD-GC/MS) instrument.
The apparatus is used with He as carrier gas at 85
kPa at the following conditions: a) Unity thermal
desorber (Marks): primary desorption 20 min at
275ºC; Cold trap at – 10ºC, heated at maximum
heating rate up to 320ºC, hold time 15 min; flow
path temperature 200ºC; b) Trace GC Ultra-Gas
chromatography (Thermo Instruments): capillary
column 30m ZB 5-MS x 0.25 mm x 0.25 µm
Phenomenex; temperature program – 3 min at 30ºC,
heated 8ºC/min to 100 ºC, heated 12ºC/min to
310ºC, hold time 5 min; c) DSQ-Mass spectrometer
(Thermo Instruments): EI spectra; Ionization
energy – 70 eV; Scan range – m/z 33-480 in 0.4s.
Deuterated thiophene, d4-thiophene, 3 μg, is applied
as a standard. NIST library spectra are used for
peak identification. Homologous series are MS
tracked by single ion monitoring (SIM) technique.
RESULTS AND DISCUSSION
The yield of prepared HA is 45 %. Leonardite
HA proximate characteristics are the following, in
wt. % as received: Ash - 10.20; Moisture - 11.84;
VM - 32.23; Cfix - 45.73. Ultimate analysis is
calculated on “dry ash free” basis: C - 63.02; H -
6.12; N - 1.16; S - 4.12; Odiff.
- 25.58.
Contents of all compound classes detected in
pyrolysate of the leonardite HA subjected to
pyrolysis are gathered in Table 1.
Table 1. Contents of compound classes.
Compound classes Content
µg mg/gCorg
Aliphatic: n-Alkenes/n-Alkanes
220.0
11.0
Monoaromatic:
Benzenes
525.8
26.3
Diaromatic:
Biphenyls
Naphthalenes/Acenaphthylenes
33.6 168.4
1.7 8.4
Oxygen containing:
Phenols
Methoxy phenols
Furans/Benzofurans
206.5
55.5
6.4
10.3
2.8
0.3
Sulphur containing:
Di/Tri Sulphides
Thiophenes/Benzothiophenes
24.0
27.0
1.2
1.4
Nitrogen containing:
Benzonitriles
Indoles
Quinolines
1.4
3.4
4.0
0.1
0.3
0.2 Total 1276.0 63.8

M. Stefanova et al.: Reductive Pyrolysis of Leonardite Humic Acids
125
Their sum represents 6.4% from the organic
carbon of the pyrolysed material. Compound
classes contents in rel. % are illustrated in Fig. 1.
TD-GC/MS chromatograms of 250oC÷550
oC and
550oC÷950
oC pyrolysates are shown in Fig. 2 and
Fig.3, respectively.
The main components in the pyrolysate flue
gases of HA destruction in the 250oC-550
oC region
are benzene and its alkylated homologs, being 26.3
mg/g Corg, or about 40% of all registered
components (Fig.1). Generally, alkylaromatics are
considered as a product of the humification of
primary plant materials and microbial metabolites
that form the skeletons of humic substances. A
defined origin of alkyl benzenes could be ascribed
only in conjunction with other compounds. Thus,
aromatic pyrolysates are ascribed to proteins, and
specifically to microbial material, when pyridine
and toluene are found simultaneously. A partial
microbial origin could be certainly assumed for the
HA under study because of the presence of N-
containing compounds. However, it should be
pointed out that they are in several folds lower
amount compared to aromatics (Table 1).
Linear hydrocarbons, nC6-nC14, i.e. mono-
unsaturated (n-alkenes) and saturated (n-alkanes),
are registered only in the first tube. These
compounds amount up to 17.2 rel. % (Fig.2).
Alkylated naphththalenes are abundant in the
second tube. The detection of polycyclic aromatic
compounds with higher degree of condensation
cannot be expected, bearing in mind the immaturity
of the sample under study.
With temperature increase, alkylated aromatic
compounds are gradually replaced by phenolic
structures. Vanillyl phenols, i.e. phenol-2-methoxy
and methyl-2-methoxy phenols, are dominant. It is
a proof for the presence of rests from conifer lignin
arranged in the structural units of the organic matter
from leonardite HA. High contents of phenol and
its alkylated homologues are an indication for the
proceeding of the coalification accompanied by
demethoxylation and subsequent phenolic groups
rearrangement [12].
During thermal decomposition of leonardite HA
a broad range of other species is released as well.
Leonardite organic matter is rich in oxygen (~
26%), where beside phenolic structures furans and
benzofurans are also detected. However the
phenolic structures are more abundant compared to
the oxygen in cyclic form.
According to the elemental composition of the
sample under study, sulphur in leonardite HA is
rather high, 4.12%. The relative low ash content of
the sample gave us ground to assume that it is more
likely distributed in the organic forms. Based on
TD-GC/MS data, it is supposed that sulphur is
arranged in bridges and cycles. Mass spectro-
metrically registered sulphur species are linear
aliphatic polysulphides (dimethyl disulphide and
dimethyl trisulphide), 1.2%, and cyclic sulphur
compounds (thiophenes and benzothiophenes),
1.4%. The concept that with maturation aliphatic
sulphur forms are lost and thiophenes represent the
organic sulphur in higher rank coals is well
documented in the literature. This is confirmed by a
Fig. 1. Distribution of compound classes, in rel. %.

M. Stefanova et al.: Reductive Pyrolysis of Leonardite Humic Acids
126
Fig. 2. TD-GC/MS of 250
oC-550
oC pyrolysate region.
Fig. 3. TD-GC/MS of 550
oC-950
oC pyrolysate region
variety of instrumental techniques, i.e. non-
destructive XPS, XANES and destructive ones, as
wet chemical determination, and pyrolytic methods,
all reviewed by Olivella et al. [13]. Simultaneously,
AP-TPR measurements on different rank coals have
demonstrated that with maturation the amounts of
both aliphatic and aromatic sulphides decrease,
while the amount of thiophene sulphur increases
[14]. Our results show that sulphur in sulphidic and
thiophenic structures for leonardite HA is in

M. Stefanova et al.: Reductive Pyrolysis of Leonardite Humic Acids
127
comparable amount. However, it should be stressed
that pyrolytic experiments are conducted in a
reducing atmosphere (hydrogen flow). It is already
proved that in such circumstances most of the
above mentioned sulphur containing compounds
are reduced to H2S [15]. Therefore a general
conclusion on organic sulphur distribution in
leonardite HA should be regarded with precaution.
N-containing species are also registered and
listed in Table 1. Some of N-compounds could have
microbial origin, but others can be both of
microbial and plant input [16-17]. Some amounts of
N-compounds accompanied by carbohydrate
pyrolysis products other than levosugars imply the
presence of microbial organic matter. This point
needs a special concern in the future.
Cyclopentenones, CnH2n-4O, with n=6 and 7
(Fig. 2), are largely associated with pyrolysis of
plant-derived organic matter, especially when they
are accompanied with rests of lignin and small
contributions of N-compounds. The negligible
contents of 2-methyl-2-cyclopenten-1-one (C6H8O,
M+.
96) and its dimethyl derivative (M+.
110) in the
pyrogram (Fig.2) could be attributed to products of
carbohydrates pyrolysis [18].
CONCLUSION
Structural study of leonardite humic acids from
Kaz Daglari (Turkey) revealed some charac-
teristics. From chemical point of view, according to
the reductive pyrolysis data, their structural units
are mainly composed by 1-2 aromatic cycles,
condensed or coupled. Experimental data confirm
sample low maturity as lignin residues and products
of carbohydrate pyrolysis are still capable for
identification. Results of pyrolysis give ground to
assume that conifers are the predominant vegetation
in the palaeomire. Heteroatoms are also admitted.
Leonardite humic acids from Kaz Daglari
(Turkey) are characterized by high oxygen content.
Therefore they are promising for an economically
sustainable exploration as raw materials for
agriculture, horticulture, cosmetics, drilling, filter
systems products etc. However, attention should be
paid to the relative high content of the other
heteroatoms, i.e. nitrogen 1.16% and sulphur
4.12%, and to consider their eventual harmful
impact.
REFERENCES
1. S. Kalaitzidis, S. Papazisimou, A. Giannouli, A.
Bouzinos, K. Christanis, Fuel, 82, 859 (2003).
2. M. R. Karaman, M. Turan, A. Tutar, M. Dizman, S.
Şahin, J. Arts & Sci., 14, 457 (2012).
3. A. Sanli, T. Karadogan, M. Tonguc, Turk. J. Field
Crops, 18, 20 (2013).
4. V. T. Engin, I. Cocen, U. Inci, J. Arts & Sci., 14, 435
(2012).
5. P. Janoš, J. Chromatogr. A, 983 (2003).
6. S. P. Marinov, M. Stefanova, V. Stamenova, R.
Carleer, J. Yperman, Proc. 16th Int. Sym. Anal. &
Appl. Pyr., 163 (2004).
7. M. Stefanova, S. P. Marinov, L. Grasset, A. Amblés,
Proc. IHSS, 2, 100 (2010)
8. M. Stefanova, S. P. Marinov, R. Carleer, J. Yperman,
Ecol. & Future 2, 83 (2003).
9. L. Gonsalvesh, S. P. Marinov, M. Stefanova, R.
Carleer, J. Yperman, Fuel, 97, 489 (2012).
10. M. Stefanova, D. Velinova, S.P. Marinov, R.
Nikolova, Fuel, 72, 681 (1993).
11. J. Yperman, I. Maes, H. Van de Rul, S. Mullens, J.
Van Aelst, D. Franco, Anal. Chim. Acta, 395, 143
(1999).
12. P. G. Hatcher, D. J. Clifford, Org. Geochem., 27, 251
(1997).
13. M. A. Olivella, J. C. del Río, J. Palacios, M. A.
Vairavamurthy, F. X. C. de las Heras, J. Anal. &
Appl. Pyr., 63, 59 (2002).
14. I. I. Maes, G. Gryglewicz, H. Machnikowska, J.
Yperman, D. V. Franco, J. Mullens, L. C. Van
Poucke, Fuel, 76, 391 (1997).
15. L. Gonsalvesh, S. P. Marinov, M. Stefanova, Y.
Yürüm, A. G. Dumanli, G. Dinler-Doganay, N.
Kolankaya, M. Sam, R. Carleer, G. Reggers, E.
Thijssen, J. Yperman, Fuel, 87, 2533 (2008).
16. B. Allard, Geoderma, 130, 77 (2006).
17. S. Nasir, T.B. Sarfaraz, T. V. Verheyen, A. L.
Chaffee, Fuel Proc. Tech., 92, 983 (2011).
18. M. Mehrabanian, J. Soil Sci.& Envir. Management,
4, 11 (2013).

M. Stefanova et al.: Reductive Pyrolysis of Leonardite Humic Acids
128
РЕДУКЦИОНЕН ПИРОЛИЗ НА ХУМИНОВИ КИСЕЛИНИ ОТ ЛЕОНАРДИТ
М. Стефанова1*, Л. Гонсалвеш
1, С. П. Маринов
1, Я. Чех
2, Р. Карлие
2, Я. Иперман
2
1Институт по Органична химия с Център по Фитохимия, Българска Академия на Науките, ул. Акад. Г. Бончев,
бл. 9, 1113 София, България 2Изследователска група по Приложна и Аналитична Химия, Университет Хаселт, B-3590 Дипенбиик,
Белгия
Постъпила на 16 юни 2014 г.; Коригирана на 17 юли 2014 г.
(Резюме)
Хуминови киселини от леонардит от находище Каз Деглари (Турция) са изследвани чрез редукционен
пиролиз. Пробата е пиролизирана в ток на водород в температурен интервал 250oC ÷ 950
oC. Летливите
вещества са задържани в две охладени с ледена баня тубички, запълнени с адсорбент Tenax. За доказване на
органичните съединения апаратурата за температурно програмирана редукция при атмосферно налягане (AP-
TPR) е свързана в режим на “off-line” с апаратура за термично десорбционна газова хроматография -
масспектрометрия (TD-GC-MS). По време на термичното разграждане на пробата е получена широка гама
органични съединения. Алифатни съединения, в т.ч. n-алкени/n-алкани, nC6 ÷ nC14; ароматни съединения в т.ч.
бензоли, нафталини, бифенили; кислород съдържащи съединения, в т.ч. феноли, метокси феноли, фурани;
сяросъдържащи съединения, в т.ч. ди- и три- полисулфиди, тиофени; и азотни съединения, в т.ч. бензонитрили,
индоли и хинолини. Данните са интерпретирани количествено. Органичната маса на леонардита е богата на
кислород, като фенолните структури са най-разпространени. Според данните от пиролиза „средните“
структурни единици на хуминови киселини от леонардитa най-вероятно са изградени от 1-2 ароматни пръстени
и/или ароматни системи от две ароматни ядра при директно свързване на ароматните цикли. Възможно е и
участие на хетероатомни съединения на азота и сярата. Експерименталните данни от редукционния пиролиз
доказват ниската зрялост на изследваната проба, указание за което са присъствието на остатъци от лигнин
(метокси феноли) и разпадни продукти на въглехидрати (2-циклопентен-1-он, 2-метил).

129
Bulgarian Chemical Communications, Volume 46, Special Issue A (pp. 129– 133) 2014
Conversion of polyolefin wax to carbon adsorbents by thermooxidation treatment
I. G. Racheva1*, B. G. Tsyntsarski
1, B. N. Petrova
1, T. K. Budinova
1, N. V. Petrov
1, B. Nagel
2, S.
Pusz2, U. Szeluga
2
1Lab. Chemistry of Solid Fuels, Institute of Organic Chemistry with Centre of Phytochemistry, Bulgarian Academy of
Sciences, Acad. G. Bonchev str., bl. 9, 1113 Sofia, Bulgaria 2Center of Polymer and Carbon Materials of the Polish Academy of Sciences, M. Sklodowskiej-Curie 34, 41-819
Zabrze, Poland
Received April 29, 2014; Revised May 26, 2014
Dedicated to Acad. Dimiter Ivanov on the occasion of his 120th
birth anniversary
Carbon adsorbents with different properties were obtained from furfural and mixture of furfural and polymer waste
(polyolefine wax) with different activation reagents and different conditions of treatment. The carbons obtained have
insignificant ash content. It was determined, that pore volume, pore size distribution and the chemical character of the
surface of the carbon adsorbents depend on the selected activation reagents and temperature of treatment. The IR
spectra and Boehm method show that various oxygen-containing groups with acidic (carboxylic, carboxylic in lactone-
like bonding, phenolic, hydroxyl and carbonyl groups) and basic character are present on the carbon surface. Our
investigations reveal that on the base of polymer waste, different activated carbons were obtained, and they could be
used as effective adsorbents for removal of toxic metal and organic pollutants.
Key words: adsorbents, polymer waste, furfural, surface characterization
INTRODUCTION
Many materials in everyday life are produced
from plastics and other petroleum derivatives.
Plastics have unique properties and strong chemical
bonds, which are not biodegradable, thus
contributing to environmental pollution after use.
Utilization of plastic waste can be performed by
using of various methods of thermal destruction
including thermal cracking (pyrolysis), catalytic
cracking, gasification and hydrocracking. Pyrolysis
is often used as effective method to convert waste
plastic into useful products - fuels, lubricant oils,
different chemicals, etc.
There are a lot of investigations dedicated on
synthesis of carbon materials from polymer
materials – polymers, polymer resins and polymer
waste [1-21]. Thermoplastic polymers (poly-
ethylene, polypropylene, polyvinyl chloride, poly-
amide, polystyrene, polyacrylic, etc.) and thermo-
setting resins /epoxy resins, formaldehyde resins,
melamine resin, etc./ also are suitable precursors.
Polyvinyl chloride (PVC) as thermoplastic polymer
is suitable precursor for porous activated carbons,
synthesized by oxidation and subsequent procedu-
res of carbonization and activation [1-6]. PVC has
melting temperature of 160°C (but around 140°C it
starts to decompose), and when heating is first
decomposed to hydrogen chloride and unsaturated
polymers, which decompose later to other low-
molecular products [7,8]. Some authors report
about preparation of polystyrene-based activated
carbon [9,10]. There are some papers concerning
polyethylene terephthalate PET utilization [11-14],
however the methods used are complicated, due to
the fact that the material is hardly degradable. Some
authors produced activated carbon (AC) from
polyurethane [15]. Others [11,16] used polyacrylo-
nitril (PAN) fibres to obtain porous carbon. There
are also some investigations dedicated to utilization
of paper [11] and automobile tyres [17,18].
Polyethylene is also potential precursor. The
bags used in grocery stores to carry foods and
goods are made of high-density polyethylene
(HDPE), and the bags usually used in department
and fashion stores are made of low-density poly-
ethylene (LDPE). Polyethylene is a product of
petroleum, a non-renewable resource which takes
many centuries to break down when put in a land-
fill. The composition of products from the pyrolysis
of pure polyethylene was studied by several
researchers [19-21]. Polyolefin wax ((CH2)nH2,
where n ranges between about 50 and 100) is a by-
product from polyethylene production, and it is
formed as a result of side reactions, i.e. poly-
ethylene cracking at high temperatures (>400°C).
© 2014 Bulgarian Academy of Sciences, Union of Chemists in Bulgaria
* To whom all correspondence should be sent:
E-mail: [email protected]

I. G. Racheva et al.: Conversion of polyolefin wax to carbon adsorbents by thermooxidation treatment
130
The aim of this study is to obtain porous
activated carbon using polyolefin wax as precursor.
EXPERIMENTAL
The polyolefin wax sample (waste product of
polyethylene production at low pressure; from
Burgas petroleum plant, Bulgaria) has melting point
115oC, average molecular mass of 1100. When
heating in air at 360oC it decomposes (without solid
residue) to low-molecular products, which evapo-
rate.
200 g polyolefin wax (POW) was heated up to
115oC until melting. Concentrated sulfuric acid was
added by drops during continuous stirring, and the
temperature was increased up to 160oC. The
obtained solid product was washed with water,
dried at 150oC and carbonized at 600
oC.
POW carbonizate was subjected to oxidative
thermal treatment at 400oC for 1h in a quartz boat
in a horizontal tube furnace in a flow of air. The
obtained sample is denoted POW-OC.
POW carbonizate was subjected to water steam
activation at 800oC for 1 h. The obtained solid
product is denoted as POW-AC.
Mixture of 120 g POW and 80 g furfural was
heated up to 115oC until melting. The furfural is
added for intensification of polymerization and
polycondensation, thus decreasing the expense of
H2SO4. Conc. H2SO4 acid was added by drops
during continuous stirring, and the temperature was
increased up to 160oC. The obtained solid product
was washed with water, and then dried at 150oC
and carbonized at 600oC. The carbonizate was
subjected to water steam activation at 800oC for 1
h. The obtained solid product is denoted as FPOW-
AC.
FTIR experiments were performed by
spectrometer IFS 113V using pellets with KBr.
Textural characterization was carried out by
measuring the N2 adsorption isotherms at -196oC
using Micrometrics ASAP 2010. Prior to the
adsorption measurements the samples were out-
gassed in situ under vacuum at 120oC overnight, to
remove any adsorbed moisture and gases.
The isotherms were used to calculate specific
surface area SBET, and total pore volume Vt,
assuming a slit-shaped pore geometry [22].
The content of oxygen-containing functional
groups with acidic character on the carbon surface
was determined applying the Boehm method by
neutralization with bases of increasing strength:
NaHCO3, Na2CO3, NaOH, and sodium ethoxide
[23]. About 0.5 g of the sample was put in contact
with 100 mL of 0.05 N base solution in sealed
flasks. The suspensions were shaken at least 16 h,
and then filtered. The excess of base remaining in
the solution was determined from back-titration
after adding an excess of standard HCl solution. It
was assumed that NaHCO3 was capable of neutral-
lizing all carboxylic groups, Na2CO3-carboxylic
and lactonic groups, NaOH-carboxylic, lactonic and
phenolic groups, and sodium ethoxide was assumed
to neutralize all acidic groups. The total number of
basic sites was determined with 0.05 N HCl [24].
The procedure is the same as above mentioned, as
back-titration of the excess of HCl was performed
using titration with 0.05 N NaOH solution.
Carlo Erba 1106 combustion elemental analyzer
was used for C and H. Sulfur content was
determined by Eshka method. Oxygen content was
determined by the difference.
RESULTS AND DISCUSSION
The results from elemental analysis of the
obtained samples are presented on Table 1.
Table 1. Chemical characterization.
Sample Ash
mf
wt. % C
a
wt. %
Ha
wt. %
Sb
wt. %
Oc
wt. %
POW
carbonizate 0.10 87.1 3.7 1.0 8.2
POW-OC 0.10 80.2 3.7 0.9 16.7
POW-AC 0.11 87.4 3.5 0.5 8.6
FPOW-AC 0.12 88.6 1.1 0.3 10.0 mfmoisture free sample; adata from combustion elemental
analyzer; bdata from Eshka method; cdetermined by the
difference.
Elemental analysis shows that activated samples
have higher carbon content due to the higher
temperature treatment and structure changes of the
sample. The oxidation with air leads to significant
increase of oxygen content.
The results from N2 adsorption isotherms (Fig.
1) show that FPOW-AC is characterized with an
opening of the knee at low relative pressures. This
indicates the development of mesoporosity and a
widening of the microporosity in these samples.
The surface characteristics are presented in Table 2.
The results show that FPOW-AC is distinguished
by very high surface area and micropore volume,
while POW-AC and POW-OC have considerable
amount of micropores and moderate surface area.
The oxygen-containing functional groups on the
surface of carbons are a very important specific
characteristic. The experimental data from Boehm
titration (Table 3) show that various oxygen-
containing groups (carboxyl groups, carboxyl
groups in lactone-like binding, phenolic hydroxyl

I. G. Racheva et al.: Conversion of polyolefin wax to carbon adsorbents by thermooxidation treatment
131
and carbonyl groups) of acidic and basic character,
and with different chemical properties, are present
on the surface of the samples. Basic groups are not
detectable in the oxidized samples. These results
are confirmed by the elemental analysis.
Fig. 1. N2 adsorption isotherm of investigated carbon
samples.
IR spectra of the samples are presented on Fig.
2. Stretch vibrations of associated –OH groups
(3400–3230 cm-1
) were detected.
The absorption is a consequence of the presence
of OH groups in the precursor. The bands at 3000-
2800 cm-1
are due to aliphatic stretching vibrations.
C-H stretching vibrations in the region of 3000–
2800 cm-1
and C-H deformation vibrations in the
region 1470–1350 cm-1
are related to aliphatic
structures. The band at 1704 cm-1
could be related
to the stretching of C=O in linear aliphatic
aldehydes, ketones and carboxyls [25]. The bands
around 1600 cm-1
cannot be interpreted
unequivocally. They could be due to: 1) aromatic
ring stretching coupled to highly conjugated
carbonyl groups (C=O); 2) stretch vibrations of
C=C bonds in aromatic structures; 3) OH groups.
The bands in the region of 1360–1150 cm-1
are due
to C–O in complex ethers and ring structures. The
IR spectroscopy results confirm the presence of
oxygen-containing groups on the surface.
Table 3. Chemical characterization.
Sample NaHCO3 Na2CO3 NaOH NaOEt Basic
groups
POW
carbonizate 0.12 0.250 0.340 0.900 0.120
POW-OC 0.69 0.39 2.51 3.510 BDL
POW-AC BDL 0.100 0.220 2.100 0.600
FPOW-AC BDL 0.135 0.28 2.334 0.552 BDL-below detection limit.
Fig. 2. IR spectra of the investigated samples: 1- POW
carbonizate; 2 - POW-OC; 3 - FPOW-AC; 4 - POW-AC.
In summary, oxidized carbons have different
properties (hydrophilic character, selective ion-
exchange capacity, etc.) than water vapor activated
carbons, due to the chemical nature of the surface.
The carboxylic groups on oxidized carbon surface
have cation exchange properties and oxidized
carbons can be used as highly selective cationites.
The carboxylic groups on oxidized carbon
surface have cation exchange properties and
oxidized carbons can be used as highly selective
cationites. Basic surface oxides are always present
and carbons exhibit an anion exchange capacity
too. The presence of surface oxides, together with
chemical and radiation stability of oxidized
carbons, provide their advantages over the synthetic
resin cationites.
Table 2. BET surface area and pore volume of the samples determined by N2 adsorption.
Sample BET m2/g Vtot cm
3/g V micro cm
3/g V meso cm
3/g V macro cm
3/g I2 mg/g
POW-OC 500 0.586 0.263 0.120 0.203 490
POW-AC 513 0.600 0.270 0.140 0.190 600
FPOW-AC 1000 0.486 0.338 0.033 0.115 1200

I. G. Racheva et al.: Conversion of polyolefin wax to carbon adsorbents by thermooxidation treatment
132
CONCLUSION
Synthetic carbon adsorbents with different
properties are obtained from polymer and biomass
treatment products. They possess insignificant ash
and sulfur content. The results from IR spectro-
scopy and Boehm titration show the presence of
oxygen-containing surface groups. Porous structure
and high content of surface groups of the activated
carbon samples, produced from polyolefin wax
characterize them as potentially effective adsor-
bents for different pollutants - heavy metals
(oxidized sample), organics (physically activated
sample), etc.
Acknowledgements: These studies were carried out
in the frame of the Polish - Bulgarian Joint
Research Project for Years 2013-2015 entitled
“Preparation and characterization of carbon
materials from polymer by-products and wastes”.
REFERENCES
1. K. Iguchi, R. Tsunoda, S. Takeshita, Int. Chem. Eng.,
14, 381 (1974).
2. A. Noboru, J. Chem. Soc. Jpn., Chem. Ind. Chem., 7,
1217 (1975).
3. I. Iguchi, H. Uziki, T. Ishikawa, J. Chem. Soc. Jpn.,
Pure Chem. Sect., 75, 634 (1954).
4. C. Pierce, J. W. Wiley, R. N. Smith, J. Phys. Chem.,
53, 669 (1949).
5. S. Ootani, J. Chem. Soc. Jpn., Ind. Sect., 61, 447
(1958).
6. J. J. Kipling, J. N. Sherwood, P. V. Shooter, N. R.
Thompson, Carbon, 1, 315 (1964).
7. C. Huggett, B. C. Levin, Fire Mater., 2, 131 (1987).
8. R. Miranda, H. Pakdel, C. Roy, C. Vasile, Polym.
Degrad. Stabil., 73, 47 (2001).
9. D. Hines, A. Bagreev, T. J. Bandosz, Langmuir, 20,
3388 (2004).
10. Q. Wang, X. Liang, W. Qiao, Ch. Liu, X. Liu, L.
Zhan, L. Ling, Fuel Process. Technol., 90, 381
(2009).
11. K. Laszlo, A. Bota, L. G. Nagy, I. Cabasso, Colloid.
Surf. A, 151, 311 (1999).
12. J. B. Parra, C. O. Ania, A. Arenillas, J. J. Pis, Stud.
Surf. Sci. Catal., 144, 537 (2002).
13. J. B. Parra, C. O. Ania, A. Arenillas, F. Rubiera, J. J.
Pis, Appl. Surf. Sci., 238, 304 (2004).
14. J. B. Parra, C. O. Ania, A. Arenillas, F. Rubiera, J.
M. Palacios, J. J. Pis, J. Alloy. Compd., 379, 280
(2004).
15. W. Yang, Q. Dong, Sh. Liu, H. Xie, L. Liu, J. Li,
Proc. Envir. Sci., 16, 167 (2012).
16. J.-H. Yang, G.-Z. Yang, D.-G. Yu, X. Wang, B.
Zhao, L.-L. Zhang, P. Du, X.-K. Zhang, Carbon, 53,
231 (2013).
17. R. Murillo, M. V. Navarro, T. Garcia, J. M. Lopez,
M. S. Callen, E. Aylon, A. M. Mastral, Ind. Eng.
Chem. Res., 44, 7228 (2005).
18. R. Murillo, A. Aranda, E. Aylon, M. S. Callen, A. M.
Mastral, Ind. Eng. Chem. Res., 45, 1734 (2006).
19. J. A. Onwudili, N. Insura, P. T. Williams, J. Anal.
Appl. Pyrol., 86, 293 (2009).
20. N. Insura, J. A. Onwudili, P. T. Williams, Energ.
Fuel., 24, 4231 (2010).
21. J. K. Koo, S. W. Kim, Y. H. Seo, Resour. Conserv.
Recycl., 5, 365 (1991).
22. J. P. Olivier, J. Porous Mater., 2, 9 (1995).
23. H. P. Boehm, in: Advances in Catalysis and Related
Subjects, D. D. Eley, H. Pines, P. B. Wesz (eds.), vol.
16, Academic Press, New York, 1966, p. 179.
24. E. U. Papier, S. Li, J. Donnet, Carbon, 25, 243
(1987).
25. A. Oberlin, M. Villey, A. Couebay, Carbon, 16, 73
(1978).

I. G. Racheva et al.: Conversion of polyolefin wax to carbon adsorbents by thermooxidation treatment
133
ТЕРМООКИСЛИТЕЛНА КОНВЕРСИЯ НА ПОЛИОЛЕФИНОВ ВОСЪК ДО ВЪГЛЕРОДНИ
АДСОРБЕНТИ
И. Г. Рачева1*, Б. Г. Цинцарски
1, Б. Н. Петрова
1, T. K. Будинова
1, Н. В. Петров
1, Б. Нагел
2, С.
Пуш2, У. Шелуга
2
1Лаб. Химия на твърдите горива, Институт по органична химия с Център по фитохимия, Българска Академия
на Науките, ул. Акад. Г. Бончев, бл. 9, 1113 София, България 2Център за полимерни и въглеродни материал към Полската Академия на Науките, ул. Мария Склодовска-
Кюри 34, 41-819 Забже, Полша
Постъпила на 29 април 2014 г.; Коригирана на 26 май 2014 г.
(Резюме)
Въглеродни адсорбенти с различни свойства бяха получени на основата на фурфурол и смеси от фурфурол
и полимерни отпадъци (полиолефинов восък) при различни условия на синтез и активиращи агенти.
Получените въглени се характеризират с незначително пепелно съдържание. Бе установено, че обемът и
разпределението на порите, както и химичният характер на повърхността, зависят от активиращия реагент и от
температурата на термохимичната обработка. ИЧ спектрите и охарактеризирането на повърхностните групи по
метода да Бьом показаха наличие на различни кислород-съдържащи групи с кисел и основен характер. Нашите
изследвания показват, че на основата на полимерни отпадъци са получени различни активни въглени, които
поради свойствата си са перспективни за приложение като ефективни адсорбенти на токсични метални и
органични замърсители.

134
Bulgarian Chemical Communications, Volume 46, Special Issue A (pp. 134 – 140) 2014
Cobalt and iron modified activated carbons from renewable sources as catalysts in
methanol decomposition: Effect of the precursor
I. Genova1, B. Tsyntsarski
1, M. Dimitrov
1, D. Paneva
2, D. Kovacheva
3, T. Budinova
1, R. Ivanova
1,
I. Mitov2, N. Petrov
1, T. Tsoncheva
1*
1Institute of Organic Chemistry with Centre of Phytochemistry, Bulgarian Academy of Sciences, Acad. G. Bonchev str.,
bl.9, 1113 Sofia, Bulgaria 2Institute of Catalysis, Bulgarian Academy of Sciences, Acad. G. Bonchev str., bl.11, 1113 Sofia, Bulgaria
3 Institute of General and Inorganic Chemistry, Bulgarian Academy of Sciences, Acad. G. Bonchev str., bl.11, 1113
Sofia, Bulgaria
Received April 24, 2014; Revised May 27, 2014
Dedicated to Acad. Dimiter Ivanov on the occasion of his 120th
birth anniversary
Activated carbons, prepared from different biomass waste precursors, such as peach and olive stones, were modified
with nanosized cobalt and iron species by incipient wetness impregnation technique. The obtained materials were
characterized by nitrogen physisorption, XRD, UV–Vis, FTIR, TPR, Moessbauer spectroscopy and tested as catalysts in
methanol decomposition to hydrogen and CO. Both modifications of the activated carbon obtained from peach stones
show higher catalytic activity. Among them, the Co modification is more active and significantly more selective and it
could be successfully used as a low-cost and efficient catalyst for methanol decomposition to hydrogen and CO.
Key words: iron and cobalt nanoparticles, activated carbon, methanol decomposition
INTRODUCTION
Methanol decomposition attracts growing
interest due to the advantage of safe and efficient in
situ production of hydrogen which can find
application in gas turbines, fuel cells, vehicles and
industry [1-7]. Also the high endothermic character
of reaction allows recovering the waste heat from
vehicle exhausted gases and industrial processes [1-
7]. Low-cost, working at relatively low tempera-
tures, highly active and selective catalyst for the
decomposition reaction is essential for the
utilization of this concept. Activated carbons (ACs)
are used worldwide in a huge number of
applications that goes from domestic to industrial
uses, such as gas storage, removal of pollutants and
odours, gas purification and separation, as catalysts
or catalyst supports and in a number of medical
uses [8,9]. Wood and stones from different
lignocellulosic materials are the most used
precursors for the production of ACs, but other
agricultural by-products have also been investi-
gated, such as date pits, palm shells, almond tree
pruning, sugar cane bagasse, sunflower seed hull,
olive and peach stones, lignin, coconut shell, cherry
stone and rice straws amongst others [8-15]. Thus
obtained ACs possess very high specific surface
areas and their pore size distributions can be varied
from almost completely microporous to ones
containing substantial amount of meso- and
macropores as well [9]. Their textural characteristic
makes ACs very suitable as catalyst hosts,
especially when contain substantial amount of
mesoporosity that can facilitate the transportation
of reactants and products of a given catalytic
reaction. To improve the catalytic activity of
activated carbons, usually an active metal
component is introduced in order to reduce reaction
times and allow working at milder operating
conditions [16]. Besides, nanosized Co particles
display a wide range of interesting size-dependent
structural, electrical, magnetic, and catalytic
properties. It was reported [17] that cobalt
containing catalysts represent high activity for
Fischer-Tropsch synthesis and NOx reduction [18].
Besides, catalysts based on iron oxide/activated
carbon system were found promising in the organic
compounds removal from aqueous solution [19],
H2S elimination [20], and NOx reduction [21]. We
have investigated highly active iron and cobalt
containing catalysts supported on activated carbon
obtained by waste coal treatment by-products for
methanol decomposition [22]. We reported that the
dispersion and the composition of the loaded metal
© 2014 Bulgarian Academy of Sciences, Union of Chemists in Bulgaria
* To whom all correspondence should be sent:
E-mail: [email protected]

I. Genova et al.: Cobalt and iron modified activated carbons from renewable sources as catalysts in methanol decomposition:...
135
phase depend significantly on the presence of
support surface functional groups [22].
The aim of current paper is to elucidate the role
of agriculture precursor and the textural properties
of the obtained activated carbon support material on
the state of the introduced cobalt and iron
nanoparticles. XRD, Nitrogen physisorption, UV-
Vis, FTIR, temperature programmed reduction with
hydrogen (TPR) were used for the samples
characterization. The catalytic behaviour of the
obtained nanocomposite materials was tested in
methanol decomposition to CO and hydrogen.
EXPERIMENTAL
Materials
Biomass based activated carbons were produced
by one-step process of hydro-pyrolysis, which
includes treatment of 15 g precursor (crushed peach
stones and olive stones) with water steam at 1023 K
for 1 h at atmospheric pressure, and a heating rate
of 10°C/min, in a stainless steel vertical reactor
placed in a tube furnace. The obtained activated
carbon samples are denoted as PAC and OAC,
respectively. Their modification with Fe and Co
was performed by incipient wetness impregnation,
using the corresponding nitrate precursors. The
metal loading in all materials was 8 wt. %. The
nitrate precursor decomposition was performed at
773 K for 6 h. The obtained supported samples are
denoted as M/S, where M is Co or Fe and S is PAC
or OAC.
Methods of characterization
The porous structure of all activated carbons
was studied by nitrogen physisorption at 77 K on
Micromeritics ASAP 2020 instrument. The amount
of various acidic oxygen-containing functional
groups was determined by Boehm method using
aqueous solutions of NaHCO3, Na2CO3, NaOH, and
C2H5ONa according the procedure described in
[23]. The amount of basic sites was determined
with 0.05 N HCl according the procedure described
in [24].
Powder X-ray diffraction patterns were collected
within the range of 5.3 to 80° 2θ on a Bruker D8
Advance diffractometer with Cu Kα radiation and
LynxEye detector. The average crystallite size was
evaluated by using the Scherrer equation. The UV–
Vis spectra were recorded on a Jasco V-650 UV-
Vis spectrophotometer equipped with a diffuse
reflectance unit. The IR spectra (KBr pellets) were
recorded on a Bruker Vector 22 FTIR spectrometer
at a resolution of 1–2 cm−1
, accumulating 64–128
scans. The Moessbauer spectra were obtained in air
at room temperature with a Wissel
(Wissenschaftliche Elektronik GmbH, Germany)
electromechanical spectrometer working in a
constant acceleration mode. A 57
Co/Cr (activity
10 mCi) source and -Fe standard were used. The
experimentally obtained spectra were fitted by the
least square-method. The TPR/TG (temperature-
programmed reduction/thermo-gravimetric) analy-
ses were performed in a Setaram TG92 instrument
in a flow of 50 vol % H2 in Ar (100 cm3 min
-1) and
a heating rate of 5 K/min-1
.
Catalytic investigation
Methanol conversion was carried out in a fixed
bed flow reactor, and argon is being used as carrier
gas (50 cm3min
-1). The methanol partial pressure
was 1.57 kPa. The catalysts (0.055 g) were tested
under conditions of a temperature-programmed
regime within the range of 350–770 K with a
heating rate of 1 Kmin-1
. On-line GC analysis was
performed on HP 5890 apparatus equipped with
flame ionization and thermo-conductivity detectors
and a PLOT Q column. The absolute callibration
method and carbon based material balance were
used for the product yields elucidation. CO
selectivity was calculated as XCO/Xtot*100, where
XCO and Xtot are the yield of CO and the amount
of converted metahnol molecules.
RESULTS AND DISCUSSION
Supports characterization
XRD patterns of parent AC materials (Fig. 1a)
represent broad peaks around 26° and 43° 2θ which
are generally assigned to the formation of
crystalline carbonaceous structure. The results
show that PAC sample is characterized with more
ordered structure (more intense 100 hkl reflection at
43°) and higher degree of carbonization than OAC.
The OAC XRD pattern also shows additional
reflections around 29° and 31° due to small Ca2CO3
and NaCl impurities, respectively. The nitrogen
adsorption isotherms of parent activated carbons
are of type I/IV, according to the IUPAC
classification, which is characteristic of materials
with well developed micro-mesoporous structure
(Fig. 1b). The calculated textural parameters (Table
1) reveal that the activated carbon obtained from
the olive stones possesses higher specific surface
area and larger portion of micropores.

I. Genova et al.: Cobalt and iron modified activated carbons from renewable sources as catalysts in methanol decomposition:...
136
10 20 30 40 50 60 70 80
OAC
PAC
Inte
nsity,
a.u
2 , deg
a
(a)
0.0 0.2 0.4 0.6 0.8 1.0150
200
250
300
350
b
p/p0
V a
ds , c
m3/g
(S
TP
)
OAC
PAC
(b)
Fig. 1. Nitrogen physisorption isotherms (a) and XRD
patterns (b) of pure AC materials.
The FTIR spectra of pure AC materials (not
shown) display bands at 3000-2800 cm−1
that
indicate the presence of aliphatic C–H stretching
vibrations. Besides, the presence of bands at
1743 cm-1
and 1600-1500 cm-1
denotes the
existence of carbonyl/carboxyl groups and an
aromatic C=C ring stretching vibrations, respect-
tively. More precise study of the accessible surface
functional groups was performed by Boehm
method. The experimental data show predominant
presence of hydroxyl and carbonyl groups on both
ACs, the latter being significantly more on OAC.
Both ACs represent almost similar amount of basic
groups (Table 2).
Physicochemical characterization of Fe and Co
modified activated carbons
The preservation of the isotherm shape after
impregnation procedure reveals absence of
structural collapse of ACs (Fig. 2a). The observed
decrease in both BET surface area and total pore
volume in comparison with the parent ACs could
be assigned to the deposition of metal particles
within the support pores or nearby pore openings
(Table 1). The observed changes are more
significant for OAC modified samples where
predominant blocking of micropores could be
assumed.
The XRD patterns of Fe/PAC and Fe/OAC (Fig.
2b) represent an intensive reflection at 35.4° and
several smaller reflections at 30.5°, 43.5°, 57°,
62.9° 2θ which could be assigned to face-centered
cubic (fcc) structure of Fe3O4 (PDF#19-0629) with
average particle size of 11 and 19 nm, respectively.
Intensive reflections at 36.5°, 42.2° and 61.4° 2θ in
the XRD pattern of Co/PAC (Fig. 2b), indicate the
presence of face centered (fcc) CoO phase
(PDF#43-1004) with average particle size of 18
nm. New type of reflections, at 44.3°, 51.7° and
75.6° 2θ, belonging to cubic Co0 phase (PDF#15-
0806) with average particle size of 21 nm is
registered for Co/OAC as well.
The FTIR spectra of the iron and cobalt
modifications (not shown) display broad bands in
the 600-500 cm-1
range, that could assigned to the
absorption of the Me–O bond in iron and cobalt
oxide structures. The UV-Vis spectra of all modi-
fications are presented in Fig. 3a. The absorption
peaks are not well resolved. However, the slight
absorption features with a maximum reflection at
about 460-500 nm for the cobalt modifications
could be carefully assigned to the presence of Co2+
ions in octahedral coordination and this is in
accordance with the XRD data, where CoO was
detected. The absorption above 400-500 nm for the
Table 1. Nitrogen physisorption data of the parent and modified activated carbons.
Sample SBET, [m2/g] Vtot, [cm
3/g] Vmic(DFT) [cm
3/g] Vmeso(DFT) [cm
3/g] ΔSBET, % ΔVtot, %
PAC 820 0.41 0.27 0.08
OAC 910 0.63 0.33 0.09
Fe/PAC 617 0.28 0.24 0.04 25 32
Fe/OAC 462 0.20 0.16 0.02 49 67
Co/PAC 655 0.28 0.20 0.04 20 30
Co/OAC 502 0.24 0.16 0.03 45 62

I. Genova et al.: Cobalt and iron modified activated carbons from renewable sources as catalysts in methanol decomposition:...
137
Table 2. Quantification of oxygen-containing groups on AC surface (meq/g).
Sample Acid surface functional groups Basic
groups Carboxyl Lactonic Hydroxyl Carbonyl
PAC BDL BDL 0.29 1.07 1.04
OAC BDL BDL 0.21 1.69 1.19 BDL – below detection limits
100
150
200
0.0 0.2 0.4 0.6 0.8 1.0
50
100
150
200
V a
ds , c
m3/g
(S
TP
)
Fe/PAC
Fe/OAC
a
Co/PAC
p/p0
Co/OAC
b
(a)
10 20 30 40 50 60 70 80
Fe/OAC
Fe/PAC
b
2 , deg
Co/OAC
Co/PAC
Inte
nsity,
a.u
.
(b)
Fig. 2. Nitrogen physisorption isotherms with pore size
distributions as insets (a) and XRD patterns (b) of iron
and cobalt modified AC materials, respectively.
cobalt modifications could be carefully assigned to
the presence of Co2+
ions in octahedral coordination
and this is in accordance with the XRD data, where
CoO was detected. The absorption above 400-500
nm in the spectra of iron modifications could be
assigned to Fen+
←O2-
CT transitions in FeOx
particles.
200 300 400 500 600 700 800
Co/PAC
Fe/PAC
PAC
a
Co/OAC
Fe/OAC
Ab
so
rba
nc
e, a
.u.
Wavelength, nm
OAC
(a)
370 470 570 670 770
Co/OAC
Co/PAC
Fe/PAC
Fe/OAC
b
DTG
TP
R-D
TG
, a.u
.TP
R-T
G, a.u
.
Temperature, K
TG
(b)
Fig. 3. UV-Vis specra (a) and TPR data (b) of Fe- and
Co- modified AC materials.
More information for the state of loaded iron
species in the corresponding iron modifications is

I. Genova et al.: Cobalt and iron modified activated carbons from renewable sources as catalysts in methanol decomposition:...
138
Table 3. Moessbauer parameters of Fe/PAC and Fe/OAC samples before and after the catalytic test (*).
Sample Components IS, mm/s QS, mm/s Heff, T FWHM, mm/s G, %
Fe/PAC
Sx1-α-Fe2O3 0.32 -0.10 49.8 0.50 3 Sx2-Fe3O4 0.30 0.01 47.6 0.42 10 Sx3-Fe3O4 0.64 0.01 43.7 1.35 61
Db1-Fe3+
octa – SPM 0.34 0.72 - 0.52 12
Db2-Fe3+
octa – SPM 0.31 1.05 - 0.73 14
Fe/OAC
Sx1-Fe3O4 0.27 0.00 48.9 0.30 25 Sx2-Fe3O4 0.63 0.00 45.8 0.54 66
Db1-Fe3+
octa – SPM 0.31 1.45 - 0.50 3 Db2-Fe
3+ octa – SPM 0.31 0.55 - 0.50 7
Fe/PAC*
Sx1- Fe3O4 0.28 0.00 48.4 0.50 17 Sx2-Fe3O4 0.60 0.00 44.6 0.95 43 Sx3- Fe3C 0.20 0.02 20.5 0.69 19
Db1-Fe3+
octa – SPM 0.35 0.58 - 0.45 10 Db2-Fe
3+octa – SPM 0.35 1.02 - 0.58 11
Fe/OAC*
Sx1- Fe3O4 0.29 0.00 48.2 0.50 5 Sx2-Fe3O4 0.65 0.00 45.1 0.75 7 Sx3- α-Fe 0.00 0.00 33.2 0.28 39 Sx4-Fe3C 0.19 0.00 21.1 0.39 29
Db1-Fe2+
octa – FeO 1.14 0.02 - 0.76 7 Db2-Fe
3+octa – SPM 0.31 0.66 - 0.54 13
obtained by Moessbauer spectroscopy. The spectra
of all iron modifications (not shown) are well fitted
with sextets and doublets components. The calcula-
ted Moessbauer parameters (Table 3) of Fe/PAC
show presence of hematite (Sx1-α-Fe2O3) particles
with a relative weight of about 3%. The spectra of
both iron samples consist mainly of sextets (Sx2
and Sx3) with parameters corresponding to highly
dispersed magnetite phase with particle size bellow
30 nm and their relative weight is higher for
Fe/OAC. The doublet part in the spectra reveals
presence of ultra-dispersed iron oxide particles (up
to 3-4 nm) with super paramagnetic (SPM)
behaviour (Table 3).
Additional information for the type and
environment of metal ions was obtained by
temperature programmed reduction with hydrogen
(Fig. 3b). For the cobalt modifications, the
observed effects up to 650 K could be assigned to
the reduction to metallic cobalt of a mixture of
Co3O4 and CoO species with different dispersion
and location into the support porous structure [25].
In the case of Co/OAC, the reduction degree is
smaller than the expected one. In accordance with
XRD data this is due to the presence of substantial
amount of metallic cobalt. Above 700 K, a
significant weight loss was observed for both cobalt
modifications that could be ascribed to the
gasification of activated carbons promoted by the
presence of metallic Co, and this is much
pronounced for the PAC modification.
The TPR profiles for both iron modifications
(Fig. 3b) represent broad reduction effect in the
range of 400-650 K, which in accordance with
XRD and Moessbauer data can be predominantly
ascribed to step-wise reduction of Fe3O4 to FeO and
then to Fe0. The TPR profile for Fe/OAC is broader
and slightly shifted to higher temperature. Taking
into account Moessbauer and nitrogen physic-
sorption data, this could be due to lower dispersion
of Fe3O4 and/or due to blocking of iron oxide
particles into the micropores of the support. The
significant weight loss is registered for both iron
modifications above 660 K, which could be
ascribed to gasification of the activated carbon
supports, and again this is more pronounced for
Fe/PAC.
The temperature dependencies of methanol
conversion and CO selectivity on all modifications
are presented in Fig. 4. The pure AC samples do
not show any catalytic activity, and hence the
influence of the observed by XRD impurities could
be neglected. Among the iron modifications,
Fe/PAC exhibits higher catalytic activity but lower
selectivity to CO (below 60%) due to the formation
of methane and CO2. The Moessbauer data of
Fe/PAC after the catalytic test (Table 3) show
disappearance of the hematite phase and a decrease
in the relative weight of Fe3O4 with the formation

I. Genova et al.: Cobalt and iron modified activated carbons from renewable sources as catalysts in methanol decomposition:...
139
of Fe3C instead. At the same time, the ultra-
dispersed nanoparticles with SPM behaviour
remain almost unchanged, indicating that the
reduction transformations affect only the larger
particles. More pronounced reduction transforma-
tions of magnetite particles to α-Fe and Fe3C under
the influence of the reaction medium were
established for Fe/OAC (Table 3).
550 600 650 700 7500
20
40
60
80
100
Co
nve
rsio
n,
mo
l %
Temperature, K
Fe/PAC
Fe/OAC
Co/PAC
Co/OAC
a
(a)
600 650 700 750 8000
20
40
60
80
100
CO
Sele
ctivity, m
ol %
Temperature, K
Fe/PAC
Fe/OAC
Co/PAC
Co/OAC
b
(b)
Fig. 4. Methanol conversion (a) and CO selectivity (b) vs
temperature on Fe- and Co- modifications of PAC and
OAC.
Appearance of new phase of FeO nanoparticles
with SPM behaviour was also registered. So, the
observed differences in the catalytic behaviour of
iron modifications (Fig. 4b) reflects in a complex
way by the variations in the initial state of loaded
iron (dispersion, location) and the reductive
changes with it under the reaction medium.
Obviously, the more pronounced blocking of
micropores in OAC by the loaded iron species
renders difficult the accessibility to the reactant
molecules, leading to lower catalytic activity.
However the more pronounced reduction changes
with the iron oxide phase for Co/OAC seems to
increase the CO selectivity. Among cobalt modify-
cations, Co/PAC exhibits increase in the catalytic
activity in a narrow temperature range above 600 K
up to about 100% (Fig. 4a) and formation mainly of
H2 and CO (Fig. 4b). At the same time, Co/OAC
(Fig. 2b) facilitates the methanol conversion even
below 500 K, which is probably related to the
presence of active metallic Co phase. However, the
conversion curve for this sample is smoother with a
maximum at 720 K due to fast deactivation, and
this could be assigned to partial blocking of active
phase into the micropores.
CONCLUSION
Highly active catalysts for methanol decompo-
sition were prepared by deposition of cobalt and
iron nanoparticles on activated carbons, obtained
from waste biomass precursors, such as peach and
olive stones. The dispersion, oxidative state and
location of loaded particles could be successfully
controlled by the textural peculiarities of the AC
matrix. The best catalytic activity and selectivity is
observed for cobalt modified AC from peach shells
and it could be successfully used as low-cost
efficient catalyst for methanol decompo-sition to
hydrogen and CO.
Acknowledgements: Financial support from BAS
and Bulgarian National Science Fund at the
Ministry of Education and Science under Project
DFNI-Е01/7/2012 is gratefully acknowledged.
REFERENCES
1. J. R. Croy, S. Mostafa, J. Liu, Y. Sohn, B. R.
Cuenya, Catal. Lett., 118, 1 (2007).
2. G. A. Olah, Catal. Lett., 93, 1 (2004).
3. P. Mizsey, E. Newson, T. B. Truong, P. Hottinger,
Appl. Catal. B, 213, 233 (2001).

I. Genova et al.: Cobalt and iron modified activated carbons from renewable sources as catalysts in methanol decomposition:...
140
4. K. W. Park, D. S. Han, Y. E. Sung, J. Power
Sources, 163, 82 (2006).
5. M. Borasio, O. R. de la Fuente, G. Rupprechter, H. J.
Freund, J. Phys. Chem. B, 109, 17791 (2005).
6. H. Borchert, B. Jurgens, T. Nowitzki, P. Behrend, Y.
Borchert, V. Zielasek, S. Giorgio, C. R. Henry, M.
Baumer, J. Catal., 256, 24 (2008).
7. J. C. Brown, E. Gulari, Catal. Commun., 5, 431
(2004).
8. K. Y. Foo, B. H. Hameed, Chem. Eng. J., 184, 57
(2012).
9. T. Budinova, D. Savova, B. Tsyntsarski, C. O. Ania,
B. Cabal, J. B. Parra, N. Petrov, Appl. Surf. Sci., 255,
4650 (2009).
10. W. Li, L. B. Zhang, J. H. Peng, N. Li, X. Y. Zhu, Ind.
Crop. Prod., 27, 341 (2008).
11. J. Gãnán, J. F. González, C. M. González-García, A.
Ramiro, E. Sabio, S. Román, Appl. Surf. Sci., 252,
5993 (2006).
12. M. Olivares-Marín, C. Fernández-González, A.
Macías-García, V. Gómez-Serrano, Appl. Surf. Sci.,
252, 5967 (2006).
13. S. Guo, J. Peng, W. Li, K. Yang, L. Zhang, S. Zhang,
H. Xia, Appl. Surf. Sci., 255, 8443 (2009).
14. W. C. Lim, C. Srinivasakannan, N. Balasubramanian,
J. Anal. Appl. Pyrolysis 88, 181 (2010).
15. I. I. Gurten, M. Ozmak, E. Yagmur, Z. Aktas,
Biomass Bioenergy, 37, 73 (2002).
16. A. Quintanilla, J. A. Casas, J. J. Rodríguez, Appl.
Catal. B, 76, 135 (2007).
17. M. Arsalanfar, A. A. Mirzaei, H. R. Bozorgzadeh, H.
Atashi, S. Shahriari, A. Pourdolat, J. Nat. Gas Sci.
Eng., 9, 119 (2012).
18. Z. H. Zhu, L. R. Radovic, G. Q. Lu, Carbon, 38, 451
(2000).
19. M. H. Do, N. H. Phan, T. D. Nguyen, T. T. S. Pham,
V. Nguyen, T. T. Vu, T. K. Nguyen, Chemosphere,
85, 1269 (2011).
20. X. Yonghou, W. Shudong, W. Diyong, Y. Quan,
Separ. Pur. Tech., 59, 326 (2008).
21. X. Gao, S. Liu, Y. Zhang, Z. Luo, K. Cen, J. Hazard.
Mater., 188, 58 (2011).
22. T. Tsoncheva, I. Genova, B. Tsintsarski, M.
Dimitrov, D. Paneva, Z. Cherkezova-Zheleva, T.
Budinova, R. Ivanova, I. Mitov, N. Petrov, J. Porous
Mater., DOI: 10.1007/s10934-014-9797-4, in press.
23. H. P. Boehm, in: Advances in Catalysis and Related
Subjects, D. D. Eley, H. Pines, P. B. Weisz (eds.),
vol. 16, Academic Press, New York, 1966, p. 179.
24. E. Papier, S. Li, J. B. Donnet, Carbon, 25, 243
(1987).
25. Y. Du, Q. Meng, J. Wang, J. Yan, H. Fan, Y. Liu, H.
Dai, Micropor. Mesopor. Mater., 162, 199 (2012).
КАТАЛИЗАТОРИ ЗА РАЗЛАГАНЕ НА МЕТАНОЛ НА ОСНОВАТА НА КОБАЛТ И
ЖЕЛЯЗО МОДИФИЦИРАН АКТИВЕН ВЪГЛЕН ОТ ВЪЗОБНОВЯЕМИ ИЗТОЧНИЦИ:
ВЛИЯНИЕ НА ПРЕКУРСОРА
И. Генова1, Б. Цинцарски
1, M. Димитров
1, Д. Панева
2, Д. Ковачева
3, Т. Будинова
1, Р.
Иванова1, И. Митов
2, Н. Петров
1, Т. Цончева
1*
1 Институт по органична химия с Център по фитохимия, Българска Академия на Науките, ул. Акад. Г.
Бончев,бл. 9, 1113 София, България 2 Институт по катализ, Българска Академия на Науките, ул. Акад. Г.Бончев, бл. 11, 1113 София, България
3 Институт по обща и неорганична химия, Българска Академия на Науките, ул. Акад. Г. Бончев, бл. 11, 1113
София, България
Постъпила на 24 април 2014 г.; Коригирана на 27 май 2014 г.
(Резюме)
Два вида активен въглен, получени от различни прекурсори на основата на отпадъчна биомаса, съответно
костилки от праскови и маслини, бяха модифициран с железни и кобалтови наночастици чрез импрегниране.
Получените материали бяха охарактеризирани с помощта на физична адсорбция на азот, рентгенова дифракция
(XRD), температурно-програмирана редукция с водород (TPR), UV-Vis, ИЧ- (FTIR) и Мьосбауерова
спектроскопия и тествани като катализатори в реакция на разпадане на метанол до водород и СО. По-висока
каталитична активност показаха модификациите на въглена, получен от прасковени костилки. Измежду тях,
Co-съдържащият активен въглен е най-активен и значително по-селективен, и може с успех да бъде използван
като евтин и ефективен катализатор в реакцията на разпадане на метанол до водород и СО.

141
Bulgarian Chemical Communications, Volume 46, Special Issue A (pp. 141 – 148) 2014
Study on the catalytic activity of nanosized NiOx for oxidative degradation of 2,4-
dichlorophenol in aqueous solutions
V. V. Ivanova, M. K. Stoyanova, S. G. Christoskova*
Department of Physical Chemistry, University of Plovdiv, 24 Tzar Assen str, 4000 Plovdiv, Bulgaria
Received May 04, 2014; Revised May 26, 2014
Dedicated to Acad. Dimiter Ivanov on the occasion of his 120th
birth anniversary
Nanosized NiOx was prepared and tested as heterogeneous catalyst for low-temperature oxidation of 2,4-
dichlorophenol in aqueous solution using air as an oxidant. The catalyst employed was synthesized by non-conventional
ultrasound assisted precipitation-oxidation method with reverse order of precipitation. The physicochemical properties
of the as-prepared catalyst were characterized by several techniques, such as XRD, TEM, SAED, FT-IR spectroscopy
and chemical analysis. Characterization data reveal that the applied synthesis yields highly dispersed oxide material
with a high content of over-stoichiometric active oxygen (O*~8 %), loosely bonded to the surface Ni- ions. The catalyst
studied exhibited high activity in degradation of 2,4-dichlorophenol and 100% decomposition could be achieved in
short duration of 5 minutes at the optimum conditions, while complete oxidation could be attained in 120 minutes. The
effect of several operational parameters, such as catalyst loading, temperature, and pH on the efficiency of the oxidation
process was investigated.
Key words: 2,4-dichlorophenol, heterogeneous catalytic oxidation, Ni-oxide system, active oxygen, wastewater
treatment
INTRODUCTION
Chlorophenols (CPs) constitute an important
group of aromatic compounds which are widely
used in the production of pesticides, herbicides,
disinfectants and preservatives in wood, dyes, and
leather. The large scale production and heavy con-
sumption of CPs generate wastewaters containing
these substances at high concentrations. Owing to
their high potential of phytotoxicity and zoo-
toxicity, CPs represent one of the most abundant
families of industrial environmental pollutants.
Chlorophenols could be produced when drinking
and industrial waters are disinfected with chlorine
but could also be formed as a result of bio-
accumulation of compounds with lower molecular
weight in natural bodies of water [1-3]. In
particular, 2,4-dichlorophenol (2,4-DCP), listed by
US EPA as a priority pollutant, is a precursor to the
manufacture of the widely used herbicide 2,4-
dichlorophenoxyacetic acid. It is also the main by-
product of sun induced photolysis of 2,4- di-
chlorophenoxyacetic acid in soil and water [4]. Due
to high toxicity of 2,4-DCP even at low con-
centrations, resistance for biodegradation as well as
its capacity to form organic macromolecules it is
necessary to treat effluents containing
chlorophenols prior to its discharge into water [5,6].
At present, the conventional methods used to
treat wastewater containing such organic pollutants
include biological treatments, adsorption, inci-
neration, air stripping, etc. In general these treat-
ments are inexpensive and safe but have several
disadvantages. Biological oxidation can be affected
by the toxicity of CPs and requires longer retention
time. Non-destructive adsorption method is proven
to be effective, however, new secondary waste
could be generated that required further treatment
and thus increasing the operational cost. Inci-
neration present considerable emission of other
hazardous compounds. These essential drawbacks
limit considerably practical application of these
treatment technologies [7].
Recently, advanced oxidation processes (AOPs)
have attracted great scientific and technological
interest in the area of water treatment. AOPs are
generally based on the production of highly reactive
and non-selective hydroxyl radicals through
employment of different approaches. These radicals
are capable of readily attacking organic conta-
minants in water, thereby transforming them into
harmless end products [8-10]. One of the methods
for generation of hydroxyl radical employs photo-
catalytic processes under exposure of UV light in
the presence of semiconductors. The photocatalytic
© 2014 Bulgarian Academy of Sciences, Union of Chemists in Bulgaria
* To whom all correspondence should be sent:
E-mail: [email protected]

V. V. Ivanova et al.: Study on the catalytic activity of nanosized NiOx for oxidative degradation of 2,4-dichlorophenol in aqueous …
142
activity of nanosized TiO2 and ZnO for oxidation of
2,4-DCP has been studied "Ba- [11]. The results
show that 98% extent of 2,4-DCP oxidation could
be achieved for 90 and 60 minutes, respectively, in
the presence of these photo-catalysts. The main
disadvantage of TiO2 as a photocatalyst is its
inability to absorb visible light that represents 97%
of the solar spectrum. This is the reason why
scientists have focused their attention on modi-
fication of TiO2 in order to increase its adsorption
ability within the visible spectrum.
The photocatalytic activity of TiO2 modified
with porphyrin has been studied in order to evaluate
the degree of oxidative destruction of 2,4-DCP
under irradiation with visible light. The results
indicate that in 4 hours a degree of reduction of the
substrate is in the range from 42% to 81% has been
achieved when рН=10 [12]. The low level of de-
struction of toxic substance when visible light is
used and the high price of the method when
combination with UV light is used limits the possi-
bilities for large scale application of photocatalysis.
An effective and economically feasible process
for destruction of a variety of hazardous pollutants
in wastewater is based on heterogeneous catalytic
reactions providing complete oxidation. Using both
suitable catalytic systems and reaction conditions a
high selectivity towards environmentally harmless
products can be achieved at mild conditions (room
temperature and atmospheric pressure).
Our previous studies showed that NiOx is highly
effective catalyst for low-temperature oxidative
liquid-phase degradation of phenol using air as
oxidant. The results obtained show that phenol is
completely oxidized for 30 minutes to harmless
products - carboxylic acids and CO2 at ambient
temperature and pH 6.0-7.0 [15].
The primary objective of this study is to
investigate the effectiveness of Ni-oxide system as
heterogeneous catalyst for the oxidative degra-
dation of 2,4-DCP in aqueous solutions. The kine-
tics of the oxidation process and the effect of
various operating parameters influencing 2,4-DCP
removal efficiency such as catalyst loading, tem-
perature, and solution pH were studied.
EXPERIMENTAL
Preparation of catalyst
The procedure applied for the synthesis of the
catalytic sample was in accordance with the basic
requirements to the environmental low-temperature
catalysts for complete oxidation in aqueous
solution. Some of the typical features of these
catalysts include: high dispersity of the catalytically
active phase; high content of active oxygen; high
oxidation state and octahedral coordination of metal
ions; low binding energy of the M-O bond on the
catalyst surface, presence of OH-groups. In order to
synthesize the Ni-oxide system complying with
these requirements a non-conventional precipita-
tion-oxidation method with reversed order of
feeding the precipitator to the system was applied.
The synthesis process was assisted by ultrasonic
activation using ultrasonic homogenizer UP100H
[16]. On the one hand ultrasonic treatment contri-
butes for the more effective homogenization of the
reaction mixture and on the other hand it is a
prerequisite for the production of nanosized sys-
tems with high dispersity and higher specific
surface. A certain volume of nickel nitrate aqueous
solution (1 M) was added to a mixture of aqueous
solutions of NaOH (4M) and NaOCl (1 M) under
continuous stirring. The resulting black precipitate
was pretreated for 20 min with the ultrasonic
homogenizer and allowed to stay in mother liquor
for 24 hours. Then it was filtered, washed with
distilled water until negative reaction for Cl- and
neutral pH, followed by drying at 105°C overnight.
Catalyst characterization
XRD analysis was conducted using X-ray
diffractometer TUR-MA 62 equipped with a
computerized HZG-3, operated at U = 37kV, Cu
Kα radiation (λ = 1.5406 Å) and I=20mA. The
sample was scanned in the 2θ =10-800 range.
The infrared spectra were recorded with a model
1750 Perkin Elmer FT-IR spectrophotometer in
KBr tablets (2 mg of the respective sample in 200
mg KBr).
The structural analysis of the samples has been
made with high-resolution transmission electron
microscope JEOL JEM 2100 at acceleration tension
of 200 kV. The two basic operation modes of the
microscope have been used namely bright field
transmission electron microscopy (BF TEM) and
selected area diffraction (SAED).
The chemical analysis of the synthezised
catalyst included measurement of the total amount
of active oxygen (О*), represented in both % and g-
at.g-1
.
Active oxygen is the amount of over-stoichio-
metric oxygen in the oxide above that correspond-
ding to the lowest stable oxidation state. The total
active oxygen content of the catalysts was determi-
ned iodometrically. A known amount catalyst 0.1 g
± 0.001) was added to 25 cm3 dilute (1:10) sulfuric
acid containing 2g of potassium iodide in a flask
supplied with a ground stopper. After complete

V. V. Ivanova et al.: Study on the catalytic activity of nanosized NiOx for oxidative degradation of 2,4-dichlorophenol in aqueous …
143
dissolution of the sample, the solution is allowed to
stand for 10 min and the liberated iodine is titrated
with 0.1 N sodium thiosulfate solution using starch
as indicator. The relative standard deviation of the
method is 4.71%.
The total active oxygen content in g-at.g-1
and %
was determined according to the Eq. (1) and Eq.
(2):
gatg
m
mgEVNO
O/,
16* 2
(1)
,%100* 2
m
mgEVNO
O
(2)
where: N – normality of the titrant; V – volume of
the consumed titrant solution, cm3; m- catalyst
amount, g; 008.02OmgE , milligram equiv. О2.
Catalytic activity test
Heterogeneous catalytic oxidation of 2,4-DCP in
aqueous solution was conducted in a thermostated
glass reactor of 150 см3 capacity at batch mode
with constant stirring at around 400 rpm using
magnetic stirrer. All experiments followed the
following procedure: 100 см3 50 mg dm
-3 aqueous
solution of 2,4-DCP was transferred into the reactor
and was saturated with air for 20 minutes. Then a
fixed amount of catalyst in powder form was added.
The reaction was carried out under continuous
airflow passing through the system, thus maintain-
ning stationary concentration of oxygen dissolved
in water. At given intervals of oxidation process,
samples of 4 ml were withdrawn from the sus-
pension, centrifuged at 4000 rpm for 1 min to
remove the catalyst and analyzed for residual
content of 2,4-DCP and oxidation products.
The reaction progress was followed by UV–Vis
spectroscopy and HPLC. The UV-Vis spectra of
the samples were recorded from 200 to 500 nm
using a UV–Vis double beam spectrophotometer
(Cintra 101, GBS, Australia). Due to the very fast
catalytic transformation of the substrate (2,4-DCP)
in the presence of NiOx, the reaction kinetics was
determined by monitoring decrease in absorbance
at the maximum wavelength (254 nm) of the
intermediate compound produced during the
oxidation process.
HPLC analyses were performed using a Knauer
Series HPLC system equipped with DAD detector.
Separations were carried out by a Purospher Rstar
RP-18e column (250 mm × 4.6 mm i.d.; silica
particle size 5 µm). The mobile phase consisted of
acetonitrile mixed with water (v/v; 50:50) at a flow
rate of 1 mL/ min; an isocratic elution mode was
used. Detection was performed at 254 nm.
pH values of the reaction mixture were
measured by digital pH meter (inoLab 740, WTW).
The catalytic activity of the NiOx was evaluated
through the degree of conversion of the formed
intermediate compound (α, %), calculated accor-
ding to the Eq. (3) as well as by the rate constant (k,
min-1
), determined in accordance with a first-order
kinetics equation (Eq. 4):
100.A
AAo (3)
A
A
tk oln
1 (4)
where А0 and А are the measured absorptions of the
intermediate compound at the moment of its
formation and at a any instant time t, respectively.
RESULTS AND DISCUSSION
Powder X-ray diffraction
The XRD measurements of the NiOx show that
the catalyst is X-ray amorphous. The amorphous
character of the as-prepared sample determines the
chemical and structural isotropy of the active sites
centers on the catalytic system surface area which
is a prerequisite for high selectivity in the oxidation
processes. Although not detectable by the XRD
technique, the crystallographic structure of the
catalyst was determined through application of
ТЕМ and SAED analyses.
TEM and SAED analyses
Fig. 1 shows the typical TEM and the
corresponding SAED image of NiOx, deposited on
a carbon coated copper grid. As observed in Fig.1a,
the catalyst’s nanoparticles have spherical form and
diameter in the range 5 nm- 20 nm forming large
agglomerates amounting hundreds of particles. The
SAED patterns (Fig.1b) obtained from the TEM
showed well-defined rings characteristic of the
nanocrystalline materials. After the indexation of
the diffraction pattern it has been found that they
correspond to reflections from non-stochiometric
monoclinic Ni15O16 [PDF 72-1464].

V. V. Ivanova et al.: Study on the catalytic activity of nanosized NiOx for oxidative degradation of 2,4-dichlorophenol in aqueous …
144
Fig. 1. SAED (b) and TEM (a) micrographs of bulk
NiOx catalyst.
FT-IR spectroscopy
The FT-IR spectrum of the synthesized catalyst
is shown in Fig. 2. Characteristic feature of the
spectrum is the presence of wide and intense
absorption band located at 573 cm-1
. This band is
provided by stretching vibrations of the Ni-O bond
on the oxide and indicates the presence of active
oxygen. Thereupon the intensity of the indicated
bands is proportional to the content of O*. The
spectral range of appearance of these bands is an
evidence for the covalent character of oxygen
bonding to the metal ions of the surface, which in
its turn justifies the assumption of high activity of
the synthesized samples in reactions of complete
oxidation.
Wavenumber (cm )-1
Transm
itta
nce
, %
Fig. 2. IR spectrum of bulk NiOx.
The infrared spectrum of the studied catalytic
system show also a broad band with a maximum
centered at about 3370 cm-1
(O-H stretching),
together with a band at 1630 cm-1
(H-O-H bending).
The band at 3370 cm-1
can be ascribed to hydroxyl
groups bonded through hydrogen bonds, whereas
the band at 1630 cm-1
corresponds to adsorbed
molecular water. The inclusion of ОН – groups in
the composition of the oxide system (as a result of
the reverse order of feeding of the precipitator) is
considered appropriate, since they are involved in
the oxidation mechanism of the studied process.
Chemical analysis
Data from the chemical analysis of the
synthesized oxide system indicated that NiOx is
characterized with high total content of active
oxygen (5.33%) and about 80% of it is located on
the sample surface. This loosely bonded surface
oxygen is a key factor determining high activity of
the catalyst in complete oxidation reactions.
It should also be noted that the incorporation of
over-stoichiometric (i.e. active) oxygen into oxide
system is a direct consequence of the applied
synthesis method. As a result of the electron trans-
fer between the precursor Ni(OH)2 and the oxygen
from NaOCl the oxidation state of metal ions in the
oxide system increases and high concentration of
ionic oxygen species (O-, O
-2) on the surface is
provided. The latter play a basic role in oxidation
catalysis. Most probably the active oxygen is
formed as a result of chemosorption of the nascent
oxygen (produced on decomposition of NaOCl in
strongly alkaline medium) on the precursor surface
during the synthesis.
The experimental results obtained from
characterization of NiOx give grounds to conclude
that the applied synthesis method meets the preli-
minary requirements described in part 2.1.
Liquid-phase catalytyic oxidation of 2,4-DCP over
Ni-oxide system
Initially, in order to assess the contribution of
non-catalytic oxidation of 2,4-DCP with air on the
overall degree of its degradation a preliminary
control test was carried out without adding of
catalyst to the reaction mixture. It was found that a
negligible destruction of 2,4- DCP occurred with
air alone (Fig.3, curve 2). The removal efficiency
was less than 1% after reaction for 6 hours,
indicating that chemical oxidation of substrate is
very slow.
However, the simultaneous presence of NiOx
and oxidant significantly improved the removal rate
of 2,4-DCP under the certain conditions. The
gradual decrease in 2,4-DCP concentration in the
course of oxidation reaction was followed by
recording the UV spectra illustrated in Fig.3. It
should be underlined that almost complete
reduction of the intensity of the absorption band at
286 nm corresponding to the maximum absorption
wavelength of 2,4-DCP is achieved in very short
duration of about 5 minutes. Considering the negli-

V. V. Ivanova et al.: Study on the catalytic activity of nanosized NiOx for oxidative degradation of 2,4-dichlorophenol in aqueous …
145
gible parallel removal of contaminant molecules by
oxidation with air alone it may be concluded that
the very fast destruction of 2,4-DCP under hetero-
geneous oxidation mode is due to its catalytic
transformation.
Fig. 3. UV spectrum profiles of the reaction mixture
during chemical oxidation (2) and heterogeneous
catalytic oxidation (3) on NiOx; (Co = 50 mg dm-3
; pH =
6.0, t = 60oC, Ccat =2 g dm
-3).
In the meantime, a new absorbance band at
about 254 nm appears at the very beginning of
reaction (even at 1 min), but subsequently almost
disappears after 120 min, implying that a new
structure unit is formed from destruction of 2,4-
DCP molecules which further is also complete
degraded. The latter is confirmed by results
obtained from HPLC analysis.
Fig. 4 shows HPLC chromatograms at 254 nm
of 50 mg dm-3
2,4-DCP before and after catalytic
oxidation over NiOx. It is evident that as the
catalytic reaction occurs, the intensity of 2,4-DCP
peak at tr=10.70 min significantly declined and
disappeared after 5 minutes. Simultaneously, a new
well resolved peak at tr=5.87 min is registered,
implying generation of one intermediate compound
as a result of 2,4-DCP oxidation over NiOx.
According to literature reference this peak most
likely corresponds to chlorocatechol [17]. Consi-
dering very fast catalytic destruction of 2,4-DCP,
the kinetic parameters of the oxidation process -
reaction rate constant (к,min-1
) and degree of 2,4-
DCP conversion (α,%) were calculated on the basis
of the gradual decrease of the intensity of the
absorption band of intermediate compound. The
linear plot of ln(Ao/A) versus time confirms the
assumed first-order kinetics (not shown).
The influence of the main operational para-
meters such as pH, amount of the catalyst and
temperature on the efficiency and selectivity of the
oxidation process were studied.
Fig. 4. HPLC chromatograms of the reaction mixture
during heterogeneous oxidation on NiOx; (Co = 50 mg
dm-3
; pH = 6.0, t = 60oC, Ccat =2 g dm
-3).
Fig. 5 illustrates the effect of temperature on the
effectiveness of 2,4-DCP oxidative degradation.
Experiments were carried out at three different
temperatures – 25oC, 40
oC and 60
oC. Results indi-
cate that at 25oC and 40
oC an insignificant destruc-
tion of the formed intermediate compound is
observed even for 120 min, while at temperature of
60oC a complete oxidation is attained within the
same reaction period. Therefore, further studies on
the influence of рН and catalyst amount on the
reaction kinetics were conducted at a constant
temperature of 60oC.
Fig. 5. UV spectrum profiles of the reaction mixture
during oxidation with NiOx at different reaction
temperatures. (Co=50 mg dm-3
; pH = 6.0, Ccat =2 g dm-3
)
Fig. 6 depicts the kinetic curves of catalytic
oxidation of 2,4-DCP at 60oC using three different
concentrations of NiOx - 0.5 g dm-3
, 2 g dm-3
and 5
g dm-3
. It was found that four-fold increase in
catalyst amount led to complete complete degra-
dation of the intermediate compound in 120 min.
Moreover, there is no change in reaction rate
constant when the catalyst concentration is
increased from 2 g dm-3
to 5 g dm-3
(Table 1). These
results imply that a catalyst concentration of 2 g

V. V. Ivanova et al.: Study on the catalytic activity of nanosized NiOx for oxidative degradation of 2,4-dichlorophenol in aqueous …
146
dm-3
is still enough to achieve complete oxidation
of the intermediate absorbing at 254 nm and further
incremental addition of the catalyst does not
influence the reaction kinetics.
Fig. 6. Effect of catalyst loading on 2,4-DCP
degradation. (Co = 50 mg dm-3
; pH= 6.0; t=60°С).
Table 1. Rate constants of 2,4-DCP oxidation with
different catalyst’s concentrations. (Co = 50 mg dm-3
; pH
= 6.0; t = 60°C).
Catalyst dosage
(g dm-3
)
First-order rate
constants, k.102 (min
-1)
0.5 0.6
2.0 3.6
5.0 3.8
In order to determine the optimal conditions for
complete oxidation of 2,4-DCP to harmless
products the influence of рН on the efficiency and
selectivity of the process was investigated. The
results obtained are presented in Fig. 7.
Fig. 7. Effect of pH on the effectiveness of the oxidation
process. (Co = 50 mg dm-3
, Ccat =2 g dm-3
, t=60°C).
It is seen that the higher conversion degree of
intermediate compound is achieved when the oxi-
dation process is conducted at pH = 5.0 ( is
~100% in 120
minute). The increase of the
alkalinity (with other constant parameters) causes a
decrease in the conversion degree and the process is
strongly retarded. At pH = 10.0 only 5% of 2,4-
DCP was converted into intermediate for 60
minutes and the latter does not further oxidize.
Similar effect of pH was observed during liquid
phase oxidation of phenol using the same catalytic
system [15] and could be explained by comparing
the UV spectra of initial solution of 2,4-DCP at
рН=5 and pH=10 (Fig. 8). A batochromic shift of
the absorption maximum of 2,4-DCP in alkaline
medium is registered which is caused by the
formation of phenolate anion characterized with
λmax = 303 nm.
Fig. 8. UV spectrum profiles of the 50 mg dm
-3 2,4-
DCP initial solutions at pH=5 and pH=10.
Based on these results it could be suggested that
the oxidation process is most probably initiated by
dissociative adsorption of the substrate on the
catalyst surface through tearing of an H atom off
from the phenolic ОН group. The latter interacts
with the active oxygen of the catalyst, thus forming
highly reactive surface ·ОН radicals that attack the
2,4-DCP molecule and cause its destruction. The
reduced surface of the catalyst becomes reoxidized
by oxygen from air continuously bubbled during
oxidation. At pH=10.0 2,4-DCP is found mostly in
the form of phenolate anion in the solution which
makes impossible the formation of ·ОН radicals
and respectively the oxidation of substrate. Further-
more, when the oxidation was carried out without
bubbling of air in the reaction mixture (depletive
oxidation) a different 2,4-DCP degradation profile
is observed. Initially, the depletive 2,4-DCP oxide-
tion occurs as fast as the reaction carried out in the
presence of oxygen and then a strong decrease of
the oxidation rate with reaction time is observed.
Chemical analysis also showed a decrease in the
active oxygen content of the catalyst after depletive
oxidation experiment (from 5.33% in the fresh
NiOx to 1.09% in used sample). However, the
active oxygen content could be completely reco-
vered on the regeneration of the reduced catalyst

V. V. Ivanova et al.: Study on the catalytic activity of nanosized NiOx for oxidative degradation of 2,4-dichlorophenol in aqueous …
147
with NaOCl. These results give us ground to
conclude that the catalytic oxidation of 2,4-DCP in
an aqueous phase with the participation of NiOx
follows the Mars-van Krevelen oxidation-reduction
mechanism. The observed relationship between the
amount of Ni-oxide system and the effectiveness of
the oxidation process also supports the proposed
mechanism of heterogeneous catalytic oxidation,
i.e. that the active oxygen of the catalyst takes part
in the oxidation process. The larger is the amount
of the active oxygen (the mass of the oxide,
respecttively), more ОН are formed resulting in
higher rate of the process.
The long-term stability is an important property
for effective catalyst and is crucial for its practical
application. To evaluate the stability of the NiOx
catalyst, three rounds of the 2,4-DCP degradation
reaction was conducted with the recycling of the
catalyst under the same reaction conditions. After
the degradation was finished, the catalyst was
recovered from the reaction mixture, washed
thoroughly with double distilled water and dried
overnight before the next run. The recycling test
results showed that the catalyst activity remained
unaffected in the second round reuse and decreased
slightly in the third test whereupon 2,4-DCP
removal was still about 90% at 5 minute.
CONCLUSION
Nickel oxide catalyst was prepared by
employing non-conventional ultrasound assisted
precipitation-oxidation method with reverse order
of feeding of the precipitator to the system. The
catalytic performance of the as-prepared NiOx for
low-temperature oxidation of 2,4-DCP in aqueous
solutions with air was studied. The obtained results
show that 2,4-DCP could be completely degraded
in aqueous solutions by heterogeneous catalytic
oxidation over NiOx in 120 min at temperature
60°C. The high catalytic activity of the sample is
due to the high content of active oxygen and the
nano-dimension of the catalyst’s particles, resulting
from the applied non-conventional synthesis
procedure. The effect of the main operating para-
meters on the reaction kinetics and 2,4-DCP
degradation efficiency were investigated as well.
The obtained results indicate that 2,4-DCP is
completely oxidized to harmless products at
temperature 60°C, pH 5.0-6.0. and concentration of
the catalyst 2 g dm-3
. The simple scheme for the
synthesis of the Ni-oxide system and its efficiency
for degradation of 2,4-DCP is a prerequisite for its
practical application for purification of wastewaters
containing toxic organic compounds.
Acknowledgements: The authors gratefully
acknowledge financial support by the National
Science Fund (Projects DDVU 02-7/10, DFNI-
E01/7) and by the University of Plovdiv Research
Fund (Project HF-13-006).
REFERENCES
1. M. Czaplicka, Sci. Total Environ., 322, 21 (2004).
2. M. Fukushima, K. Tatsumi, Environ. Sci. Technol.,
35, 1771 (2001).
3. J. F. Peng, J. F. Liu, X. L. Hu, G. B. Jiang, J.
Chromatogr. A, 1139, 165 (2007).
4. M. M. Ba-Abbada, A. A. H. Kadhuma, A. B.
Mohamad, M. S. Takriff , K. Sopian, Int. J. Thermal
Envir. Eng., 1, 37 (2010).
5. US EPA. National Emission Standards for Hazardous
Air Pollutants: Miscellaneous Organic Chemical
Manufacturing; Final Rule, Federal Register Part V,
40 CFR Part 63, United States Environmental
Protection Agency, 2006.
6. US EPA/OSHA, US EPA Office of pollution
prevention and toxics and occupational safety and
health administration, USA, 2000.
7. B. Bayarri, J. Giménez, D. Curcó, S. Esplugas, Catal.
Today, 101, 227 (2005)
8. S. Esplugas, J. Gimnez, S. Contreras, E. Pascual, M.
Rodríguez, Water Res., 36, 1034 (2002).
9. M. Pera-Titus, V. García-Molina, M. A. Baños, J.
Giménez, S. Esplugas, Appl. Catal. B- Environ., 47,
219 (2004).
10. R. Andreozzi, V. Caprio, A. Insola, R. Marotta,
Catal. Today, 53, 51 (1999).
11. M. M. Ba-Abbad, A. A. H. Kadhum, A. B.
Mohamad, M. S. Takriff, K. Sopian, Int. J.
Electrochem. Sci., 7, 4871 (2012).
12. M.-Y. Chang, Y.-H. Hsieh, T.-C. Cheng, K.-S. Yao,
M.-C. Wei, C.-Y. Chang, Thin Solid Films, 517,
3888 (2009).
13. T. Thornton, D. LaDue, P. Savage, Environ. Sci.
Technol. 25, 1507 (1991).
14. U. S. Ozkan, R. B. Watson, Catal. Today, 100, 101
(2005).
15. S. Christoskova, M. Stoyanova, Wat. Res., 35, 2073
(2001).
16. S. Christoskova, M. Stoyanova, M. Georgieva, D.
Mehandzhiev, Appl. Catal. A- Gen., 173, 95 (1998).
17. S. Chaliha, K. Bhattacharyya, Catal. Today, 141, 225
(2009).
V. V. Ivanova et al.: Study on the catalytic activity of nanosized NiOx for oxidative degradation of 2,4-dichlorophenol in aqueous …
148
ИЗСЛЕДВАНЕ НА КАТАЛИТИЧНАТА АКТИВНОСТ НА НАНОРАЗМЕРЕН NiOx ЗА
ОКИСЛИТЕЛНА ДЕСТРУКЦИЯ НА 2,4-ДИХЛОРФЕНОЛ ВЪВ ВОДНИ РАЗТВОРИ
В. В. Иванова, М. К. Стоянова, С. Г. Христоскова*
Пловдивски университет „Паисий Хилендарски”, Химически факултет, ул. Цар Асен 24, 4000 Пловдив,
България
Постъпила на 04 май 2014 г.; Коригирана на 26 май 2014 г.
(Резюме)
Синтезиран е наноразмерен NiOx и е проучена каталитичната му активност за нискотемпературно
окисление на 2,4-ДХФ във водни разтвори с въздух. За получаването на каталитичния образец беше приложен
неконвенционален утаечно-окислителен метод с обратен порядък на утаяване, подпомогнат с ултразвукова
активация. Синтезираната по посочения метод наноразмерна каталитична система беше охарактеризирана чрез
XRD, FTIR, TEM, SAED и химичен анализ. Данните от охарактеризирането показаха, че приложеният метод за
синтез благоприятства получаването на високо дисперсни наноразмерни оксидни материали, характеризиращи
се с високо съдържание на силно подвижен свръхстехиометричен активен кислород (O*~8 %). Резултатите от
настоящото проучване показват, че изследваният катализатор проявява висока каталитична активност относно
окислителната деструкция на 2,4-ДХФ във водни разтвори с въздух. Пълно превръщане на субстрата се постига
за реакционен период от 5 мин. при оптималните условия на процеса, а минерализацията и на интермедиата се
извършва за реакционен период от 120 мин.. Изследвано е влиянието на основни операционни параметри върху
ефективността на процеса- температура, рН и маса на катализатора.

149
Bulgarian Chemical Communications, Volume 46, Special Issue A (pp. 149 – 156) 2014
Experimental and DFT studies on the IR spectral and structural changes arising from
the conversion of 4-amino-N-[amino(imino)methyl] benzenesulfonamide
(sulfaguanidine) into azanion
A. Popova*, B. Stamboliyska, E. Velcheva
Institute of Organic Chemistry with Centre of Phytochemistry, Bulgarian Academy of Sciences, Acad. G. Bonchev str.,
bl. 9, 1113 Sofia, Bulgaria
Received May 10, 2014; Revised July 15, 2014
Dedicated to Acad. Dimiter Ivanov on the occasion of his 120th
birth anniversary
The structure of 4-amino-N-[amino(imino)methyl] benzenesulfonamide (sulfaguanidine) and of its azanion have
been studied on the basis of both infrared spectra and DFT calculations. A good agreement has been found between the
theoretical and experimental vibrational characteristic of the particles studied. The theoretical method used gives a good
description of the strong spectral changes caused by the conversion of the sulfaguanidine molecule into the
corresponding azanion. The structural changes which accompany this conversion take place at and next to azanionic
centre. According to the present calculations, the new (anionic) charge of azanion is distributed, as follows: -0.07 e-, -
0.37 e- and -0.56 e
- over the amino group, phenylene ring and sulfonylguanidine fragment, respectively.
Key words: sulfaguanidine, azanion, IR, DFT
INTRODUCTION
4-Amino-N-[amino(imino)methyl]benzene-
sulfonamide (sulfanilylguanidine, sulfaguanidine,
SG) is the first sulfanilamide antimicrobial agent
that is used to treat enteric infections such as
bacillary dysentery. In April, 1940, Roblin et al. [1]
presented the synthesis and physical properties of
sulfanilylguanidine to the Division of Medicinal
Chemistry at the meeting of the American
Chemical Society. In September, 1940, Marshall,
Jr., et al. [2] published a report of their experiments
with sulfanilylguanidine. They had studied its
antibacterial properties and its absorbability when
given orally and intra-peritoneally. Although fairly
soluble in water, sulfanilylguanidine is poorly
absorbed from the intestinal tract, but it is a very
effective antimicrobial agent.
The crystalline forms of sulfaguanidine have
been studied extensively [3-8]. Yang and Guillory
[5] found four polymorphic forms and discuss the
possibilities of the system of hydrogen bonds. The
crystal structure of sulfaguanidine monohydrate
[6,7] and molecular structure of anhydrous
sulfaguanidine is defined by means of X-ray
diffraction [8].
The infrared (IR) spectra of SG in the solid state
together with the main band assignments were
reported long time ago [9,10] Trius using infrared
spectroscopy for the identification of sulfonamide
drugs [11]. The most recent IR spectroscopic
investigation, complemented by theoretical studies
of the SG has been reported by Chandran et.al.
[12]. However, this investigation is incomplete, as
only one tautomeric form (imino) was examined. It
is known from NMR spectroscopic [9,13] and X-
ray studies [6-8 ] that the preferred form assumed
by the molecule of SG is the symmetrical structure
(amino form).
Neither the IR spectra nor structure of sulfa-
guanidine azanion have been studied theoretically
or experimentally. The conversions of neutral
molecules into radical anions, carbanions, azanions,
etc., are accompanied with essential changes in the
vibration spectra. So these changes are very
informative for the structural variations that result
from the above conversions [14-18]. The purpose
of the present investigation is to follow the spectral
and structural changes, caused by the conversion of
sulfaguanidine molecule into the corresponding
azanion on the basis of both DFT computations and
IR spectroscopic experiments.
EXPERIMENTAL AND COMPUTATIONS
The sulfaguanidine anion (counter ion Na+) was
prepared by adding 0.05 and 0.2 mol/l DMSO/
DMSO-d6 solutions of the parent sulfaguanidine to
© 2014 Bulgarian Academy of Sciences, Union of Chemists in Bulgaria
* To whom all correspondence should be sent:
E-mail: [email protected]

A. Popova et al.: Experimental and DFT studies on the IR spectral and structural changes arising from the conversion of 4-amino-
150
equimolar quantities of dry alkali-metal methoxides
-d0 and -d3 under argon. The conversion was
practically complete (no bands of the parent
compound were seen in the spectra after
metalation).
The IR spectra were measured on a Bruker
Tensor 27 spectrophotometer in a CaF2 cell of 0.13
mm path length for DMSO/DMSO-d6 solutions and
in KBr disk, at a resolution of 1 cm-1
and 64 scans.
The quantum chemical calculations were
performed using the Gaussian 09 package [19]. The
geometry optimizations of the structures
investigated were done without symmetry
restrictions, using density functional theory (DFT).
We employed B3LYP hybrid functional, which
combines Becke’s three-parameter nonlocal
exchange with the correlation functional of Lee et
al. [20,21], adopting 6-31+G* and 6-311+G(2df,p)
basis sets. The stationary points found on the
molecular potential energy hypersurfaces were
characterized using standard harmonic vibrational
analysis. The theoretical vibrational spectra were
interpreted by means of potential energy
distributions (PEDs) using VEDA 4 program [22].
For a better correspondence between experimental
and calculated values, we modified the results using
the empirical scaling factors [23].
RESULTS AND DISCUSSION
Energies and conformational isomers
The sulfaguanidine molecule can exist as two
tautomers, SG1 and SG2 which have its guanidine
group in amino and imino form, respectively. All
tautomers of sulfaguanidine and its protonated and
deprotonated forms have different conformers
resulting from rotation about C-S, S-N and N-C
bonds. After a systematic conformation search on
the B3LYP/6-31+G* potential energy of studied
species, four different minima for molecule and six
– for anion and cation are located. The structure of
the most stable conformers were reoptimized at
B3LYP/6-311(2df,p)G** and can be seen in
Scheme 1; their total energies are compared in
Table 1. The following comments can be made on
the basis of the corresponding energy values:
The tautomer SG1 is predicted to be more stable
than SG2 one by more than 40 kJ.mol-1
.
According to Minkin at al. [24] prototropic
conversions are probable in case when the
energy differences between the initial and the
final structure do not exceed 25 kJ.mol-1
, with
activation barrier not higher than 105 kJ.mol-1
.
As it could be seen in Table 1 the energy
difference is larger in the present case, and
convinces that only SG1 should be expect to
exist in real system. The presence of the same
amino tautomer SG1 was established by
crystallographic analysis [6,8] and experimental
NMR spectral data in DMSO [9]. In recently
published DFT vibrational analysis, Chandran
and co-workers [12] computed only imino SG2
structure, which is less stable.
The anion SG1–
is the most stable among the
possible anionic isomers, obtained through
elimination of a proton from the guanidine
group and with the 45 kJmol-1
more stable than
anion SG2– obtained through elimination of a
proton from amino group.
SG1H+ protonated at the guanidine group is the
significantly more stable protonated isomer. The
other isomer protonated at the N atom connected
with phenyl ring highly improbable in gas state.
SG1 SG2
SG1
- SG2
-
SGH1+ SGH2
+
Scheme 1. B3LYP/6311+G(2df,p) optimized structures
of the tautomers of sulfaguanidine molecule SG1 and
SG2 and their protonated and deprotonated species.
The deprotonation energy (ED) of a given speci-
es can be calculated as a difference between ZPVE-
corrected energies of the most stable conformer of
this species and of the corresponding deprotonated
form. So, for species studied we can calculate from
the data in Table 1:

A. Popova et al.: Experimental and DFT studies on the IR spectral and structural changes arising from the conversion of 4-amino-
151
Table 1. Total Etot (in hartree) and relative Erel (in
kJ/mol) energies of sulfaguanidine molecule, its proto-
nated and deprotonated species.
Speciesa B3LYP/6-31+G* B3LYP/6-311+G(2df,p)
Etot Erel Etot Erel
SG1 -1040.41404 -1040.66028
SG2 -1040.39780 42.55 -1040.64383 43.19
SG1H+ -1040.79436 -1041.04101
SG2H+ -1040.75752 96.72 -1041.00436 96.20
SG1– -1039.85858 -1040.10438
SG2– -1039.84153 44.74 -1040.08710 45.36 a Numbering according Scheme 1.
ED of the sulfaguanidine:
1DSGE = 1459.52 kJ/mol
ED of the protonated sulfaguanidine:
1999 60
D
SG HE = k. J/mol
The ED values are related qualitatively with the
acidities of the C–H, C–N etc. acids in DMSO and
other solvents (lower ED, higher acidity, lower
pKa’s). In the present case the above ED value are
also in a qualitative agreement with the experiment:
the protonated sulfaguanidine is a strong acid
(pKa=2.75 [25]) and sulfaguanidine itself is a weak
acid (pKa=12.1 [26]).
Spectral analysis
The theoretical and experimental IR data,
measured in DMSO solvent for the sulfaguanidine
molecule are compared in Table 2. We can see
there a good agreement between experimental and
scaled theoretical frequencies. The mean absolute
deviation between them is nearly 13 cm-1
.
The largest differences between theoretical and
experimental IR data correspond to the NH2
stretching vibrations. The calculations predict that
the highest frequency band (3572 cm-1
) corresponds
to the asymmetric deformation of amino group, the
following frequencies (3561 cm-1
, 3560 cm-1
)
correspond to the asymmetric NH2 modes of
guanidine structural motif, whereas the other ones
(3464 cm-1
, 3463 cm-1
, 3387 cm-1
) are assigned
respectively to the symmetric ones. The measured
amino frequencies are significantly lower than
theoretically predicted ones, due to the formation of
strong hydrogen bonds between the sulfaguanidine
molecules and DMSO-d6 solvent. The theory
predicted well the low intensities of the ν(PhH)
bands. The stretching ν(NC) strongly coupled with
deformation vibrations of δ(NH2) of guanidine frag-
ment is predicted to appear at 1626 cm-1
as a very
intense band. Experimentally, a strong band was
detected at 1640 cm-1
. Deformation vibration of the
amino group is predicted as pure in 1607 cm-1
and
found at 1600 cm-1
. The strong bands of the
νas
(SO2) and νas
(SO2) frequencies, appear at 1269
cm-1
and 1137cm-1
, respectively. For comparison the
corresponding bands of the saccharin molecule
have been found at 1326 cm-1
and 1177 cm-1
(in
DMSO solvent) [27] and we have found those of
sulfanilamide molecule at 1317 cm-1
and 1153 cm-1
(in DMSO solvent) [16].
The theoretical and experimental IR data for the
sulfaguanidine anion are compared in Table 3. As
above we can find there a good agreement between
experimental and scaled theoretical frequencies.
The mean deviation between them is 13 cm-1
within
the corresponding interval of 9-25 cm-1
, typical for
DFT calculations of frequencies for series of
carbanions [28,29], azanions [14] and oxyanions
[15] (and references therein). The conversion of
sulfaguanidine into the azanion results in very
essential changes in the IR spectrum (Tables 2 and
3; Fig. 1). In agreement between theory and
experiment, the conversion results in considerable
frequency decreases in both νas
(SO2) and
νas
(SO2)bands, which sum is: predicted 115 cm-1
,
measured 110 cm-1
. The latter value is rationally
larger than the corresponding values for other
molecule-azanion pairs, containing additional
electron-withdrawing groups (compound, SO2
sum): o-sulfobenzimide (saccharin), 93 cm-1
[28];
o-sulfothiobenzimide (thiosaccharin), 60 cm-1
[30]
and less than in sulfanilamide, 140 cm-1
[16].
Fig. 1. Experimental IR spectra of sulfaguanidine and its
azanion.
A new band was registered and it was attributed
to the deformation δ(CNH-) of deprotonated guani-
dine fragment. The band at 1600 cm-1
assigned as
(NH2) remained unchanged.

A. Popova et al.: Experimental and DFT studies on the IR spectral and structural changes arising from the conversion of 4-amino-
152
Table 2. Theoretical (B3LYP/6-311+G(2df,p)) and experimental (DMSO) IR data of sulfaguanidine molecule.
No. B3LYP/6311+G(2df,p)
Approximate description b Experimental data
ν (cm-1
) νa (cm
-1) A (km/mol)
1 3687 3572 36.5 2
99 as
NH 3508 sh.
2 3676 3561 97.5 2
100 as
NH 3420
3 3676 3561 22.2 2
100 as
NH -
c
4 3576 3464 39.4 2
98 s
NH 3336
5 3576 3463 37.3 2
98 s
NH -
c
6 3496 3387 134.4 2
99 s
NH 3218
7 3199 3099 2.3 97 CH
3088
8 3198 3098 1.5 96 CH
3068
9 3160 3060 18.2 96 CH
3056
10 3159 3060 12.3 97 CH
3033
11 1679 1626 750.8 2 N=C45 , 26 guanidine
NH 1640
12 1659 1607 274.5 2
min72 a o
NH 1600
13 1639 1587 90.8 2
min32 , 15 a o
CC NH -
c
14 1629 1578 230.8 2
68 guanidine
NH 1574
15 1613 1563 10.4 54 , 13 CC CCC 1554
16 1582 1533 238.8 2NH N=C49 δ , 31 νguanidine
1509
17 1535 1487 55.9 61 CCH -
c
18 1465 1419 66.8 32 , 10 , 11 CC CCC NCN 1436
19 1462 1416 116.2 2
42 , 10 C NH NCN 1420
20 1356 1314 3.9 2
min40 , 32 , 12 a o
CC CCC NH 1316
21 1330 1289 70.4 54 , 31 CCH CC 1297
22 1313 1272 101.2 2
min52
a o
C NH -
c
23 1299 1258 201.1 2
92 as
SO 1269
24 1207 1169 4.0 68 CCH -
c
25 1198 1160 115.6 2
rock
NH N=C CCH46 δ , 23 ν , δ
1179
26 1151 1115 12.7 2
58 , 23 ,10 (amino) rock
CCH CC NH -
c
27 1137 1101 213.6 2
39 , 22 , 13 s
SO CC SC 1137
28 1101 1063 23.2 2
48 , 23 CNH C NH 1083
29d 1084 1047 88.1
225 ,18 s
SO CNH -
c a Scaled by 0.9858 [23].b Vibrational modes: ν, stretching; δ, bendings. The numbers before the mode symbols indicate %
contribution (10 or more) of a given mode to the corresponding normal vibration, according to the potential energy distribution
matrix. c These bands were not detected in the experimental spectrum. d Followed by 37 lower-frequency normal vibrations.

A. Popova et al.: Experimental and DFT studies on the IR spectral and structural changes arising from the conversion of 4-amino-
153
Table 3. Theoretical (B3LYP/6-311+G(2df,p) and experimental (DMSO) IR data of sulfaguanidine anion.
No. B3LYP/6311+G(2df,p)
Approximate description b Experimental data
ν (cm-1
) νa (cm
-1) A (km/mol)
1 3636 3522 32.0 2
99 as
NH -
c
2 3632 3518 7.1 2
100 as
NH -
c
3 3540 3428 2.1 2
100 as
NH -
c
4 3502 3392 50.1 2
98 s
NH -
c
5 3490 3381 3.0 98 N H -
c
6 3194 3094 5.0 97 CH
- c
7 3180 3081 9.2 96 CH
3030
8 3137 3039 31.6 96 CH
- c
9 3134 3035 39.2 97 CH
3080
10 1650 1598 93.9 2
min67 a o
NH 1600
11 1636 1585 24.1 2
min55 ν , 15 a o
CC NH - c
12 1621 1570 167.5 2
44 , 19 NH C N 1564sh
13 1618 1567 12.6 2
45 ν , 13 guanidine
CC NH - c
14 1600 1550 654.8 2NH48 ν , 28 δ
guanidine
C N 1540
15 1530 1482 80.8 68 CCH 1502
16 1453 1407 5.3 30 , 26 CCH CC - c
17 1417 1373 273.5 2
33 , 16 NHC N H 1384
18 1352 1309 1.1 53 , 22 CCH CC 1335
19 1324 1282 16.7 29 , 20 CC CCH 1291
20 1275 1235 65.2 2
min48 , 20
a o
C NH CCH 1255
21 1241 1202 310.3 2
76 as
SO 1234
22 1219 1181 19.6 2
32 , 16 , 10
guanidine
C NS NHC N H 1199
23 1202 1164 12.8 82 CCH 1166
24 1168 1131 192.9 2
51 , 16
guanidine
NH C NS 1128
25 1143 1108 8.5 2 ( min )60 , 17 rock
CCH NH a o - c
26d 1115 1080 162.0
242 , 26 , 13 s
SO CC SC 1106 a Scaled by 0.9858 [23].b Vibrational modes: ν, stretching; δ, bendings. The numbers before the mode symbols indicate %
contribution (10 or more) of a given mode to the corresponding normal vibration, according to the potential energy distribution
matrix. c These bands were not detected in the experimental spectrum. d Followed by 37 lower-frequency normal vibrations.
Structural analysis
According to both X-ray diffraction
experimental data [6] and DFT calculations the
sulfaguanidine molecule is composed of atoms
lying approximately in two planes: one of the
phenylene rings and amino group, and the other of
the guanidine moiety. The angle between these
planes has been experimentally found to be 94.4°;
the same angle for the isolated sulfaguanidine
molecule has been theoretically estimated at 96.7°.
The corresponding value for the free sulfaguanidine
anion is 82.1°.

A. Popova et al.: Experimental and DFT studies on the IR spectral and structural changes arising from the conversion of 4-amino-
154
The theoretical and experimental bond lengths
and angles in the sulfaguanidine and its azanion are
listed in Table 4. As seen, there is a good
agreement between the experimental and the
theoretical values. The largest deviation from
0.053Å is in bond S13 - N17 and can be associated
with the formation of hydrogen bonds in the solid
state. The mean absolute deviations (m.a.d.)
between theoretical and experimental bond lengths
and angles of sulfaguanidine molecule are 0.017 Å
and 1.06, respectively. This result leads us to
believe that the theoretical bonds lengths and angle
for the sulfaguanidine anion are also reliable. The
most significant changes caused by the conversion
molecule azanion take place both at the azanionic
center and next to it, with agrees the data for other
azanions [14,16,28,30]. They are strong shortening
of the N20-C18 and S13-N17 bonds, strong
lengthening of the C18-N17 and C18-N19 bonds.
The net electric charges qi of the fragments of
the species studied are given in Scheme 2. The
charge change values Δqi= qi (anion) - qi (molecule)
Table 4. Theoretical (B3LYP/6-311+G(2df,p)) and experimental bond lengths R (Å), angles A (°) in the
sulfaguanidine molecule and its azanion.
Molecule Anion
Experimental a Theoretical b
Theoretical c
Bond lengths d
R(C1C
2) 1.379 1.380 1.384 0.004 1.387 0.003
R(C1C
6) 1.401 1.389 1.401 0.006 1.398 -0.003
R(C2C
3) 1.387 1.387 1.391 0.004 1.393 0.002
R(C3C
4) 1.388 1.388 1.392 0.004 1.389 -0.003
R(C3S
13) 1.767 1.763 1.773 0.008 1.814 0.041
R(C4C
5) 1.378 1.386 1.383 0.001 1.391 0.008
R(C5C
6) 1.379 1.380 1.402 0.023 1.395 -0.007
R(C6N
14) 1.399 1.396 1.386 -0.012 1.410 0.024
R(O11
S13
) 1.445 1.450 1.466 0.019 1.476 0.010 R(O
12S
13) 1.442 1.430 1.446 0.010 1.458 0.012
R(N17
S13
) 4.589 1.587 1.642 0.053 1.576 -0.066 R(N
17C
18) 1.343 1.340 1.302 -0.039 1.374 0.072
R(C18
N19
) 1.336 1.326 1.356 0.025 1.401 0.045 R(C
18N
20) 1.322 1.337 1.372 0.043 1.296 -0.076
Bond angles d
A(C2C
1C
6) 121.0 120.5 120.6 -0.150 120.7 0.100
A(C1C
2C
3) 120.1 120.0 120.0 -0.050 120.4 0.400
A(C2C
3C
4) 119.6 119.8 120.1 0.400 119.1 -1.000
A(C2C
3S
13) 121.8 121.2 120.3 -1.200 120.5 0.200
A(C4C
3S
13) 118.5 119.0 119.7 0.950 120.3 0.600
A(C3C
4C
5) 120.4 119.9 120.0 -0150 120.6 0.600
A(C4C
5C
6) 120.5 120.8 120.7 0.050 120.6 -0.100
A(C1C
6C
5) 118.3 119.0 118.7 0.050 118.6 -0.100
A(C1C
6N
14) 120.4 121.2 120.7 -0.100 120.6 -0.100
A(C5C
6N
14) 121.2 119.8 120.6 0.100 120.8 0.200
A(C3S
13O
11) 107.0 107.2 107.5 0.400 104.7 -2.800
A(C3S
13O
12) 107.7 107.9 108.1 0.300 104.5 -3.600
A(C3S
13N
17) 106.0 106.1 101.9 -4.150 106.7 4.800
A(O11
S13
O12
) 115.0 116.5 118.0 2.250 115.6 -2.400 A(O
11S
13N
17) 114.3 112.6 111.9 -1.550 115.2 3.300
A(O12
S13
N17
) 106.2 105.9 108.3 2.250 109.2 0.900 A(S
13N
17C
18) 121.5 121.6 123.6 2.050 126.1 2.500
A(N17
C18
N19
) 124.7 126.5 127.4 1.800 120.3 -7.100 A(N
17C
18N
20) 116.5 116.2 117.1 0.750 122.8 5.700
аSee Ref. [8]. bAlgebraic deviations (Å, degrees) between theoretical and experimental values. c Algebraic deviations (Å, degrees)
between theoretical values of the anion and molecule. d Atom numbering according to Scheme 1.

A. Popova et al.: Experimental and DFT studies on the IR spectral and structural changes arising from the conversion of 4-amino-
155
Scheme 2. Mulliken net electric charges qi over fragments of sulfaguanidine molecule SG1 and its azanion SG1-.
are usually quite informative in showing the
distributions of the new charges in anions (Refs.
[28-30] and references therein). According to the
present calculations, the anionic charge of azanion
is distributed, as follows: -0.07 e-, -0.37 e
- and -0.56
e- are delocalized over the amino group, phenylene
ring and sulfonylguanidine fragment, respectively.
CONCLUSION
The spectral and structural changes, caused by
the conversion of the sulfaguanidine molecule into
the corresponding azanion have been studied by IR
spectra DFT method at B3LYP/6-311+G(2df,p)
level.
A comparison of calculated with measured
infrared data can be used as a test for the reliability
of the structural predictions for various molecules
and anions of this and similar types. These
predictions can be very useful in cases of molecules
and ions for which experimental structural
parameters are inaccessible or unknown. IR spectral
changes, which take place as a result of the
conversion of molecule into azanion, were adequate
predicted by same theoretical method.
Acknowledgements: Financial support of National
Science Fund, Bulgaria (DID02/33/2009 and
DRNF-02/13/2009) is gratefully acknowledged.
REFERENCES
1. R. O. Roblin Jr., J. H. Williams, Ph. S. Winnek, J. P.
English, J. Am. Chem. Soc., 62, 2002 (1940).
2. E. K. Marshall, A. C. Bratton, H. J. White, J. T.
Litchfield, Johns Hopkins Hosp. Bull., 67, 163
(1940).
3. M. Kuhnert-Brandstätter, Oesterr. Apoth. Ztg., 13,
297 (1959).
4. M. Kuhnert-Brandstätter, S. Wunsch, Microchim.
Acta, 1297 (1969).
5. S. S. Yang, J. K. Guillory, J. Pharm. Sci., 61 (1972)
26.
6. C. H. Koo, H. S. Kim, W. Shin, C. Choe, J. Kor.
Chem. Soc., 18, 97 (1974).
7. M. Alleaume, Acta Cryst., B32, 669 (1976).
8. A. Kalman, M. Czugler, G. Argay, Acta Cryst., B37,
868 (1981).
9. G. Schwenker, Arch Pharm. 295, 753 (1962).
10. M. Brandstätter, F. Bachleitner-Hofmann,
Spectrohim. Acta, A27, 191 (1971).
11. N. V. Trius, Khim.-Farm. Zh., 13, 103 (1979).
12. A. Chandran, H. T. Varghese, C. Yohannan, G.
Rajendran, Orient. J. Chem., 27, 611 (2011).
13. G. R. Sullivan, J. D. Roberts, J. Org. Chem., 42,
1095 (1977).
14. A. D. Popova, E. A. Velcheva, B. A. Stamboliyska,
J. Mol. Struct., 1009, 23 (2012).
15. E. A. Velcheva, B. A. Stamboliyska, P. J. Boyadjiea,
J. Mol. Struct., 963, 57 (2010).
16. A. D. Popova, M. K. Georgieva, O. I. Petrov, K.V.
Petrova, E. A. Velcheva, Int. J. Quant. Chem., 107,
1752 (2007).
17. S. Stoyanov, J. A. Tsenov, D. Y. Yancheva, J. Mol.
Struct., 1009, 42 (2012).
18. S. Stoyanov, J. Phys. Chem., 114 5149 (2010).
19. M. J. Frisch, G. W. Trucks, H. B. Schlegel, G. E.
Scuseria, M. A. Robb, J. R. Cheeseman, G. Scalmani,
V. Barone, B. Mennucci, G. A. Petersson, H.
Nakatsuji, M. Caricato, X. Li, H. P. Hratchian, A. F.
Izmaylov, J. Bloino, G. Zheng, J. L. Sonnenberg, M.
Hada, M. Ehara, K. Toyota, R. Fukuda, J. Hasegawa,
M. Ishida, T. Nakajima, Y.Honda, O. Kitao, H.
Nakai, T. Vreven, J.A. Montgomery, Jr., J. E. Peralta,
F. Ogliaro, M. Bearpark, J. J. Heyd, E. Brothers, K.
N. Kudin, V. N. Staroverov, R. Kobayashi,
J.Normand, K. Raghavachari, A. Rendell, J. C.
Burant, S. S. Iyengar, J. Tomasi, M. Cossi, N. Rega,
J. M. Millam, M. Klene, J. E. Knox, J. B. Cross, V.
Bakken, C. Adamo, J. Jaramillo, R. Gomperts, R. E.
Stratmann, O. Yazyev, A.J. Austin, R. Cammi, C.
Pomelli, J. W. Ochterski, R. L. Martin, K.
Morokuma, V. G. Zakrzewski, G. A. Voth, P.

A. Popova et al.: Experimental and DFT studies on the IR spectral and structural changes arising from the conversion of 4-amino-
156
Salvador, J. J. Dannenberg, S. Dapprich, A. D.
Daniels, Ö. Farkas, J. B. Foresman, J. V. Ortiz, J.
Cioslowski, D. J. Fox, Gaussian 09, Revision A1,
Gaussian Inc., Wallingford CT, 2009.
20. A. D. Becke, J. Chem. Phys., 98, 5648 (1993).
21. C. Lee, W. Yang, G. R. Parr, Phys. Rev., B37, 785
(1998).
22. H. J. Michal, VEDA 4, Warsaw, 2004.
23. J. P. Merrick, D. Moran, L. Radom, J. Phys. Chem.,
A111, 11683 (2007).
24. I. Minkin, B. Y. Simkin, R. M. Minyaev, Quantum
chemistry of organic compounds. Mechanisms of
reactions, Springer, Heidelberg, 1990.
25. B. E. Ballard, E. Nelson, J. Pharmacol. Exp. Ther.,
135, 120 (1962).
26. B. C. Rudy, B. Z. Senkowski, Analyt Profiles., 2, 234
(1973).
27. I. G. Binev, B. A. Stamboliyska, E. A. Velcheva,
Spectrochim. Acta Part A, 52, 1135 (1996).
28. J. A. Tsenov, S. S. Stoyanov, I. G. Binev, Bulg.
Chem. Commun., 40, 538 (2008).
29. J. A. Tsenov, S. S. Stoyanov, I. G. Binev, Bulg.
Chem. Commun., 37, 361 (2005).
30. Y. G. Binev, C. T. Petkov, L. Pejov, Spectrochim.
Acta, A56, 1949 (2000).
ЕКСПЕРИМЕНТАЛНО И ТЕОРЕТИЧНО ИЗСЛЕДВАНЕ НА ИЧ СПЕКТРАЛНИ И
СТРУКТУРНИ ПРОМЕНИ, ПРОИЗТИЧАЩИ ОТ ПРЕВРЪЩАНЕТО НА 4-АМИНО-N-
[АМИНО(ИМИНО)МЕТИЛ] БЕНЗЕНСУЛФОНАМИД (СУЛФАГУАНИДИН) В АЗАНИОН
А. Попова*, Б. Стамболийска, Е. Велчева
Институт по Органична химия с Център по Фитохимия, Българска Академия на Науките, ул. Акад. Г. Бончев,
бл. 9, 1113 София, България
Постъпила на 10 май 2014 г.; Коригирана на 15 юли 2014 г.
(Резюме)
Структурата на амино-N-[аминo(имино)метил]бензенсулфонамид (сулфагуанидин) и неговия азанион са
изследвани с помощта на инфрачервени спектри и DFT пресмятания. Намерено е добро съответствие между
експерименталните и теоретичните вибрационни характеристики на изследваните частици. Използваният
теоретичен метод добре предсказва силните спектрални промени, възникващи при превръщането на молекулата
на сулфагуанидина в азанион. Превръщането в азанион поражда и значителни промени в структурата при и
непосредствено до азанионния ценрър. Според изчисленията новият (азанионен) заряд e разпределeн както
следва: -0.07 e-, -0.37 e
- и -0.56 e
- върху амино групата, фениленовото ядро и сулфонилгуанидиновия фрагмент,
съответно.

157
Bulgarian Chemical Communications, Volume 46, Special Issue A (pp. 157 – 163) 2014
IR spectral and structural changes, caused by the conversion of
4-cyanobenzenosulfonamide into azanion
A. D. Popova*, E. A. Velcheva
Institute of Organic Chemistry with Centre of Phytochemistry, Bulgarian Academy of Sciences, Acad. G. Bonchev str.,
bl. 9, 1113 Sofia, Bulgaria
Received May 28, 2014; Revised July 14, 2014
Dedicated to Acad. Dimiter Ivanov on the occasion of his 120th
birth anniversary
A combined IR experimental/DFT computational approach has been applied to follow the spectral and structural
changes, caused by the conversion of 4-cyanobenzenesulfonamide into azanion. The conversion has shown a weak
effect on the cyano stretching band C N and strong effects on both 2
asSO and
2
sSO stretching bands. According to
the computations, the strong structural changes, caused by the conversion, take place at and next to the azanionic center.
The new (azanionic) charge is distributed as follows: 0.08 e-, 0.25 e
- and 0.10 e
- are delocalized over the cyano,
phenilene and sulfonyl groups, respectively, and 0.57 e- of it remain localized in the azanionic center.
Key words: IR spectra, DFT/B3LYP, 4-cyanobenzenesulfonamideamide, azanion
INTRODUCTION
Sulfonamides (SA) are well known for their
various biological activities: antibacterial, diuretic,
antidiabetic etc. [1]. The unsubstituted in sulfamide
group aromatic/heterocyclic SA are known as
inhibitors of the zinc-enzyme Carbonic anhydrase
(CA) with diuretic activities, hypoglycemic activity
and anticancer properties [2,3]. This enzyme
catalyzes the reversible hydration of carbon dioxide
and both meta- and para- substituted SAs are
specific and potent inhibitors of CA. The inhibition
mechanism seems to be mainly connected with the
generation of an electrostatic field of the zinc ion
which favors the correct orientation of the SO2NH2
group and its anticipated deprotonation. So, the
inhibitory action is caused by the binding of the
sulfamide anion to the Zn2+
of the enzyme,
mimicking the bicarbonate anion in the transition
state [3-5]. Due to their pharmacology applications
and widespread use in medicine, these compounds
have gained attention in many fields of drug
chemistry.
4-Cyanobenzenesulfonamide is a representative
of the benzenesulfonamides with primary sulfon-
amide group. 4-Cyanobenzenesulfonamide was first
prepared almost 120 years ago by Remsen et al. [6]
using a multistep synthesis, starting with 4-(amino-
sulfonyl)benzoic acid. There is a recent study of the
title compound by Camí and coworkers [7]. They
have synthesized 4-cyanobenzenesulfonamide and
its copper complex and reported their UV, IR and
Raman spectra and B3LYP calculations. The
structure and IR spectra of 4-cyanobenzene-
sulfonamide azanion itself have never been studied
experimentally or theoretically. The conversions of
neutral molecules into radical anions, carbanions,
azanions, etc., are accompanied with essential
changes in the vibration spectra. So, these changes
are very informative for the structural variations
that result from the above conversions [8-11].
The purpose of the present investigation is to
follow the spectral and structural changes, caused
by the conversion of 4-cyanobenzenesulfonamide
molecule into the corresponding azanion on the
basis of both DFT computations and IR spectro-
scopic experiments.
EXPERIMENTAL
The sample of p-cyanobenzenesulfonamide
(Manchester Organic Limited, spectroscopic grade)
was used without any additional purification. Its
azanion was prepared by adding dimethyl sulfoxide
(DMSO/DMSO-d6) solutions of the parent com-
pound to excess of dry CD3O-Na
+ under argon, and
collecting the clear azanion solution with a syringe-
filter. We prepared the sample of CD3O-Na
+ itself
by reacting CD3OD (Fluka, 99% at. enrichment)
with Na and evaporating the excess of methanol in
vacuo. p-Cyanobenzenesulfonamide reacted with
© 2014 Bulgarian Academy of Sciences, Union of Chemists in Bulgaria
* To whom all correspondence should be sent:
E-mail: [email protected]

A. D. Popova, E. A. Velcheva: IR spectral and structural changes, caused by the conversion of 4-cyanobenzenosulfonamide …
158
CD3O-Na
+ to form the azanion in DMSO/DMSO-d6
promptly (within 1-2 min) and practically comple-
tely: no bands of the parent compound were seen in
the spectra after metalation.
The IR spectra are recorded on a Brucker Tensor
27 FTIR spectrophotometer in a CaF2 cell of 0.129
mm path length(for DMSO/ DMSO-d6 solutions), a
KBr cells of 0.6 mm path length (for saturated
CDCl3 solutions) and in KBr and CsI disks, at a
resolution of 1cm-1
and 64 scans.
COMPUTATIONS
The quantum chemical calculations were
performed using the Gaussian 09 package [12] on a
MADARA grid. The geometry optimizations of the
structures investigated were done without
symmetry restrictions, using density functional
theory (DFT). We employed B3LYP hybrid
functional, which combines Becke’s three-
parameter nonlocal exchange with the correlation
functional of Lee, Yang and Parr [13,14], adopting
6-31++G(d,p), 6-311+G(2df,p) and aug-cc-pVTZ
basis sets. The stationary points found on the
molecular potential energy hypersurfaces were
characterized using standard harmonic vibrational
analysis. The absence of imaginary frequencies
confirmed that the stationary points corresponded
to minima on the potential energy hypersurfaces. In
order to check statistically which basis set
performed agrees best with the experimental data
for the species studied, we have treated the correla-
tions between their theoretical and experimental IR
frequencies. The comparison has shown that the
B3LYP/6-311+G(2df,p) IR data correlate best with
the experimental ones. For a better correspondence
between experimental and calculated values, we
modified the results using the empirical scaling
factors [15].
RESULTS AND DISCUSSION
Energy analysis
The full conformational search on the potential
energy surface of the molecule and azanion of 4-
cyanobenzenesulfonamide allowed the identifica-
tion of two different minima of the molecule, all of
them bearing the sulfamide nitrogen atom placed in
the perpendicular orientation relatively to the
aromatic ring and differing from each other in the
orientation of the amide hydrogen atoms and one
minimum of the azanion. The conformers of the
species studied are shown in Fig. 1 and their
energies are compared in Table 1. The depro-
tonation energy of a given Bröensted acid can be
defined [16,17] (and references therein) as
D anion moleculecorr corrE E E
(for the most stable conformers of these species).
Georgieva and Velcheva [16] have found that ED
(B3LYP/6-31++G(d,p)) values correlate fairly well
with pKa’s of Bröensted acids, containing cyano or
carbonyl groups, measured in DMSO solvent,
according to correlation equation:
DpKa(DMSO)=0.11507 x E -150.04(kJ/mol) .
So, having in mind corrE of 1 and 2 in Table 1,
we can estimate pKa (DMSO) of 4-cyanobenzen-
sulfonamide near 9.4. Hence, 4-cyanobenzen-
sulfonamide should be a moderately weak N-H
acid, (for comparison literature data for pKa
(DMSO) of benzenesulfonamide is 16.1 [18]).
1
1a
2
Fig. 1. B3LYP/6-311+G(2df,p) optimized structures of
the species studied.
Spectral analysis
Theoretical and experimental IR data for 4-
cyanobenzenesulfonamide molecule are compared
in Table 2. We can see there is a good agreement
between experimental and scaled theoretical frequ-
encies. M.a.d between them is 12.9 cm-1
, which
value lies within the interval of 9-20 cm-1
, typical
for the DFT calculations for molecules containing

A. D. Popova, E. A. Velcheva: IR spectral and structural changes, caused by the conversion of 4-cyanobenzenosulfonamide …
159
cyano or carbonyl groups [17,19-23] (and refe-
rences therein). We include in Table 2 the fre-
quencies 2
asNH and
2
sNH measured in CDCl3, as
the stretching frequencies of –XHn groups (X=
O, N, etc.), measured in DMSO, are strongly
underestimated, and the bending ones strong
–XHn - - - O=S(CH3)2 hydrogen bonds, which
effects can be estimated only qualitatively
Table 1. Zero-point vibrational energy (ZPVE) corrected total energies (corr.E in hartree) of 4-
cyanbenzenesulfonamide molecule 1 and of its azanion 2, as well as their differences (∆E in kJ/mol).
Species B3LYP 6-31++G(d,p) B3LYP/aug-cc-pVTZ B3LYP/6-311+(2df,p)
corr.E E corr.E E
corr.E E
Molecule 1 -928.322889 0.00 -928.679457 0.00 -928.539333 0
Molecule 1a -928.320810 5.46 -928.678335 2.95 -928.538131 3.16
Azanion 2 -927.795230 1385.37 -928.138421 1420.49 -928.012712 1382.64
Table 2. Theoretical B3LYP/6-311+(2df,p) and experimental (in DMSO/DMSO-d6) IR frequencies (ν in cm-1
) and
integrated intensities (A in km/mol) of 4-cyanobenzenesulfonamide molecule.
B3LYP/6-311+(2df,p) Experimental data
ν c No. ν A aν Approximate description
b
1 3642 57.6 3595 2
asNH 3456
d
2 3527 61.9 3481 2
sNH 3350
d
3 3220 2.2 3178 PhH 3153d
4 3218 0.0 3177 PhH - e
5 3204 1.0 3162 PhH 3096d
6 3203 0.0 3162 PhH - e
7 2334 26.1 2303 C N 2232 m
8 1628 0.2 1607 CC , PhH 1601 sh
9 1594 2.1 1573 CC , PhH 1570 broad
10 1574 34.0 1554 2
scNH 1554 sh
11 1514 6.0 1495 PhH , CC 1491 m
12 1419 20.6 1400 PhH , CC 1397 m
13 1371 175.7 1353 2
asSO ,
2
rockNH , CC 1342 vs
14 1327 2.3 1310 PhH , C S , CCC - e
15 1320 20.5 1303 PhH , CCC 1282 m
16 1215 1.6 1199 PhH , C CN 1197 sh
17 1201 1.3 1186 PhH , C CN 1185 m
18 1156 216.7 1141 2
sSO ,
2
scNH , C S , CCC 1165 vs
19 1131 4.3 1116 PhH 1111 vw
20 1093 26.6 1079 C S , PhH 1095 m
21 1071 1.2 1057 2
rockNH -
e
22d 1028 4.7 1015 CCC -
e
а Scaled by 0.9686 [15].b Vibrational modes: ν, stretching; δ, bendings. c Relative intensities: vs, very strong; s, strong; m, moderate;
w, weak; vw, very weak; sh, shoulder. d Solvent CDCl3. e These bands were not detected in the experimental spectrum. d Followed by
26 lower-frequency normal vibrations.

A. D. Popova, E. A. Velcheva: IR spectral and structural changes, caused by the conversion of 4-cyanobenzenosulfonamide …
160
Table 3. Theoretical B3LYP/6-311+(2df,p) and experimental (in DMSO/DMSO-d6) IR frequencies (ν in cm-1
) and
integrated intensities (A in km/mol) of 4-cyanobenzenesulfonamide azanion.
B3LYP/6-311+(2df,p) Experimental data
ν c No. ν A aν Approximate description
b
1 3496 6.2 3451 NH
-d
2 3204 4.4 3162 PhH -d
3 3203 7.1 3161 PhH -d
4 3178 9.9 3137 PhH 3076 vw
5 3176 9.9 3135 PhH -d
6 2301 225.7 2271 C N 2227 s
7 1612 102.2 1592 CC PhH, 1593 m
8 1574 3.2 1554 PhH , CC -d
9 1503 10.3 1483 PhH , CC 1487 m
10 1417 7.5 1398 PhH , CC 1396 w
11 1326 0.5 1309 CCC -d
12 1313 0.4 1296 PhH 1295 vw
13 1248 220.2 1231 2
asSO ,
CNH , PhH 1228 vs
14 1213 15.2 1197 C CN PhH CC, , 1190 vw
15 1190 11.5 1174 PhH 1177 vw
16 1132 167.5 1117 2
sSO , PhH SNH, 1134 vs
17 1116 24.4 1102 PhH , CNH -
d
18 1091 46.8 1077 CNH , C S 1096 s
19 1077 113.6 1063 SNH , CCC , C S -d
20e 1029 2.7 1015 CCC -
c
а Scaled by 0.9686 [15].b Vibrational modes: ν, stretching; δ, bendings. c Relative intensities: vs, very strong; s, strong; m, moderate;
w, weak; vw, very weak. d These bands were not detected in the experimental spectrum. e Followed by 25 lower-frequency normal
vibrations.
within the Onzeger’s approach [24]. There are no
peculiarities of the cyano stretching band:
moderately high frequency C N and
intensity C NA , as the cyano and phenylene groups
are in resonance. The frequencies of the strongest in
the spectrum sulfonyl stretching bands 2
asSO and
2
sSO measured in DMSO agree well with those
measured in solid state (Fig. 2 curves a and b). Its
frequencies of 1342 cm–1
and 1165 cm–1
are higher
with 37 cm–1
(sum) than corresponding values of
sulfanilamide (solvent DMSO-d6) [9] due to
electron-withdrawing effect of cyano group.
We compare in Table 3 theoretical and expe-
rimental IR data for the azanion of 4-
cyanobenzenesulfonamide (2 in Fig. 1). The
agreement between experimental and scaled
theoretical frequencies is essentially better than
above. M.a.d between them is 10.1 cm-1
only, close
to the lower limit of the corresponding integral of
9-25 cm-1
, typical for DFT calculations of vibra-
tional frequencies for anions containing cyano or
carbonyl groups [17, 19-23] (and references
therein). The experimental IR spectra of azanion
and molecule (in DMSO/ DMSO-d6) are compared
in Fig. 2 (curves c and b).

A. D. Popova, E. A. Velcheva: IR spectral and structural changes, caused by the conversion of 4-cyanobenzenosulfonamide …
161
Fig. 2. Experimental spectra of 4-cyanobenzenesulfon-
amide (a in KBr; b in DMSO/DMSO-d6) and its azanion
c (0.1 mol-1
solutions in DMSO/DMSO-d6).
The following spectral changes take place as a
result of the conversion of 4-cyanobenzene-sulfon-
amide into azanion:
i) According to the computations, both 2
asSO and
2
sSO undergo essential frequency decreases,
which sum is: predicted 146 cm-1
, measured 145
cm-1
. The latter value is rationally larger than the
corresponding values for other cases of
molecule-azanion pairs, containing additional
electron-withdrawing groups (compound, 2SO
sum): o-sulfobenzimide (saccharin), 93 cm-1
[25]; o-sulfothiobenzimide (thiosaccharin), 60
cm-1
[26] and similar than in sulfanilamide, 140
cm-1
[9].
ii) The computational method used predicts only
qualitatively the changes in the cyano stretching
band characteristics, viz.: C N decreases:
predicted 32 cm-1
, measured 5 cm-1
only.
iii) According to the calculations, in the azanion a
new CNH mode takes essential parts in
vibrations Nos. 13, 18, and 19 (Table 3).
Structural analysis
We can see in Table 4 a good agreement
between experimental [7] and theoretical bond
lengths of 4-cyanobenzenesulfonamide molecule 1:
the mean absolute deviation between them is 0.019
Å. There are no experimental structural data for 4-
cyanobenzenesulfonamide azanion. According to
our computations, the conversion of the molecule
into azanion causes certain essential steric structure
variations (Table 4). It is seen in there that the
largest bond length changes should take place at the
azanionic center (shortening of the S8-N
11 bond by
0.106 Å) and next to it (lengthening of the C5-S
8
bond by 0.037 Å) etc. The same rule is also valid
for the corresponding bond angles changes.
Table 4. Selected B3LYP/6-311+G(2df,p) bond lengths
R (Å), bond angles A(degrees) and dihedral angle
D(degrees) of 4-cyanobenzenesulfonamide molecule 1
and its azanion 2.
Indicesa
Molecule Azanion
c Theor. Exper.
b R(1,2) 1.403 1.383 1.409 0.006 R(1,6) 1.390 1.387 1.386 -0.004 R(2,3) 1.403 1.383 1.404 0.001 R(2,7) 1.433 1.462 1.429 -0.004 R(3,4) 1.390 1.387 1.391 0.001 R(4,5) 1.395 1.377 1.398 0.003 R(5,6) 1.394 1.377 1.401 0.007 R(5,8) 1.792 1.777 1.829 0.037
R(7,12) 1.158 1.130 1.162 0.004 R(8,9) 1.444 1.420 1.464 0.020
R(8,10) 1.444 1.420 1.473 0.029 R(8,11) 1.667 1.601 1.561 -0.106
A(4,5,8) 119.3 118.7 121.1 1.8 A(5,8,9) 107.3 107.4 102.4 -4.9
A(5,8,10) 107.3 107.4 103.1 -4.2 A(5,8,11) 103.4 108.7 106.0 2.6 A(9,8,10) 122.7 119.6 116.8 -5.9 A(9,8,11) 107.3 106.6 110.7 3.4 D(6,5,8,9) -22.6 -26.4 -45.8 -23.2
D(6,5,8,11) 90.6 88.7 70.3 -20.3 D(10,8,11,17) 2.9 - 26.1 -23.2 a Atomic numbering, according to Figure 1. b See Ref. [7]. c
Algebraic deviations (Å, degrees) between theoretical and
experimental values of the anion and molecule. The largest
values are given in bold.
The changes in the electronic structure of 4-
cyanobenzenesulfonamide, caused by its conver-
sion into azanion, can be demonstrated on the basis
of net electronic charges. Scheme 1 contains values
of net electric charges iq over fragments of mole-
cule 1 and azanion 2 studied. The electric charge
changes anion moleculei i iq q q are usually quite
informative to demonstrate the distribution of the
new (carbanionic, azanionic, etc.) charge between
individual fragments of anions [8,9,17,27,28] (and
references therein). According to our calculations,
the anionic charge in 4-cyanobenzenesulfonamide
azanion is distributed, as follows: 0.08, 0.25 and
0.10 e- are delocalized over the cyano, phenylene
and sulfonyl groups, respectively, and 0.57 e- of it
remains localized in the azanionic center.

A. D. Popova, E. A. Velcheva: IR spectral and structural changes, caused by the conversion of 4-cyanobenzenosulfonamide …
162
Scheme 1. Mulliken net electric charger qi over fragments of molecule 1 and azanion 2 of 4-
cyanobenzenesulfonamide.
CONCLUSION
We found on the basis of both experimental and
computational IR data that the effect of the
conversion of 4-cyanobenzenesulfonamide into
azanion on the cyano group was weak and was
essential on the pharmacological important
sulfonamide group. This statement was confirmed
by the analysis of both steric and electronic
structures, computed for the species studied.
REFERENCES
1. T. H. Maren, Annu. Rev. Pharmacol. Toxicol., 16,
309 (1976).
2. T. Mann, D. Keilin, Nature, 146, 164 (1940).
3. M. A. Ilies, Drug Design of Zinc-Enzyme Inhibitors:
Functional, Structural, and Disease Applications,
John Wiley & Sons, Inc., Hoboken, NJ, USA (2009).
4. K. Kanamori, J. D. Roberts, Biochem., 22, 2658
(1983).
5. M. C. Menziani, M. Cocchi, P. G. D. Benedetti, J.
Mol. Struct. (THEOCHEM), 88, 217 (1992).
6. I. Remsen, R. N. Hartman, A. M. Muckenfuss, Am.
Chem. J., 18, 163 (1896).
7. G. E. Cami, M. E. C. Villalba, P. Colinas, G. A.
Echeverria, G. Estiu, D. B. Soria, J. Mol. Struct.,
1024, 110 (2012).
8. A. D. Popova, E. A. Velcheva, B. A. Stamboliyska,
J. Mol. Struct., 1009, 23 (2012).
9. A. D. Popova, M. K. Georgieva, O. I. Petrov, K. V.
Petrova, E. A. Velcheva, Int. J. Quant. Chem., 107,
1752 (2007).
10. S. S. Stoyanov, J. A. Tsenov, D. Y. Yancheva, J.
Mol. Struct., 1009, 42 (2012).
11. S. Stoyanov, J. Phys. Chem., 114, 5149 (2010).
12. M. J. Frisch, G. W. Trucks, H. B. Schlegel, G. E.
Scuseria, M. A. Robb, J. R. Cheeseman, G. Scalmani,
V. Barone, B. Mennucci, G. A. Petersson, H.
Nakatsuji, M. Caricato, X. Li, H. P. Hratchian, A. F.
Izmaylov, J. Bloino, G. Zheng, J. L. Sonnenberg, M.
Hada, M. Ehara, K. Toyota, R. Fukuda, J. Hasegawa,
M. Ishida, T. Nakajima, Y. Honda, O. Kitao, H.
Nakai, T. Vreven, J. A. Montgomery, Jr., J. E.
Peralta, F. Ogliaro, M. Bearpark, J. J. Heyd, E.
Brothers, K. N. Kudin, V. N. Staroverov, R.
Kobayashi, J. Normand, K. Raghavachari, A.
Rendell, J. C. Burant, S. S. Iyengar, J. Tomasi, M.
Cossi, N. Rega, J. M. Millam, M. Klene, J. E. Knox,
J. B. Cross, V. Bakken, C. Adamo, J. Jaramillo, R.
Gomperts, R. E. Stratmann, O. Yazyev, A. J. Austin,
R. Cammi, C. Pomelli, J. W. Ochterski, R. L. Martin,
K. Morokuma, V. G. Zakrzewski, G. A. Voth, P.
Salvador, J. J. Dannenberg, S. Dapprich, A. D.
Daniels, O. Farkas, J. B. Foresman, J. V. Ortiz, J.
Cioslowski, and D. J. Fox, Gaussian 09, Revision
A.02, Gaussian, Inc., Wallingford CT, 2009.
13. C. Lee, W. Yang, R.G. Parr, Phys. Rev., B 37, 785
(1988).
14. A. D. Becke, J. Chem. Phys., 98, 56548 (1993).
15. J. Merrick, D. Moran, L. Radom, J. Phys. Chem. A,
111, 11683 (2007).
16. M. K. Georgieva, E. A. Velcheva, Int. J. Quantum.
Chem., 106, 1316 (2006).
17. L. I. Daskalova, J. Mol. Struct. (THEOCHEM), 848,
9 (2008).
18. F. G. Bordwell, Acc. Chem. Res., 21, 456 (1988).
19. M. K. Georgieva, N. B. Nedelchev, I. N. Juchnovski,
Bulg. Chem. Commun., 37, 235 (2005).
20. S. S. Stoyanov, A. D. Popova, J. A. Tsenov, Bulg.
Chem. Commun., 40, 538 (2008).
21. M. K. Georgieva, P. J. Vassileva-Boyadjieva, P. N.
Angelova, Bulg. Chem. Commun., 37, 366 (2005).
22. L. I. Daskalova, E. A. Velcheva, I. G. Binev, J. Mol.
Struct., 826, 198 (2007).
23. A. D. Popova, E. A. Velcheva, I. G. Binev, Asian
Chem. Lett., 13, 187 (2009).
24. E. A. Velcheva, L. I. Daskalova, I. G. Binev,
Bulg.Chem. Commun., 36, 230 (2004).
25. I. G. Binev, B. A. Stamboliyska, E. A. Velcheva,
Spectrochim. Acta, A52, 1135 (1996).
26. Y. Binev, C. Petkov, L. Pejov, Spectroch. Acta, 56A,
1949 (2000).
27. J. A. Tsenov, S. S. Stoyanov, I. G. Binev, Bulg.
Chem. Commun., 37, 361 (2005).
28. J. A. Tsenov, S. S. Stoyanov, I. G. Binev, Bulg.
Chem. Commun., 40, 320 (2008).

A. D. Popova, E. A. Velcheva: IR spectral and structural changes, caused by the conversion of 4-cyanobenzenosulfonamide …
163
ИЧ-СПЕКТРАЛНИ И СТРУКТУРНИ ПРОМЕНИ, ПОРОДЕНИ ОТ ПРЕВРЪЩАНЕТО НА
4-ЦИАНОБЕНЗЕНСУЛФОНАМИД В АЗАНИОН
А. Попова*, Е. Велчева
Институт по Органична химия с Център по Фитохимия, Българска Академия на Науките, ул. Акад. Г. Бончев,
бл. 9, 1113 София, България
Постъпила на 28 май 2014 г.; Коригирана на 14 юли 2014 г.
(Резюме)
Приложен е комбиниран ИЧ експериментален/DFT теоретичен подход за проследяване на спектралните и
структурни промени, породени от превръщането на 4-цианобензенсулфонамида в азанион. Ефектът на
превръщането се проявява слабо върху валентното трептение на нитрилната група C N
и силно върху двете
валентни трептения на сулфонамидната група 2
asSO и
2
sSO . Според изчисленията, превръщането в азанион
поражда значителни промени в структурата при и непосредствено до азанионния център. Според нашите
изчисления новият (азанионен) заряд се разпределя както следва: 0.08 е-, 0.25 е
- и 0.10 е
- са делокализирани
съответно върху циано, фенилен и сулфонилната групи и 0.57 е- от него остават локализирани при азаниония
център.

164
Bulgarian Chemical Communications, Volume 46, Special Issue A (pp. 164 – 169) 2014
Development of FTIR spectra database of reference art and archaeological materials
Z. I. Glavcheva1*, D. Y. Yancheva
1, Y. K. Kancheva
2, E. А. Velcheva
1, B. A. Stamboliyska
1
1Institute of Organic Chemistry with Centre of Phytochemistry, Bulgarian Academy of Sciences, Acad. G. Bonchev str.,
bl. 9, 1113 Sofia, Bulgaria 2National Gallery of Foreign Art, St. A. Nevsky Square, 1 19 Feb. str., 1000 Sofia, Bulgaria
Received June 06, 2014; Revised July 21, 2014
Dedicated to Acad. Dimiter Ivanov on the occasion of his 120th
birth anniversary
Fourier Transform Infrared (FTIR) spectroscopy is a reliable analytical technique to study both organic and
inorganic materials. FTIR spectroscopy has been widely applied in investigation of art and archaeological objects. The
specificity and complexity of such analysis require the availability of comprehensive database containing standards of
cultural heritage materials. In this paper, the development of FTIR spectra database of art and archaeological materials
is presented. The database provides absorption FTIR spectra, total attenuated reflectance (ATR) spectra, as well as
information on a number of pigments and dyes, adhesives, oils, resins, gums and other binders, bulk components, fillers
and etc. The composition of several ancient art and archaeological materials was determined by means of our spectral
database.
Key words: art and archaeological materials, database, FTIR, ATR
INTRODUCTION
Globally, there is a huge interest in preservation
of the cultural heritage. The care, maintenance and
investigation of the Bulgarian museums’ collections
play significant role in the conservation of the
Bulgarian cultural heritage. Protection, conser-
vation and restoration of cultural valuables are
needed in order to preserve them ensuring national
and worldwide appreciation. Archaeological, histo-
rical and artistic objects bear not only aesthetical
value but also can be considered for their historical
and cultural context. [1,2] In the field of fine arts,
archeological and monumental conservation, sci-
ence and technology play fundamental role for the
characterization of the materials constituting the
cultural heritage (historical buildings, monuments,
archaeological objects, works of art, ancient papers,
manuscripts, etc.) [3]. FTIR spectroscopic techni-
ques are widely used in investigation of both orga-
nic and inorganic art and archaeological materials
[1,3,4]. The main advantages of this spectroscopic
method are the speed, accessibility and the require-
ment for very small sample amount, the latter being
very important factor when studying artworks.
Thanks to these characteristics and the broader
scope of application for analysis of cultural heritage
objects, the FTIR spectroscopy has been selected as
main analytical method in many different types of
artwork investigations [3,4]. A large number of
papers have been published showing the impor-
tance of FTIR spectroscopy and covering all kinds
of specimens and materials used in different art
techniques in wall paintings [5-7], icons [8-11]
pottery [12,13], metal artifacts [14,15], poly-
chromed sculptures [16,17], etc.
In the process of artwork creation, various
inorganic and organic materials are used. Natural
aging and changes in environmental conditions
have specific impact on the cultural heritage objects
In order to have an appropriate identification of an
artwork material, it is essential to use spectral
database of standard art and archaeological mate-
rials. In general, the available spectral databases
[4,18-20] provide one spectrum per compound,
typically as an image file, thus the spectra cannot
be used with the appropriate spectroscopic software
and the information given about the material is not
sufficiently detailed.
The scope of the paper is focusing on develop-
ping FTIR spectra database of art and archaeo-
logical materials. All tested samples of reference
materials and Bulgarian art and archaeological art-
work samples are classified according to their type,
chemical composition and historical period in
which they were used. A matter of particular inte-
rest is the availability of their FTIR-ATR spectra.
This paper illustrates the usefulness of FTIR
spectroscopy as an applied method for the study of
cultural heritage presenting example spectra of
© 2014 Bulgarian Academy of Sciences, Union of Chemists in Bulgaria
* To whom all correspondence should be sent:
E-mail: [email protected]

Z. I. Glavcheva et al.: Development of FTIR spectra database of reference art and archaeological materials
165
some reference and artefacts materials. The e-lib-
rary would be a particularly useful tool for analy-
sing unknown cultural valuables by comparison
with similar artworks available in the database.
MATERIALS AND METHODS
Commercially available materials have been
selected on the basis of their chemical properties,
and their application as art and archaeological
materials. The main part of standard materials (pig-
ments and dyes, some natural and synthetic resins
and gums) has been kindly provided by the conser-
vator-restorers Yoana Kancheva and Elitsa
Tzvetkova and by the National Academy of Art,
Sofia. The remaining materials under study have
been purchased from Aldrich (e. g. calcium carbo-
nate, barium sulphate, gypsum) and from food su-
permarkets (e. g. egg, honey, beeswax, oils produ-
ced from walnut, sunflower, almond, sesame, soy-
beans, etc.). Some substances were synthesised in
the laboratory (e.g. Punic wax) or obtained from
natural sources (e.g. cherry gum).
All samples were characterized by means of
FTIR spectral methods. Vibrational spectra were
taken at standard conditions:
(а) Absorption spectra in the middle IR region
(4000-400 cm-1
)
(b) Reflection (ATR) spectra in the middle (4000-
600 cm-1
) IR region
Reference art and archaeological materials of
pigments and/or dyes, waxes, oils, resins, proteins,
gums, and different carbonates, sulphates, silicates,
etc., as well as ancient art and archaeological
materials were studied. The ancient art and
archaeological materials of organic origin were
obtained from the samples by extraction with a
suitable solvent. Commercially available spectral
quality solvents were used. The extracted solutions
were kept at room temperature for several days and
the dry materials were analysed.
All samples were measured in solid state (KBr
pеllet) and/ or in the case of ATR technique they
were directly applied on a diamond crystal. The
spectra were recorded on Bruker Tensor 27 FT
spectrometer with MIRacle-Diamond ATR ace-
ssory (Pike technologies). For KBr pellet technique,
a resolution of 2 cm-1
and 64 scans were applied
with background spectrum of pure KBr. In the ATR
measurements, the spectra were recorded with a
resolution of 2 cm-1
and 128 scans referencing to
the air as background spectrum.
DATA PROCESSING
All spectra were recorded and processed by
OPUS software (Bruker Optics). The absorptions of
the atmospheric moisture and carbon dioxide were
removed in all cases by automatic compensation
which is included in the software package OPUS,
version 6.5.
Spectral data were saved in several formats
(spectral-JCAM-DX and ASCII, and graphics-GIF,
JPG or PDF) in order to be easily compared with
the spectra of materials from real artistic and
archaeological objects, as well as to be processed
with the available spectrum software. For each
spectra the frequencies and intensities of the
characteristic bands were described.
RESULTS AND DISCUSSION
Multi-layered structure of each cultural heritage
object is a complex and complicated issue for
analysis. FTIR spectroscopy provides molecular
and structural information for the organic as well as
for inorganic materials. FTIR spectra of art and
archaeological standards (reference materials) were
measured. In order to provide more detailed
spectroscopic information, it is necessary to record
more than one spectrum for each sample.
Total attenuated reflectance (ATR) is a very
suitable and useful technique for the analysis of
artefacts, especially using high refractive index
crystal such as diamond. Due to its durability and
chemical inertness, it allows direct deposition on
the crystal without sample preparation for a wide
range of solid and liquid samples. Furthermore, the
ATR accessory available in our laboratory has a
very small diamond crystal, 2 mm across.
It diminishes the amount of sample required for
analysis to a few milligrams. When obtaining
spectra with this technique, it should be taken into
account that the absorption peak intensity shows
wavenumber dependency. As a result, the spectral
bands in the low wavenumber region appear with
enhanced intensity compared to those obtained with
absorption measurement with KBr technique. Also
peak deformation toward the first-order differential
form is possible in the ATR spectra of inorganic
and other high-refractive-index samples due to the
anomalous dispersion of the refractive index. Some
differences in the intensities, bands shapes and
peak’s position could appear depending on the
different spectra collection technique or sample
origin. As an example, the spectra of Gum Arabic
obtained by absorption measurement with KBr and
ATR are illustrated in Fig. 1. The stretching of

Z. I. Glavcheva et al.: Development of FTIR spectra database of reference art and archaeological materials
166
polysaccharides O-H group at 3429 cm-1
is shifted
at 3291 cm-1
in the case of ATR spectrum. Other
notable FTIR pattern differences are the two intense
C-O stretching bands at 1073 cm-1
and 1032 cm-1
in
the absorption spectrum and the corresponding
shoulder at 1063 cm-1
and peak at 1026 cm-1
in the
ATR spectrum.
Fig. 1. Normalized FTIR spectra of Arabic gum: KBr
pellet (black line), ATR-FTIR on a diamond crystal (red
line).
The data for each standard contains spectral and
additional (name, synonyms, origin, etc.)
information (example- Gum Arabic Fig. 1 and
Animal glue Table 1). The presence of such
additional information is quite helpful. For
example, identical names have been used to
describe more than one pigment in antiquity. In
Roman times, minium was reserved for cinnabar
(HgS) but was applied increasingly to red lead
(Pb3O4) by the Renaissance [21]. On the other hand,
most of the varnishes, binders, dyes, pigments and
etc. included in the artworks have their own history
of occurrence and certain (historical) periods of use
as well as geographical areas of distribution. This
information can be added to the results of chemical
analyses (and sometimes by the method of
exclusion) in order to specify and limit the search.
Some materials used in artworks are not
commercially available. Such example is the Punic
wax, which is produced by boiling beeswax with
alkaline carbonates or hydroxides. In this way, the
esters and free fatty acids in the beeswax are
partially converted into alkaline salts (soaps).
Emulsions of Punic wax in water were used as paint
vehicle. In order to provide a reference spectrum of
Punic wax, a sample of beeswax purchased from
the local market was subjected to saponification by
potassium carbonate (potash) according to a
literature recipe [22]. The obtained emulsion was
dried on glass and the spectrum was measured by
ATR technique. The superimposed spectra of
beeswax and Punic wax are presented in Fig. 2. The
main difference between the spectra of beeswax
and Punic wax is the appearance of IR bands for the
carboxylate stretching vibrations at 1561 and 1414
cm-1
. Saponification was carried out also by
potassium hydroxide and led to the same spectral
changes.
Table 1. Animal glue information. Name Animal glue
Obsolete and
synonym
names/Varieties
Hide glue, bone glue, skin glue, fish glue,
etc.
tutkal (in Bulgarian)
Origin Animal (rabbit, fish, goats, sheep, etc.)
Chemical
composition
Natural organic product extracted from
animal tissues and bones.
It consists primarily of gelatine and other
proteins, residues of collagen, karate or
elastin.
Compatibility
and permanence
It swells when it is soaked in cold water
and it may be dissolved by gentle heating.
When dry it hardens but do not change
chemically. Thus it can be dissolved again
in water.
Use and
applications
Adhesive, binder of pigments and grounds
(primers), consolidating agent.
Possible
adulterations
and mixtures
The addition of a bulking agent to the glue
causes some changes in the chemical and
physical properties of the protein network,
most of these correlate to changes seen in
cross-linked polymers.
FTIR Spectrum sample 1, sample 2, sample 3,….
ATR-FTIR
Spectrum sample 1, sample 2, sample 3,…
Fig. 2. ATR-FTIR spectra of reference beeswax (black
line) and Punic wax (red line).
Vegetable drying oils (sometimes with or
without the addition of siccative) were used in the
paintings as binding media. In order to provide
more versatile examples, including some oils

Z. I. Glavcheva et al.: Development of FTIR spectra database of reference art and archaeological materials
167
typically used in Bulgarian artistic objects, several
reference spectra were recorded. This group
includes linseed oil which is commonly used in the
painting art in many countries and oils from some
other locally grown seeds - sunflower, walnut, corn
etc. Vegetable oils consist basically of triglycerides
with different substitution patterns whose main
differences are the degree and the form of
unsaturation of the acyl groups and their length.
Despite of these differences, the IR spectra of
vegetable oils show a great similarity (Fig. 3). The
discrimination is possible based on the position of
band of the C-H stretching of the cis-double bond
above 3000 cm–1
. The oil composition affects the
exact position of this band which for vegetable oils
rich in polyunsaturated fatty acids such as linseed
oil, is about 3010 cm–1
. In oils with higher content
of monounsaturated fatty acids, such as olive and
almond oil, the band appears about 3005 cm-1
. The
ratio of the absorbance of the bands responsible for
the C-H stretching of the cis-double bonds and the
asymmetric C-H stretching the methylene bonds at
2925 cm–1
could also be used for differentiation.
Fig. 3. FTIR-ATR spectra of linseed (black line), walnut
(red line), sunflower (blue line) and corn oils (green
line).
The interpretation of the spectra of art and
archaeological samples were carried out by
comparing the spectra of the reference materials.
This allows identification of the materials of
interest in actual samples and establishing their age.
When it was impossible to use “automatic search”
for analysing the vibrational spectra from the
available electronic spectral database (since this
method is only reliable for pure samples and the
investigated materials usually are complex mixture
of different substances), it was more appropriate to
apply an analytical approach, namely: "peak by
peak" comparison of the spectrum of the sample
with the characteristic bands in the spectrum of
reference material taking into account aging,
atmospheric and degradation process, as well as
applying of the fundamental analytical approach in
IR spectral analysis. This method is slower but
gives much better results and usually all peaks of
the samples could be identified. As an illustration
the spectrum of a red sample from the Thracian
tomb wall paintings at Alexandrovo, Bulgaria
(fourth century BC), is given in Fig.4, together with
spectra of CaCO3 and red ochre standards. It is
obvious that this archaeological sample contains
both materials CaCO3 (characteristic bands at 2512,
1797, 1427, 876 and 712 cm-1
) and red ochre
(characteristic bands at 3698, 3621, 3427, 1092,
1032, 1009, 913, 799, 778, 538 and 472 cm-1
).
Fig. 4. FTIR spectra (KBr pellet) of Alexandrovo
Thracian tomb wall paintings red sample (black line);
standard CaCO3 (blue line) and standard red ochre (red
line).
Thanks to the high sensitivity for organic
compounds, FTIR spectroscopy is indispensable
when studying organic materials used in artworks
and archaeological sites. However, since usually
the analysed sample is a complex matrix of several
materials, FTIR spectrum often includes collective
information for the primer, pigment and/or binder,
etc. This leads to complications when identifying
individual components due to overlapping of
spectral bands and relative signal intensity. As an
example, the spectra of archaeological sample
(decoration with white incrustation paste) from
Deneva Mogila (dated in the early or in the late
Chalcolithic period), located south-east from the
village of Salmanovo, Bulgaria are presented (Fig.
5). The predominant compound in the studied
archaeological sample is CaCO3. The binder was

Z. I. Glavcheva et al.: Development of FTIR spectra database of reference art and archaeological materials
168
extracted with distilled water. After water
evaporation white medium was obtain. The exact
composition of the binder is under investigation.
According to historical information and the FTIR
spectrum of water-extracted mass (aggregation)
(Fig. 5, red line) the closest presumable binder
compound is gum from a plant origin (such as Gum
Arabic or Cherry gum).
Fig. 5. FTIR spectra (KBr pellet) of Devina Mogila
white sample (black line); reference CaCO3 (blue line)
and binder in Devina Mogila sample (red line).
CONCLUSION
The necessity and usefulness of FTIR database
of reference art and archaeological materials have
been demonstrated using various examples. Taking
into account the collected spectroscopic, art,
archaeological and historical information, it is
possible to gain appropriate and complete artefact
information.
The currently available FTIR database of
reference art and archaeological materials needs to
be constantly updated. Also fluorescence
spectroscopic analysis, additional information and
materials (modern art materials, conservation
products, mixtures, etc.) will be included. The
provision of a much wider and more comprehensive
database of standards would facilitate more
accurate study and description of art and
archaeological materials. Moreover, the data on
newly studied cultural heritage objects will be
included in order to create artefacts’ database which
will be useful in investigation of other art and
archaeological objects. This will be of great benefit
to the cultural heritage preservation science and
society in Bulgaria and worldwide.
REFERENCES
1. I. Kuleff, Archaeometry, Sv. Kliment Ohridski,
Sofia, 2012.
2. H. G. M. Edwards, J. M. Chalmers, Raman
Spectroscopy in Archaeology and Art History, Royal
Society of Chemistry, Cambridge, 2005.
3. G. Bitoss, R. Giorgi, M. Mauro, B. Salvadori, L. Dei,
Appl. Spectros. Rev., 40, 187 (2005).
4. M. R. Derrick, D. Stulik, J. M. Landry, Infrared
Spectroscopy in Conservation Science, The Getty
Conservation Institute Los Angeles, 1999.
5. C. Maruţoiu, I. Bratu, A. Trifa, M. Botiş, V. C.
Maruţoiu, Int. J. Conserv. Sci., 2, 29 (2011).
6. J. Cuní, P. Cuní, B. Eisen, R. Savizky, J. Bové, Anal.
Methods, 4, 659 (2012).
7. M. L. V. de Ágredos Pascual, M. T. D. Carbó, A. D.
Carbó, J.Cult. Herit., 12, 140 (2011).
8. D. Kovala-Demertzi, L. Papathanasis, R. Mazzeo, M.
A. Demertzis, E. A. Varella, S. Prati, J. Cult. Herit.,
13, 107 (2012).
9. I. C. A. Sandu, S. Bracci, I. Sandu, M. Lobefaro,
Microsc. Res. Techniq., 72, 755 (2009).
10. I. C. A. Sandu, C. Luca, I. Sandu, V. Vasilache, M.
Hayashi, Rev. Chem. (Bucuresti), 59, 384 (2008).
11. A. Baciu, Z. Moldovan, I. Bratu, O.F. Măruţoiu, I.
Kacsó, I. Glăjar, A. Hernanz, C. Măruţoiu, Curr.
Anal. Chem., 6, 53 (2010).
12. D. Barilaro, G. Barone, V. Crupi, D. Majolino, P.
Mazzoleni, G. Tigano, V. Venuti, Vib. Spectrosc., 48,
269 (2008).
13. S. Legnaioli, F. A. Garcia, A. Andreotti, E. Bramanti,
D. D. Pace, S. Formola, G. Lorenzetti, M. Martini, L.
Pardini, E. Ribechini, E. Sibilia, R. Spiniello, V.
Palleschi, Spectrochim. Acta A, 100, 144 (2013).
14. J. Baeten, K. Romanus, P. Degryse, W. De Clercq,
H. Poelman, K. Verbeke, A. Luypaerts, M. Walton,
P. Jacobs, D. De Vos, M. Waelkens, Microchem. J.,
95, 227 (2010).
15. W. Luo, T. Li, C. Wang, F. Huang, J. Archaeol. Sci.,
39, 1227 (2012).
16. D. Cauzzi, G. Chiavari, S. Montalbani, D. Melucci,
D. Cam, H. Ling, J. Cult. Herit., 14, 70 (2013).
17. A. Sarmiento, M. Pérez-Alonso, M. Olivares, K.
Castro, I. Martínez-Arkarazo, L. A. Fernández, J. M.
Madariaga, Anal. Bioanal. Chem., 399, 3601 (2011).
18. C. Montagner, M. Bacci, S. Bracci, R. Freeman, M.
Picollo, Spectrochim. Acta A, 79, 1669 (2011).
19. http://www.irug.org
20. http://www.ut.ee/katsekoda/IR_Spectra/index1.htm
21. H. G. M. Edwards, D. W. Farwell, E. M. Newton, F.
R. P. Miium, Analyst, 124, 1323 (1999).
22. H. Kühn, Stud. Conserv., 2, 71 (1960).

Z. I. Glavcheva et al.: Development of FTIR spectra database of reference art and archaeological materials
169
СЪЗДАВАНЕ НА СПЕКТРАЛНА БАЗА ДАННИ ОТ РЕФЕРЕНТНИ ХУДОЖЕСТВЕНИ И
АРХЕОЛОГИЧЕСКИ МАТЕРИАЛИ
З. И. Главчева1*, Д. Я. Янчева
1, Й. К. Кънчева
2, Е. А. Велчева
1, Б. А. Стамболийска
1
1Институт по Органична химия с Център по Фитохимия, Българска Академия на Науките, ул. Акад. Г. Бончев,
бл. 9, 1113 София, България 2Национална галерия за чуждестранно изкуство, Площад "Св. Александър Невски", ул. 19 февруари 1, 1000
София, България
Постъпила на 06 юни 2014 г.; Коригирана на 21 юли 2014 г.
(Резюме)
ИЧ спектроскопията е надеждна аналитична техника за изследване както на органични, така и на
неорганични материали. Тя намира широко приложение при анализа на художествени и археологически
обекти. Спецификата и сложността на подобни анализи изисква наличието на обширна база данни на
референтни художествени и археологически материали. Настоящата работа представя създаването на
спектрална ИЧ база данни на такива материали. Базата данни съдържа набор от абсорбционни и отражателни
(ATR) спектри, както и информация за голям брой пигменти, багрила, лепила, масла, смоли, гуми, и други
свързватели, градивни материали, пълнители и т.н. Материалният състав на различни старинни художествени и
археологически обекти беше определен с помощта на създадената спектрална база данни.

170
Bulgarian Chemical Communications, Volume 46, Special Issue A (pp. 170 – 178) 2014
IR spectra and structure of 1,1,3,3-tetracyanopropane and its carbanions:
experimental and quantum chemical study
S. S. Stoyanov*, J. A. Tsenov
Institute of Organic Chemistry with Centre of Phytochemistry, Bulgarian Academy of Sciences, Acad. G. Bonchev str.,
bl. 9, 1113 Sofia, Bulgaria
Received June 10, 2014; Revised July 21, 2014
Dedicated to Acad. Dimiter Ivanov on the occasion of his 120th
birth anniversary
A combined IR experimental/DFT computational approach has been applied to follow the spectral and structural
changes, caused by the conversion of 1,1,3,3-tetracyanopropane in mono-, di-, and trianion. The conversion of molecule
into carbanion has shown a weak effect on the cyano stretching band ν(C≡N) of cyanogroups remote of anionic center
(down to 13 cm-1
) and strong on the cyano stretching band ν(C≡N) of cyanogroups which are directly bonded with
anionic center (down to 140 cm-1
). The carbanionic charge is distributed mainly at anionic centre and cyanogroups
which are directly bonded to it (overall 0.85 e-). The conversion of the molecule into di- and trianion are pursued with
stronger lowering of ν(C≡N) down to 300 cm-1
. A very good agreement between experimental and theoretical data has
been found. According to the computations the anionic charge formed by second and third step of deprotonation is
distributed nearly uniformly over all fragments.
Key words: IR spectra, DFT B3LYP, structure, 1,1,3,3-tetracyanopropane, anion
INTRODUCTION
1,1,3,3-Тetracyanopropane (methylene-bis-ma-
lononitrile) 1 in Scheme 1 was synthesized for the
first time by Diels as early as in 1922 [1] from
formaldehyde and malononitrile, with vinylidene
cyanide 2 (1,1-dicianoetan) as intermediate [1-3].
Scheme 1. Methylene-bis-malononitrile 1 and some
possible products of its decomposition.
Compound 1 and its derivatives undergo
reaction of cyclo-dimerization (Michael-Thorpe)
[2-5], leading to the formation of cyano-containing
cyclohexane amines and imines (see Scheme 1) or
decomposition to vinylidene cyanide ("reverse"
Michael) [2]. There are complexes of 1 with
transition metals such as Au and Pt [6,7]. A detailed
study of the structure on 1 by IR, Raman, mass
spectra and X-ray diffracttion has been reported [8].
Although the structure, chemistry and covalent
complexes of methylene-bis-malononitrile with
transition metals are studied, there are no data about
its anions available in the literature.
Scheme 2. Methylene-bis-malononitrile 1 and its anions
2-4.
Its mono- and dianion 2, 3 (Fig. 1) are clearly
intermediates in many of the above reactions. The
purpose of the present study is to generate the
anions of methylene-bis-malono-nitrile and investi-
gate their structure and IR spectra on the basis of
experimental/DFT computational approach.
EXPERIMENTAL
Synthesis of neutral compound
Malononitrile is hightly reactive and polymerize
on being kept. For this reason commercial malono-
© 2014 Bulgarian Academy of Sciences, Union of Chemists in Bulgaria
* To whom all correspondence should be sent:
E-mail: S_Stoyanov @orgchm.bas.bg

S. Stoyanov, J. Tsenov: IR spectra and structure of 1,1,3,3-tetracyanopropane and its carbanions: experimental and quantum …
171
1a 1b
0 50 100 150 200 250 300 350
0
5
10
15
20
25
30
E (
kJ.m
ol-1
)
Diedric Angle С(3)-С(1)-С(2)-Н(8)
1a
1b
1c
1c Energy differences between formations
Fig. 1. Stability of conformers of methylene-bis-malononitrile 1.
nitrile (Aldrich) was used in present study after
purification by vacuum distillation. The resulting
distillate was crystallized in colorless crystals of
melting point 30ºC. 1,1,3,3-Tetratsianopropane 1
was synthesized by modifying the method of Bell et
al. [6] (Scheme 3).
Scheme 3. Synthesis of 1 by Bell et al. [6].
In a round bottom flask equipped with a stirrer
and thermometer 7.5 ml 96% ethanol were mixed
with 1.5 g (0.0227 mol) of purified malononitrile.
The mixture was heated to 40ºC and stirred until
malononitrile was completely dissolved. The solu-
tion was cooled in ice bath to 10-12º C, and 0.86 ml
(0.0144 mol) of 37% formaldehyde, and a few
crystals of β-alanine as catalyst were added. The
stirring was continued at this temperature, the
solution became yellow (formation of vinylidene
cyanide). When the solution became cloudy (app. 1
hour after the start) the reaction was stopped. 15
minutes after the crystallization started the mixture
was filtered and washed several times with ice cold
ethanol. The product was used without further
purification. The product was dried and showed m.
p. 132-135ºC. The reaction is highly influenced by
the temperature and stoichiometry and several
adverse reactions such as polymerization and cyclo-
dimerization to side products are possible to occur
(Scheme 1).
Conversion of neutral compound into anions
The monoanion of methylene-bis-malononitrile
(DMSO solution) was prepared by adding dimethyl
sulfoxide solution of the parent compound to excess
of dry CH3O-
Na+ under argon, stirring and
collecting the clear anion solution with a syringe-
filter. We prepared the sample of dry CH3O-
Na+
itself by reacting CH3OH with Na and evaporating
the excess of methanol in vacuo. Methylene-bis-
malononitrile 1 reacted with CH3O-Na
+ to form
monoanion in DMSO promptly (within 1-2 min)

S. Stoyanov, J. Tsenov: IR spectra and structure of 1,1,3,3-tetracyanopropane and its carbanions: experimental and quantum …
172
and practically completely: no bands of the parent
compound were shown in the spectra after
metalation. The IR spectra were recorded on Bruker
Tensor 27 FTIR spectrometers in a CaF2 cell of
0.129 mm path length, at a resolution of 1cm-1
and
64 scans.
The dianion of the methylene-bis-malononitrile
was prepared by reacting with dimsyl sodium
(Sodium salt of dimethylsulfoxide). Dimsyl sodium
was formed by reacting sodium metal with excess
of DMSO. The solution of this reagent (excess) was
added to the solution of the neutral compound 1 and
transferred to IR cell, previously flushed with
argon. The conversion was nearly complete. The IR
bands, corresponding to dianion strongly dominate
over those, corresponding to monoanion. The latter
bands appeared like little shoulders.
Trianions of methylene-bis-malononitrile 1 were
prepared by reacting with red naphthalene lithium,
naphthalene sodium and naphthalene potassium in
THF solution. Alkali reagents (dianions of naphtha-
lene) were formed previously in ampulla with
excess of alkali metals in dry THF. The metal
reagents (more than 3-fold excess) were added to
the solution of neutral compound 1 and were
transferred immediately into IR cell, previously
flushed with argon. The conversion into trianions
was incomplete, as in all spectra bands corres-
ponding to their dianions appeared.
COMPUTATIONS
Full optimization of geometries was done using
Gaussian-98 program package [9]. We performed
DFT B3LYP computations, the latter combined
Becke’s three-parameter nonlocal exchange [10]
with the correlational functional of Lee, Yang and
Parr [11-12], adopting a 6-31++G** basis set
without any symmetry restrictions. The stationary
points found on the potential energy hypersurfaces
for each structure, were characterized using the
standard harmonic vibrational analysis. The
absence of imaginary frequencies confirmed that
the stationary points corresponded to local minima
on the potential hypersurfaces. A standard least-
squares program was used to calculate the single-
parameter linear regression indices.
RESULTS AND DISCUSSION
Energy analysis
B3LYP/6-31++G** theoretical level has been
chosen to perform all computations. This level
2a ΔE = 0 kJ.mol
-1 2b ΔE = 0 kJ.mol
-1
0 50 100 150 200 250 300 350 400
0
5
10
15
20
25
30
E (
kJ.m
ol-1
)
Dihedral Angle H(13)-C(1)-C(3)-C(8)
2a2b
-50 0 50 100 150 200 250 300 350 400
0
5
10
15
20
E (
kJ.m
ol-1
)
Dihedral Angle H(14)-C(1)-C(2)-C(4)
2a2a
Energy differences between confirmations by
rotation around C(1)-C(3) bond Energy differences between confirmations by
rotation around C(1)-C(2) bond
Fig. 2. Stabilities of the conformers of methylene-bis-malononitrile carbanion 2.

S. Stoyanov, J. Tsenov: IR spectra and structure of 1,1,3,3-tetracyanopropane and its carbanions: experimental and quantum …
173
3a 3b 4
Fig. 3. Optimized structures of di- 3a-3b and trianion 4 of methilene-bis-malononitrile.
shows a good prediction of IR spectra of nitriles
and their anions [13-19]. The mean absolute
deviation (MAD) of predicted values of cyano
stretching frequencies for a large series of nitriles is
6 cm-1
аnd 11 cm-1
in a series of nitrile anions [19].
Different conformations of the molecule of
methylene-bis-malononitrile 1 by rotation around
C(1)-C(3) and C(1)-C(2) bonds in steps of 6° are
presented in Fig 1. According to the theoretical
calculations, among all possible conformations of
the molecule 1 the three most stable conformers 1a-
1c should exist. 1a possess the lowest energy
among them, and the energy difference between 1a
and the other two is approximately 12 and 17
kJ.mol-1
. According to the X-ray diffraction [8],
only 1a exists in the crystalline state. IR spectra
measured in DMSO, THF and CHCl3 solutions
show no evidences for the presence of more than
one conformer. So, we can assume, that only 1a
exists in solution. We have calculated the energy of
the different conformations of the anion 2 (Fig. 2),
by rotation around C(1)-C(3) and C(1)-C(2) bonds
in steps of 6°. Four minima were found by this
procedure. By reason of symmetry of anionic
dicyanomethanide fragment three of them corres-
pond to identical structure - 2a. The fourth structure
2b in fact is a chiral conformer of 2a, which is
energetically degenerated. For di- and trianion 3-4
there is only one stable conformer (Fig 3).
However, 3 possesses a chiral axis and two
enantiomers 3a and 3b.
Spectral analysis
In Table 1 the theoretical and experimental
frequencies of the molecule of methylene-bis-
malononitrile 1 measured in solid state are
presented. They show a very good correlation:
correlation coefficient R=0.99985; standard devia-
tion SD = 14.75; number of points n = 28. The
resulting correlation Equation (1) is used for scaling
the theoretical frequencies:
0.94388 43.0scaled native (1)
The mean absolute deviation (MAD) is 11 cm-1
.
This value lies within the range 9-25 cm-1
, typical
for molecules and anions containing cyano and
carbonyl groups [20-24].
In the IR spectra of methylene-bis-malononitrile
1 nitrile vibrations are four, two of them are
symmetrical and degenerated and two are asym-
metrical also degenerated (see Table 2). The
splitting between them is only several cm-1
, so only
a single band was observed in the solid-state and
solution IR spectra. However a distinct high-
frequency shoulder is present corresponding to
νs(C≡N). In the IR spectra measured in DMSO-d6
solution the bands responsible for νC-H stretching
vibrations decrease around 30-70 cm-1
in
comparison to the corresponding bands observed in
KBr tablet. These shifts are due to hydrogen
bonding with the molecules of solvent DMSO.
Similar to molecule 1 in the IR spectra of di-
and trianions 3, 4, the stretching vibrations of the
cyano group have mixed origin (see Table 2). In the
molecule the frequencies of both symmetric and
asymmetric vibrations are very close to each other,
and they have in phase and anti-phase components
(Table 2). The differences in the frequencies are a
bit larger in the free di- and trianion 3, 4 than
observed in the molecule 1. They also have in-
phase and anti-phase components. Only in the free
carbanion 2 the four nitrile vibrations are isolated.
The νC≡N in the anionic fragment are lower than
those corresponding to the fragment which is
remote from the anionic centre and they are stron-
gly decoupled. The frequencies and intensities of
former bands are very similar to those, observed in
other dicyanomethanides [14,15,17,21-23]. They

S. Stoyanov, J. Tsenov: IR spectra and structure of 1,1,3,3-tetracyanopropane and its carbanions: experimental and quantum …
174
interact much less with νC≡N of the cyano groups
remote from carbanion centre. In general, the
relative intensities of the latter are very low and the
frequencies are close to those observed in the
molecule 1.
Fig. 4 illustrates the experimental and theoretical
spectral changes caused by the conversion of the
molecule in the anions. Given the data in Table 2
and Figure 4, we can conclude that the conversion
of the molecule 1 in anion 2 causes a decrease in
nitrile frequencies of the cyano group in carbanion
center predicted by theory as 98 (νsC≡N) and 139
cm-1
(νas
C≡N), and observed in practice - 96 and
135 cm-1
respectively. The conversion of the carb-
anionanion 2 into dianion 3 leads to further
decrease of nitrile frequencies. It is larger in the
cyano group directly bonded to the second carb-
anionic center: predicted 128, measured 126 cm-1
.
The lowering of the nitrile frequency at the first
carbanionic center is smaller: predicted 52, measu-
red 35 cm-1
. Theory provides further lowering in
the nitrile frequencies at conversion of the dianion
3 into trianion 4 of about 50-70 cm-1
. We could not
obtain measurable amounts of trianion in DMSO
solution, which generally can be expected to exist
as free (uncoordinated) anion. However the IR
spectra in THF solution show presence of mixture
of di- and trianion. The conversion to trianion is
significant when counterion is K+, higher when
counterion is Na+, and dominant when counterion is
Li+. This fact allowed to decompose the complex
bands into components. The polarity of THF as a
Table 1. B3LYP 6-31++G** theoretical and experimental (KBr tablet) frequencies(ν в cm-1
) and relative
intensities of methylene-bis-malononitrile molecule 1.
No. Theoretical data Experimental data
a
νb A Approximate description
c ν Ad
1 3020 0.2 νas
(CH2) 3020 m
2 2965 0.6 νs(CH2) 2959 m
3 2916 2.2 ν(CH) }2912 vw
4 2915 4.9 ν(CH)
5 2282 1.8 νs (C≡N)
}2278 sh 6 2281 0.1 ν
s (C≡N)
7 2275 0.4 νas
(C≡N) }2266 m
8 2275 0.5 νas
(C≡N)
9 1452 6.7 δsciss
(CH2) + δ(CH) 1450 s
10 1349 6.5 γwag
(CH2) + δ(CH) 1370 w
11 1325 5.3 γtwist
(CH2) + δ(CH) 1340 w
12 1293 3.8 ν(CC) + δ(CH) + γwag
(CH2) 1293 m
13 1287 2.7 δ(CH) + γtwist
(CH2) 1284 m
14 1243 3.7 δ(CH) + γwag
(CH2) 1247 s
15 1177 0.6 ν(CC) + δ(CH) + γwag
(CH2) 1181 m
16 1056 4.9 ν(CC) + ν(C-CN) 1072 m
17 1054 7.7 ν(CC) + ν(C-CN) 1072 m
18 1018 7.0 ν(CC) 1058 s
19 992 0.1 ν(CC) + δ(CH) 1020 s
20 948 7.3 ν(CC) 953 m
21 854 0.1 ν(C-CN) + ν(CC) 850 w
22 792 4.6 ν(C-CN) + ν(CC) 787 w
23 621 7.4 δ(C-CN) + δ(skeletal) 602 m
24 587 0.2 δ(C-CN) + δ(skeletal) 571 m
25 585 0.4 δ(C-CN) + δ(skeletal) 571 m
26 579 0.8 δ(C-CN) + δ(skeletal) 562 m
27 500 0.6 δ(skeletal) + δ(C-CN) 482 m 28
e 479 0.4 δ(skeletal) + δ(C-CN) 464 m MAD
f 10.86 - - - - aMeasured after having decomposed the complex bands into components. bScaled, according to correlation Eqn. (1). cVibrational modes: ν, stretching; δ, in-plane bending; γ, out-of-plane bending; superscripts: s, symmetrical; as, asymmetrical;
sciss, scissoring; wag, wagging. dRelative intensities: s, strong; m, moderate; w, weak; v, very; sh, shoulder. eFollowed by 11
lower-frequency vibrations. fMean absolute deviation.

S. Stoyanov, J. Tsenov: IR spectra and structure of 1,1,3,3-tetracyanopropane and its carbanions: experimental and quantum …
175
Table 2. B3LYP/6-31++G** theoretical and experimental (ν in cm-1
DMSO solutions) nitrile frequencies and
relative intensities for methylene-bis-malononitrile molecule 1 and their anions 2-4.
No. Theoretical data Experimental data
a
νb A
c Approximate description
d ν Ae
1
2266 0.7 )( NCs
af 2264 sh
2265 0.0 )( NCs
sf 2264 sh
2259 0.1 )( NCas
sf 2258 vw
2259 0.2 )( NCas
af 2258 vw
2
2269 7.2 )( NCs 2268 w
2253 14.4 )( NCs 2251 w
2168 73.9 )( NCas 2161 m
2120 261.2 )( NCas 2113 s
3
2141 16.9 )( NCs
sf 2142 m
2128 157.8 )( NCs
af 2115 vw
2074 679.9 )( NCas
sf 2091 s
2068 114.0 )( NCas
af 2078 s
4
2061 21.7 )( NCs
sf 2111f m
2056 266.1 )( NCs
af 2071f m
1975 764.3 )( NCas
sf 1975f s
1969 3.2 )( NCas
af 1969f m
MADf 8.0 - - - -
aMeasured after having decomposed the complex bands into components. bScaled with 0.9552 for νC≡N for molecule of 1 and
0.9642 for anions 2-4 [19]. cScaled theoretical intensities with 0.4010 [19] dVibrational modes: ν, stretching;, s-symmetrical,
as-asymmetrical, sf-sinphase, af-antiphase. eRelative intensities: m, moderate; w, weak; v, very; sh, shoulder. fMeasured in
THF solution, counter-ion Na+.
2300 2200 2100 2000 1900 1800
monoanion
dianion
trianion
Ab
so
rba
nce
Un
its
Frequencies
23
4
2300 2200 2100 2000 1900 1800
Ab
so
rba
nce
Un
its
Frequencies
2
3
4
(a) (b)
Fig. 4. Experimental (a) and theoretical (b) IR spectra of anions 2-4 in nitrile stretch region 2300-1800 cm-1
.
solvent is significantly lower than DMSO and we
have no doubts in the existence of ion aggregation.
The position of nitrile bands varies within 10 cm-1
depending on counterion (Li+, Na
+, K
+). Never-
theless, the nitrile frequencies of trianion 4 are
predictted satisfactorily by the computations
performed for the free trianion.
As we can see in Table 2, the theory predicts
very well the frequencies of the bands observed in
the nitrile stretch region. By analogy with other
studied anionic dicyanometanides we believe that
the same can be said about the intensity. The
theoretical values of intensities of carbanion 2 lies
in the interval 50-100 km.mol-1
for νs(C≡N) and
200-300 km.mol-1
for νas
(C≡N) typical for other
dicyanometanides [14-19]. The mean absolute
deviation (MAD) for nitrile frequencies is only 8

S. Stoyanov, J. Tsenov: IR spectra and structure of 1,1,3,3-tetracyanopropane and its carbanions: experimental and quantum …
176
cm-1
and it is smaller than those observed in a wide
variety of nitriles, and their anions [18,19].
Structural analysis
The experimental [8] and theoretical data on the
structure of the molecule 1 are compared in Table
3. It is interesting, to note that according to the
experimental data the comparison of methylene-bis-
malononitrile with maloninitrile shows a significant
lengthening of the triple bond of the cyano group:
1.157 Å [25] (Table 3), malononitrile 1.132 Å [8].
The theory does not provide similar effect and the
differences are in the fourth digit. However bond
angles, are predicted good by the theory, as the
average absolute deviation is in the first digit.
According to the computations, the conversion
of the molecule 1 into monoanion 2 and the mono-
ion 2 into dianion 3 (Scheme 1, Fig 2, 3) leads to
change of the configuration of the carbanionic
centres from sp3 to sp
2 (atom C(2) and atom C(3)).
Only the formation of third anionic center (atom
C(1)) leads to preservation of the tetragonal confi-
guration. According to the data listed in Table 3 the
largest structural changes are at and near to the
carbanionic centers. On every step of deprotonation
C≡N bonds are lengthened, and C-CN bonds are
shortened. The changes in bond lengths and bond
angles remote from the carbanionic centrer are
smaller.
The electronic structure of the molecule and the
anions of methylene-bis-malononitrile is presented
in Scheme 4. The electronic charge changes qi =
qi(anion) - qi(molecule) are usually quite informa-
tive to demonstrate the distribution of the new
carbanionic charge over individual fragments of
anions. These charge changes of the fragments at
each step of deprotonation are given in parentheses.
According to the theory, the changes in electron
density are greatest in and near to the newly created
carbanion centers, and yet they are distributed in all
fragments. Upon conversion of the molecule 1 to
carbanion 2 and the carbanion 2 to dianion 3 the
electron density of cyano groups situated far from
the new carbanionic centers increases by 0.08 e-
and 0.14 e- respectively. The electronic density of
the newly created charge in 2 and 3 is distributed
almost uniformly between the carbanion center and
the cyano groups (0.42 to 0.49 e-) attached to it.
0.56 e- of the third carnanionic charge remains
localized in the middle fragment and the remaining
electron density is distributed over the four cyano
groups.
Table3. B3LYP/6-31++G** theoretical and experimental (Roentgen diffraction) bond lengths (Ǻ) and bond angles
(degree) of methylene-bis-malononitrile 1 and its anions 2-4. The largest changes in the values are given in bold. bond lengths
and bond
anglesa
Molecule 1 Monoanion 2 Dianinon 3 Trianion 4
Theoretical
data
Experimental
data [8]
Theoretical
datab
Theoretical
datab
Theoretical
datab
C(4)≡N(5) 1.160 1.132(3) 1.178 1.183 1.195 C(6)≡N(7) 1.160 1.132(3) 1.179 1.185 1.191
C(8)≡N(11) 1.160 1.132(3) 1.161 1.183 1.195 C(9)≡N(10) 1.160 1.132(3) 1.162 1.185 1.191 C(1)–C(2) 1.556 1.546(3) 1.501 1.153 1.527
C(2)–C(4) 1.475 1.486(3) 1.402 1.400 1.408 C(2)–C(6) 1.473 1.478(3) 1.402 1.398 1.402
C(1)–H(14) 1.092 1.03(2) 1.099 1.100 1.099
C(2)–H(8) 1.099 1.04(2) - - -
MAD 0.029 - - - - <C(2)C(4)N(5) 178.0 177.9(3) 175.5 179.2 175.4 <C(2)C(6)N(7) 176.6 176.6(3) 178.2 178.5 178.1 <C(1)C(2)C(4) 110.1 108.8(2) 117.9 121.7 121.1 <C(4)C(2)C(6) 111.0 110.3(2) 120.8 119.9 113.7 <C(2)C(1)C(3) 112.6 112.5(2) 113.0 120.1 121.2 <C(1)C(2)C(6) 111.4 111.7(2) 120.8 120.6 124.4
<C(2)C(1)H(14) 108.4 109(1) 112.5 109.4 107.3 <C(2)C(1)H(15) 109.6 109(1) 110.7 105.7 - <C(1)C(2)H(8) 109.3 111(1) - - - <C(6)C(2)H(8) 107.6 107(1) - - -
<H(14)C(1)H(15) 108.2 109(2) 107. 105.7 -
MAD 0.6 - - - - aAtom numbering according to Figure 1. bThe larges changes towards values of molecule 1 are given in bold.

S. Stoyanov, J. Tsenov: IR spectra and structure of 1,1,3,3-tetracyanopropane and its carbanions: experimental and quantum …
177
Scheme 4. NBO electronic charges of methylene-bis-
malononitrile 1 and its anions.
CONCLUSION
We found on the basis of both experimental and
computational IR data that the effect of conversion
of 1,1,3,3-tetracyanopropane into anions is strong.
The cyano stretching frequencies at the first step of
deprotonation decreases by maximum 140 cm-1
upon deprotonation and further to 200 and 300 cm-1
upon the next steps of deprotonation. At every step
a large change in the geometry occurs and signi-
ficant part of the electronic charge generated by the
formation of carbanionic centers is distributed over
the cyanogroups. 0.42 e-, 0.49 e
- and 0.56 e
- from
the newly generated anionic charge remains locali-
zed over the first, second and third carbanionic
center respectively. This findings are in agreement
with the observed spectral change.
REFERENCES
1. O. Diels, B. Conn, Berichte, 56B, 2076 (1923).
2. A. Ardis, S. Averill, H. Gilbert, F. Miller, R.
Schmidt, F. Stewart, H. Trumbull, J. Am. Chem. Soc.,
72, 1305 (1950).
3. J. Krajewski, J. Moyer, Can. J. Chem., 52, 3626
(1974).
4. T. J. Johnson, K. W. Hipps, R. D. Willett, J. Phys.
Chem., 92, 6892 (1988).
5. J. Westfahl, T. Gresham, J. Org. Chem., 21, 319
(1956).
6. D. Yarrow, J. Ibers, M. Lenarda, M. Graziani, J.
Organomet. Chem., 65, 133 (1974).
7. M. Dinger, W. Henderson, J. Organomet. Chem. 577,
219 (1999).
8. R. A. Bell, B. E. Brown, M. Durate, H. E. Howard-
Lock, Can. J. Chem., 65, 261 (1987).
9. M. J. Frisch, G.W. Trucks, H. B. Schlegel, G. E.
Scuseria, M. A. Robb, J. R. Cheeseman, V. G.
Zakrzewski, J. A. Montgomery, Jr., R. E. Stratmann,
J. C. Burant, S. Dapprich, J. M. Millam, A. D.
Daniels, K. N. Kudin, M. C. Strain, O. Farkas, J.
Tomasi, V. Barone, M. Cossi, R. Cammi, B.
Mennucci, C. Pomelli, C. Adamo, S. Clifford, J.
Ochterski, G. A. Petersson, P. Y. Ayala, Q. Cui, K.
Morokuma, D. K. Malick, A. D. Rabuck, K.
Raghavachari, J. B. Foresman, J. Cioslowski, J. V.
Ortiz, A. G. Baboul, B. B. Stefanov, G. Liu, A.
Liashenko, P. Piskorz, I. Komaromi, R. Gomperts, R.
L. Martin, D. J. Fox, T. Keith, M. A. Al-Laham, C.
Y. Peng, A. Nanayakkara, C. Gonzalez, M.
Challacombe, P. M. W. Gill, B. Johnson, W. Chen,
M. W. Wong, J. L. Andres, M. Head-Gordon, E. S.
Replogle and J. A. Pople, Gaussian 98, Revision A.7,
Gaussian, Inc., Pittsburgh PA, 1998.
10. A. D. Becke, J. Chem., Phys., 98, 5648 (1993).
11. C. Lee, W. Yang, G. R. Parr, Phys. Rev. B, 37, 785
(1988).
12. P. J. Stephens, F. J. Devlin, C. F. Chabalowski, M. J.
Frisch, J. Phys. Chem., 98, 623 (1994).
13. J. A. Tsenov, S. S. Stoyanov, I. G. Binev, Bulg.
Chem. Commun., 40, 520 (2008).
14. S. S. Stoyanov, A. D. Popova, A. D. Tsenov, Bulg.
Chem. Commun., 40, 538 (2008)
15. S. S. Stoyanov, J. A. Tsenov, I. G. Binev, Assian
Chem. Lett. 13, 155 (2009).
16. S. S. Stoyanov, J. A. Tsenov, I. G. Binev, Assian
Chem. Lett. 13, 171 (2009).
17. S. S. Stoyanov, J. A. Tsenov, D. Y. Yancheva, J.
Mol. Struct., 1009, 42 (2012).
18. S. S. Stoyanov, Compt. Rend. L’Acad. Bulg. Sci. 62,
445 (2009).
19. S. S. Stoyanov, J. Phys. Chem. A, 114, 5149 (2010).
20. A. D. Popova, M. K. Georgieva, O. I. Petrov, K. V.
Petrova, E. A. Velcheva. Int. J. Quant. Chem., 107,
1752 (2007) (and refferences therein)
21. I. N. Juchnovski, I. G. Binev, Chem. Phys. Lett., 12,
40 (1971).
22. Y. I. Binev, J. A. Tsenov, I. N. Juchnovski, I. G.
Binev, J. Mol. Struct. THEOCHEM, 625, 207,
(2003).
23. I. G. Binev, Y. I. Binev, B. A. Stamboliyska, I. N.
Juchnovski, J. Mol. Struct., 435, 235 (1997).
24. E. A. Velcheva, Y. I. Binev, M. J. Petrova, J. Mol.
Struct., 475, 65 (1999).
25. J. Demaison, G. Wlodarezak, H. Rueck, K. N.
Wiedenmann, H. D. Rudolph, J. Mol. Struct., 376,
399 (1996).

S. Stoyanov, J. Tsenov: IR spectra and structure of 1,1,3,3-tetracyanopropane and its carbanions: experimental and quantum …
178
ИЧ-СПЕКТРИ И СТРУКТУРA НА 1,1,3,3-ТЕТРАЦИАНОПРОПАН И НЕГОВИТЕ
КАРБАНИОНИ: ЕКСПЕРИМЕНТАЛНО И КВАНТОВОХИМИЧНО ИЗСЛЕДВАНЕ
С. С. Стоянов*, Й. А. Ценов
Институт по Органична химия с Център по Фитохимия, Българска Академия на Науките, ул. Акад. Г. Бончев,
бл. 9, 1113 София, България
Постъпила на 10 юни 2014 г.; Коригирана на 21 юли2014 г.
(Резюме)
Приложен е комбиниран ИЧ експериментален/DFT теоретичен подход за проследяване на спектралните и
структурни промени, породени от превръщането на 1,1,3,3-тетрацианопропан в моно-, ди- и трианион.
Превръщането на молекулата в монойон се отразява слабо върху валентното трептение на ν(C≡N) на
отдалечените от карбаниония център цианогрупи (13 cm-1
) и силно върху близкоразположените цианогрупи
(140 cm-1
). Карбанионният заряд е разпределен главно в аниония център и цианогрупите директно свързани с
него (общо 0,85 e-). Превръщането на молекулата в ди- и трианион е съпроводено с по-силно понижение на
ν(C≡N), достигащо до 300 cm-1
. Установено е много добро съответствие между експерименталните и
теоретичните данни. Според изчисленията разпределението на карбанионния заряд, получен при второто и
третото депротониране се разпределя почти равномерно във всички фрагменти.

179
Bulgarian Chemical Communications, Volume 46, Special Issue A (pp. 179 – 186) 2014
Influence of the environment on the antioxidant action of two 6-(propan-2-yl)-4-
methyl-morpholine-2,5-diones
D. Yancheva1*, S. Stoyanov
1, B. Stambolyiska
1, L. Daskalova
1, E. Cherneva
2, A. Smelcerovic
3
1Institute of Organic Chemistry with Centre of Phytochemistry, Bulgarian Academy of Sciences, Acad. G. Bonchev str.,
bl. 9, 1113 Sofia, Bulgaria 2Department of Chemistry, Faculty of Pharmacy, Medical University of Sofia, 2 Dunav str., 1000 Sofia, Bulgaria 3Department of Chemistry, Faculty of Medicine, University of Niš, 81 Dr. Zorana Djindjica blv., 18000 Niš, Serbia
Received May 21, 2014; Revised August 11, 2014
Dedicated to Acad. Dimiter Ivanov on the occasion of his 120th
birth anniversary
Density functional theory was used to study diketo and enol structures of two cyclodidepsipeptides, 3-(2-me-
thylpropyl)-6-(propan-2-yl)-4-methyl-morpholine-2,5-dione and 3,6-di(propan-2-yl)-4-methyl-morpholine-2,5-dione,
able to form radicals and act as reducing agents. Three possible mechanisms of antioxidant action were considered: H-
atom abstraction (HAT), single electron transfer (SET), and sequential proton loss electron transfer (SPLET). The
influence of the environment was elucidated by calculating the respective dissociation enthalpy (BDE), ionization
potential (IP), proton dissociation enthalpy (PDE), proton affinity (PA), and electron transfer enthalpy (ETE) in non
polar solvent benzene, and polar solvents methanol and water. The preferred mechanism in different environment was
outlined based on the obtained reaction enthalpies and showed that the reaction pathway depends on the environment
polarity. HAT is the most probable mechanism in nonpolar phase, while SPLET is the preferred one in polar
environment.
Key words: cyclodidepsipeptide, 6-(propan-2-yl)-3-methyl-morpholine-2,5-dione, antioxidant activity, reaction
mechanism, solvent polarity
INTRODUCTION
Cyclodidepsipeptides are the simplest members
of cyclodepsipeptides family, which have an ester
group and an amide group in the same 6-membered
ring. They contain only one residue of amino acid
and one residue of lactic, α-hydroxyisovaleric or
other α-hydroxy acid. The cyclodidepsipeptides
exhibit antimicrobial [1,2], immunomodulating
[1,3,4], anticoagulant [5], and inhibitory activity
towards acyl-CoA:cholesterol acyltransferase [6],
α-glucosidase [7-9] and xanthin oxidase (XO) [10].
In this way they are interesting candidates for phar-
macological application. As a part of our continu-
ing study of identification [11], synthesis [11,2] and
biological activities [1,2,4,10] of cyclic didepsi-
peptides, recently we elucidated the antioxidant
activity of the two synthesized cyclodidepsipeptides
3-(2-methylpropyl)-6-(propan-2-yl)-4-methyl-mor-
pholine-2,5-dione (1a) and 3,6-di(propan-2-yl)-4-
methyl-morpholine-2,5-dione (2a), by applying two
assays, 2,2-diphenyl-1-picrylhydrazyl (DPPH)-radi-
cal scavenging capacity and total reducing power
[12]. Our data indicate moderate antioxidant
potentials of the two studied cyclodepsipeptides. A
high correlation between DPPH-radical scavenging
capacity and total reducing power were found.
Diketo, enol and dienol structures of compounds 1
and 2 (Fig. 1), able to form radicals and act as
reducing agents, were examined using density
functional theory (DFT) calculations in gas phase.
The calculated total energies indicate the diketo
form "a" as the most stable.
Fig. 1. Tautomeric structures of compounds 1 and 2.
© 2014 Bulgarian Academy of Sciences, Union of Chemists in Bulgaria
* To whom all correspondence should be sent:
E-mail: [email protected]

D. Yancheva et al.: Influence of the environment on the antioxidant action of two 6-(propan-2-yl)-4-methyl-morpholine-2,5-diones
180
One possible mechanism by which the anti-
oxidants can deactivate a free radical is H-atom
abstraction (HAT mechanism) [13-16]:
A-H A. + H
. (HAT)
The efficacy of the antioxidant to react via HAT
is characterized by the bond dissociation enthalpy
(BDE). Higher stability of A, i.e., lower BDE
values, corresponds to good antioxidant capacity of
A-H. Another possible mechanism is electron trans-
fer (SET mechanism), in which the radical cation is
first formed followed by deprotonation [16-19]:
A-H A+.
+ e- (SET)
A+.
A. + H
+
For evaluation of reactivity via SET, the
ionization potential (IP) is used. A lower IP implies
an easier electron release. More recently a third
mechanism has been discussed – sequential proton
loss electron transfer (SPLET) [13, 20]:
A-H A- + H
+ (SPLET)
A- A
. + e
-
In the first step of this mechanism an anion is
formed by initial proton transfer, followed by an
electron transfer. The proton affinity (PA) of the
formed anion is used as a measure for reactivity via
SPLET. Higher stability of A-, i.e., lower PA
values, indicates an easier extraction of the proton.
The net result of the three antioxidant action
mechanisms is the same. SET and SPLET mecha-
nisms are favoured in polar environment because
the generated charged species are stabilized by the
solvent. Based on calculation of the reaction enthal-
pies for each of the mechanisms, it is possible to
suggest the most probable mechanism of action of a
particular group of compounds [13].
In the case of the two cyclodidepsipeptides 1
and 2 studied by us, hydrogen atom abstraction
from the activated C-H group at 3-position in the
diketo form was found to be the most probable
mechanism of antioxidant action in gas phase.
However, these calculations do not account for the
influence of the polarity of the surrounding
medium. For this reason, the main goal of the
present contribution is to determine the preferred
mechanism of antioxidant action in polar environ-
ment as a description of the processes taking place
in the living organism. Calculations in benzene will
be performed in order to improve the description of
the antioxidant action of 1 and 2 in nonpolar
environment representing the biological membra-
nes. The polar medium is also very important as
illustration of the biological liquids and therefore
the relevant enthalpies will be calculated in water.
Based on the obtained enthalpies it will be clarified
which of the three possible mechanisms of
antioxidant action (HAT, SET or SPLET) is the
most probable in polar liquid environment. In this
way, the expected mechanism of antioxidant action
of the title compounds will be described for all
potential sites in the living organism. The study will
be complemented also by computations in methanol
in order to take account of the conditions used in
the in vitro radical scavenging assays [12].
COMPUTATIONAL DETAILS
All theoretical calculations were performed
using the Gaussian 09 package [21] of programs.
Geometry and vibrational frequencies of species
studied were performed by analytical gradient
technique without any symmetry constraint. All the
results were obtained using the density functional
theory (DFT), employing the B3LYP (Becke’s
three-parameter non-local exchange [22] and Lee et
al. correlation [21] potentials). To establish the
stability order for the neutral, radical and ionic
species in solvent we used the Integral Equation
Formalism Polarizable Continuum Model (IEF-
PCM) [23] at the same level of theory.
The geometries of all possible isomers of the
studied compounds, radicals, radical cations were
fully optimized by application of the UB3LYP
functional in conjunction with the 6-311++G**
basis set. The optimized structures were further
characterized by analytical computations of
harmonic vibrational frequencies at the same level.
Dissociation enthalpy (BDE), ionization potential
(IP), proton dissociation enthalpy (PDE), proton
affinity (PA), and electron transfer enthalpy (ETE)
were calculated according the equations given by
Klein et al. [13].
BDE = H(A.) + H(H
.) – H(A-H)
IP = H(A+.
) + H(e-) – H(A-H)
PDE = H(A.) + H(H
+) – H (A
+.)
PA = H(A-) + H(H
+) – H (A-H)
ETE = H(A.) + H(e
-) – H (A
-)
The enthalpy of hydrogen atom, H(H.), for each
solvent was obtained by the same method and basis
set. All reaction enthalpies were calculated for 298
K. Solvation enthalpies of proton H(H+), electron,

D. Yancheva et al.: Influence of the environment on the antioxidant action of two 6-(propan-2-yl)-4-methyl-morpholine-2,5-diones
181
H(e-), in organic solvents, determined using IEF-
PCM DFT/B3LYP/6-311++G** calculations, were
taken from the literature [24].
Natural bond orbitals (NBO) analysis [25-27]
has been performed to characterize the deloca-
lization of electron density within the molecule.
RESULTS AND DISCUSSION
In order to determine the preferred geometry of
the compounds studied, a large number of probable
geometries should be constructed taking into
account the flexibility of the ring system and the
change-over to chair- and boat-conformations. For
each boat or chair ring conformation, all relevant
combinations of axial and equatorial positions of
the 3- and 6-alkyl groups should also be considered.
In previous studies [2,11,28], it was demonstrated
that in all cases the morpholine-2,5-dione ring
adopts boat conformation and the most favourable
orientation of the larger 3- and 6-substituents is
equatorial/axial and axial/equatorial.
The title compounds, 1a and 2a, are synthesized
in a condensation reaction of 2-bromo-3-
methylbutanoyl chloride with (L)-N-methylleucine
or (L)-N-methylvaline, respectively, followed by
intramolecular cyclization [11]. The mechanism of
the amide group formation does not involve
conversion of the stereo configuration of the amino
acid residues, therefore only the (3S) diastereo-
isomers could be considered in the structure
optimizations. In gas phase the most stable among
them is the (3S,6R) form [11]. It was also found
that the higher polarity of the environment (in
solvents such as water and DMSO) does not
influence the stability order of diastereoisomers of a
related com-pound 6-(propan-2-yl)-3-methyl-
morpholine-2,5-dione [2]. For this reason, in the
present study, only the most stable gas-phase
diastereoisomers of 1a and 2a were taken for the
optimization in benzene, water and methanol. The
structural parameters of 1a and 2a in all employed
solvents are similar. The morpholine-2,5-dione
rings are in boat confor-mations with the sp3 C3
and C6 atoms displaced by 25-35o out of the plane
formed by O1, C2, N4 and C5.
For the antioxidant action, the interconversion
between diketo, enol and dienol structures is more
important as it leads to the formation of different
radicals able to act as reducing agents. In order to
examine the prototropic tautomerism, the relative
stability of the two most stable gas-phase structures
of 1 and 2 – diketo “a” and 2-enol “b” were
optimized in the different solvents. The calculated
total energies are summarized in Table 1.
Table 1. Calculated total and relative energies, and dipole moments of neutral, radical and ionic species of 1 and 2.
Species Etot, (Hartree) E,
kJ/mol
μ,
D Etot, (Hartree)
E,
kJ/mol
μ,
D
Benzene (2.271)a
Molecule 1a -750.593201 4.08 2a -711.261514 4.27
Enol 1b -750.567096 68.53b 3.35 2b -711.239677 57.3
a 3.28
Radical 1c -749.963946 4.46 2c -710.636419 4.37
1d -749.946488 45.83c 2.91 2d -710.615411 55.1
b 3.23
Radical cation 1e -750.310199 3.52 2e -710.981092 3.33
Anion 1f -750.065192 6.80 2f -710.737265 5.31
1g -750.047205 47.2d 6.56 2g -710.719960 45.4
c 4.33
Methanol (32.613)a
Molecule 1a -750.600900 5.00 2a -711.269287 5.13
Enol 1b -750.573064 73.1b 4.23 2b -711.245598 62.2
a 4.18
Radical 1c -749.971607 5.40 2c -710.643888 5.38
1d -749.952652 49.7c 3.51 2d -710.621738 58.1
b 3.84
Radical cation 1e -750.345624 4.81 2e -711.015835 4.16
Anion 1f -750.103919 8.67 2f -710.775302 6.95
1g -750.083373 53.9d 4.97 2g -710.757432 46.9
c 3.28
Water (78.355)a
Molecule 1a -750.601392 5.07 2a -711.269769 5.19
Enol 1b -750.573430 73.4b 4.29 2b -711.245968 62.5
a 4.24
Radical 1c -749.972081 5.47 2c -710.644359 5.45
1d -749.953045 50.0c 3.56 2d -710.622133 58.3
b 3.88
Radical cation 1e -750.347428 4.91 2e -711.017557 4.21
Anion 1f -750.105869 8.80 2f -710.777227 7.07
1g -750.085170 54.3d 4.93 2g -710.759315 47.1
c 3.25
a Relative dielectric permittivity [35 and references therein]; b E = E(enol) – E(keto); c E = E(radical 1c) – E(radical 1d);
d E = E(anion 1f) –
E(anion 1g).

D. Yancheva et al.: Influence of the environment on the antioxidant action of two 6-(propan-2-yl)-4-methyl-morpholine-2,5-diones
182
In all cases the energy differences between
diketo and enol forms are much higher than 50
kJ/mol; therefore prototropic conversion is not
expected to occur. The values in water are higher
than the corresponding in benzene (Table 1)
showing in this way that the diketo structures of 1
and 2 are further stabilized by the polar
environment. This result is in accordance with the
experimental NMR and IR data for 1 and 2 showing
that both compounds are present in diketo form in
solid state and chloroform. The possibility of
prototropic tautomerism of a related compound, 6-
(propan-2-yl)-3-methyl-morpholine-2,5-dione, was
recently studied in solution and in this case again
no evidence of enol formation was found neither in
polar nor in nonpolar environment [2]. So further
only diketo forms will be taken into account for
evaluation of their capability to form radicals and
act as reducing agents via HAT, SET and SPLET
mechanisms in different environment.
The calculated reaction enthalpies, involved in
the three mechanisms of antiradical activity of 1
and 2, are presented in Table 2. Two possible sites
for hydrogen atom abstraction were estimated – C3
(radicals “c”) and C6 (radicals “d”, respectively) as
well as for generation of anion species –
deprotonation at C3 (anions “f”) and C6 (anions
“g”, respectively).
Table 2. DFT bond dissociation enthalpy (BDE),
ionization potential (IP), proton dissociation enthalpy
(PDE), proton affinity (PA), and electron transfer
enthalpy (ETE) values of 1a and 2a in kJ/mol. Species BDE IP PDE PA ETE
Gas phasea
1a 306 824 782 1439 167
2a 294 818 776 1427 167
Benzene (2.271)b
1a 312 733 -7 459 267
2a 301 727 -12 449 266
Methanol (32.613)b
1a 311 583 -78 235 269
2a 300 578 -85 226 267
Water (78.355)b
1a 302 559 -59 246 254
2a 291 555 -65 238 252 a According to [12]; b Relative dielectric permittivity [35 and
references therein].
Site C3 is more reactive both via HAT and
SPLET as demonstrated by the relative stability of
the radicals produced by proton transfer from C3
and C6 (HAT) and the anions produced by
deprotonation at C3 and C6 (SPLET). The energy
differences between the more stable radicals of 1c
and 2c and the less stable 1d and 2d in benzene is
smaller than in water. The same trend is observed
also with the stability of anions 1f and 2f versus 1g
and 2g.
Important information for the radical stability
could be derived also from atomic spin population
analysis. The energy of a free radical can be
efficiently decreased if the odd electrons are
delocalized through the conjugated system. Fig. 2
illustrates the spin density distribution over the
fragments in 1c, 1d, 2c and 2d in benzene and
water obtained by NBO population analysis.
Approximately 0.5 of the spin density in 1c and 2c
is localized on C3 and the rest is distributed equally
between the ester and the amide moiety. The spin
density in the radicals generated by abstraction of a
hydrogen atom from C6 is less effectively
delocalized indicating lower stability of the
respective radicals. Comparing the values in
benzene and water, it could be concluded the in
polar environment 1c and 2c show slightly higher
stability which would be favourable for their radical
scavenging efficiency.
In order to rationalize the solvent polarity signi-
ficance for the stabilization of the molecules and
their derivatives (enols, radicals, and ions), data for
their dipole moments are presented in Table 1. As
could be seen there, the polarity of the anionic
derivatives is considerably higher than those of the
radical species. Therefore, the polarity of the envi-
ronment is expected to have a bigger impact on the
processes involving anionic species. In accordance
with this, when analysing the reaction enthalpies
for the HAT, SET and SPLET mechanisms in gas
phase [12] and in different solvents presented in
Table 2, it can be noted the C-H bond dissociation
enthalpies (BDEs) are similar in all solvents i.e. the
energy requirements for HAT do not change much
with the environment polarity. On the other hand,
the solvation of the electron and the positively
charged radical species of 1a and 2a exerted even
by nonpolar solvents such as benzene lowers the IP
values in liquid phase. As a result of the greater
stabilisation in polar environment (water) the
corresponding IPs are significantly lower than in
benzene. As the SPLET mechanism is also
involving charged species, the respective reaction
enthalpies are affected by the solvation and the
medium polarity. Mainly due to the large enthalpy
of H+
solvation, the PAs in benzene differ
dramatically from those in gas-phase. They are
further lowered in aqueous environment.
The comparison of the respective BDE, IP and
PA values outlines clearly the most probable
mechanism of antioxidant activity of 1a and 2a in

D. Yancheva et al.: Influence of the environment on the antioxidant action of two 6-(propan-2-yl)-4-methyl-morpholine-2,5-diones
183
Fig. 2. Calculated NBO spin density over fragments of radicals 1c, 1d, 2c and 2d in benzene and water (in bold).
the polar and nonpolar environment. Similarly to
the gas phase, in benzene the BDE values of 1a and
2a are lower than the IPs and PAs which supports
the assumption of HAT as the most probable
mechanism in nonpolar environment. Taking into
account the interactions with the surrounding non-
polar molecules is necessary to conclude accurately
on the preferred mechanism in nonpolar environ-
ment. These interactions change dramatically the
thermodynamic requirements of the SPLET reac-
tion and examination of the gas-phase reaction
enthalpies alone might not lead to the right con-
clusions.
Clarification of the possible mechanism of
antioxidant action of 1a and 2a in nonpolar
environment is very important in relation to the
lipophilic nature of both compounds and their
favourable physico-chemical properties for efficient
blood penetration and intestinal absorption [28].
This would allow their transportation to different
possible sites of action. Their partition into lipid
bilayers would provide increased local concen-
tration and thus antiradical activity. Free lipid-
peroxyl radicals of the type LOO.typically display a
BDE of about 367 kJ/mol [29]. Thus, an effective
chain-breaking antioxidant that could prevent lipid
peroxidation should have a lower BDE value. A
well-known antioxidant that reacts via HAT is α-
tocopherol, for which a BDE values of 327 kJ/mol
was calculated in gas-phase and 293 kJ/mol in
water using the same computational scheme [13].
In the present case, the calculated BDE values are
also within this range and suggest good potential of
1a and 2a to prevent lipid peroxidation. Compo-
unds 1a and 2a exhibit antimicrobial [1] and anti-
oxidant [12] activity. Furthermore, they were
excellent inhibitors of XO and significantly sup-
pressed the activation of the nuclear factor κB (NF-
κB) [10]. NF-κB is a redox-associated transcription
factor that is required for maximal transcription of a
wide array of pro-inflammatory mediators. It is
well known that Reactive Оxygen Species (ROS)
stimulate the NF-κB pathway in the cytoplasm
through IκB (inhibitor of kappa B) degradation.
Overexpression of the antioxidant proteins was
shown to inhibit NF-κB activation [28]. Xu et al.
[30] have found NF-κB binding site on human
xanthine dehydrogenase (XDH) gene, and it is

D. Yancheva et al.: Influence of the environment on the antioxidant action of two 6-(propan-2-yl)-4-methyl-morpholine-2,5-diones
184
known that XDH conversion to XO may represent a
feed-forward mechanism for stimulation of ROS
production [31]. It can be concluded that NF-κB
may directly affect the XO activity and ROS
production. 1a and 2a were confirmed as non-toxic
in thymocites [1] and therefore may give a promise
to be used in the treatment of gout and other
excessive uric acid production or inflammatory
conditions [10].
The feasibility of the three mechanisms of
antioxidant action in polar environment will give us
a clue to the processes in physiological liquids
whose main constituent is water. The BDE values
in the three polar solvents are similar to those in
nonpolar environment, so the preferred reaction
pathway depends on the changes in the IP and PA
induced by the polar solvent. The reactivity of 1a
and 2a via SET was estimated according to the
principle defined by Wright et al. [16], i.e., when
IPs drop to ca. 167 kJ/mol below phenol, the SET
mechanism gains importance in solution. The IP
value of phenol in water is calculated at the same
theoretical level as 346 kJ/mol [13]. In all studied
polar solvents, the IPs of 1a and 2a are higher than
500 kJ/mol. It implies that the SET mechanism is
not preferred for this type of compounds in any
kind of environment. SET mechanism is typical
mainly for electron-donating compounds containing
a conjugated system of double bonds. Such exam-
ple are the pyrrolopyrimidines, which were des-
cribed as effective in vitro and in vivo antioxidants
possessing neuroprotective activity in brain injury
and ischemia models [32]. Another class of com-
pounds reported recently to act as lipid peroxidation
inhibitors presumably via SET mechanism are the
2-amino-5-alkylidenethiazol-4-ones [33].
As can be seen in Table 2, the first step of
SPLET has lower energy requirements than HAT
and SET in water. This indicates the SPLET as the
most probable mechanism in polar environment in
general. In some cases, the HAT mechanism could
be competitive to the SPLET one, because in spite
of the low values of PA, the second step of the
SPLET mechanism, i.e., electron transfer might re-
quire higher energy than the corresponding hydro-
gen atom abstraction [34]. However, in the present
case not only the PAs, but also the ETE values are
lower than the BDEs which confirms that the
SPLET mechanism is the most probable mecha-
nism of antioxidant action in polar environment.
The PAs in methanol are slightly lower than in
water due to the greater solvation enthalpy of the
proton [24]. Similarly to water solution, the expec-
ted mechanism of antioxidant action is SPLET.
CONCLUSION
Density functional theory (DFT) calculations in
benzene, methanol and water were used to study
diketo and enol structures of compounds 1 and 2,
able to form radicals and act as reducing agents.
The calculated energy differences between diketo
and enol forms are much higher than 50 kJ/mol and
therefore prototropic conversion is not expected to
occur. The ability of compounds 1 and 2 to be
oxidized according to HAT, SET and SPLET
mechanisms was estimated in the above-mentioned
solvents. The environment polarity hardly affects
the BDEs of the C-H bond, while the IPs and PAs
are significantly lowered in the polar environment.
The dramatic change of the reaction enthalpy of
SPLET (three time less compared to the gas phase)
results in a reversal of the antioxidant mechanism
of 1 and 2 in polar solvents. Hence, HAT is the
most probable mechanism in nonpolar phase, while
SPLET is expected to be the preferred one in polar
environment. Hydrogen atom abstraction and
deprotonation might occur at two possible sites (C3
and C6), but C3 is found to be more reactive both
via HAT and SPLET in all media.
Acknowledgments: The financial support of this
work by the National Science Fund of Bulgaria
(Contracts: DMU-03/66 and RNF01/0110) and the
Ministry of Education and Science of the Republic
of Serbia (Grant No.172044) is gratefully
acknowledged.
REFERENCES
1. V. Pavlovic, A. Djordjevic, E. Cherneva, D.
Yancheva, A. Smelcerovic, Food Chem. Toxicol., 50,
761 (2012).
2. D. Yancheva, L. Daskalova, E. Cherneva, B.
Mikhova, A. Djordjevic, Z. Smelcerovic, A.
Smelcerovic, J. Mol. Struct., 1016, 147(2012).
3. M. Iijima, T. Masuda, H. Nakamura, H. Naganawa,
S. Kurasawa, Y. Okami, M. Ishizuka, T. Takeuchi,
Y. Iitaka, J. Antibiot., 45, 1553 (1992).
4. V. Pavlovic, E. Cherneva, D. Yancheva, A.
Smelcerovic, Food Chem. Toxicol., 50, 3014 (2012).
5. T. Kagamizono, E. Nishino, K. Matsumoto, A.
Kawashima, M. Kishimoto, N. Sakai, B. M. He, Z.
X. Chen, T. Adachi, S. Morimoto, K. Hanada, J.
Antibiot., 48, 1407 (1995).
6. K. Hasumi, C. Shinohara, T. Iwanaga, A. Endo, J.
Antibiot., 46, 1782 (1993).
7. A. Arcelli, D. Balducci, A. Grandi, G. Porzi, M.
Sandri, S. Sandri, Monatsh. Chem., 135, 951 (2004).

D. Yancheva et al.: Influence of the environment on the antioxidant action of two 6-(propan-2-yl)-4-methyl-morpholine-2,5-diones
185
8. A. Arcelli, D. Balducci, A. Grandi, G. Porzi, M.
Sandri, S. Sandri, Tetrahedron: Asymmetry, 16, 1495
(2005).
9. A. Arcelli, D. Balducci, S. F. E Neto, G. Porzi, M.
Sandri, Tetrahedron: Asymmetry, 18, 562 (2007).
10. A. Smelcerovic, M. Rangelov, Z. Smelcerovic, A.
Veljkovic, E. Cherneva, D. Yancheva, G. M. Nikolic,
Z. Petronijevic, G. Kocic, Food Chem. Toxicol., 55,
493 (2013).
11. A. Smelcerovic, D. Yancheva, E. Cherneva, Z.
Petronijevic, M. Lamshoeft, D. Herebian, J. Mol.
Struct., 985, 397 (2011).
12. V. Stankov-Jovanovic, J. C. Tabet, P. Dzodic, L.
Daskalova, E. Cherneva, D. Yancheva, A.
Smelcerovic, Acta Chim. Slov., 59, 939 (2012).
13. E. Klein, V. Lukes, M. Ilcin, Chem. Phys., 336, 51
(2007).
14. G. W. Burton, T. Doba, E. J. Gabe, L. Hughes, F. L.
Lee, L. Prasad, K. U. Ingold, J. Am. Chem. Soc., 107,
7053 (1985).
15. M. I. de Heer, P. Mulder, H. Korth, K. U. Ingold, J.
Lusztyk, J. Am. Chem. Soc., 122, 2355 (2000).
16. J. S. Wright, E. R. Johnson, G. A. DiLabio, J. Am.
Chem. Soc., 122, 1173. (2001).
17. M. Musialik, G. Litwinienko, Org. Lett., 7, 4951
(2005).
18. A. P. Vafiadis, E. G. Bakalbassis, Chem. Phys., 316,
195 (2005).
19. J. Rimarcik, V. Lukes, E. Klein, M. Ilcin, J. Mol.
Struct. (Theochem), 952, 25 (2010).
20. M. Musialik, R. Kuzmicz, T. S. Pawlowski, G.
Litwinienko, J. Org. Chem., 74, 2699 (2009).
21. M. J. Frisch, G. W. Trucks, H. B. Schlegel, G. E.
Scuseria, M. A. Robb, J. R. Cheeseman, G. Scalmani,
V. Barone, B. Mennucci, G. A. Petersson, H.
Nakatsuji, M. Caricato, X. Li, H. P. Hratchian, A. F.
Izmaylov, J. Bloino, G. Zheng, J. L. Sonnenberg, M.
Hada, M. Ehara, K. Toyota, R. Fukuda, J. Hasegawa,
M. Ishida, T. Nakajima, Y. Honda, O. Kitao, H.
Nakai, T. Vreven, J. A. Montgomery, Jr., J. E.
Peralta, F. Ogliaro, M. Bearpark, J. J. Heyd, E.
Brothers, K. N. Kudin, V. N. Staroverov, R.
Kobayashi, J. Normand, K. Raghavachari, A.
Rendell, J. C. Burant, S. S. Iyengar, J. Tomasi, M.
Cossi, N. Rega, J. M. Millam, M. Klene, J. E. Knox,
J. B. Cross, V. Bakken, C. Adamo, J. Jaramillo, R.
Gomperts, R. E. Stratmann, O. Yazyev, A. J. Austin,
R. Cammi, C. Pomelli, J. W. Ochterski, R. L. Martin,
K. Morokuma, V. G. Zakrzewski, G. A. Voth, P.
Salvador, J. J. Dannenberg, S. Dapprich, A. D.
Daniels, O. Farkas, J. B. Foresman, J. V. Ortiz, J.
Cioslowski, and D. J. Fox, Gaussian 09, Revision
A.1, Gaussian Inc., Wallingford CT, 2009.
22. S. F. Nelsen, M. N. Weaver, J. I. Zink, J. P. Telo, J.
Am. Chem. Soc., 127, 10611 (2005).
23. J. Tomasi, B. Mennucci, E. Cances, J. Mol. Struct.
(THEOCHEM), 464, 211 (1999).
24. J. Rimarčík, V. Lukeš, E. Klein, M. Ilčin, J. Mol.
Struct. (Theochem.), 952, 25 (2010).
25. A. E. Reed, L. A. Curtiss, F. Weinhold, Chem. Rev.,
88, 899 (1988).
26. J. E. Carpenter, F. Weinhold, J. Mol. Struct.
(Theochem), 46, 41 (1988).
27. F. Weinhold, J. E. Carpenter, in: The Structure of
Small Molecules and Ions, R. Naaman, Z. Vager
(eds), Plenum, 1988, p. 227.
28. A. Smelcerovic, P. Dzodic, V. Pavlovic, E.
Cherneva, D. Yancheva, Amino Acids, 46, 825
(2014).
29. J. Berkowitz, G. B. Ellison, D. Gutman, J. Phys.
Chem., 98, 2744 (1994).
30. P. Xu, T. P. Huecksteadt, J. R. Hoidal, Genomics, 34,
173 (1996).
31. J. S. McNally, A. Saxena, H. Cai, S. Dikalov, D. G.
Harrison, Arterioscler. Thromb. Vasc. Biol., 25, 1623
(2005).
32. E. D. Hall, P. K. Andrus, S. L. Smith, T. J. Fleck, H.
M. Scherch, B. S. Lutzke, G. A. Sawada, J. S.
Althaus, P. F. Vonvoigtlander, G. E. Padbury, P. G.
Larson, J. R. Palmer, G. L. Bundy, J. Pharmacol.
Exp. Ther., 281, 895 (1997).
33. J. Zvezdanovic, L. Daskalova, D. Yancheva, D.
Cvetkovic, D. Markovic, M. Anderluh, A.
Smelcerovic, Monatsh. Chem., 145, 945 (2014).
34. Z. Marković, D. Milenković, J. Đorović, J. M.
Dimitrić Marković, V. Stepanić, B. Lučić, D. Amić,
Food Chem., 135, 2070 (2012).
35. E. Wilhelm, R. Battino, Chem. Rev., 73, 1 (1973).
D. Yancheva et al.: Influence of the environment on the antioxidant action of two 6-(propan-2-yl)-4-methyl-morpholine-2,5-diones
186
ВЛИЯНИЕ НА ОБКРЪЖАВАЩАТА СРЕДА ВЪРХУ АНТИОКСИДАНТНОТО ДЕЙСТВИЕ
НА ДВА 6-(ПРОПАН-2-ИЛ)-4-МЕТИЛ-МОРФОЛИН-2,5-ДИОНА
Д. Янчева1*, С. Стоянов
1, Б. Стамболийска
1, Л. Даскалова
1, Е. Чернева
2, А. Шмелцерович
3
1Институт по Органична химия с Център по Фитохимия, Българска Академия на Науките, ул. Акад. Г. Бончев,
бл. 9, 1113 София, България 2Фармацевтичен Факултет, Медицински Университет - София, ул. Дунав 2, 1000 София, България
3Факултет по медицина, Университет - Ниш, бул. Д-р Зоран Джинджич 81, 18000 Ниш, Сърбия
Постъпила на 21 май 2014 г.; Коригирана на 11 август 2014 г.
(Резюме)
Теорията на плътностния фукционал беше използвана за изследване на дикето и енолни форми на два
циклодидепсипептида, 3-(2-метилпропил)-6-(пропан-2-ил)-4-метил-морфолин-2,5-дион и 3,6-ди(пропан-2-ил)-
4-метил-морфолин-2,5-дион, способни да образуват радикали и да действат като редуктори. Бяха разгледани
три възможни механизма на антиоксидантно действие: откъсване на водороден атом (HAT), пренос на електрон
(SET) и отделяне на протон, последвано от пренос на електрон (SPLET). Влиянието на полярността на средата
беше изследвано чрез определяне на съответните енталпии на дисоциация (BDE), йонизационни потенциали
(IP), енталпии на дисоциация на протона (PDE), протонни афинитети (PA) и енталпии на електронния пренос
(ETE) в неполярен разтворител бензен и полярни разтворители вода и метанол. Предпочетеният механизъм в
различните обкръжения беше изяснен на базата на получените енталпии. Резултатът показва, че реакционният
път зависи от полярността на средата. Откъсването на водороден атом е най-вероятният процес в неполярна
среда, докато в полярна среда предпочетен механизъм е отделянето на протон, последвано от пренос на
електрон.

187
Bulgarian Chemical Communications, Volume 46, Special Issue A (pp. 187 – 195) 2014
DFT/B3LYP calculated bond-dissociation enthalpies, radical-scavenging and
antioxidant activities of natural-like coumarins
S. E. Angelova1*, A. K. Slavova-Kazakova
1, L. Saso
2, S. Malhotra
3,4, A. K. Prasad
3, M. E. Bracke
5,
V. S. Parmar3,5
, V. D. Kancheva1
1Institute of Organic Chemistry with Centre of Phytochemistry, Bulgarian Academy of Sciences, Acad. G. Bonchev str.,
bl. 9, 1113 Sofia, Bulgaria 2Department of Human Physiology and Pharmacology“Vittorio Erspamer”, University of Rome “La Sapienza”,
00185 Rome, Italy 3Bioorganic Laboratory, Department of Chemistry, University of Delhi, 110 007 Delhi, India
4Institut für Chemie und Biochemie, Freie Universität Berlin, 14195 Berlin, Germany
5Laboratory of Experimental Cancer Research, University Hospital, University of Gent, B-9000 Gent, Belgium
Received May 28, 2014; Revised August 04, 2014
Dedicated to Acad. Dimiter Ivanov on the occasion of his 120th
birth anniversary
Bond dissociation enthalpies (BDEs) of O-H groups of a set of hydroxy- and dihydroxy-4-methylcoumarins have
been calculated in gas phase and in acetone by means of density functional theory calculations at B3LYP/6-31+G(d,p)
level. The study has been done to determine the capacity of bond-dissociation enthalpy to explain the observed radical-
scavenging and chain-breaking antioxidant activities of the studied coumarins. DPPH radical scavenging activity (RSA)
in acetone solution [as %RSA and stoichiometry coefficient (n) for the fast (2 min) and total (20 min) kinetics] and the
chain-breaking antioxidant activity (as protection factor, PF) during bulk phase lipid autoxidation have been used in the
experimental study. The experimental results for the studied compounds show that the two phenolic groups at ortho
position work in tandem, while the same at meta position work independent of each other. According to the theoretical
results, the substitution in the benzene ring of the coumarin system is very important for the chain-breaking antioxidant
activity. At the same time, theoretical calculations reveal that the introduction of methyl group and/or various
substituents at the C-3 and C-4 positions of the pyrone ring affects the BDEs insignificantly. Interestingly, the radical
scavenging activity towards DPPH radical of 7,8-dihydroxy-4-methylcoumarins are much higher than that of the 6,7-
dihydroxy-4-methylcoumarins, 5,7-dihydroxy-4-methylcoumarin and 7-hydroxy-4-methylcoumarin. Differences in
RSA of studied coumarins could be explained with the solvent effect of acetone. Our findings revealed that BDE can
serve as a probe for radical scavenging and antioxidant activities and even have predictive capacity, but for some tiny
effects a precise description of the solvent effects is required.
Key words: coumarins, hydroxycoumarins, DFT, bond-dissociation enthalpy, chain- breaking antioxidant activity,
radical-scavenging activity
INTRODUCTION
In nature, coumarins are abundantly found in
plants and are formed via the shikimate pathway
[1,2]. Natural coumarins and their synthetic
analogues manifest a wide range of activities such
as anticoagulant, antitumor, antiviral, anti-inflam-
matory, antimicrobial, antioxidant (radical-scaven-
ging), and enzyme inhibition activity [3-6]. The
presence of different substituents on the coumarin
ring system strongly influences the antioxidant and
biological activities of the resulting derivatives
[5,7]. The pharmacological applications of couma-
rins are limited by the tendency to form mutagenic
and toxic C-3, C-4 coumarin epoxide intermediates
during their metabolic degradation [8,9]. Intro-
duction of methyl group at the C-4 position is a
possible way to prevent formation of these
dangerous C-3, C-4 epoxides during the metabolic
degradation of the coumarins [10]. In a detailed
investigation of the structure-activity relationship of
dihydroxy-4-methylcoumarins by Kancheva et al.
[11], the effects of the substituents in both rings of
the coumarin system have been substantiated: the
substituents in the benzene ring are responsible for
the antioxidant activity of the studied hydroxy-4-
methylcoumains, while the effect of substituents in
the pyrone ring (at positions C-3 and C-4) is
insignificant for the biological activity.
In the present study, a set of coumarin
derivatives has been selected in order to correlate
© 2014 Bulgarian Academy of Sciences, Union of Chemists in Bulgaria
* To whom all correspondence should be sent:
E-mail: [email protected]
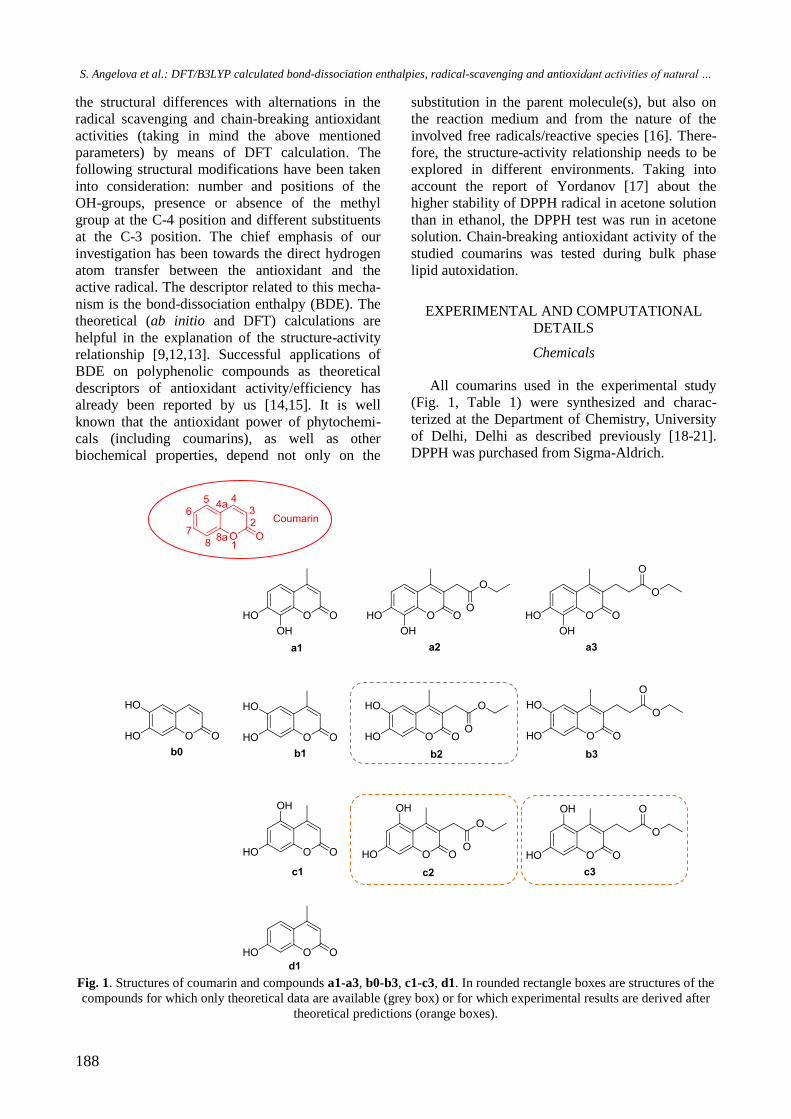
S. Angelova et al.: DFT/B3LYP calculated bond-dissociation enthalpies, radical-scavenging and antioxidant activities of natural …
188
the structural differences with alternations in the
radical scavenging and chain-breaking antioxidant
activities (taking in mind the above mentioned
parameters) by means of DFT calculation. The
following structural modifications have been taken
into consideration: number and positions of the
OH-groups, presence or absence of the methyl
group at the C-4 position and different substituents
at the C-3 position. The chief emphasis of our
investigation has been towards the direct hydrogen
atom transfer between the antioxidant and the
active radical. The descriptor related to this mecha-
nism is the bond-dissociation enthalpy (BDE). The
theoretical (ab initio and DFT) calculations are
helpful in the explanation of the structure-activity
relationship [9,12,13]. Successful applications of
BDE on polyphenolic compounds as theoretical
descriptors of antioxidant activity/efficiency has
already been reported by us [14,15]. It is well
known that the antioxidant power of phytochemi-
cals (including coumarins), as well as other
biochemical properties, depend not only on the
substitution in the parent molecule(s), but also on
the reaction medium and from the nature of the
involved free radicals/reactive species [16]. There-
fore, the structure-activity relationship needs to be
explored in different environments. Taking into
account the report of Yordanov [17] about the
higher stability of DPPH radical in acetone solution
than in ethanol, the DPPH test was run in acetone
solution. Chain-breaking antioxidant activity of the
studied coumarins was tested during bulk phase
lipid autoxidation.
EXPERIMENTAL AND COMPUTATIONAL
DETAILS
Chemicals
All coumarins used in the experimental study
(Fig. 1, Table 1) were synthesized and charac-
terized at the Department of Chemistry, University
of Delhi, Delhi as described previously [18-21].
DPPH was purchased from Sigma-Aldrich.
Fig. 1. Structures of coumarin and compounds a1-a3, b0-b3, c1-c3, d1. In rounded rectangle boxes are structures of the
compounds for which only theoretical data are available (grey box) or for which experimental results are derived after
theoretical predictions (orange boxes).

S. Angelova et al.: DFT/B3LYP calculated bond-dissociation enthalpies, radical-scavenging and antioxidant activities of natural …
189
Table 1. Compound names.
Coumarin 2H-chromen-2-one a1 7,8-dihydroxy-4-methyl-2H-chromen-2-one a2 ethyl 2(7,8-dihydroxy-4-methyl-2-oxo-2H-chromen-3-yl)acetate a3 ethyl 3-(7,8-dihydroxy-4-methyl-2-oxo-2H-chromen-3-yl)propanoate b0 6,7-dihydroxy-2H-chromen-2-one b1 6,7-dihydroxy-4-methyl-2H-chromen-2-one b2 ethyl 2(6,7-dihydroxy-4-methyl-2-oxo-2H-chromen-3-yl)acetate b3 ethyl 3-(6,7-dihydroxy-4-methyl-2-oxo-2H-chromen-3-yl)propanoate c1 5,7-dihydroxy-4-methyl-2H-chromen-2-one c2 ethyl 2(5,7-dihydroxy-4-methyl-2-oxo-2H-chromen-3-yl)acetate c3 ethyl 3-(5,7-dihydroxy-4-methyl-2-oxo-2H-chromen-3-yl)propanoate d1 7-hydroxy-4-methyl-2H-chromen-2-one
Screening for free radical scavengers by DPPH test
Kinetics of DPPH absorbance decrease for a
quantitative determination of radical scavenging
activity at the ratio antioxidant (AH) and DPPH
[AH]/[DPPH] = 0.40 and physiological temperature
37oC was studied. For experimental details, please
see ref.10. The main kinetic parameters for the fast
kinetics (t=2 min) %RSAfast and nfast and for the
total kinetics (t=20 min) %RSAtot and ntot were
determined by the following formulae:
%RSA = [(Abs0 – Abst)/Abs0 ] x 100,
n = [(Abs0 – Abst)]/[AH],
where: Abs0 and Abst stay for the DPPH absorption
at 517 nm for time t=0 and t=2 min (fast kinetics)
or t=20 min (total kinetics), n is the stoichiometric
coefficient, meaning how many DPPH radicals
were trapped from 1 molecule of AH, molar
extinction coefficient = 1.2x10⁴ M
-1s
-1.
Chain-breaking antioxidant activity of couma-
rins under study presented as protection factor (PF),
means how many times the added antioxidant AH
can increase the oxidation stability of lipid substrate
was studied as described in our earlier publication
[11]. Here we report new data about a3 and b3
coumarins.
Computational details
As a descriptor of antiradical/antioxidant
activity, calculated homolytic bond dissociation
enthalpy (BDE) was utilized. B3LYP calculations
were chosen for this study because this functional
provides reliable geometries, frequencies, and bond
lengths [22]. The geometries of compounds studied
and their radicals were optimized using unrestricted
open-shell approach (UB3LYP) and 6-31+G(d,p)
basis set [23-25] without symmetry constraints with
the default convergence criteria. Frequency
calculations at the same level of theory were carried
out to confirm that the obtained structures
correspond to energy minima. Unscaled thermal
corrections to enthalpy were added to the total
energy values. The BDEs for the generation of the
respective radicals from the parent compounds are
calculated by the formula BDE = H298(A•) + ET(H•)
- H298(AH) where H298(A•) and H298(AH) are
enthalpies calculated at 298 K for radical species
A• and neutral molecule AH, respectively, and
ET(H•) (calculated total energy of H•) is -313.93
kcal mol-1
. In order to take into account the solvent
effect, the integral equation formalism (IEF) of the
polarizable continuum model (PCM) [26-28] was
employed for acetone and all the structures were
optimized in this surrounding environment. All
quantum chemical calculations were carried out
using GAUSSIAN 09 program package [29].
RESULTS AND DISCUSSION
UB3LYP/6-31+G(d,p) calculated enthalpies
(H298) at 298 K, enthalpy differences (ΔH298)
between rotamers of the compounds studied and
their radicals and bond dissociation enthalpy (BDE)
in gas phase and in solvent acetone are listed in
Table 2. For the coumarins belonging to group a
and b, only rotamers with intramolecular hydrogen
bonds are studied. These rotamers differ in the
position of the hydrogen atoms from the hydroxyl
groups in the coumarin moiety. The structures of
the denoted “rotamers 1 & 2” are shown in Table 2.
Two rotamers of compounds from group c with
different orientation of the OH hydrogen atoms in
position 7 are also considered. In gas phase the
following relations can be noticed: for all the com-
pounds, rotamer 2 is more stable than rotamer 1,
and the BDEs of the radicals formed from this
rotamer are considered (in spite of the lower BDE
values characterizing the radical, formed from rota-

S. Angelova et al.: DFT/B3LYP calculated bond-dissociation enthalpies, radical-scavenging and antioxidant activities of natural …
190
mer 1). The enthalpy difference between the rota-
mers of group a compounds is about 5 kcal mol-1
,
of group c compounds is about 1 kcal mol-1
, while
rotamers of group b compounds have almost equal
Table 2.UB3LYP/6-31+G(d,p) calculated enthalpies (H298) at 298 K (in Hartree), enthalpy differences (ΔH298)
between rotamers of compounds studied and their radicals (in kcal mol-1
) and bond dissociation enthalpy
(BDE) (in kcal mol-1
). The values in acetone are given in parentheses. Rotamer 1 Radical 1: 7(7,8) Rotamer 2 Radical 2: 8(7,8)
a1
H298=-686.645831
(-686.661963)
∆H298=5.50 (1.86)
H298=-686.028641
(-686.041754)
BDE=73.37 (75.26)
H298 =-686.654589
(-686.664920)
∆H298=0.00 (0.00)
H298=-686.030393
(-686.044250)
BDE=77.76 (75.54)
a2
H298=-993.064035
(-993.081013)
∆H298=5.26 (1.94)
H298=-992.447700
(-992.461856)
BDE =72.83 (74.59)
H298=-993.072418
(-993.084112)
∆H298=0.00 (0.00)
H298=-992.448975
(-992.464084)
BDE =77.29 (75.14)
a3
H298=-1032.352843
(-1032.369799)
∆H298=5.18 (2.86)
H298=-1031.736581
(-1031.752441)
BDE = 72.78 (73.47)
H298=-1032.361095
(-1032.37436)
∆H298=0.00 (0.00)
H298=-1031.737713
(-1031.754311)
BDE= 77.25 (75.15)
Rotamer 1 Radical 1: 6(6,7) Rotamer 2 Radical 2: 7(6,7)
b0 H298=-647.357275
(-647.371649)
∆H298=0.06 (0.00)
H298=-646.741251
(-646.751778)
BDE =72.63 (75.04)
H298=-647.357375
(-647.371162)
∆H298=0.00 (0.31)
H298= -646.740335
(-646.751314)
BDE =73.21 (75.33)
b1
H298=-686.650881
(-686.665921)
∆H298=0.26 (0.00)
H298=-686.035698
(-686.046682)
BDE =72.11(74.65)
H298=-686.651300
(-686.665549)
∆H298=0.00 (0.23)
H298=-686.034081
(-686.045675)
BDE =73.38 (75.04)
b2 H298=-993.069272
(-993.084718)
∆H298=0.12 (0.00)
H298=-992.454061
(-992.466346)
BDE=72.12 (74.10)
H298=-993.069462
(-993.084623)
∆H298=0.00 (0.06)
H298=-992.453109
(-992.465771)
BDE=72.84 (74.40)
b3
H298=-1032.357886
(-1032.375617)
∆H298=0.21 (0.00)
H298=-1031.742831
(-1031.756799)
BDE=72.03 (74.38)
H298=-1032.358213
(-1032.375137)
∆H298=0.00 (0.30)
H298=-1031.742023
(-1031.756515)
BDE= 72.74 (74.26)

S. Angelova et al.: DFT/B3LYP calculated bond-dissociation enthalpies, radical-scavenging and antioxidant activities of natural …
191
Rotamer 1 Radical 1: 5(5,7) Rotamer 2 Radical 2: 7(5,7)
c1 H298=-686.647224
(-686.661877)
∆H298=1.15 (0.27)
H298=-686.022300
(-686.034022)
BDE=78.22 (80.05)
H298=-686.649058
(-686.662311)
∆H298=0.00 (0.00)
H298= -686.016344
(-686.029859)
BDE=81.96 (82.67)
c2
H298=-993.064037
(-993.081188)
∆H298=1.13 (0.26)
H298=-992.440251
(-992.454364)
BDE=77.51 (79.41)
H298=-993.065837
(-993.08161)
∆H298=0.00 (0.00)
H298= -992.434172
(-992.449879)
BDE=81.32 (82.22)
c3 H298=-1032.352611
(-1032.369611)
∆H298= 1.12 (0.29)
H298=-1031.729210
(-1031.74345)
BDE=77.26 (78.99)
H298=-1032.354388
(-1032.370074)
∆H298=0.00 (0.00)
H298=-1031.723117
(-1031.739294)
BDE=81.09 (81.60)
Rotamer 1 Rotamer 2 Radical: 7
d1 H298=-611.431360
(-611.443368)
∆H298=0.44 (0.03)
H298=-611.432056
(-611.443410)
∆H298=0.00 (0.00)
H298=-610.799536
(-610.811495)
BDE=82.55 (82.57)
enthalpies (∆H298=0.06÷0.21 kcal mol-1
). For d1 the
difference is also very low – 0.44 kcal mol-1
. In
acetone medium the enthalpy difference between
the rotamers of the compounds from a and c groups
decreases but with different scale, the rotamers 1 of
group b are preferred with very low ∆H298
(0.06÷0.31 kcal mol-1
), for d1 both rotamers are
isoenergetic (∆H298=0.03 kcal mol-1
). It can be
concluded that the addition of acetone (as surroun-
ding environment) equalize the BDEs for both OH-
groups of the dihydroxy compounds as for
compounds c this trend is not so strong.
The BDEs for the preferred rotamers of
compounds a1-a3, c1-c3, both rotamers of
compounds from b group and of d1 are presented
graphically on Fig. 2. The values in gas phase and
in acetone are compared. In gas phase compounds
from b group are characterized with the lowest
BDE values, followed by a group with higher
BDEs, while the compounds with OH-groups in
positions 5,7 (c1-c3) and with one OH group (d1)
are with highest BDEs. The substituent in position
3 does not affect (BDE6(6,7)) or affect weakly the
BDEs, as in almost all cases (exception – group c)
the lengthening of substituent’s chain in this
position leads to lower BDE values. When the
solvent is taken into account, the BDEs of
compounds a1-a3 decrease, the BDE of d1 is not
affected, while the BDEs of compounds b and c
increase (exception - c2). As a result, the BDEs of a
and b groups are equalized in acetone medium, but
the separation of compounds in two groups (with
and without catechol moiety) is preserved, i. e. the
BDE values of a and b groups remain lower than
those of c and d groups. The observed tendency is
in accordance with the conclusion of Zhang et al.
that the catechol moiety in the coumarins is a
beneficial structural factor that reduces BDE and
the coumarins with this fragment are strong
antioxidants [13].
The effect of the CH3-group on the BDE can be
estimated from the comparison of the BDEs of b0
and b1. The presence of CH3-group at position 4 in
the tested coumarins does not act equally on both
the OH-groups in gas phase: b0 is characterized
with higher BDE6(6,7) and lower BDE7(6,7) in
comparison to b1, while in acetone both OH-groups
of b1 have lower BDEs than b0.
The BDE of the more stable rotamers
(respectively in gas phase and in solvent acetone)

S. Angelova et al.: DFT/B3LYP calculated bond-dissociation enthalpies, radical-scavenging and antioxidant activities of natural …
192
Fig. 2. Selected BDEs (in kcal mol
-1) in gas phase (solid fill) and in acetone (pattern fill). The position of OH group
from which H atom is abstracted and the positions of OH groups in the coumarin main structure (in parentheses) are
denoted.
Table 3.Theoretical parameters (BDE in gas phase and in acetone) and the main experimental kinetic parameters:
antioxidant efficiency, presented as a protection factor (PF) during lipid autoxidation, % RSA and stoihiometry
(n) for the fast (t=2 min) and total (t=20 min) kinetics of DPPH radical absorption decrease at 516-517 nm.
BDE (gas
phase),
kcal mol-1
PF BDE
(acetone)
kcal mol-1
RSAfast,
% nfast,
M-1
s-1
RSAtot,
% ntot,
M-1
s-1
a1 77.76 1.3 75.54 35.8 0.9 49.1 1.1
a2 77.29 1.5 75.14 - - - -
a3 77.25 1.4 75.15 48.8 1.2 64.2 1.6
b0 73.21a 3.7 75.04
b - - - -
b1 73.38a 3.4 74.65
b 16.3 0.4 17.3 0.4
b3 72.74a 3.4 74.38
b 18.6 0.5 21.2 0.5
c1 81.96 1.2 82.67 3.0 0.1 3.0 0.1
c2 81.32 1.2 82.22 - - - -
c3 81.09 1.1 81.60 - - - -
d1 82.55 1.0 82.57 2.2 0.1 2.2 0.1 a - BDE 7(6,7); b - BDE 6(6,7).
for each structure is compared to the experimentally
derived data in Table 3. The presented experimental
data are chain-breaking antioxidant activity (as PF)
and DPPH scavenging (as %RSA and n) for the fast
and total kinetics. The protection factors (PF) of b0,
b1 and b3 are in the range 3.4-3.7 while the rest of
compounds are characterized with values in the
range of 1.0-1.5, i.e. compounds from b-group have

S. Angelova et al.: DFT/B3LYP calculated bond-dissociation enthalpies, radical-scavenging and antioxidant activities of natural …
193
the highest antioxidant efficiency during lipid
autoxidation. The gas phase calculated BDEs are in
agreement with these results: the compounds with
high PF have low BDE values and vice versa. The
coumarins from group a (a3 and a1) demonstrate
strong RSA (%RSA > 40%), coumarins from group
b (b1 and b3) – moderate RSA (15%< %RSA <
40%), c1 and d1 – weak RSA (%RSA < 15%). The
much lower value of %RSA for c1 (meta-
dihydroxy-coumarin) than ortho-dihydroxy-couma-
rins is not unforeseen considering the position of
OH groups. The OH groups of compound c react
individually with DPPH radical, not in tandem (like
ortho-dihydroxy-coumarins) and %RSA is close to
the value for the mono-hydroxycoumarin (d1). The
compounds from b group are characterized with
lower %RSAtot values (17.3 and 21.2) than those
from a group (41.9 and 64.2) inspite of the ortho
positioning of the OH-groups in all of them. The
BDEs in acetone for both groups a and b of ortho-
dihydroxy-coumarins are close, all values being in
the range of 74.38-75.54 kcal mol-1
. The failure of
the calculations to distinguish these groups could be
explained with the incomplete description of the
solvent-solute interactions by the model used
(PCM). The difference in the RSAs of compounds
from a and b groups is probably due to the
formation of different active intermediates from
7,8-diOH and 6,7-diOH, which react with different
rates with DPPH. Monophenolic coumarin d1 in
the cross-recombination reaction form inactive
products. Meta-dihydroxy coumarin reacts as two
mono-phenolic antioxidants. Each OH-group reacts
individually (not in tandem as ortho-substituted)
and thus the formation of active intermediates
cannot increase their RSA. Meta-dihydroxy couma-
rin c1 shows RSA close to that of the monophenolic
coumarin and much lower than that of ortho-
dihydroxycoumarins. The stoichiometric coeffici-
ents ntot for ortho-dihydroxycoumarins (group b)
are lower than 1 (0.4 and 0.5 for b1 and b3
respectively) and much lower for c1 and d1 (ntot =
0.1). Compounds a1 and a3 are characterized with
different stoichiometric coefficients ntot - 1.1 and
1.6 M-1
s-1
. The proposed mechanisms which
explain the different values of the experimentally
derived stoichiometry coefficient for a1 and a3 are
listed in Table 4. One molecule a1 can trap one
DPPH radical (n = 1), while one molecule a3 can
trap 1.5 DPPH radicals (n = 1.5).
DFT calculated BDEs in gas phase and in
acetone are able to distinguish the effects of the
substituents at positions 3 and 4, but failed in the
description of the activity of the systems sensible to
the solvent effects (ortho-dihydroxy-coumarins
from a and b groups).
CONCLUSION
In this study, the power (capacity) of DFT
calculations for the explanation of radical-
scavenging and antioxidant activities of mono- and
dihydroxycoumarins is tested. A relatively good
correlation between antioxidant efficiency (PF) of
lipid autoxidation and O-H BDEs in gas phase is
found. The studied hydroxycoumarins are divided
into three groups: strong (PF=3.4-3.7, BDE=72.74-
73.21 kcal mol-1
), moderate (PF=1.3-1.5,
BDE=77.25-77.76 kcal mol-1
) and weak
antioxidants (PF=1.0-1.2, BDE=81.96-82.55 kcal
mol-1
), i.e. the compounds with high PF have low
BDE values and vice versa. We observed that in
acetone BDE values are grouped into two groups:
1) ortho-dihydroxy-coumarins a1-a3 and b0-b3
(BDE=74.10-75.54 kcal mol-1
) and 2) meta-
dihydroxy-coumarins c1-c3 and monohydroxy-
coumarin d1 (BDE=81.60-82.64 kcal mol-1
).
Calculated BDEs in acetone for compounds of the
series a and b are close and do not explain the
difference in the experimentally derived RSA and
stoichiometry coefficient n for the fast and total
kinetics of the decreased DPPH radical absorption
of the ortho-dihydroxycoumarins. We propose that
Table 4. The proposed mechanism of action between DPPH radical and coumarins of group a (a1 and a3) for
explanation of the experimentally observed total stoichiometry (ntot).
ntot,
M-1
s-1
Mechanism
A1H and A3H- the correspond coumarins; A1•and A3•- coumarins’
radicals; A-A – unactive dimer
Stoichiometry coefficient for
the proposed mechanism
a1 1.1 A1H + DPPH• A1• + DPPH – H x2; H atom transfer
2 A1• A1-A1; homo-recombinaton reaction n = 1
2 A1H + 2DPPH• 2DPPH – H +A1-A1
a3 1.6
A3H + DPPH• A3• + DPPH – H x2; H atom transfer
A3• + DPPH• A3-DPPH; cross-recombination reaction
2 A3• A3-A3; homo-recombinaton reaction n = 1.5
2 A3H + 3DPPH• 2DPPH – H + A3-DPPH + A3-A3

S. Angelova et al.: DFT/B3LYP calculated bond-dissociation enthalpies, radical-scavenging and antioxidant activities of natural …
194
DFT calculated BDEs have the potential as a probe
for radical scavenging and antioxidant activities but
more precise description of the solvent effects
where the specific interactions are taken into
account is highly recommended and the results
must be handled carefully.
Acknowledgements: The authors appreciate the
possibility to run DPPH absorbance kinetics on
UV-Vis spectrophotometer in the laboratory of
Prof. L. Antonov, IOCCP-BAS. Partial financial
support by the Project BG051PO001-3.3.06-0025
operative program “Development of human
resources” is gratefully acknowledged. The part of
the calculations was performed on the computer
system installed at IOCCP – BAS with the financial
support of the Bulgarian Scientific Fund under
Project “MADARA” (RNF01/0110, contract
N_DO02-52/2008).V. Parmar was supported by a
Grant from EU under its Erasmus Mundus EMA-2
Svaagata Programme.
REFERENCES
1. A. R. Knaggs, Nat. Prod. Rep., 20, 119 (2003).
2. P. M. Dewick, Chapter 4. The Shikimate Pathway:
Aromatic Amino Acids and Phenylpropanoids,
Medicinal Natural Products: A Biosynthetic
Approach, Second Edition, Wiley, 2002.
3. J. R. Hoult, M. Payá, Gen. Pharmacol., 27, 713
(1996).
4. K. C. Fylaktakidou, D. J. Hadjipavlou-Litina, K. E.
Litinas, D. N. Nicolaides, Curr. Pharm. Des., 10,
3813 (2004).
5. F. Borges, F. Roleira, N. Milhazes, L. Santana, E.
Uriarte, Curr. Med. Chem., 12, 887 (2005).
6. I. Kostova, S. Bhatia, P. Grigorov, S. Balkansky, V.
S. Parmar, A. K. Prasad, Curr. Med. Chem., 18, 3929
(2011).
7. D. Egan, R. O'Kennedy, E. Moran, D. Cox, E.
Prosser, R. D. Thornes., Drug Metab. Rev., 22, 503
(1990).
8. H. G. Raj, V. S. Parmar, S. C. Jain, S. Goel, P.
Himanshu, S. Malhotra, A. Singh, C. E. Olsen, J.
Wengel, Bioorg. Med. Chem., 6, 833 (1998).
9. A. Barzegar, M. D. Davari, N. Chaparzadeh, N.
Zarghami, J. Z. Pedersen, S. Incerpi, L. Saso, A. A.
Moosavi-Movahedi, J. Iranian Chem. Soc., 8, 973-
982 (2011).
10. J. Z. Pedersen, C. Oliveira, S. Incerpi, V. Kumar, A.
M. Fiore, P. De Vito, A. K. Prasad, S. V. Malhotra,
V. S. Parmar, L. Saso, J. Pharm. Pharmacol., 59,
1721, (2007).
11. V. D. Kancheva, L. Saso, P. V. Boranova, M. K.
Pandey, S. Malhorta, J. T. Nechev, A. K. Prasad, M.
B. Georgieva, A. L. DePass, V. S. Parmar,
Biochimie, 92, 1089 (2010).
12. M. C. Foti, J. Pharm. Pharmacol., 59, 1673 (2007).
13. H.-Y. Zhang, L.-F. Wang, J. Mol. Struct.
(Theochem), 673, 199 (2004).
14. S. Angelova, V. Kancheva, A. Slavova-Kasakova, L.
Saso, G. Delogu, D. Fabbri, M. A. Dettori, M. C.
Foti, A. Prasad, V. S. Parmar, 10th
Indo-Italian
Workshop on Chemistry and Biology of
Antioxidants, 9-13 Nov. 2011, Department of
Biochemical Sciences, Sapienza University, Rome,
Italy, Abstracts, p. 83.
15. S. Angelova, L. Saso, V. Kancheva, A. Slavova-
Kasakova, M. Foti, C. Daquino, O.Firuzi, V. Enchev,
J. Nechev, Fifth National Pharmaceutical Congress
with International Participation, 1-3 April 2011,
Hisarya, Bulgaria, Abstracts, p. 31.
16. V. D. Kancheva, in: Phytochemicals and Human
Health: Pharmacological and Molecular Aspects,
Nova Science Publishers Inc., USA, A. A. Farooqui
(ed.), 2012, Chapter I, pp. 1-45.
17. N. D. Yordanov, Appl. Magn. Reson., 10, 330 (1996).
18. V. Kumar, S. Tomar, R. Patel, A. Yousaf, V. S.
Parmar, S. V. Malhorta, Synth. Commun., 38, 2646
(2008).
19. S. Tomar, PhD Thesis, Department of Chemistry,
University of Delhi, 2010.
20. S. S. Bahekar, D. B. Shinde, Tetrahedron Lett., 45,
7999 (2004).
21. V. S. Parmar, S. Singh, P. M. Boll, Magn. Reson.
Chem., 26, 430 (1988).
22. T. Brinck, M. Haeberlein, M. Jonsson, J. Phys.
Chem., 119, 4239 (1997).
23. W. J. Hehre, R. Ditchfield, J. A. Pople, J. Chem.
Phys., 56, 2257 (1972).
24. T. Clark, J. Chandrasekhar, G. W. Spitznagel, P. v.
R. Schleyer, J. Comp. Chem., 4, 294 (1983).
25. M. J. Frisch, I. A. Pople, J. S. Binkley, J. Chem.
Phys., 80, 3265 (1984).
26. R. Cammi, M. Cossi, J. Tomasi, J. Chem. Phys., 104,
4611 (1996).
27. R. Cammi, M. Cossi, B. Mennucci, J. Tomasi, J.
Chem. Phys., 105, 10556 (1996).
28. J. Tomasi, R. Cammi, B. Mennucci, C. Cappelli, S.
Corni, Phys. Chem. Chem. Phys., 4, 5697 (2002).
29. M. J. Frisch, G. W. Trucks, H. B. Schlegel, G. E.
Scuseria, M. A. Robb, J. R. Cheeseman, G. Scalmani,
V. Barone, B. Mennucci, G. A. Petersson, H.
Nakatsuji, M. Caricato, X. Li, H. P. Hratchian, A. F.
Izmaylov, J. Bloino, G. Zheng, J. L. Sonnenberg, M.
Hada, M. Ehara, K. Toyota, R. Fukuda, J. Hasegawa,
M. Ishida, T. Nakajima, Y. Honda, O. Kitao, H.
Nakai, T. Vreven, J. A. Montgomery, Jr., J. E.
Peralta, F. Ogliaro, M. Bearpark, J. J. Heyd, E.
Brothers, K. N. Kudin, V. N. Staroverov, R.
Kobayashi, J. Normand, K. Raghavachari, A.
Rendell, J. C. Burant, S. S. Iyengar, J. Tomasi, M.
Cossi, N. Rega, J. M. Millam, M. Klene, J. E. Knox,
J. B. Cross, V. Bakken, C. Adamo, J. Jaramillo, R.

S. Angelova et al.: DFT/B3LYP calculated bond-dissociation enthalpies, radical-scavenging and antioxidant activities of natural …
195
Gomperts, R. E. Stratmann, O. Yazyev, A. J. Austin,
R. Cammi, C. Pomelli, J. W. Ochterski, R. L. Martin,
K. Morokuma, V. G. Zakrzewski, G. A. Voth, P.
Salvador, J. J. Dannenberg, S. Dapprich, A. D.
Daniels, O. Farkas, J. B. Foresman, J. V. Ortiz, J.
Cioslowski, D. J. Fox, Gaussian 09, Revision A.02,
Gaussian, Inc., Wallingford CT, 2009.
DFT/B3LYP ИЗЧИСЛИТЕЛНИ ЕНТАЛПИИ НА ДИСОЦИАЦИЯ НА ВРЪЗКА,
РАДИКАЛОВО-УЛОВИТЕЛНА И АНТИОКСИДАНТНА АКТИВНОСТ НА СИНТЕТИЧНИ
АНАЛОЗИ НА ПРИРОДНИ КУМАРИНИ
С. Е. Ангелова1*, А. К. Славова-Казакова
1, Л. Сасо
2, Ш. Малхотра
3,4, А. К. Прасад
3, М. Е.
Браке5, В. С. Пармар
3,5, В. Д. Кънчева
1
1Институт по Органична химия с Център по Фитохимия, Българска Академия на Науките, ул. Акад. Г. Бончев,
бл. 9, 1113 София, България 2Департамент по физиология на човека и фармакология “Виторио Ерспамер”, Университет на Рим,“Ла
Сапиенца”, 00185 Рим, Италия 3Биоорганична лаборатория, Департамент по химия, Университет на Делхи, 110 007 Делхи, Индия
4Институт по химия и биохимия, Свободен университет на Берлин, 14195 Берлин, Германия
5Лаборатория за експериментално изследване на рака, Университетска болница, Университет на Гент,
B-9000 Гент, Белгия
Постъпила на 28 май 2014 г.; Коригирана на 04 август 2014 г.
(Резюме)
Енталпиите на дисоциация на връзка (ЕДВ) в O-H групи на серия от хидрокси и дихидрокси-4-метил
кумарини са изчислени в газова фаза и в ацетон чрез използване на теория на функционала на плътността на
B3LYP/6-31+G(d,p) ниво. Изследването е проведено с цел да се определи способността на енталпиите на
дисоциация на връзка да обяснят наблюдаваните радикалоулавяща и прекъсваща окислителната верига
антиоксидантна активности на изследваните кумарини. При експерименталното изследване са използвани
дифенилпикрилхидразил (ДФПХ) радикалоулавяща активност в разтвор на ацетон [като %RSA и
стехиометричен коефициент n за бърза (2 мин.) и тотална (20 мин.) кинетика] и прекъсваща окислителната
верига антиоксидантна активност (като фактор на стабилизиране, PF) по време на липидно автоокисление в
хомогенна среда. Експерименталните резултати за изследваните съединения показват, че двете фенолни групи в
орто положение действат съвместно, докато в мета положение не зависят една от друга. Според теоретичните
данни заместването в бензеновия пръстен на кумариновата система е много важно за прекъсващата
окислителната верига антиоксидантна активност. Също така според теоретичните изчисления въвеждането на
метилова група и/или други заместители в положение С-4 и С-3 на пироновия пръстен влияе върху ЕДВ
незначително. Интересното е, че радикалоулавящата активност (РУА) спрямо ДФПХ радикал на 7,8-
дихидрокси-4-метил-кумарините е много по-висока от тази на 6,7-дихидрокси-4-метил-кумарините, 5,7-мета-
дихидрокси-4-метил-кумарина и 7-хидрокси-4-метил-кумарина. Разликите в РУА на изследваните съединения
вероятно се дължи на влиянието на разтворителя (ацетон). ЕДВ може да се използва като мярка за
радикалоулавяща и прекъсваща окислителната верига антиоксидантна активности и има предсказваща
способност, но за някои фини ефекти се налага да се отчитат детайлно ефектите на разтворителя.

196
Bulgarian Chemical Communications, Volume 46, Special Issue A (pp. 196 – 202) 2014
Metal-ligand interactions in transition metal complexes of glyoxilic acid oxime
I. Georgieva, N. Trendafilova*
Institute of General and Inorganic Chemistry, Bulgarian Academy of Sciences, Acad. G. Bonchev str., bl. 11, 1113 Sofia,
Bulgaria
Received April 04, 2014; Revised May 16, 2014
Dedicated to Acad. Dimiter Ivanov on the occasion of his 120th
birth anniversary
The simplest derivative of 2-(hydroxyimino)carboxylic acids, glyoxilic acid oxime (gaoH2), was used as a model
compound for investigation of the metal-ligand interactions in a series of metal complexes: Cu(gaoH)2(H2O)2,
Zn(gaoH)2(H2O)2, Co(gaoH)2(H2O)2, Ni(gaoH)2(H2O)2, [Cd(gaoH)2(H2O)2]H2O, K[Pd(gao)(gaoH)] and
K[Pt(gao)(gaoH)]3/4H2O. The coordination abilities of the active ligand forms, gaoH− and gao
2−, in gas phase and in
solution have been studied and discussed at theoretical level. In agreement with X-ray data for Cu(II), Zn(II), Cd(II),
Pt(II) and Pd(II) complexes, the calculations have shown that the most preferred binding is the bidentate one through
the carboxylic oxygen and the oxime nitrogen atoms (M-gaoH(N,O)). The solvent polarization and the second gaoH−
ligand play crucial role for the preferred M-gaoH(N,O) binding mode. The nature and the strength of the metal-ligand
interactions were estimated in terms of molecular orbital analysis at the DFT(B3LYP/TZVP) level of theory. The
largest interaction energy, accompanying by significant net charge transfer from the gao ligand to the metal ion was
found for Cu(II) and Pt(II) complexes.
Key words: metal-ligand interactions, transition metal complexes, glyoxilic acid oxime, DFT, ab initio
INTRODUCTION
Glyoxilic acid oxime (gaoH2, (H)O-N=C(H)-
C(O)-O(H), (IUPAC name: 2-(hydroxyimino)acetic
acid)) (oxime analogue of glycine) is the simplest
representative of 2-(hydroxyimino)carboxylic acids
which exhibit original coordination properties to
metal ions. The oxime derivatives are used as
suitable matrices for organometallic reactions [1],
as very effective complexing agents in the analy-
tical chemistry [2-5], as low temperature precursors
for metal oxide ceramic [6] for design and synthesis
of magnetic polynuclear assemblies [7] and as
model compounds for investigation of metal-
protein interactions [8-10]. Metal complexes of
gaoH2 have also shown versatile bioactivity as
chelation therapy agents, drugs, inhibitors of
enzymes and as intermediates in the biosynthesis of
nitrogen oxide [11,12]. The alternative donor
centers of the oxime group (N,ON) and of the
carboxylic group (O,O) lead to many different
metal-ligand bindings: monodentate, bidentate
chelate (forming four-, five- and six-membered
stable rings) and bridging. The O,N-bidentate
complexes were found as cis [12] and trans [13]
isomers, the first one being stabilized by hydrogen
bonding between the protonated and deprotonated
oxime groups. The present work aims to
demonstrate the potential of the theoretical methods
to gain deeper insight into the coordination
properties of the glyoxilic acid oxime to metal ions
as well as to estimate the nature and the strength of
the metal-ligand interactions in the Zn(II), Cu(II),
Ni(II), Co(II), Pt(II) and Pd(II) complexes. The
theoretical estimations were done by means of the
calculated M-O/N(gao) bond lengths, M(II)-gao
interaction energies, NPA metal charges, M-
O/N(gao) 2-center Wiberg (Mayer) bond orders
(BO), polarization energy contributions, donation
and back-donation Mgao contributions to the
bond energy.
RESULTS AND DISCUSSION
Glyoxilic acid oxime is a small molecule with
16 possible conformations which arise from
internal rotations around the C–O, C–C, C=N and
N–O bonds [14,15]. DFT(BHLYP/6-311G(d,p),
B3LYP/6-31++G(d)), HF, MPn and QCISD(T)
calculations have successfully predicted the lowest
energy conformer of gaoH2, ectt, (Fig. 1). Single
crystal XRD data confirmed the prediction made
and showed that in the solid state four gaoH2
molecules in ectt conformation are linked by O∙∙∙H-
O and N∙∙∙H–O hydrogen bonds, forming stable
tetramer structure, (Fig. 1) [16]. Vibrational
© 2014 Bulgarian Academy of Sciences, Union of Chemists in Bulgaria
* To whom all correspondence should be sent:
E-mail: [email protected]

I. Georgieva, N. Trendafilova, Metal-ligand interactions in transition metal complexes of glyoxilic acid oxime
197
analysis at B3LYP/6-31G(d) level suggested
cooperativity in the cyclic H-bonded aggregates in
the solid state [17].
Fig. 1. Cyclic tetramer of glyoxilic acid oxime (ectt
conformation) with “head-to-tail” bondings, as obtained
from single crystal XRD analysis [16]. The lowest
energy monomer conformation, ectt, is given in a frame.
The most important properties of the glyoxilic
acid oxime, however, are revealed in solvent
environment. Mono- and doubly deprotonated
species of the ligand exist in water solution and
they are the active forms of the ligand in
complexation reactions with metal ions [15]. O–H
bond deprotonation energies (BDE), proton affinity
(PA), gas-phase basicity (GB) as well as reactive
sites for electrophilic attack were theoretically
predicted by detailed comprehensive DFT, MP2
and CCSD(T) studies of gaoH2, gaoH− and gao
2− in
gas phase and in solution (SCRF-PCM method)
[15]. For the neutral gaoH2, the calculations in
solution predicted lower O–H bond deprotonation
energy of the COOH group as compared to the
NOH group and thus the carboxylic group should
firstly be deprotonated in solution [12,13]. The
molecular electrostatic potential (MEP) values
obtained for gaoH−
and gao2−
predicted bidentate
coordination to metal(II) ions through both the
carboxylic oxygen atoms (O,O) or through the
oxime nitrogen and the carboxylic oxygen (N,O)
(Fig. 2). The theoretical predictions for the coordi-
nation properties of the gaoH− and gao
2− ligand
species made on the basis of ab initio and DFT
computations were proved by experimental studies
of Zn(II), Ni(II), Cu(II), Co(II), Cd(II), Pt(II) and
Pd(II) complexes of this ligand: single crystal XRD
analysis, magnetic measurements, electronic-,
NMR-, IR- and Raman spectroscopies
[12,13,17,18].
(a)
(b)
(c)
Fig. 2. Molecular electrostatic potential (MEP) of (a)
gaoH2; (b) gaoH−; (c) gao
2− species, mapped onto an
isosurface of electron density with 0.001 e-1
/bohr3.
Zn(II), Ni(II), Cu(II), Co(II) and Cd(II) complexes
of glyoxilic acid oxime
The coordination properties of the deprotonated
ligand to Cu(II) were previously studied through
calculations of different isomer models for
Cu(II):gao = 1:1 in gas phase [19]. As a result, a
stabilization of the [Cu-gaoH(O,O)]+ (bidentate
ligand binding through both carboxylic oxygens)
was predicted. This finding however does not
correspond to the experimentally observed M-L

I. Georgieva, N. Trendafilova, Metal-ligand interactions in transition metal complexes of glyoxilic acid oxime
198
binding mode in the complexes studied,
[Cu(gaoH(N,O))]+. Therefore, in the present study
we extend the theoretical investigation with
modeling species Cu(II):gao = 1:2 both in gas
phase and in solution. The calculations were
performed at DFT(B3LYP/6-31++G(d,p)/6-
311++G(d)) levels using the Gaussian09 program
package [20]. Two [Cu(gaoH)]+, two [Cu(gaoH)2]
and two [Cu(gao)] structures were computed with
the most stable anionic and dianionic conformers
both in gas phase and in aqueous solution. The
calculations of the [Cu(gaoH(O,O))]+ and
[Cu(gaoH(N,O))]+ structures in gas phase predicted
more stable [Cu(gaoH(O,O))]+
structure by 4.0
kcal/mol. In solution, however, the (N,O)
coordination in the [Cu(gaoH(N,O)]+ structure is by
6.6 kcal/mol more stable. With addition of a second
gaoH¯ ligand the [Cu(gaoH(N,O))2] structure
appeared more stable both in the gas phase and in
polar solution (by ~11 and 14 kcal/mol, respect-
tively). Obviously, the inclusion of the solvent and
of the second gaoH− ligand stabilized the M-
gaoH(N,O) bidentate binding, which is in
agreement with X-ray data obtained for Cu(II),
Zn(II), Cd(II) (Fig. 3), Pt(II) and Pd(II) complexes
(Fig. 4) [12,13]. In the case of gao2-
-Cu(II)
coordination mode, the calculations in the gas
phase predicted slight stabilization of the
[Cu(gao(O,O))] structure (by 1.1 kcal/mol) as
compared to [Cu(gao(N,O))]. In solution, however,
the [Cu(gao(N,O))] binding appears more stable by
7.6 kcal/mol which is consistent with the
experimentally observed gao2-
(N,O) coordination
realized in the studied complexes [12]. In the Cu(II)
and Zn(II) complexes (Fig.3a), the gaoH− ligands
form two planar five-membered chelate rings in
trans position. Two water molecules complete the
coordination sphere of the metal atoms taking the
axial positions of a distorted octahedron with equal
M-O4 bond distances. In the Cd(II) complex of
gaoH−(Fig. 3b), Cd(II) is seven-coordinated and in
addition to the two gaoH−(N,O) ligands in trans
position, the third gaoH− molecule acts simul-
taneously as bridging (through the COO− group)
and chelating ligand (it lies in a plane different
from that of the other two gaoH− ligands). Two free
coordination sites of the Cd(II) complex are
occupied with water molecules which are located
above and below the plane of the other two ligands.
Pt(II) and Pd(II) bis-chelate square-planar
complexes, K[Pt(gaoH)(gao)]·3/4H2O and
K[Pd(gaoH)(gao)], have been synthesized and
characterized by IR, Raman, NMR and UV-vis
spectroscopies as well as by single crystal XRD
analysis [12,18].
(a)
(b)
Fig. 3. Molecular structure of: a) M(gaoH)2(H2O)2 (M =
Cu(II), Zn(II)) and b) [Cd(gaoH)2(H2O)2]H2O, as
obtained from X-ray diffraction analysis.
Pt(II) and Pd(II) complexes of glyoxilic acid oxime
Each complex contains one mono- and one
doubly deprotonated ligand coordinated to Pt(II)
and Pd(II) via the carboxylic oxygen and oxime
nitrogen atoms (O,N), forming two cis-oriented
five-membered planar chelate rings, as shown in
Fig. 4. The two ligands are connected via
intramolecular hydrogen bond of the N–O···H–O–
N type.

I. Georgieva, N. Trendafilova, Metal-ligand interactions in transition metal complexes of glyoxilic acid oxime
199
Fig. 4. Molecular structure of cis-K[M(gaoH)(gao)] (M
= Pt(II) and Pd(II)), as obtained from X-ray diffraction
analysis.
Theoretical estimation of the metal(II)-gao
interactions
The molecular structures of complexes studied
were optimized at the B3LYP level with 6-
311+G(d) basis sets for Co(II), Ni(II), Cu(II),
Zn(II), ECPs (SDD) for Pt(II) and Pd(II) and 6-
31++G(d,p) for all other atoms. Metal(II)-gao
interactions in the neutral M(gaoH)2(H2O)2 (M =
Co, Ni, Cu, Zn) and in the ionic K[M(gaoH)(gao)]
complexes (M = Pd, Pt) were analyzed by means of
the calculated M-O/N(gao) bond lengths, M(II)-gao
interaction energies, charge-transfer and polariza-
tion energy contributions, donation and back-
donation Mgao contributions to the M(II)-gao
bond energy (Charge Decomposition Analysis,
CDA) [21,22] (in the frame of 2 fragment orbitals
calculations), NPA metal charges, M-O/N(gao) 2-
center (atoms) Wiberg (Mayer) bond order (BO)
indices. The CDA and BO components help to
analyze the chemical bonding in molecular systems
and to monitor changes in the electron density
distribution. The CDA approach decomposes the
Kohn-Sham determinant of a complex [ML] in
terms of fragment orbitals of the ligand, L and the
metal [M]. The [M] ← L donation is then given by
mixing of the occupied orbitals of L and vacant
orbitals of [M]. The [M] → L back-donation is
given by the mixing of the occupied orbitals of [M]
and vacant orbitals of L. The mixing of the
occupied orbitals of both fragments gives the
repulsive polarization and the mixing of the
unoccupied orbitals - residual term. The 2-center
“generalized” Wiberg and Mayer indices,
calculated from the canonical MOs in the AO basis
resemble the “classical” bond order in diatomic
molecule defined as one half of the difference
between the number of electrons in the bonding and
antibonding states in the corresponding bond. BO
value suggests how “strong” the bond is (for single
bond the value is close to 1). The Mayer bond
orders are:
where P (P = P
+ P) and P
s (P
s = P
- P
) are the
density and spin-density matrices, respectively, P
and P are - and -electron density matrices and S
is the overlap matrix. In closed-shell spin-singlet
state calculations, P
= P, BAB
= BAB
and BAB
(Mayer) = BAB (Wiberg). In a general case with P
P, the generalized Wiberg and Mayer bond
orders are not equal.
The molecular orbital analysis, BO and CDA
computations were performed with the
B3LYP/TZVP method applying the AOMix
program [23,24]. The metal-ligand interac-
tions/bond in the studied metal complexes were
estimated in terms of two fragments:
M(gaoH)(H2O)2+ (1) and gaoH
− (2) for Cu(II),
Zn(II), Ni(II) and Co(II) complexes and two types
fragments M(gaoH)+
(1) and gaoK− (2), and
K[M(gao)]+
(1) and gaoH− (2) for the Pt(II) and
Pd(II) complexes. The two-fragment approach used
for Cu(II), Zn(II), Ni(II) and Co(II) complexes
better describes the metal-gao bonding in the
complexes since it takes into account the
perturbation of metal ions by one gao ligand and
two water molecules. The results are listed in Table
1 for the Co(II), Ni(II), Cu(II), Zn(II) complexes
and in Table 2 for the Pt(II) and Pd(II) complexes.
In keeping with the experimental effective
magnetic moments [13], the Co(II), Ni(II) and
Cu(II) complexes were calculated in high spin
states: multiplicity = 4, 3 and 2, respectively. The
calculated bond lengths and bond orders for the
neutral Co(II), Ni(II), Cu(II) and Zn(II) complexes
(Table 1) predicted a stronger M-O bond than the
M-N one. The calculated M-gao interaction energy,
M-O/N bond lengths, M-O/N bond orders and
overlap populations suggested the strongest M-gao
bonding in the Cu(gaoH)2(H2O)2 complex and the
weakest one in the high spin Co(gaoH)2(H2O)2
complex. The same conclusions were derived by
previous analyses of the spectral behavior of
ν(COO), ν(M-O) and ν(M-N) frequencies [13]. The
charge decomposition analysis results listed in
Table 1 showed that at equilibrium Cu-gao distance
the gaoH− Cu
+ donation
is the most significant
one, 0.846 e (including the largest net charge
donation from the ligand to the metal and the
electron polarization contribution), whereas the
back-donation Cu+ gaoH
− is very small. The cal-

I. Georgieva, N. Trendafilova, Metal-ligand interactions in transition metal complexes of glyoxilic acid oxime
200
Table 1. NBO and CDA data for neutral M(gaoH)2(H2O)2 complexes (M = Co(II), Ni(II), Cu(II), Zn(II))*
Complex RM-gao (Å) qM
(a.u.)
E
(kcal/mol)
BO
(a.u.)
overlap
population Electronic
polarization
PL(1)-
PL(2)
Net charge
donation
CT(21)-
CT(12)
d b r
Co(gaoH)2
(H2O)2
1.997M-O
2.120M-N
2.268M-Ow
0.97 -181.3/
-651.4t
0.503
0.343
0.199
0.140
0.087
0.053
0.205
0.158
0.096
0.053 0.529 0.681 -0.021 -0.272
Ni(gaoH)2
(H2O)2
2.003M-O
2.047M-N
2.191M-Ow
0.90
-182.6/
-674.4t
0.476
0.413
0.237
0.136
0.119
0.061
0.193
0.186
0.114
0.063 0.564 0.712 -0.011 -0.279
Cu(gaoH)2
(H2O)2
1.944M-O
/1.944exp
1.981M-N
/2.063exp
2.598M-Ow
0.96
-191.4/
-691.8t
0.579
0.510
0.031
0.160
0.132
0.016
0.207
0.218
0.013
0.123 0.788 0.846 -0.030 -0.258
Zn(gaoH)2
(H2O)2
1.983M-O
/2.042exp
2.175
M-N/2.178
exp
2.319M-Ow
1.21
-182.7/ -653.2
t
0.475 0.286
0.156
0.183 0.111
0.065
0.183 0.111
0.065
0.019 0.508 0.683 -0.026 -0.214
*Geometry optimizations - at B3LYP/6-31++G(d,p)/6-311+G(d) level (the latter for Co(II), Ni(II), Cu(II), Zn(II)); population
analysis - at B3LYP/TZVP level; BO and CDA calculations with AOMix program. RM-gao – optimized M-O and M-N bond lengths;
qM - NPA charge of metal ion in the complex; E - interaction energy between M(gaoH)(H2O)2+(1) - gaoH−(2) fragments (M=Cu, Zn,
Ni, Co); BO- 2-centers Bond Order (Mayer BO – for open shell complexes, Wiberg BO - for closed shell complexes); net charge
donation (gaoH− M(gaoH)(H2O)2+); gaoH− M(gaoH)(H2O)2
+ donation d (including charge donation and electronic polarization);
M(gaoH)(H2O)2+ gaoH− back-donation b; M(gaoH)(H2O)2
+ gaoH− repulsive polarization r.
Table 2. NBO and CDA data for ionic K[M(gaoH)(gao)] complexes (M=Pt(II), Pd(II))a
Complex RM-gao (Å) qM
(a.u.) E
(kcal/mol)
BO
(a.u.)
overlap
population Electronic
polarization
PL(1)-
PL(2)
Net charge
donation
CT(21)-
CT(12)
d b r
K[Pd(gaoH)
(gao)]
2.054M-O*
/2.036exp
1.996M-N*
/1.957exp
2.054M-O**
/2.021exp
1.997M-N**
/ 1.948exp
0.62 -191.9*
-280.5**
0.512
0.590
0.421
0.608
0.153
0.204
0.105
0.201
0.153
0.204
0.105
0.201
0.033
-0.074
0.657
0.923
0.719
0.781
0.176
-0.017
-0.504
-0.504
K[Pt(gaoH) (gao)]
2.069M-O*
1.986M-N*
2.059
M-O**
1.994M-N**
0.30 -212.3*
-298.4**
0.521
0.659 0.457
0.655
0.138
0.176 0.106
0.159
0.138
0.176 0.106
0.159
0.016 -0.096
0.688 0.935
0.728 0.806
0.153 -0.049
-0.624 -0.624
aMolecular optimizations are performed at B3LYP/6-31++G(d,p)/SDD level (the latter - for Pt(II) and Pd(II)); population analysis -
at B3LYP/TZVP level; WBO and CDA calculations with AOMix program. RM-gao – optimized M-O and M-N bond lengths; qM -
NPA charge of metal ion in the complex; E* - interaction energy between M(gaoH)+(1) - gaoK−- (2) fragments, E** - interaction
energy between K[M(gao)]+(1) - gaoH− (2) fragments (M = Pt, Pd); BO- 2-center Bond Order (Wiberg); net charge donation
(*gaoH− M(gao)K+ and **Kgao−- MgaoH+); *gaoH− M(gao)K+ and **Kgao− MgaoH+ donation d (including charge
donation and electronic polarization); *K[M(gao)]+gaoH− and **MgaoH+ gaoK− back-donation b; *K[M(gao)]+ gaoH−and
**MgaoH+ gaoK− repulsive polarization r.
culations revealed that the gaoH− ligand is a strong
donor and a weak acceptor in all the neutral
complexes studied.
The calculated M(II)-N/O bond lengths and the
corresponding BOs for the ionic Pt(II) and Pd(II)
complexes of gao predicted stronger M(II)-N bonds
than M(II)-O ones which is in contrast to the results
obtained for the neutral Co(II), Ni(II), Cu(II) and
Zn(II) complexes of gao. The interaction energies
of Pt(II)-gaoH−/gao
2− are larger as compared to the
corresponding Pd(II)-gaoH−/gao
2− ones. More
negative interaction energy and stronger metal-
ligand bonding (larger donation contribution to the
M(II)-gao2−
bond energy) were predicted for the
metal-dianion binding (Pt(II)/Pd(II)-gao2−
) than for
the metal-monoanion binding (Pt(II)/Pd(II)-gaoH−).
CONCLUSION
As the simplest derivative of the 2-
(hydroxyimino) carboxylic acids the glyoxilic acid
oxime is a very suitable model compound for
investigation of metal-ligand interactions in
transition-metal complexes. The coordination abili-
ties of the active gaoH− and gao
2− forms in solution
were predicted by MEP calculations and different
metal-ligand bonding isomers. The largest
stabilization was found for the structures with M-
gaoH(N,O) bidentate binding through the carbo-
xylic oxygen and the oxime nitrogen atoms, which
is in agreement with X-ray data for Cu(II), Zn(II),
Cd(II), Pt(II) and Pd(II) complexes. The solvent
polarization and the second gaoH− ligand play
crucial role for the preferred M-gaoH(N,O) binding

I. Georgieva, N. Trendafilova, Metal-ligand interactions in transition metal complexes of glyoxilic acid oxime
201
mode. The calculated M(II)-N/O bond lengths and
the corresponding bond orders for the ionic Pt(II)
and Pd(II) complexes of gao predicted a stronger
M(II)-N bond than the M(II)-O one, which is in
contrast to the results obtained for the Co(II),
Ni(II), Cu(II) and Zn(II) neutral complexes of gao,
where the M(II)-O interaction is stronger than the
M(II)-N one. Among the studied neutral transition
metal complexes, the largest interaction energy was
found for Cu(II)-(gaoH−)2 and among the ionic
metal complexes, the larger interaction energy is
predicted for Pt(II)-gaoH−/gao
2−. For these comple-
xes, the net charge transfer energy contribution
from the gao ligand to the metal ion is the largest
one in the series of complexes studied.
Acknowledgements: The authors thank the
Computer Center for Advanced Studies in
Molecular Design, New Materials and
Nanotechnology (MADARA) at the Bulgarian
Academy of Sciences (Institute of Organic
Chemistry with Center of Phytochemistry) where
all computations were performed.
REFERENCES
1. V. Y. Kukushkin, D. Tudela, A. J. L. Pombeiro,
Coor. Chem. Rev., 156, 333 (1996).
2. I. O. Fritsky, R. Lampeka, V. Skopenko, Y.
Simonov, T. Malinovski, Z. Naturforsch. B, 48, 270
(1993).
3. V. V. Skopenko, I. O. Fritskii, R. D. Lampeka, Zh.
Neorg. Khim., 39, 1478 (1994).
4. V. V. Skopenko, T. Yu. Sliva, Yu. A. Simonov, A.
A. Dvornik, M. D. Mazus, R. D. Lampeka, T. I.
Malinovski, Zh. Neorg. Khim., 35, 1743 (1990).
5. A. A. Dvorkin, Yu. A. Simonov, T. Yu Sliva, R. D.
Lampeka, M. D. Mazus, V. V. Skopenko, T. I.
Malinovski,, Zh. Neorg. Khim., 34, 2582 (1989).
6. A. W. Apblett, G. D. Georgieva, Phosphorus Sulfur,
93, 479 (1994).
7. R. Ruiz, J. Sanz, B. Cervera, F. Lloret, M. Julve, C.
Bois, J. Faus, M. Carmen Munoz, J. Chem. Soc.
Dalton Trans., 1623 (1993).
8. D. Mansuy, P. Battioni, J. P. Battioni, Eur. J.
Biochem., 184, 267 (1989).
9. B. Meunier, Chem. Rev., 92, 1411 (1992).
10. J. Custot, J.-L. Boucher, S. Vadov, C. Guedes, S.
Dijols, M. Delaforge, D. Mansuy, J. Biol. Inorg.
Chem., 1, 73 (1996).
11. A. Garoufis, S. K. Hadjikakou, N. Hadjiliadis, Coor.
Chem. Rev., 253, 1384 (2009).
12. N. I. Dodoff, M. Kubiak, J. Kuduk-Jaworska, A.
Mastalarz, A. Kochel, V. Vassilieva, N. Vassilev, N.
Trendafilova, I. Georgieva, M. Lalia-Kantouri, M.
Apostolova, Chemija, 20, 208 (2009).
13. I. Georgieva, N. Trendafilova, G. Bauer,
Spectrochim. Acta A, 63, 403 (2006).
14. N. Trendafilova, G. Bauer, I. Georgieva, V. Delchev,
J. Mol. Struct., 604, 211 (2002).
15. I. Georgieva, N. Trendafilova, Chem. Phys., 321, 311
(2006).
16. I. Georgieva, D. Binev, N. Trendafilova, G. Bauer,
Chem. Phys., 286, 205 (2003).
17. I. Georgieva, N. Trendafilova, D. Binev, Vib.
Spectrosc., 31, 143 (2003).
18. I. Georgieva, N. Trendafilova, N. I. Dodoff, J.
Photoch. Photobiol. A, 267, 35 (2013).
19. I. Georgieva, N. Trendafilova, L. Rodriguez-
Santiago, M. Sodupe, J. Phys. Chem. A, 109, 5668
(2005).
20. R. D. Gaussian 09, Revision A.02, M. J. Frisch, G.
W. Trucks, H. B. Schlegel, G. E. Scuseria, M. A.
Robb, J. R. Cheeseman, G. Scalmani, V. Barone, B.
Mennucci, G. A. Petersson, H. Nakatsuji, M.
Caricato, X. Li, H. P. Hratchian, A. F. Izmaylov, J.
Bloino, G. Zheng, J. L. Sonnenberg, M. Hada, M.
Ehara, K. Toyota, R. Fukuda, J. Hasegawa, M.
Ishida, T. Nakajima, Y. Honda, O. Kitao, H. Nakai,
T. Vreven, J. A. Montgomery, Jr., J. E. Peralta, F.
Ogliaro, M. Bearpark, J. J. Heyd, E. Brothers, K. N.
Kudin, V. N. Staroverov, R. Kobayashi, J. Normand,
K. Raghavachari, A. Rendell, J. C. Burant, S. S.
Iyengar, J. Tomasi, M. Cossi, N. Rega, J. M. Millam,
M. Klene, J. E. Knox, J. B. Cross, V. Bakken, C.
Adamo, J. Jaramillo, R. Gomperts, R. E. Stratmann,
O. Yazyev, A. J. Austin, R. Cammi, C. Pomelli, J. W.
Ochterski, R. L. Martin, K. Morokuma, V. G.
Zakrzewski, G. A. Voth, P. Salvador, J. J.
Dannenberg, S. Dapprich, A. D. Daniels, Ö. Farkas,
J. B. Foresman, J. V. Ortiz, J. Cioslowski, and D. J.
Fox, Gaussian, Inc., Wallingford CT, 2009.
21. S. Dapprich, G. Frenking, J. Phys. Chem. A, 99, 9352
(1995).
22. G. Frenking, N. Frohlich, Chem. Rev., 100, 717
(2000).
23. S. I. Gorelsky, AOMix: Program for Molecular
Orbital Analysis; University of Ottawa (2011),
http://www.sg-chem.net/.
24. S. I. Gorelsky, A. B. P. Lever, J. Organomet. Chem.,
635, 187 (2001).

I. Georgieva, N. Trendafilova, Metal-ligand interactions in transition metal complexes of glyoxilic acid oxime
202
МЕТАЛ-ЛИГАНД ВЗАИМОДЕЙСТВИЯ В КОМПЛЕКСИ НА ПРЕХОДНИ МЕТАЛИ С
ОКСИМА НА ГЛИОКСИЛОВАТА КИСЕЛИНА
И. Георгиева, Н. Трендафилова*
Институт по обща и неорганична химия, Българска Академия на Науките, ул. Акад. Г. Бончев, бл. 11, 1113
София, България
Постъпила на 4 април 2014 г.; Коригирана на 19 май 2014 г.
(Резюме)
Оксимът на глиоксиловата киселина (gaoH2) е използван като модел за изследване на метал-лиганд
взаимодействията в серия комплекси на преходни метали с този лиганд: Cu(gaoH)2(H2O)2, Zn(gaoH)2(H2O)2,
Co(gaoH)2(H2O)2, Ni(gaoH)2(H2O)2, [Cd(gaoH)2(H2O)2]H2O, K[Pt(gao)(gaoH)]3/4H2O and K[Pd(gao)(gaoH)].
Координационната способност на активните форми на лиганда, gaoH− и gao
2−, в газова фаза и в разтвор е
изследвана на теоретично ниво. В съгласие с рентгеноструктурни данни за комплексите на Cu(II), Zn(II), Cd(II),
Pt(II) и Pd(II) изчисленията показват, че най-предпочетеното свързване е бидентатно чрез карбоксилния
кислороден атом и азотния атом от оксимната група, M-gaoH(N,O). Установено е, че ефектът на полярния
разтворител и присъствието на втори лиганд в молекулата имат определяща роля при реализиране на
свързването M-gaoH(N,O). Природата и силата на метал-лиганд взаимодействията в изследваните комплекси са
оценени чрез МО изчисления на DFT(B3LYP/TZVP) ниво на теорията. Най-голяма стойност на енергията на
взаимодействие и най-голям пренос на заряд от лиганда към металния йон е намерен за комплексите на Cu(II) и
Pt(II).

203
Bulgarian Chemical Communications, Volume 46, Special Issue A (pp. 203 – 208) 2014
Xanthine and hypoxanthine: in a search for conical intersections S0/S1 connected with
deformations of pyrimidine residue of the purine ring
V. B. Delchev*
Department of Physical Chemistry, University of Plovdiv, Tzar Assen 24 str., 4000 Plovdiv, Bulgaria
Received March 19, 2014; Revised April 09, 2014
Dedicated to Acad. Dimiter Ivanov on the occasion of his 120th
birth anniversary
The oxo N9H tautomers of xanthine and hypoxanthine were studied theoretically at the CC2/aug-cc-pVDZ level in
order to find conical intersections S0/S1, which show deformations of the pyrimidine rings. The conical intersections
were characterized locally by adiabatic surfaces constructed on the narrow grid. The accessibility of the conical
intersections from the excited state was also implied.
Key words: CC2 method, conical intersections, hypoxanthine, xanthine
INTRODUCTION
Xanthine (XA) is a purine base, which can be
found in most human body tissues. This compound
is produced through purine degradation. It is
obtained enzymatically from guanine and
hypoxanthine (HXA) by deamination and oxidation
respectively. Hypoxanthine is a naturally occurring
deaminated form of adenine. It is obtained as an
intermediate in the purine catabolism reaction. It is
also included in the anticodon of tRNA as the
nucleoside base inosine [1].
Scheme 1. Canonical structures of xanthine and
hypoxanthine N9H tautomers.
The canonical structures of N9H tautomers of
xanthine and hypoxanthine are given in Scheme 1.
As one can see, hypoxanthine has one extra C=N
bond in pyrimidine residue (canonical structure)
than xanthine. To our knowledge, the internal
conversions of the excited states of pyrimidines and
purines occur through a twisting around the double
bond(s) within the rings [2-6]. These mechanisms
are known to be main channels for a non-radiative
decay of the excited states [7,8], which determine
their high photostability with respect to UV
radiation. Unfortunately for purines, especially for
(hypo)xanthine, these reactions are not very well
clarified, even though some excited states have
been an object of the theoretical research of
Farrokhpour et al. [9], who have tried to explain the
photoelectron spectra of both compounds.
However, no information for the excited states’
deactivation channels has been given [9]. Some
excited-state non-radiative decay paths of xanthine
through conical intersections S0/S1 have been
studied theoretically; however they concern only
the imidazole part of the ring [10].
Theoretical calculations and experimental UV
spectral investigations have revealed that in
aqueous solution the N9H tautomer of hypo-
xanthine is dominant over the keto-N7H form [11-
14]. In the crystalline phase this tautomer is the
most stable one either [15]. The keto and enol
tautomers, and their stability in aqueous solution
have been reported in the paper of Stimson et al
[16]. They have been established by UV
spectroscopy that in acid solution the enol forms of
hypoxanthine and xanthine dominate [16]. Some
recent investigations have revealed that hypo-
xanthine in aqueous solution shows absorption
maximum at 250 nm [17]. It was found also that the
lifetimes of hypoxanthine in aqueous media are
2.30.3 ps (probe 250 nm) and 13020 fs (probe
570 nm) [17]. The major conclusion of the latter
research is that hypoxanthine appears to decay non-
radiatively by puckering of the six-membered ring
© 2014 Bulgarian Academy of Sciences, Union of Chemists in Bulgaria
* To whom all correspondence should be sent:
E-mail: [email protected]

V. Delchev: Xanthine and hypoxanthine: in a search for conical intersections S0/S1 connected with deformations of pyrimidine …
204
in aqueous media. However, a concrete mechanism
has not been proposed and commented.
The aim of the reported research is to throw
light upon the deformation mechanisms of pyrimi-
dine fragments of xanthine and hypoxanthine and to
clarify their contribution to internal conversions
S0/S1 or fluorescence in both compounds. The study
requires a search of accessible and reliable conical
intersection(s) mediating the S1→S0 decay (internal
conversion). Such conical intersections and their
accessibility could explain the high UV photo-
stability of both compounds. In the cases of excited
state decay either internal conversion or fluores-
cence may dominate. The knowledge which process
prevails is important to the understanding of
whether the compound could find application as
photoprotector or not.
THEORETICAL METHODS
The ground-state equilibrium geometries of the
N9H tautomers of xanthine and hypoxanthine were
optimized at the CC2 level [18,19]. Their structures
were used to calculate subsequently the vertical
excitation energies of the minima with no
symmetry restrictions.
The emission energies were found with the
optimized structures of the excited states (CC2).
The optimizations of the excited state equilibrium
geometries were carried out using symmetry
restrictions - CS. This approach allows distingui-
shing of the excited states under consideration by
symmetry, which is always useful in the studies of
electronic states involving a large number of
configurations. Thus, the 1ππ
* excited states have
symmetry A’, while the 1nπ
* and
1πσ
* excited states
have symmetry A”. The optimizations of the exci-
ted states without symmetry restrictions led to a
mixing of excited states and the assignment of the
states is not always possible.
For the generation of adiabatic structures on the
narrow grid around the conical intersections we
orthogonalized the vectors g=2GD and h=DC by
the Yarkony’s procedure [20]. Further procedure
for the PESs’ constructions is described in the
paper of Woywod [20]. The adiabatic PESs were
constructed using the normal modes of the
geometry-minimum, as obtained from CASSCF
computations [21,22].
All computations were performed at the
CC2/aug-cc-pVDZ level with the TURBOMOLE
program package [18,23]. Only the optimizations of
the conical intersections and the geometries-minima
for the adiabatic PESs were performed at the
CASSCF(6,6)/6-31G* level with the program
GAUSSIAN 03 [24].
RESULTS AND DISCUSSION
Equilibrium geometries
xanthine hypoxanthine
Fig. 1. CC2 ground-state equilibrium geometries of
xanthine and hypoxanthine.
The ground-state equilibrium geometries of XA
and HXA found at the CC2 level are illustrated in
Fig. 1. The structures are planar which allows using
symmetry (CS) to study the excited states which are
vertically located over the ground-state minima. As
seen HXA has one extra C=N bond in the
pyrimidine residue than XA. This bond implies
twisting around which is usually favored in the
excited state than in the ground state.
Vertical excitation and emission energies
Table 1. Vertical excitation and emission energies of
xanthine and hypoxanthine.
XA HXA
State eV nm State eV nm
vertical excitation energies 1πσ
* 4.918 252
1ππ
* 4.884 254
1nπ
* 5.080 244
1nπ
* 5.253 236
1ππ
* 5.297 234
1nπ
* 5.422 229
1ππ
* 5.821 213
1ππ
* 5.429 229
1πσ
* 5.827 213
1πσ
* 5.436 228
emission energies (Cs symmetry) 1ππ
* (A’) 4.659 266
1ππ
* (A’) 3.574 347
1πσ
*(A”) 4.307 288
1πσ
*(A”) 3.574 248
The calculated vertical excitation energies of the
tautomers of both compounds are presented in
Table 1. The data show that the bright 1ππ
* excited
state of xanthine (at 5.297 eV) is the third excited
state (ordered by energy), while it is the lowest
excited state in hypoxanthine (at 4.884 eV). That
could be explained with the extra oxygen atom,
which is present in xanthine as compared to hypo-
xanthine; such bases with carbonyl groups have 1nπ
* excited states with lower energies than those of
1ππ
* excited states [8,10,11]. The molecular orbitals
under consideration are illustrated in Fig. 2.

V. Delchev: Xanthine and hypoxanthine: in a search for conical intersections S0/S1 connected with deformations of pyrimidine …
205
σ*-МО
π*-МО
π-МО
n-МО
xanthine hypoxanthine
Fig. 2. Selected molecular orbitals involved in the
electronic transitions leading to the excited states under
consideration.
The calculated 1ππ
* emission energy (in eV) of
hypoxanthine is considerably lower than this of
xanthine. In other words, the fluorescence maxi-
mum of xanthine is expected to be blue-shifted with
respect to this of hypoxanthine. To the contrary, the
emission energy of the 1πσ
* excited state (if any
maximum of this state can be measured) of
xanthine should be red-shifted as compared to
hypoxanthine.
Conical intersections
The structures of the optimized conical inter-
sections are illustrated in Fig. 3.
CIxa CIhxa
Fig. 3. Conical intersections of xanthine and
hypoxanthine obtained through deformations of the
pyrimidine residues of purine rings.
They both show deformations in pyrimidine
fragment of the purine ring. As seen, the conical
intersection S0/S1 of XA shows deformation of the
carbonyl oxygen at the second position (IUPAC).
The C=O bond is star-ched to 1.580 Ǻ as compared
to the minimum (Fig. 1). The carbonyl oxygen is
located in the upper side of the purine ring.
The optimized intersection S0/S1 of HXA shows
a typical twisting of the C=N bond of pyrimidine
ring. As expected, this twisting is accompanied by a
deviation of the hydrogen atom of the nearest
carbon atom out of the molecular plane.
(a)
(b)
Fig. 4. Adiabatic potential energy surfaces of the
electronic states S0 (W1) and S1 (W2) of a) xanthine and
b) hypoxanthine.
The adiabatic surfaces W1 and W2 of the
electronic states S0 and S1 are presented in Fig. 4.
As seen in both cases, for XA and HXA, the two
electronic states are degenerated in the point 0/0:
the conical intersection S0/S1 is located there. The
slope of the S0-surface after the conical intersection
is indicative enough for the course of the reaction
since it shows in which direction the reaction could
proceed. In other words, the steeper the slope, the
higher probability for the reaction to proceed. The
S0-surface of XA shows the steepest slope in the
direction 1/-1 (these are the end values of g and h
correspondingly). The S0-surface of HXA indicates
the steepest slope in the direction -1/-1.

V. Delchev: Xanthine and hypoxanthine: in a search for conical intersections S0/S1 connected with deformations of pyrimidine …
206
Energy-level diagrams
In Fig. 5 are depicted the energy-level diagrams
and the possible pathways (dashed arrows) of the
deactivation processes of the excited states as well
as the basic optical transitions (full arrows).
(a)
(b)
Fig. 5. Energy-level diagrams of the possible
deactivation pathways of the N9H tautomers of a)
xanthine and b) hypoxanthine – CC2/aug-cc-pVDZ level
(gas phase).
As seen, the conical intersection S0/S1 of XA has
higher energy than the energy of the spectro-
scopically active 1ππ
* excited state. In other words,
this conical intersection is not accessible through
the lowest bright state. The second bright 1ππ
*
excited state of XA (Table 1) has lower energy
either than the energy of the conical intersection
S0/S1. As seen from Fig. 5a, the 1ππ
* excited state
equilibrium geometry is of lower energy than the
vertical excitation energy of this state. It indicates a
Stokes shift of 0.638 eV between absorption and
fluorescence energies. The experiment has shown
fluorescence maximum at 435 nm but in strong acid
media (pH=1) [25]. This value is not directly
comparable to the calculated one here since, as it
was mentioned in the introduction section, it can be
associated with the enol tautomer, which is
dominant at pH=1 [16]. At pH=7.2 the fluorescence
is about 325 nm [26]. Obviously, the fluorescence
maximum is approaching the predicted here value
despite the fact that the calculations are referred to
molecules in the gas phase.
Fig. 5b shows the energy-level diagram of
HXA. The picture shows that the conical inter-
section S0/S1 has lower energy than the lowest
bright 1ππ
* excited state, and thus it can be accessed
through this state and a proper excited-state decay
path. Our future research will be dedicated to a
search of such path connecting both stationary
points on the W2-adiabatic-PES of HXA. Perhaps,
this conical intersection could be also accessed
from the equilibrium geometry of the 1ππ
* excited
state, whose energy is lower (the gray area of the
picture).The results imply a Stokes shift of 1.31 eV
between absorption and fluorescence maxima.
CONCLUSION
The oxo N9H tautomers of xanthine and
hypoxanthine were studied theoretically at the
CC2/aug-cc-pVDZ level in order to find conical
intersections S0/S1 which correspond to defor-
mations of the pyrimidine fragment of the purine
ring. The energies of the conical intersections and
the minima were summarized in energy-level dia-
grams which shed light upon the possible deacti-
vation channels of the two compounds. It was
shown that the conical intersection S0/S1 of XA
cannot be accessed through the spectroscopically
active 1ππ
* excited state. Obviously, with respect to
these mechanisms only fluorescence is expected; in
other words the compound does not exhibit photo-
protective properties. To the contrary, the conical
intersection S0/S1 of HXA could be easily accessed
through the lowest bright active 1ππ
* excited state
of the compound. The domination of the internal
conversion of HXA shows that the compound can
exhibit photoprotective properties. We found also
that HXA should show larger Stokes shift than XA
between the absorption and fluorescence maxima.
Acknowledgements: The author thanks prof. Petko
Ivanov (Institute of Organic Chemistry – Bulgarian
Academy of Sciences) for the given computational
quota and the technical support of the CC2
calculations (Linux-cluster MADARA), Project
RNF01/0110.

V. Delchev: Xanthine and hypoxanthine: in a search for conical intersections S0/S1 connected with deformations of pyrimidine …
207
REFERENCES
1. J. M. Berg, J. L. Tymoczko, L. Stryer, Biochemistry
(5th ed.), W. H. Freeman, New York, 2002.
2. K. A. Kistler, S. Matsika, J. Chem. Phys., 128,
215102 (2008).
3. S. Matsika, P. Krause, Annu. Rev. Phys. Chem., 62,
621 (2011).
4. S. Matsika, J. Phys. Chem. A, 108, 7584 (2004).
5. S. Yamazaki, W. Domcke, A. Sobolewski, J. Phys.
Chem. A, 112, 11965 (2008).
6. S. Yamazaki, W. Domcke, J. Phys. Chem. A, 112,
7090 (2008).
7. C. Canuel, M. Mons, F. Piuzzi, B. Tardivel, I.
Dimicoli, M. Elhanine, J. Chem. Phys., 122, 074316
(2005).
8. V. B. Delchev, A. L. Sobolewski, W. Domcke, Phys.
Chem. Chem. Phys., 12, 5007 (2010).
9. H. Farrokhpour, F. Fathi, J. Comput. Chem., 32, 2479
(2011).
10. S. Yamazaki, A. L. Sobolewski, W. Domcke, Phys.
Chem. Chem. Phys., 11, 10165 (2009).
11. M. Shukla, J. Leszczynski (ed.), Radiation induced
molecular phenomena in nucleic acids: a
comprehensive theoretical and experimental analysis,
Springer, 2008.
12. M. K. Shukla, J. Leszczynski, J. Phys. Chem. A, 104,
3021 (2000).
13. M. K. Shukla, J. Leszczynski, J. Mol. Struct.
(Theochem), 529, 99 (2000).
14. B. Hernandez, F.T. Luque, M. Orozco, J. Org.
Chem., 61, 5964 (1996).
15. D. Lichtenberg, F. Bergmann, Z. Neiman, Isr. J.
Chem., 10, 805 (1972).
16. M. M. Stimson, M. A. Reuter, J. Am. Chem. Soc.,
65, 153 (1943).
17. J. Chen, B. Kohler, Phys. Chem. Chem. Phys., 14,
10677 (2012).
18. C. Hättig, F. Weigend, J. Chem. Phys., 113, 5154
(2000).
19. C. Hättig, J. Chem. Phys., 118, 7751 (2003).
20. C. Woywod, W. Domcke, A. L. Sobolewski, H.-J.
Werner, J. Chem. Phys., 100, 1400 (1994).
21. R. H. A. Eade, M. A. Robb, Chem. Phys. Lett., 83,
362 (1981).
22. H. B. Schlegel, M. A. Robb, Chem. Phys. Lett., 93,
43 (1982).
23. R. Ahlrichs, M. Baer, M. Haeser, H. Horn, C.
Koelmel, Chem. Phys. Lett., 162, 165 (1989).
24. M. J. Frisch, G. W. Trucks, H. B. Schlegel, G. E.
Scuseria, M. A. Robb, J. R. Cheeseman, J. A.
Montgomery, Jr., T. Vreven, K. N. Kudin, J. C.
Burant, J. M. Millam, S. S. Iyengar, J. Tomasi, V.
Barone, B. Mennucci, M. Cossi, G. Scalmani, N.
Rega, G. A. Petersson, H. Nakatsuji, M. Hada, M.
Ehara, K. Toyota, R. Fukuda, J. Hasegawa, M.
Ishida, T. Nakajima, Y. Honda, O. Kitao, H. Nakai,
M. Klene, X. Li, J. E. Knox, H. P. Hratchian, J. B.
Cross, V. Bakken, C. Adamo, J. Jaramillo, R.
Gomperts, R. E. Stratmann, O. Yazyev, A. J. Austin,
R. Cammi, C. Pomelli, J. W. Ochterski, P. Y. Ayala,
K. Morokuma, G. A. Voth, P. Salvador, J. J.
Dannenberg, V. G. Zakrzewski, S. Dapprich, A. D.
Daniels, M. C. Strain, O. Farkas, D. K. Malick, A. D.
Rabuck, K. Raghavachari, J. B. Foresman, J. V.
Ortiz, Q. Cui, A. G. Baboul, S. Clifford, J.
Cioslowski, B. B. Stefanov, G. Liu, A. Liashenko, P.
Piskorz, I. Komaromi, R. L. Martin, D. J. Fox, T.
Keith, M. A. Al-Laham, C. Y. Peng, A.
Nanayakkara, M. Challacombe, P. M. W. Gill, B.
Johnson, W. Chen, M. W. Wong, C. Gonzalez, J. A.
Pople, Gaussian 03, Revision D.01, Gaussian, Inc.,
Wallingford CT, 2004.
25. D. E. Duggan, R. L. Bowman, B. B. Brodie, S.
Udenfriend, Arch. Biochem. Biophys., 68, 1 (1957).
26. M. K. Shukla, P. C. Mishra, J. Mol. Struct., 324, 241
(1994).

V. Delchev: Xanthine and hypoxanthine: in a search for conical intersections S0/S1 connected with deformations of pyrimidine …
208
КСАНТИН И ХИПОКСАНТИН: В ТЪРСЕНЕ НА КОНИЧНИ СЕЧЕНИЯ S0/S1, СВЪРЗАНИ
С ДЕФОРМАЦИЯ НА ПИРИМИДИНОВИЯ ФРАГМЕНТ НА ПУРИНОВИЯ ПРЪСТЕН
В. Б. Делчев
Пловдивски университет “П. Хилендарски”, Катедра Физикохимия, ул. Цар Асен 24, 4000 Пловдив, България
Постъпила на 19 март 2014 г.; Коригирана на 9 април 2014 г.
(Резюме)
N9H тавтомерите на оксо ксантина и хипоксантина са изследвани на CC2/aug-cc-pVDZ теоретично ниво с
цел да се намерят конични сечения от типа S0/S1, за да се изучат механизмите на безизлъчвателна дезактивация
на възбудените им състояния, които са свързани с деформации на пиримидиновите остатъци в пуриновите
пръстени. Намерените конични сечения са охарактеризирани чрез адиабатните повърхнини на двете електронни
състояния S0 и S1, построени в ограничено пространство около тях.

209
Bulgarian Chemical Communications, Volume 46, Special Issue A (pp. 209 – 214) 2014
Use of the descriptor fingerprints to clustering of chemical datasets
B. P. Stoyanov1, P. R. Kostadinov
1, M. V. Kolev
1, Z. A. Mustafa
2, M. N. Moskovkina
3, R. S.
Milina2, I. P. Bangov
3*
1Department of Computer Informatics, Faculty of Mathematics and Informatics, Konstantin Preslavski University of
Shumen, 115 Universitetska str., 9712 Shumen, Bulgaria 2Central Research Laboratory, Faculty of Natural Sciences, Prof. Assen Zlatarov University, 62 San Stefano str.,
8001 Burgas, Bulgaria 3General Chemistry Chair, Faculty of Natural Sciences, Konstantin Preslavski University of Shumen, 115
Universitetska str., 9712 Shumen, Bulgaria
Received April 28, 2014; Revised May 20, 2014
Dedicated to Acad. Dimiter Ivanov on the occasion of his 120th
birth anniversary
A novel approach in the area of chemoinformatics, the use of descriptor fingerprints has been applied to the problem
of clustering of chemical databases. This approach coupled with the clustering method of Butina (originally created for
structural fingerprints) was tested with a set of 96 biodiesel fuels. The influence of the threshold values from 0.0 to 1.0
of the Tanimoto index on the clustering results was studied. The results show a good discrimination power of the
method, biodiesels of the same oils fall in one the same clusters. It was also shown that similar cetane number (CN)
values of biodiesels within the statistical accuracy fall in the same cluster.
Key words: clustering analysis, descriptor fingerprints, Tanimoto index, biodiesels
INTRODUCTION
There are many methods developed in the field
of chemoinformatics, such as neuronal networks,
partial least square (PLS), multivariable regression,
discriminant analysis etc. They have their advan-
tages and drawbacks. For a year we have develop-
ping a novel approach - descriptor fingerprints
devised by one of the authors (IB) [1-3], toward the
similarity of different chemical and/or non-
chemical materials. Its potentials have been demon-
strated with the creation of a server on the net for
allergen and non allergen food proteins compared
with servers based on the traditional chemo-
informatics methods [2]. Hence, the purpose of this
work is to study the influence of the threshold value
on the results from similarity clustering with
descriptor fingerprints.
The basic idea of descriptor fingerprints comes
from the well known structural fingerprints [4-6].
Both structural and descriptor fingerprints are
defined either as a character or binary string of 0s
and 1s.
In the case of structural fingerprint an array of
structural fragments is juxtaposed to the fingerprint
array, each element of the former corresponding to
the element of the latter being at the same location.
The general scheme is shown on Fig. 1.
Fig. 1. Fingerprint generation of chemical structures.
The program automatically determines these
minimum and maximum values for each descriptor
from all the descriptors in the set. A precision
(resolution) - resValue of each descriptor is user
defined. Hence, for each real value descriptor its
interval is divided into N=(initValue-endValue)/
resValue discrete sub-intervals. Some descriptor
could be binary, e.g. the presence or absence of a
property. They are encoded by one interval. Thus,
the formation of the fingerprint from all its
descriptors is carried out by concatenation of all
their sub-intervals. In case a descriptor real value
falls in an interval a 1 is put in the corresponding
position of the fingerprint array, the other elements
corresponding to the descriptor remaining 0s. The
formation of a descriptor fingerprint is illustrated in
Fig. 2.
© 2014 Bulgarian Academy of Sciences, Union of Chemists in Bulgaria
* To whom all correspondence should be sent:
E-mail: [email protected]

B. P. Stoyanov et al.: Use of the descriptor fingerprints to clustering of chemical datasets
210
Fig. 2. Formation of a descriptor fingerprint.
The similarity search of two objects (chemical
structures, materials, etc.) is carried out by compa-
ring their fingerprints using any similarity measure
[7,8]. In this work the Tanimoto measure has been
employed to this end. It has the following form:
T=NC/(NA+NB-NC). (1)
Here, NA is the number of elements having value
1 in the first fingerprint A, NB is the number of
elements having value 1 in the second fingerprint
B, and NC is the number of the common elements
(being in the same position in both fingerprints)
having value 1. This index has real values between
0.0 and 1.0. The higher is the value the more
similar are the two objects.
CLUSTERING OF SETS OF OBJECTS
Clustering of set of objects is based on the
cluster analysis. Here is a definition from
Wikipedia [9]:
“Cluster analysis or clustering is the task of
grouping a set of objects in such a way that objects
in the same group (called a cluster) are more
similar (in some sense or another) to each other
than to those in other groups (clusters). It is a main
task of exploratory data mining, and a common
technique for statistical data analysis, used in many
fields, including machine learning, pattern
recognition, image analysis, information retrieval,
and bioinformatics.”
There are several algorithms for clustering of
different sets of objects. Some of them are the
connectivity based, distance measure based, other
are centroid based approaches. Here we use the
clustering algorithm of Butina [10]. It consists of
the following procedures:
First, the Tanimoto index is calculated pairwise
for all the objects in the set within the given
threshold value (the smallest Tanimoto value
accepted for a pair).
Second, the objects are sorted according to the
number of their neighbours, i.e. forming from
most to less numerous pairs within the given
threshold value, i.e., with Tanimoto value
between the threshold value and 1.0.
Further, another pass of pairwise fingerprint
Tanimoto calculation is carried out, starting
from the first pair of the sorted set. All its
neighbours form the first cluster and are
subsequently flagged as “used”. Then, follows
the same procedure with the second unused
object, applied to the remaining unused
fingerprints only, and the second cluster is
formed, then the next clusters are formed in the
same way. A last cluster is formed from the
objects having 1 neighbour only.
An additional procedure of automatic perception
of the threshold value (TV) was developed by
us. An extra preliminary pairwise Tanimoto
calculation of the data set with a subsequent
ranking of the pairs was carried out. Further a
procedure scan the names of the ranked pairs
and finds out at what value the Tanimoto index
produces false result. This value increase by
0.00001 is taken for a threshold value (TVauto).
APPLICATION, RESULTS AND DISCUSSION
We applied this clustering approach to a set of
96 biodiesel fuels of several vegetable oils:
sunflower (SF), soya beans (SB), corn (CR), rape
seed (RS), peanut (PN), palm (PM) and some
mixed cases (MIX). They have been selected from
different feed stocks (with different composition
and properties respectively). In as much as the
biodiesel fuel is a mixture of fatty acid methyl
esters (FAME) its properties depend on the
chemical structure of the individual FAME and
their contents (FAME profile) [11-14]. Hence, the
descriptor fingerprint method has been based on
their gas chromatographic FAME profiles [15-19].
To the aim some available literature data on FAME
profiles of biodiesels from several types of oils
were used [11,14,20-22].
Our method of descriptor fingerprint clustering was
applied to a set of different biodiesel fuels in order
to derive a new alignment for them into some
groups (clusters).
In this paper we study the influence of the
threshold value (TV) on the clustering. The results
are provided in Table 1.
One can see from Table 1, that the best
clustering is with threshold value TV=0.7. Thus, it
is seen that a perfect discrimination leading to
separation of the different biodiesels, say, all sun-

B. P. Stoyanov et al.: Use of the descriptor fingerprints to clustering of chemical datasets
211
Table 1. Results of the biodiesel oils clustering.
Cluster
No
Vegetable
oils in
biodiesels
TV=
0.0
TV=
0.1
TV=
0.2
TV=
0.3
TV=
0.4
TV=
0.5
TV=
0.6
TV=
0.7
TV=
0.8
TV=
0.9
TV=
1.0
TVauto=
0.5263158
1
SF 33 33 32 30 28 25 21 5 3 13
SB 19 19 19 18 12 1 11 7
CR 8 8 8 7 2
PN 6 5
RS 19 19 12
PM 6 6 5
Mix 5 5 1 1
2
SF 1 3 2 11 6
SB 1 1 14 15 3 2 12
CR 2
Mix 2
3
SF 2 2 4 5 3 2 2
SB 6 1
CR 2 2
RS 7 18
Mix 2
4
SF 4 1 3 3 4
PN 6
RS 14
PM 6
SB 2
CR 1
5
SB 2 2 2
PN 4
RS 2 5
SF 2
PM 4
6
RS 6
PM 6
Mix 3
SF 3 3
SB 1 2 2
CR 2
7
CR 2
PN 2
PM 5
SF 2
SB 2 2 1
RS 5
8
SF 2 3
RS 3 3 2 2
SB 1
9
CR 3
PN 3
SF 2 3
RS 3
PM 5
10 RS 2 4 2 2 3
Mix 2
11
PN 2 2
RS 4 3
PM 2
CR 2

B. P. Stoyanov et al.: Use of the descriptor fingerprints to clustering of chemical datasets
212
12
RS 3 2
SF 2
PN 3
13
PN 3
RS 2
PM 3
14 PN 2
SF 2 2
15 SF 2
RS 2
Last
SF 1 2 10 14 23 25
SB 1 3 6 8 10 17
CR 1 3 5 8 8 8 8
PN 1 1 3 4 6 6 6
RS 1 3 3 11 13 17 19
PM 1 1 1 2 4 6 6
Mix 1 3 5 5 5 5 5 5
Table 2. Statistical data concerning cetane number of biodiesel fuels for the highest Tanimoto index values.
Cluster N class CN Mean Standard
deviation
Confidence
level (95%)
T=1
1 14 SF 48.695 48.508 0.166 0.413
1 17 SF 48.453
1 21 SF 48.377
2 61 SB 49.260 49.020 0.340 3.056
2 67 SB 48.779
3 6 SF 47.758 47.884 0.177 1.595
3 7 SF 48.009
T=0.9
1 14 SF 48.695 48.467 0.182 0.226
1 15 SF 48.584
1 16 SF 48.224
1 17 SF 48.453
1 21 SF 45.377
2 61 SB 49.260
2 67 SB 48.779 48.774 0.489 1.214
2 76 SB 48.283
3 5 SF 48.191
3 6 SF 47.758 47.986 0.217 0.540
3 7 SF 48.009
flower biodiesels in one cluster, all soy bean
biodiesels in another etc., is not achieved. We have
two clusters of sunflower biodiesels, two clusters of
soy bean biodiesels. This situation can be explained
with different fatty acid composition of vegetable
oils.
The results from TV=0.6, TV=0.7, TV=0.8, and
TV=0.9 providing best discrimination are
visualized in Fig. 3, Fig.4, Fig. 5, and Fig. 6.
One can see from Table 1 and Fig. 3, Fig. 4, Fig.
5, and Fig. 6 that the number of biodiesels grouped
in a separate cluster depends on the value of TV. At
low TVs the number of objects in a cluster
increases but the number of clusters decreases.
Thus, at TV=0.0, and TV=0.1 we have only 1
cluster.
Fig. 3. Distribution of the different biodiesels at TV=0.6.

B. P. Stoyanov et al.: Use of the descriptor fingerprints to clustering of chemical datasets
213
Fig. 4. Distribution of the different biodiesels at TV=0.7.
Fig. 5. Distribution of the different biodiesels at TV=0.8.
Fig. 6. Distribution of the different biodiesels at TV=0.9.
There are various parameters, used for
characterization of different biodiesel grades. The
determination of the cetane number (CN) is an
important index from our clustering analyses. The
CN values of the biodiesel fuels, grouped in
clusters having T-values 1.0 and T=0.9 are shown
in Table 2. Some statistical indicators such as mean
and standard deviation (confidence level 95%) are
presented also in Table 2.
One can see that the oils grouped in a given
cluster are of the same type on the one hand and on
the other hand they produce similar CN values.
The lowering of Tanimoto index value extends
the frontiers of the cluster; this tendency is
characterized by the statistical indicator of the
Standard Deviation value, presented in Table 2.
CONCLUSION
A group of 96 biodiesel oils of different origin
was used for creation of descriptor fingerprints
based on their gas chromatographic FAME profiles.
The influence of the threshold value on the
clustering results was studied. As a result of the
clustering analysis based on descriptor fingerprints
biodiesel oils of the same type were grouped into
distinct clusters. It was observed that in general,
biodiesels having similar values of some important
parameters (properties) fall in the same clusters. It
was shown the CN values are correlating with the
Tanimoto index are within the statistical accuracy.
The obtained results allow us to carry out in-depth
studies on the ability of the method of descriptor
fingerprints for prediction of various analytical
properties.
REFERENCES
1. I. Bangov, L. Naneva, M. N. Moskovkina, I.
Dimitrov, I. Doytchinova, Annual of Konstantin
Preslavski University of Shumen, Natural Sciences,
Chemistry, XXII B1, 28 (2013).
2. I. Dimitrov, L. Naneva, I. Doytchinova, I. Bangov,
Bioinformatics, 30, 846 (2014).
3. I. Dimitrov, N. Kochev, M. Moskovkina, L. Naneva,
V. Paskaleva, R. Milina, Z. Mustafa, I. Doychinova,
I. Bangov, Acta Sci. Natur., (2013) submitted.
4. J. M. Barnard, in Handbook of Chemoinformatics, 1,
27 (2003).
5. J. Tomczak, in Handbook of Chemoinformatics, 2,
392 (2003).
6. T. Engel, in Chemoinformatics. A textbook, 15
(2003).
7. P. Willett, in Handbook of Chemoinformatics, 2, 904
(2003).
8. N. Kochev, V. Monev, I. Bangov, in
Chemoinformatics. A textbook, 291 (2003).
9. http://en.wikipedia.org/wiki/Cluster_analysis.
10. D. Butina, J. Chem. Inf. Comput. Sci., 39, 747
(1999).
11. S. K. Hoekman, A. Broch, C. Robbins, E. Ceniceros,
M. Natarajan, Renew. Sust. Energ. Rev., 16, 143
(2012).
12. Y. C. Sharma, B. Singh, S. N. Upadhyay, Fuel, 87,
2355 (2008).
13. A. E. Atabania, A. S. Silitonga, I. A. Badruddina, T.
M. I. Mahlia, H. H. Masjuki, S. Mekhilef, Renew.
Sust. Energ. Rev., 16, 2070 (2012).
14. M. J. Ramos, C. M. Fernandez, A. Casas, L.
Rodriguez, A. Perez, Bioresource Technol., 100, 261
(2009).
15. C. P. Prados, D. R. Rezende, L. R. Batista, M. I. R.
Alves, N. R. A. Filho, Fuel, 96, 476 (2011).
16. E. D. Dodds, M. R. McCoy, L. D. Rea, M. J.
Kennish, Lipids, 40, 419 (2005).
17. L. Mondello, A. Casilli, P. Q. Tranchida, R. Costa, B.
Chiofalo, P. Dugo, J. Chromatogr. A, 1035, 237
(2004).
18. E. Bravy, G. Perrety, L. Montanary, J. Chromatogr.
A, 1134, 210 (2006).

B. P. Stoyanov et al.: Use of the descriptor fingerprints to clustering of chemical datasets
214
19. R. Milina, Z. Mustafa, Petroleum & Coal, 55, 12
(2013).
20. B. R. Moser, S. F. Vaughn, Biomass Bioenerg., 37,
31 (2012).
21. D. Brodnjak-Voncina, Z. C. Kodba, M. Novich,
Chemometr. Intell. Lab., 75, 31 (2005).
22. E. G. Giakoumis, Renew. Energ., 50, 858 (2013).
ИЗПОЛЗВАНЕ НА ДЕСКРИПТОРНИТЕ ОТПЕЧАТЪЦИ НА ПРЪСТИТЕ ЗА
КЛЪСТЕРИРАНЕ НА ХИМИЧНИ МНОЖЕСТВА ОТ ДАННИ
Б. П. Стоянов1, П. Р. Костадинов
1, М. В. Колев
1, З. А. Мустафа
2, М. Н. Московкина
3, Р. С.
Милина2, И. П. Бангов
3*
1Катедра по компютърна информатика, Факултет по математика и информатика, Шуменски университет
“Константин Преславски”, ул. Университетска 115, 9712 Шумен, България 2Централна изследователска лаборатория, Факултет по природни науки, Университет “Проф. Асен
Златаров”, ул. Сан Стефано 62., 8001 Бургас, България 3Катедра Обща химия, Факултет по природни науки, Шуменски университет “Константин Преславски”, ул.
Университетска 115, 9712 Шумен, България
Постъпила на 28 април 2014 г.; Коригирана на 20 май 2014 г.
(Резюме)
Един нов подход в областта на хемоинформатиката - използването на дескрипторните отпеачатъци на
пръстите е приложен към проблема за клъстериране на бази от химически данни. Този подход, придружен с
метода на Бутина (първоначално създаден за структурни дескриптори) беше тестват с група от 96 биодизелни
горива. Влиянието на праговата стойност от 0.0 до 1.0 на индекса на Танимото върху резултатите от
клъстерирането беше изследвано. Резултатите показаха една добра разделителна способност на метода, като
биодизели с еднакви масла попадат в едни и същи клъстери. Беше показано също, че подобни стойности на
цетановото число на биодизелите попадат в едни и същи клъстери в рамките на статистическата точност.

215
Bulgarian Chemical Communications, Volume 46, Special Issue A (pp. 215 – 219) 2014
A novel program for computer-aided generation of 2D chemical structures
B. P. Stoyanov1, E. P. Petrov
1, N. T. Kochev
2, I. P. Bangov
3*
1Department of Computer Informatics, Faculty of Mathematics and Informatics, Konstantin Preslavski University of
Shumen, 115 Universitetska str., 9712 Shumen, Bulgaria 2 Plovdiv University
“Paisii Hilendarski”, Faculty of Chemistry, Department of Analytical Chemistry and Computer
Chemistry, 24 Tsar Assen str., 4000 Plovdiv, Bulgaria 3Department of Chemistry, Faculty of Natural Sciences, Konstantin Preslavski University of Shumen, 115
Universitetska str., 9712 Shumen, Bulgaria
Received April 30, 2014; Revised July 01, 2014
Dedicated to Acad. Dimiter Ivanov on the occasion of his 120th
birth anniversary
A novel software product STRGEN-2D for generation of 2D chemical structures from a gross formula is
implemented. It is based on an approach developed by one of the authors (IB). Various functionalities and options of the
program are discussed. The output of STRGEN-2D software is compared with the generated structures by MOLGEN
software. The generation efficiency and correctness of obtained structure sets are proved.
Key words: structure generation, 2D chemical structures, generation tree, depth-first approach
INTRODUCTION
2D computer-aided structure-generation plays a
special role in QSAR/QSPR investigations.
Structure-generator software provides new
prospective candidate-structures for both biological
activity and chemical and physical properties
studies in these fields.
The implementation of 2D chemical structure
generator programs comes across on some specific
mathematical problems. Its algorithm is exponential
which leads to the so called combinatorial
explosion. This explosion is conducive to genera-
tion of enormous number of structures with the
increase of number of atoms participating in the
generation process. Hence it is challenging to be
processed by the most powerful computer equip-
ment on the one hand, and on the other hand it is
virtually impossible to be inspected by the users.
Furthermore, the generation is a blind process
which leads to so called isomorphism problem i.e.
generation of isomorphic (duplicated) structures.
Thus, if we have N atoms a permutation of 2 atoms
will produce (N-2)! duplicated structures.
During the 80’s a novel approach to the solution
of these problems was devised by one of the
authors (IB) [1-12]. This approach was oriented
towards the development of a computer-assisted
structure elucidation based on 13
C spectral
information [8]. Our new development is oriented
toward QSAR/QSPR problems. The software was
implemented in C++ programming language. The
aim of this paper is to study the efficiency and
correctness of our new software by comparing the
generated structures with structures from other
sources.
ALGORITHM DESCRIPTION
A chemical structure is mathematically consi-
dered a chemical graph G(A,B). Here A is a set of
atoms (vertices of the graph), and B is a set of
bonds (edges of the graph). Efficient two-row
representation of the chemical structure is used [1-
3] as it is illustrated in Fig. 1. In order to alleviate
the combinatorial process we devised the following
separation of the chemical graph vertices. Consider
a chemical structure represented by a directed graph
(the orientations of the edges are given by arrows)
depicted in Fig. 1.
Hence, we separate the vertices into two groups,
vertices presented in Fig. 1 with arrows pointing to
other vertices (we call them Saturating Valences -
SVs), and vertices which accept the arrows, called
Saturation Sites, SSs).One can see that each atom
except the first has 1 SV and n-1 SSs. Here n is the
atom valency. The first atom has all its n valencies
of SS type. In case of a cycle closure (see atom 6
from Fig. 1) a SS is transformed into SV. Accor-
dingly the generation process is carried out by level
by level saturation of the SS with the SVs, each
level represented by one SV as shown in Fig. 1.
© 2014 Bulgarian Academy of Sciences, Union of Chemists in Bulgaria
* To whom all correspondence should be sent:
E-mail: [email protected]

B. P. Stoyanov et al.: A Novel Program for Computer-Aided Generation of 2D Chemical Structures
216
Fig. 1. Two-dimensional matrix structure representation and depicture of level-by-level structure generation.
Each saturation produces a fragment which is
practically an extension to the formation of
complete chemical structures. Thus, a structure
generation tree shown in Fig. 2 is formed.
The process of saturation can be carried in two
ways: either depth-first with backtracking. In this
case the formation of a structure goes to its end and
then follows backtracking over the generation tree
and generation of a new structure. The other
approach is breath-first approach. In this case all
the SSs of a given level are saturated producing
fragments the their SSs are saturated at the next
level, and so on, to the generation of the full set of
structure at the highest level.
For our QSAR/QSPR we have found the latter
approach to be more appropriate. This allows some
further developments towards pruning any
chemically and physically inappropriate extensions,
on the one hand, and the introduction of parallel
processing on the other [9].
Our approach toward the isomorphism problem
lies on the following principles:
as it was suggested [4-6] the isomorphism
is a consequence of the automorphism (vertex
equivalence) the equivalence of the different
vertices at each extension is studied by using
the following local charge-related index (LCI):

B. P. Stoyanov et al.: A Novel Program for Computer-Aided Generation of 2D Chemical Structures
217
Li=nv+q-NH (1)
where nv is the atom valence, q is the atom
charge and NH is the number of attached
hydrogen atoms. The equivalent vertices
(atoms) give the same value LCIs within the
computer-word accuracy we accept up to 6th
sign after decimal point. Hence, permutations
between equivalent atoms are forbidden. Such
permutations are generated if two equivalent
SVs saturate two equivalent SSs and then
exchange their SSs. As shown in Fig. 1. Hence,
in case of equivalent SVs saturating equivalent
SSs, each next level starts from the atom next
to the atom that has been saturated in the
previous level.
Besides the previous principle some
duplications still remain because of the mirror
symmetry of some structures cannot be
predicted during the course of generation.
Further, the CTI index for each extension has
been calculated and compared with the CTI
indices [3,13-15] of the extensions at the
current level. The CTI has the following form:
i j ij
ji
D
LLCTI 2/1 (2)
Here Li are the local indices (1) and Dij are
topological distance matrix elements. In a recent
paper [15] it was shown by us that CTIs provide
extremely good discriminating power, the equiva-
lent (isomorphic) structures have the same CTI,
whereas the different structures possess different
CTIs within a computer word precision up to 7th
sign after the decimal point. Thus, all the remaining
branches containing isomorphic structures are
pruned from the generation tree.
Fig. 2. Structure generation tree with depicture of the steps of structure generation algorithm.

B. P. Stoyanov et al.: A Novel Program for Computer-Aided Generation of 2D Chemical Structures
218
TEST RESULTS
In order to test the correctness of the result
structure set from STRGEN-2D software we
performed analogous calculation with MOLGEN
[16,17] method for various gross formulas. The
results from MOLGEN were exported as *.MOL
files and additionally converted into canonical
linear notations SMILES. The STRGEN-2D
program transforms internally the structures into
SMILES forms. The generated from the two
programs structures were compared on the base of
both the SMILES canonical linear notation and
with the CTI index mentioned above. The
comparison results for some gross formulas are
provided in Table 1. One can see that the numbers
of generated structures by our method are the same
with these generated by MOLGEN method.
Table 1. Number of generated structures by MOLGEN
and STRGEN-2D programs and times of generation by
STRGEN-2D program.
Gross
formula
MolGen
(number of
structures)
STRGEN 2D
Number of
structures
Time in
seconds
C6N1H11 1111 1111 4.85
C6N2H14 2338 2338 11.82
C6N3H17 1395 1395 7.56
C6N2O1H14 31984 31984 2478.30
C6N3O1H17 20368 20368 1754.04
C6O2H12 1313 1313 4.72
C6O3H12 6171 6171 83.27
C6O4H12 24562 24562 2059.28
The times of generation from the STRGEN-2D
software are also provided in Table 1. However
they cannot be compared with these from the
MOLGEN program for several reasons. Our
program runs on a 64bit processor whiles the
MOLGEN program on a 32bit processor. Further-
more, the two programs have different output
which produces different times. And more
important, our breadth-first approach with explo-
ring each level makes the program slower. Instead
of simple combinatorial process the program
generates SMILES codes of the fragments at each
level. However, we need this approach for our
further QSAR/QSPR developments. Accordingly, it
was clear for us that the STRGEN-2D is slower
than the other programs for structure enumeration,
only.
Additionally some results generated by using
fragments which obviously reduce the number of
generated structures are provided in Table 2.
Table 2. Number of generated structures having certain
fragments.
Gross
Formula Fragments
Number of
generated
structures
C6N2O2H14
CC
32192 C=N
CO
C6N1H11 C=NC 141
C6N1H11 C=C=N 18
C6O3H12 C=O 703
C6N3H17 NN 708 CN
C6N2H14 C1CC1
63
NN
C6N2H14 C1CCN1
198
CONCLUSION
A software product for two dimensional
structure generation was created. It was developed
towards the perception of novel chemical structures
for a further QSAR/QSPR processing. It is based on
a multilevel breath-first approach, at each level a
set of substructures (fragments) is generated and
transformed in SMILES codes.
Acknowledgements: We acknowledge the
Bulgarian Science Fund for its financial support
(Grant SFSI I01/7).
REFERENCES
1. I. P. Bangov, MATCH Commun. Math. Comput.
Chem., 14, 235 (1983).
2. I. P. Bangov, K. D. Kanev, J. Mathem. Chem., 2, 31
(1988).
3. I. P. Bangov, J. Chem. Inform. Comput. Sci., 30, 277
(1990).
4. I. P. Bangov, J. Chem. Inf. Comput. Sci., 32, 167
(1992).
5. I. P. Bangov, MATCH Commun. Math. Comput.
Chem., 27, 3 (1992).
6. I. P. Bangov, J. Chem. Inf. Comput. Sci., 34, 318
(1994).
7. I. P. Bangov, M. I. Spassova, Bulgarian Chem.
Commun., 28, 443 (1997).
8. T. Laidboeur, I. Laude, D. Cabrol-Bass, I. P. Bangov,
J. Chem. Inf. Comput. Sci., 34, 171 (1994).
9. I. Bangov, S. Simova, I. Laude, D. Cabrol-Bass, J.
Chem. Inf. Comput. Sci., 34, 546 (1994).
10. I. P. Bangov, Discrete Appl. Math., 67, 27 (1996).

B. P. Stoyanov et al.: A Novel Program for Computer-Aided Generation of 2D Chemical Structures
219
11. I. P. Bangov, in: Handbook of Chemoinformatics, 1,
178 (2003).
12. I. P. Bangov, Annual of Konstantin Preslavski
Shumen University, Natural Sciences, Chemistry,
ХXI В1, 29 (2011).
13. P. A. Demirev, A. Dyulgerov, I. P. Bangov, J. Math.
Chem., 8, 367 (1991).
14. N. Kochev, V. Monev, I. P. Bangov, in:
Chemoinformatics. A Textbook, 291 (2003).
15. E. Petrov, B. Stoyanov, N. Kochev, I. Bangov,
MATCH Commun. Math. Comput. Chem., 71, 645
(2014).
16. C. Benecke, R. Grund, R. Hohberger, A. Kerber, R.
Laue, T. Wieland, Anal. Chim. Acta, 314, 141
(1995).
17. MOLGEN (Molecule Structure Generation),
http://www.molgen.de/ (last accessed 25 April,
2014).
ЕДНА НОВА ПРОГРАМА ЗА ГЕНЕРИРАНЕ НА 2D ХИМИЧНИ СТРУКТУРИ С
ПОМОЩТА НА КОМПЮТРИ
Б. П. Стоянов1, Е. П. Петров
1, Н. Т. Кочев
2, И. П. Бангов
3*
1Катедра по компютърна информатика, Факултет по математика и информатика, Шуменски университет
“Константин Преславски”, ул. Университетска 115, 9712 Шумен, България 2Катедра по аналитична химия и компютърна химия, Пловдивски университет “Паисий Хилендарски”, ул. Цар
Асен 24, 4000 Пловдив, България 3Катедра Обща химия, Факултет по природни науки, Шуменски университет “Константин Преславски”, ул.
Университетска 115, 9712 Шумен, България
Постъпила на 30 април 2014 г.; Коригирана на 01 юли 2014 г.
(Резюме)
Един нов софтуерен продукт STRGEN-2D за генериране на 2D химични структури от брутна формула бе
създаден. Той се основава на един подход разработен от един от авторите (ИБ). Различните функции и опции са
дискутирани. Изходните резултати от софтуера STRGEN-2D са сравнени с генерираните структури със
софтуерния продукт MOLGEN. Ефективността и правилността на получените структури при генерацията са
доказани.

220
Bulgarian Chemical Communications, Volume 46, Special Issue A (pp. 220 – 227) 2014
Stereoselectivity in intramolecular Diels-Alder reactions of 2,4-pentadienyl
butadienamides in the “Remote Stereocontrol Group” approach
A. Z. Patleeva*, D. D. Enchev, G. D. Neykov
Department of Organic Chemistry and Technology, Faculty of Natural Sciences, University of Shumen, Shumen,
Bulgaria
Received May 12, 2014; Revised May 26, 2014
Dedicated to Acad. Dimiter Ivanov on the occasion of his 120th
birth anniversary
The possible reaction paths of intramolecular pericyclic reactions of buta-2,3-dienoic penta-2,4-dienylamide ([1,5]-
sigmatropic shift and subsequent Intramolecular [4+2] cycloaddition, Alder-ene reaction and Intramolecular [4+2]
cycloaddition) were modeled as asynchronous concerted processes at semi-empirical, ab initio and DFT theoretical
level. The endo/exo and -diastereofacial stereoselectivity of the amide-tethered IMDA reaction of 2,4-pentadienyl
butadienamides was investigated using the “Remote Stereocontrol Group” (RSG) approach. The localized transition
states (TS) of the investigated reactions were fully optimized at MP2/6-31G(d) and DFT B3LYP/6-31G(d) levels. The
relative TS free energies were calculated to determine the stereochemical outcome of the kinetically controlled
reactions.
Key words: stereoselectivity, Diels-Alder reaction, Remote Stereocontrol Group, ab initio, DFT, pentadienyl
butadienamides
INTRODUCTION
The intramolecular Diels-Alder (IMDA)
reaction, popular in organic synthesis for producing
polycyclic structures, draws the attention of many
theoretical chemists. The computational investiga-
tion of IMDA reactions enables predicting chemo-,
regio- and stereoselectivities and gives opportunity
to examine ways to alter the expected structures,
varying conformational, steric and electronic
effects independently. It has been established that
the stereoselectivity of IMDA reactions could be
changed by a suitable choice of diene, dienophile
and the type of the tether [1,2]. A large amount of
experimental and theoretical studies have
investigated the origin of chemical stereoselectivity
in intramolecular cycloadditions – reactions of
1,3,8-nonatrienes, 1,3,9-decatrienes and 1,3,10-un-
decatrienes [3], substituted 3,5-hexadienyl acrylates
and acrylamides [4], pentadienyl acrylates [5,6],
diene and dienophile linked by a (CH2)n chain,
(n=1, 2, 3 и 4) [7]. Despite the existence of
computational models of allene as dienophile in the
intermolecular Diels-Alder reaction [8,9], models
of intramolecular cycloadditions are not available.
In this respect we have been interested in mode-
ling the transition structures (TS), predicting and
varying, using Remote Stereocontrol Group (RSG),
the stereochemical outcome of the IMDA reactions
of pentadienyl butadienamides (R-a), (R-b), (R-c)
and (R-d).
RSG1 RSG2
(R-a)
(R-b) Br
(R-c) CH3
(R-d) Br CH3
COMPUTATIONAL PROCEDURE
Geometries of the reactants, transition structures
(TS) and products were fully optimized at
B3LYP/6-31G(d) and MP2/6-31G(d) level. The
precursors and the expected products were
connected via transition structures using the IRC
procedure, Gonzalez-Schlegel method. All structu-
res were characterized as minima (no imaginary
frequencies) or a saddle point (1 imaginary
frequency) on the potential energy surface (PES) by
frequency calculations at the same computational
© 2014 Bulgarian Academy of Sciences, Union of Chemists in Bulgaria
* To whom all correspondence should be sent:
E-mail: [email protected]

A. Z. Patleeva et al.: Stereoselectivity in intramolecular Diels-Alder reactions of 2,4-pentadienyl butadienamides in the “Remote …
221
level. The calculated total energies, enthalpies and
free energies were corrected by zero-point energy
(unscaled), estimated from the harmonic frequency
calculations under atmospheric pressure and tempe-
rature 373K, which we believe is typical for
modeled reactions. The relative free energies of the
TS at the 373K were calculated to determine the
stereochemical outcome of the kinetically
controlled reactions.
All calculations were performed using the
Firefly QC package [10], which is partially based
on the GAMESS (US) [11] source code.
RESULTS AND DISCUSSION
The calculations of the three reaction pathways
of the competing intramolecular pericyclic
reactions (Fig. 1) were performed at the semi-
empirical (AM1, PM3) theoretical level. The aim of
the preliminary computations was to evaluate the
activation and reaction energies, to determine
whether the reactions are feasible, which is
particularly important in the absence of
experimental data and to compare the competing
processes. Reasonable pericyclic reactions
(reaction path 1 - Intramolecular [4+2]
cycloaddition, reaction path 2 – [1,5]-sigmatropic
shift and subsequent Intramolecular [4+2]
cycloaddition, reaction path 3 - Alder-ene reaction)
of (R-a, b, c, d) were modeled as asynchronous
concerted processes. The reaction path 3 (Alder-
ene reaction, Fig. 1) was definitely eliminated.
Nevertheless, to obtain accurate energies and hence
the correct prediction of the preferred cycloadducts,
higher levels of theory were required. An adequate
geometry for the asynchronous TS, reactants and
products was furnished by calculations at the semi-
empirical level.
To perform higher level calculations, we used
the hybrid B3LYP functional with the 6-31G(d)
basis set which has been proven to be particularly
successful for modeling TS and energetics of
pericyclic reactions [12-14], and the many-body
perturbation method of MØller and Plesset (MP2)
with the same basis, for estimating the effect of
dynamic electron correlation. Despite of the
limitations of DFT methods leading to overestima-
Fig. 1. Modeled pericyclic reactions of buta-2,3-dienoic penta-2,4-dienylamide (R-a) at AM1 (presented TS models)
semi-empirical computational level.

A. Z. Patleeva et al.: Stereoselectivity in intramolecular Diels-Alder reactions of 2,4-pentadienyl butadienamides in the “Remote …
222
Fig. 2. Modeled IMDA reactions of precursors (R-a) and (R-b); Reactions 1a and 1b.
Fig. 3. Modeled IMDA reactions of precursors (R-c) and (R-d); Reactions 1c and 1d.
tion of the energy of conversion of bonds into
bonds, which might result in errors in DFT
energetics of electrocyclic reactions [15], the
functional B3LYP remains very popular due to the
balance between accuracy and efficiency.
The Diels-Alder reaction goes primarily in an
endo rather than an exo direction when the product
formation is kinetically controlled. It is known that
C3 substituent manipulates the stereochemical
outcome of IMDA reaction and shifts product
distribution toward trans-fused (exo) bicyclic
products [1], so we have used bromine, reported as
a successful RSG and the 5-methyl tether
substituent - another stereo controlling element
which also effectively accelerates the rate of IMDA
reactions [3].
Competing IMDA reactions (reaction paths 1a,
1b, 1c, 1d) and corresponding [1,5]-sigmatropic
shifts (reaction paths 2a, 2 b, 2c, 2d) are presented
on Fig. 2, Fig. 3 and Fig. 4. Computed relative free
energies for the competing IMDA Reactions and
corresponding [1,5]-sigmatropic shifts at DFT and
ab initio MP2 level are given in Table 1.
Fig. 4. Modeled [1,5]-sigmatropic shifts of precursors
(R-a, R-b, R-c, R-d), Reactions 2a, 2b, 2c, 2d.
The reagents (R-a, b, c, d) are presented by the
conformation having the lowest energy. The
relative free energy of the proper conformer (Re-n,
Fig.5) is the “cost” of reaching suitable configura-
tion for the corresponding transition state and could
reach 10-12 kcal.mol-1
(Table 1).

A. Z. Patleeva et al.: Stereoselectivity in intramolecular Diels-Alder reactions of 2,4-pentadienyl butadienamides in the “Remote …
223
Table 1. Computed free energies
(∆G
# and ∆G, kcal.mol
-1) at 373 К for the competing IMDA Reactions 1a-d (Fig. 2,
Fig. 3) and corresponding [1,5]-sigmatropic shifts (Reactions 2a-d, Fig. 4) at DFT and ab initio MP2 level.
G#/G, kcal.mol
-1
B3LYP/6-31G(d) MP2/6-31G(d)
a (X=H) b (X=Br) c (X=H) d (X=Br) a (X=H) b (X=Br) c (X=H) d (X=Br)
Rea
ctio
n 1
R* 0.00 0.00 0.00 0.00 0.00 0.00 0.00 0.00
Re-1 11.32 12.38 5.02 4.79 4.44 10.82 7.03 1.97
Re-2 7.87 9.19 8.95 8.13 4.25 7.43 10.50 7.54
Re-3 7.39 8.76 9.94 9.24 2.69 10.70 11.66 8.63
Re-4 7.84 10.73 3.44 6.35 2.52 7.19 4.79 7.09
(TS-1) 34.53 33.98 28.99 30.08 23.53 25.64 25.36 22.71
(TS-2) 35.31 35.79 30.87 35.19 23.31 26.19 26.91 27.95
(TS-3) 39.11 37.73 30.73 32.32 26.07 27.49 26.04 25.86
(TS-4) 39.83 39.88 29.77 32.57 26.77 27.61 24.90 24.02
Pr-1 -34.53 -35.08 -39.79 -35.53 -48.44 -42.61 -48.84 -47.73
Pr-2 -33.18 -31.16 -38.81 -37.87 -51.37 -44.08 -48.69 -50.81
Pr-3 -26.66 -26.48 -38.29 -37.45 -45.25 -36.63 -45.72 -47.18
Pr-4 -28.46 -27.58 -37.66 -31.11 -47.25 -42.43 -45.22 -44.25
Rea
ctio
n
2
a (X=H) b (X=Br) c (X=H) d (X=Br) a (X=H) b (X=Br) c (X=H) d (X=Br)
Re 5.27 2.93 0.48 2.33 0.88 3.23 5.54 2.98
(TS) 31.94 32.19 32.94 34.46 27.10 31.38 34.05 32.91
Pr -4.06 -6.24 -5.61 -7.77 -7.46 -4.04 -1.60 -2.19 * The reagents, TS and products are marked as “Re-n, Pr-n, TS-n, exo/endo, lk/ul”, where lk/ul – Seebach-Prelog descriptors, n -
the number of the relevant product (Fig. 3). The substrates, TS and cycloadducts of the reactions 1c and 1d having high activation
energy and hence negligible product distribution are omitted.
Re-1a Re-2a Re-3a Re-4a Re-a
Fig. 5. The models of the conformations (Re-1a, Re-2a, Re-3a and Re-4a, Re-a) of the reagent (R-a) computed at MP2
level for reactions 1a and 2a.
Geometries of the TS having lowest value of
G#rel, for the IMDA reactions 1a, 1b and corres-
ponding competing [1,5]-sigmatropic shift, reac-
tions 2a, 2b (TS-a, TS-b) are shown in Fig. 6.
Models of the TS for reactions 1c and 1d are
shown in Fig. 7. All computed TS are asynchronous
with a longer developing peripheral bond (r1, Å)
then the developing internal bond (r2, Å).
Calculated differences between r1 and r2 (r) were
used as a measure of asynchronicity (Table 3).
The exo-TS are less asynchronous and closer to
the TS in Intermolecular Diels-Alder reaction of
propadiene and 1,3-butadiene [8]. MP2 calculations
significantly increased reaction asynchronicity. The
computed forming and breaking bond lengths of the
TS are reasonable for pericyclic reactions [13].
The free energy profile of all reactions 1a-1d,
2a-2d (Table 1, Fig. 8-reaction 1a) estimated with
MP2 level disfavored reactions 2a-d – sigmatropic
shift. The comparison of the relative free energy of
the computed MP2 TS predicted as preferable (Pr-
2a, no RSG) and (Pr-4c, 5-methyl RSG) (endo)
cycloadducts. Bromine as RSG shifted distribution
toward trans-fused (exo) products (Pr-1b, Pr-1d)
(Table 1, Table 2). In fact, the MP2 calculations
determined reaction 1a as stereo unselective,
reaction 1b - as a reaction with moderate stereo-
selectivity in favor of the (exo) product, reaction 1c
- as a reaction with moderate stereoselectivity
toward cis-fused (endo) product. Using two RSG -
bromine and methyl substituents led to increasing
amount of (exo) products considerably – (Pr-1d,
exo, lk; Pr-5d, exo, lk).

A. Z. Patleeva et al.: Stereoselectivity in intramolecular Diels-Alder reactions of 2,4-pentadienyl butadienamides in the “Remote …
224
Table 2. Computed free energies
(∆G
# and ∆G, kcal.mol
-1) at 373 К for the competing IMDA Reactions 1a-d (Fig. 2,
Fig. 3) and corresponding [1,5]-sigmatropic shifts (Reactions 2a-d, Fig. 4) at DFT and ab initio MP2 level.
G#rel, kcal.mol
-1
B3LYP/6-31G(d) MP2/6-31G(d)
a (X=H) b (X=Br) a (X=H) b (X=Br)
Reaction 2
Reaction 1
(TS) 0.0 0.0 0.2 5.7
(TS-1) exo 2.6 1.8 0.0 0.0
(TS-2) endo 3.4 3.6 2.8 0.6
(TS-3) exo 7.2 5.5 3.5 1.9
(TS-4) endo 7.9 7.7 3.8 2.0
c (X=H) d (X=Br) c (X=H) d (X=Br)
Reaction 2 (TS) 3.9 4.4 9.1 10.2
Reaction 1 (TS-1) exo, lk 0.0 0.0 0.5 0.0
(TS-2) exo, ul 1.9 5.1 2.0 5.2
(TS-3) endo, lk 1.7 2.2 1.1 3.2
(TS-4) endo, ul 0.8 2.5 0.0 1.3
(TS-5) exo, lk 4.2 2.8 2.7 3.1
(TS-6) exo, ul 5.5 8.1 3.8 6.5
(TS-7) endo, lk 5.4 5.0 3.8 2.9
(TS-8) endo, ul 6.5 8.4 4.6 4.9
TS-2a, endo
2.18
2.16
2.60 2.54
2.49
2.41 2.25 2.25
Br
TS-1b, exo
2.47
2.41 2.27
2.26
TS-1a, exo Br
2.57
2.46
2.20
2.20
TS-2b, endo
1.42 1.44
1.39
1.40
TS-b
Br
1.43 1.45
TS-a
1.39
1.41
133°
Fig. 6. Computed length
(Å) of developing bonds for TS (Reactions 1a, 1b, 2a and 2b) at MP2/6-31G(d) (bold) and
B3LYP/6-31G(d) (italics) level.
TS-4c, endo, ul
2.17
2.15
3.21
3.18
3.02 3.05
2.47
2.40
2.28
2.27
2.94
2.93
3.26
3.29
TS-1c, exo, lk TS-3c, endo, lk
2.64
2.61
2.62
2.55
TS-2c, exo, ul
2.45 2.39
2.29 2.27
2.71 2.72
2.20 2.19
2.58
2.50
3.56
3.59
TS-1d, exo, lk
2.48
2.38 2.26 2.27 2.96
2.96
Br
TS-2d, exo, ul
2.47 2.40
2.27
2.25
3.40
3.40 Br
TS-3d, endo, lk
2.56 2.44
2.23
2.22
2.58
2.57 Br
TS-4d, endo, ul
3.59
3.57
2.60
2.49
2.18
2.18
Br
3.03
3.06
Fig. 7. Computed geometries for TS (reactions 1c and 1d) at MP2/6-31G(d) (bold) and B3LYP/6-31G(d) (italics) level.
Bond lengths are given in Å. Geometries for TS having a low product distribution are not presented.

A. Z. Patleeva et al.: Stereoselectivity in intramolecular Diels-Alder reactions of 2,4-pentadienyl butadienamides in the “Remote …
225
Table 3. Computed bond lengths of the developing peripheral bond (r1, Å) and the developing internal bond (r2, Å) in
TS* of IMDA Reactions 1a-d (Fig. 2, Fig. 3).
TS r1, Å r2, Å r = r1 - r2, Å
B3LYP/6-31G(d) MP2/6-31G(d) B3LYP/6-31G(d) MP2/6-31G(d) B3LYP/6-31G(d) MP2/6-31G(d)
Intermolecular TS** 2.357 2.261 0.10
TS-1a, exo 2.408 2.469 2.258 2.274 0.15 0.20 TS-2a, endo 2.540 2.602 2.158 2.179 0.38 0.42 TS-1b, exo 2.407 2.489 2.247 2.253 0.16 0.24
TS-2b, endo 2.464 2.573 2.203 2.198 0.26 0.38 TS-1c, exo, lk 2.397 2.471 2.269 2.278 0.13 0.19 TS-2c, exo, ul 2.386 2.453 2.268 2.285 0.12 0.16
TS-3c, endo, lk 2.499 2.580 2.187 2.202 0.31 0.38 TS-4c, endo, ul 2.546 2.616 2.152 2.174 0.39 0.44 TS-1d, exo, lk 2.381 2.479 2.269 2.264 0.11 0.22 TS-2d, exo, ul 2.400 2.468 2.252 2.269 0.15 0.20
TS-3d, endo, lk 2.439 2.545 2.218 2.226 0.22 0.32 TS-4d, endo, ul 2.489 2.597 2.178 2.183 0.31 0.41
* Bond lengths for the TS having a low product distribution are not presented; ** ТS of Intermolecular Diels-Alder reaction of
propadiene and 1,3-butadiene [8].
-51.37, Pr-2a endo
0.00, R-a
27.10, TS-a
23.53, TS-1a exo
23.31, TS-2a endo
26.07, TS-3a exo
26.77, TS-4a endo
-45.25, Pr-3a exo
-47.25, Pr-4a endo
-48.44, Pr-1a exo
-7.46, Pr-a
Fig. 8. Free energy profiles for reactions 1a (—) and 2a (– ∙ –). The relative free energies (∆G# and ∆G)
given in
kcal.mol-1
are computed at MP2/6-31G(d) level of theory (Table 1).
In contrast, DFT computations favored reaction
paths 2a, 2b (Fig. 4) [1,5]-sigmatropic shift and
subsequent Intramolecular [4+2] cycloaddition and
hence the yielding of (Z) and (E) cycloadducts
(Fig. 1, reaction path 2) with a more active in
IMDA reactions 1-methyl substituted diene moiety.
The methyl SDG shifted reaction path toward
Diels-Alder reaction and hence the group changed
reaction regioselectivity. The B3LYP/6-31G(d) exo
cycloadducts - (Pr-1a), exo (reaction 1a) and (Pr-

A. Z. Patleeva et al.: Stereoselectivity in intramolecular Diels-Alder reactions of 2,4-pentadienyl butadienamides in the “Remote …
226
1b), exo (reaction 1b) - were preferred. Bromine
SDG shifted the product ratio towards the trans-
fused (exo) cycloadduct (Fig. 2). Use of SDG led to
decreasing activation free energy of Diels-Alder
reaction and accelerates the reaction rate (Table 1).
Computed relative free energy differences of the
favored products (Pr-1c) exo, lk and (Pr-4c), endo,
ul by DFT and MP2 methods for reaction 1c were
opposite (Table 2).
Distances between C5 substituent and C3
connected H atom (causing destabilizing 1,3
A strain)
and C5 substituent and C4 connected H atom
(causing destabilizing eclipsing interactions) were
optimized in the preferred products (Pr-1c) exo, lk
and (Pr-4c), endo, ul (Fig. 7). When C3 and C5
substituents were incorporated in the precursor (R-
d) a similar results were computed at
MP2/6-31G(d) and B3LYP/6-31G(d) levels and
reaction 1d (Fig. 3) was found to be
stereoselective.
Generally, the steric effects appear more
important than the electronic ones in the IMDA
reactions, especially in the presence of C3 and C5
substituents. C5 methyl substituent switches
reaction paths 1 and 2 according to DFT calcu-
lations. Both methods are in agreement that in the
presence of bromine and methyl substituents at C3
and C5 positions stereochemical outcome shifts
toward (exo) cycloadduct.
Acknowledgements: This paper is supported by the
Project BG051PO00l-3.3.06-0003 “Building and
steady development of PhD students, post-PhD and
young scientists in the areas of the natural,
technical and mathematical sciences”. The Project
is realized by the financial support of the Operative
Program “Development of the human resources”
of the European social found of the European
Union. The calculations were performed on
Supermicro A+ Server 4042G-TRF, CPU AMD
Opteron 16 Cores Abu Dhabi 6376 2.30GHz,
purchased with funds from the Project DFNI IO1/7,
realized by financial support of Bulgarian National
Science Fund.
REFERENCES
1. A. G. Fallis, Can. J. Chem., 62, 183 (1984).
2. D. Craig, Chem. Soc. Rev., 16, 187 (1987).
3. M. K.Diedrich, F-G. Klarner, B. R. Beno, K. N.
Houk, H. Senderowitz, W. Clark Still, J. Am. Chem.
Soc., 119, 10255 (1997). 4. D. J. Tantillo, K. N. Houk, M. E. Jung, J. Org.
Chem., 66, 1938 (2001). 5. M. J. Lilly, M. N. Paddon-Row, M. S. Sherburn, C. I.
Turner, Chem. Commun., 2213 (2000). 6. T. Cayzer, L.Wong, P. Turner, M. N. Paddon-Row,
M. S. Sherburn, Chemistry, 739 (2002). 7. R. Vijaya, G. N. Sastry, J. Mol. Struct.:
THEOCHEM, 617, 201 (2002). 8. M. Nendel, L. Tolbert, L. Herring, M. Islam, K. N.
Houk, J. Org. Chem., 64, 976 (1999). 9. M. Manohan, P. Venuvanalingam, J. Chem. Soc.,
Perkin Trans. 2, 1423 (1996). 10. A. A. Granovsky, Firefly version 8.0.0, www
http://classic.chem.msu.su/gran/firefly/index.html 11. M. W. Schmidt, K. K. Baldridge, J. A. Boatz, S. T.
Elbert, M. S. Gordon, J. J. Jensen, S. Koseki, N.
Matsunaga, K. A. Nguyen, S. Su, T. L. Windus, M.
Dupuis, J. A. Montgomery, J. Comput. Chem., 14,
1347 (1993). 12. V. Guner, K. S. Khuong, A. G. Leach, P. S. Lee, M.
D. Bartberger, K. N. Houk, J. Phys. Chem. A, 107,
11445 (2003). 13. V. A. Guner, K. S. Khuong, K. N. Houk, A. Chuma,
P. Pulay, J. Phys. Chem. A, 108, 2959 (2004) 14. D. H. Ess, K. N. Houk, J. Phys. Chem. A, 109, 9542
(2005). 15. S. N. Pieniazek, F. R. Clemente, K. N. Houk, Angew.
Chem. Int. Ed. Engl., 47, 7746 (2008).

A. Z. Patleeva et al.: Stereoselectivity in intramolecular diels-alder reactions of 2,4-pentadienyl butadienamides in the “remote …
227
ТЕОРЕТИЧНО ИЗСЛЕДВАНЕ НА СТЕРЕОСЕЛЕКТИВНОСТТА НА
ВЪТРЕШНОМОЛЕКУЛНА РЕАКЦИЯ НА ДИЛС-АЛДЕР НА 2,4-ПЕНТАДИЕНИЛ
БУТАДИЕНАМИДИ С УЧАСТИЕТО НА КОНТРОЛИРАЩИ
СТЕРЕОСЕЛЕКТИВНОСТТА ГРУПИ
А. Ж. Патлеева*, Д. Д. Енчев, Г. Д. Нейков
Факултет по природни науки, Шуменски университет „Епископ Константин Преславски“, Шумен, България
Постъпила на 29 април 2014 г.; Коригирана на 26 май 2014 г.
(Резюме)
Конкуриращи се вътрешномолекулни перициклични реакции на 2,4-пентадиенил бутадиенамиди
(вътешномолекулна реакция на Дилс-Алдер; [1,5]-сигматропна прегрупировка и следващо [4+2]
циклоприсъединяване; Алдер-ене реакция) са моделирани като асинхронни съгласувани процеси с
полуемпирични, ab initio и DFT теоретични методи. Изследвана е промяната в регио- и стереоселективността на
вътрешномолекулните реакции с помощта на контролиращи съотношението между стереоизомерите
заместители на C3 и C5 позиция. Предпочитаните циклоадукти са определени от относителните енергии на
моделираните преходни структури.

228
Bulgarian Chemical Communications, Volume 46, Special Issue A (pp. 228 – 237) 2014
Prediction of the color of dyes by using time-dependent density functional theory
(TD-DFT)
S. Kawauchi1*, L. Antonov
1,2*, Y. Okuno
3
1Department of Organic and Polymeric Materials, Tokyo Institute of Technology, 2-12-1 O-okayama, Meguro-ku, 152-
8552 Tokyo, Japan 1Institute of Organic Chemistry with Centre of Phytochemistry, Bulgarian Academy of Sciences, Acad. G. Bonchev str.,
bl. 9, 1113 Sofia, Bulgaria 3Center for Information Science, Kokushikan University, 4-28-1, Setagaya, Setagaya-ku, 154-8515 Tokyo, Japan
Received May 16, 2014; Revised June 17, 2014
Dedicated to Acad. Dimiter Ivanov on the occasion of his 120th
birth anniversary
Time-dependent density functional theory calculations (6-31+G* basis set) at four functional levels of theory
(B3LYP, B97XD, M06-2X, and PBE0) have been performed in order to estimate their applicability to predict the
visible spectra of organic colorants. The absorption wavelength calculations give the following order of performance:
M06-2X>B97XD>PBE0>B3LYP when set of ionic and neutral dyes is used. In the case of neutral dyes only, the
performance at all time-dependent PBE0, B97XD and M06-2X methods is statistically comparable. The importance of
the specific interactions on the max prediction in the case of anionic phenylhydrazone dyes is shown. The comparison
between experimental and calculated oscillator strengths was possible only in the case of anthraquinone dyes and has
shown that all four methods predict reasonably well the trend of change of the oscillator strength as function of the
substituents.
Key words: UV-Vis spectra, organic dyes, TD-DFT, B97XD, M06-2X, PBE0
INTRODUCTION
A correct prediction of the color (as position of
the long-wavelength absorption band, measured as
max) and its intensity (as molar absorptivity of this
band and/or the oscillator strength of the corres-
ponding transition) are of crucial importance for the
development of new dyes and pigments for traditi-
onal and high-technology use [1-3]. During last two
decades many attempts to find computational tools
that predict the colouristic properties of the most
intensively used dyes have been made by applying
semi-empirical [4-7] and density functional theory
(DFT) [8-12] methods.
Currently the DFT method [13,14] is the most
popular technique for electronic structure calcula-
tions with good computational cost/ molecular size
ratio, which makes it suitable for electronic structu-
re study of relatively large organic compounds in
ground state. The number of the research applica-
tions by using time-dependent DFT (TD-DFT) [15]
in the prediction of the spectral characteristics in
the UV-Vis area is also growing [16,17]. Although
its performance in this case had been found mode-
rate for charge-transfer system, which comes as a
consequence of the DFT inborn defects, the deve-
lopment of the new functionals tends to improve
significantly the situation. Unfortunately, no syste-
matic way for such improvement is known up to
now, in contrast to some of the traditional wave-
function-based methods like configuration interact-
tion or coupled cluster theory, and the current
approach is to test the TD-DFT results obtained by
using various functionals against experimentally
measured spectral data (max and in some rare cases
- oscillator strengths) of selected organic dyes. In
many of the cases direct conclusions about the
performance of the different density functionals is
impossible, because on one side different basis sets
are used and on the other side there is no
standardized spectral data set to test on. The most
intensively used set of spectral data containing 30
dye structures (neutral and ionized, Scheme 1) had
been introduced by Adachi and Nakamura [5] and
has been used to estimate the performance of
B3LYP and BPW91 [8] functionals. Later, this set
has been enlarged to 100 structures by Jacquemin et
al. [11], who used them to test five conventional
and long-range corrected DFT functionals (PBE,
PBE0, LC-PBE, LC-PBE and CAM-B3LYP).
© 2014 Bulgarian Academy of Sciences, Union of Chemists in Bulgaria
* To whom all correspondence should be sent:
E-mails: [email protected] (SK)
[email protected] (LA)

S. Kawauchi et al.: Prediction of the color of dyes by using time-dependent density functional theory (TD-DFT)
229
Recently, intensive TD-DFT benchmarking (~500
compounds) has been performed using 29 DFT
functionals (LDA, GGA, meta-GGA, global and
long-range corrected hybrids), showing that any
conclusion is strongly dependent on the set of
organic molecules selected [18].
Scheme 1. Investigated dye structures.
In the present study, we estimate the ability of
four DFT functionals (B3LYP [19-22], B97XD
[23], M06-2X [24], and PBE0 [25,26]) to predict
the max of organic dyes using a balanced spectral
data set of 50 organic dyes (enlarged set of Adachi
and Nakamura [5] including neutral and ionic
dyes), where special emphasis has been given to
find in the literature spectral data in non-polar
solvents, when possible, and to avoid the compli-
cations of solvent effects description.
COMPUTATIONAL METHOD
For the current study representative compounds
from several classes of dyes have been selected
(Scheme 1): indigo (1), azobenzene (2), diphenyl-
amine (3), anthraquinone (4), naphthoquinone (5),
2,4-dinitrophenylhydrazone (6), malachite green
cation (7). The structural modifications include
change of the skeleton atom(s) and/or adding
substituent(s) as presented in Tables 1-7.
Initially the structures were built using
SPARTAN [27] interface, and then structural rela-
xation with Merck molecular force field [28] have
been performed. This was carried out for each
compound in order to determine a global minimum
structure among one or more of minimum struc-
tures including local minimum structures.
Then, structures were optimized without any
restrictions by using Gaussian 09 program suite
[29] at four levels of theory, namely B3LYP,
B97XD, M06-2X and PBE0, and then were
characterized as true minima by vibrational fre-
quency calculations. In all cases 6-31+G(d) basis
set [30] was applied. After the structure optimi-
zation, TD-DFT calculations were carried out at the
same basis set in order to get straightforward
conclusions about the effect of the basis set size on
the reliability of the spectral predictions [31]. The
largest absorption wavelength (i.e. lowest excitation
energy) having more than 0.01 oscillator strength
(this avoids in most of the cases the low intensive
n-* transitions) is used to compare with the
experimental results. In order to model the solvent
effect the Polarizable Continuum Model (PCM),
using the integral equation formalism variant
(IEFPCM [32]), has been used as implemented in
Gaussian 09 [24]. The corresponding solvents are
listed in Tables 1-7. In the case of the anionic 4,6-
dinitrophenylhydrazone dyes (6a, 6c, 6e) ethanol
was used as a solvent, while acetic acid was the
solvent medium for the malachite green family 7.
In the case of the anionic 4,6-dinitro-phenyl-
hydrazone dyes (6a, 6c, 6e) two type of complexes
(with Na+ and with ethanol molecule) were mode-
led by optimization in vacuum using 6-31+G**
basis set using full counterpoise (CP) method
[33,34] to correct the basis set superposition error.
The corresponding TD-DFT calculations were
carried out at 6-31+G* basis set at these optimized
structures to be comparable with the result for the
rest of the calculated dyes. It is worth to be noted
that the DFT functionals chosen for this study are
hybrid ones obtained by fitting against various trai-
ning sets of molecules. The B3LYP is one of the
most popular and intensively used functionals [18].
The PBE0 functional is also well known [21]. In
comparison to them, the functional B97XD is a
range-separated functional, where the switching
between DFT and HF exchange is controlled by
=0.2, the short range HF exchange is ~22%, while
the long-range one is 100% [19]. It yields high
accuracy in thermochemistry, kinetics and nonco-
valent interacttions. The M06-2X functional deve-
loped by Zhao and Truhlar [20] is a high-non-
locality functional with doubled amount of nonlocal
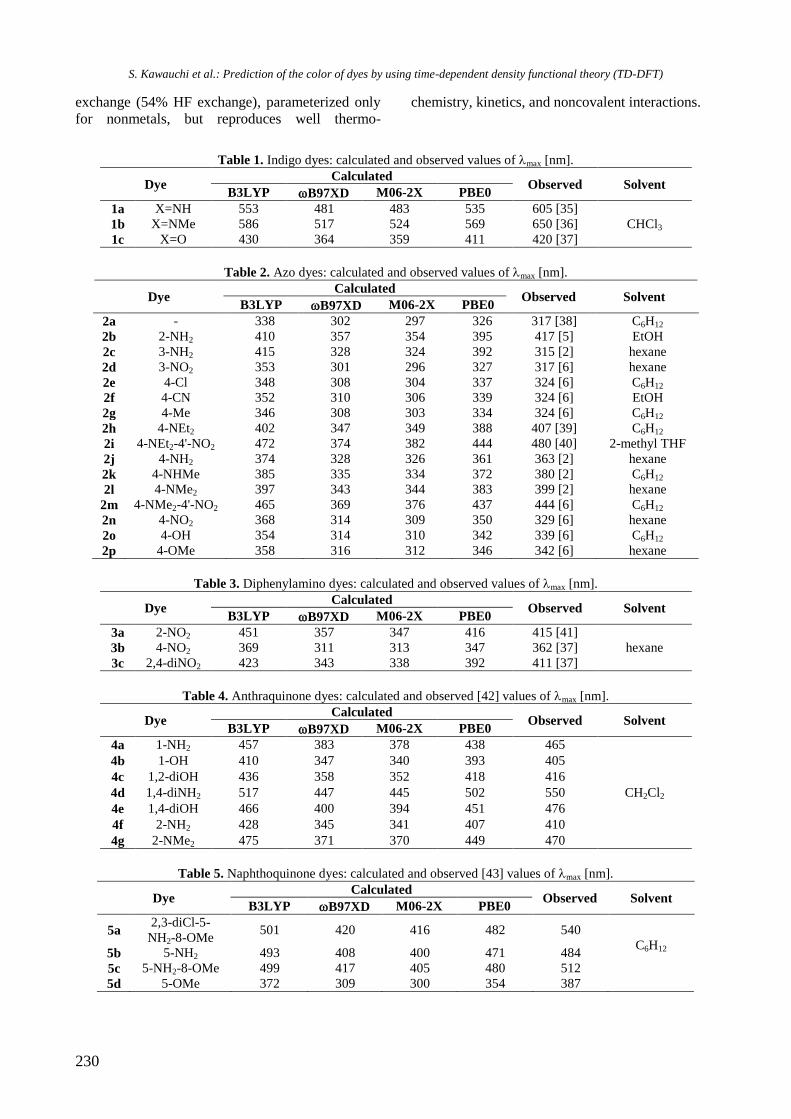
S. Kawauchi et al.: Prediction of the color of dyes by using time-dependent density functional theory (TD-DFT)
230
exchange (54% HF exchange), parameterized only
for nonmetals, but reproduces well thermo-
chemistry, kinetics, and noncovalent interactions.
Table 1. Indigo dyes: calculated and observed values of max [nm].
Dye Calculated
Observed Solvent B3LYP B97XD M06-2X PBE0
1a X=NH 553 481 483 535 605 [35]
CHCl3 1b X=NMe 586 517 524 569 650 [36]
1c X=O 430 364 359 411 420 [37]
Table 2. Azo dyes: calculated and observed values of max [nm].
Dye Calculated
Observed Solvent B3LYP B97XD M06-2X PBE0
2a - 338 302 297 326 317 [38] C6H12
2b 2-NH2 410 357 354 395 417 [5] EtOH
2c 3-NH2 415 328 324 392 315 [2] hexane
2d 3-NO2 353 301 296 327 317 [6] hexane
2e 4-Cl 348 308 304 337 324 [6] C6H12
2f 4-CN 352 310 306 339 324 [6] EtOH
2g 4-Me 346 308 303 334 324 [6] C6H12
2h 4-NEt2 402 347 349 388 407 [39] C6H12
2i 4-NEt2-4'-NO2 472 374 382 444 480 [40] 2-methyl THF
2j 4-NH2 374 328 326 361 363 [2] hexane
2k 4-NHMe 385 335 334 372 380 [2] C6H12
2l 4-NMe2 397 343 344 383 399 [2] hexane
2m 4-NMe2-4'-NO2 465 369 376 437 444 [6] C6H12
2n 4-NO2 368 314 309 350 329 [6] hexane
2o 4-OH 354 314 310 342 339 [6] C6H12
2p 4-OMe 358 316 312 346 342 [6] hexane
Table 3. Diphenylamino dyes: calculated and observed values of max [nm].
Dye Calculated
Observed Solvent B3LYP B97XD M06-2X PBE0
3a 2-NO2 451 357 347 416 415 [41]
hexane 3b 4-NO2 369 311 313 347 362 [37]
3c 2,4-diNO2 423 343 338 392 411 [37]
Table 4. Anthraquinone dyes: calculated and observed [42] values of max [nm].
Dye Calculated
Observed Solvent B3LYP B97XD M06-2X PBE0
4a 1-NH2 457 383 378 438 465
CH2Cl2
4b 1-OH 410 347 340 393 405
4c 1,2-diOH 436 358 352 418 416
4d 1,4-diNH2 517 447 445 502 550
4e 1,4-diOH 466 400 394 451 476
4f 2-NH2 428 345 341 407 410
4g 2-NMe2 475 371 370 449 470
Table 5. Naphthoquinone dyes: calculated and observed [43] values of max [nm].
Dye Calculated
Observed Solvent B3LYP B97XD M06-2X PBE0
5a 2,3-diCl-5-
NH2-8-OMe 501 420 416 482 540
C6H12 5b 5-NH2 493 408 400 471 484
5c 5-NH2-8-OMe 499 417 405 480 512
5d 5-OMe 372 309 300 354 387

S. Kawauchi et al.: Prediction of the color of dyes by using time-dependent density functional theory (TD-DFT)
231
Table 6. Neutral and deprotonated hydrazone dyes: calculated and observed [44] values of max [nm].
Dye Calculated
Observed Solvent B3LYP B97XD M06-2X PBE0
6a H, H (anion) 501 414 404 466 500 EtOH/NaOH
6b H, H (neutral) 392 331 322 369 345 CHCl3
6c p-NH2C6H4, Me
(anion) 539 427 419 500 461 EtOH/NaOH
6d p-NH2C6H4, Me
(neutral) 510 366 366 465 403 CHCl3
6e p-NO2C6H4, Me
(anion) 601 484 501 566 540 EtOH/NaOH
6f p-NO2C6H4, Me
(neutral) 435 349 344 403 382 CHCl3
Table 7. Malachite green dyes: calculated and observed [45-48] values of max [nm].
Dye Calculated
Observed Solvent B3LYP B97XD M06-2X PBE0
7a None 489 448 460 476 621
98% acetic
acid
7b 2-NO2 502 461 474 487 637
7c 2-OMe 496 454 468 482 625
7d 2,2'-diMe 499 460 473 487 634
7e 3-OMe 506 449 461 482 623
7f 4-Cl 493 451 463 480 628
7g 4-CN 505 460 472 492 643
7h 4-Me 488 445 458 475 617
7i 4-NO2 516 463 476 499 645
7j 4-OH 487 441 454 474 603
7k 4-OMe 487 439 453 474 608
RESULTS AND DISCUSSION
The predicted band positions in vacuum are
compared with the experimental ones in Tables 1-7
and the overall performance of the used TD-DFT
methods is shown in Fig. 1.
The visual inspection of Fig. 1 allows several
interesting conclusions to be pointed out. In the
case of TD-B3LYP and TD-PBE0 there are obvious
correlation trends where compounds 6c, 6e and 6d,
and the whole class of dyes 7, i.e., Malachite green
dyes, are outliers. In the case of TD-B97XD and
TD-M06-2X the Malachite green dyes are part of
the linear tendency, while 6c and 6e remain, to a
certain extent, deviated from the relation along with
5d. Visually the performance of TD-B97XD and
TD-M06-2X is better than the TD-B3LYP and TD-
PBE0.
The statistical information collected in Table 8
support these initial conclusions.
The statistical analysis, comparing predicted and
experimentally observed max, shows substantially
lower mean average errors in the cases of B3LYP
and PBE0. This is not in contradiction with Fig. 1
since these two methods do not give systematical
shift of the predicted band positions, i.e. there are
large negative and positive deviations, which at end
neutralize each other. According to the deviations
given in Table 8, the observed values for 7 are
underestimated by the calculations (largest positive
deviations are 138 nm and 151 nm for B3LYP and
PBE0 respectively, both in the case of 7g), while
the band positions for the anionic dyes are
overestimated (with 107 nm for TD-B3LYP and 64
nm for TD-PBE0, both in the case of 6d).
The TD-B97XD and TD-M06-2X calculated
max quantities are systematically deviated, under-
estimating the experiment, which leads to larger
mean absolute error (MAE) and root mean square
(RMS) values. However, according to our results
and the previously published prediction of band
positions by various DFT functionals [9-12] there is
no DFT method that directly predict the real band
positions, i.e. there is inherent problem associated
with the TD calculation with the hybrid DFT
methods.
The practical solution is to find a DFT method
whose predictions correlate with the experiment
and to use this correlation for additional correction
of the calculated max values. Actually this has been
performed and the linear regression parameters are
collected in Table 8. In the ideal case the linear fit
coefficients a and b must tend to 1 and 0

S. Kawauchi et al.: Prediction of the color of dyes by using time-dependent density functional theory (TD-DFT)
232
respectively, but as we mentioned above the tested
functionals do not directly predict experimentally
observed band positions. The data in Table 8 show
very clearly that B97XD and M06-2X results
correlate very satisfactory with the experiment and
substantially better than those of B3LYP and PBE0.
This leads to substantially lower MAE and RMS
values and narrow limits of the maximal positive
and negative deviations. As seen after the fitting the
Malachite green dyes remain problematic for
B3LYP, while in the case of the rest three DFT
methods largest positive deviation is obtained at 5d.
The anionic dyes also remain problematic, but in
smaller extent for M06-2X.
Taking into account the all statistical date we
can conclude that the order of performance of the
tested four functionals is as follows: M06-
2X>B97XD>PBE0>B3LYP. According to the
recent data of Jacquemin et al. [11], obtained with
6-311+G(2d,p) basis set (at PBE0/6-311G**
geometry), the performance of their tested function-
nals with a set of 100 neutral dyes follows the
PBE>PBE0>CAM-B3LYP>LC-PBE>LC-PBE>
HF sequence. Since the used sets of dyes overlap
and although the used basis sets are different we
1b
1a
6d
6c
6e
300
400
500
600
300 400 500 600Observed band position [nm]
Cal
cula
ted
ban
d p
osi
tio
n [
nm
]
a)
1b
1a6e
6c
5d300
400
500
600
300 400 500 600Observed band position [nm]
Cal
cula
ted
ban
d p
osi
tio
n [
nm
]
b)
(a) (b)
1a
1b
6e
6c
300
400
500
600
300 400 500 600Observed band position [nm]
Cal
cula
ted
ban
d p
osi
tio
n [
nm
]
c)
1b
1a
6c
6d
6e
300
400
500
600
300 400 500 600Observed band position [nm]
Cal
cula
ted
ban
d p
osi
tio
n [
nm
]
d)
(c) (d)
Fig. 1. Comparison between calculated (in vacuum) and experimental band positions at: a) B3LYP; b) B97XD; c)
M06-2X; d) PBE0. The families of dyes are presented as following colors: 1 – blue; 2 – grey; 3 – orange; 4 – brown; 5
– pink; 6 – red; 7 – green. The calculated values for the complexes of 6a,c,e with Na+ are given with empty symbols.

S. Kawauchi et al.: Prediction of the color of dyes by using time-dependent density functional theory (TD-DFT)
233
Table 8. Statistical analysis of the prediction capacity in vacuum and in solution (underlined). The corresponding
values obtained by taking into account the interaction between anionic phenylhydrazone dyes and Na+ are presented in
curly brackets.
Parameter B3LYP B97XD M06-2X PBE0
without fit
MAE* [nm] 47
52
83 {84}
63 {65}
82 {83}
63 {64}
48
44
RMS** [nm] 69
65
99 {100}
81 {81}
96 {97}
76 {77}
71
59
largest positive deviation*** [nm] 138 (7g)
106 (7d)
183 (7g)
148 (7g)
171 (7g)
133 (7g)
151 (7g)
116 (7d)
largest negative deviation [nm] -107 (6d)
-169 (6d)
-
-7 (6c)
-
-
-62 (6d)
-108 (6c,6d)
with correction equation**** a.calc-b, obtained by linear fit between obs and calc
a 1.968
1.704
1.927 {1.953}
1.724 {1.736}
1.739 {1.767}
1.560 {1.572}
1.938
1.724
b 415
348
293 {279}
228 {231}
202 {210}
162 {165}
364
317
R2
0.712
0.672
0.917 {0.936}
0.929 {0.940}
0.936 {0.955}
0.947 {0.954}
0.785
0.773
MAE [nm] 56
59
23 {20}
20 {18}
18 {16}
18 {16}
46
45
RMS [nm] 70
77
33 {29}
30 {28}
29 {24}
26 {24}
57
59
largest positive deviation [nm] 76 (7a)
85 (7h)
64 (5d)
66 (5d)
67 (5d)
67 (5d)
66 (5d)
76 (5d)
largest negative deviation [nm] -226 (6e)
-258 (6c)
-120 (6e)
-119 (6c)
-129 (6e)
-94 (6c)
-193 (6e)
-204 (6c) * mean absolute error; ** root mean square; *** deviations are calculated as difference between observed and calculated band
position, namely: obs - calc; in this case the statistical analysis (MAE, RMS and deviations) is based on comparison between ’calc
(’calc=a.calc+b) and obs.
can conclude that M06-2X method could be used
for practical prediction of the experimental spectra
of organic dyes. The exclusion of the ionic dyes (6
and 7) from the linear fitting leads to correlation
(R2) 0.9725, 0.9530 and 0.9690 for TD-PBE0, TD-
B97XD and TD-M06-2X respectively, which
means that these three methods are comparable in
the case of neutral dyes, but the M06-2X performs
much better (Table 8) when ionic dyes are included.
According to Table 8 and Fig. 2 the introduction
of the solvent effect does not improve substantially
the performance of the tested functionals, even in
two of them (B3LYP and PBE0) decrease of the
correlation is observed. Generally the solvent
inclusion leads to decrease of both slope and inter-
cept of the liner fit, but the systematic deviation in
the case of ionic dyes remain unaffected (Fig. 2).
As seen from Fig. 1b,c and 2b,c in the case of
B97XD and M06-2X functionals the anionic dyes
of phenylhydrazone family are substantially devia-
ted from the linear tendency and the situation is
practically not affected by introducing solvent
environment. This means that the effects are either
systematically related to DFT performance or rela-
ted to specific, intermolecular, effects in solution.
Compounds 6b, 6d and 6f are treated with NaOH in
ethanol solution to give the deprotonated species
6a, 6c and 6e, resp., which could lead to hypothesis
for specific interaction with Na+ or with ethanol
molecule. According to the calculations, the
optimized complexes with Na+ have shown much
more stability in both vacuum and solvent field in
all three anionic dyes comparing to the corres-
ponding ethanol complexes. As seen from Fig. 1
and 2 the use of the Na complexes of the anionic
phenylhydrazones leads to some improvement of
the overall performance, but it does not substan-
tially changes the overall statistical parameters (as
shown in Table 8). Evidently latter comes from the
fact that the three anionic dyes have negligible
weight in the whole set of 50 compounds.
As it was mentioned before, the prediction of the
band position is only one side of the overall color/
properties elucidation. The real dye development
needs information for the intensity of the color in
the same extend, or even in larger, as the
information for the long-wavelength band position.
Such information is provided by the TD-DFT as

S. Kawauchi et al.: Prediction of the color of dyes by using time-dependent density functional theory (TD-DFT)
234
oscillator strength (), which fundamental value
defines how probable is the corresponding tran-
sition [49].
The corresponding values for the studied dyes
and the used DFT functionals are available from the
authors upon request. Unfortunately in most of the
cases there is no way for direct comparison with the
experiment. Where available, the experimental data
are presented as molar absorptivity (max) at max.
The fundamental relation between and max is well
known:
~)~(. d910394
where the spectrum must be presented in wave
numbers (~). If the spectral band is individual
(resolved mathematically [50] or experimentally)
and its shape is assumed to be Gaussian function
[29,30], as it is in UV-Vis spectra, the integral band
can be presented as follows:
210631 /max~..~)~(
od
1b
1a
6d
6c 6e
300
400
500
600
300 400 500 600Observed band position [nm]
Cal
cula
ted
ban
d p
osi
tio
n [
nm
]
a)
1b
1a
6e6c
5d
300
400
500
600
300 400 500 600Observed band position [nm]
Cal
cula
ted
ban
d p
osi
tio
n [
nm
]
b)
(a) (b)
1b
1a
6c
6e
5d300
400
500
600
300 400 500 600Observed band position [nm]
Cal
cula
ted
ban
d p
osi
tio
n [
nm
]
c)
1b
1a6c
6d
6e
300
400
500
600
300 400 500 600Observed band position [nm]
Cal
cula
ted
ban
d p
osi
tio
n [
nm
]
d)
(c) (d)
Fig. 2. Comparison between calculated (in corresponding solvents) and experimental band positions at: a) B3LYP; b)
B97XD; c) M06-2X; d) PBE0. The families of dyes are presented as following colors: 1 – blue; 2 – grey; 3 – orange; 4 –
brown; 5 – pink; 6 – red; 7 – green. The calculated values for the complexes of 6a,c,e with Na+ are given with empty symbols.

S. Kawauchi et al.: Prediction of the color of dyes by using time-dependent density functional theory (TD-DFT)
235
Table 9. Anthraquinone dyes: calculated and observed [38] oscillator strengths.
Dye Calculated
Observed B3LYP B97XD M06-2X PBE0
4a 1-NH2 0.119 0.1692 0.1595 0.128 0.114
4b 1-OH 0.1238 0.1737 0.1621 0.1334 0.113
4c 1,2-diOH 0.0952 0.1495 0.1342 0.1052 0.119
4d 1,4-diNH2 0.1866 0.235 0.2242 0.1988 0.157
4e 1,4-diOH 0.1727 0.2263 0.213 0.1848 0.131
4f 2-NH2 0.0495 0.0742 0.0762 0.0488 0.091
4g 2-NMe2 0.07 0.1096 0.1117 0.0773 0.109
Depending on the extent of band overlapping in
the visible area (which is usually substantial) the
experimental maximal molar absorptivity (max)
differs from the individual one ( omax ). In addition
there is no way of estimation of the band width
( 21/~ ) from the experimental spectrum without
resolving it mathematically [29]. For these reasons,
assuming a universal value for the band width of
4000 cm-1
as it was made [8] does not have physical
meaning and finally cannot bring any conclusions.
In the experimental dye set used by us the
experimentally determined oscillator strengths are
available for the anthraquinone dyes 4 (Table 9),
which allows a direct comparison. This comparison
shows that the DFT methods tested in this study
correctly predict the tendency (with statistically
comparable correlation in all four cases), but the
data are not sufficient to make statistically valid
conclusions about the overall performance.
CONCLUSION
TD-DFT calculations with 6-31+G* basis set at
four functional levels of theory, namely B3LYP,
B97XD, M06-2X, and PBE0, have been
performed in order to estimate their applicability to
predict the visible spectra of organic colorants. For
this purpose a set of 50 dye structures, including
ionic and neutral, has been used. It has been found
that there are good correlation relationships bet-
ween the calculated wavelength values and the
observed wavelength values. The absorption wave-
length calculations at the M06-2X and B97XD
functional levels were found to provide better
prediction than those at the B3LYP and PBE0
functional levels. Comparing our data and data,
previously published by other authors, we can
conclude that M06-2X could be recommended for
predicting visible spectra of organic dyes. The use
of solvent effect description (as PCM) leads also to
improvement of the results.
The comparison between experimental and
calculated oscillator strengths was possible only in
the case of anthraquinone dyes and has shown that
all four methods predict reasonably well the trend
of change of the oscillator strength.
This study has shown that there is need for
establishment of a standard set of dyes (as
structures with colors equally distributed through
the visible area and strictly determined oscillator
strengths), which to be used for comparative testing
of various methods and basis sets.
Acknowledgements: LA is indebted to JSPS for the
fellowship provided. The numerical calculations
were carried out on the TSUBAME2.5 super-
computer at the Tokyo Institute of Technology,
Tokyo, Japan, and on the supercomputer at the
Research Center for Computational Science,
Okazaki, Japan.
REFERENCES
1. H. Zollinger, Color - A Multidisciplinary Approach,
Wiley-VCH, Weinheim, 1999.
2. J. Fabian, H. Hartmann, Light Absorption of Organic
Colorants: Theoretical Treatment and Empirical
Rules, Springer-Verlag, Berlin, 1980.
3. J. Griffiths, Colour and Constitution of Organic
Molecules, Academic Press, London, 1976.
4. C. Forber, E. Kelusky, N. Bunce, M. Zerner, J. Am.
Chem. Soc., 107, 5884 (1985).
5. M. Adachi, S. Nakamura, Dyes Pigm., 17, 287
(1991).
6. A. Matsuura, H. Sato, W. Sotoyama, A. Takahashi,
M. Sakurai, J. Mol. Struct.: Theochem, 860, 119
(2008).
7. S. Kawauchi, K. Mita, M. Satoh, J. Komiyama, J.
Watanabe, Y. Tamura, K. Mori, K. Suzuki,
Nonlinear Optics, 26, 221 (2000).
8. D. Guillaumont, S. Nakamura, Dyes Pigm., 46, 85
(2000).
9. P. C. Chen, Y. C. Chieh, J. C. Wu, J. Mol. Struct.:
Theochem, 715, 183 (2005).
10. C. Adamo, D. Jacquemin, Chem. Soc. Rev., 42, 845
(2013).

S. Kawauchi et al.: Prediction of the color of dyes by using time-dependent density functional theory (TD-DFT)
236
11. A. D. Laurent, D. Jacquemin, Int. J. Quant. Chem.,
17, 2019 (2013).
12. D. Jacquemin, J. Preat, E. A. Perpete, D. P.
Vercauteren, J.-M. Andre, I. Ciofini, C. Adamo, Int.
J. Quant. Chem., 111, 4224 (2011).
13. P. Hohenberg, W. Kohn, Phys. Rev., 136B, 864
(1964).
14. W. Kohn, L. J. Sham, Phys. Rev., 140, A1133 (1965).
15. R. E. Stratman, G. E. Scuseria, M. J. Frisch, J. Chem.
Phys., 109, 8218 (1998).
16. B. Mennucci Computational Spectroscopy, Ed. J.
Grunenberg, Wiley-VCH, Weinheim, 2010, pp. 151-
168.
17. P. H. P. Harbach, A. Dreuw, Modeling of Molecular
Properties, ed. by P. Comba, Wiley-VCH, Weinheim,
2011, pp. 29-45.
18. D. Jacquemin, V. Watherlet, E. A. Perpete, G. E.
Scuseria, C. Adamo, J. Chem. Theory Comput., 5,
2420 (2009) and the references cited therein in
respect of the available training sets.
19. A. D. Becke, J. Chem. Phys., 98, 5648 (1993).
20. C. Lee, W. Yang, R.G. Parr, Phys. Rev., 37B, 785
(1988).
21. S. H. Vosko, L. Wilk, M. Nusair, Can. J. Phys., 58,
1200 (1980).
22. P. J. Stephens, F. J. Devlin, C. F. Chabalowski, M. J.
Frisch, J. Phys. Chem., 98, 11623 (1994).
23. J.-D. Chai, M. Head-Gordon, Phys. Chem. Chem.
Phys., 10, 6615 (2008).
24. Y. Zhao, D. G. Truhlar, Theor. Chem. Acc., 120, 215
(2008).
25. J. P. Perdew, K. Burke, M. Ernzerhof, Phys. Rev.
Lett., 77, 3865 (1996).
26. C. Adamo, V. Barone, J. Chem. Phys., 110, 6158
(1999).
27. Y. Shao, L.F. Molnar, Y. Jung, J. Kussmann, C.
Ochsenfeld, Phys. Chem. Chem. Phys., 8, 3172
(2006).
28. T. A. Halgren, J. Comp. Chem., 17, 490 (1996).
29. M. J. Frisch, G. W. Trucks, H. B. Schlegel, G. E.
Scuseria, M. A. Robb, J. R. Cheeseman, G. Scalmani,
V. Barone, B. Mennucci, G. A. Petersson, H.
Nakatsuji, M. Caricato, X. Li, H. P. Hratchian, A. F.
Izmaylov, J. Bloino, G. Zheng, J. L. Sonnenberg, M.
Hada, M. Ehara, K. Toyota, R. Fukuda, J. Hasegawa,
M. Ishida, T. Nakajima, Y. Honda, O. Kitao, H.
Nakai, T. Vreven, J. A. Montgomery, Jr., J. E.
Peralta, F. Ogliaro, M. Bearpark, J. J. Heyd, E.
Brothers, K. N. Kudin, V. N. Staroverov, R.
Kobayashi, J. Normand, K. Raghavachari, A.
Rendell, J. C. Burant, S. S. Iyengar, J. Tomasi, M.
Cossi, N. Rega, J. M. Millam, M. Klene, J. E. Knox,
J. B. Cross, V. Bakken, C. Adamo, J. Jaramillo, R.
Gomperts, R. E. Stratmann, O. Yazyev, A. J. Austin,
R. Cammi, C. Pomelli, J. W. Ochterski, R. L. Martin,
K. Morokuma, V. G. Zakrzewski, G. A. Voth, P.
Salvador, J. J. Dannenberg, S. Dapprich, A. D.
Daniels, O. Farkas, J. B. Foresman, J. V. Ortiz, J.
Cioslowski, D. J. Fox, Gaussian 09, Revision A.02,
Gaussian, Inc., Wallingford CT, 2009.
30. J. S. Binkley, J. A. Pople, W. J. Hehre, J. Am. Chem.
Soc., 102, 939 (1980).
31. R. Improta, UV–Visible Absorption and Emission
Energies in Condensed Phase by PCM/TD-DFT
Methods, in Computational Strategies for
Spectroscopy, V. Barone (Ed.), Wiley-VCH,
Weinhein, 2012.
32. J. Tomasi, B. Mennucci, R. Cammi, Chem. Rev., 105,
2999 (2005).
33. S. B. Boys, F. Bernardi, Mol. Phys., 19, 553 (1970).
34. S. Simon, M. Duran, J. J. Dannenberg, J. Chem.
Phys., 105, 11024 (1996).
35. W. R. Brode, E. G. Pearson, G. M. Wyman, J. Am.
Chem. Soc., 76, 1034 (1954).
36. R. Pummerer, G. Marondel, Liebigs Ann. Chem.,
602, 228 (1957).
37. R. Pummerer, G. Marondel, Chem. Ber., 93, 2834
(1960).
38. S. Yamamoto, N. Nishimura, S. Hasegawa, Bull.
Chem. Soc. Jpn, 44, 2018 (1971).
39. H. Mustroph, Dyes Pigm., 15, 129 (1991).
40. S. Lunak Jr., M. Nepas, R. Hrdina, H. Mustroph,
Chem. Phys., 184, 255 (1994).
41. M. G. W. Bell, M. Day, A. T. Peters, J. Soc. Dyers
Colour., 82, 410 (1966).
42. H. Labhart, Helv. Chim. Acta, 40, 1410 (1957).
43. K.-Y. Chu, J. Griffiths, J. Chem. Res. (S), 180
(1978).
44. L. A. Jones, C. K. Hancock, J. Org. Chem., 25, 226
(1960).
45. C. C. Barker, M. H. Bride, G. Hallas, A. Stamp, J.
Chem. Soc., 1285 (1961).
46. C. C. Barker, G. Hallas, J. Chem. Soc., 1529 (1961).
47. A. S. Ferguson, G. Hallas, J. Soc. Dyers Colour., 87,
187 (1971).
48. A. S. Ferguson, G. Hallas, J. Soc. Dyers Colour., 89,
22 (1973).
49. L. Antonov, D. Nedeltcheva, Chem. Soc. Rev., 29,
217 (2000).
50. L. Antonov, S. Stoyanov, Appl. Spectrosc., 47, 1030
(1993).

S. Kawauchi et al.: Prediction of the color of dyes by using time-dependent density functional theory (TD-DFT)
237
ПРЕДСКАЗВАНЕ НА ЦВЕТА НА БАГРИЛА ПОСРЕДСТВОМ ЗАВИСЕЩА ОТ ВРЕМЕТО
ТЕОРИЯ НА ФУНКЦИОНАЛА НА ПЛЪТНОСТТА (TD-DFT)
С. Каваучи1*, Л. Антонов
1,2*, И. Окуно
3
1Департамент по Органични и полимерни материали, Токийски Технологичен институт, 152-8552 Токио,
Япония 2Институт по Органична химия с Център по Фитохимия, Българска Академия на Науките, ул. Акад. Г. Бончев,
бл. 9, 1113 София, България 3Център по Информационни науки, Университет Кокушикан, 154-8515 Токио, Япония
Постъпила на 16 май 2014 г.; Коригирана на 17 юни 2014 г.
(Резюме)
Беше проверена приложимостта на четири TD-DFT метода (B3LYP, B97XD, M06-2X, and PBE0) при
базичен набор 6-31+G* за предсказване на спектрите на органични багрила във видимата област на спектъра.
При използване на набор от неутрални и йонни багрила най-добри резултати за положението на дълго-
вълновите спектрални максимуми са получени в реда M06-2X>B97XD>PBE0>B3LYP. При използване само
на неутрални багрила трите метода, PBE0, B97XD и M06-2X, показват статистически сравними резултати.
При фенилхидразоновите багрила е показана важността на специфичните взаимодействия в разтвор върху
коректното предсказване на max. Сравнението на експериментално наблюдаваните и предсказаните сили на
осцилатора, което беше възможно само при серията антрахинонови багрила, показа, че и четирите метода
предсказват добре общата тенденция на промяна като функция от ефекта на заместителите.

238
Bulgarian Chemical Communications, Volume 46, Special Issue A (pp. 238 – 245) 2014
Further studies on the conformations of large-ring cyclodextrins
P. Ivanov 1Institute of Organic Chemistry with Centre of Phytochemistry, Bulgarian Academy of Sciences, Acad. G. Bonchev str.,
bl. 9, 1113 Sofia, Bulgaria
Received May 07, 2014; Revised June 18, 2014
Dedicated to Acad. Dimiter Ivanov on the occasion of his 120th
birth anniversary
The dependence of the results from the conformational search on the starting geometry of large-ring cyclodextrins
(LR-CDs) was examined for the set of macrorings CDn, n = 16, 17, 18, 19, 20, 21. The structures obtained earlier for
CDn, n=16, 17, 18, 19 were confirmed, but not those for CD20 and CD21, although the tendency is evident for opening
of the macrorings. Results from DFT studies on a model system, using different functionals, justify our choice to use
the AMBER Glycam04 parameterization for modeling the conformations of large-ring cyclodextrins. The
configurations of hydrogen bonds that determine the geometries of the preferred syn and anti conformations were also
examined.
Key words: large-ring cyclodextrins, molecular dynamics, Glycam04 and Glycam06 AMBER parameterizations, DFT
INTRODUCTION
As a natural consequence of the long-lasting
interest and the numerous applications of the native
cyclodextrins (small cyclodextrins; α-CD, β-CD
and γ-CD, respectively, cyclohexa-, cyclohepta-,
and cyclooctaamylose), their larger analogues, the
large-ring cyclodextrins (LR-CDs; CDs with a
degree of polymerization (DP) higher than eight)
[1-5], also attracted attention in recent years, and
advances were marked in the study of their physic-
chemical properties [6,7], in spite of existing
difficulties in their synthesis, isolation and purifica-
tion. The existence of LR-CDs has been proven as
products from the action of 4-α-glucanotransferases
on amylose and amylopectin [2] almost a century
later after the first evidences for the existence of
cyclodextrins [8]. The expectations were that, in
addition to the numerous well-known useful for the
practice properties of the small cyclodextrins, na-
mely to provide heterogeneous microenvironment
to molecules, accommodated in their cavities, that
acquire significantly modified properties compared
to the free forms, some of the LR-CDs may have
new, specific properties.
It took about twenty years after the first report
for the existence of LR-CDs (DP = 9-14) [9]
preparation method for LR-CDs mixtures to be
worked out and δ-CD (DP = 9) [10] to be isolated
and its crystal structure to be characterized [11].
This opened the renewed interest on LR-CDs:
within very short time the crystal determinations of
CD10 (ε-CD) [12-14], CD14 (ι-CD) [12, 13], CD26
(υ-CD) [15,16] were reported. Important further
steps related with the development of an effective
purification method for LR-CDs [4] was the first
chemical synthesis of a LR-CD, as well as the
synthesis of the first chemically modified LR-CD
(CD9). The experimental information about the
conformations of LR-CDs is scarce. Crystal struc-
ture determinations were so far successful only for
four of them. The difficulties in forming intramo-
lecular and intermolecular hydrogen bonds, due to
the high flexibility of their macrocyclic rings, as
well as the low nucleation rates of sugars, that has
to precede crystal growth [3], are considered to be
the main cause for the low crystallinity of most LR-
CDs.
An advantage of the LR-CDs in comparison
with the small CDs, especially with α-CD and β-
CD, is that they are without any significant toxicity
and that nutritionally they can be regarded as starch
[2]. Commercially available CD-mixtures contain-
ning LR-CDs with a degree of polymerization from
9 to 21 were examined as additives to food (retro-
gradation retardant in breads, for freeze resistant
jellies and for production of non-sticky rice) and
drink products (high energy additive to soft drinks)
for improving their texture, mouth feeling, flavor,
taste, and palatability [6]. Others were studied as
stabilization and solubilization for drugs. LR-CDs
mixtures with a degree of polymerization from 22
to 45, and greater than 50 exhibited an efficient
© 2014 Bulgarian Academy of Sciences, Union of Chemists in Bulgaria
* To whom all correspondence should be sent:
E-mail: [email protected]

P. Ivanov: Further studies on the conformations of large-ring cyclodextrins
239
artificial chaperone effect for protein refolding (a
protein refolding kit containing a mixture of LR-
CDs as one of the active components is on the
market [3] - the first practical application of LR-
CDs in biotechnology). Such LR-CDs mixtures
were able to strip detergent molecules of unfolded
protein-detergent complexes, thus allowing the
protein molecules to refold to their proper, folded,
active state [2]. LR-CDs have been suggested for
applications in the paper industry as an improved
paper coating material and as starch substitutes in
adhesives and biodegradable plastics.
LR-CDs may be good host molecules for
relatively large guest compounds [6]. An increased
flexibility of these molecules allows them either to
present a more suitable cavity prior to complex
formation or adapt to the guest molecules by an
induced fit mechanism [2]. Since the large CDs are
able to present a variety of cavity sizes, compared
to the small CDs, they may be useful for special
applications. δ-CD, for example, has demonstrated
to form a stable complex with C70 Buckminster-
fullerene that allows its solubilization in water [17].
It has been proven that -CD (12 glucoses) is
effective in the partial separation of carbon nano-
tubes [18], i.e. not only fullerenes, but also single-
wall carbon nanotubes were dissolved into water
using LR-CD [3]. Increased interest is evident from
the literature on developing techniques for isolation
of LR-CDs [19,20] and for examining the proper-
ties of these macromolecules as new polysaccha-
ride-based biomaterials [21].
In view of the difficulties with the experimental
examination of the conformations of large-ring
cyclodextrins, computational modeling and simula-
tion methods provide useful tool to gain infor-
mation about their conformational dynamics, the
energetics, and the complex-forming ability. The
conformations of some LR-CDs were systemati-
cally examined using molecular dynamics simulati-
ons as conformational search protocol [22,23-29].
Representative conformations of the macrocycles
were obtained for different ranges of DP. There still
exist however some problems that deserve further
elucidation:
1. The range of DP from 16 to 21 was
considered as appropriate test cases to examine
alternative starting conformations for the conforma-
tional searches. This is the range of macroring sizes
that differ significantly from the reference struc-
tures CD14 and CD26 for which experimental
crystal structure determinations are available.
2. We used the AMBER (parm99) force filed in
our earlier studies [22]. The parameterization for
carbohydrates, Glycam04 (AMBER v.8) [30] was
later adopted [23,24,28]. The most recent develop-
ment of the Glycam series of parameterizations,
Glycam06 (in AMBER v. 11) [31], is recom-
mended to be used instead of Glycam04. It is
natural now to adopt this new development. We
tested however different methods on representative
syn and anti conformations of α-D-glucopyranosyl-
(14)-α-D-glucopyranoside (all they have six
intramolecular hydrogen bonds). A syn confor-
mation was estimated to have the lowest energy,
whereas the following relative energies of the
flipped (anti) conformation of the lowest energy
were obtained (in kcal mol-1
): DFT(6-311++G**):
5.7 (B3LYP), 5.7 (LC-wPBE), 6.1 (CAM-B3LYP),
6.4 (wB97XD); SE-MO: 7.6 (AM1), 6.0 (PM3), 6.5
(PM6); UFF: 3.8; MMFF94: 5.7; Glycam04: 4.6;
Glycam06: 2.9, i.e. Glycam06 estimated too low
relative energy for the flipped conformation. How
this result will reflect on the outcome from the
Glycam06 modeling studies? Thus we consider
important to justify our choice of using the
Glycam04 parameterization for modeling the
conformations of LR-CDs by comparing results for
a model structure obtained with Glycam04 and
DFT methods.
COMPUTATIONAL DETAILS
The MD simulation trajectories were obtained
with the AMBER program (version 11 [30]) using
the parameterization for carbohydrates, Glycam04
[30]. The molecular dynamics simulations were run
for aqueous solution (a box with TIP4P water
molecules) using the particle mesh Ewald (PME)
method for the treatment of the long-range electro-
statics. A 9.0 Å distance cutoff was used for direct
space nonbonded calculations and a 1.0x10⁻⁵
Ewald
convergence tolerance for the inclusion of long-
range electrostatic contributions. The ‘solvateBox’
command of LEaP was used to create cubic solvent
box around the CD with buffer distances 15.0 Å
between the walls of the box and the closest atoms
of the solute. The SHAKE option (tolerance 5.0 x
10-5
Å) was used for constraining bonds involving
hydrogen atoms. The starting geometries were
derived following schemes based on the X-ray geo-
metries of CD14 and CD26 as key reference struc-
tures and adding or removing residues. The same
protocol from our previous studies was used for the
preparation of the systems for the simulation
[24,28,29]. Additional 500.0 ps simulation
(NPT) was executed before starting the produc-
tive runs. The productive runs were performed
with the recommended maximum time-step 2.0 fs
when SHAKE is used, at 300 K and an average

P. Ivanov: Further studies on the conformations of large-ring cyclodextrins
240
pressure 1.0 bar with isotropic position scaling. The
simulation time was 100.0 ns. Samplings were
taken every 2.0 ps.
RESULTS AND DISCUSSION
For the purpose of the representation we have to
introduce some designations. Fig. 1 displays a
schematic representation of a fragment of a
cyclodextrin macroring with the numbering of the
atoms and examples for syn and anti orientations of
neighbouring glucose units.
C 4
C 3 C 2
C 1
O 5 C 5
O 2 O 3
C 6
O 6
O 4 C 4
C 3 C 2
C 1
O 5 C 5
O 4
C 6
O 6
O 3 O 2
n n+1 n+2
C 4 C 3
C 2
C1
O5 C
O 2
O 3
C
O 6
O 4 n-1
C 4 C 3
C 2
C1 O5
C
O 2
O 3
C
O 6
O 4 5 6
5 6
anti syn syn
(a)
syn anti kink
(b)
Fig. 1. a) Schematic representation for a cyclodextrin
showing the atomic numbering. Each individual glucose
unit is designated by a number “n”. Atoms are identified
by a letter and a number that indicates its position in the
glucose. (b) Relative conformations of neighbor gluco-
ses: syn, anti and kink.
Dependence of the results from the starting
geometry
The three groups of LR-CDs examined by us so
far [25-27] present structures from different ranges
of values for the degree of polymerization. The
starting geometries in two of these cases were
derived from the experimental crystal structures of
cyclodextrins which were closer in size, CD14 [26]
and CD26 [25]. It should not be surprising that for
the third group of cyclodextrins, CDn (n=18, 19,
20) [27], averaged geometries of CD20 were
obtained that differ from the structures of the same
macroring obtained earlier using different starting
geometry (Fig. 2) [25]. This prompted us to exami-
ne in more detail the conformations of these LR-
CDs using different starting geometries. The
systems studied were CDn, n=16, 17, 18, 19, 20,
21. Indeed we found that such dependences exist.
(a) (b)
Fig. 2. Averaged structures of CD20 derived after
conformational searches with different starting
geometries for the molecular dynamics simulations: a)
Results from Ref. 27; b) Results from Ref. 25.
The scheme for generating the starting
geometries differs considerably from the one we
used before. The starting geometries in the earlier
study were derived following a scheme based on
the X-ray geometry of CD14 as a key reference
structure and adding or removing residues:
CD14CD15CD16CD18CD20CD19.
The leading idea in the present examination was to
start from flips-free geometries (Fig. 3).
CD16 CD17 CD18
CD19 CD20 CD21
Fig. 3. Starting geometries for the conformational
searches.
We prepared for the purpose starting geometry
of CD16 using molecular graphics, whereas the
other necessary structures were derived according
to the sequence CD16CD18CD17CD19
CD20, CD19 CD21. Fig. 4 contains average

P. Ivanov: Further studies on the conformations of large-ring cyclodextrins
241
geometries for 10.0 ns simulation time intervals of
the conformational searches. CD20 was used also
to examine the dependence of the results from the
value of the buffer parameter for the thickness of
the water layer (Fig. 4). Using the same starting
geometry, the value 15.0 Å for the solvent buffer
parameter was used in this study, whereas the
results designated with CD20s were obtained with
the smaller value 10.0 Å.
The structures obtained earlier for CDn, n=16,
17, 18, 19 were confirmed [26,27], but not those for
CD16
CD17
CD18
CD19
CD20
CD20s
CD21
1.0-10.0 10.0-20.0 30.0-40.0 50.0-60.0 70.0-80.0 90.0-100.0
Fig. 4. Averaged geometries of CDn (n=16, 17, 18, 19, 20, 21) for different 10.0 ns intervals of the conformational
searches.

P. Ivanov: Further studies on the conformations of large-ring cyclodextrins
242
(0.0; 0.26; 4a3b) (0.1; 0.22; 3a3b)
(a)
(5.0; 0.0; 4abc) (5.1; 0.0; 3a2c)
(b)
Fig. 5. Stereo views of optimized geometries of the lowest-energy conformations of α-D-glucopyranosyl-(14)-α-D-
glucopyranoside obtained with the MMFF94S force field: (a) syn conformations; (b) anti conformations. In parentheses
are given the relative steric energies, the populations of the conformations and the letter-code describing the hydrogen
bonding.
CD20 and CD21 [25], although the tendency is
evident for opening of the macrorings. Longer
duration of the simulations most probably may
manifest also the geometries of CD20 and CD21 in
Fig. 25 in Ref. 28. The observation of extended
narrow antiparallel double helixes for the cyclo-
dextrins with DP in the range of 18 to 20 (Fig. 4),
when using two different starting geometries, one
of which has opened macroring, is additional evi-
dence in support for the existence of such structu-
res. Thicker water layer enhances the appearance of
narrow extended geometries (Fig. 4, results for
CD20). CD16 and CD17 display the figure-eight-
like conformations with two β-CD pseudocavities.
The cyclodextrins with even number of glucose
residues, CD18 and CD20, present more symmet-
rical extended structures, probably due to more
favorable torsional deformations about glycosidic
bonds diametrically positioned along the perimeter
of the macrocycle. Three segments, each of 6-7
glucoses, may produce more open cavities for
CD21 (Fig. 4).
Validation of the Glycam04 AMBER
parameterization for conformational studies on
large-ring cyclodextrins – a DFT study on a model
system α-D-glucopyranosyl-(14)-α-D-
glucopyranoside
We will recall again the reasons hidden behind
this examination. Tests with the Glycam06 para-
meterization (vide supra) gave too low relative
energy for the flipped conformation. A conse-
quence of this result, when applying Glycam06 on
the flexible LR-CD systems, could be unreliable
modeling of local syn/anti transitions. In order to
validate our preference for using the Glycam04
parameterization (adopted not only because of this
reason), we examined with molecular mechanics
(MMFF94S force field) the conformations of α-D-
glucopyranosyl-(14)-α-D-glucopyranoside. The
total of 6697 conformations were obtained with
relative energies less than 24.0 kcal mol-1
. The first
130 lowest-energy conformations were further
modeled also with four DFT functional [32]. The
results for some of them are given in Table 1. We
used two “standard” hybrid functionals not inclu-
ding dispersion (B3LYP, PBEh1PBE), one func-
tional that has been constructed to account for
dispersion (wB97XD) and the Zhao-Truhlar’s high-
nonlocality functional M06 with double the amount
of nonlocal exchange (2X) that has been recom-
mended for noncovalent interactions. Fig. 5
presents MMFF94S optimized geometries of the
lowest-energy syn and anti conformations. Table 1
contains also data for the dihedral angles of low-
energy structures. For simplicity a letter-code was
used to designate the values of the dihedral angles:
s – dihedral angles in the range -30.0° – (+30.0°); g
+
– dihedral angles in the range 30.0° – 130.0°; g
- –
dihedral angles in the range -30.0° – (-130.0°); a –
dihedral angles in the range 130.0° – (-130.0°). The
pair of dihedrals (Φ,Ψ) determines whether a
particular conformation can be characterized as syn,

P. Ivanov: Further studies on the conformations of large-ring cyclodextrins
243
kink or anti. The four DFT methods estimate rela-
tive energies of ‘band-flipped’ conformations in
accord with the Glycam04 results. The results
justify our choice to use Glycam04 for modeling
the conformations of large-ring cyclodextrins.
Let us examine the configurations of hydrogen
bonds that determine the geometries of the
preferred syn and anti conformations. For simpli-
city of the presentation we will introduce a letter-
code for designation of the type of hydrogen bon-
ding: a - a hydrogen bond between hydroxyl gro-
ups; b - a hydrogen bond between a hydroxyl group
and a ring-oxygen atom or glycosidic oxygen; c -
bifurcated hydrogen bond with proton acceptors
hydroxyl oxygen and glycosidic or ring-oxygen
atoms. Then, 4a2bc will designate the case with
four hydrogen bonds of type a, two hydrogen bonds
of type b and one hydrogen bonding of type c.
The typical chain of four hydrogen bonds (4a)
between the secondary hydroxyl groups determine
the geometry of the lowest energy conformation
optimized with molecular mechanics. The two
primary hydroxyls form hydrogen bond with the
ring-oxygen atoms. This is the typical case enco-
untered in cyclodextrins. The second low-energy
conformation has the same hydrogen bonds, the
only difference being the orientation of the primary
hydroxyl group with respect to the C5(n)-O5(n)
bond. This hydrogen bonding is not present in the
third conformation. The same type of hydrogen
bonding of conformations one and two charac-
terizes also conformations four (kink conformation)
and five, but some dihedral angles have different
values. Five hydrogen bonds of type a, constituting
a ‘proton-relay’-like fragment, determine the con-
formation of the sixth syn conformation. One and
Table 1. Relative energies (kcal mol-1
) of some low-energy conformations of α-D-glucopyranosyl-(14)-α-D-
glucopyranoside determined with molecular mechanics and DFT methods.
No. E
a Dihedral angles
d,e,f
B3LYP wB97XD PBEh1
PBE M062X
MMFF
94S Φ Ψ θ
1
1 θ1
2 θ1
3 θ1
4 θ2
1 θ2
2 θ2
3 θ2
4 φOH φOG+
1 1.6 1.8 1.7 2.6 0.0 g+ g
+ g
+ g
+ g
- g
- g
+ g
- s g
- g
+ g
+
2 0.0 0.0 0.0 0.0 0.1 g+ g
+ g
- g
+ g
- g
- g
+ g
- s g
- g
+ g
+
3 1.1 0.5 0.7 0.6 0.1 g+ g
+ g
- a g
- g
- g
+ g
- s g
- g
+ g
+
4b
0.0 0.0 0.0 0.0 0.8 a a g- g
+ g
- g
- g
+ g
- g
- g
- g
+ g
+
5 1.6 1.6 1.7 2.7 1.0 g+ g
+ g
+ g
- g
- g
- g
- g
+ s g
- g
+ g
+
6 1.7 1.7 1.7 2.8 1.1 g+ g
+ g
+ g
- g
- g
- a g
+ s g
- g
+ g
+
7 2.0 2.3 2.2 2.9 1.6 g+ g
+ g
+ g
- g
- g
- g
+ g
- g
- g
- g
+ g
+
8 0.2 0.6 0.2 0.8 1.7 g+ g
+ g
- g
+ g
- g
- g
- g
+ s g
- g
+ g
+
9 1.1 0.5 0.9 1.1 1.7 g+ g
+ g
+ a g
- g
- g
+ g
- s g
- g
+ g
+
10b
1.4 1.8 1.5 2.6 1.8 a a g+ g
- g
- g
- g
+ g
- g
- g
- g
+ g
+
11 1.7 1.4 1.5 1.8 1.9 g+ g
+ g
- g
+ g
- g
- g
+ g
+ s g
- g
+ g
+
12 0.0 0.6 0.0 0.9 1.9 g+ g
+ g
- g
+ g
- g
- a g
+ s g
- g
+ g
+
13 2.2 3.2 2.4 3.4 2.1 g+ g
+ g
+ g
- a a a a a a a g
+
14 1.1 0.7 0.8 0.7 2.1 g+ g
+ g
- g
- g
- g
- g
+ a s g
- g
+ g
+
15b
0.2 0.6 0.2 0.8 2.1 a a g- g
+ g
- g
- g
- g
+ g
- g
- g
+ g
+
16b
0.0 0.6 0.0 0.9 2.3 a a g- g
+ g
- g
- a g
+ g
- g
- g
+ g
+
17 3.0 3.4 3.2 4.2 2.4 g+ g
+ g
+ g
- g
- g
- g
+ g
+ s g
- g
+ g
+
18b
2.2 2.5 2.4 2.6 2.4 a a g- a g
- g
- g
+ g
- g
- g
- g
+ g
+
19 2.2 2.5 2.4 2.6 2.5 g+ g
+ g
- g
+ a a a a a a a g
+
20 2.9 3.6 3.1 4.1 2.6 g+ g
+ g
+ g
- g
- g
- g
+ a s g
- g
+ g
+
21b
1.0 1.6 1.1 2.2 2.8 a a g+ g
- g
- g
- g
- g
+ g
- g
- g
+ g
+
71c
6.7 6.2 6.3 6.2 5.0 g+ g
- a a g
- g
- g
+ s s g
- g
+ g
+
72c 4.7 4.1 4.4 3.8 5.1 g
+ g
- a a a a g
+ a s g
- g
+ g
+
a Total energies of the lowest-energy conformations: (Eo)
3B LYP
g = -1337.662286 a.u., (Eo)97wB XD
g = -1337.269492 a.u., (Eo)1PBEh PBE
g =
-1336.333340 a.u., (Eo)062M X
g = -1337.1721753 a.u., (Eo)94MMFF S
g = 176.1 kcal mol-1
. b kink-conformations.
cband-flipped conformations.
d
Definition of the dihedral angles according to the numbering of the atoms in Fig. 1: Φ = C4(n)-O4(n)-C1(n+1)-O5(n+1); Ψ = C3(n)-C4(n)-
O4(n)-C1(n+1); θ1
1 = O5(n)-C5(n)-C6(n)-O6(n); θ1
2 = C5(n)-C6(n)-O6(n)-H; θ1
3 = C1(n)-C2(n)-O2(n)-H; θ1
4 = C2(n)-C3(n)-O3(n)-H; θ2
1 =
O5(n+1)-C5(n+1)-C6(n+1)-O6(n+1); θ2
2 =C5(n+1)-C6(n+1)-O6(n+1)-H; θ2
3 = C1(n+1)-C2(n+1)-O2(n+1)-H; θ2
4 =C2(n+1)-C3(n+1)-
O3(n+1)-H; φOH = C3(n+1)-C4(n+1)-O4(n+1)-H; φOG+ = C4(n-1)-O4(n-1)-C1(n)-H. e
Results with MMFF94S. f A letter-code: s – dihedral
angles in the range -30.0° – (+30.0°); g
+ - dihedral angles in the range 30.0
° – 130.0°; g
- - dihedral angles in the range -30.0
° – (-130.0°); a -
dihedral angles in the range 130.0° – (-130.0°).

P. Ivanov: Further studies on the conformations of large-ring cyclodextrins
244
the same 4abc-type anti conformation was found by
all methods used. In addition to the two sets of
three hydrogen bonds, a bifurcated hydrogen bond
is also formed with the participation of the
glycosidic oxygen atom. With the same energy,
determined with MMFF94S, and with lower
energy, determined by all DFT methods, is another
anti conformation characterized by 4ac or 3a2c
types of hydrogen bonding. The lowest energy anti
conformaion has one or two hydrogen bonds less
than the corresponding syn counterpart. What is
more interesting however is that the lowest energy
anti form has one hydrogen bond less than the other
anti conformation.
CONCLUSION
Evidences were acquired on the validation of the
modeling and simulation results on large-ring
cyclodextrins from the starting geometry for the
conformational search. The dependence of the
results from the starting geometries was examined
for the set of macrorings CDn, n= 16, 17, 18, 19,
20, 21. The structures obtained earlier for CDn,
n=16, 17, 18, 19 were confirmed, but not those for
CD20 and CD21, although the tendency is evident
for opening of the macrorings. Results from DFT
studies on a model system using different
functionals (B3LYP, wB97XD, PBEh1PBE, M06-
2X) justify our choice to use Glycam04 for mode-
ling the conformations of large-ring cyclodextrins.
The configurations of hydrogen bonds that deter-
mine the geometries of the preferred syn and anti
conformations were also examined.
Acknowledgements: The financial support is from
the National Science Fund within the project
TK01/0167. CPU-hours grants from HPC-
EUROPA2 (RII3-CT-2003-506079 – Research
Infrastructure Action under the FP6 and the FP7
“Structuring the European Research Area”
Programme) and RNF01/0110 (NSF-Bulgaria)
projects, as well as stimulating discussions with
partners in the COST action CM1002 are also
acknowledged.
REFERENCES
1. W. Saenger, J. Jacob, K. Gessler, T. Steiner, D.
Hoffmann, H. Sanbe, K. Koizumi, S. Smith, T.
Takaha, Chem. Rev., 98, 1787 (1998).
2. K. L. Larsen, J. Incl. Phenom. Mol. Recognit. Chem.,
43, 1 (2002).
3. T. Endo, H. Ueda, J. Pharm. Sci., 29, 27 (2004).
4. H. Ueda, T. Endo, in: Cyclodextrins and their
complexes. Chemistry, analytical methods,
applications; H. Dodziuk, Ed.; Weinheim: Wiley-
VCH, 2006; pp. 370-380.
5. T. Endo, Trends Glycosci. Glycotechnol., 23, 79
(2011).
6. H. Ueda, J. Incl. Phenom. Macrocyclic Chem., 44, 53
(2002).
7. K. L. Larsen, F. Mathiesen, W. Zimmermann,
Carbohydr. Res., 298, 59 (1997).
8. M. A. Villier, Comptes. Rendus. Acad. Sci., 112, 536
(1891).
9. D. French, A. O. Pulley, J. A. Effenberger, M. A.
Rougvie, M. Abdullah, Arch. Biochem. Biophys., 111, 153 (1965).
10. S. Kobayashi, M. Fukuda, M. Monma, T. Harumi, M.
Kubo, Abstracts of Papers, the Annual Meeting of
the Agricultural Chemical Society of Japan, Kyoto,
April 1986, p. 649 (in Japanese).
11. T. Fujiwara, N. Tanaka, S. Kobayashi, Chem. Lett.,
739 (1990).
12. J. Jacob, K. Gessler, D. Hoffmann, H. Sanbe, K.
Koizumi, S. M. Smith, T. Takaha, W. Saenger,
Angew. Chem. Int. Ed. Eng., 37, 606 (1998).
13. J. Jacob, K. Gessler, D. Hoffmann, H. Sanbe, K.
Koizumi, S. M. Smith, T. Takaha, W. Saenger,
Carbohydr. Res., 322, 228 (1999).
14. K. Imamura, O. Nimz, J. Jacob, D. Myles, S. A.
Mason, S. Kitamura, T. Aree, W. Saenger, Acta
Cryst. B, B57, 833 (2001).
15. K. Gessler, I. Uson, T. Takaha, N. Krauss, S. M.
Smith, S. Okada, G. M. Sheldrick, W. Saenger, Proc.
Natl. Acad. Sci. USA, 96, 4246 (1999).
16. O. Nimz, K. Gessler, I. Uson, S. Laettig, H. Welfle,
G. M. Sheldrick, W. Saenger, Carbohydr. Res., 338,
977 (2003). 17. T. Furuishi, T. Endo, H. Nagase, H. Ueda, T. Nagai,
Chem. Pharm. Bull., 46, 1658 (1998).
18. H. Dodziuk, A. Ejchart, W. Anczewski, H. Ueda, E.
Krinichnaya, G. Dolgonos, W. Kutner, Chem.
Commun., 986 (2003).
19. F. Ellouze, N. Ben Amar, A. Deratani, W.
Zimmermann, Results presented at the 15th
International Cyclodextrin Symposium, O12, May 9-
12, 2010, Vienna, Austria.
20. J. Wang, A. Jiao, Y. Tian, X. Xu, Z. Jin, Y. Li, J.
Chromatography A, 1218, 863 (2011).
21. S. Toita, N. Morimoto, K. Akiyoshim, Biomacro-
molecules, 11, 397 (2010).
22. P. M. Ivanov, C. Jaime, J. Phys. Chem. B, 108, 6261
(2004).
23. M. G. Gotsev, P. M. Ivanov, J. Phys. Chem. B, 113,
5752 (2009).
24. P. M. Ivanov, J. Phys. Chem. B, 114, 2650 (2010).
25. P. M. Ivanov, Chirality, 23, 628 (2011).
26. P. M. Ivanov, J. Mol. Struct., 1009, 3 (2012).

P. Ivanov: Further studies on the conformations of large-ring cyclodextrins
245
27. P. M. Ivanov, in: Nanoscience & Nanotechnology -
Nanostructured materials - Application and
Innovation Transfer, E. Balabanova, E.; I. Dragieva,
I. Eds., 2011, issue 11, 14.
28. P. Ivanov, Curr. Phys. Chem., 2, 413 (2012), and
references cited therein.
29. P. Ivanov, E. Atanassov, C. Jaime, J. Mol. Struct., 1056-1057, 238 (2014).
30. D. A. Case, T. A. Darden, T. E. Cheatham III, C. L.
Simmerling, J. Wang, R. E. Duke, R. Luo, M.
Crowley, R. C. Walker, W. Zhang, K. M. Merz, B.
Roberts, B. Wang, S. Hayik, A. Roitberg, G. Seabra,
I. Kolossvary, K. F. Wong, F. Paesani, J. Vanicek, X.
Wu, S. Brozell, T. Steinbrecher, H. Gohlke, Q. Cai,
X. Ye, J. Wang, M.-J. Hsieh, G. Cui, D. R. Roe, D.
H. Mathews, M. G. Seetin, C. Sagui, V. Babin, T.
Luchko, S. Gusarov, A. Kovalenko, P. A. Kollman,
(2010), AMBER 11, University of California, San
Francisco.
31. K. N. Kirschner, A. B. Yongye, S. M. Tschampel, J.
González-Outeiriño, C. R. Daniels, B. L. Foley, R. J.
Woods, J. Comput. Chem., 29, 622 (2007).
32. Gaussian 09, Revision A.1, M. J. Frisch, G. W.
Trucks, H. B. Schlegel, G. E. Scuseria, M. A. Robb,
J. R. Cheeseman, G. Scalmani, V. Barone, B.
Mennucci, G. A. Petersson, H. Nakatsuji, M.
Caricato, X. Li, H. P. Hratchian, A. F. Izmaylov, J.
Bloino, G. Zheng, J. L. Sonnenberg, M. Hada, M.
Ehara, K. Toyota, R. Fukuda, J. Hasegawa, M.
Ishida, T. Nakajima, Y. Honda, O. Kitao, H. Nakai,
T. Vreven, J. A. Montgomery, Jr., J. E. Peralta, F.
Ogliaro, M. Bearpark, J. J. Heyd, E. Brothers, K. N.
Kudin, V. N. Staroverov, R. Kobayashi, J. Normand,
K. Raghavachari, A. Rendell, J. C. Burant, S. S.
Iyengar, J. Tomasi, M. Cossi, N. Rega, J. M. Millam,
M. Klene, J. E. Knox, J. B. Cross, V. Bakken, C.
Adamo, J. Jaramillo, R. Gomperts, R. E. Stratmann,
O. Yazyev, A. J. Austin, R. Cammi, C. Pomelli, J. W.
Ochterski, R. L. Martin, K. Morokuma, V. G.
Zakrzewski, G. A. Voth, P. Salvador, J. J.
Dannenberg, S. Dapprich, A. D. Daniels, Ö. Farkas,
J. B. Foresman, J. V. Ortiz, J. Cioslowski, D. J. Fox,
Gaussian, Inc., Wallingford CT, 2009.
ИЗСЛЕДВАНЕ ВЪРХУ КОНФОРМАЦИИТЕ НА ГОЛЕМИ ЦИКЛОДЕКСТРИНИ
П. Иванов
Институт по Органична химия с Център по Фитохимия, Българска Академия на Науките, ул. Акад. Г. Бончев,
бл. 9, 1113 София, България
Постъпила на 07 май 2014 г.; Коригирана на 18 юни 2014 г.
(Резюме)
Изследвана е зависимостта на резултатите от изходните геометрии при конформационно търсене за набор от
големи циклодекстрини, CDn, n = 16, 17, 18, 19, 20, 21, Потвърдени бяха получени по-рано структури за CDn,
n=16, 17, 18, 19, но не и такива за CD20 и CD21, но се наблюдава тенденция към разтваряне на
макропръстените, установено по-рано при тях. Резултати от DFT пресмятания с различни функционали на
моделна система са в подкрепа на направения от нас избор на силово поле, Amber Glycam04, за моделиране на
конформациите на големи циклодекстрини. Проучени са и конфигурациите от вътрешномолекулни водородни
връзки, определящи геометриите на предпочетените syn и anti конформации.

246
Bulgarian Chemical Communications, Volume 46, Special Issue A (pp. 246 – 250) 2014
Application of Isohypses method for AES quantification of semiconductor solid
solutions
G. S. Spasov
Institute of Optical Materials and Technologies “Academician Jordan Malinovski”, Bulgarian Academy of Sciences,
Acad. G. Bonchev str., bl. 109, 1113 Sofia, Bulgaria
Received April 17, 2014; Revised May 26, 2014
Dedicated to Acad. Dimiter Ivanov on the occasion of his 120th
birth anniversary
The Isohypses method (IHM), previously used in energy dispersive X-ray microanalysis, is discussed as a tool for
AES quantification of ternary and quaternary semiconductor quasi-binary solid solutions. It is with standards, which
components are mainly with an unit less than those of the analyzed compound (The standards are peripheral points on
the concentration triangle/square). For that reason a less number of standards are requested, which is a principal
advantage of the IHM compared to the method of a complete standards’ description. The method is based on the
assumption, that when mixing binary systems in which the values of response of the A element are equal to each other,
the response is not changed. As a procedure it consists of: I. Construction of a nomograph according to Auger standards
data and, II. Determination by it the sample composition from the Auger intensities. The essence of the method is
presented in the paper and the specifications required by the considered class compounds. Applications for AlxGa1-xAs,
InxGa1-xAs and InxGa1-xPyAs1-y are discussed.
Key words: Auger electron spectroscopy, AES analysis, Semiconductor solid solutions
INTRODUCTION
Three reasons make us to remind the already
proposed Auger quantification by isohypses [1]: I.
The semiconductor solid solutions continue to be of
interest and a subject of scientific research; II.
Miniaturization strengthens the AES analyses
importance, but III. Still the accurate Auger
quantification is problematic. The total calibration
by standard compositions perhaps is most accurate,
but the method' use is limited when the number of
components is more than three.
The Isohypses method (IHM) for AES
quantification is developed by analogy of its use in
energy dispersive X-ray microanalysis [2]. The
term “isohypse” (from Greek “hypsos” – height) is
cartographic. There it means a line connecting the
points with equal altitude, in our case, respectively,
equal Auger signal.
The method is based on the assumption, that
when mixing binary systems in which the values of
response of the element A are equal to each other,
the response is not changed. It can be shown that
this leads to the conclusion that the composition'
isohypses for ternary and quaternary solid solutions
are straight lines.
It is not known someone to have used into
Auger practice the IHM. Hoping to have followers
we submit an IHM application for AlxGa1-xAs,
InxGa1-xAs and InxGa1-xPyAs1-y systems. This is new
at this work and its essence. But preliminary the
general IHM procedure is exposed briefly
according to our work [1].
THEORY
First IHM quantification will be demonstrated
for three-component system (A, B, C). The
concentration triangle sides AB, BC and AC
conform to the homonymous binary systems. Their
Auger response characteristics (experimentally or
theoretically obtained) are plotted on the ordinates
KA, KB, KC (Fig. 1). Through them, the binary
compositions a', a'', etc., are constructed by the
signal intensities KAS, KB
S, KC
S of the analyzed
specimen. They define the isohypses a'-a", b'-b", c'-
c", which crossings form the searched composition
triangle A'B'C'. Its sizes reflect the experiment
precision and the applicability of the IHM. If they
are small, it is possible to treat A'B'C' as a point.
The atomic part of ith-element, ci
S, is equal to the
distance from this point, O, to the ABC side,
opposite to the ith-apex, normalized to the altitude
(e.g., cBS = OM/BS). Otherwise these operations are
performed toward the centre of gravity of A'B'C'.
© 2014 Bulgarian Academy of Sciences, Union of Chemists in Bulgaria
* To whom all correspondence should be sent:
E-mail: [email protected]

G. S. Spasov: Application of Isohypses method for AES quantification of semiconductor solid solutions
247
Now it will be presented the possibility of
applying the IHM to four-component solid
solutions of the type AB1-x-yCxDy and AxB1-xC1-yDy.
The concentration triangle is replaced by a
tetrahedron. The composition of first type
semiconductors (e.g., GaAs1-x-yPxSby) is represented
by a triangle with apexes the binary compounds
AB, AC, AD (GaAs, GaP, GaSb). The availability
of the intrinsic standard (cA = 50%) allows
analysing similar to that from Fig. 1.
Fig. 1. IHM for a three-component system.
Fig. 2. IHM for a 4-component system AxB1-xC1-yDy.
The case of AxB1-xC1-yDy appears to be more
general and requires a detailed examination. All
these compositions (0≤x≤1, 0≤y≤1) correspond to
the square tetrahedron' section with apexes AC,
AD, BD, BC, shown on Fig. 2.
Again Auger response characteristics (now 3
each) are constructed on the figure' sides. The
Auger signal of the ith-element (for example, A) has
intensity 0 along the side BC-BD. Starting at 0, it
increases along BC-AC cut, it is biggest – but
changes less – in AC-AD cut and decreases along
BD-AD cut. The quantification is similar to that for
the three-component system. The Auger signals
obtained from the analyzed specimen KiS lead to the
isohypses a'- a", etc. The figure of the errors is now
а tetragon with its median point O. Since x varies
(from 0 to 1) along the horizontal square' side and y
– along the vertical, the distances of point O to the
square side are just x and y content.
Nomograph Construction
IHM will be applied to the systems AlxGa1-xAs
and InxGa1-xAs at first. Their quasi-binarity is of
main importance, giving the As contents cAs = 0.5.
For AlxGa1-xAs, it is located along the cut AlAs-
GaAs (coincident with the As-isohypse) of the
concentration triangle. The exclusion of As-side
allows to present Fig. 1 simplified, as AlGaAs
triangle tear in the top As and stood up straight: As-
Al-Ga-As, Fig. 3 and Fig. 4. The points a' and a"
(determining the isohypse for Al) and b' and b"
(determining the isohypse for Ga) are found as in
Fig. 1. Тhe sought x is the medial between the
points of intersection of these isohypses with the
cut AlAs-GaAs. Now it becomes convenient to
work with relative (toward As) Auger signals. The
normalization is done by the value of the As-
intensity from the stoichiometric binary compo-
sition (e.g., GaAs for the side As-Ga).
It seems a difficulty that on the mentioned sides
there may not be the continuous solid solutions. But
the ends and the middle point (i.e., As, GaAs, Ga)
are enough to construct a "rough" response
characteristic true reflecting analyses specificity.
The fitting curve "Auger intensity vs. Ga contents"
must be of "matrix correction" type:
y = x/[F + x(1 – F)] (1)
where F is the matrix correction factor (comprising
the ion etching effects). Тhe Ga (or Аs) contents in
GaAs after etching must be known for curve'
theoretic determination. The surface composition
Ga/As (1keV Ar+) is 1/0.92 [3] and the calculated
"atomic density – attenuation length [4] – back-
scattering factor" correction for Ga in GaAs is 0.94.
So the dependence (1), (which is 0 at As and 1 at
Ga), decreases with about 2% from the linear at 0.5,
Fig. 3 and Fig. 4.

G. S. Spasov: Application of Isohypses method for AES quantification of semiconductor solid solutions
248
0 1 2 3
1
2
3
0.25
0.50
0.75
1.00
, Ga
, Al
IS
Al/As
IGa/As
b' b"a'
IAl/As
As GaAs Ga Al AlAs As
IS
Ga/As
a"
Fig. 3. IHM for the system AlxGa1-xAs (after Arthur’s
data [11]). The concentration triangle sides As-Ga, Ga-
Al, Al-As are unfolded on the axis x, corresponding to 0-
1, 1-2, 2-3.
0 1 2 3
1
2
1
2
b' b"a'
IAl/As
, After [6]
, After [8]
, After [13]
, , , Ga
, , , Al
As GaAs Ga Al AlAs As
IGa/As
a"
Fig. 4. IHM for the system AlxGa1-xAs (Bulk
composition determined by the surface data).
But for the side Al-As we have neither AlAs
standard, nor its sputtering data. Therefore getting
the experimental intensity ratio Al/AsGaAs
(The last
symbol means that As is from GaAs) and correcting
it by 1.14 (average from [5-8] for AsAlAs
/AsGaAs
),
we obtain Al/AsAlAs
1.10. I.e. the relative (to As)
Al-intensity is 0.55. This value for the compound
AlAs is 0.51 (average from [9-12]), which gives for
the mean of the side Al-As a decrease with about
7% compared to the linear dependency, Fig. 3 and
Fig. 4.
As to the nomograph's part of the two elements
from III group, it should not be forgotten that quasi-
binary compounds are of analytical interest. So
Auger behaviour of III-III alloys may not be useful
to the response characteristics. It is more reliable
the reconstruction to be made by the quasi-binars
themselves. Assuming that these characteristics are
proportional to the corresponding ones from the
quasi-binary cut (AlxGa1-xAs; 0≤x≤1), so, the
normalized Al characteristic at x≤0.5 is Al/As from
AlxGa1-xAs and that of Ga at x≥0.5 is Ga/As from
AlxGa1-xAs. (For the rest parts of the range these
characteristics are not important: Ga and Al don’t
surpass 50% in the analyzed compositions.) If some
of the metals (e.g., Ga) is characterized theo-
retically (in Part As-Ga of the x axis) and
experimentally (in Part Ga-Al of the x axis), it is
necessary to fit one curve to the other at the binary
stoichiometric composition. This is most visible for
In оf Fig. 5.
0 1 2 3
1
2
3
1
2
3
4 I
Ga/As
As GaAs Ga In InAs As
IS
Ga/As
IS
In/As
a'a" b' b"
IIn/As
Fig. 5. IHM for the system InxGa1-xAs.
The first AlxGa1-xAs application is after Arthur
and LePore’s work [11]. They analyse the surface
composition, receiving linear dependency оf x to
Al/As (0.47 for AlAs) and Ga/As (1.67 for GaAs).
As a standard we used their sample with (AlAs)-
atomic part 0.42. Its relative intensities Al/As 0.18
and Ga/As 0.96 are constructed on Fig. 3, setting
the points a' and a" for Ga' isohypse, and b' and b"
for Al' isohypse. The concentrations are found from
these points by a calculating procedure.
At the next application the bulk composition of
AlxGa1-xAs layer is determined by the surface data.
Influenced by the ion etching, now the Auger
intensities are a non-linear function of x. They are
found by a "matrix corrected" fitting of the data of
several literary sets [6,10,13] (conformed with the
analytical regime), Fig. 4. The medial composion
from [10] is viewed as a sample, because it is
located closest to the fitted curve.
By analogy the nomograph for the system
InxGa1-xAs is constructed, Fig. 5. Now the construc-
tion of the response characteristics on the side Ga-
In is by one experimental point. The ion etching is
with 3 keV Ar+. The composition of both standard
and sample (3μm liquid-epitaxial layers on GaAs
subsrate) is measured by the electron probe
microanalysis. The very different sputtering beha-
viour of InxGa1-xAs and InAs makes worse the IHM
analysis' result for this system.
InxGa1-xPyAs1-y analysis is made by a specimen,
which composition is measured by EPMA. Its
Auger intensities (in arbitrary units) are Ga(30.5),
In(133.0), As(52.5), P(22.0). We use the simplest
model, accepting all response characteristics are
straight lines connecting the binary apexes. The
measured Auger intensities (in arbitrary units) are
GaAs(132; 86), InAs(189; 58), InP(140; 116),
GaP(104; 136); the figures in brackets correspond
to the order of the elements in the formula. As this
model allows to determine the isohypses' cuts by

G. S. Spasov: Application of Isohypses method for AES quantification of semiconductor solid solutions
249
simple trigonometric calculations, Fig. 6 displays
only the isohypses.
0.0 0.2 0.4 0.6 0.8 1.00.0
0.2
0.4
0.6
0.8
1.00.0 0.2 0.4 0.6 0.8 1.0
0.0
0.2
0.4
0.6
0.8
1.0
x
y
GaAs InAs
GaP InP
a'
a"b'
b"
c'
c"
d'
d"
Fig. 6. IHM for the system InxGa1-xP1-yAsy.
RESULTS AND DISCUSSION
The test of one method for quantification usually
consists of evaluation by it of a standard (specimen
with known composition), what we do. All received
results are listed in Table 1.
Table 1. Quantification results
Specimen True x IHM x Δx/x, % Δl/l, %
AlxGa1-xAs [11] 0.42 0.41 2.4 1.2 AlxGa1-xAs [10] 0.51 0.56 10.1 1
InxGa1-xAs 0.73 59 19.3 1
InxGa1-xPyAs1-y
(this row is to y)
0.74 0.75 2.4 0.7
0.17 0.17 1.6 0.8
The presented analytic applications prove that
the isohypses method (IHM) is a useful and
accurate tool for a quantitative Auger analysis (let
remember that the elemental sensitivity factors
method is semi-quantitative; the methods with one
or two standards are very erroneous, while the
method with fully tabulation is practically inappli-
cable for four-component compositions because of
the great number of necessary standards). The
standards' number for IHM is at least an order less
(equidistant traveling over the figure periphery
compared to that of its area).
Simpler compositions are used as the standards.
Since their components number is usually less by
one compared to the one of the analyzed, their
preparation would offer no difficulty, too.
These standards are close to the analyzed
specimen from physicochemical point of view
(lattice type and constant, orientation, density, etc.).
On the other hand, this closeness is the general
condition for the matrix effects decrease, which
increases the linearity of the analysis.
The IHM combines the taking into account of all
matrix effects (inherent of the method used а series
of compositions as standards) with applicability to
quaternary compounds.
The IHM procedure is easy and leads to
unambiguous result.
The work demonstrates that the Auger response
characteristics can be received not only experiment-
tally, but also by modelling. That’s why a partial
lack of experimental data is not an obstacle to the
method utilization.
CONCLUSION
The Isohypses method is concretized and tested
for AES quantification of a few ternary and
quaternary quasi-binary solid solutions. It proves to
be adaptable and accurate enough.
The Isohypses method’ advantage is the using of
less in number and simpler in composition
standards, close to the analyzed sample.
REFERENCES
1. V. A. Moshnikov, G. S. Spassov, 12th
Intern.
Congress X-Ray Optics & Microanal. (Ed. S.
Jasienska, L. J. Maksymowicz), Academy of Mining
& Metallurgy, Cracow, Vol. I, 308, 1989.
2. V. B. Nesterenko, X-ray Spectroscopic and Electron
Microscopic Methods for the Structure and the
Properties of Materials Examination, Science and
Technics, Minsk, 1980 (in Russian).
3. J. B. Malherbe, Crit. Rev. Sol. St. Mater. Sci., 19, 129
(1994).
4. M. P. Seah, W. A. Dench, Surf. Interface Anal., 1, 2
(1979).
5. C. M. Garner, Y. D. Shen, J. S. Kim, G. L. Pearson,
W. E. Spicer, J. Appl. Phys., 48, 3147 (1977).
6. W. D. Chen, H. Bender, A. Demesmaeker, H. E.
Maes, Surf. Interface Anal., 12, 156 (1988).
7. K. Kajiwara, H. Kawai, Surf. Interface Anal., 15, 433
(1990).
8. K. Satori, Y. Haga, R. Minatoya, M. Aoki, K.
Kajiwara, J. Vac. Sci. Technol., A 15, 478 (1997).
9. R. Ludeke, L. Esaki, L. L. Chang, Appl. Phys. Let.,
24, 417 (1974).
10. L. L. Chang, A. Koma, Appl. Phys. Let., 29, 138
(1976).
11. J. R. Arthur, J. J. LePore, J. Vac. Sci. Technol., 14,
979 (1977).
12. T. S. Stewart, S. I. Boldish, J. A. Osmer, N. Marquez,
D. G. Heflinger, G. A. Evans, J. B. Kirk, A. Mantie,
T. Stockton, Proc. SPIE, 323, 164 (1982).
13. S. L. Wright, R. F. Marks, R. J. Savoy, J. Vac. Sci.
Technol., B 6, 1105 (1988).

G. S. Spasov: Application of Isohypses method for AES quantification of semiconductor solid solutions
250
ПРИЛОЖЕНИЕ НА МЕТОДА НА ИЗОХИПСИТЕ ЗА ЕЛЕКТРОНЕН ОЖЕ
СПЕКТРОСКОПСКИ КОЛИЧЕСТВЕН АНАЛИЗ НА ПОЛУПРОВОДНИКОВИ ТВЪРДИ
РАЗТВОРИ
Г. С. Спасов
Институт по оптични материали и технологии, Българска Академия на Науките, ул. Акад. Г. Бончев, бл. 109,
1113 София, България
Постъпила на 17 април 2014 г.; Коригирана на 26 май 2014 г.
(Резюме)
Разисква се количествен Оже електронен спектроскопски анализ на тройни и четворни полупроводникови
квазибинарни твърди разтвори посредстом Метода на изохипсите, МИХ (вече използван в рьонгеновия
микроанализ). Методът е със стандарти, като броят на елементите, които те съдържат, е поне с единица по-
малък от този на анализирания състав – стандартите се явяват точки от периферията на концентрационния
триъгълник/квадрат. Оттук, по-малкият брой необходими стандарти – основно предимство на МИХ спрямо
метода на пълно привързване към стандарти. В основата на МИХ е приемането, че при смесване на бинарни
системи с равни сигнали от елемента А, сигналът не се променя. Процедурно методът се състои от: I.
Построяване на номограма по данните на стандартите; и II. Определяне чрез нея на състава на образеца по Оже
интензитетите му. В статията е представена същността на метода и спецификата, налагана за разглеждания клас
съединения. Разисквани са 4 приложения за AlxGa1-xAs, InxGa1-xAs и InxGa1-xPyAs1-y.

251
Bulgarian Chemical Communications, Volume 46, Special Issue A (pp. 251 – 255) 2014
Optical properties of silver-doped organic polymer films as solar control coating
materials for advanced architectural glazing application
R. Todorov1*
, Y. Ilieva2, V. Lozanova
1, A. Lalova
1
1Institute of Optical Materials and Technologies “Acad. J. Malinowski”, Bulgarian Academy of Sciences, Acad. G.
Bonchev str., bl. 109, 1113 Sofia, Bulgaria 2Faculty of Architecture, Higher School of Construction Engineering “L. Karavelov”, 175 Suhodolska str., 1373
Sofia, Bulgaria
Received May 01, 2014; Revised July 02, 2014
Dedicated to Acad. Dimiter Ivanov on the occasion of his 120th
birth anniversary
Metal-polymer nanocomposites possess a great potential for minimization of heat transfer losses and heat gains
through the building envelope, finding application in the field of solar control coating materials. In the present paper we
report the optical properties of a metal-polymer from Ag and polymethyl methacrylate (PMMA) nanocomposite
fabricated by layer-by layer deposition technique. The X-ray diffraction pattern confirms the presence of silver particles
in the thin films. The average size of silver particles was calculated by Debye-Scherrer formula. An absorbance band in
the spectral range 350-550 nm due to the surface plasmon resonance of the silver nanoparticles was observed in
transmittance spectra. The position of the absorbance band has been analyzed by the Bruggeman’s model for the
effective media. On the base of the obtained results the polymer-inorganic hybrid coatings were suggested for
application as sun protective coatings.
Key words: nanocomposite films, silver, polymethyl methacrylate, Bruggeman’s model
INTRODUCTION
Glazing elements are significant portion of the
building envelope, although traditionally more
attention is paid to the solid part of walls and roofs
and they are one of the weakest thermal control
points in building interiors. For example in a
standard family residence, 10-20 % of all heat loss
occurs through the windows [1]. Therefore in the
glazing design, it is necessary to consider perfor-
mance in terms of heat transfer, thermal comfort,
light transmission, and appearance. To achieve
good thermal insulation effect, the solar-protected
glasses must be manufactured with a special
coating that provides high transmittance of the
visible light and reflected the IR beams. All coating
must reflected the infrared beams in the spectral
range 5-12 μm. In this region of the electro-
magnetic spectra the electrical appliances, heaters
and the human body, i.e. internal heat sources for
the building emit their thermal energy. Window
glazing that reduces the entry of the infrared solar
radiation (spectral range 0.8-2 μm) is most effective
in summer and reduces the cooling demand. In
contrast, in winter, this type of glazing increases the
need for heating because it hinders the use of solar
energy for passive heating. The development of
glazing that reduces the quantity of solar radiation
should not affect the possibility of seeing through
windows, especially when a large amount of natural
light is required, such as in office buildings. A
reduction in natural daylight causes a corres-
ponding increase in artificial light. This signifies
higher energy costs as well as an increase in indoor
temperature.
In [2] it is shown that the coatings which consist
of alternating dielectric and metal (D/M/D) films on
glass exhibit great energy saving effects by
reflecting the IR radiation by the infrared reflective
metal film and transmitting visible and near IR
radiation. Film-plating glazing is treated with layers
of another material to improve its thermal perfor-
mance. The most common coatings are done with
metals (Cr, Ti, Ag and stainless steel), metal
nitrides (CrN, TiN, ZrN), or metal oxides (SnO2,
TiO2, ZnO). The coating layers can be low-
emissivity films, reflective films, tinted films or
spectrally selective coating [1]. Many different
polymers also can be incorporated in prototype
solar energy control devices, e.g. poly- and mono-
meric pyrrole,viologens,4,40-diaminodiphenyl sul-
fone, poly(3-me-tylthiophene) or diclofenac, poly-
aniline (PANI) and poly(3,4-ethylene-dioxy-thio-
phene) (PEDOT) [3]. According to [2], the ideal
© 2014 Bulgarian Academy of Sciences, Union of Chemists in Bulgaria
* To whom all correspondence should be sent:
E-mail: [email protected]

R. Todorov et al.: Optical properties of silver-doped organic polymer films as solar control coating materials for advanced …
252
film thickness is between 40 and 80 nm. Metal-
polymer nanocomposites have an advantage over
the oxide/noble metal multilayers in terms of ease
of synthesis. There have been several co-evapo-
ration and co-sputtering approaches to synthesize
the nanocomposite structure [4]. They possess good
adhesion to the organic polymer materials such as
urethane-acrylate and poly-carbonate (PC) which
are well known as a glazing material [2,5]. The
special advantage of PC panels is that they can
transmit to 90% from the visible light and they have
good resistance to external conditions.
When nanoparticles embedded in a dielectric
matrix are excited by light, the electric vector of the
electromagnetic wave induces a charge density
oscillation [6] corresponding to the plasmon fre-
quency (νp) of metal particles, resulting in strong
absorption of light at a particular wavelength (λp =
c/νp, where c is the velocity of light). Apart from
the optical, applications as bandpass filters [7],
there is a tremendous interest in achieving an
optical absorber extending from the visible to the
far-IR region [8] for a variety of applications. The
broad absorption band in visible spectral range and
increase of conductivity of metal-polymer films
make them potential materials for applications in
the field of solar absorbers.
In the present work, we report the synthesis and
optical properties of a metal–polymer (Ag-poly-
methyl methacrylate, hereafter referred to as Ag-
PMMA) nanocomposite by layer-by layer depo-
sition technique. The possibility of deposition of
coatings for control of the spectrum of the
transmitted true the window sunlight is discussed.
EXPERIMENTAL
The coatings were formed in one cycle of
thermal evaporation in high vacuum of 10-3
Pa from
two sources - of silver and PMMA, respectively.
The ratio between the evaporation rates of the two
substances was controlled during the process. The
films were deposited at 0.2 - 0.3 nm/s. To obtain
thin films uniform in composition, the substrates
were rotated continuously during the process of
thermal evaporation. The substrate holder is a
dome-shaped calotte that can be considered as a
segment of a sphere. The evaporation sources are
located approximately at the geometric centre of
this sphere. The coatings consist of 6 alternating
layers from silver and PMMA with three different
thickness’s ratio Ag/PMMM - 0.3, 0.13 and 0.25.
The thickness of the silver layers was kept a
constant ~ 5 nm. The phase structure of thin films
was probed by X - ray diffraction (XRD). The
substrate holder is a dome-shaped calotte that can
be considered as a segment of a sphere. The
evaporation sources are located approximately at
the geometric centre of this sphere. Optical trans-
mittance and reflectance measurements at normal
incidence of light beam were carried out in the
spectral range from 300 to 2000 nm using an UV–
VIS–NIR spectrophotometer (Cary 05E, Australia).
RESULTS AND DISCUSSION
The transmittance and reflectance spectra of Ag-
PMMA coatings in the spectral range 300-2000 nm
are shown in Fig. 1.
500 1000 1500 20000
20
40
60
80
100
a)
Tra
nsm
issio
n [
%]
Wavelength [nm]
Ag/PMMA ratio
0.3
0.25
0.15
(a)
500 1000 1500 20000
5
10
15
20
b)
Re
fle
cta
nce
[%
]
Wavelength [nm]
Ag/PMMA ratio
0.3
0.25
0.15
(b)
Fig. 1. Transmittance (a) and reflectance (b) spectra of
thin Ag-PMMA coatings with different Ag contain.
The transmittance spectra showed that the Ag-
PMMA coatings possess transmission higher than
80% in the infrared spectral range. All spectra
demonstrate an absorption band situated in the 400-
550 nm due to silver surface plasmon resonance.
The plasmon peak in the spectra of the thin films
indicates that the silver is included in the coatings
in the form of small particles. According to [9] the
increase of the particle’s size leads to shift of the

R. Todorov et al.: Optical properties of silver-doped organic polymer films as solar control coating materials for advanced …
253
absorption band due to plasmon excitation at longer
wavelengths and can explain the shift of the
absorption band at higher Ag/PMMA ratios. The
width and magnitude of the absorption band depend
on the metal fraction in the nanocomposite, and
therefore can be engineered. The spectra of the
composite coatings show that the color appearance
can be tailored, which presents a potential for
applications in architectural windows and auto-
motive glazing.
The X-ray diffraction pattern of the nano-
composite Ag-PMMA film at ratio 0.15 is shown in
Fig. 2. Peaks due to the diffraction from the
crystallographic planes (111) and (200) of silver are
seen in the pattern. Two diffraction peaks at 32.8°
and 35.6° indicate for the presence of Ag2O in Ag-
PMMA. The possible reason for the presence of
Ag2O in the thin films is the interaction of the silver
with the oxygen atoms in the monomer building the
polymer network of the PMMA.
30 35 40 450
200
400
600
800
1000
1200
Ag2O (200) Ag (200)
Ag (111)
Ag2O (111)
Inte
nsity [
arb
. u
nits]
2 [deg] Fig. 2. X-ray diffraction pattern of thin Ag-PMMA film.
The Debye-Scherrer formula was applied for
calculation of the average crystallite size:
(1)
where β is the peak width, λ is wavelength of the
X-rays (in the present study Cuα line was used and
λ = 1.54056Å). Applying equation (1) for the
diffraction peaks of the silver we found that the size
of the crystallites is 25.9 nm.
In the next step we calculated the optical
constants (refractive index, n and extinction co-
efficient, k) of the thin films. The calculation
procedure is described in our previous papers
[10,11]. It is seen that the refractive index of the
thin films in the infrared spectral range (800-2000
nm) is 1.45-1.35. Abnormal dispersion is observed
for wavelengths shorter than 550 nm.
400 600 800 1000 1200 1400 1600 1800 20001.3
1.4
1.5
1.6
1.7
1.8 a)
Re
fra
ctive
in
de
x
Wavelength [nm]
Ag/PMMA ratio
0.3
0.25
0.15
(a)
400 600 800 1000 1200 1400 1600 1800 20000.0
0.1
0.2
0.3
0.4
0.5
b)
Extin
ctio
n c
oe
ffic
ien
t
Wavelength [nm]
Ag/PMMA ratio
0.3
0.25
0.15
(b)
Fig. 3. Dispersion of the refractive indices (a) and
extinction coefficients (b) of Ag-PMMA films.
The real and imaginary parts of the complex
permittivity, = ’+i” can be calculated from the
refractive index and extinction coefficient by the
following equations:
’ = n2 – k
2 and ” = 2nk (2)
We applied the Burgemman effective media
theory to analyze the dispersion of the composite
coatings. According to [12] the effective complex
permittivity, is given by the equation 3, where εm
and εd are the complex permittivity of the metal and
dielectric material respectively, while f1 and f2 are
their fractions, which satisfy the following con-
dition - .
The relation between the fractions f1 and f2 of
the thin films in the multilayered coatings and their
thickness is given in [13]. The period of the
structure is a = d1 + d2, where d1 and d2 are the
thicknesses of the metal and polymer thin films,
respectively. The volume filling fractions f1 and f2
for the metal and polymer films are given by the
following equations: f1 = d1/a and f2 = d2/a.

R. Todorov et al.: Optical properties of silver-doped organic polymer films as solar control coating materials for advanced …
254
(3)
(4)
To describe the complex permittivity, (ω), of
the silver as a function of the angular frequency we
used the Drude-Sumerfield model, given by the
equation 4, where is the relative dielectric cons-
tant (for the silver [12]).
is the metal plasma frequency,
where ne is the number of free electrons, e and m
are the electron’s charge and mass, respectively. Γ
is a damping parameter and is related with the
electron mean free path, l = 4.37510-8
m-1
and the
Fermi velocity vF= 1.4106 m/s by:
(5)
For the description of the dispersion of the
PMMA we used the data for the Sellmeier’s
coefficients published in [14]. In Fig. 4 a com-
parison is given of the real and imaginary parts of
the complex permittivity calculated by Eqs. 2 and
simulated from Eq. 3. Good coincidence between
both is seen. Deviation close to the resonance
frequency suggests the use of the Drude-Sumerfield
model along with a critical point model [15].
It is well known that the pure PMMA films
transmits up to 92% of visible light and gives a
reflection of about 4% from each of its surfaces
[14]. It filters ultraviolet (UV) light at wavelengths
below about 300 nm (similar to ordinary window
glass). Some additives to PMMA can be used to
improve absorption in the 300-400 nm range. In
Fig. 5 the simulated transmittance and reflectance
are presented for a coating consisting of 10
alternate films from PMMA and Ag-PMMA. It is
seen that the transmission drops drastically in the
UV spectral range for wavelengths shorter than 400
nm and such coatings can be used for protection
from the UV beams in the spectral range 300-380
nm. The coating possesses good transmittance in
the visible spectral range. The value of T increase
from 25-70% in the spectral range 400-550 and the
coating possesses higher than 70 % transmittance
for the wavelengths longer than 550 nm. It is
known that the PMMA transmits infrared light up
to 2.8 μm and blocks longer wavelengths up to 25
μm [14] which would insure good heat-insulation
performance.
500 1000 1500 20000.0
0.5
1.0
1.5
2.0
2.5
3.0
3.5
' ,
"
Wavelength [nm]
'
''
Fig. 4. Calculated (symbols) and simulated (dash lines)
spectra of the complex permittivity, ε = ε’ + iε” for a
coating with Ag/PMMA ratio 0.15 (or f1 = 0.055).
500 1000 1500 2000
0.0
0.2
0.4
0.6
0.8
1.0
R
T
T,
R
Wavelength [nm]
T
R
Fig. 5. Simulated transmittance and reflectance spectra
of coating consisting from 10 alternated films from
PMMA and Ag-PMMA with ratio 0.15.
CONCLUSION
The present paper reports the optical properties
of nanocomposite materials from Ag and poly-

R. Todorov et al.: Optical properties of silver-doped organic polymer films as solar control coating materials for advanced …
255
methyl methacrylate (PMMA) deposited though
layer-by layer technique. The single Ag-PMMA
coating demonstrates an absorption band in 350-
550 nm range due to surface plasmon resonance in
silver nanoparticles. The complex permittivity, ε
was analyzed by the Bruggeman’s model for the
effective media. The optical properties of each
individual layer were studied in order to consider
the possibilities for optimization of the heat-
insulation performance and the visible-light trans-
mittance of the heat-insulating multilayers.
REFERENCES
1. R. Pacheco, J. Ordóñez, G. Martínez, Renewable
Sustainable Energy Rev., 16, 3559 (2012).
2. M. Kamalisarvestani, R. Saidur, S. Mekhilef, F. S.
Javadi, Renewable Sustainable Energy Rev., 26, 353
(2013).
3. R. Baetens, B. Petter Jelle, A. Gustavsen, Sol. Energ.
Mat. Sol. C., 94, 87 (2010).
4. D. K. Avasthi, Y. K. Mishra, D. Kabiraj, N. P. Lalla,
J. C. Pivin, Nanotechnology, 18, 125604 (2007).
5. Y-W. Chang, S. W. Kim, Surf. Coat. Tech., 232, 182,
(2013).
6. M. J. Bloemer, M. Scalora, Appl. Phys. Lett., 72,
1676 (1998).
7. A. Biswas, Z. Marton, J. Kanzow, J. Kurse, V.
Zaporojtchenko, T. Strunskus, F. Faupel, Nano Lett.,
3, 69 (2003).
8. H. Takele, H. Greve, C. Pochstein, V.
Zaporojtchenko, F. Faupel, Nanotechnology, 17,
3499 (2006).
9. C. A. Foss Jr., G. L. Hornyak, J. A. Stockert, C. R.
Martin, J. Phys. Chem., 98, 2963 (1994).
10. R. Todorov, A. Lalova, K. Petkov, J. Tasseva,
Semicond. Sci. Tech., 27, 115014 (2012).
11. V. Lozanova, J. Tasseva, R. Todorov, Bulg. Chem.
Commun., 45(B), 43 (2013).
12. W. Cai, V. Shalaev, Optical Metamaterials,
Fundamentals and Applications, Chapters 1 and 2,
Springer New York, Dordrecht Heidelberg, London,
2010, pp. 1-36.
13. M. Tschikin, S-A. Biehs, R. Messina, P. Ben-
Abdallah, J. Opt., 15, 105101 (2013).
14. I. D. Nikolov, C. D. Ivanov, Appl. Opt., 39, 2067
(2000).
15. A. Vial, T. Laroche, J. Phys. D: Appl. Phys., 40,
7152, (2007).
ОПТИЧНИ СВОЙСТВА НА СРЕБРО-ОРГАНИЧНИ ПОЛИМЕРНИ ТЪНКИ СЛОЕВЕ КАТО
СЛЪНЦЕЗАЩИТНИ ПОКРИТИЯ ЗА СЪВРЕМЕННИ ПРИЛОЖЕНИЯ В
АРХИТЕКТУРАТА
Р. Тодоров1*
, Ю. Илиева2, В. Лозанова
1, А. Лалова
1
1Институт по оптични материали и технологии "Акад. Й. Малиновски ", Българска Академия на Науките, ул.
Акад. Г. Бончев, бл. 109, 1113 София, България 2Архитектурен факултет, Висше Строително Училище “Л. Каравелов”, ул. Суходолска река 175, 1373 София,
България
Постъпила на 01 май 2014 г.; Коригирана на 02 юли 2014 г.
(Резюме)
В настоящата статия е представено изследване на оптичните свойства на нанокомпозит от слой от сребро и
полиметилметакрилат (PMMA) получен чрез техника на послойно отлагане. Чрез рентгенова дифракция е
потвърдено присъствието на сребърни частици в тънки слоеве. Средният размер на сребърни частици се
изчислява чрез формулата на Дебай-Шерер. Абсорбционната ивица в спектралния диапазон 350-550 nm в
спектрите на пропускане се дължи на повърхностен плазмонен резонанс на сребърни наночастици. Позицията
на ивицата е анализирана чрез прилагане на модела на Бругеман за ефективната среда. На основата на
получените резултати за оптичните свойства на полимерни-неорганични хибридни слоеве са направени изводи
за приложение, като слънцезащитни покрития.

256
Bulgarian Chemical Communications, Volume 46, Special Issue A (pp. 256 – 260) 2014
Holographic investigation of the corona discharge effect on the photo-doping of Ag,
Au and Cr into nano-sized As2S3 films
I. Bodurov1*, R. Todorov
2, T. Yovcheva
1, S. Sainov
3
1Plovdiv University “Paisii Hilendarski”, Department of Experimental Physics, 24 Tsar Asen str., 4000 Plovdiv,
Bulgaria 2Institute of Optical Materials and Technologies “Acad. Jordan Malinowski”, Bulgarian Academy of Sciences, Acad.
G. Bonchev str., bl. 109, 1113 Sofia, Bulgaria 3HOLOBUL Ltd, Acad. G. Bonchev str., bl. 109, 1113 Sofia, Bulgaria
Received June 30, 2014; Revised August 13, 2014
Dedicated to Acad. Dimiter Ivanov on the occasion of his 120th
birth anniversary
The paper presents the results of holographically investigated photo-diffusion of Ag, Au and Cr ions into nano-sized
As2S3 films. Evanescent wave’s holographic recordings with spatial resolution 2 500 mm-1
in chalcogenide/metal
sandwich like structures with 50 nm thick As2S3 layer, were performed. When the exposure was switched off at the
maximum point of the diffraction efficiency during the holographic recording, 5 kV corona discharge was applied.
During the holographic recording 5 kV corona discharge was applied. The maximum measured value of the diffraction
efficiency was greater than 8%. The metal ions (Ag, Au and Cr) mobility in thin chalcogenide films was investigated.
The mobility of the metal ions, μ, at temperature 17°C was calculated by the Nernst-Einstein equation. The diffusion
coefficient D is obtained using the method of holographic grating spectroscopy (Forced Rayleigh Scattering). The
values of the mobility and the diffusion coefficients for Ag, Au and Cr ions were discussed.
Key words: chalcogenide glasses, Forced Rayleigh Scattering, metal electromigration, diffusion coefficient, metal ions
mobility
INTRODUCTION
The diffusion of silver into thin semiconductor
layers is reported for the first time by Kostyshin
and co-authors [1] in 1966. In this study the
photographic properties of thin semiconductor
layers of lead (II) iodide and As2S3, deposited on
silver substrates were investigated. The authors
observed that the layers become photosensitive in
the red region of the visible light (the region that
usually the layers are non-sensitive) and the hidden
image turns visible without feature processing.
They assumed that this phenomenon is caused by
diffusion of the metal ions from substrate into
layers, thus causing a chemical reaction leading to
the occurrence of new chemical compounds.
Subsequent studies revealed that the same effect is
observed in different kind of photosensitive layers
deposited on substrates made from Cu, Zn, Pb, Cd,
Al, Fe, Ni and others.
Despite of the numerous models which have
been proposed, the mechanism of metal photo-
doping in chalcogenide glasses is still not clear. To
solve this problem it is necessary exact knowledge
of the diffusion coefficients of the metal atoms in
the glassy network. This is reason to apply different
methods for their determination. Investigations on a
diffusion of Au and Ag into As2S3 chalcogenide
glasses are carried out by Suptitz and Willert [2].
They use radioactive tracers Ag110
and Au198
to
make evaluation of the diffusion coefficient of
these metals into bulk As2S3 and its temperature
dependence.
In [3] for investigation of photo-induced
diffusion of Ag in As2S3 the method of direct
weighting is used. The authors have been using the
fact that the compounds which are a product of the
reaction of Ag with As2S3 are resistant to alkalis
and it can be dissolved only in HF at 180°C. They
have etched removed the non-reacted silver by
etching in acid (HCl) after illumination. By
measuring the mass of As2S3 layer and the mass of
silver layers before the illumination, the authors
determined the amount of silver that had penetrated
into the chalcogenide layer. They have found that
the amount of silver increases with exposure
increasing.
In [4,5] a technique for measuring the metal
diffusion kinetics in As2S3 by changes in the
electric conductivity of the layer is proposed. The
© 2014 Bulgarian Academy of Sciences, Union of Chemists in Bulgaria
* To whom all correspondence should be sent:
E-mail: [email protected]

I. Bodurov et al.: Holographic investigation of the corona discharge effect on the photo-doping of Ag, Au and Cr into nano-sized …
257
results show a connection between the exposition
energy, the wavelength used for illumination, the
thickness of metal layer, the thickness of chalco-
genide glass and the conductivity.
Terakado and Tanaka [6] demonstrated that the
photo-doping rate can be controlled by applying
bias voltage of ~0.1 V. This rate modulation can be
attributed to modulation of an effective internal
electric field in the photo-doped layer.
Despite of the studies made, there is not enough
systematic, reliable and modern data on these
photo-induced processes. This article is continua-
tion of our previous researches [7,8] related to the
diffusion of metal ions in the amorphous layers.
The aim of this paper is to investigate the electro-
stimulated diffusion of Ag, Au and Cr ions into
As2S3 films and to provide new exact data for
diffusion and mobility coefficients.
EXPERIMENTAL
Sample preparation
We performed holographic recording in an
As2S3/Metal/Cr multilayer system. Firstly, a thin
transparent chromium electrode with 10 nm
thickness was deposited on a glass substrate by
radio-frequency sputtering in argon plasma. A thin
metal layer (d ~ 20 nm) was sputtered over the
chromium film in the same vacuum cycle. Thin
As2S3 films with thicknesses 50 nm were deposited
on the metal coating by high vacuum thermal
evaporation in a Leybold Heraeus A 720 Q
deposition system. The chalcogenide films were
prepared in a vacuum of 10-3
Pa, at a deposition rate
of 0.1 nm/s. The constant thickness of the obtained
layers was guaranteed by the planetary rotation of
the substrate holders.
Optical arrangement
The general optical arrangement for holographic
recording is given in Fig. 1.
In the optical system a crown K-8 glass 45-90-
45 prism for the holographic recording is used. The
refractive index of the prism at wavelength λ = 442
nm was n = 1.526 and the calculated critical angle
was φcr = 40.9°. Therefore the incidence angle φ =
41.5° was selected for the experiments. The total
light intensity of the recording He-Cd laser was 10
μW/cm2. For real-time diffraction efficiency
monitoring a He-Ne laser with 23 μW/cm2 intensity
was used. The reconstructed red light beam was
measured with “ThorLabs” PM 130 powermeter.
Signal to noise ratio was higher than 100:1.
Microscope oil with refractive index 1.53 was used
as a matching liquid between the substrate and the
prism’s reflecting wall. When the exposure was
switched off at the maximum point of the
diffraction efficiency (DE), high voltage with
different polarity (±5 kV) was applied to the corona
electrode (needle), situated at a distance of 10 mm
from the As2S3 film. The Cr sub layer was used
with a spring contact as a second electrode and to
improve the adhesion of the other metals to the
glass substrate. The corona discharge occurred
between the needle and the grounded electrode (Cr
sub-layer).
Fig. 1. Optical set-up for evanescent-wave holographic recording.

I. Bodurov et al.: Holographic investigation of the corona discharge effect on the photo-doping of Ag, Au and Cr into nano-sized …
258
RESULTS AND DISCUSSION
The time dependences of the diffraction
efficiency during the holographic recording at the
presence of positive or negative corona discharge of
As2S3/Ag/Cr multilayer system are shown in Fig. 2.
Fig. 2. Normalized diffraction efficiency of holographic
recording in As2S3/Ag films the presence of a corona
discharge.
The experimental results show that the
diffraction efficiency time dependences are not
influenced by the corona polarity. That is why the
subsequent experiments are carried out with
applying only negative voltage to the corona
electrode. The time dependences of the diffraction
efficiency during the holographic recording at the
presence of negative corona discharge for
As2S3/Au/Cr and As2S3/Cr/Cr multilayer system are
shown in Fig. 3 and Fig. 4.
Fig. 3. Normalized diffraction efficiency of holographic
recording in As2S3/Au the presence of a negative corona
discharge.
The results observed show that the diffraction
efficiency changes more drastically in the first 30 s
of the holographic recording process. The time-
dependent decay of the diffraction efficiency is
proportional to the interference term and its time
constant τ can be obtained by fitting of the
experimental data with time dependent expression
described in [9].
Fig. 4. Normalized diffraction efficiency of holographic
recording in As2S3/Cr in the presence of a negative
corona discharge.
The diffusion coefficient D are calculated by the
method of the holographic grating relaxation
spectroscopy (Forced Rayleigh Scattering) [7] by
the following relation using already obtained values
of the time constant τ:
114.8410D
cm2/s, for 442 nm (1)
With the obtained values of the diffusion
coefficient, the mobility of metal ions are
calculated using the modified Nernst-Einstein
relation:
1q e
D DkT kT
(2)
where:
e is the elementary charge of the electron;
q is the metal ions charge;
k is the Boltzmann constant;
T is the absolute temperature;
∆ is the correlation coefficient [10] and in our
case it is defined as:

I. Bodurov et al.: Holographic investigation of the corona discharge effect on the photo-doping of Ag, Au and Cr into nano-sized …
259
0
0
1
2 2 1
(3)
For As2S3 the constant ε0 is 7.8 [11,12] and the
correction coefficient was calculated from eqn. (3)
to be Δ = 0.205. This result is in very good
agreement with the experimentally obtained value
of the silvers ion charge
1.2 0.2q e .
The results obtained by eqn. (1) and eqn. (2) are
presented in Table 1.
Table 1. Calculated values of the coefficients of
diffusion and mobility.
Metal Atomic
number Ion
charge D , ×10
-13
cm2/s
μ , ×10-11
cm2/V.s
Ag 47 +1 3.43 1.65
Au 79 +1 2.02 1.01 Cr 24 +2, +3 2.49 1.19
The results for the coefficients of diffusion and
mobility indicate that they decrease with increasing
of the atomic number as well as increase of the
charge of the ions. To explain this result, we
applied the Born-Mayer potential, which can be
written as follows:
expc aq q rU Z
r
(4)
where is the pseudo-Madelung constant, r is the
internuclear distance, Z is the coordination number
of metal cations in glassy network, ρ is the repul-
sion parameter and λ is the empirical parameter, qc
and qa are the charges of metals cations and anions
from the glassy network of the chalcogenide films,
respectively.
The second term in eqn. (4) takes into account
the bonding interactions as the electronic
delocalization of the metal atoms, overlap of the
valence electron and bond stretch. And it explains
the lower values of the diffusion coefficient of the
gold in comparison to that of the silver ions. The
ion charge of silver and gold is equal and does not
influence on the diffusion coefficient value. The
gold atomic number is 1.68 times bigger than the
silver atomic number which is in very good
agreement with the diffusion coefficient ration of
silver and gold that is 1.70.
This first term in the eqn. (4) describes the
electrostatic interactions between charged ions and
glassy network. It is seen that the increase of the
charge of the ions leads to increasing of the
electrostatic forces of interaction of ions with
anions from the chalcogenide network which the
ion’s jumps more difficult.
The ratio of the diffusion coefficients of
chromium and silver is 0.73 while the atomic
number of the silver is 1.96 times higher than the
chromium atomic number. The difference between
the diffusion coefficients cannot be explained only
with the radius of the atoms of both metals. In this
case the value of the diffusion coefficient for
chromium could be explained if we take into
account two terms of the eqn. (4). On the base of
the second term the silver atomic number is 1.96
times higher than the chromium atomic number
which is not is not in agreement with diffusion
coefficient ration of chromium and silver that is
0.73. On the base of the first term if we take into
account that the average chromium ion charge is
2.5 times higher than the silver ion charge and
multiplied by it the ratio 0.73 we get 1.83 that is
close to 1.96.
Analogically, we could compare the diffusion
coefficient of chromium and gold. The gold/
chromium atomic number ratio is 3.29 and the
chromium/gold diffusion coefficient ratio is 1.23. If
we multiply the second ratio by 2.5, we get 3.08
that is close to 3.29.
For more clear understanding and explanation of
this phenomenon the good knowledge of the
coordination numbers of silver, gold and chromium
is necessity.
CONCLUSION
The combination between the holographic
grating spectroscopy (Forced Rayleigh Scattering
and corona charging seems to be a useful
experimental method for electromigration study of
metal diffusion coefficient and ion mobility in
nanometer-thick amorphous chalcogenide layers.
Two coefficient values for three metal ions – silver,
gold and chromium were experimentally calculated
and analyzed by the Born-Mayer potential equation.
It was obtained that the diffusion coefficient and
the ion mobility of silver are the highest and of gold
are the lowest.
Acknowledgements: The financial support by the
EU projects BG161PO003-1.1.005-0085-C0001, is
gratefully acknowledged.
I. Bodurov et al.: Holographic investigation of the corona discharge effect on the photo-doping of Ag, Au and Cr into nano-sized …
260
REFERENCES
1. M. Kostyshin, E. Mikhaylovskaya, P. Romanenko,
Sov. Phys. Solid State, 8, 451 (1966).
2. P. Suptitz, J. Teltow, E. Lebedev, I. Willert, Phys.
Stat. Sol. A, 31, 31 (1975).
3. V. V. Petrov, A. A. Kryuchin, Proc. USSR Acad.
Sci., 230, 326 (1976)..
4. D. Goldschmidt, P. S. Rudman, J. Non-Cryst. Solids,
22, 229 (1976).
5. D. Goldschmidt, T. Bernstein, P. S. Rudman, Phys.
Stat. Sol. A, 41, 283 (1977).
6. N. Terakado, K. Tanaka, Thin Solid Films, 519, 3773
(2011).
7. S. Sainov, R. Todorov, I. Bodurov, T. Yovcheva, J.
Opt., 15, 105705 (2013).
8. I. Bodurov, R. Todorov, T. Yovcheva, G. Spassov, S.
Sainov, Bul. Chem. Commun., 45 B, 86 (2013).
9. S. Sainov, J. Chem. Phys., 104, 6901 (1996).
10. E. Katz, Phys. Rev., 99, 1334 (1955).
11. N. Goyal, A. Zolanvari, S. K. Tripathi, JOAM, 3, 741
(2001).
12. Z. Borisova, Semiconductrors, Plenum Press, New
York, 1981.
ХОЛОГРАФСКО ИЗСЛЕДВАНЕ НА ВЛИЯНИЕТО НА КОРОННИЯ РАЗРЯД ПРИ
ФОТОДОПИНГ НА СРЕБРО, ЗЛАТО И ХРОМ В НАНОРАЗМЕРНИ ФИЛМИ ОТ As2S3
И. Бодуров1*, Р. Тодоров
2, Т. Йовчева
1, С. Съйнов
3
1Пловдивски университет „Паисий Хилендарски“, Катедра Експериментална физика, ул. Цар Асен 24, 4000
Пловдив, България 2Институт по оптически материали и технологии „Акад. Йордан Малиновски“, Българска Академия на
Науките, ул. Акад. Г. Бончев, бл. 109, 1113 София, България 3“ХОЛОБУЛ“ ООД, ул. Акад. Г. Бончев, бл. 109, 1113 София, България
Постъпила на 30 юни 2014 г.; Коригирана на 13 август 2014 г.
(Резюме)
В настоящата работа са изследвани подвижността и фото-дифузията на йоните на Ag, Au и Cr в
наноразмерни слоеве от системата As2S3 при прилагане на коронен разряд. Холографските записи в структура
тип сандвич от слой As2S3 с дебелина 50 nm и метален слой са направени с помощта на нормално падаща и на
затихваща вълна, създадена при пълно вътрешно отражение при пространствена честота 2 500 мм-1
. При
достигане на максималната дифракционна ефективност, записващият лазерен лъч се изключва и се прилага
електричното поле на 5 kV коронен разряд. Измеренаат максимална дифракционна ефективност е по-голяма от
8%. Изследвана е подвижността на металните йони (Ag, Au and Cr) в тънки халкогенидни филми.
Подвижността на металните йони, при температура 17°C е изчислена с уравнението на Нернст-Айнщайн.
Коефициентът на дифузия D е получен по метода на холографската релаксационна спектроскопия (Форсирано
разсейване на Релей). Обсъдени са получените стойности за подвижността и коефициента на дифузия за йоните
на Ag, Au и Cr.

261
Bulgarian Chemical Communications, Volume 46, Special Issue A (pp. 261– 275) 2014
Inter- and intra-molecular interactions in anionic polymerization of polar vinyl
monomers
Ch. P. Novakov, Ch. B. Tsvetanov*
Institute of Polymers, Bulgarian Academy of Sciences, Acad. G. Bonchev str., bl. 103, 1113 Sofia, Bulgaria
Received July 19, 2014; Revised August 18, 2014
Dedicated to Acad. Dimiter Ivanov on the occasion of his 120th
birth anniversary
This review article presents the results on the nature of the active centers of propagation (AC) in anionic
polymerization of polar vinyl monomers such as acrylates, methacrylates, vinyl nitriles and vinyl ketones and especially
their interactions with donor-acceptor ligands, carried out in the Laboratory of Polymerization Processes of the Institute
of Polymers, Bulgarian Academy of Sciences. Particular attention to the interactions involving AC with lithium and
magnesium counter-ions was paid due to their strong tendency of interacting with a variety of ligands, as well as in
reactions of self-association resulting in numerous possibilities of controlling the structure of the polymers as well as
the composition of copolymers. The model compounds or “living”oligomers of polar vinyl monomers were studied
intensively by using IR spectroscopy and conductometry. Their physicochemical characteristics in solution, before and
after adding of ligands, were investigated. A typical feature is the use of lithium picrate as a model in studying the
interactions with monomers, compounds with polar groups, and most typical additives: alkoxide, LiCl,
tetraalkylammonium salts and trialkylaluminum compounds.
Key words: anionic polymerization, polar vinyl monomers, “living”oligomers, propagation active centers, polymer
tacticity, ambifunctional nucleophilic species, ligands
INTRODUCTION
The chemistry of carbanions is a traditional
subject for research in Bulgaria. The first studies in
the field of the chemistry of organometallic
compounds are placed by acad. D. Ivanov and his
world-known school. Carbanions are the centers for
the growth of the polymer chain in the anionic
polymerization. By means of anionic polymeriza-
tion can be obtained the so-called “living” polymers
in which the growing centers or propagation active
centers (AC) retain their reactivity after full
consumption of the monomer. Indeed, living
anionic polymerization is the first successful
method for the synthesis of polymers with very
narrow molecular weight distribution (MWD), for
the synthesis of macromers and active polyconden-
sation oligomers, as well as for the preparation of
well defined block copolymers. Until now “living”
polymerization is the best method for achieving
good control over the molecular weight and the
polymer tacticity. It is apparent that the anionic
polymerization is far more complex process as
compared to the radical polymerization. To study
the mechanism of anionic polymerization resear-
cher must be familiar with the chemistry of carb-
anions, all modern spectral methods, kinetic
methods for fast reactions in solution, non-aqueous
solutions electrochemistry, etc.
There are several reviews (cited below)
describing anionic polymerization of (meth)acryla-
tes: mainly kinetic results and MWD of the poly-
mers obtained. The present review article presents
the results on the nature of the active centers of pro-
pagation in anionic polymerization of polar vinyl
monomers (PVM) such as acrylates, methacrylates,
acrylonitriles, and vinyl ketones and especially their
interactions with donor-acceptor ligands, carried
out in the Laboratory of Polymerization Processes
of the Institute of Polymers, Bulgarian Academy of
Sciences. Mostly works of our own are presented,
since our approach is not so much popular as the
kinetic investigations.
Anionic polymerization of PVM is by far more
complex than that of styrene and dienes. In
contradiction with the simplicity of polymerization
of nonpolar monomers, the polymerization of PVM
is rather complicated due to the presence of polar
groups. Indeed, PVMs are bidentate species, and
each polar group competes with the double ›C=C‹
bond for the initiator or the propagating centers. A
problem arises from: a) the side reactions by
nucleophilic attack of the AC onto the monomer or
polymer unit due to the reactive side group (e.g.
© 2014 Bulgarian Academy of Sciences, Union of Chemists in Bulgaria
* To whom all correspondence should be sent:
E-mail: [email protected]

Ch. Novakov, Ch. Tsvetanov: Inter- and intra-molecular interactions in anionic polymerization of polar vinyl monomers
262
ester, nitrile, amide, or keto groups); b) different,
sometimes competitive, available forms of aggrega-
tion of AC, as in contrast to polystyrene active
chain, the AC aggregation in the case of PVM
occurs also in polar solvents like ethers; c)
ambident nature of the AC, which refers to active
species containing two centers susceptible to
monomer attack, in other words, two nucleophilic
sites. Table 1 represents the most important ambi-
dent nucleophilic species, typical for the anionic
polymerization of PVM.
Characteristic of our investigations is the wide
use of IR spectroscopy of carbanions having a
cyano- or a carbonyl group adjacent to the anion.
From the pioneering works of Juchnovski [7,8] on
nitriles and Lochmann on ester enolates [5,9], it is
well known that in such cases the IR C≡N and C=O
stretching frequencies decrease by 20 to 200 cm-1
.
On account that the AC of the anionic polymeri-
zation of PVMs are ambident nucleophiles, diffe-
rent forms of active species coexist such as free
ions, contact or solvent-separated ion-pairs, triple
ions, dimers, and higher associates (see Scheme 1)
depending on the solvent medium nature (polar or
non-polar), size of counter ion, concentration and
temperature. The above mentioned ionic forms are
in dynamic equilibrium and most of them are
capable of initiating the polymerization, but with
different rates and mode of addition.
Each active site for a certain time can exist in
any of the ionic forms shown in Scheme 1 involved
in the propagation reaction in a manner consistent
with the current state. A slow equilibrium between
ionic species results in broadening and even
multimodality of the MWD. Obviously, aggrega-
tion and ion dissociation of anionic AC direct the
course of the anionic polymerization. Hence, the
propagation rate, the MWD and the polymer
stereoregularity strongly depend on the reaction
conditions.
The mechanism of living anionic polymerization
is associated primarily with the nature of the active
centers of growth and donor-acceptor interactions
in which they participate.
In polar medium:
In nonpolar medium:
Scheme 1. Different forms of active species in anionic
polymerization of PVM.
There are five main interactions involving the
active site of growth:
1. AC – solvent molecules or other cation-binding
ligands (e.g. ethers, glymes, crown-ethers,
cryptands)
2. AC – polar groups from polar vinyl monomer or
monomer unit
AC – additives:
3. AC – μ-type ligands (e.g. LiCl, LiClO4, tert-
BuOLi)
4. AC – Lewis acid agents (e.g. AlR3, BR3, ZnR2)
5. AC – quaternary ammonium salts
Another characteristic feature of our research is
that for the purpose of estimating the interactions of
the AC with different ligands, the approach of
studying a reference system was adopted, i.e.
lithium picrate (LiPi) in dioxane (DO). We look
upon the picrate as a model of ambident organo-
lithium compound imitating the AC. The interact-
tion LiPi/ligands were studied in DO, a solvent of
comparatively low solvation capacity and low pola-
rity. This avoids the formation of solvent separated
ion pairs and free ions and, hence,
Table 1. Ambifunctional nucleophilic growing centers in anionic polymerization of PVM. No Nucleophilic site Anion structure υCN or υCO IR absorption (cm
-1) Polymer
1 Alkyl cyanide anions
2000 – 2050 alkali cations [1,2]
2050 – 2080 Mg+2
[3]
Polyacrylonitrile (R = H)
Polymethacrylonitrile (R =
CH3)
2 Ketoenolate anions
1560-1610 [4] Polyvinylketone
3 Esterenolate anions
1620 – 1680 [5,6] Polyacrylate
Polymethacrylate

Ch. Novakov, Ch. Tsvetanov: Inter- and intra-molecular interactions in anionic polymerization of polar vinyl monomers
263
reduces the number of possible structural types of
AC when small amounts of ligands are introduced.
The method was firstly applied to investigate weak
interactions of organic compounds with polar
groups and LiPi [10].
These AC/ligand interactions have a decisive
influence on the overall mechanism of the polymer-
rization process and the polymer properties. A
striking example of the importance of the additives
is the influence of LiCl on the MWD of tert- butyl
acrylate as shown in Fig. 1 [11].
Fig. 1. Influence of LiCl as additive in anionic
polymerization of tert-butyl acrylate: no salt (a);
LiCl/AC = 5 (b) [11].
Clarification of the nature of AC/polar group
and AC/additive interactions contributes to finding
the most suitable conditions under which polymeri-
zation process takes place with minimal involve-
ment of side reactions, preparation of polymer with
defined molecular mass and narrow MWD, as well
as stereocontrol of the propagation step. In this
review, we will pay particular attention to the
interactions involving AC with lithium or in some
cases magnesium counter-ions. As opposed to the
other alkali ions, they show strong tendency of
interacting with a variety of ligands, as well as in
reactions of self-association. This results in nume-
rous possibilities of controlling the structure of the
polymers as well as the composition of copolymers.
TYPES OF INTERACTIONS INVOLVING
AC OF ANIONIC POLYMERIZATION OF
VINYL NITRILES
The AC in the anionic polymerization of AN or
MAN are ambident anions. Therefore, the negate-
ve charge is distributed on the group
,
the nitrogen atom being partially charged. This
might result in increased electrostatic interaction
between the counterions, which hampers the
formation of loose or solvent separated ion-pairs. In
order for a clearer distinction of the interactions,
typical for the closest to the AC cyano-groups, the
following model compounds were used: α-lithiated
isobutyronitrile (P1(CN)Li) and 1,3,3-trimethylgluta-
ronitrile (P2(CN)Li). The quantum-chemical calcula-
tions indicate the existence of different conformers
of P2(CN)Li in non-polar media [12]. The distance
between Li+ and the penultimate CN group is 2.2 to
4.4 Å (see Scheme 2). Obviously, the structure in
which the distance is smallest, i.e. 2.2 Å, is
characterized by the strongest interaction between
Li+ and the penultimate CN group in P2(CN)Li:
N
C Li
C N
2,2 Å
NC
C
LiN
4 4 Å,
Scheme 2. Conformers of P2(CN)Li, according to [12].
The results on measurements of the dissociation
constant in THF are consistent with the calcula-
tions: they show very low values for KD of order 10-
11M and close to the theoretical values of
counterion distance [13] (see Table 2).
Table 2. Dissociation constants of ion pairs (KD) and ion
triples (kT) of lithium salts of ambident anions (Pn(X)Li)
as model living oligomers of PVM in THF at -30°C
[13,14]. “Living”
oligomer KD x 1012 M kT x 104 M [ABA]-/[A]-
P1(X)Li
P1(CN)Li 69 7.0 7
P1(COC(CH3)3)Li 75 6.5 8
P1(COOR)Li 0.4 0.2 250
P2(X)Li
P2(CN)Li 6.0 1.0 50
P2(COOR)Li 1.5 3.0 16
It should be noted that the calculations of the
dissociation constants were made by using
Woosters equation [15]. The anion triple A-,Li
+,A
-
is energetically more stable than the triple Li+,A
-
,Li+ [16], so we suppose the existence mainly of
negative ion triple. The ionic equilibrium can be
described by the following equations:

Ch. Novakov, Ch. Tsvetanov: Inter- and intra-molecular interactions in anionic polymerization of polar vinyl monomers
264
KD values are in agreement with data for the
dissociation constants of other anions, containing a
heteroatom, e.g. 2-ethylpyridine salts [17], and
“living”MMA oligomers [14]. Mainly tight ion
pairs are formed with the interionic distance of
about 2.5 Å. Importantly, the dissociation constants
of the studied salts are smaller than these of
polybutadienyl lithium and polyisoprenyl lithium
[18], and diminish in the following order:
KD > KD ~ KD > KD (“living” poly
butadienyl
lithium)
(-lithiated
ketone)
(-lithiated
nitrile)
(-lithiated
ester)
In the case of lithium derivatives of nitriles, the
dissociation constant of the dimer P2(CN)Li is one
order of magnitude less than that of P1(CN)Li, which
is indicative of chelate complex formation [19].
Both P1(CN)Li and P2(CN)Li tend to form ion triples,
the concentration of ion triples in P2(CN)Li solutions
being much higher than in solutions of P1(CN)Li.
We consider the most probable structure of the ion
triple to be as shown:
NC
NC
Li+
CN
CN(-)
(-)
Obviously, the –CN group competes with THF
molecules for the lithium coordinating sites. The
formation of ion triple is consistent with the results
on measurements of binding constants (KL)
between lithium picrate, used as model of ambident
AC, and some nitriles and THF as presented in
Table 3 [20,21]. It is widely assumed that interact-
tions of alkali metal cations with oxygen donor
atoms are stronger than with the softer nitrogen
atoms, contrary to the data for aliphatic nitriles
shown in Table 3. In our opinion, the rod-like
structure of the most nitriles suggests that in
complex formation with LiPi steric hindrance is
less important than for the cyclic ethers. This could
be the reason why KL (THF) ‹ KL (CH3CN) in spite
of the higher DN for THF. In addition to a
favorable steric factor, interaction of Li+ with the π
system of the nitrile group may contribute to the
binding energy.
IR spectroscopy is especially convenient for
studying the character and changes of the AC
during the polymerization process. It should be
noted that the study of mechanism of chain propa-
gation of AN/MAN polymerization by IR assisted
measurements is complicated because of insolubi-
lity of the polymers. In order to prepare soluble
species, polybutadiene and polystyrene “living”
chains were used as initiators. Thus, a technique of
“capped” polymers was successfully used by
addition of small number (n = 1-6) of AN/MAN
monomer units to the quite soluble polybutadiene
or polystyrene active ends [22,1]. Thus, polymeri-
zation does not lead to precipitation and made it
possible to study the solution properties of AC in
the anionic propagation of AN/MAN directly in the
range of AC concentrations 1.10-1
– 1.10-3
M.
Table 3. Complex formation constants KL of lithium
picrate with THF and some nitriles, ketones and esters in
dioxane at 25°C [20,21]. Ligand KL, M
-1 DN ε THF 0.95 20 7.6
Acetonitrile 1.22 14.0 36.2
Acetone 1.16 17.0 20.7
Ethylacetate 0.75 17.1 6.0
iso-Butyronitrile 1.80 15.4 20.8
Propionitrile 2.80 16.1 27.7
Methacrylonitrile 0.55
Acrylonitrile 0.46 38
Methylmethacrylate 0.16
The carbanion next to the cyano group reduces
the absorption frequency of the latter by 20 - 200
cm-1
[23]. It should be noted that the wave length of
the nitrile absorption bands at the AC are strongly
dependent on the nature of the counterion and
solvent as well on the presence of donor or acceptor
additives, but remain unchanged within the whole
temperature range between 20°C and -60°C in THF
[24,2].
Fig. 2. IR spectra of P1(CN)Li (a) and P2(CN)Li (b) in THF
[25].
P2(CN)Li resembles to a greater extent the real
AC in comparison to P1(CN)Li, because it possesses
one more monomer unit. As in the case of conduc-
tivity measurements, the characteristics of IR band

Ch. Novakov, Ch. Tsvetanov: Inter- and intra-molecular interactions in anionic polymerization of polar vinyl monomers
265
have to be greatly influenced by the second nitrile
group being in interaction with lithium counterion.
Indeed, as seen from Fig. 2, the νCN band of the
active site for P2(CN)Li is significantly wider and
shifted to higher wave numbers (2037 cm-1
→ 2042
cm-1
).
The result is in full agreement with the data
obtained in the synthesis of "living" oligomers of
MAN at different initial ratio M/In [1] as shown in
Fig.3.
Fig. 3. IR spectra of MAN active species in the reaction
of oligostyryllithium with different M/In ratio:
MAN/In=1 (a); MAN/In=2.2 (b); MAN/In=3.6 (c);
MAN/In = 5.5 (d); THF, ambient temperature [2]
The shift of the band at 2020-2060 cm-1
towards
higher frequencies, as the number of adjacent
monomer units is increased (Fig. 3) is explained by
interaction of the AC with the nitrile groups of the
polymer chain next to the growing end. The
dependence of the shift of the maxima in the IR
spectra on the number of the groups attached is
shown in Fig. 4.
Fig. 4. Dependence of the band (νCN) shift of MAN AC
on the number of MAN units attached to the polymer
chain [2].
The addition of about 3-4 monomer units
changes the position of the IR spectral bands. At
higher ratios νCN levels off. The results are direct
evidence of the intramolecular interaction of active
centers with neighboring monomer units (penulti-
mate effect), which was hinted at in conductivity
studies.
With the aid of IR spectroscopy it is possible to
follow the interaction of AC’s with the cyano group
of the monomer. The intermolecular interaction
Li+…CN characterized by the appearance of a band
at 2255-2285 cm-1
is of special importance and it is
quite similar to that between LiI and a nitrile
[26,27]. Indeed, in non-polar solvents the AC’s of
oligomethacrylonitrile with lithium and magnesium
counterions form complexes with nitriles having
characteristic bands in the range 2250-2280 cm-1
[2,3]. In case of organomagnesium compounds,
used as initiators, the AC or the initiator itself form
complexes even with the monomer without addition
reaction. This observation is especially worth no-
ting, since it permits a more detailed investigation
of the initial act of complex formation between the
initiator and the monomer or between the AC and
the monomer before the propagating step:
The organomagnesium compounds are very
suitable for such studies because of their lower
reactivity: thus in hydrocarbon media, they do not
initiate AN, or MAN polymerization at temperatu-
res below -60°C. No polymer formation takes place
on mixing the ether-free organomagnesium halide
[(C12H35)3Mg2Br]n in toluene with MAN [25]. The
IR spectrum of the mixture at room temperature
exhibits an absorption band at 2225 cm-1
(free
monomer), and at 2263 cm-1
(initiator/monomer
complex) as shown in Fig. 5.
Fig. 5. IR spectra of the reaction mixture MAN/
[R3Mg2Br]n in toluene (a); after adding THF (b); after
adding hexamethylphosphortriamide (HMPT) (c) [3]
Addition of equivalent amount of THF, causes
increasing of intensity of the band for free
monomer and disappearance of band at 2263 cm-1
.
This is due to the greater binding constant of THF
as compared to that of MAN (Table 3). When the
additive is HMPT, the new band for AC appears.

Ch. Novakov, Ch. Tsvetanov: Inter- and intra-molecular interactions in anionic polymerization of polar vinyl monomers
266
The observed interactions can be represented
schematically (Scheme 3) thus:
R R X XR
+THFR R X RR MAN
Mg Mg Mg MgMg+MAN
+HMPT
2020 cm -1 RMgX.THF + MAN
MAN
2225 cm-1
complex
CN2263
-C(CH )CH.MgX3
(-) (+)
Scheme 3. Complex formation between MAN and
[R3Mg2Br]n in toluene [3].
Dielectric susceptibility and electric conduc-
tivity measurements carried out on the [R3Mg2Br]n
solution during “titration” with MAN reveal that
the MAN/Mg complex is 2:1.
The investigations have shown also that two
types of AC (AC I and AC II) are formed during
polymerization of MAN initiated by organo-magne-
sium compounds. Growth of the polymer chain in
ether solvents proceeds through AC I. AC II are
found by polymerization in toluene, initiated with
R2Mg. This is in agreement with studies of Joch et
al. [28], who suggested, on the basis of MWD, the
existence of two types of AC in the polymerization
of MAN in toluene initiated with diethylmagne-
sium:
Li+…RCN complex was formed also when
trimethylacetonitrile (TMAN) is added to the
benzene solution of “living” MAN oligomers [2].
The complex formation is characterized by a new
IR band at 2260 cm-1
. As in the case of [R3Mg2Br]n
and MAN, the complex is in equilibrium with the
free nitrile and AC:
Scheme 4. Equilibrium between AC and complex of AC
with TMAN in benzene. Equilibrium constant at 20°C, K
= 0.25 ± 0.05 M [2].
The result reveals the possibility for inter-
molecular interaction with the participation of –CN
groups attached to the monomer units. This is
clearly shown in the case of P2(CN)Li. In the IR
spectrum of a mixture of P2(CN)Li and non-metalated
dimer P2(CN)H in benzene along with the band of the
unperturbed CN-group a band at 2265 cm-1
is again
observed (Fig. 6).
Fig. 6. IR spectra of a mixture of lithiated and non-
metallated dimer in benzene, P2(CN)H/P2(CN)Li=50.
[P2(CN)Li]=0.071 M (a); [P2(CN)Li]=0.06 M (b); [P2(CN)Li]
= 0.33 M [25]
Evidences for the interaction of AC with tert-BuOLi
The serious drawback of the anionic polymeri-
zation of AN and MAN is that it is accompanied by
several side reactions. The reason for the formation
of these byproducts is the high capacity of the
nitrile group to react with strong bases, as well as to
take part in donor-acceptor interactions. It is well
known that t-BuOLi is able to interact with the AC
of acrylates and methacrylates [29,30] and is suc-
cessfully used to improve the mode of poly-
merization. Therefore, it is of great interest to study
the interactions of polyAN and polyMAN AC with
lithium alkoxide in order to use it as additive in
more efficient polymerization process.
The interaction between Pn(CN)Li and t-BuOLi is
very different from PnLi…NC- complex formation.
t-BuOLi affects the association equilibria of the AC
of PVM transforming them into mixed associates
and on these ground this kind of interaction can be
formulated as associative.
The interaction of AC and t-BuOLi causes a
shift of the band of the νCCN- toward higher wave
numbers. The IR spectrum of the system P1(CN)Li/t-
BuOLi shows changes that indicate a specific
interaction between AC and t-BuOLi (Fig. 7) [25].
The intensity of the absorption of the group
decreases in the presence of additive depending on
the mole ratio of the two compounds. At the same
time, there is an increase in intensity of a new band
at 2047 cm-1
. The assumption for complex
formation is confirmed by the conductometric
measurements of P1(CN)Li solutions with different
[t-BuOLi]/P1(CN)Li ratios, which indicates the
existence of adduct with 1:1 stoichiometry. It
should be noted, that both P1(cN)Li and t-BuOLi and

Ch. Novakov, Ch. Tsvetanov: Inter- and intra-molecular interactions in anionic polymerization of polar vinyl monomers
267
their adducts are aggregates in THF, which
hampers more detailed study.
Fig. 7. IR spectra of P1(CN)Li without and in the presence
of t-BuOLi in THF: [P1(CN)Li]=0.06 M (a); [t-
BuOLi]/[P1(CN)Li]=3 (b); t-BuOLi]/[P1(CN)Li] = 1 (c) [25]
The interaction of P2(CN)Li and t-BuOLi has a
more complicated character. At the ratio [t-
BuOLi]/P2(CN)Li] = 2, however, unlike P1(CN)Li, the
larger part still exists in a form of free AC. Most
probably, the explanation is in the possibility t-
BuOLi to interact both with AC and the second
nitrile group of P2(CN)Li.
INTERACTIONS INVOLVING AC OF ANIONIC
POLYMERIZATION OF VINYL KETONE
The ACs of vinyl ketones resemble enolates, the
most characteristic representatives of ambient
anions. The negative charge in an enolate is
delocalized between a carbon atom and an oxygen
atom, and their site may act as a nucleophile
depending on the reaction conditions. Thus, enolate
are capable of forming covalent bonds with both
carbon and oxygen atoms, when interacting with
electrophilic compounds [31,32]. The effects of
solvent, counterion, and temperature as well as the
structure of the nucleophile and the electrophile on
this C/O competition, have been studied extensive-
ly. It should be noted that the data of dissociation
constants KD and kT of α-lithiated ketones and
nitriles are very close (see Table 2).
As it is the case in the anionic polymerization of
vinyl nitriles, the AC of vinyl ketones are able to
interact with the adjacent monomeric units, thus
forming intramolecular complexes. The keto groups
of the last one unit and the next to it are situated
near the cation as shown (Scheme 5) for the trimer
conformations.
The intramolecular interactions, shown in Sche-
me 5 are in agreement with the results of Lyons and
Catterall [33] who proposed the formation of cyclic
products with the growing AC as a result of
interaction between the Li+ counterion and the car-
bonyl group of the next to the last but one mono-
meric unit. Indeed, for some conformers, shown in
Scheme 5, the distance between the lithium and the
carbonyl group does not exceed 3.5 Å, which
proves the formation of coordinative bonds.
The negative charge distributed on 3 atoms
causes decreased adsorption of the carbonyl
group, characterized by a band at 1560-1610
cm-1
, attributed to the stretching vibrations of
the delocalized group
[4].
Alkali derivatives of acetone (ADA) are simplest
model compounds of AC. In contrast to nitriles, the
position of the
band strongly depends on the counterion
dimensions (Fig. 8).
The most probable explanation for this
dependence is the decreased electrostatic interact-
tion between the counterions from Li+ to Cs
+, due
to the increased average contact ion pair interionic
distance. The band at 1688 cm-1
in the spectrum of
acetone-lithium can be observed only in the
presence of unreacted acetone in solution. If
acetone is fully metalated only one band at 1602
im-1
is observed. The addition of acetone results in
the appearance of maxima at 1688 and 1712 cm-1
(free acetone) as well as decrease of the band
intensity at 1602 cm-1
(Fig. 9).
O
O
O
Li
O
Li
OO
Li
O
OO
O
LiOO
Scheme 5. Different conformations of P3(COCH3)Li.

Ch. Novakov, Ch. Tsvetanov: Inter- and intra-molecular interactions in anionic polymerization of polar vinyl monomers
268
Fig. 8. IR spectra of ADA in THF with different
counterions at 25°C, Li+ (a); Na
+ (b); K
+ (c); Cs
+ (d) [4].
Fig. 9. IR spectra of ADA (Li
+) in THF at different
[acetone]/[ADA] ratios: r = 13.3 (a); r = 3.8 (b); r = 1.2
(c); r = 0.27 (d) [4]
Temperature dependence between these three
bands was established as well. At low temperature
the peak at 1688 cm-1
increases in intensity, thus
compensating the maxima at 1602 and 1712 cm-1
.
Obviously, this is due to the formation of 1:1
complex, proved also by electroconductivity
measurements:
The coordination of AC with the next carbonyl
group (self-association) resembles the interaction
between ADA and acetone. The IR spectra of solu-
tions of “living” oligoisopropenylmethyl ketone
exhibit nearly the same bands. They easily form
intramolecular complex characterized by bands at
1685-1700 cm-1
. The equilibrium process in
“living”oligomers is rather complicated since the
AC of the trimer can form complexes with different
monomeric units, each of them being characterized
by a definite equilibrium constant. The strength of
interaction decreases in the order Li+ › Na
+› K
+ ›
Cs+. It is established that the MWD of the polymer
narrows by diminishing the intramolecular
Mt+…C=O interaction: e.g. by using Cs counterion
the most narrow MWD is obtained (Fig. 10) [34].
Fig. 10. GPC curves for poly(isopropenyl methyl)
ketone by polymerization in THF at -70°C with
counterions: Cs+(a); Li+(b); K+(c) [34]
It should be noted that the intramolecular
interaction Li… C=O is much stronger that the
interaction Li…CN: IR spectra of α-lithiated
oligomers of methyl isopropenyl ketone give
evidence for intramolecular complex formation
between the lithium counterion and the carbonyl
groups of the neighboring monomer units even in
THF at temperature as high as 20°C [4], whereas
the IR spectra of the α-lithiated dimer of MAN
indicates strong chelate formation only in benzene
and toluene [2].
STRUCTURE OF LITHIUM ESTER ENOLATES
IN THF
The dissociation constants of α-lithiated esters
are smaller by about two orders of magnitude in
comparison with lithium derivatives of nitriles and
ketones (Table 2). This can be explained by the
possibility for existence of mesomeric structures of
ester anion:
The partial charge distribution on –OR group
leads to lower electron density of the ester enolate
group in contrast to the same group in lithium keto-
enolates, which may be judged by the different
shifts of ν›CCO bands in the IR spectra of α-lithiated
esters [5] and lithium keto-enolates [4] (Table 1).
The resonance structure is supported also by 13
C-
NMR measurements of Vancea and Bywater [35],
who reported reduced freedom of motion of the
alkoxy groups in THF solutions of α-lithiated
methylisobutyrate at low temperatures.

Ch. Novakov, Ch. Tsvetanov: Inter- and intra-molecular interactions in anionic polymerization of polar vinyl monomers
269
In contrast to lithium derivatives of nitriles, the
difference between the dissociation constants of
P1(COOR) Li and P2(COOR) Li is insignificant, the cons-
tants of the dimer being slightly higher (see Table
2). The values of KD are of the order 10-12
M. It can
be assumed that the AC of MMA exists in THF
mainly as the nonchelated E form contact ion-pair:
13C-NMR spectra of the lithiated dimer in THF
are also not in accordance with the formation of
chelate Z structures [36], neither are the IR spectra
of the same model at different concentrations
indicative for intramolecular complexation.
The strong –O-Li bond in ester enolates tends to
form aggregated species. The tendency of lithium
ester enolates (P1COORLi and P2COORLi) to aggregate
in THF was observed for the first time by Halaska
and Lochmann [37] by using vapor pressure
osmometry as presented in Table 4.
In contrast to the cyano derivatives, the
concentration of ion triples in solution of P1(COOR)Li
is several times higher than that of P2(COOR)Li
solutions, which is in agreement with decreased
aggregation tendency for P2(COOR)Li shown in Table
2. In case the lithium cation lays over the plane of a
nearly planar CCOOR group as postulated by
Eizner et al. [38], the ion triples (ABA)- should
possess a sandwich structure which is energetically
more favorable for P1(COOR)Li than for P2(COOR)Li:
Obviously, the principal difference in the
structure of ion triples of lithiated dimers of MMA
and MAN consists in the assumption that the cyano
group of the second monomer unit in the lithiated
dimer of MAN has a share in the ion triple
construction by formation of a coordinate bond,
whereas complexation of counterion with the
second ester group is not likely in the case of the α-
lithiated dimer of MMA. This assumption is in
agreement with the complexation order of nitriles
and esters towards lithium picrate in dioxane: nitrile
› esters [20] (Table 3). It should be mentioned,
however, that lithium counterion in P3(COOR)Li is
able to coordinate intramolecular with the carbonyl
group of the third monomer unit (γ-carbonyl) [39].
Ligated growing centers
In the last 20 years of 20th century efficient
ligands have been discovered able to control the
livingness and stereospecificity of anionic
polymerization of (meth)acrylic ester monomers.
The most important function of ligand additives is
steric hindrance (steric shielding or electronic
protecting of the functional groups of the polar
vinyl monomers) providing space area around the
AC contact ion pair. It appears to be determining
factor for the controlled living polymerization. At
least, steric hindrance leads to stabilization of the
linear P3COORLi as rotational isomerization of
P3COORLi is found to be the bottleneck in the
intramolecular cyclization reaction. The efficient
ligands, discovered to date are classified into the
following main groups:
- Lithium alkoxides [40] and enolates [21].
- - Inorganic salts:
- Lithium and magnesium halide i.e. LiCl, and
MgBr2 [41,42].
- Salts with bulky groups i.e. LiClO4 or R4NX
[43,44].
- Aluminium and boron alkyls [45- 47].
Lithium alkoxide and enolate as additives
The role of lithium alkoxides as additives, studi-
ed in considerable detail by Trekoval, Lochmann,
and Müller, turned out to be significant in both
reaction kinetics and tacticity of the resulting poly-
mers [29,48]. Cross-associates such as AC/t-BuOLi
are acting as propagating centers. The AC’s are
“enveloped” by alkoxide molecules and the inner
voids of the contact ion pair loses most of the
solvent molecules. This makes the access to the AC
more difficult. As a result, the polymerization pro-
cess is practically insensitive to the solvent nature
because of the strong shielding effect of t-BuOLi.
Obviously, the mixed associate P1(COOR)Li/t-BuOLi
Table 4. Average degree of aggregation for model ester enolates in THF [37]. Ester enolate Degree of aggregation
(CH3)2CLi COOCH3 3.5
(CH3)2CHCO2C(CH3)2CH2C(CH3)LiCO2C(CH3)3 1.7

Ch. Novakov, Ch. Tsvetanov: Inter- and intra-molecular interactions in anionic polymerization of polar vinyl monomers
270
is strong enough to withstand competitive solvation
by solvent or monomer molecules, thus, preventing
the influence of σ-ligands such as glymes or crown
ethers on the mode of polymerization process.
P1(COOR)Li/t-BuOLi lowers the basicity of the AC
but for steric reasons considerably restricts side
reactions like intramolecular cyclization.
In P1(COOR)Li and P2(COOR)Li the cation is close to
the O atom of the ester enolate group resembling
the lithium alkoxide structure. Indeed, alkoxide,
keto-enolates and ester enolates tend to form
aggregates such as dimers, trimers or tetramers with
a slow exchange rate [49]. Because, in the most
cases, the initiator is not fully consumed during the
polymerization process, the unreacted P1(COOR)Li
plays the role of additive in the same manner as the
ligation by t-BuOLi. This means that additive like t-
BuOLi should compete with the unreacted lithium
enolate in case of low initiator efficiency. This
raises the question, which of both compounds has a
higher binding capacity.
Table 5. Association constants, Kass of LiPi complexes
with different μ-ligands and AlEt3 in dioxane [21]. Additive Kass, M
-1 λmax, nm LiCl 75 337
t-BuOLi 120 400
Pin-Li 150 390
P1(COOR)Li 600 404
AlEt3 350 325 Pin-Li = α-Lithiopinacolone
The problem was solved with the aid of LiPi,
which services as a model compound for AC.
According to measurements of the interaction LiPi-
additive, shown in Table 5 the association ability of
Li-alkoxide and Li-enolate ranges as follows:
Kass Li-esterenolate › Kass Li-ketoenolate › Kass Li-
alkoxide
The data, presented in the Table 5, indicate that
the t-BuOLi associates several times less than
lithium ester enolate. It is evident that in order to
have an effect as an additive on the polymerization
kinetics as well as on the stereochemistry on the
polyaddition reaction, the ratio alkoxide/initiator
should be much greater than the equimolar ratio.
Indeed, Lochman and Müller [30] found that in
order to decrease the propagation rate constant by
one order of magnitude, addition of t-BuOLi at
alkoxide/enolate ratio of 3/1 is needed. Wang et al.
[50] also studied the effects of t-BuOLi on the
stereochemistry of methyl methacrylate anionic
polymerization upon addition of 10 equiv. t-BuOLi.
Lithium chloride as additive
It has been shown by the Teyssie group that
LiCl-modified organolithium compounds initiate
living anionic polymerization of methyl metha-
crylate, t-butyl methacrylate and t-butyl acrylate at
low temperatures in THF [41]. This enables
synthesis of (meth)acrylate based block copolymers
with high efficiency and low polydispersity [51].
The explanation of the complexation behavior of
LiCl with the lithium oligomers of t-BuMA was
presented in [52]. The interaction between lithium
ester enolate and LiCl is regarded as strong
electrostatic interaction. The most pronounced
effect of LiCl as an additive is the lowering of poly-
dsipersity index of PMMA and PBuA. Addition of
LiCl leads to only one type of complex growing
center species with equimolar ratio. Our studies on
the interaction between LiCl and lithium picrate in
dioxane as reference system is in agreement with
the equimolar complex ratio. The association cons-
tant Kass 75 M-1
(Table 5) is several times less than
Kass for alkoxide and enolate derivatives. This gives
us grounds to believe that by simultaneous presence
of lithium alkoxide/lithium enolate and LiCl, the R-
OLi additive will be favored by the interactions
with ACs.
Organometallic Lewis acids as additives
Tsvetanov et al. [45] first employed AlEt3, Al(i-
Bu)3, Al(n-Bu)3 , BEt3 , and ZnEt2 as additives and
s-BuLi as initiator in the polymerization of MMA
in THF and toluene at -70°C. The AC of oligo-
MMA form 1:1 complexes with trialkylaluminum
and triethylboron. Addition of acceptors leads to
decrease in the rate of MMA polymerization. The
presence of such kind of additives increases sub-
stantially the syndiotactic sequences. Later on,
Hatada et al., studied anionic polymerization of
MMA in toluene at -78°C by using t-BuLi as
initiator and aluminum alkyls as additives [42,53].
Syndiotactic polymers with controlled molecular
weight and narrow MWD were obtained. The steric
hindrance due to the bulkiness of the aluminum
alkyls plays important role. Ballard et al. [47] were
able to polymerize alkyl methacrylates at elevated
temperatures (0 – 40°C) in toluene by using bulky
diaryloxyalkyl-aluminum as additives. The AC in
the form of “ate” complexes is very stable.
Another improvement was the use of tetraalkyl-
ammonium halides as co-additives forming a comp-
lex with trialkylaluminium, e.g., NBu4[Al2Et6Br]
[54]. The rate of polymerization is two orders of

Ch. Novakov, Ch. Tsvetanov: Inter- and intra-molecular interactions in anionic polymerization of polar vinyl monomers
271
magnitude higher as compared to polymerization,
initiated by P1(COOR)Li/AlEt3 and the MWD is very
narrow (PDI ‹ 1.1).
The system AC/AlR3 is much more complex
than with the other additives because of the
presence of three potential ligands for the acceptor
additive: the growing species, the monomer, and
the ester group of the monomer units. Moreover,
AlR3 is regarded as acceptor in contrast to Li-
alkoxide or Li-enolates. This is clearly seen by
comparing UV spectra of LiPi solutions in dioxane
in the presence of AlEt3 and P1(COOR)Li (Fig. 11)
[21]:
Fig. 11. UV spectra of LiPi (a); and its adducts with
P1(COOR)Li (b) and AlEt3 (c)
In the presence of AlEt3 the UV spectrum of
LiPi solutions in dioxane undergoes a slight blue
shift from 337 to 325 nm. The interaction is fully
reversible with well defined isosbestic points. The
equilibrium constant is Kass 350 M-1
, comparable
with the association constants of LiPi and lithium
alkoxide/lithium enolate (Table 5). IR measure-
ments also confirm that [45,55] Al and B alkyls
interact with the MMA and MAN AC as acceptors.
The withdrawal of negative charge leads to
decreased electron density on
or
groups and reduced reactivity of the AC. By
analogy with similar complexes the following
structure can be postulated:
The lithum counterion is substantially separated
from the growing anion in contrast to the action of
other additives. The oncoming monomer has to
interact with the central aluminum atom.
In the case of LiCl and t-BuOLi additives no
significant change in tacticity in THF was observed
[39]. The different nature of the interaction
AC/Ligand in the case of t-BuOLi and AlR3 leads
to entirely different structure of the resulting
polymers especially in hydrocarbon solvent toluene
as shown in Table 6.
Tetraalkylammonium salts as additives
The anionic polymerization of MMA, initiated
by organolithium compounds in toluene, is
characterized by complex kinetics and broad mole-
cular weight distribution. Despite these drawbacks,
the process is of great interest since it leads to
highly isotactic polymer and has a definite
advantage over the one in THF as far as the
industrial application is concerned: it is desirable to
carry out anionic polymerization of MMA in
toluene at higher temperature and to obtain a highly
syndiotactic PMMA (over 90%) with controlled
molecular characteristics and low polydispersity.
As already mentioned, Hatada et al. [42] were the
first who succeeded in producing highly syn-
diotactic PMMA with narrow MWD using a t-
BuLi/AlR3 initiator system in toluene (Table 6).
The AlR3 addition changes the electron distribution
and induces steric hindrance around the growing
species. It may be inferred that the coordination
sphere around the AC exerts a pronounced effect on
Table 6. Effect of additives on the PMMA tacticity.
Initiator Solvent T°C Additive [Add]/[In] mm mr rr Ref. n-BuLi
Toluene 20 - 0.71 0.17 0.12
[29] t-BuOLi t-BuOLi * 0.83 0.12 0.05
t-BuLi Toluene -78 - - 0.78 0.16 0.06
[42] AlEt3 3 0.00 0.10 0.90
Al(n-Bu)3 0.00 0.08 0.92
s-BuLi THF 0 - 0.22 0.35 0.43
[45] Al(i-Bu)3 4 0.04 0.30 0.66
AlEt3 0.06 0.24 0.70 *t-BuOLi efficiency as initiator is low, therefore, unreacted t-BuOLi acts as an additive.

Ch. Novakov, Ch. Tsvetanov: Inter- and intra-molecular interactions in anionic polymerization of polar vinyl monomers
272
the incoming monomer. The idea of industrial
researchers is to prepare AC with high-volume
complex counter ion, thus, it will “screen” the
growing species from side reactions [47]. Thus, for
example, the intramolecular cyclization reaction
requires a metal ion like lithium for the activation
of ester group and the expulsion of alkoxide ions.
In order to avoid the influence of the metal
counterion, Reetz [56] was the first, who used non-
metallic tetrabutyl ammonium counterion in anionic
polymerization of (meth)acrylic monomers.
We set ourselves the task to expand the research
by examining the interaction of P1(COOR)Li with
quaternary ammonium salts (QAS) with quite
different structure and size [45,57]. Once again,
LiPi was considered as a model of an AC of chain
propagation as it is well known that the optical
spectrum of the picrate anion is very sensitive
towards changes in the interionic distance [58].
In contact with LiPi, the QAS can intervene in
two ways. On one hand, counter ion exchange
reactions are possible:
where R = alkyl substituent, X = Cl, Br
The exchange reaction leads to a definite change
in the behavior of the picrate anion. The quaternary
ammonium cation (Q+) makes the organophobic
picrate anion soluble, while LiX is insoluble in
toluene. In case of Pn(COOR)Li/QAS system the
exchange reaction leads to formation of AC with
bulky Q+.
The second possible reaction is the formation of
mixed associates (Q+,Pi
-,Li
+X
-)n. In this case Li
+
remained in the solution. As already mentioned, the
two cases are distinguished by the ability of lithium
to be dissolved in toluene. Indeed, Table 7 reveals
that depending on QAS salts structure, these two
quite different types of interactions can be recog-
nized. In the case of symmetrical R4N+X, almost
quantitative counter ion exchange occurs, whereas
the presence of QAS with very long chain alkyl
groups namely C17C12Me2NBr or (C12)2Me2NBr,
leads to increase in Li+ solubility more than two
orders of magnitude, i.e. to the formation of mixed
associates. In order to diminish the steric hindrance,
the Q+ is oriented to the growing anion from the
side of the smaller size groups, e.g. methyl groups
(Scheme 6).
The longer fatty alkyl chains participate in the
formation of the first solvation shell. This way the
microenvironment is highly hydrophobic, shifting
the mode of monomer addition to Pn(COOR)Li
towards isotactic structure.
Scheme 6. Sketch of the mixed associate (Q
+,Pi
-,Li
+X
-)n
[44].
Completely different, when the QAS additive
causes ion exchange, the syndiotactic addition is
much more pronounced, the size of Q+ being very
important: rr Hex4N+ › rr Bu4N
+.
Results, presented in Table 7 show that in both
cases the ester enolate species are not “naked” as it
is traditionally termed in the phase transfer catalysis
reactions. Obviously, the growing species penetrate
also into the void spaces of R4N+:
N
+
OR
O_
Due to the steric hindrance, the anion penet-
ration suppresses the attack of the ester enolate
anion to the carbonyl group of the third (γ) unit.
This type of propagating species favors syndiotactic
placement. The same trends were observed when
using t-BuOK [59] and Bu2Mg [60] initiators.

Ch. Novakov, Ch. Tsvetanov: Inter- and intra-molecular interactions in anionic polymerization of polar vinyl monomers
273
Table7. Comparison between the solubility of LiPi in toluene in the presence of QAS and PMMA stereochemistry
when P1(COOR)Li is used as initiator.
QAS LiPi P1(COOR)Li/QAS, PMMA triad placements
λmax, nm [Li+]/[PiQ] x10
3 mm mr rr
- 337 - 80 17 3
Bu4NBr 364 ‹ 1 65 18 17
Hex4NCl 361 ‹ 1 16 28 56
(C12)2Me2NBr 360.5 214 77 16 7
C17C12Me2NBr 360.5 299 95 4 1
CONCLUSION
The fine control of the anionic polymerization of
polar vinyl monomers and especially of
(meth)acrylates has been successfully realized in
the 1980s and 1990s. One of the strategies that
received a special attention is the ligated anionic
polymerization. The interest in this field has produ-
ced a large number of excellent comprehensive
reviews [39,61,62]. The attention of researchers has
been focused mainly on the study of the polymeri-
zation kinetics and preparation of well defined
poly(meth) acrylates or their blockcopolymers with
narrow molecular weight distribution.
This review paper summarizes the research on
the penultimate effects in anionic polymerization
and the influence of ligands performed in the Insti-
tute of Polymers, BAS during 1980s and 1990s.
The approach in our studies is slightly different.
The main subjects of our study are model compo-
unds or “living”oligomers of polar vinyl monomers,
such as nitrile, esters, and ketons. Their physico-
chemical characteristics in solution, before and
after adding of ligands, were investigated with the
aid of IR spectra and conductometry. In almost all
cases the interactions involve lithium counter ion.
A typical feature is the use of LiPi as a model in
studying the interactions with monomers, compo-
unds with polar groups, and most typical additives:
alkoxide, LiCl, tetraalkylammonium salts and
trialkylaluminum compounds.
We will mention some of the most important
conclusions of the study:
1. The propagating species comprise contact ion
pairs and ion triples in THF.
2. In THF the interaction growing center-
penultimate monomer unit is not typical for
PMMA, but it was demonstrated in living oligo-
mers of AN, MAN, and vinyl ketone.
3. In the case of anionic polymerization in
toluene of AN and MAN, initiated by lithium or
magnesium compounds, interactions AC-monomer
and AC-polar group of monomer unit are regis-
tered.
4. The approach by using reference system LiPi
in dioxane distinguishes four types of interactions:
LiPi-electron pair donors (polar groups of monomer
or monomer unit); LiPi – μ ligands (LiCl, ROLi,
Li-ketoenolate, and Li-esterenolate); LiPi – Lewis
acids (R3Al); and LiPi – quaternary ammonium
salts.
REFERENCES
1. Ch. Tsvetanov, I. Panayotov, B. Erussalimsky, Eur.
Polym. J., 10, 557 (1974).
2. Ch. B. Tsvetanov, I. M. Panayotov, Eur. Polym. J.,
11, 209 (1975).
3. Ch. B. Tsvetanov, Eur. Polym. J., 15, 503 (1979).
4. Ch. B. Tsvetanov, D. T. Petrova, I. M. Panayotov,
Makromol. Chem., 183, 517 (1982).
5. L. Lochmann, J. Trekoval, Makromol. Chem., 182,
1361 (1982).
6. I. M. Panayotov, Ch. B. Tsvetanov, A. C.
Alexandrov, Eur. Polym. J., 11, 875 (1975).
7. I. N. Juchnovski, Theor. Eksp. Khim., 3, 410 (1967);
Chem. Abstr. 68, 100, 135.
8. I. N. Juchnovski, Ch. Tsvetanov, I. Panayotov,
Monatsh. Chem., 100, 1980 (1969).
9. L. Lochmann, D. Lim, J. Organomet. Chem., 50, 9
(1973).
10. D. K. Dimov, E. B. Petrova, I. M. Panayotov, Ch. B.
Tsvetanov, Macromolecules, 21, 2733 (1988).
11. R. Fayt, R. Forte, C. Jacobs, R. Jerome, T. Oukadi, P.
Teyssie, S. K. Varshney, Macromolecules, 20, 1442
(1987).
12. Ch. B. Tsvetanov, Y. Y. Eizner, B. L. Erussalimsky,
Eur. Polym.J., 16, 219 (1980).
13. Ch. B. Tsvetanov, D. T. Dotcheva, J. Polym. Sci.:
Part A: Polym. Chem., 24, 2253 (1986).
14. D. Dotcheva, Ch. B. Tsvetanov, L. Lochmann, J.
Polym. Sci., Polym. Chem. Ed., 25, 3005 (1987).
15. C. B. Wooster, J. Am.Chem. Soc., 59, 377 (1937).
16. D. Hounore, J. C. Kavier, P. Sigwalt, M. Fontanille,
Europ. Polym. J., 10, 425 (1974).
17. T. E. Hogen-Esch, W. L. Jenkins, J. Am. Chem. Soc.,
103, 36666 (1981).
18. L. V. Vinogradova, V. N. Zgonnik, N. I. Nikolaev,
Ch. B. Tsvetanov, Eur. Polym. J., 15, 545 (1979).
19. M. Tardi, D. Rouge, P. Sigwalt, Eur. Polym. J., 3, 85
(1967).

Ch. Novakov, Ch. Tsvetanov: Inter- and intra-molecular interactions in anionic polymerization of polar vinyl monomers
274
20. Ch. B. Tsvetanov, E. B. Petrova, D. K. Dimov, I. M.
Panayotov, J. Smid, J. Solution Chem., 19, 425
(1990).
21. Ch. B. Tsvetanov, D. K. Dimov, E. B. Petrova, D. T.
Dotcheva, Macromol. Chem., Makromol. Symp., 60,
297 (1992).
22. Ch. Tsvetanov, V. Sgonnik, I. Panayotov, B.
Erussalimsky, Justus Liebigs Ann. Chem., 763, 53
(1972).
23. I. N. Juchnovski, I. G. Binev in: The Chemistry of
Functional Groups, Suppl. C, Part 1, S. Patai and Z.
Rappoport, Eds., p. 107, John Wiley & Sons, 1983.
24. Ch. B. Tsvetanov, D. T. Dotcheva, D. K. Dimov, E.
B. Petrova, I. M. Panayotov in: Recent Advances in
Anionic Polymerization, T.E. Hogen-Esch, J. Smid,
Eds., Elsevier 1987.
25. H.-J. Adler, L. Lochmann, D. T. Dotcheva, Ch. B.
Tsvetanov, Makromol. Chem., 187, 1253 (1986).
26. I. S. Pominov, A. Z. Gadjiev, Izv. Vuzov SSSR Phys.,
19 (1965).
27. Y.-S. Kim, T.-H. Kim, A. Lee, H.-K. Song, Energy
Environm. Sci, 4, 4038 (2011).
28. Y. Joch, S. Kurihara, T. Tomita, J. Polym. Sci., B9,
1463 (1971).
29. J. Trekoval, Coll. Czech. Chem. Commun.,42, 1259
(1977).
30. L. Lochmann, A.H.E. Müller, Makromol. Chem.,
191, 1657 (1990).
31. O. A. Reutov, A. L. Kurts, Russ. Chem. Rev. (Engl.
Transl.), 46, 1040 (1977).
32. O. A. Reutov, I. P. Beletskaya, A. L. Kurts, Ambident
Anions, Plenum Publishing Corp. New York 1983.
33. A. R. Lyons, E. Catterall, Eur. Polym. J., 7, 839
(1971).
34. D. Dotcheva, Ch. B. Tsvetanov, Macromol. Chem.,
186, 2103 (1985).
35. L. Vancea, S. Bywater, Macromolecules, 14, 1321
(1981).
36. L. Vancea, S. Bywater, Macromolecules, 14, 1776
(1981).
37. V. Halaska, L. Lochmann, Coll. Czech. Chem.
Commun., 38, 1780 (1973).
38. Y. Y. Eizner, B. L. Erussalimsky, Eur. Polym. J., 12,
59 (1976)
39. C. Zune, R. Jerome, Prog. Polym. Sci., 24, 631
(1999).
40. L. Lochmann, M. Rodova, J. Trekoval, J. Polym.
Sci., Polym. Chem. Ed., 12, 2091 (1974).
41. S. K. Varshney, J. P. Hautekeer, R. Fayt, R. Jerome,
P. Teyssie, Macromolecules, 23,.2618 (1990).
42. T. Kitayama, T. Shinozaki, T. Sakamoto, M.
Yamamoto, K. Hatada, Makromol. Chem., Suppl., 15,
167 (1989).
43. D. Baskaran, S. Sivaram, Macromolecules, 30, 1550
(1997).
44. Ch. B. Tsvetanov, Ch. P. Novakov, Macromolecular
Symposia, 107, 265 (1996).
45. Ch. B. Tsvetanov, D. T. Petrova, P. H. Li, I. M.
Panayotov, Eur. Polym. J., 14, 25 (1978); Erratum:
Eur. Polym. J., 14, 391 (1978).
46. K. Hatada, K. Ute, Y. Okamoto, T. Kitayama, Polym.
Bull., 18, 1037 (1986).
47. D. G. H. Ballard, R. J. Bowles, D. M. Haddleton, S.
N. Richards, R. Sellens, D. L. Twose,
Macromolecules, 25, 5907 (1992).
48. M. Janata, L. Lochmann, A. H. E. Müller, Makromol.
Chem.,191, 2253 (1990).
49. J. Kriz, J. Dybal, L. Lochmann, M. Janata, Macromol
Chem. Phys, 195, 3039 (1994).
50. J.-S. Wang, R. Jerome, R. Warin, P. Teyssie,
Macromolecules, 26, 5984 (1993).
51. S. K. Varshney, C. Jacobs, J. P. Hautekeer, P.
Bayard, R. Jerome, R. Fayt, P. Teyssie,
Macromolecules, 24, 4997 (1991).
52. C. Zune, P. Dubois, R. Jerome, J. Kriz, J. Dybal, L.
Lochmann, M. Janata, P. Vlcek, T. M. Werkhoven, J.
Lugtenburg, Macromolecules, 31, 2744 (1998).
53. T. Kitayama, T. Shinizaki, E. Masuda, M.
Yamamoto, K. Hatada, Polym. Bull., 20, 505 (1988).
54. H. Schlaad, B. Schmitt, A. H. E. Müller, Angew.
Chem. Int. Ed., 37, 1389 (1998).
55. Ch. Tsvetanov, V. N. Sgonnik, C. r. Acad. bulg. Sci.,
32, 55 (1979).
56. M. T. Reetz, Angew. Chem., 100, 1026 (1988).
57. Ch. P. Novakov, Ch. B. Tsvetanov, Macromol. Rapid
Commun., 16, 741 (1995).
58. K. H. Wong, K. Yagi, J. Smid, J. Membr. Biol., 18,
379 (1974).
59. Ch. P. Novakov, Ch. B. Tsvetanov, Macromol. Rapid
Commun., 17, 181 (1996).
60. Ch. P. Novakov, Ch. B. Tsvetanov, Macromol.
Symp., 132, 273 (1998).
61. J.-S. Wang, R. Jerome, P. Teyssie, J. Phys. Org.
Chem., 3, 208 (1995).
62. D. Baskaran, A. H. E. Müller, Prog. Polym. Sci., 32,
173 (2007).

Ch. Novakov, Ch. Tsvetanov: Inter- and intra-molecular interactions in anionic polymerization of polar vinyl monomers
275
МЕЖДУ- И ВЪТРЕШНО МОЛЕКУЛНИ ВЗАИМОДЕЙСТВИЯ ПРИ АНИОННАТА
ПОЛИМЕРИЗАЦИЯ НА ПОЛЯРНИ ВИНИЛОВИ МОНОМЕРИ
Хр. П. Новаков и Хр. Б. Цветанов*
Институт по Полимери, Българска Академия на Науките, ул. Акад. Г. Бончев, бл. 103, 1113 София, България
Постъпила на 19 юли 2014 г.; Коригирана на 18 август 2014 г.
(Резюме)
Настоящата обзорна работа представя резултатите от изследванията, проведени в лаборатория
„Полимеризационни процеси” на Института по полимери – БАН, върху природата на активните центрове на
нарастване (АЦ) в процеса на анионна полимеризация на полярни винилови мономери (ПВМ) – акрилати,
метакрилати, винилови нитрили и винилови кетони, като е обърнато внимание на взаимодействията на АЦ с
донорно-акцепторни лиганди. Обект на особен интерес са взаимодействията на АЦ с различни лиганди
съдържащи литиев и магнезиев противойон, поради протичащите процеси на взаимодействие и
самоасоцииране, които осигуряват възможност за осъществяване на контрол на структурата и състава на
получаваните (съ)полимери. Използвани са и моделни съединения или „живи” олигомери на ПВМ, като чрез
ИЧ спектроскопия и кондуктометрично са изследвани физикохимичните им характеристики в разтвор, преди и
след добавяне на лиганд. Литиевият пикрат е използван като моделно съединение за изучаване на
взаимодействието с мономери, съединения с полярни групи и най-типичните добавки: алкоксиди, литиев
хлорид, кватернерни амониеви соли и триалкилалуминиеви съединения.

Bulgarian Chemical Communications, Volume 46, Special Issue A, 2014
276
BULGARIAN CHEMICAL COMMUNICATIONS
Instructions about Preparation of Manuscripts
General remarks: Manuscripts are submitted in
English by e-mail or by mail (in duplicate). The text
must be typed double-spaced, on A4 format paper
using Times New Roman font size 12, normal
character spacing. The manuscript should not
exceed 15 pages (about 3500 words), including
photographs, tables, drawings, formulae, etc.
Authors are requested to use margins of 3 cm on all
sides. For mail submission hard copies, made by a
clearly legible duplication process, are requested.
Manuscripts should be subdivided into labelled
sections, e.g. Introduction, Experimental, Results
and Discussion, etc.
The title page comprises headline, author’s
names and affiliations, abstract and key words.
Attention is drawn to the following:
a) The title of the manuscript should reflect
concisely the purpose and findings of the work.
Abbreviations, symbols, chemical formulas, refer-
ences and footnotes should be avoided. If indis-
pensable, abbreviations and formulas should be given
in parentheses immediately after the respective full
form.
b) The author’s first and middle name initials,
and family name in full should be given, followed
by the address (or addresses) of the contributing
laboratory (laboratories). The affiliation of the author(s)
should be listed in detail (no abbreviations!). The
author to whom correspondence and/or inquiries
should be sent should be indicated by asterisk (*).
The abstract should be self-explanatory and
intelligible without any references to the text and
containing not more than 250 words. It should be
followed by key words (not more than six).
References should be numbered sequentially in
the order, in which they are cited in the text. The
numbers in the text should be enclosed in brackets
[2], [5, 6], [912], etc., set on the text line. Refer-
ences, typed with double spacing, are to be listed in
numerical order on a separate sheet. All references
are to be given in Latin letters. The names of the
authors are given without inversion. Titles of
journals must be abbreviated according to Chemical
Abstracts and given in italics, the volume is typed in
bold, the initial page is given and the year in
parentheses. Attention is drawn to the following
conventions:
a) The names of all authors of a certain
publications should be given. The use of “et al.” in
the list of references is not acceptable.
b) Only the initials of the first and middle names
should be given.
In the manuscripts, the reference to author(s) of
cited works should be made without giving initials,
e.g. “Bush and Smith [7] pioneered...”. If the refer-
ence carries the names of three or more authors it
should be quoted as “Bush et al. [7]”, if Bush is the
first author, or as “Bush and co-workers [7]”, if
Bush is the senior author.
Footnotes should be reduced to a minimum.
Each footnote should be typed double-spaced at the
bottom of the page, on which its subject is first
mentioned.
Tables are numbered with Arabic numerals on
the left-hand top. Each table should be referred to in
the text. Column headings should be as short as
possible but they must define units unambiguously.
The units are to be separated from the preceding
symbols by a comma or brackets.
Note: The following format should be used when
figures, equations, etc. are referred to the text
(followed by the respective numbers): Fig., Eqns.,
Table, Scheme.
Schemes and figures. Each manuscript (hard
copy) should contain or be accompanied by the
respective illustrative material as well as by the
respective figure captions in a separate file (sheet).
As far as presentation of units is concerned, SI units
are to be used. However, some non-SI units are also
acceptable, such as °C, ml, l, etc.
The author(s) name(s), the title of the
manuscript, the number of drawings, photographs,
diagrams, etc., should be written in black pencil on
the back of the illustrative material (hard copies) in
accordance with the list enclosed. Avoid using more
than 6 (12 for reviews, respectively) figures in the
manuscript. Since most of the illustrative materials
are to be presented as 8-cm wide pictures, attention
should be paid that all axis titles, numerals,
legend(s) and texts are legible.
The authors are asked to submit the final text
(after the manuscript has been accepted for
publication) in electronic form either by e-mail or
mail on a 3.5’’ diskette (CD) using a PC Word-
processor. The main text, list of references, tables
and figure captions should be saved in separate files
(as *.rtf or *.doc) with clearly identifiable file
names. It is essential that the name and version of

Bulgarian Chemical Communications, Volume 45, Number 1, 2013
277
the word-processing program and the format of the
text files is clearly indicated. It is recommended that
the pictures are presented in *.tif, *.jpg, *.cdr or
*.bmp format, the equations are written using
“Equation Editor” and chemical reaction schemes
are written using ISIS Draw or ChemDraw
programme.
The authors are required to submit the final text
with a list of three individuals and their e-mail
addresses that can be considered by the Editors as
potential reviewers. Please, note that the
reviewers should be outside the authors’ own
institution or organization. The Editorial Board of
the journal is not obliged to accept these proposals.
EXAMPLES FOR PRESENTATION OF REFERENCES
REFERENCES
1. D. S. Newsome, Catal. Rev.–Sci. Eng., 21, 275 (1980).
2. C.-H. Lin, C.-Y. Hsu, J. Chem. Soc. Chem. Commun., 1479 (1992).
3. R. G. Parr, W. Yang, Density Functional Theory of Atoms and Molecules, Oxford Univ. Press, New York, 1989.
4. V. Ponec, G. C. Bond, Catalysis by Metals and Alloys (Stud. Surf. Sci. Catal., vol. 95), Elsevier, Amsterdam, 1995.
5. G. Kadinov, S. Todorova, A. Palazov, in: New Frontiers in Catalysis (Proc. 10th Int. Congr. Catal., Budapest,
1992), L. Guczi, F. Solymosi, P. Tetenyi (eds.), Akademiai Kiado, Budapest, 1993, Part C, p. 2817.
6. G. L. C. Maire, F. Garin, in: Catalysis. Science and Technology, J. R. Anderson, M. Boudart (eds), vol. 6, Springer-
Verlag, Berlin, 1984, p. 161.
7. D. Pocknell, GB Patent 2 207 355 (1949).
8. G. Angelov, PhD Thesis, UCTM, Sofia, 2001.
9. JCPDS International Center for Diffraction Data, Power Diffraction File, Swarthmore, PA, 1991.
10. CA 127, 184 762q (1998).
11. P. Hou, H. Wise, J. Catal., in press.
12. M. Sinev, private communication.
13. http://www.chemweb.com/alchem/articles/1051611477211.html.

Bulgarian Chemical Communications, Volume 46, Special Issue A, 2014
278
CONTENTS
B. Blagoev, ACADEMICIAN DIMITER IVANOV 120 Years of His Birth ……………………………………. 5
P. M. Ivanov, I. G. Pojarlieff, S. D. Simova, G. D. Velinov, Interaction between charged groups. pK-values and
conformations of the diastereomers of 3-amino-2,3-diphenylpropanoic acids and their ester and N-acetyl
derivatives ………………………………………………………………………………………………………... 9
V. Dimitrov, Catalytic method for synthesis of Grignard compounds with magnesium attached to tertiary bridge
head C-atom ……………………………………………………………………………………………….……… 16
I. Philipova, G. Stavrakov, V. Dimitrov, Phosphino-carboxamide hybrid ligands with a camphane scaffold for
Pd-catalyzed asymmetric allylic alkylation ………………………………………………………………………. 21
G. Stavrakov, I. Philipova, V. Valcheva, G. Momekov, Synthesis and antimycobacterial activity of bornylamine
derived amido-alcohols …………………………………………………………………………………………… 27
K. Dikova, M. Kamenova-Nacheva, K. Kostova, V. Dimitrov, Enantioselective addition of diethylzinc to
ferrocene carbaldehyde - reaction outcome by using natural compound based catalysts ……………..………….. 33
I. E. Ismailov, I. K. Ivanov, V. C. Christov, Bifunctionalized allenes. Part XIV. A convenient and efficient
regioselective synthesis of phosphorylated -hydroxyallenes with protected and unprotected hydroxy group 39
V. B. Kurteva, L. A. Lubenov, S. D. Simova, 2,3-Disubstituted imidazo[1,2-a]pyridines from 2-aminopyridines
and acetophenones. Catalyst’s efficiency and solid state NMR study. …………………………………………. 47
V. T. Angelova, W. Frey, I. C. Ivanov, N. Vassilev, T. N. Glasnov, One-pot synthesis of a chromeno[4,3,2-de]-
1,6-naphthyridine derivative from 4-chlorocoumarin-3-carbaldehyde …………………………………………… 53
M. G. Kratchanova, P. N. Denev2, C. G. Kratchanov, Rose hip extract synergistically increase antioxidant
activity of fruit and herb extracts …………………………………………………………………………………. 59
A. H. Atanasova, P. N. Denev, I. I. Tringovska, S. Y. Grozeva, D. G. Ganeva, M. G Kratchanova, I. N. Panchev,
Optimization of the key parameters for extraction of polyphenol compounds from tomato fruits (Solanum
lycopersicum L.). Kinetics of the process. ………………………………………………………………………... 65
M. Nikolova, M. G. Kratchanova, E. V. Pavlova, I. Ianakieva, V. Kussovsli, Purification and biological activity
of pectic polysaccharides from leek ………………………………………………………………………………. 71
M. H. Ognyanov, Y. N. Georgiev, I. Z. Yanakieva, V. К. Kussovski, M. G. Kratchanova, Chemical composition
and anti-complementary activity of enzyme-modified citrus pectins …………………………………………….. 79
M. Popova, A. Stoyanova, N. Valyovska-Popova, V. Bankova, D. Peev, A new coumarin and total phenolic and
flavonoids content of Bulgarian celeriac ………………………………………………………………………….. 88
D. V. Nedeltcheva-Antonova, K. S. Tsandeva, R. D. Dimitrova, Determination of Benzethonium Chloride in
Grapefruit Seed Extracts - a GC/MS alternative ………………………………………………………………….. 94
Z. Y. Petkova, G. A. Antova, Phospholipid composition of Cucurbitaceae seed oils …………………………….. 100
T. N. Ovcharova, M. D. Zlatanov, A. S. Ivanov, Sterol and fatty acid composition of grape seed oils …………... 106
Y. Raynova, S. Todinova, D. Yordanov, K. Idakieva, SDS-induced phenoloxidase activity of Helix aspersa
maxima hemocyanin ……………………………………………………………………………………………… 111
M. Popova, K. Yoncheva, A. Szegedi, Y. Kalvachev, N. Benbassat, V. Mavrodinova, Resveratrol loading on
mesoporous silica and zeolite carriers by solid state method …………………………………………………….. 117
M. Stefanova, L. Gonsalvesh, S. P. Marinov, J. Czech, R. Carleer, J. Yperman, Reductive pyrolysis of
leonardite humic acids …………………………………………………………………………………………….. 123
I. G. Racheva, B. G. Tsyntsarski, B. N. Petrova, T. K. Budinova, N. V. Petrov, B. Nagel, S. Pusz, U. Szeluga ,
Conversion of polyolefin wax to carbon adsorbents by thermooxidation treatment ……………………………... 129
I. Genova, B. Tsyntsarski, M. Dimitrov, D. Paneva, D. Kovacheva, T. Budinova, R. Ivanova, I. Mitov, N.
Petrov, T. Tsoncheva, Cobalt and iron modified activated carbons from renewable sources as catalysts in
methanol decomposition: Effect of the precursor ………………………………………………………………… 134
V. V. Ivanova, M. K. Stoyanova, S. G. Christoskova, Study on the catalytic activity of nanosized NiOx for
oxidative degradation of 2,4-dichlorophenol in aqueous solutions ………………………………………………. 141
A. Popova, B. Stamboliyska, E. Velcheva, Experimental and DFT studies on the IR spectral and structural
changes arising from the conversion of 4-amino-N-[amino(imino)methyl] benzenesulfonamide (sulfaguanidine)
into azanion ……………………………………………………………………………………………………….. 149
A. D. Popova, E. A. Velcheva, IR spectral and structural changes, caused by the conversion of 4-
cyanobenzenosulfonamide into azanion ………………………………………………………………………….. 157
Z. I. Glavcheva, D. Y. Yancheva, Y. K. Kancheva, E. А. Velcheva, B. A. Stamboliyska, Development of FTIR
spectra database of reference art and archaeological materials …………………………………………………… 164
S. S. Stoyanov, J. A. Tsenov, IR spectra and structure of 1,1,3,3-tetracyanopropane and its carbanions:
experimental and quantum chemical study ……………………………………………………………………….. 170
D. Yancheva, S. Stoyanov, B. Stambolyiska, L. Daskalova, E. Cherneva, A. Smelcerovic, Influence of the
environment on the antioxidant action of two 6-(propan-2-yl)-4-methyl-morpholine-2,5-diones ……………….. 179

Bulgarian Chemical Communications, Volume 46, Special Issue A, 2014
279
S. E. Angelova, A. K. Slavova-Kazakova, L. Saso, S. V. Malhotra, A. K. Prasad, M. E. Bracke, V. S. Parmar, V.
D. Kancheva, DFT/B3LYP calculated bond-dissociation enthalpies, radical-scavenging and antioxidant
activities of natural-like coumarins ……………………………………………………………………………….. 187
I. Georgieva, N. Trendafilova, Metal-ligand interactions in transition metal complexes of glyoxilic acid oxime 196
V. B. Delchev, Xanthine and hypoxanthine: in a search for conical intersections S0/S1 connected with
deformations of pyrimidine residue of the purine ring …………………………………………………………… 203
B. P. Stoyanov, P. R. Kostadinov, M. V. Kolev, Z. A. Mustafa, M. N. Moskovkina, R. S. Milina, I. P. Bangov,
Use of the descriptor fingerprints to clustering of chemical datasets …………………………………………….. 209
B. P. Stoyanov, E. P. Petrov, N. T. Kochev, I. P. Bangov, A novel program for computer-aided generation of 2D
chemical structures ………………………………………………………………………………………………... 215
A. Z. Patleeva, D. D. Enchev, G. D. Neykov, Stereoselectivity in intramolecular Diels-Alder reactions of 2,4-
pentadienyl butadienamides in the “Remote Stereocontrol Group” approach ……………………………………. 220
S. Kawauchi, L. Antonov, Y. Okuno, Prediction of the color of dyes by using time-dependent density functional
theory (TD-DFT) ……………………………………………………………………………………………….…. 228
P. Ivanov, Further studies on the conformations of large-ring cyclodextrins …………………………………….. 238
G. S. Spasov, Application of Isohypses method for AES quantification of semiconductor solid solutions ……... 246
R. Todorov, Y. Ilieva, V. Lozanova, A. Lalova, Optical properties of silver-doped organic polymer films as solar
control coating materials for advanced architectural glazing application ………………………………………… 251
I. Bodurov, R. Todorov, T. Yovcheva, S. Sainov, Holographic investigation of the corona discharge effect on the
photo-doping of Ag, Au and Cr into nano-sized As2S3 films …………………………………………...………... 256
Ch. P. Novakov, Ch. B. Tsvetanov, Inter- and intra-molecular interactions in anionic polymerization of polar
vinyl monomers …………………………………………………………………………………………………… 261
INSTRUCTIONS TO THE AUTHORS …………………………………………………………………..……… 276

Bulgarian Chemical Communications, Volume 46, Special Issue A, 2014
280
СЪДЪРЖАНИЕ
Б. Благоев, Академик Димитър Иванов 120 години от рождението му ……………...............……….…….... 5
П. М. Иванов, И. Г. Пожарлиев, С. Д. Симова, Г. Д. Велинов, Взаимодействие на заредени групи. рК и
конформации на диастереомерите на 3-амино-2,3-дифенилпропановата киселина, метиловите и
етиловите й естери и n-ацетилни производни ……………………………………………………….….……... 9
В. Димитров, Каталитичен метод за синтез на Гринярови съединения с магнезий свързан с третичен
мостови въглероден атом …………………………………………………………………………….…………. 16
И. Филипова, Г. Ставраков, В. Димитров, Фосфин-карбоксамиди с камфанов скелет като лиганди за Pd-
катализирано асиметрично алкилиране ………………………………………………………………………... 21
Г. Ставраков, И. Филипова, В. Вълчева, Г. Момеков, Синтез и антимикобактериална активност на
амидоалкохоли производни на борниламин …………………………………………………………………… 27
К. Дикова, М. Каменова-Начева, К. Костова, В. Димитров, Енантиоселективно присъединяване на
диетилцинк към фероценкарбалдехид – резултати oт използване на природни съединения като
катализатори ……………………………………………………………………………………………………... 33
И. Е. Исмаилов, И. К. Иванов, В. Х. Христов, Бифункционализирани алени. Част XIV. Удобен и
ефикасен региоселективен синтез на фосфорилирани -хидроксиалени със защитена и незащитена
хидрокси група …………………………………………………………………………………………………... 39
В. Б. Куртева, Л. А. Любенов, С. Д. Симова, 2,3-Дизаместени имидазо[1,2-а]пиридини от 2-
аминопиридини и ацетофенони. Ефективни катализатори и ЯМР изследване в твърдо състояние. ……… 47
В. T. Ангелова, В. Фрай, И. Х. Иванов, Н. Василев, Т. Н. Гласнов, Едностъпков синтез на хромено[4,3,2-
d,e]-1,6-нафтиридиново производно от 4-хлорокумарин-3-карбалдехид ……………………………………. 53
M. Г. Крачанова, П. Н. Денев, Х. Г. Крачанов, Екстракт от шипка синергично повишава
антиоксидантната активност на плодови и билкови екстракти ………………………………………………. 59
А. Х. Атанасова, П. Н. Денев, И. И. Тринговска, С. Й. Грозева, Д. Г. Ганева, М. Г. Крачанова, И. Н.
Панчев, Оптимизация на ключови параметри на екстракция на фенолни компоненти от доматени
плодове (Solanum lycopersicum L.). Кинетика на процеса. ……………………………………………… 65
М. Николова, М. Крачанова, Е. Павлова, И. Янакиева, В. Късовски, Пречистване и биологична
активност на пектинови полизахариди от праз ………………………………………………………………... 71
М. Х. Огнянов, Й. Н. Георгиев, И. Ж. Янакиева, В. К. Късовски, М. Г. Крачанова, Химичен състав и
антикомплементарна активност на ензимно-модифицирани цитрусови пектини ………………………….. 79
М. Попова, А. Стоянова, Н. Вальовска-Попова, В. Банкова, Д. Пеев, Нов кумарин и съдържание на
тотални флавоноиди и тотални феноли в българска целина …………………………………………………. 88
Д. В. Неделчева-Антонова, К. С. Цандева, Р. Д. Димитрова, Определяне на бензетониев хлорид в
екстракти от семена на грейпфрут – алтернативен подход чрез използване на газова хроматография с
масспектрална детекция ………………………………………………………………………………………… 94
Ж. Ю. Петкова, Г. А. Антова, Фосфолипиден състав на масла от сем. Cucurbitaceae …………………….. 100
T. Овчаровa, M. Златанов, A. Иванов, Стеролов и мастно-киселинен състав на масло от гроздови семки 106
Ю. Райнова, С. Тодинова, Д. Йорданов, К. Идакиева, SDS-индуцирана фенолоксидазна активност на
хемоцианин от Helix aspersa maxima …………………………………………………………………………... 111
М. Попова, К. Йончева, А. Сегеди, Ю. Кълвачев, Н. Бeнбасат, В. Мавродинова, Натоварване на
ресвератрол върху мезопорести силикатни и зеолитни носители чрез твърдофазен метод ……………….. 117
М. Стефанова, Л. Гонсалвеш, С. П. Маринов, Я. Чех, Р. Карлие, Я. Иперман, Редукционен пиролиз на
хуминови киселини от леонардит ………………………………………………………………………………. 123
И. Г. Рачева, Б. Г. Цинцарски, Б. Н. Петрова, T. K. Будинова, Н. В. Петров, Б. Нагел, С. Пуш, У.
Шелуга, Термоокислителна конверсия на полиолефинов восък до въглеродни адсорбенти ……………… 129
И. Генова, Б. Цинцарски, M. Димитров, Д. Панева, Д. Ковачева, Т. Будинова, Р. Иванова, И. Митов, Н.
Петров, Т. Цончева, Катализатори за разлагане на метанол на основата на кобалт и желязо
модифициран активен въглен от възобновяеми източници: влияние на прекурсора ………………………. 134
В. В. Иванова, М. К. Стоянова, С. Г. Христоскова, Изследване на каталитичната активност на
наноразмерен NiOx за окислителна деструкция на 2,4-дихлорфенол във водни разтвори …………….…. 141
А. Попова, Б. Стамболийска, Е. Велчева, Експериментално и теоретично изследване на ИЧ спектрални
и структурни промени, произтичащи от превръщането на 4-амино-N-[амино(имино)метил] бензенсулфонамид (сулфагуанидин) в азанион ……………………………………………………………….. 149
А. Попова, Е. Велчева, ИЧ-спектрални и структурни промени, породени от превръщането на 4-
цианобензенсулфонамид в азанион …………………………………………………………………………….. 157
Bulgarian Chemical Communications, Volume 46, Special Issue A, 2014
281
З. И. Главчева, Д. Я. Янчева, Й. К. Кънчева, Е. А. Велчева, Б. А. Стамболийска, Създаване на спектрална
база данни от референтни художествени и археологически материали ……………………………………... 164
Д. Янчева, С. Стоянов, Б. Стамболийска, Л. Даскалова, Е. Чернева, А. Шмелцерович, Влияние на
обкръжаващата среда върху антиоксидантното действие на два 6-(пропан-2-ил)-4-метил-морфолин-2,5-
диона ……………………………………………………………………………………………………………… 179
С. Е. Ангелова, А. К. Славова-Казакова, Л. Сасо, Ш. В. Малхотра, А. К. Прасад, М. Е. Браке,
В. С.
Пармар, В. Д. Кънчева, DFT/B3LYP изчислителни енталпии на дисоциация на връзка, радикалово-
уловителна и антиоксидантна активност на синтетични аналози на природни кумарини ………………… 187
И. Георгиева, Н. Трендафилова, Mетал-лиганд взаимодействия в комплекси на преходни метали с
оксима на глиоксиловата киселина …………………………………………………………………………….. 196
В. Б. Делчев, Ксантин и хипоксантин: в търсене на конични сечения S0/S1, свързани с деформация на
пиримидиновия фрагмент на пуриновия пръстен …………………………………………………………….. 203
Б. П. Стоянов, П. Р. Костадинов, М. В. Колев, З. А. Мустафа, М. Н. Московкина, Р. С. Милина, И. П.
Бангов, Използване на дескрипторните отпечатъци на пръстите за клъстериране на химични множества
от данни …………………………………………………………………………………………………………... 209
Б. П. Стоянов, Е. П. Петров, Н. Т. Кочев, И. П. Бангов, Една нова програма за генериране на 2D химични структури с помощта на компютри ………………………………………………………………….. 215
А. Ж. Патлеева, Д. Д. Енчев, Г. Д. Нейков, Теоретично изследване на стереоселективността на
вътрешномолекулна реакция на Дилс-Алдер на 2,4-пентадиенил бутадиенамиди с участието на
контролиращи стереоселективността групи …………………………………………………………………… 220
С. Каваучи, Л. Антонов, И. Окуно, Предсказване на цвета на багрила посредством зависеща от времето
теория на функционала на плътността (TD-DFT) ……………………………………………………………... 228
П. Иванов, Изследване върху конформациите на големи циклодекстрини …………………………………. 238
Г. С. Спасов, Приложение на метода на изохипсите за електронен Oже спектроскопски количествен
анализ на полупроводникови твърди разтвори ………………………………………………………………... 246
Р. Тодоров, Ю. Илиева, В. Лозанова, А. Лалова, Оптични свойства на сребро-органични полимерни
тънки слоеве като слънцезащитни покрития за съвременни приложения в архитектурата ………………... 251
И. Бодуров, Р. Тодоров, Т. Йовчева, С. Съйнов, Холографско изследване на влиянието на коронния
разряд при фотодопинг на сребро, злато и хром в наноразмерни филми от As2S3…………………….. 256
Хр. П. Новаков и Хр. Б. Цветанов, Между- и вътрешно молекулни взаимодействия при анионната
полимеризация на полярни винилови мономери …………………………………………………………….... 261
ИНСТРУКЦИЯ ЗА АВТОРИТЕ ………………………………………………………………………………... 276