BCC_2012_44_Special_Issue.pdf - Bulgarian Chemical ...
152
BULGARIAN CHEMICAL COMMUNICATIONS Journal of the Chemical Institutes of the Bulgarian Academy of Sciences and of the Union of Chemists in Bulgaria Volume 44 / Special Issue Proceedings of the III rd National Crystallographic Symposium
-
Upload
khangminh22 -
Category
Documents
-
view
1 -
download
0
Transcript of BCC_2012_44_Special_Issue.pdf - Bulgarian Chemical ...

BULGARIAN CHEMICAL COMMUNICATIONS
Journal of the Chemical Institutes of the Bulgarian Academy of Sciences and of the Union of Chemists in Bulgaria
Volume 44 / Special Issue Proceedings of the IIIrd National Crystallographic Symposium


5
P r e f a c e
Dear reader,
This special issue of the “Bulgarian Chemical Communication” puts together the best studies, rep-resented during the 3rd National Crystallographic Symposium (NCS’11), which took place on October 3–5, 2011 at the grounds of the “Earth and Man National Museum” in Sofia. For a sec-ond consecutive year, the organizers of this event gratefully take the chance to reach the audience, through the pages of this journal.
The National Crystallographic Symposium (NCS) is the annual meeting of the active and rap-idly growing Bulgarian crystallographic commu-nity as well as the most important activity of the recently re-established Bulgarian Crystallographic Society (BCS). During the last years it won recog-nition as the leading scientific event, not only for the Bulgarian crystallographers, but also welcom-ing participants from different European countries. Along with the invited distinguished lecturers in
key fields of crystallography, the reputation of the event is based on the participation of Bulgarian scientists, working abroad and using the experi-ence of approved crystallographic schools. A tes-timony for the growing interest to the National Crystallographic Symposium is the fact that the second and third symposiums were both attended by over 100 participants.
With up to 14 hours of continuous face-to-face communication each symposium day, attendees find out about the latest developments from research and industry, participate in workshops, improve their skills at hands-on demonstrations or join other sessions, which feed their minds in creative and fun ways.
The participants of the last NCS’11 now have the chance to refresh their memories about the ideas, represented at the symposium and get acquainted about all the details that couldn’t find place during the presentations; Those who didn’t have the chance to be there – to find a reason to attend the next meet-ing in the fall of 2012.
Wishing you thrilling reading,
Guest editors of the special issue:D. Kovacheva
T. Kerestedjian

6

7
* To whom all correspondence should be sent:E-mail: [email protected]
© 2012 Bulgarian Academy of Sciences, Union of Chemists in Bulgaria
Bulgarian Chemical Communications, Volume 44, Proceedings of the IIIrd National Crystallographic Symposium (pp. 7–16) 2012
Crystallographic, chemical and structural characteristics of harmotome from Zlatolist, Eastern Rhodopes, Bulgaria
R. Atanassova1*, R. D. Vassileva1, M. Kadiyski2, Z. Zlatev3
1 Geological Institute, Bulgarian Academy of Sciences, 1113 Sofia; 2 Institute of Mineralogy and Crystallography, Bulgarian Academy of Sciences, 1113 Sofia;
3 Bulgarian Mineralogical Society, Sofia
Received February 15, 2012; Revised March 15, 2012
Large volumes of intermediate and acid volcaniclastic rocks were formed during the Paleogene in the Eastern Rhodopes, South Bulgaria. Most of them were deposited in a shallow marine environment, lately transformed into clays, adularia, opal-CT and zeolites. Rare mineralization was observed in voids and cavities of basaltic rocks near the Zlatolist village. The voids, now amygdales are filled by calcite, quartz and several zeolites (harmotome, analcime, mordenite, heulandite etc.). Among these harmotome occurs as remarkably well-defined crystals up to 3.5 cm in size.
Harmotome has been characterized using optical microscopy, X-ray, SEM/EDS, EPMA, LA-ICP-MS and DTA. The investigated crystals invariably consist of complex penetration twins and twinning simulates pseudo-orthorhombic forms according to the morvenite law. Crystals are elongated along the a-axis, and flattened on the {010}. Such complex twinning results in an optical heterogeneity and characteristic uneven extinction.
The average chemical formula is: Ba2.46Ca0.17K0.26[Al5.89Si10.19O32]•12H2O. Registered are 35 trace elements, up to 1.3 wt.% Na, 330 ppm Sr, and 26 ppm Ti. The thermal behavior of harmotome represents water loss in three steps: at 125, 210, and 280 °C, and complete dehydration at 400 °C.
A crystal fragment of harmotome was used also for single crystal X-ray diffraction study. Reliable structure model with satisfactory R-values (R1 = 0.0403; Rall = 0.0473) was obtained using the P2/m space group and it was chosen for the structure refinement. The obtained unit cell dimensions are: a = 9.8903(5), b = 14.1394(3), c = 8.6713(4) Å, β = 124.628(7)° and V = 997.81(8) Å3. The final refinement included all atomic coordinates and anisotropic thermal displacement parameters.
Key words: zeolites, phillipsite series, harmotome, crystal structure refinement, crystal morphology.
INTRODUCTION
Zeolites are crystalline hydrated aluminosili-cates of the alkali and alkaline elements. They have a framework structure characterized by the presence of interconnected channels or cages, occupied by relatively large cations and water molecules [1]. Depending on their structure and composition, zeolites are widely used as sorbents, detergents, ion-exchangers, and especially as ma-terials for heterogeneous catalysis [2]. Large zeo-lite crystals provide an ideal possibility for crystal structure determinations [3], studies of the crystal growth mechanism [4], adsorption and diffusion measurements, and more recently spatially re-solved probing of catalytic events [5].
Harmotome Ba2(Ca0.5,Na)4[A15Si11O32]·12H2O and phillipsite K2(Ca0.5,Na)4[A16Si10O32]·12H2O are members of a continuous series with exchangeable cations from barium to potassium. Considerable calcium and sodium content is commonly present. Barium is the most abundant extra-framework cati-on in harmotome. The name harmotome (after Haüy, 1801, in Combs et al. [6]) predates phillipsite; on grounds of history and usage, both are retained in spite of the rules of the report of the CNMMN [6]. Named from Greek words for a “joint” and “to cut”, in allusion to a tendency to split along junctions (twin planes). It is well known that crystal individu-als invariably consist of complex twins, and Deer et al. [7] suggest that the twinning may simulate single crystal forms (mimetic twins), such as tetragonal and rhombic dodecahedra. Sahama and Lehtinen [8] described sectorial twinning in harmotome from Finland. Akizuki [9, 10] has interpreted sector twin-ning in some minerals in terms of atomic order-

8
R. Atanassova et al.: Crystallographic, chemical and structural characteristics of harmotome from Zlatolist ...
ing of such cations as Al/Si and Fe3+/Al, produced during growth. The surface and internal textures of harmotome suggest that the sectorial twinning may originate by the same mechanism. Untwinned crystals have not been found so far. A transparent, spindle-shaped variety of harmotome that was orig-inally described from the Strontian mines north of Morven (now Morvern), Argyllshire, Scotland, UK [11], later was used to describe a type of twinning also observed for phillipsite. The complex interpen-etration twinning of phillipsite was classified by Lacroix (1897, 1923 in: Tschernich [12]) to include the Morvenite twin, Marburg twin, Perier twin and Stempel twin according to the dominant habits.
Harmotome is typically monoclinic, although its actual space group is debatable due to acentricity, which is lowering the symmetry [13]. Harmotome and phillipsite have the same (structural code, PHI) framework topology with double “crankschafts” parallel to the a-axis.
Until now harmotome was known from one occurrence in Bulgaria. It was described from fissures of latitic lavas North of Iskra, Haskovo district with laumontite and heulandite [14]. In this study, we present the crystallographic, min-eralogical and chemical data on harmotome from Zlatolist, Eastern Rhodopes. In addition, the val-
ues of the cell parameters are obtained by single-crystal X-ray diffractometry.
GEOLOGICAL OVERVIEW
Intense collision-related volcanism took place in the East Rhodopes, South Bulgaria during the Paleogene. Eruptive products, both lava and vol-caniclastic rocks, are assigned to four intermediate (to basic) phases alternating in time with five acidic ones [15]. The first two phases (intermediate and acidic) are Priabonian while all following are of Rupelian age. Large volumes of pyroclastic rocks were erupted during the first three acidic volcanic phases and deposited in a shallow marine environ-ment. They were subsequently transformed into zeolites, clay minerals, adularia and opal-CT [15].
Rare zeolite mineralization was observed in voids and in some microdruses and cavities of ba-saltic andesits near the Zlatolist village, Eastern Rhodopes (Fig. 1). The voids, now amygdales are filled predominantly by calcite, quartz, chalcedony and several zeolites (mainly represented by harmo-tome, analcime, chabasite, mordenite and heulan-dite). Among these zeolites, harmotome occurs as remarkably well-defined large crystals.
Fig. 1. Photographs of: a) outcrop of basaltic rocks near Zlatolist, b-d) handspecimens representing large harmotome crystals in amygdales

9
EXPERIMENTAL AND ANALyTICAL PROCEDURES
Harmotome has been characterized using optical microscopy, X-ray diffraction, SEM/EDS, EPMA, LA-ICP-MS and DTA.
Detailed morphological studies on separate crys-tals and aggregates were carried with a binocular optical and scanning electron microscopes JEOL JSM 6390 with EDS Oxford INCA system (SEM). Electron probe microanalyses (EPMA) were per-formed with a JEOL JSM CF with Tracor Northern – 2000 analyzing system at an accelerating voltage of 25 kV and a beam diameter of 1 µm. Electron microprobe analyses are performed on the same samples used for the structure determination. In each crystal, several spots were analyzed to check for sample homogeneity.
LA-ICP-MS analytical system consists of a 193 nm ArF excimer laser and an ELAN DRC-e ICP quadrupole mass spectrometer. For control-led ablation, an energy density of above 10 J/cm2 on the sample and a laser pulse frequency of 10 Hz were used. Analyses were performed with 50 or 75 µm beam diameters and external standardiza-tion on NIST glass standard SRM-610.
TG-DTA-DTG measurements were performed in air with heating rate 10 °C/min.
The powder diffraction patterns of harmotome were measured on a D2 Phaser Bruker AXS at room temperature with Ni-filtered Cu-Kα radia-tion (λ = 1.5406 Å). Data was collected in step-scan mode from 4 to 70 °2θ with 0.05 °2θ step and 1s exposure time.
CRySTAL STRUCTURE
A single crystal of harmotome from Zlatolist with dimensions 0.25 × 0.22 × 0.20 mm was mounted on a glass fibre and measured on an Oxford diffrac-tion Supernova diffractometer equipped with Atlas CCD detector. X-ray data collection was carried out at room temperature with monochromatic Mo-Kα radiation (λ = 0.71073 Å). After the initial matrix procedure, a C-centred unit cell (Laue class mmm) with parameters a = 9.9034(5), b = 14.2979(9), c = 14.1612(7) Å, and V = 2005.2(2) Å3 was selected. Data collection strategy was chosen for 100% com-pleteness and redundancy of 3.9. Data reduction and analysis were carried out with the CrysAlisPro program [16]. Lorentz and polarization corrections were applied to intensity data using WinGX [17]. Reliable model with satisfactory R-values was ob-tained using the P2/m space group and it was chosen for the refinement. For the framework atoms, start-ing coordinates were taken from [18], and the extra-
framework cations and water molecules were then assigned from the difference Fourier list. Structure refinements were performed using the program SHELXTL [17], employing neutral atomic scatter-ing factors. Due to the Si, Al disorder, tetrahedral positions were later refined with Si scattering fac-tors. Extraframework cations and water molecules were first refined using isotropic temperature fac-tors. Each occupancy parameter was refined by fix-ing the occupancies of the remaining atoms. At the final stage of refinement, anisotropic temperature factors were introduced. Unit cell dimensions and experimental details are given in Table 1.
The analysis of measured intensity peaks and diffraction patterns confirmed that the sample is harmotome (Fig. 2, PDF Card 00-053-1175) [19]. Atomic coordinates, thermal displacement param-eters, T–O–T angles, and T–O bond lengths, ac-quired from the X-ray single crystal measurement are listed in Tables 2-4.
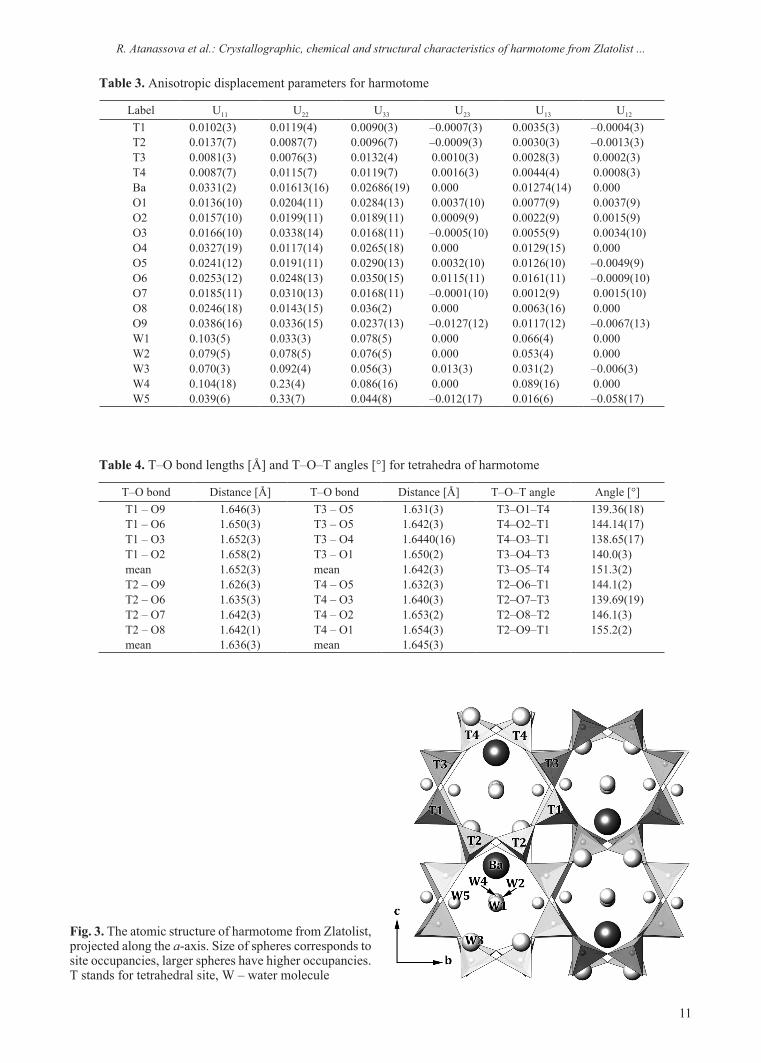
The structure of harmotome from Zlatolist has a phillipsite-type framework with chains of four-membered rings, parallel to the a-axis (Fig. 3). The arrangement of Si, Al tetrahedra leads to the for-mation of three types of eight-membered rings, run-ning along the three axes. Barium cations occupy the centre of the channels, parallel to the c-axis.
R. Atanassova et al.: Crystallographic, chemical and structural characteristics of harmotome from Zlatolist ...
Table 1. Experimental details for harmotome from Zlatolist
SampleParameter
Harmotome (this study)P121/m1
a [Å] 9.8903(5)b [Å] 14.1394(3)c [Å] 8.6713(4)β [°] 124.628(7)V [Å3] 997.81(8)№ of reflections 8642Rint 0.0266Rsigma 0.0344h min –12h max 13k min –20k max 18l min –9l max 13theta min [°] 2.85theta max [°] 32.82unique reflections 3516Ref. Fo > 4sigFo 3099№ of parameters 156R1 0.0403R(all) 0.0473GooF 1.064

10
R. Atanassova et al.: Crystallographic, chemical and structural characteristics of harmotome from Zlatolist ...
Table 2. Atomic coordinates, Uiso(Ueq) parameters and occupancies for harmotome
Label x y z Uiso or Ueq Occ.T1 –0.05692(10) –0.00826(6) 0.73246(10) 0.01031(16) 1T2 0.12075(10) 0.13889(6) 0.58390(10) 0.0110(6) 1T3 0.42053(10) 0.14073(6) 0.90646(10) 0.00990(16) 1T4 0.26340(10) –0.02459(6) 1.04746(11) 0.0105(6) 1Ba 0.86210(5) ¼ 0.16707(4) 0.02476(11) 0.93O1 0.6148(3) 0.11714(19) 0.9344(3) 0.0207(5) 1O2 0.0960(3) –0.05218(18) 0.8903(3) 0.0192(5) 1O3 0.2190(3) –0.0137(2) 1.2151(3) 0.0225(5) 1O4 0.4111(5) ¼ 0.9672(5) 0.0230(7) 1O5 0.3516(3) 0.07257(19) 1.0193(3) 0.0232(5) 1O6 –0.0049(3) 0.0915(2) 0.6651(4) 0.0269(6) 1O7 0.3119(3) 0.1291(2) 0.7102(3) 0.0234(5) 1O8 0.0666(5) ¼ 0.5432(5) 0.0261(8) 1O9 0.1035(4) 0.0921(2) 0.4077(4) 0.0318(6) 1W1 0.8845(10) ¼ 0.8450(9) 0.0621(19) 1W2 1.1986(10) ¼ 0.1881(10) 0.071(2) 1W3 0.6983(7) 0.1375(4) 0.3277(6) 0.0702(14) 1W4 0.532(3) ¼ 0.548(3) 0.124(12) 0.38W5 0.508(2) 0.048(3) 0.4793(19) 0.21(2) 0.42
Fig. 2. Powder pattern of harmotome from Zlatolist. All intensity peaks correspond to the diffraction pattern of harmotome (PDF Card 00-053-1175)
Barium is coordinated by seven O atoms from the framework (2 × O1, 2 × O3, 2 × O5, and O9) and by four water molecules (W1, W2, and 2 × W3). Two of the five refined water molecules (W4 and W5) are disordered and are not bonded to barium, similar to [18].
MORPHOLOGICAL PROPERTIES
Harmotome from Zlatolist is transparent with vitreous luster, and though crystals are typically col-ourless, some fragments may be yellow-brownish or pale beige. Crystal size ranging from several mm to
11
R. Atanassova et al.: Crystallographic, chemical and structural characteristics of harmotome from Zlatolist ...
Table 3. Anisotropic displacement parameters for harmotome
Label U11 U22 U33 U23 U13 U12
T1 0.0102(3) 0.0119(4) 0.0090(3) –0.0007(3) 0.0035(3) –0.0004(3)T2 0.0137(7) 0.0087(7) 0.0096(7) –0.0009(3) 0.0030(3) –0.0013(3)T3 0.0081(3) 0.0076(3) 0.0132(4) 0.0010(3) 0.0028(3) 0.0002(3)T4 0.0087(7) 0.0115(7) 0.0119(7) 0.0016(3) 0.0044(4) 0.0008(3)Ba 0.0331(2) 0.01613(16) 0.02686(19) 0.000 0.01274(14) 0.000O1 0.0136(10) 0.0204(11) 0.0284(13) 0.0037(10) 0.0077(9) 0.0037(9)O2 0.0157(10) 0.0199(11) 0.0189(11) 0.0009(9) 0.0022(9) 0.0015(9)O3 0.0166(10) 0.0338(14) 0.0168(11) –0.0005(10) 0.0055(9) 0.0034(10)O4 0.0327(19) 0.0117(14) 0.0265(18) 0.000 0.0129(15) 0.000O5 0.0241(12) 0.0191(11) 0.0290(13) 0.0032(10) 0.0126(10) –0.0049(9)O6 0.0253(12) 0.0248(13) 0.0350(15) 0.0115(11) 0.0161(11) –0.0009(10)O7 0.0185(11) 0.0310(13) 0.0168(11) –0.0001(10) 0.0012(9) 0.0015(10)O8 0.0246(18) 0.0143(15) 0.036(2) 0.000 0.0063(16) 0.000O9 0.0386(16) 0.0336(15) 0.0237(13) –0.0127(12) 0.0117(12) –0.0067(13)W1 0.103(5) 0.033(3) 0.078(5) 0.000 0.066(4) 0.000W2 0.079(5) 0.078(5) 0.076(5) 0.000 0.053(4) 0.000W3 0.070(3) 0.092(4) 0.056(3) 0.013(3) 0.031(2) –0.006(3)W4 0.104(18) 0.23(4) 0.086(16) 0.000 0.089(16) 0.000W5 0.039(6) 0.33(7) 0.044(8) –0.012(17) 0.016(6) –0.058(17)
Table 4. T–O bond lengths [Å] and T–O–T angles [°] for tetrahedra of harmotome
T–O bond Distance [Å] T–O bond Distance [Å] T–O–T angle Angle [°]T1 – O9 1.646(3) T3 – O5 1.631(3) T3–O1–T4 139.36(18)T1 – O6 1.650(3) T3 – O5 1.642(3) T4–O2–T1 144.14(17)T1 – O3 1.652(3) T3 – O4 1.6440(16) T4–O3–T1 138.65(17)T1 – O2 1.658(2) T3 – O1 1.650(2) T3–O4–T3 140.0(3)mean 1.652(3) mean 1.642(3) T3–O5–T4 151.3(2)T2 – O9 1.626(3) T4 – O5 1.632(3) T2–O6–T1 144.1(2)T2 – O6 1.635(3) T4 – O3 1.640(3) T2–O7–T3 139.69(19)T2 – O7 1.642(3) T4 – O2 1.653(2) T2–O8–T2 146.1(3)T2 – O8 1.642(1) T4 – O1 1.654(3) T2–O9–T1 155.2(2)mean 1.636(3) mean 1.645(3)
Fig. 3. The atomic structure of harmotome from Zlatolist, projected along the a-axis. Size of spheres corresponds to site occupancies, larger spheres have higher occupancies. T stands for tetrahedral site, W – water molecule

12
1.5 cm (Figs 4, 6). Large crystals up to ~3.5 cm have been collected rarely.
Optical and SEM observations indicate that the mineral prevalently forms penetration twins without re-entrant angels. The crystal habit is characterized by short prismatic pseudo-orthorhombic forms. Equant crystals and radiating aggregates are common. The
crystals are always pseudo-orthorhombic penetration twins. Twinning suture and combination striations can be detected on each crystal (Fig. 4b-d). Judging from the values of interfacial angles, the presence of characteristic striae parallel to the edge between {010} and {110} and twin suture running parallel to {001} the twin variety form pseudo-orthorhombic
R. Atanassova et al.: Crystallographic, chemical and structural characteristics of harmotome from Zlatolist ...
Fig. 4. Morphology of harmotome crystals: a) small amygdale partially filled by quartz, analcime and harmotome; b) twin variety after so-called morvenite law according to the characteristic striae parallel to the edge between {010} and {110} and twin suture running parallel to {001}; c) pseudo-orthorhombic twin, composed by four individuals; d) transparent crystals with oriented, stepped hillocks on {010} faces
Fig. 5. Crystallographic characteristics: a) microphotograph with characteristic uneven extinction, thin section under crossed polars; b) habit of a simple penetration twin
13
R. Atanassova et al.: Crystallographic, chemical and structural characteristics of harmotome from Zlatolist ...
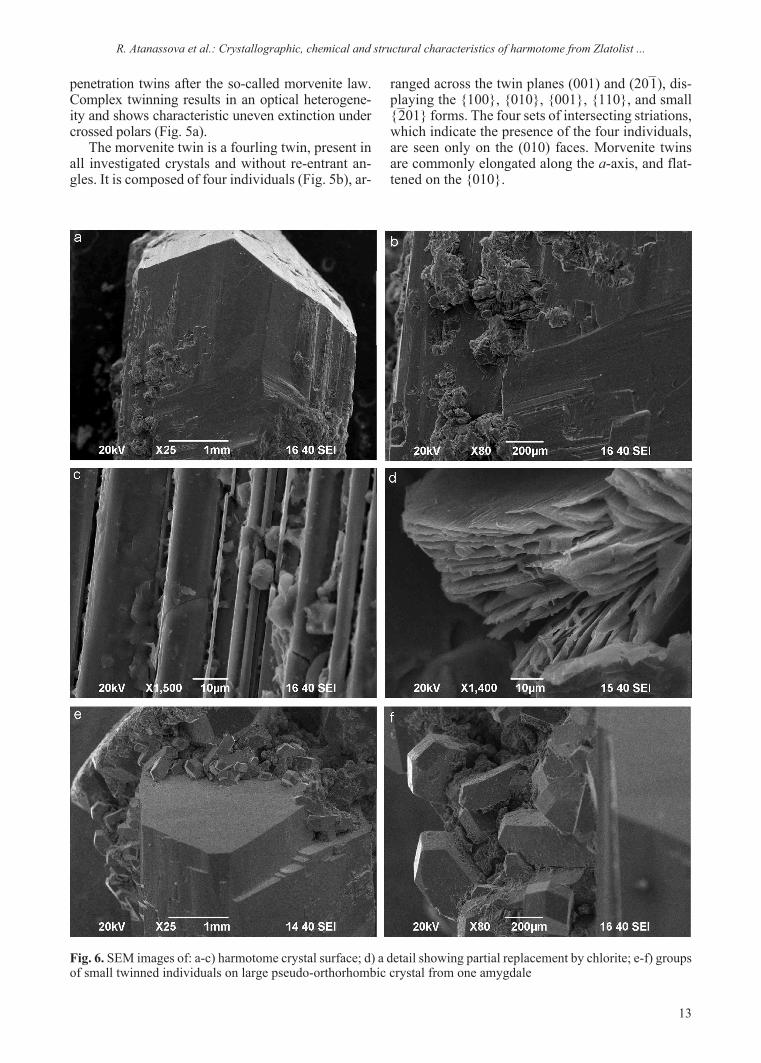
Fig. 6. SEM images of: a-c) harmotome crystal surface; d) a detail showing partial replacement by chlorite; e-f) groups of small twinned individuals on large pseudo-orthorhombic crystal from one amygdale
penetration twins after the so-called morvenite law. Complex twinning results in an optical heterogene-ity and shows characteristic uneven extinction under crossed polars (Fig. 5a).
The morvenite twin is a fourling twin, present in all investigated crystals and without re-entrant an-gles. It is composed of four individuals (Fig. 5b), ar-
ranged across the twin planes (001) and (20–1), dis-playing the {100}, {010}, {001}, {110}, and small {–201} forms. The four sets of intersecting striations, which indicate the presence of the four individuals, are seen only on the (010) faces. Morvenite twins are commonly elongated along the a-axis, and flat-tened on the {010}.

14
R. Atanassova et al.: Crystallographic, chemical and structural characteristics of harmotome from Zlatolist ...
Under SEM it is revealed that mineral surfaces of some crystals are decorated by spherulitic aggre-gates (Fig. 6b–d), probably after partial replacement by chlorite (?).
CHEMICAL COMPOSITION
The average chemical formula based on EPMA is as follows: Ba2.46Ca0.17K0.26[Al5.89Si10.19O32]·12H2O. Calcium and potassium are both conspicuous in the chemical composition of the harmotome stud-ied (Table 5). Sodium, magnesium and iron often reported in harmotome [20, 21] was not found us-ing EPMA. Additionally, the mineral analysed is characterized by distinctly higher amounts of alu-minium and barium than those cited in the literature. Si/(Si+Al) ratio shows an average value of 0.71 in Zlatolist, and ranges from 0.68 in crystals from trachy-andesite of Iskra, Bulgaria [14], to 0.76 in crystals from basalts of Weitendorf, Austria [22]. According to the average ratio (Ra) after Passaglia and Sheppard [23]
and experimentally determined in this study Ra=0.63 harmotome can be classified as intermediate zeolite.
Data are “reliable”, i.e. with the content of tet-rahedral cations (Si+Al) close to half of the oxy-gen atoms and the balance error E = [(Al–Altheor.)/Altheor.]×100 lower than 10% [24].
Chemical analyses were performed by electron microprobe and the water content is the result of normalization of data to 100%. The number of water molecules is known to be related to both structural and chemical parameters because it increases with Si/Al and divalent/monovalent cation ratios. Contents of H2O tend to decrease with increasing number and size of extra-framework cations, as well as with in-creasing temperature and decreasing P(H2O). Such variations can be vital to petrological, geochemical, environmental, and experimental considerations [6].
Minor and trace elements in harmotome are reg-istered also by LA-ICP-MS. Determined are up to 1.3 wt.% Na, 1.2 wt.% K, and 0.6 wt.% Ca. Traces of: Sr (330), V (100), Rb (65), Ti (26), Zn (20), Mn (16), Cu (15), P (15), Fe (14) in ppm are found.
Table. 5. Chemical analyses and formulae on the basis of 32 oxygens
wt.% Bar1 p.1 Bar1 p.2 Bar1 p.3 Bar2 p.1 Bar2 p.2 Bar2 p.3 Bar3 p.1 Bar3 p.2
Al2O3 18.42 18.68 22.18 18.29 18.11 21.72 18.57 18.65SiO2 39.53 40.55 38.3 39.04 40.81 37.99 39.91 39.23K2O 0.34 0.51 0.6 0.95 0.82 1.58 0.85 0.58CaO 0.63 1.68 0.25 0.42 0.46 0.71 0.15 0.56BaO 25.68 23.42 23.41 25.87 25.64 21.72 25.28 25.37MnO – 0.19 0.16 – 0.15 0.25 0.08 0.15Total 84.6 85.03 84.9 84.57 85.99 83.97 84.84 84.54H2O* 15.4 14.97 15.1 15.43 14.01 16.03 15.16 15.46*–H2O by difference to approx. 100 wt.% total
Weight % – analyses computed to 100% without H2OAl2O3 21.77 21.97 26.12 21.63 21.06 25.87 21.89 22.06SiO2 46.73 47.69 45.11 46.16 47.46 45.24 47.04 46.40K2O 0.40 0.60 0.71 1.12 0.95 1.88 1.00 0.69CaO 0.74 1.98 0.29 0.50 0.53 0.85 0.18 0.66BaO 30.35 27.54 27.57 30.59 29.82 25.87 29.80 30.01MnO 0.00 0.22 0.19 0.00 0.17 0.30 0.09 0.18Total 100.00 100.00 100.00 100.00 100.00 100.00 100.00 100.00
Number of cations on the bases of 32 oxygen equivalents, ignoring H2OAl 5.67 5.65 6.65 5.67 5.47 6.56 5.68 5.74Si 10.32 10.42 9.75 10.27 10.46 9.73 10.36 10.25K 0.11 0.17 0.20 0.32 0.27 0.52 0.28 0.19Ca 0.18 0.46 0.07 0.12 0.13 0.20 0.04 0.16Ba 2.63 2.10 2.33 2.67 2.58 2.18 2.57 2.60Mn 0.00 0.04 0.03 0.00 0.03 0.05 0.02 0.03
Si/(Si+Al) 0.65 0.65 0.59 0.64 0.66 0.60 0.65 0.64K/(K+Ba) 0.04 0.07 0.08 0.11 0.09 0.19 0.10 0.07
E% –5.56 –5.76 10.84 –5.45 –8.81 9.34 –5.35 –4.28

15
R. Atanassova et al.: Crystallographic, chemical and structural characteristics of harmotome from Zlatolist ...
The thermal behavior of harmotome, from TG-DTA-DTG measurements, with five different water sites in the structure, represents water loss in three steps: at 125, 210, and 280 °C, and complete dehy-dration at 400 °C.
GENETIC AND CONCLUDING REMARKS
Zeolites can originate from a variety of precur-sor materials including volcanic and impact glasses, aluminosilicate minerals including other zeolites, smectite, feldspars and feldspathoids [25]. Most of the famous zeolite specimens known from the mineral collections are incrustations on the walls of geodes and vugs of basic lavas (basalts sensu lato). The genesis of these crystals could be considered, as those occurring in non-volcanic rocks, due to hy-drothermal deposition [26]. Harmotome is known to have both sedimentary and hydrothermal origin; the second one being by far the most common [1, 25, 27]. However, zeolitic rocks, widespread in Eastern Rhodopes, are known as product of volcanic glass and pyroclastics transformation. Zeolites form more rapidly from glass than from crystalline materi-als, and the reaction rate of glass varies inversely with its silica content [28]. Most of the features of Zlatolist zeolites differ compared to microcrystal-line zeolites formed in sediments. Well-developed large crystals, number of zeolite species and aver-age chemical composition are indicative for hydro-thermal origin, according to the criteria suggested by Gottardi [26].
The source of barium, the element necessary in the formation of harmotome, could be barite concretions in adjacent pyroclastic rocks. Also, in some basic to intermediate rock varieties from the volcanic complex Ba-content up to 1970 ppm was determined [29]. Barium could have been derived from feldspars, common in the volcanic varieties of the area, as well. Moreover, Ba-sanidine with up to 8.9 wt.% BaO was recently described by yanev and Ivanova [30] from the acid volcanic varieties from the adjacent region in the Eastern Rhodopes.
Finally, the co-existence of the Zlatolist harmo-tome with chalcedony, quartz and calcite crystals and its occurrence in geodes indicates the hydro-thermal, probably low temperature, origin of the mineral with a transport of the substance at some distance.
Acknowledgements: The authors would like to ex press thanks to Stela Atanasova (Institute of Physical Chemistry, BAS) for SEM/EDS analyses and Vilma Petkova (Institute of Mineralogy and Crystallography, BAS) for DTA measurements.
REFERENCES
1. G. Gotardi, E. Galli, in: Natural zeolites, Springer-Verlag, 1985, p. 135.
2. A. Corma, Chem. Rev., 95, 559 (1995).3. Z. A. D. Lethbridge, J. J. Williams, R. I. Walton, K.
E. Evans, C. W. Smith, Micropor. Mesopor. Mater., 79, 339 (2005).
4. R. Brent, M.W. Anderson, Angew. Chem. Int. Ed., 47, 5327 (2008).
5. M. H. F. Kox, E. Stavitski, B. M. Weckhuysen, Angew. Chem. Int. Ed., 46, 3652 (2007).
6. D. Coombs, A. Alberti, T. Armbruster, G. Artioli, C. Colella, E. Galli, J. D. Grice, F. Liebau, J. A. Mandarino, H. Minato, E. H. Nickel, E. Passagila, D. R. Peacor, S. Quartieri, R. Rinaldi, M. Ross, R. A. Sheppard. E. Tllmanns, G. Vezzalini, Canadian Mineralogist, 35, 1571 (1997).
7. W. A. Deer, R. A. Howie, J. Zussman, Rock-forming minerals, vol. 4, Framework silicates, Longman, London, 1963.
8. Th. G. Sahama, M. Lehtinen, Mineralogical Magazine, 36, 444 (1967).
9. M. Akizuki, American Mineralogist, 66, 403 (1981).10. M. Akizuki, American Mineralogist, 70, 822 (1985).11. T. Thomson, Outlines of Mineralogy, geology and
mineral analysis, vols. I and II, London, 1836.12. R. Tschernich, Zeolites of the World, Geoscience
Pres., Arizona, 1992.13. T. Armbruster, M. Gunter, in: Natural Zeolites:
Occurrence, Properties, Applications, D. L. Bish, D. W. Ming (eds.), vol 45, Mineralogical Society of America, Virginia, 2001, p. 217.
14. I. Kostov, Annu. Univ. Sofia, Fac. Biol. Geol. Geogr. livre 2, Geol., 55, 159 (1962).
15. y. yanev, J.-J. Cochemé, R. Ivanova, O. Grauby, E. Burlet, R. Pravchanska, N. Jb. Miner. Abh., 182(3), 265 (2006).
16. Oxford Diffraction. CrysAlis PRO, Oxford Diffraction Ltd, yarnton, England, 2010.
17. G. M. Sheldrick, Acta Crystallographica A, 64, 112 (2008).
18. E. Stuckenschmidt, H. Fuess, A. Kvick, European Journal of Mineralogy, 2, 861 (1990).
19. J. Faber, T. Fawcett, Acta Crystallographica B, 58, 325 (2002).
20. R. Rinaldi, J. J. Pluth, J. V. Smith, Acta Crystallographica B, 2426 (1974).
21. P. Cherny, R. Rinaldi, R.C. Surdam, Neues Jahrb. Miner. Abh., 128(3), 312 (1977).
22. T. Armbruster, M. Wenger, T. Kohler, Mitt. Abt. Mineral. Landesmus., 59, 13 (1991).
23. E. Passaglia, R. A. Sheppard, in: Natural Zeolites: Occurrence, Properties, Applications, D. L. Bish, D. W. Ming (eds.), vol 45, Mineralogical Society of America, Virginia, 2001, p. 69.
24. E. Passaglia, American Mineralogist, 55, 1278 (1970).
25. R. L. Hay, R. A. Sheppard, in: Natural Zeolites: Occurrence, Properties, Applications, D. L. Bish, D. W. Ming (eds.), vol 45, Mineralogical Society of America, Virginia, 2001, p. 217.

16
26. G. Gottardi, European Journal of Mineralogy, 4, 479 (1989).
27. T. Wieser, Mineralogia Polonica, 16, 3 (1985).28. R. A. Sheppard, R. L. Hay, in: Natural Zeolites:
Occurrence, Properties, Applications, D.L. Bish, D.W Ming (eds.), vol 45, Mineralogical Society of America, Virginia, 2001, p. 261.
R. Atanassova et al.: Crystallographic, chemical and structural characteristics of harmotome from Zlatolist ...
29. y. yanev, R. Ivanova, Geochemistry, Mineralogy and Petrology, 48, 39 (2010).
30. B. yardonov, S. Sarov, S. Georgiev, V. Valkov, E. Balkanska, V. Grozdev, R. Marinova, N. Mar-kov, Explanatory note to the Geological Map of the Republic of Bulgaria Scale 1:50 000, 2008, p. 124.
КристалографсКи, химични и струКтурни хараКтеристиКи на хармотом от Златолист, иЗточни родопи, България
р. атанасова1*, р. д. Василева1, м. Кадийски2, З. Златев3
1Геологически институт, Българска академия на науките, 1113 София; 2 Институт по минералогия и кристалография , Българска академия на науките, 1113 София;
3 Българско минералогическо дружество, София
постъпила на 15 февруари, 2012 г.; приетa на 15 март, 2012 г.
(резюме)
през палеогена големи количества от средни и кисели вулканокластични скали са отложени в източните родопи, Южна България. повечето от тях са образувани в плиткоморски условия и в последствие са транс-формирани в глини, адулар, опал-CT и зеолити. интересна минерализация беше установена в празнини и ку-хини на базалтови андезити в района на с. Златолист. празнините, сега миндали са запълнени с калцит, кварц и разнообразни зеолити (хармотом, аналцим, морденит, хейландит и др.). сред тях хармотомът се отличава със забележителни добре оформени кристали с размер достигащ до 3,5 cm.
хармотомът е характеризиран с оптична микроскопия, прахова и монокристална рентгенография, SEM/EDS, микросондови анализи, LA-ICP-MS и DTа. изследваните кристали неизменно са изградени от комплек сни проникващи двойници. двойникуването симулира псевдоромбични форми съгласно морвени-тов закон на срастване. Кристалите са удължени по а-оста и с плочесто развитие по {010}. това комплексно двойникуване се отразява на оптичната хетерогенност и анизотропия.
средната кристалохимична формула е: Ba2.46Ca0.17K0.26[Al5.89Si10.19O32]·12H2O. определени са и 35 елементи-примеси и следи: до 1.3 тегл.% Na, 330 ppm Sr, and 26 ppm Ti. термичното поведение на хармотома се изразява в загуба на вода на три стъпки: при 125, 210, и 280 °C. окончателна дехидратация се достига при 400 °C.
Кристален фрагмент от хармотом е характеризиран и с монокристална рентгенова дифрактометрия. добър модел с удовлетворителни стойности на R (R1 = 0.0403; R(all) = 0.0473) е достигнат с използване на простран-ствената група P2/m, която е избрана за структурни уточнения. получените параметри на елементарна клетка са: a = 9.8903(5), b = 14.1394(3), c = 8.6713(4) Å, β = 124.628(7)° и V = 997.81(8) Å3. финалните уточнения включват всички атомни координати и анизотропни термични параметри.

17© 2012 Bulgarian Academy of Sciences, Union of Chemists in Bulgaria
* To whom all correspondence should be sent:E-mail: [email protected]
Bulgarian Chemical Communications, Volume 44, Proceedings of the IIIrd National Crystallographic Symposium (pp. 17–23) 2012
X-Ray, DTA and TGA analysis of zinc sulfide concentrates and study of their charging for roasting in fluidized bed furnace
B. S. Boyanov*, A. B. Peltekov
Paisii Hilendarski University of Plovdiv, Department of Chemical Technology 24 Tsar Asen St., Plovdiv, Bulgaria
Received March 20, 2012; Revised April 17, 2012
Bulgaria is a major producer of zinc in Central and Eastern Europe (about 100 000 tons per year). The two zinc metallurgical plants in KCM S.A., Plovdiv and LZC S.A., Kardjali deliver the necessary raw materials from Bulgaria and abroad.
In this connection, 7 Bulgarian and imported zinc concentrates have been investigated with the use of chemical analysis, X-ray phase analysis, DTA and тGа. The following phases were established: β-ZnS; nZnS.mFeS; CuFeS2; PbS; SiO2 (α-quartz). The phase β-ZnS is present in all concentrates and the other established phases are represented differently in the studied concentrates.
The results obtained are interpreted from the standpoint of receipt by roasting of an appropriate zinc calcine on the basis of its chemical and phase content. For this purpose a Web-based software system, developed by mathematicians and technologists from the Paisii Hilendarski University of Plovdiv, for calculating the charges of zinc concentrates at a fixed optimizing criterion was used. This enables appropriate mixture of materials to be processed during roasting of concentrates in fluidized bed furnace. This promotes obtaining of zinc calcine with minimum insoluble zinc ferrite and content of admixtures below certain technology requests.
Key words: ZnS, zinc concentrates, X-ray analysis, DTA and TGA, roasting.
INTRODUCTION
The synthesis and properties of pure ZnS [1–4] and ZnS doped with different impurities (P, Cu, Mn, Ag, Se, Te, etc.) [5–7] have been of interest for many years. This is due to the use of this sulfide in electronics, semiconductor equipment, optics, as a pigment, etc. [8–10]. Furthermore, iron ions are introduced into the crystal lattice of ZnS to obtain ZnS single-phase thin films showing ferromagnet-ism [11–13].
Zinc sulfide is essential zinc mineral in zinc ores [14]. Its two polymorphs are β-ZnS (Sphalerite) and α-ZnS (Wurtzite). Sphalerite is a typical hy-drothermal mineral with cubic structure m F 34 , and tetrahedrally coordinated zinc and sulfur atoms. Wurtzite has hexagonal (C63mc) symmetry, usually stabilized by some Cd. It is a rare species.
Sphalerite is the common mineral in zinc ores. It almost always contains iron. Varieties with more
than 6% Fe are named marmatite. Since marmatite has a brilliant black color like the black sphalerite, it very often goes unrecognized.
In addition to Fe, sphalerite in high-temperature deposits often contains Co, Cu, In, Sn and Se. Its impurities in low-temperature deposits are mainly Cd, Ga, Ge, Hg and Tl [14]. During the flotation of zinc ores, other mineral phases contribute Pb, SiO2, Al2O3, CaO, MgO, Ni, As, Sb, Cl, F to the chemical composition of zinc concentrates.
Currently, during the incoming control of zinc concentrates in processing plants, about 20 compo-nents are analyzed to determine whether a raw ma-terial is suitable for the used technology [15].
Very often it turns out that chemical analysis alone is not sufficient to choose the most suitable conditions for the successive implementation of the process chain “roasting of zinc concentrates – calcine leaching – electrowinning of zinc”. The main problem is the presence of increased contents of Fe, Pb and SiO2. Iron in the zinc concentrates can be connected as FeS2, CuFeS2 or incorporated in the crystal lattice of ZnS [16–18]. During the oxidation of zinc concentrates in the temperature

18
range 920–950 °C iron-containing sulfides oxidize and Fe2O3 is obtained. The iron (III) oxide forms ferrites with various metal oxides (mainly ZnO, ob-tained from the oxidation of ZnS). The formation of ZnFe2O4 [19–21] decreases the rate of leaching of zinc and necessitates further processing of the zinc-containing cake [22–24]. To reduce this unfa-vorable phenomenon, complete preliminary char-acterization of zinc concentrates is necessary.
Usually in practice various zinc raw materials are used simultaneously – often 5–6 zinc concen-trates having different origins and chemical, phase and granulometric compositions. It is necessary to conduct a preliminary assessment of the possibili-ties for optimization of the technological process, by calculating and using appropriate charges from zinc-containing materials.
The aim of this study is to characterize most completely the Bulgarian and imported zinc sulfide concentrates by chemical, X-ray, differential ther-mal and thermogravimetric analysis and to use the obtained results for their optimal processing. This can be done using the Web-based expert system for calculating zinc concentrate charges [15, 25].
EXPERIMENTAL
Seven zinc sulfide concentrates from Bulgaria, Turkey, Greece, Morocco and Peru are studied.
The X-ray phase analysis of the concentrates was carried out with an apparatus “TUR-M62” (Dresden, Germany) equipped with a computer-controlled HZG-4 goniometer with Co-Kα radiation and Bragg-Brentano geometry. Data base (Powder Diffraction Files, Joint Committee on Powder Diffraction Standards, Philadelphia PA, USA, 1997) was used for the phase identification.
DTA and TGA (Q Derivatograph, Hungary) were carried out under the following conditions: sensitiv-ity of DTA, 0.5 mV; DTG, 1 mV; TG, 100 mg; heat-ing rate, 10° min–1; sample mass 100 mg. A ceramic crucible was used. All the studies were performed in air medium.
A Web-based information system for calculation and prognosis of the chemical and phase composi-tion of the mix proportions of concentrates is used [15, 25]. It is built on a modular principle using serv-er programming language PHP. Its main modules provide opportunities for construction, management and use of Web-based database of zinc concentrates [15, 25] in the management control system relation-al database MySQL.
The used Web-based information system gives the following opportunities:
1. Input of the chemical composition of the used (available or in the process of being contracted to
be purchased) zinc concentrates, each of which is allotted a name and a number. Thus the main database of the system is created. At present there are data entered for 67 concentrates with different origin (Bulgarian, Turkish, etc.).
2. From the data in the main database up to 15 concentrates can be used, with which a working database is created that serves for calculations.
3. With concentrates from the working database the following calculations can be made:
A) In user mode calculations are made at user-selected ratio of the concentrates in the working database. For that purpose the percentage share of each separate concentrate is specified, and the sys-tem calculates the composition of the charge from zinc concentrates of 18 components.
B) In automatic mode the system calculates charges that meet restrictive conditions with regard to 11 components that are selected together with ex-perts in the field of zinc hydrometallurgy.
In this specific case work was performed sat-• isfying the following input restrictions (in mass %): Zn > 50; S – 31 ± 1%; Pb < 2.5; Fe < 9.0; SiO2 < 2.5; Sb < 0.008; As < 0.12; MgO < 0.3; CaO < 0.5; F < 0.02; Ge < 30 g/t.Various step changes in iterations of the con-• centrates can be selected – from 1 to 15%.The content is calculated of each charge that • meets the restrictive conditions and is present-ed under an appointed number.During oxidized roasting in a fluidized bed of • the charge made out of zinc concentrates a zinc calcine is obtained that is extracted using solu-tions of sulfuric acid.On the basis of data from literature, own stud-• ies and experience from practice coefficients are offered with which, based on the chemi-cal composition of the charge, calculations are made for the prognostic chemical and phase composition of the calcine.When more than one charge is obtained an op-• timization criterion is used according to which the charges are ranked in descending or as-cending order.For the optimization criterion in this study • “Zinc soluble in 7% solution of sulfuric acid” is used.The aim is to select a charge with maximum • soluble zinc in a 7% solution of sulfuric acid so that the extraction of the calcine can be carried out at the best technical and economical indices. All calculated charges are arranged in descend-ing order according to this technical index.The system also allows the use of other optimi-• zation criteria – minimal quantity of obtained zinc ferrite, maximum percentage of zinc in the charge, minimal prime cost of the charge, etc.
B. S. Boyanov, A. B. Peltekov: XRay, DTA and TGA analysis of zinc sulfide concentrates and study of their charging ...

19
Table 1. Chemical composition of sulfide zinc concentrates from Bulgaria (1, 2), Turkey (3, 4), Greece (5), Morocco (6), Peru (7)
Component Content (mass %)1 2 3 4 5 6 7
Zn 51.10 54.60 47.45 53.65 53.57 51.19 54.60S 31.60 30.30 34.50 31.50 32.50 33.20 32.40Fe 8.20 6.45 9.75 3.58 8.85 11.90 8.95Pb 2.85 1.60 0.65 4.28 1.06 0.67 0.61SiO2 2.25 4.30 3.30 3.58 0.95 0.66 1.75Cu 1.96 1.02 2.06 0.63 0.27 0.68 0.38Cd 0.29 0.28 0.23 0.25 0.30 0.10 0.09As 0.002 0.005 0.05 0.029 1.02 0.099 0.028Sb 0.001 0.001 0.002 0.003 0.02 0.002 0.001Co 0.006 0.027 0.006 0.012 0.001 0.006 0.006Ni 0.002 0.002 0.002 0.002 0.002 0.001 0.002CaO 0.38 0.54 0.43 0.19 0.30 0.42 0.41
RESULTS AND DISCUSSION
Chemical composition
The chemical composition of the studied zinc concentrates is presented in Table 1.
Most concentrates show high content of Pb and SiO2. Improper mixing of such concentrates can lead to partial aggregation of calcine and increase of the sulfide sulfur in it. Iron is particularly undesirable in terms of ferrite formation. Its harmful effects may be limited by appropriate selection of a charge, well balanced in its chemical composition. Especially unfavorable in terms of As and Sb are the concen-trates with numbers 5 and 6. The strong harmful in-fluence of these components in zinc еlectrowinning from zinc sulfate solutions is well known, as well as all the negative consequences [26].
Xray phase analisis
Sphalerite (β-ZnS) is the main phase in sulfide zinc concentrates. This shows that in terms of the process of oxidative roasting the majority of zinc will form oxide, which is favorable for the calcine leaching.
At the same time it can be argued with some prob-ability that in all concentrates the phase marmatite (nZnS.mFeS) is observed. The crystal lattice of ZnS can include different amounts of iron [27–29]. Co-oxidation of zinc and iron sulfide at 920–950 °C leads to the formation of zinc ferrite that goes di-rectly into the cake after zinc leaching. The Zn con-tent in the cake is in the range of 15–17% the major part of which is due to the ferrite.
The studied zinc concentrates were subjected to X-ray analysis to determine their phase compo-sition. The resulting X-ray diffraction patterns are presented in Figure 1 and summarized in Table 2.
Fig. 1. X-ray diffraction patterns of studied zinc sulfide concentrates: Bulgaria (1, 2), Turkey (3, 4), Greece (5), Morocco (6), Peru (7)
DTA and TGA study
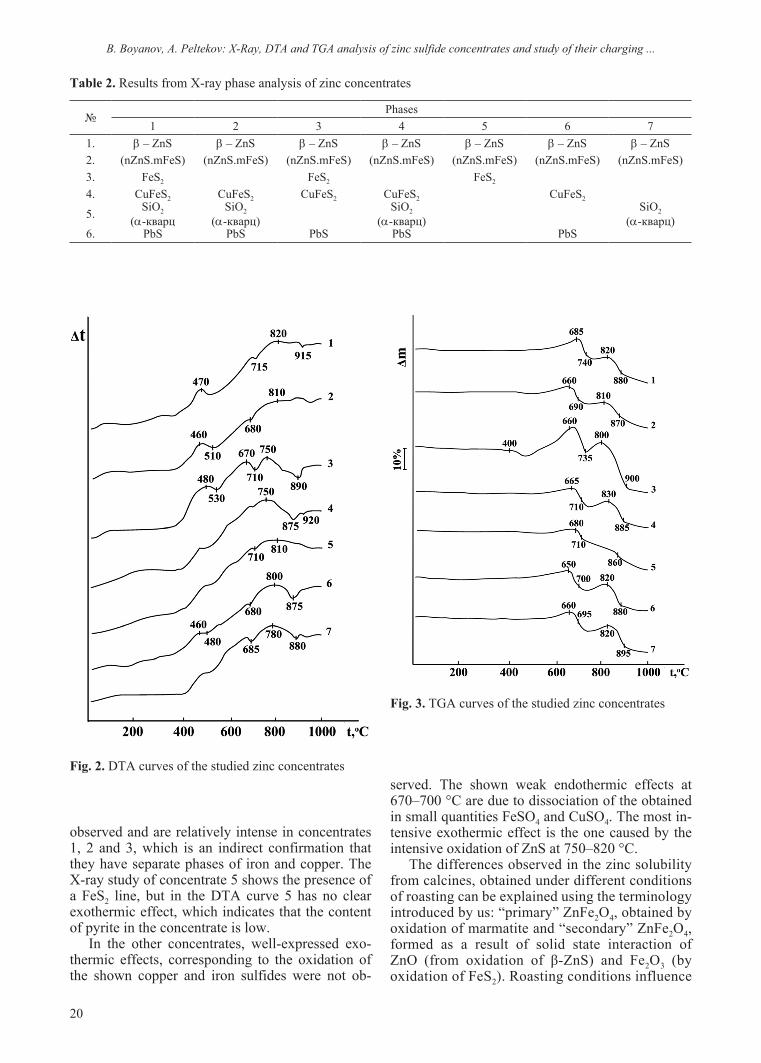
The obtained DTA and TGA curves are com-bined into general graphs (Figs. 2 and 3). The ob-served exothermic effects in the temperature range of 450–500 °C are due to oxidation of iron and cop-per sulfides (CuFeS2, FeS2). These effects are best
B. S. Boyanov, A. B. Peltekov: XRay, DTA and TGA analysis of zinc sulfide concentrates and study of their charging ...
20
observed and are relatively intense in concentrates 1, 2 and 3, which is an indirect confirmation that they have separate phases of iron and copper. The X-ray study of concentrate 5 shows the presence of a FeS2 line, but in the DTA curve 5 has no clear exothermic effect, which indicates that the content of pyrite in the concentrate is low.
In the other concentrates, well-expressed exo-thermic effects, corresponding to the oxidation of the shown copper and iron sulfides were not ob-
served. The shown weak endothermic effects at 670–700 °C are due to dissociation of the obtained in small quantities FeSO4 and CuSO4. The most in-tensive exothermic effect is the one caused by the intensive oxidation of ZnS at 750–820 °C.
The differences observed in the zinc solubility from calcines, obtained under different conditions of roasting can be explained using the terminology introduced by us: “primary” ZnFe2O4, obtained by oxidation of marmatite and “secondary” ZnFe2O4, formed as a result of solid state interaction of ZnO (from oxidation of β-ZnS) and Fe2O3 (by oxidation of FeS2). Roasting conditions influence
B. Boyanov, A. Peltekov: XRay, DTA and TGA analysis of zinc sulfide concentrates and study of their charging ...
Table 2. Results from X-ray phase analysis of zinc concentrates
№Phases
1 2 3 4 5 6 71. β – ZnS β – ZnS β – ZnS β – ZnS β – ZnS β – ZnS β – ZnS2. (nZnS.mFeS) (nZnS.mFeS) (nZnS.mFeS) (nZnS.mFeS) (nZnS.mFeS) (nZnS.mFeS) (nZnS.mFeS)3. FeS2 FeS2 FeS2
4. CuFeS2 CuFeS2 CuFeS2 CuFeS2 CuFeS2
5. SiO2 (α-кварц
SiO2 (α-кварц)
SiO2 (α-кварц)
SiO2 (α-кварц)
6. PbS PbS PbS PbS PbS
Fig. 2. DTA curves of the studied zinc concentrates
Fig. 3. TGA curves of the studied zinc concentrates
21
B. S. Boyanov, A. B. Peltekov: XRay, DTA and TGA analysis of zinc sulfide concentrates and study of their charging ...
tained calcine. The system also allows optimization on economic criteria, when the concentrate prices are known.
CONCLUSIONS
1. X-ray, differential thermal and thermogravi-metric analysis of 7 Bulgarian and imported zinc sulphide concentrate are made.
2. The relationship between the phase composi-tion and type of the obtained DTA and TG curves is shown, highlighting the influence of FeS2 and CuFeS2 phases on the mass change of samples and allowing the opportunity to establish the presence of these phases in concentrates on the basis of the TG curves obtained.
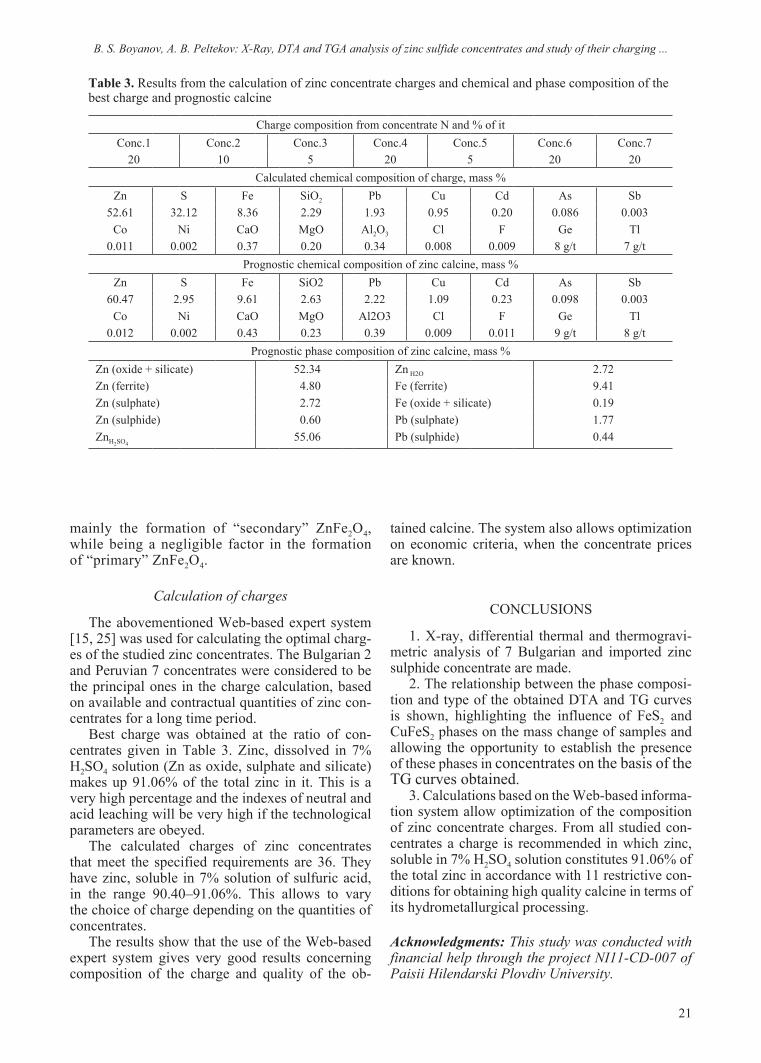
3. Calculations based on the Web-based informa-tion system allow optimization of the composition of zinc concentrate charges. From all studied con-centrates a charge is recommended in which zinc, soluble in 7% H2SO4 solution constitutes 91.06% of the total zinc in accordance with 11 restrictive con-ditions for obtaining high quality calcine in terms of its hydrometallurgical processing.
Acknowledgments: This study was conducted with financial help through the project NI11CD007 of Paisii Hilendarski Plovdiv University.
Table 3. Results from the calculation of zinc concentrate charges and chemical and phase composition of the best charge and prognostic calcine
Charge composition from concentrate N and % of itConc.1 Conc.2 Conc.3 Conc.4 Conc.5 Conc.6 Conc.7
20 10 5 20 5 20 20Calculated chemical composition of charge, mass %
Zn S Fe SiO2 Pb Cu Cd As Sb52.61 32.12 8.36 2.29 1.93 0.95 0.20 0.086 0.003
Co Ni CaO MgO Al2O3 Cl F Ge Tl0.011 0.002 0.37 0.20 0.34 0.008 0.009 8 g/t 7 g/t
Prognostic chemical composition of zinc calcine, mass %Zn S Fe SiO2 Pb Cu Cd As Sb
60.47 2.95 9.61 2.63 2.22 1.09 0.23 0.098 0.003Co Ni CaO MgO Al2O3 Cl F Ge Tl
0.012 0.002 0.43 0.23 0.39 0.009 0.011 9 g/t 8 g/tPrognostic phase composition of zinc calcine, mass %
Zn (oxide + silicate) 52.34 Zn H2O 2.72Zn (ferrite) 4.80 Fe (ferrite) 9.41Zn (sulphate) 2.72 Fe (oxide + silicate) 0.19Zn (sulphide) 0.60 Pb (sulphate) 1.77ZnH2SO4
55.06 Pb (sulphide) 0.44
mainly the formation of “secondary” ZnFe2O4, while being a negligible factor in the formation of “primary” ZnFe2O4.
Calculation of charges
The abovementioned Web-based expert system [15, 25] was used for calculating the optimal charg-es of the studied zinc concentrates. The Bulgarian 2 and Peruvian 7 concentrates were considered to be the principal ones in the charge calculation, based on available and contractual quantities of zinc con-centrates for a long time period.
Best charge was obtained at the ratio of con-centrates given in Table 3. Zinc, dissolved in 7% H2SO4 solution (Zn as oxide, sulphate and silicate) makes up 91.06% of the total zinc in it. This is a very high percentage and the indexes of neutral and acid leaching will be very high if the technological parameters are obeyed.
The calculated charges of zinc concentrates that meet the specified requirements are 36. They have zinc, soluble in 7% solution of sulfuric acid, in the range 90.40–91.06%. This allows to vary the choice of charge depending on the quantities of concentrates.
The results show that the use of the Web-based expert system gives very good results concerning composition of the charge and quality of the ob-

22
REFERENCES
1. R. Vacassy, S. M. Scholz, J. Dutta, C. J. G. Plummer, R. Houriet, H. Hofmann, Journal of the American Ceramic Society, 81, 2699 (1998).
2. M. Bouroushian, Electrochemistry of Metal Chalco-genides, Springer-Verlag Berlin Heidelberg, 2010.
3. T. Kanniainen, Studies of Zinc and Lead Chalcogenide Thin Films Grown by SILAR (Successive Ionic Layer Adsorption and Reaction) Technique, University of Helsinki, 2001, ISBN 952-91-3895-4 (Print), ISBN 952-10-0155-0 (PDF)
4. y. Ding, X. D. Wang, Z. L. Wang, Chemical Physics Letters, 398, 32 (2004).
5. C. F. Wang, H. Bo, H. H. yi, W. B. Li, Optics & Laser Technology, 43, 1453 (2011).
6. J. Liu, C. Zhao, Z. Li, J. Chen, H. Zhou, S. Gu, y. Zeng, y. Li, y. Huang, Journal of Alloys and Compounds, 509, 9428 (2011).
7. P. yang, M. Lu, D. Xu, D. yuan, G. Zhou, Chemical Physics Letters, 336, 78 (2001).
8. Z. Zhao, F. Geng, H. Cong, J. Bai, H.M. Cheng, Nanotechnology, 17, 4731 (2006).
9. W. Q. Peng, G. W. Cong, S. C. Qu, Z. G. Wang, Optical Materials, 29, 313 (2006).
10. y. F. Nicolau, M. Duouy, M. Brunel, Journal of the Electrochemical Society, 137, 2915 (1990).
11. P. P. Chin, J. Ding, J. B. yi, B. H. Liu, Journal of Alloys and Compounds, 390, 255 (2005).
12. O. Khani, H. R. Rajabi, M. H. yousefi, A. A. Khosravi, M. Jannesari, M. Shamsipur, Spectrochimica Acta – Part A: Molecular and Biomolecular Spectroscopy, 79, 361 (2011).
13. F. Zhu, S. Dong, G.yang, Optoelectronics and Advanced Materials – Rapid Communications, 4, 2072 (2010).
14. I. Kostov, Mineralogy, Nauka i Izkustvo, Sofia, 1973 (in Bulgarian).
15. B. S. Boyanov, M. P. Sandalski, K. I. Ivanov, World Academy of Science, Engineering and Technology, 73, 420 (2011).
16. B. S. Boyanov, R. I. Dimitrov, Z. D. Zivkovic, Thermochimica Acta, 269, 123 (1997).
17. R. I. Dimitrov, N. Moldovanska, I. K. Bonev, Z. Ziv-covic, Thermochimica Acta, 362, 145 (2000).
18. Z. D. Zivkovic, D. Zivkovic, D. Grujicic, N. Strbac, V. Savovic, Journal of Thermal Analysis, 54, 35 (1998).
19. T. T. Chen, J. E. Dutrizac, JOM, 56, 46 (2004).20. R. Hansson, P.C. Hayes, E. Jak, Metal. Meter. Trans.
B, Process Metallurgy and Materials Processing Science, 36, 179 (2005).
21. B. S. Boyanov, R. I. Dimitrov, Journal of Mining and Metallurgy, 33 (1B) 95 (1997).
22. V. N. Ramachandra Sarma, K. Deo, A. K. Biswas, Hydrometallurgy, 2, 171 (1976).
23. H. Takala, Erzmetall: Journal for Exploration, Mining and Metallurgy, 52, 37 (1999).
24. J. Krueger, R. Puellenberg, Erzmetall: Journal for Exploration, Mining and Metallurgy, 34, 380 (1981).
25. M. P. Sandalski, B. S. Boyanov, P. G. Georgiev, A. K. Sotirov, Proceedings of 42nd International October Conference of Mining and Metallurgy, S. Ivanov, D. Zivkovic (eds.), University of Belgrade – Technical Faculty in Bor, 2010, p. 569.
26. J. C. Balarni, L. d. O. Poli, T. L. S. Miranda, R. M. Z. d. Castro, A. Salum, Minerals Engineering, 21, 100 (2008).
27. K. Wright, J. D. Gale, Geochimica et Cosmochimica Acta, 74, 3514 (2010).
28. E. G. Osadchii, y. E. Gorbaty, Geochimica et Cosmochimica Acta, 74, 568 (2010).
29. S. Kharbish, Physics and Chemistry of Minerals, 34, 551 (2007).
B. S. Boyanov, A. B. Peltekov: XRay, DTA and TGA analysis of zinc sulfide concentrates and study of their charging ...

23
рентгенофаЗоВ, DTA и TG аналиЗ на сулфидни цинКоВи Концентрати и иЗследВане тяхното пържене
В пещ с Кипящ слой
Б. с. Боянов, а. Б. пелтеков
Пловдивски университет „Паисий Хилендарски“, катедра „Химична технология“, ул. „Цар Асен“ № 24, Пловдив, България
постъпила на 20 март, 2012 г.; приетa на 17 април, 2012 г.
(резюме)
България е основен производител на цинк в централна и източна европа (около 100 000 тона годишно). двата цинкови завода в Кцм ад, пловдив и оцК еоод, Кърджали доставят необходимите суровини от България и чужбина.
В тази връзка, 7 български и вносни цинкови концентрати бяха изследвани с използване на химичен, рентгенофазов анализ, дта и тга. В тях са установени следните фази: β-ZnS; nZnS.mFeS; CuFeS2; PbS; SiO2 (α-кварц). фазата β-ZnS присъства във всички концентрати, а другите фази са представени в различна степен в изследваните концентрати.
получените резултати са интерпретирани от гледна точка на получаване на подходяща цинкова угарка при пърженето съгласно нейния химичен и фазов състав. За тази цел е използвана Web-базирана програмна система, разработена от математици и технолози от пловдивския университет „паисий хилендарски“ за из-числяване на шихти от цинкови концентрати при използване на определен оптимизиращ критерий. това поз-волява по време на пърженето на концентратите в пещ с кипящ слой да се преработват подходящи по състав шихти. това допринася за получаване на цинкова угарка с минимално количество неразтворим цинков ферит и съдържание на примесни компоненти съгласно определени технологични изисквания.
B. S. Boyanov, A. B. Peltekov: XRay, DTA and TGA analysis of zinc sulfide concentrates and study of their charging ...

24
* To whom all correspondence should be sent:E-mail: [email protected]
© 2012 Bulgarian Academy of Sciences, Union of Chemists in Bulgaria
Bulgarian Chemical Communications, Volume 44, Proceedings of the IIIrd National Crystallographic Symposium (pp. 24–29) 2012
Preparation and investigation of nanodimensional nickel ferrite
Z. P. Cherkezova-Zheleva1*, K. L. Zaharieva1, V. S. Petkova2, B. N. Kunev1, I. G. Mitov1
1 Institute of Catalysis, Bulgarian Academy of Sciences, “Acad. G. Bonchev” St., Bl. 11, 1113 Sofia, Bulgaria 2 Institute of Mineralogy and Crystallography, Bulgarian Academy of Sciences, Acad. G. Bonchev St.,
Block 107, 1113 Sofia, Bulgaria
Received April 27, 2012; Revised May 4, 2012
Nickel ferrites with different Ni content – NixFe3–xO4, 0 ≤ x ≤1 are technologically important materials for micro-wave, electronic and magnetic storage devices. These materials are members of solid solution series of spinel-type materials (Fe3O4–NiFe2O4) having specific magnetic properties and different degree of electron delocalization. They demonstrate good gas sensing properties and catalytic activity in various catalytic processes, such as complete oxi-dation of waste gases, oxidative dehydrogenation of hydrocarbons, decomposition of alcohols etc. Up today, much attention has been paid to the preparation of such nanocrystalline materials, because of difficulty of their synthesis procedures and special techniques used. However the problem is still topical. The nickel contained ferrite materials NixFe3–xO4 (x=0.25, 0.5, 1) were prepared by co-precipitation method using FeCl3·6H2O, FeCl2·4H2O and NiCl2·6H2O as precursors in our previous investigations. But small quantities of intermediate phase – FeOOH was obtained in synthesized material. So the aim of the study is to find cheap and easy way for preparation of nano-sized magnetite-type materials. In order to prepare single phase spinel material thermogravimetric, differential thermogravimetric and differential thermal analysis (TG, DTG and DTA), as well as different chemical and structural studies such as X-ray diffraction (XRD), Moessbauer spectroscopy, were done. As a result of investigation the appropriate prepara-tion conditions are obtained. The synthesis procedure includes combination of co-precipitation combined with low temperature thermal treatment of materials.
Key words: nickel ferrites, nano-sized powders, low temperature theatment, thermal analysis, Moessbauer spectroscopy, X-ray diffraction analysis.
INTRODUCTION
Preparation of high-quality magnetic nanopar-ticles with a narrow size distribution, reproduc-ible physical properties and production with short processing times is one of the key issues in nano-particle research today. Recent studies have also fo-cused on the development of novel synthesis tech-niques for the production of uniform magnetic oxide materials [1]. Nanoparticles with controlled sizes and properties can be synthesized by wet chemi-cal techniques [2]. It is known that the crystal size is related to the relative interdependence between the nucleation and growth steps, which in turn can strongly be affected by the solution chemistry and precipitation conditions [3].
Nanosized NiFe2O4 is one type of ferrite that has been studied intensively. It shows peculiar struc-tural and magnetic properties. Small particle size promotes a mixed spinel structure whereas the bulk form is an inverse spinel. As far as the magnetic properties of these materials are concerned, spin glass like behavior can be considered as the most interesting property that leads to high field irrevers-ibility, shift of the hysteresis loops, and anomalous relaxation dynamics [4]. The properties of ferrite particles are influenced by the composition and microstructure, which are sensitive to the prepara-tion methodology used in their synthesis [5]. The magnetic and the electrical properties of ferrites are reported to be highly sensitive to the cation distribu-tion, which in turn depend on the material of synthe-sis and sintering conditions [1]. The catalytic prop-erties of spinels containing transition metal ions are dependent on the redox properties of substituting ions and on their distribution among the octahedral and tetrahedral coordination sites. The surface of

25
Z. CherkezovaZheleva et al.: Preparation and investigation of nanodimensional nickel ferrite
spinel oxide powders contains mainly octahedral sites and, consequently, its catalytic activity is cru-cially related to the octahedral cations [6].
The main direction of our present research is to obtain a single phase nano-sized nickel ferrites NixFe3–xO4 (x=0.25, 0.5, 1) promising as catalyst and magnetic material. In order to obtain this ferrite material will be made low temperature treatment at different temperatures of nickel contained ferrite sample produced by chemical co-precipitation pro-cedure. The structural properties of samples at each stage of the synthesis are studied using the follow-ing methods as Thermal analysis, X-ray diffraction analysis, Moessbauer spectroscopy.
EXPERIMENTAL
The nickel contained ferrite samples: Sample A – NixFe3–xO4 (x=0.25), Sample B – NixFe3–xO4 (x=0.5) and Sample C – NixFe3–xO4 (x=1) were produced using chemical co-precipitation method described in details previously [7]. Dried brown ferrite pow-ders were investigated by using several methods for characterization.
The thermal analysis as TG, DTG and DTA are obtained with a “Stanton Redcroft” (England) in-stallation equipped with a PC. The 10.00 mg pre-pared nickel contained ferrite samples are heating in the temperature range 20–1000 °C at 10 °C/min heating rate in stabilized corundum crucible and air medium with flow – 1l/h.
Moessbauer measurements were carried out with apparatus Wissenschaftliche Elektronik GmbH, working with a constant acceleration mode, 57Co/Cr source, α-Fe standard. The computer fitting was used to determine the parameters of hyperfine interactions of Moessbauer spectral components: isomer shift (IS), quadrupole splitting (QS), hyperfine effective magnetic field in the site of iron nuclei (Heff), line widths (FW) and component relative weights (G).
X-ray diffraction (XRD) patterns of the nanos-tructured nickel ferrite samples during the synthesis were performed with a TUR M62 apparatus with computer management and data collection, working with HZG-4 goniometer and CoKα radiation. The presence of the phases was determined with JCPDS database (Powder Diffraction Files, Joint Committee on Powder Diffraction Standards, Philadelphia PA, USA, 1997). Scherrer equation was used to made calculation of the average crystallite size, lattice microstrain parameter and unit cell parameter of the ferrite samples [8].
The effect of thermal treatment of the nickel contained ferrites is investigated for different times and at different temperatures in argon medium in the furnace “Eurotherm”, England.
RESULTS AND DISCUSSION
Series of nickel contained ferrite samples with different stoihiometry NixFe3–xO4 (x=0.25, 0.5 and 1) were produced using co-precipitation procedure [7]. These materials are members of solid solution series of spinel materials Fe3O4–NiFe2O4 and different de-gree of incorporation of Ni metal ion in the magnet-ite host matrix is expected. Physicochemical char-acterization of materials shows their ultradisperse character. However small quantities of intermediate oxihydroxide phase (FeOOH) was also obtained in
Fig. 1. TG, DTG and DTA curves of synthesized nickel contained ferrite samples
26
all samples, due to incompletely realized synthesis process. In order to prepare single phase material number of initial analysis are carried out. The be-haviour of synthesized ferrite materials during the thermal treatment gives results concerning the fur-ther investigations about effect of calcinations as the dehydration and dehydrogenation temperatures and crystallisation processes (see Fig. 1).
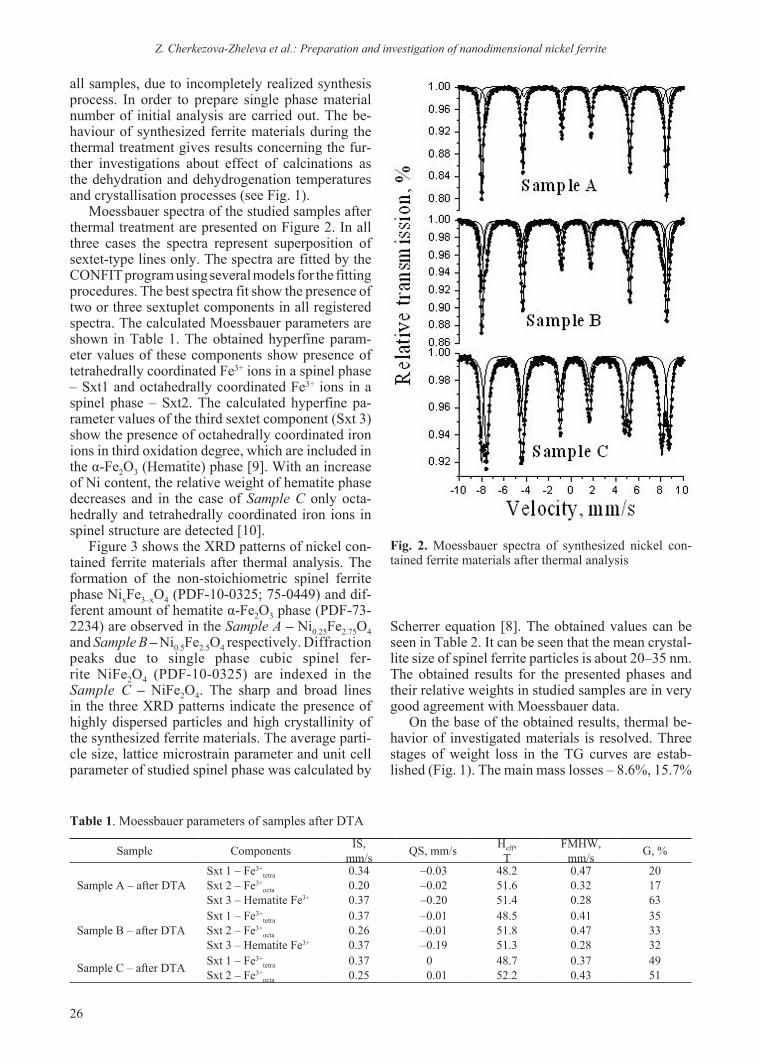
Moessbauer spectra of the studied samples after thermal treatment are presented on Figure 2. In all three cases the spectra represent superposition of sextet-type lines only. The spectra are fitted by the CONFIT program using several models for the fitting procedures. The best spectra fit show the presence of two or three sextuplet components in all registered spectra. The calculated Moessbauer parameters are shown in Table 1. The obtained hyperfine param-eter values of these components show presence of tetrahedrally coordinated Fe3+ ions in a spinel phase – Sxt1 and octahedrally coordinated Fe3+ ions in a spinel phase – Sxt2. The calculated hyperfine pa-rameter values of the third sextet component (Sxt 3) show the presence of octahedrally coordinated iron ions in third oxidation degree, which are included in the α-Fe2O3 (Hematite) phase [9]. With an increase of Ni content, the relative weight of hematite phase decreases and in the case of Sample C only octa-hedrally and tetrahedrally coordinated iron ions in spinel structure are detected [10].
Figure 3 shows the XRD patterns of nickel con-tained ferrite materials after thermal analysis. The formation of the non-stoichiometric spinel ferrite phase NixFe3–xO4 (PDF-10-0325; 75-0449) and dif-ferent amount of hematite α-Fe2O3 phase (PDF-73-2234) are observed in the Sample A – Ni0.25Fe2.75O4 and Sam ple B – Ni0.5Fe2.5O4 respectively. Diffraction peaks due to single phase cubic spinel fer-rite NiFe2O4 (PDF-10-0325) are indexed in the Sample C – NiFe2O4. The sharp and broad lines in the three XRD patterns indicate the presence of highly dispersed particles and high crystallinity of the synthesized ferrite materials. The average parti-cle size, lattice microstrain parameter and unit cell parameter of studied spinel phase was calculated by
Fig. 2. Moessbauer spectra of synthesized nickel con-tained ferrite materials after thermal analysis
Table 1. Moessbauer parameters of samples after DTA
Sample Components IS,mm/s QS, mm/s Heff,
TFMHW,
mm/s G, %
Sample A – after DTASxt 1 – Fe3+
tetra
Sxt 2 – Fe3+octa
Sxt 3 – Hematite Fe3+
0.340.200.37
–0.03–0.02–0.20
48.251.651.4
0.470.320.28
201763
Sample B – after DTASxt 1 – Fe3+
tetra
Sxt 2 – Fe3+octa
Sxt 3 – Hematite Fe3+
0.370.260.37
–0.01–0.01–0.19
48.551.851.3
0.410.470.28
353332
Sample C – after DTA Sxt 1 – Fe3+tetra
Sxt 2 – Fe3+octa
0.370.25
00.01
48.752.2
0.370.43
4951
Scherrer equation [8]. The obtained values can be seen in Table 2. It can be seen that the mean crystal-lite size of spinel ferrite particles is about 20–35 nm. The obtained results for the presented phases and their relative weights in studied samples are in very good agreement with Moessbauer data.
On the base of the obtained results, thermal be-havior of investigated materials is resolved. Three stages of weight loss in the TG curves are estab-lished (Fig. 1). The main mass losses – 8.6%, 15.7%
Z. CherkezovaZheleva et al.: Preparation and investigation of nanodimensional nickel ferrite

27
pared with this one at 356.8 °C for Ni0.5Fe2.5O4. The absence of exothermic effect around this tem-perature in the thermal behavior of ferrite material Sample C – NiFe2O4 is connected with the presence of single spinel ferrite phase only. The registered DTA thermograms of all studied samples show the second exothermic peak at 590.7 °C, 565.0 °C and 554.6 °C, respectively. It can be attributed to forma-tion and crystallization of nickel ferrite phase in all prepared ferrite samples.
In order to prepare single phase materials the co-precipitated samples have to be heated in inert atmosphere to avoid oxidation. The interpretation of the above presented thermal analysis data gives as a result the appropriate temperature of heating 300 °C. The crystal water from the materials is dehydrated at temperatures lower than 300 °C and therefore the synthesis of ferrites below this temperature can be done. The lowest temperature to start the synthesis in isothermal conditions is 300 °C. A fresh reaction surface is formed, during the process of dehydra-tion. Getting a fresh reactive surface and the heat-ing in the inert atmosphere, are a basics for the syn-thesis of ferrite compounds. Figure 4 presents the X-ray diffraction pattern of Sample B – Ni0.5Fe2.5O4
Z. CherkezovaZheleva et al.: Preparation and investigation of nanodimensional nickel ferrite
Fig. 3. XRD patterns of synthesized nickel contained fer-rite materials after thermal analysis
Table 2. Calculated values of mean crystallite size (D), lattice strain (e) and unite cell parameter (a) of spinel ferrite phase
Sample D, nm e, a.u a, ANi0.25Fe2.75O4 21 3,5.10-3 8.34Ni0.5Fe2.5O4 28 2,4.10-3 8.33
NiFe2O4 34 0,7.10-3 8.31
Fig. 4. XRD pattern of Sample B – Ni0.5Fe2.5O4 after heat-ing at 300 °C in argon media
and 16.7% results from dehydration process. The presence of endothermic peak in the temperature re-gion 20–200 °C is related to remove of water mol-ecules coordinated in crystal lattice. The exothermic effects at 348.0oC, 356.8oC of the ferrite materials Sample A – Ni0.25Fe2.75O4 and Sample B – Ni0.5Fe2.5O4 in the DTA curves and weight losses 7.8%, 5.1% and 6.5% are assigned to the thermal transforma-tion of intermediate phase β-FeOOH and formation of hematite phase α-Fe2O3 respectively [11–14]. A high presence of hematite due to a low content of nickel in spinel ferrite Ni0.25Fe2.75O4 explains the more intensive exothermic peak at 348.0 °C com-
28
Z. CherkezovaZheleva et al.: Preparation and investigation of nanodimensional nickel ferrite
after heating at 300 °C in inert atmosphere (Ar me-dia) as an example. It clearly shows the preparation of ultra dispersed single phase spinel material. The exact composition of sample will be established by chemical analysis, but all studied materials are members of solid solution series Fe3O4 (PDF-75-0449) – NiFe2O4 (PDF-10-0325). The presence of single phase composition shows the incorporation of Ni2+ ions in the magnetite host matrix.
CONCLUSIONS
Physicochemical characterization of prepared by co-precipitation procedure series of ferrite materials with different stoichiometry NixFe3–xO4 (x = 0.25, 0.5, 1) are carried out using different techniques. The DTA-TG study and the obtained analysis results show the dehydration and dehydrogenation tem-peratures and crystallisation processes, as well as the appropriate conditions for preparation of single phase materials. High dispersion and nano-size par-ticles is registered in all studied samples. The stud-ied materials are members of solid solution series of magnetite-type materials (Fe3O4). With increasing of Ni-content in materials increasing of particle size is obtained. The low temperature thermal treatment at 300 °C in argon media leads to production of sin-gle phase spinel nickel ferrite material.
Acknowledgements: The financial support by the Bulgarian National Science Fund at the Ministry of Education and Science – Project DO 02295/2008 is gratefully appreciated.
REFERENCES
1. C. Venkataraju, G. Sathishkumar, K .Sivakumar, Journal of Magnetism and Magnetic Materials, 322, 230 (2010).
2. J. C. Aphesteguy, S. E. Jacobo, N. N. Schegoleva, G. V. Kurlyandskaya, Journal of Alloys and Compounds, 495, 509 (2010).
3. y. Cedeño-Mattei, O. Perales-Pérez, Microelectronics Journal, 40, 673 (2009).
4. A. Ceylan, S. Ozcan, C. Ni, S. I. Shah, Journal of Magnetism and Magnetic Materials, 320, 857 (2008).
5. J. Jiang, y.-M. yang, Materials Letters, 61, 4276 (2007).
6. A. S. Albuquerque, M. V. C. Tolentino, J. D. Ardisson, F. C. C. Moura, R. de Mendonça, W. A. A. Macedo, Ceramics International, 38 (9), 2225 (2012).
7. Z. Cherkezova-Zheleva, K. Zaharieva, B. Kunev, M. Shopska, I. Mitov, in: Nanoscience & Nanotechnology, E. Balabanova and I. Dragieva (eds.), vol. 12, Prof. Marin Drinov Academic Publishing House, Sofia, 2012, in press.
8. U. Schwertmann, R. Cornell, Iron Oxides in the Laboratory, Weinheim, New york-Basel-Cambridge, 1991.
9. V. Rusanov, R. G. Gilson, A. Lougear, A. X. Trautwein, Hyperfine Interactions, 128, 353 (2000).
10. y. Sui, W.-H. Su, F.-L. Zheng, D.-P. Xu, Materials Science and Engineering, A286, 115 (2000).
11. D. Thickett, M. Odlyha, Journal of Thermal Analysis and Calorimetry, 80, 565 (2005).
12. S. A. Kahani, M. Jafari, Journal of Magnetism and Magnetic Materials, 321, 1951 (2009).
13. S. Musić, S. Krehula, S. Popović, Materials Letters, 58, 444 (2004).
14. M. D. Meroño, J. Morales, J. L. Tirado, Thermochimica Acta, 92, 525 (1985).

29
Z. CherkezovaZheleva et al.: Preparation and investigation of nanodimensional nickel ferrite
синтеЗ и иЗследВане на нанораЗмерен ниКелоВ ферит
З. п. черкезова-желева1*, К. л. Захариева1, В. петкова2, Б. н. Кунев1, и. г. митов1
1 Институт по катализ, Българска академия на науките, ул. „Акад. Г. Бончев“, бл.11, 1113 София, България
2 Институт по минералогия и кристалография, Българска академия на науките, ул. „Акад. Г. Бончев“, бл. 107, 1113 София, България
постъпила на 27 април, 2012 г.; приетa на 4 май, 2012 г.
(резюме)
никеловите ферити с различно съдържание на никел – NixFe3–xO4, 0 ≤ x ≤1 са технологично важни мате-риали за микровълнови, електронни и магнитни запомнящи устройства. тези материали са представители на серия от твърди разтвори на шпинелов тип материали (Fe3O4–NiFe2O4), имащи специфични магнитни свойства и различна степен на електронна делокализация. те показват добри газ-детекторни свойства и висока катали-тична активност в различни процеси като пълно окисление на отпадъчни газове и летливи органични съедине-ния, окислително дехидрогениране на въглеводороди, разлагане на алкохоли и др. понастоящем голямо вни-мание се отделя на получаването на такива нанокристални материали. проблемът все е още актуален поради редица трудности при техния синтез и използването на специални техники. никел-съдържащи феритни мате-риали NixFe3-xO4 (x=0.25, 0.5, 1) са получени по метода на утаяване с използване на FeCl3·6H2O, FeCl2·4H2O и NiCl2·6H2O като прекурсори в наши предишни изследвания. но в синтезираните материали са регистрирани малки количества междинна фаза – FeOOH. цел на изследването е да се намери евтин и лесен начин за полу-чаването на наноразмерни материали от магнетитов тип. с цел да се получат еднофазни шпинелни материали са проведени термогравиметричен, диференциален термогравиметричен и диференциален термичен анализ, както и различни химични и структурни изследвания като рентгенова дифракция и мьосбауерова спектроско-пия. В резултат на изследването са намерени подходящите условия на получаване. синтезът включва процес на утаяване, комбинирано с ниско температурна термична обработка на материалите.

30
* To whom all correspondence should be sent:E-mail: [email protected]
© 2012 Bulgarian Academy of Sciences, Union of Chemists in Bulgaria
Bulgarian Chemical Communications, Volume 44, Proceedings of the IIIrd National Crystallographic Symposium (pp. 30–36) 2012
Adsorption capacity of modified metallurgical slag
S. V. Dimitrova1, I. K. Mihailova2*, V. S. Nikolov3, D. R. Mehandjiev4
1 Department of Water Supply, Sewerage and Water Treatment, University of Architecture, Civil Engineering and Geodesy, 1 Christo Smirnenski blvd., 1046 Sofia, Bulgaria
2 Department of Silicate Technology, University of Chemical Technology and Metallurgy, 8 St. Kliment Ohridski blvd., 1756 Sofia, Bulgaria
3 Institute of General and Inorganic Chemistry, Bulgarian Academy of Sciences, Acad. Georgi Bonchev str., bld. 11, Sofia 1113, Bulgaria
4 Institute of Catalysis, Bulgarian Academy of Sciences, Acad. Georgi. Bonchev str., bld. 11, Sofia 1113, Bulgaria
Received March 12, 2012; Revised April 24, 2012
A study was conducted of the adsorption capacity of slag samples obtained by crystallization of granulated blast furnace slag with and without Al2O3 and MgO additions in aqueous solutions of Cu (II), and a comparison was made between the original amorphous slag and the synthesized samples with main phases gehlenite and åkermanite. The purpose of the study was to make evaluation of the adsorption of heavy metal ions by the main phases (crystalline and amorphous) of blast furnace slag. The comparative analysis of adsorption and XRD data showed that the formation in slag of melililite crystal phases (gehlenite and åkermanite) and merwinite results in an almost double increase of Cu (II) adsorption, compared to amorphous slag. The addition of Al2O3 alone and in combination with MgO leads to crystallization of a sorption inactive spinel phase.
Key words: blast furnace slag, Cu (II) adsorption, crystallization, merwinite, melilite.
INTRODUCTION
The disposal of a large volume of metallurgi-cal slags as by-products in iron and steel indus-try is an important environmental and economic problem. Its solution should be sought in three directions: 1) use in construction (production of cement, concrete, railroad ballast, roof coverings, mineral wool, glass, etc.); 2) extraction of useful components 3) water treatment reagents (neutrali-zation and precipitation systems for purification of industrial water contaminated by heavy metals, adsorbents).
The good adsorption capacity of blast-furnace slag (BFS) for heavy metals, phosphates, arsenic (V and III) and organic pollutants [1-6] provides good opportunity for the use of slag in locally based proc-esses of waste water treatment. Slag low price and large quantities are a prerequisite for the economic efficiency of such treatment processes. The BFS chemical composition and structure play a key role in the adsorption activity. Previous research on sorp-
tion-active phase/phases in BFS [7, 8] has shown the positive effect of the thermal treatment of granulated blast furnace slag (GBFS) due to the crystallization of melilite – a crystal phase typical for BFS. The term melilite is used to denote the representatives of isomorphic series gehlenite (Ca2Al2SiO7) – åker-manite (Ca2MgSi2O7). However, in its broad sense the term also encompasses other crystalline phases of a melilite-type structure. The melilite structure tolerates isomorphic substitutions; therefore, the formation of a melilite phase with a complex com-position is highly probable, given the complex com-position of Kremikovtsi BFS (presence of Mn, Fe, Ba, Na, etc.). In addition to components such as geh-lenite (Ca2Al2SiO7) and åkermanite (Ca2MgSi2O7), amounts of Ca2MnSi2O7, Ca2Fe2+Si2O7, Ca2Fe3+
2SiO7 as well as partial substitutions in the structural posi-tions of Ca by Ba and Na should also be expected. Similar-type melilites containing barium and man-ganese have been found in Kremikovtsi BFS crystal samples [9]. Furthermore, synthetic melilites with a higher Ca content have been reported to exhibit large stoichiometric deviations [10]. For these rea-sons, the quantity of the formed melilite phase often exceeds the expected quantity based on prelimi-nary calculations.

31
S. Dimitrova et al.: Adsorption capacity of modified metallurgical slag
The formation of melilites in Kremikovtsi BFS is limited by its low Al2O3 and мgо content. It could be assumed that an appropriate ratio modification of the major oxides CaO, MgO Al2O3 and SiO2 would enhance the crystallization of adsorption-active phases with a melilite structure. Therefore, the goal of the study was to add аl2о3 and мgо in amounts that promote melilite crystallization. The amounts to be added in slag were calculated based on the chemical composition of the original slag. The ef-fect of these additions on the adsorption capacity of BFS was evaluated in terms of adsorption capacity to remove copper ions from aqueous solutions.
EXPERIMENTAL
Synthesis of samples
The samples were synthesized using GBFS with the following composition (in %mass): SiO2 – 34.0; CaO – 44.0; Al2O3 – 6.40; MnO – 2.33; MgO – 2.45; BaO – 3.2. In the present study the original granu-lated slag sample is denoted as sample GBFS.
The following samples were synthesized:– Sample GBFS/1050 – the sample of granulated
blast furnace slag was crushed with a mortar and then heated at 1050 °C for 6 hours in air.
– Sample GBFS/1400 – using the same proce-dure, heated at 1400 °с.
– Sample GBFS+Al2O3 – mixture of 2 g slag and 0.72 g of aluminum oxide crushed and heated for 6 hours at 1400 °с.
– Sample GBFS+MgO – mixture of 2 g slag and 0.3 g magnesium oxide heated at 1400 °с for 6 hours.
– Sample GBFS+Al2O3+MgO was obtained by using the above procedure plus additions of 0.24 g aluminum oxide and 0.15 g magnesium ox-ide to amount of 2 g of the original slag.
The synthetic gehlenite (2CaO.Al2O3.SiO2) was obtained through solid-state synthesis using the fol-lowing high purity (over 98.5%) reagents: CaCO3, Al2O3 and SiO2. A stoichiometric mixture of 1.56 g CaCO3, 1.02 g Al2O3 and 0.60 g SiO2, crushed in an agate mortar and placed in a corundum crucible, was heated successively at 1000, 1200 and 1400 °с for 6 hours with intermediate grinding of the prod-uct. The same procedure was used to synthesize syn-thetic åkermanite (2CaO.MgO.2SiO2), by mixturing 1.56 g CaCO3, 0.403 g MgO and 1.20 g SiO2. The synthesis of samples was preformed in a high-tem-perature Kanthal Super furnace with Temperature Controller/Programmer. The XRD analysis showed that the synthesis of both minerals occurred at tem-peratures above 1200 °с. The synthesis was con-ducted at the maximum temperature (1400 °с) at
which they are treated slag samples. Under these conditions, the main phases in the samples are, re-spectively, gehlenite and åkermanite.
Experimental methods
Structural characterization was performed by powder X-ray diffraction (XRD) using a Bruker D8 Advance Powder Diffractometer with CuKα radiation and a SolX detector. XRD spectra were recorded at room temperature. Data were collected in the 2θ range from 10 to 80 degree with a step 0.04 degree and 1s/step counting time. The crys-talline phases were identified using the powder diffraction files PDF 35-0755, PDF 35-0592, PDF 79-2422, PDF 79-2423, PDF 79-2424, PDF 74-0874, PDF 35-591, PDF 33-0302, PDF 70-2144, PDF 34-1350 and PDF 82-2424 from database JCPDS - International Centre for Diffraction Data PCPDFWIN v.2.2. (2001) [11]
Adsorption evaluation of Cu (II) cations by the synthesized samples was conducted through an ad-sorption test under the following static conditions: 9 samples of 0.1 g of each sample and 100 ml of CuSO4 solution; Cu (II) concentration of 25.45 mg/L; pH 5.40, placed for 48 hours in an oven thermostat at 25 °с to establish equilibrium.
Then samples were filtered and the values of the pH of the filtrate and Cu (II) concentration were measured. The concentration of Cu (II) was de-termined photometrically at λ = 560 nm using DR 2800 Spectrophotometer.
The adsorption capacity was calculated as:
0( )C C VAm
- ´= ,
Where: А – adsorption capacity (mg/g); C0 – origi-nal Cu(II) concentration in the solution (mg/L); C - Cu(II) concentration in solution after 48 h. (mg/L); V – Cu (II) solution volume (L); m – mass of the sample (g).
RESULTS AND DISCUSSION
Figures 1 and 2 represent the X-ray diffraction patterns of the studied samples. In Fig. 1 (Sample GBFS XRD pattern) a halo is observed between 20 and 40° 2θ, which points to the predomination of an amorphous phase in the sample, i.e. slag glass. The diffraction peaks are related to the early stages of melilite crystallization. Heat treatment of blast furnace slag at 1050 °C (sample GBFS/1050) leads to melilite (PDF 79-2423) crystallization, accompa-nied by crystallization of calcium silicate CaSiO3 pseudowollastonite (PDF 74-0874). The increase

32
of treatment temperature up to 1400 °C (sample GBFS/1400) resulted in melt crystallization of mer-winite Ca3Mg[SiO4]2 (PDF 35-591) and melilite (79-2424). The separate or simultaneous addition of MgO and Al2O3 affected differently the phase formation. The X-ray diffractogramms of sample GBFS+Al2O3 (with added Al2O3) and GBFS/1050 sample are similar in the predomination of melilite (PDF 79-2423 and PDF 79 -2422) in both samples. Differences are found in the other crystal phases. The addition of Al2O3 leads to crystallization of some amounts of spinel (PDF 82-2424) in sample GBFS+Al2O3. Melilite (PDF 79-2423) is also the main phase in sample GBFS+Al2O3+Mgо and the amount of the accompanying spinel is higher. The X-ray diffraction pattern of sample GBFS+MgO shows increased amounts of merwinite (PDF 35-591, compared to sample GBFS/1400 (without additions), both samples treated at the same temperature.
Figure 1 shows the X-ray diffraction patterns of the synthesized minerals gehlenite and åker-manite. The XRD patterns show successful syn-thesis of the specified minerals, but intermediate
S. Dimitrova et al.: Adsorption capacity of modified metallurgical slag
phases are also found. In Gehlenite sample these are gehlenite Ca2Al2SiO7 (PDF 35-0755), larnite Ca2SiO4 (PDF 33-0302), and mayenite Ca12Al14O33 (PDF 70-2144). In Åkermanite sample åkerman-ite Ca2MgSi2O7 (PDF 35-0592) is the predominant crystal phase, but bredigite Ca7Mg[SiO4]4 (PDF 34-1350) is also present.
Adsorption-capacity (AC) data is given in Tables 1 and 2. It can clearly be seen that slag AC is determined by the level of crystallization and the type of the crystalline phases. The lowest capac-ity is shown by the original sample, which is (ac-cording to XRD data) amorphous for the most part and contains small amount of melilite. The sample (sample GBFS/1050) heat treatment up to 1050 °с for 6 hours induces a higher level of crystallization. Melilite and pseudowollastonite are formed and the adsorption capacity (AC) is raised by 9%, compared to the original sample (GBFS). Heat treatment at 1400ос results in a sharp 83% increase in the re-tained Cu (II) compared with the original sample. Apart from melilite, in sample (GBFS/1400) mer-winite is also present. The amount of melilite in sample GBFS/1400 is significantly smaller than in
Fig. 1. XRD patterns of thermal treated slag samples and synthesized samples with main phases åkermanite (Ca2MgSi2O7) and gehlenite (Ca2AlSiO7)
Fig. 2. XRD patterns of thermal treated slag samples with Al2O3 and MgO additions

33
S. Dimitrova et al.: Adsorption capacity of modified metallurgical slag
sample GBFS/1050. Therefore, the higher AC of the slag sample treated at higher temperature can be related to the formation of a merwinite crystal phase and/or a residual glass phase.
The AC of slag samples with Al2O3 and MgO additions is generally lower when compared to the sample GBFS/1400 without additions, treated at the same temperature (Table 2). One exception is sam-ple GBFS+MgO, which shows the maximum AC increase of 88 %, compared to the original slag ma-terial. The phase composition of this sample also dif-fers, merwinite being its main phase. This leads to a conclusion that the presence of merwinite improves the adsorption properties of slag materials. AC data for the remaining slag samples with Al2O3 and MgO additions is similar and corresponds to their close phase composition. It is evident that additions in slag do not lead to an increase of the amount of me-lilite. The amount of the melilite phase in pure slag treated at 1050 °с is higher. In most of the samples, the additions react with other components in slag and new adsorption-inactive phases are formed: spinels. The synthetic samples with gehlenite and åkermanite as predominant phases also have a high AC. The obtained results are in complete accord-ance with previous findings [7, 8] reporting that increase of the level of crystallization and the pres-ence of melilite phases (such as gehlenite and åker-manite) result in significant increase of slag AC. On the other hand, one should bear in mind the presence of other crystal phases in the samples that also affect the AC. Therefore, we can not make firm conclusions about the roles played by åkermanite and gehlenite.
According to the XRD data (Fig. 1 and 2), many slag samples contain identical amounts of åkermanite and gehlenite in the melilite crystal phase of the synthesized samples. However, slag samples with a predominant melilite crystal phase exhibit lower AC compared to the synthesized samples. This means that besides the phase composition and respectively quantity of the melilite phase, other factors have a significant impact on the adsorption properties, most probably the structural characteristics of the samples and the chemical composition of formed melilite. The obtained experimental data does not permit to establish clear dependency between the amounts of melilite in samples and the AC value, but it is indisputable that a 9-15 % higher AC is ob-served in slag samples with a predominant melilite, compared to the original slag.
The presented experimental data allows finding a correlation between the phase composition and the adsorption properties of BFS. The presence of merwinite and melilite induces a higher AC of the slag samples. The results allow us to make a new and interesting conclusion – merwinite also exhibits a high AC, apart from the minerals gehlenite and åkermanite. This is proved by the fact that samples containing this mineral showed the highest AC. The addition of Al2O3 and Al2O3+MgO did not consid-erably influence the adsorption properties of slag samples. Only MgO addition positively affected the promotion of the merwinite crystallization. As already known [1, 7], the AC of metallurgical slag take place primarily by a cation exchange process. The adsorption is based on exchange reactions rep-resented by the following scheme:
[Al,Si,O]Ca2+ + Cu2+ → [Al,Si,O]Cu2+ + Ca2+ (1)
[Al,Si,O,Ca]Mg2+ + Cu2+ → [Al,Si,O,Ca]Cu2+ + Mg2+ (2)
The possibility of exchange depends on the structure of slag and accordingly of the crystal struc-ture of the formed minerals. Schematic diagrams of åkermanite and merwinite crystal structures are shown in Figs. 3 and 4. We have chosen åkerman-ite instead of gehlenite for its Mg2+ content. Both minerals belong to different structural types and the coordination of Mg2+ and Ca2+ cations differs. As shown earlier, [12, 13] åkermanite and gehlenite are tetragonal. The crystal cell data are: space group
mP 124 , a = 7.8288(8) Å, c = 5.0052(2) Å for åker-manite and. space group mP 124 , a = 7.6850(4) Å, c = 5.0636(3) Å for gehlenite [13]. Åkermanite is part of the silicates with diorthogroups of silicon-oxygen tetrahedra. These structural units are linked with each other through the so-called “particular type” of tetrahe dra [MgO4]. The tetrahedral lay-
Table 1.
Sample A, mg/L Phases
GBFS 13.3 amorphous phase + meliliteGBFS/1050 14.5 melilite + pseudowollastonite
GBFS/1400 24.4 amorphous phase +merwinite + melilite
Gehlenite 23.4 gehlenite + mayenite + larniteÅkermanite 21.6 åkermanite + bredigite
Table 2.
Sample A, mg/L Crystal phases
GBFS+Al2O3 15.2 melilite + spinelGBFS+Al2O3+MgO 15.3 melilite + spinelGBFS+MgO 25.0 merwinite + melilite

34
S. Dimitrova et al.: Adsorption capacity of modified metallurgical slag
ers alternate along c-axis with layers of calcium polyhedrons. The coordination number of Ca2+ is 8. Merwinite crystallizes in the orthorhombic space group P21/a and the cell parameters are a = 13.254(21) Å, b = 5.293(9) Å, c = 9.328(17) Å, β = 91.90(15)° The structure of merwinite is an extreme example of dense packing where both O2- and Ca2 ions make up the dense-packed layers. The [MgO6] octahedra are linked at every corner by [SiO4] tetra-hedra. The [MgO6] octahedra are linked by [SiO4] tetrahedra and form slabs parallel to (100). The Ca2+ ions have three structural positions with coordina-tion numbers between 8 and 9 [15]. Despite the ob-vious differences, a common feature of both struc-tures is the location of Ca2+ cations in layers between slabs of linked silicon and magnesium polyhedrons. Probably this structural feature permits the easy ex-change of Mg2+ and Ca2+ cations, which increases the AC of slag containing these minerals.
The experimental results show that besides the melilite group, merwinite has certain adsorption capacity towards heavy metals, too. This finding extends the possible application of slag and slag based products in the purification of water contaminated by heavy metals.
CONCLUSIONS
The experimental results demonstrate the possi-bility to increase the AC of granulated blast furnace slag for heavy metals (CuII) with over 80% through crystallization.
The crystallization of granulated slag or a mix-ture of granulated blast-furnace slag with 13% addi-tion of MgO leads to the formation of crystal phases – melilite and merwinite. The presence of both min-erals in slag leads to an almost double increase in
Fig. 3. Crystal structure of merwiniteCrystal structure of merwinite (Ca3Mg[SiO4]2) projected on the (100) plane (a) and the (010) plane (b). White spheres are calcium atoms, dark polyhedra are MgO6 octahedra, and light polyhedra are SiO4 tetrahedra. Some details of structure are presented. [MgO6] octahedron is linked at every corner by [SiO4] tetrahedra (c). The [MgO6] octahedra linked by [SiO4] tetrahedra form slabs parallel to (100) (d).

35
S. Dimitrova et al.: Adsorption capacity of modified metallurgical slag
(alone and in combination with MgO) does not lead to an increase of the adsorption activity.
The minerals merwinite, gehlenite and åkerman-ite are adsorption-active phases determinative for the very high levels of adsorption of heavy metal ions by blast furnace metallurgical slag.
Slag samples with a main crystal phase merwi-nite exhibit the highest adsorption capacity. The promotion of merwinite crystallization would allow synthesizing materials with high adsorption capac-ity towards CuII.
Acknowledgements: The authors kindly acknowledge Dr. Daniela Kovacheva from Institute of General and Inorganic Chemistry, Bulgarian Academy of Sciences for her assistance in obtaining XRD data.
REFERENSES
S. V. Dimitrova, 1. Water Res., 30, 228 (1996).S. V. Dimitrova, 2. Water Res., 36, 4001 (2002).L. J. Westholm, 3. Water, 2, 826 (2010).E. Oguz, 4. J. Hazard. Mater., 114, 131 (2004).S. R. Kanel, H. Choi, J. y. Kim, S. Vigneswaran, 5. W. G. Shim, Water Qual .Res. J. Canada, 41, 130 (2006).A. K. Jain, V. K.Gupta, A. S Bhatnagar, 6. J. Hazard. Mater., 101, 31 (2003).S. Dimitrova, V. Nikolov, D. Mehandjiev, 7. J. Mater. Sci., 36, 2639 (2001).S. Dimitrova, V. Nikolov, D. Mehandjiev, 8. C.R. Acad. Bulg. Sci., 62, 335 (2009). и. т. иванов, 9. Годишник на Висшия Химико-технологически институт – София, 20 (2) 345 (1972). D. Stavrakeva, I. Georgieva, 10. C.R. Acad. Bulg. Sci., 48, 91 (2005).JCPDS - International Centre for Diffraction Data 11. PCPDFWIN v.2.2. (2001) M. Kimata, N. Ii, The crystal structure of synthetic 12. akermanite, Ca2MgSi207. N. Jb. Miner. Monat., 1, 10 (1981).I. P. Swainson, M. T. Dove, W. W. Schmahl, A. 13. Putnis, Phys. Chem. Miner., 19 185 (1992).S. V. Dimitrova, , D. R. Mehandjiev, 14. Water Res., 34, 1957 (2000).P. B. Moore and T. Araki, 15. Am. Mineral. 57, 1355 (1972).
Fig. 4. Crystal structure of åkermaniteCrystal structure of åkermanite (Ca2MgSi2O7) projected on the (001) plane (a) and the (100) plane (b). White spheres are calcium atoms, dark polyhedra are MgO4 tet-rahedra, and light polyhedra are SiO4 tetrahedra
adsorption activity compared to the original amor-phous product.
The crystallization of a mixture containing granulated blast-furnace slag with addition of Al2O3
36
S. Dimitrova et al.: Adsorption capacity of modified metallurgical slag
адсорБционна спосоБност на модифицирана металургична ШлаКа
с. В. димитрова1*, и. К. михайлова2, В. с. николов3, д. р. механджиев4
1 Катедра „Водоснабдяване, канализация и пречистване на води“, Университет по архитектура, строителство и геодезия, бул. „Хр. Смирненски” №1, София 1036, България
2 Катедра „Технология на силикатите“, Химикотехнологичен и металургичен университет, бул. „Кл. Охридски“ № 8, София 1756, България
3 Институт по обща и неорганична химия, Българска академия на науките, бул. „Акад. Г. Бончев“, бл. 11, София 1113, България
4 Институт по катализа, Българска академия на науките, бул. „Акад. Г. Бончев“, бл. 11, София 1113, България
постъпила на 12 март, 2012 г.; приетa на 24 април, 2012 г.
(резюме)
адсорбционният капацитет на шлакови образци, получени чрез кристализация на гранулирана доменна шлака без и с добавки на Al2O3 и MgO, беше изследван във водни разтвори на Cu(II) и сравнен с този на изходна аморфна шлака и на синтезирани образци с основни фази геленит и акерманит. целта на изслед-ването беше: оценка на адсорбционната активност на основните фази в доменната шлака (кристални и аморфни) към тежки метални йони. сравнителният анализ на адсорбционните данни и XRD показа, че формирането на кристалните фази мервинит и мелилит (геленит и акерманит) в шлаката предизвиква почти двойно увеличение на адсорбционният капацитет по отношение на Cu(II) в сравнение с аморфната шлака. добавката на Al2O3 самостоятелно, както и в комбинация с MgO води до кристаллизация на сорбционно неактивна фаза шпинел.

37
* To whom all correspondence should be sent:E-mail: [email protected]
© 2012 Bulgarian Academy of Sciences, Union of Chemists in Bulgaria
Bulgarian Chemical Communications, Volume 44, Proceedings of the IIIrd National Crystallographic Symposium (pp. 37–46) 2012
Synthesis and structural details of perovskites within the series PrCo1–xCrxO3 (x = 0, 0.33, 0.5, 0.67 and 1)
S. Dimitrovska-Lazova1*, D. Kovacheva2, S. Aleksovska1, M. Marinšek3, P. Tzvetkov2
1 University “St. Cyril and Methodius”, Faculty of Natural Sciences and Mathematics, Arhimedova 5, Skopje, R. Macedonia
2 Institute of General and Inorganic Chemistry, Bulgarian Academy of Science, “Acad. Georgi Bonchev” bl. 11, 1113 Sofia, Bulgaria
3 University of Ljubljana, Faculty of Chemistry and Chemical Technology, Aškerčeva c. 5, 1000 Ljubljana, R. Slovenia
Received March 21, 2012; Revised May 2, 2012
Results on synthesis, structural investigations and the morphology of complex perovskites of general formula PrCo1–xCrxO3 (with x = 0, 0.33, 0.5, 0.67 and 1) are presented. The synthesis of the perovskites within this series was performed by solution combustion method using two different fuels: urea and glycine. The annealed samples were identified using X-ray powder diffraction. The purity of the compounds obtained using glycine as a fuel was better and for further investigations perovskites obtained with this fuel were used. The crystal structure was refined by the Rietveld method, and the morphology of the particles was investigated using SEM. All compounds within the series crystallize in Pnma space group (Z = 4). The effect of the substitution of Co3+ ion with Cr3+ was investigated by analyzing different crystallochemical parameters (bond-lengths and tilt angels of the coordination octahedra, global instability index etc). A very interesting trend in changes of the structural distortion and global stability of the compounds in respect to x e.g. substitution of Co3+ with Cr3+ was found.
Key words: complex perovskites, XRD, SEM, crystallochemical calculations.
INTRODUCTION
Within the field of material science one of the most interesting groups of compounds belongs to perovskite structural type. Perovskite structure en-compasses compounds with general formula ABX3, where A and B are cations and X is an anion. In the ideal perovskite structure the B-cation is coordinat-ed by six anions in almost regular octahedron. The BX6 octahedra are sharing same corners thus form-ing three-dimensional network of octahedral chains. The cavities formed by the octahedra are filled by A-cations which are cubooctahedrally coordinated by the anions. This kind of arrangement leads to cu-bic (Pm3m) structure [1, 2]. An important feature of perovskite structure is possible rotation (for small angle) of the BX6 octahedra, while still retaining the chain-like connectivity. As a result, the sym-metry of the structure is lowered to orthorhombic, monoclinic, hexagonal, etc. This structural flex-
ibility enables including almost all elements from the periodic table in the perovskite structure. So, there is great number of possible combinations of different cations in A and B positions, but also dif-ferent anions in the X-position may be found, such as oxygen, halogen ions, cyanide group etc. Among these anions the most common are perovskites with oxide anion. Another important feature of the per-ovskite structure is the possibility for multiple sub-stitutions in the positions of the cations, thus form-ing so-called complex perovskites. This possibility drastically enlarges the number of compounds with perovskite structure.
Depending on the nature of A and B cations and particular crystal structure, the physical and chemical properties of perovskites may vary in a wide range. Namely, in this group of compounds different physical and chemical properties emerge, namely: pyroelectricity, piezoelectricity, colossal magnetoresistance, catalytic activity, ferromagnet-ism, superconductivity etc. [1, 3]. From this point of view the perovskites containing cobalt ion in the B-position are intensively studied. Namely, cobalt-perovskites (RCoO3) exhibit interesting properties

38
S. DimitrovskaLazova et al.: Synthesis and structural details of perovskites within the series PrCo1–xCrxO3 ...
such as high electronic conductivity [4], metal to insulator transition with increasing temperature [5], significant catalytic activity [3], specific magnetic properties [6−8], etc. Properties of cobaltates are tightly connected with some characteristics of cobalt ions such as the possibility to change the oxidation state (Co4+, Co3+, Co2+) and also the possibility of altering the spin state of the Co3+ ion [7, 9, 10]. The change of the oxidation state of cobalt ion is usually triggered by substitutions in A or B positions (as in R1–xSrxCoO3) [11]. The spin state of the cobalt ion in compounds with rare earth metal in A-position has been a subject of investigation in a large number of studies [7, 9, 10, 12−16]. The spin state of Co3+ ion may change from low spin (LS) with t2g
6 electron con-figuration, intermediate spin state (IS) with one elec-tron in eg-orbital (t2g
5eg1) or high spin state (HS) with
configuration t2g4eg
2. It is expected that compounds with IS and HS state of the Co3+ ion to encounter Jahn-Teller distortion of the CoO6 octahedra. At room temperature in most of the RCoO3 perovskites (R is rare earth) Co3+ is in LS state. It is found that at room temperature the amount of IS Co3+ ions is the highest in LaCoO3, while it is smaller in PrCoO3 [10] Actually, with decreasing of the ionic radii of R3+ in the RCoO3 series, the amount of the LS state of Co3+ ions is increasing [10, 16].
Continuing our investigation on different per-ovskites with cobalt ion [17, 18], in this work we present the synthesis of the perovskite series of general formula PrCo1–xCrxO3 (with x = 0, 0.33, 0.5, 0.67 and 1), the investigations of their crys-tal structure and some important crystallographic characteristics connected with the substitution of the cations in B position.
Although there is literature data [19−30] for the end members of the series (PrCoO3 and PrCrO3), any data about the solid solution between these two compounds have not been found yet. The literature data shows that PrCoO3 and PrCrO3 may be syn-thesized by different methods such as: solid stated synthesis [7, 19, 20], decomposition of citrate pre-cursor [21−24, 8, 11], synthesis based on complex precursors [25−29], self-propagating high tempera-ture synthesis [30] and hydrothermal synthesis [30]. In this work the synthesis of Pr-perovskites by solu-tion combustion method using two fuels – glycine and urea is presented.
It should be pointed out that the crystal struc-tures of the end members of the series presented in this paper are already known. According to some literature data PrCoO3 is cubic [19, 21, 24], but ac-cording to some others, it is orthorhombic [7, 8, 10, 11, 20, 22]. Some more detailed structural analy-sis of PrCoO3 by XRD and neutron diffraction [11, 22] point out also that this compound crystallizes in the orthorhombic system (space group Pnma). The
crystal structure of PrCrO3 was also reported [20, 26, 30, 31] as orthorhombic, space group Pnma. Taking these findings into consideration, it is expected that the new-synthesized complex perovskites of cobalt and chromium should crystallize in the orthorhom-bic system. Also, it is expected that the substitution of Co3+ (r(Co3+) = 0.545 Å, LS) with chromium Cr3+ ion, which has slightly bigger ionic radii (r(Cr3+) = 0.615 Å), would increase the lattice parameters and, consequently, the volume of the unit cell. In order to analyze the influence of substitution of Co3+ with Cr3+ on the crystal structure, the synthesized com-pounds were characterized by XRD and their crys-tal structure and several crystallographic parameters were calculated and compared. The morphology of the studied samples was also investigated by scan-ning electron microscopy (SEM).
EXPERIMENTAL
Synthesis
The synthesis of the PrCo1–xCrxO3 perovskites was performed by solution combustion method. For this purpose, nitrates of the constituting metals were used as starting materials. Calculated amounts of metal nitrates (Pr(NO3)3·6H2O, Co(NO3)2·6H2O and Cr(NO3)3·9H2O) were dissolved in small amount of distilled water. The obtained solutions were thor-oughly mixed on a stirrer. These solutions were used as starting mixtures in the combustion synthesis. The combustion syntheses were performed using two fu-els: urea (CO(NH2)2) or glycine (NH2CH2COOH). The amounts of the fuels were calculated on the ba-sis of propellant chemistry and were set to 1 [32]. The composition of the solutions varied according to the formula of the synthesized perovskite.
The synthesis of the perovskites using urea as a fuel was performed in the following manner: ap-propriate quantity of urea was dissolved in small amount of diluted nitric acid (1:1) and this solution was added to the particular mixture containing metal nitrates. After the homogenization of the solution it was transferred in muffle furnace. The mixture was slowly heated to temperature of ~500 °C. After the evaporation of water a vigorous combustion reac-tion started. In a very short time spongy powders were formed. Resulting materials were hand milled, transferred to ceramic dish and subjected to addi-tional heating for 6 hours at 800 °C.
The procedure using glycine as a fuel was just a little bit different. Glycine was dissolved in small amount of distilled water and this solution was added to pre-prepared mixture of metal nitrates so-lutions. The obtained mixture was heated at 80 °C under constant stirring. After the evaporation of

39
the water and gelatinization of the solution the ves-sel was transferred on a hot plate preheated above 300 °C. The gel boiled and after the evaporation of remaining water an initialization and combustion of the mixtures started. As a result, black (only in case of PrCrO3 the product was green) spongy pow-ders were formed. As-prepared samples were hand milled and calcined at 800 °C for 6 hours (2h and additional 4h).
XRD
The resulting powders were analyzed by X-ray diffraction. The XRD patterns were recorded on Bruker D8 Advance with CuKα radiation and SolX detector within the range 10–120° 2θ at room tem-perature with step-scanning of 0.02°. The crystal structures were refined by the method of Rietveld using the Fullprof program [33].
SEM
The microstructure of the obtained compounds was investigated by SEM. Field-Emission FE-SEM Zeiss ULTRA PLUS microscope using accelerat-ing voltage of 2kV was used. The samples were put onto graphite tape and were not gold sputtered prior to the microscopy. Images were taken using In-lens and/or standard Evernhart-Thornley secondary elec-tron (SE) detectors.
RESULTS AND DISCUSSION
As was mentioned in the experimental part, the solid solutions PrCo1–xCrxO3 (x = 0, 0.33, 0.5, 0.67
and 1) were synthesized using both urea and gly-cine as a fuel. The recorded XRD patterns of the samples showed that in both cases perovskite com-pounds with same structure were obtained but the samples prepared using glycine as a fuel, were of better purity. This is illustrated by the XRD pat-terns (Fig. 1) for one of the members of the series (PrCo0.5Cr0.5O3).
The XRD pattern on Figure 1a corresponds to PrCo0.5Cr0.5O3 synthesized using urea and the others (Figs. 1b-d) using glycine as a fuel. Some impuri-ties of Co3O4 could be detected in the compound obtained via urea (Fig. 1a), which are not present in the compound obtained at same temperature but via glycine (Fig. 1d). It should be mentioned that in the case of PrCo0.5Cr0.5O3 the formation of the per-ovskite phase began right after the combustion of the initial mixture (as-synthesized sample, Fig. 1b) but by further heating on 800 °C a better crystallin-ity was obtained (Fig. 1b–d). Since the purity of the samples obtained using glycine was better than that using urea, the further investigations and discussion of the results were carried out on the samples syn-thesized by glycine.
The XRD patterns of the perovskite series PrCo1–xCrxO3 (x = 0, 0.33, 0.5, 0.67 and 1) obtained by the same synthetic route (heated 4 h on 800 °C) are presented on Figure 2.
As expected, the obtained compounds are iso-structural and with perovskite structure. Namely, the obtained XRD patterns of the end members of the series, PrCoO3 and PrCrO3, are in accordance with the literature data [8, 22, 34]. Complex per-ovskites within the series show gradual shifting
S. DimitrovskaLazova et al.: Synthesis and structural details of perovskites within the series PrCo1–xCrxO3 ...
Fig. 1. XRD patterns of PrCo0.5Cr0.5O3 obtained using (a) urea (heat treated for 6h at 800 °C), (b) glycine (as-synthesized) (c) glycine (after heat treatment for 2h at 800 °C), (d) glycine (after additional heat treatment for 4h at 800 °C)

40
S. DimitrovskaLazova et al.: Synthesis and structural details of perovskites within the series PrCo1–xCrxO3 ...
Fig. 2. XRD patterns of (a) PrCoO3, (b) PrCo0.67Cr0.33O3, (c) PrCo0.5Cr0.5O3, (d) PrCo0.67Cr0.33O3, (e) PrCrO3
Table 1. Unit cell parameters, b/√2, pseudo-cubic parameter ap calculated using the equation ap = (V/Z)1/3 where Z is number of atoms in assymetric unit and volume (V) of the unit cell
a/Å b/Å c/Å (b/√2)/Å ap/Å V/Å3 ratioPrCoO3 5.34355(8) 7.57728(10) 5.37634(8) 5.3580 3.7896 217.6857 c > b/√2 > aPrCo0.67Cr0.33O3 5.3834(3) 7.6139(4) 5.4027(4) 5.3838 3.8113 221.4495 c > b/√2 ≈ aPrCo0.5Cr0.5O3 5.4141(3) 7.6502(7) 5.4145(6) 5.4095 3.8274 224.2630 а ≈ c > b/√2PrCo0.33Cr0.67O3 5.43702(20) 7.6750(3) 5.4292(2) 5.4270 3.8404 226.5558 a > b/√2 > cPrCrO3 5.47897(10) 7.71528(16) 5.45127(11) 5.4555 3.8622 230.4349 a > b/√2 > c
of the diffraction peaks towards smaller 2θ values with increasing of the value of x (Fig. 2), suggesting gradual increase of the substitution of cobalt ion. These results are in accordance with the expected changes in the XRD pattern in a case when smaller cation (Co3+) is substituted with bigger one (Cr3+).
As previously mentioned, the end members of the series, PrCoO3 and PrCrO3, have GdFeO3-orthorhombic structure [8, 22, 34] and, accordingly, it was expected that all members of the series would be orthorhombic. The refinement of the crystal structures showed that all compounds crystallize in the orthorhombic space group Pnma, with four for-mula units per unit cell. The unit cell parameters, cell volumes, as well as, the pseudo-cubic param-eter are presented in Table 1.
In aim to present the complete crystal structure of the newly synthesized members of the series, the Rietveld refinement approach was undertaken. The refinements were carried out using the structural model for PrCoO3 as a starting model. For the inter-mediate structures it was assumed that the Co(III) and Cr(III) cations are randomly distributed in same crystallographic positions. The calculated and ob-
served patterns obtained by Rietveld refimenent for one of the compounds (PrCo0.5Cr0.5O3) is presented on Fig. 3 just as an example.
The fractional atomic coordinates and the discrep-ancy factors are presented in Table 2, and Table 3 presents selected distances and angles as well as the distortions of the coordination polyhedrons.
The values of the unit cell parameters of the end members of this series are in good agreement with the literature data [8, 22, 34]. Analyzing the changes of the unit cell parameters throughout the series and the relations between them, some interesting facts have arisen. Namely, as expected, the substitution of smaller Co3+ with slightly bigger Cr3+ increases the unit cell parameters, cell volumes, and the pseudo-cubic parameter ap (Table 1). However, it is interest-ing to note the changes in the relationship between a and c parameters. As may be noticed from Figure 4, this relationship changes from c > a (PrCoO3 and PrCo0.67Cr0.33O3) through c ≈ a (PrCo0.5Cr0.5O3) to c < a (PrCo0.33Cr0.67O3 and PrCrO3).
Obviously, in PrCo1–xCrxO3 series the decrease of the ionic radii of B-cation (from r(Cr3+) = 0.615 Å to r(Co3+) = 0.545 Å) leads toward change in the

41
Fig. 3. Observed and calculated XRD patterns for PrCo0.5Cr0.5O3 as well as their difference plot obtained by Rietveld refinement
Table 2. Fractional atomic coordinates and discrepancy factors for PrCo1–xCrxO3 solid solution
Atoms Param. PrCoO3 PrCo0.67Cr0.33O3 PrCo0.5Cr0.5O3 PrCo0.33Cr0.67O3 PrCrO3
Pr
xyzB
0.02913(13)0.250.9954(5) 0.33(2)
0.02964(15)0.250.9955(6)0.29(3)
0.03142(13)0.250.9940(5) 0.25(2)
0.03306(10)0.250.9947(4)0.292(19)
0.03545(8)0.250.9927(2)0.390(14)
Co/Cr B 0.06(3) 0.18(4) 0.06(3) 0.12(3) 0.22(2)
O1
x yz B
0.4947(15)0.250.060(2) 1.9(4)
0.4893(16)0.250.054(3)0.2(6)
0.4864(15)0.250.060(3)0.6(7)
0.4897(14)0.250.072(4)0.9(6)
0.4869(10)0.250.0643(18)0.9(3)
O2
x y z B
0.274(2)0.0388(14)0.7138(19) 0.9(3)
0.282(3)0.0420(17)0.700(3)1.8(3)
0.288(3)0.0353(16)0.701(3)0.9(3)
0.294(2)0.0364(14)0.7086(19)0.9(3)
0.2905(13)0.0428(10)0.7101(13)1.04(16)
RI
Rp/%Rwp/%Rexp/%χ2
RB/%
14.610.79.45 1.283.09
13.811.99.501.562.33
11.310.48.981.341.88
10.39.868.501.352.14
7.748.667.721.261.68
relationship of the unit cell parameters from a < c to c > a. This a/c relationship points out to the reasons for distortion of perovskite structure. Namely, it is known that the transition from cubic to orthorhom-bic structure (Pnma) due to the tilting of the octa-hedra leads to unit cell with c < a. The inverse re-lationship, a < c is characteristic for perovskites in which additional distortion of the BO6 octahedrons appears [10]. It this series, the additional distortion appears in cases when the content of Co3+ prevails
that of Cr3+, such as in PrCo0.67Cr0.33O3. This ad-ditional octahedral distortion may also be noticed from the comparison of a, b√2 and c (Table 1). It is interesting to point out that only in PrCrO3 and PrCo0.33Cr0.67O3 the relation between these parame-ters is a > b√2 > c as in the O-type perovskites. In this type of perovskites the octahedral tilting is primarily the only distortional mechanism and the lattice dis-tortion is small. In PrCo0.5Cr0.5O3 a and c parameters are almost identical, а ≈ c > b/√2 and this perovskite
S. DimitrovskaLazova et al.: Synthesis and structural details of perovskites within the series PrCo1–xCrxO3 ...

42
is orthorhombic with pseudo-tetragonal unit cell. In the last two members (PrCoO3 and PrCo0.67Cr0.33O3) the ratio between the unit cell parameters changes to c > b/√2 > a, which also highlights some additional distortion of the octahedra. It is interesting to com-pare these results with structural changes in RCoO3 (R = lantanide) series [7, 22], where the change in the mutual relationship between a and c parameters (from a > c to c > a) is driven by the increasing of the ionic radii of A-cation. This change ends with change in symmetry from orthorhombic to rombo-hedral (at LaCoO3).
Taking into consideration these changes in the unit cell parameters relationship due to the Co3+/Cr3+ sub-
stitution an additional crystallochemical calculations were done. Also, it seemed interesting to examine the possibility of changes in morphology and dimensions of the crystals obtained by Co3+/Cr3+ substitution in the perovskite structure.
The distortion of the octahedra may be pa-rameterized by the bond-length distortion of the octahedra, ∆6, calculated using the equation: ∆ = Σ[(ri −r)/r]/n · 103 (Table 3). As was pointed out previously, the calculated ∆6 values for PrCoO3 and PrCo0.67Cr0.33O3 are higher and are empha-sizing an increased distortion of the octahedra. The maximal ∆6 is found in PrCo0.67Cr0.33O3 and throughout the complex perovskites in the series,
S. DimitrovskaLazova et al.: Synthesis and structural details of perovskites within the series PrCo1–xCrxO3 ...
Table 3. Values of Pr-O and B-O distances, average <Pr-O> distances in twelve coordinated praseodymium and average distance in BO6 octahedra, ∆12, ∆10 and ∆6, B-O1-B and B-O2-B angles
PrCoO3 PrCo0.67Cr0.33O3 PrCo0.5Cr0.5O3 PrCo0.33Cr0.67O3 PrCrO3
Pr-O1
2.877(8)2.512(8)2.992(11)2.397(11)
2.926(9)2.495(9)2.977(16)2.444(16)
2.972(8)2.489(8)3.010(16)2.427(16)
2.984(8)2.518(8)3.09(2)2.36(2)
3.031(6)2.504(6)3.048(10)2.430(10)
Pr-O2 x 2
2.562(11)2.384(11)3.140(11)2.697(11)
2.627(15)2.324(15)3.235(15)2.682(14)
2.673(15)2.356(14)3.238(15)2.641(14)
2.667(11)2.365(11)3.254(11)2.658(11)
2.623(7)2.362(7)3.304(7)2.723(8)
<Pr-O>12 2.6953 2.7148 2.7262 2.7367 2.7531∆12 9.9624 12.429 12.39 13.46 14.06∆10 5.7991 6.5998 6.917 8.18 7.885B-O1 x 1 1.9218(18) 1.927(2) 1.941(3) 1.959(4) 1.9617(18)
B-O2 x2 1.885(11)1.978(10)
1.891(16)2.026(16)
1.921(16)2.003(16)
1.979(11)1.958(11)
1.988(7)1.981(7)
<B-O> 1.9283 1.948 1.955 1.9653 1.9769∆6 0.3933 0.8586 0.3189 0.0242 0.0316B-O1-B 160.6 162.24 160.24 156.74 158.98B-O2-B 157.8 153.6 154.7 154.7 153.6
Fig. 4. The change of the relation between the unit cell parameters a and c in PrCo1–xCrxO3 with increasing of x (x = 0, 0.33, 0.5, 0.67 and 1)

43
S. DimitrovskaLazova et al.: Synthesis and structural details of perovskites within the series PrCo1–xCrxO3 ...
the ∆6 is decreasing. Analyzing the values of the particular B-O distances, two facts may be no-ticed. Firstly, the distances between the B cation and the O1 anions are increasing from PrCoO3 to PrCrO3. This trend is the same for B-O2 distances, although not so regular. More careful examina-tion of the values of these distances shows that at the beginning of the series the first from the two B-O2 distances is longer, while at the end of the series (at PrCrO3) the second one is shorter than the first one. Bearing in mind that the B-O2 dis-tances are along a and c axes the interchange of these distances is in accordance with the change of the a/c relationship.
Contrary to the direction of the changes in bond-length distortion of the BO6 polyhedra, the distor-tion of the coordination polyhedra of the A cation is increasing with increasing of the amount of chro-mium ion e.g. with increasing of x (Table 3). The average <Pr-O>12 distances for twelve coordinat-ed Pr are increasing from 2.6953 Å in PrCoO3 to 2.7531 Å at PrCrO3. This change influences the co-ordination around Pr-cation. Namely, starting from PrCo0.67Cr0.33O3 two of the Pr-O2 distances are too long to be encountered as a part of the coordination of Pr3+, and probably the coordination number of praseodymium changes to 10. This change in the co-ordination of praseodymium is expressed in high val-ues of the distortion parameters ∆12. More precisely, these values are significantly higher than the values for ∆10 in all compounds except in PrCoO3, suggest-ing change in coordination sphere from 12 to 10.
The deviation from the ideal cubic perovskite structure may be also described by the observed so called tolerance factor, to [35]. This factor represents the ratio between the average <Pr-O>12 and <B-O>6 distances and is calculated by the equation: to = <Pr-O>12/√2 <B-O>6. The observed tolerance factor is related with the degree of the octahedral tilting. The values close or equal to 1 corresponds to the structures without tilting of the octahedra [36]. In order to check the trend of changes of the observed
tolerance factors in relation with tilting within this perovskite series, the tilt angles θ, φ and Φ were calculated (Table 4).
These tilt angles represents the rotation of the octahedra around [110]p, [001]p and [111]p pseudo-cubic axes and are calculated using the fractional atomic coordinates [2]. It may be noticed that in the structure of PrCoO3 the value of to (calculated assuming coordination number 12 for A cation, to(12), and 10 to(10)) is closer to 1 and this compound has the smallest tilt angles. The values of to are in-creasing throughout the series, with increasing of x, and also the tilting of the octahedra is more pro-nounced (θ, φ and Φ, Table 4). These results are also in accordance with the values of the tilt angles calculated on the bases of the experimental B-O1-B and B-O2-B angles, using the formula φ* = (180 − <B-O1,2-B>)/2, where <B-O1,2-B> is the average value of B-O1,2-B angles (Table 4). Obviously, in complex perovskites, the tilt angles of the octahedra are increasing with increasing of x, e.g. of the sub-stitution of Co3+ with Cr3+. These values suggest that the overlap of the oxygen orbitals with the orbit-als of the B cation is smaller. Namely, as this angle deviates more from 180° smaller orbital overlap is achieved [11].
In order to evaluate the overall distortion of the perovskite structure in the series, additional distor-tion parameters were also calculated: orthorhombic distortion, spontaneous strain (s), d-cell distortion (Table 4). These parameters are calculated using the unit cell parameters and they pointed out to the change in the type of the distortion. It may be concluded that these values are diminishing from PrCoO3 to PrCo0.5Cr0.5O3, (the smallest value) and then they start rising again.
According to the previous discussion it may be concluded that there are two types of distortions in the structures of the members of this perovskite se-ries. In PrCoO3 and PrCo0.67Cr0.33O3, in which the content of Co3+ prevails the content of Cr3+, the oc-tahedra are more distorted in respect to the bond
Table 4. Change of values of several crystallographic parameters throughout the series. Calculated parameters are: orthorhombic distortion [35], spontaneous strain (s) [2], d-cell distortion [7], Global Instability index (GII) [2], observed tolerance factors to(12) and to(10) [2], tilt angles calculated using fractional atomic coordinates [2] and tilt angle obtained from B-O1,2-B angles
Orthorhombic distortion
Spontaneous strain (s)
d-cell distortion GII to(12) to(10)
Tilt anglesθ φ Φ φ*
PrCoO3 0.0171 –0.0061 0.0626 0.2112 0.9884 0.9558 9.700 7.012 11.950 10.4PrCo0.67Cr0.33O3 0.0112 –0.0036 0.0279 0.2225 0.9855 0.9477 8.879 9.538 13.004 11.04PrCo0.5Cr0.5O3 0.0072 –7.4 · 10–5 0.0018 0.1967 0.9860 0.9490 9.880 9.948 13.985 11.265PrCo0.33Cr0.67O3 0.0963 0.0014 0.0062 0.1812 0.9846 0.9474 11.630 9.697 15.099 12.14PrCrO3 0.2341 0.0051 0.0497 0.0762 0.9847 0.9453 10.509 9.136 13.891 11.855

44
S. DimitrovskaLazova et al.: Synthesis and structural details of perovskites within the series PrCo1–xCrxO3 ...
lengths. This leads to bigger instability and stress in the structure, which are expressed in the high val-ues of GII (global instability index, Table 4). These high values (> 0.2 valence units) of GII, point out to big strain in these structures. This type of distortion may be connected with possible existence of Co3+ ion in intermediate spin (IS) state. Namely, the IS would increase the deformation of the octahedra as a result of appearance of Jahn-Teller distortion.
In PrCo0.33Cr0.57O3 and PrCrO3, in which the con-tent of Cr3+ prevails the content of Co3+ the distor-tion is mainly due to the rotation of the octahedra, while the bond-lengths distortion of the octahedra is significantly smaller. The most stable structure is that of PrCo0.5Cr0.5O3. It seems that the effects of the
bond-lengths distortion and tilting of the octahedral act in opposite directions in this perovskite series, leading to stabilization of the structure.
In aim to check the influence of these structural changes due to partial substitution of the cations in B-position, on their morphology, SEM images of the perovskites of this series were recorded. Figure 5 shows the SEM micrographs of PrCo1–xCrxO3 pow ders obtained by heat treatment at 800 °C for 4 hours.
The images show single perovskite phases with appropriate nanosize crystallinity. The porous struc-ture implies the outflow of gases produced by de-composition of nitrates and combustion of glycine. As can be seen, the morphology of the compounds within the series is very similar.
Fig. 5. SEM images of a) PrCoO3; b) PrCo0.67Cr0.33O3; c) PrCo0.5Cr0.5O3; d) PrCo0.33Cr0.67O3 and e) PrCrO3 obtained by same synthetic procedure

45
CONCLUSION
The perovskites within the series PrCo1–xCrxO3 were obtained by solution combustion method using urea or glycine as a fuel. The purity of the samples obtained using glycine was better than that using urea, so the further investigations were car-ried out on the samples synthesized by glycine. The Rietveld refinement of the crystal structures showed that all compounds within this series crystallize in the orthorhombic space group Pnma with four for-mula units per unit cell.
In aim to study the influence of Co3+/Cr3+ substi-tution on the perovskite structure, several crystallo-chemical parameters were calculated. The detailed analysis of structural changes due to substitution of Co3+ with Cr3+ revealed some interesting features. Thus, it was concluded that in perovskites where the content of Co3+ prevails that of Cr3+ (PrCoO3 and PrCo0.67Cr0.33O3), except the distortion due to octahe-dral tilting the octahedral distortion in respect to the bond lengths is also significant. This leads to bigger instability and stress in the structure, which are ex-pressed in the high values of GII. In PrCo0.33Cr0.57O3 and PrCrO3, in which the content of Cr3+ prevails the content of Co3+
the distortion is mainly due to the octahedral tilting. The most stable structure is that of PrCo0.5Cr0.5O3.
Acknowledgement: The authors thank the National Science Fund of Bulgaria and the Ministry of Education and Science of Republic of Macedonia for the financial support under contract DNTS/Macedonia 01/7/08.12.2011.
REFERENCES
1. F. S. Galasso, Perovskites and High Tc Supercon-ductors, Gordon and Breach Science Publishers, 1990.
2. R. H. Mitchell, Perovskites: Modern and Ancient, Almaz press – Thunder Bay, 2002.
3. M. A. Peña, J. L. G. Fierro, Chem. Rev., 101, 1981 (2001).
4. T. Ishihara (Ed), Perovskite Oxide for Solid Oxide Fuel Cells (Fuel Cells and Hydrogen Energy), Springer, Dordrecht, 2009.
5. S. yamaguchi, y. Okimoto, y. Tokura, Phys. Rev. B, 54, R11022 (1996).
6. A. Fondado, J. Mira, J. Rivas, C. Rey, M. P. Breijo, and M. A. Señarís-Rodríguez, J. App. Phys., 87(9), 5612 (2000).
7. K. Knížek, Z. Jirák, J. Hejtmánek, M. Veverka, M. Maryљko, G. Maris, T. T. M. Palstra, Eur. Phys. J. B, 47, 213 (2005).
8. H. W. Brinks, H. Fjellvåg, A. Kjekshus, B. C. Hau-back, J. Solid State Chem., 147, 464 (1999).
9. J.-Q. yan, J.-S. Zhou, J. B. Goodenough, Phys. Rev. B, 69, 134409 (2004).
S. DimitrovskaLazova et al.: Synthesis and structural details of perovskites within the series PrCo1–xCrxO3 ...
10. J.-S. Zhou, J.-Q. yan, J. B. Goodenough, Phys. Rev. B, 71, 220103R (2005).
11. G.Ch. Kostogloudis, N. Vasilakos, Ch. Ftikos, Solid State Ionics, 106, 207 (1998).
12. A. P. Sazonov, I. O. Troyanchuk, V. V. Sikolenko, Crystallogr. Rep., 51, 11 (2006).
13. T. Fujita, T. Miyashita, y. yasui, y. Kobayashi, M. Sa-to, E. Nishibori, M. Sakata, y. Shimojo, N. Igawa, y. Ishii, K. Kakurai, T. Adachi, y. Ohishi, M. Takata J. Phys. Soc. Jpn., 73, 1987 (2004).
14. X. G. Luo, X. Li, G. y. Wang, G. Wu, X. H. Chen, J. Solid State Chem., 179, 2175 (2006).
15. R. Caciuffo, D. Rinaldi, and G. Barucca, J. Mira, J. Rivas, M. A. Señarís-Rodríguez, P. G. Radaelli, D. Fio rani, J. B. Goodenough, Phys. Rev. B, 59, 1068 (1999).
16. G. Thornton, F. C. Morrison, S. Partingtont, B. C. Tofield, D. E. Williams, J. Phys. C: Solid State Phys., 21, 2871 (1988).
17. S. Dimitrovska-Lazova, D. Kovacheva, S. Aleksovska, V. Mirceski, Proceedings of 45th Meeting of Serbian Chemical Society, Novi Sad, 2007.
18. S. Dimitrovska-Lazova, V. Mirceski, D. Kovacheva, S. Aleksovska, J. Solid State Electrochemistry, 16, 219 (2012).
19. V. V. Kharton, E. N. Naumovich, A. A. Vecher, A. V. Ni ko laev, J. Solid State Chem., 120, 128 (1995).
20. S. Pal, S. H´ebert, C. yaicle, C. Martin, A. Maignan, Eur. Phys. J. B, 53, 5 (2006).
21. J. L. G. Fierro, M. A. Pena, L. Gonzalez Tejuca, J. Mater. Sci., 23, 1018 (1988).
22. J. A. Alonso, M. J. Martínez-Lope, C. de la Calle, V. Pomjakushin, J. Mater. Chem., 16, 1555 (2006).
23. J.-W. Moon, y. Masuda, W.-S. Seo, K. Koumoto, Mater. Sci. Eng., B85, 70 (2001).
24. y. Ren, B. Li, J. Wang, X. Xu, J. Solid State Chem., 177, 3977 (2004).
25. P S. Devi, M. S. Rao, J. Therm. Anal., 48, 909 (1997).
26. P. S. Devi, J. Mater. Chem., 3, 373 (1993).27. P. A. Brayshaw, A. K. Hall, W. T. A. Harrison, J. M.
Har rowfield, D. Pearce, T. M. Shand, B. W. Skelton, C. R. Whitaker, A. H. White, Eur. J. Inorg. Chem., 1127 (2005).
28. y. Sadaoka, E. Traversa, M. Sakamoto, J. Mater. Chem., 6, 1355 (1996).
29. y. Seto, K. Umemoto, T. Arii, y. Masuda, J. Therm. Anal. Calorim., 76, 165 (2004).
30. M. V. Kuznetsov, Ivan P. Parkin, Polyhedron, 17, 4443 (1998).
31. K. Sardar, M. R. Lees, R. J. Kashtiban, J. Sloan, R. I. Walton, Chem. Mater., 23, 48 (2011).
32. M. M. A. Sekar, K. C. Patil, J. Mater. Chem., 2, 739 (1992).
33. Ј. Rodriguez-Carvajal, Physica B, 192, 55 (1993).34. S. Geller, Acta Crystallogr., 10, 243 (1957).35. G. Huo, D. Song, Q. yang, F. Dong, Ceram. Int., 34,
497 (2008).36. Sasaki, C. T. Prewitt, J. D. Bass, W. A. Schulze, Acta
Crystallogr., C43, 1668 (1987).37. C. L. Bull, P. F. McMillan, J. Solid State Chem., 177,
2323 (2004).

46
S. DimitrovskaLazova et al.: Synthesis and structural details of perovskites within the series PrCo1–xCrxO3 ...
синтеЗ и струКтурни детайли на пероВсКити от серията PrCo1–xCrxO3 (x = 0, 0.33, 0.5, 0.67 и 1)
с. димитровска-лазова1*, д. Ковачева2, с. алексовска1, м. маринчек3, п. цветков2
1 Университет „Св. Кирил и Методии“, Факултет по Естествени науки и Математика, Архимедова 2, Скопие, Македония
2 Институт по обща и неорганична химия, Българска академия на науките, „Акад. Г. Бончев“ бл.11, София, България
3 Университет на Любляна, Факултет по химия и химични технологии, Aškerčeva c. 5, 1000 Любляна, Словения
постъпила на 21 март, 2012 г.; приетa на 2 май, 2012 г.
(резюме)
предствен е синтез, структурно изследване и морфология на комплексни перовскити с обща формула PrCo1–xCrxO3 (with x = 0, 0.33, 0.5, 0.67 и 1). получените перовскити са синтезирани по метода на комбустия през разтвор с използване на два вида гориво: урея и глицин. накалените об-разци са идентифицирани с прахова рентгенова дифракция. получените съединения с глицин като гориво са с по-голяма чистота и за изследване бяха използвани образци синтезирани с това гориво. Кристалната структура беше уточнена по метода на ритвелд, а морфологията на частиците характе-ризирана със SEM. Всички съединения от серията кристализират в пространствена група Pnma (Z = 4). ефекта от заместване на Co3+ с Cr3+ е изследван с анализ на различни кристалохимични па-раметри (дължина на връзки и ъгли на накланяне на координационните октаедри, глобален индекс на нестабилност и др.). Беше установена интересна промяна в дисторзията на структурата и глобал-ният индекс на стабилност в зависимост от степента на заместване на Co3+ с Cr3+.

47
* To whom all correspondence should be sent:E-mail: [email protected]
© 2012 Bulgarian Academy of Sciences, Union of Chemists in Bulgaria
Bulgarian Chemical Communications, Volume 44, Proceedings of the IIIrd National Crystallographic Symposium (pp. 47–54) 2012
Structural characteristics of GdCo1–xCrxO3 (x = 0, 0.33, 0.5, 0.67, 1) perovskites
S. Dimitrovska-Lazova1*, D. Kovacheva2, P. Tzvetkov2
1 University “St. Cyril and Methodius”, Faculty of Natural Sciences and Mathematics, Arhimedova 5, Skopje, R. Macedonia
2 Institute of General and Inorganic Chemistry, Bulgarian Academy of Science, “Acad. Georgi Bonchev” bl. 11, 1113 Sofiа, Bulgaria
Received March 21, 2012; Revised May 2, 2012
In this paper the synthesis, crystal structure determination and calculation of structural parameters within the GdCo1–xCrxO3 (x = 0, 0.33, 0.5, 0.67 and 1) are presented. The compounds were synthesized by solution combustion method starting with the nitrates of the constituent metals and urea as a fuel. The perovskites within the series crystallize in Pnma with Z=4. The lattice parameters and distances and angles were used to calculate several crystallographic parameters such as, cell distortion, orthorhombic distortion, bond and angle deformation, the tilting angles, bond valences, and global instability index. These were used to obtain a clearer picture of the influence of substitution of Co3+ with Cr3+ in these complex perovskites on the distortion and stability of the perovskite structure.
Key words: complex perovskites, X-ray diffraction, crystal structure, crystallographic parameters.
INTRODUCTION
The role of the perovskites in science and tech-nology is constantly increasing. This is a result of numerous possibilities for application of these ma-terials due to their interesting physical and chemical properties. For example these compounds exhibit wide spread of conducting properties from insulators to conductors, superconductivity, colossal magne-toresistance, giant magneto resistance, catalytic ac-tivity toward different catalytic reactions, etc [1−3]. These properties are connected to specific structural characteristics of perovskites as well as with charac-teristic properties of constituting elements.
Perovskites are usually designated with the for-mula ABX3, where A and B are cations and X is the anion. The positions of the cations may be occupied by different metals from the periodic table, while as an anion most frequently oxygen can be found but there are compounds with halogenides, OH−, CN−, or H− anion. The diversity in perovskite structure is a result of possible multiple substitutions in the
positions of the cations, leading to a great number of so-called complex perovskites.
The ideal perovskite structure is fairly simple. Namely, in cubic unit cell B-cations are surrounded by six anions arranged in octahedral geometry shar-ing the same vertex. This arrangement forms cu-booctahedral cavity in which the A-cation is placed. This structure is very flexible. Namely, the BO6 octahedra may be rotated to small angle leading to structural distortions and lowering of the cubic sym-metry. As a result, large number of distorted (or-thorhombic, tetragonal, hexagonal etc.) perovskites are known.
In the present study the structural investigation of complex perovskites with cobalt and chromium (3+) cations in B-position is presented. Our focus is on structural changes driven by mutual substitu-tion of these ions in GdCo1–xCrxO3 (x = 0, 0.33, 0.5, 0.67 and 1) solid solution. The role of cobalt ion in perovskites on their properties is thoroughly studied [4−8] and it is evident that this cation is responsible for a number of interesting properties found in co-balt-containing perovskites. Thus, as a result of pos-sible temperature driven spin state change of Co3+ and of its oxidation state, Co-containing perovskites exhibit interesting electrical and magnetic proper-ties, as well as, pronounced catalytic activity [3, 9]. The change in oxidation state of Co3+ ion (to Co2+ or
48
S. DimitrovskaLazova et al.: Structural characteristics of GdCo1–xCrxO3 (x = 0, 0.33, 0.5, 0.67, 1) perovskites
Co4+ state) is accompanied with appearance of va-cancies or change of oxidation state of other cations in the compound, while the spin state directly influ-ences the deformation of the structure as a result of the fact that from the three possible spin states of the cobalt ion (low, intermediate and high spin state) the intermediate and high spin state of Co3+ exhibit Jahn-Teller effect.
On the other hand, rare earth chromites are in-teresting because of their electrical conductivity, re-sistance to oxidation and high melting points [10].
The literature data for the end members of the series GdCo1–xCrxO3 (x = 0, 0.33, 0.5, 0.67 and 1), GdCoO3 and GdCrO3, showed that these compounds may be synthesized using different methods such as: solid state reaction [11, 12−16], sol-gel meth-od [17−19], synthesis using complex precursors [20−22], hydrothermal method [23, 24], self-prop-agating high-temperature synthesis [10], decom-position or combustion synthesis using citric acid [9, 25] and by decomposition of nitrate salts [7, 26]. In this study, the solution combustion method was used for the synthesis of investigated compounds. Namely, in recent years the combustion synthesis is becoming one of the most popular methods for ob-taining wide variety of oxide materials. Combustion synthesis is fast and inexpensive that enables pro-ducing homogeneous, very fine, crystalline, mul-ticomponent oxide powders, without intermediate decomposition steps [27, 28]. It involves highly ex-othermic reaction between oxidant (usually nitrate salts of metal ions) and an organic fuel. The aim to use this fuel is to be a source of C and H, which are reducing elements in the combustion reaction. The most often used compounds as fuels are: urea, gly-cine, sucrose, alanine, citric acid, etc. The pathway of the reaction and the temperature of the synthesis are highly dependent on the ratio between fuel and oxidizer (metal nitrates) [29]. This ratio is usually set to 1, but it may be smaller (to 0.7) or bigger than 1. In this study nitrates of the consisting metals were used аs oxidizers and the fuel was urea. The ratio between them was set to 1.
The formation of the perovskite phase was ex-amined by X-ray diffraction. The crystalographic characteristics of the end members of the series, GdCoO3 and GdCrO3, are known from the litera-ture [10, 13, 14, 16, 17, 23, 24]. These compounds are orthorhombic and they belong to GdFeO3-type perovskites (space group Pnma). To the best of our knowledge, the intermediate members of the solid solution are synthesized for the first time and we expected that they have the same crystallographic characteristics as the end members. The refinement of the crystal structure confirmed that Co3+ and Cr3+ ions are completely interchangeable and may be substituted in the whole region of x (from 0 to 1).
EXPERIMENTAL
The starting materials for the synthesis were nitrates of the consisting metals: Gd(NO3)3·6H2O, Co(NO3)2·6H2O and/or Cr(NO3)3·9H2O. The nitrates were dissolved in small amount of deionised wa-ter. The obtained solutions were thoroughly mixed together. As previously mentioned the fuel (F) to oxidizer (O) ratio was set to 1 and according to the stoichiometry, the quantity of the fuel was calcu-lated separately for each compound. The calculated amount of urea was dissolved in 1:1 solution of ni-tric acid and was added to the solution of metal ions. The final solution was transferred to muffle furnace and heated up to ~500 °C. After the evaporation of the water the combustion reaction started and was followed by large emission of gasses CO2, N2 and H2O. The resulting products were substances, which showed voids, pores, and were highly friable. All powders were black except GdCrO3 that has pale green color.
The combustion reaction for one of the systems may be presented as follows:
2Gd(NO3)3 + Co(NO3)2 + Cr(NO3)3 + 9(NH2)2CO + 4.5O2 → 2GdCo0.5Cr0.5O3 + 9CO2 + 9N2 + 9H2O
The obtained powders were hand grinded and subjected to additional heating at 800 °C for 4h.
The resulting powders were analyzed by X-ray diffraction. The XRD patterns were recorded on Bruker D8 Advance with CuKα radiation and SolX detector within the range 10–120° 2θ at room tem-perature with step scanning rate of 0.02°. The crys-tal structures were refined by the method of Rietveld (program Fullprof).
RESULTS AND DISCUSION
The XRD analysis of the powders obtained af-ter the combustion reaction showed that perovskite phase was formed only in the case of GdCrO3, right after the combustion of the initial solution. This as-prepared phase contains small quantity of im-purity identified as GdCrO4. The impurities were removed by additional heating of the obtained GdCrO3 perovskite at 800 °C (Fig. 1).
In the case of the other samples the perovskite phase was not formed directly after the combus-tion reaction, but by further heating at 800 °C for 4 hours. The perovskite structure of the resulting powders was confirmed according to the XRD pat-terns (Fig. 2).
The analysis of the XRD patterns of the synthe-sized compounds showed continuous shift of the positions of the diffraction peaks towards lower val-ues with increasing x (Fig. 2). As expected, this shift

49
is a result of the continuous substitution of smaller Co3+ ion (r(Co3+) = 0.545 Å) with the larger Cr3+ one (r(Cr3+) = 0.65 Å) , leading to increasing of the lattice parameters from GdCoO3 to GdCrO3. These results showed that these two ions may be substi-tuted in the whole range of x (form x = 0 to x = 1) and continuous solid solution may be formed.
The crystal structures of the perovskites within the GdCo1–xCrxO3 (x = 0, 0.33, 0.5, 0.67 and 1) series were refined using the Rietveld method (program Fullprof) and starting with the structural model of
GdCrO3 [30]. All perovskites within this series crys-tallize in Pnma space group (Z = 4) (Table 1). The selected distances and angles are given in Table 2.
The structural data for GdCoO3 and GdCrO3 are already reported in the literature, and the crystal-lographic data for mixed Co3+, Cr3+ perovskites are given in this paper. The refined values of the unit cell parameters for GdCoO3, a = 5.39074(12), b = 7.45514(17) and c = 5.22527(12) are close to the literature values [14, 16] and the obtained values for GdCrO3, a = 5.52447(12), b = 7.60552(16) and
S. DimitrovskaLazova et al.: Structural characteristics of GdCo1–xCrxO3 (x = 0, 0.33, 0.5, 0.67, 1) perovskites
Fig. 2. XRD patterns of a) GdCoO3; b) GdCo0.67Cr0.33O3 c) GdCo0.5Cr0.5O3; d) GdCo0.33Cr0.67O3 and e) GdCrO3 heated 4h at 800 °C
Fig. 1. XRD patterns of a) as-pre-pared GdCrO3 (the arrow indicates the peak suggesting presence of GdCrO4 as impurity) and b) GdCrO3 heated for 2h at 800 °C

50
c = 5.31310(11), are also in good agreement to the literature values [13, 23].
In a series of solid solutions like this one it is im-portant to investigate the structural distortions and the stability of the compounds resulting from the substitution of one cation with another. So, below is given the thorough structural study of the perovskites within this series. In order to quantify the structural distortion of the perovskite structure, usually the first step is to calculate the well known Goldshmidt tolerance factor, t [31]. It is calculated according to
S. DimitrovskaLazova et al.: Structural characteristics of GdCo1–xCrxO3 (x = 0, 0.33, 0.5, 0.67, 1) perovskites
the equation t = (r(A) + r(O))/√2(r(B) + r(O), taking into account the ionic radii of the constitutent met-als regarding the A-cation as twelve coordinated, and B-cation and O as six coordinated. The bound-aries of t for perovskite structure are from 0.78–1.05 [32], and it is expected that in compounds with in-creasing distortion from ideal perovskite structure the tolerance factor will shift to lower values. The obtained tvalues for the investigated compounds are at the lower limit for perovskite structure and are suggesting distorted structures. The values of
Table 1. Structural data from X-ray powder diffraction studies of GdCo1–xCrxO3 perovskites
Atoms Parameters GdCoO3 GdCo0.67Cr0.33O3 GdCo0.5Cr0.5O3 GdCo0.33Cr0.67O3 GdCrO3
a (Å)b (Å)c (Å)
5.39074(12)7.45514(17)5.22527(12)
5.4357(3)7.5046(4)5.2541(3)
5.4573(3)7.5280(4)5.2685(3)
5.4832(2)7.5572(3)5.28499(20)
5.52447(12)7.60552(16)5.31310(11)
GdxzB
0.05792(19)0.9870(5)0.06(4)
0.05740(18)0.9858(4)0.07(4)
0.05808(16)0.9850(3)0.17(3)
0.05827(14)0.9860(3)0.08(3)
0.05890(12)0.9852(2)0.25(2)
Co/Cr B 0.08(7) 0.19(6) 0.12(5) 0.19(5) 0.01(4)
O1xzB
0.4816(17)0.085(2)1.5(3)
0.4750(16)0.0861(19)1.8(3)
0.4734(14)0.0855(17)1.7(3)
0.4744(14)0.0940(15)1.4(3)
0.4701(12)0.0942(13)1.8(2)
O2
xyzB
0.2958(17)0.0461(11)0.7085(18)0.5(3)
0.2949(15)0.0496(10)0.7091(17)0.3(3)
0.2969(14)0.0483(10)0.7056(15)0.5(2)
0.2960(12)0.0479(8)0.7022(13)0.42(19)
0.2968(10)0.0497(7)0.7035(10)0.87(16)
RI
Rp:Rwp:Rexp:χ2:RB:
22.913.912.571.225.78
17.613.210.921.454.43
16.612.911.161.353.17
15.412.210.871.253.07
12.110.69.821.162.45
Table 2. Selected distances and angles in GdCo1–xCrxO3 perovskites
GdCoO3 GdCo0.67Cr0.33O3 GdCo0.5Cr0.5O3 GdCo0.33Cr0.67O3 GdCrO3
Gd − O1 3.149 3.209 3.234 3.252 3.304Gd − O1 2.341 2.33 2.328 2.352 2.344Gd − O1 3.017 3.038 3.041 3.1 3.117Gd − O1 2.274 2.293 2.31 2.267 2.288Gd − O2 x 2 2.464 2.458 2.484 2.506 2.508Gd − O2 x 2 2.313 2.312 2.312 2.322 2.329Gd − O2 x 2 3.323 3.36 3.384 3.4 3.434Gd − O2 x 2 2.614 2.66 2.65 2.648 2.679<Gd − O>9 2.490 2.502 2.508 2.519 2.531Co − O1 x 2 1.919 1.935 1.941 1.959 1.9731Co − O2 x 2 1.962 1.979 1.983 1.977 2Co − O2 x 2 1.91 1.928 1.941 1.965 1.971<Co − O>6 1.930 1.947 1.955 1.967 1.981B − O1 − B 152.56 151.74 151.77 149.43 149.01B − O2 − B 151.6 150.7 150.3 150.1 149.6

51
t for the investigated series are decreasing from 0.911 for GdCoO3 to 0.880 for GdCrO3 (Table 3).
Both end members of the series GdCoO3 and GdCrO3 are orthorhombicaly distorted perovskites [13, 14, 16, 23]. As expected, the middle members of the series are also distorted orthorhombic perovskites and the values of the unit cell parameters are increas-ing from GdCo0.67Cr0.33O3 to GdCrO3 (Table 1). The relationship between the unit cell parameters in
S. DimitrovskaLazova et al.: Structural characteristics of GdCo1–xCrxO3 (x = 0, 0.33, 0.5, 0.67, 1) perovskites
these compounds is b > c/√2 > a as in O-type per-ovskites, where the tilting of the octahedra is the primary source of deformation (Fig. 3). This trend is maintained throughout the entire series. Using the values of the unit cell parameters two crystallo-graphic parameters were calculated – cell distortion [33] and orthorhombic distortion [6] (Table 3). The obtained values point out that the distortion of the unit cell (from ideal cubic) increases with Cr con-
Table 3. Crystallographyc parameters of GdCo1–xCrxO3 perovskites
GdCoO3 GdCo0.67Cr0.33O3 GdCo0.5Cr0.5O3 GdCo0.33Cr0.67O3 GdCrO3
t 0.911 0.901 0.895 0.89 0.88cell distortion 1.731 2.048 2.199 2.395 2.677
orthorhom. distortion 0.2892 0.2900 0.2901 0.2905 0.2914Δ9 7.906 8.634 8.374 9.459 9.779Δ10 12.727 14.138 14.244 15.234 16.186Δ6 0.138 0.134 0.103 0.014 0.044θ/° 13.722 14.131 14.116 15.283 15.493ϕ/° 9.931 9.763 10.362 10.62 10.571Φ/° 16.882 17.119 17.448 18.538 18.683
BV-A 3.276 3.219 3.16 3.12 3.04BV-Co 2.721 2.598 2.544 2.46 /BV-Cr / 3.287 3.218 3.112 2.995
GII 0.199 0.189 0.183 0.161 0.054
Note: For the calculation of cell distortion first the value of ap (pseudocubic a parameter) was found according the equation: ap = (a/√2 + b/√2 + c/2)/3 and then it was used to obtain the cell distortion as: [(a/√2 − ap)2 + (b/√2 − ap)2 + (c/2 − ap)2]/3ap [33]. The orthorhombic distortion was calculated using the equation: {[Σ(ai – a)2]1/2}/a, where ai = a, b, c/√2 and a is an average of ai [6]. The calculation of the polyhedron bond length distortion parameters ∆9, ∆10 and ∆6 was performed using the equation: ∆ = Σ[(ri −r)/r]/n x 103, where ri is individual bond length (A − O or B − O), r is the average bond length and n is a number of bonds [34]. The tilt angles are calculated using the fractional atomic coordinates of oxygen atoms [1]. For the calculation of bond valence the used equations are: si = exp(ro − ri,j)/B and BV = Σsi, where ro is empirical parameter, ri,j is the bond distance and B = 0.37 [35]. The global instability index was calculated using the equation GII = [(Σdi
2)/N]1/2, where di is the discrepancy between calculated BV and theoretical oxidation number [36].
Fig. 3. Relationship between the tolerance factor and the orthorhombic distortion and distortion of the unit cell in the analyzed series GdCo1–xCrxO3

52
tent. These results are in accordance with expected increase in the deformation of the structure obtained from the values of the tolerance factor.
The refined values of the fractional atomic co-ordinates (Table 1) were used to calculate different structural parameters. These parameters were also used to analyze the contribution of the particular cation in the compound to the structural distor-tions within the series. Firstly, the change in the surrounding of the gadolinium ion was considered. In the ideal cubic perovskites the coordination of the A-cation is 12 but in orthorhombic perovskites the coordination number is usually lowered to 10, 9 or 8. In this series of perovskites the coordination of Gd3+ is becoming more distorted as the content of Cr3+ is increasing. This may be noticed from the values of the Gd−O distances, which are increasing with enhancement of the substitution of Co3+ ion. As a consequence, the coordination number of Gd3+ changes and it is lowered from 10 in GdCoO3 to 9 in GdCrO3. This effect is also obvious from the values of the polyhedron bond length distortion ∆9 and ∆10. Namely, these parameters are reflecting the defor-mation of the distances in the coordination polyhe-dron. It may be noticed that the highest values are obtained for GdCrO3.
Contrary to the trend in deformation of the co-ordination of gadolinium ion the deformation of the B-cations (Co3+ and/or Cr3+) octahedra is decreasing from GdCoO3 to GdCrO3 (Table 3). Although the Co/Cr−O bond lengths (Table 2) are increasing the polyhedron bond length distortion parameter, ∆6, is decreasing (Table 3) in the same direction. This parameter shows that the distortion of the bonds in the octahedra is decreasing and the octahedron is becoming more regular. The obtained values for the first members of the series are relatively high, espe-cially if we compare them to the values of ∆6 in fer-rites (GdFeO3, ∆6 = 0.032) [1], but they remain still smaller than the values found in manganites, where
Mn3+ is a Jahn-Teller ion (GdMnO3, ∆6 = 6.701) [37]. It is interesting to note that as the octahedron becomes more regular across the series, the tilt an-gles are increasing. Namely, if the values of the tilt angles (φ, θ, and Φ), calculated using the atomic coordinates of oxygen atoms [1] are compared, it could be stated that these values are increasing with increasing of x. From these results it may be concluded that importation of chromium ion in place of Co3+ makes the octahedron more regular in respect to its bond lengths but in the same time it is more tilted.
The increase in the tilting angle of the octahe-dra is reflected in lowering of the B−O1−B and B−O2−B angles. From Table 2 it is evident that these angles are substantially different from 180° – the value characteristic for ideal cubic perovskites. These low values are suggesting smaller Co/Cr-3d and oxygen-2p orbital overlap. Namely, as the angle is increased and approaches 180°, a greater overlap is achieved. This overlap directly controls the inter-action integral β, which is proportional to the width of the Co/Cr–O bands [38].
The bond length and the valence of the bond are related in the bond valence model given by I. D. Brown [35]. The calculated values of the bond valence of cations are also presented in Table 3. It is obvious that there are positive and nega-tive deviations from the theoretical values of the oxidation states of the cations. The values for the Gd3+ and Cr3+ ions are larger than the theoretical ones, which suggests that the average Gd−O and Cr−O distances in these compounds are shorter than the average bond distances in other oxides containing Gd or Cr compounds. It is also obvi-ous that the values for the bond valence of cobalt ion are becoming smaller throughout the series (Table 3) with pronounced differences from the theoretical value. The values for the bond valence are used to calculate the global instability index,
S. DimitrovskaLazova et al.: Structural characteristics of GdCo1–xCrxO3 (x = 0, 0.33, 0.5, 0.67, 1) perovskites
Fig. 4. Change of the global insta-bility index with increasing x in the series GdCo1–xCrxO3

53
GII. This index reflects the overall stress in the structure. The values of GII are usually smaller than 0.1 in structures without internal stress, the values between 0.1 and 0.2 are characteristic for compounds with lattice-induced strains, and high-er than 0.2 - for unstable structures [36]. From the calculated values of GII it may be pointed that GdCrO3 (GII = 0.054) meets the requirement for structure without internal stress (Fig. 4) and GII for cobalt containing compounds within the series (of values between 0.1 and 0.2) indicate existence of lattice-induced strains.
CONCLUSION
The complex perovskites of general formula GdCo1–xCrxO3 (x = 0, 0.33, 0.5, 0.67 and 1) were obtained by solution combustion method using urea as a fuel. The Rietveld refinement of the crys-tal structures showed that they crystallize in Pnma with Z = 4. According to the lattice parameters and the distances and angles in the compounds, several important parameters were calculated indicating the influence of the mutual substitution of Co3+ with Cr3+ to the distortion and stability of the perovskite structure. Thus, it was concluded that by increasing of the content of Cr3+ ions in the perovskite struc-ture the BO6 octahedron becomes more regular but the tilting of octahedron is more pronounced. Also the deformation of Gd-O polyhedron increases with increasing of the Cr3+ content. The calculated bond valences and global instability indices indicate for existence of lattice-induced strains in the structure of the cobalt containing compounds.
Acknowledgements: The authors thank the National Science Fund of Bulgaria and the Ministry of Education and Science of Republic of Macedonia for the financial support under contract DNTS/Macedonia 01/7/08.12.2011.
REFERENCES
1. R. H. Mitchell, Perovskites: Modern and Ancient, Almaz press – Thunder Bay, 2002.
2. F. S. Galasso, Perovskites and High Tc Supercon-ductors, Gordon and Breach Science Publishers, 1990.
3. M. A. Peña, J. L. G. Fierro, Chem. Rev., 101, 1981 (2001).
4. T. Ishihara (Ed), Perovskite Oxide for Solid Oxide Fuel Cells (Fuel Cells and Hydrogen Energy), Springer, Dordrecht, 2009.
5. S. yamaguchi, y. Okimoto, y. Tokura, Phys. Rev. B, 54, R11022 (1996).
6. K. Knížek, Z. Jirák, J. Hejtmánek, M. Veverka, M. Maryško, G. Maris, T. T. M. Palstra, Eur. Phys. J. B, 47, 213 (2005).
7. A. Fondado, J. Mira, J. Rivas, C. Rey, M. P. Breijo, and M. A. Señarís-Rodríguez, J. App. Phys., 87(9), 5612 (2000).
8. H. W. Brinks, H. Fjellvåg, A. Kjekshus, B. C. Hau-back, J. Solid State Chem., 147, 464 (1999).
9. J.-W. Moon, y. Masuda, W.-S. Seo, K. Koumoto, Mater. Sci. Eng. B, 85, 70 (2001).
10. M. V. Kuznetsov, I. P. Parkin, Polyhedron, 17, 4443 (1998).
11. A. K. Tripathi, H. B. Lal, J. Mater. Sci., 17, 1595 (1982).
12. B. Rajeswaran, D. I. Khomskii, A. Sundaresan, C. N. R. Rao, Phys. Rew. B, in press.
13. K. yoshii, J. Solid State Chem., 159, 204 (2001).14. S. V. Kurgan, G. S. Petrov, L. A. Bashkirov, A. I. Klyn -
dyuk, Inorg. Mater., 40, 1224 (2004).15. H. B. Lal, R. D. Dwivedi, K. Gaur, J. Mater. Sci.:
Mater. Electron., 1, 204 (1990).16. W. Wei-Ran, X. Da-Peng, S. Wen-Hui, D. Zhan-
Hui, X. yan-Feng, S. Geng-Xin, Chin. Phys. Lett., 22, 2400 (2005).
17. P. S. Devi, J. Mater. Chem., 3, 373 (1993).18. R. A. da Silva, R. N. Saxena, A. W. Carbonari, G. A.
Cabrera-Pasca, Hyperfine Interact., 197, 53 (2010).19. N. B. Ivanova, N. V. Kazak, C. R. Michel, A. D.
Balaev, S. G. Ovchinnikov, A. D. Vasil’ev, N. V. Bulina, E. B. Panchenko, Phys. Solid State, 49, 1498 (2007).
20. P. A. Brayshaw, A. K. Hall, W. T. A. Harrison, J. M. Harrowfield, D. Pearce, T. M. Shand, B. W. Skelton, C. R. Whitaker, A. H. White, Eur. J. Inorg. Chem., 1127 (2005).
21. y. Seto, K. Umemoto, T. Arii, y. Masuda, J. Therm. Anal. Calorim., 76, 165 (2004).
22. R. Sawano, y. Masuda, J. Therm. Anal. Calorim., 92, 413 (2008).
23. K. Sardar, M. R. Lees, R. J. Kashtiban, J. Sloan, R. I. Walton, Chem. Mater., 23, 48 (2011).
24. A. Jaiswal, R. Das, S. Adyanthaya, P. Poddar, J. Nanopart. Res., 13, 1019 (2011).
25. A. Patil, S. C. Parida, S. Dash, V. Venugopal, Thermochimica Acta, 465, 25 (2007).
26. F. H. M. Cavalcante, A. W. Carbonari, R. F. L. Mala-vasi, G. A. Cabrera-Pasca, R. N. Saxena, J. Mestnik-Filho, J. Magn. Magn. Mater., 320, 32 (2008).
27. A. L. A. da Silva, G. G. G. Castro, M. M. V. M. Sou-za, Ј. Therm. Anal. Calorim., 1000 (2011).
28. K. C. Patil, M. S. Hegde, T. Rattan, S. T. Aruna, Chemistry of nanocrystalline oxide , World Scientific Publishing, Singapore, 2008.
29. A. S. Mukasyan, C. Costello, K. P. Sherlock, D. La far ga, A. Varma, Sep. Purif. Technol., 25, 117 (2001).
30. JCPDS International Center for Diffraction Data, Power Diffraction File (entry 00-025-1056), Swarth-more, PA, 1995.
31. V. M. Goldschmidt, Naturwiss., 14, 477485 (1926).32. P. M. Woodward, Acta Cryst., B53, 44 (1997).33. G. Huo, D. Song, Q. yang, F. Dong, Ceram. Int., 34,
497 (2008).34. R. D. Shannon, Acta Crystallogr., A32, 751
(1976).
S. DimitrovskaLazova et al.: Structural characteristics of GdCo1–xCrxO3 (x = 0, 0.33, 0.5, 0.67, 1) perovskites

54
S. DimitrovskaLazova et al.: Structural characteristics of GdCo1–xCrxO3 (x = 0, 0.33, 0.5, 0.67, 1) perovskites
струКтурно хараКтериЗиране на GdCo1–xCrxO3 (x = 0, 0.33, 0.5, 0.67, 1) пероВсКити
с. димитровска-лазова1*, д. Ковачева2, п. цветков2
1 Университет „Св. Кирил и Методии“, Факултет по Естествени науки и Математика, Архимедова 2, Скопие, Македония
2 Институт по обща и неорганична химия, Българска академия на науките, „Акад. Г. Бончев“ бл.11, София, България
постъпила на 21 март, 2012 г.; приетa на 2 май, 2012 г.
(резюме)
В статията са представени синтез, определяне на кристалната структура и калкулирани структурни парамет-ри за серията GdCo1-xCrxO3 (x = 0, 0.33, 0.5, 0.67 и 1). съединенията са получени по метода на комбустия през разтвор, като са използвани нитрати на съответните метали и урея за гориво. серията получени перовскити кристализират в пространствена група Pnma, Z = 4. определените параметри на елементарната клетка, разстоя-ния и ъгли са използани за пресмятане на някои кристалографски параметри, като дисторзия на елементарната клетка, орторомбична дисторзия, деформация на разстояния и ъгли, ъгли на накланяне, сума на валентните връзки и глобален индекс на нестабилност. тези параметри са използвани да се изясни по-доб ре влиянието на заместването на Co3+ с Cr3+ върху степента на деформация и стабилност на перовскитовата структура.
35. I. D. Brown, D. Altermatt, Acta Crystallogr., B41, 244 (1985).
36. M. W. Lufaso, P. M. Woodward, Acta Crystallogr., B57, 725 (2001).
37. y. Chen, H. yuan, G. Li, G. Tian, S. Feng, J. Cryst. Growth, 305, 242 (2007).
38. G. Ch. Kostogloudis, N. Vasilakos, Ch. Ftikos, Solid State Ionics, 106, 207 (1998).

55
* To whom all correspondence should be sent:E-mail: [email protected]
© 2012 Bulgarian Academy of Sciences, Union of Chemists in Bulgaria
Bulgarian Chemical Communications, Volume 44, Proceedings of the IIIrd National Crystallographic Symposium (pp. 55–62) 2012
Molten Zn-exchanged clinoptilolite – structural behaviour and properties at high temperature
L. T. Dimowa1*, S. L. Petrov2, B. L. Shivachev1
1 Institute of Mineralogy and Crystallography, Bulgarian Academy of Sciences, “Acad. Georgi Bonchev” str. building 107, Sofia 1113, Bulgaria
2 Department of Chemistry, University of Toronto, 80 St. George Street, Toronto, ON, M5S 3H6 (Canada)
Received March 20, 2012; Revised May 5, 2012
A molten exchange of ZnCl2 in clinoptilolite is reported for the first time. The molten exchange occurs under solid state conditions and decreases significantly the time that is necessary for reaching a full exchange. This provides a potential alternative to the classical ion-exchange in liquids. The mechanism of the incorporation of Zn+2 cations in the channels of CPT-framework (their positions, Zn-content and movements along the channels) was evaluated at different temperatures by in situ high temperature (HT) X-ray diffraction. It is shown that molten exchanged Zn-CPT possesses a firm framework, which is thermally more resistant than natural CPT, due to the locations of Zn+2 cations in the eight-member channel.
Key words: clinoptilolite, zeolite, molten exchange, X-ray diffraction.
INTRODUCTION
The ion-exchange technique has been considered as an important method for improving technological properties of various natural zeolites by changing their cation content. In the ion-exchange process the cations easily exchange each other and the new ones integrate and adjust themselves in various po-sitions into the system of pores and channels. The cation-exchanged zeolites commonly preserve their micro-porous structures unaffected. The process of ion-exchanging in zeolites is typically carried out by replacing Na+ [1–3] with different ions, such as Ag2+, K+, Cs+ and Sr2+ or through a pre-exchange of zeolite to its H-form [4] and further exchange the H-form with metal ions. Zinc-containing micro-porous materials (including natural zeolites) have drawn attention because of their antibacterial [5–7] and anti-tumor [8] properties. In contrast, formation of toxic ZnO-nanoclusters has been also reported [9]. Interestingly, results for ion-exchange of natu-ral clinoptilolite (CPT) with Zn2+ salts, are almost missing [10–11] probably because of intrinsic dif-ficulties of incorporation of Zn2+ in CPT structure at ambient temperatures (around 60–100 °C). Because of this, a classic liquid ion-exchange of Zn2+ in CPT
commonly requires prolonged time for a sufficient high-rate Zn-exchange to take place. In this case, an alternative cation-exchange approach - the molten exchange was carried out. The molten exchange requires significantly less time – only a few hours [12, 13]. The major benefit of this approach is the improved stability of the initial CPT-structure at higher temperatures than the exchanged CPT-structure obtained by a common liquid ion-ex-change [in preparation].
In this work, Zn-containing clinoptilolite (Zn-CPT) was produced by using a molten-exchange process. A NH4
+ exchanged intermediate product (NH4-CPT) was obtained from clinoptilolite rich tuff (“Beli plast”, Khardjali) and ZnCl2 was used as the Zn-source. The experimental results for the weight losses, the thermal stability of the CPT-structure un-der in situ heating, the unit cell variations and the diffusion of Zn2+ in clinoptilolite’s structure are dis-cussed below.
EXPERIMENTAL
Molten exchange
In our molten-exchange experiment, CPT was chosen as a substrate and ZnCl2 (1:1 mass) - as the ion source. The CPT-substrate was subjected to preliminary removal of concomitant minerals such as quartz, plagioclase, mica, and then was NH4
+ ex-

56
L. Dimowa et al.: Molten Znexchanged clinoptilolite – structural behaviour and properties at high temperature
changed in order to ensure the optimal exchange conditions. The molten-exchange temperature and the processing times were varied (360–400 °C and 30 to 360 minutes). Optimal temperature and time were found to be 380 °C and 240 minutes.
Xray diffraction
The structural properties of the samples were analyzed with in situ HT X-ray powder diffraction (equipment: Bruker D2 Phaser, Cu-Kα radiation and Dron 3M, Co-Kα radiation). The in situ heat-ing was conducted from room temperature (RT) to 800 °C using an in house temperature device. The heating scheme was: 100 °C step and 30 minutes re-tention time. Data collection was carried out at each HT-step with scan speed 0.02 °/sec. on a range from 5–35° 2-theta.
Rietveld Refinement
Rietveld analysis on the powder X-ray diffrac-tion patterns was carried out with Topas v.3.0 [14] suite of programs. A pseudo-Voight profile function was used. Profile parameters (2θ zero correction, background, cell parameters) were refined first and then the positional parameters (locations and site oc-cupancies) of Zn2+ cations at various temperatures: RT, 300 °C and 500 °C. Unit cell parameters for all samples (RT to 800 °C) were calculated primary by Pawley-extraction.
DTA/TGMS
The weight losses were monitored by DTA/TG-MS on Setaram Setsys DTA/TG equipment coupled with a Thermo Scientific mass spectrometer for evolved gas analysis (EGA). The experiment was carried out by placing approximately 15–20 mg of the Zn-CPT sample into a corundum crucible and heating at a rate of 10 °C min–1 from ambient tem-perature to 700 °C under flowing (20 mL min–1) high purity argon gas. Baseline curves measured under the same experimental conditions were acquired to account for buoyancy effects on the balance. The mass to charge ratios selected for analysis were 18, 35.5 and 65.4 amu. A one second acquisition time for each mass unit was set, thus requiring 0.13 min (or 1.3 °C) for each cycle. The chemical composition of the samples was determined by ISP-OES, apparatus Varian Vista MPX CCD simultaneous analyses.
Chlorine determination
One of the most widely used methods for the de-termination of chlorides at relatively low levels and where the error is in the range of 1–2% is the Mohr’s
method [15]. It is based on the reactions and the for-mation of hardly soluble precipitates with the condi-tion that the reaction of precipitation is fast and that there is a true indicator that shows the end of the ti-tration. To determine the concentration of chloride, samples were prepared as follows: the sample has been transferred into Erlenmeyer flask and diluted by distilled water (about 100 ml) and added 2 ml of 5% K2CrO4. Titration of the sample prepared in this way was carried out with standard solution of 0.0975 mol l–1 AgNO3 under constant steering of the solution. Titration was completed when a reddish solution appeared. The obtained concentration for Cl– was 11 (±0.09) g l–1.
The Fourier transform infrared (FTIR) spectra were recorded on a Bruker Tensor 37 spectrometer at a resolution of 4 cm–1 accumulating 50 scans (in this case the samples were prepared in the form of KBr pellets).
RESULTS AND DISCUSSION
The chemical compositions of the starting NH4-CPT and molten exchanged Zn-CPT are shown in Table 1. It is obvious that the amount of cations in the NH4-CPT is very low with respect to the natural poly-cationic CPT [16]. Interestingly, the Zn2+ con-tent in the molten exchanged CPT is 14.32 wt.% – a value significantly higher compared with the one in liquid ion-exchanged CPT-Zn (2.2 wt.%, 30 days at 100 °C [16]). The incorporation of Zn2+ in the chan-nels of CPT structure causes visible changes in the intensities of some diffraction peaks in the pattern, which is another ultimate proof for the conducted cation exchange. A comparison of the powder dif-fraction patterns of Zn2+ CPT and non-exchanged CPT are shown on Figure 1. The changes on the XRD patterns are basically the same as previously established [16]: in Zn-CPT the 220 peak disap-
Table 1. Chemical composition (ICP-OES) of initial CPT and after molten exchange process
OxidesNH4-CPT Zn-CPT
wt.%SiO2 68.19 57.08Al2O3 12.51 10.32CaO 0.06 0.20Na2O 0.09 0.09K2O 0.19 0.19MgO 0.26 0.10ZnO – 14.32LOI (1000 °C) 18.7 17.70
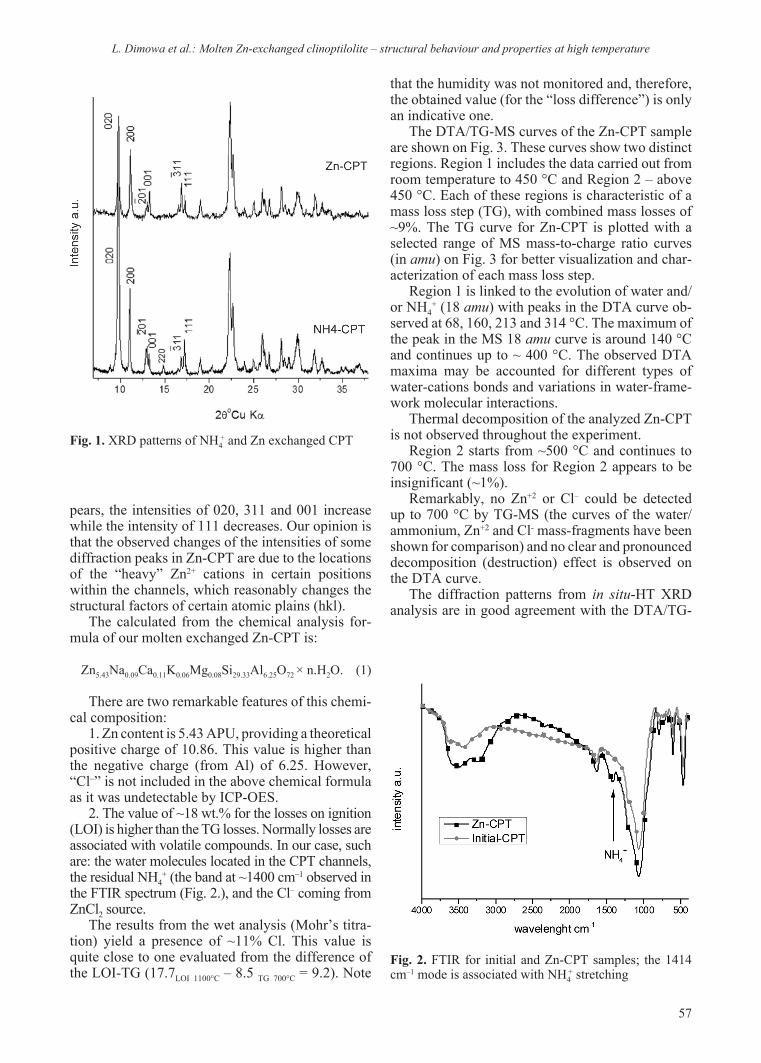
57
L. Dimowa et al.: Molten Znexchanged clinoptilolite – structural behaviour and properties at high temperature
pears, the intensities of 020, 311 and 001 increase while the intensity of 111 decreases. Our opinion is that the observed changes of the intensities of some diffraction peaks in Zn-CPT are due to the locations of the “heavy” Zn2+ cations in certain positions within the channels, which reasonably changes the structural factors of certain atomic plains (hkl).
The calculated from the chemical analysis for-mula of our molten exchanged Zn-CPT is:
Zn5.43Na0.09Ca0.11K0.06Mg0.08Si29.33Al6.25O72 × n.H2O. (1)
There are two remarkable features of this chemi-cal composition:
1. Zn content is 5.43 APU, providing a theoretical positive charge of 10.86. This value is higher than the negative charge (from Al) of 6.25. However, “Cl–” is not included in the above chemical formula as it was undetectable by ICP-OES.
2. The value of ~18 wt.% for the losses on ignition (LOI) is higher than the TG losses. Normally losses are associated with volatile compounds. In our case, such are: the water molecules located in the CPT channels, the residual NH4
+ (the band at ~1400 cm–1 observed in the FTIR spectrum (Fig. 2.), and the Cl– coming from ZnCl2 source.
The results from the wet analysis (Mohr’s titra-tion) yield a presence of ~11% Cl. This value is quite close to one evaluated from the difference of the LOI-TG (17.7LOI 1100°C – 8.5 TG 700°C = 9.2). Note
that the humidity was not monitored and, therefore, the obtained value (for the “loss difference”) is only an indicative one.
The DTA/TG-MS curves of the Zn-CPT sample are shown on Fig. 3. These curves show two distinct regions. Region 1 includes the data carried out from room temperature to 450 °C and Region 2 – above 450 °C. Each of these regions is characteristic of a mass loss step (TG), with combined mass losses of ~9%. The TG curve for Zn-CPT is plotted with a selected range of MS mass-to-charge ratio curves (in amu) on Fig. 3 for better visualization and char-acterization of each mass loss step.
Region 1 is linked to the evolution of water and/or NH4
+ (18 amu) with peaks in the DTA curve ob-served at 68, 160, 213 and 314 °C. The maximum of the peak in the MS 18 amu curve is around 140 °C and continues up to ~ 400 °C. The observed DTA maxima may be accounted for different types of water-cations bonds and variations in water-frame-work molecular interactions.
Thermal decomposition of the analyzed Zn-CPT is not observed throughout the experiment.
Region 2 starts from ~500 °C and continues to 700 °C. The mass loss for Region 2 appears to be insignificant (~1%).
Remarkably, no Zn+2 or Cl– could be detected up to 700 °C by TG-MS (the curves of the water/ammonium, Zn+2 and Cl- mass-fragments have been shown for comparison) and no clear and pronounced decomposition (destruction) effect is observed on the DTA curve.
The diffraction patterns from in situ-HT XRD analysis are in good agreement with the DTA/TG-
Fig. 1. XRD patterns of NH4+ and Zn exchanged CPT
Fig. 2. FTIR for initial and Zn-CPT samples; the 1414 cm–1 mode is associated with NH4
+ stretching

58
L. Dimowa et al.: Molten Znexchanged clinoptilolite – structural behaviour and properties at high temperature
MS results showing no collapse of the CPT structure up to 700 °C (Fig. 4). The diffraction patterns taken from heated Zn-CPT (from RT to 700 °C) clearly in-dicate that the overall structure remains unchanged up to 700 °C. Indeed, HT-diffraction patterns do not show any significant structural changes in the framework. As expected, there are some variations of the unit cell as a function of the temperature and
they are shown on Fig. 5 and Table 2. It was found that the heating affects mainly b parameter, while a, c and β remain almost unchanged. The collapse of the Zn-CPT structure is not accompanied by a collapse of the B channel (Table 3). Some elonga-tion of A-channel semi-major axis is observed but the values of the semi-axis for B-channel are ba-sically unaffected. The variation of the eccentric-
Fig. 3. (a) DTA/TG for Zn-CPT (b) TG-MS for Zn-CPT
Fig. 4. Zn-CPT diffraction patterns from in situ-HT XRD analysis (RT –800 °C)
a) b)

59
L. Dimowa et al.: Molten Znexchanged clinoptilolite – structural behaviour and properties at high temperature
Fig. 5. Variations of the unit cell parameters of Zn-CPT in function of the temperature
Table 2. Unit cell parameters for all samples (RT to 800 °C) calculated by Pawley-extraction1 and by Rietveld method2 along with Rwp value
°C a b c β V Rwp
RT1 17.664(12) 17.999(13) 7.404(3) 116.109(25) 2111.60(2.4) 11.136RT2 17.642(15) 17.978(16) 7.401(4) 116.078(38) 2108.49(3.0) 11.2011001 17.660(21) 17.941(23) 7.398(6) 116.162(41) 2104.12(2.3) 11.7232001 17.685(10) 17.873(12) 7.405(3) 116.073(31) 2103.22(2.2) 12.8213001 17.681(14) 17.900(17) 7.405(4) 116.049(33) 2105.53(2.6) 12.3333002 17.688(16) 17.863(15) 7.401(4) 116.134(42) 2099.33(3.0) 11.3514001 17.679(10) 17.850(15) 7.399(3) 116.103(33) 2096.92(2.5) 11.3015001 17.659(12) 17.847(13) 7.395(4) 116.074(35) 2093.55(2.5) 12.1925002 17.658(17) 17.823(21) 7.383(5) 116.08935) 2086.65(3.2) 12.9816001 17.658(14) 17.815(18) 7.391(4) 116.161(32) 2086.72(3.1) 11.6437001 17.639(17) 17.758(15) 7.391(4) 116.240(41) 2076.92(2.9) 12.176
in heated samples up to 200 °C. The location of water molecules by XRD cannot be evaluated cor-rectly because most of the positions are not fully occupied and the heating increases their thermal displacement/diffusion inside the CPT channels. As a result, the electron density associated with water molecules is very shallow and is not clearly visible on the [FoFc] difference map. On the other hand, as Zn+2 cation possesses more electrons than Si+4 and Al+3 (the main building units of the CPT frame-work), we expected its main locations in the CPT channels to be accessed by Rietvled analysis. The total amount of Zn located in the CPT channels is in agreement with the ICP-OES data (5.43 from ICP vs 5.64 at RT, 5.44 at 300 °C and 5.47 at 500 °C). The positions of Zn+2 cations, in both A- and B-channels as they were assigned from Rietveld refinement are shown on Fig. 6 and Table 4.
At ambient conditions (RT) four different Zn+2 positions are found: three in A-channel (“Zn1”, “Zn2” and “Zn3”) and one in B-channel (“Zn4”). The “Zn4” position in B-channel sits close to the well established Ca2+ (M2) position in natural clinoptilo-lite [18]. Two of the positions in A-channel, “Zn1” and “Zn2”, are located close to its center. The “Zn1”
ity is different for both channels: for A-channel it increases towards a value of 1 – thus, the shape is more compressed (elongated) along the semi-minor axis, while for B-channel the decrease leads to more spherical shape of the channel. Similarly to ref. [17], we could not associate a collapse phase or trend unit cell/channel shape to the collapse of the structure. However, as both in situ-HT XRD and DTA data have been collected for a relatively short period of time (4 hours of total heating time), the effect may have not been well expressed. One reason could be that the structure was not allowed to “relax” due to insufficient time.
Rietveld method was applied mainly for evaluat-ing unit cell parameters and locating the atoms in the CPT channels. The performed Rietveld refine-ment of the XRD patterns locates water molecules
Table 3. Variation of major (h index) and minor (v index) semi-axes for A- and B-channels
Temperature [°C]size [Å]
A1h A2v B2v B1h
20 (RT) 9.08 6.02 6.07 6.44300 9.45 5.99 6.34 6.43500 9.49 5.95 6.31 6.45

60
L. Dimowa et al.: Molten Znexchanged clinoptilolite – structural behaviour and properties at high temperature
position is sited exactly in the center of the channel taking the position of Mg2+ [17]. The other centered position, “Zn2”, corresponds to the one designated by Dimowa for ion-exchanged Zn-CPT [15]. The third position, “Zn3”, is located very close to the intersection of A- and B-channels and matches the known “M3” position in non-exchanged clinoptilo-lite [18]. The estimated amounts of Zn+2 cations in A- and B-channel are 3.92 vs 1.72 respectively.
It was expected that at higher temperatures the Zn+2 cations will move (diffuse) and change their
initial positions due water molecules expelling from the structure, which causes re-location of the cati-ons to maintain the initial charge balance. This was confirmed by the performed Rietvled analyses on the diffraction patterns at various temperatures.
At 300 °C the Zn+2 cations are also located in four positions, but some of them change from the intial RT positions. Namely, “Zn1” position disappeared, “Zn2” position slightly shifts along a allowing the appearance of a new “Zn21” position. The “Zn3” position also shifted along a towards the B-channel.
Table 4. Positions of Zn sites for Zn-CPT at RT and heated at 300 and 500 °C
Zn positionsAtomic coordinates
RT 300 °C 500 °CA channel
Zn1 0 0 0.5 – –Zn2 0.092 0 0.464 0.1 0 0.444 –Zn21 – 0.580 0.468 0.104 –Zn22 – – 0.070 0.072 0.76Zn3 0.234 0.5 0.035 0.220 0.5 0.151 0.217 0.5 0.084
B channelZn4 0.043 0.5 0.27 – –Zn42 – 0.095 0.5 0.16 –Zn42 – – 0.085 0.420 0.09
Fig. 6. The positions of Zn+2 cations in both A- and B-channels as they were assigned from Rietveld refinement. The positions of Zn at RT are shown in green/full circles; in yellow/x at 300 °C; and in red/● at 500 °C (colors are available in the online version of the manuscript)

61
L. Dimowa et al.: Molten Znexchanged clinoptilolite – structural behaviour and properties at high temperature
The disappearance of “Zn1” [17] is associated with the loss of the coordination water surround-ing the hydrated Zn+2 cations at RT. Zn4 position (B-channel) shifts along c, closer to the negatively charged framework producing Zn4'. A more general comparison of the positioning of the Zn atoms in the channels at RT and 300 °C shows that all Zn sites are located closer to the Si/Al framework. In order to compensate its surcharge, the Zn+2 shifts towards the negatively charged framework preserving the initial charge balance. At 300 °C, the distribution of Zn+2 cations in A and B-channel is 3.52 vs 1.92 APU respectively. The distribution of the Zn sites indicates a slight positive “shift” of the compensat-ing charges towards the B-channel.
At 500 °C Zn+2 is found in three sites in the CPT framework. The already modified at 300 °C “Zn21” position in A-channel moves now closer to the CPT framework – “Zn22” position. The “Zn3” position situated at the intersection of the two channels is almost unchanged, but slightly migrates towards the B-channel. Finally, a new “Zn42” position appears as a result of the shift and splitting of Zn4 → Zn41
→ Zn42 positions. At 500 °C the distribution of the Zn atoms in A and B channel is 2.55 vs. 2.92 APU respectively. Thus, the charge transfer from A to B channel, already noticed at 300 °C, is even more pronounced. Similarly to “RT vs. 300 °C” the “300 vs. 500 °C” general comparison of the Zn sites in the channels shows further displacement of the cati-ons towards the framework. The distribution and Zn amounts in the channels, described above is shown on Fig. 7. The results indicate that there is a diffusion of Zn+2 from A to B-channel. The “Zn3” position is serving as a bridge between the channels [15]. On
the other hand, the loss of Zn+2-coordination seems to occur first in the A-channel (associated with the disappearance of “Zn1” site) and thus further pro-motes the diffusion of Zn+2. The occupancy of the “Zn3” site in A-channel diminishes in favor of the Zn4/Zn4' and Zn4" located in the B-channel. As the amount of Zn remains the same at RT, 300 °C and 500 °C the observed changes and shifts of the Zn-sites are associated with the increased mobility (thermal motion) of the cations inside the channels.
The saturation of the Zn42 position (leading to the presence of 2.92 Zn APU in B channel at 500 °C) is probably responsible for the stabilization of the CPT framework. If we consider the systems of channels acting like interconnected vessels one can assume that the transfer of Zn to B-channel rigidifies it and preventing its structural deformation. This enhanced stability of B-channel also inhibits the deformation of A-channel (interconnected vessels).
The enhanced thermal motion and diffusion of both the CPT framework and cations profits the mutual compensation of the charges and prohibits the release of the cations. Thus, the overall effect is a relative stabilization of the CPT structure at high temperatures.
CONCLUSIONS
Molten exchange of ZnCl2 in NH4+ exchanged
clinoptilolite is reported. The amount of Zn incor-porated in the CPT structure after four hours molten exchange is about five times greater than that one of the liquid ion-exchanged Zn-CPT for 30 days. The temperature of 380 °C required for the mol-ten exchange does not affect the structural order-ing. Instead, it was found out that Zn+2 presence in the channels improves the overall thermal stability of CPT structure. The stabilization occurs through a diffusion of Zn+2 cations from A to B-channel, which prevents the deformation of B channel. The CPT system of channels acts as interconnected ves-sels and the rigidified B-channel hampers the de-formation of A-channel. The higher amount of Zn-cations achieved in the molten- exchange process and their locations and transport through the chan-nels in CPT-structure at elevated temperature play an important role for this stabilization.
REFERENCES
1. A. Langella, M. Pansini, P. Cappelleti, B. de Gen-naro, M. de. Gennaro, C. Collela, Microporous and Mesoporous Materials, 37, 337 343 (2000).
2. T. Armbruster, P. Simoncic, N. Dobelin, A. Malsy, P. yang, Microporous and Mesoporous Materials, 57, 121 131 (2003).
Fig. 7. The distribution of Zn amounts (APU) in the clinoptilolite channels

62
3. J. Stolz, P. yang, T. Armbruster, Microporous and Mesoporous Materials, 37, 233 242 (2000).
4. A. Ssirkecioglu, A. Erdem-Senatalar, Clays and Clay Minerals, 44 686 692 (1996).
5. L. Habbena, B. Koopmans, H. E. Menke, S. Doorn-weerd, K. de Boule, British Journal of Dermatology, 121, 497 502 (1989).
6. K. T. Holland, R. A. Bojar, W. J. Cunliffe, A. G. Cut-cliffe, E. A. Eady, L. Farooq, A. M. Farrel1, E. M. Grib-bon, D. Taylor, British Journal of Dermatology, 126, 505 509 (1992).
7. G. Cerri, M. de Gennaro, M. C. Bonferoni, C. Cara-mella, Applied Clay Science, 27, 141 150 (2004).
8. K. Pavelic, M. Katic, V. Sverko, T. Marotti, B. Bosnjak, T. Balog, R. Stojkovic, M. Radacic, M. Colic, M. Poljak-Blazi, J. Cancer Res. Clin. Oncol., 128, 37 44 (2002).
9. R. Brayner, R. Ferrari-Iliou, N. Brivois, S. Djediat, M. F. Benedetti, F Fievet, Nano Letters 6, 4 866 870 (2006).
L. Dimowa et al.: Molten Znexchanged clinoptilolite – structural behaviour and properties at high temperature
10. I. R. Iznaga, V. Petranovskii, F. Castillon, M. Farias, Optical Materials, 29, 105 109 (2006).
11. A. Top, S. Ulku, Applied Clay Science, 27, 13 19 (2004).
12. Park, M., C. S. Seung, L. C. Choy, D. H. Lee, W. T. Lim, S. Komarneni, M. C. Kim, J. Choi, N. H. Cheo, 2001, Role of framework on NH4NO3 occlu-sion in zeolite pores. Microporous and Mesoporous Materials, 50, 91–99.
13. M. Liquornik, y. Marcus, J. Phys. Chem., 72, 13, 4704 4705 (1968).
14. DiffracPlus TOPAS v. 3.0 (2008) Bruker AXS Karls-ruhe – Germany.
15. X. M.A. Herrero, J. Atiemza, R. P. Maquieira, Analyst, 117 (1992) 1019.
16. L. Dimowa, PhD Thesis, IMC, Sofia, 2011.17. T. Armbruster, American Mineralogist, 78, 260 264
(1993).18. K. Koyama, y. Takeuchi, Zeitschrift fur Kristallo
graphie, 145, 216 239 (1977).
оБмен на Клиноптилолит от стопилКа ZnCl2: струКтурни осоБености и сВойстВа при ВисоКа температура
л. т. димова1*, с. л. петров2, Б. л. Шивачев1
1 Институт по Минералогия и кристалография, Българка Академия на Науките, „Акад. Георги Бончев“ бл. 107, София 1113, България
2 Университет в Торонто, Химически факултет, ул. „Сейнт Джордж“ 80, Торонто, ON, M5S 3H6, Канада
постъпила на 20 март, 2012 г.; приетa на 5 май, 2012 г.
(резюме)
За първи път е направен обмен на стопилка ZnCl2 в клиноптилолит (Zn-CPT). обменът се осъществява в твърдо-течно състояние и намалява значително времето, което е необходимо за постигане пълен цинков обмен в клиноптилолита. методът е потенциална алтернатива на класическия йонен обмен от разтвор. механизмът на включването на Zn2+ катиони в каналите на клиноптилолита структура е изследван с различни методи, като високо температурна рентгенова дифракция, инфрачервена спектроскопия, диференциално термичен анализ, и др. показано е, че обмененият на Zn клиноптилолит е термично по-устойчиви от природния, поради наси-щане на осем членния Б-канал на Zn2+ катиони.

63
* To whom all correspondence should be sent:E-mail: [email protected]
© 2012 Bulgarian Academy of Sciences, Union of Chemists in Bulgaria
Bulgarian Chemical Communications, Volume 44, Proceedings of the IIIrd National Crystallographic Symposium (pp. 63–69) 2012
ZnO thin films preparation on glass substrates by two different sol-gel methods
N. V. Kaneva*, C. D. Dushkin, A. S. Bojinova
Laboratory of Nanoparticle Science and Technology, Department of General and Inorganic Chemistry, Faculty of Chemistry and Pharmacy, University of Sofia, 1 James Bourchier Blvd.,1164 Sofia, Bulgaria
Received February 20, 2012; Revised March 29, 2012
Here we present thin films of ZnO with photocatalytic application in purifying water from organic pollutants. The films were obtained from stable colloidal precursor sol, prepared by two sol-gel methods (A and B) using zinc acetate and varying the solvents. These sols are deposited on glass substrates via dip-coating technique. The films are characterized by different methods (XRD, SEM, FTIR). By XRD was established that the zinc oxide is of hexagonal crystal structure.
A comparison of the determined morphology, composition and structure for the prepared by two different method films is studied. The morphology of films obtained with 1-propanol and 1-butanol, as shown is not homogeneous. The film surface is not uniform and there are many cracks and bubbles. Layers in such films is very easy to peel off after their ignition. Therefore, a third synthesis of the sol-gel method A is performed, with any changes in the formulation, only alcohol is substituted by 2-propanol. There is ganglia typical surface structure of the so obtained film, which is established by SEM. They are evenly distributed over the entire film surface. The film surface in the sol-gel B was investigated by SEM. The film surface has characteristic ganglia-like patterns.The resulting samples are more uniform, show much better adhesion of the layers and higher density, compared to films from the sol-gel method A. The difference in the films morphology has influence their photocatalytic performance.
Key words: zinc oxide, thin films, crystallites, glass substrate, dip coating, sol-gel method.
INTRODUCTION
The zinc oxide (ZnO) is an important II–VI group semiconductor material, with a hexagonal wurtzite crystal structure (c = 5.21 Å and a = 3.25 Å) [1], wide and direct band gap of 3.37 eV (at 300 K), large free-exciton binding energy (60 meV) [2], strong cohesive energy of 1.89 eV [3], high mechanical and thermal stabilities [4], and radiation hardness [5–7]. ZnO possesses a wurtzite structure similar to GaN [8, 9], which is widely used in high-performance optoelectronic devices.
Undoped and doped zinc oxide thin films have many interesting properties, such as, transparency in the visible and high infrared reflectivity [10], excellent piezoelectrical properties [11], hexagonal wurtzite structure n-type conductivity [12], etc. All these properties make them widely applied in many fields, such as, transparent conductors [13], solar cells [14], electrical, piezoelectric or luminescent
devices and also as gas sensors, chemical sensors, surface acoustic wave devices (SAW) [15], UV laser and catalysts. Semiconductor catalysts have been studied extensively [16–18] to promote the degradation of potential organic pollutants present in waste water [19, 20].
ZnO films can be prepared by various methods, including vapor deposition [21], pulsed laser deposition [22], molecular beam epitaxy [23], metal organic chemical vapor deposition (MOCVD) [24], sputtering [25], electron beam evaporation [26], spray pyrolysis [27] and sol–gel [28,29]. Sol–gel is an attractive method for films preparation because of its easy control, low cost and low fabricating temperature [30]. It is well known that the sensing mechanism of semiconducting oxide gas sensors is based on the surface reaction and a high surface–volume ratio. The grain size and the porosity of the sensing material are the most important factors for high sensitivity and short response time sensors.
This paper presents preliminary results on the crystalline structure, morphology and photocatalytic properties of nanocrystalline ZnO thin films prepared by both sol–gel methods. When dip-coating sol–gel technique is used, the withdrawal

64
speed is the most important processing parameter affecting the porosity of the films. It was found that higher withdrawal rates resulted in films of lower quality. The surface of films obtained with 1-butanol and 1-propanol were observed bubbles, cracks and haven’t good photocatalytic properties. While films with 2-propanol manifest homogeneous ganglia-like surface structure. Nanostructured zinc oxide films with 2-methoxyethanol have improved ganglia-like structure, but much more developed. They degrade most completely the dye (97% for 3 hours) and have the highest photocatalytic activity.
EXPERIMENTAL SECTION
Preparation of ZnO films
Materials: Zinc acetate dihydrate Zn(CH3COO)2. 2H2O (>99.5%), n-propanol (>99.0%), 2-propanol (>99.0%), n-butanol (>99.0%), glycerol (>99,0%), ethylene glycol (>99,0%), triethylamine (>99.5%), 2-methoxyethanol (>99.5%) and monoethanolamine (>99%) were supplied from Fluka. Malachite green
(MG) oxalate was from Croma-G mbH & Co. The glass slides (ca. 76×26 mm), used for substrates of the ZnO films, were from ISO-LAB (Germany). All other reagents were of analytical grade. The soda-lime microscope glasses were cleaned with a chromerge solution (H2SO4/Cr2O3), then with a mixture of hydrochloric and nitric acid and finally with ethanol and acetone successively.
Solgel method (A): The sol was prepared using zinc acetate dihydrate (Zn(CH3COO)2.2H2O), ethylene glycol (C2H6O2), alcohols (1-propanol, 2-propanol, 1-butanol), glycerol (C3H8O3) and triethylamine (C6H15N) (Fig. 1a). Ethylene glycol (2.5 ml) and zinc acetate dihydrate (10 g) were mixed in a round-bottomed flask and heated at 100 °C for 15 min to obtain a uniform transparent mixture. During the heating, water vapor evolved from the mixture equivalent to the water of hydration of zinc acetate dihydrate. After cooling down to room temperature the content of the flask solidifies to a transparent brittle solid, which is then dissolved in alcohol. The addition of glycerol (0.5 ml) enhances the solubility of zinc acetate as well as the film formation property of the sol. Triethylamine (1 mol eq.) is also added
N. Kaneva et al.: ZnO thin films preparation on glass substrates by two different solgel methods
Fig. 1. Scheme of experimental procedures: (a) sol A and (b) sol B
(a) (b)
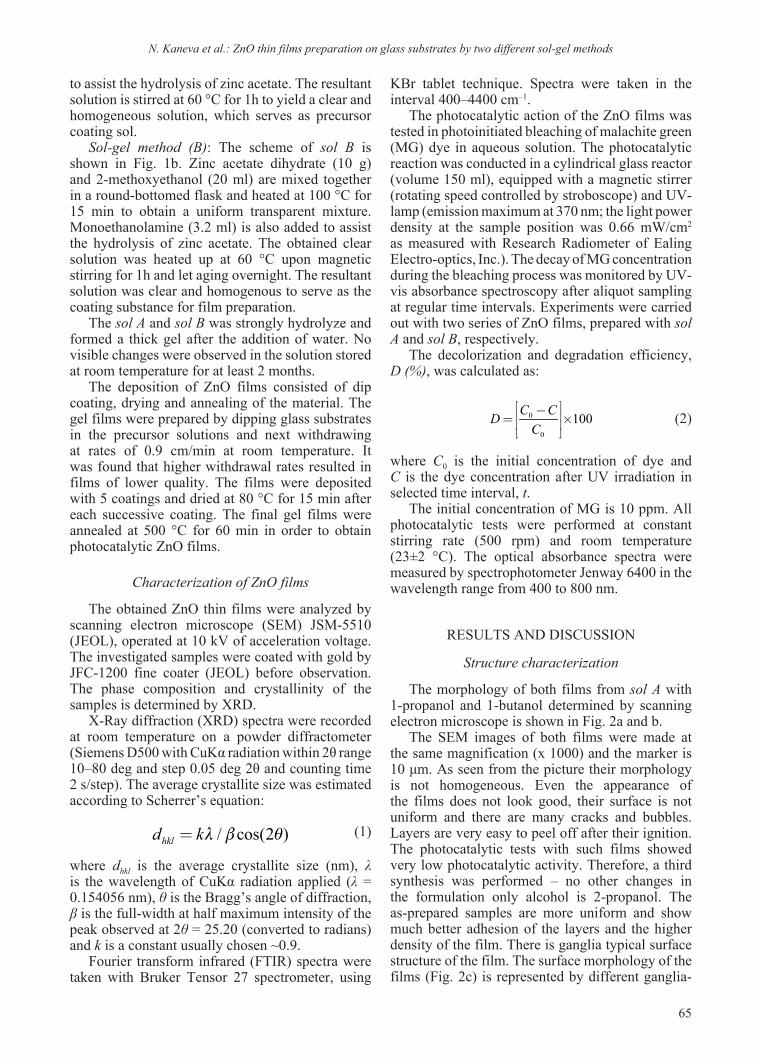
65
to assist the hydrolysis of zinc acetate. The resultant solution is stirred at 60 °C for 1h to yield a clear and homogeneous solution, which serves as precursor coating sol.
Solgel method (B): The scheme of sol B is shown in Fig. 1b. Zinc acetate dihydrate (10 g) and 2-methoxyethanol (20 ml) are mixed together in a round-bottomed flask and heated at 100 °C for 15 min to obtain a uniform transparent mixture. Monoethanolamine (3.2 ml) is also added to assist the hydrolysis of zinc acetate. The obtained clear solution was heated up at 60 °C upon magnetic stirring for 1h and let aging overnight. The resultant solution was clear and homogenous to serve as the coating substance for film preparation.
The sol A and sol B was strongly hydrolyze and formed a thick gel after the addition of water. No visible changes were observed in the solution stored at room temperature for at least 2 months.
The deposition of ZnO films consisted of dip coating, drying and annealing of the material. The gel films were prepared by dipping glass substrates in the precursor solutions and next withdrawing at rates of 0.9 cm/min at room temperature. It was found that higher withdrawal rates resulted in films of lower quality. The films were deposited with 5 coatings and dried at 80 °C for 15 min after each successive coating. The final gel films were annealed at 500 °C for 60 min in order to obtain photocatalytic ZnO films.
Characterization of ZnO films
The obtained ZnO thin films were analyzed by scanning electron microscope (SEM) JSM-5510 (JEOL), operated at 10 kV of acceleration voltage. The investigated samples were coated with gold by JFC-1200 fine coater (JEOL) before observation. The phase composition and crystallinity of the samples is determined by XRD.
X-Ray diffraction (XRD) spectra were recorded at room temperature on a powder diffractometer (Siemens D500 with CuKα radiation within 2θ range 10–80 deg and step 0.05 deg 2θ and counting time 2 s/step). The average crystallite size was estimated according to Scherrer’s equation:
/ cos(2 )hkld kl b q= (1)
where dhkl is the average crystallite size (nm), λ is the wavelength of CuKα radiation applied (λ = 0.154056 nm), θ is the Bragg’s angle of diffraction, β is the full-width at half maximum intensity of the peak observed at 2θ = 25.20 (converted to radians) and k is a constant usually chosen ~0.9.
Fourier transform infrared (FTIR) spectra were taken with Bruker Tensor 27 spectrometer, using
KBr tablet technique. Spectra were taken in the interval 400–4400 cm–1.
The photocatalytic action of the ZnO films was tested in photoinitiated bleaching of malachite green (MG) dye in aqueous solution. The photocatalytic reaction was conducted in a cylindrical glass reactor (volume 150 ml), equipped with a magnetic stirrer (rotating speed controlled by stroboscope) and UV-lamp (emission maximum at 370 nm; the light power density at the sample position was 0.66 mW/cm2
as measured with Research Radiometer of Ealing Electro-optics, Inc.). The decay of MG concentration during the bleaching process was monitored by UV-vis absorbance spectroscopy after aliquot sampling at regular time intervals. Experiments were carried out with two series of ZnO films, prepared with sol A and sol B, respectively.
The decolorization and degradation efficiency, D (%), was calculated as:
0
0
100C CDC
é ù-ê ú= ´ê úë û (2)
where C0 is the initial concentration of dye and C is the dye concentration after UV irradiation in selected time interval, t.
The initial concentration of MG is 10 ppm. All photocatalytic tests were performed at constant stirring rate (500 rpm) and room temperature (23±2 °C). The optical absorbance spectra were measured by spectrophotometer Jenway 6400 in the wavelength range from 400 to 800 nm.
RESULTS AND DISCUSSION
Structure characterization
The morphology of both films from sol A with 1-propanol and 1-butanol determined by scanning electron microscope is shown in Fig. 2a and b.
The SEM images of both films were made at the same magnification (x 1000) and the marker is 10 μm. As seen from the picture their morphology is not homogeneous. Even the appearance of the films does not look good, their surface is not uniform and there are many cracks and bubbles. Layers are very easy to peel off after their ignition. The photocatalytic tests with such films showed very low photocatalytic activity. Therefore, a third synthesis was performed – no other changes in the formulation only alcohol is 2-propanol. The as-prepared samples are more uniform and show much better adhesion of the layers and the higher density of the film. There is ganglia typical surface structure of the film. The surface morphology of the films (Fig. 2c) is represented by different ganglia-
N. Kaneva et al.: ZnO thin films preparation on glass substrates by two different solgel methods

66
like hills with typical width of about 1 μm and a height of 1–2 μm. They are evenly distributed over the entire surface of the film. Cross-sectional SEM image inset picture allows us to determine the film thickness, which is about 0.5 μm. At the places whit intensively formed ganglia, the thickness can reach 2–2.5 μm.
Scanning electron microscope was also used to monitor and study the surface of films obtained by method B (Fig. 2d). Cross section of the films was also characterized using SEM. The SEM images show that the surface is homogeneous and much more developed. There are different ganglia with a typical width of about 1 μm and a length of 5 μm to 15 μm. The results show that the average film thickness is about 5–10 μm. Ganglia-like hills along the entire surface of the film and have a height of about 2.5–3μm. They are reproducible, regardless of the conditions under which films are obtained. They can be seen on the surface of various other movies. An example can be given to the first synthesis of films of ZnO. The surface of the samples obtained using different reagents can be observed ganglia similar entities. With the difference that in the
first case they are not as wide and thick, but smaller and not so expressed. From cross section of the two films is clearly evident that ganglia-like formations are composed of very small nano-sized particles of ZnO.
The XRD spectra of thin ZnO films are presented in Figure 3. The blades resemble many spectra of literature on thin films of zinc oxide. The spectrum of both types nanostructured films consist of well-defined diffraction peaks showing good crystallinity. The three characteristic peaks clearly proof the existence of ZnO, which correspond to different crystallographic orientations of the crystal lattice of wurtzite (from left to right) (100) – at (2θ = 31.76°); (002) – at (2θ = 34.39°) and (101) – at 2θ = 36.24°. Almost the same peak height shows that the nanocrystallites are with different orientations of the axes. Crystalline structure of both films is hexagonal wurtzite. The size of crystallites, calculated by Scherer (Equation 1) is 30 nm. We assume that annealing for 1h at 500 °C leads to decomposition of Zn (II) hydroxide and its transformation into ZnO with hexagonal structure, which can be seen from diffraction spectra.
N. Kaneva et al.: ZnO thin films preparation on glass substrates by two different solgel methods
Fig. 2. SEM images of ZnO film prepared by sol A with (a) 1-propanol, (b) 1-butanol, (c) 2-propanol, (d) sol B with 2-methoxyethanol. The inset SEM images show the cross-section of the both last films

67
Figure 3 are compared to the first peaks of spectrums of ZnO, obtained by both methods. The paintings are completely identical and correspond to the zinc oxide. Attempt was made to find, even small differences in half-width of the major peaks and their positions. For this purpose, the peaks were approximated with a Gaussian function. Within experimental error has been found only difference
either in width or in the angular positions of the more intensive (three) peaks. An interesting phenomenon is the observed change in the relative intensity of three diffraction peaks, which increase with the movies, the first synthesis compared with those of the second method. The latter can be attributed to the different precursors, used in methods A and B (2-propanol and 2-metoxyethanol), favoring different orientation of the as grown crystallites.
FTIR spectra of gel films are shown in Figure 4. FTIR spectrum shows several interesting areas in both cases. The first is in the range 3000–3750 cm–1 with a maximum of 3436 cm–1 due to the absorption of O-H groups. The second area of absorption (in the range 1250–1750 cm–1) corresponds to COO–
(1620 cm–1) group. The third absorption region with a peak between 1000–1300 cm–1 due to CO stretch-ing vibration absorption (1021 cm–1). The maximum absorption peak in the range 440–450 cm–1 is attrib-uted to ZnO. Some other groups absorption can also be found in the well ignited movies, for example, can give the group between 2988 and 1381 cm–1 CH, which indicates the presence of some organic products. The lack of such groups in the range 500–3000 cm–1 shows that there are only traces of other organic substances. Both films contain only ZnO.
Characterization of the photocatalytic activity
The purification of wastewater from dyes in the textile industry is becoming a serious environmental problem because of their unacceptable color need high oxygen content, and their resistance to differ-ent methods of destruction – chemical, photochemi-cal and biological. We have chosen photocatalytic degradation of malachite green (as a representative
N. Kaneva et al.: ZnO thin films preparation on glass substrates by two different solgel methods
Fig. 3. XRD spectra of nanostructured films annealed for 1 hour at 500 °C (sol A with 2-propanol) (a) and sol B (b). The crystallite sizes are about 30 nm in both cases
Fig. 4. FTIR spectrum of ZnO films obtained by sol A with 2-propanol (a) and sol B (b)

68
of such dyes) in the presence of a catalyst under UV-light illumination. This will be assessed the in-fluence of photocatalysts. The initial dye concentra-tion in these experiments is constant – 10 ppm.
Four types of experiments were made with four different types of films, obtained using different al-cohols (sol A and sol B) for preparation of the pre-cursor sol: 1-propanol, 2-propanol, 1-butanol and 2-methoxyethanol. The aim is to investigate kinetics of decolorization of the dye and to determine which of the four types of samples manifests higher pho-tocatalytic effeciency and rates of dye photodegra-dation. Nanostructured films made with 2-methox-yethanol rapidly degrade dye (96.77%) and have the best photocatalytic efficiency compared to films with 2-propanol (67.88%). All the rates of dye deg-radation are calculated using (Equation 2) and the results are presented in Figure 5. Very clearly and distinctly visible trend of rapid degradation of the dye films with 2-methoxyethanol is seen from the date in Fig. 5. Thin films with 1-butanol degraded dye most slowly about 54% for period of three hours. Films with 2-methoxyethanol are better cata-lysts than those prepared with 2-propanol, are con-sistent with the observed surface morphology (SEM images). They have formation of ganglia-like hills on the films surface. The difference in morphol-ogy is that the ganglia formed in films obtained by the second method are larger in width, height and length as well as cash. This has a decisive influence on their photocatalytic properties.
N. Kaneva et al.: ZnO thin films preparation on glass substrates by two different solgel methods
The results show that the films that have signifi-cantly developed surface area are better photocata-lysts. Thin ZnO films are promising and efficient catalysts for the decomposition of organic pollut-ants by photocatalytic oxidation.
CONCLUSION
Thin films of nanostructured ZnO are success-fully prepared by two sol-gel methods from zinc acetate and different solvents. The sol is deposited on glass substrates by dip coating method and the obtained films are dried and annealed to form na-nostructured zinc oxide. The film structure is char-acterized be means of XRD, FTIR spectroscopy and SEM. It is shown that the thin films are porous and formed of zinc oxide nanoparticles with an aver-age diameter of 30 nm. The morphology of films obtained with 1-propanol and 1-butanol, as shown is not homogeneous. The film surface is not uni-form and there are many cracks and bubbles. The prepared with 2-propanol and 2-methoxyethanol samples have typical ganglia structure, which is es-tablished by SEM. The resulting samples from sol B are more uniform show much better adhesion of the layers and higher density, compared to films from the first sol-gel method. All films pertain to the hex-agonal wurtzite structure without preferred orienta-tion irrespective to the manner of film preparation.
Further the obtained ZnO films are characterized by photo-initiated bleaching of malachite green in aqueous solutions. The photocatalytic activities of the films obtained by sol A are lower than those of the films obtained by sol B. The results obtained show that the films morphology has significant influence on the photocatalytic properties. The ZnO thin films prepared by us are promising and efficient catalyst for photocatalytic degradation of malachite green.
Acknowledgements: The authors are thankful to projects DDVU 0236/10 of the Bulgarian Ministry of Education and Science.
REFERENCES
1. y. Kim, W. Tai, S. Shu, Thin Solid Films, 491, 153 (2005).
2. H. Brown, J. Phys. Chem. Solids, 15, 86 (1960).3. R. Chuang, R. Wu, L. Lai, C. Lee, Appl. Phys. Lett.,
91, 231113 (2007).4. A. Ohtomo, M. Kawasaki, y. Sakurai, I. Ohkubo,
R. Shiroki, y. yoshida, T. yasuda, y. Segawa, H. Koinuma, Mater. Sci. Eng. B, 56, 263 (1998).
5. D. Look, D. Reynolds, J. Hemsky, R. Jones, J. Sizelove, Appl. Phys. Lett., 75, 811 (1999).
Fig. 5. Photocatalytic degradation of MG solution at 3 hour by ZnO films under UV-light illumination. The initial con-centration of MG is 10 ppm

69
6. C. Coskun, D. Look, G. Farlow, J. Sizelove, Semicond. Sci. Technol., 19, 752 (2004).
7. A. Burlacu, V. Ursaki, D. Lincot, V. Skuratov, T. Pau-porte, E. Rusu, I. Tiginyanu, Phys. Status Solidi (Rapid Res. Lett.), 2, 68 (2008).
8. Ü. Özgur, ya. Alivov, C. Liu, A. Teke, M. Reshchikov, S. Dogan, V. Avrutin, S. Cho, H. Morkoc, J. Appl. Phys., 98, 041301 (2005).
9. V. Karpina, V. Lazorenko, C. Lashkarev, V. Dobrowol-ski, L. Kopylova, V. Baturin, S. Pustovoytov, A. Kar-penko, S. Eremin, P. Lytvyn, V. Ovsyannikov, E. Ma-zu renko, Cryst. Res. Technol., 39, 980 (2004).
10. B. Ismail, M. Abaab, B. Rezig, Thin Solid Films, 383, 92 (2001).
11. J. Liu, W. Weng, W. Ding, K. Cheng, P. Du, G. Shen, G. Han, Surf. Coating Technol., 198, 274 (2005).
12. y. Natsume, H. Sakata, Thin Solid Films, 372, 30 (2000).
13. S. Chen, J. Zhang, X. Feng, X. Wang, L. Luo, y. Shi, Q. Xue, C. Wang, J. Zhu, Z. Zhu, Appl. Surf. Sci., 241, 384 (2005).
14. J. Aranovich, D. Golmayo, A. Fahrenbruch, R. Bube, J. Appl. Phys., 51, 4260 (1980).
15. M. Wang, J. Wang, W. Chen, y. Cui, L. Wang, Mater. Chem. Phys., 97, 219 (2006).
16. M. Hoffmann, S. Martin, W. Choi, D. Bahnemann, Chem. Rev., 95, 69 (1995).
N. Kaneva et al.: ZnO thin films preparation on glass substrates by two different solgel methods
17. J. Herrmann, C. Guillard, P. Pichat, Catal. Today, 17, 7 (1993).
18. R. Mathews, Water Res., 20, 569 (1986).19. N. Kaneva, D. Dimitrov, C. Dushkin, Appl. Surf. Sci.,
257, 8113 (2011).20. N. Kaneva, C. Dushkin, Col. and Sur. A, 382, 211
(2011).21. y. Alivov, J. Nostrand, D. Look, Appl. Phys. Lett.,
83, 2943 (2003).22. R. Casero, A. Llorente, O. Moll, W. Seiler, R. Defour-
neau, D. Defourneau, E. Millon, J. Perriere, P. Goldner, B. Viana, J. Appl. Phys., 97, 054905 (2005).
23. D. Oh, T. Suzuki, J. Kim, H. Makino, T. Hanada, M. Cho, T. yao, Appl. Phys. Lett., 86, 032909 (2005).
24. W. Xu, Z. ye, y. Zeng, L. Zhu, B. Zhao, L. Jiang, J. Lu, H. He, S. Zhang, Appl. Phys. Lett., 88, 173506 (2006).
25. D. Hwang, S. Kang, J. Lim, E. yang, J. Oh, J. yang, S. Park, Appl. Phys. Lett., 86, 222101 (2005).
26. A. Kuroyanagi, Jpn. J. Appl. Phys., 28, 219 (1989).27. J. Bian, X. Li, X. Gao, W. yu, L. Chen, Appl. Phys.
Lett., 84, 541 (2004).28. J. Lee, K. Ko, B. Park, J. Cryst. Growth, 247, 119
(2003).29. y. Kim, W. Tai, S. Shu, Thin Solid Films, 491, 153
(2005).30. J. Liu, W. Weng, W. Ding, K. Cheng, P. Du, G. Shen,
G. Han, Surf. Coating Technol., 198, 274 (2005).
получаВане на тънКи филми от ZnO Върху стъКло по дВа раЗлични Зол–гел метода
н. В. Кънева*, ц. д. душкин, а. с. Божинова
Лаборатория по наука и технология на наночастиците, Катедра по Обща и неорганична химия, Факултет по химия и фармация, Софийски университет, 1 Джемс Баучер Бул.,1164 София, България
постъпила на 20 февруари, 2012 г.; приетa на 29 март, 2012 г.
(резюме)
В настоящето изследване представяме фотокаталитичното приложение на тънки филми от ZnO за пречистване на вода от органични замърсители. филмите са получени от стабилен колоиден прекурсорен зол, приготвен по два различни зол-гел метода (A и B) от цинков ацетат и при вариране на разтворителите. покритията са отложени на стъкло по метода на потапяне на подложката. филмите са характеризирани чрез различни методи на анализ (XRD, SEM, FTIR). XRD показват, че цинковият оксид е с хексагонална кристална структура.
сравнени са морфологията, състава и структурата на получените по двата метода филми. морфологията на филмите, получени с 1-пропанол и 1-бутанол е нехомогенна. по повърхността се наблюдават множество балончета и пукнатини. Затова е направен трети синтез по метод A, като е използван 2-пропанол. ганглийната структура на повърхността на така получените филми е установена със SEM. подобна ганглийна структура е наблюдавана и при филмите, получени по метод B. was investigated by SEM. получените образци са хомогенни, с по-добра адхезия и по-висока плътност, в сравнение с филмите, получени по метод A. разликата в морфологията на филмите оказва влияние върху фотокаталитичната им ефективност.

70
* To whom all correspondence should be sent:E-mail: [email protected]
© 2012 Bulgarian Academy of Sciences, Union of Chemists in Bulgaria
Bulgarian Chemical Communications, Volume 44, Proceedings of the IIIrd National Crystallographic Symposium (pp. 70–76) 2012
Size and distribution of Pt nanoparticles in LDH nanocomposites at different temperatures
D. B. Karashanova1*, D. D. Kostadinova2, S. V. Vasilev2, N. L. Petrova3
1 Institute of Optical Materials and Technologies “Acad. Jordan Malinovski”, Bulgarian Academy of Sciences, 1113 Sofia, Bulgaria
2 Institute of Electrochemistry and Energy Systems, Bulgarian Academy of Sciences, 1113 Sofia, Bulgaria 3 Institute of Mineralogy and Crystallography, Bulgarian Academy of Sciences, 1113 Sofia, Bulgaria
Received February 15, 2012; Revised April 17, 2012
Nanocomposites were succesfully synthesized from multicationic layered double hydroxides (LDHs) and platinum nanoparticles (PtNPs). The features of the nanocomposite layer structure were characterized by XRD and IR analyses while the thermal behaviour by DTA-TG. The observed interlayer contraction can be explained by the grafting of interlayer organic anions onto the hydroxylated layers. The change of the mean size and the size distribution of the PtNPs after heat treatment of the samples at 500 °C and 1000 °C were observed by TEM. The intercalated in the support PtNPs were coalesced under heating. Spherical and highly dispersed nanopatricles were observed at room temperature while rough and granular aggregates were formed at 500 °C and large, dense and well-faceted particles at 1000 °C.
Key words: Pt-LDH nanocomposite, TEM of Pt nanoparticles, thermal treatment.
INTRODUCTION
A recent review has shown the great potential of layered double hydroxides (LDHs) as precursors of metal particles on basic supports with very unique properties [1, 2], as regards metal-support interac-tion (“electron transfer”) and metal-support coop-eration (“metal-base bifunctional catalysis”). It is known also that LDHs are good precursors for load-ing noble metals and non noble metals [3]. LDHs of general formula [M2+
1–x M3+x(OH)2][An–
x/n.mH2O] can contain different M2+ and M3+ metal cations in their brucite-like sheets, and various An– charge-compensating anions in their interlayer space. LDH compounds easily decompose into mixed oxides of the M2+M3+(O) type after calcination [4–6]. These materials have both basic and redox functions as catalysts.
Three general routes are available for synthesis of LDHs precursors: first, the synthesis of LDHs containing M2+ and/or M3+elements with redox be-haviour within the sheets; second, the exchange with anionic metal precursors of the desired metal
in the interlayer space of the LDHs; third, the depo-sition or grafting of inorganic or organometallic precursors onto the calcined precursor LDH. The advantage of the second route for synthesis is that the steric hindrance in the interlayer space prevents aggregation of the nanoparticles and allows the con-trol of their growth. However these routes of cata-lysts preparation suffer from several limitations: (i) pure LDH phases cannot be obtained with a noble metal content larger than 5 at.% [7, 8]; (ii) catalyti-cally active ions of too large ionic radius or without octahedral coordination cannot be accommodated in the brucite-like sheets [1, 4] and (iii) the sizes of the metal particles obtained after calcination and reduction of the LDH or mixed oxides are not easily controlled, aggregation often takes place leading to large particle sizes [9]. Keeping in mind these draw-backs, there is a demand to design new synthesis routes for obtaining highly loaded metal catalysts with control of noble metal particles in size and dis-tribution starting from LDH precursors.
A recent report has described a novel prepara-tion method of such materials by intercalation of preformed negatively charged Ni-based nanopar-ticles in Mg/Al LDH [10]. It has been shown that a better control of nanosized Ni0 particles could be achieved. Three approaches are considered in or-der to prepare LDH nanocomposites incorporating

71
D. Karashanova et al.: Size and distribution of Pt nanoparticles in LDH nanocomposites at different temperatures
large negatively charged entities: the LDH co-pre-cipitation and the reconstruction of the host LDH in the presence of the anionic species, and the anion exchange route of, for example, nitrate-containing LDH with the anions [10–11]. The first two meth-ods yield poorly ordered layered structures, while the third yields well-ordered lamellar structures. Moreover, the anionic exchange route is the only one that allows us to tailor Ni particle sizes in the calcined and reduced materials.
The aim of the present work was therefore the preparation of highly disperse supported Pt-metal catalyst by intercalation of platinum nanoparticles into multicationic LDHs and fine control of the size and microstructure of Pt NPs at room temperature and after heat treatment at 500 °C and 1000 °C. For this purpose original Pt-containing LDH nanocom-posites were prepared by exchange route of nega-tively charged Pt colloids with controlled sizes of the nanoparticles.
EXPERIMENTAL
Preparation of PtColloid
Colloidal suspensions of Pt-based particles were obtained by hydrolysis of an aqueous solu-tion of (H3O)2PtCl6 (8%) and Na3(C6O7H3) (1%) with NaOH (4%). This modified method of synthe-sis is created on the basis of works of Turkevich [12] and Harriman [13]. The molar ratio x = [ci-trate]/[Pt] was 3.45. Hydrolysis of Pt2+ ions was performed at a controlled platinum hydroxylation ratio h = [OH]/[Pt]=7,95 at alkaline pH =10 and temperature of 80 °C. The general equation of the reactions of formation of Pt-complex, followed by hydrolysis can be presented by:
(H3O)2PtCl6 + xNa3Citrate + hNaOH → [Pt(Cit)x(OH)h]2–
Preparation of LDH Host Structure, PtLDH nanocomposite and its conformations
after heat treatment
(i) The host NO3-Mg/Ni/Al sample (Mg/Ni/Al = 2:0.5:1) was prepared by co-precipitation at con-stant pH=10 of suitable amounts of Mg(NO3)2.6H2O (21.7%), Al(NO3)3.9H2O (15.8%) and Ni(NO)2.6H2O (6.1%) with a solution of NaOH (4%). The addition of the alkaline solution was controlled by using a pH-STAT Titrino (Metrohm) apparatus to keep the pH constant. The suspension was stirred at 80 °C for 17 h, and then the solid fraction was separated by centrifugation, washed thoroughly with distilled
water and dried overnight at 80 °C [14]. These sam-ples will be hereafter labeled NO3-LDH.
(ii) The Pt-LDH nanocomposite was prepared from the NO3-LDH by anionic exchange of nitrate ions: 0.6 g of the host NO3-LDH was dispersed in the required amounts of a 2% aqueous suspension of Pt-based nanoparticles ([citrate]/[Pt])=3.45; ([OH]/[Pt])=7.95). The exchange process was performed by stirring the mixture in air at temperature of 80 °C for 6 h. The solid fraction was then recovered and washed by dispersion and centrifugation in distilled water and finally dried at 80 °C for 12 h.
(iii) Two conformations of the Pt-layered na-nocomposite were obtained after heat treatment at 500 °C – mixed oxide Mg/Ni/Al(O) and 1000 °C – spinel MgNiAl2O4 type phase.
Methods of characterization
Phase identification was performed using pow-der XRD data obtained by XRD patterns recorded on a Bruker D8 Advance instrument using the Cu Kα1 radiation (λ= 1.542 Å, 40 kV, and 50 mA).
The infrared absorption spectra were measured with a Tensor 37, Bruker FTIR spectrometer in the MIR 400–4000 cm–1 spectral range with a 2 cm–1 spectral resolution, after averaging 72 scans on standard KBr pallets.
DTA-TG analyses were performed on Stanton Redcroft, STA 780 equipment operating at a heat-ing rate of 10° min–1, dynamic air conditions and Al2O3 used as a reference.
The microstructure of the samples was investi-gated by means of HRTEM JEOL JEM 2100, oper-ated at 200 kV accelerating voltage. For the phase composition identification Selected Area Electron Diffraction (SAED) was applied. Pt-LDH nano-composite and thermally treated powders were dis-persed in ethanol. Micro-quantities of the colloids were dropped on standard Cu TEM grids, coated with carbon and dried for subsequent observation.
RESULTS AND DISCUSSION
Characterization of PtLDH nanocomposite
XRD patterns of the host NO3-LDH and of the Pt colloid-exchanged LDH are shown in Figure 1. In all cases the XRD patterns are typical for LDHs structures. The reflections can be indexed in a hex-agonal lattice with a R3hm rhombohedral symme-try. The two sharp and intense characteristic diffrac-tion lines appearing as symmetric lines at 2Ө angles below 25 °C in the NO3-LDH are ascribed to (003) and (006) planes (Fig. 1a). The basal spacing value of d003=0.886 nm is consistent with the presence of
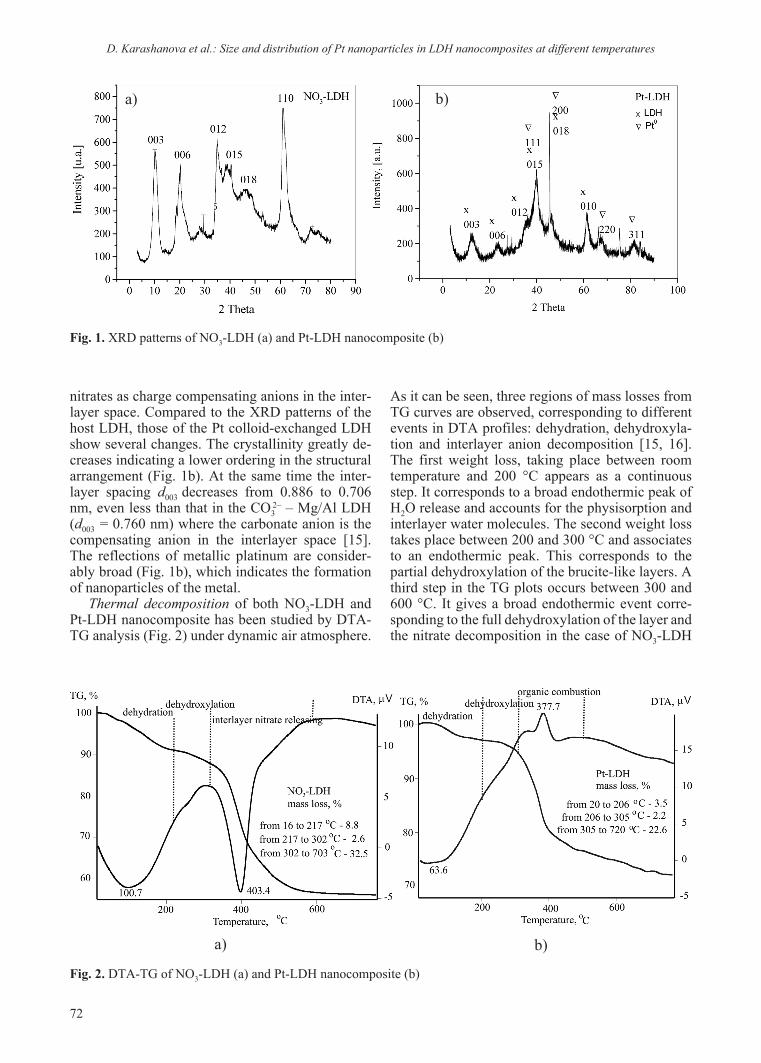
72
D. Karashanova et al.: Size and distribution of Pt nanoparticles in LDH nanocomposites at different temperatures
nitrates as charge compensating anions in the inter-layer space. Compared to the XRD patterns of the host LDH, those of the Pt colloid-exchanged LDH show several changes. The crystallinity greatly de-creases indicating a lower ordering in the structural arrangement (Fig. 1b). At the same time the inter-layer spacing d003 decreases from 0.886 to 0.706 nm, even less than that in the CO3
2– – Mg/Al LDH (d003 = 0.760 nm) where the carbonate anion is the compensating anion in the interlayer space [15]. The reflections of metallic platinum are consider-ably broad (Fig. 1b), which indicates the formation of nanoparticles of the metal.
Thermal decomposition of both NO3-LDH and Pt-LDH nanocomposite has been studied by DTA-TG analysis (Fig. 2) under dynamic air atmosphere.
As it can be seen, three regions of mass losses from TG curves are observed, corresponding to different events in DTA profiles: dehydration, dehydroxyla-tion and interlayer anion decomposition [15, 16]. The first weight loss, taking place between room temperature and 200 °C appears as a continuous step. It corresponds to a broad endothermic peak of H2O release and accounts for the physisorption and interlayer water molecules. The second weight loss takes place between 200 and 300 °C and associates to an endothermic peak. This corresponds to the partial dehydroxylation of the brucite-like layers. A third step in the TG plots occurs between 300 and 600 °C. It gives a broad endothermic event corre-sponding to the full dehydroxylation of the layer and the nitrate decomposition in the case of NO3-LDH
Fig. 1. XRD patterns of NO3-LDH (a) and Pt-LDH nanocomposite (b)
Fig. 2. DTA-TG of NO3-LDH (a) and Pt-LDH nanocomposite (b)
a) b)
a) b)
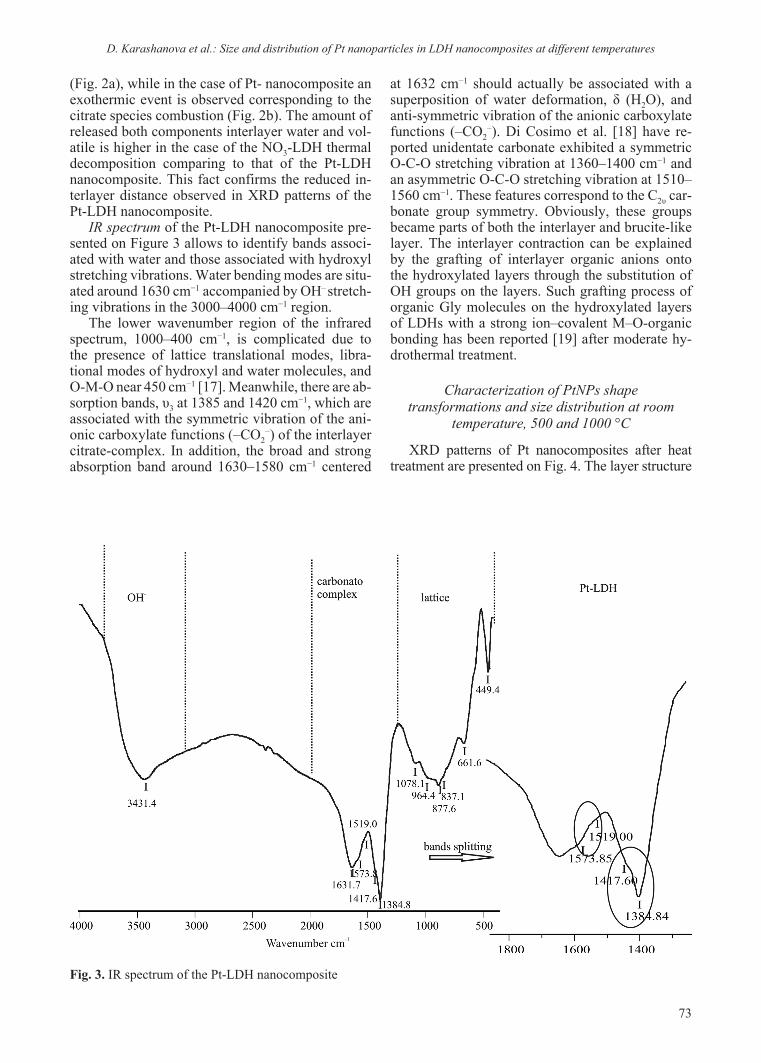
73
D. Karashanova et al.: Size and distribution of Pt nanoparticles in LDH nanocomposites at different temperatures
(Fig. 2a), while in the case of Pt- nanocomposite an exothermic event is observed corresponding to the citrate species combustion (Fig. 2b). The amount of released both components interlayer water and vol-atile is higher in the case of the NO3-LDH thermal decomposition comparing to that of the Pt-LDH nanocomposite. This fact confirms the reduced in-terlayer distance observed in XRD patterns of the Pt-LDH nanocomposite.
IR spectrum of the Pt-LDH nanocomposite pre-sented on Figure 3 allows to identify bands associ-ated with water and those associated with hydroxyl stretching vibrations. Water bending modes are situ-ated around 1630 cm−1 accompanied by OH– stretch-ing vibrations in the 3000–4000 cm−1 region.
The lower wavenumber region of the infrared spectrum, 1000–400 cm−1, is complicated due to the presence of lattice translational modes, libra-tional modes of hydroxyl and water molecules, and O-M-O near 450 cm−1 [17]. Meanwhile, there are ab-sorption bands, υ3 at 1385 and 1420 cm−1, which are associated with the symmetric vibration of the ani-onic carboxylate functions (–CO2
−) of the interlayer citrate-complex. In addition, the broad and strong absorption band around 1630–1580 cm−1 centered
at 1632 cm−1 should actually be associated with a superposition of water deformation, δ (H2O), and anti-symmetric vibration of the anionic carboxylate functions (–CO2
−). Di Cosimo et al. [18] have re-ported unidentate carbonate exhibited a symmetric O-C-O stretching vibration at 1360–1400 cm−1 and an asymmetric O-C-O stretching vibration at 1510–1560 cm−1. These features correspond to the C2υ car-bonate group symmetry. Obviously, these groups became parts of both the interlayer and brucite-like layer. The interlayer contraction can be explained by the grafting of interlayer organic anions onto the hydroxylated layers through the substitution of OH groups on the layers. Such grafting process of organic Gly molecules on the hydroxylated layers of LDHs with a strong ion–covalent M–O-organic bonding has been reported [19] after moderate hy-drothermal treatment.
Characterization of PtNPs shape transformations and size distribution at room
temperature, 500 and 1000 °C
XRD patterns of Pt nanocomposites after heat treatment are presented on Fig. 4. The layer structure
Fig. 3. IR spectrum of the Pt-LDH nanocomposite

74
D. Karashanova et al.: Size and distribution of Pt nanoparticles in LDH nanocomposites at different temperatures
of the nanocomposite (Fig. 1b) transforms into mixed oxide (Fig. 4a) and spinel-like structure (Fig. 4b) at 500 and 1000 °C, respectively. At the same time, the reflections of metallic platinum become sharp, which indicates increasing of both the size and crystallinity of Pt particles with the heating temperature.
The microstructure of Pt nanocomposites, treated at the different temperatures is visualized on Fig. 5, where the bright field micrographs and correspond-ing SAED patterns as insets are presented. The phase composition identification confirms the presence of metal Pt phase in all three cases. A substantial in-crease of the mean Pt particle size is established as in [20]. The corresponding size distributions are pre-sented on Fig. 6. The mean diameter is estimated to be 4 nm for the PtNPs at room temperature, 6 nm
Fig. 4. XRD patterns of Pt- nanocomposites at 500 (a) and 1000 °C (b)
at 500 °C and about 120 and 200 nm at 1000 °C. It is seen that not only the size of the PtNPs, but their shape was also changed under the heating. Initially spherical, the particles intercalated in the support coalesced, thus forming rough and granular aggre-gates, still spherical at 500 °C while large, dense and well-faceted, particles appeared at 1000 °C. The last ones exhibit a shape anisotropy consisting of two dif-ferent dimensions in the two mutually perpendicular directions. For more of the particles one of these di-mensions was significantly larger than the other. To characterize this anisotropy, two independent meas-urements in the two perpendicular directions for each Pt NP, annealed at 1000 °C were performed. As a result two groups of columns on the histogram were formed – one between 100 and 150 nm, correspond-
Fig. 5. Bright field TEM images and corresponding SAED patterns of Pt nanocomposites at room temperature (a), 500 °C (b) and 1000 °C (c)

75
D. Karashanova et al.: Size and distribution of Pt nanoparticles in LDH nanocomposites at different temperatures
ing to the less dimension and one between 180 and 240 nm, due to the larger dimension.
CONCLUSIONS
An effective method for synthesis of PtNPs based nanocomposite as a promising material for catalytic applications was established. A thermal treatment for size and microstructure fine control of the PtNPs was applied. It was observed that in-tercalated in the precursor PtNPs were coalesced becoming dense and well-faced under heating. Thus, the layer structure of the catalytic nanocom-posite favors in best way the fine distribution and nanosize control of the Pt particles.
REFERENCES
1. A. Vaccari, Appl. Clay Sci., 14, 161 (1999).2. D. Tichit, B. Coq, B. Cattech, 7, 206 (2003).3. S. Narayanan, Bulletin of the Catalysis Society of
India, 2, 107 (2003).4. F. Cavani, F. Trifiro, A. Vaccari, Catal. Today, 11,
173 (1991).5. A. De Roy, C. Forano, K. El Malki, J. P. Besse, in:
Synthesis of Microporous Materials, M. L. Occelli, H. Robson (eds.), Van Nostrand Reinhold: New york, 1992, p. 108.
6. V. Rives, Layered Double Hydroxides: Present and Future, V. Rives (ed.), Nova Science Publishers:
Fig. 6. Size distributions of PtNPs in the samples presented on Fig. 5
New york, 2001, p. 115.7. F. Basile, L. Basini, G. Fornasari, M. Gazzano, F. Tri -
firo, A. Vaccari, J. Chem. Soc., Chem. Commun., 2435 (1996).
8. F. Basile, G. Fornasari, M. Gazzano, A. Vaccari, Appl. Clay Sci., 16, 185 (2000).
9. M. K. Titulaer, J. Ben, H. Jansen, J. Geus, Clays Clay Miner., 42, 249 (1994)
10. C. Gerardin, D. Kostadinova, N. Sanson, D. Fran-cova, N. Tanchoux, D. Tichit, B. Coq, Stud. Surf. Sci. Catal., 156, 357 (2005).
11. V. Rives, M. Ulibarri, A. Coord. Chem. Rev., 61, 181 (1999).
12. J. Turkevich, P. Stevenson, J. Hillier, Discuss. Faraday. Soc., 11, 55 (1951).
13. A. Harriman, G. R. Millward, P. Neta, M.C. Richoux, J. M. Thomas, J. Phys.Chem., 92, 1286 (1988).
14. D. Kostadinova, G. Topalov, A. Stoyanova, E. Lef te- rova, I. Dragieva, Bulgarian Chemical Communications, 43, 1, 150 (2011).
15. Ts. Stanimirova, I. Vergilov, G. Kirov, N. Petrova, J. Mater. Sci., 34, 4153 (1999).
16. C. Ge´rardin, D. Kostadinova, N. Sanson, B. Coq, D. Tichit, Chem. Mater., 17, 6473 (2005).
17. S. J. Palmer, L. Frost, T. Nguen, Coordination Chemistry Reviews, 253, 250 (2009).
18. J. I. Di Cosimo, V. K. Diez, M. Xu, E. Iglesia, C. R. Apesteguia, J. Catal., 178, 499 (1998).
19. F. Li, L. Zhang, D. G. Evans, C. Forano, X. Duan, Thermoch. Acta, 424, 15 (2004).
20. A. V. Lukashin, M. V. Chernysheva, A. A. Vertegel, yu. D. Tret’yakov, Doklady Chemistry, 388, 1–3, 19 (2003).

76
D. Karashanova et al.: Size and distribution of Pt nanoparticles in LDH nanocomposites at different temperatures
раЗмер и раЗпределение на Pt наночастици В LDH наноКомпоЗити при раЗлични температури
д. Б. Карашанова1*, д. д. Костадинова2, с. В. Василев2, н. л. петрова3
1 Институт по оптически материали и технологии „Акад. Йордан Малиновски“, Българска академия на науките, 1113 София, България
2 Институт по електрохимия и енергийни системи, Българска академия на науките, 1113 София, България
3 Институт по минералогия и кристалография, Българска академия на науките, 1113 София, България
постъпила на 15 февруари, 2012 г.; приетa на 17 април, 2012 г.
(резюме)
успешно са синтезирани нанокомпозити от мултикатионни слоисти двойни хидроксиди (LDH) и плати-нови наночастици (PtNPs). слоистата структура на нанокомпозитите е охарактеризирана с рентгенова ди-фракция (XRD) и инфрачервена (IR) спектроскопия, а термичните им свойства – посредством диференциален термичен и термогравиметричен (DTA-TG) анализ. установено е свиване на междуслойното пространство, което може да бъде обяснено с вграждането на органичните аниони, разположени там, в хидроксилираните слоеве. с помощта на трансмисионна електронна микроскопия (TEM) е наблюдавана промяната на размера и разпределението на PtNPs след термично третиране на образците при 500 °C и 1000 °C. В резултат на нагря-ването, интеркалираните в подложката PtNPs коалесцират. при стайна температура те са сферични и силно диспергирани по повърхността на подложката, докато при 500 °C се групират в агрегати с неправилна форма, а при 1000 °C се трансформират в големи, плътни и добре остенени частици.
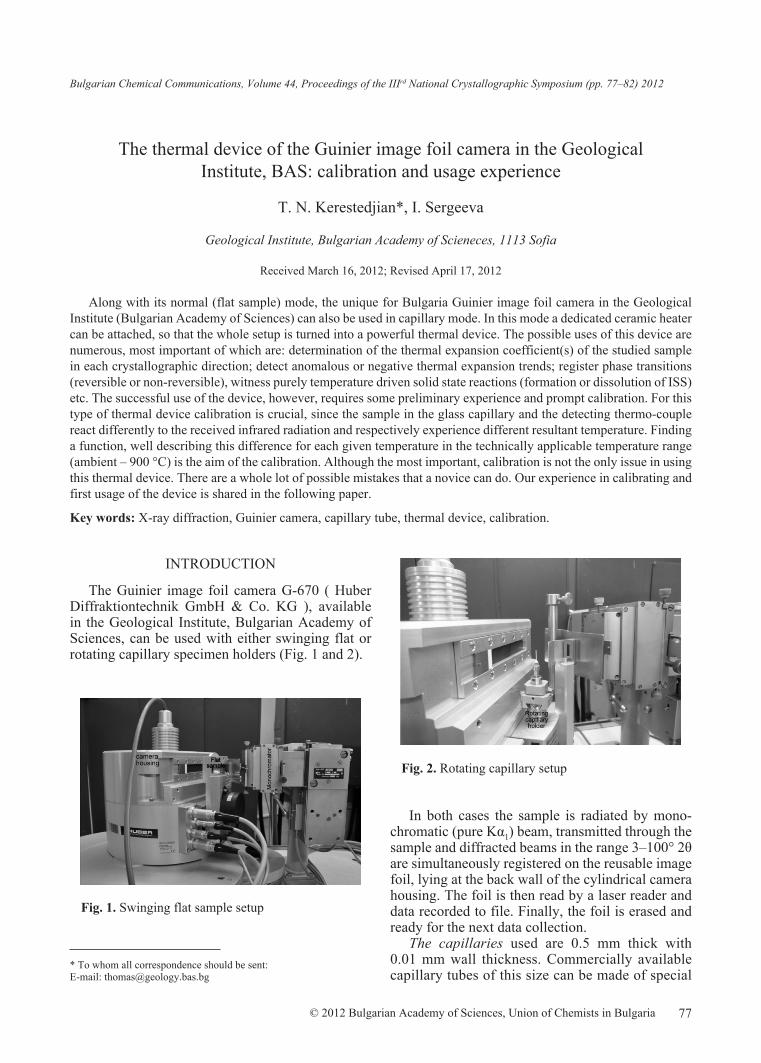
77
* To whom all correspondence should be sent:E-mail: [email protected]
© 2012 Bulgarian Academy of Sciences, Union of Chemists in Bulgaria
Bulgarian Chemical Communications, Volume 44, Proceedings of the IIIrd National Crystallographic Symposium (pp. 77–82) 2012
The thermal device of the Guinier image foil camera in the Geological Institute, BAS: calibration and usage experience
T. N. Kerestedjian*, I. Sergeeva
Geological Institute, Bulgarian Academy of Scieneces, 1113 Sofia
Received March 16, 2012; Revised April 17, 2012
Along with its normal (flat sample) mode, the unique for Bulgaria Guinier image foil camera in the Geological Institute (Bulgarian Academy of Sciences) can also be used in capillary mode. In this mode a dedicated ceramic heater can be attached, so that the whole setup is turned into a powerful thermal device. The possible uses of this device are numerous, most important of which are: determination of the thermal expansion coefficient(s) of the studied sample in each crystallographic direction; detect anomalous or negative thermal expansion trends; register phase transitions (reversible or non-reversible), witness purely temperature driven solid state reactions (formation or dissolution of ISS) etc. The successful use of the device, however, requires some preliminary experience and prompt calibration. For this type of thermal device calibration is crucial, since the sample in the glass capillary and the detecting thermo-couple react differently to the received infrared radiation and respectively experience different resultant temperature. Finding a function, well describing this difference for each given temperature in the technically applicable temperature range (ambient – 900 °C) is the aim of the calibration. Although the most important, calibration is not the only issue in using this thermal device. There are a whole lot of possible mistakes that a novice can do. Our experience in calibrating and first usage of the device is shared in the following paper.
Key words: X-ray diffraction, Guinier camera, capillary tube, thermal device, calibration.
INTRODUCTION
The Guinier image foil camera G-670 ( Huber Diffraktiontechnik GmbH & Co. KG ), available in the Geological Institute, Bulgarian Academy of Sciences, can be used with either swinging flat or rotating capillary specimen holders (Fig. 1 and 2).
Fig. 1. Swinging flat sample setup
Fig. 2. Rotating capillary setup
In both cases the sample is radiated by mono-chromatic (pure Kα1) beam, transmitted through the sample and diffracted beams in the range 3–100° 2θ are simultaneously registered on the reusable image foil, lying at the back wall of the cylindrical camera housing. The foil is then read by a laser reader and data recorded to file. Finally, the foil is erased and ready for the next data collection.
The capillaries used are 0.5 mm thick with 0.01 mm wall thickness. Commercially available capillary tubes of this size can be made of special

78
T. Kerestedjian, I. Sergeeva: The thermal device of the Guinier image foil camera in the Geological Institute, BAS ...
Fig. 3. Capillary adjustment Fig. 4. Heater device
glass, boron-rich glass, or quartz glass. The linear absorption coefficients of CuKα in these mate-rials vary from 110 (in special glass) to 76 cm–1
(in quartz glass). Respective values for MoKα are approximately 10 times lower. Both boron- and quartz- glasses have comparable and acceptable for most purposes absorption coefficients, how-ever, softening temperature of boron glass is about 820 °C, while for the quartz glass it is 1730 °C. Keeping in mind, that technically achievable tem-perature limit of the device is 900 °C, the use of quartz glass is economically reasonable only for studies in the higher-most end of the temperature range. In most other cases far cheaper boron-glass is the better choice.
Filling of the powdered sample in the capillary tube is facilitated by the funnel that it usually has on one end. However, some source of vibration should be applied on it too, in order to move all powder particles down to the capillary bottom. A dedicated vibrating device named “capillary boy” is offered by Huber Diffraktiontechnik GmbH & Co. KG.
Once filled, the capillary is to be glued in its holder. This is made using wax, if normal ambient temperature studies are to be done, and special, heat resistant, bi-component glue in case of high tem-perature studies. The holder is then adjusted in a special goniometric head, so that it is rotated strictly along its own axis, exposing all the sample particles simultaneously to the direct X-ray beam (Fig. 3).
High temperature setup is achieved by attaching a ceramic fork with built-in heating coil. The heater is adjusted over the capillary tube, containing the powdered sample (Fig. 4).
Adjustment is a rather tricky point. Following are some practical advices, from our experience:
The length of the capillary must be chosen • properly, so that the entire sample is placed fully in-
side the heater and its top is as close to the thermo-couple (the ball in the upper-most part of the heater, Fig. 5) as possible. The latter is achieved also by proper adjustment of the heater height. If longer, part of the sample (outside the heater) will remain less heated and will produce inconclusive results. If shorter, the sample will either remain far from the thermocouple and its temperature will differ too much from that registered by it, or the heater has to be lowered too much and may be hit by the rotating capillary holder.
Positioning the heater over the capillary should • start with rotating the ceramic fork around its own axis, so that the line connecting its two legs passes through the axis, holding the heater shoulder (i.e. it is made strictly radial to the arc, drawn by moving the heater shoulder). Otherwise, adjustment will al-most surely end up with broken capillary.
Fig. 5. Ceramic heater fork with the detecting thermo-couple ball in the uppermost part of the opening
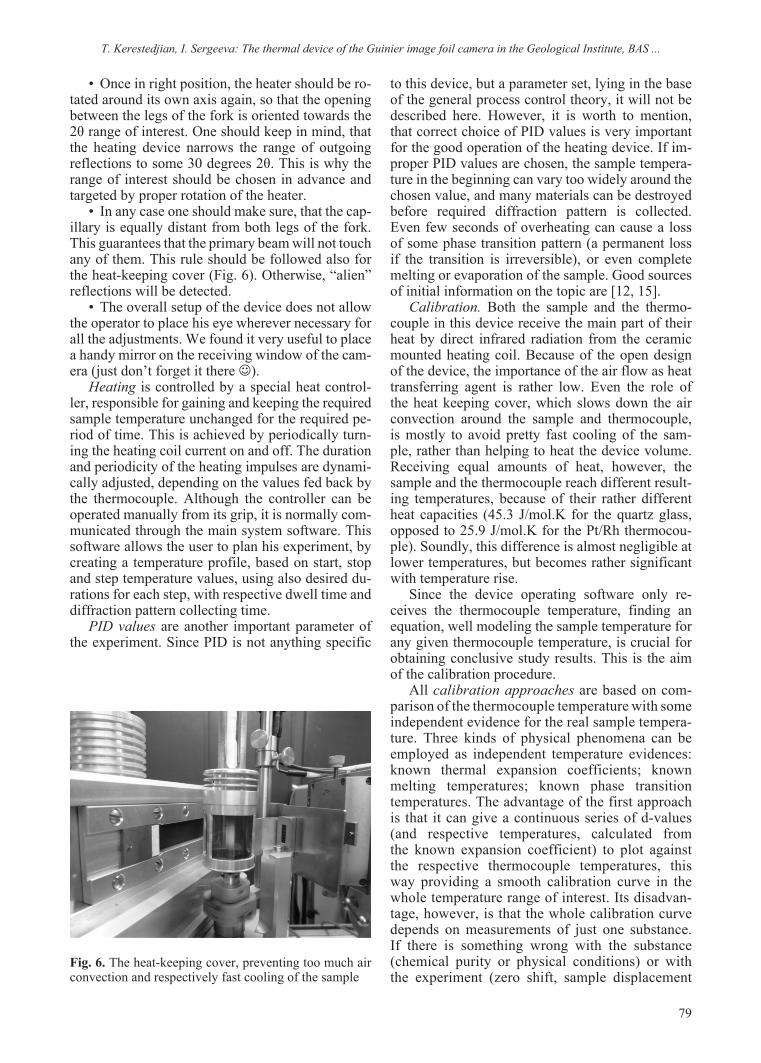
79
Once in right position, the heater should be ro-• tated around its own axis again, so that the opening between the legs of the fork is oriented towards the 2θ range of interest. One should keep in mind, that the heating device narrows the range of outgoing reflections to some 30 degrees 2θ. This is why the range of interest should be chosen in advance and targeted by proper rotation of the heater.
In any case one should make sure, that the cap-• illary is equally distant from both legs of the fork. This guarantees that the primary beam will not touch any of them. This rule should be followed also for the heat-keeping cover (Fig. 6). Otherwise, “alien” reflections will be detected.
The overall setup of the device does not allow • the operator to place his eye wherever necessary for all the adjustments. We found it very useful to place a handy mirror on the receiving window of the cam-era (just don’t forget it there J).
Heating is controlled by a special heat control-ler, responsible for gaining and keeping the required sample temperature unchanged for the required pe-riod of time. This is achieved by periodically turn-ing the heating coil current on and off. The duration and periodicity of the heating impulses are dynami-cally adjusted, depending on the values fed back by the thermocouple. Although the controller can be operated manually from its grip, it is normally com-municated through the main system software. This software allows the user to plan his experiment, by creating a temperature profile, based on start, stop and step temperature values, using also desired du-rations for each step, with respective dwell time and diffraction pattern collecting time.
PID values are another important parameter of the experiment. Since PID is not anything specific
T. Kerestedjian, I. Sergeeva: The thermal device of the Guinier image foil camera in the Geological Institute, BAS ...
to this device, but a parameter set, lying in the base of the general process control theory, it will not be described here. However, it is worth to mention, that correct choice of PID values is very important for the good operation of the heating device. If im-proper PID values are chosen, the sample tempera-ture in the beginning can vary too widely around the chosen value, and many materials can be destroyed before required diffraction pattern is collected. Even few seconds of overheating can cause a loss of some phase transition pattern (a permanent loss if the transition is irreversible), or even complete melting or evaporation of the sample. Good sources of initial information on the topic are [12, 15].
Calibration. Both the sample and the thermo-couple in this device receive the main part of their heat by direct infrared radiation from the ceramic mounted heating coil. Because of the open design of the device, the importance of the air flow as heat transferring agent is rather low. Even the role of the heat keeping cover, which slows down the air convection around the sample and thermocouple, is mostly to avoid pretty fast cooling of the sam-ple, rather than helping to heat the device volume. Receiving equal amounts of heat, however, the sample and the thermocouple reach different result-ing temperatures, because of their rather different heat capacities (45.3 J/mol.K for the quartz glass, opposed to 25.9 J/mol.K for the Pt/Rh thermocou-ple). Soundly, this difference is almost negligible at lower temperatures, but becomes rather significant with temperature rise.
Since the device operating software only re-ceives the thermocouple temperature, finding an equation, well modeling the sample temperature for any given thermocouple temperature, is crucial for obtaining conclusive study results. This is the aim of the calibration procedure.
All calibration approaches are based on com-parison of the thermocouple temperature with some independent evidence for the real sample tempera-ture. Three kinds of physical phenomena can be employed as independent temperature evidences: known thermal expansion coefficients; known melting temperatures; known phase transition temperatures. The advantage of the first approach is that it can give a continuous series of d-values (and respective temperatures, calculated from the known expansion coefficient) to plot against the respective thermocouple temperatures, this way providing a smooth calibration curve in the whole temperature range of interest. Its disadvan-tage, however, is that the whole calibration curve depends on measurements of just one substance. If there is something wrong with the substance (chemical purity or physical conditions) or with the experiment (zero shift, sample displacement
Fig. 6. The heat-keeping cover, preventing too much air convection and respectively fast cooling of the sample

80
T. Kerestedjian, I. Sergeeva: The thermal device of the Guinier image foil camera in the Geological Institute, BAS ...
etc.) these errors are cast over the whole range of results as systematic errors.
A big disadvantage of the second approach is that melting is not an abrupt phenomenon. It always takes a temperature range with smooth disappearance of the diffraction lines and hence the accuracy of the calibration curve, created this way, is pretty poor.
For the reasons expressed above, we choose the third approach – using phase transitions in our cali-bration experiments.
In this approach, each point of the calibration curve is determined by the results of a separate ex-periment, using proper substance with well known phase transition effect. Before each experiment, available reference data have been carefully inves-tigated, to make sure that there is no discrepancy in the literature, about the character and the tempera-ture at which the targeted phase transition occurs. Another important information to collect before the experiment was to learn at what Bragg angle the most visible transition effect should be expected. This was done in order to adjust the heater and its cover, so that reflections in the respective 2 theta range are to be observed.
Since preliminary reference data showed that the thermocouple systematically shows temperatures lower than the real sample temperature, and at the high end of the range (900 °C) this discrepancy can even reach 250 °C, we used to start stepwise heat-ing far before the expected phase transition. The step was chosen larger at the beginning and was decreased with approaching the expected transition point. The result was a series of diffraction data, which could be plotted in some stacking diagram, to visualize the changes.
Duration of the heating step. Structural and re-spective diffraction pattern changes, which appear on heating, require some time to take place. Since the required tempering time is specific for each sub-stance and each phase transition, no general sugges-tion for the proper step duration can be drawn out. This is why we used to adjust step duration experi-mentally, by consecutive collection of diffraction patterns at constant temperature, until they remain unchanged.
The character of the change in the diffraction pattern depends on the character of the structural change. Since phase transitions usually refer to slight distortions of the atomic arrangement and respective slight displacements of the diffraction peaks, they are best recognized, when extinction conditions are changed. In this case, a new peak appears right from the flat background (Fig. 7). In most cases, however, the change is expressed by deformation of some peaks, loss of intensity and finally growth of new peak at the foothills of an existing one. Often the new and old peaks coex-ist over some temperature range, forming a typical saddle shape on the stacking diagram (Fig. 8), but we need certain strict temperature value to assign to the phase transition. We choose to assign it the temperature of first appearance of the new peak, since presumably this should be the point of sym-metry change.
The set of substances, used for the creation of the calibration curve, was chosen on the grounds of available reference data, temperature of phase transition and of course – availability in acces-sible labs. Our choice is given in the following Table 1.
Fig. 7. Example of RbNO3. Tetragonal phase appears on flat background at 160 °C. So does the cubic phase at 205 °C
Fig. 8. Typical saddle shape of the stacking diagram for the trigonal/hexagonal transition in quartz

81
T. Kerestedjian, I. Sergeeva: The thermal device of the Guinier image foil camera in the Geological Institute, BAS ...
The calibration curve was built on the base of the data, obtained from the above described experi-ments on the above listed substances. The results are given in Figure 9.
Discussion. The obtained calibration curve con-firms the observation of [16], that set temperatures (those sensed by the thermo-couple) are always lower than actual sample ones and at the hot end of the range (900 °C) this difference can reach 250 °C. It is very similar to that in the unpublished study of M. Nippus (2000) from Huber GMBH, who pro-poses the following approximation function: Tset = Tsample – A*(1 – exp(B*Tsample^2)), where A and B are fitting parameters, specific for each individual heating device. Instead, we found a pretty good fit of the obtained results with a polynomial of order 5. The most satisfying result, however, is that the ob-tained dependence differs from a simple linear func-tion Tset = 0.7*Tsample +10 within an accuracy range of ±10 °C, which is acceptable, for many purposes.
Table 1. List of used substances and respective reference data
Substance Reference Substance Reference
TlNO3 [3, 4, 5, 6] Quartz [3, 13]
KNO3 [3, 5, 6, 7, 8] KCl [3, 15]
RbNO3 [3, 5, 6, 9, 10, 11, 12] NaCl [3, 15]
Ag2SO4 [3] SrCO3 [5, 14]
Fig. 9. Constructed calibration curve, with the underlying data base (on the left): list of used substances with known phase transitions; sample (presumably equal to reference) and set (read from the thermocouple) temperatures for each phase transition. Polynomial equation of the approximating curve is given below the set curve
REFERENCES
K. J. Åström, PID Control, in: Control System De-1. sign, (2002).http://en.wikipedia.org/wiki/PID_controller2. 3. Table of Calibration Standards by Dr. M. Emrich. http://www.mpi-stuttgart.mpg.de/xray/html/temper-ature_calibration.htmlR. N. Brown, A. C. McLaren, 4. Acta Cryst., 15, 977 (1962).C. N. R. Rao, B. Prakash, M. Natarajan, 5. NSRDSNBS 53, (1975).K. H. Stern, 6. J. Phys. Chem. Ref. Data, 1, 747 (1972).A. Paar, XRD Temperature Calibration with Phase 7. Transitions. Sources of errors, advantages and limitations.J. K. Nimmo, B. W. Lucas, 8. Acta Cryst., B32, 1968 (1976).E. L. Charsley, P. G. Laye, H. M. Markham, J. O. 9. Hill, B. Berger, T. T. Griffiths, Thermochim. Acta, 469, 65 (2008).

82
T. Kerestedjian, I. Sergeeva: The thermal device of the Guinier image foil camera in the Geological Institute, BAS ...
R. N. Brown, A. C. McLaren, 10. Acta Cryst., 15, 974, (1962).S. Wacharine, D. Hellali, H. Zamali, J. Rogez, M. 11. Jemal, J. Therm Anal Calorim, DOI 10.1007/s10973-011-1544-3, (2011).B. W. Lucas, 12. Mater. Sci. For., 27-28, 95 (1988).
P. J. Heaney, D. R. Veblen, 13. Amer. Miner., 76, 1018 (1991).S. M. Antao, I. Hassan, 14. Can. Min., 47, 1245, (2009).http://www.gcsescience.com/imeltcomplz.htm15. G. E. Brown, S. Sueno, C. T. Prewitt, 16. Am. Mineral. 58, 698 (1973).
термичната пристаВКа на цифроВата гиние Камера В геологичесКия институт на Бан: КалиБриране и натрупан опит
т. н. Керестеджиян*, и. сергеева
Геологически институт, Българска академия на науките, 1113 Sofia
постъпила на 16март, 2012 г.; приетa на 17 април, 2012 г.
(резюме)
наред с нормалния (с плосък препарат) режим, уникалната за България цифрова гиние камера в геологическия институт (Бан), може да бъде използувана и с препарат в капилярна тръбичка. В този режим е възможно към системата да се добави специален керамичен нагревател, превръщащ установката в мощен инструмент за in-situ термична дифрактометрия. има множество възможните приложения на тази система, най-важните от които са: определяне на коефициента(ите) на термично разширение на материала по всяко кристалографско направление, установяване на аномални или отрицателни трендове на термично разшире-ние, регистрация на фазови преходи (обратими или необратими), проследяване на термично предизвикани, твърдотелни реакци (образуване на междинни твърди разтвори) и др. успешната употреба на системата, оба-че, изисква някои предварителни знания и внимателно калибриране. За този тип термична приставка кали-брирането е от решаващо значение, доколкото препаратът в капилярната тръбичка и отчитащата температу-рата термодвойка реагират различно на постъпващото инфра-червено облъчване и постигат различна резул-татна температура. целта на калибрирането е да се намери подходяща функция, добре описваща температур-ното състояние на образеца, за всяка избрана температура на термодвойката в рамките на работния интервал (0–900 °C). Въпреки че калибрирането е основната, то не е единствената трудност при работа с термичната приставка. има множество възможни грешки, които неопитният изследовател може да допусне. В тази работа авторите споделят резултатите от калибрирането и първоначалния си опит от използуването на системата.
83
* To whom all correspondence should be sent:E-mail: [email protected]
© 2012 Bulgarian Academy of Sciences, Union of Chemists in Bulgaria
Bulgarian Chemical Communications, Volume 44, Proceedings of the IIIrd National Crystallographic Symposium (pp. 83–89) 2012
Two-stage protonation of a small-pore microporous zirconosilicate Na2ZrSi2O7.H2O
V. V. Kostov-Kytin*, R. P. Nikolova, N. L. Lihareva
Institute of Mineralogy and Crystallography, Bulgarian Academy of Science, Acad. G. Bonchev Str., Bl. 107 Sofia, Bulgaria
Received February 15, 2012; Revised March 27, 2012
The crystal chemical changes occurring upon protonation of the small-pore zirconosilicate Na2ZrSi2O7.H2O have been studied. It has been noticed that variations of the reaction’s medium initial pH influence the degree of sodium leaching of this material. It is found that this dependence is closely related to the structural positions of the Na atoms. The crystal structures of partially and completely protonated samples were refined and compared with the one of the as-synthesized material. In general, the protonation process preserves the framework topology but, however, it noticeably causes mutual shifting of the adjacent layers, which affects the unit cell parameters. Initially, the unit cell volume increases from 673.56Å3 (as-synthesized phase) to 684.9 Å3 (partially protonated sample) and next shrinks to 660.8(1) Å3 (completely protonated material). The monoclinic arrangement becomes pseudo-orthorhombic with values of β = 89.519(9)° and 89.872(3)° for the partially and fully protonated samples, respectively. The evaluation of the framework deformation evidences that protonation causes higher degree of framework deformations than the dehydration process.
Key words: zirconosilicate, protonation, crystal structure, framework deformation.
INTRODUCTION
A new microporous phase was hydrothermally synthesized in the system Na2O–ZrO2–SiO2–H2O [1]. Subsequently, the structure of this powdered material was successfully solved based on the Rietveld refinement routine carried out with the GSAS program [2] and EXPGUI [3] and using the suitably modified atomic coordinates of the topo-logically identical Na3ScSi2O7 as a starting structural model [4]. It has been found that Na2ZrSi2O7.H2O is a small-pore compound with framework built up of ZrO6 octahedra and SiO4 tetrahedra in a manner that results in the formation of layers (alpha-ZrP type [5]) parallel to (001), where silicate groups lie both above and below the plane of the zirconium atoms. The adjacent layers are related by rotation and are connected to each other via oxygen atoms creating [Si2O7] pyrogroups. The structure is thus a three-di-mensional framework and possesses system of two interconnected channels running parallel to (001). The sodium ions and water molecules reside within
the channels. Sodium occupies two crystallographic positions – general and special ones. While the oc-cupied in half “general” Na resides together with the water molecules almost in the central parts of the channels, the “special” Na lies in cavities set up between the alpha-ZrP type of layers building up the polyhedral (ZrSi2O4 ) framework [4]. Lately, it was found that upon heating the monoclinic structure of the title compound converts into orthorhombic one, however preserving the initial topology. The proc-ess is accompanied by water release and a slowly rehydration is possible for this material only up to 300 °C. Above this temperature the orthorhombic structure is preserved up to 800 °C and next an irre-versible transition into a phase with denser triclinic structure occurs thus, precluding the ion-exchange properties of this compound [6]. Further on, the ion-exchange properties of Na2ZrSi2O7.H2O have been investigated (unpublished data). Upon exchange on Sr, substantial changes of the peaks intensity ratios in the powder XRD patterns of the final products have been detected being more pronounced at lower initial pH of the reaction media. Chemical analyses and simulated XRD pattern of “fully exchanged” on Sr material have been indicative that such drastic peak ratio differences could not be obtained only on the account of Sr uptake. Thus, it has become clear

84
that the observed changes are due to Na leaching. Taken alone this fact confirms the microporosity of the title compound. However, our attention was at-tracted by the possibility to investigate the mecha-nism and degree of protonation of Na2ZrSi2O7.H2O upon various experimental conditions (initial pH) as well as the structural changes occurring upon these processes.
EXPERIMENTAL
Sample preparation
The starting compound Na2ZrSi2O7.H2O was hydrothermally synthesized following a procedure described by Kostov-Kytin and Kalvachev [1]. Best results were achieved from gels with the following starting composition (moles): 37.5Na2O – 2.5ZrO2 – 8SiO2 – 675H2O and 480 hours synthesis duration at 200 °C.
Protonation procedure
Several samples of the as-synthesized mate-rial of one gram each were stirred in distilled water for 7 hours at 60 °C and solid –to- liquid ratio of 1:200. The initial pH was adjusted by adding HNO3. Subsequently, only two of the samples were chosen for further investigations designated as HM-1 and HM-2, 1 and 2 meaning 0.1 and 0.2N acid solution used in each experiment, respectively.
Analytical Procedures
Initial characterization of the HNO3 treated sam-ples were performed by powder X-ray diffraction (XRD) analysis using a Bruker D2Phaser diffrac-tometer with CuKα radiation in the 2θ range from 5 to 90° and in a step-scan regime (step 0.015° and time 6 s). Sodium content in the run products af-ter the treatment was determined by AAS (Perkin Elmer 3030) under conditions prescribed by the manufacturer. TG and DTA studies were performed on a Stanton Redcroft thermal analyzer (STA 780) at a heating rate 10 deg/min in static air.
Structure Refinement
The atomic coordinates of Na2ZrSi2O7.H2O were used as a starting structural model for Rietveld re-finement of HM-1 and HM-2 carried out with the GSAS program [2] and EXPGUI [3]. Initial chemi-cal compositions for the acid-treated phases were adjusted in accordance with the number of water molecules and sodium content obtained from the TG-DTA data and the chemical analyses, respec-
V. KostovKytin et al.: Twostage protonation of a smallpore microporous zirconosilicate Na2ZrSi2O7.H2O
tively - a procedure, which will be described in de-tails in the following section. Both structures were initially refined with soft constraints imposed on the Zr-O and Si-O bond distances and in the final refinement cycles they were released. In the case of HM-2 this did not cause substantial structural dis-tortions before convergence achievement. However, unrealistic bond distances and angles were received for HM-1, whereas no substantial improvement of the statistical Rietveld parameters was achieved. Thus, only the results for the constrained struc-tural refinement of HM-1 are presented, here. The bond restraints χ2 contribution for each one of the 10 restraints inserted is 6.71. In addition, a small 2θ range from 17.615 to 18.245° has been excluded from the refinement of HM-1 due to the presence of a negligible amount of impurity phase. In both refinements: (i) all atoms in the structures were re-fined isotropically, (ii) expecting similar Uiso values for the O atoms these ones were refined in a group, (iii) neutral atomic scattering factors, as stored in GSAS, were used for all atoms, and (iv) no correc-tions were made for absorption.
RESULTS
Figure 1 presents the powder XRD patterns of the as-synthesized Na2ZrSi2O7.H2O and the two acid-treated samples together with the final difference plot of the XRD Rietveld refinement. Results from DTA-TG analyses of the investigated materials are shown in Figure 2. The 1.79% weight loss after 500 °C (Fig. 2a) is assumed to be due to decomposition of some nitrogen-containing products. Whereas water liberates HM-1 within a single stage, two distinct stages of water release are detected for HM-2, most probably being due to the interrelation peculiarities of the sodium cations and H2O molecules. Based on the chemical analyses and assuming that weight loss-es in the temperature range of 100–500 °C are being totally due to water release the following empirical formulas have been calculated: H2ZrSi2O7.2.6H2O for HM-1 and H0.5Na1.5ZrSi2O7.1.4H2O for HM-2, respectively. Further on, taking into consideration the crystallographic position peculiarities of sodium atoms in the initial phase and assuming that Na from the general position (Nag) is more susceptible to the protonation process than the structurally more “hidden” Na from the special position (Nap) oc-cupying the cavities attached to the structural lay-ers we have suggested the following formula for HM-2: H0.5Nag0.5NapZrSi2O7.1.4H2O. Initially, no other crystallographic position has been suggested for the excessive water in this structure. As for the totally protonated HM-1 we have assumed three crystallographically distinct positions for the H2O

85
V. KostovKytin et al.: Twostage protonation of a smallpore microporous zirconosilicate Na2ZrSi2O7.H2O
Fig. 1. Powder XRD patterns of: a) as-synthesized Na2ZrSi2O7.H2O; b) HM-1; c) HM-2; The difference (bottom line) of the observed (crosses) vs. calculated (continuous line) profiles for each sample after the final XRD Rietveld refinement are plotted bellow each pattern
Fig. 2. TG-DTA curves of: a) HM-1 and b) HM-2

86
molecules: first of them coinciding with that one of the water in the structure of the as-synthesized compound, and the other two have been placed in the positions of Nap and Nag, respectively. Namely these considerations have been used to prepare the structural models of both acid-treated phases for the Rietveld procedure. In the final stages of the struc-ture refinements structural positions and occupan-cies of the two sodium atoms in the partially proto-nated HM-2 and the same for the water molecules in both phases have been refined. In contrast to the completely protonated phase an unrealistic excess of water has been established for HM-2. Then we inserted additional H2O molecule (Owg) there and constrained its coordinates and occupancy with those ones of Nag taken from the structure of the as-synthesized compound. The subsequent refine-
V. KostovKytin et al.: Twostage protonation of a smallpore microporous zirconosilicate Na2ZrSi2O7.H2O
ment of atomic coordinates and occupancies of the extra-framework species completed with a structur-al model, which crystal chemistry stays very close to our notion about the occurring changes and the mechanism of protonation. The resulting compo-sitions are in perfect agreement with the obtained chemical analyses. The final crystallographic and Rietveld parameters for the studied compounds are listed in Table 1. The crystal structures of the initial and the protonated samples are presented in Fig. 3.
DISCUSSION
As seen from Figure 3 the investigated material preserves its framework topology despite the inten-sity of the applied treatment. As it was pointed out
Table 1. Crystallographic data and results of the Rietveld refinement of Na2ZrSi2O7·H2O
Reference [4] HM-2 this study HM-1 this study
Space groupCell parameters:
a (Å)b (Å)c (Å)
αangles (°) β γ
V (Å3)
C2/c
5.4715(4)9.4111(6)13.0969(8)
90.000092.851(7)90.0000
673.56(7)
C2/c
5.4552(6)9.6215(13)13.0505(19)
90.000089.519(9)90.0000684.9(2)
C2/c
5.4227(7)9.4160(27)12.9418(21)
90.000089.872(3)90.0000660.8(3)
Empirical formulaFwZ
Na2ZrSi2O7 (H2O)1285.46
4
H0.4Nag0.6ZrSi2O7 1.4(H2O)1276.98
4
H2ZrSi2O7 2.5(H2O)1198.49
4Ρcalc (g cm–3)
Wavelength (Å)2θ range (deg)
3.171.54195–90
3.0961.54195–90
3.0121.54195–90
Step-scan increment (2θ), deg 0.01 0.015 0.015
Step-scan time, s 5 6 6No of data points
No of contributing reflections
4089
514
5665
594
5632
583No of structural
parameters 29 43 33No of profile parameters 7 5 5
Profile function Pseudo-Voight Pseudo-Voight Pseudo-VoightRwp
Rp
RF2
χ2
0.09140.07130.02074.33
0.12490.09620.1053
2.6
0.09110.07070.21321.468
Occupancies of extra-framework species:
Nag
Nap
OwOwg
Owp
0.291
0.520.21
–
––
0.490.490.55

87
V. KostovKytin et al.: Twostage protonation of a smallpore microporous zirconosilicate Na2ZrSi2O7.H2O
earlier [4] such kind of framework is very flexible with respect to the exhibited geometrical features of the [Si2O7] pyrogroup. Its configuration can be described by two angles: T-O-T' (τ) angle corre-sponding to the tilting of the TO4 tetrahedra over the common oxygen atom and Op-Tp-Op' (ρ) angle indi-cating the twisting of the triangular faces set by the terminal oxygen atoms (Fig. 4). Such approach was applied before to describe the degree of structural deformations occurring upon thermal treatment of the studied material [6]. Thus, we can now compare the values of the tilting and twisting angles for the as-synthesized compound with those ones obtained after its heating and/or protonation. As mentioned in the “Introduction” section water releasing upon heat treatment of the as-synthesized phase causes framework relaxation and the initially monoclinic
structure converts into an orthorhombic one without topological changes. The tilting and twisting angles for monoclinic and orthorhombic structures do not differ substantially and have values: τ = 156.9°, ρ = 7.53° and τ = 145.07°, ρ = 0°, respectively. Similar structural behavior has been observed for Na2ZrSi2O7.H2O upon its acid-treatment. The crystal structures of the protonated samples exhibit pseu-do-orthorhombic symmetry with β = 89.51(1) and 89.87(1)° for HM-2 and HM-1, respectively. Cell volume increase from 673.56Å3 (as-synthesized phase) to 684.9 Å3 (partially protonated sample) is observed when the reaction’s media concentration has been adjusted to 0.2N HNO3. The successful refinement of the structure of HM-2 confirms our initial assumption that the “mid channel located” sodium (Nag) is more susceptible to the protonation process than the stronger bound to the framework oxygen atoms “cavity located” (Nap) one. Leaching would hardly be possible on Na atoms of special po-sition before this process has been totally completed for sodium placed in general position. Attempts to refine the structure with partial decrease of Nap oc-cupancy or total elimination of this position failed. When all of the sodium ions are leached (c ≈ 0.1N HNO3) from the structure the cell volume decreas-es to 660.8(1) Å3. These data suggest a two-stage protonation mechanism for the studied material that could be controlled through adjustment of the reaction’s media pH. The values of τ =179.18°, ρ =27° and τ =152.37°, ρ =22° for HM-2 and HM-1 respectively confirm the enlargement of the frame-work channels during the first protonation stage and subsequent relaxation upon further protonation. The obtained values for the twisting angles of both pro-tonated samples characterizing the mutual rotation of the adjacent layers differ substantially from those ones found in the initial and dehydrated samples
Fig. 3. Crystal structure of initial (a) and protonated sam-ples HM-2 (b) and HM-1 (c)
Fig. 4. Angles indicating the degree of pyrogroups defor-mation. Op, Op' and Tp are projections of O, T, T' and O' on the plane perpendicular to T-T'

88
(Table 2). This suggests that protonation process causes higher degree of framework deformations as compared to the dehydration one. Although this process is accompanied with increase of the water content in the channels this could not compensate for the lack of “inner” stabilization caused by leach-ing of sodium from them.
CONCLUSION
An experimental procedure for controlled pro-tonation of a new small-pore microporous zirco-nosilicate is reported. The occurring composi-tional and structural changes have been studied and described by means of atomic absorption spectroscopy, TG-DTA, and Rietveld refinement routine. Two pH-dependent protonation stages of the Na2ZrSi2O7.H2O have clearly been defined. Crystal structures of the partially and completely protonated samples have been refined. Evaluation of the framework deformation in terms of tilting and twisting angles of the Si2O7 groups has giv-en evidence that the protonation process causes stronger deformations as compared to those ones occurring upon dehydration of the same structure. Apparently, sodium leaching deprives the chan-nels from their “inner” stabilization causing sub-stantial mutual shifting of the neighboring build-
V. KostovKytin et al.: Twostage protonation of a smallpore microporous zirconosilicate Na2ZrSi2O7.H2O
ing layers, however without changing the initial topology of this material.
Acknowledgements: This study is part of the cooperation within the frames of Joint Research Project between Bulgarian Academy of Sciences and Academy of Sciences of the Czech Republic, as well as by the Joint Research Project between the CLMCBAS, Sofia and the ISPEUAS, Kiev and financially supported by the National Science Fund Bulgarian Ministry of Education, Youth and Science under contract DO0238.
REFERENCES
1. V. Kostov-Kytin, yu. Kalvachev, Meeting “Micro and mesoporous mineral phases” Rome, December 6-7, 2004, Extended Abstracts, 235 (2005).
2. A. C. Larson, R. B. Von Dreele, Report LAUR 86-748, Los Alamos National Laboratory (2000).
3. B. H. Toby, J. Appl. Crystal. 34, 210 (2001).4. R. P. Nikolova, K. Fujiwara, N. Nakayama, V. Kos-
tov-Kytin, Solid State Sci., 11, 2, 382 (2009).5. P. Pertierra, M. A. Salvado, S. Garcia-Granda, C. Tra -
bajo, J. R. Garcia, A. y. Bortun, A. Clearfield, Journal of Solid State Chemistry, 148 (1), 41 (1999).
6. N. R. Petrova, N. Nakayama, S. Bakardjieva, P. Bez-dicka, V. Kostov-Kytin, Solid State Sciences, 13 (5), 1187 (2011).
Table 2. Comparison of the values of the tilting and twisting angles of the as-synthesized compound and its dehydrated and protonated forms
Material Tilting angle (τ) ° Twisting angle (ρ) °
as-synthesized Na2ZrSi2O7.H2O 156.9 7.53dehydrated Na2ZrSi2O7 145.07 0partially protonated HM-2 179.18 27completely protonated HM-1 152.37 22

89
V. KostovKytin et al.: Twostage protonation of a smallpore microporous zirconosilicate Na2ZrSi2O7.H2O
дВустадийно протониране на миКропорест цирКоносилиКат Na2ZrSi2O7.H2O
В. В. Костов-Китин*, р. п. николова, н. л. лихарева
Институт по минералогия и кристалография, Българска академия на науките, ул. „Акад. Г. Бончев“, бл. 107, София, България
постъпила на 15 февруари, 2012 г.; приетa на 27 март, 2012 г.
(резюме)
изследвани са кристалохимичните промени настъпващи в процеса на протониране на микропорестия цир-коносиликат Na2ZrSi2O7.H2O. показано е, че степента на киселинност на първоначалния разтвор влияе върху степента на излужване на натрия от пробата. уточнени са кристалните структури на частично и напълно протонирани проби и получените данни са сравнени с аналогичните за изходната фаза. В процеса на прото-ниране кристалната структура запазва своята топология, но се наблюдава взаимно завъртане на съседните слоеве, кое то рефлектира съответно в промяна на параметрите на елементарна клетка. В първия етап обемът на елементарна клетка се увеличава от 673.56Å3 (синтезирана фаза) до 684.9 Å3 (частично протонирана фаза) а при втория намалява до 660.8(1) Å3 (напълно протонирана фаза). доказано е, че в процеса на протониране, кристалната структура релаксира до псевдо-орторомбична със стойности за ъгъл β = 89.519(9)° и 89.872(3)° съответно за частично и напълно протонираната фаза. данните показват, че процесът на протониране води до по-значителни промени в кристалната структура от процеса на дехидратация на изследвания материал.

90
* To whom all correspondence should be sent:E-mail: [email protected]
© 2012 Bulgarian Academy of Sciences, Union of Chemists in Bulgaria
Bulgarian Chemical Communications, Volume 44, Proceedings of the IIIrd National Crystallographic Symposium (pp. 90–97) 2012
Synthesis and characterization of magnetic nano-sized Fe3O4 and CoFe2O4
D. Kovacheva1*, T. Ruskov2, P. Krystev2, S. Asenov2, N. Tanev2, I. Mönch3, R. Koseva3, U. Wolff3, T. Gemming3, M. Markova-Velichkova1, D. Nihtianova1, K.-F. Arndt4
1 Institute of General and Inorganic Chemistry, Bulgarian Academy of Sciences, 1113 Sofia, Bulgaria 2 Institute for Nuclear Research and Nuclear Energy, 1784 Sofia, Bulgaria
3 Leibniz Institute of Solid State and Materials Research Dresden, D01069, Dresden, Germany 4 Department of Chemistry, Physical Chemistry of Polymers, TU Dresden, D0162, Dresden, Germany
Received February 20, 2012; Revised April 2, 2012
The synthesis of Fe3O4 and CoFe2O4 nanomaterials was performed by co-precipitation of corresponding metal hydroxides and their further decomposition to oxides under ultrasonic irradiation. The particles were characterized by X-Ray diffraction (XRD), transmission electron microscopy (TEM) and vibrating sample magnetometry (VSM). The crystallite sizes were 7.1 nm for the Fe3O4 sample and from 1.9 to 21 nm for the CoFe2O4 sample depending on the synthesis conditions. Mössbauer spectra of Fe3O4 and CoFe2O4 were measured at room temperature and 77 K. They revealed that samples show either superparamagnetic behavior or a mixture of superparamagnetism and ferrimagnet-ism depending on the crystallite sizes and temperature. Cation distribution for 10.4 nm CoFe2O4 was obtained from the Mössbauer spectra as well.
Key words: nanoparticle, spinel ferrites, sonochemical synthesis.
INTRODUCTION
Nano-sized materials made of magnetite (Fe3O4) and cobalt ferrite (CoFe2O4) are attractive both from fundamental point of view and for various physical, chemical and biological applications. The general formula of spinel ferrites is MO.Fe2O3 (where M is usually a divalent transition metal ion with an ionic radius, r < 1Å). The spinel ferrite structure con-sists of a cubic close-packed oxygen arrangement, in which cations occupy tetrahedral and octahedral interstices. Occupation of tetrahedral sites with di-valent metal ions yields a normal spinel structure typical for M2+ = Zn2+, Cd2+, Mn2+, while occupation of octahedral sites with divalent metal ions results in an inverse spinel structure when M2+ = Fe2+, Co2+, Ni2+, Cu2+. Ferrites comprise a broad and important class of magnetic materials, with important tech-nological applications. Recently it was found that magnetic properties of nanosized spinel ferrites dif-fer strongly from those of the corresponding bulk materials. For example magnetic saturation and coercitivity change drastically when the size of the
particles becomes very small. Nanoparticle’s physi-cal and chemical characteristics are interesting not only from a fundamental point of view but also from a practical, since they offer possibilities for vari-ous new physical, chemical and biological applica-tions. Special attention was paid to their application in medicine, where they can be used as magnetic resonance imaging agents in diagnostic, heat media-tors in hyperthermia treatments as well as magnetic guidance for drug delivery [1–6].
Various synthetic methods have been developed to synthesize oxide nanoparticles, among them co-precipitation, thermal decomposition, sol-gel, mi-croemulsion and other techniques [7–14]. It was established that the degree of crystallinity, particle size and particle morphology of oxide nanoparti-cles are strongly dependent on the method used for their preparation. The simplest synthetic procedure is based on the co-precipitation method, which in-volves the co-precipitation of M2+ and M3+ ions in basic aqueous media. Recently, the sonochemical method started to be applied widely in material sci-ence because it allows obtaining a wide range of functional materials such as magnetic nanocompos-ites, catalysts, molecular sieves etc. [15–18]. The mechanism of sonochemical reactions in aqueous and non-aqueous solutions is governed by two ma-

91
D. Kovacheva et al.: Synthesis and characterization of magnetic nanosized Fe3O4 and CoFe2O4
jor effects accompanying the interaction of ultra-sonic radiation with liquid media. The first one is the intensification of mass-transfer processes and the second one is cavitation. The collapse of cavi-tation bubbles results in an enormous rise of local temperatures and pressures leading to the decompo-sition of dissolved volatile compounds and the for-mation of amorphous and crystalline nanopowders.
In the present work we applied the sonochemi-cal method for the synthesis of nanosize spinel ox-ide materials, namely Fe3O4 and CoFe2O4 samples with particle sizes in the range from 1.9 to 21 nm and investigated their size dependent structural and magnetic characteristics.
EXPERIMENTAL
The synthesis was performed by co-precipitation of corresponding metal hydroxides and their further decomposition to oxides under ultrasonic irradiation. As starting compounds FeCl2.6H2O, Fe(NO3)3.9H2O, Co(NO3)2.6H2O and NaOH in a molar ratio of 1:2 were used. Metal nitrates and NaOH were dissolved separately in appropriate amount of distilled water. To obtain materials with different particle sizes for the CoFe2O4 samples the concentration of the ini-tial solutions was varied. The co-precipitation took place while metal salt solutions were dropwise add-ed to the solution of NaOH. The sonication of the precipitate was performed at 20 KHz, and 750 W in an ultrasonic processor SONIX, USA. The total sonication time was 1 hour. The obtained products were repeatedly washed with distilled water, filtered and finally dried at 50 °C.
Materials were first characterized by X-ray diffraction. Powder X-ray diffraction patterns were collected within the range from 10 to 80° 2θ with a constant step of 0.02° 2θ on a Bruker D8 Advance diffractometer with Cu Kα radiation and a LynxEye detector. Phase identification was per-formed with the Diffracplus EVA using the ICDD-PDF2 Database. The powder diffraction patterns were evaluated with the Topas-4.2 software pack-age using the fundamental parameters peak shape description including appropriate corrections for the instrumental broadening and diffractometer geom-etry. Unit cell parameters were obtained by whole powder XRD pattern fitting using as a starting val-ues the data taken from the files in ICDD-PDF2 (#79-416 for magnetite and #70-8729 for CoFe2O4). Unit cell parameters, profile parameters as well as zero shift were varied to obtain a good fit with the experimental data. The mean crystallite domain siz-es were determined using the same whole powder XRD pattern fitting mode of the program. For this purpose the integral line breadth approach for the
generalized treatment of the domain size broaden-ing – βi=λ/Lvolcosθ was employed, where βi is the integral breadth of the diffraction line i and Lvol is the volume weighted mean column height.
The specific surface area was determined by low temperature adsorption of nitrogen according to the B.E.T. method [19].
The particle size and morphology were deter-mined using a TEM JEOL 2100 at 200 kV. The specimens are prepared by grinding the samples in an agate mortar and dispersing them in acetone by ultrasonic treatment for 6 min. A droplet of the sus-pension is dripped on standard carbon films on Cu grids. Additional crystal structure data are obtained using the selected area electron diffraction method (SAED). Particle size distributions were calculated on 100 to 200 particles in different images in bright field mode.
Magnetization measurements of the magnetite and CoFe2O4 samples were performed in a Quantum Design superconducting magnet system (PPMS) with vibrating sample magnetometer (VSM) option in fields up to 5 T at room temperature and 5 K.
57Fe Mössbauer measurements were performed using a constant acceleration spectrometer. A source of 57Co(Rh) with an activity of 50 mCi was used. The Fe3O4 and CoFe2O4 spectra were taken in the transmission mode at room temperature and at liq-uid nitrogen temperature (77 K). The Mössbauer ab-sorbers with a thickness of 40 mg cm–2 were made by mixing the studied nanomaterial powder with poly-vinyl alcohol (glue material) and then pressed into disk pellets. Each experimental Mössbauer spec-trum was decomposed either through the so-called “thin sample approximation” when the spectrum is represented as a sum of few simple spectra (sextets or doublets) or to avoid thickness effect it was fitted using an integral Lorentzian line shape approxima-tion [20, 21]. When such decomposition is not pos-sible one needs to take into account a distribution of spectra over a range of effective magnetic fields and/or electric field gradients. The geometric effect is taken into account as well.
RESULTS AND DISCUSSION
Figure 1 shows the XRD pattern of the nano-sized magnetite material. The pattern was indexed within the cubic Fd-3m space group typical for the spinel structure. The unit cell parameter was measured to be 8.388(1) Å, which is closer to the value of 8.394 Å (ICDD-PDF2 #79-416 of crys-talline magnetite (Fe3O4)), but differs from the unit cell parameter of maghemite 8.351 Å (ICDD-PDF2 #89-3850 cubic non-stoichiometric spinel γ-Fe2O3). The measured value for the unit cell parameter sug-
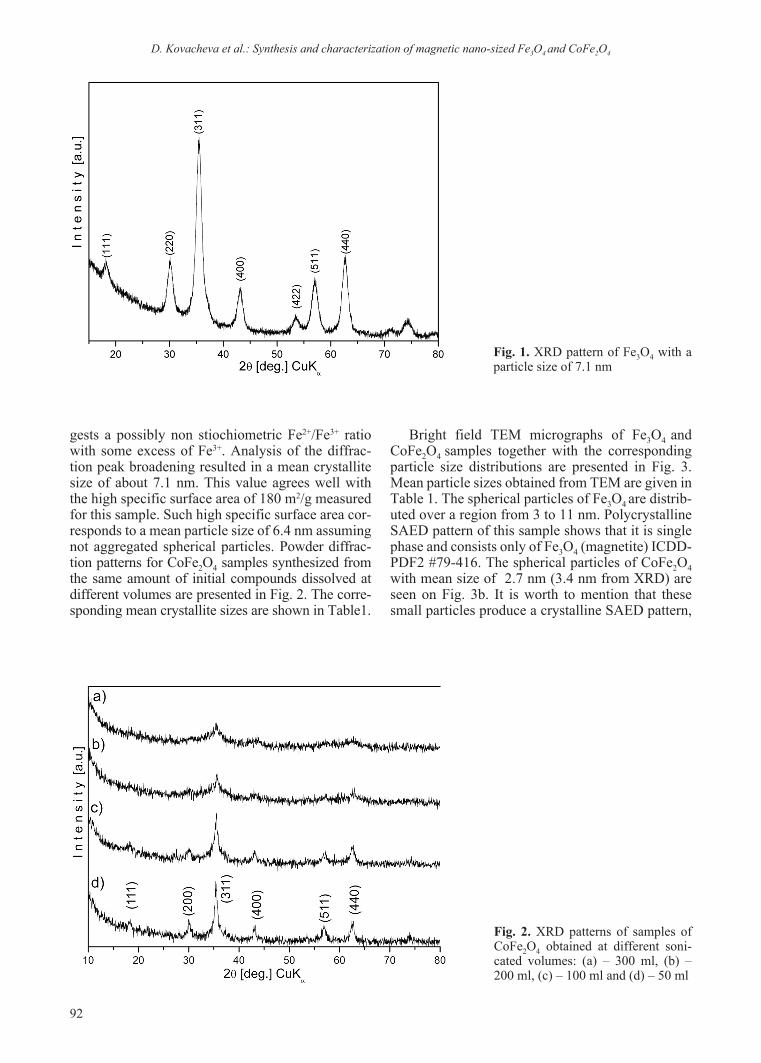
92
D. Kovacheva et al.: Synthesis and characterization of magnetic nanosized Fe3O4 and CoFe2O4
Fig. 1. XRD pattern of Fe3O4 with a particle size of 7.1 nm
Fig. 2. XRD patterns of samples of CoFe2O4 obtained at different soni-cated volumes: (a) – 300 ml, (b) – 200 ml, (c) – 100 ml and (d) – 50 ml
gests a possibly non stiochiometric Fe2+/Fe3+ ratio with some excess of Fe3+. Analysis of the diffrac-tion peak broadening resulted in a mean crystallite size of about 7.1 nm. This value agrees well with the high specific surface area of 180 m2/g measured for this sample. Such high specific surface area cor-responds to a mean particle size of 6.4 nm assuming not aggregated spherical particles. Powder diffrac-tion patterns for CoFe2O4 samples synthesized from the same amount of initial compounds dissolved at different volumes are presented in Fig. 2. The corre-sponding mean crystallite sizes are shown in Table1.
Bright field TEM micrographs of Fe3O4 and CoFe2O4 samples together with the corresponding particle size distributions are presented in Fig. 3. Mean particle sizes obtained from TEM are given in Table 1. The spherical particles of Fe3O4 are distrib-uted over a region from 3 to 11 nm. Polycrystalline SAED pattern of this sample shows that it is single phase and consists only of Fe3O4 (magnetite) ICDD-PDF2 #79-416. The spherical particles of CoFe2O4 with mean size of 2.7 nm (3.4 nm from XRD) are seen on Fig. 3b. It is worth to mention that these small particles produce a crystalline SAED pattern,

93
D. Kovacheva et al.: Synthesis and characterization of magnetic nanosized Fe3O4 and CoFe2O4
Fig. 3. TEM images and particle size distribution of (a) – Fe3O4 and CoFe2O4 obtained at different sonicated volumes: (b) – 200 ml, (c) – 100 ml and (d) – 50 ml
a) b)
c) d)

94
which corresponds to CoFe2O4 (spinel) phase ICDD-PDF2 #70-8729. On Fig. 3c and 3d we present spherical particles of CoFe2O4 samples with larger mean sizes. SAED patterns of these samples unam-biguously show that they are crystalline and consist only of one phase: CoFe2O4 (spinel) ICDD-PDF2 #70-8729. For CoFe2O4 samples it can be seen that with increasing the mean size of the particles their distribution becomes wider.
Saturation magnetization Ms, remanent mag-netization Mr, and coercivity Hc are the main tech-nical parameters to characterize the magnetism of a ferromagnetic sample. The magnetization curves at room temperature of the magnetite sample and different CoFe2O4 samples are shown in Fig. 4a,b respectively. At room temperature the coercivity as well as the remanent magnetization of the CoFe2O4 samples is decreasing with smaller particle size (Table 1). The change of the magnetization of the nanoparticles (small particle sizes) follows spon-taneously the orientation of the applied magnetic field. The samples with the smallest particle size of 1.9 and 3.4 nm exhibit a complete superparamag-netic behaviour (Fig. 4b), which was also confirmed by Mössbauer spectroscopy (Fig. 7a). CoFe2O4 na-noparticles show typical hysteresis for their field-dependent magnetization below the blocking tem-perature. Fig. 5 is showing the hysteresis curves of two CoFe2O4 samples with a particle size of 3.4 and 10.4 nm measured at 5 K. The magnetization of the nanoparticles is not following the applied magnetic field simultaneously, but has to overcome a certain magnetic field value. This coercive field represents the value which is needed to surpass the anisotropy barrier [22–24]. Therefore, the coercivities for the CoFe2O4 samples strongly increased with lower temperature. The measurements show clearly that the coercivity HC is strongly size and temperature dependent [25, 26].
The Mössbauer spectrum of nanosized magnet-ite (Fe3O4) taken at room temperature is shown in Fig. 6a. The extremely broadened six lines indicate that the sample consists of a mixture of superpara-magnetic and ferrimagnetic phases rather than a
D. Kovacheva et al.: Synthesis and characterization of magnetic nanosized Fe3O4 and CoFe2O4
Table 1. Dependence of the coercitivity on the crystallite size of the samples
Sample Crystallite size [nm]XRD
Particle diameter [nm]TEM
Coercivity HC [mT] at room temperature
Coercivity HC [mT] at 5 K
Magnetite 7.1(2) 7.7(2) 70CoFe2O4 1.9(2) 0CoFe2O4 3.4(2) 2.9(4) 0 264CoFe2O4 10.4(3) 11.4(2) 30 1157CoFe2O4 21.0(5) 20.0(5) 105
Fig. 4a) Room temperature magnetization curve of Fe3O4 (7 nm). The majority of particles are in an intermediate region (between the superparamagnetic and ferromagnetic state). The inset shows the hysteresis curve measured up to ± 3 T
Fig. 4b) Magnetization curves of CoFe2O4 nanoparticles, measured at room temperature: 1.9 nm – open circles, 3.4 nm – filled circles, 10.4 nm – filled triangles, and 21 nm – open triangles. The first two groups of nanopari-cles are completely in the superparamagnetic state, while the third and the fourth are in an intermediate region of a mixed superparamagnetic and ferrimagnetic state
-400 -200 0 200 400-80
-60
-40
-20
0
20
40
60
80
mag
netic
mom
ent [
emu/
g]
magnetic field µ0H [mT]
-3000 -1500 0 1500 3000-80-60-40-20
020406080
mag
netic
mom
ent [
emu/
g]
magnetic field µ0H [mT]
-400 -200 0 200 400-80
-60
-40
-20
0
20
40
60
80
10.4 nm 1.9 nm 3.4 nm 21 nm
magnetic field µ0H [mT]
mag
netic
mom
ent [
emu/
g]

95
D. Kovacheva et al.: Synthesis and characterization of magnetic nanosized Fe3O4 and CoFe2O4
Fig. 5. Hysteresis loops at 5 K for CoFe2O4 samples with a particle size of 3.4 nm – open triangles and 10.4 nm – filled triangles
pure superparamagnetic. The spectrum was fitted as a magnetic sextet’s distributions of 100 closely spaced sextets with a hyperfine magnetic field dis-tribution (Fig. 6b). The average isomer shift and hyperfine magnetic field are: IS=0.41 mm/s and H = 364 kOe. The Mössbauer spectrum of the same sample at liquid nitrogen temperature (Fig. 6c) was fitted as a superposition of two magnetic sextets. At this temperature the superparamagnetic relaxa-tions are blocked for the majority of the magnetic nanoparticles, however the broadening of the reso-nance lines for both sextets still could be explained as small influence of the superparamagnetism. The isomer shifts for sextets (1) and (2) are 0.46 mm/s and 0.38 mm/s respectively showing that the Fe2+ in the magnetite sample is partially oxidized to Fe3+, forming some part of maghemite (γ-Fe2O3). The hy-perfine magnetic fields derived from the sextets (1)
Fig. 6. Mössbauer spectrum of Fe3O4 taken at room tem-perature – fitted as a magnetic sextet’s distribution (a); the hyperfine magnetic field distribution (b); Mössbauer spectrum of the sample taken at 77 K – fitted as a super-position of two magnetic sextets (c)
Fig. 7. Mössbauer spectrum of CoFe2O4 (3.4 nm) taken at room temperature – fitted as a quadrupole doublet (a); Mössbauer spectrum of the same sample taken at 77 K – fitted as a magnetic sextet’s distribution (b); the hyper-fine magnetic field distribution (c)
-5000 -2500 0 2500 5000
-30
-15
0
15
30
magnetic field µ0H [mT]
mag
netic
mom
ent [
emu/
g]
10.4 nm 3.4 nm
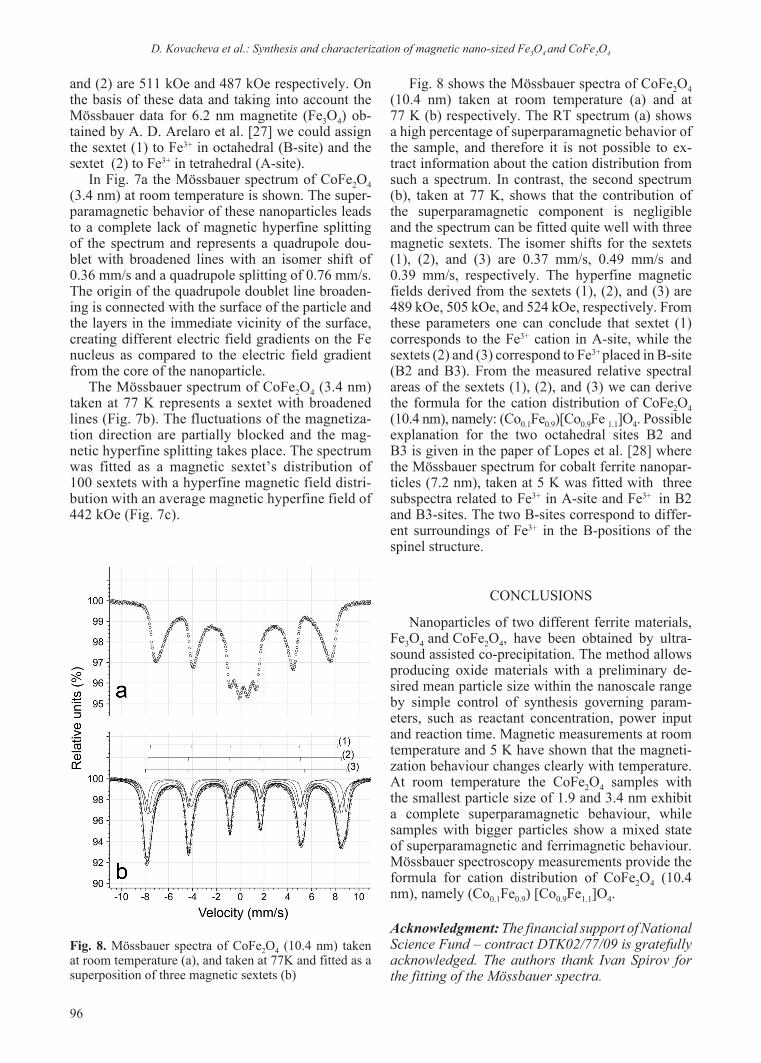
96
and (2) are 511 kOe and 487 kOe respectively. On the basis of these data and taking into account the Mössbauer data for 6.2 nm magnetite (Fe3O4) ob-tained by A. D. Arelaro et al. [27] we could assign the sextet (1) to Fe3+ in octahedral (B-site) and the sextet (2) to Fe3+ in tetrahedral (A-site).
In Fig. 7a the Mössbauer spectrum of CoFe2O4 (3.4 nm) at room temperature is shown. The super-paramagnetic behavior of these nanoparticles leads to a complete lack of magnetic hyperfine splitting of the spectrum and represents a quadrupole dou-blet with broadened lines with an isomer shift of 0.36 mm/s and a quadrupole splitting of 0.76 mm/s. The origin of the quadrupole doublet line broaden-ing is connected with the surface of the particle and the layers in the immediate vicinity of the surface, creating different electric field gradients on the Fe nucleus as compared to the electric field gradient from the core of the nanoparticle.
The Mössbauer spectrum of CoFe2O4 (3.4 nm) taken at 77 K represents a sextet with broadened lines (Fig. 7b). The fluctuations of the magnetiza-tion direction are partially blocked and the mag-netic hyperfine splitting takes place. The spectrum was fitted as a magnetic sextet’s distribution of 100 sextets with a hyperfine magnetic field distri-bution with an average magnetic hyperfine field of 442 kое (Fig. 7c).
D. Kovacheva et al.: Synthesis and characterization of magnetic nanosized Fe3O4 and CoFe2O4
Fig. 8 shows the Mössbauer spectra of CoFe2O4 (10.4 nm) taken at room temperature (a) and at 77 K (b) respectively. The RT spectrum (a) shows a high percentage of superparamagnetic behavior of the sample, and therefore it is not possible to ex-tract information about the cation distribution from such a spectrum. In contrast, the second spectrum (b), taken at 77 K, shows that the contribution of the superparamagnetic component is negligible and the spectrum can be fitted quite well with three magnetic sextets. The isomer shifts for the sextets (1), (2), and (3) are 0.37 mm/s, 0.49 mm/s and 0.39 mm/s, respectively. The hyperfine magnetic fields derived from the sextets (1), (2), and (3) are 489 kOe, 505 kOe, and 524 kOe, respectively. From these parameters one can conclude that sextet (1) corresponds to the Fe3+ cation in A-site, while the sextets (2) and (3) correspond to Fe3+ placed in B-site (B2 and B3). From the measured relative spectral areas of the sextets (1), (2), and (3) we can derive the formula for the cation distribution of CoFe2O4 (10.4 nm), namely: (Co0.1Fe0.9)[Co0.9Fe 1.1]O4. Possible explanation for the two octahedral sites B2 and B3 is given in the paper of Lopes et al. [28] where the Mössbauer spectrum for cobalt ferrite nanopar-ticles (7.2 nm), taken at 5 K was fitted with three subspectra related to Fe3+ in A-site and Fe3+ in B2 and B3-sites. The two B-sites correspond to differ-ent surroundings of Fe3+ in the B-positions of the spinel structure.
CONCLUSIONS
Nanoparticles of two different ferrite materials, Fe3O4 and CoFe2O4, have been obtained by ultra-sound assisted co-precipitation. The method allows producing oxide materials with a preliminary de-sired mean particle size within the nanoscale range by simple control of synthesis governing param-eters, such as reactant concentration, power input and reaction time. Magnetic measurements at room temperature and 5 K have shown that the magneti-zation behaviour changes clearly with temperature. At room temperature the CoFe2O4 samples with the smallest particle size of 1.9 and 3.4 nm exhibit a complete superparamagnetic behaviour, while samples with bigger particles show a mixed state of superparamagnetic and ferrimagnetic behaviour. Mössbauer spectroscopy measurements provide the formula for cation distribution of CoFe2O4 (10.4 nm), namely (Co0.1Fe0.9) [Co0.9Fe1.1]O4.
Acknowledgment: The financial support of National Science Fund – contract DTK02/77/09 is gratefully acknowledged. The authors thank Ivan Spirov for the fitting of the Mössbauer spectra.
Fig. 8. Mössbauer spectra of CoFe2O4 (10.4 nm) taken at room temperature (a), and taken at 77K and fitted as a superposition of three magnetic sextets (b)

97
D. Kovacheva et al.: Synthesis and characterization of magnetic nanosized Fe3O4 and CoFe2O4
REFERENCES
1. L. Babes, B. Denizot, G. Tanguy, J. Le Jeune, P. Jal-let, J Colloid Inter Sci, 212, 474 (1999).
2. I. Safarik, M. Safarikova, Monats Chem, 133, 737 (2002).
3. Q. Pankhurst, J. Connolly, S. Jones, J. Dobson, J Phys D: Appl Phys, 36, 167 (2003).
4. X. Wang, H. Gu, Zh. yang, J Magn Magn Mater, 293, 334 (2005).
5. M. Lin, H. Kim, H. Kim, M. Muhammed, K. Kim Do, Nano Reviews, 1, 4883 (2010).
6. A. Figuerola, R. Di Corato, L. Manna, T. Pellegrino, Pharmacological Research, 62, 126 (2010).
7. K. Haneda, A. Morrish, J de Physique, 38, C1-321 (1977).
8. T. Hosono, H. Takahashi, A. Fijita, R. Justin Josey-phus, K. Tohji, B. Jeyadevan, J Magn Magn Mater, 321, 3019 (2009).
9. V. Blaskov, V. Petkov, V. Rusanov, Li. Martinez, B. Martinez, J. Monos, M. Mikhov, J Magn Magn Mater, 162, 331 (1996).
10. P. Sraravanan, S. Alam, G. Mathur, J Mater Sci Lett, 22, 1283 (2003).
11. D. Maity, S. Kale, R. Kaul-Ghanekar, Xue Jun-Min, J. Ding, J Magn Magn Mater, 321, 3093 (2009).
12. Z. Hua, R. Chen, C. Li, S. yang, M. Lu, B. Gu, y. Du, J Alloys Comp, 427, 199 (2007).
13. M. Liu, X. Li, H. Imrane, y. Chen, T. Googrich, Z. Cai, K. Ziemer, J. Huang, N. Sun, Appl Phys
Lett, 152501 (2007). 14. S. Santra, R. Tapes, N. Theodoropoulou, J. Dobson,
A. Hebard, W. Tan, Langmuir, 17, 2900 (2001).15. J. Bang, K. Suslick, Adv Mater, 22, 1039 (2010).16. I. Ray, S. Chakraborty, A. Chowdhury, S. Majumdar,
A. Prakash, R. Pyare, A. Sen, Sensors and Actuators B, 130, 882 (2008).
17. E. Kim, H. Lee, H. Shao, Key Eng Mater, 277-279, 1044 (2005).
18. S. Park, J. Kim, C. G. Kim, C. O. Kim, Current Appl Phys, 8, 784 (2008).
19. S. Brunauer, H. Emmett, E. Teller, J. Am. Chem. Soc., 60, 309 (1938).
20. G. Shenoy, J. Friedt, H. Maleta, S. Ruby, Mössbauer Effect Methodology, 9, 277 (1974).
21. T. Cranshaw, J Phys E, 7, 122 (1974).22. S. Laureti, G. Varvaro, A. M. Testa, D. Fiorani, E.
Ago stinelli, G. Piccaluga, A. Musinu, A. Ardu, D. Peddis, Nanotechnology, 21, 315701 (2010).
23. Ch. Liu, Z. J. Zhang, Chem. Mater., 13, 2092 (2001).
24. Ch. Liu, B. Zou, A. J. Rondinone, Z. J. Zhang, J. Am. Chem. Soc., 122, 6263 (2000).
25. G. Herzer, IEEE Trans Mag, 26, 1397 (1990).26. G. Herzer, J Magn Magn Mater, 112, 258 (1992).27. A. Arelaro, L. Rossi, H. Rechenberg, Journal of
Physics: conference series, 217, 012126 (2010).28. J. L. Lopez, H. D. Pfannes, R. Paniago, J. P. Sin-
nicker, M. A. Novak, J Magn Magn Mater, 320, e327 (2008).
синтеЗ и хараКтериЗиране на магнитни нанораЗмерни Fe3O4 и CoFe2O4
д. Ковачева1, т. русков2, п. Кръстев2, с. асенов2, н. танев2, и. мьонж3, р. Косева3, у. Волф3, т. геминг3, м. маркова-Величкова1, д. нихтянова1, К.-ф. арндт4
1 Институт по обща и неорганична химия, Българска академия на науките, 1113 София, България 2 Институт за ядрени изследвания и ядрена енергетика, 1784 София, България
3 Лайбниц институт за изследвания на твърдо състояние и материали, Дрезден, D-01069, Дрезден, Германия
4 Катедра по химия, Физикохимия на полимери, ТУ - Дрезден, D-0162, Дрезден, Германия
постъпила на 20 февруари, 2012 г.; приетa на 2 април, 2012 г.
(резюме)
синтезът на наноразмерните Fe3O4 и CoFe2O4 бе проведен чрез съутаяване на съответните метални хидроксиди и тяхното по-нататъшно разлагане до оксиди под въздействие на ултразвуково облъчване. получените материали са характеризирани с рентгенова дифракция (XRD), трансмисионна електронна микроскопия (тем) и вибрационна магнитометрия (VSM). получените материали са със средни размери на кристалитите 7.1 нанометра за Fe3O4 проба и от 1.9 до 21 нанометра при CoFe2O4 проби в зависимост от условията на синтез. мьосбауеровите спектри на Fe3O4 и CoFe2O4, измерени при стайна температура и 77 К показаха, че пробите проявяват или суперпарамагнитно поведение или смес от суперпарамагнитно и феримагнитно в зависимост от на размера на кристалитите и температурата. чрез мьосбауеровата спектроскопия е определено и катионното разпределение за образец от CoFe2O4 с размер на кристалитите 10.4 nm.

98
* To whom all correspondence should be sent:E-mail: [email protected]
© 2012 Bulgarian Academy of Sciences, Union of Chemists in Bulgaria
Bulgarian Chemical Communications, Volume 44, Proceedings of the IIIrd National Crystallographic Symposium (pp. 98–108) 2012
Rare-earth doped optical waveguides in LiNbO3
M. Kuneva
Institute of Solid State Physics – Bulgarian Academy of Sciences, 72 Tzarigradsko Chaussee Blvd, Sofia 1784, Bulgaria
Received February 15, 2012; Revised March 26, 2012
Doping of dielectric hosts with laser-active ions, such as the rare earth ones, is widely researched recently. The great interest has been provoked by the miniature waveguide solid state lasers obtained that way, and the opportunity for monolithic integration of these lasers and other elements on a common substrate.
The present article is a data review on the doping of LiNbO3 with ions of rare-earth elements. Here, an attempt is made to summarize the most important results on technologies for doping with rare earths of optical waveguides in LiNbO3 substrates and for obtaining of optical waveguides in rare-earth doped LiNbO3. The sequence of the techno-logical steps depends on the methods of doping and particularly on the temperature. The main methods of doping are described: ion implantation, diffusion from a layer deposited on the LiNbO3 crystal substrate, diffusion from a melt. The main points of consideration are the effect of substrate orientation and of the initial doping on the subsequent dif-fusion processes, mechanism of rare-earth ion penetration and the possible positions they occupy in the lattice, struc-tural changes due to the doping versus technological parameters, etc. A special attention is paid to the low-temperature methods of diffusion; they imply ion exchange or diffusion without ion exchange when the doping ions are situated in existing vacations of the host. The influence of the melt composition, temperature and duration of the diffusion on the concentration of the dopant in the waveguide is discussed, as well as the conditions at which that kind of anisotropic diffusion process becomes self-restricted.
Key words: Rare earths, Optical waveguides, LiNbO3
INTRODUCTION
Being a crystal with strong electro-optical and non-linear properties, lithium niobate (LN) is one of the main materials having application in integrated optics. Of particular interest in recent years are the possibilities to obtain waveguide lasers based on LN doped with rare-earth elements, since the lifetime of their excited states in crystal matrices vary from 1 to 23 ms – a time sufficient for inverse population to appear [1]. The integrated-optical technologies based on the use of LN make possible the mono-lithic integration of waveguide lasers with other functional elements on a common substrate. An entire family of waveguide lasers already exists [2, 3–5] having excellent parameters, mainly based on erbium-doped LN, and emitting in the range 1530 nm < λ < 1610 nm. This range belongs to the third telecommunication spectral window, in which the
losses in fiber-optical cables are the lowest. It is also important to note that, unlike rare-earth-doped glass fibers, the dopant positions occupy particular sites in the crystal lattice, which reduces band broaden-ing due to inhomogeneities, i.e. the pumping and amplification efficiencies are increased [6].
The obtaining of waveguide lasers consists of two technological steps: (1) doping with a rare-earth element, and (2) obtaining of a waveguide.
METHODS OF RARE EARTH CRySTAL DOPING
Doping during crystal growth (Nd3+, Er3+, Yb3+, Er3++Yb3+, Yb3++Pr3+)
The doping takes place by adding the activating compound – usually an oxide (e.g. Er2O3 for erbium doping [7]) – to the melt, in which the growth of the crystal starts (usually a congruent melt com-position with Li+ to Nb5+ concentration ratio of the order of 0.945). The congruent melt gives rise to Li-defficient crystals that need intrinsic defects to satisfy the overall charge compensation.

99
The doping of LN with erbium is the most ex-tensively studied one. The erbium concentration changes the parameters of the lattice and the inten-sity of the absorption band. Erbium-doped LN crys-tals with an erbium concentration of 0.5 to 8 mol% have been grown by Czochralski’s method in order to study the integration of erbium in the lattice of LN [7]. It was observed that the erbium concentra-tion in the crystal changes linearly depending on the melt concentration up to a concentration which remains constant, independent of the increase of the dopant concentration in the melt. The maximal amount of erbium ions integrated in the lattice is about 3 mol%. This value should correspond to the concentration limit of presence of erbium in LN. The research of other authors indicates that the rare-earth component occupies random places in LN’s lattice and that, when the concentration limit is reached (the limit of solubility of the dopant in the crystal, corresponding to non-clustered or axially-positioned erbium ions), the possibility appears that chaotically positioned clusters or precipitates form [8, 9]. Their formation is stimulated also by the large ion radius of rare-earth elements. As shown in [8], the clusters formed above the saturation point cause distortions of the lattice and change the ma-trix’s crystallography. The presence of clusters is proven experimentally in [10, 11]. When the erbium concentration increases, radiation trapping effect of the emission at 1.5 μm is observed, which decreases the lifetime of the excited states.
The doping of LN with ytterbium is also well-studied experimentally [6, 12] and theoretically [13] regarding the concentration and the sites oc-cupied by the dopant in the lattice during the crys-tal growht, which is of particular importance, as it was shown above. The concentrations of the dopant considered in this case are relatively low (1.0 wt.% and 0.8 wt.% for LN: yb, and LN: yb, Pr, respec-tively [14]). The results show that the rare-earth ions occupy mainly Li+ sites, and when co-doping with another element takes place (e.g. Pr), yb3+ ions may also occupy Nb5+ sites [13] or form yb3+ pairs in an LN matrix with one yb3+ ion placed at the Li+ site and another one at the Nb5+ site, while the rest of the yb3+ ions are randomly distributed over the Li+ sites [15, 16].
More research is also needed to clarify the in-fluence of rare-earth elements on the crystal of the incongruent LN [7].
Since the domain structure also strongly de-pends on the concentration of the dopant in the crystal, the concentration of Er and yb influences the formation of PPLN (periodically poled LN). The best PPLN structures are formed by doping with 0.5 mol% with erbium as well as ytterbium. Below 0.5 mol%, a regular domain structure is
M. Kuneva: Rareearth doped optical waveguides in LiNbO3
observed, whereas at dopant concentrations over 1 mol% the domain structure is distorted and be-comes non-periodic [7].
A very important conclusion from the technolog-ical point of view is the one that at very low concen-trations of the rare-earth element (below 0.1 at.%) the doping does not lead to luminescent activation of the crystal, and at higher concentrations (above 0.6 at.%) effects appear which lead to quenching of the luminescence. Due to these reasons, the most ef-fective concentration of the rare-earth element hap-pens to be in the range from 0.1 to 0.6 at.%.
The simultaneous doping of LN with more than one rare-earth element is used to avoid ef-fects harmful to optical amplifiers and lasers such as photorefraction and luminescence quenching. Also, at co-doping with erbium and ytterbium, the yb3+ ions act as sensitizers of the еr3+ lumines-cence, absorbing the pumping light and effectively transmitting it to the erbium which then emits it [17]. With this co-doping, compact and highly efficient waveguide lasers and amplifiers are ob-tained. The proportions in the quantity of co-dop-ing elements for growing LiNbо3:еr3+/yb3+ and the parameters of the growing process are also described elsewhere [18]. The structural analysis performed by these authors shows that both types of rare-earth ions occupy sites in the crystal lattice slightly shifted towards lithium sites (ca. 0.25 Å). The doping with both ion types changes the re-fractive indices of the crystal so that their values are maximal at concentration of 1.1–1.2 mol% in the crystal.
However, it has to be emphasized that it is not at all easy to dope the crystal homogeneously during its growth, especially when a low concentration of the dopant is required (e.g. 0.5 mol%), since in that case the relative inhomogeneity reaches high val-ues. Besides, the doping of the bulk material is not the best solution for waveguide integrated optics, because, at excitation, all parts of the waveguide will absorb. The integrated-optical devices are thin-layer ones and they do not require bulk dop-ing. Therefore, the methods for local doping of LN are preferred [19]. The bulk-doped crystals are of interest mainly with regard to the construction of high-gain-switched lasers; they operate at concen-trations up to 2%, which cannot be reached with the methods for local doping (indiffusion).
Ion implantation followed by annealing (Nd3+, Eu3+, Er3+)
The attractiveness of ion implantation as a meth-od for local doping is mainly due to the fact that it provides the possibility to adjust better the obtained profile of the dopant in the layer with the profile of

100
M. Kuneva: Rareearth doped optical waveguides in LiNbO3
the optical waveguide which is obtained thereafter [20]. High-energy (MeV) ion implantation is used for doping of LN with erbium ions at ion beam en-ergy of 2.0 or 3.5 MeV and surface density of the beam of 2×10¹⁴ and 7.5×10¹⁵ сm–2. The obtained doped layers after annealing do not differ in their optical properties from bulk-doped LN. The erbium ions occupy optically active sites, so the photolumi-nescent spectra and the lifetime of the I13/2 level are the same. No luminescence quenching is observed at erbium ion concentrations up to 0.12 at.% in the layer, which is the maximal concentration obtained under these conditions. Ion implantation could be used also for the modification of already obtained waveguides in order to introduce laser/amplifier-active ions such as Er3+ which offers attractive pos-sibilities for new devices.
Since the ion beam damages the structure of the crystal close to the surface and causes amorphiza-tion of the 50–60 nm thick subsurface layer, the implantation always requires subsequent annealing for recrystallization. The recrystallization may not always be complete. It takes place at high tempera-tures (800–1250 °C), close to the Curie tempera-ture for LN, so the electro-optical properties of the material may be lost. At the annealing, along with recrystallization, the diffusion of the rare-earth el-ement in depth also continues, and the profile of its distribution changes from steplike to Gaussian [21]. This ensures a better overlap of the doped re-gion and the field in the optical waveguide formed thereafter. On the other hand, the amorphized re-gion provides higher mobility for the dopant ions and hence, at the thermal treatment, they migrate more to the surface and less in the depth of the crystal, so that the effective doping does not coin-cide with the field of the optical mode propagat-ing in the waveguide. This increases the losses of erbium fluorescence. Also, the annealing requires special attention since the higher concentrations of the doping element combined with the higher tem-peratures raise the risk of formation of nano-sized atomic metal clusters of the dopant, which leads to luminescence quenching [2]. This makes ion im-plantation not only an expensive method, but also a risky one [22].
Indiffusion
The doping by diffusion allows avoiding the use of expensive equipment for doping during crystal growth as well as the high energy in ion implanta-tion. It allows local control of the doping element concentration by using photolithographic techniques and the obtaining of a large variety of integrated-optical devices in any combination on a common substrate at a higher rate of integration.
a) Thermal diffusion from a metal layer deposited onto LN substrate (Nd3+, Er3+, Tm3+, yb3+)
The doping by diffusion of rare-earth ions from a metal layer deposited on the crystal surface takes place at high temperatures (1050–1130 ос) for a quite long time (50–250 h depending on the crystal orientation of the substrate) in a flow of dry oxygen. These high temperatures and time are required due to the relatively large ion radii of rare-earth elements and their harder entry into the LN crystal. Since the Curie temperature (тс = 1142 °с for congruent LN) is close to the diffusion one, the risk exists that dur-ing the diffusion the crystal loses its ferrooelectric and electro-optical properties. The diffusion creates a homogeneously doped but very thin surface layer (nm) in the substrate, so additional annealing is re-quired for the dopant to enter deeper into the crystal. At the beginning of the process, while the source is not yet exhausted, the distribution of the dopant from the surface to the depth of the crystal has the shape of an erfc-function. After that, at further ther-mal treatment after the diffusion of the layer, the profile transforms to a Gaussian one [23, 24]. In an aerial atmosphere the metal oxidizes and forms a hard matte layer. It worsens the optical quality of the crystal. In that case, either the diffusion should be continued until the metal oxide transfers entirely to the substrate, or the crystal surface should be pol-ished carefully to minimize the losses from surface scattering in the optical waveguide to be obtained thereafter in the rare-earth-doped layer [23]. Due to the low mobility of the ions of rare earth ele-ments, the doping with them is always the first step of the obtaining of doped waveguides. The above discussed shows that the thermal diffusion from a layer deposited on the surface is also a process quite difficult from the technological point of view. Nevertheless, this method has a number of advan-tages which will be discussed below with the exam-ple of the thermal diffusion of erbium ions from a thin vacuum-deposited metal layer.
Besides having the most appropriate emission spectrum for optical communications, erbium is also the rare-earth element most frequently used for diffusion due to its low ion diameter compared to other rare-earth elements which provides it with a relatively good mobility during the diffusion proc-ess [25]. The electron transitions of Er3+:LiNbO3 used for laser generation with a wavelength of 1550 nm are a quasi three level system with ground state absorption. Therefore the erbium doping has to be limited to these regions of the integrated-optical de-vice for the function of which pumping is required; otherwise strong absorption takes place and the effi-ciency of the device decreases strongly. Such selec-tive doping cannot be performed during the crystal

101
M. Kuneva: Rareearth doped optical waveguides in LiNbO3
growth but only by indiffusion from a structured vacuum-deposited layer [23]. This method allows avoiding the clustering of erbium ions in the ma-trix and is compatible with the diffusion methods for obtaining of waveguides. It allows concentration values to be reached close to the solubility limit for a solid solution (ca. 0.18 at.% at 1060 °C) without flu-orescence quenching [21]. This is a prerequisite for a significant optical amplification in a short distance (experimentally achieved up to 2 dB/cm). For ex-ample, the diffusion of an erbium layer (23 Å thick) for 40 h at 1060 °C results in a subsurface layer with erbium concentration of 3.6×10¹⁹ сm–3 [26].
To understand the physical mechanisms behind the optical properties of the doped LN, it is neces-sary to be known which sites the dopant occupies in that pseudo-perovskite matrix. The authors of [27] have found that in the diffusion from a metal layer, the Er atoms occupy sites located at 0.46 Å from the lithium sites in a ferroelectric state directed along the optical axis; at higher erbium concentrations the diffusion resembles an exchange, where Li and Nb ions are replaced by erbium ions, thus changing considerably the structure of the crystal. It remains well-ordered, with strongly coherent fractions of er-bium and niobium atoms located in the respective positions as in [27].
Varioius waveguide lasers have been obtained by thermal diffusion from a metal layer: Distributed Bragg Reflector (DBR) laser [3], Distributed Feed-back (DFB) laser [4], DFB-DBR coupled cavity laser [5], etc.
b) Diffusion from a melt (Er3+)
Although the methods described above allow the obtaining of high-quality doped waveguides, they are time-consuming, require high temperatures or high energy and are risky and technologically com-plicated. Very promising seems the doping by diffu-sion from melts of eutectic mixtures of nitrates [28] or sulphates [29], where the diffusion quite prob-ably takes the form of an ion exchange. The process takes place by dipping the substrate in the doping mixture at relatively low temperatures (a few hun-dred degrees). Until now this technology has been studied and applied only for doping of LN with er-bium. It has to be noted that the diffusion coefficient of erbium with this method is twice higher than with diffusion from a metal layer [30]. Melts with the fol-lowing composition have been proposed (I–III):
76 CsNO3 + 14 Ba(NO3)2 + 10 Er(NO3)3 [28] (I)
The diffusion takes place at a temperature of about 400 °C and for about 5 h. This way, a very thin doped surface layer is obtained having an er-
bium concentration of up to 9 wt%. The post-diffu-sion annealing at 400 °C for 20–40 hours increases the depth of the doped region and lowers the dopant concentration in the subsurface layer. The tempera-ture should not exceed 500 °C since higher temper-atures cause microcracks to appear on the sample surface, probably due to the too fast relaxation of the tensions in the diffused region [28]. The best re-sults are obtained for X-cut samples.
90 KNO3 +10 Er(NO3)3 [28] (II)
The diffusion lasts about 5 hours at a temperature of 350–400 °C in a platinum crucible. Under these conditions, in X-cut samples, a thin (50 nm) doped layer is obtained having a dopant concentration up to 20 at.%. Erbium ions have a homogeneous (step-like) distribution. The erbium concentration in the different cuts differs significantly – from ca. 3 at.% for y- and Z-cut to 20 at.% for X-cut. Erbium ions may diffuse into the crystal when additional anneal-ing is applied at 350 °C, and their distribution be-comes Gaussian [28].
The change in lithium concentration in the doped layer (i.e. lithium decrease) is studied by the Neutron Depth Profiling (NDP) method. The distribution of the integrated erbium atoms is determined us-ing Rutherford Backscattering Spectrometry (RBS) [19]. The RBS spectrum shows that erbium ions are located in a ca. 100 nm thick layer (after anneal-ing) on the surface of the crystal, and that there is a strong anisotropy when doping substrates having dif-ferent crystal orientations. While with y- and Z-cut substrates the erbium concentration does not exceed 5 at.%, in the cases of an X-cut it could easily reach 20 at.%. This may be explained, to some extent, as owing to the known different wettability of the Z-cut compared to the X- and y-cut by the melt. The wetta-bility of Z-cuts by the melt is impeded most probably due to the pyroelectric effect (the pyroelectric axis of LN is perpendicular to the Z-cut substare). This can-not, however, explain the different behaviour of X- and y-cuts.
The study on concentration profiles of lithium shows that no lithium decrease is observed in the doped layer, therefore erbium ions do not occupy lithium sites during low-temperature doping, and it does not take the form of an exchange, but of an interstitial diffusion. Erbium ions most probably occupy the majority of vacancies, which explains the higher concentration of erbium ions in the X-cut samples [28].
Other authors have an interpretation slightly op-posing the above – they assume that the diffusion has the form of an ion exchange [30]. These authors use sulphate melts instead of nitrate ones (III) [29]. Ion exchange is a transfer of different types of ions
102
between phases brought to a contact. The gradi-ent in chemical potential at their interface leads to movement and exchange of the different ion types, so that electrical neutrality is preserved. When ion exchange is not isovalent, the diffusion coefficient depends on many parameters and it is not easy to predict the profile of the doping element (i.e. of its distribution in depth). Within this exchange, a com-plex rearrangement of the crystal structure takes place, for which no thorough model has been cre-ated yet [31].
19.4К2Sо4+9.9Na2SO4+70.7Li2SO4
+0.125 wt.% Er2(SO4)3 [29] (III)
The diffusion lasts 24 hours at 680 °C. The ex-change takes place at temperatures of 560–700 °C. The profile of erbium distribution depends on the speed of melt heating – fast (300 °C/h) or slow (150 °C/h). The diffusion time varies from 4 to 24 hours. Additional annealing at 900 °C for 15 h is also performed. By varying the amount of erbium sulphate in the melt from 0.002 wt.% to 5 wt.%, it has been found that below 0.002 wt.% the exchange is inefficient even at longer times and higher tem-peratures. Above 5 wt.% the thickness of the ion-exchange layer decreases. A thickness of a few mi-crometers is achievable at a concentration of 0.6 %, time below 10 hours and temperature about 600 °C. At concentrations of erbium sulphate between 0.1– 0.6 wt.% the luminescence intensity increases lin-early with concentration, i. e. within this range there is still no luminescence quenching. The systematic study done by these authors to establish the de-pendence of erbium profile on diffusion parameters shows that it is preferable to use lower temperatures and shorter times, since the process seems to be self-limiting. The authors state that, due to the high-er mobility of lithium compared to erbium, a local unbalanced charge appears which limits the further diffusion of erbium into the matrix. The gradient in ion concentration leads to the formation of a barrier layer which blocks the diffusion of ions involved in the process. As a possible explanation for the fact that in X-cut samples the exchange layer is thicker than in Z-cut ones, these authors also point out the better wettability of X-cut substrates. It is harder in terms of energy for erbium to enter Z-cut substrates due to its lower concentration on the surface.
The analysis of concentration profiles using SIMS and RBS shows complete lithium depletion of the subsurface layer, and a stoichiometry close to Er1Nb1O4.5 which corresponds to a mixture of erbium and niobium oxides. Under the subsurface layer, a multivalent Er3+-3Li+ exchange takes place. Thicker layers are formed in X-cut substrates than in Z-cut ones, i.e. these authors also find anisotropy
M. Kuneva: Rareearth doped optical waveguides in LiNbO3
of diffusion. Moreover, they also find that in the case of X-cut samples, both surfaces of the sample dipped in the melt are equally and homogeneously doped, whereas with Z-cut, active erbium agglom-erates are formed, probably due to the different ori-entation of the ferroelectric domains in the crystal, which results in doping with active erbium ions of only one surface of the substrate.
Ion exchange in a salt melt is the most conven-ient technology for local doping, if no co-doping with another element is needed. With this method the thermal stress upon the crystal is minimal and the risk of depolarization and loss of electro-optical properties is avoided.
To use rare-earth doped substrates in integrated-optical circuits, after the doping it is necessary to obtain high-quality optical waveguides.
WAyS FOR OBTAINING ACTIVE WAVEGUIDES
Creation of the the waveguide by the doping itself
It has been found with erbium diffusion from ni-trate melts [28], that all samples regardless of their crystal orientation have waveguiding properties stemming from a change in the extraordinary refrac-tive index in the range 0.003–0.005 for wavelength of 0.633 μm. The waveguides obtained this way are quite thick – up to 9 μm [19]. This waveguide effect of the diffused layer results solely from the pres-ence of erbium ions. However, due to a number of reasons, the waveguides so obtained do not have a practical application.
Creation of an optical waveguide in a rareearth doped crystal
For the formation of optical waveguides in LN previously doped with rare-earth elements, ion im-plantation, diffusion from a metal layer, and proton exchange have been used. It has to be mentioned that the rare-earth doping also changes the refrac-tive index, and if it is a local one, it also creates a waveguide itself.
The two widely accepted technologies for ob-taining of optical waveguides in LN by diffusion are titanium diffusion and proton exchange. Proton exchange has the advantage of increasing the pho-torefractive resistance and the generation of a strong waveguide effect, but the obtained waveguides maintain only one polarization, since only the ex-traordinary refractive index rises. This makes some authors state that the waveguides obtained by pro-ton exchange are not suitable for laser action, since

103
M. Kuneva: Rareearth doped optical waveguides in LiNbO3
the fluorescence of the system La3+:LN has both polarizations [32]. Many authors however consider proton-exchanged waveguides as a good alternative to titanium ones for the obtaining of integrated-op-tical lasers [28, 33].
a) In-diffusion of Ti or Zn from a metal layer
тhe most frequently used and approved tech-nology is the diffusion of Ti in LiNbO3. Until now, this is the technology providing the highest qual-ity of waveguides formed in LN previously doped with rare-earth ions. A thin layer of titanium with a thickness of 20-200 nm is deposited onto a crystal substrate and after that, the thermal diffusion takes place at ca. 950–1100 ос for several (5–20) hours in flowing Ar gas atmosphere (to prevent oxidation of the metal) replaced by O2 during cool-down to allow reoxidation. If the diffusion takes place in an argon atmosphere, the ions directly enter the sub-strate and diffuse from the metal layer until its ex-haustion. If the diffusion is carried out in an oxy-gen atmosphere, the layer is first oxidized to TiO2 or ZnO2 respectively, and the metal ions enter the substrate from the oxide layer. In this case, as with the rare-earth activation from a metal layer depos-ited onto the crystal surface, it is very important that the diffusion of Ti/Zn is complete. If the metal layer diffuses incompletely, it is necessary to polish the surface in order to obtain a high-quality, low-loss waveguide.
Diffusion gives a profile which is typically half-Gaussian or error-function in shape, with a maximal change at the surface.
The formation of the waveguide structure is per-formed by photolithography, followed by deposition of a Ti layer and thermal diffusion. Due to the high losses and the instability of the obtained waveguides, additional annealing in an oxygen atmosphere or periodic poling is needed [32]. The obtained opti-cal waveguide overlaps the rare-earth doped region. Since the diffusion temperature and the duration of the process of waveguide formation also allow the
rare-earth element to enter deeper into the crystal, it is best to consider this process as an additional annealing of the doped layer when calculating the final diffusion depth of the rare-earth element. At the same time, titanium has a faster diffusion (due to its shorter ion radius) and this way it provides the necessary larger width of the waveguide channel compared to the width of the rare-earth region.
In Figure 1, the transverse section of a crystal is shown, surface-doped with a rare-earth element sur-rounded by a stripe waveguide, obtained by titanium diffusion or proton exchange. The rare-earth doped area has a smaller width than the waveguide and a smaller doping depth than the waveguide channel depth. The maximal concentration of the rare-earth dopant is located in the center below the surface of the crystal.
A good combination of the technologies for ob-taining of erbium-doped LN and for the formation of optical waveguides by titanium diffusion is dem-onstrated by the authors of [34-36], as well as opti-cal amplifiers and lasers based thereon [2].
The obtaining of waveguides by diffusion of ti-tanium or zinc in the activated systems (Nd/Er/Tm/yb):LiNbO3 has been described [37]. Single-mode waveguides are formed by diffusion of 7 μm wide, 100 nm thick Ti-stripes for 9 hours at 1060 °с. The crystal orientation of the substrates is selected with regard to the type of laser device to be obtained: for DBR/DFB lasers or for acoustooptically tunable la-sers, X-cut substrates are used, and a propagation of the light beam along Z in the first case, and along y in the second one. For the obtaining of Q-switched and modelocked lasers, Z-cut substrates are selected and a propagation of the light beam along X, in or-der to use the highest value of the electro-optical coefficient for more efficient modulation.
The main advantages of the formation of optical waveguides by thermal indiffusion of a metal layer in LN are: high reproducibility, increase of both ordinary and extraordinary refractive indices, high stability of waveguide parameters and low losses in the obtained waveguides. As disadvantages,
Fig. 1. A transverse section of a rare-earth doped waveguide channel in LN

104
the following may be cited: the high temperature required and the parasitic waveguides formed by out-diffusion, as well as the 100-fold reduction in the optical damage threshold power density from the bulk value.
b) Proton exchange
Proton exchange (PE) takes place in a surface layer of a substrate immersed in an appropriate acidic melt [38]. PE modifies the surface layer (several µm in depth) by Li-H ion exchange at a relatively low temperature (160–250 °C) causing a large extraordinary index change ∆ne (∆ne @ 0.12 at 0.633 µm). The PE layers show complex phase behavior depending on the hydrogen concentration. Strong protonation considerably worsens electro-optical properties of the waveguiding layer [39] and causes higher losses (2 to 5 dB/cm) [40] and some instability of the parameters over time. However, taking into consideration that other methods (melt buffering and/or annealing) exist for the adjust-ment of phase composition [41], these drawbacks can be corrected or even turned into advantages for the possibility to modify the electro-optical proper-ties. These can also be avoided by using the meth-ods for optimization of proton concentration [42]. Waveguide fabrication by PE has multiple varia-tions, including post-exchange annealing (APE) [42]. Proton-exchanged LN waveguide devices are preferred over Ti-diffused LN ones in cases where high optical powers are to be transmitted and/or sin-gle polarization operation is desired.
Considering proton exchange of rare-earth doped LN, it should be taken into account that radiative lifetime reduction and strong fluorescence quench-ing occur because of the coupling to OH-phonons [43, 44]. Due to these reasons, some authors do not find the combination of rare-earth doping with subsequent obtaining of the optical waveguide by proton exchange a good one for waveguide lasers, since the presence of hydrogen has a killing effect on the excited erbium electrons, shortening their lifetimes, which then results in a drastically reduced optical gain [2, 24, 36, 44, 45]. Promising results have been obtained with selection of appropriate conditions for carrying out proton exchange with subsequent annealing for the formation of the op-tical waveguide [19, 28, 29], or with using reverse proton exchange (RPE) [46]. Waveguide lasers have been described based on stripe waveguides obtained in er bium-doped LN by proton exchange for 2 h in benzoic acid buffered with 1 mol% lith-ium benzoate at 200 °с, with subsequent anneal-ing for 3–4 hours at 350 °с [47]. сontinuous-wave laser action at 1084.5° nm at room temperature in LiNbO3:Nd3+ channel waveguides, fabricated by
RPE, is reported.[46]. yb-diffused LiNbO3 an-nealed/proton-exchanged waveguide lasers are also demonstrated. A Fabry-Pérot waveguide laser of 3-cm length is fabricated and characterized. For op-tical pumping at 918-nm wavelength, stable contin-uous-wave laser oscillation is achieved at 1061 nm with a threshold power of 40 mW. [33]. It has been demonstrated that Er-doped optical waveguides produced by a moderate temperature process (APE, for example) are quite effective [19]. With appro-priately chosen parameters of the APE technology [43], the hydrogen content in the waveguides could be decreased to a level not causing photolumines-cent quenching, so that such waveguides could be used in active integrated-optical structures.
The results of the study of APE layers in LN doped with erbium or erbium+ytterbium show also that during the APE process, no loss of rare-earth elements from the substrate previously doped with them is observed. The waveguide properties and the PE process itself in doped samples do not differ from those of non-doped ones. The presence of dop-ing ions (rare-earth as well as hydrogen ones) leads to worsening of the electro-optical properties of LN, but a carefully designed APE technology may re-store them almost to the degree of a non-doped LN. This may be done by modeling the distribution of lithium in the waveguide area, since а correlation between the uniform distribution of lithium and the high values of the electro-optical coefficient r33 has been found. A homogeneous distribution of lithi-um and a very low content of hydrogen has been obtained in the long-time-annealed waveguiding layers [48].
It has to be mentioned that the problems with lu-minescence quenching are observed only with pro-tonation of erbium-doped LN, whereas, for exam-ple, after protonation of a neodymium-doped LN, a very effective luminescence has been registered around 1 μm wavelength and no quenching prob-lems are reported [44, 49]. Besides, luminescence quenching after the proton exchange has not always been observed in the case of erbium activation of LN. This effect has been reported when the doping has been performed either during crystal growth by ion implantation, or by diffusion from a metal layer [2, 24, 44, 45] and does not take place when the doping has been performed with a low-temperature process in a melt [19, 28–29, 50–52].
The advantages of proton exchange as a meth-od for obtaining of optical waveguides in LN are: a fast and simple waveguide formation procedure; non-toxicity and lower cost; possibility of thermal tuning of the refractive index; a strong waveguid-ing effect; an increased photorefractive resistance; flexibility and compatibility with other technolo-gies; a large variety of optimization steps. Its main
M. Kuneva: Rareearth doped optical waveguides in LiNbO3

105
disadvantages are: multiphase composition of the waveguide layer; deterioration of electro-optical properties in strongly protonated layers; some insta-bility over time.
Doping of a previously obtained optical waveguide with laseractive ions (rare earths)
Since for the formation of laser-active wave-guides the opposite procedure is also generally pos-sible – proton exchange and subsequent diffusion of a rare-earth element – the influence of proton exchange on the following erbium-ion doping has been studied, in the case that the obtaining of the optical waveguide is chosen as the first step in the fabrication of the waveguide light amplifier or laser [19, 28]. It has been found that with the diffusion of erbium the amount of diffused erbium depends not only on the crystal orientation but also on the histo-ry of the substrate – untreated or previously proton-exchanged. This dependence is strongest with X-cut samples, in which the proton exchange lowers about 15 times the amount of erbium ions compared to that in non-protonated subtstrates under identical condi-tions [28]. This is most probably due to the gradual transition of the structure of LN towards monocline one after PE. Although the lattice parameters do not change significantly, that suppresses the diffusion of erbium ions. Due to these reasons, the erbium dop-ing should be performed before the APE process,
since the completely changed structure of APE lay-ers impedes the process of rare-earth doping [19].
In Figure 2-A, the steps for the obtaining of a stripe optical waveguide activated by a rare-earth el-ement are schematically shown. The first step is the deposition of structured photoresist (PR) onto the crystal surface, thereby obtaining photoresist-free channels in the area subjected to rare-earth doping. The second step is the deposition of the rare-earth element (RE) by sputtering or vaccum evaporation in the form of a metal or a metal oxide, after which the photoresist (PR) together with the overlying lay-er are removed by the lift-off technique. This results in a small rare-earth stripe (RE) deposited onto the surface of the crystal substrate (S); the stripe would diffuse in S in the next step. This diffusion takes place during the first thermal treatment (T1) in an atmosphere of Ar-O2, the temperature and duration being so chosen that a controlled diffusion depth is achieved which has to be smaller than the depth of the waveguide channel, which should be inserted thereafter. It has been shown, for example [49] that with Z-cut substrates, an average diffusion depth of 5 μm is reached after 100 h at 1050 °с, and at 1080 °с the depth is 7.2 μm. The diffusion depth is defined as 1/e of the surface concentration. The next step is the deposition of silica-gel (sol-gel) (SG) onto the crystal surface, followed by the second thermal treatment (T2) which leads to partial out-diffusion of the dopant close to the surface through the sur-
M. Kuneva: Rareearth doped optical waveguides in LiNbO3
Fig. 2. Scheme of the technological steps for obtaining an active waveguide

106
face in the gel. This way, an area with a maximal dopant concentration is formed under the surface of the crystal. At the same time, the rare-earth doped area becomes deeper. The next step is the deposition of titanium (Ti) onto the structured photoresist (PR) onto the surface of S and its diffusion in the crystal during the third thermal treatment (T3), again in an atmosphere of Ar-O2. A titanium stripe is deposited over the center of the rare-earth doped area, and as a result, the axis of the waveguide channel is parallel to that of the rare-earth channel. With a 95 nm thick titanium layer and a diffusion of 10 h at 1050 °с, a single-mode waveguide is obtained.
In Figure 2-B, another method is shown for the formation of the lateral borders of the waveguide channel. This process comprises an initial deposi-tion of a rare-earth layer (RE) onto a wide area of the crystal substrate (S) and its diffusion during the first thermal treatment (T1). After that, again over a wide area, a waveguide is formed by Ti diffusion or PE. The next step is the deposition of photore-sist (PR) onto the doped area (DR), the photoresist being so structured that a small stripe of photore-sist (PR1) remains where the waveguide channel should be formed. In the following step, the surplus doped material at both sides of the stripe is etched by ion etching, and the photoresist is removed in the next step. This way a small stripe – a narrow stripe waveguide doped with a rare-earth element – stays on the crystal.
Ion implantation (He+, Ne+)
Iоn implantation is performed usually at ener-gies from 7 keV to 2 MeV. The change of the re-fractive index depends on the ion energy and is relatively large – from 0.02 to 0.08 [53]. After the implantation, annealing is always performed to re-store the crystal structure [2, 25]. The implantation of H+ in erbium-doped LN easily leads to chemical reactions, for example formation of OH-groups, and they are important centers of luminescence quench-ing [2]. In this case, for ion-implanted waveguides, co-doped LN substrates are used, for example with MgO, which avoids the quenching by OH-groups. Waveguides with a high optical quality have been obtained with implantation of H+ in LiNbO3 bulk-doped with Eu3+ and MgO [54]. There, no lumines-cence quenching is observed and the fluorescence in the waveguide is the same as bulk fluorescence.
The method has the advantages of preserving the bulk material properties, depth control and pos-sibility for obtaining multilayer structures, as well as an opportunity of writing optical circuits by ion beam. However, it is a very expensive method and some instability of waveguide parameters over time has been demonstrated.
CONCLUSIONS
The choice of technological conditions for • rare-earth doping of LN affects the dopant penetra-tion and location as well as the structural changes of the doped layers.
The concentration of the dopant and the sites • its ions occupy in the crystal lattice of the LN matrix are crucial for both the dopant’s luminescent activa-tion and its optical properties.
The local doping of LiNbO• 3 exhibits strong anisotropy.
In many cases lasing efficiency and optical • properties of the waveguides obtained could be im-proved by co-doping.
The most convenient and promising methods • for obtaining waveguide lasers are the diffusion ones – for rare-earth doping as well as for the sub-sequent fabrication of the optical waveguides.
Better results are achieved when the doping • with rare-earth ions precedes the fabrication of the optical waveguides, although in some cases the re-verse procedure is also possible.
REFERENCES
1. L. Tsonev,Optical Materials, 30, 892 (2008).2. Ch. Buchal, S. P. Withrow, C. W. White, D. B. Poker,
Annual Revue of Materials Science, 24, 125 (1994).3. B. K. Das, H. Suche, W. Sohler,Appl. Phys. B, 73,
(2001).4. B. K. Das, R. Ricken, W. Sohler, Appl. Phys. Lett.,
l82, 1515 (2003).5. B. K. Das, R. Ricken, V. Quiring, H. Suche,W.
Sohler, Opt. Lett., 29, 165 (2004).6. G. Burns, D. F. O’Kane, R. S. Title, Phys. Rev., 167,
314 (1968). 7. V. Bermudez, M. D. Serrano, J. Torento, E. Diegues,
Solid State Communications, 112, 699 (1999).8. L. Rebouta, M. F. Da Silva, J. C. Soares, D. Serrano,
E. Diéguez, F. Agulló-López, J. Tornero. Appl. Phys. Lett. 70, 1070 (1997).
9. B. Herreros, PhD Thesis, UAM, Madrid, Spain, 1997. 10. L. Nuñez, R. Duchowicz, M. Voda F. Cussó, J.
Physique IV, 4, C4–443 (1994). 11. D. M. Gill, J. C. Wright and L. McCaugan, Appl.
Phys. Lett. 64, 2483 (1994).12. C. Bonardi, C. J. Magon, E. A. Vidoto, M. C. Terrile,
L. E. Bausa, E. Montoya, D. Bravo, A. Martin, F. J. Lopez, J. Alloy Comp., 323-324, 340 (2001).
13. H.-N. Dong, S.-y. Wu , W.-C. Zheng, J. Phys. Chem. Solids, 64, 695 (2003).
14. I. Pracka, M. Malinowski, A. L. Bajor, B. Surma, Z. Galazka, M. Swirkowicz, M. Mozdzonek, Proc. SPIE, 3178, 295 (1997).
15. E. Montoya, O. Espeso, L. E. Bausa, J. Lumin., 87-89, 1036 (2000).
16. E. Montoya, L. E. Bausa, B. Schaudel , P. Goldner, J. Chem. Phys., 114, 3200 (2001).
M. Kuneva: Rareearth doped optical waveguides in LiNbO3

107
17. C. Huang, L. McCaughan, IEEE Photonics Technology Letters, 9, 599 (1997)
18. V. A. Fedorov, yu. Korkishko, J. A. Sanz-Garcia, E. Can telar, R. Nevado, G. Lifante, F. Gusso, in: Proc. ECIO’01, Padeborn, April 2001, 297 (2001).
19. V. Perina, J. Vacik, V. Hnatovicz, J. Cervena, P. Kolarova, J. Spirkova-Hradilova, J. Schröfel, NIMB, 139, 208 (1998).
20. M. Fleuster, Ch. Buchal, H. Holzbrecher, E. Snoeks, A. Polman, J. Appl. Phys., 75, 173 (1994).
21. M. Fleuster, Ch. Buchal, E. Snoeks,A. Polman, Appl. Phys. Lett., 65, 225(1994).
22. P. Moretti, B. Canut, S. M. M. Ramos, P. Thevenard, D. Poker, J. B. M. Da Cunha, L. Amaral, A. Vasquez, J. Mater. Res., 8, 2679 (1993).
23. I. Baumann, R. Brinkmann, M. Dinand, W. Sohler, L. Beckers, Ch. Buchal, M. Fleuster, H. Holzbrecher, H. Paulus, K.-H. Müller, Th. Gog, G. Materlick, O. Witte, H. Stolz, W. von der Osten, Appl. Phys. A, A64, 33 (1997).
24. I. Baumann, S. Bosso, R. Brinkmann, R. Corsini, M. Dinand, A. Greiner, K. Schäfer, J. Söchtig, W. Sohler, H. Suche, R. Wessel, IEEE J. Select. Topics in Quantum Electron, 2, 355 (1996).
25. W. Sohler, B. K. Das, D. Dey, S. Reza, H. Suche, R. Ricken,IEICE Trans. Electron., E88–C, 990 (2005).
26. I. Baumann, R. Brinkmann, Ch. Buchal, M. Dinand, M. Fleuster, H. Holzbrechel, W. Sohler, H. Suche, in: Proc. ECIO’93, Neuchatel, 1993, p. 3.
27. Th. Gog, M. Griebenow and G. Materlik, Physics Letters A, 181, 417 (1993).
28. J. Hradilova, P. Kolarova, J. Schröfel, J. Ctyroky, J. Vacik, V. Perina, Proc. SPIE, 2775, 647 (1996).
29. C. Sada, E. Borsella, F. Caccavale, F. Gonella, F. Segato, yu. N. Korkishko, V. A. Fedorov, T. M. Morozova, G. Battaglin, R. Polloni, Appl. Phys. Lett., 72, 3431 (1998).
30. F. Caccavale, C. Sada, F. Segato, B. Allieri, L. E. Depero, L. Sangaletti, V. A. Fedorov, yu. N. Korkishko, T. V. Morozova, J. Non Cryst. Solids, 280, 156 (2001).
31. F. Caccavale, C. Sada, F. Segato, in: Properties of Lithium Niobate, K. K. Wong (ed.), INSPEC Inc., 2002, p. 300.
32. J. K. Jones, J. P. de Sandro, M. Hempstead, D. P. Shepherd, A. C. Large, A. C. Tropper, J. S. Wilkinson, Optics Letters, 20, 1477 (1995).
33. M. Fujimura, H. Tsuchimoto, T. Suhara, Photonics Technology Letters, (IEEE 17), 130 (2005).
34. A. Lorenzo, L. E. Bausa, J. Garcia-Sole, Phys. Rev. B, 51, 16643 (1995).
M. Kuneva: Rareearth doped optical waveguides in LiNbO3
35. K.A. Winick, Proc.SPIE, 3280, 88 (1998).36. A. Fukumi: PhD Thesis, Hiroshima University, June
2002.37. E. Cantelar, R. Nevado, G. Martin, J. A. Sanz-Garcia,
G. Lifante, F. Cusso, M. J. Hernandez, P. L. Pernas, J. Luminesc.,87/ 89, 109 (2000).
38. J. Jackel, C. Rice, J. Veselka, Appl. Phys. Lett., 41, 607 (1982).
39. M. Rottschalk, A. Rash, W. Karthe, J. Opt. Commun., 9, 19 (1988).
40. A. Loni, R. De La Rue, J. Winfield, in: Technical Digest Series 5 (Proc. Topical Meeting on Integrated & Guided Wave Optics, March 28-30, Santa Fe, New Mexico), 1988, p. 84.
41. K. Wong , Gec. J. Research, 3, 243 (1985).42. S. M.Al-Shukri, S., A. Dawar, R. De La Rue, A.
Nutt, M. Taylor, J. Tobin, in: Proc. 7th Top. Meet. on Integrated and Guided Wave Optics, Florida, April 1984, PD7/1.
43. J. K. Jones, J. P. De Sandro, M. Hempstead, D. P. Shepherd, A. C. Tropper, J. S. Wilkinson, in: Proc. Symp. on Materials for Advanced Solid State Lasers, Boston, 1993, publ. by, Materials Research Society, Pittsbourgh, PA, 1994, p. 233.
44. Marc P. De Micheli, Proc. SPIE, 2996, 62 (1997). 45. A. C. Cino, S. Riva Sanseverino, M. P. De Micheli,
K. El Hadi, F. Cusso, G. Lifante, Proc. SPIE, 3280, 152 (1998).
46. E. Cantelar, G. Lifante, F. Cussó, M. Domenech, A. Busacca, A. Cino, S. Riva-Sanseverino, Optical Materials, 30, 1039 (2008).
47. W. Sohler, H. Suche,US Patent 5 473 722 (1995).48. P. Nekvindova, J. Cervena, P. Capek, A. Mackova,
V. Perina, J. Schröfel, J. Spirkova, Optical Materials, 24, 527 (2003).
49. M. Hempstead, J. S. Wilkinson, L. Reekie, IEEE Photon. Technol. Lett., 4, 852 (1992).
50. P. Nekvindova, J. Spirkova-Hradilova, J. Schroefel, M. Slunecko, V. Perina, J. Vacik, Proc. SPIE, 3858, 180(1999).
51. F. Zhou, y. Zhou, Singapore J. Phys. 12, 21 (1996). 52. J. Spirkova-Hradilova, P. Nekvindova, J. Vacik, J.
Cervena, V. Perina, A. Mackova, J. Schroefel, M. Budnar, A. Raspet, B. Zorko, P. Pelicon, Proc. SPIE, 4277, 200 (2001).
53. A. Polman, E. Snoeks, G. N. van den Hoven, M. L. Brongersma, R. Serna, J. H. Shin, P. Kik, E. Radius, Nucl. Instr. Meth. Phys. Res. B, 106, 393 (1995).
54. C. Mignotte, P. Moretti, K.E. Lipinska-Kalita, G. Boulon, J. Mugnier, J. Optics, 27,259 (1996).

108
M. Kuneva: Rareearth doped optical waveguides in LiNbO3
оптични ВълноВоди В литиеВ ниоБат, дотиран с реКоЗемни елементи
м. Кънева
Институт по физика на твърдото тяло „Акад. Г. Наджаков“ – Българска академия на науките, бул. „Цариградско шосе“ № 72, София 1784, България
постъпила на 15 февруари, 2012 г.; приетa на 26 март, 2012 г.
(резюме)
дотирането на диелектрици с лазерно-активни йони, каквито са йоните на редкоземните елементи, е пред-мет на широко изследване през последните години. големият интерес се дължи на възможността за получа-ване по този начин на миниатюрни твърдотелни лазери и за монолитно интегриране на тези лазери и други елементи върху обща подложка.
настоящата публикация представлява обзор на по-важните изследвания в областта на дотирането на ли-тиев ниобат с йони на редкоземни елементи. направен е опит за обобщаване на резултатите по отношение на технологиите за дотиране на LiNbO3 с лазерно-активни йони и за получаване на оптични вълноводи в дотираните с редкоземни елементи подложки от LiNbO3. основните методи за дотиране са: въвеждане на примеса при израстването на кристала, йонна имплантация, дифузия от слой, отложен върху кристалната подложка, дифузия от стопилка. разгледано е влиянието на ориентацията на подложката върху дотирането, влиянието на дотирането върху следващи дифузионни процеси, възможните позиции на примесните йони в решетката на LiNbO3-матрица, структурните промени в нея и зависимостта им от технологичните параметри на дифузионния процес и т.н. специално внимание е отделено на нискотемпературните методи за дифузия, при които се извършва йонен обмен или дифузия без йонен обмен, при която дотиращите йони се разполагат в съществуващите ваканции в кристалната решетка на LiNbO3. обсъдено е влиянието на състава на стопилка-та, температурата и продължителността на дифузията върху концентрацията на дотиращия елемент, както и условията, при които анизотропната дифузия става самоограничаващ се процес.

109
* To whom all correspondence should be sent:E-mail: [email protected]
© 2012 Bulgarian Academy of Sciences, Union of Chemists in Bulgaria
Bulgarian Chemical Communications, Volume 44, Proceedings of the IIIrd National Crystallographic Symposium (pp. 109–114) 2012
Synthesis and characterization of zinc phosphates doped with samarium and manganese
G. I. Patronov1*, I. P. Kostova1, Z. y. Stoeva2, D. T. Tonchev1, 2
1 Dept. Chem. Technology, Plovdiv University “Paisii Hilendarski”, 4000 Plovdiv, Bulgaria 2 DZP Technologies Ltd., 22 Signet Court, Cambridge CB5 8LA, United Kingdom
Received February 15, 2012; Revised April 6, 2012
Samarium and manganese doped zinc phosphate compositions were prepared by high-temperature ceramic syn-thesis where ZnO, NH4H2PO4 and Sm2O3 (or MnO) of pre-determined ratios were powdered, mixed and placed in alumina crucibles. The synthesis was performed at 950 °с for 3 hours in a muffle furnace. Samples were quenched out of the melt to room temperatures and after that annealed at 250 °с for 2 hours. Sm2O3 and MnO doping varied between 0.03 and 0.28 mol percentage.
Using powder X-ray diffraction, we have found that the observed fundamental crystalline phase is iso-structural with α-Zn2P2O7, where samarium and manganese ions most probably substitute for Zn2+. This is supported by the obtained photoluminescence spectra. The lattice parameters obtained from the Le Bail calculations for the doped zinc phosphate crystalline phase are very similar to the lattice parameters of α-Zn2P2O7. Deviation of lattice parameters is associated with different ionic radius of dopant Sm3+ and Mn2+.
Key words: doped zinc phosphates, samarium, manganese, crystal structure, photoluminescence.
INTRODUCTION
Recently there has been significant interest in materials based on phosphates (P2O5), doped with rare earths and others elements (such as transition elements) due to their unique optical and electri-cal properties and related photo-, electro-, lumi-nescent effects and others. These materials have potential applications in advanced devices such as laser sources, sensors, photodiodes, X-ray imaging plates, anti-counterfeit printing additives etc.
These compositions, stoichiometric or alloys, have been synthesized by different methods – sin-tering, melting, sol – gel and others. They may have polycrystalline, amorphous or amorphous-crystal-line mixed phase composition. The amorphous state provides technological and functional advantage in many cases. Attention is directed to changing their optical, mechanical and thermal properties for dif-ferent ratio of ZnO and P2O5 and different contents of doped elements [1–4].
Our research on samarium and manganese doped zinc phosphates has demonstrated that UV
and X-ray exited photo-luminescence in the visible spectra and glass ceramics materials are formed in the ZnO – rich compositions. We believe the strong photoluminescence is due to the stabilisation of sa-marium and manganese ions within both the glass matrix and within the crystalline phases dispersed into these scintillating materials. It is of particu-lar interest to investigate crystalline phases in this glassy matrix and to study their structures, in order to understand their relationship with the photo-lu-minescence properties.
In our work we present synthesis and characteri-sation studies of samarium and manganese doped ZnO-rich zinc phosphate material of composition yM – (72y)ZnO – 28P2O5 where: M = Sm2O3 or MnO, y varied between 0.03 and 0.28 mol%. We examine the difference between the two dopant structures, and we correlate them to the observed photo-luminescence properties.
EXPERIMENTAL
Sample preparation
All samples were prepared by high-temperature ceramic methods using NH4H2PO4, ZnO and Sm2O3 (or MnO) as starting materials. The reagents were
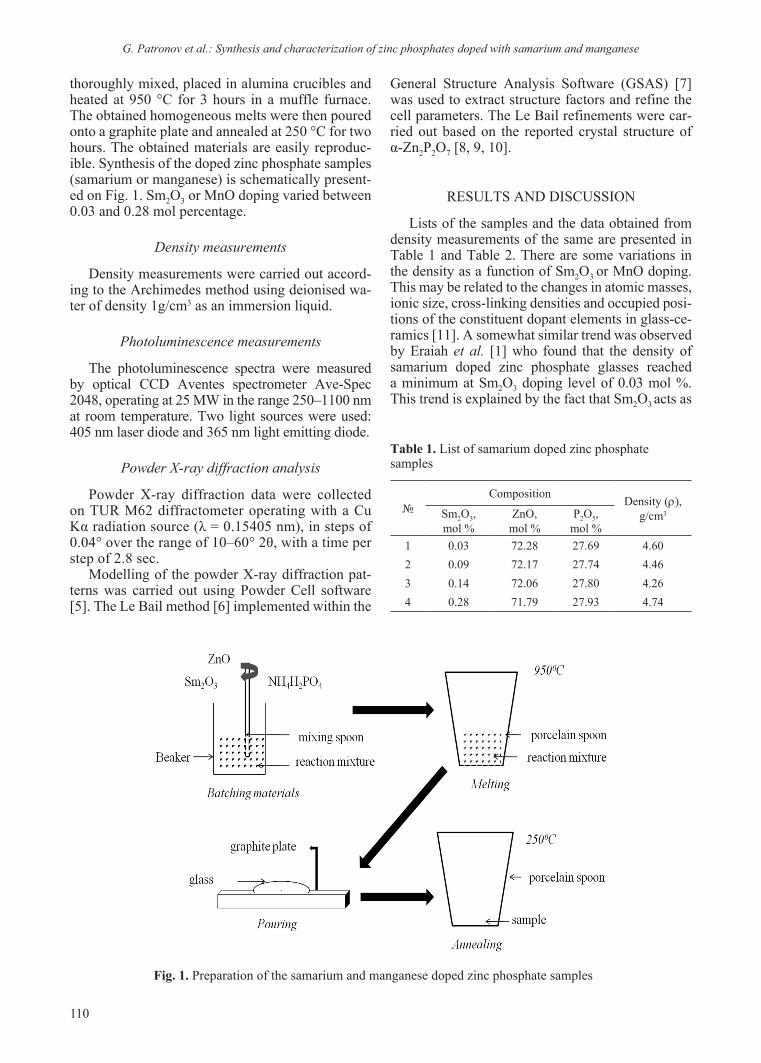
110
G. Patronov et al.: Synthesis and characterization of zinc phosphates doped with samarium and manganese
thoroughly mixed, placed in alumina crucibles and heated at 950 °C for 3 hours in a muffle furnace. The obtained homogeneous melts were then poured onto a graphite plate and annealed at 250 °C for two hours. The obtained materials are easily reproduc-ible. Synthesis of the doped zinc phosphate samples (samarium or manganese) is schematically present-ed on Fig. 1. Sm2O3 or MnO doping varied between 0.03 and 0.28 mol percentage.
Density measurements
Density measurements were carried out accord-ing to the Archimedes method using deionised wa-ter of density 1g/cm3 as an immersion liquid.
Photoluminescence measurements
The photoluminescence spectra were measured by optical CCD Aventes spectrometer Ave-Spec 2048, operating at 25 MW in the range 250–1100 nm at room temperature. Two light sources were used: 405 nm laser diode and 365 nm light emitting diode.
Powder Xray diffraction analysis
Powder X-ray diffraction data were collected on TUR M62 diffractometer operating with a Cu Kα radiation source (λ = 0.15405 nm), in steps of 0.04° over the range of 10–60° 2θ, with a time per step of 2.8 sec.
Modelling of the powder X-ray diffraction pat-terns was carried out using Powder Cell software [5]. The Le Bail method [6] implemented within the
General Structure Analysis Software (GSAS) [7] was used to extract structure factors and refine the cell parameters. The Le Bail refinements were car-ried out based on the reported crystal structure of α-Zn2P2O7 [8, 9, 10].
RESULTS AND DISCUSSION
Lists of the samples and the data obtained from density measurements of the same are presented in Table 1 and Table 2. There are some variations in the density as a function of Sm2O3 or MnO doping. This may be related to the changes in atomic masses, ionic size, cross-linking densities and occupied posi-tions of the constituent dopant elements in glass-ce-ramics [11]. A somewhat similar trend was observed by Eraiah et al. [1] who found that the density of samarium doped zinc phosphate glasses reached a minimum at Sm2O3 doping level of 0.03 mol %. This trend is explained by the fact that Sm2O3 acts as
Fig. 1. Preparation of the samarium and manganese doped zinc phosphate samples
Table 1. List of samarium doped zinc phosphate samples
№Composition Density (ρ),
g/cm3Sm2O3,mol %
ZnO,mol %
P2O5,mol %
1 0.03 72.28 27.69 4.602 0.09 72.17 27.74 4.463 0.14 72.06 27.80 4.264 0.28 71.79 27.93 4.74

111
G. Patronov et al.: Synthesis and characterization of zinc phosphates doped with samarium and manganese
a glass modifier that increases the fraction of non-bridging oxygen atoms and leads to increased poros-ity and reduced density of the glass.
The densities of the samples in our work are higher than the densities reported for samarium doped zinc phosphate glasses by Eraiah et al. [1]. This could be expected, given the higher molar frac-tion of ZnO in our material (70%), compared to the
glasses studied by Eraiah et al. [1] where the molar fraction of ZnO was 60%.
All synthesized materials display photolumi-nescence. Representative emission spectra for samples 1–4 are illustrated in Figure 2 and reveal four emission bands in the wavelength range be-
Table 2. List of manganese doped zinc phosphate samples
№Composition Density (ρ),
g/cm3MnO,mol %
ZnO,mol %
P2O5,mol %
5 0.03 72.28 27.69 3.956 0.09 72.17 27.74 3.897 0.14 72.06 27.80 3.688 0.17 72.01 27.82 3.259 0.23 71.90 27.87 3.6810 0.28 71.79 27.93 3.76
Fig. 2. Photoluminescence spectra of samples 1–4 at ex-citation wavelength 405 nm
Fig. 3. Powder X-ray diffraction patterns for samarium (Fig. 3a) and manganese (Fig. 3b) doped zinc phosphate samples: No1 (0.03 mol% Sm2O3), No2 (0.09 mol% Sm2O3), No3 (0.14 mol% Sm2O3), No4 (0.28 mol% Sm2O3) No5 (0.03 mol% MnO), No6 (0.09 mol% MnO), No7 (0.14 mol% MnO), No8 (0.17 mol% MnO), No9 (0.23 mol% MnO), No10 (0.28 mol% MnO)

112
G. Patronov et al.: Synthesis and characterization of zinc phosphates doped with samarium and manganese
tween 450 and 750 nm, namely 564 nm, 600 nm, 645 nm and 710 nm. The band at 600 nm which corresponds to orange emission is the most in-tense. As shown in Figure 2, the emission bands can be assigned to the 4f–4f transitions from the excited 4G5/2 level to the ground state 6H5/2 and higher levels 6HJ (J > 5/2) of the trivalent Sm3+ ions which have 4f5 configuration. The spectra in-dicate that the luminescence reddish colour of UV irradiated (LED 365 and 405 nm) Zn-phosphate materials are due to Sm3+ ions only (no Sm2+ ions present) [12, 13].
Powder X-ray diffraction was used to iden-tify the crystalline phases present in the obtained samples. The X-ray diffraction patterns, pre-sented in Figure 3, confirm that all samples con-tain one or more crystalline phases. However, the poorly defined peak shapes and the presence of a high background, which is attributable to an amorphous phase, indicate the formation of mixed amorphous-crystalline (glass ceramic like) material.
Inspection of the powder patterns using Powder Cell software shows that the observed crystalline phases are iso-structural with α-Zn2P2O7 [8, 9, 10], illustrated in Figure 4, where samarium and man-
ganese ions most likely substitute for Zn2+. The material crystallises with monoclinic symmetry in space group I2/c with unit cell parameters a = 20.068(15) Å, b = 8.259(6) Å, c = 9.099(8) Å, β = 106.35(5)°. Some of Zn2+ sites in the structure are 5-coordinated and others are 6-coordinated. The structure is composed of layers of PO4 tetrahedra alternating with layers of Zn atoms. The sugges-tion that the Sm and Mn dopant ions substitute for the Zn sites in the structure is in agreement with the observed photo-luminescence spectra that confirm that all samarium ions are present in 3+-valence state, as shown in Figure 2.
In order to further investigate the crystalline phase that was present in all samples, the Le Bail method was used to compare the calculated pow-der X-ray diffraction pattern of α-Zn2P2O7 against the experimental pattern of sample 2 and sample 8. The resulting fit is shown in Figure 5 and the lat-tice parameters obtained from the Le Bail calcu-lations for sample 2 and sample 8 are listed in Table 3. It is evident that they are very similar to the lattice parameters of α-Zn2P2O7 but slightly increased because of the Sm3+ and Mn2+ doping. Deviation of lattice parameters is associated with different ionic radius of Sm3+ and Mn2+.
Fig. 4. Crystal structure of α-Zn2P2O7 according to Robertson et al [8]The picture shows the content of a single unit cell. The phosphorous atoms are shown by small circles that are located inside corner-sharing PO4 tetrahedra, shown in grey. The zinc atoms, presented by light grey circles, occupy two dif-ferent cites in the structure

113
G. Patronov et al.: Synthesis and characterization of zinc phosphates doped with samarium and manganese
Fig. 5. Le Bail calculations for sample 2 and sample 8Grey crosses show the ob-served data points, solid grey line represents the calculated diffraction pattern and dif-ference profile is shown at the bottom of the plot. Black vertical marks repre-sent the calculated reflection positions
Table 3. Lattice parameters for the crystalline phase in samples 2 and 8
Lattice parameters of Sm3+ doped Zn2P2O7 (sample 2)
Lattice parameters ofMn2+ doped Zn2P2O7 (sample 6)
Lattice parameters ofα-Zn2P2O7 from reference [4]
space group I2/ca = 20.071(2) Åb = 8.261(9) Åc = 9.101(2) Åβ = 106.42(1)°
V = 1447.3(3) Å3
space group I2/ca = 20.126(3) Åb = 8.328(2) Åc = 9.015(2) Åβ = 106.07(1)°
V = 1451.8(3) Å3
space group I2/ca = 20.068(15) Åb = 8.259(6) Åc = 9.099(8) Åβ = 106.35(5)°V = 1447.1 Å3

114
CONCLUSIONS
In our work, we present synthesis and charac-terisation studies of samarium and manganese doped zinc phosphate materials, we examine the difference between the two doped structures, and we correlate them to the observed photo-luminescence properties.
X-ray diffraction studies of the crystalline phases shows that they are iso-structural with α-Zn2P2O7, where samarium and manganese ions most likely sub-stitute for Zn2+. The lattice parameters obtained from the Le Bail calculations for doped zinc phosphate materials are very similar to the lattice parameters of α-Zn2P2O7. Deviation of lattice parameters is associ-ated with different ionic radius of Sm3+ and Mn2+.
Acknowledgments: This research was funded by the “Scientific Research” fund at Plovdiv University, Grant № NI 11 HF 007. We are grateful to Mr Zlatkov of Plovdiv University for his help with the powder Xray diffraction measurements.
REFERENCES
B. Eraiah, S. G. Bhat, 1. J. Phys. Chem. Solids, 68, 581 (2007).
R. Seema, P. Suri, P. K. Shishodia, R. M. Mehra, 2. Solar Energy Materials & Solar Cells, 92, 1639 (2008).M. Kawano, H. Takebe, M. Kuwabara, 3. Opt. Materials, 32, 277 (2009).L. Gacem, A. Artemenko, D. Ouadjaout, J. P. 4. Chaminade, A. Garcia, M. Pollet, O. Viraphong, Solid St. Sci., 11, 1854 (2009).G. Nolze, W. Kraus, 5. J. Appl. Cryst., 29, 301 (1996).A. Le Bail, H. Duroy, J. L. Fourquet, 6. Mat. Res. Bull., 23, 447 (1988).A.C.Larson, R.B.von Dreele, The General Structure 7. Analysis System, Los Alamos National Laboratories, Report LAUR 086-748; LANL:Los Alamos, NM, 2000.B. E. Robertson, C. Calvo, 8. J. Solid St. Chem., 1, 120 (1970).M. A. Petrova, V. I. Shitova, G. A. Mikirticheva, V. 9. F. Popova, E. Malshikov, J. Solid St. Chem., 119, 219 (1995).L. N. Ji, J. B. Li, J. K. Liang, B. J. Suna, y. H. Liu, 10. J. y. Zhang, G. H. Rao, Journal of Alloys and Compounds, 459, 481 (2008).S. M. El-Rabie, 11. J. Optoelectr. Adv. Mat., 9, 2046 (2007).G. Lakshminarayana, H. yang, y. Teng, J. Qiu, 12. J. Luminesc., 129, 59 (2009).G. Belev, G. Okada, D Tonchev, C. Koughia. C. 13. Varoy, A. Edgar, T. Wysokinski, D. Chapman, S. Kasap, Phys. St. Solidi C, 8 (9), 2822 (2011).
G. Patronov et al.: Synthesis and characterization of zinc phosphates doped with samarium and manganese
синтеЗ и хараКтеристиКа на цинКоВи фосфати, дотирани със самарий и манган
г. и. патронов1, и. п. Костова1, З. й. стоева2, д. т. тончев1,2
1 Катедра Химична технология, Пловдивски Университет „Паисий Хилендарски“, 4000 Пловдив, България
2 DZP Technologies Ltd., 22 Signet Court, Cambridge CB5 8LA, United Kingdom
постъпила на 15 февруари, 2012 г.; приетa на 6 април, 2012 г.
(резюме)
дотираните със самарий и манган цинк фосфатни композиции са получени чрез високотемпературен син-тез от ZnO, NH4H2PO4 и Sm2O3 (или MnO) в определено съотношение. изходните реагенти са стрити, смесени и сместа е поставена в керамичен тигел. синтезът е извършен при температура от 950 °с за 3 часа в муфелна пещ. пробите са охладени до стайна температура и след това темперирани при 250 °с за 2 часа. дотирането със самарий и манган варира между 0,03 и 0,28 mol%.
извършен е рентгеноструктурен анализ, който показва че получената основна кристална фаза е изострук-турна с α-Zn2P2O7, в която самариевите и манганови йони най-вероятно заместват частично Zn2+. това се по-твърждава от получените фотолуминесцентни спектри. определените в резултат на изчислителния метод на Le Bail параметри на кристалната решетка на дотираната цинк фосфатна кристална фаза са много близки до тези на α-Zn2P2O7. тази разлика в параметрите на кристалната решетка се свързва с различния йонен радиус на дотиращите йони Sm3+ и Mn2+.

115
* To whom all correspondence should be sent:E-mail: [email protected]
© 2012 Bulgarian Academy of Sciences, Union of Chemists in Bulgaria
Bulgarian Chemical Communications, Volume 44, Proceedings of the IIIrd National Crystallographic Symposium (pp. 115–119) 2012
The optical influence of Cr3+ and P5+ ions on the properties of doped Bi12SiO20
P. Petkova*
Shumen University “Konstantin Preslavsky”, 115 Universitetska street, 9712 Shumen, Bulgaria
Received February 15, 2012; Revised April 20, 2012
The absorption coefficient of Bi12SiO20:Cr+P and Bi12SiO20:P single crystals is measured in the visible and far IR spectral regions. The influence of P5+ ions is determined in double doped sillenite. The energy level diagram of Cr3+ is produced. The Jahn-Teller effect is explained in the concrete crystals. The Racah parameters have been calculated also. The magnitude of the composite oscillations is determined in far IR region.
Key words: doped sillenites, Jahn-Teller effect, energy level diagram, composite oscillations.
INTRODUCTION
The sillenite-type Bi12SiO20 (BSO) crystals have applications in the dynamic holography, optical information processing, optical phase conjugation and real-time interferometry [1]. This is the reason of the investigation of their optical properties. The determination of the valence and the local symme-try of the involved dopants in the crystal structure is very important for optimization of the synthesis conditions of these materials. That is why the aim of the present work is to be presented the energy level diagram of Cr3+ in BSO:Cr+P and to be de-termined the composite oscillations in the crystals BSO:P and BSO:Cr+P.
EXPERIMENTAL
The investigated BSO crystals, either undoped or doped with Cr, P and co-doped with Cr+P were grown from stoichiometric melts Bi2O3:SiO2 = 6:1 using the Czochralski method under conditions de-scribed in detail elsewhere [2]. High purity Bi2O3, SiO2, Cr2O3 and P2O5 were used for syhthesis and doping. The concentration of P5+ is 1.6×10²⁰ N/cm–1 in BSO:P and the concentration of this ion is 1.13×10²⁰ N/cm–1 in BSO:Cr+P. The Cr3+ ions are inculcated on the co-doped crystal with the concen-tration 8.1×10¹⁶ N/cm–1. The thickness of the samples is as follows: dBSO:Cr+P = 0.101 cm, dBSO:P = 0.062 cm.
The experimental set up for measurement of the absorption coefficient in the visible region consists of the following: a halogen lamp with a stabilized 3H-7 rectifier, a SPM-2 monochromator, a sys-tem of quartz lenses, a polarizer, a crystal sample holder, and a Hamamatsu S2281-01 detector. The measurements in the far IR region are performed by use of an IRAffinity-1Shimadzu Fourier Transform Infrared Spectrophotometer.
The absorption spectrum is measured in the spec-tral region 1.55–2.6 eV for BSO:Cr+P (Fig. 1a). The energetic level diagram of Cr3+ ion is presented in Fig. 2. The two-phonon absorption of BSO, BSO:P and BSO:Cr+P is shown in the spectral region 400–2000 cm–1 (Fig. 3a and 4a). The electron-vibration-al interaction in far IR region of these crystals is measured in the spectral region 5000–6000 cm–1 (Fig. 3b and 4b).
RESULTS AND DISCUSSION
The absorption coefficient is calculated using the formula: α = (1/d)ln(I0/I), where I0 is the in-tensity of the incident light, I is the intensity of the passing light and d is the sample thickness (Fig. 1a). The first derivative of the absorption coefficient at photon energy is calculated to be in the 1.5–2.6 eV spectral region (Fig. 1b). The [dα/d(hν)] determines only the number of electron transitions in а Cr3+ ion and it does not give an ex-act information about the energy position of these transitions. This is the reason for the calculation of the second derivative of the absorption coefficient [d2α/d(hν)2] (Fig. 1c).

116
The d-orbital eg is split of e±2(δ) and the d-orbital t2g is split of the two orbitals e±1(π) and a1(σ), when the symmetry changes from Td to C3v [3] (Fig. 2). The transformation of the symmetry due to the Jahn-Teller effect. The radial parameters Ds and Dt are conditioned by the potential Vtetr. [4]. In the case of C3v symmetry the distance between e+2(δ) and e-1(π) is ∆1 = 3Ds – 5Dt = 129 cm–1 = 0.16 eV. This is the distance between the first and the second electronic transition in the Cr3+ ion (Fig. 2). The distance be-tween e+1(π) and a1(σ) is ∆2 = Ds + 10Dt = 299 cm–1 = 0.37 eV. This is the distance between the second and the third 3d-electronic transition in the chromi-um (Fig. 2). The values of these two parameters are calculated by our experiment. Thus the values of the parameters Dt and Ds are as follow 21.94 and 79.6. McClure [5] has determined the next parameters δσ = σz – σxy = –1.5Ds – 1.88Dt and δπ = πz – πxy = 1.5Ds + 2.5Dt. The values of these two parameters for the complex [CrO4]6– are δσ = –161 and δπ = –65 and they can be considered as indirect indicators for the antibonding properties of σ- and π- ligands. The literature [6] informs us of the Nephelauxetic pa-rameter β = B (complex)/B (free ion). If the value of β is in the interval 0.54–0.81, it manifests the metal ligand σ bond. The calculation of this parameter for
BSO:Cr+P (β = 0.4) shows that the metal ligand π bond is done. The spin-orbit interaction splits the state 4T1 (4F) of one sextet (J = 5/2), one quartet (J = 3/2) and one doublet (J = 1/2) (Fig. 2).
The high-frequency part of the spectrum of the two-phonon absorption (Fig. 3 and 4) is given by the phonons related to vibrations of [SiO4] and [PO4]3– complexes. The frequency of the two-pho-non transition is equal to the sum or the difference of the frequencies ωi and ωj of the fundamental oscillations [7]. The oscillations of the crystal lattice are due to oscillations of [MO4]. The tetrahedrons are surrounded by heavy Bi atoms and this is the rea-son for the absence of absorption structure displace-ments. That is why Cr does not shift the position of the absorption maxima at 1616 cm–1, 1662 cm–1, 1868 cm–1 and 1934 cm–1. The Cr3+ ions make the absorption maxima at 1616 cm–1 and 1662 cm–1
more intensive and the phosphorus removes com-pletely these two maxima in this spectral region. The doping of the crystal lattice with P5+ ions leads to the observation of the maxima at 1868 cm–1 (965 + 903) and at 1934 cm–1 (967 × 2). The Cr3+ ions make these two maxima only more intensive. The next two maxima at 1361 cm–1 (680.5 × 2) and 1397 cm–1 (679 + 718) are due only to the influence
P. Petkova: The optical influence of Cr3+ and P5+ ions on the properties of doped Bi12SiO20
Fig. 1. The absorption coefficient (a), the calculated first derivative of α(E) (b) and the second derivative of absorption coefficient (c) for BSO:Cr+P in the spectral region 1.55–2.6 eV

117
P. Petkova: The optical influence of Cr3+ and P5+ ions on the properties of doped Bi12SiO20
of the phosphorus in the crystal lattice. The first of them consists of the overtone (TM × 2) and the second one consists of the composite oscillations (TM + AM). The absorption maximum at 1260 cm–1
(668 + 603) consists of the composite oscillations (TM + F). The phosphorus completely removes this maximum (Fig. 3a) and the chromium makes the same maximum more intensive (Fig. 4a). The
Fig. 2. The energetic level diagram of Cr3+ ion
Fig. 3. a) Two-phonon absorption of BSO and BSO:P in the spectral region 400–2000 cm–1; b) electron-vibrational interaction in far IR region of these crystals in the spectral region 5000–6000 cm–1
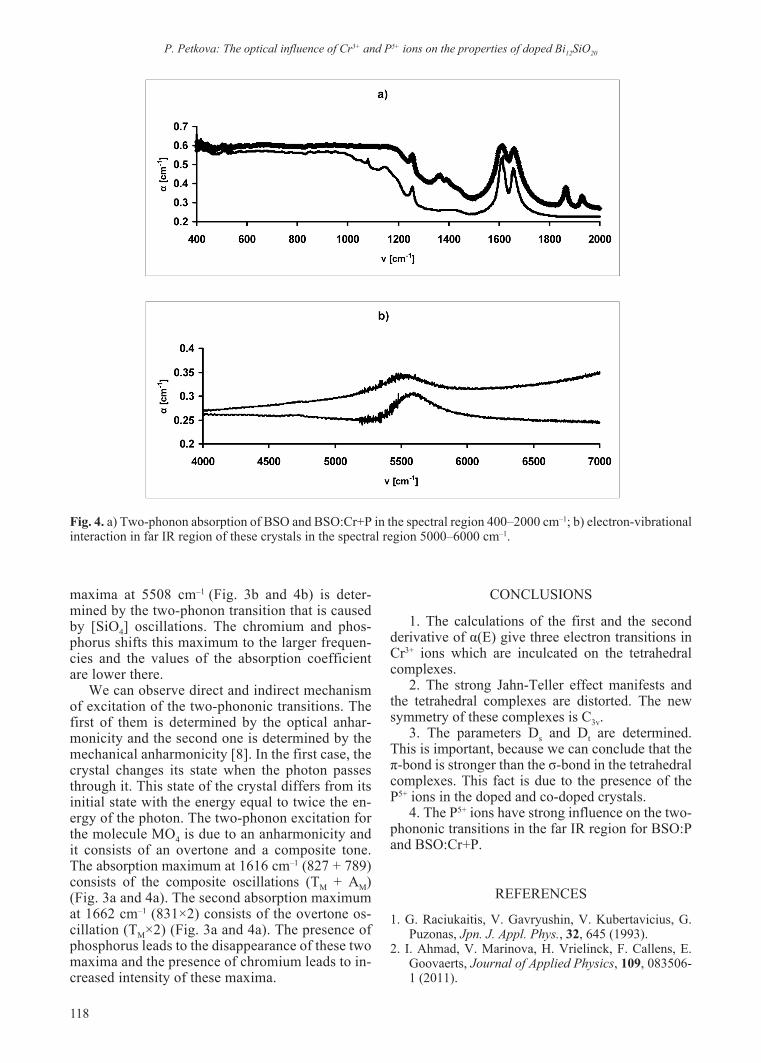
118
maxima at 5508 cm–1 (Fig. 3b and 4b) is deter-mined by the two-phonon transition that is caused by [SiO4] oscillations. The chromium and phos-phorus shifts this maximum to the larger frequen-cies and the values of the absorption coefficient are lower there.
We can observe direct and indirect mechanism of excitation of the two-phononic transitions. The first of them is determined by the optical anhar-monicity and the second one is determined by the mechanical anharmonicity [8]. In the first case, the crystal changes its state when the photon passes through it. This state of the crystal differs from its initial state with the energy equal to twice the en-ergy of the photon. The two-phonon excitation for the molecule MO4 is due to an anharmonicity and it consists of an overtone and a composite tone. The absorption maximum at 1616 cm–1 (827 + 789) consists of the composite oscillations (TM + AM) (Fig. 3a and 4a). The second absorption maximum at 1662 cm–1 (831×2) consists of the overtone os-cillation (TM×2) (Fig. 3a and 4a). The presence of phosphorus leads to the disappearance of these two maxima and the presence of chromium leads to in-creased intensity of these maxima.
P. Petkova: The optical influence of Cr3+ and P5+ ions on the properties of doped Bi12SiO20
CONCLUSIONS
1. The calculations of the first and the second derivative of α(E) give three electron transitions in Cr3+ ions which are inculcated on the tetrahedral complexes.
2. The strong Jahn-Teller effect manifests and the tetrahedral complexes are distorted. The new symmetry of these complexes is C3v.
3. The parameters Ds and Dt are determined. This is important, because we can conclude that the π-bond is stronger than the σ-bond in the tetrahedral complexes. This fact is due to the presence of the P5+ ions in the doped and co-doped crystals.
4. The P5+ ions have strong influence on the two-phononic transitions in the far IR region for BSO:P and BSO:Cr+P.
REFERENCES
1. G. Raciukaitis, V. Gavryushin, V. Kubertavicius, G. Puzonas, Jpn. J. Appl. Phys., 32, 645 (1993).
2. I. Ahmad, V. Marinova, H. Vrielinck, F. Callens, E. Goovaerts, Journal of Applied Physics, 109, 083506-1 (2011).
Fig. 4. a) Two-phonon absorption of BSO and BSO:Cr+P in the spectral region 400–2000 cm–1; b) electron-vibrational interaction in far IR region of these crystals in the spectral region 5000–6000 cm–1.

119
P. Petkova: The optical influence of Cr3+ and P5+ ions on the properties of doped Bi12SiO20
3. G. S. Nikolov, Structure and properties of the coor-dination compounds, Book Company “Science and Art”, Sofia, 1977.
4. R. Drago, Physical Methods in Chemistry, University of Illinois, Urbana, 1981.
5. D. S. McClure, Advances in the Chemistry of Coordina-tion Compounds, Macmillan, New york, 1961.
6. S. Chandra, L. Gupta, Spectrochimica Acta Part A 62, 1125 (2005).
7. V. Burkov, V. Gorelik, A. Egorysheva, yu. Kargin, Journal of Russian Laser Research 22, 243 (2001).
8. H. Poulet, J. P. Mathieu, Spectres de Vibration et Symétrie des Cristaux, Gordon and Breach, Paris – Londres – New york, 1970.
оптично Влияние на йоните Cr3+ и P5+ Върху сВойстВата на легирани Кристали от Bi12SiO20
п. петкова*
Шуменски Университет „Епископ Константин Преславски“, ул. „Университетска“ № 115, 9712 Шумен, България
постъпила на 15 февруари, 2012 г.; приетa на 20 април, 2012 г.
(резюме)
измерен е коефициентът на поглъщане на единични кристали от Bi12SiO20, легирани с фосфор и двойно легирани с хром и фосфор във видимата и в далечната ич област. определено е влиянието на йоните P5+ в двойно легирания силенит. представена е енергетичната диаграма на нивата на йона Cr3+. обяснен е ефектът на ян-телер в конкретните кристали. изчислени са също и параметрите на рака. определен е директният и индиректният механизъм на двуфононното поглъщане в далечната ич област.

120
* To whom all correspondence should be sent:E-mail: [email protected]
© 2012 Bulgarian Academy of Sciences, Union of Chemists in Bulgaria
Bulgarian Chemical Communications, Volume 44, Proceedings of the IIIrd National Crystallographic Symposium (pp. 120–123) 2012
The electron-phonon interaction in Bi12SiO20 doped with Fe3+, Cr3+ and P5+ ions
P. Petkova*
Shumen University “Konstantin Preslavsky”, 115 Universitetska street, 9712 Shumen, Bulgaria
Received February 15, 2012; Revised April 23, 2012
The absorption coefficient of Bi12SiO20:Fe, Bi12SiO20:P and Bi12SiO20:Cr+P single crystals is measured in the spectral region of Urbach’s rule (2.5–3.1 eV) at room temperature. The parameters of electron-phonon interaction, Urbach’s energy and the constants of Urbach’s rule are calculated. It is established the behavior of the donors Fe3+ and Cr3+ and this of the acceptor P5+ in Urbach’s rule region.
Key words: doped sillenites, Urbach’s rule, electron-phonon interaction, Urbach’s energy.
INTRODUCTION
The crystals Bi12SiO20 are piezoelectric, electro- and magnetooptic materials. The optical activity, photoconductivity and photorefractivity are a char-acteristic for BSO and their combination allow the use of these materials in various acousto and opto-electronic devices (piezo sensors, space-time light modulators etc.) [1, 2, 3, 4]. The doping of these crystals with different impurities change their phys-ical and chemical properties. Therefore, the elec-tron-phonon interaction is discussed in doped BSO and then it is compared with the same interaction in these materials in the frame of this work.
EXPERIMENTAL
The investigated BSO crystals, either undoped or doped with Cr, P and co-doped with Cr+P were grown from stoichiometric melts Bi2O3:SiO2 = 6:1 using the Czochralski method under conditions de-scribed in detail elsewhere [5]. High purity Bi2O3, SiO2, Cr2O3 and P2O5 were used for syhthesis and doping. The concentration of P5+ is 1.6×10²⁰ N/cm–1 in BSO:P and the concentration of this ion is 1.13×10²⁰ N/cm–1 in BSO:Cr+P. The Cr3+ ions are inculcated on the BSO:Cr with the concentra-tion 8.6×10¹⁸ N/cm–1 and these ions are inculcated
on the co-doped crystal with the concentration 8.1×10¹⁶ N/cm–1. The thickness of the samples is as follows: dBSO:Cr+P = 0.101 cm, dBSO:P = 0.062 cm.
The Fe3+ ions were inculcated on the crystal lat-tice as Fe2O3 oxide. The concentration of Fe dopant 1.4x10¹⁸ N/cm–3 into the grown crystal was deter-mined by flame (Zeeman 3030) and electro-thermal atomic (Varian 240) absorption spectrometry. The thickness of BSO:Fe is dBSO:Fe = 0.152 cm and the thickness of the undoped sample is dBSO = 0.04 cm. The experimental set up for measurement of the absorption coefficient in the visible region consists of the following: a halogen lamp with a stabilized 3H-7 rectifier, a SPM-2 monochromator, a system of quartz lenses, a polarizer, a crystal sample hold-er, and a Hamamatsu S2281-01 detector.
The experimental dependence lnα(E) for all the investigated crystals is presented in Fig. 1. Urbach’s rule for undoped and doped BSO in the spectral re-gion 2.5–3.1 eV is shown in Fig. 2. Urbach’s en-ergy for the undoped and doped Bi12SiO20 is pre-sented in Fig. 3.
RESULTS AND DISCUSSION
The behaviour of the absorption coefficient α has been investigated at the absorption edge using the Urbach’s formula lnα = A+B(ħω/T), where A and B are the constants, T is the temperature. The con-stant B is expressed by the dependence B = σ(T)/k, where σ(T) is the parameter characterizing the slope of the absorption edge, k is the Boltzmann constant. The value of σ(T) is 0.27 for Bi12SiO20 and σ(T) var-

121
ies from 0.32 to 0.88 in the case of doped Bi12SiO20 (Table 1). The BSO:Fe has a value of σ(T) close to that of undoped sample. The value of the parameter σ(T) is biggest for P5+ ions. This is the reason for the bigger value of this parameter for co-doped BSO.
On the other hand, we have the next equation Wd = kT/σ [6]. The magnitude Wd describes the broadening of the absorption edge due to the dy-namic disorder. When the temperature is higher, the absorption edge is wider due to the dynamic disor-der in the crystal lattice. Wd = 96 meV for undoped BSO and Wd = 29–81 meV for doped BSO (Table 1). Therefore, we can generalize that the absorption edge of BSO:P has smallest dynamic disorder in the crystal lattice due to the phosphorus. Therefore this fact, the dynamic disorder has small value in BSO:Cr+P. The Fe3+ leads to the large dynamic dis-order in the doped sillenites. The σ(T) and Wd are calculated at room temperature (T = 300 K).
The approximation of the experimental data shows that σ(T) = σ0(2kT/hν0)th(hν0/2kT), where hν0 is the energy of the effective phonons, strongly interacting with photons, and σ0 is the high tem-perature constant [7]. The magnitude hν0 for our in-vestigated crystals corresponds to the energy hν0 =
P. Petkova: The electronphonon interaction in Bi12SiO20 doped with Fe3+, Cr3+ and P5+ ions
31.7 meV of the longitudinal optical phonons (ω = 257 cm–1) which are observed in the IR absorption spectra of BSO [8].
In our case, the obtained values of σ0 are as fol-lows: σ0 = 0.27 (Bi12SiO20) and σ0 = 0.32 – 0.88 (doped Bi12SiO20) (Table 1). When we compare the values of σ0 for our samples with the values of the same constant, obtained in [9], we can summarize that our undoped sillenite has a small surplus of Bi ions in the crystal lattice.
The dependence g = 2/3σ0 determines the strength of the electron-phonon interaction [8]. When g > 1, the electron-phonon interaction is strong. This strength has a highest value (g = 2.47) for undoped BSO and g = 0.76 – 2.08 for doped BSO (Table 1). Therefore, we can conclude that the impurity ions reduce this interaction in the crystal lattice. The P5+ ions make the electron-phonon interaction very weak in the sillenites. Therefore the electron-pho-non interaction is a weaker in BSO:Cr+P. On the other hand, the Fe3+ ions lead to the strong electron-phonon interaction in BSO:Fe.
The Urbach’s region for undoped BSO is almost the same as for the sample BSO:Fe (Fig. 2). The Urbach’s region is shifted (2.8–3.1 eV) for BSO:P
Table 1. The parameters which are characterized the Urbach’s rule region
sillenitesat T = 300 K σ σ0 g Wd [meV] E0 [meV] σa[cm2]
Bi12SiO20 0.27 0.27 2.47 96 301 –Bi12SiO20:Fe 0.32 0.32 2.08 81 239 1.83×10⁻¹⁸
Bi12SiO20:Cr+P 0.52 0.52 1.28 50 154 7.91×10⁻¹⁷
Bi12SiO20:P 0.88 0.88 0.76 29 97 4.87×10⁻¹⁷
Fig. 1. The experimental de-pendence lnα(E) for all the investigated crystals

122
P. Petkova: The electronphonon interaction in Bi12SiO20 doped with Fe3+, Cr3+ and P5+ ions
and BSO:Cr+P. It is interesting that the phospho-rus shifts the Urbach’s region to the biggest ener-gies. Therefore the absorption edge is shifted to the smallest wavelengths for BSO:P (Fig. 1).
The Urbach’s energy is connected with the car-rier impurity interaction, the carrier–phonon inter-action and the structural disorder [10]. That is why this energy is calculated by the formula Eu = α(E)/
(dα/dE). The Eu is not a constant for undoped and Fe doped crystals in the spectral region 2.5–3.1 eV. The values of the Urbach’s energy of the BSO:Fe are smaller than the Eu of the BSO (Fig. 3a). The pa-rameter E0 = 1/[d(lnα)/d(hν)] is known as Urbach’s slope [11]. We can see the values of E0 at T = 300 K in Table 1 for undoped, doped and co-doped BSO. Next step in the calculations is the determination of
Fig. 3. Urbach’s energy for the un-doped and doped Bi12SiO20
Fig. 2. Urbach’s rule for undoped and doped BSO in the spectral region 2.5–3.1 eV

123
P. Petkova: The electronphonon interaction in Bi12SiO20 doped with Fe3+, Cr3+ and P5+ ions
the cross-section of the impurity absorption [12]. It is very important to establish how the radiation is absorbed by the impurity ions in the crystals. The total cross-section σa of the impurity absorption is defined by the integration within the absorption band of the impurity ions
,
where N is the number of the impurity ions in the unit volume, α is the impurity absorption coeffi-cient typical of an energetic interval from E1 to E2. For the investigated crystals here E1 = 2.5 eV and E2 = 3.1 eV. The cross-section σa can vary signifi-cantly from one absorption band to another. The value of σa is smallest for the crystal BSO:Fe and it is biggest for the co-doped BSO (Table1).
CONCLUSIONS
1. The parameter σ has the biggest value for BSO:P, but the electron-phonon interaction is the lowest in this case. The dynamic disorder in the crystal lattice is the smallest again in BSO:P. The value of the parameter E0 is the smallest for the same crystal.
2. The acceptor P5+ has the greatest impact on the value of the cross-section σa.
3. The Urbach’s energy for BSO:Fe in the spec-tral region 2.5–2.8 eV follows the shape of this en-ergy for BSO. The shape of the Urbach’s energy for BSO:Cr+P and BSO:P is the same.
REFERENCES
1. T. Panchenko, K. Strelets, Condensed Matter Physics, 10, 289 (2007).
2. D. Nesheva, Z. Aneva, M. Gospodinov, J. Phys. Chem. Solids, 54, 857 (1993).
3. D. Nolte, Condensed Matt. News, 1, 17 (1992).4. N. Vainos, M. Gower, Opt. Lett., 16, 363 (1991).5. I. Ahmad, V. Marinova, H. Vrielinck, F. Callens, E.
Goovaerts, Journal of Applied Physics, 109, 083506-1 (2011).
6. V. Kunets, N. Kulish, Vas. Kunets, M. Lisitsa, Semiconductor Physics, Quantum Electronics & Optoelectronics 5, 9 (2002).
7. M. Kurik, Phys. Status Solidi (a) 8, 9 (1971).8. W. Woidovsky, T. Lukasiewicz, W. Nazariwicz, J.
Zmija, Phys. Status Solidi (b) 94, 649 (1979).9. T. Panchenko, S. Kopylova, yu. Osetskié, Solid
State Physics 37, 1415 (1995).10. Sk. Faruque Ahmed, Myoung-Woon Moon, Kwang-
Ryeol Lee, Thin Solid Films 517, 4035 (2009).11. I.A. Vainshtein, A.F. Zatsepin, V.S. Kortov, Glass
Phys. Chem. 25, 67 (1999).12. Optical Properties of Condensed Matter and
Applications, Edited by Jai Singh, John Wiley & Sons, 2006.
елеКтрон-фононно ВЗаимодейстВие В Bi12SiO20, легиран с йоните Fe3+, Cr3+ и P5+
п. петкова*
Шуменски Университет „Епископ Константин Преславски“, ул. „Университетска“ №115, 9712 Шумен, България
постъпила на 15 февруари, 2012 г.; приетa на 23 април, 2012 г.
(резюме)
измерен е коефициентът на поглъщане на единичните кристали Bi12SiO20:Fe, Bi12SiO20:P и Bi12SiO20:Cr+P в спектралния диапазон на правилото на урбах (2,5–3,1 eV) при стайна температура. изчислени са параметрите на електрон-фононното взаимодействие, енергията на урбах и константите, участващи в правилото на урбах. установено е влиянието на донорите Fe3+ и Cr3+, както и това на акцептора P5+ в областта на урбах.

124
* To whom all correspondence should be sent:E-mail: [email protected]
© 2012 Bulgarian Academy of Sciences, Union of Chemists in Bulgaria
Bulgarian Chemical Communications, Volume 44, Proceedings of the IIIrd National Crystallographic Symposium (pp. 124–130) 2012
Classification of step bunching phenomena
V. Tonchev
Institute of Physical Chemistry, Bulgarian Academy of Sciences, 1113 Sofia, Bulgaria
Received March 20, 2012; Revised May 15, 2012
The classification of bunching of straight steps on vicinal crystal surfaces identifies two types according to the behavior of the minimal step-step distance in the bunch lmin with increasing the number of steps N in it. In the B1-type lmin remains constant while in the B2-type it decreases. Both types are illustrated by new results for well-known mod-els. The precise numerical analysis is aimed at the intermediate asymptotic regime where self-similar spatiotemporal patterns develop. In the model of Tersoff et al. the regular step train is destabilized by step-step attraction of infinite range. It is shown that this model belongs to the B1-type and the same time-scaling exponent of 1/5 for N, terrace width and bunch width is obtained. An extended set of scaling exponents is obtained from the model of S.Stoyanov of diffusion-limited evaporation affected by electromigration of the adatoms. This model is of B2-type and shows a systematic shift of the exponents with respect to the predictions of the hypothesis for universality classes in bunching thus requiring further modification of it.
Key words: Vicinal crystal surface, Step-step interactions, Step bunching, Modeling and simulation, Scaling and universality, classification.
RETROSPECTIVE
The most intensive studies of the bunching of straight steps on vicinal crystal surfaces were initiated by the discovery of Latyshev et al. [1] – equally spaced steps gather in groups in result of resistive DC-heating of Si(111)-vicinals (surfaces of a monocrystal that are slightly deviated from the (111)-plane and the result is sequence of straight equidistant monoatomic steps). A theoretical ex-planation of the phenomenon was suggested by Stoyanov [2] who identified as source of the in-stability the electromigration of Si-adatoms which causes bias of the surface diffusion and thus uneven contribution of the two terraces adjacent to a step to its motion. In these initial years the theoretical efforts were focused on understanding and predict-ing the initial stages of the process – the way the instability arises and grows further. More recently were addressed [3–5] also the late stages of the process when the instability is well developed and enters into the so called intermediate asymptotic re-gime [6] in which the surface morphology becomes self-similar both in space and in time. The adequate description of this regime is given in terms of scal-
ing laws which include a combination of model parameters, length-scale(s) of the phenomenon and time. There are several reasons for the continuing interest in bunching studies: (i) the so called step flow growth mode is the important one from tech-nological point of view; (ii) bunched surfaces are nowadays used as templates for bottom-up strate-gies to grow nanostructures [7]; (iii) this is a clear and very rich case of surface self-organization after the system is driven out of equilibrium [8] and op-posite tendencies compete – surface destabilization due to various kinetic or thermodynamic factors op-posed by the omnipresent step-step repulsion which favors the equidistant step distribution.
CLASSIFICATION
The classification was introduced recently by Staneva et al. [9]. The step bunching phenomena are classified according to the behavior of the minimal step-step distance in the bunch lmin with increasing the number of step N in it as shown in the Table 1.
There are several reasons that hindered formula-tion of the classification in the years: (i) the commu-nities that carry out active research on the two types practically do not overlap; (ii) the property of con-stant lmin was not explicitly recognized in the model studies of the B1-type [10, 11]; (iii) the number of necessary length-scales to describe the step bunch-
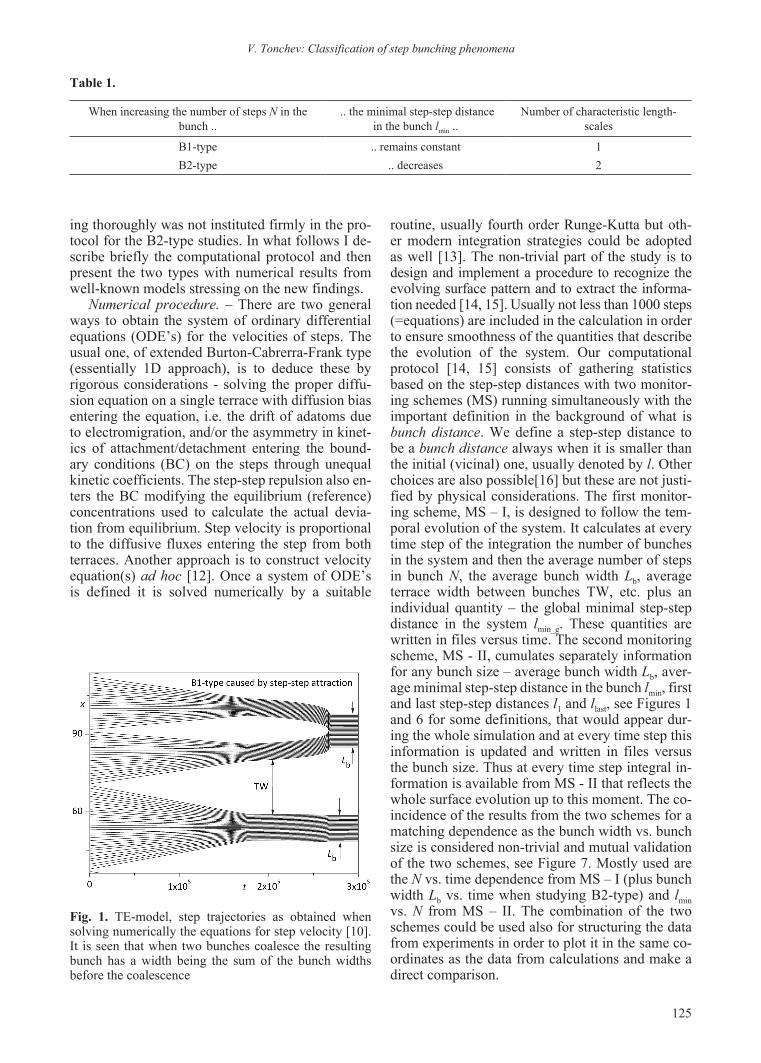
125
ing thoroughly was not instituted firmly in the pro-tocol for the B2-type studies. In what follows I de-scribe briefly the computational protocol and then present the two types with numerical results from well-known models stressing on the new findings.
Numerical procedure. – There are two general ways to obtain the system of ordinary differential equations (ODE’s) for the velocities of steps. The usual one, of extended Burton-Cabrerra-Frank type (essentially 1D approach), is to deduce these by rigorous considerations - solving the proper diffu-sion equation on a single terrace with diffusion bias entering the equation, i.e. the drift of adatoms due to electromigration, and/or the asymmetry in kinet-ics of attachment/detachment entering the bound-ary conditions (BC) on the steps through unequal kinetic coefficients. The step-step repulsion also en-ters the BC modifying the equilibrium (reference) concentrations used to calculate the actual devia-tion from equilibrium. Step velocity is proportional to the diffusive fluxes entering the step from both terraces. Another approach is to construct velocity equation(s) ad hoc [12]. Once a system of ODE’s is defined it is solved numerically by a suitable
routine, usually fourth order Runge-Kutta but oth-er modern integration strategies could be adopted as well [13]. The non-trivial part of the study is to design and implement a procedure to recognize the evolving surface pattern and to extract the informa-tion needed [14, 15]. Usually not less than 1000 steps (=equations) are included in the calculation in order to ensure smoothness of the quantities that describe the evolution of the system. Our computational protocol [14, 15] consists of gathering statistics based on the step-step distances with two monitor-ing schemes (MS) running simultaneously with the important definition in the background of what is bunch distance. We define a step-step distance to be a bunch distance always when it is smaller than the initial (vicinal) one, usually denoted by l. Other choices are also possible[16] but these are not justi-fied by physical considerations. The first monitor-ing scheme, MS – I, is designed to follow the tem-poral evolution of the system. It calculates at every time step of the integration the number of bunches in the system and then the average number of steps in bunch N, the average bunch width Lb, average terrace width between bunches TW, etc. plus an individual quantity – the global minimal step-step distance in the system lmin_g. These quantities are written in files versus time. The second monitoring scheme, MS - II, cumulates separately information for any bunch size – average bunch width Lb, aver-age minimal step-step distance in the bunch lmin, first and last step-step distances l1 and llast, see Figures 1 and 6 for some definitions, that would appear dur-ing the whole simulation and at every time step this information is updated and written in files versus the bunch size. Thus at every time step integral in-formation is available from MS - II that reflects the whole surface evolution up to this moment. The co-incidence of the results from the two schemes for a matching dependence as the bunch width vs. bunch size is considered non-trivial and mutual validation of the two schemes, see Figure 7. Mostly used are the N vs. time dependence from MS – I (plus bunch width Lb vs. time when studying B2-type) and lmin vs. N from MS – II. The combination of the two schemes could be used also for structuring the data from experiments in order to plot it in the same co-ordinates as the data from calculations and make a direct comparison.
V. Tonchev: Classification of step bunching phenomena
Table 1.
When increasing the number of steps N in the bunch ..
.. the minimal step-step distance in the bunch lmin ..
Number of characteristic length-scales
B1-type .. remains constant 1B2-type .. decreases 2
Fig. 1. TE-model, step trajectories as obtained when solving numerically the equations for step velocity [10]. It is seen that when two bunches coalesce the resulting bunch has a width being the sum of the bunch widths before the coalescence
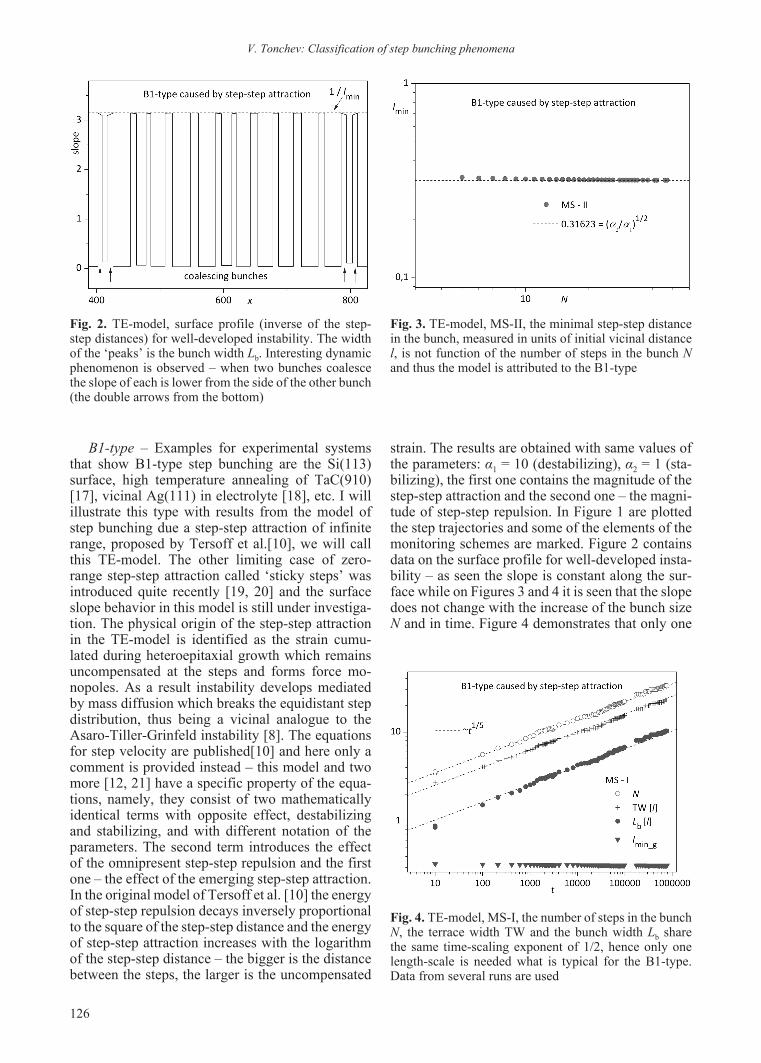
126
B1type – Examples for experimental systems that show B1-type step bunching are the Si(113) surface, high temperature annealing of TaC(910) [17], vicinal Ag(111) in electrolyte [18], etc. I will illustrate this type with results from the model of step bunching due a step-step attraction of infinite range, proposed by Tersoff et al.[10], we will call this TE-model. The other limiting case of zero-range step-step attraction called ‘sticky steps’ was introduced quite recently [19, 20] and the surface slope behavior in this model is still under investiga-tion. The physical origin of the step-step attraction in the TE-model is identified as the strain cumu-lated during heteroepitaxial growth which remains uncompensated at the steps and forms force mo-nopoles. As a result instability develops mediated by mass diffusion which breaks the equidistant step distribution, thus being a vicinal analogue to the Asaro-Tiller-Grinfeld instability [8]. The equations for step velocity are published[10] and here only a comment is provided instead – this model and two more [12, 21] have a specific property of the equa-tions, namely, they consist of two mathematically identical terms with opposite effect, destabilizing and stabilizing, and with different notation of the parameters. The second term introduces the effect of the omnipresent step-step repulsion and the first one – the effect of the emerging step-step attraction. In the original model of Tersoff et al. [10] the energy of step-step repulsion decays inversely proportional to the square of the step-step distance and the energy of step-step attraction increases with the logarithm of the step-step distance – the bigger is the distance between the steps, the larger is the uncompensated
V. Tonchev: Classification of step bunching phenomena
strain. The results are obtained with same values of the parameters: α1 = 10 (destabilizing), α2 = 1 (sta-bilizing), the first one contains the magnitude of the step-step attraction and the second one – the magni-tude of step-step repulsion. In Figure 1 are plotted the step trajectories and some of the elements of the monitoring schemes are marked. Figure 2 contains data on the surface profile for well-developed insta-bility – as seen the slope is constant along the sur-face while on Figures 3 and 4 it is seen that the slope does not change with the increase of the bunch size N and in time. Figure 4 demonstrates that only one
Fig. 2. TE-model, surface profile (inverse of the step-step distances) for well-developed instability. The width of the ‘peaks’ is the bunch width Lb. Interesting dynamic phenomenon is observed – when two bunches coalesce the slope of each is lower from the side of the other bunch (the double arrows from the bottom)
Fig. 3. TE-model, MS-II, the minimal step-step distance in the bunch, measured in units of initial vicinal distance l, is not function of the number of steps in the bunch N and thus the model is attributed to the B1-type
Fig. 4. TE-model, MS-I, the number of steps in the bunch N, the terrace width TW and the bunch width Lb share the same time-scaling exponent of 1/2, hence only one length-scale is needed what is typical for the B1-type. Data from several runs are used

127
V. Tonchev: Classification of step bunching phenomena
time-scaling exponent is found for three different quantities – N, terrace width and bunch width and it is 1/5, different from 1/4 as found by Tersoff et al. [10]. The reasons for this difference are still unclear and subject to further studies.
B2type – Some typical examples for experi-mental systems that show B2-type of step bunch-ing, besides the most studied one – that of evaporat-ing Si(111)-vicinals [1], are the KDP crystal growth [22, 23] and SiC epitaxial growth [24] although the latter shows quite rich bunching behavior and at-tribution to the B1-type is also possible after careful analysis of the experimental data using our system-atic approach. I will illustrate this type with results on the model of diffusion limited vicinal evapora-tion already studied by Stoyanov and Tonchev [3] (called here EvEm-model) and the reason for this revisit is that the original study was restricted by the computational power at that time to the method of single bunch. Later on specially designed experi-ments [25] have shown that the process of Si(111) vicinal evaporation is actually controlled by the dif-fusion of the Si-adatoms on the terraces rather than by the attachment/detachment kinetics at the steps as suggested by a later study [16]. Very recently sophisticated experimental setup was developed [26] that would permit to study the time depend-encies describing thoroughly the bunching process. As usually, systematic numerical studies play im-portant role in planning experimental strategy and understanding its results.
The equations for step velocity are rather com-plex [3] and I will not adduce them here. Also, the original values of the parameters are preserved and only the parameter that contains the magnitude of the step-step repulsion is increased approximately thrice in order to permit faster computations. The reason is that in the method of single bunch used [3] one deals with systems of maximum 60–70 equa-tions (steps) while in the present computation are included 1000 steps. The initial vicinal geometry comprises steps randomly deviated from their equi-distant positions in order to permit development of the instability in a way similar to the real one. As for the previous, TE-model, these calculations in-clude only the value n=2 from the step-step repul-sion law, i.e. the repulsion energy decays with the inverse square of the step-step distance. The bunch-ing process in the EvEm model is illustrated qualita-tively by the step trajectories, Figure 5, and surface slope, Figure 6, and quantities that are monitored are marked.
Next are shown the studies of the size-scaling (MS-II), first of the bunch width Lb, Figure 7, and then of the minimal, first and last step-step distance, Figure 8. Together with the studies of the time-scal-ing (MS-I) of the relevant quantities, Figure 9, these
Fig. 5. Step trajectories in the model of diffusion limited vicinal evaporation affected by electromigration of the adatoms (EvEm-model). Every step moves in the up direction mediating the vicinal surface evaporation. It is well seen how bunches split in two
Fig. 6. EvEm-model, surface profile for well developed instability. With arrows are shown the places where appear some of the quantities used by the monitoring schemes. The higher slope is in the bunch with more steps (the right one), hence B2-type
scaling exponents form a set that could be compared with the predictions of the universality classes in bunching hypothesis [16, 27]. Here I will only stress that the comparison leads to the following conclu-sion: the set of obtained exponents with n=2, corre-sponds to the originally predicted for n=0 and thus is systematically shifted down in n with 2. There is still no explanation for such a shift and thus the present results are a challenge for further modifica-tion of the continuum equation which reflects the hypothesis of universality.
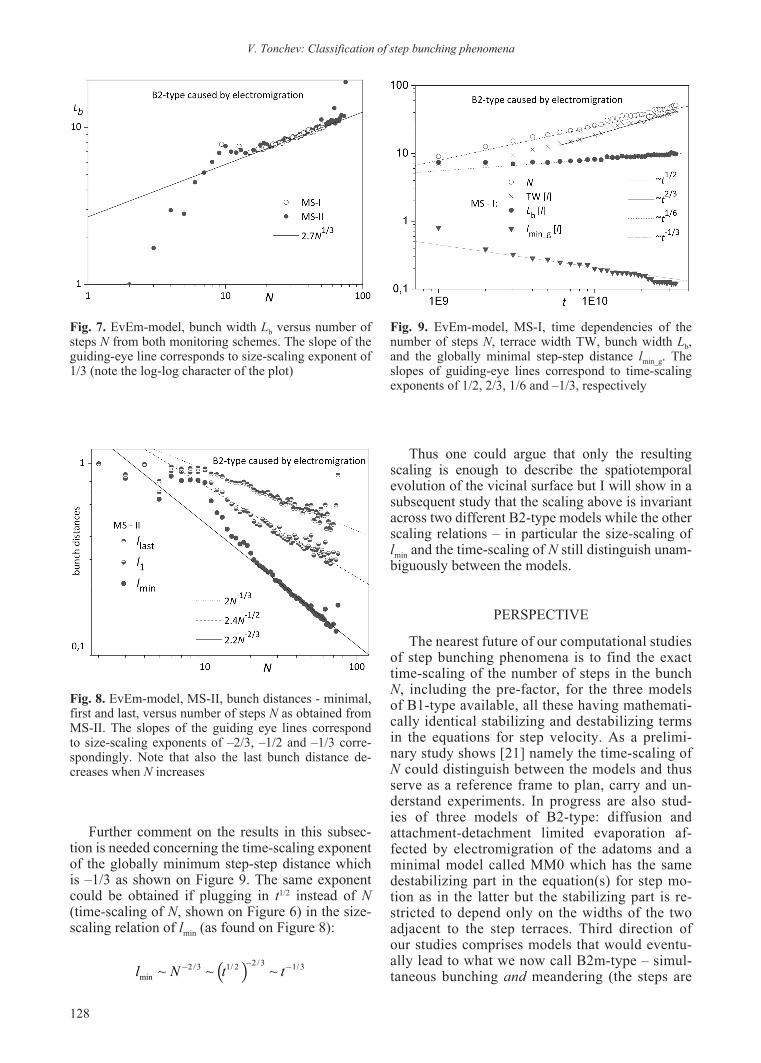
128
Further comment on the results in this subsec-tion is needed concerning the time-scaling exponent of the globally minimum step-step distance which is –1/3 as shown on Figure 9. The same exponent could be obtained if plugging in t1/2 instead of N (time-scaling of N, shown on Figure 6) in the size-scaling relation of lmin (as found on Figure 8):
Thus one could argue that only the resulting scaling is enough to describe the spatiotemporal evolution of the vicinal surface but I will show in a subsequent study that the scaling above is invariant across two different B2-type models while the other scaling relations – in particular the size-scaling of lmin and the time-scaling of N still distinguish unam-biguously between the models.
PERSPECTIVE
The nearest future of our computational studies of step bunching phenomena is to find the exact time-scaling of the number of steps in the bunch N, including the pre-factor, for the three models of B1-type available, all these having mathemati-cally identical stabilizing and destabilizing terms in the equations for step velocity. As a prelimi-nary study shows [21] namely the time-scaling of N could distinguish between the models and thus serve as a reference frame to plan, carry and un-derstand experiments. In progress are also stud-ies of three models of B2-type: diffusion and attachment-detachment limited evaporation af-fected by electromigration of the adatoms and a minimal model called MM0 which has the same destabilizing part in the equation(s) for step mo-tion as in the latter but the stabilizing part is re-stricted to depend only on the widths of the two adjacent to the step terraces. Third direction of our studies comprises models that would eventu-ally lead to what we now call B2m-type – simul-taneous bunching and meandering (the steps are
V. Tonchev: Classification of step bunching phenomena
Fig. 7. EvEm-model, bunch width Lb versus number of steps N from both monitoring schemes. The slope of the guiding-eye line corresponds to size-scaling exponent of 1/3 (note the log-log character of the plot)
Fig. 8. EvEm-model, MS-II, bunch distances - minimal, first and last, versus number of steps N as obtained from MS-II. The slopes of the guiding eye lines correspond to size-scaling exponents of –2/3, –1/2 and –1/3 corre-spondingly. Note that also the last bunch distance de-creases when N increases
Fig. 9. EvEm-model, MS-I, time dependencies of the number of steps N, terrace width TW, bunch width Lb, and the globally minimal step-step distance lmin_g. The slopes of guiding-eye lines correspond to time-scaling exponents of 1/2, 2/3, 1/6 and –1/3, respectively
( ) 2 / 32 / 3 1/ 2 1/ 3min ~ ~ ~l N t t
-- -

129
V. Tonchev: Classification of step bunching phenomena
no more straight but wavy or meandered), which phenomenon is still anti-paradigmatic in a sense that in the paradigm the preconditions for bunch-ing – normal Ehrlich-Schwoebel effect in (vici-nal) evaporation or inverse Ehrlich-Schwoebel ef-fect in (vicinal) growth, and meandering – normal Ehrlich-Schwoebel effect in growth or inverse Ehrlich-Schwoebel effect in evaporation cannot be realized simultaneously (downstep electromi-gration of the adatoms destabilizes both growing and evaporating vicinal surfaces). Nevertheless, there is sufficient experimental evidence both on metal [28, 29] and semiconductor [30] vicinal surfaces for simultaneous bunching and meander-ing although the instability scenario is somewhat different. The bunches of B2m-type are expected to have their minimal step-step distance (largest slope) in the beginning of the bunches [14] rather than in the middle as seen on Figure 6 for the B2-type. Quite recently similar type of behavior was reported [31] in a KMC study of evaporating vici-nal surface of GaN(0001).
Acknowledgments: Our present HPC facility MADARA was built with the prevailing financial support from the Bulgarian National Science Fund through grant No. ДОО02-52/RNF01/0110. Some financial support from the same fund through IRC CoSiM grant is also appreciated.
REFERENCES
1. A. V. Latyshev, A. L. Aseev, A. B. Krasilnikov, S. I. Stenin, Surf. Sci., 213, 1, 169 (1989).
2. S. Stoyanov, Jap. J. Appl. Phys., 30, 1, 1 (1991). 3. S. Stoyanov, V. Tonchev, Phys. Rev. B, 58, 3, 1590
(1998). 4. D.-J. Liu, J. D. Weeks, Phys. Rev. B, 57, 23, 14891
(1998). 5. M. Sato, M. Uwaha, Surf. Sci., 442, 318 (1999). 6. G. I. Barenblat, Scaling, self-similarity and interme-
diate asymptotics, CUP, Cambridge, 1996.7. I. Berbezier, A. Ronda, Surf. Sci. Rep., 64, 47
(2009).
8. C. Misbah, O. Pierre-Louis, y. Saito, Rev. Mod. Phys., 82, 981 (2010).
9. D. Staneva, B. Ranguelov, V. Tonchev, CR Acad.Bulg. Sci., 65, 8, 1051, (2012).
10. J. Tersoff, y. H. Phang, Z. Zhang, M. G. Lagally, Phys. Rev. Lett., 75, 2730 (1995).
11. F. Liu, J. Tersoff, M. G. Lagally, Phys. Rev. Lett., 80, 1268 (1998).
12. B. Ranguelov, V. Tonchev, C. Misbah, in: Nano-science and Nanotechnology 6, E. Balabanova and I. Dragieva (eds.), Heron Press, Sofia, 2006.
13. W. H. Press, S. A. Teukolski, W. T. Vetterling, B. P. Flannery, Numerical Recipes in Fortran 77, CUP, Cambridge, 1997.
14. V. Tonchev, B. Ranguelov, H. Omi, A. Pimpinelli, Eur. Phys. J. B, 73, 539 (2010).
15. D. Staneva, B. Ranguelov, V. Tonchev, in: Nano-science and Nanotechnology 10, E. Balabanova and I. Dragieva (eds.), Heron Press, Sofia, 2010.
16. J. Krug, V. Tonchev, S. Stoyanov, A. Pimpinelli, Phys. Rev. B, 71, 045412 (2005).
17. J. K. Zuo, T. Zhang, J. F. Wendelken, D. M. Zehner, Phys. Rev. B, 63, 334041 (2001).
18. S. Baier, H. Ibach, M. Giesen, Surf. Sci., 573, 17 (2004).
19. N. Akutsu, J. Cryst. Growth, 318, 1, 10 (2011).20. N. Akutsu, J. Phys.: Cond. Matt., 23, 485004 (2011).21. V. Tonchev, B. Ranguelov, D. Staneva, arXiv:1011.
1863v1.22. N. A. Booth, A. A. Chernov, P. G. Vekilov, Journal
of Crystal Growth, 237-239, 1818 (2002).23. P. Vekilov, private communication. 24. M. Syväjärvi, R. yakimova, E. Janzén, Journal of
Crystal Growth, 236, 297 (2002).25. B. J. Gibbons, S. Schaepe, J. P. Pelz, Surf. Sci., 600,
2417 (2006).26. V. Usov, C. O. Coileain, I. V. Shvets, Phys. Rev. B,
82, 153301 (2010).27. A. Pimpinelli, V. Tonchev, A. Videcoq, M.
Vladimirova, Phys. Rev. Lett., 88, 206103 (2002). 28. N. Neel, T. Maroutian, L. Douillard, H.-J. Ernst,
Phys. Rev. Lett., 91, 226103 (2003). 29. N. Neel, T. Maroutian, L. Douillard, H.-J. Ernst, J.
PhysCond. Matt., 15, S3227 (2003). 30. H. Omi, y. Homma, V. Tonchev, A. Pimpinelli,
Phys. Rev. Lett., 95, 216101 (2005).31. M. A. Załuska-Kotur, F. Krzyżewski, J. Appl. Phys.,
111, 114311 (2012).

130
V. Tonchev: Classification of step bunching phenomena
КласифиКация на яВленията на групиране
В. тончев
Институт по Физикохимия, Българска Академия на Науките, 1113 София, България
постъпила на 20 март, 2012 г.; приетa на 15 май, 2012 г.
(резюме)
Класификацията на групирането на прави стъпала върху вицинални кристални повърхности обособява два типа според поведението на минималното разстояние в групата lmin с нарастване на броя стъпала в нея N. В B1-типа lmin остава постоянно докато в B2-типа то намалява. двата типа са илюстрирани с нови резултати за известни модели. точният числен анализ е насочен към режима на междинна асимптотика, в който се формират самоподобни пространствено-времеви структури. В модела на терсоф и сътр. поредицата равно-отдалечени стъпала е дестабилизирана от междустъпално привличане с безкраен обхват. показано е, че този модел принадлежи към B1-типа и степента 1/5 е получена за времевото поведение на N, ширината на терасата между групите и ширината на самите групи. една разширена поредица от степени е получена за модела на с. стоянов на дифузионно-контролирано изпарение, повлияно от електромиграция на адатомите. този модел е от B2-тип и показва систематично отместване на степените спрямо предсказанията на хипотезата за класове на универсалност в групирането, което налага по-нататъшна ѝ модификация.

131
* To whom all correspondence should be sent:E-mail: [email protected]
© 2012 Bulgarian Academy of Sciences, Union of Chemists in Bulgaria
Bulgarian Chemical Communications, Volume 44, Proceedings of the IIIrd National Crystallographic Symposium (pp. 131–136) 2012
Parawollastonite (wollastonite-2M polytype) from the skarns in Zvezdel pluton, Eastern Rhodopes – a single crystal study
y. Tzvetanova*, M. Kadyiski, O. Petrov
Institute of Mineralogy and Crystallography, Bulgarian Academy of Sciences, 1113 Sofia, Acad. Georgi Bonchev Str., Bl. 107
Received June 20, 2012; Revised July 9, 2012
The wollastonite polytype in three samples from different zones of skarns in Zvesdel pluton was determined by single-crystal XRD structure refinement. The studied wollastonite crystals are nearly pure CaSiO3 but containing a few tenths of FeO wt.% (determined using microprobe analysis). The structure refinement confirmed the monoclinic symmetry of the studied samples (space group P21/a and unit cell parameters a = 15.413(17) Å, b = 7.336(5) Å, c = 7.070(3) Å, β = 95.24(5)° for the crystal from the plagioclase-pyroxene-wollastonite+garnet zone; a = 15.409(7) Å, b = 7.320(3) Å, c = 7.063(2) Å, β = 95.36(3)° – wollastonite from the plagioclase-pyroxene-wollastonite zone, and a = 15.3770(11) Å, b = 7.2990(4) Å, c = 7.0491(5) Å, β = 95.340(6)° – wollastonite from the plagioclase-pyroxene-wollastonite+epidote zone). The latter structure was refined to R1 = 0.0521 and R(all) = 0.0754 using 1970 unique reflections. The Si–O bond lengths vary between 1.580(3) and 1.667(3) Å (mean 1.624 Å), Ca–O bond lengths be-tween 2.251(3) and 2.662(3) Å (mean 2.390 Å), and the Si–O–Si angles are 140.03(17), 139.39(18), and 150.81(18)° (mean 143.31°).
The proved monoclinic wollastonite (wollastonite-2M) is regarded as a higher temperature polytype with respect to the triclinic one. The presence only of the wollastonite-2M polytype in the studied skarns indicates longer duration of the thermal influence at the contact of carbonate xenoliths with monzonite magma or could be a result of an external stress, which is probably the stretching of the crystals due to differences in the thermal expansion coefficient of wol-lastonite with respect to the surrounding matrix.
Key words: skarn, wollastonite-2M, single crystal X-ray diffraction.
INTRODUCTION
Wollastonite (CaSiO3) occurs in two struc-turally different forms: high-temperature α-wollastonite stable above ca. 1150 °C and low-temperature β-wollastonite that is the common CaSiO3-polymorph found in crustal rocks. The low-temperature wollastonite contains dreier sin-gle chains, i.e. chains with three [SiO4]-tetrahedra in the repeat unit (pyroxenoid type). The chains are linked to three columns of Ca-centred octa-hedra. Because of the size mismatch of the tetra-hedral repeat units and the octahedral bands, the tetrahedra are tilted to accommodate their apices to the octahedral apices [1–4]. Both chains and bands run parallel to the b-axis.
A series of natural polytypes have been reported [3–11] with different packing arrangements of the single chains: triclinic polytypes (1T, 3T, 4T, 5T, 7T) and monoclinic parawollastonite (wollastonite-2M). The structure of wollastonite-1T was deter-mined by Mamedov and Belov [5] and refined by Buerger and Prewitt [6], and Ohashi and Finger [3]; that one of wollastonite-2M was solved by Tolliday [7], Trojer [8], Ohashi [4], and Hesse [9]. The struc-tures of the higher polytypes 3T, 4T, 5T and 7T were described by Henmi et al. [10] and Henmi et al. [11]. The structural difference between triclinic wollastonite and monoclinic parawollastonite has been interpreted to be due to different modes of stacking along the direction of the a-axis. These forms are not easily distinguishable except by sin-gle-crystal XRD refinement, since they differ only in the reflexions with k odd, which are always weak [7]. The structural state of wollastonite is a useful petrogenetic indicator for the deformation and cool-ing history of a rock. The aim of this study is to identify the polytypic modification of wollastonite

132
Fig. 1. Hand specimens of wollastonite-bearing skarn zones showing banded and massive texture (a–c); Photomicrographs (plane polarised light) showing wollastonite crystals of: (d) plagioclase-pyroxene-wollastonite-epidote skarn zones, (e) plagioclase-pyroxene-wollastonite-garnet zone; and (f) plagioclase-pyroxene-wollastonite zone. Woll – wollastonite, Px – clinopyroxene, Gt – garnet.
from different skarn zones and to interpret its oc-currence at Zvezdel-Pcheloyad ore deposit (Eastern Rhodopes, Bulgaria).
MATERIALS
The studied wollastonite crystals were col-lected from zoned skarn nodules included in mon-zonites of the Zvezdel pluton. The following zones are determined from the proximal parts of the nodules towards the contact with the monzonites: garnet, pyroxene-garnet, plagioclase-pyroxene-wollastonite+garnet (Pl-Px-W-Gt), plagioclase-pyroxene-wollastonite (Pl-Px-W), plagioclase-py-roxene-wollastonite+epidote (Pl-Px-W-Ep), and plagioclase-pyroxene. Wollastonite, clinopyrox-ene, plagioclase, calcite, and grossular-andradite garnet are the major constituents of the wollas-tonite-bearing zones. Quartz is a subordinate phase and the associated minor minerals include epidote, prehnite, and chlorite. Titanite, apatite and mag-netite are present as accessories.
The wollastonite-bearing zones exhibit massive or banded fabrics (Fig. 1a, b, c) with no visible preferred orientation of the crystals. The content of wollastonite averages 25–30%, but locally at-tains 70%. Wollastonite occurs mainly as nodular aggregates or forms prismatic grains up to about 3 mm in length along b (Fig. 1d, e, f). Wollastonite
displays an overlapping composition among the three zones. It is nearly pure CaSiO3 typically con-taining a few tenths of FeO wt.% (determined with microprobe analysis).
EXPERIMENTAL
Three wollastonite crystals from the zones Pl-Px-W-Gt, Pl-Px-W, and Pl-Px-W-Ep were selected for single-crystal XRD study. The specimens used in this study have prismatic habit, 0.2–0.3 mm long (along b), and cross sections of 0.1–0.2 mm. The crystals were mounted on glass fibres and measured on an Oxford diffraction Supernova diffractometer equipped with an Atlas CCD detector. X-ray data collection was carried out at room temperature with monochromatized Mo-Kα radiation (λ = 0.71073 Å). Data collection strategy was chosen for 100% com-pleteness and redundancy of 4. Data reduction and analysis were carried out with the CrysAlisPro pro-gram [12]. Lorentz and polarization corrections were applied to intensity data using WinGX [13]. Reliable model with satisfactory R-values was obtained using the P21/a space group and it was chosen for the refine-ment. Starting atomic coordinates were taken from [9]. Structure refinements were performed using the program SHELXTL [13], employing neutral atom scattering factors. At the final stage of refinement, anisotropic temperature factors were introduced.
Y. Tzvetanova et al.: Parawollastonite (wollastonite2M polytype) from the skarns ... – a single crystal study

133
Fig. 2. Polyhedral model of the crys tal structure of wollas-tonite-2M showing the stacking sequence of the a [(100) module] slabs (crystal from the Pl-Px-W-Ep zone)
RESULTS AND DISCUSSION
The results after the refinement confirmed the monoclinic symmetry of the studied samples with space group P21/a (Fig. 2). The final refinement unit cell dimensions are presented in Table 1.
The structure of a crystal selected from the Pl-Px-W-Ep zone was refined to R1 = 0.0521 and R(all) = 0.0754 using 1970 unique reflections. The experimental details are given in Table 2. Final atomic coordinates and thermal displacement pa-rameters are listed in Tables 3 and 4. The Si–O bond lengths vary between 1.580(3) and 1.667(3) Å (mean 1.624 Å), Ca–O bond lengths are between 2.251(3) and 2.662(3) Å (mean 2.390 Å), and Si–O–Si angles are 140.03(17), 139.39(18) and 150.81(18)° (mean 143.31°) (Table 5). The re-
Y. Tzvetanova et al.: Parawollastonite (wollastonite2M polytype) from the skarns ... – a single crystal study
Table 1. Unit cell parameters of the studied samples
SampleParameter
wollastonite fromPl-Px-W-Gt zone
wollastonite fromPl-Px-W zone
wollastonite fromPl-Px-W-Ep zone
a [Å] 15.413(17) 15.409(7) 15.3770(11)b [Å] 7.336(5) 7.320(3) 7.2990(4)c [Å] 7.070(3) 7.063(2) 7.0491(5)β [°] 95.24(5) 95.36(3) 95.340(6)V [Å3] 796.0(7) 793.2(7) 787.68(9)
Table 2. Experimental details for wollastonite-2M from the Pl-Px-W-Ep zone
№ of reflections 6826Rint 0.0541Rsigma 0.0446h min –20h max 19k min –9k max 10l min –9l max 8theta min [°] 3.75theta max [°] 29.68unique reflections 1970Ref. Fo > 4sigFo 1290№ of parameters 131R1 0.0521R(all) 0.0754GooF 1.081
sults are in good agreement with those obtained by Hesse [9] and Ohashi [4].
Wollastonite-2M polytype was established for all wollastonite-bearing zones in the skarns at Zvezdel. This polytype is regarded as a higher temperature polytype with respect to the triclinic one [e.g. 10, 14]. Interesting results were reported by Henmi et al. [10]. The authors studied wollastonites from zoned skarns, which were formed around andesite dike at Kushiro, Hiroshima Prefecture, Japan and deter-mined 1T, 2M, 3T, 4T, and 5T polytypes. The ratios of 2M to 1T in the skarns decrease gradually with increasing distances from the dike, and that 3T, 4T and 5T polytypes were found only at localities where both 1T and 2M exist. Mazzucato and Gualtieri [14] studied experimentally the wollastonite polytypes in the system CaO–SiO2 in the temperature range

134
Y. Tzvetanova et al.: Parawollastonite (wollastonite2M polytype) from the skarns ... – a single crystal study
Table 3. Atomic coordinates, Uiso(Ueq) parameters and occupancies for wollastonite-2M from the Pl-Px-W-Ep zone
Label x y z Uiso or Ueq Occ.Si1 –0.69845(7) 0.12375(16) –0.44502(14) 0.0107(3) 1Si2 –0.59235(7) –0.15867(15) –0.23179(15) 0.0101(3) 1Si3 –0.59227(7) 0.40752(15) –0.23147(15) 0.0105(3) 1Ca1 –0.59925(6) –0.12739(15) –0.74079(11) 0.0117(2) 1Ca2 –0.60095(5) 0.37808(15) –0.73757(11) 0.0119(2) 1Ca3 –0.74879(5) –0.37530(17) –0.02460(11) 0.0109(2) 1O1 –0.6527(2) –0.1142(5) –0.0375(4) 0.0143(6) 1O2 –0.6510(2) 0.3645(5) –0.0365(4) 0.0146(6) 1O3 –0.4912(2) –0.1210(5) –0.2326(4) 0.0150(6) 1O4 –0.7856(2) 0.1246(5) –0.3011(4) 0.0143(6) 1O5 –0.7008(2) 0.1259(5) –0.6727(4) 0.0123(6) 1O6 –0.4903(2) 0.3720(5) –0.2350(4) 0.0162(6) 1O7 –0.6355(2) 0.3033(4) –0.4073(4) 0.0147(6) 1O8 –0.63592(19) –0.0552(4) –0.4087(4) 0.0143(6) 1O9 –0.6082(2) –0.3755(4) –0.2759(4) 0.0202(7) 1
Table 4. Anisotropic displacement parameters for wollastonite-2M (sample from the Pl-Px-W-Ep zone)
Label U11 U22 U33 U23 U13 U12Si1 0.0093(6) 0.0122(5) 0.0114(6) 0.0000(4) –0.0044(4) 0.0004(5)Si2 0.0062(6) 0.0139(7) 0.0105(6) 0.0002(4) –0.0021(4) 0.0002(4)Si3 0.0061(6) 0.0140(7) 0.0117(6) –0.0002(4) –0.0024(4) –0.0004(4)Ca1 0.0147(4) 0.0133(4) 0.0074(4) –0.0015(5) 0.0045(3) –0.0020(5)Ca2 0.0104(5) 0.0131(4) 0.0125(4) 0.0025(3) –0.0032(3) –0.0028(3)Ca3 0.0070(5) 0.0115(4) 0.0148(4) 0.0006(3) –0.0048(3) –0.0002(3)O1 0.0099(16) 0.0200(15) 0.0127(14) 0.0023(15) 0.0001(11) 0.0044(15)O2 0.0119(16) 0.0190(14) 0.0126(14) 0.0009(15) 0.0003(11) –0.0031(16)O3 0.0072(15) 0.0165(13) 0.0221(16) 0.0016(17) –0.0048(12) –0.0003(17)O4 0.0113(16) 0.0176(13) 0.0140(15) –0.0004(13) –0.0013(12) 0.0004(14)O5 0.0097(15) 0.0139(12) 0.0138(14) 0.0004(13) –0.0038(11) –0.0035(14)O6 0.0061(15) 0.0179(14) 0.0246(16) 0.0007(17) –0.0015(12) 0.0008(18)O7 0.0137(17) 0.0135(13) 0.0174(16) –0.0012(11) –0.0032(12) –0.0032(12)O8 0.0131(16) 0.0152(13) 0.0151(15) 0.0033(11) –0.0053(12) 0.0043(12)O9 0.0216(17) 0.0116(13) 0.0294(17) –0.0009(13) –0.0134(13) 0.0002(13)
700–1000 °C using in situ synchrotron X-ray pow-der diffraction data for determination of the kinet-ics of phase transformation. The authors observed the following reaction sequence of crystallisation of the CaO–SiO2 parent glass: 1T-wollastonite forms first and progressively transforms in an intermedi-ate 1Td-wollastonite metastable disordered form. Both phases in turn transform into 2M-wollastonite polytype at 950–1000 °C.
The presence only of a higher temperature poly-type (wollastonite-2M) in the studied skarn samples could be interpreted as a result of a longer duration of thermal influence at the contact of carbonate xe-noliths with monzonite magma by infiltration of hot fluids that were derived during the crystallisa-tion of the pluton. The crystallisation temperature of the second monzonite phase of the Zvezdel plu-ton according to the two-feldspar geothermometer

135
Y. Tzvetanova et al.: Parawollastonite (wollastonite2M polytype) from the skarns ... – a single crystal study
is estimated at about 675 °C [15]. The occurrence of wollastonite+plagioclase assemblages in the skarn zones indicates that the temperature was in excess of 600 °C [16] during the formation of early anhy-drous minerals in the skarns. This temperature sup-plies the energy needed for the shift of the tetrahe-dral chains by 1T→2M polytype transition in wol-lastonite. This is possible through breaking Ca–O bonds bridging the chains with the 2M-polytype remaining stable during cooling of the system in the late stages of the skarn processes. Swami and Dubrovinsky [17] observed indications of Ca–O bonds breaking by 1T→2M polytype transition in Raman spectra. The estimated lower temperature of formation of wollastonite-2M polytype compared to the experimentally obtained results [14] could be interpreted as due to other factors like inhomoge-neity of the rock, the chemical composition of the protolith and the fluid.
These polytype transformations have been ex-plained as a result of deformation under conditions of shear stress or strain by some authors [18–21]. Guggenheim [19] stated that a combination of sev-eral processes may be necessary to produce the peri-odic faulting that yield polytypes with a repeat unit along [100] greater than one. During the field obser-vation we could not find evidence for shear stress at
the time of formation of that polytype, but we can-not exclude the possibility that the shear displace-ment leading to the formation of wollastonite-2M could be a result of an external stress. The latter ex-plains the stretching of the crystals due to difference in the thermal expansion coefficient of wollastonite with respect to the surrounding matrix.
REFERENCES
D. R. Peacor, C. T. Prewitt, 1. Am. Mineral., 48, 1527 (1963).F. J. Trojer, 2. Zeitschrift für Kristallographie, 127, 291 (1968).y. Ohashi, L. W. Finger, 3. Am. Mineral., 63, 274 (1978).y. Ohashi, 4. Physics and Chemistry of Minerals, 10, 217 (1984).K. S.Mamedov, N. V. Belov, 5. Dokl. Acad. Sci. USSR, 107, 463 (1956).M. J. Buerger, C. T. Prewitt, 6. Proc. Natl. Acad. Sci., 47, 1884 (1961).J. Tolliday, 7. Nature, 182, 1012 (1958).F. J. Trojer, 8. Zeitschrift für Kristallographie, 127, 291 (1968).K. F. Hesse, 9. Zeitschrift für Kristallographie, 168, 93 (1984).
Table 5. Si–O bond lengths [Å], Ca–O bond lengths [Å], and Si–O–Si angles [°] for polyhedra of wollastonite-2M (sample from the Pl-Px-W-Ep zone)
Si–O bond Distance [Å] Ca – O bond Distance [Å]Si1 – O4 1.604(3) Ca1 – O6 2.251(3)Si1 – O5 1.608(3) Ca1 – O3 2.283(3)Si1 – O8 1.656(3) Ca1 – O1 2.319(3)Si1 – O7 1.667(3) Ca1 – O8 2.414(3)mean 1.634(3) Ca1 – O5 2.436(3)Si2 – O3 1.580(3) Ca1 – O4 2.530(3)Si2 – O1 1.613(3) Ca2 – O6 2.301(3)Si2 – O9 1.634(3) Ca2 – O2 2.311(3)Si2 – O8 1.653(3) Ca2 – O3 2.347(3)mean 1.620(3) Ca2 – O7 2.404(3)Si3 – O6 1.586(3) Ca2 – O5 2.415(3)Si3 – O2 1.605(3) Ca2 – O4 2.501(3)Si3 – O9 1.637(3) Ca3 – O1 2.325(3)Si3 – O7 1.644(3) Ca3 – O5 2.339(2)mean 1.618(3) Ca3 – O2 2.345(3)Si–O–Si angle Angle [°] Ca3 – O4 2.406(3)Si3–O7–Si1 140.03(17) Ca3 – O1 2.408(3)Si2–O8–Si1 139.39(18) Ca3 – O2 2.418(3)Si2–O9–Si3 150.81(18) Ca3 – O9 2.662(3)

136
C. Henmi, A. Kawahara, K. Henmi, I. Kusachi, y. 10. Takeuchi, Am. Mineral., 68, 156 (1983).C. Henmi, I. Kusachi, A. Kawahara, K. Henmi, 11. Mineral. Journal, 9, 169 (1978).Oxford Diffraction, CrysAlis PRO. Oxford 12. Diffraction Ltd, yarnton, England, 2010.G. M. Sheldrick, 13. Acta Crystallographica A, 64, 112 (2008).E. Mazzucato, A. F. Gualtieri, 14. Physics and Chemistry of Minerals, 27, 8, 565 (2000).R. Nedialkov, B. Mavroudchiev, in: Proceedings of 15. the XV Congress of the Carpatho-Balcan Geological
Y. Tzvetanova et al.: Parawollastonite (wollastonite2M polytype) from the skarns ... – a single crystal study
Association. Geol. Soc. Greece, Sp. Publ., 1995, No 4/2, September 17–20, Athens, Greece, p. 561.T. M. Gordon, H. J. Greenwood, 16. Amer. Mineral., 56, 1674 (1971).V. Swamy, L. S. Dubrovinsky, 17. Geochim. Cosmochim. Acta, 61, 1181 (1997).H. R. Wenk, 18. Contributions to Mineralogy and Petrology, 22, 238 (1969).S. Guggenheim, 19. Amer. Mineral., 63, 1260 (1978).R. S. Coe, 20. Contrib. Mineral. Petrol., 26, 3, 247 (1970).R. Milke, R. Wirth, 21. Physics and Chemistry of Minerals, 30, 4, 230 (2003).
параВоластонит (политип Воластонит-2M) от сКарните В ЗВеЗделсКия плутон, иЗточни родопи – моноКристално
рентгеноструКтурно иЗследВане
я. цветанова, м. Кадийски, о. петров
Институт по минералогия и кристалография, Българска академия на науките, ул. „Акад. Георги Бончев“, бл. 107, 1113 София
постъпила на 20.06.2012 г.; приетa на 09.07. 2012 г.
(резюме)
структурните разлики между политипите на триклинния воластонит и моноклинния параволастонит се състоят в различния начин на подредба на пироксеноидния тип вериги по посока на а-оста. тези форми са трудно различими, освен с монокристална рентгенова дифрактометрия, тъй като се различават само по рефле-ксите с k-нечетно число, които обикновено са много слаби.
с монокристална рентгенова дифрактометрия е изследвана политипията на воластонит от три различни скарнови зони от Звезделския плутон. химичният състав на изследваните монокристали се доближава до идеалния – CaSiO3, като данните от рентгеноспектралния микроанализ показват незначително присъствие на FeO (0,n тегл.%). структурните уточнения показват моноклинна симетрия на анализираните воластонитови кристали (пространствена група P21/a и параметри на елементарната клетка a = 15.413(17) Å, b = 7.336(5) Å, c = 7.070(3) Å, β = 95.24(5)° за воластонита от зоната плагиоклаз-пироксен-воластонит+гранат; a = 15.409(7) Å, b = 7.320(3) Å, c = 7.063(2) Å, β = 95.36(3)° – от зоната плагиоклаз-пироксен-воластонит, и a = 15.3770(11) Å, b = 7.2990(4) Å, c = 7.0491(5) Å, β = 95.340(6)° – от зоната плагиоклаз-пироксен-воластонит+епидот). при рафинацията са достигнати удовлетворителни стойности на R1 = 0.0521 и R(all) = 0.0754. Връзките Si–O вари-. Връзките Si–O вари- Si–O вари-Si–O вари-–O вари-O вари- вари-вари-рат между 1.580(3) и 1.667(3) Å (средно 1.624 Å), дължината на връзките Ca–O – между 2.251(3) и 2.662(3) Å (средно 2.390 Å), а ъглите между Si–O–Si са 140.03(17), 139.39(18) и 150.81(18)° (средно 143.31°).
по експериментални данни моноклинната модификация воластонит-2м се определя като по-високотем-пературния политип по отношение на триклинния. присъствието само на моноклинния политип във всички скарнови зони (независимо от тяхната отдалеченост от монцонита) би могло да се обясни с по-продължител-ното времетраене на термичното влияние на монцонитовата магма на контакта с карбонатните ксенолити. Възможно е образуването му да е резултат и от външни напрежения, възникващи при растежа на кристалите, поради разлики в термичния коефициент на разширение на воластонита по отношение на заобикалящата го матрица по време на прогресивния етап на метасоматичния процес.

137
* To whom all correspondence should be sent:E-mail: [email protected]
© 2012 Bulgarian Academy of Sciences, Union of Chemists in Bulgaria
Bulgarian Chemical Communications, Volume 44, Proceedings of the IIIrd National Crystallographic Symposium (pp. 137–145) 2012
Synthesis and crystal structure of new PbBaFe2–xMnxO5 perovskite-type compounds
P. Tzvetkov1*, D. Kovacheva1, D. Nihtianova1,2, N. Velichkova1, T. Ruskov3
1 Institute of General and Inorganic Chemistry, Bulgarian Academy of Sciences 1113 Sofia “Acad. Georgi Bonchev” str. bld.11
2 Institute of Mineralogy and Crystallography, Bulgarian Academy of Sciences 1113 Sofia “Acad. Georgi Bonchev” str. bld.107
3 Institute for Nuclear Research and Nuclear Energy, Bulgarian Academy of Sciences 1784 Sofia “Tzarigradsko chaussee” 72 Blvd.
Received March 22, 2012; Revised April 27, 2012
New perovskite-based compounds with general formula PbBaFe2–xMnxO5 (0≤x≤1.5) were synthesized by sol-id-state reaction under argon atmosphere. The compounds were characterized by X-ray powder diffraction, TEM (SAED) and 57Fe Mössbauer spectroscopy. The crystal structure of PbBaFeMnO5 and PbBaFe0.5Mn1.5O5 members of the series is determined by Rietveld refinement method. The basic crystallographic sections in orientations [100] and [010] are obtained by SAED method. The Rietveld refinement results are in good agreement with the SAED data. The compounds crystallize in the orthorhombic space group Pnma with unit cell parameters a ≈ √2ap, b ≈ ap, and c ≈ 4√2ap (ap – the parameter of the perovskite subcell). The crystal structure of the studied phases consists of perovskite blocks separated by ½[110]p(
–101)p (p – the perovskite subcell) crystallographic shear planes. Inside the blocks the octahedral B–position is occupied by Fe3+ and Mn3+ ions and the twelve coordinated A–position is fully occupied by Ba2+ ions. The perovskite blocks are connected to each other by double chains of edge-sharing (Fe, Mn)O5 distorted tetragonal pyramids running along the b–axis. The double chains delimit six-sided tunnels fully occupied by Pb2+ cations. The pyramidal chains adopt two mirror-related configurations (“left” L and “right” R) and layers consisting of chains of the same configuration alternate along the c–axis in –L–R–L–R– sequence. The Mössbauer spectroscopy reveals a transition from magnetic ordering to paramagnetic state in PbBaFe1.5Mn0.5O5 at room temperature with the substitu-tion of Fe3+ by Mn3+ cations. The measurements at 77 K show that the Mn3+ cations replace the Fe3+ cations for the octahedral (1) and the pyramidal (2) sites in equal proportions.
Key words: perovskites, crystallographic shear planes, cation substitutions.
INTRODUCTION
Perovskite-type compounds with general for-mula ABO3 are extensively studied for many years due to their various electric and magnetic proper-ties: dielectrics, high temperature superconductors, ion conductors, colossal magneto-resistant materi-als, optical materials, etc. The perovskite structure consists of cubic close packing of oxygen atoms and A-cations, with ¼ of the octahedral interstices occu-pied by B-cations. Many structures can be derived from that of perovskite by various ways: by mixed occupancy and cation ordering in A and B positions; vacancy ordering in the cation and anion sublattices;
intergrowth of perovskite and other structure type blocks (NaCl, CaF2 and other structure types) and the formation of hexagonal perovskite polytypes. The oxygen vacancies ordering in the perovskite structure gives rise to many compounds with dif-ferent structures (Ca2Mn2O5, La2Ni2O5, Ca2Fe2O5) [1, 2]. Recently, new class of oxygen deficient perovskite-type compounds incorporating periodi-cally ordered translational interfaces was synthe-sized. The first published member of the class is Pb1.33Sr0.67Fe2O5 (Pnma, a = 5.687 Å, b = 3.920 Å, c = 21.075 Å) [3] with relations to the perovskite subcell (ap): a ≈ √2ap, b ≈ ap, c ≈ 4√2ap. The structure can be described as an anion deficient perovskite in which half of the B3+ cations are located in octa-hedral coordination as in the prototype perovskite structure and the other half are five-coordinated in distorted tetragonal pyramids. The pyramids

138
P. Tzvetkov et al.: Synthesis and crystal structure of new PbBaFe2–xMnxO5 perovskitetype compounds
share common edges and form double chains and channels between them along the b-axis, alternat-ing with perovskite blocks along the c-axis. Inside the channels the Pb2+ cations are coordinated by six oxygen atoms and one 6s2 electron lone pair of the lead atom. The A2+ cation position is situated within the perovskite block and has mixed occupancy by Pb2+ and Sr2+ ions. The introduction of periodically ordered translational interfaces into the perovskite structure was based on the basis of detailed trans-mission electron microscopy investigations of Pb and Fe-containing compounds [4, 5, 6]. The trans-lational interfaces were found to have similar crys-tallographic properties as the crystallographic shear planes (CS planes) in ReO3 structure type. The struc-ture of Pb1.33Sr0.67Fe2O5 incorporates alternating CS planes and perovskite blocks along the c – axis. The shear planes remove a layer of oxygen atoms and displace the perovskite blocks with respect to each other by 1/2[110]p vector. Derivative compounds of Pb1.33Sr0.67Fe2O5 with different chemical composition and thickness of the perovskite block are part of the homologous series AnBnO3n-2 (n = 4, 5, 6) (A = Pb, Ba, Bi; B = Fe, Co, Mn, Ti, Sn) [7]. Chemical com-positions Pb1.33Sr0.67Fe2O5 [3], Pb1.33Sr0.67-xBaxFe2O5 (0 ≤ x ≤ 0.67) [8], Pb2-xBaxFe2O5 (0.6 ≤ x ≤ 1.0) [9], Pb2Mn2O5 [10] and PbBaFe2-xCoxO5 (0 ≤ x ≤ 1) [11] represents the n = 4 member of the homologous series. Partial replacement of B3+ by other cation with formal charge 4+ can enlarge the thickness of the perovskite block as compared to the prototype Pb1.33Sr0.67Fe2O5 structure. The members of the se-ries Pb2.9Ba2.1Fe4TiO13 and Pb2.85Ba2.15Fe4SnO13 (n = 5) [12, 13] and Pb3.8Bi0.2Ba2Fe4.2Ti1.8O16 (n = 6) [12] represent 1.5 (n = 5) and 2 (n = 6) times the thick-ness of perovskite block.
In this work we report on the synthesis and crys-tal structure of PbBaFe2-xMnxO5 (0 ≤ x ≤ 1.5) solid solution, a new member of the homologous series AnBnO3n–2 (n = 4).
EXPERIMENTAL
Polycrystalline samples with chemical compo-sition PbBaFe2–xMnxO5 (0≤x≤1.5, ∆x=0.25) were prepared by high temperature solid state reaction. Analytical grade PbO, BaCO3, Fe2O3 and MnO were used as starting compounds. Stoichiometric mixtures of the reagents were homogenized in agate mortar with acetone and pressed into pellets. The pellets were heated at 800 °C for 24 hours in argon flow with intermediate regrinding every 6 hours. After each regrinding the samples were annealed at 400 °C for 1 hour in air.
Powder X-ray diffraction (XRD) patterns were collected at room temperature on Bruker D8 Advance
diffractometer using CuKα radiation and LynxEye PSD detector within the range 13–130° 2θ, step 0.02° 2θ and 6 sec/strip (total of 1050 sec/step) counting time. To improve the statistics, sample rotating speed of 30 rpm was used. The crystal structure parameters were refined using TOPAS 4.2 program [14].
The TEM (SAED) investigations were per-formed by transmission electron microscope JEOL 2100 at 200 kV accelerating voltage. The specimens were grinded and dispersed in ethanol by ultrasonic treatment for 6 min. The suspensions were dripped on standard holey carbon/Cu grids.
Mössbauer measurements were performed us-ing a constant acceleration spectrometer. A source of 57Co(Rh) with activity of 50 mCi was used. The PbBaFe1.5 Mn0.5O5 spectra were taken in the trans-mission mode at room temperature and at 77 K. The sample with a thickness of 50 mg cm–2 was mounted in a cryostat of He exchange cooling gas. The Mössbauer spectra were fitted using an integral Lorentzian line shape approximation or thin sam-ple approximation [15, 16]. The isomer shifts are referred to the centroid of α-iron foil reference spec-trum at room temperature. The geometric effect is taken into account as well.
RESULTS AND DISCUSSION
Single phase samples of PbBaFe2–xMnxO5 were obtained for x = 0, 0.25, 0.5, 0.75, 1.0, 1.25 and 1.5. The powder XRD patterns of all samples were indexed in orthorhombic symmetry, space group Pnma and unit-cell parameters a ≈ √2ap, b ≈ ap, c ≈ 4√2ap. To prevent the oxidation of Mn3+ to Mn4+ and the formation of BaMnO3 as additional phase, all manganese containing samples were synthesised in argon flow. Since lead oxide starts to evaporate at temperatures above 800 °C to compensate pos-sible losses an excess of 3% wt. was added to the stoichiometric mixture. The samples with higher Mn content (x > 1.5) are beyond the homogeneity range and contain PbO (Massicot) and BaFeO2.25 as impurity phases. Samples PbBaFeMnO5 and PbBaFe0.5Mn1.5O5 were chosen for detailed struc-tural investigation. The starting unit cell param-eters and zero shift value were determined during the preliminary characterization using the whole powder pattern matching procedure (Pawley fit) (Table 1). The XRD phase analysis of PbBaFeMnO5 and PbBaFe0.5Mn1.5O5 revealed a single phase for the first sample and small impurities of PbO – Massicot in the last one. The determined amount of PbO from the Rietveld refinement is 2.73% wt. The Pawley fit of XRD patterns during the preliminary char-acterization of both samples revealed considerable

139
P. Tzvetkov et al.: Synthesis and crystal structure of new PbBaFe2–xMnxO5 perovskitetype compounds
anisotropic peak shape broadening. The structure refinement without introducing a model for describ-ing the anisotropic peak shapes leads to RB = 2.28 and RB = 2.21 respectively. Satisfactory results were achieved by using 8-th order spherical harmonics [17]. The reliability factors show considerable im-provement of RB = 1.59 and 1.76 for PbBaFeMnO5 and PbBaFe0.5Mn1.5O5, respectively. The observed anisotropic line broadening is probably due to rela-tively high level of structural disorder in the samples under investigation. The unit cell parameters of the solid-solution series PbBaFe2–xMnxO5 (0 ≤ x ≤ 1.5) are given in Table 1. With the increase of the man-
ganese content the parameters a and c increase mo-notonically, while the b parameter decreases. This result has not straightforward explanation, because the ionic radii of Fe3+ and Mn3+ in octahedral and five fold pyramidal coordination are almost equal – 0.645 Å and 0.58 Å, respectively [18]. One possible explanation is the Jahn-Teller effect of Mn3+ atoms.
The experimental and calculated selected area electron diffraction (SAED) patterns of sample PbBaFeMnO5 are given in Fig. 1. The indexing of the patterns was performed in orthorhombic lattice. The unit cell parameters were taken from powder XRD data measurements in Table 1. The reflection
Table 1. Unit-cell parameters for PbBaFe2–xMnxO5 (0 ≤ x ≤ 1.5)
x a (Å) b (Å) c (Å)
0.00 5.7656(2) 3.9920(1) 21.1433(6)0.25 5.7661(4) 3.9733(3) 21.176(2)0.50 5.7806(4) 3.9510(3) 21.281(2)0.75 5.7839(6) 3.9382(4) 21.311(2)1.00 5.7994(3) 3.9095(3) 21.407(1)1.25 5.8123(3) 3.8962(2) 21.4752(8)1.50 5.8182(2) 3.8816(1) 21.5115(5)
Fig. 1. Experimental (above) and calculated (below) SAED patterns of PbBaFeMnO5 in [100] and [010] directions

140
conditions: 0kl:k+l = 2n, hk0:h = 2n, h00:h = 2n, 0k0:k = 2n, 00l:l = 2n determined from the electron diffraction patterns, are in agreement with the pro-posed Pnma space group. The Rietveld refinement structural parameters of PbBaFeMnO5 were used for the calculated SAED patterns in Fig. 1. The ex-perimental data are in very good agreement with the proposed structural data.
The crystal structures of PbBaFeMnO5 and PbBaFe0.5Mn1.5O5 were refined using powder XRD data. The atomic positions for Pb1.08Ba0.92Fe2O5 [9] were used as initial parameters for the refinement. Since the X-ray atomic scattering factors of man-ganese and iron are very close, their population in
the mixed occupancy positions can not be deter-mined precisely from the Rietveld refinement data. Therefore, statistical distribution of Fe and Mn at-oms in the octahedral – Fe2(Mn)O6 and pyramidal – Fe1(Mn)O5 sites was used.
The refined structural parameters of both sam-ples are given in Table 2 and 3. Typical Rietveld plot of PbBaFe0.5Mn1.5O5 is shown in Fig. 2. Table 4 represents calculated metal-oxygen distances and bond-valence sums in comparison with the cor-responding values calculated for Pb1.2Ba0.8Fe2O5 [9]. The average metal-oxygen distances around the Pb1 position inside the double chains of pyra-mids slightly increase with the manganese substitu-
P. Tzvetkov et al.: Synthesis and crystal structure of new PbBaFe2–xMnxO5 perovskitetype compounds
Table 2. Refined structural parameters for PbBaFeMnO5SG: Pnma(62), a=5.7992(1), b=3.9099(1), c=21.4070(4), Z=4
Atom Wyck. x/a y/b z/c SOF Biso(Å2)Pb1 4c 0.0461(3) 1/4 0.5702(1) 1.00 0.72(4)Ba1 4c 0.5594(3) 1/4 0.6854(1) 1.00 0.46(5)Fe1 4c 0.459(1) 1/4 0.4484(2) 0.50 0.26(6)Mn1 4c 0.50 0.26(6)Fe2 4c 0.9328(9) 1/4 0.3152(2) 0.50 0.26(6)Mn2 4c 0.50 0.26(6)O1 4c 0.937(3) 3/4 0.3218(7) 1.00 1.1(2)O2 4c 0.676(3) 1/4 0.2512(9) 1.00 1.1(2)O3 4c 0.194(3) 1/4 0.3928(8) 1.00 1.1(2)O4 4c 0.696(3) 1/4 0.3847(8) 1.00 1.1(2)O5 4c 0.441(3) 3/4 0.4578(7) 1.00 1.1(2)
RB = 1.59, Rwp = 4.95, Rexp = 1.95, GOF = 2.53
Table 3. Refined structural parameters for PbBaFe0.5Mn1.5O5SG: Pnma(62), a= 5.8172(1), b= 3.8808(1), c= 21.5068(2), Z=4
Atom Wyck. x/a y/b z/c SOF Biso(Å2)
Pb1 4c 0.0608(2) 1/4 0.5709(1) 1.00 0.83(3)Ba1 4c 0.5769(3) 1/4 0.6851(1) 1.00 0.43(4)Fe1 4c 0.4409(8) 1/4 0.4492(1) 0.25 0.28(5)Mn1 4c 0.75 0.28(5)Fe2 4c 0.9150(7) 1/4 0.3146(2) 0.25 0.28(5)Mn2 4c 0.75 0.28(5)O1 4c 0.921(2) 3/4 0.3217(5) 1.00 0.8(1)O2 4c 0.654(2) 1/4 0.2499(6) 1.00 0.8(1)O3 4c 0.190(2) 1/4 0.3971(6) 1.00 0.8(1)O4 4c 0.677(2) 1/4 0.3868(6) 1.00 0.8(1)O5 4c 0.424(3) 3/4 0.4631(5) 1.00 0.8(1)
RB = 1.76, Rwp = 4.86, Rexp = 1.90, GOF = 2.56

141
P. Tzvetkov et al.: Synthesis and crystal structure of new PbBaFe2–xMnxO5 perovskitetype compounds
Fig. 2. Experimental (circles), calculated (line) and difference (bottom line) powder XRD patterns for PbBaFe0.5Mn1.5O5. Lower tick bars represent peak positions for PbBaFe0.5Mn1.5O5 and the impurity phase PbO (Massicot)
Fig. 3. Polyhedral representation of a) Pb1.2Ba0.8Fe2O5 [9], b) PbBaFeMnO5, and c) PbBaFe0.5Mn1.5O5 along [010] direction. Pyramids – Fe(Mn)O5, octahedra – Fe(Mn)O6, small dark spheres – Pb atoms, large light spheres – Ba atoms
a) b) c)
tion. The Pb1 columns of atoms are ordered in a straight line along the c – axis in the structure of Pb1.2Ba0.8Fe2O5 with coordinate x = 0.0032(8) [9]. According to the refined data for PbBaFeMnO5 and PbBaFe0.5Mn1.5O5, lead atoms are considerably
shifted along the a – axis having coordinates x = 0.0461(3) and 0.0608(2), respectively (Fig. 3). The average distances in Fe1(Mn)O5 pyramids does not change notably. The shortest ones are observed in PbBaFe0.5Mn1.5O5, mainly because of the significant

142
decrease in Fe1(Mn) – O3 bond distance, which is partially compensated with the increase of Fe1(Mn) – O4 bonds. The average metal-oxygen distances in Fe2(Mn)O6 octahedra monotonically increase with the substitution. The oxygen atoms O3 and O4 are common for Fe1(Mn)O5 pyramids and Fe2(Mn)O6 octahedra in the perovskite blocks. With increase of Mn substitution level the Fe2(Mn) – O3 bond dis-tance increases to almost non bonding 2.390(14) Å in PbBaFe0.5Mn1.5O5. The distance Fe2(Mn) – O4 is less changed and decreases to 2.081(13) Å. The twelve-fold oxygen coordination around the Ba at-
oms does not undergo notable changes. Recently, a comprehensive study of Pb2Mn2O5 employing trans-mission electron microscopy methods was reported [10]. This compound is synthesized under high pres-sure conditions as a mixture with two other phases. The proposed structural model by Hadermann et al. was found to share many common features with the Rietveld refinement results of the present samples. They report Jahn-Teller distortion of MnO6 octahe-dra in the ac plane with two long and two short Mn–O distances (see Fig. 8c, Ref. 10). The Jahn-Teller deformation of octahedral oxygen coordina-
P. Tzvetkov et al.: Synthesis and crystal structure of new PbBaFe2–xMnxO5 perovskitetype compounds
Table 4. The calculated metal-oxygen distances and bond-valence sums for Pb1.2Ba0.8Fe2O5, PbBaFeMnO5 and PbBaFe0.5Mn1.5O5
Metal-oxygendistances
CompositionPb1.2Ba0.8Fe2O5* PbBaFeMnO5 PbBaFe0.5Mn1.5O5
Pb1
O(1) 2.287(9) 2.314(15) 2.312(11)O(3)x2 2.478(6) 2.528(11) 2.523(8)O(4)x2 2.631(6) 2.644(12) 2.630(8)O(5) 2.673(9) 2.888(17) 2.913(12)O(5) 3.241(9) 3.034(17) 3.085(12)Average 2.631(3) 2.654(5) 2.660(4)Valence 2.04(1) 1.88(2) 1.89(2)
Ba1
O(1) 2.873(11) 2.883(18) 2.900(12)O(1) 2.884(11) 2.924(18) 2.924(12)O(1) 2.840(12) 2.921(15) 2.939(11)O(2)x2 2.771(10) 2.747(13) 2.743(10)O(2)x2 2.836(10) 2.854(13) 2.857(10)O(3)x2 3.009(9) 2.943(13) 2.954(11)O(4)x2 2.925(9) 2.875(13) 2.887(10)O(5) 3.113(11) 3.064(15) 3.186(11)Average 2.899(3) 2.886(4) 2.903(3)Valence 2.36(2) 2.43(3) 2.35(2)
Fe, Mn1
O(3) 1.928(10) 1.947(18) 1.840(14)O(4) 1.867(10) 1.933(18) 1.921(13)O(5)x2 2.023(2) 1.968(2) 1.966(2)O(5) 2.012(8) 2.090(16) 2.043(11)Average 1.971(3) 1.981(4) 1.947(4)Valence 2.87(3) 2.77(5) 3.06(4)
Fe, Mn2
O(1)x2 1.9944(7) 1.960(1) 1.947(1)O(2) 1.963(12) 2.019(19) 2.059(14)O(2) 1.979(12) 2.006(19) 1.963(14)O(3) 2.106(10) 2.246(18) 2.390(14)O(4) 2.159(10) 2.025(18) 2.081(13)Average 2.033(4) 2.036(6) 2.064(5)Valence 2.92(3) 2.92(5) 2.82(3)
* – The data for Pb1.2Ba0.8Fe2O5 are taken from Nikolaev et al. [9].

143
tion around the Mn3+ ions is well known in many compounds and was found to be crucial for the sta-bilization of Pb2Mn2O5 structure. Similar defor-mation of the octahedra is observed in the crystal structure of PbBaFeMnO5 and PbBaFe0.5Mn1.5O5. The degree of deformation increases with the increase of the manganese content. Most likely this is the main reason for the observed change of the unit cell parameters with the increase of manganese content (Table 1). The bond distance Fe2(Mn) – O1 contracts with the increase of manganese and can be determined straight form the b-parameter. The average Fe1(Mn) – O dis-tances also decrease with manganese substitu-tion. Thereby, the observed increase in unit cell parameters along the a- and c-axis is mainly due to the Jahn-Teller distortion of MnO6 octahedra within the (010) plane.
The Mössbauer spectra taken at room tempera-ture and at 77 K are presented in Fig. 4a and Fig. 4b, respectively. The parameters of the fitted spectra corresponding to an isomer shift (IS), a quadrupole splitting/shift (QS), a full width at half maximum (FWHM) of the resonance lines, a magnetic hyper-fine field at the site of the Fe nucleus (H), and the relative spectral area are summarized in Table 5. The spectrum measured at room temperature was fitted by superposition of two quadrupole doublets: (1) and (2) and a continuous distribution of magnetic Zeeman sextets. The doublets (1) and (2) correspond to two iron sites in PbBaFe1.5 Mn0.5O5 – octahedral (1) and pyramidal (2) ones, respectively. The distri-bution of the magnetic sextets at room temperature shows an intermediate magnetic state with the pres-ence of a paramagnetic state (two quadrupole dou-blets with approximately 40% of relative spectral area), and 60% of magnetic ordering.
The Mössbauer spectrum taken at 77 K was fit-ted by superposition of two magnetic sextets cor-responding to the two positions of magnetically ordered iron in PbBaFe1.5Mn0.5O5 (Fig. 4b). The broadening of magnetic components as compared to the corresponding resonance lines at 77 K for PbBaFe2O5 [9] could be explained by random dis-
tribution of magnetic cations, Fe and Mn, at octa-hedral and pyramidal positions leading to differ-ent exchange interaction for the Fe–Fe and Fe–Mn cations. Actually we have two magnetic sextet dis-tributions for the two iron sites, but for the fitting procedure an approximation was used with three different line-widths for the magnetic components of the spectra (1st – 6th), (2nd – 5th) and (3rd – 4th), as it is shown in Table 5.
Comparing with the data for PbBaFe2O5 at 77 K [9], a diminution of the magnetic hyperfine field at the site of the Fe nucleus (H) is observed in PbBaFe1.5 Mn0.5O5 due to the presence of manganese. Finally, our measurements show that the Mn cations replace the Fe cations for the octahedral (1) and the pyra-midal (2) sites in equal proportions (within the sta-tistical error). This result is very different from the data previously reported by us on Mössbauer spec-
P. Tzvetkov et al.: Synthesis and crystal structure of new PbBaFe2–xMnxO5 perovskitetype compounds
Table 5. 57Fe Mössbauer spectral parameters of hyperfine interaction for PbBaFe1.5Mn0.5O5 at 300K and 77K
SiteT
[K]IS
[mm/s]QS
[mm/s]FWHM± 0.05
[mm/s]H
[kOe] Rel area [%]
Oct(1)300
0.35 ± 0.03 0.58 ± 0.04 0.21 20 ± 3Pyr(2) 0.30 ± 0.03 1.01 ± 0.04 0.75 19 ± 3Oct(1)
770.53 ± 0.04 -0.13 ± 0.04 0.87 0.74 0.46 513 ± 1 48 ± 3
Pyr(2) 0.47 ± 0.04 0.1 ± 0.04 1.12 0.67 0.45 482 ± 1 52 ± 3
Fig. 4. Mössbauer spectrum of PbBaFe1.5Mn0.5O5 taken at a) 300K and b) 77K

144
troscopy of PbBaFe1.5Co0.5O5 [11]. The latter com-pound was found to have magnetic ordering at room temperature and the Co atoms were found to prefer-ably occupy the pyramidal positions, as opposed to the new compound PbBaFe1.5Mn0.5O5 described in this paper.
CONCLUSION
New solid-solution series PbBaFe2–xMnxO5 was successfully synthesized. The members of the se-ries are part of the homologous series AnBnO3n–2 (n = 4). The homogeneity range was determined for x up to 1.5. The crystal structures of PbBaFeMnO5 and PbBaFe0.5Mn1.5O5 wеre refined by Rietveld method. The degree of structural deformation in-creases with the increase of the manganese content. This fact should be considered as the main reason for the observed changes of the unit cell parameters with the increase of manganese content. The experi-mental and calculated selected area electron diffrac-tion (SAED) patterns are in very good agreement with the obtained structural data. The Mössbauer spectroscopy reveals a transition from magnetic ordering in PbBaFe2O5 to paramagnetic state in PbBaFe1.5Mn0.5O5 at room temperature. The meas-urements at 77 K show that the Mn cations replace the Fe cations for the octahedral (1) and the pyrami-dal (2) sites in equal proportions.
Acknowledgements: We thank Ivan Spirov for his help for the Mössbauer measurements and fitting of the spectra. We thank also the National Science Fund of Bulgaria for the financial support under contract DTK02/77 – 2009 and DO02224/17.12.2008.
REFERENCES
M. Anderson, J. Vaughey, K. Poeppelmeier, 1. Chem. Mater., 5, 151 (1993).J. Vaughey, K. Poeppelmeier, 2. NIST Special Publication, 804, 419 (1991).
V. Raynova-Schwarten, W. Massa, D. Babel, 3. Z. Anorg. Allg. Chem., 623, 1048 (1997).A. Abakumov, J. Hadermann, S. Bals, I. Nikolaev, 4. E. Antipov, G. Van Tendeloo, Angew. Chem. Int. Ed., 45, 6697 (2006).J. Hadermann, A. Abakumov, I. Nikolaev, E. Anti-5. pov, G. Van Tendeloo, Solid State Sci., 10, 382 (2008).D. Batuk, J. Hadermann, A. Abakumov, T. Vranken, 6. A. Hardy, M. Van Bael, G. Van Tendeloo, Inorg. Chem., 50, 4978 (2011).A. Abakumov, J. Hadermann, M. Batuk, H. 7. D’Hondt, O. Tyablikov, M. Rozova, K. Pokholok, D. Filimonov, D. Sheptyakov, A. Tsirlin, D. Niermann, J. Hemberger, G. Van Tendeloo, E. Antipov, Inorg. Chem., 49, 9508 (2010).P. Tzvetkov, N. Petrova, D. Kovacheva, 8. J. Alloy. Compd., 485, 862 (2009).I. Nikolaev, H. D’Hondt, A. Abakumov, J. Hader-9. mann, A. Balagurov, I. Bobrikov, D. Sheptyakov, V. Pomjakushin, K. Pokholok, D. Filimonov, G. Van Tendeloo, E. Antipov, Phys. Rev. B, 78, 024426 (2008).J. Hadermann, A. Abakumov, T. Perkisas, H. D’Hondt, 10. H. Tan, J. Verbeeck, V. Filonenko, E. Antipov, G. Van Tendeloo, J. Solid State Chem., 183, 2190 (2010).P. Tzvetkov, D. Kovacheva, D. Nihtianova, T. Rus-11. kov, Z. Kristallogr. Proc. 1, 397 (2011).A. Abakumov, J. Hadermann, M. Batuk, H. D’Hondt, 12. O. Tyablikov, M. Rozova, K. Pokholok, D. Filimo-nov, D. Sheptyakov, A. Tsirlin, D. Niermann, J. Hem -berger, G. Van Tendeloo, E. Antipov, Inorg. Chem., 49, 9508 (2010).O. Korneychik, M. Batuk, A. Abakumov, J. Hader-13. mann, M. Rozova, D. Sheptyakov, K. Pokholok, D. Filimonov, E. Antipov, J. Solid State Chem., 184, 3150 (2011).TOPAS V4: General profile and structure analysis 14. software for powder diffraction data, User’s Manual, Bruker AXS, Karlsruhe, Germany Bruker AXS (2008).G. Shenoy, J. Friedt, H. Maleta, S. Ruby, 15. Mössbauer Effect Methodology, 9, 277 (1974).T. Cranshaw, 16. J. Phys. E, 7, 122 (1974).M. Järvinen, J. Appl. Cryst., 17. 26, 525 (1993).R. D. Shannon, 18. Acta Cryst. A, 32, 751 (1976).
P. Tzvetkov et al.: Synthesis and crystal structure of new PbBaFe2–xMnxO5 perovskitetype compounds

145
P. Tzvetkov et al.: Synthesis and crystal structure of new PbBaFe2–xMnxO5 perovskitetype compounds
синтеЗ на ноВи PbBaFe2–xMnxO5 съединения с пероВсКитоВ тип струКтура
п. цветков1*, д. Ковачева1, д. нихтянова1,2, н. Величкова, т. русков3
1 Институт по Обща и Неорганична Химия, Българска Академия на Науките, 1113 София, бул. „Акад. Георги Бончев“, бл. 11
2 Институт по Минералогия и Кристалография, Българска Академия на Науките, 1113 София, бул. „Акад. Георги Бончев“, бл. 107
3 Институт за Ядрени изследвания и Ядрена енергия, Българска Академия на Науките, 1784 София „Цариградско шосе“, бл. 72
постъпила на 22.03.2012 г.; приетa на 27.04. 2012 г.
(резюме)
нови съединения с перовскитов тип структура и обща формула PbBaFe2–xMnxO5 (0≤x≤1.5) бяха синтезира-ни чрез твърдофазен синтез в атмосфера от аргон. получените съединения бяха характеризирани с прахова рентгенова дифракция (XRD), TEM (SAED) и 57Fe мьосбауерова спектроскопия. Кристалната структура на PbBaFeMnO5 и PbBaFe0.5Mn1.5O5 членове на серията е определена по метода на ритвелд. дифракционните картини по направления [100] и [010] са получени чрез SAED. резултатите от структурната рафинация по метода на ритвелд са в добро съгласие с данните от електронната дифракция. съединенията кристализират в орторомбична пространствена група Pnma и параметри на елементарната клетка a ≈ √2ap, b ≈ ap, и c ≈ 4√2ap (ap – параметър на перовскитовата подклетка). Кристалната структура на изучените фази се състои от перов-скитови блокове отделени от ½[110]p(
–101)p кристалографски равнини на срязване. В блоковете октаедричната B-позиция е заета от Fe3+ и Mn3+ йони и дванадесет координираната а-позиция е изцяло заета от Ba2+ йони. перовскитовите блокове са свързани помежду си с двойни вериги от изкривени (Fe, Mn)O5 тетрагонални пирамиди, които споделят общи ръбове. Веригите са по протежение на b-оста и ограничават шестоъгълни тунели запълнени изцяло от Pb2+ катиони. пирамидалните вериги имат две огледално свързани конфигурации („лява“ – L и „дясна“ – R), като слоеве изградени само от една от двете конфигурации се редуват по протеже-ние на c–оста в –L–R–L–R– последователност. мьосбауеровата спектроскопия на PbBaFe1.5Mn0.5O5 показва, че с увеличаване на заместването на Fe3+ от Mn3+ катиони температурата на прехода от магнитно подредено в парамагнитно състояние се понижава. направените измервания при 77 K показват, че Mn3+ замества Fe3+ в октаедричната и пирамидална позиции в еднаква степен.

146
* To whom all correspondence should be sent:E-mail: [email protected]
© 2012 Bulgarian Academy of Sciences, Union of Chemists in Bulgaria
Bulgarian Chemical Communications, Volume 44, Proceedings of the IIIrd National Crystallographic Symposium (pp. 146–150) 2012
A preparation of high-molecular poly(ethylene-oxide)-urea complexes from a solution and their structural changes on heating
S. Uzova1*, B. Bogdanov2, V. Velev2, T. Angelov3, A. Popov4
1 “Prof. Assen Zlatarov” PGT–Burgas, 8000 Burgas, Bulgaria 2 “Konstantin Preslavski” UniversityShumen, 9712 Shumen, Bulgaria
3 Lukoil Neftohim Burgas AD, Burgas, Bulgaria 4 “Prof. Assen Zlatarov” UniversityBurgas, 8010 Burgas, Bulgaria
Received February 27, 2012; Revised April 18, 2012
The preparation of high-molecular poly(ethylene oxide)-urea molecular complex by mixing their benzene and methanol solutions had been studied. The composition of the soluble and insoluble solid dispersed phase in benzene-methanol mixture had been investigated by means of X-ray and calorimetric analyses. It is shown that at molar ratio between poly(ethylene oxide) and urea of 1:2, which corresponds to the molecular complex composition, the yield of solid dispersed phase increases in a non-linear mode with an extension of the interaction time to 50 hours and after that it doesn’t change any more.
The structural changes of poly(ethylene oxide)-urea molecular complex on heating from room temperature up to 147.5 °C had been studied using high-temperature X-ray analyses. It was shown that improvement processes of the molecular complex crystal structure were carried out in the temperature range before melting.
Key words: poly(ethylene-oxide), urea, complexes, preparation, structure.
INTRODUCTION
It is known that poly(ethylene oxide) (PEO) and urea form crystal molecular complex (MC) by mixing [1–5]. The molar ratio of PEO and urea in the molecular complex is 1:2. It has been es-tablished that the MC crystal structure is different from the crystal structure of the initial components [4, 5]. Its melting temperature (Tm=144.5 °C) is higher than the melting temperature of PEO (65 °C) and urea (132 °C).
Till now there are no references available con-cerning investigation of the structural changes in PEO-urea MC on heating and cooling. Wide-angle X-ray is an useful method for this purpose. The structure and the structural transformations of high-molecular PEO-urea molecular complex on heating and its mixtures with the initial compo-nents have been studied by means of this method. The results obtained are the subject discussed in the present paper.
EXPERIMENTAL
High-molecular PEO “Badimol”, produced in-dustrially by “Chemist plant” at Dimitrovgrad with a molecular weight, determined viscosimetrically Mv=2.7×10⁶ was used for the preparation of PEO-urea molecular complex and their binary mixtures with the initial components. The urea is chem. pure for analysis, supplied by “Riedel de Hoen-Germany. The PEO content in its urea mixtures was changed from 15 to 90 wt.%, which corresponds to the change of PEO-urea molar ratio from 1:3.5 to 1:0.1.
PEO-urea binary mixtures were prepared by mix-ing a 1% solution of PEO in benzene with methanol solutions of urea (10 wt.%) at 20 °C and benzene: methanol ratio of 1:0.27 volume parts. After some time in the range from 1 to 200 hours, the resulting insoluble precipitate was separated by a decantation and it was washed out with benzene. The decanted solution was evaporated under vacuum at 50 °C. The resulting solid residuum and the washed pre-cipitate were dried at 50 °C under vacuum to a con-stant weight.
The X-ray investigations were carried out at room and elevated temperature by an apparatus “Dron-3” – Russia and “Tur-M 611” – Germany with Ni-filtered CuKα radiation under a reflection

147
condition in the angular range (2θ) from 8 to 44°. A differential scanning calorimeter “DSC-111”, a product of Setaram, France, was also used.
RESULTS AND DISCUSSION
A heterophase system of a solid dispersed phase and a liquid continuous phase is obtained by mixing monophased PEO solutions in benzene and a meth-anol solution of urea at a temperature of 20 °C. The content and the composition of the insoluble solid dispersed phase depend on the initial ratio of the components PEO and urea and on the interaction period. At PEO-urea ratio of 1:2 molar fractions, corresponding to the molecular complex composi-tion, the solid dispersed phase yield, which is in-soluble in a benzene-methanol mixture increases in a non-linear mode with an extension of the interac-tion period 50 hours, it reaches 75–80 wt.% towards PEO-urea mixture and it doesn’t change any more (Fig. 1, curve 1).
S. Uzova et al.: A preparation of highmolecular poly(ethyleneoxide)urea complexes from a solution ...
Fig. 1. Dependence of production of insoluble fraction in PEO-urea mixtures on the PEO content in the initial mixture (curve 2) and on the interaction period at PEO-urea ratio of 1:2 molar fractions (curve 1)
Fig. 2. Wide-angle X-ray diffractograms of PEO-urea mixtures, prepared from a solution (insoluble fraction). PEO – urea ratio, molar fractions: curve 1 – 0:1; curve 2 – 1:0; curve 3 – 1:0.5; curve 4 – 1:2; curve 5 – 1:3.5
It has been established by means of X-ray and ca-lorimetry, that the liquid phase and the solid fraction, dissolved in it and separated after the evaporation of a benzene-methanol mixture, represents PEO-urea molecular complex (Fig. 2, curve 4; Fig. 3, curve 2; Fig. 4, curve 3, 4).
The PEO-urea interaction at a ratio of 1:2 molar fractions and the formation of a molecular complex are carried out relatively quickly at the conditions investigated. Almost a complete (100%) association in a molecular complex has been observed. After 50 hours equilibrium between the soluble and insolu-
Fig. 3. Wide-angle X-ray diffractograms of PEO-urea mixtures, prepared from a solution (soluble fraction). PEO-urea ratio, molar fractions: curve 1 – 1:0.5; curve 2 – 1:2; curve 3 – 1:3.5.

148
ble fraction of the molecular complex in a benzene-methanol mixtures is established (Fig. 1, curve 1).
PEO-urea mixtures with a content of the first component from 17.3 to 59.5 wt.% in a benzene-methanol solution at an interaction period of 50 hours and at identical other conditions are prepared. The dependence of the insoluble fraction yield on the proportion between the two components is pre-sented in Fig. 1, curve 2. It has been established by means of X-ray and calorimetry, that the insoluble fraction represents PEO-urea molecular complex at an urea content in the initial mixture from 0.5 to 2 molar fractions per ethylene oxide unit (Fig. 2, curves 3, 4; Fig. 4, curves 1, 3). The insoluble frac-tion represents PEO-urea molecular complex and traces of free urea at an urea content higher than 2 molar fractions per ethylene oxide unit (Fig. 2, curve 5; Fig. 4, curve 6).
It has been established as it was expected from the results obtained that the soluble fraction in
S. Uzova et al.: A preparation of highmolecular poly(ethyleneoxide)urea complexes from a solution ...
Fig. 4. DSC curves on heating of insoluble (1, 3, 6) and soluble (2, 4, 5) fractions in a benzene-methanol mixture of PEO-urea binary system. Molar fractions of PEO and urea: curves 1, 2 – 1:0; curves 3, 4 – 1:2 and curves 5, 6 – 1:3.5
a benzene-methanol mixture differ in a compo-sition from the insoluble solid dispersed phase, when the initial PEO-urea ratio is different from the complex composition. At a PEO content high-er then 26.8 wt.% towards its urea mixture (less then 2 moles of urea per one monomeric unit), the soluble fraction in solid state represents mo-lecular complex and free PE mixture, which form separate crystal phases (Fig. 3, curve 1; Fig. 4, curve 2). When the urea content in the initial mix-ture is above 73.2 wt.% towards its PEO mixture (above 2 moles of urea per ethylene oxide unit), the soluble fraction in solid state contains mainly free urea (Fig. 3, curve 3; Fig. 4, curve 5).
The structural changes on heating of PEO-urea molecular complex fro room temperature to 147.5 °C have been investigated using high-temper-ature X-ray (Fig. 5).
It has been established that on first heating in the range about 120 to 135 °C, a slight but measurable increase of the integral intensity of the reflexes is observed, due to MC, 002 (2θ = 19.42°), 202 (2θ = 27.35°) and 102 (2θ = 21.64°) and also decrease of their half-width is observed (Fig. 6, 7).
Fig. 5. Wide-angle X-ray diffractograms of PEO-urea MC, prepared from a solution (1:2 molar fractions) at different temperatures. First heating temperature, °C: curve 1–18; curve 2–120; curve 3–130; curve 4–145; curve 5–147.5

149
S. Uzova et al.: A preparation of highmolecular poly(ethyleneoxide)urea complexes from a solution ...
Above 135 °C the intensity of the diffraction maximums of the molecular complex crystal phase (Fig. 6) and the degree of crystallinity (Fig. 8) abruptly decrease.
This temperature coincides with the initial melt-ing temperature of the molecular complex deter-mined calorimetrically. Consequently, improve-ment processes of the molecular complex crystal structure are carried out on heating in the tempera-ture range before melting. Similar effects have been observed earlier (Fig. 6, 7) for high-molecular PEO and they are explained with the structural changes of the crystal phase into plastic state.
Acnowledgement: The financial support of the Bul garian Ministry of Education and Sciences (National Science Fund), contract DO–02–61/2008 and NIH244, is gratefully acnowledged.
REFERENCES
E. A. Бектуров, р. е легкунец, ассоциация поли-1. меров с малыми молекулами, алма – ата, наука, 208, 1983. м. м. тарноруцкий, л. с. Школьникова, а. К. ло- 2. рей, В. и. диндойн, л. и. Зыкова, Высокомолеку-лярные соединения, Б 17, 817 (1975). F. E. Bailey, H. G. France, 3. J. Polym. Sci., 49, 397 (1961). G. Hild, 4. Rev. gen. et plast., 46, 771 (1969). G. Hild, 5. Bull. Soc. Chim. France, 8, 2840 (1969). M. Hresteva, E. Nedkov, M. Michailov, 6. Bulg. J. Phys., 7, 63 (1980). M. Michailov, 7. Makromol. Chem. Suppl., 7, 87 (1984).
Fig. 6. Dependence of intensity of crystal reflexes in the wide-angle X-ray diffractograms of PEO-urea MC (1:2 molar fractions)(prepared from a solution), on the heating temperature, 2θ: 1–25.5°; 2–21.64°; 3–27.35°; 4–19.42°
Fig. 7. Dependence of integral half-width of crystal re-flexes in the wide-angle X-ray diffractograms of PEO-urea MC (1:2 molar fractions), prepared from a solu-tion, on the heating temperature, 2θ: 1–25.5°; 2-27.35°; 3–21.64°; 4–19.42°
Fig. 8. Dependence of X-ray degree of crystallinity (αc) of PEO-urea MC (1:2 molar fractions), prepared from a solution, on the temperature

150
S. Uzova et al.: A preparation of highmolecular poly(ethyleneoxide)urea complexes from a solution ...
получаВане на КомплеКси на ВисоКомолеКулен полиетиленоКсид и КарБамид от раЗтВор и струКтурните
им промени при нагряВане
с. узова1*, Б. Богданов2, В. Велев2, т. ангелов3, а. попов4
1 ПГТ „Проф. д-р Ас. Златаров“ – Бургас, 8000 Бургас, България 2 Университет „Еп. К. Преславски“ – Шумен, 9712 Шумен, България
3 Лукойл Нефтохим Бургас АД, Бургас, България 4 Университет „Проф. д-р Ас. Златаров“ – Бургас, 8010 Бургас, България
постъпила на 27.02.2012 г.; приетa на 18.04. 2012 г.
(резюме)
получен бе молекулен комплекс от високомолекулен полиетиленоксид и карбамид чрез смесване на техни бензенови и метанолни разтвори. Композицията на разтворимата и неразтворимата твърда дисперсна фаза в бензен–метанолната смес беше изследвана рентгеноструктурно и калориметрично. Беше показано, че при молно съотношение между полиетиленоксида и карбамида 1:2, съответстващо на молекулния комплекс, ко-личеството на твърдата дисперсна фаза нараства нелинейно с увеличаване на реакционното време до 50 часа и след това не се изменя повече.
структурните изменения на молекулния комплекс между полиетиленоксида и карбамида при нагрява-не от стайна температура до 147.5 °с бяха изследвани с помощта високотемпературна прахова рентгенова дифрактометрия. показано беше, че в температурния интервал преди топене се усъвършенства кристалната структура на молекулния комплекс.

151
General remarks: Manuscripts are submitted in English by e-mail or by mail (in duplicate). The text must be typed double-spaced, on A4 format paper using Times New Roman font size 12, normal character spacing. The manuscript should not exceed 15 pages (about 3500 words), including photographs, tables, drawings, formulae, etc. Authors are requested to use margins of 3 cm on all sides. For mail submission hard copies, made by a clearly legible duplication process, are requested. Manuscripts should be subdivided into labelled sections, e.g. Introduction, Experimental, Results and Discussion, etc.
The title page comprises headline, author’s names and affiliations, abstract and key words.
Attention is drawn to the following:a) The title of the manuscript should reflect
concisely the purpose and findings of the work. Abbreviations, symbols, chemical formulas, refer-ences and footnotes should be avoided. If indis-pensable, abbreviations and formulas should be given in parentheses immediately after the respec-tive full form.
b) The author’s first and middle name initials, and family name in full should be given, followed by the address (or addresses) of the contributing laboratory (laboratories). The affiliation of the author(s) should be listed in detail (no abbreviations!). The author to whom correspondence and/or inquiries should be sent should be indicated by asterisk (*).
The abstract should be self-explanatory and intelligible without any references to the text and containing not more than 250 words. It should be followed by key words (not more than six).
References should be numbered sequentially in the order, in which they are cited in the text. The num-bers in the text should be enclosed in brackets [2], [5, 6], [9−12], etc., set on the text line. References, typed with double spacing, are to be listed in numeri-cal order on a separate sheet. All references are to be given in Latin letters. The names of the authors are given without inversion. Titles of journals must be abbreviated according to Chemical Abstracts and given in italics, the volume is typed in bold, the initial page is given and the year in parentheses. Attention is drawn to the following conventions:
BULGARIAN CHEMICAL COMMUNICATIONS
Instructions about Preparation of Manuscripts
a) The names of all authors of a certain publications should be given. The use of “et al.” in the list of references is not acceptable.
b) Only the initials of the first and middle names should be given.
In the manuscripts, the reference to author(s) of cited works should be made without giving initials, e.g. “Bush and Smith [7] pioneered...”. If the refer-ence carries the names of three or more authors it should be quoted as “Bush et al. [7]”, if Bush is the first author, or as “Bush and co-workers [7]”, if Bush is the senior author.
Footnotes should be reduced to a minimum. Each footnote should be typed double-spaced at the bottom of the page, on which its subject is first mentioned.
Tables are numbered with Arabic numerals on the left-hand top. Each table should be referred to in the text. Column headings should be as short as possible but they must define units unambiguously. The units are to be separated from the preceding symbols by a comma or brackets.
Note: The following format should be used when figures, equations, etc. are referred to the text (followed by the respective numbers): Fig., Eqns., Table, Scheme.
Schemes and figures. Each manuscript (hard copy) should contain or be accompanied by the respective illustrative material as well as by the respective figure captions in a separate file (sheet). As far as presentation of units is concerned, SI units are to be used. However, some non-SI units are also acceptable, such as °C, ml, l, etc.
The author(s) name(s), the title of the manuscript, the number of drawings, photographs, diagrams, etc., should be written in black pencil on the back of the illustrative material (hard copies) in accordance with the list enclosed. Avoid using more than 6 (12 for reviews, respectively) figures in the manuscript. Since most of the illustrative materials are to be presented as 8-cm wide pictures, attention should be paid that all axis titles, numerals, legend(s) and texts are legible.
The authors are asked to submit the final text (after the manuscript has been accepted for publication) in electronic form either by e-mail or mail on a 3.5"

152
diskette (CD) using a PC Word-processor. The main text, list of references, tables and figure captions should be saved in separate files (as *.rtf or *.doc) with clearly identifiable file names. It is essential that the name and version of the word-processing program and the format of the text files is clearly indicated. It is recommended that the pictures are presented in *.tif, *.jpg, *.cdr or *.bmp format, the equations are written using “Equation Editor” and
chemical reaction schemes are written using ISIS Draw or ChemDraw programme.
The authors are required to submit the final text with a list three individuals and their e-mail addresses that can be considered by the Editors as potential reviewers. Please, note that the reviewers should be outside the authors’ own institution or organization. The Editorial Board of the journal is not obliged to accept these proposals
EXAMPLES FOR PRESENTATION OF REFERENCES
REFERENCES
D. S. Newsome, 1. Catal. Rev.–Sci. Eng., 21, 275 (1980).C.-H. Lin, C.-y. Hsu, 2. J. Chem. Soc. Chem. Commun., 1479 (1992).R. G. Parr, W. yang, Density Functional Theory of Atoms and Molecules, Oxford Univ. Press, New york, 3. 1989.V. Ponec, G. C. Bond, Catalysis by Metals and Alloys (Stud. Surf. Sci. Catal., vol. 95), Elsevier, Amsterdam, 4. 1995. G. Kadinov, S. Todorova, A. Palazov, in: New Frontiers in Catalysis (Proc. 10th Int. Congr. Catal., Budapest, 5. 1992), L. Guczi, F. Solymosi, P. Tetenyi (eds.), Akademiai Kiado, Budapest, 1993, Part C, p. 2817.G. L. C. Maire, F. Garin, in: Catalysis. Science and Technology, J. R. Anderson, M. Boudart (eds), vol. 6, 6. Springer-Verlag, Berlin, 1984, p. 161.D. Pocknell, 7. GB Patent 2 207 355 (1949).G. Angelov, PhD Thesis, UCTM, Sofia, 2001.8. JCPDS International Center for Diffraction Data, Power Diffraction File, Swarthmore, PA, 1991.9. CA 10. 127, 184 762, (1998).P. Hou, H. Wise, 11. J. Catal., in press.M. Sinev, private communication.12. http://www.chemweb.com/alchem/articles/1051611477211.html.13.

153
Bulgarian Chemical Communications, Volume 44, 2012, Proceedings of the IIIrd National Crystallographic Symposium
CONTENTS
PREFACE .......................................................................................................................................................................5
R. Atanassova, R. D. Vassileva, M. Kadiyski, Z. Zlatev, Crystallographic, chemical and structural characteristics of harmotome from Zlatolist, Eastern Rhodopes, Bulgaria .......................................................7
B. S. Boyanov, A. B. Peltekov, X-Ray, DTA and TGA analysis of zinc sulfide concentrates and study of their charging for roasting in fluidized bed furnace ....................................................................................17
Z. P. CherkezovaZheleva, K. L. Zaharieva, V. S. Petkova, B. N. Kunev, I. G. Mitov, Preparation and investigation of nanodimensional nickel ferrite ......................................................................................24
S. V. Dimitrova, I. K. Mihailova, V. S. Nikolov, D. R. Mehandjiev, Adsorption capacity of modified metallurgical slag ............................................................................................................................................30
S. DimitrovskaLazova, D. Kovacheva, S. Aleksovska, M. Marinšek, P. Tzvetkov, Synthesis and structural details of perovskites within the series PrCo1–xCrxO3 (x = 0, 0.33, 0.5, 0.67 and 1) ................37
S. DimitrovskaLazova, D. Kovacheva, P. Tzvetkov, Structural characteristics of GdCo1–xCrxO3 (x = 0, 0.33, 0.5, 0.67, 1) perovskites ..................................................................................47
L. T. Dimowa, S. L. Petrov, B. L. Shivachev, Molten Zn-exchanged clinoptilolite – structural behaviour and properties at high temperature ..................................................................................................................55
N. V. Kaneva, C. D. Dushkin, A. S. Bojinova, ZnO thin films preparation on glass substrates by two different sol-gel methods .....................................................................................................................63
D. B. Karashanova, D. D. Kostadinova, S. V. Vasilev, N. L. Petrova, Size and distribution of Pt nanoparticles in LDH nanocomposites at different temperatures ...........................................................70
T. N. Kerestedjian, I. Sergeeva, The thermal device of the Guinier image foil camera in the Geological Institute, BAS: calibration and usage experience ...............................................................77
V. V. KostovKytin, R. P. Nikolova, N. L. Lihareva, Two-stage protonation of a small-pore microporous zirconosilicate Na2ZrSi2O7.H2O.......................................................................................................................83
D. Kovacheva, T. Ruskov, P. Krystev, S. Asenov, N. Tanev, I. Mönch, R. Koseva, U. Wolff, T. Gemming, M. MarkovaVelichkova, D. Nihtianova, K.F. Arndt, Synthesis and characterization of magnetic nano-sized Fe3O4 and CoFe2O4 ........................................................................................................................90
M. Kuneva, Rare-earth doped optical waveguides in LiNbO3 ......................................................................................98
G. I. Patronov, I. P. Kostova, Z. Y. Stoeva, D. T. Tonchev, Synthesis and characterization of zinc phosphates doped with samarium and manganese ........................................................................................109
P. Petkova, The optical influence of Cr3+ and P5+ ions on the properties of doped Bi12SiO20 .....................................115
P. Petkova, The electron-phonon interaction in Bi12SiO20 doped with Fe3+, Cr3+ and P5+ ions ....................................120
V. Tonchev, Classification of step bunching phenomena ............................................................................................124
Y. Tzvetanova, M. Kadyiski, O. Petrov, Parawollastonite (wollastonite-2M polytype) from the skarns in Zvezdel pluton, Eastern Rhodopes – a single crystal study ......................................................................131
P. Tzvetkov, D. Kovacheva, D. Nihtianova, N. Velichkova, T. Ruskov, Synthesis and crystal structure of new PbBaFe2–xMnxO5 perovskite-type compounds ...................................................................................137
S. Uzova, B. Bogdanov, V. Velev, T. Angelov, A. Popov, A preparation of high-molecular poly(ethylene-oxide)-urea complexes from a solution and their structural changes on heating ...................146
Instructions to the authors ...........................................................................................................................................151

154
Bulgarian Chemical Communications, Volume 44, 2012, Proceedings of the IIIrd National Crystallographic Symposium
съдържание
предгоВор .................................................................................................................................................................5
Р. Атанасова, Р. Д. Василева, М. Кадийски, З. Златев, Кристалографски, химични и структурни характеристики на хармотом от Златолист, източни родопи, България ..................................................16
Б. С. Боянов, А. Б. Пелтеков, рентгенофазов, DTA и TG анализ на сулфидни цинкови концентрати и изследване тяхното пържене в пещ с кипящ слой ..................................................................................23
З. П. Черкезова-Желева, К. Л. Захариева, В. Петкова, Б. Н. Кунев, И. Г. Митов, синтез и изследване на наноразмерен никелов ферит ..................................................................................................................29
С. В. Димитрова, И. К. Михайлова, В. С. Николов, Д. Р. Механджиев, адсорбционна способност на модифицирана металургична шлака .......................................................................................................36
С. Димитровска-Лазова, Д. Ковачева, С. Алексовска, М. Маринчек, П. Цветков, синтез и структурни детайли на перовскити от серията PrCo1–xCrxO3 (x = 0, 0.33, 0.5, 0.67 и 1) ..............................................46
С. Димитровска-Лазова, Д. Ковачева, П. Цветков, структурно характеризиране на GdCo1–xCrxO3 (x = 0, 0.33, 0.5, 0.67, 1) перовскити ................................................................................54
Л. Т. Димова, С. Л. Петров, Б. Л. Шивачев, обмен на клиноптилолит от стопилка ZnCl2: структурни особености и свойства при висока температура ........................................................................................62
Н. В. Кънева, Ц. Д. Душкин, А. С. Божинова, получаване на тънки филми от ZnO върху стъкло по два различни зол–гел метода ..................................................................................................................69
Д. Б. Карашанова, Д. Д. Костадинова, С. В. Василев, Н. Л. Петрова, размер и разпределение на Pt наночастици в LDH нанокомпозити при различни температури ....................................................76
Т. Н. Керестеджиян, И. Сергеева, термичната приставка на цифровата гиние камера в геологическия институт на Бан: калибриране и натрупан опит ..........................................................82
В. В. Костов-Китин, Р. П. Николова, Н. Л. Лихарева, двустадийно протониране на микропорест цирконосиликат Na2ZrSi2O7.H2O ..................................................................................................................89
Д. Ковачева, Т. Русков, П. Кръстев, С. Асенов, Н. Танев, И. Мьонж, Р. Косева, У. Волф, Т. Геминг, М. МарковаВеличкова, Д. Нихтянова, К.-Ф. Арндт, синтез и характеризиране на магнитни наноразмерни Fe3O4 и CoFe2O4 .....................................................................................................................97
М. Кънева, оптични вълноводи в литиев ниобат, дотиран с рекоземни елементи .............................................108
Г. И. Патронов, И. П. Костова, З. Й. Стоева, Д. Т. Тончев, синтез и характеристика на цинкови фосфати, дотирани със самарий и манган ............................................................................114
П. Петкова, оптично влияние на йоните Cr3+ и P5+ върху свойствата на легирани кристали от Bi12SiO20 ....................................................................................................................................................119
П. Петкова, електрон-фононно взаимодействие в Bi12SiO20, легиран с йоните Fe3+, Cr3+ и P5+ ........................123
В. Тончев, Класификация на явленията на групиране ...........................................................................................130
Я. Цветанова, М. Кадийски, О. Петров, параволастонит (политип воластонит-2M) от скарните в Звезделския плутон, източни родопи – монокристално рентгеноструктурно изследване ...............136
П. Цветков, Д. Ковачева, Д. Нихтянова, Н. Величкова, Т. Русков, синтез на нови PbBaFe2–xMnxO5 съединения с перовскитов тип структура .....................................................................145
С. Узова, Б. Богданов, В. Велев, Т. Ангелов, А. Попов, получаване на комплекси на високомолекулен полиетиленоксид и карбамид от разтвор и структурните им промени при нагряване .........................150
инструкция за авторите ............................................................................................................................................151