
2018 - Bulgarian Chemical Communications
218
BULGARIAN CHEMICAL COMMUNICATIONS 2018 Journal of the Chemical Institutes of the Bulgarian Academy of Sciences and of the Union of Chemists in Bulgaria Volume 50 / Special Issue F Proceedings of the VII th National Crystallographic Symposium
-
Upload
khangminh22 -
Category
Documents
-
view
1 -
download
0
Transcript of 2018 - Bulgarian Chemical Communications
BULGARIAN CHEMICALCOMMUNICATIONS
2018
Journal of the Chemical Institutes of the Bulgarian Academy of Sciencesand of the Union of Chemists in Bulgaria
Volume 50 / Special Issue F
Proceedings of the VIIth National Crystallographic Symposium

Симпозиумът се организира със съдействието на Фонд „Научни изследвания“, договор № ДПМНФ 01/37/2018
5
P r e f a c e
Dear reader,
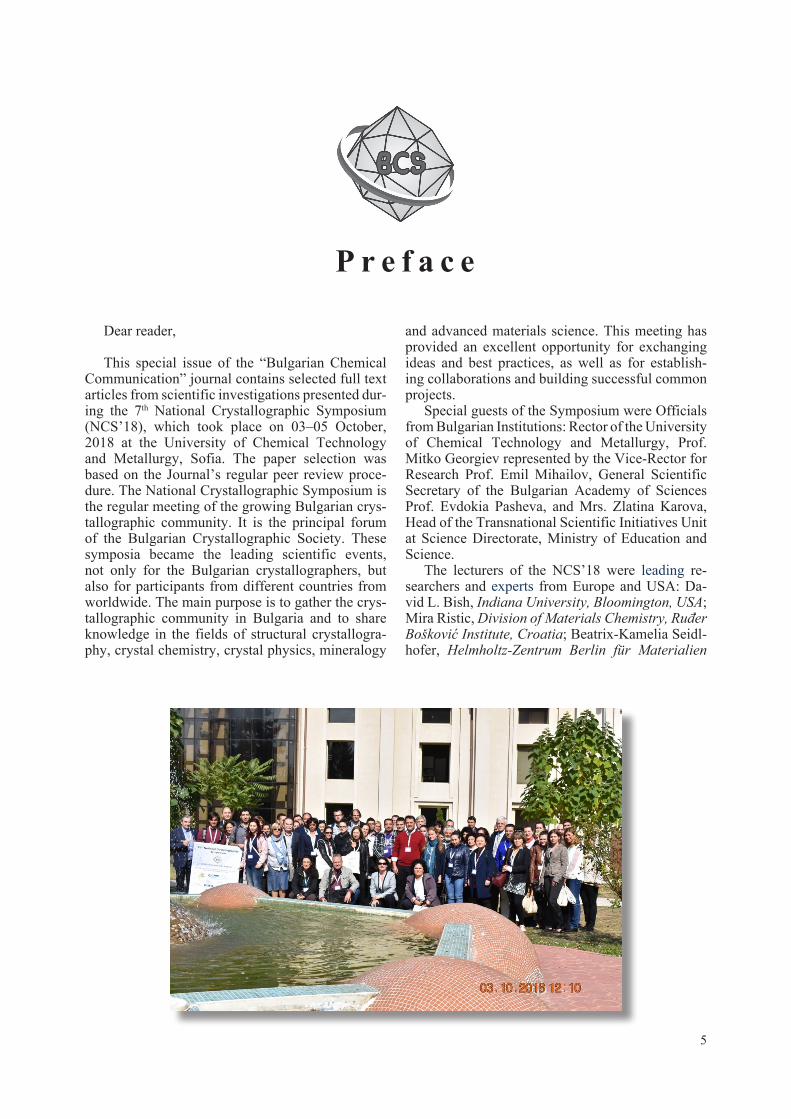
This special issue of the “Bulgarian Chemical Communication” journal contains selected full text articles from scientific investigations presented dur-ing the 7th National Crystallographic Symposium (NCS’18), which took place on 03–05 October, 2018 at the University of Chemical Technology and Metallurgy, Sofia. The paper selection was based on the Journal’s regular peer review proce-dure. The National Crystallographic Symposium is the regular meeting of the growing Bulgarian crys-tallographic community. It is the principal forum of the Bulgarian Crystallographic Society. These symposia became the leading scientific events, not only for the Bulgarian crystallographers, but also for participants from different countries from worldwide. The main purpose is to gather the crys-tallographic community in Bulgaria and to share knowledge in the fields of structural crystallogra-phy, crystal chemistry, crystal physics, mineralogy
and advanced materials science. This meeting has provided an excellent opportunity for exchanging ideas and best practices, as well as for establish-ing collaborations and building successful common projects.
Special guests of the Symposium were Officials from Bulgarian Institutions: Rector of the University of Chemical Technology and Metallurgy, Prof. Mitko Georgiev represented by the Vice-Rector for Research Prof. Emil Mihailov, General Scientific Secretary of the Bulgarian Academy of Sciences Prof. Evdokia Pasheva, and Mrs. Zlatina Karova, Head of the Transnational Scientific Initiatives Unit at Science Directorate, Ministry of Education and Science.
The lecturers of the NCS’18 were leading re-searchers and experts from Europe and USA: Da-vid L. Bish, Indiana University, Bloomington, USA; Mira Ristic, Division of Materials Chemistry, Ruđer Bošković Institute, Croatia; Beatrix-Ka melia Seidl-hofer, Helmholtz-Zentrum Berlin für Ma terialien

6
und Energie GmbH, Germany, CALIPSOplus; Vladimir Stilinović, Department of Chemistry, Uni-versity of Zagreb; George Tzvetkov, Sofia Univer-sity; Angel Ugrinov, Department of Chemistry and Biochemistry, North Dakota State University, USA; Ana Proykova, Sofia University; Boris Shivachev, IMC-BAS; Hristo Kolev, IC-BAS; Vladislav Kos-tov, IMC-BAS; Krastyo Buchkov, ISSP-BAS; Alek-sandar Nikolov, IMC-BAS; Zara Cherkezova-Zhel-eva, IC-BAS. The presented investigations were focused on the current topics in material design and preparation, advanced characterisation techniques. 20 oral and 67 poster presentations focused on the crystallography were presented by 165 participants from 7 countries (see the photo). 39 of all 87 papers were presented by PhD students and young scien-tists. They took the opportunity to disseminate their research results, to discuss problems, to ask ques-tions and to give their personal opinion. According to an established tradition the organizers of the Na-tional Crystallographic Symposia strongly encour-age and support the successful scientific career of young researchers by giving an award for the best young scientist poster presentation. The members of the international jury had the difficult task to select the winner. The NCS’18 award was given to Ekate-rina Serafimova. In addition, Aleksandar Nikolov, Hristina Sbirkova-Dimitrova and Totka Todorova
also received special certificates for the recognition of their achievements.
The special honorary sign of the Bulgarian Crystallographic Society has been dedicated to Prof. Michail Maleev for his overall activity and his outstanding contribution to the development of crystallography in Bulgaria.
The papers in the present issue outline the latest research developments of Bulgarian crystallogra-phers. They cover a wide interdisciplinary range of advanced and emergency materials with a special attention paid to the synthesis procedures, investi-gation of their structure and properties of interest. We sincerely hope that this issue reveals the high quality work of Bulgarian crystallographers and that it is a good basis for provoking business inter-est in the investment in innovations and production of advanced materials.
The symposium NCS’18 has been organized with the financial support of the National Science Fund, contract № DPMNF 01/37/2018. We also acknowledge the financial support of sponsors of the 7th National Crystallographic Symposium – Malvern-PANalytical, ROFA, Aquachim, Lab-expert, InfoLab and Eurotest Control.
We are looking forward to welcome you at the 8th National Crystallographic Symposium, which will be held in Sofia, 2020.
Prof. Zara Cherkezova-Zheleva, Guest editor of the special issue of the Journal Bulgarian Chemical Communications, and Co-chair of the Organizing Committee

7© 2018 Bulgarian Academy of Sciences, Union of Chemists in Bulgaria
* To whom all correspondence should be sent:
Bulgarian Chemical Communications, Volume 50, Special Issue F (pp. 7–14) 2018
Crystallization and crystal structure of lysozyme in the presence of nanosized Titanium dioxide
H. I. Sbirkova-Dimitrova1*, S. Georgieva2, V. Ganev1, B. L. Shivachev1
1 Institute of Mineralogy and Crystallography “Acad. Ivan Kostov”, Bulgarian Academy of Sciences, Acad. G. Bonchev str., bl. 107, 1113 Sofia, Bulgaria
2 University of chemical technology and metallurgy, 8 Blvd. Kl. Ohridski, Sofia 1756, Bulgaria
Received October 31, 2018; Accepted November 19, 2018
We present a single crystal XRD, LA-ICP-MS and cyclic voltammetry studies on the observed interaction of the protein lysozyme and TiO2 nanosized particles (JRC NM-101, anatase). The diffraction quality of lysozyme single crystals grown in presence and absence of TiO2 was comparable. The X-ray structure solution reveled that lysozyme crystallizes in the P43212 space group and disclosed the presence of electron density that was assigned to Na+ and Ti4+ ions. LA-ICP-MS analyses were conducted on both lysozyme-TiO2 single crystals and SDS-PAGE featuring lysozyme-TiO2 interaction. LA-ICP-MS data confirmed the presence of Ti4+ ions and the increased concentration of Na+. Cyclic voltammetry and differential pulls polarography results suggest that titanium binds successfully with the enzyme and that the complex formation is irreversible, at least in slightly acidic conditions (pH 6.5).
Keywords: lysozyme, TiO2 nanoparticles, single crystal, XRD, LA-ICP-MS.
INTRODUCTION
Engineered nanomaterials (ENM) are entering more and more in our surroundings while the ex-istence or absence of effects on the environment (ecotoxicity etc.), on human health (uptake, release, interaction, nanotoxicity, nanogenotoxicity etc.) re-mains questionable [1–4]. Though TiO2 is suppos-edly to be “inert”, several studies have detected the presence of Ti4+ ions in human blood mainly in pa-tients with titanium implants [5, 6]. The detection of “ionic” titanium is largely related to the corrosion of implants in such patients and yet its presence cannot be clearly explained or understood as the concentra-tion are higher than anticipated [7, 8]. Nanosized titanium dioxide is used in sun creams as UV filter [9], as supplement for whitening and brightening foods [10], as catalyst for degradation and treatment of wastewaters and pesticides [11] etc.
Nowadays crystallization of Hen egg white (HEW) lysozyme is easily achievable as it is rou-tinely used as a model system [12, 13]. Usually the crystallization of a protein is a function of several parameters starting from the “solution” (purity, pH, additive(s), concentrations of protein and/or salts,
etc.) and even small changes or variations can un-dermine successful outcomes [14–16]. In this paper we report data for crystallization of HEW lysozyme in the presence of TiO2 nanoparticles, crystal struc-ture solution and observed presence of Ti4+ ions in the HEW lysozyme single crystals and mixtures. The crystallization experiments were performed us-ing constant lysozyme concentration and buffer, the only variation was the presence or absence of TiO2 nanoparticles. The observation of structural and chemical adjustments was assessed by single crystal diffraction, LA-ICP-MAS and cyclic voltammetry.
EXPERIMENTAL
Sample crystallization
The enzyme HEW lysozyme was crystallized by the hanging drop vapor diffusion method. The initial crystallization conditions included 20 mg/ml lysozyme (Sigma L6876) in absence or presence of TiO2 2.56 mg/ml (JRC NM-101, [17]), well/solu-tion: 10% w/v sodium chloride (NaCl), 0.1M sodi-um acetate (C2H3NaO2) buffer (pH 5.0), 25% (v/v) ethylene glycol (C2H6O2). The drop size was 4 µl (2 µl Lys + 2 µl well solution). Crystallization plates were stored in controlled temperature rooms (16–20°C). Large crystals (0.4 x 0.35 x 0.35 mm3) E-mail: [email protected]

8
suitable for single crystal X-ray analysis, formed within а month (Fig. 1).
Data collection and crystal structure refinement
The obtained crystals were colorless (Fig. 1) and diffracted up to 1.8 Å resolution. Crystals were mounted on loops and were flash frozen at 130 K directly under the nitrogen cryo stream (Cobra, Oxfordcryosystems). All data were collected at low temperature (130 K) on an Oxford diffraction Supernova diffractometer using Cu-Kα radiation (λ = 1.54056 Å) from micro-focus source. The deter-mination of unit cell parameters, data integration, scaling and absorption correction were carried out using the CrysalisPro software [18]. The phases were obtained by molecular replacement with Phaser [19] using 1DPX [20] as starting model. The refinement of the structure involved several cycles of refinement using Refmac [21] and Coot [22] pro-grams. The water and heavier atoms (Ti, Cl and Na) were positioned on the Fo-Fc difference map using the interface of Coot program [22]. A summary of the fundamental crystal data and refinement indica-tors is provided in Table 1. Graphical analyses of the model, the electron-density maps and the fig-ures were carried out using programs Coot [22] and PyMOL [23]. The coordinates and structure factors have been deposited in the PDB as entry 6G5C.
Cyclic Voltammetry (CV) and Differential Puls Polarography (DPP)
The voltammograms (CV and DPP) were re-corded on a Metrohm 797 VA trace analyzer and a 797 VA stand. The Ag/AgCl, (3 mol l–1) KCl electrode was used as the reference electrode, the static mercury drop electrode as the working elec-trode, and the carbon electrode as the auxiliary elec-trode. A 0.1 mol l–1 sodium tartrate buffer solution (pH 6.5 ± 0.1) was used as a supporting electrolyte. The stock solutions of TiO2 (0.002088 mol l–1) and
lysozyme (ligand) (0.01303 mol l–1) were prepared by dissolution of TiO2 in 7% H2SO4 and lysozyme in distilled and sterilized water. A working solution was prepared mixing TiO2and lysozyme in con-centrations 0.001044 mol l–1 and 0.002088 mol l–1 (nTi (mmol) : nLys (mmol) = 1 : 2) in sodium tar-trate buffer (0.1 mol l–1; pH 6.5). All used reagents were of analytical grade.
Procedure
Cyclic voltammetry. A 6 ml volume of tartrate buffer and 20 μl of TiO2 stock solution were pi-petted in the electrochemical cell. Oxygen was re-moved by bubbling of pure nitrogen through the solution for 10 minutes. The voltammogram was registered at the follow parameters: working elec-trode: HMDE, Voltage step 5 mV, Sweep rate 0.500 mV s–1. 10 μl of the stock solution containing lysozyme was introduced in the cell. The solution was purged with nitrogen for 5 min and the analyti-cal signal was registered.
Differential Puls Polarography: A 20 μl of the titanium stock solution and 6 ml tartrate buffer were
Fig. 1. Obtained Lysozyme single crystals a) in absence of TiO2 and b) in presence of TiO2 (TiO2 is the white dispersion).
Table 1. Selected crystallographic data-collection statistics and refinement indicators for 6G5C
Crystal system Tetragonal Space group P43212cell dimensionsa, b, c, Å 78.87, 78.87, 36.89α, β, γ, º 90, 90, 90independent molecules 1diffraction datawavelength, Å 1.54056resolution, Å 1.8reflections 11235completeness, % 99.7I/σ(I) 11.68Redundancy 8.2Rmerge % 16.6(20.4)Refinementreflections used 10691resolution, Å 1.8no. of atoms 1120Amino Acids (protein) 1000Ti, Na, Cl/ion, EDO 16waters 104average B fatcor, Å2 10.0R.m.s.d.bond lengths, Å 0.019bond angles, ° 1.855PDB code 6G5C
H. Sbirkova-Dimitrova et al.: Crystallization and crystal structure of lysozyme in the presence of nanosized Titanium oxide

9
mixed and after that oxygen was removed by pass-ing nitrogen gas for 10 min. The cathodic peak of Ti(IV) was registered at a static mercury dropping electrode (SMDE), amplitude –50 mV, voltage step 5 mV, voltage step time 0.4 s and scan rate of po-tential – 12.6 mV s–1. Volumes from 10 to 40 μl of the working solution of the complex Ti(IV)-Lys and volumes of 10 to 300 μl of the stock ligand solution were introduced in the electrochemical cell. After each Ti(IV)-Lys volume was added the solution was purged with nitrogen for 10 min. The analytical signal was registered and the peak potential and the current were measured.
Laser Ablation Inductively Coupled Plasma Mass Spectrometry (LA-ICP-MS)
The qualitative content of Ti4+ and Na+ was determined by laser ablation inductively coupled plasma (LA-ICP-MS) measurements. The meas-urements were performed on PerkinElmer ELAN DRC-e ICP-MS instrument in standard mode inte-grated with New Wave Research (ESI) UP-193FX ArF excimer laser ablation system in single abla-tion spot setup (laser energy 7.5 mJ; repetition rate 10 Hz; spot size 50 µm). Optimized dry plasma conditions are obtained by precisely controlled carrier (He) and make-up (Ar) gas flows. MFC is used for ablation chamber environment and carrier gas supply.
Procedure
Single crystals of lysozyme in presence of TiO2 were harvested from the drop and transferred into a drop with crystals not containing TiO2 for 10–20 second. This procedure was performed just prior to the LA-ICP-MS experiment. If possible the crystals were washed several time before the LA-ICP-MS
collection. One should note that if excessive “trans-fer” from drop to drop occurs the single crystals started to degrade. The crystals were fished out of the drop and placed onto a cover slip (18 x 18 mm) which was immediately introduced into the LA-ICP-MS chamber. The experiment was conducted immediately and a clear spot from the laser ablation was observed (Fig. 2).
The experiments using SDS-PAGE required, after staining and destaining of the gel (Coomassie blue), to cut pieces of the gel (with protein). Two types of positioning of the cut samples were per-formed: one was flat and the other one included a 90° tilt so that the laser could be focused in the “thin” part of the gel (Fig. 2a). Then the cut pieces were introduced into the LA-ICP-MS chamber and the experiment was conducted.
RESULTS AND DISCUSSION
Currently, studies involving the interaction of nanomaterials with biological molecules are be-coming more and more routine though the em-ployed protocols and procedures have not been re-ally standardized. Even the preparative procedures of ENM for routine analyzes using commonly em-ployed methods for physico-chemical characteri-zation (TEM, ICP, SEM, DLS etc.) vary between laboratories and are prone to empirical adjustment. It is interestingly to note that dispersion protocol of ENM may include the presence of protein, sup-posedly acting as surfactant or coating [17, 24]. Though different methods can be employed for detecting quantitatively and qualitatively protein-ligand interaction, only NMR and diffraction tech-niques can provide structural insights. On the other hand it is difficult to draw information regarding the chemical composition based solely on NMR or dif-fraction techniques. Thus a combination of meth-ods and techniques must be envisaged to ascertain the interaction from both structural and chemical approach. Nowadays the procedure of lysozyme crystallization has been nearly perfected and thus it is well suited for crystallographic studies. We have exploited this robust crystallization “know-how” as model system in order to assess the interaction between TiO2 and lysozyme. The concept was just to ascertain or reject a possible interaction between nanosized TiO2 and lysozyme (as a model). Several similar studies on protein-nanosized materials have been conducted, aiming at detecting the crystalliza-tion role of protein [25–27] or the absorption of the protein on the surface of the nanomaterial [28, 29]. The employed in this study nanosized anatase (e.g. JRC NM-101) has also been thoroughly character-ized Fig. 3 and ref. 17.
Fig. 2. LA-ICP-MS samples a) cut pieces of the gel with dif-ferent orientations: surface of the gel and tilted by 90° exposing the inside of the gel and b) Lysozyme single crystal after laser ablation; the spot of the ablation is well preserved and no crys-tal degradation is observed.
H. Sbirkova-Dimitrova et al.: Crystallization and crystal structure of lysozyme in the presence of nanosized Titanium oxide

10
Single crystal data collection has been attempted for several different crystals. One should note that the dataset collected diffracted to a resolution of 1.8 Å and was from a crystal that was harvested from the drop ten (10) days after it was spotted. Crystals with similar or even bigger dimensions (size) that were allowed to “stabilize” for more than a month in the crystallization drop diffracted usually at reso-lution up to 2.5 Å. Attempts for data collection at room temperature (19 °C) were performed on a few crystals, however observed quality of the diffraction was not comparable with that for experiments con-ducted at 130 K. The presence of Titanium dioxide in the crystallization conditions may have played a role for the rapid crystal structure stabilization and subsequent destabilization. However, based on the quality of the collected diffraction data, it seems that the introduction of TiO2 (2.56 mg/ml) to the crystallization conditions has no or very little effect on the lysozyme crystal growth. The structure solu-tion showed that 6G5C corresponds to a classical C-type lysozyme [12, 20]. The asymmetric unit of 6G5C consists of one lysozyme molecule and com-prises 104 water solvent molecules. Some of these waters are first hydration-shell, ordered and well defined. In addition the Fo-Fc difference map, sug-gests the presence of heavier atoms (heavier than water) e.g. Ti4+, Na+ and Cl– ions (Fig. 4). Such in-organic ions as Ti4+ could, in principle, inhibit the ability of lysozyme to attach to a bacterial cell wall and catalyze lysis [30, 31].
The conducted LA-ICP-MS analyses on the lysozyme+TiO2 gel and single crystals confirmed the suggested by the XRD presence of Na+ and Ti4+
ions. The LA-ICP-MS analyses showed also that the Na+ and Ti4+ ions were present not only at the surface of the crystals (e.g. as contamination) but also in the bulk. One can clearly see from the analy-ses that the concentration of both Na+ and Ti4+ ions remains stable even when the ablation resulted from the inside of the single crystal (Fig. 5). The SDS-PAGE analyses included the presence of Na ions (from the Na-dodecyl sulfate) and thus the amount of Na could be adjusted in order to act as internal standard and to allow the quantification of Ti4+ ions.
The comparison of the LA-ICP-MS data ob-tained from different single crystals, for the pres-ence or absence of Ti4+ showed increased amounts of Ti4+ (Table 2). Interestingly, results for Ti48 and
Fig. 3. Collected a) powder diffraction pattern of employed anatase NM-101 and b) TEM micrograph showing that the particle size is below 20 nm (reproduced from ref. 17).
Fig. 4. View of the asymmetric unit of 6G5C (backbone is shown in green color, Ti4+ in black, Cl– in green, Na+ in blue).
H. Sbirkova-Dimitrova et al.: Crystallization and crystal structure of lysozyme in the presence of nanosized Titanium oxide

11
Ti49 isotopes were not comparable. While based on Ti48 one could detect a 40 fold increase of Ti4+ the Ti49 data was drifting from a 50 fold increase to lower values e.g. below limit of detection (LOD) for Ti4+
. The observed variations between single crys-tals may be due to the different time of nucleation and crystal growth, the washing conditions and a plausible degradation of the crystal. Although quan-titative, the data also revealed increased amounts of Na+ which is also supported by the crystal structure refinement. Indeed in 6G5C there are far more Na
sites compared to similar structures present in the database. The data and its analyses lead to the as-sumption that one should consider carefully which “Ti” isotope should be used for correct assessment of the interactions.
The LA-ICP-MS on samples cut from the SDS-PAGE gels also suggested a steady interaction be-tween TiO2 nanoparticles and lysozyme (Table 3). As the PAGE features Na its amounts can be ad-justed to allow its use as an internal standard and thus obtain quantitative results. Unfortunately such
Fig. 5. Representation of LA-ICP-MS data obtained from single crystal (left) and SDS PAGE gel (right) of lysozyme samples in presence of TiO2.
Table 2. LA-ICP-MS qualitative data for the presence of Ti4+ obtained from single crystals
Lys+TiO2 Single crystal 1 Na23 Ti48 Ti49
spot sample µg/g µg/g µg/g
3 Proba-2-1 1118.81 26.37 70.624 Proba-2-1 1022.12 23.22 40.715 Proba-2-1 1582.13 44.68 <LOD6 Proba-2-1 1333.56 45.37 < LOD7 Proba-2-1 1443.58 55.10 < LOD
Average: 1300.04 38.95 55.67Lys+TiO2 Single crystal 2 Na23 Ti48 Ti4911 Proba-2-90 2369.05 68.16 < LOD12 Proba-2-90 2283.29 58.21 < LOD13 Proba-2-90 1948.51 27.48 < LOD
Average: 2200.29 51.28 n/aLys no TiO2 Single crystal 3 Na23 Ti48 Ti493 Proba-2-1 8.57 1.49 16.194 Proba-2-1 6.01 0.93 10.365 Proba-2-1 7.35 1.16 < LOD6 Proba-2-1 8.90 1.54 < LOD7 Proba-2-1 10.25 2.11 < LOD
Average: 8.22 1.45 13.28
H. Sbirkova-Dimitrova et al.: Crystallization and crystal structure of lysozyme in the presence of nanosized Titanium oxide

12
Table 3. Quantitative LA-ICP-MS data obtained from SDS-PAGE using Na+ as internal standard
Standard Na23 S34 Ti46 Ti47 Ti48 Ti49µg/g µg/g µg/g µg/g µg/g µg/g
Nist-612-s01 100000.00 <LOD 75.08 39.97 216.06 37.14Nist-612-s02 100000.00 <LOD 77.80 41.20 213.75 39.86
Lys + TiO2 Na23 S34 Ti46 Ti47 Ti48 Ti49µg/g µg/g µg/g µg/g µg/g µg/g
SDS -01 1000.00 <LOD 454.48 489.41 299.17 504.54SDS -02 1000.00 <LOD 482.94 504.18 306.41 509.78SDS -03 1000.00 <LOD 561.08 583.90 363.58 607.64
Lys no TiO2 Na23 S34 Ti46 Ti47 Ti48 Ti49µg/g µg/g µg/g µg/g µg/g µg/g
SDS-01 1000.00 164544.77 <LOD <LOD <LOD <LODSDS-02 1000.00 174465.22 <LOD <LOD <LOD <LODSDS-03 1000.00 152881.82 <LOD <LOD <LOD <LOD
BSA no TiO2 Na23 S34 Ti46 Ti47 Ti48 Ti49µg/g µg/g µg/g µg/g µg/g µg/g
BSA-01 1000.00 77651.04 <LOD <LOD <LOD <LODBSA-03 1000.00 74009.70 <LOD <LOD <LOD <LOD
an experiment has a drawback as it will hide the increase or decrease of lysozyme-Na interaction. While the “absence” of Ti4+ in the samples with-out TiO2 is not surprising the variation of the sulfur amounts is interesting. It is quite clear that when TiO2 is present in the “condition” the amounts of sulfur (S34) are below the LOD. Such an “interac-tion” “sulfate-TiO2” has been already noticed [32, 33]. On the other hand, when no TiO2 is available the S34 levels are well above the LOD. This may be due to the employed nanosized TiO2 while if a bulk-ier material is used the effect may remain hidden.
Cyclic voltamperometry and DPP were used in the study of interfacial and redox behavior of the complex Ti(IV)-Lys and the free ligand (lysozyme) in sodium tartrate buffer (pH 6.5). Cyclic vol-tammograms for 6.959x10⁻⁶ mol l–1 Ti(IV) in the presence and the absence of lysozyme (ligand, 1.392x10⁻⁵ mol l–1) are shown on Fig. 6. The CV of Ti(IV) in sodium tartrate buffer corresponds to the those reported in the literature [34]. Two peaks at Ered = –1.25 V and Eox = –1.38 V were observed. After the addition of the ligand (Lysozyme) the ca-thodic peak was shifted to a more negative potential (Ered = –1.47 V) which proves the formation of a complex between Ti(IV) and lysozyme [35]. The immediate reverse potential scan in a positive di-rection in the presence of Lysozyme in the solution did not produce any anodic peak between –0.70 and –1.7 V indicating that the reoxydation of the
Fig. 6. Cyclic voltammograms of 6.959x10⁻⁶ mol l–1 Ti(IV) in 0.1 mol l–1 sodium tartrate buffer (inserted graphic) and in pres-ence of 1.392x10⁻⁵ mol l–1 Lysozyme, scan rate 500 mVs–1.
complex between Ti4+ and lysozyme is irreversible (Fig. 6).
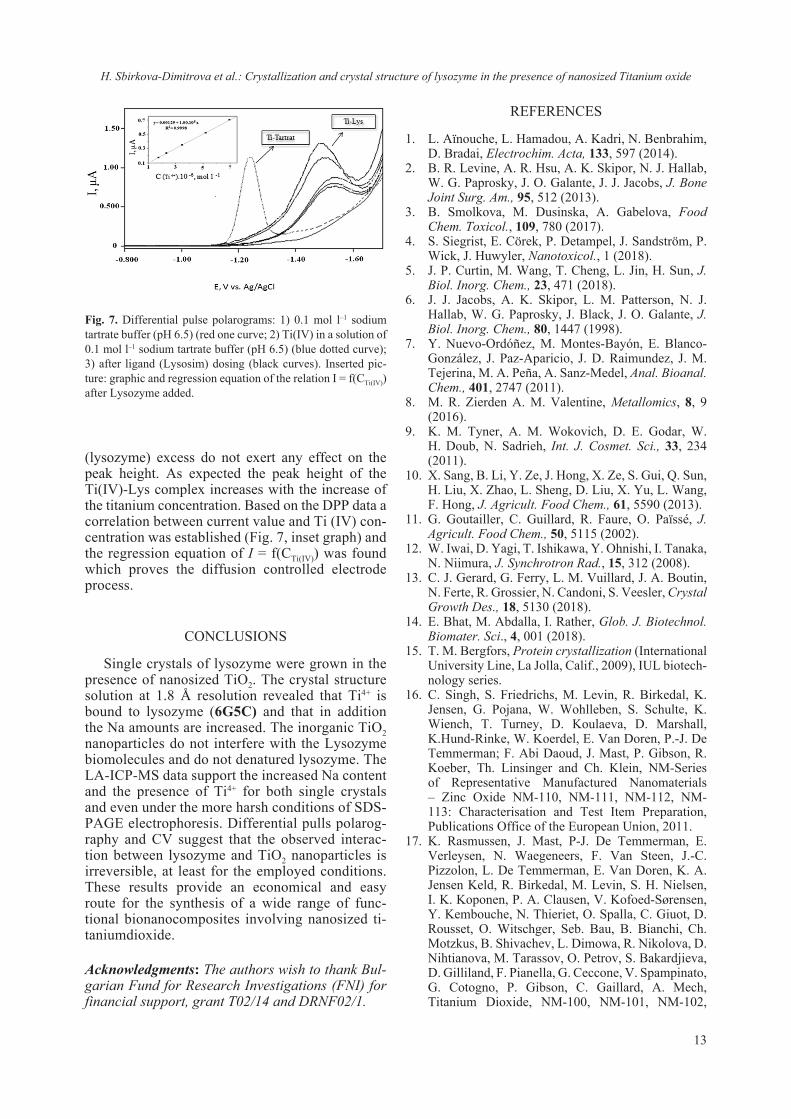
Differential pulls polarography was performed on the ligand solution in the 0.1 mol l–1 tartrate buffer solution (Fig. 7). The profile was similar to the blank voltammogram obtained for the support-ing electrolyte solution (0.1 mol l–1 tartrate buffer) with no peaks observed (data not shown) in the scan range of –0.7 to –1.7 V (Fig. 7). Complexation equi-libria of Ti-lysozyme system at different concentra-tions of titanium and lysozyme were also studied by DPP and the voltammograms obtained are shown on Fig. 7. It was found that 10 and 100 fold ligand
H. Sbirkova-Dimitrova et al.: Crystallization and crystal structure of lysozyme in the presence of nanosized Titanium oxide
13
(lysozyme) excess do not exert any effect on the peak height. As expected the peak height of the Ti(IV)-Lys complex increases with the increase of the titanium concentration. Based on the DPP data a correlation between current value and Ti (IV) con-centration was established (Fig. 7, inset graph) and the regression equation of I = f(CTi(IV)) was found which proves the diffusion controlled electrode process.
CONCLUSIONS
Single crystals of lysozyme were grown in the presence of nanosized TiO2. The crystal structure solution at 1.8 Å resolution revealed that Ti4+ is bound to lysozyme (6G5C) and that in addition the Na amounts are increased. The inorganic TiO2 nanoparticles do not interfere with the Lysozyme biomolecules and do not denatured lysozyme. The LA-ICP-MS data support the increased Na content and the presence of Ti4+ for both single crystals and even under the more harsh conditions of SDS-PAGE electrophoresis. Differential pulls polarog-raphy and CV suggest that the observed interac-tion between lysozyme and TiO2 nanoparticles is irreversible, at least for the employed conditions. These results provide an economical and easy route for the synthesis of a wide range of func-tional bionanocomposites involving nanosized ti-taniumdioxide.
Acknowledgments: The authors wish to thank Bul-garian Fund for Research Investigations (FNI) for financial support, grant T02/14 and DRNF02/1.
Fig. 7. Differential pulse polarograms: 1) 0.1 mol l–1 sodium tartrate buffer (pH 6.5) (red one curve; 2) Ti(IV) in a solution of 0.1 mol l–1 sodium tartrate buffer (pH 6.5) (blue dotted curve); 3) after ligand (Lysosim) dosing (black curves). Inserted pic-ture: graphic and regression equation of the relation I = f(CTi(IV)) after Lysozyme added.
REFERENCES
1. L. Aïnouche, L. Hamadou, A. Kadri, N. Benbrahim, D. Bradai, Electrochim. Acta, 133, 597 (2014).
2. B. R. Levine, A. R. Hsu, A. K. Skipor, N. J. Hallab, W. G. Paprosky, J. O. Galante, J. J. Jacobs, J. Bone Joint Surg. Am., 95, 512 (2013).
3. B. Smolkova, M. Dusinska, A. Gabelova, Food Chem. Toxicol., 109, 780 (2017).
4. S. Siegrist, E. Cörek, P. Detampel, J. Sandström, P. Wick, J. Huwyler, Nanotoxicol., 1 (2018).
5. J. P. Curtin, M. Wang, T. Cheng, L. Jin, H. Sun, J. Biol. Inorg. Chem., 23, 471 (2018).
6. J. J. Jacobs, A. K. Skipor, L. M. Patterson, N. J. Hallab, W. G. Paprosky, J. Black, J. O. Galante, J. Biol. Inorg. Chem., 80, 1447 (1998).
7. Y. Nuevo-Ordóñez, M. Montes-Bayón, E. Blanco-González, J. Paz-Aparicio, J. D. Raimundez, J. M. Tejerina, M. A. Peña, A. Sanz-Medel, Anal. Bioanal. Chem., 401, 2747 (2011).
8. M. R. Zierden A. M. Valentine, Metallomics, 8, 9 (2016).
9. K. M. Tyner, A. M. Wokovich, D. E. Godar, W. H. Doub, N. Sadrieh, Int. J. Cosmet. Sci., 33, 234 (2011).
10. X. Sang, B. Li, Y. Ze, J. Hong, X. Ze, S. Gui, Q. Sun, H. Liu, X. Zhao, L. Sheng, D. Liu, X. Yu, L. Wang, F. Hong, J. Agricult. Food Chem., 61, 5590 (2013).
11. G. Goutailler, C. Guillard, R. Faure, O. Païssé, J. Agricult. Food Chem., 50, 5115 (2002).
12. W. Iwai, D. Yagi, T. Ishikawa, Y. Ohnishi, I. Tanaka, N. Niimura, J. Synchrotron Rad., 15, 312 (2008).
13. C. J. Gerard, G. Ferry, L. M. Vuillard, J. A. Boutin, N. Ferte, R. Grossier, N. Candoni, S. Veesler, Crystal Growth Des., 18, 5130 (2018).
14. E. Bhat, M. Abdalla, I. Rather, Glob. J. Biotechnol. Biomater. Sci., 4, 001 (2018).
15. T. M. Bergfors, Protein crystallization (International University Line, La Jolla, Calif., 2009), IUL biotech-nology series.
16. C. Singh, S. Friedrichs, M. Levin, R. Birkedal, K. Jensen, G. Pojana, W. Wohlleben, S. Schulte, K. Wiench, T. Turney, D. Koulaeva, D. Marshall, K.Hund-Rinke, W. Koerdel, E. Van Doren, P.-J. De Temmerman; F. Abi Daoud, J. Mast, P. Gibson, R. Koeber, Th. Linsinger and Ch. Klein, NM-Series of Representative Manufactured Nanomaterials – Zinc Oxide NM-110, NM-111, NM-112, NM-113: Characterisation and Test Item Preparation, Publications Office of the European Union, 2011.
17. K. Rasmussen, J. Mast, P-J. De Temmerman, E. Verleysen, N. Waegeneers, F. Van Steen, J.-C. Pizzolon, L. De Temmerman, E. Van Doren, K. A. Jensen Keld, R. Birkedal, M. Levin, S. H. Nielsen, I. K. Koponen, P. A. Clausen, V. Kofoed-Sørensen, Y. Kembouche, N. Thieriet, O. Spalla, C. Giuot, D. Rousset, O. Witschger, Seb. Bau, B. Bianchi, Ch. Motzkus, B. Shivachev, L. Dimowa, R. Nikolova, D. Nihtianova, M. Tarassov, O. Petrov, S. Bakardjieva, D. Gilliland, F. Pianella, G. Ceccone, V. Spampinato, G. Cotogno, P. Gibson, C. Gaillard, A. Mech, Titanium Dioxide, NM-100, NM-101, NM-102,
H. Sbirkova-Dimitrova et al.: Crystallization and crystal structure of lysozyme in the presence of nanosized Titanium oxide

14
NM-103, NM-104, NM-105: Characterisation and Physico-Chemical Propertie, Publications Office of the European Union, 2014.
18. A. Technologies, Agilent Technologies UK Ltd Oxford, UK, 2012.
19. A. J. McCoy, R. W. Grosse-Kunstleve, P. D. Adams, M. D. Winn, L. C. Storoni, R. J. Read, J. App. Cryst., 40, 658 (2007).
20. M. S. Weiss, G. J. Palm, R. Hilgenfeld, Acta Crystallogr. D, 56, 952 (2000).
21. M. D. Winn, G. N. Murshudov, M. Z. Papiz, Methods in enzymology, vol. 374, Elsevier, 2003, p. 300.
22. P. Emsley, K. Cowtan, Acta Cryst Crystallogr. D, 60, 2126 (2004).
23. The PyMOL Molecular Graphics System, Version 1.6pre, Schrödinger, LLC.
24. K. Rasmussen, J. Mast, P-J De Temmerman, E. Verleysen, N. Waegeneers, F. Van Steen, J.-C. Pizzolon, L. De Temmerman, E. Van Doren, K. A. Jensen, R. Birkedal, P. A. Clausen, Y. Kembouche, N. Thieriet, O. Spalla, C. Giuot, D. Rousset, O. Witschger, S. Bau, B. Bianchi, B. Shivachev, L. Dimowa, R. Nikolova, D. Nihtianova, M. Tarassov, O. Petrov, S. Bakardjieva, Ch. Motzkus, |G. Labarraque, C. Oster, G. Cotogno, C. Gaillard, Multi-walled Carbon Nanotubes, NM-400, NM-401, NM-402, NM-403: Characterisation and Physico-
Chemical Properties, Publications Office of the European Union 2014.
25. T. Oh, J. C. Ku, J.-H. Lee, M. C. Hersam,C. A. Mirkin, Nano Lett., 18, 6022 (2018).
26. B. K. Shanbhag, C. Liu, V. S. Haritos, L. He, ACS Nano, 12, 6956 (2018).
27. Y. W. Chen, C.-H. Lee, Y. L. Wang, T. L. Li, H. C. Chang, J. Am. Chem. Soc. Langmuir, 33, 6521 (2017).
28. D. J. McClements, Adv. Colloid Interface Sci., 253, 1 (2018).
29. C. Andreoli, G. Leter, B. De Berardis, P. Degan, I. De Angelis, F. Pacchierotti, R. Crebelli, F. Barone, A. Zijno, J. Appl. Toxicol., 38, 1471 (2018).
30. H. R. Luckarift, M. B. Dickerson, K. H. Sandhage, J. C. Spain, Small, 2, 640 (2006).
31. N. A. Caveney, F. K. Li, N. C. Strynadka, Curr. Opin. Struct. Biol., 53, 45 (2018).
32. C. E. Nanayakkara, J. Pettibone,V. H. Grassian, Phys. Chem. Chem. Phys., 14, 6957 (2012).
33. I. Szilágyi, E. Königsberger, P. M. May, Inorg. Chem., 48, 2200 (2009).
34. Z. Wang, J. Zeng, G. Tan, J. Liao, L. Zhou, J. Chen, P. Yu, Q. Wang, C. Ning, Bioact. Mater., 3, 74 (2018).
35. L. Diaz-Gomez, A. Concheiro, C. Alvarez-Lorenzo, App. Surf. Sci., 452, 32 (2018).
H. Sbirkova-Dimitrova et al.: Crystallization and crystal structure of lysozyme in the presence of nanosized Titanium oxide
15© 2018 Bulgarian Academy of Sciences, Union of Chemists in Bulgaria
* To whom all correspondence should be sent:
Bulgarian Chemical Communications, Volume 50, Special Issue F (pp. 15–22) 2018
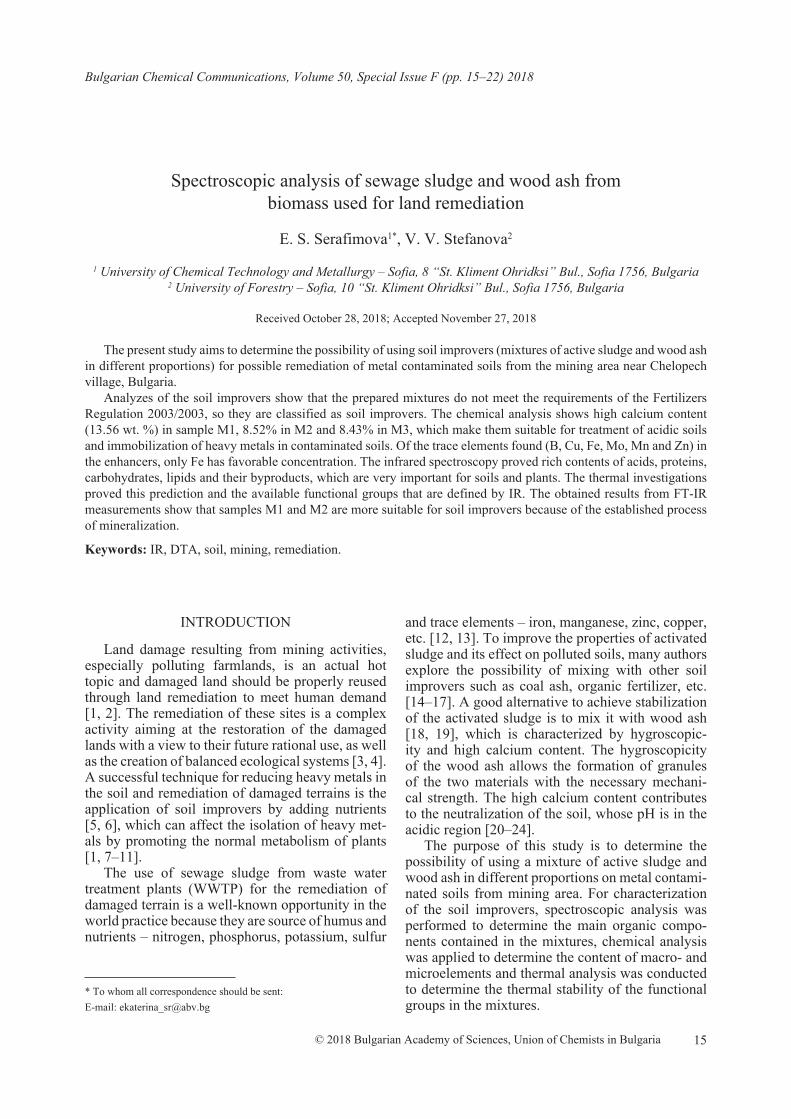
Spectroscopic analysis of sewage sludge and wood ash from biomass used for land remediation
E. S. Serafimova1*, V. V. Stefanova2
1 University of Chemical Technology and Metallurgy – Sofia, 8 “St. Kliment Ohridksi” Bul., Sofia 1756, Bulgaria 2 University of Forestry – Sofia, 10 “St. Kliment Ohridksi” Bul., Sofia 1756, Bulgaria
Received October 28, 2018; Accepted November 27, 2018
The present study aims to determine the possibility of using soil improvers (mixtures of active sludge and wood ash in different proportions) for possible remediation of metal contaminated soils from the mining area near Chelopech village, Bulgaria.
Analyzes of the soil improvers show that the prepared mixtures do not meet the requirements of the Fertilizers Regulation 2003/2003, so they are classified as soil improvers. The chemical analysis shows high calcium content (13.56 wt. %) in sample M1, 8.52% in M2 and 8.43% in M3, which make them suitable for treatment of acidic soils and immobilization of heavy metals in contaminated soils. Of the trace elements found (B, Cu, Fe, Mo, Mn and Zn) in the enhancers, only Fe has favorable concentration. The infrared spectroscopy proved rich contents of acids, proteins, carbohydrates, lipids and their byproducts, which are very important for soils and plants. The thermal investigations proved this prediction and the available functional groups that are defined by IR. The obtained results from FT-IR measurements show that samples M1 and M2 are more suitable for soil improvers because of the established process of mineralization.
Keywords: IR, DTA, soil, mining, remediation.
E-mail: [email protected]
INTRODUCTION
Land damage resulting from mining activities, especially polluting farmlands, is an actual hot topic and damaged land should be properly reused through land remediation to meet human demand [1, 2]. The remediation of these sites is a complex activity aiming at the restoration of the damaged lands with a view to their future rational use, as well as the creation of balanced ecological systems [3, 4]. A successful technique for reducing heavy metals in the soil and remediation of damaged terrains is the application of soil improvers by adding nutrients [5, 6], which can affect the isolation of heavy met-als by promoting the normal metabolism of plants [1, 7–11].
The use of sewage sludge from waste water treatment plants (WWTP) for the remediation of damaged terrain is a well-known opportunity in the world practice because they are source of humus and nutrients – nitrogen, phosphorus, potassium, sulfur
and trace elements – iron, manganese, zinc, copper, etc. [12, 13]. To improve the properties of activated sludge and its effect on polluted soils, many authors explore the possibility of mixing with other soil improvers such as coal ash, organic fertilizer, etc. [14–17]. A good alternative to achieve stabilization of the activated sludge is to mix it with wood ash [18, 19], which is characterized by hygroscopic-ity and high calcium content. The hygroscopicity of the wood ash allows the formation of granules of the two materials with the necessary mechani-cal strength. The high calcium content contributes to the neutralization of the soil, whose pH is in the acidic region [20–24].
The purpose of this study is to determine the possibility of using a mixture of active sludge and wood ash in different proportions on metal contami-nated soils from mining area. For characterization of the soil improvers, spectroscopic analysis was performed to determine the main organic compo-nents contained in the mixtures, chemical analysis was applied to determine the content of macro- and microelements and thermal analysis was conducted to determine the thermal stability of the functional groups in the mixtures.

16
EXPERIMENTAL
MaterialsMaterials: Active sludge from sewage treatment
plant – Blagoevgrad and wood ash from Svilosa AD, Svishtov were used.
To achieve the objectives of the present study three mixtures were prepared with different con-tents of sewage sludge (SS) and wood ash (WA): mixture 1 (M1) has a material ratio of 50:50; mix-ture 2 (M2) and mixture 3 (M3) respectively – 60:40 and 70:30, in favor of SS. An attempt was made to create a 40:60 mixture in favor of WA. This proved impossible due to the insufficient amount of moisture in the components and the in-ability to stick together.
MethodsTo perform the chemical analysis and determine
the qualitative and quantitative composition of the sludge, the High Dispersion ICP-OES Prodigy ap-paratus of Teledyne Leeman Labs, USA, was used.
Infrared spectroscopy, by identifying character-istic vibrations of the functional groups, was per-formed by FT-IR Spectrometer, Varian 660-IR, Austria, 2009; KBr pellets.
The thermal analysis was done with STA PT 1600 TG-DTA/DSC (STA Simultaneous Thermal Analysis), manufactured by LINSEIS Messgeräte GmbH, Germany. The analysis is carried out in a dynamic heating mode in the temperature range of
20–1000 °C with a heating rate of 10 °C.min–1. The specimen type is a powder with a particle size of 0.5 mm. The gas environment is static air gas. All analyzes were carried out at the Central Research Laboratory (CRL) at the University of Chemical Technology and metallurgy, Sofia.
RESULTS AND DISCUSSION
The chemical analysis shows high calcium con-tent of 13.56 wt.% for M1, 8.52 for M2 and 8.43 for M3 in the mixtures and presence of Mg. The pres-ence of these elements is of particular importance for the efficiency of soil improvers. Their content in these amounts helps to neutralize the pH of contam-inated soils, which is in the range of 4.0–5.0. These changes in pH value help to immobilize heavy met-als in contaminated soils.
The chemical analysis also shows that soil im-provers meet the requirements for minimum trace elements in Regulation (EC) No 2003/2003 of the European Parliament and of the Council from 13 October 2003 relating to fertilizers on the basis of the fertilizer by weight of B, Cu, Fe, Mo and Zn. The requirements for the production of compost from ac-tive sludge set the following boundary values: Cd – 3 mg/kg DW, Cu – 500 mg/kg DW, Ni – 100 mg/kg DW, Pb – 200 mg/kg DW, Zn – 1500 mg/kg DW, Hg – 3 mg/kg DW, Cr – 150 mg/kg DW, As – 0 mg/kg DW. The results of the chemical analyses of the three mixtures are presented in Table 1.
Table 1. Results of the ICP-OES test on samples wood ash (WA) and sewage sludge (SS) and the soil improvers M1, M2, M3
ValueWood ash Sewage sludge M1 M2 M3
Total Amounts of Mineral Elements (dry subst.), mg.kg–1
K 520 636 893 587 684Na 265 165 331 217 225Ca 14500 2728 13560 8527 8433Mg 129 1443 1715 1049 1271P 717 1400 923.2 830 1148Total Metals (dry subst.), mg.kg–1
Al 7450 1944 6306 4065 4163As 11 50 49 30 28Be <0.1 <0.1 <0.1 <0.1 <0.1Bi <0.2 <0.2 <0.2 <0.2 <0.2Cd 4.47 <0.2 0.15 0.06 0.12Cr 21.9 10.0 18.32 12.15 12.77Cu 179 47.4 39.85 29.52 35.48Fe 6798 3382 5933 4080 4426Hg <0.2 <0.2 <0.2 <0.2 <0.2Ni <0.2 <0.2 <0.2 <0.2 <0.2Pb 77 10 4.23 3.38 5.23Sb <0.2 <0.2 <0.2 <0.2 <0.2Sn <0.2 <0.2 <0.2 <0.2 <0.2Zn 270 180 62.46 56.21 78.23
E. Serafimova, V. Stefanova: Spectroscopic analysis of sewage sludge and wood ash from biomass used for land...

17
Fig. 1. FTIR Spectrum of WA, SS and the mixtures M1, M2 and M3.
Considering that the IR spectra reflect the chem-ical composition, preliminary studies of a particu-lar mixture are necessary to select the criteria indi-cating the decomposition processes of the organic matter. In order to fully characterize soil improv-ers, they are subjected to infrared spectroscopy by identifying the characteristic vibrations of the func-tional groups. The results are shown in Figure 1. The peaks in the IR spectra fall within the ranges of acids, proteins, carbohydrates, lipids and their prod-ucts and prove their high content in the mixtures we have made. The results of IR analysis of WA, SS and the three mixtures are presented in Table 2.
The components Ca(OH)2 and Mg(OH)2 are available in the raw SS and the mixture M3, which are characterized in the range 3619–3750 cm–1. Ca(OH)2 reduces the mobility of metals and phyto-stability and also reduces absorption of metals from plants.
The absorption bands in the 3407–3424 cm–1 range are typical for bonded and unbounded hy-
droxyl groups and H2O molecules. Other hydrox-yl groups are in the range 2501–2508 cm–1. These bonds are characteristic for amino acids. This is im-portant for plant productivity and also plays essen-tial role in all plant growth processes. Roots have the ability to take up organic N in the form of amino acids. They are contained in all mixtures.
The presence of a band at 1872 cm–1 in raw SS and 1815 cm–1 bond in mixture M3 is a sign for presence of alkenes and lactam. Both of them con-taminate soils -alkenes with hydrocarbons, which are part of petroleum oil and lactam is resistant culturable bacteria. The other characteristic band (1234 cm–1 and 914 cm–1) for SS is for sulfones and phosphate esters, which are toxic for plants and damage the soil. Due to the presence of high per-centage of precipitate in the M3 mixture, this peak also appears there (1154 cm–1 and 909 cm–1). Acid chlorides (914 cm–1) are available only in raw SS.
The main absorbance in the FT-IR spectra of SS and the three mixtures (Fig. 1) in the region 1080–
E. Serafimova, V. Stefanova: Spectroscopic analysis of sewage sludge and wood ash from biomass used for land...

18
Table 2. Infrared spectroscopy of soil improvers WA, SS, M1, M2 and M3
No Band/ cm–1 Bond Compounds1 WA SS M1 M2 M3 –
2 – 36963619 – –
375036983652
ν (Ca–O)ν (Mg–O) Ca(OH)2, Mg(OH)2
3 – – 3564 35653519
35863551 νs (O–H) Internally bonded Hydroxyl groups
[28]
4 3424 3407 34213379
3421 3418 νs (O–H)ν (N–H)
Absorbed water [28]Amino groups
5 – 3282 3239 3243 3271 νas (N–H) R–NH2 – Amine group in Aromatic primary amine
6 – 3077 – – 3072νas (C–H) νs (C–H) νas (N–H)
–CH3 and –CH2 – Aliphatic methylene group in Hemicellulose, Aldehyde, Ketone, Carboxylic acids, Esters, Alkanes[28–37]
7 2989 29562927
29732928 2980 2959
29288 – 2854 2857 2883 –9 – – – 2834 2851
10 – 2503 2501 2505 2508 νs (O–H)ν (N–H)
Hydroxyl groups very broadAmino acid(NH3
+)
11 – 1872 – – 1815ν (C=C)ν (C=O)
ν (R–NH=O)
AlkenesAnhydrides Laktam
12 – – 1790 1780 – R–C–Cl Acid chlorides (carbonyls)13 – 1734 – 1721 – R–CO–SH Thioester
14 – – – 1700 17141703 νs (C=O)
Carbonyl group in Hemicellulose, Aldehyde, Ketone, Carboxylic acids, Esters, Acide halides [13–20]
15 – 1654 1675 1633 16501613
νs (C–O) νs (С=О) νs (C=C) δas (О–Н)
Aromatic ring modes, Alkenes, Amides I, Carboxylates [24,31] Absorbed water
16 – 1542 – νs(N–H) Amides I
17 – 1525 15671518
155215381511
νs (С=О)
δas (О–Н)
Aromatic skeletal vibtarion of Lignin and Lingo Cellulose, Alcohols [34]
18 – 1450 14621424 1416 1461
1416
νas (C–O)νas (COO–) νas (C=C) δas (C–H2)
Carbonate (CaCO3) Carboxylic acides; Lignin aromatic skeletal vibration [34,35]
19 – 1405 – – – νas (N–O)νas (N–H)
NO3– group in Nitrate
Amines I [28, 33, 36]
20 – 1367 1357 – 1364 νs (C–N) Aromatic primary and secondary amines
21 – 1234 – – – (OR)3P=Oνas (R–S=O)
Phosphate estersSulfones
22 – – – 1154νs (R–S=O)
(P=O)(C–O)
SulfonesPhosphine oxidesCarbonyl compounds: acids
23 1102 – 1105 1113 1112
νs (C–O–C)δas (C–Н)
νas (Si–O–Si) νas (Р=О) νas (S=O)
Secondary aliphatic alcohol, Organic Silicon in Oxy compounds [37] Lignocelluloses [29,31]РО4
3– in β–Ca3(PO4)2 SO4
2– in Sulphates
24 1056 10891037 1038 1042 1038
νas (Si–O–Si) νas (Р=О)νs(C–O)
Organic Silicon in Oxy compands, РО4
3– in β–Ca3(PO4)2 Symmetric stretching (cellulose; hemi-cellulose; methoxy groups of lignin [29, 31]
E. Serafimova, V. Stefanova: Spectroscopic analysis of sewage sludge and wood ash from biomass used for land...
19
25 – 914 – – 909 νs (S–O)νs (P–O)
SulfonatePhosphate esters
26 – – 867 874 870δs (C–O out–of plane bending
mode)Carbonate
27 780 788 780 786 783δs C–Н
out of plane (N–H)
Aromatic compounds, R–NH2 in Primary amines
28 677 646 678 674 667 δs С–Нδs and L(O–H)
νs (S=O)
Alkynes, Alcohols SO4
2– in Sulphates [37]29 593 524 597 591 604
30 462 468 461 461 468 δas(O–Si–O) νs (S=O)
Quartz SiO2[37] SO4
2– in Sulphates [37]
31 – 428 – – 424 δs (O–P–O) РО43– in Phospates
Table 2. (continued)
1030 cm–1 is assigned to C–O stretching of polysac-charides or polysaccharide-like substances, Si–O of silicate impurities, and clay minerals, possibly in a complex with humic acids and cellulose; hemicel-lulose; and methoxy groups of lignin [24].
Absorption bands in the region 1500–1600 cm–1 could be assigned to the aromatic rings of lignin. Lignin, a major component of cell walls of vascular plants, is considered as a first line defense against successful penetration of invasive pathogens. Lignification renders the cell wall more resistant to mechanical pressure applied during penetration by fungal appressoria as well as more water resistant and thus less accessible to cell wall-degrading en-zymes [25]. Additional bands of hemicellulose are available in mixtures M2 and M3 in ranges 1700–1714cm–1 and 1511–1567 cm–1.
Carbonate (CaCO3) with 1316–1462 cm–1 and 867–874 cm–1 bands is present in all mixtures. Its presence reduces the phytotoxicity in soils.
Comparison of the IR spectra of WA (Table 2) showed a similarity of the absorption bands in the 1102 cm–1 and 1056 cm–1 region. These bands are available for the mixtures as well. The absorption bands in the 950–1200 cm–1 region correspond to the C–O, C–C groups and deformation vibrations of ring structures of CH2OH origin [24]. The most intensive broad absorption band appears in the char-acteristic carbohydrate region with maxima at 1058 and 1033 cm–1 assigned to vibrations of C-3-H–O-3-H and C-6-H2– O-6-H of cellulose groups [24].
Three broad bands at 1542, 1654, 1405 cm–1 are of protein origin (Amide II and Amide I, respec-tively) but the Amide I band disappears in a recast in mixtures SS spectra. In the spectra of SS the absorption bands at 2834–3077cm–1 are attributed to aliphatic methylene groups and assigned to fats and lipids. These bands are in all mixtures. Lipids
are an important fraction of SS that could influence the water retention capacity of amended soils, their structural stability and the biodegradation–humifi-cation balance in soils [24].
As much as 20% of soil humus occurs in the form of lipids. Lipids of the following types are known to be present: paraffin hydrocarbons, phos-pholipids, fats, waxes, fatty acids, and terpenoids. It is thus possible to deduce from the wavelength of the carbonyl absorption band whether (for example) the environment of this grouping is a carboxylic acid or ester. Similar considerations apply to other groupings [26].
The spectra 1102–1113 cm–1 is also characteris-tic for РО4
3– in β-Ca3(PO4)2 which reduce the mobil-ity of the metals from the roots to the plants.
The bands at 424–468 cm–1 and 590–677 cm–1 in the raw materials and mixtures proved the content of sulfate groups. They occupy the center of the S cycle, with a significant portion of the cycle being in soils. Soil as a medium for plant growth and de-velopment receives SO4
2– from a variety of sourc-es, part of which is used by plants, incorporated in microbial biomass retained in soils by chemical or physicochemical reactions, and yet a fourth portion is lost from the soil system by leaching [27].
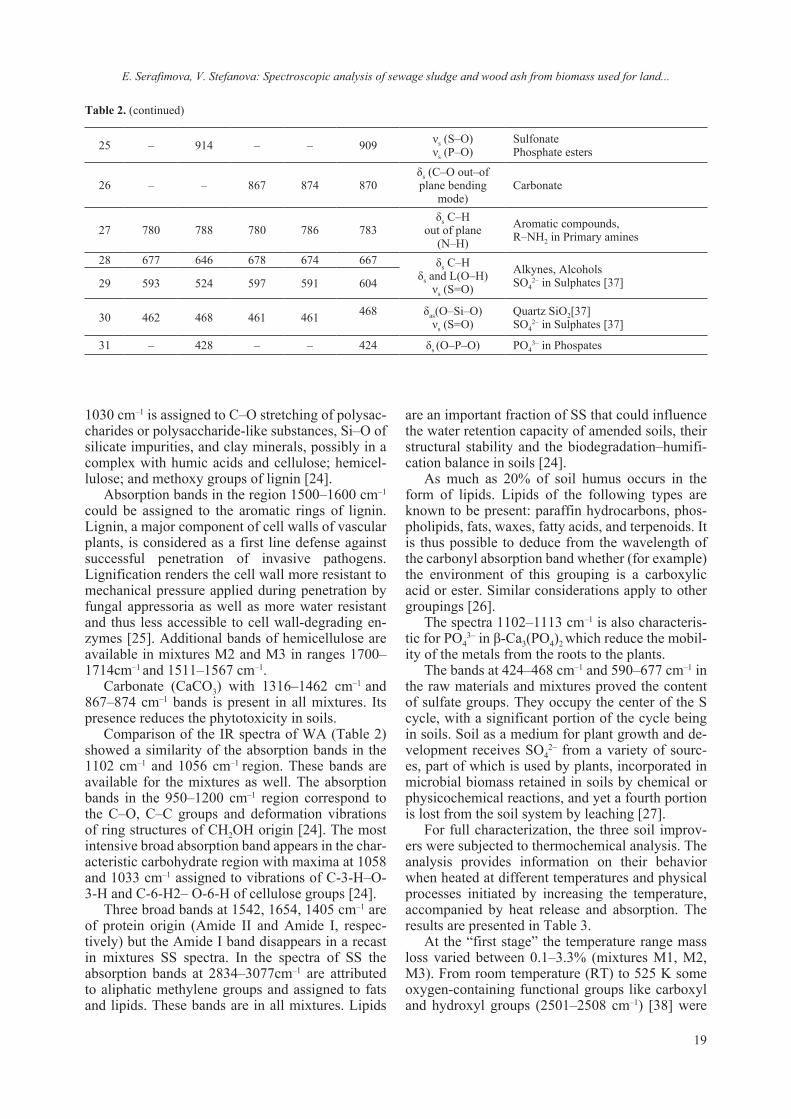
For full characterization, the three soil improv-ers were subjected to thermochemical analysis. The analysis provides information on their behavior when heated at different temperatures and physical processes initiated by increasing the temperature, accompanied by heat release and absorption. The results are presented in Table 3.
At the “first stage” the temperature range mass loss varied between 0.1–3.3% (mixtures M1, M2, M3). From room temperature (RT) to 525 K some oxygen-containing functional groups like carboxyl and hydroxyl groups (2501–2508 cm–1) [38] were
E. Serafimova, V. Stefanova: Spectroscopic analysis of sewage sludge and wood ash from biomass used for land...
20
Table 3. Effects of thermal treatment of soil improvers M1, M2, M3
Mixture Effect number Effect
Temperature, K Mass loss
Inflectionpoint
Beginning,Тonset
End,Toffset
%
M1
1 Endo316.6396.6456.5505.2
312.8 525.2 –0.1
2 Exo
552.5592.6646.3694.9762.4
525.2 789.7 –6.0
3 Exo
809.7922.1940.6984.51033.21094.41132.91166.61206.7
789.7 1226.5 –13.3
Total: –19.5 %
M2
1 Endo
331.6394.1435.2451.5503.8
298.0 521.9 –2.6
2 Exo598.6669.9711.0
521.9 765.8 –5.3
3 ExoEndo
785.9828.3923.3951.9985.81034.41093.11131.71171.61232.8
765.8 1195.9 –14.9
Total: –22.5 %
M3
1 Endo330.4399.1455.2
304.2 493.2 –3.3
2 Exo
507.6561.3593.9666.1709.7758.6
493.2 787.6 –8.5
3 ExoEndo
811.0860.9919.6985.81004.31029.41139.21200.41230.2
787.6 1175.6 –12.2
Total: –24.5 %
E. Serafimova, V. Stefanova: Spectroscopic analysis of sewage sludge and wood ash from biomass used for land...

21
decomposed and organic materials began to un-dergo some thermal decomposition, losing chemi-cally bound moisture (dehydration of crystal water and adsorbed water 3379–3424 cm–1). Between 423–473 K (organic materials) and in the range 1357–1367 cm–1 (aromatic primary and secondary amines (-C-N-) the bands indicate undergoing of some thermal decomposition. The effects are en-dothermic due to the absorption of heat from the released moisture.
Second stage – the 521–789 K range corresponds to decomposition of crystal and release of structural H2O molecules (3519–3586 cm–1). Hemicelluloses are degraded at 473 K to 523 K, cellulose at 513 K to 623K, and lignin at 553K to 773K (2854–3077 cm–1; 1511–1567 cm–1; 1416–1462 cm–1; 1101–1113 cm–1, respectively). For humic acids, exothermic re-actions below 673K have been attributed to the thermal degradation of aliphatic and carbohydrate compounds, and higher temperature exotherms to oxidation of aromatic rings [39]. The tempera-ture range between 693–785 K is associated with dehydrolization of Ca(OH)2 (3619–3750 cm–1). Resulting from the burning of volatile components, proteins, carbohydrates and lipids all of the peaks are exothermic. These chemical conversions occur concurrently with rapid changes in mass loss dur-ing the partial combustion process, which has to be taken into account when quantifying the chemical changes. Reported mass losses are from 5.3 to 8.5% from different mixtures.
Decomposition of the mixtures continues during the third stage of the thermal process in the range of 765–1226 K. The weight loss is the greatest (13–16%) and is due to the “burning” of macromol-ecules of the organic component. Sulphur remains as a sulphate (1102–1113 cm–1) until approximately 758–786 K at which temperature it starts to trans-form to an insoluble sulphide. At these temperatures the decomposition of inorganic components, mainly calcite, occurs. Above 953–963 K an exothermic re-action process is running indicating decarbonization of CaCO3 (867–870 cm–1). An endothermic effect is detected too mainly due to thermal decomposition of carbonates
CONCLUSIONS
From the performed analyzes we can conclude that the produced mixtures do not meet the require-ments of the Fertilizers Regulation 2003/2003, and they are classified as soil improvers. The concentra-tions of Ca and Mg in the produced soil improv-ers make them suitable for treatment of acidic soils. From the trace elements found in the enhancers, only Fe has a favorable concentration. The ICP-
OES analysis demonstrated the presence of As and Pb is in the range of 0.002–0.04% (As) and 0.003–0.005% (Pb). Infrared spectroscopy proves the rich content of (amino) acids, proteins, carbohy-drates, lipids and their byproducts, which are very important for soils and plants. The thermal analy-ses reveal that weight losses due to the burning of macromolecules and the organic component are in the range 13–16%. The obtained results from FT-IR measurements show that samples M1 and M2 are more suitable for soil improvers because of estab-lished process of mineralization.
REFERENCES
1. E. Zheleva-Bogdanova, Rehabilitation of damaged terrains, PSSE, Sofia, 2010.
2. E. Zheleva, P. Bozhinova, N. Dinev, Remediation of contaminated soils and overcoming the ecological damages from “OCC” JSC – Kardzhali, Ambroziq NT Ltd, Sofia 2012.
3. A. Atanasov, Ecological Problems and Recultivation of Land Degraded by the Mining Industry,Publish. House “St. Ivan Rilski “, Sofia, 2007.
4. B. Zaharinov, Y. Naydenov, Recultivation and meth-ods for soil research, NBU, Sofia, 2014.
5. B. Wang, Z. Xie, J. Chen, J. Env. Sci., 20, 1109, (2008).
6. A. Singh, M. Agrawal, Eco. Eng., 36, 1733 (2010).7. G. C. Chen, Z. L. He, J. Trace Elem. Med. Bio., 20,
127 (2006).8. J. M. Novak, W.J. Busscher, D.L. Laird, M.
Ahmedna, D.W. Watts, M. A. S. Niandou, Soil Sci., 174, 105 (2009).
9. L. Beesley, O. Inneh, Envir. Pollution, 186, 195 (2014).
10. S. Kabas, A. Faz, J. Acosta, J. Geochemic. Explor. 123, 69 (2012).
11. A. Mahar, P. Wang, R. Li, Pedosphere, 25(4): 555 (2015).
12. M. Banov, S. Marinova, A. Tasev, (First conf. of the BAV, Sofia, 2016), The sludge from the WWTP: problems and solutions, Sofia, 2016, p.62
13. Ciarán J. Lynn, Ravindra K. Dhir, Gurmel S. Gha-taora, Leaching assessment, Resources, Conserva-tion & Recycling 136, 306 (2018).
14. L. Wang, Y. Zhang, J. Lian, J. Chao, Y. Gao, F. Yang, L. Zhang, Bioresour. Technol. 136, 281 (2013).
15. L. Wang, Z. Zheng, Y. Zhang, J. Chao, Y. Gao, X. Luo, J. Zhang, J. Hazard. Mater. 244 (2013).
16. J.W.C. Wong, Envir. Int., 29, 895 (2003).17. H. Zhang, S. Lina, J. Env. Sci., 20, 710 (2008).18. R. Rehmana, M. Rizwanb, M. Farooq Qayyuma,
S. Alib, M. Zia-ur-Rehmanc, M. Zafar-ul-Hyea, F. Hafeezd, J. Env. Manag.,223, 607 (2018).
19. J. Pesonen, V. Kuokkanen, J. Env. Chem. Eng., 4(4), 4817 (2015).
20. J. Xu, X. Dong, Q. Wang, J. Hazard. Mater., 217– 218, 58 (2012).
E. Serafimova, V. Stefanova: Spectroscopic analysis of sewage sludge and wood ash from biomass used for land...

22
21. M. Wolters, E. Brannvall, R. Sjoblom, J. Kumpiene, J. Env. Manag., 159, 27 (2015).
22. A. Merino, B. Omil, M. T. Fonturbel, J. A. Vega, M. A. Balboa, Appl. Soil Ecology, 100, 195 (2016).
23. L. Żołnierz, J. Weber, M. Gilewska, S. Strączyńska, D. Pruchniewicz, Catena, (2015).
24. M. Grubea, J.G. Lin, P.H. Leeb, S. Kokorevicha, Geoderma, 130, 324 (2006).
25. N. H. Bhuiyan, G. Selvaraj, Y. Wei, J. King, Plant Signal Behav., 4(2), 158 (2009).
26. D. Chapman, J. Am. Oil Chem. Soc., 42(5), 353 (1965).
27. M. AN Tabatabai, Physicochemical Fate of Sulfate in Soils – JAPCA, 37, 34-38 (1987).
28. K. Nakamoto, Infra Red and Raman Spectra of Inorganic and Coordination Compounds, John-Wiley & Sons, Hoboken, 2009.
29. B. C. Keri, G H. Patrick, U. Minori, M. N. Jeffrey, S. Ro Kyoung, Bioresource Technol.,107,419 (2012).
30. M. Keiluweit, P.S. Nico, M.G. Johnson, M. Kleber, Environ. Sci. Technol., 44(4), 1247 (2010)
31. A. Ouatmane, M.R. Provenzano, M. Hafidi, N. Senesi, Compost Sci. Util.; 8, 124 (2000).
32. K.H. Tan, Humic Matter in Soil and the Environment – Principles and Controversies. Marcel Dekker, New York Basel, 2003.
33. M.R. Derrik, D. Stulik, J.M. Landry, Infrared Spectroscopy in Conservation Science, Scientific Tools for Conservation, Los Angeles1999.
34. M. Hesse, H. Meier, B. Zeeh, Spektroskopische Methoden in der organischen Chemie, Georg Thieme Verlag Stuttgart, New York, (1987).
35. D.C. Lee, D. Chapman, Bioscience Rep., 6(3), 235 (1986).
36. G. Davis, Compost Maturity and Nitrogen Release Characteristics in Central Coast Vegetable Production – Integrated waste management board, Integrated Waste Management Board, Sacramento, (2002).
37. J. Coates, Interpretation of Infrared Spectra, A Practical Approach – Encyclopedia of Analytical Chemistry, R.A. Meyers (Ed.), John Wiley & Sons Ltd, Chichester, 2000.
38. L. Liqing, Y. Xiaolong, L. Hailong, L. Zheng, M. Weiwu, L. Xin, Jour. of Chem. Eng. of Japan, 47(1), 21 (2014).
39. J. Leifeld, Org.Geochem., 38, 112–127 (2007).
E. Serafimova, V. Stefanova: Spectroscopic analysis of sewage sludge and wood ash from biomass used for land...

23© 2018 Bulgarian Academy of Sciences, Union of Chemists in Bulgaria
* To whom all correspondence should be sent:
Bulgarian Chemical Communications, Volume 50, Special Issue F (pp. 23–30) 2018
Conformational polymorphism in (3-acetamidophenyl)boronic acid
V. M. Dyulgerov*, L. T. Dimowa, R. Rusev, R. P. Nikolova, B. L. Shivachev
Institute of Mineralogy and Crystallography “Acad. Ivan Kostov”, Bulgarian Academy of Sciences, Acad. G. Bonchev str., bl. 107, 1113 Sofia, Bulgaria
Received October 10, 2018; Accepted November 29, 2018
This study focuses on the structural peculiarities of two conformational polymorphs of (3-acetamidophenyl)bo-ronic acid, C8H10BNO3. The two polymorphs were generated by crystallization from different solvents: chloroform and ethanol. The crystal structures of both polymorphs have been characterized by single-crystal X-ray diffraction analyses, DTA/TG and FTIR. Single crystal analyses showed that the title compound crystallizes in the triclinic system space group P–1 (No 2) and in the monoclinic crystal system, space group P21/c (No 14) in function of the employed crystallization solvent. The differences between the two crystal structures are centered on the different hydrogen bonding pattern, producing a different three-dimensional arrangement of the molecules. The DTA/TG and FTIR spectra of the two polymorphs are nearly identical and therefore they are not very suitable for differentiation. The DFT calculations showed that the energy minima of the two polymorphs differ by 0.9 kcal.mol–1 while the gener-ated potential energy surface revealed a low value of 5.8 kCal mol–1 for the barrier of rotation of the acetamide group.
Keywords: boronic acid, conformational polymorphism, single crystal, FTIR, DTA, ab initio calculations.
Email: [email protected]
INTRODUCTION
Synthetic boronic acids are widely used in or-ganic chemistry as chemical building blocks in the Suzuki (carbon-carbon bond forming) reaction [1, 2], in medicine e.g. Boron Neutron Capture Therapy (BNCT) [3, 4] as anticancer agents [5, 6], as sac-charide binders [7, 8] and as a stable synthon for crystal engeenering. Nowadays boronic acids are also investigated as potential sensors and indicators for the identification of metabolites in the disease and pathology of diabetes [9]. Boronic acids form consistent hydrogen bonds based on the –B(OH)2 fragment, and these weak interactions are seeming-ly independent of the different substitution groups. The repeatability of the hydrogen bonding pattern is due to the formation of strong cyclic O—H...O hydrogen bonds from the B(OH)2 group, analogous to the interaction of –COOH, usually producing a R2
2(8) graph set, [10, 11]. One should note that such type of hydrogen bonding interactions (e.g. R2
2(8)) are amongst the most frequently encountered and employed for crystal engineering [12–14]. In solid state of materials polymorphism occurs when one
chemical (with conserved composition and geomet-rical features) produces more than one crystalline phase [15]. However most of the organic molecules with bulky substituents linked by single bonds ex-hibit free rotation resulting in a huge number of pos-sible conformations. The phenomenon, when differ-ent conformers occur in different crystal forms is termed conformational polymorphism (the chemi-cal composition is conserved, but the geometry of the building unit is different usually) [16]. They are two other frequently discussed cases of “polymor-phism”: tautomerism and desmotropy. The latest generally requires a proton “relocation” [15]. The present work emphases on the structural particulari-ties of two conformational polymorph of (3-aceta-midophenyl)boronic acid based on single crystal, FTIR, DTA and DFT experiments.
MATERIALS
The (3-acetamidophenyl)boronic acid was ob-tained from Frontier Scientific and employed as is. The employed chloroform and ethanol were liq-uid chromatography grade, (LiChrosolv, Merck). Crystals of the two polymorphic conformers, suit-able for single crystal X-ray diffraction analyses were grown by slow evaporation from chloroform (1) and ethanol (2).

24
EXPERIMENTAL SECTION
The FTIR spectra (4000–400cm−1) of com-pounds were recorded in KBr pellets on a Bruker, Ten sor37 spectrophotometer.
The thermogravimetric (TG) and differential thermal analysis (DTA) curves in the 20–250 °C temperature range were obtained from samples of crystalized pieces (sample weight ~10 mg) placed in corundum crucibles, under a constant heating rate of 10 °C min−1 and argon flow of 40 ml min−1 on a
Stanton Redcroft thermo-analyzer. The stability of the compounds and eventual phase transitions were derived from these studies.
The crystallographic analysis of compound 1 was carried out on an EnrafNonius CAD4 diffrac-tometer, using graphite monochromatic Mo-Kα radiation (λ = 0.7107 Å) at room temperature and ω/2θ technique. The unit cell parameters for com-pound 1 were determined from 15 reflections and refined by employing 22 higher-angle reflections (17.92 < θ < 19.46°). CAD-4 Nonius Diffractometer
Table 1. Important crystallographic and refinement details for compounds 1 and 2
Compound 1 2
Chemical formula C8H10BNO3 C8H10BNO3
MW 178.98 178.98Crystal system Triclinic MonoclinicSG P–1 P21/ca [Å] 5.028 (3) 4.9039 (3)b [Å] 5.055 (4) 18.1624 (9)c [Å] 17.035 (6) 9.7928 (6)α [°] 82.85 (2) 90β [°] 82.70 (2) 93.911(6)γ [°] 87.454 (9) 90V [Å3] 425.9 (4) 870.18(9)Z 2 4F000 188 376Dx [Mg m−3] 1.396 1.366Radiation, λ [Å] MoKα, 0.7107 MoKα, 0.7107 Cell parameters From 22 reflections From 1237 reflectionsµ [mm−1] 0.10 0.10T [K] 290 290Crystal size [mm3] 0.24 × 0.21 × 0.19 0.31 × 0.25 × 0.21Radiation source Fine focus sealed tube SuperNova (Mo) micro-focus X-ray sourcemonochromator Graphite MirrorDetector Scintillation, LiI Atlas CCD, 10.3974 pixels mm–1
Data collection x scans non-profiled ω/2θ scans ω scansMeasured reflections 2480 5741Independent reflections 2017 2904Reflections with I > 2σ(I) 1172 1129Parameters 122 119Rint 0.035 0.039θmax/θmin [º] 28.0/1.2 32.7/3.1h max/min 6, –6 4, –7k max/min 6, –6 24, –27l max/min 3, –22 14, –14Absorption correction none Multi-scanTmin/Tmax none 0.572, 1Refinement on F2 on F2
Least-squares matrix full fullR[F2 > 2σ(F2)]/all 0.0595/0.1184 0.0537/0.1497wR(F2) 0.187 0.122S (GOF) 1.2 0.79Hydrogen site location Inferred from neighboring sites Inferred from neighboring sites(Δ/σ)max < 0.001 < 0.001Δρmax/Δρmin [e Å−3] 0.24/–0.23 0.23/–0.25
V. Dyulgerov et al.: Conformational polymorphism in (3-acetamidophenyl)boronic acid
25
Control Software was used for data collection [17]. The diffraction data of compound 2 were collect-ed at room temperature on an Agilent Diffraction SupernovaDual four-circle diffractometer equipped with Atlas CCD detector, mirror monochroma-tized MoKα radiation from micro-focus source (λ = 0.7107 Å) using ω-scan technique. The determina-tion of cell parameters, data integration, scaling and absorption correction for compound 2, were carried out using the CrysAlisPro program package [18].
Both structures were solved by direct methods and were refined by the full-matrix least-squares method using ShelXS97 and ShelXL97 computer programs [19]. The molecular graphics were made by ORTEP-3 for Windows [20] and crystal packing were drawn using Mercury [21]. The non-hydrogen atoms were refined anisotropically, N and O hydro-gen atoms were located from difference Fourier map while carbon hydrogen atoms were placed at ideal-ized positions. All hydrogen atoms were refined us-ing the riding model. A summary of the fundamental crystal and refinement data is provided in Table 1. Crystallographic data (excluding structure factors) for the structural analysis were deposited with the Cambridge Crystallographic Data Centre, CCDC No. 993979 and 993980. A copy of this information may be obtained free of charge from: The Director, CCDC, 12Union Road, Cambridge, CB21EZ,UK.Fax: +441223336033, e-mail: [email protected], or www.ccdc.cam.ac.uk.
Density functional calculations were carried out using the Gaussian 09 package [22]. Geometry op-timizations employed the B3LYP/6-31+G(d) level of theory [23, 24]. Vibrational frequencies were cal-culated for optimized structures at the same theory level in order to confirm that the optimized struc-tures are true stationary points.
RESULTS AND DISCUSSION
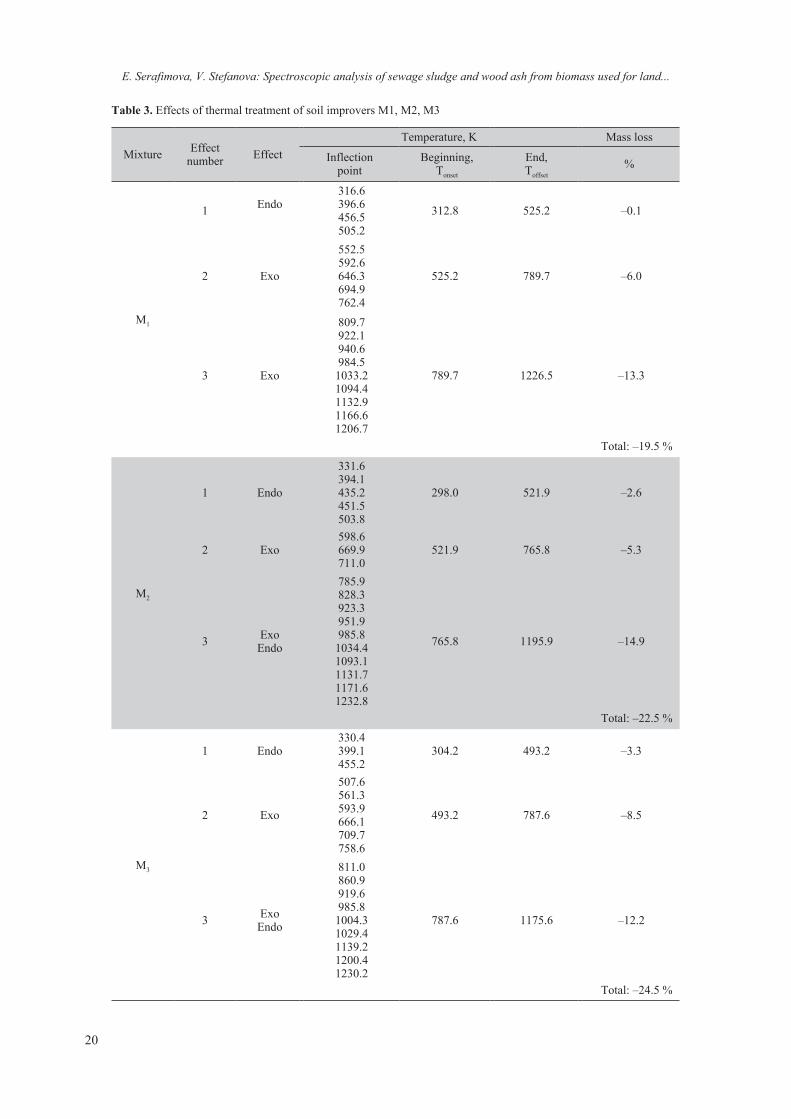
The DTA/TG curves (effects) of the two poly-morphs are shown on Fig. 1. Around 145 °C both compounds exhibit an endo effect (related to melt-ing). At the same temperature the TG shows ~8% weight losses, occurring a little bit slower in 1. The overall impression from the DTA/TG experiment is to expect a similar comportment of the two crystal-line forms.
The crystal structure analysis showed that com-pound 1 crystallizes in the triclinic system space group P–1 (No2) while compound 2 crystallizes in the monoclinic crystal system, space group P21/c (No 14). In both structures (1 and 2) only one in-dependent molecule is present in the asymmet-ric unit cell Fig. 2. The molecular features (bond
Fig. 1. DTA/TG curves for compound 1 and compound 2.
Fig. 2. ORTEP[20] drawings of the basic crystallographic units: a) 1; b) 2; ellipsoids are at 50% probability while the hydrogen atoms are shown as small spheres of arbitrary radii.
V. Dyulgerov et al.: Conformational polymorphism in (3-acetamidophenyl)boronic acid

26
lengths and angles) of the molecules of 1 and 2 are comparable (Table 2) and are quite close to those commonly encountered in related compounds [25, 26]. For comparison, a superposition of the two in-dependent molecules and a superposition using only the phenyl boronic moiety is presented in Fig. 3.
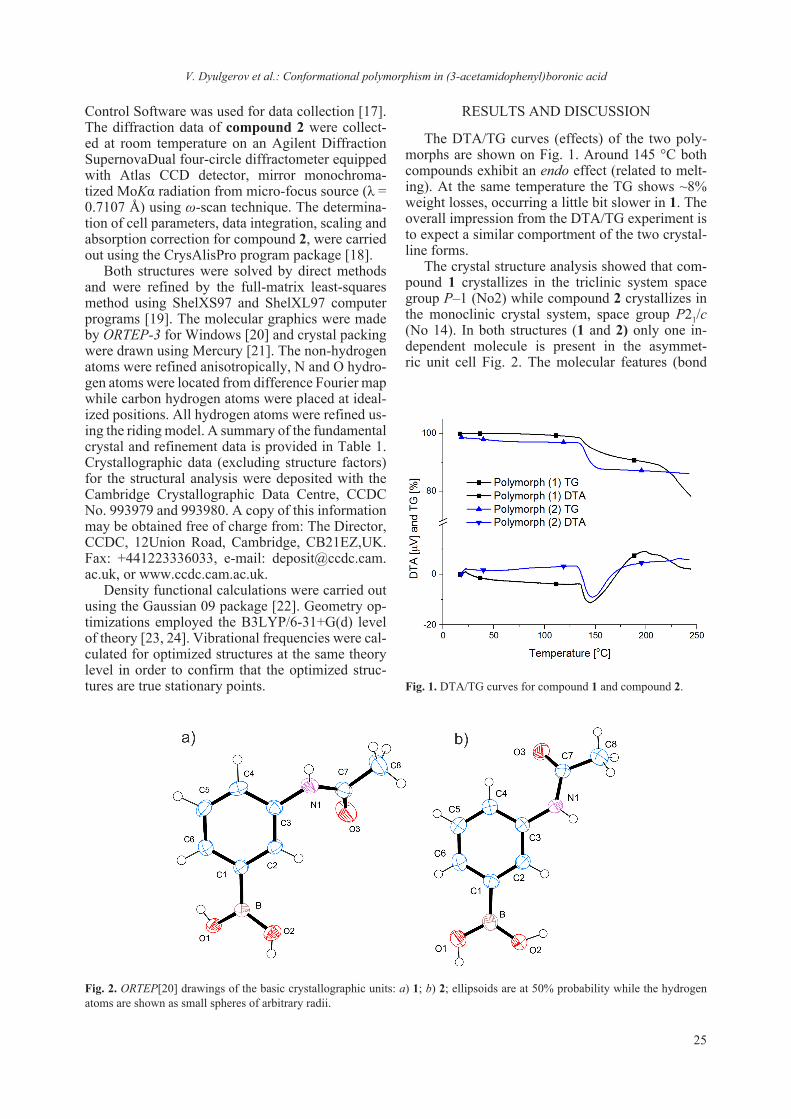
One can clearly see the cis (1) and trans (2) con-formational isomers (or the syn/anti orientation of the carbonyl to B(OH)2 group, Fig. S2). The values of the C-N-C angle (C3-N1-C7) of 126.9(2)° and 127.62(14)° in 1 and 2 respectively, are somewhat higher than 120° and thus the N atom is probably not sp2 hybridized (the mean value for the C-N-C angle as obtained from CCDC-CSD is 122.194° see Fig. S1). In addition to the cis/trans isomerism the hydrogen atoms of O1 and O2 are in anti/syn and syn/anti positions in 1 and 2 respectively. As one can suppose the hydrogen bonding patterns for 1 and 2 are also different (Table 3). Indeed in com-pound 1 the B(OH)2 moiety participates in a typical O2-H2O…O1 hydrogen bond, producing cyclic di-mers with graph set R2
2(8) (Fig. 4a). The “lateral” interaction of the B(OH)2 group is with another
Table 2. Selected distances and bond angles for 1 and 2 (the numbering scheme is as shown on Fig. 3)
Bond distance [Å] Bond angle [º] Torsion angle [º]
1 2 1 2 1 2
B1-O1 1.359(4) 1.359(2) O1-B1-O2 117.8(3) 117.9(2) O1-B1-C1-C6 23.1(5) –10.1(3)B1-O2 1.363(4) 1.361(2) O1-B1-C1 122.9(3) 118.3(2) O1-B1-C1-C2 –158.1(3) 170.5(2)B1-C1 1.561(4) 1.560(3) C1-C2-C3 121.6(3) 121.6(2) O2-B1-C1-C6 –155.0(3) 169.2(2)N1-C3 1.424(4) 1.424(2) C5-C6-C1 120.8(3) 121.7(2) O2-B1-C1-C2 23.8(5) –10.3(3)N1-C7 1.342(4) 1.344(2) C3-N1-C7 126.9(2) 127.6(3) C1-C2-C3-C4 2.1(4) –0.4(2)C7-O3 1.226(4) 1.230(2) N1-C7-O3 123.2(3) 123.2(3) C3-C4-C5-C6 0.7(5) 1.0(3)C7-C8 1.497(4) 1.493(3) N1-C7-C8 115.9(3) 116.5(3) C2-C3-N1-C7 37.7(5) 157.9(2)
O3-C7-C8 120.9(3) 120.3(3) C3-N1-C7-O3 5.1(5) –5.8(3)
Fig. 3. Overlay of the molecules of 1 (in green) and 2 a) super-position of the two independent molecules and b) superposition using only the phenyl boronic moiety.
Table 3. Hydrogen bonds (Å, °) in 1 and 2
D—H···A D—H H···A D···A < D—H···A
Compound 1
N1—H1N···O3i 0.86 2.08 2.925(4) 170O1—H1O···O2ii 0.81 2.14 2.849(3) 147O2—H2O···O1iii 0.84 1.93 2.771(3) 175
Symmetry codes: (i) x, y+1, z; (ii) x−1, y, z; (iii) −x+1, −y, −z+2.
Compound 2
N1—H1N···O3i 0.86 2.23 3.069(2) 164O1—H1O···O2ii 1.09 1.69 2.793(2) 180O2—H2O···O3iii 0.98 1.78 2.735(2) 162C4— H4···O3 0.93 2.35 2.882(2) 116
Symmetry codes: (i) x, −y+1/2, z+1/2; (ii) −x+3, −y, −z+2; (iii) x+1, −y+1/2, z+1/2.
V. Dyulgerov et al.: Conformational polymorphism in (3-acetamidophenyl)boronic acid
27
B(OH)2, graph set R22(8). The donors and acceptor
of the amide fragment are involved in a N1-H1N…O3 hydrogen bond that produces C1
1(4) chains propagating along b. Similarly, in compound 2 an O1-H1O…O2 hydrogen bond (from B(OH)2 moi-ety) produces cyclic dimers with graph set R2
2(8). However, the lateral interaction of the B(OH)2 group in 2 is with the amide group O2-H2O…O3 (Fig. 4b). The donors and acceptor of the amide fragment are also involved in an N1-H1N…O3 hy-drogen bond C1
1(4) chains propagating along c. Though in 1 and 2 the hydrogen bonding net-
work is different, the type and number of the hy-drogen bonds are the same (two O-H…O and one N-H…O) bonds. This explains the fact that the melting temperatures of two polymorphs are near-ly identical.
The cis and trans isomer geometries were opti-mized using DFT. Starting geometries were taken from X-ray refinement. The barrier of rotation of the amide group was estimated by calculating the energies resulting from the rotation of the amide moiety along the C3-N1 bond. The trans isomer was chosen as a starting point and the potential en-ergy was scanned using a 5° step.
The C-C, B-O, C=O and C-N bond distances and angles characterizing the molecules in the DFT cal-culated models are comparable to those determined experimentally (Table S1). The observed differ-ences between calculated and observed geometries could e attributed to the crystal packing of the mol-ecules. The DFT calculations showed that the en-ergy difference between the trans and cis conform-ers is not considerable (0.9 kcal mol–1 in favor of
Fig. 4. Hydrogen bonding interactions in a) compound 1 and b) compound 2; symmetry operations are listed in Table HB.
V. Dyulgerov et al.: Conformational polymorphism in (3-acetamidophenyl)boronic acid

28
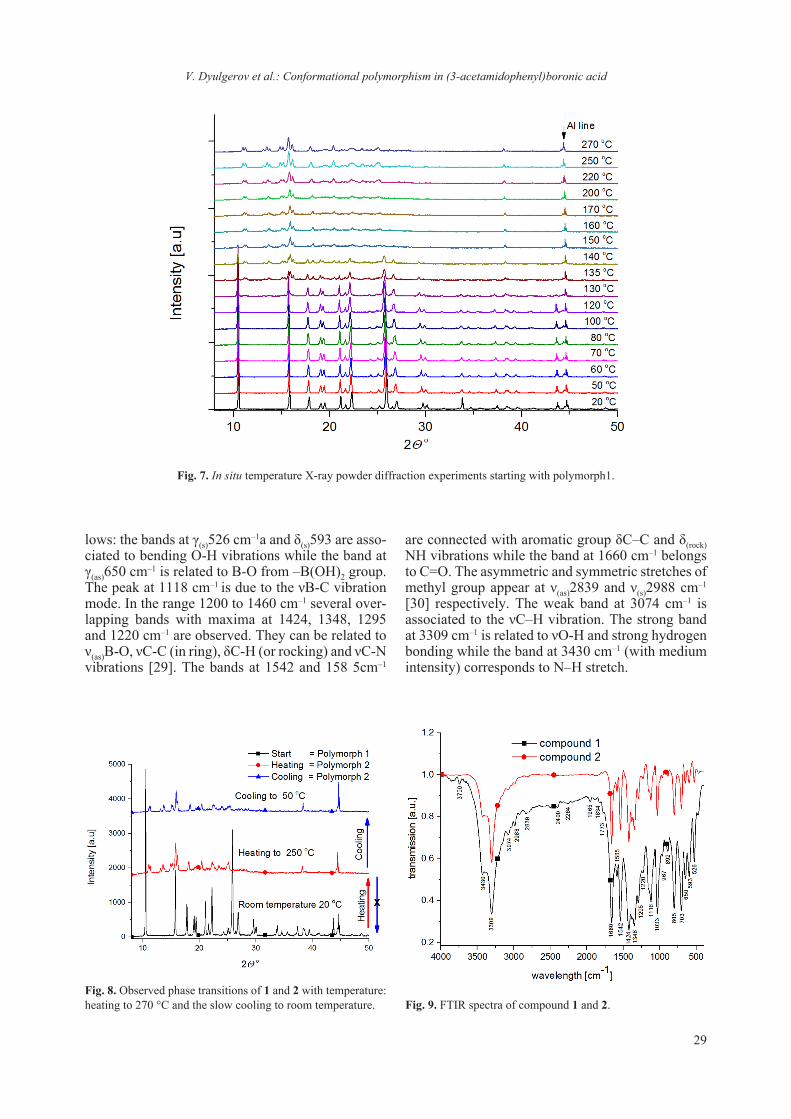
the trans conformer). The computed barrier of rota-tion of 5.8 kcal mol–1 between the two conformers is not excessively high (cis to trans rearrangement, Fig. 5). However, one should note that the computa-tion does not include the hydrogen bonding interac-tions present in the crystal and the resulting differ-ent orientation of the molecules in the two confor-mational polymorphs (e.g. in 1 the B(OH)2 group interacts laterally with another B(OH)2 group while in 2 the B(OH)2 group interacts with the amide moiety, Fig. 6). As both moieties (amide and phe-nyl boronic) are apt to rotate along the C-N bond the synergy leads probably to a lower rotation en-ergy barrier than the one of amide or phenyl groups alone [27, 28]. The conducted in situ temperature X-ray powder diffraction experiments showed that Polymorph 1 is converted into polymorph 2 under heating. The conversion start is detected at 135 °C and is completed at 150 °C (Fig. 7). The structure of polymorph 2 is stable up to 270 °C. If the heating is removed and the sample is allowed to cool down slowly to room temperature no phase transition of 2 to 1 is observed (Fig. 8). One should note that the in situ X-ray data does not explain the observed DTA comportment of 2. One explanation is that the phase transition 2 to 1 is very slow and has not been de-tected by the in situ experiment.
Fig. 5. Potential energy surface and projected contour maps showing the barrier between trans/cis conformers (the inset shows the energy surface). The energy corresponds to the dif-ference between single point calculation corresponding to C2-C3-N1-C7 and C3-N1-C7-O3 angles and the global minimum energy, with a positive offset of 4 kcal.
Fig. 6. Three-dimensional arrangement of the molecules in a) compound 1 and b) compound 2.
The FTIR spectra of compounds 1 and 2 are il-lustrated on Fig. 9. Although the crystal system and space group of 1 and 2 are different the spectra show almost identical band positions and intensi-ties. The assignment of the observed bands is as fol-
V. Dyulgerov et al.: Conformational polymorphism in (3-acetamidophenyl)boronic acid
29
Fig. 7. In situ temperature X-ray powder diffraction experiments starting with polymorph1.
Fig. 8. Observed phase transitions of 1 and 2 with temperature: heating to 270 °C and the slow cooling to room temperature. Fig. 9. FTIR spectra of compound 1 and 2.
lows: the bands at γ(s)526 cm–1a and δ(s)593 are asso-ciated to bending O-H vibrations while the band at γ(as)650 cm–1 is related to B-O from –B(OH)2 group. The peak at 1118 cm–1 is due to the νB-C vibration mode. In the range 1200 to 1460 cm–1 several over-lapping bands with maxima at 1424, 1348, 1295 and 1220 cm–1 are observed. They can be related to ν(as)B-O, νC-C (in ring), δC-H (or rocking) and νC-N vibrations [29]. The bands at 1542 and 158 5cm–1
are connected with aromatic group δC –C and δ(rock)NH vibrations while the band at 1660 cm–1 belongs to C=O. The asymmetric and symmetric stretches of methyl group appear at ν(as)2839 and ν(s)2988 cm–1 [30] respectively. The weak band at 3074 cm–1 is associated to the νC–H vibration. The strong band at 3309 cm–1 is related to νO-H and strong hydrogen bonding while the band at 3430 cm–1 (with medium intensity) corresponds to N–H stretch.
V. Dyulgerov et al.: Conformational polymorphism in (3-acetamidophenyl)boronic acid

30
CONCLUSIONS
Two conformational polymorphs of (3-acetami-dophenyl)boronic acid were obtained and charac-terized by single crystal diffraction analyses, FTIR and DFT to further elucidate the crystal formation mechanisms. The two polymorphs exhibited almost identical thermal and spectral absorption features (in the range 400–4000 cm–1). This result is fur-ther supported by DFT calculations showing mini-mal energy difference between the two conformers (molecules). The crystal structures solution pointed that the hydrogen-bonding scheme was different in the two polymorphs, while the type and number of interactions remained the same. The same number of hydrogen bonding interactions present in both polymorphs is probably the main reason for the ob-served almost identical thermal comportment of the modifications. The results suggest that in order to correctly describe and identify different crystalline polymorphic forms the combination of employed methods must include diffraction experiments.
Acknowledgments: This work was supported by NSF Grant DRNF 02/1 and T02/14.
REFERENCES
1. C. Y. Liu, Y. Li, J. Y. Ding, D. W. Dong, F. S. Han, Chem-Eur. J., 20, 2373 (2014).
2. T. Moriya, N. Miyaura, A. Suzuki, Chem. Lett., 22, 1429 (1993).
3. S. I. Miyatake, M. Furuse, S. Kawabata, T. Maruyama, T. Kumabe, T. Kuroiwa, K. Ono, Neuro-Oncology, 15, 650 (2013).
4. R. Asano, A. Nagami, Y. Fukumoto, K. Miura, F. Yazama, H. Ito, I. Sakata, A. Tai, Bioorg. Med. Chem. Lett., 24, 1339 (2014).
5. J. K. Zhang, L. Q. Shen, J. C. Wang, P. H. Luo, Y. Z. Hu, Med. Chem., 10, 38 (2014).
6. J. Wang, W. Wu, Y. J. Zhang, X. Wang, H. Q. Qian, B. R. Liu, X. Q. Jiang, Biomaterials, 35, 866 (2014).
7. Z. F. Xu, K. M. A. Uddin, T. Kamra, J. Schnadt, L. Ye, Appl. Mater. Inter., 6, 1406 (2014).
8. M. Kumai, S. Kozuka, M. Samizo, T. Hashimoto, I. Suzuki, T. Hayashita, Anal. Sci., 28, 121 (2012).
9. W. Takayoshi, M. Imajo, M. Iijima, M. Suzuki, H. Yamamoto, Y. Kanekiyo, Sensor Actuat. B-Chem., 192, 776 (2014).
10. V. V. Zhdankin, P. J. Persichini, L. Zhang, S. Fix, P. Kiprof, Tetrahedron Lett., 40, 6705 (1999).
11. J. H. Fournier, T. Maris, J. D. Wuest, W. Z. Guo, E. Galoppini, J. Am. Chem. Soc., 125, 1002 (2003).
12. E. R. T. Tiekink, J. J. Vittal, M. Zaworotko, Organic crystal engineering: frontiers in crystal engineering, Wiley, Chichester, U.K., 2010.
13. H. G. Brittain, Polymorphism in pharmaceutical sol-ids, 2nd ed., Informa Healthcare, New York, 2009.
14. G. R. Desiraju, Crystal design: structure and func-tion, Wiley, Chichester, West Sussex, England; Hoboken, NJ, 2003.
15. J. Elguero, Cryst. Growth Des., 11, 4731 (2011).16. A. Nangia, Accounts Chem. Res., 41, 595 (2008).17. CAD-4 EXPRESS. Version 5.1/1.2. Enraf Nonius,
Delft, the Netherlands.18. Agilent, in, Agilent Technologies, UK Ltd, Yarnton,
England, 2011.19. G. M. Sheldrick, Acta Crystallogr. A, 64, 112 (2008).20. L. Farrugia, J. Appl. Crystallogr., 30, 565 (1997).21. C. F. Macrae, I. J. Bruno, J. A. Chisholm, P. R.
Edgington, P. McCabe, E. Pidcock, L. Rodriguez-Monge, R. Taylor, J. van de Streek, P.A. Wood, J. Appl. Crystallogr., 41, 466 (2008).
22. M. J. Frisch, G. W. Trucks, H. B. Schlegel, G. E. Scuseria, M. A. Robb, J. R. Cheeseman, G. Scalmani, V. Barone, B. Mennucci, G. A. Petersson, H. Nakatsuji, M. Caricato, X. Li, H. P. Hratchian, A. F. Izmaylov, J. Bloino, G. Zheng, J. L. Sonnenberg, M. Hada, M. Ehara, K. Toyota, R. Fukuda, J. Hasegawa, M. Ishida, T. Nakajima, Y. Honda, O. Kitao, H. Nakai, T. Vreven, Jr, J. E. Peralta, F. Ogliaro, M. Bearpark, J. J. Heyd, E. Brothers, K. N. Kudin, V. N. Staroverov, R. Kobayashi, J. Normand, K. Raghavachari, A. Rendell, J. C. Burant, S. S. Iyengar, J. Tomasi, M. Cossi, N. Rega, J. M. Millam, M. Klene, J. E. Knox, J. B. Cross, V. Bakken, C. Adamo, J. Jaramillo, R. Gomperts, R.E. Stratmann, O. Yazyev, A.J. Austin, R. Cammi, C. Pomelli, J. W. Ochterski, R. L. Martin, K. Morokuma, V. G. Zakrzewski, G. A. Voth, P. Salvador, J. J. Dannenberg, S. Dapprich, A. D. Daniels, Farkas, J. B. Foresman, J. V. Ortiz, J. Cioslowski, D. J. Fox, Gaussian 09 Revision A.02, Gaussian Inc. Wallingford CT 2009, 2009.
23. C. Lee, W. Yang, R. G. Parr, Phys. Rev. B, 37, 785 (1988).
24. A. D. Becke, J. Chem Phys., 98, 5648 (1993).25. V. Dyulgerov, R. P. Nikolova, L. T. Dimova, B. L.
Shivachev, Acta crystallogr. E., 68, o2320 (2012).26. D. Zhang, L. E. Harrington, H. Tanaka, R. Pelton,
Acta Crystallogr. E, 63, o4628 (2007).27. R. Chaudret, G. Trinquier, R. Poteau, L. Maron, New
J Chem., 33, 1833 (2009).28. V. S. Dimitrov, V. B. Kurteva, M. J. Lyapova, B. P.
Mikhova, I. G. Pojarlieff, Magn. Reson. Chem., 26, 564 (1988).
29. J. A. Faniran, H. F. Shurvell, Can. J. Chem., 46, 2089 (1968).
30. M. Avram, G. D. Mateescu, Infrared spectroscopy: applications in organic chemistry, Wiley-Inter sci-ence, New York, 1972.
V. Dyulgerov et al.: Conformational polymorphism in (3-acetamidophenyl)boronic acid
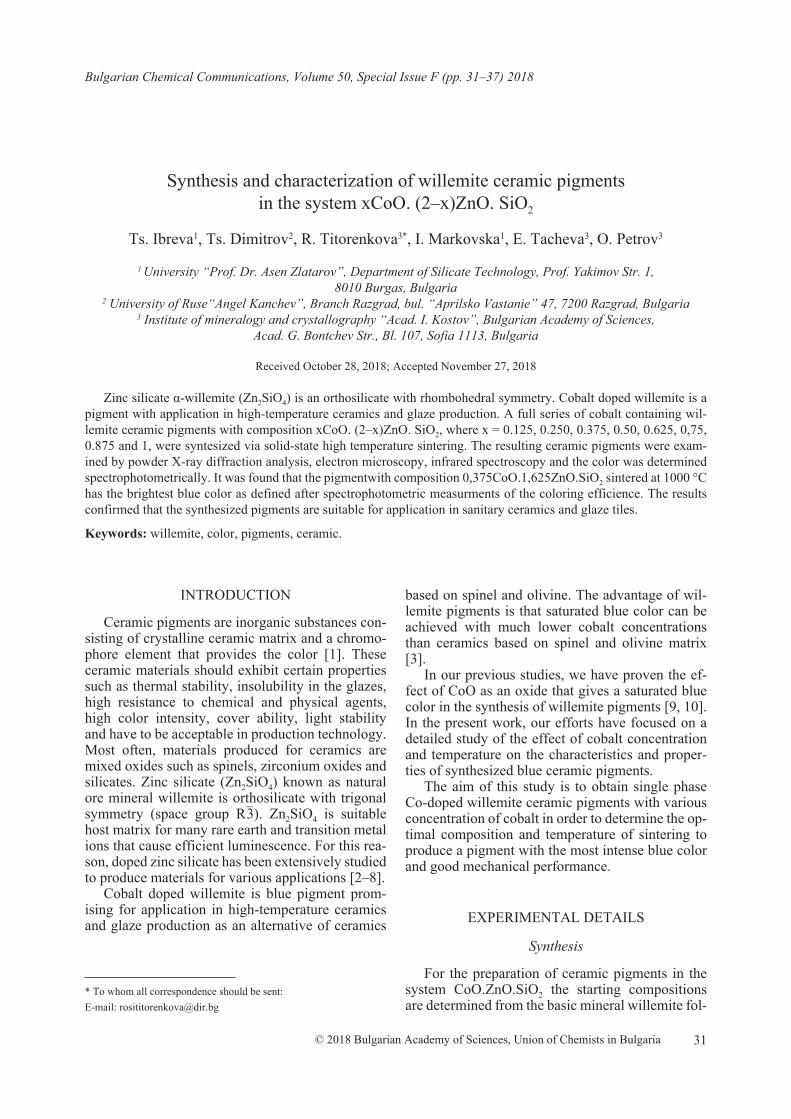
31© 2018 Bulgarian Academy of Sciences, Union of Chemists in Bulgaria
* To whom all correspondence should be sent:
Bulgarian Chemical Communications, Volume 50, Special Issue F (pp. 31–37) 2018
Synthesis and characterization of willemite ceramic pigments in the system xCoO. (2–x)ZnO. SiO2
Ts. Ibreva1, Ts. Dimitrov2, R. Titorenkova3*, I. Markovska1, E. Tacheva3, O. Petrov3
1 University “Prof. Dr. Asen Zlatarov”, Department of Silicate Technology, Prof. Yakimov Str. 1, 8010 Burgas, Bulgaria
2 University of Ruse“Angel Kanchev”, Branch Razgrad, bul. “Aprilsko Vastanie” 47, 7200 Razgrad, Bulgaria 3 Institute of mineralogy and crystallography “Acad. I. Kostov”, Bulgarian Academy of Sciences,
Acad. G. Bontchev Str., Bl. 107, Sofia 1113, Bulgaria
Received October 28, 2018; Accepted November 27, 2018
Zinc silicate α-willemite (Zn2SiO4) is an orthosilicate with rhombohedral symmetry. Cobalt doped willemite is a pigment with application in high-temperature ceramics and glaze production. A full series of cobalt containing wil-lemite ceramic pigments with composition xCoO. (2–x)ZnO. SiO2, where x = 0.125, 0.250, 0.375, 0.50, 0.625, 0,75, 0.875 and 1, were syntesized via solid-state high temperature sintering. The resulting ceramic pigments were exam-ined by powder X-ray diffraction analysis, electron microscopy, infrared spectroscopy and the color was determined spectrophotometrically. It was found that the pigmentwith composition 0,375CoO.1,625ZnO.SiO2 sintered at 1000 °C has the brightest blue color as defined after spectrophotometric measurments of the coloring efficience. The results confirmed that the synthesized pigments are suitable for application in sanitary ceramics and glaze tiles.
Keywords: willemite, color, pigments, ceramic.
E-mail: [email protected]
INTRODUCTION
Ceramic pigments are inorganic substances con-sisting of crystalline ceramic matrix and a chromo-phore element that provides the color [1]. These ceramic materials should exhibit certain properties such as thermal stability, insolubility in the glazes, high resistance to chemical and physical agents, high color intensity, cover ability, light stability and have to be acceptable in production technology. Most often, materials produced for ceramics are mixed oxides such as spinels, zirconium oxides and silicates. Zinc silicate (Zn2SiO4) known as natural ore mineral willemite is orthosilicate with trigonal symmetry (space group R–3). Zn2SiO4 is suitable host matrix for many rare earth and transition metal ions that cause efficient luminescence. For this rea-son, doped zinc silicate has been extensively studied to produce materials for various applications [2–8].
Cobalt doped willemite is blue pigment prom-ising for application in high-temperature ceramics and glaze production as an alternative of ceramics
based on spinel and olivine. The advantage of wil-lemite pigments is that saturated blue color can be achieved with much lower cobalt concentrations than ceramics based on spinel and olivine matrix [3].
In our previous studies, we have proven the ef-fect of CoO as an oxide that gives a saturated blue color in the synthesis of willemite pigments [9, 10]. In the present work, our efforts have focused on a detailed study of the effect of cobalt concentration and temperature on the characteristics and proper-ties of synthesized blue ceramic pigments.
The aim of this study is to obtain single phase Co-doped willemite ceramic pigments with various concentration of cobalt in order to determine the op-timal composition and temperature of sintering to produce a pigment with the most intense blue color and good mechanical performance.
EXPERIMENTAL DETAILS
Synthesis
For the preparation of ceramic pigments in the system CoO.ZnO.SiO2 the starting compositions are determined from the basic mineral willemite fol-

32
lowing the expression xCoO (2-x) ZnO.SiO2, where x = 0.125, 0.250, 0.375, 0.50, 0.625, 0.75, 0.875 and 1.00. Ceramics were synthesized via solid-state high temperature sintering. Starting materials used for the synthesis are CoO, ZnO and SiO2.nH2O as a source of SiO2. The used SiO2.nH2O with parti-cle size in the range 2–7 μm is much more reac-tive than conventionally used quartz sand. NaF was used as a mineralizer. Calculated quantities of materials for 100 g batch are weighed with a preci-sion, then mixed and dry homogenized in planetary mill PULVERIZETE-6 (FRITCH). Synthesis was carried out in a laboratory muffle furnace in porce-lain crucibles with a heating rate of 300-400°C/h in air with isothermal retention of 1 hour at the final temperature. The resulting powder mixtures were sintered at 800, 900, 1000, 1100 and 1200 °C in or-der to obtain blue ceramic pigments. The composi-tions of the synthesized pigments are presented in Table 1.
Characterization
The resulting ceramic pigments were exam-ined by powder X-ray diffraction (XRD) analysis, electron microscopy, infrared spectroscopy and the color was determined spectrophotometrically.
Phase composition of the synthesized ceramic pigments was determined using XRD with a Bruker D8 diffractometer operating at 40 kV and 40 mA with CuKα radiation.
FT-IR spectra were collected using a Tensor 37 spectrometer (Bruker) with 4 cm–1 resolution after averaging 72 scans on standard KBr pallets in the spectral region 400–4000 cm–1 at room temperature.
Electron probe microanalyses (EPMA) and sec-ondary electron (SE) images of the materials were carried out on ZEISS SEM EVO 25 LS – EDAX Tri dent (IMC-BAS) at acceleration voltage of 20 kV and beam current of 500 pA. The standard less quantification results were performed through
automatic background subtraction, matrix correc-tion, and normalization to 100% for all of the ele-ments in the peak identification list.
The color of pigments is determined by tintom-eter (Lovibont Tintometer RT 100 Colour) and pre-sented in the CIELab color space as defined by the International Commission on Illumination (CIE).
RESULTS AND DISCUSSION
A series of Co-doped ceramics with various con-centration of CoO were prepared successively at 800, 900, 1000 and 1100 °C and characterized.
X-ray diffraction (XRD) analysis
The crystal structure of a- Zn2SiO4 polymorph is phenakite type, space group R–3, where both Zn2+ and Si4+ ions are coordinated by four oxygen atoms [11]. The powder XRD revealed that cobalt doped willemite ceramics were successfully synthesized even at 800 °C. XRD patterns for two compositions sintered at different temperatures are presented on Figure 1.
At 800 °C no peaks of β-Zn2SiO4 phase are ob-served, pointing to formation of willemite α- Zn2SiO4 phase. The XRD patterns show well defined sharp peaks with peak positions corresponding to the standard pattern of willemite PDF 46-1316 (Powder Diffraction File of the International Centre for Diffraction Data – ICDD. Some of the low intensity peaks, marked in Figure 1 with asterisk, reveal pres-ence of minor amount of ZnO in samples sintered at 800 and 900 °C. Such impure phases disappeared at higher temperature of sintering. According to the XRD data the optimal temperature of sintering is 1000 °С as no other impurity peaks are detected.
Figure 2 presents the XRD patterns for the pig-ments with various concentration of CoO sintered at 1000 °C. Calculated crystallite sizes vary in
Table 1. Compositions of the synthesized pigments
№ Willemite pigment CоO[g]
ZnO[g]
SiO2.nH2O[g]
NaF[g]
1 0.125.CоO.1.875.ZnO.SiO2 0.2 6.86 3.52 0.22 0.250.CоO.1.750.ZnO.SiO2 0.86 6.42 3.54 0.23 0.375.CоO.1.625.ZnO.SiO2 1.28 5.98 3.56 0.24 0.500.CоO.1.500.ZnO.SiO2 1.71 5.55 3.58 0.25 0.625.CоO.1.375.ZnO.SiO2 2.15 5.10 3.60 0.26 0.750.CоO.1.250.ZnO.SiO2 2.59 4.66 3.62 0.27 0.875.CоO.1.125.ZnO.SiO2 3.03 4.23 3.64 0.28 1.000.CоO.1.000.ZnO.SiO2 3.52 3.81 3.66 0.2
Ts. Ibreva et al.: Synthesis and characterization of willemite ceramic pigments in the system xCoO. (2–x)ZnO. SiO2

33
Fig. 1. XRD patterns: a) 0.5CоO 1.5ZnO.SiO2 and b) 1.0 CоO 1.0ZnO.SiO2 at 800, 900, 1000 and 1100 °C. The presence of ZnO is marked with asterisks.
Fig. 2. XRD patterns of full series Co-doped ceramics at 1000 °C.
close range between 80–100 nm. Lattice parameters (Table 2) do not revealed significant differences due to Co for Zn substitution because of close ionic radii in tetrahedral coordination (Zn2+ 0.60 Å, Co2+ 0.58 Å).
Morphological analysis
Figure 3 presents SEM micrograph of pigment with composition 1.0CоO1.0ZnO.SiO2 sintered at
different temperatures. It is seen that idiomorphic crystals are formed at 800 °C with average size of about 3–5 µm in length. More dense and compact texture is formed with increase of temperature.
FT-IR analysis
FT-IR spectra of Co doped willemite reveal in-tensive absorption at 900, 930 and 973 cm–1 due to
Ts. Ibreva et al.: Synthesis and characterization of willemite ceramic pigments in the system xCoO. (2–x)ZnO. SiO2

34
Table 2. Cell parameters of full series Co-doped ceramic pigments sintered at 1000 °C
№ Sample a (Å) c (Å) V (Å3)
1 0.125.CоO.1.875.ZnO.SiO2 13.934(5) 9.338(3) 1570(1)2 0.250.CоO.1.750.ZnO.SiO2 13.940(4) 9.337(2) 1571(1)3 0.375.CоO.1.625.ZnO.SiO2 13.940(4) 9.329(2) 1570(1)4 0.500.CоO.1.500.ZnO.SiO2 13.942(5) 9.329(2) 1570(2)5 0.625.CоO.1.375.ZnO.SiO2 13.941(5) 9.329(2) 1570(2)6 0.750.CоO.1.250.ZnO.SiO2 13.925(3) 9.331(2) 1567(1)7 0.875.CоO.1.125.ZnO.SiO2 13.943(5) 9.328(3) 1570(1)8 1.000.CоO.1.000.ZnO.SiO2 13.942(4) 9.330(2) 1570(1)
Ref. (Zn, Co)2SiO4 PDF 46-1316 13.950 9.336 1574
Fig. 3. SEM images of 1.0CоO1.0ZnO.SiO2 at 800, 900, 1000 and 1100 °C.
Si–O antisymmetric and near 865 cm–1 due to the symmetrical stretching mode of SiO4 tetrahedra. The absorption peak at 460 cm–1 is attributed to the Si–O antisymmetric bending mode. The peak at 580 cm–1 is assigned to Zn–O totally symmetric stretching mode and the band at 614 cm–1 to an-tisymmetric stretching mode of Zn–O [12]. The presence of these characteristic peaks confirms that crystalline willemite is formed.
Probably, part of the amorphous SiO2 has not reacted with ZnO, which is visible from the broad absorption band at 1100 cm–1, characteristic for amorphous silica.
It is seen that temperature (Fig. 4) and cobalt concentration (Fig. 5) have a similar effect on the spectral characteristics, namely, their increase leads to a shift to lower wave numbers (Table 3). In the range of Si-O stretching a systematic shift of the
Ts. Ibreva et al.: Synthesis and characterization of willemite ceramic pigments in the system xCoO. (2–x)ZnO. SiO2

35
Fig. 4. IR spectra of 0.5CоO 1.5ZnO.SiO2 and 1.0 CоO 1.0ZnO.SiO2 synthesized at different temperatures.
Fig. 5. IR spectra of full series Co-doped ceramics at 1000 °C.
peak at 978 cm–1 to low frequency is observed with increase of Co concentration, pointing that cobalt is structurally incorporated. In the range of Zn-O stretching a shoulder at 589 cm–1 is visible in the spectra of samples with low Co concentration. This peak disappeared at higher concentration of cobalt.
At low temperature, additional peak near 670 cm–1 points to a presence of another mineral phase, prob-ably Co3O4 (Fig. 5). The band at 456 cm–1 could arise from ZnO presence. Infrared spectra confirmed that residual phases could be detected at low temperatures of sintering.
Ts. Ibreva et al.: Synthesis and characterization of willemite ceramic pigments in the system xCoO. (2–x)ZnO. SiO2

36
Table 3. IR peak positions of samples with different Co concentration at 900 and 1000 °C
Sampleν4 Si-O [cm–1] ν1 Zn-O[cm–1] ν3 Zn-O[cm–1] ν1 Si-O [cm–1] ν3 Si-O [cm–1]
900 °C 1000 °C 900 °C 1000 °C 900 °C 1000 °C 900 °C 1000 °C 900 °C 1000 °C
0.25CoO.1.75ZnO. SiO2
460 459 576 589 576 616 615 867 867907933977
902932976
0.5CoO.1.5ZnO. SiO2
460 459 574 590 575 615 615 865 866907933976
900931975
0.75CoO.1.25ZnO. SiO2
459 459 572 590 574 615 614 864 965906932975
898930974
Color measurements
Color is one of the most important indicators of the pigment quality. Colored substances absorb and convert light rays of a certain wavelength into the visible portion of the spectrum, due to their atomic structure.
The CIELab space expresses color with three numerical values, where L* is a lightness; a* de-fines the green–red and b* defines the blue–yellow color components. The value of lightness (L*), rep-resents black at L* = 0, and white at L* = 100. The color channels, a* and b*, represent true neutral gray values at a* = 0 and b* = 0. The a* axis rep-resents the green–red component, with green in the negative direction and red in the positive direction. The b* axis represents the blue–yellow component, with blue in the negative direction and yellow in the positive direction. The scaling and limits of the a*
and b* axes run in the range of ±100 or −128 to +127 (signed 8-bit integer). The CIELab system de-fines colors not only for the ceramic pigments but also of other materials, indicating that this system is universal and has a wide application. The color space of the CIELab space is presented in Figure 6 and the results for the ceramics sintered at 1000 °C are presented in Table 4.
Increasing the amount of the CoO the parameter b* reaches the highest negative value at x = 0.375, af-ter which the amount of blue color begins to decrease. Generally, as the x increases, L* decreases and the pigments become darker. It can be seen that the most intense blue color is obtained with the pigment 0.375.CoO.1.625.ZnO.SiO2 synthesized at 1000 °C, with the value of blue color being –b* = –52.85.
A tendency of decrease of lightness L* was ob-served for all the pigments (they became darker) with increase of the sintering temperature.
Fig. 6. CIELab model.
Ts. Ibreva et al.: Synthesis and characterization of willemite ceramic pigments in the system xCoO. (2–x)ZnO. SiO2

37
CONCLUSIONS
The synthesis of Co-doped willemite pigments was successfully performed and the optimal pa-rameters for the process of synthesis of all the ini-tial mixtures were established. It was found that the best results were obtained with composition 0.375CoO.1.625ZnO.SiO2 synthesized at 1000 °C. In this case no residual phases are detected and the measured color coordinates in the system CIELab re-vealed highest value of the blue color (b* = –52.85). The same composition showed also highest lumi-nance (L* = 37,56) and saturation of the color. The synthesized pigments are suitable and can be suc-cessfully applied in glaze tiles and sanitary ceramics.
REFERENCES
1. Г. Н. Масленникова, И. В. Пищ, Керамические пигменты, Стройматериалы, Москва, 2009.
2. R. Eppler, J. Am. Ceram. Soc. Bull., 66, 1600 (1987).
3. E. Ozel, H. Yurdakul, S. Turan, M. Ardit, G. Cruciani, M. Dondi, Journal of the European Ceramic Society, 30(16), 3319 (2010).
4. G. T. Chandrappa, S. Ghosh, K. C. Patil, Journal of Materials Synthesis and Processing, 7(5), 273 (1999).
5. М. Lusar, A. Forés, J. Badenes, J. Calbo, M. Tena, G. Monrós, Journal of the European Ceramic Society, 21(8), 1121 (2001).
6. G. N. Masslennikova., A. I. Glebicheva, N. P. Fomina, Glass and Ceramics, 8, 23 (1974).
7. G. N. Masslennikova, N. P. Fomina, A. I. Glebiche-va, Glass and Ceramics, 4, 26 (1975).
8. B. Chandra Babu, B. Vengla Ra, M. Ravi, S. Babu, J. Mol. Struct., 1127(5), 6 (2017).
9. Ts. Dimtrov, I. Markovska, Ts. Ibreva, Eurasian Union of Scientists (ЕUS), 5(50), 55 (2018).
10. Ts. Dimitrov, Proc. of Universit of Ruse Angel Kanchev, 55 (10.1), 102 (2016).
11. H. McMurdie, M. Morris, E. Evans, B. Paretzkin, W. Wong-Ng, C. Hubbard, Powder Diffr., 1, 274 (1986).
12. C. C. Lin, P. Shen, Journal of non-crystalline solids, 171, 281 (1994).
Table 4. Results of color coordinates measurements using CIELabе system
Pigment – 1000 oC L* a* b*
0.125.CоO 1.875.ZnO.SiO2 45.55 2.33 –45.25
0.250.CоO 1.750.ZnO.SiO2 46.93 6.52 –48.26
0.375.CоO 1.625.ZnO.SiO2 37.56 13.18 –52.85
0.500.CоO 1.500.ZnO.SiO2 36.09 9.68 –47.22
0.625.CоO 1.375.ZnO.SiO2 32.73 8.75 –44.42
0.750.CоO 1.250.ZnO.SiO2 30.56 5.35 –33.10
0.875.CоO 1.125.ZnO.SiO2 30.44 3.65 –28.27
Ts. Ibreva et al.: Synthesis and characterization of willemite ceramic pigments in the system xCoO. (2–x)ZnO. SiO2

38 © 2018 Bulgarian Academy of Sciences, Union of Chemists in Bulgaria
* To whom all correspondence should be sent:
Investigation on crystallization and transformation processes in amorphous alloy Fe81B13.5Si3.5C2
D. Paneva1*, Z. Cherkezova-Zheleva1, V. Petkova2,3, B. Kostova2, H. Kolev1, G. Avdeev4, G. Stefanov4
1 Institute of Catalysis, Bulgarian Academy of Sciences, Acad. G. Bonchev St., Bld. 11, 1113 Sofia, Bulgaria
2 New Bulgarian University, Department of Natural Sciences, 21 Montevideo St., 1618 Sofia, Bulgaria
3 Institute of Mineralogy and Crystallography, Bulgarian Academy of Sciences, bl. 107, Acad. G. Bonchev St., 1113 Sofia, Bulgaria
4 Institute of Physical Chemistry, Bulgarian Academy of Sciences, Acad. G. Bonchev St., Bld. 11, 1113 Sofia, Bulgaria
Received November 07, 2018; Accepted November 26, 2018
Amorphous Fe81B13.5Si3.5C2 ribbons produced by the melt spinning technique were used for the study of crystal-lization as a model system. Thermal treatment up to 1000 °C was performed in three media – vacuum, air and argon. Crystallization process was registered by thermal analysis, X-ray diffraction and Mössbauer spectroscopy. The ther-mal treatment above the crystallization temperature of the amorphous Fe81B13.5Si3.5C2 alloy results in formation of multiphase crystalline structure composed by α-Fe and iron borides and silicides. Mössbauer data show rearrangement of iron neighbors as a result of thermal treatment.
Keywords: Fe81B13.5Si3.5C2 ribbons, crystallization, in situ high temperature XRD, 57Fe Mössbauer spectroscopy.
E-mail: [email protected]
INTRODUCTION
Amorphous Fe-Si-B-C alloys are widely used in production of different types of transformers, sen-sors, medical devices [1, 2]. Elements like Ni, Co, Mo (critical raw materials) are added to iron-based amorphous alloys to improve their properties [3, 4]. The amorphous structure of thus obtained alloys is thermodynamically unstable. Alloys have an amor-phous structure which is thermodynamically unsta-ble. In the process, the materials undergo changes that lead to a stable transition and a change in the phase composition [5]. Formation of crystallite phases as a result of heating in such materials gives rise to loss of their advanced properties. The combi-nation of several metalloids is intended much easier glass-formers, but complicates the crystallization process. We use amorphous Fe81B13.5Si3.5C2 ribbons produced by the melt spinning technique as a model system for the study of the crystallization process.
EXPERIMENTAL
The materials were characterized by X-ray pow-der diffraction (X-ray diffractometer for investiga-tion of thin films and nanostructures, Empyrean fitted with a high temperature attachment HTK 16N – Anton Paar, CuKα radiation). TG-DSC-DTG analyses of samples were carried out on a Setsys Evolution 2400, SETARAM, France, combined with OmniStar mass-spectrometer operating in the temperature range 20–1000 °С at heating rate of 10 °C.min–1. The operational characteristics of the TG–DSC system were: sample mass of 18.0±2.0 mg; ceramic sample pan; static air and inert (100% Ar) atmosphere. Mössbauer spectra were recorded by 57Co/Rh source and Wissenschaftliche Elektronik GmbH electromechanical apparatus (Germany), operating at a constant acceleration mode. The pa-rameters of hyperfine interactions of the obtained spectral components (isomer shift (IS), quadruple splitting (QS), hyperfine effective field (Heff), line width (FWHM) and partial area of the spectra (A) were determined by CONFIT program. The errors for IS, QS, and FWHM are ±0.01 mm/s. The error
Bulgarian Chemical Communications, Volume 50, Special Issue F (pp. 38–41) 2018

39
for Heff is ± 0.1T. Spectra were calibrated by α-Fe standard. The computer fitting was based on the least squares method.
RESULTS AND DISSCUSION
X-ray diffraction pattern of initial sample Fe81B13.5Si3.5C2 (Fig. 1) is characteristic of the amor-phous material and consist of broad maxima with-out any crystalline phases registered. Mössbauer spectrum is presented in Fig. 2. It clearly shows the presence of magnetic (sextet type) components only. Calculated parameters obtained after spec-trum evaluation are given in Table 1. After fitting procedure we have distinguish tree components corresponding to the different environment of Fe atoms. The three components have an isomer shift that indicates the presence of non-iron neighbors. The iron atoms in the first and second coordination sphere have many combinations of noniron neigh-bours and also at slightly different interatomic dis-tances, causing the occurrence of internal magnetic fields with different values. This can be explained by the homogeneous distribution of non-iron ions in the structure of the ribbons. Registered sextet com-ponents with broad and overlapped lines are typical of amorphous alloys [4, 5].
Differential Scanning Calorimetry (DSC) was used to investigate thermal stability of studied amor-phous foil in two different media – inert (100% Ar gas) and air flow (see Fig. 3). DSC curve obtained
for the amorphous alloy exhibits 2 intensive exo-thermic peaks at 896 and 956 °C (in Air medium) and 508, 535 °C (in Ar medium) are correspond-
Fig. 1. X-ray diffraction pattern measured at indicated temperatures of heating ribbon.
Fig. 2. Mössbauer spectra of sample Fe81B13.5Si3.5C2after differ-ent treatment.
D. Paneva et al.: Investigation on crystallization and transformation processes in amorphous alloy Fe81B13.5Si3.5C2

40
Table 1. Mössbauer parameters of sample Fe81B13.5Si3.5C2after different treatment
Sample Components IS, mm/s QS, mm/s Heff, T FWHM, mm/s A, %
Initial sample Sx1-Fe0
Sx2-Fe0
Sx3-Fe0
0.110.100.09
0.030.010.00
28.925.922.7
0.530.610.53
263737
after DSC in air Sx1-Fe3+ – α-Fe2O3Sx2-Fe3+ – Fe3-xO4Sx3-Fe2,5 – Fe3-xO4Db-Fe3+
0.360.290.660.38
–0.100.000.000.48
51.649.746.0–
0.280.570.380.51
751078
after DSC in Ar Sx1-Fe0 – α-FeSx2-Fe0 – α-Fe(Si,C)Sx3-Fe0 – Fe3BSx4-Fe0 – Fe2B
0.030.070.160.13
0.000.010.010.01
33.631.227.023.9
0.310.380.320.33
3325636
after in situ XRD Sx1-Fe0 – α-FeSx2-Fe0 – α-Fe(Si,C)Sx3-Fe0 – Fe3BSx4-Fe0 – Fe2B
0.040.070.100.13
0.010.010.020.01
33.330.927.623.5
0.240.280.320.31
25221043
Fig. 3. DSC curves measured in the temperature range from RT to 1000 °C in different media – Ar and Air.
ing to the crystallization processes in the sample. DSC results indicate that the crystallization process occurs in two stages [6]. The different temperature maxima obtained by the thermal analysis in the two processing media could be related to different phase transitions and respectively different final phases obtained. X-ray diffraction patterns and Mössbauer spectra were measured in order to determine the phase composition of the samples after the crys-tallization process. Data obtained using the both methods allow the identification of the presented phases. X-ray pattern analysis has been identified the formation of α-Fe, Fe2B, FeSi, Fe3Si as result
of thermal treatment in Ar atmosphere. Mössbauer spectrum of sample treated in Ar consist of 4 differ-ent sextets. According to the obtained Mössbauer parameters these components can be referred to the following iron-containing phases: α-Fe, α-Fe(Si,C), Fe3B, Fe2B [7]. On the other hand, the DSC study in air flow shows the formation of iron oxides (he-matite and magnetite) and boron oxides. Metal iron phases were completely converted into oxides after DSC treatment in air. In Ar atmosphere the change from amorphous to crystalline state is associated with the formation of metallic iron and non-metallic elements included in the matrix. The similar result
D. Paneva et al.: Investigation on crystallization and transformation processes in amorphous alloy Fe81B13.5Si3.5C2

41
was registered for in situ investigation of the sample in a high temperature X-ray chamber.
In situ high temperature X-Ray Diffraction anal-ysis of studied sample was performed in vacuum up to 1000 °C. X-ray chamber allows us to investigate the crystallization process in details. Upon heating to 800 °C, there was no significant change in the XRD peaks of initial amorphous iron alloys. At a temperature of 1000 degrees, a partial transforma-tion of the amorphous component into a crystalline form, which comprises two phases of bcc iron and iron boride tetragonal Fe3B phase, is obtained (see Fig. 1). Mössbauer spectra analysis of sample af-ter thermal treatment in high temperature chamber confirmed these observations. Sextet component Sx1 has parameters very similar to those of metal-lic iron – α-Fe. Such a component was not regis-tered in the spectrum of initial amorphous ribbon sample. Sextet component Sx2 has parameters close to those of α-Fe, but the field values are lower and the isomer shift values are respectively higher. Sx3 and Sx4 components of the Mossbauer spectra are associated with two types of iron borides with dif-ferent iron boron ratios. Lines corresponding to the Fe3C phase were not identified, probably due to the small amount of carbon [6]. The situation is similar when the sample is heated under argon atmosphere during DSC analysis. Thus, in both cases (in inert or air media thermal treatment) the crystallization process of the amorphous Fe81B13.5Si3.5C2 alloy is as-sociated with the formation of iron rich areas (α-Fe matrix) and the incorporated additional elements, which are improving the magnetic properties and stability of the alloy, are separating into iron-boron and iron-silicon regions. The same behavior of the investigated amorphous alloys was reported in the literature [6, 8].
CONCLUSIONS
Thermal treatment of the amorphous alloy Fe81B13.5Si3.5C2 above the crystallization tempera-ture results in formation of multiphase crystal-
line structure composed by α-Fe, iron borides and silicides. These crystallization processes are responsible for the loss of primary advanced mag-netic properties and for the operational stability of the studied material. Mössbauer data clearly show change of iron neighborhood and rearrangement of additive elements as a result of thermal treatment. The separation of several iron-containing compo-nents α-Fe, α-Fe(Si,C), Fe3B, Fe2B have been also registered. The mostly presented phase is the α-Fe, and it works as a matrix in which the other phases are embedded.
Acknowledgments: Authors gratefully acknowl-edge the financial support of the Bulgarian National Science Fund at the Ministry of Education and Science - Project № DCOST 01/22/ 2017.
REFERENCES
1. M. Carter, S. Mitra, B. Chin, J. Li, Z. Aguilar, A. Simonian, Sensors, Actuators, and Microsystems General Session, ECS Transaction, Vol. 66, issue 38, 43 (2015).
2. A. D. Lantada, Handbook of Active Materials for Medical Devices: Advances and Applications, Pan Stanford Publishing Pte. Ltd., 2012.
3. K. Russew, L. Stojanova, Glassy Metals, Springer-Verlag GmbH, Berlin, Heidelberg, 2016.
4. W. Gao, Zh. Li, N. M. Sammes, An Introduction to Electronic Materials for Engineers, World Scientific Publishing C. Pte. Ltd., 2011.
5. D. M. Minić, D. M. Minić, T. Žák, P. Roupcova, B. David, J. Magn. Magn. Mater., 323, 400 (2011).
6. B. Bhanu Prasad, Anil K. Bhatnagar, R. Jagannathan, Appl. Phys., 54, 2019 (1983).
7. N. N. Greenwood, T.C. Gibb, Mössbauer Spectro-scopy Chapman and Hall, 1971.
8. V. V. Mukhgalin and V. I. Lad’yanov in: (LAM-15) Proc. XV Liquid and amorphous metals International conference, 2013, Beijing, China, Luhong Wang and Haozhe Liu (Eds.), AIP Conference Proceedings 1673, 020019 (2015).
D. Paneva et al.: Investigation on crystallization and transformation processes in amorphous alloy Fe81B13.5Si3.5C2

42 © 2018 Bulgarian Academy of Sciences, Union of Chemists in Bulgaria
* To whom all correspondence should be sent:
Sol-gel synthesis and properties of Sm modified TiO2 nanopowders
S. I. Yordanov1, A. D. Bachvarova-Nedelcheva2*, R. S. Iordanova2, I. D. Stambolova2
1 Institute of Metal Science, equipment, and technologies “Acad. A. Balevski” with Center for Hydro- and Aerodynamics at the Bulgarian Academy of Sciences,
67 Shipchenski prohod str., 1574 Sofia, Bulgaria 2 Institute of General and Inorganic Chemistry, Bulgarian Academy of Sciences,
Acad. G. Bonchev str., bld. 11, 1113 Sofia, Bulgaria
Received November 11, 2018; Accepted November 28, 2018
The present investigation deals with the sol-gel synthesis and properties of samarium doped TiO2 nanopowders and the impact of Sm3+ on the structural and thermal properties of the obtained samples was established. By XRD was found that the heat treated up to 300 °C gels exhibit a predominantly amorphous phase and its amount gradually decreases with increasing the temperature (above 400 °C). The first TiO2 (anatase) crystals were detected at about 400 °C and the average crystallite size of the samples heat treated at 400 °C is about 25–30 nm. By DTA was established that the organics decomposition is accompanied by strong weight loss occurring in the temperature range 240–350 °C. The completeness of the hydrolysis – condensation reactions was verified by IR and UV-Vis analyses.
Keywords: sol-gel, powders, thermal stability, X-ray diffraction.
INTRODUCTION
It is well known that TiO2, especially its anatase phase, has been recognized as the preferable one for photocatalytic degradation of organic pollutants and other environmental applications due to its high photosensitivity, strong oxidizing power, nontoxic nature, and chemical stability [1–3]. Titanium di-oxide is also a promising wide-gap (3.2 eV) semi-conductor which appears to be suitable host for the introducing of different ions such as noble metals, transition metals, lanthanide cations, as well as ani-ons of non-metal elements, which usually could be introduced by oxides, salts, sulfides, halcogenides or more complex compounds [1–5]. Among the dif-ferent dopants, the rare earth (RE) impurities have been recognized as most effective to achieve effi-cient emission in the visible range [1, 2]. Recently, lanthanides have been widely investigated due to their electronic, optical and chemical characteristics arising from their 4f electrons. It has been shown that the doping only with a few rare earth ions (Nd3+,
Eu3+, La3+, Er3+ and Sm3+) lead to a significant im-pact on the TiO2 properties [6–12]. To best of our knowledge, the synthesis, characterization and op-tical properties of sol-gel derived Sm doped TiO2 have not been studied in details. Up to now, for the preparation of Sm doped TiO2 composites, mainly two methods (sol-gel and hydrothermal) have been applied [13–16]. It is proved that the sol-gel method is an excellent technique to prepare both oxides thin films and powders and it allows syntheses in a wide range of compositions using a variety of precursors. On the other hand, by sol-gel technique can be ob-tained materials with high TiO2 content which usu-ally need high temperatures for synthesis. Powders can be easily characterized applying different tech-niques but not all of them are applicable to films. The information obtained for the powders could be helpful to determine the experimental conditions for the sol-gel synthesis of the films as well as for the prediction of their thermal behavior and properties.
Our team has gained experience in the study of sol-gel synthesis, characterization and proper-ties of pure and modified nanosized TiO2 powders [17–21]. In our previous papers, many problems regarding the influence of precursors during the synthesis, phase formation upon heating of the gels, thermal stability and properties of the ob-E-mail: [email protected]
Bulgarian Chemical Communications, Volume 50, Special Issue F (pp. 42–48) 2018

43
tained powdered products were studied but there are still unclarified points. The present study con-tinues our investigations for obtaining of pure and modified TiO2 nanopowders applying the sol-gel technique.
The rare earth doped TiO2 thin films obtained by sol-gel method exhibited good anticorrosion prop-erties [22, 23]. Our investigations on Sm doped TiO2 films are still in course and they showed in-creased corrosion resistance. Due to the existing re-strictions for structural characterization of the films and in order to achieve better understanding of the relationship “composition – structure – property – application”, powders with the same Sm/TiO2 com-positions have been prepared. In the present work the attention is paid to the phase and structural char-acterization as well as thermal properties of sol-gel derived Sm modified TiO2 nanopowders.
EXPERIMENTAL
Samples preparation
Ti(IV) butoxide (TBT, Merck), Samarium oxide (Sm2O3) (Janssen Chimica, Belgium 99,9%), isopro-panol (i-PrOH, >99.5%, Merck) have been used as main precursors for the obtaining of titaniа powders. The acetylacetonate (acac, Sigma-Aldrich) was used as a chelating agent to form stable complexes with TBT. The experimental conditions for obtaining the initial solutions for powders and films are identical and they consisted of several steps. The first solu-tion was prepared by mixing of TBT, i-PrOH and AcAc at vigorous stirring while keeping the molar ratio TBT/C3H7OH/AcAc = 1:30:1. The resulting solution was transparent with orange color which is typical for the formed chelate complex. The other solution was obtained by Sm2O3 dissolved in 1.5 ml HNO3 and isopropanol. Finally, both solutions were mixed at vigorous stirring. During the experimen-tal procedure no additional water was added. The sol-gel hydrolysis reaction was accomplished only in presence of air moisture. The pH of as-prepared solutions was measured to be between 4 and 5. The ageing of the gels was performed in air for several days in order to allow further hydrolysis. Aiming to verify the phase transformations, all gels were sub-jected to stepwise heating in air from 200 to 700 °C for one hour exposure time for each temperature. The heat treatment regime has been selected on the basis of our previous investigations. Three differ-ent samarium concentrations have been selected for modification of TiO2 in the synthesized samples – 0.5, 1 and 2 mol%. The investigated samples were denoted as follow: TBT/0.5%Sm, TBT/1%Sm and TBT/2%Sm.
Samples characterization
XRD patterns on powdered samples were reg-istered at room temperature with a Bruker D8 Advance diffractometer using CuKα radiation. The thermal behavior of the gels dried at room tempera-ture was determined by differential thermal analysis (LABSYSТМ EVO apparatus) with Pt-Pt/Rh ther-mocouple at a heating rate of 10 K/min in air flow, using Al2O3 as a reference material. The accuracy of the temperature maintenance was determined as ±5 °C. Gases evolved (EGA) during the thermal treatments were analyzed by mass spectrometry (MS) with a Pfeiffer OmniStarTM mass spectrom-eter. Mass spectra recorded for samples show the m/z = 14, 15, 18 and 44 signals, being ascribed to CH2, CH3, H2O and CO2, respectively. The IR spec-tra were registered in the range 1600–400 cm–1 us-ing the KBr pellet technique on a Nicolet-320 FTIR spectrometer with 64 scans and a resolution of ±1 cm–1. The specific surface area of samples heat treated at 500 °C was measured using BET analysis (Quantachrome Instruments NOVA 1200e (USA) apparatus). The optical absorption spectra of the powdered samples in the wavelength range 200–800 nm were recorded at room temperature using a UV-Vis diffused reflectance spectrophotometer “Evolution 300” using a magnesium oxide reflec-tance standard as the baseline fort wavelengths in the range of 200–1000 nm. The absorption edge and the optical band gap were determined follow-ing Dharma et al. instructions [24]. The band gap energies (Eg) of the samples were calculated by the Planck’s equation: Eg = hc/λ, where Eg is the band gap energy (eV), h is the Planck’s constant (eV s), c is the light velocity (m/s), and λ is the wavelength (nm).
RESULTS AND DISCUSSION
Phase transformations and thermal stability
All prepared gels were transparent with bright or-ange color. The XRD patterns of gels and heat treat-ed samples in the temperature range 200–700 °C are shown in Fig. 1. The analysis of the results showed that the X-ray diffraction patterns of sample TBT/1%Sm are identical to those of sample TBT/2%Sm and only the latter were presented. Samarium phases were not registered by X-ray diffraction analysis. As it is seen in both samples (TBT/0.5%Sm and TBT/2%Sm) the amorphous phase is dominant up to 300 °C. The first crystals of TiO2 (anatase) (ICDD 78-2486) are reg-istered at 400 °C which is the main crystalline phase up to 700 °C. From Fig. 1 it could be seen that the increasing of calcination temperature led to an in-
S. I. Yordanov et al.: Sol-gel synthesis and properties of Sm modified TiO2 nanopowders
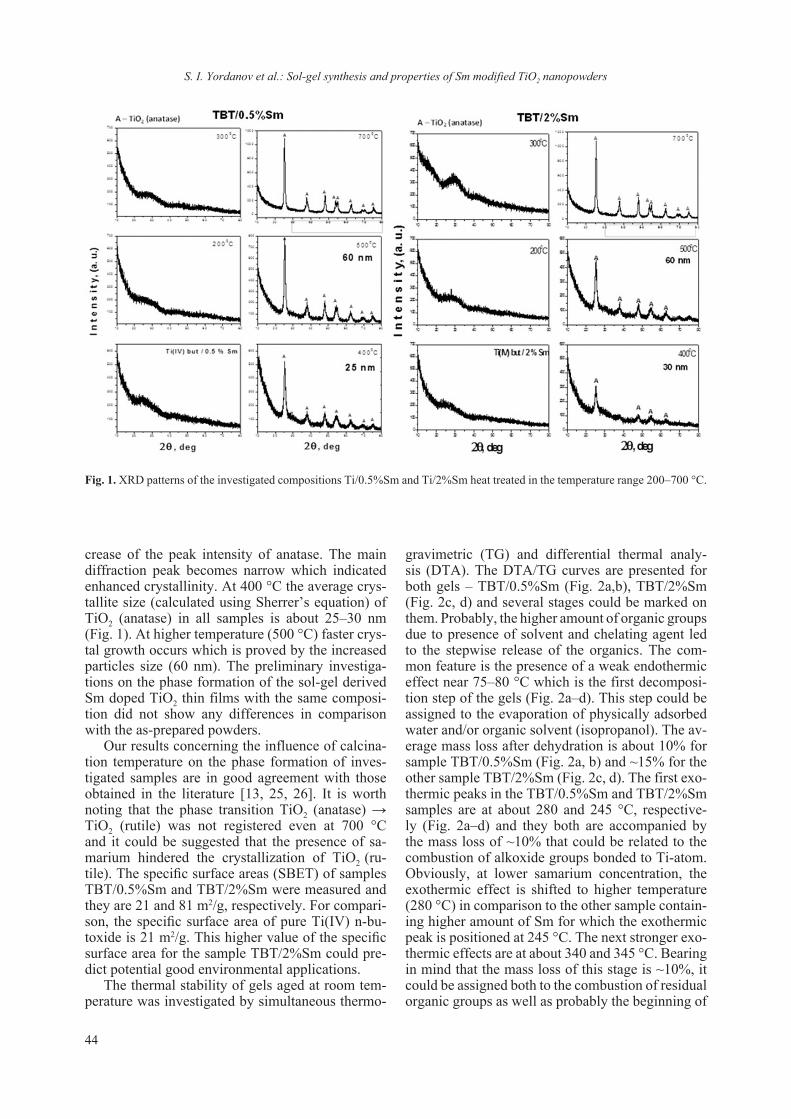
44
crease of the peak intensity of anatase. The main diffraction peak becomes narrow which indicated enhanced crystallinity. At 400 °C the average crys-tallite size (calculated using Sherrer’s equation) of TiO2 (anatase) in all samples is about 25–30 nm (Fig. 1). At higher temperature (500 °C) faster crys-tal growth occurs which is proved by the increased particles size (60 nm). The preliminary investiga-tions on the phase formation of the sol-gel derived Sm doped TiO2 thin films with the same composi-tion did not show any differences in comparison with the as-prepared powders.
Our results concerning the influence of calcina-tion temperature on the phase formation of inves-tigated samples are in good agreement with those obtained in the literature [13, 25, 26]. It is worth noting that the phase transition TiO2 (anatase) → TiO2 (rutile) was not registered even at 700 °C and it could be suggested that the presence of sa-marium hindered the crystallization of TiO2 (ru-tile). The specific surface areas (SBET) of samples TBT/0.5%Sm and TBT/2%Sm were measured and they are 21 and 81 m2/g, respectively. For compari-son, the specific surface area of pure Ti(IV) n-bu-toxide is 21 m2/g. This higher value of the specific surface area for the sample TBT/2%Sm could pre-dict potential good environmental applications.
The thermal stability of gels aged at room tem-perature was investigated by simultaneous thermo-
gravimetric (TG) and differential thermal analy-sis (DTA). The DTA/TG curves are presented for both gels – TBT/0.5%Sm (Fig. 2a,b), TBT/2%Sm (Fig. 2c, d) and several stages could be marked on them. Probably, the higher amount of organic groups due to presence of solvent and chelating agent led to the stepwise release of the organics. The com-mon feature is the presence of a weak endothermic effect near 75–80 °C which is the first decomposi-tion step of the gels (Fig. 2a–d). This step could be assigned to the evaporation of physically adsorbed water and/or organic solvent (isopropanol). The av-erage mass loss after dehydration is about 10% for sample TBT/0.5%Sm (Fig. 2a, b) and ~15% for the other sample TBT/2%Sm (Fig. 2c, d). The first exo-thermic peaks in the TBT/0.5%Sm and TBT/2%Sm samples are at about 280 and 245 °C, respective-ly (Fig. 2a–d) and they both are accompanied by the mass loss of ~10% that could be related to the combustion of alkoxide groups bonded to Ti-atom. Obviously, at lower samarium concentration, the exothermic effect is shifted to higher temperature (280 °C) in comparison to the other sample contain-ing higher amount of Sm for which the exothermic peak is positioned at 245 °C. The next stronger exo-thermic effects are at about 340 and 345 °C. Beаring in mind that the mass loss of this stage is ~10%, it could be assigned both to the combustion of residual organic groups as well as probably the beginning of
Fig. 1. XRD patterns of the investigated compositions Тi/0.5%Sm and Ti/2%Sm heat treated in the temperature range 200–700 °C.
S. I. Yordanov et al.: Sol-gel synthesis and properties of Sm modified TiO2 nanopowders

45
the TiO2 (anatase) crystallization. As it is seen there is a difference in the thermal behavior of the inves-tigated samples above 500 °C. The comparison of the DTA-TG curves of the samples showed that one exothermic effect at about 540 °C is observed in the TBT/0.5%Sm gel while in the other one, three consecutive exothermic effects were detected (at 520 °C, 545°C and 570 °C). It is also obvious that in both cases a mass loss of about 10 % is observed. On the basis of these experimental facts it could be assumed that the effects in the range 520–540 °C could be related to the oxidation of residual carbon and release of CO2. The last exothermic effects at 570 °C observed only in the sample TBT/2%Sm is very strong and it could be associated to the inten-sive crystallization of anatase (Fig. 2c, d). The re-sults obtained by DTA correspond well to the above pointed XRD data (Fig. 1) as well as to the results obtained by other authors for Sm doped powders [27].
IR and UV-Vis characterization
The IR spectroscopy was used mainly to evalu-ate the rate and degree of hydrolysis and condensa-
tion processes in the prepared gels and heat treated samples. The IR spectra of investigated samples are presented in Fig. 3. The vibrational spectra of pure Ti(IV) butoxide as well as of 2-propanol were shown and discussed already elsewhere [28–31]. By analogy with our previous papers, the assignments of the vibrational bands of separate structural units are made on the basis of well-known spectral data for Ti(IV) n-butoxide, isopropanol and crystalline TiO2 (anatase). Looking at Figure 3, intensive bands are observed in the IR spectra of the gels and their intensities decreased with the increasing of tem-perature. No differences could be seen regarding the position and intensity of the bands for the heat treated samples (TBT/0.5%Sm and TBT/2%Sm) in the range 200–500 °C. Generally, the bands lo-cated between 1500–1300 cm–1 are assigned to the bending vibrations of CH3 and CH2 groups. The band at 1120 cm–1 is characteristic for the stretch-ing vibrations of Ti-O-C, while those at 1190 and 1020 cm–1 are assigned to the vibrations of terminal and bridging C-O bonds in butoxy ligands [28, 32–34]. The absorption bands below 1000 cm–1 in the samples correspond to C-H, C-O and deformation Ti-O-C vibrations [32, 35]. In our previous inves-
Fig. 2. a–b, DTA/TG curves of the Ti/0.5% Sm; c–d, DTA/TG curves of the Ti/2% Sm.
S. I. Yordanov et al.: Sol-gel synthesis and properties of Sm modified TiO2 nanopowders

46
tigations [30, 31] it was found that the absorption region 1100–1020 cm–1 is very complex due to the overlapping of the vibrations of different structural units from the alkoxide and solvent. In spite of that, many authors [36–38] use these bands for the inter-pretation of the degree of hydrolysis-condensation processes. The bands below 800 cm–1 correspond to the vibrations of TiO6 units [36, 37]. Bearing in mind that the typical Sm – O stretching vibrations are in the range 510–430 cm–1 [39] an overlapping between the inorganic structural polyhedral is sug-gested. The obtained by us IR spectra of pure Ti(IV) butoxide [29–31] and Sm/TiO2 were compared and it was established that the Sm doping did not influ-ence the short range order of the resulting products.
The UV-Vis spectroscopy is used in order to obtain additional structural information for the in-vestigated samples as well as to evaluate the com-pleteness of hydrolysis – condensation processes. The spectra of gels (25 °C) {Ti(IV) n-butoxide, TBT/0.5%Sm and TBT/2%Sm} are presented in Fig. 4. The interpretation of the UV-Vis spectra is made on the basis of literature data as well as our previous results obtained in various systems con-taining TiO2 [30, 31, 36, 37, 40–42]. Looking at the UV-Vis spectra of investigated samples sever-al peaks could be distinguished. Bands at 250 and
320 nm are observed in the spectrum of pure Ti(IV) n-butoxide gel, while those at 260, 340–350 and 360 nm were detected for the samarium doped TiO2 gels. A red shift of the absorption edge in the Sm doped TiO2 powders (431.98 nm – TBT/0.5%Sm
Fig. 3. IR spectra of Ti/0.5%Sm, Ti/1% Sm and Ti/2%Sm gels and heat treated up to 500 °C samples.
Fig. 4. UV-Vis spectra of Ti/0.5%Sm, Ti/1% Sm and Ti/2%Sm gels and heated at 200 °C samples.
S. I. Yordanov et al.: Sol-gel synthesis and properties of Sm modified TiO2 nanopowders
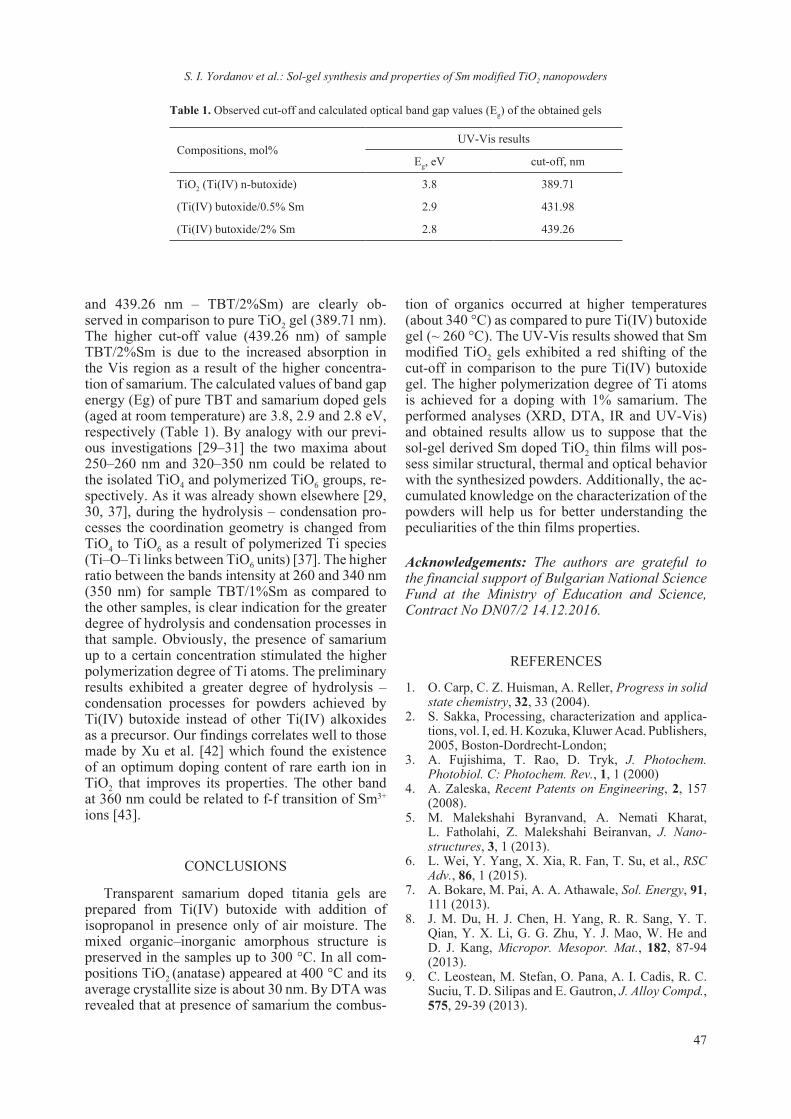
47
and 439.26 nm – TBT/2%Sm) are clearly ob-served in comparison to pure TiO2 gel (389.71 nm). The higher cut-off value (439.26 nm) of sample TBT/2%Sm is due to the increased absorption in the Vis region as a result of the higher concentra-tion of samarium. The calculated values of band gap energy (Eg) of pure TBT and samarium doped gels (aged at room temperature) are 3.8, 2.9 and 2.8 eV, respectively (Table 1). By analogy with our previ-ous investigations [29–31] the two maxima about 250–260 nm and 320–350 nm could be related to the isolated TiO4 and polymerized TiO6 groups, re-spectively. As it was already shown elsewhere [29, 30, 37], during the hydrolysis – condensation pro-cesses the coordination geometry is changed from TiO4 to TiO6 as a result of polymerized Ti species (Ti–O–Ti links between TiO6 units) [37]. The higher ratio between the bands intensity at 260 and 340 nm (350 nm) for sample TBT/1%Sm as compared to the other samples, is clear indication for the greater degree of hydrolysis and condensation processes in that sample. Obviously, the presence of samarium up to a certain concentration stimulated the higher polymerization degree of Ti atoms. The preliminary results exhibited a greater degree of hydrolysis – condensation processes for powders achieved by Ti(IV) butoxide instead of other Ti(IV) alkoxides as a precursor. Our findings correlates well to those made by Xu et al. [42] which found the existence of an optimum doping content of rare earth ion in TiO2 that improves its properties. The other band at 360 nm could be related to f-f transition of Sm3+ ions [43].
CONCLUSIONS
Transparent samarium doped titania gels are prepared from Ti(IV) butoxide with addition of isopropanol in presence only of air moisture. The mixed organic–inorganic amorphous structure is preserved in the samples up to 300 °C. In all com-positions TiO2 (anatase) appeared at 400 °C and its average crystallite size is about 30 nm. By DTA was revealed that at presence of samarium the combus-
tion of organics occurred at higher temperatures (about 340 °C) as compared to pure Ti(IV) butoxide gel (~ 260 °C). The UV-Vis results showed that Sm modified TiO2 gels exhibited a red shifting of the cut-off in comparison to the pure Ti(IV) butoxide gel. The higher polymerization degree of Ti atoms is achieved for a doping with 1% samarium. The performed analyses (XRD, DTA, IR and UV-Vis) and obtained results allow us to suppose that the sol-gel derived Sm doped TiO2 thin films will pos-sess similar structural, thermal and optical behavior with the synthesized powders. Additionally, the ac-cumulated knowledge on the characterization of the powders will help us for better understanding the peculiarities of the thin films properties.
Acknowledgements: The authors are grateful to the financial support of Bulgarian National Science Fund at the Ministry of Education and Science, Contract No DN07/2 14.12.2016.
REFERENCES
1. O. Carp, C. Z. Huisman, A. Reller, Progress in solid state chemistry, 32, 33 (2004).
2. S. Sakka, Processing, characterization and applica-tions, vol. I, ed. H. Kozuka, Kluwer Acad. Publishers, 2005, Boston-Dordrecht-London;
3. A. Fujishima, T. Rao, D. Tryk, J. Photochem. Photobiol. C: Photochem. Rev., 1, 1 (2000)
4. A. Zaleska, Recent Patents on Engineering, 2, 157 (2008).
5. M. Malekshahi Byranvand, A. Nemati Kharat, L. Fatholahi, Z. Malekshahi Beiranvan, J. Nano-structures, 3, 1 (2013).
6. L. Wei, Y. Yang, X. Xia, R. Fan, T. Su, et al., RSC Adv., 86, 1 (2015).
7. A. Bokare, M. Pai, A. A. Athawale, Sol. Energy, 91, 111 (2013).
8. J. M. Du, H. J. Chen, H. Yang, R. R. Sang, Y. T. Qian, Y. X. Li, G. G. Zhu, Y. J. Mao, W. He and D. J. Kang, Micropor. Mesopor. Mat., 182, 87-94 (2013).
9. C. Leostean, M. Stefan, O. Pana, A. I. Cadis, R. C. Suciu, T. D. Silipas and E. Gautron, J. Alloy Compd., 575, 29-39 (2013).
Table 1. Observed cut-off and calculated optical band gap values (Eg) of the obtained gels
Compositions, mol%UV-Vis results
Eg, eV cut-off, nm
TiO2 (Ti(IV) n-butoxide) 3.8 389.71
(Ti(IV) butoxide/0.5% Sm 2.9 431.98
(Ti(IV) butoxide/2% Sm 2.8 439.26
S. I. Yordanov et al.: Sol-gel synthesis and properties of Sm modified TiO2 nanopowders

48
10. S. Sadhuab and P. Poddar, RSC Adv., 3, 10363 (2013).
11. J. Reszczýnska, T. Grzyb, J. W. Sobczak, W. Li-sowski, M. Gazda, B. Ohtani and A. Zaleska, Appl. Catal. B-Environ., 163, 40 (2015).
12. D. J. Park, T. Sekino, S. Tsukuda, A. Hayashi, T. Kusunose and S. I. Tanaka, J. Solid State Chem., 184, 2695 (2011).
13. S. Ezhil Arasi, J. Madhavan and M. Victor Antony Raj, J. Taibah University for Science, 12 (2) 186 (2018).
14. E. Madhukar, E. Athare Anil, H. Kolhe Nitin, Oriental J. Chem., 32 (2), 933 (2016).
15. V. Kiisk, M. Šavel, V. Reedo, A. Lukner, I. Sildos, Phys. Procedia, 2, 527 (2009).
16. V. Kiisk, V. Reedo, O. Sild, I. Sildos, Optical Materials, 31, 1376 (2009).
17. A. Stoyanova, N. Ivanova, A. Bachvarova-Ne-delcheva, R. Iordanova, Bulg. Chem. Commun., 47 (1), 330 (2015).
18. A. Stoyanova, Ts. Krumova, A. Bachvarova-Nedelcheva, R. Iordanova, Bulg. Chem. Commun., 47, Special issue C, 118 (2015).
19. A. Bachvarova-Nedelcheva, R. Iordanova, A. Stoyanova, R. Gegova, Y. Dimitriev, A. Loukanov, Centr. Eur. J. Chem., 11 (3), 364 (2013).
20. A. Stoyanova, H. Hitkova, N. Ivanova, A. Bach-varova-Nedelcheva, R. Iordanova, M. Sredkova, Bulg. Chem. Commun., 45 (4), 497 (2013).
21. A. Stoyanova, N. Ivanova, R. Iordanova, A. Bachvarova-Nedelcheva, Nanoscience and Nanotechnology, 13, 166 (2013).
22. S.Yordanov, L. Lakov, I. Stambolova,V. Blaskov, S. Vassilev, V. Dyakova, A. Eliyas, Compt. Rend. de l’Acad. Bulg. Sci., 71, 625 (2018).
23. S.Yordanov, I. Stambolova, L. Lakov, B. Jivov, V. Blaskov, S. Vasilev, J. Chem. Technol. Metall., 53, 1179 (2018).
24. J. Dharma, A. Pisal, Simple method of measuring the band gap energy value of TiO2 in the powder form using a UV/Vis/NIR spectrometer. Application note. PerkinElmer, Shelton, CT, (2009).
25. V. Aware Dinkar, S. Jadhav Shridhar , E. Navgire Madhukar, E. Athare Anil and H. Kolhe Nitin,
Orient. J. Chem., 32 (2), 933 (2016).26. G. V. Khade, M. B. Suwarnkar, N. L. Gavade, K.
M. Garadkar, J. Mater Sci: Mater Electron, 27 (6), 6425 (2016).
27. Wei Niu, Xiaoguo Bi, Gang Wang, Xudong Sun, Int. J. Electrochem. Sci., 8, 11943 (2013).
28. M. J. Velasco, F. Rubio, J. Rubio, J. Oteo, Spectr. Lett., 32, 289 (1999).
29. R. Iordanova, A. Bachvarova-Nedelcheva, R. Gegova, Y. Dimitriev, J. Sol-Gel Sci. Technol., 79 (1), 12 (2016).
30. R. Iordanova, R. Gegova, A. Bachvarova-Nedelcheva, Y. Dimitriev, Phys. Chem. Glasses: Eur. J. Glass Sci. Technol. B, 56 (4), 128 (2015).
31. St. I. Yordanov, A. D. Bachvarova-Nedelcheva, R. S. Iordanova, Bulg. Chem. Commun., 49 (special is-sue D), 265 (2017).
32. S. Doeuff, M. Henry, C. Sanchez, J. Livage, J. Non-Cryst. Sol., 89, 206 (1987).
33. M. Henry, J. Leavage, C. Sanchez, Progr. Sol. State Chem., 18, 259 (1988).
34. P. D. Moran, G. A. Bowmaker, R. P. Cooney, Inorg. Chem., 37, 2741 (1998).
35. S. Barboux-Doeuff, C. Sanchez, Mater. Res. Bull., 29, 1 (1994).
36. X. Gao, IE Wachs, Cat Today, Catal. Today, 51, 233 (1999).
37. V. Barlier, V. Bounor-Legare, G. Boiteux, J. Da-venas, Appl. Surf. Sci., 254, 5408 (2008).
38. A. Bachvarova-Nedelcheva, R. Gegova, A. Stoya-nova, R. Iordanova, V. E. Copcia, N. Ivanova, I. Sandu, Bulg. Chem. Commun., 46, 585 (2014).
39. S. P. Tandon , P. C. Mehta, and R. N. Kapoor, Z. Naturforsch., 25b, 142 (1970).
40. R. Gegova, A. Bachvarova-Nedelcheva, R. Iorda-nova, Y. Dimitriev, Bulg. Chem. Commun., 47 (1), 378 (2015).
41. R. Gegova, R. Iordanova, A. Bachvarova-Ne del-cheva, Y. Dimitriev, J. Chem. Technol. Metall., 50 (4), 449 (2015).
42. A.-W. Xu, Y. Gao, H.-Q. Lin, J. Catal., 207, 151 (2002).
43. M. M. Antoinette, S. Israel, Intern. Res. J. Eng. Techn. (IRJET), 04 special iss., 276 (2017).
S. I. Yordanov et al.: Sol-gel synthesis and properties of Sm modified TiO2 nanopowders

49© 2018 Bulgarian Academy of Sciences, Union of Chemists in Bulgaria
* To whom all correspondence should be sent:
Bulgarian Chemical Communications, Volume 50, Special Issue F (pp. 49–53) 2018
TEM analysis of gold nanoparticles attached on the surface of organoclay and obtained by two different methods
V. A. Angelov*, E. H. Ivanov, R. K. Kotsilkova
Open Laboratory for Experimental Mechanics of Micro and Nanomaterials (OLEM) Institute of Mechanics, Bulgarian Academy of Sciences, Acad. Georgi Bonchev St., bl. 4 1113 Sofia, Bulgaria
Received October 07, 2018; Accepted November 30, 2018
This article studies two different methods for synthesis of gold nanoparticles over organoclay. The preparation of the organoclay suspension is done with two different solvents – i-propanol and distilled water. The study is focused on the determination of the size of gold nanoparticles synthesized with the two different methods, using TEM and corresponding computer software. The results from the TEM analysis show that the sample prepared with the solvent distilled water provides better control over the size of the Au nanoparticles.
Keywords: synthesis, gold nanoparticles, organoclay, TEM.
E-mail: [email protected]
1. INTRODUCTION
Typical gold nanoparticles synthesis involves the chemical reduction of gold chloride using so-dium borohydride and sodium citrate, producing particles with size of 2–10 and 12–100 nm, respec-tively [1].
To support gold nanoparticles on a stable inor-ganic or organic matrix is a prime requirement in applications such as catalysis. Varieties of supports such as SiO2, TiO2, Al2O3, Fe2O3, carbon, clay and polymer for stabilizing gold nanoparticles have been reported [2–5].
The decoration of gold nanoparticles on layered silicates has been reported in the scientific litera-ture by Zhang et al. [6]. They suggested a simple wet chemical method to synthesize clay-APTES-Au nanocomposites. APTES (3-aminopropyltrieth-oxysilane) acts as the linkage. The silane terminal of APTES formed bonds with the clay surface, while the other –NH2 terminal bonds to gold na-noparticles.
Another approach was suggested by Belova et al. [7] in which a sonochemical method for inter-calation of Au nanoparticles into multilayered Na+ montmorillonite clays had been used.
Zhu et al. [8] prepared supported gold nanoparti-cles on clay minerals (particularly montmorillonite
and sepiolite) by cation adsorption from cationic gold precursor Au(en)2Cl3 (en=ethylenediamine). They reported that the increase of the amount of the gold precursor had resulted in agglomeration of gold nanoparticles.
Chen et al. [9] used polyethylenimine (PEI) to prepare Au nanoparticles on polyethylenimine modi-fied montmorillonite. PEI has been used as both a stabilizer and a reducing agent for preparation of Au nanoparticles.
Patel et al. [10] suggested a method for prepara-tion of gold nanoparticles anchored on surfactant in-tercalated montmorillonite (MMT). They have used two approaches for synthesis of gold nanoparticles. In the first approach the gold nanoparticles have been synthesized by reduction of gold salt in hexa-decyltrimethylammonium bromide (HDTA) and dioctadecyldimethylammonium chloride (DODA), followed by exchange of HDTA and DODA solu-tion containing gold nanoparticles into MMT. In the second approach, HDTA and DODA with gold salt has been exchanged with MMT, and next reduced to obtain gold nanoparticles.
Tamoto et al. [11] described new methods to pre-pare gold nanoparticle/silica nanohelix hybrid nano-structures which form a 3D network in the aqueous phase. Nanometric silica helices and tubules have been obtained by a sol-gel polycondensation on or-ganic templates of self-assembled amphiphilic mol-ecules, further funcionalized with (3-aminopropyl)-triethoxysilane (APTES) or (3-mercaptopropyl)-tri-ethoxysilane (MPTES).

50
Si et al. [12] described a one-step, surfactant-assisted, seed-mediated method for growth of short gold nanorods with reasonable yield by modifying an established synthesis protocol. Among the vari-ous parameters that influence nanorod growth, the impact of the bromide counterion has been closely scrutinized.
Turkevich method [13, 14] of synthesis of gold nanoparticles involves the reaction of small amounts of hot chloroauric acid with small amounts of sodium citrate solution. In general, the method of Turkevich is used to produce modestly mono-disperse spherical gold nanoparticles, suspended in water, with diameter of around 10–20 nm. The formation of colloidal gold is a result of citrate ions acting as both a reducing agent and a capping agent. The capping agent is used in the gold nanoparticle synthesis to stop the particles growth and aggrega-tion. Larger gold nanoparticles can be produced if less sodium citrate is added. S. Nasir et al. [15] present in their study the approximate amount of sodium citrate and the corresponding sizes of the prepared gold nanoparticles.
The aim in the present study is to obtain organo-clay decorated with high number of gold nanoparti-cles, eventually leading to electrical conductivity in nanocomposites based on the decorated organoclay. The gold nanoparticles have been synthesized using Turkevich method, without any modifications. The novelty in the present study is the use of two different solvents (i-propanol and distilled water) for disperga-tion of the organoclay during the process of decora-tion of the organoclay with the gold nanoparticles.
2. EXPERIMENTAL SECTION
2.1. Materials
Clay Cloisite 30B (Southern Clay Products, Inc.), organically modified with methyltallow bis-2-hydroxyethyl quaternary ammonium chloride (MT2EtOH) was used as a substrate for the gold nanoparticle synthesis. Tetrachloroaurate trihydrate (HAuCl4·3H2O) from Sigma-Aldrich was the pre-cursor for the synthesis of the gold nanoparticles. Trisoduim citrate dihydrate (Na3C6H5O7.2H2O) from Merck was used as a reducing agent for the synthesis of the gold nanoparticles. Isopropanol from Sigma-Aldrich was used as solvent.
2.2. Preparation protocols
2.2.1. First preparation method (i-propanol as solvent)
The Turkevich method [13] was applied for the synthesis of gold nanoparticles using triso-
dium citrate as a chemical reducing agent. 10 ml of 2.05 wt% HAuCl4 solution is added to 60 ml of boiling distilled water, and the mixture was heat-ed at 100 °C, and then 5 ml of 18.06 wt% sodium citrate was added. The citrate was selected with the appropriate concentration in order to get the following mole ratio:
[Au3+]/[citrate] = 0.0006 mol/0.0035 mol = 0.17.
After the citrate had been added to the gold salt solution, the mixture was stirred for 5−10 min. The color of the mixture stared to change first to blue and then to dark red. After the last color change, the heating was stopped and the mixture was left to cool to room temperature. The size of the gold nanopar-ticles synthesized using the above [Au3+]/[citrate] mole ratio was expected to be around 10 nm.
Further on, a suspension of 1 g of clay in 30 ml of isopropanol was prepared by ultrasonic treatment for 15 min at 250 W and then poured into the wa-ter solution containing the gold nanoparticles. The clay/gold suspension was again submitted to an ul-trasonic treatment for 15 min. The mixture was then filtrated and the gold nanoparticles decorated clay (AuNPs/clay) is dried in oven for 16 h at 80 °C.
2.2.2. Second preparation method (distilled water as solvent)
In the first part of the synthesis, 9 ml of 0.1 wt% HAuCl4 solution was added to 40 ml of boiling dis-tilled water. The mixture was heated at 100 °С, until it starts boiling again. After that 5 ml of 0.9 wt% sodium citrate was added to the mixture. The citrate was selected with the appropriate concentration in order to perform the following mole ratio:
[Au3+]/[citrate] ratio = 0.0000265 mol/ 0.00017 mol = 0.16
After the citrate had been added to the gold salt solution, the mixture was stirred for 5−10 min. The color of the mixture started to change first to blue and then to dark red. After the last color change, the heating was stopped and the mixture was left to cool to room temperature. The size of the gold nanopar-ticles synthesized using the above [Au3+]/[citrate] mole ratio was expected to be around 10 nm.
Suspension of 1,03 g organoclay in 50 ml dis-tilled water was prepared and then is mechanically mixed for 15 minutes and dispergated with ultra-sonic treatment for 15 minutes at 250 W. In the pre-pared suspension of organoclay in water, 5 ml of 0.9 wt% sodium citrate was added. Sodium citrate has been added to the suspension for two reasons: first, it ensures the completion of the reduction process of the gold cations and second, the sodium citrate acts as a stabilization agent, which prevents the agglomeration of gold nanoparticles. The pre-
V. Angelov et al.: TEM analysis of gold nanoparticles attached on the surface of organoclay and obtained by two different...
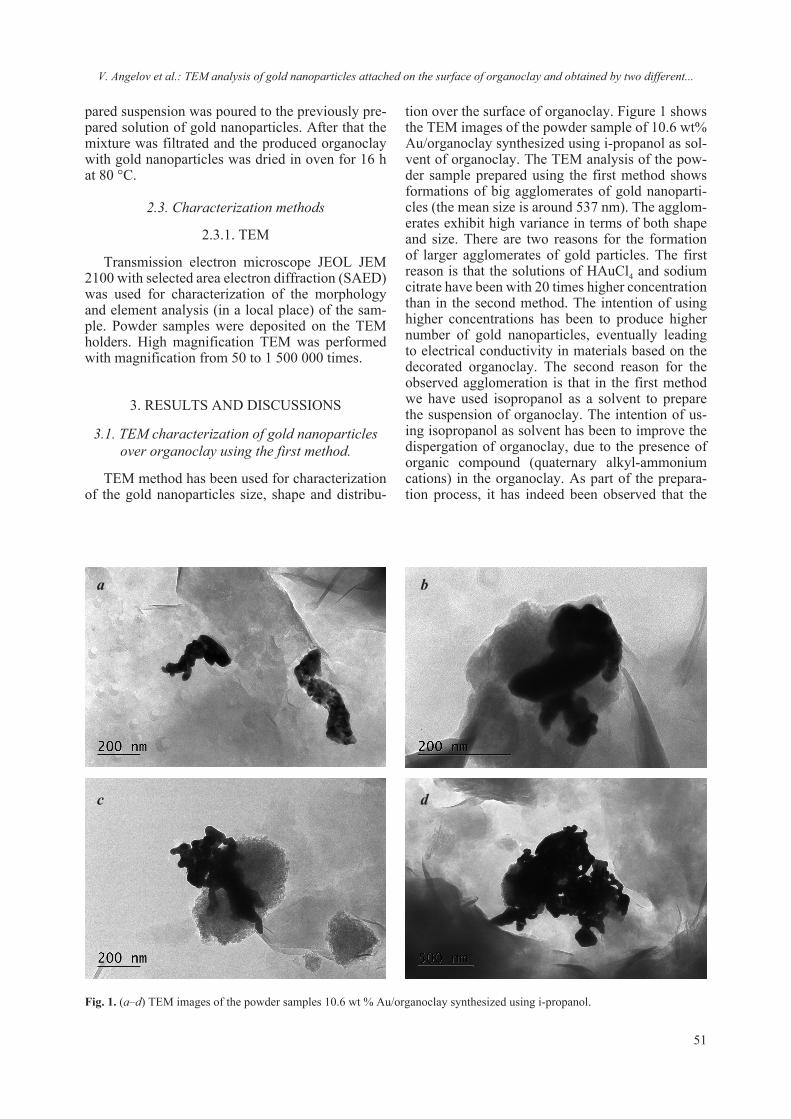
51
pared suspension was poured to the previously pre-pared solution of gold nanoparticles. After that the mixture was filtrated and the produced organoclay with gold nanoparticles was dried in oven for 16 h at 80 °C.
2.3. Characterization methods
2.3.1. TEM
Transmission electron microscope JEOL JEM 2100 with selected area electron diffraction (SAED) was used for characterization of the morphology and element analysis (in a local place) of the sam-ple. Powder samples were deposited on the TEM holders. High magnification TEM was performed with magnification from 50 to 1 500 000 times.
3. RESULTS AND DISCUSSIONS
3.1. TEM characterization of gold nanoparticles over organoclay using the first method.
TEM method has been used for characterization of the gold nanoparticles size, shape and distribu-
tion over the surface of organoclay. Figure 1 shows the TEM images of the powder sample of 10.6 wt% Au/organoclay synthesized using i-propanol as sol-vent of organoclay. The TEM analysis of the pow-der sample prepared using the first method shows formations of big agglomerates of gold nanoparti-cles (the mean size is around 537 nm). The agglom-erates exhibit high variance in terms of both shape and size. There are two reasons for the formation of larger agglomerates of gold particles. The first reason is that the solutions of HAuCl4 and sodium citrate have been with 20 times higher concentration than in the second method. The intention of using higher concentrations has been to produce higher number of gold nanoparticles, eventually leading to electrical conductivity in materials based on the decorated organoclay. The second reason for the observed agglomeration is that in the first method we have used isopropanol as a solvent to prepare the suspension of organoclay. The intention of us-ing isopropanol as solvent has been to improve the dispergation of organoclay, due to the presence of organic compound (quaternary alkyl-ammonium cations) in the organoclay. As part of the prepara-tion process, it has indeed been observed that the
Fig. 1. (a–d) TEM images of the powder samples 10.6 wt % Au/organoclay synthesized using i-propanol.
a b
c d
V. Angelov et al.: TEM analysis of gold nanoparticles attached on the surface of organoclay and obtained by two different...

52
which implements an accurate, unbiased, reproduc-ible, and fast method to measure the morphological parameters of a population of nanoparticles (NPs) from TEM micrographs. In this software, the mor-phological parameters of the projected NP shape have been obtained by fitting intensity models to the TEM micrograph [16].
Figure 3 shows the results of the measurement of 60 gold nanoparticles, analysed with statistical methods. The mean and the median size are around 27 nm and the standard deviation is just around 6 nm. This confirms that the majority of the gold nanoparticles, synthesized with the protocol de-scribed in Experimental Section 2.2.2, are of simi-lar size, slightly larger than the one expected in the protocol.
Fig. 2. (a–b) TEM images of the powder samples 0.5 wt % Au/organoclay synthesized using distilled water.
a b
organoclay dispergates better in i-propanol than in distilled water.
3.2. TEM characterization of gold nanoparticles over organoclay using the second method
TEM image of gold nanoparticles synthesized over organoclay using the citrate method and sol-vent distilled water are shown in Figure 2. Almost all of the particles are of similar size and they are placed on the surface of the organoclay. The vari-ance in the shape of the gold nanoparticles is still high.
The size and the shape of the gold nanoparticles shown in the TEM image can be further analyzed using PEBBLES software – a user-friendly software
Fig. 3. Histogram and statistical analysis of gold nanoparticles size on TEM image shown in Figure 2.
V. Angelov et al.: TEM analysis of gold nanoparticles attached on the surface of organoclay and obtained by two different...

53
Table 1 illustrates a comparison between the re-sults of the statistical analysis of the TEM images of the two studied methods. The mean (26.8 nm) and the median (28.7 nm) values in the second meth-od (using distilled water) are much closer to each other compared to the mean (537.47 nm) and me-dian values (505.42 nm) in the first method (using i-propanol). This confirms that citrate method and solvent distilled water (second method) provides better control over the size the synthesized gold na-noparticles compared to citrate method and solvent i-propanol (first method).
4. CONCLUSIONS
In the present study the gold nanoparticles and the dispergation of the organoclay have been ob-tained with two different methods. The prepared organoclay decorated with gold nanoparticles has been characterized using TEM. The organoclay has been better dispergated in i-propanol, however us-ing i-propanol as solvent and concentrated solutions of HAuCl4 with sodium citrate has led to the forma-tion of big agglomerates (the mean size is around 537 nm). The TEM analysis of the samples pre-pared with the second method (using distilled water as solvent) has shown the formation of individual gold nanoparticles (the mean size is around 30 nm) that have not agglomerated.
Acknowledgments: The study was supported by the COST Action MP1202.
REFERENCES
1. G. Frens, Nature Physical Science, 241 (105), 20 (1973).
2. H. Miyamura, R. Matsubara, Y. Miyazaki, S. Ko-bayashi, Angew., Chem. Int. Ed., 46, 4151 (2007).
3. W. Yan, S. M. Mahurin, B. Chen, S. H. Overbury, S. Dai, J. Phys. Chem. B., 109, 15489 (2005).
4. S. Carrettin, P. McMorn, P. Johnston, K. Griffin, C. J. Kiely, G. Hutchings, J. Phys. Chem. Chem. Phys., 5, 1329 (2003).
5. N. Aihara, K. Torigoe, K. Esumi, Langmuir, 14, 4945 (1998).
6. R. Zhang, M. Hummelgard, H. Olin, Langmuir, 26 (8), 5823 (2010).
7. V. Belova, H. Mohwald, D. Shchukin, Langmuir, 24, 9747 (2008).
8. L. Zhu, S. Letaief, Y. Liu, F. Gervais, C. Detellier, Applied Clay Science, 43, 439 (2009).
9. C. C. Chen, P. L. Kuo, Journal of Colloid and Interface Science, 293, 101 (2006).
10. H. Patel, H. Bajaj, R. Jasra, Journal of Nanoscience and Nanotechnology, 9, 5946 (2009).
11. R. Tamoto, S. Lecomte, S. Si, S. Moldovan, O. Ersen, M. H. Delville, R. Oda, Journal of Physical Chemistry C, 116, 23143 (2012).
12. S. Si, C. Leduc, M. H. Delville, B. Lounis, Chem PhysChem, 13, 193 (2012).
13. J. Turkevich, P. C. Stevenson, J. Hillier, Discuss. Faraday Soc., 11, 55 (1951).
14. J. Turkevich, P. C. Stevenson, J. Hillier, J. Phys. Chem., 57 (7), 670 (1953).
15. S. Nasir, H. Nur, Journal of Fundamental Sciences, 4, 245 (2008).
16. S. Mondini, A. M. Ferretti, A. Puglisi, A. Ponti, Nanoscale, 4, 5356 (2012).
Table 1. Statistical analysis of the size of the gold nanoparticles synthesized over organoclay by two different methods
MethodStatistical analysis of gold nanoparticle sizes (nm)
Mean Standard deviation Minimum Median Maximum
First method using solvent i-propanol 537.47 nm 254.63 nm 269.86 nm 505.42 nm 940.98 nm
Second method using solvent distilled water 26.78 nm 6.50 nm 10.00 nm 28.69 nm 35.38 nm
V. Angelov et al.: TEM analysis of gold nanoparticles attached on the surface of organoclay and obtained by two different...

54 © 2018 Bulgarian Academy of Sciences, Union of Chemists in Bulgaria
* To whom all correspondence should be sent:
Bulgarian Chemical Communications, Volume 50, Special Issue F (pp. 54–61) 2018
Characterization of a novel geopolymer based on acid-activated fayalite slag from local copper industry
A. Nikolov1*, R. Titorenkova1, N. Velinov2, Z. Delcheva1
1 Institute of Mineralogy and Crystallography, Bulgarian Academy of Science, Sofia 1113, Acad. Georgi Bonchev Str., Bulgaria
2 Institute of Catalysis, Bulgarian Academy of Science, Sofia 1113, Acad. Georgi Bonchev Str., bl. 11, Bulgaria
Received October 07, 2018; Accepted November 30, 2018
In the present study the copper smelter slag from the Aurubis enterprise (Pirdop, Bulgaria) was used as geo-polymer precursor. The X-ray fluorescence and powder diffraction analysis showed that the slag contains significant amount of iron, presented by the minerals fayalite and magnetite. The slag was activated with phosphoric acid solu-tion to prepare fresh geopolymer paste. Rapid exothermic reaction took place and the material hardened in minutes. The obtained inorganic polymer material was characterized by XRD, FTIR, DSC and Mössbauer spectroscopy. In conclusion, our study shows that the waste slag from local copper industry could be used as a potential geopolymer precursor to produce building materials. This novel method could reduce the huge amounts of fayalite slag generated during the last decades.
Keywords: geopolymer, copper slag, fayalite, acid-activated, inorganic polymer, iron silicate fines.
INTRODUCTION
The global copper industry produced 22,286 thousands of tons of copper during 2016 [1]. Apart from copper concentrate and fuel, smelter inputs include silica (800 kg/t of copper concentrate) and limestone (250 kg/t). These materials subsequently form the slag, which amounts to about 1.55 t/t, as-suming concentrate with a grade of 25%. [2]. Apart from silicates and copper, the slag typically contains 100% of the iron, 70% of the zinc, 30% of selenium and tellurium, 25% of tin and nickel, 20% of cad-mium, cobalt and antimony, and 10% of the silver, gold, platinum, and lead that was originally present in the concentrate [2]. Due to technological reasons, the slag from the flash furnace and the converters contains residual copper which is extracted through grinding and flotation [3]. Two products are ob-tained at the slag flotation plant: flotation copper concentrate and flotation tailings, called fayalite slag or iron-silicate fines. Fayalite slag is powdery material with a high content of iron and silicon di-oxide in the form of minerals, mainly fayalite, mag-netite, quartz, etc. The specific density of the mate-rial is about 3.6 g/cm3 (bulk density 2.4 g/cm3) [3].
The slag is hardly reusable, because of its specific fineness and composition. It is not economically vi-able to extract the iron at this level of technology. However, fayalite slag is marketable as a road sur-face, Portland cement production and concrete addi-tive. Still huge amount of the produced slag remains unutilized. With this in mind, geopolymer technolo-gy is focused exactly at industrial waste utilization.
Geopolymers are a class of inorganic poly-mer materials with amorphous or semi-crystalline three-dimensional silico-aluminate structure [4]. The geopolymer materials possess high compres-sive strength, chemical resistance, thermal stability, low CO2 footprint, possibility of utilizing industrial waste materials, etc. There are discussions in the scientific community about the term ‘geopolymer’ and there are other names describing the same or similar materials, including the terms: “alkali-ac-ti vated material”, “alkali-bounded-ceramics”, “hy-dro ceramics”, “inorganic polymer concrete”, “alu-mino-silicate inorganic polymer”, etc. [5, 6]. How-ever, these materials seem promising and they are potential alternative of conventional Portland ce-ment and ceramics. In the present study the term geopolymer will be used to describe the prepared material trough acid activation of fayalite slag.
According to Joseph Davidovits, the “father” of the term “geopolymer”, there are two routes of geopolymer synthesis: in alkaline medium using E-mail: [email protected]
55
alkali hydroxides and silicates; and acidic medium with phosphoric acid [4]. Depending on the com-position and synthesis route the geopolymers com-prise the following molecular units (or chemical groups):
-Si-O-Si-O- siloxo, poly(siloxo)-Si-O-Al-O- sialate, poly(sialate)
-Si-O-Al-O-Si-O- sialate-siloxo, poly(sialate-siloxo)
-Si-O-Al-O-Si-O-Si-O- sialate-disiloxo, poly(sialate-disiloxo)
-P-O-P-O- phosphate, poly(phosphate)-P-O-Si-O-P-O- phospho-siloxo, poly(phospho-
siloxo)-P-O-Si-O-Al-O-P-O- phospho-sialate,
poly(phospho-sialate)-(R)-Si-O-Si-O-(R) organo-siloxo, poly-silicone
-Al-O-P-O- alumino-phospho, poly(alumino-phospho)
-Fe-O-Si-O-Al-O-Si-O- ferro-sialate, poly(ferro-sialate) [7].
The ferro-sialate geopolymer has a molecular structure in which part of the Fe atoms are found in tetrahedral structural position within the ferro-sialate geopolymeric sequence [8].
Limited studies are attempted on acidic activa-tion of iron rich slags so far. To the best of authors’ knowledge, only one such study [9] was reported for Belgian fayalite slag, used to prepare geopoly-mer with compressive strength of up to 19 MPa. Alkali activation of similar slags were studies by: Komnitsas et. al [10–12] and Maragkos et. al [13] using Greek ferronickel slag; Onisei et al. [14–15] and Peys et al. [16] using Belgian fayalite slag. Other studies on iron rich geopolymers, synthesised from bauxite residue [17], iron rich fly ash [18] and lead smelter slag [15] are known too.
In terms of the activator, in the present study ortho-phosphoric acid was used to prepare geopoly-mers. Usually phosphoric acid is a part of acid-base reaction with a metal oxide to form inorganic poly-mer. Phosphate inorganic polymers (or phosphate–bonded ceramics/cement) are synthesized at room temperature and they set rapidly like conventional polymers. These materials find a wide range of ap-plications such as dental cements, construction ma-terials, oil well cements and hazardous and radioac-tive stabilizators [4]. Phosphate geopolymers may be formed by using virtually any divalent or triva-lent metal oxide that is sparingly soluble. In dental cements Ca and Zn is used to form hydroxyapatite (Ca5(PO4)3(OH)) and hopeite (Zn3(PO4)2·4H2O), respectively [19]. The magnesium oxide also react quickly to form products similar to those found in zinc phosphate ceramics. Magnesium phosphate-based ceramics were developed for uses in structural materials, repair cements [20], solidification of low-
level radioactive and hazardous wastes [21]. When a partially neutralized phosphoric acid solution is reacted with a metal oxide, a ceramic-like material is formed with a reaction product MxBy(PO4)(x+y)/3, where M stands for a metal and B can be hydrogen (H) or another metal such as aluminium (Al) [19].
In the present study geopolymer was formed by acid-base reaction with phosphoric acid solution and fayalite slag. The purpose of the study is to use industrial waste products to obtain new iron phos-phate geopolymer for waste stabilization and use in construction and building material. The precursors react rapidly and the geopolymer hardens in min-utes. There are economic, environmental and social benefits to develop technology utilizing fayalite slag. The scientific and technical knowledge in the field of geopolymers and phosphate cements could be the key to solving the problem with utilizing the ecologically hazardous fayalite slag.
EXPERIMENTAL
Methods of analysis
The powder XRD patterns of the precursors and the geopolymer samples were performed with Philips PW1830 and Cu Kα radiation.
The chemical composition of the raw fayalite slag was determined by XRF using apparatus Panalytical Axios Max WD.
FT-IR spectra were collected using a Tensor 37 spectrometer (Bruker) with a 4 cm–1 resolution after averaging 72 scans on standard KBr pellets in the spectral region 400–4000 cm–1 at room temperature. Micro-IR spectra were performed using Hyperion 2000 IR microscope after averaging 126 scans, col-lected from 50 µm areas.
The Mössbauer spectra were obtained at room temperature by a Wissel (Wissenschaftliche Elek-tronik GmbH, Germany) electromechanical spec-trometer working in a constant acceleration mode. A 57Co/Rh (activity =~ 20 mCi) source and a-Fe stand-ard were used. The experimentally obtained spectra were fitted using CONFIT2000 software [22]. The parameters of hyperfine interaction such as iso-mer shift (δ), quadrupole splitting (ΔEq), effective internal magnetic field (B), line widths (Γexp), and relative weight (G) of the partial components in the spectra were determined.
The differential scanning calorimetry and the thermogravimetry (DSC–TG) were carried out on the DSC–TG analyzer SETSYS2400, SETARAM at the following conditions: temperature range from 20 to 1200 °C, in a static air atmosphere, with a heating rate of 10 °C min, and 10–15 mg sample mass.
A. Nikolov et al.: Characterization of a novel geopolymer based on acid-activated fayalite slag from local copper industry
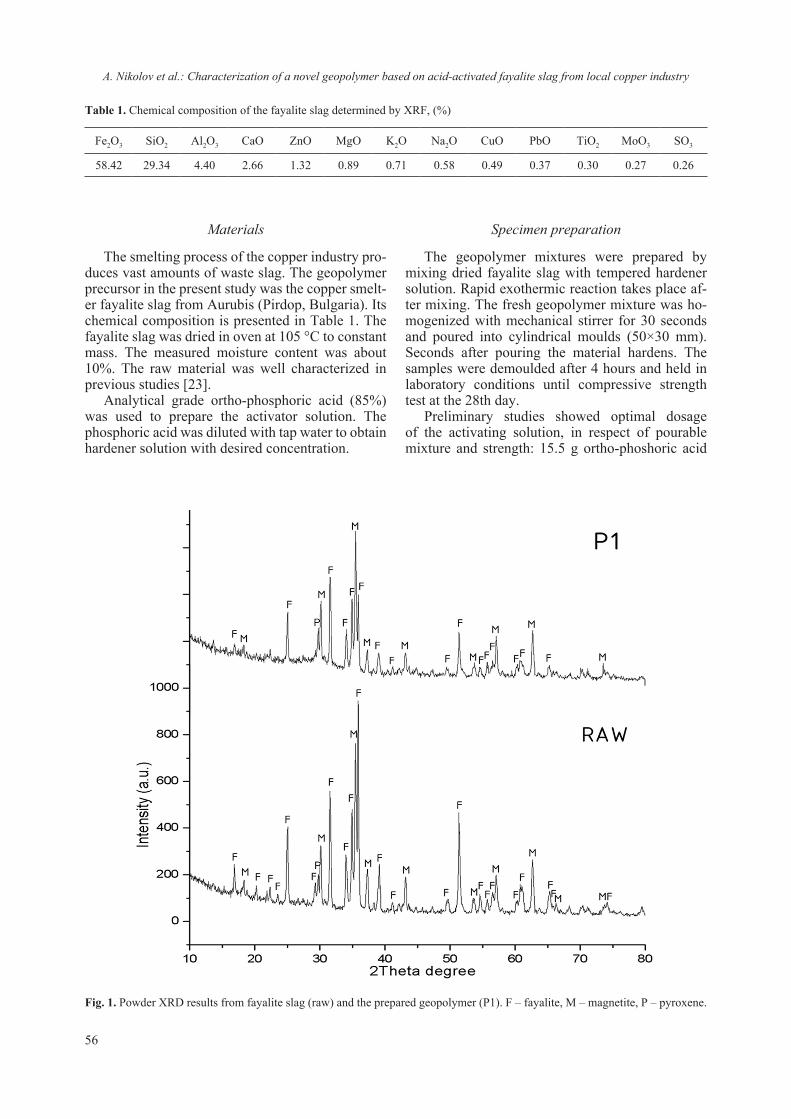
56
Materials
The smelting process of the copper industry pro-duces vast amounts of waste slag. The geopolymer precursor in the present study was the copper smelt-er fayalite slag from Aurubis (Pirdop, Bulgaria). Its chemical composition is presented in Table 1. The fayalite slag was dried in oven at 105 °C to constant mass. The measured moisture content was about 10%. The raw material was well characterized in previous studies [23].
Analytical grade ortho-phosphoric acid (85%) was used to prepare the activator solution. The phosphoric acid was diluted with tap water to obtain hardener solution with desired concentration.
Specimen preparation
The geopolymer mixtures were prepared by mixing dried fayalite slag with tempered hardener solution. Rapid exothermic reaction takes place af-ter mixing. The fresh geopolymer mixture was ho-mogenized with mechanical stirrer for 30 seconds and poured into cylindrical moulds (50×30 mm). Seconds after pouring the material hardens. The samples were demoulded after 4 hours and held in laboratory conditions until compressive strength test at the 28th day.
Preliminary studies showed optimal dosage of the activating solution, in respect of pourable mixture and strength: 15.5 g ortho-phoshoric acid
Table 1. Chemical composition of the fayalite slag determined by XRF, (%)
Fe2O3 SiO2 Al2O3 CaO ZnO MgO K2O Na2O CuO PbO TiO2 MoO3 SO3
58.42 29.34 4.40 2.66 1.32 0.89 0.71 0.58 0.49 0.37 0.30 0.27 0.26
Fig. 1. Powder XRD results from fayalite slag (raw) and the prepared geopolymer (P1). F – fayalite, M – magnetite, P – pyroxene.
A. Nikolov et al.: Characterization of a novel geopolymer based on acid-activated fayalite slag from local copper industry
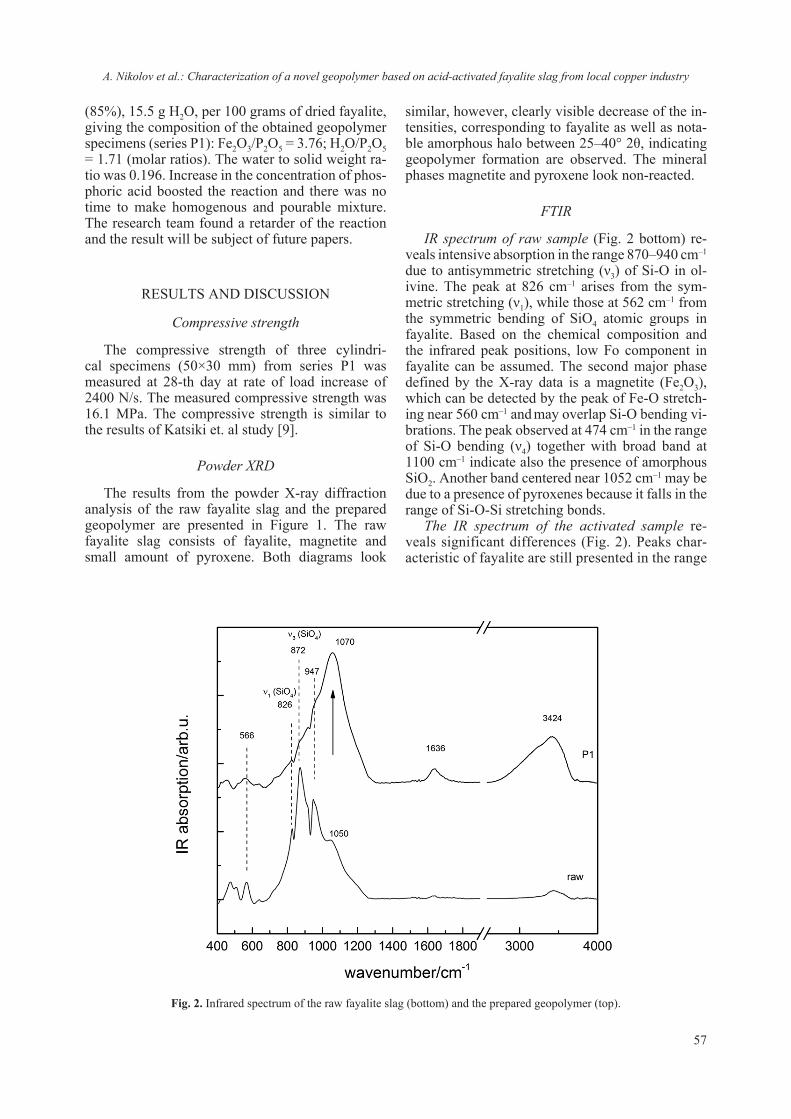
57
(85%), 15.5 g H2O, per 100 grams of dried fayalite, giving the composition of the obtained geopolymer specimens (series P1): Fe2O3/P2O5 = 3.76; H2O/P2O5 = 1.71 (molar ratios). The water to solid weight ra-tio was 0.196. Increase in the concentration of phos-phoric acid boosted the reaction and there was no time to make homogenous and pourable mixture. The research team found a retarder of the reaction and the result will be subject of future papers.
RESULTS AND DISCUSSION
Compressive strength
The compressive strength of three cylindri-cal specimens (50×30 mm) from series P1 was measured at 28-th day at rate of load increase of 2400 N/s. The measured compressive strength was 16.1 MPa. The compressive strength is similar to the results of Katsiki et. al study [9].
Powder XRD
The results from the powder X-ray diffraction analysis of the raw fayalite slag and the prepared geopolymer are presented in Figure 1. The raw fayalite slag consists of fayalite, magnetite and small amount of pyroxene. Both diagrams look
similar, however, clearly visible decrease of the in-tensities, corresponding to fayalite as well as nota-ble amorphous halo between 25–40° 2θ, indicating geopolymer formation are observed. The mineral phases magnetite and pyroxene look non-reacted.
FTIR
IR spectrum of raw sample (Fig. 2 bottom) re-veals intensive absorption in the range 870–940 cm–1 due to antisymmetric stretching (ν3) of Si-O in ol-ivine. The peak at 826 cm–1 arises from the sym-metric stretching (ν1), while those at 562 cm–1 from the symmetric bending of SiO4 atomic groups in fayalite. Based on the chemical composition and the infrared peak positions, low Fo component in fayalite can be assumed. The second major phase defined by the X-ray data is a magnetite (Fe2O3), which can be detected by the peak of Fe-O stretch-ing near 560 cm–1 and may overlap Si-O bending vi-brations. The peak observed at 474 cm–1 in the range of Si-O bending (ν4) together with broad band at 1100 cm–1 indicate also the presence of amorphous SiO2. Another band centered near 1052 cm–1 may be due to a presence of pyroxenes because it falls in the range of Si-O-Si stretching bonds.
The IR spectrum of the activated sample re-veals significant differences (Fig. 2). Peaks char-acteristic of fayalite are still presented in the range
Fig. 2. Infrared spectrum of the raw fayalite slag (bottom) and the prepared geopolymer (top).
A. Nikolov et al.: Characterization of a novel geopolymer based on acid-activated fayalite slag from local copper industry
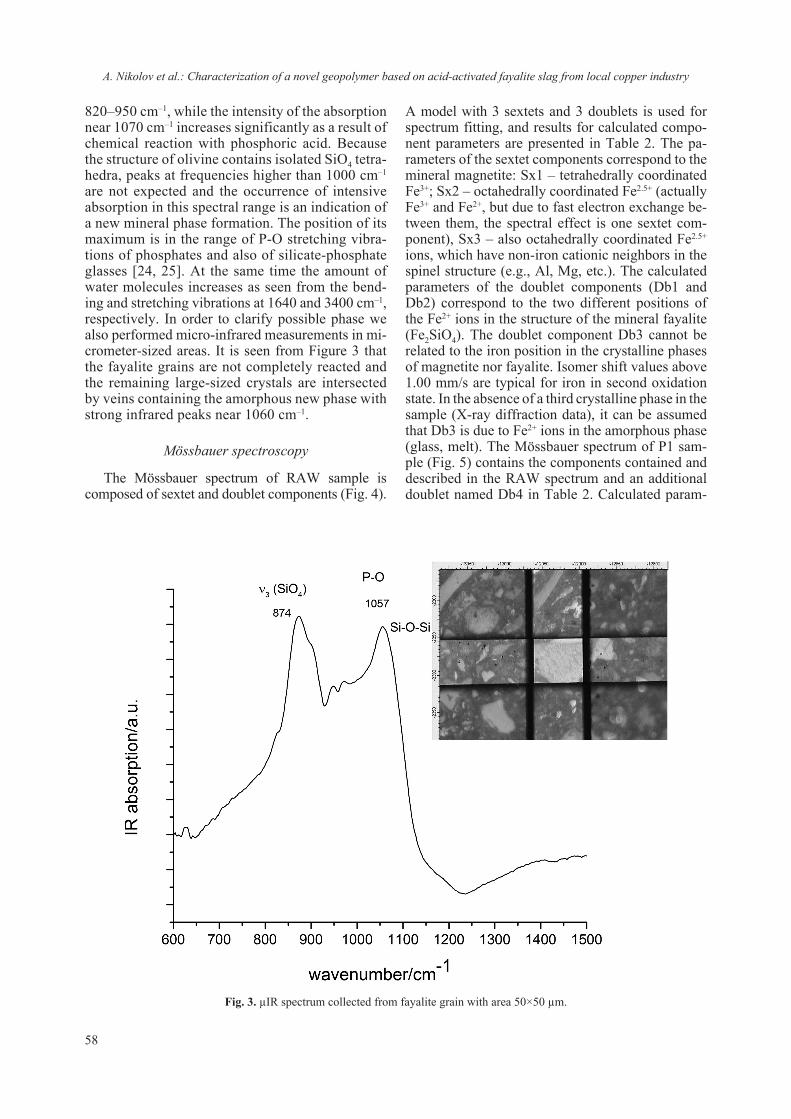
58
Fig. 3. µIR spectrum collected from fayalite grain with area 50×50 µm.
820–950 cm–1, while the intensity of the absorption near 1070 cm–1 increases significantly as a result of chemical reaction with phosphoric acid. Because the structure of olivine contains isolated SiO4 tetra-hedra, peaks at frequencies higher than 1000 cm–1 are not expected and the occurrence of intensive absorption in this spectral range is an indication of a new mineral phase formation. The position of its maximum is in the range of P-O stretching vibra-tions of phosphates and also of silicate-phosphate glasses [24, 25]. At the same time the amount of water molecules increases as seen from the bend-ing and stretching vibrations at 1640 and 3400 cm–1, respectively. In order to clarify possible phase we also performed micro-infrared measurements in mi-crometer-sized areas. It is seen from Figure 3 that the fayalite grains are not completely reacted and the remaining large-sized crystals are intersected by veins containing the amorphous new phase with strong infrared peaks near 1060 cm–1.
Mössbauer spectroscopy
The Mössbauer spectrum of RAW sample is composed of sextet and doublet components (Fig. 4).
A model with 3 sextets and 3 doublets is used for spectrum fitting, and results for calculated compo-nent parameters are presented in Table 2. The pa-rameters of the sextet components correspond to the mineral magnetite: Sx1 – tetrahedrally coordinated Fe3+; Sx2 – octahedrally coordinated Fe2.5+ (actually Fe3+ and Fe2+, but due to fast electron exchange be-tween them, the spectral effect is one sextet com-ponent), Sx3 – also octahedrally coordinated Fe2.5+ ions, which have non-iron cationic neighbors in the spinel structure (e.g., Al, Mg, etc.). The calculated parameters of the doublet components (Db1 and Db2) correspond to the two different positions of the Fe2+ ions in the structure of the mineral fayalite (Fe2SiO4). The doublet component Db3 cannot be related to the iron position in the crystalline phases of magnetite nor fayalite. Isomer shift values above 1.00 mm/s are typical for iron in second oxidation state. In the absence of a third crystalline phase in the sample (X-ray diffraction data), it can be assumed that Db3 is due to Fe2+ ions in the amorphous phase (glass, melt). The Mössbauer spectrum of P1 sam-ple (Fig. 5) contains the components contained and described in the RAW spectrum and an additional doublet named Db4 in Table 2. Calculated param-
A. Nikolov et al.: Characterization of a novel geopolymer based on acid-activated fayalite slag from local copper industry

59
eters of Db4 correspond to Fe3+ ions in octahedral coordination. In the absence of diffraction reflexes from additional crystalline phase containing Fe3+, this is probably the second amorphous phase, which could be a result of geopolymerization. The relative weight of Db4 is 15% and it is at the expense of the doublets of the fayalite phase (Db1, Db2, Db3) comparing with the RAW sample spectrum.
STA (DSC–TG)
The thermal behaviour of samples Raw and P1 was investigated. Two processes were observed on DSC–TG(DTG) curves of these samples: (i) dehy-dration and (ii) oxidation Figure 6. Both samples at first sight showed similar thermal behaviour, but
some differences were also observed. The dehydra-tion of sample RAW was minimal and marked by edno – effects 1 and 2, as the first stage is more distinct then the second. The dehydration of sample P1 in comparison with RAW, showed two well dis-tinguishable stages (endo effects 1, 2) and a small one 3 (Fig. 6 – right). The weight losses during the sample dehydration show significant differences: in sample Raw, the mass loss was 0.63% while in sample P1 = 7.53%. The dehydration continues un-til 300 °C in sample Raw, while up to 420 °C in sample P1. Both samples showed gradual exother-mic reactions after the end of dehydration processes probably due to oxidation of the iron minerals. The weight increased with 4.04% in sample Raw, while in sample P1 the weight increased with 2.08%.
Table 2. Mössbauer parameters of investigated samples
Sample Components δ, mm/s ΔEq, mm/s B, T Γexp, mm/s G, %
RAW
Sx1-Fe3O4, Fe3+tetra
Sx2-Fe3O4, Fe2.5+octa
Sx3-Fe3O4, Fe2.5+octa
Db1-Fe2SiO4, Fe2+ – M1Db2-Fe2SiO4, Fe2+ – M2Db3-Fe2+
0.300.620.721.141.171.24
0.00–0.05–0.052.682.882.19
48.045.142.3
–––
0.360.540.780.300.300.65
131513212711
PG1
Sx1-Fe3O4, Fe3+tetra
Sx2-Fe3O4, Fe2.5+octa
Sx3-Fe3O4, Fe2.5+octa
Db1-Fe2SiO4, Fe2+ – M1Db2-Fe2SiO4, Fe2+ – M2Db3-Fe2+
Db4-Fe3+
0.300.610.701.131.171.200.44
0.00–0.050.012.652.871.740.68
48.045.242.4
––––
0.350.520.860.300.300.810.40
1213141424815
Fig. 4. Mössbauer spectrum of RAW sample. Fig. 5. Mössbauer spectrum of P1 sample.
A. Nikolov et al.: Characterization of a novel geopolymer based on acid-activated fayalite slag from local copper industry
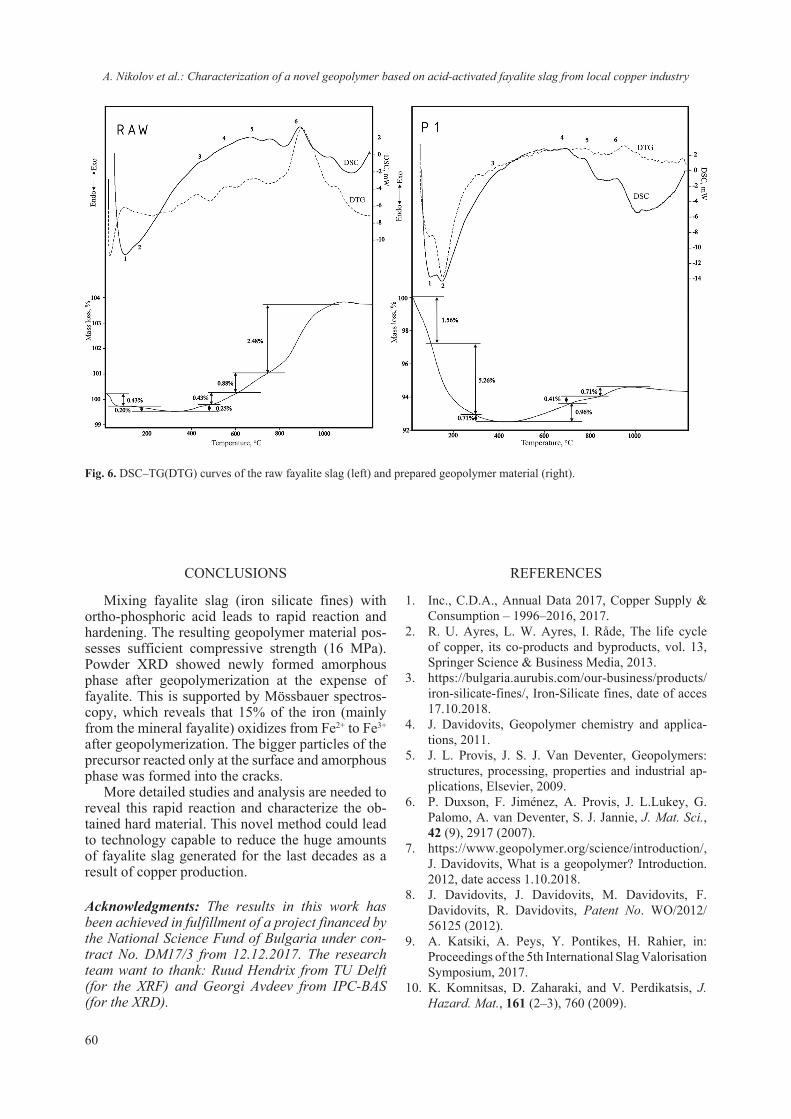
60
CONCLUSIONS
Mixing fayalite slag (iron silicate fines) with ortho-phosphoric acid leads to rapid reaction and hardening. The resulting geopolymer material pos-sesses sufficient compressive strength (16 MPa). Powder XRD showed newly formed amorphous phase after geopolymerization at the expense of fayalite. This is supported by Mössbauer spectros-copy, which reveals that 15% of the iron (mainly from the mineral fayalite) oxidizes from Fe2+ to Fe3+ after geopolymerization. The bigger particles of the precursor reacted only at the surface and amorphous phase was formed into the cracks.
More detailed studies and analysis are needed to reveal this rapid reaction and characterize the ob-tained hard material. This novel method could lead to technology capable to reduce the huge amounts of fayalite slag generated for the last decades as a result of copper production.
Acknowledgments: The results in this work has been achieved in fulfillment of a project financed by the National Science Fund of Bulgaria under con-tract No. DM17/3 from 12.12.2017. The research team want to thank: Ruud Hendrix from TU Delft (for the XRF) and Georgi Avdeev from IPC-BAS (for the XRD).
REFERENCES
1. Inc., C.D.A., Annual Data 2017, Copper Supply & Consumption – 1996–2016, 2017.
2. R. U. Ayres, L. W. Ayres, I. Råde, The life cycle of copper, its co-products and byproducts, vol. 13, Springer Science & Business Media, 2013.
3. https://bulgaria.aurubis.com/our-business/products/iron-silicate-fines/, Iron-Silicate fines, date of acces 17.10.2018.
4. J. Davidovits, Geopolymer chemistry and applica-tions, 2011.
5. J. L. Provis, J. S. J. Van Deventer, Geopolymers: structures, processing, properties and industrial ap-plications, Elsevier, 2009.
6. P. Duxson, F. Jiménez, A. Provis, J. L.Lukey, G. Palomo, A. van Deventer, S. J. Jannie, J. Mat. Sci., 42 (9), 2917 (2007).
7. https://www.geopolymer.org/science/introduction/, J. Davidovits, What is a geopolymer? Introduction. 2012, date access 1.10.2018.
8. J. Davidovits, J. Davidovits, M. Davidovits, F. Davidovits, R. Davidovits, Patent No. WO/2012/ 56125 (2012).
9. A. Katsiki, A. Peys, Y. Pontikes, H. Rahier, in: Proceedings of the 5th International Slag Valorisation Symposium, 2017.
10. K. Komnitsas, D. Zaharaki, and V. Perdikatsis, J. Hazard. Mat., 161 (2–3), 760 (2009).
Fig. 6. DSC–TG(DTG) curves of the raw fayalite slag (left) and prepared geopolymer material (right).
A. Nikolov et al.: Characterization of a novel geopolymer based on acid-activated fayalite slag from local copper industry

61
11. K. Komnitsas, D. Zaharaki, V. Perdikatsis, J. Mater. Sci., 42 (9), 3073 (2007).
12. K. Komnitsas, D. Zaharaki, G. Bartzas, Appl. Clay Sci. , 73, 103 (2013).
13. I. Maragkos, I. P. Giannopoulou, D. Panias, Min. Eng., 22 (2), 196 (2009).
14. S. Onisei, A. Douvalis, A. Malfliet, A. Peys, Y. Pontikes, J. Am. Ceram. Soc., 101 (6), 2245 (2018).
15. S. Onisei, Y. Pontikes, T. Van Gerven, G. An ge-lopoulos, T. Velea, V. Predica, P. Moldovan, J. Hazard. Mater., 205, 101 (2012).
16. A. Peys, L. Arnout, T. Hertel, R. Iacobescu, S. Onisei, L. Kriskova, H. Rahier, B. Blanpain, Y. Pon-tikes, in: Proceedings of the 5th International Slag Valorisation Symposium: From fundamentals to ap-plications, Leuven, Belgium, 2017.
17. T. Hertel, B. Blanpain, Y. Pontikes, J. Sustain. Metall., 2 (4), 394 (2016).
18. S. Kumar, J. Djobo, A. Kumar, S. Kumar, J. Build. Eng., 8, 172 (2016).
19. A. S. Wagh, Chemically bonded phosphate ceram-
ics, Elsevier, 2016.20. B. El-Jazairi, Rapid repair of concrete pavings,
Concr., 16 (9), 12 (1982).21. A. Wagh, D. Singh, S. Jeong, Handbook of mixed
waste management technology, CRC Press, Boca Raton, 2001.
22. T. Žák, Y. Jirásková, CONFIT: Mössbauer spectra fitting program, Surface and Interface Analysis: An International Journal devoted to the develop-ment and application of techniques for the analysis of surfaces, interfaces and thin films, 38 (4), 2006, p. 710.
23. I. Mihailova, D. Mehandjiev, J. Univers. Chem. Techn. Metall., 45 (3), 317 (2010).
24. R. L. Frost, W. Martens, P. Williams, J. Kloprogge, Raman and infrared spectroscopic study of the viv-ianite-group phosphates vivianite, baricite and bo-bierrite, De Gruyter, 2002.
25. J. Kuczek, J., P. Jeleń, P. Stoch, A. Błachowski, I. Wacławska, M. Szumera, J. Mol. Struct., 1170, 82 (2018).
A. Nikolov et al.: Characterization of a novel geopolymer based on acid-activated fayalite slag from local copper industry

62 © 2018 Bulgarian Academy of Sciences, Union of Chemists in Bulgaria
* To whom all correspondence should be sent:
Bulgarian Chemical Communications, Volume 50, Special Issue F (pp. 62–72) 2018
XRD study on the structural evolution of Zn-exchanged titanosilicate ETS-4 during thermal treatment
V. Kostov-Kytin1*, R. Nikolova1, G. Avdeev2
1 Bulgarian Academy of Sciences, Institute of Mineralogy and Crystallography “Acad. Ivan Kostov”, 1113 Sofia, Akad. G. Bonchev Str., bl. 107, Bulgaria
2 Bulgarian Academy of Sciences, Institute of Physical Chemistry “Rostislaw Kaischew”, 1113 Sofia, Аkad. G. Bonchev Str., bl. 11, Bulgaria
Received October 07, 2018; Accepted November 30, 2018
In situ time-resolved powder X-ray diffraction technique has been applied to investigate the structural evolution of Zn-exchanged polycrystalline titanosilicate ETS-4 upon heating within the temperature interval from 25 to 375 °C. The facilities of the Rietveld method as implemented in the software package GSAS have been used to control the plau-sibility of the obtained crystal-chemical characteristics at each stage. Previous single crystal structure determination of the title compound has served as initial model for the refinement procedure held on a sample at room temperature. Subsequently, the structure model of each increasing temperature step has been taken from the previous refinement. The structural evolution has been evaluated in terms of the unit cell parameters changes, water molecules site oc-cupancies (during the dehydration period), the titano-silicate framework flexibility (pore sizes), and possible atomic motion during the thermal treatment. The obtained results and previously accumulated knowledge on the crystal-chemical peculiarities of ion-exchanged ETS-4 and its behavior upon heating have been interpreted in terms of the elastic properties of this titanosilicate structure and its thermal stability.
Keywords: Zn-ETS-4, Rietveld refinement, structural evolution.
E-mail: [email protected]
INTRODUCTION
The synthetic zeolite-like titanosilicate ETS-4 (Engelhard Titanium Silicate-4), was patented by Kuzniki et al. in 1989 and 1990 [1, 2]. Since then the interest of the scientific community towards preparation of microporous and layered titanosili-cates with potential application in various areas of technology such as catalysis, gas separation, energy storage, optoelectronics, radioactive waste manage-ment, etc has steadily increased. ETS-4 has as a nat-ural analogue the mineral zorite with ideal chemi-cal formula Na6Ti5Si12O34(O,OH)5·11H2O [3, 4]. Sandomirskii and Belov recognized the order-disor-der (OD) character of zorite structure and solved its superposition (family) structure in the space group Cmmm [4]. The averaged structure model of these authors is also applicable to ETS-4 materials (as-synthesized and ion-exchanged forms). It can be described as consisting of chains of TiO6 octahedra (Ti1) parallel to the [010] direction laterally linked
by a chain of four SiO4 tetrahedra along [100] di-rection. These SiO4 groups are linked in [010] di-rection by a chain-bridging unit including the Ti(2) site with statistically reverted polarity of its polyhe-dron (Fig. 1). An interesting peculiarity is the co-ordination of Ti(2) atom. Some authors have found evidences for the hemi-octahedral coordination of Ti in the chain-bridging site and other support its six-coordination. Detailed discussion on this is presented by M. Sacerdoti and G. Cruciani in 2011 [5]. Both ETS-4 and zorite are disordered crystal-line materials, being faulted in the [100] and [001] directions. Crystallographically, their structure is described as an intergrowth of four polytypes which differ in the stacking of the titanosilicate bridging units in the [100] and [001] directions [6, 7]. Such disorder blocks the 12-membered rings along the c direction (Fig. 1a), and as a result, the transport is controlled by limiting 8-membered ring openings running along [010] (Fig. 1b).
The ion-exchange forms of zorite and ETS-4 have been studied by several authors [6–14]. Sum-marizing some of the results in these works in 2011 Spiridonova et al. [11, 15] classified the extra-framework cation sites into three groups denoted as

63
AI, AII, AIII (Fig. 1b). The same authors demon-strated how the degree of cation exchange depends upon the experimental conditions. Subsequent structural investigations of ion-exchange forms of the synthetic material supported this classification scheme including new species in it (e.g. Zn2+ and Mg2+) [12–14].
Over the years, the thermal stability of these materials has also been intensively studied. Naderi and Anderson (1996) described for ETS-4 a series of transformations upon heating including a partial structure rearrangement at ca. 200 °C, followed by complete amorphization at 500 °C, formation of a new layered material at 600 °C, and then of highly crystalline narsarsukite at 700 °C [16]. According to Rocha and Anderson (2000) the collapse of Na-ETS-4 to an amorphous near 200 °C was due to the loss of structural water chains present along the channel systems [17]. Although Na-form of ETS-4 is thermally unstable, it has been suggested that the ion exchange with divalent cations such as Sr2+, Ba2+, Ca2+, Mg2+, etc., would enhance the thermal stability [6, 20]. A detailed neutron powder dif-fraction and spectroscopic study was carried out by Kuznicki et al. (2001) and Nair et al. (2001b) on samples of Sr-exchanged ETS-4 heated ex situ at se-lected temperatures between 150 °C and 300 °C and showed that Sr-ETS-4 withstands thermal dehydra-tion up to 350 °C [18.19]. In [18] S.M. Kuznicki et al. (2001) suggested a plausible mechanism for
the loss of order in Sr-exchanged ETS-4 treated at temperatures higher than 250 °C as registered in the powder X-ray and neutron diffraction patterns. The authors have noticed that reflections with a k com-ponent broaden and disappear first upon heating and interpreted that as an indication for deforma-tions and eventual breaking of the titania chains that run along the b axis. Our unpublished investigations give ground to consider that the crystal structures of Ba2+- and Cs+-exchanged forms remain intact at temperatures above 400 and 450 °C, respectively.
The framework flexibility of the investigated materials upon contraction or expansion have also attracted the specialists attention as it provides op-portunity to adjust the effective size of the pores and increase its size-selectivity in the gas adsorp-tion applications and purification of water contain-ing organic and inorganic pollutant. This has been duly demonstrated on the example of thermally treated Sr-exchanged ETS-4 by Nair et al. (2001) [19] who applied for this Rietveld analysis as imple-mented in the GSAS Rietveld refinement package [21, 22]. The so-obtained material (called CTS-1, Contracted TitanoSilicate-1) has been patented by Kuznicki [20, 23–24]. In 2011 M. Sacerdoti and G. Cruciani reported results from comparing the struc-tural modifications, including the transient states, underwent by zorite and Na-ETS-4 when dynami-cally (continuously) heated up to 400 °C. They were achieved by means of temperature-resolved in situ
Fig. 1. A view of the ETS-4 structure projected along [001] (a) and along [010] (b). Extra-framework species have been omitted for clarity.
V. Kostov-Kytin et al.: XRD study on the structural evolution of Zn-exchanged titanosilicate ETS-4 during thermal treatment
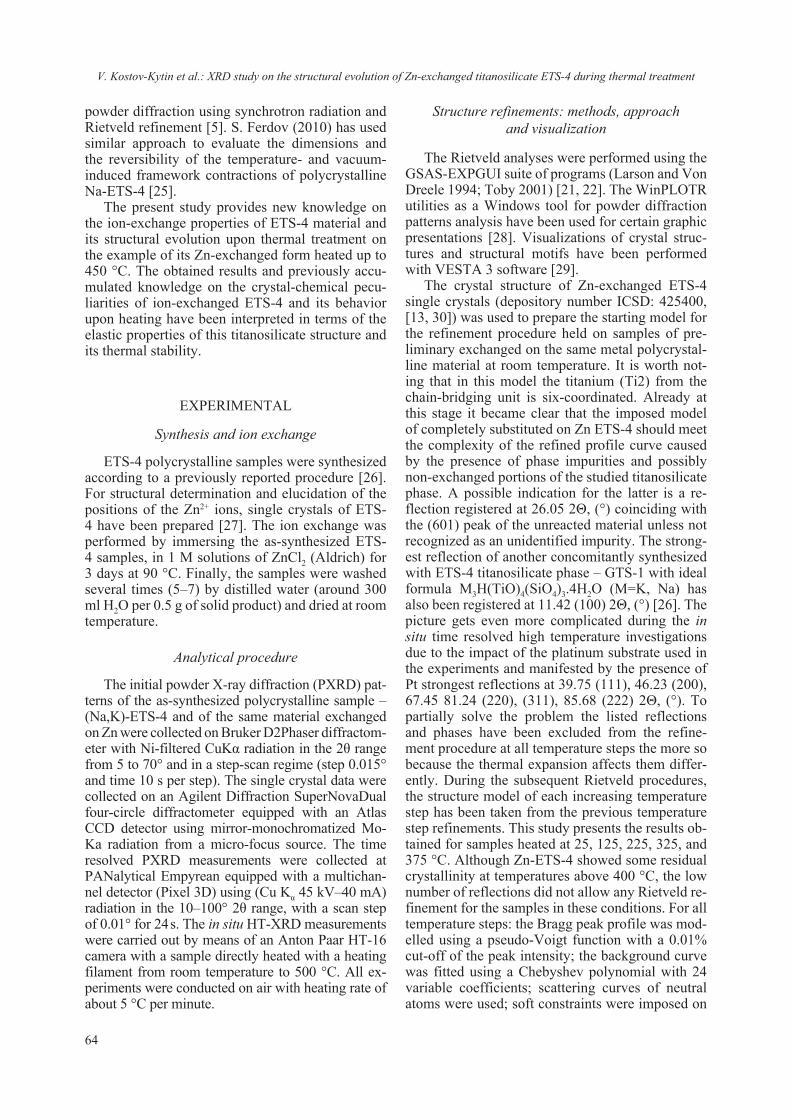
64
powder diffraction using synchrotron radiation and Rietveld refinement [5]. S. Ferdov (2010) has used similar approach to evaluate the dimensions and the reversibility of the temperature- and vacuum-induced framework contractions of polycrystalline Na-ETS-4 [25].
The present study provides new knowledge on the ion-exchange properties of ETS-4 material and its structural evolution upon thermal treatment on the example of its Zn-exchanged form heated up to 450 °C. The obtained results and previously accu-mulated knowledge on the crystal-chemical pecu-liarities of ion-exchanged ETS-4 and its behavior upon heating have been interpreted in terms of the elastic properties of this titanosilicate structure and its thermal stability.
EXPERIMENTAL
Synthesis and ion exchange
ETS-4 polycrystalline samples were synthesized according to a previously reported procedure [26]. For structural determination and elucidation of the positions of the Zn2+ ions, single crystals of ETS-4 have been prepared [27]. The ion exchange was performed by immersing the as-synthesized ETS-4 samples, in 1 M solutions of ZnCl2 (Aldrich) for 3 days at 90 °C. Finally, the samples were washed several times (5–7) by distilled water (around 300 ml H2O per 0.5 g of solid product) and dried at room temperature.
Analytical procedure
The initial powder X-ray diffraction (PXRD) pat-terns of the as-synthesized polycrystalline sample – (Na,K)-ETS-4 and of the same material exchanged on Zn were collected on Bruker D2Phaser diffractom-eter with Ni-filtered CuKα radiation in the 2θ range from 5 to 70° and in a step-scan regime (step 0.015° and time 10 s per step). The single crystal data were collected on an Agilent Diffraction SuperNovaDual four-circle diffractometer equipped with an Atlas CCD detector using mirror-monochromatized Mo-Ka radiation from a micro-focus source. The time resolved PXRD measurements were collected at PANalytical Empyrean equipped with a multichan-nel detector (Pixel 3D) using (Cu Kα 45 kV–40 mA) radiation in the 10–100° 2θ range, with a scan step of 0.01° for 24 s. The in situ HT-XRD measurements were carried out by means of an Anton Paar HT-16 camera with a sample directly heated with a heating filament from room temperature to 500 °C. All ex-periments were conducted on air with heating rate of about 5 °C per minute.
Structure refinements: methods, approach and visualization
The Rietveld analyses were performed using the GSAS-EXPGUI suite of programs (Larson and Von Dreele 1994; Toby 2001) [21, 22]. The WinPLOTR utilities as a Windows tool for powder diffraction patterns analysis have been used for certain graphic presentations [28]. Visualizations of crystal struc-tures and structural motifs have been performed with VESTA 3 software [29].
The crystal structure of Zn-exchanged ETS-4 single crystals (depository number ICSD: 425400, [13, 30]) was used to prepare the starting model for the refinement procedure held on samples of pre-liminary exchanged on the same metal polycrystal-line material at room temperature. It is worth not-ing that in this model the titanium (Ti2) from the chain-bridging unit is six-coordinated. Already at this stage it became clear that the imposed model of completely substituted on Zn ETS-4 should meet the complexity of the refined profile curve caused by the presence of phase impurities and possibly non-exchanged portions of the studied titanosilicate phase. А possible indication for the latter is a re-flection registered at 26.05 2Θ, (°) coinciding with the (601) peak of the unreacted material unless not recognized as an unidentified impurity. The strong-est reflection of another concomitantly synthesized with ETS-4 titanosilicate phase – GTS-1 with ideal formula M3H(TiO)4(SiO4)3.4H2O (M=K, Na) has also been registered at 11.42 (100) 2Θ, (°) [26]. The picture gets even more complicated during the in situ time resolved high temperature investigations due to the impact of the platinum substrate used in the experiments and manifested by the presence of Pt strongest reflections at 39.75 (111), 46.23 (200), 67.45 81.24 (220), (311), 85.68 (222) 2Θ, (°). To partially solve the problem the listed reflections and phases have been excluded from the refine-ment procedure at all temperature steps the more so because the thermal expansion affects them differ-ently. During the subsequent Rietveld procedures, the structure model of each increasing temperature step has been taken from the previous temperature step refinements. This study presents the results ob-tained for samples heated at 25, 125, 225, 325, and 375 °C. Although Zn-ETS-4 showed some residual crystallinity at temperatures above 400 °C, the low number of reflections did not allow any Rietveld re-finement for the samples in these conditions. For all temperature steps: the Bragg peak profile was mod-elled using a pseudo-Voigt function with a 0.01% cut-off of the peak intensity; the background curve was fitted using a Chebyshev polynomial with 24 variable coefficients; scattering curves of neutral atoms were used; soft constraints were imposed on
V. Kostov-Kytin et al.: XRD study on the structural evolution of Zn-exchanged titanosilicate ETS-4 during thermal treatment
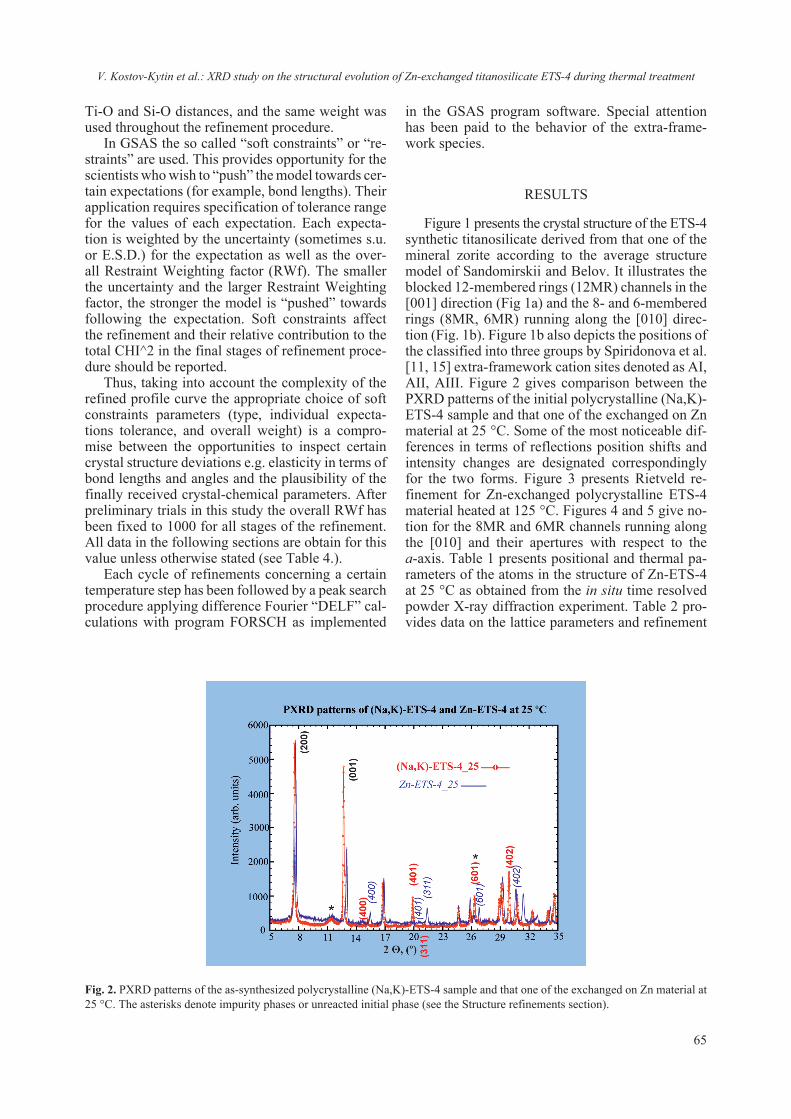
65
Ti-O and Si-O distances, and the same weight was used throughout the refinement procedure.
In GSAS the so called “soft constraints” or “re-straints” are used. This provides opportunity for the scientists who wish to “push” the model towards cer-tain expectations (for example, bond lengths). Their application requires specification of tolerance range for the values of each expectation. Each expecta-tion is weighted by the uncertainty (sometimes s.u. or E.S.D.) for the expectation as well as the over-all Restraint Weighting factor (RWf). The smaller the uncertainty and the larger Restraint Weighting factor, the stronger the model is “pushed” towards following the expectation. Soft constraints affect the refinement and their relative contribution to the total CHI^2 in the final stages of refinement proce-dure should be reported.
Thus, taking into account the complexity of the refined profile curve the appropriate choice of soft constraints parameters (type, individual expecta-tions tolerance, and overall weight) is a compro-mise between the opportunities to inspect certain crystal structure deviations e.g. elasticity in terms of bond lengths and angles and the plausibility of the finally received crystal-chemical parameters. After preliminary trials in this study the overall RWf has been fixed to 1000 for all stages of the refinement. All data in the following sections are obtain for this value unless otherwise stated (see Table 4.).
Each cycle of refinements concerning a certain temperature step has been followed by a peak search procedure applying difference Fourier “DELF” cal-culations with program FORSCH as implemented
in the GSAS program software. Special attention has been paid to the behavior of the extra-frame-work species.
RESULTS
Figure 1 presents the crystal structure of the ETS-4 synthetic titanosilicate derived from that one of the mineral zorite according to the average structure model of Sandomirskii and Belov. It illustrates the blocked 12-membered rings (12MR) channels in the [001] direction (Fig 1a) and the 8- and 6-membered rings (8MR, 6MR) running along the [010] direc-tion (Fig. 1b). Figure 1b also depicts the positions of the classified into three groups by Spiridonova et al. [11, 15] extra-framework cation sites denoted as AI, AII, AIII. Figure 2 gives comparison between the PXRD patterns of the initial polycrystalline (Na,K)-ETS-4 sample and that one of the exchanged on Zn material at 25 °C. Some of the most noticeable dif-ferences in terms of reflections position shifts and intensity changes are designated correspondingly for the two forms. Figure 3 presents Rietveld re-finement for Zn-exchanged polycrystalline ETS-4 material heated at 125 °C. Figures 4 and 5 give no-tion for the 8MR and 6MR channels running along the [010] and their apertures with respect to the a-axis. Table 1 presents positional and thermal pa-rameters of the atoms in the structure of Zn-ETS-4 at 25 °C as obtained from the in situ time resolved powder X-ray diffraction experiment. Table 2 pro-vides data on the lattice parameters and refinement
Fig. 2. PXRD patterns of the as-synthesized polycrystalline (Na,K)-ETS-4 sample and that one of the exchanged on Zn material at 25 °C. The asterisks denote impurity phases or unreacted initial phase (see the Structure refinements section).
V. Kostov-Kytin et al.: XRD study on the structural evolution of Zn-exchanged titanosilicate ETS-4 during thermal treatment

66
Fig. 3. Rietveld refinement for the Zn-ETS-4 sample heated at 125 °C. The experimental XRD data are denoted with x-symbols; the line through the markers is the result from the refinement; the Bragg positions are shown as short vertical lines; at the bottom is the difference plot between the data and the calculated profile; the asterisks mark the excluded from the refinement regions (see the Structure refinements section).
Fig. 4. View of the 8MR and 6MR channels running along the [010] and their apertures with respect to the a-axis for the Zn-ETS-4 sample heated at 125 °C.
Fig. 5. Topology of the 6MR channels running along the [010] with positions of the residing there Zn1.
details for selected Zn-exchanged ETS-4 samples within the temperature range 25–375 °C. Table 3 presents selected bond distances (Å) for the studied Zn-exchanged ETS-4 at RWf = 1000. Figure 6 il-lustrates the 8MR and 6MR contractions and expan-sions during the thermal treatment (RWf = 1000). Table 4 presents data demonstrating the impact of
the overall Restraint Weight factor choice on the measured dimensions on the example of the 8MR and 6MR for Zn-ETS-4 heated at 375 °C. Figure 7 compares the PXRD patterns of Zn-ETS-4 heated at 25 and 325 °C. Figure 8 presents the 6MR channels topology of Zn-ETS-4 at 25 and 375 °C along [010]. The position of the “DELF” map strongest peak (rho = 4.225, x = 0.2432, y = 0.3816, z = 0.5000) obtained after refinement procedures and applica-tion of the program FORSCH for the sample heated at 375 °C is designated there as Ti1-1.
DISCUSSION
Figure 2 illustrates the extent of the ion-ex-change process for the studied compound in terms
V. Kostov-Kytin et al.: XRD study on the structural evolution of Zn-exchanged titanosilicate ETS-4 during thermal treatment
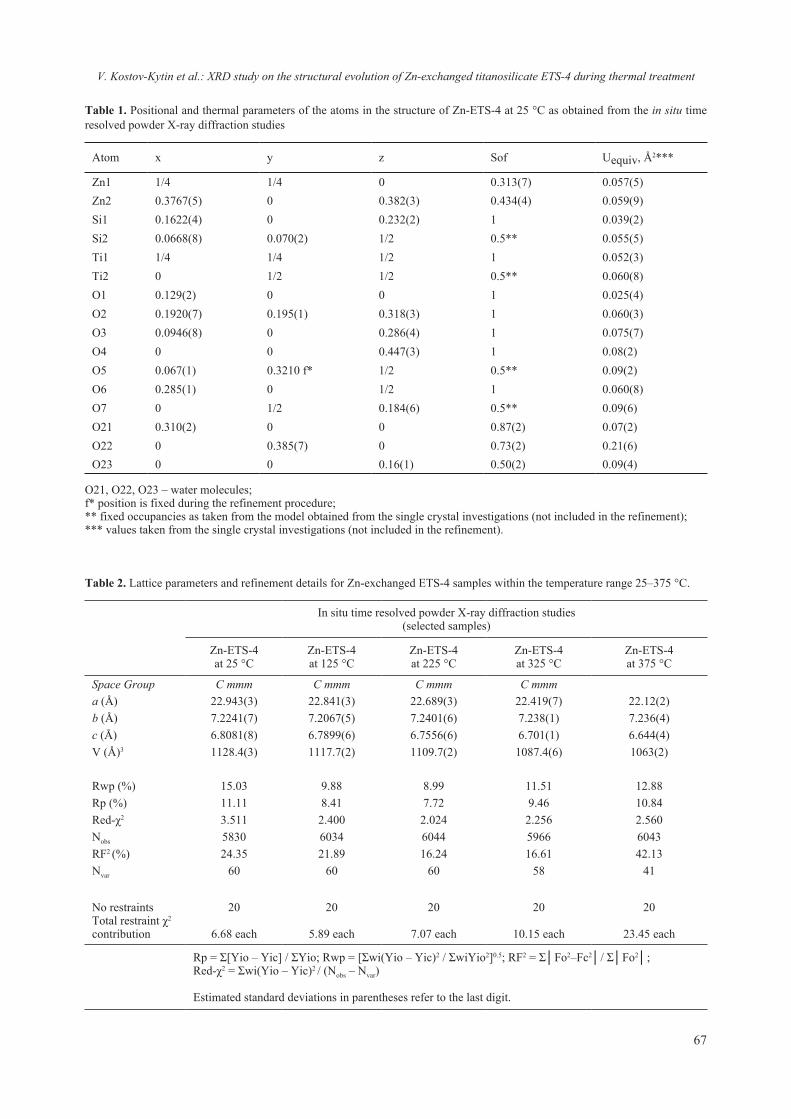
67
Table 1. Positional and thermal parameters of the atoms in the structure of Zn-ETS-4 at 25 °C as obtained from the in situ time resolved powder X-ray diffraction studies
Atom x y z Sof Uequiv, Å2***
Zn1 1/4 1/4 0 0.313(7) 0.057(5)Zn2 0.3767(5) 0 0.382(3) 0.434(4) 0.059(9)Si1 0.1622(4) 0 0.232(2) 1 0.039(2)Si2 0.0668(8) 0.070(2) 1/2 0.5** 0.055(5)Ti1 1/4 1/4 1/2 1 0.052(3)Ti2 0 1/2 1/2 0.5** 0.060(8)O1 0.129(2) 0 0 1 0.025(4)O2 0.1920(7) 0.195(1) 0.318(3) 1 0.060(3)O3 0.0946(8) 0 0.286(4) 1 0.075(7)O4 0 0 0.447(3) 1 0.08(2)O5 0.067(1) 0.3210 f* 1/2 0.5** 0.09(2)O6 0.285(1) 0 1/2 1 0.060(8)O7 0 1/2 0.184(6) 0.5** 0.09(6)O21 0.310(2) 0 0 0.87(2) 0.07(2)O22 0 0.385(7) 0 0.73(2) 0.21(6)O23 0 0 0.16(1) 0.50(2) 0.09(4)
O21, O22, O23 – water molecules; f* position is fixed during the refinement procedure; ** fixed occupancies as taken from the model obtained from the single crystal investigations (not included in the refinement); *** values taken from the single crystal investigations (not included in the refinement).
Table 2. Lattice parameters and refinement details for Zn-exchanged ETS-4 samples within the temperature range 25–375 °C.
In situ time resolved powder X-ray diffraction studies(selected samples)
Zn-ETS-4 at 25 °C
Zn-ETS-4 at 125 °C
Zn-ETS-4 at 225 °C
Zn-ETS-4 at 325 °C
Zn-ETS-4 at 375 °C
Space Group C mmm C mmm C mmm C mmma (Å) 22.943(3) 22.841(3) 22.689(3) 22.419(7) 22.12(2)b (Å) 7.2241(7) 7.2067(5) 7.2401(6) 7.238(1) 7.236(4)c (Å) 6.8081(8) 6.7899(6) 6.7556(6) 6.701(1) 6.644(4)V (Å)3 1128.4(3) 1117.7(2) 1109.7(2) 1087.4(6) 1063(2)
Rwp (%) 15.03 9.88 8.99 11.51 12.88Rp (%) 11.11 8.41 7.72 9.46 10.84Red-χ2 3.511 2.400 2.024 2.256 2.560Nobs 5830 6034 6044 5966 6043RF2 (%) 24.35 21.89 16.24 16.61 42.13Nvar 60 60 60 58 41
No restraintsTotal restraint χ2 contribution
20
6.68 each
20
5.89 each
20
7.07 each
20
10.15 each
20
23.45 each
Rp = Σ[Yio – Yic] / ΣYio; Rwp = [Σwi(Yio – Yic)2 / ΣwiYio2]0.5; RF2 = Σ│Fo2–Fc2│/ Σ│Fo2│; Red-χ2 = Σwi(Yio – Yic)2 / (Nobs – Nvar)
Estimated standard deviations in parentheses refer to the last digit.
V. Kostov-Kytin et al.: XRD study on the structural evolution of Zn-exchanged titanosilicate ETS-4 during thermal treatment

68
Table 3. Selected bond distances (Å) for Zn-exchanged ETS-4 samples obtained within the temperature range 25–375 °C
In situ time resolved powder X-ray diffraction studies(selected samples, RWf = 1000)
Zn-ETS-4 at 25 °C
Zn-ETS-4 at 125 °C
Zn-ETS-4 at 225 °C
Zn-ETS-4 at 325 °C
Zn-ETS-4 at 375 °C
Si1-O1 1.75(2) 1.58(1) 1.56(1) 1.54(2) 1.62(3)Si1-O2[x2] 1.68(1) 1.63(1) 1.61(1) 1.63(2) 1.94(2)Si1-O3 1.59(2) 1.52(2) 1.47(2) 1.52(3) 1.71(4)Si2-O3[x2] 1.67(2) 1.68(2) 1.72(2) 1.59(3) 1.66(3)Si2-O4 1.61(2) 1.47(2) 1.38(1) 1.50(3) 1.59(3)Si2-O5 1.82(2) 1.73(1) 1.76(2) 1.82(3) 1.85(5)Ti1-O2[x4] 1.86(1) 1.88(1) 1.89(1) 1.91(2) 1.96(3)Ti1-O6[x2] 1.98(1) 2.04(1) 2.08(1) 2.23(2) 2.29(3)Ti2-O5[x4] 2.00(2) 2.11(2) 2.09(2) 2.09(2) 2.01(2)Ti2-O7[x2] 2.14(4) 2.11(4) 2.09(3) 2.04(3) 2.05(4)
2.45(5)Zn1-O2[x4] 2.57(2) 2.30(2) 2.25(1) 2.11(2) 2.24(4)Zn1-O21[x2] 2.224(2) 2.360(2) 2.45(2) – –Zn2-O2[x2] 2.45(4)Zn2-O5[x2] 2.07(2) 1.95(2) 1.96(2) 2.16(1) 2.18(1)Zn2-O6 2.22(3) 2.03(2) 1.91(2) 2.09(3) 2.14(4)Zn2-O7 2.612(9)
Note: Estimated standard deviations in parentheses refer to the last digit. For E.S.D. meaning obtained for the restrained bond distances (Ti-O and Si-O) see the Structure refinements section.
Table 4. Impact of the overall Restraint Weighting factor (RWf) value on measured dimensions for Zn-ETS-4 at 375 °C
RWf = 10 000 RWf = 5 000 RWf = 2 000 RWf = 1 000
Apertures ofthe 8MR and 6MRchannels with respectto the a-axis (Å)
Rwp (%) 13.56 13.41 13.22 12.88Rp (%) 11.42 11.26 11.11 10.84Red-c2 2.68 2.65 2.605 2.56Novar 41 41 41 41No restraints 20 20 20 20Total restraintc2 contribution 10.98 14.45 15.53 23.45
Lattice parametersa (Å) 22.16(2) 22.15(2) 22.13(2) 22.12 (2)b (Å) 7.211(4) 7.215(4) 7.220(4) 7.236(4)c (Å) 6.651(4) 6.649(4) 6.646(4) 6.644(4)
Selected bond distances (Å)Si1-O1 1.57(2) 1.61(2) 1.65(3) 1.62(3)Si1-O2[x2] 1.60(1) 1.66(2) 1.75(2) 1.94(2)Si1-O3 1.51(2) 1.51(3) 1.49(4) 1.71(4)Si2-O3[x2] 1.67(1) 1.69(3) 1.72(2) 1.66(3)Si2-O4Si2-O5
1.61(2)1.65(2)
1.58(2)1.65(2)
1.55(3)1.70(4)
1.59(3)1.85(5)
Ti1-O2[x4] 2.082(9) 2.07(1) 2.04(2) 1.96(3)Ti1-O6[x2] 2.14(1) 2.17(2) 2.24(2) 2.29(3)Ti2-O5[x4] 2.064(8) 2.06(1) 2.05(2) 2.01(2)Ti2-O7[x2] 2.07(1) 2.07(2) 2.07(3) 2.05(4)
Note: Estimated standard deviations in parentheses refer to the last digit. For E.S.D. meaning obtained for the restrained bond dis-tances (Ti-O and Si-O) see the Structure refinements section.
V. Kostov-Kytin et al.: XRD study on the structural evolution of Zn-exchanged titanosilicate ETS-4 during thermal treatment

69
of certain reflections position shifts and intensity changes. The PXRD profile of Zn-ETS-4 has well been fitted with the calculated one from the starting structural model with the exception of the reflection registered at 26.05 2Θ, (°) coinciding with the (601) peak of the unreacted material. It may as well be-long to an impurity phase. As it has been explained in the Experimental sections certain 2Θ regions of the PXRD patterns have been excluded from the fit-ting procedures (Fig. 3).
According to the initial structural model and the subsequent Rietveld refinements Zn2+ occupies posi-tions AI and AII. Zn1 resides in the 6MR channels (Fig. 4 and Fig. 5) whereas Zn2 can be detected in the 7MR channels running along [001] (see Fig. 1a). Part of the water molecules occupy the 8MR chan-
nels, the rest is in the 6MR channels. Data in Table 2 support the correctness of the initially chosen structural model for the refinements of all stud-ied samples with the exception of that one heated at 375 °C. The observed by previous investigators structure shrinkage upon heating has also been reg-istered, here in terms of lattice parameters values.
Upon heating the water molecules exhibit posi-tional shifts and logical decrease of site occupancy (Fig. 6). No water is present in Zn-ETS-4 after 300 °C. On their side both Zn1 and Zn2 are more stationary. Attempts have been made to increase the multiplicities of their sites thus providing opportunity for motion. In general, under the chosen refinement conditions any attempts to register substantial Zn2+ motions within the temperature range 25–325 °C by applying program FORSCH failed. Table 3 data indicate that the Zn-O distances decrease when temperature rises reaching boundary levels. This leads to the suggestion that in these circumstances they act more as framework cations hindering and slowing up the structural collapse. The experimental data revealed that the most elastic part of the ETS-4 structure appeared to be the 8MR built of SiO4 tetrahedra. Figure 6 il-lustrates their expansion and shrinkage during the dehydration process and subsequent thermal expan-sion in the [100] direction. Similar behavior has al-ready been observed for Sr-ETS-4 [19], Na-ETS-4 and zorite [5]. Nair et al. (2001b) noted that beyond 200 °C , the dimension D2 (along the a-axis diam-eter of the 8MR in the Sr-exchanged form) expands relatively, so that the 8MR distorts from an “oc-tagonal” toward a “quadrilateral” cross section just the same as for Zn-ETS-4 at 375 °C in this study (Fig. 6). Probably, this should have happened at the earlier stages of thermal treatment provided that more precise and accurate experimental data have been processed. The role of the overall Restraint Weight should also be taken into account. Its impact over the final results is demonstrated in Table 4 on the example of Zn-ETS-4 at 375 °C. Anyway the obtained in this study results support the tendencies observed from previous investigations in terms of the unit cell parameters changes, water molecules site occupancies (during the dehydration period), and the titano-silicate framework flexibility (pore sizes) of ETS-4 materials upon heating.
At 375 °C the refinement results are already indicative for onset of structural breakdown. The “DELF” map strongest peak (rho=4.225) positioned at x = 0.2432, y = 0.3816, z = 0.5000 has been rec-ognized as shifted Ti1 (see Table 1) and the fact has been interpreted as breaking of the Ti-O-Ti chains running along [010] thus initiating the subsequent structural collapse. Kuznicki et al. (2001) foresaw such scenario when discussing the observed by them broadening and disappearing of the reflections with
Fig. 6. Aperture dimensions, (Å) of the 8MR and 6MR of Zn-ETS-4 heated at different temperatures and measured (RWf = 1000) along the a- and c-axes. The pie chart type of circles filling applied for the extra-framework species corresponds to the refined occupancy of these sites.
V. Kostov-Kytin et al.: XRD study on the structural evolution of Zn-exchanged titanosilicate ETS-4 during thermal treatment
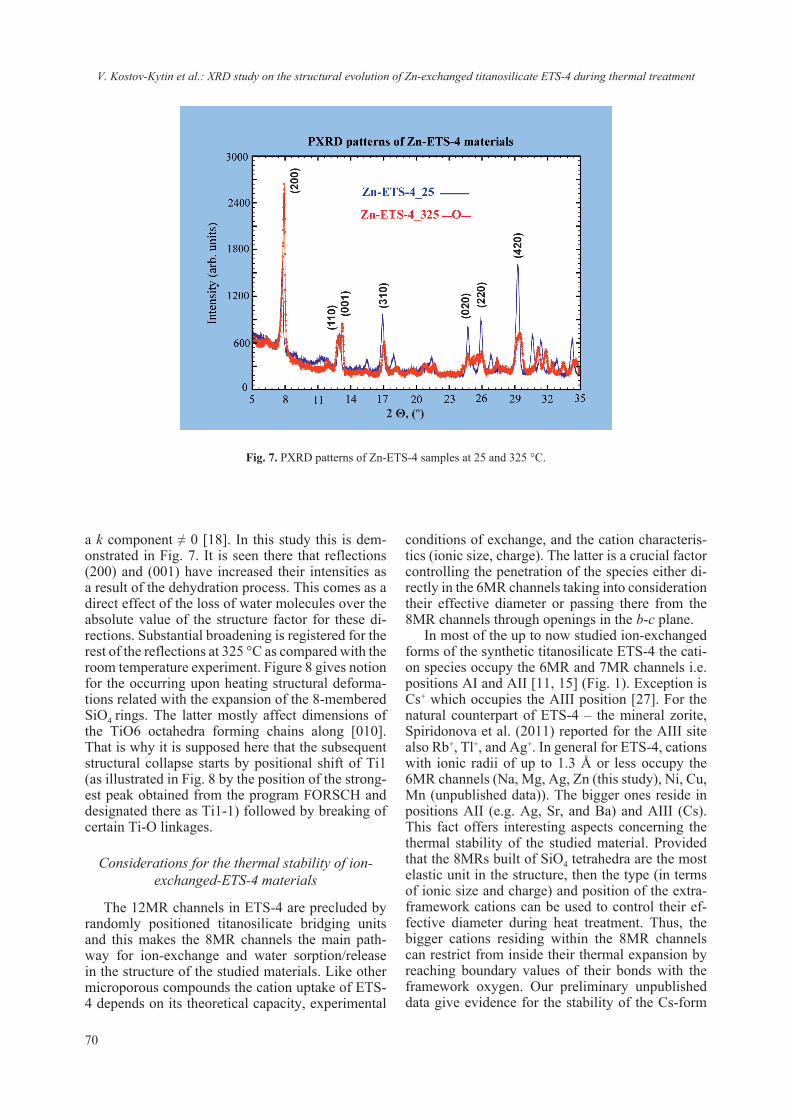
70
a k component ≠ 0 [18]. In this study this is dem-onstrated in Fig. 7. It is seen there that reflections (200) and (001) have increased their intensities as a result of the dehydration process. This comes as a direct effect of the loss of water molecules over the absolute value of the structure factor for these di-rections. Substantial broadening is registered for the rest of the reflections at 325 °C as compared with the room temperature experiment. Figure 8 gives notion for the occurring upon heating structural deforma-tions related with the expansion of the 8-membered SiO4 rings. The latter mostly affect dimensions of the TiO6 octahedra forming chains along [010]. That is why it is supposed here that the subsequent structural collapse starts by positional shift of Ti1 (as illustrated in Fig. 8 by the position of the strong-est peak obtained from the program FORSCH and designated there as Ti1-1) followed by breaking of certain Ti-O linkages.
Considerations for the thermal stability of ion-exchanged-ETS-4 materials
The 12MR channels in ETS-4 are precluded by randomly positioned titanosilicate bridging units and this makes the 8MR channels the main path-way for ion-exchange and water sorption/release in the structure of the studied materials. Like other microporous compounds the cation uptake of ETS-4 depends on its theoretical capacity, experimental
conditions of exchange, and the cation characteris-tics (ionic size, charge). The latter is a crucial factor controlling the penetration of the species either di-rectly in the 6MR channels taking into consideration their effective diameter or passing there from the 8MR channels through openings in the b-c plane.
In most of the up to now studied ion-exchanged forms of the synthetic titanosilicate ETS-4 the cati-on species occupy the 6MR and 7MR channels i.e. positions AI and AII [11, 15] (Fig. 1). Exception is Cs+ which occupies the AIII position [27]. For the natural counterpart of ETS-4 – the mineral zorite, Spiridonova et al. (2011) reported for the AIII site also Rb+, Tl+, and Ag+. In general for ETS-4, cations with ionic radii of up to 1.3 Å or less occupy the 6MR channels (Na, Mg, Ag, Zn (this study), Ni, Cu, Mn (unpublished data)). The bigger ones reside in positions AII (e.g. Ag, Sr, and Ba) and AIII (Cs). This fact offers interesting aspects concerning the thermal stability of the studied material. Provided that the 8MRs built of SiO4 tetrahedra are the most elastic unit in the structure, then the type (in terms of ionic size and charge) and position of the extra-framework cations can be used to control their ef-fective diameter during heat treatment. Thus, the bigger cations residing within the 8MR channels can restrict from inside their thermal expansion by reaching boundary values of their bonds with the framework oxygen. Our preliminary unpublished data give evidence for the stability of the Cs-form
Fig. 7. PXRD patterns of Zn-ETS-4 samples at 25 and 325 °C.
V. Kostov-Kytin et al.: XRD study on the structural evolution of Zn-exchanged titanosilicate ETS-4 during thermal treatment

71
up to 450 °C. On the other hand, the cation species from the 6MR channels withstand such expansion from outside the 8MR. The bigger their sizes and the stronger their bonds with the framework oxy-gens the slower the enlargement of 8MRs and the contraction of 6MRs and the subsequent structural collapse. The same is the action of the cations posi-tioned in AII.
Such data can be used for tailoring of new mate-rials for selective adsorption based on appropriately ion-exchanged forms of ETS-4 and heated within a definite temperature range.
CONCLUSIONS
The present study provides new knowledge on the ion-exchange properties and characteristics of
the synthetic titanosilicate ETS-4 on the example of its Zn-exchanged form.
The facilities of the Rietveld analysis as imple-mented in program GSAS have been demonstrated as a powerful means for investigation of the struc-tural evolution of the studied and similar materials upon thermal treatment. In this work it has been evaluated in terms of the unit cell parameters chang-es, water molecules site occupancies (during the dehydration period), the titano-silicate framework flexibility (pore sizes), and possible atomic motion.
The obtained results and previously accumulated knowledge on the crystal-chemical peculiarities of ion-exchanged ETS-4 and its behavior upon heating have been interpreted in terms of the elastic prop-erties of this titanosilicate structure and its thermal stability.
The obtained data can be used for design of new materials based on their appropriately chosen ion-exchanged forms and systematically contracted mi-croporous framework upon heat treatment in order to adjust their effective pores sizes and to increase their size-selectivity in e.g. gas adsorption applications.
Acknowledgements: This work was financial-ly supported by the National Science Fund of Bulgaria under contract No. DNTS/Russia 02/8 from 15.06.2018.
REFERENCES
1. S. M. Kuzniki, US Patent 4:853–202, (1989).2. S. M. Kuzniki, US Patent 4:938–989, (1990).3. A. N. Mer’kov, I. V. Bussen, E. A. Goiko, E. A.
Kul’chitskaya, Yu. P. Men’shikov, A. P. Nedorezova, Zap VMO, 102 (1), 54 (1973) (in Russian).
4. P. A. Sandomirskii, N. V. Belov, Sov. Phys. Crystal-logr, 24, 686, Kristallographiya, 24, 1198 (1979).
5. M. Sacerdoti, G. Cruciani, in: Minerals as Advanced Materials II., Springer, S. V. Krivovichev (ed), Springer Heidelberg New York Dordrecht London, 2011, p. 187.
6. C. Braunbarth, H. W. Hillhouse, S. Nair, M. Tsa-patis, A. Burton, R. F. Lobo, R. M. Jacubinas, S. M. Kuznicki, Chem. Mater., 12, 1857 (2000).
7. S. Nair, H.K. Jeong, A. Chandrasekaran, C. Braun-barth, M. Tsapatis, S.M. Kuznicki, Chem Mater, 13, 4247 (2001).
8. N. V. Zubkova, D. Yu. Pushcharovsky, G. Giester, I. V. Pekov, A. G. Turchkova, N. V. Chukanov, E. Tillmanns, Crystallogr Rep, 50, 367 (2005).
9. N. V. Zubkova, D. Yu. Pushcharovsky, G. Giester, I. V. Pekov, A. G. Turchkova, E. Tillmanns, N. V. Chukanov, Crystallogr Rep, 51, 379 (2006).
10. S. V. Krivovichev, S. N. Britvin, D. V. Spiridonova, V. N. Yakovenchuk, T. Armbruster, in: Minerals as advanced materials I. Springer, S. V. Krivovichev (ed.) Heidelberg, 2008, p. 65.
Fig. 8. 6MR channel topologies of Zn-ETS-4 at 25 and 375 °C. The arrows denote direction of forces causing structural deformations. Position of the strongest peak obtained from the program FORSCH is designated as Ti1-1.
V. Kostov-Kytin et al.: XRD study on the structural evolution of Zn-exchanged titanosilicate ETS-4 during thermal treatment

72
11. D. V. Spiridonova, S. N. Britvin, S. V. Krivovichev, V. N. Yakovenchuk, Vestnik Sankt-Peterburgskogo Universiteta. Ser Geol Geogr, (3), 41 (2008) (in Russian).
12. R. Nikolova, B. Shivachev, S. Ferdov, Microporous and Mesoporous Materials, 165, 121 (2013).
13. S. Ferdov, E. Shikova, Z. Ivanova, L. T. Dimowa, R. P. Nikolova, Zhi Lin, B. L. Shivachev, RSC Advances, 3 (23), 8843 (2013).
14. L. Tsvetanova, N. Petrova, S. Ferdov, V. Kostov-Kytin, R. Nikolova, Bulg. Chem. Commun., 47(1), 201 (2015).
15. D. V. Spiridonova, S. V. Krivovichev, S. N. Britvin, V. N. Yakovenchuk, in: Minerals as Advanced Ma-terials II., Springer, S. V. Krivovichev (ed.), Sprin ger Heidelberg New York Dordrecht London, 2011, p. 199.
16. M. Naderi, M. W. Anderson, Zeolites, 17, 437 (1996).
17. J. Rocha, M. W. Anderson, Eur. J. Inorg. Chem., 5, 801 (2000).
18. S. M. Kuznicki, V. A. Bell, S. Nair, H. W. Hillhouse, R. M. Jacubunas, C. M. Braunbarth, M. H. Toby, M. Tsapatsis, Nature, 412, 720 (2001).
19. S. Nair, M. Tsapatsis, B. H. Toby, S. M. Kuznicki, J. Am. Chem. Soc., 123, 12781, (2001b).
20. S. M. Kuznicki, I. Petrovic, B. T. Desai, US patent 6, 068,682 (1990).
21. A. C. Larson, R. B. Von Dreele, General Structure Analysis System (GSAS). Report LAUR 86-748, Los Alamos National Laboratory, 2000.
22. B. H. Toby, J. Appl. Crystallogr., 34, 210 (2001).23. S. M. Kuzniki, US Patent 6:340–433 (2002).24. S. M. Kuzniki, US Patent 6:517–611 (2003).25. S. Ferdov, Langmuir, 26 (4), 2684 (2010).26. V. Kostov-Kytin, S. Ferdov, Yu. Kalvachev, B.
Mihailova, O. Petrov, Microporous Mesoporous Mater., 105, 232 (2007).
27. R. P. Nikolova, B. L. Shivachev, S. Ferdov, Micro-porous Mesoporous Mater., 165, 121 (2013).
28. T. Roisnel, J. Rodriguez-Carvajal, in: Materials Science Forum (Proceedings of the Seventh Eu-ropean Powder Diffraction Conference (EPDIC 7), R. Delhez and E. J. Mittenmeijer (eds.), 2000, p. 118.
29. K. Momma, F. Izumi, VESTA 3 for three-dimen-sional visualization of crystal, volumetric and mor-phology data, J. Appl. Crystallogr., 44, 1272 (2011).
30. Inorganic Crystal Structure Database (ICSD), Karls-ruhe: Gmelin Institute für anorganische Chemie, 2005.
V. Kostov-Kytin et al.: XRD study on the structural evolution of Zn-exchanged titanosilicate ETS-4 during thermal treatment

73© 2018 Bulgarian Academy of Sciences, Union of Chemists in Bulgaria
* To whom all correspondence should be sent:
Bulgarian Chemical Communications, Volume 50, Special Issue F (pp. 73–79) 2018
Physicochemical characterization on clinically retrieved TriTanium orthodontic archwires
A. Stoyanova-Ivanova1, I. Ilievska1*, V. Petrova1, M. Gueorgieva2, V. Petrov2, L. Andreeva2, A. Zaleski3, V. Mikli4
1 G. Nadjakov Institute of Solid State Physics, Bulgarian Academy of Sciences, 72 Tzarigradsko Chaussee, 1784 Sofia, Bulgaria
2 Faculty of Dental Medicine, Medical University Sofia, St. G. Sofiiski Blvd., 1431 Sofia, Bulgaria 3 Institute of Low Temperatures and Structure Research, Polish Academy of Science, AS,
50-422 Wroclaw, Poland 4 Institute of Materials and Environmental Technology, Tallinn University of Technology,
19086 Tallinn, Estonia
Received October 30, 2018; Accepted November 29, 2018
The orthodontic archwire TriTanium® has three distinct thermally activated force regions which release the cor-rect force in the anterior, premolar, and molar arch-regions in order to efficiently level, align and torque. During patient treatment, in the leveling phase of teeth alignment, fixed appliances in the frontal area require weak forces while for the lateral section greater forces are needed. This work aims to identify the chemical composition, structure and thermal behavior of clinically retrieved (at least six weeks wearing) TriTanium (0.41×0.56 mm2) archwires. The studies were conducted in the three regions of elasticity: anterior – including the four incisions teeth, middle teeth – including the canine teeth and the premolars and the posterior e.g. the molars. To achieve the aim the following methods are used: XRD, EDX, SEM and DSC. The EDX analysis shows that Ni and Ti are the main elements in the composition of the examined archwires and the 1:1 ratio of elements is kept during treatment. The room temperature XRD patterns show typical peaks for a Ni-Ti alloy with austenite type structure. SEM micrographs show different morphology in the three (3) zones of the investigated archwires. The DSC measurements were conducted in the –50 °C to +50 °C temperature range and revealed three phase transitions (austenite, martensite and R-phase) in the 3 zones. Тhe wearing of the archwires in the patients’ mouth alters the thermal phase transitions in the three investi-gated regions of TriTanium archwires.
Keywords: clinically retrieved TriTanium archwire, XRD, SEM, EDX, DSC.
E-mail: [email protected]
INTRODUCTION
The variety of materials used in orthodontics is considerable. As elements orthodontic archwires are of great importance for the teeth correction treatment mainly using the fixed orthodontic tech-nique. They are as well the main source of force in orthodontic treatment [1].
Over the years biomaterials have improved in or-thodontics to allow orthodontists to get closer to the ideal of weak incessant forces to achieve rapid tooth movement without damaging teeth or periodon-tal tissues [2]. The shape of the archwires has also
evolved from round, square and rectangular to bev-elled surfaces [3]. The ideal orthodontic archwire would provide relatively weak biomechanical force and wide elastic (working) range for tooth move-ment. It needs to be easily manipulated to avoid fracture and to be “joined” to form more complex appliances. It should not present concerns regard-ing in-vivo corrosion and problematic ion release and finally should be relatively inexpensive. None of the metallic orthodontic wires meet all of these desired aspects fully, and rational clinical selection involves consideration of a balanced performance for any particular case [1].
There are many types of orthodontic archwires depending on the metal alloy used. Nowadays, one of the most used is the NiTi type of archwires. They have the property of exerting permanent weak forces,
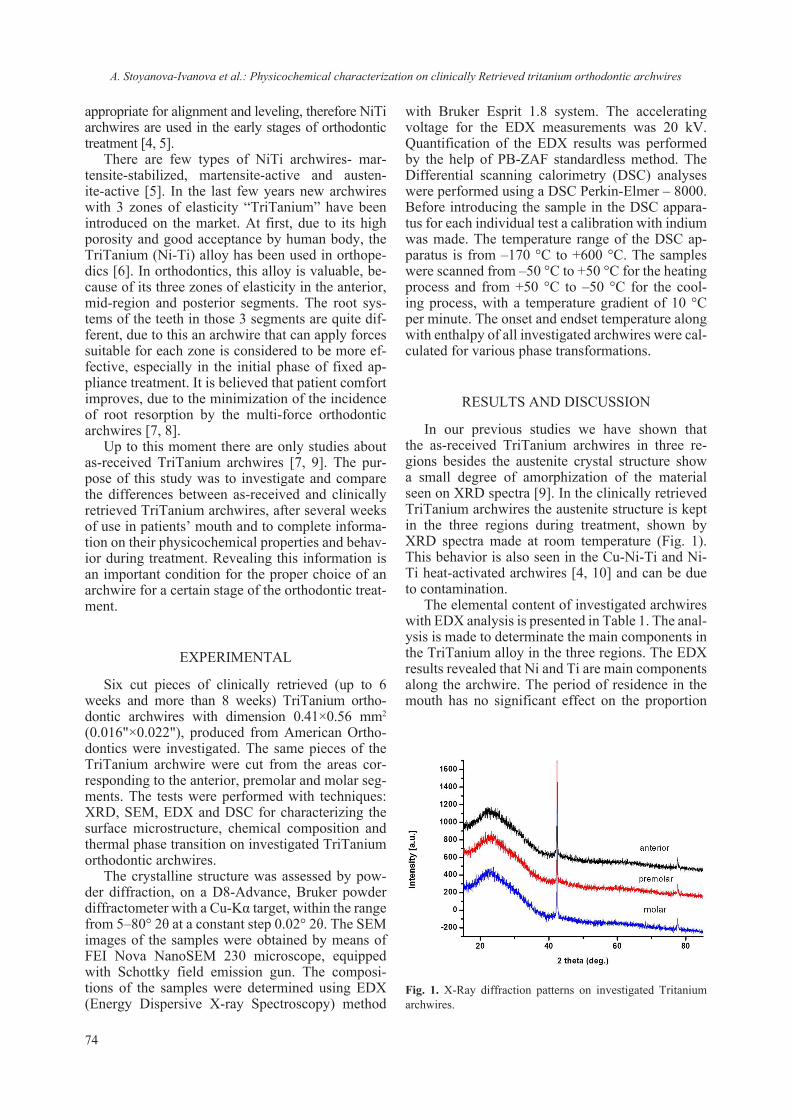
74
appropriate for alignment and leveling, therefore NiTi archwires are used in the early stages of orthodontic treatment [4, 5].
There are few types of NiTi archwires- mar-tensite-stabilized, martensite-active and austen-ite-active [5]. In the last few years new archwires with 3 zones of elasticity “TriTanium” have been introduced on the market. At first, due to its high porosity and good acceptance by human body, the TriTanium (Ni-Ti) alloy has been used in orthope-dics [6]. In orthodontics, this alloy is valuable, be-cause of its three zones of elasticity in the anterior, mid-region and posterior segments. The root sys-tems of the teeth in those 3 segments are quite dif-ferent, due to this an archwire that can apply forces suitable for each zone is considered to be more ef-fective, especially in the initial phase of fixed ap-pliance treatment. It is believed that patient comfort improves, due to the minimization of the incidence of root resorption by the multi-force orthodontic archwires [7, 8].
Up to this moment there are only studies about as-received TriTanium archwires [7, 9]. The pur-pose of this study was to investigate and compare the differences between as-received and clinically retrieved TriTanium archwires, after several weeks of use in patients’ mouth and to complete informa-tion on their physicochemical properties and behav-ior during treatment. Revealing this information is an important condition for the proper choice of an archwire for a certain stage of the orthodontic treat-ment.
EXPERIMENTAL
Six cut pieces of clinically retrieved (up to 6 weeks and more than 8 weeks) TriTanium ortho-dontic archwires with dimension 0.41×0.56 mm2 (0.016"×0.022"), produced from American Ortho-dontics were investigated. The same pieces of the TriTanium archwire were cut from the areas cor-responding to the anterior, premolar and molar seg-ments. The tests were performed with techniques: XRD, SEM, EDX and DSC for characterizing the surface microstructure, chemical composition and thermal phase transition on investigated TriTanium orthodontic archwires.
The crystalline structure was assessed by pow-der diffraction, on a D8-Advance, Bruker powder diffractometer with a Cu-Kα target, within the range from 5–80° 2θ at a constant step 0.02° 2θ. The SEM images of the samples were obtained by means of FEI Nova NanoSEM 230 microscope, equipped with Schottky field emission gun. The composi-tions of the samples were determined using EDX (Energy Dispersive X-ray Spectroscopy) method
with Bruker Esprit 1.8 system. The accelerating voltage for the EDX measurements was 20 kV. Quantification of the EDX results was performed by the help of PB-ZAF standardless method. The Differential scanning calorimetry (DSC) analyses were performed using a DSC Perkin-Elmer – 8000. Before introducing the sample in the DSC appara-tus for each individual test a calibration with indium was made. The temperature range of the DSC ap-paratus is from –170 °C to +600 °C. The samples were scanned from –50 °C to +50 °C for the heating process and from +50 °C to –50 °C for the cool-ing process, with a temperature gradient of 10 °C per minute. The onset and endset temperature along with enthalpy of all investigated archwires were cal-culated for various phase transformations.
RESULTS AND DISCUSSION
In our previous studies we have shown that the as-received TriTanium archwires in three re-gions besides the austenite crystal structure show a small degree of amorphization of the material seen on XRD spectra [9]. In the clinically retrieved TriTanium archwires the austenite structure is kept in the three regions during treatment, shown by XRD spectra made at room temperature (Fig. 1). This behavior is also seen in the Cu-Ni-Ti and Ni-Ti heat-activated archwires [4, 10] and can be due to contamination.
The elemental content of investigated archwires with EDX analysis is presented in Table 1. The anal-ysis is made to determinate the main components in the TriTanium alloy in the three regions. The EDX results revealed that Ni and Ti are main components along the archwire. The period of residence in the mouth has no significant effect on the proportion
Fig. 1. X-Ray diffraction patterns on investigated Tritanium archwires.
A. Stoyanova-Ivanova et al.: Physicochemical characterization on clinically Retrieved tritanium orthodontic archwires
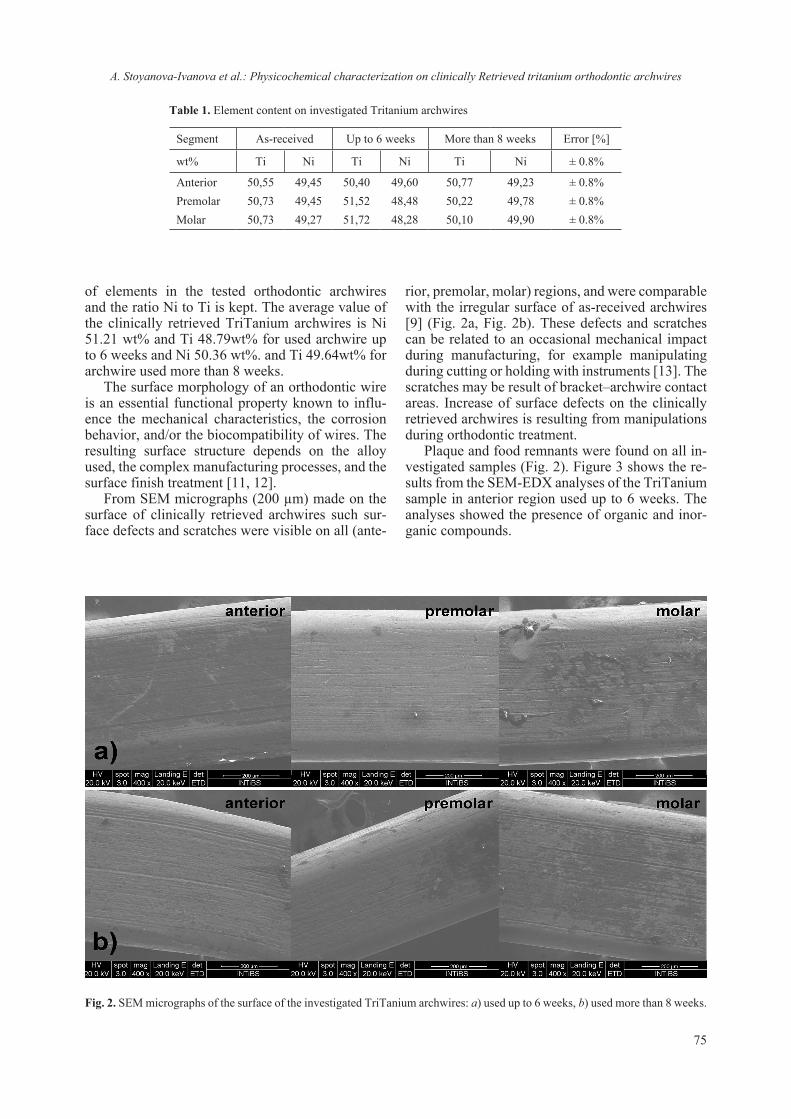
75
Table 1. Element content on investigated Tritanium archwires
Segment As-received Up to 6 weeks More than 8 weeks Error [%]
wt% Ti Ni Ti Ni Ti Ni ± 0.8%
Anterior 50,55 49,45 50,40 49,60 50,77 49,23 ± 0.8%Premolar 50,73 49,45 51,52 48,48 50,22 49,78 ± 0.8%Molar 50,73 49,27 51,72 48,28 50,10 49,90 ± 0.8%
of elements in the tested orthodontic archwires and the ratio Ni to Ti is kept. The average value of the clinically retrieved TriTanium archwires is Ni 51.21 wt% and Ti 48.79wt% for used archwire up to 6 weeks and Ni 50.36 wt%. and Ti 49.64wt% for archwire used more than 8 weeks.
The surface morphology of an orthodontic wire is an essential functional property known to influ-ence the mechanical characteristics, the corrosion behavior, and/or the biocompatibility of wires. The resulting surface structure depends on the alloy used, the complex manufacturing processes, and the surface finish treatment [11, 12].
From SEM micrographs (200 µm) made on the surface of clinically retrieved archwires such sur-face defects and scratches were visible on all (ante-
rior, premolar, molar) regions, and were comparable with the irregular surface of as-received archwires [9] (Fig. 2a, Fig. 2b). These defects and scratches can be related to an occasional mechanical impact during manufacturing, for example manipulating during cutting or holding with instruments [13]. The scratches may be result of bracket–archwire contact areas. Increase of surface defects on the clinically retrieved archwires is resulting from manipulations during orthodontic treatment.
Plaque and food remnants were found on all in-vestigated samples (Fig. 2). Figure 3 shows the re-sults from the SEM-EDX analyses of the TriTanium sample in anterior region used up to 6 weeks. The analyses showed the presence of organic and inor-ganic compounds.
Fig. 2. SEM micrographs of the surface of the investigated TriTanium archwires: a) used up to 6 weeks, b) used more than 8 weeks.
A. Stoyanova-Ivanova et al.: Physicochemical characterization on clinically Retrieved tritanium orthodontic archwires
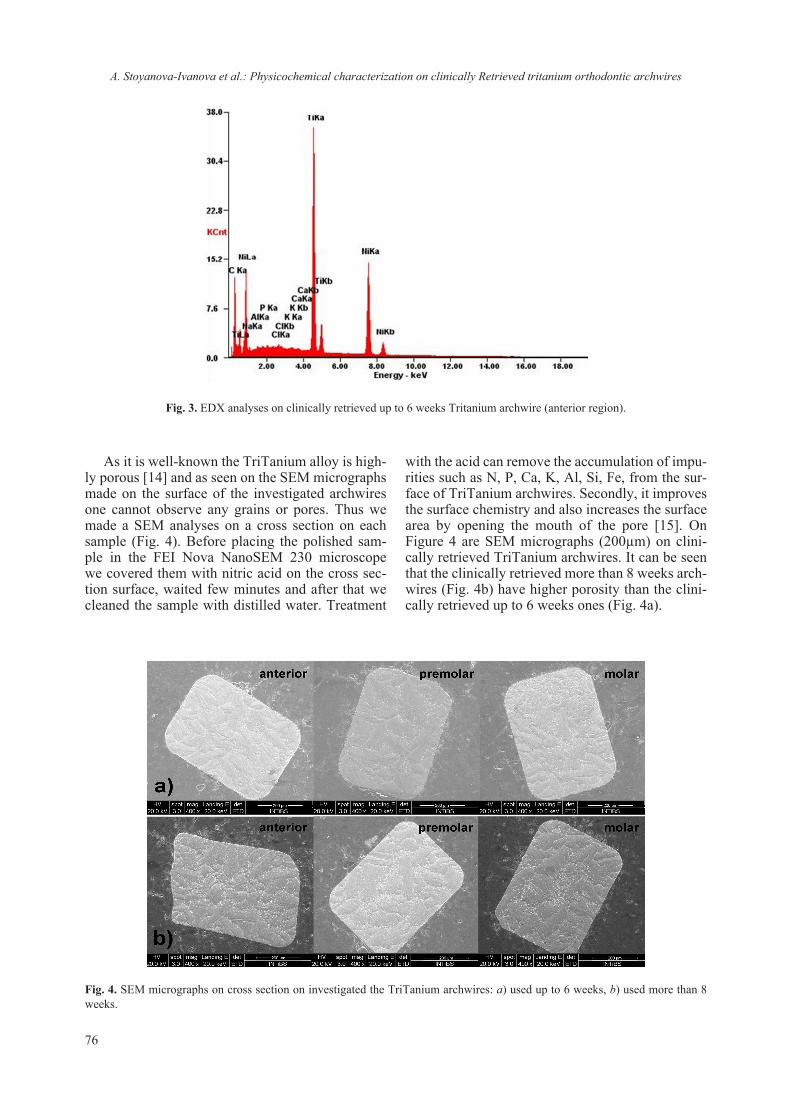
76
As it is well-known the TriTanium alloy is high-ly porous [14] and as seen on the SEM micrographs made on the surface of the investigated archwires one cannot observe any grains or pores. Thus we made a SEM analyses on a cross section on each sample (Fig. 4). Before placing the polished sam-ple in the FEI Nova NanoSEM 230 microscope we covered them with nitric acid on the cross sec-tion surface, waited few minutes and after that we cleaned the sample with distilled water. Treatment
with the acid can remove the accumulation of impu-rities such as N, P, Ca, K, Al, Si, Fe, from the sur-face of TriTanium archwires. Secondly, it improves the surface chemistry and also increases the surface area by opening the mouth of the pore [15]. On Figure 4 are SEM micrographs (200µm) on clini-cally retrieved TriTanium archwires. It can be seen that the clinically retrieved more than 8 weeks arch-wires (Fig. 4b) have higher porosity than the clini-cally retrieved up to 6 weeks ones (Fig. 4a).
Fig. 3. EDX analyses on clinically retrieved up to 6 weeks Tritanium archwire (anterior region).
Fig. 4. SEM micrographs on cross section on investigated the TriTanium archwires: a) used up to 6 weeks, b) used more than 8 weeks.
A. Stoyanova-Ivanova et al.: Physicochemical characterization on clinically Retrieved tritanium orthodontic archwires

77
XRD studies made at room temperature show that the three regions of the clinically retrieved TriTanium archwires possess an austenite struc-ture. To trace the thermal behavior of the clini-cally retrieved archwires and the austenite/mar-tensite transition we carried out DSC analyses in the temperature range –50 °C to +50 °C. We choose to investigate the archwires in the interval from –50 °C to +50 °C, because we expect the archwire to be “completely” in martensite state at –50 °C. In clinical environment the orthodontist can cool the surface of the archwire to lower temperatures with spray. The upper temperature +50 °C is higher and close to the maximum temperature in the oral cav-ity [16] and the alloy is completely transformed in austenite state. The austenite phase/formation in a cyclic process was verified by DSC analysis of the clinically retrieved TriTanium orthodontic wire. For this, a sample of rectangular orthodontic wire under-
went two cyclic processes as follows: the sample was heated up to 50 °C at a rate of 10 °C min–1. Then, the sample was cooled, also at a rate of 10 °C min–1, to –50 °C. Afterward, all the heating–cooling steps were repeated.
In Table 2 and Table 3 the DSC and temperature curves are recorded for clinically retrieved TriTanium archwires (up to 6 weeks and more than 8 weeks), for the two cycles in their three region as follows: anterior, premolar and molar. In both cycles, on the DSC curve for investigated archwire (up to 6 weeks of clinical us-age), the thermal effects of austenitic phase transitions for anterior As = 17.93 °C and Af = 27.97 °C, premo-lar As = 22.54 °C and Af = 26.78 °C and molar As = 14.57 °C and Af= 24.30 °C were identified. The same identification was done for investigated arch-wire (more than 8 weeks of clinical usage): anterior As = 21.03 °C and Af = 25.22 °C, premolar As = 16.87 °C and Af = 33.59 °C and molar As = 17.56 °C
Table 2. DSC curves on investigated Tritanium archwires – heating process
Tritanium archwire
Wire segment
Heating processWire
segment
Heating processWire
segment
Heating process
As temp (°C)
Af temp (°C)
As temp (°C)
Af temp (°C)
As temp (°C)
Af temp (°C)
Literature*
Anterior
18.2 25.5
Premolar
17.0 24.4
Molar
11.8 20.5As-received** 16.16 25.55 11.92 21.23 8.26 20.82Up to 6 weeks 17.93 27.97 22.54 26.76 14.57 24.30More than 8 weeks 21.03 25.22 16.87 33.59 17.56 23.53
Table 3. DSC curves on investigated Tritanium archwires – cooling process
Tritanium archwire Wiresegment
Cooling process
Rs temp (°C) Rf temp (°C) Ms temp (°C) Mf temp (°C)Literature*
Anterior
16.2 11.5 –22.5 –34.5As- received** 12.99 6.93 –21.07 –36.80Up to 6 weeks 17.16 9.91 –19.76 –35.02More than 8 weeks – – 22.56 13.04Literature*
Premolar
16.5 13.0 –25.5 –39.5As- received** 12.76 6.57 –30.93 –46.17Up to 6 weeks 14.35 9.96 –21.92 –36.40More than 8 weeks – – 22.16 15.94Literature*
Molar
14.6 9.4 –33.3 –48.5As- received** 12.28 3.17 –38.95 –35.11Up to 6 weeks – – 15.64 9.40More than 8 weeks – – 24.15 13.08
* Thermomechanical characterization of variable force NiTi orthodontic archwires, Anjali Sudershan Krishan Mehta, Marquette University.** Elemental composition and structure characteristics of as-received tritanium orthodontic archwire, I. Ilievska, V. Petrov, V. Mihailov, S. Karatodorov, L. Andreeva, A. Zaleski, V. Mikli, M. Gueorgieva, V. Petrova, A. Stoyanova-Ivanova.
A. Stoyanova-Ivanova et al.: Physicochemical characterization on clinically Retrieved tritanium orthodontic archwires

78
and Af = 23.53 °C. Other studies for as-received TriTanium archwires have Af = 25.5 °C for an-terior, Af = 24.4 °C, Af = 21.23 °C for premolar and Af = 20.5 °C, Af = 20.82 °C for molar region (Table 2) [7, 9]. Compared to other studies we no-ticed an increase of Af in clinically retrieved arch-wires, especially in premolar region in clinically used more than 8 weeks (Fig. 5). Values of the mar-tensitic formation was also obtained for both arch-wires, with a maximum of Ms = –21.92 °C and Mf = –36.40 °C for investigated archwire up to 6 weeks clinical usage in premolar region. Differential scan-ning calorimetric studies have identified the pres-ence of additional peaks during the heating/cooling curves, and they have been attributed to the presence of an intermediate rhombohedral “R” phase. This phase may be present in some proportion relative to the other two phases [7]. The studies of as-received TriTanium archwires show presence of R-phase in the three regions [9]. The investigated clinically re-trieved TriTanium archwires have R-phase only in anterior and premolar regions of clinical usage up to 6 weeks.
Based on the obtained results, we show austen-itic, martensitic and R-phase phases with different thermal transition temperatures amongst the as-received and clinically retrieved TriTanium arch-wires. As the time of clinical usage is increasing it can be noticed a temperature difference especially for Af temperature in the premolar region. We as-sume that the changes in the canine teeth region
(premolar) might be due to their placement in the most curved part of the archwire and in that region the tensions are the greatest [17]. This is the most exploited and “amortized” part of the archwire. The investigated TriTanium archwire do in fact deliver different forces depending on the region (anterior, premolar, molar). The manufacturing steps and also the duration of the archwires in the patients’ mouth can alter their thermal transitions.
CONCLUSIONS
This study contributes to the establishment of some peculiarities related to the thermal behavior of the investigated archwires. Our studies revealed that after a prolonged period of time in the patient’s mouth, the investigated regions of TriTanium arch-wire have no significant changes in the elements ra-tio close to 1:1 ( Ni 51.21 wt% and Ti 48.79wt%) for archwire used up to 6 weeks and Ni 50.36 wt%. and Ti 49.64wt% for archwire used more than 8 weeks. From SEM analyses made on the surface of clinically retrieved archwires surface defects and scratches were visible in all regions. On the SEM micrographs made on the cross section the porosity of the TriTanium alloy is observed. The clinically retrieved more than 8 weeks archwires have higher porosity than the clinically retrieved up to 6 weeks ones. From XRD analyses we observed that clini-cally retrieved TriTanium archwires have austenite
Fig. 5. DSC curves heating/cooling for Tritanium archwire used for more than 8 weeks (premolar region).
A. Stoyanova-Ivanova et al.: Physicochemical characterization on clinically Retrieved tritanium orthodontic archwires

79
structure at room temperature in the three regions during treatment. Based on the results obtained by DSC, we show different thermal transition tempera-ture of austenitic, martensitic and R phase phases amongst the as-received and clinically retrieved TriTanium archwires. As the time of clinical usage is increasing it can be noticed a temperature differ-ence especially Af temperature in the premolar re-gion with ~8°C. Тhe duration of the archwires in the patients’ mouth alters the thermal phase transi-tions in the three investigated regions of TriTanium archwires.
Acknowledgments: This work was a part of a bi-lateral project between the Bulgarian Academy of Sciences and Estonian Academy of Science, Tallinn University of Technology (Estonian pro-jects TAR16016 and IUT-T4) and bilateral project between the Bulgarian Academy of Sciences and Polish Academy of Science, Institute of low tem-perature and structure research, Wroclaw, Poland.
REFERENCES
1. Th. Eliades, W. A. Brantley, Orthodontic Appli-cations of Biomaterials, 2017.
2. J. Gilbert, Master thesis, Marquette University, 2014.3. https://www.slideshare.net/gauravacharya1/ortho-
dontic-archwires-44771334.
4. I. Ilievska, V. Petrov, L. Andreeva, D. Kovacheva, A. Zaleski, M. Drozd, E. Bukowska, V. Mikli, A. Stoyanova-Ivanova, Bul. Chem. Commun., 49, 33 (2017).
5. R. P. Kusy, The Angle Orthod., 67, 197 (1997).6. J. Muth, M. Poggie, G. Kulesha, R. M. Meneghini,
JOM, 65 (2), (2013).7. A. S. K. Mehta, Master Thesis, Marquette University,
2015.8. O. Oguienko, Master Thesis, University of Toronto,
2017.9. I. Ilievska, V. Petrov, V. Mihailov, S. Karatodorov,
L. Andreeva, A. Zaleski, V. Mikli, M. Gueorgieva, V. Petrova, A. Stoyanova-Ivanova, IOP Conf. Series: Journal of Physics: Conf. Series, 992, (2018).
10. Iv. Ilievska, V. Petrov, V. Mihailov, St. Karatodorov, L. Andreeva, Ang. Stoyanova-Ivanova, Orthodontic review, 18 (1), (2016).
11. C. Pernier, B. Grosgogeat, L. Ponsonnet, G. Benay, M. Lissac, Eur. J. Orthod., 27 (1), 72 (2005).
12. P. Neumann, C. Bourauel, A. Jäger, Journal of Materials Science: Materials in Medicine, 13 (2), 141 (2002).
13. J. Daems, J. P. Celis, G. Willems, Eur. J. Orthod., 31 (3), 260 (2009).
14. TriTanium® basic science summary, Stryker. 15. A. Allwar, R. Hartati, I. Fatimah, American Institute
of Physics Conf. Proceedings, 1823 (1), (2017). 16. R. J. Moore, J. T. Watts, J. A. Hood, D. J. Burritt,
Eur. J. Orthod., 3, 249 (1999).17. S. Zinelis, T. Eliades, N. Pandis, G. Eliades, Ch.
Bourauel, Am. J. Orthod. Dentofacial Orthop., 132 (1), 84 (2007).
A. Stoyanova-Ivanova et al.: Physicochemical characterization on clinically Retrieved tritanium orthodontic archwires
80 © 2018 Bulgarian Academy of Sciences, Union of Chemists in Bulgaria
* To whom all correspondence should be sent:
Bulgarian Chemical Communications, Volume 50, Special Issue F (pp. 80–85) 2018
Elastic behavior of the titanosilicate framework in Mn-ETS-4
L. Tsvetanova1*, V. Kostov-Kytin1, S. Ferdov2, R. Nikolova1
1 Bulgarian Academy of Sciences, Institute of Mineralogy and Crystallography “Acad. Ivan Kostov”, 1113 Sofia, Akad. G. Bonchev Str., bl. 107, Bulgaria
2 Department of Physics, University of Minho, 4800-058 Guimarães, Portugal
Received October 30, 2018; Accepted November 27, 2018
Microporous titanosilicate Na-K-ETS-4 has been synthesized and subsequently exchanged on Mn2+. The crystal structures of the as-synthesized and the exchanged forms have been analyzed by single crystal X-ray diffraction at 290 K and 150 K, correspondingly. The elasticity and stability of the titanosilicate framework have been investigated as important characteristics of the studied material with impact on its ion-exchange and sorption properties. The ob-tained results reveal that the crystal structure of ETS-4 is stable at temperatures of 150 K and well adapts to the new conditions through non-destructive, mutually compensating each other deformations of the pores and the channel systems within the titanosilicate framework. The exchange on Mn2+ ions affects the degree of structural deformation at low temperature conditions.
Keywords: synthetic zeolites, crystal structure, low temperature studies.
E-mail: [email protected]
INTRODUCTION
ETS-4 (Engelhard titanium silicate – 4) is a mi-croporous titanosilicate built up of silicon tetrahe-dra and titanium octahedra which interconnect in a way to produce a framework structure with an elec-tronegative charge. This charge is compensated by positively charged ions residing in the cavities of the channel systems within the framework. Three types of channel systems have been formed as two of them run along the [010] direction being con-structed by 6- and 8-membered rings, correspond-ingly. The third channel built by 7-membered rings is parallel to the [001] (Fig. 1) [1].
The position of the cations in the cavities and the channel systems depends on their ionic radius, the charge, the physico-chemical exchange condi-tions, etc. The 6-membered ring is inhabited by ions with a smaller ionic radius generally presented by e.g. Na+, Mg2+, Ni2+. The occupancy of this posi-tion is predominantly about 50% and varies from 16 to 85%. Compensating cations of bigger ionic radius such as Ag+, Cs+, Sr2+, Ba2+, Y3+, Mn2+, Cu2+ and Zn2+ are localized within the channels built by 7-membered rings as the occupancy in this position according to the published results is about 75% but
also varies widely (10 to 84%) [2–8]. The channels formed by 8-membered rings typically contain a different number of water molecules as well as ions with a large ionic radius such as Cs+. The occupancy of the position is usually less than 50%. [2]. There is a trend according to which the exchange of di-valent ions results in a more significant reduction of elemental cell volume and higher thermal stabil-ity, compared to monovalent ions exchange [1, 4, 5, 9, 10]. The high degree of elasticity of the tita-nosilicate framework of ETS-4 allows reversibility of the deformations occurring upon dehydration at temperatures below 250 °С [9]. This peculiarity provides opportunity for varying of the effective pore sizes of the studied material and subsequently for control of its sorption and separation properties [9–12].
Our studies are aimed at assessing the elastic-ity of ETS-4 titanosilicate framework by compar-ing the results obtained by single crystal X-ray dif-fraction measurements on as-synthesized and Mn-exchanged form at 290 K (RT) and 150К (LT) and taking into consideration the fact that at low temper-ature conditions dehydration and consequently sig-nificant change in cell volume cannot be expected.
EXPERIMENTAL
The Na-K ETS-4 samples were prepared hydro-thermally (sol-gel method) from a starting batch of

81
the following molar composition: 5Na2O–0.6K2O–0.29TiO2–5.4SiO2–675H2O. The crystallization was performed under static conditions at 200 °С and for 24 hours. The run products were cooled, the sam-ples washed with distilled water and dried at room temperature [13].
The Mn-ETS-4 samples were obtained by ion exchange from a 1М solution of MnCl2.
Single crystal X-ray diffraction (XRD)
Single crystals of Na-K ETS-4 and Mn ETS-4 have been investigated. Each of the samples has been measured at room temperature – 290 K (RT) and at 150 K (LT). The Mn exchanged sample has been additionally measured at room temperature after a two-month period of tempering and struc-ture relaxation after the low-temperature experi-ment. Data collections were performed by ω-scan technique on an Agilent Diffraction SuperNova Dual four-circle diffractometer, equipped with Atlas CCD detector using mirror-monochroma-tized MoKα radiation from micro-focus source (λ = 0.7107 Å). During the LT data collection the sam-
ples were kept at 150 K with an Oxford Instruments Cobra controller device and in nitrogen atmosphere. The determination of unit cell parameters, data in-tegration, scaling and absorption corrections were carried out using the CrysAlis Pro program pack-age [14]. The structures were solved by direct meth-ods (SHELXS-97/2013) and refined by full-matrix least-square procedures on F2 (SHELXL-97/2013) [15]. The structure visualization was performed by Crystal Maker (version 2.6.2, SN2080) [16]. Further details of the crystal structure investigation may be obtained from Fachinformationszentrum Karlsruhe, 76344 Eggenstein-Leopoldshafen, Germany (fax: (+49)7247 808 666; e-mail: [email protected], http://www.fizkarlsruhe.de/request_for_depos-ited_data.html on quoting the CSD-1880698, CSD-1881336, CSD-1881337.
RESULTS AND DISCUSSION
Crystal data and structure refinement parameters for Na-K-ETS-4 and Mn-ETS-4 samples measured at different temperature conditions are given in
Fig. 1. Schematic representation of the ETS-4 structure.
L. Tsvetanova et al.: Elastic behavior of the titanosilicate framework in Mn-ETS-4

82
Tab
le 1
.
Sam
ple
Na-
K-E
TS-4
Mn-
ETS-
4
Che
mic
al
com
posi
tion
H2.
36K
0.72
Na 5.
92Si
12Ti
5O38
(O
H) ×
11.
28 H
2OH
2.38
K0.
96N
a 5.66
Si12
Ti5O
38
(OH
) × 1
1.04
H2O
H0.
08M
n 4.46
Si12
Ti5O
38
(OH
) × 8
.73
H2O
H0.
44M
n 4.72
Si 12
Ti 5 O
38
(OH
) × 8
.42
H2O
H0.
64M
n 4.18
Si12
Ti5O
38
(OH
) × 7
.11
H2O
Tem
pera
ture
(K)
RT
LTR
TLT
RT
Cry
stal
syst
em/
spac
e gr
oup
Orth
orho
mbi
c/C
mm
m
unit
cell
(Å)
a b c
23.2
26(2
) 7.
2103
(9)
6.96
10(8
)
23.2
14(1
)7.
1932
(6)
6.95
84(6
)
23.1
3(1)
7.18
2(2)
6.88
4(3)
23.0
86(1
4)7.
156(
2)6.
874(
3)
23.1
0(1)
7.18
67(1
)6.
876(
3)V
olum
e (Å
3 )/Z
1165
.7(2
)11
61.9
(1)
1143
.4(8
)11
35.7
(9)
1141
.2(7
)D
x [M
g m
−3]
(Cry
stal
den
city
)2.
201
2.20
82.
302
2.33
22.
247
μ [m
m–1
]1.
381
1.40
42.
452
2.45
72.
445
Tmin
– T
max
0.19
28 –
1.0
00.
8942
/10.
887
– 1.
000
0.48
6 –
1.00
00.
547
- 1.0
00R
efle
ctio
ns
colle
cted
2614
2673
1581
1854
3958
Inde
pend
ent
refle
ctio
ns84
784
460
159
187
0
Para
met
ers
7888
8088
87Fi
nal R
indi
ces
(I >
2σ(
I))
R1 =
0.0
772
wR
2 = 0
.170
3R
1 = 0
.058
4w
R2 =
R
1 = 0
.097
1w
R2 =
0.2
370
R1 =
0.0
873
wR
2 = 0
.223
9R
1 =
0.12
38w
R2=
0.2
900
θ min –
θm
ax2.
926/
29.2
162.
927/
29.5
213.
513
- 24.
369
2.96
3 - 2
6.15
73.
529
- 23.
338
F 000
759
759
771
775
751
R in
dice
s (al
l dat
a)R
1 = 0
.121
7w
R2 =
0.2
019
R1 =
0.0
875
wR
2 = 0
.157
5R
1 =0.
1390
wR
2 = 0
.269
2R
1 = 0
.146
5w
R2 =
0.2
764
R1 =
0.1
967
wR
2 = 0
.346
7R
int
0.10
40.
0913
0.12
190.
1054
Goo
dnes
s-of
-fit
on F
21.
085
1.11
31.
051
0.94
91.
169
L. Tsvetanova et al.: Elastic behavior of the titanosilicate framework in Mn-ETS-4
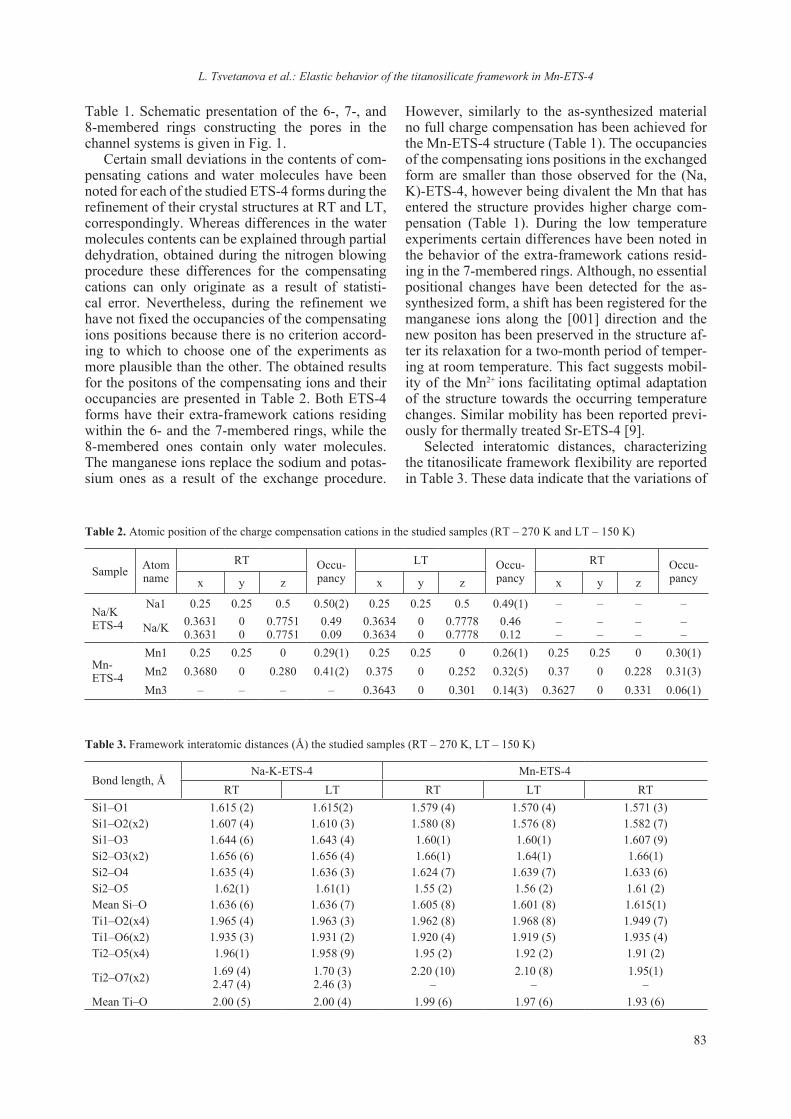
83
Table 1. Schematic presentation of the 6-, 7-, and 8-membered rings constructing the pores in the channel systems is given in Fig. 1.
Certain small deviations in the contents of com-pensating cations and water molecules have been noted for each of the studied ETS-4 forms during the refinement of their crystal structures at RT and LT, correspondingly. Whereas differences in the water molecules contents can be explained through partial dehydration, obtained during the nitrogen blowing procedure these differences for the compensating cations can only originate as a result of statisti-cal error. Nevertheless, during the refinement we have not fixed the occupancies of the compensating ions positions because there is no criterion accord-ing to which to choose one of the experiments as more plausible than the other. The obtained results for the positons of the compensating ions and their occupancies are presented in Table 2. Both ETS-4 forms have their extra-framework cations residing within the 6- and the 7-membered rings, while the 8-membered ones contain only water molecules. The manganese ions replace the sodium and potas-sium ones as a result of the exchange procedure.
However, similarly to the as-synthesized material no full charge compensation has been achieved for the Mn-ETS-4 structure (Table 1). The occupancies of the compensating ions positions in the exchanged form are smaller than those observed for the (Na, K)-ETS-4, however being divalent the Mn that has entered the structure provides higher charge com-pensation (Table 1). During the low temperature experiments certain differences have been noted in the behavior of the extra-framework cations resid-ing in the 7-membered rings. Although, no essential positional changes have been detected for the as-synthesized form, a shift has been registered for the manganese ions along the [001] direction and the new positon has been preserved in the structure af-ter its relaxation for a two-month period of temper-ing at room temperature. This fact suggests mobil-ity of the Mn2+ ions facilitating optimal adaptation of the structure towards the occurring temperature changes. Similar mobility has been reported previ-ously for thermally treated Sr-ETS-4 [9].
Selected interatomic distances, characterizing the titanosilicate framework flexibility are reported in Table 3. These data indicate that the variations of
Table 2. Atomic position of the charge compensation cations in the studied samples (RT – 270 K and LT – 150 K)
Sample Atom name
RT Occu-pancy
LT Occu-pancy
RT Occu-pancyx y z x y z x y z
Na/KETS-4
Na1 0.25 0.25 0.5 0.50(2) 0.25 0.25 0.5 0.49(1) – – – –
Na/K 0.36310.3631
00
0.77510.7751
0.490.09
0.36340.3634
00
0.77780.7778
0.460.12
––
––
––
––
Mn-ETS-4
Mn1 0.25 0.25 0 0.29(1) 0.25 0.25 0 0.26(1) 0.25 0.25 0 0.30(1)Mn2 0.3680 0 0.280 0.41(2) 0.375 0 0.252 0.32(5) 0.37 0 0.228 0.31(3)Mn3 – – – – 0.3643 0 0.301 0.14(3) 0.3627 0 0.331 0.06(1)
Table 3. Framework interatomic distances (Å) the studied samples (RT – 270 K, LT – 150 K)
Bond length, ÅNa-K-ETS-4 Mn-ETS-4
RT LT RT LT RTSi1–O1 1.615 (2) 1.615(2) 1.579 (4) 1.570 (4) 1.571 (3)Si1–O2(х2) 1.607 (4) 1.610 (3) 1.580 (8) 1.576 (8) 1.582 (7)Si1–O3 1.644 (6) 1.643 (4) 1.60(1) 1.60(1) 1.607 (9)Si2–O3(х2) 1.656 (6) 1.656 (4) 1.66(1) 1.64(1) 1.66(1)Si2–O4 1.635 (4) 1.636 (3) 1.624 (7) 1.639 (7) 1.633 (6)Si2–O5 1.62(1) 1.61(1) 1.55 (2) 1.56 (2) 1.61 (2)Mean Si–O 1.636 (6) 1.636 (7) 1.605 (8) 1.601 (8) 1.615(1)Ti1–O2(x4) 1.965 (4) 1.963 (3) 1.962 (8) 1.968 (8) 1.949 (7)Ti1–O6(x2) 1.935 (3) 1.931 (2) 1.920 (4) 1.919 (5) 1.935 (4)Ti2–O5(x4) 1.96(1) 1.958 (9) 1.95 (2) 1.92 (2) 1.91 (2)
Ti2–O7(x2) 1.69 (4)2.47 (4)
1.70 (3)2.46 (3)
2.20 (10)–
2.10 (8)–
1.95(1)–
Mean Ti–O 2.00 (5) 2.00 (4) 1.99 (6) 1.97 (6) 1.93 (6)
L. Tsvetanova et al.: Elastic behavior of the titanosilicate framework in Mn-ETS-4

84
these parameters are wider for the exchanged form than for the as-synthesized sample. This is most likely due to the smaller atomic radius of manga-nese ions as compared to those of sodium and potas-sium, the lower occupancy of positions in the 6- and 7-membered rings and the smaller amount of water molecules. The recorded changes in the lengths of the interatomic distances correspond to the changes of the unit cell parameters, both after the ion ex-change and in the low temperature conditions. The unit cell volume decreases by about 2% due to the ion exchange with manganese and up to 1% under the low temperature conditions, with Mn ETS-4
deformation being comparatively greater than that of the parent sample (Table 1). To investigate the degree and direction of deformation for the three channel systems, the distances between the oxy-gen atoms constituting the 6-, 7- and 8-membered rings have been measured. In Table 4, the longest and shortest distance values for each of the rings are presented and designated as in Figure 2. The figure also shows the directions of shrinkage and expand-ing of the rings. The size of the 6- and 8-membered rings decreases after the manganese ion exchange, the most significant being the change in direction [001] by about 6%, whereas the deformations at
Table 4. Interatomic distances (Å) defining the 6-, 7-, and 8-membered rings geometry (RT – 270 K, LT – 150 K)
RT LT RT RT LT RT6-membered ring D61 D62Na-K-ETS-4 2.809 2.804 4.366 4.374Mn-ETS-4 2.725 2.696 2.762 4.332 4.336 4.2437-membered ring D71 D72Na-K-ETS-4 2.175 2.179 5.86 5.843Mn-ETS-4 2.179 2.212 2.182 5.832 5.806 5.8378-membered ring D81 D82Na-K-ETS-4 2.977 2.97 5.827 5.9Mn-ETS-4 2.925 2.905 2.886 5.81 5.797 5.911
Fig. 2. Schematic representation of ETS-4 framework channels. The distances shown on Table 4 are marked.
L. Tsvetanova et al.: Elastic behavior of the titanosilicate framework in Mn-ETS-4

85
the 7-membered ring are insignificant and are car-ried out in the directions [100] and [010]. The low-temperature conditions influence differently the two tested samples. In the initial (Na, K)-ETS-4 no dif-ference is observed for the distances at room and low temperature and the largest one is for D82 – 0.09 Å (Table 4). The Mn ETS-4 exhibits deforma-tion of all rings, which is expressed in the exten-sion of the ring in one direction and compensating it shrinkage in the other. The process is reversible and, when the temperature is recovered from low to room, there are opposite restoring changes in the size of the rings.
CONCLUSIONS
The ability of the ETS-4 titanosilicate frame-work to deform under the influence of various physicochemical effects (e.g. ion exchange, high temperature or pressure) is a subject of study by many authors. Knowing the directions and degree of deformation of the channel systems and the be-havior of the compensating ions in these processes are important for the evaluation and control of the separating properties of the studied material.
The described results complement the already known facts about the behavior of ETS-4, namely how this material deforms in a low-temperature en-vironment, and the influence of manganese ions on the extent of these deformations.
The structure of Na-K-ETS-4 has been shown to be less susceptible to deformation at 150 K than that one of Mn-ETS-4, mainly due to the lower oc-cupancy of the compensating ion positions.
In the case of manganese samples, a mobility of the compensating ions from the 7- towards the 6-membered ring is observed and a relatively high degree of deformation is recorded in the 7-mem-bered ring, correspondingly.
Acknowledgements: This work was financially sup-ported by the National Science Fund of Bulgaria un-der contract No. DNTS/Russia 02/8 from 15.06.2018.
REFERENCES
1. A. Philippou, M W. Anderson, Zeolites, 16 (2), 98 (1996).
2. R. Nikolova, B. Shivachev, S. Ferdov, Microporous Mesoporous Mater., 165, 121 (2013).
3. S. Ferdov, E. Shikova, Z. Ivanova, L. T. Dimowa, R. P. Nikolova, Zhi Lin, B. L. Shivachev, RSC Ad-vances, 3 (23), 8843 (2013).
4. S. Nair, H .K. Jeong, A. Chandrasekaran, C. Braunbarth, M. Tsapatis, S. M. Kuznicki, Chem. Mater., 13, 4247 (2001).
5. R. Marathe, S. Farooq, M. Srinivasan, J. Phys. Chem. B, 109 (8), 3257 (2005).
6. L. Tsvetanova, L. Dimowa, S. Ferdov, R. Nikolova, Bulg. Chem. Commun., 45(4):522, (2013).
7. L. Tsvetanova, N. Petrova, S. Ferdov, V. Kostov-Kytin, R. Nikolova, Bulg. Chem. Commun., 47, 1, 201 (2015).
8. L. Tsvetanova, PhD Thesis, IMC, Sofia, 2017.9. S. Nair, M. Tsapatsis, B. H. Toby, S. M. Kuznicki, J.
Am. Chem. Soc., 123 (51), 12781 (2001).10. M. Sacerdoti, G. Cruciani, in: Minerals as Advanced
Materials II., S .V. Krivovichev (ed.), Springer, Hei-delberg New York Dordrecht London, 2011, p. 187.
11. S. M. Kuznicki, V. A. Bell, S. Nair, H. W. Hillhouse, R. M. Jacubunas, C. M. Braunbarth, M. H. Toby, M. Tsapatsis, Nature, 412, 720 (2001).
12. S. Ferdov, Langmuir, 26 (4), 2684 (2010).13. V. Kostov-Kytin, S. Ferdov, Yu. Kalvachev, B.
Mihailova, O. Petrov, Microporous Mesoporous Mater., 105, 232 (2007).
14. CrysAlis, C., CrysAlis RED and associated pro-grams: Oxford Diffraction Program name (s), Oxford Diffraction Ltd, Abingdon, England, 2006.
15. G. M. Sheldrick, 10. Acta. Cryst., A, 64 (1), 112 (2008).
16. Crystal Maker (version 2.6.2, SN2080).
L. Tsvetanova et al.: Elastic behavior of the titanosilicate framework in Mn-ETS-4

86 © 2018 Bulgarian Academy of Sciences, Union of Chemists in Bulgaria
* To whom all correspondence should be sent:
Bulgarian Chemical Communications, Volume 50, Special Issue F (pp. 86–92) 2018
Synthesis, structure and properties of hybrids doped with copper ions in the silica-hydroxypropyl cellulose system
N. Rangelova1*, L. Aleksandrov2, Ts. Angelova3, N. Georgieva3
1 University of Chemical Technology and Metallurgy, Department of Fundamentals of Chemical Technology, 8 Kl. Ohridski Blvd., 1756 Sofia, Bulgaria
2 Institute of General and Inorganic Chemistry, Bulgarian Academy of Sciences, Acad. G. Bonchev str. bl. 11, 1113 Sofia, Bulgaria
3 University of Chemical Technology and Metallurgy, Department of Biotechnology, 8 Kl. Ohridski Blvd., 1756 Sofia, Bulgaria.
Received October 30, 2018; Accepted November 27, 2018
In the present study, the formation of copper-doped hybrids and their structure were examined. The XRD analysis showed that all samples are in amorphous state. The IR spectra are characterized with typical bands for silica network (~460, 650, 795, 960, 1085, 1200 and 3480 cm–1), and vibration of Cu-O bonds (460–480 cm–1). The thermal stability decreased with increasing of Cu content from 15 to 25 mass%. By optical microscopy it was found that in the sample containing 5 wt.% Cu, CuSO4*nH2O separated from the amorphous matrix and it was no able to incorporate into the hybrid material. After heat treatment of as prepared copper-doped hybrids the XRD, IR and UV-VIS analysis were done. The amorphous state of the hybrids remains except the sample containing 5 wt.% Cu. There are three refrac-tion peaks on the amorphous halo observed assigned to the CuO. The calculated band gap energy (Eg) values sharply decreased after heat treatment process: 3.66–3.97 eV for raw materials up to 2.54–1.30 eV for heated samples. The obtained materials were tested as antibacterial agents against Escherichia coli K12 used as a model microorganism.
Keywords: sol-gel method, silica hybrid materials, copper ions, antibacterial agent.
E-mail: [email protected]
INTRODUCTION
The biocidal properties of copper, its salts and alloys have been known for centuries. It is success-fully used as an antibacterial agent in the food and beverage package materials, as a wood conservation material in textile and various paints. Another field of application is in medicine where copper-con-taining materials are used to minimize the spread of hospital bacterial infections. In agriculture, cop-per compounds are used as fungicide/bactericide to control plant diseases [1–3].
An important step in the development of new materials is to provide a suitable matrix for incor-poration of metal ions. In this case, the matrix must provide a homogeneous structure (without the pro-cesses of phase separation, different phase composi-tion and morphology) in which metal particles are uniformly disintegrated [1, 3, 4]. On the other hand, it is clear that amorphous materials have good bio-
compatibility and in the last, few years have been the subject for the development of appropriate ma-trixes for incorporation of metal ions. One of the basic methods for synthesis of biopolymer-metal oxide-metal hybrids is the sol-gel approach [5–9]. Obtained by this method the materials are classified as a new class of high efficiency materials due to the combination of both organic and inorganic proper-ties. On the other hand, in the literature there are in-sufficient data available on the synthesis and prop-erties of the hybrids in the system copper-doped silica-cellulose ether materials.
A major problem for copper nanoparticles is their strong affinity to oxidation by atmospheric oxygen and the instability of the formed oxide [2, 10]. The possibility of successful crosslinking of doped ions and their homogeneous distribution is an important part of the development and applica-tion of such materials. The antimicrobial activity of the materials depends on the difference in oxidation state of the copper as well as their size, shape, dis-tribution and type of linking. It has also been found that CuO and Cu2O have antimicrobial properties, but with a lower degree than copper ions [4, 10, 11].
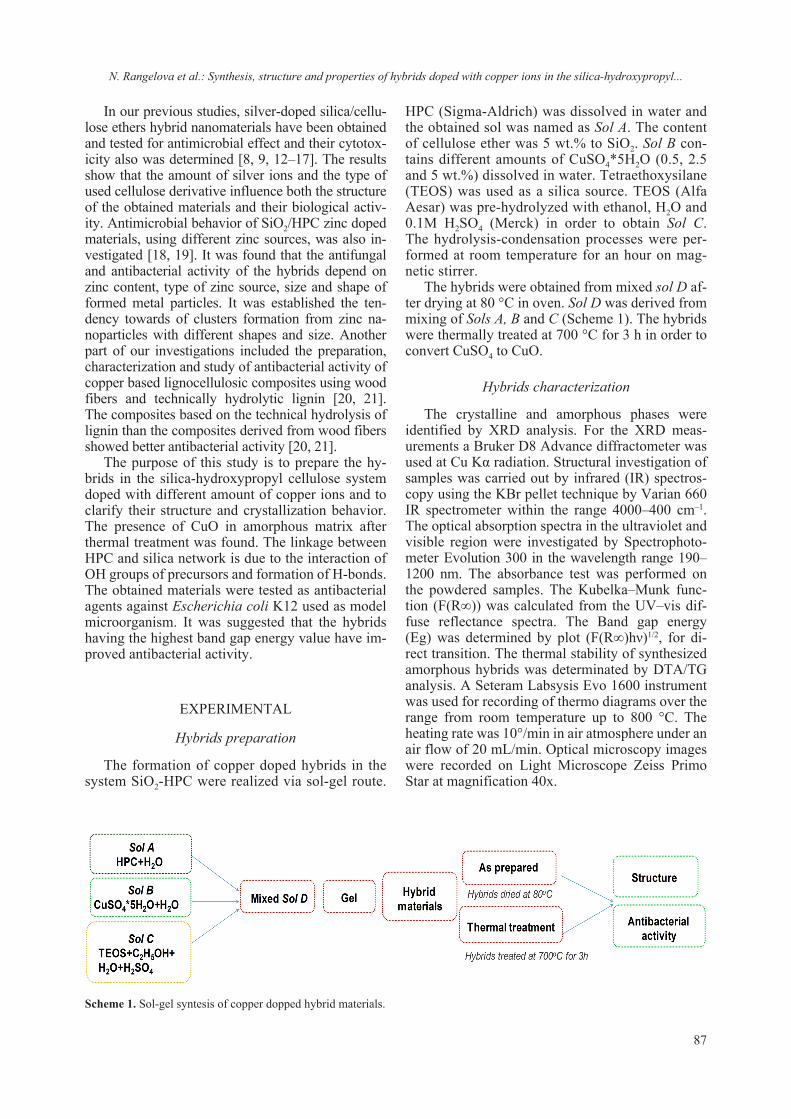
87
In our previous studies, silver-doped silica/cellu-lose ethers hybrid nanomaterials have been obtained and tested for antimicrobial effect and their cytotox-icity also wаs determined [8, 9, 12–17]. The results show that the amount of silver ions and the type of used cellulose derivative influence both the structure of the obtained materials and their biological activ-ity. Antimicrobial behavior of SiO2/HPC zinc doped materials, using different zinc sources, was also in-vestigated [18, 19]. It was found that the antifungal and antibacterial activity of the hybrids depend on zinc content, type of zinc source, size and shape of formed metal particles. It was established the ten-dency towards of clusters formation from zinc na-noparticles with different shapes and size. Another part of our investigations included the preparation, characterization and study of antibacterial activity of copper based lignocellulosic composites using wood fibers and technically hydrolytic lignin [20, 21]. The composites based on the technical hydrolysis of lignin than the composites derived from wood fibers showed better antibacterial activity [20, 21].
The purpose of this study is to prepare the hy-brids in the silica-hydroxypropyl cellulose system doped with different amount of copper ions and to clarify their structure and crystallization behavior. The presence of CuO in amorphous matrix after thermal treatment was found. The linkage between HPC and silica network is due to the interaction of OH groups of precursors and formation of H-bonds. The obtained materials were tested as antibacterial agents against Escherichia coli K12 used as model microorganism. It was suggested that the hybrids having the highest band gap energy value have im-proved antibacterial activity.
EXPERIMENTAL
Hybrids preparation
The formation of copper doped hybrids in the system SiO2-HPC were realized via sol-gel route.
HPC (Sigma-Aldrich) was dissolved in water and the obtained sol was named as Sol A. The content of cellulose ether was 5 wt.% to SiO2. Sol B con-tains different amounts of CuSO4*5H2O (0.5, 2.5 and 5 wt.%) dissolved in water. Tetraethoxysilane (TEOS) was used as a silica source. TEOS (Alfa Aesar) was pre-hydrolyzed with ethanol, H2O and 0.1M H2SO4 (Merck) in order to obtain Sol C. The hydrolysis-condensation processes were per-formed at room temperature for an hour on mag-netic stirrer.
The hybrids were obtained from mixed sol D af-ter drying at 80 °C in oven. Sol D was derived from mixing of Sols A, B and C (Scheme 1). The hybrids were thermally treated at 700 °C for 3 h in order to convert CuSO4 to CuO.
Hybrids characterization
The crystalline and amorphous phases were identified by XRD analysis. For the XRD meas-urements a Bruker D8 Advance diffractometer was used at Cu Kα radiation. Structural investigation of samples was carried out by infrared (IR) spectros-copy using the KBr pellet technique by Varian 660 IR spectrometer within the range 4000–400 cm–1. The optical absorption spectra in the ultraviolet and visible region were investigated by Spectrophoto-meter Evolution 300 in the wavelength range 190–1200 nm. The absorbance test was performed on the powdered samples. The Kubelka–Munk func-tion (F(R∞)) was calculated from the UV–vis dif-fuse reflectance spectra. The Band gap energy (Eg) was determined by plot (F(R∞)hν)1/2, for di-rect transition. The thermal stability of synthesized amorphous hybrids was determinated by DTA/TG analysis. A Seteram Labsysis Evo 1600 instrument was used for recording of thermo diagrams over the range from room temperature up to 800 °C. The heating rate was 10°/min in air atmosphere under an air flow of 20 mL/min. Optical microscopy images were recorded on Light Microscope Zeiss Primo Star at magnification 40x.
Scheme 1. Sol-gel syntesis of copper dopped hybrid materials.
N. Rangelova et al.: Synthesis, structure and properties of hybrids doped with copper ions in the silica-hydroxypropyl...

88
Antibacterial activity
Bacterial strain used in this study included Gram-negative Escherichia coli K12 (obtained from the culture collection of Bulgarian National Bank of Industrial Microorganisms and Cell Cultures). The growth conditions were described in our previous studies [8, 14]. The antibacterial effect of materi-als onto model bacterial strain was measurement by zones of inhibition formed around the materials [8, 14, 17, 18].
RESULTS AND DISCUSSION
The thermal behavior of obtained copper dopped SiO2/HPC hybrid materials in the temperature range from 25 to 800 °C was investigated by DTA/TG analysis (Fig. 1 a and b). The DTA curves (Fig. 1a) of the hybrids showed high intensive endothermic effect with maximum at 130 °C that can be attrib-uted with evaporation of the absorbed water. In this temperature range are the general mass losses (Fig. 1b) from the samples. The second part from the DTA curves characterized with two exo-effects with low intensity around 370 and 480 °C that can be connected with decomposition of the organic part. The last effects are difficult to distinguish from DTA curves but on the TG curves there is a mass loss around 700 °C especially for the sample containing 5 wt.% Cu and can be attributed to the decomposition of CuSO4 to CuO. The final mass losses of the hybrids vary between 15–25% depend-ing on the copper content in the samples. Base on DTA/TG analysis the as prepared hybrid materials have been thermally treated at 700 °C for 3 hours.
The XRD analysis (Fig. 2) of as prepared hy-brids showed that the all samples are amorphous due to the silica network. The existence of diffrac-tion peaks in the sample containing 5% copper was connected with the presence of CuSO4*5H2O and CuSO4*3H2O (JPDS: No 98-016-6102 and JPDS: No 98-006-0059). After thermal treatment at 700 °C the all hybrids are still in amorphous state. The sam-ple containing 5 wt.% Cu displayed well-defined diffraction peaks characteristic of crystalline CuO (JPDS: No 01-080-1916).
Figure 3a and b shows the IR spectra of syn-thesized hybrid materials before and after thermal treatment. The absorption bands at 1079, 797, and 450 cm–1 can be assigned to valence asymmetric, symmetric and deformation vibrations of Si–O–Si bonds [8,9,12, 22–24]. The shoulder at 1192 cm–1 is due to Si–O–Si linkage [25, 26]. The characteris-tic vibrations of silanol group at 940 and 570 cm–1
can be found. The band at 1634 cm–1 is character-istic for adsorbed water on the sample surface. In the range 3670–3440 cm–1 the OH stretching vibra-tions of H-bonded water and/or intra H-bonding in the hybrids between Si–OH and hydroxyl groups from HPC can be found. The hypothesis for suc-cessful cross-linking between organic and inor-ganic components was described in details in our previous work using mathematical approach [9, 24]. The asymmetric shape of the band in this area, and theoretical existence of the vibration above 3500 cm–1 give as the opportunity to propose the successful bonding between silica network and cel-lulose ether via H-bonds [9, 12, 24]. After thermal treatment of the samples (Fig. 3b) the disappearance of the peaks characteristic of the Si–OH groups is observed. The bands at 940 cm–1 completely disap-
Fig. 1. DTA (a) and TG (b) curves of Cu dopped SiO2/HPC hybrid materials.
N. Rangelova et al.: Synthesis, structure and properties of hybrids doped with copper ions in the silica-hydroxypropyl...

89
Fig. 2. XRD patterns of Cu dopped SiO2/HPC hybrid materials before (a) and after thermal treatment (b).
Fig. 3. IR spectra of Cu dopped SiO2/HPC hybrid materials before (а) and after thermal treatment (b).
pears and a shoulder at 590 cm–1 is observed. These facts could be assigned to the structural rearrange-ment in the obtained hybrids [7, 22, 23]. The bands in the range 3670–3440 cm–1 also undergo changes, their intensity decreases, and they are broaden. The band at 3730 cm–1 is due to free OH groups [22–24]. Must be mentioned that the Me–O (Cu–O) vibration bands are situated around 460 cm–1 and overlapped with Si–O–Si bridging linkage and in our case is difficult to distinguish [22, 23, 27].
The optical absorption spectra of as prepared and thermally treated hybrids are shown on Fig. 4, a and b. The absorption bands around 248 and 253 nm in the spectra of as prepared hybrids can be attrib-uted to the specific different structural characteris-
tics approach from the precursors. As can be seen with increase in copper content the absorption band around 800 nm also increases. This bands can be related with the presence of copper in the divalent state in the hybrids. The band is characteristic to the 2Eg→2Tg transition of Cu2+ ions coordinated octahedrally with oxygen ions [28, 29]. By Taucʼs plot method the Band gap energy (Eg) for indi-rect electronic transition of Cu dopped SiO2/HPC hybrid materials before and after thermal treat-ment was calculated and presented on Fig. 4, c and d. The band gap energy for as prepared hybrids (Fig. 4c) vary between 3.66 and 3.97 eV, which are the typical values for semiconductor materials. After thermal treatment of the samples (Fig. 4d) the
N. Rangelova et al.: Synthesis, structure and properties of hybrids doped with copper ions in the silica-hydroxypropyl...

90
band gap energy decreases in the range from 3.44 to 1.3 eV with increase of copper content. Compared with the reported data for Eg value of bulk CuO vary between 1.0 and 1.5 eV [30]. This data confirm the results from XRD analysis for the formation of CuO after thermal treatment of the samples.
Optical microscopy images on the surface of Cu dopped SiO2/HPC as prepared hybrid materials are shown on Fig. 5. As can be seen the samples con-taining 0.5 and 2.5 wt.% copper are homogenous but the sample with 5 wt.% Cu is characterized with indigested CuSO4*nH2O probably due to the presence of limited functional groups. As was men-tioned above the linkage between HPC and silica network is due to the interaction of OH groups of precursors and formation of H-bonds. This leads to the presence of limit free OH functional groups capable to link with the doped metal ions. Because the silica network is too dense and there is no other possibility for surplus amount of the metal ions to
connect with initial matrix and the only possible op-portunity is to be deposited on the sample surface.
The antibacterial properties of hybrids were investigated by measuring the inhibition zones formed around the materials containing different copper amounts in presence of reference strain for Gram-negative (E. coli K 12) bacteria. Figure 6 rep-resents the antibacterial activity of as prepared hy-brids (Fig. 6a), thermally treated samples (Fig. 6b) and for comparison commercial CuO (Fig. 6c) was used. As can be seen the antibacterial activity ex-hibit only the as prepared hybrids (Fig. 6a). The thermally treated samples (Fig. 6b) and commer-cial CuO (Fig. 6c) did not show any antibacterial activity. This results can be explain by the fact that Cu–O bonds (in CuO) are extremely stable than the existence of Cu2+ ions in the copper sulphate where the distance between Cu and oxygen is too longer and is easy to separate and this will influence on the antibacterial activity. Moreover, Li et al [31]
Fig. 4. Uv-Vis spectra and Band gap energy of Cu dopped SiO2/HPC hybrid materials before and after thermal treatment.
N. Rangelova et al.: Synthesis, structure and properties of hybrids doped with copper ions in the silica-hydroxypropyl...

91
discussed that the CuO did not produce mesurable reactive oxygen species (ROS) which play most important role for antibacterial activity. After 24 h cultivation it was observed that as prepared hybrids proved clear zone of inhibition around the materi-als (Fig. 6a). The sample with the highest copper content (5 wt.%) showed the biggest zone of inhibi-tion – 10.5 mm. The results reveal that 2.5 wt.% Cu formed an inhibitory zone of 9.5 mm. The lowest copper concentration (0.5 wt.%) also influence the strain growth and measured zone is 5.5 mm. It is clear that the size zone depends on the copper con-tent. As above mentioned results for band gap in the present system the increasing of the copper content leads to increase of Eg values (Fig. 4c). Obviously, in our case the higher band gap prefer antibacterial activity. Due to the low Eg values of thermal treat-ment samples (Fig. 4d) we supposed probably good photocatalytical properties and this will be the next step of our investigations.
CONCLUSIONS
Copper doped SiO2/HPC hybrid materials have been prepared by sol-gel method. The hybrids were thermally treated in order to obtain CuO. The phase analysis shown that the all samples are in amor-phous state except heat treated sample containing 5 wt.% Cu characterized with well-defined diffrac-tion peaks corresponding to CuO. According to structural investigation the formation of hydrogen bonds between organic and inorganic parts was pro-posed. The morphology investigation of as prepared hybrids showed that the samples containing 0.5 and 2.5 wt.% copper are homogenous but the sample with 5 wt.% Cu is characterized with indigested phase separation between the matrix and doped cop-per sulphate due to the presence of limit functional groups. Based on optical spectra the band gap en-ergy was calculated and parameters values vary in the regions 3.66–3.97 eV for as prepared samples
Fig. 5. Optical microscopy images on the surface of Cu dopped SiO2/HPC as prepared hybrid materials: (a) 0.5 wt.% Cu; (b) 2.5 wt.% Cu; and (c) 5 wt.% Cu.
Fig. 6. Inhibition zones of E. coli К12 around Cu dopped SiO2/HPC hybrid materials: (a) as prepared materials; (b) after thermal treatment; and (c) commercial CuO.
N. Rangelova et al.: Synthesis, structure and properties of hybrids doped with copper ions in the silica-hydroxypropyl...

92
and 3.44–1.30 eV for thermal treatment samples. The antibacterial properties of hybrids were inves-tigated against reference strain for Gram-negative (E. coli K 12) bacteria. It was found that the po-tential of materials as antimicrobial agents increase with incerasing of copper content in the hybrids. It was established that size zone also depend on the copper content.
REFERENCES
1. Y. H. Kim, D. K. Lee, H. G. Cha, C. W. Kim, Y.C. Kang, Y. S. Kang, J. Phys. Chem. B, 110, 24923 (2006).
2. J. Ramyadevi, K. Jeyasubramanian, A. Marikani, G. Rajakumar, A. A. Rahuman, Mater. Lett., 71, 114 (2012).
3. P. Maniprasad, S. Santra, J. Biomed. Nanotechnol., 8, 558 (2012).
4. C. C. Trapalis, M. Kokkoris, G. Perdikakis, G. Kordas, J. Sol.-Gel. Sci. Technol., 26, 1213 (2003).
5. Y. Dimitriev, Y. Ivanova, R. Iordanova, J. Univ. Chem. Technol. Metall., 43, 118 (2008).
6. P. Gómez-Romero, C. Sanchez, Functional Hybrid Materials, WILEY-VCH Verlag GmbH & Co. KGaA, Germany, 2004.
7. N. Rangelova, S.Nenkova, L. Radev, B. Samuneva, B. Aleksiev, in: Nanoscience & Nanotechnology, E. Balabanova, I. Dragieva (eds), vol 7, Heron press, 2007, p. 230.
8. Ts. Angelova, N. Rangelova, R. Yuryev, N. Geor-gieva, R. Müller, Mater. Sci. Eng. C, 32, 1241 (2012).
9. N. Rangelova, L. Aleksandrov, Ts. Angelova, N. Georgieva, R. Müller, Carbohydr. Polym., 101, 1166 (2014).
10. O. Akhavan, E. Ghaderi, Surf. Coat. Technol., 205, 219 (2010).
11. H. Pang, F. Gao, Q. Lu, Chem. Commun., 7, 1076 (2009).
12. N. Rangelova, N. Georgieva, K. Mileva, R. Yuryev, R. Müller, C. R. Acad. Bulg. Sci., 65(8), 1057 (2012).
13. Ts. Angelova, N. Georgieva, N. Rangelova, V. Uzu-nova, T. Andreeva, R. Tzoneva, R. Müller, C. R. Acad. Bulg. Sci., 67(10), 1355 (2014).
N. Rangelova et al.: Synthesis, structure and properties of hybrids doped with copper ions in the silica-hydroxypropyl...
14. Ts. Angelova, N. Rangelova, H. Dineva, N. Geor-gieva, R. Müller, Biotechnol. Biotechnol. Equip., 28, 747 (2014).
15. Ts. Angelova, N. Rangelova, V. Uzunova, N. Geor-gieva, T. Andreeva, A. Momchilova, R. Tzoneva, R. Müller, Turk. J. Biol., 40(6), 1278 (2016).
16. Ts. Angelova, N. Georgieva, H. Dineva, N. Rangelova, R. Müller, J. Chem. Technol. Metall., 49(2), 121 (2014).
17. Ts. Angelova, R. Abdel Aty Eissa Mohamed, N. Rangelova, N. Georgieva, J. Chem. Technol. Metall., 51(2), 141 (2016).
18. T. Angelova, N. Rangelova, N. Georgieva, Food Sci. Appl. Biotechnol., 1(2), 104 (2018).
19. D. Pencheva, A. Sestrimska, A. Dimitrova, L. Bo-risova, R. Karamfilova, N. Rangelova, Ts. Angelova, N. Georgieva, Problems of Infectious and Parasitic Diseases, 46(1), 41 (2018).
20. N. Rangelova, S. Nenkova, N. Lazarova, N. Geor-gieva, Bulg. Chem. Commun., 47(A), 39 (2015).
21. N. Rangelova, L. Aleksandrov, N. Georgieva, N. La-zarova-Zdravkova, S. Nenkova, C. R. Acad. Bulg. Sci., 69, 1563 (2016).
22. C. J. Brinker, S.W. Scherer, Sol-Gel Science: The Physic and Chemistry of Sol-Gel Processing. Academic Press, New York, 1990, p. 541.
23. R. M. Almeida, A. C. Marques, in: Handbook of Sol-Gel Science and Technology, L. Klein, M. Aparicio, A. Jitianu (eds.), Springer International Publishing, Switzerland, 2016, p. 1.
24. N. Rangelova, L. Aleksandrov, S. Nenkova, J. Sol-Gel Sci. Technol., 85, 330 (2018).
25. E. I. Kamitsos, A. P. Patsis, G. Kordas, Phys. Rev. B: Condens. Matter., 48, 12499 (1993).
26. E. I. Kamitsos, Phys Rev B: Condens Matter., 53, 14659 (1996).
27. A. A. Radhakrishnan, B. B. Beena, Indian J. Adv. Chem. Sci., 2(2), 158 (2014).
28. M. Nogami, Y. Abe, A. Nakamura, J. Mater. Res., 10, 2648 (1995).
29. G. De, M. Epifani, A. Licciulli, J. Non-Cryst. Solids, 201, 250 (1996).
30. J. Koshy, M. S. Samuel, A. Chandran, K. C. George, AIP Conf. Proc., 1391, 576 (2011).
31. Y. Li, W. Zhang, J. Niu, Y. Chen, ACS Nano, 6, 5164 (2012).
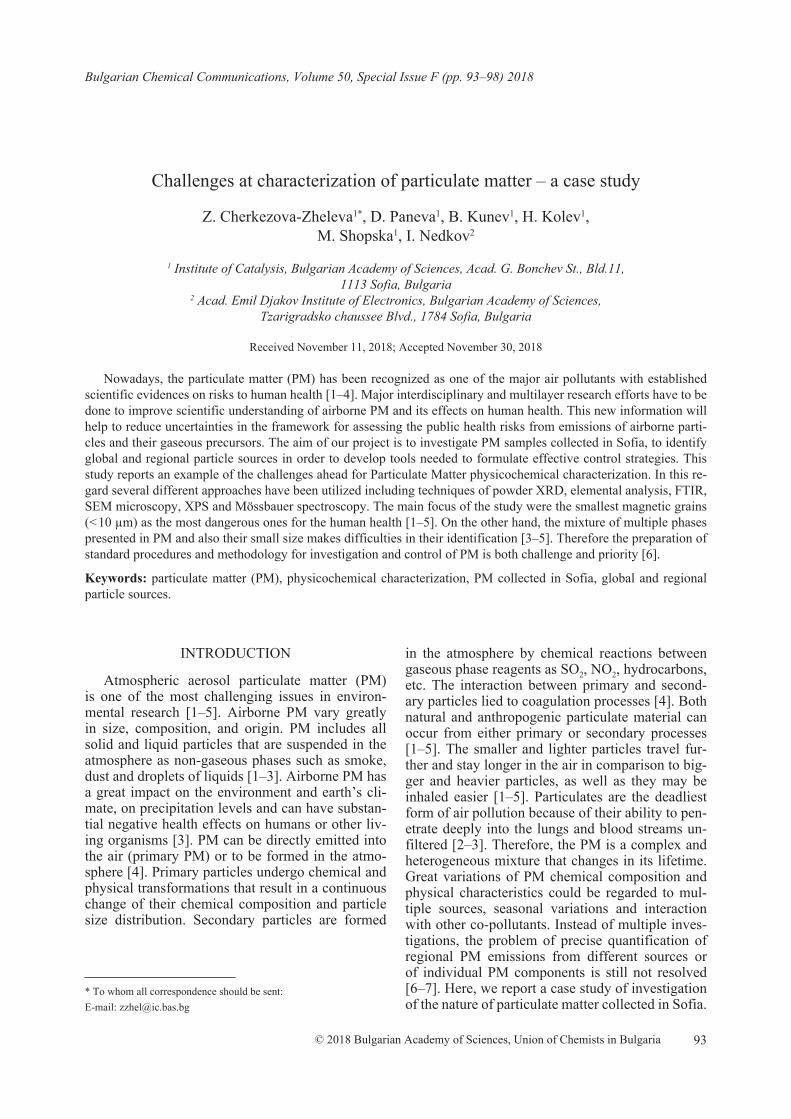
93© 2018 Bulgarian Academy of Sciences, Union of Chemists in Bulgaria
* To whom all correspondence should be sent:
Bulgarian Chemical Communications, Volume 50, Special Issue F (pp. 93–98) 2018
Challenges at characterization of particulate matter – a case study
Z. Cherkezova-Zheleva1*, D. Paneva1, B. Kunev1, H. Kolev1, M. Shopska1, I. Nedkov2
1 Institute of Catalysis, Bulgarian Academy of Sciences, Acad. G. Bonchev St., Bld.11, 1113 Sofia, Bulgaria
2 Acad. Emil Djakov Institute of Electronics, Bulgarian Academy of Sciences, Tzarigradsko chaussee Blvd., 1784 Sofia, Bulgaria
Received November 11, 2018; Accepted November 30, 2018
Nowadays, the particulate matter (PM) has been recognized as one of the major air pollutants with established scientific evidences on risks to human health [1–4]. Major interdisciplinary and multilayer research efforts have to be done to improve scientific understanding of airborne PM and its effects on human health. This new information will help to reduce uncertainties in the framework for assessing the public health risks from emissions of airborne parti-cles and their gaseous precursors. The aim of our project is to investigate PM samples collected in Sofia, to identify global and regional particle sources in order to develop tools needed to formulate effective control strategies. This study reports an example of the challenges ahead for Particulate Matter physicochemical characterization. In this re-gard several different approaches have been utilized including techniques of powder XRD, elemental analysis, FTIR, SEM microscopy, XPS and Mössbauer spectroscopy. The main focus of the study were the smallest magnetic grains (<10 µm) as the most dangerous ones for the human health [1–5]. On the other hand, the mixture of multiple phases presented in PM and also their small size makes difficulties in their identification [3–5]. Therefore the preparation of standard procedures and methodology for investigation and control of PM is both challenge and priority [6].
Keywords: particulate matter (PM), physicochemical characterization, PM collected in Sofia, global and regional particle sources.
E-mail: [email protected]
INTRODUCTION
Atmospheric aerosol particulate matter (PM) is one of the most challenging issues in environ-mental research [1–5]. Airborne PM vary greatly in size, composition, and origin. PM includes all solid and liquid particles that are suspended in the atmo sphere as non-gaseous phases such as smoke, dust and droplets of liquids [1–3]. Airborne PM has a great impact on the environment and earth’s cli-mate, on precipitation levels and can have substan-tial negative health effects on humans or other liv-ing organisms [3]. PM can be directly emitted into the air (primary PM) or to be formed in the atmo-sphere [4]. Primary particles undergo chemical and physical transformations that result in a continuous change of their chemical composition and particle size distribution. Secondary particles are formed
in the atmosphere by chemical reactions between gaseous phase reagents as SO2, NO2, hydrocarbons, etc. The interaction between primary and second-ary particles lied to coagulation processes [4]. Both natural and anthropogenic particulate material can occur from either primary or secondary processes [1–5]. The smaller and lighter particles travel fur-ther and stay longer in the air in comparison to big-ger and heavier particles, as well as they may be inhaled easier [1–5]. Particulates are the deadliest form of air pollution because of their ability to pen-etrate deeply into the lungs and blood streams un-filtered [2–3]. Therefore, the PM is a complex and heterogeneous mixture that changes in its lifetime. Great variations of PM chemical composition and physical characteristics could be regarded to mul-tiple sources, seasonal variations and interaction with other co-pollutants. Instead of multiple inves-tigations, the problem of precise quantification of regional PM emissions from different sources or of individual PM components is still not resolved [6–7]. Here, we report a case study of investigation of the nature of particulate matter collected in Sofia.

94
EXPERIMENTAL
Materials
Studied powder materials were collected in one of the most polluted areas in Sofia – “Orlov most” square, according to the results obtained by Lidar detector.
Lidar mapping experiments were performed by equipment operating in the EARLINET Sofia Lidar Station in IE-BAS Laser Radars Laboratory. The scanning lidar is based on Cu vapour laser emits simultaneously 2 waves (510.6 nm and 578.2 nm) with a frequency 5–8 kHz. Lidar monitoring sys-tem was used for remote scanning from a single position (Lidar Station) over the whole Sofia area, covering the entire urban area and the surroundings. Lidar maps of good quality were obtained for radial operational distances above 25 km from the Lidar Station [8].
Characterization Methods
Elemental analysis was done using Inductively coupled plasma – Atomic emission spectroscopy (ICP-AES), Perkin Elmer 5000 spectrophotom-eter. The chemical composition of sample was de-termined by means of classical silicate analysis (in mass%).
Powder X-ray diffraction patterns were regis-tered using TUR M62 diffractometer with CoKα radiation within the range of 5 to 80° 2θ with a con-stant step 0.02° 2θ. Phase identification was per-formed with the X’Pert program using ICDD-PDF2 Database [9].
Mössbauer spectra were recorded by Wissen-schaftliche Elektronik GmbH electromechanical ap-paratus (Germany), operating at a constant accelera-tion mode. A 57Co/Rh source and an α-Fe standard were used. The Mössbauer spectra were collected at room temperature. The parameters of hyperfine in-teractions of the obtained spectral components were calculated by CONFIT program: isomer shift (IS), quadrupole splitting (QS), hyperfine effective field (Heff) as well as line width (FW) and component relative weight (G). Computer fitting was based on the least squares method.
The morphology of materials was studied using a JEOL SEM T-200 scanning electron microscope. Before SEM observations, the samples were cov-ered with vacuum-deposited carbon and gold films in order to amplify picture contrast.
Infrared (IR) spectra of the samples were record-ed on a Nicolet 6700 FTIR spectrometer (Thermo Electron Corporation, USA) by material dilution in KBr pellets (0.5% of studied substance). The spec-tra were collected in the far and in the middle infra-
red regions using 100 scans at a resolution of 4 (data spacing 1.928 cm−1).
X-ray photoelectron measurements have been carried out on the ESCALAB MkII (VG Scientific, now Thermo Fisher Scientific) electron spectro-meter at a base pressure in the analysis chamber of 5×10⁻¹⁰ mbar using twin anode MgKα/AlKα X-ray source with excitation energies of 1253.6 and 1486.6 eV, respectively. The spectra are recorded at the total instrumental resolution (as it was measured with the FWHM of Ag3d5/2 photoelectron line) of 1.06 and 1.18 eV for MgKα and AlKα excitation sources, respectively. The energy scale has been calibrated by normalizing the C1s line to 285.0 eV. The processing of the measured spectra includes a subtraction of X-ray satellites and Shirley-type background [10]. The relative concentrations of the different chemical species are determined based on normalization of the peak areas to their photoioniza-tion cross-sections, calculated by Scofield [11].
RESULTS AND DISCUSSION
Analysis of major elements presented in stud-ied PM is key point for better interpretation of all other analyses. However a specific and challeng-ing problem of dust analysis is the small available mass for analysis, its apriori unknown elemental composition and its chemical complexity with ele-ments varying from main component level to trace elements. Alumino-silicate compounds were found to be a substantial part of the PM content being SiO2 (46.53%) and Al2O3 (20.12%), respectively. CaO (3.79%), K2O (1.99%), MgO (1.22%), Na2O (0.26%), SO3 (0.25%), TiO2 (0.93%), P2O5 (0.33%) are also presented. The metals with major concen-trations in PM were Fe2O3 (16%), CuO (12%) and MgO (20%), respectively. Small quantities of Ni, Cr, Pb and Zn oxides less than 1% were also reg-istered.
SEM images are shown on Fig. 1. It can be very well seen that PM greatly vary in size from nanom-eters to several tenths of micrometers. The most of particles are observed to be an agregates of small particles. The size distribution and differences in the material morphology are registered at higher magnification (Fig. 1a, 1b and 1c).
Powder XRD (Fig. 2) show the presence of low intensity and broad X-ray diffraction peaks laid on non-selective background in pattern of studied sam-ple. The main crystallite phases registered in X-ray diffactogram are silicate, aluminosilicate, carbon-ate, silicate hydroxide and sulfate phases. The characteristic patterns of quartz SiO2 (78-1252), anorthite (73-0264), Mn silicate (12-0215), calcite CaCO3 (03-0596) and K-Mg silicate hydroxide (26-
Z. Cherkezova-Zheleva et al.: Challenges at characterization of particulate matter – a case study

95
Fig. 1. SEM images of studied PM.
Fig. 2. X-ray diffraction pattern of PM material (a) and analysis (b) showing peaks derived from the pattern compared to the JCPDS standard pattern numbers.
(a)
(b)
Z. Cherkezova-Zheleva et al.: Challenges at characterization of particulate matter – a case study
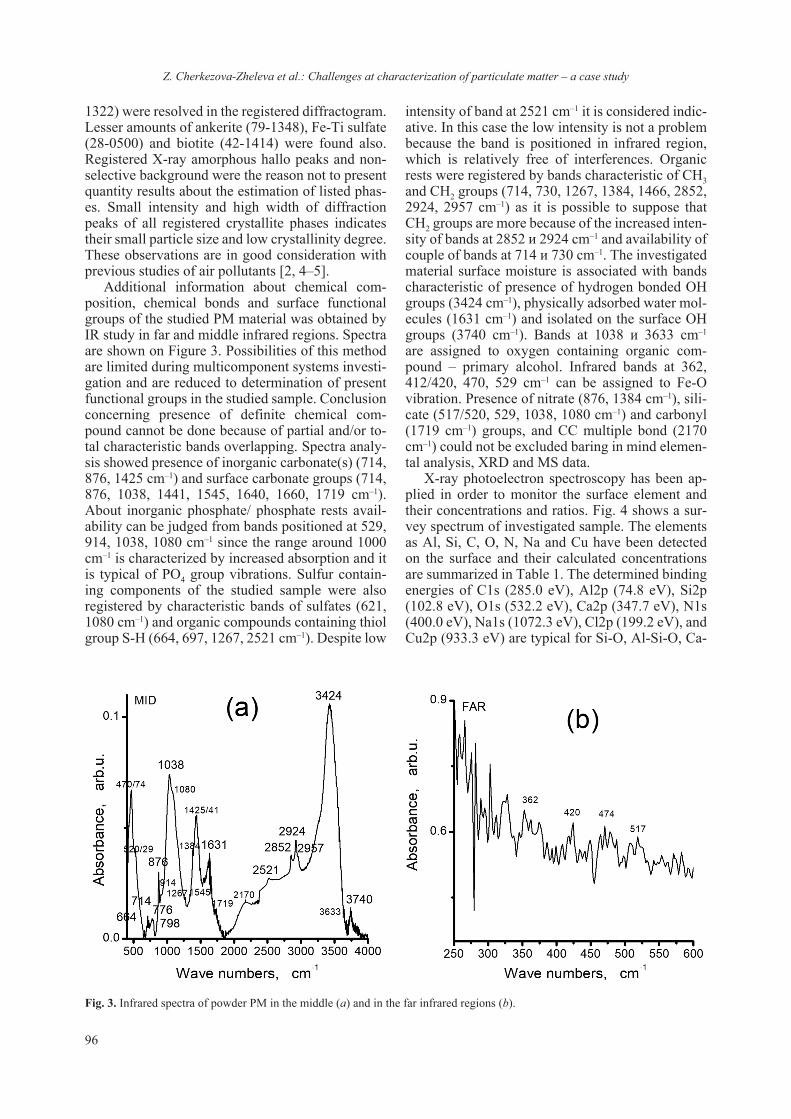
96
1322) were resolved in the registered diffractogram. Lesser amounts of ankerite (79-1348), Fe-Ti sulfate (28-0500) and biotite (42-1414) were found also. Registered X-ray amorphous hallo peaks and non-selective background were the reason not to present quantity results about the estimation of listed phas-es. Small intensity and high width of diffraction peaks of all registered crystallite phases indicates their small particle size and low crystallinity degree. These observations are in good consideration with previous studies of air pollutants [2, 4–5].
Additional information about chemical com-position, chemical bonds and surface functional groups of the studied PM material was obtained by IR study in far and middle infrared regions. Spectra are shown on Figure 3. Possibilities of this method are limited during multicomponent systems investi-gation and are reduced to determination of present functional groups in the studied sample. Conclusion concerning presence of definite chemical com-pound cannot be done because of partial and/or to-tal characteristic bands overlapping. Spectra analy-sis showed presence of inorganic carbonate(s) (714, 876, 1425 cm–1) and surface carbonate groups (714, 876, 1038, 1441, 1545, 1640, 1660, 1719 cm–1). About inorganic phosphate/ phosphate rests avail-ability can be judged from bands positioned at 529, 914, 1038, 1080 cm–1 since the range around 1000 cm–1 is characterized by increased absorption and it is typical of РО4 group vibrations. Sulfur contain-ing components of the studied sample were also registered by characteristic bands of sulfates (621, 1080 cm–1) and organic compounds containing thiol group S-H (664, 697, 1267, 2521 cm–1). Despite low
intensity of band at 2521 cm–1 it is considered indic-ative. In this case the low intensity is not a problem because the band is positioned in infrared region, which is relatively free of interferences. Organic rests were registered by bands characteristic of СН3 and СН2 groups (714, 730, 1267, 1384, 1466, 2852, 2924, 2957 cm–1) as it is possible to suppose that CH2 groups are more because of the increased inten-sity of bands at 2852 и 2924 cm–1 and availability of couple of bands at 714 и 730 cm–1. The investigated material surface moisture is associated with bands characteristic of presence of hydrogen bonded ОН groups (3424 cm–1), physically adsorbed water mol-ecules (1631 cm–1) and isolated on the surface ОН groups (3740 cm–1). Bands at 1038 и 3633 cm–1 are assigned to oxygen containing organic com-pound – primary alcohol. Infrared bands at 362, 412/420, 470, 529 cm–1 can be assigned to Fe-O vibration. Presence of nitrate (876, 1384 cm–1), sili-cate (517/520, 529, 1038, 1080 cm–1) and carbonyl (1719 cm–1) groups, and CC multiple bond (2170 cm–1) could not be excluded baring in mind elemen-tal analysis, XRD and MS data.
X-ray photoelectron spectroscopy has been ap-plied in order to monitor the surface element and their concentrations and ratios. Fig. 4 shows a sur-vey spectrum of investigated sample. The elements as Al, Si, C, O, N, Na and Cu have been detected on the surface and their calculated concentrations are summarized in Table 1. The determined binding energies of C1s (285.0 eV), Al2p (74.8 eV), Si2p (102.8 eV), O1s (532.2 eV), Ca2p (347.7 eV), N1s (400.0 eV), Na1s (1072.3 eV), Cl2p (199.2 eV), and Cu2p (933.3 eV) are typical for Si-O, Al-Si-O, Ca-
Fig. 3. Infrared spectra of powder PM in the middle (a) and in the far infrared regions (b).
Z. Cherkezova-Zheleva et al.: Challenges at characterization of particulate matter – a case study

97
CO3, C-H-N, C-H-NOx, C-H-N-Cl, Na-C-H-N-Cl, Cu-Cl-C-N-H-O, Cu-O bonding, respectively [12]. So, the analysis shows that the surface of investi-gated PM sample consists mainly of silicate, alu-mosilicate compounds and of organic and inorganic carbon phases.
So we have collected a data set of studied PM sample, however no clear conclusions about the presented chemical compounds, their quantity and dispersion were possible. On the other hand the iron is not the only transition metal found in par-ticulate matter, but it is one of the predominant ones. Furthermore the elemental analysis of sample showed a bigger iron content in studied PM than in the usual ones. In this regard 57Fe Mössbauer spec-troscopy was applied and this allows us to become deeper into the PM characteristics.
Mössbauer spectra of sample (Fig. 5) reveal a phase composition and dispersity of presented iron-contaning phases. Four sextet and two doublet com-ponents were obtained after spectrum evaluation. They have the characteristic parameters of phases presented in Table 2. The first sextet component has hyperfine parameters characteristic of hema-tite phase – α-Fe2O3. The calculated value of Heff is lower than the typical one of bulk hematite (52 T) which shows that particle size is about 20 nm [13–14]. Sextets 2 and 3 are characteristic for Fe3O4 which corresponds to iron in a tetrahedral (sublattice A) and octahedral (sublattice B) oxygen configura-tion in spinel Fe3+[Fe2+Fe3+]O4. Mössbauer spectrum of stoichiometric magnetite consists of two sextet components resultant from presence of Fe3+ in tetra-hedral position (Sxt2) and only one sextet (Sxt3) due
Fig. 4. Survey X-ray photoelectron spectrum of powder PM.
Table 1. Surface atomic concentration of powder PM
Elements C1s O1s Al2p Si2p Na1s Cl2p Ca2p Cu2p N1s
Concentration, at. % 48 31 3 12 0.42 1 3 0.22 1
Table 2. Mössbauer parameters obtained after PM spectrum evaluation
IS, mm/s QS, mm/s Heff, T FWHM, mm/s G, %
Sx1 0.37 –0.09 51.7 0.25 8Sx2 0.28 0.00 49.0 0.25 5Sx3 0.66 0.00 46.4 0.56 6Sx4 0.06 0.00 10.6 0.46 3Db 0.37 0.72 – 0.53 56Db 1.13 2.54 – 0.63 21
Fig. 5. Mössbauer spectrum of PM sample.
Z. Cherkezova-Zheleva et al.: Challenges at characterization of particulate matter – a case study

98
to electron dislocation between octahedrally coordi-nated ions Fe2+ and Fe3+, so-called mixed valency state Fe“2.5+” [13–14]. Partial oxidation of magnetite and/or the presence of maghemite phase – γ-Fe2O3 leads to a reduction of the “2.5+” component intensi-ty paralleled by an increase of the relative intensity of a sextet attributed to tetrahedrally-coordinated Fe3+. According to previous investigations the hy-perfine parameters of the fourth sextet should be re-garded to Fe0 in metal phase. IS not equal to 0mm/s, i.e. this is the intermetalic phase, which includes not only iron, but also other elements [13]. The first of doublet components (Dbl1), which is the main Fe-bearing phase presented in the spectrum of the sam-ple, show that Fe is in paramagnetic (glass phases, sulfates, etc.) or superparamagnetic (SPM) phases with nanometric size (oxides or hydroxides) [15–16]. The second paramagnetic component (Dbl 2) is indicative for the presence of Fe2+ in aluminosilicate glass, ankerite, iron-containing carbonates, biotite or other phase [15–17].
The obtained results using Mössbauer analysis were successfully combined with the observations of the other characterization methods in this study. This allows us to make conclusions about chemi-cal composition of studied PM sample, both crystal and amorphous phases, as well as about the quan-tity and dispersion of compounds. The main phases registered in the sample are silicate, aluminosilicate and sulfate compounds, as well as an organic and inorganic (carbonate and coal) carbon phases. The obtained bigger than usual content of iron in PM could be regarded to the airborn particles produced by transport and mainly by car engine performance [13]. The main source of silicate and aluminosili-cate compounds was recognised to be born by natu-ral and anthropogenic sources and the last ones are connected by street and house reparation activities [4–5]. Combustion products and residuals from the exhaust gases originating from power plants, small houses and different engines [1–5, 13, 15–16] could be also regarded to their sources after preparation of characterization procedure for atmospheric particu-late matter monitoring.
CONCLUSIONS
This paper is an investigation on the nature of particulate matter collected in the area of Orlov most square, in Sofia. The physicochemical char-acteristics of the studied PM sample revealed its high heterogeneity and complexity. It was shown that detailed information about iron-bearing com-pounds could be obtained using Mössbauer spec-troscopy, which allows us to get information about the phase composition and the size of the particles
because the hyperfine parameters are affected by the difference in the microscopic environments of the iron ions. Drawing conclusions from the experi-ments discussed in this study is not an easy task. It demonstrates that, in spite of advancements, a lot of efforts should be put in regard to suggest the com-mon characterization procedure to distinguish PM emissions from different sources or individual PM components. However we are motivated to continue to further progress. Preparation of a methodology will be used for quantifying and characterizing the PM and also will enable further activities in order to reduce the atmospheric PM pollution.
Acknowledgments: Authors gratefully acknowl-edge the financial support of the Bulgarian National Science Fund – Project DN 18/16/ 2017.
REFERENCES
1. F. J. Kelly, J. C. Fussell, Atmos. Environ., 60, 504 (2012).
2. H. Chen, A. Laskin, J. Baltrusaitis, C. A. Gorski, M. M. Scherer, V. H. Grassian, Environ. Sci. Technol., 46 (4), 2112 (2012).
3. J. M. Veranth, K. R. Smith, A. A. Hu, J. S. Lighty, A. E. Aust, Chem. Res. Toxicol., 13, 382 (2000).
4. J. Kukutschová, P. Moravec, V. Tomásek, V. Ma-tejka, J. Smolík, J. Schwarz, J. Seidlerová, K. Sa-fárová, P. Filip, Environ. Pollut., 159, 998 (2011).
5. S. S. Amaral, J. A. Carvalho Jr., M. A. Martins Costa, C. Pinheiro, Atmosphere, 6, 1327 (2015).
6. European Environment Agency, Air pollution fact sheet – Bulgaria, 2017.
7. N. Dimov, Report of the Ministry of Environment and Water, 2017 (in Bulgarian).
8. D. Stoyanov, T. Dreischuh, I. Grigorov, G. Kolarov, A. Deleva, Z. Peshev, I. Nedkov, in: Proceedings Sixth Scientific Meeting – EuNetAir AMA.
9. JCPDS International Center for Diffraction Data, Power Diffraction File, Swarthmore, PA, 1991.
10. D. Shirley, Phys. Rev. B, 5, 4709 (1972).11. J. H. Scofield, J. Electron Spectrosc. Relat. Phenom.,
8, 129 (1976).12. Moulder, F., Sticke, W. F., Sobol, P. E., Bombel,
K. D. (1992). Handbook of X-ray Photoelectron Spec troscopy (vol. Second edition), J. Castain (ed.) Minnesota, USA, Perkin-Elmer Corporation, Physical Electron Division.
13. A. R. Muxworthy, E. Schmidbauer, N. Petersen, Geophys. J. Int., 150, 558 (2002).
14. J. Fock, M. F. Hansen, C. Frandsen, S. Mørup, J. Magn. Magn. Mater., 445, 11 (2018).
15. R. Vandenberghe, V. G. De Resende, E. De Grave, Hyperfine Interact., 191, 44 (2009).
16. T. Szumiata, K. Brzózka, B. Górka, M. Gawroński, M. Gzik-Szumiata, R. Świetlik, M. Trojanowska, Hyperfine Interact., 226, 483 (2014).
17. E. De Grave, R. Vochten, Phys. Chem. Miner., 12, 108 (1985).
Z. Cherkezova-Zheleva et al.: Challenges at characterization of particulate matter – a case study

99© 2018 Bulgarian Academy of Sciences, Union of Chemists in Bulgaria
* To whom all correspondence should be sent:
Bulgarian Chemical Communications, Volume 50, Special Issue F (pp. 99–106) 2018
Mg- and Zn-modified calcium phosphate fine powders examined by Rietveld refinement
K. Sezanova*, D. Kovacheva, D. Rabadjieva, R. Gergulova
Institute of General and Inorganic Chemistry, Bulgarian Academy of Sciences, Acad. G. Bonchev Str., Bl. 11, 1113 Sofia, Bulgaria
Received October 23, 2018; Accepted November 30, 2018
Fine powders, consisting of single phase Mg- or Zn-modified β-tricalcium phosphate (Mg/Zn-β-TCP) or biphase mixture of Mg/Zn-β-TCP and hydroxyapatite (HA) with a (Ca+Mg+Zn)/P ratio of 1.3–1.4 and Me/(Me+Ca) (Me = Mg, Zn) molar ratios from 0 to 0.10 were prepared by a two-step method: (i) continuous precipitation in biomimetic electrolyte systems of simulated body fluids, keeping pH=8; and (ii) step-wise calcination to 1000 °C. Rietveld refine-ment of the XRD data was performed. The refinement confirms that both Mg2+ and Zn2+ ions substitute the Ca2+ ions in the octahedral Ca(5) sites of Mg/Zn-β-TCP, which results in a decreasing trend of Ca(5)-O average distances and a and c cell parameters. The contraction of the crystal lattice is more pronounced for the Zn-substituted samples due to differences in the preferred coordination polyhedrons оf Zn and Mg. The results also show that in the case of Mg substitution, as well as for the low levels of Zn substitutions, Ca(1), Ca(2) and Ca(3) positions remain fully occupied by Ca2+ ions. For high levels of Zn substitution Ca(1) and Ca(2) are partially occupied by Ca2+ ions, thus calcium va-cancies appear. The latter affects the values of Ca(2)-O and Ca(4)-O mean distances by increasing them.
Keywords: Mg-β-TCP, Zn-β-TCP, biomimetic synthesis, Rietveld refinement.
E-mail: [email protected]
INTRODUCTION
The studies on the preparation of various nano-sized calcium phosphate apatites having predeter-mined structure and properties [1], applicable to bone reconstruction and remodeling, have gained increasing interest in the development of new bio-compatible materials. Of particular interest are ion-modified calcium phosphates that have a concentra-tion of ionic substituent higher than that in the bone, since they may have additional antimicrobial prop-erties, may increase the solubility of the ceramic material, or be a depot for the release of biogenic elements. In this sense, there is a scientific interest in obtaining ion-substituted calcium phosphates and studying the impact of additives on their chemical and structural parameters. Among the substitutents, Mg and Zn are the preferable ones due to their significance for the living organisms. Magnesium is widely studied, being the fourth most abundant cation in the human body [2]. Enamel, dentin and bone contain 0.44, 1.23, and 0.72 wt% of Mg, re-spectively [3]. This element plays an important
role in the formation and initial growth of the bone tissue, stimulating osteoblast proliferation [4]. Zn content ranges from 0.0126 to 0.0217 wt% in hu-man bones [5] and this element is important for the normal growth and development of the skeletal sys-tem, so its deficiency is associated with a decrease in bone density [6]. Mg2+ and Zn2+ ions participate by modifying morphology and crystallinity (inhibit it) of biological apatite [7–8]. Thus, they are used as additives in calcium phosphate materials that favor bone self-recovery rather than entirely replacing it [9].
The synthesis of Mg- and Zn-containing calcium phosphates could be performed through both solid-state reaction and wet chemical synthesis. Studies in the literature are mainly directed to the prepa-ration of Mg- and Zn-substituted hydroxyapatite and a series of solid solutions with varying con-tent of substituting ions are produced and charac-terized [10–13]. In recent years, ionic substituents in β-TCP (β-Ca3(PO4)2) are of great interest due to their favorable features like higher solubility than hydroxyapatite and thus active participation in the process of bone regeneration [15–17].
In our previous works [18, 19] we have studied the metastable and stable equilibria during the pre-cipitation of Mg- and Zn-substituted calcium phos-

100
phates in biomimetic conditions and the influence of type and concentration of substituent ions on the phase composition by low- and high-temperature transformations.
The aims of this work were to enlarge our studies on biomimetically prepared Mg- and Zn-modified fine powders, consisting of single phase Mg- or Zn-modified β-tricalcium phosphate (Mg/Zn-β-TCP) or biphase mixture of Mg/Zn-β-TCP and HA by Rietveld refinement of the XRD data and to com-pare their structural characteristics.
MATERIALS AND METHODS
Preparation of samples
The detailed description of the precipitation con-ditions is given elsewhere [18, 19]. Briefly, Mg- and Zn-modified calcium phosphate precursors were biomimetically synthesized in an electrolyte medium of simulated body fluids (SBFs). Modified simulated body fluids (Table 1) were prepared on the base of the well-known conventional SBF [20]. Modified calcium-free conventional simulated body fluid (SBFc-mCa) was used as a solvent for K2HPO4. Modified phosphorus-free conventional simulated body fluids (SBFc-mP1 and SBFc-mP2) were used as solvents for CaCl2 and MgCl2 or ZnCl2, respec-tively (Table 1), thus, preliminary precipitation and seed formation were avoided. The pH of the solu-tions SBFc-mP1 and SBFc-mCa was adjusted to 8 using 0.1 M HCl or 0.05 M Tris (hydroxymethyl) aminomethane, while the pH of SBFc-mP2 was ad-justed to 6 owing to the formation of Zn hydroxy salts at higher pH. Analytical grade (A.R.) reagents were used.
The method of continuous precipitation was ap-plied and all three reagents (SBFc-mP1, SBFc-mP2
and SBFc-mCa) were dropwise added to a glycine buffer medium with a rate of 3 ml/min, keeping pH = 8 by 1M KOH at room temperature.
The precipitates were matured in the mother liq-uid for 24 h at room temperature, washed and lyo-philized.
The dry precursors were stepwise calcined at 200, 400, 600, 800 and 1000 °C at atmospheric pressure in a high-temperature furnace, type VP 04/17 of LAC Ltd Company. The working regime was: heating with a rate of 3 °C/min until the de-sired temperature was reached and keeping it con-stant for 3 h.
Characterization
Chemical analysis. The sum of Ca2+, Mg2+ and Zn2+ ions in the solid samples was determined com-plexometrically with EDTA at pH 10. The con-centrations of Zn2+, Mg2+, K+ and Na+ ions were determined by ICP-OES (PRODIGY 7, Teledyne Leeman Labs, USA) and the concentrations of PO4
3– and Cl– ions were determined spectrophoto-metrically by NOVA 60 equipment using Merck and Spectroquant® test kits.
X-ray diffraction analysis. The phase transfor-mations of the amorphous precursor to crystalline products in high-temperature treated calcium phos-phates were studied by a Bruker D8 advance XRD equipment operating at 40 kV and 40 mA with CuKa radiation and LynxEye detector within the 2θ range of 5.4–120° 2θ with a step of 0.02° 2θ and over-all counting time of 175 s/step. The phase analysis was performed with the Eva program using ICDD-PDF2 (2014) database. The main calcium phos-phate phases in the studied samples corresponded to β-TCP (β-Ca3(PO4)2 – PDF # 09-0169) and HA, (Ca5(PO4)3(OH) – PDF # 09-0432).
Table 1. Ion content (mmol/l) of the initial solutions
Ion content SBFc [20] SBFc-mCa SBFc-mP1 SBFc-mP2
Na+ 142.0 141.9 141.9 141.9K+ 5.0 506.4 3.0 3.0Mg2+ 1.5 1.5 x 1.5Ca2+ 2.5 – 418.9 - x 418.9 – xZn2+ – – – хCl– 147.8 142.8 975.6 975.6SO4
2– 0.5 0.5 0.5 0.5HCO3
– 4.2 4.2 4.2 4.2HPO4
2– 1.0 251.7 – –
x = 0–83.9 mmol/l
K. Sezanova et al.: Mg- and Zn-modified calcium phosphate fine powders examined by Rietveld refinement
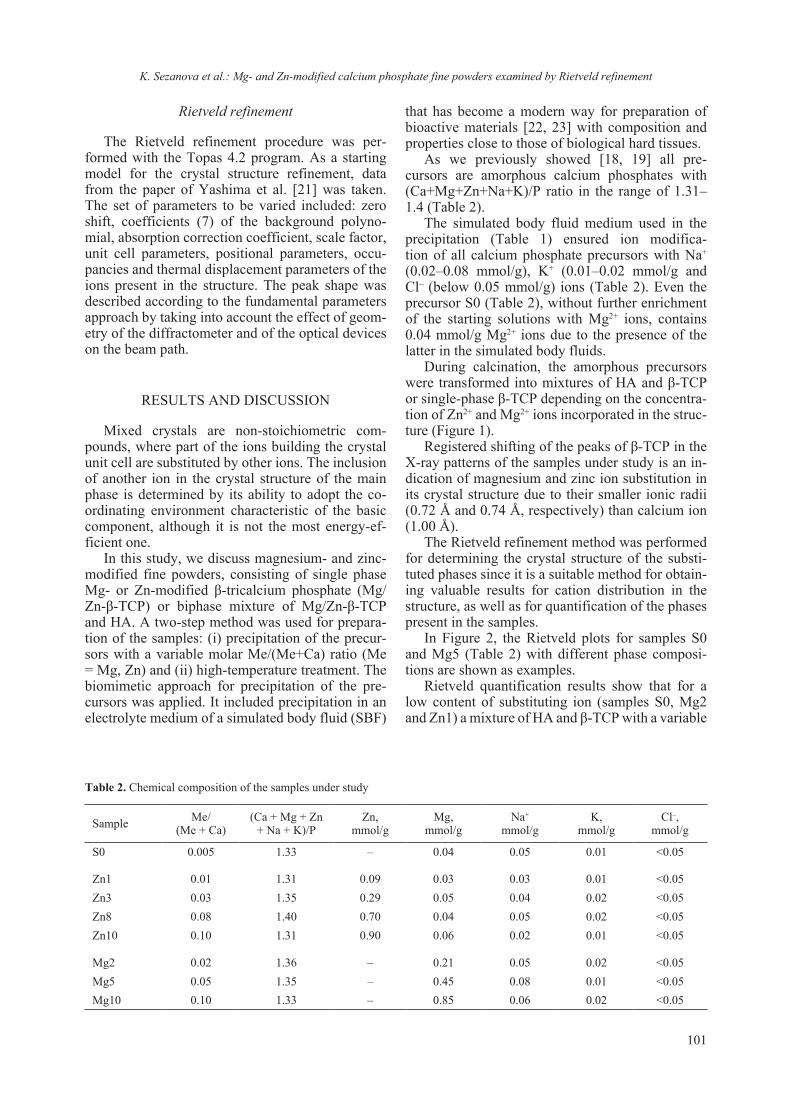
101
Rietveld refinement
The Rietveld refinement procedure was per-formed with the Topas 4.2 program. As a starting model for the crystal structure refinement, data from the paper of Yashima et al. [21] was taken. The set of parameters to be varied included: zero shift, coefficients (7) of the background polyno-mial, absorption correction coefficient, scale factor, unit cell parameters, positional parameters, occu-pancies and thermal displacement parameters of the ions present in the structure. The peak shape was described according to the fundamental parameters approach by taking into account the effect of geom-etry of the diffractometer and of the optical devices on the beam path.
RESULTS AND DISCUSSION
Mixed crystals are non-stoichiometric com-pounds, where part of the ions building the crystal unit cell are substituted by other ions. The inclusion of another ion in the crystal structure of the main phase is determined by its ability to adopt the co-ordinating environment characteristic of the basic component, although it is not the most energy-ef-ficient one.
In this study, we discuss magnesium- and zinc-modified fine powders, consisting of single phase Mg- or Zn-modified β-tricalcium phosphate (Mg/Zn-β-TCP) or biphase mixture of Mg/Zn-β-TCP and HA. A two-step method was used for prepara-tion of the samples: (i) precipitation of the precur-sors with a variable molar Me/(Me+Ca) ratio (Me = Mg, Zn) and (ii) high-temperature treatment. The biomimetic approach for precipitation of the pre-cursors was applied. It included precipitation in an electrolyte medium of a simulated body fluid (SBF)
that has become a modern way for preparation of bioactive materials [22, 23] with composition and properties close to those of biological hard tissues.
As we previously showed [18, 19] all pre-cursors are amorphous calcium phosphates with (Ca+Mg+Zn+Na+K)/P ratio in the range of 1.31–1.4 (Table 2).
The simulated body fluid medium used in the precipitation (Table 1) ensured ion modifica-tion of all calcium phosphate precursors with Na+ (0.02–0.08 mmol/g), K+ (0.01–0.02 mmol/g and Cl– (below 0.05 mmol/g) ions (Table 2). Even the precursor S0 (Table 2), without further enrichment of the starting solutions with Mg2+ ions, contains 0.04 mmol/g Mg2+ ions due to the presence of the latter in the simulated body fluids.
During calcination, the amorphous precursors were transformed into mixtures of HA and β-TCP or single-phase β-TCP depending on the concentra-tion of Zn2+ and Mg2+ ions incorporated in the struc-ture (Figure 1).
Registered shifting of the peaks of β-TCP in the X-ray patterns of the samples under study is an in-dication of magnesium and zinc ion substitution in its crystal structure due to their smaller ionic radii (0.72 Å and 0.74 Å, respectively) than calcium ion (1.00 Å).
The Rietveld refinement method was performed for determining the crystal structure of the substi-tuted phases since it is a suitable method for obtain-ing valuable results for cation distribution in the structure, as well as for quantification of the phases present in the samples.
In Figure 2, the Rietveld plots for samples S0 and Mg5 (Table 2) with different phase composi-tions are shown as examples.
Rietveld quantification results show that for a low content of substituting ion (samples S0, Mg2 and Zn1) a mixture of HA and β-TCP with a variable
Table 2. Chemical composition of the samples under study
Sample Me/(Me + Ca)
(Ca + Mg + Zn + Na + K)/P
Zn,mmol/g
Mg,mmol/g
Na+
mmol/gK,
mmol/gCl–,
mmol/g
S0 0.005 1.33 – 0.04 0.05 0.01 <0.05
Zn1 0.01 1.31 0.09 0.03 0.03 0.01 <0.05Zn3 0.03 1.35 0.29 0.05 0.04 0.02 <0.05Zn8 0.08 1.40 0.70 0.04 0.05 0.02 <0.05Zn10 0.10 1.31 0.90 0.06 0.02 0.01 <0.05
Mg2 0.02 1.36 – 0.21 0.05 0.02 <0.05Mg5 0.05 1.35 – 0.45 0.08 0.01 <0.05Mg10 0.10 1.33 – 0.85 0.06 0.02 <0.05
K. Sezanova et al.: Mg- and Zn-modified calcium phosphate fine powders examined by Rietveld refinement
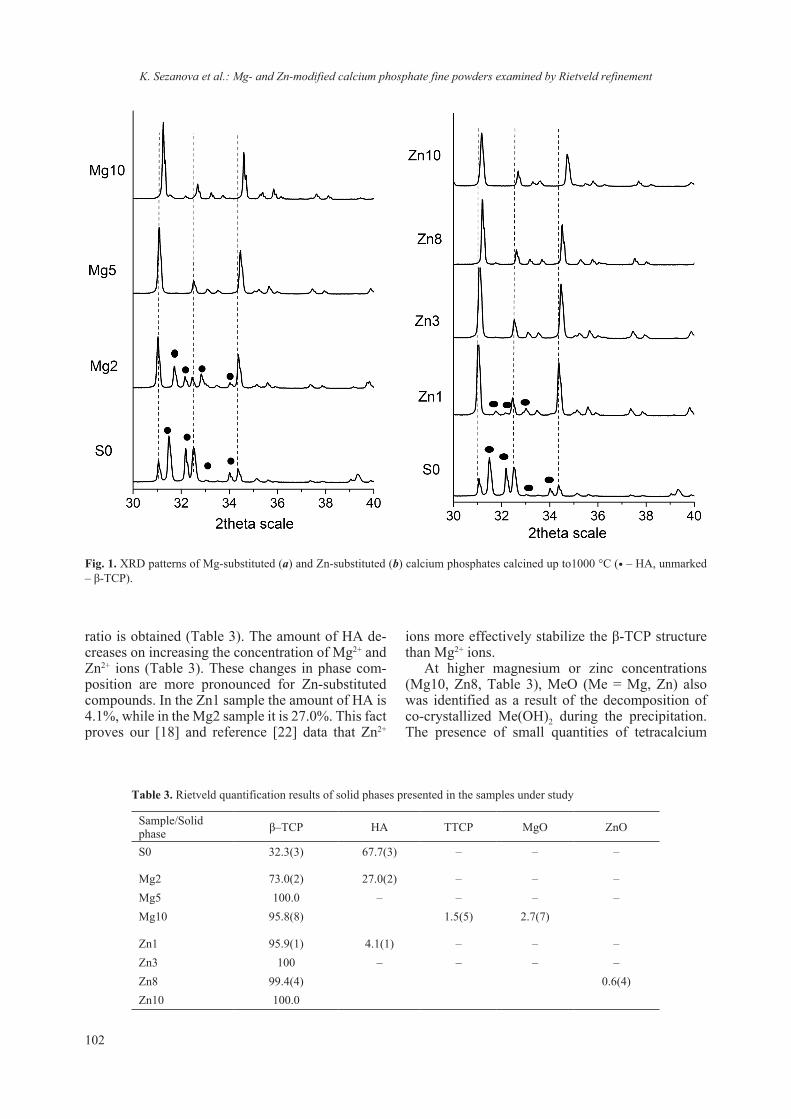
102
Fig. 1. XRD patterns of Mg-substituted (a) and Zn-substituted (b) calcium phosphates calcined up to1000 °C (• – HA, unmarked – β-TCP).
ratio is obtained (Table 3). The amount of HA de-creases on increasing the concentration of Mg2+ and Zn2+ ions (Table 3). These changes in phase com-position are more pronounced for Zn-substituted compounds. In the Zn1 sample the amount of HA is 4.1%, while in the Mg2 sample it is 27.0%. This fact proves our [18] and reference [22] data that Zn2+
Table 3. Rietveld quantification results of solid phases presented in the samples under study
Sample/Solid phase β–TCP HA TTCP MgO ZnO
S0 32.3(3) 67.7(3) – – –
Mg2 73.0(2) 27.0(2) – – –Mg5 100.0 – – – –Mg10 95.8(8) 1.5(5) 2.7(7)
Zn1 95.9(1) 4.1(1) – – –Zn3 100 – – – –Zn8 99.4(4) 0.6(4)Zn10 100.0
ions more effectively stabilize the β-TCP structure than Mg2+ ions.
At higher magnesium or zinc concentrations (Mg10, Zn8, Table 3), MeO (Me = Mg, Zn) also was identified as a result of the decomposition of co-crystallized Me(OH)2 during the precipitation. The presence of small quantities of tetracalcium
K. Sezanova et al.: Mg- and Zn-modified calcium phosphate fine powders examined by Rietveld refinement

103
Fig. 2. Comparison of the observed and calculated powder diffraction patterns and the different profiles: (a) sample S0; (b) sample Mg5.
(a)
(b)
phosphate (TTCP) is a result of thermal decomposi-tion of calcium-deficient apatite [16].
Тhe main phase in the obtained by us Mg- and Zn modified calcium phosphate powders is β-TCP. It crystallizes into a rhombohedral crystalline system, a space group R3c, with crystal lattice parameters: a = b = 10.439(1), c = 37.375(6) Å; γ = 120° [24]. The structure consists of isolated PO4 tetrahedrons forming disrupted layers perpendicular to c-axis.
Five crystallographically different Ca sites – Ca(1), Ca(2), Ca(3), Ca(4) and Ca(5) can be found in this structure. Each calcium ion is coordinated with different number oxygen atoms from PO4 groups. The position Ca(4) is threefold coordinated with oxygen atoms and has a partial occupancy factor of 0.5. Each of the Ca(1), Ca(2), Ca(3), and Ca(5) is fully occupied by Ca ions and these positions are coordinated with seven, eight, eight, and six oxygen
K. Sezanova et al.: Mg- and Zn-modified calcium phosphate fine powders examined by Rietveld refinement
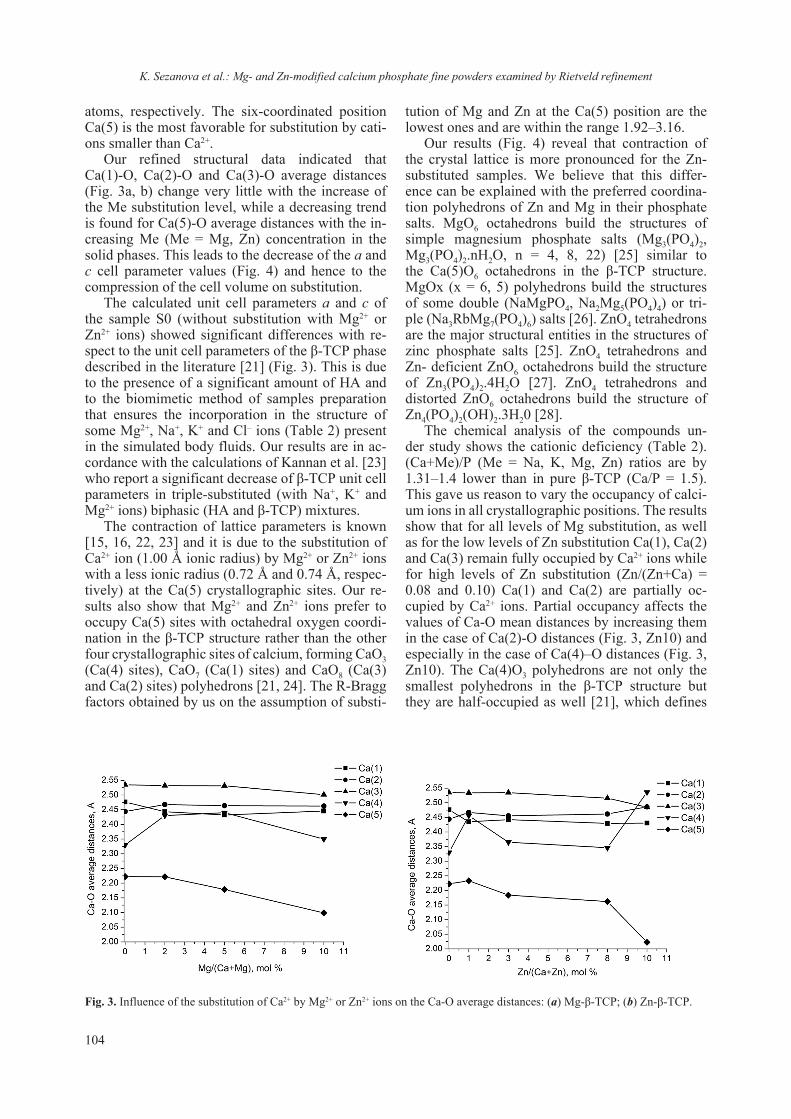
104
atoms, respectively. The six-coordinated position Ca(5) is the most favorable for substitution by cati-ons smaller than Ca2+.
Our refined structural data indicated that Ca(1)-O, Ca(2)-O and Ca(3)-O average distances (Fig. 3a, b) change very little with the increase of the Me substitution level, while a decreasing trend is found for Ca(5)-O average distances with the in-creasing Me (Me = Mg, Zn) concentration in the solid phases. This leads to the decrease of the a and c cell parameter values (Fig. 4) and hence to the compression of the cell volume on substitution.
The calculated unit cell parameters a and c of the sample S0 (without substitution with Mg2+ or Zn2+ ions) showed significant differences with re-spect to the unit cell parameters of the β-TCP phase described in the literature [21] (Fig. 3). This is due to the presence of a significant amount of HA and to the biomimetic method of samples preparation that ensures the incorporation in the structure of some Mg2+, Na+, K+ and Cl– ions (Table 2) present in the simulated body fluids. Our results are in ac-cordance with the calculations of Kannan et al. [23] who report a significant decrease of β-TCP unit cell parameters in triple-substituted (with Na+, K+ and Mg2+ ions) biphasic (HA and β-TCP) mixtures.
The contraction of lattice parameters is known [15, 16, 22, 23] and it is due to the substitution of Ca2+ ion (1.00 Å ionic radius) by Mg2+ or Zn2+ ions with a less ionic radius (0.72 Å and 0.74 Å, respec-tively) at the Ca(5) crystallographic sites. Our re-sults also show that Mg2+ and Zn2+ ions prefer to occupy Ca(5) sites with octahedral oxygen coordi-nation in the β-TCP structure rather than the other four crystallographic sites of calcium, forming CaO3 (Ca(4) sites), CaO7 (Ca(1) sites) and CaO8 (Ca(3) and Ca(2) sites) polyhedrons [21, 24]. The R-Bragg factors obtained by us on the assumption of substi-
tution of Mg and Zn at the Ca(5) position are the lowest ones and are within the range 1.92–3.16.
Our results (Fig. 4) reveal that contraction of the crystal lattice is more pronounced for the Zn-substituted samples. We believe that this differ-ence can be explained with the preferred coordina-tion polyhedrons оf Zn and Mg in their phosphate salts. MgO6 octahedrons build the structures of simple magnesium phosphate salts (Mg3(PO4)2, Mg3(PO4)2.nH2O, n = 4, 8, 22) [25] similar to the Ca(5)O6 octahedrons in the β-TCP structure. MgOx (x = 6, 5) polyhedrons build the structures of some double (NaMgPO4, Na2Mg5(PO4)4) or tri-ple (Na3RbMg7(PO4)6) salts [26]. ZnO4 tetrahedrons are the major structural entities in the structures of zinc phosphate salts [25]. ZnO4 tetrahedrons and Zn- deficient ZnO6 octahedrons build the structure of Zn3(PO4)2.4H2O [27]. ZnO4 tetrahedrons and distorted ZnO6 octahedrons build the structure of Zn4(PO4)2(OH)2.3H20 [28].
The chemical analysis of the compounds un-der study shows the cationic deficiency (Table 2). (Ca+Me)/P (Me = Na, K, Mg, Zn) ratios are by 1.31–1.4 lower than in pure β-TCP (Ca/P = 1.5). This gave us reason to vary the occupancy of calci-um ions in all crystallographic positions. The results show that for all levels of Mg substitution, as well as for the low levels of Zn substitution Ca(1), Ca(2) and Ca(3) remain fully occupied by Ca2+ ions while for high levels of Zn substitution (Zn/(Zn+Ca) = 0.08 and 0.10) Ca(1) and Ca(2) are partially oc-cupied by Ca2+ ions. Partial occupancy affects the values of Ca-O mean distances by increasing them in the case of Ca(2)-O distances (Fig. 3, Zn10) and especially in the case of Ca(4)–O distances (Fig. 3, Zn10). The Ca(4)O3 polyhedrons are not only the smallest polyhedrons in the β-TCP structure but they are half-occupied as well [21], which defines
Fig. 3. Influence of the substitution of Ca2+ by Mg2+ or Zn2+ ions on the Ca-O average distances: (a) Mg-β-TCP; (b) Zn-β-TCP.
K. Sezanova et al.: Mg- and Zn-modified calcium phosphate fine powders examined by Rietveld refinement

105
their stronger dependence on other structural de-fects like additional calcium deficiency. Hence, the chemical formula of the β-TCP phases in our cases may be written as shown in Table 4.
The differences in Me/(Ca+Me) ratio (Me=Mg, Zn) obtained by chemical (Table 2) and Rietveld (Table 4) analysis revealed that not the entire amount of Mg2+ and Zn2+ ions present in the solid phases is included in the β-TCP crystal structure. The Ritveld analysis applied by us in this study con-firmed our previous assumptions [18, 19] that pre-
cipitation, co-precipitation, ion substitution and ion inclusion reactions take place simultaneously in the complicated electrolyte system of SBFs in particu-lar, and in the natural body fluids in general.
CONCLUSIONS
Zn or Mg modified, cation deficient amorphous phosphates ((Ca+Mg+Zn+Na+K)/P = 1.3–1.4) were prepared by biomimetic approach, that ensures
Fig. 4. Influence of the substitution of Ca2+ by Mg2+ or Zn2+ ions on the unit cell parameters a (а) and c (b) and the cell volume (c) of the Me-β-TCP structure.
Table 4. Chemical formulas of β-TCP phases according Rietveld analysis
Sample Formula Me/(Ca+Me)
Mg2 Ca2.94Mg0.06P2O8 0.02Mg5 Ca2.905Mg0.095P2O8 0.032Mg10 Ca2.758Mg0.242P2O8 0.08Zn1 Ca2.99Zn0.01P2O8 0.003Zn3 Ca2.915Zn0.085P2O8 0.028Zn8 Ca2.820Zn0.146□0.034P2O8 0.049Zn10 Ca2.805Zn0.195□0.065P2O8 0.065
K. Sezanova et al.: Mg- and Zn-modified calcium phosphate fine powders examined by Rietveld refinement

106
ion modification of all calcium phosphates with Na+ (0.02–0.08 mmol/g), K+ (0.01–0.02 mmol/g and Cl– (below 0.05 mmol/g) ions. During the calci-nation till 1000 °C, mixtures of HA and β-TCP or single-phase β-TCP depending on the concentration of Zn2+ and Mg2+ ions incorporated in the structure were obtained. At high Mg concentration other phases as MgO and TTCP were identified in neg-ligible amount.
The Rietweld refinement have confirmed both Mg2+ and Zn2+ ions substitute the Ca2+ ions on the octahedral Ca(5) sites of Mg/Zn- β-TCP. Lower ionic radii of Mg and Zn ions leads to decreasing trend in a and c axis parameter values and Ca(5) – O distances with the increasing Me (Me = Mg, Zn) concentration in the solid phases. Decreasing in cell parameter values is more pronounced at Zn sub-stituted samples due to differences in the preferred coordination polyhedrons оf Zn and Mg. Contrary, appearing of calcium vacancies in Ca(1) and Ca(2) sites at high levels of Zn substitution increase Ca(2) – O and Ca(4)–O mean distances.
REFERENCES
1. K. L. Lin, C. T. Wu, J. Chang, Acta Biomater., 10, 4071 (2014).
2. I. Cacciotti, A. Bianco, M. Lombardi, L. Montanaro, J. Eur. Ceram. Soc., 29, 2969 (2009).
3. R. Z. LeGeros, Calcium Phosphates in Oral Biology and Medicine. Monographs in Oral Sciences, KargerBasel, Switzerland, Basel, 1991.
4. K. Lilley, U. Gbureck, J. Knowles, D. Farrar, J. Barralet, J. Mater. Sci.: Mater. Med., 16, 455 (2005).
5. W. J. Bettger, B. L. O’dell, J. Nutr. Biochem., 4, 194 (1993).
6. A. M. Pietak, J. W. Reid, M. Sayer, Biomater., 26, 3819 (2005)
7. B. R. Constantz, I. C.Ison, M. T. Fulmer, R. D. Poser, S. T. Smith, M. VanWagoner, J. Ross, S. A.
Goldstein, J. B. Jupiter, D. I. Rosenthal, Science, 267, 1796 (1995).
8. A. K. Lynn, W. Bonfield, Acc. Chem. Res., 38, 202 (2005).
9. X. Luo, D. Barbieri, N. Davison, Y. Yan, J. D. de Bruijnac, H. Yuan, Acta Biomater., 10, 477 (2014).
10. S. J. Kalita, H. A. Bhatt, Mater. Sci. Eng. C, 27, 837 (2007).
11. F. Ren, R. Xin, X. Ge, Y. Leng, Acta Biomater., 5, 3141 (2009).
12. D. Shepherd, S. M Best, Biomed. Mater., 8, 025003 (2013).
13. R. J. Friederichs, H. F. Chappell, D. V. Shepherd, S. M. Best, J. R. Soc. Interface, 12, 20150190 (2015).
14. I. R. Zerbo, A. L. J. J. Bronckers, G. deLange, E. H. Burger, Biomater., 26, 1445 (2005)
15. A. Ito, R. Z. LeGeros, Key Eng. Mater., 377, 85 (2008).
16. S. Kannan, F. Goetz-Neunhoeffer, J. Neubauer, J. M. F. Ferreira, J. Am. Ceram. Soc., 94, 230 (2011).
17. S. Pina, P. M. C. Torres, J. M. F. Ferreira, J. Mater. Sci.: Mater. Med., 21, 431 (2010).
18. D. Rabadjieva, S. Tepavitcharova, R. Gergulova, K. Sezanova, R. Titorenkova, O. Petrov, E. Dyulgerova, J. Mater. Sci: Mater. Med., 22, 2187 (2011).
19. D. Rabadjieva, S. Tepavitcharova, K. Sezanova, R. Gergulova, J. Solution Chem., 45, 1620 (2016).
20. T. Kokubo, J. Non-Cryst. Solids, 120, 138 (1990); 21. M. Yashima, A. Sakai, T. Kamiyama, A. Hoshikawa,
J. Solid State Chem., 175, 272 (2003).22. S. Kannan, F. Goetz-Neunhoeffer, J. Neubauer, J. M.
F. Ferreiraw, J. Am. Ceram. Soc., 92, 1592 (2009).23. S. Kannan, F. Goetz-Neunhoeffer, J. Neubauer, J. M.
F. Ferreiraw, J. Am. Ceram. Soc., 91, 1 (2008).24. B. Dickens, L. W. Schroeder, W. E. Brown, J. Solid
State Chem., 10, 232 (1974)25. D. M.C. Huminicki, F. C. Hawthorne, Reviews in
Mineralogy and Geochemistry, 48, 123 (2002).26. T. Ben Hamed, A. Boukhris, A. Badri, M. Ben
Amara, Acta Cryst., E73, 817 (2017).27. J. H. Roderic, J. B. Jones, Am. Mineral., 61, 987
(1976).28. L. Fanfani, A. Nunzi, P.F. Zanazzi, Mineral. Mag.,
38, 687 (1972).
K. Sezanova et al.: Mg- and Zn-modified calcium phosphate fine powders examined by Rietveld refinement

107© 2018 Bulgarian Academy of Sciences, Union of Chemists in Bulgaria
* To whom all correspondence should be sent:
Bulgarian Chemical Communications, Volume 50, Special Issue F (pp. 107–114) 2018
Polydentate ligands combining pirlinidole and piperazine fragments
V. B. Kurteva1*, B. L. Shivachev2, R. P. Nikolova2
1 Institute of Organic Chemistry with Centre of Phytochemistry, Bulgarian Academy of Sciences, Acad. G. Bonchev street, bl. 9, 1113 Sofia, Bulgaria
2 Institute of Mineralogy and Crystallography “Acad. Ivan Kostov”, Bulgarian Academy of Sciences, Acad. G. Bonchev street, bl. 107, 1113 Sofia, Bulgaria
Received October 23, 2018; Accepted November 30, 2018
A series of polydentate ligands possessing pirlindole and piperazine fragments are synthesized. Their structures are assigned by 1D and 2D NMR spectra and confirmed by single crystal XRD of selected samples.
Keywords: pirlindole, piperazine, NMR, single crystal XRD.
E-mail: [email protected]
INTRODUCTION
Heterocyclic compounds constitute the larg-est group of organic compounds with a wide range of applications, namely as ligands in coordination chemistry, catalysts, pharmaceuticals, agrochemi-cals, veterinary products, etc. [1–6]. In particular, nitrogen-containing heterocycles have shown re-markable coordination abilities and are widely found in natural products and pharmaceuticals [7–11]. Driven by the ubiquitous occurrence of N-heterocycles, their economic importance and ac-ademic significance, the preparation of libraries of novel molecules is still among the main goals of the synthetic organic chemistry [12, 13].
Pirlindole, known also as pyrazidole, is a tet-racyclic compound with antidepressant properties [14–20], which is clinically used as a psychotropic drug nowadays [21]. From the other side, pipera-zine derivatives have shown remarkable variety of biological activity profiles [22–30]. In a search of novel bioactive compounds, arose the idea to com-bine both fascinating units in a common molecule. In the same time, the designed compounds 4, shown on Fig. 1, possess four inequivalent nitrogens, which make them perspective candidates for coordination applications.
Herein, we report on the synthesis and solution and solid state characterization of a series of poly-dentate ligands, possessing bridged pirlindole and piperazine fragments.
EXPERIMENTAL
Synthesis
General: All reagents were purchased from Aldrich, Merck and Fluka and were used without any further purification. The deuterated solvents were purchased from Deutero GmbH. Fluka silica gel (TLC-cards 60778 with fluorescent indica-tor 254 nm) were used for TLC chromatography and Rf-values determination. Merck Silica gel 60 (0.040–0.063 mm) was used for flash chromatog-raphy purification of the products. The melting points were determined in capillary tubes on SRS MPA100 OptiMelt (Sunnyvale, CA, USA) auto-mated melting point system. The NMR spectra were recorded on a Bruker Avance II+ 600 spectrometer (Rheinstetten, Germany) in CDCl3; the chemical shifts were quoted in ppm in δ-values against tetra-methylsilane (TMS) as an internal standard and the coupling constants were calculated in Hz. The spec-tra were processed with Topspin 3.5.5 program. The numeration schemes of the compounds are given on Fig. 1. The turbo spray mass spectra were taken on API 150EX (AB/MAS Sciex) mass-spectrometer. The yields, melting points and Rf -values are listed on Table 2.

108
Fig. 1. Numeration schemes of compounds 4a-4d. The numeration in chloride 2 follows the same scheme.
Table 1. Crystal data and the most important structure refinement indicators for compounds 4a and 4b
4a 4b
Chemical formula C29H36N4O C29H34FN4OMW 456.62 473.60Crystal system, space group Triclinic, P-1 Triclinic, P-1Temperature (K) 290 290a, b, c (Å) 9.3374 (5), 12.0577 (5), 12.2983 (6) 9.4517(12). 12.1050(11), 12.6200(14)α, β, γ (°) 110.962 (4), 104.727 (5), 90.867 (4) 69.079(18), 69.957(14), 89.335(14)V (Å3) 1241.86 (11) 1256.9(3)Z 2 2Radiation type Mo Kα, λ = 0.71073 Mo Kα, λ = 0.71073µ (mm−1) 0.08 0.082Crystal size (mm3) 0.3 × 0.25 × 0.12 0.32 × 0.3 × 0.28
Diffractometer SuperNova, Dual, Cu at zero, Atlas, diffractometer Enraf Nonius CAD4
Absorption correction Multi-scan noneTmin, Tmax 0.775, 1.000 0.910, 1.000No. of measured, independent and ob-served [I > 2σ(I)] reflections 11845, 5650, 3716 7594, 7198, 3168
Rint 0.032 0.025(sin θ/λ)max (Å−1), 0.685R[F2 > 2σ(F2)], wR(F2), S 0.064, 0.179, 1.03 0.0837, 0.207, 1.09No. of reflections 5650 7198No. of parameters 308 317No. of restraints 0 0H-atom treatment constrained constrainedΔρmax, Δρmin (e Å−3) 0.20, −0.22 0.38, -0.31CCDC number 1875825 1875826
Compound 2: To a solution of pyrazidol (free base, 10 mmol) in dry DCM (25 ml), K2CO3 (30 mmol) and then 4-chlorobutyryl chloride (10 mmol) were added and the suspension was stirred at room tem-perature for 45 min. The products were partitioned between DCM and water. The organic phase was washed with water, dried over anhydrous Na2SO4, and evaporated to dryness to give the crude chloride 2, which was pure enough (NMR) and was further
used without purification: 75% yield; Rf 0.67 (5% MeOH/DCM); NMR (293К) 1Н 1.393 (bs, 1H, ½ CH2-4), 1.988 (m, 1H, ½ CH2-5), 2.154 (m, 1H, ½ CH2-5), 2.213 (m, 3H, CH2-3’ + ½ CH2-4), 2.452 (s, 3H, CH3), 2.645 (m, 3H, CH2-2’ + ½ CH2-4), 2.698 (bm, 1H ½ CH2-6), 2.798 (bm, 1H, ½ CH2-6), 3.135 (bs, 1H, ½ CH2-2), 3.695 (t, 2H, J 5.7, CH2-4’), 3.998 (bs, 1H, ½ CH2-1), 4.132 (bs, 1H, ½ CH2-1), 4.944 (bs, 1H, ½ CH2-2), 5.225 (bs, 1H, CH-3a),
V. B. Kurteva et al.: Polydentate ligands combining pirlinidole and piperazine fragments
109
7.024(dd, 1H, J 1.0, 8.2, CH-9), 7.145 (d, 1H, J 8.2, CH-10), 7.288 (bs, 1H, CH-7); 13С 20.24 (CH2-6), 21.43 (CH3), 21.99 (CH2-5), 27.91 (CH2-3’), 32.10 (CH2-2’), 44.34 (CH2-1), 44.89 (CH2-4’), 51.47 (CH-3a), 108.74 (CH-10), 109.65 (Cq-6a), 118.57 (CH-7), 122.97 (CH-9), 128.07 (Cq-6b), 128.96 (Cq-8), 133.34 (Cq-3a1), 136.48 (Cq-10a), 168.37 (Cq-1’).
Compounds 4. General procedure: A solution of crude chloride 2 (1 mmol), piperazine 3 (1 mmol), KI (1.5 mmol) and K2CO3 (2 mmol) in dry DMF (4 ml) was heated at 120 °С in a closed vessel for 12 h. The crude product was purified by flash chroma-tography on silica gel by using EtOAc:Et3N 100:1 as a mobile phase and was then recrystallized from DCM-hexane.
Compound 4а: NMR (323К) 1Н 1.505 (bs, 1H, ½ CH2-4), 1.965 (t, 2H, J 7.0, CH2-3’), 2.005 (m, 1H, ½ CH2-5), 2.154 (m, 1H, ½ CH2-5), 2.440 (s, 3H, CH3), 2.481 (t, 2H, J 6.8, CH2-4’), 2.494 (t, 2H, J 7.2, CH2-2’), 2.532 (m, 1H, ½ CH2-4), 2.612 (m, 4H, CH2-3”+ CH2-5”), 2.683 (m, 1H ½ CH2-6), 2.779 (ddt, 1H, J 1.4, 8.6, 16.0, ½ CH2-6), 2.907 (bs, 1H, ½ CH2-2), 3.180 (t, 4H, J 5.0, CH2-2”+ CH2-6”), 3.958 (td, 1H, J 2.4, 11.7, ½ CH2-1), 4.088 (dt, 1H, J 2.2, 12.3, ½ CH2-1), 4.415 (bs, 1H, ½ CH2-2), 5.208 (d, 1H, J 9.8, CH-3a), 6.822 (tt, 1H, J 1.0, 7.3, p-Ph), 6.888 (dd, 2H, J 1.0, 8.8, o-Ph), 6.999 (dd, 1H, J 1.5, 8.3, CH-9), 7.109 (d, 1H, J 8.3, CH-10), 7.228 (dd, 2H, J 7.3, 8.8, m-Ph), 7.265 (bs, 1H, CH-7); 13С 20.33 (CH2-6), 21.41 (CH3), 22.10 (CH2-5), 22.62 (CH2-3’), 29.40 (CH2-4), 31.58 (CH2-2’), 44.64 (CH2-1), 49.21 (CH2-2”+CH2-6”), 51.87 (CH-3a), 53.26 (CH2-3”+CH2-5”), 57.60 (CH2-4’), 108.77 (CH-10), 109.63 (Cq-6a), 116.07 (2xCH, o-Ph), 118.62 (CH-7), 119.67 (CH, p-Ph), 122.95 (CH-9), 128.34 (Cq-6b), 128.94 (Cq-8), 129.12 (2xCH, m-Ph), 133.40 (Cq-3a1), 136.94 (Cq-10a), 151.42 (Cq, i-Ph), 172.74 (Cq-1’); ESI (TIS)-Q m/z 457.45 [M+1]+, C29H36N4O.
Compound 4b: NMR 1Н (323К) 1.512 (bs, 1H, ½ CH2-4), 1.982 (m, 3H, J 7.0, CH2-3’ + ½ CH2-5), 2.161(bm, 1H, ½ CH2-5), 2.443 (s, 3H, CH3), 2.521 (m, 5H, CH2-2’ + CH2-4’ + ½ CH2-4), 2.645 (m, 4H, CH2-3”+ CH2-5”), 2.690 (m, 1H ½ CH2-6), 2.787 (ddt, 1H, J 1.4, 6.7, 15.8, ½ CH2-6), 2.916 (bs, 1H, ½ CH2-2), 3.119 (t, 4H, J 4.6, CH2-2”+ CH2-6”), 3.982 (td, 1H, J 2.3, 12.1, ½ CH2-1), 4.109 (dt, 1H, J 2.2, 12.3, ½ CH2-1), 4.412 (bs, 1H, ½ CH2-2), 5.218 (d, 1H, J 9.8, CH-3a), 6.839 (dd, 2H, J 4.6, 9.2, CH2-2”’+ CH2-6”’), 6.930 (dd, 2H, J 8.3, 9.2, CH2-3”’+ CH2-5”’), 7.006 (dd, 1H, J 1.5, 8.3, CH-9), 7.118 (d, 1H, J 8.3, CH-10), 7.269 (bs, 1H, CH-7); 13С (293К) 20.29 (CH2-6), 21.45 (CH3), 22.01 (CH2-5), 22.12 (CH2-3’), 32.09 (CH2-2’), 44.55 (CH2-1), 50.03 (CH2-2”+CH2-6”), 53.12 (CH2-3”+CH2-5”), 57.46 (CH2-4’), 108.74 (CH-10), 109.59 (Cq-6a), 115.51 (CH2-3”’+CH2-5”’, J 22.1),
117.82 (CH2-2”’+CH2-6”’, J 7.5), 118.58 (CH-7), 122.87 (CH-9), 128.09 (Cq-6b), 128.91 (Cq-8), 134.61 (Cq-3a1), 136.71 (Cq-10a), 147.84 (Cq,-1”’), 157.20 (Cq,-4”’, J 238.5); ESI (TIS)-Q m/z 475.05 [M+1]+, C29H35FN4O.
Compound 4c: NMR 1Н (323К) 1.492 (bs, 1H, ½ CH2-4), 1.924 (t, 2H, J 7.0, CH2-3’), 1.974 (m, 1H, ½ CH2-5), 2.147 (m, 1H, ½ CH2-5), 2.468 (m, 16H, CH2-2’, CH2-4’, CH2-2”, CH2-3”, CH2-5”, CH2-6”, ½ CH2-4, CH3; 2.446 – s, CH3), 2.678 (m, 1H ½ CH2-6), 2.788 (ddt, 1H, J 1.2, 6.7, 15.8, ½ CH2-6), 2.896 (bs, 1H, ½ CH2-2), 3.953 (td, 1H, J 1.9, 11.8, ½ CH2-1), 4.088 (dt, 1H, J 2.2, 12.4, ½ CH2-1), 4.209 (s, 1H, NCHPh2), 4.396 (bs, 1H, ½ CH2-2), 5.201 (d, 1H, J 10.0, CH-3a), 7.005 (dd, 1H, J 1.3, 8.3, CH-9), 7.115 (d, 1H, J 8.3, CH-10), 7.154 (m, 2H, p-Ph), 7.231 (2t, 4H, m-Ph), 7.367 (2d, 4H, o-Ph), 7.273 (bs, 1H, CH-7); 13С (293К) 20.33 (CH2-6), 21.46 (CH3), 22.03 (CH2-5), 22.21 (CH2-3’), 32.35 (CH2-2’), 44.64 (CH2-1), 51.09 (CH-3a), 53.26 (CH2-3”+CH2-5”), 57.48 (CH2-2”+CH2-6”), 76.18 (NCHPh2), 108.71 (CH-10), 109.36 (Cq-6a), 118.56 (CH-7), 122.82 (CH-9), 126.93 (CH, p-Ph), 127.89 (2xCH, o-Ph), 128.10 (Cq-6b), 128.46 (2xCH, m-Ph), 128.88 (Cq-8), 142.61 (Cq, i-Ph); ESI (TIS)-Q m/z 547.65 [M+1]+, C36H42N4O.
Compound 4d: NMR 1Н (293К) 1.631 (bs, 1H, ½ CH2-4), 1.912 (bs, 2H, CH2-3’), 1.955 (m, 1H, ½ CH2-5), 2.134 (m, 1H, ½ CH2-5), 2.25-2.60 (m, 16H, CH2-2’, CH2-4’, CH2-2”, CH2-3”, CH2-5”, CH2-6”, ½ CH2-4, and s for CH3 at 2.453 inside), 2.672 (m, 1H ½ CH2-6), 2.789 (bdd, 1H, J 5.9, 15.9, ½ CH2-6), 3.093 (bs, 1H, ½ CH2-2), 3.959 (bs, 1H, ½ CH2-1), 4.099 (bd, 1H, J 10.1, ½ CH2-1), 4.164 (s, 1H, NCHAr2), 4.928 (bs, 1H, ½ CH2-2), 5.211 (bs, 1H, CH-3a), 7.018 (bd, 1H, J 8.2, CH-9), 7.134 (d, 1H, J 8.3, CH-10), 7.178 (t, 1H, J 7.3, p-Ph), 7.239 (m, 4H, Ar) 7.289 (bs, 1H, CH-7), 7.338 (m, 4H, Ar); ESI (TIS)-Q m/z 581.35 [M+1]+, C36H41ClN4O.
Crystallography
The crystals of 4a and 4b were mounted on a glass capillary and all geometric and intensity data were taken from these crystals. Diffraction data for 4a were taken on an Agilent SupernovaDual dif-fractometer equipped with an Atlas CCD detector using micro-focus Mo Kα radiation (λ = 0.71073 Å) at room temperature. For 4b data was collected on a CAD4, Enrafnonius diffractometer, using graph-ite monochromatized Mo Kα radiation using ω/2θ methode. The determination of the unit cell param-eters, data collection and reduction were performed with Crysalispro software [31]. The structures were solved by direct methods and refined by the full-matrix least-squares method on F2 with ShelxS and ShelxL 2018/1 programs [32]. All non-hydrogen at-
V. B. Kurteva et al.: Polydentate ligands combining pirlinidole and piperazine fragments

110
oms, were located successfully from Fourier maps and were refined anisotropically. The H atoms were placed in idealized positions (C—H = 0.86 to 0.93 Å) and were constrained to ride on their parent atoms, with Uiso(H) = 1.2Ueq(C) or 1.5Ueq(Cmethyl). The most important crystallographic and refinement indica-tors are listed on Table 1.
RESULTS AND DISCUSSION
The idea of the current study is to build novel polydentate ligands possessing pirlindole and pip-erazine fragments connected via a flexible four-carbon aliphatic linker. The later was designed in an attempt to ensure steric freedom of both units to occupy different mutual orientations. Piperazines with aryl or benzyl type substituents were chosen due to the observed remarkable biological activities of compounds possessing analogues structural ele-ment.
The target compounds were obtained via two step protocol; classical N-acylation by chlorobu-tyryl chloride followed by nucleophilic substitution of a series of mono-substituted piperazines without preliminary purification of chloride 2 (Scheme 1).
The second reaction was performed by heating the reaction mixture in a closed vessel in halogen me-tathesis conditions, e. g. in the presence of potas-sium iodide, in order to override the low reactivity of terminal chlorine. The products 4 were isolated by column chromatography and subsequent recrys-tallization in moderate overall yields as listed on Table 2.
The structures of the products were assigned by 1D and 2D NMR experiments. The spectra at room temperature show broad signals due to exchange between two sides; e. g. hindered rotations around tertiary amide bond. Contrary, at 323K almost all signals are sharp and well defined. This pattern is valid for all compounds instead of 4d where par-tial decomposition was detected at elevated tem-perature. The signals in the proton spectrum of 4d at room temperature were assigned by comparison with those of the other products. The latter is pos-sible as the aliphatic protons possess similar signals (Fig. 2), while the only difference is in the aromatic area, which is much better resolved.
The structures of the products were confirmed by singe crystal XRD of selected samples [33]. Compounds 4a and 4b (Figs. 3 and 4) crystalize in P–1 space group with a single molecule in the asym-
Scheme 1. Synthesis of target compounds 4.
Table 2. Yields and analytical data of compounds 4a-4d
Compd. Yield, %a m. p., °C Rfb
4a 54 184.9–185.1 0.184b 46 179.3–179.6 0.134c 62 169.4–169.6 0.214d 48 154.4–154.9 0.23
a Overall from two steps; b Mobile phase: ethyl acetate:triethylamine 100:1.
V. B. Kurteva et al.: Polydentate ligands combining pirlinidole and piperazine fragments

111
Fig. 2. Aliphatic area of the proton spectra of ligands 4а-4с at 323К and 4d at 293К. The asterisks indicate the signals for methyne NCHAr2 protons in 4c and 4d.
Fig. 3. ORTEP view of 4a with the atomic numbering scheme; ellipsoids are drawn at 50% probability, hydrogen atoms are shown as small spheres with arbitrary radii.
Fig. 4. ORTEP view of 4b with the atomic numbering scheme; ellipsoids are drawn at 50% probability, hydrogen atoms are shown as small spheres with arbitrary radii.
V. B. Kurteva et al.: Polydentate ligands combining pirlinidole and piperazine fragments

112
metric unit and almost identical unit cell parameters (Table 1), e.g. they are nearly isostructural though there is an additional F atom in 4b. It was found that piperazine substituent does not influenced signifi-cantly the reaction out-put and preferred geometry.
Even though the variations of the cell param-eters and chemical composition of 4a and 4b are marginal (Table 1), the compounds may be differ-entiated from powder X-ray experiments (Fig. 5). In addition the presented powder diffraction data may serve as a basis for further investigations on compounds having almost similar crystal structures.
Interestingly the supposedly “flexible” four-car-bon aliphatic linker bridging the pirlindole and pip-erazine moieties has a “conserved” geometry. What is more, on both sides the four-carbon linker is connected to sp3 N atom, thus the eventual rotation around the C–N bond is hampered. Consequently the molecular geometry of 4a or 4b is preserved as it can be acknowledged by the overlay of the two molecules (Fig. 6).
The three dimensional arrangement of the mol-ecules in the crystal structure is governed by the closest packing and hence the in 4a and 4b no typi-cal hydrogen bond acceptors are present the latest is ruled by weak C–H…O and C–H…π interactions (Fig. 7). Not unexpectedly, the observed weak in-termolecular interactions are nearly identical. As a result of the conserved molecular geometry, the
Fig. 5. Comparison of powder diffraction patterns of 4a and 4b.
Fig. 6. Overlay of 4a and 4b (in blue/dark) based on the four-carbon linking the pirlindole and piperazine groups.
equal intermolecular interactions resulting in a comparable three-dimensional arrangement, the crystal structure is compelled to accommodate and additional F atom. This stringency is reflected by the lowering of melting point of 4b by nearly 10 °C when compared to 4a.
CONCLUSIONS
Novel polydentate ligands containing bridged pirlindole and piperazine fragments were obtained via a two-step protocol in moderate overall yields. The low reactivity of intermediate chloride was overridden by performing the reaction in halogen metathesis conditions under pressure. The products were characterized by NMR, mass spectra and sin-gle crystal XRD of selected samples.
V. B. Kurteva et al.: Polydentate ligands combining pirlinidole and piperazine fragments
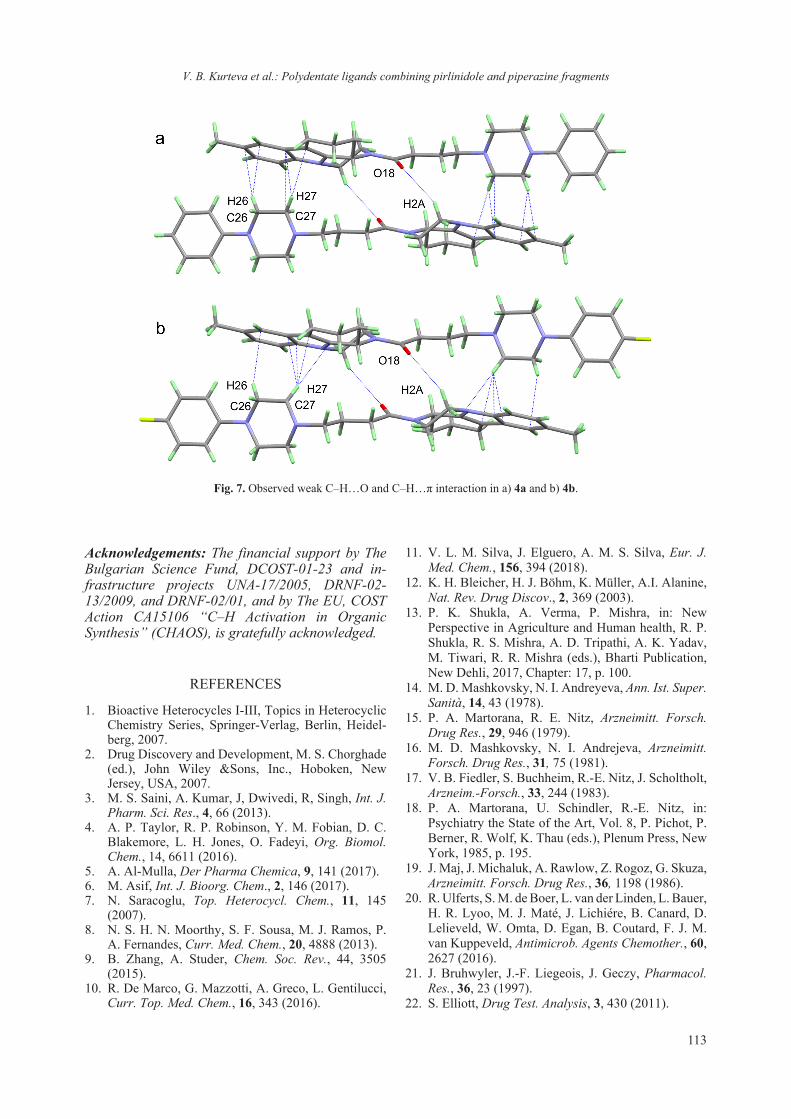
113
Acknowledgements: The financial support by The Bulgarian Science Fund, DCOST-01-23 and in-frastructure projects UNA-17/2005, DRNF-02-13/2009, and DRNF-02/01, and by The EU, COST Action CA15106 “C–H Activation in Organic Synthesis” (CHAOS), is gratefully acknowledged.
REFERENCES
1. Bioactive Heterocycles I-III, Topics in Heterocyclic Chemistry Series, Springer-Verlag, Berlin, Hei del-berg, 2007.
2. Drug Discovery and Development, M. S. Chorghade (ed.), John Wiley &Sons, Inc., Hoboken, New Jersey, USA, 2007.
3. M. S. Saini, A. Kumar, J, Dwivedi, R, Singh, Int. J. Pharm. Sci. Res., 4, 66 (2013).
4. A. P. Taylor, R. P. Robinson, Y. M. Fobian, D. C. Blake more, L. H. Jones, O. Fadeyi, Org. Biomol. Chem., 14, 6611 (2016).
5. A. Al-Mulla, Der Pharma Chemica, 9, 141 (2017).6. M. Asif, Int. J. Bioorg. Chem., 2, 146 (2017).7. N. Saracoglu, Top. Heterocycl. Chem., 11, 145
(2007).8. N. S. H. N. Moorthy, S. F. Sousa, M. J. Ramos, P.
A. Fernandes, Curr. Med. Chem., 20, 4888 (2013).9. B. Zhang, A. Studer, Chem. Soc. Rev., 44, 3505
(2015).10. R. De Marco, G. Mazzotti, A. Greco, L. Gentilucci,
Curr. Top. Med. Chem., 16, 343 (2016).
11. V. L. M. Silva, J. Elguero, A. M. S. Silva, Eur. J. Med. Chem., 156, 394 (2018).
12. K. H. Bleicher, H. J. Böhm, K. Müller, A.I. Alanine, Nat. Rev. Drug Discov., 2, 369 (2003).
13. P. K. Shukla, A. Verma, P. Mishra, in: New Perspective in Agriculture and Human health, R. P. Shukla, R. S. Mishra, A. D. Tripathi, A. K. Yadav, M. Tiwari, R. R. Mishra (eds.), Bharti Publication, New Dehli, 2017, Chapter: 17, p. 100.
14. M. D. Mashkovsky, N. I. Andreyeva, Ann. Ist. Super. Sanità, 14, 43 (1978).
15. P. A. Martorana, R. E. Nitz, Arzneimitt. Forsch. Drug Res., 29, 946 (1979).
16. M. D. Mashkovsky, N. I. Andrejeva, Arzneimitt. Forsch. Drug Res., 31, 75 (1981).
17. V. B. Fiedler, S. Buchheim, R.-E. Nitz, J. Scholtholt, Arzneim.-Forsch., 33, 244 (1983).
18. P. A. Martorana, U. Schindler, R.-E. Nitz, in: Psychiatry the State of the Art, Vol. 8, P. Pichot, P. Berner, R. Wolf, K. Thau (eds.), Plenum Press, New York, 1985, p. 195.
19. J. Maj, J. Michaluk, A. Rawlow, Z. Rogoz, G. Skuza, Arzneimitt. Forsch. Drug Res., 36, 1198 (1986).
20. R. Ulferts, S. M. de Boer, L. van der Linden, L. Bauer, H. R. Lyoo, M. J. Maté, J. Lichiére, B. Canard, D. Lelieveld, W. Omta, D. Egan, B. Coutard, F. J. M. van Kuppeveld, Antimicrob. Agents Chemother., 60, 2627 (2016).
21. J. Bruhwyler, J.-F. Liegeois, J. Geczy, Pharmacol. Res., 36, 23 (1997).
22. S. Elliott, Drug Test. Analysis, 3, 430 (2011).
Fig. 7. Observed weak C–H…O and C–H…π interaction in a) 4a and b) 4b.
V. B. Kurteva et al.: Polydentate ligands combining pirlinidole and piperazine fragments

114
23. R. Kharb, K. Bansal, A. K. Sharma, Der Pharma Chemica, 4, 2470 (2012).
24. R. V. Patel, S. W. Park, Mini Rev. Med. Chem., 13, 1579 (2013).
25. C. P. Meher, A. M. Rao, M. Omar, Asian J. Pharm. Sci. Res., 3, 43 (2013).
26. T. Liu, Z. Weng, X. Dong, L. Chen, L. Ma, S. Cen, N. Zhou, Y. Hu, PLoS ONE, 8, e53636 (2013).
27. M. Asif, Int. J. Adv. Sci. Res., 1, 5 (2015).28. M. Al-Ghorbani, A. B. Begum, Zabiulla, S. V. Ma-
matha, S. A. Khanum, J. Chem. Pharm. Res., 7, 281 (2015).
29. A. K. Rathi, R. Syed, H.-S. Shin, R. V. Patel, Expert Opin. Ther. Pat., 26, 777 (2016).
30. S. Verma, S. Kumar, Med. Chem. (Los Angeles), 7, 750 (2017).
31. Rigaku Oxford Diffraction, CrysAlisPro Software system, version 1.171.37.35, Rigaku Corporation, Oxford, UK 2018.
32. G. M. Sheldrick, Acta Cryst. A, 64, 112 (2008).33. Crystallographic data (with structure factors) for
the structural analysis have been deposited with the Cambridge Crystallographic Data Centre, Nos. CCDC-1875825 (4a) and 1875826 (4b). Copies of this information may be obtained free of charge from: The Director, CCDC, 12 Union Road, Cambridge, CB2 1EZ, UK. Fax: +44(1223)336-033, e-mail:[email protected], or www: www.ccdc.cam.ac.uk.
V. B. Kurteva et al.: Polydentate ligands combining pirlinidole and piperazine fragments

115© 2018 Bulgarian Academy of Sciences, Union of Chemists in Bulgaria
* To whom all correspondence should be sent:
Bulgarian Chemical Communications, Volume 50, Special Issue F (pp. 115–125) 2018
Antibacterial activity of novel quaternary ammonium salts of quinoline and 4-pyrolidino pyridine
R. I. Rusew1, V. B. Kurteva2, B. L. Shivachev1
1 Institute of Mineralogy and Crystallography “Acad. Ivan Kostov”, Bulgarian Academy of Sciences, Acad. G. Bonchev str., bl. 107, 1113 Sofia, Bulgaria
2 Institute of Organic Chemistry with Centre of Phytochemistry, Bulgarian Academy of Sciences, Acad. G. Bonchev str., bl. 9, 1113 Sofia, Bulgaria
Received October 23, 2018; Accepted November 30, 2018
Three new quaternary ammonium compounds were synthesized by Menshutkin reaction adapted for aromatic tertiary amines. The purity of the novel compounds was confirmed by 1H-NMR and 13C NMR spectroscopic tech-niques. Single crystal X-ray diffraction studies showed that all three compounds crystalize in the monoclinic crystal system (two in P21/c and one in P21/n space group) as bromide or iodide salts. The crystal structures are stabilized by a network of strong intermolecular halogen bonding interaction of C-H…X type (X = I, Br). DTA/TGA analyzes confirmed the stabilizing role of the counter ion by showing that the compounds decompose immediately after the elimination of the halogen atom. The quaternary ammonium compounds were tested for antibacterial activity against Gram-positive and Gram-negative bacterial strains using Kirby-Bauer disk diffusion test. Antibacterial effect was ob-served only on Gram-positive bacteria namely Bacillus subtilis and Staphylococcus aureus. The minimum inhibitory (MIC) and non-inhibitory (NIC) concentrations for all three compounds were obtained using the Gompertz function. Compound 2 showed the best results with MIC values of 0.321, 0.504 μM and NIC values of 0.053, 0.030 μM for S. aureus and B. subtilis respectively.
Keywords: Quaternary ammonium salts, Menshutkin reaction, Single-crystal X-ray diffraction, NMR, DTA\TGA, halogen bonding, antibacterial properties.
Email: [email protected]
INTRODUCTION
Quaternary ammonium salts (QAS) have a “head” with a positively charged nitrogen atom that forms four chemical bonds with different alkyl, aryl and alkenyl substituents e.g. the “tail”. QASs are usually synthesized by Menshutkin reaction [1] that refers to alkylation of tertiary amines with an alkyl halide [2]. The reaction yield is enhanced by polar aprotic solvents such as 1,2-dichlororethane or acetonitrile that helps the formation of solvated product [3]. Other methods for QAS synthesis in-clude quaternization with dimethyl sulfate [4, 5] which is toxic and carcinogenic [6] or with dime-thyl carbonate [7, 8] which is ecofriendly but gives lower yields. QASs have found various applications as cationic surfactants [9], phase-transfer catalysts [10], fabric softeners [11] etc. In addition, QAS constitute the cationic part of the majority ionic liq-
uids [12, 13] as well as antibacterial agents. The in-creased drug resistance of bacteria as a consequence of excessive and improper use of antibiotics and the lack of “new” antibacterial drugs to overcome that resistance is a concerning tendency [14]. The most important mechanisms of bacterial resistance to an-tibiotics are gene mutations [15, 16] and horizontal gene transfer (HGT) [17, 18]. In order to evade those defensive mechanisms, researchers seek out differ-ent types of compounds, natural or synthetic, that have improved or unaffected antimicrobial proper-ties [19–21]. It has been acknowledged that quater-nary ammonium compounds that feature a “long aliphatic chain” (aliphatic groups with 8–18 car-bons) possess antibacterial activity against Gram-positive, Gram-negative bacteria, as well as against some fungal strains and protozoa [22–25]. The anti-microbial action of QAS is based on their surfactant nature and begins when they reach the surface of the bacterial cell. When QAS are sufficiently close to the membrane they interact through hydropho-bic and electrostatic attraction with the negatively charged bacterial cell surfaces. After their adsorp-

116
tion on the outer of the cell, QAS molecules replace Ca2+ and Mg2+ ions from the cytoplasmic membrane [26]. This ion exchange destabilizes the intracellular matrix of the bacterium and leads to leakage of in-tracellular fluids [26]. The antimicrobial activity of QAS may also include destruction and denaturation of structural proteins and enzymes in the cell [27]. These processes inevitably lead to bacterial death. However, the lethal and inhibitory effects of quater-nary ammonium compounds are strongly dependent on environmental factors – pH, temperature, ions concentration, etc. [28]. Their activity is enhanced at higher temperatures, continuous administration and presence of chelating agents but rapidly de-creases in water/solutions rich in mineral salts [28]. The main concerns of QAS antibacterial activity are the ability of some multidrug resistant bacteria to block the penetration or export the drug through the cell membrane. This process is called “efflux” and it is carried out by “efflux-pump” proteins [29, 30].
The present work is focusing on a facile one step synthesis and structural characterization of new QAS and a study on their antimicrobial activity. The new QAS combines quinoline, 4-methyl qui-noline and 4-pyrolidino pyridine moieties that will serve as a starting base for structure activity rela-tionship (SAR) evaluation.
MATERIALS AND METHODS
Synthesis
All reagents were purchased from Alfa Aesar, Sigma Aldrich, Fluka and Riedel-de Haën and were used without further purification. The deuterated solvents were purchased from Deutero GmbH. The
NMR spectra were recorded on a Bruker Avance II+ 600 spectrometer (Rheinstetten, Germany), 1H at 600 MHz and 13C at 151 MHz, in DMSO-d6; the chemical shifts were quoted in ppm in δ-values against tetramethylsilane (TMS) as an internal standard and the coupling constants were calculated in Hz. The spectra were processed with Topspin 2.1 program.
Synthesis of 1-(2-(naphthalen-2-yl)-2-oxoethyl) quinolin-1-ium bromide – (1)
Quinoline (60 µl, 65 mg, 0.5 mmol) and 2-bro-mo-2’-acetonapthone (125 mg, 0.5 mmol) were dissolved in 1,2-dichloroethane (10 ml). The re-action was performed under inert atmosphere (ar-gon) at ambient temperature. Orange precipitate was formed after 24h that was filtered and washed with 1,2-dichloroethane. Yield: 135 mg (65%) – Naphthalene ring is depicted as “prime”. 1H NMR 7.172 (s, 2H, СН2), 7.732 (ddd, 1H, J 1.2, 7.0, 8.1, CH-7’), 7.780 (ddd, 1H, J 1.2, 7.0, 8.2, CH-6’), 8.078 (m, 2H, CH-6 + CH-3’), 8.102 (d, 1H, J 8.2, CH-5’), 8.170 (d, 1H, J 8.6, CH-4’), 8.229 (ddd, 1H, J 1.4, 6.9, 8.8, CH-7), 8.251 (d, 2H, J 8.2, CH-8’), 8.357 (dd, 1H, J 5.8, 8.4, CH-3), 8.517 (d, 1H, J 8.9, CH-8), 8.576 (dd, 1H, J 1.1, 8.2, CH-5), 8.986 (s, 1H, CH-1’), 9.477 (d, 1H, J 8.3, CH-4), 9.587 (dd, 1H, J 1.2, 5.8, CH-2); 13C NMR 63.53 (СН2), 119.45 (CH-8), 122.54 (CH-3), 123.74 (CH-3’), 127.79 (CH-7’), 128.23 (CH-5’), 129.01 (CH-4’), 129.61 (Cq-4a), 129.79 (CH-6’), 130.06 (CH-8’), 130.31 (CH-6), 130.97 (CH-5), 131.29 (Cq-2’), 131.57 (CH-1’), 132.37 (Cq-8a’), 135.88 (Cq-4a’), 136.32 (CH-7), 138.82 (Cq-8a), 148.98 (CH-4), 151.29 (CH-2), 190.88 (C=O).
Scheme 1. General scheme of the synthetic procedure.
R. I. Rusew et al.: Antibacterial activity of novel quaternary ammonium salts of quinoline and 4-pyrolidino pyridine

117
Synthesis of 1-butyl-4-methylquinolin-1-ium iodide – (2)
4-methyl quinoline (67 µl, 72 mg, 0.5 mmol) and 1-iodobutane (57 µl, 92 mg, 0.5 mmol) were mixed in acetonitrile (10 ml). The reaction was performed under inert atmosphere (argon) at ambient tempera-ture. Green precipitate was formed after 24 h that was filtered and washed with acetonitrile. Yield: 128 mg (78%) – Butyl chain is depicted as “prime”. 1H NMR 0.905 (t, 3H, J 7.4, СН3-4’), 1.387 (m, 2H, СН2-3’), 1.917 (m, 2H, СН2-2’), 3.003 (d, 3H, J 0.4, СН3-4), 5.028 (t, 2H, J 7.5, СН3-1’), 8.047 (ddd, 1H, J 8.4, 7.0, 0.8, CH-6), 8.090 (dd, 1H, J 6.0, 7.0, 0.7, CH-3), 8.255 (ddd, 1H, J 8.9, 6.9, 1.4, CH-7), 8.537 (dd, 1H, J 8.5, 1.2, CH-5), 8.616 (d, 1H, J 8.9, CH-8), 9.469 (d, 1H, J 6.0, CH-2); 13C NMR 13.42 (СН3-4’), 19.10 (СН2-3’), 19.79 (СН3-4), 31.38 (СН2-2’), 56.72 (СН2-1’), 119.38 (CH-8), 122.61 (CH-3), 127.15 (CH-5), 128.91 (Cq-4a), 129.56 (CH-6), 135.09 (CH-7), 136.64 (Cq-8a), 148.28 (CH-2), 158.48 (Cq-4).
Synthesis of 1-(2-(naphthalen-2-yl)-2-oxoethyl)-4-(pyrrolidin-1-yl) pyridin-1-ium bromide – (3)
4-pyrolidino pyridine (75 mg 0.5 mmol) and 2-bromo-2’-acetonapthone (125 mg, 0.5 mmol) were dissolved in acetonitrile (10 ml). The reaction was performed under inert atmosphere (argon) at ambient temperature. After 24h white precipitate was formed that was filtered and washed with ace-tonitrile. Yield: 158 mg (77%) – Pyrrolidine ring is depicted as “prime”, naphthalene ring as “second”. 1H NMR 2.040 (m, 4H, СН2-3’+4’), 3.551 (m, 4H, СН2-2’+5’), 6.105 (s, 2H, СН2), 7.003 (d, 2H, J 7.7, CH-3+5), 7.696 (ddd, 1H, J 1.2, 6.9, 8.1, CH-7”), 7.746 (ddd, 1H, J 1.2, 6.9, 8.1, CH-6”), 8.025 (dd, 1H, J 1.7, 8.6, CH-3”), 8.070 (d, 1H, J 8.0, CH-5”), 8.133 (d, 1H, J 8.7, CH-4”), 8.198 (d, 1H, J 8.1, CH-8”), 8.229 (d, 2H, J 7.7, CH-2+6), 8.790 (s, 1H, CH-1”); 13C NMR 24.54 (СН2-3’+4’), 48.16 (СН2-
2’+5’), 62.31 (СН2), 107.76 (CH-3+5), 122.94 (CH-3”), 127.26 (CH-7”), 127.72 (CH-5”), 128.57 (CH-4”), 129.11 (CH-6”), 129.42 (CH-8”), 130.07 (CH-1”), 131.54 (Cq-2”), 132.34 (Cq-8a”), 135.61 (Cq-4a”), 142.99 (CH-2+6), 153.45 (Cq-4), 192.77 (C=O).
Single crystal X-ray diffraction
Suitable single crystals of the quaternary ammo-nium compounds were mounted on glass capillaries. The intensity and diffraction data were collected on Agilent SupernovaDual diffractometer equipped with an Atlas CCD detector using micro-focus MoKα / CuKα radiation (λ = 0.71073/1.54184 Å, respectively). The structures were solved by direct methods and refined by the full-matrix least-squares method on F2 with ShelxS and ShelxL programs [31]. All non-hydrogen atoms, including solvent molecules, were located successfully from Fourier map and were refined anisotropically. Hydrogen atoms were placed at calculated positions using a riding scheme (Ueq = 1.2 for C-Haromatic = 0.93 Å and C-Hmethylene = 0.97 Å). The ORTEP [32] views of the molecules present in the asymmetric unit and the most important crystallographic param-eters from the data collection and refinement are shown in Fig. 1 and Table 1 respectively. Selected bonds lengths, angles and torsion angles are given in Table 2. The figures concerning crystal structure description and comparison were prepared using Mercury software (version 3.9) [33].
Differential Thermal Analysis (DTA) and Thermogravimetric Analysis (TGA)
DTA and TGA were performed on Stanton Redcroft 1500 STA (Simultaneous thermal ana-lyzer). Samples were heated in corundum crucibles from ambient temperature to 450 °C (10 °C. min–1) in argon (flow 3 ml. min–1).
Fig. 1. ORTEP views of the molecules in the asymmetric unit (ASU) of the crystal structures of a) compound 1, b) compound 2 and c) compound 3. Atomic displacement parameters (ADP) are drawn at the 50% probability level. Hydrogen atoms are shown as spheres with arbitrary radii.
R. I. Rusew et al.: Antibacterial activity of novel quaternary ammonium salts of quinoline and 4-pyrolidino pyridine
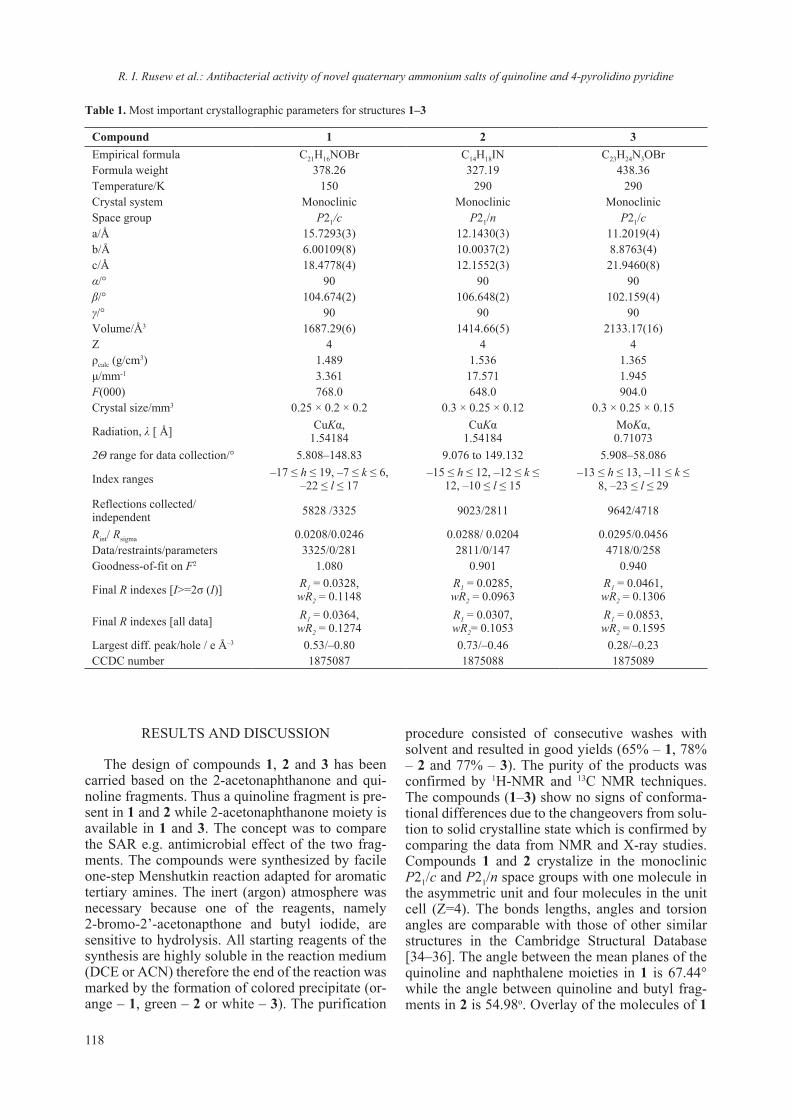
118
Table 1. Most important crystallographic parameters for structures 1–3
Compound 1 2 3Empirical formula C21H16NOBr C14H18IN C23H24N3OBrFormula weight 378.26 327.19 438.36Temperature/K 150 290 290Crystal system Monoclinic Monoclinic MonoclinicSpace group P21/c P21/n P21/ca/Å 15.7293(3) 12.1430(3) 11.2019(4)b/Å 6.00109(8) 10.0037(2) 8.8763(4)c/Å 18.4778(4) 12.1552(3) 21.9460(8)α/° 90 90 90β/° 104.674(2) 106.648(2) 102.159(4)γ/° 90 90 90Volume/Å3 1687.29(6) 1414.66(5) 2133.17(16)Z 4 4 4ρcalc (g/cm3) 1.489 1.536 1.365μ/mm-1 3.361 17.571 1.945F(000) 768.0 648.0 904.0Crystal size/mm3 0.25 × 0.2 × 0.2 0.3 × 0.25 × 0.12 0.3 × 0.25 × 0.15
Radiation, λ [ Å] CuKα,1.54184
CuKα 1.54184
MoKα,0.71073
2Θ range for data collection/° 5.808–148.83 9.076 to 149.132 5.908–58.086
Index ranges –17 ≤ h ≤ 19, –7 ≤ k ≤ 6, –22 ≤ l ≤ 17
–15 ≤ h ≤ 12, –12 ≤ k ≤ 12, –10 ≤ l ≤ 15
–13 ≤ h ≤ 13, –11 ≤ k ≤ 8, –23 ≤ l ≤ 29
Reflections collected/ independent 5828 /3325 9023/2811 9642/4718
Rint/ Rsigma 0.0208/0.0246 0.0288/ 0.0204 0.0295/0.0456Data/restraints/parameters 3325/0/281 2811/0/147 4718/0/258Goodness-of-fit on F2 1.080 0.901 0.940
Final R indexes [I>=2σ (I)] R1 = 0.0328,wR2 = 0.1148
R1 = 0.0285, wR2 = 0.0963
R1 = 0.0461,wR2 = 0.1306
Final R indexes [all data] R1 = 0.0364,wR2 = 0.1274
R1 = 0.0307, wR2= 0.1053
R1 = 0.0853,wR2 = 0.1595
Largest diff. peak/hole / e Å–3 0.53/–0.80 0.73/–0.46 0.28/–0.23CCDC number 1875087 1875088 1875089
RESULTS AND DISCUSSION
The design of compounds 1, 2 and 3 has been carried based on the 2-acetonaphthanone and qui-noline fragments. Thus a quinoline fragment is pre-sent in 1 and 2 while 2-acetonaphthanone moiety is available in 1 and 3. The concept was to compare the SAR e.g. antimicrobial effect of the two frag-ments. The compounds were synthesized by facile one-step Menshutkin reaction adapted for aromatic tertiary amines. The inert (argon) atmosphere was necessary because one of the reagents, namely 2-bromo-2’-acetonapthone and butyl iodide, are sensitive to hydrolysis. All starting reagents of the synthesis are highly soluble in the reaction medium (DCE or ACN) therefore the end of the reaction was marked by the formation of colored precipitate (or-ange – 1, green – 2 or white – 3). The purification
procedure consisted of consecutive washes with solvent and resulted in good yields (65% – 1, 78% – 2 and 77% – 3). The purity of the products was confirmed by 1H-NMR and 13C NMR techniques. The compounds (1–3) show no signs of conforma-tional differences due to the changeovers from solu-tion to solid crystalline state which is confirmed by comparing the data from NMR and X-ray studies. Compounds 1 and 2 crystalize in the monoclinic P21/c and P21/n space groups with one molecule in the asymmetric unit and four molecules in the unit cell (Z=4). The bonds lengths, angles and torsion angles are comparable with those of other similar structures in the Cambridge Structural Database [34–36]. The angle between the mean planes of the quinoline and naphthalene moieties in 1 is 67.44° while the angle between quinoline and butyl frag-ments in 2 is 54.98o. Overlay of the molecules of 1
R. I. Rusew et al.: Antibacterial activity of novel quaternary ammonium salts of quinoline and 4-pyrolidino pyridine
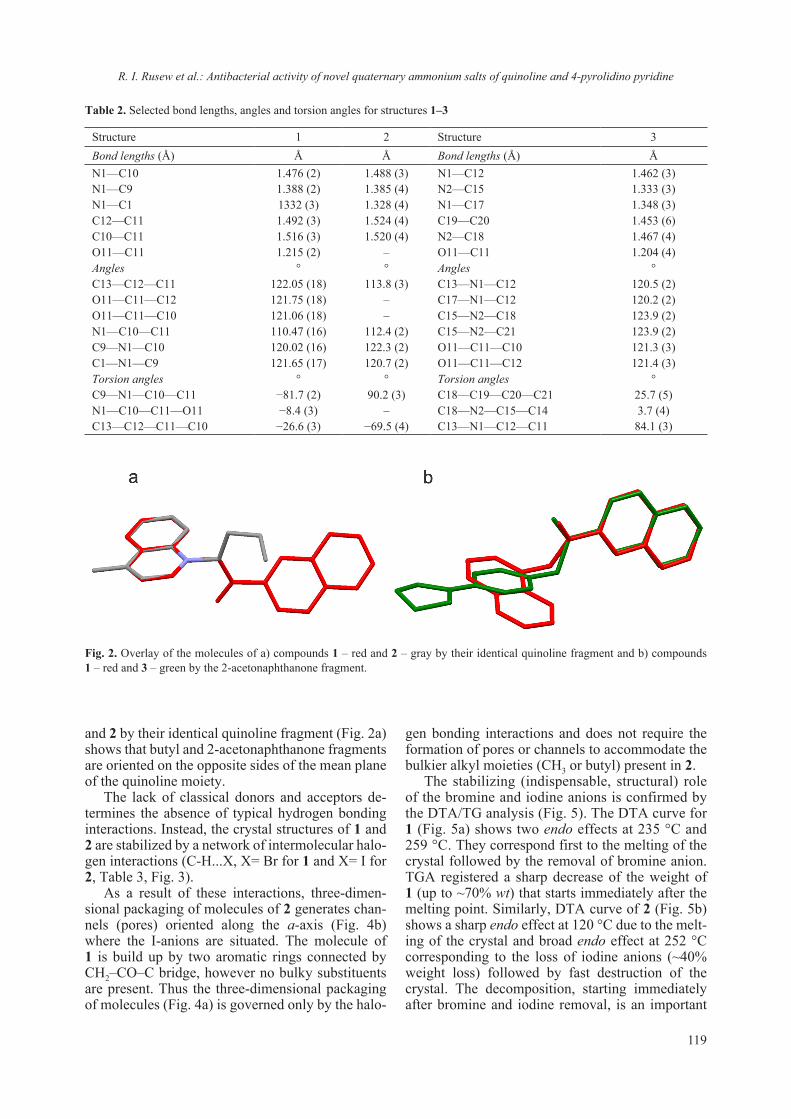
119
and 2 by their identical quinoline fragment (Fig. 2a) shows that butyl and 2-acetonaphthanone fragments are oriented on the opposite sides of the mean plane of the quinoline moiety.
The lack of classical donors and acceptors de-termines the absence of typical hydrogen bonding interactions. Instead, the crystal structures of 1 and 2 are stabilized by a network of intermolecular halo-gen interactions (C-H...X, X= Br for 1 and X= I for 2, Table 3, Fig. 3).
As a result of these interactions, three-dimen-sional packaging of molecules of 2 generates chan-nels (pores) oriented along the a-axis (Fig. 4b) where the I-anions are situated. The molecule of 1 is build up by two aromatic rings connected by CH2–CO–C bridge, however no bulky substituents are present. Thus the three-dimensional packaging of molecules (Fig. 4a) is governed only by the halo-
gen bonding interactions and does not require the formation of pores or channels to accommodate the bulkier alkyl moieties (CH3 or butyl) present in 2.
The stabilizing (indispensable, structural) role of the bromine and iodine anions is confirmed by the DTA/TG analysis (Fig. 5). The DTA curve for 1 (Fig. 5a) shows two endo effects at 235 °C and 259 °C. They correspond first to the melting of the crystal followed by the removal of bromine anion. TGA registered a sharp decrease of the weight of 1 (up to ~70% wt) that starts immediately after the melting point. Similarly, DTA curve of 2 (Fig. 5b) shows a sharp endo effect at 120 °C due to the melt-ing of the crystal and broad endo effect at 252 °C corresponding to the loss of iodine anions (~40% weight loss) followed by fast destruction of the crystal. The decomposition, starting immediately after bromine and iodine removal, is an important
Table 2. Selected bond lengths, angles and torsion angles for structures 1–3
Structure 1 2 Structure 3Bond lengths (Å) Å Å Bond lengths (Å) ÅN1—C10 1.476 (2) 1.488 (3) N1—C12 1.462 (3)N1—C9 1.388 (2) 1.385 (4) N2—C15 1.333 (3)N1—C1 1332 (3) 1.328 (4) N1—C17 1.348 (3)C12—C11 1.492 (3) 1.524 (4) C19—C20 1.453 (6)C10—C11 1.516 (3) 1.520 (4) N2—C18 1.467 (4)O11—C11 1.215 (2) – O11—C11 1.204 (4)Angles ° ° Angles °C13—C12—C11 122.05 (18) 113.8 (3) C13—N1—C12 120.5 (2)O11—C11—C12 121.75 (18) – C17—N1—C12 120.2 (2)O11—C11—C10 121.06 (18) – C15—N2—C18 123.9 (2)N1—C10—C11 110.47 (16) 112.4 (2) C15—N2—C21 123.9 (2)C9—N1—C10 120.02 (16) 122.3 (2) O11—C11—C10 121.3 (3)C1—N1—C9 121.65 (17) 120.7 (2) O11—C11—C12 121.4 (3)Torsion angles ° ° Torsion angles °C9—N1—C10—C11 −81.7 (2) 90.2 (3) C18—C19—C20—C21 25.7 (5)N1—C10—C11—O11 −8.4 (3) – C18—N2—C15—C14 3.7 (4)C13—C12—C11—C10 −26.6 (3) −69.5 (4) C13—N1—C12—C11 84.1 (3)
Fig. 2. Overlay of the molecules of a) compounds 1 – red and 2 – gray by their identical quinoline fragment and b) compounds 1 – red and 3 – green by the 2-acetonaphthanone fragment.
R. I. Rusew et al.: Antibacterial activity of novel quaternary ammonium salts of quinoline and 4-pyrolidino pyridine
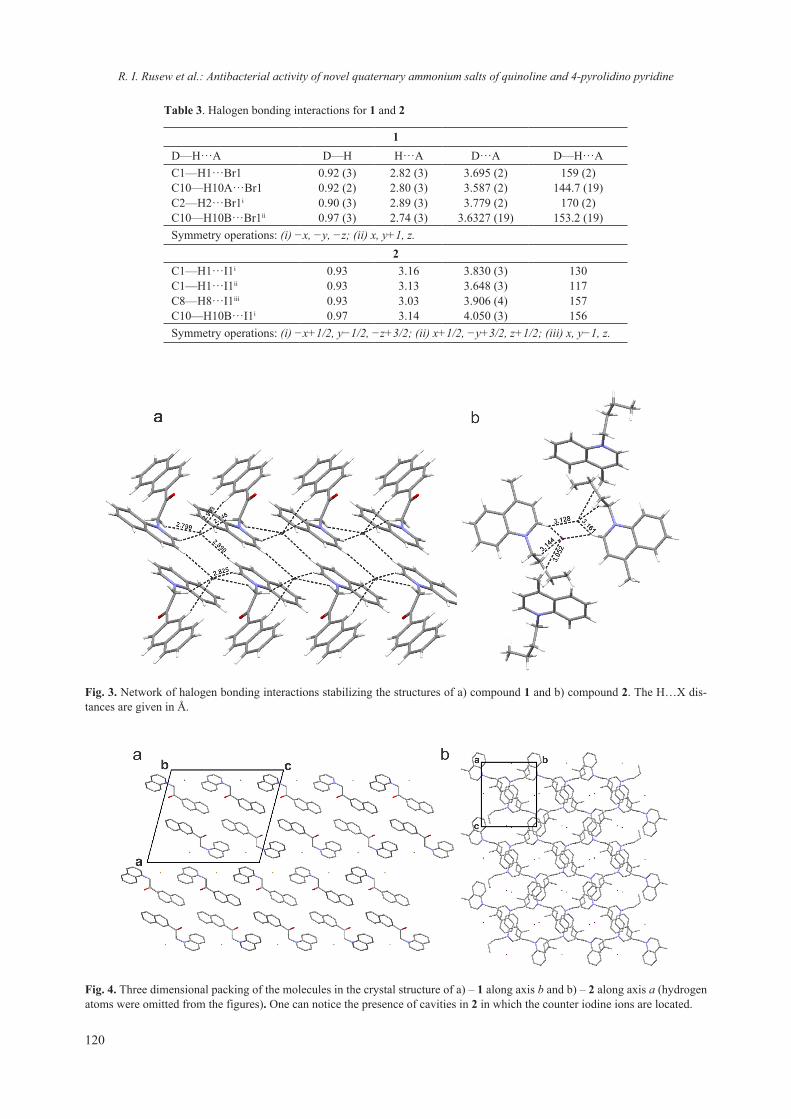
120
Table 3. Halogen bonding interactions for 1 and 2
1D—H···A D—H H···A D···A D—H···AC1—H1···Br1 0.92 (3) 2.82 (3) 3.695 (2) 159 (2)C10—H10A···Br1 0.92 (2) 2.80 (3) 3.587 (2) 144.7 (19)C2—H2···Br1i 0.90 (3) 2.89 (3) 3.779 (2) 170 (2)C10—H10B···Br1ii 0.97 (3) 2.74 (3) 3.6327 (19) 153.2 (19)Symmetry operations: (i) −x, −y, −z; (ii) x, y+1, z.
2C1—H1···I1i 0.93 3.16 3.830 (3) 130C1—H1···I1ii 0.93 3.13 3.648 (3) 117C8—H8···I1iii 0.93 3.03 3.906 (4) 157C10—H10B···I1i 0.97 3.14 4.050 (3) 156Symmetry operations: (i) −x+1/2, y−1/2, −z+3/2; (ii) x+1/2, −y+3/2, z+1/2; (iii) x, y−1, z.
Fig. 3. Network of halogen bonding interactions stabilizing the structures of a) compound 1 and b) compound 2. The H…X dis-tances are given in Å.
Fig. 4. Three dimensional packing of the molecules in the crystal structure of a) – 1 along axis b and b) – 2 along axis a (hydrogen atoms were omitted from the figures). One can notice the presence of cavities in 2 in which the counter iodine ions are located.
R. I. Rusew et al.: Antibacterial activity of novel quaternary ammonium salts of quinoline and 4-pyrolidino pyridine
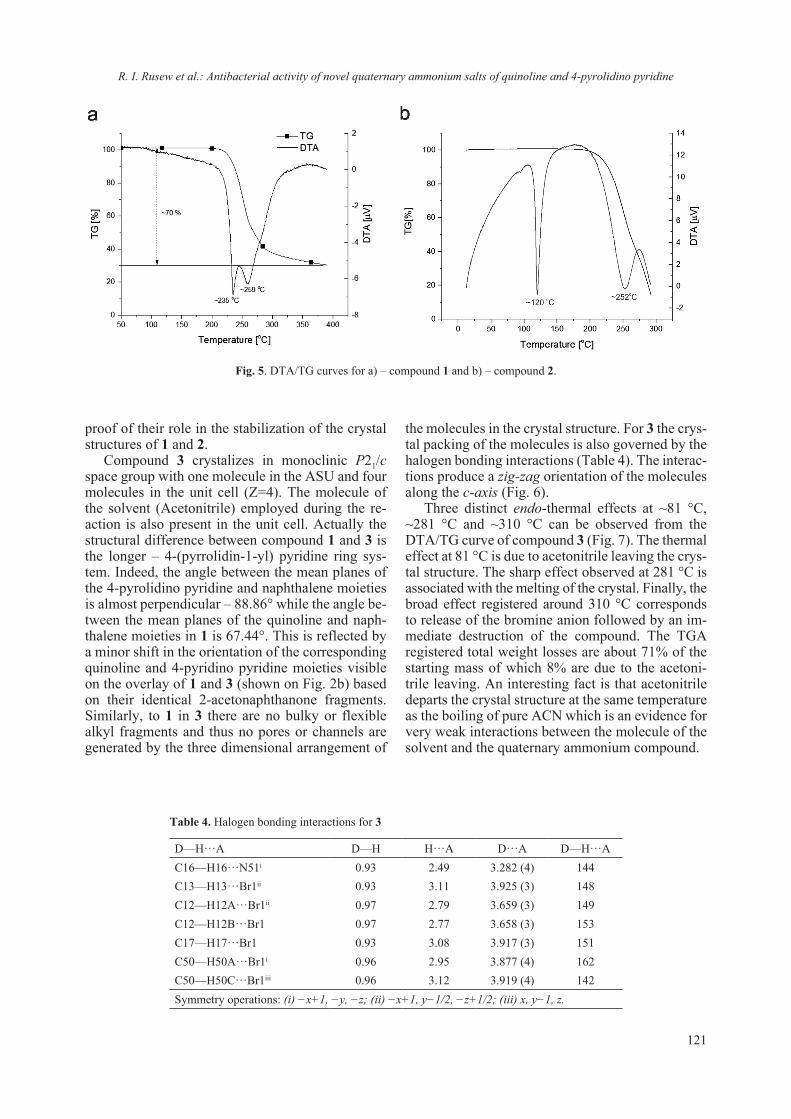
121
proof of their role in the stabilization of the crystal structures of 1 and 2.
Compound 3 crystalizes in monoclinic P21/c space group with one molecule in the ASU and four molecules in the unit cell (Z=4). The molecule of the solvent (Acetonitrile) employed during the re-action is also present in the unit cell. Actually the structural difference between compound 1 and 3 is the longer – 4-(pyrrolidin-1-yl) pyridine ring sys-tem. Indeed, the angle between the mean planes of the 4-pyrolidino pyridine and naphthalene moieties is almost perpendicular – 88.86° while the angle be-tween the mean planes of the quinoline and naph-thalene moieties in 1 is 67.44°. This is reflected by a minor shift in the orientation of the corresponding quinoline and 4-pyridino pyridine moieties visible on the overlay of 1 and 3 (shown on Fig. 2b) based on their identical 2-acetonaphthanone fragments. Similarly, to 1 in 3 there are no bulky or flexible alkyl fragments and thus no pores or channels are generated by the three dimensional arrangement of
the molecules in the crystal structure. For 3 the crys-tal packing of the molecules is also governed by the halogen bonding interactions (Table 4). The interac-tions produce a zig-zag orientation of the molecules along the c-axis (Fig. 6).
Three distinct endo-thermal effects at ~81 °C, ~281 °C and ~310 °C can be observed from the DTA/TG curve of compound 3 (Fig. 7). The thermal effect at 81 °C is due to acetonitrile leaving the crys-tal structure. The sharp effect observed at 281 °C is associated with the melting of the crystal. Finally, the broad effect registered around 310 °C corresponds to release of the bromine anion followed by an im-mediate destruction of the compound. The TGA registered total weight losses are about 71% of the starting mass of which 8% are due to the acetoni-trile leaving. An interesting fact is that acetonitrile departs the crystal structure at the same temperature as the boiling of pure ACN which is an evidence for very weak interactions between the molecule of the solvent and the quaternary ammonium compound.
Fig. 5. DTA/TG curves for a) – compound 1 and b) – compound 2.
Table 4. Halogen bonding interactions for 3
D—H···A D—H H···A D···A D—H···AC16—H16···N51i 0.93 2.49 3.282 (4) 144C13—H13···Br1ii 0.93 3.11 3.925 (3) 148C12—H12A···Br1ii 0.97 2.79 3.659 (3) 149C12—H12B···Br1 0.97 2.77 3.658 (3) 153C17—H17···Br1 0.93 3.08 3.917 (3) 151C50—H50A···Br1i 0.96 2.95 3.877 (4) 162C50—H50C···Br1iii 0.96 3.12 3.919 (4) 142Symmetry operations: (i) −x+1, −y, −z; (ii) −x+1, y−1/2, −z+1/2; (iii) x, y−1, z.
R. I. Rusew et al.: Antibacterial activity of novel quaternary ammonium salts of quinoline and 4-pyrolidino pyridine

122
Fig. 6. Three dimensional packing of the molecules in the crystal structure of 3 (hydrogen atoms were omitted from the figures). One can observe zig-zag orientation of the molecules along the c-axis.
Antibacterial study
Bacterial strains synthesizing metabolic com-ponents such as organic acids, hydrogen peroxide and bacteriocins exhibit resistance to currently used antibacterial agents. Therefore, antibacte-rial activity is a desirable property and a plethora of compounds have been designed and synthesized in order to achieve higher bacterial susceptibility.
Fig. 7. DTA/TGA curves for structure 3.
Compounds 1-3 were tested for antibacterial activ-ity against Gram positive bacteria – Bacillus subtilis and Staphylococcus aureus and Gram negative bac-teria – Escherichia coli and Klebsiella pneumoniae using Kirby- Bauer disk diffusion test according to Clinical and Laboratory Standards Institute [37]. Mueller – Hinton agar was autoclaved (121°C, 1.5 atm for 30 minutes) and used as a microbiological growth medium.
Disk – diffusion method
Bacterial suspension in liquid growth medium with concentration of ~1.107 cfu/ml was prepared. A volume of 12–16 ml of warm (50–55 °C) Muller Hinton agar (~1.5% agar) medium was poured into 90 mm sterile Petri dishes. After solidification and cooling of the medium, 0.2 ml of the bacterial sus-pension was gently spread on the surface using cell spreader. Sterile cellulose discs (6 mm in diam-eter) were submerged in test compound solutions (10 µM) and were placed on the growth medium. The plates are then incubated at 37 °С for 24 h. The diameters of the areas around the wells in which no growth is observed were measured. The size of the inhibition zones (Table 5) was measured with ImageJ software [38]. Compounds exhibiting zones without observed bacterial growth with a diameter greater than 5–6 mm are assumed to possess inhibi-tion properties.
Minimal (MIC) and non-inhibitory (NIC) concentrations
MIC is the lowest concentration which prevents the visible growth of the bacterium. Broth micro di-lution test was performed in plastic 96 well flat bot-tom plates (Sarstedt, 83.1835.50) using 10 µM of the test compounds 1–3. The plates were incubated for 24 hours at 37 °C, afterward the optical density at 600 nm (Bio-Tek ELx800, Universal Microplate Reader) was determined. The Gompertz function [39] is used to model the inhibition profiles from data using two principle parameters: the inflexion point of the function and the slope. The graphical representation of the Gompertz fit for calculation of MIC and NIC of 2 (most active compound) is shown on Fig. 8. The values for MIC and NIC for compounds 1–3 are summarized in Table 6.
CONCLUSIONS
Three novel aromatic quaternary ammonium compounds have been synthesized by facile one step synthesis as bromine or iodine salts. The sin-gle crystal X-ray diffraction study determined that
R. I. Rusew et al.: Antibacterial activity of novel quaternary ammonium salts of quinoline and 4-pyrolidino pyridine
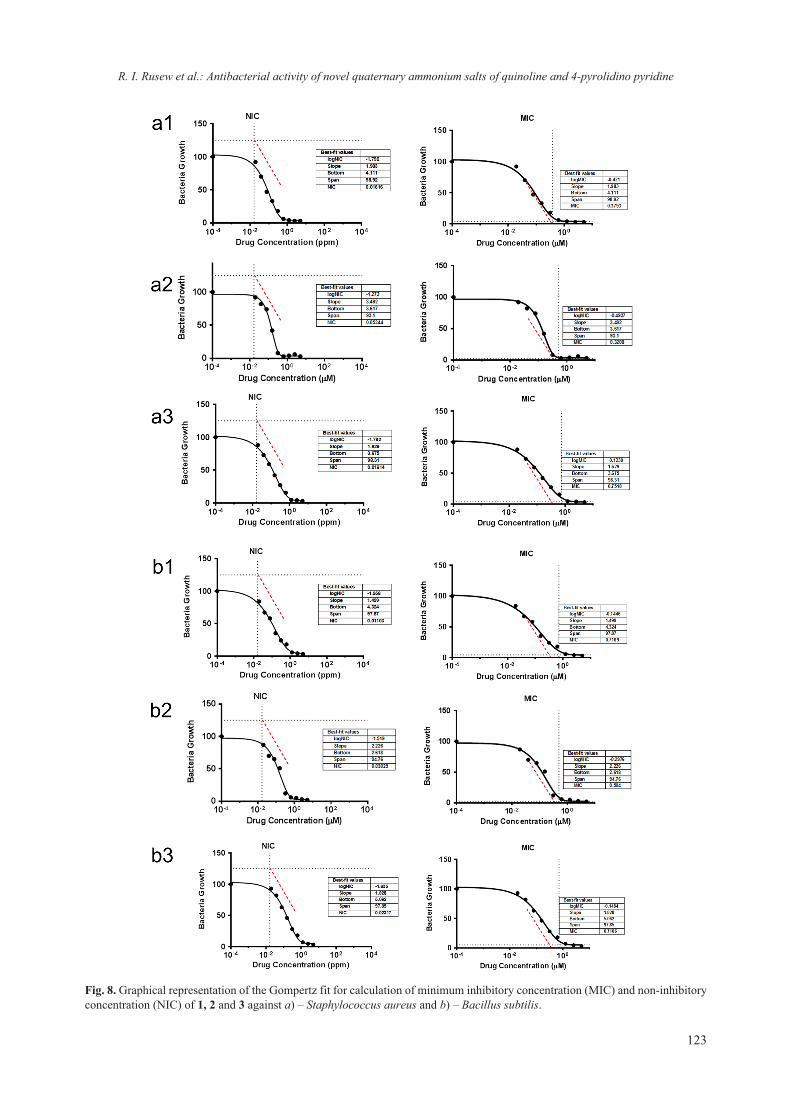
123
Fig. 8. Graphical representation of the Gompertz fit for calculation of minimum inhibitory concentration (MIC) and non-inhibitory concentration (NIC) of 1, 2 and 3 against a) – Staphylococcus aureus and b) – Bacillus subtilis.
R. I. Rusew et al.: Antibacterial activity of novel quaternary ammonium salts of quinoline and 4-pyrolidino pyridine

124
Table 5. Inhibition zone (mm) for compounds 1, 2 and 3 against Gram-positive bacteria – Bacillus subtilis and Staphylococcus aureus and Gram-negative – Escherichia coli and Klebsiella pneumoniae using disc-diffusion method
Inhibition zone (mm)
BacteriaCompound
Staphylococcus aureus Bacillus subtilis Escherichia
coliKlebsiella
pneumoniae
1 15 10 2 –2 18 15 5 23 16 8 – –
Table 6. MIC and NIC for compounds 1–3
МIC [µM]Bacteria
CompoundStaphylococcus
aureusBacillus subtilis
1 0.379 0.7552 0.321 0.5043 0.717 0.710
NIC [µM]1 0.16 0.162 0.05 0.033 0.01 0.02
their crystal structures are stabilized by a network of strong intermolecular halogen bonding. The com-pounds were tested for antibacterial activity against Gram-negative and Gram-positive bacterial strains. QAS showed moderate growth inhibition properties against the Gram-positive bacteria – Staphylococcus aureus and Bacillus subtilis and lower antibacterial effect against the Gram-negative – Escherichia coli and Klebsiella pneumoniae.
REFERENCES
1. J. L. M. Abboud, R. Notario, J. Bertrán, M. Solà, Progr. Phys. Org. Chem., 19, 7 (1990).
2. E. M. Arnett, R. Reich, J. Am. Chem. Soc., 102, 5892 (1980).
3. M. Sola, A. Lledos, M. Duran, J. Bertran, J. L. M. Abboud, J. Am. Chem. Soc., 113, 2873 (1991).
4. L. Deady, Aust. J. Chem., 26, 1949 (1973).5. B. Trivedi, A. Digioia, P. Menardi, J. Am. Oil Chem.
Soc., 58, 754 (1981).6. J. Rippey, M. Stallwood, Emerg. Med. J., 22, 878
(2005).7. Y. Jiang, T. Geng, Q. Li, J. Surfactants Deterg., 15,
67 (2012).8. Z. Zheng, T. Wu, X. Zhou, Chem. Commun., 1864
(2006).9. F. M. Menger, J. S. Keiper, Angew. Chem. Int. Ed.,
39, 1906 (2000).
10. B. Lygo, B. I. Andrews, Acc. Chem. Res., 37, 518 (2004).
11. S. Mishra, J. Oleo Sci., 56, 269 (2007).12. Z. B. Zhou, H. Matsumoto, K. Tatsumi, Chem. Eur.
J., 12, 2196 (2006).13. H. Sakaebe, H. Matsumoto, Electrochem. Commun.,
5, 594 (2003).14. R. J. Fair, Y. Tor, Perspect. Med. Chem., 6, PMC.
S14459 (2014).15. S. A. Chisholm, J. Dave, C. A. Ison, Antimicrob.
Agents Chemother., 54, 3812 (2010).16. K. S. Long, B. Vester, Antimicrob. Agents
Chemother., 56, 603 (2012).17. C. M. Thomas, K. M. Nielsen, Nat. Rev. Microbiol,
3, 711 (2005).18. J. R. Huddleston, Infect. Drug Resist., 7, 167 (2014).19. B. Deslouches, J. D. Steckbeck, J. K. Craigo, Y. Doi,
J. L. Burns, R. C. Montelaro, Antimicrob. Agents Chemother., 59, 1329 (2015).
20. A. C. Rios, C. G. Moutinho, F. C. Pinto, F. S. Del Fiol, A. Jozala, M. V. Chaud, M. M. Vila, J. A. Teixeira, V. M. Balcão, Microbiol. Res., 191, 51 (2016).
21. M. F. Chellat, L. Raguž, R. Riedl, Angew. Chem. Int. Ed., 55, 6600 (2016).
22. T. Thorsteinsson, M. Másson, K. G. Kristinsson, M. A. Hjálmarsdóttir, H. Hilmarsson, T. Loftsson, J. Med. Chem., 46, 4173 (2003).
23. J.-Y. Sun, J. Li, X.-L. Qiu, F.-L. Qing, J. Fluorine Chem., 126, 1425 (2005).
24. L. Massi, F. Guittard, S. Géribaldi, R. Levy, Y. Duccini, Int. J. Antimicrob. Agents, 21, 20 (2003).
25. B. Dizman, M. O. Elasri, L. J. Mathias, J. Appl. Polym. Sci., 94, 635 (2004).
26. S. P. Denyer, Int. Biodeterior. Biodegrad., 36, 227 (1995).
27. S. Buffet-Bataillon, P. Tattevin, M. Bonnaure-Mallet, A. Jolivet-Gougeon, Int. J. Antimicrob. Agents, 39, 381 (2012).
28. K. Hegstad, S. Langsrud, B. T. Lunestad, A. A. Scheie, M. Sunde, S. P. Yazdankhah, Microb. Drug Resist., 16, 91 (2010).
29. K. Poole, Ann. Med., 39, 162 (2007).30. L. J. Piddock, Nat. Rev. Microbiol, 4, 629 (2006).31. G. M. Sheldrick, Acta Crystallogr. Sect. A: Found.
Crystallogr., 64, 112 (2008).
R. I. Rusew et al.: Antibacterial activity of novel quaternary ammonium salts of quinoline and 4-pyrolidino pyridine

125
32. L. J. Farrugia, J. Appl. Crystallogr., 45, 849 (2012).33. C. F. Macrae, P. R. Edgington, P. McCabe, E.
Pidcock, G. P. Shields, R. Taylor, M. Towler, J. v. d. Streek, J. Appl. Crystallogr., 39, 453 (2006).
34. A. Schmidt, T. Mordhorst, M. Nieger, Org. Biomol. Chem., 3, 3788 (2005).
35. C. Ni, D. Dang, Z. Ni, Z. Tian, Y. Li, J. Xie, Q. Meng, Y. Yao, J. Coord. Chem., 57, 705 (2004).
36. Y. Chen, Q.-y. Chen, M.-h. Chen, X.-s. Chen, J.-r.
Zhou, C.-l. Ni, Chem. Res., 5, 010 (2012).37. M. A. Wikler, Performance standards for antimi-
crobial disk susceptibility tests: Approved stand-ard (Clinical and laboratory standards institute, 2006).
38. C. A. Schneider, W. S. Rasband, K. W. Eliceiri, Nat. Methods, 9, 671 (2012).
39. R. Lambert, J. Pearson, J. Appl. Microbiol., 88, 784 (2000).
R. I. Rusew et al.: Antibacterial activity of novel quaternary ammonium salts of quinoline and 4-pyrolidino pyridine

126 © 2018 Bulgarian Academy of Sciences, Union of Chemists in Bulgaria
* To whom all correspondence should be sent:
Bulgarian Chemical Communications, Volume 50, Special Issue F (pp. 126–134) 2018
Bi-axial dielectric anisotropy of crystalline materials and its characterization by resonance microwave methods
P. I. Dankov*, M. T. Iliev, V. P. Levcheva
Sofia University “St. Kliment Ohridski”, Faculty of Physics, 5 J. Bourchier blvd., 1164 Sofia, Bulgaria
Received October 15, 2018; Accepted November 30, 2018
In this paper, the dielectric parameters (permittivity and dielectric loss tangent) of different single and poly-crys-talline or crystalline-like samples have been characterized in the microwave range (especially in the C and X bands; 4–12 GHz). A proven specific property of many crystalline materials is their dielectric anisotropy – different dielectric parameters along different directions and/or crystallographic axes. We consider the anisotropy as a very informative parameter for the sample structure, composition, inclusions, used technology and conditions for the crystal growth or layer deposition. The authorship two-resonator method or some its variants have been used for characterization of the crystalline samples. A lot of results has been presented for the anisotropy of different materials selected as typical examples (crystals, ceramics, glasses, semi-conductor wafers, unknown composites, carbon-content samples: graphite, Graphene, etc.), with different shapes (disks, prisms, cylinders, multilayer composites, thin films, etc.) and different orientation (sample axes orientated along crystallographic axes or in arbitrary directions). Depending on the samples’ kind, the observed anisotropy falls in the intervals from 0.35 up to 3.50. The presented data set for the dielectric properties show good correlation with the sample structure and used technology and allow a reliable micro-wave characterization of the samples, which can add new useful information to the results, obtained by other standard experimental methods applicable for crystals.
Keywords: crystals, dielectric anisotropy, microwave methods, permittivity.
E-mail: [email protected]
INTRODUCTION
The determination of the dielectric properties of single and poly-crystalline materials (dielectric constant or permittivity εr and dielectric loss tangent tanδε) [1] is a classical problem in the microwave frequency range. There exist different methods for characterization of the dielectric properties of crystals; the most accurate are the resonance ones [2]. However, an additional circumstance for these materials is the presence of relatively strong bi-ax-ial anisotropy in many cases, which usually is not taken into account – different dielectric parameters along the different axes, e.g. εxx ≠ εyy ≠ εzz and tanδεxx ≠ tanδεyy ≠ tanδεzz. The anisotropy can be calculated as ratios Aεx,y = εxx/εzz or εyy/εzz and Atanδε x,y = tanδexx/tanδεzz or tanδεyy/tanδεzz. In principle, these materi-als are homogeneous, but the tightly packed and orientated building blocks of the crystals act as in-teracting electrical dipoles, which orientation in the
high-frequency electric fields causes the observed anisotropy. The possible inclusions in the crystal lattice also influence the anisotropy. Due to these and additional reasons the crystalline dielectric ani-sotropy Aεx,y and Atanδεx,y could be very informative parameters for the sample composition, inclusions, used technology and conditions for the samples’ formation. However, the possible anisotropy makes the characterization of the crystalline dielectric pa-rameters more difficult and the most of the known measurement methods cannot give any information for this parameter. Fortunately, we have developed a set of authorship resonance methods, which allow accurate determination of the dielectric anisotropy of different materials, including crystalline samples. One of the most efficient is the two-resonator meth-od [3, 4] and some its modifications [5, 6].
In this paper, we continue to develop reliable measurement methods especially for determination of the dielectric anisotropy of crystalline materials and to show how this parameter could be bound with other sample parameters and formation condi-tions. We have presented several typical situations for characterization of different crystalline and crys-

127
talline-like samples from different types: ceramics, glasses, mono- and poly-crystals, semiconductors, ferrites, metamaterials; also samples with differ-ent shapes: cylinders, disks, prisms, planar sub-strates, thin layers, multi-layer composites, etc. The extraction of the dielectric parameters εxx, yy, zz and tanδεxx, yy, zz has been realized by simulations of syn-thesized 3-D models of the resonance structures, measured with and without samples, trough 3-D electromagnetic simulator ANSYS®HFSS in ei-gen-mode option [7] and the corresponding anisot-ropy parameters Aεx,y and Atanδεx,y have been calcu-lated, compared and discussed.
MEASUREMENT METHOD
The complex permittivity εr of the materials in the microwave region varies between the dc permit-tivity εdc at very low frequencies up to optical value ε∞ at very high frequencies according to the known Cole-Cole model [8]. Exactly due to this reason the “microwave” complex permittivity εMW of the crys-tals could be enough informative for the relaxation mechanism understanding, specific crystal structure, used inclusions and other properties of these materi-als. However, due to the difficulties for the samples’ preparation, their specific forms, small sizes, etc., the most of the crystalli-ne and crystalline-like ma-terials could not be measured by the popular free-space and transmission-line methods, based on rela-tively big samples. Only the rectangular wave-guide method is able to determine the crystal permittivity and even crystals’ anisotropy [2]. The resonance methods, which are more accurate in comparison to the waveguide methods, also meet some difficul-ties, mainly due to the large values of the permittiv-ity and needs for reliable mode identifications in the resonator spectrum with sample.
In [3–5] we describe in details the so-called two-resonator method, developed especially for deter-mination of the dielectric anisotropy in flat planar single- and multi-layer samples. The method is based on measurements of the resonance param-eters (resonance frequencies and unloaded quality (Q-) factors) of two cylinder resonators with differ-ent height, which support modes TE011 and TM010 with mutually perpendicular electric fields – see the schematic illustrations in Fig. 1. The sample under test can fill the entire cross section of the resonators or may have smaller sizes. In the first case, when the sample is a disk with diameter coinciding with the resonator diameter, the dielectric parameters of the materials could be extracted by the analytical mod-el, introduced in [3, 4]. The extraction of the dielec-tric parameters in the second case, when the sample has arbitrary, but regular shape and sizes, is based on 3-D simulations of well-constructed 3-D model of the measurement resonator with sample follow-ing the procedure, described in [5]. The measure-ment accuracy in the both cases has been ensured by introducing of equivalent dimensions and conduc-tivity of the metallic walls after measurement of the empty resonator, which takes into account their de-viation from the ideal shape and the wall roughness. Based on these simple measurement principles, we managed to determine the dielectric parameters and especially to estimate with satisfied accuracy the di-electric anisotropy of many samples, including mi-crowave hard and artificial soft ceramics [5].
The described above two-resonator method is convenient for dielectric anisotropy characterization of thin substrates with equal diameter (but for differ-ent frequencies) or with different diameters at close frequencies; samples with relatively small sizes are also applicable. Due to the cylindrical symmetry, the method gives the so-called uni-axial anisotropy – only the pair of the parallel and perpendicular die-
Fig. 1. Two-resonator method (resonators R1, R2) (a) and electric (E-) field distribution (b).
P. I. Dankov et al.: Bi-axial dielectric anisotropy of crystalline materials and its characterization by resonance microwave...

128
lectric parameters, i.e. εpar = εxx = εyy; tanδεpar = tanδεxx ≠ tanδεyy and εperp = εzz; tanδεperp = tanδεzz. For bulk samples with regular shapes (prisms or cylinders) and sizes smaller than the resonator diameter and height, more reliable is the measurement method, based on application of a single resonator (either R1 with TE011 mode TM010 or R2 with TM010 mode), when each sample has been placed in three different orientations according to the resonator axis – see il-lustrations in Fig. 2, 3. In the case of prism samples, the actual bi-axial anisotropy could be determined: full set of parameters: εxx,yy zz and tanδεxx,yy,zz.
The symmetry of the presented measurement structures with and without sample allows to split twice the corresponding 3-D models and to make the simulations more time efficient and accurate. However, specific symmetrical boundary condi-tions should be applied in this case at the splitted surfaces: E-field symmetry – for parallel E fields along the surface and H-field symmetry – for per-pendicular E field [7] (Fig. 3).
The proven measurement accuracy for the two-resonator method is ±5 % for the dielectric constant anisotropy and up to ±15% for the dielectric loss tangent anisotropy [3] for relatively thin disk sam-ples (thickness ~ 0.5–1.5 mm and dielectric constant less than 10). The accuracy decreases for thicker cylinders and prisms, very thin layers and for high-permittivity materials due to different reasons: screening effect of the resonator walls; appearance of parallel E-field components in TM-mode resona-tor and v.v., sample preparation; accuracy for deter-mination of the actual sample dimensions, etc.
RESULTS AND DISCUSSION
In this section of the paper we present and dis-cuss the results for the dielectric parameters and dielectric anisotropy of several typical crystalline and crystalline-like materials by the described reso-nance methods in the C and X bands (4–12 GHz). In
Fig. 2. Measurement setup (a); resonator R2 with disk samples in two positions (b); possible positions inside the resonator of prism and disk (cylinder) samples (c).
Fig. 3. Illustration of the E-field vector distribution in the measurement resonators R1 and R2 with disk and prisms samples in dif-ferent positions as in Fig. 2.
P. I. Dankov et al.: Bi-axial dielectric anisotropy of crystalline materials and its characterization by resonance microwave...

129
fact, the two-resonator method and its variants have been applied for characterization of huge amount of different samples in the last 15 years: microwave substrates [5], multi-layer antenna radomes [3], ceramics and ferrites [4, 9, 10], thin layers [11], foams, absorbers [12] and recently textile fabrics [13], fresh plant tissues [14], 3-D printed materials [15] and even metamaterials [16]. Therefore, we selected here several very typical cases with some older results and many new data for application of the authorship two-resonator method for this class of materials, which could be considered as lattices with ordered building blocks, i.e. crystals, crystal-line-like materials and some metamaterials.
Let’s start with the ceramics and high-permit-tivity (high-K) substrates with mic-rowave applica-tions. Actually, the microwave engineers know the dielectric anisotropy phenomena mainly from some of the first applications of the Alumina (Al2O3) ce-ramics and Sapphire (α-Al2O3) substrates for micro-strip lines with very low losses (e.g. see [17, 18]). Another high quality materials as substitute of the Alumina is the Polycore (Al2O3 + 0.3% MgO). The glass ceramic material Sitall was a solution for good microwave substrate with slightly bigger losses, but with extremely low temperature coefficient of ex-panding. These materials were the basics for the
starting of the first planar hybrid microwave inte-grated schemes (MIC’s) since more than 40 years. These materials are low-loss and relatively high-K, suitable for compact MIC’s, but the relatively big difference between the absolute values of the par-allel and perpendicular dielectric constants was a serious design problem; rows 1, 2 in Table 1. The measured anisotropy Aε of these first microwave ce-ramics falls in relatively narrow interval 0.93–1.15; however, due to their high-K properties the abso-lute difference between the permittivity values in the both directions is relatively big; definitely, this was a serious design problem in these early stages of the hybrid MICs [7]. Another, more isotropic al-ternative was the fused Quartz substrate (the anisot-ropy is several times smaller – see the correspond-ing values in Table 1, row 4), but this substrate was very unacceptable from technological point of view. Then the substrate producers began to of-fer attractive artificial soft ceramics – plastic sub-strates with high-K ceramic filling. One of the first soft ceramics were 3M®Epsilam10 and then the popular now materials Rogers® Ro3010, TMM10i and RT Duroid®6010. However, these new artifi-cial ceramics even have bigger anisotropy (see data in rows 5–9 in Table 1). They again consist of or-dered non-spherical grains (ceramic inclusions); if
Table 1. Dielectric parameters and uni-axial anisotropy of some ceramic substrates, measured by the two-resonator method [3–5]
No MaterialReference values Shape D, h, mm Freq.
bandsparallel:
εpar; tanδεpar perpendicular: εperp; tanδεperp
anisotropy:Aε; Atanδε
1 Corsa® Alumina (Al2O3) 9.8-10.7 disk ϕ30; 0.6 C, X 9.65/0.0003 10.35/0.0004 0.93/0.75
2 Polycore (Al2O3 + 0.3% MgO) disk ϕ30; 0.5 C, X 10.035/0.0002 9.21/ 0.0003 1.09/0.67
3 Sitall (glass ceramic) disk ϕ30; 0.635 C, X 8.19/0.0042 7.16/ 0.0038 1.14/1.114 Fused quartz disk ϕ30; 0.8 C, X 4.38/~0.0001 4.26/~0.0001 1.03/~1
5 3M® Epsilam 109.8/0.0020 disk ϕ30; 0.635 C, X 11.64/0.0022 9.25/0.0045 1.26/0.49
6 Rogers® TMM10i9.80/0.0020 disk ϕ30; 0.635 C, X 11.04/0.0019 10.35/0.0035 1.07/0.54
7 Rogers® Ro301010.20/0.0035 disk ϕ30, 18;
0.635C, X, Ku 11.74/0.0025 10.13/0.0038 1.16/0.66
8 Rogers® Ro301010.20/0.0035 disk ϕ30, 18;
0.25 X, Ku 11.76/0.0024 9.26/0.0041 1.27/0.59
9 RT Duroid ® 6010 10.2/0.0023 disk ϕ30, 18;
0.25 X, Ku 10.71 10.252 1.045
10 ACX® LTCC7.5/0.003 disk ϕ30, 18;
0.2; 2.0 X, Ku 7.60/0.007 6.68/0.0075 1.13/0.93
11 ACX® LTCC7.5/0.003 disk ϕ10; 0.2 Ka 7.90/0.008 6.70/0.0085 1.18/0.94
12 YIG Garnet 14.8; Ms 1.7 kA/cm disk ϕ30; 1.0 C, X 15.83/0.00020 13.11/0.00027 1.21/0.74
P. I. Dankov et al.: Bi-axial dielectric anisotropy of crystalline materials and its characterization by resonance microwave...

130
the electric field is orientated along the bigger axis of these ellipses, the resultant dielectric constant increases (the parallel value εpar in these cases). In fact, the producers introduced also low-permittiv-ity reinforced substrates with bigger success; they have fiber-glass fabrics with ceramic or other filling and the resultant materials are also anisotropic (see data in Table 2). Now the origin of the anisotropy is another – the ordered reinforcing fibers increase the dielectric constant in parallel directions of the planar substrates and the dielectric constants are εpar > εperp. In 2002 we were the first researchers [19], which indicated the problem of the dielectric anisot-ropy in the modern reinforced substrates and intro-duced the two-resonator method [5], but only after 2009 the bigger substrate producers became to share information for this parameter. Now a new class of microwave ceramics is applicable in the monolithic MIC’s and in the devices for millimeter wavelength range – LTCC (low-temperature co-fired ceramics). The LTCC samples are made from many stacked single ceramic layers (each with thickness less than 0.1 mm); this is again a new source of anisotropy, even slightly smaller – see data in rows 10–11 of
Table 1. The LTCC ceramics are nowadays a good substitute of the standard Alumina ceramics, but at higher prices.
Among the ceramic-like materials with micro-wave applications we can add the microwave fer-rites with different composition. They have prop-erties like ceramics (high permittivity; low losses – see Table 1, row 12), but have magnetic proper-ties: saturation magnetization Ms and relative per-meability μ ≠ 1. Due to this fact, the ferrites are more difficult for characterization of the dielectric parameters (we have special procedure by the two-resonator method, developed for ferrites and ferrite absorber films [10–12]).
The last example for a reliable application of the authorship two-resonator me-thod is connected with characterization of very thin metamaterials (con-trollable growth metal nanowire inclusions with di-ameter 30 nm and length 4–6 nm on a thin porous dielectric matrix; the samples have been prepared in the Microelectronic department of the Technical University, Sofia – see Table 3). The samples are really very thin: ~12 mm; they are supported by a pair of thin plastic Kapton disks, because the single
Table 2. Dielectric parameters and uni-axial anisotropy of some reinforced substrates, made by fiber-glass fabrics with ceramic filling [5]
NoSubstrate;
(IPC TM 650 2.5.5.5 ref. data)
D, h, mm f, GHz /Q factor
parallel: εpar; tanδεpar
f, GHz /Q factor
perpendicular:εperp; tanδεperp
anisotropy:Aε; Atanδε
1 Rogers® Ro4003(3.38/0.0027) ϕ30; 18 0.51 12.5050/1780 3.67/0.0037 12.4235
/2834 3.38/0.0028 1.086/1.32
2 Arlon® 25N (3.38/0.0025) ϕ30; 18 0.52 12.5254/1492 3.57/0.0041 12.4243
/2671 3.37/0.0033 1.059/ 1.242
3 Isola® 680(3.38/0.0030)
ϕ30; 18 0.525 12.4820/1280 3.71/0.0049 12.4215
/1767 3.32/0.0042 1.117/ 1.167
4 Taconic® RF-35 (3.50/0.0033)
ϕ30; 18 0.512 12.4552/1176 3.90/0.0049 12.4254
/2729 3.45/0.0038 1.130/ 1.289
5 Neltec® NH9338(3.38/0.0025)
ϕ30; 18 0.520 12.4062/1171 4.02/0.0051 12.4303
/2849 3.14/0.0025 1.280/ 2.040
Table 3. Dielectric parameters and uni-axial anisotropy of some crystalline samples, measured by different pairs of measurement resonators by two-resonator method
No Sample; sizes, mm f, GHz /Q factor
parallel:εpar; tanδεpar
f, GHz /Q factor
perpendicular: εperp; tanδεperp
anisotropy:Aε; Atanδε
1 Sapphire (single crystal)Prism: 17.7×12.5×5.6
6.5510 / 16655
10.1118 / 0.0000293
5.3658 / 3800 8.425 / 0.000001 1.200 / 29.3
2 Sapphire (single crystal)Prism: 10.3×8.0×5.3
9.1840 / 20750
10.2915 / 0.0000302
6.4057 / 3938 7.820 / 0.000005 1.316 / 6.04
3 Quartz (fused)Prism: 12.8×12.3×9.3
9.4450 / 9700 4.462 / 0.0000685 5.3520 /
3766 4.177 / 0.000021 1.068 / 3.26
P. I. Dankov et al.: Bi-axial dielectric anisotropy of crystalline materials and its characterization by resonance microwave...

131
meta-layer cannot behave as an independent sam-ple. In this specific case, we first have to determine the parameters of the thin support Kapton sample ~100 μm (isotropic, without sample) (see row 3), and then to extract the dielectric parameters of the meta-layers (rows 1–2). We can indicate the very big anisotropy due to the ordered metal nano-wire inclusions; Aε ~ 2.6–4.4.
The next part of our discussion is devoted to the comments of comparative data, obtained by the sin-gle-resonator method for crystalline samples (bulk prisms and cylinders) with different orientations (positions P1, P2 and P3 or positions D1, D2 in Fig. 2, 3). Similar to our method with cylindrical resonators is those, described in [20] for rectan-gular resonator. First of all, we present in Table 5 (for disk/cylinder samples) and Table 6 (for prism samples) dielectric parameters and anisotropy of similar or the same samples as in the previous measurements. Definitely, we obtain very similar results for the already measured samples by other methods, e.g. for LTCC, fused Quartz, Alumina ceramics, etc. In the same time, there appear some well-observed differences for the other samples. The anisotropy of samples from a given materials implemented as a single-crystal or poly-crystal-line sample, is different; the single crystals always show bigger anisotropy – see data for samples from Quartz, Sapphire, etc. For example, fused and sin-gle-crystal Quartz samples have equal values for
the perpendicular permittivity, εzz ~ 4.27–4.32 (the c-axis coincides with the resonator axis 0z), while the values for the parallel permittivity εxx, εyy are dif-ferent: ~3.74–3.84 in the single crystal along the a-axes; ~4.31–4.32 in the fused Quartz (see rows 1, 2 in Table 6). Similar isotropic-like behavior we ob-served in the bulk polycrystalline Alumina (row 5); while some glasses with inclusions don’t show iso-tropic behavior (rows 3, 4), opposite to the expecta-tions for such homogenous materials. In fact, most of the selected samples in Tables 5, 6 show more or less expressed anisotropy: Sapphire, Magnesium Titanate MgTiO3, ferrites, etc. (rows 6–8). Mica, a sheet silicate (phyllo-silicate) mineral, includes several closely related layers having nearly perfect basal cleavage, explained by the hexagonal sheet-like arrangement of its atoms. Due to this property Mica sample shows relatively big dielectric ani-sotropy Aε ~ 1.60 (row 9). A detectable relatively strong anisotropy we observe also for the present-ed semiconductor samples – single silicon crystal (for Si wafers) and semi-isolated GaAs for wafers (Aε ~ 1.32–1.43; rows 10, 11 in Table 6) (the sam-ples have been given up from the Faculty of Physics in Sofia University “St. Kliment Ohridski”).
A very interesting and informative example with completely new results has been presented in Table 7 – results for the dielectric parameters of several Carbon-content disk samples: spectral pure Graphite, air-filled Graphite, tick pressed Graphene
Table 4. Dielectric parameters and uni-axial anisotropy of very thin metamaterial samples with nono-wire inclusions on isotropic Kapton substrates
No Sample Shape D, mm; h, μm
Freq. bands
parallel: εpar; tanδεpar
perpendicular: εperp; tanδεperp
anisotropy:Aε; Atanδε
1 1D (nano-wire length 4 nm) disk ϕ18.1;
~12KuK
3.780 / 0.00854.030 / 0.0094
1.295 / 0.00331.180 / 0.0011
2.92/2.583.42/8.55
2 2D (nano-wire length 6 nm) disk ϕ18.1;
~12KuK
5.450 / 0.03906.880 / 0.0382
2.100 / 0.01001.580 / 0.0190
2.59/3.904.35/2.01
3 Kapton (2 × 50 mm) disk ϕ18; 100
KuK
3.150 / 0.02253.184 / 0.0230
3.100 / 0.02173.280 / 0.0180
1.16/1.040.97/1.28
Table 5. Dielectric parameters and uni-axial anisotropy of cylinder and disk samples by single resonator method with different sample orientations (cylinder axis is orientated along 0z)
No Material D, mm; h, μm parallel: εpar; tanδεpar
perpendicular: εperp; tanδεperp
anisotropy:Aε; Atanδε
1 ACX® LTCC ϕ 10.98; 1.96 7.66 / 0.0069 6.20 / 0.0048 1.24/1.442 MgTiO3 ϕ 4.92; 5.02 14.61 / 0.00028 15.10 / 0.00018 0.97/1.563 Alumina (Al2O3) ϕ 8.74; 8.46 8.40 / 0.000075 9.22 / 0.00006 0.91/1.254 Bulk soft ceramic ϕ 8.02; 10.02 9.78 / 0.00080 10.20 / 0.00075 0.96/1.07
P. I. Dankov et al.: Bi-axial dielectric anisotropy of crystalline materials and its characterization by resonance microwave...

132
Table 6. Dielectric parameters and bi-axial anisotropy of prism samples by single resonator method with different sample orientations
No Material along Ox: εxx; tanδεxx
along Oy: εyy; tanδεyy
along Oz: εzz; tanδεzz
anisotropy:Aεxz; Atanδεxz
anisotropy:Aεyz; Atanδεyz
1 Quartz (single crystal)Prism: 3.00×9.14×10.82
3.74 / 0.00005
3.84 / 0.00005
4.27 / 0.00010 0.88/0.50 0.90/0.50
2 Quartz (fused)Prism: 1.26×7.18×12.0
4.32 / 0.00012
4.31 / 0.00013
4.325 / 0.00041 0.99/0.29 0.99/0.32
3 Silica glassPrism: 3.00×9.14×10.82
5.15 / 0.0030
5.23 / 0.0031
4.30 / 0.00215 1.20/1.40 1.21/1.44
4 Optical glass with LiNbO3Prism: 1.16×4.92×7.62
32.25 / 0.000407
29.4 / 0.00039
22.8 / 0.00065 1.41/0.62 1.29/0.60
5 Alumina (Al2O3) (bulk)Prism: 5.88×6.70×8.14
9.35 / 0.00003
9.36 / 0.00003
9.38 / 0.00007 0.99/0.43 0.99/0.43
6 Sapphire (single crystal)Prism: 5.26×8.08×10.20
8.54 / 0.000015
8.87 / 0.000015
10.32 / 0.000017 0.83/0.88 0.79/0.88
7 MgTiO3 (bulk sample)Prism: 4.62×8.32×9.90
14.35 / 0.000675
14.10 / 0.00064
17.90 / 0.005 0.80/0.14 0.91/0.13
8 Ferrite (16СЧ4)Prism: 2.54×4.06×10.20
12.6 / 0.0018
13.2 / 0.0015
10.5 / 0.0026 1.20/0.69 1.25/0.58
9 Mica (multi-layer silicate)Prism: 2.720.80×8.50×10.34
4.87 / 0.00047
4.70 / 0.00050 3.0 / 0.0042 1.62/0.11 1.56/0.12
10 Crystalline Si for waferPrism: 2.72×4.10×8.0 10.75 / 0.45 10.15 / 0.52 8.125 / 0.38 1.32/1.18 1.25/1.37
11 SI (semi-isolated) GaAs waferPrism: 0.62×4.20×9.62
11.30 / 0.015
11.10 / 0.016 7.9 / 0.085 1.43/0.18 1.41/0.19
Table 7. Dielectric parameters and uni-axial anisotropy of disk carbon-content samples by single resonator method with different sample orientations (disk axis is orientated along 0z)
No Material D, mm; h, μm parallel:εpar; tanδεpar
perpendicular: εperp; tanδεperp
anisotropy:Aε; Atanδε
1 Graphite (spectral pure) ϕ 8.04; 3.18 135 (?) / 0.075.60 / 0.10 *) 15.9 / 0.0175 0.35/5.51
2 Air-filled Graphite ϕ 6.74; 1.66 1.53 / 0.0192 1.65 / 0.0205 0.93/0.94
3 Graphene (pressed thick sample) ϕ 5.92; 4.96 75 (?) / 0.25
4.08 / 0.15 *) 7.50 / 0.111 0.54/1.35
4 N-Graphene (pressed thick sample) ϕ 8.74; 8.46 155 (?) / 0.4
4.25 / 0.27 *) 4.95 / 0.21 0.86/1.29
*) measured by R1 resonator with TE011 mode
and N-doped Graphene (the last two samples have been submitted from IST, Lisbon). The air-filled Graphite acts as isotropic foam-like material with big losses. The perpendicular permittivity of other materials has been measured without any problems – the obtained values are ~4.95 for N-Graphene, ~7.50 for pure Graphene and up to 15.9 for pure Graphite. However, in the case of the parallel ori-entation of the sample the resonance frequencies for all samples decrease considerably, for which the simulator gives very high permittivity values – up
to 75–155, which is quite unrealistic for the con-sidered samples. In fact, we found out the reasons. In the simulations for the considered resonance structure: R2 resonator with disk sample placed vertically (as in Fig. 2c, Pos. 3), we can replace the sample with an ideal metal disk; Now the calcu-lated resonance frequency is close to the measured ones. This fact shows that the screening effect of the resonator walls and in the considered high-con-ductivity carbon samples cannot give possibility of the E fields to penetrate deeply in the sample in this
P. I. Dankov et al.: Bi-axial dielectric anisotropy of crystalline materials and its characterization by resonance microwave...
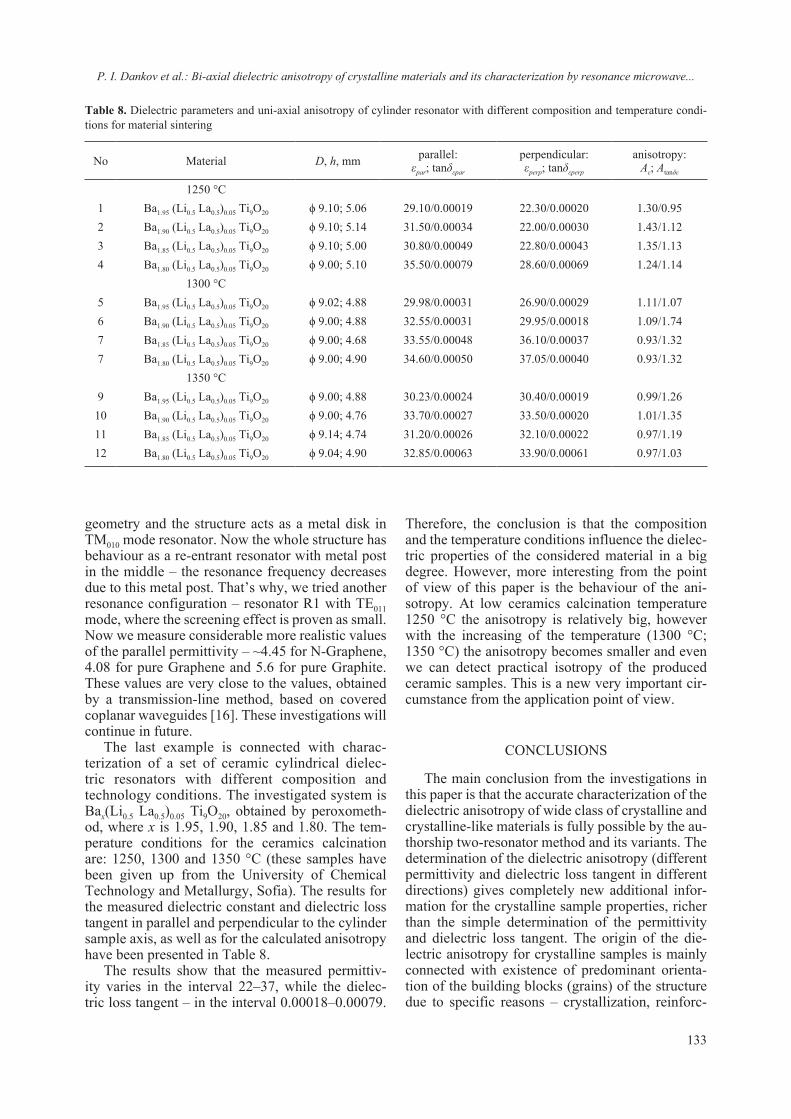
133
geometry and the structure acts as a metal disk in TM010 mode resonator. Now the whole structure has behaviour as a re-entrant resonator with metal post in the middle – the resonance frequency decreases due to this metal post. That’s why, we tried another resonance configuration – resonator R1 with TE011 mode, where the screening effect is proven as small. Now we measure considerable more realistic values of the parallel permittivity – ~4.45 for N-Graphene, 4.08 for pure Graphene and 5.6 for pure Graphite. These values are very close to the values, obtained by a transmission-line method, based on covered coplanar waveguides [16]. These investigations will continue in future.
The last example is connected with charac-terization of a set of ceramic cylindrical dielec-tric resonators with different composition and technology conditions. The investigated system is Bax(Li0.5 La0.5)0.05 Ti9O20, obtained by peroxometh-od, where x is 1.95, 1.90, 1.85 and 1.80. The tem-perature conditions for the ceramics calcination are: 1250, 1300 and 1350 °C (these samples have been given up from the University of Chemical Technology and Metallurgy, Sofia). The results for the measured dielectric constant and dielectric loss tangent in parallel and perpendicular to the cylinder sample axis, as well as for the calculated anisotropy have been presented in Table 8.
The results show that the measured permittiv-ity varies in the interval 22–37, while the dielec-tric loss tangent – in the interval 0.00018–0.00079.
Therefore, the conclusion is that the composition and the temperature conditions influence the dielec-tric properties of the considered material in a big degree. However, more interesting from the point of view of this paper is the behaviour of the ani-sotropy. At low ceramics calcination temperature 1250 °C the anisotropy is relatively big, however with the increasing of the temperature (1300 °C; 1350 °C) the anisotropy becomes smaller and even we can detect practical isotropy of the produced ceramic samples. This is a new very important cir-cumstance from the application point of view.
CONCLUSIONS
The main conclusion from the investigations in this paper is that the accurate characterization of the dielectric anisotropy of wide class of crystalline and crystalline-like materials is fully possible by the au-thorship two-resonator method and its variants. The determination of the dielectric anisotropy (different permittivity and dielectric loss tangent in different directions) gives completely new additional infor-mation for the crystalline sample properties, richer than the simple determination of the permittivity and dielectric loss tangent. The origin of the die-lectric anisotropy for crystalline samples is mainly connected with existence of predominant orienta-tion of the building blocks (grains) of the structure due to specific reasons – crystallization, reinforc-
Table 8. Dielectric parameters and uni-axial anisotropy of cylinder resonator with different composition and temperature condi-tions for material sintering
No Material D, h, mm parallel: εpar; tanδεpar
perpendicular: εperp; tanδεperp
anisotropy:Aε; Atanδε
1250 °C1 Ba1.95 (Li0.5 La0.5)0.05 Ti9O20 ϕ 9.10; 5.06 29.10/0.00019 22.30/0.00020 1.30/0.952 Ba1.90 (Li0.5 La0.5)0.05 Ti9O20 ϕ 9.10; 5.14 31.50/0.00034 22.00/0.00030 1.43/1.123 Ba1.85 (Li0.5 La0.5)0.05 Ti9O20 ϕ 9.10; 5.00 30.80/0.00049 22.80/0.00043 1.35/1.134 Ba1.80 (Li0.5 La0.5)0.05 Ti9O20 ϕ 9.00; 5.10 35.50/0.00079 28.60/0.00069 1.24/1.14
1300 °C5 Ba1.95 (Li0.5 La0.5)0.05 Ti9O20 ϕ 9.02; 4.88 29.98/0.00031 26.90/0.00029 1.11/1.076 Ba1.90 (Li0.5 La0.5)0.05 Ti9O20 ϕ 9.00; 4.88 32.55/0.00031 29.95/0.00018 1.09/1.747 Ba1.85 (Li0.5 La0.5)0.05 Ti9O20 ϕ 9.00; 4.68 33.55/0.00048 36.10/0.00037 0.93/1.327 Ba1.80 (Li0.5 La0.5)0.05 Ti9O20 ϕ 9.00; 4.90 34.60/0.00050 37.05/0.00040 0.93/1.32
1350 °C9 Ba1.95 (Li0.5 La0.5)0.05 Ti9O20 ϕ 9.00; 4.88 30.23/0.00024 30.40/0.00019 0.99/1.2610 Ba1.90 (Li0.5 La0.5)0.05 Ti9O20 ϕ 9.00; 4.76 33.70/0.00027 33.50/0.00020 1.01/1.3511 Ba1.85 (Li0.5 La0.5)0.05 Ti9O20 ϕ 9.14; 4.74 31.20/0.00026 32.10/0.00022 0.97/1.1912 Ba1.80 (Li0.5 La0.5)0.05 Ti9O20 ϕ 9.04; 4.90 32.85/0.00063 33.90/0.00061 0.97/1.03
P. I. Dankov et al.: Bi-axial dielectric anisotropy of crystalline materials and its characterization by resonance microwave...

134
ing, vacuum evaporation of orientated inclusions, pressing, layering, sintering, etc. Therefore, the ani-sotropy is very informative parameter for clarifying the specificity of the used technological process and the samples composition. The obtained results show also that anisotropy is bigger for single-crystalline samples in comparison to the poly-crystalline sam-ples from the same material. The sample homogeni-zation is possible for some technological processes, e.g. fusing. The sintering at high temperature also can decrease the anisotropy. The results for the ani-sotropy of some carbon-content samples: Graphene and Graphite, are presented for the first time.
Acknowledgements: The investigations have been supported financially by the National Research Fund in Bulgaria under Contract DN07-15. The authors would like to thank to different their col-leagues from Faculty of Physics of Sofia University and University of Chemical Technology and Metallurgy, Bulgaria, Technical University, Sofia for the given samples.
REFERENCES
1. P. R. Andrade, and S. P. S. Porto, Annu. Rev. Mater. Sci., 4, 287 (1974) https://doi.org/10.1146/annurev.ms.04.080174.001443
2. L. F. Chen, C. K. Ong, C. P. Neo, V. V. Varadan, V. K. Varadan, Microwave Electronics: Measurement and Materials Characterization, John Wiley & Sons Ltd., England, 2004 (Ch. 5/8).
3. P. I. Dankov, IEEE Trans. MTT, 54, 1534 (2006)4. V. N. Levcheva, B. N. Hadjistamov, P. I. Dankov,
Bulg. J. Phys., 35, 33 (2008)
5. P. I. Dankov, in: Microwave and Millimeter Wave Technologies from Photonic Bandgap Devices to Antenna and Applications, Igor Minin (ed.), In-Tech Publ., Austria, 2010, ISBN 978-953-7619-66-4.
6. P. I. Dankov, B. N. Hadjistamov, I. I. Arestova, V. P. Levcheva, PIERS Online, 5, 6, 501 (2009).
7. ANSYS HFSS, https://www.ansys.com/products/electronics/ansys-hfss
8. K. S. Cole, R. H. Cole, J. Chem. Phys., 9, 341 (1941)9. A. Badev, I. Iliev, J. P. Cambronne, T. Lebey, A.
Barnabe, V. Levcheva, Optoelectron. Adv. Mater. – Rapid Commun., 1, 10, 207 (2007).
10. P. I. Dankov, V. P. Levcheva, I. I. Arestova, in: Proc. ICMF’2007, Budapest, Hungary, 2007, p. 27.
11. P. Dankov, S. Kolev and S. Ivanov, in: Proc. 17th EM Field & Materials, Warsaw, Poland, 2004, p. 89.
12. V. P. Levcheva, I. I. Arestova, B. R. Nikolov, P. I. Dankov, Telfor. J., 1, 2, 57 (2009).
13. P. I. Dankov, M. I. Tsatsova, V. P. Levcheva, in: Proc. of PIERS 2017, Singapore, 2017 (online avail-able on IEEE Xplore).
14. P. I. Dankov, in: Proc. 47th EuMC2017, Nurenburg, Germany, 2017, p. 954.
15. P. I. Dankov, in: Proc. 48th EuMC2018, Madrid, Spain, 2018, p. 335.
16. P. Dankov, invited paper in: 8th International Workshop and Summer School on Plasma Physics (IWSSPP’2018), Kiten, Bulgaria, 2018 (to be pub-lished in IOP Conference Series 2019).
17. U. Fritsch, I. Wolff, in: Proc. IEEE MTT-S Digest, 1992, p. 1131.
18. R. P. Owens, J. E. Aitken, T. C. Edwards, IEEE Trans. MTT, 8, 499 (1976).
19. S. A. Ivanov, P. I. Dankov, J. Electrical Engineering (Slovakia), 53, 9s, 93 (2002).
20. G. Mumcu, K. Sertel, J. L. Volakis, IEEE Trans. MTT, 56, 217 (2008).
P. I. Dankov et al.: Bi-axial dielectric anisotropy of crystalline materials and its characterization by resonance microwave...

135© 2018 Bulgarian Academy of Sciences, Union of Chemists in Bulgaria
* To whom all correspondence should be sent:
Bulgarian Chemical Communications, Volume 50, Special Issue F (pp. 135–142) 2018
Åkermanite based bioactive ceramics: structural and in-vitro bioactivity characterization
I. K. Mihailova*, L. N. Radev
University of Chemical Technology and Metallurgy, 8 St. Kliment Ohridski Blvd., 1756 Sofia
Received October 22, 2018; Accepted December 01, 2018
Ceramics with chemical composition corresponding to åkermanite (2CaO.MgO.2SiO2) was synthesized by us-ing sol gel technique. The obtained dried gel was subjected to a two-step thermal treatment firstly at 700 °C for 2 hours and then at 1000, 1100, 1300 °C respectively for 2 hours. X-ray diffraction showed the temperature dependent structure evolution. The peculiarities of the crystallization of gels proceeding in the system CaO-MgO-SiO2 provide the synthesis of materials of an identical chemical but with various phase composition, microstructure аnd relevant properties. All obtained samples from 700 to 1300 °C were multiphase. The quantity of åkermanite was increased with the increasing of the temperature.
The structural behavior of the synthesized after two-step thermal treatment at 700 and 1300 °C ceramics was examined by means of X-ray diffraction (XRD), Fourier Transform Infrared Spectroscopy (FTIR) and Scanning Electron Microscopy (SEM). Åkermanite, as the main crystalline phase, merwinite and diopside, as the minor phases, were identified. The XRD results were in good agreement with FTIR analysis.
The main purpose of the paper was the evaluation of the in vitro bioactivity of the åkermanite ceramics in static con-ditions for different periods of time – 7, 14 and 28 days in Simulated Body Fluid (SBF). The formation of carbonated apatite layer on the surface of the immersed samples was verified by FTIR, SEM and Energy Dispersive Spectroscopy (EDS) techniques. The change of ions concentrations in SBF was also carried out by Inductively Coupled Plasma Optical Emission Spectrometry (ICP-OES).
Keywords: CaO-MgO-SiO2, ceramics, åkermanite, in vitro bioactivity.
E-mail: [email protected]
INTRODUCTION
Over the last few decades, scientific research in the field of biomaterials has progressively increased. This is certainly due to scientific development and the opportunities offered by current research meth-ods and equipment. On the other hand, the life ex-pectancy of people in developed societies is increas-ing without necessarily eliminating their health problems. Regenerative medicine addresses pre-cisely this problem by enabling for a higher quality of life for the elderly as well as for those who, due to trauma and illness, need medical treatment. This is all the more valid for bone regenerative medicine. The improvement and the development of new ther-apeutic approaches cannot be achieved without the development and application of new biomaterials. Biomaterials must comply with numerous and vary-ing criteria, depending on the type of application.
Biomaterials function in direct contact with living tissues, in order to provide maximum support (stim-uli) to the natural regenerative mechanisms of the body. To ensure this function, materials with appro-priate chemical phase composition, structure and properties should be selected. For example, when developing implants for bone regeneration, one of the most important properties is their bioactivity, i.e. their ability to accumulate a mineral layer on the surface when placed in a biological environment, with a composition close to the mineral composi-tion of the bone. This ensures that they can make a connection with the living bone.
Bioceramics in the CaO-MgO-SiO2 system has been subject of a lot of research [1–14] that has identified them as promising for biomedical appli-cations due to their in vitro and in vivo bioactivity, biodegradability, biocompatibility, etc. A number of studies have evaluated either the influence of the chemical composition (e.g. the magnesium content [1, 2]) or the phase composition by studying and comparing single-phase materials (e.g. bioceram-ics containing diopside [5, 6], åkermanite [7–9],

136
merwinite [10–11], bredigite [12–13], etc.). In this system, the strong impact was found of gels thermal treatment mode on crystallization and phase com-position of the obtained glass-ceramic and ceram-ics [15]. This gives the opportunity to synthesize various materials containing crystalline phases in varying proportions without altering the chemical composition. Differences in the in vitro bioactivity of the synthesized materials could be expected giv-en the effect of phase composition and structure on the properties of the materials. The purpose of this study is to synthesize and make a structural as well as in vitro bioactivity characterization of polyphase bioceramics with a chemical composition corre-sponding to åkermanite. This study is a continuation of our previous research on polyphase materials produced by a similar method of synthesis but with a chemical composition corresponding to merwinite [16–17]. Applying the same approach in previous research and current study allows to make a com-parison of the obtained in vitro bioactivity results.
EXPERIMENTAL
Sample preparation
Ceramics have been prepared with sol-gel method by using tetraethyl orthosilicate ((C2H5O)4Si, TEOS), magnesium nitrate hexahy-drate (Mg(NO3)2.6H2O) and calcium nitrate tet-rahydrate (Ca(NO3)2.4H2O) as raw materials. Nitric acid (HNO3, 2N) was used to catalyze the hydroly-sis of TEOS. The TEOS was mixed with absolute ethanol, water and 2N HNO3 (molar ratio: TEOS/H2O/HNO3=1:8:0.16) and hydrolyzed for 1 h under stirring. Then, the solutions of Ca(NO3)2.4H2O and Mg2(NO3).6H2O were added into the mixture (mo-lar ratio TEOS:Mg(NO3)2.6H2O:Ca(NO3)2.4H2O = 2:1:2), and reactants were stirred for 6 h at room temperature. After mixing, the solution was dried at 100 °C for 2 days to obtain the dry gel. The dried gel was calcined at 700 °C for 2 h. Finally, the pow-ders were thermally treated at 1000, 1100, 1300 °C respectively for 2 h.
Characterization techniques
Thermal analysis was conducted to deter-mine the temperature of heat treatment using a TG/ DTA system (STA PT1600 TG-DTA/DSC (STA Simultaneous Thermal Analysis) LINSEIS Messgerate GmbH Germany equipped with ther-mogravimetric (TG) and differential scanning calo-rimetry (DSC) units. The specimen was annealed at increasing temperature from 20 °C to 1000 °C in open air. The heating rate was set at 10°C/min.
X-ray powder diffraction (XRD) analysis was applied for phase identification. An X-ray diffrac-tometer Philips at Cu Kα radiation was used in the range from 8° to 90° 2θ (step size: 0.05°, counting time per step: 1 s). The crystalline phases were iden-tified using the powder diffraction files: PDF № 83-1815, PDF № 74-382 and PDF № 71-1067 from da-tabase JCPDS – International Centre for Diffraction Data PCPDFWIN v.2.2. (2001). The quantitative phase analysis was performed with the PowderCell 2.4 software [18].
FTIR spectroscopy has also been applied. Infrared transmittance spectra were recorded by us-ing the pressed pellet technique in KBr. KBr pellets were prepared by mixing ~1 mg of the sample with 300 mg KBr. The measurements were made by a FTIR spectrometer Brucker Tensor 27 in the wave number/wavelength range from 4000 to 400 cm–1. The transmittance spectra were recordered using MCT detector with 64 scans and 1 cm–1 resolution.
The morphology of the surface and chemical composition were analyzed using Scanning Elec-tron Microscopy SEM Hitachi SU‒70 equipped with energy dispersive spectrometer (EDS).
In vitro test for bioactivity in SBF solution
In order to estimate the in vitro bioactivity (po-tential for apatite formation) of the sample, we used the Simulated Body Fluid (SBF) proposed by Kokubo et al. [19], the Tris-buffered SBF (Na+ 142.0, K+ 5.0, Mg2+ 1.5, Ca2+ 2.5, Cl– 147.8, HCO3
– 4.2, HPO4
2– 1.0 and SO42– 0.5 mol m–3; 7.4 pH).
The concentration of various ions in the SBF was adjusted to be similar to those in human blood plasma.
0.3 g of the homogenized ceramic powders were uniaxially pressed to obtain pellets 2 mm in thickness and 10 mm in diameter. The pellets were placed in polyethylene bottles containing 20 ml of SBF at 37 ± 0.5 °C. The sample surface area to SBF volume (SA/V) ratio was equal to 0.1 cm–1.
Pellets were removed after 7, 14 and 28 days of soaking, gently rinsed with deionized water and ac-etone, and dried at room temperature.
Sample surfaces and cross-sections, before and after SBF treatment, were examined by SEM and EDS. The changes in the samples during the in vitro test were also registered by FTIR spectroscopy.
The SBF was removed after several periods of immersion and calcium, magnesium, phospho-rus, and silicon ion concentration in the removed SBF was determined by inductively coupled plas-ma optical emission spectrometry (Prodigy High Dispersion ICP-OES Spectrometer from Teledyne Leeman Labs ‒ USA).
I. Mihailova, L. Radev: Åkermanite based bioactive ceramics: structural and in-vitro bioactivity characterization

137
RESULTS AND DISCUSSION
Phase composition of the samples depending on the thermal treatment of the dry gel
The purpose of the first stage of thermal treat-ment was to decompose the nitrates and remove the residues of the solvents used after the gel-drying step. Its temperature was determined by DTA-TG analysis of the dry gel. The experimental DTA curve (Fig. 1) revealed endoeffects, accompanied by a mass loss up to 540 °C. Based on these data, the 700 °C temperature was determined for the first stage of the thermal treatment.
According to the results of the XRD analy-sis (Table 1), the crystallization of the gel with a composition of 2CaO.MgO.2SiO2 (corresponding to the stoichiometry of åkermanite) starts with the formation of Ca2SiO4 and Ca3MgSi2O8 merwinite, i.e. crystalline phases that are richer in CaO com-pared to the composition of the starting gel. Such crystallization behavior of gel is characteristic for the CaO-MgO-SiO2 system and according to [15] is due to the varying cation mobility. This determines system specificity and the significant effect of gel thermal treatment mode on the phase composition of the obtained glass-ceramics and ceramics. This system gives the opportunity to synthesize a wide
Fig. 1. Thermal (TG-DTA) analysis of the dry gel.
Table 1. Phase composition of the samples depending on the thermal treatment of the dry gel
Thermal treatmentof dry gel
Crystalline phasesidentified in the sample
700°/2h 700°/2h + 1000°/2h
700°/2h +1100°/2h
700°/2h +1300°/2h
Åkermanite, Ca2MgSi2O7 – 16% 24% 57%Diopside, CaMgSi2O6 – 28% 26% 22%Merwinite, Ca3MgSi2O8 30%* 54% 50% 21%Larnite, β-Ca2SiO4 56%* – – –Periclase, MgO 14%* 1.2% – –
* These are the ratios only between the crystalline phases, however there is a significant amount of amorphous phase in the sample that is not calculated.
I. Mihailova, L. Radev: Åkermanite based bioactive ceramics: structural and in-vitro bioactivity characterization

138
variety of materials containing crystalline phases in varying proportions without altering the chemical composition. Given the effect of phase composition and structure on the materials bioactivity, differenc-es in the in vitro bioactivity can be expected, both between the synthesized materials, as well as when compared to single-phase ceramics, which typically require continued thermal treatment at high synthe-sis temperatures.
Structure of åkermanite based ceramics (ÅBC)
In this study, ceramics obtained after thermal treatment at 1300 °C, hereinafter referred to as ÅBC (Åkermanite Based Ceramics), was selected in order to make a more detailed structural analy-sis and evaluation of the apatite forming ability in a SBF environment. As can be seen from Fig. 2 and Table 1, its phase composition is characterized by the predominant presence of åkermanite and the presence of similar amounts of merwinite and di-opside. According to the literature data, the three phases exhibit suitable properties for biomedical applications [3–11].
The FTIR spectrum of ÅBC sample is presented in Fig. 3 (a). The vibrations of the [Si2O7]6– group in the åkermanite structure are positioned from 1020 to 600 cm–1. The band at 1020 cm–1 is assigned to the antisymmetric stretching of oxygens in åker-manite, whereas the bands at 972, 933 and 905 cm–1 are assigned to symmetrical stretching modes of terminal oxygens [20]. The bands at 683 cm–1 and
587 cm−1 could be related to symmetrical stretch-ing, νs(Si–O–Si) mode of bridging oxygen of the pyrosilicate units, and to the presence of CaO group [20].
Fig. 2. X-ray diffraction pattern of the ceramics ÅBC.
Fig. 3. FTIR spectra of the prepared ceramics ÅBC (a) and after its immersion in SBF for 7 (b), 14 (c) and 28 (d) days in static conditions.
I. Mihailova, L. Radev: Åkermanite based bioactive ceramics: structural and in-vitro bioactivity characterization

139
The bands posited in the range 1050–850 cm–1 correspond to internal antisymmetric and symmet-ric stretching vibrations of SiO4 tetrahedra in mer-winite [21]. The peaks near 1020, 972, 933, 905 and 587 cm–1 in the FTIR spectrum of ÅBC correspond to the vibration modes of both phases [16, 20, 21].
The FTIR spectrum of pyroxene has a very characteristic pattern with three strong bands in the range of 1070 to 850 cm–1. The adsorption at ≈ 1070 cm–1 may be attributed to the νas(Si–O–Si) mode in the diopside structure [22]. The bands at 972 and 850 cm–1 are due to the symmetrical
νs(Si–O–) and antisymmetric νas(Si–O–) stretching of the terminal nonbridging oxygens in the py-roxene chains. The band at 637 cm–1 corresponds to the symmetric stretching of bridging oxygen νs(Si–O–Si) [22].
The other complex intensive bands in the region 550 to 450 cm–1 could be assigned to Si–O–Si bend-ing vibration and to vibrations of the MgO6 and MgO4 groups [20]. The presented FTIR results are in good agreement with XRD analysis.
The microstructure of the ÅBC sample is shown in Fig. 4 (a) and (b). Micropores and polygonal
Fig. 4. SEM images of ÅBC-surface: as synthesized, i.e. before in vitro test (a)1000×, (b) 15000×; and after soaking in SBF for 7 days (c) 1000×, (d) 15000×; for 14 days (e) and for 28 days (f)
a b
c d
e f
I. Mihailova, L. Radev: Åkermanite based bioactive ceramics: structural and in-vitro bioactivity characterization

140
crystals with dimensions of 1–1.5 μm were found. The structural features are characteristic of liquid phase sintering.
In vitro bioactivity of åkermanite based ceramics
The FTIR spectra of ÅBC after soaking in SBF up to 28 days (Fig. 3) show that the main spectral characteristics remain unchanged during the testing period. At the same time the results show a decrease in the relative intensity of some absorption bands, an increase in the intensity of others, and the ap-pearance of new absorption bands in ceramics spec-tra with the increase in the time of soaking in SBF. These changes can be explained by the partial dis-solution of the silicate phases and the formation of phosphates. Absorbance at 1100–1000 cm–1 relates to ν3 PO4
3–, the new band at 560 cm–1 corresponds to ν4 PO4
3– and the shoulder at 460 cm–1 belongs to ν2 PO4
3–. These vibrational modes are characteristic of the PO4
3– ions in hydroxyapatite (HA) struc-ture [23]. With the increase of the soaking time in SBF, the complex absorption band between 1500– 1400 cm–1 rises, which is associated with the pres-ence of carbonates [24]. Carbonate groups can sub-stitute for [PO4]3– and (OH)– groups in the structure of hydroxyapatite, but they are also likely to form carbonate phases. After 28 days of soaking, absorp-tion peaks at 875 and 715 cm–1 in the spectrum of the sample were also observed, which could also be attributed to a carbonate group [24].
SEM micrographs of the ÅBC surface after 7 days in SBF (Fig. 4. b, c) show a significant change. The surface is covered with newly formed spherical aggregates with the typical morphology of apatite. The sphere sizes reach up to 1 μm. The EDS data in Fig. 5 shows that the composition of the formed layer is calcium phosphate (Ca:P = 2,11)
According to the ICP results, no phosphorus content was detected in SBF after 7 days of soaking, i.e. the whole content was depleted within 7 days of soaking the ceramics, while the concentrations of Ca, Mg, Si have increased (Fig. 6) as a result of the dissolution of the ceramics phases.
The obtained results from FTIR, SEM, EDS and ICP-OES reveal the formation of an apatite layer on the ceramic surface after 7 days of soaking in SBF. Therefore, the studied ÅBC ceramics has in vitro bioactive properties.
According to some authors [20] the presence of merwinite in åkermanite ceramics leads to a faster apatite layer formation compared to that in the sin-gle-phase åkermanite. However, it is important to note that, besides the phase composition, material’s bioactivity is affected by a number of other factors, e.g., the microstructural features of the material.
The absence of phosphorus in the solution after 7 days of soaking in SBF inhibits the further apatite deposition. On the other hand, the ICP data after 14 and 28 days of soaking in SBF show an increase in the concentration of Ca, thus indicating a continued process of dissolution and preferential passage of Ca from ceramics into the solution. The dissolution of ÅBC ceramics in SBF environment is a factor that enhances its bioactivity, making it promising for bone regeneration. During this time-frame, the deposition of the surface layer continues, with the possible inclusion of silicon and magnesium in the composition of the formed phases. This is in line with the ICP data that shows a reduction in the con-centrations of these elements in the SBF. The corre-sponding ÅBC surface morphology after 14 and 28 days of soaking in SBF is illustrated in Fig. 4 (e, f)
Fig. 6 shows the evolution of SBF ion concen-tration during the in vitro soaking test of ÅBC, and for comparison purposes, our published results for merwinite ceramics MC1 [16] and MC2 [17]. MC1 mervinite ceramics (85% mervinite and 15% åkermanite) is obtained by sol-gel synthesis simi-lar to that used for ÅBC (including the same ther-mal treatment). Interesting results are obtained by comparing the in vitro bioactivity of both ceram-ics. SEM morphology analysis: the newly formed spherical aggregates after soaking in SBF for 7 days are very similar in type, size and distribution.
The Ca, Mg, Si ions concentration after soaking in SBF for 7 days is higher in the solution with åker-manite ceramics (ÅBC) than that with merwinite
Fig. 5. EDS data for the ceramic surface, after soaking in SBF for 7 days.
I. Mihailova, L. Radev: Åkermanite based bioactive ceramics: structural and in-vitro bioactivity characterization
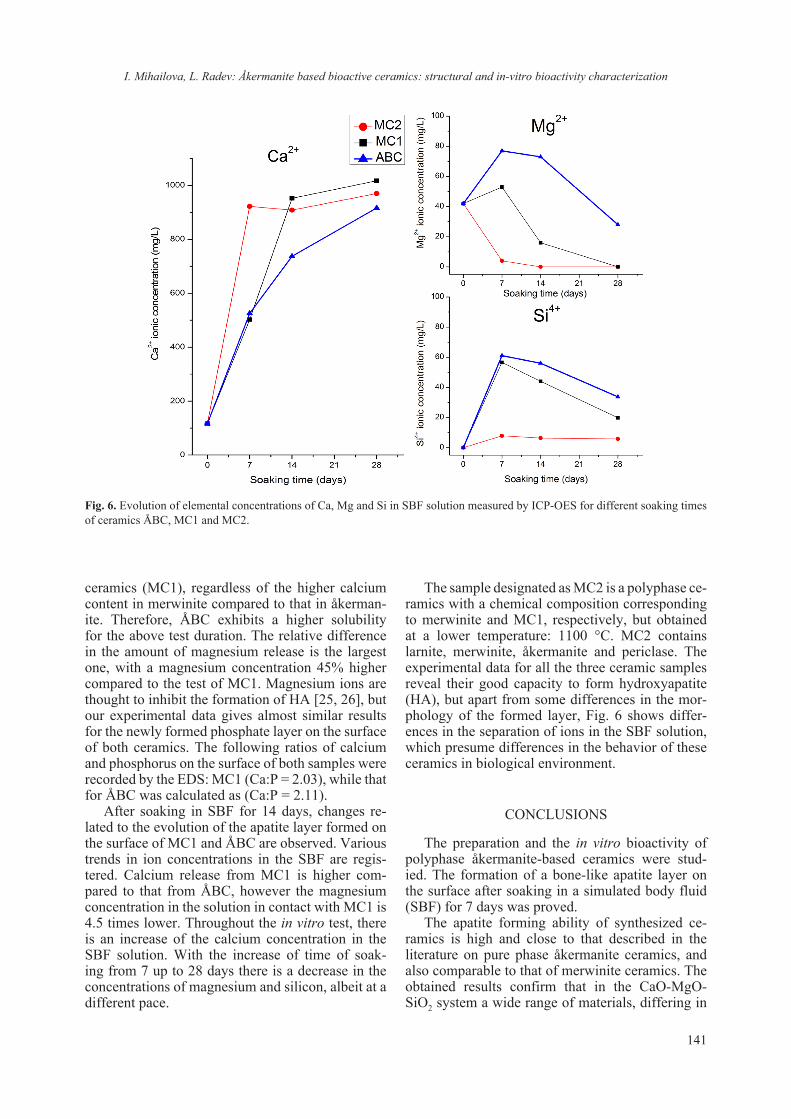
141
ceramics (MC1), regardless of the higher calcium content in merwinite compared to that in åkerman-ite. Therefore, ÅBC exhibits a higher solubility for the above test duration. The relative difference in the amount of magnesium release is the largest one, with a magnesium concentration 45% higher compared to the test of MC1. Magnesium ions are thought to inhibit the formation of HA [25, 26], but our experimental data gives almost similar results for the newly formed phosphate layer on the surface of both ceramics. The following ratios of calcium and phosphorus on the surface of both samples were recorded by the EDS: MC1 (Ca:P = 2.03), while that for ÅBC was calculated as (Ca:P = 2.11).
After soaking in SBF for 14 days, changes re-lated to the evolution of the apatite layer formed on the surface of MC1 and ÅBC are observed. Various trends in ion concentrations in the SBF are regis-tered. Calcium release from MC1 is higher com-pared to that from ÅBC, however the magnesium concentration in the solution in contact with MC1 is 4.5 times lower. Throughout the in vitro test, there is an increase of the calcium concentration in the SBF solution. With the increase of time of soak-ing from 7 up to 28 days there is a decrease in the concentrations of magnesium and silicon, albeit at a different pace.
The sample designated as MC2 is a polyphase ce-ramics with a chemical composition corresponding to merwinite and MC1, respectively, but obtained at a lower temperature: 1100 °C. MC2 contains larnite, merwinite, åkermanite and periclase. The experimental data for all the three ceramic samples reveal their good capacity to form hydroxyapatite (HA), but apart from some differences in the mor-phology of the formed layer, Fig. 6 shows differ-ences in the separation of ions in the SBF solution, which presume differences in the behavior of these ceramics in biological environment.
CONCLUSIONS
The preparation and the in vitro bioactivity of polyphase åkermanite-based ceramics were stud-ied. The formation of a bone-like apatite layer on the surface after soaking in a simulated body fluid (SBF) for 7 days was proved.
The apatite forming ability of synthesized ce-ramics is high and close to that described in the literature on pure phase åkermanite ceramics, and also comparable to that of merwinite ceramics. The obtained results confirm that in the CaO-MgO-SiO2 system a wide range of materials, differing in
Fig. 6. Evolution of elemental concentrations of Ca, Mg and Si in SBF solution measured by ICP-OES for different soaking times of ceramics ÅBC, MC1 and MC2.
I. Mihailova, L. Radev: Åkermanite based bioactive ceramics: structural and in-vitro bioactivity characterization

142
chemical and phase composition, exhibit high in vitro bioactivity. Therefore, the opportunity should be explored to obtain bioceramic materials with varying phase content and structure, but the same chemical composition, in view of their optimization (improvement) for different applications.
REFERENCES
1. C. Wu, J. Chang, J. Biomed. Mater. Res. Part B, 83B, 153 (2007).
2. X. Chen, J. Ou, Y. Wei, Z. Huang, Y. Kang, G. Yin, J. Mater. Sci. Mater. Med., 21, 1463 (2010).
3. M. Diba, O.-M. Goudouri, F. Tapia, A. R. Boccaccini, Curr. Opin. Solid State Mater. Sci., 18, 147 (2014).
4. K. Marzban, S. M. Rabiee, Nanomed. Res. J., 2, 1 (2017).
5. T. Nonami, S. Tsutsumi, J. Mater. Sci., Mater. Med., 10, 475 (1999).
6. N. Y. Iwata, G. H. Lee, Y. Tokuoka, N. Kawashima, Colloids Surf. B, 34, 239 (2004).
7. Y. Huang, X. G. Jin, X. L. Zhang, H. L. Sun, J. W. Tu, T. T. Tang, et al. Biomaterials, 30, 5041 (2009).
8. F. Shamoradi, R. Emadi, H. Ghomi, J. Alloys Compd., 693, 601 (2017).
9. A. K. Sharafabadi, M. Abdellahi, A. Kazemi, A. Khandan, N. Ozada, Mater. Sci. Eng., C, 71, 1072 (2017).
10. X. Chen, G. Yin, J. Ou, H. Zhu, J. Funct. Mater., 38, 435 (2007).
11. M. Hafezi, A. Reza Talebi, S. Mohsen Miresmaeili, F. Sadeghian, F. Fesahat, Ceram. Int., 39, 4575 (2013).
12. C. T. Wu, J. Chang, W. Y. Zhai, S. Y. Ni, J. Mater. Sci. Mater. Med., 18, 857 (2007).
13. Y. Zhou, C. Wu, X. Zhang, P. Han, Y. Xiao, J. Mater. Chem. B, 1, 3380 (2013).
14. W. Zhai, H. Lu, C. Wu, L. Chen, X. Lin, K. Naoki, et al., Acta Biomater., 9, 8004 (2013).
15. J. Gillot, M. Roskosz, H. Leroux, F. Capet, P. Roussel, J. Non-Cryst. Solids, 357, 3467 (2011).
16. I. K. Mihailova, L. Radev, V. A. Aleksandrova, I. V. Colova, I. M. M. Salvado, M. H. V. Fernandes, Bulg. Chem. Commun., 47 253 (2015).
17. I. Mihailova, L. Radev, V. Aleksandrova, I. Colova, I. M. M Salvado, M. H. V. Fernandes, J. Chem. Techn. Metall., 50 502 (2015).
18. W. Kraus, G. Nolze, Powdercell2.4, Federal Institute for materials Research and Testing Rudower Chaus-see 512485 Berlin, Germany.
19. T. Kokubo, H. Kushitani, S. Sakka, T. Kitsugi and T. Yamamuro, J. Biomed. Mater. Res., 24, 721 (1990).
20. R. Choudhary, S. Koppala, S. Swamiappan, J. Asian Ceram. Soc., 3, 173 (2015).
21. L. Kriskova, Y. Pontikes, O. Cizer, A. Malfliet, J. Dijkmans, B. Sels, K. Van Balen, B. Blanpain, J. Am. Ceram. Soc., 97, 3973 (2014).
22. M. S. Rutstein, W. B. White, Am. Mineral., 56, 877 (1971).
23. I. Rehman, W. Bonfield, J. Mater. Sci.: Mater. Med., 8, 1 (1997).
24. M. Cerruti, C. Morterra, Langmuir, 20, 6382 (2004).25. J. Ma, C. Z. Chen, D. G. Wang, J. H. Hu., Mater.
Lett., 65, 130 (2011).26. J. Ma, C. Z. Chen, D. G. Wang, X. Shao, C. Z. Wang,
H. M. Zhang, Ceram. Int., 38, 6677 (2012).
I. Mihailova, L. Radev: Åkermanite based bioactive ceramics: structural and in-vitro bioactivity characterization

143© 2018 Bulgarian Academy of Sciences, Union of Chemists in Bulgaria
* To whom all correspondence should be sent:
Bulgarian Chemical Communications, Volume 50, Special Issue F (pp. 143–149) 2018
The influence of the modification of zirconium tungstate with Eu(III) on the α → β phase transition temperature and optical band gap
E. D. Encheva, M. K. Nedyalkov, M. P. Tsvetkov, M. M. Milanova*
University of Sofia “St. Kl. Ohridski”, Faculty of Chemistry and Pharmacy, Department of Inorganic Chemistry, Laboratory of rare and rare earth elements, 1 J. Bourchier Blvd., 1164 Sofia, Bulgaria
Received October 22, 2018; Accepted December 01, 2018
The hydrothermal method was used to obtain pure and Eu(III)-modified ZrW2O8. Tungstates modified with 1, 2, and 5 mol% Eu(III) were synthesized in order to investigate the influence of Eu(III) doping on the properties of zirconium tungstate. The samples obtained were phase homogeneous as shown by XRD. High temperature XRD was used to follow the temperature of the alpha-beta phase transition. It was observed that the higher the content of Eu(III), the higher the temperature of the transition. The unit cell parameters decrease both with the Eu(III) content and the temperature increasing. Тhe values of the thermal expansion coefficients obtained decreased with increasing Eu(III) for both the alpha and beta phases of ZrW2O8. Doping with increasing amounts of Eu(III) increased the energy of the optical band gap as well.
Keywords: zirconium tungstate, Eu(III) modification, XRD, phase transition, band gap energy.
E-mail: [email protected], [email protected]
INTRODUCTION
In the recent years the modification of tung-states isostructural with CaWO4 was studied for their potential application for light emitting di-odes [1–3]. Among those studied is the tungstate NaY(WO4)2, where Y3+ can be substituted by other lanthanide ions, Ln3+, due to their similar ionic ra-dii [3]; NaLn(WO4)2 can be additionally co-doped with other Ln3+ [4]. However, because the materials mentioned have a positive coefficient of thermal ex-pansion (CTE) and the impurities (sources of lumi-nescence) worsen the mechanical properties, they cannot operate in an environment with large tem-perature changes. Therefore, potential replacements could be the tungstates of Zr and Hf, which have negative coefficients of thermal expansion [5–8].
The cubic ZrW2O8 (primitive cubic space group P213, a = 9.1600 Å, PDF 00-050-1868) is the subject of interest in the research presented here. Its nega-tive thermal expansion (–10.2×10⁻⁶ K–1, 30–120 °C [9]) is isotropic and relatively constant over a wide temperature range of –273 °C to 777 °C. In this range, the phase transition α-ZrW2O8 → β-ZrW2O8 occurs (primitive cubic space group Pa3–, a = 9.1371 [5]) that is associated with an order-disorder transi-
tion. The temperature of the transition is not well defined and in the literature the values for it vary in the range between 157 °C and 175 °C [10]. Heating above 777 °C can lead to the decomposition of the compound to its constituent oxides, ZrO2 and WO3 [6, 7].
Although the crystal lattice is flexible with re-spect to temperature changes, the literature data show that the cations in ZrW2O8 are difficult to substitute in both cationic sublattices [8]. The only complete substitution in the zirconium sublattice is with Hf in Zr1–xHfxW2O8 [5, 11]. The ions Ti4+ and Sn4+ were studied as possible substituting ions for the Zr4+ position in ZrW2O8. Attempts to replace Zr have resulted in the substitution of only 30% for Sn4+ [12] and 5% for Ti4+ cations [13]. Substitution studies indicate that isomorphic solid solutions are obtained, described by the general formula ZrW1–xTixO8 [13, 14]. There are no reports in the lit-erature of attempts to replace Zr with other tetrava-lent ions. Substitutions with lanthanide ions are limited to 5% and are only obtained for ions with small ionic radius. The literature data related to the preparation of ZrW2O8-based red phosphorus by modification with Eu3+ are limited [15].
Data on the influence of different modifiers on the properties of cubic tungstates are rather incom-plete. It was found that even small amounts of a modifying agent may influence the phase transition temperature and the coefficient of thermal expan-

144
sion (CTE) [16]. The introduction of ions with dif-ferent radius and charge can lead to a disorder in the crystalline structure of the tungstate and conse-quently to a change in their properties [8].
Although tungstates of Zr (as well as that of Hf) are difficult to produce, different methods have been successfully applied, among them coprecipitation [17], solid state reaction [18–22], low-temperature spark plasma sintering [23], sol gel method [9, 24], and hydrothermal synthesis [25–27]. Hydrothermal synthesis is considered suitable and economically advantageous because it is carried out at relatively low temperatures and produces phase homogeneous materials [27].
In the work presented here, the hydrothermal method was applied for zirconium tungstate syn-thesis and its modification with different contents of Eu(III). The influence of the temperature and the content of the modifying agent on the coefficient of thermal expansion were followed. The band gap energy was calculated in order to evaluate the po-tential application of the semiconductors obtained in photochemical processes.
EXPERIMENTAL
Materials
ACS grade starting materials ZrOCl2.8H2O
(Sigma-Aldrich) and Na2WO4.2H2O (Aldrich) were
used. Eu(NO3)3.nH2O was synthesized from Eu2O3
(Fluka, p.a.) by dissolving it in heated dilute HNO3, followed by crystallization after cooling of the so-lution. The amount of water of crystallization was determined by titration.
Synthetic procedure
Synthesis of pure ZrW2O8
Initial solutions of ZrOCl2.8H2O and Na2WO4
. 2H2O in water with a concentration of 0.1 and 0.2 M, respectively, were prepared. They were mixed in stoichiometric ratio calculated Zr/W = 1:2, heated to 60 °C and stirred for 30 min. To the homoge-neous solution obtained 15 ml 6M HCl was added (final concentration of HCl about 3М), followed by additional heating at 60 °C for 2 hours. After adding 5 ml of 1-butanol, the solution was heated in a 75 ml Teflon autoclave for 15 h at 180 °C while stirring. After cooling down to room temperature, the sus-pension obtained was filtered, washed with water and EtOH and dried at 50 °C. After calcination in preheated oven at 600 °C for 1 h and quick cooling down to room temperature, the sample obtained was ready for analysis.
Synthesis of ZrW2O8 modified with Eu(III)
A procedure analogous to the above for the pure ZrW2O8 was followed except that in the first step, a 0.01 M water solution of Eu(NO3)3
.nH2O was added in such amount to obtain ZrW2O8 samples with 1, 2 and 5 mol% Eu(III).
Methods for characterization
High temperature XRD was performed using a PANalytical Empyrean diffractometer with PIXcel 3D detector. The XRD patterns were recorded be-tween 15–90° 2θ with step 0.026°. An Anton Paar HTK 16N camera was used for in situ high tem-perature measurements in the interval 25–250 °C with different steps. The unit cell parameters were calculated by the least square method using the FullProf software [28]. For the starting model of the α-ZrW2O8 the structure provided by [29] was used, while for the β-phase the structure of ZrWMoO8 which adopts the Pa3– space group at room tempera-ture [30] was used.
UV-VIS absorption spectroscopy – an Evolution 300 UV-Vis spectrometer (Thermo Scientific) was used for measuring the absorption of the samples in the range 200–900 nm.
Band gap energy calculations. The optical prop-erties (absorption and optical band gap energy) of the samples were studied using UV-Vis absorption spectra. In all cases absorption was registered from 200 to 400 nm. The UV-Vis data were analyzed for the relation between the optical band gap, absorp-tion coefficient and energy (hν) of the incident pho-ton for near edge optical absorption in semiconduc-tors. The band gap energy was calculated from the measured curves by fits according to Tauc’s equa-tion [31] αhν = A(hν − Eg)n/2, where A is a constant independent of hν, Eg is the semiconductor band gap and n depends on the type of transition. The value used for n was 1, reflecting a direct transition. The well-known approach for semiconductor band gap energy determination from the intersection of lin-ear fits of (αhν)1/n versus hv on the x-axis was used, where n can be 1/2 and 2 for direct and indirect band gap, respectively.
RESULTS AND DISCUSSION
Characterization of the samples by XRD phase analysis
Тhe XRD patterns from the high temperature analysis from 25 to 250 °C for pure ZrW2O8 are pre-sented in Figure 1. The Eu(III)-modified ZrW2O8 samples show the same tendency that is why their
E. D. Encheva et al.: The influence of the modification of zirconium tungstate with Eu(III) on the α → β phase transition...

145
XRD patterns are not included in the text. The pow-der X-ray diffraction patterns of the samples proved their crystalline nature and the peaks matched well with literature ZrW2O8 reflections. All the diffracto-grams show the reflection peaks typical for ZrW2O8. No additional phases containing W or Zr are ob-served. The reflection peaks at 39.28 and 45.67 2θ, typical for Pt (111) and (002), respectively, are due to the substrate used during the measurements.
In order to observe the phase transition α-ZrW2O8 → β-ZrW2O8, the change in the intensity of the re-flection peaks (110) and (310) was followed. These
peaks are typical for the low-temperature α-ZrW2O8 but not for the high-temperature β-ZrW2O8 phase. The dashed lines in Figure 1 point out that with the temperature increase the intensity of these reflec-tion peaks decreases and they disappear above the temperature of phase transition.
Based on the evolution of reflection peak (310) during the high temperature investigations, it can be concluded that the modification of ZrW2O8 with Eu(III) causes an increase of the phase transition temperature (Fig. 2). The absence of the reflection peak (310) in the diffraction pattern of the non-
Fig. 1. XRD for pure ZrW2O8 at increasing temperature in the interval 25–250 °C; dashed lines illustrate the changes in the reflec-tion peaks with the temperature. The asterisks denote Pt (111) and (002) reflections.
Fig. 2. Influence of Eu(III) on the increase of the phase transition temperature: XRD for ZrW2O8, pure and modified with 1 and 2 mol% Eu(III) at 453 K from bottom to top.
E. D. Encheva et al.: The influence of the modification of zirconium tungstate with Eu(III) on the α → β phase transition...

146
modified tungstate at 180oC (453 K) is evidence for the complete transition to β-ZrW2O8 phase. In the diffraction pattern of the ZrW2O8 modified with 1 and 2 mol% Eu(III) at that temperature the reflec-tion peak (310) is still visible.
The phase transition along with the complete phase reverse α-ZrW2O8 ⇌ β-ZrW2O8 after cooling back to 25 °C is shown in Figure 3. The difference in the structure of α-ZrW2O8 and β-ZrW2O8 phases is also presented. For the low temperature α-ZrW2O8 phase the corner-sharing octahedra ZrO6 and tetra-hedra WO4 are shown, each WO4 tetrahedron shares three of its oxygen with the adjacent octahedra. In the high-temperature β-ZrW2O8 phase two crystal-lographic WO4 share three joined O atoms [8].
It is known that the transition α-ZrW2O8 → β-ZrW2O8, called order-to-disorder phase transition, depends on the orientation of WO4 tetrahedra [5]. A characteristic parameter η′T has been proposed to evaluate the extent of the disorder of WO4 tetra-hedra depending on the temperature [32]. The pa-rameter can be calculated by the integrated intensity of the reflection peak (310) versus (210) with the formula
.
From Figure 4 it can be seen that in the presence of the modification agent Eu(III) the approach of the parameter η′T value equal to zero i.e. complete disorder WO4, is shifted to higher temperatures.
The dependence observed by us is different from the results published in the literature when the lan-thanide ions are present in the structure of ZrW2O8 [32]. Quite likely the reason for the difference is the incomplete crystallization of our samples (small av-erage crystallite size) as can be seen from the data in Table 1. The data show that the crystallites are growing during the measurements, which could cause an additional rearrangement of WO4 and as a result a shift of the curve to higher temperatures is observed.
The coefficients of thermal expansion (CTE) calculated for the interval 25–100 °C (α-ZrW2O8 phase) and 200–250 °C (β-ZrW2O8 phase) are pre-sented in Table 1. The calculations were made by the classical formula for linear thermal expansion:
,
where α is the linear expansion coefficient, aT1 and
aT2 are the unit cell parameters at low and high tem-
perature, respectively and ΔT is the temperature dif-ference.
Fig. 3. Reversibility of the phase transition α-ZrW2O8 ⇌ β-ZrW2O8: XRD for ZrW2O8 at 25 and 250 °C, and after cooling at 25 °C, from bottom to top.
𝜂𝜂�, � � ��𝐼𝐼𝐼𝐼𝐼�𝐼𝐼𝐼𝐼𝐼�����𝐼𝐼𝐼𝐼𝐼 𝐼𝐼𝐼𝐼𝐼� ����𝐼���𝐼���
� � �𝑎𝑎�� ��𝑎𝑎���𝑎𝑎��. 𝛥𝛥𝛥𝛥
E. D. Encheva et al.: The influence of the modification of zirconium tungstate with Eu(III) on the α → β phase transition...
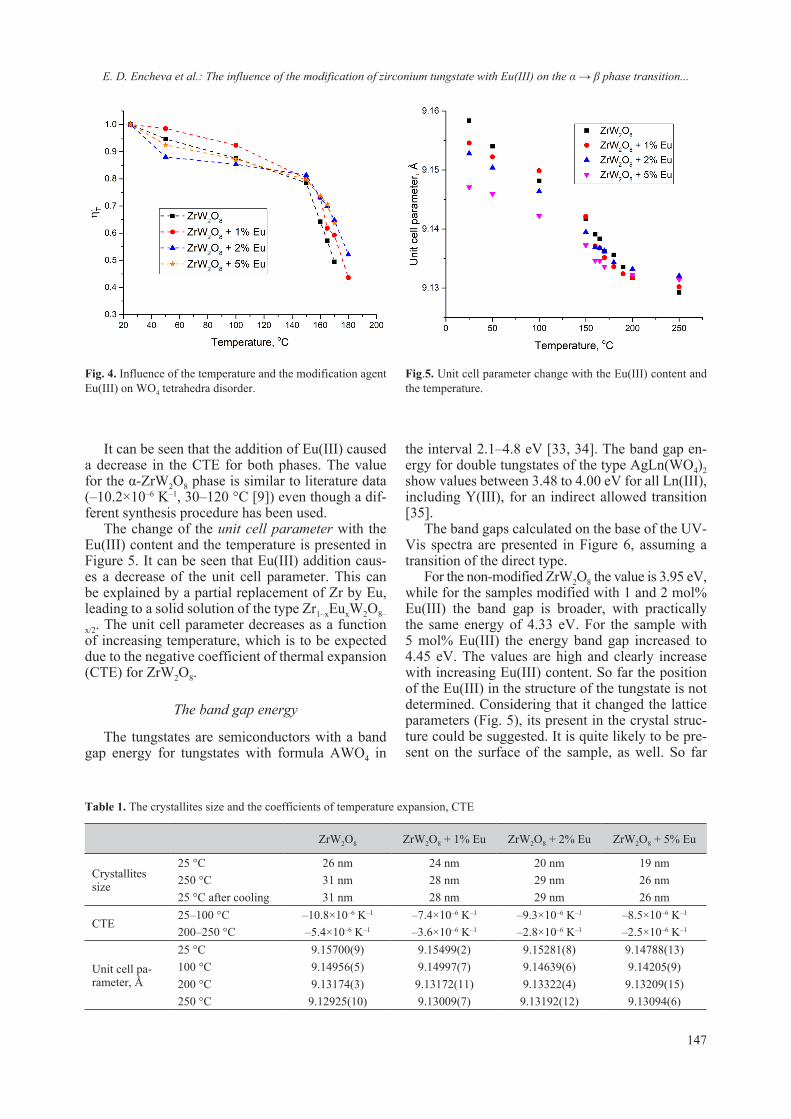
147
It can be seen that the addition of Eu(III) caused a decrease in the CTE for both phases. The value for the α-ZrW2O8 phase is similar to literature data (–10.2×10⁻⁶ K–1, 30–120 °C [9]) even though a dif-ferent synthesis procedure has been used.
The change of the unit cell parameter with the Eu(III) content and the temperature is presented in Figure 5. It can be seen that Eu(III) addition caus-es a decrease of the unit cell parameter. This can be explained by a partial replacement of Zr by Eu, leading to a solid solution of the type Zr1–xEuxW2O8–
x/2. The unit cell parameter decreases as a function of increasing temperature, which is to be expected due to the negative coefficient of thermal expansion (CTE) for ZrW2O8.
The band gap energy
The tungstates are semiconductors with a band gap energy for tungstates with formula AWO4 in
the interval 2.1–4.8 eV [33, 34]. The band gap en-ergy for double tungstates of the type AgLn(WO4)2 show values between 3.48 to 4.00 eV for all Ln(III), including Y(III), for an indirect allowed transition [35].
The band gaps calculated on the base of the UV-Vis spectra are presented in Figure 6, assuming a transition of the direct type.
For the non-modified ZrW2O8 the value is 3.95 eV, while for the samples modified with 1 and 2 mol% Eu(III) the band gap is broader, with practically the same energy of 4.33 eV. For the sample with 5 mol% Eu(III) the energy band gap increased to 4.45 eV. The values are high and clearly increase with increasing Eu(III) content. So far the position of the Eu(III) in the structure of the tungstate is not determined. Considering that it changed the lattice parameters (Fig. 5), its present in the crystal struc-ture could be suggested. It is quite likely to be pre-sent on the surface of the sample, as well. So far
Table 1. The crystallites size and the coefficients of temperature expansion, CTE
ZrW2O8 ZrW2O8 + 1% Eu ZrW2O8 + 2% Eu ZrW2O8 + 5% Eu
Crystallites size
25 °C 26 nm 24 nm 20 nm 19 nm250 °C 31 nm 28 nm 29 nm 26 nm25 °C after cooling 31 nm 28 nm 29 nm 26 nm
CTE 25–100 °C –10.8×10⁻⁶ K–1 –7.4×10⁻⁶ K–1 –9.3×10⁻⁶ K–1 –8.5×10⁻⁶ K–1
200–250 °C –5.4×10⁻⁶ K–1 –3.6×10⁻⁶ K–1 –2.8×10⁻⁶ K–1 –2.5×10⁻⁶ K–1
Unit cell pa-rameter, Å
25 °C 9.15700(9) 9.15499(2) 9.15281(8) 9.14788(13)100 °C 9.14956(5) 9.14997(7) 9.14639(6) 9.14205(9)200 °C 9.13174(3) 9.13172(11) 9.13322(4) 9.13209(15)250 °C 9.12925(10) 9.13009(7) 9.13192(12) 9.13094(6)
Fig. 4. Influence of the temperature and the modification agent Eu(III) on WO4 tetrahedra disorder.
Fig.5. Unit cell parameter change with the Eu(III) content and the temperature.
E. D. Encheva et al.: The influence of the modification of zirconium tungstate with Eu(III) on the α → β phase transition...

148
it is difficult to explain the influence of Eu(III) on the broadening of the band gap. A possible reason could be the reduced average crystallite size. It is known that the presence of Ln(III) can decrease the rate of crystal growth [36]. As shown in Table 1, the pure ZrW2O8 has an average crystallite size of 26 nm, while for the sample modified with 5 mol% Eu(III), it is 19 nm. The smaller crystallite size sug-gests quantum effects which expands the forbidden zone [37].
CONCLUSIONS
Homogeneous pure and Eu(III) modified ZrW2O8 samples were obtained by hydrothermal synthesis. High temperature XRD showed that the modification of ZrW2O8 leads to an increase of the phase transition temperature. The presence of Eu(III) causes a decrease of the coefficients of thermal expansion both for alpha- and beta-ZrW2O8 phases. The reversibility of the alpha-beta transition was observed by high temperature XRD. The band gap energy for pure ZrW2O8 was calculated from UV-Vis spectra to be 3.95 eV. The modification with Eu(III) caused an increase up to 4.45 eV.
The research presented is a part of a study in or-der to determine the influence of lanthanides on the properties of Zr(IV) and Hf(IV) tungstates. Future investigations will study the effect of the different lanthanide ions on the phase transition as a function of the ionic radius.
Acknowledgments: The financial support of the Bulgarian Fund for Scientific Investigations by Contract DМ 19/5 is highly acknowledged. The high
temperature XRD measurements were performed at the Institute of Physical Chemistry, BAS, by Assoc. Prof. G. Avdeev.
REFERENCES
1. M. Nazarov, D. Y. Noh, J. Rare Earths, 28, 1 (2010).2. Q. Zhang, Q. Meng, Y. Tian, X. Feng, J. Sun, S. Lu,
J. Rare Earths, 29 (9), 815 (2011).3. T. Liu, Q. Meng, W. Sun, J. Rare Earths, 33(9), 915
(2015).4. X. Yu, Y. Qin, M. Gao, L. Duan, Z. Jiang, L. Gou, P.
Zhao, Z. Li, J. Lumin., 153, 1 (2014).5. J. Evans, T. A. Mary, T. Vogt, M. A. Subramanian,
A. W. Sleight, Chem. Mater., 8(12), 2809 (1996).6. J. Graham, A. D. Wadsley, J. H. Weymouth, L. S.
Williams, JACS, 42 (11), 570 (1959).7. N. Ulbrich, W. Tröger, T. Butz, P. Blaha, Z.
Naturforsch. A, 55 (1–2), 301 (2000).8. C. Lind, Mater., 5(6), 1125 (2012).9. C. Georgi, H. Kern, Ceram. Int., 35(2), 755 (2009).10. T. Tsuji, Y. Yamamura, N. Nakajima, Thermochim.
Acta, 416, 93 (2004).11. C. Closmann, A. W. Sleight, J. C. Haygarth, J. Solid
State Chem., 139, 424 (1998).12. C. De Meyer, F. Bouree, J. S. O. Evans, K. De
Buysser, E. Bruneel, I. Van Driessche, S. Hoste, J. Mater. Chem., 14, 2988 (2004).
13. K. De Buysser, I. Van Driessche, B. V. Putte, P. Vanhee, J. Schaubroeck, S. Hoste, Inorg. Chem., 47, 736 (2007).
14. K. De Buysser, I. Van Driessche, B. V. Putte, J. Schaubroeck, S. Hoste, J. Solid State Chem., 180(8), 2310 (2007).
15. J. Liao, S. Liu, H.-R. Wen, L. Nie, L. Zhong, Mater. Res. Bull., 70, 7 (2015).
16. Y. Yamamura, N. Nakajima, T. Tsuji, A. Kojima, Y. Kuroiwa, A. Sawada, S. Aoyagi, H. Kasatani, Phys. Rev. B, 70, 104107:1 (2004).
17. A. Khan, A. A. P. Khan, A. M. Asiri, I. Khan, J. Alloys Compd., 723, 811 (2017).
18. Q. Liu, J. Yang, X. Cheng, G. Liang, X. Sun, Ceram. Int., 38, 541 (2012).
19. J. Graham, A. D. Wadsley, J. H. Weymouth, L. S. Williams, JACS, 42(11), 570 (1959).
20. J. C. Chen, G. C. Huang, C. Hu, J. P. Weng, Scr. Mater. (Scripta Metallurgica), 49, 261 (2003).
21. S. Nishiyama, T. Hayashi, T. Hattori, J. Alloys Compd., 417, 187 (2006).
22. J. Tani, M. Takahashi, H. Kido, Journal European Ceramic Society, 30(6), 1483 (2010).
23. H. Wei, M. Hasegawa, S. Mizutani, A. Aimi, K. Fujimoto, K. Nishio, Materials, 11(9), 1582 (2018).
24. N. Khazeni, B. Mavis, G. Gündüz, Ü. Çolak, Mater. Res. Bull., 46(11), 2025 (2011).
25. J. A. Colin, DeMarco V. Camper, S. D. Gates, M. D. Simon, K. L. Witker, C. Lind, J. Solid State Chem., 180, 3504 (2007).
Fig. 6. The energy band gap.
E. D. Encheva et al.: The influence of the modification of zirconium tungstate with Eu(III) on the α → β phase transition...

149
26. A. I. Gubanov, E. S. Dedova, P. E. Plyusnin, E. Y. Filatov, T. Y. Kardash, S. V. Korenev, S. N. Kulkov, Thermochim. Acta, 597, 19 (2014).
27. Z. Peng, Y. Z. Sun, L. M. Peng, Mater. Des., (1980–2015) 54, 989 (2014).
28. J. Rodriguez-Carvajal, International Union for Crys-tal lography, Newletter, N°20 (1998).
29. J. Huang, A. Sleight, Golden Book of Phase Transi-tions, Wroclaw, vol. 1, 2002, pp. 1–123.
30. U. Kameswari, A. W. Sleight, J. S. O. Evans, Int. J. Inorg. Mater., 2, 333 (2000).
31. J. Tauc, Mater. Res. Bull., 3, 37 (1968).32. H.-H. Li, J.-S. Han, H. Ma, L. Huang, X.-H. Zhao, J.
Solid State Chem., 180, 852 (2007).
33. R. Lacomba-Perales, J. Ruiz-Fuertes, D. Errando nea, D. Martinez-Garcia, A. Segura, EPL, 83, 37002 (2008).
34. D. V. S. Muthu, B. Chen, A. W. Sleigh, J. M. Wrobel, M. B. Kruger, Solid State Commun., 122(1–2), 25 (2002).
35. P. Godlewska, E. Tomaszewicz, L. Macalik, M. Ptak, P. E. Tomaszewskic, M. Berkowski, K. Lemański, P. Solarz, P. J. Dereń, J. Hanuza, J. Alloys Compd., 745, 779 (2018).
36. J. S. Church, N. W. Cant, D. L. Trimm, Appl. Catal., 101, 105 (1993).
37. D. L. Ferreira, J. C. L. Sousa, R. N. Maronesi, J. Bettini, M. A. Schiavon, A. V. N. C. Teixeira, A. G. Silva, J. Chem. Phys., 147, 154102 (2017).
E. D. Encheva et al.: The influence of the modification of zirconium tungstate with Eu(III) on the α → β phase transition...

150 © 2018 Bulgarian Academy of Sciences, Union of Chemists in Bulgaria
* To whom all correspondence should be sent:
Bulgarian Chemical Communications, Volume 50, Special Issue F (pp. 150–157) 2018
Structural characterization of Au/Cu1–хMnхFe2O4 catalysts suitable for WGSR
T. M. Petrova*, N. I. Velinov, I. B. Ivanov, T. T. Tabakova, V. D. Idakiev, I. G. Mitov
Institute of Catalysis, Bulgarian Academy of Sciences, 1113 Sofia, Bulgaria
Received October 12, 2018; Accepted December 04, 2018
The spinel ferrites are known to have many important properties as magnetic, optical, catalytic etc., which provokes the scientific interest. Copper-manganese-iron samples with nominal compositions Cu1–хMnхFe2O4 (x=0; 0.2; 0.4; 0.6; 0.8 and 1) were prepared by auto-combustion sol-gel method and modification by gold was carried out by deposition-precipitation procedure. Their performance in the water-gas shift reaction (WGSR) was investigated. Structural char-acteristics of samples were determined by X-Ray diffraction and Mössbauer spectroscopy. Spinel ferrite phase and gold phase were proved in all synthesized samples. In copper-rich composition additional phase of CuO was present. The cation distribution in octahedral and tetrahedral positions in spinel lattice and the presence of superparamagnetic particles were evaluated by Mössbauer spectroscopy. Catalytic activities in the WGSR of studied samples followed the order: Au/Cu0.2Mn0.8Fe2O4 ≥ Au/Cu0.5Mn0.5Fe2O4 > Au/Cu0.8Mn0.2Fe2O4 > Au/CuFe2O4 ≥ Au/MnFe2O4. Some changes in the phase composition and structure of both gold and spinel ferrite phases were found after WGSR. Full or partial alloying of gold with copper was evidenced. The main samples transformation in reactive atmosphere was partial reduction of the ferrite phase. The result of this reduction was the formation of metallic copper and copper and/or manganese substituted magnetite in mixed copper-manganese containing samples. Simultaneous presence of both phases could be considered as a reason for better catalytic activity of mixed ferrites.
Keywords: copper-manganese ferrites, gold catalysts, Mössbauer spectroscopy, WGSR.
E-mail: [email protected]
1. INTRODUCTION
Depending on the distribution of divalent and trivalent cations in tetrahedral and octahedral posi-tions, the spinel structure is divided into three groups – normal, inverse and partially inverse. When all di-valent cations occupy only tetrahedral positions, the spinels are called normal, inverse – when divalent cations occupy only octahedral sites and partially inverse when divalent ions are distributed in tetra-hedral and octahedral positions. Certain fact is that different metal cations have different preferences to occupy tetrahedral and octahedral positions in the structure of spinel [1, 2]. It is also known that cationic distribution affects the functional proper-ties of ferrites such as magnetic, optical, catalytic, etc. [3–10]. This fact provoked the study of the re-lationship between the structure and the functional properties of spinel ferrites [3–5], [11]. A typical example of catalyst with spinel structure is magnet-
ite (Fe3O4), which is the main active phase of the iron-containing catalysts in the high temperature stage of WGSR, which is carried out at 350–450 °C [6].
Various spinel ferrite materials have been suc-cessfully synthesized by applying auto-combustion sol-gel technology [12–17]. It has been shown that the conditions of synthesis affect the phase impuri-ties, the crystallinity, and therefore the particle size, the agglomerating ability, which actually reduces the specific surface [12]. However, it has been found that in some cases the multi-component fer-rites have better catalytic behaviour than the mono-component ferrite [7–9], [18]. The development of copper-based ferrite catalysts has been a major challenge in recent years [19]. An example of this is copper ferrite, which is an inverse spinel, since the iron atoms are distributed in tetrahedral and octahedral positions, and the copper ions occupy predominantly octahedral positions. In addition, magnetite materials substituted with Cr, Mn, Co, Ni, Cu, Zn and Ce ions have a very simple Fe3+ ⇔ Fe2+ reducing pair, from which it can be concluded that Cu-containing ferrites are very promising for
151
WGSR applications [20]. In his article, Khan et al. [20], note that the rapid electron exchange between Fe3+ ⇔ Fe2+ in the Fe3O4 is essential for conducting the WGS reaction. It has also been shown that the precious metal catalysts (platinum and gold) have very good catalytic activity in WGSR, and modified by gold oxide exhibits high catalytic activity at low temperature [21].
The aim of the present work is to study struc-tural characteristics of gold modified copper-man-ganese ferrite catalysts. Object of the investigation are materials with compositions Au/Cu1–xMnxFe2O4 (0≤x≤1) before and after catalytic test in WGSR. The correlation between Cu/Mn ratio, catalyst structure, and catalytic activity are also discussed.
2. EXPERIMENTAL
2.1. Synthesis
Copper-manganese-iron samples with nominal compositions Cu1–хMnхFe2O4, where x=0; 0.2; 0.4; 0.6; 0.8 and 1 were prepared by auto-combustion sol-gel method using the procedure reported in [10]. Shortly, the experimental procedure was as follows: the corresponding stoichiometric amount from the starting nitrate salts Cu(NO3)2.3H2O, Mn(NO3)2.4H2O and Fe(NO3)3.9H2O was dissolved in distilled water at room temperature and constant stirring; citric acid was added to the solution in a molar ratio equal to the sum of the metal ions (Cu, Mn, Fe) and stirring was continued at 60 °C; the water was evaporated from the solution by heating and continuous stirring on a magnetic stirrer; the auto-combustion process was performed by heating the samples in an oven at 150 °C for 1 hour. The samples were further thermally treated at 300 °C.
The modification of ferrite samples by gold (2 wt.%) was carried out by deposition-precipitation method. The ferrite material was suspended in wa-ter, and the deposition was performed by simultane-ous addition of an aqueous solution of HAuCl4 and Na2CO3 at 60 °C and pH 7. The next steps included aging at 60°C for 1 hour, filtering and washing until complete removal of Cl– ions, drying under vacuum at 80 °C and calcination in air at 400 °C for 2 hours. The samples were denoted as Au/Cu1–хMnхFe2O4.
2.2. Methods of characterization
Powder X-ray diffraction (XRD) analysis was carried out by TUR M62 diffractometer with Co Kα radiation. Phase identification was performed using ICDD-PDF2 Database. The structural char-acteristics of the studied phases were determined from the experimental XRD profiles by using the
PowderCell-2.4 software [21]. The average crystal-lites size is determined using the Williamson-Hall method with appropriate corrections for the instru-mental broadening. According to the method, the diffraction lines are treated using the Voigt func-tion, which Lorentzian and Gaussian components are used for the elucidation of the average particles size and microstrain, respectively.
The Mössbauer spectra were obtained in air at room temperature (RT) with a Wissel (Wissen-schaftliche Elektronik GmbH, Germany) electrome-chanical spectrometer working in a constant accel-eration mode. A 57Co/Rh (activity ≅ 50 mCi) source and α-Fe standard were used. The experimentally obtained spectra were fitted using CONFIT2000 software [23]. The parameters of hyperfine interac-tion such as isomer shift (δ), quadrupole splitting (ΔEq), effective internal magnetic field (B), line widths (Γexp), and relative weight (G) of the partial components in the spectra were determined.
2.3. Catalytic experiments
The water-gas shift activity tests were carried out in a flow reactor at atmospheric pressure. The catalytic measurements were conducted at the tem-perature range of 140–300 °C. The applied experi-mental conditions were as follows: catalyst bed vol-ume – 0.5 cm3, space velocity – 4000 h–1 and the reactant feed with model gas mixture (3.76 vol.% CO, 25.01 vol.% H2O and 71.23 vol.% Ar). Before catalytic tests the samples were submitted to con-trolled mild reduction in a reaction mixture (CO/Ar and water vapor) up to 300 °C. The catalytic activity data were expressed by degree of CO conversion. The measurements were recorded after establishing of the steady-state conditions of conversion at cor-responding temperatures.
3. RESULTS AND DISCUSSION
XRD patterns and calculated structural param-eters of synthesized Au/Cu1–хMnхFe2O4 samples are presented in Figure 1 and Table 1. Spinel ferrite phase and gold phase were proved in all synthesized samples. In copper-rich composition additional phase of CuO was present. Simultaneous presence of spinel phases with cubic (S.G.: Fd–3m, No. 227) and tetragonal (S.G.: I41/amd, No. 141) symmetry was found in Au/CuFe2O4, while even small sub-stitution with manganese stabilize the cubic spinel phase. Average crystallite size of the cubic spinel phase was determined in the range 18–58 nm, as the size increases with increasing copper content. It could be noted that calculated lattice parameters are lower than expected. For example, calculated lattice
T. M. Petrova et al.: Structural characterization of Au/Cu1–хMnхFe2O4 catalysts suitable for WGSR

152
Fig. 1. X-ray diffraction patterns of Au/Cu1–хMnхFe2O4 samples.
parameter of cubic spinel phase in Au/CuFe2O4 is 8.35 Å but standard parameter for CuFe2O4 is 8.37 Å. Because of that and presence of copper oxide phase found in the sample it can be concluded that the spi-nel phase is Cu-deficient and could be presented as Cu(1–y)Fe(2+y)O4.
Mössbauer spectra and fitted parameters are pre-sented in Figure 2 and Table 2. Spectra were fit-ted with model consisting of two or three sextets and one doublet. The sextets with lower values of isomer shift (Sx1) correspond to tetrahedrally co-ordinated Fe3+ in spinel lattice. The sextets named Sx2 have higher isomer shift than Sx2 and are re-lated to Fe3+ in octahedral positions. Calculated hyperfine parameters of sextets in spectrum of Au/CuFe2O4 sample are typical for CuFe2O4 phase [9]. For the best fitting of spectra of Mn-containing samples a model with one additional sextet (Sx3) with lower values for hyperfine field and large line widths was used. The presence of this sextet could be explained with different number of tetrahedral Fe3+ near neighbours of octahedral Fe3+ accomplish-ing superexchange interactions. Therefore, part of Mn2+ and/or Cu2+ ions occupy tetrahedral positions in spinel lattice. It could be suggested that these ions are mainly Mn2+, because of the fact that quantity of
iron ions occupying tetrahedral positions decreases with increasing of Mn substitution. The doublet components in the spectra could be related to finely dispersed spinel particles with superparamagnetic behaviour.
The samples were also characterized after cata-lytic test in WGSR. XRD patterns and calculated structural parameters are presented in Figure 3 and Table 1. The presence of cubic spinel phase and me-tallic copper and/or gold phases was established. Mössbauer analysis of these samples (Fig. 4, Table 2) evidenced changes in the ferrite phase. As it is seen in Table 2 isomer shift of the sextets related to oc-tahedral iron ions increased compare to the values before catalytic test. This observation is an evidence for decreasing of the oxidation state of iron ions in octahedral coordination. The values of isomer shift are typical for magnetite where half of iron ions oc-tahedral positions are in 2+ state and fast electron exchange with octahedral Fe3+ is realized. The pres-ence of more than one sextet in spectra related to oc-tahedral iron is due to small particles sizes and sub-stituting elements of Cu and Mn in the spinel lattice. Obtaining of Cu- and/or Mn-substituted magnetite after WGSR is confirmed by increasing of lattice parameters of spinel phase after WGSR (Table 1).
T. M. Petrova et al.: Structural characterization of Au/Cu1–хMnхFe2O4 catalysts suitable for WGSR
Fig. 2. Mössbauer spectra of Au/Cu1–хMnхFe2O4 samples.

153
Table 1. Average crystallites size (D) and lattice parameters of the crystalline phases in Au/Cu1–хMnхFe2O4 samples after thermal treatment at 300 °C and after WGSR determined from the experimental XRD profiles
Sample Phase D,nm
Lattice parameters,Å %
Au/CuFe2O4 Spinel, cubicSpinel, tetrag.
AuCuO
57.721.7
25.219.9
a = 8.35a = 5.83c = 8.61a = 4.08a = 4.67b = 3.45c = 5.11
beta = 99.55
4041
118
Au/Cu0.8Mn0.2Fe2O4 Spinel, cubicAuCuO
26.329.912.5
a = 8.37a = 4.08a = 4.68b = 3.46c = 5.13
beta = 99.96
80119
Au/Cu0.5Mn0.5Fe2O4 Spinel, cubicAuCuO
24.129.713.0
a = 8.38a = 4.07a = 4.68b = 3.43c = 5.07
beta = 99.42
88111
Au/Cu0.2Mn0.8Fe2O4 Spinel, cubicAu
18.414.6
a = 8.38a = 4.07
982
Au/MnFe2O4 Spinel, cubicAu
18.421.7
a = 8.38a = 4.08
982
Au/CuFe2O4WGSR
Spinel, cubicCu
64.155.9
a = 8.40a = 3.61
7723
Au/Cu0.8Mn0.2Fe2O4WGSR
Spinel, cubicAuCu
39.416.233.6
a = 8.42a = 4.04a = 3.62
84115
Au/Cu0.5Mn0.5Fe2O4WGSR
Spinel, cubicAuCu
37.311.910.7
a = 8.47a = 4.03a = 3.63
9118
Au/Cu0.2Mn0.8Fe2O4WGSR
Spinel, cubicAuCu
33.812.111.9
a = 8.50a = 4.03a = 3.64
9514
Au/MnFe2O4WGSR
Spinel, cubicAu
18.725.5
a = 8.49a = 4.08
991
For better visualization of the changes of metal-lic phases during the catalytic reaction a graph with lattice parameters is presented in Figure 5. The cal-culated lattice parameters of gold and copper before and after catalytic tests and standard parameters ac-cording to PDF 4-784 and PDF 4-836 for gold and copper, respectively, are reported. The a parameter of gold in fresh samples is equal or nearly equal to the standard. In the XRD pattern of Au/CuFe2O4 sample after WGSR diffraction lines of gold were not observed, while a parameter of gold in sample Au/MnFe2O4 remained unchanged during reaction.
The lattice parameters of gold supported on mixed copper-manganese ferrites decreased after WGSR. This experimental result could be explained with copper incorporation in gold phase i.e. Au1–xCux al-loy formation.
The temperature dependence of the degree of CO conversion during the WGSR over modified by gold copper and/or manganese ferrites is shown in Figure 6. The catalytic measurements revealed con-siderable differences in the catalysts activity. The following order was registered: Au/Cu0.2Mn0.8Fe2O4 ≥ Au/Cu0.5Mn0.5Fe2O4 > Au/Cu0.8Mn0.2Fe2O4 > Au/
T. M. Petrova et al.: Structural characterization of Au/Cu1–хMnхFe2O4 catalysts suitable for WGSR

154
Fig. 3. X-ray diffraction patterns of Au/Cu1–хMnхFe2O4 samples after WGSR.
CuFe2O4 ≥ Au/MnFe2O4. A strong synergetic ef-fect between copper and manganese ions was ob-served. The CO conversion degree at 220 °С was more that 30% higher over the samples contain-ing mixed copper-manganese ferrites in compari-son with mono-component ones. The best perfor-mance above 220 °С exhibited Au/Cu0.2Mn0.8Fe2O4. Detailed structural characterization of the samples before and after catalytic tests allowed explaining the registered trend in the WGS activity. The main phase transformation after catalyst activation con-cerned the reduction of ferrite phase. According to XRD analysis, metallic copper phase and Cu and/or Mn substituted magnetite were formed in mixed copper-manganese formulations under reductive at-mosphere. The simultaneous presence of these two phases could be considered as responsible for bet-ter WGS activity of the samples. The composition of mixed copper-manganese ferrites affected ben-eficially the formation of highly dispersed metallic copper particles. As reported in Table 1, the cop-per crystallites average size in mixed ferrites was significantly lower (between 10.7 and 33.6 nm) in comparison with those in Au/CuFe2O4 (55.9 nm). Additionally, analysing the role of gold modifica-
T. M. Petrova et al.: Structural characterization of Au/Cu1–хMnхFe2O4 catalysts suitable for WGSR
Fig. 4. Mössbauer spectra of Au/Cu1–хMnхFe2O4 samples after WGSR.
tion, it could be also suggested its effect on phase transformation. In both samples with lower copper content, i.e. the most active Au/Cu0.2Mn0.8Fe2O4 and Au/Cu0.5Mn0.5Fe2O4 with close activity in the low-temperature range up to 230 °C, metallic gold and copper particles with very similar sizes were found. In these cases the contribution of gold on spinel decomposition and highly dispersed copper particles stabilization could be hypothesized. The lower average size of spinel particles in these sam-ples should be also mentioned. In agreement with data, reported in Figure 5, the modification by gold of the samples with higher amount of copper, i.e. Au/Cu0.8Mn0.2Fe2O4 and Au/CuFe2O4, obviously favoured alloying of gold and copper particles. The relatively higher size of copper crystallites and missing reflections of gold in XRD patterns of Au/CuFe2O4 allowed assuming of Au1–xCux alloy formation. This phenomenon affected negatively WGS activity by two reasons. The first one is re-lated to the well-established ability of gold nan-oparticles to activate CO molecules on their low coordination sites [24]. The second one concerns water dissociation that is a crucial step in the WGS reaction mechanism. Zhao et al. have reported

155
Table 2. Mössbauer parameters of investigated samples (δ – isomer shift, ΔEq – quadrupole splitting, B – effective internal magnetic field, Bmean – mean effective internal magnetic field, Γexp – line widths, G – relative weight of the partial components in the spectra)
Sample Components δ,mm/s
ΔEq,mm/s
B,T
Γexp,mm/s
G,%
Au/CuFe2O4 Sx1 – Fe–tetraSx2 – Fe–octaDb – Fe3+
0.280.370.39
0.00–0.130.63
49.151.3
–
0.480.470.29
46522
Au/Cu0.8Mn0.2Fe2O4 Sx1 – Fe–tetraSx2 – Fe–octaSx3 – Fe–octaDb – Fe3+
0.300.350.320.36
0.000.03–0.020.72
48.650.544.2
–
0.560.461.570.40
4327273
Au/Cu0.5Mn0.5Fe2O4 Sx1 – Fe–tetraSx2 – Fe–octaSx3 – Fe–octaDb – Fe3+
0.320.340.330.34
0.00–0.01–0.010.82
49.447.343.1
–
0.490.591.570.58
2731348
Au/Cu0.2Mn0.8Fe2O4 Sx1 – Fe–tetraSx2 – Fe–octaSx3 – Fe–octaDb – Fe3+
0.330.350.380.34
0.000.01–0.010.88
48.245.541.1
–
0.490.731.650.61
14183533
Au/MnFe2O4 Sx1 – Fe–tetraSx2 – Fe–octaSx3 – Fe–octaDb – Fe3+
0.310.320.320.31
0.000.000.020.90
46.341.531.3
–
0.500.801.000.58
1114966
Au/CuFe2O4WGSR
Sx1 – Fe–tetra, Fe3O4Sx2 – Fe–octa, Fe3O4Sx3 – Fe–octa, Fe3O4
0.290.640.63
0.00–0.020.07
48.745.843.3
0.330.470.79
344422
Au/Cu0.8Mn0.2Fe2O4WGSR
Sx1 – Fe–tetraSx2 – Fe–octaSx3 – Fe–octa Sx4 – Fe–octa
0.300.460.590.63
0.00–0.01–0.030.02
49.047.345.442.6
0.340.500.560.90
25182829
Au/Cu0.5Mn0.5Fe2O4WGSR
Sx1 – Fe–tetraSx2 – Fe–octa Sx3 – Fe–octaSx4 – Fe–octa
0.310.430.480.54
0.000.01–0.01–0.01
48.546.343.840.0
0.370.510.660.99
19223524
Au/Cu0.2Mn0.8Fe2O4WGSR
Sx1 – Fe–tetraSx2 – Fe–octaSx3 – Fe–octaSx4 – Fe–octa
0.320.410.440.48
0.000.03–0.01–0.03
48.345.943.339.4
0.410.550.671.19
15243427
Au/MnFe2O4WGSR
Sx1 – Fe–tetraSx2 – Fe–octaSx3 – Fe–octaSx4 – Fe–octaDb1 – Fe3+
Db2 – Fe2+
0.320.400.430.460.311.08
0.000.020.02–0.050.800.78
48.646.744.641.9
––
0.380.400.520.940.600.67
1714243834
photoemission and STM studies for the adsorption and dissociation of water on Ce-Au(111) alloys found that alloys exhibited a relatively low reactiv-ity toward water [25]. In this sense, the formation of Au-Cu alloy particles could cause diminished ability for water activation and, consequently, de-creased WGS activity.
4. CONCLUSIONS
Copper-manganese-iron samples with nominal compositions Cu1–хMnхFe2O4, where x=0; 0.2; 0.4; 0.6; 0.8 and 1 were prepared by auto-combustion sol-gel method. The materials were modified by gold. Spinel ferrite phase and gold phase were es-
T. M. Petrova et al.: Structural characterization of Au/Cu1–хMnхFe2O4 catalysts suitable for WGSR

156
tablished in all synthesized samples. An increase of crystallite size of the cubic spinel phase was observed with increasing the copper content. The results of Mössbauer analysis showed that part of Mn2+ and/or Cu2+ ions occupy tetrahedral positions in spinel lattice and it could be suggested that these ions are mainly Mn2+. Partial reduction of iron ions in ferrite phase and formation of Cu, Mn-substituted magnetite was proved in samples after catalytic test. Reduction of the copper ions to metallic copper and formation of Au1–xCux alloy was evidenced, too. The role of the Cu-Mn ferrites composition on the WGS performance of gold-modified samples was studied and the following activity order was found: Au/Cu0.2Mn0.8Fe2O4 ≥ Au/Cu0.5Mn0.5Fe2O4 > Au/Cu0.8Mn0.2Fe2O4 > Au/CuFe2O4 ≥ Au/MnFe2O4. The variations in ferrites composition affected the WGS activity of the gold catalysts. A strong synergistic
effect was observed in mixed copper-manganese ferrites. This effect could be attributed to signifi-cant difference in the size of metallic copper and spinel particles formed under reaction conditions. The impact of gold on spinel transformation and highly dispersed copper particles stabilization was assumed.
Acknowledgements: T. Petrova and N. Velinov acknowledge financial support by the Bulgarian National Science Fund, Project DCOST 01/22/2017. I. Ivanov, T. Tabakova and V. Idakiev acknowledge financial support by the Bulgarian National Science Fund, Contract ДН 09/5/2016.
REFERENCES
1. P. V. Kovtunenko, Glass. Ceram., 54, 143 (1997).2. N. I. Velinov, T. M. Petrova, I. B. Ivanov, T. T.
Tabakova, V. D. Idakiev, I. G. Mitov, Hyperfine Interact., 238, 72 (2017).
3. A. M. Wahba, M. B. Mohamed, J. Magn. Magn.Mater., 378, 246 (2015).
4. R. Tholkappiyan, K. Vishista, Mater. Sci. Semicond. Process., 40, 631 (2015).
5. K. Liu, A. I. Rykov, J. Wang, T. Zhang, Adv. Catal., 58, 1 (2015).
6. G. K. Reddy, P. G. Smirniotis, Water Gas Shift Reaction – Research Developments and Applications, Elsevier B.V, Amsterdam, 2015.
7. N. Velinov, K. Koleva, T. Tsoncheva, D. Paneva, E. Manova, K. Tenchev, B. Kunev, I. Genova, I. Mitov, Cent. Eur. J. Chem., 12, 250 (2014).)
8. N. Velinov, K. Koleva, T. Tsoncheva, E. Manova, D. Paneva, K. Tenchev, B. Kunev, I. Mitov, Catal. Commun., 32, 41 (2013).
9. T. Tsoncheva, E. Manova, N. Velinov, D. Paneva, M. Popova, B. Kunev, K. Tenchev, I. Mitov, Catal. Commun., 12, 105 (2010).
10. N. Velinov, T. Petrova, I. Genova, I. Ivanov, T. Tsoncheva, V. Idakiev, B. Kunev, I. Mitov, Mater. Res. Bull., 95, 556 (2017).
11. L. L. Lang, J. Xu, Z. Z. Li, W. H. Qi, G. D. Tang, Z. F. Shang, X. Y. Zhang, L. Q. Wu, L. C. Xue, Physica B, 462, 47 (2015).
12. A. Sutka, G. Mezinskis, Front. Mater. Sci., 6, 128 (2012).
13. H. Waqas, A. H. Qureshi, J. Therm. Anal. Calorim., 98, 355 (2009).
14. J. Azadmanjiri, S. A. SeyyedEbrahimi, H. K. Sale-hani, Ceram. Int., 33, 1623 (2007).
15. I. Szczygieł, K. Winiarska, J. Therm. Anal. Calorim., 115, 471 (2014).
16. J. Li, H. Yuan, G. Li, Y. Liu, J. Leng, J. Magn. Magn.Mater., 322, 3396 (2010).
17. S. Sam, A. Samson Nesaraj, Int. J. Appl. Sci. Eng., 9, 223 (2011).
18. K. Koleva, N. Velinov, T. Tsoncheva, I. Mitov,
T. M. Petrova et al.: Structural characterization of Au/Cu1–хMnхFe2O4 catalysts suitable for WGSR
Fig. 5. Graphic of the calculated parameters.
Fig. 6. Water-gas shift activity of Au/Cu1–хMnхFe2O4 samples.

157
Hyper fine Interact., 226, 89 (2014).19. X. Lin, Y. Zhang, L. Yin, C. Chen, Y. Zhan, D. Li,
Int. J. Hydrogen Energy, 39, 6424 (2014).20. A. Khan, P. G. Smirniotis, J. Mol. Catal. A: Chem.,
280, 43 (2008).21. D. Andreeva, V. Idakiev, T. Tabakova, A. Andreev,
J. Catal., 158, 354 (1996).22. W. Kraus, G. Nolze, PowderCell for Windows,
Federal Institute for Materials Research and Testing, Berlin, 2000.
23. T. Žák, Y. Jirásková, Surf. Interface Anal., 38, 710 (2006).
24. F. Boccuzzi, A. Chiorino, M. Manzoli, D. Andreeva, T. Tabakova, J. Catal., 188, 176 (1999).
25. X. Zhao, S. Ma, J. Hrbek, J. A. Rodriguez, J. Surf. Sci., 601, 2445 (2007).
T. M. Petrova et al.: Structural characterization of Au/Cu1–хMnхFe2O4 catalysts suitable for WGSR

158 © 2018 Bulgarian Academy of Sciences, Union of Chemists in Bulgaria
* To whom all correspondence should be sent:
Bulgarian Chemical Communications, Volume 50, Special Issue F (pp. 158–162) 2018
TEM characterization of silver and gold nanoparticles synthesized by а ‘green’ method using water extract of Rosa Damascena
petals waste and beer yeast
B. C. Georgieva1, D. B. Karashanova1*, R. R. Angelov1, A. M. Slavov2, I. N. Vasileva2, T. M. Dodevska2
1 Institute of Optical Materials and Technologies “Acad. J. Malinowski”, Bulgarian Academy of Sciences, Acad. G. Bonchev Str., Bl. 109, 1113 Sofia, Bulgaria
2 Department of Organic Chemistry and Inorganic Chemistry, Technological Faculty, University of Food Technologies, 26 Maritza Blvd., Plovdiv 4002, Bulgaria
Received October 12, 2018; Accepted December 03, 2018
In this study we present “green” synthesis of Ag and Au nanoparticles by reduction of AgNO3 and HAuCl4 using water extracts of solid waste from Rosa Damascena essential oil industry, as well as pasteurized and live beer yeasts and combinations thereof. Мorphology, microstructure and phase composition of the Ag and Au NPs obtained by ten different recipes are investigated by High Resolution Transmission Electron Microscopy (HRTEM) and Selected Area Electron Diffraction (SAED). Histograms of nanoparticles distributed by their diameters are constructed using the data acquired with Image J computer program. The histograms demonstrate that the predominant population of Ag NPs has diameter between 0 and 5 nm, regardless some of Ag NPs reach larger sizes, up to 50 nm. In the same time, the main part of Au NPs possesses diameters in the range 0–15 nm. The indexing of SAED patterns revealed the presence of cubic and hexagonal metal Ag and cubic metal Au phases. The relation between synthesis conditions, phase composition and size distribution of Ag and Au nanoparticles is followed and discussed.
Keywords: Ag and Au nanoparticles, green synthesis, Rosa Damascena water extract, beer yeast, TEM.
E-mail: [email protected]
INTRODUCTION
Metal nanoparticles (NPs) with a variety of shapes and sizes are of the most studied nanoma-terials due to their great potential for application in medicine, pharmacy and electrochemistry, as biosensors and catalysts for detection and elimi-nation of biotoxins, etc. [1]. Silver (Ag) and gold (Au) NPs are of high importance, because of their specific properties – high thermal and electrical conductivity, chemical inertness, non-cytotoxicity, biocompatibility, antioxidative stress, antitumor and anticancer activity, possibility to provide tun-able optical properties of glasses, etc. [2–4]. Despite the huge number of chemical and physical methods for synthesis of NPs (chemical, electrochemical and photochemical reduction, gas-phase synthesis and deposition, laser ablation, sol-gel techniques,
etc.[5]), recently the efforts of the scientists have been focused on the development of new, perspec-tive, cheap and environmentally friendly methods. Among them are the so-called “green” methods for synthesizing metal NPs[6], which are based on nat-ural products and wastes from agricultural and food industries [7, 8]. One of the “green” methods is the plant extract-based method [9] using water extracts of leaves [10–14], barks [15], fruits [16, 17] and pet-als [18]. Another example of NPs “green” synthesis is the biosynthesis realized by microorganisms such as beer yeast [19, 20]. The rose oil industry is one of the most popular manufactures in Bulgaria. More than 5500 tons of rose petals were processed in 2015 [21] and almost as much is the solid waste. In the same time, the rose petals and the water extracts of rose petals are rich of polyphenols and flavonoids – compounds which are the main reducing agents in the metal NPs “green” synthesis. The mechanism of the oxidation-reduction reaction between Ag and Au precursors and polyphenols and flavonoids is described by S. M. Ghoreishi et al. [22]. According to our current research, the water extract of Rosa

159
Damascena waste is also rich in polyphenols and flavonoids as Neochlorogenic acid, Caffeic acid, Quercetin, Myricetin, etc. and it is able to reduce the Ag+ and Au3+. The spent live and pasteurized beer yeasts are found to contain fewer amounts of phe-nolic compounds than Rosa Damascena waste wa-ter extract. That’s why the beer yeasts are also able to reduce Ag+ and Au3+, but they start the synthesis of Ag and Au NPs relatively slowly. Indication for the presence of Ag or Au NPs is the color change of the solution from colorless to brown or black. Using Rosa Damascena water extract as reducing agent, the color is changed in few minutes, while for live beer yeast the color change is observed after 35 min and for pasteurized one – after 24 hours. It could be expected that the combinations of pasteur-ized and live beer yeasts with water extract of Rosa Damascena waste are able also to produce Ag and Au NPs relatively quickly. This is the way to in-tensify the process of synthesis of Ag and Au NPs using beer yeasts.
This study presents a detailed research of the mi-crostructure and phase composition of the “green” synthesized Ag and Au NPs by means of water extracts of Rosa Damascena waste, spent live and pasteurized beer yeasts and combinations thereof. Data on the morphology, size distribution and phase composition of Ag and Au NPs, synthesized by the aforementioned method, contribute to clarifying the relation between preparation conditions and poten-tial applications.
EXPERIMENTAL
Materials and methods
The Rosa Damascena wastes were obtained from ECOMAAT distillery (Mirkovo, Sofia region, Bulgaria, 2017 harvest). The beer yeasts both pasteur-ized and live were obtained from ABM Production Ltd. (Plovdiv, Bulgaria). Prior to the synthesis of Ag and Au NPs, the water extracts of Rosa Damascena and of both pasteurized and live beer yeasts were pre-pared according to procedure described as follows: 75 g dry rose waste was mixed with one liter dis-tilled water for 60 min at 60 °C then left for 24 h at room temperature (22 °C) at constant stirring. The mass was filtered and the solid residue was treated with 250 mL water at the same conditions; the pas-teurized beer yeast was dissolved in distilled water at 1% w/v at constant stirring for 24 h and then filtered; the live beer yeast was diluted with distilled water (1:13) to 1% dry content. Silver nitrate (AgNO3) of Merck, Germany, and Chloroauric acid (HAuCl4) of Sigma-Aldrich, USA, were used as initial substances for synthesis reactions. The “green” synthesis of Ag
NPs was performed by mixing in five test tubes each 0.3 ml 0.01 M AgNO3 with 0.1 ml distilled water and then the following extracts were added: 1) for sample 0B – 0.1 ml extract of Rosa Damascena; 2) for sam-ple 1B – 0.1 ml pasteurized beer yeast; 3) for sam-ple 2B – 0.1 ml live beer yeast; 4) for sample 3B – 0.1 ml extract of Rosa Damascena and 0.1 ml pas-teurized beer yeast; and 5) for sample 4B – 0.1 ml ex-tract of Rosa Damascena and 0.1 ml live beer yeast. The “green” synthesis of AuNPs was performed by mixing in five test tubes each 0.4 ml 0.001M HAuCl4 and the following extracts: 1) for sample 0G – 0.1 ml extract of Rosa Damascena; 2) for sample 1G – 0.1 ml pasteurized beer yeast; 3) for sample 2G – 0.1 ml live beer yeast; 4) for sample 3G – 0.1 ml extract of Rosa Damascena and 0.1 ml pasteurized beer yeast; and 5) for sample 4G – 0.1 ml extract of Rosa Damascena and 0.1 ml live beer yeast.
The study of morphology, microstructure and phase composition of Ag and Au NPs was per-formed by TEM. High Resolution Transmission Electron Microscope JEOL JEM 2100 (JEOL Ltd., Japan) was used for acquisition of bright field im-ages and SAED patterns of the samples at acceler-ating voltage of 200 kV. For TEM investigation, the samples were sonicated and then microquanti-ties of their suspensions were dropped on stand-ard Cu grids coated with amorphous carbon and finally dried in a clean atmosphere under ambient conditions.
Using ImageJ software [23] the particles’ diam-eters were measured and their size distribution was presented as histograms. The phase composition of Ag and Au NPs was determined on the basis of SAED patterns by means of PCPDFWIN program and PDF-2 data base of the International Centre for Diffraction Data (ICDD).
RESULTS AND DISCUSSION
TEM micrographs of Ag and Au NPs synthe-sized by the receipt described in the Experimental section are presented in Figs. 1 and 2, respectively. The shown TEM images and size distribution histo-grams in the two figures correspond to reduction of Ag+ or Au3+ by: a) water extract of Rosa Damascena, b) pasteurized beer yeast, c) live beer yeast, d) com-bination of water extract of Rosa Damascena and pasteurized beer yeast, and e) combination of wa-ter extract of Rosa Damascena and live beer yeasts. Representative SAED patterns and HRTEM micro-graphs are also included it the figures as Fig. 1f and g and Fig. 2f and g.
It is seen that the shape of AgNPs is spherical in all samples and the particles are relatively separated from each other. Organic components existing in
B. C. Georgieva et al.: TEM characterization of silver and gold nanoparticles synthesized by а ‘green’ method using...

160
Fig. 1. TEM images and corresponding size distributions of Ag nanoparticles synthesized using reduction agents: water extract of Rosa Damascena, sample 0B (a); pasteurized beer yeast, sample 1B (b); live beer yeast, sample 2B (c); both water extract of Rosa Damascena and pasteurized beer yeast, sample 3B (d); both water extract of Rosa Damascena and live beer yeast, sample 4B (e); and representative SAED pattern (f); and HRTEM image (g).
the Rosa Damascena water extracts or beer yeasts solutions are also visualized as envelopes attached to NPs with less contrast than that of the metal NPs. They are well seen in some cases, especially in
Fig. 1b and e. There are some procedures as cen-trifugation and dialysis, described in the literature [24], which allow the separation of NPs from the or-ganic components in suspensions. These procedures were not applied in the present study because the or-ganic components in the samples were amorphous and did not hinder the use of TEM or diffraction methods. The measured Ag NPs’ diameters are in the nanometric scale, below 50 nm, with the maxi-mal frequency in the interval 0–5 nm. Broad size distribution of Ag NPs is established for samples, reduced by Rosa Damascena water extract (Fig. 1a) and live beer yeast (Fig. 1c), while a narrow size distribution is observed for samples, reduced by pasteurized beer yeast (Fig. 1b). The reason is that pasteurized bear yeast contains the lowest quantity of polyphenols (1.53 µmol/100 g), compared to live beer yeast (8.4 µmol/100 g) and Rosa Damascena water extract (133.70 µmol/100 g). The low con-tent of polyphenols, known as the main reducing agent of Ag+, ensures limited number of Ag0 in the solution and respectively the Ag NPs grow slowly and remain predominantly with small sizes, below 5 nm. Conversely, the polyphenol-rich water extract of Rosa Damascena predisposes to the formation of larger amounts of Ag0 and larger size of Ag NPs. Therefore the size distribution is narrow for the sample with pasteurized beer yeast and broad in the case of Rosa Damascena water extracts. The NPs size distributions obtained for the mixtures of Rosa Damascena and the two beer yeasts (Fig. 1d and e) are also broad because of the effect of the rose ex-tract. In addition, SAED pattern and HRTEM image recorded for the sample produced by the mixture of Rosa Damascena and pasteurized beer yeast water extracts are presented in Fig. 1f and g. Experimental SAED pattern consists of 7 diffraction rings, 4 of them corresponding to 4 interplanar distances of cu-bic Ag (S.G. Fm-3m, PDF 87-0720) and 3 of them – to hexagonal Ag (S.G. P63/mmc, PDF 87-0598). This result is in accordance with the investigations of E. Rodriges-Leon et al., who have also identified cubic and hexagonal silver in their samples, pro-duced by “green” method [25]. In our study the two silver phases are found in all samples, except this one, reduced by pasteurized beer yeast, where the
B. C. Georgieva et al.: TEM characterization of silver and gold nanoparticles synthesized by а ‘green’ method using...

161
Fig. 2. TEM images and corresponding size distributions of Au nanoparticles synthesized using reduction agents: water extract of Rosa Damascena, sample 0G (a); pasteurized beer yeast, sample 1G (b); live beer yeast, sample 2G (c); both water ex-tract of Rosa Damascena and pasteurized beer yeast, sample 3G (d); both water extract of Rosa Damascena and live beer yeast, sample 4G (e); and representative SAED pattern (f); and HRTEM image (g).
only phase is the cubic silver. In this sample, which is poor in polyphenols, the quantity of atomic silver is insufficient for growing of large Ag NPs and as a result the small Ag NPs with a cubic crystal struc-
ture dominate [25]. Hexagonal AgNPs appear in the solution when already formed small cubic AgNPs become seeds for following rapid growth of hexagonal Ag in Ag0-rich medium [25]. Some of the diffraction rings in the pattern are diffusive, especially those that are close to the central beam. These rings are embedded by the amorphous hallo in the center of the pattern, which is due to the amorphous component in the solution. In addi-tion, some of the inner rings, corresponding to two phases – cubic and hexagonal, are very close to each other and look as single, but vague ring. The presence of small Ag NPs, especially these with diameters less than 5 nm also influence the rings and make them diffusive.
Typical Ag NPs with lattice fringes at measured distance equal to 2.03 Å is presented in the HRTEM image in Figure 1g. This value correspond well with the interplanar distance d = 2.0386 Å of (200) planes in Ag face centered cubic crystal lattice. Similar particles are found in all samples. Although, the diffraction signal from h-Ag was registered by SAED, nanoparticles of this phase were not visual-ized in HRTEM mode.
From TEM images in Figure 2a–e it is seen that the shape of Au NPs is also spherical, but large ag-gregates are generally visualized for Au samples. However, in the peripheral areas of these aggre-gates the individual Au NPs are still distinguished so their shape and size could be defined. Gold NPs grow larger than silver ones and their diameters are within interval 0–80 nm as the prevailing part is be-low 15 nm. This is not concerned for the case of Au NPs, produced by Rosa Damascena water extract (Fig. 2a), where a broad size distribution of NPs is observed, similarly to the corresponding Ag NPs (Fig. 1a). SAED pattern and HRTEM image of a Au NP produced by mixture of Rosa Damascena wa-ter extract and pasteurized beer yeast are presented in Figure 2f and g. The indexing of SAED patterns gives evidence for the presence of face centered cubic Au (S.G. Fm–3m, PDF 04-0784) in all sam-ples. These data are confirmed by HRTEM image in Figure 2g, which visualizes the lattice fringes cor-responding to interplanar distance d200 = 2.0390 Å of the face centered cubic Au.
B. C. Georgieva et al.: TEM characterization of silver and gold nanoparticles synthesized by а ‘green’ method using...

162
The synthesized and characterized in the present study AgNPs will be applied as a component of graphite electrode – catalyst for reduction of H2O2 and will be tested for amperometric quantitative de-termination of H2O2 and other analytes. As AuNPs, synthesized by Rosa Damascena water extract and beer yeasts tend to aggregate, it is needed to be sta-bilized and separated using surfactants [24] before finding an application.
CONCLUSIONS
The microstructure, phase composition and size distribution of Ag and Au NPs, synthesized for the first time by “green” method, using Rosa Damascena water extract and pasteurized and live beer yeasts are studied. The presence and co-exist-ence of two Ag phases – face centered cubic and hexagonal and face centered cubic for Au NPs are proved by SAED and HRTEM. The shape of both Ag and Au NPs is spherical and their diameters are in the interval 0–50 nm for Ag NPs and 0–80 nm for Au NPs. The prevailing parts of Ag NPs are below 5 nm and of Au NPs - below 15 nm, which could be used in electrochemical, medical and other applica-tions of these nanoparticles.
Acknowledgment: The authors are grateful to the financial support of National Science Fund of Bulgaria; project DN 17/22“Valorization and ap-plication of essential oil industry wastes for “green” synthesis of metal nanoparticles”.
REFERENCES
1. R. G. Saratalea, I. Karuppusamyb, G. D. Saratalec,A. Pugazhendhid, G. Kumare, Y. Parka, G. S. Ghodakef,R. N. Bharagavag, J. R. Banuh, H. S. Shin, Colloids Surf. B: Biointerfaces, 170, 20 (2018).
2. K. Alaqad, T. A. Saleh, J. Environ. Anal. Toxicol., 6, 384 (doi:10.4172/2161-0525.1000384) (2016).
3. M. Traykova, G. Bocheva, S. Razmirov, D. Karashanova, T. Traykov, Bulg. Chem. Commun., 50, Special Issue C, 225 (2018).
4. N. N. Nedyalkov, P. A. Atanasov, R. A. Toshkova, E. G. Gardeva, L. S. Yossifova, M. T. Alexandrov, D. Karashanova, in: Proceedings of SPIE – The International Society for Optical Engineering, 8427, doi: 10.1117/12.921776, 2012.
5. A. M. Ealias, M. P. Saravanakumar, IOP Conf. Series: Materials Science and Engineering, 263, 032019 (2017).
6. S. K. Srikar, D. D. Giri, D. B. Pal, P. K. Mishra, S. N. Upadhyay, Green and Sustainable Chem., 6, 34 (2016).
7. Y. Li, J. Y. Lan, J. Liu, J. Yu, Z. Luo, W. Wang, L. Sun, Ind. Eng. Chem. Res., 54, 21, 5656 (2015).
8. P. R. Ghosh, D. Fawcett, S. B. Sharma, G. E. J. Poinern, Mater., 10, 852 (2017).
9. M. Noruzi, Biosynthesis of gold nanoparticles us-ing plant extracts, Bioprocess. Biosyst. Eng. 38, 1 (2015).
10. T. D. Sundeep, P. S. V. Kumar, R. V. S. Rao, S. S. N. Ravikumar, A. G. Krishna, Prog. Biomater., 6, 57 (2017).
11. E. R. Carmona, N. Benito, T. Plaza andG.Recio-Sánchez, Green Chem. Lett. Rev., 10, 4, 250 (2017).
12. M. Gomathi, P.V. Rajkumar, A. Prakasam, Results in Phys., 10, 858 (2018).
13. M. M.H. Khalil, E. H. Ismail, F. El-Magdoub, Arabian J. Chem., 5, 431 (2012).
14. A. A. A. Aljabali, Y. Akkam, M. S. Al Zoubi, K. M. Al-Batayneh, B. Al-Trad, O. A. Alrob, A. M. Alkilany, M. Benamara, D. J. Evans, Nanomater., 8, 174 (2018).
15. A. Astalakshmi, P. Nimaand, V. Ganesan, Int. J. Pharm. Sci. Rev. Res., 23 (1), 09, 47 (2013).
16. N. Ahmad, S. Sharma, Green and Sustainable Chem., 2, 141 (2012).
17. S. Naraginti, Y. Li, J. Photochem. Photobiol. B: Biology, 170, 225 (2017).
18. J. Suarez-Cerda, G. Alonso-Nunez, H. Espinoza-Gomez, L. Z. Flores-Lopez, J. Colloid Interface Sci., 458, 169 (2015).
19. F. Niknejad, M. Nabili, R. Daie Ghazvini, M. Moazeni, Curr. Med. Mycol., 1 (3), 17 (2015).
20. M. Pinto, E. Coelho, A. Nunes, T. Brandão, M. A. Coimbra, Carboh. Polym., 116, 215 (2015).
21. Agro statistics, Ministry of Agriculture, Food and Forestry, December 2016, 315.
22. S. M. Ghoreishi, M. Behpour, M. Khayatkashani, Physica E, 44, 97 (2011).
23. W. S. Rasband, Image J. Bethesda, Maryland, USA: U. S. National Institutes of Health.
24. R. LaSpina, V. Spampinato, D. Gilliland, I. Ojea-Jimenez, G. Ceccone, Biointerphases, 12 (3), 031003 (2017).
25. E. Rodriguez-Leon, R. Iniguez-Palomares, R. E. Navarro, R. Herrera-Urbina, J. Tanori, C. Iniguez-Palomares, A. Maldonado, Nanoscale Res. Lett., 8, 318 (2013).
B. C. Georgieva et al.: TEM characterization of silver and gold nanoparticles synthesized by а ‘green’ method using...

163© 2018 Bulgarian Academy of Sciences, Union of Chemists in Bulgaria
* To whom all correspondence should be sent:
Bulgarian Chemical Communications, Volume 50, Special Issue F (pp. 163–166) 2018
A new phase obtained by oxidation of nanosized spinel MnFe2O4
T. I. Lazarova, D. G. Kovacheva*
Institute of General and Inorganic Chemistry, Bulgarian Academy of Sciences, Acad. G. Bonchev str., Bl 11, 1113 Sofia, Bulgaria
Received October 12, 2018; Accepted December 03, 2018
In a bulk form MnFe2O4 is a partially inverse spinel where about 80% of Mn2+ ions are located at tetrahedral (A) coordination sites. MnFe2O4 is used as catalyst, as adsorbent for removing heavy metals in water, as ferrofluids, in biomedicine, in energy storage devices and others. Solution combustion synthesis was used for the preparation of nanosized MnFe2O4 with a mixture of two fuels – glycine and glycerol (0.75:0.25 reducing power ratio). The result-ing material was characterized by X-ray diffraction (XRD). As-prepared sample is single phase spinel with unit cell parameter 8.470 Å. After a thermal treatment in argon flow at 40 °C for 2 hours, the unit cell parameter increases to 8.488 Å. Additional thermal treatment at 400 °C in air resulted in a new diffraction pattern, indicative for structural transformation. Indexing the entire set of diffraction lines gave a solution with a good reliability factor within a rhom-bohedral space group (unit cell parameters a = 6 Å and c = 28.6 Å). Possible space groups were R3, R3m and R–3m. Preliminary structural data for the new phase are presented. The new structure is closely related to that of the spinel. It was found that the oxygen layer packing sequence remained unchanged, but the displacement of the oxygen positions resulted in lowering of the cubic symmetry to hexagonal. The arrangement of the cation positions also remains close to that of the spinel, alternating the Oh3 layers and T2O layers. The cation to anion ratio of the new phase is considered to be close to that of γ-Fe2O3 and is cation deficient.
Keywords: MnFe2O4, oxidation, rhombohedral spinel-like phase.
E-mail: [email protected]
INTRODUCTION
The spinel ferrites, MFe2O4 (M = Co, Ni, Mn, Mg, etc.) are attractive for many technological ap-plications due to their specific electrical and mag-netic properties including high permeability and moderate magnetization [1]. These properties define their use in many devices like filters, phase shifters, circulators, high frequency transformers and other microwave applications. Recently, they were also applied successfully in biomedical technologies for cancer remediation therapies [2, 3]. Their impor-tance in electronics stems in part from their applica-bility for efficient production of large quantities of clean materials at relatively low temperatures. It has been shown that the cation distribution in spinel fer-rites determines their electrical, magnetic and cata-lytic properties [4]. Manganese ferrite MnFe2O4 is a well-known microwave ferrite material with a par-tially inverse spinel structure in a bulk form. Earlier work, which studied the size dependent magnetic
properties of 5–15 nm MnFe2O4 particles, suggested that its Néel temperature TN increased with decreas-ing particle size in a manner consistent with a finite size scaling model [5]. Some reports show that the cation distribution remained essentially the same in MnFe2O4 particles of different sizes and indeed the small particles have higher TN than larger ones [6]. Single phase MnFe2O4 powders having crystallite sizes ranging between 9.5 and 40 nm have also been obtained by mechanochemical synthesis. The de-gree of inversion in these samples was found to re-main unchanged and independent of size. The Néel temperature was constant irrespective of the particle size. [7] The cation distribution and oxidation state of ferrous and nonferrous ions are essential in un-derstanding the magnetic and electronic properties of ferrite materials. The occupancy of Mn ions at octahedral sites was found to greatly influence the Néel temperature[8].
EXPERIMENTAL
Solution combustion synthesis was applied for the preparation of nanosized MnFe2O4 using a mix-

164
ture of two types of fuel, namely glycine and glyce-rol in a 0.75:0.25 reducing power ratio. Starting reagents – analytical grade Mn(NO3)2.4H2O and Fe(NO3)3.9H2O, were taken as oxidants and precur-sors in a molar ratio 1:2. The fuel to oxidant ratio (1:1) was calculated on the base of oxidation and re-duction power of the corresponding compounds as proposed by Jain et al. [9]. The calculated amounts of all starting reagents were dissolved in deionized water and the resulting solution was heated on a plate with magnetic stirrer. Soon after the dehydra-tion of the solution, it reaches its flash point and ignites releasing a large amount of heat resulting in a fine powder denoted as “as prepared” sample. Two samples were obtained – first by thermal treat-ment of the as prepared sample at 400 °C in argon atmosphere for 2 hours and the second – by subse-quent thermal treatment of previous sample for 12 h at 400 °C in air.
The resulting materials were characterized by X-ray diffraction (XRD). Powder XRD patterns were registered at room temperature on a Bruker D8 Advance diffractometer with CuKα radiation and LynxEye detector. The Rietveld refinement pro-cedure was performed with the Topas 4.2 program [10].The set of parameters that were refined in-clude: zero shift, coefficients (7) of the background Chebyshev polynomials, the absorption correction coefficient, scale factor, unit cell parameters, po-sitional parameters, occupancies and thermal dis-placement parameters of the ions presented in the structure. The peak shapes were described accord-ing to the fundamental parameters approach taking into account the geometry of the diffractometer and the optical devices on the beam path.
RESULTS AND DISCUSSIONS
The as-prepared sample is a single phase with spinel-type structure having unit cell parameter 8.470 Å and mean crystallite size of about 40 nm. After the thermal treatment in argon flow at 400 °C for 2 hours, the unit cell parameter increases to 8.488 Å and the average crystallite size decreases to 35 nm. Additional thermal treatment at 400 °C of the same sample in air resulted in a new diffrac-tion pattern, indicative for structural transformation Fig. 1. The detailed analysis of the newly obtained diffraction pattern shows that the positions and in-tensities of its reflexions can not be unambiguously attributed to any known phases in the Mn-Fe-O sys-tem, neither as mixed or simple oxides.
Indexing the entire set of diffraction lines with Topas 4.2 delivered a solution with a good confi-dence factor within a rhombohedral space group with unit cell parameters (a = 6 Å and c = 28.6 Å). On the basis of systematic extinctions, possible space groups were R3, R3m and R–3m.
The axial metric relations showed that this unit cell has the following relationships with that of the spinel:
aH = aSp/√2, cH = 6aSp/√3,
where aH and cH are the cell parameters of the rhombohedral cell in hexagonal representation and aSp is the cell parameter of the cubic spinel. Having in mind the cell relations mentioned above several models for the structure of the new phase were built. The models assuming hexagonal close packing of the oxygen atoms did not lead to plausible solutions
Fig. 1. Powder diffraction patterns of the samples of MnFe2O4 obtained after thermal treatment in argon (black) and in air (red).
T. I. Lazarova, D. G. Kovacheva: A new phase obtained by oxidation of nanosized spinel MnFe2O4

165
thus models with cubic close packing were fur-ther considered. As a starting model for the crystal structure refinement the data for oxygen positions in cobaltian aerugite, Co8.5As3O16 (65630-ICSD) were taken. The cation positions were further deter-mined. The Rietveld refinement of the model struc-ture showed that about 10 mass% of the sample is residual spinel. Preliminary structural data for the new phase are presented in the Table 1. Rietveld plot is presented in Fig 2. The polyhedral presenta-tion of the structure is given in Fig 3.
The new structure is closely related to that of the spinel. It was found that the oxygen layer packing sequence remained unchanged (a cubic close pack-ing), but the displacements of the oxygen positions resulted in disappearance of two of the trifold axes.
As a result the cubic symmetry decreases to hex-agonal. The arrangement of the cation positions also remains close to that of the spinel, alternating Oh3 and T2O layers. Due to the supposed oxidation of the cations, the cation to anion ratio of the new phase should be close to that of the γ-Fe2O3 (magh-emite) and is assumed to be cation deficient. Unlike maghemite, where cation vacancies are distributed with preserving the cubic symmetry, in the current structure the vacancies seem to be located in one position (the octahedral position in one of the T2O layers) which is in good agreement with the conclu-sions made by other authors [11]. Due to the small difference in atomic scattering factors between iron and manganese ions in the presented preliminary structure refinement the cations are distributed over
Fig. 2. Rietveld plot of the oxidized MnFe2O4.
Table 1. Preliminary structural data for the new phaseS.G. R–3m, Unit cell parameters: a (Å) = 6.0060(2), c (Å)=28.529(1)Rbragg – 1.05, Rwp – 3.92, GOF – 1.265
Site Multiplicity Ion x y z Occupancy B iso
O1 18 O–2 0.1447(6) –0.1447(6) –0.0438(3) 1 0.84(8)O2 6 O–2 0 0 0.3784(5) 1 0.84(8)O3 6 O–2 0 0 0.1256(6) 1 0.84(8)O4 18 O–2 0.4974(7) –0.4974(7) –0.1190(3) 1 0.84(8)Fe1 18 Fe+3 –0.1706(2) 0.1706(2) 0.9137(9) 1 1.01(4)Fe2 3 Fe+3 0 0 0 1 1.01(4)Mn1 6 Mn+3 0 0 0.8096(2) 1 0.45(4)Mn2 6 Mn+3 1/3 –1/3 –0.0222(1) 1 0.45(4)
T. I. Lazarova, D. G. Kovacheva: A new phase obtained by oxidation of nanosized spinel MnFe2O4
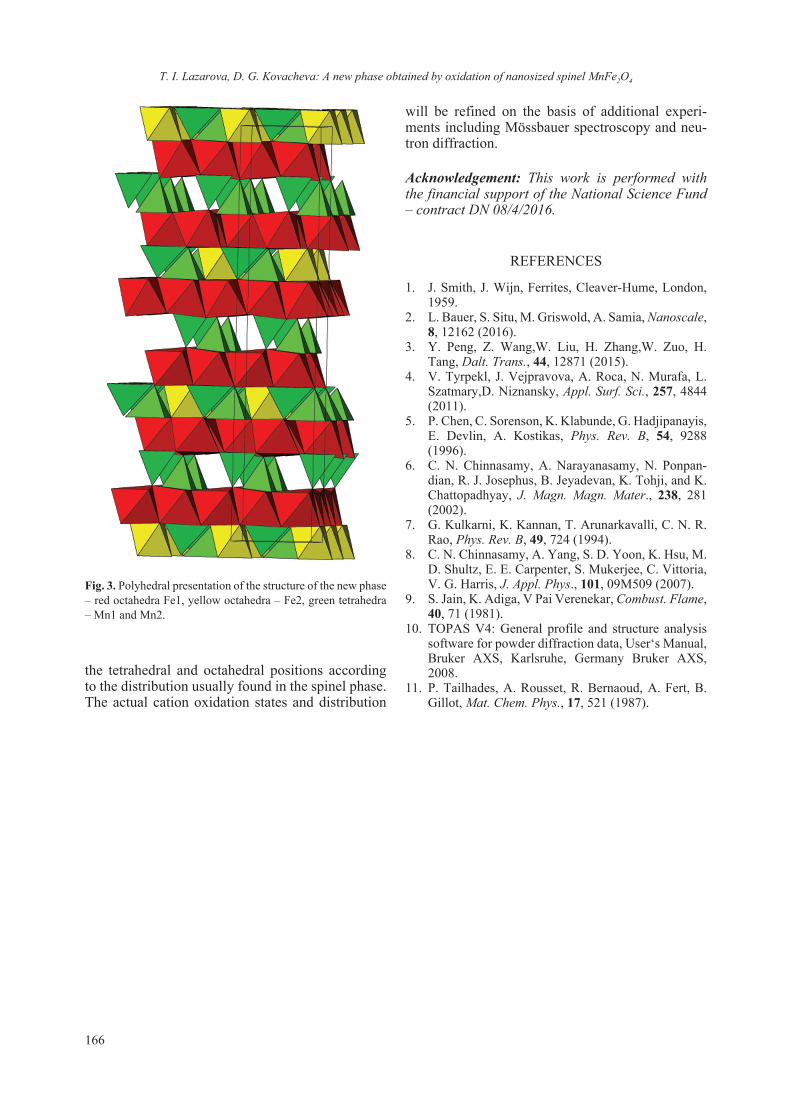
166
the tetrahedral and octahedral positions according to the distribution usually found in the spinel phase. The actual cation oxidation states and distribution
will be refined on the basis of additional experi-ments including Mössbauer spectroscopy and neu-tron diffraction.
Acknowledgement: This work is performed with the financial support of the National Science Fund – contract DN 08/4/2016.
REFERENCES
1. J. Smith, J. Wijn, Ferrites, Cleaver-Hume, London, 1959.
2. L. Bauer, S. Situ, M. Griswold, A. Samia, Nanoscale, 8, 12162 (2016).
3. Y. Peng, Z. Wang,W. Liu, H. Zhang,W. Zuo, H. Tang, Dalt. Trans., 44, 12871 (2015).
4. V. Tyrpekl, J. Vejpravova, A. Roca, N. Murafa, L. Szatmary,D. Niznansky, Appl. Surf. Sci., 257, 4844 (2011).
5. P. Chen, C. Sorenson, K. Klabunde, G. Hadjipanayis, E. Devlin, A. Kostikas, Phys. Rev. B, 54, 9288 (1996).
6. C. N. Chinnasamy, A. Narayanasamy, N. Ponpan-dian, R. J. Josephus, B. Jeyadevan, K. Tohji, and K. Chattopadhyay, J. Magn. Magn. Mater., 238, 281 (2002).
7. G. Kulkarni, K. Kannan, T. Arunarkavalli, C. N. R. Rao, Phys. Rev. B, 49, 724 (1994).
8. C. N. Chinnasamy, A. Yang, S. D. Yoon, K. Hsu, M. D. Shultz, E. E. Carpenter, S. Mukerjee, C. Vittoria, V. G. Harris, J. Appl. Phys., 101, 09M509 (2007).
9. S. Jain, K. Adiga, V Pai Verenekar, Combust. Flame, 40, 71 (1981).
10. TOPAS V4: General profile and structure analysis software for powder diffraction data, User‘s Manual, Bruker AXS, Karlsruhe, Germany Bruker AXS, 2008.
11. P. Tailhades, A. Rousset, R. Bernaoud, A. Fert, B. Gillot, Mat. Chem. Phys., 17, 521 (1987).
Fig. 3. Polyhedral presentation of the structure of the new phase – red octahedra Fe1, yellow octahedra – Fe2, green tetrahedra – Mn1 and Mn2.
T. I. Lazarova, D. G. Kovacheva: A new phase obtained by oxidation of nanosized spinel MnFe2O4
167© 2018 Bulgarian Academy of Sciences, Union of Chemists in Bulgaria
* To whom all correspondence should be sent:
Bulgarian Chemical Communications, Volume 50, Special Issue F (pp. 167–172) 2018
The effect of different acid stabilizers on the morphology and optical properties of ZrO2 sol-gel films
O. Dimitrov1*, I. Stambolova2, K. Lazarova3, T. Babeva3, S. Vassilev1, M. Shipochka2
1 Institute of Electrochemistry and Energy Systems, Bulgarian Academy of Sciences, G. Bonchev Str., bl. 10, 1113, Sofia, Bulgaria
2 Institute of General and Inorganic Chemistry, Bulgarian Academy of Sciences, G. Bonchev Str., bl. 11, 1113, Sofia, Bulgaria
3 Institute of Optical Materials and Technologies, Bulgarian Academy of Sciences, G. Bonchev Str., bl. 109, 1113, Sofia, Bulgaria
Received October 16, 2018; Accepted December 03, 2018
Transparent and homogeneous ZrO2 films were obtained by sol-gel technique using different acids as stabilizing agents. Tetragonal ZrO2 phase with small nanosized crystallites is characteristic for the studied films. The surface morphology of the samples is smooth and continuous without visible cracks. An average transmittance of about 80% was observed for the samples in the visible range. The refractive indexes of the films prepared using CH3COOH and HNO3 are 1.672 and 1.602, respectively. The chemical composition of the films as revealed by XPS analysis show the presence of oxygen defects. Photoluminescence (PL) properties were also studied in the range of 300–550 nm. The PL spectra of the samples obtained from solutions with CH3COOH and HNO3 exhibit broad emission band with maximum at 401 and 415 nm, respectively. The later PL peak has stronger intensity, due to the larger size of crystal-lites of the HNO3 films, as opposed to the CH3COOH samples.
Keywords: zirconia, thin films, chelating agents, photoluminescence.
Email: [email protected]
INTRODUCTION
Zirconium thin films exhibit unique physico-chemical properties: thermal and chemical stability, high hardness, corrosion resistance, high refractive index, biocompatibility etc. These properties make them attractive material for application in opto-electronic devices [1], thermal and corrosion pro-tection coatings [2], wear resistance coatings [3], sensors [4] and bio implants [5]. Various physical and chemical methods for preparation of zirconia films are applied: plasma spraying [6], RF sputter-ing [7], pulsed laser deposition [8], chemical vapor deposition (CVD) [9], electrochemical deposi-tion [10], spray pyrolysis method [11] and sol-gel method [12]. The sol-gel method is a wet-chemical low temperature method, based on hydrolysis and condensation reactions [13]. At present the clas-sical sol-gel process is one of the most appropri-ate technology for preparation of homogeneous,
uniform and high quality ZrO2 films [14, 15] аnd powders [16, 17]. The proper selection of the type of chelating agent and acid catalysts is very impor-tant in order to control the hydrolysis and conden-sation reaction rates of the metal alkoxide and the preparation of a stable sol, which affects the films properties and uniformity. Various chelating agents (diethanolamine [1], acetic acid [14], acetylacetone [18] and strong acids such as hydrochloric acid or nitric acid [19, 20]) have been used. In the avail-able literature, very few articles are devoted to the influence of chelating agents and acids on the pho-toluminescence properties of ZrO2 sol-gel films. Lakshmi et al. have revealed that ZrO2 films, de-posited from zirconium butoxide and acetylacetone possess intrinsic defects, which are responsible for the luminescence properties [21]. Vinogradov et al. have revealed that both nucleation and phase com-position of sol-gel TiO2 films are influenced by the addition of acids with different degrees of dissocia-tion [22]. The aim of this paper is to investigate for the first time the effect of addition of weak or strong acid as stabilizing agents on the photoluminescence and morphology of ZrO2 nanosized films.
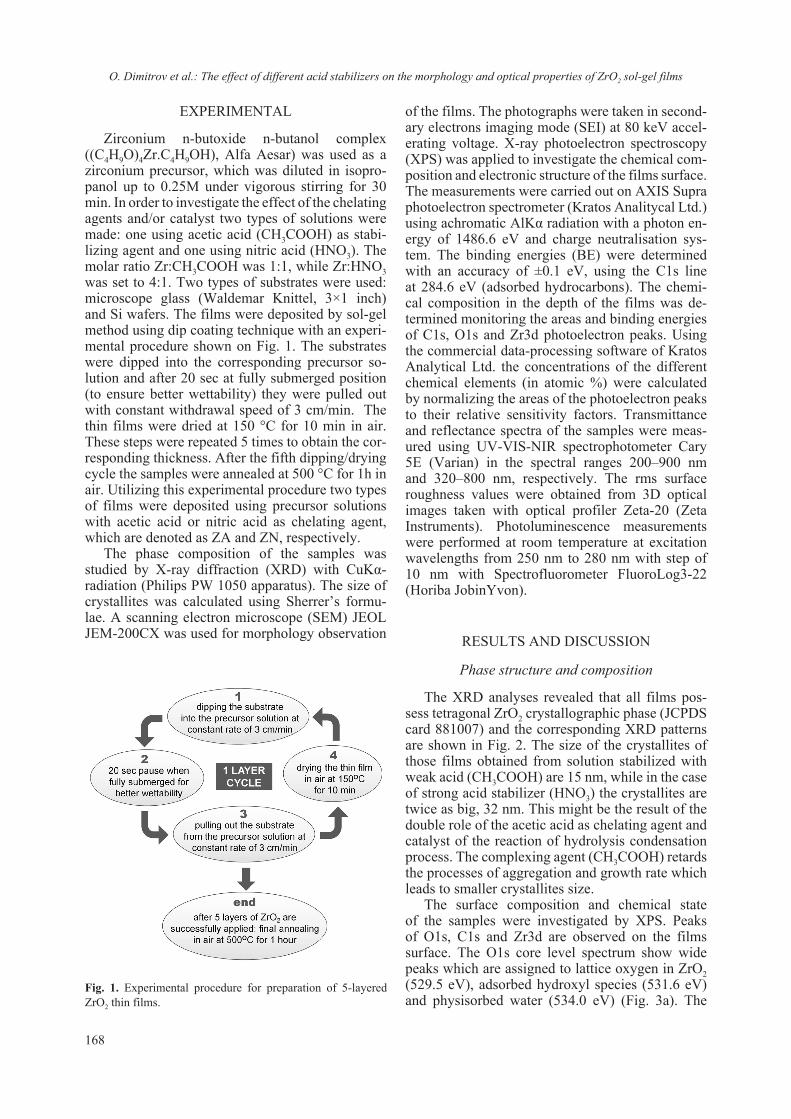
168
EXPERIMENTAL
Zirconium n-butoxide n-butanol complex ((C4H9O)4Zr.C4H9OH), Alfa Aesar) was used as a zirconium precursor, which was diluted in isopro-panol up to 0.25M under vigorous stirring for 30 min. In order to investigate the effect of the chelating agents and/or catalyst two types of solutions were made: one using acetic acid (CH3COOH) as stabi-lizing agent and one using nitric acid (HNO3). The molar ratio Zr:CH3COOH was 1:1, while Zr:HNO3 was set to 4:1. Two types of substrates were used: microscope glass (Waldemar Knittel, 3×1 inch) and Si wafers. The films were deposited by sol-gel method using dip coating technique with an experi-mental procedure shown on Fig. 1. The substrates were dipped into the corresponding precursor so-lution and after 20 sec at fully submerged position (to ensure better wettability) they were pulled out with constant withdrawal speed of 3 cm/min. The thin films were dried at 150 °C for 10 min in air. These steps were repeated 5 times to obtain the cor-responding thickness. After the fifth dipping/drying cycle the samples were annealed at 500 °C for 1h in air. Utilizing this experimental procedure two types of films were deposited using precursor solutions with acetic acid or nitric acid as chelating agent, which are denoted as ZA and ZN, respectively.
The phase composition of the samples was studied by X-ray diffraction (XRD) with CuKα-radiation (Philips PW 1050 apparatus). The size of crystallites was calculated using Sherrer’s formu-lae. A scanning electron microscope (SEM) JEOL JEM-200CX was used for morphology observation
of the films. The photographs were taken in second-ary electrons imaging mode (SEI) at 80 keV accel-erating voltage. X-ray photoelectron spectro scopy (XPS) was applied to investigate the chemical com-position and electronic structure of the films surface. The measurements were carried out on AXIS Supra photoelectron spectrometer (Kratos Analitycal Ltd.) using achromatic AlKα radiation with a photon en-ergy of 1486.6 eV and charge neutralisation sys-tem. The binding energies (BE) were determined with an accuracy of ±0.1 eV, using the C1s line at 284.6 eV (adsorbed hydrocarbons). The chemi-cal composition in the depth of the films was de-termined monitoring the areas and binding energies of C1s, O1s and Zr3d photoelectron peaks. Using the commercial data-processing software of Kratos Analytical Ltd. the concentrations of the different chemical elements (in atomic %) were calculated by normalizing the areas of the photoelectron peaks to their relative sensitivity factors. Transmittance and reflectance spectra of the samples were meas-ured using UV-VIS-NIR spectrophotometer Cary 5E (Varian) in the spectral ranges 200–900 nm and 320–800 nm, respectively. The rms surface roughness values were obtained from 3D optical images taken with optical profiler Zeta-20 (Zeta Instruments). Photoluminescence measurements were performed at room temperature at excitation wavelengths from 250 nm to 280 nm with step of 10 nm with Spectrofluorometer FluoroLog3-22 (Horiba JobinYvon).
RESULTS AND DISCUSSION
Phase structure and composition
The XRD analyses revealed that all films pos-sess tetragonal ZrO2 crystallographic phase (JCPDS card 881007) and the corresponding XRD patterns are shown in Fig. 2. The size of the crystallites of those films obtained from solution stabilized with weak acid (CH3COOH) are 15 nm, while in the case of strong acid stabilizer (HNO3) the crystallites are twice as big, 32 nm. This might be the result of the double role of the acetic acid as chelating agent and catalyst of the reaction of hydrolysis condensation process. The complexing agent (CH3COOH) retards the processes of aggregation and growth rate which leads to smaller crystallites size.
The surface composition and chemical state of the samples were investigated by XPS. Peaks of O1s, C1s and Zr3d are observed on the films surface. The O1s core level spectrum show wide peaks which are assigned to lattice oxygen in ZrO2 (529.5 eV), adsorbed hydroxyl species (531.6 eV) and physisorbed water (534.0 eV) (Fig. 3a). The
Fig. 1. Experimental procedure for preparation of 5-layered ZrO2 thin films.
O. Dimitrov et al.: The effect of different acid stabilizers on the morphology and optical properties of ZrO2 sol-gel films
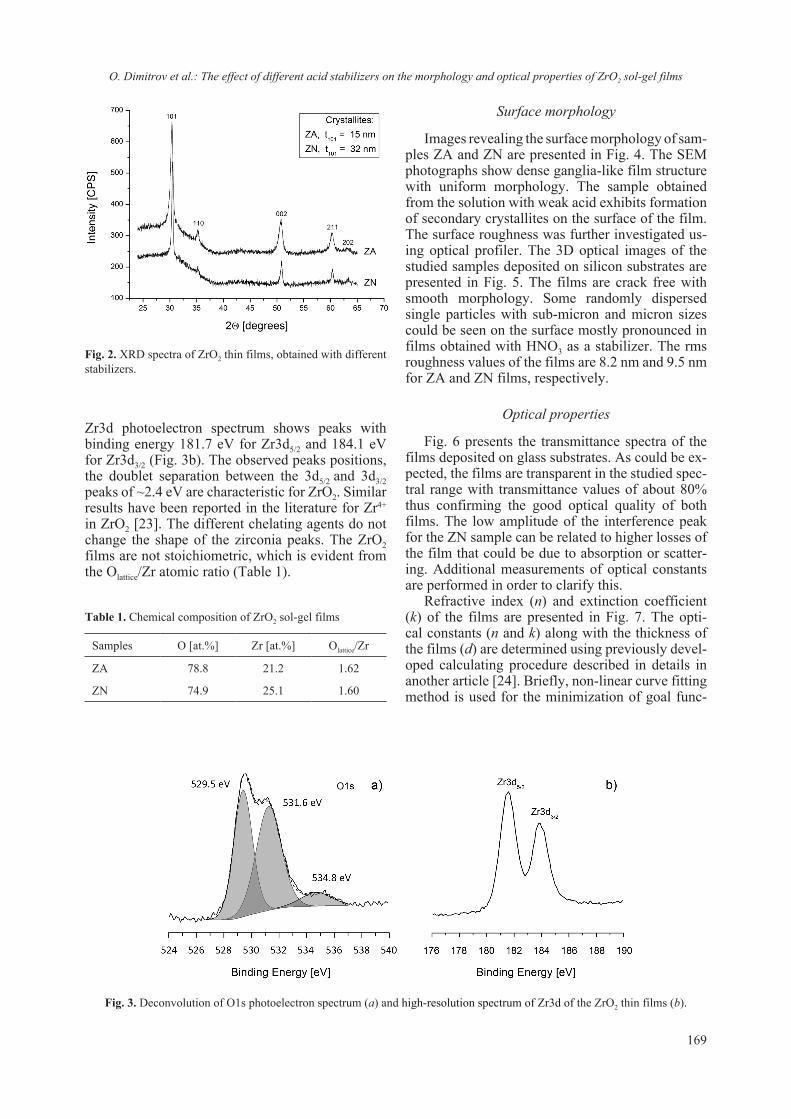
169
Zr3d photoelectron spectrum shows peaks with binding energy 181.7 eV for Zr3d5/2 and 184.1 eV for Zr3d3/2 (Fig. 3b). The observed peaks positions, the doublet separation between the 3d5/2 and 3d3/2 peaks of ~2.4 eV are characteristic for ZrO2. Similar results have been reported in the literature for Zr4+ in ZrO2 [23]. The different chelating agents do not change the shape of the zirconia peaks. The ZrO2 films are not stoichiometric, which is evident from the Olattice/Zr atomic ratio (Table 1).
Surface morphology
Images revealing the surface morphology of sam-ples ZA and ZN are presented in Fig. 4. The SEM photographs show dense ganglia-like film structure with uniform morphology. The sample obtained from the solution with weak acid exhibits formation of secondary crystallites on the surface of the film. The surface roughness was further investigated us-ing optical profiler. The 3D optical images of the studied samples deposited on silicon substrates are presented in Fig. 5. The films are crack free with smooth morphology. Some randomly dispersed single particles with sub-micron and micron sizes could be seen on the surface mostly pronounced in films obtained with HNO3 as a stabilizer. The rms roughness values of the films are 8.2 nm and 9.5 nm for ZA and ZN films, respectively.
Optical properties
Fig. 6 presents the transmittance spectra of the films deposited on glass substrates. As could be ex-pected, the films are transparent in the studied spec-tral range with transmittance values of about 80% thus confirming the good optical quality of both films. The low amplitude of the interference peak for the ZN sample can be related to higher losses of the film that could be due to absorption or scatter-ing. Additional measurements of optical constants are performed in order to clarify this.
Refractive index (n) and extinction coefficient (k) of the films are presented in Fig. 7. The opti-cal constants (n and k) along with the thickness of the films (d) are determined using previously devel-oped calculating procedure described in details in another article [24]. Briefly, non-linear curve fitting method is used for the minimization of goal func-
Fig. 2. XRD spectra of ZrO2 thin films, obtained with different stabilizers.
Fig. 3. Deconvolution of O1s photoelectron spectrum (a) and high-resolution spectrum of Zr3d of the ZrO2 thin films (b).
Table 1. Chemical composition of ZrO2 sol-gel films
Samples O [at.%] Zr [at.%] Olattice/Zr
ZA 78.8 21.2 1.62
ZN 74.9 25.1 1.60
O. Dimitrov et al.: The effect of different acid stabilizers on the morphology and optical properties of ZrO2 sol-gel films

170
Fig. 4. SEM images of ZrO2 thin films, obtained with acetic acid (a, b) and nitric acid (c, d).
Fig. 5. 3D images of the surface of ZA (a) and ZN (b) thin films at 100 times magnification.
tion consisting of discrepancies between the meas-ured and calculated reflectance spectra. Purposely the thin films are deposited on silicon substrates and their reflectance spectra (R) are measured at normal light incidence. The experimental errors for R, n, k and d are 0.3%, 0.005, 0.003 and 2 nm, respectively.
It is seen from Fig. 7 that for both films the dis-persion curves of n and k obey normal dispersion, i.e n and k decrease with increasing of wavelength. This could be expected considering the transparency of the films in the studied spectral range. The refrac-tive index of the films prepared using CH3COOH is
higher as compared to this prepared with HNO3 and has values at wavelength of 600 nm of 1.672 and 1.602, respectively; the calculated thickness values are 203 nm and 165 nm, respectively. Because the thicknesses of the two films are similar, the thick-ness dependence of refractive index as a possible reason for the difference in n-values for the two films could be ruled out. In the visible spectral range both films have low losses with extinction coefficients at wavelength of 600 nm of 0.009 and 0.020 for ZA and ZN films, respectively. Thus, the higher losses of films prepared using HNO3, men-
O. Dimitrov et al.: The effect of different acid stabilizers on the morphology and optical properties of ZrO2 sol-gel films

171
tioned above, are related to higher absorption of the films. Additionally, stronger scattering losses due to the higher surface roughness of these films could also attribute to lower transmittance.
The photoluminescence spectra of the films were obtained in the wavelength range of 300–550 nm under 4 excitation energies as presented in Fig. 8. It can be seen that both samples possess broad emission band with maximum at 401 and 415 nm for ZA and ZN, respectively. The peaks are in the visible range and correspond to violet emission. Their intensity is stronger for the ZN films, due to the larger size of crystallites, as opposed to the ZA sample. Another research group has reported that the intensity of the luminescence band of ZrO2 powders increases drastically upon increasing the crystal size [25].
Fig. 6. Transmittance spectra of ZrO2 thin films, obtained with different stabilizers.
Fig. 7. Refractive index (a) and extinction coefficient (b) of ZrO2 thin films, obtained with different stabilizers.
Fig. 8. Photoluminescence spectra of ZrO2 thin films, obtained with acetic acid (a) and nitric acid (b).
O. Dimitrov et al.: The effect of different acid stabilizers on the morphology and optical properties of ZrO2 sol-gel films

172
The Zr4+ ion itself do not exhibit photolumines-cence properties. The broad emission band could be attributed to the ionized oxygen vacancies in the ZrO2 nanomaterials [26]. The XPS analysis has re-vealed that the ratio Olattice/Zr for both samples is about 1.6, suggesting the presence of oxygen de-fects.
It is well known that the sol-gel deposition pa-rameters (solution composition, annealing tempera-ture and duration, the type of catalyst, etc.) influ-ence greatly the type of defects that occur on the films surface. That is why the emission spectra of studied samples differ from those presented in the literature [21]. Thus obtained ZrO2 thin films could find application in photonic devices due to their lu-minescence properties in the short wavelength.
CONCLUSIONS
Thin nanosized homogeneous ZrO2 films were deposited by dip coating sol-gel technique using weak or strong acid as stabilizing agents. In both cases the films crystallize in tetragonal ZrO2 phase. The addition of strong acid (HNO3) promotes two times larger crystallites than those obtained with weak acid (CH3COOH). The films have dense, continuous surface with low rough-ness value. Both films have good optical qual-ity with transmittance values of about 80%. The refractive indexes of the films prepared using CH3COOH and HNO3 are 1.672 and 1.602 respec-tively. The XPS analysis revealed non stoichio-metric chemical composition with oxygen defects that play an important role for the photolumines-cence properties. The PL spectra exhibit broad emission band with maximum at 401 and 415 nm for the samples obtained from solution with weak and strong acid, respectively. The intensity of the PL peak is stronger for the ZN films, as opposed to the ZA samples, due to the larger crystallites sizes. The observed short wavelength PL emission makes studied ZrO2 films suitable candidates for application in light emitting devices.
REFERENCES
1. L. Liang, Y. Xu, D. Wu, Y. Sun, Mater. Chem. Phys., 114, 252 (2009).
2. K. Izumi, N. Minami, Y. Uchida, Key Eng. Mater., 150, 77 (1998).
3. Z. Zhang, G. Ji, Z. Shi, Surf. Coat. Technol., 350, 128 (2018).
4. A. Dankeaw, G. Poungchan, M. Panapoy, B. Ksapabutr, Sens. Actuators, B, 242, 202 (2017).
5. G. S. Kaliaraj, V. Vishwakarma, K. Kirubaharan, T. Dharini, B. Muthaiah, Surf. Coat. Technol., 334, 336 (2018).
6. M. Friis, C. Persson, J. Wigren, Surf. Coat. Technol., 141, 115 (2001).
7. S. Zhao, F. Ma, K. W. Xu, H. F. Liang, J. Alloys Comp., 453, 453 (2008).
8. B. Hobein, F. Tietz, D. Stover, E. W. Kreutz, J. Power Sources, 105, 239 (2002).
9. D. J. Burleson, J. T. Roberts, W. L. Gladfelter, S. A. Campbell, R. C. Smith, Chem. Mater., 14, 1269 (2002).
10. P. Stefanov, D. Stoychev, I. Valov, A. Kakanakova-Georgieva, T. S. Marinova, Mater. Chem. Phys., 65, 222 (2000).
11. M. Garcı́a-Hipólito, O. Alvarez-Fregoso, E. Martı́-nez, C. Falcony, M. A. Aguilar-Frutis, Opt. Mater., 20, 113 (2002).
12. J.-S. Lee, T. Matsubara, T. Sei, T. Tsuchiya, J. Mater. Sci., 32, 5249 (1997).
13. C. J. Brinker, G. W. Scherer, Sol–gel science. The physics and chemistry of sol–gel processing, Academic Press, San Diego, 1990.
14. X. Wang, G. Wu, B. Zhou, J. Shen, J. Alloys Comp., 556, 182 (2013).
15. G. Ehrhart, B. Capoen, O. Robbe, Ph. Boy, S. Turrell, M. Bouazaoui, Thin Solid Films, 496, 227 (2006).
16. F. Davara, A. Hassankhani, M. R. Loghman-Estarki, Ceram Int., 39, 2933 (2013).
17. C. Lin, C. Zhang, J. Lin, J. Phys. Chem. C, 111, 3300 (2007).
18. X. Changrong, C. Huaqiang, W. Hong, Y. Pinghua, M. Guangyao, P. Dingkun, J. Membr. Sci., 162, 181 (1999).
19. B. Babiarczuk, A. Szczurek, A. Donesz-Sikorska, I. Rutkowska, J. Krzak, Surf. Coat. Technol., 285, 134 (2016).
20. M. Kumar, G. B. Reddy, AIP Adv., 1, 022111 (2011).21. J. S. Lakshmi, I. J. Berlin, G. P. Daniel, P. V. Thomas,
K. Joy, Physica B, 406, 3050 (2011).22. A. V. Vinogradov, V. V. Vinogradov, J. Am. Ceram.
Soc., 97, 290 (2014).23. G. I. Cubillos, J. J. Olaya, M. Bethencourt, G.
Cifredo, G. Blanco, Revista Mexicana de Fısica, 60, 233 (2014).
24. K. Lazarova, M. Vasileva, G. Marinov, T. Babeva, Opt. Laser Technol., 58, 114 (2014).
25. A. Patra, C. S. Friend, R. Kapoor, P. N. Prasad, Appl. Phys. Lett., 83, 284 (2003).
26. L. Kumari, W. Z. Li, J. M. Xu, R. M. Leblanc, D. Z. Wang, Y. Li, H. Guo, J. Zhang, Cryst. Growth Des., 9, 3874 (2009).
O. Dimitrov et al.: The effect of different acid stabilizers on the morphology and optical properties of ZrO2 sol-gel films

173© 2018 Bulgarian Academy of Sciences, Union of Chemists in Bulgaria
* To whom all correspondence should be sent:
Bulgarian Chemical Communications, Volume 50, Special Issue F (pp. 173–178) 2018
Rare Earth doped silicate glass-ceramics for LED application
I. Koseva1, P. Tzvetkov1*, P. Ivanov2, A. Yordanova, V. Nikolov1
1 Institute of General and Inorganic Chemistry, Bulgarian Academy of Sciences, 1113 Sofia, Bulgaria 2 Institute of Optical Materials and Technology, Bulgarian Academy of Sciences, 1113 Sofia, Bulgaria
Received October 28, 2018; Accepted December 03, 2018
Rare earth doped glasses from the system Li2O-Al2O3-SiO2-LiBO2 (19.6:19.6:39.1:21.7 mol%) are prepared with concentration of the dopants 0.5 at.% for Tb3+ and 0.1 at.% for Eu3+. Glass-ceramics are obtained after thermal treat-ment of the parent glass at two different temperatures (580 and 630 °C) and for three different durations (2, 5 and 24 hours). The crystallizing phases, the crystallization degree and the particle size are determined. The main crystal-lizing phase after thermal treatment with different duration time is LiAlSiO4 in two different structural modifications – β-Eucryptite and γ-Eucryptite. Powder XRD analyses show the presence of additional phases with quantity less than 5%. The crystallinity of all samples is about 90%. The particle size depends slightly on the Rare Earth ion and varies between 80 and 120 nm according to the thermal treatment regime. Emission and excitation spectra of the glass-ceramics show the characteristic peaks of Tb3+ and Eu3+. The main emission peak of Tb3+ is 5D4 → 7F5 transition at 545 nm, corresponding to green color. The main emission peak of Eu3+ is 5D0 → 7F2 transition at 613 nm, correspond-ing to orange-red color. CIE coordinates of the samples show different emission colors, which depend on the active ion and the thermal treatment regime. The obtained results show that as-prepared terbium doped glass-ceramics could be used as a blue-green phosphor. Europium doped glass-ceramics could be used as an orange-red phosphor. Different emission colors could be obtained by using different thermal treatment regimes.
Keywords: silicate phosphor, nano glass-ceramic, Rare-Earth ions, X-ray, photoluminescence.
E-mail: [email protected]
INTRODUCTION
Light emitting diodes as an energy and envi-ronment saving devices are of special interest and become more and more popular in the modern life [1, 2]. Different colors are obtained by doping with different ions [3–10] or mixing of multicolor phos-phors [11–15]. For example, white light emitting di-odes can be realized by combining the emission of blue and yellow phosphors or by mixing the emis-sion of blue, green and red phosphors [1, 16]. The luminescence of the rare earth ions strongly depends on the concentration of the activator, composition and crystal structure of the host and on preparative method [16]. Silicates are one of the most suitable materials because of their high chemical and me-chanical stability and various crystal structures [2]. Silicate, silicate glasses and glass-ceramics doped by rare earth ions are among the most popular ma-terials for optical fibers, LEDs, wave guides for optoelectronic communication and color display devices. Rare earth doped glass ceramics are a good
alternative to conventional phosphors and glasses because of the low cost preparation process, sim-ple manufacturing procedure and free from the halo effect. Mechanical, thermal, electrical and optical properties of the material could be improved by controlled heat treatment of the parent glass [17–19]. Therefore, many investigations are realized and published in recent years on doped silicate glass-ceramics [19–24].
Tb3+ doped phosphor materials possess a strong excitation band in the near UV region (around 379 nm) and show green emission due to 5D4 → 7F5 (545 nm) transition. In lower concentrations of the Tb3+ ion (in order of 1%) it also emitted from the higher levels in the blue region of the spectra. When the concentration of Tb3+ ion is lower, Tb–Tb dis-tances are large and emission from the 5D3 and 5D4 excited states is observed. At higher Tb concentra-tions, cross-relaxation quenches the emission from the 5D3 levels. Eu3+ doped phosphor materials pos-sess an excitation band in the near UV light (around 400 nm) and show orange-red emission correspond-ing to 5D0 → 7F1 (592 nm) or 5D0 → 7F2 (612 nm) tran-sitions. Their photoluminescence emission strongly depends on the symmetry of the crystal structure of the host. If the Eu3+ ions occupy the sites with in-

174
version symmetry, the emission is from the 5D0 → 7F1 magnetic-dipole transition in the range 590– 600 nm. This emission is not affected much by the site symmetry. The emission at approximately 612 nm is due to the 5D0 → 7F2 electric dipole transi-tion and will dominate if the Eu3+ ion occupies the site without inversion symmetry [5, 9, 16, 25].
Our previous investigations on the system Li2O-Al2O3-SiO2-LiBO2 revealed us an opportunity to ob-tain glass-ceramics containing LiAlSiO4 as a main crystallizing phase [26].
LiAlSiO4 is a technologically relevant ceramic, owing to its near to zero thermal expansion coeffi-cient, great thermal and chemical shock resistance, exceptional thermal stability. Up to now, this mate-rial is used not only in the field of domestic cook-ware, but also for various specific applications like heat exchangers, ring laser gyroscopes, precision optical devices and radiation dosimetry purposes [27].
The LiAlSiO4 structure has been studied by Winkler and has been confirmed by Roy et al. [28, 29]. High eucryptite, LiAlSiO4, is isomorphous with high quartz, where half of the Si atoms are replaced by Al forming the three-dimensional network of corner-sharing AlO4 and SiO4 tetrahedra. The Li+ ions are placed in void channels within the spirals of (Si,Al)O4 tetrahedra. According to Schulz, the unit cell is with hexagonal symmetry (P6222) [30, 31]. The high eucryptite form is stable on cooling even with prolonged heating at low temperatures [32]. Roy et al. also established the reconstructive inver-sion of the high eucryptite to the rhombohedral phe-nacite type of low eucryptite (α-eucryptite) at 972o ± 10 °C. At about 650 °C γ-eucryptite is formed, and its structure is monoclinic with space group Pa. At 900–1000 °C γ-eucryptite transforms into the final high-temperature polymorph β-eucryptite [33, 34].
Only one article is published on doping of LiAlSiO4 by rare earth ion (Sm3+) [35]. The com-pound is synthesized by conventional solid state technique.
In this paper, we report obtaining of Tb3+ doped and Eu3+ doped LiAlSiO4 nano glass-ceramics for LED applications (0.5 at.% for Tb3+ and 0.1 at.% for Eu3+) in the system Li2O-Al2O3-SiO2-LiBO2 (19.6:19.6:39.1:21.7 mol%). To our knowledge this kind of investigations is not published to this moment.
EXPERIMENTAL
Li2CO3 (p.a.), Al2O3 (p.a.), SiO2 (p.a.), H3BO3 (p.a.), Tb4O7 (p.a.) and Eu2O3 (p.a.) were used as raw materials. Glass syntheses were carried out in a resistive furnace with Kantal heating wire per-
mitting maximum working temperature of 1200 °C and in a chamber furnace with MoSi2 heating ele-ments allowing maximum working temperature of 1550 °C. The temperature was controlled with Pt/Pt–10%Rh thermocouple. Glasses were melted in platinum crucibles. First, the mixture was heated at 700 °C for decomposition of the lithium carbon-ate and boric acid and then the melt was heated at 1300 °C for three hours for homogenization. The as-obtained glass was cooled down to room temper-ature by quick removal from the furnace.
Different thermal analyses were done on the DTA/TG device of SETARAM Labsys evo 1600, France. The samples were investigated at a heat-ing rate of 10 °C/min in Ar flow at a flow rate of 20 ml/min from room temperature up to 900 °C.
The prepared glasses were thermally treated for establishing of the crystallizing phases. Structural characterization was carried out by powder X-ray diffraction (XRD) using a Bruker D8 Advance powder diffractometer with Cu Kα radiation and LynxEye detector. The XRD patterns were collect-ed at room temperature in the range from 10 to 80° 2θ. Qualitative phase analysis was performed by us-ing Bruker EVA 2 program [36]. The mean crystal-lite size was calculated from the integral breadth of all peaks by using whole powder pattern fitting pro-cedure (Pawley fit) and Scherrer equation as imple-mented in Bruker TOPAS 3 program [37]. The area of the amorphous phase was determined by using a straight line for a description of the background and single line for fitting the amorphous component.
The emission and excitation spectra were meas-ured on Horiba Fluorolog 3-22 TCS spectropho-tometer equipped with a 450 W Xenon Lamp as the excitation source. All spectra were measured at room temperature.
RESULTS AND DISCUSSION
Figure 1 presents the DTA curves of Tb3+ doped and Eu3+ doped precursor glasses. The glass transi-tion temperature (Tg), crystallization onset (Tx) and crystallization temperature (Tc) appear at 510, 567 and 630 °C for the first one and 502, 555 and 623 °C for the latter one. Glass stability parameters Tx-Tg are 57 and 53 °C respectively. Therefore, glasses show not high thermal stability. We choose two dif-ferent temperatures for thermal treatment – 580 and 630 °C. The first is near the crystallization onset and the second is near the exothermic peak of crystal-lization.
The XRD phase analyses show that the main crystallizing phase after thermal treatment with different duration and time is LiAlSiO4 in two dif-ferent crystallographic modifications – hexagonal
I. Koseva et al.: Rare Earth doped silicate glass-ceramics for LED application
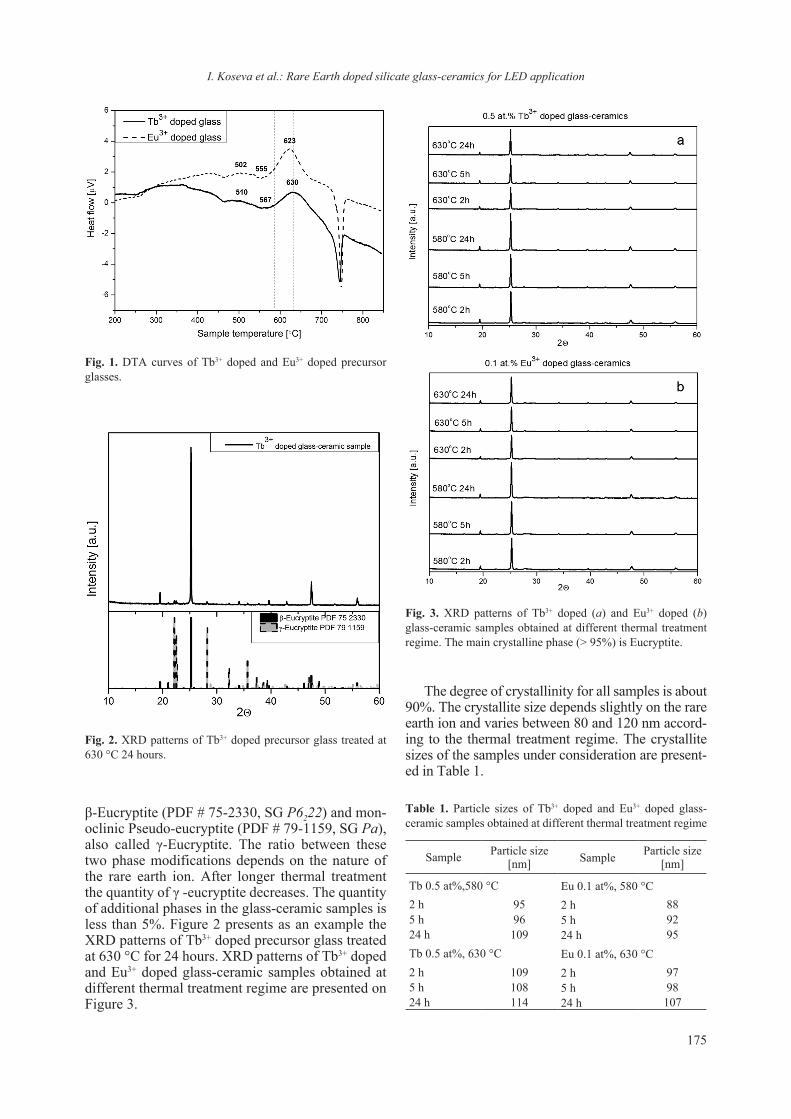
175
β-Eucryptite (PDF # 75-2330, SG P6222) and mon-oclinic Pseudo-eucryptite (PDF # 79-1159, SG Pa), also called γ-Eucryptite. The ratio between these two phase modifications depends on the nature of the rare earth ion. After longer thermal treatment the quantity of γ -eucryptite decreases. The quantity of additional phases in the glass-ceramic samples is less than 5%. Figure 2 presents as an example the XRD patterns of Tb3+ doped precursor glass treated at 630 °C for 24 hours. XRD patterns of Tb3+ doped and Eu3+ doped glass-ceramic samples obtained at different thermal treatment regime are presented on Figure 3.
The degree of crystallinity for all samples is about 90%. The crystallite size depends slightly on the rare earth ion and varies between 80 and 120 nm accord-ing to the thermal treatment regime. The crystallite sizes of the samples under consideration are present-ed in Table 1.
Fig. 1. DTA curves of Tb3+ doped and Eu3+ doped precursor glasses.
Fig. 2. XRD patterns of Tb3+ doped precursor glass treated at 630 °C 24 hours.
Fig. 3. XRD patterns of Tb3+ doped (a) and Eu3+ doped (b) glass-ceramic samples obtained at different thermal treatment regime. The main crystalline phase (> 95%) is Eucryptite.
Table 1. Particle sizes of Tb3+ doped and Eu3+ doped glass-ceramic samples obtained at different thermal treatment regime
Sample Particle size[nm] Sample Particle size
[nm]
Tb 0.5 at%,580 °C Eu 0.1 at%, 580 °C 2 h 95 2 h 88 5 h 96 5 h 92 24 h 109 24 h 95 Tb 0.5 at%, 630 °C Eu 0.1 at%, 630 °C 2 h 109 2 h 97 5 h 108 5 h 98 24 h 114 24 h 107
I. Koseva et al.: Rare Earth doped silicate glass-ceramics for LED application

176
Fig. 4. (a) Excitation spectrum of Tb3+ doped glass-ceramic sample treated at 630 °C 2 h; (b) Emission spectra of the Tb3+ doped glass-ceramic samples thermal treated at 580 °C 2, 5 and 24 h; (c) Emission spectra of the Tb3+ doped glass-ceramic sam-ples thermal treated at 630 °C 2, 5 and 24 h.
Fig. 5. (a) Excitation spectrum of Eu3+ doped glass-ceramic sample treated at 630 °C 2 h; (b) Emission spectra of the Eu3+ doped glass-ceramic samples thermal treated at 580 °C 2, 5 and 24 h; (c) Emission spectra of the Eu3+ doped glass-ceramic sam-ples thermal treated at 630 °C 2, 5 and 24 h.
The excitation and emission spectra of the glass-ceramic samples are presented on Figures 4 and 5.
The Tb3+ excitation spectrum in the range from 300 to 500 nm shows characteristic transitions of
Tb3+, attributed to the f–f transitions. The strong-est peak is located at 379 nm corresponding to the 7F6 → 5D3 transition. The main emission peak of Tb3+ is 5D4 → 7F5 transition at 545 nm, correspond-
I. Koseva et al.: Rare Earth doped silicate glass-ceramics for LED application

177
ing to the green color. Other transitions are located at 417 (5D3 → 7F5), 440 (5D3 → 7F4), 465 (5D3 → 7F3), 488 (5D4 → 7F6), 586 (5D4 → 7F4) and 621 (5D4 → 7F3) nm.
The Eu3+ excitation spectrum in the range from 300 to 500 nm shows characteristic transitions of Eu3+, attributed also to the f–f transitions. The strongest peak is located at 393 nm corresponding to the 7F0 → 5L6 transition. The main emission peak of Eu3+ is 5D0 → 7F2 transition at 613 nm, corre-sponding to the orange-red color. Other transitions are located at 590 (5D0 → 7F2), 653 (5D0 → 7F3) and 702 (5D0 → 7F4) nm. As the dominant peak in the spectra is due to the 5D0 → 7F2 electric dipole transi-tion, the Eu3+ ion is located at the site without inver-sion symmetry.
Emission and excitation spectra of the glass-ce-ramics show the characteristic peaks of Tb3+ and Eu3+.
Figure 6 and Table 2 present the CIE coordinates of the Tb3+ doped and Eu3+ doped glass-ceramic
samples obtained at different thermal treatment re-gimes. As can be seen, the CIE coordinates of the samples show different emission colors which de-pend on the nature of the active ion and the thermal treatment regime.
CONCLUSION
Terbium doped and europium doped glasses from the system Li2O-Al2O3-SiO2-LiBO2 are prepared with a concentration of the dopants 0.5 at% for Tb3+ and 0.1 mol% for Eu3+. Glass-ceramics are obtained after thermal treatment of the parent glass at two different temperatures and three different durations of treatment. The crystallizing phases, the degree of crystallinity and the particle size are determined. The main crystallizing phase after thermal treatment is LiAlSiO4 in two different crystallographic modi-fications – β-Eucryptite and γ-Eucryptite. The ratio between these two phase modifications depends on the nature of the rare earth ion. After longer thermal treatment γ-Eucryptite transforms almost completely in β-Eucryptite. The quantity of additional crystalline phases is less than 5%. The degree of crystallinity for all samples is about 90%. The particle size varies be-tween 80 and 120 nm according to the thermal treat-ment regime depending slightly on the Rare Earth ion nature.
Emission and excitation spectra of the glass-ceramics show the characteristic peaks of Tb3+ and Eu3+. The main emission peak of Tb3+ is 5D4 → 7F5 transition at 545 nm, corresponding to green color. The Tb3+ excitation spectrum, shows characteristic transitions of Tb3+, attributed to the f–f transitions. The strongest peak is located at 379 nm correspond-ing to the 7F6 → 5D3 transition. The main emission peak of Eu3+ is 5D0 → 7F2 transition at 613 nm, cor-responding to orange-red color. The Eu3+ excitation spectrum shows characteristic transitions of Eu3+, at-tributed to the f–f transitions. The strongest peak is located at 393 nm corresponding to the 7F0 → 5L6 tran-sition. CIE coordinates of the samples show different emission colors, which depend on the active ion and thermal treatment regime. The obtained results show that as-prepared terbium doped glass-ceramics could be used as a blue-green phosphor. Europium doped glass-ceramics could be used as an orange-red phos-phor. Different emission colors could be obtained by using different thermal treatment regimes.
REFERENCES
1. C. C. Lin, R.S. Liu, J. Phys. Chem. Lett., 2, 1268 (2011).
2. M. S. Shur, R. Zukauskas, Proceedings of the IEEE, 93, 1691 (2005).
Fig. 6. CIE coordinates of the Tb3+ doped and Eu3+ doped glass-ceramic samples obtained at different thermal treatment regime.
Table 2. CIE coordinates of the Tb3+ doped and Eu3+ doped glass-ceramic samples obtained at different thermal treatment regime
Sample Particle size[nm] Sample Particle size
[nm]
Tb 0.5 at%, 580 °C Eu 0.1 at%, 580 °C 2 h 95 2 h 88 5 h 96 5 h 92 24 h 109 24 h 95 Tb 0.5 at%, 630 °C Eu 0.1 at%, 630 °C 2 h 109 2 h 97 5 h 108 5 h 98 24 h 114 24 h 107
I. Koseva et al.: Rare Earth doped silicate glass-ceramics for LED application

178
3. D. Wei, Y. Huang, S. Kim, Y. Yu, H. Seo, Mater. Lett., 99, 122 (2013).
4. I. Sabikoglu, M. Ayvacıklı, A. Bergeron, A. Ege, N. Can, J. Lumin., 132, 1597 (2012).
5. Y. P. Naik, M. Mohapatra, N. D. Dahale, T. K. Seshagiri, V. Natarajan, S. V. Godbole, J. Lumin., 129, 1225 (2009).
6. D. S. Jo, Y. Luo, K. Senthil, K. Toda, B. S. Kim, T. Masaki, D. H. Yoon, Opt. Mater., 34, 696 (2012).
7. M. Nayak, T. R. N. Kutty, Mater. Chem. Phys., 57, 138 (1998).
8. G. U. O. Yuzhu, Y. U. Xibin, L. I. U. Jie, Y. Xuyong, J. Rare Earth, 28, 34 (2010).
9. J. Dhoble, B. P. Kore, A. N. Yerpude, R. L. Kohale, P. W. Yawalkar, N. S. Dhoble, Optik, 126, 1527 (2015).
10. A. Kumar, S. J. Dhoble, D. R. Peshwe, J. Bhatt, J. Alloys Compd., 609, 100 (2014).
11. Q. Lu, J. Li, D. Wang, Curr. Appl. Phys., 13, 1506 (2013)
12. K. Li, S. Liang, H. Lian, M. Shang, B. Xing, J. Lin, J. Mat. Chem. C, 4, 3443 (2016).
13. L. Wenzhen, G. Ning, J. Yongchao, Z. Qi, Y. Hongpeng, Opt. Mater., 35, 1013 (2013).
14. Y. Liu, X. Zhang, Z. Hao, Y. Luo, X. Wang, L. Ma, J. Zhang, J. Lumin., 133, 21 (2013).
15. J. Zhou, T. Wang, X. Yu, D. Zhou, J.i Qiu, Mat. Res. Bull., 73, 1 (2016).
16. S. Shionoya, W. M. Yen, H. Yamamoto (eds.), Phosphor handbook, CRC press, 2006.
17. P. Babu, K. H. Jang, C. S. Rao, L. Shi, C. K. Jaya-sankar, V. Lavín, H. J. Seo, Opt. Express, 19, 1836 (2011).
18. R. Krsmanović, S. Bals, G. Bertoni, G. Van Tendeloo, Opt. Mater., 30, 1183 (2008).
19. D. Chen, W. Xiang, X. Liang, J. Zhong, H. Yu, M. Ding, Z. Ji, J. Eur. Ceram. Soc., 35, 859 (2015).
20. R. Krsmanović, S. Bals, G. Bertoni, G. V. Tendeloo, Opt. Mater., 30, 1183 (2008).
21. M. A. N. Xiaoqin, Y. U. Lixin, S. U. N. Jiaju, L. I. Songchu, J. Zhong, J. Rare Earths, 35, 446 (2017).
22. E. Trusova, A. Vaitkevičius, Y. Tratsiak, M. Korjik, P. Mengucci, D. Rinaldi, L. Montalito, V. Marciulionyte, G. Tamulaitis, Opt. Mater., 84, 459 (2018).
23. H. Bouchouicha, G. Panczer, D. de Ligny, Y. Guyot, R. Ternane, Opt. Mater., 85, 41 (2018).
24. N. Dai, H. Luan, Z. Liu, Y. Sheng, J. Peng, Z. Jiang, J. Li, J. Non-Cryst. Solids, 358, 2970 (2012).
25. R. S. Liu (ed.), Phosphors, Up Conversion Nano Particles, Quantum Dots and Their Applications, Vol. 1, Springer, 2016. ISBN: 978-3-662-52769-6 (Print) 978-3-662-52771-9 (Online).
26. I. Koseva, P. Tzvetkov, A. Yordanova, M. Marychev, O. Dimitrov, V. Nikolov, Bulg. Chem. Commun., 49, 366 (2017).
27. V. Correcher, L. Sanchez-Munoz, J. Garcia-Guinea, J. M. Gomez-Ros, A. Delgado, Nuc. Instrum. Meth. A, 562, 456 (2006).
28. H. G. F. Winkler, Acta Cryst., 1, 27 (1948).29. R. Roy, D. M. Roy, E. F. Osborn, J. Am. Ceram.
Soc., 33, 152 (1950).30. H. Schulz, V. Tscherry, Acta Cryst. B, 28, 2174
(1972).31. W. I. Abdel-Fatah, M. S. Fayed, S. R. Gooda, W. F.
F. Mekky, J. Sol–Gel Sci. Techn., 13, 981 (1998).32. J. H. Westbrook, J. Am. Ceram. Soc., 41, 433 (1958).33. P. Norby, Zeolites, 10, 193 (1990).34. B. E. Douglas, S. M. Ho, in: Structure and Chemistry
of Crystalline Solids, Springer, ISBN-10: 0-387-26147-8; ISBN-13: 978-0387-26147-8, 2006, p. 253
35. U. B. Gokhe, K. A. Koparkar, S. K. Omanwar, J. Alloys Compd., 689, 992 (2016).
36. Bruker AXS (2009) EVA 2, DIFFRACplus Evaluation Package.
37. Bruker AXS (2005) TOPAS V3, General profile and structure analysis software for powder diffraction data.
I. Koseva et al.: Rare Earth doped silicate glass-ceramics for LED application

179© 2018 Bulgarian Academy of Sciences, Union of Chemists in Bulgaria
* To whom all correspondence should be sent:
Bulgarian Chemical Communications, Volume 50, Special Issue F (pp. 179–185) 2018
Catalytic oxidation of ethyl acetate by copper modified Ce-Mn and Ce-Ti mesoporous nanostructured oxides
R. N. Ivanova1*, M. D. Dimitrov1, G. S. Issa1, D. G. Kovacheva2, T. S. Tsoncheva1
1 Institute of Organic Chemistry with Centre of Phytochemistry, BAS, Bulgaria 2 Institute of General and Inorganic Chemistry, BAS, Sofia, Bulgaria
Received October 28, 2018; Accepted December 11, 2018
Ceria-based materials continue to be investigated for their structural and chemical reduction behaviour and non-stoichiometry, oxygen storage capacity and metal-ceria interactions. These materials show promising application as catalysts for environmental protection. In the current investigation mesoporous ceria-titania and ceria-manganese binary oxides were used as a host matrix of nanosized copper oxide species. The textural, structural and redox proper-ties of the obtained composites were investigated using Nitrogen physisorption, X-ray diffraction, UV-Vis, Raman spectroscopy as well as temperature-programmed reduction with hydrogen. Their catalytic activity for total oxidation of volatile organic pollutants was studied using ethyl acetate as a probe molecule. The state of the loaded copper spe-cies and the related catalytic behavior depends on the degree of deffectness of the metal oxide support, which could be controlled by using binary oxide systems.
Keywords: mesoporous nanostructured ceria-titania, ceria-manganese oxides, total oxidation of ethyl acetate, copper oxide.
E-mail: [email protected]
INTRODUCTION
Metal oxides represent one of the most impor-tant and widely employed categories of solid cata-lysts, either as active phases or as supports. Metal oxides are utilized both for their acid–base and re-dox properties and constitute the largest family of catalysts in heterogeneous catalysis. Transition and noble group metals are frequently used as catalyst components and their activity has been attributed to the outer electron configuration [1]. Among the metal oxide catalysts, those of transition metals oc-cupy a predominant place owing to their low cost of production, easy regeneration and selective re-activity. They are used in widely different types of organic reactions, such as oxidation, dehydra-tion, dehydrogenation and isomerization [2]. Their catalytic activity may be traced to the presence of partially filled d-shells of the metal ion and to the influence of the oxide ligand field on this partially filled d-shell. Among the transition metal and rare earth mixed oxide catalysts, the MnOx-CeO2 mixed
oxides have been found to be promising catalysts that can be practically used for some oxidation re-actions. For the synergistic mechanism between MnO2 and CeO2, the binary oxides exhibited good catalytic activity for the oxidation of ammonia in supercritical water [3]. Moreover, the MnOx-CeO2 catalysts also showed high activity for complete oxidation of formaldehyde and methane at low tem-perature due to more Mn4+ ions and richer lattice oxygen [4, 5]. Previous investigations have shown that the catalytic activity is strongly influenced by the composition of MnOx-CeO2 mixed oxide cata-lysts [6]. It has been well accepted that the interac-tions between MnOx and CeO2 vary with compo-sition, resulting in the evolution of their textural, structural, and oxidation state [6, 7]. On the other hand, titanium oxide has received much attention in many technological areas. Doping titania with tran-sition metals (Ce, Mn, Zr, Sn, Cu, etc.) can increase its catalytic activity and thermal stability as a result of specific interaction between the various metal oxide particles [8, 9]. It was established that the ac-tivity and selectivity of copper containing catalysts depend to great extent on the dispersion of the CuOx species which could be regulated by the surface and texture properties of the support [10–12]. Besides, it is known that copper–cerium materials could be considered as effective oxidation catalysts, though
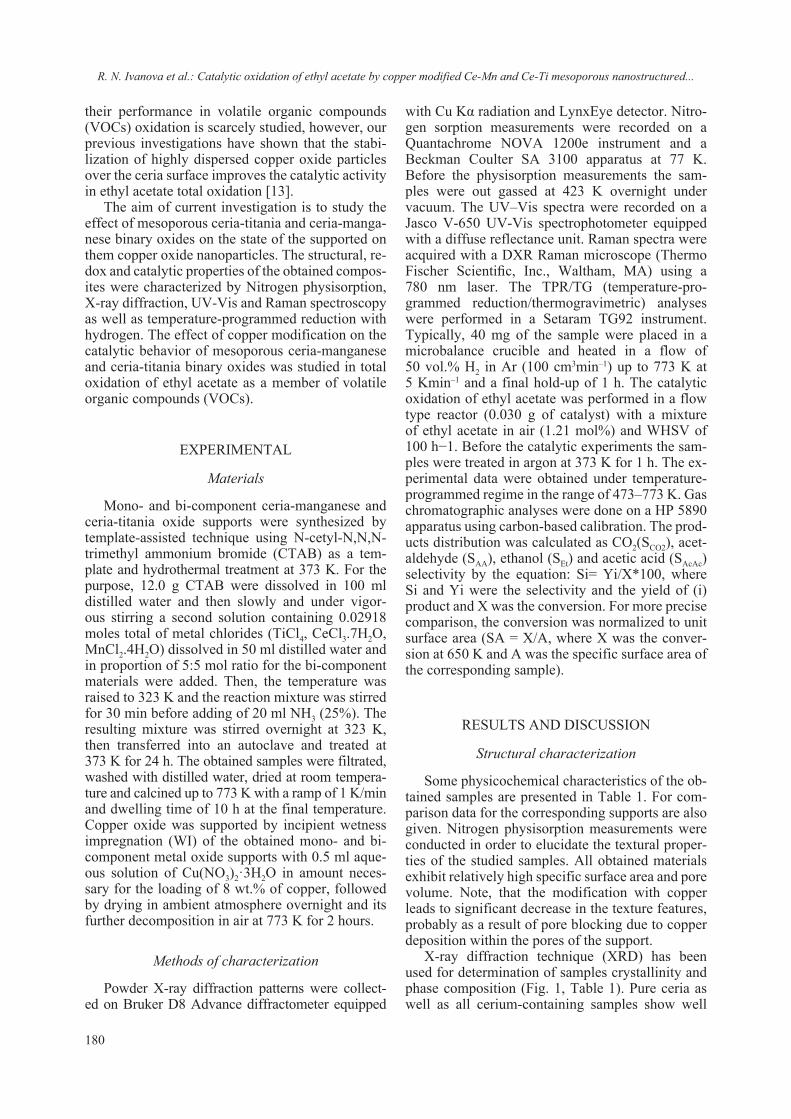
180
their performance in volatile organic compounds (VOCs) oxidation is scarcely studied, however, our previous investigations have shown that the stabi-lization of highly dispersed copper oxide particles over the ceria surface improves the catalytic activity in ethyl acetate total oxidation [13].
The aim of current investigation is to study the effect of mesoporous ceria-titania and ceria-manga-nese binary oxides on the state of the supported on them copper oxide nanoparticles. The structural, re-dox and catalytic properties of the obtained compos-ites were characterized by Nitrogen physisorption, X-ray diffraction, UV-Vis and Raman spectroscopy as well as temperature-programmed reduction with hydrogen. The effect of copper modification on the catalytic behavior of mesoporous ceria-manganese and ceria-titania binary oxides was studied in total oxidation of ethyl acetate as a member of volatile organic compounds (VOCs).
EXPERIMENTAL
Materials
Mono- and bi-component ceria-manganese and ceria-titania oxide supports were synthesized by template-assisted technique using N-cetyl-N,N,N-trimethyl ammonium bromide (CTAB) as a tem-plate and hydrothermal treatment at 373 K. For the purpose, 12.0 g CTAB were dissolved in 100 ml distilled water and then slowly and under vigor-ous stirring a second solution containing 0.02918 moles total of metal chlorides (TiCl4, CeCl3.7H2O, MnCl2.4H2O) dissolved in 50 ml distilled water and in proportion of 5:5 mol ratio for the bi-component materials were added. Then, the temperature was raised to 323 K and the reaction mixture was stirred for 30 min before adding of 20 ml NH3 (25%). The resulting mixture was stirred overnight at 323 K, then transferred into an autoclave and treated at 373 K for 24 h. The obtained samples were filtrated, washed with distilled water, dried at room tempera-ture and calcined up to 773 K with a ramp of 1 K/min and dwelling time of 10 h at the final temperature. Copper oxide was supported by incipient wetness impregnation (WI) of the obtained mono- and bi-component metal oxide supports with 0.5 ml aque-ous solution of Cu(NO3)2·3H2O in amount neces-sary for the loading of 8 wt.% of copper, followed by drying in ambient atmosphere overnight and its further decomposition in air at 773 K for 2 hours.
Methods of characterization
Powder X-ray diffraction patterns were collect-ed on Bruker D8 Advance diffractometer equipped
with Cu Kα radiation and LynxEye detector. Nitro-gen sorption measurements were recorded on a Quantachrome NOVA 1200e instrument and a Beckman Coulter SA 3100 apparatus at 77 K. Before the physisorption measurements the sam-ples were out gassed at 423 K overnight under vacuum. The UV–Vis spectra were recorded on a Jasco V-650 UV-Vis spectrophotometer equipped with a diffuse reflectance unit. Raman spectra were acquired with a DXR Raman microscope (Thermo Fischer Scientific, Inc., Waltham, MA) using a 780 nm laser. The TPR/TG (temperature-pro-grammed reduction/thermogravimetric) analyses were performed in a Setaram TG92 instrument. Typically, 40 mg of the sample were placed in a microbalance crucible and heated in a flow of 50 vol.% H2 in Ar (100 cm3min–1) up to 773 K at 5 Kmin–1 and a final hold-up of 1 h. The catalytic oxidation of ethyl acetate was performed in a flow type reactor (0.030 g of catalyst) with a mixture of ethyl acetate in air (1.21 mol%) and WHSV of 100 h−1. Before the catalytic experiments the sam-ples were treated in argon at 373 K for 1 h. The ex-perimental data were obtained under temperature-programmed regime in the range of 473–773 K. Gas chromatographic analyses were done on a HP 5890 apparatus using carbon-based calibration. The prod-ucts distribution was calculated as CO2(SCO2), acet-aldehyde (SAA), ethanol (SEt) and acetic acid (SAcAc) selectivity by the equation: Si= Yi/X*100, where Si and Yi were the selectivity and the yield of (i) product and X was the conversion. For more precise comparison, the conversion was normalized to unit surface area (SA = X/A, where X was the conver-sion at 650 K and A was the specific surface area of the corresponding sample).
RESULTS AND DISCUSSION
Structural characterization
Some physicochemical characteristics of the ob-tained samples are presented in Table 1. For com-parison data for the corresponding supports are also given. Nitrogen physisorption measurements were conducted in order to elucidate the textural proper-ties of the studied samples. All obtained materials exhibit relatively high specific surface area and pore volume. Note, that the modification with copper leads to significant decrease in the texture features, probably as a result of pore blocking due to copper deposition within the pores of the support.
X-ray diffraction technique (XRD) has been used for determination of samples crystallinity and phase composition (Fig. 1, Table 1). Pure ceria as well as all cerium-containing samples show well
R. N. Ivanova et al.: Catalytic oxidation of ethyl acetate by copper modified Ce-Mn and Ce-Ti mesoporous nanostructured...

181
Table 1. Nitrogen physisorption and XRD data of pure supports and copper modified materials
Sample Space Group Unit cell,Å
Particles size, nm
BET, m2/g
Total Pore Volume,
ml/g
TiO2 Anatase, synTetragonal – Body-centered I41/amd
3.7869.493
17.4 85 0.29
Cu/TiO2 Anatase, synTetragonal – Body-centered I41/amd
Tenorite
3.7869.488
4.6913.4195.13899.594
20.8
36.4
40 0.24
Ce-Ti Cerium oxideCubic – Face center – Fm–3m
5.403 12.0 99 0.45
Cu/CeTi Cerium oxideCubic – Face center – Fm–3m
Tenorite
5.405
4.7163.4315.12699.578
12.5
45.8
69 0.39
MnxOy 24% Mn2O3 (Ia–3) 67% Mn5O8 (C2/m)
9% Mn3O4 (I41/amd)
853366
7.4 0.025
Cu/MnxOy Mn2O3 Bixbyte C (Ia–3) (71-636)
Mn5O8 (C2/m) (72-1427)
CuO (C2/c)
CuMn2O4 (Fd–3m)
9.412
10.3775.7264.871109.39
4.7743.3305.12699.93
8.288
62
24
60
32
5.7 0.02
Ce-Mn 84% CeO2 (Fm–3m)12% Mn5O8 (C2/m)4% Mn2O3 (Ia–3)
5.334 7 65.6 0.47
Cu/CeMn Fm–3m
Mn5O8 C2/m (72-1427)
CuO (C2/c) – traces
5.35
10.315.684.89108.9
4.83.365.399
7
13
6
58.3 0.40
CeO2 Cerium oxideCubic – Face center – Fm–3m
5.413 21.8 46 0.26
Cu/CeO2 Cerium oxideCubic – Face center – Fm–3m
Tenorite
5.413
4.6793.4405.13099.44
22.0
29.3
24 0.20
R. N. Ivanova et al.: Catalytic oxidation of ethyl acetate by copper modified Ce-Mn and Ce-Ti mesoporous nanostructured...

182
Fig. 1. XRD patterns of all studied materials.
defined reflections of cubic fluorite-like structure with variations in particle sizes. It should be noted that the unit cell parameter is smaller for the mixed oxide samples, which could be an indication of par-tial Ti, Mn or Cu introduction within the ceria fluo-rite structure. Anatase phase with average crystallite sizes of about 17 nm is registered for pure TiO2. No significant changes in the lattice parameters for ti-tania occur after the modification with copper. The XRD patterns of copper modified materials contain reflections at 2θ = 35.5°, 38.5° and 48.5°, which are due to the presence of well crystallized tenorite phase (space group C2/c, ICDDPDF2#48-1548). The observed relatively large CuO crystallite size indicates their partial location on the outer surface of the mesoporous oxide support (Fig. 1, Table 1). The absence of any additional reflections of copper oxide phase for Cu/CeMn sample could be due the fine dispersion of the supported phase, but we can-not fully exclude also better mixing of the oxides and the obtaining of a structure with high degree of defectiveness. This is well demonstrated by the changes in the unit cell parameters of the corre-sponding phases (Table 1). For Cu/MnxOy sample, presence of CuMn2O4 phase is registered as well, which suggests strong interaction between the cop-per species and the support.
Spectral measurements
Raman spectroscopy was applied for better un-derstanding the microstructure of the obtained ma-terials (Fig. 2a). The Raman shifts in the spectrum of Cu/TiO2 confirm the XRD analyses for the pres-ence of pure anatase phase (peaks at about 143 cm−1
(E1g), 195 cm−1 (E2g), 396 cm−1 (B1g), 514 cm−1
(A1g) and 637 cm−1 (E3g)). The additional bands at about 297, 344, 629 cm−1 correspond to well crys-talline CuO phase [14]. The spectrum of Cu/CeO2 show the main Raman shift at 463 cm−1 (E2g) typical of CeO2. The appearance of additional band at 600 cm−1 indicates presence of oxygen vacancies in the ceria lattice probably originated with the in-teraction between CeO2 and CuO. Such interaction between the copper species and MnxOy support is considered on the base of the observed weak and less intensive CuO bands for the Cu/MnxOy sample, which is consistent with the XRD results. Significant variations in the dispersion of the loaded copper particles occur when binary oxides were used as a support (Fig. 2a). For the Cu/Ce-Ti sample, well re-solved Raman shifts, typical of relatively large CuO crystallites, are observed which is in consistence with the XRD data. Just the opposite, the observed very low intensive Raman shifts in the spectrum of Cu/Ce-Mn indicate improved dispersion for all metal oxides in the composite, which could be due to the existence of strong interaction between them.
UV–Vis analyses were performed in order to get information about the absorption properties of the obtained materials (Fig. 2b). The strong absorption feature in the UV-Vis spectrum of titania modifica-tion above 350 nm is due to d-d electronic transition between Ti4+-ion and O2- ligand in pure anatase [15], which is consistent with the XRD data. The spec-trum of ceria modification displays absorption in the 300–500 nm range corresponding to Ce4+←O2– charge transfer, which is typical of ceria phase [16]. Formation of oxygen vacancies and high amount of Ce3+ could also be suggested. The spectrum of manganese oxide modification represents absorp-tion feature, which is due to variations in manga-nese oxidation state (Mn2+, Mn3+, and Mn4+) [17]. The observed continuous absorption in the 400– 800 nm region for this sample reveals changes in the environment of Mn and Cu ions, which is con-sistent with the assumption of the XRD data (Fig. 1, Table 1) for the formation of CuMn2O4 mixed oxide phase. The absorption in the range of 240–320 nm and 600–800 nm regions for all copper modifica-tion is related to O2−→Cu2+ CT and d–d transitions, respectively, of crystalline CuO [18]. They are most pronounced for the CeO2-TiO2 binary modification and practically absent in the spectrum of MnxOy-CeO2 based composite. This confirms the XRD
R. N. Ivanova et al.: Catalytic oxidation of ethyl acetate by copper modified Ce-Mn and Ce-Ti mesoporous nanostructured...
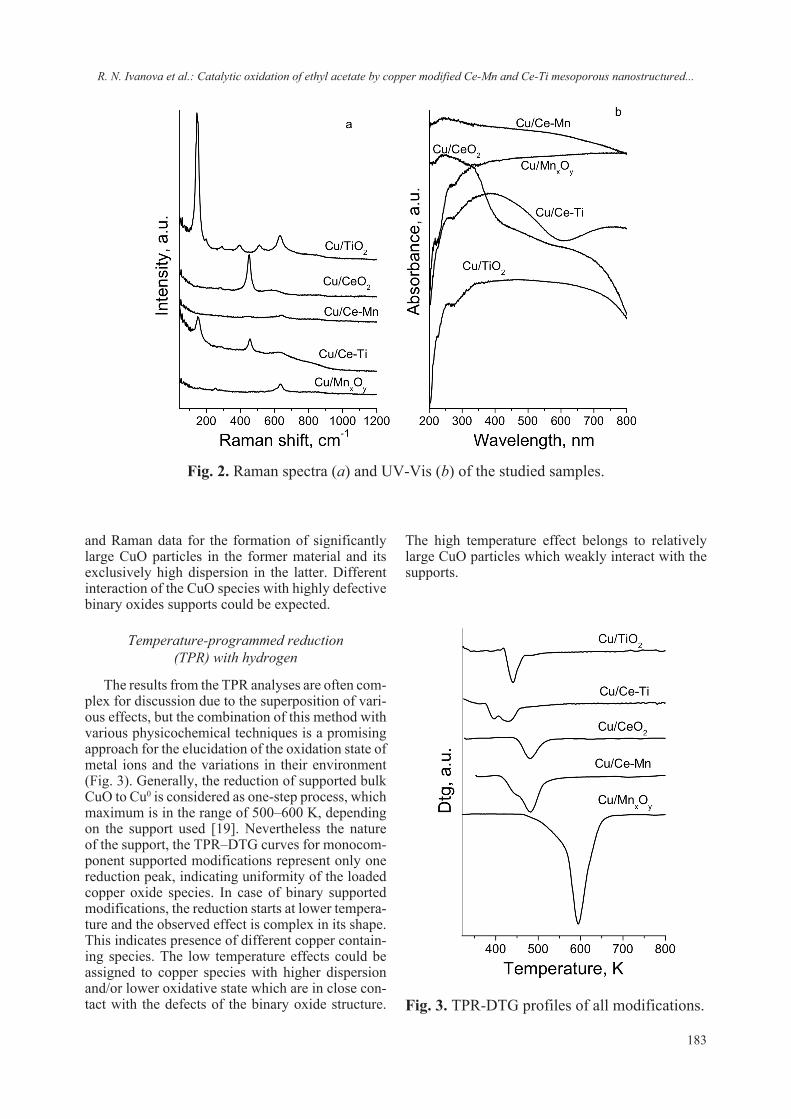
183
Fig. 2. Raman spectra (a) and UV-Vis (b) of the studied samples.
and Raman data for the formation of significantly large CuO particles in the former material and its exclusively high dispersion in the latter. Different interaction of the CuO species with highly defective binary oxides supports could be expected.
Temperature-programmed reduction (TPR) with hydrogen
The results from the TPR analyses are often com-plex for discussion due to the superposition of vari-ous effects, but the combination of this method with various physicochemical techniques is a promising approach for the elucidation of the oxidation state of metal ions and the variations in their environment (Fig. 3). Generally, the reduction of supported bulk CuO to Cu0 is considered as one-step process, which maximum is in the range of 500–600 K, depending on the support used [19]. Nevertheless the nature of the support, the TPR–DTG curves for monocom-ponent supported modifications represent only one reduction peak, indicating uniformity of the loaded copper oxide species. In case of binary supported modifications, the reduction starts at lower tempera-ture and the observed effect is complex in its shape. This indicates presence of different copper contain-ing species. The low temperature effects could be assigned to copper species with higher dispersion and/or lower oxidative state which are in close con-tact with the defects of the binary oxide structure. Fig. 3. TPR-DTG profiles of all modifications.
The high temperature effect belongs to relatively large CuO particles which weakly interact with the supports.
R. N. Ivanova et al.: Catalytic oxidation of ethyl acetate by copper modified Ce-Mn and Ce-Ti mesoporous nanostructured...
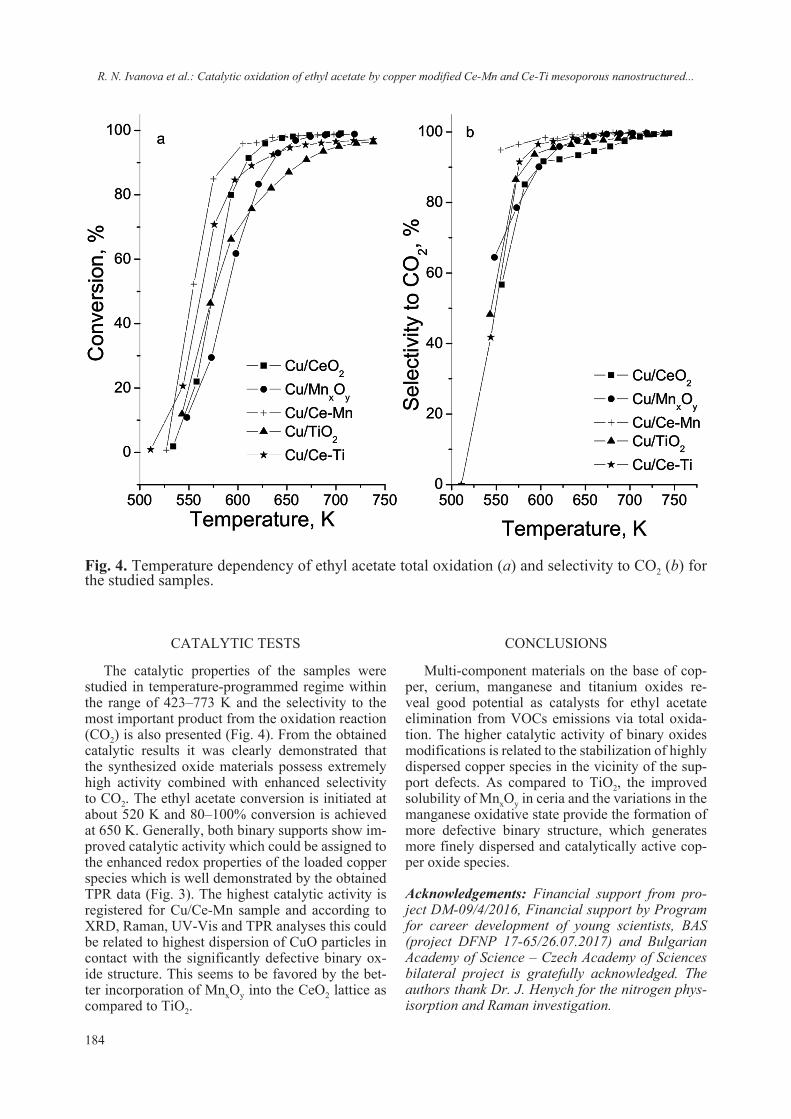
184
CATALYTIC TESTS
The catalytic properties of the samples were studied in temperature-programmed regime within the range of 423–773 K and the selectivity to the most important product from the oxidation reaction (CO2) is also presented (Fig. 4). From the obtained catalytic results it was clearly demonstrated that the synthesized oxide materials possess extremely high activity combined with enhanced selectivity to CO2. The ethyl acetate conversion is initiated at about 520 K and 80–100% conversion is achieved at 650 K. Generally, both binary supports show im-proved catalytic activity which could be assigned to the enhanced redox properties of the loaded copper species which is well demonstrated by the obtained TPR data (Fig. 3). The highest catalytic activity is registered for Cu/Ce-Mn sample and according to XRD, Raman, UV-Vis and TPR analyses this could be related to highest dispersion of CuO particles in contact with the significantly defective binary ox-ide structure. This seems to be favored by the bet-ter incorporation of MnxOy into the CeO2 lattice as compared to TiO2.
CONCLUSIONS
Multi-component materials on the base of cop-per, cerium, manganese and titanium oxides re-veal good potential as catalysts for ethyl acetate elimination from VOCs emissions via total oxida-tion. The higher catalytic activity of binary oxides modifications is related to the stabilization of highly dispersed copper species in the vicinity of the sup-port defects. As compared to TiO2, the improved solubility of MnxOy in ceria and the variations in the manganese oxidative state provide the formation of more defective binary structure, which generates more finely dispersed and catalytically active cop-per oxide species.
Acknowledgements: Financial support from pro-ject DM-09/4/2016, Financial support by Program for career development of young scientists, BAS (project DFNP 17-65/26.07.2017) and Bulgarian Academy of Science – Czech Academy of Sciences bilateral project is gratefully acknowledged. The authors thank Dr. J. Henych for the nitrogen phys-isorption and Raman investigation.
Fig. 4. Temperature dependency of ethyl acetate total oxidation (a) and selectivity to CO2 (b) for the studied samples.
R. N. Ivanova et al.: Catalytic oxidation of ethyl acetate by copper modified Ce-Mn and Ce-Ti mesoporous nanostructured...

185
REFERENCES
1. H. Kung, Stud. Surf. Sci. Catal., 45, 1 (1989).2. Manoj B. Gawande, Rajesh K. Pandey, Radha V.
Jayaram, Catal. Sci. Technol., 2, 1113 (2012).3. Z. Ding, L. Li, D. Wade, E. Gloyna, Ind. Eng. Chem.
Res., 37, 1707 (1998).4. X. Tang, Y. Li, X. Huang, Y. Xu, H. Zhu, J. Wang,
W. Shen, Appl. Catal. B: Environ., 62, 265 (2006).5. L. Shi, W. Chu, F. Qu, S. Luo, Catal. Lett., 113, 59
(2007).6. R. Ivanova, T. Tsoncheva, Bulg. Chem. Commun.,
49, 176 (2017).7. S. Limin, C. Wei, Q. Fenfen, H. Jinyan, L. Minmin,
J. Rare Earths, 26, 836 (2008).8. M. Gawande, R. Pandey, R. Jayaram, Catal. Sci.
Technol., 2, 1113 (2012).9. X. Yao, Q. Yu, Z. Ji, Yuanyuan Lv, Y. Cao, C.Tang,
F. Gao, L. Donga, Y. Chen, Appl. Catal. B: Environ., 130–131, 293 (2013).
10. X. Chen, S. Carabineiro, S. Bastosa, P. Tavares, J. Órfão, M. Pereira, J. Figueiredo, Appl. Catal. A: Gen., 472, 101 (2014).
11. J. Liu, X. Li, Q. Zhao, D. Zhang, P. Ndokoy, J. Mol.
Catal. A: Chem., 378, 115 (2013).12. X. Yaoa, L. Zhanga, L. Li, L. Liua, Y. Caoa, X.
Dong, F. Gao, Y. Deng, C. Tang, Z. Chen, L. Donga, Y. Chena, Appl. Catal. B: Environ., 150–151, 315 (2014).
13. T. Tsoncheva, G. Issa, T.Blasco, M. Dimitrov, M. Popova, S. Hernández, D. Kovacheva, G. Atanasova, J.M. López Nieto, Appl. Catal. A: General, 453, 1 (2013).
14. H. Hagemann, H. Bill, W. Sadowski, E. Walker, M. Francois, Solid State Commun., 73, 447 (1990).
15. M. Dimitrov, R. Ivanova, N. Velinov, J. Henych, M. Slušná, V. Štengl, I. Mitov, T. Tsoncheva, J. Tolasz, Nano-Struct. & Nano-Objects., 7, 56 (2016).
16. A. Kambolis, H. Matralis, A. Trovarelli, Ch. Papadopoulou, Appl. Catal., A: Gen., 377, 16 (2010).
17. Y. Lin, S. Ming, Y. Jian, Y. Qian, H. Zhifeng, L. Chaosheng, Chin. J. Catal., 29, 1127 (2008).
18. T. Tsoncheva, D. Kovacheva, J. Henych, V. Štengl, R. Ivanova, Reac. Kinet. Mech. Cat., 116, 397 (2015).
19. P. Ratnasamy, D. Srinivas, C. Satyanarayana, P. Manikandan, R. Senthil Kumaran, M. Sachin, V. Shetti, J. Catal., 221, 455 (2004).
R. N. Ivanova et al.: Catalytic oxidation of ethyl acetate by copper modified Ce-Mn and Ce-Ti mesoporous nanostructured...
186 © 2018 Bulgarian Academy of Sciences, Union of Chemists in Bulgaria
* To whom all correspondence should be sent:
Bulgarian Chemical Communications, Volume 50, Special Issue F (pp. 186–191) 2018
Spectroscopic and XRD analysis of sulphuric acid treated biodegradable waste
E. Serafimova1, V. Petkova2,3*, B. Kostova2
1 University of Chemical Technology and Metallurgy – Sofia, 8 St. Kliment Ohridksi Bul., 1756 Sofia, Bulgaria
2 New Bulgarian University, Department of Natural Sciences, 21 Montevideo Str., 1618 Sofia, Bulgaria 3 Institute of Mineralogy and Crystallography, Bulgarian Academy of Sciences,
Acad. G. Bonchev Str., Bldg. 107, 1113 Sofia, Bulgaria
Received October 28, 2018; Accepted December 10, 2018
The number of realized projects in Bulgaria for recovery of poultry wastes as secondary raw material energy re-source is limited. However, the problem with recovery of poultry wastes has also no sustainable solution worldwide.
In this paper we investigate the possibility of recovery two types of solid wastes – chicken litter from poultry farm and wood ash from cellulose factory. For the purpose we prepared mixtures of mentioned above wastes and sulfuric acid. The obtained samples were investigated by elemental analysis, powder X-Ray diffraction and Fourier trans-formed infrared spectroscopy.
It was found that the raw materials have a structure and composition, classifying them as suitable components to obtain soil improvers, due to their content of essential micro-nutrients without excessive of heavy and toxic elements.
Keywords: biodegradable waste, soil improvers, IR, XRD.
E-mail: [email protected]
INTRODUCTION
It is known that the production of 2000 eggs or the yield of 100 kg of meat is realized the 450– 500 kg poultry excrements [1, 2]. In Bulgaria there exist more than 200 poultry farms, growing between 15 and 22 million birds producing daily between 4000–6000 t excrement (chicken litter) and yearly – 500 000 t excrement respectively. The large live-stock farms generate a massive soil contamination with excrement residues – nitrates [3, 4]. These en-vironmental damages can be avoided by applying the right techniques and technologies of excrements recovery.
Recently, two chicken litter recovery technolo-gies have been developed through the production of: (i) poultry fertilizers and (ii) biocrackers.
The production of bird fertilizers is suitable tech-nology for removing heavy metals from the soils. The numerous investigations [5–8] proved that suit-able combination of inorganic and organic fertiliz-
ers as well as of cultivated vegetation can restore soils contaminated with heavy metals and prevent human health risks by reducing the intake of heavy metals in edible plants [9, 10]. The bird’s fertilizers reduce the metal solubility, phytotoxicity and ions exchange. On the other hand, the ash biomass re-duces heavy metal concentrations and their ability to penetrate into groundwater. The investigations of biochar are mainly related to energy production, not to soil improvers and fertilizers. In the litera-ture, there is insufficient information on the nutrient properties of biochar. As the biochar is produced by biomass, it is expected to have high carbon content as well as range of macro and micro nutrients for the plants.
In this paper we proposed a new solution for chicken litter application, recovering and additional biomass waste – wood ash to obtain the soil improv-ers. The selected raw materials and obtained new waste mixtures were examined by elemental anal-ysis, powder X-Ray diffraction and Fourier trans-formed infrared spectroscopy. It was found that the raw materials have a structure and composition, classifying them as suitable components to obtain soil improvers, due to their content of essential mi-cro-nutrients without excessive of heavy and toxic elements.

187
EXPERIMENTAL
Materials
The used raw materials for mixture preparation are: chicken litter (CL), wood ash (WA) and H2SO4 (SA). The CL originates in Bulgaria, Kustendil town, “Valentin Georgiev Valdis” company. Approxi-mately 10 kg CL of 28 sampling points were taken. For representativeness of the sample is taken into account the ratio quantity of CL – occupied area of the birds. The WA is a wood burning waste, gen-erated in “Svilosa AD” company, Svishtov town, Bulgaria, where the organized burning of wood generates WA of approximately 10,000 t per year [11]. A quantity of 12 kg WA was taken from 34 sampling points located in the “Svilosa AD” land-fill. The representatively of the samples has been achieved by collecting material equal in volume and depth from each sampling point. The used sulfuric acid (Merck ) was with a mass’ percentage (%) con-centration in the interval from 10–50%.
The addition of sulfuric acid is a suitable method for elimination of pathogens, molds an fungi in CL [12–13]. The prepared four mixtures of CL + WA + SA (samples S1, S2, S3 and S4) and one mixture of CL + WA (sample S5 – used as control mixture) were dried for 4 h at 60°C. The component mass ratio of the mixtures is shown in Table 1.
Methods
The mixtures were prepared according to EN 14899 “Characterization of waste sampling of waste materials Framework for the preparation and application of a Sampling Plan” and EN 15002 “Characterization of waste. Preparation of test por-tions from the laboratory sample” as well.
The chemical composition of the raw materi-als (CL and WA) was determined by Inductively Coupled Plasma Optical Emission Spectrometry (ICP-OES) (Teledyne Leeman Labs, USA) with dual monitor plasma, “L-PAD” detector (high reso-lution of 0.007 nm and continuous spectral range from 165 to 1100 nm) and RF generator (power up
to 2 kW at 40.68 MHz). high resolution (0.007 nm), continuous spectral range (from 165 to 1100 nm).
The spectrometer calibrations were made by standard solutions in three concentrations intervals: (i) 0.000–10.000 mg/L; (ii) 0.000–1.000 mg/L; (iii) 0.000–0.100 mg/L. For the zero concentration (0.000 mg/L), the double distillated water was used. As the first concentration interval is very broad, it was necessary to use more than three standard solutions, namely: 1.000, 2.000, 5.000, 8.000 and 10.000 mg/l. The measurements of components with higher concentrations were made after appro-priate dissolution, where the obtained results are presented multiplied by dilution factor. At the sec-ond and third intervals, three standard solutions are sufficient for calibration: 0.100, 0.500, 1.000 mg/L and 0.010; 0.050; 0.100 mg/L respectively.
Powder X-ray diffraction (XRD) patterns were collected at room temperature in a step-scan re-gime (a step of 0.05, 2-theta in the range of 5 to 75° 2-theta) on a D2 Phaser – Bruker AXS diffractom-eter. The experiments were performed in Bragg–Brentano geometry with Ni-filtered Kα radiation (λ = 0.15418 nm) at accelerating voltage of 10 kV and a current of 30 mA.
The measurements of the infrared spectra were performed on a FT-IR Spectrometer Varian 660-IR, Austria, 2009, covering the range of 400– 4000 cm–1. The samples have been prepared as pel-lets consisting of low-dispersed KBr and powder of prepared mixture. The transmittance spectra were collected using MCT detector with 64 scans and 1 cm–1 resolution.
RESULTS AND DISCUSSION
Elemental analysis
The most variable component of CL is the con-centrations of nutrients resulting from the processes of aerobic fermentation [14]. These factors affect the chemical composition and properties of the CL, and to the physical qualities [15]. More than 1/3 of the dry matter is determined by the content of
Table 1. Mass ratio of chicken litter, wood ash and sulphuric acid in the mixture samples
No Mixture sample
Chickenlitter(CL)
Wood ash(WA)
Sulphuricacid(SA)
1. S5 1.00 1.00 -2. S1 1.00 0.10 0.103. S2 1.00 0.50 0.254. S3 1.00 0.75 0.755. S4 1.00 1.00 0.50
E. Serafimova et al.: Spectroscopic and XRD analysis of sulphuric acid treated biodegradable waste

188
microorganisms and germs included in the active biological transformations [16]. Therefore it is very important to make a elemental analysis of essential nutrients to be defined the possibility of subsequent treatment and application [17, 18]. For the purposes we made chemical analysis of micro- and macro-nutrients and verification for the presence of heavy metals of the raw materials (CL and WA) as well as of the control sample S5.
Table 2 presents the obtained results from the elemental analysis of CL and WA, recalculated as oxides of the relevant elements. The measurements show that the raw materials are suitable for use only as soil improvers, because of the insufficient quantity of the elements. For example, to be classified some material as fertilizer the minimum quantity of P2O5
tot must be 16%, MgO – 15%, K2O – 29%, etc. [18], which values significantly exceed those in investi-gated samples (Table 2). The heavy metals (Cu and Zn) do not exceed the permitted values in EU [19].
Powder X-ray diffraction
Figure 1 shows the XRD patterns of the mix-tures. It is seen that the samples have such low intensity of crystallinity. The sample S2 has the
highest degree of crystallinity, where S1 – the lowest one. The phase analysis of S1, S2, S3 and S4 (Table 3) shows relict phases, preserved from the raw materials: quartz (SiO2) (JCPDS [20] 46-1045: d, Å = 3.34, 4.28), CaSO4.2H2O (JCPDS 33-0311: d, Å = 7.63, 4.28, 3.06), and calcite CaCO3, (JCPDS 24-0027: d, Å = 3.03, 3.35, 1.87) in all investigated samples as well as new-formed phas-es as a result of the reaction of CL and WA with SA [21, 22]. The identified new-formed phases are CaSO4.0.5H2O (JCPDS 41-0224: d, Å = 3.00, 2.80, 6.01), K2SO4 (JCPDS 24-0703: d, Å = 2.90, 2.99, 2.88), CaHPO4.2H2O (JCPDS 72-0713: d, Å = 7.59, 4.23, 3.04), Ca(H2PO4)2 (JCPDS 70-1380: d, Å = 3.49, 3.57, 3.63), (NH4)2SO4 (JCPDS 44-1413: d, Å = 4.33, 4.39, 2.65), KCl (JCPDS 26-0921: d, Å = 3.15, 2.23, 1.82) and NaCl (JCPDS 26-0920: d, Å = 3.02, 2.23, 1.82) in S1 and S4 iden-tified in the all SA-treated samples. The formation of CaSO4.0.5H2O and K2SO4 is a result from the re-action of organic sulphur with part of CaO and K2O, contained in WA, under the impact of acidic reac-tion medium produced by the mineral acid – H2SO4. The most important from the new-formed phases are CaHPO4.2H2O and Ca(H2PO4)2 (water-soluble salts of Ca and P) [23, 24]. Both are analogues of
Table 2. Chemical analysis of raw materials (CL and WA)
Sample P2O5tot/
%K2O/
%Na2O/
%CaO/
%MgO/
%Cu/%
Fe/%
Zn/%
B/%
SO3/%
CL 3.70±0.06
2.16±0.12
0.31±0.02
10.47±0.72
0.60±0.07 <0.006* 0.12
±0.07 <0.03* <0.010* 0.17±0.01
WA <0.02* 0.48±0.02
0.40±0.02
3.35±0.17
0.50±0.07 <0.006* 3.20
±0.17 <0.03* <0.010* 0.17±0.01
* The measured concentration is below limit of detection.
Table 3. Identified inorganic phases with powder XRD analysis
№ Sample Identified phases
1 S5 SiO2, CaCO3, CaSO4.2H2O, Ca3(PO4)2
2 S1 SiO2, CaCO3, CaSO4.2H2O, new: CaSO4.0.5H2O, K2SO4, Ca(H2PO4)2, NaCl, (NH4)2SO4
3 S2 SiO2, CaCO3, CaSO4.2H2O, new: CaSO4.0.5H2O, K2SO4, KNO3, KCl, Ca(H2PO4)2, Ca(NO3)2, Ca(OH)2, Mg(OH)2, (NH4)2SO4
4 S3 SiO2, CaCO3, CaSO4.2H2O, new: CaSO4.0.5H2O, K2SO4, KNO3, KCl, Ca(H2PO4)2, K2SO4, Ca(OH)2, Mg(OH)2, (NH4)2SO4
5 S4 SiO2, CaCO3, CaSO4.2H2O, new: CaSO4.0.5H2O, Ca(H2PO4)2, K2SO4, KNO3, (NH4)2SO4
6 CL SiO2, CaCO3, CaSO4.2H2O [25]7 WA SiO2, Ca3(PO4)2 [25]
E. Serafimova et al.: Spectroscopic and XRD analysis of sulphuric acid treated biodegradable waste

189
Fig. 1. XRD patterns for mixtures S1–S5.
fertilizer components, because they contained the important for plants Ca, P and H2O. Also, the for-mation of gypsum is important as well, as it can be used as improver of acidic soils [21, 22]. Another two new-formed phases: Ca(OH)2 (JCPDS 44-181: d, Å = 2.62, 4.90, 1.92 and Mg(OH)2 (JCPDS 44-1482: d, Å = 2.36, 1.79, 4.75) are identified in S2 and S3. Having the highest degree of crystallinity and containing the all identified new-formed phas-es, the sample S1 shows the most appropriate char-acteristics for a soil improver.
The organic component and amorphous inorgan-ic salts in the samples was characterized by FT-IR spectroscopy measurements.
Fourier Transformed Infrared Spectroscopy
Figure 2 shows the results from FT-IR measure-ments of raw CL, WA and selected samples.
The obtained results correspond to a wide va-riety of functional groups, characterized inorganic and organic components in the investigated samples – methyl and methylene groups, carbonyl, chlo-rides and sulfonyl chloride, amino groups, hydroxyl groups and carboxyl groups. The presence of inor-ganic components is considered by bands that can be assigned to the functional groups: carbonate, sulphate and ammonium groups. These bands are situated in several intervals: 1420–1430 cm–1 and 860–780 cm–1 (for carbonates), 1140–1040 cm–1, 615–595 cm-1 (for SO4) and a wide band ~ 3140–3040 cm–1 which is overlapped with antisymmetric and symmetric stretching vibrations of methyl and methylene groups and also 1397–1398 cm–1 (for NH4
+). The sulphate and carbonate ions are evidence of
mineralization process [25, 26]. The presence of the carbonate ion can be explained by the process of mineralization, as well as by inorganic impurities in the raw materials. At the measured spectra are seen and the absorption bands, characteristic for incor-poration of P and Si in oxygen compounds [18, 25].
The biggest variety of functional groups of dif-ferent organic compounds is detected for CL due to incomplete aerobic fermentation processes. In CL-samples the bands of inorganic compounds – sulphates and carbonates have been detected. At WA-sample, the bands of organic components missing and the bands of functional groups of inor-ganic compounds are identified (mainly quartz and tri-calcium phosphate) only, whose presence is a result from the wood burning. In the spectra of mix-tures S1, S3 and S4 was observed the conversion of the methylene groups – “fresh” biomass markers (2923–2929 cm–1) into products of initial minerali-zation (Fig. 2).
E. Serafimova et al.: Spectroscopic and XRD analysis of sulphuric acid treated biodegradable waste

190
Fig. 2. IR spectrum of mixtures S1, S4, control sample S5 and the raw materials (CL and WA).
– The absorption bands in 3413–3424 cm–1 range are typical for antisymmetric and symmetric stretch-ing vibrations of water molecules. In the spectrum appears a new absorption band at 3540–3550 cm–1 [27, 28].
– In the samples CL, S5, S1–S4 there exist fresh – unchanged and non-mineralized part because of: (i) presence of the methylene groups with absorp-tion bands at 2923–2850 cm–1 and (ii) presence of C-N groups in primary aromatic amines, detected by oscillation absorption band at 1322 cm–1 [27].
– In the samples S1, S3 and S4 start mineraliza-tion process, proven by: i) appearance of aliphatic methylene groups bands in the range of 2834– 2855 cm–1; ii) disappearance of the band at 1320–1322 cm–1, and iii) appearance of new bands in the range of 1640–1740 cm–1 (observed in the all mix-ture samples treated with SA). The mineralization process is marked by the transformation of some of the initial organic compounds to new one and the appearance of the functional groups of the inorganic compounds as a result from impact of SA [11–25]. The evidence for the transformation of the meth-ylene groups are the absorption bands of sulpho-carbonyl and carbonyl groups to aldehydes, ketones and carboxylic acids and esters.
The FT-IR measurements show that samples S1 are more suitable for soil improver because of es-tablished process of mineralization.
The obtaining of required components is possi-ble due to chemical composition of the raw materi-als and occurs by the following main reactions:
K2O + H2SO4 → K2SO4 + H2O (1)
CaCO3 + H2SO4 → CaSO4 + H2CO3 (2)
Ca3(PO4)2 + 2H2SO4 → Ca(H2PO4)2 + 2CaSO4 (3)
Ca3(PO4)2 + H2SO4 → 2CaHPO4 + CaSO4 (4)
2R-NH2 + 3H2SO4 → 2R-HSO4 + (NH4)2SO4 (5)
CONCLUSIONS
It was found that the selected raw materials have a structure and composition, which defines them as carriers of essential micro-nutrients for the plants, without excessive content of heavy metals. These findings allow these materials to be classified as suitable for obtaining soil improvers.
The experimental results show that the investi-gation of the prepared mixture samples with XRD and FT-IR are required to determine the phase com-position of inorganic and organic components.
The impact of SA results in acceleration of min-eralization process at mixture samples, elimination
Taking into account the origin of the samples, and the distribution of the absorption bands in the spectra we can made the following findings from FT-IR analysis:
E. Serafimova et al.: Spectroscopic and XRD analysis of sulphuric acid treated biodegradable waste

191
of the pathogenic microorganisms in raw materials as well as participation in the synthesis reactions of inorganic compounds.
Acknowledgments: Authors gratefully acknowl-edge the financial support of the Department of Natural Sciences and Chemical Laboratory – FBO of New Bulgarian University.
REFERENCES
1. P. Abelha, I. Gulyurtlu, D. Boavida, J. Seabra Barros, I. Cabrita, J. Leahy, B. Kelleher, M. Leahy, Fuel, 82, 687 (2003).
2. R. Abu-Zahra, A. B. Tahboub, World Appl. Sci. J., 5 (3), 383 (2008).
3. N. Koukouzas, J. Hamalainen, D. Papanikolaou, A. Tourunen, T. Jantti, Fuel, 86, 2186 (2007).
4. V. Petkova, E. Serafimova, B. Kostova, J. Therm. Anal. Cal., 126 (1), 149 (2016).
5. G. C. Chen, Z. L. He, J. Trace Elem. Med. Biol., 20, 127 (2006).
6. B. Wang, Z. Xie, J. Chen, J. Environ. Sci., 20, 1109 (2008).
7. L. Beesley, O. Inneh, Environ. Pollut., 186, 195 (2014).
8. S. Kabas, A. Faz, J. Acosta, J. Geochem. Explor., 123, 69 (2012).
9. A. Singh, M. Agrawal, Ecol. Eng., 36, 1733 (2010).10. J. M. Novak, W. J. Busscher, D. L. Laird, M.
Ahmedna, D. W. Watts, M. A. S. Niandou, Soil Sci., 174, 105 (2009).
11. F. Carlile, World’s Poult. Sci. Jpn., 40, 99 (1984).12. R. Cenni, B. Janisch, H. Spliethoff, Waste Manage.,
21, 17 (2001).13. S. Beis, S. Kim, R. Tarrant, N. Mante, Waste
Manage., 30, 298 (2010).14. Z. Dou, J. Toth, D. Galligan, C. Ramberg, J. Environ.
Qual., 29, 508 (2000).
15. S. Hunger, J. Sims, D. L. Sparks, J. Environ. Qual., 34, 382 (2005).
16. M. Pautler, J. Sims, Soil Sci. Soc. Am. J., 64, 765 (2000).
17. J. Robinson, A. Sharpley, Soil Sci. Soc. Am. J., 60, 1583 (1996).
18. C. Sonneveld, W. Voogt. Plant Nutrition of Greenhouse Crops, Springer, Nederland, 2009.
19. Establishing the ecological criteria for the award of the EU Ecolabel for growing media, soil improv-ers and mulch. Official Journal of the European Union, L 303/75. COMMISSION DECISION (EU) 2015/2099 of 18 November 2015 (notified under document C(2015) 7891)].
20. ICDD – Powder Diffraction File, Set 1–51. Swarthmore: ICPDS – International Center for Diffraction Data (2001).
21. T. H. Dao, H. Zhang, Annals Environ. Sci., 1, 69 (2007).
22. N. Koukouzas, J. Hamalainen, D. Papanikolaou, Fuel, 86, 2186 (2007).
23. J. B. Lambert, H. F. Shurvell, R. G. Cooks, In-troduction to Organic Spectroscopy, 1st edition (May 1987), ISBN-13:978-0023673009 ISBN-10:0023673001, Macmillan, New York, 1987.
24. B. Smith, Infrared Spectral Interpretation, CRC Press, Boca Raton, London, New York, Washington DC, 1999.
25. V. Petkova, Ek. Serafimova, T. Kaljuvee, Y. Pe-lovsky, J. Therm. Anal. Calorim., 113 (2), 683 (2013).
26. M. Amon, M. Dobeic, R. Sneath, V. Phillips, T. Missel brook, B. Pain, Bioresour. Technol., 61, 229 (1997).
27. J. Coates, in: Encyclopedia of Analytical Chemistry, R. A. Meyers (ed.), John Wiley & Sons Ltd, Chi-chester, 2000, p. 10815.
28. K. Nakamoto, Infrared and Raman spectra of inor-ganic and coordination compounds. Part A: theory and applications in inorganic chemistry, 6th edition, Wiley, New York, 2009.
E. Serafimova et al.: Spectroscopic and XRD analysis of sulphuric acid treated biodegradable waste

192 © 2018 Bulgarian Academy of Sciences, Union of Chemists in Bulgaria
* To whom all correspondence should be sent:
Bulgarian Chemical Communications, Volume 50, Special Issue F (pp. 192–197) 2018
Sol-gel silica hybrid materials – characterisation and long-term stability
E. Todorova, G. Chernev*
Department of Silicate Technology, University of Chemical Technology and Metallurgy, 8 Kl. Ohrydski blvd. 1756 Sofia, Bulgaria
Received October 31, 2018; Accepted December 12, 2018
Main goal of the present work was the synthesis of reactive silica hybrid materials and the investigation of their water stability for a long period of time. For the improvement of silica reactivity, which is the base structural compo-nent of these hybrids different types of natural and synthetic organic materials were used – chitosan (CS), 2-hydroxy-ethyl methacrylate (HEMA), methyl methacrylate (MMA) and methacrylic acid (MA). The structural characteristics of the obtained silica hybrids are investigated via XRD and SEM analysis. The XRD data reveals successfully forma-tion of amorphous silica hybrid material. The SEM micrographs show the specific chemical properties of the chosen organic components, play important role on the final hybrid morphology .EDX analysis is used for establishment of the hybrid materials chemical/elemental composition.. In order to investigate their long-term stability, the synthesised sol-gel silica hybrids are immersed in a water solution for 48 and 168h. Their weight changes were evaluated. The experimental results of the immersed samples presented high stability for a long period for the specimens from the following compositions-silica/MMA and silica/CS/MMA. The opposite behaviour (low stability) was shown from the silica hybrids with participation of HEMA and combination of CS and HEMA.
Keywords: sol-gel, silica, chitosan, acrylates, water stability.
E-mail: [email protected]
1. INTRODUCTION
The hybrid materials, based on sol-gel silica, are interesting type of chemical structures, because of their long term stability in different pH media [1].This property is favoured by the dense inorganic structure, which is formed via hydrolysis and con-densation reactions. Other main advantage of these types of silica materials is the easy preparation tech-nique, based on the mixing of liquid precursor, dis-tilled water and acid solution [2, 3].
The application area of sol-gel silica materi-als can be expanded via modification with organic components and development of innovative hybrid structures with specific properties. There is a vari-ety of organic additives to choose from, depending on the requirements towards the end hybrid mate-rial, i.e. long or short organic chain length, one or more end reactive groups, biocompatibility, stabil-ity, hydrophilicity and others [4, 5].
Our research group is focused on the develop-ment of silica hybrid materials, which can be ap-plied as sorbents for contaminants [6, 7]. For that
purpose, we synthesised silica hybrids with par-ticipation of natural (chitosan) and synthetic (meth-acrylic acid, methyl methacrylate and hydroxyl ethyl methacrylate) organic materials. The chosen organic components are known as biocompatible, reactive materials, which can be successfully ap-plied for the sorption of contaminants [8, 9].
Copello et al. [10] investigated the dye sorption behaviour of chitosan/SiO2 hybrid materials. Via FTIR and XPS analysis, the authors established that the synthesised hybrids are of crossed linked chain type, i.e. combination between organic and inorgan-ic units, bonded/connected/joined through covalent bonds. This can be used as a proof for the preparation of stable in water media structures. Furthermore, testing the absorption behaviour of the synthesized materials, there was found great attraction ability between the negatively charged end groups of the used organic dyes and positively charged amino end groups of chitosan. Another researcher group [11] investigated the behaviour of silica-chitosan mem-branes in different media at different pH (varying from 2.5 to 7.5). The silica component is chosen because of its stability in different media, while the chitosan is used for its pH sensitivity. In acid media, the chitosan expands, because of amino group pro-tonation, while in basic media the polysaccharide

193
structure, and has the ability to shrink. The test re-sults showed expanding of the hybrid structure for a pH increase from 2.5 to 7.5.
Acrylates are synthetic organic components, which exhibit good compatibility with silica. The combination of SiO2 and acrylate leads to formation of highly mechanical and thermally stable hybrid structures. On the other hand, the organic compo-nents can improve/increase the sorption capacity of silica due to presence of free reactive end groups [12–17].
The combination of chitosan and acrylate should lead to an improved sorption capacity for Cr of the obtained hybrid silica-based material. Tahaet al. [18] synthesised silica hybrid materials with the participa-tion of modified chitosan. As modifier of the natural organic component is used poly butyl acrylate, as the reason is activating chitosan reactivity. The IR analysis showed that the prepared hybrid structures contain –OH and –NH2/–NH3 groups. After contact of the synthesized material with chromium ions, the characteristic peaks of reactive centres have been shifted from 3429.43 cm−1 to 3525.88 cm−1, which proved the interaction of the contaminant (Cr) and sorbent. Furthermore, the intensity of Si-OH peak is decreased, which showed that the silica network also takes part in water purification process.
The main goal of the present work is the estab-lishment of the long-term stability in water media of the obtained silica hybrid materials. For synthe-sis via sol-gel of potential stable hybrid structures different combinations of inorganic (silica) and or-ganic components are used. XRD, SEM and EDX analyses are used for investigations of the correla-tion between structure and properties.
2. EXPERIMENTAL
2.1. Materials used
Tetraethyl orthosilicate (TEOS, Sigma Aldrich, 98%), chitosan (CS, degree of deacetylation 75–
85%, Fluka), 2-hydroxyethyl methacrylate (HEMA, 97%, Sigma Aldrich), dH2O, HCl (37%, Fluka), methyl methacrylate (MMA, Fluka), methacrylic acid (MA, Sigma Aldrich) and acetic acid (99%, Sigma Aldrich) were used as initial precursors for the preparation of silica hybrid materials.
2.2. Synthesis procedure
For the synthesis of the silica hybrid materials the following sequence has been used – preparation via sol-gel reactions of silica network, addition of organic components and drying at ambient condi-tions. The silica matrix is obtained via mixture of TEOS, dH2O and 1M HCl, as catalyst, in a solu-tion ratio – 1:0.4:0.4. The ratio was kept constant for all samples. Separately 1 g chitosan powder was dissolved into 100 ml 1M acetic acid solution. After full dissolution of chitosan, the calculated amount of organic solution was added to the obtained silanol. The solution was stirred for 30 min and after that the acrylate components were added to the homogeneous sol and the stirring continued for another 30 minutes. The obtained hybrid “sol” was poured onto Petri dishes in order to achieve its transformation into gel. The synthesis scheme of obtained silica hybrid mate-rials is presented on Fig. 1. The ratio of initial com-ponents as well as abbreviations of the synthesized hybrid materials are presented in Table 1.
2.3. Methods for characterization
XRD (Brucker D8 Advance; Cu-Kα radiation with scan rate of 0.02° min−1 in the 2θ range between 10 and 80° was used to determine the phase com-position and state (amorphous or crystalline) of the obtained hybrid materials. SEM and EDX spectros-copy (Hitachi SU-70) were used for observation of the surface and volume characteristics of the synthe-sized hybrid materials. The long-term stability of the synthesized hybrid materials was evaluated via im-mersion for 48 and 168 h in water solution (pH = 7).
Fig. 1. Synthesis scheme of obtained hybrid materials.
E. Todorova, G. Chernev: Sol-gel silica hybrid materials – characterisation and long-term stability
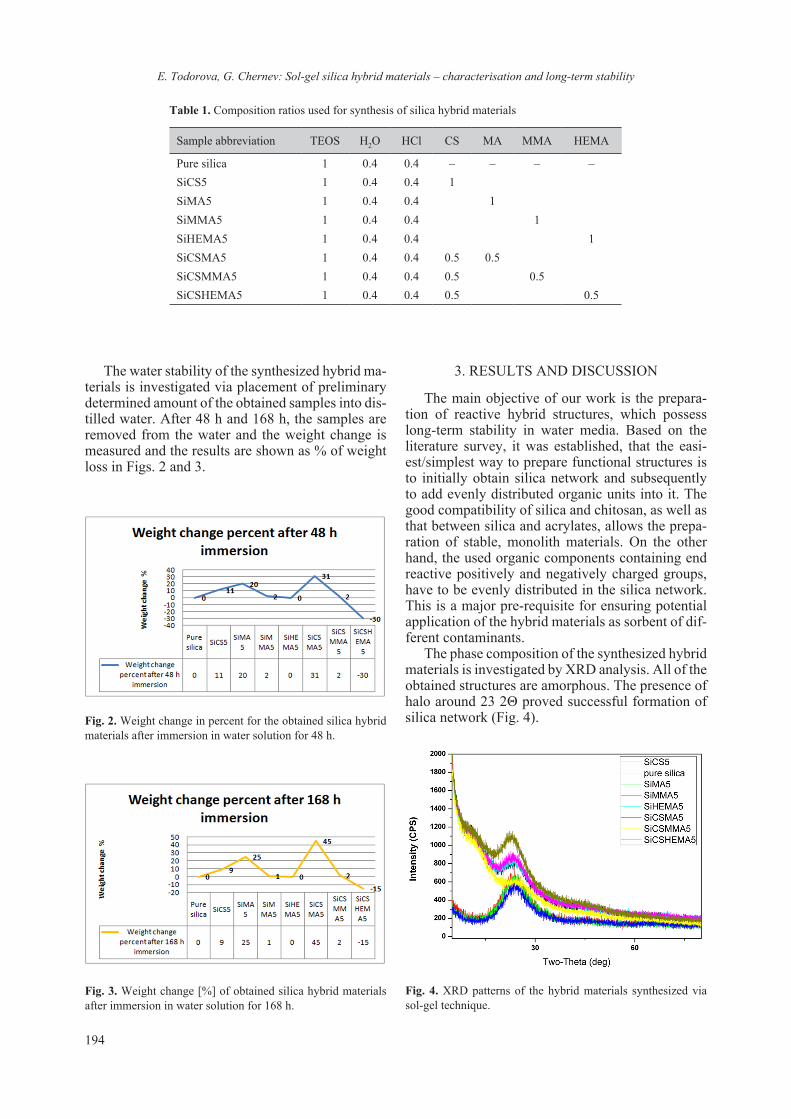
194
Table 1. Composition ratios used for synthesis of silica hybrid materials
Sample abbreviation TEOS H2O HCl CS MA MMA HEMA
Pure silica 1 0.4 0.4 – – – –SiCS5 1 0.4 0.4 1SiMA5 1 0.4 0.4 1SiMMA5 1 0.4 0.4 1SiHEMA5 1 0.4 0.4 1SiCSMA5 1 0.4 0.4 0.5 0.5SiCSMMA5 1 0.4 0.4 0.5 0.5SiCSHEMA5 1 0.4 0.4 0.5 0.5
The water stability of the synthesized hybrid ma-terials is investigated via placement of preliminary determined amount of the obtained samples into dis-tilled water. After 48 h and 168 h, the samples are removed from the water and the weight change is measured and the results are shown as % of weight loss in Figs. 2 and 3.
Fig. 2. Weight change in percent for the obtained silica hybrid materials after immersion in water solution for 48 h.
Fig. 3. Weight change [%] of obtained silica hybrid materials after immersion in water solution for 168 h.
3. RESULTS AND DISCUSSION
The main objective of our work is the prepara-tion of reactive hybrid structures, which possess long-term stability in water media. Based on the literature survey, it was established, that the easi-est/simplest way to prepare functional structures is to initially obtain silica network and subsequently to add evenly distributed organic units into it. The good compatibility of silica and chitosan, as well as that between silica and acrylates, allows the prepa-ration of stable, monolith materials. On the other hand, the used organic components containing end reactive positively and negatively charged groups, have to be evenly distributed in the silica network. This is a major pre-requisite for ensuring potential application of the hybrid materials as sorbent of dif-ferent contaminants.
The phase composition of the synthesized hybrid materials is investigated by XRD analysis. All of the obtained structures are amorphous. The presence of halo around 23 2Θ proved successful formation of silica network (Fig. 4).
Fig. 4. XRD patterns of the hybrid materials synthesized via sol-gel technique.
E. Todorova, G. Chernev: Sol-gel silica hybrid materials – characterisation and long-term stability

195
The surface morphology characteristics of the synthesized hybrid structures are investigated by SEM (the micrographs are shown in Fig. 5).
The micrograph of the 1st sample presents the smooth, monolith structure of pure silica. Due to the appropriate ratio between the silica precursor, dH2O
and acid a uniform surface is formed. The 2nd micro-graph, corresponding to the silica – chitosan hybrid materials, showed improvement of silica roughness. The small particles, which are evenly distributed all over the surface and with varied sizes, are associ-ated to the added chitosan component.
Fig. 5. SEM micrographs of sol-gel synthesized silica hybrid materials.
E. Todorova, G. Chernev: Sol-gel silica hybrid materials – characterisation and long-term stability

196
Significant difference in the obtained micro-structure is observed for the combination of silica and MA (Fig. 5 – SiMA5). A lot of pores with equal size are observed all over the hybrid surface. The porosity of the hybrid structure is due to used syn-thetic component. The presence of pores into the silica network improves the contact surface area with external moieties, e.g. contaminants in the waste water for example.
The combination of silica with MMA and HEMA leads to formation of homogeneous struc-tures (based on sol-gel silica network) showing evenly distributed particles with size between 0.5 and 10 µm.
Some differences in the SEM micrographs of silica hybrids for/in case of combination of natural and synthetic organic components are observed. The combination of CS and MA leads to formation of larger pores all over the hybrid surface (larger than 50 µm).
The addition of MMA to the SiCS hybrid struc-ture led to a decrease of particle sizes and roughness of the surface. The addition of CS to the silica-HE-MA structure led to increasing number of particles all over the surface.
The chemical composition of some of the hy-brid materials – pure silica, SiMA5 and SiCSMA5 is investigated by EDX analysis (Fig. 6). All of the spectra presented existence of Si, O and C atoms. Differences of percent/ concentration values are ob-served – the quantity of C and O atoms increased with addition of organic components to the silica network. Existence of C atoms in the structure of the sample corresponding to pure silica (0, 6) is due to used sol-gel synthesis at ambient conditions.
The results from the water stability tests showed, that the pure silica material didn’t change its weight during the immersion in water. The combination of silica and chitosan possesses different behavior – the weight increases after immersion for 48 h with 11% and slightly decrease to 9% after 168 h. This behavior can be associated with the property of chi-tosan component, which expands its units in neu-tral media. The existence of –OH and amino groups of CS supports the easy interaction and sorption of water molecules onto the respective hybrid materi-als. There are the silanol units, due to used sol-gel technique, realized at standard conditions that also improve the sorption properties. The SiMA5 mate-rial possesses the highest weight loss in percent – 20% at 48 h and 25% at 168 h. This behaviour is due to porosity of the material, which increases the contact surface area between water molecules and reactive hydroxyl groups of MA and silica units. Opposite property/behaviour showed the samples SiCSMMA5 and SiCSHEMA5, which slightly/scarcely change their weights.
Fig. 6. EDX analysis of some of the obtained hybrid materials – pure silica, SiMA5 and SiCSMA5.
Increased weight change in % showed sample SiCSMA5 in comparison to SiMA5 and SiCS5. The combination of chitosan’s property to expand its units and the porosity of MA lead to increas-ing the weight with 31% after immersion for 48 h and with 45% for 168 h in the water solution. The high sorption capacity of these hybrid materials ensures their improved contact with external ions. The addition of CS to the SiMMA5 hybrid structure didn’t change the sorption capacity of the materi-als. This property showed that SiCSMA5 has long term stability in water media. The results for hybrid SiCSHEMA5 are different comparing them with
E. Todorova, G. Chernev: Sol-gel silica hybrid materials – characterisation and long-term stability

197
the results for the other hybrid samples – the weight change in percent showed, that after immersion for 48 h/168 h of SiCSHEMA5 30%/15% is lost in the solution. These values demonstrated the low stabil-ity of this composition, which restrict its application as a sorbent [19–21].
4. CONCLUSIONS
Amorphous silica hybrid materials, with partici-pation of natural and synthetic organic components were successfully obtained via sol-gel route. The in-vestigation of the structural characteristics showed strong dependence on the specific properties of or-ganic units which influence the hybrid structure. The long term stability of the hybrid materials was investigated via immersion in neutral media for 48 h and 168 h. The weight change in percent showed the excellent stability of pure silica, combination of silica and MA, as well as silica and MMA. Lower stability presented the silica hybrid materials with participation of CS and HEMA. In order to find fur-ther potential applications of the synthesized hybrid materials, their behaviour in acidic and basic solu-tions should be investigated, as well as more struc-tural analysis are necessary to be made.
REFERENCES
1. F. Guerra, M. Attia, D. Whitehead, F. Alexis, Molecules, 23, 1760 (2018).
2. B. Leemann, Cem. Concr. Res., 68, 156 (2015).3. P. Kortesuo, M. Ahol, M. Kangas, M. Jokinen, T.
Leino,L. Vuorilehto, S. Laakso, J. Kiesvaara, A. Marvol, Biomater., 23, 2795 (2002).
4. Al. V. Vinogradov, Vl. V. Vinogradov, RSC Adv., 4, 45903 (2014).
5. Y. Dimitriev, Y. Ivanova R. Iordanova, J. Univ. Chem. Tech. Metall., 43, 181 (2008).
6. E. Todorova, G. Chernev, S. Djambazov, Open J. Inorg. Non-Metallic Mater., 4, 35 (2014).
7. G. Chernev, E. Todorova, S. Djambazov, I. Salvado, J. Ivanova, J. Univ. Chem. Tech. Metall., 49, 128 (2014).
8. J. Chruściel, E. Leśniaka, Progr. Polymer Sci., 41, 67 (2015).
9. M. Cakir , I.Kartal, H. Demirer, R. Samur, Sci. Res. Essays, 7, 805 (2012).
10. G. Copello, A. Mebert, M. Raineri, M. Pesenti, L. Diaz, J. Hazard. Mater., 186, 932 (2011).
11. M. Dasha, F. Chiellini, R.M. Ottenbrite, E. Chiellini, Progr. Polymer Sci., 36, 981 (2011).
12. S. Jun, E. Lee, S. Yook, H. Kim, H. Kim, Y. Koh, ActaBiomater., 6, 302 (2010).
13. D. Clausen, I.Pires, C. Tarley, Mater. Sci. Eng. C, 44, 99 (2014).
14. S. Frings, H.Meinema, C. van Nostruma, R. Linde, Progr. Org. Coat., 33, 126 (1998).
15. H. Yang, J. Pi, K. Liao, H. Huang, Q. Wu, X. Huang, Z. Xu, ACS Appl. Mater. Interfaces, 6, 2566 (2014).
16. Y. Chen, J. O. Iroh, Chem. Mater., 11, 1218 (1999).17. S. Li, A. Shah, A. Hsieh, R. Haghighat, S. S. Praveen,
I. Mukherjee, E. Wei, Z. Zhang, Y. Wei, Polymer, 48, 3982 (2007).
18. A.Taha, Y. Wu, H. Wang, F. Li, J. Environ. Manage., 112, 10 (2012).
19. S. Pal, A. Sh. Patra, S. Ghorai, A. K. Sarkar, R. Dasa, S. Sarkar, Environ. Sci.: Water Res. Technol., 1, 84 (2015).
20. Y. Yaoa, J. Qina, H. Chena, F. Wei, X. Liua, J. Wanga, S. Wang, J. Hazard. Mater., 291, 28 (2015).
21. T. Budnyak, V. Tertyk, E. Yanovska, Mater. Sci., 2, 177 (2014).
E. Todorova, G. Chernev: Sol-gel silica hybrid materials – characterisation and long-term stability
198 © 2018 Bulgarian Academy of Sciences, Union of Chemists in Bulgaria
* To whom all correspondence should be sent:
Bulgarian Chemical Communications, Volume 50, Special Issue F (pp. 198–204) 2018
Heterogeneous photocatalytic degradation of Reactive Black 5 in aqueous suspension by La-modified ZnO powders
N. Kaneva*, A. Bojinova, K. Papazova, D. Dimitrov
Laboratory of Nanoparticle Science and Technology, Department of General and Inorganic Chemistry, Faculty of Chemistry and Pharmacy, University of Sofia, 1164 Sofia, Bulgaria
Received November 09, 2018; Accepted December 09, 2018
La-modified ZnO powders with different dopants concentration (0, 0.5, 1.0, 1.5, 2.0, 2.5 and 3.0 mol%) are prepared by simple thermal method. The obtained homogeneous charge is annealed at 100 °C. The structural and photocatalytic properties of the samples are characterized by X-ray diffraction, Scanning electron microscopy, BET surface area and UV−vis spectroscopy. The result of XRD shows that La3+ is successfully introduced into ZnO lat-tice. It is found out that the crystallite size of La-modified ZnO is greater as compared to pure ZnO and increases with the increasing La content. Surface area (BET) measurements show higher surface areas and pores volume for La–ZnO catalysts in comparison to pure ZnO. The photocatalytic investigations revealed that all the La-modified ZnO powders exhibited excellent photocatalytic degradation of Reactive Black 5, compared with the ZnO, under UV and visible light irradiation. The optimal dopant concentration is experimentally found to be 2 mol% La in terms of the photocatalytic efficiency. The result shows that La3+ doping concentration has a remarkable effect on the efficiency of photocatalytic activity.
Keywords: zinc oxide, lanthanum, Reactive Black 5, photocatalysis.
E-mail: [email protected]
INTRODUCTION
The annual dye production worldwide is report-ed as one million tons, 70% of which are azo dyes [1–3]. The azo dyes, containing as chromophore azo group of two nitrogen atoms (–NN–), represent the largest class of textile dyes widely used in the industry. The group of azo dyes includes different types of dyes: reactive, acid, basic, disperse, direct, mordant, metal complex and sulphur dyes. Among these types most used are the reactive azo dyes. At the same time, the reactive azo dyes are also the most problematic pollutants of textile wastewater contaminants, because the reactive dyeing process is accompanied with more than 15% losses of tex-tile dye in wastewater stream [4]. These dyes per-sist in textile dye house wastewater in concentra-tion range 5–1500 mgl–1 due to their poor fixation to fabrics [5]. The purification of dye contaminated wastewaters is quite complicated due to the high chemical, biochemical and photochemical stability of the modern synthetic dyes. Discharge of azo dyes is undesirable not only for aesthetic reasons but
also because many azo dyes and their intermediate products are toxic to aquatic life and mutagenic to humans [6, 7]. The conventional physical, biologi-cal and chemical methods used for wastewater treat-ment are not suitable for dye contaminated water.
The physical methods (adsorption, membrane filtration, flocculation, and electrocoagulation) can-not achieve sufficient degradation and mineraliza-tion of dyes [8]. These techniques just separate the dye from the water phase and require additional treatment of the generated secondary waste, thus increasing the operation cost [9]. Most of chemi-cal dye removal methods (ozonation [10–12], chlo-rination [13], wet air oxidation [14, 15], etc.) have essential drawbacks, which limit their application. For example: ozonation and wet air oxidation are efficient, but expensive due to high operation costs, need of special equipment; during chlorination products with higher toxicity compared to the initial compound can be formed. Biodegradation is ineffi-cient for many azo dyes because of their resistance to aerobic degradation and in some cases hazardous aromatic amines are formed [16, 17]. The formed intermediates are more toxic than the dye molecules themselves [6].
An efficient approach for dyes degradation seems the advanced oxidation processes (AOPs) such as

199
Fenton reaction and photocatalysis. Fenton’s rea-gent (iron–based catalysts and hydrogen peroxide) is typical powerful oxidizing agent and is explored for organic dye degradation. However, this ap-proach has several limitations: requirement of low pH; sludge residues formation; rapid generation of hydroxyl radicals and their ineffective utilization; limited organic carbon removal [18, 19]. Titania and zinc oxide are the notable and most commonly studied photocatalysts as they are available, chemi-cal stable, low cost, abundance and non-toxic com-pounds [20]. In the case of ZnO, the lifetime value of electrons is significantly higher and the rate of recombination is lower in comparison with TiO2, making it an attractive material in photocatalytic applications [21]. Therefore, the trend of publica-tions of nanostructured ZnO photocatalyst in the past decade shows an exponential growth of the in-vestigations in this direction (Fig. 1). Modification of electronic structure via doping is very necessary for improved photocatalytic efficiency. The choice of dopant is of great importance and depends on the desired application. The rare earth elements appear as suitable dopants for photocatalytic applications. Many studies have shown that the doping of semi-conductor oxides (ZnO, TiO2, SnO2) with RE atoms can improve greatly the photocatalytic performanc-es of these materials [22–24].
In this work, we have selected one of the most used reactive dyes in textile industry – Reactive Black 5 (RB5), as a representative dye contami-nant of the industrial wastewaters. RB5 is one of the most common dyes used in the textile industry for dyeing of different fabrics, such as wool, cot-ton, viscose and polyamide. It is also used in the clinical laboratories as a stain dye for cell biologi-cal, hematological and histological tests. The study
is a continuation of our previous investigations on: UV induced photodegradation of Malachite Green and Reactive Black 5 by sol-gel obtained ZnO na-noparticles, doped with 0.5 and 1% La [25]; photo-catalytic oxidation of ethylene as model air pollut-ant in gas-phase under UV irradiation by Ln-doped ZnO powders [26]. This study is directed to clarify the influence of dopants concentration on the pho-tocatalytic efficiency and to check the effect in pho-tocatalysis with La-doped ZnO under visible light irradiation.
EXPERIMENTAL
Reagents
Commercial oxide powders – ZnO (>99.0%), La2O3 (>99.0%) and absolute ethanol, used in the experiments, were purchased from Fluka. Distilled water was used in all experiments.
The organic dye Reactive Black 5 was supplied from Sigma–Aldrich (C26H21N5Na4O19S6, molecu-lar weight 991.82, λmax = 595 nm, dye content ca. 55%). This dye was used in the photocatalytic tests as modal water contaminant, due to its huge practi-cal application. RB5 is diazo compound with four phenyl groups. Its water solutions have dark blue color due to connection between aromatic rings and azo groups [27]. RB5 may cause asthma problems, allergy or breathing difficulties, as pointed by the supplier.
Catalysts modification and characterization
Pure ZnO and La-modified powders were ob-tained by green, simple and fast thermal procedure [26] – at simple preparation conditions, reduced synthesis time, using only stable natural and non-toxic reagents, without any chemical residue after the preparation. La-modified photocatalysts were prepared using commercial oxide powders ZnO and La2O3. The calculated amounts of the substances desired ratio (7 series of La-modified ZnO powder samples of 5 g; containing 0, 0.5, 1.0, 1.5, 2.0, 2.5 or 3.0 mol% La respectively) were homogenized in a ceramic vessel with addition of small quanti-ties (8–10 droplets) of ethanol as a mixing medium. The resultant suspension was sonicated for 30 min (IKEDA RIKA ultrasonic bath, 100 V 50/60Hz, 110 W) and then dried for 1 h at 100 °C in order to obtain the ZnO/La powders for photocatalytic tests.
The surface morphology of as-obtained nano-sized powders (pure and La-modified ZnO) was observed by Scanning Electron Microscope (SEM) JSM-5510 (JEOL), operated at 10 kV of accelera-
Fig. 1. Rise in the Annual number of publications on photoca-talysis with ZnO for the past ten years (2009–2018). Data from Sciencedirect database using the keywords “photocataly*” and “ZnO” in the sections title and article text.
N. Kaneva et al.: Heterogeneous photocatalytic degradation of Reactive Black 5 in aqueous suspension by La-modified ZnO...
200
tion voltage. The investigated samples were coated with gold by JFC-1200 fine coater (JEOL) before observation.
The phase composition and crystallinity of the powder pure and La-modified ZnO samples was identified by X-ray diffraction analysis (XRD) and energy dispersive X-ray (EDX) spectroscopy used for the elemental analysis or chemical characteriza-tion of the samples (EDX detector: Quantax 200, Bruker Resolution 126 eV). The XRD was per-formed at room temperature on powder diffractom-eter Siemens D500 with CuKα radiation within 2θ range 30–70 at a step of 0.05 2θ and counting time 2 s/step.
The surface area of all powder samples was determined by BET analyses, using standard BET apparatus and volumetric technique. N2 adsorption and desorption were performed at 77 K. Before the N2 adsorption the analyzed samples were degassed for 4 h at 150 °C.
The prepared samples were checked for pho-todegradation of RB5 from aqueous solutions by a standard testing procedure [25]. The volume of dye solution was 250 ml. The catalyst loading was 0.5 g.L–1. The initial RB5 concentration was 20 ppm. The irradiation sources were as follows: UVA lamp (Sylvania 18W BLB T8, emitting mainly in the range of 315–400 nm) placed at 10 cm above and linear Tungsram lamp for the visible irradiation (500 W K1R7s 9700 Lm, maximal emission at 700 nm) fixed at 50 cm above the dye solution. The intensity of irradiation at the suspensions sur-face was: 0.014 W/cm2 in case of UV light irradia-tion and 8.9 mW/cm2 for visible light illumination. Prior testing the suspension was stirred for 30 min in complete darkness to reach the sorption-desorp-tion equilibrium between dye solution and catalysts surface. During the photocatalysis aliquot samples (2 ml) were taken regularly from the investigated solution at selected time intervals. The change in RB 5 concentration with the time of photocatalysis was monitored at 597 nm by UV-VIS spectropho-tometer Thermo scientific, Type Evolution 300 BB.
The photocatalytic degradation of RB5 (D%) was calculated by the equation:
D% = (C0 – Ct)/C0 × 100 (1)
where C0 is the initial dye concentration and Ct is the concentration of dye pollutant after selected time of irradiation t.
After measurement, aliquots were returned back to the treated solution. The solutions were stirred constantly by electromagnetic stirrer (rotation speed of 370 rpm). All photocatalytic experiments were performed at room temperature of 23±2 °C.
The pH of the investigated suspensions, deter-mined by pH meter Hanna instruments, was found to be in the range of 5.8–6.1.
RESULTS AND DISCUSSION
X-ray diffraction spectra the analyzed pure and La-modified ZnO powder samples and correspond-ing EDX analysis are presented in Fig. 2. The EDX results confirm the presence of La at the catalysts surface. The sharp and intense characteristic peaks from the XRD patterns indicate high crystallinity of ZnO. The (100), (002) and (101) peaks of pure ZnO correspond to hexagonal Wurtzite structure type (PDF#77-0191). Any impurity characteristic peaks of phases such as Zn(OH)2 are not observed for all samples. The crystallite size of ZnO, calculated by Scherrer formula from the main peak (101), is about 37 nm for the pure and 42 nm for La-modified ZnO. The XRD spectra of the La-modified ZnO samples (Fig. 2b) are similar to that of pure ZnO. There are very low peaks corresponding to formation of La2O3 (PDF # 83-1350), which can be due to the low do-pants concentration – 2 mol%. The ZnO crystal structure remains almost unchanged in pure and La-modified samples. The latter indicates also that La is uniformly arranged between the ZnO nanoparti-cles in form of small clusters La2O3.
SEM micrographs shown in Figure 3 compare the microstructure and morphology of pure and ZnO/La (2 mol%) powders. The average particle size of 0.25 μm for ZnO (Fig. 3a and 3b) is determined from the SEM images. As seen from Fig. 3c and 3d, the La-modified ZnO particles are flowerlike in shape. Their average particle size, also determined from SEM micrographs is found to be ~0.43 μm. The SEM images of the rest ZnO/La powders – with La content of 0.5, 1, 1.5, 2.5 and 3 mol% are similar to that of ZnO/La (2 mol%) sample. There is a tendency of slight increasing particle size – from 0.4 to 0.45 μm, with the rise of dopants concentra-tion from 0 to 3 mol%.
Doping of ZnO with La leads to rise of the crys-tallite size (from 37 to 42 nm) and average particle size (from 0.25 to 0.45 μm) due to the larger ion radius of La3+ – 103 pm, than that of Zn2+ – 74 pm [28].
The determined specific surface area values ac-cording to BET analysis of ZnO and La-modified powder samples are shown in Table 1. The surface area of ZnO/La catalysts is greater than that of pure ZnO (10.30 m2/g). The surface area values increase with the La concentration up to 0.5, 1, 1.5, there is a maximum at 2 mol% (32.34 m2/g) and then decrease (2.5 and 3 mol%). Illuminated greater surface area is a key factor for more efficient photocatalysis. The
N. Kaneva et al.: Heterogeneous photocatalytic degradation of Reactive Black 5 in aqueous suspension by La-modified ZnO...

201
Fig. 2. XRD patterns of the pure ZnO (a), ZnO/La (2 mol%) powders (b) and EDX spectra of ZnO powders modified with 2 mol% La (c).
Fig. 3. SEM images of pure (a, b) and ZnO/La 2 mol% (c, d) powders at different magnifications.
N. Kaneva et al.: Heterogeneous photocatalytic degradation of Reactive Black 5 in aqueous suspension by La-modified ZnO...

202
effect of this parameter is confirmed in the photo-catalytic experiments – the more developed surface increases the total illuminated surface area, thus in-creasing the number of active surface sites and en-hancing the photocatalytic capacity of the samples.
Two series of experiments are performed in order to prove the photocatalytic activity of La-modified ZnO powder catalysts with respect to RB5 degradation. First – the RB5 aqueous suspensions of ZnO/La powders with different dopant concen-tration (0, 0.5, 1.0, 1.5, 2.0, 2.5 and 3.0 mol%) are exposed to UV light, and second –the experimental tests performed at the same other conditions, but under exposure of visible light illumination. The re-sults from these photocatalytic tests are presented in Figs. 4 and 5. Fig. 4 demonstrates the bleaching kinetics of RB5 aqueous solutions by all kinds of La-modified ZnO powder catalysts exposed to UV (Fig. 4a) and visible (Fig. 4b) light irradiation. As seen from the presented data, the pure ZnO shows
the lowest photcatalytic efficiency, as compared to that of La-modified samples, irrespective or type of illumination. The best photocatalytic performance is manifested by the sample ZnO/La (2 mol%) in both cases – under UV and under visible light ir-radiation. The heterogeneous photocatalytic process is considered to be pseudo-first-order reaction with respect to RB5 and can be described according to the equation:
ln(Ct/C0) = −kt (2)
Here C0 is the initial concentration of dye solu-tion, Ct is the dye concentration at reaction time t, and k is the rate constant of photocatalysis. The rate constants can also be calculated from the plots of ln(C0/C) versus reaction time presented in Fig. 4. The initial slope of the linear fit of the experimental data by Eq (2) (the solid lines in the figure) gives the
Table 1. Specific surface area according to BET analysis and photocatalytic results (rate con-stants, degradation of RB5) of ZnO/La powders
La-doped ZnO samples, mol%
Surface area, m2/g
Rate constants, min–1 Degradation of Reactive Black 5, %
UV VIS UV VIS0 10.30 0.0431 0.0186 72.35 40.710.5 23.68 0.0617 0.0233 84.73 50.221.0 25.97 0.0684 0.0282 87.28 54.301.5 31.56 0.0725 0.0294 89.71 56.922.0 32.34 0.0811 0.0334 92.04 61.862.5 30.87 0.0546 0.0194 81.53 46.213.0 30.19 0.0524 0.0172 79.31 43.08
Fig. 4. Kinetics of RB5 dye photodecomposition from 20 ppm aqueous solutions by ZnO and different La-modified ZnO powder catalysts under UV (a) and visible (b) light illumination. The catalysts concentration is 1 g/dm3.
N. Kaneva et al.: Heterogeneous photocatalytic degradation of Reactive Black 5 in aqueous suspension by La-modified ZnO...

203
rate constant value, k. The values of as-calculated rate constants are presented in Table 1.
A comparison of the achieved degree of photo-catalytic mineralization of RB5 in 20 ppm water sus-pension by all powder samples at 30 min of irradia-tion is shown in Fig. 5. According to the presented data, the order of photodegradation degree of doped ZnO powders is as follows: 0<0.5<1<1.5<2>2.5>3 mol% La. Moreover, according to Table 1 where the relationship between different parameters are clearly seen, it should be pointed that this order is the same as that of surface area and rate constant values of photocatalysis.
The above results demonstrated that there are certain relationships between doping and photo-catalytic activity. The photocatalytic efficiency at first increased with La concentration, reaches maxi-mum and then decreases. The higher activity of La-modified samples can be attributed to production of high number surface oxygen vacancies and defects (related to the different charge and electronegativity of La and Zn ions and also geometrical reasons). La3+ easily attracts O atoms from the ZnO lattice, as it is more positive and has larger ion radius. As higher number of oxygen vacancies is, as stronger is the adsorption of OH− ions onto the ZnO surface,
namely, the larger content of oxygen vacancies and defects, the higher photocatalytic activity. During the process of photocatalytic reactions, oxygen vacancies and defects could become the centers to capture photoinduced electrons so that the recom-bination of photoinduced electrons and holes could be effectively inhibited. In addition – the introduced by doping La energy levels, lead to enhanced pho-tocatalytic efficiency of ZnO, due to suppressed recombination of the photogenerated electrons and holes [30].
At concentrations, higher than the optimal of La doping, the photocatalytic efficiency decreases. The reason is that a lot of chemical bonds Zn–O–La be-tween the three elements occur and that is why the content of surface oxygen vacancies and surface de-fects decreases [29].
The results show that La-modified ZnO pow-ders are promising and efficient catalysts for textile wastewater purification.
CONCLUSIONS
La-modified ZnO powders are prepared by sim-ple hydrothermal method. Their photocatalytic ef-ficiency has been established in Reactive Black 5 mineralization from aqueous suspensions under UV and visible light irradiation. Doping of ZnO with La leads to rise of the crystallite size (XRD) and aver-age particle size (SEM) due to the larger ion radius of La3+. Surface area (BET) measurements show higher surface areas for La–modified ZnO catalysts in comparison to pure ZnO. The optimal dopant con-centration is established – 2 mol% La. The results show that La3+ doping has a remarkable effect on the photocatalytic efficiency of zinc oxide photocata-lysts, dye to formation of surface oxygen vacancies and defects and successful charge separation.
Acknowledgements: Authors are grateful to Oper-ational program “Science and Education for Smart Growth”, project BG05M2OP001-2.009-0028, DFNI-T02/16, Russian Presidential Program of en-gineer advanced trading and Horizon 2020 project ID: 692146-H2020-eu.4.b “Materials Networking”.
REFERENCES
1. M. Stoyanova, I. Slavova, St. Christoskova, V. Ivanova, Appl. Cat. A, 476, 121 (2014).
2. S. Garcia-Segura, F. Centellas, C. Arias, J. A. Garrido, R. M. Rodriguez, P. L. Cabot, E. Brillas, Electrochim. Acta, 58, 303 (2011).
3. B. Palas, G. Ersoz, S. Atalay, Chemosphere, 209, 823 (2018).
Fig. 5. Photomineralization degree of Reactive Black 5, de-pending on dopants concentration of La-modified ZnO pow-ders. The data correspond to 30 min illumination time with UV (a) and visible light (b).
N. Kaneva et al.: Heterogeneous photocatalytic degradation of Reactive Black 5 in aqueous suspension by La-modified ZnO...

204
4. M. S. Lucas, J. A. Peres, Dyes and Pigments, 71, (3) 236 (2006).
5. J. Pierce, J. Soc. Dyers Colourists, 110, 131 (1994).6. S. Meric, D. Kaptan, T. Olmez, Chemosphere, 54,
435 (2004).7. A. Gottlieb, C. Shaw, A. Smith, A. Wheatley, S.
Forsyth, J. Biotechnol., 101, 49 (2003).8. F. Harrelkas, A. Azizi, A. Yaacoubi, A. Benhammou,
M.N. Pons, Desalination, 235, 330 (2009).9. T. Robinson, G. McMullan, R. Marchant, P. Nigam,
Bioresour. Technol., 77, 247 (2001).10. M. Constapel, M. Schellanträger, J.M. Marzinkowski,
S. Gäb, Water Res., 43, 733 (2009).11. S. Song, H. Ying, Z. He, J. Chen, Chemosphere, 66,
1782 (2007).12. F. Zhang, A. Yediler, X. Liang, Chemosphere, 67,
712 (2007).13. Q. Zeng, J. Fu, Y. Shi, H. Zhu, Ozone Sci. Eng., 31,
37 (2009).14. B. Gözmen, B. Kayan, A.M. Gizir, A. Hesenov, J.
Hazard. Mater., 168, 129 (2009).15. L. Lei, Q. Dai, M. Zhou, X. Zhang, Chemosphere,
68, 1135 (2007).16. W. Azmi, R. K. Sani, U. C. Banerjee, Enzyme
Microb. Technol., 22, 185 (1998).17. J. Ge, J. Qu, Appl. Catal. B, 47, 133 (2004).18. F. Ji, Ch. Li, L. Deng, Chem. Eng. J., 178, 239
(2011).19. R. M. Liu, S. H. Chen, M. Y. Hung, C. S. Hsu, J. Y.
Lai, Chemosphere, 59, 117 (2005).20. J. Fanga, H. Fana, Y. Ma, Z. Wang, C. Qi, Appl. Surf.
Sci., 332, 47 (2015).21. M. A. Hernández-Carrillo, R. Torres-Ricárdez, M.
F. García-Mendoza, E. Ramírez-Morales, G. Pérez-Hernández, Catalysis Today, in press (2018). Available online 30 April 2018 https://doi.org/10.1016/j.cat-tod.2018.04.060.
22. H. V. Fajardo, E. Longo, L. F. D. Probst, A. Valentini, N. L. V. Carreňo, M. R. Nunes, A. P. Maciel, E. R. Leite, Nanoscale Res. Lett., 3, 194 (2008).
23. S. Anandan, Y. Ikuma, V. Murugesan, Int. J. Photoenergy, 2012, (2012) Article 921412.
24. F. Jiang, Z. Peng, Y. Zang, X. Fu, J. Adv. Ceram., 2, (3) 201 (2013).
25. N. Kaneva, A. Bojinova, K. Papazova, J. Phys. Conf. Ser., 682, 012022 (2016).
26. N. Kaneva, A. Bojinova, K. Papazova, D, Dimitrov, A. Eliyas, Bulg. Chem. Commun., 49, (G) 172 (2017).
27. N. Yousefi, A. Fatehizadeh, E. Azizi, M. Ahmadian, A. Ahmadi, A. Rajabizadeh, A. Toolabi Sacha, J. Environ. Studies, 1, 81 (2011).
28. A. F. Wells, Structural Inorganic Chemistry, 5th ed., Clarendon Press, Oxford, 1984, p. 1288.
29. J. Liqiang, S. Xiaojun, X. Baifu, W. Baiqi, C. Weimin, F. Hongganga, J. Solid State. Chem., 177, (10) 3375 (2004).
30. N. Kaneva, A. Bojinova, K. Papazova, D, Dimitrov, Catalysis Today, 252, 113 (2015).
N. Kaneva et al.: Heterogeneous photocatalytic degradation of Reactive Black 5 in aqueous suspension by La-modified ZnO...

205© 2018 Bulgarian Academy of Sciences, Union of Chemists in Bulgaria
* To whom all correspondence should be sent:
Bulgarian Chemical Communications, Volume 50, Special Issue F (pp. 205–210) 2018
Characterization of in-situ-sampled particulate matter in air pollution localized by lidar monitoring
I. V. Grigorov1, G. V. Kolarov1, L. L. Gurdev1, Z. P. Cherkezova-Zheleva2, L. S. Slavov1, Ch. G. Ghelev1, R. V. Ilieva3, M. V. Iliev3, V. I. Groudeva3,
D. V. Stoyanov1, I. I. Nedkov1*
1 Institute of Electronics, Bulgarian Academy of Sciences, 72, Tsarigradsko Chaussee blvd., 1784 Sofia, Bulgaria 2 Institute of Catalysis, Bulgarian Academy of Sciences, Acad. G. Bonchev str., bl. 11, 1113 Sofia, Bulgaria
3 Faculty of Biology, St. Kl. Ohridski University of Sofia, 8, Dragan Tsankov blvd., 1164 Sofia, Bulgaria
Received October 30, 2018; Accepted December 10, 2018
The work presents part of comprehensive studies performed during 2018 that dealt with particulate matter (PM), more specifically such with size ≤ 10 µm (PM10) and ≤ 2.5 µm (PM2.5), in the atmospheric aerosol. The experiments combined lidar monitoring over a densely populated urban area (city of Sofia, capital of Bulgaria) with on-the-spot sampling at sites with high concentration of dust products. Once the place of high PM concentration was localized by the lidar, samples were taken using a Hygitest 106 (Maimex) – a high-efficiency portable device for sampling and con-centration determination of PM in atmospheric aerosol. X-ray diffraction and Mössbauer studies at room temperature were used to study the PM inorganic part. The material collected was also subjected to microbiological investigation by first applying a standard procedure for isolation of pure microbial cultures. The bacterial and fungal obtained iso-lates were identified on the basis of their morphological, physiological and biochemical characteristics. Thus, it was found that the surface of the micron-sized particles can adsorb both mechanical and microbial contaminants, while the liquid envelope, when the PM is dispersed as aerosols, may preserve this nano-world and, in some cases, create conditions favoring the occurrence of chemical and bio-processes. The lidar maps constructed can be further used for tracing the full air mass transport carrying contamination from a number of pollution sources (chemical, biological, dust, etc.), distributed over the scanned region.
Keywords: lidar monitoring, particulate matter, bio-aerosols, air quality.
E-mail: [email protected]
INTRODUCTION
Particulate matter (PM) air pollution originates from different sources and has different chemical and physical properties [1, 2]. Monitoring ambi-ent levels of PM facilitates the planning of effec-tive control strategies to combat urban pollution. Lidar mapping data can add synoptic information and visualization to ground-based air-quality data modeling. Together, the integrated data increase the usefulness of any single dataset. However, the re-cent research and policy emphasis on regional and intercontinental transport of air pollutants, such as fine particulate matter smaller than 10 µm and 2.5 µm in diameter (PM10 and PM2.5), has highlighted the need for additional data sources to monitor air pollution as it moves in multiple dimensions, both spatially
and temporally. The combination of lidar remote sensing and ground-based PM monitoring data can form the basis of an integrated air-quality charac-terization [3].
The research described here pertains to the air pollution of the city of Sofia (capital of Bulgaria), which was recently (2015) ranked as the 33rd most polluted city in a study including 157 European cit-ies [4]. It is a continuation of our work on PM in the atmospheric aerosol over the city of Sofia and couples lidar monitoring over critical in terms of pollution urban areas, as determined by lidar sens-ing, with contact on-the-spot sampling. The city is located in a large valley surrounded by mountains hindering the processes of self-cleaning of the at-mosphere. Moreover, a typical characteristic of the weather in the region are cold spells and calm atmosphere during the winter-spring transition pe-riod (months of February – May) resulting in tem-perature inversions that contribute to the already significant overall pollution over the city. Thus, we

206
chose to study the air pollution on windless days at three city sites typical in terms of heavy traffic and altitude above sea level (ASL), two of them being adjacent to the Tsarigradsko Chaussee blvd. (the city’s busiest thoroughfare) at four kilometers away from the city center, ASL 620 m [5] and with-in the central city area. The third site is adjacent to Dragan Tsankov blvd. (the building of the Faculty of Biology, University of Sofia, ASL 610 m) – an-other busy thoroughfare near the city center with heavy traffic during rush hours (average intensity according to Sofia Municipality of about 1000 ve-hicles per hour), interestingly forming a border be-tween a densely populated residential district and a large park (Borisova Gradina).
METHODS, INSTRUMENTS AND PROCEDURES
The lidar mapping was performed by a lidar sys-tem installed on the roof of Institute of Electronics (eight kilometers from the city center); the site at Dragan Tsankov blvd. is located at a distance of 5.5 km from the lidar. This lidar system, developed in the Laser Radar Laboratory of the Institute of Electronics, is capable of scanning the horizontal and vertical aerosol distributions and transport of air masses with a spatial resolution of 30 m and a beam divergence of ~1omrad at operational distanc-es of about 25 km. The laser emitter (wavelength of 510.6 nm) is a pulsed CuBr vapor laser, designed and built in the Institute of Solid-State Physics, Bulgarian Academy of Sciences, with a repetition rate of 10 KHz at a 15-ns pulse duration. The receiv-ing system comprises a Carl Zeiss Jena Cassegrain telescope (aperture of 20 cm, a focal distance of 1 m), a 2-mm-wide focal diaphragm, an interference filter with 2-nm-wide passband, and an EMI 9789 photo-multiplier tube operating in a photon-counting mode. The receiving system is fully computerized for collecting and processing the lidar data using a PCO 1001 1024-channel digital interface system for signal strobing and accumulation. The strobe interval along the line of sight (LOS) is 30-m long.
The samples were taken using a Hygitest 106 (Maimex), a high-efficiency portable device for sampling and concentration determination of PM in atmospheric aerosol. The flow-rate of the aspirated air was measured by an analog unit, while the value of the sampled volume (300 m3) through the filter was digitized by means of a six-bit ADC. The dust was collected on a filter (boro-silicon oxide) with #3 µm and #8 µm (FILTER-LAB, Material MCE, Lot.180509006 and 07). Additionally, the material collected on the filters after three hours of aspiration during the lidar monitoring was studied by SEM
and EDAX. Mössbauer analysis was made using a Wissenschaftliche Elektronik GmbH apparatus, working at a constant acceleration mode; 57Co/Cr source, α-Fe standard. The parameters of hyperfine interactions of the Moessbauer spectral components were determined by computer fitting: isomer shift (IS), quadrupole splitting (QS), hyperfine effective magnetic field in the site of iron nuclei (Heff), as well as line widths (FW) and component relative weights (G). In the experiments presented, we directed the lidar beam to the sites of contact sampling to probe the near-surface atmosphere in a horizontal direc-tion. The measurement time covered practically the entire period of the evening traffic maximums, while maximums of the PM pollutions were clearly observed in the backscattered lidar signals, as re-ceived and processed by our system.
RESULTS AND DISCUSSION
Using the data for the mass concentration, Ma, acquired by the sampling device, we calibrated the two major lidar signal parameters, namely, the ex-tinction coefficient α(r) and the backscattering co-efficient β(r) [6]. For the lidar ratio LiR = α(r)/β(r) we assumed the typical value LiR = 50 [7]. Under the condition of a homogeneous atmosphere in a horizontal plane, the parameters β(r) and α(r) were calculated using the lidar equation:
, (1)
where P(r) is the power of detected laser radiation backscattered by the atmosphere from a distance r = ct/t, t being the time interval following the emis-sion of the laser pulse, τ is the pulse duration, and C is a coefficient related to the specific physical and mechanical parameters of our equipment. Under the same assumption of homogeneity, the extinction co-efficient α(r) is calculated by
, (2)
where S(r) = ln [r2P(r)].Figure 1 presents the dependence of the mass
concentration M in mg/m3 as a function of α(r) cal-culated using the data of all sampling measurements. The linear fit (Y = A + BX) shows a small, accepta-ble, value for the standard deviation (~0.01004, i.e., a relative error of less than 4%), while the correla-tion coefficient exceeds 0.99.
Figure 2 presents a series of successive in time horizontal lidar profiles arranged vertically and su-perimposed on the Google Sofia City map. As evi-
I. V. Grigorov et al.: Characterization of in-situ-sampled particulate matter in air pollution localized by lidar monitoring
r
rdrr
rrCcPrP
0
')'(2exp)(2
)( 20
drrdSr
21
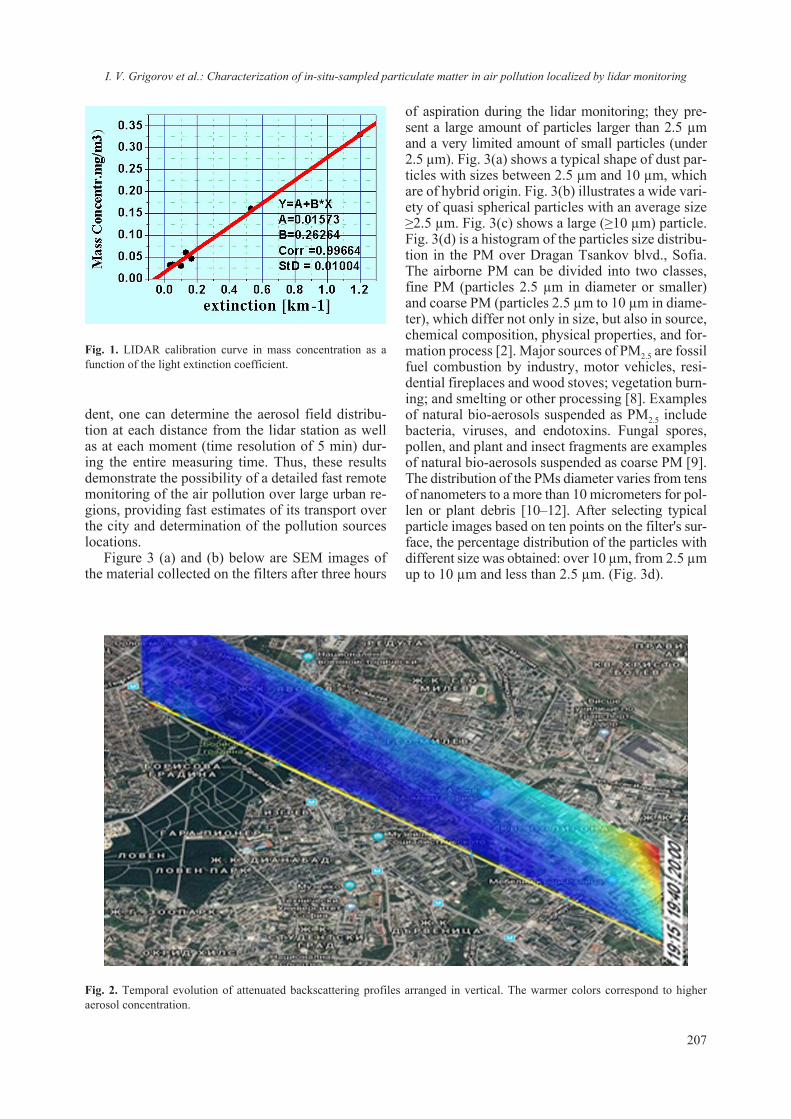
207
dent, one can determine the aerosol field distribu-tion at each distance from the lidar station as well as at each moment (time resolution of 5 min) dur-ing the entire measuring time. Thus, these results demonstrate the possibility of a detailed fast remote monitoring of the air pollution over large urban re-gions, providing fast estimates of its transport over the city and determination of the pollution sources locations.
Figure 3 (a) and (b) below are SEM images of the material collected on the filters after three hours
of aspiration during the lidar monitoring; they pre-sent a large amount of particles larger than 2.5 µm and a very limited amount of small particles (under 2.5 µm). Fig. 3(a) shows a typical shape of dust par-ticles with sizes between 2.5 µm and 10 µm, which are of hybrid origin. Fig. 3(b) illustrates a wide vari-ety of quasi spherical particles with an average size ≥2.5 µm. Fig. 3(c) shows a large (≥10 µm) particle. Fig. 3(d) is a histogram of the particles size distribu-tion in the PM over Dragan Tsankov blvd., Sofia. The airborne PM can be divided into two classes, fine PM (particles 2.5 µm in diameter or smaller) and coarse PM (particles 2.5 µm to 10 µm in diame-ter), which differ not only in size, but also in source, chemical composition, physical properties, and for-mation process [2]. Major sources of PM2.5 are fossil fuel combustion by industry, motor vehicles, resi-dential fireplaces and wood stoves; vegetation burn-ing; and smelting or other processing [8]. Examples of natural bio-aerosols suspended as PM2.5 include bacteria, viruses, and endotoxins. Fungal spores, pollen, and plant and insect fragments are examples of natural bio-aerosols suspended as coarse PM [9]. The distribution of the PМs diameter varies from tens of nanometers to a more than 10 micrometers for pol-len or plant debris [10–12]. After selecting typical particle images based on ten points on the filter's sur-face, the percentage distribution of the particles with different size was obtained: over 10 µm, from 2.5 µm up to 10 µm and less than 2.5 µm. (Fig. 3d).
Fig. 1. LIDAR calibration curve in mass concentration as a function of the light extinction coefficient.
Fig. 2. Temporal evolution of attenuated backscattering profiles arranged in vertical. The warmer colors correspond to higher aerosol concentration.
I. V. Grigorov et al.: Characterization of in-situ-sampled particulate matter in air pollution localized by lidar monitoring

208
Fig. 3. PM with sizes between 2.5 µm – 10 µm (a); PM with size ≥2.5 µm, the fibers reveal the filter structure (b); a large (≥10 µm) particle (c); and particles size distribution in PM over Dragan Tsankov blvd., Sofia (d).
a) b) c)
d)
The dry fraction of the material absorbed on the filters was studied by EDAX analysis for the pres-ence of metals. The data (Fig. 4) showed the presence of Fe, Si, Pb, etc. Our attention was focused on iron, whose concentration was about 0.17 mg/m3 per day, with the permissible limit being 0.04 mg/m3.
The data obtained using Mössbauer spectrosco-py revealed the presence of iron containing phases. The material collected near Dragan Tsankov blvd. has a complicated spectrum (see Fig. 5) in which magnetic and paramagnetic phases can be resolved, i.e. the spectrum is a superposition of sextet- and doublet-type components. The hyperfine parameters
calculated after spectrum evaluation are presented in Table 1. The four sextet components observed in the spectrum have the hyperfine parameters values characteristic of iron oxide phases – hematite (Sxt1 = α-Fe2O3), magnetite (Sxt2 and Sxt3 = Fe3O4), as well as a metal iron phase of α-Fe (Sxt 4). The value obtained of the hyperfine effective magnetic field of this metal iron phase is lower than the one characteristic for bulk material, namely, 33 Т [13]. It is well known that the relation between the hy-perfine field and the magnetic particles volume can be expressed using the collective magnetic excita-tion (CME) model; in our case it reveals the pres-
Fig. 4. EDAX data for powders from the investigated area.
I. V. Grigorov et al.: Characterization of in-situ-sampled particulate matter in air pollution localized by lidar monitoring
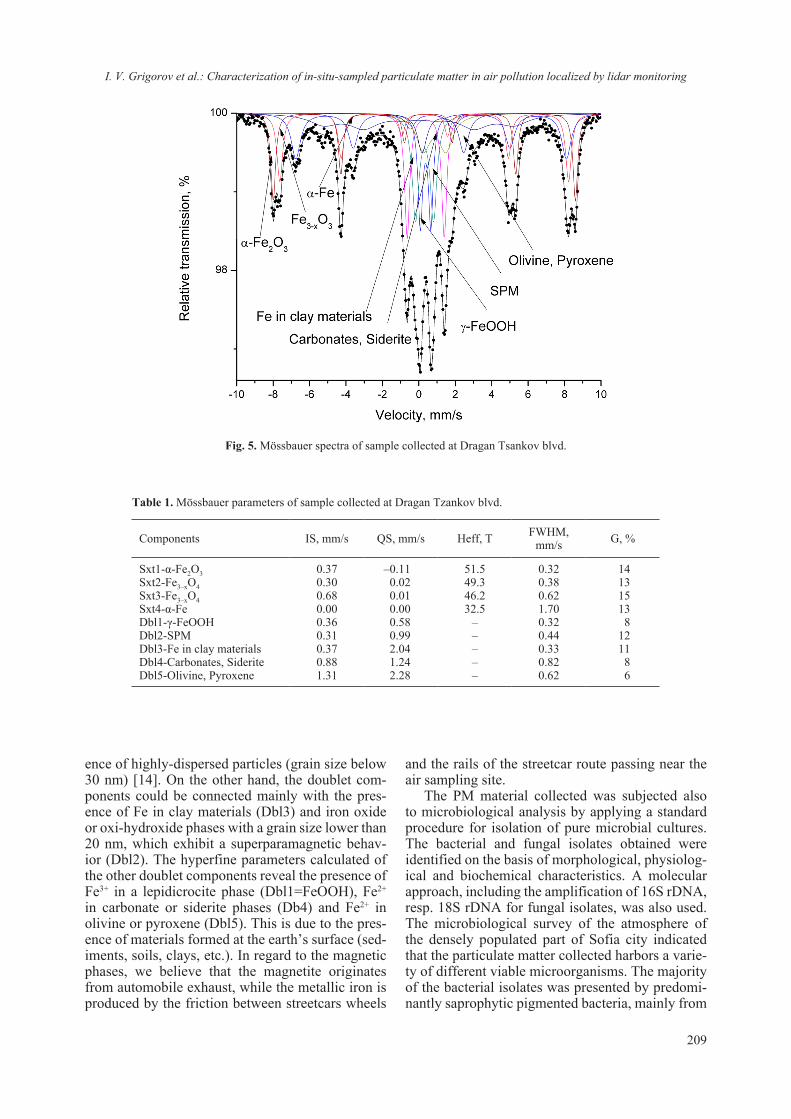
209
ence of highly-dispersed particles (grain size below 30 nm) [14]. On the other hand, the doublet com-ponents could be connected mainly with the pres-ence of Fe in clay materials (Dbl3) and iron oxide or oxi-hydroxide phases with a grain size lower than 20 nm, which exhibit a superparamagnetic behav-ior (Dbl2). The hyperfine parameters calculated of the other doublet components reveal the presence of Fe3+ in a lepidicrocite phase (Dbl1=FeOOH), Fe2+ in carbonate or siderite phases (Db4) and Fe2+ in olivine or pyroxene (Dbl5). This is due to the pres-ence of materials formed at the earth’s surface (sed-iments, soils, clays, etc.). In regard to the magnetic phases, we believe that the magnetite originates from automobile exhaust, while the metallic iron is produced by the friction between streetcars wheels
and the rails of the streetcar route passing near the air sampling site.
The PM material collected was subjected also to microbiological analysis by applying a standard procedure for isolation of pure microbial cultures. The bacterial and fungal isolates obtained were identified on the basis of morphological, physiolog-ical and biochemical characteristics. A molecular approach, including the amplification of 16S rDNA, resp. 18S rDNA for fungal isolates, was also used. The microbiological survey of the atmosphere of the densely populated part of Sofia city indicated that the particulate matter collected harbors a varie-ty of different viable microorganisms. The majority of the bacterial isolates was presented by predomi-nantly saprophytic pigmented bacteria, mainly from
Fig. 5. Mössbauer spectra of sample collected at Dragan Tsankov blvd.
Table 1. Mössbauer parameters of sample collected at Dragan Tzankov blvd.
Components IS, mm/s QS, mm/s Heff, T FWHM, mm/s G, %
Sxt1-α-Fe2O3Sxt2-Fe3–xO4Sxt3-Fe3–xO4Sxt4-α-FeDbl1-γ-FeOOHDbl2-SPMDbl3-Fe in clay materialsDbl4-Carbonates, SideriteDbl5-Olivine, Pyroxene
0.370.300.680.000.360.310.370.881.31
–0.110.020.010.000.580.992.041.242.28
51.549.346.232.5
–––––
0.320.380.621.700.320.440.330.820.62
141315138
121186
I. V. Grigorov et al.: Characterization of in-situ-sampled particulate matter in air pollution localized by lidar monitoring

210
the genus Micrococcus (66%). The genus Bacillus was also abundant, presented by representatives of the species B. pumilus, B. cereus, B. thuringen-sis and B. cereus. One isolate was determined as Staphylococcus equorum. The fungal presence was expressed mainly by the genera Penicillium and Aspergillus. Two of the isolates were related to the genera Cladosporium and Symmetrospora. Figure 6 shows the origin of the organic contamination ab-sorbed on the particles and the estimated number of viable microorganisms in colony-forming units (CFU).
CONCLUSIONS
Combining lidar monitoring with in-situ sam-pling represents an effective first step toward the creation of a highly informative near-real-time monitoring system for a complex analysis of the air quality. This investigation shows that the surface of the micron-sized particles can adsorb both mechani-cal and microbial contaminants, while the liquid en-velope, when the PM is dispersed as aerosols, may preserve this nano-world and, in some cases, create conditions favoring the occurrence of chemical and bio-processes. The lidar maps constructed can be further used for tracing the full air-mass transport, carrying contamination from a number of pollution sources (chemical, biological, dust, etc.), distrib-uted over the scanned region. Further, the sampling schedule should be so chosen as to reveal any char-acteristic seasonal hazardous contamination.
Acknowledgment: This work was financed in part under contract DN 18/16 with the National Science
Fig. 6. Number of microorganisms (CFU/m3) detected at the sampling point: from left to right – heterotrophic aerobic bacteria; oligotrophic microorganisms; fungi; spore-forming bacteria.
Fund, Bulgaria, and included in the European Pro-gram of the COST Аction CA16202.
REFERENCES
1. S. Fuzzi, U. Baltensperger, K. Carslaw, S. Decesari, H. Denier Van Der Gon, M. C. Facchini, D. Fowler, I. Koren, B. Langford, U. Lohmann, E. Nemitz, E., Atmos. Chem. Phys., 15 (14), 8217 (2015).
2. L. Raisi, M. Lazaridis, E. Katsivela, Global NEST J., 12 (1), 84 (2010).
3. C. Mazzoleni, Remote Sensing, 2 (4), 1077 (2010).4. http://www.nsi.bg/nrnm/show2.php?sid=57422&
ezik=bul&e=1281425. L. Slavov, M. Iliev, R. Ilieva, R. Angelova, Ch.
Ghelev, I. Grigorov, G. Kolarov, L . Gurdev V. Gru-deva, D. Stoyanov, I. Nedkov, Machines Technol. Mater., 12 (10), 412 (2018).
6. Al. Carswell, Can. J. Phys., 61, 378 (1983).7. D. Althausen, R. Engelmann, B. Holger, B. Heese, A.
Ansmann, D. Mueller, J. Atmos. Oceanic Technol., 26, 2366 (2009).
8. World Health Organization, Health effects of par-ticulate matter (ISBN 978 92 890 0001 7), 2013.
9. J. Fröhlich-Nowoisky, D. A. Pickersgill, V. R. Després, U. Pöschl, in: Proc. Nat. Acad. Sci., 106 (31), 12814 (2009).
10. R. Jaenicke, Science, 308 (5718), 73 (2005).11. William C. Hinds, Aerosol technology: properties,
behavior, and measurement of airborne particles, John Wiley & Sons, 2012.
12. U. Pöschl, Angew. Chem. Int. Ed., 44 (46), 7520 (2005).
13. B. Fultz, in: Charac terization of Materials. E. Kauf-mann, Wiley, New York, 2011.
14. U. Schwertmann, R. M. Cornell, C. B. Koch, Iron Oxides in the Laboratory: Preparation and Characterization, 3rd Edition, Wiley, New York, 2017.
I. V. Grigorov et al.: Characterization of in-situ-sampled particulate matter in air pollution localized by lidar monitoring

211© 2018 Bulgarian Academy of Sciences, Union of Chemists in Bulgaria
* To whom all correspondence should be sent:
Bulgarian Chemical Communications, Volume 50, Special Issue F (pp. 211–218) 2018
Preparation and antimicrobial properties of silver nanoparticles supported by natural zeolite clinoptilolite
M. I. Panayotova1*, N. N. Mintcheva1, O. T. Gemishev2, G. T. Tyuliev3, G. D. Gicheva1, L. P. Djerahov1
1 Department of Chemistry, University of Mining and Geology, Sofia 1700, Bulgaria 2 Faculty of Biology, Sofia University ‘’St. Kl. Ohridski’’, Sofia 1000, Bulgaria
3 Institute of Catalysis, Bulgarian academy of sciences, Sofia 1113, Bulgaria
Received October 15, 2018; Accepted December 15, 2018
Nanocomposites (AgNPs-zeolite) comprising of silver nanoparticles supported by the natural Bulgarian zeolite clinoptilolite have been prepared by two-step synthesis: silver ions (Ag+) immobilization on the zeolite followed by their thermal reduction and formation of silver nanoparticles (AgNPs). The structure and surface chemistry of as-pre-pared nanocomposites, morphology and size distribution of the obtained AgNPs were characterized by various meth-ods (XRD, BET, XPS, SEM, and TEM). SEM and EDS analyses have shown around 11 wt% Ag which is uniformly dispersed in the zeolite host. On TEM images it can be seen that the composites contain small (3–5 nm) AgNPs situ-ated in the microstructural defects of the zeolite crystals, and bigger AgNPs (20–25 nm) that are located on the surface of zeolite crystallites. The AgNPs-zeolite composites, at low amount added to Peptone water, cease the Escherichia coli cell growth. The synthesized AgNPs-clinoptilolite composites could find an application in the water disinfection.
Keywords: silver nanoparticles, nanocomposites, AgNPs-zeolite, antimicrobial activity.
E-mail: [email protected]
INTRODUCTION
The antimicrobial action of silver species is well known. In doses used, silver is a non-toxic to human, which makes it desirable for applications in sensi-tive media such as drinking water, foods, etc. It is reported that the high specific surface area of silver nanoparticles (AgNPs) leads to higher bactericide activity in comparison with bulk silver metal [1]. In order to be applied effectively for water disinfec-tion, nanoparticles must be protected from aggrega-tion and supported on substrates such as polymers [2], clays [3, 4] or their mixtures [5]. Zeolites are aluminosilicate mesoporous ion exchange materials that have been used to host a variety of metallic spe-cies, including silver. Due to their stable network of hollow channels and pores and their thermal stabil-ity, natural and synthetic zeolites are ideal templates for formation and growth of various nanoparticles. In addition, small nanoparticles are physically pre-vented from aggregation to larger nanoparticles or micron-sized particles [6]. Thus, the zeolites have
attracted the attention as promising material for pro-ducing composite materials bearing AgNPs.
Composites containing AgNPs and different synthesized zeolites (A, L, ZSM-5, and Y), have been prepared in order to test their antibacterial properties [6–10]. The number of works, where nat-ural zeolites are used, is relatively low [11–14]. It is worth to mention that synthetic zeolites are manu-factured by energy consuming processes, using chemicals, and usually these materials have silica to alumina ratio of 1 to 1, while in natural clinoptilo-lite type zeolites this ratio is around 5 to 1. That’s why natural clinoptilolite and its composites are more acid resistant and do not break down in a mild acidic media, where synthetic zeolites do. Natural clinoptilolite is nontoxic and it is widely used as a soil amendment and as a food additive. Moreover, zeolites with low field strength and with higher Si content, such as clinoptilolite, are more selective towards cations with lower charge density, such as Ag+ [15].
All above-described advantages render clinop-tilolite a valuable material for preparing AgNPs-clinoptilolite composites and have attracted our attention. Herein we present the preparation of AgNPs-zeolite nanocomposites by thermal reduc-tion of Ag-loaded zeolite. TEM images and XPS

212
spectra confirm the formation of ultra-small Ag na-noparticles. Ag-containing composites demonstrate rapid antimicrobial activity against Escherichia coli.
EXPERIMENTAL
Natural zeolitic rock from East Rhodopes region of Bulgaria was used. After milling, the fraction 0.09-0.325 mm was deployed. Zeolite was washed following procedure described in our previous work [16]. The zeolite chemical composition, determined by means of silicate analysis, is (in wt.%): SiO2 – 70.19, Al2O3 – 10.90, CaO – 2.87, MgO – 0.51, K2O – 3.41, Na2O – 0.36, Fe2O3 – 0.28, MnO – 0.04, TiO – 0.06, P2O3 < 0.05, SO3 < 0.05, LOI – 10.99. The theoretical cation exchange capacity (TCEC) was found to be 211 meq/100 g zeolite. It is in the same range as the TCEC determined by other authors for clinoptilolite from nearby geographic region [15, 17, 18]. The XRD analysis of washed material has revealed that it contains 73% zeolite clinoptilolite.
Zeolite was loaded with silver ions (Ag+) by placing it in contact with 0.1 M and 0.01 M AgNO3 solutions at solid to liquid ratio (m:v) = 1:20 for 4 hours. At the end of contact time, the AgNO3 so-lution was analyzed by ICP-OES for Na+, K+ and Ca2+. Ag-loaded zeolite was washed with distilled water till negative reaction for Ag+ in washings was observed and then it was dried at 50 °C overnight. During all experiments precautions were taken due to silver light sensitivity. Higher loading of zeolite with Ag+ has been achieved at higher initial con-centration of AgNO3 solution (e.g. 0.1 M). More detail description on the preparation of the Ag-loaded zeolite can be found in our previous work [16]. Samples of the Ag-loaded zeolite were heated at temperatures 200, 400 and 600 °C under air con-ditions for 2 hours. Thus obtained composites were denoted respectively as “z – initial Ag concentra-tion – heating temperature”. For example, z-0.1-200 means “Ag-loaded zeolite, obtained by contacting the zeolite with 0.1 M AgNO3 solution and then heating the material at 200 °C for 2 hours”.
The samples obtained were subjected to XRD (BRUKER D2 Phaser, Cu/Ni radiation, l=1.54184 Å, 30 kV, 10 mA, 2 theta – 5–70, time 1720 s) and SEM-EDS (JEOL – JSM-6010PLLIS/LA) analy-ses. The specific surface area of samples was meas-ured by applying the Brunauer, Emmett and Teller (BET) method and using Quantachrome NOVA 1200e Analyzer working with N2. The samples were preliminary heated at 200 °C, for 16 hours under vacuum. The XPS measurements were car-ried out in the analysis chamber of electron spec-trometer Escalab-MkII (VG Scientific) with a base
pressure of 1 × 10⁻¹⁰ mbar. The spectra were excited with AlKα radiation (hν = 1486.6 eV) at instrumen-tal resolution of 1.1 eV as measured by FWHM of Ag3d5/2 photoelectron line. Energy calibration was made by using the strongest O1s line in the spec-tra centered at 532.7 eV. In order to minimize the effect of irradiation during data acquisition, a low power (5 mA/6 kV) for the X-ray source was used. TEM analysis was carried out on JEOL, model JEM 2100, 200 kV analytical electron microscope.
E. coli strain 3398 was pre-grown on a Luria agar for 16 h at 37 ± 0.1 °C to obtain cultures in a log phase of growth. Antibacterial activity was in-vestigated in peptone water (PW) that was prepared by dissolving the 10.0 g of peptone (Sigma Aldrich) and 0.5 g of NaCl (p.a.) in 1 L distilled water (pH = 7.0). PW and tested materials were sterilized by autoclaving at 121 °C, 20 min. In each one of fif-teen sterile tubes 10 mL of PW were poured. First three tubes with PW and without E. coli were used as negative control. Tested AgNPs – clinoptilolite composites were added in concentration 0.1 wt% to the other three sets each one of three tubes, respec-tively z-0-400, z-0.1-400 and z-0.1-600. 10 mL of E. coli cell suspension, prepared in PW and con-taining 105 colony forming units per milliliter were added to all tubes, except the first three (i.e. the neg-ative control). The tubes containing only PW and E. coli suspension but without any addition of zeolite represented a positive control. All tubes were placed in a thermostat at temperature 37 °C. Samples were taken at 0, 1, 3, 6, 12 and 24 hours. To monitor the cell growth, the samples’ optical density (OD) was measured at 630 nm. The data from the three paral-lel samples are reported after averaging them.
RESULTS AND DISCUSSION
X-ray diffraction
XRD patterns of unloaded zeolite and Ag-loaded-zeolites annealed at 400 °C for 2 h are pre-sented in Fig. 1.
The peak positions of pure zeolite and silver loaded zeolite are essentially identical which indi-cates that the zeolite structure was preserved after silver immobilization. This shows that the zeolite material can be used as an effective support for the fabrication of AgNPs-zeolite composites. However, the intensity of the characteristic clinoptilolite peaks decreases slightly with increasing the silver content in the composite. Since the clinoptilolite is structur-ally stable up to 750 °C [15] this effect may be due to some changes of charge distribution and electro-static fields occurring when exchangeable zeolite ions are replaced by silver ions, as stated also by
M. I. Panayotova et al.: Preparation and antimicrobial properties of silver nanoparticles supported by natural zeolite...

213
other authors [9]. Characteristic silver peaks are not observed for the sample z-0.01-400 (zeolite bearing lower amount of silver), and the Ag peak with the maximum intensity at 2Θ = 38.4° is barely recog-nizable for z-0.1-400 sample. Other characteristic peaks of Ag (according to JCPDS card No.04-0783) are not observed, probably due to the relatively low amount of silver in the zeolite. Similar effects were observed also by other authors [6, 12, 19].
For further characterization of AgNPs-zeolite composites we chose the ones with higher Ag-loading, namely samples z-0.1-200; z-0.1-400 and z-0.1-600 (treated at temperatures 200, 400 and 600 °C).
BET surface
Data on the BET surface of pure and Ag+-loaded zeolite, heated at temperatures 200, 400, 600 °C, i. e. in the range of the clinoptilolite thermal stability, are presented in Table 1.
The values of the BET surface determined for the pure zeolite are in the range of BET values ob-tained by other authors for clinoptilolite from the nearby geographic region (19.6 m2/g – [20] and 30 m2/g – [21]). The relatively low values found for
specific surface area are due to the fact that N2 can-not enter into voids with diameter less that 2 nm [21], such as channels of the natural clinoptilolite and it is adsorbed mainly on the external surface of the zeolite crystals [22].
Samples heating lead to decrease in the BET sur-face with increase of temperature in similar manner for the non-loaded and silver-loaded zeolite. BET analysis showed a reduction in surface area of the silver bearing zeolite with approximately 20% com-pared to non-treated zeolite, most probably because the formed AgNPs could cover some of the zeolite sites. This could be explained by the exchange of K+ and Na+ ions by Ag+ ions and further reduction of Ag+ to Ago. K+ has ionic radius of 152 pm, the ionic radius of Na+ is 116 pm, whereas Ago has an atomic radius of 165 pm [23, 24]. Moreover, forma-tion of silver clusters and growth of AgNPs partially blocks the zeolite pores, thus the specific surface area decreases and the measured pores volume is smaller too. The exchange of K+ for Ag+ has been confirmed by the ICP analysis.
XPS analyses
XPS spectra (Ag3d photoelectron and AgMNN Auger-lines) of studied composites, prepared by silver-loaded zeolite annealing at different tempera-tures, are presented in Fig. 2. The sample z-0.1-600 was additionally crushed in agate mortar before insertion into the analysis chamber for analysis. Results are presented in Fig. 3 and Table 2.
As shown in Fig. 2, the XPS spectra of Ag3d region exhibit a peak at binding energy (BE) of 369.3 eV. It could be assigned to Ago, thus indicat-ing that silver presents as Ago on the zeolite surface. The binding energy of the Ag3d5/2 and Ag3d3/2 doublet for metalic silver is observed at 368.3 eV and 374.3 eV, respectively [25, 26]. Shift to higher BE could be due to the fact that silver is in the form of small particles, only few nanometers in size. In Ag3d region two main peaks centered at 368.7–368.8 eV for Ag3d5/2 and 374.7–374.8 eV for Ag3d3/2 have been reported for AgNPs-faujasite zeolite compos-
Fig. 1. X-ray diffraction patterns of unloaded and Ag-loaded samples: 1 – z-0-400; 2 – z-0.01-400; 3 – z-0.1-400.
Table 1. BET surface of the studied samples and pores volume
Zeolite type z-0-xxx z-0.1-xxx
Temperature, °C SBET, m2/g VP, cm3/g SBET, m2/g VP, cm3/g
200 22 0.09 18 0.07400 20 0.08 16 0.07600 18 0.08 14 0.06
xxx – the corresponding temperature.
M. I. Panayotova et al.: Preparation and antimicrobial properties of silver nanoparticles supported by natural zeolite...

214
Fig. 2. XPS spectra of composites z-0.1-200, z-0.1-400, z-0.1-600 – Ag3d photoelectron and AgMNN Auger spectra.
Fig. 3. XPS spectra of composite z-0.1-600 – Ag3d photoelectron and AgMNN Auger spectra of as prepared and crushed sample.
Table 2. Surface composition (in atomic %) for z-0.1-600 sample in as prepared form and after crushing in agate mortar before insertion into the analysis chamber for analysis
Sample O Si Al Fe Mg K Ca Cl Ag
As prepared 58.5 30 5.43 0.81 1.3 0.7 0.2 0.2 2.84
Crushed 56.1 29.7 5.08 0.5 0.93 1 0.52 0.95 5.17
ite [12] for particles bigger than the described in the present paper. Practically, the temperature at which the silver-loaded zeolite is annealed does not impact the BE, as it can be seen in Fig. 2. According to the literature, the standard Auger parameter of metal-lic state silver is 726.0 eV, and that of silver ion is 724.0 eV [12]. The calculated Auger parameters for
our sample is 724.6 eV thus suggesting that the silver is under different forms in the composite. Figure 3 further confirms that both metallic (Ag3d5/2 at 369.1 eV (BE), and AgM4VV at 355.2 eV (KE)) and ionic silver (369.7 eV and 352.7 eV respectively) present in the samples. The presence of Ago parti-cles in the zeolite implies that a thermal reduction
M. I. Panayotova et al.: Preparation and antimicrobial properties of silver nanoparticles supported by natural zeolite...

215
process of Ag+ has occurred under air conditions in the Ag+-bearing zeolite. Similar processes under oxidative conditions were observed also by other authors [8, 11].
Data presented in Fig. 3 (peaks’ intensity) and Table 2 show that the additional crushing leads to an increase of Ag3d peaks indicating higher abun-dance of AgNPs on the surface. This could be as-signed to an additional exposure of silver nanopar-ticles which come from the zeolite cavities on the surface.
SEM and EDS analyses
Scanning electron micrographs of the studied samples (z-0-400 and z-0.1-400) are presented in Figs. 4 and 5 respectively. The morphology of
zeo lite is changed after its loading with silver, as it can be seen in Fig. 4. Treatment in AgNO3 solution for 4 hours to achieve silver ions immobilization causes size decrease of the zeolite particles. EDS spectrum of AgNPs-clinoptilolite composite and the mapping with respect to Ag are presented in Fig. 6. Elemental composition of pure zeolite and AgNPs-clinoptilolite composite are compared in Table 3. EDS elemental mapping (Fig. 6b) shows that sil-ver is uniformly dispersed in the zeolite host. EDS analysis indicated the presence of around 11 wt.% Ag on the surface of sample z-0.1-400.
TEM analyses
Transmission electron microscope images of the AgNPs-zeolite composite are presented in Fig. 7.
Fig. 4. Scanning electron micrographs – overview of samples (a) z-0-400, (b) z-0.1-400.
Fig. 5. Scanning electron micrographs of samples (a) z-0-400, (b) z-0.1-400.
a) b)
a) b)
M. I. Panayotova et al.: Preparation and antimicrobial properties of silver nanoparticles supported by natural zeolite...

216
TEM analysis indicates that AgNPs could be ob-served both on the crystallites’ surface (Fig. 7a) and on the zeolite crystals (Fig. 7b). AgNPs located on the crystallites are bigger (20–25 nm) than those situated on the active sites of the zeolite crystals (3–5 nm). The primary building units of zeolites are the SiO4 and AlO4 tetrahedra. They are connected via oxygen into secondary building units, which
are then linked into a three-dimensional crystalline structure of zeolite. The building units are connect-ed in a way forming three types of channels. Two of them are parallel, and made of ten and eight-membered rings of Si/AlO4. The free diameters of the 10-ring channels are 0.44×0.72 nm, while the free diameters of the 8-member ring channels are 0.41×0.47 nm. The third type of channels is defined
Fig. 6. EDS and SEM results: (a) EDS spectrum of z-0.1-400 sample – points 1-4 on Fig. 4b, (b) Elemental mapping (Ag) of z-0.1-400 sample.
Table 3. Elemental composition (wt.%) of samples z-0-400, z-0.1-400 based on EDS data
Sample z-0-400 Sample z-0.1-400Point1 O Si Ca Al K Point2 O Si Ca Al K Ag1 47.57 38.13 2.89 6.78 4.62 1 46.92 31.28 1.64 6.20 2.67 11.282 50.99 36.96 2.64 5.82 3.58 2 48.00 31.52 1.60 6.24 2.65 9.983 46.68 39.43 3.17 6.39 4.33 3 38.34 37.25 2.34 6.47 2.07 13.534 48.24 37.65 2.95 6.93 4.24 4 44.90 34.25 1.47 5.84 1.83 11.705 47.02 45.02 1.71 3.58 2.67 Aver. 44.54 33.58 1.76 6.19 2.31 11.62Aver. 48.10 39.44 2.67 5.90 3.89
1 – see Fig. 5a; 2 – see Fig. 5b.
a)
b)
M. I. Panayotova et al.: Preparation and antimicrobial properties of silver nanoparticles supported by natural zeolite...

217
by eight-membered rings with free diameters 0.40 × 0.55 nm. These channels are vertical [15]. The described structure defines primary porosity (or mi-croporosity) of zeolite mineral crystals, where the AgNPs cannot be aligned. Additionally, clinoptilo-lite possesses secondary structure of fracture-type porosity, with pores from 25–50 nm to 100 nm in size, shaped between clinoptilolite crystals [21], which are capable to accommodate AgNPs formed by thermal reduction of incorporated silver ions. Thus, considering the zeolite structure we believe that the small-sized AgNPs are located on the sur-face of zeolite crystals and are uniformly distrib-uted, while the bigger AgNPs are formed in the mesoporous structure of zeolite crystallites by ag-gregation.
Antibacterial activity
Antibacterial activity of pure zeolite and two Ag-loaded zeolite samples (z-0.1-400 and z-0.1-600)
against E. coli strain 3398 were tested. Data on the antibacterial activity of the AgNPs-zeolite compos-ite material are presented in Fig. 8. As it can be seen in Fig. 8, the synthesized AgNPs-zeolite composite is an efficient bactericide material with respect to E. coli even in low concentration. There is no growth E. Coli for samples z-0.1-400 and z-0.1-600. The measured optical density of the samples coincides with that of the positive control at the zero hour. Destruction of E. Coli present in nutritive media by silver nanoparticles supported on Mexican clinop-tilolite have been reported by other authors [13]. AgNPs could act as a platform to deliver and release the Ag+ ions inside the bacteria cells. In the pres-ence of a zeolite free of silver, bacteria are attached to zeolite, thus stabilized and reproduce themselves rapidly.
The behavior of both composites (z-0.1-400 and z-0.1-600) is very similar, indicating no significant effect of annealing temperature of the silver loaded zeolite on their antibacterial activity.
Fig. 7. Transmission electron microscope images of the AgNPs-zeolite composite material (sample z-0.1-400).
a) b)
Fig. 8. Antibacterial activity of the Ag NPs-zeolite composite material – (0.1 wt%) in peptone water toward E. coli 3398: 1 ― - ― negative control; 2 ― ― ― positive control; 3 - - - - - - sample z-0-400; 4 ――― sample z-0.1-400; 5 ― - - ― sample z-0.1-600.
a) b)
M. I. Panayotova et al.: Preparation and antimicrobial properties of silver nanoparticles supported by natural zeolite...

218
CONCLUSIONS
As results of the study carried out the following conclusions can be drawn:
1. Zeolite loaded with Ag+ can be used as a pre-cursor to prepare AgNPs-zeolite composites by re-duction of Ag+ ions at elevated temperature (200–600 °C) under air conditions.
2. Composites containing around 11 wt% Ag in the zeolite have been prepared.
3. Annealing temperature of Ag-loaded zeo-lite does not impact the properties of AgNPs-composites.
4. The composites contain small (3–5 nm) AgNPs situated in the microstructural defects of the zeolite crystals, and bigger AgNPs (20–25 nm) that are located on the surface of zeolite crystallites.
5. The AgNPs-zeolite composites, at low amount added to Peptone water, stop the Escherichia coli cell growth.
Acknowledgements: The authors thank the National Science Fund of Bulgaria for the financial support of the project DN-17/20.
REFERENCES
1. B. L. Ouay, F. Stellacci, Nano Today, 10, 339 (2015). 2. O. Eksik, A. T. Erciyes, Y. Yagci, Pure Appl. Chem.,
45, 698 (2008).3. H. Miyoshi, H. Ohno, K. Sakai, N. Okamura, H.
Kourai, J. Colloid Interface Sci., 345, 2, 433 (2010).4. T. Phothitontimongkola, K. Sanuwong, N. Siebers,
N. Sukpirom, F. Unob, Appl. Clay Sci., 80–81, 346 (2013).
5. S. C. Motshekga, S. S. Ray, M. S. Onyango, M. N. B. Momba, Appl. Clay Sci., 114, 330 (2015).
6. M. S.-Li Yee, P. S. Khiew, Y. F. Tan, W. S. Chiu, Y.-Y. Kok, C.-O. Leong, Microporous Mesoporous Mater., 218, 69 (2015).
7. D. Jiraroj, S. Tungasmita, D. N. Tungasmita, Powder Technol., 264, 418 (2014).
8. R. Bartolomeu, R. Bértolo, S. Casale, A. Fernandes, C. Henriques, P. da Costa, F. Ribeiro, Microporous Mesoporous Mater., 169, 137 (2013).
9. S. Meenakshi, S. Devi, K. Pandian, R. Devendiran, M. Selvaraj, Mater. Sci. Eng., C 69, 85 (2016).
10. A. M. Hanim, N. A. N. N. Malek, Z. Ibrahim, Appl. Surf. Sci., 360, 121 (2016).
11. N. S. Flores-Lopez, J. Castro-Rosas, R. Rami rez-Bon, A. Mendoza-Cordova, E. Larios-Rodriguez, M. Flores-Acosta, J. Mol. Struct., 1028, 110 (2012).
12. L. Ferreira, A. M. Fonseca, G. Botelho, C. Almeida-Aguiar, I. C. Neves, Microporous Mesoporous Mater., 160, 126 (2012).
13. R. Guerra, E. Lima, M. Viniegra, A. Guzman, V. Lara, Microporous Mesoporous Mater., 147, 267 (2012).
14. B. Khodadadi, M. Bordbar, A. Yeganeh-Faal, M. Nasrollahzadeh, J. Alloy Compd., 719, 82 (2017).
15. K. Margeta, N. Z. Logar, M. Šiljeg, A. Farkaš, in: Water Treatment, W. Elshorbagy, R. K. Chowdhury (eds.), IntechOpen, UK, 2013, p. 81.
16. M. Panayotova, N. Mintcheva, L. Djerahov, G. Gicheva, J. Min. Geol. Sci., 61, part II, 87 (2018).
17. M. Tomašević-Čanović, J. Serb. Chem. Soc., 70, (11), 1335 (2005).
18. O. Santiago, K. Walsh, B. Kele, E. Gardner, J. Chapman, Springerplus, 5, 571 (2016).
19. Y. Liu, F. Chen, S. M. Kuznicki, R. E. Wasylishen, Z. Xu, J. Nanosci. Nanotechnol., 9, 2768 (2009).
20. L. R. Harutyunyan, G. P. Pirumyan, Proc. Yerevan State University, Chem. Biol., 1, 21 (2015).
21. P. Kowalczyk, M. Sprynskyy, A. P. Terzyk, M. Lebedynets, J. Namieśik, B. Buszewski, J. Colloid Interface Sci., 297, 77 (2006).
22. G. V. Tsitsishvili, in: Molecular Sieves, ACS, Wash-ington DC, 1973.
23. https://en.wikipedia.org/wiki/Ionic_radius.24. https://en.wikipedia.org/wiki/Atomic_radii_of_the_
elements_(data_page).25. Perkin-Elmer Corporation, Handbook of X-ray
photoelectron spectroscopy, Physical electronics, Minnesota, USA, 1992.
26. M. T. Anthony, M. P. Seah, Surf. Interface Anal., 6 (3), 95 (1984).
M. I. Panayotova et al.: Preparation and antimicrobial properties of silver nanoparticles supported by natural zeolite...
219
CONTENTS
Preface ............................................................................................................................................................................5
H. I. Sbirkova-Dimitrova, S. Georgieva, V. Ganev, B. L. Shivachev, Crystallization and crystal structure of lysozyme in the presence of nanosized Titanium dioxide ............................................................................7
E. S. Serafimova, V. V. Stefanova, Spectroscopic analysis of sewage sludge and wood ash from biomass used for land remediation ................................................................................................................................15
V. M. Dyulgerov, L. T. Dimowa, R. Rusev, R. P. Nikolova, B. L. Shivachev, Conformational polymorphism in (3-acetamidophenyl)boronic acid ................................................................................................................23
Ts. Ibreva, Ts. Dimitrov, R. Titorenkova, I. Markovska, E. Tacheva, O. Petrov, Synthesis and characterization of willemite ceramic pigments in the system xCoO. (2–x)ZnO. SiO2 ..................................31
D. Paneva, Z. Cherkezova-Zheleva, V. Petkova, B. Kostova, H. Kolev, G. Avdeev, G. Stefanov, Investigation on crystallization and transformation processes in amorphous alloy Fe81B13.5Si3.5C2 ................38
S. I. Yordanov, A. D. Bachvarova-Nedelcheva, R. S. Iordanova, I. D. Stambolova, Sol-gel synthesis and properties of Sm modified TiO2 nanopowders ................................................................................................42
V. A. Angelov, E. H. Ivanov, R. K. Kotsilkova, TEM analysis of gold nanoparticles attached on the surface of organoclay and obtained by two different methods ...................................................................................49
A. Nikolov, R. Titorenkova, N. Velinov, Z. Delcheva, Characterization of a novel geopolymer based on acid-activated fayalite slag from local copper industry..............................................................................54
V. Kostov-Kytin, R. Nikolova, G. Avdeev, XRD study on the structural evolution of Zn-exchanged titanosilicate ETS-4 during thermal treatment ................................................................................................62
A. Stoyanova-Ivanova, I. Ilievska, V. Petrova, M. Gueorgieva, V. Petrov, L. Andreeva, A. Zaleski, V. Mikli, Physicochemical characterization on clinically retrieved TriTanium orthodontic archwires .........................73
L. Tsvetanova, V. Kostov-Kytin, S. Ferdov, R. Nikolova, Elastic behavior of the titanosilicate framework in Mn-ETS-4 ...................................................................................................................................................80
N. Rangelova, L. Aleksandrov, Ts. Angelova, N. Georgieva, Synthesis, structure and properties of hybrids doped with copper ions in the silica-hydroxypropyl cellulose system ...........................................................86
Z. Cherkezova-Zheleva, D. Paneva, B. Kunev, H. Kolev, M. Shopska, I. Nedkov, Challenges at characterization of particulate matter – a case study .......................................................................................93
K. Sezanova, D. Kovacheva, D. Rabadjieva, R. Gergulova, Mg- and Zn-modified calcium phosphate fine powders examined by Rietveld refinement .....................................................................................................99
V. B. Kurteva, B. L. Shivachev, R. P. Nikolova, Polydentate ligands combining pirlinidole and piperazine fragments .......................................................................................................................................................107
R. I. Rusew, V. B. Kurteva, B. L. Shivachev, Antibacterial activity of novel quaternary ammonium salts of quinoline and 4-pyrolidino pyridine .........................................................................................................115
P. I. Dankov, M. T. Iliev, V. P. Levcheva, Bi-axial dielectric anisotropy of crystalline materials and its characterization by resonance microwave methods ......................................................................................126
I. K. Mihailova, L. N. Radev, Åkermanite based bioactive ceramics: structural and in-vitro bioactivity characterization ............................................................................................................................................135
E. D. Encheva, M. K. Nedyalkov, M. P. Tsvetkov, M. M. Milanova, The influence of the modification of zirconium tungstate with Eu(III) on the α → β phase transition temperature and optical band gap.............143
T. M. Petrova, N. I. Velinov, I. B. Ivanov, T. T. Tabakova, V. D. Idakiev, I. G. Mitov, Structural characterization of Au/Cu1–хMnхFe2O4 catalysts suitable for WGSR ............................................................150
B. C. Georgieva, D. B. Karashanova, R. R. Angelov, A. M. Slavov, I. N. Vasileva, T. M. Dodevska, TEM characterization of silver and gold nanoparticles synthesized by а ‘green’ method using water extract of Rosa Damascena petals waste and beer yeast ...............................................................................158
Bulgarian Chemical Communications, Volume 50, Special Issue F, 2018
220
T. I. Lazarova, D. G. Kovacheva, A new phase obtained by oxidation of nanosized spinel MnFe2O4 .......................163
O. Dimitrov, I. Stambolova, K. Lazarova, T. Babeva, S. Vassilev, M. Shipochka, The effect of different acid stabilizers on the morphology and optical properties of ZrO2 sol-gel films .................................................167
I. Koseva, P. Tzvetkov, P. Ivanov, A. Yordanova, V. Nikolov, Rare Earth doped silicate glass-ceramics for LED application ............................................................................................................................................173
R. N. Ivanova, M. D. Dimitrov, G. S. Issa, D. G. Kovacheva, T. S. Tsoncheva, Catalytic oxidation of ethyl acetate by copper modified Ce-Mn and Ce-Ti mesoporous nanostructured oxides ......................................179
E. Serafimova, V. Petkova, B. Kostova, Spectroscopic and XRD analysis of sulphuric acid treated biodegradable waste ......................................................................................................................................186
E. Todorova, G. Chernev, Sol-gel silica hybrid materials – characterisation and long-term stability ........................192
N. Kaneva, A. Bojinova, K. Papazova, D. Dimitrov, Heterogeneous photocatalytic degradation of Reactive Black 5 in aqueous suspension by La-modified ZnO powders .....................................................................198
I. V. Grigorov, G. V. Kolarov, L. L. Gurdev, Z. P. Cherkezova-Zheleva, L. S. Slavov, Ch. G. Ghelev, R. V. Ilieva, M. V. Iliev, V. I. Groudeva, D. V. Stoyanov, I. I. Nedkov, Characterization of in-situ-sampled particulate matter in air pollution localized by lidar monitoring ....................................................205
M. I. Panayotova, N. N. Mintcheva, O. T. Gemishev, G. T. Tyuliev, G. D. Gicheva, L. P. Djerahov, Preparation and antimicrobial properties of silver nanoparticles supported by natural zeolite clinoptilolite ..................................................................................................................................................211
Bulgarian Chemical Communications, Volume 50, Special Issue F, 2018